FULL TITLE HERE IN ALL CAPS IN A FORMAT - NOVA
246
Design and Evaluation of a Technological-enhanced Lab Environment for a Systems and Network Administration Course Tareq M. Alkhaldi BCompEd, MIT A thesis submitted in fulfilment of the requirements for the degree of Doctor of Philosophy in Information Technology School of Electrical Engineering and Computing The University of Newcastle Australia January 2019
-
Upload
khangminh22 -
Category
Documents
-
view
1 -
download
0
Transcript of FULL TITLE HERE IN ALL CAPS IN A FORMAT - NOVA
Design and Evaluation of a Technological-enhanced
Lab Environment for a Systems and Network
Administration Course
Tareq M. Alkhaldi
BCompEd, MIT
A thesis submitted in fulfilment of the requirements for the degree of
Doctor of Philosophy in Information Technology
School of Electrical Engineering and Computing
The University of Newcastle
Australia
January 2019

ii
Statement of Originality
I hereby certify that the work embodied in the thesis is my own work, conducted under
normal supervision. The thesis contains no material which has been accepted, or is being
examined, for the award of any other degree or diploma in any university or other tertiary
institution and, to the best of my knowledge and belief, contains no material previously
published or written by another person, except where due reference has been made. I give
consent to the final version of my thesis being made available worldwide when deposited
in the University’s Digital Repository, subject to the provisions of the Copyright Act 1968
and any approved embargo.
Tareq Alkhaldi

iii
Statement of Authorship
I hereby certify that the work embodied in this thesis contains published papers of which I
am a joint author. I have included as part of the thesis a written statement, endorsed by my
supervisor, attesting to my contribution to the joint publications.
Tareq M. Alkhaldi
By signing below, I confirm that Tareq Alkhaldi contributed to the following publications:
• Alkhaldi T., et al., “A review of contemporary virtual and remote laboratory
implementations: observations and findings”, Journal of Computers in Education,
Sept. 2016, vol. 3, issue 3., pp.329-351.
• Athauda, R.I., et al., “Design of a Technology-enhanced Pedagogical Framework for
a Systems and Networking Administration course incorporating a Virtual Laboratory”
to appear in the Proceedings of the 2018 IEEE Frontiers in Education conference, San
Jose, CA, USA.
Supervisor: Dr Rukshan I. Athauda

iv
Acknowledgments
I would like to thank the people who contributed to the completion of this thesis.
Firstly, I would like to thank Dammam University in Saudi Arabia for offering the
scholarship and sponsoring me financially throughout my studies. I also would like to thank
my supervisors Dr Rukshan Athauda and Dr Ilung Pranata for their continuous support of
my PhD study and related research. Their guidance and knowledge helped me throughout
the research process and the writing of this thesis.
I would like to express my sincere thanks to my family.
I also would like to extend my thanks to the research participants who made a major
contribution toward achieving the goal of this study. Finally, I would like to thank every
person who offered help and support at every stage of my study.

v
Table of Contents
Chapter Page
Acknowledgments ......................................................................................................... iv
Table of Contents ............................................................................................................v List of Tables............................................................................................................... viii
List of Figures ............................................................................................................... xi List of Acronyms ......................................................................................................... xiii
Abstract ........................................................................................................................xiv List of Publications ........................................................................................................ xv
Chapter I........................................................................................................................ 16 1. Introduction ........................................................................................................ 16
1.1 Background ..................................................................................................... 16 1.2 Motivations, Significance and Benefits ............................................................ 18
1.3 Research Approach .......................................................................................... 18 1.4 Thesis Structure ............................................................................................... 20
1.5 Summary ......................................................................................................... 21 Chapter II ...................................................................................................................... 22
2. Literature Review ............................................................................................... 22 2.1 Virtual and Remote Lab Implementations in Different Disciplines .................. 22
2.1.1 Virtual and Remote Laboratories for Programming Robots .......................... 23 2.1.2 Remote Lab in Biology ................................................................................ 24
2.1.3 The Virtual Chemistry Lab (ChemLab) ........................................................ 25 2.1.4 Virtual Laboratory for Physics ..................................................................... 26
2.1.5 VISIR Remote Labs in Engineering ............................................................. 27 2.1.6 Virtual Laboratory Project in Science and Engineering ................................ 28
2.1.7 Online Labs for STEM Education ................................................................ 29 2.1.8 VPLab: Virtual Programming Laboratory .................................................... 29
2.1.9 Virtual Computing Lab ................................................................................ 30 2.1.10 NVBLab: The Virtual Collaborative Networking Lab .................................. 31
2.1.11 Virtual Networking Lab ............................................................................... 32 2.2 Observations and Findings ............................................................................... 32
2.2.1 Advantages of Technology-enhanced Labs .................................................. 35 2.2.2 Revisiting the Research Question ................................................................. 37
2.3 Technology-enhanced Labs in System Level Courses in Computing ................ 40 2.3.1 Virtualization Technologies and Virtual Computing Labs ............................ 40
2.3.2 Virtual Labs for System Level Courses in Computing .................................. 43 2.4 Summary ......................................................................................................... 56
Chapter III ..................................................................................................................... 58 3. Proposed Framework .......................................................................................... 58
3.1 TPACK Framework......................................................................................... 58 3.2 Pedagogy and Learning Theories/Principles (PLTs) ......................................... 60
3.2.1 Constructive Alignment ............................................................................... 60 3.2.2 Kolb’s Experiential Learning Cycle ............................................................. 61
3.2.3 Bloom and SOLO Taxonomies .................................................................... 62

vi
3.2.4 Collaborative Learning................................................................................. 64 3.2.5 Formative Assessments and Feedback .......................................................... 65
3.3 Applying PLTs in the Proposed Framework .................................................... 66 3.3.1 Curriculum Design ....................................................................................... 66
3.3.2 Design of Teaching and Learning Activities ................................................. 68 3.3.3 Design of Assessment Tasks ........................................................................ 71
3.4 Design of Technology Architecture and Artefacts ............................................ 73 3.5 Summary ......................................................................................................... 77
Chapter IV ..................................................................................................................... 79 4. Research Methodology........................................................................................ 79
4.1. Design-Based Research (DBR) ........................................................................... 79 4.2. Research Methods ............................................................................................... 83
4.2.1. Quantitative Research ...................................................................................... 83 4.2.2. Qualitative Research ........................................................................................ 84
4.2.3. Mixed Methods ............................................................................................... 85 4.3. Iterations - Development of Prototypes ............................................................... 87
4.3.1. Iteration 1 ........................................................................................................ 87 4.3.2. Iteration 2 ........................................................................................................ 90
4.4. Summary ............................................................................................................ 93 Chapter V ...................................................................................................................... 94
5. Iteration 1 – Centralised Lab and Feedback Tool ................................................. 94 5.1 Context ................................................................................................................ 94
5.2 Research Design .................................................................................................. 96 5.3 Data Collection .................................................................................................. 101
5.4 Results and Discussion ....................................................................................... 102 5.5 Summary ........................................................................................................... 127
Chapter VI ................................................................................................................... 128 6. Iteration 2 – TePF Implementation & Evaluation .............................................. 128
6.1. Aims.............................................................................................................. 128 6.2. Research Design ............................................................................................ 129
6.3. Results and Discussion .................................................................................. 132 6.4. Summary ....................................................................................................... 174
Chapter VII ................................................................................................................. 177 7. Design Principles .............................................................................................. 177
7.1. Reflections .................................................................................................... 177 7.2. Deriving Design Principles ............................................................................ 179
7.3. Summary ....................................................................................................... 182 Chapter VIII ................................................................................................................ 183
8. Conclusion ........................................................................................................ 183 8.1. Summary ....................................................................................................... 183
8.1.1. First Iteration ............................................................................................. 185 8.1.2. Second Iteration ......................................................................................... 186
8.1.3. Design Principles ....................................................................................... 187 8.2. Main Contributions ........................................................................................ 189
8.3. Future Work .................................................................................................. 190 References ................................................................................................................... 193
vii
Appendix A: Survey– 2016.......................................................................................... 205 Appendix B: Survey– 2017 .......................................................................................... 207
Appendix C: Focus Group Discussion ......................................................................... 213 Appendix D: Screenshots from the Feedback tool and Dashboard ................................ 214
Appendix E: The Redesigned Labs for INFT2031 ....................................................... 215 Appendix F: Reliability Statistics................................................................................. 225
Appendix G: Descriptive Analysis of Quantitative Data............................................... 240

viii
List of Tables
Table Page
Table 2.1: Virtual and Remote Lab Implementations in Different Disciplines ................ 34
Table 2.2: Virtual Labs (based on virtualization technologies) for System Level Courses
in Computing ................................................................................................................. 44
Table 2.3: Classification of Related Work ...................................................................... 55 Table 3. 1: Revised Bloom’s Taxonomy Levels (Anderson & Krathwohl, 2001) ........... 62
Table 3. 2: Cognitive Processes in SOLO levels (Biggs & Collis, 1982; Biggs, 2003, p.
34-53) ............................................................................................................................ 63
Table 3. 3: Alignment of Learning Outcomes, Teaching and Learning Activities and
Assessment Tasks .......................................................................................................... 66
Table 3. 4: Teaching and Learning Plan for Systems and Network Administration Course
...................................................................................................................................... 67
Table 4. 1: Factor Loading of CFA to verify the construct validity of items in the
instrument ..................................................................................................................... 88
Table 4. 2: Model Fit Summary for the TAM model (n= 147) ........................................ 88
Table 4. 3: Cronbach alpha Reliability Coefficient (Reliability Analysis)....................... 89
Table 4. 4: Scale for Mean ............................................................................................. 89
Table 4. 5: Results of Confirmatory Factor Analysis (CFA) ........................................... 91
Table 4. 6: Summary of Confirmatory Factor Analysis (CFA) in Iteration 2 .................. 92 Table 5. 1: Course Plan for INFT2031 ........................................................................... 95
Table 5. 2: Types of Virtual Labs and Feedback Tool used in INFT 2031 for the
Experiment .................................................................................................................... 99
Table 5. 3: Quasi-experimental Design to Answer RQ3 ............................................... 101
Table 5. 4: Descriptive Statistics of Student Responses about the Decentralised Virtual
Lab Environment ......................................................................................................... 102
Table 5. 5: Descriptive Analysis for Decentralised Labs (n=83) ................................... 103
Table 5. 6: Descriptive Statistics of Student Responses to the Centralised Virtual Lab
Environment ................................................................................................................ 104
Table 5. 7: Descriptive Analysis on Centralised Lab Environment Responses (N=69).. 105
Table 5. 8: The Relationships between the Factors that Affect Student Satisfaction ..... 106
Table 5. 9: Paired t-test for the Two Virtual Labs in INFT2031 ................................... 107
Table 5. 10: Qualitative Analysis of Q1 in the Survey .................................................. 109
Table 5. 11: Thematic Analysis for Q12 – Preference for Centralised Lab ................... 110
Table 5. 12: Thematic Analysis for Q12 – Preference for Decentralised Lab ................ 112
Table 5. 13 : Thematic Analysis for Q13 – Disadvantages for Azure Cloud and External
Drive ........................................................................................................................... 114

ix
Table 5. 14: Thematic Analysis of Q14 – Suggestions for Cloud Lab ........................... 117
Table 5. 15: Thematic Analysis of Q15 – Reasons for not using the Feedback Tool ..... 119
Table 5. 16: Item Descriptive Analysis Results of the Feedback Scripts Tool (n=51) ... 120
Table 5. 17: Thematic Analysis of Q17 – Reason for Rating of Feedback Tool ............ 121
Table 5. 18: Thematic Analysis of Q23– Suggestions to Improve Feedback Tool ........ 123
Table 5. 19: Number of students’ marks used for the Quasi-experiment ....................... 125
Table 6. 1: Quasi-Experiment Design for Iteration 2 .................................................... 130
Table 6. 2: The Structure of the Survey used to evaluate the TePF ............................... 131
Table 6. 3: Number of Students Participating in the Quasi-Experiment ........................ 132
Table 6. 4: Students’ Responses to Survey Question “Overall, what contributed most
significantly to your learning in INFT2031? In other words, what are the important
features to help in learning INFT2031? (Select all that apply)” ................................... 135
Table 6. 5: Thematic Analysis of Question 2 in Survey Section 4 – “Which kind of
activities helped you most in learning? (i.e., group work, review questions, online
quizzes, reading activities, discussion boards). Explain your answer.” ........................ 137
Table 6. 6: Survey Results for Evaluation of Lab Activities (n = 71) ............................ 140
Table 6. 7: Descriptive Statistics for Evaluation of Lab Activities (n= 71) ................... 141
Table 6. 8: Survey Results for Lab Activities Experiential Learning Stages (n= 72) ..... 142
Table 6. 9: Descriptive Statistics for Experiential Learning Stages (n= 71) .................. 142
Table 6. 10: Descriptive statistics for the Student Approaches to Learning (R-SPQ-2F) (n
=68) ............................................................................................................................. 143
Table 6. 11: Descriptive Statistics for Student Approaches to Learning (n = 68) .......... 144
Table 6. 12: Correlation Analysis for Evaluation of Lab Activities among Survey
Instruments Scales (n= 74)........................................................................................... 145
Table 6. 13: Survey Results for Evaluation of Virtual Lab (n= 70) ............................... 146
Table 6. 14: Evaluation of Scales for Virtual Labs (n = 70) .......................................... 146
Table 6. 15: Cloud vs Server-Based Lab ...................................................................... 147
Table 6. 16: Thematic Analysis for “What do you like most in the virtual IT infrastructure
lab? Why? Explain your answer”. ................................................................................ 147
Table 6. 17: Thematic Analysis for “Any disadvantages of using virtual IT infrastructure
lab?” ........................................................................................................................... 150
Table 6. 18: Focus Group Discussion – “What is your opinion on the virtual labs used in
labs in INFT2031? Did you find the virtual labs easy to use?” ..................................... 152
Table 6. 19: Thematic Analysis for “What are the features that you would like to see
implemented in future?”............................................................................................... 155
Table 6. 20: Reasons for Choosing Server-based Lab Environment ............................. 157
Table 6. 21: Reasons for Choosing PC-based Lab Environment ................................... 158
Table 6. 22: Thematic Analysis of Section 2, Question 1. ............................................ 160
Table 6. 23: Comparison of Ratings of the Feedback Tool between the 2016 and 2017
Cohorts ........................................................................................................................ 162

x
Table 6. 24: Results for “What is the primary reason for your rating in question 2
above?” ....................................................................................................................... 162
Table 6. 25: Descriptive Analysis of the Feedback Script Tool (n= 44) ........................ 164
Table 6. 26: Thematic analysis for “What features did you like in the INFT2031 labs? For
example, did you find the feedback and dashboard with the virtual labs easy to use and
user-friendly?” ............................................................................................................ 165
Table 6. 27: Thematic Analysis of Section 2, Question 1 ............................................. 166
Table 6. 28: Descriptive Analysis on Items related to the Dashboard Tool (n= 29) ....... 168
Table 6. 29: Results for “How satisfied are you with the dashboard view?” ................. 168
Table 6. 30: Thematic Analysis for “What is the primary reason for your rating in
question 2 above?” ...................................................................................................... 169
Table 6. 31: Thematic Analysis of Focus Group Question – “How did you find the course
INFT2031? The structure, lectures, labs, formative assessments (such as quizzes, review
questions, group work, practical test, etc.)” ................................................................. 170
Table 6. 32: Thematic Analysis for Focus Group Questions - “What is your overall
opinion about INFT2031? How can INFT2031 be improved? Would you recommend it to
another student?” ........................................................................................................ 172

xi
List of Figures
Figure Page
Figure 1.1 The Overall Structure of the Thesis ............................................................... 21 Figure 2.1 (a) Type 1 hypervisor (b) Type 2 hypervisor ................................................. 42 Figure 3. 1 TPACK Framework (Mishra & Koehler, 2006) ............................................ 58
Figure 3. 2 Biggs’s Theory of Constructive Alignment (Biggs, 2003) ............................ 61
Figure 3. 3 Kolb’s Experiential Learning Cycle (Kolb, 1984) ........................................ 61
Figure 3. 4 Revised Bloom’s Taxonomy (Anderson & Krathwohl, 2001)....................... 62
Figure 3. 5 Lab 1 Activities Design based on Kolb’s ELC and Bloom’s Levels (1-6) ..... 69
Figure 3. 6 Architectural Design of the TePF ................................................................. 73
Figure 3. 7 Architecture of the Virtual Lab .................................................................... 74
Figure 3. 8 Student Interface to the Virtual Lab ............................................................. 75
Figure 3. 9 Architecture of the Feedback Tool ............................................................... 76
Figure 3. 10 A Sample Report from the Feedback Tool .................................................. 76 Figure 4. 1 DBR – Iterations of Systematic Design Cycles (Plomp, 2013, p. 17) ............ 80
Figure 4. 2 DBR Approach (adapted from Reeves, 2006, p. 59) ..................................... 81
Figure 4. 3 Application of the DBR Methodology in the Research Project ..................... 82
Figure 4. 4 Mixed Methods Triangulation Design .......................................................... 85 Figure 5. 1 Screenshot of Feedback Scripts Providing Automatic Feedback for a Lab
Tutorial.......................................................................................................................... 98
Figure 5. 2 Students’ Responses about using the Decentralised Virtual Lab Environment
.................................................................................................................................... 102
Figure 5. 3 Students’ Responses to the Centralised Virtual Lab Environment............... 104
Figure 5. 4 Students' Perception of Centralised and Decentralised Lab Environments .. 106
Figure 5. 5 Students' Perception categorised by Virtual Lab Environments. ................. 107
Figure 5. 6 Feedback Tool Mean Survey Question Results (based 10-point scale) ........ 121
Figure 5. 7 Overall Rating of Feedback Tool ............................................................... 121
Figure 5. 8 Results of Independent t-test for Practical Test 1 Marks between Control and
Experimental Groups ................................................................................................... 125
Figure 5. 9 Results of Independent t-test for Practical Test 2 Marks between Control and
Experimental Groups ................................................................................................... 126
Figure 6. 1 Results of Independent t-test for Practical Test 1 Marks between Control and
Experimental Groups ................................................................................................... 133
Figure 6. 2 Results of Independent t-test for Practical Test 2 Marks between Control and
Experimental Groups ................................................................................................... 134
Figure 6. 3 Mean Practical Test 1 and Practical Test 2 Scores between the 2015 Cohort
(Control) and the 2017 Cohort (Experimental) ............................................................. 134

xii
Figure 6. 4 Student responses to categories which contributed most to learning ........... 136
Figure 6. 5 Student Rating for each Category ............................................................... 136
Figure 6. 6 Evaluation of Lab Activities....................................................................... 141
Figure 6. 7 Rating of the Feedback Tool between Iteration 1 and Iteration 2 ................ 162
Figure 6. 8 The Mean for Survey Questions between Iteration 1 and 2 based on 10-point
Scale ............................................................................................................................ 164
Figure 6. 9 The Overall Student Satisfaction with the Feedback Tool........................... 165
Figure 6. 10. Responses to Satisfaction with the Dashboard View ................................ 168 Figure 7. 1 Components for the design of Technology-enhanced Learning Environments,
Interventions and Innovations in Education ................................................................. 180
Figure 7. 2 Design Principle 3 – Process of design and evaluating the TePF ................ 182

xiii
List of Acronyms
CA Constructive Alignment
DBR Design-Based Research
ELC Experiential Learning Cycle (Kolb, 1984)
ICT Information, Communication and Technology
LMS Learning Management System
PLTs Pedagogy and Learning Theories and Principles
SAT Students Satisfaction
TAM Technology Acceptation Model
TePF Technology-enhanced Pedagogical Framework
VCL Virtual Computer Laboratory
VM Virtual Machine
Further details are presented where appropriate in the relevant chapters.

xiv
Abstract
Advances in technology are influencing all fields including education. Recently, we have observed a wide use of emerging technologies to support and facilitate the establishment of virtual
laboratories with many benefits that overcome the constraints of traditional physical laboratories.
These laboratories provide a number of advantages such as remote 24/7 access, flexibility, freedom
to learn at one’s own pace, to reset/retrial experiments without wasting resources in a safe environment and providing new opportunities for learning. Although virtual and remote
laboratories provide many new opportunities for learning, they have not necessarily been shown to
assist students in achieving higher learning outcomes. How do we design technology-enhanced lab
environments for effective learning?
To answer this research question, this thesis conducts a comprehensive literature review on
technology-enhanced lab environments. In the literature review, we observe that pedagogical
techniques integrated with virtual lab environments provide the best outcomes for student learning. Based on the findings, a hypothesis is proposed that considers a holistic view of designing
technology-enhanced lab environments taking into consideration learning context, curriculum,
learning activities, assessments, technology artefacts based on pedagogical and learning theories
and principles (PLTs).
To validate the hypothesis, a technology-enhanced lab environment is developed and evaluated for
a particular learning context: a systems-level course in computing. A literature review on technology-enhanced lab environments in systems level courses in computing reveal that only a
few studies consider pedagogy in the design of such lab environments.
In this thesis, we propose, design and evaluate a comprehensive pedagogical framework that
incorporates both technological and pedagogical considerations for teaching in a network and system administration course. The framework incorporates learning theories and principles, such
as Biggs’s Constructive Alignment, Kolb’s Experiential Learning Cycle (ELC), in its design and
innovative technology tools such as virtual labs and feedback tool.
The proposed framework is developed in two iterations and evaluated in real-world classroom
environments following a Design-based Research (DBR) methodology. The evaluation consists of
student perceptions of the proposed framework using mixed methods and the impact on student learning. In the first iteration, two architectures for virtual labs implementation and a feedback tool
are developed and evaluated. A quasi-experiment is conducted to evaluate the impact of the
technology intervention. The results provided useful insights that guided the design of the second
iteration.
In the second iteration, the proposed framework is implemented and evaluated in its entirety. A
quasi-experiment was conducted and students’ assessments scores were compared. The results
showed that the students in the experimental group, who were subjected to the proposed framework, scored higher marks which was statistically significant than the students who did not use the
proposed framework. Furthermore, the findings indicated that the learning process encouraged a
deep approach to learning. These results not only provided evidence of higher learning outcomes
by students but also that a deeper learning process was undertaken when using the proposed framework. The lab activities incorporated the PLTs in their design, and the benefit of this approach
was validated, supporting the hypothesis. Furthermore, components of the framework were
evaluated providing useful insights and suggestions for improvements in future.
Finally, we reflect on the overall process used in the design, implementation, and evaluation of the
framework. From this activity, design principles are derived that provide guidelines/principles to
designing technology-enhanced lab environments for effective learning in future.

xv
List of Publications
Dissemination: Journal articles:
1. Alkhaldi, T., Pranata, I., & Athauda, R. I. (2016). A Review of Contemporary
Virtual and Remote Laboratory Implementations: Observations and
Findings. Journal of Computers in Education, 3(3), 329-351.
Conference Paper:
2. Athauda, R., Alkhaldi, T., Pranata, I., Daniel, D., Frank, C., Thorne, W. & Dean,
R., (2018). Design of a Technology-Enhanced Pedagogical Framework for a
Systems and Networking Administration course incorporating a Virtual
Laboratory. Paper accepted at the IEEE Frontiers in Education Conference (FIE),
2018.

Chapter I
1. Introduction
This chapter introduces the thesis with a background on the use of technology to provide many
opportunities for developing lab environments but limited guidelines to do so. The broad research
question addressed in this research is presented next. Integrating pedagogical techniques in the
design of technology-enhanced labs such as virtual labs have motivated the research. Significance
and benefits of this research project are presented. The research approach to address the research
question and evaluate the proposed solution are then explained. Finally, an outline of the thesis
structure is given.
1.1 Background
In today’s society, we have various emerging technologies that impact our lives in different ways.
Technologies change how we communicate and interact and, importantly for this thesis, the way
we learn and teach. Information and Communication Technology (ICT) is providing us with new
opportunities to access and gain knowledge. Technology-enhanced learning experiences are
becoming the norm for today’s learner. Many, if not all, higher education students use the Internet
to: access learning materials; interact with the content, instructors and other learners; and obtain
support during the learning process. ICT is also transforming pedagogy by providing new ways to
involve learners with different forms of content and activities in their learning experiences.
Different learning environments, including blended learning, online learning, computer-based
instruction and web communities have all created new opportunities for learning.
In many fields such as the natural sciences, engineering and computing, practical work and
laboratory activities are paramount to learning. These types of activities provide opportunities for
in-depth learning through application (learning by doing) and observation. Tuysuz (2010) found
that laboratory activities increase student achievements and interest in the subject matter and

Chapter 1 – Introduction
17
further help them to learn and grasp new knowledge (Ma & Nickerson, 2006; Chen et al., 2010;
Lustigova & Novotna, 2013).
In a traditional laboratory environment, learners conduct experiments physically in a laboratory.
This type of lab is known as a physical or hands-on lab. Advances in technology have resulted in
technology-enhanced laboratory environments. Technology-enhanced lab environments can be
broadly classified into two categories: remote labs which allow learners to access physical
equipment via networks (e.g., the Internet) and conduct experiments remotely (Chaos et al., 2013;
Marques et al., 2014; Hossain et al., 2015); and virtual labs which allow learners to conduct
experiments in computer-simulated environments, which are also called simulated labs
(Woodfield et al., 2005; Ding & Fang, 2009; Alharbi et al., 2012; de Jong et al., 2014; Razvan et
al., 2012 and others).
The main limitations of hands-on labs are the high cost of the initial set up of the lab and that the
students must be located in the lab in order to perform experiments. The students cannot access
the physical lab when it is being used by another class or during closed periods. This limited
accessibility associated with physical labs is avoided in remote and virtual labs. In remote and
virtual labs, students usually have the freedom to access and conduct experiments 24/7 from
remote locations. This provides flexibility and availability over physical labs. Students also have
the freedom to learn at their own pace, to re-set, repeat or re-trial experiments and to explore at
their own convenience with minimal restrictions. Virtual and remote labs allow learners to
experiment in a safe environment especially if the experiments use hazardous materials
(Woodfield et al., 2005). Physical labs are geared towards on-campus students. However, with the
ever-increasing numbers of distance learners, remote and virtual labs often provide the only means
for such learners to access lab environments. Moreover, virtual environments provide new
opportunities for learning, such as simulations focused on pedagogical aspects and scaffolding
learners, that are not practical in physical lab settings (Chaos et al., 2013; Hossain et al., 2015).
Although virtual and remote labs have many advantages, in the literature many studies (Nickerson
et al., 2007; Helps & Ekstrom, 2008; Li et al., 2009; Brinson, 2015; Heradio et al., 2016) argue
that physical labs are important for learning in different educational contexts. Other studies state
that virtual and remote labs have similar learning outcomes to physical labs (Anisetti et al., 2007).

Chapter 1 – Introduction
18
Some studies point out that one type of lab does not replace the other, but rather they can be used
to complementarily, taking advantage of the strengths of each lab type to enable rich learning
environments (Razvan et al., 2012; Chaos et al., 2013; Alkhaldi et al., 2016).
With the rapid evolution of technology, new possibilities for designing lab environments are
constantly being created. In the literature, many studies implement technology-enhanced labs for
different educational contexts. However, a generic model, methodology or framework for
developing lab environments to take advantage of technology to enhance learning is not yet
documented in the research. This thesis therefore aims to address the following broad research
question: How do we design a lab environment to take advantage of technology for effective
learning?
1.2 Motivations, Significance and Benefits
Today millions of people learn in online environments, and technology-enhanced classrooms and
virtual settings are becoming the norm. The rise in Massive Open Online Courses (MOOCs),
which provide free online courses available for anyone to learn in a flexible way (e.g.,
http://mooc.org/) is a testament to this fact. It is not uncommon to have classes with many
thousands of distance learners. In many fields of study, practical work and hands-on activities are
paramount to learning. It is typical to do experiments in laboratory settings to conduct such
practical work. Technology advances have enabled the development of innovative labs such as
virtual and remote labs for learning. These technology-enhanced labs often provide the only means
for distance learners to participate in laboratory activities while also giving flexibility and freedom
to on-campus learners. Thus, it is becoming increasingly important to research how such lab
environments can be effectively designed, developed and utilised for learning. This thesis aims to
address this question and contribute towards filling this research gap. Developing such effective
laboratory environments can have significant contributions and impacts on society.
1.3 Research Approach
This research project aims to address the broad research question by firstly conducting a
comprehensive literature review of technology-enhanced labs. This analysis of the literature

Chapter 1 – Introduction
19
provides insights as to what strategies are effective for learning when innovative labs are
implemented. This analysis also reveals areas of focus and gaps in the field of application of
technology-enhanced labs.
The literature review and analysis produced a number of helpful insights with regard to
implementing technology-enhanced labs. An apparent gap in the literature that was identified is
that there are no clear guidelines, methodologies or frameworks to follow when integrating
technology-enhanced labs into different educational contexts. Rather the literature provides studies
which develop and apply technology-enhanced labs in specific educational contexts and
sometimes provide an evaluation.
An observation of the analysis is that technology-enhanced labs and related technologies provide
new opportunities to learn for both on-campus and distance learners. However, technology-
enhanced labs are tools like any other tool. Integrating such tools effectively in learning requires
careful consideration and appropriate decisions to meet educational goals. Considering the labs in
isolation, without considering the context, is not sufficient. From the analysis, it is clear that it is
the combination of tools, such as technology-enhanced labs, learner support, effective curriculum
design and tutor interaction which are all essential components, that create a rich learning
environment to achieve learning outcomes. Thus, in order to answer the overall research question,
the thesis postulates that design decisions should not only consider the capabilities and
opportunities that the technology provides but take a holistic approach that also considers the
educational context, learning goals and design learning environments based on sound pedagogy
and learning theories and principles to create an effective learning environment. This has led to
the following hypothesis posed in the research project:
Design of technology-enhanced lab environments taking a holistic view of learning incorporating
the learning context, curriculum design, lab activities, assessments, resources and technology
artefacts based on sound pedagogical and learning principles and theories have a higher potential
for effective learning.
To validate this hypothesis, the thesis implements and evaluates a technology-enhanced lab in a
particular educational context. A system level course in an undergraduate computing program was
selected. A virtual lab was designed and implemented. A number of pedagogy and learning

Chapter 1 – Introduction
20
theories and principles (PLTs) are reviewed and selected to design the integration of the virtual
lab. Also, many other technology tools and artefacts are utilised to support learning. Overall, a
technology-enhanced pedagogical framework (TePF) for a lab environment integrating a virtual
lab is implemented and evaluated. The research project follows a Design-based Research (DBR)
methodology to develop, implement and evaluate the framework. The success of the approach
helps us derive “design principles” that can guide in the development of such technology-enhanced
lab environments in future. The next section provides an overview of the thesis chapters and its
structure.
1.4 Thesis Structure
This thesis is organised into the following chapters: Chapter 1 provides an introduction to the
thesis, the overarching research question, the hypothesis addressing the research questions and
provides a summary of the approach taken in the thesis. Chapter 2 is divided into two sections.
The first section provide a review of the technology-enhanced labs in different fields. This analysis
helped us to come up with a hypothesis addressing the research question. In the second section, a
particular learning context (i.e. systems-level courses in computing) is selected to validate the
hypothesis. A literature review for this context (i.e. virtual labs in system-level courses) is
conducted next. Chapter 3 presents a framework for a technology-enhanced laboratory
environment in a systems-level course in computing. The DBR methodology is utilised to
implement and evaluate the framework in two iterations. Chapter 4 discusses DBR methodology
while the two iterations used to develop and evaluate the proposed framework are discussed in
chapters 5 and 6. Chapters 7 derives reflects upon the entire project and derives “design principles”
addressing the broad research question. Chapter 8 concludes the thesis with a discussion on future
research directions. Figure 1.1 depicts the organisation of the thesis.

Chapter 1 – Introduction
21
Figure 1.1 The Overall Structure of the Thesis
1.5 Summary
Hands-on activities play an essential role in student learning in many fields. Technology provides
many opportunities to develop effective lab environments. Methods of designing and developing
effective technology-enhanced lab environments to enhance learning are still in their infancy. This
thesis takes a holistic view to designing technology-enhanced lab environments based on sound
pedagogical and learning theories and principles. A technology-enhanced lab environment for a
system level course in computing is implemented and evaluated iteratively with pilot studies. The
evaluation provides useful insights to the effectiveness of the proposed approach.
The following chapter presents a literature review of related work.
Introduction
Proposed Framework
Literature Review
Research Methodology
Iterations 1 & 2:
Implementation & Evaluation
Design Principles
Conclusion & Future Work
Chapter 2
Chapter 1
Chapter 4
Chapter 3
Chapters 5, 6
Chapter 7
Chapter 8

Chapter II
2. Literature Review
This chapter presents a literature review which builds the foundation for the thesis. Firstly, in
section 2.1, a review of technology-enhanced labs (remote and virtual labs) implemented in
different disciplines are presented and analysed. The analysis provides us with a number of
observations, findings and insights which are discussed in section 2.2. A key insight that helps us
answer the main research question presented in Chapter 1 is that taking a holistic view to design
technology-enhanced labs by taking into account learning context, curriculum design, resources,
assessments and technology artefacts following sound PLTs can result in learning environments
for effective learning. Thus, the hypothesis which will be evaluated in the thesis is presented in
section 2.2.2. To validate the hypothesis, this thesis develops and evaluates a technology-enhanced
lab environment for a selected learning context. Recently, system level courses in computing have
developed virtual labs, taking advantage of virtualization technologies. Therefore, a review of the
literature in this domain is carried out in section 2.3. The analysis revealed a research gap as most
implementations of virtual labs focus mainly on the technical aspects and very few take a holistic
view with a PLT focus. Finally, in section 2.4, a summary of the chapter is presented.
2.1 Virtual and Remote Lab Implementations in Different Disciplines
This section reviews remote and virtual laboratory implementations in different disciplines. The
analysis uncovers a number of interesting observations, findings and insights into virtual and
remote laboratory implementations. Several research initiatives have been undertaken in various
disciplines demonstrating how these laboratories could work in their respective areas.
Chapter 2 – Literature Review
23
2.1.1 Virtual and Remote Laboratories for Programming Robots
Based on a study by Chaos, Chacon, Lopez-Orozco and Dormido (2013), both virtual and remote
laboratories were developed for an Autonomous Robots subject in the Master of Systems
Engineering and Automatic Control at the Spanish National University for Distance Education
(UNED) and at the Complutense University of Madrid (UCM). These laboratories were set up for
distance and online education. Students are given access to control the robot both manually and/or
through programmed interfaces. The difference is that students interact using a simulated
environment in the virtual laboratory while they interact with a real robot in the remote laboratory.
A number of sensors are incorporated into the robot which allows students to program based on
sensor readings. Students are first given access to the virtual laboratory environment to attempt
their tasks and once a mastery of the interface and programming is achieved, access is given to the
real robot environment through the remote laboratory. Although the interface is the same in terms
of manipulating the robot in the simulated environment, manipulating the robot in the real world
has additional complexities. For example, the motor may suffer from nonlinear effects, such as
saturation on acceleration and dead zones. Moreover, sensors may be affected by noise, outliers in
measurements, delays and failures in communication. Students are given a time-slot to test their
solutions in the remote laboratory and it is moderated by lab assistants who are able to solve issues
(such as collisions, mechanical failures, etc.) that cannot be remotely addressed by the students.
The hands-on real-world experience provides a rich source of knowledge to enhance the learning
process of students so they can deal with practical problems usually neglected in theory.
These virtual and remote laboratories have been operating in the program for two years. They have
proven to be extremely useful for teaching the role that sensors play in robotics. A student
satisfaction survey has shown that they either agree or completely agree with the fact that these
laboratories are necessary for a complete understanding of robotic sensors.
In Chaos et al. (2013), it is shown that both virtual and remote laboratories are effective and useful.
Virtual laboratories provide a safe, easily accessible environment for students to master their skills
prior to applying them in a real-world environment through remote laboratories. Also, by applying
their knowledge and skills in a real-world environment, students are exposed to the complexities
of real-life situations which are hard to emulate in virtual environments and typically are ignored
in theory. The authors state “using the virtual laboratory like the remote one has been a success:

Chapter 2 – Literature Review
24
students can get confidence in their work before testing in the real robot and they can make a first
debug of the code before testing it in the real robot; 74% of the students feel more comfortable if
they can use the virtual laboratory before connecting with the real robot”. Overall, this study
successfully integrated both virtual and remote laboratories in a robotics subject to provide a rich
learning experience for students.
2.1.2 Remote Lab in Biology
Hossain et al. (2015) presented an architecture and implementation for a remote laboratory in
biology. A specific set of experiments based on P. polycephalum, which is a single celled, multi-
nuclei, cytoplasmic organism, were conducted. Initially, a system administrator would start an
experimental session by preparing Petri dishes inoculated with P. polycephalum in the centre
unless a special initial condition was specified by a student ahead of time. Students were notified
with access keys once all experiments were loaded. A student then accessed experiments remotely
using a web interface. This experimental session would last two to three days in which time there
would be no further manual intervention. During this time, students were able to manipulate and
investigate the state of their experiments through a web-based UI at any time and from any place
without having to book a time slot. All experimental data were archived when the session expired
and students were able to investigate these later at any time using the same UI. Students also could
share their experiments and data with others.
The remote laboratory was used in a graduate bio-physics course. Four students conducted eleven
online experimentation sessions. Student activities were logged and three one-on-one interviews
were conducted in weeks 2, 5 and 10. Both the student activity and the feedback were analysed.
The student feedback indicated that this platform lowered the threshold of entry to biology
experimentation in three ways: it empowered non-biologists to perform real experiments without
concerns about wet lab training and safety. The system abstracted away all of the wet lab details
and allowed the students to concentrate on experimental strategies and data analysis. The system
provided convenience by allowing students to remain engaged with their experiments from any
place at any time. Also, the logs provided data that could be used in learning analytics to provide
useful insights.

Chapter 2 – Literature Review
25
Hossain et al.'s (2015) proposed platform considers the development of an innovative Biotic
Processing Unit (BPU) to handle specific types of experiments and automation in biology. The
current implementation is proof of concept for a particular type of experiment in biology. This
paper demonstrates the benefits of such a remote laboratory.
2.1.3 The Virtual Chemistry Lab (ChemLab)
Woodfield et al. (2004) and Woodfield et al. (2005) discuss the Virtual ChemLab project which is
a simulated lab that allows students to simulate chemistry experiments in a number of ways. Virtual
ChemLab simulation does not replace physical wet labs where students learn how to conduct a
chemistry experiment (such as cleaning test tubes, setting up experiments, etc.). Rather, the goal
of each Virtual ChemLab simulation is to provide students with an intuitive, safe, open-ended,
unrestricted simulation environment, similar to a hands-on experiment, where they can create
experiments, perform tests and view their results. The general features of a ChemLab simulation
includes 26 cations that can be added to test tubes in any combination, 11 reagents that can be
added to the test tubes in any sequence and any number of times, necessary laboratory
manipulations including centrifugation, flame tests, decanting, heating, pH measurements and
stirring, a lab book for recording results and observations, and a stockroom window for creating
test tubes with known mixtures, generating practice unknowns or retrieving instructor-assigned
unknowns. The simulation uses over 2500 actual pictures to show the results of reactions and over
220 videos to show the different flame tests. ChemLab provides a truly exploratory open-ended
experiment framework as the 26 cations that can be combined in any order or combination and the
11 reagents that can be added in any order, create in excess of 1016 possible outcomes in the
simulation.
The research team evaluated ChemLab’s Inorganic Qualitative Analysis simulation using online
surveys sent to over 1400 students enrolled in freshman level chemistry courses between January
2001 and April 2002 at Brigham Young University. The surveys consisted of Likert-type questions
and free response questions. Additionally, interviews and observations of students were conducted.
Data was analysed through descriptive statistics and several analyses of variance (ANOVAs) and
linear regressions. The most interesting observations and findings occurred when the student’s
opinion and performances were correlated with each student’s personality profile. The personality

Chapter 2 – Literature Review
26
profile of each student was determined by the Herrmann Brain Dominance Instrument (HBDI)
(Herrmann, 1995).
Woodfield et al. (2005) found that creative learners (higher cerebral score) are more likely to
explore and experiment in ChemLab simulations than structured learners (higher limbic score) not
because they were less capable but because of their individual learning preferences. The study also
found that students who are structured in their thinking and more precise (left-brained preferences)
were more satisfied with the simulation than the students who are intuitive, nonlinear and
experientially oriented (right-brained preferences). Perhaps the largest educational benefit of the
inorganic simulation is that students can focus on the principles of general chemistry rather than
focusing on troubleshooting aspects in a wet laboratory setting. This does not mean that wet labs
are unimportant as skills to conduct real experiments remain important and the use of the ChemLab
simulation in conjunction with wet labs provides the best learning experience. Students like the
fact that they can repeat, so can use trial and error, in a safe, convenient and flexible manner that
is not practical in a wet lab.
2.1.4 Virtual Laboratory for Physics
Ding and Fang (2009) investigated the effectiveness of a simulation laboratory on teaching and
learning of physics concepts. Students usually have a set of opinions about physical phenomena
derived from their everyday experience. However, these assumptions are normally incorrect and
create misconceptions. To address these misconceptions, the authors aimed to produce an
alternative constructivist teaching approach that could facilitate active engagement in learning and
effectively allow students to apply physics concepts and principles in various situations. The
authors created a simulation laboratory using C++ Builder. The laboratory was able to simulate
the diffraction and reflection of light and allowed students to configure parameters for experiments
and observe the rules of physics. In addition, its powerful display environment enhances an
understanding of physical concepts and analysis of scientific knowledge. Hence, it promotes a
better understanding of physical models.
In this study (Ding and Fang, 2009), 64 college students at Hubei University were selected to
undertake the experiment. Data were collected through interviews with 6 students in the
experimental group and 32 anonymous written testimonies of the same (control) group. The result

Chapter 2 – Literature Review
27
of the study shows that this method indeed improved research skills and the capacity for
exploration in the experimental group. The findings suggest that simulation laboratories have
potential to improve teaching and learning of physical processes and encourage students in physics
to engage in exploratory learning.
2.1.5 VISIR Remote Labs in Engineering
Marques et al. (2014) present a study on the implementation of Virtual Instrument Systems In
Reality (VISIR) remote labs in a range of engineering courses; in particular they focus on the
impact of such labs on achieving learning outcomes. A VISIR (Tawfik et al., 2013) developed by
the Blekinge Institute of Technology in Sweden provides a flexible environment to construct and
test different electrical and electronic circuits. It has been widely used to create remote laboratories.
The authors examined the VISIR implementations against various aspects, such as achievement of
learning objectives, implementation and user access, student academic results and teacher and
student perceptions. The authors used a multi-case research study methodology, with each case
representing a different course where VISIR was integrated. The study was carried out during two
successive semesters in 2010 and 2011 covering seven courses, one course in the first semester
and the remaining six courses in the second semester. These courses were drawn from various
engineering degrees representing various student educational backgrounds. Two dimensions were
used to analyse the results: a didactical approach and results obtained. The former looked into
learning outcomes, integration design, teacher supervision and implementation problems while the
latter looked into the actual use of VISIR, teacher and student’ perceptions of usefulness and
student learning achievements. The paper addresses the research question Is VISIR always useful,
no matter how it is integrated into a course? Or are there certain conditions/characteristics that
maximize student learning? through analysis of a multi-case research study. The authors found
that instructional support for VISIR is crucial. VISIR can always be useful for some students (those
more motivated or with a learning style leaning more towards to this kind of tool), but it can be
reinforced when a particular condition is put in place - that students have a hands-on practice
session before they start to use VISIR. VISIR is more useful in introductory courses and in terms
of learning outcomes, VISIR labs increase student confidence in labs, with students who use VISIR
generally having improved lab reports, improved lab examination results, higher grade
distributions, statistically significant correlations between the number of times VISIR was
Chapter 2 – Literature Review
28
accessed and lab grade, and higher learning gains. VISIR is a good choice when combined with a
hands-on lab as it diversifies students’ methods of learning and enables them to practice freely,
increasing their confidence in the lab and enhancing their lab skills.
2.1.6 Virtual Laboratory Project in Science and Engineering
The Virtual and Accessible Laboratories Universalizing Education (VALUE) project (Achuthan
et al., 2011) was initiated by Amrita University in support of the National Mission on Education
through Information and Communication Technology Scheme in India. Amrita University’s goal
was to provide college and university students throughout India with access to virtual laboratories,
allowing them to experiment, discover and have learning experiences similar to colleagues who
had access to physical laboratories. The virtual experiments were all developed using the same
coordinated processes. Firstly, an experiment was selected based on the All India Council for
Technical Education and the University Grants Commission model curricula. Next, virtual lab
research assistants reacquainted themselves with the experiment. They then worked with one of
the Amrita University e-learning teams to create storyboards, provide suggestions for the
experiment design, and test and evaluate interim versions. The virtual lab research assistants also
collected reference materials and assisted the subject matter faculty members with the
development of the theory and procedure discussions, assignments and self-evaluation quizzes.
Amrita University’s e-learning team, the Center for Research in Advanced Technologies for
Education (CREATE @ Amrita) was responsible for creating the virtual lab interactive animations
and simulations. After the experiments were completed, they underwent extensive beta testing in
the hands of the virtual lab research assistants and were reviewed by the faculty involved. Each
experiment had a standard format with seven components: Theory, Procedure, Self-Evaluation,
Simulator, Assignment, Reference and Feedback. By 2011, ninety-eight experiments had been
completed in physical sciences, chemical sciences and biotechnology. All are available online
(http://vlab.amrita.edu/). A workshop was conducted to disseminate the use of these virtual labs
among faculties across a number of higher education institutions. At the end of each workshop,
exit surveys were given. The survey contained several questions regarding the perceived
effectiveness of the virtual labs. The survey results indicated that the faculties felt that virtual labs
could be an effective tool with more than 94% of the responses to be either good, very good or
excellent, with over half of those respondents responding with excellent or very good. In response

Chapter 2 – Literature Review
29
to the question “Do you feel such a virtual lab site aids/assists you in your job as a teacher?” 97%
of the respondents answered yes. Overall VALUE virtual labs showed that incorporated guided
labs with theory, procedure and static and dynamic simulations, as well as in some cases remote
labs, self-assessment, assignment, references and feedback in a single portal, is easy for students
and faculty to use and allows for self-directed experimentation.
2.1.7 Online Labs for STEM Education
de Jong, Sotiriou, and Gillet (2014) created the Go-Lab project. The main aim of the Go-Lab
project is to provide school children with a motivating environment to acquire scientific inquiry
skills and undertake engaging guided science experimentation. To meet this objective, Go-Lab
provided a platform that incorporates remote and virtual labs as well as dataset analysis tools
(collectively called online labs). In Go-Lab, the central pedagogical approach is inquiry learning.
In inquiry learning, students are not directly offered information but rather are guided through an
investigation process whereby a research question/hypothesis is derived, investigations are
conducted via experimentation, results are observed and conclusions are made. This approach has
proven to be more effective than other lab approaches using “cookbook” procedures or discovery
approaches. Teachers are one of the main stakeholders in the project. Go-Lab provides teachers
with authoring facilities to create and share their own Inquiry Learning Spaces. The Go-Lab portal
(www.golabz.eu) provides many tools and facilities for creating and sharing inquiry-based labs in
science and technology fields. This project has developed a number of labs and expects to pilot
across 1000 schools within Europe in the future.
2.1.8 VPLab: Virtual Programming Laboratory
Prieto-Blazquez, Herrera-Joancomarti and Guerrero-Roldán (2009) mainly focus on designing the
Virtual Programming Laboratory (VPLab). It identifies several critical components required to
ensure the success of VPLab in enhancing student knowledge and skills in computer programming
language. The critical components are categorised into three types of resources: technological
resources; pedagogic and strategic resources; and academic staff resources. The technological
resources focus on the technology artefacts that can be used to simulate virtual laboratories and
assess student knowledge and understanding. These technology artefacts are the Virtual
Communication Environment (VCE), the SIMulator (SIM), the REMote Laboratory (REM), the

Chapter 2 – Literature Review
30
Virtual Machine (VM), and the Automatic Assessment Tool (AAT). The pedagogic and strategic
resources focus on the theory and the pedagogical approach and methodology that allow the
understanding and/or creation of knowledge. The pedagogic and strategic resources used in VPLab
are learning methodology, supporting documentation and other materials, and evaluation. The
academic staff resources focus on the teachers or members of academic staff who help students
reach their individual objectives and personalise learning by giving attention to each student. The
authors also conducted a questionnaire type survey across 284 participants who were distance
learning students to evaluate the relevance of the proposed structure and their critical components.
The survey is divided into two parts where the first part obtains a profile of survey respondents
and the second part analyses the significance of each critical component. The components that
score highly in the survey are:
• The teacher component of academic staff resources;
• The evaluation and learning methodology of pedagogic and strategic resources; and
• The VCE, SIM, VM and AAT of the technological resources.
An interesting finding in the study was that although technological resources were rated highly by
the students, the distance learning students appeared to place more importance on the pedagogical
and human factors.
2.1.9 Virtual Computing Lab
Alharbi, Athauda and Simon (2012) provided a virtual computer lab for students in an IT
undergraduate course. A virtual computer was provided to each student as a pre-configured Virtual
Machine (VM) that was hosted on a private cloud environment. Students accessed a virtualised
desktop that had the look and feel of accessing a local machine. A pilot study was conducted to
evaluate the feedback of students about the virtual computing lab in a course consisting of
laboratory-based individual tutorials, and assignments which included group work. The authors
conducted a survey on 33 students to evaluate their satisfaction and experience. The survey was
divided into four sections: assistance in learning, accessibility and ease of use; virtual labs vs
physical labs; and overall experience. Students were highly positive about the flexibility,
accessibility and ease-of-use of the VCLs from any location and at any time without any need to
install and configure software for use in their tutorials and assignments. It was clear that students
when working individually preferred to use the VCLs, however, when they needed to meet group

Chapter 2 – Literature Review
31
members, have tutor interactions or for social purposes, they preferred to come to physical labs.
Having access to virtual computing labs while also having regular physical labs for tutor and group
interactions provided the best learning experience in this study. Another large scale virtual
computing lab deployments mentioned in the paper was Schaffer et al. (2009).
2.1.10 NVBLab: The Virtual Collaborative Networking Lab
Hwang, Kongcharoen and Ghinea (2014) discuss an experiment where students in a networking
class work on a number of ICT network-based assignments from basic to advanced labs using two
platforms. The control group use VMs installed on their PC to do assignments while the
experimental group of students are given access to guest Operating Systems (OSs) with a web-
based GUI interface featuring a web terminal, a command search window, laboratory materials
and chat windows – group and individual. The platform is called the Network Virtualization -
Based Laboratory (NVBLab).
The experiment was conducted during the summer semester (2013) at Kasetsart University with a
total of 35 students, the control group having 15 students and with 20 students in the experimental
group. The experiment had four steps: 1) Lab orientation and pre-test 1; 2) Experimental treatment
and post-test 1 for basic labs; 3) Pre-test 2 and experimental treatment for advanced labs; and 4)
Post-test 2 and a questionnaire. The basic labs were conducted individually for both experimental
and control groups, while the advanced labs were conducted individually for the control group and
in groups of 5 for the experimental group who had access to chat windows for collaborations which
allowed for communication between group members, teaching assistants and the lecturer when
doing assignments. In the advanced labs, control group conducted collaborative work and used
online chat window of NVBLab following Online Collaborative Learning (OCL) (Harasim 2011)
principles.
The pre-test results revealed no statistically significant difference between the experimental and
control groups indicating they had similar background skills in both basic and advanced labs. In
addition, post-test 1 showed no statistically significant difference between the control and
experimental groups. However, there is a statistically significant difference between the results of
the experimental group and those of the control group with post-test 2 showing improved student
learning achievements among the experimental group. The paper also evaluated the command

Chapter 2 – Literature Review
32
count and chat message count in the experimental group. It concluded that the group interaction
and immediate feedback and support from other group members had increased student interest
with the result that the experimental group completed more assignments and achieved higher
learning outcomes (scores).
2.1.11 Virtual Networking Lab
Razvan, Wilson, Winckles, Cirstea and Jones (2012) proposed and implemented an architecture
for a cloud-based virtual networking lab. The networking lab experiments required students to
configure and test complex network scenarios using network hardware and software. Typically,
such network labs are constrained by the hardware resources available in a lab. However, by
creating a virtual networking lab, students are able to configure complex network scenarios using
virtual networking hardware and resources. A virtual networking lab requires students to configure
multiple VMs and other virtual hardware such as routers, switches, etc. The authors of the paper
present an architecture for a virtual networking lab and implemented it by employing virtualization
technologies such as VMWare and NetLab+. The networking lab was successfully deployed with
over 900 labs and over 1700 hours of lab work used to test the described NetLab+ solution,
conducted by over 260 students. The survey evaluations surpassed expectations as almost all
students believed that their study experience was enhanced by the proposed virtual infrastructure.
Some suggestions for improvement included providing better mobile access to the virtual labs as
well as access to physical networking hardware. As all labs were conducted in a virtual
environment, students still lacked the experience of working with real physical hardware devices.
Related observations from the literature review are discussed below.
2.2 Observations and Findings
A number of observations and findings from the above review are discussed below.
• Complementary nature to physical labs: With all the advantages that remote and virtual labs
provide, it has been observed that they do not still replace physical/hands-on labs. In many
disciplines, such as chemistry and biology, wet lab training is an essential part of learning to
conduct experiments which cannot be obtained by virtual and remote labs alone. However,
these different types of labs are complementary in nature and may be combined in ways that

Chapter 2 – Literature Review
33
provide a rich and engaging learning experience for the learners. For instance, in the virtual
chemistry lab (Woodfield et al., 2005), the authors clearly state the importance of using wet
labs: “We believe that learning the how is vitally important, which is why we believe Virtual
ChemLab is best used with a ‘wet’ laboratory”. In Marques et al. (2014), the authors concluded
in their multi-case study that a VISIR lab was a good choice when combined with a hands-on
lab. In Razvan et al. (2012), the authors found that when using a virtual networking lab, lack
of experience with real hardware was one of the suggestions for improvement.
• Different types of labs and technologies developed for different contexts: In addition, another
observation is that different types of labs have been developed for different contexts (i.e.,
discipline, learning outcome, lab experiment objective, type of experiment, etc.). For example,
Chaos et al. (2013) developed both virtual and remote laboratories to teach students to control
robots in virtual and remote settings. In Hossain et al. (2015), the authors developed a remote
biology laboratory to create experiments on P. polycephalum. Woodfield et al. (2005) provided
a virtual environment allowing students to simulate chemistry experiments. In the study carried
out by Prieto-Blazquez et al. (2009), students were provided with a set of tools and an
environment to learn programming. Similarly, Razvan et al. (2012) provided students with a
virtual network lab that allowed students to configure and test networks. It is evident that we
cannot generalise the remote and virtual robotics lab developed in Chaos et al. (2013) for
students to do biology experiments on P. polycephalum. Additionally, even if we consider a
single discipline such as biology, the remote lab for P. polycephalum discussed in Hossain et
al. (2015) may not be relevant for other types of biology experiments.
• Different types of labs may cater to different learner personalities and preferences: An
interesting finding from Woodfield et al. (2005) was that personality profiles and learning
preferences had an impact on opinion, performance and exploratory use of Virtual ChemLab.
Woodfield et al. (2005) found that, to within a 99.9% confidence interval, the higher someone’s
cerebral score (creative learner), the less help they feel they need in using the inorganic
simulation while the higher someone’s limbic score (structured learner), the more help they
need. Also, structured learners, with a confidence interval of 95%, report that they spent a
smaller percentage of time exploring or conducting what-if experiments in Virtual ChemLab.
Woodfield et al. (2005) show that structured learners have a much harder time experimenting

Chapter 2 – Literature Review
34
in Virtual ChemLab, and also indicate that these students may have difficulty learning in any
loosely structured learning environment, not because they are incapable, but because of their
individual learning preference.
According to the literature, there have been many technologies used and tools developed for
remote and virtual labs. For example, the above review came across a range of innovations and
technologies available: Easy Java Simulations and LabView in Chaos et al. (2013); virtualization
technologies such as VMWare in Alharbi et al. (2012); VISIR in Marques et al. (2014); and biotic
processing units (BPUs) in Hossain et al. (2015). Some of the literature also focuses on technology
that can be used to develop virtual and remote laboratories. Table 2.1 summarises the literature
review on virtual and remote laboratory implementations.
Table 2.1: Virtual and Remote Lab Implementations in Different Disciplines
Subject
Paper Sample
Size
Lab
Technology
Description
Engineering Chaos et al.
(2013)
n = 30 LabVIEW
MATLAB Easy
Java Simulations
Both virtual and remote laboratories are effectively used
to provide a flexible, safe, easily accessible environment
for students to develop their skills prior to applying them
to a real robot using remote laboratories.
Marques et
al. (2014)
n =
1272
VISIR VISIR remote labs are popularly used in engineering.
This study aims to find what factors impact integration
of VISIR labs to courses. It found that instructional
support for VISIR is crucial.
Sciences Hossain et al. (2015) –
Biology
n = 4 BPU
This remote biology laboratory provided convenience by allowing students to remain engaged with their
experiments from any place at any time. Also, a log
provided data that can be used in learning analytics to
provide useful insights.
Ding & Fang
(2009) -
Physics
n = 64 C++ Builder
Students were provided with a simulation environment
to explore topics in diffraction and reflection of light.
Both research skills and exploratory learning are
encouraged.
Woodfield et
al. (2005) - Chemistry
n =
1400
Java A virtual chemistry lab (ChemLab) provides students
the freedom to conduct chemistry experiments in an exploratory manner which is not practically possible in
a physical lab. The authors observed that creative
learners are more likely to explore and experiment in
ChemLab simulations than structured learners because
of their individual learning preferences.
Information
Technology
(IT)
Prieto-
Blazquez et
al. (2009)
n = 284 VPLab VPLab proposed a general structure on virtual labs for
undergraduate courses in computer programming
language. It identifies several critical components
required and evaluates student views on different

Chapter 2 – Literature Review
35
Subject
Paper Sample
Size
Lab
Technology
Description
resources. An interesting finding is that teacher
interactions are highly rated by distance learners along
with technology artefacts.
Hwang et al. (2014)
n = 35 Network Virtualization -
Based Lab
NVBLab
A networking class work on a number of network-based assignments in basic and advanced labs with individual
and group work. The group-based advanced labs with
communication between tutors and peers had a
statistically significant impact on learning outcomes.
Razvan et al.
(2012)
n = 260 VMWare/
NetLab+
Use of cloud computing in network course labs to
implement and test complex networking and security
scenarios. The students believe that their study
experience is enhanced by the proposed virtual
infrastructure.
Alharbi et al. (2012)
n = 33 VMWare A private cloud and VMWare virtualization platform id used to design VMs that can emulate computer labs
which are accessible from anywhere. The aim of the
experiments was to analyse student satisfaction with
VCLs.
STEM Achuthan et
al. (2011)
Not
stated
Web
technologies
Provide labs to experiment in virtual and remote lab
settings provided through a web interface for students
who are unable to access physical labs. Each experiment
is developed with Theory, Procedure, Self-Evaluation,
Simulator, Assignment, Reference and Feedback to
provide the pedagogical framework and context for each
experiment.
de Jong et al.
(2014)
n=0 Web
technologies
The Go-Lab project provides an engaging and
motivating environment for students to experiment
through online labs using an inquiry-based learning
pedagogical approach. The Go-Lab aims to trial in over
1000 schools across Europe in the near future.
2.2.1 Advantages of Technology-enhanced Labs
A number of the benefits of using technology-enhanced labs are summarised below:
• Accessibility and availability: A major advantage of both remote and virtual laboratories over
hands-on labs are their accessibility from remote locations and availability at any time. Remote
labs provide learners with remote access to physical laboratories. For instance, in Hossain et
al. (2015) students are able to log in 24/7 from any device and observe their experiment.
Students using virtual ChemLab (Woodfield et al., 2005) can work on simulations any time
from any device connected to the browser. Marques et al. (2014) show how VISIR labs allow
students to gain confidence by letting them practice their lab experiences outside of the

Chapter 2 – Literature Review
36
physical laboratory, eventually achieving higher scores and increasing student engagement.
Also, virtual laboratories and remote laboratories may be the only option for laboratory
experience available for distance learning students. The virtual and remote robotic laboratories
in Chaos et al. (2013) are used by distance learning students at UNED and UCM. Finally,
remote laboratories allow sharing of valuable lab resources among institutions (iLab - Harward
et al. (2008), LabShare project - Mujkanovic et al. (2011); Seiler, (2013)).
• Flexibility: Learners in virtual laboratories have the freedom to explore, repeat experiments
and learn at their own pace which is not practically possible in a physical lab or even in a
remote lab. Students are able to access and experiment in a virtual lab at their own convenience
at any time from any location without the need to schedule or be restricted to a timetabled slot.
The freedom to explore without restrictions or consequences is rarely afforded in physical labs.
For instance, in ChemLab (Woodfield et al., 2005), students have the freedom to explore a vast
range of experiment simulations with 26 cations that can be combined in any order or
combination and 11 reagents that can be added in any order. Students can reset and repeat
experiments as they wish and learn at their own pace.
• Cost-effectiveness: virtual and remote labs are cost-effective when compared with physical
labs. This is one of the greatest advantages for developing remote labs as expensive equipment
can be shared by many learners remotely (Harward et al., 2008). For some types of laboratories,
the running cost for virtual labs is much lower as simulations are conducted in virtual
environments. For example, a virtual chemistry lab does not use actual chemical resources.
• Safety: Virtual and remote laboratories provide a safe environment for learners to conduct
experiments. For instance, in a chemistry simulation environment such as ChemLab
(Woodfield et al., 2005), learners are able to create experiments without the worry of chemical
explosions or using hazardous materials. Another example is that students conducting biology
experiments in a remote biology lab do not need to be concerned with safety issues (Hossain
et al., 2015).
• Newer opportunities for learning: Virtual environments enable new opportunities to perform
simulations and experimentations that sometimes are not possible to be performed in physical

Chapter 2 – Literature Review
37
or even remote labs. For instance, in the virtual network lab (Razvan et al., 2012), students
have the opportunity to configure complex network scenarios and hardware devices which are
difficult to source in a physical lab environment. In Woodfield et al. (2005) and Ding and Fang
(2009), it is clearly shown that exploratory investigation which is not practical in a physical
lab is available to students in virtual labs.
In the next section, we focus on analysis of the literature review with a view to answer the research
question posed: How do we design a lab environment to take advantage of technology for effective
learning?
2.2.2 Revisiting the Research Question
The main aim of practical activities in labs is to achieve learning goals. Technology advances have
enabled lab environment designs to overcome limitations of physical labs as well as providing new
opportunities for learning. Answering the research question posed in Chapter 1 - How do we design
lab environments to take advantage of technology for effective learning? requires further analysis.
This section aims to addresses this broad research question based on the analysis of the literature
above.
Technology-enhanced labs can create learning environments that focus on the topic or pedagogical
objective of the experiment while abstracting away complexities that may occur in a real-world
experiment and also scaffold and guide the learner to achieve learning goals. This is clearly shown
in Chaos et al. (2013). In this remote laboratory for robotics, students are first given a virtual
environment whereby they manually operate a robot in a virtual environment. The objective is to
introduce students to the control interface of the robot and to build their interest by interacting with
it. In the next phase, students write a program to control the robot based on sensor inputs and
mapping goals in order to develop their knowledge and skills in developing algorithms to
manipulate the robot. Finally, when their expertise and confidence has been developed, students
are exposed to a remote laboratory, which has real robots in action. By this time, students have
already gained the expertise, knowledge and skill to face the intricacies and complexities of the
real world situation. Had students been first exposed to the remote/hands-on lab, these
complexities could have been distracting, complicating or even overwhelming for students, which
potentially could lead to a failure in achieving the learning outcomes. In this instance, by

Chapter 2 – Literature Review
38
effectively incorporating virtual and remote laboratories using an appropriate pedagogical
structure, it allows students to perform experiments with a focus on the learning objective at hand
while abstracting the real-world complexities. The labs are designed to scaffold the learner to
develop student expertise to achieve their learning goals. Implicitly, these labs apply scaffolding
theory and zone of proximal development (Lev Vygotsky, 1978) where students are guided to
higher level tasks by first completing simpler tasks prior to attempting more complex tasks (from
simulations to real-world manipulation of robots in remote labs).
Abstracting complexities can allow the learner to reach learning goals, especially novice learners.
This is observed in the remote biology lab in Hossain et al. (2015) and the virtual chemistry lab
discussed in Woodfield et al. (2005). Hossain et al. (2015) discussed how a non-biology student
with no wet lab training is able to conduct biology experiments using a remote lab. This allows the
student to focus on the P. polycephalum experiment by abstracting away from the wet lab training
which is not the objective of the lab experiment. This sentiment is re-iterated by Woodfield et al.
(2005:1674):
“…the largest educational benefit of the inorganic simulation is that students can focus on the
principles of general chemistry, rather than focusing on troubleshooting aspects in a laboratory
setting. These troubleshooting aspects imply more than just laboratory technique. Laboratory
technique focuses on how to do something, whereas the troubleshooting aspects focus more on why
something does not happen the way it should. One of the reasons beginning chemistry students feel
overwhelmed in their first laboratory class is because, we believe, they are consumed by the details
of lab technique and the troubleshooting aspects in the laboratory.”
Other studies have also used PLTs in their design. In Hwang et al. (2014), students who
collaborated in NVBLab achieved higher learning outcomes in comparison to the control group.
The authors designed tools and laboratory activities for collaborative work based on Online
Collaborative Learning (OCL) theory (Harasim, 2011), resulting in improved learning outcomes.
Ding and Fang (2009) combined constructivist teaching approaches and a simulated lab
environment where students are able to explore diffraction and reflection of light by configuring
parameters in experiments in order to learn physics concepts. The Virtual ChemLab (Woodfield et
al., 2005) also allowed students to explore in an unrestricted simulation environment where they
can create experiments, test and view their results.

Chapter 2 – Literature Review
39
Exploratory learning (Njoo and de Jong, 1993) was enabled through simulated lab environments.
In de Jong et al. (2014), students are guided and supported to learn by following an inquiry-based
learning approach. Students are not directly offered information but rather taken through a guided
investigation process whereby a research question/hypothesis is derived, investigations are
conducted via experimentation using remote and simulated labs, results are observed and
conclusions are made.
In the VALUE project (Achuthan et al., 2011), rather than providing a simulation or virtual
experiment environment by itself, each experiment is guided by Theory, Procedure, Self-
Evaluation, Simulator, Assignment and References for further information. This approach
combines each experiment with background context and learning materials taking a holistic
approach to the design of virtual labs and lab activities. Prieto-Blazquez et al. (2009) argue that
rather than simply providing a virtual lab, a number of critical components, including technological
resources, pedagogic and strategic resources, and academic staff resources should be developed to
enhance student knowledge and skills in programming. They conclude with students rating
pedagogical and human factors highly in addition to the technological resources in VPLab (Prieto-
Blazquez et al., 2009). It is clear from the above analysis that in order to achieve learning goals
the above studies did not present the technology-enhanced labs by themselves but provided
supporting tools and resources for learning and followed sound PLTs (e.g., inquiry-based learning)
in their design.
This analysis provides us with evidence to answer our research question - “How do we design lab
environments to take advantage of technology for effective learning?”. It reveals that the design of
such lab environments for effective learning needs to integrate technology artefacts (such as virtual
and remote labs), leveraging their benefits while also providing the necessary support, tools and
resources for effective learning guided by sound PLTs. Thus, this thesis postulates the following
hypothesis to answer the above research question:
Hypothesis: Design of technology-enhanced lab environments taking a holistic view of learning
incorporating learning context, curriculum design, lab activities, assessments, resources and
technology artefacts based on sound pedagogical and learning principles and theories have a
higher potential for effective learning.

Chapter 2 – Literature Review
40
The design of a technology-enhanced lab environment that includes curriculum design, lab
activities, support tools, resources and technology artefacts based on sound PLTs is referred to as
a Technology-enhanced Pedagogical Framework (TePF) for lab environments in this thesis. A
TePF for a lab environment needs to be implemented in a particular learning context. Thus, this
thesis implements and evaluates a TePF for a lab environment in a system level course in
computing education to validate the above hypothesis. The next section discusses related work in
technology-enhanced labs in system level courses in computing.
2.3 Technology-enhanced Labs in System Level Courses in Computing
Similar to other disciplines, lab work is critical for student learning in computing and information
technology fields. In particular, system level courses in computing education, such as information
security, networking, system administration and operating systems, use hands-on activities that
require students to configure hardware and system level software (operating systems, firewalls,
security settings, etc.) with administrative privileges in complex networked environments. Such
laboratory activities require specialised physical labs with equipment isolated from other campus
networks. This can be prohibitive, both financially and practically, and this approach inherits other
constraints of physical labs such as restricted access.
Virtualization and related cloud computing technologies have provided the means to implement
virtual computing labs that enable students to create, configure and deploy virtual IT infrastructure
(e.g., VMs, switches, routers, etc.) and conduct experiments without the need to have specialised
physical labs for system level courses in computing. In the literature, a number of virtual lab
implementations using virtualization s have been researched. The following sections presented a
discussion of virtualization technologies and virtual computing labs in general followed by a
review of related work.
2.3.1 Virtualization Technologies and Virtual Computing Labs
Virtualization technologies have provided capabilities to virtualise hardware, software and
network infrastructure. These technologies are fuelling cloud computing infrastructure and newer
IT service delivery models. Organisations can now provision virtual IT infrastructure on demand

Chapter 2 – Literature Review
41
hosted in centralised data centres accessible remotely via networks. The physical infrastructure
can be managed within an organisation (private cloud environments) or hosted external to the
organisation by third party cloud providers (public cloud).
Virtualization is a group of technologies that allows configuration of virtual infrastructure over
physical resources. Thus, with virtualization technologies, we can configure multiple virtual
machines (VMs) with configured hardware (such as disk space, RAM, CPU, etc.) to run on a single
piece of physical hardware (which is called the host). Similarly, we can configure complex network
resources (e.g. virtual switches, virtual routers, storage, etc.), in this virtual environment. These
capabilities have been exploited and revolutionised the delivery and deployment of IT services
today – generally known as cloud computing. IT organisations (such as Google, Amazon,
Microsoft and others) have used these technologies in their data centres to virtualise and deliver
IT resources as IT services to organisations and communities. These service providers are
commonly known as public cloud service providers. Nowadays, a person or an organisation can
rent computing resources (e.g. servers, storage, computing power, etc.) through the Internet from
these cloud providers. Additionally, internal IT departments of organisations have taken advantage
of these technologiesand provide IT resources to their organisations which are generally known as
private cloud environments. Cloud service providers offer different levels of IT services. These
services are broadly classified as: Infrastructure as a Service (IaaS); Platform as a Service (PaaS);
and Software as a Service (SaaS). In IaaS, IT infrastructure resources such as storage and CPU are
provided. Examples of such providers are Amazon Web Services (AWS) and Microsoft Azure. In
PaaS, developers are provided with an environment to develop and deploy web applications in
cloud environments. An example of this is Google’s App Engine. In SaaS, rather than installing
software on local machines, users rent IT applications from cloud providers. Examples include
Google Docs (from Google), Office 365 (from Microsoft) and other offerings.
At the heart of virtualization is the hypervisor technology. This is a software layer that enables the
deployment of different re-configurable virtual resources (storage, memory, CPUs, etc.) on
physical hardware. There are two main types of hypervisors – Type 1 are bare-metal hypervisors
and Type 2 are embedded hypervisors. In the Type 1 (bare metal) hypervisor, the hypervisor runs
on the hardware and provides a virtualization platform. In Type 2, the host’s operating system runs
on the hardware while the hypervisors run as an application on the host Operating System allowing
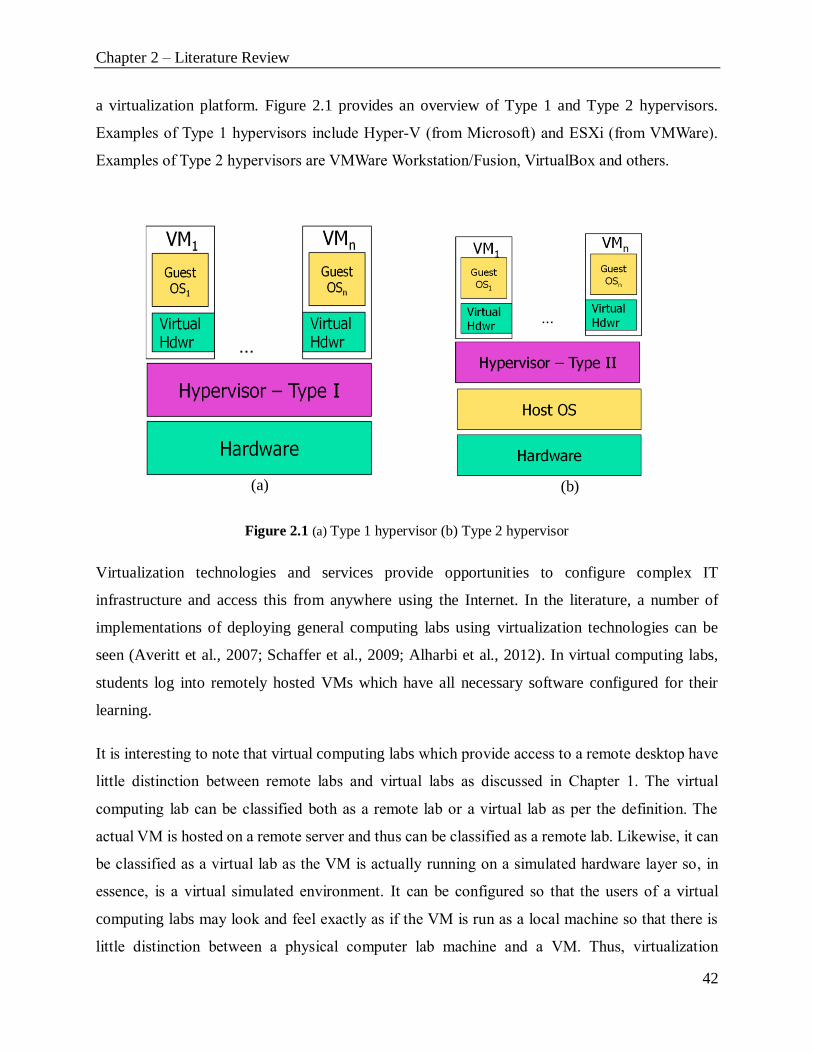
Chapter 2 – Literature Review
42
a virtualization platform. Figure 2.1 provides an overview of Type 1 and Type 2 hypervisors.
Examples of Type 1 hypervisors include Hyper-V (from Microsoft) and ESXi (from VMWare).
Examples of Type 2 hypervisors are VMWare Workstation/Fusion, VirtualBox and others.
Figure 2.1 (a) Type 1 hypervisor (b) Type 2 hypervisor
Virtualization technologies and services provide opportunities to configure complex IT
infrastructure and access this from anywhere using the Internet. In the literature, a number of
implementations of deploying general computing labs using virtualization technologies can be
seen (Averitt et al., 2007; Schaffer et al., 2009; Alharbi et al., 2012). In virtual computing labs,
students log into remotely hosted VMs which have all necessary software configured for their
learning.
It is interesting to note that virtual computing labs which provide access to a remote desktop have
little distinction between remote labs and virtual labs as discussed in Chapter 1. The virtual
computing lab can be classified both as a remote lab or a virtual lab as per the definition. The
actual VM is hosted on a remote server and thus can be classified as a remote lab. Likewise, it can
be classified as a virtual lab as the VM is actually running on a simulated hardware layer so, in
essence, is a virtual simulated environment. It can be configured so that the users of a virtual
computing labs may look and feel exactly as if the VM is run as a local machine so that there is
little distinction between a physical computer lab machine and a VM. Thus, virtualization
(a)
(b)

Chapter 2 – Literature Review
43
technologies allow the centralisation of management of computing resources to provide virtual
computing labs which combine the advantages of remote and virtual labs (i.e., access to the
computing lab from anywhere at any time while also having the look and feel of a local machine).
The virtual computing labs discussed above use a centralised approach to deploying labs whereby
VMs are hosted and managed centrally and students connect to them remotely. This approach is
also called centralised labs. Another deployment approach is decentralised deployment of labs. In
the decentralised approach, VMs are configured and hosted on each student’s computer and not
hosted centrally by the university/organisation. Each student installs a hypervisor and hosts the
VM on his or her computer. This provides more flexibility to the student as s/he can configure the
VM as needed, however they do require technical know-how to install and configure VMs and run
hypervisors, and it also takes up resources on the host VM on student computers.
Virtual computing labs are typically implemented to access a single VM for students to meet their
learning needs. System level courses in computing, such as networking and system administration,
information security, require access to multiple networked resources such as multiple VMs,
switches, routers, in complex networked environments to meet the students’ learning needs. This
requires more complex IT infrastructure deployments than standard desktop environments. The
following section provides a review of the implementation of virtual laboratories for system level
courses in computing.
2.3.2 Virtual Labs for System Level Courses in Computing
This section reviews implementations of virtual labs using virtualization technologies in the
literature for system level courses in computing. Table 2.2 provides a list of related work on virtual
labs in system level courses in computing that use virtualization technologies. The table outlines
the author(s) of study, the subject area (such as computer networks, operating systems, system
administration and/or information security), the type of lab (virtual, remote or physical), a
description of the study and the results, whether any technology tools were developed for teaching
and learning, the virtualization platform used for the virtual lab, whether the study had an
evaluation and if any PLTs were explicitly used in the study.

Chapter 2 – Literature Review
44
Table 2.2: Virtual Labs (based on virtualization technologies) for System Level Courses in Computing
Paper Author
and Year
Subject Type of
Lab
Description Tech.
Tools
Virtualization
Platform
Evalu
ation
Pedagogy
Theories
Anisetti et
al., 2007
Computer
Networks and Information
Security
Virtual The paper describes Open Virtual Lab (OVL) - a virtual lab for networking and information
security that uses a para-virtualization approach and an open source Xen platform. To evaluate, two case studies were conducted. In both case studies, students unanimously
reported their satisfaction with the OVL environment. In the second case study, results show
online students exposed to OVL achieved better results than those attending the traditional
laboratory course. In the second case study, on-campus students used physical labs while
online students used OVL.
No Xen Yes None
Border, 2007 Computer
Networks,
System
Admin and
Information Security
Virtual The author develops the Remote Laboratory Emulation System (RLES) to facilitate
access to the virtual laboratory environment through the Web for both distance and local
students at Rochester Institute of Technology. RLES implements four technologies:
Microsoft Windows Terminal Services, Microsoft Remote Desktop Communications,
Microsoft Remote Assistance and VMWare Workstation to deliver virtual labs. Students use this environment to complete labs in Principles of System Administration
course in Winter quarter 2005.
No VMWare
Workstation
No None
Ramalingam,
2007
Computer
Networks,
System
Admin and
Information
Security
Virtual This paper presents a decentralised lab environment where a Virtual PC platform is used to
create VMs for different courses and store them in lab PCs allowing students to work on
their images with administrative privileges and to be able to save the state throughout the
term. The limitation is that the VM images are stored on the client lab machine and students
need to attend the lab to access the client machine that hosts their VMs.
No Virtual PC No None
Wannous, et
al., 2007
Computer
Networks
Virtual This paper describes the design of a virtual lab for networking. It is a hands-on lab using the
Xen virtualization platform and VNC Server for remote access.
No Xen No None
Duignan &
Hall, 2008
Operating
Systems
Virtual
In this paper, the authors consider a constructivist approach to teaching operating systems.
A number of pedagogy theories (such as activity theory, active learning, sociality,
collaboration, etc.) are considered. A group project spanning the entire term is provided
whereby the students work on the project throughout the term using virtualization to meet
the course objectives. Overall the students rated the labs higher, and the use of virtualization
technologies provided a lab environment that contributed to a positive student learning
experience.
No VMWare Yes Constructivist
approach
Hu & Wang,
2008
Information
Security
Virtual In this paper, the authors present the xSec lab environment which uses the Xen platform and
both Linux and Windows VMs to teach network security. A number of labs in the xSec
No Xen No None

Chapter 2 – Literature Review
45
Paper Author
and Year
Subject Type of
Lab
Description Tech.
Tools
Virtualization
Platform
Evalu
ation
Pedagogy
Theories
course project involve students extending/modifying the source code of Linux to enhance
security features.
Gaspar et al., 2008
System oriented
courses
Virtual The paper discusses three projects that consider open-source virtualization technologies and how they can be applied to teaching different system level courses in computing education:
1) XenWorlds which provides a free modifiable virtualization platform based on Xen
(hypervisor for Linux); 2) V-Net Lab which is developed for cybersecurity courses that
require students to be given administrative access to entire networks. V-Net can provide
hands-on activities for the student to develop and configure defensive technologies such as
firewalls and intrusion detection systems and attack these defences using live exploits and
malware including viruses and worms; and 3) The SOFTICE project (Scalable, Open source,
Fully Transparent and Inexpensive Clustering for Education) aimed at leveraging open-
source virtualization and clustering technologies to support innovative pedagogies for
system level courses such as operating systems and networking.
No Xen No None
Li & Mohammed,
2008
Information Security
Virtual This study describes the use of decentralised labs in teaching an intrusion detection course. In the decentralised labs, student machines use VMs deployed on their own computers to
conduct labs. VMs, related packages and trace files are provided for students to conduct lab
activities. Two iterations of the course in Fall 2006 and Fall 2007 were delivered and
evaluated with both on-campus and distance education students. Students acknowledge the
usefulness of the virtual labs to understand lecture topics and gave positive feedback.
Decentralised labs had advantages over centralised labs and could be used as a complement
to centralised labs in system level courses.
No VMware Yes None
Li, 2009 Information
Security
Virtual This paper describes the use of decentralised labs to teach intrusion detection courses. The
decentralised labs use student machines to deploy VMs, packages, trace files, etc. The lab
activities are conducted on the student machines, decreasing the load for resources on the institution’s centralised labs. The intrusion detection course was delivered and evaluated 3
times over 3 years with different virtualization platforms. The platforms were VMWare
Player (2006), VMWare Workstation (2007) and VirtualBox (2008). The student experience
was positive in all years. Usability was similar between platforms. Students felt that
VMWare used more resources than VirtualBox. Also, in 2008, students were provided an
opportunity to use the centralised VCL for 2 bonus lab projects. Most students used the
decentralised lab for the project work. No clear correlation was found between the lab grade
averages and the virtualization options (VirtualBox vs VMWare) used by students.
No VMWare
VirtualBox
Yes None

Chapter 2 – Literature Review
46
Paper Author
and Year
Subject Type of
Lab
Description Tech.
Tools
Virtualization
Platform
Evalu
ation
Pedagogy
Theories
Li, Toderick
& Lunsford,
2009
Computer
Networks,
Information
Security
Virtual This paper describes using VCL (Averitt et al, 2007) to provide centralised labs for system
level courses at East Carolina University. The VCL was used to provide centralised labs for
3 courses (2 information security and 1 networking course). Evaluation of the centralised
labs was positive, however only a small percentage of students preferred to use the centralised labs. This may be due to a lack of familiarity given that most labs were conducted
using decentralised labs while the VCL was provided as an option. Centralised and
decentralised labs have different strengths and can be used to complement each other.
No VMWare,
VirtualBox
Yes None
Stewart,
Humphries &
Andel, 2009
Computer
Networks,
System
Admin and
Information
Security
Virtual This paper describes an architecture to deploy sandboxed decentralised virtual labs for
students (with the constrained memory requirements of student machines) in networking,
system administration and information security courses. The use of open-source software
platforms and packages (such as Linux kernel with OpenVZ, libvirt, etc.) and a centralised
image library for instructors to deploy images for lab activities are discussed.
No Linux kernel
with libvirt,
OpenVZ or
QEMU/
KVM, or
VMWare
No None
Li &
Toderick, 2010
Networking
and System Admin
Virtual
This paper describes and implements different cloud in cloud architectures (i.e. virtual data
centres). Three different architectures to create and deploy virtual data centres useful for teaching and research purposes are described. Then the implementation of these
architectures using different virtualization platforms is described. A VCL (Averitt et al.,
2007; Dreher et al., 2009) is used to deploy virtual data centres as system images from a
library.
No VirtualBox
VMWare, ProxMox VE,
OpenVZ, Xen
No None
Wannous &
Nakano,
2010
Computer
Networks
Virtual NVBLab incorporates a virtual lab-based Xen virtualization platform where students can
create multiple VMs and access network resources – routers, switches, etc. VNC server and
clients are used to access the VMs remotely. In addition, two new tools – Designer and
Builder were developed. In Designer, students can graphically design a network to be
deployed in the NVBLab environment. Once the designed network scenario is finalised, it
can be deployed to the virtual lab using the Builder tool. A case study was conducted to evaluate NVBLab as a part of a computer network course. In addition to student feedback
on NVBLab, pre- and post-tests were completed to discover the impact on learning. Students
had positive feedback for the tools and the virtual lab with some feedback for improvements
for the user interface and performance. Also, student learning had improved.
Yes –
Design-
er,
Builder
Xen Yes None
Wang,
Hembroff &
Yedica, 2010
Information
Security,
Computer
Networks
Virtual This paper describes the implementation and experience of a virtual lab using VMWare
platform tools including VMWare Lab Manager, vCentre, ESX and related technologies. A
number of features of Lab Manager are discussed along with ways to deploy virtual labs for
different requirements and scenarios in system administration and information security
courses. The authors’ experience, the resource implications and training needs are presented.
No VMWare No None
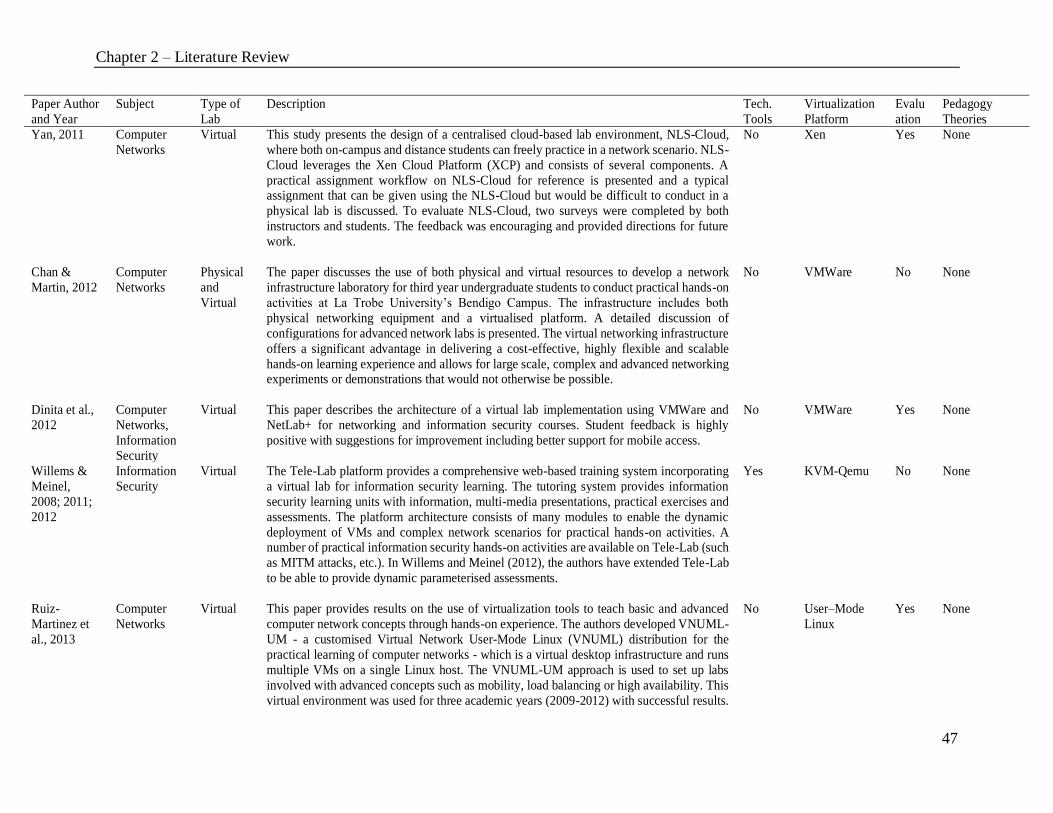
Chapter 2 – Literature Review
47
Paper Author
and Year
Subject Type of
Lab
Description Tech.
Tools
Virtualization
Platform
Evalu
ation
Pedagogy
Theories
Yan, 2011 Computer
Networks
Virtual This study presents the design of a centralised cloud-based lab environment, NLS-Cloud,
where both on-campus and distance students can freely practice in a network scenario. NLS-
Cloud leverages the Xen Cloud Platform (XCP) and consists of several components. A
practical assignment workflow on NLS-Cloud for reference is presented and a typical assignment that can be given using the NLS-Cloud but would be difficult to conduct in a
physical lab is discussed. To evaluate NLS-Cloud, two surveys were completed by both
instructors and students. The feedback was encouraging and provided directions for future
work.
No Xen Yes None
Chan &
Martin, 2012
Computer
Networks
Physical
and
Virtual
The paper discusses the use of both physical and virtual resources to develop a network
infrastructure laboratory for third year undergraduate students to conduct practical hands-on
activities at La Trobe University’s Bendigo Campus. The infrastructure includes both
physical networking equipment and a virtualised platform. A detailed discussion of
configurations for advanced network labs is presented. The virtual networking infrastructure
offers a significant advantage in delivering a cost-effective, highly flexible and scalable
hands-on learning experience and allows for large scale, complex and advanced networking experiments or demonstrations that would not otherwise be possible.
No VMWare No None
Dinita et al.,
2012
Computer
Networks,
Information
Security
Virtual
This paper describes the architecture of a virtual lab implementation using VMWare and
NetLab+ for networking and information security courses. Student feedback is highly
positive with suggestions for improvement including better support for mobile access.
No VMWare
Yes None
Willems &
Meinel,
2008; 2011;
2012
Information
Security
Virtual The Tele-Lab platform provides a comprehensive web-based training system incorporating
a virtual lab for information security learning. The tutoring system provides information
security learning units with information, multi-media presentations, practical exercises and
assessments. The platform architecture consists of many modules to enable the dynamic
deployment of VMs and complex network scenarios for practical hands-on activities. A number of practical information security hands-on activities are available on Tele-Lab (such
as MITM attacks, etc.). In Willems and Meinel (2012), the authors have extended Tele-Lab
to be able to provide dynamic parameterised assessments.
Yes KVM-Qemu No None
Ruiz-
Martinez et
al., 2013
Computer
Networks
Virtual This paper provides results on the use of virtualization tools to teach basic and advanced
computer network concepts through hands-on experience. The authors developed VNUML-
UM - a customised Virtual Network User-Mode Linux (VNUML) distribution for the
practical learning of computer networks - which is a virtual desktop infrastructure and runs
multiple VMs on a single Linux host. The VNUML-UM approach is used to set up labs
involved with advanced concepts such as mobility, load balancing or high availability. This
virtual environment was used for three academic years (2009-2012) with successful results.
No User–Mode
Linux
Yes None
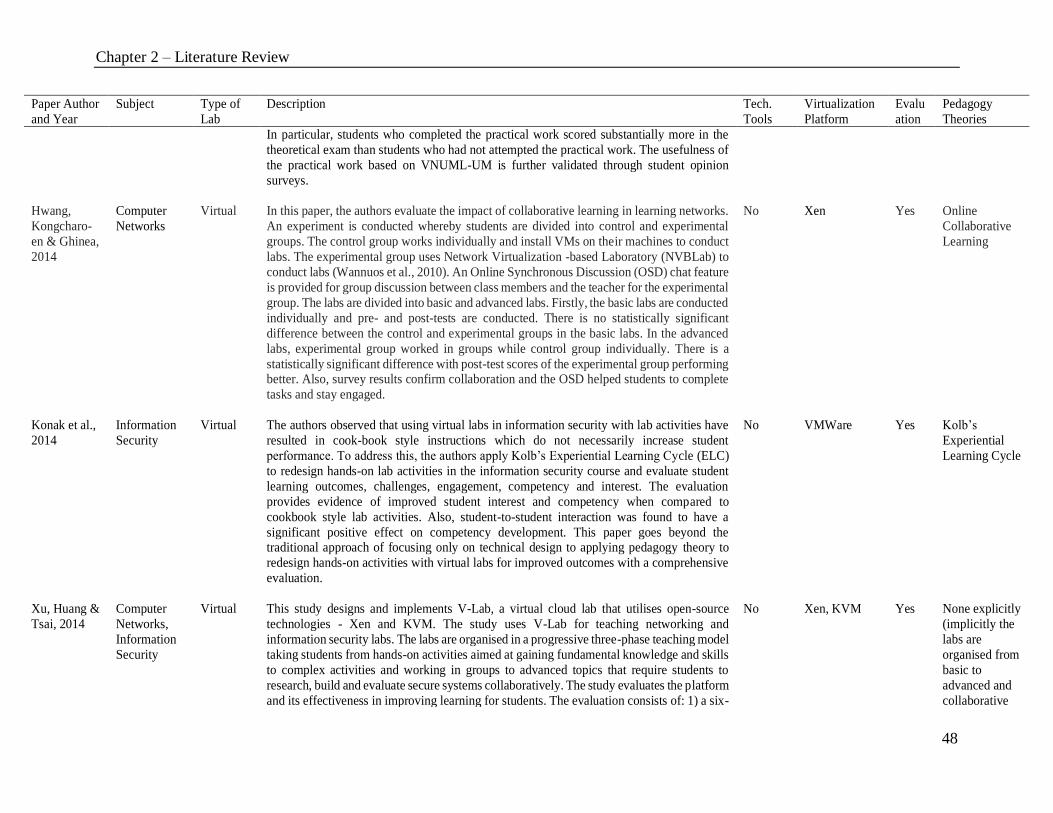
Chapter 2 – Literature Review
48
Paper Author
and Year
Subject Type of
Lab
Description Tech.
Tools
Virtualization
Platform
Evalu
ation
Pedagogy
Theories
In particular, students who completed the practical work scored substantially more in the
theoretical exam than students who had not attempted the practical work. The usefulness of
the practical work based on VNUML-UM is further validated through student opinion
surveys.
Hwang,
Kongcharo-
en & Ghinea,
2014
Computer
Networks
Virtual In this paper, the authors evaluate the impact of collaborative learning in learning networks.
An experiment is conducted whereby students are divided into control and experimental
groups. The control group works individually and install VMs on their machines to conduct
labs. The experimental group uses Network Virtualization -based Laboratory (NVBLab) to
conduct labs (Wannuos et al., 2010). An Online Synchronous Discussion (OSD) chat feature
is provided for group discussion between class members and the teacher for the experimental
group. The labs are divided into basic and advanced labs. Firstly, the basic labs are conducted
individually and pre- and post-tests are conducted. There is no statistically significant
difference between the control and experimental groups in the basic labs. In the advanced
labs, experimental group worked in groups while control group individually. There is a
statistically significant difference with post-test scores of the experimental group performing better. Also, survey results confirm collaboration and the OSD helped students to complete
tasks and stay engaged.
No Xen Yes Online
Collaborative
Learning
Konak et al.,
2014
Information
Security
Virtual The authors observed that using virtual labs in information security with lab activities have
resulted in cook-book style instructions which do not necessarily increase student
performance. To address this, the authors apply Kolb’s Experiential Learning Cycle (ELC)
to redesign hands-on lab activities in the information security course and evaluate student
learning outcomes, challenges, engagement, competency and interest. The evaluation
provides evidence of improved student interest and competency when compared to
cookbook style lab activities. Also, student-to-student interaction was found to have a
significant positive effect on competency development. This paper goes beyond the traditional approach of focusing only on technical design to applying pedagogy theory to
redesign hands-on activities with virtual labs for improved outcomes with a comprehensive
evaluation.
No VMWare Yes Kolb’s
Experiential
Learning Cycle
Xu, Huang &
Tsai, 2014
Computer
Networks,
Information
Security
Virtual This study designs and implements V-Lab, a virtual cloud lab that utilises open-source
technologies - Xen and KVM. The study uses V-Lab for teaching networking and
information security labs. The labs are organised in a progressive three-phase teaching model
taking students from hands-on activities aimed at gaining fundamental knowledge and skills
to complex activities and working in groups to advanced topics that require students to
research, build and evaluate secure systems collaboratively. The study evaluates the platform
and its effectiveness in improving learning for students. The evaluation consists of: 1) a six-
No Xen, KVM Yes None explicitly
(implicitly the
labs are
organised from
basic to
advanced and
collaborative

Chapter 2 – Literature Review
49
Paper Author
and Year
Subject Type of
Lab
Description Tech.
Tools
Virtualization
Platform
Evalu
ation
Pedagogy
Theories
factor pedagogical model for experiments (motivation, knowledge, collaboration, creativity,
demonstration and feedback); 2) teaching phases (basic, intermediate and advanced
experiments); 3) observations with and without V-Lab in terms of increases in the number
of hands-on experiments with V-Labs, reduced hours for lab setup and configuration, and increased percentage of students finishing experiments on time; 4) improved positive
feedback and better grades for students who used V-Lab compared to traditional laboratories.
The evaluation clearly summarises the benefits of using V-Lab.
work is
incorporated)
Salah et al.,
2015
Information
Security
Virtual This study highlights and summarises several major challenges and limitations of practical
cybersecurity in traditional labs. It shows how the Amazon Web Services (AWS) cloud can
be used as a platform to carry out various lab exercises for local and remote students. In
particular, they show how Amazon can be used to allow students to manage, monitor,
analyse and configure subnets, network hosts, devices and protocols. For example, in a
traditional laboratory, the network lab requires a number of network devices including
routers, switches and relevant network software packages. With the existence of local and
remote students taking the same course across multiple university campuses, they would need to replicate the physical setting. The cloud computing model solved most (if not all) of
the problems experienced by having physical lab set ups. The cloud can provide on-demand,
flexible, isolated, scalable, (virtually) unlimited and easily configurable labs. This study
compares and contrasts the AWS cloud lab for teaching cybersecurity exercises. The
majority of networking lab exercises were carried out effectively in the cloud with the
exception of a few activities that required physical hardware. The cloud-based labs were
highly educational and motivational for students. They were able to gain significant
cybersecurity skills as well as additional understanding of using cloud resources and
services.
No AWS Yes None
Zhu, 2015 Computer Networks
Virtual The paper aims to support hands-on network programming projects to develop Internet applications, routing algorithms, and to understand protocol layers in computer network
courses using VMs hosted on a public cloud in comparison to the previous approach where
students were running multiple VMs on the same computer. The Amazon Web Services
(AWS) cloud platform was used to provide hands-on network programming projects and lab
exercises. A survey was conducted to understand student satisfaction when using cloud-
based VMs. Most students agreed that using the AWS cloud was helpful for their learning
in this course and career development and were in favour of using the AWS cloud not only
in this course but also in other computer science courses.
No AWS Yes None
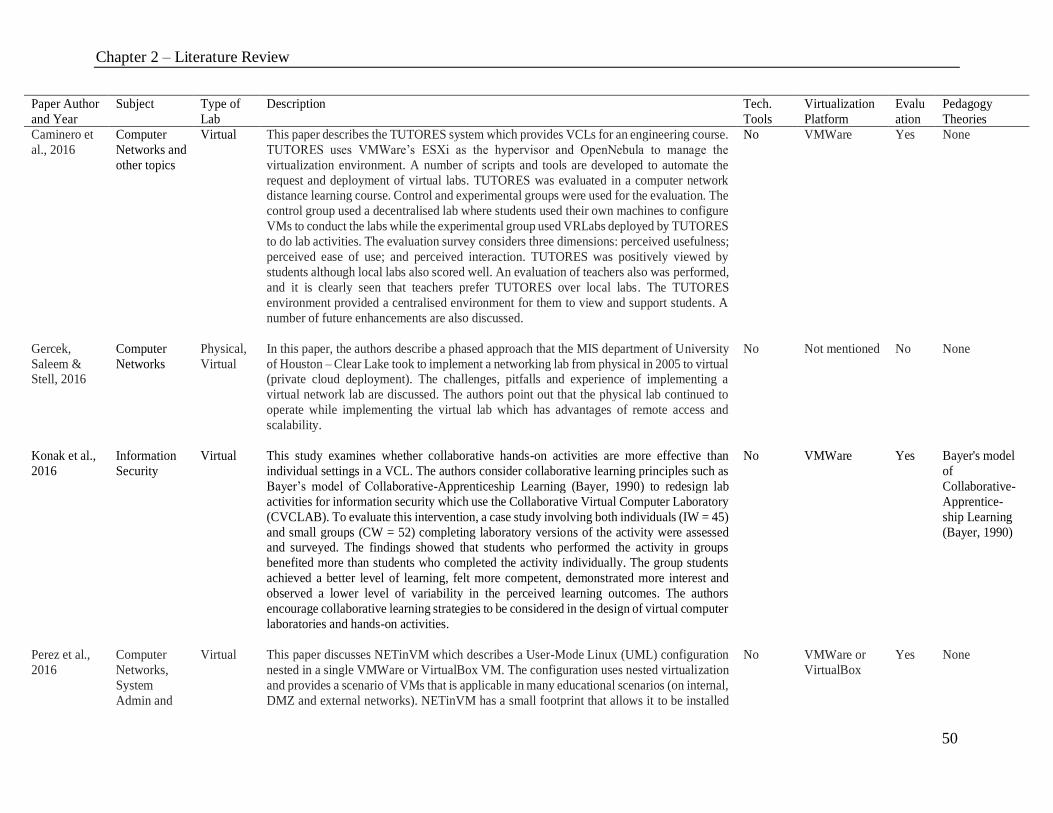
Chapter 2 – Literature Review
50
Paper Author
and Year
Subject Type of
Lab
Description Tech.
Tools
Virtualization
Platform
Evalu
ation
Pedagogy
Theories
Caminero et
al., 2016
Computer
Networks and
other topics
Virtual This paper describes the TUTORES system which provides VCLs for an engineering course.
TUTORES uses VMWare’s ESXi as the hypervisor and OpenNebula to manage the
virtualization environment. A number of scripts and tools are developed to automate the
request and deployment of virtual labs. TUTORES was evaluated in a computer network distance learning course. Control and experimental groups were used for the evaluation. The
control group used a decentralised lab where students used their own machines to configure
VMs to conduct the labs while the experimental group used VRLabs deployed by TUTORES
to do lab activities. The evaluation survey considers three dimensions: perceived usefulness;
perceived ease of use; and perceived interaction. TUTORES was positively viewed by
students although local labs also scored well. An evaluation of teachers also was performed,
and it is clearly seen that teachers prefer TUTORES over local labs. The TUTORES
environment provided a centralised environment for them to view and support students. A
number of future enhancements are also discussed.
No VMWare Yes None
Gercek,
Saleem & Stell, 2016
Computer
Networks
Physical,
Virtual
In this paper, the authors describe a phased approach that the MIS department of University
of Houston – Clear Lake took to implement a networking lab from physical in 2005 to virtual (private cloud deployment). The challenges, pitfalls and experience of implementing a
virtual network lab are discussed. The authors point out that the physical lab continued to
operate while implementing the virtual lab which has advantages of remote access and
scalability.
No Not mentioned No None
Konak et al.,
2016
Information
Security
Virtual This study examines whether collaborative hands-on activities are more effective than
individual settings in a VCL. The authors consider collaborative learning principles such as
Bayer’s model of Collaborative-Apprenticeship Learning (Bayer, 1990) to redesign lab
activities for information security which use the Collaborative Virtual Computer Laboratory
(CVCLAB). To evaluate this intervention, a case study involving both individuals (IW = 45)
and small groups (CW = 52) completing laboratory versions of the activity were assessed and surveyed. The findings showed that students who performed the activity in groups
benefited more than students who completed the activity individually. The group students
achieved a better level of learning, felt more competent, demonstrated more interest and
observed a lower level of variability in the perceived learning outcomes. The authors
encourage collaborative learning strategies to be considered in the design of virtual computer
laboratories and hands-on activities.
No VMWare Yes Bayer's model
of
Collaborative-
Apprentice-
ship Learning
(Bayer, 1990)
Perez et al.,
2016
Computer
Networks,
System
Admin and
Virtual This paper discusses NETinVM which describes a User-Mode Linux (UML) configuration
nested in a single VMWare or VirtualBox VM. The configuration uses nested virtualization
and provides a scenario of VMs that is applicable in many educational scenarios (on internal,
DMZ and external networks). NETinVM has a small footprint that allows it to be installed
No VMWare or
VirtualBox
Yes None

Chapter 2 – Literature Review
51
Paper Author
and Year
Subject Type of
Lab
Description Tech.
Tools
Virtualization
Platform
Evalu
ation
Pedagogy
Theories
Information
Security
on student machines. It has been evaluated in a computer security course with traditional
lecture-based learning and a problem-based course in security. In both instances, students
ranked the course with NETinVM higher than other courses. Also, the paper discusses the
use of NETinVM in an enterprise web application course and also it is also used by parties external to the university for a number of scenarios in teaching hands-on activities.
Soceanu et
al., 2017
Information
Security
Virtual This paper describes Project DECAMP which aims to provide ICT security labs for
European partner universities. DECAMP builds several components to allow labs to be
shared and integrated to Learning Management Systems (LMS) in partner universities for
seamless access by students. The solution has components that enable integration with
Moodle and the use of a single sign-on from Moodle to access courses and labs. OpenStack
is used as the platform to integrate cloud computing resources from all partner universities
to provide virtual labs. An OpenStack-Moodle plug-in was developed for integrating the
virtual labs with the LMS. The students can now directly deploy VM images for their course
work on OpenStack platforms to complete these information security labs.
No OpenStack No None
Kongcharoen
et al., 2017
Computer
Networks
Virtual In this paper, the authors evaluate the effective collaboration mechanism— called
Synchronized Pair Configuration (SPC) —in computer network labs to explain collaborative
activities, and information transformation in the team. The proposed framework consists of
three main components: Pair users, SPC, and VBLab (Virtualization-based Laboratory)
which is shown in their previous version (Hwang et al., 2014). First, the VBLab provide four
features to support lab activities namely (1) a synchronized web terminal allows the pair to
exchange driver and navigator roles immediately (2) a chat feature that allows students to
have both face-to-face and online synchronous discussion (OSD) for discussing and sharing
ideas (3) Command search, and (4) lab materials. Second, SPC system aimed to reduce
instructor effort and enhance interaction and collaboration between paired students to help
them accomplish lab assignments through one shared synchronized terminal. This proposed system is based on Distributed Cognition theory (Flor &Hutchins, 1991; Hutchins, 1990).
This allows the pair works only on their monitor while they communicate with their partner
through three ways: face-to-face, online discussion, or synchronized terminal. However, this
protocol differs from the original distributed cognition system in which the pair works on
two separate terminals using only face-to-face communication. The finding of pre-test, post-
test, and homework scores were positive. Both Basic and Advanced Labs, paired students in
the experimental group performed better than the control group. Also, students’ perceptions
using the TAM model and interviews indicate that the experimental group had high
motivation to use the proposed system.
Yes Xen Yes Distributed
cognition
theory

Chapter 2 – Literature Review
It can be observed that many implementations of virtual labs focus on technical designs to
provide improved access and new opportunities for teaching and learning. Although
technology-enhanced labs provide significant benefits to learning, the combination of a
good pedagogical framework, learner support, quality content and tutor interaction are all
essential components to create a learning environment where students can excel and
achieve higher learning outcomes (Alkhaldi et al., 2016).
In our work (Athauda et al., 2018), we classify the implementation of virtual labs for system
level courses in computing into two levels of evolution as follows: Level I: Technology
innovation and evaluation; and Level II: Technology, pedagogy and evaluation.
Level I: Technology innovation and evaluation: Most studies in the literature can be
categorised as Level I. At Level I, the focus of study is on the technical design and
evaluation. Capabilities of technology innovations to overcome existing limitations and to
provide opportunities for new learning are discussed and demonstrated. The details of the
technical design are presented. Evaluation is typically conducted using a case study where
the technology intervention is implemented in real class environments. Level I studies can
be further categorised based on their evaluation as follows: Technical Design (TD);
Technical Design and Technical Evaluation (TD and TE) and Technical Design, Technical
Evaluation and Learning Impact (TD, TE and LI).
In the TD stage, studies focus on technical design aspects of technology innovations and
no evaluation is presented. For instance, the study by Hu and Wang (2008) focuses on
creating a lab environment for a hands-on exercise in computer security using Linux and
Xen. In Li and Toderick (2010), the authors describe three architectural approaches to
deploy virtual labs using virtualization technologies. In Stewart, Humphries and Andel
(2009), the authors present an environment using full and operating system virtualization
that can be used in networking, systems administration and cyber security education. Other
studies that fall into this category include Soceanu, Vasylenko and Gradinaru (2017),
Gercek, Saleem and Steel (2016) and Wannous, Nakano, Kita and Sugitani (2007).
In the TD and TE stage, studies not only discuss the technical design but also present an
evaluation of the technology intervention focused on technology acceptance and user
Chapter 2 – Literature Review
53
experience. Typically, the technology innovation is applied in real class environments to
conduct the evaluation. The evaluation could be either focused on technology evaluation
only and/or focused on the technology innovation’s impact on learning. In a technology
evaluation, technology acceptance and user experience are examined. Technology
evaluations typically demonstrate a capacity to provide new opportunities for learning
and/or overcoming limitations. For instance, in Salah, Hammoud and Zeadally (2015), the
authors use a public cloud environment (Amazon EC2) to implement cybersecurity labs.
The advantages and detailed technical configuration of implementing a cybersecurity lab
are discussed. The authors teach a cybersecurity course using the cloud lab and evaluate
the acceptance of such labs using student surveys. Other studies that fall in to this category
include Prieto-Blázquez, Arnedo-Moreno and Herrera-Joancomartí (2008), Li and
Mohammed (2008), Duignan and Hall (2008), Li, Toderick and Lunsford (2009), Yan
(2011), Dinita, Wilson, Winckles, Cirstea and Jones (2012) and Zhu (2015).
Some studies in Level I also evaluate the impact on learning due to the technology
innovation, which is classified as TD, TE and LI. Often an experiment is conducted with a
pre/post-test of student learning (assessment scores and survey results) or with control and
experimental groups of students where only experimental group is exposed to the
technology innovation. For instance, in Wannous and Nakano (2010), a virtual network lab
is created along with two tools, Designer and Builder, which allow students to design a
network scenario and deploy the scenario in a virtual environment. The tool is evaluated
using pre- and post-tests to evaluate the impact on learning. Also, student perspectives on
the tools are evaluated with survey questions. In Ruiz-Martinez, Pereniguez-Garcia, Marin-
Lopez, Ruiz-Martínez and Skarmeta-Gomez (2013), hands-on lab activities to learn
advanced network concepts (such as mobility, load balancing and high availability) are
provided using a VMUML-UM tool and evaluated with pre- and post-test assessment
results and surveys to determine the learning impact. Other studies in this category include
Anisetti et al. (2007) and Xu, Huang and Tsai (2014).
Level II: Technology, pedagogy and evaluation: It has been observed that only a few
studies in literature can be classified at Level II. Level II studies explicitly use PLTs when
integrating or designing technology innovations to learning environments and also

Chapter 2 – Literature Review
54
designing related teaching and learning activities. The evaluations in these studies consider
technology acceptance, user experience and impact on learning through these
interventions. The advantage of designing technology innovations based on PLTs is that
the researchers have access to formal PLTs to guide the design teaching and learning
activities and technology innovations rather than using a trial-and-error approach. Also,
due to these formal theories/principles, researchers and educators have insights as to why
certain strategies or approaches are effective in their learning environments.
For example, in Konak, Clark and Nasereddin, (2014), Kolb’s Experiential Learning Cycle
(ELC) (Kolb, 1984) is used to redesign hands-on lab activities incorporating a VCL into
an information security course. Control and experimental groups of students were
evaluated for their learning experience and outcomes. The control group conducted the lab
activities individually following a “cook-book” approach to the hands-on activities, while
the experimental group’s learning activities were designed to follow each phase of Kolb’s
ELC. The teaching and learning activities were evaluated on learning impact and outcomes
based on student surveys and quiz results. The students in the experimental group achieved
higher learning outcomes and revealed a significant positive effect on competency
development. In Konak and Bartolacci (2016), Collaborative Learning Theories (Bayer,
1990; Laal, 2013 and others) were applied to design collaborative teaching and learning
activities for virtual labs in information security courses. This study evaluated the
collaborative approach empirically in a real-class environment. A control group of students
were provided with lab activities based on individual work and the experimental group
conducted the activities in a collaborative manner. Data is collected using surveys, open-
ended questions and quiz results. It was shown that students in the experimental group have
higher and more consistent levels of competency and interest as well as higher post-test
scores than the control group. Other studies that fall into this category include Hwang,
Kongcharoen and Ghinea (2014) and Kongcharoen, Hwang and Ghinea (2017).
The studies in the literature are classified into the two levels are shown in Table 2.3. The
stages of evolution in applying technology innovations in education can be observed as
follows: firstly, studies that focus on the technical design of the technology innovation to
take advantage of the opportunities that new technologies provide (TD); next, studies that

Chapter 2 – Literature Review
55
focus on the technical design and empirically evaluate technology acceptance and user
experience (TD and TE); and thirdly, those studies that also evaluate the impact on learning
(TD, TE and LI). At Level II, studies consider theories and principles in education when
designing teaching and learning activities (TLAs) and integrating technology innovations
to take advantage of the opportunities that technology advances provide and empirically
evaluate the impact on learning (TP&E). The goal in TP&E interventions are to utilise
technology innovations and TLAs to improve learning. The use of theories and principles
in education assist to guide the design/integration of technology and TLAs. The goal of
TD, TD & TE and TD, TE & LI stages is to demonstrate the use of technology/technical
designs to address limitations in existing learning environments or demonstrate new
opportunities for teaching/learning.
Table 2.3: Classification of Related Work
Study
Level 1 – Technical Design &/or
Evaluation
Level 2 – Technology,
Pedagogy &
Evaluation
TD
TD &
TE
TD, TE & LI TP & E
Anisetti et al., 2007 √ √
Ramalingam, 2007 √
Wannous et al., 2007 √
Duignan & Hall, 2008 √
Hu & Wang, 2008 √
Gasper et al., 2008 √
Li & Mohammed, 2008 √ √
Li, 2009 √ √
Li, Toderick & Lunsford, 2009 √ √
Stewart, Humphries & Andel, 2009 √
Li & Toderick, 2010 √
Wannous & Nakano, 2010 √ √ √
Wang, Hembroff & Yedica, 2010 √
Yan, 2011 √ √
Chan & Martin, 2012 √
Dinita et. al., 2012 √ √
Willems & Meinel, 2008, 2011,
2012
√
Ruiz-Martinez et. al., 2013 √ √ √
Hwang, Kongcharoen & Ghinea, 2014
√
Konak et al., 2014 √
Xu, Huang and Tsai, 2014 √ √ √
Salah, Hammoud & Zeadally, 2015 √ √

Chapter 2 – Literature Review
56
Study
Level 1 – Technical Design &/or
Evaluation
Level 2 – Technology,
Pedagogy &
Evaluation
TD
TD &
TE
TD, TE & LI TP & E
Zhu, 2015 √ √
Caminero et al., 2016 √ √
Gercek, Saleem and Steel, 2016 √
Konak et al., 2016 √ √
Perez et al., 2016 √ √
Soceanu et al., 2017 √
Kongcharoen et al., 2017 √ TD – Technical Design, TE – Technical Evaluation, LI – Learning Impact, TP&E – Technology, Pedagogy
& Evaluation
It can be observed from the above literature review that, in comparison to Level I (24
studies), only a few (4) studies take a Level II approach (i.e., using PLTs in the design of
virtual laboratories). The hypothesis in section 2.2.2 states that the design of technology-
enhanced lab environments based on sound PLTs have a higher potential for effective
learning. This thesis aims to fill this research gap.
This research project presents a Level II approach by designing a technology-enhanced
pedagogical framework incorporating a virtual lab for a systems and networking course.
The course is designed to take into consideration PLTs, providing a sound theoretical
foundation. Technology artefacts such as virtual labs, automated feedback tools, discussion
boards and dashboards are integrated to create a rich learning environment. The proposed
framework is presented in Chapter 3.
2.4 Summary
In this chapter, a literature review was conducted on research into technology-enhanced
labs in different disciplines with a view to answer the broad research question presented in
Chapter 1 - How do we design a lab environment to take advantage of technology for
effective learning? The literature review resulted in a number of observations, findings and
insights. One particular insight was that rather than considering the lab by itself, it is crucial
to consider a holistic view of the learning context, curriculum, support tools, materials and
resources, and to follow sound pedagogical theories and principles in the design of

Chapter 2 – Literature Review
57
technology-enhanced lab environments for effective learning. This led to postulating the
hypothesis in Chapter 2 to answer the broad research question posed in Chapter 1 as
follows: Design of technology-enhanced lab environments taking a holistic view of
learning incorporating the learning context, curriculum design, lab activities, assessments,
resources and technology artefacts based on sound pedagogical and learning principles
and theories have a higher potential for effective learning.
In order to validate the hypothesis, this research project aims to design and evaluate a
technology-enhanced lab environment incorporating curriculum design, lab activities,
assessments, resources and technology artefacts based on sound pedagogical and learning
theories and principles (PLTs) for a particular learning context – this is termed a
Technology-enhanced Pedagogical Framework (TePF) for a lab environment.
The first step in developing a TePF for a lab environment is to decide a particular learning
context. This research project takes a technology-enhanced lab environment in system level
courses in computing as the learning context.
In the recent past, with the maturing and expanding use of virtualization technologies, the
development of virtual labs for system level courses in computing overcome many
limitations of existing physical labs. In the literature, a number of implementations of such
virtual labs can be found. In this chapter, a comprehensive literature review of virtual labs
based on virtualization technologies was undertaken. The review showed us that the
majority of studies focus on technical aspects of developing virtual labs to overcome
limitations of existing environments taking advantage of new opportunities for learning.
Very few studies consider PLTs in the design of these technology-enhanced labs. This gap
provided us with an opportunity to focus on developing and evaluating a TePF for a lab
environment in system level computing education. The proposed TePF is presented in the
next chapter.

Chapter III
3. Proposed Framework
This chapter details the proposed pedagogical framework – TePF (Athauda et al., 2018).
Firstly, in section 3.1, the theoretical model that forms the basis for the proposed
framework is discussed. Next, section 3.2 outlines a number of pedagogical and learning
theories/principles (PLTs) that are used by the framework. Section 3.3 describes the
application of PLTs to develop the framework. The technology artefacts of the framework
are presented in section 3.4. Finally, section 3.5 concludes the chapter.
3.1 TPACK Framework
The Technological Pedagogical Content Knowledge (TPACK) framework (Mishra &
Koehler, 2006; Koehler & Mishra, 2009) provides a theoretical reference model for the
proposed framework. Mishra and Koehler (2006) extend Shulman’s (1986) model that
describes teacher knowledge domains with the incorporation of the technological
knowledge domain (T) to present the TPACK model – see Figure 3.1.
Figure 3. 1 TPACK Framework (Mishra & Koehler, 2006)
Content
Knowledge
Pedagogical
Knowledge
Pedagogical Content Knowledge
Technology
Knowledge
Technological Content Knowledge
Technological Pedagogical Knowledge
Technological Pedagogical
Content Knowledge

Chapter 3 – Proposed Framework
59
The different knowledge domains in TPACK are described below:
• Content Knowledge (CK): Knowledge pertaining to a particular subject matter (e.g.
Mathematics, History, etc.).
• Pedagogical Knowledge (PK): Knowledge about teaching and learning approaches,
processes, methods and also of overall education purposes, values and aims (e.g.
classroom management, lesson plan development, etc.).
• Pedagogical Content Knowledge (PCK): Knowledge of which teaching/learning
approaches are appropriate to a particular subject or content (e.g. laboratories for
sciences, etc.). “PCK is concerned with the representation and formulation of
concepts, pedagogical techniques, knowledge of what makes concepts difficult or
easy to learn, knowledge of students’ prior knowledge, and theories of
epistemology” (Mishra & Koelher, 2006).
• Technology Knowledge (TK): Knowledge about standard technologies (e.g. use of
word processors, browsers, etc.).
• Technological Pedagogical Knowledge (TPK): Knowledge of existing
technologies and their capabilities for use in teaching and learning contexts (e.g.
Learning Management Systems (LMSs), discussion boards, etc.)
• Technological Pedagogical Content Knowledge (TPCK): “TPCK is an emergent
form of knowledge that goes beyond all three components (content, pedagogy, and
technology). This knowledge is different from knowledge of a disciplinary or
technology expert and also from general pedagogical knowledge shared by
teachers across disciplines. TPCK is the basis of good teaching with technology
and requires an understanding of the representation of concepts using
technologies; pedagogical techniques that use technologies in constructive ways to
teach content; knowledge of what makes concepts difficult or easy to learn and how
technology can redress some of the problems that students face; knowledge of
students’ prior knowledge and theories of epistemology; and knowledge of how
technologies can be used to build on existing knowledge and to develop new
epistemologies or strengthen old ones.” (Mishra & Koelher, 2006).
TPCK requires knowledge of all three domains, content, pedagogy and technology, to
develop and deliver successful teaching. The proposed framework has utilised TPCK
knowledge in its design to develop an effective learning environment.
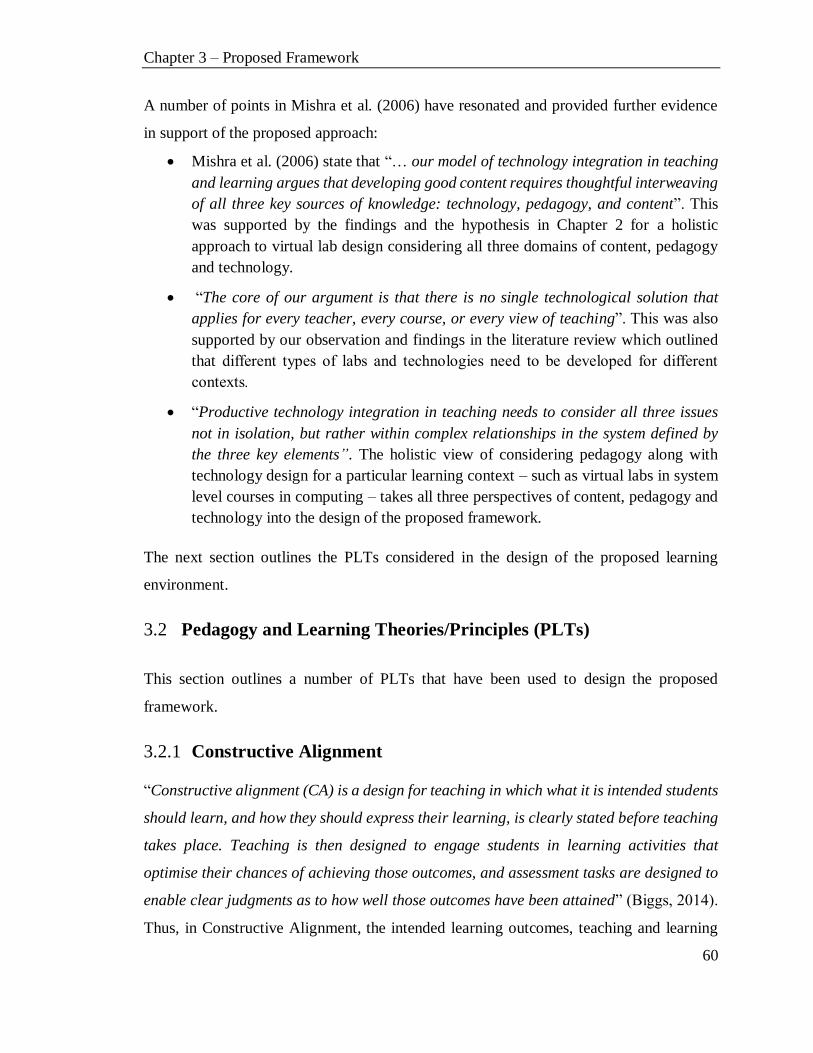
Chapter 3 – Proposed Framework
60
A number of points in Mishra et al. (2006) have resonated and provided further evidence
in support of the proposed approach:
• Mishra et al. (2006) state that “… our model of technology integration in teaching
and learning argues that developing good content requires thoughtful interweaving
of all three key sources of knowledge: technology, pedagogy, and content”. This
was supported by the findings and the hypothesis in Chapter 2 for a holistic
approach to virtual lab design considering all three domains of content, pedagogy
and technology.
• “The core of our argument is that there is no single technological solution that
applies for every teacher, every course, or every view of teaching”. This was also
supported by our observation and findings in the literature review which outlined
that different types of labs and technologies need to be developed for different
contexts.
• “Productive technology integration in teaching needs to consider all three issues
not in isolation, but rather within complex relationships in the system defined by
the three key elements”. The holistic view of considering pedagogy along with
technology design for a particular learning context – such as virtual labs in system
level courses in computing – takes all three perspectives of content, pedagogy and
technology into the design of the proposed framework.
The next section outlines the PLTs considered in the design of the proposed learning
environment.
3.2 Pedagogy and Learning Theories/Principles (PLTs)
This section outlines a number of PLTs that have been used to design the proposed
framework.
3.2.1 Constructive Alignment
“Constructive alignment (CA) is a design for teaching in which what it is intended students
should learn, and how they should express their learning, is clearly stated before teaching
takes place. Teaching is then designed to engage students in learning activities that
optimise their chances of achieving those outcomes, and assessment tasks are designed to
enable clear judgments as to how well those outcomes have been attained” (Biggs, 2014).
Thus, in Constructive Alignment, the intended learning outcomes, teaching and learning
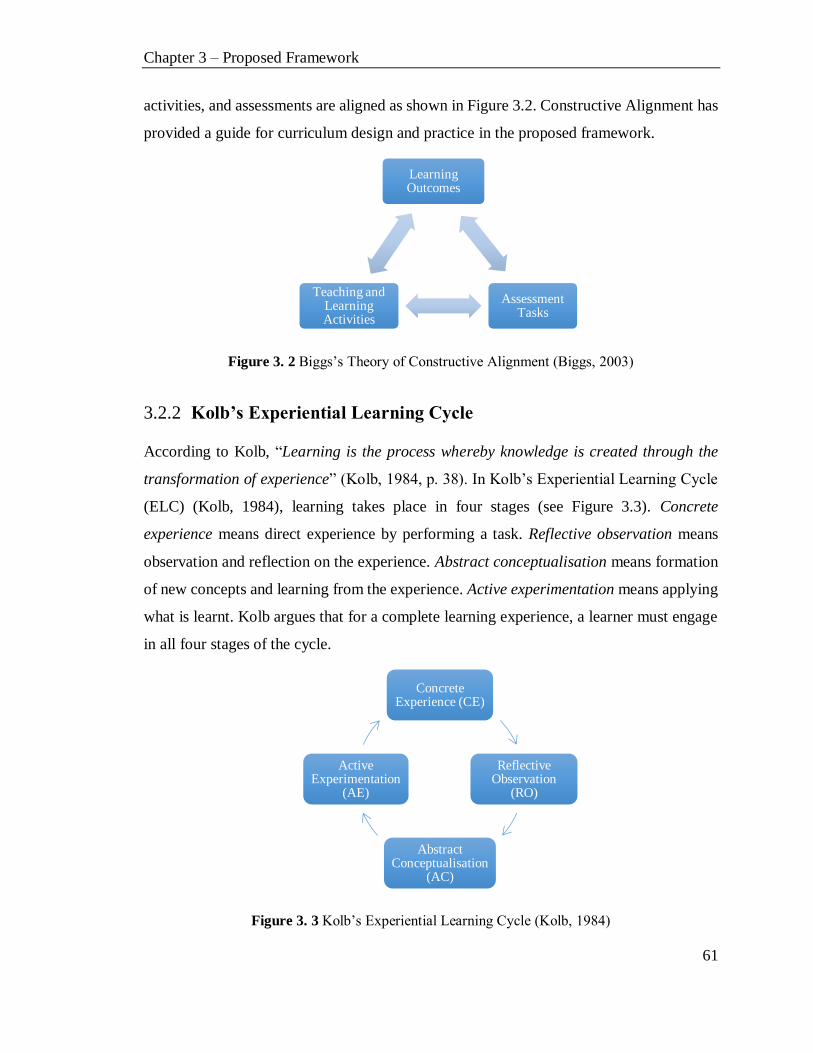
Chapter 3 – Proposed Framework
61
activities, and assessments are aligned as shown in Figure 3.2. Constructive Alignment has
provided a guide for curriculum design and practice in the proposed framework.
Figure 3. 2 Biggs’s Theory of Constructive Alignment (Biggs, 2003)
3.2.2 Kolb’s Experiential Learning Cycle
According to Kolb, “Learning is the process whereby knowledge is created through the
transformation of experience” (Kolb, 1984, p. 38). In Kolb’s Experiential Learning Cycle
(ELC) (Kolb, 1984), learning takes place in four stages (see Figure 3.3). Concrete
experience means direct experience by performing a task. Reflective observation means
observation and reflection on the experience. Abstract conceptualisation means formation
of new concepts and learning from the experience. Active experimentation means applying
what is learnt. Kolb argues that for a complete learning experience, a learner must engage
in all four stages of the cycle.
Figure 3. 3 Kolb’s Experiential Learning Cycle (Kolb, 1984)
Learning Outcomes
Assessment Tasks
Teaching and Learning Activities
Concrete Experience (CE)
Reflective Observation
(RO)
Abstract Conceptualisation
(AC)
Active Experimentation
(AE)

Chapter 3 – Proposed Framework
62
In the literature, Abdulwahed and Nagy (2009) and Konak et al. (2014) applied Kolb’s
ELC to successfully develop engaging laboratory activities to achieve higher learning
outcomes.
3.2.3 Bloom and SOLO Taxonomies
The Taxonomy of Educational Objectives (frequently referred to as Bloom’s Taxonomy)
was originally proposed by Bloom et al. (1956) and revised in 2001 by Anderson et al.
(2001). The revised Bloom’s Taxonomy (Anderson & Krathwohl, 2001) provides a
classification of six cognitive levels of complexity (Figure 3.4). Table 3.1 provides the
definitions for the levels arranged from simple to complex (Anderson & Krathwohl, 2001).
The taxonomy is hierarchical in that each higher level subsumes the lower level. For
instance, a learner at the “Applying” level has mastered the “Understanding” and
“Remembering” levels. The taxonomy can guide curriculum designers in developing
learning activities and assessments.
Figure 3. 4 Revised Bloom’s Taxonomy (Anderson & Krathwohl, 2001)
Table 3. 1: Revised Bloom’s Taxonomy Levels (Anderson & Krathwohl, 2001) Bloom's Cognitive Level Learning Activity
Remembering Retrieving, recognising and recalling relevant knowledge from long-
term memory.
Understanding Constructing meaning from oral, written and graphic messages
through interpreting, exemplifying, classifying, summarising,
inferring, comparing and explaining.
Applying Carrying out or using a procedure through executing or
implementing.
6. Creating
5. Evaluating
4. Analysing
3. Applying
2. Understanding
1. Remembering

Chapter 3 – Proposed Framework
63
Analysing Breaking material into constituent parts, determining how the parts relate to one another and to an overall structure or purpose through
differentiating, organising and attributing.
Evaluating Making judgments based on criteria and standards through checking and critiquing.
Creating Putting elements together to form a coherent or functional whole; reorganising elements into a new pattern or structure through
generating, planning or producing.
Biggs and Collis (1982) proposed the Structure of Observed Learning Outcomes (SOLO)
defined as “a simple and robust way of describing how learning outcomes grow in
complexity from surface to deep understanding” (Biggs & Collis, 1982). It is a systematic
way to describe how learner performance evolves from simple to complex and is a learning
model that helps teachers and students develop and understand the learning process. Thus,
SOLO provides a structured framework for students to use to progress their thinking and
learning. Table 3.2 below describes the SOLO levels of understanding.
Table 3. 2: Cognitive Processes in SOLO levels (Biggs & Collis, 1982; Biggs, 2003, p. 34-53)
Stage- level of understanding SOLO Taxonomy Category Definitions / Example lab 2*
SOLO 1: The Pre-Structural Level - This is the first stage where
students don’t really have any knowledge or understanding. In the lab
2 example of the Peer to Peer (P2P) network, a student who is pre-structural will usually respond with ‘I don’t understand what P2P
network is’
SOLO 2: The Unistructural Level - Here the student picks up or
understands one single aspect, and there is no relationship of facts or
ideas. At this level, in the lab 2 example, students have limited knowledge of networking concepts such as NIC or IP – they remember
concepts, or they may just use instructions to change a static IP. So, a
student's response will be ‘I have some understanding of IPs’.
SOLO 3: The Multistructural Level - At this level, the student can deal
with two or more aspects of a task or understand serially but cannot
interrelate the ideas. For example, the understanding from unistructural to multistructural means that the student may be able to
distinguish IP parts (host/network parts), configure a static IP and find
out system information– but is unable to design or connect them in a P2P network. So, their response might be ‘I know a few things about
IPs’.

Chapter 3 – Proposed Framework
64
SOLO 4: The Relational Level - At this level, the student may understand relations between several aspects and can integrate them
so that the whole has a coherent structure and meaning. At the
relational level, higher level thinking is used – in the lab 2 example,
students are able to design and connect two VMs and explain several ideas related to the P2P network. The student response might be ‘I can
configure the IPs and network between two VMs and share resources’.
SOLO 5: The Extended Abstract Level - The final and most complex
level is extended abstract. At this level, in the lab 2 example, students
are not only able to network two VMs to share resources, but they can also link these to other bigger ideas and concepts such as explaining
why and when should different networks models (P2P, client-server)
needs to be used. Also, I can troubleshoot and resolve network issues.
* lab 2 – INFT 2031(IP - Internet Protocol, NIC - Network Interface Card) see Table 3.4
Each SOLO level provides a metric of the complexity of understanding of the material by
the student. The levels at the relational and extended abstract levels are considered deeper
levels of learning while the others are considered as surface-level learning.
3.2.4 Collaborative Learning
Collaborative Learning (CL) can be defined as students at various performance levels
working together toward a common goal using well-structured assignments that help guide
a group of students toward a learning outcome (Gokhale, 1995; Smith et al., 2005).
Collaborative learning can refer to several educational approaches and environments in
which students work together in small groups to solve a problem, complete a task, or create
a product (Laal & Godsi, 2012).
Several researchers have found that groups performed better than individuals on computer-
based laboratory activities (Hwang et al. 2014; Konak et al., 2016; Kongchareoen et al.,
2017). Gokhale (1995), found out that collaborative learning fosters the development of
critical thinking and problem solving through discussion, clarification of ideas and
evaluation of others’ ideas. This fact led us to consider integration of collaborative
activities.

Chapter 3 – Proposed Framework
65
3.2.5 Formative Assessments and Feedback
Formative and summative assessments are the two most widely known assessment types.
The formative assessment’s primary purpose is to provide feedback to learners, also called
assessment for learning, while the summative assessment’s primary purpose is to evaluate
learning, also called assessment of learning (Bennet, 2011). Formative assessment, a
primary category of feedback in educational research, is a process that involves assessing
the learning outcomes of a learner, formally or informally, and feeding back to him/her the
assessed outcome. In the literature, formative assessment and feedback are significant
factors that can improve learning: “There is a body of firm evidence that formative
assessment is an essential component of classroom work and that its development can raise
standards of achievement. We know of no other way of raising standards for which such a
strong prima facie case can be made” (Black & William, 2010). Formative assessment can
provide feedback at multiple levels: feedback to the learner about his/her learning and what
the next steps in learning should be and also feedback to the teacher about current levels of
student understanding (Heritage, 2007). Feedback has been emphasised as an important
factor for effective instruction (Collis et al., 2001; Dick et al., 2001; Race, 2005).
Incorporating feedback into teaching and learning has been frequently reported to enhance
the learning process in comparison with cases where no feedback has been provided
(Hanna, 1976; Krause et al., 2009). Formative assessment may involve activities such as
classroom questioning, peer- and self-assessment and the formative use of summative tests
(Black et al., 2003; Wiliam, 2000). Formative assessments and feedback help students to
take control of their own learning (Nicol & Macfarlane‐Dick, 2006) and achieve self-
regulated learning (Sadler, 1998) where feedback on student performance is given to
accelerate the student’s own learning.
While formative assessment provides regular feedback on the student learning process,
summative assessment’s purpose is to evaluate student learning. Summative assessment is
normally conducted in the middle or end of a course, such as midterm or final exams, final
projects, etc. and it is normally used to measure a level of success or proficiency in
comparison against some standard or benchmark. It is imperative to see both formative and
summative assessments working hand in hand and complementing each other.

Chapter 3 – Proposed Framework
66
3.3 Applying PLTs in the Proposed Framework
This section discusses the application of the PLTs discussed above in the proposed
framework. The first step in planning a pedagogical framework is to identify the context
of the learning environment and develop a teaching and learning plan. In this thesis, an
introductory systems and network administration course in the undergraduate computing
program at the University of Newcastle (UoN) was selected. The course is structured as a
12-week semester with 2 hours of lecture and 2 hours of lab contact weekly within the
term.
3.3.1 Curriculum Design
Constructive Alignment (Biggs, 2011) provides an overarching framework for curriculum
design and practice (see Figure 3.3). In Constructive Alignment, the intended learning
outcomes (ILOs), teaching and learning activities (TLAs) and assessment tasks (ATs) are
aligned.
In designing the curriculum for the course, CA was applied. Firstly, the ILOs were outlined
(see Table 3.3). Next, the TLAs and ATs were designed to align to the ILOs. The TLAs
aim to engage students to acquire the knowledge and skills to achieve the ILOs. The ATs
(i.e. summative assessments) were used to demonstrate the achievement of the ILOs by
students. Table 3.4 provides the teaching and learning plan for the course.
Table 3. 3: Alignment of Learning Outcomes, Teaching and Learning Activities and Assessment
Tasks
Intended Learning Outcome (ILOs) Teaching and Learning
Activities (TLAs)
Assessment Tasks
(ATs)
ILO 1: Understand the fundamental principles
of networks and network communication (hardware, models, protocols and security).
L1 – L5, L9 – L11, review exercises T1-T5 & T9-T11
A1, PT1, PT2, Formal Exam
ILO 2: Understand the role of PC-based and
Network Operating Systems (NOS) in organisations
L1 – L2, L6 – L8, T1 – T3, T6 – T9
PT1, PT2, A2
ILO 3: Demonstrate the ability to design network and Active Directory (AD) solutions
for organisation scenarios
L7, L11 A1, A2, Formal
Exam

Chapter 3 – Proposed Framework
67
ILO 4: Demonstrate ability to install, configure and troubleshoot PC, NOS and network
services
Practical activities in T1 –
T3, T6 - T9 PT1 and PT2
Table 3. 4: Teaching and Learning Plan for Systems and Network Administration Course
Week Lecture Topics Lab Activities Summative Assessments 1 L1: Introduction to course, Introduction to
hardware, OS, network and virtualization basics
2 L2: ISO/OSI Model, TCP/IP Protocol Suite
and OSI Model, network models, Windows
Shared Folder and NTFS Permissions
T1: VMs, Win10
installation, review
exercises
3 L3: Network Layer – Logical addressing with
IPv4
T2: P2P, shares, review
exercises
4 L4: IPv4 address allocation, Internet protocol,
routing
T3: Share + NTFS
permissions, review exercises
5 L5: Topologies, network hardware, ethernet,
wireless LAN
T4: Formative
Assessment - Practice
Test 1, review exercises
6 L6: Network Operating System (NOS) T5: Practical Test 1
(PT1), review exercises
PT1: Summative
Assessment
7 L7: DNS
Class exercise: Network diagrams
T6: NOS, PowerShell,
review exercises
8 L8: Active Directory (AD) T7: DHCP, review
exercises
A1: Assignment 1 –
Network Design
(Summative Assessment) 9 L9: Process-to-Process Delivery: TCP and
UDP
T8: Active Directory,
review exercises
10 L10: Network security part 1 – Cryptography,
message confidentiality, integrity,
authentication and non-repudiation, key
management
T9: Group policy,
review exercises
11 L11: Network security part 2 – IPSec, VPN,
SSL, firewalls, proxies, VLANs
Class Exercise: AD network diagrams
T10: Formative
Assessment - Practice
Test 2, review exercises
12 L12: Review, Q&A T11: Practical Test 2
(PT2), review exercises
A2: Assignment 2 – AD
Design (Summative
Assessment),
PT2: Summative
Assessment
Exam
Period
Formal Exam
Lx - Lecture x, Tx – Tutorial/Lab x, Ax – Assignment x, PTx – Practical Test x

Chapter 3 – Proposed Framework
68
ILO1 and ILO2 developed the fundamental knowledge and understanding of concepts and
ILO3 and ILO4 aimed to demonstrate the application of this knowledge and these skills to
solve real-world scenarios/problems. ILO3 and ILO4 were designed to encourage higher
levels of learning (i.e. relational and extended abstract levels of the SOLO Taxonomy or
“applying” to “creating” levels of Bloom’s Taxonomy). By applying CA, TLAs aimed to
develop the knowledge and skills of students to meet the ILOs while the assessment tasks
aimed to demonstrate students’ achievement of the ILOs.
The next sections discuss the design of the TLAs and the ATs.
3.3.2 Design of Teaching and Learning Activities
In the learning context, the course had 2 hours of lecture contact and 2 hours of laboratory
contact timetabled. The lectures required the instructor to deliver content through
presentations and interactive activities such as discussions and class exercises. The lectures
were recorded to be available to students through the Learning Management System
(LMS). The laboratory activities provided students with hands-on activities, review
questions, quizzes, group-work, discussions and interactions with the tutor to gain
knowledge and skills.
This research project applied a number of PLTs in order to redesign the lab activities.
Kolb’s ELC, Bloom’s Taxonomy and Collaborative Learning were applied in the redesign
of the lab activities. According to Kolb, “Learning is the process whereby knowledge is
created through the transformation of experience” (Kolb, 1984). In Kolb’s ELC, learning
takes place in four stages: Concrete Experience (CE); Reflective Observation (RO);
Abstract Conceptualisation (AC); and Active Experimentation (AE). Kolb argues that for a
complete learning experience, a learner must engage in all four stages of the cycle.
Abdulwahed and Nagy (2009) and Konak et al. (2014) applied Kolb’s ELC to successfully
develop engaging laboratory activities. In this current research project, all lab sessions were
redesigned to use all four stages of Kolb’s ELC. For illustration purposes, the schematic
flow of the redesigned Lab 1 activities incorporating Kolb’s ELC, Bloom’s taxonomy and
Collaborative Learning are presented (see Figure 3.5).
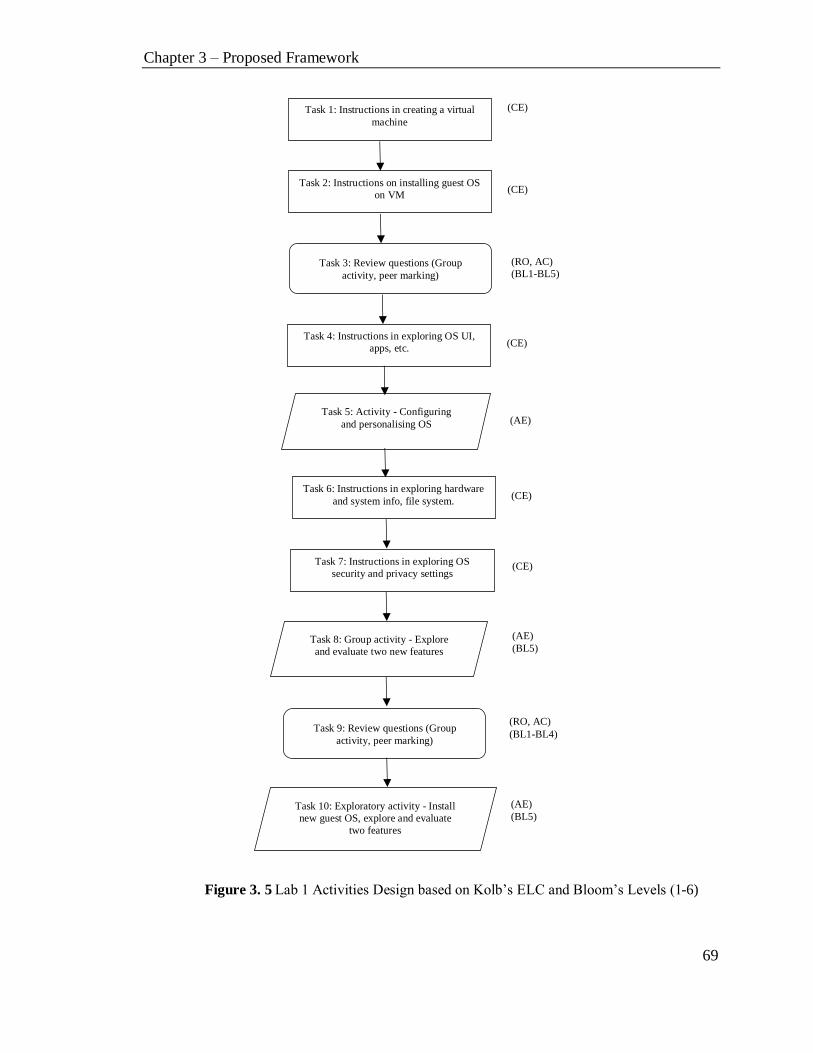
Chapter 3 – Proposed Framework
69
Task 1: Instructions in creating a virtual
machine
(CE)
Task 2: Instructions on installing guest OS
on VM (CE)
Task 3: Review questions (Group
activity, peer marking)
(RO, AC)
(BL1-BL5)
Task 4: Instructions in exploring OS UI,
apps, etc. (CE)
(AE) Task 5: Activity - Configuring
and personalising OS
Task 6: Instructions in exploring hardware
and system info, file system. (CE)
Task 7: Instructions in exploring OS
security and privacy settings (CE)
Task 8: Group activity - Explore
and evaluate two new features
(AE)
(BL5)
Task 9: Review questions (Group
activity, peer marking)
(RO, AC)
(BL1-BL4)
Task 10: Exploratory activity - Install
new guest OS, explore and evaluate
two features
(AE)
(BL5)
Figure 3. 5 Lab 1 Activities Design based on Kolb’s ELC and Bloom’s Levels (1-6)

Chapter 3 – Proposed Framework
70
The lab activities were designed to cover all stages of ELC. In Lab 1, Task 1 provided
explanation and step-by-step instruction to create a virtual machine using a selected
hypervisor. In Task 2, explanation and instruction to install a guest OS on the configured
VM was provided. In Tasks 1 and 2, learners learn through direct experience which maps
to the CE stage of Kolb’s ELC. In Task 3, a set of review questions was provided. The
review questions spanned from Bloom’s Level 1 (BL1) Remembering (For example, “what
is a hypervisor?”) to BL4 – Analysing level questions (e.g. “Describe a situation where
using a VM is not appropriate”). This activity also mapped to the RO and AC stages in the
ELC. Each student in the laboratory class had to partner with another class member to
discuss and answer the review questions. The group interaction aimed to provide
interaction, increase engagement and develop critical thinking. Next, the group posted their
answers on the LMS’s Discussion Board and shared them with the class. Also, each group
reviewed the other groups’ answers and commented on them. This peer-review process led
learners to an activity at Bloom Level 5 – Evaluating. Task 4 provided explanations and
step-by-step instructions to navigate and explore applications and guest OS’s user
interfaces which maps to the CE stage of the ELC. In the Task 5 activity, learners were
asked to customise the OS settings and configurations to personalise their preferences. The
learners explored and configured OS features, which maps to the AE stage of Kolb’s ELC.
Tasks 5 and 6 explored and explained OS hardware and device configurations, the file
system and security and privacy settings which also maps to the CE stage of the ELC. In
Task 8, students explored new features of OS versions. Also, students partnered with
another class member and discussed each others’ features. The group posted two features
on the LMS’s Discussion Board to share with the class. Also, the group evaluated and
commented on at least one other group’s posts. This activity maps to the AE stage of the
ELC and to Bloom’s Level 5 – Evaluating. The Task 9 review questions covered review
exercises from the content covered in the lecture. This activity maps to the RO and AC
stages in the ELC. Task 10 was an exploratory activity demonstrating their understanding
and skill in the entire lab. Learners created a VM and installed a guest OS (a different OS
from Task 2), explored and posted discussion on features and evaluated other groups’
features. This activity was completed by learners without explicit step-by-step instructions.
This activity maps to the AE stage of the ELC and to Bloom’s Level 5 – Evaluating. The

Chapter 3 – Proposed Framework
71
development of lab activities based on Kolb’s ELC, catering to higher levels of Bloom’s
taxonomy and integrating collaborative work have resulted in the design of an interactive
and engaging lab experience with the aim of achievement of higher levels of learning. The
redesigned labs for the entire course are presented in Appendix E.
This approach of applying Kolb’s ELC, collaborative activities and using exercises
catering to the higher levels of Bloom’s taxonomy aimed to produce interactive lab
activities that were engaging and encouraged deeper levels of learning. This research
project evaluated these redesigned labs in the following chapters. The application of Kolb’s
ELC and collaborative activities to redesign lab activities has been applied in the literature
with successful outcomes. In Konak et al. (2014) and Abdulwahed et al. (2009), the authors
applied Kolb’s ELC to redesign lab activities with successful outcomes avoiding “cook-
book” style approaches to labs in information security and chemical engineering. Konak et
al. (2016), Hwang et al. (2014) and Kongcharoen et al. (2017) all used collaborative
activities in labs to improve learning outcomes.
The next section discusses the design of the assessment tasks.
3.3.3 Design of Assessment Tasks
This section discusses the design of assessment tasks. The curriculum design incorporated
summative assessments as well as formative assessments. The formative assessment aim
was to provide feedback to improve learning while the summative assessment aimed to
provide feedback and also to assess student achievements with respect to the ILOs.
With the application of Constructive Alignment, the summative assessment tasks directly
aimed to assess student achievements with respect to the ILOs:
• Assignment 1 (A1): was an exercise aimed at designing a network (devices + addressing
scheme) for a particular organisation. This assessment aligned with ILO 1 and partly with
ILO 3.
• Assignment 2 (A2): was an exercise aimed at designing an AD hierarchy for a particular
organisation. This assessment aligned with ILO 2 and partly with ILO 3.

Chapter 3 – Proposed Framework
72
• Practical Tests 1 and 2 (PT1 & PT2): included practical assessments aimed at meeting ILO
4.
• Formal Exam: was an assessment that covered ILO 1-3 in an exam setting.
In addition to these summative assessments, formative assessments and feedback were
incorporated. Previously, research has shown that formative assessments and feedback are
considered an essential component of assessment work and their development can raise
standards of achievement (Black & Wiliam, 2010). Thus, formative assessments were
incorporated in the TLAs throughout the course in addition to the summative assessments.
A number of mechanisms and tools such as review questions, a discussion board, a
feedback tool and online quizzes were designed into the lab activities to provide formative
feedback.
The next section discusses the lab’s feedback tool in detail. In addition, the lectures and
labs incorporated a number of class discussion exercises and practice tests which provided
formative assessments aligned to summative assessments: A1, A2, PT1 and PT2. The
reasons for this approach were twofold. Firstly, this approach aimed to provide students
with an opportunity to attempt to a similar problem to the summative assessment while
having the ability to get formative feedback without grade penalty. This built up
understanding and confidence before students attempted the summative assessment which
was more detailed and extended than the formative assessment. The formative assessment
and feedback provided students with a clear understanding of the learning goals expected
by the assessment. This fact is supported by Black, Harrison, Lee, Marshall and Wiliam
(2004): “Students can achieve a learning goal only if they understand that goal and can
assess what they need to do to reach it”. Secondly, the formative assessment aimed to
engage students in the assessment as the formative assessment provided an opportunity to
learn and then demonstrate understanding with the summative assessment, thus increasing
the achievement of learning outcomes.
The next section discusses the technology architecture and artefacts of the proposed
framework.

Chapter 3 – Proposed Framework
73
3.4 Design of Technology Architecture and Artefacts
This section discusses the design of the technology architecture and artefacts of the
technology-enhanced pedagogical framework. The system architecture of the framework
is shown in Figure 3.6. The technology artefacts consist of the: Virtual IT Infrastructure
Lab; Student Interface; Feedback Tool; Student and Teacher dashboards; and LMS. The
inspiration for the immediate feedback (i.e., Feedback Tool) and dashboards was inspired
by Khan TED presentation (https://www.ted.com/talks/salman_khan_let_s_use_
video_to_reinvent_education?language=en).
Figure 3. 6 Architectural Design of the TePF
LMS: The LMS provided an online portal for learners in the course. Blackboard1 was the
adopted LMS at the university and was used as the online course portal. The LMS hosted
all content including lecture presentations, lecture recordings, laboratory sheets,
assessments and submissions, discussion boards, progressive marks, announcements,
1 Blackboard TM, http://www.blackboard.com/index.html.

Chapter 3 – Proposed Framework
74
online quizzes and links to the student lab portal and dashboards. All lectures delivered
were video captured and hosted on the LMS. The LMS was the most used technology
artefact by learners.
Virtual Laboratory and Student Interface: The virtual laboratory was hosted on a private
cloud at UoN Callaghan Campus. Hyper-V (Microsoft, 2016 a ) was used as the
virtualization platform. The private cloud hosted virtual machines (VMs) for each student.
Each student was provided a host VM which had Windows Server 2016 with nested
virtualization (Microsoft, 2016 b) enabled (see Figure 3.7). This host VM provided each
student with a sandboxed environment to create and configure guest VMs and networks to
conduct different laboratory activities without impacting any campus networks.
vWorkspace software suite (https://support.quest.com/vworkspace/8.6.3.) was utilised to
manage the private cloud environment and also provided access to the host VMs via the
browser or a client application – Student Interface to Virtual Lab (see Figure 3.8).
The virtual lab architecture had a number of advantages over physical labs including
accessibility – 24/7 remote access, flexibility to learn at the student’s own pace and other
advantages as outlined in Chapter 2. To the best of our knowledge, in the literature, this
research project was the first implementation using Microsoft Hyper-V with nested
virtualization to provide virtual labs for system level courses in computing.
Hardware Layer
Windows Server 2016 – Hyper-V (virtualization)
Hyper-V
Guest VMs
Windows Server 2016
Host (with nested virtualization enabled)
Hyper-V
….
..
Host VM Host VM
Student Interface to VM
vWorkspace Client
Figure 3. 7 Architecture of the Virtual Lab

Chapter 3 – Proposed Framework
75
Figure 3. 8 Student Interface to the Virtual Lab
Feedback Tool and Dashboards: Feedback is critical for learning (Black & Wiliam, 1998;
Hattie & Timperley, 2007). As discussed earlier, formative assessments and feedback were
integrated to TLAs in the proposed framework. Lectures included class exercises as
formative assessments, practice tests in the labs and lab activities which included feedback
from online quizzes (self-assessment), discussion board posts (peer-assessment) and tutor
interaction both during class and through discussion board posts.
It was not practical for tutors to manually check and provide feedback for each hands-on
lab activity task. Thus, a feedback tool was developed that verified each student’s lab
configuration and generated a report. Students ran the feedback tool and selected a
particular lab to verify. The feedback tool ran a Microsoft PowerShell script
https://docs.microsoft.com/en-us/powershell/) which checked the student’s lab
configurations and generated a lab report specifying correct and incorrect configurations
for the lab. The tool was designed so that the tutor could update the configurations to verify

Chapter 3 – Proposed Framework
76
by updating the XML configuration files. The PowerShell scripts and configuration files
were stored on a file server and managed centrally. The feedback tool ran the PowerShell
script which verified the configurations in the guest VMs and created output of a report
showing correct and incorrect configurations. The architecture for the feedback tool is
presented in Figure 3.9. A sample report generated by the feedback tool is provided in
Figure 3.10. Note that in the report a green tick signifies a correct configuration while a
red cross is an incorrect configuration.
Figure 3. 9 Architecture of the Feedback Tool
Figure 3. 10 A Sample Report from the Feedback Tool
Student’s Host VM
Guest VMs
Feedback
Tool
PowerShell
script
File Server
Configuration
files
1 2
Feedback
Report 3

Chapter 3 – Proposed Framework
77
Formative assessment can provide feedback at multiple levels: feedback to the learner and
also to the teacher (Heritage, 2007). Thus, in the feedback report, an option was provided
for students to submit their formative feedback reports to a centralised database. The
database was accessed from the student and teacher dashboards. The student’s dashboard
provided a view of the student’s individual progress through the labs. This helped the
students to obtain an overall view of their progress. The teacher’s dashboard provided a
collated view of student progress. The aim of this was to assist the tutor to assess the
students’ progress in lab work, identify areas where groups of students may have been
struggling and intervene where necessary.
3.5 Summary
Technology provides capabilities to develop learning environments that are engaging while
also providing new possibilities for learning. This chapter presented the proposed
framework for a lab environment. The proposed framework took into consideration a
number of PLTs in its design. Constructive Alignment (Biggs, 1992) was used for
curriculum design. The ILOs were outlined. The TLAs were organised and aligned to the
ILOs and the ATs were aligned to the ILOs and aimed to evaluate student achievement of
ILOs. The TLAs for labs were redesigned based on Kolb’s ELC and catered to all stages
of the ELC. Engaging collaborative activities were incorporated into lab activities.
Formative assessments and feedback were incorporated throughout with frequent
formative feedback/assessments and intermediate summative assessments. During lab
activities, feedback was provided through self-, peer- and tutor assessments. Students had
online quizzes, the discussion board (where peers commented and evaluated student work)
and tutor interactions. A feedback tool was designed to provide feedback for hands-on lab
configurations. To improve the transparency of learning, teacher and student dashboards
were designed. The student dashboard provided a view of the student’s progress in labs.
The teacher dashboard provided a collated view of student progress. This allowed the
teacher with a transparent view of students’ progress enabling to intervene where
necessary. The virtual labs were incorporated to the framework, providing a number of
advantages such as 24/7 remote access to labs, flexibility, ability to reset and retrial
experiments, etc. Overall technology artefacts used in the framework included: the Virtual

Chapter 3 – Proposed Framework
78
Lab, the Feedback Tool, the LMS and the Teacher and Student Dashboards. The proposed
framework integrated technology, pedagogy and content and so falls into the TPCK
dimension of the TPACK framework. Also, the proposed framework is a Level II –
TPD&E stage intervention (as discussed in Chapter 2).
The proposed framework had a number of significant characteristics that are worth noting
when compared to a physical lab environment:
• The incorporation of the virtual lab provided 24/7 remote access to labs for students.
Other advantages include flexibility, ability to reset and retrial, etc.
• The use of Constructive Alignment resulted in alignment of ILOs, TLAs and ATs.
• The use of Kolb’s ELC and Collaborative Learning to redesign labs created
interactive, engaging lab activities avoiding “cookbook” style instruction.
• Formative assessments and feedback, including for hands-on lab activities,
provided an environment that encouraged learning.
• Teacher and student dashboards provided transparency and learning progress.
Overall, by incorporating PLTs for a particular learning context and developing technology
tools/artefacts to facilitate learning to take advantage of technological advances has
resulted in a technology-enhanced pedagogical framework (TePF) for a lab environment
fulfilling the hypothesis presented in Chapter 2. The following chapters will iteratively
implement and evaluate the proposed framework presented in this chapter.
The next chapter will discuss the research methodology used for implementing and
evaluating the framework.

Chapter IV
4. Research Methodology
This chapter discusses the methodological approach, research methods and iterations taken
in the research project to design and evaluate the proposed framework, and the reasons for
choosing them. Design-Based Research (DBR) was adopted as the methodological
approach, discussed in section 4.1. Section 4.2 discusses the research methods used in data
collection and evaluation of the proposed framework. Two iterations used to develop,
implement and evaluate the proposed framework is discussed in section 4.3. Section 4.4
concludes the chapter.
4.1. Design-Based Research (DBR)
Design-Based Research (DBR) (DBR Collective, 2003) was selected as the
methodological approach for this project. In literature, this approach is also referred to as
development research (van den Akker, 1999), design experiments (Brown, 1992; Collins,
1992), and formative research (Newman, 1990 and with slightly different focus Wang &
Hannafin, 2005). A number of characteristics of DBR makes it the appropriate approach
for this research project. DBR acknowledges the complexity of educational technology
interventions and allows context-specific interventions in authentic settings (Barab &
Squire, 2004). In DBR, development and research happen through iterative cycles of
design, development, enactment, evaluation and re-design (see Figure 4.1) (Plomp, 2013).
Researchers and practitioners work in collaboration (not in isolation) (Reeves, 2006). DBR
aims to bring theory and practice closer together by developing practical applicable
theories and design principles.
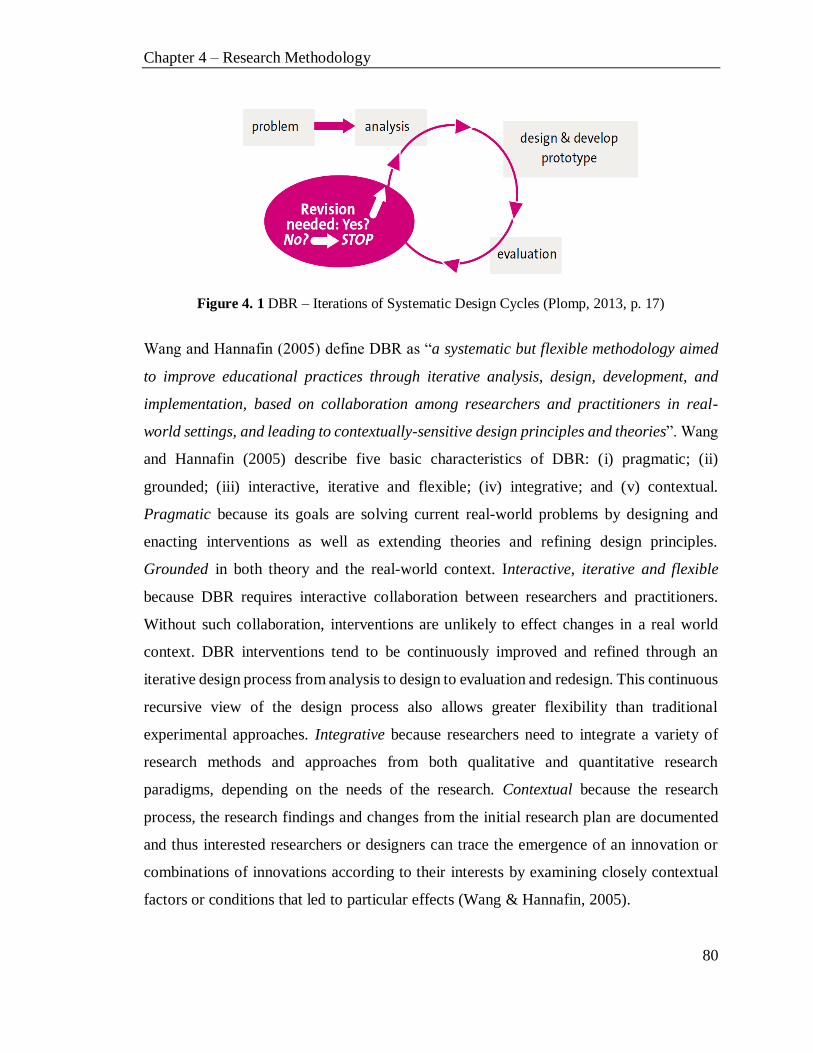
Chapter 4 – Research Methodology
80
Figure 4. 1 DBR – Iterations of Systematic Design Cycles (Plomp, 2013, p. 17)
Wang and Hannafin (2005) define DBR as “a systematic but flexible methodology aimed
to improve educational practices through iterative analysis, design, development, and
implementation, based on collaboration among researchers and practitioners in real-
world settings, and leading to contextually-sensitive design principles and theories”. Wang
and Hannafin (2005) describe five basic characteristics of DBR: (i) pragmatic; (ii)
grounded; (iii) interactive, iterative and flexible; (iv) integrative; and (v) contextual.
Pragmatic because its goals are solving current real-world problems by designing and
enacting interventions as well as extending theories and refining design principles.
Grounded in both theory and the real-world context. Interactive, iterative and flexible
because DBR requires interactive collaboration between researchers and practitioners.
Without such collaboration, interventions are unlikely to effect changes in a real world
context. DBR interventions tend to be continuously improved and refined through an
iterative design process from analysis to design to evaluation and redesign. This continuous
recursive view of the design process also allows greater flexibility than traditional
experimental approaches. Integrative because researchers need to integrate a variety of
research methods and approaches from both qualitative and quantitative research
paradigms, depending on the needs of the research. Contextual because the research
process, the research findings and changes from the initial research plan are documented
and thus interested researchers or designers can trace the emergence of an innovation or
combinations of innovations according to their interests by examining closely contextual
factors or conditions that led to particular effects (Wang & Hannafin, 2005).

Chapter 4 – Research Methodology
81
Mishra et al., (2006) summarise design experiments as follows: “Design experiments, as a
research methodology, emphasize the detailed implementation and study of interventions
with evolving pedagogical goals in rich authentic settings. It acknowledges the
complexities of classroom teaching and enlightens both practitioners and researchers by
leading to the development of theoretical ideas grounded in contexts of practice; design
experiments narrow the gap between research and practice, between theory and
application.”. Barab and Squire (2004) also describe DBR: “Design-based research is not
so much an approach as it is a series of approaches, with the intent of producing new
theories, artifacts, and practices that account for and potentially impact learning and
teaching in naturalistic settings”.
Reeves (2006) depicts DBR as follows (Figure 4.2):
Figure 4. 2 DBR Approach (adapted from Reeves, 2006, p. 59)
In this thesis, the first two steps of Figure 4.2 were completed and outlined in Chapters 1-
3. The thesis has analysed the problem of technology-enhanced lab environments,
specifically in the context of system-level courses in computing in the literature review
chapter (Chapter 2). The author has had extensive discussions with practitioners. It is
important to note that the principal supervisor of the author for this thesis is the practitioner
and was the lecturer responsible for the selected system-level course for which the
proposed pedagogical framework was implemented. Therefore, close collaboration and
discussion between practitioner and researcher was involved in the design and
implementation of the intervention. Next step was the development of a solution which is
the proposed framework which considered a number of pedagogy and learning theories

Chapter 4 – Research Methodology
82
and principles in its design (see Chapter 3). The following chapters (Chapters 5 and 6)
discuss the iterative cycles of design, development and evaluation of the proposed
framework. Finally, discussions, reflections and generation of design principles are
discussed in Chapter 7. Figure 4.3 illustrates the proposed framework within the context of
the DBR methodology. Note that the context for the intervention in this research project
(i.e., a system-level course in computing) does not entirely subsume phase 1 (Problem
Analysis) and phase 4 (Design Principles) as the problem analysis considered related work
in other contexts so that the intervention and design principles discovered will be applicable
in other contexts as well.
Figure 4. 3 Application of the DBR Methodology in the Research Project
For evaluation, DBR typically triangulates multiple sources and types of data to connect
intended and unintended outcomes to processes of enactment (DBR Collective, 2003).
Such analysis typically requires a combination of quantitative and qualitative methods to
analyse how designs work in practice and to gain an understanding of how students learn
in learning contexts. The following sections describe the quantitative and qualitative
research methods.

Chapter 4 – Research Methodology
83
4.2. Research Methods
Research methods refer to the tools and techniques for conducting a research project
(Mackenzie & Knipe, 2006). The research methods used in a study are dependent on: what
the study entails; the specific context of the study; and other components of the research
design (Maxwell, 2005). Research method designs can be summarised into two basic
approaches: quantitative and qualitative (Creswell, 2013). The next section discusses these
research methods.
4.2.1. Quantitative Research
Quantitative research methods are designed to collect data (numeric or otherwise) that can
be translated into numbers and can be numerically or statistically evaluated. Quantitative
data allows direct comparison and analysis of large datasets through mathematical and
statistical techniques. Numerical data can be collected through different instruments, such
as Likert scale surveys. In general, the quantitative approach has several advantages.
Quantitative approaches allow for accurate and systematic recording of data which permits
the management and analysis of large amounts of information. There are a number of
statistical and mathematical techniques available for the analysis of numerical data. Some
basic methods include visualisation and descriptive analysis through tables, charts and
graphs to see patterns or detect trends in data. More advanced statistical techniques are also
available to analyse large datasets. Oates (2005) states that statistical techniques “offer
more universal means and criteria for evaluating key points and making generalized
conclusions based on evidence”. They also provide statistical measures: mean, median,
mode, range, fractiles, standard deviation, correlation coefficients, chi-square tests, t-tests
and others.
A major limitation of quantitative research is that it does not consider qualitative data in its
analysis. Thus, quantitative analysis does not provide deeper meanings that can result from
the analysis of qualitative data. Qualitative data analysis considers these types of data and
is discussed in the next section.

Chapter 4 – Research Methodology
84
4.2.2. Qualitative Research
The qualitative research method deals with the gathering and analysis of qualitative data –
text, images, etc. Interpretation of qualitative data requires subjective human interpretive
analysis to obtain meaning from the data. Typically, qualitative analysis is performed to
obtain opinions, reasoning for opinions and deeper meaning. Flick et al. (2014) describe
qualitative research as “interested in analysing subjective meaning or the social production
of issues, events, or practices by collecting non-standardised data and analysing texts and
images rather than numbers and statistics”. The data gathered from a qualitative approach
is more descriptive than numerical data and requires human interpretation for analysis and
to derive meaning. Such data can be collected through qualitative research methods such
as interviews and questionnaires with open questions. This approach allows participants to
provide detailed responses on an issue, providing context and details (unlike numerical
data). The analysis of qualitative data can lead to a deeper holistic understanding of context,
reasoning and exploratory analysis. There are a number of qualitative analysis methods
including thematic analysis (Braun & Clark, 2006), grounded theory (Strauss & Corbin,
1998) and others.
There are a number of limitations to qualitative data as well. Qualitative data requires
careful analysis by a human to interpret and provide results, whereas a number of standard
statistical tests are available for analysis of quantitative data. Quantitative data analysis
methods scale to large datasets. However, qualitative data analysis requires human
interpretation and does not scale to large datasets. The results of qualitative data analysis
also depend on the ability and skill of the researcher to draw valuable conclusions whereas
quantitative data analysis has a number of statistical techniques/tests readily available.
The next section discusses mixed methods that utilise both quantitative and qualitative data
analysis.
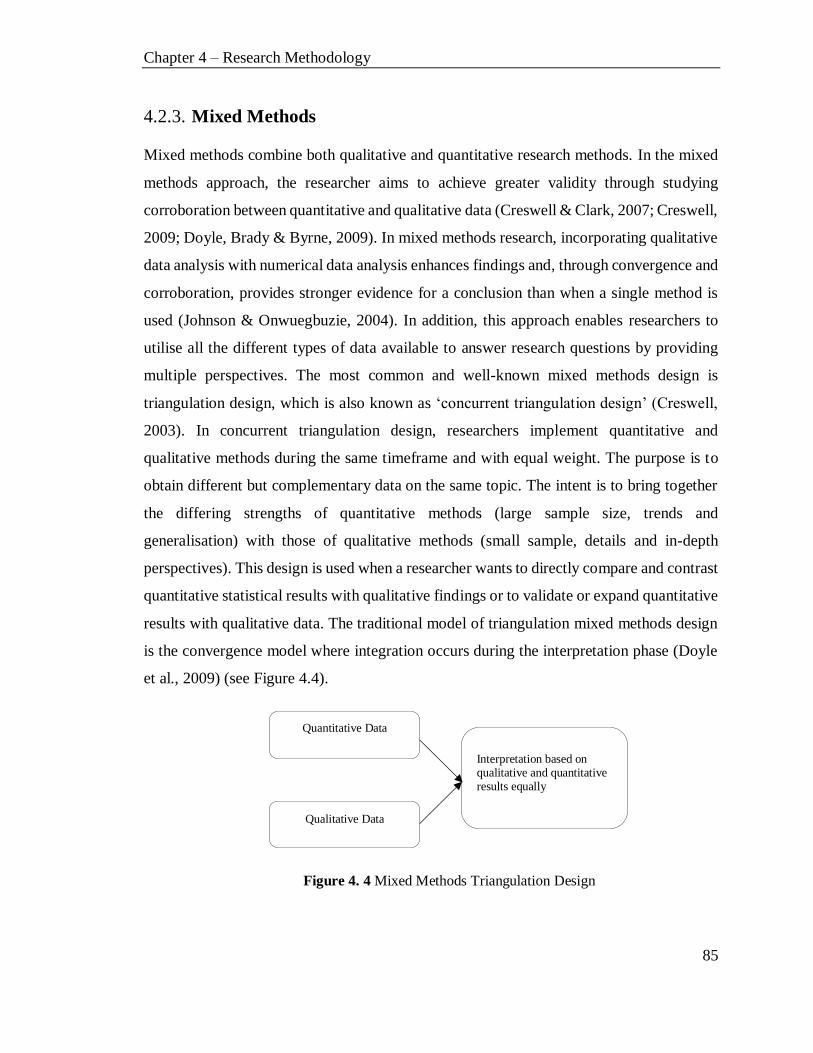
Chapter 4 – Research Methodology
85
4.2.3. Mixed Methods
Mixed methods combine both qualitative and quantitative research methods. In the mixed
methods approach, the researcher aims to achieve greater validity through studying
corroboration between quantitative and qualitative data (Creswell & Clark, 2007; Creswell,
2009; Doyle, Brady & Byrne, 2009). In mixed methods research, incorporating qualitative
data analysis with numerical data analysis enhances findings and, through convergence and
corroboration, provides stronger evidence for a conclusion than when a single method is
used (Johnson & Onwuegbuzie, 2004). In addition, this approach enables researchers to
utilise all the different types of data available to answer research questions by providing
multiple perspectives. The most common and well-known mixed methods design is
triangulation design, which is also known as ‘concurrent triangulation design’ (Creswell,
2003). In concurrent triangulation design, researchers implement quantitative and
qualitative methods during the same timeframe and with equal weight. The purpose is to
obtain different but complementary data on the same topic. The intent is to bring together
the differing strengths of quantitative methods (large sample size, trends and
generalisation) with those of qualitative methods (small sample, details and in-depth
perspectives). This design is used when a researcher wants to directly compare and contrast
quantitative statistical results with qualitative findings or to validate or expand quantitative
results with qualitative data. The traditional model of triangulation mixed methods design
is the convergence model where integration occurs during the interpretation phase (Doyle
et al., 2009) (see Figure 4.4).
Interpretation based on qualitative and quantitative results equally
Qualitative Data
Quantitative Data
Figure 4. 4 Mixed Methods Triangulation Design

Chapter 4 – Research Methodology
86
Since this research project aims to determine the impact on learning of the proposed
intervention, mixed methods triangulation was employed. To identify the impact on
learning, quantitative data such as student scores were used in the data analysis. Also, data
collection from student surveys (using Likert scales) provided quantitative data for analysis
of students’ general attitudes and satisfaction. To delve deeper into the reasoning behind
students’ opinions on, and attitudes to, the proposed framework and exploratory analysis,
qualitative data was collected and analysed through open-ended survey questions, focus
group discussions, etc.
The Technology Acceptance Model (TAM) (Davies, 1989) was utilized to measure
students’ experience and acceptance of the different types of virtual laboratories (VMware
lab, Azure lab, and server-based lab environment). To verify the validity of the survey
instruments, Confirmatory Factor Analysis (CFA) was performed using the IBM-SPSS
AMOS2 environment.
A summary of the overall model fit measures is given in Appendix F. These models were
found to be valid, as evidenced by the competence indices such as chi-square statistic (χ2).
The chi-square statistic is an intuitive index for measurement goodness of fit between data
and model. In chi-squared test of model fit, values closer to zero indicate a better fit
(Gatignon, 2010). Also, as recommended by Hair, Anderson, Tatham & Black (2003),
several other fit indices such as the root mean squared residual (RMR), the root mean
squared error of approximation (RMSEA), and the goodness-of-fit index (GFI) are
examined. According to Hair et al., (2003), GFI and CFI are best if above 0.90 and
demonstrate marginal acceptance if above 0.80, and RMR below 0.05. These fit indices
indicate that the measurement model showed a good fit for the data collected.
The next section discusses the iterative phases of design, development and evaluation of
the proposed framework in real classroom environments.
2 https://www.ibm.com/us-en/marketplace/structural-equation-modeling-
sem?mhq=AMOS&mhsrc=ibmsearch_a

Chapter 4 – Research Methodology
87
4.3. Iterations - Development of Prototypes
The framework proposed in Chapter 3 was designed, implemented and evaluated
iteratively in stages. This section discusses the iterative phases taken.
4.3.1. Iteration 1
In iteration 1, the technology artefacts - virtual lab and the feedback tool are implemented
in a real-class environment and evaluated. There are two possible implementation
architectures for the virtual lab – centralised vs. de-centralised. In the selected learning
context, a decentralised virtual lab was currently in use. Therefore, a parallel
implementation of a centralised lab was undertaken and evaluated towards the end of the
term to find out users’ perceptions with regard to the different virtual lab architectures. To
evaluate users’ perceptions, the Technology Acceptance Model (TAM) (Davies, 1989) was
used. A survey was developed based on TAM model (see Appendix A). The survey
questions consisted of 10 questions out of which 9 were categorised based on the definition
of TAM scales. These survey questions are grouped into three dimensions (three questions
measured “Perceived Usefulness”, four questions measured “Perceived Ease of Use” and
two questions measured “Attitude towards using”). Students were asked to provide their
responses through a 5-point Likert scale ranging from "1 - Strongly Disagree" to "5 -
Strongly Agree". In addition, the surveys had open-ended questions so as to collect
qualitative data regarding the use of virtual labs (see discussions in the following sections).
Last question (question 10) asked students to rate the lab overall. Likert scale 1-5 (1- Very
Poor to 5 - Excellent) was used. Confirmatory Factor Analysis (CFA) was performed to
verify model fitness to the data. Table 4.1 presents the factor loadings of the TAM
questionnaire. Missing data is handled by listwise deletion (all cases with missing
observations on any indicator are removed).

Chapter 4 – Research Methodology
88
Table 4. 1: Factor Loading of CFA to verify the construct validity of items in the instrument
Survey Questions
Factor Loadings (Decentralised labs, n=83/
Centralised labs, n=64) Perceived
usefulness
Perceived
ease of use
Attitude
towards using
1. The lab environment helped me to learn in INFT2031 .876/.738
2. The lab environment improved my performance .776/.831
3. The lab environment helped me to achieve learning outcomes .835/.824
4. The lab environment provided easy access to the lab (24x7) . 679/.671
5. Having access to the lab from any device/location is helpful to me .470/.555
6. I find it easy to use the lab environment .781/.876
7. I find the lab setting flexible to conduct my lab work .815/.834
8. I am satisfied with using the lab environment for my practical work
in INFT2031
.924/.769
9. I would like to use the lab environment in future networking and
systems administration courses
.724/.725
10. Overall, how would you rate the lab environment Overall question
Decentralised labs (using an external drive), Centralised labs (uses Azure cloud)
The TAM model achieved good fit statistics χ2 (28) = 35.058, p= .003. The RMSEA (0.079)
value ranges from 0 to 1, with smaller values indicating better model fit. CFI (.964) and
TLI (.908) values meet the criteria (0.90 or larger) for acceptable model fit (Hair et al.,
2003). Given the small sample in our study we decided using alternative absolute fit indices
such as chi-squared and GFI as these have been found to be more sensitive to sample size
than RMSEA (Gatignon, 2010). Thus, we conclude a good fit model (Table 4.2).
Table 4. 2: Model Fit Summary for the TAM model (n= 147)
Fit measures Values Recommended value
Chi squared 2 (28) = 53.058, p=.003 p>.05
CFI .964 >.90
TLI .908 >.90 RMSEA .079 <.08
Note that the model fit is for the total model and within this single model we are comparing multiple groups
(Sample size is 147). VMware lab =83, and Azure lab = 64.
A reliability analysis was carried out using Cronbach's Alpha to examine its internal
consistency (Nunnally, 1978). The instrument has a high degree of reliability if the value
of Cronbach's Alpha is obtained as follows:
• If Cronbach's Alpha> 0.90 = Very high reliability
• If Cronbach's Alpha 0.70 to 0.90 = High reliability
• If Cronbach's Alpha 0.50 to 0.70 = Reliability is quite high
• If Cronbach's Alpha <0.50 = Low reliability

Chapter 4 – Research Methodology
89
The overall Cronbach’s alpha values for all dimensions were above 0.70, which is
considered of high reliability (Creswell, 2013). This indicates that both surveys have a high
internal consistency level and are therefore statistically reliable (see Table 4.3).
Table 4. 3: Cronbach alpha Reliability Coefficient (Reliability Analysis)
Scale
N of items Cronbach’s Alpha
De-centraliased labs Centralized labs
Perceived usefulness 3 .868 .824
Perceived ease of use 4 .751 .816
Attitude towards using 2 .810 .734 Cronbach's α= (.870/.903, N of items = 9)
The descriptive statistics (i.e., Mean (M), Standard Deviation (SD) and Median) for each
question and grouping these statistics according to the categories were then analysed. A
summary of the descriptive analysis results of all measurement items related to this
dimension can be found in Appendix G. The interpretation used for the mean of grouped
data is given in Table 4.4.
Table 4. 4: Scale for Mean
Rating Scale Interpretation Range
SD =1 Strongly Disagree – Almost none of the indictors are satisfied 1.00 – 1.80
D = 2 Disagree – 25% of the indicators are satisfied 1.81 - 2.60
N = 3 Neither satisfied or dissatisfied – 50% 2.61 – 3.40
A = 4 Agree – 75% of the indicators are satisfied 3.41- 4.20
SA = 5 Strongly Agree – Almost all indicators are satisfied 4.21 -5.00
A paired t-test is used to compare the means of two populations when samples from the
populations are available, in which each individual in one sample is paired with the
himself/herself in the other sample. In our example, students who used both types of virtual
labs (i.e., centralized (n= 90) and decentralized (n=69)) are compared to evaluate any
general changes in perceptions between the two types of labs.
In addition, four open-ended questions were included in the survey to provide qualitative
data for analysis. The following questions were added to the survey:
• Did you use the Azure (i.e., centralised lab) cloud lab? If no, please explain why?
• If given the choice to use external drive (i.e., decentralised lab) vs Azure cloud lab
(i.e., centralised lab) in conducting INFT2031 labs, which do you prefer? Why?
• Any disadvantages of using External Drive (i.e., decentralised lab)/Azure cloud lab

Chapter 4 – Research Methodology
90
(i.e., decentralised lab)
• Please provide any suggestions that you would like to see implemented in the cloud
lab (i.e., centralised lab) in future?
Thematic analysis (Braun & Clarke, 2013) was performed on the qualitative data.
To evaluate the Feedback Tool, a Likert-scale questionnaire (0 – Not at all likely to 10 –
Extremely likely) was used based on the TAM model. Also, a general overall satisfaction
question. In addition, the following open-ended questions were included to gather
qualitative data to analyse:
• Did you use the PowerShell feedback scripts? If no, please explain why?
• What is the primary reason for your rating in the Feedback tool?
• Are there any suggestions for ow the feedback script could be improved?
Finally, in iteration 1, to find out if there was any observable impact on learning outcomes,
an independent t-test is conducted on practical test scores.
The evaluation in Iteration 1 provides feedback and confidence to implement the proposed
framework in the next iteration of the study. Chapter 5 presents Iteration 1 in detail.
4.3.2. Iteration 2
The iteration 2 evaluated the proposed framework - TePF. In this second iteration, the TePF
was applied with the aim to evaluate of the impact on students learning. A quasi-
experimental design with a control group not subjected to TePF and an experimental group
subjected to the TePF was carried out. The learning outcomes of the two cohorts provides
evidence on the impact of the TePF. Next, the different components of the TePF is rated
and evaluated both quantitatively and qualitatively to provide students’ perceptions of the
TePF. An overall rating of all components of the TePF is conducted. Lab activities in TePF
were designed based on a number of PLTs – such as Kolb’s ELC. To evaluate lab activities,
the survey used a number of survey instruments published in literature. Konak & Bartolacci
(2016) evaluated students’ perceptions based on a number of dimensions - Usefulness,
Interaction, Competency, Interest, Reflection and Challenge for an intervention in a virtual
lab environment. This survey instrument was used to evaluate lab activities. To evaluate
the use of different stages of Kolb’s ELC in the TePF lab activities, we used the survey

Chapter 4 – Research Methodology
91
instrument in (Kolb, 1981). Student approaches to learning were measured using the
Revised Two Factor Study Process Questionnaire (R-SPQ-2F) (Biggs et al., 2001).
Finally, the technology artefacts: virtual lab, the Feedback Tool and dashboards, was
evaluated using a 5-point Likert scale questionnaire based on the TAM dimensions (Davis,
1989). Also, qualitative data was collected and evaluated using open-ended questions and
focus group discussions. The complete survey and focus group discussion questions are
provided in Appendices B and C respectively.
Table 4.5 demonstrates the fit statistics for the TAM survey questions, latent variables, and
the reliability measures. This is followed by assessing the model fit using various fit indices
and evaluating the research model. The results of confirmatory factor analysis indicated
that the scales were reliable.
Table 4. 5: Results of Confirmatory Factor Analysis (CFA)
Survey Questions
Factor Loadings (n=70)
TAM Dimensions
Perceived
Usefulness
Perceived
Ease of use
Attitude
towards using
Cronbach's α .822 .740 .834
1. The lab environment helped me to learn in INFT2031 .734
2. The lab environment improved my performance .785
3. The lab environment helped me to achieve learning outcomes .864
4. The lab environment provided easy access to the lab (24x7) .648
5. Having access to the lab from any device/location is helpful to me .519
6. I find it easy to use the lab environment .649
7. I find the lab setting flexible to conduct my lab work .751
8. I am satisfied with using the lab environment for my practical work in INFT2031
.817
9. I would like to use the lab environment in future networking and
systems administration courses
.878
10. Overall, how would you rate the lab environment Overall question
Cronbach's α= (.853, N of items = 9)
Evaluation of student approaches to learning can be a useful way of measuring the impact
of educational interventions and provide information about how best to engage students
during their learning. The Study Process Questionnaire (SPQ) has been widely used to
evaluate student learning strategies. 74 Participants (2017 cohort) completed the revised
Study Process Questionnaire (R-SPQ-2F) (Biggs et al., 2001), which consists of 20 items
spread across 2 first-order factors (deep, surface) and 4 second-order factors (deep motive,

Chapter 4 – Research Methodology
92
deep strategy, surface motive, surface strategy). Each item is rated on a five-point Likert
scale. Total scores were calculated for each first-order factor. We reported confirmatory
factor analysis (CFA) statistics supporting the factor structure of the R-SPQ-2F. The
internal consistency statistics (Cronbach’s alpha) for all is above 0.70. We demonstrated
higher alpha scores (>0.80) for the deep and surface factors. CFA statistics for the R-SPQ-
2F are presented in Appendix F. Confirmatory factor analysis was used to determine the
fit of the data to the 2-factor structure of the R-SPQ-2F. Satisfactory fit was achieved
through the internal consistency was acceptable.
The IBM-SPSS AMOS3 was used to perform the CFA. Robust weighted least squares was
used as the estimation method as the data were ordinal. The chi-square statistic is used to
report the fit of the data to the model, however there is no agreement as to the other fit
statistics that should be presented. Hair et al. (2003) suggest that the comparative fit index
(CFI), Goodness-of-Fit Index (GFI), Tucker-Lewis index (TLI), and the root mean square
error of approximation (RMSEA) be used. The fit statistics calculated in this iteration and
the cut scores for each statistic are presented in Table 4.6.
Table 4. 6: Summary of Confirmatory Factor Analysis (CFA) in Iteration 2
Statistics The six-factor model (Konak & Bartolacci,
2016)
R-SPQ-2F (Biggs et al., 2001)
Recommended
value
2 233.131 195.660 NA
2 p-value .000 .010 p>.05
df 162 152 NA
CFI .925 .937 >.90 GFI .794 .788 > .90
TLI .903 .922 >.90
RMSEA .079 .065 <.08
Our results show that 3 fit statistics (CFI, TLI and RMSEA) indicate acceptable fit. GFI
does not meet the criteria (0.90 or larger) for acceptable model fit. This could be because
fit statistics does not work equally well with various types of fit indices, sample sizes,
estimators, or distributions (Hu, & Bentler, 1999). Appendix F presents the summary of
3 https://www.ibm.com/us-en/marketplace/structural-equation-modeling-
sem?mhq=AMOS&mhsrc=ibmsearch_a
Chapter 4 – Research Methodology
93
the models and their goodness of fit statistics, as well as the fitted unstandardized
regression weights and Pearson coefficient correlations matrix.
4.4. Summary
This chapter presented the DBR as a suitable research methodology to develop and evaluate
the TePF. The proposed framework was developed in close collaboration with practitioners
and evaluated in a real-world classroom environment. An iterative process was used to
develop and evaluate the TePF providing feedback and confidence to both researcher and
practitioner on the approach is taken. A mixed methods approach was taken to evaluate the
framework by providing data collection, determining reliability and validity of the
instruments, and analyzing data for statistical significance. CFA was performed on the
survey instruments which indicated a good fit model for the data. Also, a brief description
of the experimental treatment and procedures is discussed. The detailed results and analysis
of theses DBR’s iterations can be found in Chapter 5 and Chapter 6.

Chapter V
5. Iteration 1 – Centralised Lab and
Feedback Tool
This chapter presents the design and evaluation of the first iteration of the DBR process.
In this iteration, two technology artefacts were developed, implemented and evaluated in a
pilot study. Firstly, the context of the proposed study is discussed. Next, the research
questions answered by the iteration and the research design are presented. The data
collection procedure is discussed in section 5.3. Section 5.4 provides the results and
discussion. Finally, section 5.5 concludes the chapter.
5.1 Context
As discussed earlier, DBR is applied in authentic settings. In this research project, the first
iteration of the design and evaluation of TePF for the lab environment, as presented in
Chapter 3, was applied in an introductory system and networking course (INFT2031) at
the University of Newcastle, Australia.
Prior to the intervention (pre-2016), the course was structured as follows: INFT2031 –
Systems and Network Administration Course was offered in a 12 week semester (12
weeks) with 2 hours of lecture contact and 2 hours of lab contact per week. The labs
commenced in week 2 of the semester and spanned through to week 12. Table 5.1 below
illustrates the course plan for INFT2031.

Chapter 5 – Iteration 1
95
Table 5. 1: Course Plan for INFT2031
Week Topic Learning Activity Assessment Due
1 Introduction to Course Introduction to Hardware, OS, Network and
Virtualization basics
Lectures
2 ISO/OSI Model, TCP/IP Protocol Suite and OSI Model, Network Models, Windows Shared Folder
and NTFS Permissions
Lectures & Labs
3 Network Layer – Logical Addressing with IPv4 Lectures & Labs
4 IPv4 Address Allocation, Internet Protocol, Routing Lectures & Labs 5 Topologies, Network Hardware, Ethernet, Wireless
LAN, Network Diagrams
Lectures & Labs
6 Network Operating System Lectures & Labs Practical Test 1 7 DNS Lectures & Labs
8 Active Directory Lectures & Labs Assignment 1
9 Process-to-process Delivery: TCP and UDP Lectures & Labs 10 Network Security Part 1 – Cryptography, Message
Confidentiality, Integrity, Authentication and Non-
repudiation, Key Management
Lectures & Labs
11 AD Network Diagrams, Network Security Part 2 – IPSec, VPN, SSL, Firewalls, Proxies, VLANs
Lectures & Labs
12 Review, Q&A Lectures & Labs Assignment 2,
Practical Test 2
The lab environment was a decentralised lab environment. The course could not interfere
with the existing campus network. Students were asked to purchase an external drive to
host all their lab machines and networks for INFT2031. In 2015 and 2016, INFT2031 was
offered at two campuses – Callaghan and Ourimbah. The Callaghan Campus labs were
scheduled in a computer lab which contained Apple Mac computers while the Ourimbah
labs were timetabled a lab using in a Windows environment. The lab computers were
installed with VMware Fusion and VMware Workstation virtualization platforms at the
Callaghan and Ourimbah campuses respectively. This allowed students to create VMs and
networks among them. These VMs and networks were stored on their external drives which
students brought to the lab class every week. The external hard drive had a partition created
to store all VMs. This approach meant that students had their own lab work stored on the
external drive without any impact to existing campus networks. Also, students could use
this environment outside the campus on their personal computers as long as the students
had the appropriate VMware platform installed. All students in the course had access to
VMware’s Academic Program so they could download and install the required VMware
platform on their personal computers, if they wished, for educational purposes.

Chapter 5 – Iteration 1
96
In terms of assessments of practical work, there were two practical tests in weeks 6 and 12
of the semester respectively. Each practical test was graded (summative) out of 20 and
contributed 20% to the final grade. Out of the total 20 marks for each practical test, 15
marks were scored based on practical skills demonstrated by the accompanying system and
network configuration tasks and 5 marks were scored based on an IPv6 quiz which was
done by students after completion of an online learning module. Practical test 1 focused on
configuring and sharing resources in a P2P environment and practical test 2 focused on
configuring a client-server network environment and related network services. Prior to
each practical test, a formative test was conducted for students in preparation for the
practical tests.
To complete the practical work for the practical test, each student logged into a VM hosted
on central servers owned by the department. The servers were Microsoft Windows based
servers with Hyper-V used as the virtualization platform. In 2016, the version of Windows
Server installed was Windows Server 2012. This virtual desktop environment (VDI) was
managed by vWorkspace4 platform. The configurations on each student’s VM were
marked by the tutors after the practical tests to provide a grade for the student’s work.
5.2 Research Design
The TePF presented in Chapter 3 had a number of technology artefacts as well as a re-
design of lab activities based on PLTs. In the first iteration, the implementation and
evaluation of two technology artefacts were undertaken. The technology artefacts
evaluated in this iteration were the virtual lab and the feedback tool.
Virtual Lab: The existing architecture of the virtual lab had a number of disadvantages
pointed out by the practitioner from previous experience. Firstly, the decentralised
architecture required students to purchase an external drive (if they didn’t have one) which
was an additional cost for students. Next, if the student’s personal computer had a different
architecture to the lab computers (e.g. Mac machines in the lab and Windows on the
4 https://www.dell.com/community/vWorkspace/bd-p/workspace

Chapter 5 – Iteration 1
97
personal machines), then students had to install additional software to read the external
drive. Also, students needed to install VMware software on their personal machines if they
needed to access the lab work using their personal machines. Thus, the ability to provide
seamless access to a virtual lab 24/7 without the need for configuration was desirable. A
centralised virtual lab platform that was remotely accessible would provide such a facility.
The department’s existing virtual lab environment (based on Windows Server 2012,
Hyper-V virtualization platform and vWorkspace) could provide a single VM accessible
remotely by students. However, system-level computing courses, such as network and
system administration, require students to configure multiple VMs and network resources
without disrupting existing campus networks which needs a sandboxed environment. This
was not supported by the existing architecture of the virtual lab implementation. New
features in Windows Server 2016 with nested virtualization would have enabled
deployment of sandboxed environments, as presented in Chapter 3 – TePF. However, at
the time of iteration 1 (in 2016), this version of the Windows Server was not yet released
and was therefore unavailable. Thus, it was decided to look at other alternatives to provide
a centralised sandboxed lab environment.
Microsoft’s Azure platform5 provided the ability to deploy virtual resources through its
public cloud offerings. Upon investigation, Microsoft’s Azure Dev/Test Labs were
considered as a suitable test environment to trial a centralised lab environment for
INFT2031. Students had access to Microsoft’s Imagine6 subscription which provided them
with $100 of Azure credit. This credit was deemed sufficient to conduct a number of labs.
In this study, we used the popular Microsoft Azure (DevTest) cloud; however, the use cases
and approaches laid out in this study are also applicable to other cloud providers such as
Amazon Web Services (AWS).
Li and Jones (2011) evaluated both de-centralised and centralised labs in different system-
level courses at East Carolina University. Their findings included the result that the use of
centralised and decentralised labs are preferred over physical labs by students. Also,
5 https://azure.microsoft.com 6 https://imagine.microsoft.com
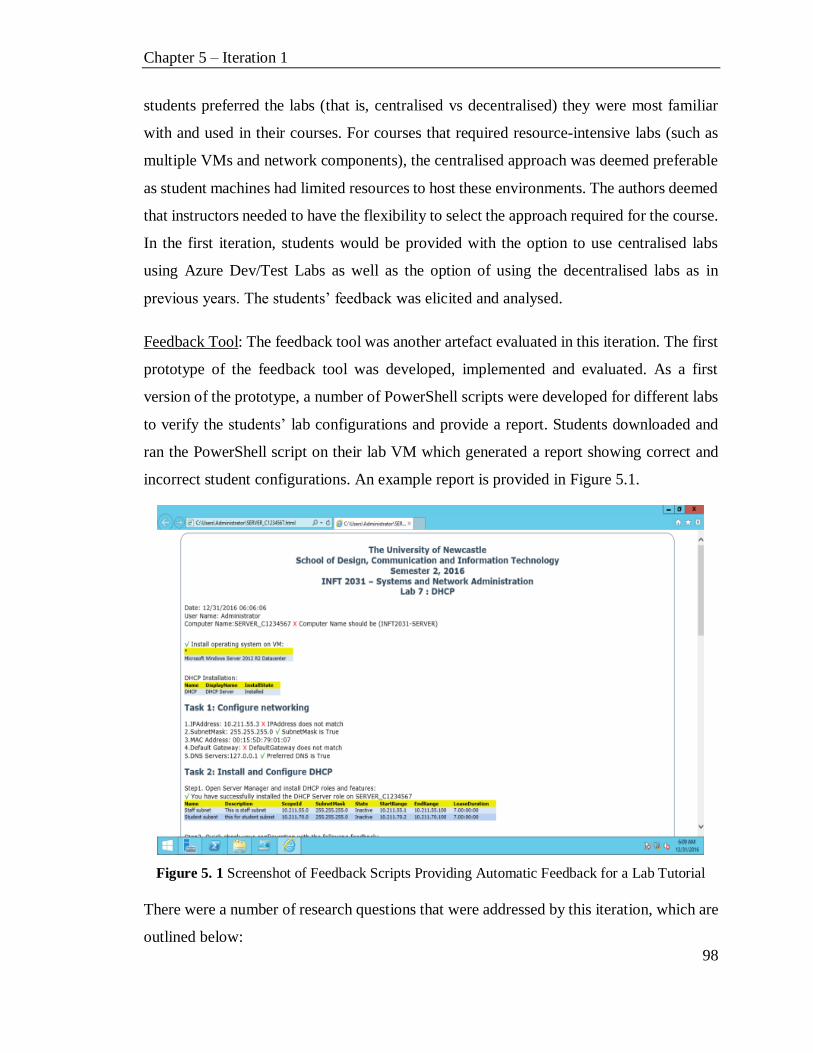
Chapter 5 – Iteration 1
98
students preferred the labs (that is, centralised vs decentralised) they were most familiar
with and used in their courses. For courses that required resource-intensive labs (such as
multiple VMs and network components), the centralised approach was deemed preferable
as student machines had limited resources to host these environments. The authors deemed
that instructors needed to have the flexibility to select the approach required for the course.
In the first iteration, students would be provided with the option to use centralised labs
using Azure Dev/Test Labs as well as the option of using the decentralised labs as in
previous years. The students’ feedback was elicited and analysed.
Feedback Tool: The feedback tool was another artefact evaluated in this iteration. The first
prototype of the feedback tool was developed, implemented and evaluated. As a first
version of the prototype, a number of PowerShell scripts were developed for different labs
to verify the students’ lab configurations and provide a report. Students downloaded and
ran the PowerShell script on their lab VM which generated a report showing correct and
incorrect student configurations. An example report is provided in Figure 5.1.
Figure 5. 1 Screenshot of Feedback Scripts Providing Automatic Feedback for a Lab Tutorial
There were a number of research questions that were addressed by this iteration, which are
outlined below:

Chapter 5 – Iteration 1
99
• RQ1 – What are students’ perceptions of centralised and decentralised virtual labs?
• RQ2 – What are students’ perceptions of the proposed feedback tool?
• RQ3 – Is there a measurable impact on learning outcomes based on the above
intervention (i.e. centralised virtual labs and feedback tool)?
To answer research questions RQ1 and RQ2, the following research design was developed
(see Table 5.2).
Table 5. 2: Types of Virtual Labs and Feedback Tool used in INFT 2031 for the Experiment
Lab (Topic) Decentralised Lab Centralised Lab Feedback Tool Labs 1 – 3 (P2P, NTFS and Shared Permissions) √
Lab 4 – Practice Test (Formative assessment)
Practical Test 1
Labs 6 - 9 (NOS, AD, DHCP, GPO) √ √ √
Lab 10 – Practice Test (Formative assessment)
Practical Test 2 + Survey
The technology artefacts – the centralised virtual lab (based on Azure Dev/Test Lab) and
the feedback tool – were deployed in the latter part of the semester. Students had the option
of using either the centralised or the decentralised lab to complete Labs 7 – 9. Also, the
feedback scripts were available for students to download on their lab VMs to be run to
generate a report. Given that the students experienced the labs with and without centralised
labs as well as with and without the feedback tool, the students were able to compare and
provide feedback for evaluation. At the end of the semester, a survey was used to gather
both quantitative and qualitative data to answer RQ1 and RQ2.
The survey consisted of 3 sections. Section 1 evaluated centralised and de-centralised labs.
The quantitative survey questions were based on the Technology Acceptance Model
(TAM) (Davis et al., 1989). In the literature, the TAM is used widely as a standard
instrument to evaluate the acceptance of technology by users. Section 2 asked qualitative
questions to elaborate on the answers in Section 1 as well as asking exploratory questions,
such as “suggestions to improve”. Section 3 of the survey collected data from students on
the feedback tool. Quantitative data was collected using a 5-point Likert scale ranging from
1 - Strongly Disagree to 5 - Strongly Agree. Open-ended questions were used to gather the
qualitative data.

Chapter 5 – Iteration 1
100
To evaluate students’ perceptions of the virtual labs and feedback tool, analysis of both the
quantitative and qualitative data was performed. A number of statistical techniques, such
as descriptive analysis, means, standard deviations, paired t-test and independent t-test, and
a thematic analysis of the qualitative data were used. Triangulation was performed to
provide a deeper understanding of student perceptions and to identify the reasons for them.
To address RQ3 - impact on learning outcomes based on the intervention - the impact on
marks for the practical tests was observed. This is because the lab activities and lab
environment aim to achieve intended learning outcome ILO4 - Demonstrate ability to
install, configure and troubleshoot PC, NOS and network services - which were evaluated
by practical tests 1 and 2. To identify the impact on learning outcomes of the intervention,
a quasi-experiment (Creswell, 2015) with a control and experimental group was performed
with an independent t-test based on marks for the practical tests. The experiment design
was as follows:
• The 2015 cohort who completed INFT2031 course was the control group. The 2016
cohort that completed INFT2031 where the intervention occurred was the
experimental group.
• Both control and experimental groups had the same teaching environment. That is,
both groups were taught with the same course materials (i.e. content and labs) by
the same lecturers in 2015 and 2016.
• Both control and experimental groups sat for the same practical tests.
• The intervention occurred in Labs 7-9 for the experimental group only.
Firstly, the marks for practical test 1 (pre-test) between the control (2015) and experimental
(2016) groups were compared using independent t-tests to see if there was any statistically
significant difference between the groups. If there was no statistically significant
difference, then we could conclude that the experiment and control groups were similar
(condition 1). Next, the marks for practical test 2 (post-test) between the control and
experimental groups were compared using independent t-tests. If there was a statistically
significant difference between the groups while condition 1 was also met, then it could be

Chapter 5 – Iteration 1
101
concluded that the intervention had an impact on the learning outcomes, answering RQ3.
This experiment’s design is presented in Table 5.3.
Table 5. 3: Quasi-experimental Design to Answer RQ3
Lab 2015 Cohort
(Control Group)
2016 Cohort
(Experimental Group)
Labs 1 - 3 No intervention No intervention
Pre-Test Practical test 1 Practical test 1
Lab 6 No intervention No intervention
Lab 7 No intervention Intervention – feedback tool
Labs 8 - 9 No intervention Intervention – Azure lab + feedback tool
Post-Test Practical test 2 Practical test 2
5.3 Data Collection
The pilot study to evaluate the above technology artefacts was conducted in semester 2,
2016 of the INFT2031 course. The course was offered on both the Callaghan and Ourimbah
campuses. Students were invited to participate in a survey at the end of the course. Prior to
the collection of any data, the researcher and supervisors had applied and obtained approval
from the Human Ethics Research Committee of the university (Ethics Application: H-
2016-0205). In 2016, a total of 103 students (85 - Callaghan, 18 - Ourimbah) completed
the course and 94 students (76 - Callaghan and 18 - Ourimbah) participated in the research
project and filled in the survey. Out of the 94 survey responses, 69 of them (73%) had used
both types of virtual labs (centralised and decentralised) while 25 of them (21%) had used
only the decentralised lab (i.e., external drive). For the evaluation of the feedback
PowerShell scripts, 51 students answered that they had used the feedback scripts, 35
students answered they did not use them, and 8 students did not answer.
For the quasi-experiment, marks for the practical tests for the 2015 and 2016 cohorts were
collected. In 2015, 87 students completed INFT2031 at Callaghan. Out of 87 students, 86
students completed practical test 1 and 82 students completed practical test 2. In 2015, at
Ourimbah, 20 students completed the INFT2031 course. All 20 students completed both
practical tests. In 2016, 94 students participated in the research project (76 from Callaghan
campus and 18 from Ourimbah campus) and they all completed Practical Tests 1 and 2.
These student marks were taken into consideration in the quasi-experiment.

Chapter 5 – Iteration 1
102
5.4 Results and Discussion
This section presents the results of the experiment aiming to answer RQ1 – RQ3. Firstly,
perceptions and acceptance of decentralised and centralised labs are presented addressing
RQ1. Next, perceptions of the feedback tool are presented addressing RQ2. RQ3 is then
addressed in section 5.4.3.
5.4.1 RQ1: Perceptions of Centralised and Decentralised Labs
All students who participated in the research project used the decentralised labs and filled
in the survey. Table 5.4 presents all responses from the research participants who used the
decentralised lab.
Table 5. 4: Descriptive Statistics of Student Responses about the Decentralised Virtual Lab
Environment
Item - VMware Fusion labs (n=83) Descriptive Statistics
M SD Median
1. The lab environment helped me to learn in INFT2031 4.33 .769 4.50
2. The lab environment improved my performance 4.25 .729 4.00
3. The lab environment helped me to achieve learning outcomes 4.24 .725 4.00
4. The lab environment provided easy access to the lab (24x7) 3.21 1.379 3.00
5. Having access to the lab from any device/location is helpful to me 3.86 1.227 4.00
6. I find it easy to use the lab environment 4.12 .817 4.00
7. I find the lab setting flexible to conduct my lab work 3.79 .959 4.00
8. I am satisfied with using the lab environment for my practical work in INFT2031
4.09 .878 4.00
9. I would like to use the lab environment in future networking and
systems administration courses
3.80 1.087 4.00
10. Overall, how would you rate the lab environment 4.03 .798 4.00
Figure 5. 2 Students’ Responses about using the Decentralised Virtual Lab Environment
4.34 4.24 4.26
3.21
3.9 4.113.76
4.13.81
4.03
1
1.5
2
2.5
3
3.5
4
4.5
5
q1 q2 q3 q4 q5 q6 q7 q8 q9 q10
Mea
n (
5-p
oin
t Lik
ert
scal
e)

Chapter 5 – Iteration 1
103
Figure 5.2 shows the percentage of participants’ answers against the total number of
participants for each question item. Table 5.5 presents the descriptive statistics, i.e. Mean
(M) and Standard Deviation (SD), for each question and groups these statistics according
to the categories of TAM. This finding is similar to that found in previous studies by
(Sarkar & Petrova, 2011; Caminero et al., 2016).
Table 5. 5: Descriptive Analysis for Decentralised Labs (n=83)
Category Items Mean SD Interpretation Median
Perceived
usefulness
1. The lab environment helped me to
learn in INFT2031
4.28
.663
Strongly Agree 4.33
2. The lab environment improved my
performance
3. The lab environment helped me to
achieve learning outcomes
Perceived ease
of use
4. The lab environment provided easy
access to the lab (24x7)
3.74
.834
Agree 3.75
5. Having access to the lab from any
device/location is helpful to me
6. I find it easy to use the lab
environment
7. I find the lab setting flexible to
conduct my lab work
Attitude
towards using
8. I am satisfied with using the lab
environment for my practical work in
INFT2031
4.00 .798 Agree 4.00
9. I would like to use the lab environment in future networking and
systems administration courses
Overall
10. Overall, how would you rate the lab
environment
4.03 .718 Agree 4.00
SAT 3.82 .718 Agree 4.40
It can be observed that the decentralised labs were rated highly for usefulness in achieving
learning outcomes and improving students’ performance in the course. Many students
considered it a valuable tool for learning and supporting course material. This can be seen
from the number of ‘Strongly Agree’ and ‘Agree’ responses for questions Q1-Q3. Q4 –
easy access (24x7) scored the lowest in the survey (M = 3.21). This was expected given
that the decentralised lab environment did not provide seamless access. Also, Q5 – access
from any device scored low (M = 3.90) in comparison. This lab environment did not
provide access from all platforms easily as the format of the external partition was
architecture specific. Q6 – ease of use – scored highly (M = 4.11) for the decentralised lab
environment. VMware platform is an intuitive tool to use for the labs and students found it

Chapter 5 – Iteration 1
104
easy to use. Q7 – flexibility – did not comparatively score high (M = 3.76). The
decentralised lab environment was not flexible to use across different OS platforms.
Students were overall satisfied and scored highly for Q8 (satisfaction) and Q10 (overall
rating) with mean scores of 4.10 and 4.03 respectively. However, interestingly, students
only gave a mean score of 3.81 when asked whether they would like to use the environment
again. This may be due to a preference for the centralised. This will be considered later in
the discussion.
Next, we examine the descriptive statistics for the centralised labs. Table 5.6 presents all
the responses for the centralised lab environment. Note that only 69 students (n = 69)
responded that they did use the centralised lab environment.
Table 5. 6: Descriptive Statistics of Student Responses to the Centralised Virtual Lab
Environment
Item –DevTest Azure Cloud labs (n=64) Descriptive Statistics
M SD Median
1. The lab environment helped me to learn in INFT2031 4.27 .730 4.00
2. The lab environment improved my performance 4.25 .859 4.00
3. The lab environment helped me to achieve learning outcomes 4.23 .719 4.00
4. The lab environment provided easy access to the lab (24x7) 4.28 .944 5.00
5. Having access to the lab from any device/location is helpful to me 4.62 .574 5.00
6. I find it easy to use the lab environment 4.17 .796 4.00
7. I find the lab setting flexible to conduct my lab work 4.25 .804 4.00
8. I am satisfied with using the lab environment for my practical work in
INFT2031
4.40 .698 5.00
9. I would like to use the lab environment in future networking and
systems administration courses
4.55 .706 5.00
10. Overall, how would you rate the lab environment 4.32 .754 4.00
Figure 5. 3 Students’ Responses to the Centralised Virtual Lab Environment
4.27 4.25 4.23 4.28
4.62
4.17 4.25 4.44.55
4.32
1
1.5
2
2.5
3
3.5
4
4.5
5
5.5
q1 q2 q3 q4 q5 q6 q7 q8 q9 q10
Mea
n (
5-p
oin
t Lik
ert
scal
e)

Chapter 5 – Iteration 1
105
Figure 5.3 shows the mean scores for each survey question. Table 5.7 shows the summary
statistics, i.e., mean (M), standard deviation (SD) and median, for each question and groups
these statistics according to the categories described in (Table 5.6 above).
Table 5. 7: Descriptive Analysis on Centralised Lab Environment Responses (N=69)
Category item Mean SD Interpretation Median
Perceived usefulness
1. The lab environment helped me to learn in INFT2031
4.24 .663 Strongly Agree 4.33
2. The lab environment improved my
performance
3. The lab environment helped me to achieve
learning outcomes
Perceived
ease of use
4. The lab environment provided easy access
to the lab (24x7)
4.34 .632 Strongly Agree 4.50
5. Having access to the lab from any
device/location is helpful to me
6. I find it easy to use the lab environment
7. I find the lab setting flexible to conduct my
lab work
Attitude
towards
using
8. I am satisfied with using the lab
environment for my practical work in
INFT2031
4.48 .624 Strongly Agree 4.50
9. I would like to use the lab environment in
future networking and systems administration
courses
Overall
10. Overall, how would you rate the lab
environment
4.32 .753 Strongly Agree 4.00
SAT 4.37 .571 Strongly Agree 4.50
From the descriptive analysis, all questions have a mean of over 4.0. This is a strong
indication of student support for the use of the centralised lab environment. The
respondents found that the Azure cloud virtual labs helped in improving their performance
and achieving the learning outcomes as seen in the 4.25 mean score for the usefulness
category. They also found that this kind of lab easier to use than the decentralised lab
environment with a higher mean score at 4.33. Furthermore, the students were satisfied
with the centralised lab environment and wished to use this type of lab again in the future
(4.48 mean score).
It is evident that although both lab environments are useful and rated highly, the centralised
lab environment was preferred and rated higher in ease of use, attitude and overall
dimensions compared to the decentralised lab. Table 5.8 and Figure 5.4 illustrate means
for each category for centralised and decentralised labs.

Chapter 5 – Iteration 1
106
Table 5. 8: The Relationships between the Factors that Affect Student Satisfaction
Category Decentralised lab environment Centralised lab environment
M (SD) Interpretation Median M (SD) Interpretation Median
Usefulness (1,2,3) 4.13 (.697) Strongly Agree 4.00 4.24 (.669) Strongly Agree 4.33
Ease of use (4,5,6,7) 3.54 (.830) Agree 3.50 4.34 (.632) Strongly Agree 4.50
Attitude (8,9) 3.84 (.924) Agree 4.00 4.41 (.627) Strongly Agree 4.50
Overall (10) 3.90 (.848) Agree 4.00 4.33 (.774) Strongly Agree 4.00
Figure 5. 4 Students' Perception of Centralised and Decentralised Lab Environments
An important point to note is that there were 94 participants in total who used decentralised
lab environment which included 69 participants who used both labs and 25 participants
who used the decentralised lab only. It is useful to examine the perceptions of each group
of respondents. So, next, the descriptive statistics for each group are presented. The
responses to the surveys are grouped as follows:
• SAT1 – The survey responses about the decentralised lab environment from participants
who only used the decentralised lab environment (n = 25)
• SAT2a – The survey responses about the decentralised lab environment from participants
who used both the centralised and decentralised lab environments (n = 69)
• SAT2b – The survey responses about the centralised lab environment from participants
who used both the centralised and decentralised lab environments (n = 69).
The responses for SAT1, SAT2a and SAT2b are shown in Figure 5.5.
4.13
3.543.84 3.9
4.24 4.34 4.41 4.33
1
2
3
4
5
Usefulness Ease of use Attitude Overall
Mea
n (
5-p
oin
t L
iker
t sc
ale)
Decentralised lab environment
Centralised lab environment

Chapter 5 – Iteration 1
107
Figure 5. 5 Students' Perception categorised by Virtual Lab Environments.
• SAT1 – mean response about the decentralised lab environment from those who only used the
decentralised lab environment.
• SAT2a – mean response about the decentralised lab environment from those who used both the
centralised and decentralised lab environments.
• SAT 2b – mean response about the centralised lab environment from those who used both the
centralised and decentralised lab environments.
From the above graph, it can be seen that students who used both lab environments rated
centralised lab environments higher in all survey questions. To verify whether the result
was significant, a paired t-test was performed. The results are presented in Table 5.9.
Table 5. 9: Paired t-test for the Two Virtual Labs in INFT2031
Category SAT 2a SAT 2b t-test
n M SD M SD df t p-value
Perceived usefulness 63 4.13 .697 4.24 .669 62 -1.029 .307
Perceived ease of use 64 3.54 .830 4.34 .632 63 -6.365 .000 Attitude towards using 63 3.84 .924 4.41 .627 62 -3.999 .000
Overall 49 3.90 .848 4.33 .774 48 -2.384 .021
SAT 64 3.80 .710 4.36 .577 63 -3.417 .000
The previous table shows that, except for the perceived usefulness dimension (which only
has a 0.1 difference in mean), all other dimensions have a statistically significant difference
in perception. From the above, it can be concluded that where the students experienced
both lab environments, most students preferred to use the centralised lab environment over
the decentralised lab environment. Analysis of the qualitative data provided further insights
about the reasons for this difference. Also, it was interesting to find out why certain
students chose to only use decentralised labs given the option of centralised labs was
q1 q2 q3 q4 q5 q6 q7 q8 q9 q10
SAT1 4.79 4.63 4.58 3.92 4.5 4.5 3.96 4.38 4.29 4.3
SAT2a 4.17 4.11 4.14 2.92 3.67 3.98 3.68 3.98 3.6 3.92
SAT2b 4.27 4.25 4.23 4.28 4.62 4.17 4.25 4.4 4.55 4.32
11.5
22.5
33.5
44.5
5
Mea
n (5
-po
int
Like
rt S
cale
)

Chapter 5 – Iteration 1
108
available in the latter part of the semester. Analysis of the qualitative data provided further
answers to these questions, as discussed next.
The qualitative analysis provided a number of insights. For qualitative data, responses from
all respondents who submitted qualitative data were collected and analysed.
Firstly, for the question Q1 in the survey (see Appendix A) - “Did you use the Azure cloud
lab? If no, explain why”, there were 25 responses. The analysis of the responses are given
below:
• Of the 24 responses, 13 felt that they did not need to use the cloud lab as they were
already familiar with the external drive which was easy to keep using and they did
not see the need to change over (e.g. “Already had my external drive and was happy
using it for the course”).
• Five respondents had not attended the lab, did not know about it, and did not have
time to try out a new environment or felt it was introduced too late.
• Two respondents felt that the cloud lab was slow, and the external drive was more
reliable.
• Two respondents had technical issues with the use of cloud labs.
• Two respondents had other reasons (wanted to keep all lab work in one location,
heard about issues in cloud labs from other students) to keep on using external
drives for the labs.
The responses and analysis are provided in Table 5.10.
From the above analysis, it is clear that over 18 out of 25 (72%) of the respondents did not
attempt to use the centralised lab environment because they either did not know/have time
or did not see a need to change to cloud labs given that they were already familiar with and
using the external drive. Out of the 25 respondents, it is clear that only 4 used the cloud lab
and then decided to stay with the decentralised lab. These respondents did so because of
technical, reliability and speed issues. Others did not attempt it as they did not see a reason
to do so or were already familiar with decentralised labs or for other reasons. The technical,
speed and reliability issues will be considered in the design of the centralised virtual lab in
the second iteration. These aspects are discussed later in the chapter.

Chapter 5 – Iteration 1
109
Table 5. 10: Qualitative Analysis of Q1 in the Survey
Theme (Frequency) Response
Already Familiar/ Didn't see the need to
change (13)
• Use to using my VM and was easiest for me
• I found it easier to use my own HD
• Already had external HDD so I just kept using that
• Already had my external drive and was happy using it for the course
• I didn't need it
• I had already started using the external drive
• I had gotten used to using the VM stored on my external drive
• I was satisfied with the external drive
• It didn't seem necessary to change how I had already been learning the
course for 8 weeks
• Used the external drive as that was what I was used to and it required no further configuring
• I was in the labs all the time
• It is easier to use the hard drive and have no lag and across to windows key
shortcuts. Flexibility to use Azure at home is great however
• I tried it on Azure from home, but I found it easier on an external VM. It was
my first time using Azure
Did not know/ Didn’t
have time /Introduced
too late (5)
• Away for tutor
• Did not attend labs, would have liked to try
• Didn't have the time to test that
• It looks so interesting. I wish I do it, but I'm doing INFT3970, I didn't have much time to do it
• I found it implemented too late and preferred using the previous Mac and
HDD method
Speed/Reliability (2) • Don't like the delay when using keyboard and mouse
• USB external was more reliable
Technical Issues (2) • Ran out of availability
• Used once, but soon ran into issues, then made progress with VM
Other (2) • I heard other students complaining that it was not as efficient as the VMs on
the ext. hard drives
• I preferred having all of my work in one location
When considering the qualitative data for question Q12 of the survey - If given the choice
to use external drive vs Azure cloud lab in conducting INFT2031 labs, which do you
prefer? Why? – 55 responses chose the Azure cloud lab (centralised lab environment) while
31 responses chose the external drive (decentralised lab environment). The thematic
analysis of the 31 responses are given in Table 5.11.
Overwhelmingly (55 out of 94 responses), students preferred the centralised (Azure) lab
due to its accessibility (from any device, remotely, 24/7 access), portability (across multiple
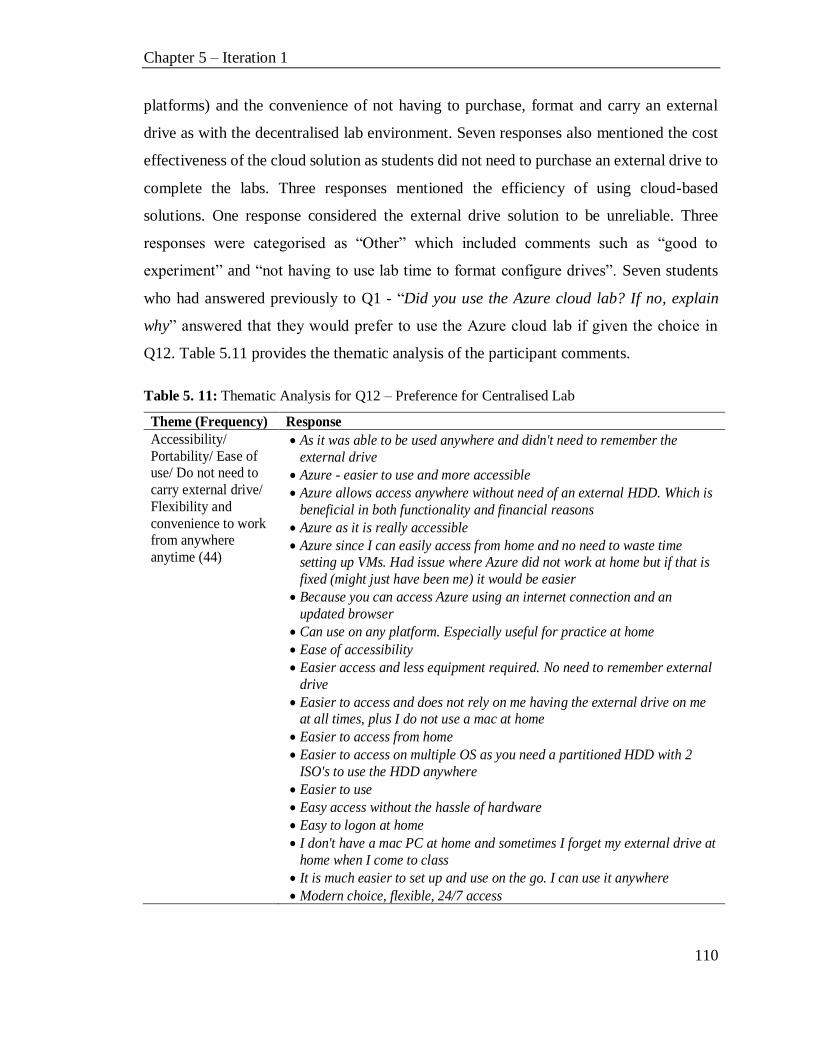
Chapter 5 – Iteration 1
110
platforms) and the convenience of not having to purchase, format and carry an external
drive as with the decentralised lab environment. Seven responses also mentioned the cost
effectiveness of the cloud solution as students did not need to purchase an external drive to
complete the labs. Three responses mentioned the efficiency of using cloud-based
solutions. One response considered the external drive solution to be unreliable. Three
responses were categorised as “Other” which included comments such as “good to
experiment” and “not having to use lab time to format configure drives”. Seven students
who had answered previously to Q1 - “Did you use the Azure cloud lab? If no, explain
why” answered that they would prefer to use the Azure cloud lab if given the choice in
Q12. Table 5.11 provides the thematic analysis of the participant comments.
Table 5. 11: Thematic Analysis for Q12 – Preference for Centralised Lab
Theme (Frequency) Response
Accessibility/
Portability/ Ease of use/ Do not need to
carry external drive/
Flexibility and
convenience to work from anywhere
anytime (44)
• As it was able to be used anywhere and didn't need to remember the
external drive
• Azure - easier to use and more accessible
• Azure allows access anywhere without need of an external HDD. Which is
beneficial in both functionality and financial reasons
• Azure as it is really accessible
• Azure since I can easily access from home and no need to waste time setting up VMs. Had issue where Azure did not work at home but if that is
fixed (might just have been me) it would be easier
• Because you can access Azure using an internet connection and an
updated browser
• Can use on any platform. Especially useful for practice at home
• Ease of accessibility
• Easier access and less equipment required. No need to remember external
drive
• Easier to access and does not rely on me having the external drive on me at all times, plus I do not use a mac at home
• Easier to access from home
• Easier to access on multiple OS as you need a partitioned HDD with 2
ISO's to use the HDD anywhere
• Easier to use
• Easy access without the hassle of hardware
• Easy to logon at home
• I don't have a mac PC at home and sometimes I forget my external drive at
home when I come to class
• It is much easier to set up and use on the go. I can use it anywhere
• Modern choice, flexible, 24/7 access
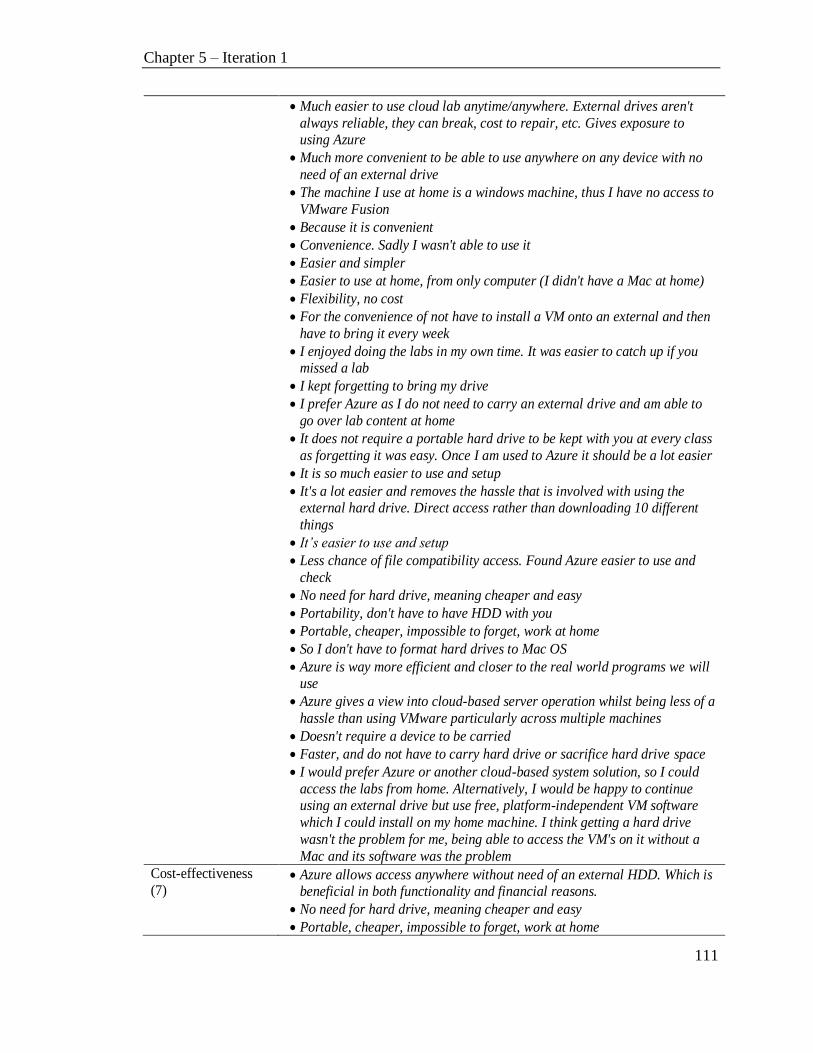
Chapter 5 – Iteration 1
111
• Much easier to use cloud lab anytime/anywhere. External drives aren't
always reliable, they can break, cost to repair, etc. Gives exposure to using Azure
• Much more convenient to be able to use anywhere on any device with no
need of an external drive
• The machine I use at home is a windows machine, thus I have no access to
VMware Fusion
• Because it is convenient
• Convenience. Sadly I wasn't able to use it
• Easier and simpler
• Easier to use at home, from only computer (I didn't have a Mac at home)
• Flexibility, no cost
• For the convenience of not have to install a VM onto an external and then
have to bring it every week
• I enjoyed doing the labs in my own time. It was easier to catch up if you missed a lab
• I kept forgetting to bring my drive
• I prefer Azure as I do not need to carry an external drive and am able to
go over lab content at home
• It does not require a portable hard drive to be kept with you at every class
as forgetting it was easy. Once I am used to Azure it should be a lot easier
• It is so much easier to use and setup
• It's a lot easier and removes the hassle that is involved with using the external hard drive. Direct access rather than downloading 10 different
things
• It’s easier to use and setup
• Less chance of file compatibility access. Found Azure easier to use and
check
• No need for hard drive, meaning cheaper and easy
• Portability, don't have to have HDD with you
• Portable, cheaper, impossible to forget, work at home
• So I don't have to format hard drives to Mac OS
• Azure is way more efficient and closer to the real world programs we will use
• Azure gives a view into cloud-based server operation whilst being less of a
hassle than using VMware particularly across multiple machines
• Doesn't require a device to be carried
• Faster, and do not have to carry hard drive or sacrifice hard drive space
• I would prefer Azure or another cloud-based system solution, so I could
access the labs from home. Alternatively, I would be happy to continue using an external drive but use free, platform-independent VM software
which I could install on my home machine. I think getting a hard drive
wasn't the problem for me, being able to access the VM's on it without a
Mac and its software was the problem
Cost-effectiveness
(7) • Azure allows access anywhere without need of an external HDD. Which is
beneficial in both functionality and financial reasons.
• No need for hard drive, meaning cheaper and easy
• Portable, cheaper, impossible to forget, work at home

Chapter 5 – Iteration 1
112
• Flexibility, no cost
• Azure. External drives can be expensive for a student.
• Don't have to purchase or format external hard drive
• VMware features a trial or license for $90. I would have used Azure if it
was available from Lab 1
Unreliable (1) • Much easier to use cloud lab anytime/anywhere. External drives aren't
always reliable, they can break, cost to repair, etc. Gives exposure to using Azure.
Other (3) • Good to experiment with
• Had to buy an external drive, would be easiest to begin with Azure, but
since I had bought the external drive and was used to it, I stuck with it.
• Letting off setting up drives takes up a week that could be used to get a
better start on the work in the course
For Q12 – “If given the choice to use external drive vs Azure cloud lab in conducting
INFT2031 labs, which do you prefer? Why?”, 31 respondents chose to use the external
drive (decentralised lab environment). Out of the 31 respondents, 21 mentioned that using
the decentralised lab environment was easier, faster, flexible, more familiar and more
reliable than the Azure cloud lab. Five respondents stated that they had never tried the
cloud lab, 3 indicated it was due to personal preference and 2 had other reasons. Table 5.12
provides the analysis of the qualitative data. Out of 31 responses, 15 responses were from
respondents who had used the cloud lab.
Table 5. 12: Thematic Analysis for Q12 – Preference for Decentralised Lab
Theme (Frequency) Response
Easier, quicker,
familiar, flexible and
reliable (21)
• Azure cloud was slow to start and lagged when changing settings and uninstalling features*,P
• Azure had more problems and was consuming much time*, P
• External Drive-Easier to play with, all settings without a chance of losing
access*, R
• I felt it was a simpler way of doing the labsE
• I found it quicker and easier. Azure seems a little slow and hard to
configure to log on*, P, E, FLEX
• Just because I prefer a fast responsive input when using a computer. Although not having to use an external hard drive is also a big benefit
• Less complications with computer*, E
• Much easier and works*, E
• When I made a mistake assigning some IP I shouldn't have on Azure, I
had to delete and recreate a VM which wasted a bunch of time. External
drives are just simpler once set up I feel*, E
• I am more familiar with this method*, F
• If Azure was implemented earlier perhaps, but due to already becoming
comfortable using an external drive, I found it easier and more physical
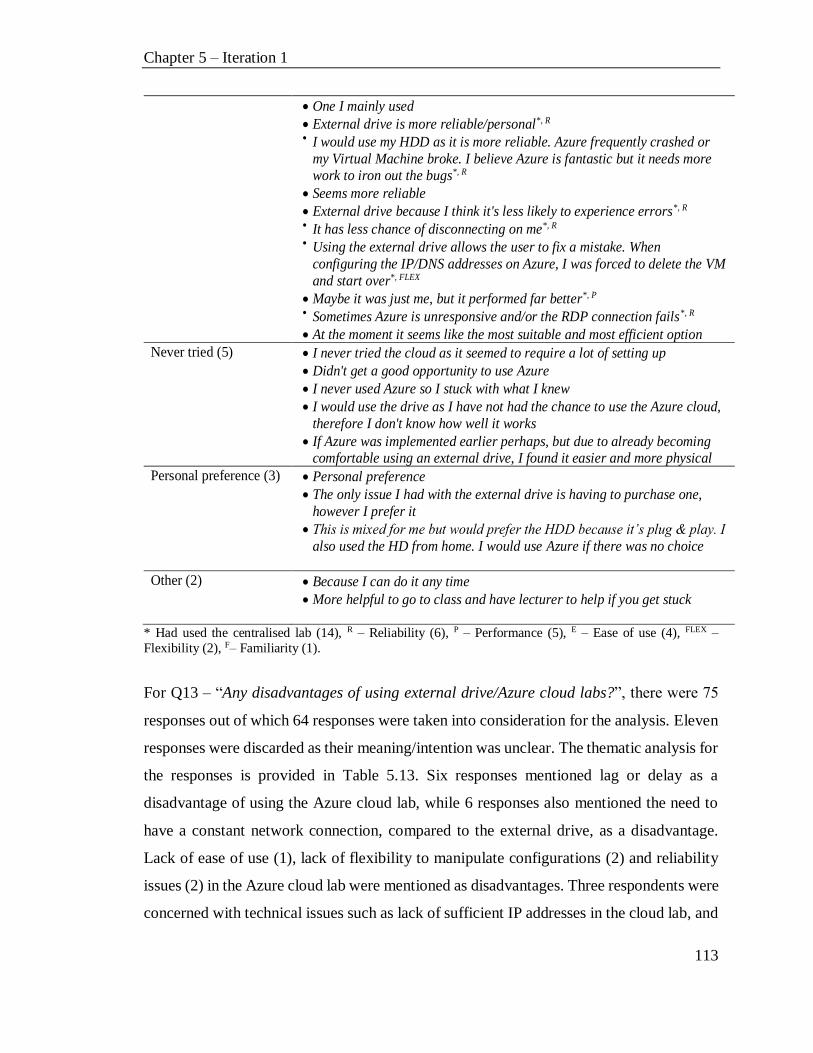
Chapter 5 – Iteration 1
113
• One I mainly used
• External drive is more reliable/personal*, R • I would use my HDD as it is more reliable. Azure frequently crashed or
my Virtual Machine broke. I believe Azure is fantastic but it needs more work to iron out the bugs*, R
• Seems more reliable
• External drive because I think it's less likely to experience errors*, R • It has less chance of disconnecting on me*, R
• Using the external drive allows the user to fix a mistake. When
configuring the IP/DNS addresses on Azure, I was forced to delete the VM
and start over*, FLEX
• Maybe it was just me, but it performed far better*, P • Sometimes Azure is unresponsive and/or the RDP connection fails*, R
• At the moment it seems like the most suitable and most efficient option
Never tried (5) • I never tried the cloud as it seemed to require a lot of setting up
• Didn't get a good opportunity to use Azure
• I never used Azure so I stuck with what I knew
• I would use the drive as I have not had the chance to use the Azure cloud,
therefore I don't know how well it works
• If Azure was implemented earlier perhaps, but due to already becoming comfortable using an external drive, I found it easier and more physical
Personal preference (3) • Personal preference
• The only issue I had with the external drive is having to purchase one,
however I prefer it
• This is mixed for me but would prefer the HDD because it’s plug & play. I
also used the HD from home. I would use Azure if there was no choice
Other (2) • Because I can do it any time
• More helpful to go to class and have lecturer to help if you get stuck
* Had used the centralised lab (14), R – Reliability (6), P – Performance (5), E – Ease of use (4), FLEX –
Flexibility (2), F– Familiarity (1).
For Q13 – “Any disadvantages of using external drive/Azure cloud labs?”, there were 75
responses out of which 64 responses were taken into consideration for the analysis. Eleven
responses were discarded as their meaning/intention was unclear. The thematic analysis for
the responses is provided in Table 5.13. Six responses mentioned lag or delay as a
disadvantage of using the Azure cloud lab, while 6 responses also mentioned the need to
have a constant network connection, compared to the external drive, as a disadvantage.
Lack of ease of use (1), lack of flexibility to manipulate configurations (2) and reliability
issues (2) in the Azure cloud lab were mentioned as disadvantages. Three respondents were
concerned with technical issues such as lack of sufficient IP addresses in the cloud lab, and

Chapter 5 – Iteration 1
114
lack of sufficient documentation and instructor help on the Azure cloud lab was mentioned
in 2 responses. Reliability was mentioned as an issue in 2 responses. These concerns and
how the study aimed to address these in the second iteration will be discussed later.
In terms of the decentralised labs, lack of accessibility and portability were the main
disadvantages (20 responses), followed by the cost of external drives (13 responses).
Overhead, hassle to purchase and the need to bring the external drives to the lab with the
possibility of loss or being forgotten were also disadvantages (11 responses). The initial
setup of the external drive also was considered a disadvantage by 6 respondents. Reliability
of external drives when conducting labs was also a concern (5 responses). Other
disadvantages included the external drive being an “old school” method, and the
requirement for an appropriately resourced computer to complete lab work outside the
allocated computer labs.
Table 5. 13 : Thematic Analysis for Q13 – Disadvantages for Azure Cloud and External Drive
Type Theme (Frequency) Response
Azure
Slow Performance (6) • Azure has some lag
• Azure: small amount of lag (to be expected)
• Azure at times didn't load fast
• Slow, internet connection may drop out
• Cloud labs were a bit slow to load
• Azure can run a bit slow
Network connection
(6) • Azure clouds require an internet connection
• Constant network connection
• Azure is reliant on a good connection
• When the network is down, external drive is more convenient to
use
• Azure needs internet
• Slow, internet connection may drop out
Ease of use,
Flexibility, Reliability (5)
• Azure - Difficult to repair after potential mistakes
• Setting VM was harder in Azure
• Azure disadvantages - cannot play with the IP address easily
without connection loss
• Azure played up on me and had to be stored
• Azure Cloud: Sometimes it breaks
Technical issues (3) • Not enough IP addresses on cloud
• Changing DNS and IP settings ruin Azure cloud
• Azure cloud - didn't have enough slots for the public IP
Lack of documentation/ help
(2)
• No instructor to help - Azure
• Azure needs more explanation on how it works and difficulty
logging in from home

Chapter 5 – Iteration 1
115
Other (2) • The Azure environment didn't work at first
• For use in lab Azure had poor compatibility with Mac
External Drive
Accessibility, Portability (20)
• External drive requires a MAC for use outside of the labs
• External drive would not be used to practice in my own time
from home and was only usable on a Mac
• Students without access to a MAC must wait for available library machines
• Disadvantage of external - I don't have a Mac
• External drive - No access at home due to Mac partition
• You cannot use the Windows version
• External: Have to have it on me, cannot use on windows
• External drive less accessible
• Azure could use anywhere. Fusion caused pain with
corruptions
• Disadvantage of using HDD - if no mac at home, won't work on
windows PC
• External is portable but since we use mac, it can't be used at home
• Using an external drive requires being on site, in the lab, at a
Mac
• External drives can suffer from compatibility issues
• Ability to use drives outside lab environments difficult due to
platform choice Mac
• External drive is Mac partition
• External Drive disadvantages - using a Mac partition made it very difficult to continue working at home
• The external drive was restricted to Mac computers which had
VM Fusion software. Which means only my lab computers had
the software and it made it hard for me to practice using the Windows Lab work
• External Drive disadvantage: harder to use at home, can’t use
virtual machines on a PC
• Had to use External Drive on Macs
• Drive must be formatted restricting user on other systems
Cost (13) • The external drive is cumbersome and expensive, if you don't
already have one. Azure is very easy
• External drive - Disadvantages = have to buy drive
• Price of drive
• External is additional cost and hassle however does all
understanding of central install and setup
• External: having to purchase/carry an external drive
• External drive had the disadvantages of costs if you didn't own one before using this course
• The external makes it so students buy $100 hard drive and
spend 2 weeks setting it up
• Having to buy external drive if you don't own one
• Yes, for some people I can see the price of an ED hard

Chapter 5 – Iteration 1
116
• Cost of external
• The price of external
• Hard drive is expensive
• Externals are expensive
Overhead to buy/bring,
can be lost/left behind (11)
• Sometimes I forgot to take the HD to the lab. Then I can't do
anything without it
• External drives can be lost/left behind
• The external drive is cumbersome and expensive, if you don't
already have one
• External is additional cost and hassle however does all understanding of central install and setup
• External: having to purchase/carry an external drive
• Better not forget/lose external drive
• External drives, unnecessary burden, easy to forget and takes
much longer to install software
• External: Have to have it on me
• Portable hard drives can get lost or forgotten very easily
• Ext. drives can easily forget
• Having to format or buy another external hard drive
Overhead to setup external drive (6)
• The fact that I had to reformat and commit 200 GB of HDD
memory was a huge negative for HDD
• External drive needed to be formatted for my home PC as its specs were different
• Having to format or buy another external hard drive
• External drive setup felt too hard for beginners
• Having to wipe your HDD. That was super annoying
• The external makes it so students buy $100 hard drive and
spend 2 weeks setting it up
Reliability (5) • External hard drive: takes too long to download everything
• ED has issues starting up
• Fusion caused pain with corruptions
• Had some drive issues in earlier labs
• Harder to lose info with Azure
Other (4) • Drive - Old school, when we need to be utilising tools that will
be used in the industry (Azure, Cisco Meraki)
• External drive needs VMware (and a powerful PC)
• External drive is slow. Easy to make mistakes and corrupt VM
need to start over
• External drives, unnecessary burden, easy to forget and takes much longer to install software
For Q14 – “Please provide any suggestions that you would like to see implemented in the
cloud lab in future”, there were 31 responses. The results of the thematic analysis are given
in Table 5.14. Eleven respondents wanted to improve the labs with tutorial videos, clearer
explanations and details, walkthroughs, etc. Five respondents requested an improved and

Chapter 5 – Iteration 1
117
more user-friendly interface. Five respondents wanted better performance (faster loading,
restarts, etc.) from the cloud lab. Four respondents stated that it would be better to have
cloud labs introduced earlier on. Three respondents wanted resolution of technical issues
and improved reliability.
Table 5. 14: Thematic Analysis of Q14 – Suggestions for Cloud Lab
Theme (Frequency) Response
Improve on help, documentation, lab
sheets, presentation
(11)
• Great detail on use and up to date notes
• Tutorial Videos
• Maybe an explanation tute of Azure
• Cleaner tutorials
• Clearer pictures and walkthroughs
• A better tutorial
• More how-to presentation style learning on a projector
• More support for servers
• More explanation on how to use
• Azure standard profile then add project for each new week
• Having a simpler server to practice with
Improve interface (8)
• More user friendly
• Easier to use interface
• Easier UI to navigate
• Too many links on the main page so I got confused. Maybe more simple.
Groups of VMs
• Resizable window. Had to scroll horizontally
• Make it easier to connect from home
• HTML5 RDP for Azure (instead of having to download an RDP app)
• Simpler resume function in event of disconnect
Improve performance
(5) • It was a bit slow at times
• The cloud lab was slow in terms of performance. I understand this is perhaps not easily solvable and the ability to complete labs from home
compensates for this. Just thinking out loud
• Faster loading, easier setting up
• Faster access
• Faster restart times
Use cloud lab early on
(4) • Use cloud labs for all lab work
• More Azure based labs
• Earlier implementation. Learning it late in the semester when everything
gets hectic might leave people reluctant to try it
• Expanded use of Azure
Resolve technical issues, improve
reliability (3)
• Make sure there's enough IP addresses :)
• A less buggy version. My VMs would crash frequently
• Ensure it works

Chapter 5 – Iteration 1
118
The above results and analysis answered RQ1 comprehensively. From the above analysis,
we can conclude that the majority of respondents preferred to use the centralised lab
environment. Many students who used only the decentralised labs did so because they were
familiar with it and did not see the need or have time to change over to use the centralised
labs. The centralised lab environment has a number of advantages that make it the preferred
choice: 24x7; flexible; and seamless access from any device remotely without the need to
purchase or configure and handle external drives. Also, the quantitative data illustrates that
participants rated the centralised labs higher than decentralised labs in most survey
questions and the centralised labs had similar or higher TAM results. Also, the paired t-test
showed that students who used both labs rated the centralised lab higher in all dimensions
with the exception of perceived usefulness (which was similar), at a statistically significant
level. However, when evaluating the qualitative data, there were 15 student respondents
who used both labs and preferred to use the decentralised labs. The main reasons for their
choice was reliability without errors, performance lag with Azure, ease of use and
flexibility to configure. The suggested improvements for the centralised lab (Q14) were:
improve labs (with more how-to and documentation); provide easier to use interface and
features; improve performance; introduce centralised labs early on in the semester; and
resolve technical issues causing errors. The second iteration addressed these suggestions.
As discussed in Chapter 3, all labs were revised by applying PLTs (such as Kolb’s ELC),
making them more interactive and engaging. The centralised virtual lab environment
outlined in Chapter 3 provides an interface which is the same as a decentralised lab
environment (a sandboxed Windows Server 2016 interface) which is easy, intuitive,
flexible and resolves technical issues such as the limited number of addresses in the Azure
environment. Also, given that the virtual lab was now hosted on a private cloud at the
university with no restrictions on budget (such as Azure credit), the instructor has the
flexibility to provide a higher resourced sandboxed environment for each student for lab
work. As the private cloud is hosted on the campus network environment (similar to the
lab network) with access using tools such as vWorkspace client, a more reliable, faster and
responsive connection was expected as opposed to using the Azure Dev/Test environment.
The centralised lab environment was made available from the first lab for students in the
second iteration. This environment was implemented and evaluated in the second iteration.

Chapter 5 – Iteration 1
119
The next section addresses RQ2 and evaluates the feedback tool.
5.4.2 RQ2: Perceptions on the Feedback Tool
This section addresses RQ2 – students’ perception on the feedback tool. Question 15 of the
survey (see Appendix A) was “Did you use the PowerShell feedback scripts?” Fifty-one
students answered yes, 35 answered no and 8 did not answer. The thematic analysis of the
second part of the question – “If no, please explain why?” is provided in Table 5.15.
Fourteen responded that they did not have enough time or had not progressed far enough.
Eight responses stated that they did not feel the need or forgot to use the feedback tool.
There were six responses where the students were unsure how to use it (had no idea). Two
others had difficulty downloading the scripts to the VM. From the above responses, it is
clear that only 2 out of 30 (five who answered no did not provide qualitative feedback)
actually had attempted to use the feedback tool and had technical difficulties (i.e. had issues
downloading the scripts), while the others had not attempted to use the feedback tool at all.
Table 5. 15: Thematic Analysis of Q15 – Reasons for not using the Feedback Tool
Theme (Frequency) Response
No time, did not progress far
enough (14)
• Ran out of time
• Didn't get time to do them a lot
• Limited time
• Didn't have the time
• Never got round to it
• Did not get the chance before they were (workstations) taken down
• Ran out of time catching up
• Did not progress far enough
• Didn’t get around to wing it
• I fell behind as a result of Mac partition limiting usability, so I didn't fully
complete each lab so didn't test
• Not enough time, would have otherwise
• Didn't get around to using them - time restriction
• Didn't get around to doing it
• I didn't have enough time during the lab class to use the feedback
Didn’t feel the need,
forgot (8) • I felt confident that I had done it well
• Didn't see the need
• Did not feel the need to
• Configured in manager
• Forgot to look at it
• I forgot to use them
• Preferred to do things manually

Chapter 5 – Iteration 1
120
• Easier alternatives
Unsure how to use
(6) • Unsure of how to utilise
• It was hard to understand
• I had no idea
• Didn't know what they were
• Missed tute
• Tutor didn't explain how to use it
Technical difficulties
(2) • Couldn't really log into Blackboard to download them onto VM
• I wasn't able to download them from my external drive VM
Of the 51 students who used the feedback tool, the quantitative data for the survey questions
are given below (see Table 5.16 and Figure 5.6). The section three survey questions Q1 to
Q5 have means over 7.5 (out of 10). All responses were above 5 (out of 10) except for 1
response of 4 (out of 10) in Q2 (fast to load) and Q3 (encourages me to do work). Q4 – “I
prefer to have this feedback script with the labs” and Q5 – “Based on this script feedback,
how likely are you to recommend it to students in next semester?” scored means of 8.35
and 8.41 respectively. Also, overall (94.1%) of students were satisfied (70.6%) or highly
satisfied (23.5%). No student responded as dissatisfied or extremely dissatisfied. This is a
highly positive result and shows acceptance of the feedback tool by the students. To find
out the reason for such ratings, a thematic analysis of Q17 of the survey – “What is the
primary reason for your rating?” was performed. The qualitative analysis is provided in
Table 5.16.
Table 5. 16: Item Descriptive Analysis Results of the Feedback Scripts Tool (n=51)
Dimension Survey Question 10-point Likert scale
Mean SD Median
Perceived ease
of use
Q1. The feedback offering descriptions were easy
to understand
7.86 1.497 8.00
Q2. The feedback page on your VM was fast to load
8.06 1.475 8.00
Perceived
usefulness
Q3. This feedback script encourages me to do my
lab work
7.72 1.715 9.00
Attitude towards
using
Q4. I prefer to have this feedback script with the
labs
8.35 1.610 8.00
Q5. Based on this script feedback, how likely are
you to recommend it to students next semester?
8.41 1.472 8.00
Overall Q6 - How satisfied are you with feedback
generated from the script?
5-point Likert scale
4.18 .518 4.00

Chapter 5 – Iteration 1
121
Figure 5. 6 Feedback Tool Mean Survey Question Results (based 10-point scale)
Figure 5. 7 Overall Rating of Feedback Tool
Table 5. 17: Thematic Analysis of Q17 – Reason for Rating of Feedback Tool
Theme (Frequency) Response Detailed, clear, useful,
intuitive feedback that
helps me and keeps me
on the right track (36)
• The scripts are very useful, a few value errors gave incorrect results at times
• It tells me what needs to be done and what I have done correctly
• simple to use, a lot of feedback
• It showed where I went wrong with (almost) no ambiguity, test feedback is
nice
• Nice to be able to get instant feedback
• It is very clear and informative
• Helped me stay on the right track
• Effective program that helped me to understand my mistakes made in the lab.
• Easy to learn functionality
• They told me whether I had done work correctly, which I would otherwise be
unsure of
• A large amount of feedback was provided but some of it was pretty vague
with no real exploration
• Helps to know if what you're doing is correct
• Detailed explanation of what I did right and wrong
• It was good to see what I achieved, but I found that it would sometimes
display data incorrectly
• Was useful however it was often buggy and incorrect
• Made sense and was able to self-analyse my work
• All feedback was comprehensive
• Easy to read, understand, annoying to execute
• Scripts made it easy to know where I went wrong so I could fix it
• It worked well
7.86 8.06 7.728.35 8.41
1
3
5
7
9
q1 q2 q3 q4 q5
Mea
n o
f 10
-po
int s
cale
0 03
36
12
0
10
20
30
40
ExtremelyDissatisfied
Dissatisfied Neither Satisfiedor Dissatisfied
Satisfied ExtremelySatisfied
Freq
uen
cy

Chapter 5 – Iteration 1
122
• Quick and easy response to work
• Made classes easier
• Often gave wrong output but still extremely useful nonetheless
• They worked well but it was sometimes hard to read at all
• Told me that I got right/wrong in my configuration instantly
• Very accurate. That way I also know if I am doing something wrong and I
can learn from mistakes
• I found it useful
• I knew what I was doing right and wrong
• It provided a very nice summary of the work I had done for checking errors
• Made checking easy
• Reason: It was satisfying
• PowerShell is good but not used by most
• They were to the point in terms of feedback
• It provided me with relevant feedback
• It gives me an idea on how I go with the lab
• It was well presented and more comprehensive than I expected Ease of use (5) • Simple to use, a lot of feedback
• Easy to learn functionality
• It seemed very intuitive
• PowerShell is easy to use and there is lots of info online
• Ease of use was a pro for me Instant feedback (5) • Nice to be able to get instant feedback
• Instant feedback was great, there were some errors in it still but
• Quick and easy response to work
• It provided immediate feedback
• Told me that I got right/wrong in my configuration instantly Error free * (8) • The scripts are very useful, a few value errors gave incorrect results at times
• Instant feedback was great, there were some errors in it still but
• Had a minor issue here and there. Overall good
• It was good to see what I achieved, but I found that it would sometimes
display data incorrectly
• Was useful however it was often buggy and incorrect
• Some code in PowerShell did not work
• Often gave wrong output but still extremely useful nonetheless
• There was a couple of questions where I did exactly as the tute notes said and it didn't see that I had done it
Feedback could be
more precise and more
explanation* (2)
• A large amount of feedback was provided but some of it was pretty vague
with no real exploration
• It will be good if there are more feedbacks Make it easier to
execute *
(1)
• Easy to read, understand, annoying to execute
Make the results easier
to read *
(1)
• They worked well but it was sometimes hard to read at all
Other (2) • I'd rate it just above average, not super intuitive * Suggestion for improvement

Chapter 5 – Iteration 1
123
From the analysis, it is clear that the feedback tool performed as expected providing useful,
detailed, clear, intuitive feedback as intended (35 responses). Students also liked the fact
that the feedback tool was easy to use (5) and provided instant feedback (5). There were a
number of comments that can be classified into feedback to be considered for improving
the feedback tool: i) make the tool bug free (8); ii) make feedback more precise (2); iii)
improve the display of the report making it easier to read (1); and iv) make it easier to
execute the scripts (1).
In the survey, Q23 asks students on suggestions for improvement of the feedback tool. The
thematic analysis of Q23 – “Are there any suggestions for how the feedback script could
be improved?” is presented in Table 5.18. It is clear from the analysis that fixing bugs is
the most frequently asked for improvement (7), followed by a more simple, precise, clear
output (4); and also detailed output where needed (3). Downloading the scripts also was
difficult (2) as stated by two respondents.
Table 5. 18: Thematic Analysis of Q23– Suggestions to Improve Feedback Tool
Theme (Frequency) Response
Error fixes (7) • Less errors, a more user-friendly interface. The user is bombarded with information about the labs. A simple table would suffice
• Some mistakes still because it's new
• Minor bug fixing of issues that [arose] :-)
• Fix any bugs/inconsistencies
• Double check if PowerShell will work properly
• Testing and revision so that the scripts are more accurate and don't give
false feedback
• Maybe better error association so you know how to fix errors
Output is precise, clear, simple (4)
• Less errors, a more user-friendly interface. The user is bombarded with
information about the labs. A simple table would suffice
• Provide a shorter summary that is quick to read
• Just making sure each point of feedback is obvious, what it's [referring] to in the lab exercises
• Simplified a little
Output detailed
where needed (3) • Evaluating the feedback given and see if any in-depth information or
explanation could be given in some section.
• Perhaps more descriptive. Like did not map drive properly, for instance :)
• Perhaps more intricate explanations or guide links
Avoid script
downloading (2) • I don't know if it's possible but downloading it onto the Virtual PC was
difficult
• Have VM's able to connect to internet so can download them

Chapter 5 – Iteration 1
124
The above results and analysis comprehensively addressed RQ2 – students’ perceptions of
the feedback tool. It can be concluded that students were highly satisfied and found it useful
and helpful in completing lab work. A number of improvements for the second iteration
were noted including: improving the scripts to be bug-free; providing more user-friendly
output with clear, precise information and detail where needed; downloading the scripts to
the VM was considered a hassle which was also a technical difficulty stated by 2
respondents as a reason for not using the feedback tool (see Table 5.17 – Technical
Difficulties). The next iteration uses an improved version of the feedback tool that
addressed these issues. It is important to note that the feedback tool outlined in the Chapter
3 architecture did not require scripts to be downloaded and had an improved user-friendly
interface. Also, the scripts were reviewed to fix bugs and provide concise, useful
information presented in a user-friendly manner. The updated version of the feedback tool
was implemented and evaluated in the second iteration (presented in Chapter 6).
The next section addresses RQ3 and presents the results of the quasi-experiment.
5.4.3 RQ3: Impact on Learning Outcomes
This section aims to address RQ3 – “Is there a measurable impact on learning outcomes
based on the above intervention?”. As discussed in the research design in section 5.2, a
quasi-experiment was conducted to verify whether there was a measurable impact on
learning outcomes based on the intervention. Marks for practical test 1 and practical test 2
for the control group (2015 cohort) and the experimental group (2016 cohort) were
examined. The control group (2015 cohort) consisted of students enrolled in INFT2031 in
semester 2, 2015 at the Callaghan and Ourimbah campuses. In the 2015 cohort, 106
students sat practical test 1 and were given marks and 102 students sat practical test 2 and
were given marks. The experimental group (2016 cohort) consisted of students enrolled in
INFT2031 in semester 2, 2016 at the Callaghan and Ourimbah campuses. From the 2016
cohort, 94 students participated in the research project and all of these students sat practical
test 1 and practical test 2. These student marks were takin into consideration (see Table
5.19).

Chapter 5 – Iteration 1
125
Table 5. 19: Number of students’ marks used for the Quasi-experiment
2015 Cohort
(Control Group)
2016 Cohort
(Experimental Group)
Practical Test 1 106 94
Practical Test 2 102 94
As discussed in the research design, a quasi-experiment was undertaken. The intervention
occurred for the 2016 cohort in Labs 7-9 (i.e., the latter part of the semester) after practical
test 1. To compare whether the control and experimental groups were similar, practical test
1 marks were compared (pre-test), which is prior to the intervention. The results of the
independent t-test are below (see Figure 5.8).
P value and statistical significance:
- The two-tailed P value equals 0.0936
- By conventional criteria, this difference is considered to be not
quite statistically significant.
Confidence interval:
- The mean of 2015 Cohort – Practical Test 1 minus 2016 Cohort –
Practical Test 1 equals -0.603
- 95% confidence interval of this difference: From -1.308 to 0.103
Intermediate values used in calculations:
- t = 1.6846
- df = 198
- standard error of difference = 0.358
Figure 5. 8 Results of Independent t-test for Practical Test 1 Marks between Control and
Experimental Groups
From the above results, it can be concluded that there was no significant difference in the
scores for the 2015 cohort’s practical test 1 (M = 16.637, SD = 2.317) and the 2016 cohort’s
practical test 1 (M = 17.239, SD = 2.740) conditions; t (198) =1.6846, p = 0.0936. This
meets condition 1 of the research design (see section 5.2) and we can conclude that the
cohorts were similar (i.e., not statistically different) based on their practical test 1 scores.
Group 2015 Cohort –
Practical Test 1
2016 Cohort –
Practical Test 1
Mean 16.637 17.239
SD 2.317 2.740
SEM 0.225 0.283
N 106 94

Chapter 5 – Iteration 1
126
Next, the intervention (i.e., using the Azure cloud lab and the feedback tool) occurred for
the 2016 cohort (experimental group) only. To determine whether a measurable impact on
learning outcomes had occurred with respect to the experimental group, an independent t-
test was conducted on the practical test 2 marks for both the control and experimental
groups.
P value and statistical significance:
- The two-tailed P value equals 0.0887
- By conventional criteria, this difference is considered to be not
quite statistically significant.
Confidence interval:
- The mean of 2015 Cohort – Practical Test 2 minus 2016 Cohort –
Practical Test 2 equals -0.754
- 95% confidence interval of this difference: From -1.624 to 0.115
Intermediate values used in calculations:
- t = 1.7110
- df = 194
- standard error of difference = 0.441
Figure 5. 9 Results of Independent t-test for Practical Test 2 Marks between Control and
Experimental Groups
The results of the independent t-test for practical test 2 for the 2015 cohort and the 2016
cohort are shown in Figure 5.9. From these results, it can be concluded that there was no
significant difference between the scores for the 2015 cohort’s practical test 2 (M=15.549,
SD=3.372) and the 2016 cohort’s practical test 2 (M=16.303, SD=2.735) (conditions: t
(194) = 1.7110, p = 0.0887). Thus, it can be concluded that there was no measurable impact
on learning outcomes (based on practical test scores) due to the intervention. There may be
a number of reasons for not observing a significant impact on the learning outcomes. The
intervention was only conducted for a short period (the last 3 labs out of 10 labs) and also
not all of the 2016 cohort used the centralised lab environment (77%) or the feedback tool
(59%). It is quite possible that the intervention period was too short, and the participant
population was insufficient to show a measurable impact on the learning outcomes. In the
Group 2015 Cohort –
Practical Test 2
2016 Cohort –
Practical Test 2
Mean 15.549 16.303
SD 3.372 2.735
SEM 0.334 0.282
N 102 94

Chapter 5 – Iteration 1
127
next iteration (detailed in Chapter 6), a complete implementation of TePF will be run for
the entire semester and then evaluated.
5.5 Summary
In this chapter, the first iteration of the DBR process was presented. Two technology
artefacts of the TePF were evaluated: i) the virtual lab; and ii) the feedback tool. Two
architectures for the virtual lab were evaluated – a centralised lab and a decentralised lab.
A comprehensive analysis of both quantitative and qualitative data was conducted and
evaluated. It is clear that the centralised virtual lab environment had a number of
advantages such as 24/7 access, flexibility and seamless access from any device remotely.
The qualitative analysis of the centralised and decentralised labs provided new insights and
issues, limitations and disadvantages of each type of lab. It was evident that advantages of
centralised labs far outnumber and outweigh those of the decentralised lab environment. In
the next iteration, a new design and implementation of a centralised virtual lab, addressing
many of the concerns revealed in this chapter is implemented and evaluated.
The first version of the feedback tool was implemented as a number of PowerShell scripts
and evaluated. Students accepted and rated the feedback scripts highly. There were a
number of suggestions for improvement including fixing bugs, a more user-friendly
interface and avoiding the need to download scripts to the VM which will be implemented
in the next version of the feedback tool (as outlined in Chapter 3) and evaluated in the
second iteration in Chapter 6.
To determine whether we could detect a measurable impact on learning outcomes due to
the intervention presented in this chapter, a quasi-experiment and independent t-test was
conducted based on the scores of practical tests 1 and 2 for the 2015 and 2016 cohorts of
students who completed INFT2031. There was no statistically significant observation
revealed by the practical test scores. Limitations of this intervention were that it was
implemented for a short period and that not all students participated in the intervention. In
the next iteration (detailed in Chapter 6), the proposed TePF will be implemented for the
entire semester and evaluated for any observable impact to learning outcomes in the lab
environment.

Chapter VI
6. Iteration 2 – TePF Implementation &
Evaluation
This chapter presents the second iteration of design, implementation and evaluation of the
Technology-enhanced Pedagogical Framework (TePF) for the lab environment. The rest
of this chapter is structured in the following manner. Section 6.1 provides the aim and
explains the proposed extension of the TePF implementation. Next, the research design
that was used to evaluate the proposed pedagogical framework is presented in Section 6.2.
Finally, details of the evaluation study and the results are presented in Section 6.3.
6.1. Aims
This iteration aims to design, implement and evaluate the entire TePF for the lab
environment presented in Chapter 3. In the previous iteration, an evaluation of two
architectures – centralised and decentralised – was performed. The analysis provided a
number of helpful insights and it was decided to use a centralised virtual lab environment
moving forward in this iteration. In addition, the first version of the feedback tool had been
developed as a set of PowerShell scripts. This was evaluated and the overwhelming
positive response for this tool resulted in development of the next version of the feedback
tool (as presented in Chapter 3). This was incorporated into the TePF in this iteration. The
other technology artefacts developed and integrated in this iteration were the teacher and
student dashboards. Another major change in the lab environment came from the
implementation of lab activities incorporating a number of PLTs (as outlined in Chapter
3). The lab activities were also facilitated by LMS features such as discussion boards,
online quizzes and other items. This chapter essentially implements the proposed TePF in
its entirety (as outlined in Chapter 3) and evaluates it with the aim of verifying the
hypothesis - Design of technology-enhanced lab environments taking a holistic view of

Chapter 6 – Iteration 2
129
learning incorporating learning context, curriculum design, lab activities, assessments,
resources and technology artefacts based on sound pedagogical and learning principles
and theories have a higher potential for effective learning. The next section presents the
research design for the experiment conducted in this iteration.
6.2. Research Design
In this iteration, the proposed TePF for the lab environment was designed following a
number of PLTs to design curriculum and lab activities, and also used technology
capabilities to facilitate learning through the incorporation of technology artefacts such as
virtual labs, feedback tools, dashboards, discussion boards, online quizzes, etc. To validate
the hypothesis, this iteration evaluates whether there were any measurable impacts on
learning by using the implemented TePF. A quasi-experiment was designed to evaluate the
TePF’s impact on learning as follows:
• Firstly, the TePF for the lab environment in INFT2031 should impact the ILOs of
learning in the labs. The labs are geared towards developing knowledge and skills
with hands-on practical work which is aligned to ILO4 - Demonstrate ability to
install, configure and troubleshoot PC, NOS and network services. ILO4 was
assessed by practical test 1 and practical test 2. Thus, the impact of learning in the
labs could be observed by observing the students’ results in practical test 1 and
practical test 2.
• Next, the quasi-experiment design has a control group which did not have the TePF
applied and an experimental group which had the TePF applied for the entire period.
In this experiment, the 2015 cohort of students who completed INFT2031 formed
the control group as these students did not have the TePF applied in their learning.
In 2017, students enrolled in the INFT2031 class did have the TePF applied to their
learning and they formed the experimental group.
• To keep all other variables as constant as practically possible, the course was taught
by the same lecturers for both control and experimental groups and evaluated using
the same practical tests.

Chapter 6 – Iteration 2
130
If an impact on learning was observed in the practical test scores, we would have strong
evidence to believe this was due to the use of the TePF. Table 6.1 outlines the quasi-
experiment for iteration 2.
Table 6. 1: Quasi-Experiment Design for Iteration 2
2015 Cohort (No TePF)
(Control Group)
2017 Cohort (TePF)
(Experimental Group)
P2P lab activities P2P lab activities
Practical test 1 Practical test 1
Server-based lab activities Server-based lab activities
Practical test 2 Practical test 2
An independent t-test of the marks for practical test 1 and practical test 2 between cohorts
was conducted to find whether any observable impact in the marks between the cohorts
could be detected.
Using the practical tests and observing any measureable impact on scores is one way to
determine the impact of learning based on the TePF. There are a number of survey
instruments that can be used to measure approaches to student learning, levels of student
learning, and attitudes and perceptions towards learning. Additionally, the TePF has
components such as lab activities based on PLTs and technological artefacts such as virtual
labs, the feedback tool and dashboards. It was considered valuable to discover students’
perceptions and levels of learning when using the TePF and its different components.
A survey to elicit both quantitative and qualitative results was deployed at the end of the
semester 2, 2017 (see Appendix B for the complete survey). The survey evaluated each
technology artefact and the lab activities in the TePF. Each technology artefact: virtual lab;
feedback tool; and dashboards, was evaluated using a 5-point Likert scale based on the
TAM dimensions (Davis, 1989). Lab activities were designed based on a number of PLTs
– such as Kolb’s ELC, Collaborative Learning, Bloom and SOLO taxonomies. To evaluate
lab activities, the survey used a number of survey instruments. An evaluation of lab
activities based on Usefulness, Interaction, Competency, Interest, Reflection and
Challenge dimensions (Konak & Bartolacci, 2016) was included. The use of different

Chapter 6 – Iteration 2
131
stages of Kolb’s ELC was measured using 12 questionnaire survey instrument (Kolb,
1981). Student approaches to learning (deep or surface) (Biggs et al., 2001) were measured
by the Revised Two Factor Study Process Questionnaire (R-SPQ-2F). Finally, an overall
rating of all components of the TePF was conducted. Table 6.2 presents the survey
structure. The complete survey is provided in Appendix B.
Table 6. 2: The Structure of the Survey used to evaluate the TePF
Areas Sections Types of survey questions
Technology artefacts
(using TAM)
1) Virtual lab 10 quantitative items
2 open-ended items
2) Feedback tool 6 quantitative items
2 open-ended items
3) Dashboard tool 8 quantitative items
2 open-ended items
4) Suggestions for improvement 4 open-ended items
Lab activities
5) Lab activities 21 quantitative items
6) Experiential learning stages 12 quantitative items
7) Students’ learning approaches 20 quantitative items
Overall 8) Overall evaluation of the TePF
components
9 quantitative items
Student info and expectations
9) General attendance, reasons and expectations
5 quantitative items
In addition to the open-ended questionnaire (which collected qualitative data), focus group
discussions were conducted to evaluate students’ learning outcomes and their satisfaction
with the TePF. Appendix C provides the sample discussion questions used in the focus
groups to elicit responses and collect data.
To evaluate students’ perceptions of the TePF, analysis of both quantitative and qualitative
data was performed. A number of statistical techniques, such as descriptive analysis, means
and standard deviations, and thematic analysis of qualitative data were used in analysing
the responses to the open-ended questions and the feedback from the focus groups
(Boyatzis, 1998; Auerbach & Silverstein, 2003). Triangulation was performed to provide
a deeper understanding of student perceptions and to identify the reasons for their
responses.
The next section presents the results and analysis of the data collected.

Chapter 6 – Iteration 2
132
6.3. Results and Discussion
This section discusses the results from the experiment in this iteration. Firstly, it examines
the data collection process. Next, the results of the quasi-experiment are presented and
discussed. Finally, the results of the survey and discussion forums are presented and
analysed.
6.3.1. Data Collection
For the quasi-experiment, marks for the practical tests for the 2015 and 2017 cohorts were
collected. In 2015, 87 students completed INFT2031 at Callaghan. Out of 87 students, 86
students completed practical test 1 while 82 students completed practical test 2. In 2015, at
Ourimbah, 20 students completed the INFT2031 course. All 20 students completed both
practical test 1 and practical test 2. In 2017, 70 students were enrolled at Callaghan campus
and 14 students at Ourimbah campus. Out of the 70 students at Callaghan, 60 students
participated in the research project and 12 students participated at Ourimbah campus. In
2017, all students who participated in the research project completed both practical test 1
and practical test 2. Table 6.3 presents the number of student scores used for the quasi-
experiment.
Table 6. 3: Number of Students Participating in the Quasi-Experiment
2015 Cohort 2017 Cohort
Practical Test 1 106 72
Practical Test 2 102 72
In 2017, 72 students completed the survey and 64 students participated in focus group
discussions (6 groups with 13, 7, 11, 13, 8 and 12) with the discussion running for about
20-25 minutes; five were held at Callaghan (52 students) and one was held at Ourimbah
(12 students).
The next section presents the results of the quasi-experiment.
6.3.2. Evaluation of Learning Outcomes
The results of the independent t-tests for practical test 1 are shown in Figure 6.1.

Chapter 6 – Iteration 2
133
P value and statistical significance:
- The two-tailed P value equals 0.0056
- By conventional criteria, this difference is considered to be
statistically very significant.
Confidence interval:
- The mean of 2015 Cohort – Practical Test 1 minus 2017 Cohort –
Practical Test 1 equals -0.919
- 95% confidence interval of this difference: From -1.565 to
-0.273
Intermediate values used in calculations:
- t = 2.8077
- df = 176
- standard error of difference = 0.327
Figure 6. 1 Results of Independent t-test for Practical Test 1 Marks between Control and
Experimental Groups
From the above results, it can be concluded that there is a statistically significant difference
in the scores for the 2015 cohort’s practical test 1 scores (M=16.637, SD=2.317) and the
2017 cohort’s practical test 1 scores (M=17.556, SD=1.855) with conditions: t (176)
=2.8077, p = 0.0056. This result provide evidence to support that the TePF had an impact
on the mean score of practical test 1 between the experimental and control groups with a
small to medium effect size (Cohen's d = (17.556 - 16.637) ⁄ 2.098751 = 0.44).
Next, an independent t-test for practical test 2 scores between the control and experimental
groups was conducted. These results are shown in Figure 6.2.
P value and statistical significance:
- The two-tailed P value equals 0.0368
Group 2015 Cohort –
Practical Test 1
2017 Cohort –
Practical Test 1
Mean 16.637 17.556
SD 2.317 1.855
SEM 0.225 0.219
N 106 72
Group 2015 Cohort –
Practical Test 2
2017 Cohort –
Practical Test 2
Mean 15.549 16.528
SD 3.372 2.438
SEM 0.334 0.287
N 102 72

Chapter 6 – Iteration 2
134
- By conventional criteria, this difference is considered to be
statistically significant.
Confidence interval:
- The mean of 2015 Cohort – Practical Test 1 minus 2017 Cohort –
Practical Test 1 equals -0.979
- 95% confidence interval of this difference: From -1.897 to -
0.061
Intermediate values used in calculations:
- t = 2.1045
- df = 172
- standard error of difference = 0.465
Figure 6. 2 Results of Independent t-test for Practical Test 2 Marks between Control and
Experimental Groups
From the above results, it can be concluded that there is a statistically significant difference
in the mean scores for the 2015 cohort’s practical test 2 scores (M=15.549, SD=3.372) and
the 2017 cohort’s practical test 2 scores (M=16.528, SD=2.438) with conditions: t (172) =
2.1045, p = 0.0368. This result provides further evidence to support the TePF having an
impact on the mean scores of practical test 2 between the experimental and control groups
with a small to medium effect size (Cohen's d = (16.528 - 15.549) ⁄ 2.942297 = 0.33).
The mean practical test scores for the 2015 and 2017 cohorts are shown in Figure 6.3.
Figure 6. 3 Mean Practical Test 1 and Practical Test 2 Scores between the 2015 Cohort (Control)
and the 2017 Cohort (Experimental)
Both independent t-test results provided strong support for a statically significant
difference in the mean test scores for practical tests 1 and 2 between the control and
experimental groups. In this experiment, variables such as lecturer and tests were kept
2015 Cohort 2017 Cohort
Practical Test 1 16.637 17.556
Practical Test 2 15.549 16.528
16.637
17.556
15.549
16.528
14.5
15
15.5
16
16.5
17
17.5
18
Practical Test 1 Practical Test 2
Linear (Practical Test 1 ) Linear (Practical Test 2)

Chapter 6 – Iteration 2
135
constant for both groups. The fact that the TePF was applied for the experimental group
but not to the control group provides evidence that the application of the TePF is the reason
for the change in mean test scores. The mean practical test scores increased in the
experimental group (2017 cohort) as compared to the control group (2015 cohort). These
results provide evidence in support of the hypothesis.
Next, this thesis uses quantitative and qualitative data from surveys and focus groups to
further evaluate the TePF and its components. Note that 2017 cohort is subjected to the
entire TePF and its components. The quantitative and qualitative data is collected from
2017 cohort for evaluation in the following sections.
6.3.3. Evaluation of TePF components
There are many components that make up the TePF for the lab environment. Lab activities
incorporated a number of PLTs and used technology artefacts such as virtual labs, a
feedback tool and dashboards. Section 9 in the survey (see Appendix C) aims to identify
the most significant components of the TePF that contributed to learning from the students’
perspective and the rating for each component. The descriptive statistics are shown below
(see Table 6.4).
Table 6. 4: Students’ Responses to Survey Question “Overall, what contributed most significantly
to your learning in INFT2031? In other words, what are the important features to help in learning
INFT2031? (Select all that apply)”
Features
N
Likert Scale (%) Descriptive Analysis
SD D N A SA Mean SD Median
1 2 3 4 5
Lecture 74 0 4 22 24 24 3.94 0.918 4.0
Discussion board 73 11 19 32 6 4 2.59 1.077 3.0
Review Questions and Quizzes 73 2 8 22 21 20 3.63 1.168 4.0
Virtual labs 74 0 2 3 32 37 4.44 0.648 5.0
Lab Activities 74 0 1 3 23 47 4.57 0.646 5.0
Assignments 74 1 2 10 36 25 4.13 0.838 4.0
Feedback tool 70 4 10 19 15 22 3.40 1.469 4.0
Dashboard Tool 70 3 13 32 11 11 3.03 1.278 3.0
Group Work 72 20 23 15 12 2 2.28 1.201 2.0

Chapter 6 – Iteration 2
136
Other
• Practical tests
• Practical test and practice runs Waraboork scenario
• Practical tests
• Third party videos exploration
• I used Lynda.com. It is good for this type of thing
The qualitative data from Other can be classified as practical tests (n=3), third party
resources (n=2) and formative class discussions (n=1).
Figure 6. 4 Student responses to categories which contributed most to learning
Figure 6. 5 Student Rating for each Category
63
59
51
47
36
25
10
5
4
5
0 10 20 30 40 50 60 70
Lab activities
Virtual labs
Assignments
Lectures
Review question and quizzes
Feedback tool
Dashboard
Discussion Board
Group work
Other
Frequency
Most Significant Contribution to Learning
4.57 4.444.13
3.943.63
3.43.03
2.592.28
1
1.5
2
2.5
3
3.5
4
4.5
5
Lab activities Virtual labs Assignments Lectures Reviewquestions
and quizzes
Feedbacktool
Dashboard Discussionboard
Group work
Mea
n o
f 5
-po
int
Like
rt s
cale

Chapter 6 – Iteration 2
137
Next, the thematic analysis of survey question 2 in section 4 – “Which kind of activities
helped you most in learning? (i.e., group work, review questions, online quizzes, reading
activities, discussion boards). Explain your answer”, is presented in Table 6.5.
Table 6. 5: Thematic Analysis of Question 2 in Survey Section 4 – “Which kind of activities helped
you most in learning? (i.e., group work, review questions, online quizzes, reading activities,
discussion boards). Explain your answer.”
Theme (Frequency) Response
Practical work/lab
activities (28) • Practical work
• Review and activities
• Practical work
• Going through configuration in the VMs. Theory best learnt on those
• Labs, IPv6 learning module. Labs were good for some hands on experience. Learning module works well to reinforce the informat ion with quizzes
• Individual lab work with easy pictures
• Just the general work that the week’s topic was about, labs the most important, virtual are very helpful
• Definitely doing hands-on stuff e.g. setting AD, DHCP scopes etc. quizzes
useful too to check your theory
• Installing and working through the lab activities
• The practical part, actually important the learning outcomes
• The lab exercises as I found them the most helpful
• Hands on configurations easiest way to learn is to do
• Working though following the lab, easy to learn in how you do it
• Lab walkthroughs
• Practical work
• Lab activities - doing the exercises that involved virtual labs
• Step by step labs with screenshots
• I think that lab activities themselves were most useful, followed by online
quizzes
• The step by step exercises were good for tests and developing skills, also online quizzes help
• The labs that were straight to the point were best
• All the practical labs
• Hands-on practical work - helped apply my knowledge
• Group work and anything practical helps to have something to actually
see where my knowledge is going
• The weekly tasks
• Labs are best for this kind of work. I am course studying work for group
• Doing the actual lab
• Just the lab were on VMs, all the other stuff ignored
• Virtual labs, I could grab the IP of the VM and use RDP from my laptop to
connect to it. Group work - no; Discussion Board - no; online quizzes -
yes; reading (IPv6) - yes
Review questions
(17) • Review questions were helpful with learning objectives
• Review and activities

Chapter 6 – Iteration 2
138
• Review questions are helpful to prepare for exam
• Review quiz examined … a lot about the tutorial
• Review questions. The questions used were current and applies user
knowledge with research to better understand concepts
• Review questions, online quizzes
• Review questions, great revision relating to the course that you may forgotten about
• Mainly the review questions. Tests to see how much of the lecture you
listened to
• Discussion board, review questions and practical test
• Review question - if I could answer it means I understood what was going
on in the labs
• Group work, review questions and IPv6, the online quizzes
• Review questions and reading achieves help to revise content
• The review question were a great [way] to revise each topic
• Review question - help me go through the task
• Review questions
• Review questions
• Review questions helped to reinforce theory
Online quizzes (14) • Online quizzes for reviewing lectures. I like IPv6 module
• Online quizzes
• Quizzes so I can test myself. Discussion board to see how my peers tackle
questions
• Online quizzes getting a good score and sense of completion of the quizzes provide motivation. I got immediate feedback on where I went wrong. The
activities (e.g. writing the IP address of the VM)
• Online quiz – it’s quick and easy to learn
• Quizzes since I can redo … multiple times and can do if on my own time
• Quizzes were nice
• Online quizzes. Do the quizzes, know my mistake
• Online quiz
• Online quizzes
• I think that lab activities themselves were most useful, followed by online
quizzes
• The step by step exercises were good for tests and developing skills, also online quizzes help
• Online quizzes
• Virtual labs, I could grab the IP of the VM and use RDP from my laptop to
connect to it. Group work - no; discussion board - no; online quizzes - yes;
reading (IPv6) - yes
Group discussion/ group work/
discussion board (6)
• Group discussion, as I could immediately see my problems
• Group work, review questions and IPv6 the online quizzes
• Group work and anything practical helps to have something to actually see where my knowledge is going
• Group work activities helps me the most because I was able to learn a lot
more
• Discussion board
• Discussion board, review questions and practical test

Chapter 6 – Iteration 2
139
Independent learning module (3)
• Labs, IPv6 learning module. Labs were good for some hands-on
experience. Learning module works well to reinforce the information with quizzes
• Group work, review questions and IPv6, the online quizzes
• Virtual labs, I could grab the IP of the VM and use RDP from my laptop to
connect to it. Group work - no; discussion board - no; online quizzes - yes;
reading (IPv6) - yes
Tutor assistance (2) • Just asking my tutor for help benefitted me the most
• Assistance from tutor
Practical tests (2) • Practical tests
• Discussion board; review questions and practical test
Practice practical test
(1) • Practice practical exam. Incredibly helpful to have someone work you
through example
Reading activities (1) • Reading activities forward it easy to read and understanding
Other (3) • None really helped me, I mostly just worked with them
• All
• Not sure
From the above results, it can be clearly seen that most students felt that lab activities
contributed the most to their learning and these also were rated the highest. The lab
activities included hands-on lab activities, review questions, quizzes, group activities, etc.
and the design of the lab activities was influenced by a number of PLTs (such as Kolb’s
ELC). It was also interesting to note that students rated virtual labs as having the second
biggest contribution to learning. This further provides support to the statement “…virtual
and remote labs and related technologies provide enormous opportunities to learning for
both on-campus and distant learners. However, we need to be aware that these tools by
themselves do not provide higher learning outcomes, rather, the combination of a good
pedagogical framework, learner support, good content and tutor interaction, etc. are all
essential to form a rich learning environment whereby learners can excel” (Alkhaldi et al.,
2016).
The next section evaluates the lab activities.
6.3.3.1. Evaluation of Lab Activities
From the above discussion, it is clear that students attributed the lab activities as
contributing most to their learning. The questionnaire consisted of three survey instruments
used to evaluate lab activities. Section 5 of the questionnaire was adopted from Konak et
al. (2016) with 21 questions categorised to 6 dimensions: Usefulness, Interaction,
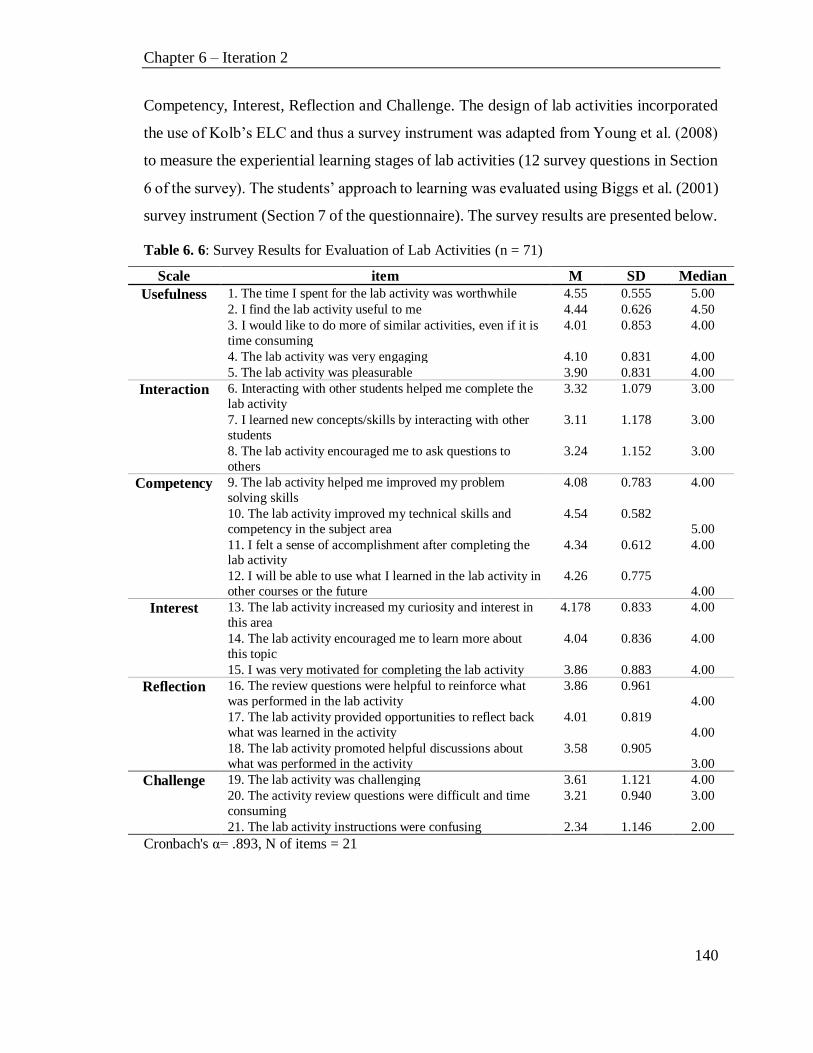
Chapter 6 – Iteration 2
140
Competency, Interest, Reflection and Challenge. The design of lab activities incorporated
the use of Kolb’s ELC and thus a survey instrument was adapted from Young et al. (2008)
to measure the experiential learning stages of lab activities (12 survey questions in Section
6 of the survey). The students’ approach to learning was evaluated using Biggs et al. (2001)
survey instrument (Section 7 of the questionnaire). The survey results are presented below.
Table 6. 6: Survey Results for Evaluation of Lab Activities (n = 71)
Scale item M SD Median
Usefulness
1. The time I spent for the lab activity was worthwhile 4.55 0.555 5.00
2. I find the lab activity useful to me 4.44 0.626 4.50
3. I would like to do more of similar activities, even if it is
time consuming
4.01 0.853 4.00
4. The lab activity was very engaging 4.10 0.831 4.00
5. The lab activity was pleasurable 3.90 0.831 4.00
Interaction
6. Interacting with other students helped me complete the
lab activity
3.32 1.079 3.00
7. I learned new concepts/skills by interacting with other
students
3.11 1.178 3.00
8. The lab activity encouraged me to ask questions to
others
3.24 1.152 3.00
Competency
9. The lab activity helped me improved my problem
solving skills
4.08 0.783 4.00
10. The lab activity improved my technical skills and
competency in the subject area
4.54 0.582
5.00
11. I felt a sense of accomplishment after completing the lab activity
4.34 0.612 4.00
12. I will be able to use what I learned in the lab activity in
other courses or the future
4.26 0.775
4.00
Interest
13. The lab activity increased my curiosity and interest in
this area
4.178 0.833 4.00
14. The lab activity encouraged me to learn more about
this topic
4.04 0.836 4.00
15. I was very motivated for completing the lab activity 3.86 0.883 4.00
Reflection
16. The review questions were helpful to reinforce what
was performed in the lab activity
3.86 0.961
4.00
17. The lab activity provided opportunities to reflect back
what was learned in the activity
4.01 0.819
4.00
18. The lab activity promoted helpful discussions about
what was performed in the activity
3.58 0.905
3.00
Challenge
19. The lab activity was challenging 3.61 1.121 4.00
20. The activity review questions were difficult and time
consuming
3.21 0.940 3.00
21. The lab activity instructions were confusing 2.34 1.146 2.00
Cronbach's α= .893, N of items = 21
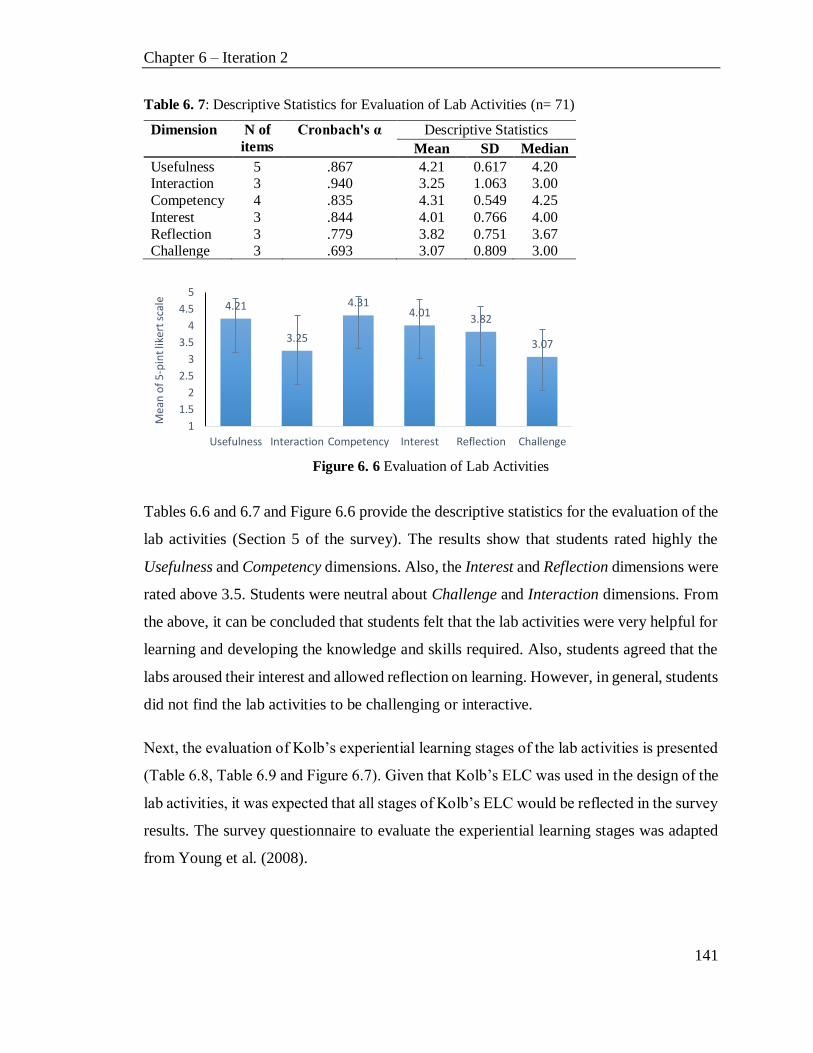
Chapter 6 – Iteration 2
141
Table 6. 7: Descriptive Statistics for Evaluation of Lab Activities (n= 71)
Dimension N of
items
Cronbach's α Descriptive Statistics
Mean SD Median
Usefulness 5 .867 4.21 0.617 4.20 Interaction 3 .940 3.25 1.063 3.00
Competency 4 .835 4.31 0.549 4.25
Interest 3 .844 4.01 0.766 4.00
Reflection 3 .779 3.82 0.751 3.67 Challenge 3 .693 3.07 0.809 3.00
Figure 6. 6 Evaluation of Lab Activities
Tables 6.6 and 6.7 and Figure 6.6 provide the descriptive statistics for the evaluation of the
lab activities (Section 5 of the survey). The results show that students rated highly the
Usefulness and Competency dimensions. Also, the Interest and Reflection dimensions were
rated above 3.5. Students were neutral about Challenge and Interaction dimensions. From
the above, it can be concluded that students felt that the lab activities were very helpful for
learning and developing the knowledge and skills required. Also, students agreed that the
labs aroused their interest and allowed reflection on learning. However, in general, students
did not find the lab activities to be challenging or interactive.
Next, the evaluation of Kolb’s experiential learning stages of the lab activities is presented
(Table 6.8, Table 6.9 and Figure 6.7). Given that Kolb’s ELC was used in the design of the
lab activities, it was expected that all stages of Kolb’s ELC would be reflected in the survey
results. The survey questionnaire to evaluate the experiential learning stages was adapted
from Young et al. (2008).
4.21
3.25
4.314.01
3.82
3.07
1
1.5
2
2.5
3
3.5
4
4.5
5
Usefulness Interaction Competency Interest Reflection Challenge
Mea
n o
f 5-
pin
t lik
ert
scal
e
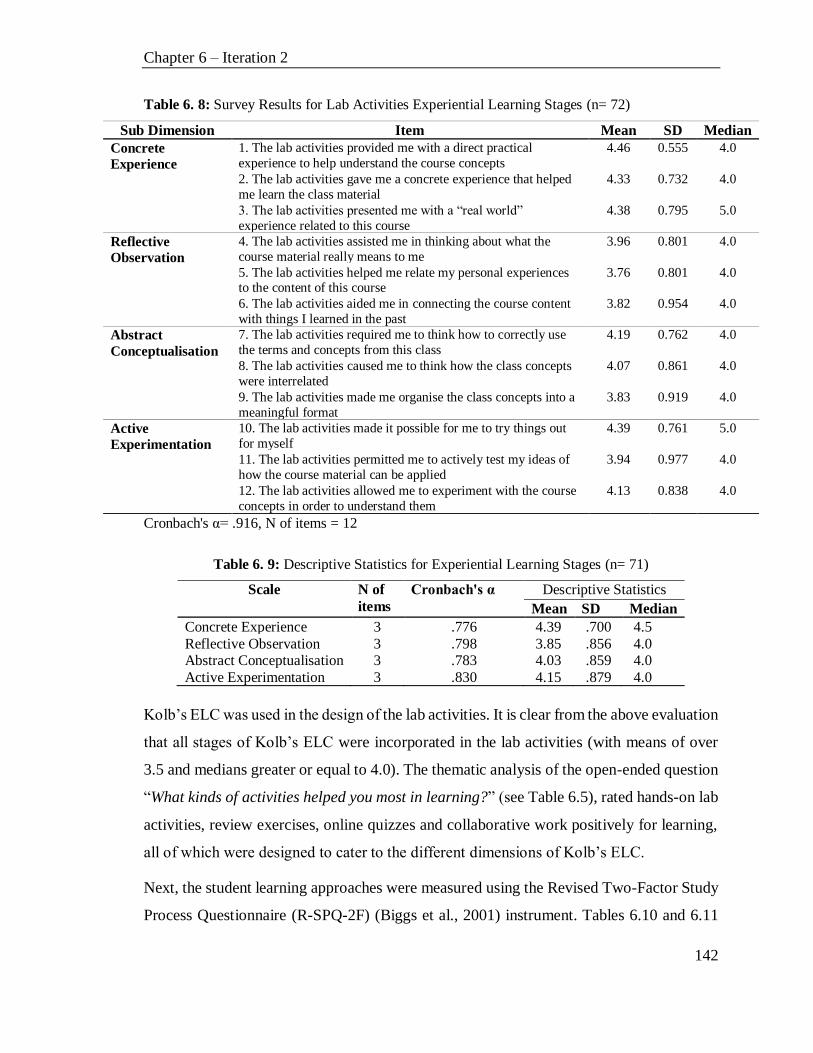
Chapter 6 – Iteration 2
142
Table 6. 8: Survey Results for Lab Activities Experiential Learning Stages (n= 72)
Sub Dimension Item Mean SD Median
Concrete
Experience
1. The lab activities provided me with a direct practical
experience to help understand the course concepts
4.46 0.555 4.0
2. The lab activities gave me a concrete experience that helped
me learn the class material
4.33 0.732 4.0
3. The lab activities presented me with a “real world”
experience related to this course
4.38 0.795 5.0
Reflective
Observation
4. The lab activities assisted me in thinking about what the
course material really means to me
3.96 0.801 4.0
5. The lab activities helped me relate my personal experiences to the content of this course
3.76 0.801 4.0
6. The lab activities aided me in connecting the course content
with things I learned in the past
3.82 0.954 4.0
Abstract
Conceptualisation
7. The lab activities required me to think how to correctly use
the terms and concepts from this class
4.19 0.762 4.0
8. The lab activities caused me to think how the class concepts
were interrelated
4.07 0.861 4.0
9. The lab activities made me organise the class concepts into a
meaningful format
3.83 0.919 4.0
Active
Experimentation
10. The lab activities made it possible for me to try things out
for myself
4.39 0.761 5.0
11. The lab activities permitted me to actively test my ideas of
how the course material can be applied
3.94 0.977 4.0
12. The lab activities allowed me to experiment with the course
concepts in order to understand them
4.13 0.838 4.0
Cronbach's α= .916, N of items = 12
Table 6. 9: Descriptive Statistics for Experiential Learning Stages (n= 71)
Scale N of
items
Cronbach's α Descriptive Statistics
Mean SD Median
Concrete Experience 3 .776 4.39 .700 4.5
Reflective Observation 3 .798 3.85 .856 4.0 Abstract Conceptualisation 3 .783 4.03 .859 4.0
Active Experimentation 3 .830 4.15 .879 4.0
Kolb’s ELC was used in the design of the lab activities. It is clear from the above evaluation
that all stages of Kolb’s ELC were incorporated in the lab activities (with means of over
3.5 and medians greater or equal to 4.0). The thematic analysis of the open-ended question
“What kinds of activities helped you most in learning?” (see Table 6.5), rated hands-on lab
activities, review exercises, online quizzes and collaborative work positively for learning,
all of which were designed to cater to the different dimensions of Kolb’s ELC.
Next, the student learning approaches were measured using the Revised Two-Factor Study
Process Questionnaire (R-SPQ-2F) (Biggs et al., 2001) instrument. Tables 6.10 and 6.11

Chapter 6 – Iteration 2
143
present the results of the R-SPQ-2F survey. In Young et al. (2008), the authors demonstrate
how catering to all stages of experiential learning can lead to a deeper learning approach.
Table 6. 10: Descriptive statistics for the Student Approaches to Learning (R-SPQ-2F) (n =68)
Scale Item Mean SD Median
Deep
Motivation
1. The lab activities gave me a feeling of deep personal
satisfaction 3.69 0.833 4.0
2. The lab activities helped me create questions that I wanted answered 3.69 0.815 4.0
3. The lab activities made me work hard because I found the
material interesting 3.94 0.879 4.0
4. The lab activities were at times as exciting as a good novel or movie 2.87 1.118 3.0
5. The lab activities were interesting once I got into it 4.03 0.880 4.0
Deep
Strategies
6. The lab activities provided me with enough work on the
topic so I could form my own conclusions 4.04 0.742 4.0
7. The lab activities caused me to look at most of the suggested
readings that pertained to the activity 3.06 1.170 3.0
8. The lab activities caused me to spend time relating its topics
to other topics, which have been discussed in different classes 3.38 1.098 3.0
9. The lab activities allowed me to test myself on important
topics until I understood them completely 3.92 0.917 4.0
10. The lab activities’ topics were interesting and I often spent
extra time trying to obtain more information about them 3.31 1.083 3.0
Surface
Motivation
11. For the lab activities, it was not helpful to study topics in
depth because all you needed was a passing acquaintance with
topics 2.97 1.063 3.0
12. I was able to get by in the lab activities by memorising key sections rather than trying to understand them 3.01 1.133 3.0
13. For the lab activities, there was no point in learning
material, which was not likely to be on the exam 2.36 1.071 2.0
14. I did not find the lab activities very interesting so I kept my work to a minimum 2.15 1.012 2.0
15. My aim for the lab activities was to complete it while doing
as little work as possible 2.31 1.091 2.0
Surface Strategies
16. The lab activities suggests the best way to pass exams is to try to remember answers to likely test questions 2.36 1.172 2.0
17. I believe that the instructor should not expect me to spend
significant amounts of time on the lab activities if it is not on an exam 2.24 1.111 2.0
18. For these lab activities, I restricted my study to what was
specifically required as it was unnecessary to do anything extra 2.51 1.215 2.0
19. For the lab activities, I learned things by going over and over them until I knew them by heart even if I did not
understand them 2.47 1.085 2.0
20. For the lab activities, I only applied what was given in class
or on the course outline 2.92 1.154 3.0

Chapter 6 – Iteration 2
144
The study sought to provide evidence for the evaluation of lab activities derived from the R-SPQ-
2F. Results suggested that data from this population fits the 2 factors (Deep and Surface). Fit
statistics and the internal consistency statistics provide evidence for the data fitting the amended
model, which is similar to that presented by (Biggs et al., 1987; Vaughan, 2016).
Table 6. 11: Descriptive Statistics for Student Approaches to Learning (n = 68)
Scale N of
items
Cronbach's α Descriptive Statistics
Mean SD Median
Deep Motivation 5 .882 3.63 1.016 4.0 Deep Strategies 5 .822 3.54 1.086 4.0
Surface Motivation 5 .789 2.56 1.151 2.0
Surface Strategies 5 .844 2.50 1.187 2.0 Cronbach's α= .837, N of items = 20
It is clear from the above results that the lab activities did encourage a deeper approach to
learning. Both deep motivation and deep strategies had means of over 3.5 and medians of
4.0 while surface motivation and surface strategies had means of around 2.5 with medians
of 2.0.
In the literature, it is stated that it is important to evaluate not only the learning outcome
but also the learning process (Young et al., 2008) “…was high performance based on the
use of surface learning strategies that may result in short-term performance but actually
lacks long-term meaningful learning…”. The results so far have indicated the success of
the approach taken (i.e., the incorporation of PLTs such as Kolb’s ELC and others to design
lab activities). The incorporation of all stages of Kolb’s ELC has been successful (see Table
6.8). Also, the majority of students perceived lab activities to be the most significant
contributor to learning as observed by the student responses to the survey instruments (see
Tables 6.4 and 6.5). The students gained improved learning outcomes as evidenced by the
higher scores in the practical tests (see quasi-experiment results above). This approach has
not only led to students achieving better learning outcomes but also to them undertaking a
deeper approach to learning (see Table 6.10).
Correlation analyses was used to examine the relationship between the three surveys
instruments used to evaluate lab activities. The cross-analysis results are presented in Table
6.12.

Chapter 6 – Iteration 2
145
Table 6. 12: Correlation Analysis for Evaluation of Lab Activities among Survey Instruments
Scales (n= 74)
Dimension The six-factor model (Konak & Bartolacci, 2016) Kolb’s ELC Biggs’s R-SPQ-2F
USE ACT COM INT REF CHA CE RO AC AE DM DS SM SS
USE
(p-value)
1 .288* .711* .724* .483* -.096 .562* .535* .652* .553* .619* .516* .016 -.081
.013 .000 .000 .000 .414 .000 .000 .000 .000 .000 .000 .891 .495
ACT
(p-value)
1 .400* .277* .357* .176 .275* .487* .371* .151 .238* .365* .097 .103
.000 .017 .002 .133 .018 .000 .001 .200 .042 .001 .412 .383
COM
(p-value)
1 .710* .485* .072 .683* .638* .717* .650* .659* .550* -.012 -.065
.000 .000 .543 .000 .000 .000 .000 .000 .000 .916 .585
INT
(p-value)
1 .617* .038 .562* .558* .703* .644* .734* .696* -.022 -.054
.000 .745 .000 .000 .000 .000 .000 .000 .850 .650
REF
(p-value)
1 .169 .403* .527* .506* .441* .574* .645* .070 .044
.151 .000 .000 .000 .000 .000 .000 .551 .710
CHA
(p-value)
1 .030 .228 .043 .000 .046 .157 .331* .298*
.801 .051 .714 .999 .698 .180 .004 .010
CE
(p-value)
1 .573* .705* .569* .494* .488* .003 -.108
.000 .000 .000 .000 .000 .980 .358
RO
(p-value)
1 .643* .522* .628* .688* .129 -.018
.000 .000 .000 .000 .274 .880
AC
(p-value)
1 .648* .560* .667* .032 -.013
.000 .000 .000 .784 .915
AE
(p-value)
1 .530* .549* .018 -.031
.000 .000 .878 .792
DM
(p-value)
1 .692* -.045 -.144
.000 .702 .220
DS
(p-value)
1 .073 .005
.538 .967
SM
(p-value)
1 .778*
.000
SS
(p-value)
1
USE – Usefulness, ACT – Interaction, COM – Competency, INT – Interest, REF – Reflection, CHA – Challenge, CE - Concrete Experience, RO - Reflective Observation, AC - Abstract Conceptualisation, AE - Active Experimentation DM - Deep Motivation, DS - Deep Strategies, SM - Surface Motivation, SS - Surface Strategies
Correlation Matrix presented in Table 6.12 support assumed positive relationships among
most variables with statistical significance (p < .50). In all instances, the scales were
positively correlated with deep learning (DM and DS scales). In certain instances, a strong
positive correlation was found (i.e., r ≥ 0.70) between scales of different survey
instruments. Competency and Interest scales were strongly correlated with Abstract
Conceptualisation (AC) in Kolb’s ELC stages, r (73) = .717, and .703 respectively (p<.01).
Interest also has a strong positive correlation with the Deep Motivation (DM), (r = .734, p
<.01) as well as Deep Strategy (DS), (r = .696, p <.01). This suggests increasing student
interest (INT) can have a positive influence in enhancing a deep approach to learning.
Next, the other components of the TePF will be evaluated, starting with virtual labs.

Chapter 6 – Iteration 2
146
6.3.3.2. Evaluation of Virtual Labs
The survey results for the evaluation of the virtual labs are shown in Table 6.13 below.
Table 6. 13: Survey Results for Evaluation of Virtual Lab (n= 70)
Scale Items Mean SD Median
Usefulness 1. Using virtual lab helped me to learn in INFT2031 4.59 0.577 5.0 2. The virtual lab improved my lab performance 4.30 0.857 5.0 3. The virtual lab helped me achieve learning
outcomes 4.37 0.726 5.0
Ease of use 4. The virtual lab provided easy access to the lab at
any time of the day (24x7) 4.06 1.020 4.0
5. Having access to the virtual lab from any
device/location (i.e. home etc.) is helpful to me 4.47 0.793 5.0
6. I find it easy to use the virtual lab 4.11 0.910 4.0 7. I find the virtual lab flexible to conduct my lab work
4.20 0.827 4.0
Attitude
8. I am satisfied with using the virtual lab for my
practical work in INFT2031 4.20 0.861 4.0
9. I would like to use Virtual labs in future
networking and systems administration courses 4.21 0.915 4.0
Overall 10. Overall, how would you rate the INFT2031
virtual laboratories 4.32 0.731 4.0
Cronbach's α= .870, N of items = 9
The factors were analysed using Cronbach’s alpha which is the most frequently reported
reliability statistic for multiple-item scales. All of the measures in this study verified
excellent internal consistency, ranging from 0.724 to 0.847 (see Table 6.14), thereby
exceeding the reliability estimates (<= 0.70) recommended by Nunnally (1967).
Table 6. 14: Evaluation of Scales for Virtual Labs (n = 70)
Scale N of items Cronbach's α Mean SD Median
Perceived usefulness 3 .822 4.43 .718 5.0 Perceived ease of use 4 .740 4.23 .901 4.0 Attitude towards using 2 .834 4.21 .860 4.0 Overall rating 4.32 .731 4.0
It can be seen that from the results above (Tables 6.13 and 6.14) that students had a high
acceptance of, and a positive outlook towards, the virtual lab (means are greater than 4.0
on all survey questions/scales and medians are 4.0 or above). This virtual lab
implementation was different to the iteration 1 implementation of the virtual lab (using the
cloud lab). A comparison of the results from 2016 is provided below (see Table 6.15). It
can be seen that both types of centralised labs, the Azure cloud lab and the server-based

Chapter 6 – Iteration 2
147
cloud lab, were rated similarly and highly. The difference is that for the 2016 cohort, the
cloud labs were used for only a few labs and decentralised labs were used for most lab
work while the 2017 cohort used the server-based centralised labs for most of their lab
work.
Table 6. 15: Cloud vs Server-Based Lab
Category
Cloud Lab
2016 Cohort (n=64)
Server-based Lab Environment
2017 Cohort (n=70)
Mean SD Mean SD
Usefulness (1,2,3) 4.24 0.669 4.43 0.718
Ease of use (4,5,6,7) 4.34 0.632 4.23 0.901
Attitude (8,9) 4.41 0.624 4.21 0.860
Overall (10) 4.33 0.774 4.32 0.751
To obtain a further analysis of the perception of the virtual labs, the qualitative data was
analysed. Table 6.16 provides the thematic analysis of the survey question “What do you
like most in the virtual IT infrastructure lab? Why? Explain your answer”. Table 6.17
provides the thematic analysis of the survey question “Any disadvantages of using virtual
IT infrastructure lab?”. Next, Table 6.18 provides a thematic analysis of the focus group
discussion - “What is your opinion on the virtual labs used in labs in INFT2031? Did you
find the virtual labs easy to use?” The thematic analysis for the survey question “What are
the features that you would like to see implemented in future?” is provided in Table 6.18.
Table 6. 16: Thematic Analysis for “What do you like most in the virtual IT infrastructure lab?
Why? Explain your answer”.
Theme (Frequency) Response Convenience,
accessibility and
24x7 availability
(30)
• Can access anywhere to complete lab work
• I like that it’s complete from home. And that you can do any lab at any time
• Feedback tool is good way to see due feedback. I like the lab
[environment] so that we can access anytime
• The virtual labs were great because it is easy to review at home
• Flexible and easy access
• Allows for access anywhere
• It is accessible for any location. It [was] fairly stable and good to work
with, really good practical experience
• Accessibility
• Liked it all. VL was a bit slow at times. Yet being able to login 24/7 is extremely appreciated. Feedback and dashboard tools were great to track
how well everyone was doing

Chapter 6 – Iteration 2
148
• Being able to access from home, having actual server to work on
• The virtual labs are accessible everywhere which is handy when I’m not
able to come to lab or practice on my own
• Virtual lab environment- it was easy to use and available to practice off campus
• It all works well together and can be used on and off campus
• Can be used anywhere and making a mistake doesn’t matter
• Ability to use anywhere i.e. at home. If I don’t want or are not able to set
up a test lab of home, I can still use the virtual lab
• The ability to use anywhere at any time
• Easily accessible
• Virtual lab - I work full time so accessing it from home was important
• Anywhere access and feedback help me correct errors
• I like the 24x7 flexibility
• Accessibility is good for working at home
• Use it anywhere and anytime
• The convenience of accessing the lab environment from any location
• It was really convenient. It all worked well
• Virtual lab environment - it is very convenient
• Virtual lab environment is really convenient for me
• The online system provides software that you may not have access to and
is very useful to have
• It was already set up and ready to go with the required software. The feedback tool was informative and there was no concern about where to
save the VM
• It is easier than having to always set up something or bring in something.
You get valuable feedback so you can find out what you’re doing wrong
• Wide access to many different VMs. Wish I could download some to my
local machine
Virtual lab
interesting and
relevant to learning (24)
• Virtual lab was the best, very information and relevant to learning
• Virtual lab environment. Using VMs to [see] how networks communicate and work was interesting and making mistakes and learning helped
• It was very interesting
• It is accessible for any location. It [is] fairly stable and good to work with,
really good practical experience
• Virtual lab, feedback tool
• It makes it easier to understand the concepts I learn in the lectures
• Because it was actual metical, hands-on things that we could do which
learning how to do things
• Virtual lab environment/feedback
• Virtual lab environment, mores labs more interactive and easies to learn
• Liked it all. VL was a bit slow at times. Yet being able to login 24/7 is extremely appreciated. Feedback and dashboard tools were great to track
how well everyone was doing
• The virtual lab, as it showed the detailed working of the course’s practical
application
• I liked the VMs
• Very rewarding setting up servers from admin perspective

Chapter 6 – Iteration 2
149
• It all works well together and can be used on and off campus
• Virtual lab mean I can return course information by applying it
practically. Feedback tool and dashboard are good to understand my real of improvement
• I understand that teaching network administration on an important
network is difficult and I feel that virtual labs environment is great tool for
solving some issues
• Virtual lab - taught me how to use windows server
• It feels pretty cool accessing a remote computer
• Virtual labs environment. Because I have never used these technology
before
• Multipurpose system, loading different VMs
• It was very interesting to use
• Server virtualization. Closer to real world application
• Virtual labs environment. I have been already interested in virtualization technology. Maybe some other students are also interested in
• Being able to access from home, having actual server to work on
Feedback Tool (13) • Feedback tool is good way to see due feedback. I like the lab
[environment] so that we can access anytime
• It was already set up and ready to go with the required software. The
feedback tool was informative and there was no concern about where to save the VM
• Feedback, it’s easy to understand
• It is easier than having to always set up something or bring in something.
You get valuable feedback so you can find out what you’re doing wrong
• Virtual lab, feedback tool
• Liked it all. VL was a bit slow at times. Yet being able to login 24/7 is
extremely appreciated. Feedback and Dashboard tools were great to track
how well everyone was doing
• Lab environment easy to use/run; Feedback tool was quiet tool
• Virtual lab environment/feedback
• I can see my performance and if I make a mistake in the lab I can go back
to it and redo the lab
• The feedback tool was incredibly helpful for helping me complete my lab
work. I wish every class had one
• The feedback tool. Learn from mistake
• Virtual lab means I can return course information by applying it
practically. Feedback tool and dashboard are good to understand my real … improvement
• Feedback tool - give the checklist
Flexibility – can
make mistakes without worry (6)
• Errors made are not permanent. Allows to set up multiple machines at
once
• Flexible and easy access
• Can be used anywhere and making a mistake doesn’t matter
• I can see my performance and if I make a mistake in the lab I can go back
to it and redo the lab
• I like the fact that you can test different configurations without risk
• I liked being able to configure any settings in a risk free environment

Chapter 6 – Iteration 2
150
Ease of use (5) • Lab environment easy to use/run; Feedback tool was quiet tool
• Virtual lab environment - it was easy to use and available to practice off
campus
• The virtual lab environment was great and having the app end not having to do it through a box was great
• Easy to use
• Virtual lab environment - easy to use and handy
Dashboard (2) • Liked it all. VL was a bit slow at times. Yet being able to login 24/7 is extremely appreciated. Feedback and dashboard tools were great to track
how well everyone was doing
• Virtual lab means I can return course information by applying it
practically. Feedback tool and dashboard are good to understand my real … improvement
Reliable (1) • It is accessible for any location. It [is] fairly stable and good to work with,
really good practical experience
Suggestions for
improvement (1) • If the speed can be enhanced
Other (1) • VMware interesting, engaging and helpful
It is clear from the above analysis, that convenience, the 24/7 accessibility remotely from
any device, is the most liked feature of the virtual lab. The opportunities for learning
created by the virtual lab also rated highly. There were 13 responses who mentioned the
feedback provided by the feedback tool as the feature mostly liked. Flexibility (6), ease of
use (5) and reliability (1) were also mentioned as most liked features. The dashboard was
mentioned by two responses as a most liked feature. The feedback tool and the dashboard
are analysed in later sections.
Table 6. 17: Thematic Analysis for “Any disadvantages of using virtual IT infrastructure lab?”
Theme (Frequency) Response
Slow performance
(38) • Sometimes was slow for unknown reasons
• Sometimes too slow
• It was often slow
• It can be slow and unresponsive at times
• Slow processing speed
• Sometimes it’s too slow if computer is not that good
• Performance issues
• Slow
• At times the mashers were slow or unresponsive
• The browser reviser is a little slow but still manageable
• Can get slow when you have a lot up on the screen
• A bit slow and easy got problem
• Slow due to overly utilised CPU/ storage

Chapter 6 – Iteration 2
151
• Not on campus, off campus it can be quite slow especially installing another
VM
• No, only thing is that it is sometimes slow
• Would be a bit slow on Mac
• Only the few slowdowns. Should be easy to fix
• It was slow sometimes
• Slow, may take up resources on my computer or laptop
• Slow at time
• Lag! Constant slow restart
• A little laggy at times
• VMs usually slow compared to just running the single OS
• Slow at times
• Can be a bit slow at times
• It’s a bit slow at times
• Slow
• Slow, I mean really slow
• Slow
• At times can be very slow, also consistently signed me out for no reason
• Slower and more laggy
• Slow sometimes; couldn’t connect sometimes from home at night
• Very slow at Ourimbah. Input (like keyboard) regularly causes major issues. I missed weeks of work because of this
• Too slow
• Speed issues
• Slow
• Installation time and no help if more access at home
• The network can get very laggy and managing computer within computer
within computers
None (8) • No
• No disadvantages
• Not sure
• I don’t think so
• No
• N/A
• N/A
• No
Connection issues
(5) • Sometimes you have [trouble] connecting to them and only one sandbox you
can make a mess with
• It can be time consuming who trying to connect if network is busy
• Sometimes the VM takes a long time to connect
• Work about works about 1/20% of the time from home
• Stable connect
Unreliable (3) • Sometimes it doesn’t work
• It would occasionally have server-side problems that I could do nothing
about
• Sometimes they crash
Not flexible (2) • If it breaks you can’t rebuild, you need IT support
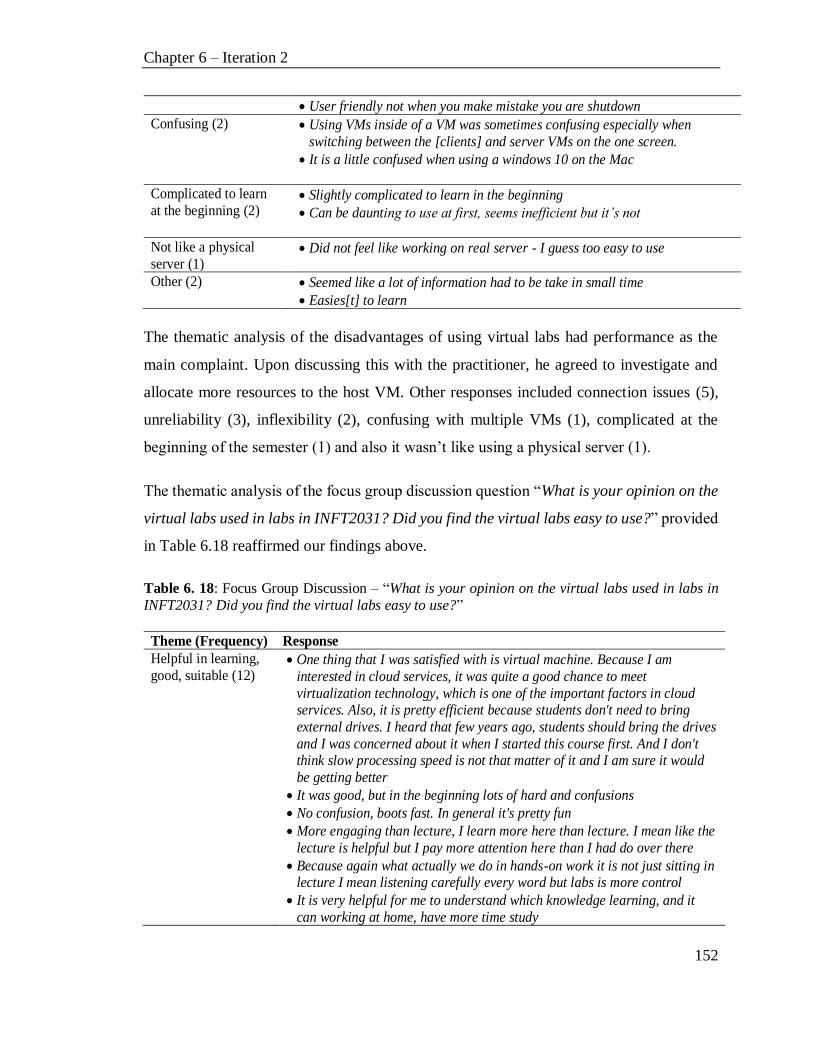
Chapter 6 – Iteration 2
152
• User friendly not when you make mistake you are shutdown
Confusing (2) • Using VMs inside of a VM was sometimes confusing especially when
switching between the [clients] and server VMs on the one screen.
• It is a little confused when using a windows 10 on the Mac
Complicated to learn
at the beginning (2) • Slightly complicated to learn in the beginning
• Can be daunting to use at first, seems inefficient but it’s not
Not like a physical
server (1) • Did not feel like working on real server - I guess too easy to use
Other (2) • Seemed like a lot of information had to be take in small time
• Easies[t] to learn
The thematic analysis of the disadvantages of using virtual labs had performance as the
main complaint. Upon discussing this with the practitioner, he agreed to investigate and
allocate more resources to the host VM. Other responses included connection issues (5),
unreliability (3), inflexibility (2), confusing with multiple VMs (1), complicated at the
beginning of the semester (1) and also it wasn’t like using a physical server (1).
The thematic analysis of the focus group discussion question “What is your opinion on the
virtual labs used in labs in INFT2031? Did you find the virtual labs easy to use?” provided
in Table 6.18 reaffirmed our findings above.
Table 6. 18: Focus Group Discussion – “What is your opinion on the virtual labs used in labs in
INFT2031? Did you find the virtual labs easy to use?”
Theme (Frequency) Response
Helpful in learning,
good, suitable (12) • One thing that I was satisfied with is virtual machine. Because I am
interested in cloud services, it was quite a good chance to meet
virtualization technology, which is one of the important factors in cloud services. Also, it is pretty efficient because students don't need to bring
external drives. I heard that few years ago, students should bring the drives
and I was concerned about it when I started this course first. And I don't think slow processing speed is not that matter of it and I am sure it would
be getting better
• It was good, but in the beginning lots of hard and confusions
• No confusion, boots fast. In general it's pretty fun
• More engaging than lecture, I learn more here than lecture. I mean like the
lecture is helpful but I pay more attention here than I had do over there
• Because again what actually we do in hands-on work it is not just sitting in lecture I mean listening carefully every word but labs is more control
• It is very helpful for me to understand which knowledge learning, and it
can working at home, have more time study

Chapter 6 – Iteration 2
153
• For what we are doing the virtual labs worked fine. Didn’t like having to
find the deit-vdi ... link to logon every time
• Virtual labs are very good for hands-on experience on server. However, it does not have the real experiment. Challenges of connectivity and access
• Virtual labs were good but sometime slow
• It is good but if there is any possibility to have actual server
• It is very good and very easy than VMware but still all step up on virtual
labs
• It is good for, like, get access to software that cannot have in the system
Performance (slow
sometimes)
(12)
• It was slow
• I found quite easy to use, only when we had a lot up on the screen did it
become very slow
• VMs are sometimes slow
• Easy to use without a doubt; sometimes issues, but that’s pretty much faster
are being tad slow
• Sometimes slow
• Yes, although I didn’t actually use the VMs from home, I appreciated the option. Performance was a bit slow
• Virtual labs easy to use. Everyone talked about slow down; RAM was
increased, yet still slow. CPU core could need to be increased
• Virtual labs were good but sometimes slow
• The nested VMs were very slow as someone who uses VMs a lot I would
prefer to keep them in a USB with no login
• It slow sometimes
• At start, little bit is slow
• Usually like especially my starting try to connect, they are little bit slower time. This is I think because start to connect these virtual machines things
like that is usually slow
Ease of use (10) • I like those VMs that all have software on it that do not necessary to have
like Visio. So, used for home was easy and then you can transfer using one
drive
• Access is a lot easier and free
• I found quite easy to use, only when we had a lot up on the screen did it become very slow
• Easy to use without a doubt; sometimes issues, but that’s pretty much faster
are being tad slow
• Virtual labs easy to use. Everyone talked about slow down; RAM was
increased, yet still slow. CPU core could need to be increased
• Easy to use
• They were easy to use and understand
• Very handy; easy to use at home and in labs
• It easy to use... and no confused
• I do not get any problem over use [of] the VMs
Accessibility (7) • It is good for work at home
• I like those VMs that all have software on it that do not necessary to have like Visio. So, used for home was easy and then you can transfer using one
drive
• Access is a lot easier and free

Chapter 6 – Iteration 2
154
• Yes, although I didn’t actually use the VMs from home, I appreciated the
option. Performance was a bit slow
• It is very helpful for me to understand which knowledge learning, and it can be working at home, have more time study
• Very handy; easy to use at home and in labs
• Yes, definitely I can use my laptop to enter into these VMs. I can do that
since I connect the network here I can reach and drag do not change that
Login cumbersome
(3) • For what we are doing the virtual labs worked fine. Didn’t like having to
find the dcit-vdi ... link to logon every time
• Virtual labs are very good for hands-on experience on server. However, it
does not have the real experiment. Challenges of connectivity and access
• Which easy way to get in to because I hate entering that big long link dcit-vd etc. it is always annoying… google it like then copy the link and putting
on other things (Domain name)
Prefer physical lab
(3) • It is good but if there is any possibility to have actual server
• It is very good and very easy than VMware but still all step up on virtual
labs
• Virtual labs are very good for hands-on experience on server. However, it
does not have the real experiment. Challenges of connectivity and access
First labs were
confusing (3) • I can find when I download Workspace so likely to have Microsoft Imagine
than can download and use Windows 10 it’s big process go through to sign
in all of that but nothing appears to sign in INFT2031 labs completely in
my Mac
• It was good, but in the beginning lots of hard and confusions
• Not always but after a few weeks I got hang of it
Other – Access to
Software +
Flexibility (2)
• We got DreamSpark (Microsoft Imagine) to download software
• Get more and full control virtual machines
It can be stated that most students were satisfied with the opportunities for learning that the
virtual lab environment provided. Ease of use and accessibility were highly positive
features of the virtual lab environment. The main concern was performance which many
felt was slow sometimes. One response mentioned that it was the starting of the VMs that
was slow. More resources allocated to the students’ sandboxed environment and nested
VMs may resolve this issue in the future. A few students felt that the login was
cumbersome. After discussing this with the practitioner (the course lecturer), it was decided
that the link could be published for easy access through the LMS in the future. Three
responses did mention that using virtual labs felt virtual and not “real”. Providing students
with access to hardware components and installing and configuring on a physical machine
may seem more “real” than installing and configuring a virtual machine. The first lab had

Chapter 6 – Iteration 2
155
students downloading ISO files and installing the VM using VMWare on lab machines (de-
centralised architecture). This seems to have been confusing initially.
Table 6. 19: Thematic Analysis for “What are the features that you would like to see implemented
in future?”
Theme (Frequency) Response
Improve performance
(13) • Stand-alone virtualization server to improve response time
• Faster
• Faster speeds
• Server with stronger CPUs
• Faster VM from home, had problems accessing practice test 2 from home
• Faster, more server resources available
• Just speed
• Making the VMware faster
• More resources for VMs (they can be slow sometimes)
• Improving the virtual machines
• More speed and less discount problems
• Probably more power on the VMs
• More allocated resources
Nothing (12) • No idea for that. Very good now
• Can’t think of any
• N/A
• Not really sure to be honest
• N/A
• Everything was great
• None. All the features helped in my learning
• None that can be thought [of]
• N/A
• None I can think of
• N/A
• Keep going
More activities similar
to existing
(6)
• More practice on assignments
• Continue using VMs on the Hyper-V manager, they are a valuable tool
• More courses with this
• Moe lab work like this
• Maybe some more in-depth tutorials/ walkthrough
• More AD features in labs
Feedback tool
expanded to all labs
(3)
• Feedback tool for every lab/work complete
• All labs should be included in the feedback tools
• Feedback tool earlier in the labs
Use physical server
environment as well
(3)
• Perhaps a second virtual machine to compare how changing the different system will work
• More VMs for practical at different system
• Using BootComp on Mac or an actual PC
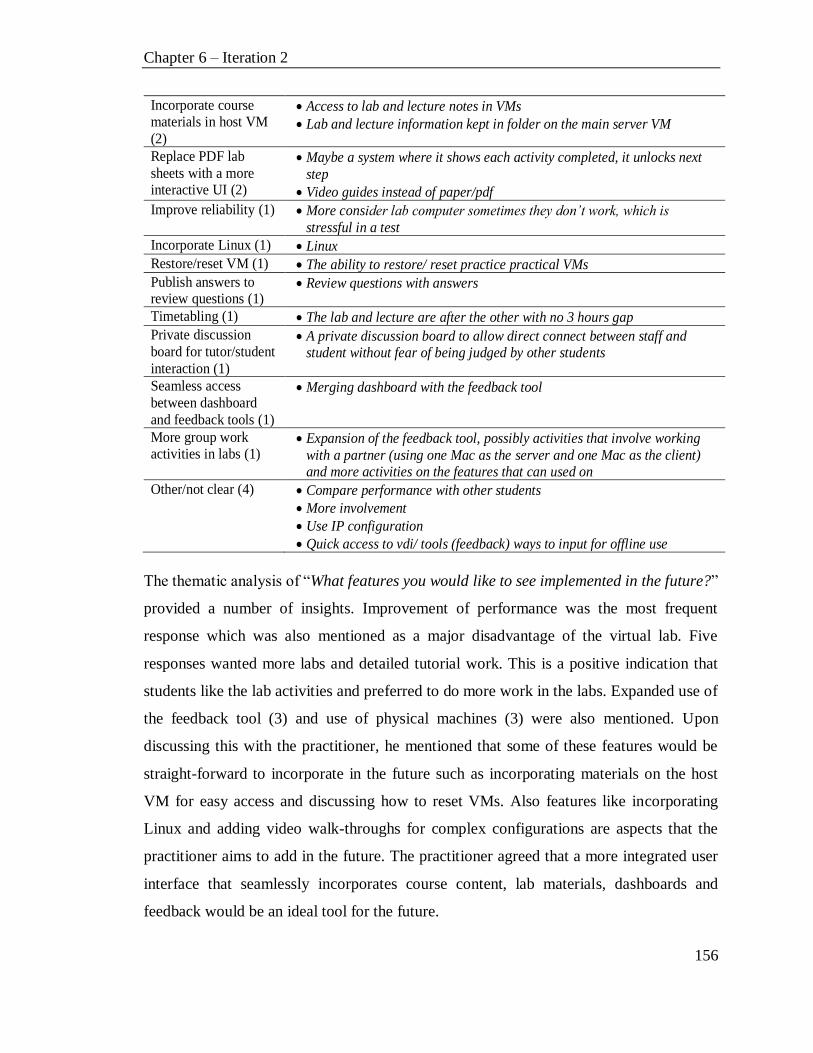
Chapter 6 – Iteration 2
156
Incorporate course materials in host VM
(2)
• Access to lab and lecture notes in VMs
• Lab and lecture information kept in folder on the main server VM
Replace PDF lab
sheets with a more interactive UI (2)
• Maybe a system where it shows each activity completed, it unlocks next
step
• Video guides instead of paper/pdf
Improve reliability (1) • More consider lab computer sometimes they don’t work, which is
stressful in a test
Incorporate Linux (1) • Linux
Restore/reset VM (1) • The ability to restore/ reset practice practical VMs
Publish answers to review questions (1)
• Review questions with answers
Timetabling (1) • The lab and lecture are after the other with no 3 hours gap
Private discussion
board for tutor/student
interaction (1)
• A private discussion board to allow direct connect between staff and student without fear of being judged by other students
Seamless access
between dashboard
and feedback tools (1)
• Merging dashboard with the feedback tool
More group work activities in labs (1)
• Expansion of the feedback tool, possibly activities that involve working
with a partner (using one Mac as the server and one Mac as the client) and more activities on the features that can used on
Other/not clear (4) • Compare performance with other students
• More involvement
• Use IP configuration
• Quick access to vdi/ tools (feedback) ways to input for offline use
The thematic analysis of “What features you would like to see implemented in the future?”
provided a number of insights. Improvement of performance was the most frequent
response which was also mentioned as a major disadvantage of the virtual lab. Five
responses wanted more labs and detailed tutorial work. This is a positive indication that
students like the lab activities and preferred to do more work in the labs. Expanded use of
the feedback tool (3) and use of physical machines (3) were also mentioned. Upon
discussing this with the practitioner, he mentioned that some of these features would be
straight-forward to incorporate in the future such as incorporating materials on the host
VM for easy access and discussing how to reset VMs. Also features like incorporating
Linux and adding video walk-throughs for complex configurations are aspects that the
practitioner aims to add in the future. The practitioner agreed that a more integrated user
interface that seamlessly incorporates course content, lab materials, dashboards and
feedback would be an ideal tool for the future.

Chapter 6 – Iteration 2
157
In this iteration, a server-based lab environment was used. There were two labs where
students installed Windows 10 and Windows Server 2016 using VMWare platforms on lab
machines. This provided students with a feel for using both the server-based environment
as well as a decentralised lab environment. Very few students seem to have used their
personal computers to conduct their lab work which became apparent when answering the
question “Did you use the server environment to configure INFT 2013 lab activities?” with
71 responding positively and only 3 responding negatively. Yet for question 12, “Given
the choice to use your PC vs server environment in conducting INFT2031, which do you
prefer? Why?”, only 33 students responded with a preference for the server lab
environment (centralised lab environment) while 35 students responded they preferred to
use the PC–based Fusion labs (decentralised lab environment). The qualitative analysis of
their reasons is provided in Tables 6.20 and 6.21.
Table 6. 20: Reasons for Choosing Server-based Lab Environment
Theme (Frequency) Response
Easy access (12) • It just is easier and faster it seems
• Server environment because easier to access anywhere. But it is too slow
when accessing off campus. VMware took too much time to configure
• Easy access at any time
• The virtual machines are much more effective than VMware Fusion. It is easy to connect to from any device and you don’t have to install the system through
a USB or other method
• Both, hard choice. More CPU resources would have dramatically increased
performance. Using VMware, yet the server environment gives more access for if completing tasks at home
• Can be accessed easily for me only need to enter login
• It’s accessible from home /uni and doesn’t require storing files locally. My
computers don’t have the space for VMs
• I can use or login to server environment anytime and anywhere, while for
Fusion I can only work during labs
• Access anywhere so can catch up on work easy
• Use anywhere and easy to set up
• Access anywhere
• Mobility and cloud computing is the future
Ease of use (3) /
Convenient (1)/
Configured for use
(3)
7
• Easy to use
• Easy to use
• Much easier to use
• More convenient
• Don’t have to install any other applications
• The server environment required less installing and had less compatibility issues. We could get straight into the work

Chapter 6 – Iteration 2
158
• Is already set up ready to configure. Usable at home. Bit slow though
Lack of resources in
PC (1) / Networking settings in PC (1)
• It’s accessible from home /uni and doesn’t require storing files locally. My
computers don’t have the space for VMs
• Setting on my personal PC might disrupt networking work
Reliability (1) • It’s a fairly stable environment to practice at the lab content
Future technology/ Interesting (2)
• Mobility and cloud computing is the future
• Seems interesting
Engaging (1) • I find a server environment makes learning more engaging
Familiarity (1) • Not sure, it seems this is what I am used to now so would prefer it
Both labs (4) • Because of mostly hardware can slow using VMware and such. Probably
server, but really both are fine
• Both, hard choice. More CPU resources would have dramatically increased
performance. Using VMware, yet the server environment gives more access for if completing tasks at home
• Not sure, it seems this is what I am used to now so would prefer it
• I am indifferent
Other (4) • More convinced
• Never worked with server before. VM did not work for me outside of campus
• Lateraled in using the technology
• Mobility and cloud computing is the future
It became evident that most students preferred the server lab due to its easy access. Also,
the convenience of having all necessary software pre-configured and ease of use were other
reasons for choosing the server-based lab environment without the need to have/use
resources on students’ personal machines. Two responses also mentioned that the server-
based lab environment was slow. What was interesting is that 4 responses who chose the
server environment still stated that they did not mind using decentralised labs.
Next, the reasons for choosing decentralised lab environment were analysed (see Table
6.21).
Table 6. 21: Reasons for Choosing PC-based Lab Environment
Theme (Frequency) Response
Faster (7) • Faster
• Hyper-V seems faster than running VM from the browser
• Using my own. The virtual machine runs faster
• The server makes using virtual lab difficult as it was very slow most at time
• My personal PC is quite fast and virtualises well
• Access everywhere although they are sometimes laggy
• As it is more flexible
Ease of use (6) • Easy to use
• I found this easy to use
• Easier to understand and more flexible
• Easy to use and helpful to learning

Chapter 6 – Iteration 2
159
• The Hyper-V manager was a clean design with easy readability and
functionality
• Easier stupes, Hyper-V is great simple, easy to use, less work that needs to be done prior
Flexibility (5) • Easy to control
• I have lose control can back up my work, reset it more a mistake
• Easier to understand and more flexible
• More flexible and work more at home
• Flexible for people who work
Easy access (3) • Having access at home is great especially when I have a course task and couldn’t attend the lab
• Can access from anywhere
• I can always go back to my actual PC without having to log out from
VMware
Reliability (2) • Server environment is very lossy. I wish I had option to use VM on USB as
well as online for people with access to use USB
• Less seems to go wrong for unknown reasons
Familiarity (1) • Because I have done my practical on it
PC has resources (1) • My personal PC is quite fast and virtualises well
Technical issues (1) • Just some of the problems with VDI made me not want to use them, but was
not a bad thing to use
Preference (1) • I prefer my own PC
Both (1) • Just some of the problems with VDI made me not want to use them, but was
not a bad thing to use
Other (4) • It allows learning of new tools that may be useful in the future
• If something goes wrong worst case I can close the VM
• Didn’t use server environment
• Multi-purpose
Analysing the results, it was clear that speed was one of the main reasons for choosing the
PC-based lab environment. Ease of use and flexibility were also reasons for preferring the
decentralised environment. Easy access and not having to log onto a server-based
environment were also considered to be advantageous. Two student responses mentioned
that they felt that the server environment was less reliable while the PC-based environment
had more control. It seems that if students have personal machines which have sufficient
resources, the decentralised lab environment may be a good option.
Overall, from the analysis, it can be summarised that students were satisfied with the
convenience of access provided by the server-based lab environment. A number of
improvements such as providing additional resources to the server-based lab environments
to improve performance and taking steps for providing an easy login (such as LMS

Chapter 6 – Iteration 2
160
integration etc.) can be considered as future improvements to the lab environment. Some
students had access to personal computers with adequate resources to run virtual machines
and networks. In such situations, it might be convenient and faster to use their own personal
machines to conduct the lab work. Thus, after discussion with the practitioner, it was
decided that the choice to use either or both centralised (server-based) and decentralised
labs to conduct hands-on lab activities can be given, so students could have the choice to
use either or both approaches depending on their preferences in the future.
The next section evaluates the feedback tool.
6.3.3.3. Evaluation of the Feedback Tool
This section addresses the students’ perception of the feedback tool. For section 2, question
1 of the survey (see Appendix B) – “Did you use the feedback tool?”, 44 answered yes
while 28 answered no. The thematic analysis for the second part of the question – “If no,
please explain why?” is provided in Table 6.22.
Table 6. 22: Thematic Analysis of Section 2, Question 1.
Theme (Frequency) Responses
Don’t know (9) • Don't know what it is
• I was not aware of it but would have liked to have used it
• Did not think to, I can see the benefit to it though
• Didn't know it was there
• Never noticed it
• Didn’t know about it
• Didn’t know about it was there
• Didn’t know about it
• I didn’t know well about it
No time (5) • Never really got the time or remember. I may go back and use it be ready to exam for study
• Haven’t got a chance to use it
• Lack of time to configure too many assignments (not this course)
• Don’t have time to use it
• Didn’t finish the lab work most of the time
Missed the lab (3) • I missed out on the labs it was implemented in
• The feedback tool activated after lab 7 (I think) where I was very busy with
work and could not attend most of the labs
• I missed the labs when it was introduced
Not required (3) • It was not required
• Wasn’t mandatory to use or directed at our marks

Chapter 6 – Iteration 2
161
• I felt like doing it (the lab) step by step, I should have everything right
anyway
Technical difficulty (1)
• Didn't work for me
Other (5) • I am very lazy. In hindsight I should have
• Didn’t study this course enough
• Didn’t know I had to
• I never really took notice of it
• No particular reason
Ten students who had not used the feedback tool stated that they were not aware of it. The
feedback tool was to be executed after completing all the hands-on activities of the lab. It
is possible that these students did not get far enough into the lab work to be aware of the
feedback tool. Also, if students did not attend the lab class, preferring to work from home
without completing the lab sheet, it is possible that they would not be aware of the feedback
tool. Four students mentioned that they had no time to use it. It was common for many
students to take more than the 2 hours allocated in the lab to complete the hands-on
activities. This may have led students to run out of time and so they may have opted not to
run the feedback tool. Three responses stated that they missed the lab and thus had not
attempted to use the feedback tool. Three students felt that the feedback tool was not needed
and, as it was optional, opted not to use it. There was one response where the student seems
to have had difficulty in using the feedback tool. Five responses were categorised as
“Other”. After discussing these results with the practitioner, the practitioner felt that most
students that were not aware, probably had not completed all the hands-on activities of the
lab to the point of using the feedback tool. The practitioner mentioned that as a future
enhancement, the feedback tool could be configured to run for particular sections of the
hands-on lab activities. This will allow the feedback tool to be introduced earlier on in the
lab and students would be more aware of it and its features/advantages.
The results for question 2 – How satisfied are you with feedback generated from the tool?
are presented in Table 6.22. It can be seen that there were no responses for Dissatisfied or
Extremely Dissatisfied, 4 (9%) responded Neutral, 22 (50%) responded Satisfied and 18
(41%) responded Extremely Satisfied. This is a highly positive result. This is also similar
to the iteration 1 results (see Figure 6.8). Next, the students were asked to justify their
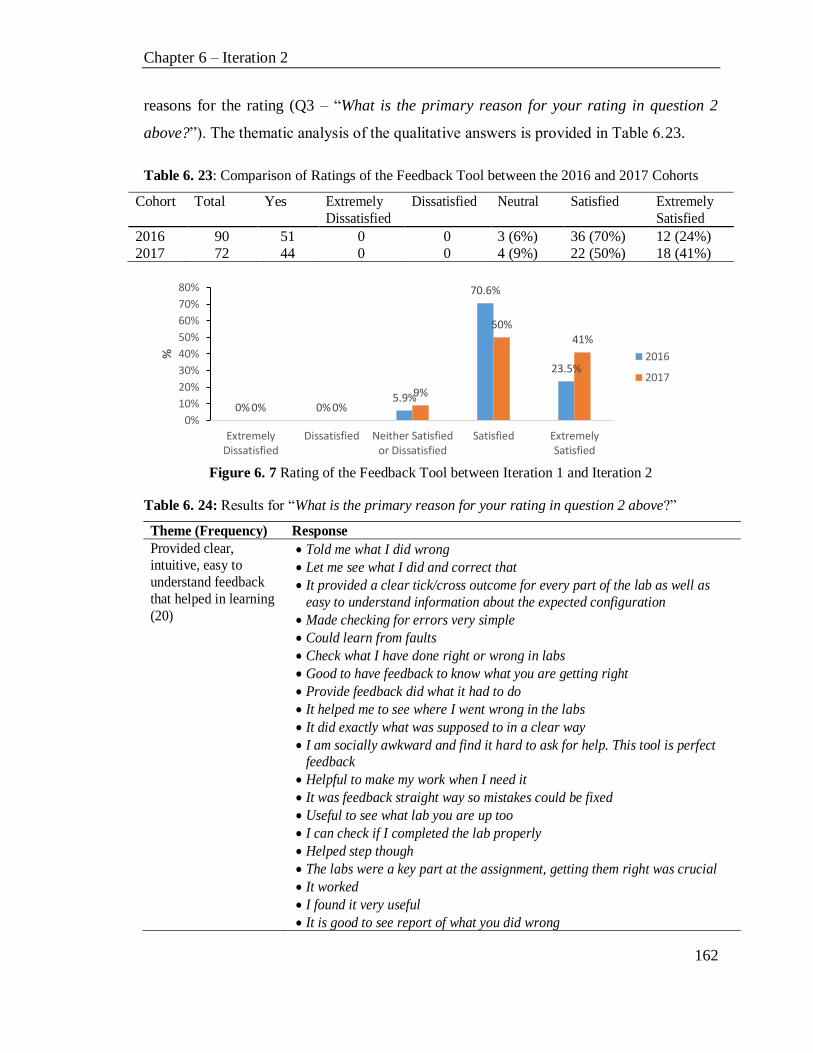
Chapter 6 – Iteration 2
162
reasons for the rating (Q3 – “What is the primary reason for your rating in question 2
above?”). The thematic analysis of the qualitative answers is provided in Table 6.23.
Table 6. 23: Comparison of Ratings of the Feedback Tool between the 2016 and 2017 Cohorts
Cohort Total Yes Extremely
Dissatisfied
Dissatisfied Neutral Satisfied Extremely
Satisfied
2016 90 51 0 0 3 (6%) 36 (70%) 12 (24%)
2017 72 44 0 0 4 (9%) 22 (50%) 18 (41%)
Figure 6. 7 Rating of the Feedback Tool between Iteration 1 and Iteration 2
Table 6. 24: Results for “What is the primary reason for your rating in question 2 above?”
Theme (Frequency) Response
Provided clear, intuitive, easy to
understand feedback
that helped in learning
(20)
• Told me what I did wrong
• Let me see what I did and correct that
• It provided a clear tick/cross outcome for every part of the lab as well as
easy to understand information about the expected configuration
• Made checking for errors very simple
• Could learn from faults
• Check what I have done right or wrong in labs
• Good to have feedback to know what you are getting right
• Provide feedback did what it had to do
• It helped me to see where I went wrong in the labs
• It did exactly what was supposed to in a clear way
• I am socially awkward and find it hard to ask for help. This tool is perfect feedback
• Helpful to make my work when I need it
• It was feedback straight way so mistakes could be fixed
• Useful to see what lab you are up too
• I can check if I completed the lab properly
• Helped step though
• The labs were a key part at the assignment, getting them right was crucial
• It worked
• I found it very useful
• It is good to see report of what you did wrong
0% 0%5.9%
70.6%
23.5%
0% 0%9%
50%41%
0%
10%
20%
30%
40%
50%
60%
70%
80%
ExtremelyDissatisfied
Dissatisfied Neither Satisfiedor Dissatisfied
Satisfied ExtremelySatisfied
%
2016
2017

Chapter 6 – Iteration 2
163
Real-time feedback (6)
• Gave real time feedback when used
• The tool was good for receiving instant feedback
• It is very quick and easy
• Install feedback was great to fix any mistakes
• It was feedback straight away so mistakes could be fixed
• I can get the feedback on time to check my mistake
Ease of use (4) • It is very quick and easy
• Easy to submit and view
• Easy to use
• Simple and easy
Kept track of progress
(3) • Know my progress in the labs
• Provides a quick way of checking how on track we are
• Because it gives a progress check
Helped in independent
learning (2) • It helped do the work at home without the lecturer help
• I could find the errors without tutor. Hope it can show more specifically
Other – Bugs (4),
Flexibility (1), Formatting (1)
(7)
• Few configurations different to worksheet
• Didn’t work for labs 6 and 7, worked quickly for 8 and 9
• Come back wrong for some things that were actually correctly configured
• It worked most of time only if was almost correct
• Don’t roles so much and often crash
• Not flexible
• Certain things live capital letters messed it up which is annoying
From the thematic analysis, it can be concluded that most students rated the feedback tool
highly due to the fact that it provided clear, intuitive and easy to understand feedback that
helped in their learning. The fact that the feedback tool gave real-time feedback on the
hands-on activities was a feature that also resulted in positive ratings. Ease of use was a
reason for 4 respondents. This version of the feedback tool avoided the need to download
PowerShell scripts which had been required in iteration 1 and also it had an improved
interface to run the scripts. Three respondents mentioned that the feedback allowed them
to keep their progress on track. Also, an interesting finding was that the feedback allowed
students to learn independently as stated by 2 respondents. There were a few instances of
bugs (4) reported. However, the number of reported bug instances have come down from
7 to 4 from iteration 1 (which only had 2 labs with the feedback scripts implemented). The
practitioner discussed this and will look at this. The practitioner mentioned that a tool to
easily configure the parameters of the feedback scripts can be looked into so that the lab
sheets and feedback scripts check for the same parameters. This enhancement will be
considered in future work.
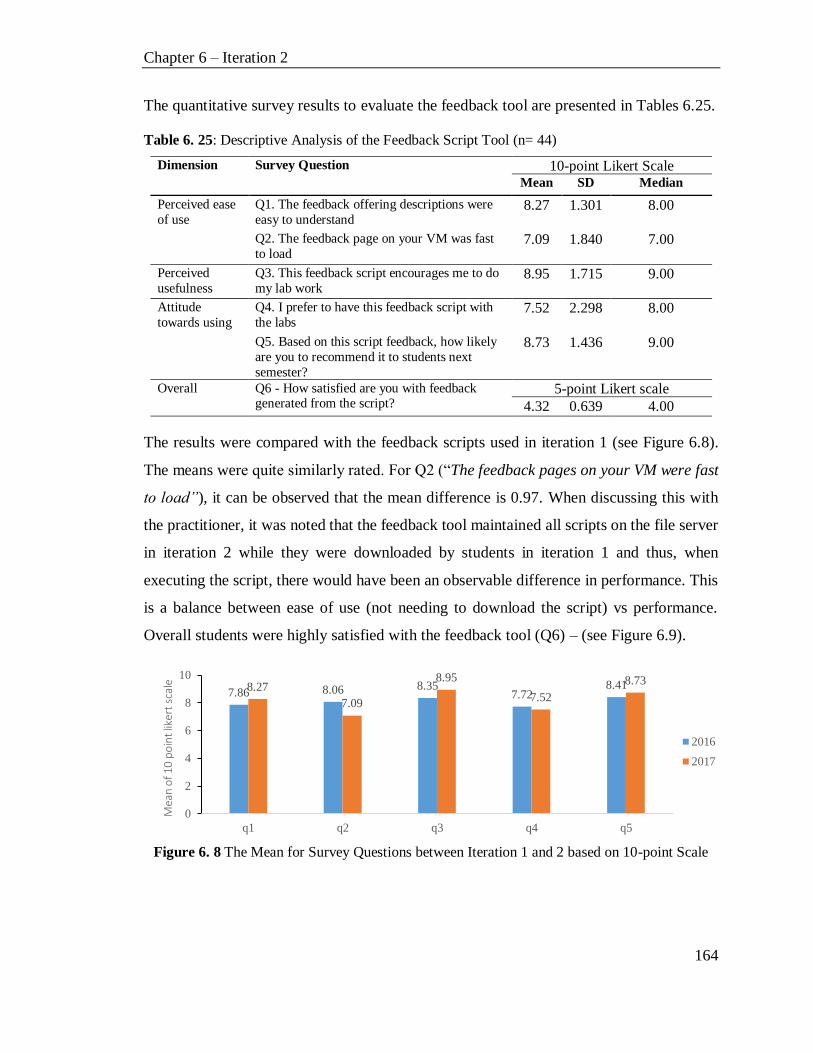
Chapter 6 – Iteration 2
164
The quantitative survey results to evaluate the feedback tool are presented in Tables 6.25.
Table 6. 25: Descriptive Analysis of the Feedback Script Tool (n= 44)
Dimension Survey Question 10-point Likert Scale Mean SD Median
Perceived ease
of use
Q1. The feedback offering descriptions were
easy to understand 8.27 1.301 8.00
Q2. The feedback page on your VM was fast
to load 7.09 1.840 7.00
Perceived
usefulness
Q3. This feedback script encourages me to do
my lab work 8.95 1.715 9.00
Attitude
towards using
Q4. I prefer to have this feedback script with
the labs 7.52 2.298 8.00
Q5. Based on this script feedback, how likely
are you to recommend it to students next
semester?
8.73 1.436 9.00
Overall Q6 - How satisfied are you with feedback generated from the script?
5-point Likert scale
4.32 0.639 4.00
The results were compared with the feedback scripts used in iteration 1 (see Figure 6.8).
The means were quite similarly rated. For Q2 (“The feedback pages on your VM were fast
to load”), it can be observed that the mean difference is 0.97. When discussing this with
the practitioner, it was noted that the feedback tool maintained all scripts on the file server
in iteration 2 while they were downloaded by students in iteration 1 and thus, when
executing the script, there would have been an observable difference in performance. This
is a balance between ease of use (not needing to download the script) vs performance.
Overall students were highly satisfied with the feedback tool (Q6) – (see Figure 6.9).
Figure 6. 8 The Mean for Survey Questions between Iteration 1 and 2 based on 10-point Scale
7.86 8.06 8.357.72
8.418.27
7.09
8.95
7.52
8.73
0
2
4
6
8
10
q1 q2 q3 q4 q5
Mea
n o
f 10
po
int l
iker
t sc
ale
2016
2017

Chapter 6 – Iteration 2
165
Figure 6. 9 The Overall Student Satisfaction with the Feedback Tool
Question 3 in the focus groups discussed learning support tools (“What features did you
like in the INFT2031 labs? For example, did you find the feedback and dashboard with the
virtual labs easy to use and user-friendly?”). The thematic analysis of Q3 is provided in
Table 6.26. It is evident that overall, students were highly satisfied with the feedback tool.
Table 6. 26: Thematic analysis for “What features did you like in the INFT2031 labs? For example, did you find the feedback and dashboard with the virtual labs easy to use and user-
friendly?”
Theme (Frequency) Response
Positive response to feedback tool
(15)
• Feedback feature is great to see how you are going
• When you do know what you doing. As oh when you think did everything
right but in reality, you could did mistakes. But with this you can see what happen and where
• Feedback tool was handy to check we did things right. I did not use the
dashboard
• Feedback tool an excellent addition. (Dashboard) Originally did not work,
but good to see once submitted the result of others
• Feedback tool good for detail, dashboard good in general
• I have not used the dashboard, but the feedback tool was an easy way to immediately see how I was doing
• The feedback system is very good. I can learn from my mistakes
• Feedback started late but was a good option. Haven’t used the dashboard
• Feedback was very helpful, especially since it was immediate, unlike some
other classes
• Very helpful but they would be more helpful if we got feedback for all the
labs not just a few of them
• Feedback tool was really helpful and user-friendly; really helpful to see errors and mistakes
• I think the feedback tool was more helpful, it is just more details, I mean
[it] told us where gets right, what is the wrongs. Whereas the dashboard is
more general that show labs where am I
0 0
9%
50%
41%
0
0.1
0.2
0.3
0.4
0.5
0.6
ExtremelyDissatisfied
Dissatisfied Neither Satisfied orDissatisfied
Satisfied Extremely Satisfied
Freq
uen
cy (%
)

Chapter 6 – Iteration 2
166
• I thought it is very useful. Yes, especially the feedback because it is very
useful where am from, like troubleshooting if I done something wrong. Like when I excelled in mix up to which of two messages need to go to two
things. Troubleshooting is very useful like to saying let me to do this; I am
using feedback tool, I scroll back and set and scroll back and see where
some crosses; see if any cross and where and that usually what the problem is, if I miss something
• It was good. Sometimes when did you change the settings or something you
not sure is it right; then you going a little make sure where your changes
that is right things or what the document ask you to do
• Just helpful because always we have to come to you and ask questions we can do it ourselves
Positive response to
dashboard (5) • Dashboard is very useful
• Labs, using VMs to implement various think dashboard helps; a lot to see
where mistakes were made; easy and user-friendly
• Feedback tool an excellent addition. (Dashboard) Originally did not work,
but good to see once submitted the result of others
• Feedback tool good for detail, dashboard good in general
• It’s always fun more graphs. It just like minimum maximum and things like that you know it always is useful
Suggestion for
improvement (3) • It is good. Make it for all labs. Embed in Blackboard and just click it
• I think like make sure it … follows the set up from lab 2 we can use it. I
found some trouble to get myself registered for the dashboard as well
• I like to start the course little quicker. A lot of people lose to use it
Other (7) • Very user-friendly; the picture in the labs made thing much easier to understand
• Comparing to other classes, we do not get any feedback
• It is useful
• Not much honestly
• It is good, keep it
• I don’t care about that; I do not have problem with averages
• I do not know what the feedback tool is
Next, an evaluation of the dashboards is provided.
6.3.3.4. Evaluation of the Dashboards
This section evaluates the dashboards implemented in the TePF from a student perspective.
Out of the 72 students who participated in the survey, 29 used the dashboard and 43
answered that they had not. The thematic analysis for the second part of the question – “If
no, please explain why?” is provided in Table 6.27.
Table 6. 27: Thematic Analysis of Section 2, Question 1
Theme (Frequency) Responses
Didn’t know (11) • Didn't know them

Chapter 6 – Iteration 2
167
• I don't know what it is
• I missed out on the labs it was implemented in
• I don’t remember the exact reason. Maybe, I wasn’t interested in
• I didn’t know well about it
• Again, I was not aware of it but would have liked to have used it
• Didn’t know about it
• Didn’t know about it
• Didn’t know about it
• Not sure what it was
• Didn't know it was there
Didn’t need it or find
it useful (6) • Didn’t seem needed
• Didn't find it necessary
• Didn’t find it useful
• I never needed to, nor was curious enough to look
• Did not need to
• Did not think to I [can] see the benefit to it though
Access is
complicated (4) • Didn’t really learn how to access it
• I want since now to use it - seemed complicated
• Too many steps just to view the result
• Had trouble setting up account
Not happy to divulge
progress (1) • I was intimidated by the idea my progress would be recorded and I would
look bad compared to other students
Other (7) • I missed the labs when it was introduced
• It started too late in the semester
• Didn’t spend enough time studying this course
• Didn’t use
• Very lazy, sorry
• I have not done much labs once it activated
• Only had a quick look
The majority of the students did not use the dashboard (43 – not used vs 29 - used). Many
students answered that they were not aware of it. Similar to the feedback tool, the
dashboards were discussed at the end of the lab sheet. It is quite possible some students
may not have completed the lab sheet or ignored this section as it was optional. Six
responses indicated that the dashboards were not useful or needed. Four responses stated
that the access was not user-friendly and complicated which was also a suggestion from
that came out of the focus group discussions. When discussing this with the practitioner,
he agreed that a separate login set up for dashboard access and seamless access from the
LMS would be beneficial and he would address this concern. One response indicated that
s/he did not wish to share their progress with others. There were also responses which
classified as Other which included “lazy” and “only had a quick look”.

Chapter 6 – Iteration 2
168
Table 6.28 provides the descriptive results of the survey for dashboards. It is clear that
among the students who used it, they are highly satisfied with the tool and its features
(mean over 7.0 for all questions except Q7 - I would like to see my rank in class using the
dashboard which scored a mean of 6.93). Qualitative analysis below provides further
insights.
Table 6. 28: Descriptive Analysis on Items related to the Dashboard Tool (n= 29)
Item 10-point Likert Scale Mean SD Median
1- The dashboard was easy to understand 8.52 1.550 9.00
2- The dashboard provides feedbacks on my learning activities
and performance
8.41 1.593 9.00
3- I prefer to have this dashboard with the labs activities 8.45 1.901 9.00 4- This dashboard encourages me to do my lab work 7.52 2.385 8.00
5- How likely are you to recommend using dashboard in next
semester
8.28 1.944 9.00
6- I would like to compare my performance with other students 7.21 2.769 8.00
7- I would like to see my rank in class using the dashboard 6.93 2.738 7.00
8- How satisfied are you with the Dashboard view? 5-point Likert Scale
3.90 1.047 4.00
The results for question 2 – “How satisfied are you with the dashboard view?” are
presented in Table 6.29 and Figure 6.10.
Table 6. 29: Results for “How satisfied are you with the dashboard view?”
Scale Frequency Percent
Extremely Dissatisfied 1 3.5% Dissatisfied 1 3.5%
Neither Satisfied or Dissatisfied 8 27.5%
Satisfied 9 31.0% Extremely Satisfied 10 34.5%
Figure 6. 10. Responses to Satisfaction with the Dashboard View
1 1
89
10
0
2
4
6
8
10
12
ExtremelyDissatisfied
Dissatisfied Neutral Satisfied ExtremelySatisfied
Fre
qu
ency

Chapter 6 – Iteration 2
169
Most students who used the dashboard seemed to be satisfied or extremely satisfied
(65.5%) with 27.5% neutral and 7% dissatisfied or extremely dissatisfied. The thematic
analysis for the reasons for this rating is provided in Table 6.30.
Table 6. 30: Thematic Analysis for “What is the primary reason for your rating in question 2
above?”
Theme (Frequency) Responses (rating)
Shows progress (8) • Pretty much the same as feedback tool {3}
• My progress and where I am going {5}
• Just to check my marks {4}
• Easy to keep track of activities {5}
• Gives a checklist {5}
• Everything that is needed for labs is on the dashboard {5}
• Didn’t really bother to see nonusers, was infused to see it and where
mistakes were made {3}
• Cool but I don’t really care how others are going {3}
Easy to use (5) • Dashboard was easy to use and gave me the outcome I needed in real time {4}
• Easy to view {5}
• Easy and useful {5}
• It was easy to use and navigate {5}
• Easy to use, good tool {4}
Compare with peers (3) • Shared how well each student did {5}
• It allows me to compare my results to the class {4}
• It helped compare my labs {4}
Hard to understand (2) • A little hard to understand {1}
• Messy and a little confusing {2}
Easy to understand (1) • Easy to understand {3}
Other (1) • Good idea {3} { } Number in brackets is the rating
The main reason provided by respondents for their rating was that the dashboard showed
their progress, was easy to use and compared their results with peers. The main reason for
the Dissatisfied (2) or Extremely Dissatisfied (1) ratings were that these students found the
dashboard hard to understand and confusing.
From the above analysis, it can be concluded that dashboard was not used by the majority
of the students (as discussed earlier). Those who did use it liked it mainly because it showed
their progress. A number of areas for improvement were discussed with the practitioner
including seamless access to the dashboard from the LMS in the future.

Chapter 6 – Iteration 2
170
6.3.3.5. Overall Evaluation
The overall evaluation of the course was analysed in the focus group discussions. The
thematic analyses of “How did you find the course INFT2031? The structure, lectures,
labs, formative assessments (such as quizzes, review questions, group work, practical test,
etc.)” and “What is your overall opinion about INFT2031? How can INFT2031 be
improved? Would you recommend it to another student?” are provided in Tables 6.31 and
6.32 respectively.
Table 6. 31: Thematic Analysis of Focus Group Question – “How did you find the course INFT2031? The structure, lectures, labs, formative assessments (such as quizzes, review
questions, group work, practical test, etc.)”
Theme (Frequency) Response
Practice test was helpful (9)
• The practice test really helpful; like how the same lee is going do for next
week and everything. It has just told you what going happen and get brain for it. Yes, I did
• I really liked having practical tests before our practical test
• I really liked the practical test before the actual ones. I thought the course
content was structured very well. I liked how the labs went alongside the
lectures
• The course is well structured, practice test is excellent
• Labs are very interesting and helpful, refer hands-on work to actually use the theory; practical tests are useful as well; quizzes and questions are
good to test lecture theory
• Practice exam because we do not have any idea what we have do in exam,
so practice exam give us idea about we have to do in exam … of course help us to get high marks
• Yes, very good I like the practice practical exam before the actual exam. It
is kind of helpful. It refreshes what we learnt over the semester because a
lot of it and all the time just sit down and practice it. I found it helpful. A
lot of content in the lecture. Sometime a bit hard to keep up with notes. Sometimes you go very quick but not too bad
• Keep that if you care about students, not because it's helpful but also sort
of aware what practice is and refresh your memories
• That is super useful. That is good. Easy make for next test
Labs are useful (6) • The best part is doing labs where we have work that actually useful
• Found labs very useful
• Lab is good
• Labs are very interesting and helpful, refer hands-on work to actually use
the theory; practical tests are useful as well; quizzes and questions are good to test lecture theory
• You can commit what to do in lab to memory it is easier
• Preferred the labs because they are many hands-on, quizzes are better than
review questions since they give feedback
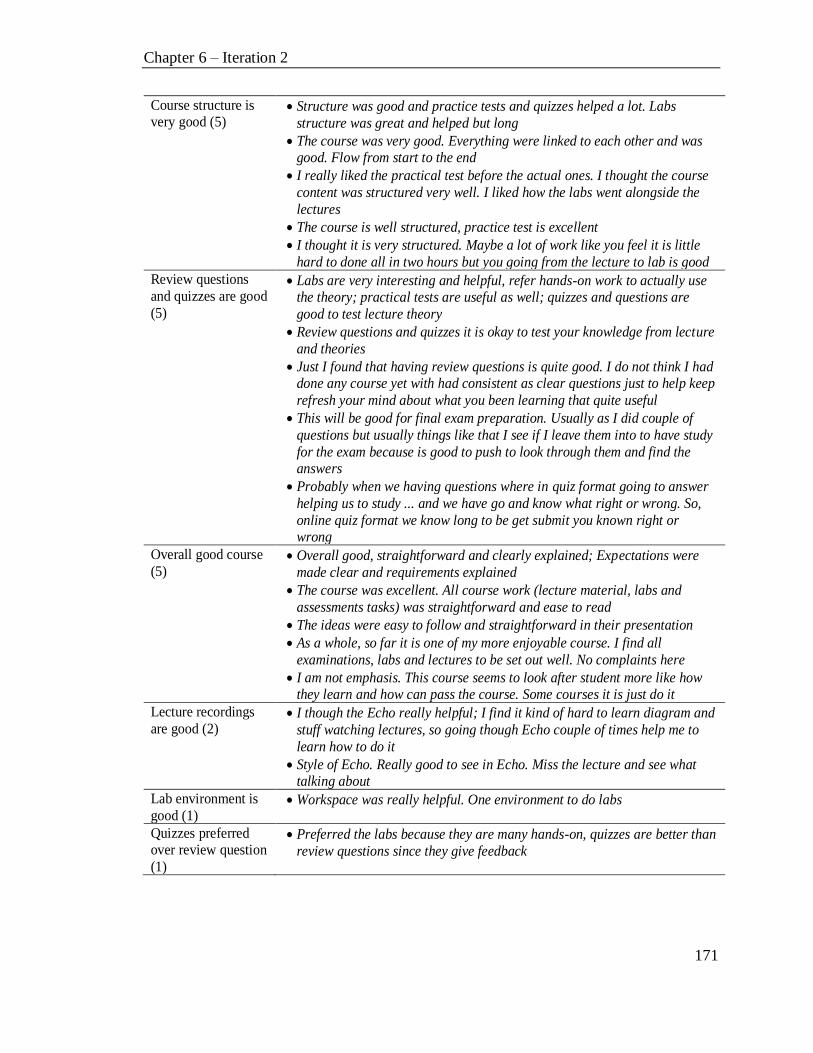
Chapter 6 – Iteration 2
171
Course structure is very good (5)
• Structure was good and practice tests and quizzes helped a lot. Labs
structure was great and helped but long
• The course was very good. Everything were linked to each other and was good. Flow from start to the end
• I really liked the practical test before the actual ones. I thought the course
content was structured very well. I liked how the labs went alongside the
lectures
• The course is well structured, practice test is excellent
• I thought it is very structured. Maybe a lot of work like you feel it is little
hard to done all in two hours but you going from the lecture to lab is good
Review questions
and quizzes are good
(5)
• Labs are very interesting and helpful, refer hands-on work to actually use the theory; practical tests are useful as well; quizzes and questions are
good to test lecture theory
• Review questions and quizzes it is okay to test your knowledge from lecture
and theories
• Just I found that having review questions is quite good. I do not think I had done any course yet with had consistent as clear questions just to help keep
refresh your mind about what you been learning that quite useful
• This will be good for final exam preparation. Usually as I did couple of
questions but usually things like that I see if I leave them into to have study
for the exam because is good to push to look through them and find the answers
• Probably when we having questions where in quiz format going to answer
helping us to study ... and we have go and know what right or wrong. So,
online quiz format we know long to be get submit you known right or wrong
Overall good course
(5) • Overall good, straightforward and clearly explained; Expectations were
made clear and requirements explained
• The course was excellent. All course work (lecture material, labs and
assessments tasks) was straightforward and ease to read
• The ideas were easy to follow and straightforward in their presentation
• As a whole, so far it is one of my more enjoyable course. I find all
examinations, labs and lectures to be set out well. No complaints here
• I am not emphasis. This course seems to look after student more like how they learn and how can pass the course. Some courses it is just do it
Lecture recordings
are good (2) • I though the Echo really helpful; I find it kind of hard to learn diagram and
stuff watching lectures, so going though Echo couple of times help me to
learn how to do it
• Style of Echo. Really good to see in Echo. Miss the lecture and see what talking about
Lab environment is
good (1) • Workspace was really helpful. One environment to do labs
Quizzes preferred over review question
(1)
• Preferred the labs because they are many hands-on, quizzes are better than
review questions since they give feedback

Chapter 6 – Iteration 2
172
Suggestions for improvement -
Lecture can be
improved (4)
• I found the labs were helpful than lectures, actually doing rather than in
lecture just listening
• Parry descent of length. We considering what we are learning it make sense it just lecture is very long like do of all these staff
• Yes, very good I like the practice practical exam before the actual exam. It
is kind of helpful. It refreshes what we learnt over the semester because a
lot of it and all the time just sit down and practice it. I found it helpful. A
lot of content in the lecture. Sometimes a bit hard to keep up with notes. Sometimes you go very quick but not too bad
• I think the lecture were maybe a little too formal as well like sometimes I
have sit in lecture like you know we need basic idea its saying behind
DHCP, routing and behind ever things. That will getting quite a bit more information in that
Suggestion for
improvement –
Other (tutor demos,
network diagram exercises, labs are
long) (3)
• Maybe we should do some work out on networks design diagram in actual
lab rather than in lecture in able to do that again
• Some of the labs quite long and sometimes a lot of things that need to do
more than what we actually doing … Yes, I think most of them it was help
when brick it up
• I just hope this looking to following the instructions sometime might a bit confused although we can ask questions, which is good. But just I am
hoping to be like Demo in front that's going to do and then just kind of
follow. I found that will be better that way. Still not bad following the instructions but sometimes if I miss some steps that I do not realise it and
after that when I do until the halfway and go back over all of that again. If
I just follow in screen appropriate will be easier and then all explanations that been given appropriately will be easier and better approach
Other/Not clear (6) • First of all, I have always been asking myself why I take this course while
taking this course. Of course, I enrolled this course since I am bachelor of IT for the core course, but I was suspicious of what I could get through this
course
• I was happy. I just more everybody does by themselves but this is an issues
I guess discussion board
• There were more helpful because they have the same things
• Hard at first but as the semester progressed it become a bit easier
• There were more helpful because they have the same things
• You can ask many questions in labs. I mean you can ask in lecture but just different things
Table 6. 32: Thematic Analysis for Focus Group Questions - “What is your overall opinion about
INFT2031? How can INFT2031 be improved? Would you recommend it to another student?”
Theme (Frequency) Response
Overall good (21) • Overall, it was quite good course and I am satisfied with it, although the
final exam is not finished yet. And I also hope that many students take this course as many as possible. Hope this email can help for this course's
future
• Really good course. I would recommend
• The course is good; I would recommend it to anyone studying IT

Chapter 6 – Iteration 2
173
• It is very good course to learn network basic knowledge
• Not too hard but not too easy. I felt like I learn a lot which is good
• I thought it was very good
• I must definitely recommend to people if they doing anything like relate to
IT by doing this course it will be very useful because never we can make useful skill to have
• It is very structured and easy to follow. I think it is good as it is; not too
easy but not too challenging
• I would recommend it, lecturer and demonstrator very helpful, everything
is very organised so you don’t fall behind
• I would recommend to other students
• It is perfect just leave it as it is
• It was a good course for introduction to networking
• It was a good course, could be made more challenging, perhaps more
Linux; would recommend
• Simple straight forward course, good for 2nd year IT. Yes, would recommend to students interested in network admin. More LINUX. Would
runs on Linux, should be more taught of uni
• Lab VMs could be sped up. Would recommend to others. Overall,
extremely impressed
• It was a good course, could be made more challenging, perhaps more Linux; would recommend
• I really liked this course and hand-on important beside an option for USB
VMs; I would recommend to another student
• It is very cool
• It was a good course for introduction to networking
• Yeah. It’s interesting and gets the brain going
• The weight of the course is pretty helpful. Like if someone has miss any, its
new experience help. It is straightforward, I think it is very helpful and it is not overly hard. I think is good keep it like this. I like the way marks are
distributed we got a lot of marking by doing practical exam
Labs are good (3) • Lecture can be bit long, but lab themselves were great
• Everything 2031 computer labs acer than lecture because we‘re actually
doing useful staff and hands-on work
• Each lab based on virtual machine or points with the lab starts then
continuing from there. In this way, it will be like if you do not have done that go back and do one before. But, here if you want to continue
Suggestion for
improvement (lab work) (3)
• More labs work and more lab time
• More communication about what is going on in the labs. Shorter lab work,
more descriptions, note on what’s going on
• Feedback on all labs, screenshots on labs activities are not always clear
Add Linux (3) • It was a good course, could be made more challenging, perhaps more
Linux; would recommend
• Simple straight forward course, good for 2nd year IT. Yes would
recommend to students interested in network admin. More LINUX. Would runs on Linux, should be more taught of uni
• It was a good course, could be made more challenging, perhaps more
Linux; would recommend

Chapter 6 – Iteration 2
174
Add more on network diagrams (1)
• Maybe the way can be improved is in first assignment it was not much
content on networks diagram, we had one lecture, did the example. Just add something to lectures that goes over the networks diagram little bit
because I am still little confused until I saw the example. Yes, maybe in the
labs
Speed up lab VMs (1) • Lab VMs could be sped up. Would recommend to others. Overall,
extremely impressed
Lecture can be long (1) • Lecture can be bit long, but labs themselves were great
Other/Not clear (2) • Probably, like mostly to me it is new concept we did know how to,
especially for the first one, like I did know how find in depth make the diagram because I saw some my friends he had up to point I had but it
showing different topologies for how actual computers should be set up.
Just knowing what kinds of details have to going to and what type of information should be in diagrams
• When we do the example yourself, you can watch him do it on the board or
whatever. I think if you are doing the exercise by yourself it might give
more better understanding
From the evaluation, it is clear that students like the course overall and the structure of the
course. Students liked the formative assessment (practice tests) prior to the actual practical
tests as a form of preparation. Lab work and review questions were noted as good aspects
of the course. There were suggestions for improvements such as adding Linux and lectures
being shorter. Upon discussing this with the practitioner, it was clear that these suggestions
will be incorporated in future. Overall, from the responses, it can be concluded that the
course is well organised, students are highly satisfied, and they would recommend it to
others.
6.4. Summary
This chapter discussed the implementation and evaluation of the entire TePF for the lab
environment as proposed in Chapter 3. This chapter examined the second iteration of the
DBR process. The virtual labs were implemented as a server-based private cloud
implementation.
A quasi-experiment was conducted and the scores of the practical tests were compared
between the control and experimental groups. It was seen that the students in the
experimental group (who used the TePF) scored higher than the students who did not use
TePF in the practical tests on average. This result was shown to be statistically significant.

Chapter 6 – Iteration 2
175
Next, surveys were used to identify which components of the TePF actually contributed
the most to learning. It was clearly indicated by the students that lab activities contributed
the most to learning in the course. The lab activities incorporated a number of PLTs in their
design as discussed in Chapter 3. The lab activities were evaluated using a number of
survey instruments from the literature. This revealed that students were catered to by all
stages of Kolb’s ELC and they also were encouraged to a deeper approach to learning.
These results confirm that the TePF has resulted in students achieving higher scores and
their learning process was deeper in nature. The virtual labs were rated the next highest as
contributing to learning. This supports the hypothesis that using sound PLTs in the design
of laboratory environments using technology can result in effective learning.
A limitation of the study was that a control group (i.e. 2015 cohort) was used only to
compare practical test scores. That is, it was shown that students in the experimental group
(i.e., 2017 cohort) scored higher marks in practical tests than the control group (i.e., 2015
cohort) which was shown to be statistically significant. Although lab activities were
evaluated using a number of survey instruments for the experimental group (6 dimension
from Konak et al. (2016), Kolb’s ELC stages based on Young et al. (2008) and approaches
to learning (R-SPQ-2F) (Biggs et al. (2001)) and shown to be positively impacting student
learning, there was no such evaluation of lab activities for the control group. Therefore, it
is not possible to compare the impact of PLTs for lab activities for the experimental versus
the control group. This limitation in the design of the experiment is practical in nature. The
ethical considerations that an intervention whereby a group of students in a single cohort
are deemed to be advantaged due to improved learning experience (i.e. experimental group)
while others are not (i.e. control group) would be seen unfavourably by University Ethics
committee for approval. Also, the limited time to complete the thesis project, meant there
is not sufficient time to run the course in different years with different lab activities to
compare. Thus, only the practical scores from 2015 cohort (i.e., control group) was
obtained and compared with practical scores from 2017 cohort (i.e., experimental group)
while the survey instruments evaluating lab activities was conducted only for the
experimental group.
Chapter 6 – Iteration 2
176
The technology artefacts of the TePF were evaluated using survey instruments. Both
quantitative and qualitative data was collected and analysed. It was clear that accessibility,
convenience and ease of use were the main advantages of using virtual labs. Improving the
performance of the virtual labs was the main suggestion. Students were highly satisfied
with the real-time feedback provided by the feedback tool. Also, although the dashboard
was not as popular as the feedback tool, the participants who used it were satisfied with its
functionality. A number of insights and suggestions to improve the technology artefacts
were gathered and discussed with the practitioner who indicated that improvements can be
implemented in the future. Overall, the application of PLTs in the design of lab
environments in this course is shown to be successful as demonstrated by the results.

Chapter VII
7. Design Principles
This chapter reflects upon the findings of the previous chapters to derive design principles
that would be useful in similar or related research projects and contexts. Firstly, reflections
on the research project are discussed with the aim of deriving the design principles. Next,
the design principles are discussed. Finally, the chapter is concluded.
7.1. Reflections
The research project outlined in this thesis aimed to answer the broad research question –
“How do we design a lab environment to take advantage of technology for effective
learning?” To answer this broad research question, the thesis reviewed the literature where
technology-enhanced labs had been implemented and examined the lessons learnt. From
the analysis, it was clear that technology advancements provide capabilities that create
many new opportunities for learning. An insightful observation was that incorporating
educational theories and principles (PLTs) in designing technology-enhanced lab
environments can create learning environments for more effective learning. This led to the
hypothesis - Design of technology-enhanced lab environments taking a holistic view of
learning incorporating curriculum design, lab activities, support tools and technology
artefacts based on sound pedagogical principles and theories have a higher potential for
effective learning. A Technology-enhanced Pedagogical Framework (TePF) that
incorporated curriculum design and delivery, lab activities, support tools and resources
based on sound pedagogical principles and theories was built. Next, this study designed,
developed and evaluated the TePF to prove the hypothesis. A context for developing a
technology-enhanced lab environment was selected to be built based on the TePF.
Recently, virtualization technologies have been used to create virtual labs for system-level
courses in computing with many advantages and new opportunities for learning. Thus, a

Chapter 7 – Design Principles
178
system-level course in computing was selected. Next, a literature review of virtual lab
implementations in system-level courses was conducted. It was clear that a majority of
studies had implemented technology innovations with little emphasis on educational
theories and practices. These studies were categorised as Level I. A few studies had gone
beyond just introducing the technology innovations. These studies considered a single or a
set of PLTs when designing technology innovations for labs. These studies were
categorised as Level II. There were very few (i.e., 4 studies) that can be classified as Level
II in literature. It was clear that there was scope for further research in this area.
For this research project, a system-level course in computing that already was using a
decentralised virtual lab for students to conduct hands-on practical work was selected. A
conceptual model of the TePF for a lab environment was designed based on a number of
PLTs. Biggs’s Constructive Alignment was used in curriculum design. Kolb’s ELC,
Collaborative Learning and the Bloom and SOLO taxonomies were referenced to re-design
the lab activities. Formative assessments as a form of feedback were incorporated
throughout the lab activities. Technology advances allowed centralised virtual lab
environments to be designed where students had remote 24/7 access to IT infrastructure
labs, and artefacts such as an automated feedback tool that provided immediate feedback
for hands-on configuration tasks and dashboards that provided a transparent view of
student progress were included. Features in the LMS, such as discussion boards, were
incorporated to enable collaborative discussion and posts.
To develop and evaluate the proposed TePF, Design-Based Research (DBR) was selected
as the research methodology. In this methodology, close collaboration between the
practitioner and researcher was needed. The framework was developed and evaluated in an
authentic practical setting. The proposed framework was developed and evaluated
iteratively using findings from the first iteration to influence the second iteration. This also
provided a means for the practitioner and researcher to develop familiarity and trust in the
proposed framework. A mixed methods approach was used to evaluate the framework
where both quantitative and qualitative data were collected and analysed.

Chapter 7 – Design Principles
179
The results clearly identified a significant improvement in learning outcomes (i.e.,
statistically significantly increased scores in practical tests) for students using the proposed
framework. Furthermore, students exposed to the proposed framework typically took a
deeper approach to learning. These results supported and validated the hypothesis - Design
of technology-enhanced lab environments taking a holistic view of learning incorporating
curriculum design, lab activities, support tools and technology artefacts based on sound
pedagogical principles and theories have a higher potential for effective learning. Next,
the different components of the proposed framework were evaluated using the mixed
methods approach. The re-designed lab activities were rated the highest by students for
their impact on learning. The design of the hands-on activities was based on a number of
PLTs. This provided further evidence to support the hypothesis that the use of educational
theories in the design of lab activities in technology-enhanced lab environments support
learning. The technology artefacts - the virtual labs, the feedback tool and the dashboards
- were highly rated by students. Analysis of the qualitative data provided a number of useful
insights and aspects that lead to the high level of satisfaction and improved learning by
examining the different components, such as hands-on activities, review questions and
quizzes in lab activities, immediate feedback from the feedback tool, 24/7 remote access
to the virtual labs and the formative assessments such as the practice tests, as well as
revealing areas for further improvement (e.g., performance improvement for the virtual
labs). Overall, students were highly satisfied with the framework and the improved learning
outcomes. This research project supports taking a holistic view with PLTs taken into
consideration when designing technology-enhanced learning environments to provide
more effective learning.
The next section discusses deriving the design principles.
7.2. Deriving Design Principles
An outcome of a DBR project is a set of design principles. Design principles “… can guide
similar research and development endeavours” (Amiel & Reeves, 2008). The content and
depth of design principles may vary. The principles may be generalised or applicable to a

Chapter 7 – Design Principles
180
certain context only (Wang & Hannafin, 2005). However, in general, design principles
should provide guidance and assistance to research projects of a similar nature.
A clear outcome in our analysis was that students rated lab activities higher than the virtual
labs (the technology innovation) in terms of significance to their learning in the proposed
framework. The design of the lab activities was based on PLTs. Thus, when considering an
educational technology innovation, although the technology innovation may provide a
number of advantages and opportunities for learning, it is beneficial to take a holistic view
considering the learning context, any relevant PLTs and the capabilities of the technology
advances in designing the technology-enhanced learning environment. So how does one
go about designing such a learning environment? The approach taken in this research
project can be generalised to the design of any technology innovation, intervention or
learning environment aimed at improving learning. That is, the consideration of the
learning context, technology advances, existing work and PLTs can improve the design of
technology innovations, technology interventions and technology-enhanced learning
environments to achieve improved learning goals (see Figure 7.1).
Figure 7. 1 Components for the design of Technology-enhanced Learning Environments,
Interventions and Innovations in Education
Design of technology
innovation(s), intervention,
learning-environment
Technology advances & capabilities
Pedagogy & learning theories/
principles
Learning context & goals
Existing work (literature review)
Chapter 7 – Design Principles
181
From the above, the following design principle can be derived.
Design Principle 1: Consider the learning context, existing work, technology
advances/capabilities and educational theories/principles in the design of technology
environment, innovation or intervention.
It is clear that Design Principle 1 will result in a Level II intervention.
Next, how do we develop and evaluate such technology-enhanced learning environments?
The use of the DBR methodology with close interaction between the practitioner,
evaluation of the design in authentic settings, use of iterative cycles of design,
implementation and evaluation, and use of mixed methods evaluation provides a sound
framework for developing and evaluating technology innovations, interventions and
technology-enhanced learning environments.
Design Principle 2: Use of the DBR methodology in authentic learning contexts with a
mixed methods approach provides a framework for developing and evaluating technology-
enhanced learning environments.
It is important to note that to evaluate the TePF, you could use other processes. Indeed,
Design Principle 1 could follow a methodology other than DBR. However, this study uses
both Design Principles 1 and 2 as the methodology to design and evaluate the TePF
intervention study.
To answer the broad research question - “How do we design a lab environment to take
advantage of technology for effective learning?”, the following process can be taken to
derive Design Principle 3.
Design Principle 3: Follow the steps below to design and evaluate a TePF intervention:
• Step 1: Design a TePF using Design Principle 1
• Step 2: Develop and evaluate the proposed TePF using an intervention study
following Design Principle 2
Chapter 7 – Design Principles
182
Figure 7. 2 Design Principle 3 – Process of design and evaluating the TePF
It is important to note that although this study focused on lab environments for evaluating
TePFs, the design guidelines can be generalised to other learning environments. The design
guidelines are intended to be applicable to general situations outside the context of this
study. Further work is needed to validate these design principles in different contexts.
7.3. Summary
This short chapter provided a reflective view of the research project and derived the design
principles. Three design principles were discussed. The next chapter concludes the thesis.
Design Principle 1
Design Principle 2
TePF intervention
study

Chapter VIII
8. Conclusion
This chapter concludes the thesis. Firstly, the chapter summarises the work carried out in
this thesis along with a discussion of the main findings of the DBR iterations. An outline
of the key contributions of this research is presented in section 8.2. Finally, several
opportunities and recommendations for future research directions are discussed in section
8.3.
8.1. Summary
In many fields of study, hands-on lab activities are paramount for learning. Technology
provides many opportunities to develop lab environments that enable learners to conduct
hands-on activities and experiments. Technology-enhanced labs are broadly classified in
the literature as virtual and remote labs. Although there are many virtual and remote lab
implementations discussed in the literature, there are still no clear guidelines or directions
on how to develop such technology-enhanced labs. Thus, this thesis poses the broad
research question – “How do we design a lab environment to take advantage of technology
for effective learning?” To answer this broad research question, a literature review of
virtual and remote lab implementations was undertaken. The analysis of the survey
provided a number of useful insights. It was evident that technology advances enable
researchers and educators to develop lab environments to provide new opportunities for
learning. However, although the technology provides such opportunities, taking a holistic
view of designing technology-enhanced lab environments by taking into consideration not
only the design of technology artefacts but also how they can be integrated to the
environment to support learning is beneficial. Pedagogy and Learning Theories and
principles (PLTs) can be used as a guide to design such environments. This analysis
resulted in posing the following hypothesis:
Chapter 8 – Conclusion
184
Design of technology-enhanced lab environments taking a holistic view of learning
incorporating curriculum design, lab activities, support tools and technology artefacts
based on sound pedagogical principles and theories have a higher potential for effective
learning.
The thesis aimed to validate the above hypothesis. To validate this hypothesis, a
technology-enhanced lab environment was developed using the TePF and then evaluated.
To test the TePF for a lab environment, a learning context was identified. The TePF was
designed for a system-level course in computing. The system-level course in computing
was chosen due to the fact that in recent years, a number of virtual lab implementations for
system-level courses in computing taking advantage of maturing virtualization and cloud
computing technologies was observed. A literature review of virtual lab implementations
in system-level courses in computing was undertaken. An observation was that, in the
literature, most studies focused on technical design and evaluation while only a handful of
studies considered PLTs in their designs. This confirmed that further research in this
direction was needed.
In Chapter 3, a number of PLTs were reviewed in the design of the TePF for a lab
environment in a systems and network administration course. PLTs considered included
Bigg’s Constructive Alignment, Kolb’s Experiential Learning Cycle (ELC), Collaborative
Learning, Bloom’s and SOLO taxonomies, formative learning and others. A number of
technology artefacts, such as virtual labs, a feedback tool, teacher and student dashboards
and integration of LMS features, were proposed. The TPACK model provided a theoretical
model for the design of the TePF. The proposed TePF was discussed in detail in Chapter
3.
The proposed TePF needs to be developed and evaluated. Chapter 4 presented Design-
Based Research (DBR) as a suitable research methodology to develop and evaluate the
TePF. The proposed framework was developed in close collaboration with practitioners
and evaluated in authentic classroom environments. An iterative process was used to
develop and evaluate the TePF providing feedback and confidence to both researcher and
practitioner on the approach taken. A mixed methods approach (using both quantitative

Chapter 8 – Conclusion
185
and qualitative data) was taken to evaluate the framework by providing multiple sources to
validate the findings.
8.1.1. First Iteration
The main technology artefact of the TePF was the virtual lab environment. There are two
main architectures to implement a virtual lab: a centralised approach and a de-centralised
approach. At the time, the course was using a de-centralised approach to conduct hands-on
activities. Thus, a centralised lab was provided as an option in the last few lab sessions of
the first pilot study. Quantitative and qualitative data were collected through surveys to
evaluate the students’ perspectives of the different approaches. It was clear from the data
analysis that the advantages of centralised labs far outnumbered those of the decentralised
labs. Thus, it was decided to design, use and evaluate centralised labs for the next iteration,
addressing some shortcomings identified through the analysis. The detailed results and
analysis were presented in Chapter 5.
The next most significant technology artefact was the feedback tool. The first version of
the feedback tool was implemented as a set of PowerShell scripts which students could
download and run for the last few lab sessions. The feedback tool was evaluated
quantitatively and qualitatively by students. It was clear that the students were highly
positive about the feedback tool. The fact that the tool provided immediate, detailed, clear
and useful feedback that helped in learning was appreciated. A number of suggestions for
improvement were revealed which were incorporated into the development of the feedback
tool in the next iteration. The detailed results and analysis can be found in Chapter.
Finally, a quasi-experiment was conducted to discover if there was any identifiable impact
on learning outcomes based on the technology artefacts introduced in the last few lab
sessions. No impact was detected based on the practical test scores. It was noted that the
technology artefacts were implemented for only the last few lab sessions and that not all
students participated in the intervention.
Chapter 8 – Conclusion
186
This iteration provided feedback and suggestions for improvement which were
incorporated to the development of the technology artefacts in the next iteration. The next
iteration was implemented to evaluate the entire TePF.
8.1.2. Second Iteration
The second iteration was implemented to evaluate the entire TePF for the lab environment
as presented in Chapter 3. Firstly, this iteration was evaluated for any observable impact to
learning outcomes by the TePF. A quasi-experiment was carried out with the experimental
group using the TePF and control group who did not use the TePF. The mean scores of the
practical tests were higher for the experimental group than the control group and the
differences were statistically significant between the groups. This provided strong evidence
that the learning outcomes were positively impacted by the TePF.
Next, surveys were used to identify which components of the TePF actually contributed
the most to learning. The students rated lab activities as contributing the most to learning.
The lab activities were evaluated using a number of survey instruments from the literature
(Konak & Bartolacci, 2016; Kolb, 1981; Biggs et al., 2001). The findings indicated that
the lab activities catered to all stages of Kolb’s ELC and that the learning process
encouraged a deep approach to learning. These results not only provided evidence of higher
learning outcomes due to the TePF but also that a deeper learning process was encouraged.
The lab activities incorporated a number of PLTs in their design and the benefit of this
approach was validated, supporting the hypothesis presented earlier. Section 6.3.3.1
provided the detailed results and analysis of the lab activities.
The virtual labs were rated as the next highest contributor to learning. Students were highly
positive in their rating of virtual labs (above 4.0 on a 5-Likert scale for all survey
questions). The virtual labs were implemented using a server-based private cloud
implementation. The qualitative results showed that accessibility, convenience, ease of use
and helpfulness in learning were the main advantages of using virtual labs. Improving the
performance of the virtual labs was the main suggestion for improvement. Although most
students preferred to use the centralised labs, a few students preferred to use the de-

Chapter 8 – Conclusion
187
centralised labs due to performance, convenience and flexibility. Section 6.3.3.2 provided
the detailed results and analysis of the virtual labs.
The students were highly satisfied with the real-time feedback provided by the feedback
tool. Although the dashboard was not as popular as the feedback tool, the participants who
used it were satisfied with its functionality. Sections 6.3.3.3 and 6.3.3.4 provided the
detailed results and analyses of the feedback tool and the dashboards.
A number of insights and suggestions to improve the technology artefacts were gathered.
Discussions with the practitioner indicated that many improvements could be implemented
in the future.
Chapter 6 concluded that the TePF design, based on PLTs and using technology artefacts,
yielded significantly higher levels of learning and student satisfaction. Overall, the
application of PLTs in the design of lab environments in this course has been successful as
demonstrated by the results.
8.1.3. Design Principles
The results and analysis of Chapter 6 validated the hypothesis by providing an instance
where the TePF for a lab environment was designed and evaluated taking a holistic view
of learning incorporating curriculum design, lab activities, support tools and technology
artefacts based on sound pedagogical principles and theories resulting in effective learning
– i.e., higher learning outcomes and a deeper approach to learning. However, the process
of designing such lab environments was not addressed. This is needed to completely
answer the overall research question - “How do we design a lab environment to take
advantage of technology for effective learning?”.
In Chapter 7, we reflected on the overall process used in the design, implementation and
evaluation of the TePF. From this activity, we derived the following design principles that
provides guidelines to designing TePF for lab environments.
Chapter 8 – Conclusion
188
• Design Principle 1: Consider the learning context, review of existing work,
technology advances/capabilities and educational theories/principles in the design
of technology environment, innovation or intervention.
• Design Principle 2: Use of DBR methodology in authentic learning contexts with
mixed methods approach provides a framework for developing and evaluating
technology-enhanced learning environments.
• Design Principle 3: Follow the steps below to design and evaluate a TePF
intervention study:
o Step 1: Design a TePF using Design Principle 1
o Step 2: Develop and evaluate the proposed TePF using an intervention study
following Design Principle 2
The above design principles have provided basic guidelines to answering the main research
question – “How do we design a lab environment to take advantage of technology for
effective learning?”. Further work is needed to gather additional evidence to support while
extending/refining the above design principles to address the broad research question.
It is important to note that an endeavour such as designing and deploying TePF mentioned
in this thesis has undertakings in terms of costs and overheads. The proposed TePF had
overheads and costs including development of technology artefacts; revision of course
materials; acquiring, configuring, managing and deployment of virtual lab infrastructure;
management of meta-data, and others. The management of virtual lab infrastructure include
network access and connectivity to lab resources, back-ups, etc. A close collaboration with
technical teams, management and academics is encouraged in such endeavours. The use
public cloud providers such as Amazon’s AWS (https://aws.amazon.com/), Microsoft’s
Azure (https://azure.microsoft.com/en-us/), may be deemed effective and effective to
deploy virtual computing labs in particular contexts.
The next section presents the main contributions of the thesis.

Chapter 8 – Conclusion
189
8.2. Main Contributions
The main contributions of this research project include:
• Literature review on technology-enhanced labs in different disciplines: A
comprehensive literature review of virtual and remote labs implemented in different
disciplines was performed. This review provided a number of insights on the
benefits of technology-enhanced labs.
• Identified research gaps: From the literature review, it was clear that there were no
clear guidelines, methodologies or frameworks to follow when integrating
technology-enhanced labs in different educational contexts in order to enhance
learning.
• An approach to designing technology-enhanced lab environments geared towards
achieving learning goals: The analysis of the literature review provided pointers to
address the research gap. The use of PLTs in the design of technology-enhanced
lab environments geared towards achieving learning goals was proposed and
evaluated in this study.
• Comprehensive literature review of virtual labs using virtualization in system-level
courses in computing: A literature review of virtual labs in system-level courses in
computing utilising virtualization and cloud computing technologies was
conducted. The studies were classified into Level I and Level II studies. Level I –
Technical Design and/or Evaluation – included studies that focused on technical
design and evaluation (and optionally evaluated learning impact). Level II –
Technology, Pedagogy and Evaluation – included studies that considered PLTs in
the design of virtual labs. It is important to note that only a few studies were classed
as Level II compared to Level I, indicating that further work in Level II studies is
needed.
• A TePF was designed for a lab environment in a systems and network
administration course. This study provided a comprehensive architecture,
implementation and evaluation of the TePF for a lab environment in a systems and
network administration course. The TePF applied PLTs in its design. The students

Chapter 8 – Conclusion
190
achieved higher learning outcomes and also took a deeper approach to learning
using the TePF.
• Innovative Technology Artefacts – virtual labs, feedback tools and dashboards. The
thesis proposed, implemented and evaluated a number of technology artefacts using
a mixed methods approach. A virtual lab based on nested virtualization using
Microsoft’s Hyper-V platform was implemented and evaluated. An innovative
feedback tool that provided instant feedback for hands-on lab activities was
implemented and evaluated. Teacher and student dashboards that provided
students’ progress on lab work were implemented and evaluated.
• A methodology to implement the TePF: The DBR methodology was applied along
with a mixed methods approach to an intervention study to design, develop and
evaluate the TePF.
• Design Principles: A number of design principles were derived that can be help and
guide future development and application of technology interventions in education
contexts including lab environments. .
The next section concludes the chapter by outlining future research directions.
8.3. Future Work
We can classify future work into two categories: Future work to improve the proposed
framework for Systems and Network Administration course based on the TePF evaluation;
and future work to improve the guidelines, methodologies to enable technology
innovations in educational context.
Evaluation of the TePF provided a number of suggestions and improvements for the future.
Upon discussion with the practitioner, it was clear that many of these suggestions can be
taken on board in future iterations.
• Provide choice of centralised and decentralised labs: It was clear that although
centralised labs provided a number of advantages over decentralised labs, some
students preferred to use decentralised labs, especially where their personal
machines had sufficient resources to run multiple VMs and the lab environment.

Chapter 8 – Conclusion
191
This may provide more flexibility and better performance while also reducing the
resources needed to provide centralised labs. Thus, in the future, the practitioner
agreed to provide both options for students with lab instructions that will clearly
state that students can use either centralised or decentralised labs. The feedback tool
and dashboards will be updated to work on decentralised architectures.
• Address performance issues in centralised labs: A major concern with the
centralised labs was intermittently slow performance on host VMs. To overcome
this, the practitioner agreed to provide more resources to the host VM, especially
in terms of virtual CPUs and memory.
• Flexibility with features such as checkpoints: To provide students with flexibility,
the practitioner agreed to discuss and provide documentation for features such as
checkpointing to allow students to rollback to a previous state of the VMs (i.e., how
to reset/restore a VM state).
• Improved interface: A seamless interface integrating course content, lab materials,
virtual labs, the feedback tool and the dashboards will be provided.
• Incorporate Unix-based labs: The practitioner agreed that content needs to be
updated so as to cover Unix-based labs.
• Improvement of lectures: Students commented that the lectures are lengthy and
could be improved. The practitioner agreed that, given that the labs had been
revised and improved, the lectures could also be improved in the future.
• Improve labs: A few students suggested having short video tutorials on
configurations and tutor demonstrations. This was discussed with the practitioner.
The other category of future work is to provide further evidence in support methodologies
and guidelines for designing technology interventions in educational contexts. A limitation
of the design principles derived in this research project addressing methods/guidelines for
technology interventions in educational contexts is that the design principles were derived
based on a single intervention study for a lab environment in a system-level course in
computing. Further work in applying the design principles in other contexts and

Chapter 8 – Conclusion
192
intervention studies will enable to further refine and develop guidelines for such
technology interventions. Future research directions can include extending to other subject
areas (not necessarily systems-level courses in computing), not limited to lab environments
but also technology innovations in education in general and evaluating with different
cohorts – online/distance learning.

References
Abdulwahed, M., & Nagy, Z. K. (2009). Applying Kolb's experiential learning cycle for laboratory
education. Journal of Engineering Education, 98(3), 283-294.
Achuthan, K., Sreelatha, K., Surendran, S., Diwakar, S., Nedungadi, P., Humphreys, S., . . .
Deepthi, A. (2011). The VALUE@ Amrita Virtual Labs Project: Using web technology to
provide virtual laboratory access to students. Paper presented at the Global Humanitarian
Technology Conference (GHTC), 2011 IEEE.
Alam, F., Hadgraft, R. G., & Subic, A. (2014). Technology-enhanced laboratory experiments in
learning and teaching. In Using Technology Tools to Innovate Assessment, Reporting, and
Teaching Practices in Engineering Education (pp. 289-302). IGI Global.
Alharbie, N., Athauda, R., & Simon, S. (2012). An Analysis of Students' Perspectives in using
Virtual Labs in an Undergraduate IT Course. ACTA international conferences in the
general areas of engineering and computer science.
Alkhaldi, T., Pranata, I., & Athauda, R. I. (2016). A review of contemporary virtual and remote
laboratory implementations: observations and findings. Journal of Computers in
Education, 3(3), 329-351.
Anderson, L. & Krathwohl, D. (2001). A Taxonomy for Learning, Teaching and Assessing: A
Revision of Bloom’s Taxonomy of Educational Objectives. New York: Longman.
Anderson, L. W., Krathwohl, D. R., Airiasian, W., Cruikshank, K. A., Mayer, R. E., & Pintrich, P.
R. (2001). A taxonomy for learning, teaching and assessing: A revision of Bloom's
Taxonomy of educational outcomes: Complete edition. NY: Longman.
Anisetti, M., Bellandi, V., Colombo, A., Cremonini, M., Damiani, E., Frati, F., ... & Rebeccani, D.
(2007). Learning computer networking on open paravirtual laboratories. IEEE
Transactions on Education, 50(4), 302-311.
Athauda, R., Alkhaldi, T., Pranata, I., Daniel, D., Frank, C., Thorne, W. & Dean, R., (2018).
“Design of a Technology-Enhanced Pedagogical Framework for a Systems and
Networking Administration course incorporating a Virtual Laboratory”. Paper accepted at
the Frontiers in Education Conference (FIE), Vol. 2018.
Barab, S. (2014). Design-based research: A methodological toolkit for engineering change The
Cambridge Handbook of the Learning Sciences (Second ed., pp. 151-170): Cambridge
University Press.
Barab, S., & Squire, K. (2004). Design-based research: Putting a stake in the ground. The journal
of the learning sciences, 13(1), 1-14.
Bayer, A. S. (1990). Collaborative-apprenticeship learning: Language and thinking across the
curriculum, K-12. WCB/McGraw-Hill.
Bazzaza, M. W., & Salah, K. (2015). Using the Cloud to Teach Computer Networks. In Utility and
Cloud Computing (UCC), 2015 IEEE/ACM 8th International Conference on (pp. 310-
314). IEEE.

194
Bennett, R. E. (2011). Formative assessment: A critical review. Assessment in Education:
Principles, Policy & Practice, 18(1), 5-25.
Bergman, M. M. (Ed.). (2008). Advances in mixed methods research: Theories and applications.
Sage.
Biggs, J. (1979). Individual differences in study processes and the quality of learning outcomes.
Higher education, 8(4), 381-394.
Biggs, J. (1999). What the student does: Teaching for enhanced learning. Higher education research
& development, 18(1), 57-75.
Biggs, J. B. (1987). Student approaches to learning and studying. Research monograph. Hawthorn,
Vic: Australian Council for Educational Research.
Biggs, J. B. (2011). Teaching for quality learning at university: What the student does. McGraw-
Hill Education (UK).
Biggs, J. B., & Collis, K. F. (2014). Evaluating the quality of learning: The SOLO taxonomy
(Structure of the Observed Learning Outcome). Academic Press.
Biggs, J., Kember, D., & Leung, D. Y. (2001). The revised two‐factor study process questionnaire:
R‐SPQ‐2F. British journal of educational psychology, 71(1), 133-149.
Black, P. & Wiliam, D. (2005). Inside the black box: Raising standards through classroom
assessment. Granada Learning.
Black, P., & Wiliam, D. (1998). Assessment and classroom learning. Assessment in Education:
principles, policy & practice, 5(1), 7-74.
Black, P., & Wiliam, D. (2004). Working inside the black box: Assessment for learning in the
classroom. Phi delta kappan, 2004. 86(1): p. 8-21.
Border, C. (2007). The development and deployment of a multi-user, remote access virtualization
system for networking, security, and system administration classes. ACM SIGCSE
Bulletin, 39(1), 576-580.
Braun, V., & Clarke, V. (2006). Using thematic analysis in psychology. Qualitative research in
psychology, 3(2), 77-101.
Braun, V., & Clarke, V. (2013). Successful qualitative research: a practical guide for beginnners.
London: Sage Publications Ltd.
Brenner, M. E. (2006). Interviewing in educational research. In J. L. Green, G. Camilli, & P. B.
Elmore (Eds.), Handbook of complementary methods in education research, Mahwah, NJ:
Lawrence Erlbaum.
Brown, A. L. (1992). Design experiments: Theoretical and methodological challenges in creating
complex interventions in classroom settings. Journal of the Learning Sciences, 2(22), 141-
178.
Bryman, A. (2016). Social research methods. Oxford university press.
Bryman, A., & Burgess, R. (Eds.) (1994). Analyzing qualitative data. London, England: Routledge.

195
Burns, R. B. (2000). Introduction to research methods (4th ed.). Frenchs Forest, NSW: Pearson
Education Australia.
Caminero, A. C., Ros, S., Hernández, R., Robles-Gómez, A., Tobarra, L., & Granjo, P. J. T. (2016).
VirTUal remoTe labORatories managEment System (TUTORES): Using cloud computing
to acquire university practical skills. IEEE transactions on Learning Technologies, 9(2),
133-145.
Chamberlin, J., Hussey, J., Klimkowski, B., Moody, W., & Morrell, C. (2017). The Impact of
Virtualized Technology on Undergraduate Computer Networking Education. In
Proceedings of the 18th Annual Conference on Information Technology Education (pp.
109-114). ACM.
Chao, L. (2014). Application of Infrastructure as a Service in IT Education. American Journal of
Information Systems, 2(2), 42-48.
Chaos, D., Chacon, J., Lopez-Orozco, J. A., & Dormido, S. (2013). Virtual and remote robotic
laboratory using EJS, MATLAB and LabVIEW. Sensors, 13(2), 2595-2612.
Chen, W., & Looi, C. K. (2007). Incorporating online discussion in face to face classroom learning:
a new blended learning approach. Australasian Journal of Educational Technology, 23(3),
307-326.
Collins, A., Joseph, D., & Bielaczyc, K. (2004). Design research: Theoretical and methodological
issues. Journal of the Learning Sciences, 13(1), 15-42.
Creswell, J. W. (2013). Research design: Qualitative, quantitative, and mixed methods approaches.
Thousand Oaks, CA: Sage Publications.
Creswell, J. W. (2015). Educational research: Planning, conducting, and evaluating quantitative
(5th ed.). Sydney: Pearson Australia.
Creswell, J. W., & Plano Clark, V. (2007). Designing and conducting mixed methods research.
Thousand Oaks, CA: Sage.
Creswell, J. W., & Tashakkori, A. (2007). Editorial: differing perspectives on mixed methods
research. Journal of Mixed Methods Research, 1(4), 303-308.
Davis Jr, F. D. (1985). A technology acceptance model for empirically testing new end-user
information systems: Theory and results. (Doctoral Thesis), Massachusetts Institute of
Technology.
Davis, F. D. (1986). A technology acceptance model for empirically testing new end-user
information systems: theory and results. Doctoral dissertation, Sloan School of
Management, Massachusetts Institute of Technology, Cambridge, MA.
Davis, F. D. (1989). Perceived usefulness, perceived ease of use, and user acceptance of
information technology. MIS Quarterly, 13(3), 319-340.
Davis, F. D., & Venkatesh, V. (1996). A critical assessment of potential measurement biases in the
technology acceptance model: three experiments. International Journal of Human-
Computer Studies, 45(1), 19-45.

196
de Jong, T., Linn, M. C., & Zacharia, Z. C. (2013). Physical and virtual laboratories in science and
engineering education. Science, 340(6130), 305-308.
de Jong, T., Sotiriou, S., & Gillet, D. (2014). Innovations in STEM education: the Go-Lab
federation of online labs. Smart Learning Environments, 1(1), 1-16.
Design-Based Research Collective (2003). Design-based research: An emerging paradigm for
educational inquiry. Educational Researcher, 32(1), 5-8.
Ding, Y., & Fang, H. (2009). Using a simulation laboratory to improve physics learning: a case
exploratory learning of diffraction grating. Paper presented at the Education Technology
and Computer Science, 2009. ETCS'09. First International Workshop on.
Dinita, R. I., Wilson, G., Winckles, A., Cirstea, M., & Jones, A. (2012). A cloud-based virtual
computing laboratory for teaching computer networks. In Optimization of Electrical and
Electronic Equipment (OPTIM), 2012 13th International Conference on (pp. 1314-1318).
IEEE.
Doyle, L., Brady, A. M., & Byrne, G. (2009). An overview of mixed methods research. Journal of
Research in Nursing, 14(2), 175-185.
Duffy, T., & Cunningham, D. (1996). Constructivism: implications for the design and delivery of
instruction. Context, 171(4), 170-198.
Duignan, S., & Hall, T. (2008). Using Platform Virtualization to Teach System Architectures in
Undergraduate Computer Science–An Evaluation of Student Learning Experiences.
In Innovative Techniques in Instruction Technology, E-learning, E-assessment, and
Education (pp. 479-484). Springer, Dordrecht.
Elawady, Y., & Tolba, A. (2009). Educational objectives of different laboratory types: A
comparative study. arXiv preprint arXiv:0912.0932.
Gaspar, A., Langevin, S., Armitage, W., Sekar, R., & Daniels, T. (2008). The role of virtualization
in computing education. In ACM sIGCsE bulletin (Vol. 40, No. 1, pp. 131-132). ACM.
Gatignon, H. (2010). Confirmatory factor analysis. In Statistical analysis of management data (pp.
59-122). Springer, New York, NY.
Gercek, G., Saleem, N., & Steel, D. (2016). Implementing cloud based virtual computer network
labs for online education: Experiences from a phased approach. International Journal of
Online Engineering (iJOE), 12(03), 70-76.
Gibbs, G. (2010). Using assessment to support student learning. Leeds Met Press.
Glasersfeld, E. von (1995). Radical constructivism: a way of knowing and learning. London,
England: RoutledgeFalmer.
Gokhale, A. A. (1995). Collaborative learning enhances critical thinking. Volume 7 Issue 1 (fall
1995).
Greene, J. C., Caracelli, V. J., & Graham, W. F. (1989). Toward a conceptual framework for mixed-
method evaluation designs. Educational Evaluation and Policy Analysis, 11(3), 255-274.
197
Guba, E. G., & Lincoln, Y. S. (2004). Competing paradigms in qualitative research. In S. Hesse-
Biber, & P. Leavy (Eds.), Approaches to qualitative research: a reader on theory and
practice. New York, NY: Oxford University Press.
Hair, J. F., Anderson, R. E., Tatham, R. L. & Black, W. C. (2003). Multivariate Data Analysis (5th Ed.), Pearson Education, India.
Hardré, P. L. (2005). Instructional design as a professional development tool-of-choice for graduate
teaching assistants. Innovative Higher Education, 30(3), 163-175.
Harward, V. J., Del Alamo, J., Lerman, S. R., Bailey, P. H., Carpenter, J., DeLong, K., . . . Jabbour,
I. (2008). The ilab shared architecture: A web services infrastructure to build communities
of internet accessible laboratories. Proceedings of the IEEE, 96(6), 931-950.
Hattie, J. and Timperley, H. (2007). The power of feedback. Review of educational research. 77(1):
p. 81-112.
Heritage, M. (2007). Formative assessment: What do teachers need to know and do?. Phi Delta
Kappan, 89(2), 140-145.
Herrington, J., McKenney, S., Reeves, T., & Oliver, R. (2007). Design-based research and doctoral
students: Guidelines for preparing a dissertation proposal. Paper presented at the World
Conference on Educational Multimedia, Hypermedia and Telecommunications 2007
Chesapeake, VA.
Herrmann, N. (1995). The Creative Brain. Quebecor Printing Book Group: Kingsport, TN.
Hossain, Z., Jin, X., Bumbacher, E., Chung, A., Koo, S., Shapiro, J. D., . . . Blikstein, P. (2015).
Interactive Cloud Experimentation for Biology: An Online Education Case Study. Paper
presented at the Proceedings of the 33rd Annual ACM Conference on Human Factors in
Computing Systems.
Hu, D. & Wang, Y. (2008). Teaching computer security using Xen in a virtual environment. in
International Conference on Information Security and Assurance (ISA 2008), IEEE.
Hu, L. T., & Bentler, P. M. (1999). Cutoff criteria for fit indexes in covariance structure analysis:
Conventional criteria versus new alternatives. Structural equation modeling: a
multidisciplinary journal, 6(1), 1-55.Abdulwahed, M., & Nagy, Z. K. (2009). Applying
Kolb's experiential learning cycle for laboratory education. Journal of Engineering
Education, 98(3), 283-294.
Hwang, W.-Y., Kongcharoen, C., & Ghinea, G. (2014). To enhance collaborative learning and
practice network knowledge with a virtualization laboratory and online synchronous
discussion. The International Review of Research in Open and Distributed Learning, 15(4).
Javid, S. R. (2014). Role of Packet Tracer in learning Computer Networks. International Journal of
Advanced Research in Computer and Communication Engineering, 3(5), 6508-6511.
Johnson, B. & Christensen, L. (2008). Educational research: quantitative, qualitative, and mixed
approaches (3rd ed.). Thousand Oaks, CA: Sage.
Johnson, R. B., & Onwuegbuzie, A. J. (2004). Mixed methods research: A research paradigm

198
whose time has come. Educational researcher, 33(7), 14-26.
Johnson, R. B., Onwuegbuzie, A. J., & Turner, L. A. (2007). Toward a definition of mixed methods
research. Journal of mixed methods research, 1(2), 112-133.
Johnson, R., & Onwuegbuzie, A. (2004). Mixed methods research: a research paradigm whose time
has come. Educational Researcher, 33(7), 14-26.
Jonassen, D. H., & Grabowski, B. L. (1993). Handbook of Individual Differences, Learning, and
Instruction. New Jersey: Lawrence Erlbaum Associates.
Jung, I., Choi, S., Lim, C., & Leem, J. (2002). Effects of different types of interaction on learning
achievement, satisfaction and participation in web-based instruction. Innovations in
Education and Teaching International, 39(2), 153-162.
Kaplan, B., & Maxwell, J. A. (2005). Qualitative research methods for evaluating computer
information systems. In Evaluating the organizational impact of healthcare information
systems (pp. 30-55). Springer, New York, NY.
Kearsley, G. & Culatta., R. . (2011). Instructional Design.org from
http://www.instructionaldesign.org/(Retrieved March 24, 2016).
Khan, B. H. (2005). Managing e-learning: design, delivery, implementation, and evaluation.
Hershey, PA: Information Science.
Kolb, A. Y., & Kolb. D. A. (2005). Learning styles and learning spaces: enhancing experiential
learning in higher education. Academy of Management Learning & Education, 4(2), 193-
212.
Kolb, D. A. (2014). Experiential learning: Experience as the source of learning and development.
FT press.
Kolb, D. A., Boyatzis, R. E., & Mainemelis, C. (2001). Experiential Learning Theory: Previous
Research and New Directions in Perspectives on Thinking, Learning, and Cognitive Styles
(Educational Psychology Series).
Kolb, David A. (1984). Experiential Learning: Experience as the Source of Learning and
Development. Prentice-Hall, Inc., Englewood Cliffs, N.J.
Kolloffel, B., & Jong, T. (2013). Conceptual understanding of electrical circuits in secondary
vocational engineering education: Combining traditional instruction with inquiry learning
in a virtual lab. Journal of Engineering Education, 102(3), 375-393.
Konak, A. & Bartolacci, M. R. (2016). Using a virtual computing laboratory to foster collaborative
learning for information security and information technology education. Journal of
Cybersecurity Education, Research and Practice. 2016(1): p. 2.
Konak, A., Clark, T. K., & Nasereddin, M. (2014). Using Kolb's Experiential Learning Cycle to
improve student learning in virtual computer laboratories. Computers & Education, 72, 11-
22.
Kongcharoen, C., Hwang, W. Y., & Ghinea, G. (2017). Synchronized pair configuration in
199
virtualization-based lab for learning computer networks. Journal of Educational
Technology & Society, 20(3), 54-68.
Kraiger, K., Ford, J. K., & Salas, E. (1993). Application of cognitive, skill-based, and affective
theories of learning outcomes to new methods of training evaluation. Journal of applied
psychology, 78(2), 311.
Krathwohl, D. R. (2002). A revision of Bloom's taxonomy: An overview. Theory into practice,
41(4), 212-218.
Kuh, G. D. (2008). High-impact educational practices: what they are, who has access to them, and
why they matter. Washington, DC: Association of American Colleges and Universities.
Laal, M. (2013). Positive interdependence in collaborative learning. Procedia-Social and
Behavioral Sciences, 93, 1433-1437.
Laal, M., & Ghodsi, S. M. (2012). Benefits of collaborative learning. Procedia-social and
behavioral sciences, 31, 486-490.
Lahoud, H. A., & Krichen, J. P. (2010). Networking labs in the online environment: Indicators for
success.
Lee, J., & Jang, S. (2014). A methodological framework for instructional design model
development: Critical dimensions and synthesized procedures. Educational Technology
Research and Development, 62(6), 743-765.
Lewis, D. I. (2014). The pedagogical benefits and pitfalls of virtual tools for teaching and learning
laboratory practices in the Biological Sciences.
Li, P. (2009). Exploring virtual environments in a decentralized lab. ACM SIGITE Research in
IT, 6(1), 4-10.
Li, P. and T. (2008). Mohammed. Integration of virtualization technology into network security
laboratory. in Frontiers in Education Conference, 2008. (FIE 2008). IEEE.
Li, P., & Toderick, L. W. (2010). Cloud in cloud: approaches and implementations. In Proceedings
of the 2010 ACM conference on Information technology education (pp. 105-110). ACM.
Li, P., Toderick, L. W., & Lunsford, P. J. (2009). Experiencing virtual computing lab in information
technology education. In Proceedings of the 10th ACM conference on SIG-information
technology education (pp. 55-59). ACM.
Likert, R. (1931). A technique for the measurement of attitudes. Archives of Psychology. New
York: Columbia University Press.
Lowe, D., Conlon, S., Murray, S., Weber, L., De La Villefromoy, M., Lindsay, E., . . . Nageswaran,
W. (2011). Labshare: Towards Cross-Institutional. Internet Accessible Remote
Laboratories: Scalable E-Learning Tools for Engineering and Science Disciplines:
Scalable E-Learning Tools for Engineering and Science Disciplines, 453.
Lustigova, Z., & Novotna, V. (2013). The Role of e-laboratories in Science Education. World
Conference on Computers in Education, 2-8.

200
Ma, J., & Nickerson, J. V. (2006). Hands-on, simulated, and remote laboratories: A comparative
literature review. ACM Computing Surveys (CSUR), 38(3), 7.
Mackenzie, N., & Knipe, S. (2006). Research dilemmas: Paradigms, methods and
methodology. Issues in educational research, 16(2), 193-205.
Makasiranondh, W., Maj, S. P., & Veal, D. (2011, January). A pedagogically rich interactive on-
line learning platform for network technology students in Thailand. In Proceedings of the
Thirteenth Australasian Computing Education Conference-Volume 114 (pp. 161-168).
Australian Computer Society, Inc.
Marques, M. A., Viegas, M. C., Costa-Lobo, M. C., Fidalgo, A. V., Alves, G. R., Rocha, J. S., &
Gustavsson, I. (2014). How Remote Labs Impact on Course Outcomes: Various Practices
Using VISIR. Education, IEEE Transactions on, 57(3), 151-159.
Mason, D. (2013). Design, Implementation and Evaluation of Virtual Learning Environments.
Online Information Review, 37(2), 340-340.
Microsoft, https://docs.microsoft.com/en-us/virtualization/hyper-v-on-windows/user-
guide/nested-virtualization. 2016 b.
Microsoft, https://technet.microsoft.com/en-us/library/mt169373(v=ws.11).aspx. 2016 a
Mishara, P., & Koehler, M. (2006). Technological pedagogical content knowlwdge: A Framework
for teacher knowlwdge. Teacher College Record, 108(6): p. 1017-10541017.
Mishra, P., & Koehler, M. J. (2007). Technological pedagogical content knowledge (TPCK):
Confronting the wicked problems of teaching with technology. In Society for Information
Technology & Teacher Education International Conference (pp. 2214-2226). Association
for the Advancement of Computing in Education (AACE).
Moore, D. S., Craig, B. A., & McCabe, G. P. (2012). Introduction to the Practice of Statistics. WH
Freeman.
Mujkanovic, A., Lowe, D., & Willey, K. (2012). Adaptive group formation to promote desired
behaviours. Paper presented at the Profession of Engineering Education: Advancing
Teaching, Research and Career.
Mujkanovic, A., Lowe, D., Guetl, C., & Kostulski, T. (2011). An architecture for automated group
formation within remote laboratories. Remote Engineering & Virtual Instrumentation, 91-
100.
Nedic, Z., Machotka, J., & Nafalski, A. (2003). Remote laboratories versus virtual and real
laboratories. IEEE, Vol. 1, pp. T3E-T3E.
Newman, D. (1990). Opportunities for research on the organizational impact of school
computers. Educational Researcher, 19(3), 8-13.
Nickerson, J. V., Corter, J. E., Esche, S. K., & Chassapis, C. (2007). A model for evaluating the
effectiveness of remote engineering laboratories and simulations in education. Computers
& Education, 49(3), 708-725.

201
Nicol, D. J., & Macfarlane‐Dick, D. (2006). Formative assessment and self‐regulated learning: A
model and seven principles of good feedback practice. Studies in higher Education,
31(2), 199-218.
Nunnally, J. C., & Bernstein, I. H. (1994). Psychometric theory (3rd ed.). New York: McGrawHill.
Oates, B. J. (2005). Researching information systems and computing. Sage.
Pérez, C., Orduña, J. M., & Soriano, F. R. (2016). A nested virtualization tool for information
technology practical education. SpringerPlus, 5(1), 443.
Plomp, T. (2013). Educational design research: An introduction. Educational design research, 11-
50.
PowerShell, https://docs.microsoft.com/en-us/powershell/.
Prieto-Blázquez, J., Arnedo-Moreno, J., & Herrera-Joancomartí, J. (2008). An integrated structure
for a virtual networking laboratory. IEEE transactions on Industrial Electronics, 55(6),
2334-2342.
Prieto-Blazquez, J., Herrera-Joancomarti, J., & Guerrero-Roldán, A. (2009). A virtual laboratory
structure for developing programming labs. International Journal of Emerging
Technologies in Learning (iJET), 4(2009), 47-52.
Quest vWorkspace - https://support.quest.com/vworkspace/8.6.3.2017
Ramalingam, D. (2007). Practicing computer hardware configuration and network installation in a
virtual laboratory environment: A case study. In Frontiers In Education Conference-
Global Engineering. FIE'07. 37th Annual (pp. F3G-21). IEEE.
Razvan, I., Wilson, G., Winckles, A., Cirstea, M., & Jones, A. (2012). A cloud-based virtual
computing laboratory for teaching computer networks. Paper presented at the Optimization
of Electrical and Electronic Equipment (OPTIM), 2012 13th International Conference on.
Reeves, T. (2006). Design research from a technology perspective. In Educational design
research (pp. 64-78). Routledge.
Reeves, T., Herrington, J., & Oliver, R. (2005). Design research: A socially responsible approach
to instructional technology research in higher education. Journal of Computing in Higher
Education, 16(2), 97-116.
Ruiz-Martínez, P. M., & Skarmeta-Gomez, A. F. (2013). Teaching advanced concepts in computer
networks: Vnuml-um virtualization tool. IEEE Transactions on Learning
Technologies, 6(1), 85-96.
Sadler, D. R. (1998). Formative assessment: Revisiting the territory. Assessment in education:
principles, policy & practice, 5(1), 77-84.
Salah, K., Hammoud, M., & Zeadally, S. (2015). Teaching Cybersecurity Using the Cloud. IEEE
Transactions on Learning Technologies, 8(4), 383-392.
Sancristobal, E., Castro, M., Harward, J., Baley, P., DeLong, K., & Hardison, J. (2010). Integration
view of web labs and learning management systems. Paper presented at the Education

202
Engineering (EDUCON), 2010 IEEE.
Sarkar, N. I., & Petrova, K. (2011). Design and evaluation of a web-based tool for teaching
computer network design to undergraduates. In Web-Based and Blended Educational
Tools and Innovations (pp. 214-234). IGI Global.
Schaffer, H. E., Averitt, S. F., Hoit, M., Peeler, A., Sills, E. D., & Vouk, M. (2009). NCSU's virtual
computing lab: a cloud computing solution. Computer, 42(7), 94-97.
Seiler, S. (2013). Current Trends in Remote and Virtual Lab Engineering. Where are we in 2013?
iJOE, 9(6), 12-16.
Sicker, D. C., Lookabaugh, T., Santos, J., & Barnes, F. (2005). Assessing the effectiveness of
remote networking laboratories. In Frontiers in Education, 2005. FIE'05. Proceedings 35th
Annual Conference (pp. S3F-S3F). IEEE.
Smith, A., & Bluck, C. (2010). Multiuser collaborative practical learning using packet tracer.
In Networking and Services (ICNS), 2010 Sixth International Conference on (pp. 356-
362). IEEE.
Soceanu, A., Vasylenko, M., & Gradinaru, A. (2017). Improving Cybersecurity Skills Using
Network Security Virtual Labs. In Proceedings of the International MultiConference of
Engineers and Computer Scientists 2017 Vol II, IMECS.
Steffe, L. P., & Gale, J. (Eds.) (1995). Constructivism in education. Hillsdale, NJ: Lawrence
Erlbaum.
Stewart, K. E., Humphries, J. W., & Andel, T. R. (2009, March). Developing a virtualization
platform for courses in networking, systems administration and cyber security education.
In Proceedings of the 2009 Spring Simulation Multiconference (p. 65). Society for
Computer Simulation International.
Strauss, A., & Corbin, J. (1998). Basics of qualitative research: Procedures and techniques for
developing grounded theory.
Tashakkori, A., & Teddlie, C. (1998). Mixed methodology: combining qualitative and quantitative
approaches. London, England: Sage.
Tawfik, M., Sancristobal, E., Martin, S., Gil, R., Diaz, G., Colmenar, A., . . . Gustavsson, I. (2013).
Virtual Instrument Systems in Reality (VISIR) for Remote Wiring and Measurement of
Electronic Circuits on Breadboard. Learning Technologies, IEEE Transactions on, 6(1),
60-72. doi:10.1109/TLT.2012.20
Tuysuz, C. (2010). The effect of the virtual laboratory on students’ achievement and attitude in
chemistry. International Online Journal of Educational Sciences, 2(1), 37-53.
van den Akker, J. (1999). Principles and methods of development research. In J. van den Akker, R.
Branch, K. Gustafson, N. Nieveen, & T. Plomp (Eds.), Design approaches and tools in
education and training (pp. 1-14). Dordrecht: Kluwer Academic Publishers.
van den Akker, J., Branch, R., Gustafson, K., Nieveen, N., & Plomp, T. (Eds.) (1999). Design
approaches and tools in education and training. Dordrecht: Kluwer Academic Publishers.

203
Vaughan, B. (2016). Confirmatory factor analysis of the Study Process Questionnaire in an Australian osteopathy student population. International Journal of Osteopathic Medicine, 20, 62-
67.
Vygotsky, L. S. (1978). Mind in society: the development of higher psychological processes. (M.
Cole, V. John-Steiner, S. Scribner & E. Souberman Eds.). Cambridge: Harvard University
Press.
Wang, F., & Hannafin, M. J. (2005). Design-based research and technology-enhanced learning
environments. Educational technology research and development, 53(4), 5-23.
Wannous, M., & Nakano, H. (2010). Constructing and Tuning a Web-based Virtual Computer-
Networks Laboratory. IEEE Multidisciplinary Engineering Education Magazine, 5(2),
p.1-6.
Wannous, M., Nakano, H., Kita, T., & Sugitani, K. (2007). A core system for a webbased virtual
computer laboratory. In Proc. Eighth Int’l Conf. Information Technology in Higher
Education and Training (pp. 196-199).
Willems, C., & Meinel, C. (2012). Online assessment for hands-on cyber security training in a
virtual lab. In Global Engineering Education Conference (EDUCON), 2012 IEEE (pp. 1-
10). IEEE.
Wohlin, C., & Aurum, A. (2015). Towards a decision-making structure for selecting a research
design in empirical software engineering. Empirical Software Engineering, 20(6), 1427-
1455.
Wolf, T. (2010). Assessing student learning in a virtual laboratory environment. Education, IEEE
Transactions on, 53(2), 216-222.
Woodfield, B. F., Andrus, M. B., Andersen, T., Miller, J., Simmons, B., Stanger, R., . . . Allen, R.
(2005). The virtual ChemLab project: A realistic and sophisticated simulation of organic
synthesis and organic qualitative analysis. Journal of Chemical Education, 82(11), 1728.
Woodfield, B. F., Catlin, H. R., Waddoups, G. L., Moore, M. S., Swan, R., Allen, R., & Bodily, G.
(2004). The virtual ChemLab project: a realistic and sophisticated simulation of inorganic
qualitative analysis. Journal of Chemical Education, 81(11), 1672.
Xu, L., Huang, D., & Tsai, W. T. (2014). Cloud-based virtual laboratory for network security
education. IEEE Transactions on Education, 57(3), 145-150.
Yalcin, Nursel, Yalcin Altun, and Utku Kose. (2015. "Educational material development model for
teaching computer network and system management." Computer Applications in
Engineering Education 23, no. 4 (2015): 621-629.
Yan, C. (2011). Bulid a laboratory cloud for computer network education. In Computer Science &
Education (ICCSE), 2011 6th International Conference on (pp. 1013-1018). IEEE.
Young, M. R., Caudill, E. M., & Murphy, J. W. (2008). Evaluating experiential learning
activities. Journal for Advancement of Marketing Education, 13(Winter), 28-40.
Zhang, Y., Liang, R., & Ma, H. (2012). Teaching innovation in computer network course for
undergraduate students with packet tracer. IERI Procedia, 2, 504-510.

204
Zhao, G., & Yuan, S. (2010). Key factors of effecting blended learning satisfaction: a study on
Peking University students. Hybrid Learning, 6248, 282-295.
Zhu, W. (2015). Hands-on network programming projects in the cloud. In Proceedings of the 46th
ACM Technical Symposium on Computer Science Education (pp. 326-331). ACM.

205
Appendix A: Survey– 2016
Comparison of Virtual Lab Environments
As you be familiar with INFT2031, you have the option of doing your labs 8 and 9 work
using external drive (as per the previous labs) as well as the option of using a cloud lab
hosted on Microsoft Azure Dev/Test Lab. In addition, you can run PowerShell feedback
scripts after each lab, which will provide you feedback on your lab work.
1. Did you use the Azure cloud lab? о Yes о No
If no, please explain why?
Section A: Lab Environment - External Drive vs Azure Cloud
Please rate your satisfaction with the following aspects of both lab environments you are
using in weeks 8 & 9:
(SD = Strongly Disagree, D= Disagree, N=Neutral, A= Agree, SA= Strongly Agree) Questions VMware Fusion with external
drive
Cloud lab hosted on Microsoft
Azure Dev/Test Lab
SD D N A SA SD D N A SA
2. The lab environment helped me to learn in INFT2031
3. The lab environment improved my performance
4. The lab environment helped me to achieve
learning outcomes
5. The lab environment provided easy access to the
lab (24x7)
6. Having access to the lab environment from any
device/location (i.e. home etc.) is helpful to me
7. I find it easy to use the lab environment
8. I find the lab setting flexible to conduct my lab
work
9. I am satisfied with using the lab environment for
my practical work in INFT2031
10. I would like to use the lab environment in future
networking and systems administration courses
11. Overall, how would you rate the lab environment Very
Poor
Poor Neutral Good Excellent Very
Poor
Poor Neutral Good Excellent
12. If given the choice to use external drive vs Azure
cloud lab in conducting INFT2031 labs, which
do you prefer?
о External drive о Azure cloud lab
Why?
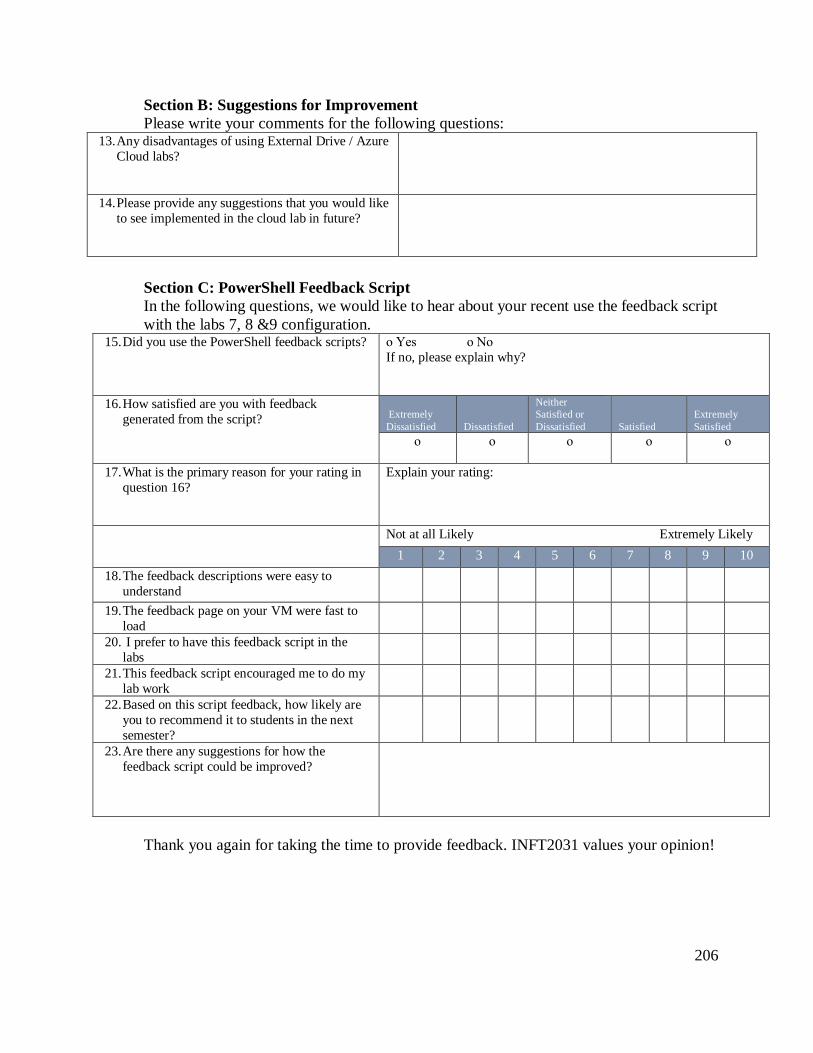
206
Section B: Suggestions for Improvement
Please write your comments for the following questions: 13. Any disadvantages of using External Drive / Azure
Cloud labs?
14. Please provide any suggestions that you would like
to see implemented in the cloud lab in future?
Section C: PowerShell Feedback Script
In the following questions, we would like to hear about your recent use the feedback script
with the labs 7, 8 &9 configuration. 15. Did you use the PowerShell feedback scripts? о Yes о No
If no, please explain why?
16. How satisfied are you with feedback
generated from the script?
Extremely
Dissatisfied Dissatisfied
Neither
Satisfied or
Dissatisfied Satisfied
Extremely
Satisfied
о о о о о
17. What is the primary reason for your rating in
question 16?
Explain your rating:
Not at all Likely Extremely Likely
1 2 3 4 5 6 7 8 9 10
18. The feedback descriptions were easy to
understand
19. The feedback page on your VM were fast to
load
20. I prefer to have this feedback script in the
labs
21. This feedback script encouraged me to do my
lab work
22. Based on this script feedback, how likely are
you to recommend it to students in the next
semester?
23. Are there any suggestions for how the
feedback script could be improved?
Thank you again for taking the time to provide feedback. INFT2031 values your opinion!

207
Appendix B: Survey– 2017
Evaluation of INFT2031 Networking Lab Environment
Section 1: Virtualization Technologies in INFT2031 1. Did you use server environment to configure INFT2031 lab activities? о Yes о No
Please rate your satisfaction with the following aspects of the virtual IT infrastructure labs: (SD = Strongly Disagree, D= Disagree, N=Neutral, A= Agree, SA= Strongly Agree)
Scale Items SD D N A SA
Usefulness 2. Using virtual lab helped me to learn in INFT2031 о о о о о 3. The virtual lab improved my lab performance о о о о о 4. The virtual lab helped me achieve learning outcomes о о о о о
Ease of Use 5. The virtual lab provided easy access to the lab at any
time of the day (24x7)
о о о о о
6. Having access to the virtual lab from any
device/location (i.e. home etc.) is helpful to me
о о о о о
7. I find it easy to use the virtual lab о о о о о 8. I find the virtual lab flexible to conduct my lab work о о о о о
Attitude
9. I am satisfied with using the virtual lab for my
practical work in INFT2031
о о о о о
10. I would like to use Virtual labs in future networking
and systems administration courses
о о о о о
Overall 11. Overall, how would you rate the INFT2031 virtual
laboratories
о Very poor о Poor о Neutral о Good о Excellent
12. If given the choice to use your PC like Fusion in labs vs server
environment in conducting INFT2031 labs, which do you prefer?
о Server environment о PC (VMware
Fusion, Hyper-V)
Why?

208
Section 2: Feedback Tool In the following question, we would like to hear about your views on the use of the feedback tool with the
INFT2031 lab configuration.
1. Did you use the feedback tool? о Yes о No
If no, please explain why?
(Go to Section 3)
2. How satisfied are you with
feedback generated from the tool.
о Extremely
Dissatisfied
о
Dissatisfied
о
Neutral
о Satisfied
о Extremely
Satisfied
3. What is the primary reason for
your rating in question 2 above?
Explain your rating:
Questionnaire item Not at all likely Extremely likely
1 2 3 4 5 6 7 8 9 10
4. The feedback offering descriptions were easy to understand о о о о о о о о о о 5. The feedback page on your VM were fast to load о о о о о о о о о о 6. I prefer to have this feedback tool with the labs о о о о о о о о о о 7. This feedback tool encourage me to do my lab work о о о о о о о о о о 8. Based on this feedback tool, how likely are you to recommend
it to students in next semester?
о о о о о о о о о о
Section 3: Dashboard In the following question, we would like to hear about your views on the use of the dashboard.
1. Did you use the dashboard tool? о Yes о No
If no, please explain why?
(Go to Section 4)
2. How satisfied are you with
dashboard view.
о
Extremely
Dissatisfied
о Dissatisfied
о
Neutral
о
Satisfied
о
Extremely
Satisfied
3. What is the primary reason for your
rating in question 2 above?
Explain your rating:
Questionnaire item Not at all likely Extremely likely
1 2 3 4 5 6 7 8 9 10
4. The dashboard was easy to understand о о о о о о о о о о 5. The dashboard provides feedbacks on my learning activities
and performance
о о о о о о о о о о
6. I prefer to have this dashboard with the labs activities о о о о о о о о о о 7. This dashboard encourage me to do my lab work о о о о о о о о о о 8. How likely are you to recommend using dashboard in next
semester
о о о о о о о о о о
9. I would like to compare my performance with other students о о о о о о о о о о 10. I would like to see my rank in class using the dashboard о о о о о о о о о о

209
Section 4: Suggestions for improvement Please write your comments for the following questions:
1. What do you like most in the virtual IT
infrastructure lab (I.e. virtual lab environment,
feedback tool and dashboard)? Why? Explain your
answer.
2. Which kind of activities helped you most in
learning? (i.e. group work, review questions, online
quizzes, reading activities, discussion boards)
Explain your answer.
3. Any disadvantages of using virtual IT
infrastructure lab?
4. What are the features that you would like to see
implemented in future?
Section 5: Lab Activities Please rate your satisfaction with the following aspects of the lab activities: (SD = Strongly Disagree, D=
Disagree, N=Neutral, A= Agree, SA= Strongly Agree)
Scale Questionnaire item SD D N A SA
Use
fuln
ess
1. The time I spent for the lab activity was worthwhile о о о о о 2. I find the lab activity useful to me о о о о о 3. I would like to do more of similar activities, even if it is time consuming о о о о о 4. The lab activity was very engaging о о о о о 5. The lab activity was pleasurable о о о о о
Inte
ract
ion
6. Interacting with other students helped me complete the lab activity о о о о о 7. I learned new concepts/skills by interacting with other students о о о о о 8. The lab activity encouraged me to ask questions to others
о о о о о
Co
mp
eten
cy
9. The lab activity helped me improved my problem solving skills о о о о о 10. The lab activity improved my technical skills and competency in the
subject area
о о о о о
11. I felt a sense of accomplishment after completing the lab activity о о о о о 12. I will be able to use what I learned in the lab activity in other courses or the
future
о о о о о
Inte
rest
13. The lab activity increased my curiosity and interest in this area о о о о о 14. The lab activity encouraged me to learn more about this topic о о о о о 15. I was very motivated for completing the lab activity о о о о о
Ref
lect
ion
16. The review questions were helpful to reinforce what was performed in the
lab activity
о о о о о
17. The lab activity provided opportunities to reflect back what was learned in the activity
о о о о о
18. The lab activity promoted helpful discussions about what was performed in
the activity
о о о о о
Ch
alle
ng
e
19. The lab activity was challenging о о о о о 20. The activity review questions were difficult and time consuming о о о о о 21. The lab activity instructions were confusing
о о о о о

210
Section 6: Experiential learning stages Please rate your satisfaction with the following aspects of the Experiential Learning Stages (Four Sub
Dimensions Combined): (SD = Strongly Disagree, D= Disagree, N=Neutral, A= Agree, SA= Strongly
Agree)
Sub Dimension Questionnaire item SD D N A SA
Concrete
Experience
1. The lab activities provided me with a direct practical
experience to help understand the course concepts
о о о о о
2. The lab activities gave me a concrete experience that helped
me learn the class material
о о о о о
3. The lab activities presented me with a “real world”
experience related to this course
о о о о о
Reflective
Observation
4. The lab activities assisted me in thinking about what the
course material really means to me
о о о о о
5. The lab activities helped me relate my personal experiences to
the content of this course
о о о о о
6. The lab activities aided me in connecting the course content
with things I learned in the past
о о о о о
Abstract
Conceptualization
7. The lab activities required me to think how to correctly use
the terms and concepts from this class
о о о о о
8. The lab activities caused me to think how the class concepts were inter-related
о о о о о
9. The lab activities made me organize the class concepts into a
meaningful format
о о о о о
Active
Experimentation
10. The lab activities made it possible for me to try things out
for myself
о о о о о
11. The lab activities permitted me to actively test my ideas of
how the course material can be applied
о о о о о
12. The lab activities allowed me to experiment with the course
concepts in order to understand them
о о о о о
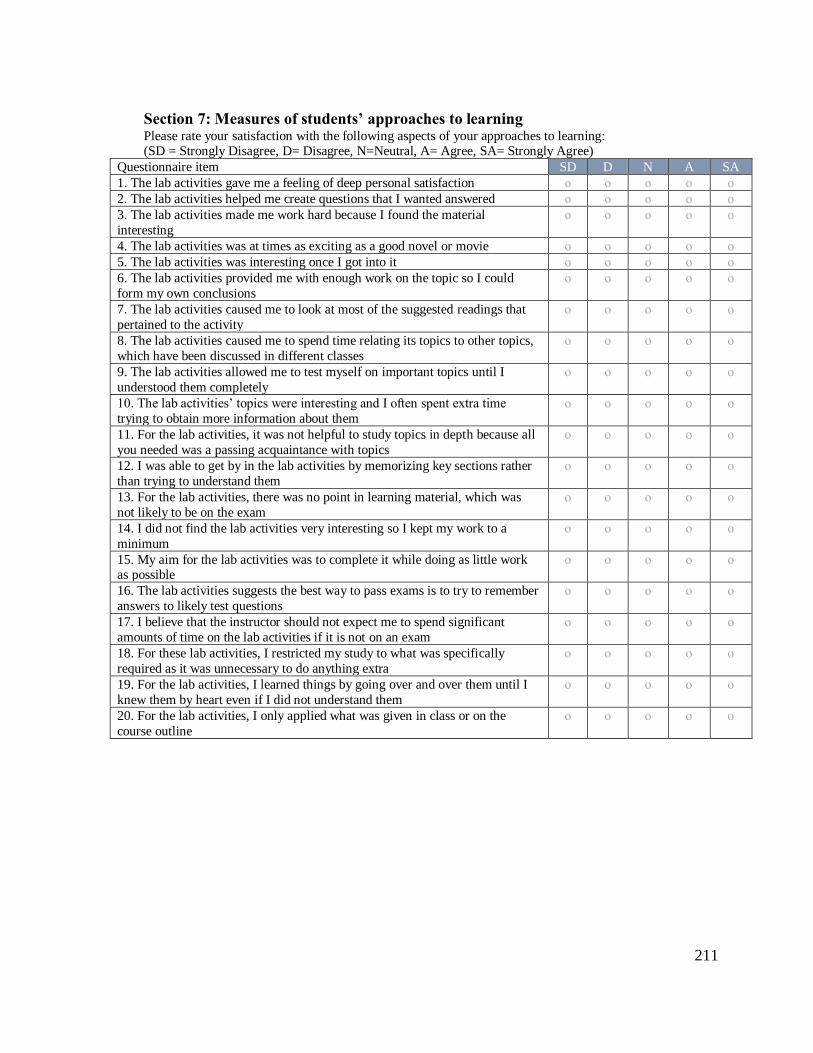
211
Section 7: Measures of students’ approaches to learning Please rate your satisfaction with the following aspects of your approaches to learning: (SD = Strongly Disagree, D= Disagree, N=Neutral, A= Agree, SA= Strongly Agree)
Questionnaire item SD D N A SA
1. The lab activities gave me a feeling of deep personal satisfaction о о о о о 2. The lab activities helped me create questions that I wanted answered о о о о о 3. The lab activities made me work hard because I found the material
interesting
о о о о о
4. The lab activities was at times as exciting as a good novel or movie о о о о о 5. The lab activities was interesting once I got into it о о о о о 6. The lab activities provided me with enough work on the topic so I could
form my own conclusions
о о о о о
7. The lab activities caused me to look at most of the suggested readings that
pertained to the activity
о о о о о
8. The lab activities caused me to spend time relating its topics to other topics,
which have been discussed in different classes
о о о о о
9. The lab activities allowed me to test myself on important topics until I
understood them completely
о о о о о
10. The lab activities’ topics were interesting and I often spent extra time
trying to obtain more information about them
о о о о о
11. For the lab activities, it was not helpful to study topics in depth because all
you needed was a passing acquaintance with topics
о о о о о
12. I was able to get by in the lab activities by memorizing key sections rather
than trying to understand them
о о о о о
13. For the lab activities, there was no point in learning material, which was
not likely to be on the exam
о о о о о
14. I did not find the lab activities very interesting so I kept my work to a
minimum
о о о о о
15. My aim for the lab activities was to complete it while doing as little work as possible
о о о о о
16. The lab activities suggests the best way to pass exams is to try to remember
answers to likely test questions
о о о о о
17. I believe that the instructor should not expect me to spend significant
amounts of time on the lab activities if it is not on an exam
о о о о о
18. For these lab activities, I restricted my study to what was specifically
required as it was unnecessary to do anything extra
о о о о о
19. For the lab activities, I learned things by going over and over them until I
knew them by heart even if I did not understand them
о о о о о
20. For the lab activities, I only applied what was given in class or on the
course outline
о о о о о

212
Section 8: Overall Evaluation Overall, what contributed most significantly to your learning in INFT2031? In other words, what are the
important features to help in learning INFT2031? (Select all that apply)
□ Feedback tool
□ Dashboard
□ Group work
□ Discussion board
□ Quizzes and review questions
□ Lab activities
□ Virtual labs
□ Assignments
□ Lectures
□ Other (please specify)
_______________
Please give on overall rating of each aspect of learning INFT2031:
Poor Excellent
1 2 3 4 5
Lectures о о о о о Discussion board о о о о о Review question and quizzes о о о о о Virtual labs о о о о о Lab activities о о о о о Assignments о о о о о Feedback tool о о о о о Dashboard о о о о о Group work о о о о о
Section 9: Student Information 1. Main reason for taking INFT2031 course: о Required о Interested о Required and
Interested о Other ___________
2. % of lab sessions attended for this course о 0-20% о 21-40% о 41-60% о 61-80% о 81-100%
3. About how many hours do you spend in a
typical 7-days week preparing for class
(studying, reading, configuring labs, and
other activities related to course)
о 1-2 о 3-5 о 6-10 о 11-15 о More than 15
4. Expected grading in the INFT2031course о HD о D о C о Pass о Fail
5. How well has this course met your
expectations?
о Not at all о Not very well
о Adequately о Well о Very well
Thank you again for taking the time to provide feedback. INFT2031 values your opinion!

213
Appendix C: Focus Group Discussion
Research Project:
Design, Implementation and Evaluation of a Learning Support Module for Virtual IT
Infrastructure Laboratory to increase Learning Outcomes
Focus Group Discussion
Sample Discussion Questions: Question
Course Organization Question 1: How did you find the course INFT2031?
The structure, Lectures, Labs, formative assessments (such as quizzes, review
questions, group work, Practical test, etc.).
Virtualization Technology used in labs
Question 2: What is your opinion on the technology used in labs in INFT2031? That is, IT infrastructure such as server environment, nested
virtualization etc.?
What is your opinion on the virtual labs used in labs in INFT2031? Did you
find the virtual labs easy to use?
Learning Support Tools
Question 3: What features did you like in the INFT2031 labs? For example,
did you find the feedback and dashboard with the virtual labs easy to use and
user-friendly?
Overall Evaluation
Question 4: What is your overall opinion about INFT2031? How can
INFT2031 be improved?
Would you recommend it to another student?

214
Appendix D: Screenshots from the Feedback tool and Dashboard
This appendix presents screenshots that show samples of the INFT2031 feedback and
dashboard tool that are provided in the TePF.
Figure D.1 A sample report from feedback tool
Figure D.2 A sample report from student’s dashboard

215
Appendix E: The Redesigned Labs for INFT2031
Table F.1: Teaching and Learning Plan for Systems and Network Administration course
Week Lecture Topics Lab Activities Summative
Assessments
1 L1: Introduction to course, Introduction to
Hardware, OS, Network and
Virtualization basics
2 L2: ISO/OSI Model, TCP/IP Protocol
Suite & OSI Model, Network models,
Windows Shared Folder & NTFS
Permissions
T1: VMs, Win10
installation, review
exercises
3 L3: Network Layer – Logical Addressing
with IPv4
T2: P2P, Shares, review
exercises
4 L4: IPv4 Address Allocation, Internet
Protocol, Routing
T3: Share + NTFS
permissions, review
exercises
5 L5: Topologies, Network Hardware,
Ethernet, Wireless LAN,
T4: Formative
Assessments - Practice
Test 1 + review
exercises
6 L6: Network Operating System T5: Practical Test 1
(PT1) + review
exercises
Practical Test 1
7 L7: DNS
Class Exercise: Network Diagrams
T6: NOS, PowerShell,
review exercises
8 L8: Active Directory T7: DHCP, review
exercises
A1– Network
Design
9 L9: Process-to-process Delivery: TCP &
UDP
T8: Active Directory,
review exercises
10 L10: Network Security Part 1 –
Cryptography, Message confidentiality,
integrity, authentication & non-
repudiation, key management
T9: Group Policy,
review exercises
11 L11: Network Security Part 2 – IPSec,
VPN, SSL, Firewalls, Proxies, VLANs
Class Exercise: AD Network Diagrams
T10: Formative
Assessment - Practice
Test 2, review exercises
12 L12: Review, Q&A T11: Practical Test 2
(PT2), review exercises
A2: AD Design,
Practical Test 2
Exam Period Formal Exam

216
Lab 1: Instructions in creating a virtual machine
Task 1: Instructions in creating a virtual machine (CE)
Task 2: Instructions on installing guest OS on VM (CE)
Task 3: Review Questions (Group Activity, Peer
Marking)
(RO, AC)
(BL1-BL5)
Task 4: Instructions in exploring OS UI, Apps, etc. (CE)
(AE) Task 5: Activity - Configuring and
Personalizing OS
Task 6: Instructions in exploring Hardware & Sys
Info, File System (CE)
Task 7: Instructions in exploring OS Security and
Privacy settings (CE)
Task 8: Group Activity - Explore and
evaluate 2 new features
(AE)
(BL5)
Task 9: Review Questions (Group Activity, Peer
Marking)
(RO, AC)
(BL1-BL4)
Task 10: Exploratory Activity- Install new guest
OS, explore and evaluate two features
(AE) (BL5)

217
Lab 2: P2P
Task 1: Finding Physical/MAC address, Finding IP
address (IPv4)
(CE)
Task 2: Packet Internet Groper (PING)
(CE)
Task 3: Exploring network utilities
(RO, AC)
(BL1-BL5)
Task 4: Configuring a Peer-to-Peer network
Creating a second Windows 8.1 Virtual Machine,
Configuring static IPs for the VMs (CE)
(AE) Task 5: Activity - testing a Peer-to-Peer
network
Task 6: Renaming computers and joining a
Workgroup
(CE)
Task 7: Create users and groups in each VM (PC1
and PC2). (CE)
(CE) Task 8: Create folders in PC1 and share them
to other machines in the workgroup.
Task 9: Review Questions (Group Activity, Peer
Marking)
(RO, AC)
(BL1-BL4)
Task 10: Exploratory Activity- Verify that the
folders are accessible from remote machine (i.e.
PC2).
(AE)
(BL5)

218
Lab 3: NTFS permissions
Task 1: Review Lab 2 (CE)
Task 2: NTFS permissions- Review NTFS
Standard and Special Permissions
(CE)
Task 3: Configuring and verifying Standard NTFS
Folder permissions
(RO, AC)
(BL1-BL5)
Task 4: Configuring and verifying Standard NTFS
File permissions
(AE)
Task 5: Applying Deny permissions
Task 6: Configuring and verifying NTFS Special
permissions
(CE)
Task 7: Exploratory Exercise - NTFS
and Shared Folder Permissions Using
Computer Management snap-in to view
Shared folders
(CE)
(CE)
Task 8: Exploratory Activity- Group
Activity - explore other test cases
(AE)
(BL5)
Task 9: Review Questions (Group Activity, Peer
Marking)
(RO, AC)
(BL1-BL4)

219
Lab 4: Practice Practical Test 1 & Review Questions
Lab 5: Practical Test 1 + Review Questions
Part I: Practice Practical Test
Part III: Review Exercises
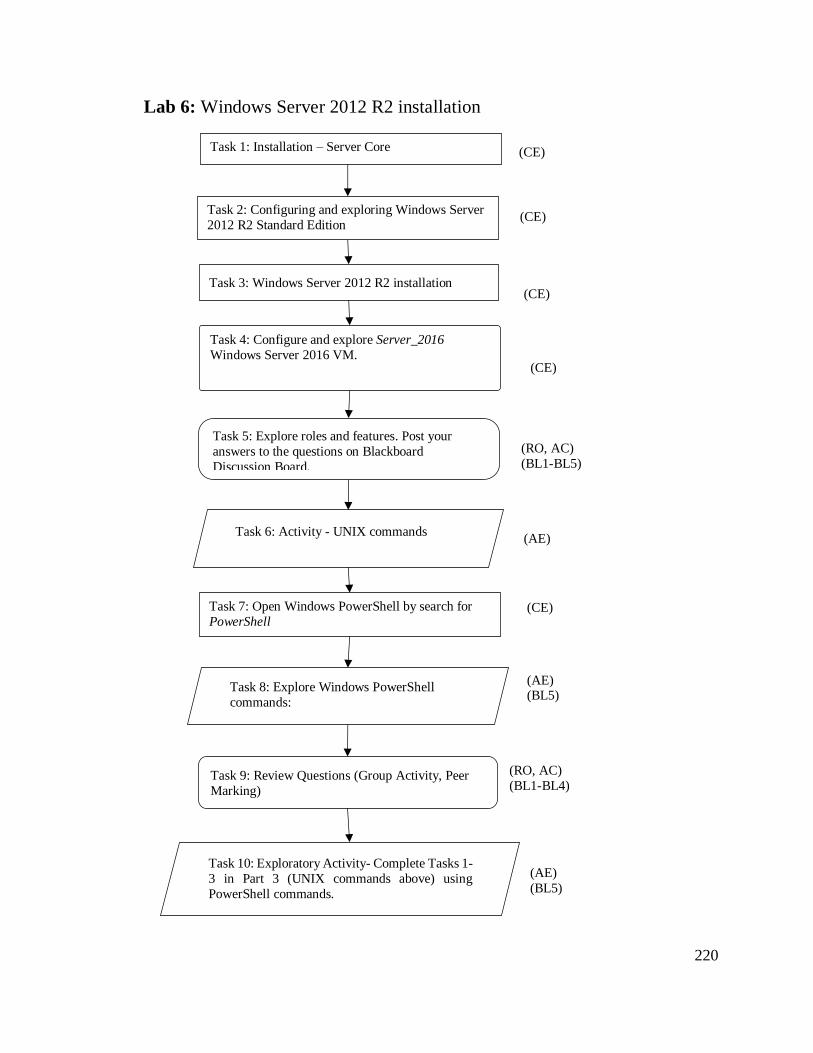
220
Lab 6: Windows Server 2012 R2 installation
Task 1: Installation – Server Core (CE)
Task 2: Configuring and exploring Windows Server
2012 R2 Standard Edition (CE)
Task 3: Windows Server 2012 R2 installation
(RO, AC)
(BL1-BL5)
Task 4: Configure and explore Server_2016
Windows Server 2016 VM.
(CE)
(AE) Task 6: Activity - UNIX commands
Task 5: Explore roles and features. Post your
answers to the questions on Blackboard
Discussion Board.
(CE)
Task 7: Open Windows PowerShell by search for
PowerShell (CE)
Task 8: Explore Windows PowerShell
commands:
(AE) (BL5)
Task 9: Review Questions (Group Activity, Peer
Marking)
(RO, AC)
(BL1-BL4)
Task 10: Exploratory Activity- Complete Tasks 1-
3 in Part 3 (UNIX commands above) using
PowerShell commands.
(AE)
(BL5)

221
Lab 7: DHCP
Task 1: DHCP Overview- How DHCP works?
(CE)
Task 2: Installing DHCP Server Service (CE)
Task 3: Run feedback script and discuss the result
with your partner.
(RO, AC)
(BL1-BL5)
Task 4: Configuring DHCP Scopes (CE)
(RO, AC) Task 5: What if you do not see the domain? (Possible
problems).
Task 6: Activity - Configuring advanced DHCP
options (CE)
Task 7: IP Address Range, Exclusions and Delay,
Lease Duration (CE)
Task 8: Group Activity - Analysis figure
above by comparing with the feedback outcomes
(AE)
(BL5)
Task 9: Review Questions (Group Activity, Peer
Marking)
(RO, AC)
(BL1-BL4)
Task 10: Exploratory Activity- You are
provided with a PowerShell script (Lab7-
script.ps1) which aims to provide feedback on
your lab. Test this configuration with your
partner.
(AE)
(BL5)

222
Lab 8: Active Directory
Task 3: Adding Server Roles and Features using
Server Manager Tool
(CE)
Task 1: Windows Server 2012 R2 has static IP
address (Server do not get different IP Address) (CE)
Task 2: How AD works? Install Active Directory
Domain Services and discuss some various
contexts in which the AD is used.
(CE)
Task 4: Install Active Directory Domain Services
(CE)
Task 6: Create a New Domain/Forest (CE)
Task 5: Install the DNS feature
Task 7: How will you verify whether the AD
installation is proper?
(RO)
(RO)
(AE) Task 8: Activity - Authorizing DHCP
Server: If the DHCP server is not a
member of an Active Directory domain,
you will not see the Authorize option.
Task 9: Creating and Managing Users and Groups
(CE)
Task 10: Review Questions (Group Activity, Peer
Marking)
Task 11: Group Activity - Exploratory Activity
(AE)
(BL5)
(RO, AC)
(BL1-BL4)
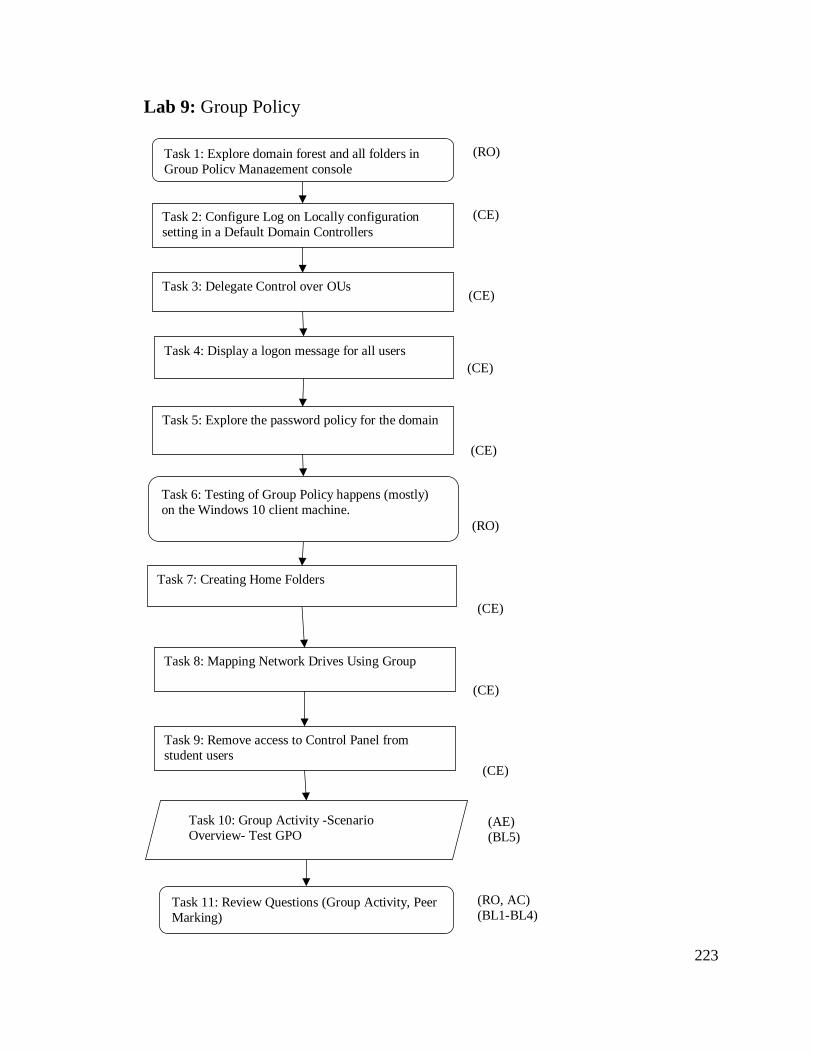
223
Lab 9: Group Policy
Task 2: Configure Log on Locally configuration
setting in a Default Domain Controllers
(CE)
Task 1: Explore domain forest and all folders in
Group Policy Management console
(RO)
Task 3: Delegate Control over OUs (CE)
(CE)
Task 4: Display a logon message for all users
Task 9: Remove access to Control Panel from
student users
(CE)
Task 7: Creating Home Folders
Task 8: Mapping Network Drives Using Group
(CE)
(RO)
(CE)
Task 5: Explore the password policy for the domain
(CE)
Task 10: Group Activity -Scenario
Overview- Test GPO
(AE)
(BL5)
Task 11: Review Questions (Group Activity, Peer
Marking)
(RO, AC)
(BL1-BL4)
Task 6: Testing of Group Policy happens (mostly)
on the Windows 10 client machine.
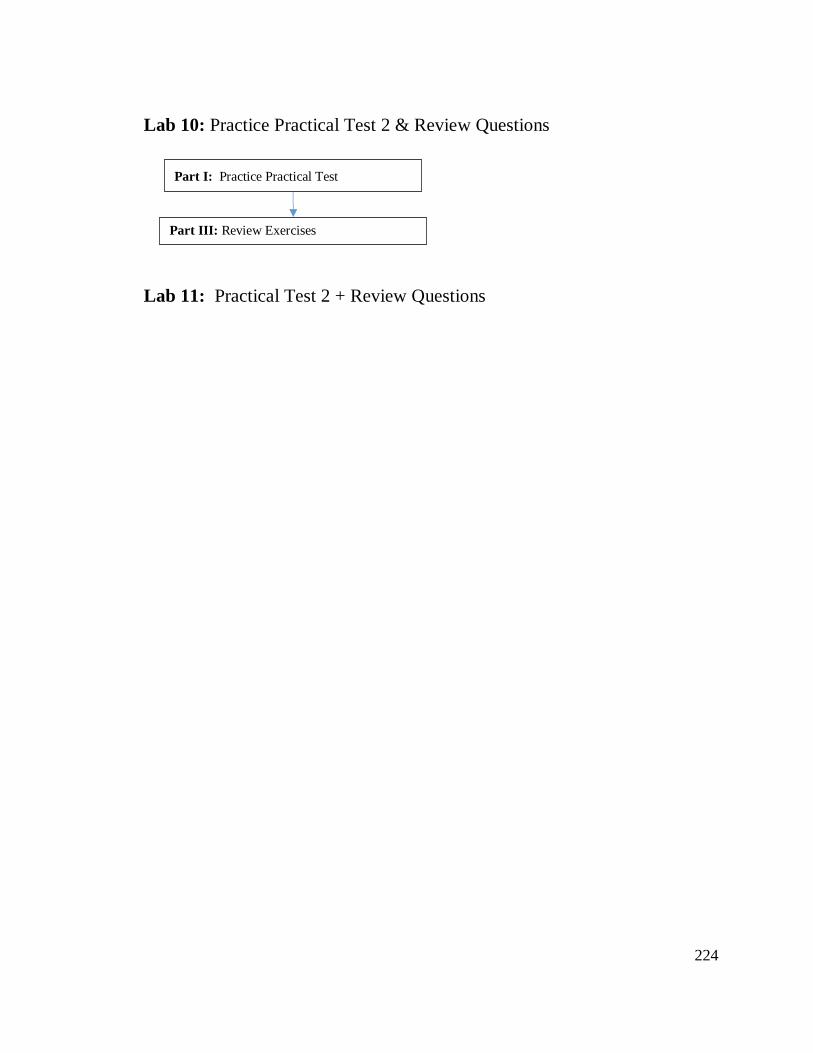
224
Lab 10: Practice Practical Test 2 & Review Questions
Lab 11: Practical Test 2 + Review Questions
Part I: Practice Practical Test
Part III: Review Exercises

225
Appendix F: Reliability Statistics
Correlations Matrix, Factor Analysis and Reliability of the Latent Variables
Pearson correlations among the items for the VMware virtual lab version (n = 83) - 2016
PU1 PU2 PU3 PEU1 PEU2 PEU3 PEU4 AT1 AT2
1. The lab environment helped me to learn in
INFT2031
1.000 .650 .748 .344 .319 .574 .491 .511 .429
2. The lab environment improved my
performance
1.000 .666 .320 .405 .459 .371 .646 .493
3. The lab environment helped me to achieve
learning outcomes
1.000 .239 .255 .506 .387 .442 .291
4. The lab environment provide easy access to the
lab (24x7)
1.000 .471 .387 .577 .446 .459
5. Having access to the lab environment from
device/cloud (home etc.) is helpful to me
1.000 .344 .329 .419 .410
6. I find it easy to use the lab environment 1.000 .623 .595 .411
7. I find the lab setting flexible to conduct my lab
work
1.000 .603 .476
8. I am satisfied with using the lab environment
for my practical work in INFT2031
1.000 .697
9. I would like to use the lab environment in
future networking and systems administration
courses
1.000
Cronbach's Alpha = .870
1) Inter-Item Correlation Matrix Perceived Usefulness
Cronbach's Alpha = .868 PU1 PU2 PU3
PU1 1.000 .650 .748
PU2 1.000 .666
PU3 1.000
2) Inter-Item Correlation Matrix Perceived Ease of Use
Cronbach's Alpha = .751
PEU1 PEU2 PEU3 PEU4
PEU1 1.000 .471 .387 .577
PEU2 1.000 .344 .329
PEU3 1.000 .623
PEU4 1.000
3) Inter-Item Correlation Matrix Attitude toward using
Cronbach's Alpha=.810
AT1 AT2
AT1 1.000 .697
AT2 1.000

226
Pearson correlations among the items for the Azure virtual lab version (n = 64) - 2016
PU1 PU2 PU3 PEU1 PEU2 PEU3 PEU4 AT1 AT2
1. The lab environment helped me to learn in
INFT2031
1.000 .569 .553 .530 .389 .661 .539 .462 .652
2. The lab environment improved my
performance
1.000 .717 .546 .296 .533 .387 .518 .447
3. The lab environment helped me to achieve
learning outcomes
1.000 .361 .515 .652 .506 .524 .480
4. The lab environment provide easy access to the
lab (24x7)
1.000 .425 .501 .529 .352 .400
5. Having access to the lab environment from
device/cloud (home etc.) is helpful to me
1.000 .478 .506 .533 .566
6. I find it easy to use the lab environment 1.000 .773 .572 .576
7. I find the lab setting flexible to conduct my lab
work
1.000 .624 .578
8. I am satisfied with using the lab environment
for my practical work in INFT2031
1.000 .580
9. I would like to use the lab environment in
future networking and systems administration
courses
1.000
Cronbach's Alpha = .905
1) Inter-Item Correlation Matrix Perceived Usefulness
Cronbach's Alpha = .824 PU1 PU2 PU3
PU1 1.000 .569 .553
PU2 1.000 .717
PU3 1.000
2) Inter-Item Correlation Matrix Perceived Ease of Use
Cronbach's Alpha = .816
PEU1 PEU2 PEU3 PEU4
PEU1 1.000 .425 .501 .529
PEU2 1.000 .478 .506
PEU3 1.000 .773
PEU4 1.000
3) Inter-Item Correlation Matrix Attitude toward using
Cronbach's Alpha=.734
AT1 AT2
AT1 1.000 .580
AT2 1.000

227
CFA – TAM model
Figure F.1 Path diagram of confirmatory factor analysis of the TAM items and their respective
factors. The three factors of the TAM represented by the circles. Each rectangle represents one
item of the questionnaire, linked to its parent factor by a single-headed arrow. We use IBM-SPSS Amos to conduct a confirmatory factor analysis (CFA). There were three latent variables,
perceived usefulness; perceived ease of use; and attitudes and nine manifest variables in the
model: (PU = Perceived Usefulness), PU1, PU2, PU3; (PEU = Perceived Ease of Use) PEU1,
PEU2, PEU3, PEU4; and (AT = Attitude) AT1, AT2.

228
Model Fit Summary CMIN
Model NPAR CMIN DF P CMIN/DF
Default model 62 53.058 28 .003 1.895
Saturated model 90 .000 0
Independence model 18 772.982 72 .000 10.736
RMR, GFI
Model RMR GFI AGFI PGFI
Default model .039 .931 .778 .290
Saturated model .000 1.000
Independence model .333 .329 .161 .263
Baseline Comparisons
Model NFI
Delta1
RFI
rho1
IFI
Delta2
TLI
rho2 CFI
Default model .931 .823 .966 .908 .964
Saturated model 1.000 1.000 1.000
Independence model .000 .000 .000 .000 .000
RMSEA
Model RMSEA LO 90 HI 90 PCLOSE
Default model .079 .045 .111 .075
Independence model .259 .243 .276 .000
Results of Multi group confirmatory factor analysis (CFA)
Item Perceived Usefulness Perceived Ease of Use Attitude towards usage
1 .876 .738
2 .776 .831
3 .835 .824
4 . 679 .671
5 .470 .555
6 .781 .876
7 .815 .834
8 .924 .769
9 .724 .725

229
Multiple Group CFA:
(a) CFA of TAM model – Vmware - 2016
(b) CFA of TAM model – Azure - 2016

230
CFA–Lab Activities
Figure F.2 Path diagram of confirmatory factor analysis of the lab activities items and their
respective factors. The six factors of the lab activities (Konak & Bartolacci, 2016) represented by
the circles. Each rectangle represents one item of the questionnaire, linked to its parent factor by a
single-headed arrow.

231
The survey questions, latent variables, and the reliability measures - 2017 Latent Variable
(Cronbach's α)
Questions
Descriptive Statistics Factor loadings (CFA)
Mean SD 1 2 3 4 5 6
1. Usefulness
(.867)
q1 4.55 .555 .877
q2 4.44 .626 .837
q3 4.01 .853 .599
q4 4.10 .831 .730 q5 3.90 .831 .706
2. Interaction
(.940)
q6 3.32 1.079 .954
q7 3.11 1.178 .937 q8 3.24 1.152 .867
3. Competency
(.835)
q9 4.04 .783 .809
q10 4.51 .582 .686
q11 4.35 .612 .829 q12 4.27 .675 .774
4. Interest
(.844)
q13 4.18 .833 .843
q14 4.04 .836 .899
q15 3.86 .883 .685
5. Reflection
(.779)
q16 3.86 .961 .641
q17 4.01 .819 .873
q18 3.58 .905 .696
6. Challenge (.693)
q19 3.61 1.021 .561 q20 3.21 .940 .735
q21 2.34 1.146 .705
Cronbach's Alpha = .893 (No of items=21)
Standardized Regression Weights: Estimate
q5 <--- USE .706
q4 <--- USE .730
q3 <--- USE .599
q2 <--- USE .837
q1 <--- USE .877
q8 <--- ACT .867
q7 <--- ACT .937
q6 <--- ACT .954
q12 <--- COM .774
q11 <--- COM .829
q10 <--- COM .686
q9 <--- COM .809
q15 <--- INT .685
q14 <--- INT .899
q13 <--- INT .843
q18 <--- REF .696
q17 <--- REF .873
q16 <--- REF .641
q21 <--- CHA .705
q20 <--- CHA .735
q19 <--- CHA .561

232
Correlations: Estimate
USE <--> ACT .254
USE <--> COM .798
USE <--> INT .639
USE <--> REF .483
USE <--> CHA -.111
ACT <--> COM .413
ACT <--> INT .233
ACT <--> REF .346
ACT <--> CHA .177
COM <--> INT .786
COM <--> REF .608
COM <--> CHA .076
INT <--> REF .657
INT <--> CHA .056
REF <--> CHA .246
Model Fit Summary
CMIN
Model NPAR CMIN DF P CMIN/DF
Default model 69 233.131 162 .000 1.439
Saturated model 231 .000 0
Independence model 21 1163.067 210 .000 5.538
RMR, GFI
Model RMR GFI AGFI PGFI
Default model .087 .794 .707 .557
Saturated model .000 1.000
Independence model .268 .246 .170 .223
Baseline Comparisons
Model NFI
Delta1
RFI
rho1
IFI
Delta2
TLI
rho2 CFI
Default model .800 .740 .929 .903 .925
Saturated model 1.000 1.000 1.000
Independence model .000 .000 .000 .000 .000
RMSEA
Model RMSEA LO 90 HI 90 PCLOSE
Default model .079 .055 .101 .026
Independence model .255 .240 .269 .000

Inter-Item Correlation Matrix – Section 5 in 2017 survey
q1 q2 q3 q4 q5 q6 q7 q8 q9 q10 q11 q12 q13 q14 q15 q16 q17 q18 q19 q20 q21
q1 1.000 .779 .556 .624 .460 .128 .122 .149 .439 .584 .600 .593 .335 .380 .568 .254 .297 .156 .136 -.198 -.229
q2 1.000 .603 .575 .523 .274 .223 .249 .486 .520 .562 .666 .337 .374 .578 .127 .294 .204 .228 -.086 -.049
q3 1.000 .562 .546 .212 .169 .229 .341 .417 .510 .464 .318 .440 .685 .264 .245 .174 .220 -.164 -.122
q4 1.000 .677 .283 .149 .273 .543 .515 .549 .411 .407 .447 .701 .322 .418 .417 .148 -.155 -.261
q5 1.000 .291 .216 .219 .468 .400 .491 .430 .542 .521 .721 .376 .464 .533 .105 -.138 -.175
q6 1.000 .892 .821 .389 .258 .322 .291 .140 .143 .363 .114 .253 .449 .273 .101 .049
q7 1.000 .811 .367 .228 .261 .249 .139 .140 .290 .140 .191 .407 .239 .069 .077
q8 1.000 .369 .221 .325 .320 .162 .212 .357 .134 .314 .455 .300 .085 .111
q9 1.000 .516 .714 .438 .536 .543 .587 .350 .445 .469 .432 .027 .032
q10 1.000 .614 .558 .483 .454 .419 .155 .284 .304 .341 -.068 -.261
q11 1.000 .599 .544 .529 .516 .280 .246 .273 .317 -.106 -.091
q12 1.000 .470 .537 .519 .323 .406 .258 .259 -.090 .011
q13 1.000 .789 .540 .390 .415 .426 .304 -.068 .024
q14 1.000 .608 .452 .500 .402 .288 -.084 .030
q15 1.000 .431 .457 .425 .207 -.101 -.136
q16 1.000 .602 .424 .263 -.172 .070
q17 . 1.000 .625 .263 .126 .147
q18 1.000 .358 .056 .085
q19 1.000 .371 .372
q20 1.000 .556
q21 1.000
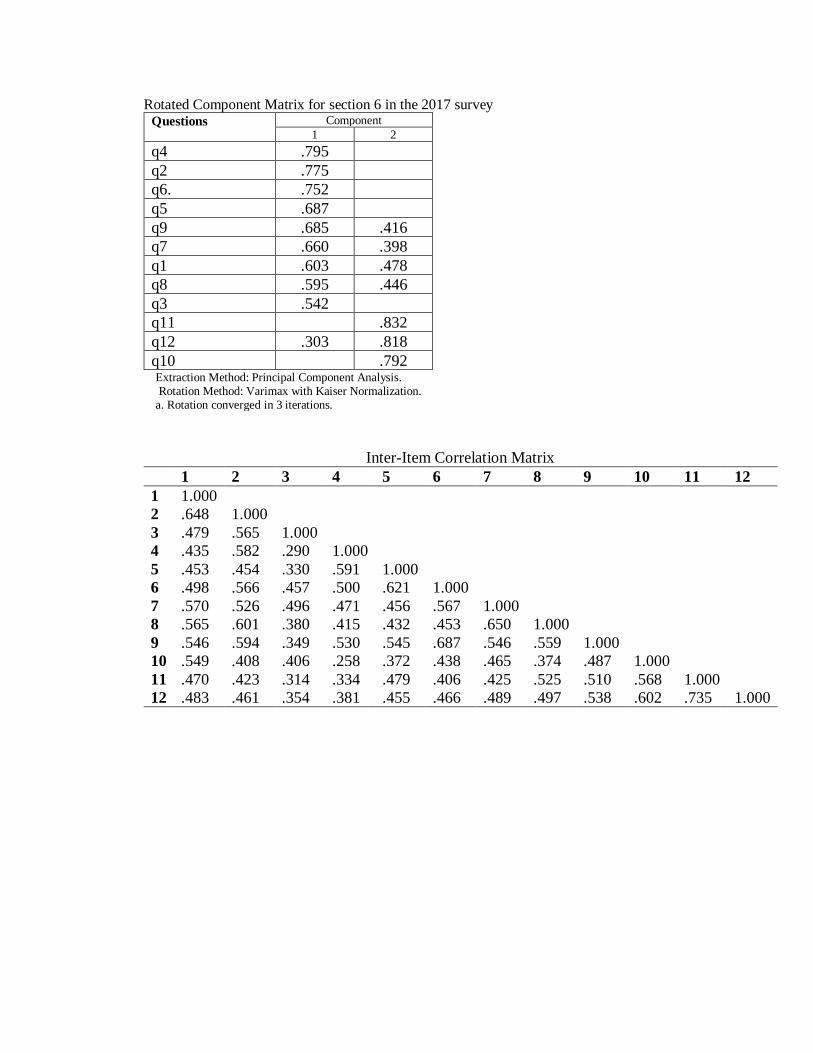
Rotated Component Matrix for section 6 in the 2017 survey Questions Component
1 2
q4 .795
q2 .775
q6. .752
q5 .687
q9 .685 .416
q7 .660 .398
q1 .603 .478
q8 .595 .446
q3 .542
q11 .832
q12 .303 .818
q10 .792 Extraction Method: Principal Component Analysis. Rotation Method: Varimax with Kaiser Normalization. a. Rotation converged in 3 iterations.
Inter-Item Correlation Matrix
1 2 3 4 5 6 7 8 9 10 11 12
1 1.000
2 .648 1.000
3 .479 .565 1.000
4 .435 .582 .290 1.000
5 .453 .454 .330 .591 1.000
6 .498 .566 .457 .500 .621 1.000
7 .570 .526 .496 .471 .456 .567 1.000
8 .565 .601 .380 .415 .432 .453 .650 1.000
9 .546 .594 .349 .530 .545 .687 .546 .559 1.000
10 .549 .408 .406 .258 .372 .438 .465 .374 .487 1.000
11 .470 .423 .314 .334 .479 .406 .425 .525 .510 .568 1.000
12 .483 .461 .354 .381 .455 .466 .489 .497 .538 .602 .735 1.000

235
Lab Activities – R-SPQ-2F
Figure 3: Path diagram of confirmatory factor analysis of the R-SPQ-2F items and their respective factors. The four factors of the R-SPQ-2F represented by the circles. Each rectangle
represents one item of the questionnaire, linked to its parent factor by a single-headed arrow.

236
Rotated Component Matrix for the R-SPQ-2F using Exploratory Factor Analysis - 2017
Questions -the R-SPQ-2F Component
1 2 3 4
Deep
Motivation
(DM)
1. The lab activities gave me a feeling of deep personal
satisfaction .804
2. The lab activities helped me create questions that I wanted
answered .734
3. The lab activities made me work hard because I found the
material interesting .836
4. The lab activities was at times as exciting as a good novel
or movie .766
5. The lab activities was interesting once I got into it .786
Deep Strategies
(DS)
6. The lab activities provided me with enough work on the
topic so I could form my own conclusions .535
7. The lab activities caused me to look at most of the
suggested readings that pertained to the activity .785
8. The lab activities caused me to spend time relating its topics to other topics, which have been discussed in
different classes .847
9. The lab activities allowed me to test myself on important
topics until I understood them completely .684
10. The lab activities’ topics were interesting and I often
spent extra time trying to obtain more information about
them .746
Surface
Motivation
(SM)
11. For the lab activities, it was not helpful to study topics in
depth because all you needed was a passing acquaintance
with topics
.474
12. I was able to get by in the lab activities by memorizing
key sections rather than trying to understand them .491
13. For the lab activities, there was no point in learning
material, which was not likely to be on the exam .752
14. I did not find the lab activities very interesting so I kept
my work to a minimum .748
15. My aim for the lab activities was to complete it while
doing as little work as possible .703
Surface Strategies (SS)
16. The lab activities suggests the best way to pass exams is to try to remember answers to likely test questions
.720
17. I believe that the instructor should not expect me to
spend significant amounts of time on the lab activities if it is
not on an exam
.818
18. For these lab activities, I restricted my study to what was
specifically required as it was unnecessary to do anything
extra
.784
19. For the lab activities, I learned things by going over and
over them until I knew them by heart even if I did not
understand them
.614
20. For the lab activities, I only applied what was given in
class or on the course outline .725
Cronbach's α= .837, N of items = 20

237
Standardized Regression Weights: Estimate
q1 <--- DM .804
q2 <--- DM .734
q3 <--- DM .836
q4 <--- DM .766
q5 <--- DM .786
q10 <--- DS .746
q9 <--- DS .684
q8 <--- DS .847
q7 <--- DS .785
q6 <--- DS .535
q11 <--- SM .474
q12 <--- SM .491
q13 <--- SM .752
q14 <--- SM .748
q15 <--- SM .703
q20 <--- SS .725
q19 <--- SS .614
q18 <--- SS .784
q17 <--- SS .818
q16 <--- SS .720
Correlations:
Estimate
DM <--> DS .733
DM <--> SM -.080
DM <--> SS -.251
DS <--> SM -.034
DS <--> SS -.134
SM <--> SS .952

238
Model Fit Summary CMIN
Model NPAR CMIN DF P CMIN/DF
Default model 58 195.660 152 .010 1.287
Saturated model 210 .000 0
Independence model 20 888.246 190 .000 4.675
RMR, GFI
Model RMR GFI AGFI PGFI
Default model .099 .788 .708 .571
Saturated model .000 1.000
Independence model .359 .297 .223 .268
Baseline Comparisons
Model NFI
Delta1
RFI
rho1
IFI
Delta2
TLI
rho2 CFI
Default model .780 .725 .941 .922 .937
Saturated model 1.000 1.000 1.000
Independence model .000 .000 .000 .000 .000
RMSEA
Model RMSEA LO 90 HI 90 PCLOSE
Default model .065 .034 .091 .181
Independence model .234 .219 .250 .000

Inter-Item Correlation Matrix for section 7 in the 2017 survey
q1 q2 q3 q4 q5 q6 q7 q8 q9 q10 q11 q12 q13 q14 q15 q16 q17 q18 q19 q20
q1 1.000 .627 .708 .644 .582 .505 .356 .445 .544 .488 -.054 .006 -.054 -.380 .064 .016 -.189 -.224 -.090 -.255
q2 1.000 .537 .544 .429 .492 .442 .555 .456 .516 .099 .006 -.004 -.243 .048 -.015 -.144 -.319 -.092 -.244
q3 1.000 .660 .677 .439 .395 .538 .437 .537 .044 -.077 -.043 -.347 .017 -.021 -.214 -.167 -.097 -.201
q4 1.000 .671 .421 .303 .376 .380 .589 .044 -.003 .111 -.202 .178 -.006 -.021 -.037 -.048 -.156
q5 1.000 .432 .331 .357 .429 .554 .066 .001 .069 -.203 .147 -.040 -.130 -.084 -.124 -.083
q6 1.000 .375 .361 .446 .447 .136 .073 .001 -.223 .058 .049 .041 -.175 -.118 .096
q7 1.000 .746 .326 .527 .111 .170 .116 -.029 -.060 .081 .034 -.179 .155 .051
q8 1.000 .506 .562 .150 .119 -.009 -.218 .020 .029 -.153 -.217 .067 -.061
q9 1.000 .544 .040 .184 .034 -.281 -.031 .093 -.150 -.206 .003 -.087
q10 1.000 .094 .117 -.023 -.225 .014 .023 -.028 -.179 .031 -.091
q11 1.000 .358 .476 .309 .323 .282 .290 .324 .308 .552
q12 1.000 .611 .249 .273 .470 .385 .261 .521 .362
q13 1.000 .515 .509 .613 .533 .501 .603 .466
q14 1.000 .522 .391 .647 .612 .377 .598
q15 1.000 .522 .545 .509 .370 .380
q16 1.000 .556 .509 .659 .466
q17 1.000 .655 .449 .567
q18 1.000 .498 .635
q19 1.000 .405
q20 1.000

Appendix G: Descriptive Analysis of Quantitative Data
Frequency of student responses to the decentralised virtual lab environment (n=90)
Item - VMware Fusion labs -2016 Likert Scale- Frequency (%)
n SD (%) D (%) N (%) A (%) SA (%)
1. The lab environment helped me to learn in INFT2031 90 0 (0%) 2 (2%) 10 (11%) 33 (37%) 45 (50%)
2. The lab environment improved my performance 90 0 (0%) 2 (2%) 11 (12%) 40 (44%) 37 (41%)
3. The lab environment helped me to achieve learning outcomes 89 0 (0%) 1 (1%) 11 (13%) 41 (46%) 36 (40%)
4. The lab environment provided easy access to the lab (24x7) 89 12(13%) 20 (22%) 17 (19%) 17 (19%) 23 (26%)
5. Having access to the lab from any device/location is helpful to me 89 4 (4%) 10 (11%) 15 (17%) 22 (25%) 38 (43%)
6. I find it easy to use the lab environment 88 0 (0%) 3 (3%) 16 (18%) 37 (42%) 32 (36%)
7. I find the lab setting flexible to conduct my lab work 90 1 (1%) 9 (10%) 24 (27%) 33 (37%) 23 (26%)
8. I am satisfied with using the lab environment for my practical work
in INFT2031
89 2 (2%) 2 (2%) 16 (18%) 34 (38%) 35 (39%)
9. I would like to use the lab environment in future networking and
systems administration courses
88 4 (5%) 6 (7%) 23 (26%) 25 (28%) 30 (34%)
10. Overall, how would you rate the lab environment 70 0 (0%) 4 (6%) 9 (13%) 38 (54%) 19 (27%)
(SD = Strongly Disagree, D= Disagree, N=Neutral, A= Agree, SA= Strongly Agree)
Students’ responses and percentages about using the decentralised virtual lab environment
5041 40
2643 36
2639 34 27
3744 46
19
25 42
37
38
2854
11 12 13
19
17
18
27
18
26
13
2 2 1
22
113 10 2
760 0 0
134 0 1 2 5 0
0
20
40
60
80
100
120
q1 q2 q3 q4 q5 q6 q7 q8 q9 q10
%
SD
D
N
A
SA

241
Frequency of student responses to the centralised virtual lab environment (n=69)
Item – Azure cloud labs – 2016 Likert Scale- Frequency (%)
n SD (%) D (%) N (%) A (%) SA (%)
1. The lab environment helped me to learn in INFT2031 67 0% 0% 11 (17%) 27 (40%) 29 (43%)
2. The lab environment improved my performance 67 0% 3 (4%) 9 (13%) 23 (34%) 32 (48%)
3. The lab environment helped me to achieve learning outcomes 66 0% 1 (1%) 8 (12%) 32 (48%) 25 (38%)
4. The lab environment provided easy access to the lab (24x7) 68 1 (1%) 2 (3%) 11 (16%) 17 (25%) 37 (54%)
5. Having access to the lab from any device/location is helpful
to me
68 0% 0% 3 (4%) 20 (29%) 45 (66%)
6. I find it easy to use the lab environment 66 0% 2 (3%) 10 (17%) 29 (43%) 25 (38%)
7. I find the lab setting flexible to conduct my lab work 67 0% 3 (2%) 9 (13%) 26 (39%) 30 (45%)
8. I am satisfied with using the lab environment for my practical
work in INFT2031
67 0% 0% 8 (12%) 24 (35%) 35 (52%)
9. I would like to use the lab environment in future networking
and systems administration courses
66 0% 1 (1%) 5 (8%) 17 (26%) 43 (65%)
10. Overall, how would you rate the lab environment 53 0% 2 (4%) 3 (5%) 24 (45%) 24 (45%)
(SA = Strongly Agree, A = Agree, N = Neutral, D = Disagree, SD = Strongly Disagree)
Students’ responses and percentages about using the centralised virtual lab environment
43 4838
5466
38 45 5265
45
40 34 4825
29
4339
3526
45
17 13 1216
417 13 12 8 5
0 4 1 3 0 3 2 0 1 40 0 0 1 0 0 0 0 0 0
0
20
40
60
80
100
120
q1 q2 q3 q4 q5 q6 q7 q8 q9 q10
%
SD
D
N
A
SA

242
Frequency of Student Responses to the Server-based Lab Environment
Item – Server-based labs – 2017 Likert Scale- Frequency (%)
n SD (%) D (%) N (%) A (%) SA (%)
1. The lab environment helped me to learn in INFT2031 71 0 0 3 (4%) 23 (32.5%) 45 (62.5%)
2. The lab environment improved my performance 71 0 3 (4.5%) 9 (12.5%) 22 (31%) 37 (52%)
3. The lab environment helped me to achieve learning outcomes 71 0 0 10 (14%) 24 (34%) 37 (52%)
4. The lab environment provided easy access to the lab (24x7) 71 1 (1.5%) 5 (7%) 13 (18%) 21 (29.5%) 31 (44%)
5. Having access to the lab from any device/location is helpful to me 71 0 2 (2.5%) 7 (10%) 17 (24%) 45 (63.5%)
6. I find it easy to use the lab environment 71 1 (1.5%) 3 (4%) 10 (14%) 30 (43%) 27 (36.5%)
7. I find the lab setting flexible to conduct my lab work 71 0 3 (4%) 10 (14%) 31 (42.5) 29 (38.5)
8. I am satisfied with using the lab environment for my practical
work in INFT2031
71 0 4 (5.5) 8 (13.5) 28 (39%) 31 (44%)
9. I would like to use the lab environment in future networking and
systems administration courses
71 1(1.4%) 2 (2.8%) 11(15.5%) 23 (32.5%) 34 (48%)
10. Overall, how would you rate the lab environment 64 0 1 (1.5) 7 (10%) 27 (42%) 29 (45.5%)
(SA = Strongly Agree, A = Agree, N = Neutral, D = Disagree, SD = Strongly Disagree)
Students’ Responses and Percentages about using the Server-based Lab Environment
4537 37
31
45
27 29 31 3429
23
22 24
21
17
3031 28 23
27
39 10
13
710
10 8 117
0 3 05
2 33
4 21
0 0 0 1 0 10 0 1
0
0
10
20
30
40
50
60
70
80
q1 q2 q3 q4 q5 q6 q7 q8 q9 q10
Freq
uen
cy
SD
D
N
A
SA

243
Responses and Percentages for Feedback Tool - Frequency (%) - 2016 Dimension Survey Question n Not at all Likely Extremely Likely
1 2 3 4 5 6 7 8 9 10
Perceived
ease of use
Q1. The feedback offering
descriptions were easy to understand 51 0
0%
0
0%
0
0%
0
0%
2
3.9%
9
17.7%
11
21.6%
11
21.6%
8
15.7%
10
19.6% Q2. The feedback page on your VM
was fast to load 51 0
0%
0
0%
0
0%
1
2%
2
3.9%
5
9.8%
7
13.7%
15
29.4%
12
23.5%
9
17.7%
Perceived
usefulness
Q3. This feedback script encourages
me to do my lab work 51 0
0%
0
0%
0
0%
1
2%
4
7.8%
9
17.7%
8
15.7%
12
23.5%
4
7.8%
12
23.5%
Attitude
towards using
Q4. I prefer to have this feedback
script with the labs 51 0
0%
0
0%
0
0%
0
0%
3
5.9%
6
11.8%
7
13.7%
5
9.8%
14
27.5%
16
31.4% Q5. Based on this script feedback,
how likely are you to recommend it to
students next semester?
51 0
0%
0
0%
0
0%
0
0%
1
2%
6
11.8%
6
11.8%
14
27.5%
6
11.8%
18
35.3%
Overall Q6 - How satisfied are you with
feedback generated from the script? 51 1 –
Extremely
Dissatisfied
2 -
Dissatisfied
3 – Neither
Satisfied nor
Dissatisfied
4 - Satisfied 5 – Extremely
Satisfied
0 (0%) 0 (0%) 3 (5.9%) 36 (70.6%) 12 (23.5%)
Descriptive Analysis of Items Related to the Feedback Tool - 2017
Dimension Survey Question n Not at all Likely Extremely Likely 1 2 3 4 5 6 7 8 9 10
Perceived
ease of use
Q1. The feedback offering
descriptions were easy to understand 44 0
0%
0 0%
0 0%
0 0%
1 2%
1 2%
12 0%
12 0%
7 0%
11 0%
Q2. The feedback page on your VM
was fast to load 44 0
0%
0 0%
0 0%
0 0%
5 10%
2 4%
1 2%
0 0%
0 0%
0 0%
Perceived
usefulness
Q3. This feedback script encourages
me to do my lab work 44 0
0%
0 0%
0 0%
0 0%
6 12%
3 6%
0 0%
0 0%
0 0%
0 0%
Attitude
towards using
Q4. I prefer to have this feedback
script with the labs 44 0
0%
0 0%
0 0%
0 0%
9 18%
4 8%
1 2%
0 0%
0 0%
0 0%
Q5. Based on this script feedback,
how likely are you to recommend it to
students next semester?
44 0 0%
0 0%
0 0%
0 0%
6 12%
1 2%
0 0%
0 0%
0 0%
0 0%
Overall Q6 - How satisfied are you with
feedback generated from the script? 44 1 –
Extremely
Dissatisfied
2 -
Dissatisfied
3 – Neither
Satisfied nor
Dissatisfied
4 - Satisfied 5 – Extremely
Satisfied
0 0 4 (9%) 22 (50%) 18 (41%)
Descriptive Analysis on Items related to the Dashboard Tool - 2017
Item n Not at all Likely Extremely Likely
1 2 3 4 5 6 7 8 9 10
1- The dashboard was easy to understand 29 0
0% 0
0% 0
0% 0
0% 1
3% 3
10% 4
14% 4
14% 6
20% 11
38% 2- The dashboard provides feedbacks on my learning activities and performance
29 0
0% 0
0% 0
0% 0
0% 3
10% 0
0% 4
14% 7
24% 5
17% 10
35%
3- I prefer to have this dashboard with the labs activities
29 0
0% 0
0% 0
0% 2
7% 2
7% 0
0% 3
10% 4
14% 6
20% 12
41%
4- This dashboard encourages me to do my lab work 29 1
3% 0
0% 1
3% 1
3% 2
7% 4
14% 4
14% 5
17% 2
7% 9
31% 5- How likely are you to recommend using dashboard in next semester
29 0
0% 0
0% 1
3% 0
0% 3
10% 1
3% 3
10% 5
17% 5
17% 11
38%
6- I would like to compare my performance with
other students
29 2
7% 0
0% 0
0% 2
7% 6
20% 1
3% 3
10% 3
10% 2
7% 10
34%
7- I would like to see my rank in class using the dashboard
29 2
7% 0
0% 0
0% 2
7% 7
24% 3
10% 1
3% 4
14% 1
3% 9
31%
8- How satisfied are you with the Dashboard view? 29 1 –
Extremely
Dissatisfied
2 -
Dissatisfied
3 – Neither
Satisfied nor
Dissatisfied
4 -
Satisfied
5 –
Extremely
Satisfied
1
3.5%
1
3.5%
8
27.5%
9
31.0%
10
34.5%

244
Frequencies of Responses for Evaluation of Lab Activities Scale item SD D N A SA
Usefulness
1. The time I spent for the lab activity was worthwhile 0 0 3 29 41
2. I find the lab activity useful to me 0 0 5 30 37
3. I would like to do more of similar activities, even if it is
time consuming
0 3 16 28 24
4. The lab activity was very engaging 0 3 12 31 26
5. The lab activity was pleasurable 0 1 25 25 20
Interaction
6. Interacting with other students helped me complete the lab
activity
2 16 22 20 12
7. I learned new concepts/skills by interacting with other
students
7 13 26 15 11
8. The lab activity encouraged me to ask questions to others 5 13 25 16 13
Competency
9. The lab activity helped me improved my problem solving
skills
0 2 13 34 23
10. The lab activity improved my technical skills and
competency in the subject area
0 0 2 29 41
11. I felt a sense of accomplishment after completing the lab
activity
0 0 5 37 29
12. I will be able to use what I learned in the lab activity in
other courses or the future
0 1 8 34 29
Interest
13. The lab activity increased my curiosity and interest in this
area
0 4 10 28 30
14. The lab activity encouraged me to learn more about this
topic
0 2 19 26 25
15. I was very motivated for completing the lab activity 0 4 24 23 21
Reflection
16. The review questions were helpful to reinforce what was
performed in the lab activity
1 5 22 22 22
17. The lab activity provided opportunities to reflect back
what was learned in the activity
0 1 20 26 25
18. The lab activity promoted helpful discussions about what
was performed in the activity
1 3 34 20 14
Challenge
19. The lab activity was challenging 1 9 20 27 15
20. The activity review questions were difficult and time consuming
2 12 33 18 7
21. The lab activity instructions were confusing
19 25 15 9 4
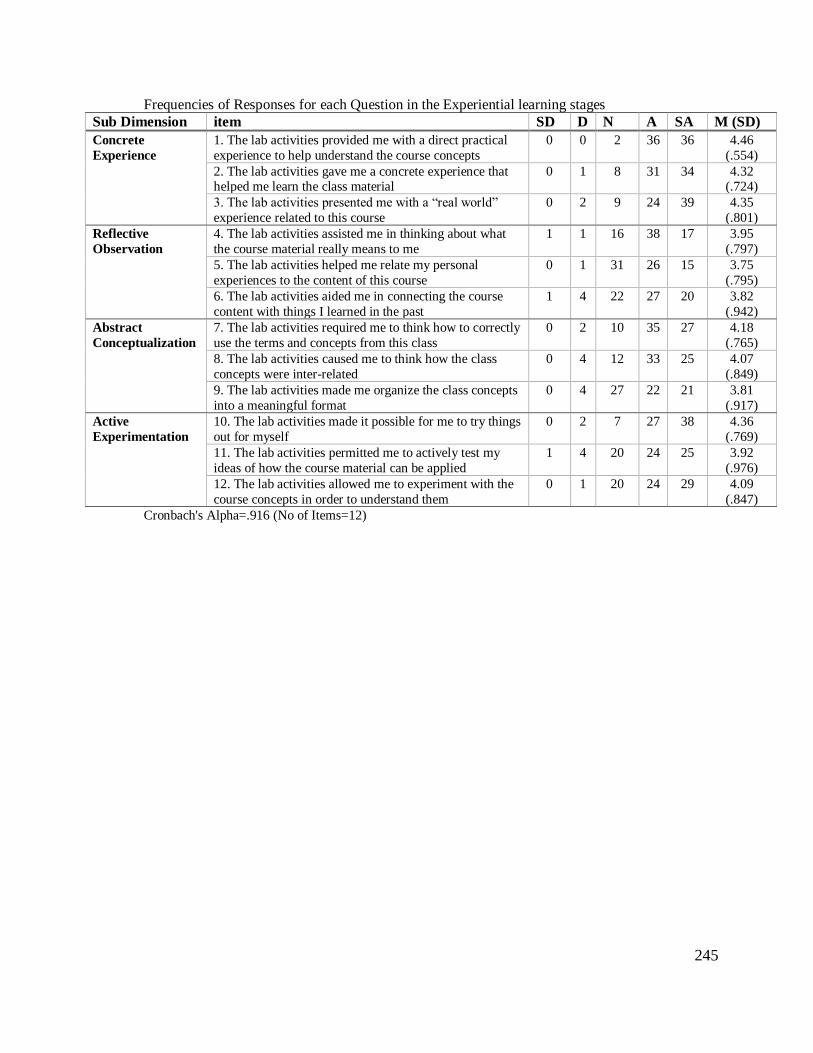
245
Frequencies of Responses for each Question in the Experiential learning stages
Sub Dimension item SD D N A SA M (SD)
Concrete
Experience
1. The lab activities provided me with a direct practical
experience to help understand the course concepts
0 0 2
36
36
4.46
(.554)
2. The lab activities gave me a concrete experience that helped me learn the class material
0 1
8
31
34
4.32 (.724)
3. The lab activities presented me with a “real world”
experience related to this course
0 2
9
24
39
4.35
(.801)
Reflective
Observation
4. The lab activities assisted me in thinking about what
the course material really means to me
1
1
16
38
17
3.95
(.797)
5. The lab activities helped me relate my personal
experiences to the content of this course
0 1
31
26
15
3.75
(.795)
6. The lab activities aided me in connecting the course
content with things I learned in the past
1
4
22
27
20
3.82
(.942)
Abstract
Conceptualization
7. The lab activities required me to think how to correctly
use the terms and concepts from this class
0 2
10
35
27
4.18
(.765)
8. The lab activities caused me to think how the class
concepts were inter-related
0 4
12
33
25
4.07
(.849)
9. The lab activities made me organize the class concepts
into a meaningful format
0 4
27
22
21
3.81
(.917)
Active
Experimentation
10. The lab activities made it possible for me to try things
out for myself
0 2
7
27
38
4.36
(.769)
11. The lab activities permitted me to actively test my
ideas of how the course material can be applied
1
4
20
24
25
3.92
(.976)
12. The lab activities allowed me to experiment with the
course concepts in order to understand them
0 1
20
24
29
4.09
(.847)
Cronbach's Alpha=.916 (No of Items=12)

246
Frequencies of Responses for each Question in the Student’s Approach to Learning Scale Question SD D N A SA
Deep
Motivation
1. The lab activities gave me a feeling of deep personal
satisfaction 1 4 25 30 12
2. The lab activities helped me create questions that I wanted
answered 1 4 24 31 12
3. The lab activities made me work hard because I found the
material interesting 0 6 12 34 19
4. The lab activities was at times as exciting as a good novel or
movie 9 19 23 14 6
5. The lab activities was interesting once I got into it 0 5 11 33 22
Deep
Strategies
6. The lab activities provided me with enough work on the topic
so I could form my own conclusions 0 1 15 35 20
7. The lab activities caused me to look at most of the suggested
readings that pertained to the activity 5 22 20 14 11
8. The lab activities caused me to spend time relating its topics to
other topics, which have been discussed in different classes 1 19 17 22 13
9. The lab activities allowed me to test myself on important topics
until I understood them completely 0 5 17 28 21
10. The lab activities’ topics were interesting and I often spent
extra time trying to obtain more information about them 3 14 26 16 13
Surface
Motivation
11. For the lab activities, it was not helpful to study topics in depth
because all you needed was a passing acquaintance with topics 4 22 23 16 6
12. I was able to get by in the lab activities by memorizing key
sections rather than trying to understand them 5 23 18 18 8
13. For the lab activities, there was no point in learning material,
which was not likely to be on the exam 16 28 19 4 5
14. I did not find the lab activities very interesting so I kept my
work to a minimum 21 31 10 8 2
15. My aim for the lab activities was to complete it while doing
as little work as possible 18 30 12 8 4
Surface Strategies
16. The lab activities suggests the best way to pass exams is to try to remember answers to likely test questions 20 23 17 7 5
17. I believe that the instructor should not expect me to spend
significant amounts of time on the lab activities if it is not on an
exam 20 27 18 2 5
18. For these lab activities, I restricted my study to what was
specifically required as it was unnecessary to do anything extra 18 22 14 13 5
19. For the lab activities, I learned things by going over and over
them until I knew them by heart even if I did not understand them 12 26 22 7 4
20. For the lab activities, I only applied what was given in class
or on the course outline 10 17 22 15 8