
Here - RAD Conference
561
-
Upload
khangminh22 -
Category
Documents
-
view
1 -
download
0
Transcript of Here - RAD Conference


PUBLISHER: RAD Association, Niš, Serbia www.rad-association.org FOR THE PUBLISHER: Prof. Dr. Goran Ristić EDITOR: Prof. Dr. Goran Ristić COVER DESIGN: Vladan Nikolić, M.Sc. TECHNICAL EDITING: Sasa Trenčić and Vladan Nikolić PROOF-READING: Saša Trenčić, MA and Mila Aleksov, BA ISBN: 978-86-80300-01-6
CIP - Каталогизација у публикацији - Народна библиотека Србије, Београд 539.16(082)(0.034.2) INTERNATIONAL Conference on Radiation and Applications in Various Fields of Research (3rd ; 2015 ; Budva) Proceedings [Elektronski izvor] / Third International Conference on Radiation and Applications in Various Fields of Research, RAD 2015, June 8-12, 2015, Budva, Montenegro ; [editor Goran Ristić]. - Niš : RAD Association, 2015 (Niš : RAD Association). - 1 elektronski optički disk (CD-ROM) ; 12 cm Sistemski zahtevi: Nisu navedeni. - Nasl. sa naslovne strane dokumenta. - Tiraž 400. - Bibliografija uz svaki rad. ISBN 978-86-80300-01-6 a) Јонизујуће зрачење - Дозиметрија - Зборници COBISS.SR-ID 215655436
PROCEEDINGS THIRD INTERNATIONAL CONFERENCE ON RADIATION AND APPLICATIONS IN VARIOUS FIELDS OF RESEARCH
JUNE 8-12, 2015 | SLOVENSKA PLAZA | BUDVA | MONTENEGRO | WWW.RAD-CONFERENCE.ORG
CONTENTS
N.A. Metlyaeva, A.Yu. Bushmanov, V.I. Krasnuk, O.V. Shcherbatih
PSYCHOPHYSIOLOGICAL PROGNOSIS OF MULTIFOCAL ATHEROSCLEROSIS OF THE PATIENT WHO TRANSFERRED ACUTE RADIATION SICKNESS OF THE I DEGREE OF SEVERITY
1
A.V. Zaitsevskii, Yu.A. Demidov, N.S. Mosyagin, L.V. Skripnikov, A.V. Titov
FIRST PRINCIPLE BASED MODELING AND INTERPRETATION OF CHEMICAL EXPERIMENTS ON SUPERHEAVY ELEMENT IDENTIFICATION
5
Marek Trojanowicz, Anna Bojanowska-Czajka, Monika Łyczko, Krzysztof Kulisa, Gabriel Kciuk, Justyna Moskal
RADIOLYTIC DECOMPOSITION OF ENVIRONMENTALLY PERSISTENT PERFLUORINATED SURFACTANTS WITH THE USE OF IONIZING RADIATION
11
Cristina Cherubini, Ornella Ursini
REACTIVITY OF SELECTED PRIMITIVE AMINO ACIDS INDUCED BY GAMMA IRRADIATION IN ASTROCHEMICAL CONTEXT
17
Natalya A. Konovalova, Vladimir B. Krapukhin, Vladimir V. Kulemin, Viktor A. Lavrikov, Sergey A. Kulyukhin
SPIRAL FILTERING ELEMENT AS THE BASIS OF THE FILTRATION SETUPS FOR REMOVAL OF THE SOLID RADIOACTIVE IMPURITIES FROM GAS AND LIQUID PHASES
21
Avni Berisha, Bujar Jashari, Valbonë Mehmeti, Kaltrina Jusufi, Jeton Halili, Teuta Selimi, Makfire Sadiku, Mentor Ismaili
PROTECTION OF MILD STEEL FROM CORROSION IN MINERAL ACID MEDIA BY THE USE OF MIXED INHIBITORS: 4-AMINOBENZOIC ACID AND SOME AMINO THIAZOLE DERIVATIVES
23
R. Panajotović1, S. Ptasinska, V. Lyamayev, K. Prince
LOW-ENERGY ELECTRON DAMAGE OF DPPC MOLECULES – A NEXAFS STUDY
27
Zdena Lahodová, Ladislav Viererbl, Miroslav Vinš, Jiří Šrank
RESEARCH OF DOSIMETRIC CHARACTERISTICS OF FUEL CONTAINING MATERIAL
33
Borislava Petrovic, Tamara Tanasijin, Milan Teodorovic, Laza Rutonjski, Milutin Baucal, Ozren Cudic, Borko Basaric, Goran Djoric, Vera Starovlah
THE VARIATION OF HOUNSFIELD UNITS ON SCANNING PARAMETERS AND INFLUENCE ON CT TO RED CONVERSION CURVES
37
Eugenia-Simona Badita, Elena Stancu, Catalin Vancea, Florea Scarlat, Ionut Calina, Anca Scarisoreanu
INFLUENCE OF HIGH ENERGY IONIZING RADIATION ON SINGLE MODE OPTICAL FIBER PROPRIETIES
41
Dimitrije Maletić, Radomir Banjanac, Dejan Joković, Vladimir Udovičić, Aleksandar Dragić, Mihailo Savić, Nikola Veselinović
CORRELATIVE AND PERIODOGRAM ANALYSIS OF DEPENDENCE OF CONTINUOUS GAMMA SPECTRUM IN THE SHALLOW UNDERGROUND LABORATORY ON COSMIC RAY AND CLIMATE VARIABLES
47
V.N. Panteleev, A.E. Barzakh, L.Kh. Batist, D.V. Fedorov, A.M. Filatova, V.S. Ivanov, F.V. Moroz 1, P.L. Molkanov, S.Yu. Orlov, Yu.M. Volkov
STATUS OF THE PROJECT OF RADIOISOTOPE COMPLEX RIC-80 (RADIOISOTOPES AT CYCLOTRON C-80) AT PNPI
51
Olga Girjoaba, Alexandra Cucu PATIENT DOSE FROM MEDICAL EXPOSURE IN ROMANIA FOR THE PERIOD 2010-2013
57
Zoran Stefanovski, Biljana Grozdanovska
QUANTIFICATION OF DOSE CONSEQUENCES DUE TO CTV-PTV MARGIN CHANGE MEASURED WITH EPID
61
Borko Basaric, Borislava Petrovic, Milan Teodorovic, Milutin Baucal, Laza Rutonjski, Ozren Cudic, Branislav Djuran, Milana Mitric - Askovic
HIGH-DOSE RATE (HDR) IR-192 BRACHYTHERAPY APPLICATION OF BASAL CELL CARCINOMA
65
G. Battistoni, F. Collamati, F. Collini, E. De Lucia, M. Durante, R. Faccini, F. Ferroni, M.P. Frallicciardi, C. La Tessa, M. Marafini, I. Mattei, S. Morganti, R. Paramatti, V. Patera, L. Piersanti, D. Pinci, A. Russomando, A. Rucinski, A. Sarti, C. Schuy, A. Sciubba, M. Senzacqua, E. Solfaroli Camillocci, M. Toppi, G. Traini, M. Vanstalle, C. Voena
MEASUREMENT OF CHARGED PARTICLE YIELDS FROM THERAPEUTIC BEAMS IN VIEW OF THE DESIGN OF AN INNOVATIVE HADRONTHERAPY DOSE MONITOR
69
M. Rabochová, M. Vinš, L. Viererbl, Z. Lahodová, V Klupák, J. Šoltés
EFFECTIVENESS OF EPITHERMAL NEUTRON BEAM AND GAMMA RADIATION SHIELDING FOR BORON NEUTRON CAPTURE THERAPY
75
M.A. Gryziński, M. Maciak, M. Wielgosz
RENAISSANCE OF THE BORON NEUTRON CAPTURE THERAPY, BNCT 79
J. M. Kreynina, V.A. Solodky, A.R. Iksanova
ADJUVANT CHEMORADIATION WITH PREVENTIVE PARA-AORTIC CONFORM IRRADIATION IN ENDOMETRIAL CANCER II-III FIGO MULTIMODAL TREATMENT
83
Andrei Roşca, Ion Bahnarel, Liuba Coreţchi
OPTIMIZATION OF RADIOTHERAPEUTIC TREATMENT AND THE PROGRAM OF QUALITY ASSURANCE IN IONIZING RADIATION THERAPY (CATEGORIES OF STAFF)
89
L. Aslamova, N. Melenevska, E. Kulich, N. Miroshnichenko, S. Miroshnichenko
APPLICATION OF CONTRAST IMPROVEMENT METHODS FOR CORPULENT PATIENTS UNDERGOING CHEST SCREENING
95
Iuliia Myronova, Yuriy Kovalenko
IMPROVEMENT OF PEDIATRIC DIAGNOSTIC IMAGING DUE TO APPLICATION OF DIGITAL MICROFOCUS RADIOGRAPHY
99
Satoru Nakamura, Kyohei Nishi, Koichi Tashiro, Fumihiko Iwano, Shunya Nakane
DAT-SCAN IN DIAGNOSIS OF IDIOPATHIC PARKINSON’S DISEASE IN OUR HOSPITAL
103
V.V. Shchedrenok, T.V. Zakhmatova, O.V. Moguchaya, I.V. Zuev, K.I. Sebelev
POSSIBILITIES OF THE BEAM DIAGNOSTICS AT PATHOLOGY OF A VERTEBRAL ARTERY
105
E. Petrova RADIOLOGICAL IMAGES AND PROGNOSIS OF PNEUMOCONIOSES IN FUNDAMENTAL INDUSTRIES IN BULGARIA
109
V.V. Shchedrenok, O.V.Moguchaya, I.V. Zuev, T.V. Zakhmatova, K.I. Sebelev
VALUE OF IMAGING FOR SPINE SURGERY
113
Silvia Serban, Viorel Serban THE NECESSITY OF HIGHER VOLTAGES FOR SPECIAL RADIOGRAPHS IN MEDICAL RADIOLOGY
119
Nevenka M. Antović, Sergey K. Andrukhovich, Alexandr V. Berestov
BACKGROUND IN A TEST OF DETECTING “COOPERATIVE” PARAPOSITRONIUM ANNIHILATION BY THE 32-CRYSTAL SPECTROMETER ARGUS
123
Gordana Pantelić, Péter Vancsura, Jelena Krneta Nikolić, Marija Janković, Nataša Sarap, Dragana Todorović, Milica Rajačić
RESULTS FROM RADIONUCLIDE INTERLABORATORY COMPARISON IN SEDIMENT AND FISH
129
S. Gushchin, V. Ivanov, A. Loutchanski, V. Ogorodniks
PERSONAL RADIATION DETECTOR γ-TRACER GT2-1 WITH A CdZnTe DETECTOR
133
S. M. Hosseini Pooya, B. Arezabak, H. Alebrahim
EVALUATION OF DOSIMETRIC CHARACTERISTICS OF A GLASS RPL PERSONAL DOSIMETER
139
M. B. Nisti, A. O. Ferreira, C. H. R. Saueia, B. P. Mazzilli
GROSS BETA ACTIVITY IN WATER BY CERENKOV METHOD 143
Jelica Kaljevic, Jelena Stankovic, Milos Zivanovic, Sandra Ceklic, Djordje Lazarevic
BUILD-UP PMMA PLATE EFFECT ON CALIBRATION OF TLD READER
147
Radomir Banjanac, Vladimir Udovičić, Dejan Joković, Dimitrije Maletić, Nikola Veselinović, Mihailo Savić, Aleksandar Dragić, Ivan Aničin
BACKGROUND SPECTRUM CHARACTERISTICS OF THE HPGE DETECTOR LONG-TERM MEASUREMENT IN THE BELGRADE LOW-BACKGROUND LABORATORY
151
Nikola Svrkota, Nevenka M. Antović, Ranka Žižić, Željko Vučević, Tomislav Anđelić, Benard Berišaj, Gordana Laštovička-Medin
EFFICIENCY OF AN HPGE DETECTOR IN DEPENDENCE ON SOURCE-DETECTOR GEOMETRY FOR POINT AND VOLUME SOURCES
155
C.H.R. Saueia, M.B. Nisti, B.P. Mazzilli
DETERMINATION OF UNAT, TH, RARE EARTH AND METALS IN SOIL AROUND IPEN FACILITIES
161
Gordana Laštovička-Medin ADVANCED TEACHING WITH THE EMBEDDED MINI LAB: PROPOSAL FOR DEVELOPING A RADIATION DETECTION PLATFORM FOR LABORATORY USE WITH MULTI RADIATION SENSOR BOARD, ARDUINO AND RASPBERRY PI
165
T. Andjelic, R.Žižić, R. Zekić, N. Svrkota, B. Berišaj
SPECIFICITIES OF APPLICATION OF ANALYTICAL METHODS IN RADIOACTIVE WASTE MANAGEMENT
175
Bojana Šećerov, Miroslav Dramićanin
ESTIMATION OF ABSORBED DOSE DURING PROCESS INTERRUPTION IN RADIATION PROCESSING
181
Pavel Marozik, Irma Mosse, Mikhail Marozik, Sergei Melnov, Colin Seymour, Carmel Mothersil
NON-TARGETED EFFECTS OF FACTORS FROM BLOOD SERUMS OF CHERNOBYL POPULATIONS
185
Fulger Ciupagea, Gabriela Rosca Fartat, Alexandra Cucu, Anton Iuliu Coroianu
STUDY OF OCCUPATIONAL EXPOSURE IN INDUSTRIAL RADIOGRAPHY PRACTICE
191
Olivera Ciraj-Bjelac, Danijela Arandjic, Predrag Bozovic, Sandra Ceklic, Jelena Stankovic, Djordje Lazarevic
ASSESSMENT OF OCCUPATIONAL DOSE IN FLUOROSCOPY PROCEDURES WHEN INDIVIDUAL MONITORING IS NOT UTILIZED
195
Ł. Murawski, M. A. Gryziński, K. Tymińska
RESEARCH STAND FOR CONCRETE SHIELDING TESTS
199
I. S. Dimitrov, Tz. Nonova, Al. Mladenov, K. Krezhov
RADIATION LEVELS AT CARRYING OUT THE REFURBISHMENT OF THE BULGARIAN RESEARCH REACTOR IRT 2000
203
Jana Hudzietzová, Jozef Sabol, Bedřich Šesták
RADIATION PROTECTION ASPECTS RELEVANT TO RADIOLOGICAL TERRORISM
209
Marija Šljivić-Ivanović, Ivana Smičiklas, Aleksandra Milenković, Slavko Dimović
RELATIONSHIPS BETWEEN BONE TREATMENT CONDITIONS AND CO2+ SORPTION CAPACITIES
217
Jelica Kaljević, Mirjana Cvijović, Jelena Stanković, Vojislav Stanić
OCCUPATIONAL EXPOSURE TO IONISING RADIATION AT COPPER MILL
223
M. R. Dashtipour, S. M. Hosseini Pooya, H. Afarideh, F. Mianji
ASSESSMENT OF THE EXTREMITY DOSE DUE TO EXPOSURE BY AN IRIDIUM-192 SOURCE USING A CLOSE-HAND PHANTOM
227
Dragana Krstic, Zoran Jovanovic, Dragoslav Nikezic, Olivera Ciraj-Bjelac
AIR KERMA TO HP(3) CONVERSION COEFFICIENTS FOR EXPOSURE OF THE HUMAN EYE LENS TO THE SELECTED STANDARD X-RAY BEAM QUALITIES
231
M. Vasyanovich, A. Ekidin, M. Zhukovsky
EXPOSURE TO RADIOACTIVE AIRBORNE DISCHARGE FROM EUROPEAN NUCLEAR POWER PLANTS
235
S. M. Hosseini Pooya, F. Mianji, M. R. Kardan, N. Rastkhah
QUANTIFIABLE TECHNICAL ASPECTS OF A QUALITY MANAGEMENT SYSTEM FOR TL PERSONAL DOSIMETRY SERVICES
239
Ivanka Antović, Nikola Svrkota, Dalibor Stojanović, Mirzeta Hadžibrahimović, Ranka Žižić, Gordana Laštovička-Medin
SOIL AND VEGETATION FROM NOVI PAZAR (SERBIA) AND ROŽAJE (MONTENEGRO): RADIOACTIVITY IMPACT ASSESSMENT
243
Kaglyan A.Ye., Gudkov D.I., Klenus V.G., Yurchuk L.P., Nazarov A.B., Pomortseva N.A.1 , Shirokaya Z.O., Shevtsova N.L.
RADIONUCLIDES IN FISH OF THE CHERNOBYL EXCLUSION ZONE: SPECIES-SPECIFICITY, SEASONALITY, SIZE- AND AGE-DEPENDENT FEATURES OF ACCUMULATION
249
Th. Sawidis, K. Tsigaridas, L. Tsikritzis
CESIUM-137 MONITORING USING MOSSES AND LICHENS FROM WEST MACEDONIA, GREECE
253
D. Ganzha, Ch. Ganzha, A. Nazarov, B. Sploshnoi
SPECIFIC USE OF PHRAGMITES AUSTRALIS FOR RADIATION MONITORING
257
Anastasija Moisejenkova, Milda Pečiulienė, Dainius Jasaitis
Variation of specific activity of 137Cs in the bottom ground of water reservoirs and waterside soil in Vilnius city, Lithuania
263
Marčiulionienė E.D., Jefanova O., Sakalauskas V., Sevriukova O.
THE ACCUMULATION PROCESS OF 137CS AND 90SR IN THE CELL OF NITELLOPSIS OBTUSA ALGAE
269
Melgunov M.S., Kropacheva M.Yu., Chuguevskii A.V., Bolsunovsky A.Ya.
ACTIVE PARTICLES IN ALLUVIAL SOILS OF THE YENISEI RIVER: ISOTOPIC COMPOSITION, MORPHOLOGY AND STRUCTURE
275
Mentor Ismaili, Kaltrina Jusufi, Tahir Arbneshi, Fitim Sopjani, Avni Berisha, Jeton Halili
MEASUREMENTS OF HEAVY METALS IN RIVER SITNICA SEDIMENTS WITH AAS AND ICP/OES TECHNIQUES
281
Dora Krezhova, Svetla Maneva, Nikolay Petrov
APPLICATION OF REMOTE SENSING TECHNIQUE FOR PRESERVATION OF PLANT ECOSYSTEMS
285
Jelena Nikolic, Milica Rajacic, Dragana Todorovic, Marija Jankovic, Natasa Sarap, Gordana Pantelic
CALIBRATION OF HPGE DETECTORS FOR ENVIRONMENTAL SAMPLES USING GEANT4 SIMULATION
291
Svetlana Yu. Artamonova, Leonid P. Rikhvanov
URANIUM AND RARE ELEMENTS IN TECHNOGENIC AEROSOL OF SIBERIAN CHEMICAL COMBINE REGION (SEVERSK, RUSSIA)
295
D. Riekstina, J. Berzins, T. Krasta, O. Skrypnik, J. Rudzitis, J. Alksnis
ASSESSMENT OF RADIONUCLIDES IN ENVIRONMENT OF LATVIA
301
R. Mikalauskienė, J. Mažeika1, O. Jefanova, P. Szwarczewski
INVESTIGATION OF LEAD-210 AND CAESIUM-137 CHRONOLOGY OF LACUSTRINE SEDIMENTATION
307
Nataša B. Sarap, Marija M. Janković, Ivan Panić, Dragana J. Todorović
RADIOACTIVITY CONCENTRATIONS IN SPA WATERS – DOSE ASSESSMENT
313
Jelena Ajtić, Dimitrije Maletić, Đorđe Stratimirović, Suzana Blesić, Jelena Nikolić, Vladimir Đurđević, Dragana Todorović
PREDICTABILITY OF LEAD-210 IN SURFACE AIR BASED ON MULTIVARIATE ANALYSIS
317
Milica M. Rajačić , Dragana J. Todorović, Marija M. Janković, Jelena D. Nikolić, Nataša B. Sarap, Gordana K. Pantelić
CORRELATION BETWEEN BERYLLIUM-7 IN ATMOSPHERIC DEPOSIT AND GROUND LEVEL AIR IN SERBIA FOR 2014 YEAR
323
E.A. Shchukina, V.Y. Osipov, K.A. Naumova, E.I. Nogovitsyna, V.E. Stepanov
INVESTIGATION OF THE TRITIUM CONTENT IN UNDERGROUND BRINES OF THE “UDACHNAYA” DIAMOND PIPE
327
A.S. Silva, M.L. Dinis, A.J.S.C. Pereira, A. Fiúza
RADON LEVELS IN PORTUGUESE THERMAL SPAS 331
A. Onishchenko, A. Varaksin, I.Yarmoshenko, M. Zhukovsky
ERROR ASSESSMENT ON THE PLANNING STAGE OF NATIONAL RADON CASE-CONTROL STUDY
337
M. Zhukovsky, I. Yarmoshenko RADON EXPOSURE AND DOSE CALCULATION: PROBLEMS OF CHOICE 343
Timur Zhdanov, Mikhail Melgunov
EMANATION CHARACTERISTICS OF WEATHERED ROCKS WITH HIGH CONTENT OF NATURAL RADIOACTIVE ELEMENTS
349
A. Onishchenko, G. Malinovsky, A. Vasiliev, M. Zhukovsky
RADON MEASUREMENTS IN KINDERGARTENS IN URAL RADON PRONE AREAS 353
Sardana E. Egorova, Kristina A. Naumova, Valery E. Stepanov, Alexandra F. Kirillina, Natalia A. Rafailova
RADON EMANATION CHARACTERISTICS IN CENTRAL YAKUTIA
357
G. Conte, P. Allegrini, M. Pacilli, S. Salvatori, D.M. Trucchi, T. K0nonenko, A. Bolshakov, V. Ralchenko, V. Konov
BURIED GRAPHITE PILLARS IN SINGLE CRYSTAL CVD DIAMOND: SENSITIVITY TO ELECTRONS
359
S. Salvatori, G. Conte, M. Pacilli, P. Allegrini, V. Ralchenko
PIXEL ARRAY DETECTORS BASED ON CVD-DIAMOND FOR UV AND X-RAY DETECTION
365
Karl Bernhardi PENETRATION DEPTH OF X-RAYS IN CYLINDRICAL X-RAY COLLIMATORS 371
Karl Bernhardi SHIELDING OF AN X-RAY COLLIMATOR AGAINST INTERFERING X-RADIATION
377

F. Ahmadov, G. Ahmadov , A.Garibov, R. Madatov, J. Naghiyev, A.Olshevski, A. Sadigov, Z. Sadygov, S. Suleymanov, F. Zerrouk
STUDY ON POSSIBILITIES OF ESTABLISHING RADIATION DOSIMETERS BASED ON SILICON MICRO-PIXEL AVALANCHE PHOTODIODE
383
Mehmet Yüksel, Z. Gizem Portakal, Tamer Dogan, Mustafa Topaksu, Emre Unsal
THERMOLUMINESCENCE GLOW CURVE PROPERTIES OF TLD-500 DOSIMETER
387
Ivan Shvetsov-Shilovskiy, Anatoly Smolin, Pavel Nekrasov, Anastasia Ulanova, Alexander Nikiforov
THE INFLUENCE OF THE DEVICE GEOMETRY ON THE PARTIALLY DEPLETED SOI TRANSISTORS TID HARDNESS
393
Jozef Huran, Ladislav Hrubčín, Pavel Boháček, Sergey B. Borzakov, Vladimir A. Skuratov, Alexander P. Kobzev, Angela Kleinová, Vlasta Sasinková
THE EFFECT OF XE ION AND NEUTRON IRRADIATION ON THE PROPERTIES OF SIC AND SIC(N) FILMS PREPARED BY PECVD TECHNOLOGY
399
Miloš Marjanović, Danijel Danković, Vojkan Davidović, Aneta Prijić, Ninoslav Stojadinović, Zoran Prijić, Nebojša Janković
MODELING AND PSPICE SIMULATION OF RADIATION STRESS INFLUENCE ON THRESHOLD VOLTAGE SHIFTS IN P-CHANNEL POWER VDMOS TRANSISTORS
405
Alexandra Demidova , Alexander Pechenkin , Alexey Borisov , Leonid Kessarinskiy, Dmitry Boychenko, Andrey Yanenko
IDENTIFICATION OF IC CHIPS BY IONIZATION RESPONSE COMPARISON ON THE EXAMPLE OF OP1177
409
Davydov G.G., Kolosova A.S., Yanenko A.V., Boychenko D.V., Pechenkin A.A.
RADIATION BEHAVIOR FEATURES OF THE MODERN TRANSCEIVER ICS
413
P. K. Skorobogatov, G. G. Davydov, A. N. Egorov, A. V. Sogoyan, A.Y. Nikiforov
NANO-OPTIC EFFECTS IN LASER DOSE RATE SIMULATION OF SUBMICRON MICROELECTRONIC DEVICES
419
Sorokoumov G.S., Bobrovskiy D.V., Chumakov A.I.
SINGLE EVENT TRANSIENTS’ INVESTIGATION IN MODERN FPGA CIRCUITS 423
Alexey Borisov, Maya Belova, Leonid Kessarinskiy, Dmitry Boychenko, Alexander Nikiforov
ANALYSIS OF TOTAL DOSE EFFECTS IN MODERN ANALOG ICS
427
Slavica M Perovich, Martin Calasan
THE SPECIAL TRANS FUNCTIONS THEORY FOR THE DEGREE OF THE NUCLEAR FUEL BURN-UP ESTIMATION
433
Maria Ângela de B. C. Menezes, Elene Cristina Pereira Maia, Radojko Jaćimović
WORKER’S HEALTH AWARENESS PROGRAM IN BELO HORIZONTE, BRAZIL: SUPPORTED BY NEUTRON ACTIVATION ANALYSIS
439
Đorđe Stratimirović, Suzana Blesić, Caradee Wright, Martin Allen, Jelena Ajtić
WAVELET ANALYSIS OF PERSONAL SOLAR UVR EXPOSURE
443
Andjelija Ž. Ilić, Saša Ćirković, Jasna L. Ristić-Djurović
EVALUATION OF SMF EXPOSURE FIELD LEVELS AND GRADIENTS OBTAINABLE USING THE 2D MAGNETIC ARRAYS
447
Maes A., Anthonissen R., Verschaeve L.
ON THE ALLEGED ASSOCIATION BETWEEN EXTREMELY LOW FREQUENCY MAGNETIC FIELD EXPOSURES AND AN INCREASED RISK OF ALZHEIMER’S DISEASE
451
A.C.M. Garrido, M. L. Dinis OCCUPATIONAL EXPOSURE TO ELECTROMAGNETIC FIELDS (EMF) IN ARC AND RESISTANCE WELDING
455
Oleg A. Gerasimchuk, Konstantin A. Epifantsev, Petr K. Skorobogatov
THE INFLUENCE OF AMBIENT TEMPERATURE ON ICS ELECTRICAL OVERSTRESS PULSE HARDNESS
459

Stanislav Pavelka RADIOMETRIC DETERMINATION OF THYROTOXIC EFFECTS OF SOME XENOBIOTICS
463
Snežana Pejić, Ana Todorović, Vesna Stojiljković, Ljubica Gavrilović, Nataša Popović, Ivan Pavlović, Snežana Pajović
ANTIOXIDANT ENZYMES IN WOMEN WITH HYPERPLASIA COMPLEX: RELATION WITH SEX HORMONES
467
Stanislav Pavelka EFFECTS OF FLUOXETINE ON THYROID HORMONES METABOLISM 471
Blerta Laze, Anila Mitre COMPARISON OF ECL AND ELISA EUROIMMUN FOR DETECTION OF CYTOMEGALOVIRUS IGM ANTIBODIES
475
Gabriela Ciobanu, Ana Maria Bargan, Constantin Luca, Octavian Ciobanu
THE BI-SUBSTITUTED HYDROXYAPATITE AS RADIO-OPAQUE MATERIAL
479
Nina Djordjevic ANTIBIOTIC-LOADED HYDROXIAPATITE AND CALCIUM SULPHATE COMPOSITE IS A POTENT BIOMATERIAL FOR ONE STAGE TREATMENT OF THE EXTENSIVE INFECTED BONE DEFECT
483
Jovan P. Šetrajčić, Ana J. Šetrajčić – Tomić, Ljubiša D. Džambas, Ivana Gušić
CORE-SHELL LAYERED MODELS OF NANOSTRUCTURED CARRIERS FOR A NANO-BIO-MEDICAL APPLICATIONS
487
Daniel Adjei, Anna Wiechec, Przemyslaw Wachulak, Mesfin Getachew Ayele, Janusz Lekki, Wojciech M. Kwiatek, Andrzej Bartnik, Ladislav Pina, Henryk Fiedorowicz
DESIGN AND CHARACTERIZATION OF A DESK-TOP LASER PLASMA X-RAY SOURCE FOR RADIOBIOLOGY STUDIES
495
Čedomir Vasić , Nina Đorđević CHALLENGES IN APPLICATION OF THE BIOMEDICAL ENGINEERING TECHNIQUES INTO THE LOCAL MEDICAL FACILITIES
501
Gabi Rosca Fartat, Constantin Popescu, Constantin D. Stanescu
THE HORIZONTAL FUEL CHANNELS IN THE CANDU 6 NUCLEAR REACTOR 505
Gabi Rosca Fartat, Constantin Popescu, Constantin D. Stanescu
THE HORIZONTAL FUEL CHANNELS IN CANDU 6 NUCLEAR REACTOR PART I: PRESENTATION AND REFERENCE PLANS FOR INSTALATION
513
Gabi Rosca Fartat, Constantin Popescu, Constantin D. Stanescu
THE HORIZONTAL FUEL CHANNELS IN THE CANDU 6 NUCLEAR REACTOR PART II: ASSEMBLY MAIN STEPS
519
Gabi Rosca Fartat, Constantin Popescu, Constantin D. Stanescu
THE HORIZONTAL FUEL CHANNELS IN THE CANDU 6 NUCLEAR REACTOR PART III: DECOMMISSIONING DEVICE
525
Gordana Laštovička-Medin WHEN SCIENCE MEETS THE ART, AND HUMAN AWARENESS MEETS THE RESPONSIBILITY
531
Gordana Laštovička-Medin AN ESSAY ON THE FUTURE OF PHYSICS AND SCANNING TECHNOLOGIES: LIMITS BY FOUR FUNDAMENTAL FORCES AND QUANTUM MECHANICS
537
Slavica Brkić MATTER IN EXTREME CONDITIONS
543
LIST OF REVIEWERS 549


PSYCHOPHYSIOLOGICAL PROGNOSIS OF MULTIFOCAL ATHEROSCLEROSIS OF THE PATIENT WHO TRANSFERRED ACUTE RADIATION SICKNESS OF THE I DEGREE OF SEVERITY
N.A. Metlyaeva, A.Yu. Bushmanov, V.I. Krasnuk, O.V. Shcherbatih
State Research Center, Burnasyan Federal Medical Biophysical Center of Federal Medical Biological Agency,
Moscow, Russia
Abstract. A patient, born in 1940, did the work of the shift chief of the plant of thermal automatics and measurements (PTAM) of the
4th unit of Chernobyl NPP in April 1986. In April 1986, at the age of 45, he suffered ARS of I degree of severity from uniform gamma-beta
radiation. The total dose to the body, according to electro-paramagnetic resonance (EPR) of the tooth enamel from 2001, was 0,77+-0,25 Gy, on
neutrophil - 1,2 Gy, in the culture of cells – 0,7 Gy. After the 30-day treatment of the patient’s ARS of I degree, the so-called multifocal
atherosclerosis (MFA) started being formed dynamically and progressed. As the main manifestations of the adverse forecast served not only
crisis courses of a hypertensive illness, episodes of the sharp heart failure (HF), rhythm and conductivity violation, myocardial infarction (MI)
recurrence (2002, 2004, 2011), but also development of failures in non-coronary arterial pools (stenosed atherosclerosis of carotids, occlusion of
the right internal carotid, cerebrovascular illness, obliterating atherosclerosis of the bottom extremities). The patient, during the first inspection
on 16.05.1986 and at dynamic supervisions during 25 years (2001,2002,2009,2010) with the aspiration to look in favorable light was a leading
resistant tendency when testing, showing in answers a strict observance of even insignificant rules and social norms (L=71,6 scale),
subdepressive and disturbing-depressive tendencies (scale 2 D-71,2, 9Ma-50,0 T-points, F1 = 5,1-7,7,-8,1 walls). The patient’s awareness of the
changes overstepping the bounds of social norms, in the form of an affective rigidity (scale of 6 Pa = 71,0), psychasthenia (a scale of 7 Pt = 71,8)
and original thinking (scale of 8 Sch = 68,8), along with the indicators of characterizing a neurologic triad (scales 1 Hs, 2 D, 3 Hy), indicate
violation not only neurologic, but also psychological adaptation, subdepressive and disturbing and depressive tendencies, caused by the weight
of all-somatic and psychosomatic pathology. The subdepressive and disturbing-depressive syndrome in the patient was an independent risk factor
of the development of multifocal atherosclerosis.
Key words: acute radiation disease, adaptation, atherosclerosis, hypertensive illness, ischemic heart disease, cerebrovascular
arteriosclerosis.
Introduction The reduction of adaptive capacities by aging
leads to age-dependent pathology. Traditionally, aging is considered to be the mechanical wear and the accumulation of mistakes. Random mistakes and stress, caused by ecological factors, lead to infringement of metabolism, the secrete of free radicals and the damage to macromolecules in every cell and tissue. Moderate stress stimulates the expression of genes of stress-resistance, thereby contributing to the prevention or the elimination of new, including spontaneous, damage that slows aging. Duration or difficulty of stress-factors deplete the compensatory mechanisms and lead to a sharp increase in the number of injuries and physiological disorders that accelerates the aging process of the body [1].
The aim of this work is to evaluate the psycho-physiological adaptation of a patient with heavy psychosomatic and somatic cardiovascular and cerebrovascular pathology, who suffered the ARS of I degree, from the general uniform gamma-beta irradiation according to his individual peculiarities of mental adaptation and periods of the stages of mental adaptation.
Material and method The patient, born in 1940, did the work of the shift
chief of the plant of thermal automatics and measurements (PTAM) of the 4th unit of Chernobyl NPP in April 1986. In April 1986, at the age of 45, he suffered ARS of I degree of severity from uniform gamma-beta radiation. The total dose to the body,
2
according to electro-paramagnetic resonance (EPR) of the tooth enamel from 2001, was 0,77+-0,25 Gy, on neutrophil - 0,2 Gy, in the culture of cells – 0,7 Gy. For 25 years, from 26 April 1986 to 5 March 2011, he was examined and treated in the Clinic of SSC Biophysics Institute - KB №6, from 2008 - in FGBU GNC FMBC of A.I. Burnazyan FMBA of Russia, for the acute and long-term effects of ARS of I degree of severity and severe progressive cardiovascular and cerebrovascular pathology.
The patient was hospitalized in the Clinic on 27 April, 1986, with ARS of I degree of severity (bone marrow form), resulting from the Chernobyl accident. During the treatment from 27 April to 24 June 1986, in addition to the symptoms of acute radiation sickness patient was bothered by, on the 30th day (from June 5 to June 21 1986) for a short duration of 5-7-10 minutes, a pain in the heart area with irradiation in the epigastric region occurred, which coincided with ECG changes as ST segment elevation II, aVF, V 5-6 declining to contour lines on the 52nd day (17.06.86) Pain caused by emotional or physical stress, passed sometimes by itself. Border hearts were within normal limits, muted tones, systolic murmur at the top were listened. Blood pressure numbers were recorded within the normal values (BP - 130/80 - 140/80 - 105/60 mm Hg.) with a tendency to hypotension.
In the re-admission to the Clinic, 6 months after the Chernobyl NPP accident (27.10.86 – 21.11.86), he continued to present the complaints about pains in the heart region and high fatigue. Blood pressure which ranged around 130/80 - 120/80 - 115/80 mm Hg, was enhanced during the attack, heart pains to 160/110 mm Hg, took sustak. First initial biochemical signs of atherosclerosis were registered, in the form of a tendency to increase of cholesterol to 7,2 – 5,4 mmol/l (norm – 3,9 - 6,5 mmol/l), beta-lipoprotein – 9,2 – 8,0 g/l (norm - 3,5 - 5,5 g/l, triglycerides – 2,05 mmol/l (norm – 0,45 – 1,9 mmol/l, glucose 5,22 – 4,05 mmol/l (norm 3,2 – 5,6 mmol/l), remained elevated indicators АСТ to 33-79 units (norm 8 - 30), АLТ - 19 - 37 units (norm 7 - 27 units), total bilirubin - 18 - 125 mmol/l (norm 4.6 - 15.1 mmol/l). ECG from 28.10.86 was marked sinus bradycardia 57 bpm. The rise of ST II, aVF, V 5-6 - above contours. The need to exclude of myocardial damage on the front wall of the left ventricle was expressed. On ECG dynamically - syndrome of early ventricular repolarization. Data from previous and present clinical and laboratory examinations allowed us to detect also ARS of I degree (bone marrow syndrome in the phase of recovery). Asthenic syndrome of moderate degree of severity. Initial signs of atherosclerosis coronarocardiosclerosis. Chronic cholecystitis. Hepatitis.
Results and discussion Psychophysiological examination of patient using
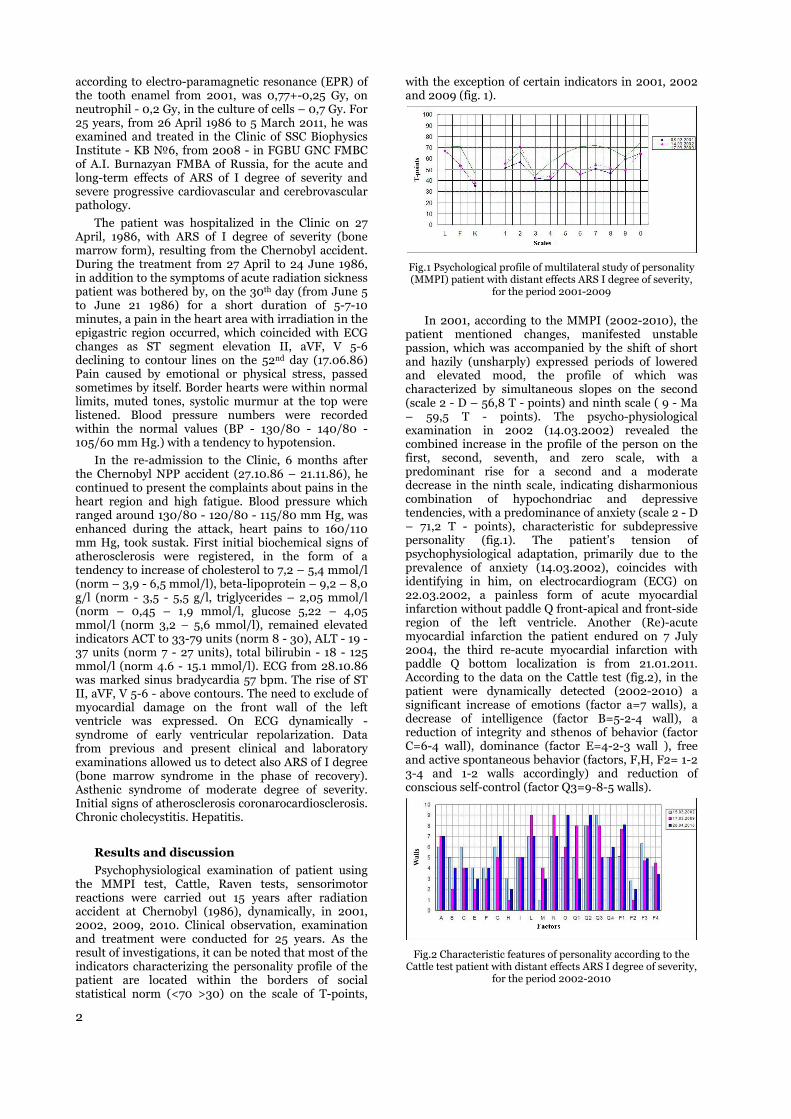
the MMPI test, Cattle, Raven tests, sensorimotor reactions were carried out 15 years after radiation accident at Chernobyl (1986), dynamically, in 2001, 2002, 2009, 2010. Clinical observation, examination and treatment were conducted for 25 years. As the result of investigations, it can be noted that most of the indicators characterizing the personality profile of the patient are located within the borders of social statistical norm (<70 >30) on the scale of T-points,
with the exception of certain indicators in 2001, 2002 and 2009 (fig. 1).
Fig.1 Psychological profile of multilateral study of personality (MMPI) patient with distant effects ARS I degree of severity,
for the period 2001-2009
In 2001, according to the MMPI (2002-2010), the patient mentioned changes, manifested unstable passion, which was accompanied by the shift of short and hazily (unsharply) expressed periods of lowered and elevated mood, the profile of which was characterized by simultaneous slopes on the second (scale 2 - D – 56,8 T - points) and ninth scale ( 9 - Ma – 59,5 T - points). The psycho-physiological examination in 2002 (14.03.2002) revealed the combined increase in the profile of the person on the first, second, seventh, and zero scale, with a predominant rise for a second and a moderate decrease in the ninth scale, indicating disharmonious combination of hypochondriac and depressive tendencies, with a predominance of anxiety (scale 2 - D – 71,2 T - points), characteristic for subdepressive personality (fig.1). The patient’s tension of psychophysiological adaptation, primarily due to the prevalence of anxiety (14.03.2002), coincides with identifying in him, on electrocardiogram (ECG) on 22.03.2002, a painless form of acute myocardial infarction without paddle Q front-apical and front-side region of the left ventricle. Another (Re)-acute myocardial infarction the patient endured on 7 July 2004, the third re-acute myocardial infarction with paddle Q bottom localization is from 21.01.2011. According to the data on the Cattle test (fig.2), in the patient were dynamically detected (2002-2010) a significant increase of emotions (factor a=7 walls), a decrease of intelligence (factor B=5-2-4 wall), a reduction of integrity and sthenos of behavior (factor C=6-4 wall), dominance (factor E=4-2-3 wall ), free and active spontaneous behavior (factors, F,H, F2= 1-2 3-4 and 1-2 walls accordingly) and reduction of conscious self-control (factor Q3=9-8-5 walls).
Fig.2 Characteristic features of personality according to the
Cattle test patient with distant effects ARS I degree of severity, for the period 2002-2010

3
At the same time the factors characterizing anxiety (F1= 5,1-7,7-8,1 walls, rigid effect (L= 7-9-7 walls), dissatisfaction with the situation and his own position in it (O= 5-9 walls), orientation to his own criteria (Q2= 8-9 walls) and frustrated tension (Q4= 5-6 walls) were increased.
According to the Raven test, difficulties in analytical and synthetic thinking activity (19.03.2002) were noted. In a psychophysiological examination in 2009, according to the MMPI, the profile personality of the patient registered above the borders of social statistical norm (<70 >30) on the scale of T-points (fig.1), indicating persistent violations of psychophysiological adaptation. Leading peaks on O scale and scale 1Hs testify about the limitation of the scope of communication in connection with somatic sense trouble (74,6 and 56 accordingly). It is necessary to note that the patient appeared to have a desire to attract attention to his own difficulties and problems (scale K= 38,2-46,0) and to show anxiety and the need for assistance (scale F= 70,8), in a person who, during the 25 years of observation in the Clinic (since May 16, 1986), a leading steady trend when testing was to appear in a positive light, displaying in the answers a strict observance of even minor rules and social norms (scale L= 71,6). Registration of patient changes in 2009, that are beyond human limits, in the form of affective rigidity (scale 6 Pa= 71,0), psychasthenia (scale 7 Pt= 71,8) and original thinking (scale 8 Sch = 68,8), along with the indicators, characterizing a neurological triad (scales 1 Hs, 2-D, 3 Hy), disclose a violation not only of neurological and psychological adaptation, due to the severity of somatic and psychosomatic pathology.
Anxiety-depressive disorders (ADD) are considered as an independent risk factor for the development and progression of cardiovascular disease. Overtension, caused by long-lasting negative emotions, is recognized as one of the leading factors in the formation of hypertensive disease (HD) and IHD [7. 8]. In general, ADD are associated with a crisis wave GB, more significant violations of daily blood pressure profile in the form of insufficient reduction at nighttime (non-dipper), higher values to the daily average blood pressure according to daily monitoring, bigger loading of pressure, the variability of BP [9, 10, 11]. The modern pathogenetic concept reflects the influence of ADD on development of GB by means of the violation of function of sympatheticotonic-adrenal, hypothalamus - hypophysial adrenal [12. 13], thyroid systems, the increased synthesis aldosteron against hyper stimulation of bark of adrenal glands, realization of anti-inflammatory and hyper coagulative shifts [14, 15, 16], and also suppression of activity of serotonin system [3, 2]. Negative impact of ADD on the clinical current of IHD is confirmed by a statistically reliable association of depression and pathological anxiety with higher class of stenocardia [7], risk of progressing of the latter [17] and a bigger lethality after the transferred coronary events [19].
Conclusion On the 30th day of the treatment of ARS of I degree
there were pains in the heart area of squeezing character, in 6 months initial biochemical symptoms of atherosclerosis were revealed. Data of the previous and
present clinical-laboratory inspection allowed to diagnose, except ARS of I degree (bone marrow syndrome in a restoration stage), an asthenic syndrome of moderate degree of severity, the initial phenomena of atherosclerotic coronary sclerosis (1986). In 1 year after the accident on the ChNPP, revealed were the fluctuations of BP to level of 160/105 mm Hg, with pains in heart area of squeezing character, changes on an ECG and bicycle ergogeny, increase of level of cholesterol, beta lipoproteins, triglycerides testified to changes of the cardiovascular system, caused by initial manifestations of atherosclerosis, hypertensive and ischemic heart disease, an angiopathy of vessels of a retina of hypertensive type. Thus, in the patient, the so-called multifocal atherosclerosis (MFA) started being formed dynamically and progressed, designating hemadynamicy significant atherosclerotic defeat of several vascular pools, defined weight of the disease, complicating a choice of adequate medical tactics and calling into question a optimistic forecast. As the main manifestations of the adverse forecast served not only the crisis courses of a hypertensive illness, the sharp heart failure (HF), rhythm and conductivity violations, recurrence of myocardial infarction (MI), but also the development of failures in non-coronary arterial pools (stenosic atherosclerosis of carotids, occlusion of the right external carotid, the cerebrovascular illness, obliterating atherosclerosis of the bottom extremities).
REFERENCES
1. A.I. Moskalev "Genetic and epigenetic of aging and longevity", Collection of works of the 3rd International conference. Russia, Sochi, pp.5-9, April 2014.
2. E.V. Balukova E.V. etc. "Disturbing frustration at patients of a medicamentous profile" Ter. arkh., vol. 6, pp. 85-88, 2007.
3. A.V. Nedostup and etc. "Psychovegetative ratios in cardiology and value of their medicamentous correction" It is grated. arch., vol. 1: pp. 68-73, 2007.
4. N.P. Garganeeva and etc. "New strategy of multiple-factor prevention of cardiovascular diseases at patients with disturbing and depressive frustrations in the conditions of a psychosocial stress" Rus. med. journal. Cardiology, vol. 26 (16), pp. 1-8, 2008.
5. V.E. Medvedev "Therapy of disturbing frustrations in patients with cardiovascular diseases (An Afobazole experience of use)" Arch. inside medical, vol. 3 (11), pp. 54-60, 2013.
6. M.A. Bobir "Clinical-epidemiological aspects of prevalence of symptomatology of uneasiness, anxiety and depression in patients with arterial hypertension" Autoref. diss. … cand. med. sciences. Russia, Velikyi Novgorod, 24 p., 2007.
7. H. Nabi et al. "Trajectories of depressive episodes and hypertension over 24 years: the Whitehall II prospective cohort study" Hypertension, vol. 57, pp. 710-716, 2011.
8. S. Patten et al. "Major depression as a risk factor for high blood pressure: epidemiologic evidence from a national longitudinal study" Psychosom. med., vol. 71 (3), pp. 273-279, 2009.
9. E. Brown et al. "Association of depression with medical illness: does cortisol play a role?" Biol. Psychitry, vol. 55, pp. 1-9, 2004.
10. E. Lambert et al. "Association between the sympathetic firing pattern and anxiety level in patients with the metabolic syndrome and elevated blood pressure" J. Hypertens, vol. 28 (3), pp. 543-550, 2010.
11. J. Empana et al. "Contributions of depressive mood and circulating inflammatory markers to coronary heart

4
disease in healthy European men: the prospective epidemiological study of myocardial infarction (PRIME)" Circulation, vol. 111, pp. 2299-2305, 2005.
12. L. Kim et al. "Association Between Clinical Depression and Endothelial Function Measured by Forearm Hyperemic Reactivity" Psychosomatic. Medicine, vol. 72 (1), pp. 20-26, 2010.
13. S.N. Mosolov "Disturbing and depressive frustrations: comorbidity and therapy" M, 64 p., 2009.
14. H. Sesso et al. "C-reactive protein and the risk of developing hypertension" JAMA, vol. 290, pp. 2945-2951, 2003.
15. R.G. Oganov and etc. "Depressive frustrations in общемедецинской practice according to the research COMPASS: look of the cardiologist" Cardiology, vol. 8, pp. 37-43, 2005.
FIRST PRINCIPLE BASED MODELING AND INTERPRETATION OF CHEMICAL EXPERIMENTS ON SUPERHEAVY ELEMENT IDENTIFICATION
A.V. Zaitsevskii 1,2, Yu.A. Demidov 1, N.S. Mosyagin 1,3, L.V. Skripnikov 1,3, A.V. Titov 1,3
1 Quantum Chemistry Laboratory, National Research Centre "Kurchatov Institute" B.P. Konstantinov Petersburg Nuclear Physics Institute, Gatchina, Leningrad district 188300, Russia; [email protected] , www.qchem.pnpi.spb.ru
2 Department of Chemistry, M. Lomonosov Moscow State University, Vorob’evy gory, Moscow 119991, Russia 3 Department of Physics, Saint Petersburg State University, Petrodvoretz 198504, Russia
Abstract. Our latest advances in studies of actinide and superheavy element (SHE) chemistry using the shape-consistent two-component small-core relativistic pseudopotential (RPP) method and two-component relativistic density functional theory (2c–RDFT) are summarized. The features of these elements due to large relativistic effects are emphasized. The RPP model, leaving for explicit correlation treatment both valence and subvalence (outercore) electrons, accounts for the finite nuclear size and incorporates relativistic effects (including the bulk of Breit interactions), providing a good basis for attaining optimal accuracy/cost ratio in the cases of large and strongly interfering relativistic and correlation effects, intrinsic for the heavy-atom compounds. The RPP/2c–RDFT approach allows one to solve the outercore-valence many-electron problem with moderate computational expenses while using practically exhaustive basis sets, optimized for the case of large differences between nl(j=l+1/2) and nl(j=l-1/2) one-electron states. Because of the exceptional role of thermochromatography on gold in the experiments on the “chemical” identification of SHEs with atomic numbers Z ≥ 112, the main attention was paid to the description of the SHE – gold interactions. Adsorption energies of SHEs on a gold surface were estimated using the cluster model. Its reliability was improved by monitoring the charge distributions in the vicinity of the adsorption site, taking account of the effects of the relaxation of the cluster compatible with its embedding into the crystal. The resulting desorption energy estimates for elements 113 and 120 single atoms from gold surface are substantially lower than the previously reported values.
Key words: relativistic pseudopotential, relativistic effective core potential, relativistic density functional theory, actinides, superheavy elements, correlation effects
6
INTRODUCTION
First principle based electronic structure modeling for molecules or clusters containing superheavy element (SHE) atoms require, in general, accounting for relativistic effects on equal footing with the electronic correlation. The straightforward way to do so is to solve the electron correlation problem for the Dirac–Coulomb(–Breit) relativistic Hamiltonian, implying the use of the four-component wave functions. However, such a way dramatically increases the computational cost compared to the corresponding nonrelativistic calculations that is particularly tedious in simulation of adsorption of a superheavy element on a surface. A most attractive alternative is to use relativistic pseudopotential (RPP) or Relativistic Effective Core Potential (RECP) theory (RPP below) since modern formulations of the theory are pretty accurate and economical. Another advantage of RPP is its good compatibility with well-developed nonrelativistic DFT versions in contrast to the all-electron relativistic DFT formulations. Below we discuss some theoretical and computational features of RPP practice for such objects.
1. RELATIVISTIC PSEUDOPOTENTIAL METHOD
The RPP method is most widely used in calculations on molecules and clusters containing heavy atoms because it drastically reduces the computational cost at the integral generation, self-consistency and integral transformation stages. When core electrons of a heavy-atom molecule do not play an active role, the effective Hamiltonian with RPP can be presented in the form
.1)]()([, ++=
vv vvv ji jiiv
Efv
SchrEf
riUihH (1)
The Hamiltonian in Eq. (1) is written only for a valence subspace of electrons, which are treated explicitly and denoted by indices iv and jv (the large core approximation). As in the case of non-relativistic pseudopotentials (PP), this subspace is often extended by inclusion of some outermost core shells for better accuracy (the small core approximation) but below we consider them as the valence shells because these outermost core and valence shells are not treated here using different approximations. In Eq. (1), hSchr is the one-electron Schrödinger Hamiltonian
,21 2
rZh icSchr −∇−= (2)
where Zic is the charge of the nucleus decreased by the number of inner core electrons. UEf in Eq. (1) is an RPP operator that is usually written in the
radially-local (semi-local) approximation [1,2,3] when the valence pseudospinors are smoothed in heavy-atom cores. Among the radially-local RPPs, the shape-consistent (or norm-conserving) RPP approaches [4] are most widely employed in calculations of heavy-atom molecules, though “energy-consistent” RPPs by Stuttgart-Dresden team are also actively used [5]. In plane-wave calculations of solids and in molecular dynamics, the separable PPs [6] are more popular now because they provide linear scaling of computational effort with the basis set size for self-consistent-field-like procedures in a more straightforward way than the radially-local PPs. Moreover, the nonlocal Huzinaga-type “ab initio model potentials” [7] conserving the nodal structure for the valence spinors are often applied. Contrary to the four-component wave function used in Dirac-Coulomb(-Breit) (DC(B)) calculations, the pseudo-wave function in the RPP case can be both two- and one-component. The PP operator simulates, in particular, interactions of the explicitly treated electrons with those, which are excluded from the PP calculations. The use of the effective Hamiltonian in Eq. (1), instead of all-electron four-component Hamiltonians, raises the issue about its accuracy. It was shown both theoretically and in calculations [8,9,10] that a typical accuracy of the radially-local RPPs is within 1000-3000 cm-1 for transition energies between low-lying states.
In our papers [9,11,12], the conventional radially-local (semi-local) form of the RPP operator (used by many groups up to now but suggested and first applied about 50 years ago [1,2,3]) was shown to be limited in accuracy, and some nonlocal corrections to the RPP operator were suggested [11,12,13,14], which have allowed us to improve significantly the RPP accuracy [8,9,10,12]. Moreover, it is known that the Breit interaction can give contributions in excess of one thousand wave numbers even to energies of transitions between lowest lying states of very heavy elements [15,16]. It is also clear that the point nuclear model becomes less appropriate when the nuclear charge is increased. Therefore, the RPPs designed for accurate calculations of actinide and superheavy element (SHE) compounds should allow one to take into account the Breit interaction and the finite size of nuclei. The most economic way is to incorporate the corresponding contributions into the RPP operator.
In a series of papers (see Refs. in [17]), a Generalized RECP (GRECP) approach was developed, that involves both radially-local, separable and Huzinaga-type potentials as its components in particular cases. Additionally, the GRECP operator can include terms of other types, known as “self-consistent” and two-electron “term-splitting” corrections [14], which are important particularly for economical (but precise) treatment of transition metals, lanthanides and actinides. With these terms, the accuracy provided by GRECPs can be even higher than the accuracy of the “frozen core” approximation (employing the same number of explicitly treated electrons) because they can account for relaxation of explicitly excluded (inner
7
core) electrons. In contrast to other RECP methods, GRECP employs the idea of separating the space around a heavy atom into three regions: inner core, outer core and valence, which are first treated employing different approximations for each. The outer core pseudospinors (nodeless) together with valence pseudospinors (nodal) are used for constructing the GRECP components [18]. Quantum electrodynamics effects (QED) (see [15,16]), arbitrary nuclear models, and correlation with inner core shells [19] can be efficiently treated within GRECP. It allows one to attain practically any desired accuracy for compounds of lanthanides, actinides, and SHEs as well, while requiring moderate computational efforts since the overall accuracy is limited in practice by possibilities of correlation methods.
2. RPP ACCURACY: EXAMPLE OF CORRELATION
CALCULATIONS OF THE E120 ATOM
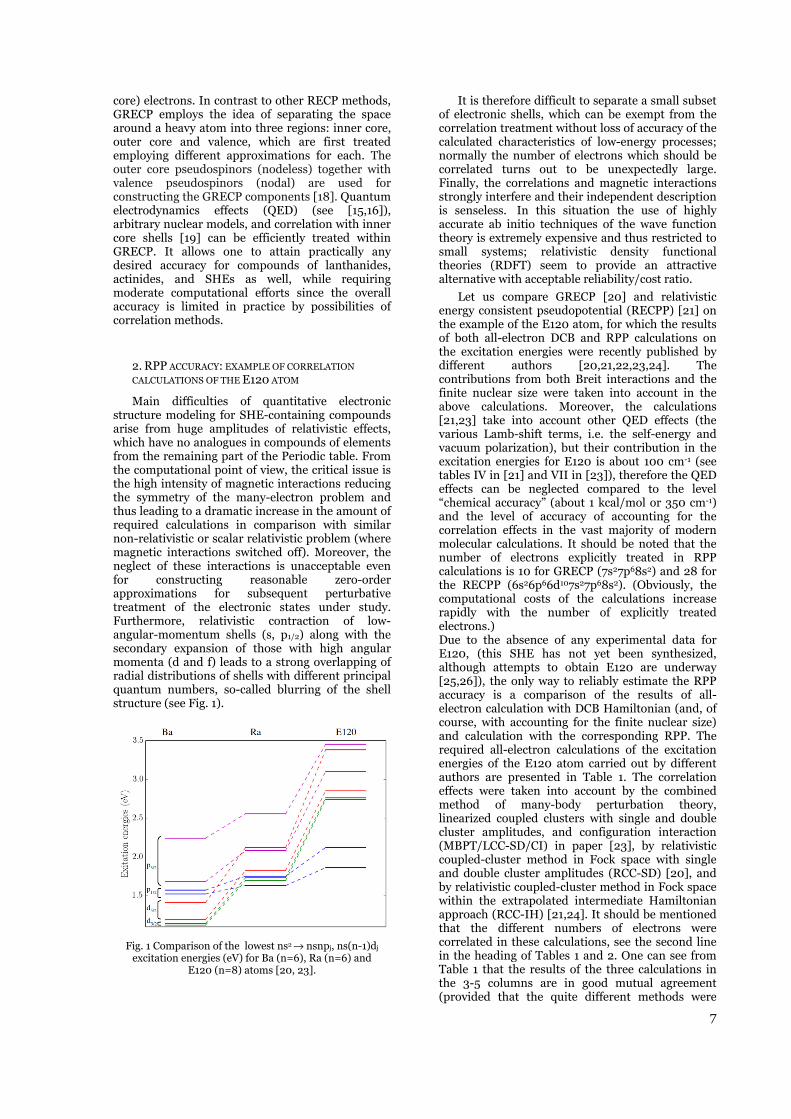
Main difficulties of quantitative electronic structure modeling for SHE-containing compounds arise from huge amplitudes of relativistic effects, which have no analogues in compounds of elements from the remaining part of the Periodic table. From the computational point of view, the critical issue is the high intensity of magnetic interactions reducing the symmetry of the many-electron problem and thus leading to a dramatic increase in the amount of required calculations in comparison with similar non-relativistic or scalar relativistic problem (where magnetic interactions switched off). Moreover, the neglect of these interactions is unacceptable even for constructing reasonable zero-order approximations for subsequent perturbative treatment of the electronic states under study. Furthermore, relativistic contraction of low-angular-momentum shells (s, p1/2) along with the secondary expansion of those with high angular momenta (d and f) leads to a strong overlapping of radial distributions of shells with different principal quantum numbers, so-called blurring of the shell structure (see Fig. 1).
Fig. 1 Comparison of the lowest ns2 → nsnpj, ns(n-1)dj
exсitation energies (eV) for Ba (n=6), Ra (n=6) and E120 (n=8) atoms [20, 23].
It is therefore difficult to separate a small subset of electronic shells, which can be exempt from the correlation treatment without loss of accuracy of the calculated characteristics of low-energy processes; normally the number of electrons which should be correlated turns out to be unexpectedly large. Finally, the correlations and magnetic interactions strongly interfere and their independent description is senseless. In this situation the use of highly accurate ab initio techniques of the wave function theory is extremely expensive and thus restricted to small systems; relativistic density functional theories (RDFT) seem to provide an attractive alternative with acceptable reliability/cost ratio.
Let us compare GRECP [20] and relativistic energy consistent pseudopotential (RECPP) [21] on the example of the E120 atom, for which the results of both all-electron DCB and RPP calculations on the excitation energies were recently published by different authors [20,21,22,23,24]. The contributions from both Breit interactions and the finite nuclear size were taken into account in the above calculations. Moreover, the calculations [21,23] take into account other QED effects (the various Lamb-shift terms, i.e. the self-energy and vacuum polarization), but their contribution in the excitation energies for E120 is about 100 cm-1 (see tables IV in [21] and VII in [23]), therefore the QED effects can be neglected compared to the level “chemical accuracy” (about 1 kcal/mol or 350 cm-1) and the level of accuracy of accounting for the correlation effects in the vast majority of modern molecular calculations. It should be noted that the number of electrons explicitly treated in RPP calculations is 10 for GRECP (7s27p68s2) and 28 for the RECPP (6s26p66d107s27p68s2). (Obviously, the computational costs of the calculations increase rapidly with the number of explicitly treated electrons.) Due to the absence of any experimental data for E120, (this SHE has not yet been synthesized, although attempts to obtain E120 are underway [25,26]), the only way to reliably estimate the RPP accuracy is a comparison of the results of all-electron calculation with DCB Hamiltonian (and, of course, with accounting for the finite nuclear size) and calculation with the corresponding RPP. The required all-electron calculations of the excitation energies of the E120 atom carried out by different authors are presented in Table 1. The correlation effects were taken into account by the combined method of many-body perturbation theory, linearized coupled clusters with single and double cluster amplitudes, and configuration interaction (MBPT/LCC-SD/CI) in paper [23], by relativistic coupled-cluster method in Fock space with single and double cluster amplitudes (RCC-SD) [20], and by relativistic coupled-cluster method in Fock space within the extrapolated intermediate Hamiltonian approach (RCC-IH) [21,24]. It should be mentioned that the different numbers of electrons were correlated in these calculations, see the second line in the heading of Tables 1 and 2. One can see from Table 1 that the results of the three calculations in the 3-5 columns are in good mutual agreement (provided that the quite different methods were
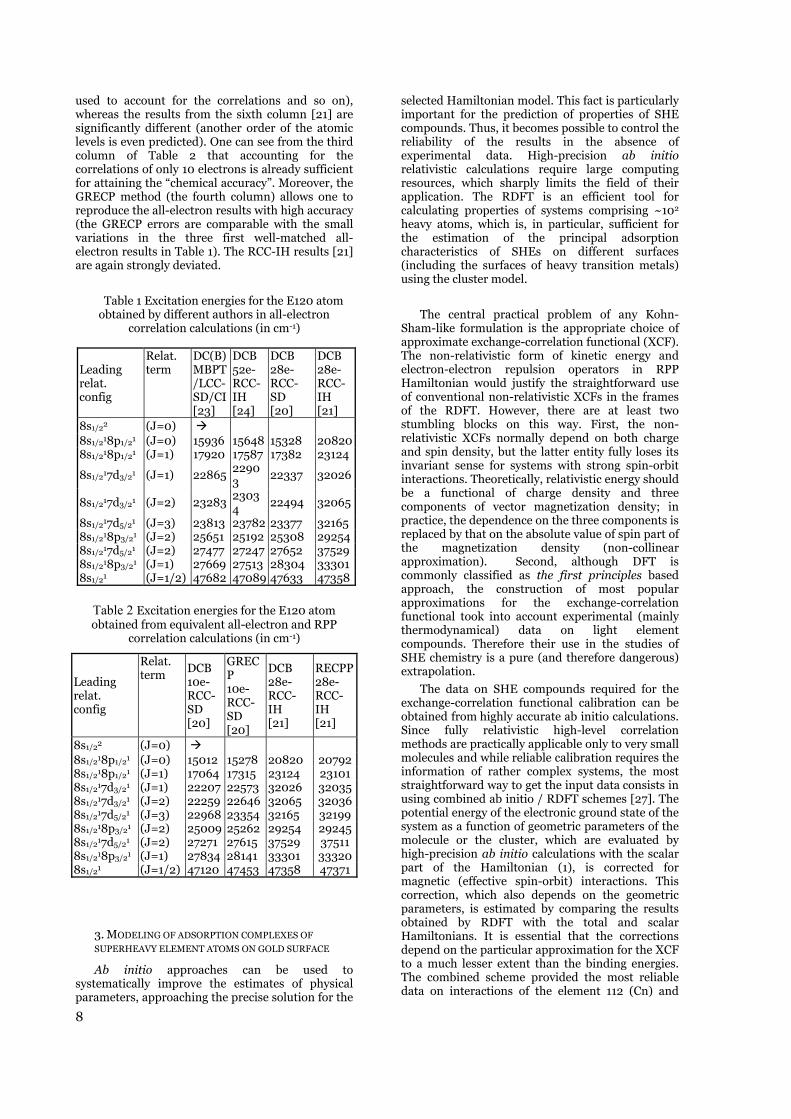
8
used to account for the correlations and so on), whereas the results from the sixth column [21] are significantly different (another order of the atomic levels is even predicted). One can see from the third column of Table 2 that accounting for the correlations of only 10 electrons is already sufficient for attaining the “chemical accuracy”. Moreover, the GRECP method (the fourth column) allows one to reproduce the all-electron results with high accuracy (the GRECP errors are comparable with the small variations in the three first well-matched all-electron results in Table 1). The RCC-IH results [21] are again strongly deviated.
Table 1 Excitation energies for the E120 atom obtained by different authors in all-electron
correlation calculations (in cm-1)
Table 2 Excitation energies for the E120 atom obtained from equivalent all-electron and RPP
correlation calculations (in cm-1)
Leading relat. config
Relat. term
DCB 10e- RCC- SD [20]
GRECP 10e- RCC- SD [20]
DCB 28e- RCC- IH [21]
RECPP28e- RCC- IH [21]
8s1/22 (J=0) 8s1/218p1/21 (J=0) 15012 15278 20820 207928s1/218p1/21 (J=1) 17064 17315 23124 231018s1/217d3/21 (J=1) 22207 22573 32026 320358s1/217d3/21 (J=2) 22259 22646 32065 320368s1/217d5/21 (J=3) 22968 23354 32165 321998s1/218p3/21 (J=2) 25009 25262 29254 292458s1/217d5/21 (J=2) 27271 27615 37529 375118s1/218p3/21 (J=1) 27834 28141 33301 333208s1/21 (J=1/2) 47120 47453 47358 47371
3. MODELING OF ADSORPTION COMPLEXES OF
SUPERHEAVY ELEMENT ATOMS ON GOLD SURFACE
Ab initio approaches can be used to systematically improve the estimates of physical parameters, approaching the precise solution for the
selected Hamiltonian model. This fact is particularly important for the prediction of properties of SHE compounds. Thus, it becomes possible to control the reliability of the results in the absence of experimental data. High-precision ab initio relativistic calculations require large computing resources, which sharply limits the field of their application. The RDFT is an efficient tool for calculating properties of systems comprising ~102 heavy atoms, which is, in particular, sufficient for the estimation of the principal adsorption characteristics of SHEs on different surfaces (including the surfaces of heavy transition metals) using the cluster model.
The central practical problem of any Kohn-Sham-like formulation is the appropriate choice of approximate exchange-correlation functional (XCF). The non-relativistic form of kinetic energy and electron-electron repulsion operators in RPP Hamiltonian would justify the straightforward use of conventional non-relativistic XCFs in the frames of the RDFT. However, there are at least two stumbling blocks on this way. First, the non-relativistic XCFs normally depend on both charge and spin density, but the latter entity fully loses its invariant sense for systems with strong spin-orbit interactions. Theoretically, relativistic energy should be a functional of charge density and three components of vector magnetization density; in practice, the dependence on the three components is replaced by that on the absolute value of spin part of the magnetization density (non-collinear approximation). Second, although DFT is commonly classified as the first principles based approach, the construction of most popular approximations for the exchange-correlation functional took into account experimental (mainly thermodynamical) data on light element compounds. Therefore their use in the studies of SHE chemistry is a pure (and therefore dangerous) extrapolation.
The data on SHE compounds required for the exchange-correlation functional calibration can be obtained from highly accurate ab initio calculations. Since fully relativistic high-level correlation methods are practically applicable only to very small molecules and while reliable calibration requires the information of rather complex systems, the most straightforward way to get the input data consists in using combined ab initio / RDFT schemes [27]. The potential energy of the electronic ground state of the system as a function of geometric parameters of the molecule or the cluster, which are evaluated by high-precision ab initio calculations with the scalar part of the Hamiltonian (1), is corrected for magnetic (effective spin-orbit) interactions. This correction, which also depends on the geometric parameters, is estimated by comparing the results obtained by RDFT with the total and scalar Hamiltonians. It is essential that the corrections depend on the particular approximation for the XCF to a much lesser extent than the binding energies. The combined scheme provided the most reliable data on interactions of the element 112 (Cn) and
Leading relat. config
Relat. term
DC(B) MBPT /LCC- SD/CI[23]
DCB 52e- RCC- IH [24]
DCB 28e- RCC- SD [20]
DCB 28e- RCC- IH [21]
8s1/22 (J=0) 8s1/218p1/21 (J=0) 15936 15648 15328 208208s1/218p1/21 (J=1) 17920 17587 17382 23124
8s1/217d3/21 (J=1) 22865 22903
22337 32026
8s1/217d3/21 (J=2) 23283 23034
22494 32065
8s1/217d5/21 (J=3) 23813 23782 23377 321658s1/218p3/21 (J=2) 25651 25192 25308 292548s1/217d5/21 (J=2) 27477 27247 27652 375298s1/218p3/21 (J=1) 27669 27513 28304 333018s1/21 (J=1/2) 47682 47089 47633 47358

9
element 113 (E113) atoms with small (up to 4 atoms) gold clusters [28, 29]. These cluster sizes are obviously insufficient to reliably evaluate the adsorption energy on gold surface in the frames of the combined scheme. Such estimations are very popular among experimentalists, since the thermochromatography on gold has been proved to be a unique method of chemical detection of heaviest elements. The adsorption of single atoms of elements 112 (copernicum, Cn) and 114 (flerovium, Fl) on a gold surface has been recently studied by this technique [30, 31]. The desorption energy values derived from the results of these experiments are 0.54 eV for Cn and 0.39 eV for Fl. According to fully relativistic (four-component) DFT calculations of Cn and Fl single atoms with gold systems, from an atom to an Aun cluster simulating the Au (111) surface, Fl should be more reactive than Cn [32]. Article [28] deals with the problem of finding the origin of this disagreement between the RDFT results and the estimations based on experimental data for Cn and its lighter homolog, Hg, atoms on gold surface. In this area further efforts are needed.
Nowadays, investigation of element 113 (E113) chemical properties is of top interest, and the first thermochromatographic experiment in this area has already been carried out [33]. Adsorption of E113 and E120 single atoms on the stable Au (111) surface was studied in the framework of the cluster model [34, 35]. We used gold clusters with up to 58 atoms to simulate the adsorption site. The equilibrium distances between the adatoms and the gold surface and the corresponding binding energies were calculated using the non-collinear two-component RDFT formulation [36]. The stability of the net Bader charge of SHE atom and the neighboring Au atoms with respect to increase of n indicated the cluster size used was appropriate. The resulting desorption energies estimates lie within the 1.0 – 1.2 eV range for E113 [34] and 2.50 eV for E120 [35], being substantially lower than previously reported values, obtained from simple semiempirical models (1.65 eV for E113 [37] and 3.67 − 3.71 eV [35, 38] for E120). More accurate RDFT desorption energies estimates can be used to parametrize semiempirical models.
4. CONCLUSIONS
Experimental data on the chemical properties of SHEs with atomic numbers of 112 and higher include only few events of gas thermochromatography. The correct and detailed interpretation of the available experimental data cannot be performed without using theoretical modeling. The criterion of the reliability of these models, along with the evident requirement of the reproduction of experimental data (which may be accidental due to the sparsity of the latter), is the agreement between the results obtained with the use of different theoretical approaches. Two-component density functional theory in its non-
collinear formulation combined with the accurate relativistic electronic structure model defined by shape-consistent small-core pseudopotentials (RDFT/PP) provides a robust basis of efficient computational schemes for predicting energetic and structural properties of complex polyatomic systems including superheavy elements. However, since the direct first-principles simulation of thermochromatographic experiments is possible only in the frames of RDFT, the estimation of the reliability of these methods and the elucidation of the scope of their applicability are worthy of particular attention.
Acknowledgement: The work was partially supported by the RFBR (grants Nos. 13-03-12252-ofi_m-2013 and 13-03-01307).
REFERENCES
1. J. C. Phillips and L. Kleinman, "New Method for Calculating Wave Functions in Crystals and Molecules", Phys. Rev., vol. 116, pp.287-293, October 1959.
2. I. V. Abarenkov and V. Heine, "The Model Potential for Positive Ions", Philos. Mag., vol. 12, pp.529-537, 1965.
3. V. Heine and I. V. Abarenkov, "A New Method for the Electronic Structure of Metals", Philos. Mag., vol. 9, pp.451-465, 1964.
4. W. C. Ermler, R. B. Ross and P. A. Christiansen, "Spin-orbit coupling and other relativistic effects in atoms and molecules", Adv. Quant. Chem., vol. 19, pp.139-182, 1988.
5. Dolg M., Cao X. "Relativistic pseudopotentials: their development and scope of applications", Chem. Rev., vol. 112, pp. 403-480, 2011.
6. G. Theurich and N. A. Hill, "Self-consistent treatment of spin-orbit coupling in solids using relativistic fully separable ab initio pseudopotentials", Phys. Rev., vol. B64, p.073106, July 2001.
7. L. Seijo and Z. Barandiaran, "Relativistic ab-initio model potential calculations for molecules and embedded clusters", in Relativistic Electronic Structure Theory. Part 2. Applications, P. Schwerdtfeger, Ed. Amsterdam: Elsevier, 2004, pp.417-475.
8. N. S. Mosyagin, E. Eliav, A. V. Titov and U. Kaldor, "Comparison of relativistic effective core potential and all-electron Dirac-Coulomb calculations of mercury transition energies by the relativistic coupled-cluster method", J. Phys., vol. B33, pp.667-676, February 2000.
9. N. S. Mosyagin, A. V. Titov and Z. Latajka, "Generalized Relativistic Effective Core Potential: Gaussian Expansions of Potentials and Pseudospinors for Atoms Hg Through Rn", Int. J. Quantum Chem., vol. 63 , pp.1107-1122, 1997.
10. T. A. Isaev, N. S. Mosyagin, M. G. Kozlov, A. V. Titov, E. Eliav and U. Kaldor, "Accuracy of RCC-SD and PT2/CI methods in all-electron and RECP calculations on Pb and Pb2+", J. Phys., vol. B33, pp.5139-5149, November 2000.
11. I. I. Tupitsyn, N. S. Mosyagin and A. V. Titov, "Generalized relativistic effective core potential. I. Numerical calculations for atoms Hg through Bi", J. Chem. Phys., vol. 103 , pp.6548-6557, October 1995.
12. A. V. Titov and N. S. Mosyagin, "Generalized
Relativistic Effective Core Potential: Theoretical
10
Grounds", Int. J. Quantum Chem., vol. 71, pp.359-401, 1999.
13. A. V. Titov and N. S. Mosyagin, "Self-Consistent Relativistic Effective Core Potentials for Transition Metal Atoms: Cu, Ag, and Au", Structural Chem., vol. 6, pp.317-321, August 1995.
14. A. V. Titov and N. S. Mosyagin, "The Generalized Relativistic Effective Core Potential Method: Theory and Calculations", Russ. J. Phys. Chem., vol. 74, Suppl. 2, pp. S376-S387, 2000.
15. A. N. Petrov, N. S. Mosyagin, A. V. Titov and I. I. Tupitsyn, "Accounting for the Breit interaction in relativistic effective core potential calculations of actinides", J. Phys., vol. B37, pp.4621-4637, December 2004.
16. N. S. Mosyagin, A. N. Petrov, A. V. Titov and I. I. Tupitsyn, "Generalized RECP Accounting for Breit Effects: Uranium, Plutonium and Superheavy Elements 112, 113, 114", in Recent Advances in the Theory of Chemical and Physical Systems, J.-P. Julien, et al., Eds. The Netherlands: Springer, 2006, pp.229-251.
17. N. S. Mosyagin, A. Zaitsevskii and A. V. Titov, "Shape-consistent Relativistic Effective Potentials of Small Atomic Cores", International Review of Atomic and Molecular Physics, vol. 1, pp.63-72, January-June 2010.
18. A. V. Titov, A. O. Mitrushchenkov and I. I. Tupitsyn, "Effective core potential for pseudo-orbitals with nodes", Chem. Phys. Lett., vol. 185, pp.330-334, October 1991.
19. N. S. Mosyagin and A. V. Titov, "Accounting for correlations with core electrons by means of the generalized relativistic effective core potentials: Atoms Hg and Pb and their compounds", J. Chem. Phys., vol. 122, p.234106, June 2005.
20. L. V. Skripnikov, N. S. Mosyagin and A. V. Titov, "Relativistic coupled-cluster calculations of spectroscopic and chemical properties for element 120", Chem. Phys. Lett., vol. 555, pp.79-83, January 2013.
21. T. Hangele, M. Dolg and P. Schwerdtfeger, "Relativistic energy-consistent pseudopotentials for superheavy elements 119 and 120 including quantum electrodynamic effects", J. Chem. Phys., vol. 138, p.174113, May 2013.
22. T. H. Dinh, V. A. Dzuba, V. V. Flambaum and J. S. M. Ginges, "Calculation of the spectrum of the superheavy element Z=120", Phys. Rev., vol. A78, p.054501, November 2008.
23. J. S. M. Ginges, V. A. Dzuba "Spectra of barium, radium, and element 120; application of the combined correlation potential, singles-doubles, and configuration interaction ab initio method", E-print: arXiv:1501.07327, 2015.
24. A. Borschevsky, V. Pershina, E. Eliav and U. Kaldor, "Ab initio predictions of atomic properties of element 120 and its lighter group-2 homologues", Phys. Rev., vol. A87, p.022502, Februrary 2013.
25. Yu. Ts. Oganessian, V. K. Utyonkov, Yu. V. Lobanov, F. Sh. Abdullin, A. N. Polyakov, R. N. Sagaidak, I. V. Shirokovsky, Yu. S. Tsyganov, A. A. Voinov, A. N. Mezentsev, V. G. Subbotin, A. M. Sukhov, K. Subotic, V. I. Zagrebaev, S. N. Dmitriev, R. A. Henderson, K. J. Moody, J. M. Kenneally, J. H. Landrum, D. A. Shaughnessy, M. A. Stoyer, N. J. Stoyer and P. A. Wilk, "Attempt to produce element 120 in the 244Pu + 58Fe reaction", Phys. Rev., vol. C79, p.024603, February 2009.
26. J. H. Hamilton, S. Hofmann, Y. T. Oganessian, "Search for Superheavy Nuclei", //Annu. Rev. Nucl. Part. Sci., vol. 63, pp. 383-405, 2013.
27. A. Zaitsevskii, E. Rykova, N. S. Mosyagin, A. V. Titov, "Towards relativistic ECP/DFT description of chemical bonding in E112 compounds: spin-orbit
and correlation effects in E112X versus HgX (X= H, Au)", Centr. Eur. J. Phys., vol. 4, p. 448, 2006.
28. A. Zaitsevskii, A. V. Titov, "Interaction of copernicium with gold: Assessment of applicability of simple density functional theories", Inter. J. Quant. Chem., vol. 113, pp. 1772-1774, 2013.
29. A. Zaitsevskii, A. V. Titov, A. A. Rusakov, C. van Wüllen, "Ab initio study of element 113-gold interactions", Chem. Phys. Lett., vol. 508, pp. 329-331, 2011.
30. R. Eichler, N. V. Aksenov, A. V. Belozerov, G. A. Bozhikov, V. I. Chepigin, S. N. Dmitriev, R. Dressler, H. W. Gaeggeler, V. A. Gorshkov, F. Haenssler, M. G. Itkis, A. Laube, V. Ya. Lebedev, O. N. Malyshev, Yu. Ts. Oganessian, O. V. Petrushkin, D. Piguet, P. Rasmussen, S. V. Shishkin, A. V. Shutov, A. I. Svirikhin, E. E. Tereshatov, G.K. Vostokin, M. Wegrzecki, A.V. Yeremin, "Chemical characterization of element 112", Nature vol. 447, p. 72, 2007.
31. R. Eichler, N. V. Aksenov, Y. V. Albin, A. V. Belozerov, G. A. Bozhikov, V. I. Chepigin, S. N. Dmitriev, R. Dressler, H. W. Gaeggeler, V. A. Gorshkov, G. Henderson, "Indication for a volatile element 114", Radiochim. Acta vol. 98, p. 133, 2010.
32. V. Pershina, J. Anton, T. Jacob, "Theoretical predictions of adsorption behavior of elements 112 and 114 and their homologs Hg and Pb", J. Chem. Phys., vol. 131, p. 084713, 2009.
33. S. N. Dmitriev, N. V. Aksenov, Y. V. Albin, G. A. Bozhikov, M. L. Chelnokov, V. I. Chepygin, R. Eichler, A. V. Isaev, D. E. Katrasev, V. Y. Lebedev et al., "Pioneering experiments on the chemical properties of element 113", Mendeleev Commun., vol. 24, p. 253, 2014.
34. A. A. Rusakov, Yu. A. Demidov, A. Zaitsevskii, "Estimating the adsorption energy of element 113 on a gold surface", Centr. Eur. J. Phys., vol. 11, pp. 1537-1540, 2013.
35. Yu. Demidov, A. Zaitsevskii, R. Eichler, "First principles based modeling of the adsorption of atoms of element 120 on a gold surface", Phys. Chem. Chem. Phys., vol. 16 pp. 2268-2270, 2014.
36. C. van Wüllen, "A Quasirelativistic Two-component Density Functional and Hartree-Fock Program", Z. Phys. Chem., vol. 224, pp.413-426, 2010.
37. V. Pershina, J. Anton, T. Jacob, "Electronic structures and properties of MAu and MOH, where M= Tl and element 113", Chem. Phys. Lett., vol. 480, pp. 157-160, 2009.
38. V. Pershina, A. Borschevsky, J. Anton, "Erratum: "Theoretical predictions of properties of group-2 elements including element 120 and their adsorption on noble metal surfaces''[J. Chem. Phys. 136, 134317 (2012)]", J. Chem. Phys., vol. 139, p.239901, 2013.
RADIOLYTIC DECOMPOSITION OF ENVIRONMENTALLY PERSISTENT PERFLUORINATED
SURFACTANTS WITH THE USE OF IONIZING RADIATION
Marek Trojanowicz 1,2, Anna Bojanowska-Czajka 1, Monika Łyczko 1, Krzysztof Kulisa 1, Gabriel Kciuk 1, Justyna Moskal 2
1 Institute of Nuclear Chemistry and Technology, Dorodna 16, 03-195 Warsaw, Poland 2 Department of Chemistry, University of Warsaw, Pasteura 1, 02-093 Warsaw, Poland
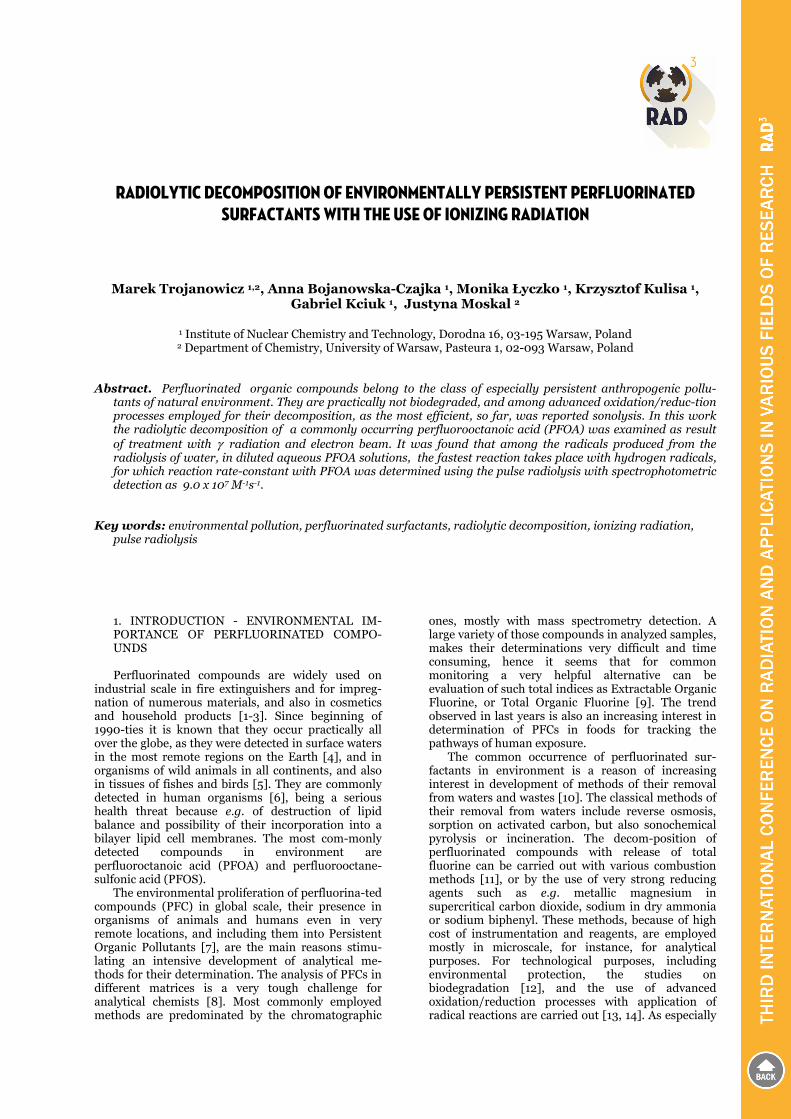
Abstract. Perfluorinated organic compounds belong to the class of especially persistent anthropogenic pollu-tants of natural environment. They are practically not biodegraded, and among advanced oxidation/reduc-tion processes employed for their decomposition, as the most efficient, so far, was reported sonolysis. In this work the radiolytic decomposition of a commonly occurring perfluorooctanoic acid (PFOA) was examined as result of treatment with γ radiation and electron beam. It was found that among the radicals produced from the radiolysis of water, in diluted aqueous PFOA solutions, the fastest reaction takes place with hydrogen radicals, for which reaction rate-constant with PFOA was determined using the pulse radiolysis with spectrophotometric detection as 9.0 x 10⁷ M-1s-1.
Key words: environmental pollution, perfluorinated surfactants, radiolytic decomposition, ionizing radiation,
pulse radiolysis
1. INTRODUCTION - ENVIRONMENTAL IM-PORTANCE OF PERFLUORINATED COMPO-UNDS Perfluorinated compounds are widely used on
industrial scale in fire extinguishers and for impreg-nation of numerous materials, and also in cosmetics and household products [1-3]. Since beginning of 1990-ties it is known that they occur practically all over the globe, as they were detected in surface waters in the most remote regions on the Earth [4], and in organisms of wild animals in all continents, and also in tissues of fishes and birds [5]. They are commonly detected in human organisms [6], being a serious health threat because e.g. of destruction of lipid balance and possibility of their incorporation into a bilayer lipid cell membranes. The most com-monly detected compounds in environment are perfluoroctanoic acid (PFOA) and perfluorooctane-sulfonic acid (PFOS).
The environmental proliferation of perfluorina-ted compounds (PFC) in global scale, their presence in organisms of animals and humans even in very remote locations, and including them into Persistent Organic Pollutants [7], are the main reasons stimu-lating an intensive development of analytical me-thods for their determination. The analysis of PFCs in different matrices is a very tough challenge for analytical chemists [8]. Most commonly employed methods are predominated by the chromatographic
ones, mostly with mass spectrometry detection. A large variety of those compounds in analyzed samples, makes their determinations very difficult and time consuming, hence it seems that for common monitoring a very helpful alternative can be evaluation of such total indices as Extractable Organic Fluorine, or Total Organic Fluorine [9]. The trend observed in last years is also an increasing interest in determination of PFCs in foods for tracking the pathways of human exposure.
The common occurrence of perfluorinated sur-factants in environment is a reason of increasing interest in development of methods of their removal from waters and wastes [10]. The classical methods of their removal from waters include reverse osmosis, sorption on activated carbon, but also sonochemical pyrolysis or incineration. The decom-position of perfluorinated compounds with release of total fluorine can be carried out with various combustion methods [11], or by the use of very strong reducing agents such as e.g. metallic magnesium in supercritical carbon dioxide, sodium in dry ammonia or sodium biphenyl. These methods, because of high cost of instrumentation and reagents, are employed mostly in microscale, for instance, for analytical purposes. For technological purposes, including environmental protection, the studies on biodegradation [12], and the use of advanced oxidation/reduction processes with application of radical reactions are carried out [13, 14]. As especially
12
effective, for instance, the sono-lytic conversion of PFOA and PFOS into inorganic products was reported [15]. Recently also reductive defluorination e.g. of perfluorooctane sulfonate (PFOS) with Ti(III)-citrate and vitamin B12 as catalyst was reported [16]. The obtained results suggest that microbial transformation of some PFOS isomers might be possible in anaerobic environ-ments. As generally the fate of PFOS and PFOA in e.g. drinking water treatment processes is reco-gnized [17], still numerous attempts for their removal from waters and wastes are investigated.
The application of ionizing radiation (γ from 60Co or 137Cs sources, or accelerated electron beam) is quite intensively investigated in recent decades as one of the most efficient advanced oxida-tion/reduction processes (AO/RP) for the removal of organic pollutants from waters and wastes. Recent papers published on their applications concerned e.g. removal of pharmaceutical residues [18-22], environmental pesticide residues [19-23], and environmental pollutants of industrial origin [24,25]. There are also studies undertaken on opera-tion of industrial-scale electron beam wastewater treatment plant [26], and decontamination of pesti-cide residues in vegetable and fruits [27].
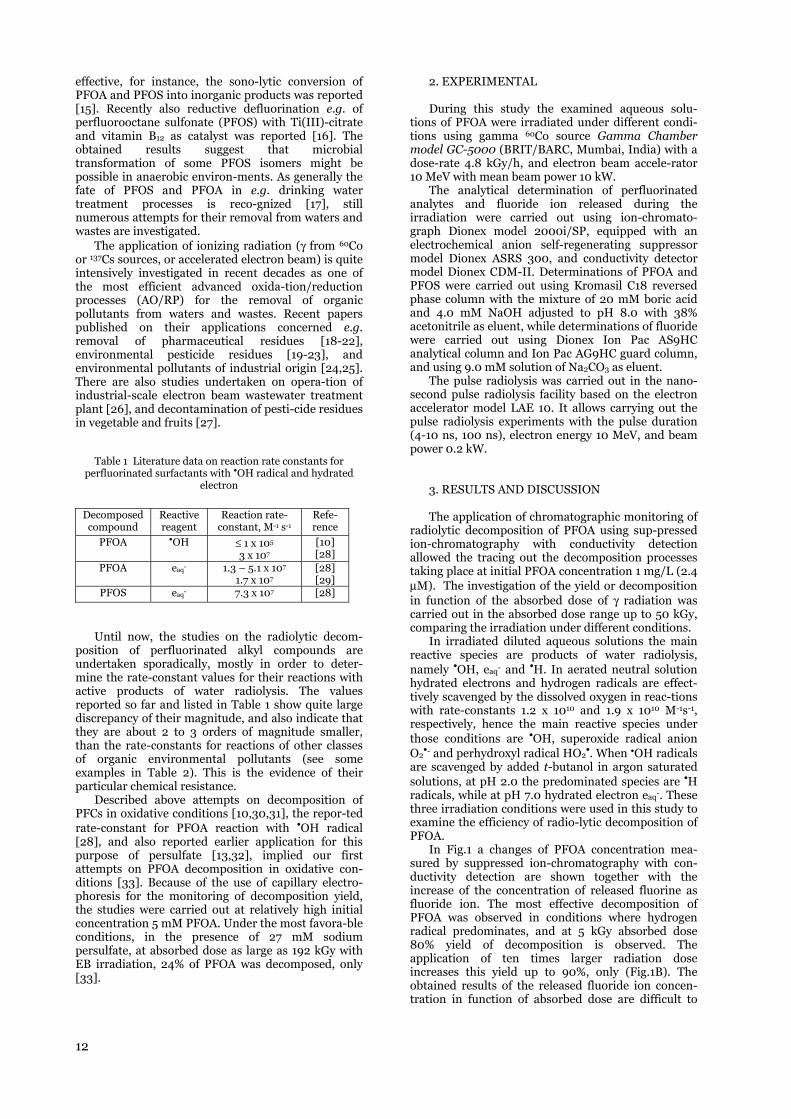
Table 1 Literature data on reaction rate constants for perfluorinated surfactants with OH radical and hydrated
electron
Decomposed
compound Reactive reagent
Reaction rate-constant, M-1 s-1
Refe-rence
PFOA OH ≤ 1 x 10⁵ 3 x 10⁷
[10][28]
PFOA eaq- 1.3 – 5.1 x 10⁷ 1.7 x 10⁷
[28][29]
PFOS eaq- 7.3 x 10⁷ [28]
Until now, the studies on the radiolytic decom-
position of perfluorinated alkyl compounds are undertaken sporadically, mostly in order to deter-mine the rate-constant values for their reactions with active products of water radiolysis. The values reported so far and listed in Table 1 show quite large discrepancy of their magnitude, and also indicate that they are about 2 to 3 orders of magnitude smaller, than the rate-constants for reactions of other classes of organic environmental pollutants (see some examples in Table 2). This is the evidence of their particular chemical resistance.
Described above attempts on decomposition of PFCs in oxidative conditions [10,30,31], the repor-ted rate-constant for PFOA reaction with •OH radical [28], and also reported earlier application for this purpose of persulfate [13,32], implied our first attempts on PFOA decomposition in oxidative con-ditions [33]. Because of the use of capillary electro-phoresis for the monitoring of decomposition yield, the studies were carried out at relatively high initial concentration 5 mM PFOA. Under the most favora-ble conditions, in the presence of 27 mM sodium persulfate, at absorbed dose as large as 192 kGy with EB irradiation, 24% of PFOA was decomposed, only [33].
2. EXPERIMENTAL During this study the examined aqueous solu-
tions of PFOA were irradiated under different condi-tions using gamma 60Co source Gamma Chamber model GC-5000 (BRIT/BARC, Mumbai, India) with a dose-rate 4.8 kGy/h, and electron beam accele-rator 10 MeV with mean beam power 10 kW.
The analytical determination of perfluorinated analytes and fluoride ion released during the irradiation were carried out using ion-chromato-graph Dionex model 2000i/SP, equipped with an electrochemical anion self-regenerating suppressor model Dionex ASRS 300, and conductivity detector model Dionex CDM-II. Determinations of PFOA and PFOS were carried out using Kromasil C18 reversed phase column with the mixture of 20 mM boric acid and 4.0 mM NaOH adjusted to pH 8.0 with 38% acetonitrile as eluent, while determinations of fluoride were carried out using Dionex Ion Pac AS9HC analytical column and Ion Pac AG9HC guard column, and using 9.0 mM solution of Na2CO3 as eluent.
The pulse radiolysis was carried out in the nano-second pulse radiolysis facility based on the electron accelerator model LAE 10. It allows carrying out the pulse radiolysis experiments with the pulse duration (4-10 ns, 100 ns), electron energy 10 MeV, and beam power 0.2 kW.
3. RESULTS AND DISCUSSION The application of chromatographic monitoring of
radiolytic decomposition of PFOA using sup-pressed ion-chromatography with conductivity detection allowed the tracing out the decomposition processes taking place at initial PFOA concentration 1 mg/L (2.4 μM). The investigation of the yield or decomposition in function of the absorbed dose of γ radiation was carried out in the absorbed dose range up to 50 kGy, comparing the irradiation under different conditions.
In irradiated diluted aqueous solutions the main reactive species are products of water radiolysis, namely •OH, eaq- and •H. In aerated neutral solution hydrated electrons and hydrogen radicals are effect-tively scavenged by the dissolved oxygen in reac-tions with rate-constants 1.2 x 10¹⁰ and 1.9 x 10¹⁰ M-1s-1, respectively, hence the main reactive species under those conditions are •OH, superoxide radical anion O2
•- and perhydroxyl radical HO2•. When OH radicals
are scavenged by added t-butanol in argon saturated solutions, at pH 2.0 the predominated species are •H radicals, while at pH 7.0 hydrated electron eaq-. These three irradiation conditions were used in this study to examine the efficiency of radio-lytic decomposition of PFOA.
In Fig.1 a changes of PFOA concentration mea-sured by suppressed ion-chromatography with con-ductivity detection are shown together with the increase of the concentration of released fluorine as fluoride ion. The most effective decomposition of PFOA was observed in conditions where hydrogen radical predominates, and at 5 kGy absorbed dose 80% yield of decomposition is observed. The application of ten times larger radiation dose increases this yield up to 90%, only (Fig.1B). The obtained results of the released fluoride ion concen-tration in function of absorbed dose are difficult to

13
interpret. While in aerated solution of pH 7.0 a monotonous increase of this concentration was ob-
Fig. 1 The effect of the absorbed dose of γ-radiation on the yield of decomposition of PFOA and release of fluoride ion both determined by ion-chromatography in aqueous solu-
tions of initial concentration 1 mg/L in: A -aerated solution of pH 7.0, B – argon saturated solution of pH 2.0 contain-ing 20 mg/L t-butanol, and C – argon saturated solution of
pH 7.0 containing 20 mg/L t-butanol.
served, in reductive conditions an increase was observed only up to 25 kGy absorbed dose, and then even slight decrease was noted, which can be partly connected to the protonation of fluoride in applied conditions (Fig.1B).
In pulse radiolysis measurements the rate constant for pseudo first order reaction between PFOA and hydrogen radical was determined. Measurements were carried out at 270 nm, where the formation of reaction product was detected. They were conducted in 1.0 mM PFOA aqueous PFOA solution of pH 1.0 saturated with argon, and with addition of 0.1 M t-butanol. For 20 Gy absor-bed dose the value of rate constant was evaluated as 9.0 x 10⁴ s-
1. In case of the necessity of applying larger doses of
radiation (>10 kGy), and especially in techno-logical applications, it is advantageous to employ rather electron beam (EB) irradiation instead of gamma radiation from cobalt or cesium sources. It can be associated, however, with certain dose-rate effect, which was reported earlier in similar studies e.g. for radiolytic decomposition of perchloroethy-lene [34], benzene, toluene, phenol and chloroform [35], and also antineoplastic drug cyterabine [36]. A high dose rate may increase the inter-radical reac-tions, hence, as it was observed for e.g. cyterabine, that gamma radiation was more efficient at elevated dose rates [36].
Fig.2 The effect of the absorbed dose of γ-irradiation () and accelerated electrons using electron beam irradiation () on the yield of PFOA decomposition (A) and fluoride ion release (B). Irradiations carried out in 1 mg/L aqueous solutions of
PFOA of pH 7.0 saturated with argon and with added 20 mg/L t-butanol.
In case of perchloroethylene, however, it was
demonstrated that gamma irradiation (low dose rate) was more efficient than EB irradiation (high dose rate). Similar comparison was conducted in this work for PFOA decomposition in reductive con-ditions. Fig.2 shows such a comparison for condi-tions, were during irradiation the hydrated electrons predominate, while in Fig.3 when hydrogen radicals predominate.
Fig.3 The effect of the absorbed dose of γ-irradiation() and accelerated electrons using electron beam irradia-tion() on
the yield of PFOA decomposition (A) and fluo-ride ion release (B). Irradiations carried out in 1 mg/L aqueous
solutions of PFOA of pH 2.0 saturated with argon, and with added 20 mg/L t-butanol.
Generally, when two different types of employed
ionizing radiation are compared - accelerated elec-trons and gamma irradiation - the 80-90% yield of radiolytic decomposition is obtained at much smaller absorbed doses when gamma radiation was used compared to EB. The application of EB is, however, much more efficient in case of complete release of fluorine from organic compounds with formation of fluoride ions, where monotonous incre-ase of concentration with absorbed dose was found.
Comparison of courses of radiolytic PFOA decomposition is also shown on the plot, which was
C

14
used for determination of initial values of radio-chemical yield Go and dose constant (Fig.4), accor-ding to commonly used procedures [37].
With the lack of linear dependence of ln(CD/CO) values on the absorbed dose magnitude, the dose constant was determined from the initial experi-mental values for the smallest applied dose. The obtained values are compared in Table 2 with those obtained in our earlier studies for other an-thropogenic organic pollutants of environment, which demonstrates a particular resistance of PFOA against radicals formed during irradiation of aqueous solutions.
Fig.4 The dose-rate effect in radiolytic decomposition of
PFOA examined by comparison of yield of irradiation in the processes with γ-irradiation (,) and EB irradiation ( , ) of 1 mg/L aqueous solution of PFOA. Irradiations carried in argon saturated solutions of pH 2.0 with 20 mg/L t-butanol
(,), and argon saturated solutions of pH 7.0 with 20 mg/L t-butanol (,). The yield of decom-position is expressed by the values of ln CD/CO, where CD is concentration of PFOA after irradiation, and CO – concen-tration of initial PFOA
solution prior to the irradiation.
This confirms also exceptional chemical stability of PFOA widely reported in literature.
REFERENCES
1. M. Pabon and J.M. Corpart, “Fluorinated surfactants: synthesis, properties, effluent trea-tment”, J. Fluorine Chem., vol. 114, pp. 149-156, 2002.
2. A.B. Lindstrom, M.J. Strynar and E.J. Libelo, “Polyfluorinated compounds: past, present, and future”, Environ. Sci. Technol., vol. 45, pp. 7954-7956, 2011.
3. M.P. Mawn, R.G. McKay, T.W. Ryan, B. Szostek, C.R. Powley and R.C. Buck, “Determination of extractable perfluorooctanoic acid (PFOA) in water, sweat simulant, saliva simulant, and methanol from textile and carpet samples by LC/MS/MS”, Analyst vol. 130, pp. 670-678, 2005.
4. P. Zareitalabad, J. Siemens, M. Hamer and W. Amelung, “Perfluorooctanoic acid (PFOA) and perfluorooctanesulfonic acid (PFOS) in surface waters, sediments, soils and wastewater – A review on concentrations and distribution coef-ficients”, Chemosphere, vol. 91, pp. 725-732, 2013.
5. C.L. Tseng, L.L. Liu, C.M. Chen and W.H. Ding, “Analysis of perfluorooctanesulfonate and rela-ted fluorochemicals in water and biological tissue
samples by liquid chromatography-ion trap mass spectrometry”, J. Chromatogr. A, vol. 1105, pp. 119-126, 2006.
6. K. Inoue, F. Okada, R. Ito, M. Kawaguchi, N. Okanuchi and H. Nakazawa, „Determination of perfluorooctane sulfonate, perfluorooctanoate and perfluorooctane sulfonylamide in human plasma by column-switching liquid chromate-graphy-electrospray mass spectrometry”, J. Chromatogr. B, vol. 810, pp. 49-56, 2004.
7. T. Wang, Y. Wang, C. Liao, Y. Cai and G. Liang, “Perspectives on the inclusion of perfluorooctane sulfonate into the Stockholm convention on persistent organic pollutants”, Environ. Sci. Technol., vol. 43, pp. 5171-5175, 2009.
8. M. Trojanowicz and M. Koc, “Recent deve-lopments in methods for analysis of perfluo-rinated persistent pollutants”, Microchim. Acta, vol. 180, pp. 957-971, 2013.
9. M. Trojanowicz, J. Musijowski, M. Koc and M. A. Donten, “Determination of Total Organic Fluo-rine (TOF) in environmental samples using flow-injection and chromatographic methods”, Anal. Meth., vol. 3, pp. 1039-1045, 2011.
10. C.D. Vecitis, H. Park, J. Cheng, B.T. Mader and M.R. Hoffmann, “Treatment technologies for aqueous perfluorooctanesulfonate (PFOS) and perfluorooctanoate (PFOA)”, Front. Environ. Sci. Engin. China, vol. 3, pp. 129-151, 2009.
11. P.B. Sweetster, “Decomposition of organic fluo-rine compounds by Wickbold oxyhydrogen flame combustion method”, Anal. Chem., vol. 28, pp. 1766-1768, 1956.
12. J.S.C. Liou, B. Szostek, C.M. DeRito and E.L. Madsen, “Investigating the biodegradability of perfluorooctanoic acid”, Chemosphere, vol. 80, pp. 176-183, 2010.
13. Y.Ch. Lee, S.L. Lo, P.T. Chiueh and D.G. Chang, “Efficient decomposition of perfluorocarboxylic acids in aqueous solution using microwave-induced persulfate”, Water Res., vol. 43, pp. 2811 -2816, 2009.
14. H. Park, C.D. Vecitis, J. Cheng, N.F. Dalleska, B.T. Mader and M.R. Hoffmann, “Reductive degradation of perfluoroalkyl compounds with aquated electrons generated from iodide photolysis at 254 nm”, Photochem. Photobiol. Sci., vol. 10, pp. 1945-1953, 2011.
15. C.D. Vecitis, H. Park, J. Cheng, B.T. Mader and M.R. Hoffmann, “Kinetics and mechanism of the sonolytic conversion of the aqueous perfluo-rinated surfactants, perfluorooctanoate (PFOA) and perfluorooctane sulfonate (PFOS) into inor-ganic products”, J. Phys. Chem. A, vol. 112, pp. 4261-4270, 2008.
16. V. Ochoa-Herrera, R. Sierra-Alvarez, A. Somo-gyi, N.E. Jacobsen, V.H. Wysocki and J.A. Field, “Reductive defluorination of perfluorooctane sulfonate”, Enviorn. Sci. Technol., vol. 42, pp. 3260-3264, 2008.
17. S. Takagi, F. Adachi, K. Miyano, M. Koizumi,H. Tanaka, I. Watanabe, S. Tanabe and K. Kannan, “Fate of perflurooctanesulfonate and perfluoro-octanoate in drinking water treatment proce-sses”, Water Res., vol. 45, pp. 3925-3932, 2011.
18. J.J. Lopez Penalver, C.V. Gomez Pacheco, M. Sanchez Polo and J. Rivera Utrilla, “Degradation of tetracyclines in different water matrices by advanced oxidation/ reduction processes based on
15
gamma radiation”, J. Chem. Technol. Bio-technol., vol. 88, pp. 1096-1108, June 2013.
19. M. Trojanowicz, A. Bojanowska-Czajka, G. Kciuk, K. Bobrowski, M. Gumiela, A. Koc, G. Nałęcz-Jawecki, M. Torun and D.S. Ozbay, „Application of ionizing radiation in decom-position of selected organic pollutants in wa-ters”, European Water, vol. 39, pp. 15-26, 2012.
20. E. Illes, E. Takacs, A. Dombi, K. Gajda-Schrantz, G. Racz, K. Gonter and L. Wojnarovits, “Hydroxyl radical induced degradation of ibu-profen”, Sci. Total Environ., vol. 447, pp. 286-292, March 2013.
21. S. Ayatollahi, D. Kalnina, W. Song, M. Turks and W.J. Cooper, ”Radiation chemistry of salicylic acid and methyl substituted salicylic acids; Models for the radiation chemistry of pharma-ceutical compounds”, Radiat. Phys. Chem., vol. 92, pp. 92-98, November 2013.
22. G. Sagi, T. Csay, G. Patzay, E. Csonka, L. Wojnarovits and E. Takacs, “Oxidative and reductive degradation of sulfamethoxazole in aqueous solutions: decomposition efficiency and toxicity assessment”, J. Radioanal. Nucl. Chem., vol. 301, pp. 475-482, August 2014.
23. M. Ismail, H.M. Khan, M. Sayed and W.J. Cooper, “Advanced oxidation for the treatment of chlorpyrifos in aqueous solution”, Chemo-sphere, vol. 93, pp. 645-651, October 2013.
24. M.M. Abdel Daiem, J. Rivera-Utrilla, R. Ocam-po-Perez, M. Sanchez-Polo and J.J. Lopez-Penalver, “Treatment of water contaminated with diphenolic acid by gamma radiation in the presence of different compounds”, Chem. Eng. J., vol. 219, pp. 371-379, March 2013.
25. Z. Guo, Q. Dong, D. He and C. Zhang, “Gamma irradiation for treatment of bisphenol A solution in presence of different additives”, Chem. Eng. J., vol. 183, pp. 10-14, February 2012.
26. B. Han, J.K. Kim, J.S. Choi and K.Y. Jeong, “Operation of industrial-scale electron beam wastewater treatment plant”, Radiat. Phys. Chem., vol. 81, pp. 1475-1478, September 2012.
27. A.A. Basfar, K.A. Mohamed and O.A. Al-Saqer, “De-contamination of pesticide residues in food by ionizing radiation”, Radiat. Phys. Chem., vol. 81,pp. 473-478, April 2012.
28. E. Szajdzińska-Pietek and J.L. Gębicki, “Pulse radiolytic investigation of perfluorinated sur-factants in aqueous solutions”, Res. Chem. Intermed., vol. 26, pp. 897-912, 2000.
29. L. Huang, W. Dong and H. Hou, “Investigation of the reactivity of hydrated electron toward perfluorinated carboxylates by laser flash photolysis”, Chem. Phys. Lett., vol. 436, pp. 124-128, 2007.
30. H. Hori, E. Hayakawa, H. Einaga, S. Kutsuna, K. Koika, T. Ibusuki, H. Kiatagawa and H. Arakawa, “Decomposition of environmentally persistent perfluorooctanoic acid in water by photoche-mical approaches”, Environ. Sci. Technol., vol. 38, pp. 6118-6124, 2004.
31. H.F. Schröder and R.J.W. Meesters, “Stability of fluorinated surfactants in advanced oxidation processes – A follow up of degradation products using flow injection-mass spectrometry, liquid chromatography-mass spectrometry and liquid chromatography-multiple stage mass spectro-metry”, J. Chromatogr. A, vol. 1082, pp. 110-119, 2005.
32. H. Hori, Y. Nagaoka, M. Murayama and S. Katsuna, “Efficient decomposition of perfluo-rocarboxylic acids and alternative fluoroche-mical surfactants in hot water”, Environ. Sci. Technol., vol. 42, pp. 7438-7443, 2008.
33. A. Bojanowska-Czajka, P. Drzewicz, L. Wójcik and M. Trojanowicz, “Degradation of perfluori-nated carboxylic acids in aqueous solutions with the use of ionizing radiation”, Annual Report INCT, pp. 51-53, 2008.
34. P. Gehringer and H. Eschweiler, „The dose rate effect with radiation processing of water – an interpretative approach“, Radiat. Phys. Chem., vol. 65, pp. 379-386, November 2002.
35. C.N. Kurucz, T.D. Waite, S.E. Otano, W.J. Cooper and M.G. Nickelsen, “A comparison of large-scale electron beam and bench-scale Co-60 irradiations of simulated aqueous waste stre-ams”, Radiat. Phys. Chem., vol. 65, pp. 367-378, November 2002.
36. R. Ocampo-Perez, J. Rivera-Utrilla, M. Sanchez-Polo, J.J. Lopez-Penalver and R. Leyva-Ramos, “Degradation of antineoplasctic cytarabine in aqueous solution by gamma radiation”, Chem. Eng. J., vol. 174, pp. 1-8, October 2011.
37. B.J. Mincher and R.D. Curry, “Considerations for choice of a kinetic fig. of merit in process radiation chemistry for waste treatment”, Appl. Rad. Isotop., vol. 52, pp. 189-193, February 2000.
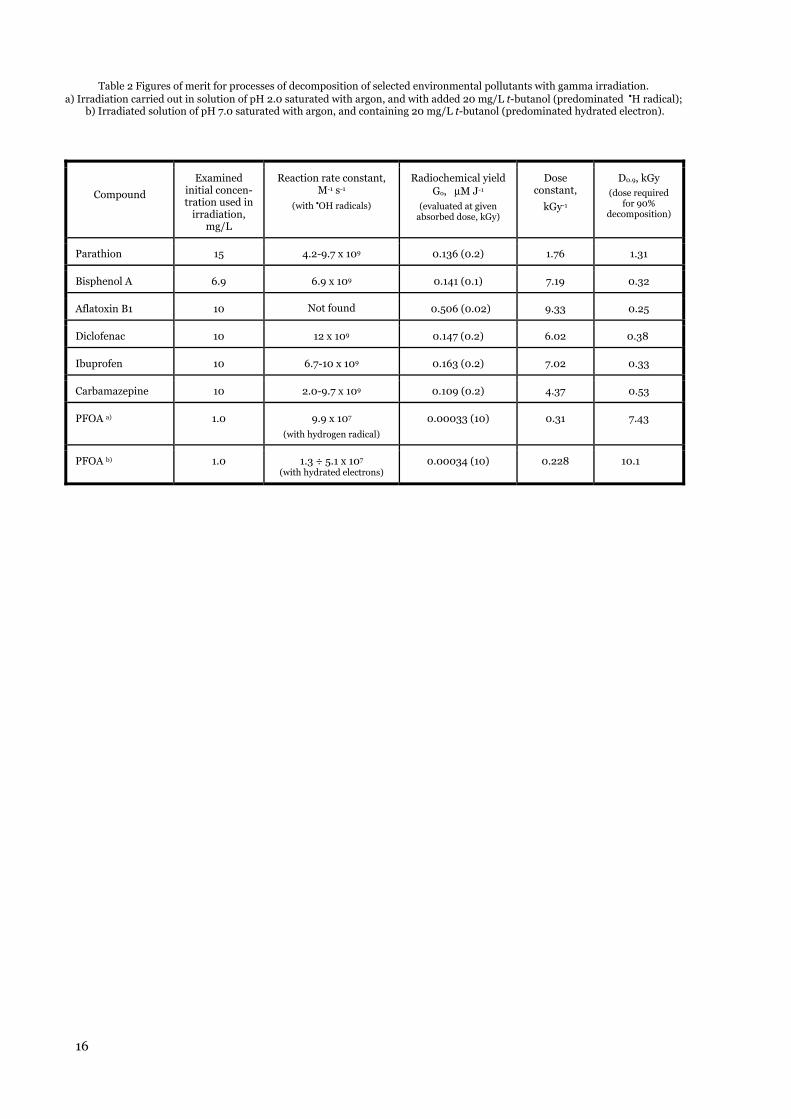
16
Compound
Examined initial concen-tration used in
irradiation, mg/L
Reaction rate constant, M-1 s-1
(with •OH radicals)
Radiochemical yield Go, μM J-1
(evaluated at given absorbed dose, kGy)
Dose constant,
kGy-1
D0.9, kGy (dose required
for 90% decomposition)
Parathion 15 4.2-9.7 x 10⁹ 0.136 (0.2) 1.76 1.31
Bisphenol A 6.9 6.9 x 10⁹ 0.141 (0.1) 7.19 0.32
Aflatoxin B1 10 Not found 0.506 (0.02) 9.33 0.25
Diclofenac 10 12 x 109 0.147 (0.2) 6.02 0.38
Ibuprofen 10 6.7-10 x 109 0.163 (0.2) 7.02 0.33
Carbamazepine 10 2.0-9.7 x 10⁹ 0.109 (0.2) 4.37 0.53
PFOA a) 1.0 9.9 x 10⁷
(with hydrogen radical)
0.00033 (10) 0.31 7.43
PFOA b) 1.0 1.3 ÷ 5.1 x 10⁷ (with hydrated electrons)
0.00034 (10) 0.228 10.1
Table 2 Figures of merit for processes of decomposition of selected environmental pollutants with gamma irradiation. a) Irradiation carried out in solution of pH 2.0 saturated with argon, and with added 20 mg/L t-butanol (predominated •H radical);
b) Irradiated solution of pH 7.0 saturated with argon, and containing 20 mg/L t-butanol (predominated hydrated electron).

REACTIVITY OF SELECTED PRIMITIVE AMINO ACIDS INDUCED BY GAMMA IRRADIATION IN ASTROCHEMICAL CONTEXT
Cristina CHERUBINI, Ornella URSINI
Institute of Chemical Methodologies - National Research Council of Italy - Via Salaria Km. 29,300-00015
Monterotondo (Rome) Italy
Abstract. Amino acids in meteorites were preserved from the action of high energy sources (cosmic rays and ultraviolet protons) by their collocation, at a depth of 20 m. At the same time, the presence of radioactive elements was the cause of amino acids degradation. The radioactive elements produced a total radiation dose of 14 MGy during the life of Solar System (4.6x10⁹ years). Beside the amino acids degradation, radiations promoted a radioracemization process that was able to reduce the L-enantiomeric excess of amino acids. Our studies are aimed to identify the radiation products formed in a solid state radiolysis using mass spectrometric techniques. Moreover, we are analyzing the radioracemization process at different irradiation conditions for proteinogenic and non proteinogenic amino acids. The amino acids show a relevant radiation and radioracemization resistance, especially the proteinaceous ones, such as leucine, valine and isoleucine. Some identified degradation pathways are significant due to their final products which can be considered precursors of more complex intermediates.
Key words: amino acids, gamma irradiation, meteoritic context
1. INTRODUCTION
Amino acids found in meteorites are the result of reactions between small organic molecules, such as CO2, CO, CH3OH, NH3 and H2O, the components of ice layers in solid dust particles. Once formed, they were incorporated into silicate structures which are the base of Solar System bodies [1]. Calculations show that amino acids and other organics are buried at a depth >20 m in asteroids, comets or other primitive bodies. On one hand this preserves them from the action different energy sources, mainly ultraviolet photons and cosmic rays. On the other hand, the presence of radioactive elements in meteoritic body, principally 40K, 232Th, 235U, 238U and 26Al, can play a role against the preservation of amino acids [2, 3]. In fact, the radionuclide decay was the main cause of the amino acids degradation in astrochemical context. According to Urey’s works [4, 5], radioactive elements produced a total radiation dose of ≈ 14 MGy during the life of Solar System (4.6x10⁹ years). Beside the fact that they can destruct the amino acids [6], radiations can also cause radioracemization, a transformation process leading to a reduction in optical activity as a consequence of two main events: firstly, the radiolysis of chiral molecules and their degradation into products without asymmetric centre; secondly, the inversion of chiral centre due to the high energy involved during irradiation [7]. In order to evaluate the radiolysis resistance of amino acids and their preservation of chirality to high energy radiations, we have started a systematic study on the radiolysis of proteinogenic and non proteinogenic amino acids, the latter ones predominant in meteorites. The used radiation dose was 3.2 MGy, which corresponds to 22.8% of the total dose they have received inside asteroids, comet and other bodies of the Solar System [8-11]. Here our attention is particularly focused on three primitive
amino acids (valine, isoleucine and leucine), in other word amino acids formed at the first stages of Solar System life. Valine, isoleucine and leucine are essential amino acids and are some of the most commonly found proteinogenic amino acids found in meteorites [12]. Using mass spectrometric techniques, we were able to identify the radiation products, investigate the possibility for amino acids to retain their initial chiral signature and examine how the lack of oxygen can influence the amino acids radioracemization.
2. EXPERIMENTAL
The amino acids L-valine, L-leucine and L-isoleucine (Fig. 1) were obtained from Sigma-Aldrich (Milan, Italy) and used as received (reagent grade min 98% TLC).
Fig. 1 Structure of analyzed amino acids: Leucine (A), Valine (B) and Isoleucine (C)

18
2.1. Irradiation experiments
The irradiation with γ rays was conducted in solid phase in a 60Co Gammacell 220 from Atomic Energy of Canada. The dose rate was 0.8 kGy/h for a total dose of 3.2 MGy. Each amino acid (300 mg for each) was irradiated separately from one another and in absence of air.
2.2. Mass spectrometric analysis
The amino acids were analyzed by a mass spectrometer Finnigan LXQ, a linear ion trap system equipped with an ESI ion source. The mass spectra were obtained by a direct injection of amino acids solutions in the mass spectrometer. L-Val, L-Leu and L-Ile were dissolved in 1 mL methanol and 1 mL of ammonium acetate solution 45 mM. The concentration for the three amino acids were, respectively, 1.0x10⁻² M, 7.8x10⁻³ M and 6.7x10⁻³ M and they were the same for irradiated and pristine samples, in order to have a more direct comparison for every amino acid. The flow injection was 10 µL/min and the analysis were conducted both in positive and in negative ion polarity mode, so as to identify products which retain the basic group (positive ion mode) and products which maintain the carboxylic group (negative ion mode). New products originated during irradiation were discovered comparing the mass spectra of pristine, non radiolyzed amino acids and the spectra of samples irradiated in absence of air. Whenever a new ion was detected in the spectrum, it was isolated in the ion trap and fragmented by collision induced dissociation (CID), operating a MSn analysis, with n up to 5. The possibility to isolate and fragment the ions derived from a first CID analysis enabled us to determine the chemical structure of irradiation products, drawing a fragmentation pathway for every new ion .
Coupling the ESI-MS with a HPLC system equipped with a teicoplanine based chiral column (stainless steel column, Astec CHIROBIOTIC™ T, 5 µm particle size, 150 mm x 4.6 mm) allowed us to measure the amount of D-enantiomer formed by irradiation process. The HPLC analysis was made using a Shimadzu liquid chromatograph LC-10AD VP. The mobile phase was a mixture of methanol, water and formic acid (70 MeOH – 30 H2O – 0.02 CH2O2) and the flow rate was 0.8 mL/min, splitted with a ratio 60/40 (waste/mass spectrometer ESI source). The purpose of the splitting was to increase sensitivity of mass spectrometer without losing resolution from the chiral column. To determine the quantity of D-enantiomer formed after irradiation, a calibration curve was constructed from standard solutions of L- and D-enantiomer. The Xcalibur program was used to calculate the relative percentage of D-enantiomer formation.
3. DISCUSION
The mass spectra of L-Leu, L-Ile and L-Val irradiated in vacuum condition are reported in Fig. 2, where it can be seen spectra recorded both in positive (Fig. 2a) and in negative ion mode (Fig. 2b). In every spectra the ions enlightened by an arrow represent
products of irradiation. The structures can be identify operating an MSn analysis.
It is possible to observe that each amino acid presents two types of radiation products: deamination and decarboxylation products. These two processes are well known mechanism of amino acid reaction towards radiations [6, 13, 14]. Due to the high energy involved in the radiation process, a series of reactions can occur in the vial, increased by the long time of irradiation. In this lapse of time the radicals can react with each other, react with neutral molecules or rearrange. The interaction with another radical or a neutral molecule leads to the formation of products with a higher molecular mass than the amino acid itself.
Fig. 2a Mass spectra of L-Leu, L-Ile and L-Val irradiated in
vacuum condition, recorded in positive ion mode with a mass range m/z 50-200. The amino acids were dissolved into a
solution 1:1 MeOH-AcNH4 45 mM

19
Fig. 2b Mass spectra of L-Leu, L-Ile and L-Val irradiated in
vacuum condition, recorded in negative ion mode with a mass range m/z 50-200. The amino acids were dissolved into a
solution 1:1 MeOH-AcNH4 45 mM
Some interesting products are the ones in which a radical was able to react with the ammonia group of the amino acid. In this case the N-substitution gives birth to molecules considered to be precursors of more complex intermediates, such as pyrimidines and purines. In Fig. 3 there are some products identified for L-Val, while in Fig. 4 there are some others identified for L-Ile and L-Leu.
Fig. 3 Some radiation products identified for valine irradiated in vacuum condition
Although isomers, leucine and isoleucine present some different irradiation products. For example, in isoleucine case, it is possible to observe the formation of glycine, absent in leucine spectra, where, instead, there are detected products derived from the reactions
of side chain radicals. Contrary to what happens when the irradiation experiment were conducted in presence of air, in vacuum condition it was not possible to observe oxidation products, because the lack of both oxygen and humidity.
Fig. 4 Radiation products identified for leucine irradiated in vacuum condition (A and B) and glycine (C) identified in the
spectrum of isoleucine irradiated in absence of air
Basically we can identify four main categories of products. The loss of small radicals from the amino acid molecules is the first category. It is represented by all the products in which there is the loss of a small group, such as CO2, NH3, CH4. Decarboxylation and deamination are the most important irradiation processes and they are considered to be the starting point of other radiation pathways, due to the fact that the formed primary radiation products were able to further react (Fig. 5).
Fig. 5 . Processes induced by radiation, starting from
decarboxylation and deamination of amino acid neutral molecules
A second category is the one in which radicals were able to react with amino acid molecules. These radicals could be either small (CO2, NH3, CH4) or large radicals, the latter derived from the amino acid side chain. The last two categories refer to the products of small and large radicals addition to those primary radiation products already mentioned. They were the most abundant types of radiation products because of their mechanisms of formation. In fact, the primary radiation products react easily with radicals. It is thought that these radicals remained in close proximity to the primary radiation products due to the fact that both of them were directly produced, at the same time, by irradiation processes.
What it is important considering the radiations in meteorites is the role they played in the survival of L-
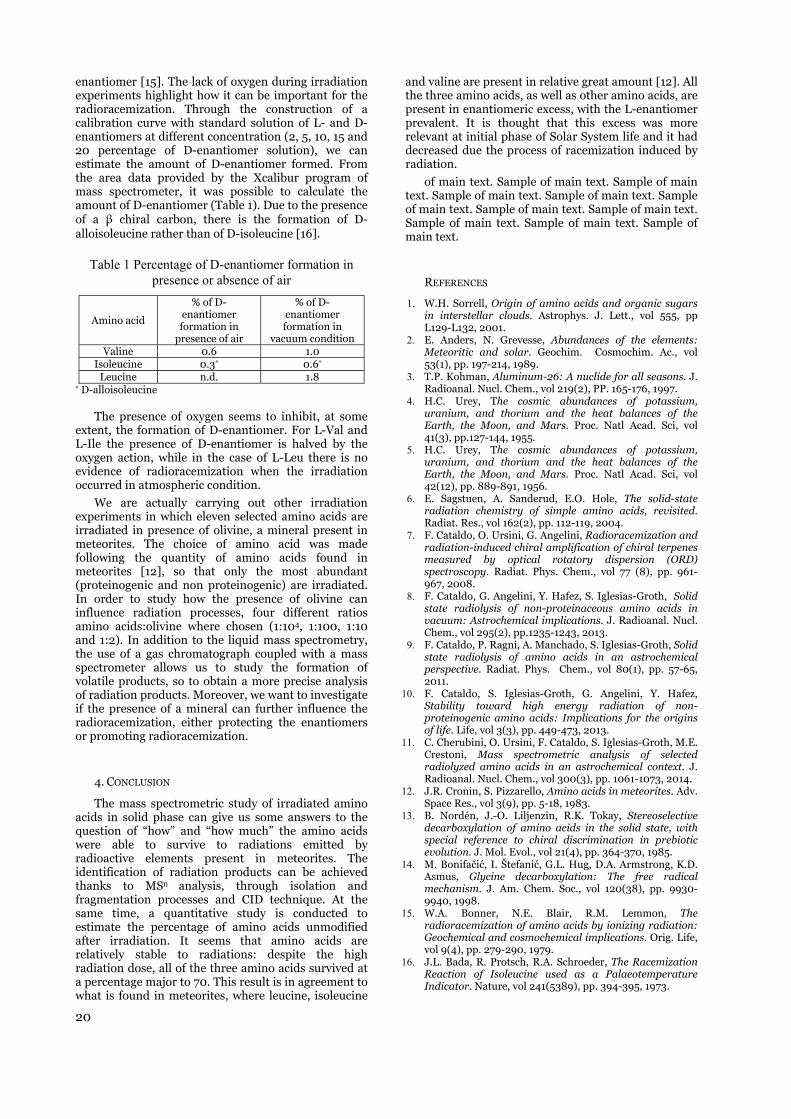
20
enantiomer [15]. The lack of oxygen during irradiation experiments highlight how it can be important for the radioracemization. Through the construction of a calibration curve with standard solution of L- and D-enantiomers at different concentration (2, 5, 10, 15 and 20 percentage of D-enantiomer solution), we can estimate the amount of D-enantiomer formed. From the area data provided by the Xcalibur program of mass spectrometer, it was possible to calculate the amount of D-enantiomer (Table 1). Due to the presence of a β chiral carbon, there is the formation of D-alloisoleucine rather than of D-isoleucine [16].
Table 1 Percentage of D-enantiomer formation in presence or absence of air
Amino acid
% of D-enantiomer formation in
presence of air
% of D-enantiomer formation in
vacuum condition Valine 0.6 1.0
Isoleucine 0.3* 0.6* Leucine n.d. 1.8
* D-alloisoleucine
The presence of oxygen seems to inhibit, at some extent, the formation of D-enantiomer. For L-Val and L-Ile the presence of D-enantiomer is halved by the oxygen action, while in the case of L-Leu there is no evidence of radioracemization when the irradiation occurred in atmospheric condition.
We are actually carrying out other irradiation experiments in which eleven selected amino acids are irradiated in presence of olivine, a mineral present in meteorites. The choice of amino acid was made following the quantity of amino acids found in meteorites [12], so that only the most abundant (proteinogenic and non proteinogenic) are irradiated. In order to study how the presence of olivine can influence radiation processes, four different ratios amino acids:olivine where chosen (1:104, 1:100, 1:10 and 1:2). In addition to the liquid mass spectrometry, the use of a gas chromatograph coupled with a mass spectrometer allows us to study the formation of volatile products, so to obtain a more precise analysis of radiation products. Moreover, we want to investigate if the presence of a mineral can further influence the radioracemization, either protecting the enantiomers or promoting radioracemization.
4. CONCLUSION
The mass spectrometric study of irradiated amino acids in solid phase can give us some answers to the question of “how” and “how much” the amino acids were able to survive to radiations emitted by radioactive elements present in meteorites. The identification of radiation products can be achieved thanks to MSn analysis, through isolation and fragmentation processes and CID technique. At the same time, a quantitative study is conducted to estimate the percentage of amino acids unmodified after irradiation. It seems that amino acids are relatively stable to radiations: despite the high radiation dose, all of the three amino acids survived at a percentage major to 70. This result is in agreement to what is found in meteorites, where leucine, isoleucine
and valine are present in relative great amount [12]. All the three amino acids, as well as other amino acids, are present in enantiomeric excess, with the L-enantiomer prevalent. It is thought that this excess was more relevant at initial phase of Solar System life and it had decreased due the process of racemization induced by radiation.
of main text. Sample of main text. Sample of main text. Sample of main text. Sample of main text. Sample of main text. Sample of main text. Sample of main text. Sample of main text. Sample of main text. Sample of main text.
REFERENCES
1. W.H. Sorrell, Origin of amino acids and organic sugars in interstellar clouds. Astrophys. J. Lett., vol 555, pp L129-L132, 2001.
2. E. Anders, N. Grevesse, Abundances of the elements: Meteoritic and solar. Geochim. Cosmochim. Ac., vol 53(1), pp. 197-214, 1989.
3. T.P. Kohman, Aluminum-26: A nuclide for all seasons. J. Radioanal. Nucl. Chem., vol 219(2), PP. 165-176, 1997.
4. H.C. Urey, The cosmic abundances of potassium, uranium, and thorium and the heat balances of the Earth, the Moon, and Mars. Proc. Natl Acad. Sci, vol 41(3), pp.127-144, 1955.
5. H.C. Urey, The cosmic abundances of potassium, uranium, and thorium and the heat balances of the Earth, the Moon, and Mars. Proc. Natl Acad. Sci, vol 42(12), pp. 889-891, 1956.
6. E. Sagstuen, A. Sanderud, E.O. Hole, The solid-state radiation chemistry of simple amino acids, revisited. Radiat. Res., vol 162(2), pp. 112-119, 2004.
7. F. Cataldo, O. Ursini, G. Angelini, Radioracemization and radiation-induced chiral amplification of chiral terpenes measured by optical rotatory dispersion (ORD) spectroscopy. Radiat. Phys. Chem., vol 77 (8), pp. 961-967, 2008.
8. F. Cataldo, G. Angelini, Y. Hafez, S. Iglesias-Groth, Solid state radiolysis of non-proteinaceous amino acids in vacuum: Astrochemical implications. J. Radioanal. Nucl. Chem., vol 295(2), pp.1235-1243, 2013.
9. F. Cataldo, P. Ragni, A. Manchado, S. Iglesias-Groth, Solid state radiolysis of amino acids in an astrochemical perspective. Radiat. Phys. Chem., vol 80(1), pp. 57-65, 2011.
10. F. Cataldo, S. Iglesias-Groth, G. Angelini, Y. Hafez, Stability toward high energy radiation of non-proteinogenic amino acids: Implications for the origins of life. Life, vol 3(3), pp. 449-473, 2013.
11. C. Cherubini, O. Ursini, F. Cataldo, S. Iglesias-Groth, M.E. Crestoni, Mass spectrometric analysis of selected radiolyzed amino acids in an astrochemical context. J. Radioanal. Nucl. Chem., vol 300(3), pp. 1061-1073, 2014.
12. J.R. Cronin, S. Pizzarello, Amino acids in meteorites. Adv. Space Res., vol 3(9), pp. 5-18, 1983.
13. B. Nordén, J.-O. Liljenzin, R.K. Tokay, Stereoselective decarboxylation of amino acids in the solid state, with special reference to chiral discrimination in prebiotic evolution. J. Mol. Evol., vol 21(4), pp. 364-370, 1985.
14. M. Bonifačić, I. Štefanić, G.L. Hug, D.A. Armstrong, K.D. Asmus, Glycine decarboxylation: The free radical mechanism. J. Am. Chem. Soc., vol 120(38), pp. 9930-9940, 1998.
15. W.A. Bonner, N.E. Blair, R.M. Lemmon, The radioracemization of amino acids by ionizing radiation: Geochemical and cosmochemical implications. Orig. Life, vol 9(4), pp. 279-290, 1979.
16. J.L. Bada, R. Protsch, R.A. Schroeder, The Racemization Reaction of Isoleucine used as a Palaeotemperature Indicator. Nature, vol 241(5389), pp. 394-395, 1973.

SPIRAL FILTERING ELEMENT AS THE BASIS OF THE FILTRATION SETUPS FOR REMOVAL OF THE SOLID RADIOACTIVE IMPURITIES FROM GAS AND LIQUID PHASES
Natalya A. Konovalova, Vladimir B. Krapukhin, Vladimir V. Kulemin, Viktor A. Lavrikov, Sergey A. Kulyukhin
Frumkin' Institute of Physical Chemistry and Electrochemistry, Russian Academy of Science, Leninskii prospekt, 31, 119071 Moscow, Russia
Abstract. After carrying out several filtration - regeneration cycles, filtering materials are irreversibly clogged up with the solid phase and need to be replaced. We developed a new spiral filtering element (SFE) having better regeneration properties in comparison with standard filters.
Key words: spiral filtering element, filtering materials.
1. INTRODUCTION
The radiation resistance of filtering materials is of great importance for removal of solid radioactive impurities from gas and liquid phases. One of such materials widely used in radiochemical industry are cermet filter elements [1 - 4]. However, this filtering material is irreversibly clogged up with the solid phase and needs replacement after carrying out several filtration - regeneration cycles, which is associated with the formation of additional amounts of high-level radioactive solid wastes. In an attempt to solve this problem without affecting high radiation resistance of the filter, we developed a new spiral filtering element (SFE), the main advantage of which are better regeneration properties in comparison with standard filters.
2. EXPERIMENT
The general view of the SFE is shown in Fig. 1. The element consists of a filtering partition 1, a cover 2, nipple 3, a frame 4 and a spring 5. The filtering surface (1) is made of corrosion-proof wire with a diameter of 0.6 to 0.8 mm in the form of a helical cylindrical spiral with gaps between its coils from 7 up to 300 microns; the diameter of the filtering partition is 16 mm, and its length is up to 370 mm. At one end, the filtering partition is closed by the cover (2), and at the other, it has the nipple (3) with a М16х1.5 external groove. The coaxial of the filtering surface coils (1) is provided by the frame (4). Sixty SFEs make a filtering surface of 1 m2. The overall diameter and length of the SFE is 25 mm and 415 mm, respectively. The SFEs are installed vertically by joining them upwards or downwards.
The specifications of the standard SFE are listed in Table 1. The spiral filtering element operates as
follows. Liquid or gas to be purified is fed onto the outside of the filtering partition (1), through which it penetrates inside the filtering elements, and is then discharged through the nipple (3). After the blockage of the filtering partition (1), regeneration of the SFE is carried out. The liquid or gas is fed into the nipple (3) in the direction opposite to the direction of the filtrate outlet. In this case, the extension of the filtering partition (1) and the increase of its filtering gaps allow impure particles to be fully removed from the filter gaps.
Fig. 1 Spiral filter element
1 - filter partition, 2 – cover, 3 – nipple, 4 – frame, 5 – spring.
Table 1. The specifications of the standard spiral filter element (SFE)
Parameter Value Material stainless steel Length, mm 400 Diameter 20 The effective area, m2 0.023 Filter clearance, mkm 5-7 The capacity, m3/m2 .h :
Water Air
5-10 at Δp = 1 аtm 300-400 at Δp = 0.1 аtm
The aerosol capacity, kg/m2 2.2 The number of cycles "sorption-desorption"
~105

22
The assessment of the number the "sorption-desorption" cycles was carried out during the filtering of a uranium-containing nitrate solution in the following way. The SFE was installed in the line for feeding the uranium-containing solution. The feeding was provided using a plunging pump with a dismounted working valve. During the operation of the pump, the filtering partition vibrated simultaneously with the reciprocal movement of the pump. The objective of the test trial was to assess the filtering partition resistance to the vibratory motion, when the partition worked in the sorption-desorption mode; i.e., in the compression-decompression mode. After carrying out 105 cycles, no damage of the filtering partition was found.
3. RESULTS AND DISCUSSION
To prove the advantages of SFE over other filtering materials, comparative tests of SFE filtering properties and cermet element (CME) were carried out using perlite as a solid phase. The results of the tests are shown in Fig. 2. Each point in the diagram is the average result for one filtering cycle, and the subsequent result is obtained after regeneration of the filter by the back flow of the liquid. Tests of filtration of radioactive solutions were also conducted. The initial quantity of the solid impurities in radioactive solution was 4.4 g/dm3. The obtained data are shown in Figs. 3 and 4. The quantity of the residual solid impurities in the filtrate was 5-7 mg/dm3.
As follows from the dependence of the filtration speed (W) on the specific load (q); i.e., the volume of the filtered liquid per unit of the filtering surface, the speed of the CME filtering continuously falls, while the speed of the SFE filtering remains virtually constant and does not depend on the number of the filtration and regeneration cycles. A similar ratio was also obtained in comparative tests using other filtering materials and elements for filtering various liquid and gas media.
Fig. 2 Comparison of the filtration performances of a cermet
filtering element (CME) and a SFE
Fig. 3 The dependence of the filtration performance (W) on the specific load (q) during filtration of industrial medium-level radioactive solutions. Filtration was carried out using
perlite
Fig. 4 The dependence of the filtration performance (W) on the specific load (q) during filtration of industrial high-level
radioactive solutions. Filtration was carried out using perlite.
4. CONCLUSION
In conclusion it is necessary to note that after regeneration the filter characteristics of spiral filter elements are almost completely restored. The technical characteristics show that the spiral filter elements can be used for purification of radioactive solution from solid impurities. Acknowledgements: The research was carried out using financial support by the Institute of Physics and Power Engineering (Obninsk, Russia) and Ministry of Education and Science of Russian Federation (contract N 1/5771 between IPCE RAS and IPPE; contract N 14.625.21.0001 between IPPE and Ministry of Education and Science of Russian Federation). REFERENCES
1. Yu. V. Krasovitsky, E. V. Romanyuk, R. A. Vazhinsky and N. N. Lobacheva, "New Design Solutions to Grain Filters and Prospects of their Application for Heat Drying in Chemical and Food Technology", Trans. State Univ. Tver', vol. 14, pp. 608-613, April 1971.
2. A. V. Ochkin, N. S. Babaev and E. P. Magomedbekov, Introduction to Radioecology, IzdAT, Moscow, 2003.
3. B. E. Ryabchikov, Cleaning of Liquid Radioactive Wastes, DeLi print, Moscow, 2008.
4. V. M. Vdovenko, Basis of Water Cleaning from Radioactive Contamination, Atomizdat, Moscow, 1974.
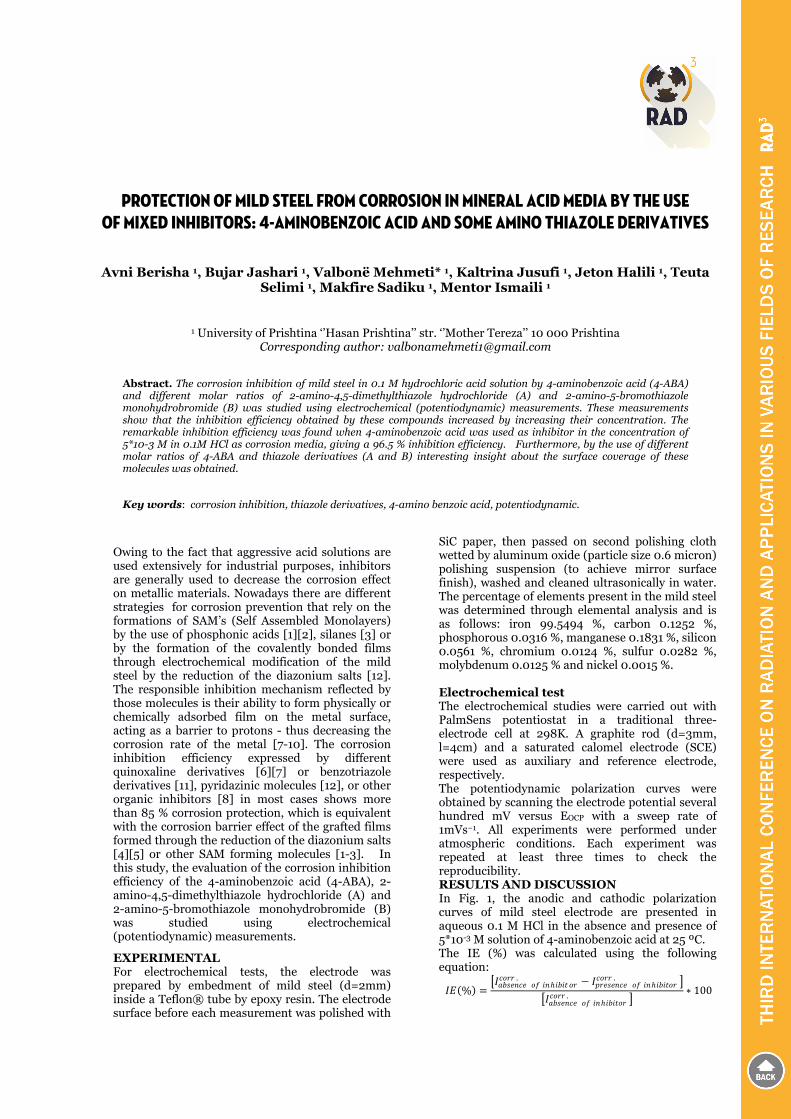
PROTECTION OF MILD STEEL FROM CORROSION IN MINERAL ACID MEDIA BY THE USE OF MIXED INHIBITORS: 4-AMINOBENZOIC ACID AND SOME AMINO THIAZOLE DERIVATIVES
Avni Berisha 1, Bujar Jashari 1, Valbonë Mehmeti* 1, Kaltrina Jusufi 1, Jeton Halili 1, Teuta Selimi 1, Makfire Sadiku 1, Mentor Ismaili 1
1 University of Prishtina ‘’Hasan Prishtina’’ str. ‘’Mother Tereza’’ 10 000 Prishtina Corresponding author: [email protected]
Abstract. The corrosion inhibition of mild steel in 0.1 M hydrochloric acid solution by 4-aminobenzoic acid (4-ABA) and different molar ratios of 2-amino-4,5-dimethylthiazole hydrochloride (A) and 2-amino-5-bromothiazole monohydrobromide (B) was studied using electrochemical (potentiodynamic) measurements. These measurements show that the inhibition efficiency obtained by these compounds increased by increasing their concentration. The remarkable inhibition efficiency was found when 4-aminobenzoic acid was used as inhibitor in the concentration of 5*10-3 M in 0.1M HCl as corrosion media, giving a 96.5 % inhibition efficiency. Furthermore, by the use of different molar ratios of 4-ABA and thiazole derivatives (A and B) interesting insight about the surface coverage of these molecules was obtained.
Key words: corrosion inhibition, thiazole derivatives, 4-amino benzoic acid, potentiodynamic.
Owing to the fact that aggressive acid solutions are used extensively for industrial purposes, inhibitors are generally used to decrease the corrosion effect on metallic materials. Nowadays there are different strategies for corrosion prevention that rely on the formations of SAM’s (Self Assembled Monolayers) by the use of phosphonic acids [1][2], silanes [3] or by the formation of the covalently bonded films through electrochemical modification of the mild steel by the reduction of the diazonium salts [12]. The responsible inhibition mechanism reflected by those molecules is their ability to form physically or chemically adsorbed film on the metal surface, acting as a barrier to protons - thus decreasing the corrosion rate of the metal [7-10]. The corrosion inhibition efficiency expressed by different quinoxaline derivatives [6][7] or benzotriazole derivatives [11], pyridazinic molecules [12], or other organic inhibitors [8] in most cases shows more than 85 % corrosion protection, which is equivalent with the corrosion barrier effect of the grafted films formed through the reduction of the diazonium salts [4][5] or other SAM forming molecules [1-3]. In this study, the evaluation of the corrosion inhibition efficiency of the 4-aminobenzoic acid (4-ABA), 2-amino-4,5-dimethylthiazole hydrochloride (A) and 2-amino-5-bromothiazole monohydrobromide (B) was studied using electrochemical (potentiodynamic) measurements.
EXPERIMENTAL For electrochemical tests, the electrode was prepared by embedment of mild steel (d=2mm) inside a Teflon® tube by epoxy resin. The electrode surface before each measurement was polished with
SiC paper, then passed on second polishing cloth wetted by aluminum oxide (particle size 0.6 micron) polishing suspension (to achieve mirror surface finish), washed and cleaned ultrasonically in water. The percentage of elements present in the mild steel was determined through elemental analysis and is as follows: iron 99.5494 %, carbon 0.1252 %, phosphorous 0.0316 %, manganese 0.1831 %, silicon 0.0561 %, chromium 0.0124 %, sulfur 0.0282 %, molybdenum 0.0125 % and nickel 0.0015 %. Electrochemical test The electrochemical studies were carried out with PalmSens potentiostat in a traditional three-electrode cell at 298K. A graphite rod (d=3mm, l=4cm) and a saturated calomel electrode (SCE) were used as auxiliary and reference electrode, respectively. The potentiodynamic polarization curves were obtained by scanning the electrode potential several hundred mV versus EOCP with a sweep rate of 1mVs−1. All experiments were performed under atmospheric conditions. Each experiment was repeated at least three times to check the reproducibility. RESULTS AND DISCUSSION In Fig. 1, the anodic and cathodic polarization curves of mild steel electrode are presented in aqueous 0.1 M HCl in the absence and presence of 5*10-3 M solution of 4-aminobenzoic acid at 25 ºC. The IE (%) was calculated using the following equation: % = ℎ. − ℎ.
ℎ. ∗ 100
24
The values of associated electrochemical parameters, such as corrosion potential (Ecorr) and corrosion current density (Icorr) were determined from the intersection of anodic and cathodic Tafel slopes and are shown in the Table 1. From the Tafel plot in Fig. 1, it’s evident that the adsorption of the 4-ABA molecule onto the mild steel surface drastically lowers the corrosion current of this alloy in this aggressive media, reflecting a very high value of the corrosion inhibition efficiency (IE≅96.5%).
Fig. 1 The Tafel plot of the mild steel electrode measured in 0.1M HCl solution: in absence (dashed line) and in presence of 5*10-3 M 4-aminobenzoic acid.
In the case of the molecule (A) and (B) (see Tafel plots in Fig. 2 and Fig. 3) the inhibition is much lower (this is also evident visually when comparing the spacing between the dashed and the full line).
Fig. 2 The Tafel plot of the mild steel electrode measured in 0.1M HCl solution: in absence (dashed line) and in presence of 5*10-3 M 2-amino-4,5-dimethylthiazole hydrochloride.
From the Tafel plots, in the case of the molecule (A), the determined inhibition efficiency is 64.47 %, whereas for the molecule (B), the inhibition efficiency reaches the value 86.92 %. Further study also involved the use of the combined (mixed inhibitors) for two purposes: a) to see if such mixed solution of inhibitors would have a ‘’synergistic’’ effect for achieving higher inhibition performance and b) to evaluate the possible surface desorption process of one molecule (4-ABA) from the other one. The experiment was performed by mixing the two inhibitors at molar rations from 0 to 1. The obtained experimental data are presented in Table 1. For both series A. 4-ABA / 2-amino-4,5-
dimethylthiazole hydrochloride and B. 4-ABA / 2-amino-5-bromothiazole monohydrobromide.
Fig. 3 The Tafel plot of the mild steel electrode measured in 0.1M HCl solution: in absence (dashed line) and in presence of 5*10-3 M 2-amino-5-bromothiazole monohydrobromide.
Molar ratio 4-ABA/(A)
IE (%) Ecorr. (V) ba (mV/dec)
bc (mV/dec)
1.0 96.34 -0.592 94.38 159.66 0.9 92.24 -0.610 78.45 139.12 0.8 93.39 -0.600 77.84 135.52 0.6 89.99 -0.591 73.45 133.24 0.5 92.24 -0.561 76.48 131.45 0.4 88.78 -0.595 72.51 133.49 0.2 91.87 -0.598 71.98 130.81 0.0 86.92 -0.577 71.21 123.84
Table 1 The inhibition efficiency of the mixed inhibitors (4-ABA/A) at different molar ratios from 0 to 1 (each 5*10-3 M) toward the mild steel in 0.1M HCl corrosion media.
From the data presented in Table 1, it’s evident that the use of mixed inhibitors in fact slightly lowers the inhibition performance of the benzoic acid, meaning that in this case the molecule of 4-ABA has stronger or almost equal sorption affinity toward the mild steel surface.
Molar ratio 4-ABA/(A)
IE (%) Ecorr. (V) ba (mV/dec)
bc (mV/dec)
1 96.34 -0.592 94.38 159.66 0.8 -23.03 -0.570 86.88 135.20 0.6 -42.83 -0.555 88.56 130.21 0.5 -51.35 -0.565 94.12 127.95 0.4 -31.08 -0.574 78.35 137.98 0.2 -23.03 -0.574 70.16 134.74 0 64.47 -0.590 69.91 127.88
Table 2 The inhibition efficiency of mixed inhibitors (4-ABA/A) at different molar ratios from 0 to 1 (each 5*10-3 M) toward the mild steel in 0.1M HCl corrosion media.
In the case of the molecule (B) we have a different situation (Table 2), where, probably due to the concurring effect of both molecules for sorption at the surface or some interaction between them in the solution, in fact we obtained a negative inhibition
25
effect, reflected in the acceleration of the corrosion of the mild steel at every molar ratio.
In the case of mixed inhibitors: (4-ABA/A) or (4-ABA/B), the values of cathodic Tafel slope (bc) are found to decrease in the presence of thiazole derivative compared with the values of the 4-ABA when used alone in the solution as an inhibitor. This variation of Tafel slope suggest that this mixture of inhibitors influences the kinetics of the hydrogen evolution reaction [13], indicating a decrease in the energy barrier for proton discharge, leading to higher gas evolution [14]. In terms of the corrosion potential (Fig. 4), the studied molecules slightly shift the corrosion potential to more negative values - showing a behavior of cathodic inhibitors for the bare mild steel in this corrosion.
-0.65
-0.63
-0.61
-0.59
-0.57
-0.55
-0.53
0 0.2 0.4 0.6 0.8 1Ecorr. for molar ratios of:
4-ABA/(B) 4-ABA/(A)
Fig. 4 The corrosion potential (V) values for the studied molar ratios of the mixed inhibitors: 4-ABA/(A) and 4-ABA/(B).
CONCLUSIONS The inhibition efficiency of the: 4-aminobenzoic acid, 2-amino-4,5-dimethylthiazole and 2-amino-5-bromothiazole monohydrobromide has been investigated for the corrosion inhibition of mild steel in 0.1M HCl as a corrosion media. Potentiodynamic measurements put in evidence that the inhibitor properties of these molecules are high. The highest corrosion inhibition performance follows: 4-aminobenzoic acid > 2-amino-5-bromothiazole monohydrobromide > 2-amino-4,5-dimethylthiazole. By analyzing the structure of the corresponding molecules, this is expected, because this order respects the structural features of the molecules: 4-aminobenzoic acid contains oxygen and nitrogen atoms (electronegative atoms) and 2-amino-5-bromothiazole monohydrobromide with respect to 2-amino-4,5-dimethylthiazole, apart from the thiazole ring, contains bromine. Using mixed inhibitors, although it only gave a negative inhibition effect, is important, because it helps to roughly evaluate the sorption tendency of the inhibitors.
REFERENCES
1. R. Laamari, J. Benzakour, F. Berrekhis, A. Abouelfida, A. Derja, D. Villemin ‘’Corrosion inhibition of carbon steel in hydrochloric acid 0.5 M by hexa methylene diamine tetramethyl-phosphonic acid’’, Arabian Journal of Chemistry, vol.4, Issue 3, pp. 271-277, 2011. 93%
2. M. Prabakaran, M. Venkatesh, S. Ramesh ‘’Corrosion inhibition behavior of propyl phosphonic acid–Zn2+ system for carbon steel in aqueous solution’’, Applied Surface Science, vol.276, pp. 592-603, 2013.
3. M. Prabakaran, M. Venkatesh, S. Ramesh ‘’Modified Silane Films for Corrosion Protection of Mild Steel’’, Procedia Materials Science, vol.6, pp. 244-248, 2014.
4. A. Chaussé, M. M. Chehimi, N. Karsi, J. Pinson, F. Podvorica, C. Vautrin-Ul ‘’The electrochemical reduction of diazonium salts on iron electrodes. The formation of covalently bonded organic layers and their effect on corrosion’’, Chem. Mater., vol.14, pp. 392–400, 2002.
5. A. Berisha, C. Combellas, F. Kanoufi, J. Pinson, F. Podvorica ‘‘Physisorption vs grafting of aryldiazonium salts onto iron: A corrosion study’’, Electrochimica Acta, vol.28, pp. 10762–10766, 2011.
6. A. Zarrouk, I. El Ouali, M. Bouachrine, B. Hammouti, Y. Ramli, E. M. Essassi, I. Warad, A. Aouniti, R. Salghi ‘‘Theoretical approach to the corrosion inhibition efficiency of some quinoxaline derivatives of steel in acid media using the DFT method’’, Research on Chemical Intermediates, vol.39, pp. 1125-1133, 2013.
7. I.B. Obot, N.O. Obi-Egbedi ‘‘2,3-Diphenylbenzoquinoxaline: A new corrosion inhibitor for mild steel in sulphuric acid’’, Corrosion Science, vol.1, pp. 282–285, 2010.
8. D. Ben Hmamou, R. Salghi, A. Zarrouk, B. Hammouti, S.S. Al-Deyab, Lh. Bazzi, H. Zarrok, A. Chakir, L. Bammou ‘‘Corrosion Inhibition of Steel in 1 M Hydrochloric Acid Medium by Chamomile Essential Oils’’, International Journal of Electrochemical Science, vol.7, pp. 2361-2373, 2012.
9. S. Sagdinc, Y. Kara, F. Kayadibia ‘‘Theoretical study of 11-thiocyanatoundecanoic acid phenylamide derivatives on corrosion inhibition efficiencies’’, Canadian Journal of Chemistry, vol.9, pp. 876-887, 2014.
10. M. Finšgar, J. Jackson ‘‘Application of corrosion inhibitors for steels in acidic media for the oil and gas industry: A review’’, Corrosion Science, vol.86, pp. 17-41, 2014.
11. R. Chen, L. Guo, S. Xu ‘‘Experimental and Theoretical Investigation of 1-hydroxybenzotriazole as a Corrosion Inhibitor for Mild Steel in Sulfuric Acid Medium’’, International Journal of Electrochemical Science, vol.9, pp. 6880-6895, 2014.
12. M. Bouklah, N. Benchat, A. Aounitia, B. Hammouti, M. Benkaddour, M. Lagrenée, H. Vezin, F. Bentiss ‘‘Effect of the substitution of an oxygen atom by sulphur in a pyridazinic molecule towards inhibition of corrosion of steel in 0.5 M H2SO4 medium’’, Progress in Organic Coatings, vol.2, pp. 118-124, 2004.
13. G. Quartarone, L. Bonaldo, C. Tortato ‘‘Inhibitive action of indole-5-carboxylic acid towards corrosion of mild steel in deaerated 0.5 M sulfuric acid solutions’’, Applied Surface Science, vol.252, pp. 8251–8257, 2006.
14. S. Tamil Selvi, V. Raman, N. Rajendran ‘‘Corrosion inhibition of mild steel by benzotriazole derivatives in acidic medium’’, Journal of Applied Electrochemistry, vol.33, pp. 1175-1182, 2003.

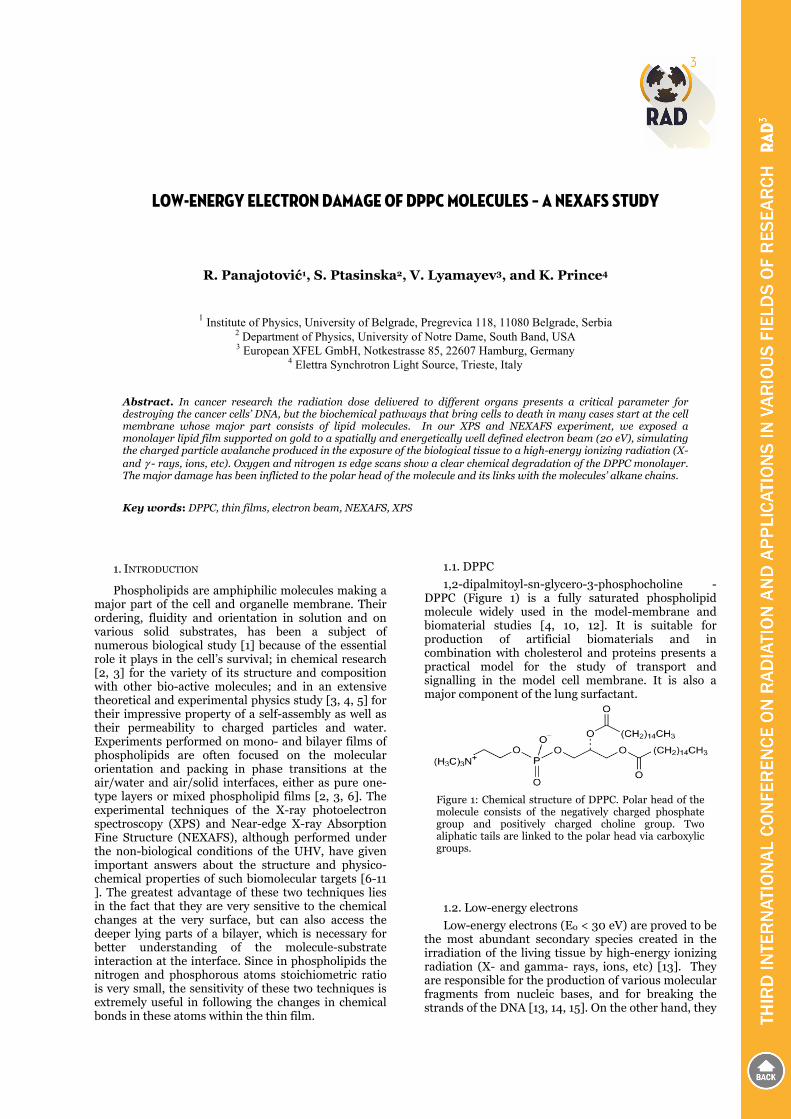
LOW-ENERGY ELECTRON DAMAGE OF DPPC MOLECULES – A NEXAFS STUDY
R. Panajotović1, S. Ptasinska2, V. Lyamayev3, and K. Prince4
1 Institute of Physics, University of Belgrade, Pregrevica 118, 11080 Belgrade, Serbia 2 Department of Physics, University of Notre Dame, South Band, USA 3 European XFEL GmbH, Notkestrasse 85, 22607 Hamburg, Germany
4 Elettra Synchrotron Light Source, Trieste, Italy Abstract. In cancer research the radiation dose delivered to different organs presents a critical parameter for destroying the cancer cells’ DNA, but the biochemical pathways that bring cells to death in many cases start at the cell membrane whose major part consists of lipid molecules. In our XPS and NEXAFS experiment, we exposed a monolayer lipid film supported on gold to a spatially and energetically well defined electron beam (20 eV), simulating the charged particle avalanche produced in the exposure of the biological tissue to a high-energy ionizing radiation (X- and γ - rays, ions, etc). Oxygen and nitrogen 1s edge scans show a clear chemical degradation of the DPPC monolayer. The major damage has been inflicted to the polar head of the molecule and its links with the molecules’ alkane chains.
Key words: DPPC, thin films, electron beam, NEXAFS, XPS
1. INTRODUCTION
Phospholipids are amphiphilic molecules making a major part of the cell and organelle membrane. Their ordering, fluidity and orientation in solution and on various solid substrates, has been a subject of numerous biological study [1] because of the essential role it plays in the cell’s survival; in chemical research [2, 3] for the variety of its structure and composition with other bio-active molecules; and in an extensive theoretical and experimental physics study [3, 4, 5] for their impressive property of a self-assembly as well as their permeability to charged particles and water. Experiments performed on mono- and bilayer films of phospholipids are often focused on the molecular orientation and packing in phase transitions at the air/water and air/solid interfaces, either as pure one-type layers or mixed phospholipid films [2, 3, 6]. The experimental techniques of the X-ray photoelectron spectroscopy (XPS) and Near-edge X-ray Absorption Fine Structure (NEXAFS), although performed under the non-biological conditions of the UHV, have given important answers about the structure and physico-chemical properties of such biomolecular targets [6-11 ]. The greatest advantage of these two techniques lies in the fact that they are very sensitive to the chemical changes at the very surface, but can also access the deeper lying parts of a bilayer, which is necessary for better understanding of the molecule-substrate interaction at the interface. Since in phospholipids the nitrogen and phosphorous atoms stoichiometric ratio is very small, the sensitivity of these two techniques is extremely useful in following the changes in chemical bonds in these atoms within the thin film.
1.1. DPPC
1,2-dipalmitoyl-sn-glycero-3-phosphocholine - DPPC (Figure 1) is a fully saturated phospholipid molecule widely used in the model-membrane and biomaterial studies [4, 10, 12]. It is suitable for production of artificial biomaterials and in combination with cholesterol and proteins presents a practical model for the study of transport and signalling in the model cell membrane. It is also a major component of the lung surfactant.
1.2. Low-energy electrons
Low-energy electrons (E0 < 30 eV) are proved to be the most abundant secondary species created in the irradiation of the living tissue by high-energy ionizing radiation (X- and gamma- rays, ions, etc) [13]. They are responsible for the production of various molecular fragments from nucleic bases, and for breaking the strands of the DNA [13, 14, 15]. On the other hand, they
Figure 1: Chemical structure of DPPC. Polar head of the molecule consists of the negatively charged phosphate group and positively charged choline group. Two aliphatic tails are linked to the polar head via carboxylic groups.

28
also proved to be an efficient tool in the production of bio-chips on the SAM structure [5]. Therefore, a deeper insight into the interaction mechanisms between low-energy electrons and biomembrane molecules is necessary to understand the radiation effects and tailor the properties of the new bio-compatible materials and bioelectronic devices.
2. EXPERIMENT
NEXAFS and XPS measurements have been performed on the Material Science beamline (bending magnet) in Synchrotron light source installation - Elettra, Trieste, Italy. It provided the soft X-ray photon beam in the energy range from 22 to 1000 eV, mainly linearly polarized.
2.1. Preparation of thin lipid films
Samples were prepared on gold coated (30 nm) B-doped silicon wafer substrates bought from Georg Albert PVD Beschichtungen, Heidelberg, Germany. The substrates (polycrystalline Au (111), rms<1 nm) have been cleaned in the Piranha solution (1:3 of 30% H2O2 and the 96% H2SO4 heated to 100 oC) and rinsed with copious amount of DI water. The monolayer of lipid molecules was formed in the Langmuir-Blodget trough by dispensing sub-microliter drops of chloroform dissolved DPPC (16:0, from Avanti Polar Lipids, USA) on the clean surface of deionized water (R > 18 MΩ) and compressing to the surface pressure of 47 mN/m. This value corresponds to the surface pressure of the solid phase, i.e. closely packed and vertical molecules. Transfer of DPPC molecules to the solid substrate was done by pulling the gold substrates mounted on the holder through the stabilized DPPC/water interface. The pull-up speed of the gold substrate was 1 mm/min, which provided sufficient time for DPPC molecules to adhere to the substrate. The barriers of the LB trough were compressing the film to keep the surface pressure constant and below the value critical for the collapse of the monolayer (52 mN/m). This deposition procedure provided for the well-ordered lipid monolayer film with acyl-chains tilted at an angle corresponding to the ~ 30 mN/m [16] surface pressure at the water/air interface. The samples were let to dry in air before their mounting on the sample holder and introduction into the load-lock chamber, where they spent at least two hours in vacuum before the measurements were performed.
2.2. Experimental method
Electron irradiation has been performed with the existing LEED gun placed in the main vacuum chamber (analysis chamber) under the UHV (p ~ 10-10 mb). Energy and beam size calibration of the gun was performed for two energies – 50 eV and 20 eV. As the electron beam at 20 eV was of a better shape and the size of the spot and the current on the sample allowed for gradual increase of the dose of electron irradiation of the monolayer film, we have used this energy to irradiate our samples. The dose of electron beam irradiation of the sample was comparable to the one used in our previous XPS measurements [17] (124 nA). With this intensity and at the energy of 20 eV the LEED gun produced a collimated electron beam over
the analysed sample area of 200 μm in diameter. We have performed two ten-minute electron-beam irradiations. Thus, the electron flux during one-time irradiation was ~ 2.4 mC/mm2. If we take that the APM (Area-Per-Molecule) in the solid-supported film is ~48 Å2 [16], then the electron beam delivered about 6700 electrons per molecule.The XPS data have been collected using the Al Kα monochromatic source with the energy of Al Kα 1486 eV and in the NEXAFS measurements we used synchrotron photon source with maximum energy of 1 keV. For the XPS measurement, the energy resolution of the analyzer was ~ 1 eV. Pass energy of the analyzer was 20 eV, angle of detection 20o, and the power of the source was 300 W. For the detailed spectra of carbon and oxygen bands, we performed ten scans, while for the nitrogen band, due to the inherent low ionization cross-section and low concentration (1/130 atoms in the DPPC molecule), we collected photoelectrons over a five times longer time and at a half number of binding energy (BE) values.
Figure 2: XPS scans of C 1s (a), O 1s (b) and N 1s (c) bands in DPPC before and after irradiation with 20 eV electrons. Low-level smoothing of the data has been applied to the N 1s curves for clearer view.

29
NEXAFS measurements were performed for two angular orientations – normal and parallel incidence of the light beam, before and after electron irradiation. Since this technique probes the absorption of electromagnetic radiation (X-rays) by excitation of core electrons into unoccupied bound or continuum states, it allows access to a set of distinctive features (resonances) in the energy region from just below the absorption edge up to approximately 50 eV above the K-edge [8]. The position of the σ*-resonances presents a measure of the intramolecular bond length while the π*-resonances provide insight into bond hybridization [17].
2. RESULTS
In order to verify the existence of the material in the sample, including the level of its degradation after the irradiation with 20 eV-electron beam, we have performed the XPS measurements at the end station. The scans of the C 1s, O1s, and the N 1s bands in figure 2 clearly show the changes in the irradiated films, both in intensity of the secondary electron yield and the structure of peaks, i.e. binding energy. For all bond and resonance identifications we used the free database [19, 20] in addition to the reported data on nanomaterials [18] and standard organic molecules [6, 8-11, 21-25].
In the C 1s band, there are at least three peaks corresponding to BE of three functional groups in DPPC - 285.2 eV, 287 eV, and 288.8 eV. The main peak (A) corresponds to the aliphatic tails of the lipid molecule. It shifts to the lower binding energy corresponding to the native carbon (284.8 eV) and decreases in intensity after first irradiation, indicating the breakage of carbon bonds in the CH2 chains. The other two (B and C) correspond to the overlapping of O-C=O and O-C-N bonds. It is evident from Figure 2 that the electrons induce chemical changes in the link of the two lipid tails (O 1s) and the choline group of the molecule (N 1s). As we were particularly looking at these two sites of bond damage, the next two band scans are of particular interest.
The O 1s band contains contribution from several bonds: C-O, C=O, P=O, P-O, and probably some contribution from bound water. Deconvolution of the oxygen spectrum is therefore very difficult. From studies of carbon nanomaterials [18, 2], we may interpret the shoulder in the region A at 531-532 eV as originating from C=O bonds, and the possible peak contribution in the region B from C-O at 533 eV. Close to this binding energy would be possible the contribution from bound water (~534 eV), and the one from phosphate group around 532 eV [9]. Although the deconvolution of the O 1s structure is ambiguous, the effect of electron-irradiation is quite distinct. The
region A clearly becomes more prominent and the oxygen peak gains both in width and intensity. This is likely due to the degradation of the C=O into the C-O bonds. An increase in the number of photoelectrons detected after electron-beam irradiation is not completely unexpected as the change in the bonds between the lipid head and acyl chains affects the orientation of the DPPC molecules in the monolayer. This would cause a decrease in attenuation of photoelectrons ejected from the O 1s state, which will increase the photoelectron yield.
The most complex effects of electron irradiation can be observed in the N 1s spectral band. The four regions in the spectrum show significant chemical changes in the DPPC films. In the A region the shift in energy after electron impact is from 399.5 eV to 400 eV, followed by the slight increase and then decrease in intensity. In the region B (402.6 eV) the shift is smaller (~ 200 meV) towards the lower binding energy and the intensity is decreased by 35 % after electron irradiation. In the region C (404 eV), the shoulder completely disappeared and in the region D (406.3 eV) the feature gradually shifted to the lower BE (405.5 eV) and increased in intensity. The region A corresponds to nitrogen in organic matrix in the cyanide type bond C-N- (~ 399.4 – 400.6 eV). The most affected region B corresponds to the N-(CH3)3 group overlapping with nitrite and nitrate compounds, as well as ammonium phosphate arising from the intermolecular bonding in the monolayer lipid film. The possible existence of nitro groups further indicates the increased complexity of the O 1s structure.
From the NEXAFS scan at the O 1s edge, taken for the grazing and normal incidence of the light, it is evident that the major change in oxygen bonds is taking place in σ* resonances. In grazing incidence (GI), the decrease in the π*resonance (π orbitals normal to the surface absorb the most light) takes place, and the shift in its energy is from 533 to 532.6 eV. At the same time, the σ* resonance (region B and C) does not change much, indicating that the σ bonds in the sample oriented parallel to the surface are not significantly affected by the electron beam. For the normal incidence (NI) of light (maximum absorption for σ bonds perpendicular to the surface and π bonds lying on the surface), B-C region is narrower than in the grazing incidence scan. As in the XPS spectrum, because of the variety of bonds in the DPPC sample including oxygen, it is not quite clear which bonds are oriented in which direction. However, the NI scan reveals a remarkable degradation in σ bonds of DPPC molecules. Instead of one broad resonance, electron beam carves two distinct features at 537.8 eV and 540.2 eV, with the third making a shoulder at 542.6 eV.

30
Grazing incidence scan (Figure 4) at the N 1s edge (the statistics in NI signal was too low) also features four distinct regions. The π* resonance at 402.2 eV stays the same as before irradiation, but the new feature appears at 400.6 eV after the second irradiation, which may indicate the decomposition of
C-N bonds in N-(CH3)3. In the σ* resonance region, on the other hand, a relatively broad feature (406.6 – 407.4 eV) only diminishes in height, but the distinct separation in energy of different bonds is not achieved.
However, the shoulder in region C, at the energy of 408.6 eV completely disappears, as is the case with the resonance in the region D at 416.8 eV. There is also a possibility of the creation of the new nitrate or ammonium feature at 413 eV, but the insufficient statistics does not allow us to claim this with certainty.
3. CONCLUSION
The problem of radiation damage in the cell and organelle membrane is particularly important considering the complexity of its role in cell’s metabolism. The integrity and stability of the lipid matrix making the major part of the bio-membrane is not only compromised by the direct absorption of high-energy ionizing radiation, but also by the effects of collisions from slow secondary electrons produced from ionization of the biological medium. For the purpose of better understanding the physicochemical mechanism behind the electron-lipid molecule interactions, a monolayer of DPPC molecules supported on gold substrate has been exposed to the monoenergetic electron beam and the bond damage analyzed by means of the X-ray photoelectron and near-edge X-ray fine structure. We have demonstrated that the electrons of 20 eV have capacity to induce significant damage to the lipid structure, and even incite the creation of new chemical groups. In particular, the bond cleavage of the carboxylic bonds linking two lipid tails to their polar head, and the degradation of the choline group of the molecule, point to the detrimental effect those secondary electrons from radiation may have on the conformation and functioning of lipids. This damage may be even enhanced in physiological conditions, where phase transitions from lamellar to non-lamellar form may induce a leaky structure incapable of maintaining the necessary boundary for the cell. Therefore, further study of the effects of low-energy charged particle /cell membrane interaction, on a model membrane, or in physiological conditions would be highly desirable.
Acknowledgement: The research presented in this paper was partially funded by the MCIRG-2007 research grant and the project OI171005, funded by the Ministry of Education, science and technological development of the Republic of Serbia. R. P. would like to thank the colleagues of the SAXS beamline at Elettra for the use of their chemical laboratory.
REFERENCES
1. Thomas A. Legace and Neal D. Ridgway, "The role of phospholipids in the biological activity and the structure of the endoplasmatic reticulum", Biochem. Biophys. Acta – BBA – Molecular Cell Research, vol. 1833(11), pp. 2499-2510
2. Soumi Mukherjee and Amitabha Chattopadhyay, “Influence of Ester and Ether Linkage in Phospholipids on the Environment and Dynamics of the Membrane
Figure 3: NEXAFS measurement at the O 1s edge – (a) grazing incidence and (b) normal incidence of the photon beam.
Figure 4: NEXAFS at the N 1s edge – normal incidence of photon beam .
31
Interface: A Wavelength-Selective Fluorescence Approach”, Langmuir, vol. 21, pp. 287-293, 2005
3. Rainer A. Bckmann and Helmut Grubmuller, “Multistep Binding of Divalent Cations to Phospholipid Bilayers: A Molecular Dynamics Study”, Angew. Chem. Int. Ed., vol. 3, pp. 1021 –1021, 2004
4. Edward T. Castellana, Paul S. Cremer, “Solid supported lipid bilayers: From biophysical studies to sensor design”, Surface Science Reports, vol. 61, pp. 429–444, 2006
5. Turchanin A, Tinazli A, El-Desawy M, Grossman H, Schnietz M, Solak H H, Tampé R, and Gölzhäuser A, " Molecular Self-Assembly, Chemical Lithography, and Biochemical Tweezers: A Path for the Fabrication of Functional Nanometer-Scale Protein Arrays", Adv. Mat. Vol. 20, pp. 471-477, 2008
6. Ketteler G, Ashby P, Mun B S, Ratera I, Bluhm H, Kasemo B, and Sameron M, “In situ photoelectron spectroscopy study of water adsorption on model biomaterial surfaces”, J. Phys. Condens. Matter. vol. 20, pp. 184024, 2008
7. Xiaosong Liu, Fan Zheng, A. Jürgensen, V. Perez-Dieste, D.Y. Petrovykh, N.L. Abbot, and F. J. Himpsel, “Self-assembly of biomolecules at surfaces characterized by NEXAFS”, Can. J. Chem., vol. 85, pp. 793-800, 2007
8. Georg Hähner, “Near edge X-ray absorption fine structure spectroscopy as a tool to probe electronic and structural properties of thin organic films and liquids”, Chem. Soc. Rev., vol. 35, pp. 1244–1255, 2006
9. Newton T. Samuel a, Chi-Ying Lee a, Lara J. Gamble b, Daniel A. Fischer c, David G. Castner, " NEXAFS characterization of DNA components and molecular-orientation of surface-bound DNA oligomers ", Small, vol. 2, No. 1, pp. 26 – 35, 2006
10. Vadim Cherezov, Ken M. Riedl and Martin Caffrey, “Too hot to handle? Synchrotron X-ray damage of lipid membranes and mesophases”, J. Synchrotron Rad. , vol. 9, pp. 333-341, 2002
11. Eva Nováková, Genoveva Mitrea, Christian Peth, Jürgen Thieme, Klaus Mann, and Tim Salditt, “Solid supported multicomponent lipid membranes studied by x-ray spectromicroscopy”, Biointerphases, vol. 3. pp.2. 2008
12. http://www.lipidmaps.org/resources/services.html 13. L. Sanche, “Low energy electron-driven damage in
biomolecules”, Eur. Phys. J. D, vol. 35, 367–390, 2005 14. Panajotovic R, Martin F, Cloutier P, Hunting D, and
Sanche L, “Effective Cross Sections for Production of Single-Strand Breaks in Plasmid DNA by 0.1 to 4.7 eV Electrons”, Radiation Research, vol. 165, pp. 452-459, 2006
15. Panajotovic R, Michaud M, and Sanche L, “Cross sections for low-energy electron scattering from adenine in the condensed phase”, Phys. Chem. Chem. Phys. , vol. 9, pp. 138, 2007
16. Erik B. Watkins, Chad E. Miller, Wei-Po Liao, and Tonya L. Kuh , “Equilibrium or Quenched: Fundamental Differences between Lipid Monolayers, Supported Bilayers, and Membranes“, ACS Nano, vol. 8, No. 4, pp. 3181-3191, 2014
17. R. Panajotovic, M. Schnietz, A. Turchanin, N. Mason, N. Mason, and A. Gölzhäuser, “Degradation of phosholipid molecules by low-energy electrons”, Radiation Research Society Conference, 25-29 September 2010, Maui, USA, Book of Abstracts, p.99
18. Tirandai Hemraj-Benny, Sarbajit Banerjee, Sharadha Sambasivan, Mahalingam Balasubramanian, Daniel A. Fischer, Gyula Eres, Alexander A. Puretzky, David B. Geohegan, Douglas H. Lowndes, Weiqiang Han, James A. Misewich, and Stanislaus S. Wong, “Near-Edge X-ray Absorption Fine Structure Spectroscopy as a tool for investigating nanomaterials”, Small, vol. 2, No. 1, 26 – 35, 2006
19. http://www.xafs.org 20. http://srdata.nist.gov/xps/ 21. T. K. Sham, B. X. Yang, J. Kirz, J. S. Tse, “K-edge near-
edge x-ray-absorption fine structure of oxygen- and
carbon-containing molecules in the gas phase”, Phys. Rev. A, vol. 40, No.2, 1989
22. Somnath Bhattacharayya, M. Lübbe, P. R. Bressler, D. R. T. Zahn, F. Richter, “Structure of nitrogenated amorphous carbon films from NEXAFS”, Diamond and Related Materials, vol. 11, pp. 8-15, 2002
23. Peter Leinweber, Jens Kruse, Fran L. Walley, Adam Gillespie, Kai-Uwe Eckhardt, Robert I. R. Blyth and Tom Regier, “Nitrogen K-edge XANES – an overview of reference compounds used to identify ‘unknown’ organic nitrogen in environmental samples”, J. Synch. Rad., vol. 14, No. 6, pp. 500-511, 2007
24. S.S. Roy, P. Papakonstantinou, T.I.T. Okpalugo, and H. Murphy, “Temperature dependent evolution of the local electronic structure of atmospheric plasma treated carbon nanotubes: Near edge x-ray absorption fine structure study”, J. Appl. Phy., vol. 100, pp. 053703, 2006
25. Luca Pasquali, Fabio Terzi, Renato Seeber, Stefano Nannarone, Debasish Datta, Celine Dablemont, Hicham Hamoudi, Maurizio Canepa, and Vladimir A. Esaulov, “UPS, XPS, and NEXAFS Study of Self-Assembly of Standing 1,4-Benzenedimethanethiol SAMs on Gold”, Langmuir, vol. 27, pp. 4713–4720, 2011


R
Absradiundechempapecomedesigstudof Vsimuhot cfor itherm
Key
1. INTR
The aipropertiecompositresearch radiation irradiatiomaterial wplants. It the reactrates. 1/4year, 1/4 four year[1].
2. ABS
The rproducts the factomaterial. absorbed intervals
2.1. R
Beforeexperimenecessary
RESEARCH
Zden
tract. In the eoactive materiaer the reactor v
mical stabilizatier estimates thees from alpha, gned for the L
died in this case.VVER 1000 nuculation samplescell and regularirradiation of smal neutron sh
y words: sacrif
RODUCTION
im of the KONes of differention). The expe
reactor are on corium
on conditionswere modeledwas assumed
tor contained4 of fuel was irof fuel for two
rs. More detai
SORBED DOSE
adiation emitin the entire
ors affecting First, it wa
doses in mafter accident
adiation in co
e any calcuental interprety to estimate
OF DOSIME
na Lahodov
1 Resear2 Ú
vent of a serioual can escape ivessel to prevenion of the melte absorbed dose
beta and gamVR-15 nuclear . The model for clear power pls with different rly monitored. samples was dielding. This pa
ficial material, c
NTAKT II projt sacrificial meriments at th
focused onm simulations and compod on VVER 10d that at the timd fuel with drradiated witho years, 1/4 foriled informati
tted from fissivolume of mothe long-ter
as necessary molten matet.
orium
ulations are tation needs the thermo-p
ETRIC CHAR
vá 1, Ladisla
rch Centre RezÚJV Řež, a. s.,
us nuclear reacinto the environnt such release t and prevent te in a hypotheti
mma radiation. research reactthe design of ca
lants, especiallcomposition ofIn the first pha
designed and teaper describes th
core-catcher, ab
ject is to studymaterials (diffe
he LVR-15 nucn the impactn samples. osition of mo00 nuclear pome of the accidifferent burnh neutrons forr three and 1/4ion is provide
ion and activaolten fuel is onrm propertie
to estimate erial at diffe
performed, to be done. hysical prope
RACTERIST
av Viererbl
z Ltd., HusineHusinec-Řež
ctor accident, mnment. A core-of radioactivitythe creation ofical material forBased on estim
tor. The high talculations andly fuel type, vef sacrificial matase, this will be ested. The capshe experiment’s
bsorbed dose, ir
y the erent clear
ct of The
olten ower ident n-up r one 4 for
ed in
ation ne of s of
the erent
an It is
erties
ICS OF FUE
1, Miroslav
c-Řež 130, Cze130, Czech Re
molten fuel can -catcher filled wy. The sacrificiaf undesirable ar different type
mates and calcutemperature effd experiments isessel constructterial were irraa visual exami
sule allows sams irradiation co
rradiation caps
of molten matthat materialand the remafuel cladding,biological shperformed usactivity levelproposed mdifferences beare within a re
Source: http
Fig. 1 Levvalues) after th
2.2. Dose r
Only radi200 °C wereEnergy relea
L CONTAIN
v Vinš 1, Jiř
ech Republic epublic
melt through rewith a sacrificiaal material shoerosols during s of radiation. Tulations, irradifects and chems based on the oion, and biolog
adiated. At presnation in the ho
mples to be irranditions.
ule
terial [2]. Ourconsists of 1
aining 90 % is, internal struhielding etc. sing ORIGEN ls of selecte
model and etween the measonable ran
p:/www.kiae.ru
vels of radioactivhe Chernobyl ac
for the prop
rate
ionuclides wiincluded in
sed per deca
NING MATER
ří Šrank 2
reactor containmal material is s
ould ensure thesubsequent ye
The majority ofiation experime
mical reactions operation and pgical shielding
sent, they are stot cell. A speciaadiated withou
r simplified m10 % of partias non-active muctures, the r
The calcu2.2 code. Fig
ed radionucliChernobyl
model and meange.
u/ru/inf/chnpp/
ivity in molten mccident and calcposed model
ith a boiling n dose rate ay was deter
RIAL
ment and suggested rmal and
ears. This f the dose ents were were not
properties . Corium
tored in a al capsule t or with
model assumedally spent fuelmaterial fromreactor vessel,lations wereg. 1 comparesides for thevalues. Theasured values
/pr_fcm.htm
material (avg. culated activity
point abovecalculations.
rmined using
d l
m , e s e e s
e . g
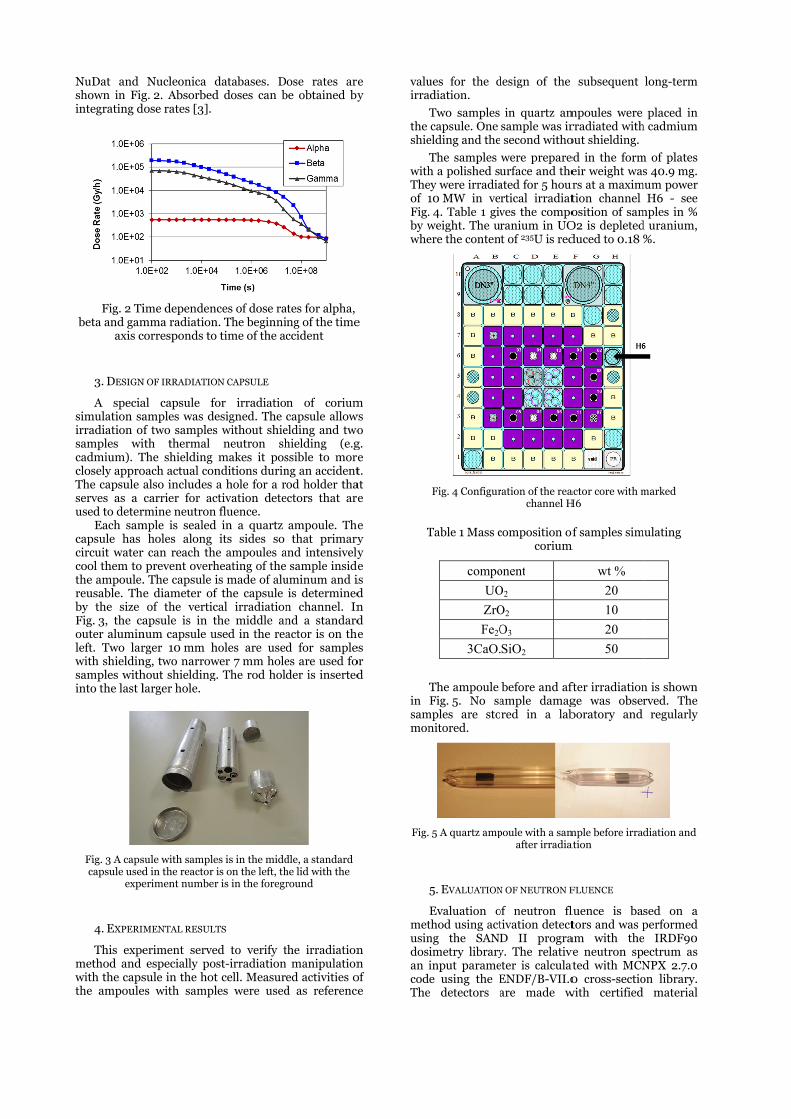
NuDat and shown in Figintegrating d
Fig. 2 Tibeta and gam
axis c
3. DESIGN
A speciasimulation sairradiation osamples wicadmium). Tclosely approThe capsule serves as a used to deter
Each samcapsule has circuit watercool them to the ampoule.reusable. Thby the size Fig. 3, the caouter aluminleft. Two larwith shieldinsamples withinto the last l
Fig. 3 A capscapsule used
expe
4. EXPERI
This expemethod and with the capsthe ampoule
Nucleonica g. 2. Absorbed
dose rates [3].
ime dependenmma radiationcorresponds to
N OF IRRADIATIO
al capsule famples was df two samplesith thermal The shielding oach actual conalso includes carrier for ac
rmine neutronmple is sealed
holes along r can reach th
prevent overh. The capsule e diameter ofof the vertic
apsule is in tnum capsule urger 10 mm hng, two narrowhout shieldinglarger hole.
sule with sampled in the reactor eriment number
MENTAL RESUL
eriment serveespecially po
sule in the hotes with sampl
databases. Dd doses can b
nces of dose ran. The beginnio time of the a
ON CAPSULE
for irradiatioesigned. The s without shie
neutron shmakes it pos
nditions durina hole for a r
ctivation deten fluence. d in a quartz
its sides so he ampoules aheating of theis made of aluf the capsule cal irradiationthe middle anused in the reaholes are usewer 7 mm holeg. The rod hol
es is in the middis on the left, thr is in the foregr
LTS
ed to verify tost-irradiationt cell. Measurles were used
ose rates arebe obtained by
ates for alpha, ing of the timeccident
n of coriumcapsule allow
elding and twohielding (e.gssible to moreng an accidentod holder tha
ectors that are
ampoule. Thethat primary
and intensively sample inside
uminum and iis determined
n channel. Innd a standardactor is on thed for samplees are used foder is inserted
dle, a standard he lid with the round
the irradiation manipulationed activities od as reference
e y
e
m ws
o g. e t. at e
e y y e is d n d e
es or d
n n
of ce
valuirra
the shie
withTheof 1Fig.by wwhe
T
in sammon
Fig.
metusindosan icodThe
ues for the dadiation.
Two samples capsule. One
elding and the
The samples h a polished suey were irradia10 MW in ve. 4. Table 1 givweight. The uere the conten
Fig. 4 Configur
Table 1 Mass c
compo
UO
ZrO
Fe2O
3CaO.
The ampoule Fig. 5. No sa
mples are stonitored.
5 A quartz amp
5. EVALUATION
Evaluation othod using actng the SANDimetry libraryinput paramee using the E
e detectors a
design of the
in quartz amsample was ir second witho
were prepareurface and theated for 5 hourrtical irradiatves the comporanium in UOt of 235U is red
ration of the reachannel H
composition ofcorium
onent
O2
O2
O3
SiO2
before and aftample damagred in a lab
poule with a samafter irradiat
N OF NEUTRON F
of neutron fltivation detectD II progray. The relativeter is calculatENDF/B-VII.0are made w
subsequent
mpoules were rradiated without shielding.
ed in the formeir weight wasrs at a maximtion channel osition of sam
O2 is depletedduced to 0.18 %
actor core with mH6
of samples simm
wt %
20
10
20
50
fter irradiationge was obserboratory and
mple before irradation
FLUENCE
luence is bators and was p
am with theve neutron spated with MCN0 cross-sectio
with certified
long-term
placed in h cadmium
m of plates s 40.9 mg.
mum power H6 - see
mples in % d uranium, %.
marked
mulating
n is shown rved. The
regularly
diation and
sed on a performed
e IRDF90 ectrum as NPX 2.7.0 on library.
material

provided Materials
Therespaced atthis experselected a(1 % of andisc-shapof 0.1 mmTab. 2. Tby the SA
The ethermal nthe bottocadmiumthe capsshielding also the two capsuwithout ssecond experime
Tab.
The activationspectrummodel.
Fig. 6 T
Measushown in the seconthe thirdcolumn. Tthe sampradionuclrespective
(0, 0.5(0.5, 0.1(0.1, 20
TotStandard de
Energy
by The CECs and Measuree were four st 2.5 cm interriment, the foas suitable mn aluminium-bped, with a dim. Neutron
The standard AND II program
nergy group cneutron groupom of the ca
m shielding. Thule’s orientataffected the rod holder.
ules separatelyshielding and similar caps
ents.
2 Neutron flucalculated by
energy specn detectors is
m is calculate
The energy specvertic
ured activitiesTab. 3. Activi
nd column andd column. AThe ratios corples, with thelides (activatiely).
1.05 eV) 5.93E1 MeV) 3.36E0 MeV) 1.55Etal 1.08Eeviation (%) 2.6
group
C JRC Instituements, Geel, Bsets of activarvals along thollowing types
materials: Fe, Nbased alloy). Tiameter of 4 menergy groupdeviation of fm was 3 %.
correspondingp has a lower napsule. This here is no wation in the sample withoIt was prop
y, one capsulthe other one
sule was m
ence for differy the SAND II p
ctrum calculs shown in
ed using MCN
ctrum of total necal channel H6
s of ampoulesities without Cd activities witctivity ratios rrespond to fi
e exception ofion products
0 3.5E+17 5.74E+17E+17 3.25E+17E+17 1.53E+17E+18 1.05E+186 2.9
FluencePosition
ute for ReferBelgium. ation detectorhe rod holder.
of detectors wNi (pure), andThe detectors wmm and thickps are shownfluence calcul
g to the E < 0.neutron fluencis caused by
ay of guarantechannel. Theout shielding osed to irrade for the sam
e with shieldinade for fur
rent energy grprogram
lated based Fig. 6. The inNP code for
eutron fluence i
with samplesCd shielding ath shielding ar
are in the ission reactionf 54Mn and 23
of 54Fe and 2
6.0 8.6.29E+17 7.00E3.56E+17 3.95E1.62E+17 1.72E1.15E+18 1.27E
2.3 2.
e (cm-2)n (cm)
rence
rs at . For were d Co were
kness n in lated
.5 eV ce at
y the eeing e Cd
and diate
mples ng. A rther
roup
on nput
the
in
s are are in
re in last
ns in 39Np 238U,
App
5E+17E+17E+17E+185
Tab. 3 M
6. CONCLU
Recently, study of sacrcorresponds performed inbeen propose[4], especiallytime. We suirradiation tireactor powe50 hours in tdose that moafter an accidwill confirm ifto the sample
Acknowledgperformed wproject suppYouth and Sp
REFERENCES
1. Yu.B.BakaP. BExpeSimuOxideGlass229,
2. L. ViecharaInterAppli
3. C. JoPhysiICAP
4. Yu.P.SazavP. PiNatu1087-No 4,
140Ba131I
140La54Mn239Np103Ru
95Zr
Nuclide
Measured activand with C
SION
great effort rificial materia
to an actun a laboratoryed. Verificatioy stability of uggest new mes, 50 ander (10 MW). the LVR-15 rolten materialdent. A muchf such a dose cs.
gement: The within the Korted by theorts.
. Petrov, Yu. rdjieva, P. SazaBezdicka, C. rimental Invest
ulation of thee-Iron Oxide Sys Physic and Che2011. ererbl, Z. Lahodacteristics in funational Confeications, Pragueourneau, P. Piical Properties fP’04, Pittsburgh Udalov, I.V. P
vsky, M. Kiseloviluzo and D.Vre of Phase Sep-6596, Glass Ph, pp. 431-443, 20
without Cd1.35E+061.05E+061.64E+081.50E+032.33E+082.32E+053.15E+05
A (
vities for sampCd shielding
has been focial. As an expual accidenty, simplified on of some c
material, wilexperiments
d 500 hours An irradiat
reactor corresl obtains ove
h higher dose can cause radi
paper is a paKONTAKT II e Ministry o
P. Udalov, avsky, M. Kiselo
Journeau, anstigation and Te Uranium Oystem in Air, ISemistry, Vol. 37
dová, M. Vinš, Jfuel containing erence on Dose, Czech Republiluso, K. N. Ffor Sever Accideh, PA USA, 200Pozniak, A.Yu. va, J. Schrank,
V. Grishchenkoparation in Oxihysic and Chem013.
with Cd w5.61E+044.41E+045.98E+061.07E+031.73E+081.38E+041.17E+04
Bq)
ples without
cused on theperiment that
cannot bemodels have
characteristicsll take a long
with longerat maximum
tion time ofsponds to ther 20-30 yearsof 500 hours
iation damage
art of research– LH12224
of Education,
J. Subrt, S.ova, P. Selucky,
nd P. Piluso:Thermodynamicxide-Zirconium
SSN 1087-6596,7, No 2, pp. 212-
J. Šrank, “Dosematerial”, 1st
imetry and itslic, 2013. rolov, “Coriument R&D”, Proc.
04. Pechenkov, P.
J. Pospekhova,: Coordination
ide Melts, ISSNmistry, Vol. 39,
Ratiowithout/with
24.0823.8127.391.401.3516.8626.83
e t e e s g r
m f e s s e
h 4 ,
. , : c
m , -
e t s
m .
. ,
n N
,

THE VARIATION OF HOUNSFIELD UNITS ON SCANNING PARAMETERS AND INFLUENCE ON CT TO RED CONVERSION CURVES
Borislava Petrovic1, Tamara Tanasijin2, Milan Teodorovic1, Laza Rutonjski1, Milutin Baucal1, Ozren Cudic1, Borko Basaric1, Goran Djoric1, Vera Starovlah1
1 Institute of oncology Vojvodina, Sremska Kamenica, Serbia 2 University of Novi Sad, Faculty of Sciences, Novi Sad, Serbia
Abstract Since CT scanning of radiotherapy patients is done by different radiation therapists (RTTs), with different daily routine, the influence of different scanning protocols (tube voltage, tube current, position in relation to the center of the table) were evaluated. The dedicated phantom was used for this purpose. Conversion curves were generated, and differences evaluated. The highest dependence of computerized tomography number-Hounsfield unit (CT number-HU) to relative electron density (RED) conversion curve is found to be on the tube voltage. The difference was observed mostly in the high density material, such as bone and dense bone. The voltage decrease of 20 kV gives the difference in range 10% to 20% in the value of Hounsfield number (HU) for the same dense material ( different types of bones). The dependence on tube current was negligible. The dependence on the off axis position of a phantom (outer parts of the CT bore) results in difference of 5% - 10% on reconstructed HU values imported in treatment planning system (TPS) in comparison to the same material when phantom is placed in the central part of the CT bore.
Key words (bold): CT simulator, quality assurance, Hounsfield unit, tube voltage
1. BACKGROUND
Radiotherapy treatment planning and delivery rely on CT data set, which contain accurate information about patient geometry, and patient tissue composition. Patient tissue composition is represented by quantitative CT values. Radiotherapy scan protocols usually require image slices of 3-5 mm thickness and longer scan volumes. The CT scan protocols for radiotherapy applications might require modification in comparison to diagnostic protocols. But, newer CT scanner softwares are often loaded with basic radiotherapy protocols [1].
1.1. Radiotherapy protocols
Tube potential (kV) is one of the most important parameters in CT scanning for radiotherapy applications [1]. The relationship between CT number and electron density is unique for each available CT scanner and tube voltage. To avoid treatment planning and especially treatment delivery errors, every radiotherapy clinic must rely on single kV settings, and
generate their own conversion curve, describing tissue electron density conversion to visible CT number [1-6]. The right selection of voltage depends on accuracy confirmation coming from comparison of treatment planning and measurement discrepancy.
Tube current (mA). The change of tube current does not influence the value of CT numbers of tissues, but does influence on soft tissue contrast as increase of tube current increases contrast. On the other hand, the increase of tube current increases the dose to the patient. Radiotherapy applications often use lower tube current (less mA) as the CT tube warms up faster than in diagnostic applications, due to the number of images (slices) to be produced by CT scanning. That produces images of lower quality, so optimal mA settings to balance image quality and loading of a CT tube must be found.
Scan time. Scan time must be short enough to enable scanning of patient in a radiotherapy position. That is often measured in seconds, depending on scanner generation and capabilities. The scan time also must be short, in order to decrease heating of a tube.
Slice thickness. The slice thickness is often 3-5 mm, and covers a continuous region of more tens of
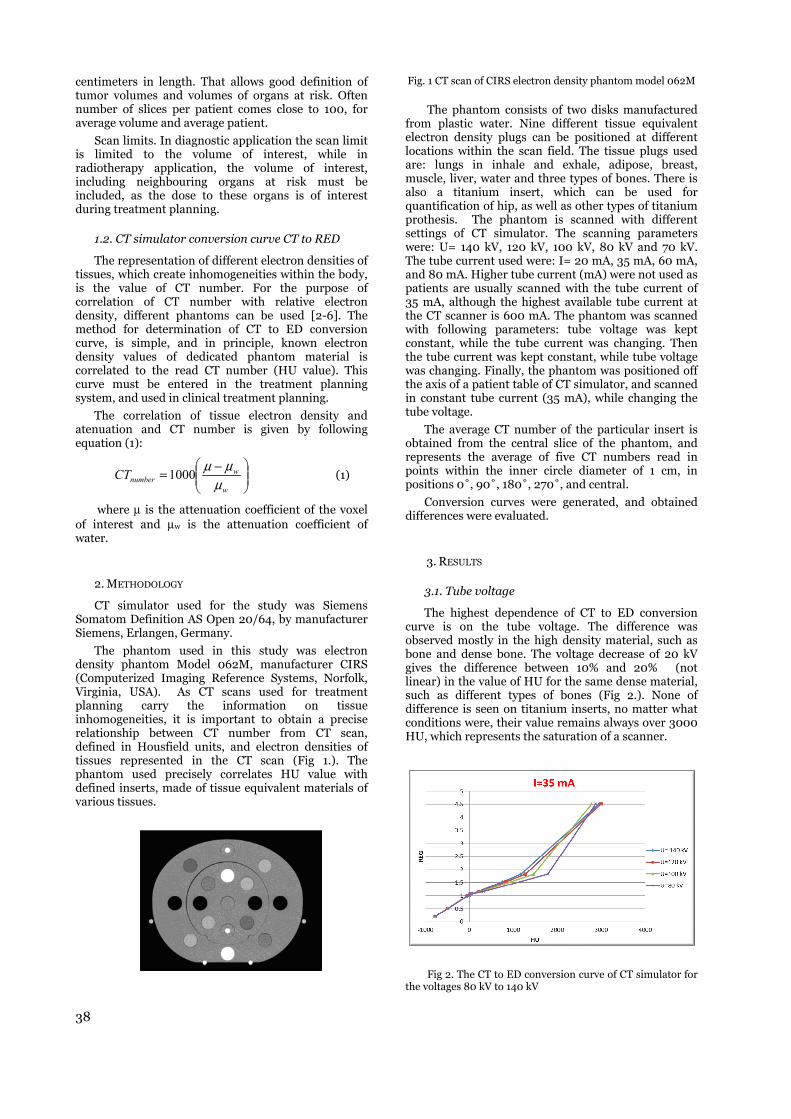
38
centimeters in length. That allows good definition of tumor volumes and volumes of organs at risk. Often number of slices per patient comes close to 100, for average volume and average patient.
Scan limits. In diagnostic application the scan limit is limited to the volume of interest, while in radiotherapy application, the volume of interest, including neighbouring organs at risk must be included, as the dose to these organs is of interest during treatment planning.
1.2. CT simulator conversion curve CT to RED
The representation of different electron densities of tissues, which create inhomogeneities within the body, is the value of CT number. For the purpose of correlation of CT number with relative electron density, different phantoms can be used [2-6]. The method for determination of CT to ED conversion curve, is simple, and in principle, known electron density values of dedicated phantom material is correlated to the read CT number (HU value). This curve must be entered in the treatment planning system, and used in clinical treatment planning.
The correlation of tissue electron density and atenuation and CT number is given by following equation (1):
−=w
wnumberCT
μμμ1000 (1)
where μ is the attenuation coefficient of the voxel of interest and μw is the attenuation coefficient of water.
2. METHODOLOGY
CT simulator used for the study was Siemens Somatom Definition AS Open 20/64, by manufacturer Siemens, Erlangen, Germany.
The phantom used in this study was electron density phantom Model 062M, manufacturer CIRS (Computerized Imaging Reference Systems, Norfolk, Virginia, USA). As CT scans used for treatment planning carry the information on tissue inhomogeneities, it is important to obtain a precise relationship between CT number from CT scan, defined in Housfield units, and electron densities of tissues represented in the CT scan (Fig 1.). The phantom used precisely correlates HU value with defined inserts, made of tissue equivalent materials of various tissues.
Fig. 1 CT scan of CIRS electron density phantom model 062M
The phantom consists of two disks manufactured from plastic water. Nine different tissue equivalent electron density plugs can be positioned at different locations within the scan field. The tissue plugs used are: lungs in inhale and exhale, adipose, breast, muscle, liver, water and three types of bones. There is also a titanium insert, which can be used for quantification of hip, as well as other types of titanium prothesis. The phantom is scanned with different settings of CT simulator. The scanning parameters were: U= 140 kV, 120 kV, 100 kV, 80 kV and 70 kV. The tube current used were: I= 20 mA, 35 mA, 60 mA, and 80 mA. Higher tube current (mA) were not used as patients are usually scanned with the tube current of 35 mA, although the highest available tube current at the CT scanner is 600 mA. The phantom was scanned with following parameters: tube voltage was kept constant, while the tube current was changing. Then the tube current was kept constant, while tube voltage was changing. Finally, the phantom was positioned off the axis of a patient table of CT simulator, and scanned in constant tube current (35 mA), while changing the tube voltage.
The average CT number of the particular insert is obtained from the central slice of the phantom, and represents the average of five CT numbers read in points within the inner circle diameter of 1 cm, in positions 0˚, 90˚, 180˚, 270˚, and central.
Conversion curves were generated, and obtained differences were evaluated.
3. RESULTS
3.1. Tube voltage
The highest dependence of CT to ED conversion curve is on the tube voltage. The difference was observed mostly in the high density material, such as bone and dense bone. The voltage decrease of 20 kV gives the difference between 10% and 20% (not linear) in the value of HU for the same dense material, such as different types of bones (Fig 2.). None of difference is seen on titanium inserts, no matter what conditions were, their value remains always over 3000 HU, which represents the saturation of a scanner.
Fig 2. The CT to ED conversion curve of CT simulator for
the voltages 80 kV to 140 kV
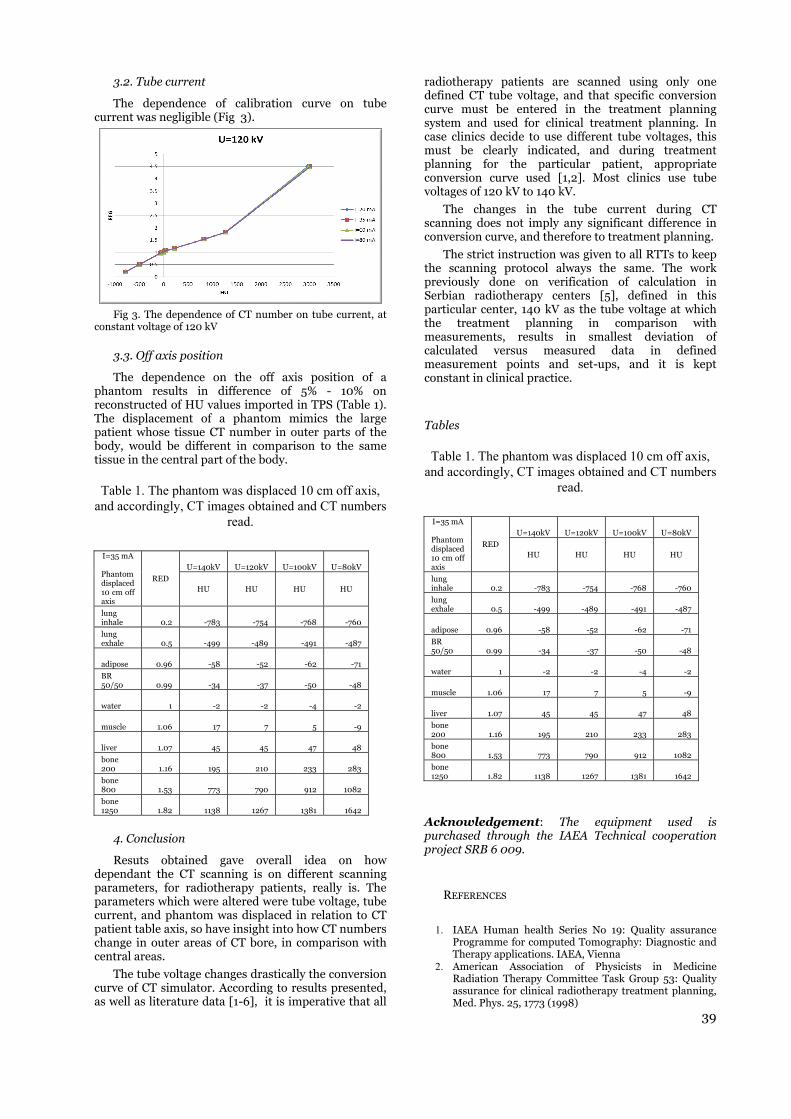
39
3.2. Tube current
The dependence of calibration curve on tube current was negligible (Fig 3).
Fig 3. The dependence of CT number on tube current, at
constant voltage of 120 kV
3.3. Off axis position
The dependence on the off axis position of a phantom results in difference of 5% - 10% on reconstructed of HU values imported in TPS (Table 1). The displacement of a phantom mimics the large patient whose tissue CT number in outer parts of the body, would be different in comparison to the same tissue in the central part of the body.
Table 1. The phantom was displaced 10 cm off axis, and accordingly, CT images obtained and CT numbers
read.
I=35 mA Phantom displaced 10 cm off axis
RED
U=140kV U=120kV U=100kV U=80kV
HU HU HU HU
lung inhale 0.2 -783 -754 -768 -760
lung exhale 0.5 -499 -489 -491 -487
adipose 0.96 -58 -52 -62 -71
BR 50/50 0.99 -34 -37 -50 -48
water 1 -2 -2 -4 -2
muscle 1.06 17 7 5 -9
liver 1.07 45 45 47 48
bone 200 1.16 195 210 233 283
bone 800 1.53 773 790 912 1082
bone 1250 1.82 1138 1267 1381 1642
4. Conclusion
Resuts obtained gave overall idea on how dependant the CT scanning is on different scanning parameters, for radiotherapy patients, really is. The parameters which were altered were tube voltage, tube current, and phantom was displaced in relation to CT patient table axis, so have insight into how CT numbers change in outer areas of CT bore, in comparison with central areas.
The tube voltage changes drastically the conversion curve of CT simulator. According to results presented, as well as literature data [1-6], it is imperative that all
radiotherapy patients are scanned using only one defined CT tube voltage, and that specific conversion curve must be entered in the treatment planning system and used for clinical treatment planning. In case clinics decide to use different tube voltages, this must be clearly indicated, and during treatment planning for the particular patient, appropriate conversion curve used [1,2]. Most clinics use tube voltages of 120 kV to 140 kV.
The changes in the tube current during CT scanning does not imply any significant difference in conversion curve, and therefore to treatment planning.
The strict instruction was given to all RTTs to keep the scanning protocol always the same. The work previously done on verification of calculation in Serbian radiotherapy centers [5], defined in this particular center, 140 kV as the tube voltage at which the treatment planning in comparison with measurements, results in smallest deviation of calculated versus measured data in defined measurement points and set-ups, and it is kept constant in clinical practice.
Tables
Table 1. The phantom was displaced 10 cm off axis, and accordingly, CT images obtained and CT numbers
read.
I=35 mA Phantom displaced 10 cm off axis
RED
U=140kV U=120kV U=100kV U=80kV
HU HU HU HU
lung inhale 0.2 -783 -754 -768 -760
lung exhale 0.5 -499 -489 -491 -487
adipose 0.96 -58 -52 -62 -71
BR 50/50 0.99 -34 -37 -50 -48
water 1 -2 -2 -4 -2
muscle 1.06 17 7 5 -9
liver 1.07 45 45 47 48
bone 200 1.16 195 210 233 283
bone 800 1.53 773 790 912 1082
bone 1250 1.82 1138 1267 1381 1642
Acknowledgement: The equipment used is purchased through the IAEA Technical cooperation project SRB 6 009.
REFERENCES
1. IAEA Human health Series No 19: Quality assurance Programme for computed Tomography: Diagnostic and Therapy applications. IAEA, Vienna
2. American Association of Physicists in Medicine Radiation Therapy Committee Task Group 53: Quality assurance for clinical radiotherapy treatment planning, Med. Phys. 25, 1773 (1998)

40
3. IAEA-TECDOC-1583, Commissioning of radiotherapy treatment planning systems: testing for typical external beam treatment techniques, IAEA, Vienna, 2008
4. Technical Report Series No 430: Commissioning and Quality Assurance of Computerized Planning Systems for Radiation Treatment of Cancer, IAEA, Vienna, 2004
5. Rutonjski L., Petrovic B., Baucal M., Teodorovic M., Cudic O., Gershkevitsh E. and Izewska J.: Dosimetric verification of radiotherapy treatment planning systems in Serbia: national audit. Radiation Oncology 2012, 7:155
6. Gershkevitsh E, Schmidt R, Velez G, Miller D, Korf E, Yip F, Wanwilairat S, Vatnitsky S: Dosimetric verification of radiotherapy treatment planning systems: Results of IAEA pilot study. Radiother Oncol 2008, 89:338-346.
Eug
AbsphotstrucMeaattenmodThe eithe
Key
1. INTR
From that the requires kradiation radiation propagatiparticles ones thatinteractio
From electromaelectromalight emepropertiedepends oof light an
To stsubstanceof view a the lineaINFLPR, The ALINenergies o8 MeV [3
In thifor the intwo typerelation boptical fidose. Threflectomabsorbed
genia-Simo
tract. The proton beams. Whecture of the op
asurements shonuation in the o
de optic fibers anresults of the mer high or low d
y words: single
RODUCTION
the nuclear pstudy of rad
knowledge of and matter is characterizion direction that compose
t must be meaon with matter
the optical poagnetic field agnetic field oerges from mes. How light on the light find on the prop
tudy the influe both from thfew irradiatio
ar electron awith two typ
N 10 acceleratof 6.2 MeV an, 4].
is article we wnteraction of pes of optical between optiiber by the ioe attenuation
meter, the No dose was
INFLUENON SIN
ona BADITA
National In
operties of singen the optical fitical fiber. In ow a dependencoptic fiber was nd for two wav
measurements hdoses of irradiat
e mode optical f
physics point odiation interaf the changes
after it interzed by inciden
and energy e it and these asured to deter [1].
oint of view itof light in
of matter. The atter, it will n
is affected bield intensity, perties of the m
uence of ionihe nuclear an
on experimentaccelerator ALpes of single or provides el
nd photon beam
will discuss exphoton and el
fibers and acal attenuatioonizing radiatn was measuroyes M 200
determined
NCE OF HIGNGLE MODE
A, Elena STCALINA,
nstitute for La
le mode opticaiber is exposed order to quantifce of the radiameasured befo
elength values.ave lead to the tion.
fiber, radiation
of view it is knaction with m
that occur boracts. The ionnt beam intens
spectrum oproperties ar
ermine the effe
t is known thanteracts withresult is that
not have the by this interaon the wavele
matter [2].
izing radiationd the optical ts were proposLIN 10 [3, 4mode optic filectron beamsms with energ
xperimental relectron beamsattempt to fion induced intion and absored via an op
0 OTDR andusing ioniz
GH ENERGY E OPTICAL
TANCU, CatAnca SCAR
ser, Plasma &
al fibers changeto high energy
ify this effect thation induced aore, during and conclusion that
induced attenu
known matter oth in nizing sity, a
of the re the fect of
at the h the
when same
action ength
on on point
sed at 4] of
fibers. s with gies of
esults s with ind a n the orbed ptical
d the zation
ce
sn
sn
oraswocfla2
cbasdthma
wT
IONIZING RFIBER PRO
talin VANCRISOREAN
& Radiation Ph
e when they arionizing radiat
he radiation indattenuation to d after electron
t these types of
uation
chambers coelectrometer.
The opticasingle mode numerical aper
2. MATERIA
The opticasingle mode numerical aper
The ultra-optical fiber isranging betweaperture of 0smaller than 2which has a stoxide (SiO2/Gcladding that hfluorine dopedacrylate repres20 µm in diam
The photocharacterized between 1500aperture of 0smaller than 2diameter of 9.0he cladding w
made of silica.acrylate and ha
The attenuwith the NoTelecommunic
RADIATIONOPRIETIES
CEA, FloreaNU
ysics (INFLPR
e exposed to hition physical deduced attenuatthe exposure dbeam exposure
optical fiber ca
onnected to
al fibers usedoptical fibersrture while the
ALS AND METHOD
al fibers usedoptical fibersrture while the
-high numeris characterizeden 1100 - 160
0.28 and a ty20 dB/km. Thtep-index of r
GeO2) and hashas a diameterd silica and thsenting the pro
meter [5].
osensitive sinby a nom
0 – 1600 nm0.13 and a ty20 dB/km. The0 μm and is m
with a diamete. The coating as a diameter
uation in the ooyes M 200 cations. The at
N
a SCARLAT
R)
igh energy elecegradation occution has been mdose. Radiatione for two types
an be used for m
o a UNID
d in the exps: one with e other is pho
DS
d in the exps: one with ae other is pho
ical aperture d by a nomin00 nm, a nomtypical attenuhe core of thisrefraction, is ms a diameter ir of 125 ± 1.5 µ
he coating is arotective cover
ngle-mode opminal wavelennm, a nomin
ypical attenue core of such
made of undoper of 125 ± 1is made fromof 250 ± 20 μ
optical fiber w0 OTDR, mattenuation val
T, Ionut
ctron and urs in the
measured. n induced s of single
measuring
OS T10005
periments area ultra-high
tosensitive.
periments arean ultra-hightosensitive.
single-modeal wavelength
minal numericuation that iss type of fibermade of silicas 2.5 µm. Theµm is made ofa double-layerr that is 250 ±
ptical fiber isngth rangingnal numericaluation that ish a fiber has aped silica and.5 μm, is also
m dual layeredm [5].
was measuredade by AFLlues measured
5
e h
e h
e h c s r a e f r ±
s g l s a d o d
d L d

42
in the opticareflectometeron the appara
The absormeasured wPrimary StanGermany. Atype) was uscylindrical iophoton radiawere connecSecondary SEnergies (STmeasure the IAEA TRS 39
The envira thermobacertain limits
The studyof optical fibperformed inirradiation weach step bedoses and difwas measureoptical fiber u
3. EXPERIM
3.1. Expebeam
The ultroptical fiberoptical fiber wALIN 10 LIN
Approximaperture sing15 m were inof 10.5 cm aremaining 30OTDR M20distinction omeasuremenattenuation mwavelengths optical fibersto calculate tThe study rnumerical aelectron beamirradiation. attenuation vthe 1310 nmwavelength.
The total optical fiber uwhich 20 m of 10.5 cm, M200 OTDRhave a betteraffects the behavior of fiber to electtwo stages of
al fiber employr (M 200 OTatus [6, 7]. rbed dose and
with ionizing ndard Dosim
A plane-paralled for the eleonizing cham
ation beams. Tcted to the UStandard DosTARDOOR) of
absorbed do98 recommend
ronmental conarometer ands during these
y regarding thbers during p
n a few stages was divided ieing characterfferent irradiaed at two waused in the ex
MENTAL
erimental set-
a-high numer and the were irradiate
NAC [3, 4].
mately 45 mgle-mode optinstalled in a sand an outer d0 m of fiber w0 reflectome
of the OTDR'snts. Before themeasurementwere carried
s types. Thesethe actual atteregarding the aperture singm exposure wa
The measurvalues for this
m wavelength
length of theused in the exwere installed15 m were u
R and the remr distinction o
measurementhe photose
ron beam expf irradiation. A
ying the opticTDR) were dir
d the absorbedchambers cal
metry Laboratolel ionizing c
ectron radiatiomber (FarmerThese two ion
UNIDOS dosimsimetry Laborf INFLPR [8]. ose was selectdations [9-11].
nditions were md were main experiments.
he behavior ophoton beamof irradiation
in several irrrized by differation times. Fibavelengths fo
xperiment.
-up at high e
erical aperturphotosensitiv
ed with electro
m of ultra-hcal fiber werepiral with an diameter of 1were used to
eter and to s noise floor te start of the irts at 1310 nmout for the tw
e measured vaenuation in th
behavior of gle-mode opas performed rement uncers optical fiberand 5.33% a
e photosensitixperiment wasd in a spiral w
used to be comaining 15 mof the OTDR nnts. The stuensitive singleposure was alsAttenuation w
al time domairectly displaye
d dose rate werlibrated at thory – PTB, ichamber (Rooon beams and
type) for thnizing chambemeter from thratory at HigThe method t
ted considerin.
monitored witntained withi
f the two typem exposure wa
n. Each stage radiation steprent irradiatiober attenuatior each type
energy electro
re single-modve single-modon beams at th
high numerice used, of whic
inner diamete1.5 cm and thconnect to thgain a bette
that affects thrradiation som
m and 1550 nmwo single-modalues were usehe optical fibe
the ultra-higptical fiber t
in two stages rtainty of thr was 8.15% foat the 1550 nm
ve single-mods of 50 m out with a diametennected to th
m were used tnoise floor thudy regardine-mode opticso performed iwas determine
in ed
re he in os
d a he
ers he gh to ng
th in
es as of
ps, on on of
on
de de he
cal ch er he he er he
me m de ed er. gh to of he for m
de of er he to
hat ng cal in ed
withnm w
Tthe SEnerthe Uspirabeamthe unce
3B
Tultrafiberinsidplastvaluemeasto bvaluethe singlperfomeaswave
Tabsoperpdistaaccelabso
4
4r
Tsinglbeamirradirrad
Fig. 4
Tirrad
a measuremwavelength an
The ionizationSecondary Stargies - STARDUNIDOS dosimal, perpendicum at a distanc
accelerator. ertainty of the
3.2.EXPERIMEN
BEAM
The optical fiba-high numerr type. It wasde diameter oftic support. Bes of attenusured and cone later subtraes as to obtainbehavior of
le-mode opticormed in tsurement uncelength and of
The ionizationorbed dose wapendicular to tance of 50 clerator. The
orbed dose was
4. EXPERIMENTA
4.1. Influence radiation
The exposure ole-mode optic
ms consisted diation stage wdiation stage w
4.1.1 Attenuatiomode optical f
The two irraddiation step t
ent uncertainnd 5% for the 1
n chamber (Roandard DosimeDOOR - of INFmeter and plaular to the die of 100 cm fr
In this caabsorbed dos
NTAL SET-UP AT
ber exposed torical aperture
arranged in f 10.5 cm and Before startinuation in thnsidered as bacacted from thn a correct resu
the ultra-higal fiber in phohree stages
certainties aref 5.6% for the 1
n chamber uas placed in ththe direction ocm from the
measuremens 3.13%.
AL RESULTS
of high ene
of the ultra-hical fiber in tof two irradi
was about 22.was about 41.5
n in ultra-high nfiber exposed to
diation stages the attenuatio
nty of 14% for1550 nm wave
Roos type), beletry LaboratoFLPR, was conaced in the cenirection of thfrom the exit wase the mease was 3.13%.
HIGH ENERGY P
o photon beame single-moda tight spirawas mounted
ng the irradihe optical fickground andhe actual meault. The studygh numericaloton beam exp
of irradiate 22% for the1550 nm wave
used to methe center of tof the photon e exit windont uncertainty
ergy electron
igh numericathe 6.23 MeV
diation stages:.40 kGy and t
53 kGy.
numerical aperto electron radiat
s showed thaton in the op
r the 1310 elength.
longing to ry of High nnected to nter of the e electron window of asurement
PHOTON
ms was the de optical l with the
d on a thin ation, the iber were
d remained asurement
y regarding l aperture posure was tion. The e 1310 nm elength.
asure the the spiral, beam at a
ow of the y for the
n ionizing
l aperture V electron : the first the second
ture single-tion n
t for each tical fiber

43
presents a linear dependence in the range of doses between 4.4 kGy and 11.5 kGy for 1310 nm and 1550 nm wavelengths. For the 4.4 kGy value we have an attenuation of 1.66 dB for the 1310 nm wavelength and 2.42 dB for the 1550 nm one. And for 11.5 kGy value we have an attenuation of 2.88 dB for the 1310 nm wavelength and 4.00 dB for the 1550 nm one
Over the whole irradiation stage the attenuation in the optical fiber has a logarithmic dependence as function of the absorbed dose, both for wavelengths, but in case of the 1550 nm wavelength the sensitivity is greater than with the 1310 nm wavelength.
The attenuation measured in the optic fiber during the electron beam irradiation, function of the dose applied in the first stage, is shown in Fig. 4.1.1. The figure shows that after being exposed to a total dose of 22.4 kGy the attenuation increases from the background value of 0.3 dB to 5.7 dB, for the 1550 nm wavelength and from 0.2 db to 4.1 dB for the 1310 nm wavelength. The increase of optical attenuation as a result of the applied irradiation dose is due to the interaction of the electron beam with the optical fiber at an electron level, more specifically to the creation of intrinsic and extrinsic defects that cause absorption and scattering of light radiation.
As we stated above, the optical fiber was irradiated in steps, in the two stages. Between each irradiation step the attenuation was measured and obtained values are presented in figure 4.1.2. Fiber attenuation was measured at two wavelengths for each type of optical fiber used in the experiment. Once the radiation source is removed, an unusual increase of attenuation (or blackening of the optical fiber) is observed for a very short period of time in range of a few seconds, probably as a result of other fault creating transitions that occur without direct radiation exposure. These transitions increase the light absorption coefficient in the fiber core for both wavelengths. A lack of this phenomenon in the background measurements that were taken prior to the irradiation suggest that the effect is not created by exposure to the laser light generated by the OTDR. Further analysis of this behavior is necessary as it is only specific to this fiber type.
Fig. 4.1.2 Attenuation in ultra-high numerical aperture single-mode optical fiber depending on the time after
irradiation
A greater absorption coefficient, characteristic to the core of this type of optical fiber, may be seen for the 1550 nm wavelength. It was noticed that after being
left to recover for a longer time (300 hours) the attenuation values decreased to around 4.2 dB at 1550 nm and 2.2 dB at 1310 nm (Fig. 4.1.3). Although the optical fiber did not show a complete recovery, a second irradiation stage was performed in order to investigate the optical fiber reaction, when it was again subject to irradiation.
The total irradiation dose in the second stage was about 41.53 kGy. The behavior of the optical fiber throughout the irradiation stage and after it, was greatly similar to the first irradiation stage.
The analysis of the two irradiation stages in electron beams for the ultra-high numerical aperture single-mode optical fiber showed that this fiber has resistance to high radiation doses and recovers very slowly after exposure. The resistance at high radiation doses is due to the fact that the core is made of silica (SiO2/GeO2) and the cladding is fluorine doped silica. These doping substances offer resistance to high radiation doses.
Fig. 4.1.3 Attenuation in ultra-high numerical aperture single-mode optical fiber depending on time after
irradiation
The irradiation of the photosensitive single-mode optical fiber in the 6.23 MeV electron beams consisted in two stages: the first irradiation stage was about 1.0 kGy and the second irradiation stage was also about 1.0 kGy. The two irradiation stages showed that for each irradiation step the attenuation in the optical fiber presents an almost linear dependence depending on the absorbed dose, both for the 1310 nm wavelength and the 1550 nm wavelength, but in case of the 1550 nm wavelength the sensitivity is lower than for the 1310 nm wavelength.

44
Fig. 4.1.4 Optical fiber attenuation during exposure to radiation
The attenuation measured in the optic fiber during electron beam irradiation, function of the dose applied in the first stage, is shown in Fig. 4.1.4.
After the irradiation stage was finished the fiber was left for some time to recover while measuring the attenuation values (Figure 4.1.5). During these measurements a decrease of the values was observed within a short time (of the order of minutes). About 21 hours after cessation of irradiation the attenuation in the optical fiber was around 1.9 dB for both wavelengths and thus a second stage of irradiation was performed.
Fig. 4.1.5 Optical fiber attenuation after an elapsed time
In Figure 4.1.4 we can see that this type of optic fiber withstands medium radiation doses. This is due to the fact that the core and cladding are made of pure silica. Because of the resistance to medium doses of irradiation and fast recovery time, the photosensitive single-mode optical fiber could be used in making solid-body radiation detectors for short-term monitoring of medium to strong radiation sources [12].
4.2. Influence of high energy photon ionizing radiation
During the exposure to photon beams the irradiation doses applied to the ultra-high numerical aperture single-mode optical fiber were: 781 Gy in the first irradiation stage, 406 Gy in the second irradiation stage and 1698 Gy in the third irradiation stage.
Fig. 4.2.1 Attenuation in ultra-high numerical aperture single-mode optical fiber during photon beam irradiation
depending on absorbed dose
All the three stages of irradiation presented a approximately linear dependence for each irradiation step as function of the applied dose. Also, this type of optical fiber shows a greater sensitivity at 1550 nm wavelength.
Fig. 4.2.1 shows the behavior of the ultra-high numerical aperture single-mode optical fiber in photon beams in the first irradiation stage. When photons interact with the optical fiber at electron level, they generate faults in the fiber that increase the optical attenuation. Inside the fiber core intrinsic and extrinsic absorption of luminous radiation occurs and some scattering phenomena are also present.
It was noticed that once the irradiation was interrupted, the attenuation was still increasing for a short period of time (Fig.4.2.2.) and then slowly began decreasing. This was similar to what was observed for the electron beam irradiation and is specific to this type of optical fiber. Analyzing the behavior of the optic fiber after a longer time (couple of months) from ceasing the irradiation, it was noticed that this type of optic fiber shows a very slow recovery
Fig. 4.2.2 Attenuation in ultra-high numerical aperture single-mode optical fiber depending on the time after
irradiation
The measurements conducted in the three irradiation stages pointed-out a dependence of the attenuation to the absorbed dose, namely, an increase of attenuation when irradiated with a photon beam. Also, it is noticeable that such an optic fiber can withstand high radiation doses and shows a very slow recovery after radiation exposure. For that reason, this type of optical fiber could be used in the fabrication of a solid-body radiation detector for long time monitoring of radiation sources.
5.CONCLUSION
Based on the measurements conducted for the development of a possible solid-body radiation detector for electron and photon beams employing the ultra-high numerical aperture single-mode optical fiber the findings showed the existence of a relation between attenuation values and the irradiation dose. If certain dose ranges were regarded, in our case, 4.4 kG and 11.5 kGy, the optical fiber had a linear dependence.
45
Beyond a certain value of the irradiation dose, a saturation phenomenon occurs that causes no measurable increases of optical attenuation in the fiber regardless of the increasing dose.
The ultra-high numerical aperture single-mode optical fiber under study, is resistant to high radiation doses of tens of kGy (over 40 kGy) during electron beam irradiation. When irradiation is ceased, the attenuation in this particular type of optical fiber has a tendency to increase but after a longer period it slowly decreases.
The attenuation measured in the ultra-high numerical aperture single-mode optical fiber during electron or photon beam irradiation, as well as after ceasing the irradiation, is greater for the 1550 nm wavelength compared to the 1310 nm wavelength.
This type of optic fiber shows a very slow recovery of the attenuation values (couple of months).
These two behavior traits indicate that the optical fiber may be used as a solid-body detector to monitor large radiation doses which exceed values of 40.0 kGy, for long-term monitoring of radiation sources in domains such as: medicine, chemical industry, foodstuff industry, mining, research, personnel radioprotection, radioactive waste treatment plants, nuclear power plants, medical instrument sterilization, pharmaceutical production, etc.[12].
The photosensitive single-mode optical fiber is resistant to medium doses of radiation (about 1.0 kGy). A higher sensitivity was observed at a wavelength of 1310 nm. This type of optical fiber provides a rapid return to attenuation values close to pre-irradiation (of the order of minutes) and can, in this way, be reused. It is appropriate for use as a solid state detector for monitoring short-term irradiation events in areas such as: medicine, chemical industry, food industry, mining, research, radiation protection for personal environment, radioactive waste treatment plants, etc. [12].
REFERENCES
1. M. Sin, "Basics of Nuclear Physics. Laboratory Supervisor", Publishing of University of Bucharest, 2005;
2. http://ftp.utcluj.ro/pub/users/cemil/dwdm/dwdm_Intro/2_5311747.pdf.
3. I. Calinescu, D. Martin, D. Ighigeanu, A. I. Gavrila, A. Trifan, M. Patrascu, C. Munteanu, A. Diacon, E. Manaila, G. Craciun, "Nanoparticles synthesis by electron beam radiolysis", Central European Journal Volume: 12, Issue: 7, Pages: 774-781, DOI: 10.2478/s11532-014-0502-x, Jul 2014.
4. M. D. Stelescu, E. Manaila, G. Craciun, M. Dumitrascu, "New Green Polymeric Composites Based on Hemp and Natural Rubber Processed by Electron Beam Irradiation", Scientific World Journal, Article Number: 684047, DOI: 10.1155/2014/684047, Published: 2014.
5. www.thorlabs.com. 6. E. Badita,E. Stancu, F. Scarlat, C. Vancea, A.
Scarisoreanu, "Study of optical fiber as new radiation dosimeter", Romanian reports in physics vol. 65 (nr. 4) 1348-1442 (2013).
7. E. Badita, E. Stancu, F. Scarlat, C. Vancea, M. Dumitrascu, A. Scarisoreanu, “Multimode optical fiber study for a new radiation dosimeter development”, ROMOPTO International Conference on Micro-to Nano-Photonics III, editor International Society for
Optics and Photonics, Proc. SPIE 8882, ROMOPTO 2012: Tenth Conference on Optics: Micro- to Nanophotonics III, 88820Z (June 10, 2013); doi:10.1117/12.2032725.
8. F. Scarlat, A. Scarisoreanu, R. Minea, E. Badita, E. Sima, M. Dumitrascu, E. Stancu, C. Vancea, “Secundary standard dosimetry laboratory at INFLPR”, Optoelectronic and Avantage Materials - Rapid Communication, Vol. 7, No. 7-8, July-August 2013, p.618-624.
9. IAEA TRS 398–2004 „Absorbed Dose Determination in External Beam Radiotherapy: An International Code of Practice for Dosimetry based on Standards of Absorbed Dose to Water”, 23 April 2004.
10. E. Stancu, C. Vancea, J. Valenta, J. Zeman, E. Badita, A. Scarisoreanu, „Absorbed dose to water measurements in high energy electron beams using different plane parallel chambers"; Romanian Reports in Physics, vol. 67, No. 2, 2015.
11. E. Stancu, C. Vancea, J. Valenta, J. Zeman, E. Badita, A. Scarisoreanu, „Assessment of absorbed dose to water in high energy photon beams using different cylindrical chambers"; Romanian Reports in Physics, vol. 67, No. 2, 2015.
12. R. B. Miller, "Electronic Irradiation of Foods", Springer Science & Business Media, 6 iul. 2005, ISBN 978-0-387-28386-9.

CORRELATIVE AND PERIODOGRAM ANALYSIS OF DEPENDENCE OF CONTINUOUS GAMMA SPECTRUM IN THE SHALLOW UNDERGROUND LABORATORY
ON COSMIC RAY AND CLIMATE VARIABLES
Dimitrije Maletić, Radomir Banjanac, Dejan Joković, Vladimir Udovičić, Aleksandar Dragić, Mihailo Savić, Nikola Veselinović
Institute of Physics University of Belgrade, Serbia
Abstract. The continuous gamma spectrum, Cosmic ray intensity and climate variables; atmospheric pressure, air temperature and humidity were continually measured in the Underground laboratory of Low Background Laboratory in the Institute of Physics Belgrade. Same three climate variables for outside air were obtained from nearby meteorological station. The obtained gamma spectrum, measured using HPGe detector, is split into three energy ranges, low, intermediate and high ending with energy of 4.4 MeV. For each of the energy intervals periodogram and correlative analysis of dependence of continuous gamma spectrum on cosmic ray intensity and climate variables is performed. Periodogram analysis is done using Lomb-Scargle periodograms. The difference of linear correlation coefficients are shown and discussed, as well as the differences in resulting periodograms.
Key words: gamma spectroscopy, surface air, underground laboratory, correlative analysis, periodogram analysis.
1. INTRODUCTION
The low-level and cosmic-ray laboratory in the
Low-Background laboratory for Nuclear Physics in the Institute of Physics Belgrade is dedicated to the measurements of low activities and to the studies of the muon and electromagnetic components of cosmic rays at the ground level and at the shallow depth under-ground, and in particular to the detailed studies of the signatures of these radiations in HPGe spectrometers situated shallow underground. The ground level part of the laboratory (GLL), at 75 m above sea level, is situated at the foot of the vertical loess cliff, which is about 10 meters high. The underground part of the laboratory (UL), of the useful area of 45 m2, is dug into the foot of the cliff and is accessible from the GLL via the 10 meters long horizontal corridor, which serves also as a pressure buffer for a slight overpressure in the UL (Fig.1). The overburden of the UL is about 12m of loess soil, equivalent to 25 meters of water. [1]
In the UL laboratory the gamma spectrum is recorded using HPGe detector and fast ADC unit made by CAEN, and analysed using software developed in our laboratory. Besides HPGe measurements the air pressure, temperature and humidity were recorded in UL also. Values for temperature, pressure and humidity of outside air was taken from publicly available web site. The time period from which the
measurements were used in this analysis is from beginning of December 2009 till end of April 2010.
Figure 1. Cross-section of the low-level and
CR laboratory at IOP, Belgrade, 44°49'N, 20°28'E, vertical rigidity cut off 5.3 GV.
Continuous Cosmic rays’ (CR) spectrum
measure-ments by means of a pair of small plastic scintillators [(50x25x5)cm] started in the GLL and UL back in 2002 and lasted for about 5 years. It agrees to the spectrum of relatively shallow underground laboratories worldwide [2]. These measurements yielded the precise values of the integral CR muon flux at the ground level and underground level laboratory, at the location of Belgrade [3]. Different analyses of the time series of these measurements have also been performed [4, 5]. Since the UL is completely lined with the hermetically sealed 1 mm thick aluminum lining, and the ventilation system keeps the overpressure of 2 mbars of doubly filtered air, the concentration of radon is kept at the low average value of about 10 Bq/m3.

48
Measurements and analysis of periodicy of gamma-rays in underground laboratory had been reported [6-7], and also for Radon measurements and periodicity [8-9] including advanced Multivariate Analysis tecniques [10-11].
Most recent research done in our laboratory [12] addresses the question of determination of origin of low energy gamma-rays detected by HPGe detector, which are coming either from environmental radiation or from CR. In this paper the correlative analysis is used to address the same question of composition of low-energy gamma-rays spectrum, thus giving us the new approach to the research done in [12].
The correlative analysis in this paper was done using Toolkit for Multivariate Analysis TMVA[13] package as part of the ROOT[14] software, widely used in analysis, especially for High Energy Physics experiments. The TMVA was used for analysis extensively in our laboratory, and it was the natural choice to use the software for correlative analysis also. Lomb-Scargle periodograms were produced using software developed in Low-Background laboratory.
2. EXPERIMENTAL SETUP
In the UL 35% efficiency radiopure HPGe
detector, made by ORTEC, is used. The HPGe is sourounded by 12 cm thick cylindrical lead castle. Cosmic ray setup consists of a single [(100x100x5)cm] plastic scintillator detector equipped with four PMTs directly coupled to the corners beveled at 45o, made by Amcrys-H of Kharkov, Ukraine. The signals from HPGe detector and plastic scintillators give output to fast ADC unit with four independent inputs each, made by CAEN, of the type N1728B. CAEN units are versatile instruments capable of working in the so-called energy histogram mode, when they perform like digital spectrometers, or/and in the oscillogram mode, when they perform like digital storage oscilloscopes. In both modes they sample at 10 ns intervals, into 214 channels. The full voltage range is ±1.1V.
CAEN units are capable of operating in the list mode, when every analyzed event is fully recorded by the time of its occurrence over the set triggering level, and its amplitude, in the same PC, which controls their workings. This enables to off-line coincide the events at all four inputs, prompt as well as arbitrarily delayed, with the time resolution of 10 ns, as well as to analyze the time series not only of all single inputs, but also of arbitrary coincidences, with any integration period from 10 ns up. The flexible software that performs all these off-line analyses is user-friendly and is entirely homemade.
The preamplifier outputs of the PMTs of detectors are paired diagonally, the whole detector thus engaging the two inputs of the CAEN unit. The signals from these inputs are later off-line coincided and their amplitudes added, to produce the singles spectra of these detectors. Offline coincidence allows that the high intensity but uninteresting low energy portion of the background spectrum of this detector (up to some 3 MeV), which is mostly due to environmental radiations, is practically completely suppressed, leaving only the high energy-loss events due to CR muons and EM showers that peak at about 10 MeV, as shown in Figure 2.
Since event of HPGe gamma spectrum and Cosmic rays consists of time-stamp and the amplitude, off-line analysis is used to create time series of arbitrary time window with selection of specific part of gamma spectrum as well as the time series of Cosmic ray flux in UL (Figure 3.). This enables that whole gamma spectrum can be divided into energy ranges, and analyze each energy range separately. The spectrum separation is done on channel numbers, and after the energy calibration, the energy ranges used in our analysis are 180-440 keV, 620-1330 keV and 1800-4440 keV. The full gamma spectrum is recorded in range of 180-6670 keV. The part of gamma spectrum of the HPGe is shown in Figure 4.
Fig. 2. The sum spectra of two diagonals of big plastic detectors in the UL and GLL .
Fig. 3. The time series of the CR muon count of the big plastic detector in the UL.
Figure 4. Gamma spectrum of the HPGe detector in 12cm lead
castle in the Underground laboratory.

49
3. RESULTS AND DISCUSSIONS
The analysis starts with correlation analysis. The software for correlative analysis is a part of TMVA package. Hourly time series of variables, atmospheric pressure P, temperature T, and humidity H for UL (P_R, T_R, H_R), and outside (P,T,H) are used, Cosmic ray time series (CR) as well as T (DT) and H (DH) difference of UL and outside values make the number of nine input variables. The table summarizing the linear correlation coefficients is shown in Table 1. We can see correlation between each input variable and HPGe gamma spectrum for full energy range in Table 1 also. DH -10 69 -9 -86 57 -22 51 -25 -64 100DT 7 -98 7 60 -30 10 -24 42 100 -64 CR -14 -42 -65 36 -14 -52 13 100 42 -25 H_R -2 30 -44 -1 42 -59 100 13 -24 51 P_R 14 -13 80 -8 -22 100 -59 -52 10 -22 T_R 1 43 -16 -41 100 -22 42 -14 -30 57 H 10 -63 -15 100 -41 -8 -1 36 60 -86 P 11 -9 100 -15 -16 80 -44 -65 7 -9 T -6 100 -9 -63 43 -13 30 -42 -98 69 HPGe 100 -6 11 10 1 14 -2 -14 7 -10
HPG
e
T P H
T_R
P_R
H_R
CR
DT
DH
Table 1. Summary table of linear correlation coefficient for all 9 input variables’ 1 hour time series and 1 hour time series of
HPGe gamma spectrum for full energy range. Correlation analysis was done also for three mentioned energy ranges, the Table 2. summarizes the results. 180-6670
keV 180-440 keV
620-1330 keV
1780-4440 keV
T -0.070 -0.045 -0.041 -0.096 P +0.111 +0.124 +0.033 +0.010 H +0.106 +0.056 +0.047 +0.101 TUG +0.013 -0.029 +0.014 -0.012 PUG +0.149 +0.111 +0.091 +0.061 HUG -0.029 -0.068 -0.030 +0.028 CR -0.140 -0.179 -0.030 +0.036 TUG-T +0.076 +0.043 +0.046 +0.100 HUG-H -0.105 -0.083 -0.055 -0.072
Table 2. Linear correlation coefficients in % for full and
three narrower energy ranges. All the correlation of HPGe gamma spectrum hourly time series and input variables are not significant. The biggest correlation coefficient with HPGe time series is pressure time series measured underground followed by Cosmic ray time series. It is interesting to notice the change of correlation coefficients with HPGe for atmospheric pressure and Cosmic rays time series. While pressure correlation coefficients tend to drop going towards higher gamma energies, Cosmic rays’ correlation coefficients are increasing from negative sign to positive one. This observation is in agreement with the fact that the Cosmic rays are contributing
more to the the gamma spectrum of higher energies, as it was shown in [12]. Since Cosmic rays and pressure are anti-correlated with correlation coefficient of -65%, as can be seen in Table 1, increase in atmospheric pressure will give negative correlation coefficient of HPGe and Cosmic rays’ time series. This can be explained by having in mind that Cosmic rays are contributing insignificantly to gamma spectrum on lower energies [12] behaving like constant in low energy range, while increase in pressure increases the air density, thus more gamma scattering events are contributing to low energy gamma spectrum. In the periodogram analysis the Lomb-Scargle periodograms were produced for atmospheric variables P, T, H and HPGe gamma spectrum. The periodograms show only daily periodicity of T, H time series as shown on figures 5 and 6. The P periodogram on Figure 7. Shows expected daily and mid-daily periodicity. It is noticeable that the periodogram for P has lowest spectral powers, which means that periodicity of P is less noticeable. Also, the unexpected 1/3 day periodicity is with low spectral power. The periodogram analysis showed that there is no significant periodicity in HPGe gamma spectrum time series, as shown on Figure 8.
Figure 5. Lomb-Scargle periodogram of air humidity.
Figure 6. Lomb-Scargle periodogram of air temperature.
Figure 7. Lomb-Scargle periodogram of air pressure.
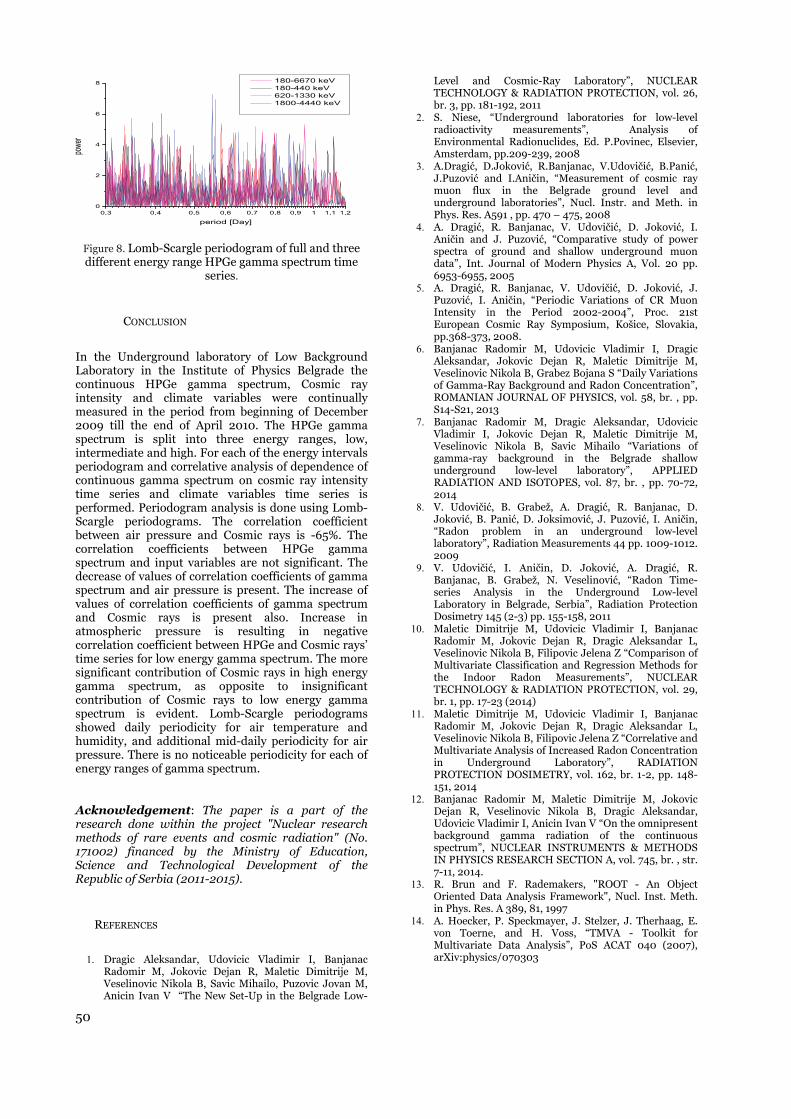
50
Figure 8. Lomb-Scargle periodogram of full and three different energy range HPGe gamma spectrum time
series.
CONCLUSION
In the Underground laboratory of Low Background Laboratory in the Institute of Physics Belgrade the continuous HPGe gamma spectrum, Cosmic ray intensity and climate variables were continually measured in the period from beginning of December 2009 till the end of April 2010. The HPGe gamma spectrum is split into three energy ranges, low, intermediate and high. For each of the energy intervals periodogram and correlative analysis of dependence of continuous gamma spectrum on cosmic ray intensity time series and climate variables time series is performed. Periodogram analysis is done using Lomb-Scargle periodograms. The correlation coefficient between air pressure and Cosmic rays is -65%. The correlation coefficients between HPGe gamma spectrum and input variables are not significant. The decrease of values of correlation coefficients of gamma spectrum and air pressure is present. The increase of values of correlation coefficients of gamma spectrum and Cosmic rays is present also. Increase in atmospheric pressure is resulting in negative correlation coefficient between HPGe and Cosmic rays’ time series for low energy gamma spectrum. The more significant contribution of Cosmic rays in high energy gamma spectrum, as opposite to insignificant contribution of Cosmic rays to low energy gamma spectrum is evident. Lomb-Scargle periodograms showed daily periodicity for air temperature and humidity, and additional mid-daily periodicity for air pressure. There is no noticeable periodicity for each of energy ranges of gamma spectrum.
Acknowledgement: The paper is a part of the research done within the project "Nuclear research methods of rare events and cosmic radiation" (No. 171002) financed by the Ministry of Education, Science and Technological Development of the Republic of Serbia (2011-2015).
REFERENCES
1. Dragic Aleksandar, Udovicic Vladimir I, Banjanac Radomir M, Jokovic Dejan R, Maletic Dimitrije M, Veselinovic Nikola B, Savic Mihailo, Puzovic Jovan M, Anicin Ivan V “The New Set-Up in the Belgrade Low-
Level and Cosmic-Ray Laboratory”, NUCLEAR TECHNOLOGY & RADIATION PROTECTION, vol. 26, br. 3, pp. 181-192, 2011
2. S. Niese, “Underground laboratories for low-level radioactivity measurements”, Analysis of Environmental Radionuclides, Ed. P.Povinec, Elsevier, Amsterdam, pp.209-239, 2008
3. A.Dragić, D.Joković, R.Banjanac, V.Udovičić, B.Panić, J.Puzović and I.Aničin, “Measurement of cosmic ray muon flux in the Belgrade ground level and underground laboratories”, Nucl. Instr. and Meth. in Phys. Res. A591 , pp. 470 – 475, 2008
4. A. Dragić, R. Banjanac, V. Udovičić, D. Joković, I. Aničin and J. Puzović, “Comparative study of power spectra of ground and shallow underground muon data”, Int. Journal of Modern Physics A, Vol. 20 pp. 6953-6955, 2005
5. A. Dragić, R. Banjanac, V. Udovičić, D. Joković, J. Puzović, I. Aničin, “Periodic Variations of CR Muon Intensity in the Period 2002-2004”, Proc. 21st European Cosmic Ray Symposium, Košice, Slovakia, pp.368-373, 2008.
6. Banjanac Radomir M, Udovicic Vladimir I, Dragic Aleksandar, Jokovic Dejan R, Maletic Dimitrije M, Veselinovic Nikola B, Grabez Bojana S “Daily Variations of Gamma-Ray Background and Radon Concentration”, ROMANIAN JOURNAL OF PHYSICS, vol. 58, br. , pp. S14-S21, 2013
7. Banjanac Radomir M, Dragic Aleksandar, Udovicic Vladimir I, Jokovic Dejan R, Maletic Dimitrije M, Veselinovic Nikola B, Savic Mihailo “Variations of gamma-ray background in the Belgrade shallow underground low-level laboratory”, APPLIED RADIATION AND ISOTOPES, vol. 87, br. , pp. 70-72, 2014
8. V. Udovičić, B. Grabež, A. Dragić, R. Banjanac, D. Joković, B. Panić, D. Joksimović, J. Puzović, I. Aničin, “Radon problem in an underground low-level laboratory”, Radiation Measurements 44 pp. 1009-1012. 2009
9. V. Udovičić, I. Aničin, D. Joković, A. Dragić, R. Banjanac, B. Grabež, N. Veselinović, “Radon Time-series Analysis in the Underground Low-level Laboratory in Belgrade, Serbia”, Radiation Protection Dosimetry 145 (2-3) pp. 155-158, 2011
10. Maletic Dimitrije M, Udovicic Vladimir I, Banjanac Radomir M, Jokovic Dejan R, Dragic Aleksandar L, Veselinovic Nikola B, Filipovic Jelena Z “Comparison of Multivariate Classification and Regression Methods for the Indoor Radon Measurements”, NUCLEAR TECHNOLOGY & RADIATION PROTECTION, vol. 29, br. 1, pp. 17-23 (2014)
11. Maletic Dimitrije M, Udovicic Vladimir I, Banjanac Radomir M, Jokovic Dejan R, Dragic Aleksandar L, Veselinovic Nikola B, Filipovic Jelena Z “Correlative and Multivariate Analysis of Increased Radon Concentration in Underground Laboratory”, RADIATION PROTECTION DOSIMETRY, vol. 162, br. 1-2, pp. 148-151, 2014
12. Banjanac Radomir M, Maletic Dimitrije M, Jokovic Dejan R, Veselinovic Nikola B, Dragic Aleksandar, Udovicic Vladimir I, Anicin Ivan V “On the omnipresent background gamma radiation of the continuous spectrum”, NUCLEAR INSTRUMENTS & METHODS IN PHYSICS RESEARCH SECTION A, vol. 745, br. , str. 7-11, 2014.
13. R. Brun and F. Rademakers, "ROOT - An Object Oriented Data Analysis Framework", Nucl. Inst. Meth. in Phys. Res. A 389, 81, 1997
14. A. Hoecker, P. Speckmayer, J. Stelzer, J. Therhaag, E. von Toerne, and H. Voss, “TMVA - Toolkit for Multivariate Data Analysis”, PoS ACAT 040 (2007), arXiv:physics/070303
STATUS OF THE PROJECT OF RADIOISOTOPE COMPLEX RIC-80 (RADIOISOTOPES AT CYCLOTRON C-80) AT PNPI
V.N. Panteleev 1, A.E. Barzakh 1, L.Kh. Batist 1, D.V. Fedorov 1, A.M. Filatova 1, V.S. Ivanov 1, F.V. Moroz 1, P.L. Molkanov 1, S.Yu. Orlov 1, Yu.M. Volkov 1.
1 NRC “Kurchatov Institute” PNPI, Gatchina, Leningrad district, Russia
Abstract. Presently a very important role in the production of radio nuclides for medicine the cyclotrons are playing, which are very safe and reliable installations. From radioisotopes produced with cyclotrons it’s rather easy to select one having appropriate nuclear-physical characteristics for the medical purpose use, than from ones produced with the reactors. At PNPI a high current cyclotron C-80 with the energy of extracted proton beam of 40-80 MeV and the current up to 200 μA is under construction. One of the main goals of C-80 is production of a wide spectrum of medical radio nuclides for diagnostics and therapy. At present time a project is worked out for the construction of radioisotope complex RIC-80 (Radioisotopes at the cyclotron C-80) at the beam of C-80. In the presented submission the project of RIC-80 complex is discussed, which includes three target stations for the production of a large set of radio nuclides for medicine. The peculiarity of the proposed radioisotope facility is the use of the mass-separator with the target-ion source device as one of the target stations for on-line, or semi on-line production of a high purity separated radioisotopes. The first results on the target development for production of different medical radio- nuclides, including radioisotope generator for PET diagnostics 82Sr, are presented as well.
Key words: medical radionuclides, radioisotope complex, production targets, mass-separator, radioisotopes of a high purity.
1. INTRODUCTION
It is well known that the main sources for production of the radioactive nuclides are thermal neutrons reactors. Although in the last decades for that purpose on the front place go the accelerators of the charged particles - cyclotrons, as the most safe and reliable technological installations. The list of cyclotron radio nuclides is longer and more varied, than ones obtained with the reactors. One of the most important characteristics of cyclotron produced radionuclides is emission of positrons that allows using them for the PET (Positron Emission Tomography) diagnostics. The rapidly growing nuclear physics studies, appropriate experimental method developments and use of very sensitive and effective detectors has given a very good possibility for elaboration of completely new direction in medical diagnostic and therapy of different kind diseases which is well known presently as nuclear medicine. The exceptional ability of the nuclear medicine methods consists in the possibility to detect and treat a large set of different diseases at a very early stage, saving many human lives and high money expenses for the treatment. The technology of nuclear medicine used for diagnostic and therapy as well is based on the employment of by a special way produced radioactive isotopes with selected properties. The most widely used methods in the nuclear diagnostic are the methods, when the used pharmaceutics are marked by specially selected radio nuclides. Measuring by specially designed detector devices the distribution of
the inserted into a human body radio isotopes it is possible to observe the function of investigated organs or their parts. Similar ways are used for the treatment of a different kind malignant tumors. One of the main advantage of the nuclear radio medicine methods is that the diagnostic and treatment can be carried out at a very early stage of the disease.
This work is the first part of the program on the target development for the new project RIC-80 (Radioactive Isotopes at cyclotron C-80) [1], which is being carried out presently in PNPI. The main task of this work is the method developments on the production and separation of isotope-generator 82Sr which is used for PET diagnostics of hart diseases and also for some other isotopes utilized for diagnostics and therapy. The methods have been worked out making use of the proton beam of a 1 GeV synchrocyclotron with the purpose to use the developed target prototypes at the new radio isotope installation RIC-80 with the proton energy 80 MeV and proton beam intensity up to 200 MeV.
2. SCHEME OF THE DESIGNED INSTALLATION RIC-80 (RADIOACTIVE ISOTOPES ON CYCLOTRON C-80)
In fig.1 the layout of RIC-80 installation is presented. It intended for production of medical radio- nuclides in the beam of the C-80 cyclotron, which is under construction at PNPI in Gatchina (Russia). The proton beam energy at the target can be varied in the
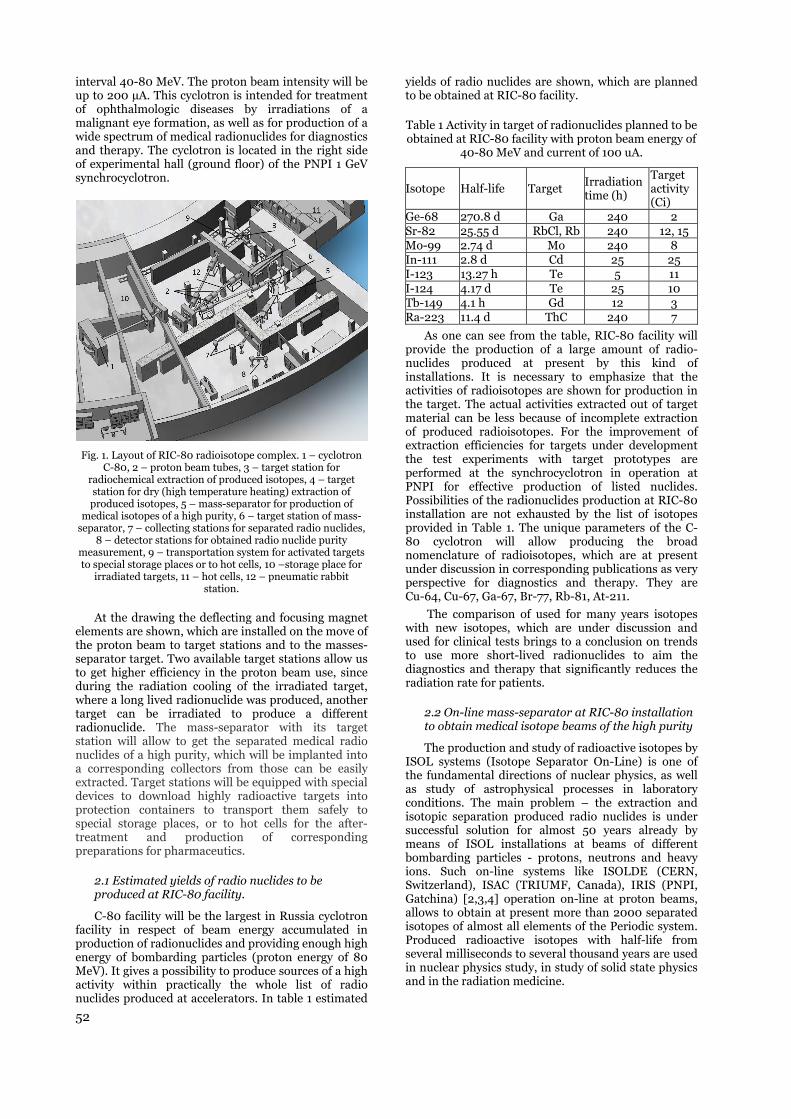
52
interval 40-80 MeV. The proton beam intensity will be up to 200 µA. This cyclotron is intended for treatment of ophthalmologic diseases by irradiations of a malignant eye formation, as well as for production of a wide spectrum of medical radionuclides for diagnostics and therapy. The cyclotron is located in the right side of experimental hall (ground floor) of the PNPI 1 GeV synchrocyclotron.
Fig. 1. Layout of RIC-80 radioisotope complex. 1 – cyclotron
C-80, 2 – proton beam tubes, 3 – target station for radiochemical extraction of produced isotopes, 4 – target station for dry (high temperature heating) extraction of produced isotopes, 5 – mass-separator for production of
medical isotopes of a high purity, 6 – target station of mass-separator, 7 – collecting stations for separated radio nuclides,
8 – detector stations for obtained radio nuclide purity measurement, 9 – transportation system for activated targets to special storage places or to hot cells, 10 –storage place for
irradiated targets, 11 – hot cells, 12 – pneumatic rabbit station.
At the drawing the deflecting and focusing magnet elements are shown, which are installed on the move of the proton beam to target stations and to the masses-separator target. Two available target stations allow us to get higher efficiency in the proton beam use, since during the radiation cooling of the irradiated target, where a long lived radionuclide was produced, another target can be irradiated to produce a different radionuclide. The mass-separator with its target station will allow to get the separated medical radio nuclides of a high purity, which will be implanted into a corresponding collectors from those can be easily extracted. Target stations will be equipped with special devices to download highly radioactive targets into protection containers to transport them safely to special storage places, or to hot cells for the after-treatment and production of corresponding preparations for pharmaceutics.
2.1 Estimated yields of radio nuclides to be produced at RIC-80 facility.
C-80 facility will be the largest in Russia cyclotron facility in respect of beam energy accumulated in production of radionuclides and providing enough high energy of bombarding particles (proton energy of 80 MeV). It gives a possibility to produce sources of a high activity within practically the whole list of radio nuclides produced at accelerators. In table 1 estimated
yields of radio nuclides are shown, which are planned to be obtained at RIC-80 facility.
Table 1 Activity in target of radionuclides planned to be obtained at RIC-80 facility with proton beam energy of
40-80 MeV and current of 100 uА.
Isotope Half-life Target Irradiation time (h)
Target activity (Ci)
Ge-68 270.8 d Ga 240 2 Sr-82 25.55 d RbCl, Rb 240 12, 15 Mo-99 2.74 d Mo 240 8 In-111 2.8 d Cd 25 25 I-123 13.27 h Te 5 11 I-124 4.17 d Te 25 10 Tb-149 4.1 h Gd 12 3 Ra-223 11.4 d ThC 240 7
As one can see from the table, RIC-80 facility will provide the production of a large amount of radio- nuclides produced at present by this kind of installations. It is necessary to emphasize that the activities of radioisotopes are shown for production in the target. The actual activities extracted out of target material can be less because of incomplete extraction of produced radioisotopes. For the improvement of extraction efficiencies for targets under development the test experiments with target prototypes are performed at the synchrocyclotron in operation at PNPI for effective production of listed nuclides. Possibilities of the radionuclides production at RIC-80 installation are not exhausted by the list of isotopes provided in Table 1. The unique parameters of the C-80 cyclotron will allow producing the broad nomenclature of radioisotopes, which are at present under discussion in corresponding publications as very perspective for diagnostics and therapy. They are Cu-64, Cu-67, Ga-67, Br-77, Rb-81, At-211.
The comparison of used for many years isotopes with new isotopes, which are under discussion and used for clinical tests brings to a conclusion on trends to use more short-lived radionuclides to aim the diagnostics and therapy that significantly reduces the radiation rate for patients.
2.2 On-line mass-separator at RIC-80 installation to obtain medical isotope beams of the high purity
The production and study of radioactive isotopes by ISOL systems (Isotope Separator On-Line) is one of the fundamental directions of nuclear physics, as well as study of astrophysical processes in laboratory conditions. The main problem – the extraction and isotopic separation produced radio nuclides is under successful solution for almost 50 years already by means of ISOL installations at beams of different bombarding particles - protons, neutrons and heavy ions. Such on-line systems like ISOLDE (CERN, Switzerland), ISAC (TRIUMF, Canada), IRIS (PNPI, Gatchina) [2,3,4] operation on-line at proton beams, allows to obtain at present more than 2000 separated isotopes of almost all elements of the Periodic system. Produced radioactive isotopes with half-life from several milliseconds to several thousand years are used in nuclear physics study, in study of solid state physics and in the radiation medicine.

53
In a very short way the work of an ISOL facility can be described as follows. The beam of bombarding particles (see fig. 1) is directed to the target of the mass-separator, which is located inside the vacuum chamber at the high temperature (of 1800-2200°С), where radionuclides are produced as a result of nuclear reactions. The products formed inside a target material get out of target container into an ion source, where the ionization occurs. Ions, going out of ionizer, are formed by the field of extraction electrode into a beam of ~ 2 х 10-2 radians divergence. Going through a focusing lens, ion beam is converted into a parallel and gains the energy of 30-50 keV. Later the beam of mono energy ions enters the magnet-analyzer, where the mass separation occurs. The cross-section dimensions of the beam at the magnet focal plane of the mass- separator are of about 1 mm in vertical and 1.5 mm in horizontal directions. Separated according their masses beams of radioactive ions enter the switchyard chamber and after that they go along vacuum ion guide tubes to the experimental hall, where they are implanted into corresponding collectors. Sources of radio nuclides obtained without any carrier and admixtures are measured in time of the accumulation process for the determination of their purity and activity rate by means of α, β and γ detectors installed close to collectors, where the implantation of radioactive ion beams occurs. Coming from aforesaid one, the mass-separator method possesses the following values:
• allows to obtain very pure beams of medical isotopes of many elements;
• several separated radionuclides can be accumulated simultaneously;
• depth implantation of several times of ten Ǻ allows to use very fine organic substrates that significantly simplifies the production of medical preparations;
• the method of the radioactive ions implantation allows to obtain the unique generators of radioactive noble gases;
• the target is used many times and does not require reconstruction;
• except a number of relatively long-lived nuclides, mass-separator on-line at accelerator or reactor allows to obtain a lot of new "short-lived" radioactive isotopes (T1/2 = from several tens of minutes to several hours) for diagnostics;
• process of the diagnostics can be realized "on-line" in medical laboratories, which are based on installations produced a big variety of short-lived mass-separated radioactive nuclides of a high purity. As the isotope production efficiency by the mass-
separator method is dependent on the ionization efficiency of produced nuclide and the ion source used, it is necessary, calculating the expected radioactivity, to take into account this value for the nuclide being produced. As to radionuclides listed above the ionization efficiency εi may be the following: for Rb - εi ≈ 80%; for Sr, In, Ra - εi ≈ 20-40%; for I - εi ≈ 30%.
3. TARGET DEVELOPMENT FOR THE RIC-80 PROJECT
3.1 Experiment description and experimental results on 82Sr production
For the first experimental tests the niobium foils, pills of yttrium carbide and rubidium chlorine powder were used as target materials for production of 82Sr. 82Sr with a half-live T1/2=25.55 d is a generator for its daughter isotope 82Rb (T1/2=1.25 min) which is widely used in PET diagnostics. The irradiated target material was placed into Ta-W container which was designed as a prototype of a target device for production of 82Sr at RIC-80. In a high vacuum the target material was heated to separate the produced nuclides and the target material [5].
For the target heating tests the target-prototype was manufactured with parameters close to the working parameters of the target which will be constructed for the RIC-80 facility. The target-prototype parameters were the following: the length of the target container – 200 mm; the target container diameter – 30 mm. The target-prototype prepared for the subsequent irradiation at the proton beam to accumulate 82Sr in the target material is shown in fig. 2.
Fig. 2. The target-prototype specially constructed for the tests on the production and thermal extraction of generator-isotope 82Sr and other radionuclides from irradiated target materials.
The samples of different target materials after irradiation by the 1 GeV proton beam were placed into the target container (tungsten-tantalum cylinder). In the central part the target container was connected to the tungsten tube with a hole of 2 mm in diameter. Through this tube the radioactive nuclides accumulated in the target material were evaporated in the course of target thermal heating and absorbed by the tantalum foil collector, contacting with cooper flange, cooled by floating water. For the tungsten tube, which the evaporated nuclides passed through, the same method of the resistant heating was used as for the target container as well. The target was heated to its working temperature 2000-2100 ºC. The high vacuum test bench was specially constructed for testing high temperature targets with the heating power up to ~9 kW. The target developed construction allows to produce and select radionuclides from different target materials such as refractory metal foils, refractory metal carbides, liquid metals and metal

54
powder compounds as well. There were some stages in the process of the target heating in a high vacuum for extraction of produced in the target material radioactive species. To select strontium from yttrium carbide target, which release from the target is characterized by relatively slow process diffusion and effusion, the target heating was started at low temperatures 1500-1800 to evaporate radioactive species with faster diffusion-effusion properties, such as Rb, Mn and other radio nuclides with high values of diffusion-effusion parameters. After that, strontium may be selectively extracted by heating the target with a higher temperature. In fig. 3 gamma spectrum is presented of irradiated sample of yttrium carbide measured by the hyperfine germanium γ-detector before the target heating. In fig. 4 gamma spectrum is presented of collected radioactivity at the cooled collector during the heating of irradiated yttrium carbide sample.
Fig. 3. Gamma-spectrum of irradiated sample of yttrium
carbide. Gamma-line 776 keV belongs to decay of 82Sr daughter isotope 82Rb, used for PET diagnostics.
Fig. 4. Gamma spectrum of collected radioactivity at the cooled collector during the heating of irradiated yttrium carbide samples at a temperature interval 1950-2000°C.
As one can see from fig. 3, 4 finally almost all radioactive species were evaporated from the irradiated target, except strontium. The final efficiency of extraction of strontium after the yttrium carbide heating at the temperature 1950-2000°C during the time interval of 10 hours was about 90%. The efficiency of removing collected radioactive strontium from the tantalum collector by HCl of 20% concentration was 85%. The yttrium carbide target is intended to be used for 82Sr production by a mass-separator method. This target material possesses good characteristics (melting point, boiling point) to be used as a target under a high
temperature coupled with the mass-separator ion source of surface ionization.
For production of 82Sr by a dry, high temperature heating method traditional target materials rubidium chloride and metallic rubidium have been used. For this purpose irradiated powder of RbCl or metallic rubidium in a tantalum cavity was placed to a heated target container. All manipulations with metallic rubidium were carried out in argon atmosphere. In a high vacuum the target material during target heating at a temperature lower than 1000°C was evaporated and collected in a special cavity for the target material collection. All target material was evaporated for the time of some hours. After that the cavity was exchanged by a tantalum foil collector for collection of strontium isotopes, which were escaping from the target container at a temperature of 1900-1950°C. For the heating time of 2 hours 90% of strontium was evaporated and collected at the cooled tantalum collector. In fig. 5 part of measured γ-spectrum of RbCl sample is shown before the heating (black circles) and collected strontium-82 during the heating irradiated rubidium chloride with the temperature 1900-1950°C after evaporation of the target material (open circles).
Fig. 5. Part of measured γ-spectrum of RbCl sample before the heating and collected strontium-82 during the heating target cavity with the temperature 1900-1950°C after evaporation of
the target material.
3.2 Production of Tl isotopes from a led target
For diagnostics of myocardial diseases in nuclear medicine radionuclide 201Tl (T1/2 =3.04 d) is used. 201Tl can be effectively produced from the led target of natural or enriched abundance. The production cross-sections are very high and this method could be used for effective production of 201Tl. The only problem is the admixture of neighboring isotopes with close half-lives 200Tl (T1/2=1.09 d) and 202Tl (T1/2=12.23 d). In this case a mass-separator method of production of a high purity mass-separated 201Tl can be explored.
In the experiment on the thallium isotope production-extraction a target of led of a natural abundance was irradiated at the 1 GeV proton beam of PNPI synchrocyclotron. The irradiation time was 24 hours. After 10 days of the radiated led cooling it was transported to the experimental hall of the IRIS facility and was placed into the heating tungsten container in the vacuum test bench. The gamma spectrum of
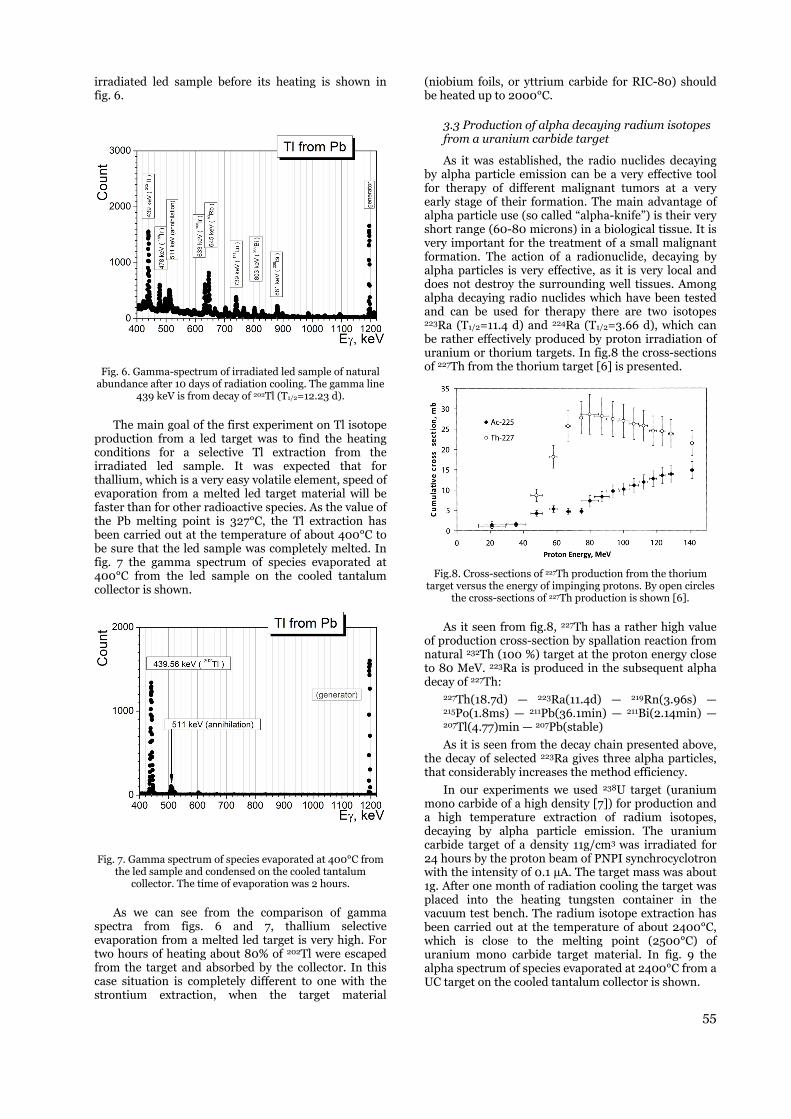
55
irradiated led sample before its heating is shown in fig. 6.
Fig. 6. Gamma-spectrum of irradiated led sample of natural abundance after 10 days of radiation cooling. The gamma line
439 keV is from decay of 202Tl (T1/2=12.23 d).
The main goal of the first experiment on Tl isotope production from a led target was to find the heating conditions for a selective Tl extraction from the irradiated led sample. It was expected that for thallium, which is a very easy volatile element, speed of evaporation from a melted led target material will be faster than for other radioactive species. As the value of the Pb melting point is 327°C, the Tl extraction has been carried out at the temperature of about 400°C to be sure that the led sample was completely melted. In fig. 7 the gamma spectrum of species evaporated at 400°C from the led sample on the cooled tantalum collector is shown.
Fig. 7. Gamma spectrum of species evaporated at 400°C from the led sample and condensed on the cooled tantalum
collector. The time of evaporation was 2 hours.
As we can see from the comparison of gamma spectra from figs. 6 and 7, thallium selective evaporation from a melted led target is very high. For two hours of heating about 80% of 202Tl were escaped from the target and absorbed by the collector. In this case situation is completely different to one with the strontium extraction, when the target material
(niobium foils, or yttrium carbide for RIC-80) should be heated up to 2000°C.
3.3 Production of alpha decaying radium isotopes from a uranium carbide target
As it was established, the radio nuclides decaying by alpha particle emission can be a very effective tool for therapy of different malignant tumors at a very early stage of their formation. The main advantage of alpha particle use (so called “alpha-knife”) is their very short range (60-80 microns) in a biological tissue. It is very important for the treatment of a small malignant formation. The action of a radionuclide, decaying by alpha particles is very effective, as it is very local and does not destroy the surrounding well tissues. Among alpha decaying radio nuclides which have been tested and can be used for therapy there are two isotopes 223Ra (T1/2=11.4 d) and 224Ra (T1/2=3.66 d), which can be rather effectively produced by proton irradiation of uranium or thorium targets. In fig.8 the cross-sections of 227Th from the thorium target [6] is presented.
Fig.8. Cross-sections of 227Th production from the thorium target versus the energy of impinging protons. By open circles
the cross-sections of 227Th production is shown [6].
As it seen from fig.8, 227Th has a rather high value of production cross-section by spallation reaction from natural 232Th (100 %) target at the proton energy close to 80 MeV. 223Ra is produced in the subsequent alpha decay of 227Th:
227Th(18.7d) — 223Ra(11.4d) — 219Rn(3.96s) — 215Po(1.8ms) — 211Pb(36.1min) — 211Bi(2.14min) — 207Tl(4.77)min — 207Pb(stable)
As it is seen from the decay chain presented above, the decay of selected 223Ra gives three alpha particles, that considerably increases the method efficiency.
In our experiments we used 238U target (uranium mono carbide of a high density [7]) for production and a high temperature extraction of radium isotopes, decaying by alpha particle emission. The uranium carbide target of a density 11g/cm3 was irradiated for 24 hours by the proton beam of PNPI synchrocyclotron with the intensity of 0.1 µA. The target mass was about 1g. After one month of radiation cooling the target was placed into the heating tungsten container in the vacuum test bench. The radium isotope extraction has been carried out at the temperature of about 2400°C, which is close to the melting point (2500°C) of uranium mono carbide target material. In fig. 9 the alpha spectrum of species evaporated at 2400°C from a UC target on the cooled tantalum collector is shown.
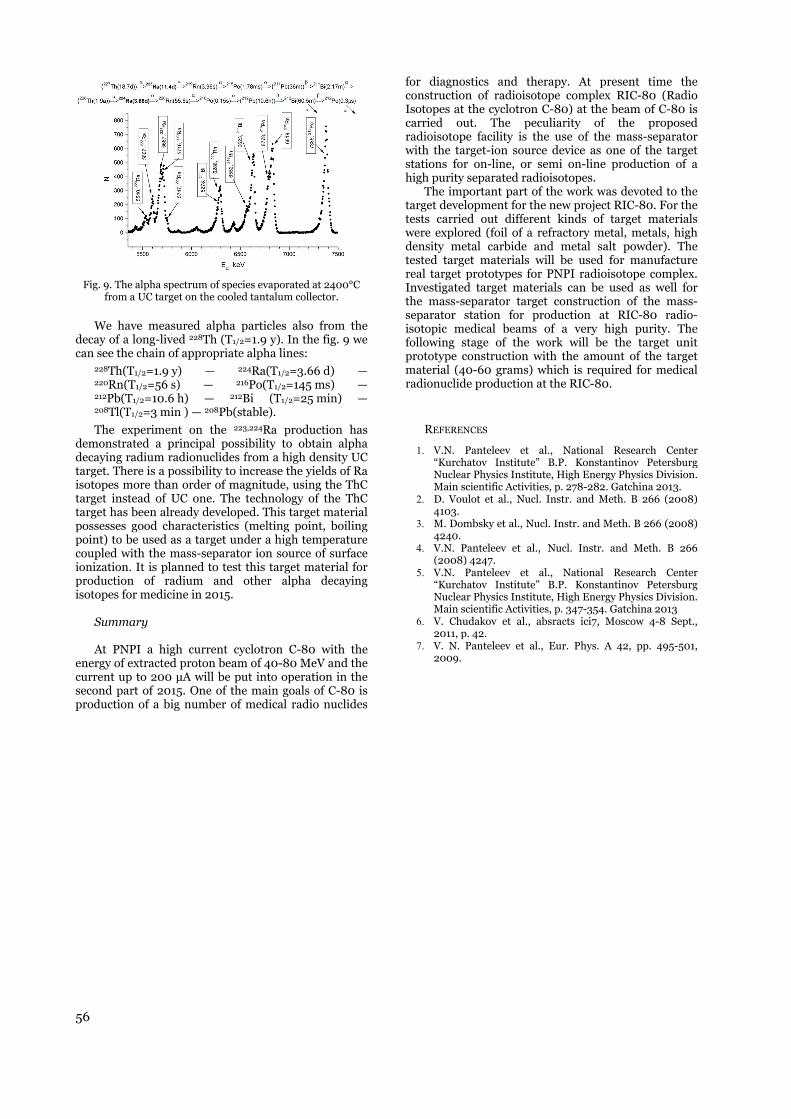
56
Fig. 9. The alpha spectrum of species evaporated at 2400°C from a UC target on the cooled tantalum collector.
We have measured alpha particles also from the decay of a long-lived 228Th (T1/2=1.9 y). In the fig. 9 we can see the chain of appropriate alpha lines:
228Th(T1/2=1.9 y) — 224Ra(T1/2=3.66 d) — 220Rn(T1/2=56 s) — 216Po(T1/2=145 ms) — 212Pb(T1/2=10.6 h) — 212Bi (T1/2=25 min) — 208Tl(T1/2=3 min ) — 208Pb(stable).
The experiment on the 223,224Ra production has demonstrated a principal possibility to obtain alpha decaying radium radionuclides from a high density UC target. There is a possibility to increase the yields of Ra isotopes more than order of magnitude, using the ThC target instead of UC one. The technology of the ThC target has been already developed. This target material possesses good characteristics (melting point, boiling point) to be used as a target under a high temperature coupled with the mass-separator ion source of surface ionization. It is planned to test this target material for production of radium and other alpha decaying isotopes for medicine in 2015.
Summary At PNPI a high current cyclotron C-80 with the
energy of extracted proton beam of 40-80 MeV and the current up to 200 μA will be put into operation in the second part of 2015. One of the main goals of C-80 is production of a big number of medical radio nuclides
for diagnostics and therapy. At present time the construction of radioisotope complex RIC-80 (Radio Isotopes at the cyclotron C-80) at the beam of C-80 is carried out. The peculiarity of the proposed radioisotope facility is the use of the mass-separator with the target-ion source device as one of the target stations for on-line, or semi on-line production of a high purity separated radioisotopes.
The important part of the work was devoted to the target development for the new project RIC-80. For the tests carried out different kinds of target materials were explored (foil of a refractory metal, metals, high density metal carbide and metal salt powder). The tested target materials will be used for manufacture real target prototypes for PNPI radioisotope complex. Investigated target materials can be used as well for the mass-separator target construction of the mass-separator station for production at RIC-80 radio- isotopic medical beams of a very high purity. The following stage of the work will be the target unit prototype construction with the amount of the target material (40-60 grams) which is required for medical radionuclide production at the RIC-80.
REFERENCES
1. V.N. Panteleev et al., National Research Center “Kurchatov Institute” B.P. Konstantinov Petersburg Nuclear Physics Institute, High Energy Physics Division. Main scientific Activities, p. 278-282. Gatchina 2013.
2. D. Voulot et al., Nucl. Instr. and Meth. B 266 (2008) 4103.
3. M. Dombsky et al., Nucl. Instr. and Meth. B 266 (2008) 4240.
4. V.N. Panteleev et al., Nucl. Instr. and Meth. B 266 (2008) 4247.
5. V.N. Panteleev et al., National Research Center “Kurchatov Institute” B.P. Konstantinov Petersburg Nuclear Physics Institute, High Energy Physics Division. Main scientific Activities, p. 347-354. Gatchina 2013
6. V. Chudakov et al., absracts ici7, Moscow 4-8 Sept., 2011, p. 42.
7. V. N. Panteleev et al., Eur. Phys. A 42, pp. 495-501, 2009.

PATIENT DOSE FROM MEDICAL EXPOSURE IN ROMANIA FOR THE PERIOD 2010-2013
Olga Girjoaba, Alexandra Cucu
National Institute of Public Health, Bucharest, Romania
Abstract X-rays play an important role in diagnosing and treating many kinds of diseases. This important medical X-ray role is always associated with biological effects and risks to the patients and medical staff. The growing concern regarding medical X-ray exposure and their possible risks, has resulted in the initiation of quality control programs and patients dose survey and assessment in Romania. A nation-wide evaluation concerning the monitoring of the patient radiation protection in diagnostic radiology and interventional radiology was initiated in 2006, but functional since 2009. All providers of radiology and medical imaging examinations have to record patient data and relevant information for assessment of doses received by patients from medical exposures to ionizing radiation. In the actual study, the frequency of X-ray examinations for 2010-2013 years (including the conventional radiology, interventional radiology, computed tomography and dental radiology) and mean effective dose per procedure were estimated. Taking into account the new Council Directive 2013/59/EURATOM provisions concerning the medical exposure, it is very important to find the best modalities for improvement of patient dose registering and reporting system. The system still needs improvement, especially in areas such as correct registration of relevant information for assessment of doses received by patients from medical exposures to ionising radiation.
Key words: medical exposure, frequency of X-ray examinations, mean effective dose, patient dose
1 INTRODUCTION
X-rays play an important role in diagnosing and treating many kinds of diseases. This important medical X-ray role is always associated with biological effects and risks to the patients and medical staff. The growing concern regarding medical X-ray exposure and their possible risks, has resulted in the initiation of quality control programs and patients dose survey and assessment in Romania.
Annual results obtained for medical exposure to ionising radiation based on the data collected from Romanian hospitals are used for the update of the national database and optimisation of diagnostic procedures.
Medical exposure level is expressed in terms of annual collective dose and is estimated from annual frequencies and the mean effective dose per procedure for different types of radiological examinations.
2 METHOD
National legal framework harmonized with the relevant Community provisions stipulate the obligation and responsibility of the public health network to provide radiological protection for medical exposure of patients to ionising radiation.
In this respect, two Orders of Health Ministry [1, 2] were promoted, which ensured a system concerning the registration, centralisation and reporting of patient doses on medical exposures to ionising radiation. Although the system was initiated in 2006, it is functional since 2009, in the first years the registration of the date being made with difficulty.
All providers of radiology and medical imaging examinations have to record patient data and relevant information for assessment of doses received by patients from medical exposures to ionising radiation. The forms for reporting the centralised data contain the exam type, procedure code, total number per exam type and its distributions on age groups and gender groups. The collected data are both for adult and paediatric patients, according with the national legislation mentioned above. Dose information is available in terms of DAP-meter values or entrance surface dose for conventional X-ray procedures and DLP indication for CT procedures. For estimation, we assume that, in one year, the total number of reported procedures per number of reporting units is proportional with the total number of estimated procedures per total number of units in the whole country. Conversion coefficients used for relating measured values of DAP/DLP indications to effective doses are estimated by the NRPB R262 [3].
The method, which has been throughly described in [4], is presented schematically in Fig. 1. The centralised data, at the hospital level (Level 1), are reported quarterly to Ionising Radiation Hygiene Laboratory of

58
the Public Health Departments (Level 2), depending on the territorial assignation. Ministry of Health through the National Institute of Public Health centralises the data of medical exposure to ionising radiation reported by providers of radiology and medical imaging examinations and elaborates an annual report (Level 3).
Leve
l 1
Leve
l 2
Leve
l 3
Fig. 1 Registering and reporting system for medical exposures
In the actual study, the frequency of X-ray examinations for 2010-2013 years (including the conventional radiology, interventional radiology, computed tomography and dental radiology), mean effective dose per procedure and annual collective effective dose per 1000 inhabitants (adults and children) were estimated.
3 RESULTS AND DISCUSSIONS
Summary of the X-ray examination frequency estimated for procedure types performed at the national level for Top 20 (defined by RP 154 [5]) and for all X-ray radiology, based on the data reported by the Ionising Radiation Hygiene Laboratories from counties and Bucharest in years 2010-2013, are presented in Fig 2 and 3. The X-ray procedure types classified in Top 20 cover the main plain X-ray radiography, fluoroscopy, IVU, cardiac angiography and CT exams with the highest frequency.
Fig. 2 X-ray examination frequency estimated for all procedure types performed at the national level
Fig. 3 X-ray examination frequency estimated for Top 20 procedure types performed at the national level
The majority of X-ray procedures are represented by the plain radiography, while the number of CT exams is almost for ten times lower. It can be remarked that the frequency of radiological procedures for all four years is almost de same.
The mean effective doses (mSv) per X-ray procedure types for Top 20 performed at the national level in years 2010-2013 are presented in Table 1 and the summary of mean effective doses per modality are presented in Table 2.
The annual collective effective dose per 1000 inhabitants for all X-ray based radiology with and without dental radiology is presented in Table 3. For comparison, the overall total collective effective dose of X-ray procedures in EU countries is 547500 man Sv, resulting a mean effective dose of 1060 mSv per 1000 capita, in accordance with DDM2 Report [6].
In the case of mean effective doses per exam type or modality, it can be remarked important differences between the first year and the last two years, although no important changes in radiological practices in the period 2010-2013 took place. We suspect that, in the first years after the system for reporting medical exposure was functional, the data regarding the patient doses were incomplete and/or incorrectly registered and reported. This can have different causes, for example:
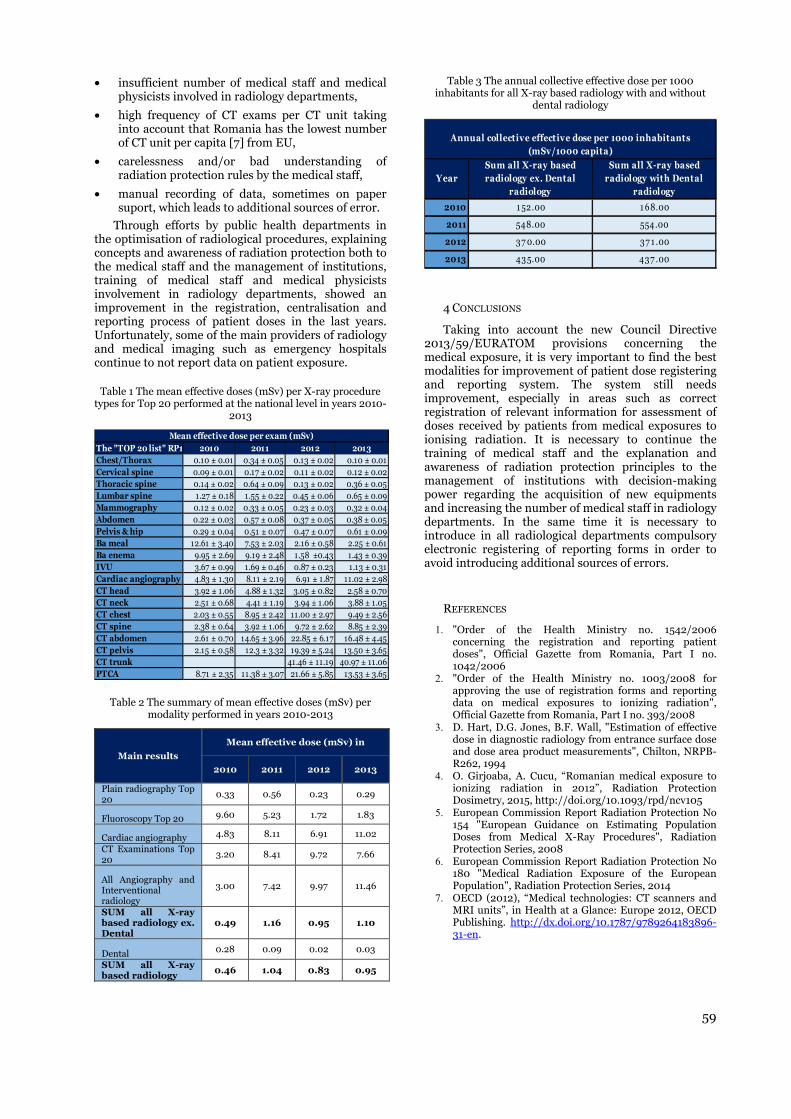
59
• insufficient number of medical staff and medical physicists involved in radiology departments,
• high frequency of CT exams per CT unit taking into account that Romania has the lowest number of CT unit per capita [7] from EU,
• carelessness and/or bad understanding of radiation protection rules by the medical staff,
• manual recording of data, sometimes on paper suport, which leads to additional sources of error.
Through efforts by public health departments in the optimisation of radiological procedures, explaining concepts and awareness of radiation protection both to the medical staff and the management of institutions, training of medical staff and medical physicists involvement in radiology departments, showed an improvement in the registration, centralisation and reporting process of patient doses in the last years. Unfortunately, some of the main providers of radiology and medical imaging such as emergency hospitals continue to not report data on patient exposure.
Table 1 The mean effective doses (mSv) per X-ray procedure types for Top 20 performed at the national level in years 2010-
2013
The "TOP 20 list" RP1 2010 2011 2012 2013Chest/Thorax 0.10 ± 0.01 0.34 ± 0.05 0.13 ± 0.02 0.10 ± 0.01Cervical spine 0.09 ± 0.01 0.17 ± 0.02 0.11 ± 0.02 0.12 ± 0.02Thoracic spine 0.14 ± 0.02 0.64 ± 0.09 0.13 ± 0.02 0.36 ± 0.05Lumbar spine 1.27 ± 0.18 1.55 ± 0.22 0.45 ± 0.06 0.65 ± 0.09Mammography 0.12 ± 0.02 0.33 ± 0.05 0.23 ± 0.03 0.32 ± 0.04Abdomen 0.22 ± 0.03 0.57 ± 0.08 0.37 ± 0.05 0.38 ± 0.05Pelvis & hip 0.29 ± 0.04 0.51 ± 0.07 0.47 ± 0.07 0.61 ± 0.09Ba meal 12.61 ± 3.40 7.53 ± 2.03 2.16 ± 0.58 2.25 ± 0.61Ba enema 9.95 ± 2.69 9.19 ± 2.48 1.58 ±0.43 1.43 ± 0.39IVU 3.67 ± 0.99 1.69 ± 0.46 0.87 ± 0.23 1.13 ± 0.31Cardiac angiography 4.83 ± 1.30 8.11 ± 2.19 6.91 ± 1.87 11.02 ± 2.98CT head 3.92 ± 1.06 4.88 ± 1.32 3.05 ± 0.82 2.58 ± 0.70CT neck 2.51 ± 0.68 4.41 ± 1.19 3.94 ± 1.06 3.88 ± 1.05CT chest 2.03 ± 0.55 8.95 ± 2.42 11.00 ± 2.97 9.49 ± 2.56CT spine 2.38 ± 0.64 3.92 ± 1.06 9.72 ± 2.62 8.85 ± 2.39CT abdomen 2.61 ± 0.70 14.65 ± 3.96 22.85 ± 6.17 16.48 ± 4.45CT pelvis 2.15 ± 0.58 12.3 ± 3.32 19.39 ± 5.24 13.50 ± 3.65CT trunk 41.46 ± 11.19 40.97 ± 11.06PTCA 8.71 ± 2.35 11.38 ± 3.07 21.66 ± 5.85 13.53 ± 3.65
Mean effective dose per exam (mSv)
Table 2 The summary of mean effective doses (mSv) per modality performed in years 2010-2013
Main results Mean effective dose (mSv) in
2010 2011 2012 2013
Plain radiography Top 20
0.33 0.56 0.23 0.29
Fluoroscopy Top 20 9.60 5.23 1.72 1.83
Cardiac angiography 4.83 8.11 6.91 11.02
CT Examinations Top 20
3.20 8.41 9.72 7.66
All Angiography and Interventional radiology
3.00 7.42 9.97 11.46
SUM all X-ray based radiology ex. Dental
0.49 1.16 0.95 1.10
Dental 0.28 0.09 0.02 0.03
SUM all X-ray based radiology 0.46 1.04 0.83 0.95
Table 3 The annual collective effective dose per 1000 inhabitants for all X-ray based radiology with and without
dental radiology
YearSum all X-ray based radiology ex. Dental
radiology
Sum all X-ray based radiology with Dental
radiology2010 1 52.00 1 68.00
2011 548.00 554.00
2012 37 0.00 37 1 .00
2013 43 5.00 437 .00
Annual collective effective dose per 1000 inhabitants (mSv/1000 capita)
4 CONCLUSIONS
Taking into account the new Council Directive 2013/59/EURATOM provisions concerning the medical exposure, it is very important to find the best modalities for improvement of patient dose registering and reporting system. The system still needs improvement, especially in areas such as correct registration of relevant information for assessment of doses received by patients from medical exposures to ionising radiation. It is necessary to continue the training of medical staff and the explanation and awareness of radiation protection principles to the management of institutions with decision-making power regarding the acquisition of new equipments and increasing the number of medical staff in radiology departments. In the same time it is necessary to introduce in all radiological departments compulsory electronic registering of reporting forms in order to avoid introducing additional sources of errors.
REFERENCES
1. "Order of the Health Ministry no. 1542/2006 concerning the registration and reporting patient doses", Official Gazette from Romania, Part I no. 1042/2006
2. "Order of the Health Ministry no. 1003/2008 for approving the use of registration forms and reporting data on medical exposures to ionizing radiation", Official Gazette from Romania, Part I no. 393/2008
3. D. Hart, D.G. Jones, B.F. Wall, "Estimation of effective dose in diagnostic radiology from entrance surface dose and dose area product measurements", Chilton, NRPB-R262, 1994
4. O. Girjoaba, A. Cucu, “Romanian medical exposure to ionizing radiation in 2012”, Radiation Protection Dosimetry, 2015, http://doi.org/10.1093/rpd/ncv105
5. European Commission Report Radiation Protection No 154 "European Guidance on Estimating Population Doses from Medical X-Ray Procedures", Radiation Protection Series, 2008
6. European Commission Report Radiation Protection No 180 "Medical Radiation Exposure of the European Population", Radiation Protection Series, 2014
7. OECD (2012), “Medical technologies: CT scanners and MRI units”, in Health at a Glance: Europe 2012, OECD Publishing. http://dx.doi.org/10.1787/9789264183896-31-en.


AbstCTVmeaWe on swithrevieachportmeain oBasmenmarlineare Thisclinsam
Key w
1. INTR
The mtarget vo(gross tususpectedtarget voprescribeexecutionprocess delivery sentirely ethese uncadd somecriterion treatmenttarget voirradiatiofrequentlythat some
Usualportal iverificatiodigitally rthe treatmof treatmcomparis
1 Univers
tract. The purpV-PTV margiasurements. recorded retr
setup fields inh EPID were iewed and thh patient. Fortal measurem
an dose in PTVoriginal planssed on these mntioned direcrgins are less e enclosing PT
shrunk by 20s shows that
nical cases. Inme confidence
words: PTV m
RODUCTION
main target voolume (CTV) umor volumed for possibleolume is exped dose dun. But there a
of treatmenso we cannot encompassed certainties aree margin arouregarding pret volume in
olume (PTV), on of CTV. By during subse kind portal v
lly this verifiimaging devon images areconstructed ment planning
ment plan makion purposes
QUANTTO CTV-P
Zora
ity Clinic of R
pose of this wn is change
trospectively n all three dircompared wi
he positional er each patientments. The neV were also r
s. measurementtions are 0.8than the gen
TV increases 0.4% in averag
the effort shn that way it
for successfu
argin, treatm
olume in radiowhich inclu
e - GTV) ple disease micpected to receuring radiothare lots of unt preparationbe sure that tby the desire
e of geometricund CTV in oescribed dose.
that way, knis expected
Before the firsequent fractiverifications to
ication is donvices (EPIDare being co
radiograph (Dg system (TPSing. Bone stru
as these st
TIFICATIONPTV MARGI
an Stefanov
Radiotherapy a
work is to ched from defa
the errors inrections. The rith DRR imagerrors in vert new target sew PTV voluecorded. Thes
ts it was foun8 cm, 0.5 cm a
eric ones (whby 7.35% (mege.
hould be madwill be possi
ul outcome.
ment uncertain
otherapy is cludes basic dilus some vo
cro invasions. eive 100% oherapy treatncertainties inn and treatthis volume wed isodose linc origin so we order to fulfil
The newly fonown as plan
to enable prst treatment,ions, it is reqo be done.
ne with elect). These p
ompared withDRR) generat) during the c
uctures are usetructures are
N OF DOSE CIN CHANGE
vski 1, Biljan
and Oncology,
heck the encloault margin
n a number ofregion of pelv
ges of setup firtical, longitustructure was
ume is recordse results wer
nd that sum ofand 0.7 cm rehich are 1 cm iedian 6.05%).
de in order tible in some
nty
linical isease olume This
of the tment n the tment
will be ne. All
must ll this ormed nning
proper , and
quired
tronic portal h the ted by course ed for
best
vimdsth
mthcth(Pisc
dhprDlormw
CONSEQUE MEASURED
na Grozdan
Vodnjanska 1
osure of PTV to the mar
f patients obtvis was considields generateudinal and las formed baseded and the ire compared
of systematic espectively. Bin all directio. With the new
o determine cases to trea
visualized on pmage and
displacement structures. Thihree coordina
In this womagnitude of the generic CT
clinic. This is nhat process o3). Simply, in
PTV with a cers changed f
calculated from
2. METHODS
We chooseduring the perhave endured patients their reviewed andDisplacement ongitudinal
recorded. All meaning that which are pos
ENCES DUE D WITH EPI
novska 1
17, 1000 Skopj
with a certargin calculat
tained with pdered and pored from the Tteral directio
ed on the marisodose valuewith the resp
and random Because all neons) the valuew margins th
the real CTVat smaller tar
portal imagesthe DRR wof the PTV
is displacemeates.
ork we have the setup erroTV-PTV margnot to establis
one should foln this work wertain isodose lfrom default m the portal m
S
e plans for 30 riod June – Otreatments in
portal images displacemenerrors of setu(y-axis) andsetup fields we make two
sitioned 90 d
ID
je, Macedonia
ain isodose linted from the
portal measurortal images oTPS. 30 patienon were recorrgins calculates for minim
pective isodos
errors for thewly found C
e of minimumhe values of t
V-PTV marginrget volume w
s. Comparisonwill show tV with regaent can be qu
made effortors and to corgins we alreadsh new marginllow different e compare theline if the CTV
margin to measurements.
0 patients whiOctober, 2014in pelvic regios for the first nt errors weup fields in lad vertical (
we take areo setup fields
degrees agains
a
ne if the e portal
rements obtained nts were rded for ted from
mum and se values
he above CTV-PTV
m isodose the PTVs
ns in all with the
n of the portalthe eventualard to bonyantified in all
ts to presentrrelate it withdy use in ourns because for
methodologye enclosure ofV-PTV margin
the margin.
ch we treated4. All patientson. For thesefraction were
ere recorded.ateral (x-axis),z-axis) weree orthogonal,s for the planst each other.
l l y l
t h r r y f
n n
d s e e . , e ,
n .
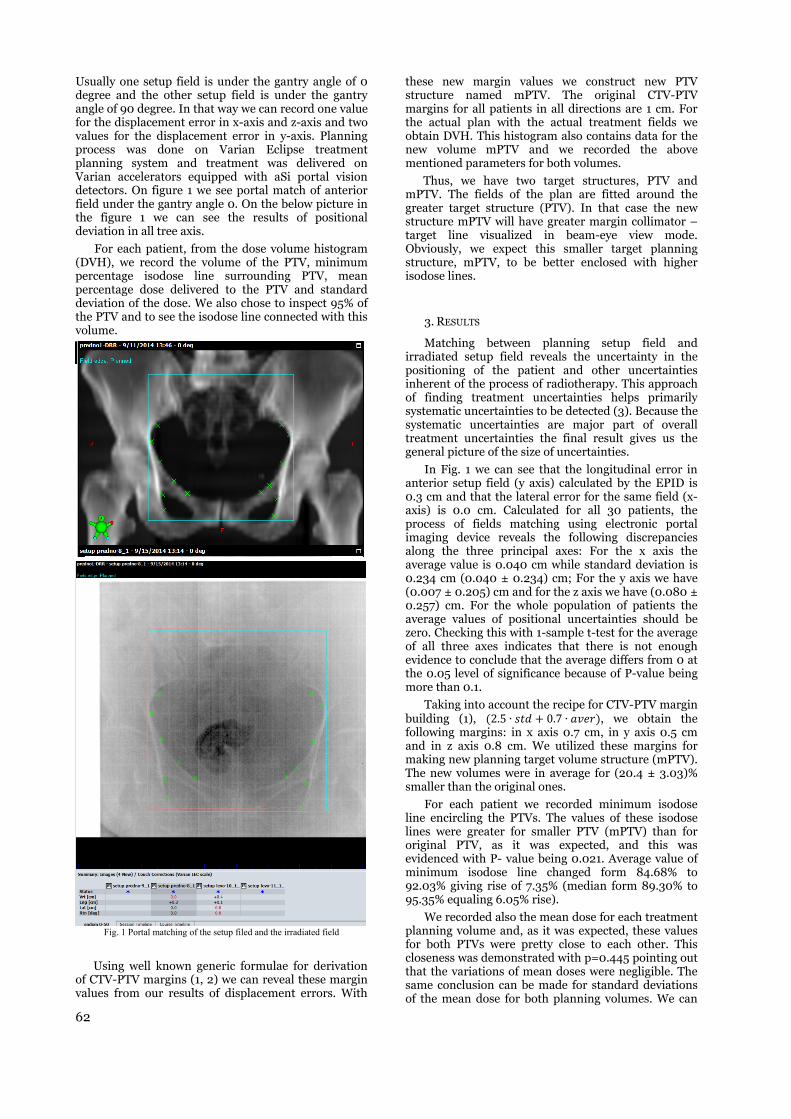
62
Usually one setup field is under the gantry angle of 0 degree and the other setup field is under the gantry angle of 90 degree. In that way we can record one value for the displacement error in x-axis and z-axis and two values for the displacement error in y-axis. Planning process was done on Varian Eclipse treatment planning system and treatment was delivered on Varian accelerators equipped with aSi portal vision detectors. On figure 1 we see portal match of anterior field under the gantry angle 0. On the below picture in the figure 1 we can see the results of positional deviation in all tree axis.
For each patient, from the dose volume histogram (DVH), we record the volume of the PTV, minimum percentage isodose line surrounding PTV, mean percentage dose delivered to the PTV and standard deviation of the dose. We also chose to inspect 95% of the PTV and to see the isodose line connected with this volume.
Fig. 1 Portal matching of the setup filed and the irradiated field
Using well known generic formulae for derivation of CTV-PTV margins (1, 2) we can reveal these margin values from our results of displacement errors. With
these new margin values we construct new PTV structure named mPTV. The original CTV-PTV margins for all patients in all directions are 1 cm. For the actual plan with the actual treatment fields we obtain DVH. This histogram also contains data for the new volume mPTV and we recorded the above mentioned parameters for both volumes.
Thus, we have two target structures, PTV and mPTV. The fields of the plan are fitted around the greater target structure (PTV). In that case the new structure mPTV will have greater margin collimator – target line visualized in beam-eye view mode. Obviously, we expect this smaller target planning structure, mPTV, to be better enclosed with higher isodose lines.
3. RESULTS
Matching between planning setup field and irradiated setup field reveals the uncertainty in the positioning of the patient and other uncertainties inherent of the process of radiotherapy. This approach of finding treatment uncertainties helps primarily systematic uncertainties to be detected (3). Because the systematic uncertainties are major part of overall treatment uncertainties the final result gives us the general picture of the size of uncertainties.
In Fig. 1 we can see that the longitudinal error in anterior setup field (y axis) calculated by the EPID is 0.3 cm and that the lateral error for the same field (x-axis) is 0.0 cm. Calculated for all 30 patients, the process of fields matching using electronic portal imaging device reveals the following discrepancies along the three principal axes: For the x axis the average value is 0.040 cm while standard deviation is 0.234 cm (0.040 ± 0.234) cm; For the y axis we have (0.007 ± 0.205) cm and for the z axis we have (0.080 ± 0.257) cm. For the whole population of patients the average values of positional uncertainties should be zero. Checking this with 1-sample t-test for the average of all three axes indicates that there is not enough evidence to conclude that the average differs from 0 at the 0.05 level of significance because of P-value being more than 0.1.
Taking into account the recipe for CTV-PTV margin building (1), (2.5 ∙ + 0.7 ∙ ), we obtain the following margins: in x axis 0.7 cm, in y axis 0.5 cm and in z axis 0.8 cm. We utilized these margins for making new planning target volume structure (mPTV). The new volumes were in average for (20.4 ± 3.03)% smaller than the original ones.
For each patient we recorded minimum isodose line encircling the PTVs. The values of these isodose lines were greater for smaller PTV (mPTV) than for original PTV, as it was expected, and this was evidenced with P- value being 0.021. Average value of minimum isodose line changed form 84.68% to 92.03% giving rise of 7.35% (median form 89.30% to 95.35% equaling 6.05% rise).
We recorded also the mean dose for each treatment planning volume and, as it was expected, these values for both PTVs were pretty close to each other. This closeness was demonstrated with p=0.445 pointing out that the variations of mean doses were negligible. The same conclusion can be made for standard deviations of the mean dose for both planning volumes. We can

63
observe that there is not enough evidence to conclude that the means of standard deviations differ at the 0.05 level of significance.
We decided to look for the values of isodose lines which encompass 95% of the planning target volume. The mean value of the line for the PTV structure was 98.22% while the mean value of the line for the mPTV structure was 98.93%. Using t statistics we can conclude that the mean of isodose lines enclosing 95% of the original PTV is significantly different from the mean of isodose lines enclosing 95% of the new-formed mPTV giving P-value equal to 0.035.
4. DISCUSSION
Every radiotherapy center has its own charac-teristics. Treatment and simulation equipment in one center can differ from similar centers. Also, simulation and treatment protocols can differ between centers. All these differences give wide specter of uncertainties in the final stage of radiotherapy treatment delivery. These uncertainties should be included in defining margin values between clinical target volumes and planning target volumes. Taking generic values from literature can sometimes be inadequate. For that reason every radiotherapy center should determine magnitudes of CTV-PTV margins for its own characteristic conditions. Our retrospective review shows that using generic margin values leads towards possible usage of bigger treatment volumes than is necessary. Despite the fact that minimal isodose line enclosing planning target volume raises dramatically (7.35%) it has negligible effect on mean target dose. Investigation of isodose lines encompassing 95% of target volumes shows that these differences are primarily because some actual plans receive unusual low minimal dose. That was in volumes which were close to the surface of the body. It should be stressed that for the purpose of determination of these margins a designed study in our clinic should be performed (3) in which in a systematic way we can determine the real CTV – PTV margins.
REFERENCES
1. Joep C. Stroom, Hans C. J. de Boer, Henk Huizenga, Andries G. Visser, "Inclusion of geometrical uncertainties in radiotherapy treatment planning by means of coverage probability”, Int. J. Radiation Oncology Biol. Phys., Vol. 43, No. 4, pp. 905–919, 1999.
2. Marcel van Hrk, Peter Remeijer, Coen Rasch and Joos V. Lebesque, “The probability of correct target dosage: dose-population histograms for deriving treatment margins in radiotherapy”, Int. J. Radiation Oncology Biol. Phys., Vol. 47, No. 4, pp. 1121–1135, 2000.
3. The Royal College of Radiologists, Society and College of Radiographers, Institute of Physics and Engineering in Medicine. On target: ensuring geometric accuracy in radiotherapy. London: The Royal College of Radiologists, 2008.

HIGH-DOSE RATE (HDR) IR-192 BRACHYTHERAPY APPLICATION OF BASAL CELL CARCINOMA
Borko Basaric, Borislava Petrovic, Milan Teodorovic, Milutin Baucal, Laza Rutonjski, Ozren Cudic, Branislav Djuran, Milana Mitric - Askovic
Oncology Institute of Vojvodina, Novi Sad, Serbia
Abstract:
Objectives: High dose rate (HDR) surface (skin) brachytherapy uses Iridium-192 source and places it in close proximity to the target lesion using a remote afterloader and delivers it precisely on specified depth from specialized catheters or applicators that are applied to the target tissue. HDR brachytherapy performs direct radiation dose delivery to the surface with rapid falloff thereby sparing deeper healthy tissues. The treatment is painless and noninvasive and may also result in less tissue destruction and scarring in sensitive facial areas such as the nose, ear, lip etc. Because of it’s localized effect and possible hypofractination, the overall treatment time is significantly less than external beam radiotherapy, with faster recovery times than invasive techniques.
Methods: Conformable custom moulds are often used for irregular surfaces like the ear or nose. In this case, custom moulds were constructed from thermoplastic material. Treatment catheters were fixed to the material, providing a custom fit to the treatment target. A great care was taken to ensure that the catheters met the afterloader’s minimum turn radius so that the source wire (Ir-192) could easily move through catheters. Treatment times were optimized in treatment planning system using Brachyvision software from Varian. Doses ranging from 45 - 50Gy in 10-15 fractions (5 times a week) were prescribed to 15 patients with basal cell carcinoma. Prescribed doses were delivered 5-10 mm in depth. An additional lead eye plaques were placed under thermoplastic mask for radiation protection where needed.
Results: 15 patients with basal cell carcinoma (15 lesions) were treated with 50 Gy (in 10 fractions) or45 Gy (in 15 fractions) during the period 2009-2015. All lesions resolved with treatment and there have been no recurrences reported to date.
Conclusions: With excellent local control rates, cosmetic out-comes, and minimal long-term toxicities, HDR brachytherapy with surface applicators should be considered to be among the first options for treatment of basal-cell-carcinoma patients.
Key words: brachytherapy, Iridium-192, high-dose rate, skin applications, basal cell carcinoma
1. HIGH-DOSE RATE BRACHYTHERAPY USING IR-192
Brachytherapy, also known as internal
radiotherapy, sealed source radiotherapy, curietherapy is a form of radiotherapy where a radiation source is placed inside or next to the area requiring treatment. Brachytherapy is commonly used as an effective treatment for cervical, prostate, breast, and skin cancer and can also be used to treat tumors in many other body sites. HDR brachytherapy performs direct radiation dose delivery to the surface with rapid falloff thereby sparing deeper healthy tissues. A key feature of brachytherapy is that the irradiation affects only a very localized area around the radiation sources. Exposure to radiation of healthy tissues farther away from the
sources is therefore reduced. In addition, if the patient moves or if there is any movement of the tumor within the body during treatment, the radiation sources retain their correct position in relation to the tumor. These characteristics of brachytherapy provide advantages over External Beam Radiotherapy (EBRT) - the tumor can be treated with very high doses of localized radiation whilst reducing the probability of unnecessary damage to surrounding healthy tissues.[1]
1.1. High-dose rate brachytherapy skin applications
HDR brachytherapy for nonmelanomatous skin
cancer, such as basal cell carcinoma and squamous cell carcinoma, provides an alternative treatment option to surgery. This is especially relevant for cancers on the

66
nose, ears, eyelids or lips, where surgery may cause disfigurement or require extensive reconstruction. Various applicators can be used to ensure close contact between the radiation source(s) and the skin, which conform to the curvature of the skin and help ensure precision delivery of the optimal irradiation dose.[1]
Brachytherapy for skin cancer provides good cosmetic results and clinical efficacy; studies with up to 5 years follow-up have shown that brachytherapy is highly effective in terms local control, and is comparable to EBRT.[2,3,4] Treatment times are typically short, providing convenience for patients.[5] It has been suggested that brachytherapy may become a standard of treatment for skin cancer in the near future.[5]High-dose rate (HDR) surface (skin) brachytherapy uses Iridium-192 source and places it in close proximity to the target lesion using a remote afterloader and delivers the dose precisely on specified depth from specialized catheters or applicators that are applied to the target tissue. These plastic applicators are embedded in thermoplastic mask so that they cannot move in any direction as shown in figure 1. Applicators are connected to afterloader through tube guidelines where every applicator must meet a specific demand in length (catheter-applicator length plus guideline length must equal 1300 mm which is the length of source wire in Varian GammaMed Plus afterloaders) Figure 2. Dwell times are optimized in treatment planning system (Varian Brachyvision) and the patient is being irradiated.
2. METHODS
Conformable custom moulds (masks) are often used for irregular surfaces like the ear or nose. In this case, custom mould was constructed from thermoplastic material. Treatment catheters were fixed to the material, providing a custom fit to the treatment target. A great care was taken to ensure that the catheters met the afterloader’s minimum turn radius so that the source wire (Ir-192) could easily move through catheters. Also one of the potential errors would occur if we used metal wire to fixate the catheters to the mask. Our experience has shown that metal wires could press and disfigure plastic catheters thus disabling wire source to move through the catheter. Instead we used a fine thread to attach them resulting a source wire to go through catheter without interruptions. Catheters were separated roughly 1 cm from each other and marked 1 to n, n being the number of catheters mounted to the mould. Varian offers two types of surface applicators: one with the source axis perpendicular to the skin (available only for GammaMed plus™), and one with the source axis parallel to the skin (available for VariSource™ and GammaMedplus). Both are offered with an assortment of inset sizes to accommodate a range of lesion sizes. A thermoplastic sheet or the Universal Clamping Device, GM11008700, can be used to hold the surface applicator next to the skin. However, considering the financial circumstances of the hospital and the fact that brachytherapy skin applications are rare, we chose
to use the custom moulds and catheters. Therefore, air-kerma strength (or reference air kerma rate) were not measured.
Fig. 1 Thermoplastic mask with plastic applicators – catheters attached to the mask with fine thread
Fig. 2 Guidelines connecting catheters and afterloader
2.1. Treatment planning system- TPS
Treatment times were optimized in treatment planning system using Brachyvision software from Varian. The first step in planning was to get radiographs (PA - posteroanterior and LAT - lateral) and that was done with a Philips C-arm. Then radiographs were imported to TPS and applicators were reconstructed on separate images (PA and LAT) as shown in figure 3.

67
Fig. 3 Reconstructed applicators (LAT) in
Brachyvision Applicators were reconstructed in TPS and the
geometry of the treatment was set. Reference lines were put 5-10 mm in depth beneath each applicator and the dwell times were optimized so that the prescribed dose was delivered at the desired depth. An additional lead eye plaques were placed under thermoplastic mask for radiation protection where needed.
Fig. 4 Planning windows in Brachyvision
A uniform distribution of dose was achieved across the area of interest. Isodose lines can be seen in planning windows in Brachyvision in three planes. See Figure 4. Also a 3D presentation of isodose volume was obtained as shown in figure 5.
Fig. 5 3D presentation – isodose volume
Overall the brachytherapy plan for skin applications consists of plan report sheet where the basic information about the treatment can be found (for example: dose prescription, dwell times in every position etc.), isodose profile (Figure 6) and DVH (Dose-Volume Histogram).
Fig. 6 Isodose profile
Due to its localized nature, the treatment time is significantly less than external beam radiotherapy, with faster recovery times than invasive techniques. A course of therapy is accelerated and hypofractionated (3-5 Gy per treatment at Oncology Institute of Vojvodina or more according to reference [7]) Table 1.

68
Table 1 Doses used in skin BT applications
Total Dose (Gy) # Fractions Dose per fractions
45 15 3
50 10 5
40 10 4 [7]
40 8 5 [7]
42 6 7 [7]
However the delivered dose might be significantly different from the planned (dose is overestimated by the treatment plan) dose due to the fact that the algorithm used by the BrachyVision software was the TG-43U1 (AAPM tg-43 and tg-84 reports). In fact, the TG-43U1 algorithm works in the hypothesis of infinite and homogenous medium which is not the case given in the reported study. Recommendations for improving the estimation of the dose include placement of some bolus material over the catheters to reproduce the conditions of the TG-43 algorithm or the quantification of a possible reduction of the delivered dose due to the particular irradiation set-up.
3. RESULTS
15 patients with basal cell carcinoma (15 lesions) were treated with 50 Gy (in 10 fractions) or 45 Gy (in 15 fractions), 5 days a week, during the period 2009-2015 at the Oncology Institute of Vojvodina. All lesions resolved with treatment and there have been no recurrences reported to date. All patients tolerated the treatment without significant toxicities. All patients had a cosmesis rating of good or excellent.
4. CONCLUSIONS
With excellent local control rates, cosmetic out-comes, and minimal long-term toxicities, HDR brachytherapy with surface applicators should be considered to be among the first options for treatment of basal-cell-carcinoma patients. The use of HDR brachytherapy with custom-made external moulds permits one to obtain a uniform dose distribution with a sharp gradient in the edges of the applicator. The custom-made moulds are easily used and permit a highly accurate daily treatment reproduction. This method allows accurate and repeatable positioning of the radiation carrier to facilitate therapy. Carriers that will be worn for extended periods must be carefully constructed to provide maximal patient comfort and to ensure, at the same time, correct dose delivery to the treatment area and reproducibility of the treatment at repeated sessions. They enable one to obtain excellent local control with minimum treatment-related sequelae or late complications. The treatment is pain-free and noninvasive and therefore does not require
needles, cutting, or sutures. This is a distinct advantage especially for elderly patients with comorbidities such as diabetes, peripheral vascular disease or if they are on blood-thinners, where surgery is relatively contraindicated due to challenges in wound healing.[7] Given the excellent results, HDR brachytherapy with external custom-made moulds is a reasonable alternative to other radiation therapy techniques for the treatment of skin carcinoma as of the head and face.[6]
REFERENCES
1. Gerbaulet, Alain; Pötter, Richard; Mazeron, Jean-Jacques; Meertens, Harm; Limbergen, Erik Van, eds. (2002). The GEC ESTRO handbook of brachytherapy. Leuven, Belgium: European Society for Therapeutic Radiology and Oncology. ISBN 978-90-804532-6-5.
2. Guix; Finestres, F.; Tello, J.; Palma, C.; Martinez, A.; Guix, J.; Guix, R. (2000). "Treatment of skin carcinomas of the face by high-dose-rate brachytherapy and custom-made surface molds". International journal of radiation oncology, biology, physics 47 (1): 95–102.doi:10.1016/S0360-3016(99)00547-7. PMID 10758310
3. Sedda, A. F.; Rossi, G.; Cipriani, C.; Carrozzo, A. M.; Donati, P. (2008). "Dermatological high-dose-rate brachytherapy for the treatment of basal and squamous cell carcinoma". Clinical and Experimental Dermatology 33 (6): 745–749. doi:10.1111/j.1365-2230.2008.02852.x. PMID 18681873K. Elissa, "Title of paper if known", unpublished.
4. Rio, E.; Bardet, E.; Ferron, C.; Peuvrel, P.; Supiot, S.; Campion, L.; Beauvillain De Montreuil, C.; Mahe, M.; Dreno, B. (2005). "Interstitial brachytherapy of periorificial skin carcinomas of the face: A retrospective study of 97 cases". International Journal of Radiation OncologyBiologyPhysics 63 (3): 753–757. doi:10.1016/j.ijrobp.2005.03.027. PMID 15927410
5. Musmacher J et al. (2006). "High dose rate brachytherapy with surface applicators: Treatment for nonmelanomatous skin cancer". Journal of Clinical Oncology 24: 15543.W. A. Sabin, The Gregg Reference Manual, 6th ed., Gregg Division, McGraw-Hill, New York, 1985.
6. Bahadir Ersu - Custom Made Mold Brachytherapy - Hacettepe University Department of Prosthodontics, Ankara, Turkey
7. www.varian.com https://www.varian.com/sites/default/files/resource_attachments/Brachytherapy_Skin_HDR_Clinical_Perspectives_0_0.pdf
8. Ajay Bhatnagar - Nonmelanoma skin cancer treated with electronic brachytherapy: Results at 1 year (2013) (Department of Radiation Oncology, School of Medicine, University of Pittsburgh, Pittsburgh, PA
and Cancer Treatment Services Arizona, Casa Grande, AZ)
MEASUREMENT OF CHARGED PARTICLE YIELDS FROM THERAPEUTIC BEAMS IN VIEW OF THE DESIGN OF AN INNOVATIVE HADRONTHERAPY DOSE MONITOR
G. Battistoni 1, F. Collamati 2, F. Collini 3, E. De Lucia 4, M. Durante 5, R. Faccini 2,6, F. Ferroni 2,6, M.P. Frallicciardi 1,7, C. La Tessa 5, M. Marafini 1,7, I. Mattei 1, S. Morganti 2, R. Paramatti 2, V. Patera 2,8, L. Piersanti 4,8, D. Pinci 2, A. Russomando 2,6,10, A. Rucinski 2, A. Sarti 4,8, C. Schuy 5, A. Sciubba 2,8, M. Senzacqua 2,6, E. Solfaroli Camillocci 10, M. Toppi 4, G. Traini 2,6, M. Vanstalle 59, C. Voena 2
1 INFN – Sezione di Milano, Milan, Italy 2 INFN – Sezione di Roma, Rome, Italy
3 INFN – Sezione di Pisa, Pisa, Italy 4 INFN – Laboratori Nazionali di Frascati, Rome, Italy
5 GSI, Darmstadt, Germany 6 Dipartimento di Fisica La Sapienza, Rome, Italy
7 Museo Storico della Fisica e Centro Studi e Ricerche “E. Fermi”, Rome, Italy 8 Dipartimento di Scienze di Base e Applicate per l’Ingegneria, La Sapienza, Rome, Italy
9 IPHC - Universitè de Strasbourg, CNRS, Strasbourg, France 10 Center for Life Nano Science@Sapienza, Istituto Italiano di Tecnologia, Roma, Italy.
Abstract. Particle Therapy (PT) is an emerging technique that makes use of charged particles to efficiently treat different kinds of solid tumors. Hadrons dose deposition have a maximum at the end of their path in matter, Brag Peak; this requires an accurate monitor of the positioning of the dose deposition in the patient to overcome the risk of under-dosage of the cancer region or of over-dosage of healthy tissues. Several range and dose monitoring techniques are currently being developed and are based on the detection of secondary particles produced by the beam interaction into the target. In particular: charged particles, result of target and/or projectile fragmentation, prompt photons coming from nucleus de-excitation and back-to-back γs, produced in the β+ annihilation from β+ emitters created in the beam interaction with the target. It has been showed that the hadron beam dose release peak can be spatially correlated with the emission pattern of these secondary particles. Here we report about of secondary particles production measurements (charged fragments and prompt γs) performed at different beams and energies: 12C beam of 80 MeV/u at LNS, 12C beam 220 MeV/u at GSI, and 12C, 4He, 16O beams with energy in the 50 - 300 MeV/u range at HIT. Finally, a project for a multimodal range and dose-monitor device exploiting the prompt photons and charged particles emission will be presented.
Key words: particle therapy, range monitoring
1. INTRODUCTION
Particle Therapy (PT) is an emerging technique [1,2,3] alternative to conventional radiotherapy (RT), which makes use of charged particles, usually protons and carbon ions, to treat different kinds of solid tumors. Charged particles most attractive feature of, with respect to the X-rays exploited in RT treatments, is their dose profile, showing the highest dose release at the end of their path inside the patient’s body, in a region called Bragg Peak (BP). Moreover carbon ions are characterized by higher LET values in the Bragg peak position with respect to X-rays and are thus more
efficient in killing radio-resistant tumors, with a higher Relative Biological Effectiveness (RBE).
Due to the ballistic precision of PT, the treatment is extremely sensitive to anatomical changes and patient mispositioning, with related risk of under-dosage of the cancer region or over-dosage of the healthy tissues. The stringent requirements on the PT dose deposition position control are calling for the development of an high precision on line monitor.
Monitoring techniques are currently being developed and are based on the detection of particles produced by the beam interaction into the target, in particular: charged particles, originating from the projectile and target fragmentation, prompt photons from nucleus de-excitation and pairs of back-to-back
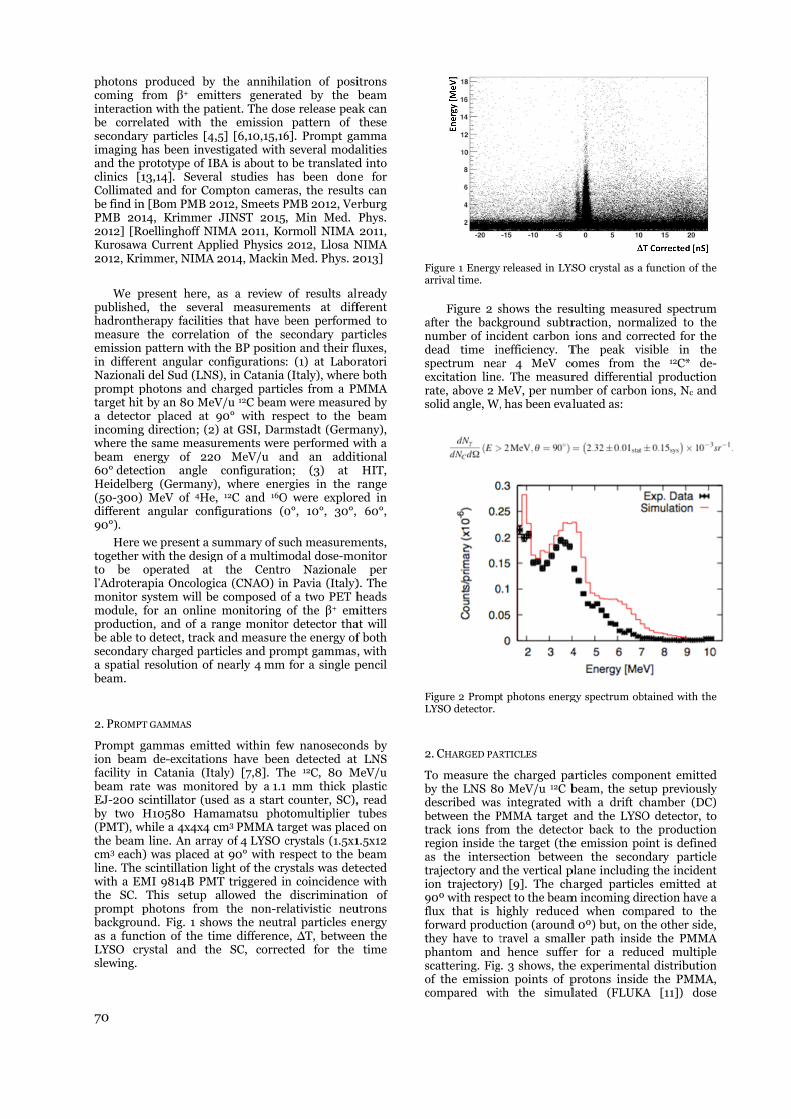
70
photons coming finteractiobe corresecondaryimaging hand the pclinics [1Collimatebe find inPMB 2012012] [RoKurosawa2012, Kri
We ppublishedhadronthmeasure emission in differeNazionaliprompt ptarget hita detectoincomingwhere thebeam en60° detecHeidelber(50-300) different 90°).
Here wtogether wto be l’Adroteramonitor smodule, productiobe able tosecondarya spatial beam.
2. PROMPT
Prompt gion beamfacility inbeam ratEJ-200 sby two H(PMT), wthe beamcm3 each)line. The with a EMthe SC. prompt pbackgrouas a funcLYSO crslewing.
produced byfrom β+ emi
on with the palated with ty particles [4has been inve
prototype of IB13,14]. Severaed and for Con [Bom PMB 214, Krimmer oellinghoff NIa Current Appmmer, NIMA
present here, d, the severaherapy facilitie
the correlatipattern with
ent angular coi del Sud (LNSphotons and ct by an 80 MeVor placed at g direction; (2e same measunergy of 220ction angle rg (Germany)
MeV of 4Heangular conf
we present a swith the desigoperated at apia Oncologisystem will befor an online
on, and of a ro detect, tracky charged parresolution of
T GAMMAS
gammas emittm de-excitation Catania (Itte was monitscintillator (usH10580 Ham
while a 4x4x4 cm line. An arra
) was placed ascintillation l
MI 9814B PMThis setup
photons fromnd. Fig. 1 sho
ction of the tirystal and th
y the annihilaitters generat
atient. The doshe emission ,5] [6,10,15,16
estigated with BA is about toal studies ha
ompton camer2012, Smeets P
JINST 2015IMA 2011, Koplied Physics 2014, Mackin
as a review al measuremes that have bion of the sethe BP positioonfigurationsS), in Catania charged particV/u 12C beam90° with res) at GSI, Darm
urements were0 MeV/u an
configuration), where ener
e, 12C and 16Ofigurations (0
summary of sugn of a multim
the Centroica (CNAO) ine composed oe monitoring range monitork and measurerticles and pro
nearly 4 mm
ted within fewons have beenaly) [7,8]. Th
tored by a 1.1 sed as a start mamatsu phocm3 PMMA taay of 4 LYSO cat 90° with relight of the cry
MT triggered inallowed the
m the non-reows the neutrime difference
he SC, correc
ation of posited by the bse release pea
pattern of 6]. Prompt ga
several modao be translatedas been doneras, the resultPMB 2012, Ver, Min Med.
ormoll NIMA 2012, Llosa N
n Med. Phys. 2
of results alrments at diff
been performecondary paron and their fl: (1) at Labor(Italy), where
cles from a PM were measur
spect to the bmstadt (Germe performed wnd an additn; (3) at rgies in the r
O were explor0°, 10°, 30°,
uch measuremmodal dose-mo
o Nazionale n Pavia (Italy)of a two PET h
of the β+ emr detector tha
e the energy ofompt gammas,
for a single p
w nanosecondn detected at he 12C, 80 M
mm thick pcounter, SC),tomultiplier
arget was placecrystals (1.5x1espect to the bystals was detn coincidencediscriminatio
elativistic neural particles ene, ΔT, betweected for the
itrons beam
ak can these
amma alities d into e for
ts can rburg Phys. 2011,
NIMA 2013]
ready ferent
med to rticles luxes, ratori
e both MMA
red by beam
many), with a tional HIT,
range red in
60°,
ments, onitor
per ). The heads
mitters at will f both , with pencil
ds by LNS
MeV/u plastic , read tubes ed on
1.5x12 beam
tected e with on of utrons nergy
en the time
Fa
andsers
FL
2
Tbdbtratio9flfothpsoc
Figure 1 Energy arrival time.
Figure 2 safter the backnumber of incdead time inspectrum neaexcitation linerate, above 2 Msolid angle, W,
Figure 2 PromptLYSO detector.
2. CHARGED PAR
To measure thby the LNS 80described wasbetween the Prack ions fro
region inside tas the interserajectory and on trajectory)
90º with respeflux that is hforward produhey have to t
phantom and scattering. Figof the emissiocompared wit
released in LYS
shows the reskground subtrcident carbon nefficiency. Tar 4 MeV coe. The measurMeV, per num, has been eval
t photons energ
RTICLES
he charged pa0 MeV/u 12C bs integrated wPMMA target m the detectothe target (theection betweethe vertical p
) [9]. The chect to the beamhighly reduceduction (aroundtravel a small
hence suffe. 3 shows, the
on points of pth the simul
YSO crystal as a
sulting measuraction, normions and corr
The peak viomes from red differenti
mber of carbonaluated as:
gy spectrum ob
articles compobeam, the setwith a drift cand the LYSOor back to the emission poen the secon
plane includinharged particlm incoming did when com
d 0º) but, on tler path insid
er for a redue experimentaprotons insidelated (FLUKA
function of the
ured spectrummalized to the
rected for theisible in thethe 12C* de-al production
n ions, Nc and
btained with the
onent emittedtup previouslychamber (DC)O detector, tohe productionoint is definedndary particleg the incidentes emitted atrection have a
mpared to thethe other side,de the PMMAuced multipleal distributione the PMMA,A [11]) dose
e
m e e e -n d
e
d y ) o n d e t t a e ,
A e n , e
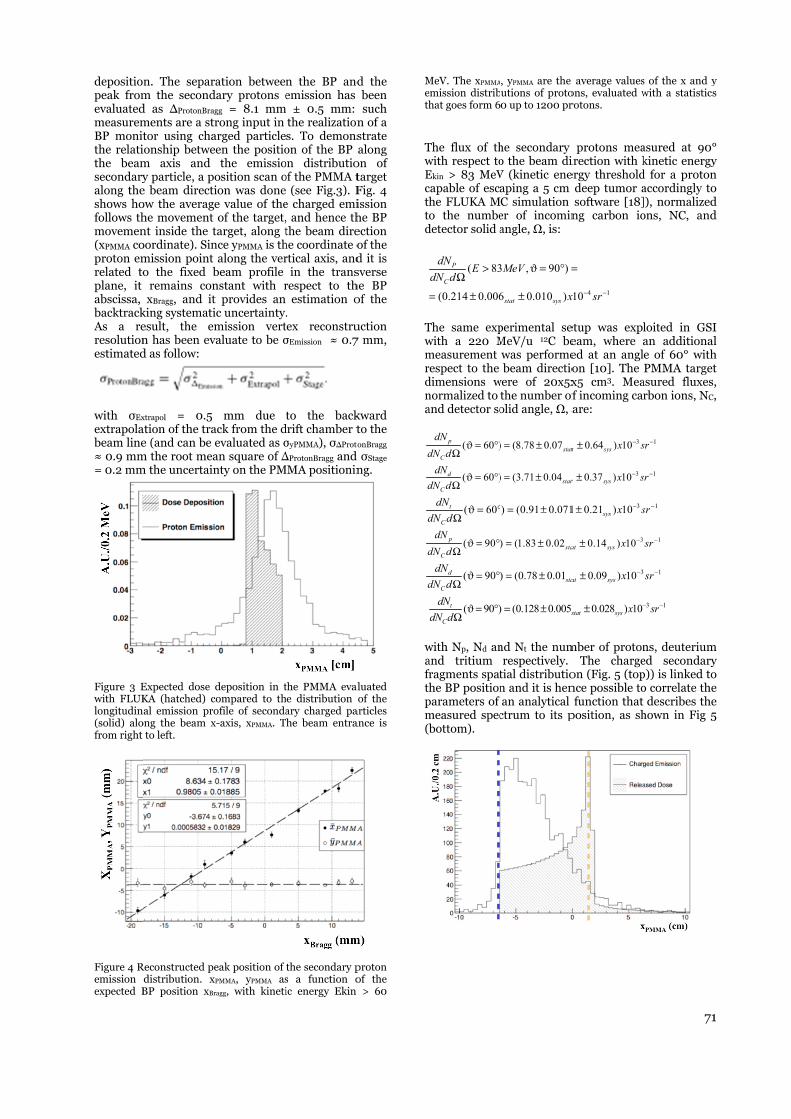
depositiopeak fromevaluatedmeasuremBP monitthe relatithe beamsecondaryalong theshows hofollows thmovemen(xPMMA coproton emrelated toplane, it abscissa, backtrackAs a reresolutionestimated
with σEx
extrapolabeam line≈ 0.9 mm= 0.2 mm
Figure 3 Ewith FLUKlongitudin(solid) alofrom right
Figure 4 Remission expected B
n. The separm the secondd as ΔProtonBrag
ments are a sttor using chaionship betwem axis and y particle, a p
e beam directiow the averaghe movement nt inside the toordinate). Sinmission point o the fixed b
remains conxBragg, and it
king systematiesult, the emn has been evd as follow:
xtrapol = 0.5 ation of the trae (and can be
m the root meam the uncertain
Expected dose KA (hatched) c
nal emission proong the beam x
to left.
Reconstructed pedistribution. xBP position xBr
ration betweendary protons e
gg = 8.1 mmrong input in
arged particleeen the positio
the emissioosition scan oion was donee value of theof the target,
target, along tnce yPMMA is th
along the verbeam profile nstant with rt provides an ic uncertainty.mission vert
valuate to be σ
mm due ack from the devaluated as σan square of Δnty on the PM
deposition in tcompared to thofile of seconda
x-axis, xPMMA. T
eak position of xPMMA, yPMMA as
ragg, with kineti
n the BP andemission has ± 0.5 mm: the realizations. To demonson of the BP
on distributioof the PMMA t
(see Fig.3). Fe charged emi, and hence ththe beam dire
he coordinate ortical axis, and
in the transrespect to th
estimation o. tex reconstruσEmission ≈ 0.7
to the backdrift chamber tσyPMMA), σΔProto
ΔProtonBragg and MMA positionin
the PMMA evalhe distribution ary charged pahe beam entra
the secondary ps a function oic energy Ekin
d the been such
n of a strate along
on of target Fig. 4 ission he BP ection of the d it is sverse he BP of the
uction 7 mm,
kward to the onBragg σStage ng.
luated of the
articles ance is
proton of the
> 60
Meth
TwEcthtd
Twmrdna
d
d
d
d
d
wafrthpm(b
MeV. The xPMMA
emission distribhat goes form 6
The flux of thwith respect toEkin > 83 MeVcapable of escahe FLUKA Mo the numbe
detector solid a
The same expwith a 220 Mmeasurement respect to the dimensions wnormalized to and detector so
( 60 )p
C
dNdN d
ϑ = °Ω
( 60 )d
C
dNdN d
ϑ = °Ω
( 60t
C
dNdN d
ϑ = °Ω
( 90 )p
C
dNdN d
ϑ = °Ω
( 90 )d
C
dNdN d
ϑ = °Ω
with Np, Nd anand tritium fragments spathe BP position
parameters of measured specbottom).
( 83
(0.214 0.006
P
C
dN EdN d
>Ω
= ±
( 90 )t
C
dNdN d
ϑ = °Ω
A, yPMMA are the utions of proto0 up to 1200 pr
he secondary o the beam diV (kinetic eneaping a 5 cm C simulation er of incominangle, Ω, is:
perimental seMeV/u 12C bewas performebeam directio
were of 20x5xthe number ofolid angle, Ω, a
) (8.78 0.07stat= ±
) (3.71 0.04stat= ±
) (0.91 0.071= ±
) (1.83 0.02sta= ±
) (0.78 0.01sta= ±
nd Nt the numrespectively.
tial distribution and it is henan analytical
ctrum to its p
3 , 90 )
6 0.010 )stat sys
MeV
x
ϑ = ° =
±
) (0.128 0.005s= ±
average valuesons, evaluated wrotons.
protons meairection with kergy threshold
deep tumor asoftware [18]
ng carbon io
etup was expleam, where aed at an anglon [10]. The x5 cm3. Meaf incoming carare:
30.64 ) 10t sys x s−±
30.37 ) 10t sys x s−±
31 0.21 ) 10sys x s−±
30.14 ) 10at sys x −±
30.09 ) 10at sys x −±
mber of protonThe charge
on (Fig. 5 (topnce possible tofunction that
position, as sh
4 110x sr− −
=
0.028 ) 10stat sys x −±
71
s of the x and ywith a statistics
asured at 90°kinetic energy
d for a protonaccordingly to]), normalizedons, NC, and
loited in GSIan additionale of 60° withPMMA target
asured fluxes,rbon ions, NC,
1sr−
1sr−
1sr−
1sr −
1sr−
ns, deuteriumed secondaryp)) is linked too correlate the
describes thehown in Fig 5
3 1sr− −
1
y s
° y n o d d
I l
h t , ,
m y o e e 5
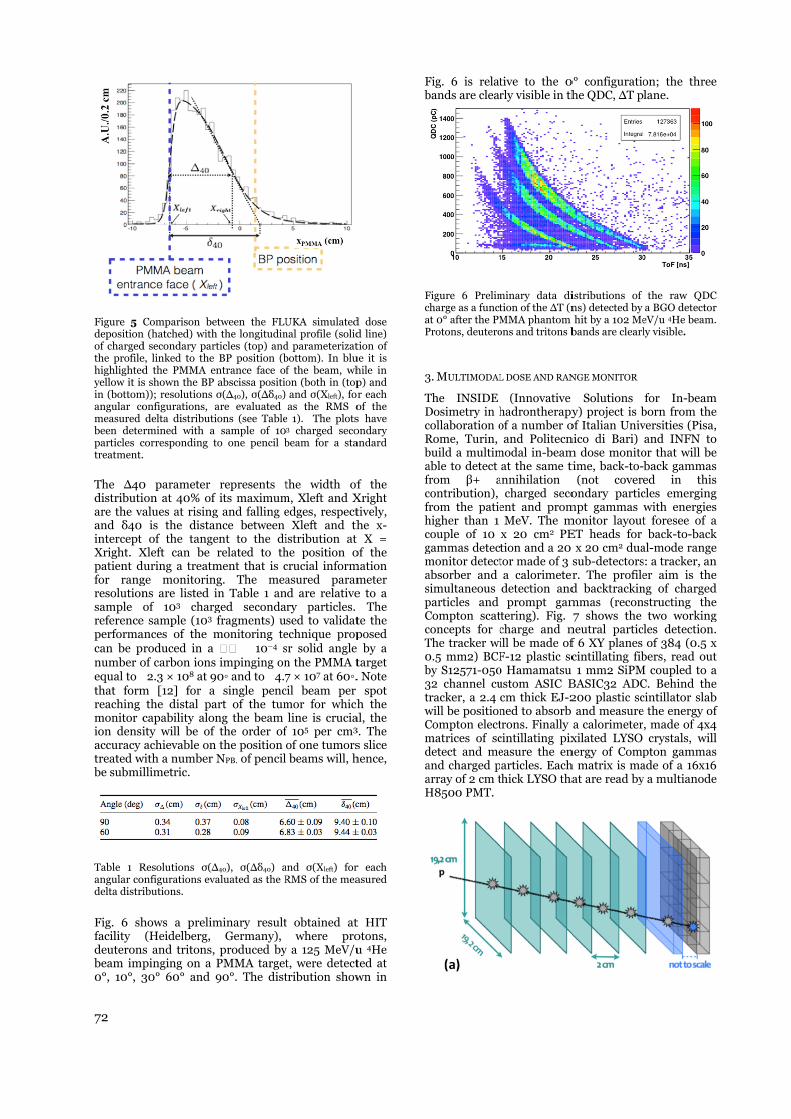
72
Figure 5 depositionof chargedthe profilehighlightedyellow it isin (bottomangular comeasured been deterparticles ctreatment.
The Δ40distributiare the vaand δ40 intercept Xright. Xpatient dfor rangresolutionsample referenceperformacan be pnumber oequal to �that formreaching monitor cion densiaccuracy treated wbe submil
Table 1 Rangular codelta distri
Fig. 6 shfacility deuteronsbeam imp0°, 10°, 3
Comparison ben (hatched) withd secondary pare, linked to the d the PMMA es shown the BP
m)); resolutions onfigurations, delta distributirmined with a
corresponding t.
0 parameter ion at 40% ofalues at rising
is the distaof the tange
Xleft can be during a treatmge monitorinns are listed iof 103 charg
e sample (103 ances of the mroduced in a
of carbon ions�2.3 × 10⁸ at 9m [12] for a
the distal pacapability aloity will be of achievable on
with a number llimetric.
Resolutions σ(Δonfigurations evibutions.
hows a prelim(Heidelberg, s and tritons,pinging on a 30° 60° and
etween the FLUh the longitudinrticles (top) and
BP position (bentrance face of
abscissa positioσ(Δ40), σ(Δδ40) are evaluated ions (see Table
a sample of 10to one pencil b
represents tf its maximumg and falling e
ance between ent to the direlated to th
ment that is cng. The meain Table 1 anged secondafragments) u
monitoring te�� � 10−4 s
s impinging on90◦ and to �4.7a single pencart of the tumng the beam
f the order ofn the position
NPB. of pencil
Δ40), σ(Δδ40) avaluated as the R
minary resultGermany),
produced byPMMA target90°. The dist
UKA simulatednal profile (solidd parameterizatbottom). In bluf the beam, whon (both in (topand σ(Xleft), foras the RMS o
e 1). The plots3 charged secobeam for a sta
the width ofm, Xleft and Xedges, respect
Xleft and thistribution at he position ocrucial informasured param
nd are relativery particles. sed to validat
echnique propsr solid angle n the PMMA t7 × 107 at 60◦.
cil beam per mor for whichline is crucia
f 105 per cm3
of one tumorsbeams will, h
and σ(Xleft) forRMS of the mea
t obtained atwhere pro
y a 125 MeV/ut, were detecttribution show
d dose d line) tion of
ue it is hile in p) and r each of the s have ondary andard
f the Xright tively, he x-
X = of the
mation meter e to a
The te the posed by a target . Note
spot h the
al, the 3. The s slice hence,
r each asured
t HIT otons, u 4He ted at wn in
Fb
FcaP
3
TDcRbafrcfrhcgmaspCcT0b3twCmdaaH
Fig. 6 is relatbands are clear
Figure 6 Prelimcharge as a functat 0° after the PMProtons, deutero
3. MULTIMODAL
The INSIDE Dosimetry in hcollaboration oRome, Turin, build a multimable to detect from β+ acontribution), from the patiehigher than 1 couple of 10 gammas detectmonitor detectabsorber and simultaneous particles and Compton scatconcepts for cThe tracker wi0.5 mm2) BCFby S12571-05032 channel curacker, a 2.4
will be positionCompton electmatrices of scdetect and meand charged parray of 2 cm tH8500 PMT.
tive to the 0rly visible in th
minary data dition of the ΔT (nMMA phantom ons and tritons b
L DOSE AND RAN
(Innovative hadrontherapyof a number o
and Politecnmodal in-beam
at the same tannihilation
charged secoent and promMeV. The m
x 20 cm2 PEtion and a 20 tor made of 3 sa calorimeterdetection andprompt gam
tering). Fig. charge and nill be made ofF-12 plastic sc
0 Hamamatsu ustom ASIC Bcm thick EJ-2ned to absorb trons. Finally cintillating pixeasure the enarticles. Each
thick LYSO tha
0° configuratiohe QDC, ΔT p
istributions of ns) detected by hit by a 102 Me
bands are clearl
NGE MONITOR
Solutions y) project is b
of Italian Univnico di Bari) m dose monitotime, back-to-
(not covereondary partic
mpt gammas monitor layoutET heads for x 20 cm2 duasub-detectorsr. The profiled backtrackinmmas (recon7 shows the
neutral particf 6 XY planes cintillating fib
u 1 mm2 SiPMBASIC32 ADC200 plastic sc and measurea calorimeterxilated LYSO
nergy of Comph matrix is maat are read by
on; the threelane.
the raw QDCa BGO detector
eV/u 4He beam.ly visible.
for In-beamborn from theversities (Pisa,and INFN to
or that will beback gammased in thiscles emergingwith energiest foresee of a
back-to-backal-mode ranges: a tracker, aner aim is the
ng of chargedstructing thetwo working
les detection.of 384 (0.5 x
bers, read outM coupled to aC. Behind thecintillator slabe the energy of, made of 4x4crystals, will
pton gammasade of a 16x16y a multianode
e
C r .
m e ,
o e s s g s a k e n e d e g .
x t a e b f 4 l s 6 e

Figure 7 Wretrieve eprotons) (a The profihardwareFLUKA Msecondarycontributmonitor tested at C
4. DISCUS
Quality cnew devichere the composeddetector charged pevents frowe perfoemission the seconby the thphantommeasuremand physpatial rethe charevaluatedat the detwith a nudivided brange.
AcknowAgreemenfor the da
REFER
1. O. JMed
2. M. Dradi
3. U. Acarb
4. E. Teby mInstr
Working principenergy informaa) and prompt g
iler geometrice technology hMC simulationy particles mtion were impis nowadays CNAO center.
SION AND CONC
control in haces for on-line
feasibility std of two PET
thought to particle trackom prompt gormed a set
points distribndary chargedherapeutic be. An accurate
ments results ysical detectoesolution to lorged particle d less than 4 mtection of the
umber NPB. of pby √NPB., thu
wledgement: nt n0 228436
ata taking at t
RENCES
akel et al, The d. Phys. 35, 5653Durante and Jiation oncology,Amaldi and G. Kbon ions, 2005 Resta et al., Dose
means of promptrum. Meth. B 26
ple of the detecation on charggammas (b).
cal layout and have been optn of a PT treat
measurements plemented. Th
under constru.
CLUSION
adrontherapy e dose monitotudy of a mT heads andoperate sim
er and to recammas. To d
t of measurebution and e
d and neutral eam interactie MC simulati
has optimizer parameterscalize the BP
spatial resomm for one peposition of a tpencil beams, us achieving t
We acknow6 of the FP7 Ethe HIT facilit
future of heav3; J.S. Loeffler, C, 2010 Nat. RevKraft, RadiotheRep. Prog. Physe Profile monitot-gamma measu67, 993;
ctor for trackinge particles (m
the corresponimized using tment in whic
presented ine multimodaluction and w
treatments nring. We prese
multi-modal ded a range momultaneously construct Comevelop this prements of ynergy spectruparticles prodng with a PMion based on ed the geomes. The achieposition, relatolution has encil beam. Aitumor slice trthis result mu
the sub-millim
wledge the GEuropean Progty.
vy ion therapy,
Charged partic. Clin. Oncol. 7, erapy with bea. 68, Vol.8 ring with carbo
urements, 2009
ng and mainly
nding a full
ch the n this l dose
will be
needs ented evice, onitor as a
mpton roject
yields, um of duced MMA
such etrical evable ted to been
iming reated ust by meter
Grant gram
2008
cles in 37;
ams of
on ions 9 Nucl.
5. K. Parodi radioactiviMed. Biol.
6. C. Agodi eof b+ emirradiationMeth. B an
7. C. Agodi etemission fdoi: 10.108
8. C. Agodi 10.1088/17
9. C. Agodi, PMMA irrPhys. Me9155/57/1
10. L. Piersanfrom PMMPhys. Me9155/59/7
11. G. Battistobenchmark
12. M. Krameheavy-iondose optimvol. 45, no
13. E.Testa et73 MeV/u measuremhttp://dx.d
14. Min APL 215. P. Henriq
for carbonPMB, Volu4669(15)
16. K.Gwosch10.1088/0
et al., In-beamity induced by47, 21;
et al., Study of thmitters from 8n on PMMA, 201nd arXiv:1202.1t al., Precise me
for carbon ion t88/1748-0221/7et al., Errata,
748-0221/8/11/Charged parti
radiated by 80 Med. Biol. 57, 8/5667;
nti, MeasuremenMA irradiated bd. Biol. 59(7):
7/1857; oni et al., The Fking AIP Conf. P
er, O. Jakel et radiotherapy:
mization” Phys. 11, p. 3299, 20al. “ Monitorincarbon ions by
ments” Appl. Phdoi.org/10.10632006
quet, et al “ Inten ion therapy mume 57, Numbe
h et al,”“ PMB 20031-9155/58/11
am PET measuy proton beam
he time and spa80 MeV/u carb12 submitted to
1676v1; easurements of therapy, 2012 J7/03/P03001; , 2013 JINST8/E11002; icle’s flux meaMeV/u carbon i
5667, doi;
nts of charged by 220 MeV/u 1:1857-72, doi;
FLUKA code: dProc. 896 31-49al., “Treatmen
: physical beasics in Medicin000. ng the Bragg py means of promhys. Lett. 93, 03/1.2975841
eraction vertexmonitoring: a fea
er 14, 21 July 2
2013 Jun 7;58(11/3755.
73
urements of β+ms, 2002 Phys.
ace distributionbon ion beam
o Nucl. Instrum.
f prompt photonJINST7, P03001
8, E11002 doi:
surement fromion beam, 201210.1088/0031-
particles yield12C beam, 201410.1088/0031-
description and9 nt planning foram model andne and Biology,
peak location ofmpt gamma ray093506 (2008);
x imaging (IVI)asibility study“2012, pp. 4655-
1):3755-73. doi:
3
+ .
n m
.
n 1
:
m 2 -
d 4 -
d
r d ,
f y ;
)
-
:

EFFECTIVENESS OF EPITHERMAL NEUTRON BEAM AND GAMMA RADIATION SHIELDING FOR BORON NEUTRON CAPTURE THERAPY
S M. Rabochová, M. Vinš, L. Viererbl, Z. Lahodová, V Klupák, J. Šoltés
Research Centre Rez Ltd., Husinec-Rez 130
Abstract. The biological effects of different boron compounds in the Boron Neutron Capture Therapy (BNCT) research are usually tested on small animals. In the case of LVR-15 research reactor (Rez, Czech Republic), the biological effect is studied on 6-days old sewer rats. Regrettably, delivered to very short time after the end of irradiation, probably as a result of high radiation dose which was received by a whole body. Therefore, special protective casks were designed to reduce unnecessary radiation (mainly from gamma and neutrons). These protective cylinders preserve the body of a rat while leaving its head unshielded. Two construction materials were considered – boron (in the form of boron carbide) and cadmium. This work is aimed at finding the more suitable material by measuring the radiation dose due to each individual component. The efficiency of the neutron and gamma shielding was measured by activation foils and thermo luminescent detectors respectively. As a result, boron carbide was found to be a better choice due to its ability to absorb neutrons without production of high energy gamma radiation. Key words: Boron neutron capture therapy, activation foils, thermoluminiscent detectors, reaction rate.
1. INTRODUCTION
Boron Neutron Capture Therapy (BNCT) is one of the few methods for a treatment of the most severe brain tumors (e.g. Glioblastoma multiforme).
Unfortunately, its usability is still limited by several drawbacks. The main problem is to find a suitable chemical compound, which would deposit selectively inside cancer cells and would not be toxic for healthy tissue. The research reactor LVR-15 (Rez, Czech Republic) participates in this field of research. It is a pool type light water reactor with forced cooling and maximum thermal power 10 MW. The reactor is equipped with the special facility for BNCT research, which consists of a horizontal beam of epithermal neutrons, an irradiation room with accessories, and a beam operation room. The beam is moderated by fluorine, aluminum, lead, and lithium (6Li) filters and moderators. Neutron fluence rate values can reach 6.5 x 108 cm-2s-1 (epithermal neutron flux), 3.8 x 10⁷
cm-2s-1 (thermal neutron flux), and 5.5 x 107 cm-2s-1 (fast neutron flux – in case with a special configuration of reactor core). The BNCT facility has been operated since 1997 and five patients were even irradiated in term of a clinical study between years 2000 - 2003. At present, basic research is still perform which is aimed at studying the uptake of different boron chemical compounds in the body or brain cells. Information about absorption of boron compound in the body is important for correct determination of therapeutic dose.
The biological effects of different boron compounds (respective their distribution in brain) are tested on the
6-days old sewer rats. At first, they are injected by the studied compound and then they are fixed in a polyethylene (PE) holder and irradiated at the BNCT epithermal beam. The irradiation usually takes 5 – 7.5 minutes. When the animals are still alive after irradiation then they are euthanized 8 hours – 3 days later. The samples of their brains and intestines are taken for consequential analysis. Also, the delay between the irradiation end and death of rat is important for experiment evaluation. Unfortunately, irradiated sewer rats usually died a very short time after the end of irradiation, probably as a result of high radiation dose delivered to whole body. Therefore, special protective casks were designed to reduce the unnecessary radiation (mainly from the gamma and neutrons). These protective casks should preserve the body of a rat while leaving its head unshielded. Two construction materials were considered – boron (in the form of boron carbide) and cadmium (Figure 1). In this contribution, both materials were tested by measuring the attenuation of neutron and gamma fields due to the presence of the casks.
Figure 1 Rats inside the cadmium protection casks and polyethylene holder.
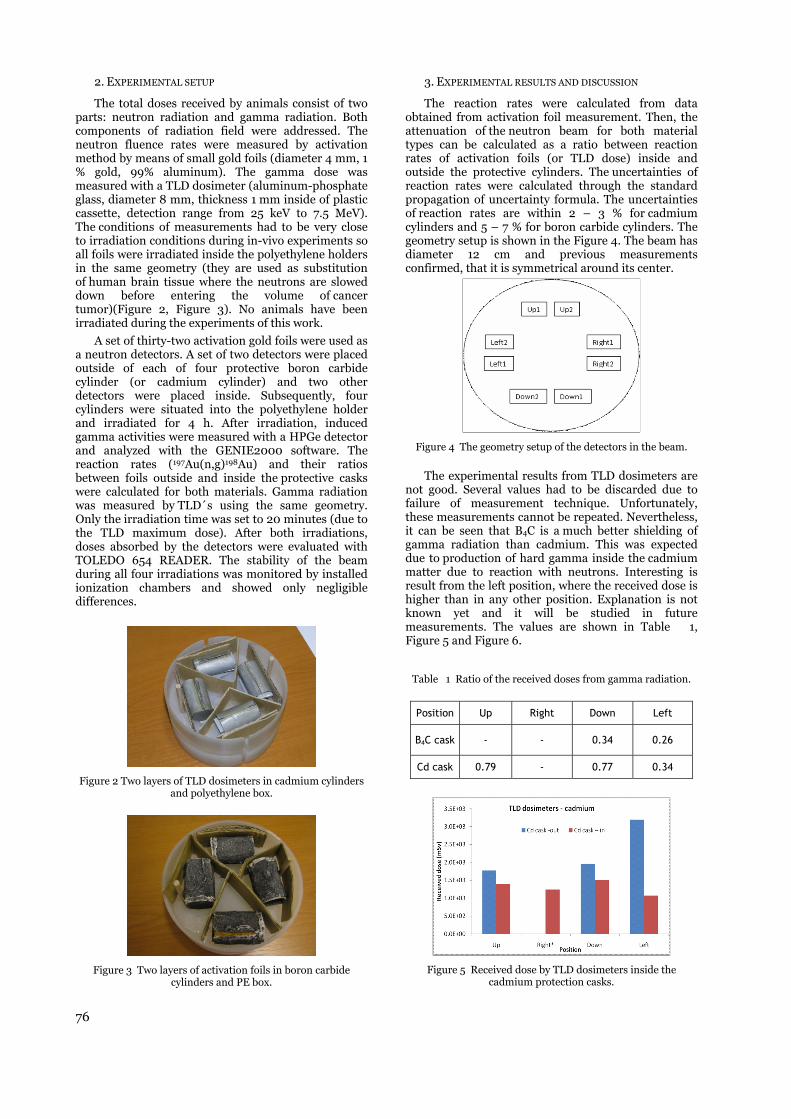
76
2. EXPERIMENTAL SETUP
The total doses received by animals consist of two parts: neutron radiation and gamma radiation. Both components of radiation field were addressed. The neutron fluence rates were measured by activation method by means of small gold foils (diameter 4 mm, 1 % gold, 99% aluminum). The gamma dose was measured with a TLD dosimeter (aluminum-phosphate glass, diameter 8 mm, thickness 1 mm inside of plastic cassette, detection range from 25 keV to 7.5 MeV). The conditions of measurements had to be very close to irradiation conditions during in-vivo experiments so all foils were irradiated inside the polyethylene holders in the same geometry (they are used as substitution of human brain tissue where the neutrons are slowed down before entering the volume of cancer tumor)(Figure 2, Figure 3). No animals have been irradiated during the experiments of this work.
A set of thirty-two activation gold foils were used as a neutron detectors. A set of two detectors were placed outside of each of four protective boron carbide cylinder (or cadmium cylinder) and two other detectors were placed inside. Subsequently, four cylinders were situated into the polyethylene holder and irradiated for 4 h. After irradiation, induced gamma activities were measured with a HPGe detector and analyzed with the GENIE2000 software. The reaction rates (197Au(n,g)198Au) and their ratios between foils outside and inside the protective casks were calculated for both materials. Gamma radiation was measured by TLD´s using the same geometry. Only the irradiation time was set to 20 minutes (due to the TLD maximum dose). After both irradiations, doses absorbed by the detectors were evaluated with TOLEDO 654 READER. The stability of the beam during all four irradiations was monitored by installed ionization chambers and showed only negligible differences.
Figure 2 Two layers of TLD dosimeters in cadmium cylinders
and polyethylene box.
Figure 3 Two layers of activation foils in boron carbide
cylinders and PE box.
3. EXPERIMENTAL RESULTS AND DISCUSSION
The reaction rates were calculated from data obtained from activation foil measurement. Then, the attenuation of the neutron beam for both material types can be calculated as a ratio between reaction rates of activation foils (or TLD dose) inside and outside the protective cylinders. The uncertainties of reaction rates were calculated through the standard propagation of uncertainty formula. The uncertainties of reaction rates are within 2 – 3 % for cadmium cylinders and 5 – 7 % for boron carbide cylinders. The geometry setup is shown in the Figure 4. The beam has diameter 12 cm and previous measurements confirmed, that it is symmetrical around its center.
Figure 4 The geometry setup of the detectors in the beam.
The experimental results from TLD dosimeters are not good. Several values had to be discarded due to failure of measurement technique. Unfortunately, these measurements cannot be repeated. Nevertheless, it can be seen that B4C is a much better shielding of gamma radiation than cadmium. This was expected due to production of hard gamma inside the cadmium matter due to reaction with neutrons. Interesting is result from the left position, where the received dose is higher than in any other position. Explanation is not known yet and it will be studied in future measurements. The values are shown in Table 1, Figure 5 and Figure 6.
Table 1 Ratio of the received doses from gamma radiation.
Position Up Right Down Left
B4C cask - - 0.34 0.26
Cd cask 0.79 - 0.77 0.34
Figure 5 Received dose by TLD dosimeters inside the
cadmium protection casks.

77
Figure 6 Received dose by TLD dosimeters inside the B4C
casks.
Results of activation foils are shown in Table 2 and the corresponding graphs are shown on the Figure 7 and Figure 8. It is evident that B4C is a better neutron shielding than cadmium because within the shielding the neutron flux decreases to 90% of the non-shielded neutron flux while the B4C decreased neutrons to 75 %.
Table 2 Ratio of reaction rates
Positions Up1 Up2 Right
1 Right
2 Down
1 Down
2 Left1 Left2
Cd cask 0.88 0.92 0.98 0.90 0.91 0.91 0.92 0.82
B4C cask 0.85 0.73 0.72 0.58 0.75 0.75 0.76 0.76
Figure 7 Reaction rates of activation foils inside the cadmium
protection casks.
Figure 8 Reaction rates of activation foils inside the boron
carbide protection casks.
4. CONCLUSION
Measurements clearly showed that the protection casks from B4C are better for following in-vivo experiments than cadmium (although some problems were found during measurements). Of course, shielding ability depends strongly on thickness of shielding material (the casks from B4C in this work had got a higher thickness than from cadmium). Nevertheless, there are quite strict space limitations for the size of the protective casks given by small dimension of the polyethylene holder. And boron carbide showed better results for a thin layer of shielding materials. Especially, the reduction of gamma dose is important and much better than in case of cadmium. This fact was more or less expected as quite hard gamma radiation is produced during the neutron capture in cadmium.
The availability of a highly efficient shielding (such as boron carbide) is a very important matter for in-vivo BNCT experiments with small animals.
Protection casks have already been used in in-vivo experiments and their utilization was successful as all irradiated rats survived the irradiation process. This demonstrates that the use of the protection casks we presented here, constitute an important improvement respect to our previous irradiation procedure. And they will be used during next BNCT measurements at the LVR-15 research reactor. Also, other material will be considered and tested in future work.
Acknowledgement: This work has been
supported by the SUSEN Project CZ.1.05/2.1.00/03.0108 realized in the framework of the European Regional
Development Fund (ERDF).
REFERENCES
1. Burian J., Gambarini G., Marek M. et al.: “Biological effects of the LVR-15 epithermal neutron beam”, In Advances in Neutron Capture Therapy 2006. Proceeding of Internacional Society for Neutron Caputre Therapy (ICNCT). ICNCT-12. Nakagawa
2. Burian J.: “Neutron beam of the LVR-15 reactor for medical and biological purposes”, Comisión Nacional de Energía Atómica, CNEA, 2010. Proceeding of Internacional Society for Neutron Caputre Therapy (ICNCT). ICNCT-14. Argentina G. Eason, B. Noble and I. N. Sneddon, "On certain integrals of Lipschitz-Hankel type involving products of Bessel functions", Phil. Trans. Roy. Soc. London, vol. A247, pp. 529-551, April 1955.

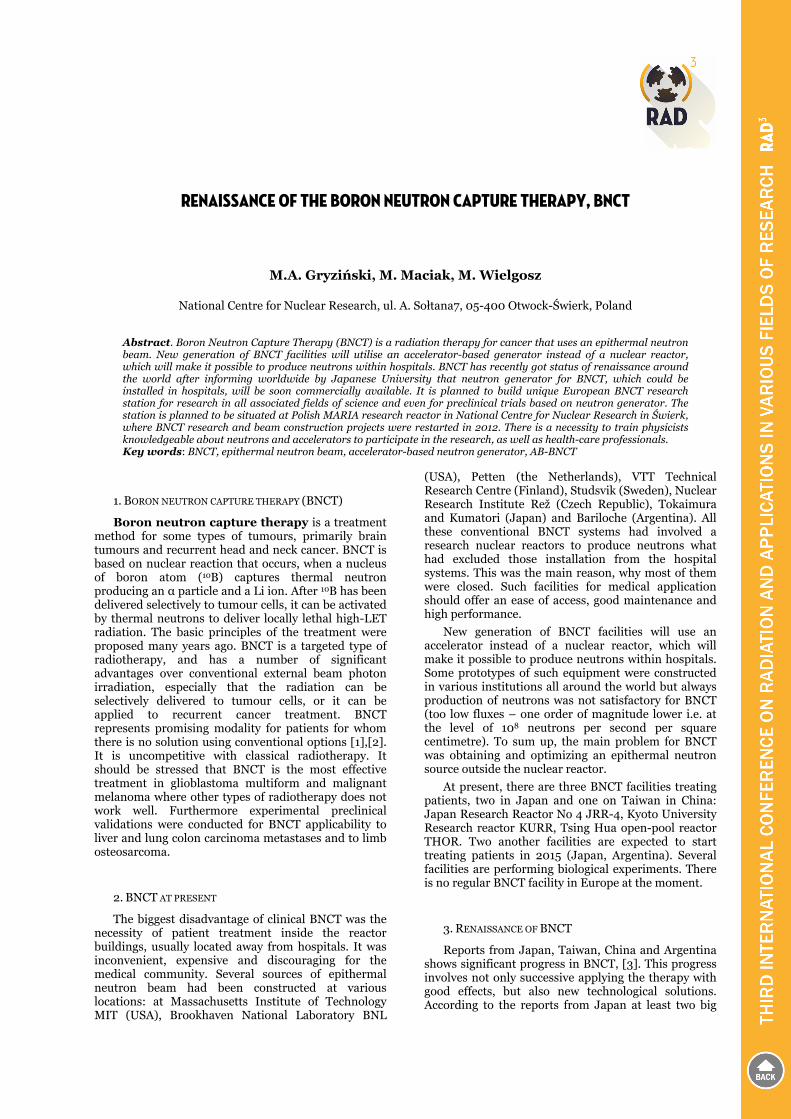
RENAISSANCE OF THE BORON NEUTRON CAPTURE THERAPY, BNCT
M.A. Gryziński, M. Maciak, M. Wielgosz
National Centre for Nuclear Research, ul. A. Sołtana7, 05-400 Otwock-Świerk, Poland
Abstract. Boron Neutron Capture Therapy (BNCT) is a radiation therapy for cancer that uses an epithermal neutron beam. New generation of BNCT facilities will utilise an accelerator-based generator instead of a nuclear reactor, which will make it possible to produce neutrons within hospitals. BNCT has recently got status of renaissance around the world after informing worldwide by Japanese University that neutron generator for BNCT, which could be installed in hospitals, will be soon commercially available. It is planned to build unique European BNCT research station for research in all associated fields of science and even for preclinical trials based on neutron generator. The station is planned to be situated at Polish MARIA research reactor in National Centre for Nuclear Research in Świerk, where BNCT research and beam construction projects were restarted in 2012. There is a necessity to train physicists knowledgeable about neutrons and accelerators to participate in the research, as well as health-care professionals. Key words: BNCT, epithermal neutron beam, accelerator-based neutron generator, AB-BNCT
1. BORON NEUTRON CAPTURE THERAPY (BNCT)
Boron neutron capture therapy is a treatment method for some types of tumours, primarily brain tumours and recurrent head and neck cancer. BNCT is based on nuclear reaction that occurs, when a nucleus of boron atom (10B) captures thermal neutron producing an α particle and a Li ion. After 10B has been delivered selectively to tumour cells, it can be activated by thermal neutrons to deliver locally lethal high-LET radiation. The basic principles of the treatment were proposed many years ago. BNCT is a targeted type of radiotherapy, and has a number of significant advantages over conventional external beam photon irradiation, especially that the radiation can be selectively delivered to tumour cells, or it can be applied to recurrent cancer treatment. BNCT represents promising modality for patients for whom there is no solution using conventional options [1],[2]. It is uncompetitive with classical radiotherapy. It should be stressed that BNCT is the most effective treatment in glioblastoma multiform and malignant melanoma where other types of radiotherapy does not work well. Furthermore experimental preclinical validations were conducted for BNCT applicability to liver and lung colon carcinoma metastases and to limb osteosarcoma.
2. BNCT AT PRESENT
The biggest disadvantage of clinical BNCT was the necessity of patient treatment inside the reactor buildings, usually located away from hospitals. It was inconvenient, expensive and discouraging for the medical community. Several sources of epithermal neutron beam had been constructed at various locations: at Massachusetts Institute of Technology MIT (USA), Brookhaven National Laboratory BNL
(USA), Petten (the Netherlands), VTT Technical Research Centre (Finland), Studsvik (Sweden), Nuclear Research Institute Rež (Czech Republic), Tokaimura and Kumatori (Japan) and Bariloche (Argentina). All these conventional BNCT systems had involved a research nuclear reactors to produce neutrons what had excluded those installation from the hospital systems. This was the main reason, why most of them were closed. Such facilities for medical application should offer an ease of access, good maintenance and high performance.
New generation of BNCT facilities will use an accelerator instead of a nuclear reactor, which will make it possible to produce neutrons within hospitals. Some prototypes of such equipment were constructed in various institutions all around the world but always production of neutrons was not satisfactory for BNCT (too low fluxes – one order of magnitude lower i.e. at the level of 108 neutrons per second per square centimetre). To sum up, the main problem for BNCT was obtaining and optimizing an epithermal neutron source outside the nuclear reactor.
At present, there are three BNCT facilities treating patients, two in Japan and one on Taiwan in China: Japan Research Reactor No 4 JRR-4, Kyoto University Research reactor KURR, Tsing Hua open-pool reactor THOR. Two another facilities are expected to start treating patients in 2015 (Japan, Argentina). Several facilities are performing biological experiments. There is no regular BNCT facility in Europe at the moment.
3. RENAISSANCE OF BNCT
Reports from Japan, Taiwan, China and Argentina shows significant progress in BNCT, [3]. This progress involves not only successive applying the therapy with good effects, but also new technological solutions. According to the reports from Japan at least two big
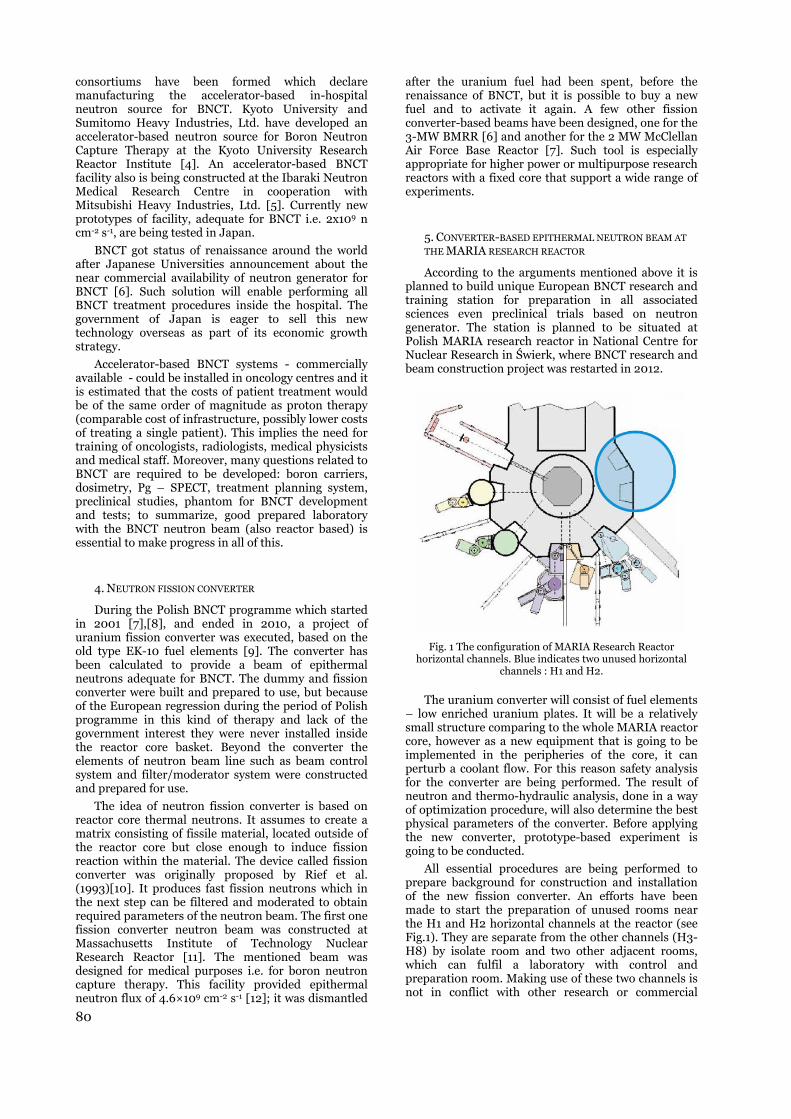
80
consortiums have been formed which declare manufacturing the accelerator-based in-hospital neutron source for BNCT. Kyoto University and Sumitomo Heavy Industries, Ltd. have developed an accelerator-based neutron source for Boron Neutron Capture Therapy at the Kyoto University Research Reactor Institute [4]. An accelerator-based BNCT facility also is being constructed at the Ibaraki Neutron Medical Research Centre in cooperation with Mitsubishi Heavy Industries, Ltd. [5]. Currently new prototypes of facility, adequate for BNCT i.e. 2x10⁹ n cm-2 s-1, are being tested in Japan.
BNCT got status of renaissance around the world after Japanese Universities announcement about the near commercial availability of neutron generator for BNCT [6]. Such solution will enable performing all BNCT treatment procedures inside the hospital. The government of Japan is eager to sell this new technology overseas as part of its economic growth strategy.
Accelerator-based BNCT systems - commercially available - could be installed in oncology centres and it is estimated that the costs of patient treatment would be of the same order of magnitude as proton therapy (comparable cost of infrastructure, possibly lower costs of treating a single patient). This implies the need for training of oncologists, radiologists, medical physicists and medical staff. Moreover, many questions related to BNCT are required to be developed: boron carriers, dosimetry, Pg – SPECT, treatment planning system, preclinical studies, phantom for BNCT development and tests; to summarize, good prepared laboratory with the BNCT neutron beam (also reactor based) is essential to make progress in all of this.
4. NEUTRON FISSION CONVERTER
During the Polish BNCT programme which started in 2001 [7],[8], and ended in 2010, a project of uranium fission converter was executed, based on the old type EK-10 fuel elements [9]. The converter has been calculated to provide a beam of epithermal neutrons adequate for BNCT. The dummy and fission converter were built and prepared to use, but because of the European regression during the period of Polish programme in this kind of therapy and lack of the government interest they were never installed inside the reactor core basket. Beyond the converter the elements of neutron beam line such as beam control system and filter/moderator system were constructed and prepared for use.
The idea of neutron fission converter is based on reactor core thermal neutrons. It assumes to create a matrix consisting of fissile material, located outside of the reactor core but close enough to induce fission reaction within the material. The device called fission converter was originally proposed by Rief et al. (1993)[10]. It produces fast fission neutrons which in the next step can be filtered and moderated to obtain required parameters of the neutron beam. The first one fission converter neutron beam was constructed at Massachusetts Institute of Technology Nuclear Research Reactor [11]. The mentioned beam was designed for medical purposes i.e. for boron neutron capture therapy. This facility provided epithermal neutron flux of 4.6×109 cm-2 s-1 [12]; it was dismantled
after the uranium fuel had been spent, before the renaissance of BNCT, but it is possible to buy a new fuel and to activate it again. A few other fission converter-based beams have been designed, one for the 3-MW BMRR [6] and another for the 2 MW McClellan Air Force Base Reactor [7]. Such tool is especially appropriate for higher power or multipurpose research reactors with a fixed core that support a wide range of experiments.
5. CONVERTER-BASED EPITHERMAL NEUTRON BEAM AT
THE MARIA RESEARCH REACTOR
According to the arguments mentioned above it is planned to build unique European BNCT research and training station for preparation in all associated sciences even preclinical trials based on neutron generator. The station is planned to be situated at Polish MARIA research reactor in National Centre for Nuclear Research in Świerk, where BNCT research and beam construction project was restarted in 2012.
Fig. 1 The configuration of MARIA Research Reactor
horizontal channels. Blue indicates two unused horizontal channels : H1 and H2.
The uranium converter will consist of fuel elements – low enriched uranium plates. It will be a relatively small structure comparing to the whole MARIA reactor core, however as a new equipment that is going to be implemented in the peripheries of the core, it can perturb a coolant flow. For this reason safety analysis for the converter are being performed. The result of neutron and thermo-hydraulic analysis, done in a way of optimization procedure, will also determine the best physical parameters of the converter. Before applying the new converter, prototype-based experiment is going to be conducted.
All essential procedures are being performed to prepare background for construction and installation of the new fission converter. An efforts have been made to start the preparation of unused rooms near the H1 and H2 horizontal channels at the reactor (see Fig.1). They are separate from the other channels (H3-H8) by isolate room and two other adjacent rooms, which can fulfil a laboratory with control and preparation room. Making use of these two channels is not in conflict with other research or commercial

81
employing channels. They can work simultaneously, moreover commercial channels covers the cost of reactor working. All this factors makes the maintenance costs of epithermal neutron beam minimized.
The only one multipurpose European epithermal research and training station will be unique because of focusing not only on neutron capture therapy research but also in many other areas e.g. recombination detectors and methods for neutron dosimetry [15]. On the Fig. 2 there is presented the design of the station, based on fission converter neutron beam at the MARIA Research Reactor.
Fig. 2 Fission converter based research/training station at the
MARIA Research Reactor.
REFERENCES
1. I. Kato, Y. Fujita, M. Ohmae , Y. Sakrai , M Suzuki , I. Murata, H. Horiike, T. Sumi, S. Iwai, M. Nakazawa, Yoshiaki Yura and K. Ono , “Boron Neutron Capture Therapy in Patients with Recurrent Head and Neck Cancers Who Have No Other Treatment Options”, 16th International Congress on Neutron Capture Therapy, Book of Abstracts, pp 54, June 14-19, Helsinki, Finland 2014
2. S. Miyatake, S. Kawabata, R. Hiramatsu, K Yokoyama, A Doi, K Onishi, S. Miyata, Y. Kuroda, Y. Hirota, G. Futamura, T. Kuroiwa and K. Ono, “Development of BNCT in 12 years at Osaka Medical College” 16th International Congress on Neutron Capture Therapy, Book of Abstracts, pp 51, June 14-19, Helsinki, Finland, 2014
3. Kreiner A.J., Bergueiroa J., Cartelli D., Baldoa M., Castell W., Asoia J.G., Padulo J., Suárez Sandín J. C., Igarzabal M., Erhardt J., Mercuri D., Valda A. A., Daniel M. Minsky D. M., Mario E. Debray, H. R. Somacal, M. E. Capoulat, M. S. Herrera, M. F. del Grosso, L. Gagetti, M. S. Anzorena, N. Canepa, N. Real, M. Gun, H. Tacca “Present status of Accelerator-Based BNCT” Rep. Pract. Oncol. Radiother., http://dx.doi.org/10.1016/j.rpor.2014.11.004, 2014
4. T. Mitsumoto, K. Fujita, T. Ogasawara, H. Tsutsui, S. Yajima, A. Maruhashi, Y. Sakurai, H. Tanaka, “BNCT System Using 30 MeV H- Cyclotron”, Proceedings of CYCLOTRONS 2010, Lanzhou, China, 2010
5. M. Yoshioka, T. Kurihara, H. Kobayashi, H. Matsumoto, N. Matsumoto, H. Kumada, A. Matsumura, H. Sakurai, S. Tanaka, T. Sugano, T. Hashirano, H. Nakashima, T. Nakamura, Y. Kiyanagi, F. Hiraga, T. Ohba and K.
Okazaki, “Construction of Accelerator-based BNCT”, 16th International Congress on Neutron Capture Therapy, Book of Abstracts, pp 66, June 14-19, Helsinki, Finland, 2014
6. Tsukuba International Strategic Zone, „BNCT Boron Neutron Capture Therapy”, brochure http://www.tsukuba-sogotokku.jp/en/we-have-released-the-bnct-brochure/, 2013
7. Golnik N., Pytel K., Dąbkowski L., “A concept and state of the art of irradiation facilities for NCT at research reactor MARIA in Poland”, in Research and Development in Neutron Capture Therapy, Eds: W. Sauerwein, R. Moss, A. Witting. Monduzzi Editore, pp. 191 – 195, 2002;
8. Golnik N., Pytel K., “Irradiation facilities for BNCT at Research Reactor MARIA in Poland”, Polish Journal of Medical Physics and Engineering, 12(3), 143-153, 2006
9. Pytel K., Andrzejewski K., Golnik N., Ośko J., “Concept of a BNCT line with in-pool fission converter at MARIA reactor in Świerk”, Polish Journal of Medical Physics and Engineering, 15(4), 209-214, 2009
10. Rief, H., Van Heusden, R., Perlini, G., “Generating epithermal neutron beams for neutron capture therapy in TRIGA reactors”, In: Soloway, A.H., Barth, R.F., Carpenter, D.E. (Eds.), Advances in Neutron Capture Therapy. Plenum Press, New York, pp. 85–88, 1993
11. Harling, O.K., Riley, K.J., Newton, T.H., Wilson, B.A., Bernard, J.A., Hu, L.W., Fonteneau, E.J., Menadier, P.T., Ali, S.J., Sutharsan, B., Kohse, G.E., Ostrovsky, Y., Stahle, P.W., Binns, P.J., Kiger III, W.S., Busse, P.M., “The fission converter based epithermal neutron irradiation facility at the Massachusetts Institute of Technology reactor” Nucl. Sci. Eng. 140, 223–240, 2002
12. Riley K.J., Binns P.J., Harling O.K., “Performance characteristics of the MIT fission converter based epithermal neutron beam”, Physics in Medicine and Biology, Volume: 48 Issue: 7 Pages: 943-958 Article Number: PII S0031-9155(03)56482-X Published: APR 7 2003
13. Liu H.B., Brugger R.M., Rorer D.C., Tichler P.R., Hu J.P., “Design of a high-flux epithermal neutron beam using 235U fission plates at the Brookhaven Medical Research Reactor” Med Phys 21:1627–1631, 1994
14. Liu H.B., Razvi J., Rucker R., Cerbone R., Merrill M., Whittemore W., Newell D., Autry S., Richards W., Boggan J., “TRIGA fuel based converter assembly design for a dual-mode neutron beam system at the McClellan Nuclear Radiation Center” in: Hawthorne MF, Shelly K., Wiersema R.J. (eds) Frontiers in neutron capture therapy, 1st edn. Kluwer Academic/Plenum Publishers, New York, pp 295–300, 2001.
15. Zielczyński M., Golnik, N., Gryziński, M.A., Tulik, P.,. „The use of recombination chambers at radiation therapy facilities”, Radiation Measurements 45, 1472-1475, 2010


ADJUVANT CHEMORADIATION WITH PREVENTIVE PARA-AORTIC CONFORM IRRADIATION IN ENDOMETRIAL CANCER II-III FIGO MULTIMODAL TREATMENT
J. M. Kreynina 1, V.A. Solodky 1, A.R. Iksanova 2
1 Russian Scientific Center of Roentgenoradiology, Moscow, Russia 2 Orsk Oncology Center, Orsk, Russia
Abstract: The article presents the current state in treatment of advanced endometrial cancer and validates the aim of our research − to improve overall and disease-free survival in such kind of patients by use of adjuvant chemoradiotherapy with prophylactic irradiation of para-aortic region. The intermediate one-year results of our research are also presented.
Key words: endometrial cancer, chemoradiotherapy, irradiation of para-aortic region.
1. INTRODUCTION
Endometrial cancer (EC) is the most common gynecologic malignancy after breast cancer in the world. Total number of people registered in the Russian Federation with EC at the end of 2013 accounted for 220,459. Despite the annual increase of women with EC identified in the early stages, the frequency of locally advanced and disseminated cancer diagnosis remains high. In recent years the tendency to increase the frequency of histologically unfavorable forms of EC has been also observed. It does not allow to improve the overall survival (OS) and to overcome the barrier of 10% mortality in the first year. [1]
1.1. The role of risk factors
Patients with early-stage low-risk cancer have favorable prognosis, 5 year OS can achieve 90%. [2,3] While risk factors such as deep myometrial invasion (>50%), cervical stroma involvement, unfavorable histological forms, positive lymph nodes, lymphovascular space invasion (LVSI) are present, 5 year OS decreases to 25-30%. [4]
The need for more aggressive therapy for patients with locally advanced cancer of the corpus uteri is associated with unsatisfactory results of the standard combination treatment for patients with risk factors. For example, unfavorable histological form (papillary serous and clear cell subtypes), high grade adenocarcinomas reduces survival to 20-30% [5]. Deep myometrial invasion reduces 5-year OS to 60% and increases rates of locoregional metastasis to 20% [6], while OS for patients with superficial invasion is not less than 90%. Serosal invasion reduces the 5-year OS and disease-free survival (DFS) to 33,3%, while patients without that feature have 5-year OS and DFS about 68,9% and 69,3%, respectively [7]. Involvement of the stroma of the cervix reduces the 5-year OS to 72.9%, whereas the progression rate
increases to 32%, and nodal and distant metastases occur three times more often (22%) than local recurrence (7.3%)[8]. The presence of LVSI increases the risk of regional metastasis to 20-30% [5]. The presence of metastatic lymph nodes reduces 5-year OS to 54% compared with 90% in the absence of positive lymph nodes [6]. At the same time, five-year OS and DFS for patients with positive para-aortic (PA) lymph nodes were significantly lower (48.8% and 44.4%) than for patients with only positive pelvic lymph nodes (69.7% and 65.6%, respectively) [9].
According to the recommendations of several treatment groups [10-13], results of meta-analyzes and several large randomized studies, we suggested the following risk groups of EC (using FIGO 2009 classification):
- low risk group: IA Gr1-2, IB Gr1, endometrioid histology
- intermediate risk group: IA Gr3, IB Gr2-3, II, LVSI, over 60 years old
- high risk group: III-IV, non-endometrioid histology
Low risk (LR) patients are not shown adjuvant radiotherapy, because it does not improve survival and locoregional control, while reducing the quality of life and increasing the risk of death. [14-17].
1.2. Adjuvant therapy for intermediate and high risk patients.
Randomized trials have shown that the pelvic radiotherapy (PRT) reduces the rate of locoregional recurrence for intermediate-risk (IR) patients, but does not improve OS. It was also found that PRT reduces the quality of life due to radiation toxicity compared with surgery only [18-21]. In the PORTEC-2 trial [22], brachytherapy proved to be equal with PRT as a method of prevention of progression for IR patients, without reducing the quality of life.
84
Some researchers allocate subgroups of IR patients for whom PRT can to increase OS. These patients were classified as intermediate-high risk (HIR). Selection criteria are not identical, but it is possible to identify common features: patients with tumor confined to the uterine corpus, with poor prognosis factors – over 70 years old, LVSI, total lesion of the uterine cavity, cervical stroma involvement, deep myometrial invasion. It’s very difficult to determine the treatment strategy for HIR patients, as well as for HR patients. In the world there is the tendency to use the combined adjuvant chemoradiation therapy.
The use of radiotherapy alone or with extended fields on para-aortic region (EFRT) or whole abdomen radiation therapy (WART) improves 5-year OS in some part of patients to 70-80% [23]. However, for patients with metastases in the lymph nodes or with poor histological type DFS and OS remain at 30-50%. In this case, predominantly distant and peritoneal metastases are found outside the radiation fields [7,24-27].
Such results have led to the need for systemic chemotherapy for HIR and HR patients. Available literature data on effectiveness of chemotherapy are controversial.
GOG 122 [28] was the first randomized Phase III trial demonstrating that chemotherapy offered a survival advantage over radiation therapy. A total of 422 patients with stage III or IV EC (FIGO 1988 criteria) were included into this trial and were randomly allocated to receive WART or chemotherapy (7 cycles doxorubicin and cisplatin). Median follow-up time was 74 months. The authors of the trials found a significant OS and DFS among the patients who received chemotherapy versus WART. The Japanese Gynecologic Oncology Group (JGOG) [29] randomized patients with stage I with > 50% invasion through stage IIIC endometrial cancer to chemotherapy (CAP regimen) or PRT. The majority (77.4%) of the registered patients had stage IC or II lesions, and only 11.9% had stage IIIC lesions. There was no significant difference between the chemotherapy and radiation therapy groups in OS or DFS and pattern of relapse. A small HR subset of patients, in which DFS was improved with chemotherapy, was identified. Maggi et al [30] conducted a randomized trial with a design similar to the JGOG study. The study enrolled patients with HR endometrioid EC limited to the pelvis (stage IG3 with > 50% myometrial invasion, stage IIG3 with myometrial invasion >50%, and stage III). Chemotherapy consisted of 5 cycles of cisplatin, doxorubicin, and cyclophosphamide. Patients on the radiation therapy arm treatment received 45-50Gy to the pelvis. There was no significant difference in OS or DFS between the two arms treatments, but there was an insignificant trend towards delayed metastasis in the chemotherapy arm treatment and delayed pelvic relapse in the radiation therapy arm treatment.
In a number of studies a high frequency of loco-regional recurrence (19%-50%) was noted among patients with positive pelvic lymph nodes, receiving only chemotherapy without radiation therapy [28,31-33]. That prompted further development of the combined chemoradiation therapy for the patients with HR endometrial cancer.
Several retro- and prospective studies have shown the safety and efficacy of simultaneous chemoradiation treatment of patients with endometrial cancer [34-39].
5-year rates of DFS have reached an average of 75-80%, OS 80-85%. The level of early and late complications was acceptable. Local control has reached 90-95%, while the para-aortic lymph nodes lesion developed in 11-15% of cases.
Hogberg et al, in a prospective, randomized study [40], compared adjuvant radiotherapy with combined chemoradiation therapy for HIR and HR patients. The analysis included results from two multicenter randomized studies. In the MANGO study, patients II-IIIc stage were included predominantly. In the combination therapy group the chemotherapy was given first (3 cycles AP), then PRT with extended fields on metastastic para-aortic lymph nodes (45Gy). The NSGO/EORTC study among patients with stage I-IIIc (Ic Gr3 - IIc - up to 97%) had radiation therapy first to a dose 45Gy, then chemotherapy (various modes were used). Brachytherapy was not required in any arm type of the study.
In a combined analysis of both studies, they have shown significant improvement of OS, DFS and DSS (disease specific survival) in the chemoradiotherapy group. It is important to note that the researchers recorded a significant reduction in the number of relapses in the combination-therapy group, both in MANGO and in NSGO/EORTC-studies [40].
Similar findings were obtained in the meta-analysis for patients with locally advanced high-risk EC [41], including 3 retro and 3 prospective studies comparing radiotherapy and chemoradiotherapy.
Conducted over the last 10 years, retro-prospective trials [42-46] have studied different sequences of radiotherapy and chemotherapy, applying different chemotherapy modes for patients with poor EC prognosis, have proved the advantage of combined chemoradiotherapy over monotherapy on the adjuvant phase. The best results were achieved by applying the so-called "sandwich" - mode, in which chemotherapy is carried out before and after radiation therapy. Five-year overall survival rate reached the level of 90-95% and increased the time before progression. [44] The complication rate was acceptable with active supportive care.
The on-going PORTEC 3 study compares radiotherapy with the concomitant and sequential use of chemotherapy and radiotherapy for patients with endometrioid stage I grade 3, stage II–III and any stage serous and clear-cell carcinomas [11]. GOG 258 is a randomized Phase III trial evaluating the use of chemoradiation (concurrent cisplatin and PRT followed by TP for 4 cycles) and chemotherapy (TP for 6 cycles) in advanced endometrial cancer. This study was designed to answer the question: is it better to treat advanced cancer with systemic treatment or both chemotherapy and radiation? The GOG 249 multi-institutional Phase III trial was opened for looking at adjuvant treatment for patients with HR early stage endometrial cancer. It compared PRT without any chemotherapy versus vaginal cuff brachytherapy followed by 3 cycles of TP chemotherapy. This study was designed to further delineate the difference between vaginal cuff brachytherapy and whole pelvic radiation [2].
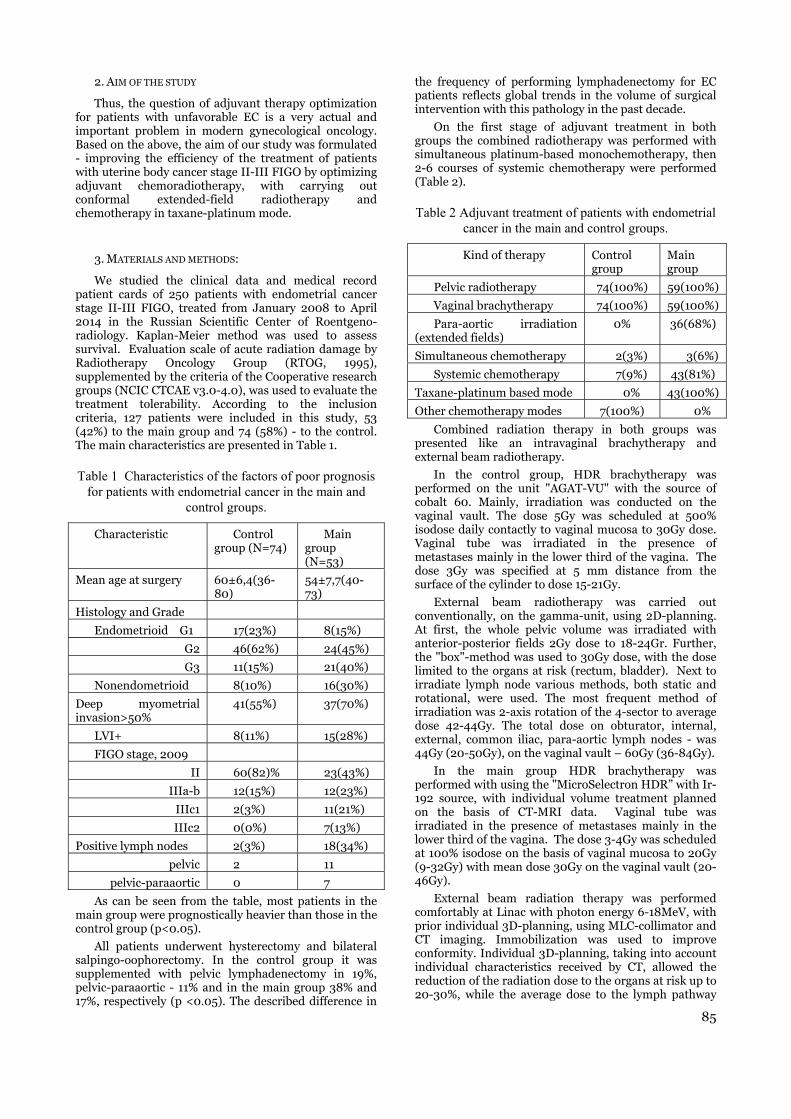
85
2. AIM OF THE STUDY
Thus, the question of adjuvant therapy optimization for patients with unfavorable EC is a very actual and important problem in modern gynecological oncology. Based on the above, the aim of our study was formulated - improving the efficiency of the treatment of patients with uterine body cancer stage II-III FIGO by optimizing adjuvant chemoradiotherapy, with carrying out conformal extended-field radiotherapy and chemotherapy in taxane-platinum mode.
3. MATERIALS AND METHODS:
We studied the clinical data and medical record patient cards of 250 patients with endometrial cancer stage II-III FIGO, treated from January 2008 to April 2014 in the Russian Scientific Center of Roentgeno-radiology. Kaplan-Meier method was used to assess survival. Evaluation scale of acute radiation damage by Radiotherapy Oncology Group (RTOG, 1995), supplemented by the criteria of the Cooperative research groups (NCIC CTCAE v3.0-4.0), was used to evaluate the treatment tolerability. According to the inclusion criteria, 127 patients were included in this study, 53 (42%) to the main group and 74 (58%) - to the control. The main characteristics are presented in Table 1.
Table 1 Characteristics of the factors of poor prognosis for patients with endometrial cancer in the main and
control groups.
Characteristic Control group (N=74)
Main group (N=53)
Mean age at surgery 60±6,4(36-80)
54±7,7(40-73)
Histology and Grade
Endometrioid G1 17(23%) 8(15%)
G2 46(62%) 24(45%)
G3 11(15%) 21(40%)
Nonendometrioid 8(10%) 16(30%)
Deep myometrial invasion>50%
41(55%) 37(70%)
LVI+ 8(11%) 15(28%)
FIGO stage, 2009
II 60(82)% 23(43%)
IIIa-b 12(15%) 12(23%)
IIIc1 2(3%) 11(21%)
IIIc2 0(0%) 7(13%)
Positive lymph nodes 2(3%) 18(34%)
pelvic 2 11
pelvic-paraaortic 0 7
As can be seen from the table, most patients in the main group were prognostically heavier than those in the control group (p<0.05).
All patients underwent hysterectomy and bilateral salpingo-oophorectomy. In the control group it was supplemented with pelvic lymphadenectomy in 19%, pelvic-paraaortic - 11% and in the main group 38% and 17%, respectively (p <0.05). The described difference in
the frequency of performing lymphadenectomy for EC patients reflects global trends in the volume of surgical intervention with this pathology in the past decade.
On the first stage of adjuvant treatment in both groups the combined radiotherapy was performed with simultaneous platinum-based monochemotherapy, then 2-6 courses of systemic chemotherapy were performed (Table 2).
Table 2 Adjuvant treatment of patients with endometrial cancer in the main and control groups.
Kind of therapy Control group
Main group
Pelvic radiotherapy 74(100%) 59(100%)
Vaginal brachytherapy 74(100%) 59(100%)
Para-aortic irradiation (extended fields)
0% 36(68%)
Simultaneous chemotherapy 2(3%) 3(6%)
Systemic chemotherapy 7(9%) 43(81%)
Taxane-platinum based mode 0% 43(100%)
Other chemotherapy modes 7(100%) 0%
Combined radiation therapy in both groups was presented like an intravaginal brachytherapy and external beam radiotherapy.
In the control group, HDR brachytherapy was performed on the unit "AGAT-VU" with the source of cobalt 60. Mainly, irradiation was conducted on the vaginal vault. The dose 5Gy was scheduled at 500% isodose daily contactly to vaginal mucosa to 30Gy dose. Vaginal tube was irradiated in the presence of metastases mainly in the lower third of the vagina. The dose 3Gy was specified at 5 mm distance from the surface of the cylinder to dose 15-21Gy.
External beam radiotherapy was carried out conventionally, on the gamma-unit, using 2D-planning. At first, the whole pelvic volume was irradiated with anterior-posterior fields 2Gy dose to 18-24Gr. Further, the "box"-method was used to 30Gy dose, with the dose limited to the organs at risk (rectum, bladder). Next to irradiate lymph node various methods, both static and rotational, were used. The most frequent method of irradiation was 2-axis rotation of the 4-sector to average dose 42-44Gy. The total dose on obturator, internal, external, common iliac, para-aortic lymph nodes - was 44Gy (20-50Gy), on the vaginal vault – 60Gy (36-84Gy).
In the main group HDR brachytherapy was performed with using the "MicroSelectron HDR” with Ir-192 source, with individual volume treatment planned on the basis of CT-MRI data. Vaginal tube was irradiated in the presence of metastases mainly in the lower third of the vagina. The dose 3-4Gy was scheduled at 100% isodose on the basis of vaginal mucosa to 20Gy (9-32Gy) with mean dose 30Gy on the vaginal vault (20-46Gy).
External beam radiation therapy was performed comfortably at Linac with photon energy 6-18MeV, with prior individual 3D-planning, using MLC-collimator and CT imaging. Immobilization was used to improve conformity. Individual 3D-planning, taking into account individual characteristics received by CT, allowed the reduction of the radiation dose to the organs at risk up to 20-30%, while the average dose to the lymph pathway

86
and vaginal vault remained unchanged. Additionally, patients in the main group underwent irradiation with extended fields on para-aortic region to the level of Th11-L2, with the maximum protection of the organs at risk (bowel, kidney feet, kidneys, liver, spinal cord). Mean dose on the para-aortic lymph nodes was 40-42Gr.
In the control group systemic adjuvant chemotherapy was performed in CAP or AP mode 3-4 cycles every 21 days for 7 patients (9.5%).
In the main group 3 women received a simultaneous chemoradiation therapy - weekly carboplatin AUC2. Systemic adjuvant chemotherapy in taxane-platinum mode was the criterion for inclusion in the main group, 2-6 cycles every 21 days.
4. RESULTS
The toxicity of treatment in the main group, despite the EFRT and systemic chemotherapy, was acceptable and not higher than in the control group. (Table 3, 4, 5)
As seen from the figures, the severity of gastrointestinal and genitourinary toxicity in both groups was the same, and there were no serious complications. Significantly higher level of hematologic toxicity II-IIIgr in the main group was noted, presented mainly by neutropenia and anemia. However, only one patient did not complete the full course of treatment due to thrombo- and neutropenia IIIgr by RTOG.
Median follow-up was 12 months. (1-79). There was a significant improvement in DFS and OS in the study group compared with the control group, with significant reductions in the loco-regional metastasis: for II stage from 20% to 9% (p<0,05), for III stage - from 36% to 21% (p<0,05). Data for distant metastases for patients with stage II in the study group were not received and for patients with III stage was marked the decline from 22% to 11% (p<0,05).
Table 3 Hematologic toxicity, RTOG scale
Grade 0 1 2 3 Main group 13 27 42 18
Control group 50 33 15 2
Table 4 Gastrointestinal toxicity, RTOG scale
Grade 0 1 2 3 Main group 64 24 12 0
Control group 66 21 12 1
Table 5 Genitourinary toxicity, RTOG scale
Grade 0 1 2 3 Main group 58 24 18 0
Control group 56 22 21 1
5. CONCLUSIONS
The first results of our study have shown good tolerability of patients with uterine body cancer stage II-III adjuvant chemoradiation therapy with prophylactic irradiation of para-aortic region. We received improved one-year treatment results in the study group compared with the control one, despite the fact that this group
originally included the patients with more aggressive forms of the tumor and a higher risk of progression. Evaluation of long-term oncologic outcomes requires prolonging observation.
Acknowledgement: The authors would like to thank to the staff of Brachytherapy and Radiosurgery Department of Russian Scientific Center of Roentgenoradiology.
REFERENCES
1. A. D. Kaprin, V. V. Starinskij, G. V. Petrova, “Situation of cancer care in Russia in 2013”. Moscow, Russia: FGBU "MNIOI names of P. A. Herzen" Russian Ministry of Health, p. 235, 2014.
2. S. B. Dewdney, D. G. Mutch, “Evidence-based review of the utility of radiation therapy in the treatment of endometrial cancer. Women's Health”, 6(5), pp. 695–704, 2010.
3. J. M. Straughn, W. K. Huh, F. J. Kelly et al, “Conservative management of stage I endometrial carcinoma after surgical staging”, Gynecol Oncol, Feb;84(2), pp. 194–200, 2002.
4. V. A. Titova, I. V. Stolyarova, Yu. M. Krejnina, “Modern technology combined treatment of endometrial cancer: Scientific and practical edition”, Moscow, Snt. Petersburg, Russia: Publishing house “Foliant”, pp. 168, 2012.
5. Ya.V. Boxman, “Guidelines for oncogynecology” Publishing house “Foliant”, p. 542, 2002.
6. G. M. Savel'eva, “Gynecology”, GEOTAR-Media, p. 432, 2012.
7. E. C. Choi, J. H. Kim, O. B. Kim et al, “Postoperative radiotherapy for endometrial cancer”, Radiat Oncol J, 30(3), pp. 108 – 116, 2012.
8. E. A. Mustafina, “Uterine cancer stage II (clinical and morphological prognostic factors and treatment”, Russian Academy of Medical Sciences, 2005.
9. A. V. Hoekstra, R. J. Kim, W. J. Small et al, “FIGO stage IIIC endometrial carcinoma: prognostic factors and outcomes”, Gynecol Oncol, Aug;114(2), pp. 273 – 278, 2009.
10. A. Klopp, B. D. Smith, K. Alektiar et al. “The role of postoperative radiation therapy for endometrial cancer: Executive Summary of an American Society for Radiation Oncology evidence-based guideline”, Practical Radiation Oncology, 4, pp. 137–144, 2014.
11. N. Colombo, E. Preti, F. Landoni et al, “Endometrial cancer: ESMO Clinical Practice Guidelines for diagnosis, treatment and follow-up”, Annals of Oncology, 24, Suppl. 6, pp. 33–38, 2013.
12. V. M. Moiseenko, “Practical guidelines for drug treatment of malignant tumors (RUSSCO)”, Society of Oncologists-Chemotherapeutists, p. 384, 2013.
13. Clinical Practice Guidelines In Oncology Uterine Neoplasms, Version 2.2015 National Comprehensive Cancer Network (NCCN), Available at: www.nccn.org.
14. W. T. Creasman, C. P. Morrow, D. N. Bundy et al, “Surgical pathologic patterns of endometrial cancer: a gynecologic oncology group”, Cancer, 60, pp. 2035 – 2041, 1987.
15. С. P. Morrow, B. N. Bundy, R. J. Kurman et al, “Relationship between surgical-pathological risk factors and outcome in clinical stage I and II carcinoma of the endometrium: a gynecologic oncology group study”, Gynecol. Oncol, 40, pp. 55 – 65, 1991.
16. B. Sorbe, В. Nordstrom, J. Maenpaa et al. “Intravaginal brachytherapy in FIGO stage I low-risk endometrial cancer: a controlled randomized study”, Int. J. Gynecol. Cancer, 19, pp. 873 – 878, 2009.
17. A. Kong, N. Johnson, H. C. Kitchener et al, “Adjuvant Radiotherapy for Stage I Endometrial Cancer: An Updated
87
Cochrane Systematic Review and Meta-analysis”, J Nat Cancer Inst, 104, pp. 1625 – 1634, 2012.
18. C. L. Creutzberg, W. L. van Putten, P. C. Koper et al, “Surgery and postoperative radiotherapy versus surgery alone for patients with stage-1 endometrial carcinoma: multicenter randomized trial. PORTEC study group. Post Operative Radiation Therapy in Endometrial Carcinoma”, Lancet, 355, pp. 1404 – 1411, 2000.
19. H. M. Keys, J. A. Roberts, V. L. Brunetto et al, “A Phase III trial of surgery with or without adjunctive external pelvic radiation therapy in intermediate risk endometrial adenocarcinoma: a Gynecologic Oncology Group Study”, Gynecol. Oncol, 92, pp.744 – 751, 2004.
20. J. Aalders, V. Abeler, P. Kolstad et al, “Postoperative external irradiation and prognostic parameters in stage I endometrial carcinoma: clinical and histopathologic study of 540 patients”, Gynecol. Oncol, 56(4), pp. 419 – 427, 1980.
21. ASTEC/EN.5 study group, “Adjuvant external beam radiotherapy in the treatment of endometrial cancer (MRC ASTEC and NCIC CTG EN.5 randomised trials): pooled trial results, systematic review, and meta-analysis”, Lancet, 373, pp. 137 –146, 2009.
22. R. A. Nout, V. T. Smit, H. Putter et al, “Vaginal brachytherapy versus pelvic external beam radiotherapy for patients with endometrial cancer of high-intermediate risk (PORTEC 2): an open-label, non-inferiority, randomized trial”, Lancet, 375, pp. 816 – 823, 2010.
23. G. Nelson, M. Randall, G. Sutton et al, “FIGO stage III endometrial carcinoma with metastases confined to pelvic lymph nodes: Analysis of treatment outcomes, prognostic variables, and failure patterns following adjuvant RT”, Gynecol Oncol, 75, pp. 211 – 214, 1999.
24. A. A. Martinez, S. Weiner, K. Podratz et al, “Improved outcome at 10 years for serous-papillary/clear cell or high-risk endometrial cancer patients treated by adjuvant high-dose whole abdomino-pelvic irradiation”, Gynecol Oncol, Sep, 90(3), pp. 537 – 546, 2003.
25. S. Kim, H. Wu, H. Lee et al, “Patterns of Failure after Postoperative Radiation Therapy for Endometrial Carcinoma”, Cancer Res Treat, 38(3), pp. 133 – 138, 2006.
26. G. Sutton, J. H. Axelrod, B. N. Bundy et al, “Whole abdominal radiotherapy in the adjuvant treatment of patients with stage III and IV endometrial cancer: A Gynecologic Oncology Group study”, Gynecologic Oncology, 97, pp. 755 – 763, 2005.
27. A. J. Mundt, J. C. Roeske, A. E. Lujan et al, “Initial clinical experience with intensity-modulated whole-pelvis radiation therapy in women with gynecologic malignancies”, Gynecol Oncol, 82, pp. 456 – 463, 2001.
28. M. E. Randall, V. L. Filiaci, H. Muss et al, “Randomized Phase III Trial of Whole-Abdominal Irradiation Versus Doxorubicin and Cisplatin Chemotherapy in Advanced Endometrial Carcinoma. A Gynecologic Oncology Group Study”, J Clin Oncol, 24, pp. 36 – 44, 2006.
29. N. Susumu, S. Saga, Y. Udagawa et al, “Randomized phase III trial of pelvic radiotherapy versus cisplatinbased combined chemotherapy in patients with intermediate-and high-risk endometrial cancer: A Japanese Gynecologic Oncology Group study”, Gynecol Oncol, 108, pp. 226 – 233, 2008.
30. R. Maggi, A. Lissoni, F. Spina et al, “Adjuvant chemother¬apy vs radiotherapy in high-risk endometrial carcinoma: Results of a randomised trial”, Br J Cancer, 95, pp. 266 – 271, 2006.
31. M.E. Randall, N. M. Spirtos, P. Dvoretsky et al, “Whole abdomi¬nal radiotherapy versus combination chemotherapy with doxorubicin and cisplatin in advanced endometrial car¬cinoma (phase III): Gynecologic Oncology Group Study”, No. 122. J Natl Cancer Inst Monogr, 19, pp. 13 – 15, 1995.
32. A. H. Klopp, A. Jhingran, L. Ramondetta et al, “Node-positive adenocarcinoma of the endometrium: Outcome and patterns of recurrence with and without external beam irradiation”, Gynecol Oncol, 115, pp. 6 – 11, 2009.
33. A. J. Mundt, R. McBride, J. Rotmensch et al, “Significant pelvic recurrence in high-risk pathologic stage I–IV endometrial carcinoma patients after adjuvant chemotherapy alone: Implications for adjuvant radiation therapy”, Int J Radiat Oncol Biol Phys, 50, pp. 1145 – 1153, 2001.
34. S.M. Hwang, D. B. Chay, S. Kim et al, “Concurrent chemoradiation with paclitaxel in high-risk endometrial cancer patients after surgery: A Korean Gynecologic Oncology Group study”. Abstracts. Gynecologic Oncology, 133(2), 207, suppl. 140, 2014.
35. A. Jhingran, L. M. Ramondetta, D.C. Bodurka et al. “A prospective phase II study of chemoradiation followed by adjuvant chemotherapy for FIGO stage I–IIIA (1988) uterine papillary serous carcinoma of the endometrium”, Gynecologic Oncology, 129, 304 – 309, 2013.
36. S. A. Milgrom, M. A. Kollmeier, N. R. Abu-Rustum et al, “Postoperative external beam radiation therapy and concurrent cisplatin followed by carboplatin/paclitaxel for stage III (FIGO 2009) endometrial cancer”, Gynecologic Oncology, 130, pp. 436 – 440, 2013.
37. Q. Wen, Z. Shao, Z. Yang et al, “Concomitant paclitaxel plus carboplatin and radiotherapy for high-risk or advanced endometrial cancer”, Int. J. Gynecol. Cancer, May, 23(4), pp. 685 – 689, 2013.
38. K. Greven, K. Winter, K. Underhill et al, “Radiation Therapy Oncology Group. Preliminary analysis of RTOG 9708: Adjuvant postoperative radiotherapy combined with cisplatin/paclitaxel chemotherapy after surgery for patients with high-risk endometrial cancer”, Int J Radiat Oncol Biol Phys, 59, pp. 168 – 173, 2004.
39. T. Hogberg, P. Rosenberg, G. Kristensen et al, “A randomized Phase III study on adjuvant treatment with radiation ± chemotherapy in early-stage high-risk endometrial cancer (NSGO-EC-9501/EORTC 55991)”, J. Clin. Onol. ASCO Annual Meeting Proceedings, 25(18), Suppl. 5503, 2007.
40. T. Hogberg, M. Signorelli, C. F. de Oliveira et al, “Sequential adjuvant chemotherapy and radiotherapy in endometrial cancer–results from two randomised studies”, Eur J Cancer, 46, pp. 2422 – 2431, 2010.
41. H. J. Park, E.J. Nama, S. Kim et al, “The benefit of adjuvant chemotherapy combined with postoperative radiotherapy for endometrial cancer: a meta-analysis”, European Journal of Obstetrics & Gynecology and Reproductive Biology, 170, pp. 39 – 44, 2013.
42. A. A. Secord, L. J. Havrilesky, V. Bae-Jump et al, “The role of multi-modality adjuvant chemotherapy and radiation in women with advanced stage endometrial cancer”, Gynecol. Oncol, 107, pp. 285 – 291, 2007.
43. A. A. Secord, L. J. Havrilesky, D. M. O’Malley et al, “A multicenter evaluation of sequential multimodality therapy and clinical outcome for the treatment of advanced endometrial cancer”, Gynecol. Oncol, 114, pp. 442 – 447, 2009.
44. A. A. Secord, M. A. Geller, G. Broadwater et al, “A multicenter evaluation of adjuvant therapy in women with optimally resected stage IIIC endometrial cancer”, Gynecologic Oncology, 128, pp. 65 – 70, 2013.
45. J. W. Miao, X. H. Deng, J. Chin, “High-risk endometrial cancer may be benefit from adjuvant radiotherapy plus chemotherapy”, Cancer Res., Dec, 24(4), pp. 332 – 339, 2012.
46. K. Lupe, J. Kwon, D. D'Souza et al, “Adjuvant paclitaxel and carboplatin chemotherapy with involved field radiation in advanced endometrial cancer: a sequential approach”, Int J Radiat Oncol Biol Phys, Jan; 67(1), pp. 110 – 116, 2007.


OPTIMIZATION OF RADIOTHERAPEUTIC TREATMENT AND THE PROGRAM OF QUALITY ASSURANCE IN IONIZING RADIATION THERAPY (CATEGORIES OF STAFF)
Andrei Roşca, Ion Bahnarel, Liuba Coreţchi
National Public Health Center of the Health Ministry of the Republic of Moldova
Abstract. The Program of Quality Assurance (QA program) in Ionizing Radiation Therapy (RT) addresses the most important problems of assuring the quality of RT utilization in the treatment of patients with neoplasm. In this context, the RT value grows considerably, hence the implementation of QA program is of great importance. This study concentrates on a detailed description of the QA program as concerns the activity involving RT devices applied in the RT departments (rooms) of public medical/sanitary institutions, science research institutions etc., where RT is employed using technogenic sources and ionizing radiation generators. In the study, annual statistics reports about the activity of the RT, and data of Cancer Registry of the Oncologic Institute of the Republic of Moldova were analyzed. The work also included an in-depth description of the personnel categories involved in QA program, possible errors in radiotherapy, the responsibilities of the medical physicist in this program, importance of source calibration, the impact of the quality control in QA program, the role of topometric training, the interaction between the medical and technical personnel and the patient. Optimization of RT is very important and necessary in the Republic of Moldova. QA program incontestable contributes to reducing specialist’s errors in planning correct treatment. It dictates the need of team work, duty of medical physicist, the influence of quality control of profile installations etc.
Key words: Quality assurance program, Ionizing Radiation Therapy, Cancer treatment.
INTRODUCTION
Quality assurance (QA) and quality control (QC) for radiation and medical oncologists mean to clarify the different components of the clinical decision, to supervise with proper methodology the required steps needed to accomplish the agreed outcomes and to control them. Quality for radiation and medical oncology means to supervise each clinical and technical component of the whole process to guarantee that all steps together will arrive at the final and best possible outcome [9].
In radiation oncology, like other fields, it is driven by the need or desire to demonstrate an identified level of patient care [5].
At the 2007 International Symposium, "Quality Assurance of Radiation Therapy: Challenges of Advanced Technology" was stipulated that government and private entities committed to improved healthcare quality and safety should support research directed toward addressing QA problems in image-guided therapies [10].
Currently, ionizing radiation therapy is successfully employed in the treatment of oncological diseases that occupy the second place in the Republic of Moldova in the ranking of the human disease morbidity [3]. In 2013, in the Republic of Moldova, 8,441 patients were diagnosed with cancer at various sites (8,204 in 2012), including rectal cancer (12.3%), breast
cancer (11.8%), bronchopulmonary cancer (10.5%), bladder cancer (6.4%) etc. In 2012- 013, 5,734 and 5,835 cancer patients died from their disease, respectively [4]. The principal causes of cancer in the republic include excessive consumption of alcohol, smoking, obesity, and sexually transmitted infections. Presently, 47,450 cancer patients are on file with the public medical/sanitary institution, the Institute of Oncology, which imposes a large scale employment of RT [3]. RT must be implemented according to a QA program in order to optimize the cancer treatment [1].
Material and methods. The work has been based on the analysis of annual statistical reports (F N30) regarding the activities of the RT service in the Republic of Moldova, the report of the working group of WHO regarding assurance of quality in the area, specialized literature on the management of RT assistance at the current stage in the republic and worldwide, and the Cancer Registry data of the Institute of Oncology. Background, documentary, and comparative and statistical analysis methods have been used using computer programs Excel and STATISTICA 7.
Results. The RT assistance must be currently provided in compliance with a QA program depending on the departmental, national or international level. The principal responsibilities for the development and implementation of QA program are assigned to the head of the program that is, as a rule, the
90
head of the RT department. This person must be convinced that the ionizing radiation treatment meets the acceptable standards at the above levels.
One of the major problems of a QA program is to ascertain that a particular clinical or physical task has been accomplished. The head of the RT department must insist that the results of the implementation of the tasks of QA and calibration, data on the patients be registered correctly and retained for an appropriate period of time.
QA program dictates the necessity of a steadfast everyday team activity and correct delegation of the responsibilities to all the qualified specialists. The QA responsibilities of the RT department personnel shall be distributed by the head who, based on their professional qualifications, delegates the clinical problems to oncologists/radiologists, while the technical ones to the medical physicist or engineers for maintenance of RT devices. Taking into account the above and the complexity of the RT application procedure, it is necessary to involve other categories of specialists who are in charge for treatment planning, dose calculation etc.
These categories are divided in some groups of specialists: medical profile specialist groups, a group of technical profile specialists, and a group of diverse profile specialists.
A. The group of medical profile specialists: 1. Radiation Oncologis (RO) who are specialized in utilization of ionizing radiation for cancer treatment and are responsible for care of the patient, clinical definition of the target volume, monitoring of the patient during the treatment and dynamic supervision, and the results of the procedures conducted.
To successfully execute their activities, RO should be specialists with: - sufficient familiariarity with all the possibilities of modern methods to diagnose of cancerous and nonspecific diseases; - ample knowledge in the therapeutic possibilities and the limitations of surgery, chemotherapy, hormone therapy etc. to make decisions about when to utilize RT; - ample training in utilization of ionizing radiation to treat cancerous and nonspecific diseases; - extra training of at least 3-4 years for perfection and acquiring experience at a prestigious oncological institution following the graduation of the medical department, specialized in all the oncological aspects of ionizing radiation biology, dosimetry, radioprotection and radiation safety; - competence in diagnostic imaging techniques, sufficient experience of general medical practice, and patient care skills in the conditions of an in-patient unit;
- an appropriate certificate issued by a national authority and a full-time employment as an oncologist/radiologist; - possibilities of continuous education during the activities in the area (lack of serious health problems, fear of traveling by the modern transportation means, traveling on altitudes etc.) [1, 8]. 2. Radiology or medical technicians are specialists with medium medical education followed by a course of at least two years of training in RT technology. The course must include both studying human anatomy, physiology and pathology including oncological diseases, and radiation physics, radiobiology, radioprotection, radiation safety, RT planning, patient care etc. [1, 8].
These specialists are responsible for: - correct positioning of the patient, wedge filters, radiation blocks etc.; - execution of routine radiation of the patient, including RT using set-up devices; - data records [1, 8]. 3. Physiotherapist and occupational therapist that help the patient to resume everyday activities; 4. Psychologist who helps the patient to overcome the emotional effects of cancer and its treatment [11]. B. The group of technical profile specialists: 1. Physicists, specialists in medical radiation, bioengineers and dosimetrists responsible for the physical aspects of radiation techniques, treatment planning, dosimetry, radioprotection, radiation safety etc. These specialists must be trained in medical applications of ionizing radiation and be knowledgeable in radiation physics, including radiation generation, dosimetry in treatment planning, radioprotection, and in human anatomy and physiology, radiobiology and oncolology.
The above specialists must hold a university or equivalent degree in the area of physics, specifically in radiation physics, be experienced in RT utilization and skills in dealing with patients. The education should be of three years and certification must be earned [1, 8].
These categories of the persons are responsible within QA program for: - radiation dosimetry; - physical aspects of RT planning; - radioprotection of the patients and medical personnel; - design and construction of equipment: beams and devices with limiting beams; - quality assurance surveillance in RT; - consulting in selecting RT equipment; - radioprotection and design of adequate facilities.
The medical physicist is in full charge of the physical and technical aspects of QA program though some less sophisticated verification may
91
be conducted by radiology technicians or dosimetrists subordinated to him/her. 2. Engineers (bioengineers) must have a high level technical education with an additional training in RT equipment. First of all the training consists in the education provided by the equipment producer followed by continuous professional training (advanced training).
Engineers (bioengineers) are responsible for: - correct technical maintenance of RT units, dosimetric equipment etc.; - resolving technical issues associated with mechanical or electronically flaws, all the aspects of ionizing radiation; - drafting, together with the rest of the personnel, of the RT program. C. The group of different profile specialists: 1. Dietician/nutritionist who recommends the best plan of alimentation during the treatment and recovery; 2. Speech therapist for assessment and treatment of any adverse reaction that might affect the speech and swallowing.
The Department QA program shall include the following responsibilities: program establishment, including the aspects of database, check on the patients’ doses, patient and personnel safety.
At the same time, no possible errors can be singled out in the patients’ treatment, which may be committed for the following reasons [11, 1, 8]: a) Incorrect definition of the patient’s anatomy: inexact completion of the sketch, incorrect positioning of the patient, incorrect appreciation of the organs at risk, erroneous estimation of tissue homogeneity etc. b) Inexact appreciation of the target volume: shape, sizes and localization, denial of the influence of the physiological motions of organs and tissues (the influence of blood circulation, respiration, unintentional motions of the patient etc.); c) Incorrect treatment planning: errors in the beam characterization, beam models, software and hardware etc.); d) Incorrect implementation of the treatment with an inaccurate calibration of the unit; e) Inexact appreciation (confusion) of the patient: incorrect identification, incorrect diagnosis, erroneous application of the medical treatment prescription and of the previous treatment results etc. An important role in QA in the RT activity is attributed to the bioengineer who is obliged to: - calibrate and technically adjust RT devices according to the duly approved treatment programs; - participate in the checks on the qualitative operation of the RT devices; - assure momentary detection of the work stoppage of any segment of ionizing radiation sources and considerable diminution or
complete exclusion of unplanned exposure to ionizing radiation of the patients under treatment and the personnel of the RT service; - contribute to reduction of the level of exposure to ionizing radiation of the patients through assuring a higher quality of RT; - correctly calculate the radiation plan for the patient so that the necessary therapeutic effect be achieved through application of minimal but efficient radiation doses, protection or effective shielding of patient’s healthy organs and tissues; - participate in the permanent medical personnel training in the issues of radioprotection and source safety pursuant to the laws [1, 2, 8].
Source calibration is the prerogative of the medical physicist who must:
- assure calibration of devices and equipment of the RT service according to the radiation energy and quality and in the units of the dose absorbed or the debit of the dose absorbed, at a distance set earlier, in specific conditions and in compliance with Council Directive 2013/59/Euratom of 5 December 2013 [6]; - conduct calibration of the closed sources for brachytherapy after the activity, the control debit of the Kerma index or of the source of the dose absorbed for an environment after a certain time fixed and at a distance determined from the source with indicating the calibration date; - calibrate radiation sources prior to starting exploitation, following each repairs (in the case of impact upon dosimetry) and in the intervals determined by the hierarchically superior bodies; - permanently improve knowledge to be a specialist accredited to calibrate the above sources in compliance with the laws.
Within RT, the medical physicist must ensure estimation and enactment of the following volumes of: - minimal and maximal doses absorbed in the planned radiation volume, radiation dose prescribed by the physician, in the point of destination and of the dose absorbed in other points determined by the physician during telegammatherapeutic procedures; - the doses absorbed for particular organs; - the dose absorbed in particular points of the patient’s body in the case of brachytherapy.
The medical physicist an optimal exploitation of the devices (equipment) so that the planned target volume designed for radiation receive the prescribed absorbed dose according to the time and energy indicated, while the radiation dose for other organs be minimal[11, 1, 2, 8].
QA of the exposure to ionizing radiation is a very important area in the profile activity, vital in meeting radioprotection and source safety [2]. In this context, the medical physicist must efficiently participate in the development and implementation of the QA program in the exposure to ionizing radiation.

92
The QA program in the exposure to ionizing radiation includes the following management measures: - the order of physical parameter evaluation for radiation devices; - verification of appropriate physical factors employed within implementation of the radiotherapeutic treatment; - quality control (QC) and the exploitation conditions of dosimetric and monitoring equipment; - systematic and high-quality verification, together with independent experts, of the order of the QA program implementation of treatment procedures. QA programs regarding medical exposure within RT application are directly influenced by the implementation, at the due level, of the QC of the RT equipment. This control is conducted at the acquisition and installation of the device with the assessment of its performances. The control is conducted periodically following repairs concerning [7]: - mechanical, electrical, and radiological safety; - mechanical and geometrical characteristics; - dosimetric characteristics of the beams.
The mechanical and electrical safety is assured through the following verification frequency: - display of functioning parameters – daily; - motion command – daily; - entrance door – daily; - emergency radiation shutdown – daily; - shutdown following treatment termination – monthly; - table shift – monthly; - scaling – quarterly. Radiological safety: - audio-video system – daily; - beam command – daily; - monitor – monthly; - patient and personnel protection – annually.
Mechanical and geometrical characteristics: - telemeter for all distances: ±0.2 mm, weekly and after intrventions; - rotation of the bracket support of the radiogenic head in the principal positions for horizontal and vertical beams; tolerance ±0,5º - monthly; - head rotation on the support in reference and scaling position 0 ±0.2 mm – monthly; - isocenter: ±0.2 mm – monthly; - centerer: the point of the beam axis entrance to the collimator axis ±0.2 mm – monthly; - light field that includes the following parameters: conicidence of the light field with radiation field, densitometric comparison with radiation fields, ±0.2 mm – monthly and after interventions; correspondence with the display indicating light field dimension; coincidence of opposite fields; - collimator rotation: ±0.5º - monthly;
- collimator symmetry and parallelism: ±0.2 mm, monthly; - penumbra – monthly [7].
Prior to starting the treatment, all the information delivered to the patient by the attending physician is recorded in the treatment consent that is signed in two copies, one for the patient and the other is attached to the medical chart. The attending physician will actively follow the medical evolution of the patient during the whole treatment period and will complete, at each consult, a monitoring sheet indicating additional investigations that the patient will have to perform during and after the treatment [11, 1, 8].
After the treatment plan has been developed, it is verified through virtual simulation, and final coordinates of the tumor volume are determined, which is indispensable for RT application [11].
After the completion of the virtual simulation, the patient is accompanied to the RT device, initially being instructed on his/her behavior in the treatment room. The radiological technician carefully verifies the patient’s identity (in this regard it is desirable to attach a recently taken photograph of the patient in the clinical observation sheet to avoid his/her confusion with another patient and rule out possible human errors). Further, the radiological technician selects the treatment plan established by special software and sets, if necessary, the positioning systems on the treatment table inviting the patient into the procedure room [11, 1].
During the treatment, the patient is monitored by the radiological technician with the help of an intercom and a camera through which they communicate with each other (the both system must be functional). The correct positioning of the patient is of a paramount importance in order to obtain the expected results. This requires supplemental verification of the patient position with the aid of radiographic imaging techniques. Therefore, a radiographic imaging system must be part of the treatment device.
The position verification is accomplished at particular RT sessions. In this context, the time the patient stays in the procedure room will range from 2-3 minutes to 10-15 minutes (sometimes more) in the case of the sessions where the patient’s position is verified with digital radiographic imaging. It is recommended to hold the first RT sessions in the afternoon when the positioning on the treatment table is verified according to a well-established procedure with the participation of the bioengineer. The time of RT sessions should be observed as much as possible in terms of radiobiological aspect without changing the RT team as they are already familiar with the

93
specificity of each patient and may inform promptly the RT attending physician on possible modifications during the treatment. Discussion. A correct radiation of the patients with malignant neoplasm is possible only if the following principles of the clinical topometry are observed [1]: - establishment of the level of “copying” of the body contour above the projection of the tumor center and decoupling of the contour itself; - accomplishment of examinations to determine the shape and actual sizes of the pathology, its topographic location, lymph circulation pathways, particular features of syntopy with adjacent organs, the depth of the location in the patient’s body; - drafting of the anatomotopographic schemes of the body transversal section at the level of the maximal tumor size; - marking of the tumor projection on the patient’s skin, formation of radiation fields, and determination of the radiation beam centering; - verification of the planning correctness and reproduction of radiation conditions [1].
Simultaneously, the topometric preparation of the patient includes the following measures, as well: 1. Strict individualization for each patient in his/her topometric preparation. 2. Strict examination of the patient in the position that will be applied during the treatment. 3. Maximal approach of the physiological condition of the patient during examination to the physiological condition during RT application (time intervals between meals, acts of defecation and urination, depth of breathing). All these measures are meant to assure an equal degree of the cavitary organ filling and the physiological condition of the organism. 4. Combination of the maximal possibility of the examination precision with assurance of minimal discomfort for the patient and milder conditions of the RT application by the personnel. Most frequently, this refers to accomplishment of radiodiagnostic investigations, early implementation of angiography, lymphography, scintigraphy, computer tomography, magnetic resonance imaging, positron emission tomography etc.
Conclusion: The QA program contributes decidedly to
reduction of the error number in the correct treatment planning. This Program dictates the necessity of the permanent daily team activity and correct delegation of the responsibilities to all the qualified specialists.
In order to obtain a beneficial result for the patient, it is currently necessary to recruit a dietician/nutritionist, speech therapist, physiotherapist, occupational therapist, and
psychologist along with the specialists incorporated into QA program up to now.
Simultaneously with the medical personnel of the institution, a major responsibility in the QA program rests on the medical physicist that is responsible for the maintenance of RT devices; correct drafting of the radiation treatment etc.
The program of quality assurance of RT implementation is directly influenced by the implementation of the quality control of the profile equipment.
Enhanced efficiency of RT may be assured by a correct topometric planning for the patient, adequate behavior of the medical and technical personnel towards the patient etc.
Optimization of the treatment with ionizing radiation may be obtained through multiple activity modalities incorporated into the QA program recurring its major importance.
References
1. A. Roşca, I. Bahnarel, L. Coreţchi. Significance of the quality assurance program execution with ionizing radiation therapy. Methodical instructions, 2014, 18 p. (in Romanian).
2. A. Roşca, L. Agachi. Contribution of medical physicist in radiation protection respecting in the sanitary institution. Methodical instructions, Chişinău, 2014, pp. 3 – 28.
3. Annual General Statistic Report (f.30) of the medical Institution of the Ministry of Health of the Republic of Moldova, 2012 (in Romanian).
4. Cancer – Registry of the Oncology Institute of the Ministry of Health of the Republic of Moldova, 1961-2012 (in Romanian).
5. Cotter G.W., Dobelbower R.R. Jr. Radiation oncology practice accreditation: the American College of Radiation Oncology, Practice Accreditation Program, guidelines and standards. Critical Reviews in Oncology/Hematology. 2005 Aug; 55(2):93-102.
6. Council Directive 2013/59/Euratom of 5 December 2013.
7. E. Bild E. Introduction in Radiation Therapy and Radiation Diagnostic. Iaşi, 2000, 373 p. (in Romanian).
8. Quality Assurance in Radiotherapy. World Health Organization. Geneva, 1988, 52 p.
9. Valentini V., Glimelius B., Frascino V. Quality assurance and quality control for radiotherapy/medical oncology in Europe: guideline development and implementation. European Journal of Surgical Oncology. 2013 Sep; 39(9):938-44.

10. Williamson J.F., Dunscombe P.B., Sharpe M.B., Thomadsen B.R., Purdy J.A., Deye J.A. Quality assurance needs for modern image-based radiotherapy: recommendations from 2007 interorganizational symposium on "quality assurance of radiation therapy: challenges of advanced technology". Int J Radiat Oncol Biol
Phys. 2008; 71 (1 Suppl): S2-12. doi: 10.1016/j.ijrobp.2007.08.080.
11. www.medist.ro/index.php./radioterapie.html.
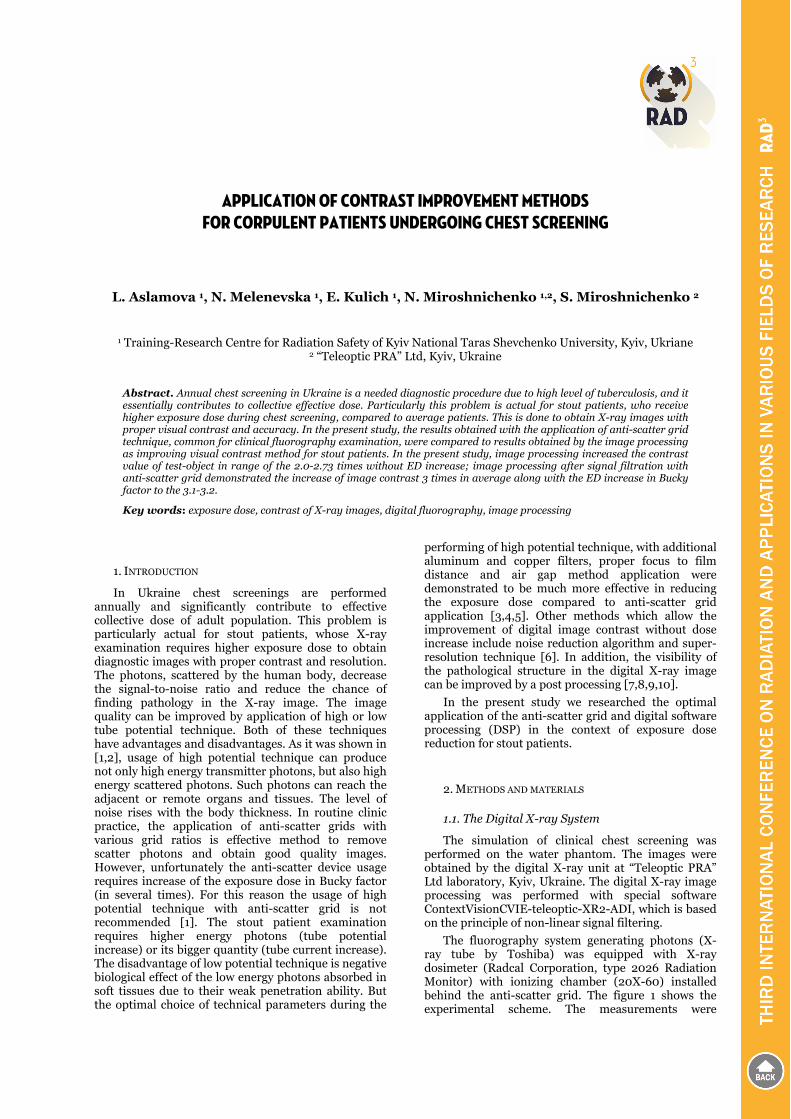
APPLICATION OF CONTRAST IMPROVEMENT METHODS FOR CORPULENT PATIENTS UNDERGOING CHEST SCREENING
L. Aslamova 1, N. Melenevska 1, E. Kulich 1, N. Miroshnichenko 1,2, S. Miroshnichenko 2
1 Training-Research Centre for Radiation Safety of Kyiv National Taras Shevchenko University, Kyiv, Ukriane 2 “Teleoptic PRA” Ltd, Kyiv, Ukraine
Abstract. Annual chest screening in Ukraine is a needed diagnostic procedure due to high level of tuberculosis, and it essentially contributes to collective effective dose. Particularly this problem is actual for stout patients, who receive higher exposure dose during chest screening, compared to average patients. This is done to obtain X-ray images with proper visual contrast and accuracy. In the present study, the results obtained with the application of anti-scatter grid technique, common for clinical fluorography examination, were compared to results obtained by the image processing as improving visual contrast method for stout patients. In the present study, image processing increased the contrast value of test-object in range of the 2.0-2.73 times without ED increase; image processing after signal filtration with anti-scatter grid demonstrated the increase of image contrast 3 times in average along with the ED increase in Bucky factor to the 3.1-3.2.
Key words: exposure dose, contrast of X-ray images, digital fluorography, image processing
1. INTRODUCTION
In Ukraine chest screenings are performed annually and significantly contribute to effective collective dose of adult population. This problem is particularly actual for stout patients, whose X-ray examination requires higher exposure dose to obtain diagnostic images with proper contrast and resolution. The photons, scattered by the human body, decrease the signal-to-noise ratio and reduce the chance of finding pathology in the X-ray image. The image quality can be improved by application of high or low tube potential technique. Both of these techniques have advantages and disadvantages. As it was shown in [1,2], usage of high potential technique can produce not only high energy transmitter photons, but also high energy scattered photons. Such photons can reach the adjacent or remote organs and tissues. The level of noise rises with the body thickness. In routine clinic practice, the application of anti-scatter grids with various grid ratios is effective method to remove scatter photons and obtain good quality images. However, unfortunately the anti-scatter device usage requires increase of the exposure dose in Bucky factor (in several times). For this reason the usage of high potential technique with anti-scatter grid is not recommended [1]. The stout patient examination requires higher energy photons (tube potential increase) or its bigger quantity (tube current increase). The disadvantage of low potential technique is negative biological effect of the low energy photons absorbed in soft tissues due to their weak penetration ability. But the optimal choice of technical parameters during the
performing of high potential technique, with additional aluminum and copper filters, proper focus to film distance and air gap method application were demonstrated to be much more effective in reducing the exposure dose compared to anti-scatter grid application [3,4,5]. Other methods which allow the improvement of digital image contrast without dose increase include noise reduction algorithm and super-resolution technique [6]. In addition, the visibility of the pathological structure in the digital X-ray image can be improved by a post processing [7,8,9,10].
In the present study we researched the optimal application of the anti-scatter grid and digital software processing (DSP) in the context of exposure dose reduction for stout patients.
2. METHODS AND MATERIALS
1.1. The Digital X-ray System
The simulation of clinical chest screening was performed on the water phantom. The images were obtained by the digital X-ray unit at “Teleoptic PRA” Ltd laboratory, Kyiv, Ukraine. The digital X-ray image processing was performed with special software ContextVisionCVIE-teleoptic-XR2-ADI, which is based on the principle of non-linear signal filtering.
The fluorography system generating photons (X-ray tube by Toshiba) was equipped with X-ray dosimeter (Radcal Corporation, type 2026 Radiation Monitor) with ionizing chamber (20X-60) installed behind the anti-scatter grid. The figure 1 shows the experimental scheme. The measurements were
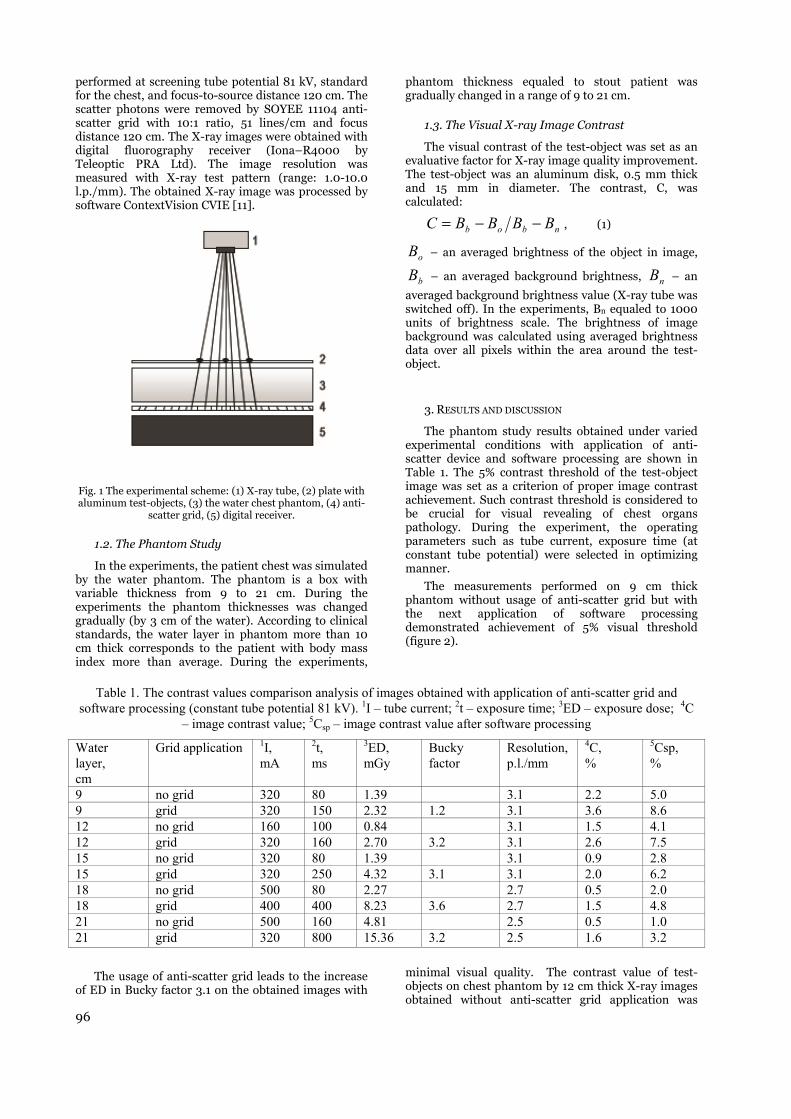
96
performed at screening tube potential 81 kV, standard for the chest, and focus-to-source distance 120 cm. The scatter photons were removed by SOYEE 11104 anti-scatter grid with 10:1 ratio, 51 lines/cm and focus distance 120 cm. The X-ray images were obtained with digital fluorography receiver (Iona–R4000 by Teleoptic PRA Ltd). The image resolution was measured with X-ray test pattern (range: 1.0-10.0 l.p./mm). The obtained X-ray image was processed by software ContextVision CVIE [11].
Fig. 1 The experimental scheme: (1) X-ray tube, (2) plate with aluminum test-objects, (3) the water chest phantom, (4) anti-
scatter grid, (5) digital receiver.
1.2. The Phantom Study
In the experiments, the patient chest was simulated by the water phantom. The phantom is a box with variable thickness from 9 to 21 cm. During the experiments the phantom thicknesses was changed gradually (by 3 cm of the water). According to clinical standards, the water layer in phantom more than 10 cm thick corresponds to the patient with body mass index more than average. During the experiments,
phantom thickness equaled to stout patient was gradually changed in a range of 9 to 21 cm.
1.3. The Visual X-ray Image Contrast
The visual contrast of the test-object was set as an evaluative factor for X-ray image quality improvement. The test-object was an aluminum disk, 0.5 mm thick and 15 mm in diameter. The contrast, C, was calculated:
nbob BBBBC −−= , (1)
oB – an averaged brightness of the object in image,
bB – an averaged background brightness, nB – an
averaged background brightness value (X-ray tube was switched off). In the experiments, Bn equaled to 1000 units of brightness scale. The brightness of image background was calculated using averaged brightness data over all pixels within the area around the test-object.
3. RESULTS AND DISCUSSION
The phantom study results obtained under varied experimental conditions with application of anti-scatter device and software processing are shown in Table 1. The 5% contrast threshold of the test-object image was set as a criterion of proper image contrast achievement. Such contrast threshold is considered to be crucial for visual revealing of chest organs pathology. During the experiment, the operating parameters such as tube current, exposure time (at constant tube potential) were selected in optimizing manner.
The measurements performed on 9 cm thick phantom without usage of anti-scatter grid but with the next application of software processing demonstrated achievement of 5% visual threshold (figure 2).
Table 1. The contrast values comparison analysis of images obtained with application of anti-scatter grid and software processing (constant tube potential 81 kV). 1I – tube current; 2t – exposure time; 3ED – exposure dose; 4C
– image contrast value; 5Csp – image contrast value after software processing
Water layer, cm
Grid application 1I, mA
2t, ms
3ED, mGy
Bucky factor
Resolution, p.l./mm
4C, %
5Сsp, %
9 no grid 320 80 1.39 3.1 2.2 5.0 9 grid 320 150 2.32 1.2 3.1 3.6 8.6 12 no grid 160 100 0.84 3.1 1.5 4.1 12 grid 320 160 2.70 3.2 3.1 2.6 7.5 15 no grid 320 80 1.39 3.1 0.9 2.8 15 grid 320 250 4.32 3.1 3.1 2.0 6.2 18 no grid 500 80 2.27 2.7 0.5 2.0 18 grid 400 400 8.23 3.6 2.7 1.5 4.8 21 no grid 500 160 4.81 2.5 0.5 1.0 21 grid 320 800 15.36 3.2 2.5 1.6 3.2
The usage of anti-scatter grid leads to the increase of ED in Bucky factor 3.1 on the obtained images with
minimal visual quality. The contrast value of test-objects on chest phantom by 12 cm thick X-ray images obtained without anti-scatter grid application was

97
1.5%, after DSP – 4.1% and the exposure dose (ED) was 0.84 mGy. The application of anti-scatter grid allowed the reception of images with 2.6% contrast value but the exposure dose increased in Bucky factor 3.2, ED = 2.70 mGy. After additional DSP it achieved the visual threshold of 5%.
Fig. 2 X-ray images of test-objects obtained for 9 cm thickness
of water phantom: without usage of anti-scatter grid before software processing (1) and after (2); with anti-scatter grid
before software processing (3) and after (4).
The test-objects’ contrast value on the 15 cm thick water phantom X-ray images under minimized working parameters equaled 0.9%, after DSP it increased up to 2.8%, ED = 1.39 mGy. The anti-scatter grid application increased the test-object image contrast value to 2.0% (with ED rise in Bucky factor 3.1 equaled 4.32 mGy) and the next additional DSP improved it up to 6.2%, reaching the visual contrast threshold. The experimental data demonstrated the successful results in obtaining of visual test-object image contrast using digital software processing (figure 3).
Fig. 3 X-ray images of test-objects obtained for 15 cm
thickness of water phantom: without usage of anti-scatter grid before software processing (1) and after (2); with anti-scatter
grid before software processing (3) and after (4).
The next variation of the phantom thickness to 18 and 21 cm demonstrated the almost equal quality image improvement possibilities of anti-scatter device and digital processing on the one hand, and both methods combining efficacy on the others. It should be noted that the fluorographic system resolution decreased from 3.2 p.l./mm to 2.5 p.l./mm. As shown in figure 4, the visual test-object image contrast decreases along with the phantom thickness variation. For the 12 cm phantom water layer, the anti-scatter device and the digital image processing improved the image contrast in 1.7 and 2.7 times respectively. These results show that the digital processing improves the contrast value in 1.6 times compared to the anti-scatter grid application while the exposure dose was 3.2 times less. The efficacies of the anti-scatter device and digital processing decreased along with rise of phantom thickness (15-21 cm) and demonstrated almost the same results in test-object image contrast improvement. The image visual contrast value obtained with anti-scatter grid application was successfully increased up to visual threshold by usage of DSP (15 and 18 cm).
Fig. 4 The graph shows the change in contrast value of test-
object image against water phantom thickness under conditions of software processing and anti-scatter grid
separate or simultaneous application.
The obtained experimental data shows the effectiveness of DSP compared to anti-scatter device in the achievement of visual threshold without delivering high exposure dose to the patient. However, the problem of digital processing application for image quality improvement without the previous anti-scattered grid signal filtering is based on the physical principles of X-ray image obtaining. The anti-scatter device allows increasing the signal-to-noise ratio on the images via removing photons scattered by patient’s body. For this reason, the anti-scatter device cannot be replaced by software processing in case of patient with higher body thickness due to the image artifacts. The reasonable combining of anti-scatter application and additional DSP allows optimizing the exposure dose and receiving the images with a proper visual contrast.
4. CONCLUSION
The X-ray images with visual contrast value of 5% were successfully obtained using the anti-scatter grid and the software processing under minimal operating

98
parameters forming exposure dose delivered to the patient.
The experimental data shows the possibilities of the software processing to increase the test-object contrast value in a range of 2.0-2.73 times without ED increase. The digitally processed image after signal filtration with anti-scatter grid demonstrated the increase of image contrast in an average of 3 times along with the ED increase in Bucky factor 3.1-3.2.
The high exposure dose delivering to the stout patient during the fluorography chest screening can be significantly reduced due to reasonable operating parameters selection, anti-scatter grid application and software processing combining.
REFERENCES
1. K.L. Fung, W.B. Gilboy, "The effect of beam tube potential variation on gonad dose to patients during chestradiography investigated using high sensitivity LiF:Mg, Cu, P thermoluminescent dosemeters", The British Journal of Radiology, 2001, vol. 74, pp 358-367.
2. C.J. Martin, "The importance of radiation quality for optimization in radiology" Biomedical Imaging and Intervention Journal, 2007, vol. 3(2), pp e38.
3. J. Vassileva, "A phantom approach to find the optimal technical parameters for plain chest radiography", The British Journal of Radiology, 2004, vol. 77, pp 648-653.
4. P. Doyle, C.J. Martin, D. Gentle "Dose-image quality optimization in digital chest radiography", Radiation Protection Dosimetry, 2005, vol. 114 (1-3), pp 269-272.
5. J. Vassileva, "A phantom for dose-image quality optimization in chest radiography", The British Journal of Radiology, 2002, vol. 75, pp 837-842.
6. P. Bernhardt, M. Lendl, F. Deinzer, "New technologies to reduce pediatric radiation doses", Pediatric Radiology, 2006, vol. 33 Suppl.2, pp 212-215.
7. U. Redlich, C. Hoeschen, W. Doehring, "Assessment and optimization of the image quality of chest-radiography systems", Radiation Protection Dosimetry, 2005, vol. 114 (1-3), pp 264-268.
8. R. Fukui, R. Ishii, K. Kodani, Y. Kanasaki et al., "Evaluation of a noise reduction procedure for chest radiography", Yonago Acta medica, 2013, vol.56, pp 85-91.
9. E. Michel-Gonzalez, M.H. Cho, S.Y. Lee, "Geometric nonlinear diffusion filter and its application to X-ray imaging", BioMedical Engineering OnLine, 2011.
10. H. Precht, O. Gerke, K. Rosendahl, A. Tingberg, D. Waaler, "Digital radiography: optimization of image quality and dose using multi-frequency software", Pediatric Radiology, 2012, vol. 42, pp 1112-118.
11. ContextVision, Available at: www.contextvision.com

IMPROVEMENT OF PEDIATRIC DIAGNOSTIC IMAGING DUE TO APPLICATION OF DIGITAL MICROFOCUS RADIOGRAPHY
Iuliia Myronova 1, Yuriy Kovalenko 2
1 KRU KTMO, Simferopol, Ukraine 2 National Medical Academy of Postgraduate Education named after P.L. Shupyk, Kyiv, Ukraine
Abstract. Pediatric patients differ significantly from each other as by the geometric dimensions as well as by the density of the structures. The aim of the work is to evaluate the diagnostic capabilities of a digital microfocus radiography in pediatrics. The results of clinical application of digital microfocus X-ray system in a children’s emergency hospital are presented. More than 150 children aged from 1 to 17 years were examined. The examinations were performed using the zoom mode from 1.0 to 2.0. The composition of digital microfocus X-ray system includes an X-ray source (output power less than 100 W, focal spot size less than 50 microns), X-ray universal tripod to perform examinations in the zoom mode, and digital receiver (the size of the working field is 18x24 cm, resolution is 4.0 p.l/ mm). In practical use of digital X-ray microfocus radiography among the children with different damages of upper extremities in 128 (83.7%) patients various fractures of the upper extremities were identified. Among these fractures physeal fractures were identified in 54 (42.2%) patients due to the peculiarities of microfocus X-ray radiography as were described above. Using digital microfocus radiography in the primary magnification mode allows to increase significantly the quality of X-ray images, enables to increase the efficiency of diagnostics of limb injuries in children of different age groups and get a full picture of differential diagnostic of different types of injuries, followed by the choice of the appropriate treatment strategy to help reduce the number of adverse outcomes of injuries.
Key words: pediatric diagnostic imaging, digital microfocus radiography, digital microfocus X-ray system, injuries childhood trauma, simulated fractures, physeal zone fracture
Aim. Traumatic injuries of bones and joints in both adults and children occupy a leading position among emergency conditions. In the total number of injuries, childhood traumas account for 25-30% [1]. Children have their own characteristics in the location and types of injuries of bones and joints. In this case, fractures can be localized in bone and cartilage (physeal or growth zones), representing a feature of children fractures in the form of epiphyseolisis, osteoepiphyseolisis, apophyseolisis. Growth or physeal zone, consisting of proliferating cartilage cells between the epiphysis and metaphysis of growing bones lack the inherent mechanical strength of bone, and therefore, this portion is more susceptible to injury than the surrounding ossified tissue. Fractures often occur in the physeal zone between ossificated and non-ossificated tissues [1,2]. The share of epiphysis among all injuries of bones and joints in childhood and adolescence is rather considerable. According to different authors, physeal fractures constitute from 3% to 60% of all skeletal injuries in children [1,3].
Radiological diagnosis of muskuloskeletal injuries in children is difficult because of anatomical and radiological features of the structure of children’s bones, variants of secondary centers of ossification and hidden fractures [4]. Errors in diagnosis are more frequently observed in children under 3 years. Lack of history, well defined subcutaneous fat, which makes it difficult to palpate, and no displacement of fragments
in fractures complicate right recognition and lead to diagnostic errors. Bruises are often diagnosed in the presence of fracture. Inadequate treatment in such cases leads to further development of deformities and disturbance of limb functions.
The main method of diagnosis of bone and joint injuries after clinical examination is radiography, including digital, which enables quick diagnosis of a fracture, establishing the involvement of neighboring joints, as well as the number and position of the fragments. However, radiographic assessment of fracture may be difficult due to the radiographic anatomy of the skeleton in children and the presence of hidden fractures. Hidden fracture is not visualized on radiographs in standard projections, often involves the physeal zone. According to different authors, hidden fractures account for 0.4 to 65% of delayed diagnoses in pediatric trauma [4, 5].
As physeal zone in young children is presented by cartilage and X-ray non-contrast, X-ray diagnosis of a fracture in the physeal zone (epiphysiolysis) can be provided based only on indirect signs. As a result, nearly 50% of children without fractures obtain unreasonable treatment, while about 30% of children with fractures do not receive appropriate treatment [6]. In this regard, studying of the problem of child trauma remains relevant.
Problems of diagnosis of physeal fractures are studied in a large number of papers of Russian and
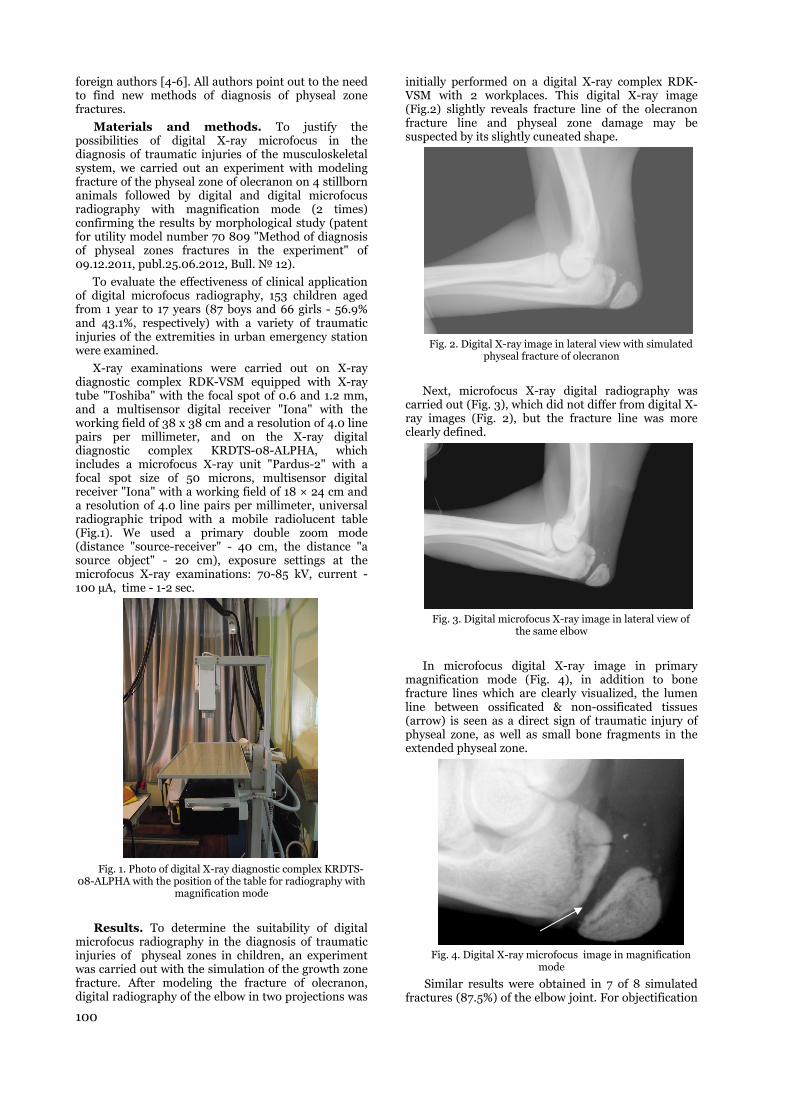
100
foreign authors [4-6]. All authors point out to the need to find new methods of diagnosis of physeal zone fractures.
Materials and methods. To justify the possibilities of digital X-ray microfocus in the diagnosis of traumatic injuries of the musculoskeletal system, we carried out an experiment with modeling fracture of the physeal zone of olecranon on 4 stillborn animals followed by digital and digital microfocus radiography with magnification mode (2 times) confirming the results by morphological study (patent for utility model number 70 809 "Method of diagnosis of physeal zones fractures in the experiment" of 09.12.2011, publ.25.06.2012, Bull. № 12).
To evaluate the effectiveness of clinical application of digital microfocus radiography, 153 children aged from 1 year to 17 years (87 boys and 66 girls - 56.9% and 43.1%, respectively) with a variety of traumatic injuries of the extremities in urban emergency station were examined.
X-ray examinations were carried out on X-ray diagnostic complex RDK-VSM equipped with X-ray tube "Toshiba" with the focal spot of 0.6 and 1.2 mm, and a multisensor digital receiver "Iona" with the working field of 38 x 38 cm and а resolution of 4.0 line pairs per millimeter, and on the X-ray digital diagnostic complex KRDTS-08-ALPHA, which includes a microfocus X-ray unit "Pardus-2" with a focal spot size of 50 microns, multisensor digital receiver "Iona" with a working field of 18 × 24 cm and a resolution of 4.0 line pairs per millimeter, universal radiographic tripod with a mobile radiolucent table (Fig.1). We used a primary double zoom mode (distance "source-receiver" - 40 cm, the distance "a source object" - 20 cm), exposure settings at the microfocus X-ray examinations: 70-85 kV, current - 100 µA, time - 1-2 sec.
Fig. 1. Photo of digital X-ray diagnostic complex KRDTS-
08-ALPHA with the position of the table for radiography with magnification mode
Results. To determine the suitability of digital microfocus radiography in the diagnosis of traumatic injuries of physeal zones in children, an experiment was carried out with the simulation of the growth zone fracture. After modeling the fracture of olecranon, digital radiography of the elbow in two projections was
initially performed on a digital X-ray complex RDK-VSM with 2 workplaces. This digital X-ray image (Fig.2) slightly reveals fracture line of the olecranon fracture line and physeal zone damage may be suspected by its slightly cuneated shape.
Fig. 2. Digital X-ray image in lateral view with simulated
physeal fracture of olecranon
Next, microfocus X-ray digital radiography was carried out (Fig. 3), which did not differ from digital X-ray images (Fig. 2), but the fracture line was more clearly defined.
Fig. 3. Digital microfocus X-ray image in lateral view of
the same elbow
In microfocus digital X-ray image in primary magnification mode (Fig. 4), in addition to bone fracture lines which are clearly visualized, the lumen line between ossificated & non-ossificated tissues (arrow) is seen as a direct sign of traumatic injury of physeal zone, as well as small bone fragments in the extended physeal zone.
Fig. 4. Digital X-ray microfocus image in magnification
mode
Similar results were obtained in 7 of 8 simulated fractures (87.5%) of the elbow joint. For objectification

101
of X-ray results, morphological study of damaged areas was carried out which confirmed the presence of the physeal zone fracture (Fig.5).
Fig.5. Physeal fracture at morphological study
According to the experiment that proved that digital X-ray microfocus radiography, especially in primary magnification mode, could be used in diagnosis of physeal fractures due to visualizing of a lumen line between ossificated & non-ossificated tissues which was regarded as a direct sign of traumatic injury of physeal zone. Visualization of such lumen line is explained by physical and technical characteristics of digital microfocus radiography, first of all such an important feature of microfocus X-ray as phase contrast. On microfocus x-ray images the phase contrast is evidenced by the presence of light and dark lines between tissues with different densities, which significantly improves their visualization.
In practical use of digital X-ray microfocus radiography, of examined children, 128 (83.7%) patients had various fractures of the upper extremities. Among these fractures physeal fractures were identified in 54 (42.2%) patients due to the peculiarities of microfocus X-ray radiography (Fig. 6-8) described above.
Fig. 6. Digital microfocus X-ray image of the right wrist
joint in frontal view of a 14 year old child shows the lumen line in the physeal zone right radius, indicating the presence of slipped epiphysis of the right radius without displacement
(arrow)
Fig. 7. Digital microfocus X-ray image of the right elbow
in 17 year old child shows an intraarticular fracture of the head of right radius with the transition to the neck of the bone
in the form of single trabeculae fracture (arrow)
a
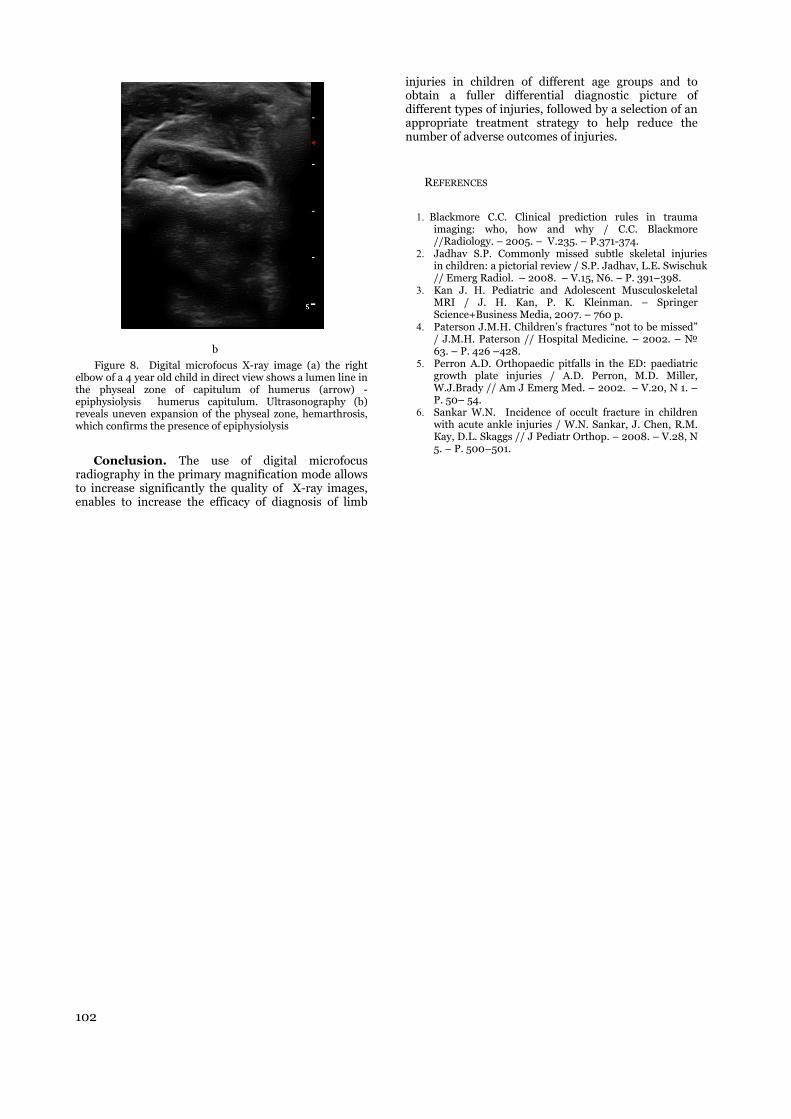
102
b
Figure 8. Digital microfocus X-ray image (a) the right elbow of a 4 year old child in direct view shows a lumen line in the physeal zone of capitulum of humerus (arrow) - epiphysiolysis humerus capitulum. Ultrasonography (b) reveals uneven expansion of the physeal zone, hemarthrosis, which confirms the presence of epiphysiolysis
Conclusion. The use of digital microfocus radiography in the primary magnification mode allows to increase significantly the quality of X-ray images, enables to increase the efficacy of diagnosis of limb
injuries in children of different age groups and to obtain a fuller differential diagnostic picture of different types of injuries, followed by a selection of an appropriate treatment strategy to help reduce the number of adverse outcomes of injuries.
REFERENCES
1. Blackmore C.C. Clinical prediction rules in trauma imaging: who, how and why / C.C. Blackmore //Radiology. – 2005. – V.235. – P.371-374.
2. Jadhav S.P. Commonly missed subtle skeletal injuries in children: a pictorial review / S.P. Jadhav, L.E. Swischuk // Emerg Radiol. – 2008. – V.15, N6. – Р. 391–398.
3. Kan J. H. Pediatric and Adolescent Musculoskeletal MRI / J. H. Kan, P. K. Kleinman. – Springer Science+Business Media, 2007. – 760 р.
4. Paterson J.M.H. Children’s fractures “not to be missed” / J.M.H. Paterson // Hospital Medicine. – 2002. – № 63. – Р. 426 –428.
5. Perron A.D. Orthopaedic pitfalls in the ED: paediatric growth plate injuries / A.D. Perron, M.D. Miller, W.J.Brady // Am J Emerg Med. – 2002. – V.20, N 1. – Р. 50– 54.
6. Sankar W.N. Incidence of occult fracture in children with acute ankle injuries / W.N. Sankar, J. Chen, R.M. Кay, D.L. Skaggs // J Pediatr Orthop. – 2008. – V.28, N 5. – Р. 500–501.
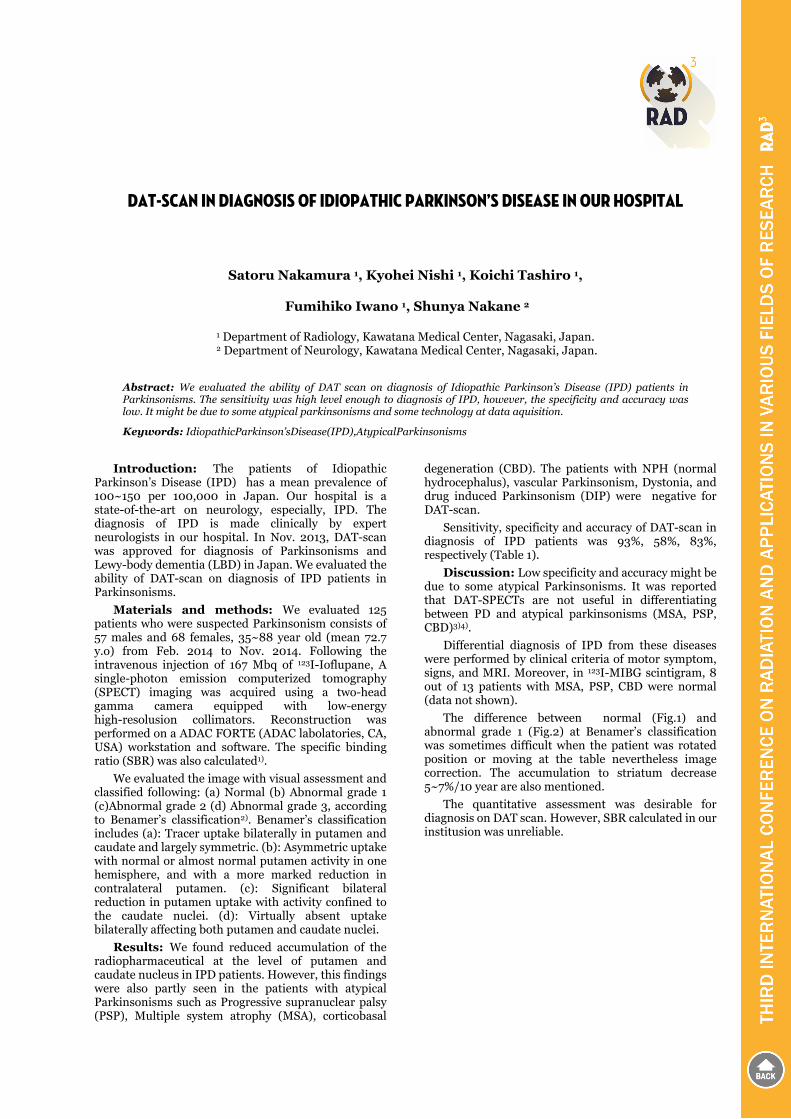
DAT-SCAN IN DIAGNOSIS OF IDIOPATHIC PARKINSON’S DISEASE IN OUR HOSPITAL
Satoru Nakamura 1, Kyohei Nishi 1, Koichi Tashiro 1,
Fumihiko Iwano 1, Shunya Nakane 2
1 Department of Radiology, Kawatana Medical Center, Nagasaki, Japan. 2 Department of Neurology, Kawatana Medical Center, Nagasaki, Japan.
Abstract: We evaluated the ability of DAT scan on diagnosis of Idiopathic Parkinson’s Disease (IPD) patients in Parkinsonisms. The sensitivity was high level enough to diagnosis of IPD, however, the specificity and accuracy was low. It might be due to some atypical parkinsonisms and some technology at data aquisition.
Keywords: IdiopathicParkinson’sDisease(IPD),AtypicalParkinsonisms
Introduction: The patients of Idiopathic Parkinson’s Disease (IPD) has a mean prevalence of 100~150 per 100,000 in Japan. Our hospital is a state-of-the-art on neurology, especially, IPD. The diagnosis of IPD is made clinically by expert neurologists in our hospital. In Nov. 2013, DAT-scan was approved for diagnosis of Parkinsonisms and Lewy-body dementia (LBD) in Japan. We evaluated the ability of DAT-scan on diagnosis of IPD patients in Parkinsonisms.
Materials and methods: We evaluated 125 patients who were suspected Parkinsonism consists of 57 males and 68 females, 35~88 year old (mean 72.7 y.o) from Feb. 2014 to Nov. 2014. Following the intravenous injection of 167 Mbq of 123I-Ioflupane, A single-photon emission computerized tomography (SPECT) imaging was acquired using a two-head gamma camera equipped with low-energy high-resolusion collimators. Reconstruction was performed on a ADAC FORTE (ADAC labolatories, CA, USA) workstation and software. The specific binding ratio (SBR) was also calculated1).
We evaluated the image with visual assessment and classified following: (a) Normal (b) Abnormal grade 1 (c)Abnormal grade 2 (d) Abnormal grade 3, according to Benamer’s classification2). Benamer’s classification includes (a): Tracer uptake bilaterally in putamen and caudate and largely symmetric. (b): Asymmetric uptake with normal or almost normal putamen activity in one hemisphere, and with a more marked reduction in contralateral putamen. (c): Significant bilateral reduction in putamen uptake with activity confined to the caudate nuclei. (d): Virtually absent uptake bilaterally affecting both putamen and caudate nuclei.
Results: We found reduced accumulation of the radiopharmaceutical at the level of putamen and caudate nucleus in IPD patients. However, this findings were also partly seen in the patients with atypical Parkinsonisms such as Progressive supranuclear palsy (PSP), Multiple system atrophy (MSA), corticobasal
degeneration (CBD). The patients with NPH (normal hydrocephalus), vascular Parkinsonism, Dystonia, and drug induced Parkinsonism (DIP) were negative for DAT-scan.
Sensitivity, specificity and accuracy of DAT-scan in diagnosis of IPD patients was 93%, 58%, 83%, respectively (Table 1).
Discussion: Low specificity and accuracy might be due to some atypical Parkinsonisms. It was reported that DAT-SPECTs are not useful in differentiating between PD and atypical parkinsonisms (MSA, PSP, CBD)3)4).
Differential diagnosis of IPD from these diseases were performed by clinical criteria of motor symptom, signs, and MRI. Moreover, in 123I-MIBG scintigram, 8 out of 13 patients with MSA, PSP, CBD were normal (data not shown).
The difference between normal (Fig.1) and abnormal grade 1 (Fig.2) at Benamer’s classification was sometimes difficult when the patient was rotated position or moving at the table nevertheless image correction. The accumulation to striatum decrease 5~7%/10 year are also mentioned.
The quantitative assessment was desirable for diagnosis on DAT scan. However, SBR calculated in our institusion was unreliable.
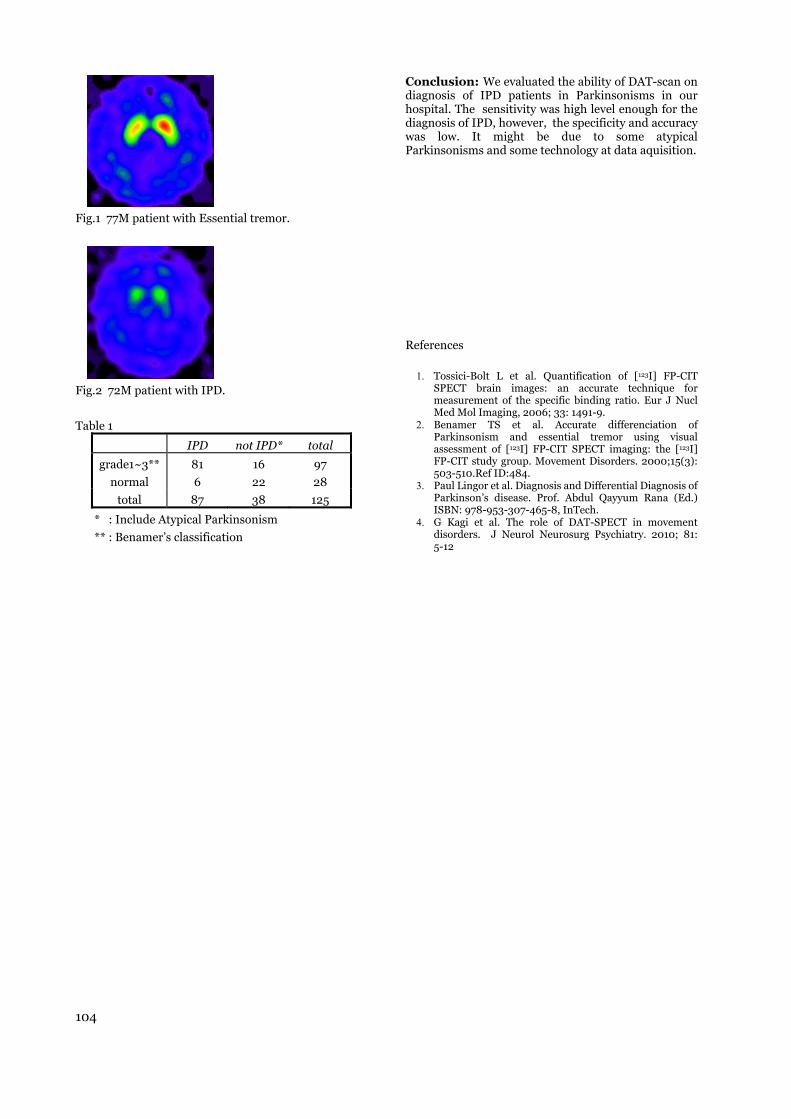
104
Fig.1 77M patient with Essential tremor.
Fig.2 72M patient with IPD.
Table 1
IPD not IPD* total
grade1~3** 81 16 97
normal 6 22 28
total 87 38 125
* : Include Atypical Parkinsonism
** : Benamer’s classification
Conclusion: We evaluated the ability of DAT-scan on diagnosis of IPD patients in Parkinsonisms in our hospital. The sensitivity was high level enough for the diagnosis of IPD, however, the specificity and accuracy was low. It might be due to some atypical Parkinsonisms and some technology at data aquisition.
References
1. Tossici-Bolt L et al. Quantification of [123I] FP-CIT
SPECT brain images: an accurate technique for measurement of the specific binding ratio. Eur J Nucl Med Mol Imaging, 2006; 33: 1491-9.
2. Benamer TS et al. Accurate differenciation of Parkinsonism and essential tremor using visual assessment of [123I] FP-CIT SPECT imaging: the [123I] FP-CIT study group. Movement Disorders. 2000;15(3): 503-510.Ref ID:484.
3. Paul Lingor et al. Diagnosis and Differential Diagnosis of Parkinson’s disease. Prof. Abdul Qayyum Rana (Ed.) ISBN: 978-953-307-465-8, InTech.
4. G Kagi et al. The role of DAT-SPECT in movement disorders. J Neurol Neurosurg Psychiatry. 2010; 81: 5-12

POSSIBILITIES OF THE BEAM DIAGNOSTICS AT PATHOLOGY OF A VERTEBRAL ARTERY
V.V. Shchedrenok 1, T.V. Zakhmatova 2, O.V. Moguchaya 1, 2, I.V. Zuev 1, K.I. Sebelev 1, 2
1Russian Polenov Neurosurgical Institute, Saint Petersburg, Russia 2Mechnikov Northwestern State Medical University, Saint Petersburg, Russia
Abstract. The research objective was the development of a method for the assessment of vertebral artery (VA) compression degree in the vertebral canal by CT and color duplex scanning (CDS) at cervical degenerative dystrophic diseases (DDD) and spinal injury (SI). Materials and methods. 110 patients with cervical DDD and SI were examined clinically and using beam. CT-morphometry was used to measure cross section area of the VA canal at the level of C3-C6 on both sides. The presence and degree of stenosis was revealed and the cross-section area of the canal (SC) at the level of the stenosis was calculated. CDS was performed and the cross-sectional area of the artery (SA) on the side of pathology outside the stenotic area was determined. Compression index was calculated (IC) by the formula IC=⅓SC:SA. When the index was 1.0 and over, no compression was observed, when it was within the ranges of 0.9 - 0.7 moderate compression of the artery was diagnosed, when it was from 0.6 to 0.4 significant compression was observed and when below 0.4 marked compression was registered. Results and discussion. Vascular geometry in the form of VA at CDS stroke deformation was found in most patients with SI (87.2%), and DDD (73.0%). Moderate compression occurred in 12.7% of cases at DDD, in 19.1% - at SI, significant – in 3.2% and 8.5%, respectively, expressed compression was found only at SI (4.3%). Systemic hemodynamic significance of local vertebral influences at DDD was found only in isolated cases (3.8%), while at SI – in 11.6% of patients. The results obtained should be considered when determining the course of treatment. The diagnostic indicators of the effectiveness of the proposed method using CT and CDS are comparable with the results of CT-angiography. Conclusions. The method of VA compression detection in vertebral canal allows to calculate the degree of expression of extravascular influences on the artery and thus choose the tactics for further surgical treatment.
Key words: color duplex scanning, vertebral artery, degenerative cervical diseases, spinal injury, extravascular compression.
1. INTRODUCTION
The study of hemodynamics in vertebral arteries (VA) at norm and disease attracts the attention of many researchers [1-5]. Degenerative dystrophic diseases (DDD) are most common for cervical spine disorders [6-8]. Various aspects of cervical spinal injury (SI) are well described in scientific literature: classification and epidemiology [9], diagnostics, clinical management [10, 11] and surgical treatment of the patients [12-15].
Researches devoted to the study of VA pathology at SI, are based, as a rule, on radiopaque angiography and magnetic resonance angiography (MRA) [16] and mainly cover VA dissection problem [17]. The lack of common criteria and approaches to the evaluation of color duplex scanning (CDS) results, their comparison with the data of computed tomography (CT), MRI, MRA and CT-angiography used to identify VA extravasal compression, necessitates the improvement of methods of neuroimaging in diagnostics of VA pathology.
2. RESEARCH OBJECTIVE
The research objective was the development of a method for the assessment of VA compression degree in the vertebral canal by CT and CDS at cervical DDD and SI.
3. MATERIALS AND METHODS
A comprehensive clinical and beam survey was performed on 110 patients (47 with SI and 63 with DDD). The examination consisted of assessment of neurological and orthopedic status, plain and functional spine radiography, MRI, MRA, CT, CT-angiography and CDS. Radiological diagnostics was performed using digital x-ray system with two tubes «Easy Diagnost Eleva» (Philips), MRI «Signa Exite 1.5T» (GE), CT «Brilliance 6S» (Philips). At beam survey, morphometry was carried out with canal VA cross-area measurement at the level of the C3-C6-vertebra on both sides using visualization console program Viewer. Then, the presence of bone (according to CT) compression was determined and comparison of cross-sectional area of VA canal on the side of the pathology with the opposite side was made (Fig. 1).

106
a b
Fig. 1 CT-morphometry. Measurement of cross-sectional area of VA canals at the level of the C3-vertebra (a) and C4-vertebra
(b) on both sides
«Vivid S6» (GE) was used for CDS. Blood flow rate (peak systolic BF rate, end-diastolic BF rate, time-averaged maximum BF flow rate) and peripheral resistance indexes (Gosling ripple index, Pourcelot resistance index, systolic diastolic ratio) were analyzed in four VA segments (V1-V4) and basilar artery (BA). The total volumetric blood flow in VA was calculated at the extracranial level.
Determining the degree of VA compression in the same canal, it is necessary to consider VA diameter on the side of the pathology since the diameters of the right and left VA can vary considerably. Therefore, a method was suggested when at CT VA canal was examined, the presence and degree of its stenosis was determined, cross-sectional area of VA (SC) canal at the level of the stenosis was calculated. Full field CDS was performed and the cross-sectional area of the artery (SA) on the side of pathology outside the area of stenosis determined. Expected VA compression index (IC) was calculated according to the formula IC=⅓SC:SA. At index value of 1.0 or more, the compression was absent, when it ranged from 0.9 to 0.7 moderate VA compression was registered, from 0.6 to 0.4 – significant, below 0.4 – marked compression was observed (Fig. 2).
a b
Fig. 2 Moderate compression of the left VA (IC=0.72): stenosis of VA canal at the level of С6-vertebra on the left (the cross-sectional area of VA (SC) canal is 21.5 mm2) (a), the cross-
sectional area of the left VA (SA) is 10 mm2 (b)
Statistical processing of the obtained results was carried out using the mathematical package «Statistica 7» (StatSoftInc) for «Windows XP». Extensive ratios (%), describing the relation of parts to a whole, as well as simple averages (M) and the mean errors of arithmetic mean values (m) due to the amplitude of variation series were calculated during statistical data processing. The probability of an erroneous deviation of a zero hypothesis was tested by χ2 criterion; difference was considered authentic (R) at the reached significance value (p) less than 0.05.
4. Results and discussion
Women prevailed among patients with DDD (67%), while men prevailed among patients with SI (83%), mean age was 54±5.2 (p=0.005) and 38±6.5 (p=0.001), respectively. No significant differences in
mean VA diameters in two groups of patients were identified. Injuries were caused by road traffic accidents (40.4%), diving in shallow water (21.2%), domestic injury (32.0%), falls from height (4.3%) and sports injuries (2.1%).
During beam examination, the following injuries were found: fractures of the dens process of C2-vertebra (8.5%), compressive, fragment and compressive-fragment fractures (61.7%) and fracture-dislocations of the vertebrae (25.5%), injury of the cervical spine with foci of spinal cord (4.3%), traumatic hernia of intervertebral discs (6.4%) and multiple injuries (6.4%).
According to the results of beam diagnostics the following changes were revealed in patients with DDD: intervertebral disc (IVD) hernias with the compression of the spinal roots and cord (55.6%), IVD hernias without the compression of neural structures (19.0%), vertebral osteoarthrosis with the compression of the spinal roots and cord (20.6%), multiple IVD protrusions without the compression of neural structures (4.8%).
CDS showed disorders of the vascular geometry in the form of VA stroke deformation, mainly at C4–C5–C6-vertebra level (Fig. 3) in most patients with SI (87.2%), and DDD (73.0%); at the same time hemodynamic significant deformations with bendings, such as S-shaped and V-shaped (Tab. 1), were more common for SI than DDD patients.
a b c
Fig. 3 CDS: C-shaped tortuosity (а) VА at DDD, S-shaped (b) and V-shaped (c) VА tortuosity at SI
Table 1 Distribution of patients due to the forms of VA at DDD and SI deformations
Forms of VA deformation in canal
DDD N=63
SIN=47
Abs. % Abs. % Angle deformation 32 50.7 23 48.9С-shape tortuosity 9 14.3 8 17.0 S-shape tortuosity 3 4.8 6 12.8 V-shape tortuosity 2 3.2 4 8.5 Straight stroke 17 27 6 12.8 In all 63 100 47 100
In VA tortuous stroke, local hemodynamic shift in the form of acceleration performance for more than 30% of the original flow rate was registered in 25.2% of cases at DDD and in 31.6% at SI (Fig. 4), which testified to the vertebral influences on VA at this level. Local hemodynamic shift in the form of acceleration performance in the field of deformations was significantly higher at SI (p=0,032) than at DDD.
Determining the degree of VA compression due to the suggested method, moderate compression (IC=0.7-0.9) was found in 12.7% at DDD and in 19.1% at SI, significant (IC=0.4-0.6) – in 3.2% and in 8.5%, respectively, marked compression (IC=0.4 and less) was registered only at SI (4.3%); in other cases no VA
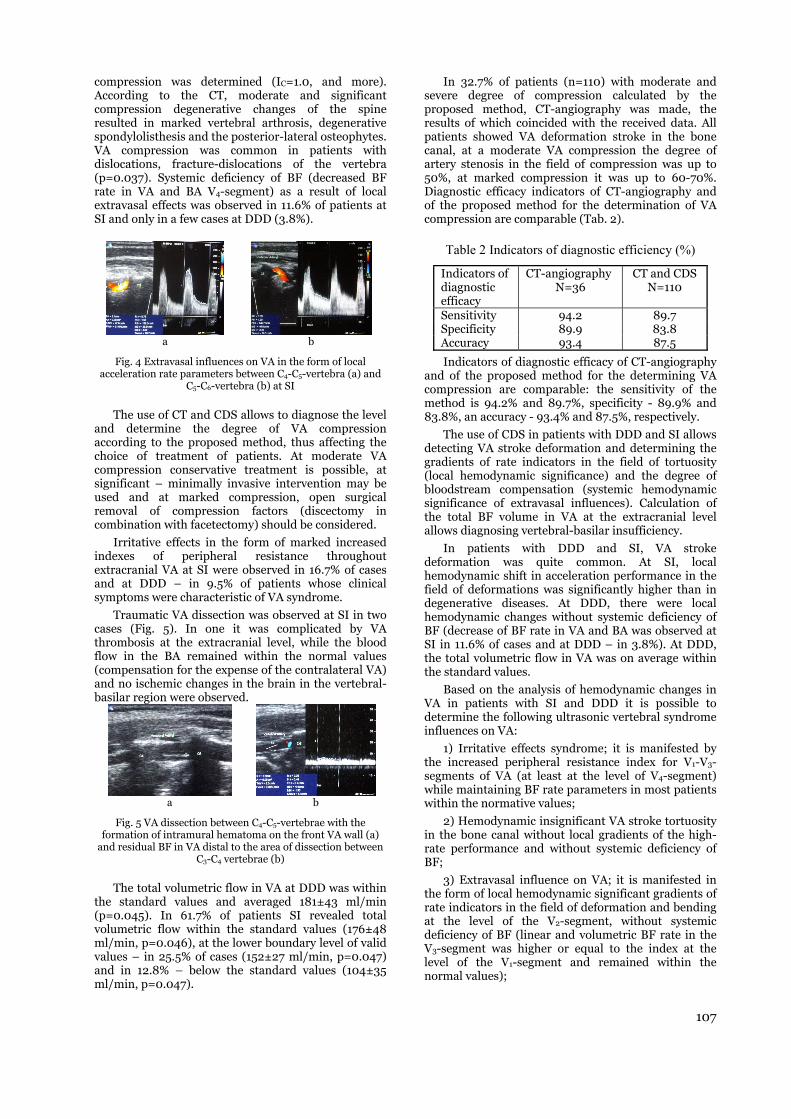
107
compression was determined (IC=1.0, and more). According to the CT, moderate and significant compression degenerative changes of the spine resulted in marked vertebral arthrosis, degenerative spondylolisthesis and the posterior-lateral osteophytes. VA compression was common in patients with dislocations, fracture-dislocations of the vertebra (p=0.037). Systemic deficiency of BF (decreased BF rate in VA and BA V4-segment) as a result of local extravasal effects was observed in 11.6% of patients at SI and only in a few cases at DDD (3.8%).
a b
Fig. 4 Extravasal influences on VA in the form of local acceleration rate parameters between C4-C5-vertebra (a) and
C5-C6-vertebra (b) at SI
The use of CT and CDS allows to diagnose the level and determine the degree of VA compression according to the proposed method, thus affecting the choice of treatment of patients. At moderate VA compression conservative treatment is possible, at significant – minimally invasive intervention may be used and at marked compression, open surgical removal of compression factors (discectomy in combination with facetectomy) should be considered.
Irritative effects in the form of marked increased indexes of peripheral resistance throughout extracranial VA at SI were observed in 16.7% of cases and at DDD – in 9.5% of patients whose clinical symptoms were characteristic of VA syndrome.
Traumatic VA dissection was observed at SI in two cases (Fig. 5). In one it was complicated by VA thrombosis at the extracranial level, while the blood flow in the BA remained within the normal values (compensation for the expense of the contralateral VA) and no ischemic changes in the brain in the vertebral-basilar region were observed.
a b
Fig. 5 VA dissection between C4-C5-vertebrae with the formation of intramural hematoma on the front VA wall (a)
and residual BF in VA distal to the area of dissection between C3-C4 vertebrae (b)
The total volumetric flow in VA at DDD was within the standard values and averaged 181±43 ml/min (p=0.045). In 61.7% of patients SI revealed total volumetric flow within the standard values (176±48 ml/min, p=0.046), at the lower boundary level of valid values – in 25.5% of cases (152±27 ml/min, p=0.047) and in 12.8% – below the standard values (104±35 ml/min, p=0.047).
In 32.7% of patients (n=110) with moderate and severe degree of compression calculated by the proposed method, CT-angiography was made, the results of which coincided with the received data. All patients showed VA deformation stroke in the bone canal, at a moderate VA compression the degree of artery stenosis in the field of compression was up to 50%, at marked compression it was up to 60-70%. Diagnostic efficacy indicators of CT-angiography and of the proposed method for the determination of VA compression are comparable (Tab. 2).
Table 2 Indicators of diagnostic efficiency (%)
Indicators of diagnostic efficacy
CT-angiography N=36
CT and CDS N=110
Sensitivity 94.2 89.7Specificity 89.9 83.8Accuracy 93.4 87.5
Indicators of diagnostic efficacy of CT-angiography and of the proposed method for the determining VA compression are comparable: the sensitivity of the method is 94.2% and 89.7%, specificity - 89.9% and 83.8%, an accuracy - 93.4% and 87.5%, respectively.
The use of CDS in patients with DDD and SI allows detecting VA stroke deformation and determining the gradients of rate indicators in the field of tortuosity (local hemodynamic significance) and the degree of bloodstream compensation (systemic hemodynamic significance of extravasal influences). Calculation of the total BF volume in VA at the extracranial level allows diagnosing vertebral-basilar insufficiency.
In patients with DDD and SI, VA stroke deformation was quite common. At SI, local hemodynamic shift in acceleration performance in the field of deformations was significantly higher than in degenerative diseases. At DDD, there were local hemodynamic changes without systemic deficiency of BF (decrease of BF rate in VA and BA was observed at SI in 11.6% of cases and at DDD – in 3.8%). At DDD, the total volumetric flow in VA was on average within the standard values.
Based on the analysis of hemodynamic changes in VA in patients with SI and DDD it is possible to determine the following ultrasonic vertebral syndrome influences on VA:
1) Irritative effects syndrome; it is manifested by the increased peripheral resistance index for V1-V3-segments of VA (at least at the level of V4-segment) while maintaining BF rate parameters in most patients within the normative values;
2) Hemodynamic insignificant VA stroke tortuosity in the bone canal without local gradients of the high-rate performance and without systemic deficiency of BF;
3) Extravasal influence on VA; it is manifested in the form of local hemodynamic significant gradients of rate indicators in the field of deformation and bending at the level of the V2-segment, without systemic deficiency of BF (linear and volumetric BF rate in the V3-segment was higher or equal to the index at the level of the V1-segment and remained within the normal values);
108
4) VA extravasal compression with hemodynamic significant local gradients of rate indicators and system of the deficit of BF. It is manifested by the increased peripheral resistance index in the proximal zone of compression, increased BF in the area of VA stroke deformation, decreased BF and peripheral resistance index distal to the zone of compression, decrease of the linear and volumetric BF rate in V3-segment comparing to the V1-segment, decrease of BF rate in intracranial department of VA;
5) Venous blood circulation in the vertebral-basilar region is manifested in the form of dilatation of the vertebral veins with acceleration rate parameters in the horizontal position of the patient; syndrome of venous disturbance of circulation in most patients was combined with other ultrasonic syndromes.
5. Conclusions
The method for determining VA compression in the bone canal was proposed. It is based on the comparison of the cross-sectional area of the canal of the artery at the level of pathology according to the CT and the area of its cross-section outside the zone of compression according to the color duplex scanning, which allows calculating the severity of extravasal influences on the vessel.
A moderate compression occurred in 12.7% of patients with degenerative dystrophic diseases and in 19.1% of cases with spinal injury; significant compression was registered in 3.2% and 8.5% of cases, respectively; and marked compression was found only at spinal injury (4.3%). At spinal injury, systemic hemodynamic significance of local vertebral influence was observed in 11.6% of patients and at degenerative diseases only in a few cases (3.8%).
Determination of the degree of compression of the vertebral artery affects the tactics for the further treatment: at moderate compression conservative treatment is possible, at a significant – minimally invasive intervention and at marked – open surgical removal of compression factors should be considered.
Analysis of hemodynamic changes in VA in patients with injuries and diseases of the cervical backbone revealed the main ultrasonic vertebral syndrome influences on the artery.
REFERENCES
1. T.M. Buckenham and I.A. Wright, “Ultrasound of the extracranial vertebral artery”, Br. J. Radiology, vol. 77, pp. 15–20, №913, January 2004.
2. B. George, М. Brubeau and R.E. Spetzier, “Pathology and Surgery around Vertebral Artery”, Paris: Springer-Verlag France, 2012.
3. J.U. Harrer, T. Wessels, S. Poerwowidjojo, W. Möller-Hartmann and C. Klötzsch, “Three-dimensional color-
coded duplex sonography for assessment of the vertebral artery origin and vertebral artery stenosis”, J. Ultrasound Med., vol. 23, pp. 1049–1056, №8, August 2004.
4. A.M. Khachatryan and D.S. Sizgunov, “The spiritus-procaine blockades in the treatment of the vertebral artery syndrome”, Eur. J. Natural History, p. 38, N 5, 2008.
5. К. Yamaki, Т. Saga, Т. Hirata, M. Sakaino, M. Nohno, S. Kobayashi and T. Hirao, “Anatomical study of the vertebral artery in Japanese adults”, Anat. Sci. Int., vol. 81, pp. 100–106, N 2, 2006.
6. N. Boos and M. Aebi, “Spinal Disorders: Fundamentals of Diagnosis and Treatment”, Berlin: Springer-Verlag Berlin Heidelberg, 2008.
7. L. Kapural, P. Kim and T. Deer, “Diagnosis, Management, and Treatment of Discogenic Pain”, Philadelphia, NY: Elsevier Science, 2011.
8. A.G. Todd, Cervical spine: degenerative conditions, Curr. Rev. Musculoskeletal Med., vol. 4, pp. 168–174, N 4, December 2011.
9. R.M. Hasler, A.K. Exadaktylos, O. Bouamra, L.M. Benneker, M. Clancy, R. Sieber, H. Zimmermann and F. Leck, “Epidemiology and Predictors of Spinal Injury in Adult and Major Trauma Patients: European Cohort Study”, Eur. Spine J., vol. 20, pp. 2174–2180, N 12, December 2011.
10. A. Bozzo, J. Marcoux, M. Radhakrishna, J. Pelletier and B. Goulet, “The Role of Magnetic Resonance Imaging in the Management of Acute Spinal Cord Injury”, J. Neurotrauma, vol. 28, pp. 1401–1411, №8, August 2011.
11. J.F. Holmes and R. Akkinepalli, “Computed tomography versus plain radiography to screen for cervical spine injury: a meta-analysis”, J. Trauma, vol. 58, pp. 902–905, N 5, May 2005.
12. M. Aebi, “Surgical Treatment of Upper, Middle and Lower Cervical Injuries and Non-unions by Anterior Procedures”, Eur. Spine J., vol. 19, suppl. 1, pp. 33–39, March 2010.
13. I.T. Benli and А. Kaya, “Complications of the cervical spine surgery”, J. Turkish Spinal Surg., vol. 17, pp. 15–32, N 2, 2006.
14. P.M. Parizel, T. van der Zijden, S. Gaudino, M. Spaepen, M.H.J. Voormolen, C. Venstermans, F. De Belder, L. van den Hauwe and J. Van Goethem “Trauma of The Spine and Spinal Cord: Imaging Strategies”, Eur. Spine J., vol. 19, suppl. 1, pp. 8–17, March 2010.
15. P.M.J. Peloso, A. Gross, T. Haines, K. Trinh, C.H. Goldsmith and S.J. Burnie, “Medicinal and Injection Therapies for Mechanical Neck Disorders (Review)”, Cochrane Library: John Wiley & Sons, issue 10, pр.1-9, 2011.
16. D. Friedman, A. Flanders, C. Thomas and W. Millar, “Vertebral artery injury after acute cervical spine trauma: rate of occurrence as detected by MR angiography and assessment of clinical consequences”, Am. J. Roentgenology, vol. 164, pp. 443–447, №2, February 1995.
17. J.P. Iannotti and R.D. Parker, “The Netter Collection of Medical Illustrations: Musculoskeletal System. Part II: Spine and Lower Limb”, Philadelphia: Elsevier Saunders, 2012.
RADIOLOGICAL IMAGES AND PROGNOSIS OF PNEUMOCONIOSES IN FUNDAMENTAL INDUSTRIES IN BULGARIA
E. Petrova
Tokuda Medical Center, Tokuda Hospital Sofia, 1407, Sofia, Bulgaria
Abstract. The object of the study are lung X-ray findings and diseases of 480 miners exposed to quartz in coal mining, and lead-zinc mining, 120 workers exposed to mixed asbestos/quartz containing dust (MAQCD), and control group of 28 non-exposed individuals. ILO International Classification of Radiographs of Pneumoconiosis (ILO’80) is used for x-ray reading and diagnostics. Methods: A cross sectional case control study of x-ray findings on chest radiographs. Information collection for dust exposure. Using of SPSS software. Results: P1/1 small round opacities have been found amongst 8 (40.0%) black, 6 (30.0%) brown, 2 (10.0%) anthracite coal miners, and 4 (20.0%) workers exposed to MAQCD. P0/1 have been detected amongst 11 (9.5%) brown coal miners, 24 (21.1%) black, 10 (18.9%) – anthracite coal miners, 34 (27.9%) lead–zinc ore miners, and 8 (7.5%) workers exposed to MAQCD. P0/1 have been found amongst 11 (9.5%) brown, 24 (21.1%) black, 10 (18.9%) anthracite coal miners, and 34 (27.9%) lead–zinc ore miners, and 8 (7.5%) workers exposed to MAQCD. Р1/0 have been detected amongst 9 (7.8%) brown, 39 (28.3%) black, 14 (26.4%) anthracite coal miners, 40 (32.0%) lead–zinc miners, and 12 (11.2%) workers exposed to MAQCD. T0/1, t1/1, and t½ irregular opacities have been found amongst 10 (8.6%) brown, 22 (19.5%) black mining, 13 (24.5%) anthracite coal mines, 3 (2.4%) lead zinc miners, and 30 (27.8%) MAQCD exposed workers. S2/1 - s3/3+ irregular opacities (asbestosis) have been found amongst 12 (11.1%) MAQCD exposed workers. T2/1-t3/3+ (asbestosis) have been detected amongst 28 (25.9%) MAQCD exposed workers. Pl (pleural fibrosis, plaques) have been detected amongst 53 (49.1%) MAQCD exposed workers, 27 (22.0%) lead-zinc miners, 6 (11.3%) anthracite, 9 (7.8%) brown, and 8(7.1%) black coal miners (Р<0.0001). Calcified pleural plaques (PLс) have been detected amongst 10 (83.3%) last workers exposed to MAQCD, and 2 (1.8%) black coal miners. Pl and Plс have been predominated amongst MAQCD exposed workers (Р<0.0001). Conclusion: P1/1 initial silicosis has been found amongst 16 miners, 4 р1/1 mixed pneumoconioses due to MAQCD exposure in KZM, 43 asbestoses amongst workers in Steam power plant and brakes production. The average MAQCD exposure is 16 years with 17 year latent period. The asbestos pleural fibrosis and calcified plaques are predominated. Due to the high dust levels in the mines, the levels of MAQCD, the dose/effect studies ‘information, and the dynamics of pneumoconiosis diseases it is possible to prognosticate the development of silicosis, asbestosis and asbestos pleural diseases in future 10-15-20 years.
Key words: silicon dioxide, mixed asbestos and quartz containing dust (MAQCD) ILO’80, chest radiography, silicosis, mixed pneumoconiosis
1. INTRODUCTION
The early detection of the radiological impairments and the diagnostics of pneumoconiosis related to quartz, asbestos, mixed and other mineral dusts exposure are taken into account by many authors during the last years [1 - 11]. The characteristics of the health status of workers exposed to mineral dust above the permissible levels (PL) in Bulgaria during the last two to three decades were discussed by a number authors [2, 3, 6]. A new assessment of the chest X-ray changes among Bulgarian workers exposed to occupational mineral dust is necessary, as well as early detection of the diseases.
THE AIM of the study is to characterize the main radiological finds, and dust lung diseases amongst workers from Bulgarian mine, and productions related to mixed asbestos and quartz containing dust (MAQCD).
2. MATERIAL AND METHODS
A case control cross sectional screening study of chest radiography deviations of 480 quartz exposed miners (116 brown coal miners, 113 black coal miners, 53 - anthracite coal miners, 198 lead-zinc miners, 120 workers exposed to MAQCD, and 28 non-exposed persons (control group), worked during 1985 – 2003 was done. The radiographs were accounted according to ILO International Classification of Radiographs of Pneumoconiosis, Geneva, 1980 [ILO’80]. The collected information for workers exposed to dust in the work environment air in different enterprises was summarized. The finds on the radiography of the lung, and the high levels of respirable dust and the concentrations of the dust in the work environment air are basal circumstances for appearance of pulmonary disease caused by non-organic dusts. SPSS software was used. Pearson Chi-Square, Likelihood Ratio and

110
statistical significance (Р) were calculated. The average dust exposure duration amongst workers from black mining has been 10.4 year, followed by mixed asbestos containing dust (MQAED) exposed workers - 16.52 y, workers in led zinc ore mines -10.95 y, anthracite mines - 12.53 y, and brown coal miners -12.59 years. The average age amongst dust exposed miners has been 38.49; asbestos exposed workers - 45.57 y, and for unexposed persons (control group) - 42.33 years. The average duration of the latent period amongst asbestos exposed workers and exposed to MQAED has been 17.45y. Tobacco smokers and alcohol abusers amongst examined workers have exceeded 60%, excluding smokers in control group. The highest dust exposure amongst miners in first and second risk groups from all mines was predominated. The lower exposure has been found in black coal mines. The number of asbestos exposed workers in KCM has been 71, followed by workers from clutch production (29p.). The number of fitter’s boiler equipment in power plant (20p.) was the lowest.
3. RESULTS
Fig. 1, 2, 3. resp. р 0/1, р 1/0 and р 1/1 small round opacities (ILO’80) found amongst quartz exposed
miners and workers from mixed quartz and asbestos exposed group (MQAEG)
Statistics: Chi-Square Tests: Pearson Chi-Square: 23.366; Р = 0.009;
P1/1 small round opacities amongst non - exposed individual (control group), as well as in the group of lead - zinc ore miners were not found. P1/1 small round opacities amongst 6 (30.0%) brown coal miners, 8 (40.0%) black coal miners, and 2 (10.0%) anthracite coal miners were detected [fig. 3]. P1/1 small opacities among 4 (20.0%) workers from MQAEG were detected. A statistical significance of the distribution of р small round opacities among dust exposed workers was established (Р<0.01). P small round opacities among 10 (52.6%) workers from KZM (furnace builders, insulators), and in MQAEG were detected. 13 (37.1%) machine locksmiths, welders, as well as fitters, and old asbestos installation have been exposed to
MQAEG. P small opacities were found in a worker exposed to asbestos in insulating bricks production. P0/1 opacities among 11 (9.5%) brown coal miners, 24 (21.1%) – in workers from black mining, 10 (18.9%) - in anthracite coal mines, as well as 34 (27.9%) – from lead – zinc ore mines, and 8 (7.5%) workers exposed to MAQCD were found [fig 1]. Р1/0 opacities among 9 (7.8%) brown coal miners, 39 (28.3%) in black mining, 14 (26.4%) – from anthracite coal mining, 40 (32.0%) workers in lead –zinc mining, and among 12 (11.2%) workers exposed to MAQCD were detected [fig.2]. S irregular opacities Саt.0/1, 1/0, 1/1, ½ (“borderline pneumoconiosis”) among 32 (27.6%) workers from brown mining, 48 (42.5%) – from black mining, 19(35.8%) – from anthracite mining, and 77 (62.6%) workers from lead zinc or mining, and 36 (33.3%) workers in MQAEG were found [fig. 4]. T irregular opacities Category (Cat.) 0/1, 1/0, 1/1, ½ (“borderline pneumoconiosis”) amongst 10(8.6%) brown coal miners”, 22 (19.5%) – black coal miners, 13 (24.5%) – among anthracite miners, as well as 3(2.4%) lead zinc or miners, and 30 (27.8%) workers from MQAEG were detected [fig. 5]. Manifest asbestosis of Cat. S2/1 up to s3/3+ amongst 12(11.1%) workers from MQAEG, as well as asbestosis of Cat. t2/1-t3/3+ among 28 (25.9%) workers was diagnosed. Cases with mixed pneumoconiosis among MQAEG were presented on Fig.5.
Fig.4, 5. Radiographic finds of s or t irregular opacities of Cat. 0/1, 1/0, 1/1 and ½, and s or t Cat. 2/1 up to Cat. 3/3+ amongst studied miners and workers in
MQAEG (ILO’80) Statistics: Pearson Chi-Square=79.036;Р <0.0001
The highest shares of u 0/1, 1/0, 1/1 and ½ irregular opacities among 79.7% miners in lead – zinc mining, followed by 73.6% anthracite miners, as well as 71.7% workers in black coal mines, and 30.2% workers from brown coal mining were established – Fig. 6 (Р<0.0001). U irregular opacities of Саt. 2/1 up to Саt. 3/3+ among 12 (10.3%) brown coal miners, followed by 12 (10.6%) black coal miners”, as well as 4

111
(7.5%) anthracite coal miners, and 3 (2.4%) lead zinc or miners were found. U2/1 up to- u3/3+ irregular opacities amongst 11 (10.2%) workers from MQAEG were detected as well (Fig.6). U irregular opacities were localized in lower lung areas - Fig. 6 (Р<0.0001). Pleural fibrosis (Pl) and pleural plaques (PLc) amongst 53 (49.1%) workers in MQAEG were detected. Highest share of Pl findings amongst 27 (22.0%) lead zinc ore miners, followed by 6 (11.3%) anthracite coal miners, as well as 9 (7.8%) black coal miners, and 8 (7.1%) brown coal miners were detected (Р<0.0001). Pleural calcified plaques (PLс) in 10 (83.3%) workers from MQAEG, as well 2 (1.8%) black coal miners without asbestos exposure were detected. Pl and pleural calcifications (Plс) amongst workers in MQAEG were predominated Р<0.0001) - Fig.7.
Fig.6. Radiographic finds of u irregular opacities of Cat. 0/1, 1/0, 1/1, ½ and u 2/1 - 3/3+ amongst miners and workers
exposed to MQAEG(ILO’80) Statisticsа: Chi-Square Tests: Pearson Chi-Square = 96.323;
P< 0. 0001
Fig. 7. Pleural fibrosis and pleural plaques (Pl, and Plс – by ILO’80) amongst miners and MQAEG exposed workers
Statistics: Chi-Square Tests: Pearson Chi-Square = 82.258; P<0. 0001;
Plc - Statistics: Chi-Square Tests: Likelihood Ratio = 27.062; P<0. 0001
4. DISCUSION
P1/1 small round opacities among 40.0% of black coal miners, followed by 30.0% of brown coal miners, as well as 10.0% of anthracite miners, and 20.0% of MQAEG were predominated. P1/1 small round opacities were defined as a sign of initial nodular
pneumoconiosis. The share of p0/1 and р1/0 small round opacities amongst brown coal miners, followed by black coal miners was predominated. They were defined as a radiological image of borderline pneumoconiosis. It can be assumed that the initial interstitial silicosis might be associated with initial elastin formation, which could be followed by collagen deposition in the pulmonary interstitium, and formation of silicosis lesions in alveolar space. L.Olivetti et al [11] have defined silicosis as "minimal interstitial silicosis", and they considered that it old be displayed by chest high resolution computed tomography (chest HRCT). S and t small irregular opacities of category (Cat.) 0/1, 1/0, 1/1, ½, 2/1, 2/2, 2/3, 3/2, and 3/3+ in miners were assumed as preclinical “borderline” silicosis. S and t 2/1, 2/2, 2/3, 3/2, 3/3+ irregular opacities in mixed quartz and asbestos exposed group (MQAEG) have defined as radiological signs of asbestosis or mixed pneumoconiosis. U0/1-u½ and u2/1 up to u3/3 irregular opacities on chest x-ray of non – exposed individuals could be related with last pneumonia or tobacco smoking. U irregular opacities among lead zinc ore miners, anthracite coal miners, black coal miners, and rarely - amongst brown coal miners were detected as well The correct differentiation of the Pl shadows on anterior posterior chest radiography was a basis for the diagnostics of benign asbestos pleural diseases (pleural fibrosis and plaques). Pleural impairments among 43.3% workers in MQAEG were registered as well. The high frequency of the findings of pleural impairments among workers exposed to asbestos and mixed asbestos containing dusts were presented. The length of the latent period from the initial asbestos exposure to the appearance of asbestos related Pl and Plc has been about 15-20 + years. The calcium plaques on parietal pleura (Plс) amongst workers in MQAEG were found, and similar findings were rarely detected among underground miners. These findings could be assumed as last tuberculosis pleurisy.
4. CONCLUSION
1. The predomination of 0/1 and р1/0 small round opacities on chest radiography amongst black coal mines, followed the same x-ray finds in patients in black coal mining are an expression of preclinical condition, named “borderline pneumoconiosis”.
2. 16 cases with р1/1 initial pneumoconiosis related to quart exposure at work place amongst brown coal mines, followed by black coal miners, and anthracite miners are diagnosed.
3. Four cases of р1/1 mixed pneumoconiosis in furnaces repairing and insulations amongst workers in MQAEG are detected.
4. Forty three cases of asbestosis amongst installers of insulation in thermal power plant, mechanics welders, workers in manufacturing of ferodo with 16 years asbestos occupational exposure and exposure to asbestos containing dust and 17 years latency period from the beginning of dust exposure are diagnosed.
112
5. Fifteen cases of asbestos related pleural fibroses and plaques are established.
6. Pleural fibrosis and plaques and calcium pleural plaques among workers exposed to asbestos and asbestos containing dust are predominated.
7. Based on the exposed contingents high levels dust in the mines, asbestos exposure, dose / effect studies and dynamics of dust diseases, increasing of incidence of silicosis, asbestosis and asbestos pleural disease from coal mining and in asbestos exposed in the next 10-15 - 20 years is predicted.
8. It is necessary to provide dynamic check up of the exposed workers at appropriate intervals by inclusion pulmonary specialists with good preparation in ILO'80 radiographs reading.
REFERENCES
1. B. Barakova. Dust exposure of workers in the repair of insulation and health furnaces. PhD Dissertation, S., 1987
2. Bozakov. Pneumoconiosis among energy-repair thermal power plants "Maritsa - Iztok" PhD Diss., S, 1987.
3. T.Burilkov, M. Dobreva, St.Ivanova- Dzhubrilova. Mineral powders in the working environment. Medicine and in physics, S., 1983.
4. M. Dobreva, R. Lukanova. Health aspects of production and use of construction materials containing asbestos, Building materials and products, S., 1990, 19 - 22.
5. R. Lukanova. Industrial relevance and application of asbestos and prevention strategy for the prevention of health risks in Bulgaria; Occupational Safety and Health, .2001, 1, 15.
6. E. Petrova. Late forms of silicosis and silicotuberculosis. PhD. Dissertation, S., 1988.
7. P. Cherneva. S. Dimitrova, S. Evstatieva. Asbestos exposure repairs, Safety and Occupational Health, 2002, 3.
8. M. Akira, K. Yokoyama, S. Yamamoto, T. Higashihara, K. Morinaga, N. Kita, S Morimoto, J. Ikezoe, T . Kozuka. Early asbestosis: evaluation with high-resolution CT. Radiology, 178, 1991, 2, 409-1
9. M. R. Becklake, L. Irwig, D. Kielkowski, et al. The predictors of emphysema in South African gold miners. Am Rev Respir. Dis., 1987, 135: 1234 – 1241.
10. Early Detection of Occupational Diseases. World Health Organization, Geneva, 1986.
11. L. Olivetti, L.Grazioli, L. Milanesio, A. Provezza, P. Chiodera, G.Tassi, R. Bergonzini Anatomo-radiologic definition of minimal interstitial silicosis and diagnostic contribution of high-resolution computerized tomography Radiol Med, 85, 1993, 5, 600 - 605.

VALUE OF IMAGING FOR SPINE SURGERY
V.V. Shchedrenok1, O.V.Moguchaya1, 2, I.V. Zuev1, T.V. Zakhmatova2, K.I. Sebelev1, 2
1Russian Polenov Neurosurgical Institute, Saint Petersburg, Russia 2Mechnikov Northwest Medical University, Saint Petersburg, Russia
Abstract. The aim of the research was to study CT-morphometry, densitometry and color Doppler Ultrasonography in establishing indications for degenerative-dystrophic diseases and backbone osteoporosis surgery. Material and methods. 330 patients with degenerative-dystrophic diseases and backbone osteoporosis underwent clinical and beam examination. CT-morphometry measuring areas of intervertebral foramens, vertebral arteries canal on both sides at the level of C3-C6, intervertebral canals volume, joint facet width and bone mineral density (BMD) was carried out. Strategy of treatment followed the principle of «accruing radicalism» with five-step staging (conservative therapy, blockades, minimally invasive surgery, decompressive and decompressive-stabilizing operations and reconstructive interventions). Results and discussion. Moderate (34% cases), expressed (31% cases) and severe (35% cases) degree of vertebral segment stenosis was revealed. It appeared that at moderate and expressed degree of stenosis minimally invasive interventions, which main targets were the intervertebral disc, vertebral artery and facet joints are more effective. Backbone osteoporosis was found in 37% of patients with degenerative-dystrophic diseases. With BMD lower than -2.5 by T criterion (S.D.) use of backbone rigid fixation (transpeducular fixation) was found inexpedient because of complications. In osteoporosis minimally invasive transcutaneous vertebroplasty is the operation of choice. To avoid instability, it should be supplemented with minimally invasive dynamic backbone fixation by means of nitinol device with self-regulating compression. Efficiency of minimally invasive interventions in degenerative-dystrophic diseases and backbone osteoporosis 16 months after operation amounted to 83%. Conclusions. Use of the color Doppler Ultrasonography, CT-morphometry for different vertebral segment parameters and densitometry allows to justify the use of different surgical methods, including minimally invasive one.
Key words: spine, degenerative and dystrophic diseases, backbone osteoporosis, beam diagnostic, surgery, vertebroplasty
1. INTRODUCTION
Backache is the second after respiratory diseases that are the most common cause for which patients seek medical aid. In most cases, there are lumbar pains, which almost every person suffers throughout his/her life. Recently, various issues of the spine degenerative-dystrophic diseases have become a socially significant problem due to their progressive prevalence, up to 75-80%, and economic losses for temporary and permanent disability [1-4]. Now, the problem of osteoporosis is particularly important due to the increase of elderly population and, in particular, the number of women in the postmenopausal period. Osteoporotic fractures, including those of the spine, significantly affect morbidity and mortality. World Health Organization’s data show that the number of bed-days per year for women in the postmenopausal period with osteoporotic fractures exceeds the incidence of such diseases as breast cancer, acute myocardial infarction, chronic lung disease and diabetes. According to epidemiological data, frequency of osteoporotic vertebral deformities is not less than 7%, and women are more vulnerable than men [5-9]. Despite significant differences of such nosological forms as degenerative-dystrophic diseases and spine
osteoporosis, orthopedic symptoms have common characteristics and most often manifest themselves in the spine biomechanical disorders with the emergence of instability and stenosis of various parameters of the vertebral segment, accompanied by compression of the neurovascular structures [10-15].
2. Research objective
The aim of the study was to determine indications for surgical treatment in degenerative-dystrophic diseases and backbone osteoporosis.
3. Materials and methods
Complex clinical and beam examination of 330 patients with the degenerative-dystrophic diseases and backbone osteoporosis of a backbone was carried out. CT-morphometry was performed for measuring intervertebral foramens (IVF), cross section of vertebral arteries canal on both sides at the level of C3-C6, intervertebral canal volume (IVC), facet joints width and bone mineral density (BMD) (see Fig 1). It should be stressed that the study did not increase radiation load on patients, and allowed to get additional data necessary to specify tactics of treatment. Estimation of the radiation load was done automatically and amounted to 1.8-2.5 mSv in

114
examination of cervical spine. All this resulted in high quality image with minimal radiation load. Special program was used to measure IVF area. IVC volume was counted as a product of IVF area multiplied by IVC length. Facet joints pathology revealed the change of the articular cleft width. Therefore, comparison of these indicators from both sides is necessary.
a b c
Fig. 1 CT-morphometry of cervical spine: IVF in sagittal projection on left (a), right (b) and facet joints in sagittal
projection (c)
X-ray examination was performed using a remote digital x-ray apparatus, MRI «Signa Exite 1.5T», CT «Brilliance 6S» (Philips) and «Light Speed 16» (GE), dual energy x-ray absorbtiometry (DERA) was done with Highlogic explorer (GE), bone densitometry with QCT «Asteion VP» (Toshiba), and color Doppler Ultrasonography with «Vivid S6» (GE). Color Doppler Ultrasonography was performed following the standard procedure. Vertebral artery was visualized in longitudinal section from frontal lateral approach in patient’s supine position, beginning from the second segment progressing to the first one (point of its origin from the clavicular artery) and then to the third segment from the posterior approach behind the mastoid bone. Linear transducer was used with the frequency ranging from 5 to 7.5 MHz. The study of the vertebral artery was in B-regime and in the regime of color Doppler mapping. B-regime was used to estimate the vertebral artery wall state and intravascular formations, while color Doppler mapping was used to specify its course, reveal deformations and areas of turbulent blood flow. Then quantitative blood flow analysis was made considering the correct angle of location (from 30 to 60°), determining parameters of blood linear flow rate, voluminous blood flow rate and indexes of peripheral resistance.
The results of the treatment were evaluated by MacNab scale, according to which good, satisfactory and unsatisfactory results were determined. Besides, evaluating the results of cervical spine treatment Neck Disability Index (NDI) was used, and in case of lumbar spine disorders Oswestry Low Back Pain Disability Questionnaire was employed. These questionnaires and indexes, due to their adequacy, have found widespread application in spine and spinal cord neurosurgery [1, 5, 7, 15].
Among the patients with osteoporosis women prevailed (83%), their mean age was 58±5 years. Mean QCT density was determined in the vertebral body spongy bone tissue by comparison with the calibrated phantom, in which BMD content was known. CT scanner was equipped with a special mat-strip in the recess of which reference phantom was inserted. To assess CT-densitometry diagnostic information, sensitivity (Se), specificity (Sp), accuracy (Ac), predictive value of positive (PVP) and negative (PVN) results of different methods of examination were
studied together with determination of BMD (Tab 1). The obtained results showed that the diagnostic value of CT densitometry (QCT) with BMD definition is high, regardless of osteoporosis severity. However, all the indicators reach absolute maximum only in critical osteoporosis, accompanied by pathological compression fractures of the vertebral bodies.
Table 1 Diagnostic information of BMD in osteoporosis, %
Diagnostic method
Indicators of information Se Sp Ac PVP PVN
Digital x-ray 65.2 69.8 63.6 66.0 62.3DERA 88.1 89.2 85.5 81.8 83.6QCT 99.4 99.5 99.3 99.1 99.2
According to WHO recommendations, there are the following groups of patients due to densitometry data: norm (T-score>-1), osteopenia (T-score>-1 and >-2.5), osteoporosis (T-score<-2.5) and critical or severe osteoporosis (value mineral density is significantly lower than -2.5).
We considered the degree of IVF, IVC and vertebral arteries stenosis to be moderate if the indicators were less than 30%, expressed – when they were from 30 to 60%, and severe – more than 60%. Strategy of treatment was based on the principle «accruing radicalism» with five-step staging (first of all, conservative therapy, then blockades, minimally invasive surgery, decompressive and decompressive-stabilizing operations, and at last reconstructive interventions) (see Fig 2).
Fig. 2 Diagram: the principle of «accruing radicalism» in treatment
Morphometry allows us to facilitate this principle. If the degree of compression is moderate conservative therapy, blockades of various neural and vascular structures should be applied. If the degree is expressed minimally invasive surgery should be regarded. If it is severe decompressive-stabilization operations and methods of reconstructive surgery may be required.
4. Results and discussion
CT-morphometry with the measurement of the vertebral artery canal cross section at the level of C3-C6 and color Doppler Ultrasonography of every segment

115
with determination of the spine artery cross section area were carried out. More than half of the examined patients with degenerative-dystrophic spinal column diseases showed radiculopathy syndrome (55.8%), while myelopathy (5.2%) and myeloradiculopathy (3.7%) were not so common. In most patients osteophytes were found at the level of С4-С5-С6-С7 vertebrae (92.5%), in the rest of the examined patients (7.5%) – at the level of С3-С4-С5 vertebrae. Due to MRT, the size of intervertebral disk hernia was in average 3.6±0.08 mm (p=0.033). IVF stenosis was revealed in 82.3% of patients. According to IVF stenosis degree, three groups were determined: moderate (76.8%), expressed (21.0%) and severe (2.2%). Spinal canal stenosis was observed in 41.5% of patients: moderate (76.1%), expressed (20.4%) and severe (3.5%). Spinal cord compression was registered in 23.5% of patients. The algorithm for choosing curative tactics in degenerative-dystrophic spine disorders is shown in fig. 3.
Fig. 3 Algorithm for choosing curative tactics in degenerative-dystrophic diseases
Vertebral artery syndrome occurs in every third patient with the cervical spine lesions. Complex symptoms include severe headache (often by the type of taking off the helmet), visual, vestibular, coordination disorders, and drop-attacks. X-rays with the functional images, MRI, MRA, CT, CT-angiography and color Doppler Ultrasonography are used for diagnostics. The obtained results suggest that color Doppler Ultrasonography data are rather informative and can be comparable with MRA and CT-angiography and in most cases they are sufficient for choosing the tactics of treatment. Similar data are available in reports by other authors [12, 14].
As an example, we present a case of examination and treatment of a female, 38 years old, with degenerative-dystrophic disease and left vertebral artery syndrome, which she has been suffering for two years. Cervical spine CT showed a decrease of vertebral artery canal at the level of C4-vertebra on the left (see Fig. 4).
a b
c d
Fig. 4 Vertebral arteries canals on both sides at the level of C3 (a), C4 (b), C5 (c) and C6 (d); decrease at the level of C4-
vertebra left
Color Doppler Ultrasonography revealed extravasal impact on the left vertebral artery without systemic deficit of blood flow and local hemodynamic disorders manifested by significant gradients of speed indicators (see Fig. 5).
a b
Fig. 5 Extravasal impact on the left vertebral artery without systemic blood flow deficit, local hemodynamic disorders are
manifested by significant gradients of speed indicators. Irritative syndrome of the vertebral artery
The patient underwent a course of blockades of the left vertebral artery with a clear-cut therapeutic effect. When examined 1 year after treatment she felt well, had no complaints and she was satisfied with the results of treatment. Thus, minimally invasive surgical treatment in the form of blockades of the vertebral arteries to achieve favorable remote results turned out to be sufficient.
Due to the results of color Doppler Ultrasonography three main ultrasound syndromes of the vertebral artery were determined. Course deformations with local vertebrogenic influences and without systemic blood flow deficit were registered in 34.5% of patients, extravasal compression of the vertebral artery with the systemic deficit of blood flow – in 7.1% of cases, irritative influences on the vertebral artery – in 16,7%, and the rest of the patients had no hemodynamic disorders in vertebral arteries. Based on the studies performed, the algorithm for choosing the tactics of treatment of vertebral artery syndrome presented in fig.6 was suggested.
Blockades of the vertebral arteries and ganglion stellate are most commonly used in the treatment of irritative syndrome (see Fig.7).
In 35% cases, dereception of intervertebral disc by intradiscal injection of 2% solution of local anesthetic and alcohol 70° in equal proportions was used. In 15% of cases, laser hernia nucleoplasty of intervertebral
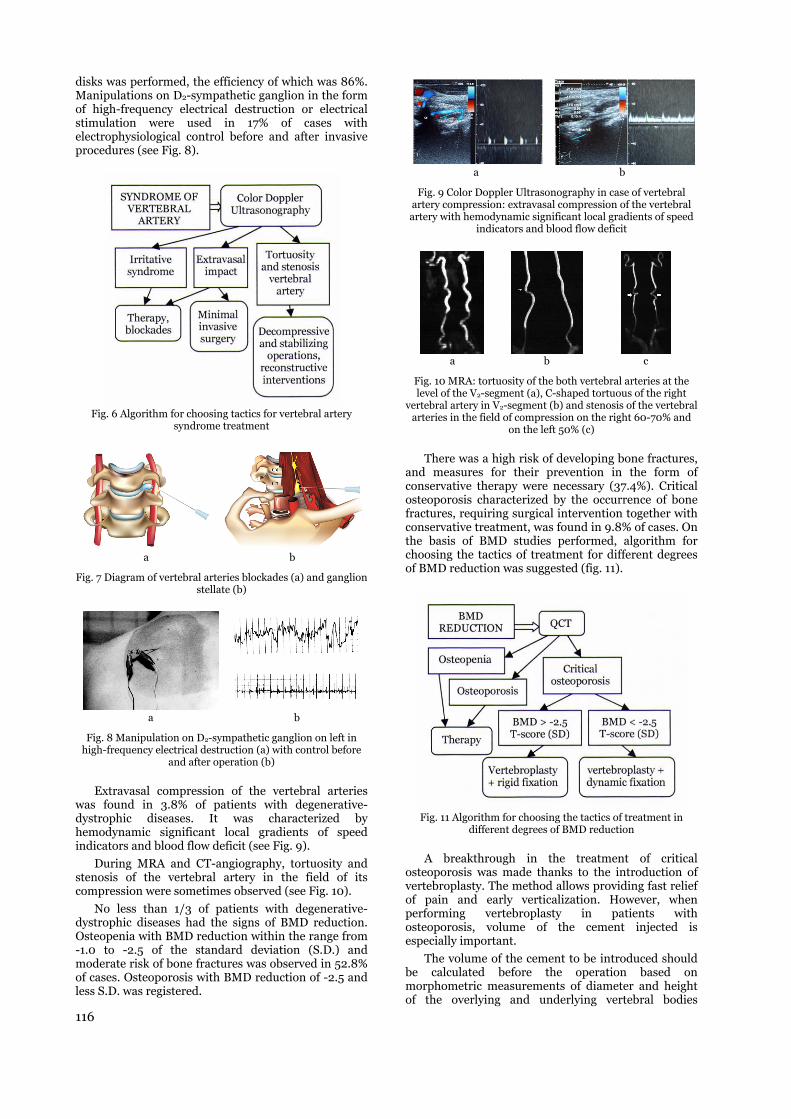
116
disks was performed, the efficiency of which was 86%. Manipulations on D2-sympathetic ganglion in the form of high-frequency electrical destruction or electrical stimulation were used in 17% of cases with electrophysiological control before and after invasive procedures (see Fig. 8).
Fig. 6 Algorithm for choosing tactics for vertebral artery
syndrome treatment
a b
Fig. 7 Diagram of vertebral arteries blockades (a) and ganglion stellate (b)
a b
Fig. 8 Manipulation on D2-sympathetic ganglion on left in high-frequency electrical destruction (a) with control before
and after operation (b)
Extravasal compression of the vertebral arteries was found in 3.8% of patients with degenerative-dystrophic diseases. It was characterized by hemodynamic significant local gradients of speed indicators and blood flow deficit (see Fig. 9).
During MRA and CT-angiography, tortuosity and stenosis of the vertebral artery in the field of its compression were sometimes observed (see Fig. 10).
No less than 1/3 of patients with degenerative-dystrophic diseases had the signs of BMD reduction. Osteopenia with BMD reduction within the range from -1.0 to -2.5 of the standard deviation (S.D.) and moderate risk of bone fractures was observed in 52.8% of cases. Osteoporosis with BMD reduction of -2.5 and less S.D. was registered.
a b
Fig. 9 Color Doppler Ultrasonography in case of vertebral artery compression: extravasal compression of the vertebral artery with hemodynamic significant local gradients of speed
indicators and blood flow deficit
a b c
Fig. 10 MRA: tortuosity of the both vertebral arteries at the level of the V2-segment (a), C-shaped tortuous of the right
vertebral artery in V2-segment (b) and stenosis of the vertebral arteries in the field of compression on the right 60-70% and
on the left 50% (c)
There was a high risk of developing bone fractures, and measures for their prevention in the form of conservative therapy were necessary (37.4%). Critical osteoporosis characterized by the occurrence of bone fractures, requiring surgical intervention together with conservative treatment, was found in 9.8% of cases. On the basis of BMD studies performed, algorithm for choosing the tactics of treatment for different degrees of BMD reduction was suggested (fig. 11).
Fig. 11 Algorithm for choosing the tactics of treatment in
different degrees of BMD reduction
A breakthrough in the treatment of critical osteoporosis was made thanks to the introduction of vertebroplasty. The method allows providing fast relief of pain and early verticalization. However, when performing vertebroplasty in patients with osteoporosis, volume of the cement injected is especially important.
The volume of the cement to be introduced should be calculated before the operation based on morphometric measurements of diameter and height of the overlying and underlying vertebral bodies

117
(Patent N 2509535 RU, publ. 20.02.2014). The method is based on the difference between normal and available volumes of the injured vertebra. Volumes of vertebrae above and below the damaged one were determined. At first, the average volume of the damaged vertebra was calculated in norm. This is an average value, calculated on the basis of the volume of the overlying and underlying vertebrae. Then the volume of the injured vertebra was determined. After that, the volume of the damaged vertebra was subtracted from a volume of a normal vertebra and thus the volume of the cement to be injected (see Fig. 12) was obtained.
a b
c d
Fig. 12 Calculation the volume of cement to be injected in vertebroplasty
As a result of mathematical actions, the following formula was received: V=π×dav²:4[hav‒h1‒(h2‒h1):2], where V is the volume of the injecting cement; dav is the average diameter and hav is the average height of the overlying and underlying vertebrae; h1 is the lowest height and h2 is the maximum height of the damaged vertebra.
Vertebroplasty is added by dereception of the underlying facet joints of a vertebra by introduction of 1.5-2.0 ml of the solution consisting of equal quantities of local anesthetic and alcohol 70°.
In some cases it was necessary to increase a basic function of a compressed vertebra. If the BMD indicator was up to -2.5 T-score (S.D.) rigid fixation (TPF) was performed. If BMD indicator was below -2.5 T-score (S.D.) dynamic fixation (nitinol) was used 7-14 days after vertebroplasty (see Fig. 13).
Reconstructive surgery consisted of the replacement of various structures of the spinal segment such as: 1) body of the vertebra, 2) intervertebral disc, 2) anterior longitudinal ligament and 3) posterior support complex.
a b c
d e f
Fig. 13 Reconstructive operations: vertebroplasty + rigid fixation (a–d) and vertebroplasty + dynamic fixation (e, f)
One of the most common reconstructive operations is vertebroplasty, which allows saving the weight-bearing capacity of the damaged vertebra and diminishing the degree of a pain syndrome.
5. Conclusions
Among patients with the spine degenerative-dystrophic diseases, asymptomatic osteopenia and osteoporosis occur in 37% of patients. In such cases QCT with the determination of BMD is a highly informative diagnostic method. Sensitivity, specificity, accuracy and predictive value of the method in critical osteoporosis reach 99%.
Morphometry serves as an optimization of CT on both sides of such parameters of the vertebral segment as the IVF area, IVC volume, cross-sectional area of the vertebral artery canal and facet joints width. The examination does not increase radiation load on the patient and allows getting high quality image and additional data to specify the tactics of treatment.
Segment-by-segment vertebral arteries morphometry with diagnostics of irritation and compression syndromes is a further improvement of color Doppler Ultrasonography. Color Doppler Ultrasonography information is comparable with the results of the MRA and CT-angiography.
Determination of vertebral artery compression allows quantitative calculation of the character and degree of the extravascular influence that defines the tactics for further surgical treatment. Modern diagnostics of cervical spine diseases must include obligatory color Doppler Ultrasonography of the main neck arteries. Development and implementation of the color Doppler Ultrasonography morphometry greatly enhances the diagnostic capabilities of this popular and economically cost-effective method of diagnostics.
The algorithm of curative tactics should be based on clinical and beam comparisons, including CT data and color Doppler Ultrasonography morphometry, followed by conservative or surgical treatment. At present, surgical treatment of degenerative-dystrophic diseases and osteoporosis of the spine includes primarily the use of minimally invasive operations. The strategy of surgical treatment has to follow the principle of «accruing radicalism». In spine
118
osteoporosis surgical treatment BMD, the degree of compression of the vertebral body and the number of affected vertebral segments should be considered. Vertebroplasty has to be combined with a differential use of the spine rigid or dynamic fixation. Rigid posterior fixation of the spine is limited by BMD deficit, which should not exceed -2.5 by T-criterion.
REFERENCES
1. A. Alexandre, M. Masini and P.P.M. Menchetti, “Advances in Minimally Invasive Surgery and Therapy for Spine and Nerves”, Acta Neurochirurg., suppl., NY: Springer-Verlag, 2010.
2. A.A. Baaj, P.V. Mummaneni, J.S. Uribe, A.R. Vaccaro and M.S. Greenberg, “Handbook of Spine Surgery”, NY: Thieme, 2011.
3. K.H. Bridwell and R.L. De Wald, “The Textbook of Spinal Surgery”, Philadelphia; Baltimore; NJ; London; Buenos Aires; Hong Kong; Sydney; Tokyo: Lippincott Williams & Wilkins, 2011.
4. M.S. Greenberg, Handbook of Neurosurgery, NY: Thieme, 2005.
5. V. Dietz, T. Nef and W.Z. Rymer, “Neurorehabilitation Technology”, London: Springer-Verlag, 2012.
6. A.R. Vaccaro, A.A. Baaj, J.S. Uribe, M.S. Greenberg and P.V. Mummaneni, “Handbook of Spine Surgery”, NY: Thieme, 2011.
7. D.K. Kim, K.H. Kim and Y.Ch. Kim, “Minimally invasive percutaneous spinal techniques”, Philadelphia: Elsevier, 2011.
8. L. Kapural, P. Kim and T. Deer, “Diagnosis, Management, and Treatment Discogenic Pain”, NY: Elsevier, 2011.
9. N. Boos and M. Aebi “Spinal Disorders Fundamentals of Diagnosis and Treatment”, Berlin: Springer-Verlag, 2008.
10. N. Hosten and T. Liebig, “Computertomographie von Kopf und Wirbelsäule”, Stuttgart; NY: Georg Thieme Verlag, 2007.
11. C.B. Lumenta, C. Di Rocco, J. Haase and J.A. Mooij, “Neurosurgery”, Berlin; Heidelberg: Springer-Verlag, 2010.
12. B. George, M. Brubeau and R.E. Spetzier, “Pathology and Surgery around Vertebral Artery”, Paris: Springer-Verlag France, 2012.
13. M. Lim, W. Hsu, D. Rigamonti and L. Kleinberg, “Handbook of Radiosurgery in CNS Disease”, NY: Demos Medical, 2013.
14. J.M. Valdueza, S.J. Schreiber, J.E. Roehl and R. Klingebiel, “Neurosonology and Neuroimaging of Stroke”, Stuttgart: Thieme Verlag KG, 2008.
15. A.R. Vaccaro, M.G. Fehlings and M.F. Dvorak, “Spinal and Spinal Cord Trauma: Evidence-Based Management”, NY; Stuttgart: Thieme Medical Publisher, 2010.
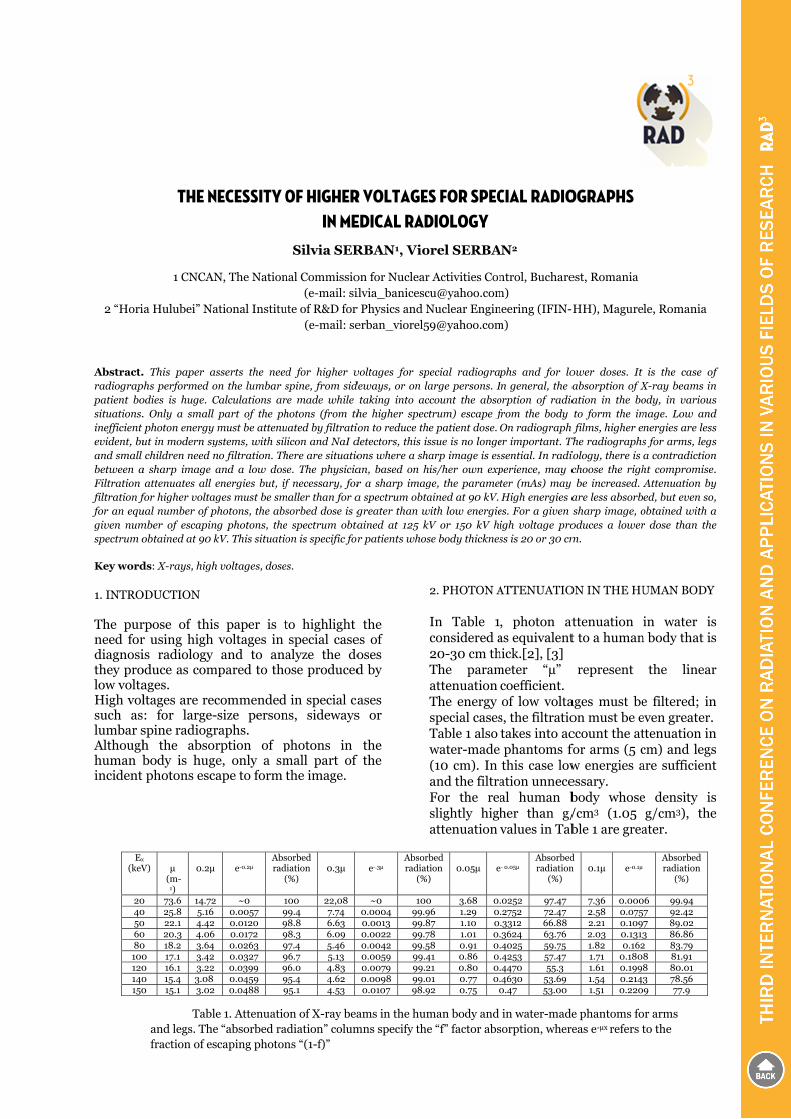
2 “Hori
Abstract.radiograppatient bosituations.inefficient evident, buand small between aFiltration filtration ffor an equgiven numspectrum o
Key word
1. INTRO The purneed fordiagnosithey prolow voltaHigh volsuch aslumbar sAlthoughhuman bincident
THE N
1 CNCAN
ia Hulubei” Na
. This paper aphs performed oodies is huge. C. Only a small photon energy
ut in modern sychildren need n
a sharp image attenuates all
for higher voltaual number of pmber of escapinobtained at 90 k
ds: X-rays, high
ODUCTION
rpose of thisr using high is radiology
oduce as comages. ltages are re: for large-spine radiogrh the absobody is hugphotons esc
NECESSITY O
N, The Nation
ational Institu
asserts the needon the lumbar sCalculations ar
part of the phmust be attenu
ystems, with silno filtration. Thand a low dosenergies but, if
ages must be smphotons, the absng photons, thekV. This situatio
h voltages, dose
s paper is tvoltages in and to ana
mpared to tho
commended-size personraphs. rption of p
ge, only a smcape to form t
OF HIGHERIN ME
Silvia SER
nal Commissio (e-mail: si
ute of R&D for (e-mail: se
d for higher vspine, from sid
re made while hotons (from thuated by filtratiolicon and NaI dhere are situatiose. The physiciaf necessary, for
maller than for asorbed dose is ge spectrum obtaon is specific for
es.
to highlight special case
alyze the doose produced
d in special cans, sideways
photons in mall part of the image.
R VOLTAGESEDICAL RAD
RBAN1, Vio
on for Nuclearilvia_banicescr Physics and Nerban_viorel5
voltages for spdeways, or on la
taking into ache higher spection to reduce thdetectors, this isons where a shaan, based on hr a sharp imaga spectrum obtagreater than wained at 125 kr patients whos
the es of oses d by
ases s or
the f the
S FOR SPECDIOLOGY orel SERBA
r Activities [email protected] [email protected]
pecial radiograparge persons. I
ccount the absotrum) escape fe patient dose. ssue is no longearp image is esis/her own exp
ge, the parametained at 90 kV.
with low energieV or 150 kV hise body thicknes
2. PHOTON A In Table 1considered a20-30 cm thThe paramattenuation The energy special casesTable 1 also water-made (10 cm). In and the filtraFor the reaslightly highattenuation
CIAL RADIO
AN2
ntrol, Bucharem) neering (IFIN-m)
phs and for loIn general, the aorption of radiafrom the body On radiograph
er important. Thsential. In radi
perience, may cter (mAs) may High energies a
es. For a given igh voltage pross is 20 or 30 cm
ATTENUATIO
, photon atas equivalenthick.[2], [3] meter “µ”
coefficient. of low volta
s, the filtratiotakes into acphantoms fthis case low
ation unneceal human bher than g/values in Tab
OGRAPHS
est, Romania
-HH), Magure
ower doses. It absorption of Xation in the boto form the im
h films, higher eThe radiographsiology, there is choose the righ be increased. Aare less absorbsharp image, o
oduces a lowerm.
ON IN THE HU
attenuation it to a human
represent
ages must beon must be eccount the atfor arms (5 cw energies aessary. body whose/cm3 (1.05 ble 1 are grea
le, Romania
is the case ofX-ray beams inody, in variousmage. Low andnergies are lesss for arms, legsa contradictionht compromise.Attenuation byed, but even so,
obtained with ar dose than the
UMAN BODY
in water isn body that is
the linear
e filtered; ineven greater.ttenuation incm) and legsare sufficient
e density isg/cm3), the
ater.
f n s d s s n .
y ,
a e
s s
r
n
n s t
s e
Ex (keV)
μ
(m-1)
0.2μ
e-0.2μ
Absorbed radiation
(%)
0.3μ e-.3μ
Absorbed radiation
(%) 0.05μ e- 0.05μ
Absorbed radiation
(%)
0.1μ
e-0.1μ
Absorbed radiation
(%)
20 73.6 14.72 ~0 100 22,08 ~0 100 3.68 0.0252 97.47 7.36 0.0006 99.9440 25.8 5.16 0.0057 99.4 7.74 0.0004 99.96 1.29 0.2752 72.47 2.58 0.0757 92.4250 22.1 4.42 0.0120 98.8 6.63 0.0013 99.87 1.10 0.3312 66.88 2.21 0.1097 89.0260 20.3 4.06 0.0172 98.3 6.09 0.0022 99.78 1.01 0.3624 63.76 2.03 0.1313 86.8680 18.2 3.64 0.0263 97.4 5.46 0.0042 99.58 0.91 0.4025 59.75 1.82 0.162 83.79100 17.1 3.42 0.0327 96.7 5.13 0.0059 99.41 0.86 0.4253 57.47 1.71 0.1808 81.91120 16.1 3.22 0.0399 96.0 4.83 0.0079 99.21 0.80 0.4470 55.3 1.61 0.1998 80.01140 15.4 3.08 0.0459 95.4 4.62 0.0098 99.01 0.77 0.4630 53.69 1.54 0.2143 78.56150 15.1 3.02 0.0488 95.1 4.53 0.0107 98.92 0.75 0.47 53.00 1.51 0.2209 77.9
Table 1. Attenuation of X-ray beams in the human body and in water-made phantoms for arms and legs. The “absorbed radiation” columns specify the “f” factor absorption, whereas e-µx refers to the fraction of escaping photons “(1-f)”
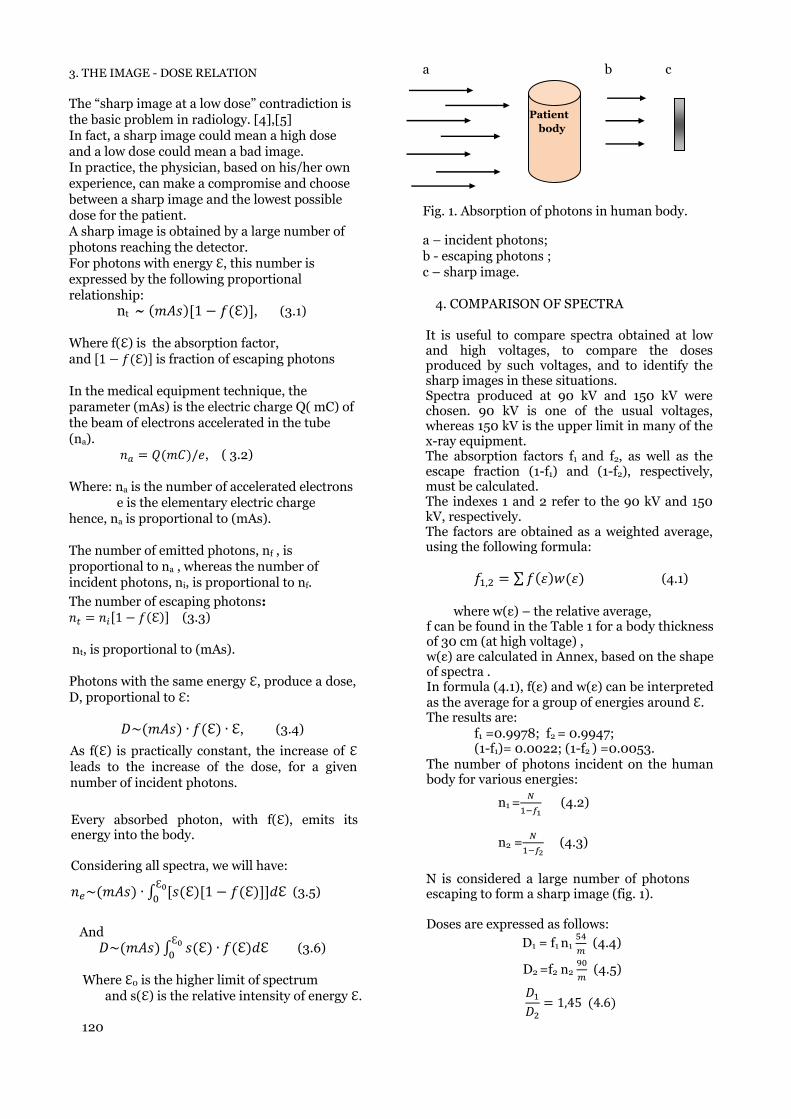
3. THE IMAGE - DOSE RELATION
The “sharp image at a low dose” contradiction is the basic problem in radiology. [4],[5] In fact, a sharp image could mean a high dose and a low dose could mean a bad image. In practice, the physician, based on his/her own experience, can make a compromise and choose between a sharp image and the lowest possible dose for the patient. A sharp image is obtained by a large number of photons reaching the detector. For photons with energy ℇ, this number is expressed by the following proportional relationship: nt ~ ( )[1 − (ℇ)], (3.1) Where f(ℇ) is the absorption factor, and [1 − (ℇ)] is fraction of escaping photons In the medical equipment technique, the parameter (mAs) is the electric charge Q( mC) of the beam of electrons accelerated in the tube (na).
= ( )/ , ( 3.2) Where: na is the number of accelerated electrons
e is the elementary electric charge hence, na is proportional to (mAs). The number of emitted photons, nf , is proportional to na , whereas the number of incident photons, ni, is proportional to nf. The number of escaping photons: = [1 − (ℇ)] (3.3) nt, is proportional to (mAs). Photons with the same energy ℇ, produce a dose, D, proportional to ℇ: ~( ) ∙ (ℇ) ∙ ℇ, (3.4) As f(ℇ) is practically constant, the increase of ℇ leads to the increase of the dose, for a given number of incident photons.
Every absorbed photon, with f(ℇ), emits its energy into the body. Considering all spectra, we will have: ~( ) ∙ [ (ℇ)[1 − (ℇ)]] ℇƐ
(3.5) And ~( ) (ℇ) ∙ (ℇ) ℇƐ
(3.6) Where ℇ0 is the higher limit of spectrum and s(ℇ) is the relative intensity of energy ℇ.
a b c
Fig. 1. Absorption of photons in human body.
a – incident photons; b - escaping photons ; c – sharp image.
Patient body
4. COMPARISON OF SPECTRA It is useful to compare spectra obtained at low and high voltages, to compare the doses produced by such voltages, and to identify the sharp images in these situations. Spectra produced at 90 kV and 150 kV were chosen. 90 kV is one of the usual voltages, whereas 150 kV is the upper limit in many of the x-ray equipment. The absorption factors f1 and f2, as well as the escape fraction (1-f1) and (1-f2), respectively, must be calculated. The indexes 1 and 2 refer to the 90 kV and 150 kV, respectively. The factors are obtained as a weighted average, using the following formula:
, = ∑ ( ) ( ) (4.1)
where w(ε) – the relative average, f can be found in the Table 1 for a body thickness of 30 cm (at high voltage) , w(ε) are calculated in Annex, based on the shape of spectra . In formula (4.1), f(ε) and w(ε) can be interpreted as the average for a group of energies around ℇ. The results are:
f1 =0.9978; f2 = 0.9947; (1-f1)= 0.0022; (1-f2 ) =0.0053. The number of photons incident on the human
body for various energies: n1 = (4.2)
n2 = (4.3)
N is considered a large number of photons escaping to form a sharp image (fig. 1). Doses are expressed as follows:
D1 = f1 n1 (4.4)
D2 =f2 n2 (4.5) = 1,45 (4.6)
120

where, m – is the irradiated body mass 54 keV and 90 keV are the averages of the
spectra energies. Thus, high voltages produce a low dose to give the number N. This is due to the difference in the fractions of escaping photons. The actual values for D1, D2 and N are determined experimentally. In the comparison of the spectra, the contrasts which vary in energy, not only in number N, should also be evaluated and. However, the difference in contrast for various energies cannot be greater than the difference between the escape fractions. The density of the body’s internal organs is similar to the average density of the human body and their size is smaller than the diameter of the body. As regards the few Compton photons escaping from the outermost body layers, they cannot change the value 1.45 much in (4.6). 5. CONCLUSIONS
In radiology, there is always a contradiction between sharp image and low dose. Although the absorption of photons in the body is huge, only a small part of the incident photons escape to form the image. Higher energies are preferable, in special cases. Inefficiently low energies must be filtered. This is not applicable to radiographs of arms and legs. There are cases where getting a sharp image is essential; the physician, based on his/her own experience, has to make a compromise and correctly choose between a sharp image and a low dose. For a sharp image obtained with a spectrum produced at 90 kV, the number of incident photons must be large; this number is small at
150 kV (see the escape fraction). Therefore, the dose is higher in the first case. The difference is given by the escape fractions. The dose-economy in (4.6) is small, but for hundreds of radiographs it means quite a lot!
6. ANNEX - CALCULATING WEIGHTS
The energetic spectra of photons may be calculated using the following formula [6]:
f(Ɛ) = K c2 Z Ɛ2( Ɛ0 –Ɛ) ( 6.1) where, K –is experimentally determined; C - speed of light; Z – anode-specific Z;
Ɛ - energy of photons;
Ɛ0 – maxim energy of spectrum.
If the spectrum abscissa and Ɛ are expressed in KeV, then ( K c2 Z) is expressed in number of photons X (KeV)-4 [the formula (6.1) is expressed in the number of photons X(KeV)-1]. Applying the integral to the following formula (6.1) supplies the number of photons in the spectrum area: S(no. of photons) =
= (Kc2Z) Ɛ (Ɛ − Ɛ) ƐƐ =
= (Kc Z) Ɛ Ɛ − Ɛ = Ɛ
(6.2)
S(no. of photons) for range ( Ɛ1, Ɛ2) is calculated:
S1,2 =(Kc2Z) ℇ (Ɛ − Ɛ) dℇ ƐƐ (6.3)
Ratio ( , ) supplies energy weighting within the
range (Ɛ1 , Ɛ2 ). For the spectrum obtained at 90 kV, four ranges were chosen, expressed in KeV: ( 0, 30); (30,50); (50, 70) and (70,90). For the spectrum obtained at 150 kV, seven ranges were chosen, expressed in KeV: (0, 30), (30,50), (50, 70), (70,90), (90,110), (110,130) and (130, 150). If all weights are used in the calculation, f1 and f2 are obtained using the following formula:
f1,2 =∑ (Ɛ) (Ɛ).
7.REFERENCES:
1. E. Mohamed-Ahmed, H. Osman, A. Sulieman. Evaluation of Patient Doses in Conventional, Computed and Digital Radiography. Proc. Int. Conf. IRPA 13, Glasgow, Great Britain, IRPA 2012.
2. E. L. Grigorescu, G. Stanescu, V. Serban, For a Better Filtration of X-Ray Beams, 4th European IRPA Congress, Geneva, Switzerland, 2014.
3.V.Serban, G.Stanescu, S.Serban, D.Stanescu, E. L. Grigorescu, Contrast versus patient dose in modern diagnostic radiology, Proc. Int. Conf. RAD 2014, Nis, Serbia
4. Moore, C. S.; Beavis, A. W.; Saunderson, J. R., Investigation of optimum X-ray beam tube voltage and filtration for chest radiography with a computed radiography system, British Journal of Radiology, 2008, Vol. 81 Issue 970, p771-777.
1211

5. C.J. Trauernicht, C. Rall, T. Percs, G. Maree, E. Hering, S. Steiner, Dose Reduction and Image Preservation After the Introduction of a 0.1 mm Cu Filter into the LODOX Statescan unit above 110 kVp, Proc. Int. Conf. IRPA 13, Glasgow, Great Britain, IRPA 2012.
6.Duliu O. G. , Dosimetry and radiation protection, Publisher University of Bucharest, 2010.
122

BACKGROUND IN A TEST OF DETECTING “COOPERATIVE” PARAPOSITRONIUM ANNIHILATION BY THE 32-CRYSTAL SPECTROMETER ARGUS
Nevenka M. Antović1, Sergey K. Andrukhovich2, Alexandr V. Berestov2
1Faculty of Natural Sciences and Mathematics, University of Montenegro, Džordža Vašingtona b.b., 81 000 Podgorica, Montenegro
2Institute of Physics, National Academy of Sciences of Belarus, pr. Nezalezhnasti 68, Minsk, 220072, Belarus
Abstract. Parapositronium – a singlet positronium ground state, has the total angular momentum of electron and positron forming the atom Js = 0, magnetic quantum moment m = 0, and its annihilation spectrum is dominantly created by the 511 keV discrete photons. A process of cooperative emission of annihilation photons (cooperative annihilation) by a system of positronium atoms, i.e., annihilation superradiance, had been considered by other researchers, and the theory of annihilation superradiance in a system of parapositronium atoms for two-photon annihilation was constructed (two interacting parapositronium atoms; emission of the 1022 keV photons flying apart at an angle of 180°). The 32-crystal spectrometer ARGUS, with 16 detector pairs at an angle of 180° capable of registering double gamma coincidences, with lead collimators (80 mm in diameter) mounted on each detector – was used to test the phenomenon. Parapositronium annihilation spectra were acquired using 22Na (A = 4⋅105 Bq) as a positron source, and SiO2 (as „positronium forming“ medium; probability: 32 %), as well as Al (as „positronium not forming“ target) used as a blank – for estimation of the background events. In the case when after emission of two starting positrons from 22Na (i.e., the 1275 keV nuclear photons) coincident registration (respecting the spectrometer time resolution) of four annihilation photons should be considered as a six-fold coincidence event, experimentally obtained counting rates were – 0.25 s-1 (SiO2) and 0.23 s-1 (Al), while theoretically predicted – 0.34 s-1. The main background process competitive to a registration of the parapositronium cooperative annihilation is four-fold coincidence event (the two 180° detectors register 1275 keV photons, and two – summing of the 511 keV annihilation photons), with experimental counting rates – 0.026 s-1 (SiO2) and 0.023 s-1 (Al), as theoretically predicted – 0.023 s-1. On the other hand, cooperative annihilation should be a four-fold coincidence event (the two 180° detectors register 1275 keV photons, and two – 1022 keV photons), which has not been registered by the ARGUS spectrometer (theoretically predicted counting rate – 1.7⋅10-5 s-1). The analyses showed that probability of detecting the parapositronium cooperative annihilation will increase significantly with increasing positron source activity, but also with decreasing diameter of lead collimators.
Key words: spectrometer ARGUS, parapositronium, cooperative annihilation, background
1. INTRODUCTION
Positronium (Ps) – an exotic atom consisting of electron and positron, has two ground states: a singlet or para-Ps [sPs(1S0) or p-Ps], and a triplet or ortho-Ps [tPs(3S1) or o-Ps]; with lifetime in vacuum – 1.25⋅10-10 s and 1.4⋅10-7 s, respectively [1]. These states are different in regard to the total angular momentum of electron and positron forming the atom – Js = 0 in the case of p-Ps (electron and positron spins are antiparallel, and magnetic quantum moment: m=0), and Jt = 1 in the case of o-Ps (electron and positron spins are parallel, and three sub-states different in magnetic quantum moment: m = +1, 0, -1, are possible). The p-Ps experiences 2γ-annihilation (the 511 keV discrete photons flying apart at an angle of 180°), while o-Ps – 3γ-annihilation (continuous energy spectrum in the range from 0 to 511 keV) [1].
Experimental research on Ps atom was basically related to the energy spectrum of annihilation photons, coincidences of 3γ-decay photons, coincidence rates of 2γ-decay photons as a function of angles between two detectors, delayed coincidences – positron emission and annihilation radiation [1], rare Ps decays – on 4γ- (p-Ps) and 5γ-rays (o-Ps) [2], asymmetric 3γ-decay [3], etc. This atom (i.e., its decay) has been also used to test, for example, CPT-invariance [e.g., 4, 5, 6].
Despite the fact that annihilation of Ps atoms (in free space, but also in various media) has been studied in considerable details, there are theoretically predicted phenomena related to Ps-annihilation which have not been experimentally confirmed (detected) so far.
This study considers possibility to detect annihilation photons from “cooperative” annihilation of p-Ps, using the 32-detector coincidence spectrometer ARGUS (Institute of Physics, National Academy of Sciences of Belarus, Minsk).

124
2. BASICS OF THE P-PS COOPERATIVE ANNIHILATION
THEORY
The process of cooperative emission of annihilation photons (cooperative annihilation) by a system of Ps atoms, i.e., annihilation superradiance, had been considered in a few works [e.g., 7, 8].
Using the concepts of Dicke’s theory of optical supperradiance in a system of two-level atoms, as well as in a system of excitations, the authors of ref. [7] (emphasizing important differences between optical and annihilation superradiance) constructed a theory of annihilation superradiance in a system of p-Ps atoms – for 2γ-annihilation. Based on interaction of the Ps atoms through the field of virtual photons (quantum electrodynamic effect of the fourth order), an equation of the annihilation radiation propagation in a Ps-medium was developed [7].
Considering electron-positron interaction as nonradiative in nature, and studying the radiative interactions of a Ps atom with the field of its own and external photons, it was concluded that a field changes significantly not only the energies, but also lifetime of the Ps atom states [8]. That is then used for the study of the annihilation decay kinetics of a p-Ps atom from two states participating in stimulated optical transitions excited by a laser [9] (while two-, three-, and six-photon cross sections and ionization rates for Ps at laser frequencies of experimental interest were also calculated [10]; and Ps in a laser field was considered extensively [e.g., 11]).
So, cooperative annihilation implies a bound state of two interacting p-Ps atoms, which decays through emission of two 1022 keV photons flying apart at an angle of 180°
sPs+sPs→2γ. (1)
If a volume (of gas, for example) under investigation contains N positrons, it can be taken that Np of them annihilate without Ps forming (a free annihilation into two 511 keV photons), and that Np-Ps and No-Ps are numbers of p- and o-Ps atoms, respectively.
According to the prediction (O. N. Gadomskii, as discussed in [12]), probability ratio: cooperative versus free annihilation of p-Ps is
Ps)P(P
sCoop
≈ 5⋅10-5. (2)
If a sample is placed between two detectors (at an angle of 180°) registering double coincidences of the 1022 keV photons, counting rate of the events corresponding to the p-Ps cooperative annihilation can be
effectN ∼ ,ΩPεN Coop21022Ps-p (3)
where ε1022 represents one-detector photoefficiency for the 1022 keV photon (assuming that detectors have the same registration efficiency); Ω is a solid angle from the source/target to the detector (there is a strong angular correlation between the decay’s photons: 180°).
Taking that (Np + Np-Ps) positrons give the decay into two 511 keV photons, it is possible to estimate the main background process. This process presents a registration (by two-detector system) of four 511 keV photons, which are products of two independent decays of p-Ps atoms (or free positron annihilation; or a combination of these processes) and due to the summing effect competitive to the photons from cooperative annihilation, i.e.,
Nbackground ∼ ,Ω)εN(N 24511Ps-p p+ (4)
where ε511 is one-detector photoefficiency for the 511 keV photon.
From Eqs. (3) and (4), the effect/background ratio would be
.Ω)εN(Nε105Ps)P(N
NN
4511Ps-p
21022
5sPs-
p
p
background
effect
+⋅⋅
≈−
(5)
3. SPECTROMETER ARGUS
The spectrometer of γ-coincidences ARGUS consists of 32 sections (12 penta- and 20 hexahedral pyramids), i.e., 32 NaI(Tl) detectors (D) of (15 x 10)
cm2 [13]. Its total solid angle is ∼0.9⋅4π sr, while the time resolution (τ) for two-fold coincidences (k = 2) is (45±5) ns at 100 % efficiency of registration [12]. There are 496 detector-duplet combinations capable of registering double gamma coincidences (among them, 16 are at an angle of 179.99°, i.e., ∼180° – see, for example [14]).
It is maintained in a low background room and shielded by concrete and lead. A special container consisting of a lead pyramid with walls up to 6 cm thick, as well as a 10 cm-thick disc, shields each of the detectors. Additionally, to reduce the probability of detecting Compton-scattered photons, a disc-shaped lead collimator (thickness 30 mm, and orifice diameters 80 mm – side facing the detector surface, and 70 mm – opposite site) was mounted on each detector (see, for example [14]).
An outside overview of the ARGUS mechanical construction is illustrated in Fig. 1a, while a detector assembly – in Fig. 1b. The detectors are denoted from 1 to 32 such that the number for one detector and the number for the detector on the opposite side differ by 16, simplifying the spectrometric data analyses. A counting mode can be integral (k≥1) or coincidence (with multiplicities from 1 to 5).
The setup has modular pulse-processing electronics made in the CAMAC standard, and is operated online
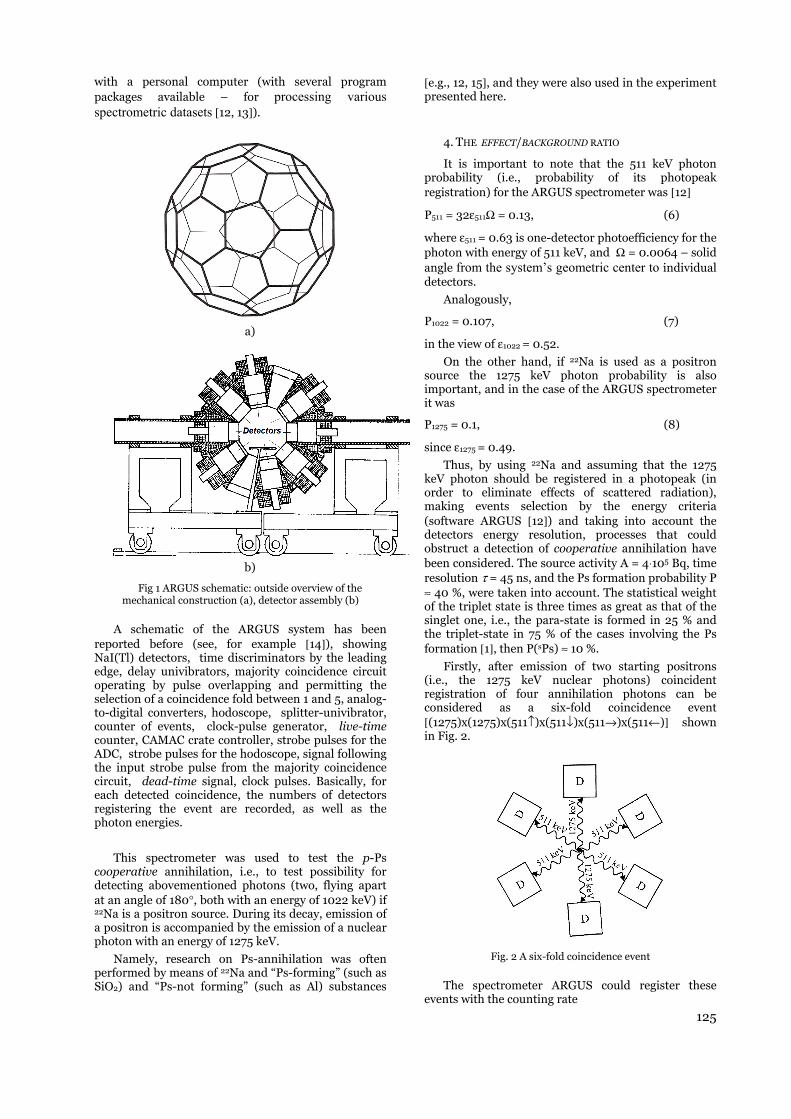
125
with a personal computer (with several program packages available – for processing various spectrometric datasets [12, 13]).
a)
b)
Fig 1 ARGUS schematic: outside overview of the mechanical construction (a), detector assembly (b)
A schematic of the ARGUS system has been reported before (see, for example [14]), showing NaI(Tl) detectors, time discriminators by the leading edge, delay univibrators, majority coincidence circuit operating by pulse overlapping and permitting the selection of a coincidence fold between 1 and 5, analog-to-digital converters, hodoscope, splitter-univibrator, counter of events, clock-pulse generator, live-time counter, CAMAC crate controller, strobe pulses for the ADC, strobe pulses for the hodoscope, signal following the input strobe pulse from the majority coincidence circuit, dead-time signal, clock pulses. Basically, for each detected coincidence, the numbers of detectors registering the event are recorded, as well as the photon energies.
This spectrometer was used to test the p-Ps cooperative annihilation, i.e., to test possibility for detecting abovementioned photons (two, flying apart at an angle of 180°, both with an energy of 1022 keV) if 22Na is a positron source. During its decay, emission of a positron is accompanied by the emission of a nuclear photon with an energy of 1275 keV.
Namely, research on Ps-annihilation was often performed by means of 22Na and “Ps-forming” (such as SiO2) and “Ps-not forming” (such as Al) substances
[e.g., 12, 15], and they were also used in the experiment presented here.
4. THE EFFECT/BACKGROUND RATIO
It is important to note that the 511 keV photon probability (i.e., probability of its photopeak registration) for the ARGUS spectrometer was [12]
P511 = 32ε511Ω = 0.13, (6)
where ε511 = 0.63 is one-detector photoefficiency for the photon with energy of 511 keV, and Ω = 0.0064 – solid angle from the system’s geometric center to individual detectors.
Analogously,
P1022 = 0.107, (7)
in the view of ε1022 = 0.52.
On the other hand, if 22Na is used as a positron source the 1275 keV photon probability is also important, and in the case of the ARGUS spectrometer it was
P1275 = 0.1, (8)
since ε1275 = 0.49.
Thus, by using 22Na and assuming that the 1275 keV photon should be registered in a photopeak (in order to eliminate effects of scattered radiation), making events selection by the energy criteria (software ARGUS [12]) and taking into account the detectors energy resolution, processes that could obstruct a detection of cooperative annihilation have been considered. The source activity A = 4⋅105 Bq, time resolution τ = 45 ns, and the Ps formation probability P ≈ 40 %, were taken into account. The statistical weight of the triplet state is three times as great as that of the singlet one, i.e., the para-state is formed in 25 % and the triplet-state in 75 % of the cases involving the Ps formation [1], then P(sPs) ≈ 10 %.
Firstly, after emission of two starting positrons (i.e., the 1275 keV nuclear photons) coincident registration of four annihilation photons can be considered as a six-fold coincidence event [(1275)x(1275)x(511↑)x(511↓)x(511→)x(511←)] shown in Fig. 2.
Fig. 2 A six-fold coincidence event
The spectrometer ARGUS could register these events with the counting rate
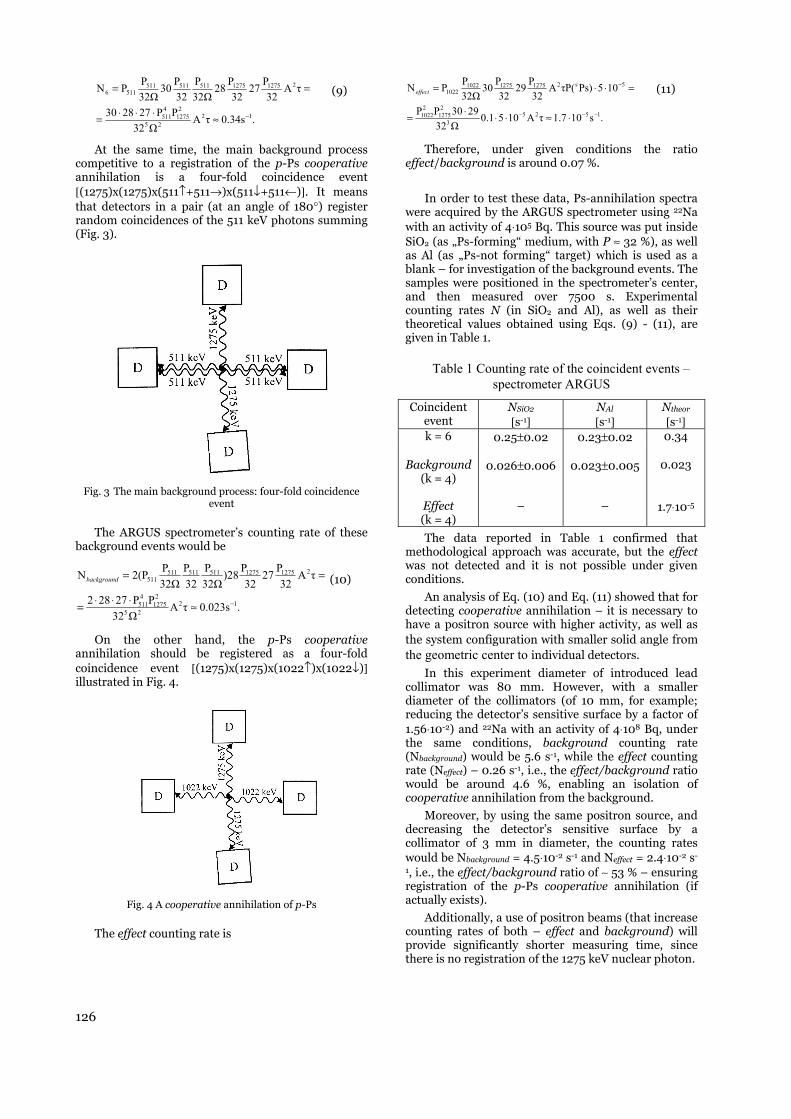
126
.0.34sτAΩ32
PP272830
τA32
P2732
P2832ΩP
32P30
32ΩPPN
1225
21275
4511
2127512755115115115116
−≈⋅⋅⋅=
== (9)
At the same time, the main background process competitive to a registration of the p-Ps cooperative annihilation is a four-fold coincidence event [(1275)x(1275)x(511↑+511→)x(511↓+511←)]. It means that detectors in a pair (at an angle of 180°) register random coincidences of the 511 keV photons summing (Fig. 3).
Fig. 3 The main background process: four-fold coincidence
event
The ARGUS spectrometer’s counting rate of these background events would be
.0.023sτAΩ32
PP27282
τA32
P2732
P)2832ΩP
32P
32ΩP2(PN
1225
21275
4511
212751275511511511511
−≈⋅⋅⋅=
==background (10)
On the other hand, the p-Ps cooperative annihilation should be registered as a four-fold coincidence event [(1275)x(1275)x(1022↑)x(1022↓)] illustrated in Fig. 4.
Fig. 4 A cooperative annihilation of p-Ps
The effect counting rate is
.s101.7τA1050.1Ω32
2930PP
105Ps)τP(A32
P2932
P3032ΩPPN
15253
21275
21022
5s21275127510221022
−−−
−
⋅≈⋅⋅⋅=
=⋅⋅=effect (11)
Therefore, under given conditions the ratio effect/background is around 0.07 %.
In order to test these data, Ps-annihilation spectra were acquired by the ARGUS spectrometer using 22Na with an activity of 4⋅105 Bq. This source was put inside SiO2 (as „Ps-forming“ medium, with P ≈ 32 %), as well as Al (as „Ps-not forming“ target) which is used as a blank – for investigation of the background events. The samples were positioned in the spectrometer’s center, and then measured over 7500 s. Experimental counting rates N (in SiO2 and Al), as well as their theoretical values obtained using Eqs. (9) - (11), are given in Table 1.
Table 1 Counting rate of the coincident events – spectrometer ARGUS
Coincident event
NSiO2 [s-1]
NAl [s-1]
Ntheor [s-1]
k = 6 0.25±0.02 0.23±0.02 0.34
Background (k = 4)
0.026±0.006
0.023±0.005
0.023
Effect (k = 4)
–
–
1.7⋅10-5
The data reported in Table 1 confirmed that methodological approach was accurate, but the effect was not detected and it is not possible under given conditions.
An analysis of Eq. (10) and Eq. (11) showed that for detecting cooperative annihilation – it is necessary to have a positron source with higher activity, as well as the system configuration with smaller solid angle from the geometric center to individual detectors.
In this experiment diameter of introduced lead collimator was 80 mm. However, with a smaller diameter of the collimators (of 10 mm, for example; reducing the detector’s sensitive surface by a factor of 1.56⋅10-2) and 22Na with an activity of 4⋅108 Bq, under the same conditions, background counting rate (Nbackground) would be 5.6 s-1, while the effect counting rate (Neffect) – 0.26 s-1, i.e., the effect/background ratio would be around 4.6 %, enabling an isolation of cooperative annihilation from the background.
Moreover, by using the same positron source, and decreasing the detector’s sensitive surface by a collimator of 3 mm in diameter, the counting rates would be Nbackground = 4.5⋅10-2 s-1 and Neffect = 2.4⋅10-2 s-
1, i.e., the effect/background ratio of ∼ 53 % – ensuring registration of the p-Ps cooperative annihilation (if actually exists).
Additionally, a use of positron beams (that increase counting rates of both – effect and background) will provide significantly shorter measuring time, since there is no registration of the 1275 keV nuclear photon.

127
5. CONCLUSIONS
Research on the cooperative decay is significant in the view of testing an interaction of Ps atoms in radiation fields.
Probability ratio – cooperative versus free annihilation of p-Ps, was evaluated to be 5⋅10-5, with the effect/background ratio depending on the experimental setup photoefficiencies for the 511 and 1022 keV photons (0.63 and 0.52, respectively – at the ARGUS spectrometer). In the experiment carried out using ARGUS with collimators (80 mm in diameter), and 22Na as a positron source (photoefficiency for the 1275 keV – 0.49), background process (four-fold coincidences) obstructed detection of the effect. An analysis showed that the source activity was too low, but also diameter of the disk-shaped lead collimator – too large.
Therefore, the cooperative p-Ps decay might be registered by the ARGUS spectrometer for a positron source (22Na) with an activity of 4⋅108 Bq, and disk-shaped lead collimators mounted on each detector with a diameter of ≤10 mm (instead of 80 mm used in this study).
Finally, a use of positron beams, when registration of the 1275 keV nuclear photon (from the 22Na decay) is avoided, would provide shortening of measurement times.
Acknowledgements: The paper is a part of the research done within the projects supported by – Ministry of Science of Montenegro, and Fundamental Research Foundation of the Belarusian Academy of Sciences.
REFERENCES
1. V. I. Goldanskii, “Physical chemistry of positron and positronium”, Science, Moscow, 1968 (in Russian).
2. M. Chiba, R. Hamatsu, T. Hirose, T. Matsumoto, J. Yang, “Measurement of electron-positron annihilation at rest into four and five photons”, Nukleonika, vol. 42(1), pp. 61-68, 1997.
3. S. K. Andrukhovich, A. V. Berestov, N. Antovich, P. Vukotich, A. A. Gurinovich, A.A. Khrutchinsky, O. N. Metelitsa, “Investigation of orthopositronium 3γ-decay using a multidetector spectrometer”, Nucl. Instrum. Methods Phys. Res. B, vol. 207(2), pp. 219-226, 2003.
4. B. K. Arbic, S. Hatamian, M. Skalsey, J. van House, W. Zheng, “Angular-correlation test of CPT in polarized positronium”, Phys. Rev., vol. 37(9), pp. 3189-3194, 1988.
5. S. K. Andrukhovich, N. Antovich, A. V. Berestov, O. N. Metelitsa, “Test CPT in the decay of polarized positronium using multidetector spectrometer”, Mater. Sci. Forum, vol. 363-365, pp. 591-593, 2001.
6. P. A. Vetter, S. J. Freedman, “Search for CPT-odd decays of positronium”, Phys. Rev. Lett., 91, 263401, 2003.
7. R. A. Vlasov, O. N. Gadomskii, V. V. Samartsev, “Annihilation superradiance in a system of positronium atoms and positron polarization of the medium”, Theor. Math. Phys., vol. 79(3), pp. 423–436, 1989 (in Russian).
8. O. N. Gadomskii, “The positronium atom in the field of an optical laser: radiation-induced energy shifts and
annihilation decay kinetics”, J. Exp. Theor. Phys., vol. 83(4), pp. 676-684, 1996.
9. O. N. Gadomskii, T. T. Idiattulov, “Long-lived positronium atom in the field of an optical laser”, Quantum Electron., vol. 28(6), pp. 469-473, 1998.
10. L. B. Madsen, P. Lambropoulos, “Scaling of hydrogenic atoms and ions interacting with laser fields: Positronium in a laser field”, Phys. Rev. A, vol. 59, pp. 4574-4579, 1999.
11. L. B. Madsen, “Positronium in laser fields”, Nucl. Instrum. Meth. B, vol. 221, pp. 174-181, 2004.
12. N. Antović, “Investigation of rare positronium decays on multidetector gamma-coincidence spectrometers”, PhD thesis, University of Belgrade, Faculty of Physics, 2000 (in Serbian).
13. S. K. Andrukhovich, A. V. Berestov, F. E. Zyazyulya, B. A. Marcinkevich, E. A. Rudak, A. M. Hil’manovich, “ARGUS”, Preprint of the Institute of Physics, AN BSSR, Minsk, 1986 (in Russian).
14. N. M. Antović, S. K. Andrukhovich, A.V. Berestov, “A contribution of the Compton scattered radiation from Mn-54 to double gamma coincidences spectra at the 32-detector system”, In: Proc. RAD2014, Niš, Serbia, pp. 127-130, 2014.
15. S. K. Andrukhovich, N. M. Antovich, A. V. Berestov, “Effect of cascade gamma-radiation summation processes on the precision of calculating the probability of three-photon annihilation of positronium” Phys. Solid State, vol. 42(9), pp. 1648-1651, 2000.


RESULTS FROM RADIONUCLIDE INTERLABORATORY COMPARISON IN SEDIMENT AND FISH
Gordana Pantelić1, Péter Vancsura2, Jelena Krneta Nikolić1, Marija Janković1, Nataša Sarap1, Dragana Todorović1, Milica Rajačić1
1University of Belgrade, Vinča Institute for Nuclear Sciences, Belgrade, Serbia 2 South Transdanubian Inspectorate for Environmental Protection, Nature Conservation and Water Management,
Pécs, Hungary
Abstract. The results of an intercomparison exercise, designed for the determination of anthropogenic and natural radionuclides in sediment and fish samples from the Danube River, are reported. The methods of gross beta and gamma spectrometry measurements were compared. Considering the uncertainties of measurements, a good agreement between the results obtained by two laboratories has been ascertained.
Key words: radionuclides, intercomparison, sediment, fish, Danube River
1. INTRODUCTION
The Paks Nuclear Power Plant, located 5 kilometres from Paks, is the first and only operating nuclear power station in Hungary. Its four reactors produce more than 40 percent of the electrical power generated in the country. The water of river Danube cools the reactors and and receives authorized radioactive liquid releases during normal operating conditions.
The radioactivity control of the Danube River was performed by water quality experts of Serbian-Hungarian Subcommittee from Serbian-Hungarian Commission for management of water resources. The radionuclide content and gross beta activity were measured in the samples of filtrated water, suspended material, sediment, algae and fish, but 90Sr activity was determined in all samples except algae due to small quantity of the sample [1]. From 1997 to 2012 samples were collected 2 times per year at Bezdan in Serbia and 2 times per year at Mohács in Hungary. In 2013 and 2014 sampling was performed only in Mohács. 137Cs activity in sediments ranged from 20 Bq/kg to 30 Bq/kg in 2000 [1].
Regarding the external quality control of the measurements, during 2014 the Vinča Institute for Nuclear Sciences from Belgrade in Serbia and South Transdanubian Inspectorate for Environmental Protection, Nature Conservation and Water Management from Pécs in Hungary, have participated in intercomparison exercise, which has been organized and developed in the framework of Serbian-Hungarian Subcommittee for water quality. The subcommittee experts have
coordinated an intercomparison exercise on gross beta activity and gamma spectrometry measurement in the sediment and fish samples with natural and artificial radionuclides. The scope of the intercomparison was to obtain information on the degree of agreement between the two laboratories. Authors expected that radioactivity control of the Danube River will continue on regular basis in the next year and it is very important to have very reliable measurement in both laboratories.
2. MATERIAL AND METHODS
2.1. Sampling technique and sample preparation
The samples were collected in October 2013 from Danube River near Mohács. The samples were taken downstream from the nuclear power plant. Surface sediments were collected at four locations close to riverbank, 2 on the left and 2 on the right coast. Sediment samples were collected from the top 5 cm layer of the material, taken by a grab sampler, in polyethylene bottles.
The samples were prepared in laboratory in Pécs. The sediment samples were packed in a container made from nonradioactive material, sealed and labelled to avoid mix up and contaminations. Each sediment is dried at 1050C to constant weight, sieved and the fraction of the particles with diameter smaller than 250 μm is taken.
Two species of fish were collected: Crucian Carp (Carassius carassius) and Zander (Stizostedion lucioperca). Each fish was cooked

130
at 1000C and after that dried at 1050C to constant weight, fragmented and homogenized. The samples were homogenized in Hungary and we only transferred them to cylindrical containers or Marinelli beaker and sealed. The samples were kept hermetically closed 6 weeks in order to reach the equilibrium due to radon emanation. Since all the samples contained natural radionuclides, the emanation and consequently the loss of radon, as a decay product of some of these radionuclides, changes the activity concentration of said radionuclides. When the samples are sealed and stored for a certain amount of time, the radon does not escape but instead reaches the equilibrium with its decay products. Rn decays to 218Po which in turn decays to 214Pb, which is used for measurement of 226Ra.
2.2. Experimental technique and method of measurements
Participating laboratories had to measure the activity of the radionuclides detected in each sample, with particular attention to natural radionuclides (from the uranium and thorium series and 40K) and 137Cs. Each laboratory was requested to apply its own routine procedure for such measurements using its most recent efficiency calibration and its usual source of nuclear data.
The measurement of gross beta activity is carried out by α-β-proportional gas counter “Thermo Eberline FHT770T” in both laboratories. The counting gas is a mixture of 90 % argon and 10 % methane. The level of background radiation is from 0.005 - 0.01 imp/s. The size of planchet is 6 cm in diameter. In Serbia calibration was performed by using standard source of 90Sr (EM 145, Czech Metrological Institute, Inspectorate for Ionizing Radiation, Prague) with an activity of 189.4 Bq on the 1st August 2011, while in Hungary calibration was done with KCl. The counting efficiencies for beta counting is 35 % in Serbia and 25 % (for fish) and 35 % (for sediment) in Hungary. The efficency for fish is lower because the fish sample amount is higher than sediment sample amount in the planchete and atenation occurs. The background of each detector was determined by counting an empty planchet for 3600 s.
A high-purity germanium detector system was used for gamma spectrometry. Each sample was mesured using standard method [2]. In Serbia two HP Ge p-type detectors Canberra with relative efficiencies of 20 % and 50 % were used for gamma spectrometry measurement. Duration of each measurement was 60000 s. Calibration of detectors for sediment measurements was performed using silicone resin matrix spiked with a series of radionuclides (241Am, 109Cd, 139Ce, 57Co,
60Co, 203Hg, 88Y, 113Sn, 85Sr and 137Cs) with total activity of 41.48 kBq on the day 31st August 2012 (Czech Metrological Institute, Inspectorate for Ionizing Radiation, Prague, 9031−OL− 420/12, type ERX). Efficiency calibration for fish samples (the cylindrical geometry 120 cm3) is performed with secondary reference materials which was produced using certified radioactive mixture solution ER X 9031-OL-427/12, issued by Czech Metrological Institute, Inspectorate for Ionizing Radiation, Prague. The radioactive solution contained following radionuclides: 241Am, 109Cd, 139Ce, 57Co, 60Co, 137Cs, 203Hg, 113Sn, 85Sr , 88Y and 210Pb, with the energies that span from 59 keV to 1898 keV with total activity of 72.4 kBq at reference date 31.08.2012. In Hungary one HP Ge p-type detector Canberra and one HP Ge n-type detector ORTEC both with relative efficiencies of 30% were used. Calibration of detectors was performed using calibrating source in cylindrical geometry, 220 cm3. Duration of measurement was 60000 s for the sediment and 250000 s for the fish samples.
Gamma lines used for determining the activity concentrations of the different natural radionuclides studied in the intercomparison were 295.22, 351.92, 609.32 and 1120.28 keV for 226Ra, 338.3 and 911.07 keV for 232Th and 1460.7keV for 40K. The activities of 137Cs was determined from its 661 keV γ−energy. For spectra processing the program Genie 2000 was used.
The accuracy and reproducibility of gamma spectrometry systems are verified on a weekly basis. The detector-shield background, detector efficiency, peak shape and peak drift are measured and verified to be within the acceptance limits [3].
Beside that both laboratories used a Certified Reference Material for radionuclides in sediment IAEA-385 for quality assurance/quality control of the analysis of radionuclides in sediment samples.
3. RESULTS AND DISCUSSION
Results obtained by the two laboratories participating in the intercomparison exercise, along with their respective combined standard uncertainties, are summarized in the Tables 1-4. We used the detector efficiency and counting uncertainty as the main contributor to the total uncertainty in the gross beta and gamma spectrometriy measurement. The measurement uncertainties are presented at the 95 % confidence level. In the figures and tables we used acronym SRB for the laboratory from Serbia and HU for the laboratory from Hungary.
The results of gross beta measurement for the sediments and fish are presented in Tables 1 and 2. There is good agreement between SRB and HU
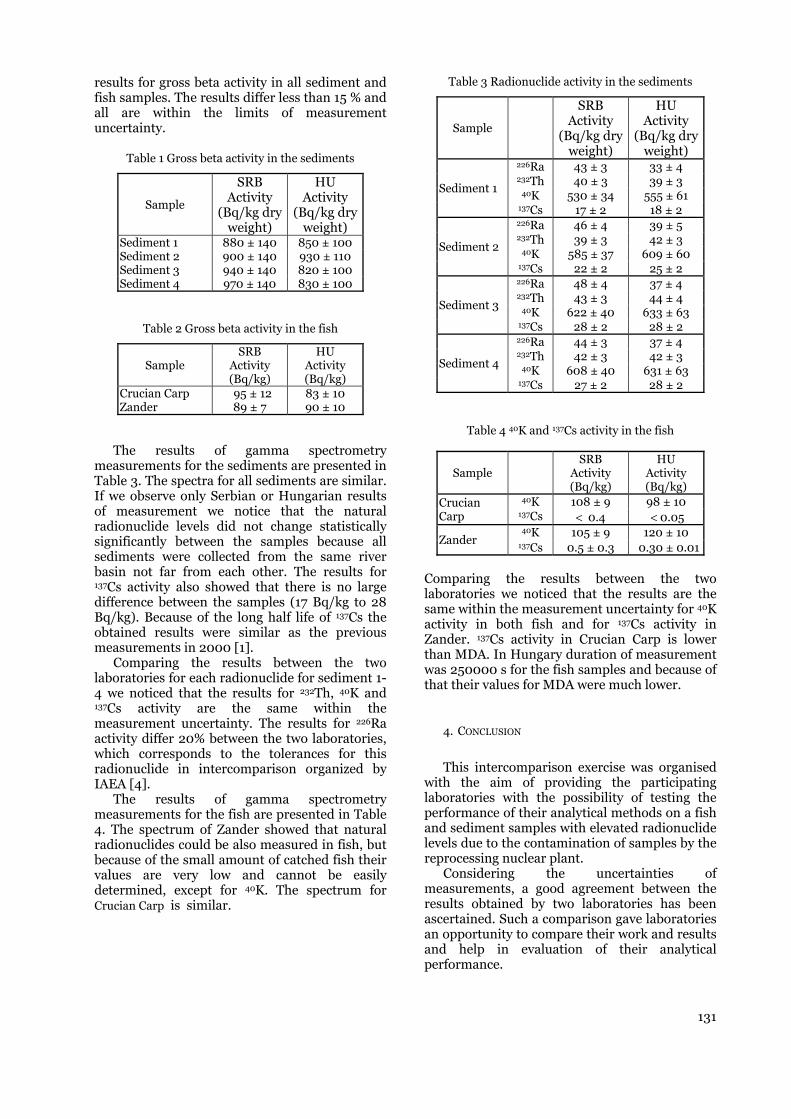
131
results for gross beta activity in all sediment and fish samples. The results differ less than 15 % and all are within the limits of measurement uncertainty.
Table 1 Gross beta activity in the sediments
Sample
SRB Activity
(Bq/kg dry weight)
HU Activity
(Bq/kg dry weight)
Sediment 1 880 ± 140 850 ± 100 Sediment 2 900 ± 140 930 ± 110 Sediment 3 940 ± 140 820 ± 100 Sediment 4 970 ± 140 830 ± 100
Table 2 Gross beta activity in the fish
Sample SRB
Activity (Bq/kg)
HU Activity (Bq/kg)
Crucian Carp 95 ± 12 83 ± 10 Zander 89 ± 7 90 ± 10
The results of gamma spectrometry measurements for the sediments are presented in Table 3. The spectra for all sediments are similar. If we observe only Serbian or Hungarian results of measurement we notice that the natural radionuclide levels did not change statistically significantly between the samples because all sediments were collected from the same river basin not far from each other. The results for 137Cs activity also showed that there is no large difference between the samples (17 Bq/kg to 28 Bq/kg). Because of the long half life of 137Cs the obtained results were similar as the previous measurements in 2000 [1].
Comparing the results between the two laboratories for each radionuclide for sediment 1-4 we noticed that the results for 232Th, 40K and 137Cs activity are the same within the measurement uncertainty. The results for 226Ra activity differ 20% between the two laboratories, which corresponds to the tolerances for this radionuclide in intercomparison organized by IAEA [4].
The results of gamma spectrometry measurements for the fish are presented in Table 4. The spectrum of Zander showed that natural radionuclides could be also measured in fish, but because of the small amount of catched fish their values are very low and cannot be easily determined, except for 40K. The spectrum for Crucian Carp is similar.
Table 3 Radionuclide activity in the sediments
Sample
SRB Activity
(Bq/kg dry weight)
HU Activity
(Bq/kg dry weight)
Sediment 1
226Ra 43 ± 3 33 ± 4 232Th 40 ± 3 39 ± 3
40K 530 ± 34 555 ± 61 137Cs 17 ± 2 18 ± 2
Sediment 2
226Ra 46 ± 4 39 ± 5 232Th 39 ± 3 42 ± 3
40K 585 ± 37 609 ± 60 137Cs 22 ± 2 25 ± 2
Sediment 3
226Ra 48 ± 4 37 ± 4 232Th 43 ± 3 44 ± 4
40K 622 ± 40 633 ± 63 137Cs 28 ± 2 28 ± 2
Sediment 4
226Ra 44 ± 3 37 ± 4 232Th 42 ± 3 42 ± 3
40K 608 ± 40 631 ± 63 137Cs 27 ± 2 28 ± 2
Table 4 40K and 137Cs activity in the fish
Sample SRB
Activity (Bq/kg)
HU Activity (Bq/kg)
Crucian Carp
40K 108 ± 9 98 ± 10 137Cs < 0.4 < 0.05
Zander 40K 105 ± 9 120 ± 10
137Cs 0.5 ± 0.3 0.30 ± 0.01
Comparing the results between the two laboratories we noticed that the results are the same within the measurement uncertainty for 40K activity in both fish and for 137Cs activity in Zander. 137Cs activity in Crucian Carp is lower than MDA. In Hungary duration of measurement was 250000 s for the fish samples and because of that their values for MDA were much lower.
4. CONCLUSION
This intercomparison exercise was organised
with the aim of providing the participating laboratories with the possibility of testing the performance of their analytical methods on a fish and sediment samples with elevated radionuclide levels due to the contamination of samples by the reprocessing nuclear plant.
Considering the uncertainties of measurements, a good agreement between the results obtained by two laboratories has been ascertained. Such a comparison gave laboratories an opportunity to compare their work and results and help in evaluation of their analytical performance.

132
Acknowledgement: The paper is a part of the research done within the project III43009 and the investigation was supported by the Ministry of Education and Science of the Republic of Serbia.
REFERENCES
1. G. Pantelić, M. Eremić, I. Petrović, Lj. Javorina, I. Tanasković, P. Vancsura, A. Lengyel Varga,J. Kövágó, “Radioactivity control of the Danube at Yugoslav-Hungarian border area“, Environmental Recovery of Yugoslavia, Monograph, Institute Vinča, pp 193-201, 2002.
2. Measurements of Radionuclides in Food and Environment, Method for Determining Gamma Emitters, IAEA Techical Reports Series No. 295, Vienna, 1989.
3. J.D. Krneta Nikolić, D.J. Todorović, M.M. Janković, G.K. Pantelić, M.M. Rajačić, “Quality Assurance and quality control in environmental radioactivity monitoring”, Quality Assurance and Safety of Crops & Foods, 6(4), pp 403-409, 2014.
4. Worldwide Open Proficiency Test: Determination of Naturally Occurring Radionuclides in Phosphogypsum andWater, IAEA Analytical Quality in Nuclear Applications Series No. 18, IAEA,Vienna, 2010.

PERSONAL RADIATION DETECTOR γ-TRACER GT2-1 WITH A CdZnTe DETECTOR
S. Gushchin, V. Ivanov, A. Loutchanski, V. Ogorodniks
ZRF RITEC SIA, Riga, LATVIA
Abstract. The Personal Radiation Detector (PRD) γ-Tracer GT2-1 was developed with a focus on gamma-radiation searches and detection and offers a gamma-radiation source localization function, enhanced PRD features and the capability of isotope energy pattern analysis. The device complies with general requirements and includes all typical features of PRD-class devices as well as supplementary modes such as multi-channel scaling (MCS), a spectrometer, library-driven analysis and a data logger. The GT2-1 uses a detector module built around a 0.4 cm3 counting-grade planar CdZnTe detector. CdZnTe offers high-efficiency gamma-radiation detection for a small detector volume and energy discrimination down to 30 keV. The GT2-1 was designed with power consumption in mind; its typical lifetime after a full battery charge exceeds 600 hours in measurements mode. Energy compensation techniques are employed for the dose rate calculations. The typical accuracy of the device in the energy range of 30–1500 keV is better than 10% for factory-calibrated devices. The GT2-1 features a library-driven isotope identification function. Its underlying concept is the use of a library of pre-calibrated user-defined isotope patterns for comparison with the isotope under investigation. The identification algorithm is designed to evaluate the isotope energy pattern match. The execution of the algorithm yields the matching results between the tested isotope and the library in graphical form. The device’s search mode employs a proprietary Background Variation Tracking (BVT) algorithm. The implemented search and gamma-radiation source localization mechanisms facilitate the rapid (1–3 sec) detection of weak gamma-radiation sources with intensities that exceed the background level by a factor of 1.5–3. Analysis of the time intervals between adjacent pulses in the input sequence is used to determine numeric characteristics that are also displayed in a user-friendly graphical form. The dedicated GUI approach and sound capabilities are tailored to facilitate search activities and support the operator in gaining experience with the device. The dedicated search algorithm implementation allows the device to be used as a homeland security detector by services responsible for the control of the relocation of radioactive materials, such as those at airports, border control checkpoints, and tolls. Test results for the GT2-1 in search mode are presented.
Key words: Personal Radiation Detector, PRD, CdZnTe detector, dose rate, dosimeter
1. INTRODUCTION
Currently, CdZnTe nuclear radiation detectors of various designs and sizes are widely and successfully used for various applications because of their favorable detection properties, including the ability to operate at room temperatures, high efficiency, good energy resolution, small dimensions and low weight. There are a number of device applications based on these detectors. Among the wide variety of devices that contain CdZnTe detectors, there are compact pocket-sized devices for the detection and measurement of gamma radiation parameters. Conventionally, such devices are divided into several groups that differ in their purposes, namely, Personal Radiation Detectors (PRDs), dosimeters, Spectral Personal Radiation Detectors (SPRDs) and Radiation Identifiers.
The primary task of a PRD is radiation detection, with the intent of raising an alarm in the case of possible radiation threat to an operator or indicating the presence of a radiation source. Modern PRDs are hand-held, lightweight tools that can be kept in a pocket or fixed to the wearer's belt. The inherent ability of such devices to register dose rates allows a PRD to
serve as a dosimeter – a device that serves to accurately measure the dose rate and the accumulated dose received by the wearer during a given exposure period. An instrument that is capable of registering and distinguishing gamma-radiation emission energies is known as an identifier tool. Its general purpose is the detection of the presence and the identification of isotopes.
Existing commercially available devices are generally designed on the basis of Geiger-Mueller counters or scintillation detectors (NaI or CsI(Tl)). The primary disadvantage of the devices based on Geiger-Müller counters is their low detection efficiency for gamma radiation, and devices based on scintillation detectors can detect radiation only in a narrow range of dose rates and are rather large in size and low in mechanical robustness. The use of CdZnTe detectors allows for the achievement of a detection efficiency that is sufficient for most tasks and extends the range of measurable dose rates. Such devices also have a low energy detection threshold; they are sensitive to energies of 20–30 keV and above.

134
Currently available SPRDs with CdZnTe detectors allow for the identification of radioactive materials based on their gamma-radiation spectra [1, 2]. Spectrometric detectors of various designs with sensitive volumes of 0.5–1.0 cm3 are used in these devices. These relatively large-volume spectrometric CdZnTe detectors are expensive. The additional cost for these devices is significant because of the detector complexity. Therefore, the use of these devices, despite their high spectrometric performance, is still limited.
CdZnTe detectors have several features that must be taken into account for their successful application. First of these is the strong dependence of the detection efficiency on the energy of the detected gamma radiation and the problem of the tissue equivalence of CdZnTe detectors [3–6]. A special energy-compensated technique must be used for correct dose rate evaluation. Additionally, the strong microphonic effect that occurs in CdZnTe detectors because of their piezoelectric sensitivity must be taken into account. These issues limit and complicate the use of CdZnTe detectors in PRDs and dosimeters for field applications.
Research efforts have resulted in the successful solution of these problems and the implementation of this solution in the commercially available GT2-1 detector. The device integrates the properties of PRDs and personal dosimeters as well as some limited capabilities of radiation identifiers. The GT2-1 was designed based on a reasonably cheap “counting-grade” CdZnTe detector with a planar geometry and a volume of 0.4 cm3. A unique feature of this device is its search mode for the search for and detection and localization of gamma-radiation sources. Measurements of the true dose rate require energy compensation of the detection efficiency. The applied compensation method uses information regarding the spectral composition of the detected radiation.
In this paper, descriptions of the device and its main features, main operating modes, signal processing algorithms and test results are presented.
2. DESCRIPTIONS OF THE MAIN FEATURES AND MODES
OF THE GT2-1
The Personal Radiation Detector GT2-1 is a pocket-sized, lightweight instrument for gamma and X-ray
radiation measurements built around a solid-state CdZnTe detector. The main parameters of the GT2-1 are summarized in Table 1. The device combines proven measurement characteristics and a rich set of functions and features with the benefits of a low-cost counting-grade planar CdZnTe detector application.
Table 1. Main GT2-1 specifications
Detector type Detector size Energy range Dose rate Dose Sensitivity to 137Cs Accuracy LCD Data recording capacity Operating time PC communication Operating temperature Weight
Counting-grade planar CdZnTe
2 cm x 1 cm x 0.2 cm30 keV–3.0 MeV
0.05–2000 µSv/h0.05 µSv–10 Sv
15 cps/µSv/h± 15%
98 x 64 pixelsup to 3000 entries
up to 900 hmicro USB
-20 °C to +50 °C200 g
The device’s affordable price, freely available suite of PC tools and long duration of continuous operation without the need to recharge provide the user with a professional-class tool with only a moderate budgetary impact. The GT2-1 features professional-grade sensitivity (10 cps at 0.01 µSv/h 241Am), a wide measuring range (5 decades), sensitivity at 30 keV and above, the capability of energy-compensated true dose rate measurements and a rich set of additional features. The selection of CdZnTe provides an extended dynamic range, enhanced accuracy, perfect linearity over 4 decades, a wide temperature range and stability over time [7]. The GT2-1 is depicted in Fig. 1.
A block diagram of the GT2-1 is shown in Fig. 2.
The detector module (DET & PA) consists of a planar “counting-grade” CdZnTe detector and a charge-sensitive preamplifier. The detector dimensions of 2 cm x 1 cm x 0.2 cm have been found to be optimal for sensitivity and budgetary reasons, though other sizes are also feasible. The electrical pulses that are generated in the detector module as a result of the
Fig. 1 Personal Radiation Detector GT2-1.
Fig. 2 Block diagram of the GT2-1.
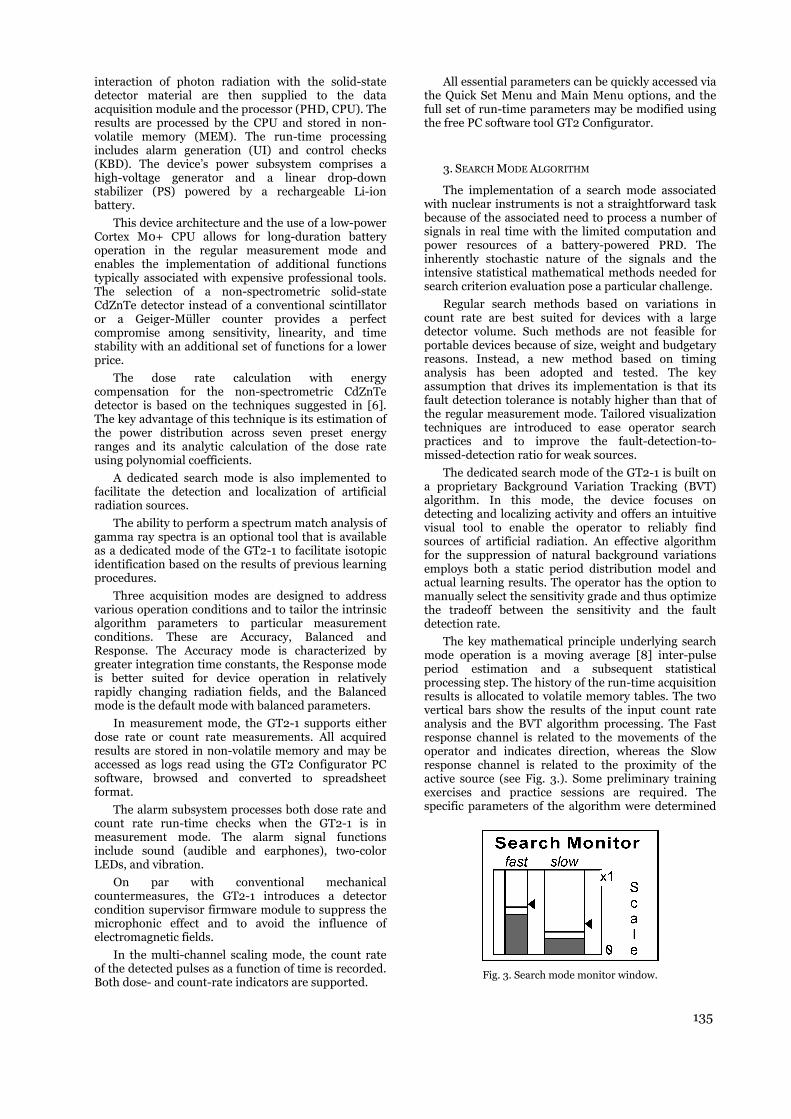
135
interaction of photon radiation with the solid-state detector material are then supplied to the data acquisition module and the processor (PHD, CPU). The results are processed by the CPU and stored in non-volatile memory (MEM). The run-time processing includes alarm generation (UI) and control checks (KBD). The device’s power subsystem comprises a high-voltage generator and a linear drop-down stabilizer (PS) powered by a rechargeable Li-ion battery.
This device architecture and the use of a low-power Cortex M0+ CPU allows for long-duration battery operation in the regular measurement mode and enables the implementation of additional functions typically associated with expensive professional tools. The selection of a non-spectrometric solid-state CdZnTe detector instead of a conventional scintillator or a Geiger-Müller counter provides a perfect compromise among sensitivity, linearity, and time stability with an additional set of functions for a lower price.
The dose rate calculation with energy compensation for the non-spectrometric CdZnTe detector is based on the techniques suggested in [6]. The key advantage of this technique is its estimation of the power distribution across seven preset energy ranges and its analytic calculation of the dose rate using polynomial coefficients.
A dedicated search mode is also implemented to facilitate the detection and localization of artificial radiation sources.
The ability to perform a spectrum match analysis of gamma ray spectra is an optional tool that is available as a dedicated mode of the GT2-1 to facilitate isotopic identification based on the results of previous learning procedures.
Three acquisition modes are designed to address various operation conditions and to tailor the intrinsic algorithm parameters to particular measurement conditions. These are Accuracy, Balanced and Response. The Accuracy mode is characterized by greater integration time constants, the Response mode is better suited for device operation in relatively rapidly changing radiation fields, and the Balanced mode is the default mode with balanced parameters.
In measurement mode, the GT2-1 supports either dose rate or count rate measurements. All acquired results are stored in non-volatile memory and may be accessed as logs read using the GT2 Configurator PC software, browsed and converted to spreadsheet format.
The alarm subsystem processes both dose rate and count rate run-time checks when the GT2-1 is in measurement mode. The alarm signal functions include sound (audible and earphones), two-color LEDs, and vibration.
On par with conventional mechanical countermeasures, the GT2-1 introduces a detector condition supervisor firmware module to suppress the microphonic effect and to avoid the influence of electromagnetic fields.
In the multi-channel scaling mode, the count rate of the detected pulses as a function of time is recorded. Both dose- and count-rate indicators are supported.
All essential parameters can be quickly accessed via the Quick Set Menu and Main Menu options, and the full set of run-time parameters may be modified using the free PC software tool GT2 Configurator.
3. SEARCH MODE ALGORITHM
The implementation of a search mode associated with nuclear instruments is not a straightforward task because of the associated need to process a number of signals in real time with the limited computation and power resources of a battery-powered PRD. The inherently stochastic nature of the signals and the intensive statistical mathematical methods needed for search criterion evaluation pose a particular challenge.
Regular search methods based on variations in count rate are best suited for devices with a large detector volume. Such methods are not feasible for portable devices because of size, weight and budgetary reasons. Instead, a new method based on timing analysis has been adopted and tested. The key assumption that drives its implementation is that its fault detection tolerance is notably higher than that of the regular measurement mode. Tailored visualization techniques are introduced to ease operator search practices and to improve the fault-detection-to-missed-detection ratio for weak sources.
The dedicated search mode of the GT2-1 is built on a proprietary Background Variation Tracking (BVT) algorithm. In this mode, the device focuses on detecting and localizing activity and offers an intuitive visual tool to enable the operator to reliably find sources of artificial radiation. An effective algorithm for the suppression of natural background variations employs both a static period distribution model and actual learning results. The operator has the option to manually select the sensitivity grade and thus optimize the tradeoff between the sensitivity and the fault detection rate.
The key mathematical principle underlying search mode operation is a moving average [8] inter-pulse period estimation and a subsequent statistical processing step. The history of the run-time acquisition results is allocated to volatile memory tables. The two vertical bars show the results of the input count rate analysis and the BVT algorithm processing. The Fast response channel is related to the movements of the operator and indicates direction, whereas the Slow response channel is related to the proximity of the active source (see Fig. 3.). Some preliminary training exercises and practice sessions are required. The specific parameters of the algorithm were determined
Fig. 3. Search mode monitor window.
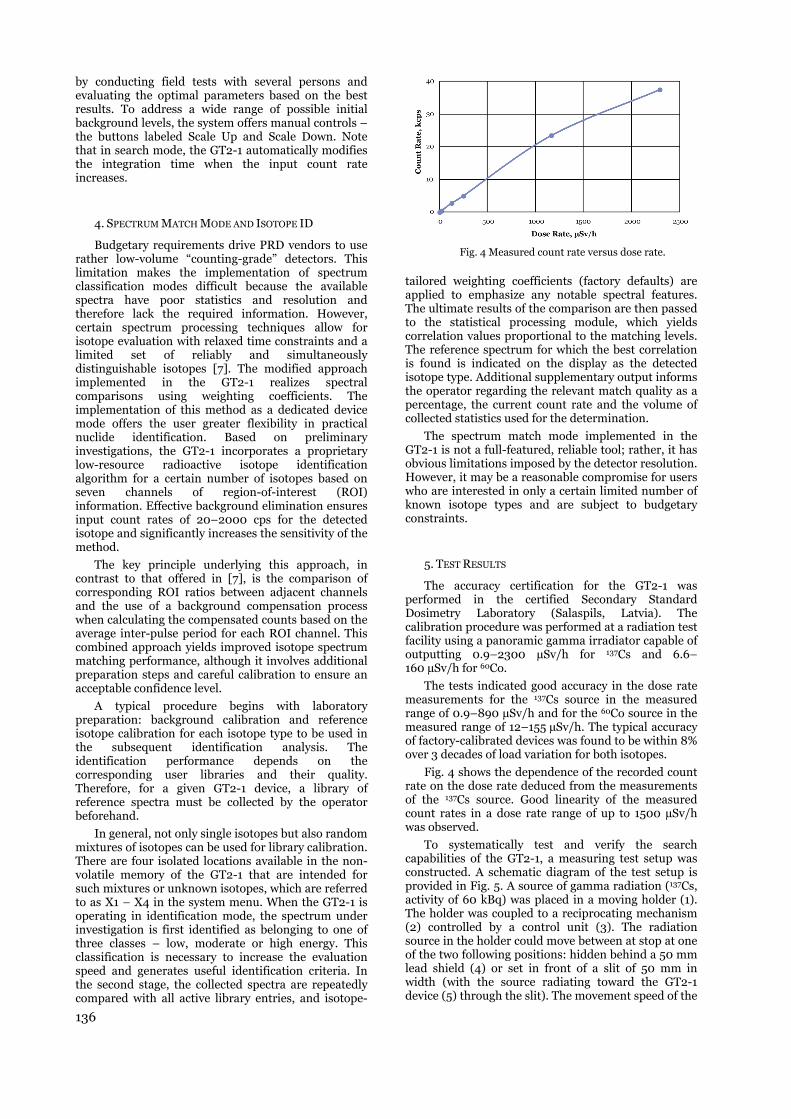
136
by conducting field tests with several persons and evaluating the optimal parameters based on the best results. To address a wide range of possible initial background levels, the system offers manual controls – the buttons labeled Scale Up and Scale Down. Note that in search mode, the GT2-1 automatically modifies the integration time when the input count rate increases.
4. SPECTRUM MATCH MODE AND ISOTOPE ID
Budgetary requirements drive PRD vendors to use rather low-volume “counting-grade” detectors. This limitation makes the implementation of spectrum classification modes difficult because the available spectra have poor statistics and resolution and therefore lack the required information. However, certain spectrum processing techniques allow for isotope evaluation with relaxed time constraints and a limited set of reliably and simultaneously distinguishable isotopes [7]. The modified approach implemented in the GT2-1 realizes spectral comparisons using weighting coefficients. The implementation of this method as a dedicated device mode offers the user greater flexibility in practical nuclide identification. Based on preliminary investigations, the GT2-1 incorporates a proprietary low-resource radioactive isotope identification algorithm for a certain number of isotopes based on seven channels of region-of-interest (ROI) information. Effective background elimination ensures input count rates of 20–2000 cps for the detected isotope and significantly increases the sensitivity of the method.
The key principle underlying this approach, in contrast to that offered in [7], is the comparison of corresponding ROI ratios between adjacent channels and the use of a background compensation process when calculating the compensated counts based on the average inter-pulse period for each ROI channel. This combined approach yields improved isotope spectrum matching performance, although it involves additional preparation steps and careful calibration to ensure an acceptable confidence level.
A typical procedure begins with laboratory preparation: background calibration and reference isotope calibration for each isotope type to be used in the subsequent identification analysis. The identification performance depends on the corresponding user libraries and their quality. Therefore, for a given GT2-1 device, a library of reference spectra must be collected by the operator beforehand.
In general, not only single isotopes but also random mixtures of isotopes can be used for library calibration. There are four isolated locations available in the non-volatile memory of the GT2-1 that are intended for such mixtures or unknown isotopes, which are referred to as X1 – X4 in the system menu. When the GT2-1 is operating in identification mode, the spectrum under investigation is first identified as belonging to one of three classes – low, moderate or high energy. This classification is necessary to increase the evaluation speed and generates useful identification criteria. In the second stage, the collected spectra are repeatedly compared with all active library entries, and isotope-
tailored weighting coefficients (factory defaults) are applied to emphasize any notable spectral features. The ultimate results of the comparison are then passed to the statistical processing module, which yields correlation values proportional to the matching levels. The reference spectrum for which the best correlation is found is indicated on the display as the detected isotope type. Additional supplementary output informs the operator regarding the relevant match quality as a percentage, the current count rate and the volume of collected statistics used for the determination.
The spectrum match mode implemented in the GT2-1 is not a full-featured, reliable tool; rather, it has obvious limitations imposed by the detector resolution. However, it may be a reasonable compromise for users who are interested in only a certain limited number of known isotope types and are subject to budgetary constraints.
5. TEST RESULTS
The accuracy certification for the GT2-1 was performed in the certified Secondary Standard Dosimetry Laboratory (Salaspils, Latvia). The calibration procedure was performed at a radiation test facility using a panoramic gamma irradiator capable of outputting 0.9–2300 µSv/h for 137Cs and 6.6–160 µSv/h for 60Co.
The tests indicated good accuracy in the dose rate measurements for the 137Cs source in the measured range of 0.9–890 µSv/h and for the 60Co source in the measured range of 12–155 µSv/h. The typical accuracy of factory-calibrated devices was found to be within 8% over 3 decades of load variation for both isotopes.
Fig. 4 shows the dependence of the recorded count rate on the dose rate deduced from the measurements of the 137Cs source. Good linearity of the measured count rates in a dose rate range of up to 1500 µSv/h was observed.
To systematically test and verify the search capabilities of the GT2-1, a measuring test setup was constructed. A schematic diagram of the test setup is provided in Fig. 5. A source of gamma radiation (137Cs, activity of 60 kBq) was placed in a moving holder (1). The holder was coupled to a reciprocating mechanism (2) controlled by a control unit (3). The radiation source in the holder could move between at stop at one of the two following positions: hidden behind a 50 mm lead shield (4) or set in front of a slit of 50 mm in width (with the source radiating toward the GT2-1 device (5) through the slit). The movement speed of the
Fig. 4 Measured count rate versus dose rate.
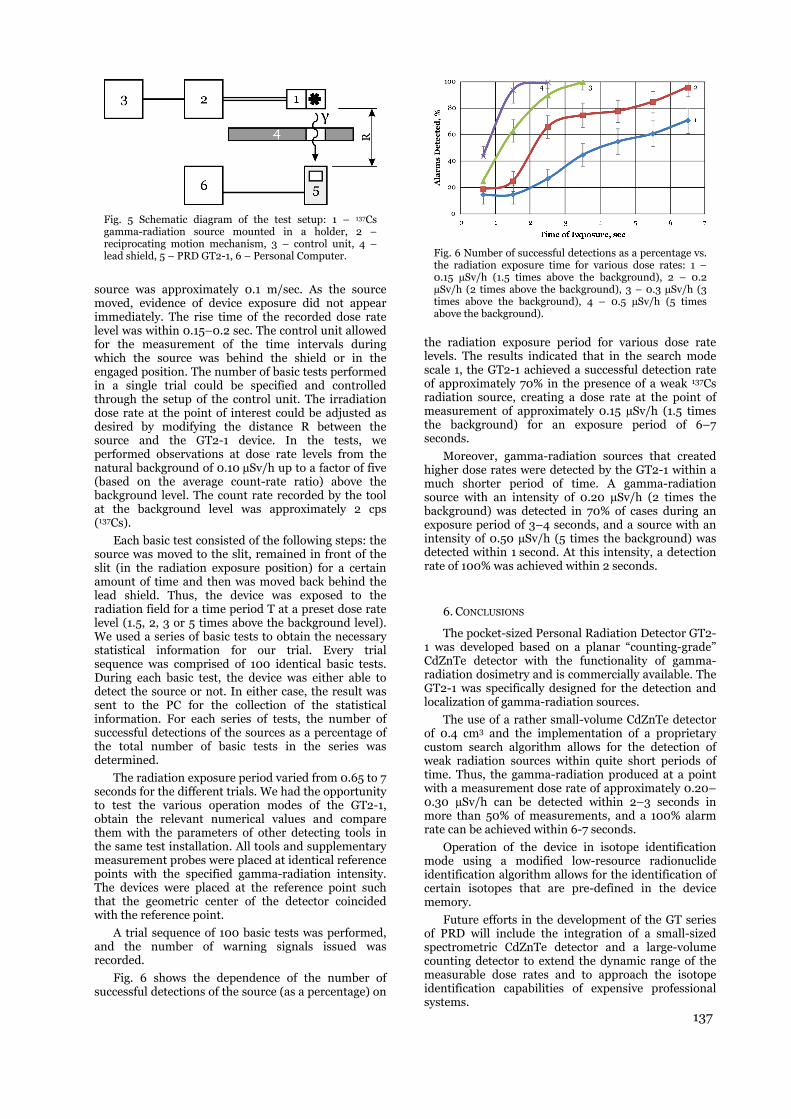
137
source was approximately 0.1 m/sec. As the source moved, evidence of device exposure did not appear immediately. The rise time of the recorded dose rate level was within 0.15–0.2 sec. The control unit allowed for the measurement of the time intervals during which the source was behind the shield or in the engaged position. The number of basic tests performed in a single trial could be specified and controlled through the setup of the control unit. The irradiation dose rate at the point of interest could be adjusted as desired by modifying the distance R between the source and the GT2-1 device. In the tests, we performed observations at dose rate levels from the natural background of 0.10 µSv/h up to a factor of five (based on the average count-rate ratio) above the background level. The count rate recorded by the tool at the background level was approximately 2 cps (137Cs).
Each basic test consisted of the following steps: the source was moved to the slit, remained in front of the slit (in the radiation exposure position) for a certain amount of time and then was moved back behind the lead shield. Thus, the device was exposed to the radiation field for a time period T at a preset dose rate level (1.5, 2, 3 or 5 times above the background level). We used a series of basic tests to obtain the necessary statistical information for our trial. Every trial sequence was comprised of 100 identical basic tests. During each basic test, the device was either able to detect the source or not. In either case, the result was sent to the PC for the collection of the statistical information. For each series of tests, the number of successful detections of the sources as a percentage of the total number of basic tests in the series was determined.
The radiation exposure period varied from 0.65 to 7 seconds for the different trials. We had the opportunity to test the various operation modes of the GT2-1, obtain the relevant numerical values and compare them with the parameters of other detecting tools in the same test installation. All tools and supplementary measurement probes were placed at identical reference points with the specified gamma-radiation intensity. The devices were placed at the reference point such that the geometric center of the detector coincided with the reference point.
A trial sequence of 100 basic tests was performed, and the number of warning signals issued was recorded.
Fig. 6 shows the dependence of the number of successful detections of the source (as a percentage) on
the radiation exposure period for various dose rate levels. The results indicated that in the search mode scale 1, the GT2-1 achieved a successful detection rate of approximately 70% in the presence of a weak 137Cs radiation source, creating a dose rate at the point of measurement of approximately 0.15 µSv/h (1.5 times the background) for an exposure period of 6–7 seconds.
Moreover, gamma-radiation sources that created higher dose rates were detected by the GT2-1 within a much shorter period of time. A gamma-radiation source with an intensity of 0.20 µSv/h (2 times the background) was detected in 70% of cases during an exposure period of 3–4 seconds, and a source with an intensity of 0.50 µSv/h (5 times the background) was detected within 1 second. At this intensity, a detection rate of 100% was achieved within 2 seconds.
6. CONCLUSIONS
The pocket-sized Personal Radiation Detector GT2-1 was developed based on a planar “counting-grade” CdZnTe detector with the functionality of gamma-radiation dosimetry and is commercially available. The GT2-1 was specifically designed for the detection and localization of gamma-radiation sources.
The use of a rather small-volume CdZnTe detector of 0.4 cm3 and the implementation of a proprietary custom search algorithm allows for the detection of weak radiation sources within quite short periods of time. Thus, the gamma-radiation produced at a point with a measurement dose rate of approximately 0.20–0.30 µSv/h can be detected within 2–3 seconds in more than 50% of measurements, and a 100% alarm rate can be achieved within 6-7 seconds.
Operation of the device in isotope identification mode using a modified low-resource radionuclide identification algorithm allows for the identification of certain isotopes that are pre-defined in the device memory.
Future efforts in the development of the GT series of PRD will include the integration of a small-sized spectrometric CdZnTe detector and a large-volume counting detector to extend the dynamic range of the measurable dose rates and to approach the isotope identification capabilities of expensive professional systems.
Fig. 5 Schematic diagram of the test setup: 1 – 137Cs gamma-radiation source mounted in a holder, 2 – reciprocating motion mechanism, 3 – control unit, 4 – lead shield, 5 – PRD GT2-1, 6 – Personal Computer.
Fig. 6 Number of successful detections as a percentage vs. the radiation exposure time for various dose rates: 1 – 0.15 µSv/h (1.5 times above the background), 2 – 0.2 µSv/h (2 times above the background), 3 – 0.3 µSv/h (3 times above the background), 4 – 0.5 µSv/h (5 times above the background).

138
REFERENCES
1. Spectroscopic personal radiation detector identiFINDER R300, FLIR Data Sheets, http://www.flir.com/uploadedFiles/flirGS/Threat_Detection/Radiation_Detection/Products/IdenitiFINDER-R300/DS_identiFINDER-R-300-en.pdf.
2. Spectrometric Personal Radiation Detector GalaxRay, Galaxray Data Sheets, http://www.galaxray.com/products.html#tabs-tab-title-2.
3. V. Nagarkar, M. Squillante, G. Entine, I. Stern, D. Sharif, CdTe detectors in nuclear radiation dosimetry, NIM, A 322, pp. 623–627, 1992.
4. В. С. Горев, В. А. Кожемякин, О. А.Матвеев, М.Д.Фирсов, А. Х Хуcaинoв, Г. К. Шульгович. Применение детекторов на основе теллурида кадмия в дозиметрии гамма-излучения, Приборы и техника Эксперимента, No. 1, pp. 60–64, 1981.
5. В. А. Мокрицкий, О.В. Маслов, О. В. Банзак, Коррекция зависимости чувствительности CdZnTe-детектора от энергии гамма-излучения, Збiрник науковыхпраць Вiйськового iнституту Киïвського нацiонального унiверситету iменi Тараса шевченко, No. 39, pp. 81–84, 2013.
6. Rybka A. V., Davydov L. N., Shlyakhov I. N., Kutny V. E., Prokhoretz I. M., Kutny D. V., Orobinsky A. N., Gamma-radiation dosimetry with semiconductor CdTe and CdZnTe detectors, NIM, A 531, pp. 147–156, 2004.
7. Arlt R., Brutscher J., Gunnink R., Ivanov V., Parnham K., Soldner S.A., Stein J., Use of CdZnTe detectors in hand-held and portable isotope identifiers to detect illicit trafficking of nuclear material and radioactive sources, Nuclear Science Symposium Conference Record, pp. 418–424, 2000 IEEE.
8. http://www.maths.qmul.ac.uk/~bb/TS_Chapter4_3&4.pdf.
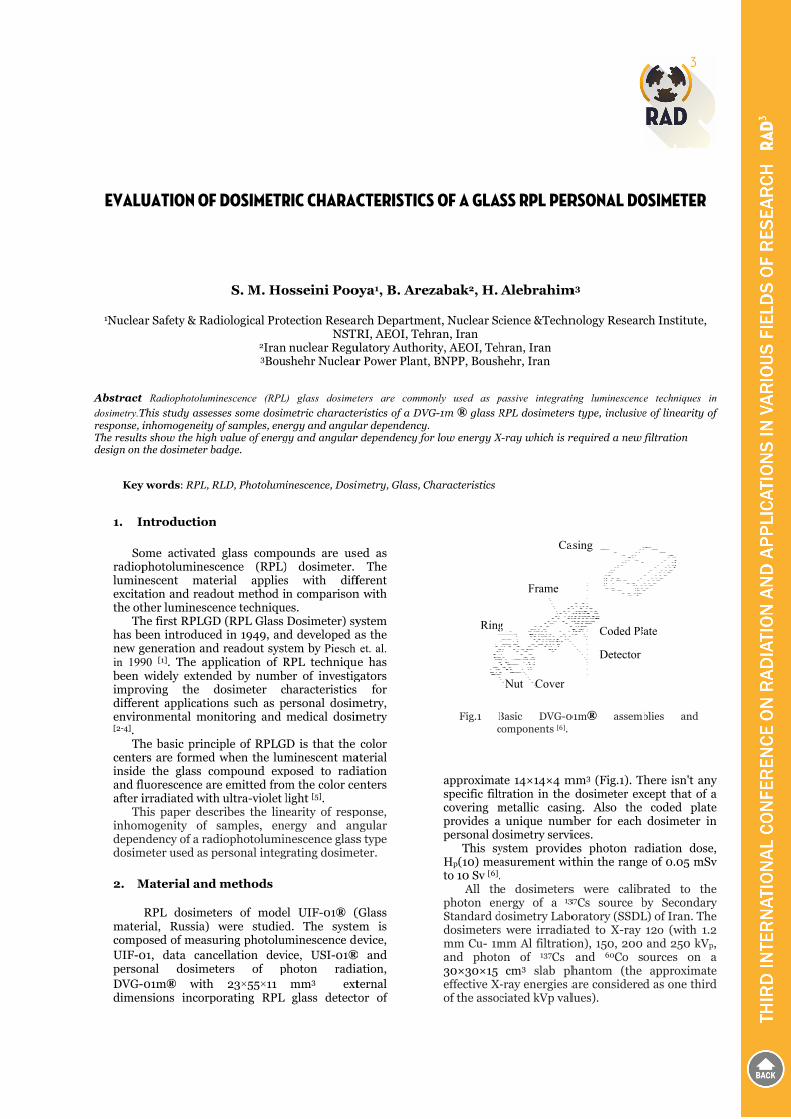
EVALU
1Nuclea
Abstract dosimetry.Tresponse, iThe resultsdesign on
Key
1. In
So
radiopluminexcitathe ot
Thhas benew gin 199been improdiffereenviro[2-4].
Thcenterinsideand flafter i
Thinhomdependosim
2. M
matercompoUIF-0personDVG-dimen
UATION OF
ar Safety & Rad
Radiophotolum
This study assesinhomogeneity s show the highthe dosimeter b
y words: RPL, R
ntroduction
ome activatedphotolumines
nescent mateation and readther luminescehe first RPLGDeen introduce
generation and90 [1]. The apwidely extend
oving the dent applicatioonmental mon
he basic princrs are formede the glass coluorescence arirradiated withhis paper descmogenity of ndency of a rad
meter used as p
Material and
RPL dosimetrial, Russia) osed of measu
01, data cancnal dosime01m® with
nsions incorp
F DOSIMETR
S. M. Ho
diological Pro
2Iran3Bou
minescence (RPL)
sses some dosimof samples, ene
h value of energbadge.
RLD, Photolumi
n
d glass compocence (RPL)erial applies
dout method ience techniqueD (RPL Glass ed in 1949, and readout systplication of Rded by numbdosimeter c
ons such as pnitoring and
ciple of RPLGd when the lumompound expre emitted fromh ultra-violet lcribes the linsamples, ene
diophotoluminpersonal integ
d methods
ters of modewere studied
uring photolumcellation deviters of p
23×55×11 porating RPL
RIC CHARAC
osseini Poo
tection ResearNSTR
nuclear Regushehr Nuclear
) glass dosimet
metric characteergy and angulagy and angular
inescence, Dosim
ounds are use) dosimeter.s with diffn comparisones. Dosimeter) syd developed atem by Piesch RPL techniqueber of investig
haracteristics ersonal dosimmedical dosim
D is that the minescent maposed to radim the color celight [5]. earity of respergy and annescence glassrating dosime
el UIF-01® (d. The systeminescence deice, USI-01®hoton radiamm3 extglass detect
CTERISTICS
oya1, B. Are
rch DepartmeRI, AEOI, Teh
ulatory Authorr Power Plant,
ters are commo
eristics of a DVGar dependency.
r dependency fo
metry, Glass, C
ed as The
ferent n with
ystem as the et. al. e has
gators for
metry, metry
color aterial iation enters
ponse, ngular s type eter.
(Glass em is evice,
® and ation, ternal tor of
S OF A GLAS
zabak2, H.
ent, Nuclear Schran, Iran rity, AEOI, Teh, BNPP, Boush
only used as p
VG-1m ® glass R.
or low energy X
Characteristics
approximaspecific filtcovering mprovides apersonal do
This syНр(10) meato 10 Sv [6].
All thphoton enStandard ddosimetersmm Cu- 1mand photo30×30×15 effective X-of the assoc
Ring
Fig.1 Bc
SS RPL PER
Alebrahim
cience &Techn
hran, Iran hehr, Iran
passive integrati
RPL dosimeters
X-ray which is r
te 14×14×4 mtration in the metallic casin
unique numosimetry serviystem provideasurement wit e dosimeters
nergy of a 13
dosimetry Labos were irradiamm Al filtratioon of 137Cs
cm3 slab ph-ray energies aciated kVp val
Ca
Frame
g
Cover Nut
Basic DVG-0components [6].
RSONAL DO
m3
nology Resear
ing luminescenc
s type, inclusive
required a new f
mm3 (Fig.1). Tdosimeter ex
ng. Also the mber for each
ices. es photon rathin the range
s were calib37Cs source boratory (SSDL
ated to X-ray on), 150, 200 and 60Co s
hantom (the are considerelues).
asing
Coded Pl
Detector
01m® assemb
OSIMETER
ch Institute,
e techniques in
e of linearity of
filtration
here isn't anyxcept that of a
coded platedosimeter in
adiation dose,e of 0.05 mSv
rated to theby SecondaryL) of Iran. The
12o (with 1.2and 250 kVp,
ources on aapproximate
d as one third
ate
blies and
n
f
y a e n
, v
e y e 2 , a e d
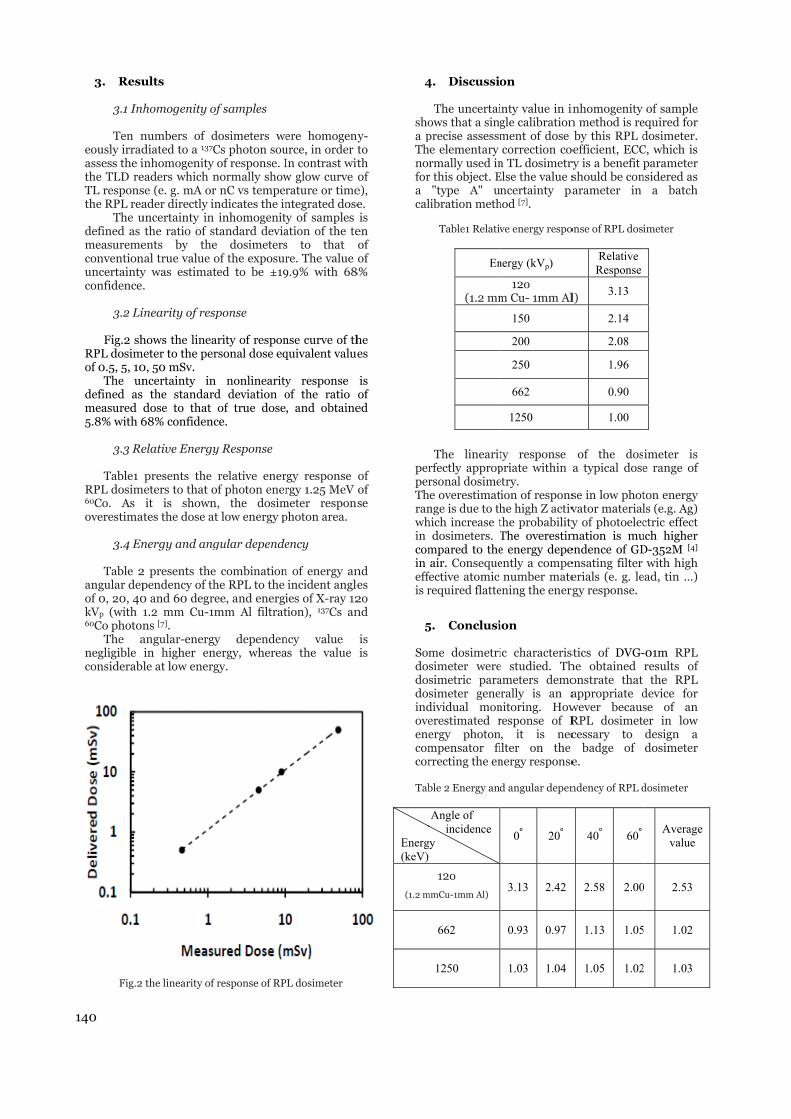
140
3. Resu
3.1 Inh Ten n
eously irradassess the ithe TLD reTL responsthe RPL rea
The udefined as measuremeconventionuncertaintyconfidence.
3.2 Li
Fig.2 shRPL dosimof 0.5, 5, 10
The undefined as measured 5.8% with 6
3.3 Re
Table1 RPL dosim60Co. As overestima
3.4 En
Table 2angular depof 0, 20, 40kVp (with 60Co photon
The anegligible considerabl
Fig.2
ults
homogenity of
numbers of ddiated to a 137Cinhomogenity eaders which nse (e. g. mA orader directly in
uncertainty in the ratio of s
ents by thenal true value oy was estimat.
inearity of resp
hows the lineameter to the per
0, 50 mSv. ncertainty in
the standarddose to that 68% confidenc
elative Energy
presents the meters to that o
it is shownates the dose at
nergy and ang
2 presents thependency of th0 and 60 degr1.2 mm Cu-1mns [7]. angular-energyin higher enle at low energ
the linearity of
of samples
dosimeters weCs photon souof response. I
normally showr nC vs temperndicates the ininhomogenit
standard deviae dosimetersof the exposurted to be ±19
sponse
arity of responrsonal dose eq
n nonlinearityd deviation oof true dose
ce.
y Response
relative enerof photon enern, the dosimt low energy p
gular depende
e combinationhe RPL to the ee, and energimm Al filtrat
y dependennergy, whereagy.
f response of RP
ere homogenyurce, in order tIn contrast witw glow curve orature or timentegrated dosey of samples
ation of the tes to that re. The value o9.9% with 68
nse curve of thquivalent value
y responseof the ratio , and obtaine
rgy response rgy 1.25 MeV
meter responsphoton area.
ency
n of energy anincident angleies of X-ray 12tion), 137Cs an
ncy value as the value
PL dosimeter
y-to th of
e), e. is
en of of
8%
he es
is of ed
of of se
nd es 2o nd
is is
4
shoa pThnofora cal
perperThranwhin comin effis r
5
Somdosdosdosindoveenecomcor
Tab
Energ(keV)
(1.2 m
4. Discussio
The uncertaiows that a singprecise assessmhe elementary
rmally used inr this object. E
"type A" ulibration meth
Table1 Relativ
En
(1.2 mm
The linearitrfectly approprsonal dosime
he overestimatnge is due to thhich increase t
dosimeters. Tmpared to theair. Conseque
fective atomic required flatte
5. Conclusi
me dosimetrisimeter weresimetric parasimeter genedividual monerestimated rergy photonmpensator firrecting the en
ble 2 Energy and
Angle of incidence
gy
12o
mmCu-1mm Al)
662
1250
on
inty value in ingle calibrationment of dose correction co
n TL dosimetryElse the value sncertainty pa
hod [7].
ve energy respo
nergy (kVp)
12o m Cu- 1mm Al
150
200
250
662
1250
ty response priate within aetry. ion of responshe high Z activthe probabilityThe overestime energy depeently a compe
number mateening the energ
ion
ic characterise studied. Thameters demorally is an a
nitoring. Howresponse of R, it is necilter on the nergy response
d angular depen
0⁰ 20⁰
3.13 2.42
0.93 0.97
1.03 1.04
inhomogenity n method is reby this RPL d
oefficient, ECCry is a benefit pshould be conarameter in
onse of RPL dosi
Relative Response
l) 3.13
2.14
2.08
1.96
0.90
1.00
of the dosa typical dose
se in low photvator materialy of photoelec
mation is muendence of GDensating filter erials (e. g. le
rgy response.
stics of DVG-he obtained onstrate that appropriate dwever becausRPL dosimetcessary to
badge of e.
ndency of RPL d
40⁰ 60⁰
2.58 2.00
1.13 1.05
1.05 1.02
of sample equired for dosimeter.
C, which is parameter
nsidered as a batch
imeter
imeter is e range of
ton energy ls (e.g. Ag) ctric effect
uch higher D-352M [4]
with high ead, tin …)
-01m RPL results of
the RPL device for se of an er in low design a dosimeter
dosimeter
Average value
0 2.53
5 1.02
2 1.03

141
REFERENCES
1. E. Piesch E., B. Burgkhardt, M.Vilgis (1990) Photoluminescence dosimetry: progress and present state of art. Radiat. Prot. Dosim. 33, 215 .
2. T. Yamamoto, D. Maki, F. Sato, Y. Miyamoto, H. Nanto, T. Iida (2011) The recent investigations of radiophotoluminescence and its application, Radiat. Meas. 46 (12) 1554-1559.
3. M. Ranogajec-Komor, Ž. Kneževic, S. Miljanic, B. Vekic (2008) Characterisation of radiophoto-luminescent dosimeters for environmental monitoring, Radiat. Meas. 43, 392 – 396.
4. Ž. Knežević, N. Beck, Đ. Milković, S. Miljanić, M.
Ranogajec-Komor(2011) Characterisation of RPL and TL dosimetry systems and comparison in medical dosimetry applications, Radiat. Meas. 46 (12) 1582-1585.
5. David Y.C. Huang, Shih-Ming Hsu (2011). Radio-Photoluminescence Glass Dosimeter (RPLGD), Advances in Cancer Therapy, Prof. Hala Gali-Muhtasib (Ed.), ISBN: 978-953-307-703-1.
6. Personal Dosimetry Monitoring System, DVG-07, “FRAMCARD”, Operation Manual, Appendix 1, Approved ПБАВ.412161.007 РЭ-ЛУ.
7. IAEA Safety Guide, RS-G-1.3, (1999) Assessment of occupational exposure due to external sources of radiation.


GROSS BETA ACTIVITY IN WATER BY CERENKOV METHOD
M. B. Nisti1, A. O. Ferreira1, C. H. R. Saueia1, B. P. Mazzilli1
1 Laboratório de Radiometria Ambiental, Instituto de Pesquisas Energéticas e Nucleares (IPEN), Av. Prof. Lineu
Prestes, 2242, São Paulo, CEP 05508 000, Brazil
Abstract Cerenkov effect occurs when the charged particle velocity in a medium is larger than the speed of light in that medium. Cerenkov radiation is produced in water by ß-emitting radionuclides of energy greater than 265 keV. The advantages of the Cerenkov method for gross beta activity determination are simplicity of sample preparation, low cost, possibility of reusing the sample, easy discard and efficiency unaffected by chemical quenching. The aim of this study is to compare the background, efficiency, Minimum Detectable Activity (MDA) and Figure Of Merit (FOM) for the determination of ß-emitting radionuclides using two scintillation counters, Quantulus and Hidex. In order to evaluate these parameters, for both equipment, three standard solutions of gross beta activity were analyzed in triplicate. The performance of the determination of gross beta activity in water was evaluated by participating in a Proficiency Test organized by Instituto de Radioproteção e Dosimetria. The values obtained for the normalized standard deviation (D) was below 2, indicating a good precision and accuracy for both equipment.
Key words (bold): Cerenkov, gross beta activity, drinking water
1. INTRODUCTION Water is more than a resource is also a life
source. Therefore, access to safe drinking water is essential to health and a component of effective policy for health protection [1].
The process of identifying individual radioactive species in drinking water and determining their concentration requires sophisticated and expensive analysis, which is normally not justified, because the very low concentrations of radionuclides in most circumstances [1].
A more practical approach is to use a screening procedure, where the total radioactivity present in the form of alpha and beta radiation is first determined, without regard to the identity of specific radionuclides.
Screening levels for drinking-water below which no further action is required are 0.5 Bq per litre for gross alpha activity and 1 Bq per litre for gross beta activity [1, 2]. If this screening level is exceeded, then the specific radionuclides producing this activity should be identified and their individual activity concentrations measured.
With respect to screening procedure, the wide use of liquid scintillation counting (LSC) is a consequence of numerous advantages: high efficiency of detection, sample preparation techniques, automation and simultaneous analysis of different radionuclides [3].
When the sample to be analyzed consists of two radionuclides, one with energy exceeding the threshold and the other with energy within the threshold, the Cerenkov method can be used combined with LSC for the determination of gross beta activity.
When the velocity of a charged particle in a transparent medium exceeds the speed of light, the resulting radiation produced is called Cerenkov Effect. The Cerenkov radiation consists of a continuous spectrum of wavelengths extending from the ultraviolet region into the visible part of the spectrum [3].
When produced at significant levels, Cerenkov radiation can be employed for the measurement of radioactivity. Some radionuclides may be counted directly in water [3]. The advantages are: without scintillation cocktail, sample suitable for any other chemical tests; simplicity of sample preparation; low cost; easy discard and efficiency unaffected by chemical quenching [3].
The disadvantages are: the method is applicable only to beta emitters; energies above the threshold and the counting efficiency is lower when compared with LSC.
The threshold energy for the production of Cherenkov photons by electrons or beta particles is 262 keV [3].
The aim of this study is to compare the background, efficiency, Minimum Detectable Activity (MDA) and Figure Of Merit (FOM) for the
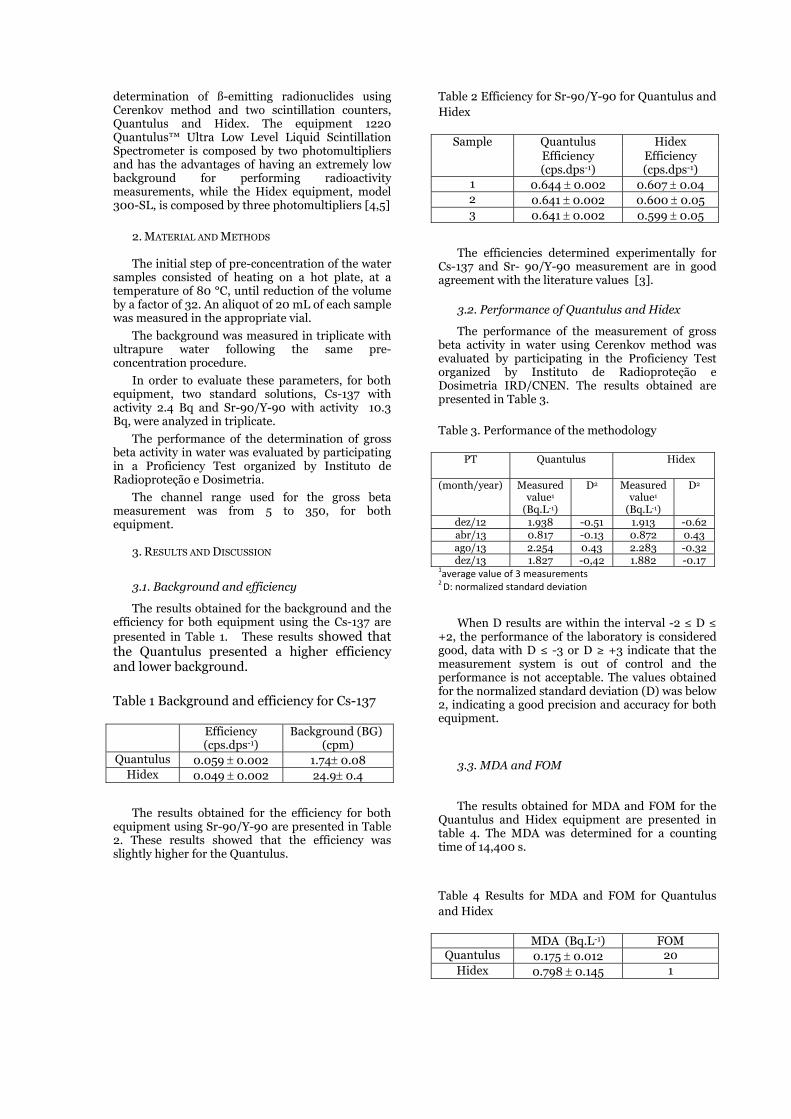
determination of ß-emitting radionuclides using Cerenkov method and two scintillation counters, Quantulus and Hidex. The equipment 1220 Quantulus™ Ultra Low Level Liquid Scintillation Spectrometer is composed by two photomultipliers and has the advantages of having an extremely low background for performing radioactivity measurements, while the Hidex equipment, model 300-SL, is composed by three photomultipliers [4,5]
2. MATERIAL AND METHODS The initial step of pre-concentration of the water
samples consisted of heating on a hot plate, at a temperature of 80 °C, until reduction of the volume by a factor of 32. An aliquot of 20 mL of each sample was measured in the appropriate vial.
The background was measured in triplicate with ultrapure water following the same pre-concentration procedure.
In order to evaluate these parameters, for both equipment, two standard solutions, Cs-137 with activity 2.4 Bq and Sr-90/Y-90 with activity 10.3 Bq, were analyzed in triplicate.
The performance of the determination of gross beta activity in water was evaluated by participating in a Proficiency Test organized by Instituto de Radioproteção e Dosimetria.
The channel range used for the gross beta measurement was from 5 to 350, for both equipment.
3. RESULTS AND DISCUSSION
3.1. Background and efficiency
The results obtained for the background and the efficiency for both equipment using the Cs-137 are presented in Table 1. These results showed that the Quantulus presented a higher efficiency and lower background.
Table 1 Background and efficiency for Cs-137
Efficiency (cps.dps-1)
Background (BG)(cpm)
Quantulus 0.059 0.002 1.74 0.08 Hidex 0.049 0.002 24.9 0.4
The results obtained for the efficiency for both
equipment using Sr-90/Y-90 are presented in Table 2. These results showed that the efficiency was slightly higher for the Quantulus.
Table 2 Efficiency for Sr-90/Y-90 for Quantulus and Hidex
Sample Quantulus HidexEfficiency (cps.dps-1)
Efficiency (cps.dps-1)
1 0.644 0.002 0.607 0.04 2 0.641 0.002 0.600 0.05 3 0.641 0.002 0.599 0.05
The efficiencies determined experimentally for
Cs-137 and Sr- 90/Y-90 measurement are in good agreement with the literature values [3].
3.2. Performance of Quantulus and Hidex
The performance of the measurement of gross beta activity in water using Cerenkov method was evaluated by participating in the Proficiency Test organized by Instituto de Radioproteção e Dosimetria IRD/CNEN. The results obtained are presented in Table 3.
Table 3. Performance of the methodology
PT Quantulus Hidex
(month/year) Measured value1
(Bq.L-1)
D2
Measured
value1 (Bq.L-1)
D2
dez/12 1.938 -0.51 1.913 -0.62abr/13 0.817 -0.13 0.872 0.43ago/13 2.254 0.43 2.283 -0.32dez/13 1.827 -0,42 1.882 -0.17
1average value of 3 measurements 2 D: normalized standard deviation
When D results are within the interval -2 ≤ D ≤
+2, the performance of the laboratory is considered good, data with D ≤ -3 or D ≥ +3 indicate that the measurement system is out of control and the performance is not acceptable. The values obtained for the normalized standard deviation (D) was below 2, indicating a good precision and accuracy for both equipment.
3.3. MDA and FOM
The results obtained for MDA and FOM for the
Quantulus and Hidex equipment are presented in table 4. The MDA was determined for a counting time of 14,400 s.
Table 4 Results for MDA and FOM for Quantulus and Hidex
MDA (Bq.L-1) FOMQuantulus 0.175 0.012 20
Hidex 0.798 0.145 1
The results obtained show that the minimum detectable activity for Quantulus was lower than for Hidex, and the FOM also presented best results for the Quantulus.
4. CONCLUSION
The Cerenkov method combined with LSC was a good choice for the determination of gross beta activity measurement of samples that consist of two radionuclides, one with energy exceeding the threshold and the other with energy within the threshold.
It can be concluded from the results obtained that both equipment are suitable for the determination of gross beta activity by Cerenkov method, although the Quantulus performance was better.
References 1. WHO, 2012. Guidelines for Drinking-Water Quality,
third ed. World Health Organization, Geneva, 2012. 2. M.S.. Nº2914 Portaria do Ministério da Saúde de
dezembro de 2011, dispõe sobre os procedimentos de controle e vigilância da qualidade da água para o consumo humano e seu padrão de potabilidade, Brasil, 2011 (in Portuguese).
3. L´Annunziata. Handbook of Radioactivity analysis, 3 ed., pp. 935-1008, 2012.
4. Quantulus, Instrument Manual-Wallac 1220 QuantulusTM Ultra Low Level Liquid Scintillation Spectrometer, PerkinElmer, 2009.
5. Hidex, Handbook 425-201Automatic Liquid Scintillation Counter, Hidex 300SL, 2008.


Jelica K
1 Vinca2 Scho
Abstprot(IMSautointerIndivconsconsand calibplateIn ththrouand donebothreadvaluhighHp(0meavaluunceIn coTLDorde
Key w
1. INTR
The exposed radiation Vinca InIndividuaaccredited17025 [1accordingThe RP monitorinaccepted
Calibrcompletelits resporesponsib
BUIL
Kaljevic 1, J
a Institute of Nool of Electrica
tract. The routitection programS) at the INNVomatic reader rnational GmbHviduals Occupa
sideration, RP 1sideration secon
of TLD cards, brated. During e of certain thichis paper, influugh changes inwithout 2 mm
e with 137Cs radh manufacturerder was calibraues for detectorsher than RCF va0.07) were arosured dose, rea
ues. The observertainties. onclusion, if a c
D system that iserly checked and
words: TLD, RC
RODUCTION
routine monindividuals c protection
nstitute of Nal monitoringd according t1]. Working g to technical
160 aims ang practices astandards and
ration of the dly performed
onsibility accoble for a pr
LD-UP PMM
Jelena Stan
Nuclear Scienal Engineering
ine monitoring m implemented aV, accredited a
and thermolH). Working proationally Expos160 is suggestindary charged this consideratreader calibrat
ckness placed inuence of the bun reader calibra
thick build-up diation source lors had 2 detectoated to measures measuring Hpalues obtained wound 1% higheader calibratioved RCF devia
constant geomes not stable for d reader calibra
CF, build-up pla
nitoring of tconstitutes anprogram imp
Nuclear Scien service (IMSo quality stanprocedures
l recommendat harmonizatand is based d documents o
dosimetric sysat the IMS. Hording [1]. Troper, reliabl
A PLATE EF
nkovic 2, 1, M
ces, Universityg, University o
of the occupatiat the Vinca Ins
according to quluminescent doocedures are im
sed to External ing that routineparticle equilib
tion should be ation, secondary
n front of dosimeuild-up plate oation factor (RCplate are prese
ocated at Seconors for measurie effective dosep(10), from bothwhen irradiatior when the plan without build
ation of Hp(0.
etry and constaa long time pe
ation should be
ate, Hp(10), Hp
the occupation integral paplemented at
nces (INNV). S) at the INNndard EN ISO
are implemedation RP 160tion of indivon internatio
of relevance [3
tems is not alwHowever, it is uTherefore, IMle and accre
FFECT ON C
Milos Zivan
y of Belgrade,of Belgrade, Bu
ionally exposedstitute of Nucleauality standardosimeters (TLD
mplemented acc Radiation, RPe calibration of
brium. As TLD applied in both y charged partieters.
on reader calibCF). RCF valueented. Exposurndary Standarding the dose eq
e in terms of Hh manufacturerons were done wate had not bed-up plate, in t.07) detector i
ant operationaleriod is the TLDdone according
(0.07)
onally art of t the
The NV, is O/IEC ented 0 [2]. vidual onally 3].
lways, under
MS is edited
cc
(cde
cTte
d
CALIBRATIO
novic 1, San
Mike Petroviculevar kralja A
d individuals coar Sciences (INNd EN ISO/IECD) from two
cording to TechnP 160 (Europeaof dosimetry sy
system in use acases: when th
icle equilibrium
bration is beinges obtained durres of whole bodd Dosimetry Laquivalent at the
Hp(10) and locars, when irradiwith the plate. Veen used. As Rterms of Hp(10is regarded as
conditions of TD reader. To avg to widely acce
calibration ofcalibration faci
When caliTLD) reader r
charge) of thedelivered radexpressed in te
L
QRCF
As this vacondition it is Thus, RCF is terms of charg
equivalent in t
Once TLD dosimeters can
ON OF TLD R
dra Ceklic
ca Alasa 12-14Aleksandra 73
onstitutes an inNNV). The IndiviC 17025, is usin
manufacturernical Recommenn Commission,stem should beat IMS INNV cohe reader and t
m can be ensured
g analyzed. Thiring reader calidy TLDs placedaboratory (SSDe depths of 10 m
al skin dose in tated without thValues of RCFs fCF value is in
0), would lead s consequence
TLDs are achievvoid inaccurateepted standards
the dosimetilities [3].
ibrating therratio between e calibration
diation quanterms of one va
.
ariable is oncalled Reader
the main linkge or counts aerms of Gray o
reader is calibn be obtained f
READER
1, Djordje L
4, 11001 Belgra3, 11120 Belgra
ntegral part of idual monitorinng Harshaw 6ers (Harshaw, endations for M, 2009). Amonge performed ta
comprises of TLthe TLD cards ad using build-u
is influence is ibration procedd on slab phant
DL) at INNV. TLmm and 0.07 mterms of Hp(0.
he plate were arfor detectors m
nversely proporto underestimaof exposure c
ved, the only pe results, RCF ss, currently in ef
tric system in
rmoluminesceaverage TL ouDosimeters
tity (L) is ariable:
nly dependanr Calibration
k between TLDand absorbed or Sievert, res
brated, the dofrom:
Lazarevic 1
ade, Serbia ade, Serbia
radiation ng service 600 Plus
RadPro Monitoring
g general aking into LD reader are being
up PMMA
observed dure with tom were LDs from mm. TLD .07). RCF round 5%
measuring rtional to ated dose
conditions
art of the should be effect.
n use in the
nt dosimetryutput (electric( Q ) and the
conveniently
(1)
nt on readerFactor (RCF).D response in
dose or dosespectively [4].
oses from field
e
y c e y
r .
n e
d
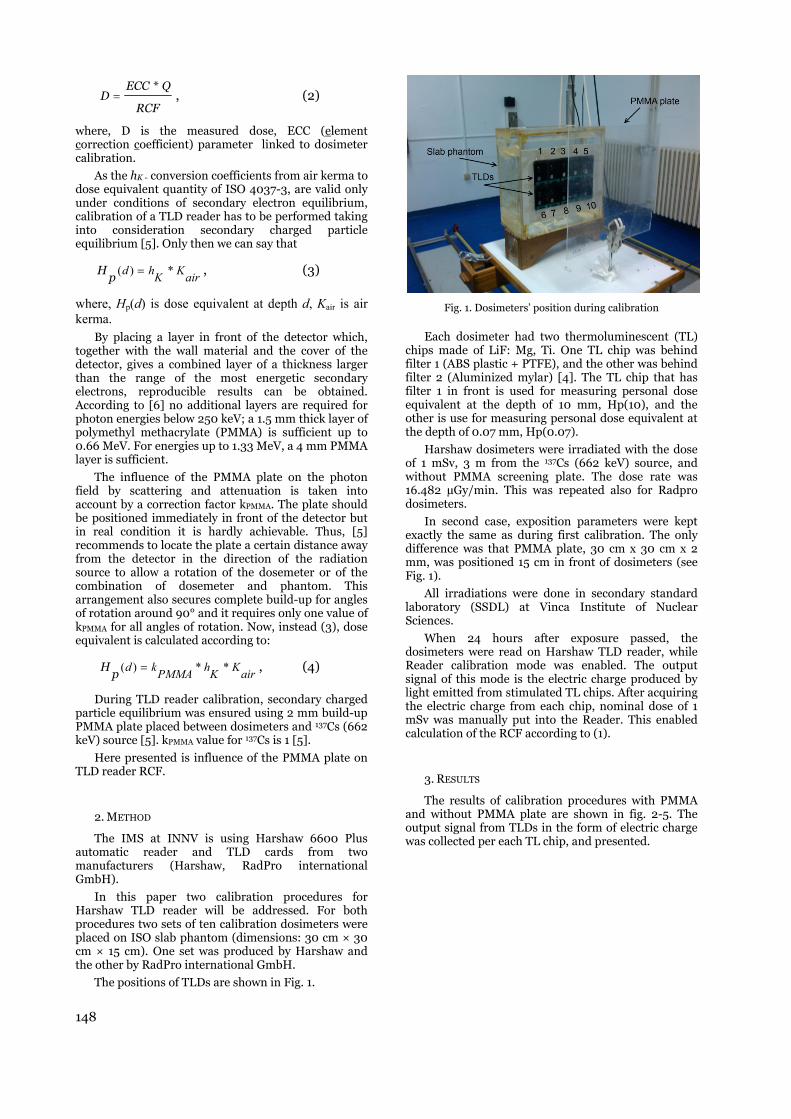
148
RCF
Q*ECCD , (2)
where, D is the measured dose, ECC (element correction coefficient) parameter linked to dosimeter calibration.
As the hK - conversion coefficients from air kerma to dose equivalent quantity of ISO 4037-3, are valid only under conditions of secondary electron equilibrium, calibration of a TLD reader has to be performed taking into consideration secondary charged particle equilibrium [5]. Only then we can say that
airK
Khd *)(
pH , (3)
where, Hp(d) is dose equivalent at depth d, Kair is air kerma.
By placing a layer in front of the detector which, together with the wall material and the cover of the detector, gives a combined layer of a thickness larger than the range of the most energetic secondary electrons, reproducible results can be obtained. According to [6] no additional layers are required for photon energies below 250 keV; a 1.5 mm thick layer of polymethyl methacrylate (PMMA) is sufficient up to 0.66 MeV. For energies up to 1.33 MeV, a 4 mm PMMA layer is sufficient.
The influence of the PMMA plate on the photon field by scattering and attenuation is taken into account by a correction factor kPMMA. The plate should be positioned immediately in front of the detector but in real condition it is hardly achievable. Thus, [5] recommends to locate the plate a certain distance away from the detector in the direction of the radiation source to allow a rotation of the dosemeter or of the combination of dosemeter and phantom. This arrangement also secures complete build-up for angles of rotation around 90° and it requires only one value of kPMMA for all angles of rotation. Now, instead (3), dose equivalent is calculated according to:
air
KK
hPMMA
kd **)( p
H , (4)
During TLD reader calibration, secondary charged particle equilibrium was ensured using 2 mm build-up PMMA plate placed between dosimeters and 137Cs (662 keV) source [5]. kPMMA value for 137Cs is 1 [5].
Here presented is influence of the PMMA plate on TLD reader RCF.
2. METHOD
The IMS at INNV is using Harshaw 6600 Plus automatic reader and TLD cards from two manufacturers (Harshaw, RadPro international GmbH).
In this paper two calibration procedures for Harshaw TLD reader will be addressed. For both procedures two sets of ten calibration dosimeters were placed on ISO slab phantom (dimensions: 30 cm × 30 cm × 15 cm). One set was produced by Harshaw and the other by RadPro international GmbH.
The positions of TLDs are shown in Fig. 1.
Fig. 1. Dosimeters’ position during calibration
Each dosimeter had two thermoluminescent (TL) chips made of LiF: Mg, Ti. One TL chip was behind filter 1 (ABS plastic + PTFE), and the other was behind filter 2 (Aluminized mylar) [4]. The TL chip that has filter 1 in front is used for measuring personal dose equivalent at the depth of 10 mm, Hp(10), and the other is use for measuring personal dose equivalent at the depth of 0.07 mm, Hp(0.07).
Harshaw dosimeters were irradiated with the dose of 1 mSv, 3 m from the 137Cs (662 keV) source, and without PMMA screening plate. The dose rate was 16.482 µGy/min. This was repeated also for Radpro dosimeters.
In second case, exposition parameters were kept exactly the same as during first calibration. The only difference was that PMMA plate, 30 cm x 30 cm x 2 mm, was positioned 15 cm in front of dosimeters (see Fig. 1).
All irradiations were done in secondary standard laboratory (SSDL) at Vinca Institute of Nuclear Sciences.
When 24 hours after exposure passed, the dosimeters were read on Harshaw TLD reader, while Reader calibration mode was enabled. The output signal of this mode is the electric charge produced by light emitted from stimulated TL chips. After acquiring the electric charge from each chip, nominal dose of 1 mSv was manually put into the Reader. This enabled calculation of the RCF according to (1).
3. RESULTS
The results of calibration procedures with PMMA and without PMMA plate are shown in fig. 2-5. The output signal from TLDs in the form of electric charge was collected per each TL chip, and presented.
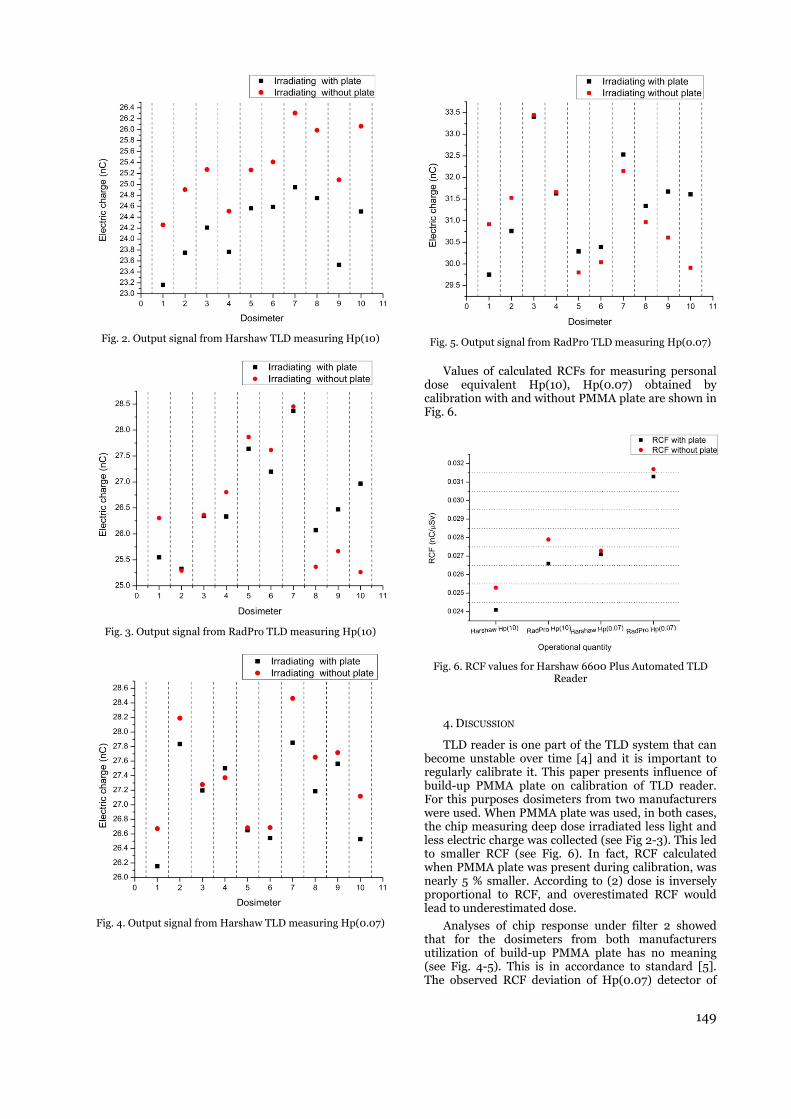
149
Fig. 2. Output signal from Harshaw TLD measuring Hp(10)
Fig. 3. Output signal from RadPro TLD measuring Hp(10)
Fig. 4. Output signal from Harshaw TLD measuring Hp(0.07)
Fig. 5. Output signal from RadPro TLD measuring Hp(0.07)
Values of calculated RCFs for measuring personal dose equivalent Hp(10), Hp(0.07) obtained by calibration with and without PMMA plate are shown in Fig. 6.
Fig. 6. RCF values for Harshaw 6600 Plus Automated TLD
Reader
4. DISCUSSION
TLD reader is one part of the TLD system that can become unstable over time [4] and it is important to regularly calibrate it. This paper presents influence of build-up PMMA plate on calibration of TLD reader. For this purposes dosimeters from two manufacturers were used. When PMMA plate was used, in both cases, the chip measuring deep dose irradiated less light and less electric charge was collected (see Fig 2-3). This led to smaller RCF (see Fig. 6). In fact, RCF calculated when PMMA plate was present during calibration, was nearly 5 % smaller. According to (2) dose is inversely proportional to RCF, and overestimated RCF would lead to underestimated dose.
Analyses of chip response under filter 2 showed that for the dosimeters from both manufacturers utilization of build-up PMMA plate has no meaning (see Fig. 4-5). This is in accordance to standard [5]. The observed RCF deviation of Hp(0.07) detector of
150
nearly 1 % (see Fig. 6) is regarded as consequence of exposure conditions uncertainties.
Uncertainties of L and Q parameter in (1) influence the results in this paper. The L and Q uncertainties are 4.4% and 1.4%, respectively with coverage factor k=2. The calculated uncertainty calculated as combined is 4.7%. This suggests that more measurements are needed to confirm that 5% difference is consequence of PMMA plate, and not of measurement uncertainty.
5. CONCLUSIONS
PMMA build-up plate, used while a radiation detector calibration is performed, assures that in the absence of the PMMA plate, the instrument correctly measures in photon fields, under conditions of electronic equilibrium which is nearly always met during TLD monitoring of occupationally exposed workers.
Calibration of Harshaw 6600 Plus TLD reader was analyzed in this paper. Influence of 2 mm PMMA build-up plate was studied. The results showed that this plate should be used when reader is to be calibrated for measuring Hp(10). Considering Hp(0.07), PMMA plate has insignificant influence on calibration.
Further studies are being planned for investigation the relation between RCF and the distance between PMMA plate and dosimeters.
Acknowledgement: The paper is a part of the research done within the project of the Ministry of Education and Science of Republic of Serbia (grant agreement III43009 and 171028).
REFERENCES
1. International Organization for Standardisation and International Electrotechnical Commission, General requirements for the competence of testing and calibration laboratories, ISO/IEC Standard 17025, 1999.
2. Technical Recommendations for Monitoring Individuals Occupationally Exposed to External Radiation, European Commission, Luxembourg, RP no. 160, 2009.
3. Fantuzzi, E., Alves, J.G., Ambrosi, P. Janzekovic, H. and Vartiainen, E., “Implementation of standards for individual monitoring in Europe”, Radiat. Prot. Dosim., vol. 112, no. 1, pp. 3-44, 2004.
4. Harshaw TLD Model 6600 Plus: Automated TLD Reader, Thermo Fisher Scientific Inc., 2007.
5. X and gamma reference radiation for calibrating dosemeters and dose-rate meters and for determining their response as a function of photon energy - Part 3: Calibration of area and personal dosemeters and the measurement of their response as a function of energy and angle of incidence, ISO 4037-3, 1999.
6. International Atomic Energy Agency, “Calibration of Radiation Protection Monitoring Instruments”, Vienna, Austria, Safety Reports Series No. 16, 2000.
BACKGROUND SPECTRUM CHARACTERISTICS OF THE HPGE DETECTOR LONG-TERM MEASUREMENT IN THE BELGRADE LOW-BACKGROUND LABORATORY
Radomir Banjanac, Vladimir Udovičić, Dejan Joković, Dimitrije Maletić, Nikola Veselinović, Mihailo Savić, Aleksandar Dragić, Ivan Aničin
Institute of Physics, Belgrade, Serbia
Abstract. The Belgrade low-level background laboratory, built in 1997, is shallow (25 m.w.e) underground space (45m2) which is constantly ventilated with fresh air against radon. The muon intensity (about 3.5 times less than at ground level), radon concentration (suppressed to averaged value of 15 Bqm-3), as well as gamma-ray background are monitoring for more than eight years. After long-term measurement using the radiopure HPGe detector with 35% relative efficiency, the measured data includes radionuclide concentration of detector surroundings, estimation of background time variation due to radon and cosmic-rays as well as MDA values for typical samples of water matrix. The detailed characteristics of gamma-ray background spectra are here presented.
Key words : Underground laboratory, Low-level background, long-term gamma-ray measurement
1. INTRODUCTION
Various experiments which strive for the detection of very rare events require the lowest possible background radiation which can be achieved only in a deep underground laboratory. Some of recent the most interesting are double beta-decay experiments, [1] and dark matter searches, [2]. In any applied measurements of low activities, a goal that is pursued by all gamma spectroscopist is to lower the minimum detectable activity (MDA) of their detection system obtaining more statistical evidence in less time.
But, any long and even short-term gamma-ray background measurement is subject to certain temporal variations due to time variability of two prominent contributors to background, cosmic-rays and radon. The most of the low background laboratories that deal with low activity measurements have developed routine measurements of background. The duration of these measurements may be from one day to even a month and they are designed to produce results with sufficiently low statistical errors for the envisaged measurements. These measurements yield only average values of the background, what in principle may lead to systematic errors in later measurements, especially of NORM samples.
The averaged values of the background, gamma lines and continuum, nuclide concentrations or MDA presenting a “personal card” of used detector system for certain samples in any low-level background laboratory, [3]. Here is attempt to present our low-level background laboratory in a similar way. First of all, the detailed description of the laboratories and used detector system are described.
2. DESCRIPTION OF THE LABORATORIES AND EQUIPMENT
The Belgrade underground low-level laboratory (UL), built in 1997 and located on the right bank of the river Danube in the Belgrade borough of Zemun, on the grounds of the Institute of Physics. The overburden of the UL is about 12 meters of loess soil, equivalent to 25 meters of water. It is equipped with ventilation system which provides low radon concentration of 15(5) Bq/m3. The “passive” shield consists of 1 mm thick aluminum foil which completely covers all the wall surfaces inside the laboratory, including floor and ceiling. As the active radon shield the laboratory is continuously ventilated with fresh air, filtered through one rough filter for dust elimination followed by active charcoal filters for radon adsorption. The UL has an area of 45m2 and volume of 135m3 what required the rate of air inlet adjusted to 800m3/h. This huge amount of fresh air contributes to greater temperature variations and the long-term mean value of temperature inside the UL is 19(4)oC. The rate of air outlet (700m3/h) was adjusted to get an overpressure of about 200 Pa over the atmospheric pressure, what prevents radon diffusion through eventual imperfections in the aluminum layer. Relative humidity is controlled by a dehumidifier device, what provides that the relative humidity in the underground laboratory does not exceed 60%. The muon intensity (which is about 3.5 times less than at ground level), radon concentration and gamma-ray background are monitoring for more than eight years. Comparative background study is performing in the GLL (at ground level) which is equipped with a Ge detector (13% relative efficiency and not intrinsically low-radioactivity level, named SGe) and a big plastic scintillator (1m2, named BPS) in veto position. The GLL is air-conditioned (average radon concentration of

152
50(30) Bq/m3) has an area of 30m2 and volume of 75m3. The Fig. 1 presents veto arrangement of the HPGe detector (BGe, in 12cm lead shield) and big plastic scintillator, inside the UL.
Fig. 1 Veto arrangement of the HPGe detector (BGe) and big plastic scintillator inside the UL
3. DESCRIPTION OF DETECTOR SYSTEMS IN THE UL
The low-level background detector system in the UL includes an intrinsically low-radioactivity level p-type Ge detector (35% relative efficiency, named BGe) and another plastic veto scintillator (1m2, named BPS) situated coaxially above the BGe detector. The BGe is a GEM30 model (made by ORTEC) in LB-GEM-SV cryostat configuration with magnesium end cap. The energy resolution at 1332.5keV, measured by analog data acquisition system, is 1.72keV, 0.65keV at 122keV as well as the Peak to Compton ratio at 1332.5keV has value of 68. The cylindrical lead shielding of the BGe, with a wall thickness of 120 mm and an overall weight of about 900kg, was cast locally out of scratch plumbing retrieved after the demolition of some old housing. Radon monitoring inside the laboratories was performed by radon monitor, model RM1029 manufactured by Sun Nuclear Corporation. The device consists of two diffused junction photodiodes as a radon detector, and is furnished with sensors for temperature, pressure and relative humidity. A pair of plastic scintillator detectors is used for CR muon measurements at both laboratories. One of them is a larger (100cmx100cmx5cm) detector (BPS), equipped with four PMT directly coupled to the corners beveled at 45°, made by Amcrys-H, Kharkov, Ukraine. The other, a smaller 50cmx23cmx5cm plastic scintillator detector, with a single PMT looking at its longest side via a Perspex light guide tapering to the diameter of a PMT, made by JINR, Dubna, Russia, and assembled locally. The smaller detector may serve as a check of stability of the muon time series obtained from the larger detector, which is important for long term measurements. Two flash analog to digital converters (FADC), made by C.A.E.N (type N1728B), which sample at 10 ns intervals into 214 channels were used
to analyze spectra from Ge detectors as well as corresponding BPS. User-friendly software was developed to analyze the C.A.E.N data with the possibility to choose the integration time for further time-series analysis that corresponds to integration time of the radon monitor. The performances of digital acquisition system as well as software developed for analysis were described in detail, [4].
4. THE RESULTS OF BACKGROUND MEASUREMENTS IN THE UL
Additional to intrinsically low-radioactivity level of the BGe itself, environmental radioactivity is low, too. The UL was built from low activity concrete about 12 Bq/kg of U-238 and Th-232, and of 23 Bq/kg and 30 Bq/kq of surrounding soil, respectively. Radioactivity of aluminum wall-lining is negligible. Pb-210 activity of used lead shield of 30Bq/kg is measured. After long-term cosmic-ray, [5], radon concentration, [6] and gamma-ray background measurements, no significant long-term time variations of gamma background was found, [7]. After several years of almost continuously background measurements, the integral background rate in the region from 40keV to 2700keV has mean value of about 0.5 cps. The lines of Co-60 are absent in the background spectrum, while the line of Cs-137 with the rate of 1×10⁻⁴ cps starts to appear significantly only if the measurement time approaches one month. Fukushima activities, though strongly presented in our inlet air filters samples, did not enter the background at observable levels, in spite of the great quantities of air that we pump into the UL to maintain the overpressure, and it seems that the double air filtering and double buffer door system, along with stringent radiation hygiene measures, is capable of keeping the UL clean in cases of global accidental contaminations. No signatures of environmental neutrons, neither slow nor fast, are present in direct background spectra.
The Fig. 2 shows a characteristic shape of background spectrum obtained in the UL after about 6 months of measuring, with distinctive Pb X-ray lines at the beginning of the spectrum, annihilation line, and lines from 40K and 208Tl (2614.5keV) at the end of the spectrum with a lot of post-radon lines between them.
Fig. 2 Background spectrum of the HPGe detector (BGe) inside the UL after about 6 months of measuring
The table 1 in the third column presents gamma-ray background values of typical spectrum measured in
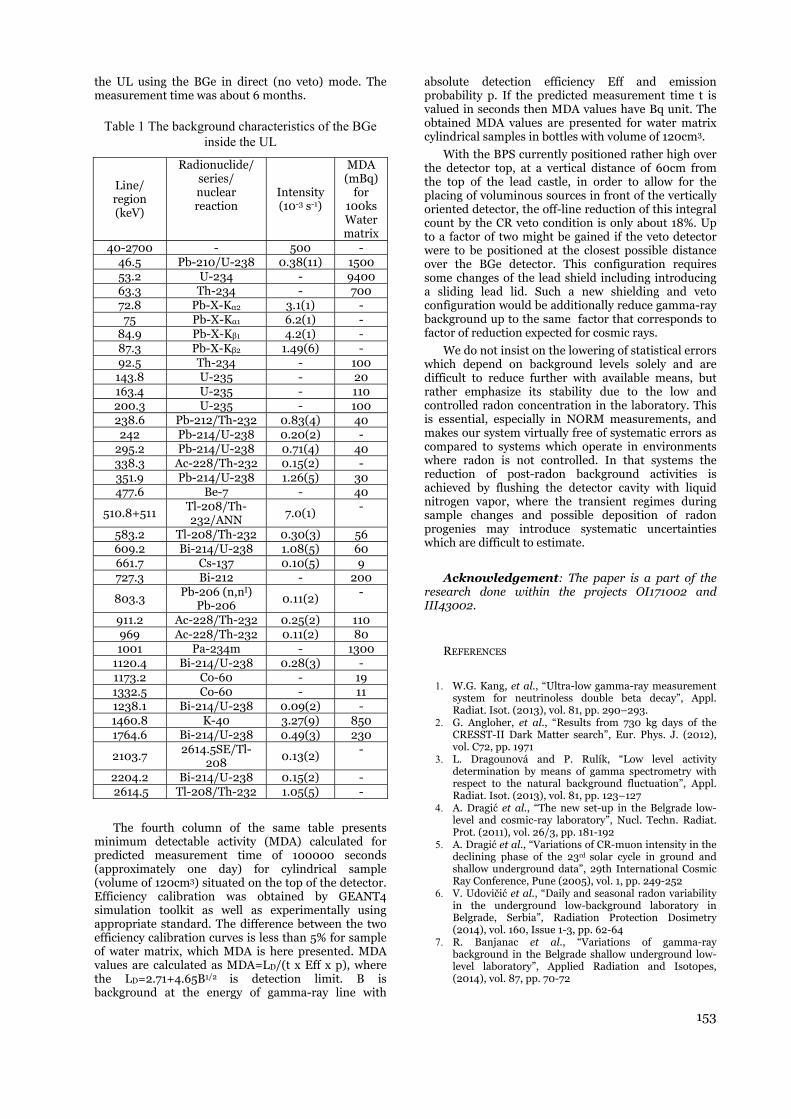
153
the UL using the BGe in direct (no veto) mode. The measurement time was about 6 months.
Table 1 The background characteristics of the BGe inside the UL
Line/ region (keV)
Radionuclide/ series/ nuclear reaction
Intensity (10-3 s-1)
MDA (mBq)
for 100ks Water matrix
40-2700 - 500 - 46.5 Pb-210/U-238 0.38(11) 1500 53.2 U-234 - 9400 63.3 Th-234 - 700 72.8 Pb-X-Kα2 3.1(1) - 75 Pb-X-Kα1 6.2(1) -
84.9 Pb-X-Kβ1 4.2(1) - 87.3 Pb-X-Kβ2 1.49(6) - 92.5 Th-234 - 100
143.8 U-235 - 20 163.4 U-235 - 110 200.3 U-235 - 100 238.6 Pb-212/Th-232 0.83(4) 40 242 Pb-214/U-238 0.20(2) -
295.2 Pb-214/U-238 0.71(4) 40 338.3 Ac-228/Th-232 0.15(2) - 351.9 Pb-214/U-238 1.26(5) 30 477.6 Be-7 - 40
510.8+511 Tl-208/Th-232/ANN
7.0(1) -
583.2 Tl-208/Th-232 0.30(3) 56 609.2 Bi-214/U-238 1.08(5) 60 661.7 Cs-137 0.10(5) 9 727.3 Bi-212 - 200
803.3 Pb-206 (n,nI)
Pb-206 0.11(2)
-
911.2 Ac-228/Th-232 0.25(2) 110 969 Ac-228/Th-232 0.11(2) 80 1001 Pa-234m - 1300
1120.4 Bi-214/U-238 0.28(3) - 1173.2 Co-60 - 19 1332.5 Co-60 - 11 1238.1 Bi-214/U-238 0.09(2) - 1460.8 K-40 3.27(9) 850 1764.6 Bi-214/U-238 0.49(3) 230
2103.7 2614.5SE/Tl-
208 0.13(2)
-
2204.2 Bi-214/U-238 0.15(2) - 2614.5 Tl-208/Th-232 1.05(5) -
The fourth column of the same table presents minimum detectable activity (MDA) calculated for predicted measurement time of 100000 seconds (approximately one day) for cylindrical sample (volume of 120cm3) situated on the top of the detector. Efficiency calibration was obtained by GEANT4 simulation toolkit as well as experimentally using appropriate standard. The difference between the two efficiency calibration curves is less than 5% for sample of water matrix, which MDA is here presented. MDA values are calculated as MDA=LD/(t x Eff x p), where the LD=2.71+4.65B1/2 is detection limit. B is background at the energy of gamma-ray line with
absolute detection efficiency Eff and emission probability p. If the predicted measurement time t is valued in seconds then MDA values have Bq unit. The obtained MDA values are presented for water matrix cylindrical samples in bottles with volume of 120cm3.
With the BPS currently positioned rather high over the detector top, at a vertical distance of 60cm from the top of the lead castle, in order to allow for the placing of voluminous sources in front of the vertically oriented detector, the off-line reduction of this integral count by the CR veto condition is only about 18%. Up to a factor of two might be gained if the veto detector were to be positioned at the closest possible distance over the BGe detector. This configuration requires some changes of the lead shield including introducing a sliding lead lid. Such a new shielding and veto configuration would be additionally reduce gamma-ray background up to the same factor that corresponds to factor of reduction expected for cosmic rays.
We do not insist on the lowering of statistical errors which depend on background levels solely and are difficult to reduce further with available means, but rather emphasize its stability due to the low and controlled radon concentration in the laboratory. This is essential, especially in NORM measurements, and makes our system virtually free of systematic errors as compared to systems which operate in environments where radon is not controlled. In that systems the reduction of post-radon background activities is achieved by flushing the detector cavity with liquid nitrogen vapor, where the transient regimes during sample changes and possible deposition of radon progenies may introduce systematic uncertainties which are difficult to estimate.
Acknowledgement: The paper is a part of the research done within the projects OI171002 and III43002.
REFERENCES
1. W.G. Kang, et al., “Ultra-low gamma-ray measurement system for neutrinoless double beta decay”, Appl. Radiat. Isot. (2013), vol. 81, pp. 290–293.
2. G. Angloher, et al., “Results from 730 kg days of the CRESST-II Dark Matter search”, Eur. Phys. J. (2012), vol. C72, pp. 1971
3. L. Dragounová and P. Rulík, “Low level activity determination by means of gamma spectrometry with respect to the natural background fluctuation”, Appl. Radiat. Isot. (2013), vol. 81, pp. 123–127
4. A. Dragić et al., “The new set-up in the Belgrade low-level and cosmic-ray laboratory”, Nucl. Techn. Radiat. Prot. (2011), vol. 26/3, pp. 181-192
5. A. Dragić et al., “Variations of CR-muon intensity in the declining phase of the 23rd solar cycle in ground and shallow underground data”, 29th International Cosmic Ray Conference, Pune (2005), vol. 1, pp. 249-252
6. V. Udovičić et al., “Daily and seasonal radon variability in the underground low-background laboratory in Belgrade, Serbia”, Radiation Protection Dosimetry (2014), vol. 160, Issue 1-3, pp. 62-64
7. R. Banjanac et al., “Variations of gamma-ray background in the Belgrade shallow underground low-level laboratory”, Applied Radiation and Isotopes, (2014), vol. 87, pp. 70-72


EFFICIENCY OF AN HPGe DETECTOR IN DEPENDENCE ON SOURCE-DETECTOR GEOMETRY FOR POINT AND VOLUME SOURCES
Nikola Svrkota1, Nevenka M. Antović2, Ranka Žižić1, Željko Vučević3, Tomislav Anđelić1, Benard Berišaj1, Gordana Laštovička-Medin2
1Center for Ecotoxicological Research, Podgorica, Montenegro
2Faculty of Natural Sciences and Mathematics, University of Montenegro, Podgorica, Montenegro 3Aluminum plant Podgorica, Podgorica, Montenegro
Abstract. Variations in efficiency of the ORTEC HPGe detector depending on the source-detector geometry (different distances from detector and different geometries at the same distance), were experimentally determined and analyzed, using the Czech Metrology Institute calibration sources. The point EFS X (mixture of radionuclides), volume 50 mL and 200 mL (type CBSS 2) sources, were put on detector (central position), as well as at the holder corners for several source-detector arrangements, and measured for the same measuring times. The ratio of central position efficiency and efficiency in positions at the holder corners (positions labeled as 1, 2, 3 and 4) for the point source was the highest for the 59.54 keV (241Am) – from 41.5 for position 4 to 48.68 for position 2 (zero-height), and from 2.18 for position 4 to 2.84 for position 2 (at the height of 10 cm). Smaller discrepancies have been determined for the 661.62 keV gamma ray (137Cs): 7.24 (the highest for position 2) at the zero height and 1.51 (the highest again for position 2) at the height of 10 cm. For the gamma ray of 1836.06 keV (88Y) it is 5.53 (position 2) at zero-height, and 1.52 (position 2) at the height of 10 cm. The same ratio between the efficiencies for 137Cs and 88Y gamma rays was registered - for all four off-center positions at the zero height, as well as for positions 2, 3 and 4 at the height of 10 cm. The cylindrical 50 mL calibration source was also measured and considered in similar way, and the highest discrepancies of efficiency ratio between central and off-center positions were registered for 241Am (position 3 for the zero height, and position 4 for the height of 10 cm). Efficiency ratios (central/off-center) for 137Cs and 60Co were 3.67 and 3.23, respectively (if positioned directly on the detector), and 1.38 and 1.44, respectively (for the height of 10 cm). In a consideration of the 200 mL cylindrical source, discrepancies of the efficiency ratio between central and off-center positions 2 and 4 for a height of 1 or 10 cm, were in the range from 1.24 (137Cs, for position 4 at the height of 10 cm) to 4.24 (241Am for position 2 at the height of 1 cm).
Key words: photoefficiency,HPGedetector,measuringgeometry
1. INTRODUCTION
Detection efficiency, as one of the main gamma detector’s characteristics, can be determined theoretically (applying various methods), semi-empirically and experimentally [1], but its experimental determination is the most commonly used [e.g., 2, 3, 4].
The results presented in this paper show changes in registration efficiency, depending on the detector-source geometry. In a standard semiconductor gamma spectrometric procedure, calibration is performed by counting standard radiation sources of various shape, volume and density, requiring the same for analyzed samples. The samples should be prepared and sealed in vessels having the same shape as the calibration source, but should also be placed on the detector in the same way. A negligible error is made when Marinelli beakers are used. In the case of smaller sources, e.g.
cylindrical and quasi point, it is possible that a tested sample has not position identical with one of the calibration source, which contributes to measurement uncertainty.
The dependence of the photopeak efficiency (detection efficiency for the total photon energy deposit by the photoelectric effect) on photon energy, source position and measuring geometry, has been examined at the ORTEC HPGe spectrometer GEM – 40190 (with relative efficiency of 40%). In a series of measurements, which included different source positions, as well as several distances from the detector, certified multistandards were used in three different geometries – quasi point, cylindrical volume of 50 mL, and cylindrical volume of 200 mL. Photons with energies of 59.54 keV, 661.62 keV and 1836.06 keV (from 241Am, 137Cs and 88Y, respectively [5]) were observed in quasi point and cylindrical measuring

geometry (241Am and 137Cs), while that of 1332.5 keV (60Co) in cylindrical geometry only.
2. SPECTROMETER AND RADIATION SOURCES
Gamma spectrometric system in the Center for Ecotoxicological Research in Podgorica (Fig. 1) consists of two ORTEC HPGe spectrometers, belonging to Extra Low Background (XLB) class. The energy range of both spectrometers is from 40 keV to 3000 keV (16 000 channels). This energy range covers the main γ–lines of a large number of radionuclides. The components of these systems are [6]: NIM BIN 4001 chassis with power supply 4002D; Double 5 kV power detector model 660; Preamplifier model 257 P with a high voltage filter 138: Spectroscopic amplifier model 672; The analyzer with four inputs model 919, Spectrum master multichannel buffer; Cryostats CFG – XLB – GEM – SV; The detector housing with protection: Von Gahlen model VG – BB – 98/19A – 2, consisting of 100 mm Pb, Cu 2 mm, 1 mm Cd, 4 mm Perspex.
As mentioned above, the coaxial HPGe detector (ORTEC, GEM-40190; relative efficiency 40 %; FWHM, 1.80 keV at 1.33 MeVFWHM, 840 eV at 122 keV; background, 1.23 cps; Softwares—Gamma Vision 32 A66-B32 V 4.12 and Gamma Vision 32 A66-B32 V 5.2; Nuclide Navigator V 1.01), is used in the present study.
Fig. 1 System for gamma spectrometry in the Center for Ecotoxicological Research (Podgorica)
Calibrations sources (Czech Metrology Institute) – quasi point and cylindrical, used in the measurements are shown in Fig. 2. Quasi point source is multistandard of the type EFS X, certificate no. 9031-OL-267/12 (May 29, 2012). The 50 mL cylinder is multistandard of the type CBSS 2, certificate no. 9031-OL-587/08 (October 24, 2008), while the 200 mL – multistandard CBSS 2, certificate no. 931-OL-093/01 (March 14, 2001). Activities of 241Am, 137Cs and 88Y were 8.154 kBq, 3.484 kBq and 7.048 kBq, respectively (quasi point source); 241Am, 137Cs and 60Co – 6.356 kBq, 2.567 kBq and 2.461 kBq, respectively (cylindrical source of 50 mL), as well as 10.75 kBq, 3.35 kBq and 3.25 kBq, respectively (cylindrical source of 200 mL).
Fig. 2 Calibration sources
The sources were firstly placed at the central position, then at the positions 1, 2, 3, 4 (off-center) [7], as well as at the E1, E2, E3 and E4 (“edge positions”), as illustrated in Fig. 3. The spectra were acquired for different heights (distances source–detector varied from 0 cm to 10 cm), as well. Measuring (live) time was 3000 s – for all the arrangements; and photoefficiences were determined in a standard procedure, i.e., using net counting rates under selected photopeaks, known activities and gamma rays intensities.
Fig. 3 Schematic of the source-detector arrangements
3. RESULTS AND DISCUSSION
First results have been obtained when calibration sources were put at the center and corners (off-center) of the detector (positions C, 1, 2, 3 and 4 in Fig. 3). Efficiencies in corners were smaller than central efficiency, up to 48.68 times (for position 2 at zero height) for 241Am gamma ray, as it was expected.
The ratio of efficiency in a central position and efficiency in positions in the holder corners for point source was found to be the highest for the 59.54 keV photons (241Am) – from 41.5 for the position 4 to 48.68 for the position 2 (zero height), and from 2.18 for the position 4 to 2.84 for the position 2 (at height of 10 cm). Considerably smaller discrepancies were determined for the 661.62 keV photons (137Cs): 7.24 (the highest for position 2) at zero distance, and 1.51 (the highest again for position 2) at the height of 10 cm. For gamma rays of 1836.06 keV (88Y) it was 5.53 (position 2) at zero height, and 1.52 (position 2) at the height of 10 cm. The same ratio between the efficiencies for the cesium and yttrium gamma rays was recorded – for all four off-center positions at zero

157
height, and for the positions 2, 3 and 4 at the height of 10 cm.
Abovementioned efficiency ratios are shown in Fig. 4 – for 241Am, 137Cs and 88Y photons emitted from quasi point source.
Fig. 4 Efficiency ratio for quasi point source –
center/corners (1, 2, 3 i 4) for: zero height (a), height of 10 cm (b)
The cylindrical 50 mL calibration source was also measured and considered in similar way, and the highest discrepancies of efficiency ratio between central and off-center positions were registered for 241Am (position 3 for the zero height, and position 4 for the height of 10 cm). Efficiency ratios (central/off-center) for 137Cs and 60Co were 3.67 and 3.23, respectively (if positioned directly on the detector), and 1.38 and 1.44, respectively (for the height of 10 cm). The efficiency ratio for cylindrical source of 50 mL is shown in Fig. 5.
For the 200 mL cylindrical source, discrepancies of the efficiency ratio between central and off-center positions 2 and 4 for a height of 1 or 10 cm, were in the range from 1.24 (137Cs, position 4 at the height of 10 cm) to 4.24 (241Am, position 2 at the height of 1 cm). As in the case of the 50 mL source, similar discrepancies of the efficiency ratio were shown by 137Cs and 60Co for both heights, and for 241Am – in particular for the position 4.
Fig. 5 Efficiency ratio for cylindrical 50 mL source –
center/corners (1, 2, 3 i 4) for: zero height (a), height of 10 cm (b)
A careful analysis showed that
the highest photoefficiency was recorded for the 661.62 keV gama rays from 137Cs – in all positions and distances from the detector;
for all considered gamma rays, efficiency was the highest in the case when the source was located on the detector, in the central position, in particular for quasi point source (by a factor of 3 higher than that for the 50 mL cylindrical geometry, and at least by a factor of 7.5 higher than for the 200 mL cylindrical geometry);
photoefficiency decreases with an increase of a distance from the detector, and it is significantly lower at a height of 10 cm than at zero height (at least by a factor of 11.4 – for quasi point source, 7 – for the 50 mL, and 3.6 – for the 200 mL cylindrical source).
In regard to efficiencies given by corner (off- center) positions and their different heights, any clear dependence could not be found. However, slightly higher photoefficiency was observed when the source was placed at the position 4. That position (4) gave the highest efficiency for the 241Am photons from quasi point source (0 cm and 10 cm from the detector), as well as for the 50 mL source at zero height.
The highest efficiency for the 137Cs photons, in the case of quasi point source, was shown by the position 1 (at zero height) and 1 and 4 (at 10 cm); but also by the position 1 (at zero height) and 3 (10 cm) – in the case of the 50 mL source; and by the position 4 (at 1 cm and 10 cm) – for the cylindrical source of 200 mL.
For the photons from 88Y emitted from quasi point source, the efficiency at zero height was found to be the highest at the position 3, while at 10 cm – at the position 1.
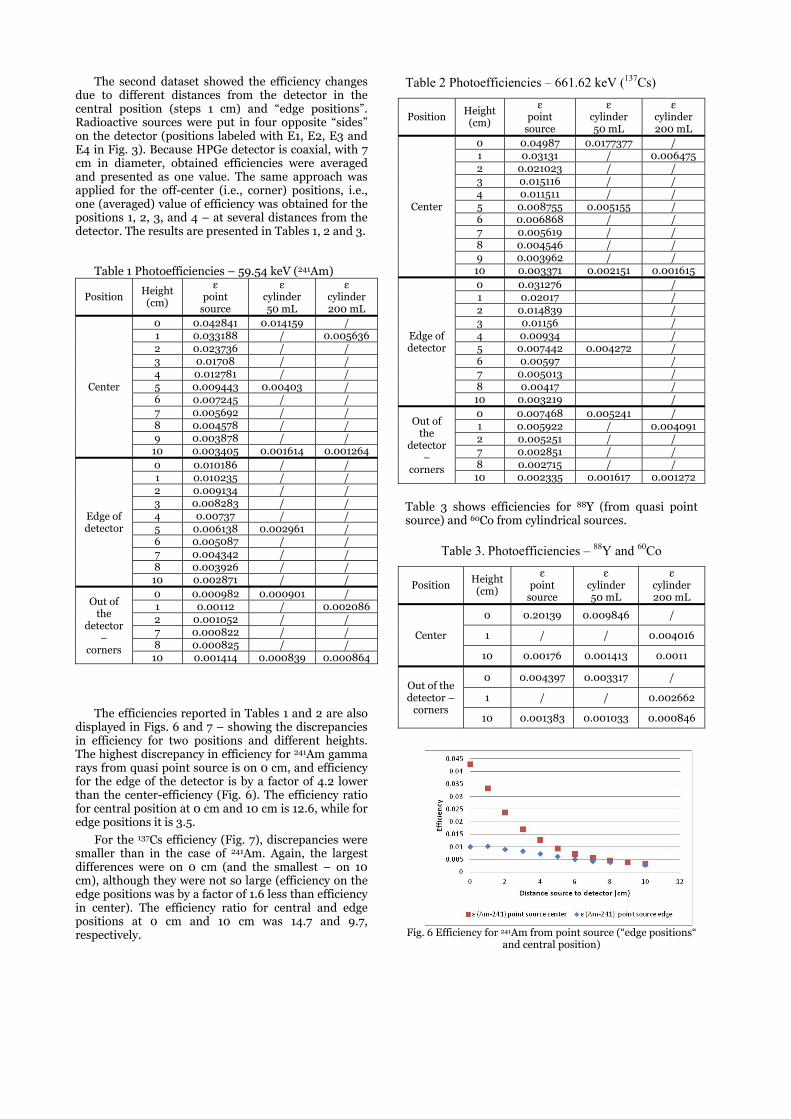
The second dataset showed the efficiency changes due to different distances from the detector in the central position (steps 1 cm) and “edge positions”. Radioactive sources were put in four opposite “sides” on the detector (positions labeled with E1, E2, E3 and E4 in Fig. 3). Because HPGe detector is coaxial, with 7 cm in diameter, obtained efficiencies were averaged and presented as one value. The same approach was applied for the off-center (i.e., corner) positions, i.e., one (averaged) value of efficiency was obtained for the positions 1, 2, 3, and 4 – at several distances from the detector. The results are presented in Tables 1, 2 and 3.
Table 1 Photoefficiencies – 59.54 keV (241Am)
Position Height (cm)
ε point
source
ε cylinder 50 mL
εcylinder 200 mL
Center
0 0.042841 0.014159 /1 0.033188 / 0.0056362 0.023736 / /3 0.01708 / /4 0.012781 / /5 0.009443 0.00403 /6 0.007245 / /7 0.005692 / /8 0.004578 / /9 0.003878 / /10 0.003405 0.001614 0.001264
Edge of detector
0 0.010186 / /1 0.010235 / /2 0.009134 / /3 0.008283 / /4 0.00737 / /5 0.006138 0.002961 /6 0.005087 / /7 0.004342 / /8 0.003926 / /10 0.002871 / /
Out of the
detector –
corners
0 0.000982 0.000901 /1 0.00112 / 0.0020862 0.001052 / /7 0.000822 / /8 0.000825 / /10 0.001414 0.000839 0.000864
The efficiencies reported in Tables 1 and 2 are also displayed in Figs. 6 and 7 – showing the discrepancies in efficiency for two positions and different heights. The highest discrepancy in efficiency for 241Am gamma rays from quasi point source is on 0 cm, and efficiency for the edge of the detector is by a factor of 4.2 lower than the center-efficiency (Fig. 6). The efficiency ratio for central position at 0 cm and 10 cm is 12.6, while for edge positions it is 3.5.
For the 137Cs efficiency (Fig. 7), discrepancies were smaller than in the case of 241Am. Again, the largest differences were on 0 cm (and the smallest – on 10 cm), although they were not so large (efficiency on the edge positions was by a factor of 1.6 less than efficiency in center). The efficiency ratio for central and edge positions at 0 cm and 10 cm was 14.7 and 9.7, respectively.
Table 2 Photoefficiencies – 661.62 keV (137Cs)
Position Height (cm)
εpoint
source
ε cylinder 50 mL
εcylinder 200 mL
Center
0 0.04987 0.0177377 /1 0.03131 / 0.0064752 0.021023 / /3 0.015116 / /4 0.011511 / /5 0.008755 0.005155 /6 0.006868 / /7 0.005619 / /8 0.004546 / /9 0.003962 / /10 0.003371 0.002151 0.001615
Edge of detector
0 0.031276 /1 0.02017 /2 0.014839 /3 0.01156 /4 0.00934 /5 0.007442 0.004272 /6 0.00597 /7 0.005013 /8 0.00417 /10 0.003219 /
Out of the
detector –
corners
0 0.007468 0.005241 /1 0.005922 / 0.0040912 0.005251 / /7 0.002851 / /8 0.002715 / /10 0.002335 0.001617 0.001272
Table 3 shows efficiencies for 88Y (from quasi point source) and 60Co from cylindrical sources.
Table 3. Photoefficiencies – 88Y and 60Co
Position Height (cm)
εpoint
source
ε cylinder 50 mL
εcylinder 200 mL
Center
0 0.20139 0.009846 /
1 / / 0.004016
10 0.00176 0.001413 0.0011
Out of the detector –
corners
0 0.004397 0.003317 /
1 / / 0.002662
10 0.001383 0.001033 0.000846
Fig. 6 Efficiency for 241Am from point source (“edge positions“
and central position)

159
Fig. 7 Efficiency for 137Cs from point source (“edge positions“
and central position)
Additionally, Fig. 8 shows efficiencies for 241Am, 137Cs and 88Y (from quasi point source) at the corner positions (averaged value) and different distances from the detector.
Fig. 8 Efficiency for 241Am, 137Cs and 88Y from point source
(corner positions)
4. CONCLUSIONS
Variations in efficiency of the ORTEC HPGe detector GEM-40190, in dependence on the source-detector geometry (different distances from detector and different geometries at the same distance), were experimentally determined and analyzed.
Presented results show that a change in position of examined source can bring error in efficiency up to 4 times (for 241Am at contact with end-cap), depending on source position and height, as well as type of radionuclide. Since reposition of tested sources increases (or can increase) a measurement uncertainty in real situation, it is very important to know how efficiency changes contribute to measurement uncertainty. Obtained information are particularly important for the analysis of quasi point and cylindrical (small) samples, and they are a good basis for a further research, which should also include the other sources, i.e., gamma rays.
Acknowledgement: The paper is a part of the research done within the project 01-683 (Ministry of Science of Montenegro).
REFERENCES
1. J. Slivka, I. Bikit, M. Vesković, Lj. Čonkić, Gamma spectrometry – special methods and applications, Faculty of Sciences, University of Novi Sad, Novi Sad, 2000 (in Serbian).
2. S. Banik, S. J. Satyajit Ghose, M. Islam, S. M. Azharul Islam, “Full energy peak efficiency calibration and efficiency transfer to ETNA in gamma-ray spectrometry”, IOSR J. Applied Phys., vol. 6(3), pp. 27-33, 2014.
3. G. Haase, D. Tait, A. Wiechen, “Determination of full energy peak efficiency for cylindrical volume sources by the use of a point source standard in gamma-spectrometry”, Nucl. Instrum. Methods Phys. Res. B, vol. 361(1-2), pp. 240-244, 1995.
4. N. M. Antović, N. Svrkota, “Detection efficiencies of 226Ra and 232Th in different modes of counting of the PRIPYAT-2M spectrometer”, Nucl. Technol. Radiat. Prot., vol. XXIV(2), pp. 109-118, 2009.
5. R. L. Heath, “Gamma-ray spectrum catalogue – Ge and Si detector spectra”, 4th edition, Idaho National Engineering and Environmental Laboratory, USA, 1998.
6. ORTEC, Gamma-vision 32, 2003. 7. Ž. Vučević, “Efficiency of the ORTEC HPGE GEM-
40190 spectrometer in dependence on source position and measuring geometry”, Spec. work, Faculty of Natural Sciences and Mathematics, University of Montenegro, Podgorica, 2013.

DETERMINATION OF Unat, TH, RARE EARTH AND METALS IN SOIL AROUND IPEN FACILITIES
C.H.R. Saueia1,2, M.B. Nisti1 and B.P. Mazzilli1
1Instituto de Pesquisas Energéticas e Nucleares (IPEN / CNEN - SP), São Paulo, Brazil 2 Universidade Nove de Julho, São Paulo, Brazil
Abstract. The aim of this study is to determine natural radionuclides (Unat and Th), rare earth elements (Ce, Eu, La, Lu, Sm, Tb and Yb) and metals (As, Ba, Co, Cr, Cs, Fe and Sc) in soil samples around Instituto de Pesquisas Energéticas e Nucleares (IPEN) facilities.
Key words: metals, natural radionuclides, rare earth elements, soil.
Introduction: For the assessment of the quality of the soil, it is important to check possible contamination due to anthropogenic influence. The aim of this study is to determine natural radionuclides (Unat and Th), rare earth elements (Ce, Eu, La, Lu, Sm, Tb and Yb) and metals (As, Ba, Co, Cr, Cs, Fe and Sc) in soil samples around Instituto de Pesquisas Energéticas e Nucleares (IPEN) facilities. IPEN is located in the city of São Paulo, Brazil, and comprises several nuclear and radioactive facilities, spread over an area of about 500,000 m2 with buildings covering 85,000 m2. Among these activities, it is worth to mention the nuclear fuel cycle (beneficiation process) and the thorium nitrate production, which can release to the environment rare earth elements, metals impurities, U and Th.
Materials and Methods: Soil samples were collected at six different locations at IPEN, using a PVC pipe with 7.2 cm of diameter and 15 cm of depth, after cleaning the surface manually. The quantity collected was about 500 g, and each sampling point was analyzed in triplicate. The soil samples were homogenized, dried to constant mass and passed through a sieve of 250 µm.
The determination of the radionuclides, rare earth elements and metals was carried out by Instrumental Neutron Activation Analysis (INAA). The technique consisted of irradiating approximately 150mg of the sample during 8 hours at a neutron flux of 1012 n cm-2
s-1, at the nuclear research reactor IEA-R1 of IPEN. The induced radioactivity was measured by gamma-spectrometry with a hyper-pure germanium detector, with 25% relative efficiency and resolution of 2.10 keV at 1332 keV. The spectra analyses were made by WinnerGamma program on InterWinner [1]. The concentration of the analyzed elements was determined by comparing the activity obtained in the samples with that obtained with the standard reference
material IAEA SL-1 and IAEA SL-3 by the expression (1):
aip
tptaipp
iai
a mA
eCmAC
)()(
(1)
where: Cai = i-element concentration in the sample (µg g-1 )
Cpi = i-element concentration in the standard (µg g-1 )
Aai = i-element peak area in the sample (cps)
Api = i-element peak area in the standard (cps)
ma e mp = standard and sample weight, respectively (g)
= radioisotope decay constant (s-1)
ta - tp = Difference between sample and standard count time (s).
The determination of the minimum detectable activity (MDA) for INAA was carried out using standard reference material by the expression (2) [2]:
CT
BgCMDA
pR
.
.3
(2)
where: MDA= minimum detectable activity (μg g-1 )
CpR = concentration of the element in the standard reference material (μg g-1)
Bg = background count of the element in the sample (counts)
T = counting time (s)
C = counting in the peak area of the element in the standard reference material (cps)
3 = level between the certified value and the definitive value.
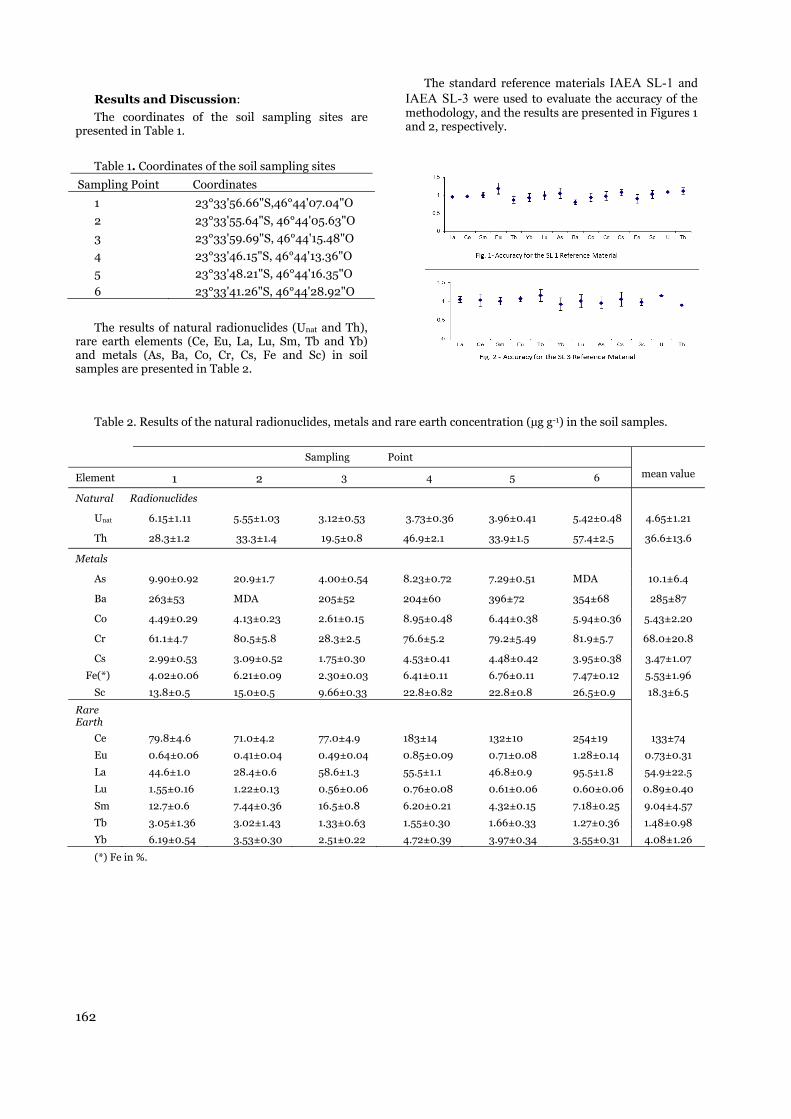
162
Results and Discussion:
The coordinates of the soil sampling sites are presented in Table 1.
Table 1. Coordinates of the soil sampling sites
Sampling Point Coordinates
1 23°33'56.66"S,46°44'07.04"O
2 23°33'55.64"S, 46°44'05.63"O
3 23°33'59.69"S, 46°44'15.48"O
4 23°33'46.15"S, 46°44'13.36"O
5 23°33'48.21"S, 46°44'16.35"O
6 23°33'41.26"S, 46°44'28.92"O
The results of natural radionuclides (Unat and Th), rare earth elements (Ce, Eu, La, Lu, Sm, Tb and Yb) and metals (As, Ba, Co, Cr, Cs, Fe and Sc) in soil samples are presented in Table 2.
The standard reference materials IAEA SL-1 and IAEA SL-3 were used to evaluate the accuracy of the methodology, and the results are presented in Figures 1 and 2, respectively.
Table 2. Results of the natural radionuclides, metals and rare earth concentration (µg g-1) in the soil samples.
Sampling Point
Element 1 2 3 4 5 6 mean value
Natural Radionuclides
Unat 6.15±1.11 5.55±1.03 3.12±0.53 3.73±0.36 3.96±0.41 5.42±0.48 4.65±1.21
Th 28.3±1.2 33.3±1.4 19.5±0.8 46.9±2.1 33.9±1.5 57.4±2.5 36.6±13.6
Metals
As 9.90±0.92 20.9±1.7 4.00±0.54 8.23±0.72 7.29±0.51 MDA 10.1±6.4
Ba 263±53 MDA 205±52 204±60 396±72 354±68 285±87
Co 4.49±0.29 4.13±0.23 2.61±0.15 8.95±0.48 6.44±0.38 5.94±0.36 5.43±2.20
Cr 61.1±4.7 80.5±5.8 28.3±2.5 76.6±5.2 79.2±5.49 81.9±5.7 68.0±20.8
Cs 2.99±0.53 3.09±0.52 1.75±0.30 4.53±0.41 4.48±0.42 3.95±0.38 3.47±1.07
Fe(*) 4.02±0.06 6.21±0.09 2.30±0.03 6.41±0.11 6.76±0.11 7.47±0.12 5.53±1.96
Sc 13.8±0.5 15.0±0.5 9.66±0.33 22.8±0.82 22.8±0.8 26.5±0.9 18.3±6.5
Rare Earth
Ce 79.8±4.6 71.0±4.2 77.0±4.9 183±14 132±10 254±19 133±74
Eu 0.64±0.06 0.41±0.04 0.49±0.04 0.85±0.09 0.71±0.08 1.28±0.14 0.73±0.31
La 44.6±1.0 28.4±0.6 58.6±1.3 55.5±1.1 46.8±0.9 95.5±1.8 54.9±22.5
Lu 1.55±0.16 1.22±0.13 0.56±0.06 0.76±0.08 0.61±0.06 0.60±0.06 0.89±0.40
Sm 12.7±0.6 7.44±0.36 16.5±0.8 6.20±0.21 4.32±0.15 7.18±0.25 9.04±4.57
Tb 3.05±1.36 3.02±1.43 1.33±0.63 1.55±0.30 1.66±0.33 1.27±0.36 1.48±0.98
Yb 6.19±0.54 3.53±0.30 2.51±0.22 4.72±0.39 3.97±0.34 3.55±0.31 4.08±1.26
(*) Fe in %.

163
The relative error ranged from 0.3% (Lu) to 9.5% (Fe) and relative standard deviation from 4.6% (La) to 10.8% (Ba) for standard reference material IAEA SL-1. For the standard reference material IAEA SL-3, the relative error ranged from 1.7% (Yb) to 9.3% (U) and relative standard deviation from 0.35% (Sm) to 10.1% (Th). In general, relative standard deviation and relative error were lower than 10% proving the precision and accuracy of the INAA technique.
The values obtained for the MDA were: U (< 1.32 μg g-1) and Th (< 0.78 μg g-1); Ce (< 5.31 μg g-1) , Eu (< 0.13 μg g-1), La (< 0.8 μg g-1), Lu (< 0.07 μg g-1), Sm (< 0.12 μg g-1), Tb (< 1.5 μg g-1) and Yb (< 0.85 μg g-1); As (< 1.2 μg g-1), Ba (< 82 μg g-1), Co (< 1.3 μg g-1), Cr (< 8.4 μg g-1), Cs (< 1.30 μg g-1), Fe (< 0.18 %) and Sc (< 0.19 μg g-1).
Ruby et al. [3] determined the concentration of U and Th in soil samples used in agriculture and in pristine area of the State of São Paulo. The results obtained range of 0.5 to 5.81 μg g-1 and 4.6 to 54.37 μg g-1 for U and Th, respectively in agriculture soil; and range of 0.24 to 3.45 μg g-1 and 4.19 to 62.42 μg g-1 for U and Th, respectively for pristine area.
Peres [4] determined the natural radioactivity concentration in the soil of the State of São Paulo. The results obtained ranged from <1.9 to 16.1 μg g-1 for U and from 2 to 20.1 μg g-1 for Th.
The State of São Paulo Environmental Agency, Companhia Ambiental do Estado de São Paulo (CETESB) [5] established also reference values for soil quality and values for prevention and intervention in industrial soil. The quality reference level corresponds to a concentration below which the soil is considered clean. Prevention reference level corresponds to a concentration upon which the soil quality can be affected. Intervention reference level is the concentration upon which potential risks to human health exists. The reference values established for CETESB are presented in Table 3. Table 3. Quality, prevention and intervention reference levels in industrial soil (µg g-1).
Metals
Quality reference
level
Prevention reference
level
Intervention reference
level
As 3.5 15 150
Ba 75 150 750
Co 13 25 90
Cr 40 75 400
Conclusion:
The results obtained of U and Th in soil samples around IPEN is in good agreement with the literature.
The concentrations obtained for As and Cr were below the prevention limits established by Cetesb. For the concentration of Ba, the values are above the prevention and below the intervention limits. The concentrations obtained for Co were below the value of the quality reference level.
There are no guiding values for the metals Cs, Fe, Sc and rare earth elements in the soil. The results obtained were compared with the values of the Continental Crust [6]. The concentration of Cs, Fe and Sc obtained in the soil samples around IPEN facilities is of the same order of magnitude of the Continental Crust.
The results obtained for the concentrations of rare earth elements were twice the values of the Continental Crust, with the exception of Eu, which concentration was below the value reported for the Continental Crust.
References
1. InterWinner, “InterWinnerTM 6.0 MCA Emulation, Data Acquisition and Analysis Software for Gamma and Alpha Spectroscopy IW-B32. ORTEC”, Oak Ridge, TN, USA. 2004.
2. L. H. Keith, W. Crummet, J. P. Deegar, R. A. Libby, J. K. Taylor, G. Wenter, “Principles of environmental analysis”, Anal. Chemistry, vol. 55, 1983, pp 2210-2218.
3. E. C. Ruby, A.M. G. Figueiredo, R. P. Modesto, M. M. G. Lemos, “Tório e Urânio em solos agrícolas do Estado de São Paulo”, Proceedings - Congresso Brasileiro de Geoquímica, Diamantina, MG, Brasil, 2013.
4. A. C. Peres, PhD Thesis, Instituto de Pesquisas Energéticas e Nucleares, Universidade de São Paulo, SP, Brazil, 2007.
5. CETESB - COMPANHIA DE TECNOLOGIA DE SANEAMENTO AMBIENTAL. “Dispõe sobre a aprovação dos Valores Orientadores para Solos e Águas Subterrâneas no Estado de São Paulo – 2005, em substituição aos Valores Orientadores de 2001, e dá outras providências. Decisão de Diretoria Nº 195-2005- São Paulo”, Brasil, 2005.
6. K. H. Wedepohl, “The composition of the continental crust”, Geochim Cosmochim Acta, vol. 59, 1995, pp. 1217-1232.


ADVANCED TEACHING WITH THE EMBEDDED MINI LAB: PROPOSAL FOR DEVELOPING A RADIATION DETECTION PLATFORM FOR LABORATORY USE
WITH MULTI RADIATION SENSOR BOARD, ARDUINO AND RASPBERRY PI
Gordana Laštovička-Medin
Faculty of Natural Sciences and Mathematics, University of Montenegro, Podgorica, Montenegro
Abstract: The aim of this paper is to present the new, innovative teaching approach and tinkering pedagogy towards developing the students skills in STEM domains (science, technology, engineering and mathematics) with aim to the designing the laboratory for radiation detector development. Involving from one side concept of social situatedness and connectedness, and from another the concept of independent, self-directed and self-regulated student learning, the project was based on assembling the mini-lab, Radiation Sensor Board for Arduino, that was originally designed to help people in Japan to measure levels of radiation in their everyday life after the Fukushima accident. As it was reported elsewhere, this product was an example of crowdsourcing. When Libelien designed the Radiation Sensor Board for Waspmote, the idea was simple: with the Arduino platform people will be able to have easily running their own detector at home while on the other hand with Waspmote platform authorities will be able to deploy autonomous sensor networks to send the radiation levels from dangerous areas using wireless sensor platform ZigBee and GPRS technologies. This paper present students developing project where the Sensor Board for Arduino was used as assembling, teaching tool. The Do-It-Yourself and Internet of Things can be used both in educational, and in the research and development purposes. Owning their own mini-lab at their disposal anytime, students worked at their learning speed. It also boosted the interest, confidence of students and highly affected three domains of learning: cognitive domain (activities like instrumentation, modeling, experimentation, data analysis and design, psychomotor domain (activities like manipulating the apparatus, sensory awareness) and affective domain (behavior and attitudes to learn from failure, creativity, collaborative communication, safety and ethics in the laboratory). We show that networking learning, supported by hands-on labs on chip, and an open source electronics prototyping platform as Arduino and Raspberry Pi, give great opportunities for teaching and learning the tinkering and inventing skills, an request we have to deal with it at the University of Montenegro. Such project support exploratory and serendipitous learning. It moved teching from an emphasis simply on linear logic and programmed instruction, towards non-linear, networked, branching, hypertext views of learning, in which connections between knowledge are made and developed. It is based on principle of situated cognition and Vigotskian thought: situatedness, commonality, interdependency and infrastructure where learning is fascinated by an activity. The presented project integrate a Virtual Learning Environment, networking knowledge and student-owned movable laboratory on the chip, where radiation was used as a topic and where electronics was embedded and embodied.
Key words: embedded, open source hardware, radiation, Fukushima, DIY, Arduino, Raspberry Pi
1. INTRODUCTION
In this technical proposal we explore and employ the open source hardware in education. We moved traditional laboratory into real world, and introduced student to open source platforms and its recurrences. We created student-owned laboratory and provoked intellectual flow. Employing the architecture and design of embedded systems as well as the architecture of sensor wireless networks into science lessons we encourage students to learn through research and to create, innovate through knowledge construction. Assembling do-it-yourself kits is creative approach in teaching students the complexity of setting and building an experiment (designing, prototyping and
technology challenge). In this paper we explore the “pedagogy of things” as emerging models of experiential learning and Do-It-Yourself as a creative approach to innovative education. As didactic and research tool we employ DIY Radiation Arduino Kits, exposing students at the same time to the real world.
The work is under progress. Due to its early stage, paper does not provide any novelty as it is stated in the first sentence of the abstract. All discussed concepts (Arduino, Raspberry Pi, ZigBee, GPRS, Geiger counter) are well known. However they have never been applied in research at the University of Montenegro, so from the technical point of view the proposal of multisensory and wireless radiation detection platform for laboratory has a certain novelty (placed in the our social context). The proposal for developing a radiation detection platform is based on the multi-radiation

166
sensory boards for Arduino and Raspberry pi which was not yet fully explored elsewhere (no published papers). The project is also part of university novel initiatives towards teaching students to develop the business agile model using disruptive technology.
At this level we do not have yet substantial results, since we still work on multi-modality platforms, applying the philosophy of LEGO system, which can be easily modified and extended. At this moment we still learn how to combine electronic components to get the best solution. As such, we found this paper very useful as tutorial for students.
Montenegro does not have developed wireless sensor radiation platform, neither web platform for in-real-time radiation monitoring and data visualization. The proposal presented here is initial step towards this issue.
1.1. The Pedagogy of Things: Emerging Models of Experiential Learning
The emergence of ubiquitous computing technologies have made the once theorized “Internet of things” a reality, and this quickly evolving technological infrastructure, in conjunction with a variety of mobile devices, including smart phones and tablets, is providing incredibly rich opportunities for learning.
There is a lot of published papers exploring the impact of authenticity activities in classroom. We refer to some of them. As pointed out in [1] : “The emerging Internet of things holds great promise for disciplines that engages in research, data collection, or activities outside of traditional classroom walls. The Association of Experiential Education defines experiential learning as “a process through which a learner constructs knowledge, skill, and value from direct experience” [2]. Grounded in Dewey’s conceptions of authenticity in instructional activities [3,4] and Vygotsky’s notions of social learning [5], experiential learning overtly connects knowledge development to interaction and environmental experiences [6]. It is within this context that pervasive and permanent technological augmentations in the real world are changing the very nature of the word “authentic” [7]. Characteristics of this new authenticity include capabilities that are not only highly supportive of student-to-student interaction, but they are also supportive of student-to environment interaction and vice versa. Our physical landscape now contains data collecting and sharing nodes that can provide a persistent and evolving connection between students, teachers, digital artifacts and the physical world via cellular, Bluetooth, WiFi, and other connectivity means. Ultimately, the new pedagogy of things is enabled, to a large extent, by the rapid and broad adoption of smart phones, tablets, and other similar devices that enable mobility while possessing connectivity functionality [8].”
1.2. Non-linear, networked, branching, hypertext views of learning
Teaching with Internet and ICT has to be carefully planed and introduced, otherwise ICT may reinforce established style of whole-class teaching
unproductively, rather than promoting new, innovative teaching approaches. ICT has to be used to support learner’s creation of knowledge, and their investigation, developing questioning, and critical thinking (for knowledge construction and knowledge creation). As it is emphasized in [9]: “The use of computers, it is argued, is best conceived in terms of metaphors from biology, rather than instruction, being medium for growth – intellectually and cognitively – rather than simply a tool. School have moved some way from an emphasis simply on linear logic and programmed instructions and learning , towards non-linear, networked, branching, hypertext views of learning, in which connection between knowledge is made and developed. “
1.3. Do-It-Yourself as a Creative Approach to Innovative Education
In what follows we explain our motivation to introduce students to Do-It-Yourself embedded kits: Firstly we want to teach students the meaning of web of things, what is it, what problem it can solve. Secondly we want to introduce students to architectural consideration (how it looks like, what the components are). Thirdly, students learn what the “ingredients” are, and how things stick together. As final aim, we want to teach student to understand the application and services, what can be built on top of it, how to apply “jigsaw”/ lego philosophy in the creation of new things using recycling material or by reconnecting, redesigning already existing DIY kits. To explore the meaning of term “things” students explore embedded device in connection to the physical object such as iPhone. Then we explore the sensor node and set of sensor nodes and/or embedded device in connection to physical things which are abstracted as one “thing” (set of sensors monitoring temperature, humidity). The software platform are still under design.
1.4. Transition towards machine generate information and research question
With the aim to build laboratory for developing detectors for nuclear and particle physics we decided to speed up teaching and make it more efficient so we introduce students to embedded systems at science lessons and basic measurement in physics at the Faculty of mathematics and science at University of Montenegro. Transition towards machine generates information and research question. The basic research question is: how to develop a low-cost, reusable, and easy-to-use wireless sensing network for a given case? What is the best architecture to meet the requirements? What protocol should be used? Is a prototype built with open-source hardware and software, which demonstrates the possibility of using the Arduino/Raspberry Pi platform for wireless network good enough for the research and education purpose?
1.5. Why to use open source software and hardware platforms?
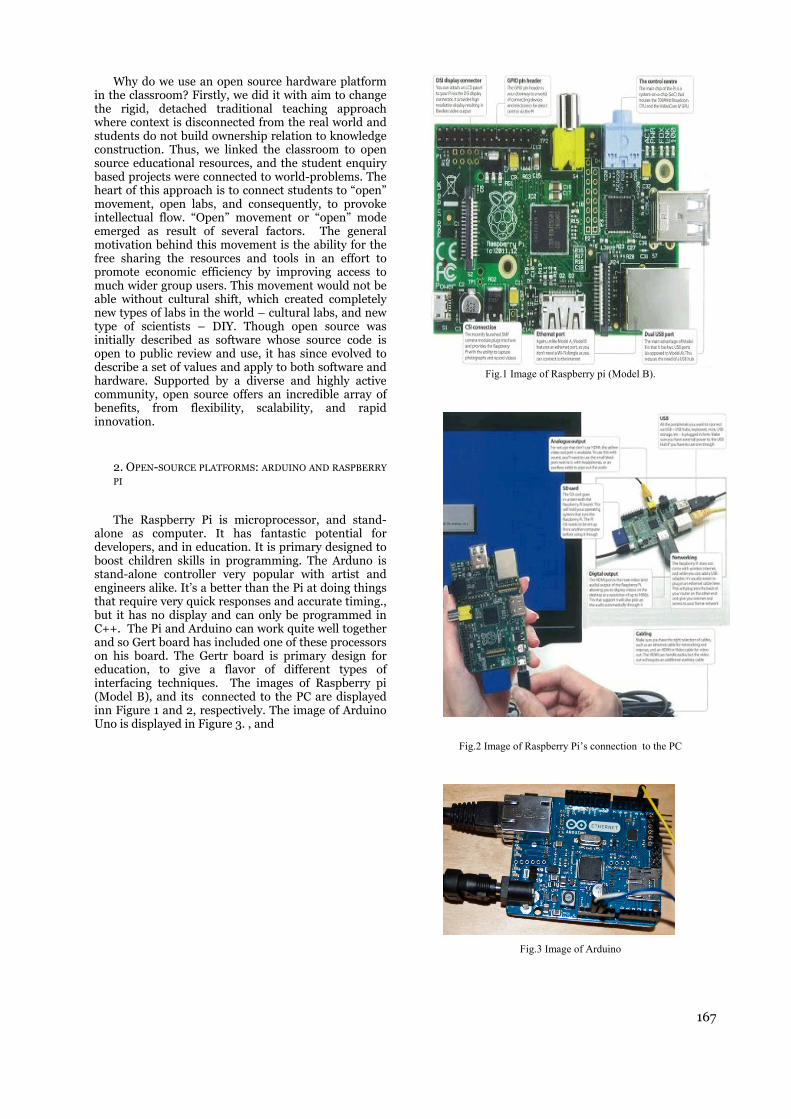
167
Why do we use an open source hardware platform in the classroom? Firstly, we did it with aim to change the rigid, detached traditional teaching approach where context is disconnected from the real world and students do not build ownership relation to knowledge construction. Thus, we linked the classroom to open source educational resources, and the student enquiry based projects were connected to world-problems. The heart of this approach is to connect students to “open” movement, open labs, and consequently, to provoke intellectual flow. “Open” movement or “open” mode emerged as result of several factors. The general motivation behind this movement is the ability for the free sharing the resources and tools in an effort to promote economic efficiency by improving access to much wider group users. This movement would not be able without cultural shift, which created completely new types of labs in the world – cultural labs, and new type of scientists – DIY. Though open source was initially described as software whose source code is open to public review and use, it has since evolved to describe a set of values and apply to both software and hardware. Supported by a diverse and highly active community, open source offers an incredible array of benefits, from flexibility, scalability, and rapid innovation.
2. OPEN-SOURCE PLATFORMS: ARDUINO AND RASPBERRY
PI
The Raspberry Pi is microprocessor, and stand-alone as computer. It has fantastic potential for developers, and in education. It is primary designed to boost children skills in programming. The Arduno is stand-alone controller very popular with artist and engineers alike. It’s a better than the Pi at doing things that require very quick responses and accurate timing., but it has no display and can only be programmed in C++. The Pi and Arduino can work quite well together and so Gert board has included one of these processors on his board. The Gertr board is primary design for education, to give a flavor of different types of interfacing techniques. The images of Raspberry pi (Model B), and its connected to the PC are displayed inn Figure 1 and 2, respectively. The image of Arduino Uno is displayed in Figure 3. , and
Fig.1 Image of Raspberry pi (Model B).
Fig.2 Image of Raspberry Pi’s connection to the PC
Fig.3 Image of Arduino
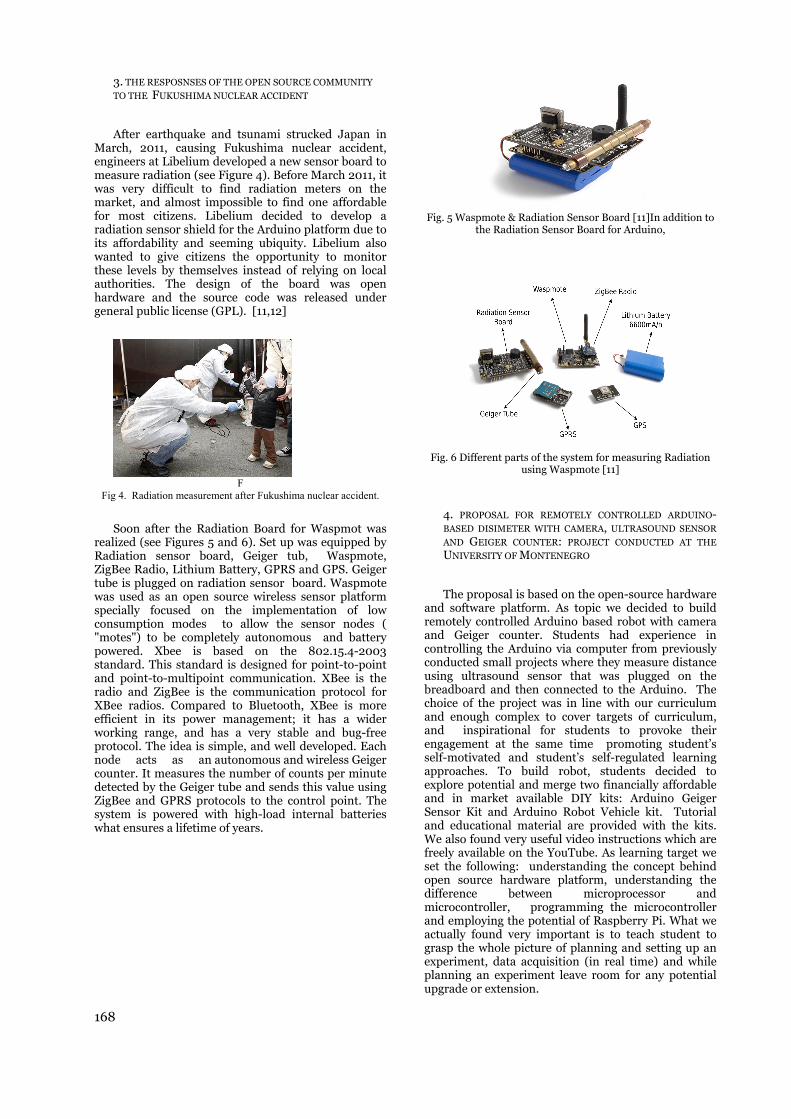
168
3. THE RESPOSNSES OF THE OPEN SOURCE COMMUNITY
TO THE FUKUSHIMA NUCLEAR ACCIDENT
After earthquake and tsunami strucked Japan in March, 2011, causing Fukushima nuclear accident, engineers at Libelium developed a new sensor board to measure radiation (see Figure 4). Before March 2011, it was very difficult to find radiation meters on the market, and almost impossible to find one affordable for most citizens. Libelium decided to develop a radiation sensor shield for the Arduino platform due to its affordability and seeming ubiquity. Libelium also wanted to give citizens the opportunity to monitor these levels by themselves instead of relying on local authorities. The design of the board was open hardware and the source code was released under general public license (GPL). [11,12]
F
Fig 4. Radiation measurement after Fukushima nuclear accident.
Soon after the Radiation Board for Waspmot was realized (see Figures 5 and 6). Set up was equipped by Radiation sensor board, Geiger tub, Waspmote, ZigBee Radio, Lithium Battery, GPRS and GPS. Geiger tube is plugged on radiation sensor board. Waspmote was used as an open source wireless sensor platform specially focused on the implementation of low consumption modes to allow the sensor nodes ( "motes") to be completely autonomous and battery powered. Xbee is based on the 802.15.4-2003 standard. This standard is designed for point-to-point and point-to-multipoint communication. XBee is the radio and ZigBee is the communication protocol for XBee radios. Compared to Bluetooth, XBee is more efficient in its power management; it has a wider working range, and has a very stable and bug-free protocol. The idea is simple, and well developed. Each node acts as an autonomous and wireless Geiger counter. It measures the number of counts per minute detected by the Geiger tube and sends this value using ZigBee and GPRS protocols to the control point. The system is powered with high-load internal batteries what ensures a lifetime of years.
Fig. 5 Waspmote & Radiation Sensor Board [11]In addition to
the Radiation Sensor Board for Arduino,
Fig. 6 Different parts of the system for measuring Radiation
using Waspmote [11]
4. PROPOSAL FOR REMOTELY CONTROLLED ARDUINO-BASED DISIMETER WITH CAMERA, ULTRASOUND SENSOR
AND GEIGER COUNTER: PROJECT CONDUCTED AT THE
UNIVERSITY OF MONTENEGRO
The proposal is based on the open-source hardware and software platform. As topic we decided to build remotely controlled Arduino based robot with camera and Geiger counter. Students had experience in controlling the Arduino via computer from previously conducted small projects where they measure distance using ultrasound sensor that was plugged on the breadboard and then connected to the Arduino. The choice of the project was in line with our curriculum and enough complex to cover targets of curriculum, and inspirational for students to provoke their engagement at the same time promoting student’s self-motivated and student’s self-regulated learning approaches. To build robot, students decided to explore potential and merge two financially affordable and in market available DIY kits: Arduino Geiger Sensor Kit and Arduino Robot Vehicle kit. Tutorial and educational material are provided with the kits. We also found very useful video instructions which are freely available on the YouTube. As learning target we set the following: understanding the concept behind open source hardware platform, understanding the difference between microprocessor and microcontroller, programming the microcontroller and employing the potential of Raspberry Pi. What we actually found very important is to teach student to grasp the whole picture of planning and setting up an experiment, data acquisition (in real time) and while planning an experiment leave room for any potential upgrade or extension.
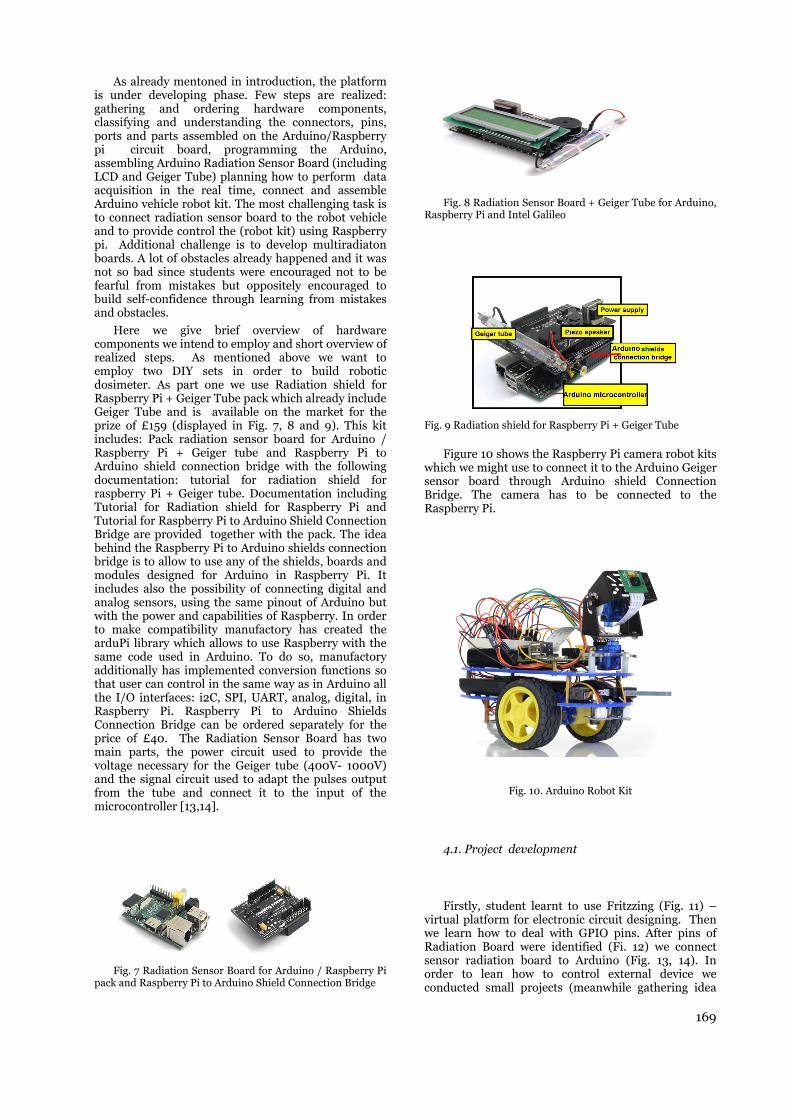
169
As already mentoned in introduction, the platform is under developing phase. Few steps are realized: gathering and ordering hardware components, classifying and understanding the connectors, pins, ports and parts assembled on the Arduino/Raspberry pi circuit board, programming the Arduino, assembling Arduino Radiation Sensor Board (including LCD and Geiger Tube) planning how to perform data acquisition in the real time, connect and assemble Arduino vehicle robot kit. The most challenging task is to connect radiation sensor board to the robot vehicle and to provide control the (robot kit) using Raspberry pi. Additional challenge is to develop multiradiaton boards. A lot of obstacles already happened and it was not so bad since students were encouraged not to be fearful from mistakes but oppositely encouraged to build self-confidence through learning from mistakes and obstacles.
Here we give brief overview of hardware components we intend to employ and short overview of realized steps. As mentioned above we want to employ two DIY sets in order to build robotic dosimeter. As part one we use Radiation shield for Raspberry Pi + Geiger Tube pack which already include Geiger Tube and is available on the market for the prize of £159 (displayed in Fig. 7, 8 and 9). This kit includes: Pack radiation sensor board for Arduino / Raspberry Pi + Geiger tube and Raspberry Pi to Arduino shield connection bridge with the following documentation: tutorial for radiation shield for raspberry Pi + Geiger tube. Documentation including Tutorial for Radiation shield for Raspberry Pi and Tutorial for Raspberry Pi to Arduino Shield Connection Bridge are provided together with the pack. The idea behind the Raspberry Pi to Arduino shields connection bridge is to allow to use any of the shields, boards and modules designed for Arduino in Raspberry Pi. It includes also the possibility of connecting digital and analog sensors, using the same pinout of Arduino but with the power and capabilities of Raspberry. In order to make compatibility manufactory has created the arduPi library which allows to use Raspberry with the same code used in Arduino. To do so, manufactory additionally has implemented conversion functions so that user can control in the same way as in Arduino all the I/O interfaces: i2C, SPI, UART, analog, digital, in Raspberry Pi. Raspberry Pi to Arduino Shields Connection Bridge can be ordered separately for the price of £40. The Radiation Sensor Board has two main parts, the power circuit used to provide the voltage necessary for the Geiger tube (400V- 1000V) and the signal circuit used to adapt the pulses output from the tube and connect it to the input of the microcontroller [13,14].
Fig. 7 Radiation Sensor Board for Arduino / Raspberry Pi
pack and Raspberry Pi to Arduino Shield Connection Bridge
Fig. 8 Radiation Sensor Board + Geiger Tube for Arduino, Raspberry Pi and Intel Galileo
Fig. 9 Radiation shield for Raspberry Pi + Geiger Tube
Figure 10 shows the Raspberry Pi camera robot kits which we might use to connect it to the Arduino Geiger sensor board through Arduino shield Connection Bridge. The camera has to be connected to the Raspberry Pi.
Fig. 10. Arduino Robot Kit
4.1. Project development
Firstly, student learnt to use Fritzzing (Fig. 11) – virtual platform for electronic circuit designing. Then we learn how to deal with GPIO pins. After pins of Radiation Board were identified (Fi. 12) we connect sensor radiation board to Arduino (Fig. 13, 14). In order to lean how to control external device we conducted small projects (meanwhile gathering idea

170
for arduino based vehicle robot) such as controlling LED diodes via Raspberry Pi (see Figure 15) .
Fig. 11 Pins of Radiation Board werer identified
Fig. 12 Pins of Radiation Board werer identified
Fig. 13 Connection of radiation board to Arduino
Fig. 14 Arduino;s connection to PC/Iphone
Fig. 15 Controling an LED using the Pi
To develop wireless sensor network (see Fifure 16, 17) we decide to use ZigBee based local sensor networks, GSM/GPRS interconnection with control center and for radiation dose rate to be transmitted we discussed to use wireless modules Xbee, or RFBee, while for data acquisition and storage we need to develop an application program
Figure 18. shows LCD connected to Arduino which will be used to visualize the measurement outcomes. Software to manipulate LCD using Arduino is already developed. An attempt to measure distance via ultrasound sensor, see Figure 19, (which will be used in robot design for the detection of obsracles) is done, and software developed.
Fig. 16 Arduino/XBee and sensor on breadboard. Test with thermistors as sensors
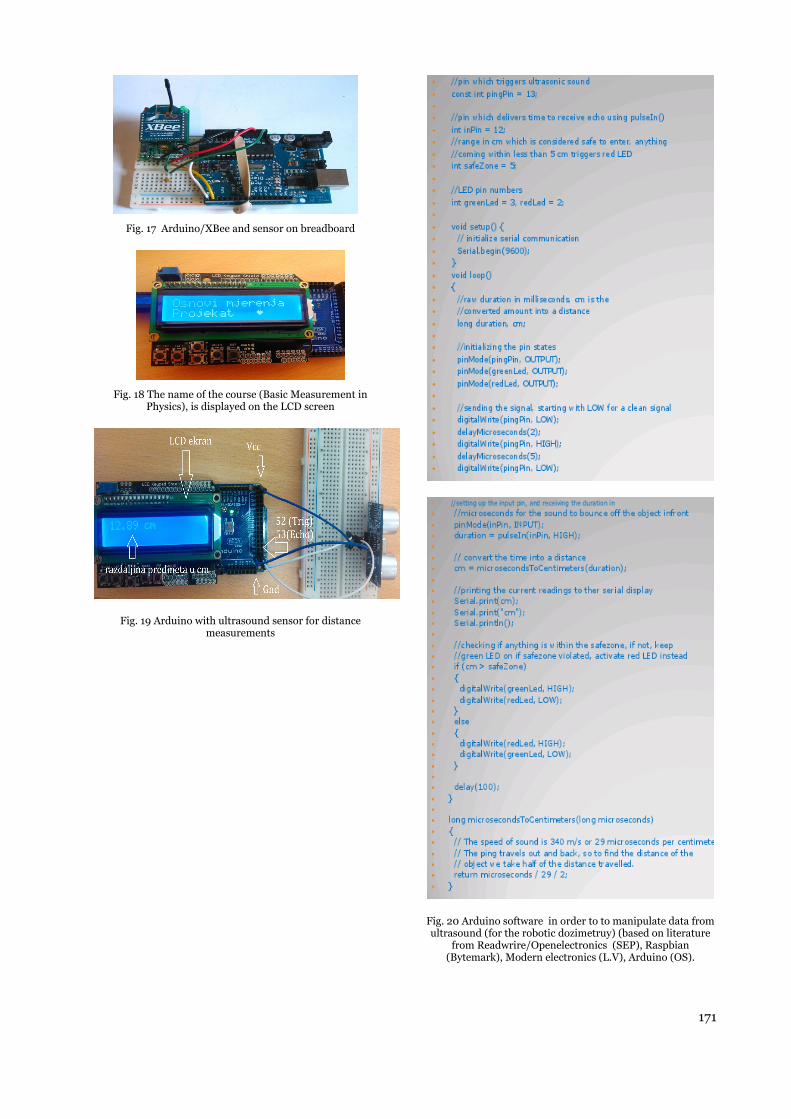
171
Fig. 17 Arduino/XBee and sensor on breadboard
Fig. 18 The name of the course (Basic Measurement in
Physics), is displayed on the LCD screen
Fig. 19 Arduino with ultrasound sensor for distance measurements
Fig. 20 Arduino software in order to to manipulate data from ultrasound (for the robotic dozimetruy) (based on literature
from Readwrire/Openelectronics (SEP), Raspbian (Bytemark), Modern electronics (L.V), Arduino (OS).
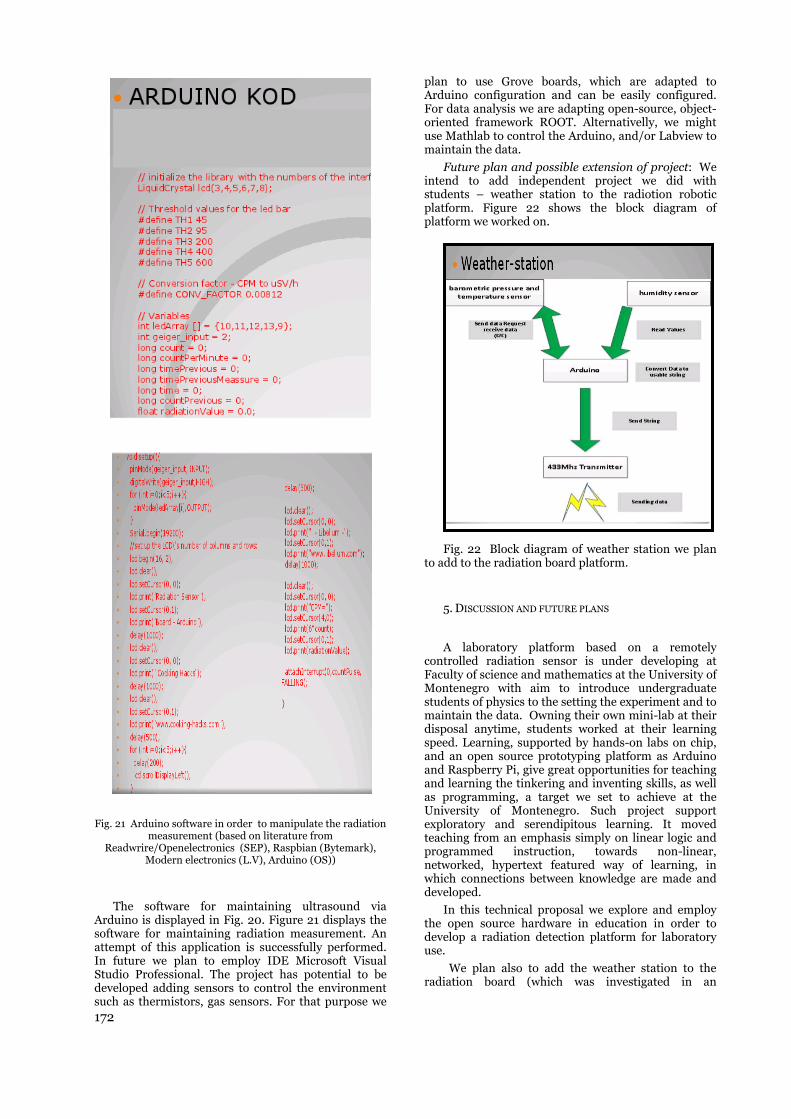
172
Fig. 21 Arduino software in order to manipulate the radiation measurement (based on literature from
Readwrire/Openelectronics (SEP), Raspbian (Bytemark), Modern electronics (L.V), Arduino (OS))
The software for maintaining ultrasound via Arduino is displayed in Fig. 20. Figure 21 displays the software for maintaining radiation measurement. An attempt of this application is successfully performed. In future we plan to employ IDE Microsoft Visual Studio Professional. The project has potential to be developed adding sensors to control the environment such as thermistors, gas sensors. For that purpose we
plan to use Grove boards, which are adapted to Arduino configuration and can be easily configured. For data analysis we are adapting open-source, object-oriented framework ROOT. Alternativelly, we might use Mathlab to control the Arduino, and/or Labview to maintain the data.
Future plan and possible extension of project: We intend to add independent project we did with students – weather station to the radiotion robotic platform. Figure 22 shows the block diagram of platform we worked on.
Fig. 22 Block diagram of weather station we plan to add to the radiation board platform.
5. DISCUSSION AND FUTURE PLANS
A laboratory platform based on a remotely controlled radiation sensor is under developing at Faculty of science and mathematics at the University of Montenegro with aim to introduce undergraduate students of physics to the setting the experiment and to maintain the data. Owning their own mini-lab at their disposal anytime, students worked at their learning speed. Learning, supported by hands-on labs on chip, and an open source prototyping platform as Arduino and Raspberry Pi, give great opportunities for teaching and learning the tinkering and inventing skills, as well as programming, a target we set to achieve at the University of Montenegro. Such project support exploratory and serendipitous learning. It moved teaching from an emphasis simply on linear logic and programmed instruction, towards non-linear, networked, hypertext featured way of learning, in which connections between knowledge are made and developed.
In this technical proposal we explore and employ the open source hardware in education in order to develop a radiation detection platform for laboratory use.
We plan also to add the weather station to the radiation board (which was investigated in an
173
independent student’s project- separately from the radiation board measurement development project).
We succeeded in testing the components and controlling them using Arduino. We also hope that sustainable results will be presented on the next conference.
Acknowledgement: The paper is a part of the Basic measurement in physics course. The author would like to give special thanks to students at the Department of Physics at the Faculty of science and mathematics at Montenegro University who participated in the project.
REFERENCES
1. C. E. Watson and J. T. Ogle, “The Pedagogy of Things: Emerging Models of Experiential Learning”, Bulletin of the IEEE Technical Committee on Learning Technology, Volume 15, Number 1, January 2013.
2. Association for Experiential Education (AEE). (1994). AEE definition of experiential education. Boulder, CO: Association for Experiential Education.
3. Dewey, J.. “Democracy and education”, New York: Macmillan., 1916.
4. Dewey, J., “Experience and education”. New York: Macmillan, 1938.
5. Vygotsky, L. S.. “Mind in society”, Cambridge, MA: Harvard University Press, 1978.
6. Kolb, D. A., “Experiential learning”, Englewood Cliffs, NJ: Prentice Hall, 1984
7. Watson, C.E.. Our new “real” world: Participatory culture and the pedagogy of things. Paper presented at the 2011 TEDxYouthGreaterNashville conference, Nashville, TN, November 2011.
8. Watson, C.E., & Plymale, W.O., “The pedagogy of things: Ubiquitous learning, student culture, and constructivist pedagogical practice”. In T. Kidd & I. Chen (Eds.), “Ubiquitous learning: A survey of applications, research, and trends”, Charlotte, NC: Information Age Publishing., 2011.
9. Louis Cohen, Lawrence Manion, Keith Morrison and Dominic Wyse, “A guide to teaching practice”, revised 5th edition, published by Routledge, 2010
10. Pete Hartwell, “How a Physically Aware Internet Will Change the World”, Mashable, October 13, 2010.
11. http://www.libelium.com/fukushima_crowdsourcing_radiation_social_project/
12. http://www.libelium.com/fukushima_crowdsourcing_radiation_social_project/http://www.cooking
13. hacks.com/documentation/tutorials/raspberry-pi-to-arduino-shields-connection-bridge
14. http://www.cooking-hacks.com/radiation-shield-for-raspberry-pi


SPECIFICITIES OF APPLICATION OF ANALYTICAL METHODS IN RADIOACTIVE WASTE MANAGEMENT
T. Andjelic, R.Žižić, R. Zekić, N. Svrkota, B. Berišaj
LLC Center for Ecotoxicological Research Podgorica, Radiation Protection and Monitoring Department, Bulevar Šarla de Gola 2, 81000 Podgorica, Montenegro
Abstract: In this article we present an analysis of special cases of certain types of radioactive waste and specificity of analytical methods which have been applied in the identification and quantification of contained radionuclides. In the article we present case studies in our work with radioactive waste that is stored in the central storage of radioactive waste in Montenegro, which is managed by Center for Ecotoxicological research Podgorica (hereinafter CETI). The scope of radioactive waste management is very complex and involves many individual stages. Radioactive waste can occur in many different forms. One of the major problems in radioactive waste management is to determine activity and/or activity concentration of radionuclides in radioactive waste. In many cases due to lack of information about initial activity, the only way is to determine the source activity by applying some of the classic analytical methods of analysis of radionuclides. In the case of radiation source which belongs in the category of sealed radioactive sources (SRS), this is the least problem, because SRS’s are sources of relatively small dimensions and with well-defined geometries, which is usually cylindrical. In this case, even on the basis of dose rate measurement, source activity can be very well determined. Problems arise in cases of radioactive sources - radioactive waste in special form or shape. Some of these types of radioactive waste are compasses with fluorescent colors that contain Ra-226 and tritium as well as metal alloys for special purposes, which contain Th-232. In these cases we have a radioactive material which is located at several places on the body of the compass, or homogeneously distributed throughout the mass and volume of the metal parts. In both cases the geometry is unfavorable and requires special analytical approach. Due to the described problems, the analysis of gamma emitters we have been doing on HPGe detectors and the calibration of efficiency is performed using the point calibration standard with a mix of radionuclides while the tritium analysis was performed on a liquid scintillation counter. In this article, we described this analysis and all the specifics that followed this analytical approach. In all cases we got valid results, based on which we were able to determine and classify radioactive waste.
Key words: radioactive waste management, gamma spectrometry, liquid scintillation counter, calibration standard, efficiency calibration,
1. INTRODUCTION
Radioactive waste management is an area which is very much known, but on the other hand in all of this there are also a lot of unknowns, hidden secrets and sometimes facts that fascinate. For example, an accident in Goiania, Brazil [1] is one of the most classical examples where the lack of regulatory control and also dysfunctional system of radioactive waste management, has led to tragic consequences. Most of things about this accident are well known, including the number of victims and the exposed persons, the amount of waste that has been accumulated during source recovery operation and decontamination, including a total cost. It is known that the source was Cs-137, but what is less known regarding the accident is that the cesium source was in the form of cesium chloride powder and its mass was 93 grams and with a volume of 31 cm3. So, 93 grams contaminate an area of
over 1 km2 and produced about 3500 m3 of radioactive waste [1]. There were about 250 people exposed out of which 20 people were hospitalized and four of them died within a month from admittance to the hospital [1]. And perhaps this is what is the most fascinating with sources of radiation and radioactive waste i.e. their real size after exclusion of all external elements, capsules, protection and other structural elements. In such a small volume there is so much potential, which can create a lot of problems and unfortunately, like in case of accident which is described, which can lead to fatal consequences on the exposed people.
The thing that fascinates also is half-life. Co-60 is radionuclide with a half-life of 5.27 years, which is not a significant time compared to other sources half-lives like 30.07 years for Cs-137, 432.2 years for Am-241, 1600 years for Ra-226 or several millions or billions of years for the isotopes of uranium and thorium. The significance of radionuclide’s half-life can be also observed by comparing the time necessary for activity of a single source to falls below a certain threshold

176
values. For example one spent sealed radiotherapy cobalt 60 source of 27.75 TBq (750 Ci), in order to decay to activity of 37 GBq (1 Ci), it takes about 50 years, and to the activity of 37 MBq (1 mCi) of about 100 years, which represents time which is longer than an average human life.
The problem of radioactive waste management is complex and requires involvement of a large number of different activities. Activities like collection, processing, conditioning, packaging, storage, disposal and some other are very well defined and there is a lot of literature and resources for them [2]. Also classification of sources, as well as available data on types, activities, is also very well covered and there are plenty of resources and data available [3].The area of nuclear waste is covered more, deeper and in more detail, having in mind importance and above all possible dangers if this type of waste is not managed properly. In many cases, the area of nuclear waste management is covered with a solid and stable financial basis and considerable capacity in terms of analytical support.
The situation is often very different in the case of small non-nuclear countries and this is particularly true in the case of developing countries that due to the development economic problems, financing of activities for radioactive waste management hold at the lowest possible level. Therefore, it often occurs that national institutions or organizations responsible for management of radioactive waste have very limited or do not have any significant analytical support. In many cases analytical support in management of radioactive waste is limited on detection, dosimetry, contamination level check and similar basic measurement techniques. Very rarely an organization or institution dealing with radioactive waste management, has a good and a fully equipped laboratory with all, sometimes necessary and sometimes of crucial importance, spectrometric techniques.
2. RADIOACTIVE WASTE MANAGEMENT IN
MONTENEGRO [4]
The problem of radioactive waste in Montenegro appeared during 2004. By reconstruction of the state union which was in form of Federal Republic of Yugoslavia to State Union of Serbia and Montenegro, all competences and authorities in the field of protection against ionizing radiation are transferred on member states. In Montenegro, at that time there was no facility of any kind that would serve for classification and processing, and temporary or permanent storage of radioactive waste material. Only such facility within the State Union of Serbia and Montenegro was located within the Vinca Institute – Belgrade, but by the Decision of the Ministry of Science and Environmental Protection of Serbia, import and storage of all types of radioactive waste from any foreign country was banned, including radioactive waste from Montenegro. Bearing in mind that an adverse situation had occured, there was urgent need for Montenegro to obtain a facility and all necessary supporting installations which would be designated and serve for treatment and temporarily store of radiation sources and radioactive waste.
Because of all this Montenegrin Ministry of Environment and Physical Planning has formed a team of experts with task to prepare project for facility for processing and temporary storage of radioactive waste. In this way, there was created initial text "Project facility for processing of radioactive waste and temporary storage", which was completed in September 2005 year. As the most suitable location for this Installation - Facility for processing radioactive waste and temporary storage the immediate vicinity of the building of CETI was chosen, reasons of physical protection requirements, infra-structure and proximity of technical and analytical support necessary for the smooth operation of the planned installation.
Since its founding in 1996 and beginning of its operations in 1998, CETI is the only institution in Montenegro that is fully equipped and functional in the field of analytics of ionizing radiation. CETI covers all major techniques such as alpha and gamma spectrometry, analysis of on a liquid scintillation and flow proportional counters, dosimetry, QA / QC of radiation sources in medicine and other applications, as well as a range of activities in the area of control of exposure of professionally exposed persons. Radioactive waste management is an activity, which is a logical and justified continuation of activities carried out earlier by CETI.
At the same time International Atomic Energy Agency - Vienna recognized importance of this Project and offered and provides its support, so soon after that that became official IAEA project “MNE/3/002 Project Strengthening Radioactive Waste Management”. As part of this Project IAEA organizes expert missions to Podgorica, and they have done a complete review of Project documentation, provide suggestions that are implemented and that was the base for construction – civil engineering part of Project. During 2005 and 2006 all preparation and construction works i.e. civil engineering works and construction of storage building was completed.
IAEA has provided all necessary working, protective, security and analytical equipment as well as all additional devices and tools necessary for smooth operation of the storage facility. IAEA also provide complete staff training and give an expert assistance in preparation of all necessary documentation. Complete licensing process of the storage facility was under the supervision of IAEA experts.
License for the radioactive waste storage facility was issued by Montenegrin Environmental Protection Agency on 13th of June 2012.
Almost immediately after licensing, trough realization of EU IPA Project Management of sealed radioactive sources, including radioactive lightning rods in former Yugoslav Republic of Macedonia, Kosovo (under UNSCR 1244/99) and Montenegro, a team from CETI managed to collect and store all known SRS including radioactive lightning rods and also some other special types of radioactive waste in Montenegro in Storage facility for radioactive waste.
Through our participation in IAEA Project, code INT9176 Strengthening Cradle-to-Grave Control of Radioactive Sources in the Mediterranean Region, IAEA provide to Montenegro INT9176 52 01 Expert mission on the Conditioning of Disused Sealed
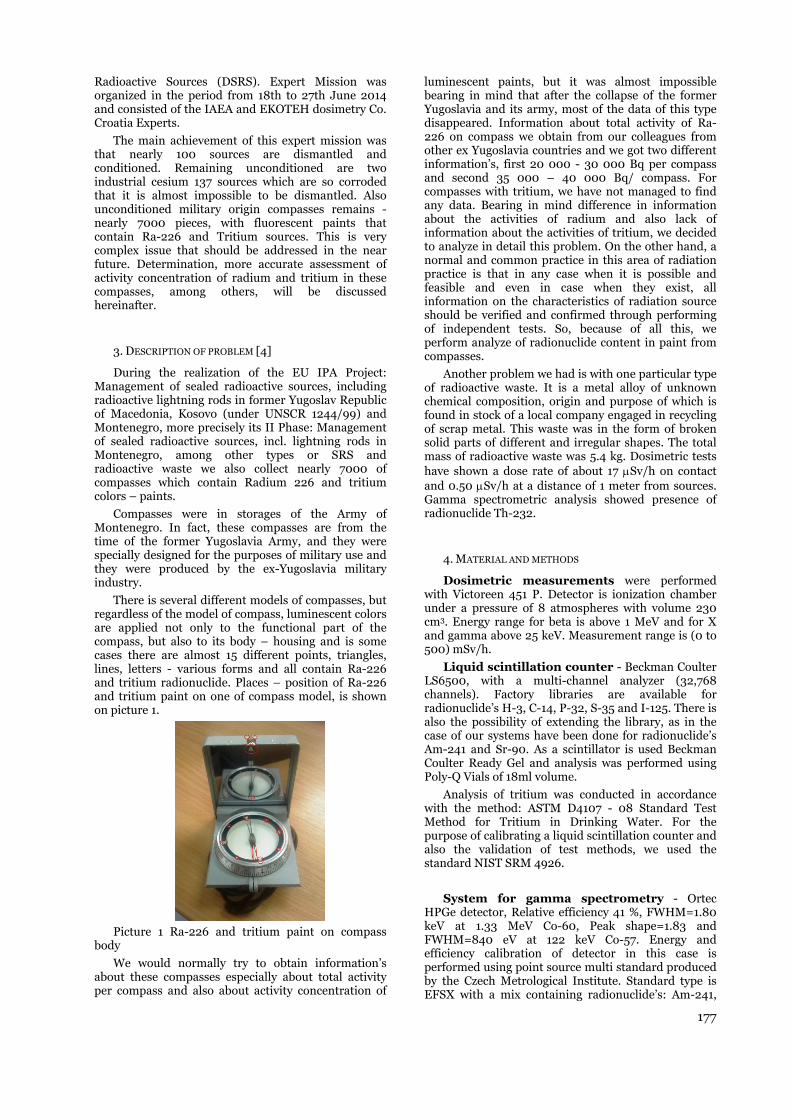
177
Radioactive Sources (DSRS). Expert Mission was organized in the period from 18th to 27th June 2014 and consisted of the IAEA and EKOTEH dosimetry Co. Croatia Experts.
The main achievement of this expert mission was that nearly 100 sources are dismantled and conditioned. Remaining unconditioned are two industrial cesium 137 sources which are so corroded that it is almost impossible to be dismantled. Also unconditioned military origin compasses remains - nearly 7000 pieces, with fluorescent paints that contain Ra-226 and Tritium sources. This is very complex issue that should be addressed in the near future. Determination, more accurate assessment of activity concentration of radium and tritium in these compasses, among others, will be discussed hereinafter.
3. DESCRIPTION OF PROBLEM [4]
During the realization of the EU IPA Project: Management of sealed radioactive sources, including radioactive lightning rods in former Yugoslav Republic of Macedonia, Kosovo (under UNSCR 1244/99) and Montenegro, more precisely its II Phase: Management of sealed radioactive sources, incl. lightning rods in Montenegro, among other types or SRS and radioactive waste we also collect nearly 7000 of compasses which contain Radium 226 and tritium colors – paints.
Compasses were in storages of the Army of Montenegro. In fact, these compasses are from the time of the former Yugoslavia Army, and they were specially designed for the purposes of military use and they were produced by the ex-Yugoslavia military industry.
There is several different models of compasses, but regardless of the model of compass, luminescent colors are applied not only to the functional part of the compass, but also to its body – housing and is some cases there are almost 15 different points, triangles, lines, letters - various forms and all contain Ra-226 and tritium radionuclide. Places – position of Ra-226 and tritium paint on one of compass model, is shown on picture 1.
Picture 1 Ra-226 and tritium paint on compass
body
We would normally try to obtain information’s about these compasses especially about total activity per compass and also about activity concentration of
luminescent paints, but it was almost impossible bearing in mind that after the collapse of the former Yugoslavia and its army, most of the data of this type disappeared. Information about total activity of Ra-226 on compass we obtain from our colleagues from other ex Yugoslavia countries and we got two different information’s, first 20 000 - 30 000 Bq per compass and second 35 000 – 40 000 Bq/ compass. For compasses with tritium, we have not managed to find any data. Bearing in mind difference in information about the activities of radium and also lack of information about the activities of tritium, we decided to analyze in detail this problem. On the other hand, a normal and common practice in this area of radiation practice is that in any case when it is possible and feasible and even in case when they exist, all information on the characteristics of radiation source should be verified and confirmed through performing of independent tests. So, because of all this, we perform analyze of radionuclide content in paint from compasses.
Another problem we had is with one particular type of radioactive waste. It is a metal alloy of unknown chemical composition, origin and purpose of which is found in stock of a local company engaged in recycling of scrap metal. This waste was in the form of broken solid parts of different and irregular shapes. The total mass of radioactive waste was 5.4 kg. Dosimetric tests have shown a dose rate of about 17 Sv/h on contact and 0.50 Sv/h at a distance of 1 meter from sources. Gamma spectrometric analysis showed presence of radionuclide Th-232.
4. MATERIAL AND METHODS
Dosimetric measurements were performed with Victoreen 451 P. Detector is ionization chamber under a pressure of 8 atmospheres with volume 230 cm3. Energy range for beta is above 1 MeV and for X and gamma above 25 keV. Measurement range is (0 to 500) mSv/h.
Liquid scintillation counter - Beckman Coulter LS6500, with a multi-channel analyzer (32,768 channels). Factory libraries are available for radionuclide’s H-3, C-14, P-32, S-35 and I-125. There is also the possibility of extending the library, as in the case of our systems have been done for radionuclide’s Am-241 and Sr-90. As a scintillator is used Beckman Coulter Ready Gel and analysis was performed using Poly-Q Vials of 18ml volume.
Analysis of tritium was conducted in accordance with the method: ASTM D4107 - 08 Standard Test Method for Tritium in Drinking Water. For the purpose of calibrating a liquid scintillation counter and also the validation of test methods, we used the standard NIST SRM 4926.
System for gamma spectrometry - Ortec HPGe detector, Relative efficiency 41 %, FWHM=1.80 keV at 1.33 MeV Co-60, Peak shape=1.83 and FWHM=840 eV at 122 keV Co-57. Energy and efficiency calibration of detector in this case is performed using point source multi standard produced by the Czech Metrological Institute. Standard type is EFSX with a mix containing radionuclide’s: Am-241,

178
Ba-133, Cd-109, Ce-139, Co-57, Cr-51, Cs-137, Mn-54, Sn-113, Sr-85, Y-88, Zn-65.
The efficiency calibration curve and method are verified through measurement of point sources standards of radionuclide’s Co-57, Co-60 and Cs-137, also produce by Czech Metrological Institute.
5. MEASUREMENTS RESULTS
Dosimetric tests done on compasses were conducted with Victoreen 451 P. Results of dosimetry tests of compasses are given in table 1.
Table 1 Dosimetric test of compasses
Compass model
Background
(Sv/h)
Measured dose rate
(Sv/h)
M53A S1 0.20 ± 0.02 2.10 ± 0.15
M53A S19 0.20 ± 0.02 2.3 ± 0.16
M53 S08 0.20 ± 0.02 0.20 ± 0.02
Dosimetry test results showed that the compass Model M53A S08 does not give an increased dose relative to the background, while on compasses model M53 S1 and M53A S19 is registered dose, which is 10-12 times higher than the background.
According to the performed dosimetry tests and based on known radiological characteristics potentially present radionuclide’s, it was assumed that in case of compasses M53A S1 and M53A S19 it is luminescent color containing Ra-226, while in compass M53 S08 we assumes presence of H-3. Presence of Ra-226 in the above mentioned compasses was confirmed by qualitative gamma spectrometric analysis, first on NaI spectrometer and later on an HPGe detector.
In this regard, analysis was continued on systems for gamma spectrometry and liquid scintillation counter. On these analytical systems qualitatively is confirmed presence of these radionuclides and by subsequent quantitative analysis we succeed to determine activity concentration of radionuclides which were investigated.
Spectrometry measurements of all models of compasses on systems for gamma spectrometry and liquid scintillation counter were performed with one general limitation. Regardless of the model of compass, common to all is that luminescent paint is applied to the functional part of the compass, also on their body in almost 15 places, as it is shown in Picture 1. These are points, triangles, lines, letters - various forms and it is impossible to perform spectrometric analysis of the entire compass, because it is a geometry that is unsuited for spectrometric analysis. Because of this, we perform spectrometric analysis of individual small parts - dots, which were removed from the body of compass, measured on analytical balance, so we obtain results of activity concentration of analyzed radionuclides.
Tritium content determination in the case of compass model M53 S08, measurements by liquid scintillation counter was performed by removing from the body of this compass model, 0.56 mg of luminescent color, which was dissolved in nitric acid.
The thus obtained solution was diluted to 50 ml, using water with a negligible content of tritium - dead water. From such obtained initial sample, 6 aliquots were taken and analyzed.
Each of the samples, analyzed on Liquid Scintillation Counter was measured in 10 cycles of 50 minutes, so a total measuring time was 500 minutes per sample. Detection limit for tritium, for described measurements conditions was 4.4 Bq / l.
Result of the analysis represents mean value of tritium content in luminescent color on compass model M53 S08 and and it is presented per unit of mass of luminescent color:
AH-3 = (90.69 11.45) x 106 Bq/g
Gamma-spectrometry examination of the compass model M53A S1 and M53A S19 was done over efficiency calibration curve, which was created with point source multi-energy standard. Samples for analysis were also in the form of point sources, in order to meet the basic requirement of methods.
In the case of the compass containing Ra-226, the measurement time was 20 000 seconds of live time for each of the analyzed samples. The limit of detection for described measurement conditions and selected geometry was 116 Bq for photo peak of Ra-226 at 185 keV and 10 Bq for photo peak Bi-214 at 609 keV.
Measuring time for samples of metal alloys containing Th-232, was 46 000 seconds of live time. The limit of detection for analyzed peak of Ac-228 at 911 keV was 2 Bq.
Ra-226 activity is calculated over its photo peak at 186 keV, with a logical assumption that it is a pure Ra-226 photo peak, so there is no contribution of U-235. This assumption is confirmed by considering that we did not registered photo peaks of U-235 on 143 and 163 keV. In order to verify, peak of Bi-214 on 609 keV is controlled, which is a descendant of the disintegration of Ra-226 and despite the fact that sample was not in equilibrium, we obtain unexpectedly good agreement between the values of Ra-226 and Bi-214, but for all subsequent calculations we used the value obtained over 186 keV. By analysis we obtain values, which are presented in table 2.
Table 2 Results of gamma spectrometric measurements of luminescent color from compasses
Compass
model
Mass of luminesc.
color sample
m(g)
A
(Bi-214 at 609 keV)
(Bq)
A
(Ra-226 at 186 keV)
(Bq)
A
(Ra-226 at 186 keV)
(106Bq/g)
M53A S1
0.00272 1436 ±
83 1799 ±
94 0.661 ± 0.079
M53A S19
0.00396 2499 ±
244 3074 ±
368 0.776 ± 0.093
From the results given in Tables 1 and 2, it can be seen that the results of dosimetry and gamma spectrometry analysis are consistent, because the difference between the measured values of dose rate is
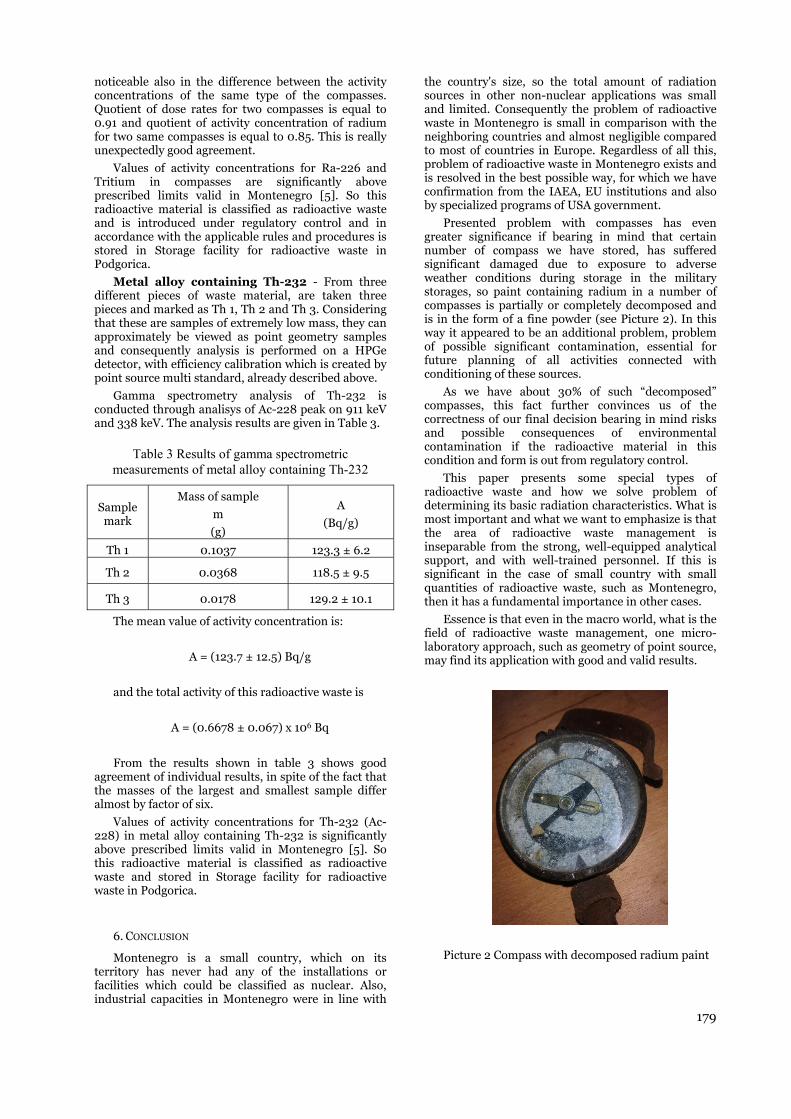
179
noticeable also in the difference between the activity concentrations of the same type of the compasses. Quotient of dose rates for two compasses is equal to 0.91 and quotient of activity concentration of radium for two same compasses is equal to 0.85. This is really unexpectedly good agreement.
Values of activity concentrations for Ra-226 and Tritium in compasses are significantly above prescribed limits valid in Montenegro [5]. So this radioactive material is classified as radioactive waste and is introduced under regulatory control and in accordance with the applicable rules and procedures is stored in Storage facility for radioactive waste in Podgorica.
Metal alloy containing Th-232 - From three different pieces of waste material, are taken three pieces and marked as Th 1, Th 2 and Th 3. Considering that these are samples of extremely low mass, they can approximately be viewed as point geometry samples and consequently analysis is performed on a HPGe detector, with efficiency calibration which is created by point source multi standard, already described above.
Gamma spectrometry analysis of Th-232 is conducted through analisys of Ac-228 peak on 911 keV and 338 keV. The analysis results are given in Table 3.
Table 3 Results of gamma spectrometric measurements of metal alloy containing Th-232
Sample mark
Mass of sample
m
(g)
A
(Bq/g)
Th 1 0.1037 123.3 ± 6.2
Th 2 0.0368 118.5 ± 9.5
Th 3 0.0178 129.2 ± 10.1
The mean value of activity concentration is:
A = (123.7 ± 12.5) Bq/g
and the total activity of this radioactive waste is
A = (0.6678 ± 0.067) x 106 Bq
From the results shown in table 3 shows good agreement of individual results, in spite of the fact that the masses of the largest and smallest sample differ almost by factor of six.
Values of activity concentrations for Th-232 (Ac-228) in metal alloy containing Th-232 is significantly above prescribed limits valid in Montenegro [5]. So this radioactive material is classified as radioactive waste and stored in Storage facility for radioactive waste in Podgorica.
6. CONCLUSION
Montenegro is a small country, which on its territory has never had any of the installations or facilities which could be classified as nuclear. Also, industrial capacities in Montenegro were in line with
the country's size, so the total amount of radiation sources in other non-nuclear applications was small and limited. Consequently the problem of radioactive waste in Montenegro is small in comparison with the neighboring countries and almost negligible compared to most of countries in Europe. Regardless of all this, problem of radioactive waste in Montenegro exists and is resolved in the best possible way, for which we have confirmation from the IAEA, EU institutions and also by specialized programs of USA government.
Presented problem with compasses has even greater significance if bearing in mind that certain number of compass we have stored, has suffered significant damaged due to exposure to adverse weather conditions during storage in the military storages, so paint containing radium in a number of compasses is partially or completely decomposed and is in the form of a fine powder (see Picture 2). In this way it appeared to be an additional problem, problem of possible significant contamination, essential for future planning of all activities connected with conditioning of these sources.
As we have about 30% of such “decomposed” compasses, this fact further convinces us of the correctness of our final decision bearing in mind risks and possible consequences of environmental contamination if the radioactive material in this condition and form is out from regulatory control.
This paper presents some special types of radioactive waste and how we solve problem of determining its basic radiation characteristics. What is most important and what we want to emphasize is that the area of radioactive waste management is inseparable from the strong, well-equipped analytical support, and with well-trained personnel. If this is significant in the case of small country with small quantities of radioactive waste, such as Montenegro, then it has a fundamental importance in other cases.
Essence is that even in the macro world, what is the field of radioactive waste management, one micro-laboratory approach, such as geometry of point source, may find its application with good and valid results.
Picture 2 Compass with decomposed radium paint

180
REFERENCES
1. The Radiological Accident in Goiania, IAEA, Vienna, 1988
2. Handling, Conditioning and Storage of Spent Sealed Radioactive Sources, IAEA-TECDOC-1145 IAEA, Vienna, 2000.
3. Classification of Radioactive Waste, General Safety Guide, No. GSG-1, International Atomic Energy Agency Vienna.
4. Safety Report for Radioactive Waste Storage Facility, CETI No. 00 – 14 – 2933/2, December 2011.
5. Rulebook on the method of collection, storage, processing and storage of radioactive waste, Official Gazette of Montenegro. 58/2011
Laborato
AbstThe qualreguthe eScienare nadvaThe the mrepr6 mibuttofuncmaxobta
Key
1.
Ravariocoverfood casesabsorThe dcertaibe hieffecthigh therequalit
InimpleISO 1– Rrequiradiasterilmicroguidadosimroutin
ESTIM
ory for Radiati
tract quality control
lity control of ulations is radiaeffect of procesnces. Establishino recommendaantage of this methanol-chlorob
most influencedroducible for plain., 8 min., 10 mon for process i
ction of absorbeximal absorbed ained by this me
y words: radiat
INTRODUCTION
adiation procus products
rs many areairradiation o
s, the qualirbed dose dudelivered abin prescribedigh enough tt, but the uto cause adv
e are the ty control of
n recent yearement the in11137 – SterilRadiation. irements th
ation sterilizize medical dobicidal actance on thmetry in dne control
MATION OF
B
ion Chemistry
l system enableradiation pro
ation sterilizatioss interruption ing the effect ofations for its im
method is the abbenzene (ECB)
d by source tranacing dosimeter
min. Measuremeinterruption (to
ed dose versus idose that can b
ethod is 154 Gy.
tion processing,
N
cessing inclus for differas, like radiaor polymer mty of produuring the irrsorbed dosed limits. Theto accomplis
upper limit sverse effects. internationa
f radiation pr
s, there was nternational slization of heThis Stan
hat, if met,zation procdevices, thativity(1). In
he requiremdevelopment,
of a radia
ABSORBEDIN RAD
ojana Šeće
and Physics, V522,
es the standardocessing. The aon. This proceson absorbed d
f process interrmplementation. ility to carry it dosimeter is usnsit, i.e. the mors. Alanine dosients of time stao sink source doirradiation timebe delivered to p
, cobalt-60, etha
udes irradiatient purpose
ation sterilizamodification. ucts dependradiation pro
e has to be we lower limit sh certain deshould not bFor this pur
al standardsrocessing(1-7).
a lot of activstandards, mealth care prndard desc
will proviess intende
t have approppart 3, it
ments relatin validation
ation steriliz
D DOSE DURDIATION PR
erov, Miros
Vinča Institut11001 Belgrad
dization of prodarea of radiatiss is used as thedose in the 60Coruption is one of
A new methodout during the
sed to select theost close to the imeters were irr
arts when the buown). The absoe is linear as exproduct during
anol-chloroben
ion of es. It ation, In all
ds on ocess. within must esired be so rpose, s for .
vity to mainly roduct cribes ide a ed to priate gives
ng to and zation
RING PROCROCESSING
slav Dramić
te of Nuclear Sde, Serbia
duct quality. Dion processinge example to deo irradiation p
of requirementsd has been work
sterilization proe suitable placesource. In the sradiated on thisutton to lift sourorbed doses werxpected. The exg source transit
nzene dosimetry
process.sterilizatioinstallationqualificatioqualificatioirradiator, and delivdefined accdetermininmapping distributiomapping foout to chato the distand to einterruptiorequiremeninterruptiocontainerabsorbedinfluencedprocess intthe result wcarried ouFor radiatdesirable tis negligib
CESS INTERR
ćanin
Sciences, Univ
osimetry has awhich is gov
scribe the new plant at the Vin
in internationaked out by grapocess. where absorbe
same time, it shs place in time irce is pressed are measured by
xtrapolation bact. In our experim
y, alanine dosim
According n process
n, operatioons. The pon is to as installed,
vering apprceptance critng dose dist
exercises ns to procor operationaracterize theribution andestablish thon on dose. Tnts for assess
on: to interruis close to dose expecby source
terruption is with those oft under norion sterilizahat the effecble, so it m
RUPTION
versity of Belgr
an important roverned most st
method for estnča Institute ofal regulations,
phical extrapola
ed dose is expechould be convenintervals: 2 min
and stops by prey ESR spectromck to zero time ment this absor
metry
to Standis validate
onal and ppurpose of demonstrate
d, is capable ropriate doteria. This istributions th
and relacess paramal qualificatie irradiator d reproducibhe effects The Standarsing the effe
upt the procethe source
cted to betransit(1). T
s evaluated bf dose mappirmal processation processct of process might be n
rade, P.O.Box
ole in the trictly by tablishing f Nuclear but there
ation. The
cted to be nient and n., 4 min., essing the
meter. The gives the
rbed dose
dard(1), theed throughperformance
operationale that theof operating
oses within achieved by
hrough doseating theseeters. Dose
ion is carriedwith respect
bility of doseof process
rd gives onlyct of processess when thee where thee the mostThe effect of
y comparinging exercisess conditions.s itself, it isinterruption
necessary to
e h e l e g n y e e e d t e s y s e e t f g s . s n o

182
interrupt thevaluate theis possible ointerruption
This artdeterminatisource transeffect of pro
2. MATERI
The Radmore detaidescription geometry w60Co plaquand shieldishuffle-dweeither contplant was dEnergie Atoand the coCompany, PUN Develoassistance bAgency. Figarrangemenradiation ssource fram1015 Bq of(diameter 1generationssource framboxes (46 csource. A sisequential ia given boroom at one6 rows (3 ro12 horizontbox is irradbetween bobetween therows next tthe dose grathe source,measured afrom the fethanol-chlodosimeters accordance the correspml glass ampoules. dosimeters irradiation position formeasured busing a cali
he process mue effect. Folloonly to estimn.
ticle presention of absosit, instead o
ocess interrup
IALS AND METH
diation Plantil elsewhere
illustrativewill be givene source, ang, product
ell conveyortinuous or designed joinomique and onveyor systParis, with fiopment Progby the Interng.1 shows a scnt of produsource. At t
me (1 m x 3 mf 60Co plac11.1 mm, lens of source rome. An autocm x 46 cmingle irradiatirradiation cyox passes the of four vertows on each tal positions iated in the s
oxes in neighe source framto them are adient, partic, is large.
at a distance front of theorobenzene were preparwith the pr
onding stanflame-se
The irradis one ho
time starts r irradiation. by the OK-ibration curv
ultiple timesowing this gu
mate the effec
ts the new morbed dose of only estimption.
HODS
t has been de(8), and one of the
n here. It cossociated sthandling ar
r system debatch oper
ntly by the CConservatom
tem was buinancial supgramme andnational Atomchematic diauct boxes athe present m) is loaded ced into songth 451 mmods are arranmatic conve x 43 cm) ttion run consycles, and inhrough the tical levels oside of the sin each one
same way. Thboring rowsme and the b
small (a fewcular in rowsDose distribof approxim
e source fra(ECB) dosim
red at Vinča rocedures ddard(9) and p
ealed phariation timeour. Measuwhen the sThe absorbe
-302/2 oscilve made ear
s in order to uidelines, it
ct of process
method for during the ation of the
described in nly a brief
irradiation onsists of a torage pool reas, and a esigned for ration. The Commission me, France, ilt by ABP port by the d technical mic Energy gram of the
around the time, the
with 5.41 x ource rods m). Several nged in this eyor carries hrough the sists of four
n each cycle irradiation
organized in ource) with e, i.e. every
The distance s, as well as boxes in the w cm), and s nearest to bution was
mately 7 cm ame, using
meters. ECB Institute in escribed in placed in 2 rmaceutical e of ECB urement of ource is in
ed dose was llotitrator(9) rlier(10). The
measRisø alanicalib
Fig.mov
Bwherhigheis pdosimand fromtime 10 mthe band irradtime irradmeasspectsoftwdose obtaifrom
surement traNational
ine as tranration(4,11).
1 Horizontal (avements of box
( ) ala
ased on there the influeest to absorb
presented inmeters (diammass betwee
m Aérial, Illkirintervals: 2
min. Measurebutton to sta
stopped bdiation interr
of sourcediation time. sured by trometer usi
ware for abscalculation
ined from thm same batch
aceability is Laboratory,
nsfer dosim
a) and vertical (bcarriers within tnine dosimeters
ese measureence of sourbed dose is lon Fig.1, whmeter 3 mm, en 37.5 – 37rch, France) min., 4 min
ements of tiart the irradiy pressing
ruption, whice transit w
The alanineMiniScope
ing AER’EDsorbed dose
n, the calibrhe set of al
h irradiated b
s achieved bDenmark,
meter in in
b) arrangementthe irradiation rs location
ements, the rce transit ocated. This
here the althickness 1.
7.6 mg, purcwere irradia
n., 6 min., 8ime started iation was pr
the buttonch means thwas includee dosimeterse MS300 DE Version e calculationration curvelanine dosimby 60Co labo
by the with
-plant
s and room
place is the
s place lanine 5 mm
chased ated in min., when
ressed n for
hat the ed in s were
ESR 2.0.4.
n. For e was meters ratory

183
source for internal calibration at known doses determined by Fricke dosimeter(12). The ESR measurement parameters were: center field 334.8 mT; modulation amplitude 0.6 mT; microwave power 10 mW; magnetic field sweep width 2.1 mT; sweep time 12 s; scan number 5; gain 2; Phase 180. The serial interfaces directly capture the reading parameters of the dosimeters as Hpp-signal from spectrometer and software calculates Sn as = (1)
where Hpp is the peak –to-peak height of the dosimeter ESR signal, and m is the dosimeter weight in milligram. The calibration curve coordinates absorbed dose to Rc value given by: = (1 + ( − ) ) (2)
Sn – dosimeter response
krpe – correction factor of ESR spectrometer
km - correction factor of spectrometer variation during measurement period (assuming that this variation is linear)
Ti – temperature of dosimeter irradiation
Tetal – main irradiation temperature of reference dosimeter
kT – temperature correction factor
The software chooses automatically the best polynomial fit with RMS, F-value and r2 criteria. Calibration parameters are directly stored under a data base to be available for absorbed dose measurements without any transcription error.
3. RESULTS AND DISCUSSION
Vertical dose distribution just in front of the central part of the source plane is presented in Fig.2. The dose distribution shows a small local minimum in the center of the source, because source rods are placed in the frame at two vertical levels. Absorbed dose maximum is at 90 cm and 120 cm distance from the bottom of the box carrier. The position at 90 cm from the bottom of the box carrier was chosen for alanine dosimeters irradiation since it was the most convenient for placing dosimeters. The place with dose rate maximum was also chosen to maximize the sensitivity of absorbed dose measurements by alanine dosimeters. Since the dose rate maximum is at this place, it is expected that it can only be lower during source transit. In the same time, it is expected that the dose rate increases at the bottom of
the box carrier, but the upper limit is the maximal dose rate measured at the selected distance from the source. The maximal increase in dose rate corresponds to the decrease at the place of maximum dose rate during source transit and this is the main reason for choosing this place for further measurements.
4 6 8 10 12 14 16 18 200
20
40
60
80
100
120
140
160
180
posi
tion
of s
ourc
e ro
dspo
sitio
n of
sou
rce
rods
Dis
tanc
e fro
m th
e bo
ttom
of t
he b
ox c
arrie
r (cm
)
Absorbed dose for 1h irradiation (kGy)
Fig. 2 Vertical dose distribution at a distance of approximately 7 cm from the central part of the source
plane, as measured by ECB dosimeters
Fig.3. presents the absorbed dose measured by alanine dosimeters at 90 cm vertical distance from the bottom of the box carrier and approximately 7 cm from the central part of the source plane as a function of irradiation time when the source transit is included in measurement of irradiation time. The function is linear, as expected. It is obvious that the dose rate in this place is 287 Gy/min, which is 17.2 kGy/h. The same result was obtained by ECB dosimeters (Fig.2.).
The function presented in Fig.3. is extrapolated to zero time and under. The absorbed dose for zero time actually represents the absorbed dose during source transit in the place of alanine dosimeters. As the time of source transit is included in irradiation time,

184
the absorbed dose in selected place has to be less during source transit than without it when the source is in position for irradiation and the dose rate value is constant (287 Gy/min). This is a reason why the sign of absorbed dose is negative in Fig.3.
0 2 4 6 8 10 120
500
1000
1500
2000
2500
3000
y = -154 + 286.5 x
Abso
rbed
dos
e (G
y)
time (min)
Fig. 3 Absorbed dose at a distance of approximately 7 cm from the central part of the source plane and 90 cm
vertical distance from the bottom of the box carrier versus irradiation time, as measured by alanine dosimeters
The graphical extrapolation to zero time gives the result of 154 Gy absorbed dose during process interruption in the nearest place of irradiated product with regard to the source, where the influence of source transit to absorbed dose is the most. This value of the absorbed dose is the upper limit of the influence of one irradiation interruption to radiation sterilization process. It can be said that the effect of one process interruption to absorbed dose in irradiated product is not greater than 154 Gy when the source activity is 5.41 x 10¹⁵ Bq in the Radiation Plant in Vinča Institute. Knowing that the sterilization dose is 25 kGy, the influence of process interruption is not greater than 0.004%, i.e. it is negligible. Compared with the uncertainty of irradiation process which is ±3.5%(13), the number of process interruptions should be more than ten to be noticed in direct measurements of absorbed dose in sterilization process.
It should be noted that the time of source transit can be determined using the linear regression extrapolated to the x axis presented in Fig.3. The absolute value of the x intercept is the equivalent of the transit time. In this case the transit time is 32s.
In conclusion, the above-described method allows the determination of absorbed dose during source transit and its effect of process interruption by graphical extrapolation to zero time of irradiation, as presented in Fig.3. For this method it is important to determine the position of the dose rate maximum at the selected distance from the source.
Acknowledgement: This research is financially supported through project no. 45020 of the Ministry of Education and Science of the Republic of Serbia and APV Provincial Secretariat for Science and Technological Development of the Republic of Serbia through project no. 114-451-3583.
REFERENCES
1. ISO 11137 “Sterilization of health care products – Radiation”, 2006.
2. ISO/ASTM 51702-2002 (E) “Standard practice for dosimetry in a gamma irradiation facility for radiation processing”, 2002.
3. ISO/ASTM 51204-2002 (E) Standard practice for dosimetry in gamma irradiation facility for food processing”, 2002.
4. ISO/ASTM 51261-2002 (E) “Standard guide for selection and calibration of dosimetry systems for radiation processing”, 2002
5. ISO/ASTM 51539-2002 (E) “Standard guide for use of radiation-sensitive indicators”, 2002.
6. ISO/ASTM 51939-2002 (E) “Standard practice for blood irradiation dosimetry”, 2002.
7. ISO/ASTM 519oo-2002 (E) “Standard guide for dosimetry in radiation research on food and agricultural products”. 2002.
8. V. M. Marković, R. Eymery and H.C. Yuan, “A new approach to 60Co plant design for introduction of radiation sterilization in developing countries”, Radiat. Phys. Chem., vol.9, pp. 625-631, 1977.
9. ISO/ASTM 51538-2002 (E) “Standard practice for use of the ethanol-chlorobenzene dosimetry system”, 2002.
10. B. Lj. Šećerov and G. G. Bačić, “Calibration of routine dosimeters in radiation processing: validation procedure for in-plant calibration”, Nuclear Technology & Radiation Protection, vol.26, No.3, pp. 271-274, December 2011.
11. P. Sharpe, A. Miller, “Guidelines of calibration of dosimeters for use in radiation processing”, NPL Report CIRM 29, 1999.
12. ASTM E 1026-95 “Standard practice for using the Fricke reference standard dosimetry system”, 1995.
13. B. Šećerov and M. Dramićanin, “The role of dosimetry in control of radiation processing – a case study at Vinča radiation Plant”, Second International Conference on Radiation and Dosimetry in various Fields of research RAD 2014, 27 – 30 May, Faculty of Electronic Engineering, Niš, Serbia, Proceedings, p.p 227 – 230, 2014.

NON-TARGETED EFFECTS OF FACTORS FROM BLOOD SERUMS OF CHERNOBYL POPULATIONS
Pavel Marozik 1, Irma Mosse 1, Mikhail Marozik 2, Sergei Melnov 2, Colin Seymour 3, Carmel Mothersil 3
1 Institute of Genetics & Cytology NAS Belarus, 27, Akademicheskaya Str., 220072, Minsk, Belarus 2 International Environmental Sakharov University, 23, Dolgobrodskaya Str., 220070, Minsk, Belarus
3 McMaster University, 1280, Main Street West, Hamilton, ON L8S4K1 Canada
Abstract. In the present work, the phenomenon of bystander effects (transfer of damaging factors from affected cells to intact cells) induced in vivo has been studied. A newly developed method allows evaluation of the effects of bystander factors from sera of different groups of populations on immortalized culture of human keratinocytes. This method has serious advantages as compared to that which was used earlier. The level of damaging bystander factors in blood of people irradiated by the Chernobyl accident was estimated. Affected population groups included liquidators of the Chernobyl accident and people living and working in areas of Gomel region contaminated by radionuclides. The data clearly shows that blood serum samples of irradiated populations contain some kind of factors, induced in vivo and able to cause cell damage when transferred to in vitro conditions. These factors are able to circulate in blood stream for more than 20 years.
Key words: bystander effects, clastogenic factors, human keratinocytes, Chernobyl liquidators, affected population
1. INTRODUCTION
Because of human activities, involving the use of naturally occurring or artificially produced radioactive substances, radioactive materials contaminate huge territories of our Planet. Radioactive pollutants affect soil, water, air. Such atmospheric pollution presents a hazard not only to those engaged in work but also the public. As a result, millions of people live and work under the conditions of chronic low dose radiation exposure.
There are various possible biological effects of ionizing radiation on human health. However, from the population viewpoint, the most serious are genetic effects, which are able to transfer from generation to generation and accumulate as a genetic load.
Ever since Roentgen made the discovery of X-rays more than a hundred years ago, it had been generally accepted that the important biological effects of ionizing radiation in mammalian cells were a direct consequence of unrepaired or misrepaired DNA damage in the irradiated cells. The classical dogma of radiation biology, as narrowly interpreted from target theory, asserts that genetic damage occurs only during or very shortly after deposition of energy in nuclear DNA (targeted effects) and, is due only to the direct action of the irradiation or from very short lived oxy-radicals generated by it, and that the course of biological consequences is fixed within one or two cell generations.
However, recent experimental evidence, mainly from in vitro α-particle studies, indicates that ionizing radiation can cause biological effects, including DNA damage, by mechanisms that are independent of nuclear traversals – “non-targeted” effects. Several studies have shown that genetic changes occur in a greater number of cells than expected when mammalian cell cultures are exposed to low fluencies of α-particles by which only a very small fraction of the cells is traversed by a particle track and thus directly exposed to radiation [1-3]. These studies, along with others involving low linear energy transfer radiation from incorporated radionuclides [4] and the transfer of growth media from irradiated to non-irradiated cell cultures [5], and microbeam studies [6] challenge the paradigm that radiation traversal through the nucleus of a cell is a prerequisite to produce genetic changes or a biological response. They indicate that cells located near directly irradiated cells or recipients of medium from irradiated cultures can also respond to the radiation exposure. These evidence suggests the existence of a phenomenon of information transfer from irradiated cells to non-irradiated (so-called radiation induced bystander effect, RIBE).
Such bystander factors could be induced not only by ionizing radiation, but also observed under different pathological conditions [7]. The specific nature of these factors and mechanism of RIBE are still unknown [8].
In recent years some evidence of RIBE induced in vitro was obtained, while the effects in vivo are not enough studied.
186
Effects of bystander factors induced in vivo in blood of people affected by the Chernobyl accident are of particular interest.
For the first time such studies were performed by Dr. I. Emerit [9], when it was shown that blood sera from liquidators of the Chernobyl accident or residents of areas contaminated by radionuclides contained an increased level of bystander factors. These factors increased the frequency of chromosome aberrations and micronuclei in own lymphocytes of serum donors even decades since irradiation.
In Emerit studies own lymphocytes of serum donors were used as a test-system. However, these cells were already exposed to ionizing radiation; as a result, the level of chromosome aberrations and micronuclei was increased there. At the same time, human peripheral blood lymphocytes under in vitro conditions could be subcultured only for 2-4 days, therefore it is impossible to evaluate serum effects for a longer period.
In the present study, a new method was developed which allows evaluation of the effects of bystander factors from sera of different groups of populations on immortalized culture of human keratinocytes. This method has serious advantages as compared to that which was used earlier: cells could be cultivated for a longer period of time (re-cultivation once a week), they are more sensitive as compared to human peripheral blood lymphocytes, and experiments could be easily repeated, allowing simple comparison and interpretation of the obtained results.
Using this method, we evaluated the level of damaging bystander factors in blood of populations affected by the Chernobyl accident.
According to the most wildly accepted estimates, the most affected groups of population are the following:
− accident liquidators – hundreds of thousands of workers and military personnel, who were involved in the emergency actions on the site during the accident and the subsequent clean-up operations which lasted for a few years;
− evacuees from dangerously contaminated territories inside the 30-km zone around the power plant;
− people living and working in contaminated areas of the former Soviet Union;
− populations outside the former Soviet Union - the radioactive materials of a volatile nature (such as iodine and cesium) that were released during the accident spread throughout the entire Northern hemisphere. The doses received by populations outside the former Soviet Union are relatively low, and show large differences from one country to another depending mainly upon whether rainfall occurred during the passage of the radioactive cloud.
In the present study, we analyzed two groups of populations – Chernobyl liquidators and people living and working in contaminated by radionuclides territories.
It is generally accepted that the group of Chernobyl liquidators was the most affected population by the accident. A restricted number, of the order of 400 people, including plant staff, firefighters and medical
aid personnel, were on the site during the accident and its immediate aftermath, and received very high doses from a variety of sources and exposure pathways.
The doses to these people ranged from a few Gy to well above 10 Gy to the whole body from external irradiation and comparable or even higher internal doses, in particular to the thyroid, from incorporation of radionuclides. The largest group of liquidators participated in clean-up operations for variable durations over a number of years after the accident. Although they were no longer working in emergency conditions, and were subject to controls and dose limitations, they received significant doses ranging from tens to hundreds of millisieverts.
By various estimates, today about several million people still reside in areas that will remain highly contaminated by Chernobyl radioactive pollution for many years to come. There were two main pathways of populations exposure: the radiation dose to the thyroid as a result of the concentration of radioiodine in the gland and the whole-body dose caused largely by external irradiation mainly from radio cesium. The Chernobyl catastrophe released enormous quantities of radioactive iodine, which becomes concentrated in the thyroid glands of exposed individuals. 131I leads to pathological cell modifications in thyroid. This process is exacerbated in areas - such as Belarus, southwest Russia and Ukraine - where iodine deficiency is endemic.
The study of the nature and possibility of modification of bystander factors, circulating in blood serum of populations, affected by the Chernobyl accident, will facilitate better understanding of radiation damage mechanisms. Knowledge of these mechanisms is increasingly important for cancer radiation therapy – for using special correcting coefficients taking into consideration effects of bystander factors. The anti-tumor therapy could be more effective and safe. Revealing the nature of the damaging bystander factors will promote more exact dose evaluation and radiation risk for people, exposed to ionizing radiation, as the risk of radiation exposure at low doses, calculated using direct and bystander effects, may be higher as compared to that calculated only from direct effects. The ability to neutralize and modify these factors may help to decrease significantly the effects of whole body radiation exposure.
2. MATERIALS AND METHODS
1.1. Subheading (Style Heading 4: 9 pt, left, indentation left 5 pt, spacing before 12 pt, after 6 pt, keep with next, keep lines together)
2.1. Cell culture
In the present study HPV-G cells (human keratinocytes, immortalized by human papilloma virus transfection), deficient in p53 were used as a test system. Cells were cultured in Dulbecco’s MEM: F12 (1:1) medium supplemented with 10% Fetal bovine serum, 1% penicillin-streptomycin (1g per 100 ml), 1% L-glutamine and 1 μg/ml hydrocortisone. The cells were maintained in an incubator at 37 degrees

187
centigrade, with 95% humidity and 5% carbon dioxide and routinely subcultured every 8-10 days.
2.2. Affected populations
The objects of investigation were blood sera from people affected by the Chernobyl accident: Chernobyl liquidators of 1986-1987 (22 persons), Polessky State Radiation Environmental Reserve workers1 (PSRER, 21 persons) and people, living in areas of Gomel region (GR) contaminated by radionuclides (15 persons). The analyzed groups also included four persons with acute virus infection (flu) living in areas contaminated by radionuclides. The control group included clinically healthy people from non-contaminated areas, corresponding to the main group in age and sex (36 persons).
2.3. Serum extraction
The blood samples were taken and placed in Vacutainers for serum extraction (Becton Dickinson, USA), centrifuged at 2000g for 10 minutes, and the serum was frozen and stored at -20°C before use. Before freezing, the sera were filtered through 0,22 μm filters (Nalgene, USA) in order to remove all residual cell components of the blood.
2.4. Radioprotective substances
Antioxidant substances melanin and melatonin were used as radioprotectors. Melanin (Belarusian pharmaceutical association, Minsk) was used at 10 mg/l concentration, melatonin (Sigma, Germany) – at 10 mg/ml.
2.5. Micronucleus assay
After plating, cells were left at 37°C in the CO2 incubator to be attached for 12 hours. The blood serum from affected populations was placed into 25 cm2 flasks (NUNC, USA) (6000 cells per flask) 1-2 days after plating, and cells were placed again in the incubator for 1-2 h. Then cytochalasin B was added (7 μg/ml concentration) and the cells were incubated for 24 hours. The cell culture medium was removed, the cells were washed with PBS and fixed with chilled Carnoy's solution (1 part of glacial acetic acid and 3 parts of methanol, 10-15 ml 3 times for 10-20 min). Later flasks were dried and stained with 10% Giemsa solution. The micronuclei count was carried out under inverted microscope. The data are presented as the micronuclei (cells with micronuclei) frequency recorded per 1000 binucleated cells ± standard error.
2.6. Alamar Blue assay
HPV-G cells were plated on 96-well microplates (NUNC, USA) at the concentration of 2×10⁴ cells/well. After plating, cells were incubated for 24 hours to allow attachment to the bottom of the well. Then the medium was removed, cells were rinsed with phosphate buffered saline (PBS) and the blood serum
1 Polessky State Radiation and Environment Reserve
(founded in 1988) is a territory of Gomel region, where humans cannot live because of the very high levels of radiation contamination. The territory of this reservation is 215.5 hectares.
from the Chernobyl accident populations was added to the cells together with melanin and melatonin as appropriate. Microplates were placed into the incubators. Twenty-four hours later, serum was removed, cells were rinsed with PBS and 100 μl of a 5% solution of Alamar Blue prepared in phenol red free DMEM media were added. Microplates were placed again into the incubators. Three hours later, fluorescence was quantified using a microplate reader (TECAN GENios, Grödig, Austria) at the respective excitation and emission wavelength of 540 and 595 nm, respectively Wells containing medium and Alamar Blue without cells were used as blanks. The mean fluorescent units for the three replicate cultures for each exposure treatment were calculated and the mean blank value was subtracted from these results.
2.7. Statistical analysis
All experiments were repeated at least three times, and within each experiment, cultures were set up in triplicate. The data are presented as the means ± standard errors.
When the distribution was normal, significance was determined using the t test. The level of significance was chosen as 95%; at t≥2.67, the difference is highly significant at p<0.01, at t≥1.96, the difference is significant at p<0.05. At p>0.05, the difference is not significant.
The Mann-Whitney U test is a nonparametric alternative to the t-test for independent samples and was calculated using STATISTICA 8.0 (Statsoft, USA). The U statistics is accompanied by a z value (normal distribution variety value), and the respective P-value.
3. RESULTS
3.1. Study of effects of blood sera from people, affected by the Chernobyl accident on micronuclei frequency in HPV-G cells
Table 1 presents data on the effects of blood serum samples from different population groups on the total micronuclei frequency in HPV-G cells (average data presented).
The micronuclei frequency in the controls indicates the level of spontaneous mutagenesis (it is comparatively low). The number of the cells with two and especially three micronuclei was very low as compared with the number of cells with one micronucleus.
As seen from Table 1, people exposed to chronic radiation (PSRER workers) have an increased level of bystander factors, expressed as a considerable increase in micronuclei frequency (almost three times as high as the control level – 248.03‰±20.77 as compared with 80.30‰±13.14, P<0.01).
At the same time, an increase in the number of the cells with more than one micronucleus was observed. Thus, the data clearly indicate that intensive chronic irradiation of PSRER workers significantly promoted accumulation of bystander factors in blood.
Similar results were observed after comparative analysis of the micronuclei frequency between the control group and the liquidators group (people
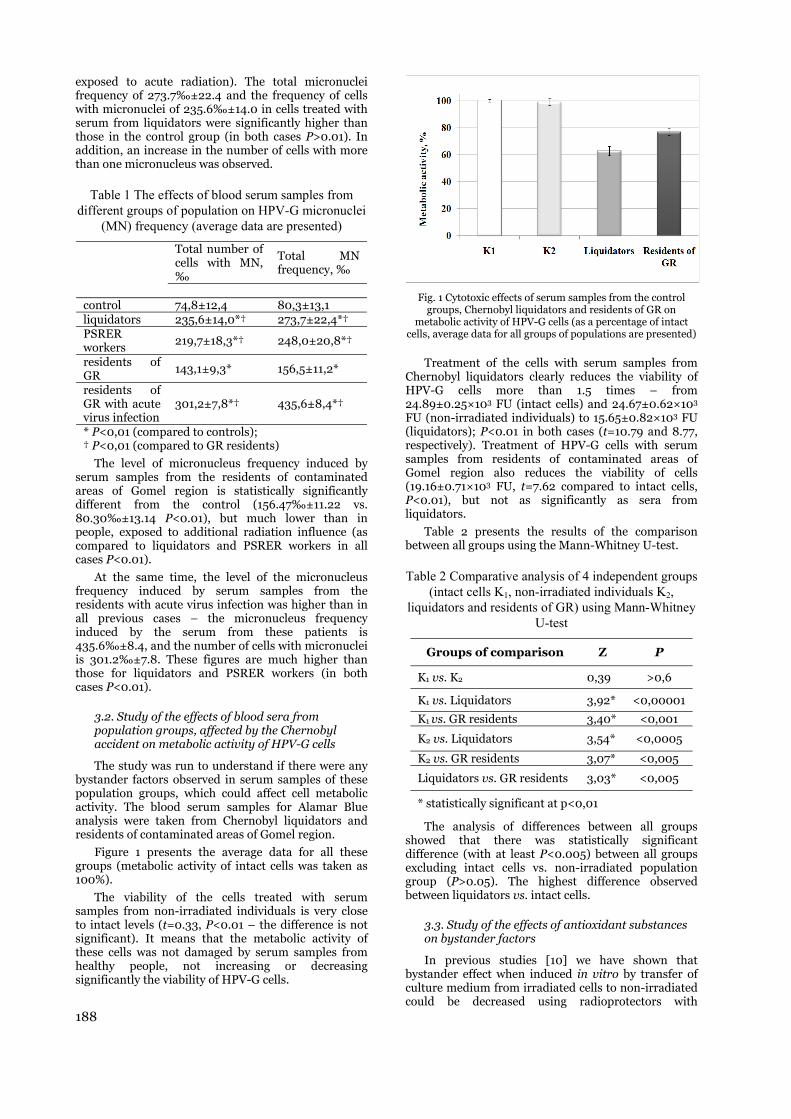
188
exposed to acute radiation). The total micronuclei frequency of 273.7‰±22.4 and the frequency of cells with micronuclei of 235.6‰±14.0 in cells treated with serum from liquidators were significantly higher than those in the control group (in both cases P>0.01). In addition, an increase in the number of cells with more than one micronucleus was observed.
Table 1 The effects of blood serum samples from different groups of population on HPV-G micronuclei
(MN) frequency (average data are presented)
Total number of cells with MN, ‰
Total MN frequency, ‰
control 74,8±12,4 80,3±13,1 liquidators 235,6±14,0*† 273,7±22,4*† PSRER workers
219,7±18,3*† 248,0±20,8*†
residents of GR
143,1±9,3* 156,5±11,2*
residents of GR with acute virus infection
301,2±7,8*† 435,6±8,4*†
* P<0,01 (compared to controls); † P<0,01 (compared to GR residents)
The level of micronucleus frequency induced by serum samples from the residents of contaminated areas of Gomel region is statistically significantly different from the control (156.47‰±11.22 vs. 80.30‰±13.14 P<0.01), but much lower than in people, exposed to additional radiation influence (as compared to liquidators and PSRER workers in all cases P<0.01).
At the same time, the level of the micronucleus frequency induced by serum samples from the residents with acute virus infection was higher than in all previous cases – the micronucleus frequency induced by the serum from these patients is 435.6‰±8.4, and the number of cells with micronuclei is 301.2‰±7.8. These figures are much higher than those for liquidators and PSRER workers (in both cases P<0.01).
3.2. Study of the effects of blood sera from population groups, affected by the Chernobyl accident on metabolic activity of HPV-G cells
The study was run to understand if there were any bystander factors observed in serum samples of these population groups, which could affect cell metabolic activity. The blood serum samples for Alamar Blue analysis were taken from Chernobyl liquidators and residents of contaminated areas of Gomel region.
Figure 1 presents the average data for all these groups (metabolic activity of intact cells was taken as 100%).
The viability of the cells treated with serum samples from non-irradiated individuals is very close to intact levels (t=0.33, P<0.01 – the difference is not significant). It means that the metabolic activity of these cells was not damaged by serum samples from healthy people, not increasing or decreasing significantly the viability of HPV-G cells.
Fig. 1 Cytotoxic effects of serum samples from the control
groups, Chernobyl liquidators and residents of GR on metabolic activity of HPV-G cells (as a percentage of intact
cells, average data for all groups of populations are presented)
Treatment of the cells with serum samples from Chernobyl liquidators clearly reduces the viability of HPV-G cells more than 1.5 times – from 24.89±0.25×10³ FU (intact cells) and 24.67±0.62×10³ FU (non-irradiated individuals) to 15.65±0.82×10³ FU (liquidators); P<0.01 in both cases (t=10.79 and 8.77, respectively). Treatment of HPV-G cells with serum samples from residents of contaminated areas of Gomel region also reduces the viability of cells (19.16±0.71×10³ FU, t=7.62 compared to intact cells, P<0.01), but not as significantly as sera from liquidators.
Table 2 presents the results of the comparison between all groups using the Mann-Whitney U-test.
Table 2 Comparative analysis of 4 independent groups (intact cells K1, non-irradiated individuals K2,
liquidators and residents of GR) using Mann-Whitney U-test
Groups of comparison Z P
K1 vs. K2 0,39 >0,6
K1 vs. Liquidators 3,92* <0,00001
K1 vs. GR residents 3,40* <0,001
K2 vs. Liquidators 3,54* <0,0005
K2 vs. GR residents 3,07* <0,005
Liquidators vs. GR residents 3,03* <0,005
* statistically significant at p<0,01
The analysis of differences between all groups showed that there was statistically significant difference (with at least P<0.005) between all groups excluding intact cells vs. non-irradiated population group (P>0.05). The highest difference observed between liquidators vs. intact cells.
3.3. Study of the effects of antioxidant substances on bystander factors
In previous studies [10] we have shown that bystander effect when induced in vitro by transfer of culture medium from irradiated cells to non-irradiated could be decreased using radioprotectors with
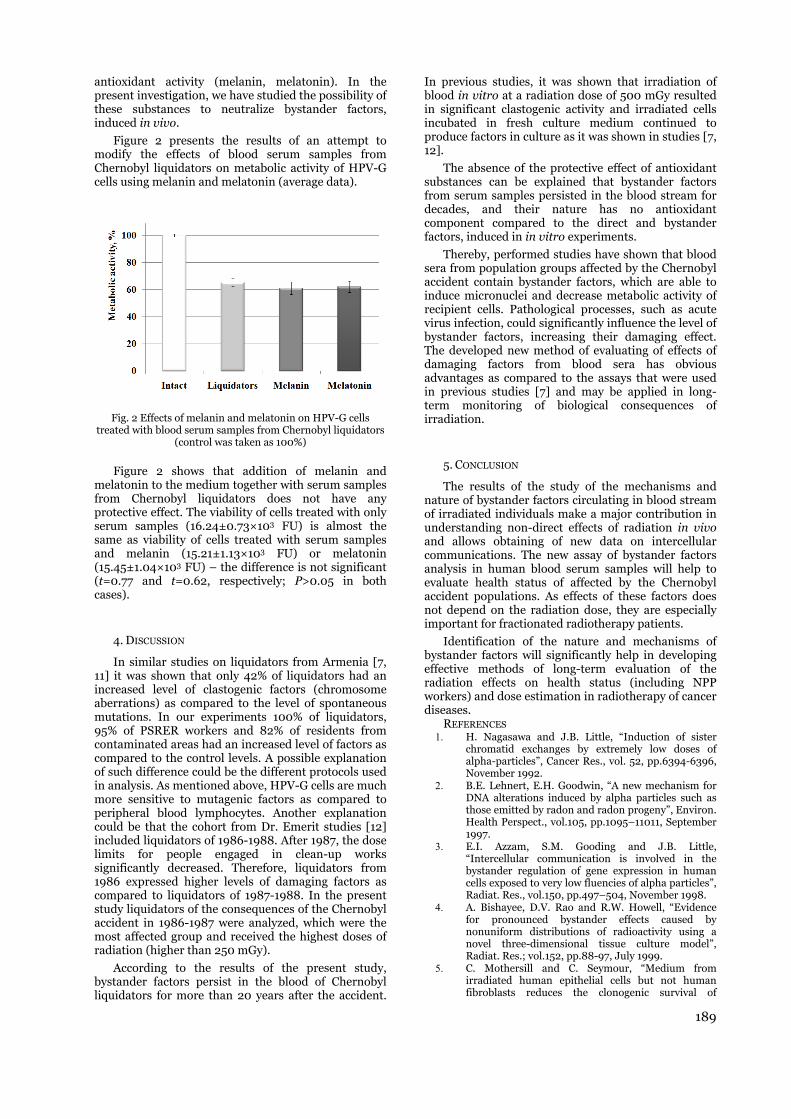
189
antioxidant activity (melanin, melatonin). In the present investigation, we have studied the possibility of these substances to neutralize bystander factors, induced in vivo.
Figure 2 presents the results of an attempt to modify the effects of blood serum samples from Chernobyl liquidators on metabolic activity of HPV-G cells using melanin and melatonin (average data).
Fig. 2 Effects of melanin and melatonin on HPV-G cells
treated with blood serum samples from Chernobyl liquidators (control was taken as 100%)
Figure 2 shows that addition of melanin and melatonin to the medium together with serum samples from Chernobyl liquidators does not have any protective effect. The viability of cells treated with only serum samples (16.24±0.73×10³ FU) is almost the same as viability of cells treated with serum samples and melanin (15.21±1.13×10³ FU) or melatonin (15.45±1.04×10³ FU) – the difference is not significant (t=0.77 and t=0.62, respectively; P>0.05 in both cases).
4. DISCUSSION
In similar studies on liquidators from Armenia [7, 11] it was shown that only 42% of liquidators had an increased level of clastogenic factors (chromosome aberrations) as compared to the level of spontaneous mutations. In our experiments 100% of liquidators, 95% of PSRER workers and 82% of residents from contaminated areas had an increased level of factors as compared to the control levels. A possible explanation of such difference could be the different protocols used in analysis. As mentioned above, HPV-G cells are much more sensitive to mutagenic factors as compared to peripheral blood lymphocytes. Another explanation could be that the cohort from Dr. Emerit studies [12] included liquidators of 1986-1988. After 1987, the dose limits for people engaged in clean-up works significantly decreased. Therefore, liquidators from 1986 expressed higher levels of damaging factors as compared to liquidators of 1987-1988. In the present study liquidators of the consequences of the Chernobyl accident in 1986-1987 were analyzed, which were the most affected group and received the highest doses of radiation (higher than 250 mGy).
According to the results of the present study, bystander factors persist in the blood of Chernobyl liquidators for more than 20 years after the accident.
In previous studies, it was shown that irradiation of blood in vitro at a radiation dose of 500 mGy resulted in significant clastogenic activity and irradiated cells incubated in fresh culture medium continued to produce factors in culture as it was shown in studies [7, 12].
The absence of the protective effect of antioxidant substances can be explained that bystander factors from serum samples persisted in the blood stream for decades, and their nature has no antioxidant component compared to the direct and bystander factors, induced in in vitro experiments.
Thereby, performed studies have shown that blood sera from population groups affected by the Chernobyl accident contain bystander factors, which are able to induce micronuclei and decrease metabolic activity of recipient cells. Pathological processes, such as acute virus infection, could significantly influence the level of bystander factors, increasing their damaging effect. The developed new method of evaluating of effects of damaging factors from blood sera has obvious advantages as compared to the assays that were used in previous studies [7] and may be applied in long-term monitoring of biological consequences of irradiation.
5. CONCLUSION
The results of the study of the mechanisms and nature of bystander factors circulating in blood stream of irradiated individuals make a major contribution in understanding non-direct effects of radiation in vivo and allows obtaining of new data on intercellular communications. The new assay of bystander factors analysis in human blood serum samples will help to evaluate health status of affected by the Chernobyl accident populations. As effects of these factors does not depend on the radiation dose, they are especially important for fractionated radiotherapy patients.
Identification of the nature and mechanisms of bystander factors will significantly help in developing effective methods of long-term evaluation of the radiation effects on health status (including NPP workers) and dose estimation in radiotherapy of cancer diseases.
REFERENCES 1. H. Nagasawa and J.B. Little, “Induction of sister
chromatid exchanges by extremely low doses of alpha-particles”, Cancer Res., vol. 52, pp.6394-6396, November 1992.
2. B.E. Lehnert, E.H. Goodwin, “A new mechanism for DNA alterations induced by alpha particles such as those emitted by radon and radon progeny”, Environ. Health Perspect., vol.105, pp.1095–11011, September 1997.
3. E.I. Azzam, S.M. Gooding and J.B. Little, “Intercellular communication is involved in the bystander regulation of gene expression in human cells exposed to very low fluencies of alpha particles”, Radiat. Res., vol.150, pp.497–504, November 1998.
4. A. Bishayee, D.V. Rao and R.W. Howell, “Evidence for pronounced bystander effects caused by nonuniform distributions of radioactivity using a novel three-dimensional tissue culture model”, Radiat. Res.; vol.152, pp.88-97, July 1999.
5. C. Mothersill and C. Seymour, “Medium from irradiated human epithelial cells but not human fibroblasts reduces the clonogenic survival of

190
unirradiated cells”, Int. J. Radiat. Biol., vol.71, pp.421-427, April 1997.
6. K.M. Prise, O.V. Belyakov, M. Folkard and B.D. Micheal, “Studies on bystander effects in human fibroblasts using a charged particle microbeam”, Int. J. Radiat. Biol., vol.74, pp.793-798, December 1998.
7. I. Emerit, L. Cernjavski, R. Arutyunyan, N. Oganesian, H. Pogosian, H. Mejlumian, T. Sarkisian, M. Gulkandanian, M. Quastel, J. Goldsmith, E. Riklis, R. Kordysh, S. Poliak and L. Merklin, “Transferable clastogenic activity in plasma from persons exposed as salvage personnel of the Chernobyl reactor”, J. Cancer Res. Clin. Oncol., vol.120, pp.558-561, September 1994.
8. K. Baverstock and O.V. Belyakov, “Some important questions connected with non-targeted effects”, Mutat. Res., vol.687, pp.84–88, May 2010.
9. I. Emerit, “Superoxide production by clastogenic factors”, in Free Radicals, Lipoproteins and Membrane Lipids, A. Crastes de Paulet, L. Douste-
Blazy and R. Paoletti, Eds. New York: Plenum Press, 1990, pp.99-104.
10. I. Mosse, P. Marozik, C. Seymour and C. Mothersill, “The effect of melanin on the bystander effect in human keratinocytes”, Mutat. Res., vol.597, pp.133-137, May 2006.
11. I. Emerit, N. Oganesian, T. Sarkisian, R. Arutyunyan, A. Pogosian, K. Asrian, A. Levy and L. Cernjavski, “Clastogenic factors in the plasma of Chernobyl accident recovery workers. Anticlastogenic effect of Ginkgo biloba extract”, Radiat. Res., vol.144, pp.198-205, November 1995.
12. I. Emerit, N. Oganesian, R. Arutyunyan, A. Pogossian, T. Sarkisian, L. Cernjavski, A. Levy and J. Feingold, “Oxidative stress-related clastogenic factors in plasma from Chernobyl liquidators: protective effects of antioxidant plant phenols, vitamins and ligoelements”, Mutat. Res., vol.377, pp.239-246, July 1997.
ST
Fu
Abstdangbasechanexporeviswas occuassois to and infordosebasemachrecoinvoannu
Key
1. INT
Romasources inSchool offirst demvarious rreinforcedoccupatioshowed thdose limframeworactivities and reguradiation reviewed standardsprogrammoccupatiocategory Special rorder to installatioannual wfor occupsince thehave beenRecommeintended effective retained results ofto demoestablishewas perf
TUDY OF O
ulger Ciupa
1Ministry of H
tract Revisiongers of ionizinged on the reconges of radiologosure situationssed Directive, c set to 20 mS
upational exposociated with the review the occu on site before rmation on doses and to discused on the doseshines, includingrded doses are
olved in the pracual exposure re
y words: occupa
TRODUCTION ania has a lonn industrial rf Bridges and
monstration ofradiographs ad concrete in
onal exposurehat doses were
mit [2]. Frork was issue carried out inulations were protection p to ensure ts and best prme requires onal exposureA workers, a
requirements limit the prons outside of
wholebody dospationally expe provisions on implementeendations hig for the use a
dose limits [4,5]. The aimf optimisation
onstrate the ed by the regformed based
OCCUPATIO
agea1, Gabri
Health, Public 2Ministry o
of the basic stg radiation elab
mmendations gical protection s which occur acaused by the ICSv/year, with tsure in planne source and usinupational expos the entry into fses for compariss about the cats recorded in sig accelerators a below the minictice received wceived as a resu
ational exposur
ng experience radiography. Id Roads in Buf X-ray prodand the first the world [1].e was publie within 50% m 1961 the
ed and reguln the country.e issued in 1policies have bthat they re
ractice. The rathe individu
s, the health and the workp
are enforced actice with mf the authoriz
se limit in Romposed workerof the Directived in 2000 [3ghlight that thas a protection
given in Pum of this studn in radiologic
compliance gulatory framd on the o
ONAL EXPO
iela Rosca F
Health Directof Health, Insti
3SC MB Tele
tandards for thborated by IAEA
of the ICRP P policy, but helpand therefore iCRP recommenthe flexibility ted exposure sing procedures ssure doses reco force of the revson and to givetegorization of ix Romanian coand gamma insimum detectabl
whole body doseult of routine op
re, industrial ra
in using radiIn March 189ucharest maduction perfor
t radiograph . The first studshed in 196of the occupat
e necessary lated the nu Since the firs
1971, the natbeen several tflect internatadiation proteual monitorinsurveillance oplaces monito by regulatio
mobile radioloed enclosuresmania was 50rs and is 20 ve 96/29 Eur3]. The latest he effective don quantity anublication 60dy is to assescal protectionwith dose l
mework. The ccupational d
OSURE IN IN
Fartat1, Ale
torate-Radiatiitute of Publicecom Ltd, Buc
he health proteA and by the CoPublication 103p to clarify the aimprove protecndations, consisto consider theituations is cosimilar to presc
orded in industrvised standarde an indication the industrial rcompanies fromstallations ( Ir-le level and 28%es ranging fromperations over t
adiography pra
iation 96 the de the rming
of a dy on
64. It tional
legal uclear st law tional times tional ection ng of of the oring. ns in ogical s. The 0 mSv mSv ratom ICRP
ose is nd the 0 are ss the n, and limits study doses
rroindmincaineinthainfao
ecmde4λspIsdrnr
DUSTRIAL
exandra Cu
ion Hygiene Lc Health, Buchcharest, Roma
ection of workeommunity unde.The revised r
application of tction standardssts in changing e 5-year averaontrolled undercriptive dose limrial radiographds. One of the m of whether theradiography wo
m 1978 to July 192 and Co-60;
% of operators rm 0.1 to 8.9 mSvthe period is bel
actice, categoriz
recorded in sirecording, repof compliance nternational
developed themore than 6nspection fo
components aassemblies. Ran dedicated a
engineering constalled. Onlyhe oversized
approval issunspections w
facilities, in woother workers
2. MATERIAL
The asseseffective dosecompanies fromonthly indivdosimetry laboexposed who 420kV) and gλ=3.7TBq), wesubject of thiprocedures fivr-192 source
source from thdoses receiverecorded. Whenot possible toradiography a
RADIOGRA
ucu2, Anton
aboratory, Buharest, Romannia
ers and the gener Article 2 (b) oecommendation
the protection sys. One of the m the dose limits
age. According r constraint op
mits for "practicy practice unde
main scopes of techniques werorkers. The ass2013 for 144 p; λ=5,5TBq). Apreceived less thav/year. It can bow the annual l
ation of worker
x Romanian corting and re with nationalstandards [6
e industrial r0 years. App
or industrialas well as foadiographic in
and shielded fontrols, safetyy in well justi components
ued by the were performeorkshop, durinwere presentsL AND METHODS
sment was pes recorded om 1978 to vidual externaoratory for 14have operate
gamma installre retrospectivs study, duri
ve events like in containerhe windout caed by the een doses recoro distinguish
and to observ
APHY PRAC
n Iuliu Coro
ucharest, Romnia
neral public agof the Euratom ns contain no ystem for all th
main amendmens. Whole body d to the new a
optimization prce". The aim of tertaken at fixed this paper is toere optimized insessment was ppersons operatipproximately 5
han 1mSv/year.be noted that th limit of 20 mSv
rs
companies foetrospective dl regulatory do6]. The comradiography pplications incl boilers suor chemical inspection wafacilities in wy and warningified situation and based regulatory a
med outside tng the night ss.
DS performed bin the abovJuly 2013. Tal doses rep44 workers oed X-ray malations (Ir-192vely analysed.ing routine g failure to fulr or disconneable were repemergency wrded were pro between fixeve a relations
CTICE
oianu3
ania
gainst the Treaty is essential
he various nts to the dose limit approach, rocedures this study
d facilities o provide
n terms of performed
ng X-ray 4% of the The staff
he highest v.
r purposes ofdemonstrationose limits and
mpanies havepractice sincecluded weldsupply steamindustry sub-
as undertakenwhich effective
g systems arens, for testingon the prior
authority, thethe shieldiedshift, when no
ased on theve mentionedThe availableorted by the
occupationallyachines (max.2 and Co-60;. In the periodgammagraphylly retract theection of theorted and the
workers wereocessed it wasd and mobileship with the
f n d e e s
m -n e e g r e d o
e d e e y . ;
d y e e e e s e e

192
workload of presented indosimetry caaccredited Devaluated anfor workers, doses due texcluded, a received as a in order to giare optimizepersonal datexposure momonthly valudosimetry labworker. The quality of theInaccuracies including lacgeometry andduring the fibadge films, d
3.RESULT
The distrexposure sou
21 % of rmale. Figurestart date
Fig. 1 Theexposure sourc
Fig. 2 Age at t The periods subject of stuof those six cThe results odoses are beland a percerecorded dosThe occupatradiography from 0.1 to Fig. 4.
laboratories. n this study aarried out usDosimetry S
nd compared which are sto the misusnumber of 5 result of routive an indicatied in terms ta of the woronitoring periue of the ext
aboratory for evalidity of thee data provide may result alck of precisiod parameter vilm badge expdose recordin
TS ribution of t
urce type is shoradiographers e 2 shows the
of work a
e distribution ce type
the start date of
of dosimetriudy for the occcompanies is reof the study shlow of the minent of 28% ses are less thaionally expospractice receiv 8.9mSv/year
All the occuare based on sing dosimeteervices. The with the annet by regulat
se of the film535 annual inine operationson of whetherof doses. We
rkers, type ofod within theternal dose reeach occupatie study’s resuled by the dosilso for other on of the movalues, positioposure, inappg errors.
the number own in Figure were female e distribution
as occupation
of the numbe
work as occupa
c monitoringcupationally exepresented in
how that 54% nimum detecti
of the indivan 1mSv/year.sed workers ived whole bodr, as it can b
upational dosethe badge film
ers supplied b results werual dose limi
tions. After thm badge werndividual doses were analyzer the techniqueere noted: thf exposure, the company, theported by thionally exposelts relies on thimetry serviceseveral reason
odels, exposurn of the worke
propriate use
of workers b 1. and 79 % wer
n by age at thnally expose
r of workers b
ationally expose
that were thxposed worke Figure 3. of the recordeion level (MDLvidual annual. nvolved in thdy dose ranginbe observed i
es m by re its he re es ed es he he he he ed he es. ns re er of
by
re he
ed.
by
ed
he ers
ed L) lly
he ng in
Fig. 3 Alsothe e3% othe vof ocexpothe mmSvannu
Fi
occpre
num
3 Dosimetric mo
, the doses recemergency opof the annualvalue of 6 mSccupationally eosure received mentioned pe. It could be ually individua
ig. 4 The range
The distributicupationally eesented in Figmber of occupa
in th
Fig. 5 The r
onitoring period
ceived by the eerations are inly individual v which charaexposed work as a result of
eriod is below observed thatal dose decrea
of the annually
ion of the whoexposed worke.5. The figure ationaly exposhe range of 1 a
recorded doses (
d/number of rad
exposed workin the same ra doses are greacterizes the c
kers. The highe routine opera
w the annual lit in the last d
ased.
individual dose
olebody doses ers per dose in reveals a relatsed workers w
and 2mSv.
(%) by dose ran
diographers
kers during ange. Only eater than category B est annual
ations over imit of 20
decade the
es values
of the nterval is tive high
with doses
nge
193
4. CONCLUSIONS In Romania, industrial radiographers are
considered to be exposed workers as they are liable to exceed 1mSv per year during their work. Undertakings are required to classify as a Category A worker an exposed worker who is liable to receive an effective dose greater than 6mSv in a period of 12 months.
All other exposed workers are categorised as category B. Currently all industrial radiographers operating in Romania are classified by their employer as Category A workers. In site radiography, the working conditions are such that some routine exposure is expected. Radiographers receive most of their exposure in the execution of the step by step procedure of industrial radiography in particular during the operation of the devices containing sealed sources when they get close to the gamma-emitting radioactive source in its shielded or unshielded position. It is not yet defined a system to quantify the contribution of the radiographers workload to the doses they receive. When registering doses, it should be established a system to distinguish between the exposures received during the performance of fixed or mobile radiography practice, outside enclosure. The distribution of doses in the interval from 0.1 to 8.9mSv/year placed below of the annual dose limit shows that, over the years, the companies have implemented good work practice. This retrospective dose assessment demonstrates the compliance with the national dose limits established according to the European and international standards [7, 8].
The results of the study demonstrate optimisation in radiological protection of the practice and the premises to controll occupational exposure in planned exposure situations under constraint optimization procedures associated with the source according to the latest recommendations and regulation.
Acknowledgement: The authors would like to thank
to Ghioca Costin – qualified radiation protection expert for his contribution in revising this paper and for the support offered to participate in the RAD 2015 Conference.
References 1. P. Manea, “Romanian contribution to the development
of the radiology world”, in Journal of Economics and Health Administration, vol. 57-58, Cluj-Napoca: Mediamira, pp 46, 2011.
2. Forje Al., Scripcaru T., Protection against radiation organization principles for performing work with nuclear radiation sources in electrical power plants commissioning sites, National Council of engineers and technicians People's Republic of Romania, The Energetic 13, pp.286-293, 1965.
3. European Commission. Council Directive 96/29 of 13 May 1996 laying down Basic Safety Standards for the Protection of the Health of Workers and the General Public Against the Dangers Arising from Ionizing Radiation. Official Journal of the European Communities L159, vol. 39 (29 June 1996) EURATOM.
4. ICRP, 1991. 1990 Recommendations of the International Commission on Radiological Protection. ICRP Publication 60 (Users Edition).
5. ICRP, 2007. The 2007 Recommendations of the International Commission on Radiological Protection. ICRP Publication 103. Ann. ICRP 37 (2-4).
6. F.Ciupagea, Ph.D. thesis, Occupationally exposed health status working in industrial defectoscopy units, 1991.
7. International Atomic Energy Agency. Radiation Protection and Safety of Radiation Sources: International Basic Safety Standards, IAEA Safety Standards Series GSR Part 3, (2013).
8. European Commission. Council Directive 2013/59/ Euratom of 5 December 2013 laying down basic safety standards for protection against the dangers arising from exposure to ionising radiation, Official Journal of the European Communities L 13, 17.1.2014.


Ol
1 School
Fluoroscobjectivebased onbeen usemountedray tube typical wfrom fewdependindoses weradiogradose to thwhen per
Key
1. INTR
The uprocedureunit are odeliveringpatients. exposure,of the aroccur, iincludingmost radoccupatioconcern finterventidevelopm
Durinray sourcseveral hprotectionsubstantilonger anmost likestaff invoaddition, detected healthcarradiologyseen in ipotential fluoroscothis appoccupatioroutinely reactions
ASSESSM
livera Ciraj
l of Electrical 2V
opy procedure of the studyn measuremeed. Four geomd lead rubber
with verticaworkload, as w to 60 µSv png on the geoere estimatedapher. The prehe eyes from rsonal dosime
y words: fluoro
RODUCTION
use of x-rays es has increasof particular cg relatively
Among oth, occupationalrea in which n particular f
g eye lens [1-4diosensitive onal exposurefor many mediional medical
ment of lens op
ng these procece and within ahours per dayn tools and mial [5]. The prind stand closeely to receive olved in intethere have b
in the lens ofre workers usiy and cardiolointerventional
for such efopy outside im
ears to be onal exposure
resulting in [5].
MENT OF OWHEN I
-Bjelac1, Da
Engineering aVinca Institute
res may lead is to assess w
ents that allometrical confr curtains in l x-ray beamwell as the p
per procedurometrical confd to be in the esented resulthe workload
eters have no
oscopy, radia
for diagnosticsed in recent concern becauhigh exposu
her categoriel exposure in increased exp
for certain org4]. As the eyetissues in t to radiation ical professionl staff since i
pacities [5-7].
dures, if staff a high scatter y, and do nomethods, the imary operatoer to the patiethe highest e
erventional pbeen recent ref the eye amoing fluoroscopogy [7,9,10]. Il radiology anffects exists f
maging departmthe only cir
es to ionizing n clinically
OCCUPATIOINDIVIDUAL
anijela AraStankov
and Vinca Instof Nuclear Sc
to increased whole body row for estimafigurations wplace, underc. The doses w
pattern of usee for radiolo
nfiguration anrange 0.03 –
lts allowed fod of the staff
ot been regula
ation dose, ey
c or interventyears. Fluoros
use of potentiures to staffs of professfluoroscopy inposure is likegans as extreme lens is one othe human bhas become a
ns, in particulait may lead t
remain near tradiation field
ot use radiolorisk may be
rs who usuallyent’s right sidxposure amon
procedures [8eports of opang some grou
py in interventIf these effectnd cardiologyfor other usements. Apparercumstance w
radiation maobservable t
ONAL DOSE L MONITOR
andjic1, Previc1, Djordje
titute of Nucleciences, Unive
radiation exp
radiation dosates of occup
were considercouch x-ray t
were estimateed of protectiogist, and frond level of pe– 2.8 mSv pe
or realistic esmembers an
arly used.
ye lens dose, s
tional scopy ial for f and sional n one ely to mities of the body, a real ar for
to the
the x-ds for ogical
ecome y stay
de are ng all
8]. In acities ups of tional ts are y, the es of ently, where ay be tissue
pbpderoncfliruCwminp
(pgIuraeapthwab[
r
IN FLUORORING IS NOT
edrag Bozove Lazarevic
ear Sciences, Ursity of Belgra
posure of radses and doses pational dosered: overcouctube with hored using distrive tools. Estiom few to 20ersonal proteer procedure fstimations of nd from the le
scatter radiat
In most cliperformed usibody dose apositioned undosimetry). Aestablished recommended organizations, not well knowcorrectness ifluoroscopy strregular use o
used, it positContrary to whwell establishemany drawbacn fluoroscopy
personal dose
Many profeor not using
protection toglasses) or/ann the cases w
used regularlyretrospectivelyapproach baseexperimental mat the fluoroscposition of thehe accuracy,
without the prand the obtainby the attenua11].
The objectiradiation dose
OSCOPY PRT UTILIZED
vic1, Sandrac2
University of Bade, Belgrade,
diologists andto the eye in
es when persch x-ray tuberizontal x-rayribution of thimated effecti
µSv per proection. Corres
for radiologithe occupatio
evel of use of r
ion, x-rays
inical situationing a single dassessment order and abovAlthough doin interven
by npractical util
wn mainly in in use of aff. In additiof personal dostion on the hole body dosied. Numerouscks in monitory including threcords [11,13
essionals are sregularly) anyols (e.g., ce
nd without pewhere personal
y, the approy the dose toed on the avmeasurementscopy room, ree particular sthese measurotection of the
ned scatter doation factor of
ive of this stues and doses
ROCEDURESD
ra Ceklic2, J
Belgrade, BelgSerbia
d other staff mn fluoroscopysonal dosimete with and w
y beam and uhe scattered rive dose was
ocedure for rsponding unpist and 0.02-onal whole boradiation pro
ns individual dosimeter aimor using twove the lead a
ouble dosimentional procnumerous lization of thi
n terms of avtwo dosime
on, many stusimeters [11,12
body remainimetry, eye dos studies havring occupatiohe lack of co3].
still working wy existing simeiling suspenersonal doseml dosimeters hoaches taken o staff membavailability of s made at cerepresentative staff membersrements are
he ceiling suspose values canf the protecti
udy is to assesto the eye in
S
Jelena
rade, Serbia
members. They procedures,ters have notwithout tableundercouch x-radiation and
in the rangeadiographer,protected eye0.78 mSv forody dose andotection tools
monitoring ismed for wholeo dosemetersapron (doubleetry is wellcedures and
professionals approach is
vailability andeters among
udies reported2], and even ifns uncertain.
osimetry is notve highlightedonal exposureomprehensive
without usingmple radiationnded screen,
meters [11,13].have not been
to estimateers often use
values fromrtain positions
of the typicals. To improveusually madeended screen,
n be correctedon tools used
ss whole bodyn fluoroscopy
e , t e -
d e , e r d s
s e s e l
d l s d g d f . t d e e
g n , .
n e e
m s l e e ,
d d
y y
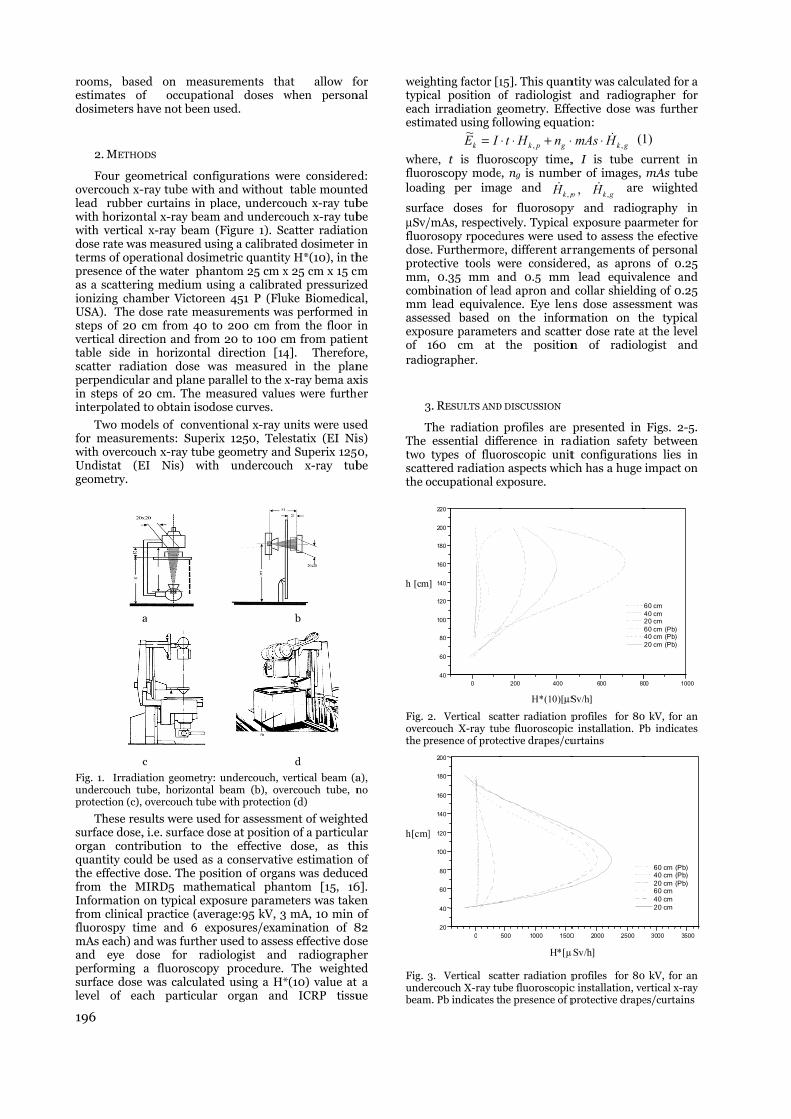
196
rooms, baseestimates ofdosimeters h
2. METHO
Four geoovercouch x-lead rubber with horizonwith verticaldose rate wasterms of operpresence of tas a scatterinionizing chamUSA). The dsteps of 20 cvertical directable side inscatter radiaperpendiculain steps of 2interpolated
Two modfor measuremwith overcouUndistat (Egeometry.
a
c
Fig. 1. Irradiaundercouch tuprotection (c),
These ressurface dose,organ contrquantity coulthe effective from the MInformation from clinical fluorospy timmAs each) anand eye dperforming surface dose level of eac
ed on measuf occupatio
have not been u
ODS
ometrical conf-ray tube with
curtains in ptal x-ray beam x-ray beam s measured usrational dosimthe water phang medium usmber Victoreedose rate meacm from 40 tction and fromn horizontal ation dose war and plane p20 cm. The mto obtain isod
dels of convenments: Super
uch x-ray tubeEI Nis) with
a
c
ation geometry:ube, horizontal overcouch tube
sults were use, i.e. surface doribution to tld be used as dose. The pos
MIRD5 matheon typical exp practice (aveme and 6 exnd was furtherose for rada fluoroscopywas calculate
ch particular
urements thaonal doses wused.
figurations weh and without place, undercom and underco(Figure 1). Sc
sing a calibratemetric quantityantom 25 cm xsing a calibraten 451 P (Flusurements wato 200 cm from 20 to 100 c
direction [14was measuredparallel to the xmeasured valuedose curves.
ntional x-ray urix 1250, Tele geometry andh undercouc
: undercouch, vbeam (b), ove
e with protection
d for assessmose at positionthe effective
a conservativsition of organematical phanposure parameerage:95 kV, 3xposures/examr used to assesdiologist andy procedure. ed using a H*r organ and
at allow fowhen person
ere considered table mounte
ouch x-ray tubouch x-ray tubcatter radiatioed dosimeter iy H*(10), in thx 25 cm x 15 cmted pressurize
uke Biomedicaas performed iom the floor im from patien4]. Thereford in the planx-ray bema axes were furthe
units were useestatix (EI Nid Superix 1250
ch x-ray tub
b
d
vertical beam (aercouch tube, nn (d)
ent of weighten of a particula
dose, as thve estimation ns was deducentom [15, 16eters was take mA, 10 min o
mination of 8ss effective dos
d radiographeThe weighte
*(10) value at d ICRP tissu
for nal
d: ed be be on in he m ed al, in in nt re, ne xis er
ed is) 0, be
a), no
ed ar
his of ed 6]. en of
82 se er ed
a ue
weigtypiceachestim
wherfluorloadi
surfaμSv/fluordoseprotemm,combmm assesexpoof 1radio
3
TThe two scattthe o
h [cm
Fig. 2overcthe p
h[cm]
Fig. 3undebeam
ghting factor [1cal position o
h irradiation gmated using fo
k IE~ =re, t is fluorroscopy modeing per ima
ace doses fo/mAs, respectirosopy rpocede. Furthermoreective tools w, 0.35 mm abination of lealead equivale
ssed based oosure paramet160 cm at ographer.
3. RESULTS AND
The radiation essential difftypes of fluo
tered radiationoccupational e
40
60
80
100
120
140
160
180
200
220
0
]
2. Vertical scacouch X-ray tubresence of prote
20
40
60
80
100
120
140
160
180
200
0
]
3. Vertical scarcouch X-ray tu
m. Pb indicates th
15]. This quanof radiologist geometry. Effeollowing equat
gpk nHt , ⋅+⋅⋅roscopy time,e, ng is numbege and
pkH ,
or fluorosopyively. Typical
dures were usee, different arrwere considerand 0.5 mm ad apron and ence. Eye lenson the informters and scatte
the position
D DISCUSSION
profiles are pference in ra
oroscopic unitn aspects whicexposure.
200 400 H*(10)[μS
atter radiation pbe fluoroscopicective drapes/cu
500 1000 1500
H*[µ
atter radiation pube fluoroscopiche presence of p
ntity was calcut and radiogrective dose wtion:
gkHmAs ,⋅⋅ (1
, I is tube cer of images,
gkp H ,, are
y and radiogexposure paa
ed to assess thrrangements ored, as apron
lead equivalcollar shieldis dose assessmation on ther dose rate an of radiolo
presented in adiation safetyt configuratioch has a huge
600 80
Sv/h]
profiles for 80c installation. Purtains
0 2000 2500 µSv/h]
profiles for 80c installation, veprotective drape
ulated for a rapher for
was further
1) current in mAs tube
wiighted
graphy in rmeter for he efective of personal ns of 0.25 lence and ng of 0.25
sment was he typical
at the level ogist and
Figs. 2-5. y between
ons lies in impact on
00 1000
60 cm40 cm20 cm60 cm (Pb)40 cm (Pb)20 cm (Pb)
0 kV, for an Pb indicates
3000 3500
60 cm (Pb) 40 cm (Pb) 20 cm (Pb) 60 cm 40 cm 20 cm
0 kV, for an ertical x-ray es/curtains
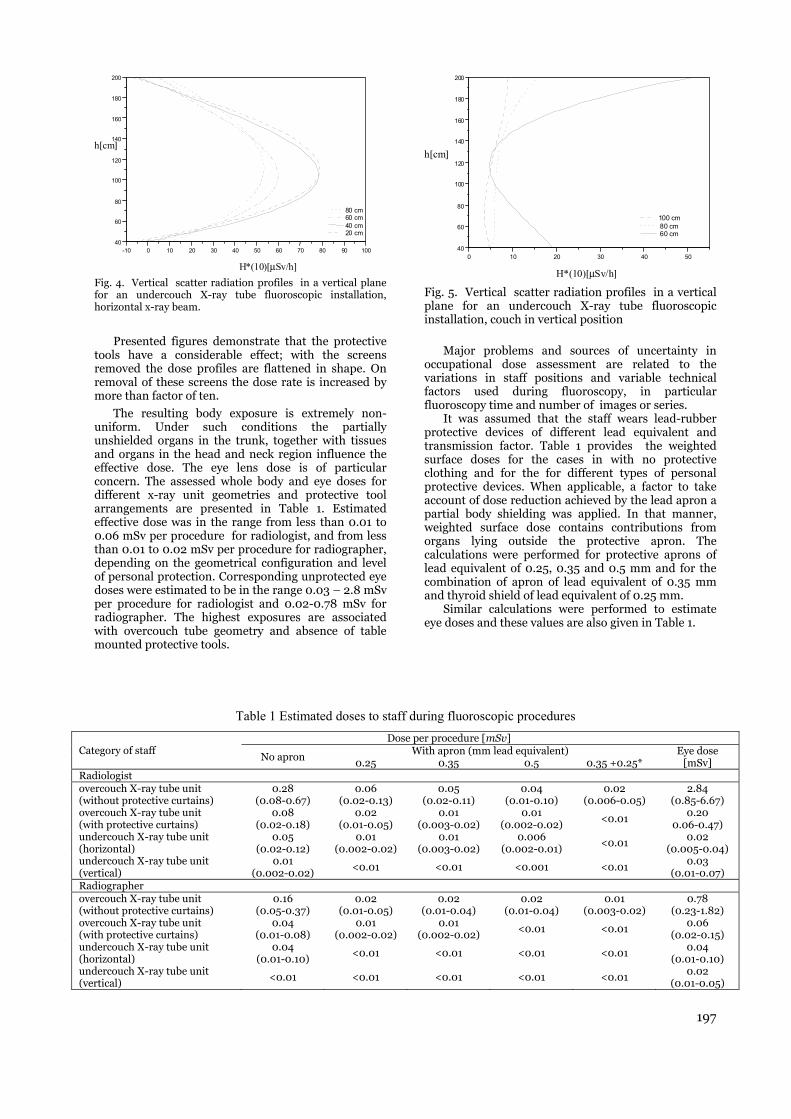
197
40
60
80
100
120
140
160
180
200
-10 0 10 20 30 40 50 60 70 80 90 100
80 cm 60 cm 40 cm 20 cm
H*(10)[μSv/h]
h[cm]
Fig. 4. Vertical scatter radiation profiles in a vertical plane for an undercouch X-ray tube fluoroscopic installation, horizontal x-ray beam.
Presented figures demonstrate that the protective tools have a considerable effect; with the screens removed the dose profiles are flattened in shape. On removal of these screens the dose rate is increased by more than factor of ten.
The resulting body exposure is extremely non-uniform. Under such conditions the partially unshielded organs in the trunk, together with tissues and organs in the head and neck region influence the effective dose. The eye lens dose is of particular concern. The assessed whole body and eye doses for different x-ray unit geometries and protective tool arrangements are presented in Table 1. Estimated effective dose was in the range from less than 0.01 to 0.06 mSv per procedure for radiologist, and from less than 0.01 to 0.02 mSv per procedure for radiographer, depending on the geometrical configuration and level of personal protection. Corresponding unprotected eye doses were estimated to be in the range 0.03 – 2.8 mSv per procedure for radiologist and 0.02-0.78 mSv for radiographer. The highest exposures are associated with overcouch tube geometry and absence of table mounted protective tools.
40
60
80
100
120
140
160
180
200
0 10 20 30 40 50
100 cm 80 cm 60 cm
H*(10)[μSv/h]
h[cm]
Fig. 5. Vertical scatter radiation profiles in a vertical plane for an undercouch X-ray tube fluoroscopic installation, couch in vertical position
Major problems and sources of uncertainty in
occupational dose assessment are related to the variations in staff positions and variable technical factors used during fluoroscopy, in particular fluoroscopy time and number of images or series.
It was assumed that the staff wears lead-rubber protective devices of different lead equivalent and transmission factor. Table 1 provides the weighted surface doses for the cases in with no protective clothing and for the for different types of personal protective devices. When applicable, a factor to take account of dose reduction achieved by the lead apron a partial body shielding was applied. In that manner, weighted surface dose contains contributions from organs lying outside the protective apron. The calculations were performed for protective aprons of lead equivalent of 0.25, 0.35 and 0.5 mm and for the combination of apron of lead equivalent of 0.35 mm and thyroid shield of lead equivalent of 0.25 mm.
Similar calculations were performed to estimate eye doses and these values are also given in Table 1.
Table 1 Estimated doses to staff during fluoroscopic procedures Category of staff
Dose per procedure [mSv]
No apron With apron (mm lead equivalent) Eye dose
[mSv] 0.25 0.35 0.5 0.35 +0.25* Radiologist overcouch X-ray tube unit (without protective curtains)
0.28 (0.08-0.67)
0.06(0.02-0.13)
0.05(0.02-0.11)
0.04(0.01-0.10)
0.02 (0.006-0.05)
2.84(0.85-6.67)
overcouch X-ray tube unit (with protective curtains)
0.08 (0.02-0.18)
0.02(0.01-0.05)
0.01(0.003-0.02)
0.01(0.002-0.02)
<0.01 0.20
0.06-0.47) undercouch X-ray tube unit (horizontal)
0.05 (0.02-0.12)
0.01(0.002-0.02)
0.01(0.003-0.02)
0.006(0.002-0.01)
<0.01 0.02
(0.005-0.04) undercouch X-ray tube unit (vertical)
0.01 (0.002-0.02)
<0.01 <0.01 <0.001 <0.01 0.03
(0.01-0.07) Radiographer overcouch X-ray tube unit (without protective curtains)
0.16 (0.05-0.37)
0.02(0.01-0.05)
0.02(0.01-0.04)
0.02(0.01-0.04)
0.01 (0.003-0.02)
0.78(0.23-1.82)
overcouch X-ray tube unit (with protective curtains)
0.04 (0.01-0.08)
0.01(0.002-0.02)
0.01(0.002-0.02)
<0.01 <0.01 0.06(0.02-0.15)
undercouch X-ray tube unit (horizontal)
0.04 (0.01-0.10)
<0.01 <0.01 <0.01 <0.01 0.04(0.01-0.10)
undercouch X-ray tube unit (vertical)
<0.01 <0.01 <0.01 <0.01 <0.01 0.02(0.01-0.05)

2
The data in the Table 1 emphasize the importance of wearing a lead apron. It is worth mentioning that increasing lead thickness above 0.35 mm dose not deliver much dose reduction, but substantially increase the apron weight. Additional thyroid shielding results in more completed shielding of the body, so the combination of apron of lead equivalent of 0.35 mm and thyroid shielding thickness of 0.25 mm Pb would be very efficient in reduction the effective dose.
Assuming a radiologist performs five procedures daily, five-day week, 48 week-year, a maximum of about 1200 examinations could be performed annually. In practice, in most cases annual workload is only a fraction of this number.
3. CONCLUSIONS
Scattered radiation rates in the vicinity of fluoroscopy equipment can be quite high, depending on type of fluoroscopic procedure and equipment configuration, as well as on the use of protective tools. In overcouch-tube fluoroscopy with the radiologist at the couch side, a significant dose to the eye may result from modest number of procedures. Under these circumstances, protective actions need to be taken.
In undercouch-tube fluoroscopy, the estimated dose is well within dose limits. Dose to eyes is, however, limiting factor. Consequently, wearing eye protective glasses should be mandatory.
In addition, it is important to consider personal monitoring arrangements for each type of procedure and equipment type, as the use of individual monitoring is the best way to track occupational exposure of an individual.
Presented methodology could be used as an option when individual monitoring is not available or regular. Using presented data, extrapolation to different diagnostics techniques can be applied, in respect to differences in workload, fluoroscopy time, exposure factors, field sizes and use of protective tools.
The presented results allowed for realistic estimations of the occupational whole body dose and dose to the eyes from the workload of the staff members and from the level of use of radiation protection tools when personal dosimeters have not been regularly used.
Acknowledgement: This work was supported by the Ministry of Education and Science of the Republic of Serbia (grant agreement 43009 and 171007).
REFERENCES
1. International Commission on Radiological Protection. Avoidance of radiation injuries from medical interventional procedures. ICRP Publication 85; Annals of the ICRP 30; 2000.
2. Faulkner, K., Moores, B. An Assessment of the Radiation Dose Received by Staff using Fluoroscopic Equipment. Br. J. Radiol. 55(1982)272-276.
3. Vano E, Kleiman NJ, Duran A, et al. Radiation-associated lens opacities in catheterization personnel: results of a survey and direct assessments. J Vasc Interv Radiol. 2013 Feb;24(2):197-204.
4. Vano E, Kleiman NJ, Duran A, et al. Radiation cataract risk in interventional cardiology personnel. Radiat Res. 2010 Oct;174(4):490-5.
5. Rehani MM, Ciraj-Bjelac O, Vano E, eta l.. ICRP Publication 117. Radiological protection in fluoroscopically guided procedures performed outside the imaging department. Ann ICRP. 2010 Dec;40(6):1-102
6. International Commission on Radiological Protection. Statement on tissue reactions. Approved by the Commission on April 21, 2011. Available at www.icrp.org/docs/ICRP Statement on Tissue Reactions.pdf.
7. Ciraj-Bjelac, O, Rehani M, Minamoto A , et al. Radiation-induced eye lens changes and risk for cataract in interventional cardiology. Cardiology. 2012;123(3):168-71.
8. Kong I Y, Struelens L, Vanhavere F, et al. Influence of standing positions and beam projections on effective dose and eye lens dose of anaesthetists in interventional procedures. Radiat Prot Dosimetry (2015) 163 (2): 181-187.
9. Vano, E, Gonzalez L, Fernandez JM, et al. Eye Lens Exposure to Radiation in Interventional Suites: Caution Is Warranted .Radiology: Volume 248: Number 3—September 2008, 945-53
10. Vano E, Gonzalez L, Guibelalde E et alRadiation exposure to medical staff in interventional and cardiac radiology Br J Radiol. 1998 Sep;71(849):954-60.
11. Vano E, Fernandez JM, Sanchez R, eta l. Realistic approach to estimate lens doses and cataract radiation risk in cardiology when personal dosimeters have not been regularly used. Health Phys. 105(4):330Y339; 2013
12. Martin, C J, A Review of Radiology Staff Doses and Dose Monitoring Requirements "Radiation Protection Dosimetry (2009), Vol. 136, No. 3, pp. 140–157
13. Ciraj-Bjelac O, Rehani M.M.Eye Dosimetry in Interventional Radiology and Cardiology: Current Challenges and Practical Considerations. Radiat Prot Dosimetry. 2013 Nov 20.
14. IEC. Medical electrical equipment. Part 1: General requirements for safety. 3. Collateral standard: General requirements for radiation protection in diagnostic X-ray equipment. IEC 601-1-3 (1994).
15. International Commission on Radiological Protection. The 2007 recommendations of the International Commission on Radiological Protection. ICRP publication 103; Ann ICRP 37, 2007.
16. Handbook of Anatomical Models for Radiation Dosimetry (Series in Medical Physics and Biomedical Engineering) ed. Xie George Xu and Keith F. Eckerman, Taylor and Francis, 2010.
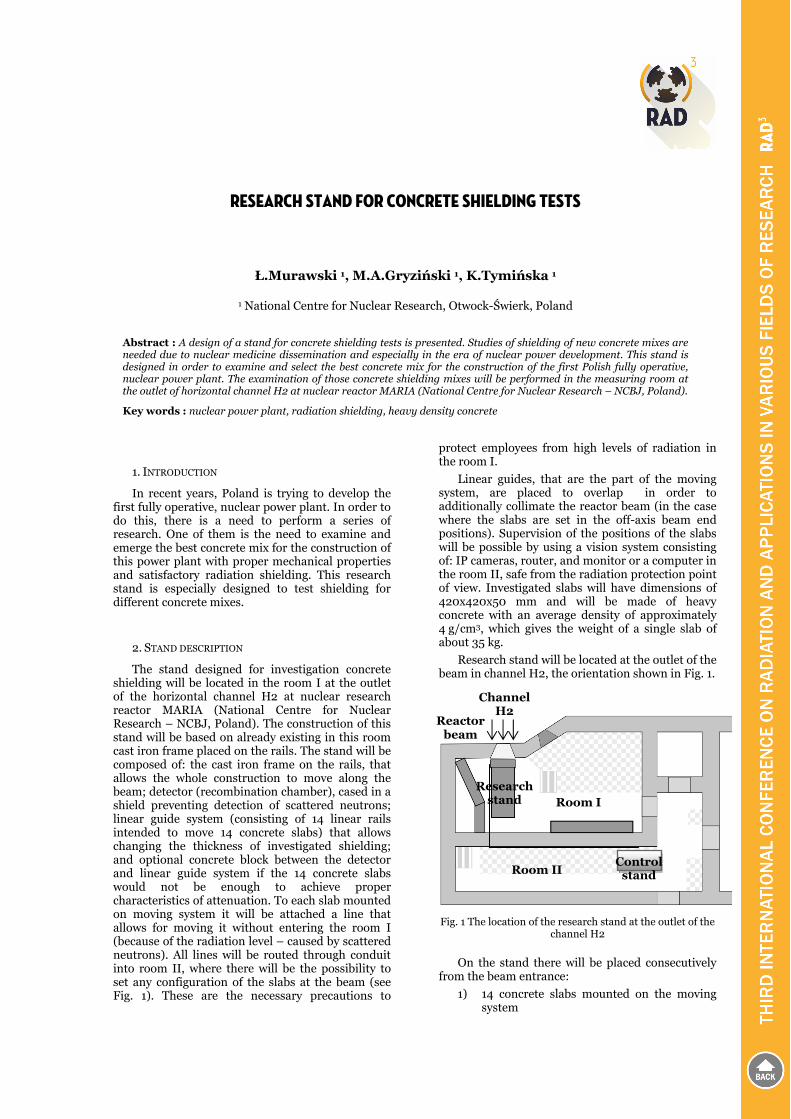
RESEARCH STAND FOR CONCRETE SHIELDING TESTS
Ł.Murawski 1, M.A.Gryziński 1, K.Tymińska 1
1 National Centre for Nuclear Research, Otwock-Świerk, Poland
Abstract : A design of a stand for concrete shielding tests is presented. Studies of shielding of new concrete mixes are needed due to nuclear medicine dissemination and especially in the era of nuclear power development. This stand is designed in order to examine and select the best concrete mix for the construction of the first Polish fully operative, nuclear power plant. The examination of those concrete shielding mixes will be performed in the measuring room at the outlet of horizontal channel H2 at nuclear reactor MARIA (National Centre for Nuclear Research – NCBJ, Poland).
Key words : nuclear power plant, radiation shielding, heavy density concrete
1. INTRODUCTION
In recent years, Poland is trying to develop the first fully operative, nuclear power plant. In order to do this, there is a need to perform a series of research. One of them is the need to examine and emerge the best concrete mix for the construction of this power plant with proper mechanical properties and satisfactory radiation shielding. This research stand is especially designed to test shielding for different concrete mixes.
2. STAND DESCRIPTION
The stand designed for investigation concrete shielding will be located in the room I at the outlet of the horizontal channel H2 at nuclear research reactor MARIA (National Centre for Nuclear Research – NCBJ, Poland). The construction of this stand will be based on already existing in this room cast iron frame placed on the rails. The stand will be composed of: the cast iron frame on the rails, that allows the whole construction to move along the beam; detector (recombination chamber), cased in a shield preventing detection of scattered neutrons; linear guide system (consisting of 14 linear rails intended to move 14 concrete slabs) that allows changing the thickness of investigated shielding; and optional concrete block between the detector and linear guide system if the 14 concrete slabs would not be enough to achieve proper characteristics of attenuation. To each slab mounted on moving system it will be attached a line that allows for moving it without entering the room I (because of the radiation level – caused by scattered neutrons). All lines will be routed through conduit into room II, where there will be the possibility to set any configuration of the slabs at the beam (see Fig. 1). These are the necessary precautions to
protect employees from high levels of radiation in the room I.
Linear guides, that are the part of the moving system, are placed to overlap in order to additionally collimate the reactor beam (in the case where the slabs are set in the off-axis beam end positions). Supervision of the positions of the slabs will be possible by using a vision system consisting of: IP cameras, router, and monitor or a computer in the room II, safe from the radiation protection point of view. Investigated slabs will have dimensions of 420x420x50 mm and will be made of heavy concrete with an average density of approximately 4 g/cm3, which gives the weight of a single slab of about 35 kg.
Research stand will be located at the outlet of the beam in channel H2, the orientation shown in Fig. 1.
Fig. 1 The location of the research stand at the outlet of the
channel H2
On the stand there will be placed consecutively from the beam entrance:
1) 14 concrete slabs mounted on the moving system
Research stand
Channel H2
Room I
Room II Control
stand
Reactor beam

200
2) Stationary concrete block (consisting of ten, or if necessary more slabs) This block will be placed only after the measurement for concrete slabs mounted on moving system in the technological break of the reactor work.
3) Detector placed immediately behind the last slab cased in the PE (in order to minimize influence of the scattered neutrons) Adding a further concrete block will require to move the frame along the rails, so the position of detector relative to the reactor will remain unchanged.
Fig. 2 Top view of the research stand with mounted linear
guides, concrete block and shielded recombination chamber
Fig. 3 Side view of the stand (assumed space between the
slabs – 4 mm)
Any modifications to the existing iron cast frame will be made on the spot and during the reactor
technological breaks. The whole construction was specially designed to hold equipment with 14 single slabs, concrete block with weight of from 350 - 700 kg, and detector shielded with PE, which gives a total carrying capacity of about 1.5 tones.
3. THE MEASUREMENT PROCEDURE
Measurement will be carried out with at least two ionization chambers: the first – measuring the dose rate, placed behind concrete slabs additionally encased by concrete, and the second – monitoring reactor power. It is planned to use recombination chambers as a detectors of gamma radiation (gamma attenuation) GW2 and neutron radiation (neutron attenuation) REM2-8. Distinguishing neutron and gamma component is also planned for obtaining in the radiation field radiation quality factor [3] what is crucial in the radiation protection point of view . For low level radiation the chambers containing boron [1] and high-pressure recombination chamber REM2-7 will be used [2].
The measuring procedure begins with the execution of measure only with front cover of the detector and with the concrete slabs placed in the end positions of the linear guide system, thereby collimating reactor beam. Next, successively slabs will be placed increasing the thickness of the concrete shielding. These slabs will be moved by a system of lines running through culverts to room II, where one can safely operate the setting of the slabs. Any change of the configuration will be controlled through the vision system.
After examining all the concrete slabs mounted on linear guide system it is necessary to wait for the technological break of the reactor, and then move the entire cast iron structure in such a way, that after the inclusion of a concrete block (understood as a set of fixed slabs) placed between moving system and cased detector, the distance between reactor and the detector remain unchanged. Then the measuring procedure is repeated.
During the technological break there will be also a possibility to change the whole concrete set to another sample of concrete type (different mixture) .
Detectors will be in advance calibrated in the Laboratory (Secondary standard) and the slabs will be also examined in the laboratory radiation fields (certificated isotopic sources).
4. SAFETY CONSIDERATIONS
Because of high level of dose rate in the room I during reactor operation, there is no possibility to enter that room in that time (radiation levels shown in Fig. 4 ).
Channel H2
Concrete slabs
Linear guides
Concrete block
Recombination chamber
shielded with PE
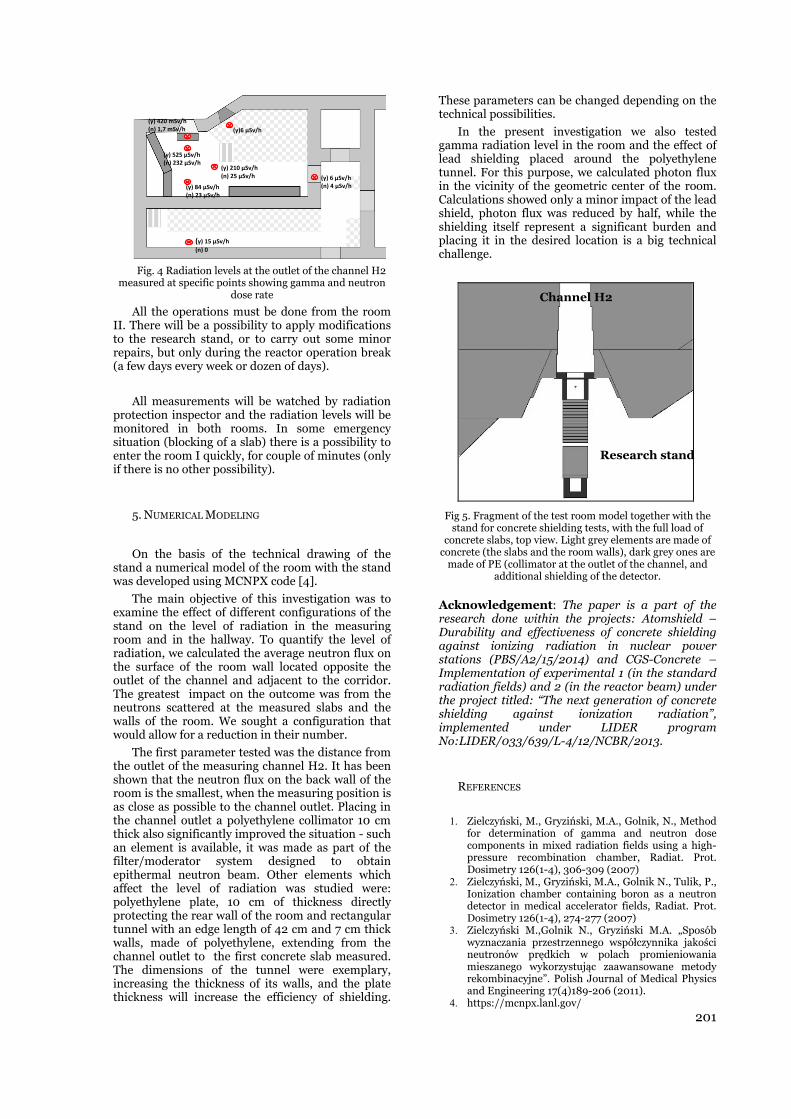
201
Fig. 4 Radiation levels at the outlet of the channel H2
measured at specific points showing gamma and neutron dose rate
All the operations must be done from the room II. There will be a possibility to apply modifications to the research stand, or to carry out some minor repairs, but only during the reactor operation break (a few days every week or dozen of days).
All measurements will be watched by radiation protection inspector and the radiation levels will be monitored in both rooms. In some emergency situation (blocking of a slab) there is a possibility to enter the room I quickly, for couple of minutes (only if there is no other possibility).
5. NUMERICAL MODELING
On the basis of the technical drawing of the stand a numerical model of the room with the stand was developed using MCNPX code [4].
The main objective of this investigation was to examine the effect of different configurations of the stand on the level of radiation in the measuring room and in the hallway. To quantify the level of radiation, we calculated the average neutron flux on the surface of the room wall located opposite the outlet of the channel and adjacent to the corridor. The greatest impact on the outcome was from the neutrons scattered at the measured slabs and the walls of the room. We sought a configuration that would allow for a reduction in their number.
The first parameter tested was the distance from the outlet of the measuring channel H2. It has been shown that the neutron flux on the back wall of the room is the smallest, when the measuring position is as close as possible to the channel outlet. Placing in the channel outlet a polyethylene collimator 10 cm thick also significantly improved the situation - such an element is available, it was made as part of the filter/moderator system designed to obtain epithermal neutron beam. Other elements which affect the level of radiation was studied were: polyethylene plate, 10 cm of thickness directly protecting the rear wall of the room and rectangular tunnel with an edge length of 42 cm and 7 cm thick walls, made of polyethylene, extending from the channel outlet to the first concrete slab measured. The dimensions of the tunnel were exemplary, increasing the thickness of its walls, and the plate thickness will increase the efficiency of shielding.
These parameters can be changed depending on the technical possibilities.
In the present investigation we also tested gamma radiation level in the room and the effect of lead shielding placed around the polyethylene tunnel. For this purpose, we calculated photon flux in the vicinity of the geometric center of the room. Calculations showed only a minor impact of the lead shield, photon flux was reduced by half, while the shielding itself represent a significant burden and placing it in the desired location is a big technical challenge.
Fig 5. Fragment of the test room model together with the stand for concrete shielding tests, with the full load of
concrete slabs, top view. Light grey elements are made of concrete (the slabs and the room walls), dark grey ones are
made of PE (collimator at the outlet of the channel, and additional shielding of the detector.
Acknowledgement: The paper is a part of the research done within the projects: Atomshield – Durability and effectiveness of concrete shielding against ionizing radiation in nuclear power stations (PBS/A2/15/2014) and CGS-Concrete – Implementation of experimental 1 (in the standard radiation fields) and 2 (in the reactor beam) under the project titled: “The next generation of concrete shielding against ionization radiation”, implemented under LIDER program No:LIDER/033/639/L-4/12/NCBR/2013.
REFERENCES
1. Zielczyński, M., Gryziński, M.A., Golnik, N., Method for determination of gamma and neutron dose components in mixed radiation fields using a high-pressure recombination chamber, Radiat. Prot. Dosimetry 126(1-4), 306-309 (2007)
2. Zielczyński, M., Gryziński, M.A., Golnik N., Tulik, P., Ionization chamber containing boron as a neutron detector in medical accelerator fields, Radiat. Prot. Dosimetry 126(1-4), 274-277 (2007)
3. Zielczyński M.,Golnik N., Gryziński M.A. „Sposób wyznaczania przestrzennego współczynnika jakości neutronów prędkich w polach promieniowania mieszanego wykorzystując zaawansowane metody rekombinacyjne”. Polish Journal of Medical Physics and Engineering 17(4)189-206 (2011).
4. https://mcnpx.lanl.gov/
(γ) 15 µSv/h (n) 0
(γ) 84 µSv/h (n) 23 µSv/h
(γ) 6 µSv/h (n) 4 µSv/h
(γ) 210 µSv/h (n) 25 µSv/h
(γ)6 µSv/h
(γ) 420 mSv/h (n) 1,7 mSv/h
(γ) 525 µSv/h (n) 232 µSv/h
Channel H2
Research stand

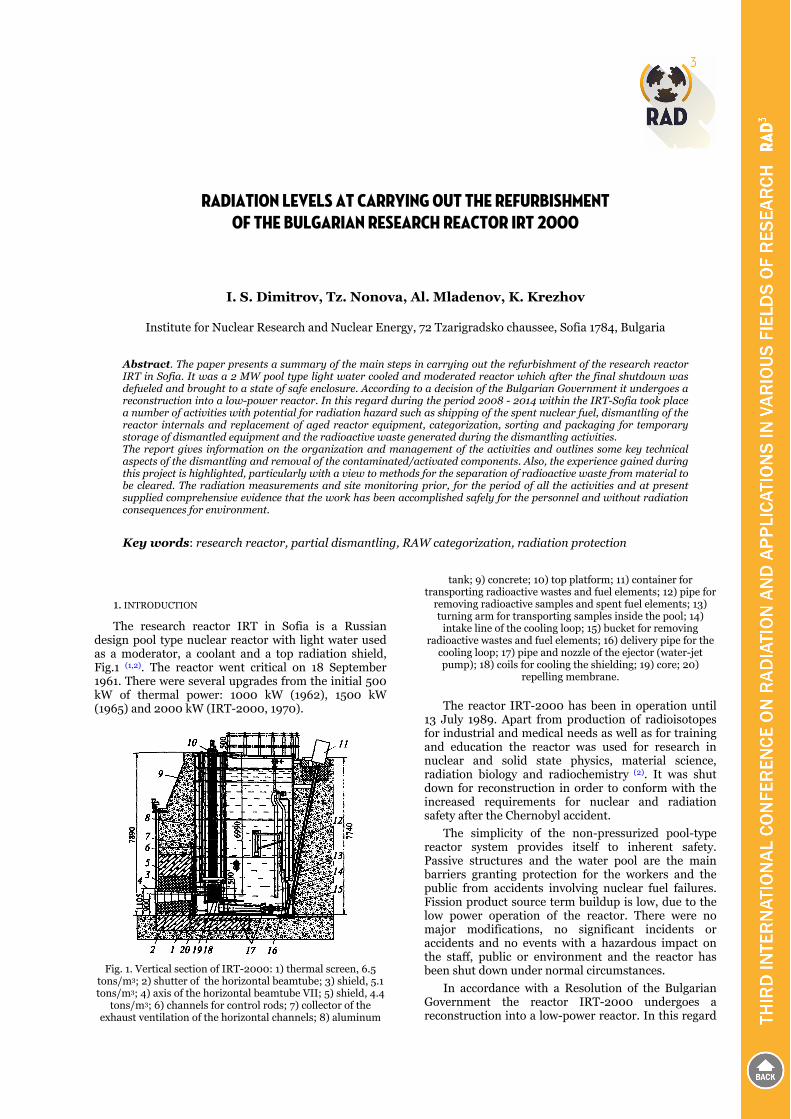
RADIATION LEVELS AT CARRYING OUT THE REFURBISHMENT OF THE BULGARIAN RESEARCH REACTOR IRT 2000
I. S. Dimitrov, Tz. Nonova, Al. Mladenov, K. Krezhov
Institute for Nuclear Research and Nuclear Energy, 72 Tzarigradsko chaussee, Sofia 1784, Bulgaria
Abstract. The paper presents a summary of the main steps in carrying out the refurbishment of the research reactor IRT in Sofia. It was a 2 MW pool type light water cooled and moderated reactor which after the final shutdown was defueled and brought to a state of safe enclosure. According to a decision of the Bulgarian Government it undergoes a reconstruction into a low-power reactor. In this regard during the period 2008 - 2014 within the IRT-Sofia took place a number of activities with potential for radiation hazard such as shipping of the spent nuclear fuel, dismantling of the reactor internals and replacement of aged reactor equipment, categorization, sorting and packaging for temporary storage of dismantled equipment and the radioactive waste generated during the dismantling activities. The report gives information on the organization and management of the activities and outlines some key technical aspects of the dismantling and removal of the contaminated/activated components. Also, the experience gained during this project is highlighted, particularly with a view to methods for the separation of radioactive waste from material to be cleared. The radiation measurements and site monitoring prior, for the period of all the activities and at present supplied comprehensive evidence that the work has been accomplished safely for the personnel and without radiation consequences for environment.
Key words: research reactor, partial dismantling, RAW categorization, radiation protection
1. INTRODUCTION
The research reactor IRT in Sofia is a Russian design pool type nuclear reactor with light water used as a moderator, a coolant and a top radiation shield, Fig.1 (1,2). The reactor went critical on 18 September 1961. There were several upgrades from the initial 500 kW of thermal power: 1000 kW (1962), 1500 kW (1965) and 2000 kW (IRT-2000, 1970).
Fig. 1. Vertical section of IRT-2000: 1) thermal screen, 6.5
tons/m3; 2) shutter of the horizontal beamtube; 3) shield, 5.1 tons/m3; 4) axis of the horizontal beamtube VII; 5) shield, 4.4
tons/m3; 6) channels for control rods; 7) collector of the exhaust ventilation of the horizontal channels; 8) aluminum
tank; 9) concrete; 10) top platform; 11) container for transporting radioactive wastes and fuel elements; 12) pipe for
removing radioactive samples and spent fuel elements; 13) turning arm for transporting samples inside the pool; 14)
intake line of the cooling loop; 15) bucket for removing radioactive wastes and fuel elements; 16) delivery pipe for the
cooling loop; 17) pipe and nozzle of the ejector (water-jet pump); 18) coils for cooling the shielding; 19) core; 20)
repelling membrane.
The reactor IRT-2000 has been in operation until 13 July 1989. Apart from production of radioisotopes for industrial and medical needs as well as for training and education the reactor was used for research in nuclear and solid state physics, material science, radiation biology and radiochemistry (2). It was shut down for reconstruction in order to conform with the increased requirements for nuclear and radiation safety after the Chernobyl accident.
The simplicity of the non-pressurized pool-type reactor system provides itself to inherent safety. Passive structures and the water pool are the main barriers granting protection for the workers and the public from accidents involving nuclear fuel failures. Fission product source term buildup is low, due to the low power operation of the reactor. There were no major modifications, no significant incidents or accidents and no events with a hazardous impact on the staff, public or environment and the reactor has been shut down under normal circumstances.
In accordance with a Resolution of the Bulgarian Government the reactor IRT-2000 undergoes a reconstruction into a low-power reactor. In this regard
204
during the period 2008 - 2014 within the reactor took place a number of actions with potential for radiation hazard such as shipping of the spent nuclear fuel, dismantling of the reactor internals and replacement of aged reactor equipment, categorization, sorting and packaging for temporary storage of dismantled equipment and of the radioactive waste (RAW) generated during the dismantling activities.
Radiation safety in all planed actions is secured in the General Program (GP) developed to comprise a detailed set of technical and organizational resources and activities in accord with the ALARA principle. Using a comprehensive approach, the experts of the Nuclear Scientific Experimental and Educational Centre (NSEEC) at the Institute for Nuclear Research and Nuclear Energy (INRNE) evaluated technical and organizational radiation protection measures for all the personnel employed in areas exposed to radiation. The GP and the Detailed Plan for Partial Dismantling (DPPD) of the reactor were approved by the Bulgarian Nuclear Regulator.
The article reports on the organization and management of the activities carried out so far and outline some key technical aspects of the dismantling and removal of contaminated/activated components.
2. REFURBISHMENT ACTIVITIES
The partial dismantling of acknowledged as obsolete systems was an important stage in the reconstruction of the reactor. Guiding principles in implementing the DPPD were protection of human health and environment, protection outside the national borders as well as control over the amount and radioactivity of the generated RAW. The shipment of spent nuclear fuel (SNF) was carried out prior to any forthcoming activities, because the SNF storage, reactor pool, reactor internals and supporting equipment are issues of refurbishment.
During facility modifications regular radiation and contamination surveys of modification areas and equipment before and after every activity were performed. The radiation monitoring comprised the personal dosimetry control, control over the radiation situation in the premises, control of the air and the filters of the operating permanent and additional (local) ventilation systems, control of radioactive waste water and sewage, control over the collection, sorting, categorization, storage and transportation of solid and liquid RAW. Radiological characterization of the reactor facilities was made before the start of partial dismantling operations, during the activities and at the end. Assessment of the radiological situation was carried out through the methods of direct measuring, taking samples and smears from the materials of the facilities (3) that were subject to dismantling and through computational methods. The results served as an early basis for determination of the type of the technique used for dismantling, instruments and devices (remote, semi-remote or manual methods), the necessity of decontamination and the choice of appropriate methods, measures for radiation protection of employees and preservation of the environment, the RAW classification, the requirements for treatment, transportation and storage of the waste during the dismantling, the price of the dismantling,
dose exposure, risk assessment and the kind of the necessary protective means for the employees at carrying out dismantling activities.
The monitoring of nuclear site environment and surrounding laboratories was performed at a grid of pre-selected observation posts. The evaluation was based on taken samples and determination of radionuclide contents in air (aerosols), water (groundwater and rainfall), soils and in selected plants – bioindicators (4,5). Particular detector systems were placed at selected locations of reactor workplace environment. The radiation monitoring system was in continuous operation. The exceeding of warning or emergency level was indicated by acoustic and optical signals. Real time information about gamma dose level can be displayed on the INRNE website.
2.1. Spent nuclear fuel loading and transportation
SNF shipment planning began in October 2004 and the actual shipment was completed in July 2008, requiring about 45 months of activities. All 16 HEU (initial enrichment: 36% U-235) spent nuclear fuel assemblies (SNFAs) of the S-36 type and 58 LEU (initial enrichment: 10% U-235) SNFAs of the EK-10 type were shipped to Russian Federation with assistance from the Russian Research Reactor Fuel Return Program (RRRFR), one of several programs of the U.S. Department of Energy National/Nuclear Security Administration’s (DOE/NNSA) Global Threat Reduction Initiative (GTRI).
A special Radiation Monitoring Procedure was developed to ensure safe execution of the preparation and transportation of the SNFAs, as well as for meeting the requirements for permitted levels of radioactive contamination on the surface of the transport casks. The procedure covered the radiation survey of systems and equipment in the reactor hall and loading spots, both before and after the required modernization.
There were some important aspects in terms of radiation levels during the preparation of SNF for transportation. Firstly, the radiation protection of the personnel directly engaged in the activities required monitoring of radioactive surface contamination of the personal (particles.cm-².min-1), equivalent dose rate limits of whole body outer irradiation Hp (6) and reference to basic limits of radiation protection. Some of the major issues that deserved special attention concerning the radiation protection of the staff were:
• Facility modifications and equipment. After the choice of using VPVR/M casks was taken, several facility modifications were identified as necessary to allow their use in the reactor hall, including:
o Replacement of the reactor hall crane with a higher capacity 12.5-ton bridge crane;
o Fabrication of a support platform to hold the VPVR/M cask above the reactor pool;
o Installation of an underwater camera and lights to assist with basket loading;
o Modification of the ventilation air-ducts above the reactor pool to exhaust potentially contaminated air to an existing filtered ventilation system
• Spent fuel inspections. To assure compliance with Russian requirements and acceptance at Mayak

205
reprocessing facility, a spent fuel inspection has been performed. The records of SNF storage water control proved absence of any failed fuel elements.
• Cask loading. It was executed by the INRNE staff and IAEA and Euratom inspectors witnessed all cask loading and applied tamper indicating seals on each cask.
The second aspect was meeting the requirements in terms of allowable levels of radioactive contamination and equivalent dose rate of the casks, transportation packages outer surface and dismantled equipment from reactor hall during facility modifications.
The equivalent dose rate at any point of the Package and transport outer surface must not exceed the value 2 mSv.h-1, and at any point at a distance of 2 m from the transport outer surface - 0.1 mSv.h-1. Radioactive contamination of the Package and transport surfaces must not exceed the values given in Table 1 (according to SanPin-2.6.1.1281-03 and adaptation of norms OST-95 to NP 053-04, TS-R-1). The limits were used at averaging of any part of the surface at any section with the area of 300 cm2.
Table 1 Allowable levels of radioactive contamination of loaded transport and Packages (particles.min-1.cm-2)
Object Non-fixed contamination
Fixed contamination
β- α- β – α - Transport outer surface
10 1 100 10
Transport inner surface
100 10 Not regulated
Transport cask outer surface
100 10
The measurements of the radiation levels could be grouped with respect to the performed activities:
• Radiation levels during preparatory activities
Measurements in the reactor hall during old crane dismantling activities showed maximum equivalent gamma dose rate of 185 nSv.h-1.
Radiological characterization of dismantled old crane parts was performed and the measurements of collected smears by alpha-beta counting and In-situ measurements are presented in Table 2. The In-situ data were obtained using a handheld device MicroCont-II (Mirion Technologies (RADOS) GmbH) and refer to contamination that has not been moved from its original place of deposition.
The highest radiation levels were measured in the time of SNF inspections. The dose of gamma radiation from one fuel rod (EK-10 type) at a distance of 1 m in the air did not exceed 0.75 mSv.h-1, while the highest gamma dose rate from SFA at a distance 1 m., but under water was 3126 mSv.h-1.
• Radiation levels during cask loading;
All three casks Skoda VPVR/M were loaded, dried and checked for leak tightness over a period lasting eight days under the close supervision of IAEA,
EURATOM and Bulgarian Nuclear Regulatory Agency (NRA) inspectors. The drying and leak testing of the casks was performed by specialists from the Nuclear Research Institute (NRI) in Řež (Czech Republic). Radiation and contamination surveys were performed before, during and after loading of every cask. For the nine days of the job the accumulated dose by each individual was between 0.008 -0.012 mSv except one value of 0.015 mSv.
Table 2 Alpha-beta counting (smears) and in-situ β-activity measurements during facility modifications
Dismantled
crane parts
Total Aα,
Bq.cm-2
Total Aβ,
Bq.cm-2
β-particles, min-1.cm-2
(in-situ)
beam 1 2.2 E-4 9.3 E-4 10-12
hook 2.2 E-5 9.0 E-4 10-12
tracks 2.5 E-3 5.4 E-4 10
beam 2 6.2 E-5 1.1 E-3 10-12
2.2. Partial dismantling
The partial dismantling of reactor facilities followed strictly the DPPD prescriptions, in full accordance with the regulations (6-15).
The DPPD described in detail the sequence of procedures concerning dismantling of the obsolete IRT-2000 equipment found of no use for the low-power reactor and the subsequent activities for reduction of the radioactive waste volume, decontamination, sorting, packaging, temporary storage and transportation for delivery to the State Enterprise “Radioactive waste”.
The dismantling of the IRT-2000 facilities and equipment was executed in two stages. The first stage comprised the dismantling of the equipment inside the reactor pool (RP) and the block with shutters of the thermal column (TC). The second stage included dismantling of the piping and pumps in the primary cooling loop (PCL) room. After the SNF removal it was dismantled the spent fuel rack on the bottom of the SNF storage following safely conducted measurements and characterization of the rack materials.
Two main zones were formed at the time of carrying out the dismantling: a) zone without radioactive contamination – “clean” zone; b) zone in which there was radioactive contamination of the equipment, the work appliances, etc. or contamination was expected - “dirty” zone. These two zones were separated with clearly visible signs and appropriate resources. At each zone boundary there was a sanitary check point supplied with dosimetry equipment for whole body measurement of the surface radioactive contamination. The order of crossing from one zone to another was regulated according to a preliminary developed plan and marking scheme of the movement of the personnel
Five working zones were recognized and delineated in the Reactor hall: Zone 1 (dismantling of RP equipment); Zone 2 (dismantling of PCL equipment); Zone 3 (dismantling and other activities at the reactor site); Zone 4 (dismantling of the TC); Zone 5 (secondary processing and deactivation of the dismantled equipment site).

206
Real measurement of radiation was essential in evaluating the effectiveness of protection measures and in assessing the radiation dose likely to be received by individuals so that both "installed" (in a fixed position) and portable (hand-held or transportable) measuring instruments for radiation protection were used (16). Installed instruments were fixed in positions known as important in assessing the general radiation hazard in the site. Examples are the installed "area" radiation monitors, gamma interlock monitors, personnel exit monitors, and airborne particulate monitors.The individual dosimetry control of the personnel was conducted by two types of individual dosimeters: thermo-luminescent detector (TLD) and electronic direct-reading dosimeter DMC 2000S (Merlin Gerin Provence Instruments, France) with integrated semiconductor detector with energy response better than ± 20 % from 60 keV to 1.3 MeV for 137Cs and measurement range 1 µSv – 10 Sv. Electronic dosimeters were reported wirelessly using the software (DOSIMAS), and the results were logged into the database (17). All working personnel were provided with TLD and DMC dosimeters, which were reported every day. At the end of the reporting period each worker received written information about his dose load.
2.3. Radioactive waste management
Radionuclides generated during the operation of a nuclear reactor are the source contributing to production of radioactive waste (RAW). By origin, the radionuclides are essentially divided into two groups: products of neutron activation and fission products. Fission products are the complex mixture of radionuclides of various chemical elements, including noble gases, which have different physical and chemical properties and different behavior in the fuel and in radioactive environments in the nuclear reactor. Activation products are due to neutron irradiation of structural materials (including the corrosion products) and present the main contribution in the RAW formation Accumulation of fission products and activation in the primary coolant in the reactor vessel and internals can be conditionally called primary contamination. All other contaminations of equipment, tools, facilities, clothing etc. are formed as a result of migration and redistribution of radionuclides occurring by different mechanisms - dissolution and crystallization, evaporation and condensation, sorption, diffusion and chemical interactions. The speed of the process and the contamination degree of course depend on the physicochemical properties of the transport medium and the interfaces, as well as on the external conditions (particularly the temperature). These contaminants are termed secondary pollution. From these radionuclides with the largest contribution to the total activity are 60Co and 137Cs. The primary contaminants are voluminous because they are distributed throughout the volume of the medium. Secondary contamination can be conditionally divided as volume and surface.
RAW source analysis specified waste streams that are identifiers for objects of generation and temporary storage of radioactive waste. RAW is mainly generated in the reactor hall and the radiochemical laboratory I class (RCL). Table 3 gives some radionuclides expected in the material resulting from the dismantling activities. Waste streams are identified by an
identification code. The relationship between the identification code and characterization data is given in Table 4.
Table 3 Preliminary list of radionuclides
Radio
nuclides
T1/2
(years)
Emi
tters
Material
Neutron activation products
H-3 12.3 β concrete, stainless steel, graphite
C-14 5730 β concrete, stainless steel, carbon steel, graphite
Fe-55 2.7 Ec concrete, stainless steel, carbon steel, graphite
Co-60 5.3 γ, β concrete, stainless steel, carbon steel, graphite /all materials/
Ni-59 7.5 E+4 Ec concrete, stainless steel, carbon steel, graphite
Ni-63 100 β concrete, stainless steel, carbon steel, graphite
Eu-152 13. 4 Ec, β, γ concrete, graphite
Fission products
Cs-137 30 β, γ-
*Ec – electron capture
The identification code is a combination of letters and numbers and is formed as follows:
Table 4 Relationship between the identification code and characterization data
Symbol position
1 2 3 4 5
Symbol А Х В АВ ХХ
Where: Position 1 represents a letter of the Latin alphabet, which indicates the physical state of the radioactive waste: L – Liquid RAW, S – Solid RAW
Position 2 is a number, which indicates the object associated with the generation of radioactive waste at IRT-2000:
1 Reactor hall
2 Reactor vessel
3 Biological shield around the thermal column
4 Primary loop
5 RCL I class
6 SNF storage
Position 3 is a letter of the Latin alphabet, associated with the time of RAW generation:
С RAW generated during the IRT-2000 operation
D RAW generated during the partial dismantling
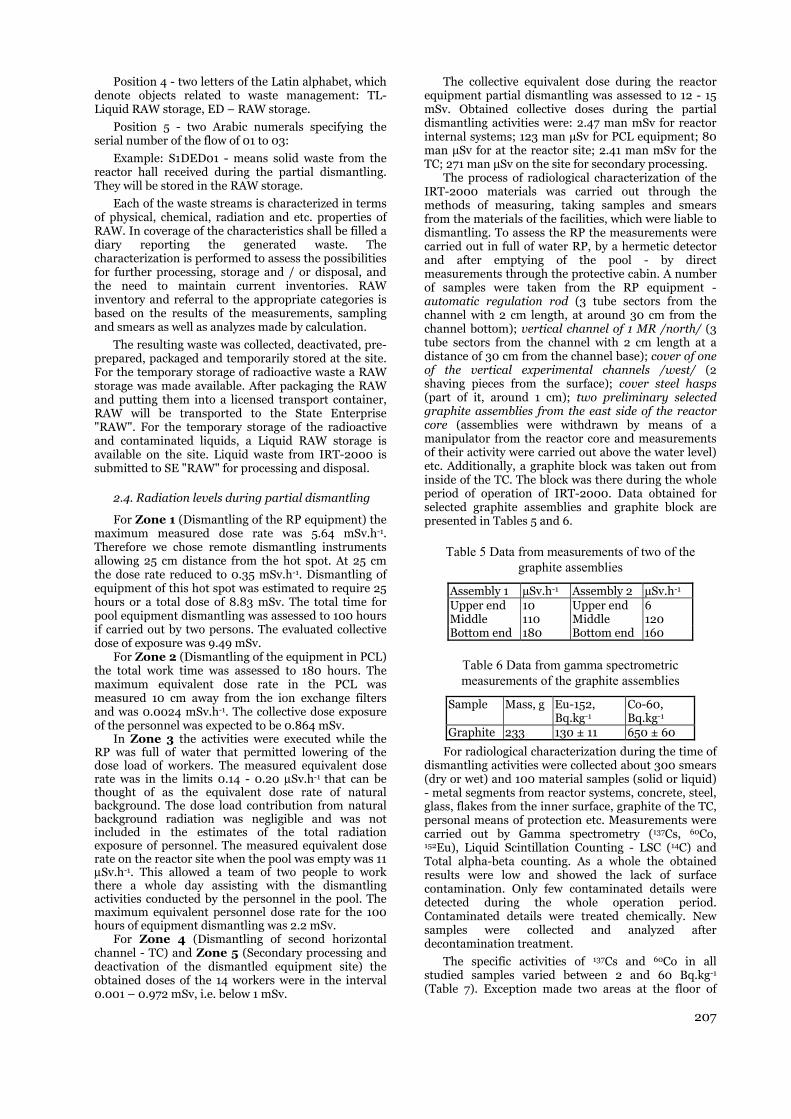
207
Position 4 - two letters of the Latin alphabet, which denote objects related to waste management: TL-Liquid RAW storage, ED – RAW storage.
Position 5 - two Arabic numerals specifying the serial number of the flow of 01 to 03:
Example: S1DED01 - means solid waste from the reactor hall received during the partial dismantling. They will be stored in the RAW storage.
Each of the waste streams is characterized in terms of physical, chemical, radiation and etc. properties of RAW. In coverage of the characteristics shall be filled a diary reporting the generated waste. The characterization is performed to assess the possibilities for further processing, storage and / or disposal, and the need to maintain current inventories. RAW inventory and referral to the appropriate categories is based on the results of the measurements, sampling and smears as well as analyzes made by calculation.
The resulting waste was collected, deactivated, pre-prepared, packaged and temporarily stored at the site. For the temporary storage of radioactive waste a RAW storage was made available. After packaging the RAW and putting them into a licensed transport container, RAW will be transported to the State Enterprise "RAW". For the temporary storage of the radioactive and contaminated liquids, a Liquid RAW storage is available on the site. Liquid waste from IRT-2000 is submitted to SE "RAW" for processing and disposal.
2.4. Radiation levels during partial dismantling
For Zone 1 (Dismantling of the RP equipment) the maximum measured dose rate was 5.64 mSv.h-1. Therefore we chose remote dismantling instruments allowing 25 cm distance from the hot spot. At 25 cm the dose rate reduced to 0.35 mSv.h-1. Dismantling of equipment of this hot spot was estimated to require 25 hours or a total dose of 8.83 mSv. The total time for pool equipment dismantling was assessed to 100 hours if carried out by two persons. The evaluated collective dose of exposure was 9.49 mSv.
For Zone 2 (Dismantling of the equipment in PCL) the total work time was assessed to 180 hours. The maximum equivalent dose rate in the PCL was measured 10 cm away from the ion exchange filters and was 0.0024 mSv.h-1. The collective dose exposure of the personnel was expected to be 0.864 mSv.
In Zone 3 the activities were executed while the RP was full of water that permitted lowering of the dose load of workers. The measured equivalent dose rate was in the limits 0.14 - 0.20 μSv.h-1 that can be thought of as the equivalent dose rate of natural background. The dose load contribution from natural background radiation was negligible and was not included in the estimates of the total radiation exposure of personnel. The measured equivalent dose rate on the reactor site when the pool was empty was 11 μSv.h-1. This allowed a team of two people to work there a whole day assisting with the dismantling activities conducted by the personnel in the pool. The maximum equivalent personnel dose rate for the 100 hours of equipment dismantling was 2.2 mSv.
For Zone 4 (Dismantling of second horizontal channel - TC) and Zone 5 (Secondary processing and deactivation of the dismantled equipment site) the obtained doses of the 14 workers were in the interval 0.001 – 0.972 mSv, i.e. below 1 mSv.
The collective equivalent dose during the reactor equipment partial dismantling was assessed to 12 - 15 mSv. Obtained collective doses during the partial dismantling activities were: 2.47 man mSv for reactor internal systems; 123 man μSv for PCL equipment; 80 man μSv for at the reactor site; 2.41 man mSv for the TC; 271 man μSv on the site for secondary processing.
The process of radiological characterization of the IRT-2000 materials was carried out through the methods of measuring, taking samples and smears from the materials of the facilities, which were liable to dismantling. To assess the RP the measurements were carried out in full of water RP, by a hermetic detector and after emptying of the pool - by direct measurements through the protective cabin. A number of samples were taken from the RP equipment - automatic regulation rod (3 tube sectors from the channel with 2 cm length, at around 30 cm from the channel bottom); vertical channel of 1 MR /north/ (3 tube sectors from the channel with 2 cm length at a distance of 30 cm from the channel base); cover of one of the vertical experimental channels /west/ (2 shaving pieces from the surface); cover steel hasps (part of it, around 1 cm); two preliminary selected graphite assemblies from the east side of the reactor core (assemblies were withdrawn by means of a manipulator from the reactor core and measurements of their activity were carried out above the water level) etc. Additionally, a graphite block was taken out from inside of the TC. The block was there during the whole period of operation of IRT-2000. Data obtained for selected graphite assemblies and graphite block are presented in Tables 5 and 6.
Table 5 Data from measurements of two of the graphite assemblies
Assembly 1 µSv.h-1 Assembly 2 µSv.h-1 Upper end 10 Upper end 6 Middle 110 Middle 120 Bottom end 180 Bottom end 160
Table 6 Data from gamma spectrometric measurements of the graphite assemblies
Sample Mass, g Eu-152, Bq.kg-1
Co-60, Bq.kg-1
Graphite 233 130 ± 11 650 ± 60
For radiological characterization during the time of dismantling activities were collected about 300 smears (dry or wet) and 100 material samples (solid or liquid) - metal segments from reactor systems, concrete, steel, glass, flakes from the inner surface, graphite of the TC, personal means of protection etc. Measurements were carried out by Gamma spectrometry (137Cs, 60Co, 152Eu), Liquid Scintillation Counting - LSC (14C) and Total alpha-beta counting. As a whole the obtained results were low and showed the lack of surface contamination. Only few contaminated details were detected during the whole operation period. Contaminated details were treated chemically. New samples were collected and analyzed after decontamination treatment.
The specific activities of 137Cs and 60Co in all studied samples varied between 2 and 60 Bq.kg-1 (Table 7). Exception made two areas at the floor of

208
premise 103 (PCL) where the mean measured values were 362 Bq.kg-1 for 137Cs and 2.62 kBq.kg-1 for 60Co. Contaminated materials were removed and treated as a radioactive waste.
Data obtained for the graphite material collected from the thermal column (obtained by chemical destruction with distillation technique and by burning procedure) show high specific activity of 14C – between 55200 and 60600 Bq.cm-2.
Table 7 Data for material samples during the partial dismantling activity
Sample Cs-137, Bq.kg-1
Co-60, Bq.kg-1
concrete 2.6 ± 0.2 8.6 ± 0,7 concrete 20.3 ± 1.8 59.5 ± 5.4 walls PCL room 19.0 ± 1.3 20.0 ± 1.6 floor PCL room 4.5 ± 0.4 24.0 ± 1.8
Final radiological survey of PCL, RP and reactor hall was carried out according to a final characterization plan. Sampling was done at different points on a sampling grid covering the entire investigated areas (walls, floors, ceilings, equipment surfaces etc.). All surfaces were separated into small fragments marked A, B, C, D etc. and each place was investigated by means of portable dosimetry and radiometry devices. The sampling points were determined after measurements of surface contamination. From the places with measured values higher than the permissible limits material samples and smears were taken. In general, the results showed lack of contamination except to two points of the pool floor. Contaminated materials were removed and classified as RAW.
2.4. Radioactive waste temporary storage
Data obtained from final radiological characterization were used to assess the situation after dismantling activities.
All dismantled equipment and the generated during the dismantling activities solid RAW (mainly metals - steel, aluminum and iron as well as small amounts of graphite, concrete, rubber and plastics) were categorized, sorted, packed and sealed in special reinforced concrete containers for transportation and storage. Categorization was performed in accordance with the regulations for transport of radioactive material and delivery of radioactive waste to the State Enterprise RAW. (6, 14-15).
Prior filling the container its inner surface of the walls and bottom were treated with epoxy corrosion protection and waterproofing primer AQUADUR, polyurethane corrosion protection HYPERDESMO and with double adhesive membrane Bitutin. RAW were distributed to containers in accordance with the regulations - dose bellow 2 mSv.h-1 at the container surface and 0.1 mSv.h-1 at a distance of 2 m from the container.(14) Filled containers were placed on a site for temporary storage specially built for the purposes of the partial dismantling.
4. CONCLUSIONS
The radiation measurements and site monitoring prior, for the period of all the activities and afterwards gave comprehensive evidence that all the work has been accomplished safely for the personnel and without radiation consequences for environment. References
1. E. P. Ryazantsev, “50th Anniversary of the IRT Reactor (History of Creation and Development)”, Atomic Energy, Vol. 104, No. 6, pp.470-482, 2008
2. K. Krezhov. “The Research Reactor IRT-Sofia: 50 Years after First Criticality”, Intern. Conf. on Research Reactors: Safe Management and Effective Utilization, 14-18 November 2011, Rabat, Morocco, IAEA-CN-188, Proceedings CD Series, IAEA, 2011.
3. Detailed plan for the partial dismantling of the IRT-2000 before its reconstruction into a low power reactor, AtomEnergoproject, Feb, 2009.
4. D. Stankov, A. Mladenov, K. Marinov, Tz. Nonova, K. Krezhov. “Individual Dosimetric Control and Monitoring of the Working Environment at the Nuclear Site IRT – Sofia”, In Proc. European Medical Physics and Engineering Conference EMPEC-2012, October 2012, Sofia, Bulgaria.
5. Al. Mladenov, D. Stankov, Tz. Nonova, K. Krezhov. “Radiation protection, radioactive waste management and site monitoring at the Nuclear Scientific Experimental and Educational Centre IRT-Sofia at INRNE – BAS”, Rad. Prot. Dosim., vol. 162 (1-2), pp. 176-181, 2014.
6. Regulation on the terms and procedure for delivery of radioactive waste to the Radioactive Waste State-Owned Company, BNRA, Sofia (2004).
7. Regulation on Basic Norms of Radiation Protection (BNRP), BNRA, Sofia (2012).
8. Regulation on ensuring the safety of research nuclear installations, BNRA, Sofia (2004).
9. Regulation on safety during decommissioning of nuclear facilities, BNRA, Sofia (2004).
10. Regulation for radiation protection during activities with sources of ionizing radiation, BNRA, Sofia (2012).
11. IAEA Safety Standards series No. RS-G-1.8, Monitoring the Discharge of Radioactive Substances from Research Reactors, Safety Standards of the Nuclear Safety Standards Commission, IAEA, Vienna (2012).
12. IAEA Safety Standards series No. NS-G-4.6, Radiation Protection and Radioactive Waste Management in the Design and Operation of Research Reactors, Safety Standards of the Nuclear Safety Standards Commission, IAEA, Vienna (2008)
13. IAEA-TECDOC-1012 – Durability of spent nuclear fuels and facility components in wet storage, 1998
14. Regulation on the conditions and procedure of transport of radioactive material, BNRA, Sofia (2014)
15. Regulation on the procedure for issuing licenses and permits for safe use of nuclear energy, BNRA, Sofia (2012)
16. Tz. Nonova, D. Stankov, Al. Mladenov, K. Krezhov. “Radiological characterization activities during the partial dismantling of the IRT - Sofia research reactor facilities”, Roman. J. Phys., vol. 59 (9-10), pp. 976 – 988, 2014.
17. Al. Mladenov, Tz. Nonova, D. Stankov, K. Krezhov. “Possibilities of automatic radiation monitoring system in Nuclear Scientific Experimental and Educational Centre”, In Proc. 2nd National Congress of Physical Sciences and 41st National Conference on Physics Education, Sept. 2013, Sofia, Bulgaria.

RADIATION PROTECTION ASPECTS RELEVANT TO RADIOLOGICAL TERRORISM
Jana Hudzietzová1, Jozef Sabol2, Bedřich Šesták2
1Faculty of Biomedical Engineering, Czech Technical University in Prague, Prague, Czech Republic 2Crisis Management Department, Faculty of Safety Management, PACR in Prague, Prague, Czech Republic
Abstract: The paper summarizes some basic issues related to the protection of people against the danger resulting from a radiological weapon or the so-called dirty bomb which can potentially be used in terrorist or other malevolent attacks. The properties of radioactive material utilized for this purpose and the quantification of the exposure of affected persons, the prevention measures against and consequences of radiological acts as well as appropriate arrangements aimed at minimizing their impacts are described. In addition, an overview of global initiatives addressing the fight against terrorism in general, including CBRN terrorism, is also presented.
Key words: radiological weapon, dirty bomb, radiation protection, quantification of exposure, mitigation measures, CBRN
1. INTRODUCTION
Radiation protection is a well-established branch of the broader area related to the use of radiation and nuclear technologies in industry, medicine, science and many other fields.
The main aim of radiation protection is to ensure the adequate safety of workers, patients and the population as well as the environment against harmful effects of ionizing radiation1. In most cases where ionizing radiation sources (radionuclides or radiation generators such as X-ray tubes and particle accelerators) and nuclear reactors are used, the health effects are very low and associated risks are lower or comparable with the risks encountered in most industries or even in our everyday life. Only in cases of incidents or accidents the radiation exposure may reach higher levels where visible detrimental effects occur.
The effects at low exposure (normal situation where everything is under control) show only stochastic (statistical) character, i.e., the effect, mostly the development of cancer in an exposed person, appears with certain probability which is proportional to the exposure. On the other hand, at higher exposures, (exceeding a certain relatively high threshold), deterministic effects, which are characterized by some specific health impairments the severity of which is proportional to the exposure, are evidenced.
Since exposure to high radiation doses can lead to serious health effects in people, there is some potential for misusing suitable radioactive sources for terrorist or other malevolent actions. At present, one cannot completely exclude such a situation and we have to be prepared to take appropriate effective measures in order to prevent this from happening, and, if it
happens, to be ready to mitigate the impact of such an emergency.
The philosophy of protection against the harmful effects of a radiological weapon or the so-called radiological dispersive device (RDD) is essentially similar to that applied with regard to any other dangerous weapons within the broad category of CBRN (chemical, biological, radiological and nuclear) material or agents.
2. PRINCIPLES INVOLVED IN THE USE OF A RADIOLOGICAL
WEAPON
The construction of a radiological weapon (dirty bomb)2,3 is rather simple: it consists of a specific radioactive substance of sufficiently high activity and a dispersive mechanism or explosive material (Fig. 1). The purpose is to disperse the radioactive substance into the air so as to cause the maximum damage to persons in the place of the attack in terms of their external exposure and internal radioactive contamination. The explosion itself can also caused some damage.
Fig. 1 Principal arrangement of a dirty bomb
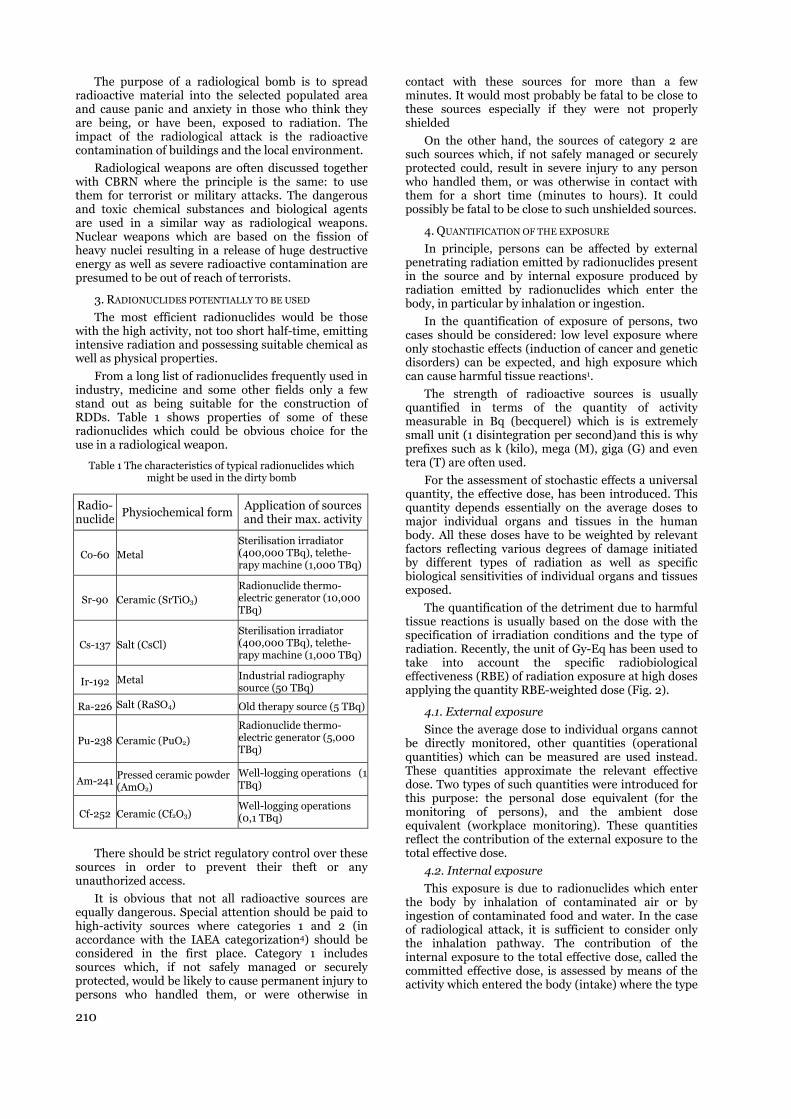
210
The purpose of a radiological bomb is to spread radioactive material into the selected populated area and cause panic and anxiety in those who think they are being, or have been, exposed to radiation. The impact of the radiological attack is the radioactive contamination of buildings and the local environment.
Radiological weapons are often discussed together with CBRN where the principle is the same: to use them for terrorist or military attacks. The dangerous and toxic chemical substances and biological agents are used in a similar way as radiological weapons. Nuclear weapons which are based on the fission of heavy nuclei resulting in a release of huge destructive energy as well as severe radioactive contamination are presumed to be out of reach of terrorists.
3. RADIONUCLIDES POTENTIALLY TO BE USED
The most efficient radionuclides would be those with the high activity, not too short half-time, emitting intensive radiation and possessing suitable chemical as well as physical properties.
From a long list of radionuclides frequently used in industry, medicine and some other fields only a few stand out as being suitable for the construction of RDDs. Table 1 shows properties of some of these radionuclides which could be obvious choice for the use in a radiological weapon.
Table 1 The characteristics of typical radionuclides which might be used in the dirty bomb
Radio-nuclide
Physiochemical formApplication of sources and their max. activity
Co-60 Metal Sterilisation irradiator (400,000 TBq), telethe-rapy machine (1,000 TBq)
Sr-90 Ceramic (SrTiO3) Radionuclide thermo-electric generator (10,000 TBq)
Cs-137 Salt (CsCl) Sterilisation irradiator (400,000 TBq), telethe-rapy machine (1,000 TBq)
Ir-192 Metal Industrial radiography source (50 TBq)
Ra-226 Salt (RaSO4) Old therapy source (5 TBq)
Pu-238 Ceramic (PuO2)
Radionuclide thermo-electric generator (5,000 TBq)
Am-241 Pressed ceramic powder (AmO2)
Well-logging operations (1 TBq)
Cf-252 Ceramic (Cf2O3) Well-logging operations (0,1 TBq)
There should be strict regulatory control over these
sources in order to prevent their theft or any unauthorized access.
It is obvious that not all radioactive sources are equally dangerous. Special attention should be paid to high-activity sources where categories 1 and 2 (in accordance with the IAEA categorization4) should be considered in the first place. Category 1 includes sources which, if not safely managed or securely protected, would be likely to cause permanent injury to persons who handled them, or were otherwise in
contact with these sources for more than a few minutes. It would most probably be fatal to be close to these sources especially if they were not properly shielded
On the other hand, the sources of category 2 are such sources which, if not safely managed or securely protected could, result in severe injury to any person who handled them, or was otherwise in contact with them for a short time (minutes to hours). It could possibly be fatal to be close to such unshielded sources.
4. QUANTIFICATION OF THE EXPOSURE
In principle, persons can be affected by external penetrating radiation emitted by radionuclides present in the source and by internal exposure produced by radiation emitted by radionuclides which enter the body, in particular by inhalation or ingestion.
In the quantification of exposure of persons, two cases should be considered: low level exposure where only stochastic effects (induction of cancer and genetic disorders) can be expected, and high exposure which can cause harmful tissue reactions1.
The strength of radioactive sources is usually quantified in terms of the quantity of activity measurable in Bq (becquerel) which is is extremely small unit (1 disintegration per second)and this is why prefixes such as k (kilo), mega (M), giga (G) and even tera (T) are often used.
For the assessment of stochastic effects a universal quantity, the effective dose, has been introduced. This quantity depends essentially on the average doses to major individual organs and tissues in the human body. All these doses have to be weighted by relevant factors reflecting various degrees of damage initiated by different types of radiation as well as specific biological sensitivities of individual organs and tissues exposed.
The quantification of the detriment due to harmful tissue reactions is usually based on the dose with the specification of irradiation conditions and the type of radiation. Recently, the unit of Gy-Eq has been used to take into account the specific radiobiological effectiveness (RBE) of radiation exposure at high doses applying the quantity RBE-weighted dose (Fig. 2).
4.1. External exposure
Since the average dose to individual organs cannot be directly monitored, other quantities (operational quantities) which can be measured are used instead. These quantities approximate the relevant effective dose. Two types of such quantities were introduced for this purpose: the personal dose equivalent (for the monitoring of persons), and the ambient dose equivalent (workplace monitoring). These quantities reflect the contribution of the external exposure to the total effective dose.
4.2. Internal exposure
This exposure is due to radionuclides which enter the body by inhalation of contaminated air or by ingestion of contaminated food and water. In the case of radiological attack, it is sufficient to consider only the inhalation pathway. The contribution of the internal exposure to the total effective dose, called the committed effective dose, is assessed by means of the activity which entered the body (intake) where the type
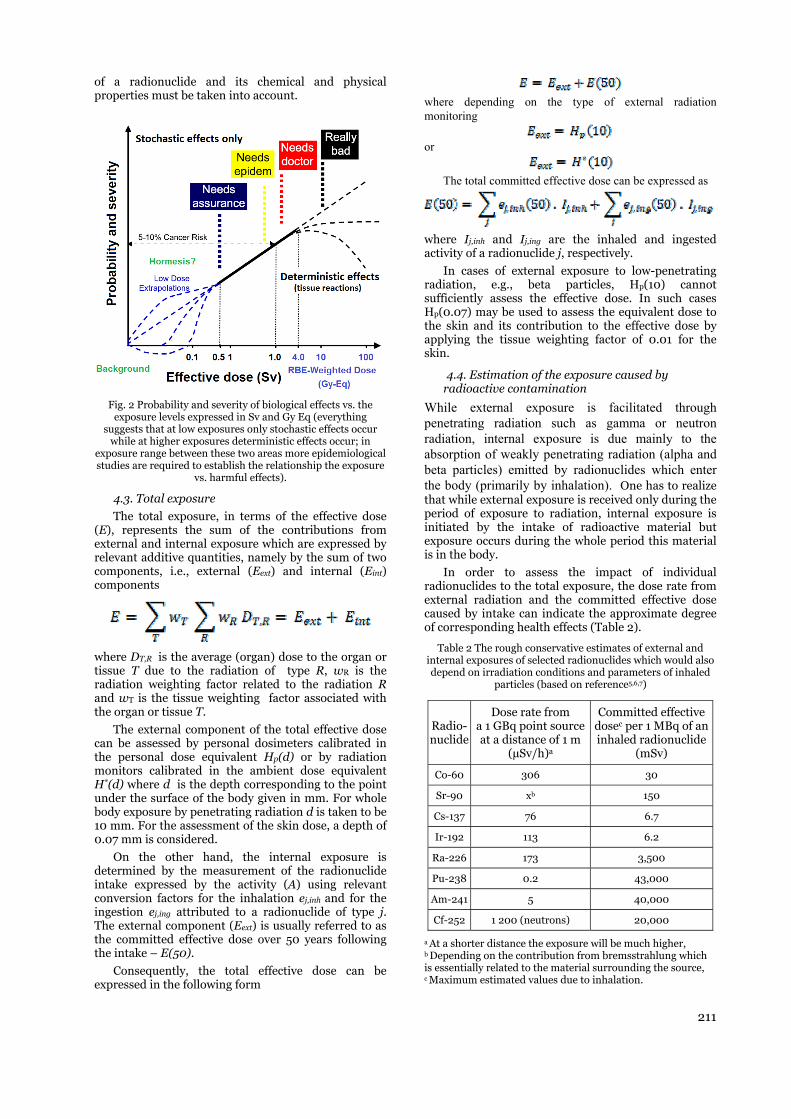
211
of a radionuclide and its chemical and physical properties must be taken into account.
Fig. 2 Probability and severity of biological effects vs. the
exposure levels expressed in Sv and Gy Eq (everything suggests that at low exposures only stochastic effects occur
while at higher exposures deterministic effects occur; in exposure range between these two areas more epidemiological studies are required to establish the relationship the exposure
vs. harmful effects).
4.3. Total exposure
The total exposure, in terms of the effective dose (E), represents the sum of the contributions from external and internal exposure which are expressed by relevant additive quantities, namely by the sum of two components, i.e., external (Eext) and internal (Eint) components
where DT,R is the average (organ) dose to the organ or tissue T due to the radiation of type R, wR is the radiation weighting factor related to the radiation R and wT is the tissue weighting factor associated with the organ or tissue T.
The external component of the total effective dose can be assessed by personal dosimeters calibrated in the personal dose equivalent Hp(d) or by radiation monitors calibrated in the ambient dose equivalent H*(d) where d is the depth corresponding to the point under the surface of the body given in mm. For whole body exposure by penetrating radiation d is taken to be 10 mm. For the assessment of the skin dose, a depth of 0.07 mm is considered.
On the other hand, the internal exposure is determined by the measurement of the radionuclide intake expressed by the activity (A) using relevant conversion factors for the inhalation ej,inh and for the ingestion ej,ing attributed to a radionuclide of type j. The external component (Eext) is usually referred to as the committed effective dose over 50 years following the intake – E(50).
Consequently, the total effective dose can be expressed in the following form
where depending on the type of external radiation monitoring
or
The total committed effective dose can be expressed as
where Ij,inh and Ij,ing are the inhaled and ingested activity of a radionuclide j, respectively.
In cases of external exposure to low-penetrating radiation, e.g., beta particles, Hp(10) cannot sufficiently assess the effective dose. In such cases Hp(0.07) may be used to assess the equivalent dose to the skin and its contribution to the effective dose by applying the tissue weighting factor of 0.01 for the skin.
4.4. Estimation of the exposure caused by radioactive contamination
While external exposure is facilitated through penetrating radiation such as gamma or neutron radiation, internal exposure is due mainly to the absorption of weakly penetrating radiation (alpha and beta particles) emitted by radionuclides which enter the body (primarily by inhalation). One has to realize that while external exposure is received only during the period of exposure to radiation, internal exposure is initiated by the intake of radioactive material but exposure occurs during the whole period this material is in the body.
In order to assess the impact of individual radionuclides to the total exposure, the dose rate from external radiation and the committed effective dose caused by intake can indicate the approximate degree of corresponding health effects (Table 2).
Table 2 The rough conservative estimates of external and internal exposures of selected radionuclides which would also depend on irradiation conditions and parameters of inhaled
particles (based on reference5,6,7)
Radio-nuclide
Dose rate from a 1 GBq point source at a distance of 1 m
(µSv/h)a
Committed effective dosec per 1 MBq of an inhaled radionuclide
(mSv)
Co-60 306 30
Sr-90 xb 150
Cs-137 76 6.7
Ir-192 113 6.2
Ra-226 173 3,500
Pu-238 0.2 43,000
Am-241 5 40,000
Cf-252 1 200 (neutrons) 20,000
a At a shorter distance the exposure will be much higher,
b Depending on the contribution from bremsstrahlung which is essentially related to the material surrounding the source, c Maximum estimated values due to inhalation.

212
In specific situations we have to consider all relevant components contributing to the total exposure which include:
• External exposure from contamination on outdoor surfaces, including ground (the exposure depends on the type of the radionuclide, its surface activity and geometry configuration);
• External exposure from contamination on indoor surfaces, floors, walls, furniture etc (the exposure depends on the same factors as above);
• External exposure from contamination on clothing and human skin (the exposure depends on the type of radionuclide and surface activity, a correction for the absorption in cloth should be taken into consideration);
• External exposure from the passing contaminated plume (the exposure depends on the type of the radionuclides and activity concentration within the plume);
• Internal exposure from inhalation during plume passage (the same as above and also physical and chemical characteristics of the radioactive substance);
• Internal exposure from inhalation of contami-nated air due to the re-suspended radioactive dust (the surface activity, characteristics of the ground as well as meteorological conditions).
Other factors influencing radiation and radioactive contamination level and its distribution may include means of dispersal (e.g. explosion, spraying, fire) and local topography, location of buildings, and other landscape features. If all relevant parameters are known, the situation can be simulated using mathematical models and codes.
A number of methods have been developed for assessing the exposure in each of the encountered situations. Some simple calculators are also available to evaluate exposure based on parameters which can be obtained from monitoring results (e.g., reference7).
In principle, two different types of monitoring can be used to assess the situation around the place of a radiological attack, namely devices for measuring external radiation and surface contamination, and air samplers to measure the activity concentration in the air based on the airborne radioactivity sampling. In addition to these workplace (area) monitors, personal dosimeters can track the exposures received by an individual.
In most cases, appropriate general purpose survey meters using scintillators, GM tubes, ion chambers or semiconductor detectors are used. Some of this equipment can also be used for sophisticated searching and identification of unknown radioactive sources.
The results of the monitoring, or the information about the activity released, can serve as a basis for setting up zones characterized by specific external radiation levels or radioactive contamination.
5. CONSEQUENCES OF RADIOLOGICAL ATTACK, PROTECTION AND MITIGATION MEASURES
The impact of the radiological attack depends on the type and activity of radioactive material dispersed. The distribution of radioactive contamination will always be affected by the morphology of the place and meteorological conditions in the time of the attack.
5.1. Impact on people and the environment
Most of people in the place where radiological weapon was used receive relatively low exposure which will only contribute to stochastic effects (i.e., the probability of cancer occurrence sometime in the future). A small number of persons may receive high enough exposure to generate deterministic effects.
One concern of radiation exposure is an elevated risk of developing cancer later in life, although studies have shown that radiation is a relatively weak carcinogen. Exposure at the low radiation doses expected from a RDD would increase the risk of cancer only slightly over naturally occurring rates.
Some further impacts might involve disruption to lives and livelihoods as the contaminated area is being cleaned up. This impact could continue even long time after the site has been cleaned up and people would be rather reluctant to return to the affected area.
The most dangerous consequences would be associated rather with the creation of panic and chaos which can result in many casualties especially when the place of the attack is heavily overcrowded. Some economic impact can also be expected because of the radioactive contamination of the surrounding areas.
The contamination of the area around the epicenter of the attack can be mapped in terms of ambient dose equivalent rate (in mSv.h-1) or surface contamination (in Bq.m2). The isolines of the dose rate caused by a radioactive plum affected by the wind direction in a town can be presented on suitable maps. This information is very useful to assess the exposure received by rescue workers engaged in the mitigation operations. This is also important for the selection of suitable personal protective equipment.
In some emergency situation there always may be some people exposed to high radiation doses. Radiation sickness, known as acute radiation syndrome (ARS), is a serious illness that occurs when the entire body (or most of it) receives a high dose of radiation, usually over a short period of time. Many survivors of the Hiroshima and Nagasaki atomic bombs in the 1940s and many of the firefighters who first responded after the Chernobyl NPP accident in 1986 became ill with ARS.
The first symptoms of ARS typically are nausea, vomiting, and diarrhea. These symptoms will start within minutes to days following the exposure. They will last for minutes up to several days, and may come and go. Then the person usually looks and feels relatively healthy for a short time, after which he or she will become sick again with loss of appetite, fatigue, fever, nausea, vomiting, diarrhea, and possibly even seizures and coma. This seriously ill stage may last from a few hours up to several months.
5.2. Prevention measures
The best prevention arrangement against radiological terrorism would be strict control and security of all high-activity radioactive sources including their production, transport, use, storage and disposal. Adequate measures should also be introduced at the borders to prevent illicit trafficking where radioactive sources may be smuggled from countries with insufficient control to other countries where they may be used for malevolent actions.
213
To construct an RDD, a terrorist group must obtain radioactive materials, use those materials to fabricate a weapon, deliver the weapon to the attack site, and detonate the device. Each of these steps suggests some specific measures that can be used to help prevent an attack. Obtaining radioactive materials requires access to the radioactive sources which must be either purchased or stolen. This is why keeping any high-activity radioactive material under strict control is so important.
5.3. Protection measures and mitigation of consequences
Any protection measures and tool are effective only in cases when they are applied correctly. This refer not only to emergency and rescue workers but also to members of the general public. The first responders are highly qualified and experienced professionals who can assess the emergency situation realistically. The perception of any risks, including the risk due to the exposure, is highly exaggerated by the public the opinion of which is usually based on the information from rumours and unreliable sources. Therefore, it is important to communicate with the public not only after the accident but rather continuously making use various appropriate contacts including disseminating correct information through the mass media.
The psychological effects from the fear of being exposed may be one of the major consequences of a dirty bomb. It is important to ensure sound understanding of the situation and cooperation of the public with authorities involved in the mitigation of an attack or accident.
Some simple instruction provided to the public may significantly reduce the impact of an emergency. If people are near the site of the detonation of a dirty bomb or release of radioactive material, they should be advised to:
• Stay away from any obvious plume or dust cloud;
• Cover the mouth and nose with a tissue, filter, or damp cloth to avoid inhaling or ingesting the radioactive material;
• Go inside a building with closed doors and windows as quickly as can be done in an orderly manner and listen for information from emergency responders and authorities;
• Remove contaminated clothing as soon as possible and place them in a sealed container such as a plastic bag (the clothing could be used later to estimate a person’s exposure);
• Gently wash the skin to remove possible contamination.
• Those already inside an intact building should stay there and close windows and reduce outside air intake if possible.
People should make sure that no radioactive material enters the mouth or is transferred to areas of the face where it could be easily moved to the mouth and ingested. One obviously has not to eat, drink, or smoke. Questions such as when it is safe to leave a building or return home, what is safe to eat and drink and when, and how children will be cared for if they are separated from their parents would be answered by authorities who would have to make decisions on
a case-by-case basis depending on the many variables of the situation.
Professionals engaged in rescue and mitigation operations are equipped with special personal protective equipment and other relevant accessories to ensure their protection.
5.4. Global initiatives in fighting radiological terrorism
Radiological terrorism as well as terrorism related to other dangerous CBRN materials has become a global problem and, consequently, it has to be fought worldwide8. Efficient cooperation and coordination of all countries and international organization has to be mobilized. In this regards, an important role is played by the United Nations, and especially its agencies the IAEA (International Atomic Energy Agency) and the UN Interregional Crime and Justice Institute). The EU with its Joint Research Centre (JRC) has become very active in this field recently. Interpol and Europol also play some special role in this context.
The EU CBRN Action Plan9 represents the main EU policy document aimed at the protection of the EU Member States against CBRN threats. The Action Plan constitutes a political commitment and may be considered as a roadmap of intentions and measures to be taken in the coming years. It recommends actions concerning prevention, detection, preparedness and response, as well as horizontal measures in the context of high-risk CBRN materials. As to its implementation, the Action Plan should be conducted with full respect for international law, including human rights and the principle of the rule of law.
The EU Action Plan includes some specific prevention measures as a) Developing lists at the EU level of high-risk CBRN materials; b) Identifying and reporting suspicious transactions and behavior; c) Enhancing security and control of high risk CBRN materials; facilities and transport infrastructure; d) Contributing to the development of a high security culture of staff, improving information exchange, e) Strengthening the import/export regime; f) Enhancing cooperation on the security of CBRN as well as dual material.
The Plan is also focused on efficient preparedness measures including: a) Improved emergency planning, b) Stronger countermeasure capabilities, c) Upgraded domestic and international information flows regarding CBRN emergencies, d) The development of new modelling and better decontamination and remediation capacities, and e) Ensuring greater capacity to conduct criminal investigations.
In accordance with the EU requirements, the responding measures should require: a) Enhanced international cooperation, b) Improved lines of communication with the public; c) More robust information tools for CBRN security, d) Advanced training courses for first responders, e) Improved personnel security, and f) Ensuring that legislation is put in place to tackle CBRN terrorism.
The goals of EU CBRN policy to minimise the threat and damage have also to address the following aspects: a) Use of a risk-based approach to security, b) Effective protection of CBRN materials including their storage and transport, c) Improved exchanges of security-related information among countries,
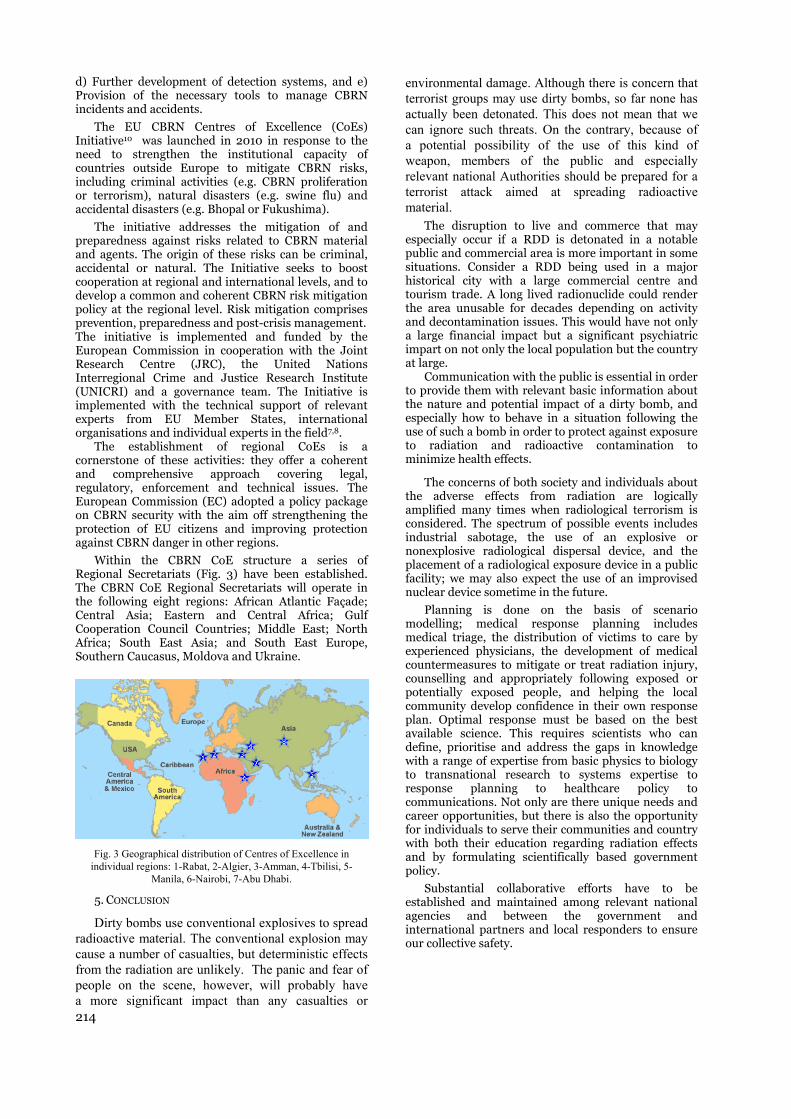
214
d) Further development of detection systems, and e) Provision of the necessary tools to manage CBRN incidents and accidents.
The EU CBRN Centres of Excellence (CoEs) Initiative10 was launched in 2010 in response to the need to strengthen the institutional capacity of countries outside Europe to mitigate CBRN risks, including criminal activities (e.g. CBRN proliferation or terrorism), natural disasters (e.g. swine flu) and accidental disasters (e.g. Bhopal or Fukushima).
The initiative addresses the mitigation of and preparedness against risks related to CBRN material and agents. The origin of these risks can be criminal, accidental or natural. The Initiative seeks to boost cooperation at regional and international levels, and to develop a common and coherent CBRN risk mitigation policy at the regional level. Risk mitigation comprises prevention, preparedness and post-crisis management. The initiative is implemented and funded by the European Commission in cooperation with the Joint Research Centre (JRC), the United Nations Interregional Crime and Justice Research Institute (UNICRI) and a governance team. The Initiative is implemented with the technical support of relevant experts from EU Member States, international organisations and individual experts in the field7,8.
The establishment of regional CoEs is a cornerstone of these activities: they offer a coherent and comprehensive approach covering legal, regulatory, enforcement and technical issues. The European Commission (EC) adopted a policy package on CBRN security with the aim off strengthening the protection of EU citizens and improving protection against CBRN danger in other regions.
Within the CBRN CoE structure a series of Regional Secretariats (Fig. 3) have been established. The CBRN CoE Regional Secretariats will operate in the following eight regions: African Atlantic Façade; Central Asia; Eastern and Central Africa; Gulf Cooperation Council Countries; Middle East; North Africa; South East Asia; and South East Europe, Southern Caucasus, Moldova and Ukraine.
Fig. 3 Geographical distribution of Centres of Excellence in individual regions: 1-Rabat, 2-Algier, 3-Amman, 4-Tbilisi, 5-
Manila, 6-Nairobi, 7-Abu Dhabi. 5. CONCLUSION
Dirty bombs use conventional explosives to spread radioactive material. The conventional explosion may cause a number of casualties, but deterministic effects from the radiation are unlikely. The panic and fear of people on the scene, however, will probably have a more significant impact than any casualties or
environmental damage. Although there is concern that terrorist groups may use dirty bombs, so far none has actually been detonated. This does not mean that we can ignore such threats. On the contrary, because of a potential possibility of the use of this kind of weapon, members of the public and especially relevant national Authorities should be prepared for a terrorist attack aimed at spreading radioactive material.
The disruption to live and commerce that may especially occur if a RDD is detonated in a notable public and commercial area is more important in some situations. Consider a RDD being used in a major historical city with a large commercial centre and tourism trade. A long lived radionuclide could render the area unusable for decades depending on activity and decontamination issues. This would have not only a large financial impact but a significant psychiatric impart on not only the local population but the country at large.
Communication with the public is essential in order to provide them with relevant basic information about the nature and potential impact of a dirty bomb, and especially how to behave in a situation following the use of such a bomb in order to protect against exposure to radiation and radioactive contamination to minimize health effects.
The concerns of both society and individuals about the adverse effects from radiation are logically amplified many times when radiological terrorism is considered. The spectrum of possible events includes industrial sabotage, the use of an explosive or nonexplosive radiological dispersal device, and the placement of a radiological exposure device in a public facility; we may also expect the use of an improvised nuclear device sometime in the future.
Planning is done on the basis of scenario modelling; medical response planning includes medical triage, the distribution of victims to care by experienced physicians, the development of medical countermeasures to mitigate or treat radiation injury, counselling and appropriately following exposed or potentially exposed people, and helping the local community develop confidence in their own response plan. Optimal response must be based on the best available science. This requires scientists who can define, prioritise and address the gaps in knowledge with a range of expertise from basic physics to biology to transnational research to systems expertise to response planning to healthcare policy to communications. Not only are there unique needs and career opportunities, but there is also the opportunity for individuals to serve their communities and country with both their education regarding radiation effects and by formulating scientifically based government policy.
Substantial collaborative efforts have to be established and maintained among relevant national agencies and between the government and international partners and local responders to ensure our collective safety.

215
REFERENCES
1. Recommendations of the International Commission on Radiological Protection. ICRP Publication 103. Ann. ICRP 37(2/4).
2. P. K. Karam, “Radiological terrorism”, Human and Ecological Risk Assessment, vol. 11, pp. 501-523, 2005.
3. Cirincionne, J., Wolfstahl, J.B., Rajkumar, M., Deadly Arsemals – Nuclear, Biological, and Chemical Threats, Carnegie Endowment for International Peace, Washington (USA), 2005.
4. IAEA, Categorization of Radioactive Sources, IAEA Safety Standards Series No. RS-G-1.9, IAEA, Vienna, 2005.
5. D. Delacroix et al., “Radionuclide and radiation protection data handbook 1998”, Radiation Prot. Dosimetry, vol. 76, Nos. 1-2, 1998. ISBN 1 870965 51 5.
6. ICRP, Compendium of Dose Coefficients Based on ICRP Publication 60, ICRP Publ. 119, Annals of the ICRP, vol. 41 (Suppl.).
7. HotSpot, Health Physics Codes for the PC, NARAC – National Atmospheric Release Advisory Center, https:// narac.llnl.gov/HotSpot/HotSpot.html.
8. EU CBRN Action Plan, http://www.ebsaweb.eu/ebsa_ media/ANNEXE1_COM_2009_ 273-p-1304.pdf.
9. Sabol, J. et al. “The Role of International Organizations in Combatting Radiological Terrorism”, Security Revue, Feb. 21, 2011; Online: http://www.securityrevue.com/ article/2011/02/the-role-of-international-organizations -in-combatting-radiological-terrorism/.
10. Can the EU’s Centres of Excellence Initiative Contribute Effectively to Mitigating Chemical, Biological, Radiological and Nuclear Risks from Outside the EU? ECA Special Report, Luxembourg, 2014 (IBSN 978-92-9207-016-8).


M
A
p
p
1. 60C
life ofindustprodupressuFurthmetal Becauthe wbe puonto d
Hysuitabmetalgrounbufferand a[5]. Aless aCo2+ sare coorganstoich70% omaterorgantreatm
Marija Šljiv
1 Univers
Abstract. 60Coof water contparticularly cobone treatmensorbents were variables betwconcentration (and factor E-saefficiency werepH values weredifferent for destablished bettreatment at 4solution (5•10-3
equilibrium pHreleased during
Key words: de
INTRODUCTION
Co is a radionf 5.3 years, wtrial and med
uct, 60Co is alsurized wateermore, inact which is ve
use of high negwastewaters courified, and fodifferent mate
ydroxyapatiteble matrix fos and radion
nd water and ring propertieanionic substi
Among variousattention has bsorption onto omposite matenic matter, mahiometric HAPof bones, theyrial for HAP
nic phase fromments can be a
RELATIO
vić-Ivanovi
sity of Belgrad
o is an importataining Co2+ ioost-effective if bint conditions an
previously preween two level(0.1 mol/L or 2ample annealine evaluated usine considered asifferent startin
tween treatmen400oC was the 3 mol/L). Depen
H values, whereg the sorption.
esign of experim
N
nuclide with rwhich is wideldical applicatiso present in
er nuclear tivate Co is
ery toxic in egative impact ontaining cobaor that purposerials can be us
(HAP) based or the immobnuclides from
soil [1-4], dues and high teitutions insides heavy metalsbeen devoted apatite mateerial consisted
ainly collagen.P represents
y were recogniextraction. In
m bones, cheapplied.
ONSHIPS BEAND Co
ić1, Ivana S
de, Vinča Insti
nt radionuclideons sorption oiological apatitend Co2+ sorptioepared using fls: factor A-thmol/L), factor
ng (without or ang statistical ans system respong concentratio
nt conditions anonly statistica
nding on initial eas no relation
ments, bioapatit
relatively shory used in resons. As a corrliquid wastespower rea
a transition elevated quanonto human halt isotopes hse sorption psed.
materials repbilization of aqueous solu
ue to low soluendency for cae the crystal s and radionu
d to investigatrials. Animal
d of HAP phasKnowing thaapproximatel
ized as low-con order to re
emical and th
ETWEEN BOo2+ SORPTI
Smičiklas1, A
itute of Nuclea
e in spent nucleon hydroxyapae from animal b
on was investigfractional factohe type of the
C-reaction temat 400oC). At thnalysis. Amounnses. The results
ns of Co2+. Connd Co2+ sorptio
ally significant fCo2+ concentrawas found betw
te, Co2+, sorptio
rt half-search, rrosion s from actors. heavy
ntities. health,
have to process
present heavy
utions, ubility, ationic lattice clides,
tion of bones
se and at non-ly 60-
ost raw emove
hermal
ONE TREATMION CAPAC
Aleksandra
ar Sciences, P.
ar fuel and liquatite (Ca10(PO4)bones is utilizedgated as a funcorial design, by
chemical reagmperature (20oChis point, the effts of Co2+ sorbe
s showed that thnsequently, no
on from 10-4 andfactor influenc
ation, various faween bone trea
on
Commerderived fromtested for Cwastewaterstudy, this mfilling for pbone char, was also fomatrix for Cstudy, thesuggested.
The systtemperaturephysico-chethat removpositively csurface aredetermined its highest s
In our chemical anproperties a[10]. For t(DOE) metchemical reand temperwere invesfactorial dtreatment (specific surcharge, Cdestablished
MENT CONDCITIES
a Milenkov
O.B. 522, 1100
uid radioactive )6(OH)2) can bd. In this study, ction of initial y simultaneousgent (H2O2 or C or 60oC), factoffects of treatmeed, amounts of rhe impact of vastatistically im
d 5•10-4 mol/L cing sorption fractors had stati
atment conditio
rcially availabm fish bones (UCd, Cu, Co, N
[6]. Based omaterial was
permeable reaproduced by
ound to be a Co2+ ions [7].
main sorp
tematic study e (400-1000emical and soal of Co2+ [8correlated wia. Maximum for the samp
pecific surfaceprevious stud
nd thermal treand Cd2+ sorptthat purposethodology waagent type, corature, and thstigated and design. The conditions a
rface area, losd2+ sorptionby statistical a
DITIONS
vić1, Slavko
00, Belgrade,
wastes. For thebe applied. Thdependence bemetal concentr
s variations of r NaOH), factoor D-contact timent factors on Creleased Ca2+ io
arious treatmenmportant relati
solutions, whefrom the most istically signific
ons and the amo
ble product - (US Patent #6Ni and Hg ron the resultcharacterized
active barriersy cattle bones
promising im Following deption mecha
on the influen0oC) onto borption prope8] and Sr2+ ith the sorb
m sorption caple heated at 4e area. dy, the effec
eatment factortion capacities
e, Design of as applied. Toncentration, he influence
compared be relationshi
and sorbentss of ignition,
n capacities, analysis.
Dimović1
Serbia
e purification he process is tween bovine ration. Eight
f five process or B-reagent me (1h or 3h) Co2+ sorption ons and final t factors was ons could be reas thermal concentrated cant effect on ounts of Ca2+
Apatite II™,,217,775), wasremoval fromts of column
d as a suitables. Commercials calcinations,mmobilizationetailed kineticanisms were
nce of heatingbovine bone
erties, showed[9] ions was
bents specificpacities were400oC, due to
ts of variousrs on the bones were studied
ExperimentsThe effects of
reaction timeof annealing,by fractionalips betweents properties
point of zeroetc.) were
, s
m n e l ,
n c e
g e d s c e o
s e d s f e , l
n s o e

218
In this study, previously prepared and characterized bone samples [10] were tested for Co2+ immobilization. The main aim was to explore and compare sorption of Co2+ ions by investigated materials using different initial concentrations of the pollutant, and to find out which treatment factors significantly affected Co2+ removal. The possible mechanisms of Co2+ sorption were also discussed.
2. METHODS AND EXPERIMENTS
2.1 Design of Experiments (DOE)
Design of Experiment (DOE) is a method for experiment planning, which is widely applied to make the experiments more efficient [11]. The strategy of DOE method is simultaneous variation of several factors in one experiment. This approach is often used for process “screening”, when the influence of a large number of process variables is investigated. The process variables are commonly varied between two levels: lower and higher. Furthermore, the effect of each variable is determined using the Yates algorithm [12], and, on the basis of calculated effects, it can be concluded whether the change of variable influences the system response. Major DOE output is the information - which process variable significantly influences the response of a chosen system.
2.2 Sorbents preparation and properties
Apatite materials were prepared using femur bovine bones. The procedure of sorbents preparation was given in details previously [10]. In general, five process variables were simultaneously varied between two levels according to the fractional factorial design matrix (Table 1). Process variables were denoted as:
A- type of chemical reagent,
B - concentration of chemical reagent,
C - reaction temperature,
D - contact time, and
E - sample annealing at 400oC.
According to the results of chemical and instrumental analyses, samples with higher amounts of organic content were B3, B5, B6 and B8 [10]. Specific surface area (SSA) determination showed that obtained samples were non-porous (B5, B6 and B8), mesoporous (B1, B2, B3 and B4) and meso- and microporous (B7). Moreover, all materials exhibited buffering properties in the range of initial pH 4 – 10, whereas the determined points of zero charge (pHPZC) values were in the range 6.67 - 7.58 [10].
2.3 Sorption experiments
The Co2+ solutions of different initial concentrations (10-4, 5•10-4 and 5•10-3 mol/L) were prepared by dissolution of Co(NO3)2•6H2O in deionized water. The initial pH values were adjusted to 5.0, using small quantities of 10-3 mol/L KOH or
HNO3 solutions. This particular pH was selected in order to prevent HAP phase dissolution at lower pH and Co(OH)2 precipitation at equilibrium pH ≥8.
Sorption experiments were conducted by mixing 0.10 g of sorbent and 20 mL of various Co2+ solutions, on a horizontal shaker (120 rpm), for 24 h to achieve equilibrium. After equilibration, the suspensions were filtrated through blue-band filter paper (pore size 2-3 μm), and Co2+ concentrations in filtrates were measured together with the final pH values. The amounts of Ca2+ ions released to the solutions were determined as well, in order to evaluate the participation of ion-exchange mechanism.
For determination of exact initial and equilibrium cation concentrations, flame Atomic Absorption Spectrometer (AAS) Perkin Elmer 3100 was used. Certified Perkin Elmer 1000 mg/L standards for Co2+ and Ca2+ were used for instrument calibration. The detection limits for Co2+ and Ca2+ ions were 0.04 mg/L and 0.03 mg/L, respectively. Sorbed amounts of Co2+ ions were calculated as differences between starting and equilibrium concentrations.
Table 1 Factorial design matrix - the combination of factor levels for each experimental run [10]
RunSample
Coded values of variablesand their levels
(A) (B) mol/L
(C) °C
(D)h
(E)
1 B1 NaOH 2 60 3 Yes2 B2 NaOH 0.1 60 1 Yes3 B3 NaOH 2 20 3 No4 B4 H2O2 2 20 1 Yes5 B5 H2O2 2 60 1 No6 B6 H2O2 0.1 60 3 No7 B7 H2O2 0.1 20 3 Yes8 B8 NaOH 0.1 20 1 No
2.4 Statistical analysis
To assure reproducibility and accuracy of experimental data, sorption experiments were conducted in duplicate. Mean values of measured parameters were used as system responses for data interpretation and statistical analysis. Statistical software MINITAB, which was used to create matrix for bone treatment conditions, was also applied for Co2+ sorption data analysis, the regression calculations and graphical interpretations.
3. RESULTS AND DISCUSSION
3.1 Co2+ sorption by different bioapatite samples
The amounts of sorbed Co2+ and released Ca2+ ions, as well as the pH values obtained after equilibration, are given in Figure 1. It is evident that sorption from 10-4 mol/L solution was almost constant for all bioapatite samples, while with initial Co2+ concentration increase, sorption capacities drastically changed and became dependant on used
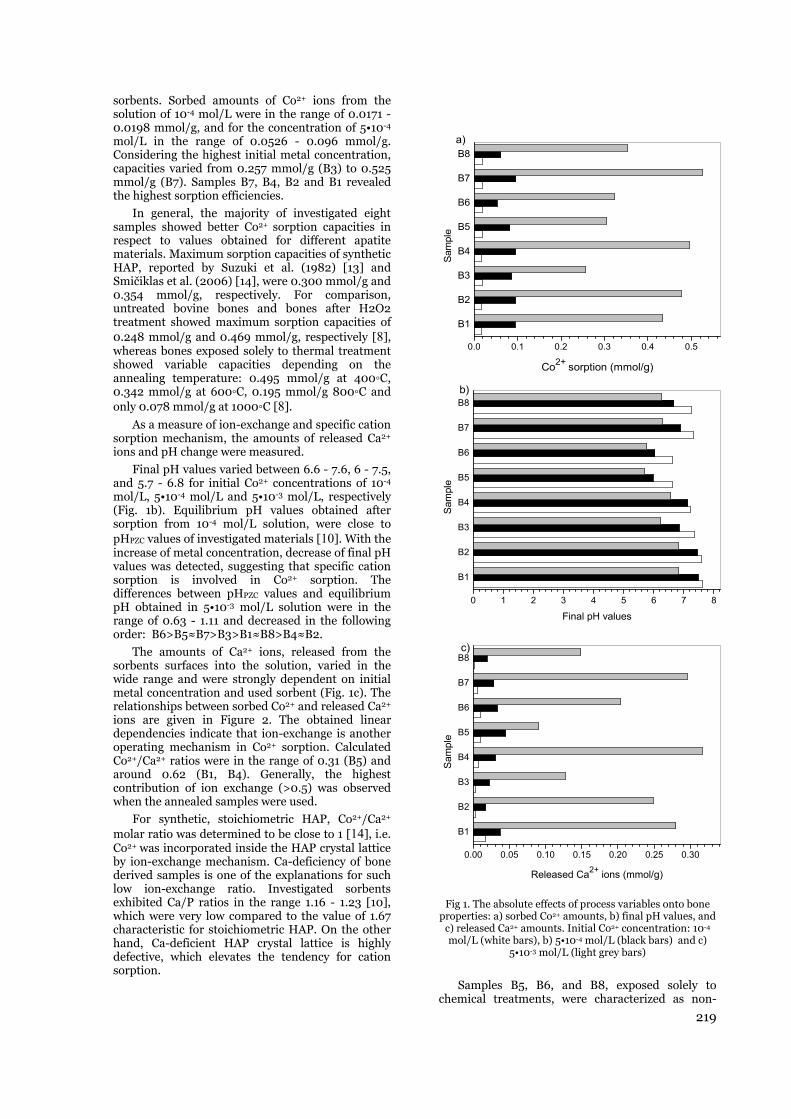
219
sorbents. Sorbed amounts of Co2+ ions from the solution of 10-4 mol/L were in the range of 0.0171 - 0.0198 mmol/g, and for the concentration of 5•10-4 mol/L in the range of 0.0526 - 0.096 mmol/g. Considering the highest initial metal concentration, capacities varied from 0.257 mmol/g (B3) to 0.525 mmol/g (B7). Samples B7, B4, B2 and B1 revealed the highest sorption efficiencies.
In general, the majority of investigated eight samples showed better Co2+ sorption capacities in respect to values obtained for different apatite materials. Maximum sorption capacities of synthetic HAP, reported by Suzuki et al. (1982) [13] and Smičiklas et al. (2006) [14], were 0.300 mmol/g and 0.354 mmol/g, respectively. For comparison, untreated bovine bones and bones after H2O2 treatment showed maximum sorption capacities of 0.248 mmol/g and 0.469 mmol/g, respectively [8], whereas bones exposed solely to thermal treatment showed variable capacities depending on the annealing temperature: 0.495 mmol/g at 400◦C, 0.342 mmol/g at 600◦C, 0.195 mmol/g 800◦C and only 0.078 mmol/g at 1000◦C [8].
As a measure of ion-exchange and specific cation sorption mechanism, the amounts of released Ca2+ ions and pH change were measured.
Final pH values varied between 6.6 - 7.6, 6 - 7.5, and 5.7 - 6.8 for initial Co2+ concentrations of 10-4 mol/L, 5•10-4 mol/L and 5•10-3 mol/L, respectively (Fig. 1b). Equilibrium pH values obtained after sorption from 10-4 mol/L solution, were close to pHPZC values of investigated materials [10]. With the increase of metal concentration, decrease of final pH values was detected, suggesting that specific cation sorption is involved in Co2+ sorption. The differences between pHPZC values and equilibrium pH obtained in 5•10-3 mol/L solution were in the range of 0.63 - 1.11 and decreased in the following order: B6>B5≈B7>B3>B1≈B8>B4≈B2.
The amounts of Ca2+ ions, released from the sorbents surfaces into the solution, varied in the wide range and were strongly dependent on initial metal concentration and used sorbent (Fig. 1c). The relationships between sorbed Co2+ and released Ca2+ ions are given in Figure 2. The obtained linear dependencies indicate that ion-exchange is another operating mechanism in Co2+ sorption. Calculated Co2+/Ca2+ ratios were in the range of 0.31 (B5) and around 0.62 (B1, B4). Generally, the highest contribution of ion exchange (>0.5) was observed when the annealed samples were used.
For synthetic, stoichiometric HAP, Co2+/Ca2+ molar ratio was determined to be close to 1 [14], i.e. Co2+ was incorporated inside the HAP crystal lattice by ion-exchange mechanism. Ca-deficiency of bone derived samples is one of the explanations for such low ion-exchange ratio. Investigated sorbents exhibited Ca/P ratios in the range 1.16 - 1.23 [10], which were very low compared to the value of 1.67 characteristic for stoichiometric HAP. On the other hand, Ca-deficient HAP crystal lattice is highly defective, which elevates the tendency for cation sorption.
Fig 1. The absolute effects of process variables onto bone properties: a) sorbed Co2+ amounts, b) final pH values, and
c) released Ca2+ amounts. Initial Co2+ concentration: 10-4 mol/L (white bars), b) 5•10-4 mol/L (black bars) and c)
5•10-3 mol/L (light grey bars)
Samples B5, B6, and B8, exposed solely to chemical treatments, were characterized as non-
B1
B2
B3
B4
B5
B6
B7
B8
0.00 0.05 0.10 0.15 0.20 0.25 0.30
Released Ca2+ ions (mmol/g)
Sam
ple
c)
B1
B2
B3
B4
B5
B6
B7
B8
0 1 2 3 4 5 6 7 8
Final pH values
Sam
ple
b)
B1
B2
B3
B4
B5
B6
B7
B8
0.0 0.1 0.2 0.3 0.4 0.5
Co2+ sorption (mmol/g)
Sam
ple
a)
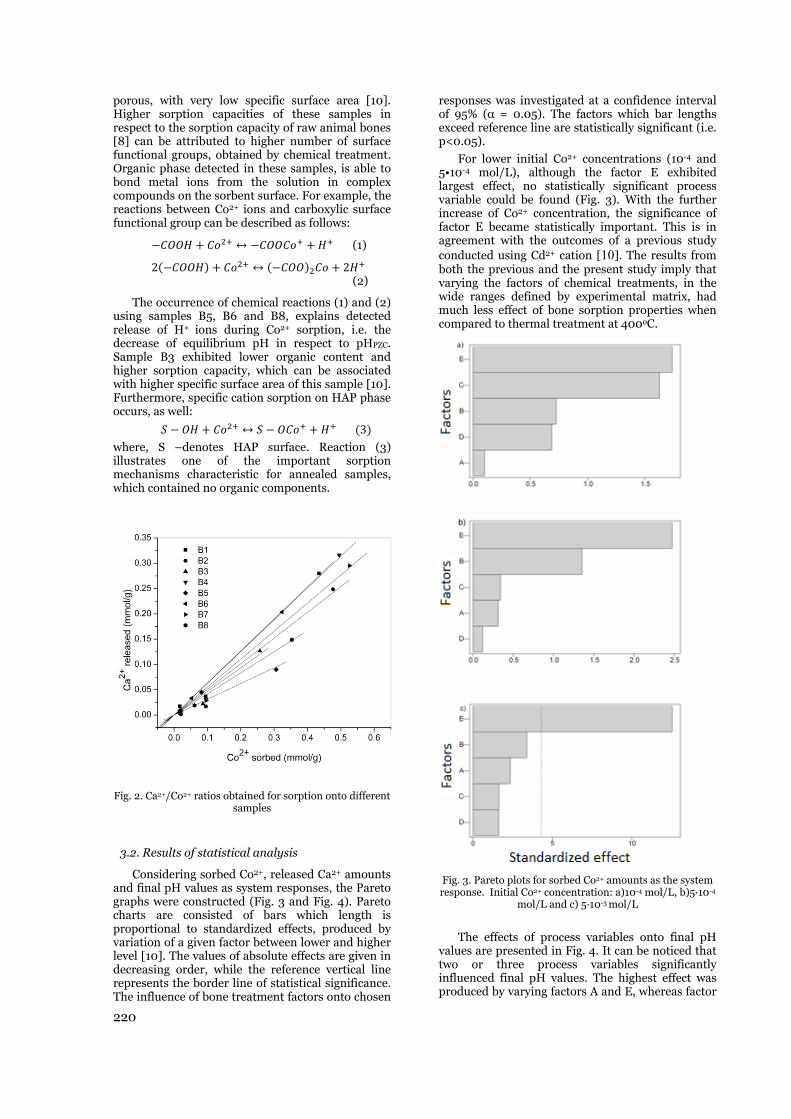
220
porous, with very low specific surface area [10]. Higher sorption capacities of these samples in respect to the sorption capacity of raw animal bones [8] can be attributed to higher number of surface functional groups, obtained by chemical treatment. Organic phase detected in these samples, is able to bond metal ions from the solution in complex compounds on the sorbent surface. For example, the reactions between Co2+ ions and carboxylic surface functional group can be described as follows: − + ↔ − + (1) 2(− ) + ↔ (− ) + 2
(2)
The occurrence of chemical reactions (1) and (2) using samples B5, B6 and B8, explains detected release of H+ ions during Co2+ sorption, i.e. the decrease of equilibrium pH in respect to pHPZC. Sample B3 exhibited lower organic content and higher sorption capacity, which can be associated with higher specific surface area of this sample [10]. Furthermore, specific cation sorption on HAP phase occurs, as well:
− + ↔ − + (3)
where, S –denotes HAP surface. Reaction (3) illustrates one of the important sorption mechanisms characteristic for annealed samples, which contained no organic components.
Fig. 2. Ca2+/Co2+ ratios obtained for sorption onto different samples
3.2. Results of statistical analysis
Considering sorbed Co2+, released Ca2+ amounts and final pH values as system responses, the Pareto graphs were constructed (Fig. 3 and Fig. 4). Pareto charts are consisted of bars which length is proportional to standardized effects, produced by variation of a given factor between lower and higher level [10]. The values of absolute effects are given in decreasing order, while the reference vertical line represents the border line of statistical significance. The influence of bone treatment factors onto chosen
responses was investigated at a confidence interval of 95% (α = 0.05). The factors which bar lengths exceed reference line are statistically significant (i.e. p<0.05).
For lower initial Co2+ concentrations (10-4 and 5•10-4 mol/L), although the factor E exhibited largest effect, no statistically significant process variable could be found (Fig. 3). With the further increase of Co2+ concentration, the significance of factor E became statistically important. This is in agreement with the outcomes of a previous study conducted using Cd2+ cation [10]. The results from both the previous and the present study imply that varying the factors of chemical treatments, in the wide ranges defined by experimental matrix, had much less effect of bone sorption properties when compared to thermal treatment at 400oC.
Fig. 3. Pareto plots for sorbed Co2+ amounts as the system response. Initial Co2+ concentration: a)10-4 mol/L, b)5·10-4
mol/L and c) 5·10-3 mol/L
The effects of process variables onto final pH values are presented in Fig. 4. It can be noticed that two or three process variables significantly influenced final pH values. The highest effect was produced by varying factors A and E, whereas factor
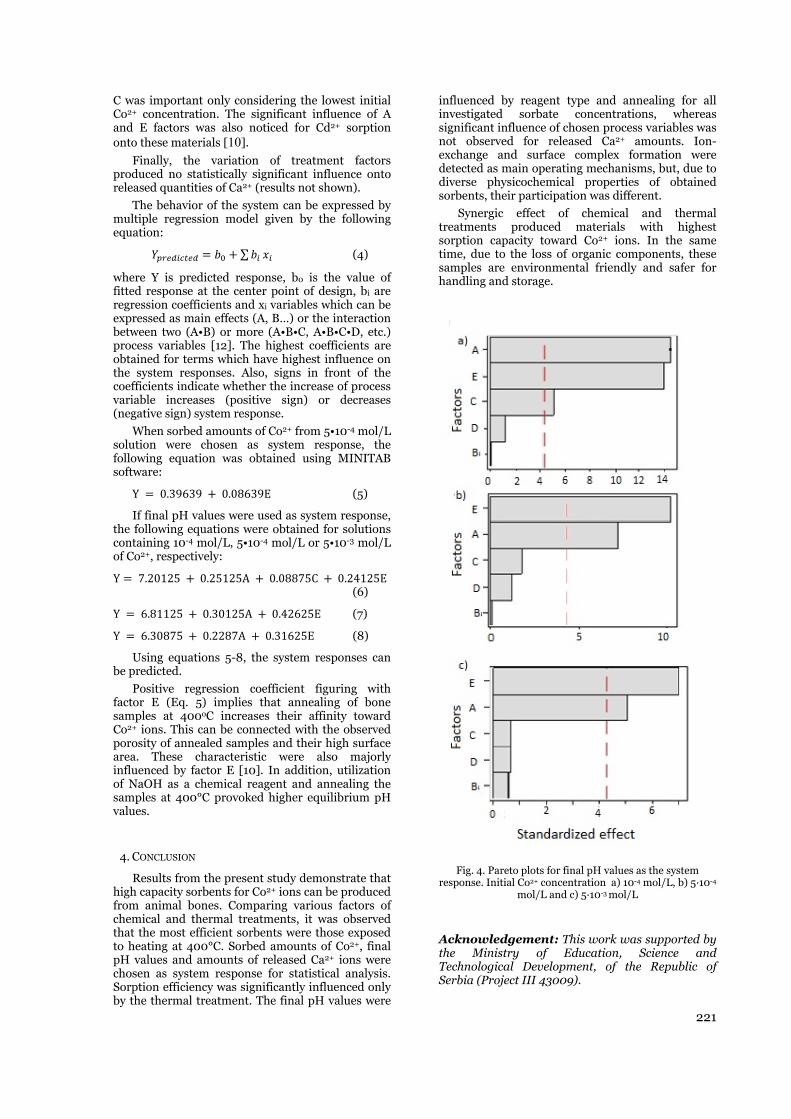
221
C was important only considering the lowest initial Co2+ concentration. The significant influence of A and E factors was also noticed for Cd2+ sorption onto these materials [10].
Finally, the variation of treatment factors produced no statistically significant influence onto released quantities of Ca2+ (results not shown).
The behavior of the system can be expressed by multiple regression model given by the following equation: = + ∑ (4)
where Y is predicted response, b0 is the value of fitted response at the center point of design, bi are regression coefficients and xi variables which can be expressed as main effects (A, B…) or the interaction between two (A•B) or more (A•B•C, A•B•C•D, etc.) process variables [12]. The highest coefficients are obtained for terms which have highest influence on the system responses. Also, signs in front of the coefficients indicate whether the increase of process variable increases (positive sign) or decreases (negative sign) system response.
When sorbed amounts of Co2+ from 5•10-4 mol/L solution were chosen as system response, the following equation was obtained using MINITAB software: Y = 0.39639 + 0.08639E (5)
If final pH values were used as system response, the following equations were obtained for solutions containing 10-4 mol/L, 5•10-4 mol/L or 5•10-3 mol/L of Co2+, respectively: Y = 7.20125 + 0.25125A + 0.08875C + 0.24125E (6) Y = 6.81125 + 0.30125A + 0.42625E (7) Y = 6.30875 + 0.2287A + 0.31625E (8)
Using equations 5-8, the system responses can be predicted.
Positive regression coefficient figuring with factor E (Eq. 5) implies that annealing of bone samples at 400oC increases their affinity toward Co2+ ions. This can be connected with the observed porosity of annealed samples and their high surface area. These characteristic were also majorly influenced by factor E [10]. In addition, utilization of NaOH as a chemical reagent and annealing the samples at 400°C provoked higher equilibrium pH values.
4. CONCLUSION
Results from the present study demonstrate that high capacity sorbents for Co2+ ions can be produced from animal bones. Comparing various factors of chemical and thermal treatments, it was observed that the most efficient sorbents were those exposed to heating at 400°C. Sorbed amounts of Co2+, final pH values and amounts of released Ca2+ ions were chosen as system response for statistical analysis. Sorption efficiency was significantly influenced only by the thermal treatment. The final pH values were
influenced by reagent type and annealing for all investigated sorbate concentrations, whereas significant influence of chosen process variables was not observed for released Ca2+ amounts. Ion-exchange and surface complex formation were detected as main operating mechanisms, but, due to diverse physicochemical properties of obtained sorbents, their participation was different.
Synergic effect of chemical and thermal treatments produced materials with highest sorption capacity toward Co2+ ions. In the same time, due to the loss of organic components, these samples are environmental friendly and safer for handling and storage.
Fig. 4. Pareto plots for final pH values as the system response. Initial Co2+ concentration a) 10-4 mol/L, b) 5·10-4
mol/L and c) 5·10-3 mol/L
Acknowledgement: This work was supported by the Ministry of Education, Science and Technological Development, of the Republic of Serbia (Project III 43009).

222
REFERENCES
1. B.M. Thompson, M. Asce, C.L. Smith, R. P. Busch
and M.D. Siegel, "Removal of metals and radionuclides using apatite and other natural
sorbents", J. Environ. Eng., vol. 129, pp. 492-499, May 2003.
2. S. Raicevic, T. Kaludjerovic-Radoicic and A. I. Zouboulis, "In situ stabilization of toxic metals in polluted soils using phosphates: theoretical
prediction and experiment verification", J. Hazard. Mater., vol. B117, pp. 41-53, January 2005.
3. www.pimsnw.com. Accessed 1. March 2015. 4. C. Waterlot, C. Pruvot, H. Ciesielski and F. Douay,
"Effects of a phosphorus amendment and the pH of water used for watering on the mobility and phytoavailability of Cd, Pb and Zn in highly contaminated kitchen garden soils", Ecol. Eng., vol. 37, pp. 1081–1093, July 2011.
5. F. Monteil-Rivera and M. Fedoroff, "Sorption of inorganic species on apatites from aqueous solutions", in Encyclopedia of Surface and Colloid Science, P. Somasundaran, Ed. New York, Marcel Dekker, Inc, 2002, pp 1–26.
6. J. Oliva, J. De Pablo, J.-L. Cortina, J. Cama and C. Ayora, "Removal of cadmium, copper, nickel, cobalt and mercury from water by Apatite II™: Column experiments", J.Hazard. Mater.,vol. 194, pp. 312–323, October 2011.
7. S. Dimović, I. Smičiklas, M. Šljivić-Ivanović, I. Plećaš and L. Slavković-Beškoski, "The effect of process parameters on kinetics and mechanisms of Co2+ removal by bone char", J. Environ. Sci. Health, Part A, vol. 46, pp. 1–12, October 2011
8. S. Dimović, I. Smičiklas, I. Plećaš, D. Antonović and M. Mitrić, "Comparative study of differently treated
animal bones for Co2+ removal", J. Hazard. Mater., vol. 164, pp. 279–287, May 2009.
9. I. Smičiklas, S. Dimović, M. Šljivić, I. Plećaš, B. Lončar and M. Mitrić, "Resource recovery of animal bones: Study on sorptive properties and mechanism for Sr2+ ions ", J. Nucl. Mater., vol. 400, pp. 15–24, May 2010.
10. M. Šljivić-Ivanović, I. Smičiklas, A. Milenković, B. Dojčinović, B. Babić and M. Mitrić, "Evaluation of the effects of treatment factors on the properties of bio-apatite materials", J. Mater. Sci., vol. 50, pp 354-365, January 2015
11. D. L. Massart, "Handbook of Chemometrics and Qualimetrics"; Elsevier:Amsterdam, 1997.
12. F. Yates, "The Design and Analysis of Factorial Experiments"; Imperial Bureau of Soil Science: Harpenden, 1937.
13. T. Suzuki, T. Hatsushika and M. Miyake, "Synthetic hydroxyapatites as inorganic cation exchangers. Part 2",J. Chem. Soc. Faraday Trans., vol. 78, pp. 3605–3611, 1982.
14. I. Smičiklas, S.Dimović, I. Plećaš and M. Mitrić, "Removal of Co2+ from aqueous solutions by hydroxyapatite", Water Res. vol. 40, pp. 2267–2274, July 2006.

Abstinducontcontthickbrasand prescategthermfor wthreedose
Key
1. INTR
The Ccopper aindustry rolling frrolling. Tmm depeand on sthicknessinstalled. measuremthicknessgamma sparticles When strthe use oHence, srays are measurem
At ththicknessThis sourwith T1/2 around 54particles emits gamyield. Therolling of(see Fig. 1
OCCUP
Jelica K
1 V2
tract. The Copustry sectors. Tetrol of copper sttactless measurekness gauges arss strips, named are under legsented here. Thegorized as "B"moluminescentwhole body TLDe-year period.
e limit of 20 mSv
y words: Coppe
RODUCTION
Copper Mill alloy product
sectors. Tecrom blocks to The standard sending on stripstrip width. Fs radio-isotop The gauges
ment of the s. For this msources are us
limits their urip material coof more than ources that e used for comments.
he Copper Mis gauges are eqrce decays by of 28.80 year45,9 keV. Furtwith T1/2 of 2mma radiatioe gauges are pf copper and b1).
PATIONAL E
aljević 1, M
Vinca Institute School of Elec
pper Mill Sevojechnological prtrip thickness rement of the mere with radio-id rolling mills. gislation dosime doses, in term" group worket system that coD-100 (LiF:Mg,The results shov.
er Mill, Thicknes
Sevojno prodts for utilizachnological p strips consistrip thicknessp composition
For the contrpe strip thicare widely usmetallic or
measurements sed, since shouse to thin anomposition va one measure
emit beta parmposition-inde
ill Sevojno, rquipped with beta minus ers [2]. Energythermore, 90Y
2.67 days. Beson of 1.7 MeVplaced on thebrass strips, n
EXPOSURE
Mirjana Cvij
e of Nuclear Scctrical Engine
no produces varocess of copperradio-isotope stetallic or non-msotope 90Sr. Th
The employees etric control. T
ms of personal ders occupationaonsists of HarshTi). Annual dos
ow that maxima
ss Gauge, 90Sr, H
duces copperation in diffprocess of costs of cold andses are from 8 n (copper or brol of copper kness gaugessed for contanon-metallic
beta sourcesort range of nd light mateariation is expement is donrticles and gaependent thic
radio-isotope radio-isotopemission to the
y of β- particleY emits 2.28 M
ide β- particleV with the 0 machines for
named rolling
TO IONISIN
ović 1, Jele
ciences, Univeeering, Univers
arious copper ar rolling from btrip thickness ga
metallic strip thihe gauges are ps that operate oThe results of
dose equivalent,ally exposed tohaw 6600 Plus ses are given foal measured pe
Hp(10), TLD, H
r and ferent opper d hot to 12
brass) strip s are
actless strip
s and alpha erials. pected ne [1]. amma ckness
strip e 90Sr. e 90Y, es are
MeV β- es 90Y 0.01% r cold mills
aaco
rm
ve
NG RADIAT
na Stankov
ersity of Belgrasity of Belgrad
and copper alloblocks to strips cauges are instaickness. At the Cplaced on the mon these rolling
dosimetric mo, Hp(10), are reo ionizing rad automatic read
or all four groupersonal annual
Harshaw
Fig.
Doses prodactivity are caactivity is fromconsidered danof workers has
The purporadiation expomills in the big
Personal dvia thermolumeffective dose v
ION AT COP
vić 2, 1, Vojis
ade, Belgrade, de, Belgrade, S
oy products forconsists of cold
alled. These gauCopper Mill Sev
machines for col mills are expos
onitoring of roleported quarterdiation. Measurder and thermops of monitoreddose is less tha
1. Duo Rolling
duced by indutegory 4 sourm 100 to 1 tingerous [3]. Th to be provide
ose of this osure to the wggest copper m
dose equivalenminescent dosivalues were es
PPER MILL
slav Stanić
, Serbia Serbia
r utilization in d and hot rollinguges are widelyvojno, radio-isold rolling of copsed to gamma lling mills wor
rly, as those worements are doluminescent dod twenty-one pean recommende
mill: 1) 90Sr gau
ustrial gaugesrces. This meatimes smaller Thus, dosimetred.
work is to workers who mmill in Serbia.
nt, Hp(10), wimeters (TLDsstimated.
1
different g. For the y used for tope strip
opper and radiation rkers are
orkers are done with osimeters ersons for ed annual
uge
without highans that their than activityric monitoring
evaluate themanage rolling
was measureds) and annual
h r y g
e g
d l
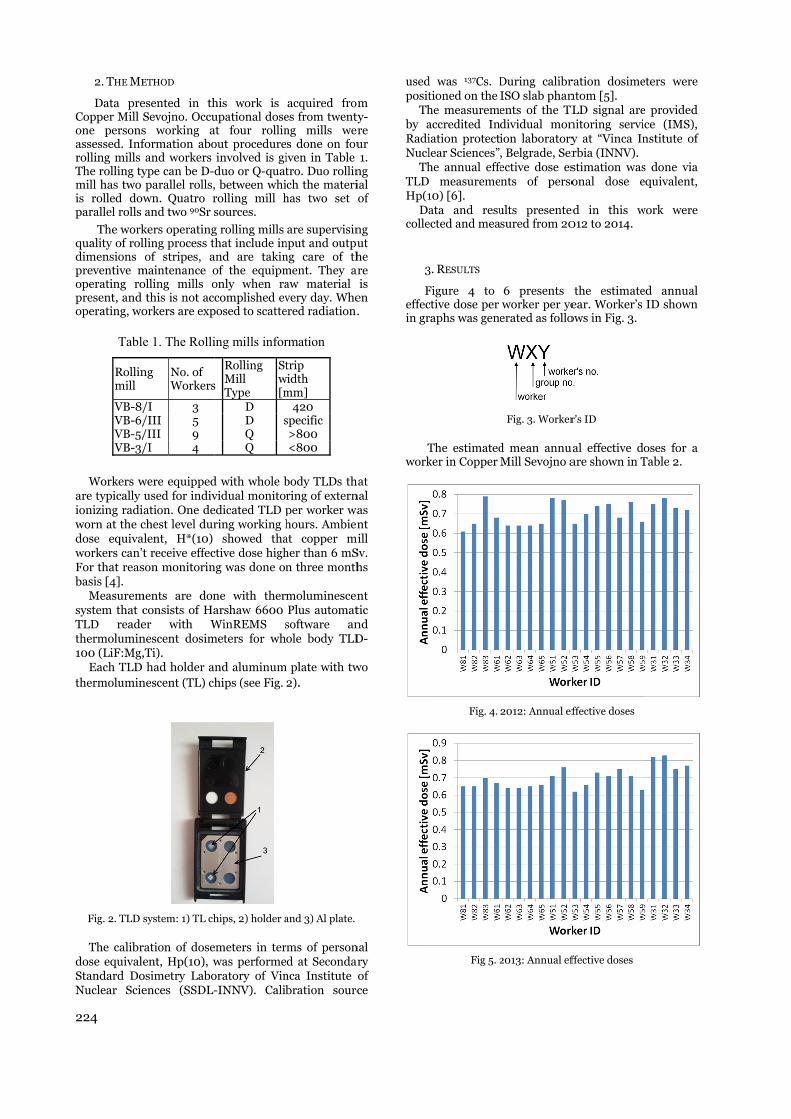
224
2. THE ME
Data preCopper Mill one personsassessed. Infrolling mills The rolling tymill has two is rolled dowparallel rolls
The workquality of roldimensions preventive moperating ropresent, and operating, wo
Table
Rollinmill
VB-8/VB-6/VB-5/VB-3/
Workers w
are typically ionizing radiworn at the cdose equivaworkers can’tFor that reasbasis [4].
Measuremsystem that cTLD readethermolumin100 (LiF:Mg,
Each TLD thermolumin
Fig. 2. TLD
The calibrdose equivaleStandard DoNuclear Scie
ETHOD
esented in thSevojno. Occus working aformation abo and workers ype can be D- parallel rolls,wn. Quatro r and two 90Sr s
kers operatinglling process tof stripes, a
maintenance oolling mills o this is not acorkers are exp
e 1. The Rolli
ng No. of Workers
/I 3 /III 5 /III 9 /I 4
were equipped used for indivation. One dechest level duralent, H*(10) t receive effec
son monitorin
ments are donconsists of Haer with Wnescent dosim,Ti). had holder a
nescent (TL) ch
system: 1) TL ch
ration of doseent, Hp(10), w
osimetry Laboences (SSDL-
his work is upational doseat four rollinout procedure involved is giduo or Q-quat, between whirolling mill hsources.
g rolling mills hat include in
and are takinof the equipmonly when racomplished ev
posed to scatte
ing mills infor
s
Rolling Mill Type
Stw[m
D D sQ Q
d with whole bvidual monitoedicated TLD pring working h showed tha
ctive dose highng was done on
ne with therarshaw 6600 WinREMS s
meters for wh
nd aluminumhips (see Fig.
hips, 2) holder a
emeters in terwas performeoratory of Vin-INNV). Calib
acquired fromes from twentyng mills weres done on fouiven in Table tro. Duo rollinich the materihas two set
are supervisinnput and outpung care of thment. They araw material very day. Whe
ered radiation.
rmation
trip width mm]
420 specific >800 <800
body TLDs thring of externper worker wahours. Ambienat copper miher than 6 mSn three month
moluminescenPlus automat
software anole body TLD
m plate with tw2).
and 3) Al plate.
rms of personed at Secondarnca Institute bration sourc
m ty-re ur 1. ng ial of
ng ut he re is
en .
at nal as nt ill
Sv. hs
nt tic nd D-
wo
nal ry of ce
usedposit
Thby aRadiNucl
ThTLDHp(1
Dacolle
3
Feffecin gr
Twork
d was 137Cs. Dtioned on the he measuremeaccredited Iniation protectilear Sciences”he annual effe measureme10) [6]. ata and resu
ected and mea
3. RESULTS
Figure 4 to ctive dose per raphs was gene
The estimatedker in Copper
Fig. 4.
Fig 5. 2
During calibrISO slab phanents of the TLdividual monion laboratory, Belgrade, Serective dose esnts of perso
ults presentesured from 20
6 presents worker per yeerated as follo
Fig. 3. Worker
d mean annuaMill Sevojno a
2012: Annual ef
2013: Annual ef
ration dosimentom [5]. LD signal are
nitoring serviy at “Vinca Inrbia (INNV). stimation wasonal dose e
ed in this w012 to 2014.
the estimateear. Worker’s
ows in Fig. 3.
r's ID
ual effective dare shown in T
ffective doses
ffective doses
eters were
e provided ice (IMS), nstitute of s done via equivalent,
work were
ed annual ID shown
oses for a Table 2.
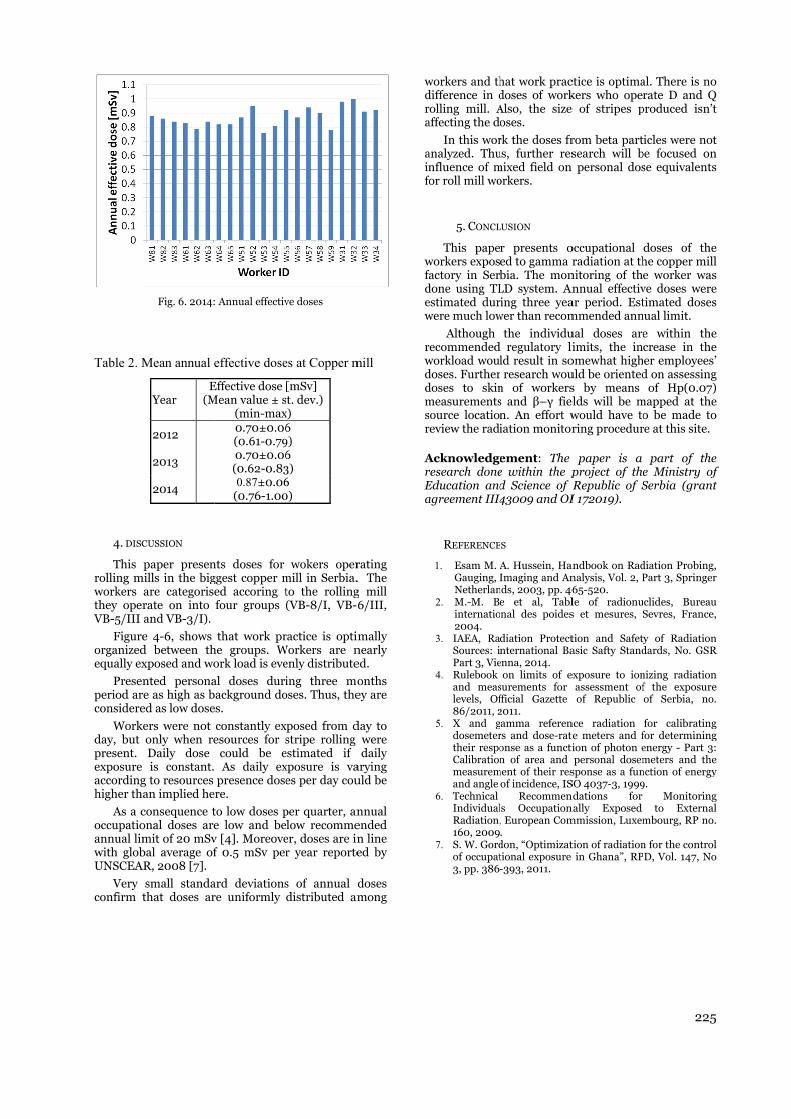
Table 2. M
4. DISC
This rolling mworkers they operVB-5/III
Figureorganizedequally ex
Presenperiod arconsidere
Workeday, but present. exposure accordinghigher tha
As a coccupatioannual limwith globUNSCEA
Very confirm t
Fig. 6. 2014:
Mean annual e
Year E
(M
2012
2013
2014
CUSSION
paper presenmills in the big
are categoriserate on into and VB-3/I).
e 4-6, shows d between thxposed and wo
nted personare as high as bed as low dose
ers were not only when reDaily dose
is constant.g to resources an implied he
consequence tonal doses aremit of 20 mSvbal average of
AR, 2008 [7].
small standathat doses ar
: Annual effectiv
effective dose
Effective dose Mean value ± s
(min-max0.70±0.06(0.61-0.790.70±0.06(0.62-0.830.87±0.06
(0.76-1.00
nts doses for ggest copper med accoring tfour groups
that work prhe groups. Work load is eve
al doses duribackground does.
constantly exesources for s
could be e As daily ex presence dose
ere.
to low doses pe low and bev [4]. Moreovef 0.5 mSv per
ard deviationsre uniformly
ve doses
es at Copper m
[mSv] st. dev.) x) 6
9) 6 3) 6 0)
wokers opermill in Serbia.to the rolling(VB-8/I, VB-6
ractice is optimWorkers are n
enly distribute
ing three mooses. Thus, the
xposed from dstripe rolling
estimated if xposure is vaes per day cou
per quarter, anlow recomme
er, doses are inr year reporte
s of annual ddistributed am
mill
rating . The g mill 6/III,
mally nearly ed.
onths ey are
day to were daily
arying uld be
nnual ended n line ed by
doses mong
wdra
ainfo
wfadew
rwddmsr
ArEa
workers and thdifference in drolling mill. Aaffecting the do
In this woranalyzed. Thunfluence of m
for roll mill wo
5. CONCL
This papeworkers exposfactory in Serbdone using TLestimated durwere much low
Although recommended workload wouldoses. Furtherdoses to skinmeasurementssource locationreview the radi
Acknowledgeresearch doneEducation andagreement III4
REFERENCE
1. Esam M. AGauging, INetherlan
2. M.-M. Beinternatio2004.
3. IAEA, RaSources: inPart 3, Vie
4. Rulebook and measlevels, Of86/2011, 2
5. X and gdosemetertheir respoCalibrationmeasuremand angle
6. Technical IndividualRadiation,160, 2009
7. S. W. Gordof occupat3, pp. 386-
hat work pracdoses of workAlso, the size oses.
rk the doses frus, further resmixed field on orkers.
LUSION
r presents oed to gamma rbia. The monLD system. Aning three yea
wer than recom
the individu regulatory lild result in so research wou
n of workerss and β–γ fieln. An effort wiation monitor
ement: The e within the pd Science of R43009 and OI
S
A. Hussein, HanImaging and An
nds, 2003, pp. 46e et al, Tablnal des poides
diation Protectnternational Ba
enna, 2014. on limits of e
surements for fficial Gazette 2011. amma referen
rs and dose-rateonse as a functin of area and
ment of their resof incidence, IS
Recommens Occupation, European Com. don, “Optimizattional exposure -393, 2011.
ctice is optimakers who opere of stripes p
rom beta partsearch will b
n personal dos
occupational radiation at th
nitoring of theAnnual effectivar period. Estmmended ann
ual doses areimits, the in
omewhat highuld be orienteds by means elds will be mwould have toring procedur
paper is a project of theRepublic of S
I 172019).
andbook on Radnalysis, Vol. 2, P65-520. le of radionus et mesures, S
tion and Safetyasic Safty Stand
exposure to ionassessment ofof Republic
nce radiation te meters and fion of photon epersonal dosem
sponse as a funSO 4037-3, 1999ndations for nally Exposed mmission, Luxem
tion of radiation in Ghana”, RP
225
al. There is norate D and Q
produced isn’t
icles were notbe focused onse equivalents
doses of thehe copper mille worker wasve doses weretimated doses
nual limit.
e within thecrease in theer employees’d on assessing
of Hp(0.07)mapped at the
o be made tore at this site.
part of thee Ministry ofSerbia (grant
diation Probing,Part 3, Springer
clides, BureauSevres, France,
y of Radiationdards, No. GSR
nizing radiationf the exposureof Serbia, no.
for calibratingfor determiningenergy - Part 3:meters and the
nction of energy9. Monitoring to Externalmbourg, RP no.
n for the controlD, Vol. 147, No
5
o Q t
t n s
e l s e s
e e ’
g ) e o
e f t
, r
u ,
n R
n e .
g g : e y
g l .
l o

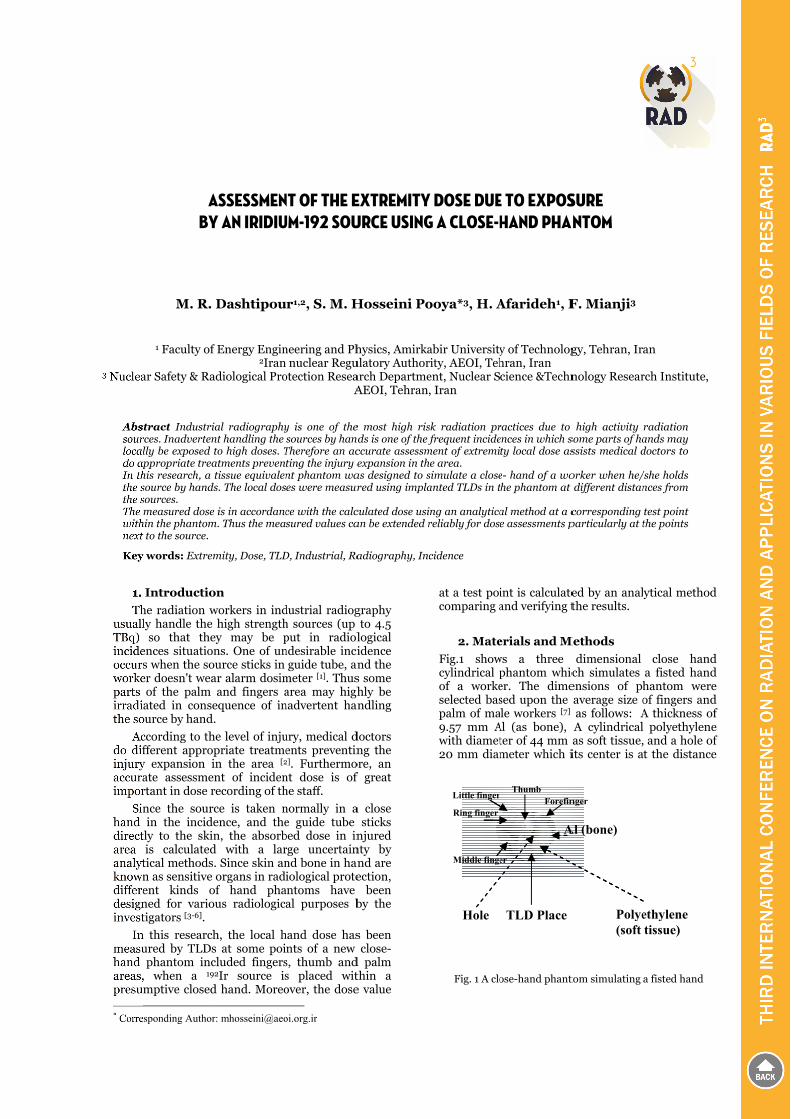
ABY
M. R.
1 Faculty of
ar Safety & Ra
tract Industrirces. Inadvertenlly be exposed tppropriate trea
his research, a source by handssources. measured dose
hin the phantomt to the source.
y words: Extrem
Introductio
he radiation wly handle the
so that theences situations when the soer doesn't wea of the palm ated in conse
ource by hand.
ccording to thfferent appropy expansion iate assessmenrtant in dose r
nce the sourc in the incidetly to the skinis calculated
tical methods.n as sensitive ent kinds oned for variotigators [3-6].
n this researchured by TLDs phantom inc, when a 19
mptive closed
esponding Author
ASSESSMENY AN IRIDIU
Dashtipou
f Energy Engin2Iran
adiological Pro
al radiographynt handling the to high doses. Tatments preventissue equivalens. The local dos
is in accordancm. Thus the mea
mity, Dose, TLD
on*
workers in ind high strengthey may be pns. One of unurce sticks in
ar alarm dosimand fingers a
equence of in.
he level of injupriate treatmein the area [2
nt of incidenrecording of th
ce is taken nence, and then, the absorb
d with a lar. Since skin an organs in radi
of hand phaus radiologica
h, the local hs at some poicluded fingers2Ir source is
d hand. Moreo
r: mhosseini@aeo
NT OF THE EUM-192 SOU
ur1,2, S. M. H
neering and Ph nuclear Regu
otection ReseaA
y is one of the sources by handTherefore an acting the injury ent phantom waes were measur
ce with the calcsured values ca
D, Industrial, Ra
dustrial radiogh sources (up put in radiolndesirable inci guide tube, an
meter [1]. Thusarea may high
nadvertent han
ury, medical dents preventin2]. Furthermont dose is of he staff.
normally in ae guide tube bed dose in inrge uncertainnd bone in haniological prote
antoms have al purposes b
hand dose hasnts of a new
s, thumb ands placed witover, the dose
oi.org.ir
EXTREMITYURCE USING
Hosseini Po
hysics, Amirkaulatory Authorarch DepartmeAEOI, Tehran,
e most high risds is one of the fccurate assessm expansion in thas designed to sred using impla
culated dose usian be extended r
adiography, Inc
graphy to 4.5 logical idence nd the s some hly be ndling
doctors ng the
ore, an f great
a close sticks njured
nty by nd are ection, been by the
s been close-
d palm thin a e value
Y DOSE DUEG A CLOSE-H
ooya*3, H. A
abir Universityrity, AEOI, Tehent, Nuclear S, Iran
sk radiation pr frequent incide
ment of extremihe area. simulate a closeanted TLDs in t
ing an analyticareliably for dose
cidence
at a test poicomparing a
2. Mate
Fig.1 showcylindrical pof a workeselected baspalm of ma9.57 mm Awith diamet20 mm diam
Fig. 1 A clo
Hole
Little finger
Ring finger
Middle finge
E TO EXPOSHAND PHA
Afarideh1, F
y of Technologhran, Iran cience &Techn
ractices due to ences in which sty local dose as
e- hand of a wothe phantom at
al method at a ce assessments p
int is calculateand verifying t
erials and M
ws a three phantom whicer. The dimesed upon the le workers [7]
Al (as bone), ter of 44 mm ameter which i
ose-hand phant
TLD Place
er
ForefinThumb
A
SURE ANTOM
F. Mianji3
gy, Tehran, Ira
nology Resear
high activity some parts of hassists medical d
orker when he/ different distan
corresponding particularly at t
ed by an analthe results.
Methods
dimensional ch simulates ensions of phaverage size o as follows: AA cylindrical as soft tissue,its center is a
tom simulating
Polye(soft
nger
Al (bone)
an
rch Institute,
radiation ands may doctors to
/she holds nces from
test point the points
ytical method
close handa fisted handhantom wereof fingers andA thickness of polyethylene and a hole oft the distance
a fisted hand
ethylene tissue)
d
d d e d f e f e

228
of 13.4 mm from centre of polyethylene.
LiF:Mg, Cu, P (GR-200, china) TLD pellets (0.9 mm thickness) were implanted at different distance from the hole (i. e. source and guide tube position) within the phantom. All the TLDs were calibrated to 137Cs photon source at the Secondary Standard Dosimetry Laboratory of Iran. A TLD reader model of HARSHAW® 4000 was used for TLD readouts.
A 192Ir source along with a stainless steel guide tube was used for the experimental exposures. Fig.2 shows the dimensions of the source and guide tube as well as the specific exposure setting for analytical comparisons.
Considering a broad beam geometry of emitted photons from the cylindrical source, the appr-oximate absorbed dose D at a test point P in the phantom (see Fig. 2 and 3) can be calculated analytically as [8]:
0
sec2
)(2de
za
rnSBD bv R
(1)
where the parameters are assigned as follows;
B: buildup factor,
Sv: source strength (Bq.cm-3),
n: number of particles per disintegration (2.36 for 192Ir) [9], r: source radius, a: distance between point P and boundary of source, z: self absorption distance which is defined as the distance from the near curved cylindrical surface to an interior line source which would yield the same flux, R: absorbed dose response function (Gy. cm2) in polyethylene which is calculated as:
Epol
enE.,
1010602.1
R (2)
E: averaged photon energy (MeV), µen/ρ: mass energy absorption coefficient.
The parameter b in Eq. 1 is defined as:
dtzb PoleFs . (3)
where, µs: Linear attenuation coefficient of source, µFe: Linear attenuation coefficient of Iron (guide tube), µPol.: Linear attenuation coefficient of Polyethylene (soft tissue), t: thickness of guide tube, d: attenuating thickness of polyethylene. The buildup factor B is obtained as BFe × BPol. where BFe and BPol. are the corresponding values for Iron and Polyethylene respectively.
Considering the Burlin cavity theory (with
d=0), the approximate dose D at any point in the phantom can be measured using TLDs as [10]:
.Pol
LiF
enTLCFD
(3)
where CF is absorbed dose calibration factor of TLD (in air), TL is the related dosimeter response of each TLD pellete, and µen/ρ is the mass energy absorption coefficient.
3. Results and Discussions
3.1. TLD measurements
Table 1 presents the maximum local dose values of fingers and the averaged dose of palm areas of a typical hand at 1 mm depth when the inserted source in guide tube is placed within the middle position of phantom in guide tube (as Fig. 2). These averaged dose values have been directly measured using implanted TLDs at different points of a phantom.
Since the distance between middle finger and source is the shortest in this experimental
Fig. 3 Geometric position of test point P in the phantom.
Guide tube
r
zTLD
P θ Source
Polyethylene
at d
14.5
mm
Fig. 2 An example of source position within phantom at middle point (left), and the source/ guide tube dimensions (right).
Source
Phantom
14.5 mm
4 mm
18 mm 5.5 mm
Gap (0.5 mm)
TLD
Guide tube
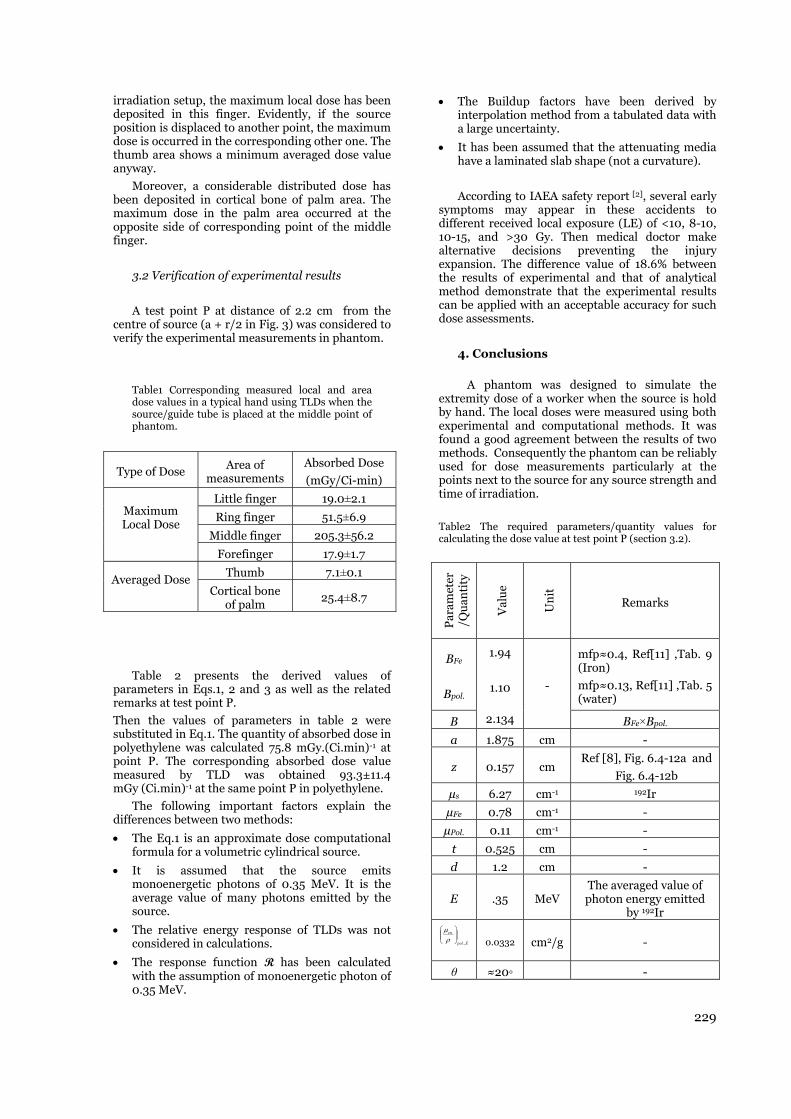
229
irradiation setup, the maximum local dose has been deposited in this finger. Evidently, if the source position is displaced to another point, the maximum dose is occurred in the corresponding other one. The thumb area shows a minimum averaged dose value anyway.
Moreover, a considerable distributed dose has been deposited in cortical bone of palm area. The maximum dose in the palm area occurred at the opposite side of corresponding point of the middle finger.
3.2 Verification of experimental results
A test point P at distance of 2.2 cm from the centre of source (a + r/2 in Fig. 3) was considered to verify the experimental measurements in phantom.
Table1 Corresponding measured local and area dose values in a typical hand using TLDs when the source/guide tube is placed at the middle point of phantom.
Type of Dose Area of measurements
Absorbed Dose
(mGy/Ci-min)
Maximum Local Dose
Little finger 19.0±2.1
Ring finger 51.5±6.9
Middle finger 205.3±56.2
Forefinger 17.9±1.7
Averaged Dose
Thumb 7.1±0.1
Cortical bone of palm
25.4±8.7
Table 2 presents the derived values of parameters in Eqs.1, 2 and 3 as well as the related remarks at test point P.
Then the values of parameters in table 2 were substituted in Eq.1. The quantity of absorbed dose in polyethylene was calculated 75.8 mGy.(Ci.min)-1 at point P. The corresponding absorbed dose value measured by TLD was obtained 93.3±11.4 mGy (Ci.min)-1 at the same point P in polyethylene.
The following important factors explain the differences between two methods:
The Eq.1 is an approximate dose computational formula for a volumetric cylindrical source.
It is assumed that the source emits monoenergetic photons of 0.35 MeV. It is the average value of many photons emitted by the source.
The relative energy response of TLDs was not considered in calculations.
The response function R has been calculated with the assumption of monoenergetic photon of 0.35 MeV.
The Buildup factors have been derived by interpolation method from a tabulated data with a large uncertainty.
It has been assumed that the attenuating media have a laminated slab shape (not a curvature).
According to IAEA safety report [2], several early symptoms may appear in these accidents to different received local exposure (LE) of <10, 8-10, 10-15, and >30 Gy. Then medical doctor make alternative decisions preventing the injury expansion. The difference value of 18.6% between the results of experimental and that of analytical method demonstrate that the experimental results can be applied with an acceptable accuracy for such dose assessments.
4. Conclusions
A phantom was designed to simulate the
extremity dose of a worker when the source is hold by hand. The local doses were measured using both experimental and computational methods. It was found a good agreement between the results of two methods. Consequently the phantom can be reliably used for dose measurements particularly at the points next to the source for any source strength and time of irradiation.
Table2 The required parameters/quantity values for calculating the dose value at test point P (section 3.2).
Par
amet
er/Q
uan
tity
Val
ue
Un
it
Remarks
BFe
Bpol.
1.94
1.10
2.134
-
mfp≈0.4, Ref[11] ,Tab. 9 (Iron)
mfp≈0.13, Ref[11] ,Tab. 5 (water)
B BFe×Bpol.
a 1.875 cm -
z 0.157 cm Ref [8], Fig. 6.4-12a and
Fig. 6.4-12b
µs 6.27 cm-1 192Ir
µFe 0.78 cm-1 -
µPol. 0.11 cm-1 -
t 0.525 cm -
d 1.2 cm -
E .35 MeV The averaged value of photon energy emitted
by 192Ir
Epol
en
.,
0.0332 cm2/g -
θ ≈20◦ -
230
REFERENCES
1. United Nations Scientific Committee on the Effects of Atomic Radiation, Sources and Effects of Ionizing Radiation, Report to General Assembly, with Scientific Annexes, United Nations Sales Publi-cationE.00.IX.3 (New York, United Nations), 2000.
2. IAEA-WHO (1998) Diagnosis and Treatment of Radiation Injuries. IAEA Safety Reports Series, No. 2, Table III (Page 7), Vienna.
3. B. Majowska, M. Tuszyński, (2005) A hand phantom for radiological measurements, Nukleonika, 50 (4) 167-172.
4. F. Becker, Ch. Blunck (2011) Investigation of radiation exposure of medical staff: Measurements supported by simulations with an articulated hand phantom, Radiat. Meas. 46, 1299-1302.
5. R. Ciolini, F. Errico A.C. Traino, E. Paternostro, A. Laganà, C. Romei1, F. Pazzagli, A. Del Gratta (2014) Development of anthropomorphic hand phantoms for personal dosimetry in 90Y-Zevalin preparation and patient delivering, Radiat Prot Dosim. 158: 216.
6. Ch. Blunck, F. Becker, L. Hegenbart, B. Heide, J. Schimmelpfeng, and M. Urban (2009) Radiation protection in inhomogeneous beta–gamma fields and modeling of hand phantoms with MCNPX Radiat. Prot Dosim. 134: 13-22.
Radiat. Prot Dosim. 134: 13-22.
7. A. Chandra, P. Chandna, S. Deswal (2011) Analysis of Hand Anthropometric Dimensions of Male Industrial Workers of Haryana State, Int. J. Eng. 5 :3, 242-256.
8. R. G. Jaeger, E. P. Blizard, A. B. Chilton, M. Grotenhuis, A. Honig, Th. A. Jaeger (1968) Engineering Compen-dium On Radiation Shielding, Volume 1, Springer-Verlag Berlin Heidelberg GmbH.
9. B. Kassas, F. Mourtada, J. L. Horton, R.G. Lane, T. A. Buchholz, E. A. Strom (2006) Dose modification factors for 192Ir high-dose-rate irradiation using Monte Carlo simulations, J. Appl. Clinic. Med. Phys.7:3, doi:10.1120 /jacmp.v7i3.2293. http://www.jacmp.org/index.php/jacmp/article/view/2293/1283.
10. F. H. Attix (2004) Introduction to radiological physics and radiation dosimetry. Weinheim, Germany: Wiley-VCH Verleg GmbH & Co.KGaA.
11. K. Takeuchi, S. Tanaka (1986) Absorbed-dose and dose-equivalent buildup factors of gamma rays including bremsstrahlung and annihilation radiation for water, concrete, iron and lead, Appl. Radiat. Isot. 37:4, 283–296.

O
D
2 V
Abseye lfor epurpoverHp(3suitarang0.14-beamwork
Key
1. I
Nulens othan risk hthreshmight[1-6]. amonIf radto wocardioregulainjurieprofesInterninitiat(RetroDose)paramsuits showelens in
CoRadioreduct20 mdose ldosimarea,
AIR KOF THE HUM
Dragana Kr
1 UniversiVinca Institute
tract. Internatlens from 150 meye lens dosimeposes. The aim rall quality of e3,ı)/Ka (in Sv/Gable cylindricalge 0.44-0.88 fo-1.56 for N-150
m qualities reakplace situation
y words: eye le
INTRODUCT
umerous studof the eye is mo
previously thhas been signihold for catart be much low Intervention
ng areas with hdiation protectorkers involveology proceduatory limit. Thes among issionals in inational Atoted a studospective Eva) to examinmedical perso
[4]. The repoed increased njuries [1,2,6]
onsequently, tological protction of dose li
mSv per year [limit has attra
metry has becincluding de
KERMA TO MAN EYE LE
rstic 1, Zora
ity of Kragujeve of Nuclear Sc
tional CommissmSv down to 20etry, while cylin of the work waeye lens dose aGy), based on Ml phantom. For or N-40, 0.72-10 beam qualityadily availablens in medicine a
ns, medium ene
ION
dies have demore sensitive t
hought, indicaficantly under
ract developmwer than it was
al radiology high potential tion is not praed in intervenures can rea
here are receninterventionalinterventionalomic Energydy in 200aluation of
ne the eyes onnel involvedorted results prevalence of.
the Internatiotection (ICRimit for eye le[7]. This 7.5
acted great attecome a very evelopment o
HP(3) CONVENS TO THE
an Jovanov
vac, Faculty ofcience, Univer
sion on Radiolo0 mSv for occupndrical phantomas to provide a
assessment. TheMonte Carlo si incident angles1.06 for N-60, y. The conversioe in the calibraand industry.
ergy X-Rays, M
monstrated thto ionizing radated that radrestimated anent in the eye
s previously thand cardiolog for risk to eye
acticed, the eyntional radioloach or exceet reports of eylists and sul suite [3-5]y Agency (8 called RLens Injuries of medicald in intervenfrom these s
f radiation in
nal CommissiRP) proposeens from 150 mfold reductionention and eyintensive res
of new dosim
VERSION CE SELECTED
vic 1, Drago
f Science, R. Drsity of Belgrad
ogical Protectiopational exposum approximati set of conversie work investigimulations for as ı from 0o to 9 0.91-1.63 for Non factors Hp(ation laborato
MCNP5/X, conve
hat the diation diation nd that e lens, hought gy are e lens.
ye dose ogy or ed the ye lens upport . The
(IAEA) RELID s and l and ntional studies nduced
ion on ed a mSv to n of a ye lens search
meters,
COEFFICIENTD STANDARD
oslav Nikezi
Domanovica 12de, M.P. Alasa
on (ICRP) has dures. The operatng the shape ofion coefficients gated the air kea standard bea
90o, the conversN-80, 1.08-1.52(3)/Ka provide
ories and are s
ersion coefficien
calibration arrangemenionizing rad
Operatiomonitoring by Internatiand measrecommendmonitoring.tissue at anspecified po
The lensdirectly memeasuring quantity Hpeye. Until rbeen in useavailable. Hscientific finfor investigand radiatiowith regulcontributes
A numboccupationaand epidemwere carriethe eye dosieye dosimetstudies aimeye lens dos
TS FOR EXPD X-RAY BE
ic 1, Olivera
2, 34000 Kraga 12, Vinca, 110
decreased the ational quantity f a head was su that could conterma to Hp(3,ı)am qualities, difsion coefficients2 for N-100, 1.d in this work suitable for ap
nts
procedures nts in variousdiation [8-15].
onal quantitie of external exional Commissurements (Ided as operat
It is the dosen appropriateoint on the hum
s of the eye deasurable. It
the above p(3), at a positecently this q
e and respectiHowever, in thndings, accuraation of correon dose, for atory dose to better radia
ber of papers al lens exposu
miological poind out to invemetry, as devters and calib
med to design tse levels, moni
POSURE EAM QUALI
a Ciraj-Bjel
gujevac, Serbia000 Belgrade,
annual dose lim Hp (3) has beeuggested for catribute to impr)conversion coeifferent angulats Hp(3,ı)/Ka we.22- 1.62 for N are related to pplication in n
and eye lenus fields of a
es for area axposures havession on RadiICRU). Thetional quantitye equivalent i
e depth of 3 man body [16-
dose, as orgat is usually mentioned tion on the hequantity has nive dosimeterhe light of theate dosimetryelation of rad verification o
limits and ation protectio
addressed thure from bothnt of view . T
estigate variovelopment of nbration procedthe methodolo
nitoring arrang
ITIES
lac 2
a , Serbia
mit for the en defined alibration oving the efficients, tions and ere in the
N-120 and standard numerous
s monitoringapplication of
nd individuale been definedological Units
e Hp(3) isy for eye lensn ICRU (soft)mm, below a-17].
n dose is notassessed by
operationalad near to the
not commonlyrs were rarelye most recenty is importantdiation effectsof compliance
it certainlyon.
he question ofh a dosimetricThose studies
ous aspects ofnew dedicateddures, clinicalogy and assessgements using
g f
l d s s s ) a
t y l e y y t t s e y
f c s f d l s g

232
different typlens dose witretrospective
The needinterest for thfrom air kerRecently, act(Optimisationstaff) calculakerma to Hp[8,9,14]. In right cylindeICRU 4-elemcalculating kerma to Hpcloser to therealistic in twithin the heto calculation14].
The aim conversion creference radInternational(ISO) publiused in cacontribute thlens dose asituation invrays.
2. MATE
The workair kerma coSv/Gy), basestandard bephantom. Cmeans of thmethod [18]transport froFor this pcoefficients wwith the shap
Dimensioand 20 cm inwith basic mmethyl-methfilled with wa
The sourbeam of 20 xof photons anterior-postfrom the phtransport wangulation ra
pes of dosimeth patient dose dose assessm
d for eye lens dhe calculationrma (Ka) to tivities carriedn of RAdiatioation of the co(3) for photonaddition, a nr (20 cm in dment tissue, the conversip(3) [13,15].
e elliptical shaterms of theead. This impns performed
of the work oefficients frodiation beaml Organizatiication ISO 4alibration labhat to improveassessment pvolving exposu
ERIALS AND M
k investigated onversion coe
ed on Monte Cam qualities alculations h
he MCNP5/X , which was
om the source purpose, calwas performe
pe of cylinder,
ons of cylindn height, with material struchacrylate (PMMater.
rce was modex 20 cm2. An a
irradiated terior AP geomhantoms. The
was modeled anging from 0
eters, correlae indices and
ment [9, 11-15]
dose monitorinn of conversion Hp(3) for p
d out under thon protection onversion factns, electrons anew phantom,diameter) and
has been pon coefficienThis cylindri
ape of the heae position of tproves accurac in the slab p
was to provom air kerma
m qualities defon for Stan
4037, that areboratories, e the overall qprocedures inure to medium
METHOD
the lens of theefficients, HpCarlo simulat and suitable
have been pe code using Mused to simu
to the volumelculation of ed by using as presented
der is 20 cm the wall thickcture in the MA), and insi
eled as a squaligned and ex
the entire pmetry at a dise calculation and perform
o to 90o.
ations of eye methods for .
ng increased n coefficients
photons [13]. he ORAMED for MEDical tors from air and neutrons shaped as a made of the
proposed for nt from air cal shape is ad and more the eye lens cy compared phantom [13,
vide a set of to Hp(3) for fined in the ndardization e commonly
that could quality of eye n workplace m energy X-
e eye dose to p(3,ı)/Ka (in tions using a e cylindrical erformed by Monte Carlo ulate photon e of interest.
conversion a phantom,
in Figure 1.
in diameter kness 0.5 cm,
wallof poly-ide area was
uare parallel xpanded field phantom in
stance of 1 m of photons
med for the
ThkeV eenerg108 sicalculBeamconvestanddefineStandas prbasedThe Hp(3and calculwith equivtissuerecomfor phtheseThe con thalongaroun
3
Thangulprese
Tabl
Angl(degre
0◦
30◦
60◦
90◦
Thapprothe hmm)
Fig 1. The cylin
he tally used tenergy cut-offgy deposited inimulations welation uncert
m qualities ersion factodard series oed in the
dardization (ISresented in Tad on methods d
calculation ,ı)/Ka, requirHp(3). The lating air kerair of radiu
valent Hp(3) ise at 3 mm dmmended to tahotons Hp(3) specified con
centers of the he midplane atg the radius nd the axial m
3. RESULTS A
he conversionlations and
ented in the Ta
le 1 conversioangulations a
e ee)
N 40 N
0.88 1.
0.88 1
0.75 0
0.44 0
he cylindricaoximate to the
head related to at which the
ndrical modeled
o score the kef for photons.n cell (in MeVre run in ordeainty, not mused for crs Hp(3,ı)/Kon photon rInternational SO) publicatiable 1. Spectdescribed eles
of converes independen
MCNP F6 trma without us 10 cm. Ts defined as thdepth in the ake the quality is equal to thditions. scoring volumt a depth of 3is 0.5 mm, tidplane.
AND DISCUSS
n factors Hp(3different be
able 1 and Figu
on factors Hp(3and different b
Hp(3)/Ka
N 60 N 80 N
06 1.63
.14 1.39
.93 1.29
.73 0.91
al phantom e best possibleo angle depene operational
d of head phant
erma was ‘F6’ w. Tally F6 givV per gram). Ter to achieve amore of 3 pecalculation oKa were nreference radl Organizatiotion ISO 4037ctra was calucsewhere [20] ersion coeffent calculationtally was usephantom in The personal
he dose equiva phantom. Ay factor Q equhe absorbed d
mes were posi3 mm. The thithe height is
SION
3)/Ka for dieam qualitieure 2.
3)/Ka for diffbeam qualities
[Sv/Gy]
N 100 N 120
1.52 1.62
1.56 1.35
1.42 1.43
1.08 1.22
was selecte extend the shndence and de quantity is d
oms
with 1-ves the Totally a small ercent.
of the narrow diation on for 7 [19] , culated
ficients n of Ka ed for sphere l dose
alent in As it is ual to 1 dose in
itioned ickness 2 cm
fferent es are
fferent s
N 150
1.56
1.38
1.44
1.14
ed to hape of epth (3 defined
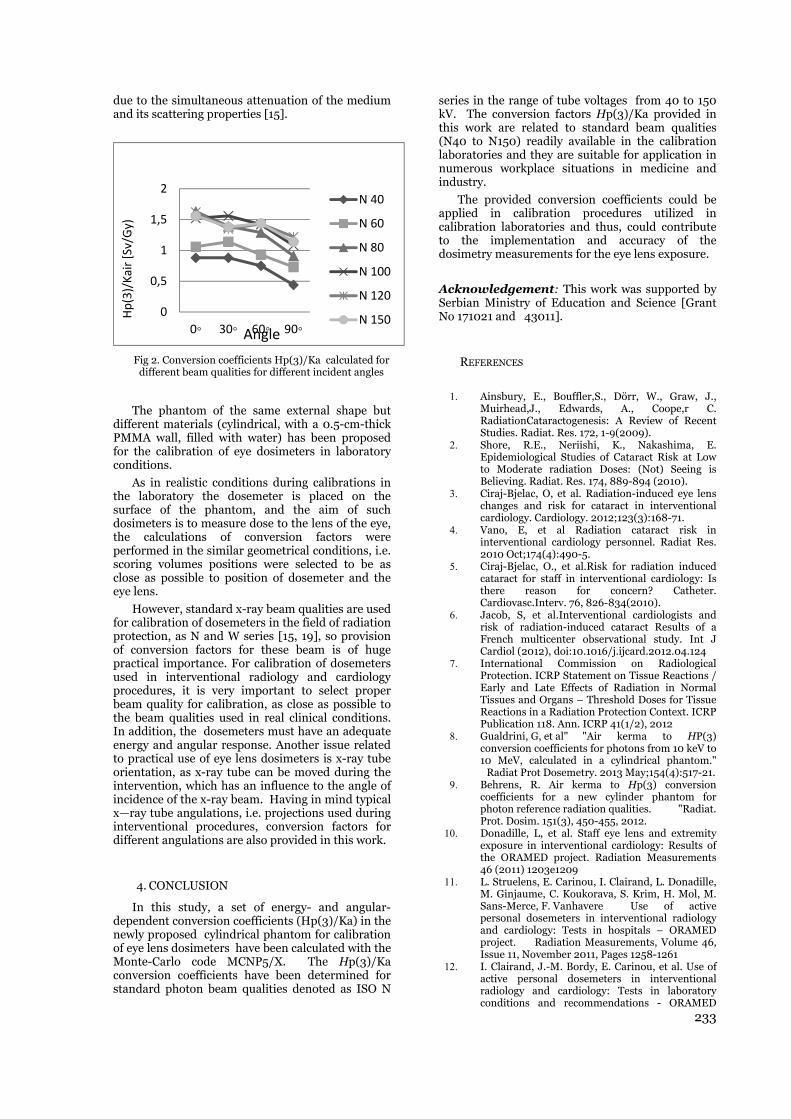
233
due to the simultaneous attenuation of the medium and its scattering properties [15].
Fig 2. Conversion coefficients Hp(3)/Ka calculated for different beam qualities for different incident angles
The phantom of the same external shape but different materials (cylindrical, with a 0.5-cm-thick PMMA wall, filled with water) has been proposed for the calibration of eye dosimeters in laboratory conditions.
As in realistic conditions during calibrations in the laboratory the dosemeter is placed on the surface of the phantom, and the aim of such dosimeters is to measure dose to the lens of the eye, the calculations of conversion factors were performed in the similar geometrical conditions, i.e. scoring volumes positions were selected to be as close as possible to position of dosemeter and the eye lens.
However, standard x-ray beam qualities are used for calibration of dosemeters in the field of radiation protection, as N and W series [15, 19], so provision of conversion factors for these beam is of huge practical importance. For calibration of dosemeters used in interventional radiology and cardiology procedures, it is very important to select proper beam quality for calibration, as close as possible to the beam qualities used in real clinical conditions. In addition, the dosemeters must have an adequate energy and angular response. Another issue related to practical use of eye lens dosimeters is x-ray tube orientation, as x-ray tube can be moved during the intervention, which has an influence to the angle of incidence of the x-ray beam. Having in mind typical x—ray tube angulations, i.e. projections used during interventional procedures, conversion factors for different angulations are also provided in this work.
4. CONCLUSION
In this study, a set of energy- and angular-dependent conversion coefficients (Hp(3)/Ka) in the newly proposed cylindrical phantom for calibration of eye lens dosimeters have been calculated with the Monte-Carlo code MCNP5/X. The Hp(3)/Ka conversion coefficients have been determined for standard photon beam qualities denoted as ISO N
series in the range of tube voltages from 40 to 150 kV. The conversion factors Hp(3)/Ka provided in this work are related to standard beam qualities (N40 to N150) readily available in the calibration laboratories and they are suitable for application in numerous workplace situations in medicine and industry.
The provided conversion coefficients could be applied in calibration procedures utilized in calibration laboratories and thus, could contribute to the implementation and accuracy of the dosimetry measurements for the eye lens exposure.
Acknowledgement: This work was supported by Serbian Ministry of Education and Science [Grant No 171021 and 43011].
REFERENCES
1. Ainsbury, E., Bouffler,S., Dörr, W., Graw, J., Muirhead,J., Edwards, A., Coope,r C. RadiationCataractogenesis: A Review of Recent Studies. Radiat. Res. 172, 1-9(2009).
2. Shore, R.E., Neriishi, K., Nakashima, E. Epidemiological Studies of Cataract Risk at Low to Moderate radiation Doses: (Not) Seeing is Believing. Radiat. Res. 174, 889-894 (2010).
3. Ciraj-Bjelac, O, et al. Radiation-induced eye lens changes and risk for cataract in interventional cardiology. Cardiology. 2012;123(3):168-71.
4. Vano, E, et al Radiation cataract risk in interventional cardiology personnel. Radiat Res. 2010 Oct;174(4):490-5.
5. Ciraj-Bjelac, O., et al.Risk for radiation induced cataract for staff in interventional cardiology: Is there reason for concern? Catheter. Cardiovasc.Interv. 76, 826-834(2010).
6. Jacob, S, et al.Interventional cardiologists and risk of radiation-induced cataract Results of a French multicenter observational study. Int J Cardiol (2012), doi:10.1016/j.ijcard.2012.04.124
7. International Commission on Radiological Protection. ICRP Statement on Tissue Reactions / Early and Late Effects of Radiation in Normal Tissues and Organs – Threshold Doses for Tissue Reactions in a Radiation Protection Context. ICRP Publication 118. Ann. ICRP 41(1/2), 2012
8. Gualdrini, G, et al" "Air kerma to HP(3) conversion coefficients for photons from 10 keV to 10 MeV, calculated in a cylindrical phantom." Radiat Prot Dosemetry. 2013 May;154(4):517-21.
9. Behrens, R. Air kerma to Hp(3) conversion coefficients for a new cylinder phantom for photon reference radiation qualities. "Radiat. Prot. Dosim. 151(3), 450-455, 2012.
10. Donadille, L, et al. Staff eye lens and extremity exposure in interventional cardiology: Results of the ORAMED project. Radiation Measurements 46 (2011) 1203e1209
11. L. Struelens, E. Carinou, I. Clairand, L. Donadille, M. Ginjaume, C. Koukorava, S. Krim, H. Mol, M. Sans-Merce, F. Vanhavere Use of active personal dosemeters in interventional radiology and cardiology: Tests in hospitals – ORAMED project. Radiation Measurements, Volume 46, Issue 11, November 2011, Pages 1258-1261
12. I. Clairand, J.-M. Bordy, E. Carinou, et al. Use of active personal dosemeters in interventional radiology and cardiology: Tests in laboratory conditions and recommendations - ORAMED
0
0,5
1
1,5
2
0◦ 30◦ 60◦ 90◦
Hp(3)/Kair [Sv/Gy)
Angle
N 40
N 60
N 80
N 100
N 120
N 150

234
project. Radiation Measurements, Volume 46, Issue 11, November 2011, Pages 1252-1257
13. J.M. Bordy J. Daures, M. Denozière et al. Proposals for the type tests criteria and calibration conditions of passive eye lens dosemeters to be used in interventional cardiology and radiology workplaces. Radiation Measurements, Volume 46, Issue 11, November 2011, Pages 1235-1238
14. Daures J, Gouriou J, Bordy JM. Monte Carlo determination of the conversion coefficients Hp(3)/Ka in a right cylinder phantom with 'PENELOPE' code. Comparison with 'MCNP' simulations. Radiat Prot Dosimetry. 2011 Mar;144(1-4):37-42.
15. Bordy JM, Gualdrini G, Daures J, Mariotti F. Principles for the design and calibration of radiation protection dosemeters for operational and protection quantities for eye lens dosimetry. Radiat Prot Dosimetry. 2011 Mar;144(1-4):257-61.
16. International Commission on Radiological Protection. Conversion coefficients for use in radiological protection against external radiation. ICRP Publication 74. Pergamon Press (1998).
17. International Commission on Radiation Units and Measurements. Conversion coefficients for use in radiological protection against external radiation. ICRU Report 57. ICRU (1998).
18. X-5 Monte Carlo Team (2003) MCNP–a General Monte Carlo N-Particle Transport Code, Version 5 Vol. I: Overview and Theory. Los Alamos, NM: Los Alamos National Laboratory; LA- UR- 03- 1987
19. International Organization for Standardization, 1996. ISO 4037-3, X and gamma referenceradiations for calibrating dosemeters and dose rate meters and for determining their response as a function of photon energy, Part 3: Calibration of area and personal dosemeters and the measurement of their response as a function of energy and angle of incidence. ISO, Geneva.
20. Poludniowski G, Landry G, DeBlois F, Evans PM, Verhaegen F. SpekCalc: a program to calculate photon spectra from tungsten anode x-ray tubes. Phys Med Biol. 2009 Oct 7;54(19):N433-8.

EXPOSURE TO RADIOACTIVE AIRBORNE DISCHARGE FROM EUROPEAN NUCLEAR POWER PLANTS
M. Vasyanovich1,2, A. Ekidin1, M. Zhukovsky1
1Institute of Industrial Ecology UB RAS, Ekaterinburg, Russia 2Ural Federal University named after the first President of Russia B. N. Yeltsin, Ekaterinburg, Russia
Abstract. The results of airborne discharge analysis from vent stacks of European nuclear power plants are demonstrated. The main purpose of this investigation is to identify the radionuclides following their level of exposure to the population. Only the normal conditions of radionuclide discharge from nuclear power plant into the atmosphere are considered. Information on discharging radionuclides was obtained from the official website of Radiation Commission of the European Union. The effective dose is assessed on the basis of information on nuclear power plants discharging with different types of reactors. The estimation of effective doses allows the determination of the list of radionuclides, which make up to 99% of the dose of population radiation exposure.
Key words: Radionuclide, airborne discharge, effective dose
1. INTRODUCTION
Activity of nuclear power plants (NPP) creates additional radiation exposure to humans and the environment. A large proportion of radiation exposure is caused by controlled airborne discharge of man-made radionuclides into the environment [1]. Doses due to the annual amount of NPPs airborne discharge do not exceed the acceptable level for population in the region. Radiation exposure assessment depends on many parameters, such as the volume of annual radionuclide emissions, which don’t exceed the acceptable level for population in the region, the meteorological data, landscape features of nuclear power plant area, the basic characteristics of the emission source, the characteristics of the population living near nuclear power plants and much more.
The question of dose-forming radionuclides list justification has been discussed for many years and no decision could be reached so far [2]. This paper presents the results of the ranging of radionuclides by their contribution to the population exposure from airborne discharge by European nuclear power plants. Since different European countries use nuclear power plants with different types of reactors, the list of emitted artificial radionuclides, that may cause 99.99% effective dose, may vary [2].
2. MATERIALS AND METHODS
The contribution assessment of each controlled radionuclide was performed for the four of the most common types of reactors: Pressurized Water Reactor (PWR), Advanced Gas-cooled Reactor
(AGR), Boiling Water Reactor (BWR) and Light Water Graphite Reactor (LWGR). The equal radiation exposure conditions for each type of nuclear power plants were assumed: the same landscape, the same age and sex population structure and the same weather conditions.
The initial data for the assessment of radiation exposure to public from airborne discharge from all NPP in Europe were obtained from the open source [3]. General list of controlled radionuclides airborne discharge of European NPP consists of 101 radionuclide and 5 general parameters. The radionuclide list differs for NPP in different countries.
Quantitative data on radionuclides discharged into the atmosphere were obtained by averaging the data from over 10 years of observation for NPP of each type of reactor, taking into account the number of reactors in the sample.
For effective dose calculation standard software CAP-88 PC 4.0.1.17 was used [4]. Three randomly chosen meteorological files from the library of CAP-88 PC software were used. For the effective height of discharge, 120 m was assumed. After calculations, all results were averaged between three sets of data. Dose assessment for population was made for the distances of 3000 m, 10 000 m and 30 000 m from the source. For each distance, effective doses were averaged over 16 geographic rhumbs. The contribution of each radionuclide in the effective dose was calculated for an individual situated to east at a distance of 10 000 m from the release point. The rural scenario of food consumption from CAP-88 PC menu was assumed. As a result, individual effective doses for adult population from external and internal radiation exposure were obtained.
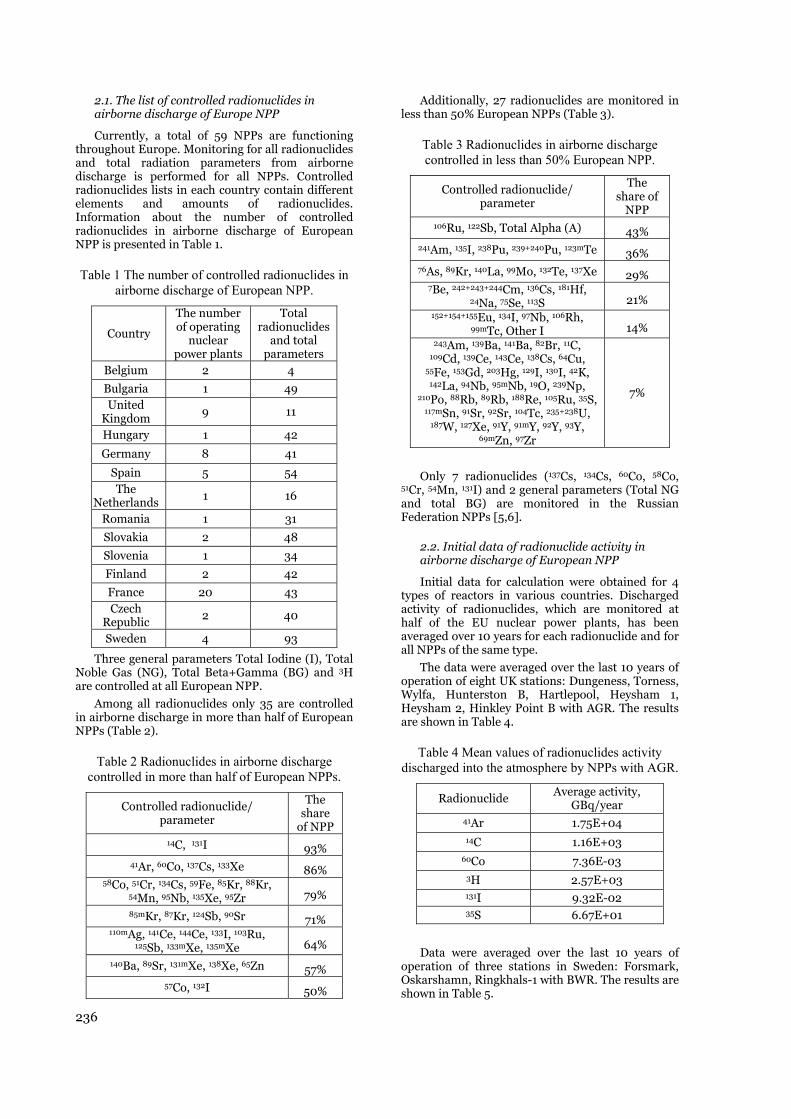
236
2.1. The list of controlled radionuclides in airborne discharge of Europe NPP
Currently, a total of 59 NPPs are functioning throughout Europe. Monitoring for all radionuclides and total radiation parameters from airborne discharge is performed for all NPPs. Controlled radionuclides lists in each country contain different elements and amounts of radionuclides. Information about the number of controlled radionuclides in airborne discharge of European NPP is presented in Table 1.
Table 1 The number of controlled radionuclides in airborne discharge of European NPP.
Country
The number of operating
nuclear power plants
Total radionuclides
and total parameters
Belgium 2 4
Bulgaria 1 49 United
Kingdom 9 11
Hungary 1 42
Germany 8 41
Spain 5 54 The
Netherlands 1 16
Romania 1 31
Slovakia 2 48
Slovenia 1 34
Finland 2 42
France 20 43 Czech
Republic 2 40
Sweden 4 93
Three general parameters Total Iodine (I), Total Noble Gas (NG), Total Beta+Gamma (BG) and 3H are controlled at all European NPP.
Among all radionuclides only 35 are controlled in airborne discharge in more than half of European NPPs (Table 2).
Table 2 Radionuclides in airborne discharge controlled in more than half of European NPPs.
Controlled radionuclide/ parameter
The share
of NPP 14C, 131I 93%
41Ar, 60Co, 137Cs, 133Xe 86% 58Co, 51Cr, 134Cs, 59Fe, 85Kr, 88Kr,
54Mn, 95Nb, 135Xe, 95Zr 79%
85mKr, 87Kr, 124Sb, 90Sr 71% 110mAg, 141Ce, 144Ce, 133I, 103Ru,
125Sb, 133mXe, 135mXe 64%
140Ba, 89Sr, 131mXe, 138Xe, 65Zn 57% 57Co, 132I 50%
Additionally, 27 radionuclides are monitored in less than 50% European NPPs (Table 3).
Table 3 Radionuclides in airborne discharge controlled in less than 50% European NPP.
Controlled radionuclide/ parameter
The share of
NPP 106Ru, 122Sb, Total Alpha (A) 43%
241Am, 135I, 238Pu, 239+240Pu, 123mTe 36% 76As, 89Kr, 140La, 99Mo, 132Te, 137Xe 29%
7Be, 242+243+244Cm, 136Cs, 181Hf, 24Na, 75Se, 113S 21%
152+154+155Eu, 134I, 97Nb, 106Rh, 99mTc, Other I 14%
243Am, 139Ba, 141Ba, 82Br, 11C, 109Cd, 139Ce, 143Ce, 138Cs, 64Cu,
55Fe, 153Gd, 203Hg, 129I, 130I, 42K, 142La, 94Nb, 95mNb, 19O, 239Np,
210Po, 88Rb, 89Rb, 188Re, 105Ru, 35S, 117mSn, 91Sr, 92Sr, 104Tc, 235+238U,
187W, 127Xe, 91Y, 91mY, 92Y, 93Y, 69mZn, 97Zr
7%
Only 7 radionuclides (137Cs, 134Cs, 60Co, 58Co, 51Cr, 54Mn, 131I) and 2 general parameters (Total NG and total BG) are monitored in the Russian Federation NPPs [5,6].
2.2. Initial data of radionuclide activity in airborne discharge of European NPP
Initial data for calculation were obtained for 4 types of reactors in various countries. Discharged activity of radionuclides, which are monitored at half of the EU nuclear power plants, has been averaged over 10 years for each radionuclide and for all NPPs of the same type.
The data were averaged over the last 10 years of operation of eight UK stations: Dungeness, Torness, Wylfa, Hunterston B, Hartlepool, Heysham 1, Heysham 2, Hinkley Point B with AGR. The results are shown in Table 4.
Table 4 Mean values of radionuclides activity discharged into the atmosphere by NPPs with AGR.
Radionuclide Average activity, GBq/year
41Ar 1.75E+04 14C 1.16E+03
60Co 7.36E-03 3H 2.57E+03 131I 9.32E-02 35S 6.67E+01
Data were averaged over the last 10 years of operation of three stations in Sweden: Forsmark, Oskarshamn, Ringkhals-1 with BWR. The results are shown in Table 5.

237
Table 5 Mean values of radionuclides activity discharged into atmosphere by NPPs with BWR.
Radionuclide Average activity,
GBq/year 110mAg 9.30E-03
41Ar 3.54E+02 140Ba 3.49E+00
14C 1.09E+03 141Ce 3.72E-04 144Ce 5.50E-03 58Co 3.34E-02 60Co 9.58E-02 51Cr 7.08E-02
134Cs 6.32E-04 137Cs 2.77E-03 59Fe 3.09E-03 3H 5.74E+02 131I 6.96E-01 133I 1.39E+00
85Kr 1.94E+03 85mKr 1.45E+04 87Kr 6.18E+04 88Kr 4.28E+04
54Mn 1.24E-02 95Nb 2.30E-03 103Ru 6.34E-04 124Sb 5.46E-03 125Sb 1.06E-03 89Sr 2.67E-02 90Sr 3.59E-03
131mXe 2.33E+04 133Xe 1.41E+04
133mXe 4.46E+02 135Xe 9.08E+04
135mXe 6.19E+04 65Zn 2.14E-02 95Zr 1.89E-03
Data were averaged over the 10 years operation of Ignalina NPP, Lithuania with LWGR. The results are presented in Table 6. Data were averaged over the 10 years of operation of nineteen stations in France: Belleville, Blayais, Bugey B, Cattenom, Chinon B, Chooz B, Civaux, Cruas, Dampierre, Fessenheim, Flamanville, Golfech, Gravelines, Nogent, Paluel , Penly, St Alban, St Laurent B and Tricastin with PWR are shown in Table 7.
Table 6 Mean values of radionuclides activity discharged in the atmosphere by NPP with LWGR.
Radionuclide Average activity,
GBq/year 41Ar 1.11E+04 14C 2.64E+01
58Co 2.98E-03 60Co 1.09E-01 51Cr 1.92E-02
134Cs 3.81E-03 137Cs 6.48E-02 59Fe 2.76E-02 131I 7.70E+00 133I 1.52E-01
85Kr 4.33E+00 85mKr 1.59E+03 87Kr 9.42E+02 88Kr 1.02E+03
54Mn 4.82E-02 95Nb 1.36E-02 89Sr 5.47E-02 90Sr 5.99E-02
133Xe 4.10E+04 133mXe 3.18E+02 135Xe 5.28E+03
135mXe 1.93E+03 65Zn 6.65E-03 95Zr 3.55E-03
Table 7 Mean values of radionuclides activity discharged in the atmosphere by NPPs with PWR.
Radionuclide Average activity, GBq/year
41Ar 7.55E+01 14C 5.35E+02
58Co 2.86E-03 60Co 2.25E-03 51Cr 2.54E-03
134Cs 1.64E-03 137Cs 1.46E-03 59Fe 6.98E-04 131I 4.23E-02 133I 4.32E-02
85Kr 1.89E+02 85mKr 4.14E+00 87Kr 2.14E+02 88Kr 5.95E+01
54Mn 2.11E-04 95Nb 2.66E-04 103Ru 5.37E-05 124Sb 1.73E-04
131mXe 1.57E+02 133Xe 1.22E+03
133mXe 1.76E+01 135Xe 3.84E+02
135mXe 2.87E+02 95Zr 3.29E-04
238
3. RESULTS
The dose calculation for critical population group was made for each radionuclide from the list of radionuclides monitored for each type of NPP.
The dominated radionuclides by their share in the effective dose for NPPs with AGR are:
14C – 61%. 35S – 24%; 41Ar – 12%;
The results of dose assessment allowed the ranging of 14 monitored radionuclides by their contribution to radiation exposure of population for NPP with BWR as follows:
88Kr + 88Rb – 40 %; 14C – 32% 87Kr – 13 %; 135Xe – 8 %; 60Co – 2%. 131I ~ 1%
The most critical radionuclides in the formation of population exposure for NPPs with LWGR are:
41Ar – 30 %; 90Sr+90Y – 18 %; 137Cs+137mBa – 17 %; 60Co – 12 %. 88Kr+88Rb – 6 %; 14C – 5% 131I – 1.5 %;
The only dominating radionuclide for NPP with
PWR is: 14C – 94-95 %;
Finally, the average value of the effective dose was calculated for each type of reactors. The results are presented in Table 8.
Table 8 Average value of effective doses due to atmosphere discharges for different types of NPPs.
Average value of effective dose, Sv/year
Reactor type Distance from discharge source, m 3 000 10 000 30 000
AGR 1.4E-07 8.1E-08 5.4E-08
BWR 3.6E-07 1.4E-07 5.2E-08
LWGR 5.2E-08 2.1E-08 9.6E-09
PWR 4.1E-08 2.4E-08 1.6E-08
4. CONCLUSION
The obtained results range radionuclides’ contribution to the population exposure from airborne discharge of NPPs. The real conditions of dispersing radionuclides in the environment and
public exposure can be very different for each NPP location. Accounting for real meteorological data, the landscape features of the NPP region, the main characteristics of emission sources, the amount of annual emissions of radionuclides, age and sex structure and food ration of the population living in NPP region can significantly affect the quantitative assessment of population.
For the simulated conditions of radiation exposure due to airborne discharges from NPPs, significant difference in the list of dominated dose-forming radionuclides for different types of reactors is observed.
It is obvious that the special attention should be focused on detailed monitoring of 14C, which dominates in effective dose formation for NPPs with AGR, BWR and PWR type of reactors.
It is particularly prominent in differences for 60Co, which causes 20% of exposure for NPP with AGR and less than 0.01% for all other types of reactors.
For all NPPs, the list of the main dose-forming radionuclides also includes NG, 137Cs+137mBa progeny, 90Sr+90Y, 60Co. For AGR type reactors the radionuclide 35S is also essential in the effective dose forming. These radionuclides create the 99% effective dose to the population from airborne discharge in European NPPs and are recommended to the European Commission for monitoring [7].
Detailed analysis of the radiation exposure conditions will probably not result in a significant qualitative change in the list of the main dose-forming radionuclides.
Acknowledgement: The paper is a part of the research done within the project 15-2-2-19 financed by Ural Branch of Russian Academy of Sciences.
5. REFERENCES
1. L. Sharpan, E. Karpenko, S. Spiridonov "Public dose assessment as a result of atmospheric emissions of Rostov NPP"// Atomic Energy. Volume 115, 2013. pp. 163-166 (in Russian) 2. S. Spiridonov, E. Karpenko, L. Sharpan "Ranking radionuclides and pathways for dose contributions from airborne discharge in NPP" // Radiation Biology. Radioecology. Volume 4, 2013. pp. 401-410 (in Russian) 3. European Commission Radioactive Discharges Database for collecting, storing, exchanging and dissemination of information on radioactive discharges (RADD). http://europa.eu/radd/ 4. CAP88-PC Version 4.0 User Guide. Trinity Engineering Associates, Inc. 8832 Falmouth Dr. Cincinnati, OH 45231-5011. 2014. 5. The Ministry of Natural Resources and Environment. "The radiation situation in Russia and nearby countries in 2012". Obninsk. 2013 (in Russian) 6. "Report of environmental protection in 2012" Rosenergoatom. Russia. 2012 (in Russian) 7. "COMMISSION RECOMMENDATION of 18 December 2003 on standardised information on radioactive airborne and liquid discharges into the environment from nuclear power reactors and reprocessing plants in normal operation"// Official Journal of the European Union. 6.1.2004.
Nuclear
AbspersThis for trequof ra
Key
1. In
A
to intmeasuindiviin a manaThe imby mareliab
ThaspectNRPDin ordmentsmeasuquant
2. M
Th
Hp(10personcalibrStand
TLRADOthe dreport
Thassess V
QUANTIF
S.
r Safety & Rad
tract The Nasonal dosimetry paper describethe implementa
uirements of ISOadiation dose.
y words: QMS,
ntroduction
quality managternational staures for conidual monitor QMS proggement. mplementatioany dosimetry
bility of measuhis paper descts of a QMS p
D—Personal Dder to achievs of ISO/IEC uring operatitity in external
Material and
he test quanti0) was measurnal dosimete
rated to 137 Cdard dosimetryLD reader moOS ® were usdose data wted via a natiohe following sed in the QM
Validation of m
FIABLE TECHFOR
M. Hossein
diological Prot
Iran
ational Radiatioy service provides some technication of a quaO/IEC 17025 an
TLD, ISO, Accr
n
gement systemandards is on
ntinuous imping service. T
gram contain
ns of QMS hay laboratories rements [1-3]. cribes the quaprogram carri
Dosimetry Serve compliance17025 [4] for tional personal dosimetry.
d methods
ity of personared using TLDers. All the
Cs photon souy Laboratory (dels of HARSsed for dosim
were calculateonal dose regis technical reS program [4]:
method
HNICAL ASPR TL PERSO
ni Pooya, F
tection ResearA
nuclear Regul
on Protection Ders via the natioal activities reaality managemnd accreditation
reditation, Dosim
m (QMS) accone of the esseprovement ofThe two main ns technical
ave been perfo demonstratin antifiable techied out by INvice (PDS) of with the req
the accreditatial dose equiv
al dose equivaD-100 and GR
dosimeters urce in Secon(SSDL) of IranSHAW 6600 ®meter readouted, recorded stry system [5].equirements
PECTS OF AONAL DOSI
F. Mianji, M
rch DepartmenAEOI, Tehran,latory Authori
Department (Nonal accredited
alized by the NRment system (Qn for testing me
metry, Radiatio
ording ential f any parts and
ormed ng the
hnical NRA—f Iran, quire- ion of valent
alent, R-200
were ndary
n. ® and ts. All and .
were
H
wrew(
m
A QUALITY METRY SER
M. R. Kard
nt, Nuclear Sc, Iran ity, AEOI, Teh
NRPD) is the rd TLD laboratorRPD to the natio
QMS). The objeeasurements of
on
Calibra Estima Interm
The qua
calculated as
TLH p ()10(
where, TL indicated on value of Telementary cfactor, RL is measuremenRL at the cali
The unceas [7]:
2
A BU U U
where UA and respectively. Tented by rectawith the haUB
2=1/3 Σai2).
The follo
measured in thType A:
A1) InhomA2) Variab
sensit
MANAGEMRVICES
dan, N. Rast
cience &Techn
hran, Iran
egulatory bodyry in Iran. onal personal T
ect is to achiev the physical an
ation ation of uncert
mediate checks
antity of Per [6]:
ECCTLBKG )
is the respo TLD reader,
TL for backgrcorrection coe the value of re
nts, and RL0 isibration date.
ertainty of me
2B
UB are the unType B uncerangular probaalf range v
owing paramehe QMS progra
mogeneity of debility of detecttivity and back
MENT SYSTE
stkhah
nology Researc
y for supervisi
TL dosimetry lave compliance
nd operational q
rtainty of meass
rsonal dose
RL
RLCFC 0
onse value oTLBKG is the c
round dosimeefficient, CF
reference lights the correspon
easurements w
(2)
uncertainty of rtainties are bability densityvalues of m
eters of unceram.
etector sensititor readings dkground.
EM
ch Institute,
ion of all
aboratory with the quantities
surements
equivalent is
(1)
of dosimeterscorrespondingeters, ECC isis calibration at the date ofnding value of
was calculated
type A and Bbeing repres-y distribution
measurements
rtainties were
ivity, due to limited
s
s g s n f f
d
B -n s
e
d
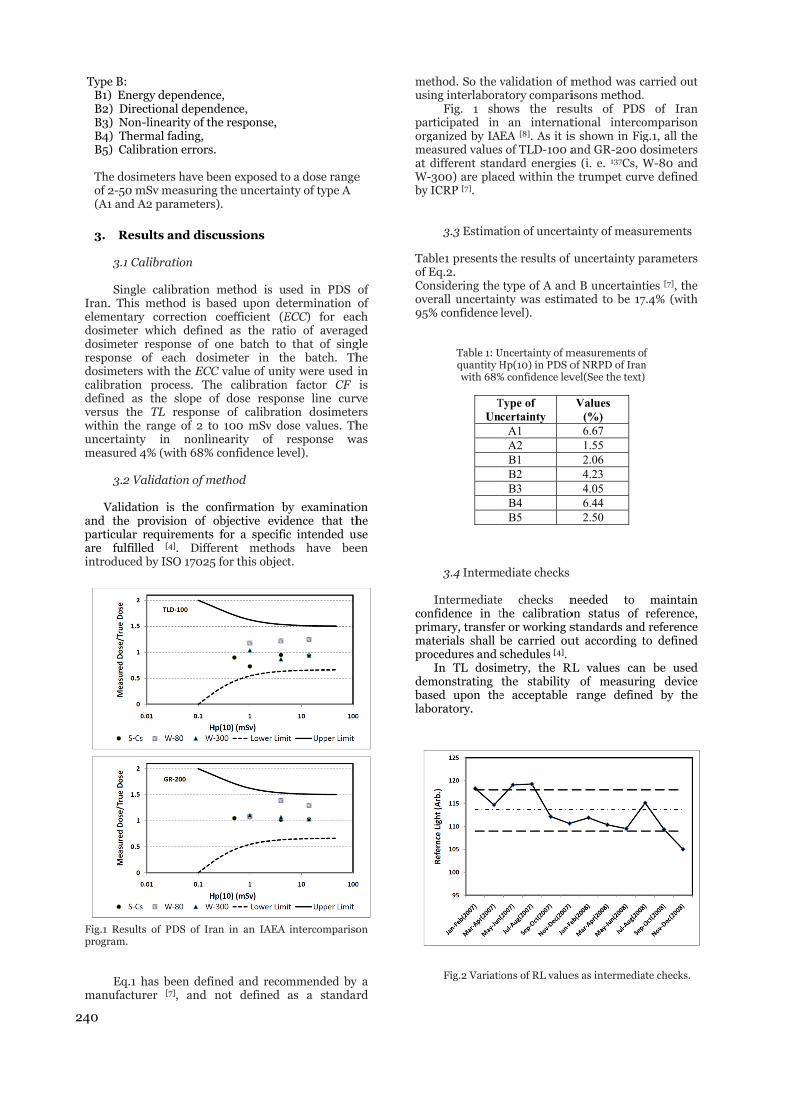
240
Type B: B1) EnerB2) DirecB3) Non-B4) TherB5) Calib The dosimof 2-50 m(A1 and A
3. Resu
3.1 Ca Single
Iran. This elementarydosimeter dosimeter response odosimeterscalibration defined as versus the within the uncertaintymeasured 4
3.2 Va
Validatiand the pparticular rare fulfilleintroduced
Fig.1 Resultsprogram.
Eq.1 hmanufactur
rgy dependencctional depend-linearity of thrmal fading, bration errors.
meters have bemSv measuringA2 parameters
ults and disc
alibration
e calibration method is ba
y correction which defineresponse of of each dos with the ECC process. Th the slope o TL response range of 2 toy in nonlin4% (with 68%
alidation of m
ion is the coprovision of orequirements ed [4]. Diffe by ISO 17025
s of PDS of Ira
has been defirer [7], and
ce, dence,
he response,
.
een exposed tog the uncertains).
cussions
method is uased upon decoefficient (E
ed as the ratone batch toimeter in th
C value of unithe calibrationof dose respoe of calibratio 100 mSv donearity of confidence lev
method
onfirmation bobjective evid for a specifi
erent method5 for this objec
an in an IAEA
ned and reconot defined
o a dose rangenty of type A
sed in PDS etermination ECC) for eactio of average that of sing
he batch. Thty were used i
n factor CF onse line curvion dosimeteose values. Thresponse wavel).
by examinatiodence that thc intended us
ds have beect.
intercompariso
mmended by as a standar
e
of of ch ed gle he in is
ve ers he as
on he se en
on
a rd
meusi
parorgmeat W-by
Tabof ECoove95%
conprimapro
dembaslab
ethod. So the ving interlabora
Fig. 1 shorticipated in ganized by IAeasured valuesdifferent stan
-300) are plac ICRP [7].
3.3 Estimat
ble1 presents Eq.2. nsidering the erall uncertain% confidence
Table 1: Uquantity H with 68%
TUn
3.4 Interme
Intermediatenfidence in timary, transfeaterials shall bocedures and s
In TL dosimmonstrating sed upon the
boratory.
Fig.2 Variati
validation of matory compariows the res an internatEA [8]. As it iss of TLD-100 andard energiesced within the
tion of uncerta
the results of
type of A andnty was estimlevel).
Uncertainty of mHp(10) in PDS o% confidence lev
Type of certainty
A1 A2 B1 B2 B3 B4 B5
ediate checks
e checks nthe calibratior or working sbe carried ouschedules [4]. metry, the RLthe stability e acceptable
ions of RL value
method was cisons method.sults of PDStional intercos shown in Figand GR-200 ds (i. e. 137Cs, We trumpet curv
ainty of measu
uncertainty p
d B uncertaintmated to be 17
measurements oof NRPD of Iranvel(See the text)
Values (%) 6.67 1.55 2.06 4.23 4.05 6.44 2.50
needed to on status of standards andut according t
RL values can of measurinrange define
es as intermedia
carried out . S of Iran omparison g.1, all the
dosimeters W-80 and ve defined
urements
parameters
ties [7], the 7.4% (with
f n )
maintain reference,
d reference to defined
n be used ng device ed by the
ate checks.
241
Fig.2 shows the variations in RL value of the used HARSHAW 6600 TLD reader within bimonthly dosimetry periods during a biannual time interval. The acceptable range is assumed to be within ±1σ from the average of RL (dashed lines). At the points out of the acceptable range (the three points), dosimetry procedure has been stopped maintaining and rechecking the systems.
4. Conclusion
The implementation of ISO/IEC 17025 requirements is considered as a valid tool to improve the quality of personal dosimetry services. The obtained values of quantifiable technical parameters of QMS program show the reliability of PDS in Iran. The continuous improvement processes would ensure the correctness of the measuring methods and technical resources being carried out and maintained in the laboratory.
REFERENCES
1. R. Martı´n, T. Navarro, A. M.Romero, M. A. Lo´pez (2011) Quality Management System in the CIEMAT
Radiation Dosimetry Service, Radiat. Prot. Dosim. 144 (1–4) 111–114.
2. N. Mod Ali (2011) Reliability in Individual Monitoring Service, Radiat. Prot. Dosim. 144 (1–4) 90–94.
3. P. Gilvin, J.G. Alves, C. Cherestes, J.W.E. van Dijk, M. Lehtinen, F. Rossi, B. Vekic (2014) Quality assurance in individual monitoring: A summary of the EURADOS survey 2012, Radiat. Meas. 71, 434–437.
4. International Organization for Standardization and the International Electrotechnical Commission. General requirements for the competence of testing and calibration laboratories. ISO/IEC Standard 17025:2005.
5. M. Jafariadeh, F. Nazeri F., S. M. Hosseini-Pooya,, et. al., (2010) Occupational Dose Assessment and National Dose Registry System in Iran, Radiat. Prot. Dosim.,144 (1-4) 52-55.
6. HARSHAW BICRON User Manual, (1992), Radiation Measurements Products, Model 6600 Automated TLD card Reader, Publication No. 6600-0-U-0592; U. S. A.
7. IAEA Safety Guide, RS-G-1.3, (1999) Assessment of occupational exposure due to external sources of radiation.
8. IAEA-TECDOC-CD-1567 (2007) Intercomparison of measurements of personal dose equivalent Hp(10) in photon fields in the west Asia region.
SOIL AND VEGETATION FROM NOVI PAZAR (SERBIA) AND ROŽAJE (MONTENEGRO): RADIOACTIVITY IMPACT ASSESSMENT
Ivanka Antović 1, Nikola Svrkota2, Dalibor Stojanović1, Mirzeta Hadžibrahimović1, Ranka Žižić2, Gordana Laštovička-Medin3
1Department for Biomedical Sciences, State University of Novi Pazar, Novi Pazar, Serbia 2Centre for Ecotoxicological Research, Podgorica, Montenegro
3Faculty of Natural Sciences and Mathematics, University of Montenegro, Podgorica, Montenegro
Abstract. Soil samples from Novi Pazar (Serbia) and Rožaje (Montenegro) were analyzed by the ORTEC HPGe detectors with relative efficiencies 35 and 40 %, for radioactivity due to 226Ra, 232Th/228Ac, 40K and 137Cs. An average radioisotope activity concentration for Novi Pazar soil was found to be 27.6, 49.5, 585 and 14.9 Bq/kg, respectively; while in Rožaje, 137Cs activity concentration was found to be significantly higher – from 33.9 to 322 Bq/kg. Obtained results were used to estimate hazard indices, such as radium equivalent activity (none of the localities showed a radium equivalent activity higher than 370 Bq/kg) and annual gonadal dose equivalent due to natural radioisotopes, as well as external terrestrial gamma absorbed dose rate due to 226Ra, 232Th/228Ac, 40K and 137Cs, and corresponding annual effective dose – used to evaluate excess lifetime cancer risk (then compared with the world average of 0.210-3, taking into account external terrestrial radiation – outdoor, i.e., average annual effective dose of 0.07 mSv). Vegetation samples from Rožaje – blackberry (Rubus fruticosus), spruce (Picea abies) and beech (Fagus sylvatica) showed 226Ra activity – 4.03, 1.1 and 0.99 Bq/kg, respectively; 232Th/228Ac – 4.5, 1.22 and 2.89 Bq/kg, respectively; 40K – 152, 98.4 and 79.3 Bq/kg, respectively; 137Cs – 3.05, 3.54 and 5.24 Bq/kg, respectively; whilst in Pinus sylvestris from Novi Pazar, they were – 2.7, 2.11, 163, 0.34 Bq/kg, respectively. Soil-plant radioisotope transfer factors were also estimated, and compared with typical ranges given in the UNSCEAR 2008 report. Since the most important radiation source for all terrestrial biota is activity from soil, the dose rates are also evaluated using known internal (and external – in soil) radioisotope activity concentrations, as well as corresponding the dose conversion coefficients for external and internal exposure to particular radioisotope.
Key words: Novi Pazar, Rožaje, soil-vegetation, radiation risks
1. INTRODUCTION
The territories of Novi Pazar (Serbia) and Rožaje (Montenegro) make a borderland between Serbia and Montenegro (illustrated in Fig. 1).
Fig. 1 Novi Pazar in Serbia, and Rožaje in Montenegro
Novi Pazar (N. Pazar) municipality has an area of 742 km2 and population of 109 327 – based on the Census in 2011, but unofficial information confirm that the population is over 120 000 1. On the other hand, Rožaje municipality with an area of 432 km2 and
population of 22 964 (from the Census in 2011) contributes with around 3.13 % to the entire Montenegro area (13 812 km2), and with 3.7 % to the total Montenegro population (620 029) 2.
As far as is known, radioactivity impacts for soil and vegetation from N. Pazar have not been analyzed before recent start with one locality – Novopazarska Banja, and the stem of “tree of heaven” Ailanthus altissima (Swingle, 1916) 3. In order to provide basic information, soils from the N. Pazar urban area were measured for radioactivity, and some health hazard indices were evaluated (radium equivalent activity, annual gonadal dose equivalent, excess lifetime cancer risk) and presented here.
In the past, several gamma spectrometry measurements were performed in the northern Montenegro using in situ 4, HPGe and multidetector (PRIPYAT-2M) spectrometry 5. Few measurements of radioisotope activities in soil from Rožaje were also performed and showed somewhat higher 137Cs activity. Therefore, soil from three different depths from one locality is additionally analyzed in the present study, and the results, together with earlier ones, are used to evaluate hazard indices.
In the light of possible radioecological significance,

244
following biocentric approach in a radioecological research (when animals and plants are considered as targets, not only as contaminants to humans 6), measurements and analyses of vegetation species from N. Pazar and Rožaje were also carried out. This is particularly because the present radiation protection activities should also be focused on non-human biota, not only on humans.
2. MATERIALS AND METHODS
Nine samples of uncultivated soil from the urban area of N. Pazar (NP1 to NP9; coordinates in Table 1) were sampled in a standard soil sampling procedure – the surface (0-5 cm) layer from a frame of 25 cm x 25 cm 7, while in Rožaje (R; coordinates in Table 1) soil was sampled from (0-5), (5-10) and (10-15) cm in depth (R-1, R-2 and R-3, respectively).
Table 1 Soil sampling localities
Locality Coordinates NP1 – Generala
Živkovića st. N 43°08'03.87" E 20°30'40.66"
NP2 – Mihajla Pupina st.
N 43°09'16.89" E 20°31'40.34"
NP3 – Miodraga Jovanovića st.
N 43°08'54.37" E 20°31'07.03"
NP4 – Relje Krilatice st.
N 43°08'46.85" E 20°31'06.36"
NP5 – Gojka Birčanina st.
N 43°08'33.96" E 20°31'04.19"
NP6 – Ramiza Koče st.
N 43°08'24.35" E 20°30'50.45"
NP7 –centre Mladost N 43°08'19.41" E 20°30'48.82"
NP8 –park N 43°08'20.13" E 20°31'02.48"
NP9 –Vuka Karadžića st.
N 43°08'18.32" E 20°31'14.91"
R – Rožaje N 42°56. 296' E 20°12. 402'
The samples were prepared (dried, sieved), weighed (NP – 0.5 kg each; R1 – 0.81 kg, R2 – 1.144 kg, R3 – 1.057 kg), and sealed in Marinelli beakers. Measurements were performed using the ORTEC HPGe detectors (40190, relative efficiency – 40 %; and 30185-S with relative efficiency – 35 %), calibrated using standard mixtures of gamma emitting isotopes in Marinelli beakers (Czech Metrology Institute). Radioisotope activity concentrations were determined in the standard photopeak analyses (using the total net counting rate under the selected photopeak, photoefficiency, gamma ray intensity and mass of the sample) – 137Cs (662 keV); 226Ra, i.e., 214Bi (609 keV); 232Th, i.e., 228Ac (911 keV); 40K (1461 keV). Measuring times were – 10 000 s for each NP sample, and 36 040.7, 27 100.3, 27 000.4 s for R-1, R-2 and R-3, respectively.
The radioisotope activity concentrations are used to calculate the external terrestrial gamma absorbed dose rate at 1 m in air, applying corresponding dose coefficients (in nGy/h per Bq/kg) 8, 9 in
D=A(226Ra)0.462+A(232Th)0.604+A(40K)
0.0417+A(137Cs)0.1243. (1)
The annual effective dose was calculated using the conversion coefficient from absorbed dose in air to effective dose of 0.7 Sv/Gy, and outdoor occupancy factor of 0.2 8, i.e.,
E = D(nGy/h)8760 h/y0.7 Sv/Gy0.2. (2)
Corresponding excess lifetime cancer risk (CR) due to the dose rate E is estimated using 10
CR = ETRF, (3)
where T is lifetime expectancy, and RF is risk factor for cancer per Sv. The 70 years lifetime (T) is taken into consideration, as well as RF of 0.05 for the public – from the ICRP60 recommendations 11.
Since distribution of 226Ra, 232Th and 40K in soil is not uniform, the radium equivalent activity (Raeq, in Bq/kg) was calculated by standard formula 12
Raeq=A(226Ra)+1.43A(232Th)+0.07A(40K). (4)
As an illustration, the annual gonadal dose equivalent (G, in µSv/y) due to 226Ra, 232Th and 40K in soil has also been calculated using standard relation 13
G=A(226Ra)3.09+A(232Th)4.18+A(40K)0.314. (5)
In addition, vegetation samples – leaves/needles of pine Pinus sylvestris (L.) (fam. Pinaceae) from N. Pazar, as well as stem of blackberry Rubus fruticosus (L.) (fam. Rosaceae), bark of beech Fagus sylvatica (L.) (fam. Fagaceae) and leaves/needles of spruce Picea abies (L.) Karst (fam. Pinaceae) from Rožaje, were analyzed for radioactivity of natural 226Ra (214Bi), 232Th (228Ac), 40K, and anthropogenic 137Cs.
Transfer factor (TF) for particular radioisotope has been evaluated by the ratio: activity concentration in vegetation sample (Bq/kg)/activity concentration in soil (Bq/kg).
As is emphasized in the UNSCEAR 2008 report related to the effects of ionizing radiation on non-human biota 14, the most important source of radiation for all terrestrial biota (including here considered vegetation) is the soil activity. Therefore, the dose rate can be calculated using 14
,ADCCADCCD int,soil,ext, i
iiii (6)
where DCCext,i is the dose conversion coefficient for the radioisotope i – external exposure (in Gy/h per Bq/kg); Asoil,i is the activity concentration of radioisotope i in soil (in Bq/kg); DCCint,i is weighted dose conversion coefficient for internal exposure to radioisotope i (in Gy/h per Bq/kg) – assuming a homogeneous activity distribution in the organism; Ai is the radioisotope i internal activity concentration in vegetation sample (in Bq/kg). The DCCexts given in the UNSCEAR 2008 report, for 137Cs, 226Ra and 232Th for on soil reference organism (pine tree), are: 1.110-4, 3.410-4, 4.310-8 Gy/h per Bq/kg, respectively, as DCCints – 3.510-4, 1.410-1, 2.310-2 Gy/h per Bq/kg, respectively 14. The DCCext and DCCint for 40K in terrestrial plants found in literature 15 are also used to evaluate dose rate levels due to this radioisotope: 2.910-4 and 3.910-4 Gy/h per Bq/kg, respectively.
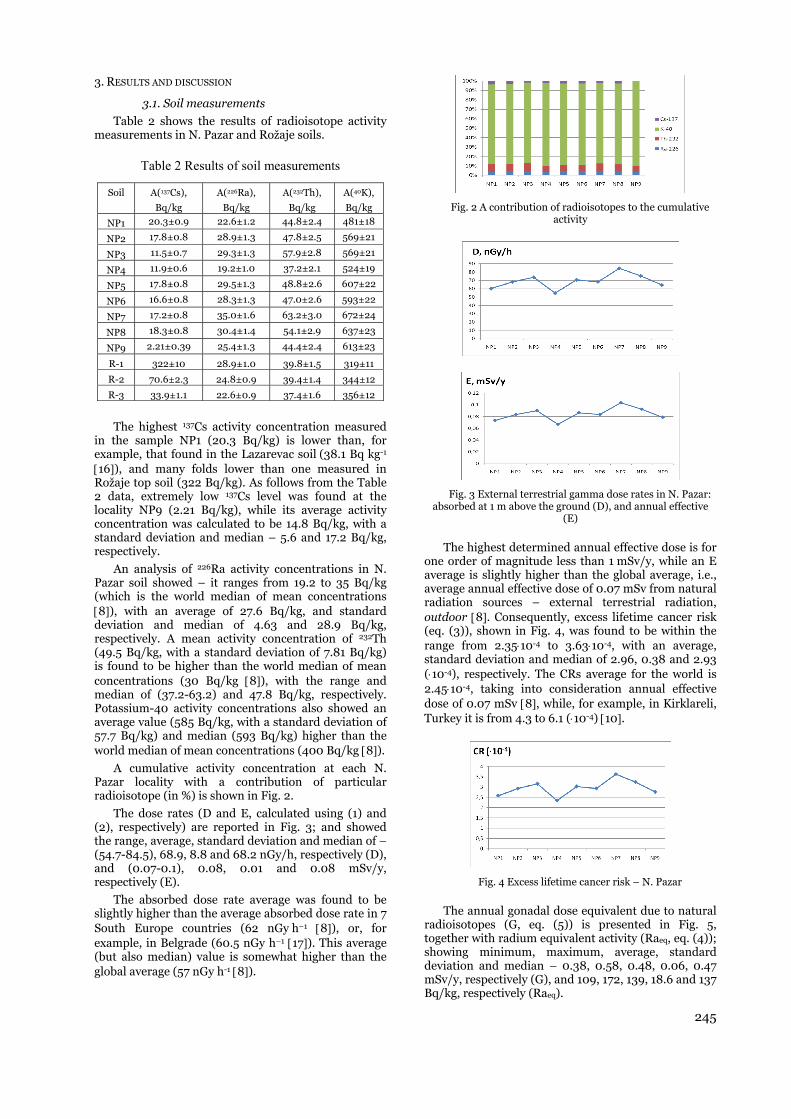
245
3. RESULTS AND DISCUSSION
3.1. Soil measurements
Table 2 shows the results of radioisotope activity measurements in N. Pazar and Rožaje soils.
Table 2 Results of soil measurements
Soil A(137Cs),
Bq/kg
A(226Ra),
Bq/kg
A(232Th),
Bq/kg
A(40K),
Bq/kg
NP1 20.3±0.9 22.6±1.2 44.8±2.4 481±18
NP2 17.8±0.8 28.9±1.3 47.8±2.5 569±21
NP3 11.5±0.7 29.3±1.3 57.9±2.8 569±21
NP4 11.9±0.6 19.2±1.0 37.2±2.1 524±19
NP5 17.8±0.8 29.5±1.3 48.8±2.6 607±22
NP6 16.6±0.8 28.3±1.3 47.0±2.6 593±22
NP7 17.2±0.8 35.0±1.6 63.2±3.0 672±24
NP8 18.3±0.8 30.4±1.4 54.1±2.9 637±23
NP9 2.21±0.39 25.4±1.3 44.4±2.4 613±23
R-1 322±10 28.9±1.0 39.8±1.5 319±11
R-2 70.6±2.3 24.8±0.9 39.4±1.4 344±12
R-3 33.9±1.1 22.6±0.9 37.4±1.6 356±12
The highest 137Cs activity concentration measured in the sample NP1 (20.3 Bq/kg) is lower than, for example, that found in the Lazarevac soil (38.1 Bq kg-1 16), and many folds lower than one measured in Rožaje top soil (322 Bq/kg). As follows from the Table 2 data, extremely low 137Cs level was found at the locality NP9 (2.21 Bq/kg), while its average activity concentration was calculated to be 14.8 Bq/kg, with a standard deviation and median – 5.6 and 17.2 Bq/kg, respectively.
An analysis of 226Ra activity concentrations in N. Pazar soil showed – it ranges from 19.2 to 35 Bq/kg (which is the world median of mean concentrations 8), with an average of 27.6 Bq/kg, and standard deviation and median of 4.63 and 28.9 Bq/kg, respectively. A mean activity concentration of 232Th (49.5 Bq/kg, with a standard deviation of 7.81 Bq/kg) is found to be higher than the world median of mean concentrations (30 Bq/kg 8), with the range and median of (37.2-63.2) and 47.8 Bq/kg, respectively. Potassium-40 activity concentrations also showed an average value (585 Bq/kg, with a standard deviation of 57.7 Bq/kg) and median (593 Bq/kg) higher than the world median of mean concentrations (400 Bq/kg 8).
A cumulative activity concentration at each N. Pazar locality with a contribution of particular radioisotope (in %) is shown in Fig. 2.
The dose rates (D and E, calculated using (1) and (2), respectively) are reported in Fig. 3; and showed the range, average, standard deviation and median of – (54.7-84.5), 68.9, 8.8 and 68.2 nGy/h, respectively (D), and (0.07-0.1), 0.08, 0.01 and 0.08 mSv/y, respectively (E).
The absorbed dose rate average was found to be slightly higher than the average absorbed dose rate in 7 South Europe countries (62 nGy h−1 8), or, for example, in Belgrade (60.5 nGy h–1 17). This average (but also median) value is somewhat higher than the global average (57 nGy h-1 8).
Fig. 2 A contribution of radioisotopes to the cumulative activity
Fig. 3 External terrestrial gamma dose rates in N. Pazar: absorbed at 1 m above the ground (D), and annual effective
(E)
The highest determined annual effective dose is for one order of magnitude less than 1 mSv/y, while an E average is slightly higher than the global average, i.e., average annual effective dose of 0.07 mSv from natural radiation sources – external terrestrial radiation, outdoor 8. Consequently, excess lifetime cancer risk (eq. (3)), shown in Fig. 4, was found to be within the range from 2.3510-4 to 3.6310-4, with an average, standard deviation and median of 2.96, 0.38 and 2.93 (10-4), respectively. The CRs average for the world is 2.4510-4, taking into consideration annual effective dose of 0.07 mSv 8, while, for example, in Kirklareli, Turkey it is from 4.3 to 6.1 (10-4) 10.
Fig. 4 Excess lifetime cancer risk – N. Pazar
The annual gonadal dose equivalent due to natural radioisotopes (G, eq. (5)) is presented in Fig. 5, together with radium equivalent activity (Raeq, eq. (4)); showing minimum, maximum, average, standard deviation and median – 0.38, 0.58, 0.48, 0.06, 0.47 mSv/y, respectively (G), and 109, 172, 139, 18.6 and 137 Bq/kg, respectively (Raeq).

246
Fig. 5 Annual gonadal dose equivalent and radium equivalent activity – N. Pazar
For a comparison, the top Rožaje soil (R-1 in Table 2) showed the G and Raeq value of around 356 Sv/y and 108 Bq/kg, respectively; D and E of 90.7 nGy/h, and 111 Sv/y, respectively; i.e., higher than those for N. Pazar – resulting in a higher excess lifetime cancer risk (3.8910-4), which is lower than an average found for Nikšić in Montenegro (4.410-4) 18.
A previous research showed that in Montenegro soils 137Cs dominantly originated from the Chernobyl accident, and its activity decreases with soil depth (i.e., it is mostly still in the surface soil layer 19), which is also confirmed in the present study for the Rožaje locality (R).
During in situ measuring campaign in 1994 4 two measuring points from the Rožaje region were included (Bašća and Kozare) and showed (32633) and (36333) Bq/kg of 137Cs, respectively; as well as 238U – (152) and (142) Bq/kg, respectively; 232Th – (172) and (142) Bq/kg, respectively; 40K – (20722) and (23723) Bq/kg, respectively.
From the Rožaje area where spruce and beech had been sampled (locality R’), surface (0-5 cm) soil was previously analyzed using the PRIPYAT-2M six-detector spectrometer, showing 137Cs, 226Ra/214Bi, 232Th/228Ac, 40K activity of (22111), (36.72.5), (45.22.8) and (40915) Bq/kg, respectively; and Raeq, G, D, E, CR – 130 Bq/kg, 431 Sv/y, 88.8 nGy/h, 109 Sv/y, 3.8110-4, respectively.
3.2. Vegetation measurements
The results of vegetation measurements are reported in Table 3. Masses of pine, blackberry, beech and spruce samples were 181.17, 171.22, 134.7 and 203.4 g, respectively; as measuring times – 53 842, 73 321, 150 179 and 46 240 s, respectively.
Table 3 Results of vegetation measurements Sample A(137Cs),
Bq/kg
A(226Ra),
Bq/kg
A(232Th),
Bq/kg
A(40K),
Bq/kg P.
sylvestris 0.34 2.7±0.18 2.11±0.58 163±7
R. fruticosus
3.05±0.23 4.03±0.31 4.5±0.64 152±6
F. sylvatica
5.24±0.32 0.99±0.12 2.89±0.84 79.3±3.7
P. abies 3.54±0.21 1.1±0.12 1.22 98.4±4.8
The pine sample was taken from the locality NP3 (lower branches with leaves; while soil was sampled at a distance of 1.5-2 m from the tree base). The TF (i.e., activity concentration ratio: P. sylvestris/soil) was found to be 0.029, 0.092, 0,036 and 0.286 – for 137Cs, 226Ra/214Bi, 232Th/228Ac and 40K, respectively.
In R. fruticosus (sampled at the R locality) considering surface soil layer R-1, the TFs are 0.009, 0.13, 0.113 and 0.476, respectively; whilst considering average activities in three soil layers (R-1 – R-3): 0.021, 0.15, 0.115 and 0.447, respectively.
In F. sylvatica (the R’ locality) they were found to be 0.024, 0.027, 0.064 and 0.194, respectively; as in P. abies 0.016, 0.03, 0.027 and 0.241, respectively.
It should be noted that data for 40K (a largest source of natural radioactivity in non-human biota) are given as an illustration only.
Typical ranges for soil-plant TFs for Ra and Cs given in the UNSCEAR 2008 report are 0.001-0.1 14. In that view, the R. fruticosus radium TF is slightly higher, and should be considered in a further study.
It is important to point out that these results cannot be used for the whole P. sylvestris (since related to leaves) which can also accumulate radioisotopes in root, stem, cones; for whole R. fruticosus, which can also accumulate radioisotopes in root, leaves and fruit itself, or for whole F. sylvatica and P. abies which also need further research. For example, nominal TF values for reference organism, pine tree (vegetation (Bq/kg)/soil (Bq/kg)), are 0.2, 0.0007 and 0.001 – for cesium, radium and thorium, respectively 14, while typical ranges of aggregated TFs for 137Cs from soil to vegetation (Bq/kg – vegetation, per Bq/m2 – soil) for R. fruticosus fruit: 0.006-0.05, for Pinus sp. needles: 0.001-0.04, Picea sp. needles: 0.0006-0.02; Fagus sp. bole wood: 0.001-0.002 and leaves: 0.002-0.003 14.
To illustrate radiation exposure levels, the total dose rates were estimated using eq. (6), assuming a homogeneous activity distribution in the organisms.
From a consideration of the areas where vegetation species were sampled, i.e., NP3 – P. sylvestris, R – R. fruticosus (an average radioisotope activity concentration has been used in calculating dose rates), and R’ – F. sylvatica, P. abies; an external exposure to radium is found to be around 9.96, 8.64 and 12.5 nGy/h, respectively, thorium – 2.49, 1.67 and 1.94 pGy/h, respectively, cesium – 1.26, 15.6 and 24.3

247
nGy/h, respectively; potassium – 165, 98.6 and 119 nGy/h, respectively. The total external exposure (137Cs,
226Ra, 232Th, 40K) on these three localities would be 0.18, 0.12 and 0.15 Gy/h, respectively.
Internal exposure of P. sylvestris, R. fruticosus, F. sylvatica and P. abies to considered radioisotopes is evaluated to be – 0.112, 0.728, 0.238 and 0.222 Gy/h, respectively; which means total exposure rate (external and internal) of 0.666, 0.851, 0.393 and 0.377 Gy/h, respectively.
Comparing these results with ones obtained in an evaluation of doses to non-human biota (terrestrial plants) at Trombay, Mumbai (India) 20, where radiation exposure was found to be 437.2-1044 μGy/y (average: 632.8 μGy/y) for 40K, 2379.8-299763.9 μGy/y (average: 48769 μGy/y) for 232Th, 21.3-2392.2 μGy/y (average: 691.23 μGy/y) for 137Cs; doses to terrestrial biota determined in the present study can be considered as significantly less.
The highest dose rate (R. fruticosus) of 0.02 mGy/d is significantly below the threshold dose for terrestrial plants (10 mGy/d), i.e., below the dose interval (2.5-25) mGy/d from recent literature compilation (ERICA project) – as explained in 6, when effects on plants under chronic exposure could be expected (growth reduction, etc.).
4. CONCLUSIONS
None of the considered localities in N. Pazar – Serbia and Rožaje – Montenegro showed a radium equivalent activity higher than 370 Bq/kg. Absorbed dose rates from terrestrial gamma radiation showed an average and median slightly higher than the world's median of average values reported in the UNSCEAR 2000 (57 nGy h-1). The annual gonadal dose equivalent for soil samples from N. Pazar studied in this work proved to be higher than the world average, while in soil from Rožaje, in the case of one locality, it is comparable with the world’s average. With life expectancy taken to be 70 years, a mean excess lifetime cancer risk was found to be 2.810-4 for N. Pazar, as well as 3.8110-4 and 3.8910-4 for Rožaje.
Transfer factors for 137Cs, 226Ra/214Bi, 232Th/228Ac from soil to vegetation ranged from 0.009 (for 137Cs from soil to R. fruticosus) to 0.13 (for 226Ra from soil to R. fruticosus).
The total dose rate – internal and external exposure of P. sylvestris, R. fruticosus, F. sylvatica and P. abies to 137Cs, 226Ra/214Bi, 232Th/228Ac and 40K, is found to be less than 0.021 mG/d (0.666, 0.851, 0.393 and 0.377 Gy/h, respectively), i.e., many folds less than the threshold dose for terrestrial plants (10 mGy/d).
Acknowledgement: A part of the research has been done within the project supported by the Ministry of Science of Montenegro (01-683/2013).
REFERENCES
1. Official site: www.novipazar.rs (in Serbian).
2. MONSTAT, “Statistical Yearbook of Montenegro”, Statistical Office of Montenegro, Podgorica, 2012.
3. Ivanka Antović, Dalibor Stojanović, Nikola Svrkota, Ranka Žižić, Mirzeta Hadžibrahimović, “Openning radioecological research in Novi Pazar – territory of Novopazarska Banja", In: Proc. 27th Symposium of the Radiation Protection Society of Serbia and Montenegro, Vrnjačka Banja – Serbia, pp. 72-75, 2013 (in Serbian).
4. P. Vukotić, N. Antović, S. Dapčević, G. I. Borisov, V. V. Kuzmič, V. M. Kulakov, M. Mirković, M. Pajović, R. Svrkota, B. Fuštić, G. Duretic, A. Dlabač, “Background gamma-radiation in Montenegro”, In: Proc. IRPA Regional Symposium on Radiation Protection in Neighbouring Countries of Central Europe, Prague, Czech Republic, pp. 477-479, 1997.
5. N. M. Antovic, N. Svrkota, I. Antovic, “Measuring 226Ra and 232Th activity in soil and vegetation samples using a method of double -coincidences“, J. Radioanal. Nucl. Chem., vol. 283(2), pp. 313-318, 2010.
6. International Union of Radioecology, http://iur-uir.org/upload/About%20IUR/radioecology_oslo_presentation2014.pdf, 2014.
7. HASL-300, “EML Procedures Manual”, Environmental Measurements Laboratory, U.S. Department of Energy, 28 Edition, 1997.
8. UNSCEAR, “Sources and Effects of Ionizing Radiation. Annex B: Exposure from natural radiation sources”, United Nations, New York, 2000.
9. E. Kapdan, A. Varinlioglu, G. Karahan, “Radioactivity levels and health risks due to radionuclides in the soil of Yalova, northwestern Turkey”, Int. J. Environ. Res, vol. 5(4), pp. 837-846, 2011.
10. H. Taskin, M. Karavus, P. Ay, A. Topuzoglu, S. Hidiroglu, G. Karahan, “Radionuclide concentrations in soil and lifetime cancer risk due to gamma radioactivity in Kirklareli, Turkey”, J. Environ. Radioactiv., vol. 100(1), pp. 49-53, 2009.
11. ICRP Publication 60, “1990 Recommendations of the International Commission on Radiological Protection”, 21/1-3, 1991.
12. J. Beretka, P. J. Mathew, “Natural radioactivity of Australian building materijals, industrial wastes and by-products”, Health Phys., vol. 48(1), pp. 87-95, 1985.
13. W. Arafa, “Specific activities and hazards of granite samples collected from the eastern desert of Egypt”, J. Environ. Radioactiv., vol. 75(3), pp. 315-327, 2004.
14. UNSCEAR, “Sources and effects of ionizing radiation. Annex E: Effects of ionizing radiation on non-human biota”, 2008 Report to the General Assembly with Scientific Annexes, United Nations, New York, 2011.
15. B. D. Amiro, “Radiological dose conversion factors for generic non-human biota used for screening potential ecological impacts”, J. Environ. Radioactiv., vol. 35, pp. 37-51, 1997.
16. S. S. Nenadovic, M. T. Nenadovic, I. S. Vukanac, M. O. Omerasevic, Lj. M. Kljajevic, “Radiological hazards of 137Cs in cultivated and undisturbed areas”, Nucl. Technol. Radiat. Prot., vol. 26(2), pp. 115-118, 2011.
17. Lj. Jankovic Mandic, S. Dragovic, “Assessment of terrestrial gamma exposure to the population of Belgrade (Serbia)”, Radiat. Prot. Dosim., vol. 140(4), pp. 369-377, 2010.
18. N. M. Antović, N. Svrkota, I. Antović, R. Svrkota, R. Žižić, D. Živković, “Radioactivity impact assessment of Nikšić region in Montenegro”, J. Radioanal. Nucl. Chem., vol. 302 (2), pp. 831-836, 2014.
19. Nevenka M. Antovic, Perko Vukotic, Nikola Svrkota, Sergey K. Andrukhovich, “Pu-239+240 and Cs-137 in Montenegro soil: their correlation and origin“, J. Environ. Radioactiv., vol. 110, pp. 90-97, 2012.
20. R. K. Singhal, K. Ajay, N. Usha, A. V. R. Reddy, “Evaluation of doses from ionizing radiation to non-human species at Tromay, Mumbai, India”, Radiat. Prot. Dosim., vol. 133(4), pp. 214-222, 2009.

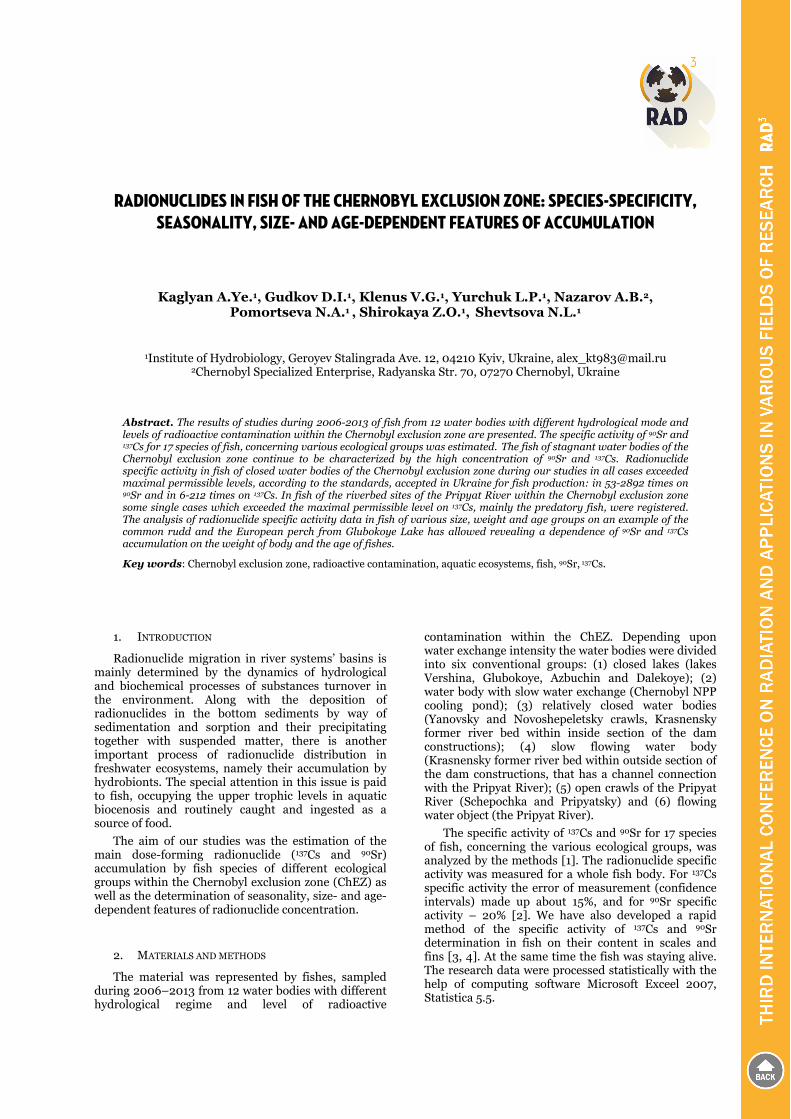
RADIONUCLIDES IN FISH OF THE CHERNOBYL EXCLUSION ZONE: SPECIES-SPECIFICITY, SEASONALITY, SIZE- AND AGE-DEPENDENT FEATURES OF ACCUMULATION
Kaglyan A.Ye.1, Gudkov D.I.1, Klenus V.G.1, Yurchuk L.P.1, Nazarov A.B.2, Pomortseva N.A.1 , Shirokaya Z.O.1, Shevtsova N.L.1
1Institute of Hydrobiology, Geroyev Stalingrada Ave. 12, 04210 Kyiv, Ukraine, [email protected]
2Chernobyl Specialized Enterprise, Radyanska Str. 70, 07270 Chernobyl, Ukraine
Abstract. The results of studies during 2006-2013 of fish from 12 water bodies with different hydrological mode and levels of radioactive contamination within the Chernobyl exclusion zone are presented. The specific activity of 90Sr and 137Cs for 17 species of fish, concerning various ecological groups was estimated. The fish of stagnant water bodies of the Chernobyl exclusion zone continue to be characterized by the high concentration of 90Sr and 137Cs. Radionuclide specific activity in fish of closed water bodies of the Chernobyl exclusion zone during our studies in all cases exceeded maximal permissible levels, according to the standards, accepted in Ukraine for fish production: in 53-2892 times on 90Sr and in 6-212 times on 137Cs. In fish of the riverbed sites of the Pripyat River within the Chernobyl exclusion zone some single cases which exceeded the maximal permissible level on 137Cs, mainly the predatory fish, were registered. The analysis of radionuclide specific activity data in fish of various size, weight and age groups on an example of the common rudd and the European perch from Glubokoye Lake has allowed revealing a dependence of 90Sr and 137Cs accumulation on the weight of body and the age of fishes.
Key words: Chernobyl exclusion zone, radioactive contamination, aquatic ecosystems, fish, 90Sr, 137Cs.
1. INTRODUCTION
Radionuclide migration in river systems’ basins is mainly determined by the dynamics of hydrological and biochemical processes of substances turnover in the environment. Along with the deposition of radionuclides in the bottom sediments by way of sedimentation and sorption and their precipitating together with suspended matter, there is another important process of radionuclide distribution in freshwater ecosystems, namely their accumulation by hydrobionts. The special attention in this issue is paid to fish, occupying the upper trophic levels in aquatic biocenosis and routinely caught and ingested as a source of food.
The aim of our studies was the estimation of the main dose-forming radionuclide (137Cs and 90Sr) accumulation by fish species of different ecological groups within the Chernobyl exclusion zone (ChEZ) as well as the determination of seasonality, size- and age-dependent features of radionuclide concentration.
2. MATERIALS AND METHODS
The material was represented by fishes, sampled during 2006–2013 from 12 water bodies with different hydrological regime and level of radioactive
contamination within the ChEZ. Depending upon water exchange intensity the water bodies were divided into six conventional groups: (1) closed lakes (lakes Vershina, Glubokoye, Azbuchin and Dalekoye); (2) water body with slow water exchange (Chernobyl NPP cooling pond); (3) relatively closed water bodies (Yanovsky and Novoshepeletsky crawls, Krasnensky former river bed within inside section of the dam constructions); (4) slow flowing water body (Krasnensky former river bed within outside section of the dam constructions, that has a channel connection with the Pripyat River); (5) open crawls of the Pripyat River (Schepochka and Pripyatsky) and (6) flowing water object (the Pripyat River).
The specific activity of 137Cs and 90Sr for 17 species of fish, concerning the various ecological groups, was analyzed by the methods [1]. The radionuclide specific activity was measured for a whole fish body. For 137Cs specific activity the error of measurement (confidence intervals) made up about 15%, and for 90Sr specific activity – 20% [2]. We have also developed a rapid method of the specific activity of 137Cs and 90Sr determination in fish on their content in scales and fins [3, 4]. At the same time the fish was staying alive. The research data were processed statistically with the help of computing software Microsoft Exceel 2007, Statistica 5.5.
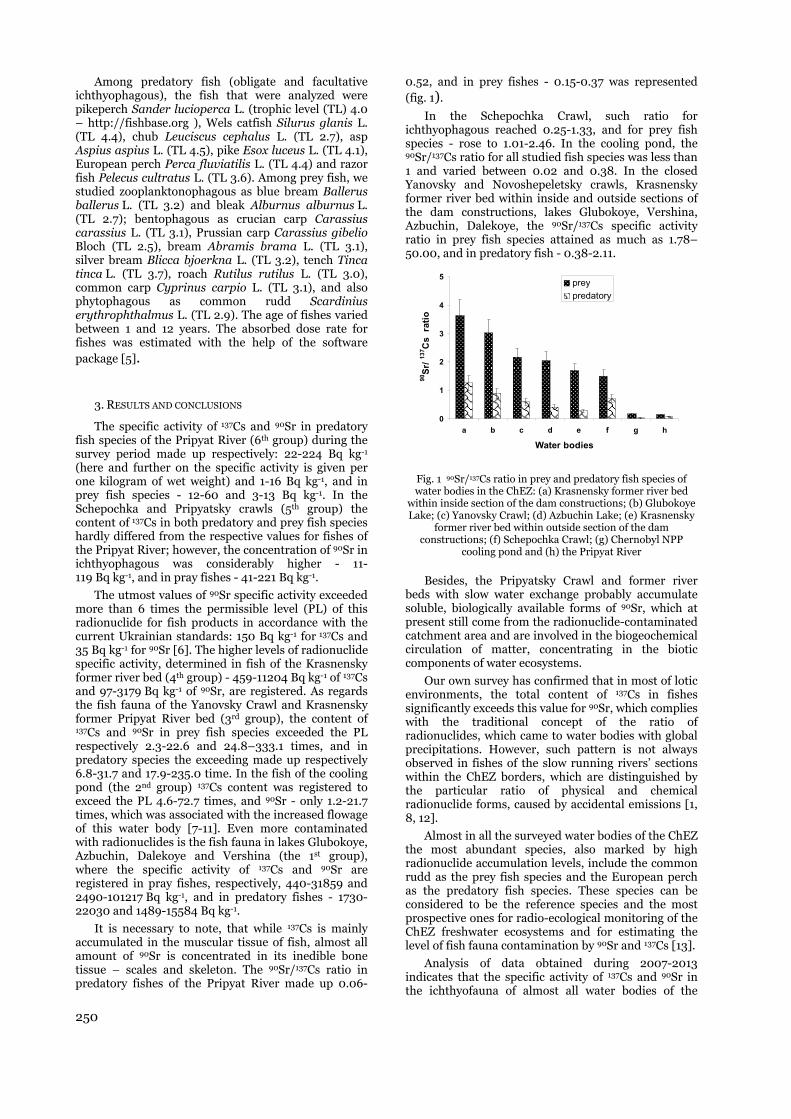
250
Among predatory fish (obligate and facultative ichthyophagous), the fish that were analyzed were pikeperch Sander lucioperca L. (trophic level (TL) 4.0 – http://fishbase.org ), Wels catfish Silurus glanis L. (TL 4.4), chub Leuciscus cephalus L. (TL 2.7), asp Aspius aspius L. (TL 4.5), pike Esox luceus L. (TL 4.1), European perch Perca fluviatilis L. (TL 4.4) and razor fish Pelecus cultratus L. (TL 3.6). Among prey fish, we studied zooplanktonophagous as blue bream Ballerus ballerus L. (TL 3.2) and bleak Alburnus alburnus L. (TL 2.7); bentophagous as crucian carp Carassius carassius L. (TL 3.1), Prussian carp Carassius gibelio Bloch (TL 2.5), bream Abramis brama L. (TL 3.1), silver bream Blicca bjoerkna L. (TL 3.2), tench Tinca tinca L. (TL 3.7), roach Rutilus rutilus L. (TL 3.0), common carp Cyprinus carpio L. (TL 3.1), and also phytophagous as common rudd Scardinius erythrophthalmus L. (TL 2.9). The age of fishes varied between 1 and 12 years. The absorbed dose rate for fishes was estimated with the help of the software package [5].
3. RESULTS AND CONCLUSIONS
The specific activity of 137Cs and 90Sr in predatory fish species of the Pripyat River (6th group) during the survey period made up respectively: 22-224 Bq kg-1 (here and further on the specific activity is given per one kilogram of wet weight) and 1-16 Bq kg-1, and in prey fish species - 12-60 and 3-13 Bq kg-1. In the Schepochka and Pripyatsky crawls (5th group) the content of 137Cs in both predatory and prey fish species hardly differed from the respective values for fishes of the Pripyat River; however, the concentration of 90Sr in ichthyophagous was considerably higher - 11-119 Bq kg-1, and in pray fishes - 41-221 Bq kg-1.
The utmost values of 90Sr specific activity exceeded more than 6 times the permissible level (PL) of this radionuclide for fish products in accordance with the current Ukrainian standards: 150 Bq kg-1 for 137Cs and 35 Bq kg-1 for 90Sr [6]. The higher levels of radionuclide specific activity, determined in fish of the Krasnensky former river bed (4th group) - 459-11204 Bq kg-1 of 137Cs and 97-3179 Bq kg-1 of 90Sr, are registered. As regards the fish fauna of the Yanovsky Crawl and Krasnensky former Pripyat River bed (3rd group), the content of 137Cs and 90Sr in prey fish species exceeded the PL respectively 2.3-22.6 and 24.8–333.1 times, and in predatory species the exceeding made up respectively 6.8-31.7 and 17.9-235.0 time. In the fish of the cooling pond (the 2nd group) 137Cs content was registered to exceed the PL 4.6-72.7 times, and 90Sr - only 1.2-21.7 times, which was associated with the increased flowage of this water body [7-11]. Even more contaminated with radionuclides is the fish fauna in lakes Glubokoye, Azbuchin, Dalekoye and Vershina (the 1st group), where the specific activity of 137Cs and 90Sr are registered in pray fishes, respectively, 440-31859 and 2490-101217 Bq kg-1, and in predatory fishes - 1730-22030 and 1489-15584 Bq kg-1.
It is necessary to note, that while 137Cs is mainly accumulated in the muscular tissue of fish, almost all amount of 90Sr is concentrated in its inedible bone tissue – scales and skeleton. The 90Sr/137Cs ratio in predatory fishes of the Pripyat River made up 0.06-
0.52, and in prey fishes - 0.15-0.37 was represented (fig. 1).
In the Schepochka Crawl, such ratio for ichthyophagous reached 0.25-1.33, and for prey fish species - rose to 1.01-2.46. In the cooling pond, the 90Sr/137Cs ratio for all studied fish species was less than 1 and varied between 0.02 and 0.38. In the closed Yanovsky and Novoshepeletsky crawls, Krasnensky former river bed within inside and outside sections of the dam constructions, lakes Glubokoye, Vershina, Azbuchin, Dalekoye, the 90Sr/137Cs specific activity ratio in prey fish species attained as much as 1.78–50.00, and in predatory fish - 0.38-2.11.
0
1
2
3
4
5
a b c d e f g h
Water bodies
90Sr
/ 137 C
s r
atio
preypredatory
Fig. 1 90Sr/137Cs ratio in prey and predatory fish species of water bodies in the ChEZ: (a) Krasnensky former river bed
within inside section of the dam constructions; (b) Glubokoye Lake; (c) Yanovsky Crawl; (d) Azbuchin Lake; (e) Krasnensky
former river bed within outside section of the dam constructions; (f) Schepochka Crawl; (g) Chernobyl NPP
cooling pond and (h) the Pripyat River
Besides, the Pripyatsky Crawl and former river beds with slow water exchange probably accumulate soluble, biologically available forms of 90Sr, which at present still come from the radionuclide-contaminated catchment area and are involved in the biogeochemical circulation of matter, concentrating in the biotic components of water ecosystems.
Our own survey has confirmed that in most of lotic environments, the total content of 137Cs in fishes significantly exceeds this value for 90Sr, which complies with the traditional concept of the ratio of radionuclides, which came to water bodies with global precipitations. However, such pattern is not always observed in fishes of the slow running rivers’ sections within the ChEZ borders, which are distinguished by the particular ratio of physical and chemical radionuclide forms, caused by accidental emissions [1, 8, 12].
Almost in all the surveyed water bodies of the ChEZ the most abundant species, also marked by high radionuclide accumulation levels, include the common rudd as the prey fish species and the European perch as the predatory fish species. These species can be considered to be the reference species and the most prospective ones for radio-ecological monitoring of the ChEZ freshwater ecosystems and for estimating the level of fish fauna contamination by 90Sr and 137Cs [13].
Analysis of data obtained during 2007-2013 indicates that the specific activity of 137Cs and 90Sr in the ichthyofauna of almost all water bodies of the
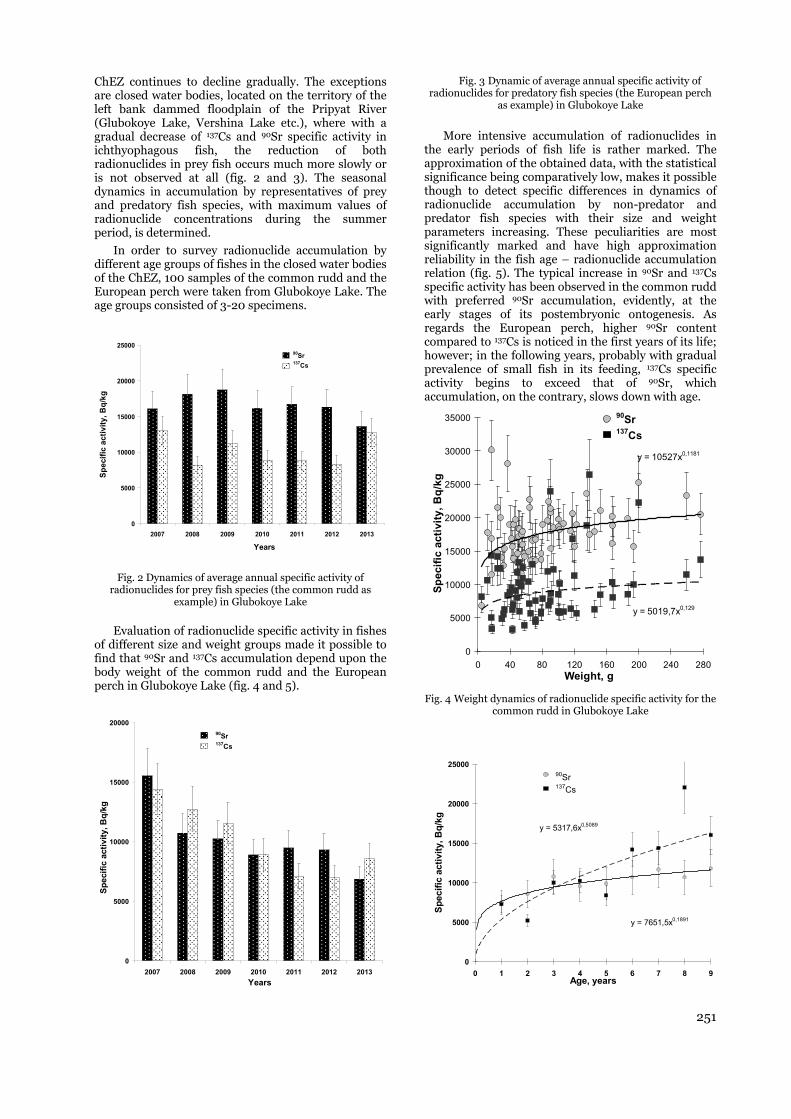
251
ChEZ continues to decline gradually. The exceptions are closed water bodies, located on the territory of the left bank dammed floodplain of the Pripyat River (Glubokoye Lake, Vershina Lake etc.), where with a gradual decrease of 137Cs and 90Sr specific activity in ichthyophagous fish, the reduction of both radionuclides in prey fish occurs much more slowly or is not observed at all (fig. 2 and 3). The seasonal dynamics in accumulation by representatives of prey and predatory fish species, with maximum values of radionuclide concentrations during the summer period, is determined.
In order to survey radionuclide accumulation by different age groups of fishes in the closed water bodies of the ChEZ, 100 samples of the common rudd and the European perch were taken from Glubokoye Lake. The age groups consisted of 3-20 specimens.
0
5000
10000
15000
20000
25000
2007 2008 2009 2010 2011 2012 2013
Years
Spec
ific
activ
ity, B
q/kg
90Sr137Cs
Fig. 2 Dynamics of average annual specific activity of radionuclides for prey fish species (the common rudd as
example) in Glubokoye Lake
Evaluation of radionuclide specific activity in fishes of different size and weight groups made it possible to find that 90Sr and 137Cs accumulation depend upon the body weight of the common rudd and the European perch in Glubokoye Lake (fig. 4 and 5).
0
5000
10000
15000
20000
2007 2008 2009 2010 2011 2012 2013Years
Spec
ific
activ
ity, B
q/kg
90Sr137Cs
Fig. 3 Dynamic of average annual specific activity of radionuclides for predatory fish species (the European perch
as example) in Glubokoye Lake
More intensive accumulation of radionuclides in
the early periods of fish life is rather marked. The approximation of the obtained data, with the statistical significance being comparatively low, makes it possible though to detect specific differences in dynamics of radionuclide accumulation by non-predator and predator fish species with their size and weight parameters increasing. These peculiarities are most significantly marked and have high approximation reliability in the fish age – radionuclide accumulation relation (fig. 5). The typical increase in 90Sr and 137Cs specific activity has been observed in the common rudd with preferred 90Sr accumulation, evidently, at the early stages of its postembryonic ontogenesis. As regards the European perch, higher 90Sr content compared to 137Cs is noticed in the first years of its life; however; in the following years, probably with gradual prevalence of small fish in its feeding, 137Cs specific activity begins to exceed that of 90Sr, which accumulation, on the contrary, slows down with age.
y = 10527x0,1181
y = 5019,7x0,129
0
5000
10000
15000
20000
25000
30000
35000
0 40 80 120 160 200 240 280Weight, g
Spec
ific
activ
ity, B
q/kg
90Sr137Cs
Fig. 4 Weight dynamics of radionuclide specific activity for the
common rudd in Glubokoye Lake
y = 5317,6x0,5089
y = 7651,5x0,1891
0
5000
10000
15000
20000
25000
0 1 2 3 4 5 6 7 8 9Age, years
Spec
ific
activ
ity, B
q/kg
90Sr137Cs
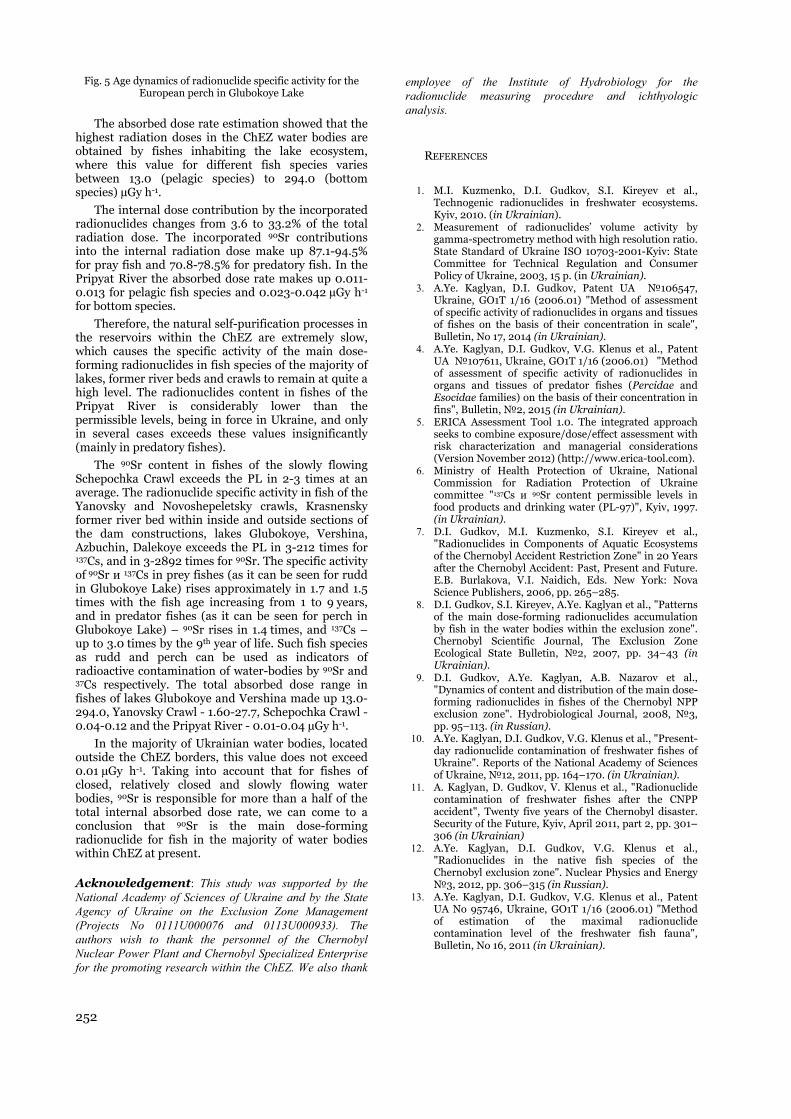
252
Fig. 5 Age dynamics of radionuclide specific activity for the European perch in Glubokoye Lake
The absorbed dose rate estimation showed that the
highest radiation doses in the ChEZ water bodies are obtained by fishes inhabiting the lake ecosystem, where this value for different fish species varies between 13.0 (pelagic species) to 294.0 (bottom species) µGy h-1.
The internal dose contribution by the incorporated radionuclides changes from 3.6 to 33.2% of the total radiation dose. The incorporated 90Sr contributions into the internal radiation dose make up 87.1-94.5% for pray fish and 70.8-78.5% for predatory fish. In the Pripyat River the absorbed dose rate makes up 0.011-0.013 for pelagic fish species and 0.023-0.042 µGy h-1
for bottom species.
Therefore, the natural self-purification processes in the reservoirs within the ChEZ are extremely slow, which causes the specific activity of the main dose-forming radionuclides in fish species of the majority of lakes, former river beds and crawls to remain at quite a high level. The radionuclides content in fishes of the Pripyat River is considerably lower than the permissible levels, being in force in Ukraine, and only in several cases exceeds these values insignificantly (mainly in predatory fishes).
The 90Sr content in fishes of the slowly flowing Schepochka Crawl exceeds the PL in 2-3 times at an average. The radionuclide specific activity in fish of the Yanovsky and Novoshepeletsky crawls, Krasnensky former river bed within inside and outside sections of the dam constructions, lakes Glubokoye, Vershina, Azbuchin, Dalekoye exceeds the PL in 3-212 times for 137Cs, and in 3-2892 times for 90Sr. The specific activity of 90Sr и 137Cs in prey fishes (as it can be seen for rudd in Glubokoye Lake) rises approximately in 1.7 and 1.5 times with the fish age increasing from 1 to 9 years, and in predator fishes (as it can be seen for perch in Glubokoye Lake) – 90Sr rises in 1.4 times, and 137Cs – up to 3.0 times by the 9th year of life. Such fish species as rudd and perch can be used as indicators of radioactive contamination of water-bodies by 90Sr and 37Cs respectively. The total absorbed dose range in fishes of lakes Glubokoye and Vershina made up 13.0-294.0, Yanovsky Crawl - 1.60-27.7, Schepochka Crawl - 0.04-0.12 and the Pripyat River - 0.01-0.04 µGy h-1.
In the majority of Ukrainian water bodies, located outside the ChEZ borders, this value does not exceed 0.01 µGy h-1. Taking into account that for fishes of closed, relatively closed and slowly flowing water bodies, 90Sr is responsible for more than a half of the total internal absorbed dose rate, we can come to a conclusion that 90Sr is the main dose-forming radionuclide for fish in the majority of water bodies within ChEZ at present.
Acknowledgement: This study was supported by the National Academy of Sciences of Ukraine and by the State Agency of Ukraine on the Exclusion Zone Management (Projects No 0111U000076 and 0113U000933). The authors wish to thank the personnel of the Chernobyl Nuclear Power Plant and Chernobyl Specialized Enterprise for the promoting research within the ChEZ. We also thank
employee of the Institute of Hydrobiology for the radionuclide measuring procedure and ichthyologic analysis.
REFERENCES
1. M.I. Kuzmenko, D.I. Gudkov, S.I. Kireyev et al., Technogenic radionuclides in freshwater ecosystems. Kyiv, 2010. (in Ukrainian).
2. Measurement of radionuclides’ volume activity by gamma-spectrometry method with high resolution ratio. State Standard of Ukraine ISO 10703-2001-Kyiv: State Committee for Technical Regulation and Consumer Policy of Ukraine, 2003, 15 p. (in Ukrainian).
3. A.Ye. Kaglyan, D.I. Gudkov, Patent UA №106547, Ukraine, GO1T 1/16 (2006.01) "Method of assessment of specific activity of radionuclides in organs and tissues of fishes on the basis of their concentration in scale", Bulletin, No 17, 2014 (in Ukrainian).
4. A.Ye. Kaglyan, D.I. Gudkov, V.G. Klenus et al., Patent UA №107611, Ukraine, GO1T 1/16 (2006.01) "Method of assessment of specific activity of radionuclides in organs and tissues of predator fishes (Percidae and Esocidae families) on the basis of their concentration in fins", Bulletin, №2, 2015 (in Ukrainian).
5. ERICA Assessment Tool 1.0. The integrated approach seeks to combine exposure/dose/effect assessment with risk characterization and managerial considerations (Version November 2012) (http://www.erica-tool.com).
6. Ministry of Health Protection of Ukraine, National Commission for Radiation Protection of Ukraine committee "137Cs и 90Sr content permissible levels in food products and drinking water (PL-97)", Kyiv, 1997. (in Ukrainian).
7. D.I. Gudkov, M.I. Kuzmenko, S.I. Kireyev et al., "Radionuclides in Components of Aquatic Ecosystems of the Chernobyl Accident Restriction Zone" in 20 Years after the Chernobyl Accident: Past, Present and Future. E.B. Burlakova, V.I. Naidich, Eds. New York: Nova Science Publishers, 2006, pp. 265–285.
8. D.I. Gudkov, S.I. Kireyev, A.Ye. Kaglyan et al., "Patterns of the main dose-forming radionuclides accumulation by fish in the water bodies within the exclusion zone". Chernobyl Scientific Journal, The Exclusion Zone Ecological State Bulletin, №2, 2007, pp. 34–43 (in Ukrainian).
9. D.I. Gudkov, A.Ye. Kaglyan, A.B. Nazarov et al., "Dynamics of content and distribution of the main dose-forming radionuclides in fishes of the Chernobyl NPP exclusion zone". Hydrobiological Journal, 2008, №3, pp. 95–113. (in Russian).
10. A.Ye. Kaglyan, D.I. Gudkov, V.G. Klenus et al., "Present-day radionuclide contamination of freshwater fishes of Ukraine". Reports of the National Academy of Sciences of Ukraine, №12, 2011, pp. 164–170. (in Ukrainian).
11. A. Kaglyan, D. Gudkov, V. Klenus et al., "Radionuclide contamination of freshwater fishes after the CNPP accident", Twenty five years of the Chernobyl disaster. Security of the Future, Kyiv, April 2011, part 2, pp. 301–306 (in Ukrainian)
12. A.Ye. Kaglyan, D.I. Gudkov, V.G. Klenus et al., "Radionuclides in the native fish species of the Chernobyl exclusion zone". Nuclear Physics and Energy №3, 2012, pp. 306–315 (in Russian).
13. A.Ye. Kaglyan, D.I. Gudkov, V.G. Klenus et al., Patent UA No 95746, Ukraine, GO1T 1/16 (2006.01) "Method of estimation of the maximal radionuclide contamination level of the freshwater fish fauna", Bulletin, No 16, 2011 (in Ukrainian).

CESIUM-137 MONITORING USING MOSSES AND LICHENS FROM WEST MACEDONIA, GREECE
Th. Sawidis1, K. Tsigaridas1 and L. Tsikritzis2
1Department of Botany, School of Biology, University of Thessaloniki, Gr-54124 Thessaloniki, Greece 2Technological Education Institution of West Macedonia, Gr-50100, Kozani, Greece
Abstract. 137Cs concentrations of mosses, lichens and substrate (soil, bark) collected from North Greece were measured 20 years after the Chernobyl accident. Archive material from previous works were also used for comparison and diachronic estimation of the radio-contamination evolution. Maximum bioaccumulation capacity of 137Cs was observed in epilithic lichens in comparison to epigeic or epiphytic ones, whilst the epilithic mosses prevailed in comparison to the epiphytic ones. Foliose or crustose lichens were more contaminated than filamentose in the same biotope. Among filamentose or fruticose species those with large surface area to biomass ratio, e.g. Usnea sp., showed also greater bioaccumulation capacity. Autoradiography revealed an amount of 137Cs distributed more or less uniformly in lichen and moss thalli. The high 137Cs activities found in lichens and mosses 20 years after Chernobyl suggest that these primitive plants are effective and suitable biological indicators of the distribution of radionuclide fallout pattern.
Key words: bioindicators, Chernobyl, 137Cs, lichens, mosses, radionuclides.
1. INTRODUCTION
Mosses and lichens may be regarded as the most commonly applied organisms for biomonitoring studies of radioactive contamination of both natural and artificial origin (Beaugelin-Seiller et al, 1994; Batzias and Siontorou, 2007). Twenty years back, the Chernobyl accident resulted in the release and global dispersion of about 3,000,000 TBq fission products mainly with 137Cs (Eisler, 1994). Within the North Greece region the highest activity concentrations were found on Mt. Vermion (Papastefanou et al, 1989; Sawidis and Heinrich, 1992). The long half-life together with its chemical and ecophysiological similarity with potassium makes 137Cs one of the most harmful radionuclides released into the environment by the nuclear industry. The aim of the present research is to continue studying the natural depuration rates of 137Cs over the last two decades and to test the performance of mosses and lichens as indicators of 137Cs deposition. Another objective of this work has been differences in interception between various moss and lichen categories (epiphytic, epigeic or epilithic) or species from the same biotope.
2. MATERIALS AND METHODS
Two sampling stations of approximately 500 m2 were selected (Figure 1) for the purpose of comparing the radioactivity over a 10-year interval. Samples were collected on March 2006. Archive material collected and measured (for 137Cs load) before and right after the accident was used for time interval comparison. All
samples were prepared according to the following procedure: air drying for 48 h, grinding, sieving through a 2-mm sieve and storing. Radiometric determinations were performed by using a 73 cm3 SILENA HP-Ge detector (10.6% relative efficiency, 1.9 keV resolution for 60Co 1.332 MeV line) connected on line with a SILENA 8192 MCA. Gamma spectra were registered for 80,000 s and processed by using SILENA GAMMA 2000 software. The detector was calibrated by using the DKD reference materials, Code 000229 (Deutscher Kalibrierdienst, 2006). In order to take autoradiographs of the samples, lichen and moss thalli were pressed and dried between two filter papers, at 25 °C, for ca 1 week. The pressed thalli were left in contact with a MIN-R mammography film 18x24 cm (Kodak) for 6 months at room temperature.
Fig. 1 Map of the study area, including the two sampling stations in Mt. Vermion and Klimataki plateau

254
3. RESULTS AND DISCUSSION
The amount of 137Cs in different lichen species collected at the same time in a given area exhibited significant differences in accumulation properties depending on the different ecological conditions. The most contaminated mosses from Mt. Vermion are both Grimmia species, namely G. decipiens (2050±65 Bq kg-1) and G. laevigata (1500±52 Bq kg-1) found on icy rocky surface. On the other hand T. muralis (277±5 Bq kg-1) and L. sciuroides (494±10 Bq kg-1), found on tree barks, are the “clear” moss species (Figure 2). In Klimataki plateau, where only epiphytic moss species were collected, L. sciuroides (1032±15 Bq kg-1) followed by H. aureum (740±26 Bq kg-1) are the most contaminated species. They occur mostly on the basal area of the oak tree trunks. On the contrary the least contaminated species is D. fluitans (75 ±8 Bq kg-1), collected from moist places.
The most contaminated lichen from Mt. Vermion was U. crustulosa (5252±417 Bq kg-1) followed by P. muralis (4005±277 Bq kg-1) both foliose, epilithic species. These lichens, collected mainly from the exposed areas at the tip of Mt. Vermion, have had the ability to colonize xeric microsites, were mostly unprotected from the direct radioactive deposition. Thus they avoided any shielding effect by trees or other vegetation. On the other hand P. furfuracea (77±8 Bq kg-1) and E. prunastri (49±4 Bq kg-1) are the less contaminated lichen species, both epiphytic foliose that grow on the bark of deciduous or coniferous trees, which provide an effective 137Cs protection. In Klimataki plateau, where only epiphytic lichens were sampled, the genus Ramalina as well as Evernia showed the lowest 137Cs content (78 Bq kg-1), whereas P. sulcata (310±23 Bq kg-1) and A. ciliaris (325±10 Bq kg-1) were the most contaminated species. Lichens with more compact thalli and hard upper surface such as Ramalina and Evernia are more effective in resistance of element accumulation.
Moreover Mt. Vermion was found to be more contaminated than the Klimataki plateau when comparing soil, moss and lichen samples, but when comparing barks the opposite findings arose. Tree barks were less contaminated in Mt. Vermion than those of the Klimataki plateau. The faster decreasing values in bark specimens on Mt. Vermion in comparison to Klimataki plateau are reinforced by the higher annual rainfall (>1000 mm) leaching down the 137Cs from the tree stems to soil. Thus the soil contamination on Mt. Vermion is much higher than in Klimataki plateau.
Autoradiographs from lichen and moss collected after the accident (1986) are presented in Figure 3.
Visualization of 137Cs distribution in lichen or moss thalli by autoradiography, revealed that this isotope was first deposited as particles and then transported together with nutrients via the transpiration system. Our autoradiographs, 10 years after the accident, revealed an amount of diffused 137Cs content not in particulate form.
Fig. 2 Average 137Cs activities in epiphytic and epilithic mosses and lichenes from Mt. Vermion versus time
a b Fig. 3 Autoradiograph of 137Cs distribution on Umbilicaria crustulosa (a) and Grimmia laevigata (b) thalli collected from Mt. Vermion in summer 1996 and covered by film in 2006
4. CONCLUSIONS
Twenty years after Chernobyl (April 1986) the 137Cs activities of lichens and mosses in the studied area are significantly lower than those of the summer of 1986, but in some species still higher than before Chernobyl. Interspecific variations in 137Cs charge may be related primarily to location, ecological requirements or morphological differences. In most of the moss and lichen species growing on trees, away from the earth surface, there is a considerable reduction of 137Cs approaching towards pre-1986 level. Based upon the decrease rates, the levels of 137Cs, even in non-epiphytic lichens and mosses of West Macedonia, Greece, will reach in a few years those observed before the Chernobyl accident. Detectable 137Cs activities in mosses and lichens 20 years after Chernobyl support the view that the latter are suitable biological monitors of the environmental radioactivity.

255
1. Batzias, F., Siontorou, C., 2007. A novel system for environmental monitoring through a cooperative/synergistic scheme between bioindicators and biosensors. J. Environ. Manage. 82, 221–239.
2. Beaugelin-Seiller, K., Baudin, J.P., Brottet, D., 1994. Use of aquatic mosses for monitoring artificial radionuclides downstream of the nuclear power plant of Bugey (River Rhone, France). J. Environ. Radioact. 24, 217–233.
3. Deutscher Kalibrierdienst DKD-K-36901, 000229, 06-01, 2006. Isotope Products Laboratory, Valencia.
4. Eisler, R., 1994. Radiation hazards to fish, wildlife, and invertebrates: a synoptic review. Contam. Haz. Rev. Rep. 29, National Biological Service, United States Department of Interior, Washington, DC, USA.
5. Papastefanou, C., Manolopoulou, M., Sawidis, T., 1989. Lichens and mosses: biological monitors of radioactive fallout from the Chernobyl reactor accident. J. Environ. Radioact. 9, 199–207.
6. Sawidis, T., Heinrich, G., 1992. 137Cesium monitoring using lichens and mosses from Northern Greece. Can. J. Bot. 70, 140–144.
REFERENCES


SPECIFIC USE OF PHRAGMITES AUSTRALIS FOR RADIATION MONITORING
D. Ganzha1, Ch. Ganzha2, A. Nazarov3, B. Sploshnoi3
1Ivano-Frankivsk Department of the Ukrainian Geographical Society 2Institute of Hydrobiology of NAS of Ukraine
3State Specialized Enterprise “Chornobyl spetskombinat”
Abstract. We compared the methods of sampling and analysis of radionuclide concentrations in samples of common reed in the Chornobyl Exclusion Zone. Selection and analysis of samples were generated using two methods. The first one is consistent with the current regulations, which allow selection and analysis of the whole plant of common reed and calculations of radionuclide concentrations in relation to the wet sample's weight. The second method, adopted in applied ecology, directs the selection of individual plant organs and the calculation of radionuclide concentrations in relation to the weight of the dry sample. It has been established experimentally that when applying the second observation method, the statistical uncertainty of measurement is 2.5 times smaller, which makes this method more suitable for radiological control and monitoring.
Key words: Chornobyl exclusion zone, field radiation measurements, radioecological monitoring, uncertainty of measurement results, Phragmites australis.
1. INTRODUCTION
For biological indication during radio-ecological control and monitoring of the environment, one of the most important metrological characteristics, which determine the reliability and reproducibility of observation results, is the uncertainty of measurement. [5]. This parameter most accurately characterizes the quality of the measurements of radionuclides in living organisms or their parts, which are used as biological indicators of the environment. Uncertainty of measurement, in this case, depends on sampling errors, laboratory measurements, allocation of radionuclides in biological indicators, and affects the number of dimensions in the implementation of the environmental mapping [1]. During the study period, which followed the 1986 disaster at the Chornobyl Nuclear Power Plant (Ukraine), the primary attention regarding the accuracy of measurements was paid to laboratory analysis of radionuclides. The dependence of accuracy of radio-ecological observations on features of field sampling has been developed less. Researchers pay particular attention to allocation of radionuclides in the soil and the influence of this factor on the methodological features of soil sampling [3]. In radio-ecological studies of vegetation more attention was paid to methodological features of leaf selection, pine needles, wood and bark of woody vegetation. Methodological features of selection of herbaceous vegetation received less attention. At the same time, operating procedures govern the location and frequency of sampling, but do not describe the requirements for the parameters of the samples taken [8]. In the practice CEZ study of aquatic vegetation are based on traditions of national radioecology, which Instructs the selection and analysis of the whole plant
and the calculation of radionuclide concentrations considering the green weight of the sample [4]. This approach is also applied to the CEZ with regard to common reed, the samples of which are taken and analyzed in the form of a non-dissected plant with fragments of plant roots and rhizomes. Besides, our studies of radionuclide accumulation by individual tissues and organs of plants [2] showed the effect of this methodological approach on the quality of measurements in environmental monitoring. Since the value of common reed for biological indication for monitoring of aquatic ecosystems in the CEZ has grown in recent years, it becomes more topical to investigate this plant as a biological indicator [9].
The aim of our study is to analyze the components of the total statistical uncertainty of measurement associated with sampling measurements of 90Sr and 137Cs accumulation of common reed.
2. MATERIAL AND METHODS
The observation was conducted in 2008-2013 in ecosystems of six reservoirs (surveillance places) in CEZ: Lake Azbuchyn, Lake Glyboke, Lake Daleke, Yaniv backwater of the Prypiat River near the Prypiat town, the cooling pond of the Chornobyl Nuclear Power Plant (NPP pool), alignment of the Prypiat River near Chornobyl (Chornobyl transit). During observations, Phragmites australis (Cav.) Trin. ex Steud were sampled. Sampling and analysis has been implemented using two methods. The first one has been done according to the current instructions in CEZ, allowing the selection and analysis of the whole plant of common reed and calculating the concentration of radionuclides regarding the green

258
weight of the sample [8]. For the first method, are one or two whole plants were collected monthly during growing season.
The second method, which we used for comparison, involves the selection of certain plant organs and calculating concentrations in relation to the weight of the dry sample. Leaves and stems of common reed fragments were collected at mid-height of the plant. For comparison, in some cases, upper and lower leaves of the plant were selected too. Sometimes, the plant roots were studied as well. For this method, samples of respective parts of 30 plants were collected, monthly during the growing season.
From leaves and stems of common reed freshly drawn using the second method of raw samples, according to current regulations [7], aqueous extracts were prepared. Extraction was carried out for 12 hours at a ratio of weight (grams) sample / water - 1/10. The aqueous extract was filtered and sent to the radio-spectrometric and electrochemical analysis.
Electrochemical analysis of the content of Ca2+ ions and K+ in aqueous extracts of leaves was carried out using the appropriate ion-selective electrodes and ion meter pX-150MI. Ion concentration was calculated in relation to the dry weight of samples.
In the laboratory of SSE "Chornobylsky special plant" the analysis of the specific activity of 137Cs and 90Sr in dry samples of selected whole plants and in aqueous extracts of common reed leaves. The analysis was performed using a spectrometer of beta energy radiation SEB 01-150 and gamma spectrometer with an analyzer 4900 Nokia LP B and Ge-detector.
The total uncertainty of measurement (u) was calculated in accordance with the recommendations [5] by the formula:
c
cuu (%)(%), (1)
where: uс is composing uncertainty of measurement. In this case, we take into account only the factors affecting the random uncertainty components: uс (%) = Vc (%) = 100
1
xs , where Vc (%) is the coefficient of
variation; s is experimental sample standard deviation,
and x is the sample mean.
The total measurement uncertainty of whole plants includes random statistical uncertainty calculated from data samples of concentrations of the measured chemicals in leaves, stems and roots of common reed.
The optimum number of samples to be selected in the surveillance location to achieve the desired magnitude of a standard uncertainty of measurement was calculated using the formula [6]:
,2
22
m
Vtn , (2)
where: t is the table value of t-test (at P=0,95, t=2,0); m is the set point accuracy of the studies with 3% under these conditions.
The ratio of the concentration of 137Cs, 90Sr, Ca2+, K+ in the organs or whole plantof common reed (Kc) was calculated as the relative difference of the measured concentrations of these compounds in the organs:
Kc, %= (C1 – C2) / C2·100, (3)
where: C1 is concentration of a substance in the plant; C2 is concentration of a substance in the organ, which is compared.
The total uncertainty in the laboratory analysis did not exceed ± 20%. The calculation of statistical sample parameters of data was performed at the confidence probability level 0.95. Assessment of the correlation links of data samples was performed by the coefficient of determination (R2).
3. RESULTS AND DISCUSSION
The results of observations show that at a 20 km distance the content of radionuclides in the common reed, selected in aquatic ecosystems, varies by orders of decimal magnitude (Fig. 1).
Fig. 1. Location of surveillance places in CEZ and common
reed leaves total activity (90Sr+137Cs) in 2009.
All surveillance places are found in similar climatic and soil conditions. The banks of surveyed ponds are covered with clay sandy gleying soils with complex long-term, seasonal, and sometimes weather dynamics of groundwater levels, which determines the mobility of radionuclides in the gley geochemical barrier [10].
Throughout the growing season, 90Sr and 137Cs in the catchment area in the surveyed ponds are seasonally affected by climate and weather conditions [11]. For example, 1.3% 90Sr and 64% 137Cs gets in the Glyboke Lake during spring floods relatively to stock of these radionuclides in the water. During this period, the ratio of 90Sr/137Cs in the lake is 0.53. Later, the most part of 137Cs mainly migrates to the slurry falls in the bottom sediments. Most of 90Sr that falls into the lake from the outside is brought by stormwater. The
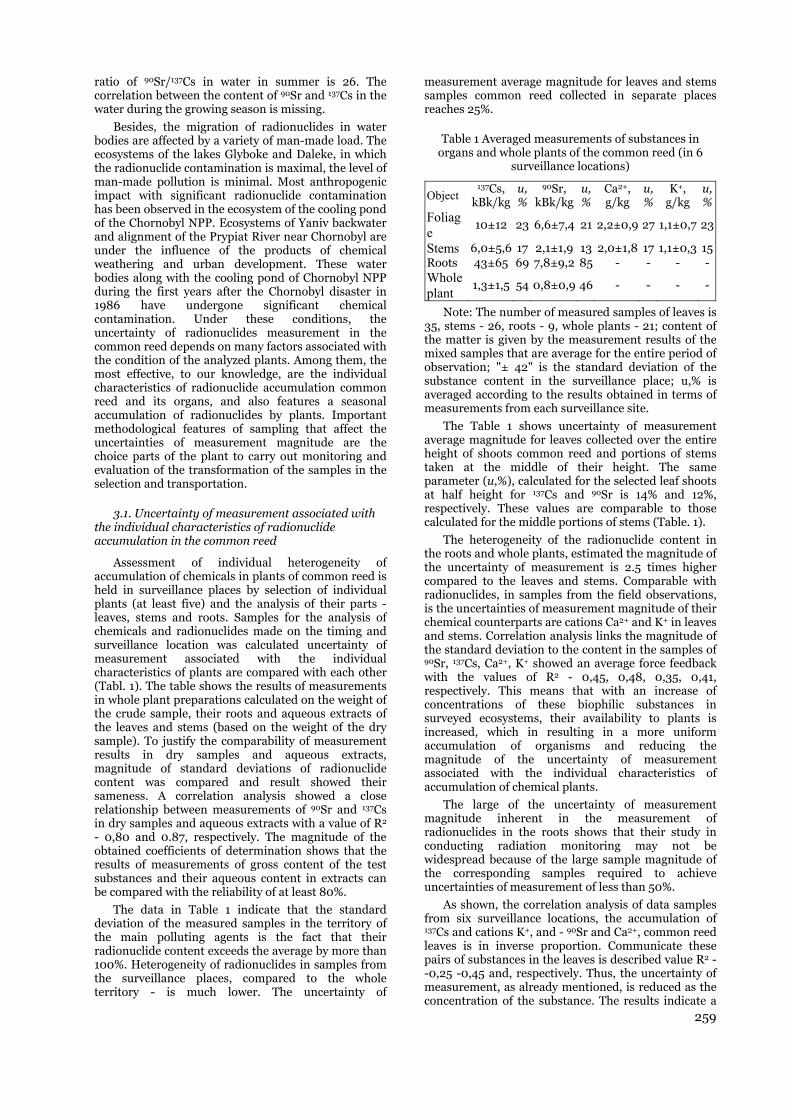
259
ratio of 90Sr/137Cs in water in summer is 26. The correlation between the content of 90Sr and 137Cs in the water during the growing season is missing.
Besides, the migration of radionuclides in water bodies are affected by a variety of man-made load. The ecosystems of the lakes Glyboke and Daleke, in which the radionuclide contamination is maximal, the level of man-made pollution is minimal. Most anthropogenic impact with significant radionuclide contamination has been observed in the ecosystem of the cooling pond of the Chornobyl NPP. Ecosystems of Yaniv backwater and alignment of the Prypiat River near Chornobyl are under the influence of the products of chemical weathering and urban development. These water bodies along with the cooling pond of Chornobyl NPP during the first years after the Chornobyl disaster in 1986 have undergone significant chemical contamination. Under these conditions, the uncertainty of radionuclides measurement in the common reed depends on many factors associated with the condition of the analyzed plants. Among them, the most effective, to our knowledge, are the individual characteristics of radionuclide accumulation common reed and its organs, and also features a seasonal accumulation of radionuclides by plants. Important methodological features of sampling that affect the uncertainties of measurement magnitude are the choice parts of the plant to carry out monitoring and evaluation of the transformation of the samples in the selection and transportation.
3.1. Uncertainty of measurement associated with the individual characteristics of radionuclide accumulation in the common reed
Assessment of individual heterogeneity of accumulation of chemicals in plants of common reed is held in surveillance places by selection of individual plants (at least five) and the analysis of their parts - leaves, stems and roots. Samples for the analysis of chemicals and radionuclides made on the timing and surveillance location was calculated uncertainty of measurement associated with the individual characteristics of plants are compared with each other (Tabl. 1). The table shows the results of measurements in whole plant preparations calculated on the weight of the crude sample, their roots and aqueous extracts of the leaves and stems (based on the weight of the dry sample). To justify the comparability of measurement results in dry samples and aqueous extracts, magnitude of standard deviations of radionuclide content was compared and result showed their sameness. A correlation analysis showed a close relationship between measurements of 90Sr and 137Cs in dry samples and aqueous extracts with a value of R2 - 0,80 and 0.87, respectively. The magnitude of the obtained coefficients of determination shows that the results of measurements of gross content of the test substances and their aqueous content in extracts can be compared with the reliability of at least 80%.
The data in Table 1 indicate that the standard deviation of the measured samples in the territory of the main polluting agents is the fact that their radionuclide content exceeds the average by more than 100%. Heterogeneity of radionuclides in samples from the surveillance places, compared to the whole territory - is much lower. The uncertainty of
measurement average magnitude for leaves and stems samples common reed collected in separate places reaches 25%.
Table 1 Averaged measurements of substances in organs and whole plants of the common reed (in 6
surveillance locations)
Object 137Cs,
kBk/kg u, %
90Sr, kBk/kg
u, %
Ca2+, g/kg
u, %
K+, g/kg
u, %
Foliage
10±12 23 6,6±7,4 21 2,2±0,9 27 1,1±0,7 23
Stems 6,0±5,6 17 2,1±1,9 13 2,0±1,8 17 1,1±0,3 15 Roots 43±65 69 7,8±9,2 85 - - - - Whole plant
1,3±1,5 54 0,8±0,9 46 - - - -
Note: The number of measured samples of leaves is 35, stems - 26, roots - 9, whole plants - 21; content of the matter is given by the measurement results of the mixed samples that are average for the entire period of observation; "± 42" is the standard deviation of the substance content in the surveillance place; u,% is averaged according to the results obtained in terms of measurements from each surveillance site.
The Table 1 shows uncertainty of measurement average magnitude for leaves collected over the entire height of shoots common reed and portions of stems taken at the middle of their height. The same parameter (u,%), calculated for the selected leaf shoots at half height for 137Cs and 90Sr is 14% and 12%, respectively. These values are comparable to those calculated for the middle portions of stems (Table. 1).
The heterogeneity of the radionuclide content in the roots and whole plants, estimated the magnitude of the uncertainty of measurement is 2.5 times higher compared to the leaves and stems. Comparable with radionuclides, in samples from the field observations, is the uncertainties of measurement magnitude of their chemical counterparts are cations Ca2+ and K+ in leaves and stems. Correlation analysis links the magnitude of the standard deviation to the content in the samples of 90Sr, 137Cs, Ca2+, K+ showed an average force feedback with the values of R2 - 0,45, 0,48, 0,35, 0,41, respectively. This means that with an increase of concentrations of these biophilic substances in surveyed ecosystems, their availability to plants is increased, which in resulting in a more uniform accumulation of organisms and reducing the magnitude of the uncertainty of measurement associated with the individual characteristics of accumulation of chemical plants.
The large of the uncertainty of measurement magnitude inherent in the measurement of radionuclides in the roots shows that their study in conducting radiation monitoring may not be widespread because of the large sample magnitude of the corresponding samples required to achieve uncertainties of measurement of less than 50%.
As shown, the correlation analysis of data samples from six surveillance locations, the accumulation of 137Cs and cations K+, and - 90Sr and Ca2+, common reed leaves is in inverse proportion. Communicate these pairs of substances in the leaves is described value R2 - -0,25 -0,45 and, respectively. Thus, the uncertainty of measurement, as already mentioned, is reduced as the concentration of the substance. The results indicate a

260
weak non-radiological impact of environmental factors in the field of observation on the magnitude of the uncertainty of radionuclides measurement in samples of common reed.
To ensure the minimum measurement uncertainty it is advisable to use common reed leaves selected at half-height. Also, leaves as the main part of the plant, are preferred as a monitoring tool, as with no additional costs for radionuclide analysis of samples selected from leaves, anatomical, morphological, physiological and other tests can be carried out. In case of stock assessment of radionuclides in biomass of the common reed, the measurement of whole plants is preferred.
To control the uncertainty of measurement under the local background radiation contamination associated with the individual characteristics of radionuclide accumulation by plants or parts thereof, required to select at least five samples of Biological indication. The results of uncertainty of measurement calculated for the sample. The resulting value is attributed to all the composite samples, as related to the individual characteristics of radionuclide accumulation component of the total uncertainty of measurement.
3.2. Uncertainty of radionuclides measurement associated with the peculiarities of their accumulation in plant organs
The problem of unequal accumulation of radionuclides by different organs is relevant only if the entire plant is analyzed. In this case, the magnitude of the uncertainty of measurement depends on the different ratio of mass of leaves, stems and roots of the entire plants selected in different places. Our estimates of the mass of leaves, stems and roots of the selected plants have shown that their ratio can vary significantly depending on season, state of the aquatic ecosystem and sampling conditions. The ratio of the content of radionuclides accumulated in organs of plants in surveillance locations was calculated using formula 3. Given the distribution of ratio of radionuclide accumulation in plant organs, uncertainty of measurement was calculated, which is proportional to mass fraction and the specific activity of the relevant part of the plant selected for analysis (Table. 2).
Table 2 Contribution of organs and the entire plant to the uncertainty of measurement (u, %) of sample mass and
specific activity of radionuclides
Object Mass 137Cs 90Sr
Foliage 23 41 42 Stems 15 20 18 Roots 3 25 8 Sum u, % 41 85 68
Studies show that when using composite samples of the entire plants for measurements, the results should be given the uncertainty of measurement magnitudes established for separate organs of such plants calculated in proportion to the ratio of their mass in a sample of the entire plant.
3.3. Uncertainty of measurement related to the peculiarities of seasonal radionuclide accumulation by the plants
During the monitoring of the environment it is important to consider phenological phases of the common reed, because some of them in time coincide with a maximum amount of 137Cs in the water bodies, others – with 90Sr. As mentioned above [10], after the spring floods in the beginning of the growing season in experimental ponds 137Cs dominates. In the period of maximum growth of cane, which takes place in June [11], 90Sr prevail in the water bodies. The concentration of available 90Sr in the water body in August, during the flowering period of the cane, can increase dramatically due to the summer-autumn drought period. These phenomena lead to the need to consider phenological phase of the plant while sampling and to assess uncertainty, which depends on changes of maximum content of radionuclides in the water bodies during the growing period.
The comparison of uncertainty of the radionuclides measurement in the samples of the entire common reed plant and its leaves was made depending on the characteristics of seasonal accumulation of radionuclides. For laboratory analysis the leaves selected at half height of the plants were used. Having as an example the radionuclide content in the leaves of the common reed, which were selected under a local background radionuclide contamination of water bodies in CEZ, one can see that the value of this parameter can be changed by 2 to 3 times by months within the growing period (Fig. 2).
Fig. 2. The radionuclides content in the common reed leaves selected from Prypiat River at the alignment of Chornobyl city
(averaged over the results of observations of 2009-2013).
Averaged over the surveillance locations value of the variation coefficients in the common reed leaves content of 137Cs and 90Sr varies from 38% to 65% with an average - 51% and from 41% to 89% with an average - 68%, respectively. At the same time, the average uncertainty of measurement associated with the individual characteristics of the relevant radionuclide accumulation in the leaves of certain plants is 23% and 21%, i.e. 2-3 fold less (Table. 1). These values show that the common reed leaves can be used to evaluate seasonal accumulation of radionuclides, as their respective uncertainties of measurement are significantly lower than this parameter. In contrast to the leaves, the entire plants have uncertainty of measurement associated with the individual characteristics of accumulation of radionuclides by 137Cs, more than seasonal one - 54% and 51%, respectively; by 90Sr, comparable to the seasonal one - 46% and 68%, respectively (Table. 1). Such a ratio of uncertainty of measurement does not allow to make a

261
reliable estimation of the seasonal differences of radionuclides accumulation by using the entire plant samples. For reliable evaluation of the radionuclide accumulation by the entire plant samples with available parameters of uncertainties of measurement, several samples in different months of the growing season are required.
3.4. Measurement uncertainly of radionuclides associated with the peculiarities of losing water in plants
Uncertainty of measurement associated with the loss of water by the plant samples during transportation from the site of selection to the laboratory is only relevant in the case of calculating the analysis results on the live weight of plants at the delivery of samples without cooling. Between the sampling and analysis of the entire plants by the first method from 2 to 8 hours passed, while, during the transportation the samples were not cooled. We conducted an experiment to assess the loss of water by leaves of the common reed due to evaporation. From each of the six surveillance locations the leaf samples were taken to the laboratory in cooler bag, in plastic packs, at temperatures of about + 5 ° C. Control weighing showed no significant changes in the weight of the samples with the above conditions of delivery.
To evaluate the losses due to evaporation of water, each sample was placed in desiccators with the presence of a pre-dried calcium chloride at the rate of - 10 sorbent parts per 1 sample part. For 8 hours after 15 min the samples were removed from the desiccators and weighed. On average, the loss of water samples consisted of 17 g/kg/hr, with a variation coefficient of 32%. The greatest loss of water had a sample from the cooling pond Chornobyl NPP ecosystem – 20% of the sample weight within 8 hours. The samples from the Prypiat River ecosystem in alignment of Chornobyl-town had lowest water loss. Since it is impossible to predict the travel time and the initial physiological state of plants at each sampling, we consider it appropriate in this case, to attribute all the results with the maximum uncertainty of measurement is 2.5% for each hour of the path stay from the selection site till the start of measurements.
3.5. Comparison of the quality of measurements using different sampling methods
Calculation of the number of samples to be selected for each of the techniques employed (Table. 3) was conducted on the basis of total uncertainty (forms. 1), the common component of which for both methods is laboratory uncertainty of measurement (20%).
In addition to the laboratory, to calculate the total uncertainty implementing the first method, the following was used: the component related to the loss of water samples during transportation for 4 hours (10%) and seasonal variability of accumulation of radionuclides (137Cs - 51%, 90Sr - 68%). The last parameter includes individual uncertainties and that related to the heterogeneity of the radionuclide content in plant organs. Calculations show that to ensure the indicator accuracy of measurement of 40-45%, about 20 plants must be measured (Table 3). With the indicated uncertainty, significant difference between
the measurements from different locations can be set in the case where there is a difference of more than 1.5 times. Furthermore, in studies that implemented the first method, in the established long-term practice, the annual sample data includes measurements of 1-2 whole plants selected monthly, which accounts for 3-4 records a year from one surveillance place. Thus, to achieve the desired reliability of measurement, samples from one surveillance location are not enough.
Table 3 The required number of samples taken from one surveillance location with the given parameters of
measurement quality
Object 137Cs 90Sr Ca2+ K+
m n m n m n m n
Foliage 10 46 10 41 10 45 10 40
Stems 10 55 10 44 10 55 10 49 Whole plant
40 16 45 19 - - - -
Note: The calculations have been performed according to the formula 2 (at P=0,95, t=2,0), using the values of u,% given in Table 1.
Given these circumstances, the annual data on the content of radionuclides in the samples of common reed (Fig. 1) can be united into three groups on the basis of radionuclide contamination. The first includes samples with background content of radionuclides selected in the ecosystem of the alignment of the Prypiat River near Chornobyl. Second, at the average level of radionuclide contamination of the sample includes samples from the Azbuchyn Lake, Chornobyl NPP cooling pool, Yanivsky backwater (intragroup differences in the content of samples: for 137Cs, Kc = 72% of 90Sr, Kc = 53%). Third, at the maximum pollution level, includes the lake Glyboke and Daleke (the difference between the content of radionuclides in the sample – 137Cs by Кс=60%, 90Sr by Кс=120%). The difference between the content of radionuclides between samples from the group with the highest and average pollution is at 137Cs Кс=250%, and 90Sr Кс=570%; between samples with the average local background pollution 137Cs Кс=5000%, 90Sr Кс=1400%. Thus, this approach allows the display of the content of radionuclides in the common reed, in case of increase in the number of surveillance locations or the frequency of observations.
Calculating the number of samples selected by the second method produced on the basis of total uncertainty, the components of which are the uncertainty of laboratory measurements and the individual characteristics of radionuclide accumulation (Table 1), showed that the measurement accuracy of leaves and stems is between 5% and 10% if selecting fifty samples from one place (Table 3). The number of samples required for quality assurance measurements of cations Ca2+ and K+ correspond to that of the radionuclides.
Thus, the performance of measurements by the second method yields quantitative results at comparable costs that are 7 times more accurate as compared with the observations carried out by the first method, which are indicative.

262
4. CONCLUSIONS
Studies have shown that in two methods used at CEZ today for sampling and analyzing the radionuclides content in samples of common reed, uncertainty of measurements is formed differently. Accordingly, the number of components of uncertainty of measurement is different. In the first method of study, when the entire plants are received for analysis and calculation of content of the radionuclides is made on the wet weight of the sample, there are several components of high magnitude of uncertainty of measurement. In this case, the uncertainty of measurement magnitude is so high that to produce a mixed sample in the surveillance location, more than 100 plants are required to ensure satisfactory quality of measurements.
The data available today on the results of long-term series of observations obtained by the first method can be used for indicator evaluation of radioecological parameters of aquatic ecosystems of CEZ. To reduce of the uncertainty of measurement results performed by the first method to group samples from different surveillance places on the basis of the similarity levels of radionuclides in the samples.
Estimation of the value of the total statistical uncertainty of measurement by the second method, which is based on selection of individual plant organs and analytical weight control of the dry samples, showed that in this case a sufficient number of components in a composite sample is 50. The magnitude of uncertainty of measurement in this method is below the difference of radionuclides content in the common reed, even in samples of ecosystems with similar levels of radioactive contamination. This method of uncertainty of measurement estimation allows to investigate the seasonal accumulation of radionuclides by the common reed, and can also be used to monitor the results obtained by the first method.
Acknowledgement: The authors would like to thank D. I. Gudkov, the Head of the Department of Freshwater Radiology of IHB of NAS of Ukraine, Doctor of Biological Sciences, Senior Research Associate, for support in conducting those observations
REFERENCES
1. D. D. Ganzha, "A choice of supervisions network criterion for monitoring of Ivano-Frankivsk urban ecosystem" Newsletter Precarpathian national University named after Vasyl Stefanyk. Herald. Biology. Ivano-Frankivsk, part XV, pp. 125–129, 2011.
2. Ch. Ganzha a, D. Gudkov, D. Ganzha, at all. "Physicochemical forms of 90Sr and 137Cs in components of Glyboke Lake ecosystem in the Chornobyl exclusion zone", Journal of Environmental Radioactivity, 127, pp. 176–181, 2014.
3. Y. V. Homutinin, V. A. Kashparov and E. I. Zhebrovskaya, "Optimization of sampling and measuring samples at radioecological monitoring", Monograph. К., UkrNIISChR, P. 160, 2001.
4. G. G. Polikarpov, V. N. Egorov, S. B. Gulin at al. "Radioecological response of the Black Sea to the Chornobyl accident". Sevastopol, ECOSEA Hydrophysics, 2008.
5. Evaluation of measurement data – Guide to the expression of uncertainty in: measurement First edition JCGM 100:2008. JCGM/WG 1, 2008.
6. B. А. Dospehov Methods of field experience. M.: Kolos, 736 p., 1965.
7. Feed. Methods for determination of ammonia nitrogen and active acidity (pH): GOST 26180–84. – [Date of introduction 07/01/85]. – Moscow: State Committee on Standards 1985. – 8 p.
8. The handbook for sampling objects of the environment department field studies VC REM and RDK "Ecocenter" (7Е –12/03-016-2012). Approved by the General Director of SSE "Chornobyl spektskombinat. "Chornobyl, 2012.
9. Ch. Ganzha, D. Ganzha, A. Nazarov "Changing the morphological and physiological parameters of common reed leaves under the influence of chronic radiation exposure", Radiation, ecology and the technosphere. Proceedings of the International Scientific Conference (Gomel, 26–27 September. 2013), Institute of Radiobiology, National Academy of Sciences; ed. сol.: A. D. Naumov [et al.]. Minsk, The Institute of Radiology, 2013, pp. 32–33. Gomel, 2013.
10. Davydchuk V.S, Zarudna R.F., Myheli S.V., et. al.,. Landscapes of Chornobyl zone and their estimation on the radionuclides migration conditions. Edited by A.M. Marinich. – Kyiv: Naukova Dumka. – 112 p., 1994.
11. Ganzha Ch. D., Ganzha D. D., Nazarov A. B., Gudkov D. І. Intake of radionuclides in the ecosystem of the Glyboke Lake with land drainage and atmospheric precipitations / IV International Scientific Conference "Physical methods in ecology, biology and medicine", September 15-18, Lviv-Shack. – P. 82-83, 2011.
VARIATION OF SPECIFIC ACTIVITY OF 137CS IN THE BOTTOM GROUND OF WATER RESERVOIRS AND WATERSIDE SOIL IN VILNIUS CITY, LITHUANIA
Anastasija Moisejenkova 1, Milda Pečiulienė 2, Dainius Jasaitis 3
1, 2, 3 Vilnius Gediminas Technical University, Saulėtekio av. 11, LT-10223 Vilnius, Lithuania
Abstract. The present work analyses the problem of radiocesium contamination of water bodies. The main object of research is the dynamics of radiocesium in water and bottom sediments of three Lithuanian lakes: Tapeliai, Juodis and Lydekinis. The Lake Tapeliai basin is of the glacier origin and has the bottom sources. The Lake Juodis is a running shallow lake with the thick layer of bottom sediments (over 7 m). The Lake Lydekinis is a small humic lake with highly colored water. Sediments and water samples were analyzed for 137Cs using a γ-spectrometric system. Investigation results deepen our knowledge on the processes of lake self-cleaning from anthropogenic pollutants and allow predicting the terms of super warm lake remediation after radioactive impacts. Estimating radioecological consequences of the radioactive impact to the natural water bodies, meromictic lakes are suggested as critical objects.
Key words: radiocesium, specific activity, activity concentration, lake, bottom sediments
1. INTRODUCTION
The migration of radionuclides in aquatic ecosystem has been raising a huge interest for some years. Radiocesium is an important indicator showing the pollution of the aquatic ecosystem [1]. Radiocesium has been investigated for a quite long time. This artificial radionuclide gained attention of the researches after the accidents of the Chernobyl and Fukushima nuclear power plants. The activity level of the radiocesium is usually indicated in soil and sea water, however, for the past decade more and more attention has been drawn to the investigation of radiocesium in river and lake waters
It is known that close lakes and water objects with sufficiently high water retention perform as accumulators of long-lived radionuclides [2,3]. They can content a high concentration of long-lived radionuclides in the water and bottom sediments [4,5]. The bottom sediments of the lake are the most important element of the water environment acting as a “filter” of radionuclides or as a temporary sink of radionuclides [6]. The vertical profiles of radiocesium bottom sediments are used to restore the chronology of the radioactive pollution, to evaluate the general load of the bottom sediments and sedimentation rate (the deposition of suspended particles in water per year) [7].
It can be stated that the processes of radionuclides’ retention are concerned with their chemical and physical processes and bottom sediments. Having occurred in the water the radiocesium migrates to the bottom sediments by direct absorption or together with suspended particles, which reach the bottom sediments later. Usually the bottom sediments are presented as
“filter” for radionuclides, however they can also be the source of radionuclides.
The main object of the study is a radiocesium behavior in a relationship with the seasonal variations of standard water parameters in Lithuanian lakes.
The main object of the study is to estimate the peculiarity of radiocesium dynamics in Vilnius city (Lithuania) lake waters, bottom sediments and near bottom water. The research has shown that the concentration of pollutants is ten times higher in lower stagnant water layer of close meromictic lakes than in the waters of dimictic lakes. Therefore such lakes must be considered as objects of increased ecological risk. The results of the research allow to explain the processes of lake self-cleaning and to predict radiocesium pollution remediation processes in lakes.
2. MATERIALS AND METHODS
Water samples (20 l each) were collected during the period of 2000–2010 from different lake depths using a Molchanov barometer (single water volume is ~4 l). The parameters of these water samples were averaged through the whole interval of 40 cm depth collector. Only the aerobic water samples were filtered in the laboratory through the filters of Filtrak 391 using vacuum filtering system. The hypolimnetic water samples, which had sufficient amount of iron oxide flock, were not filtered. Then aerobic and hypolimnetic water samples were evaporated to extract dry deposits for further analysis of radiocesium.
The bottom sediment samples were collected using an Ekman-Birge type bottom sampler made of
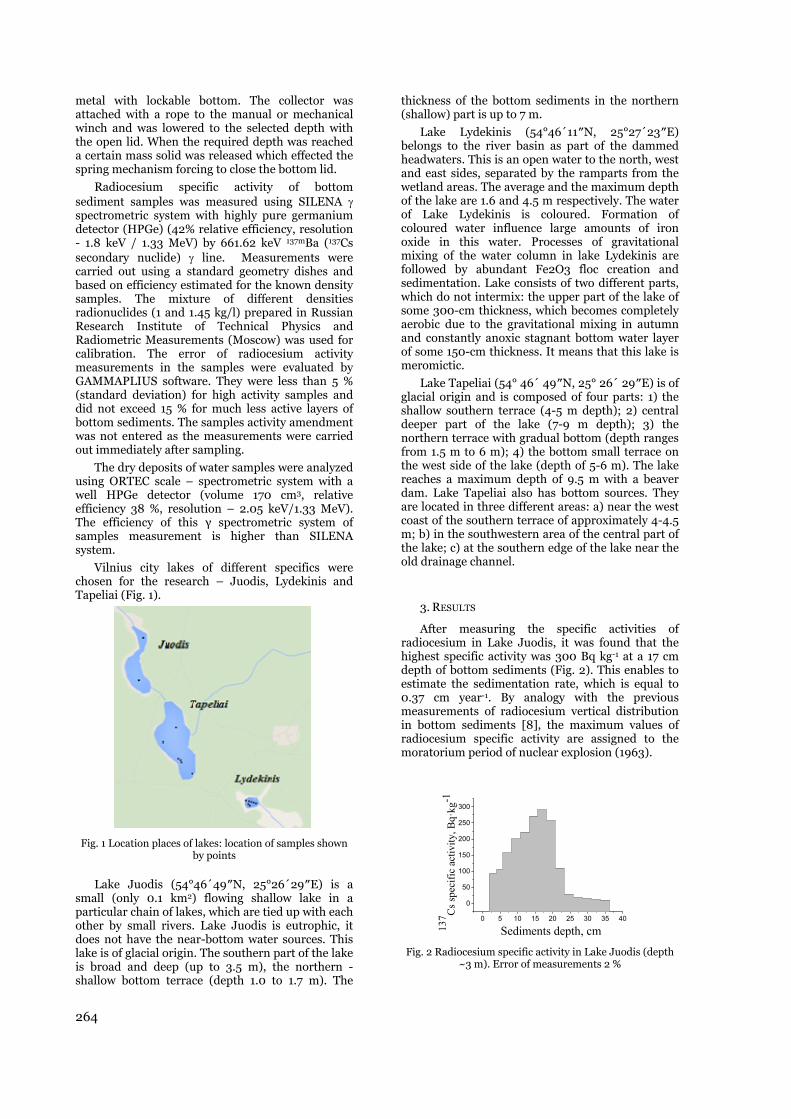
264
metal with lockable bottom. The collector was attached with a rope to the manual or mechanical winch and was lowered to the selected depth with the open lid. When the required depth was reached a certain mass solid was released which effected the spring mechanism forcing to close the bottom lid.
Radiocesium specific activity of bottom sediment samples was measured using SILENA spectrometric system with highly pure germanium detector (HPGe) (42% relative efficiency, resolution - 1.8 keV / 1.33 MeV) by 661.62 keV 137mBa (137Cs secondary nuclide) line. Measurements were carried out using a standard geometry dishes and based on efficiency estimated for the known density samples. The mixture of different densities radionuclides (1 and 1.45 kg/l) prepared in Russian Research Institute of Technical Physics and Radiometric Measurements (Moscow) was used for calibration. The error of radiocesium activity measurements in the samples were evaluated by GAMMAPLIUS software. They were less than 5 % (standard deviation) for high activity samples and did not exceed 15 % for much less active layers of bottom sediments. The samples activity amendment was not entered as the measurements were carried out immediately after sampling.
The dry deposits of water samples were analyzed using ORTEC scale – spectrometric system with a well HPGe detector (volume 170 cm3, relative efficiency 38 %, resolution – 2.05 keV/1.33 MeV). The efficiency of this γ spectrometric system of samples measurement is higher than SILENA system.
Vilnius city lakes of different specifics were chosen for the research – Juodis, Lydekinis and Tapeliai (Fig. 1).
Fig. 1 Location places of lakes: location of samples shown by points
Lake Juodis (54°46´49″N, 25°26´29″E) is a small (only 0.1 km2) flowing shallow lake in a particular chain of lakes, which are tied up with each other by small rivers. Lake Juodis is eutrophic, it does not have the near-bottom water sources. This lake is of glacial origin. The southern part of the lake is broad and deep (up to 3.5 m), the northern - shallow bottom terrace (depth 1.0 to 1.7 m). The
thickness of the bottom sediments in the northern (shallow) part is up to 7 m.
Lake Lydekinis (54°46´11″N, 25°27´23″E) belongs to the river basin as part of the dammed headwaters. This is an open water to the north, west and east sides, separated by the ramparts from the wetland areas. The average and the maximum depth of the lake are 1.6 and 4.5 m respectively. The water of Lake Lydekinis is coloured. Formation of coloured water influence large amounts of iron oxide in this water. Processes of gravitational mixing of the water column in lake Lydekinis are followed by abundant Fe2O3 floc creation and sedimentation. Lake consists of two different parts, which do not intermix: the upper part of the lake of some 300-cm thickness, which becomes completely aerobic due to the gravitational mixing in autumn and constantly anoxic stagnant bottom water layer of some 150-cm thickness. It means that this lake is meromictic.
Lake Tapeliai (54° 46´ 49″N, 25° 26´ 29″E) is of glacial origin and is composed of four parts: 1) the shallow southern terrace (4-5 m depth); 2) central deeper part of the lake (7-9 m depth); 3) the northern terrace with gradual bottom (depth ranges from 1.5 m to 6 m); 4) the bottom small terrace on the west side of the lake (depth of 5-6 m). The lake reaches a maximum depth of 9.5 m with a beaver dam. Lake Tapeliai also has bottom sources. They are located in three different areas: a) near the west coast of the southern terrace of approximately 4-4.5 m; b) in the southwestern area of the central part of the lake; c) at the southern edge of the lake near the old drainage channel.
3. RESULTS
After measuring the specific activities of radiocesium in Lake Juodis, it was found that the highest specific activity was 300 Bq kg-1 at a 17 cm depth of bottom sediments (Fig. 2). This enables to estimate the sedimentation rate, which is equal to 0.37 cm year-1. By analogy with the previous measurements of radiocesium vertical distribution in bottom sediments [8], the maximum values of radiocesium specific activity are assigned to the moratorium period of nuclear explosion (1963).
0 5 10 15 20 25 30 35 40
0
50
100
150
200
250
300
Sediments depth, cm137 C
s spe
cific
act
ivity
, Bq·
kg-1
Fig. 2 Radiocesium specific activity in Lake Juodis (depth
~3 m). Error of measurements 2 %
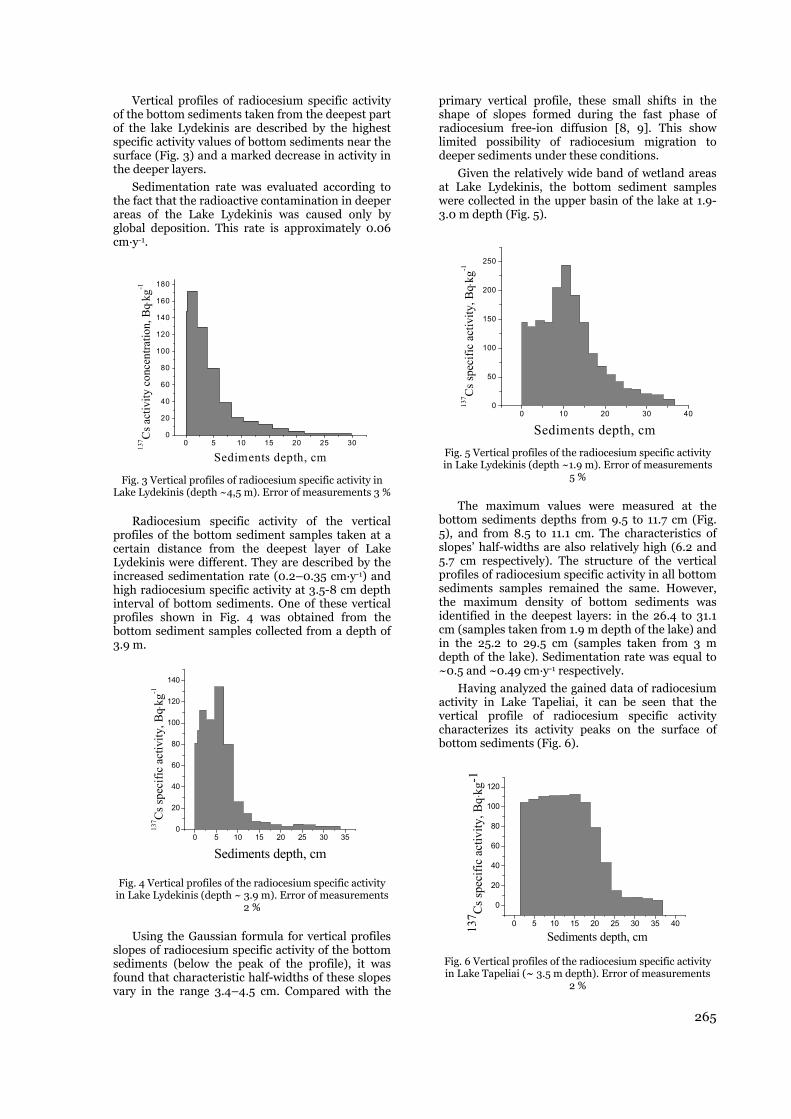
265
Vertical profiles of radiocesium specific activity of the bottom sediments taken from the deepest part of the lake Lydekinis are described by the highest specific activity values of bottom sediments near the surface (Fig. 3) and a marked decrease in activity in the deeper layers.
Sedimentation rate was evaluated according to the fact that the radioactive contamination in deeper areas of the Lake Lydekinis was caused only by global deposition. This rate is approximately 0.06 cm·y-1.
0 5 10 15 20 25 300
20
40
60
80
100
120
140
160
180
137 C
s act
ivity
con
cent
ratio
n, B
qkg
-1
Sediments depth, cm Fig. 3 Vertical profiles of radiocesium specific activity in
Lake Lydekinis (depth ~4,5 m). Error of measurements 3 %
Radiocesium specific activity of the vertical profiles of the bottom sediment samples taken at a certain distance from the deepest layer of Lake Lydekinis were different. They are described by the increased sedimentation rate (0.2–0.35 cm·y-1) and high radiocesium specific activity at 3.5-8 cm depth interval of bottom sediments. One of these vertical profiles shown in Fig. 4 was obtained from the bottom sediment samples collected from a depth of 3.9 m.
0 5 10 15 20 25 30 350
20
40
60
80
100
120
140
137 C
s spe
cific
act
ivity
, Bq
kg-1
Sediments depth, cm
Fig. 4 Vertical profiles of the radiocesium specific activity in Lake Lydekinis (depth ~ 3.9 m). Error of measurements
2 %
Using the Gaussian formula for vertical profiles slopes of radiocesium specific activity of the bottom sediments (below the peak of the profile), it was found that characteristic half-widths of these slopes vary in the range 3.4–4.5 cm. Compared with the
primary vertical profile, these small shifts in the shape of slopes formed during the fast phase of radiocesium free-ion diffusion [8, 9]. This show limited possibility of radiocesium migration to deeper sediments under these conditions.
Given the relatively wide band of wetland areas at Lake Lydekinis, the bottom sediment samples were collected in the upper basin of the lake at 1.9-3.0 m depth (Fig. 5).
0 10 20 30 400
50
100
150
200
250
137 C
s spe
cific
act
ivity
, Bq
kg-1
Sediments depth, cm Fig. 5 Vertical profiles of the radiocesium specific activity in Lake Lydekinis (depth ~1.9 m). Error of measurements
5 %
The maximum values were measured at the bottom sediments depths from 9.5 to 11.7 cm (Fig. 5), and from 8.5 to 11.1 cm. The characteristics of slopes’ half-widths are also relatively high (6.2 and 5.7 cm respectively). The structure of the vertical profiles of radiocesium specific activity in all bottom sediments samples remained the same. However, the maximum density of bottom sediments was identified in the deepest layers: in the 26.4 to 31.1 cm (samples taken from 1.9 m depth of the lake) and in the 25.2 to 29.5 cm (samples taken from 3 m depth of the lake). Sedimentation rate was equal to ~0.5 and ~0.49 cm·y-1 respectively.
Having analyzed the gained data of radiocesium activity in Lake Tapeliai, it can be seen that the vertical profile of radiocesium specific activity characterizes its activity peaks on the surface of bottom sediments (Fig. 6).
0 5 10 15 20 25 30 35 40
0
20
40
60
80
100
120
137 C
s spe
cific
act
ivity
, Bq·
kg-1
Sediments depth, cm Fig. 6 Vertical profiles of the radiocesium specific activity in Lake Tapeliai (~ 3.5 m depth). Error of measurements
2 %
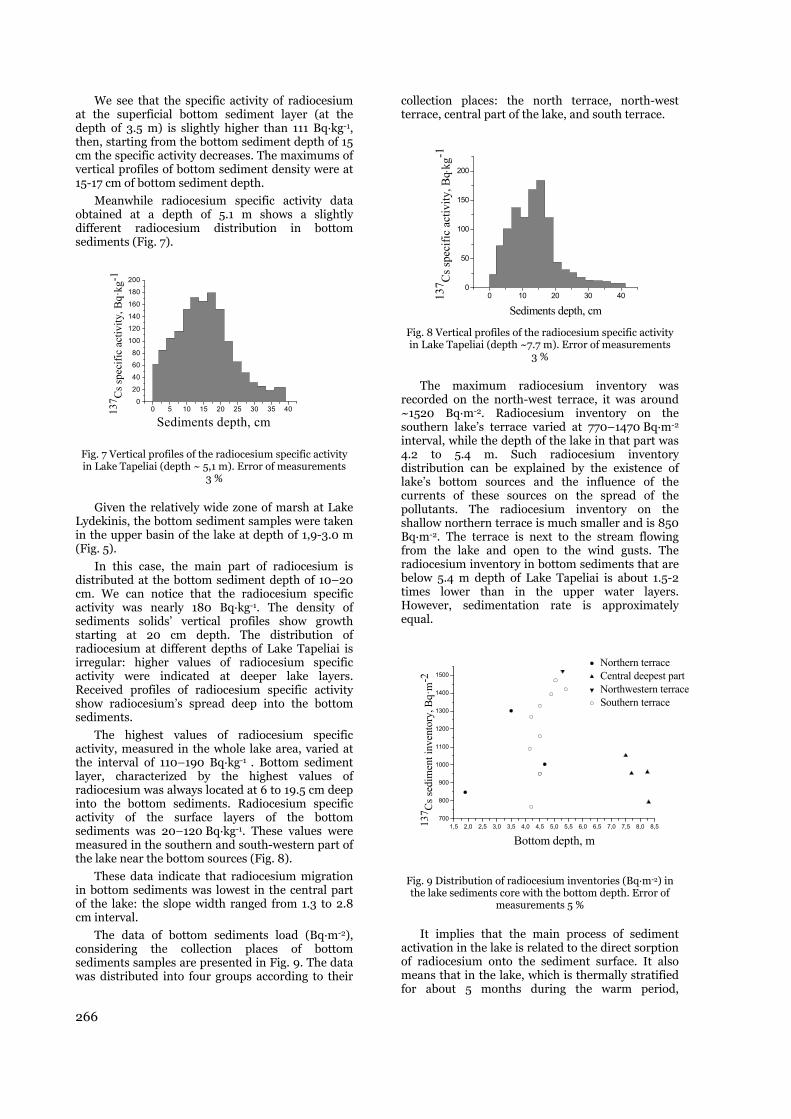
266
We see that the specific activity of radiocesium at the superficial bottom sediment layer (at the depth of 3.5 m) is slightly higher than 111 Bq·kg-1, then, starting from the bottom sediment depth of 15 cm the specific activity decreases. The maximums of vertical profiles of bottom sediment density were at 15-17 cm of bottom sediment depth.
Meanwhile radiocesium specific activity data obtained at a depth of 5.1 m shows a slightly different radiocesium distribution in bottom sediments (Fig. 7).
0 5 10 15 20 25 30 35 400
20
40
60
80
100
120
140
160
180
200
137 C
s spe
cific
act
ivity
, Bq·
kg-1
Sediments depth, cm
Fig. 7 Vertical profiles of the radiocesium specific activity in Lake Tapeliai (depth ~ 5,1 m). Error of measurements
3 %
Given the relatively wide zone of marsh at Lake Lydekinis, the bottom sediment samples were taken in the upper basin of the lake at depth of 1,9-3.0 m (Fig. 5).
In this case, the main part of radiocesium is distributed at the bottom sediment depth of 10–20 cm. We can notice that the radiocesium specific activity was nearly 180 Bq·kg-1. The density of sediments solids’ vertical profiles show growth starting at 20 cm depth. The distribution of radiocesium at different depths of Lake Tapeliai is irregular: higher values of radiocesium specific activity were indicated at deeper lake layers. Received profiles of radiocesium specific activity show radiocesium’s spread deep into the bottom sediments.
The highest values of radiocesium specific activity, measured in the whole lake area, varied at the interval of 110–190 Bq·kg-1 . Bottom sediment layer, characterized by the highest values of radiocesium was always located at 6 to 19.5 cm deep into the bottom sediments. Radiocesium specific activity of the surface layers of the bottom sediments was 20–120 Bq·kg-1. These values were measured in the southern and south-western part of the lake near the bottom sources (Fig. 8).
These data indicate that radiocesium migration in bottom sediments was lowest in the central part of the lake: the slope width ranged from 1.3 to 2.8 cm interval.
The data of bottom sediments load (Bq·m-2), considering the collection places of bottom sediments samples are presented in Fig. 9. The data was distributed into four groups according to their
collection places: the north terrace, north-west terrace, central part of the lake, and south terrace.
0 10 20 30 400
50
100
150
200
137 C
s spe
cific
act
ivity
, Bq
kg-1
Sediments depth, cm Fig. 8 Vertical profiles of the radiocesium specific activity in Lake Tapeliai (depth ~7.7 m). Error of measurements
3 %
The maximum radiocesium inventory was recorded on the north-west terrace, it was around ~1520 Bq·m-2. Radiocesium inventory on the southern lake’s terrace varied at 770–1470 Bq·m-2 interval, while the depth of the lake in that part was 4.2 to 5.4 m. Such radiocesium inventory distribution can be explained by the existence of lake’s bottom sources and the influence of the currents of these sources on the spread of the pollutants. The radiocesium inventory on the shallow northern terrace is much smaller and is 850 Bq·m-2. The terrace is next to the stream flowing from the lake and open to the wind gusts. The radiocesium inventory in bottom sediments that are below 5.4 m depth of Lake Tapeliai is about 1.5-2 times lower than in the upper water layers. However, sedimentation rate is approximately equal.
1,5 2,0 2,5 3,0 3,5 4,0 4,5 5,0 5,5 6,0 6,5 7,0 7,5 8,0 8,5700
800
900
1000
1100
1200
1300
1400
1500
137 C
s sed
imen
t inv
ento
ry, B
q·m
-2
Bottom depth, m
Northern terraceCentral deepest partNorthwestern terraceSouthern terrace
Fig. 9 Distribution of radiocesium inventories (Bq·m-2) in the lake sediments core with the bottom depth. Error of
measurements 5 %
It implies that the main process of sediment activation in the lake is related to the direct sorption of radiocesium onto the sediment surface. It also means that in the lake, which is thermally stratified for about 5 months during the warm period,
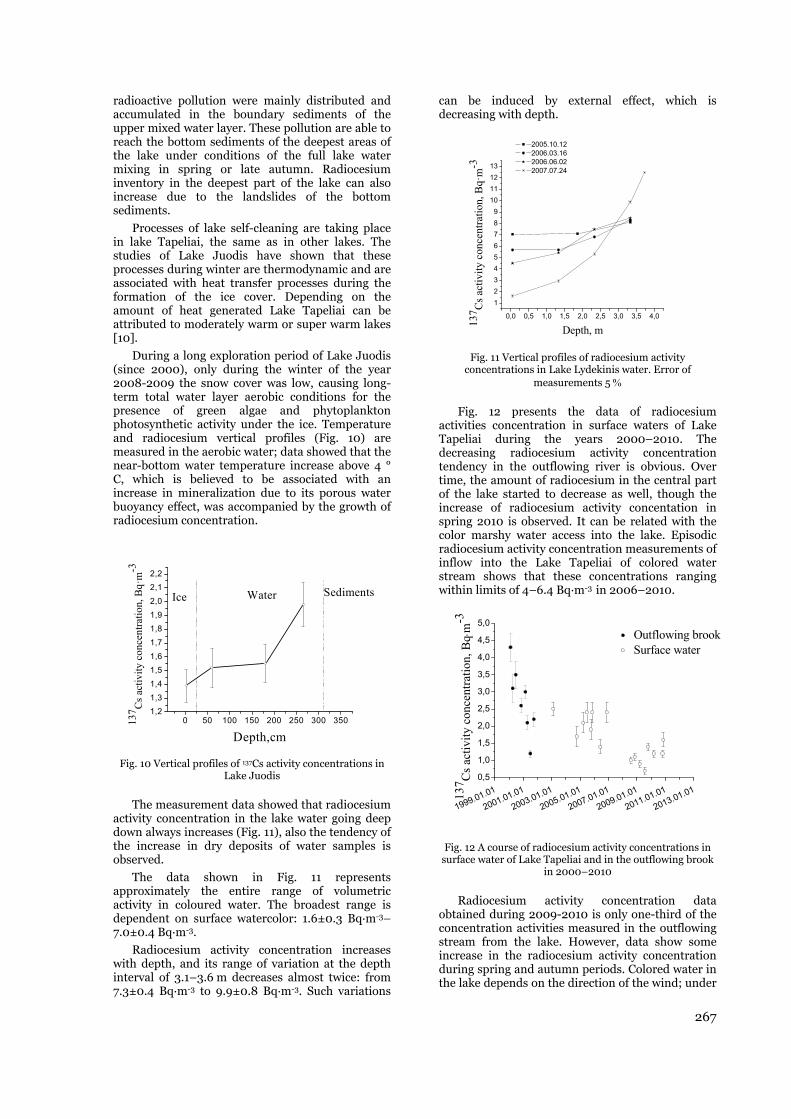
267
radioactive pollution were mainly distributed and accumulated in the boundary sediments of the upper mixed water layer. These pollution are able to reach the bottom sediments of the deepest areas of the lake under conditions of the full lake water mixing in spring or late autumn. Radiocesium inventory in the deepest part of the lake can also increase due to the landslides of the bottom sediments.
Processes of lake self-cleaning are taking place in lake Tapeliai, the same as in other lakes. The studies of Lake Juodis have shown that these processes during winter are thermodynamic and are associated with heat transfer processes during the formation of the ice cover. Depending on the amount of heat generated Lake Tapeliai can be attributed to moderately warm or super warm lakes [10].
During a long exploration period of Lake Juodis (since 2000), only during the winter of the year 2008-2009 the snow cover was low, causing long-term total water layer aerobic conditions for the presence of green algae and phytoplankton photosynthetic activity under the ice. Temperature and radiocesium vertical profiles (Fig. 10) are measured in the aerobic water; data showed that the near-bottom water temperature increase above 4 ° C, which is believed to be associated with an increase in mineralization due to its porous water buoyancy effect, was accompanied by the growth of radiocesium concentration.
0 50 100 150 200 250 300 3501,21,31,41,51,61,71,81,92,02,12,2
137 C
s act
ivity
con
cent
ratio
n, B
q·m
-3
Depth,cm
Ice Water Sediments
Fig. 10 Vertical profiles of 137Cs activity concentrations in
Lake Juodis
The measurement data showed that radiocesium activity concentration in the lake water going deep down always increases (Fig. 11), also the tendency of the increase in dry deposits of water samples is observed.
The data shown in Fig. 11 represents approximately the entire range of volumetric activity in coloured water. The broadest range is dependent on surface watercolor: 1.6±0.3 Bq·m-3–7.0±0.4 Bq·m-3.
Radiocesium activity concentration increases with depth, and its range of variation at the depth interval of 3.1–3.6 m decreases almost twice: from 7.3±0.4 Bq·m-3 to 9.9±0.8 Bq·m-3. Such variations
can be induced by external effect, which is decreasing with depth.
0,0 0,5 1,0 1,5 2,0 2,5 3,0 3,5 4,0
123456789
10111213
137 C
s act
ivity
con
cent
ratio
n, B
q·m
-3
Depth, m
2005.10.122006.03.162006.06.022007.07.24
Fig. 11 Vertical profiles of radiocesium activity
concentrations in Lake Lydekinis water. Error of measurements 5
Fig. 12 presents the data of radiocesium activities concentration in surface waters of Lake Tapeliai during the years 2000–2010. The decreasing radiocesium activity concentration tendency in the outflowing river is obvious. Over time, the amount of radiocesium in the central part of the lake started to decrease as well, though the increase of radiocesium activity concentation in spring 2010 is observed. It can be related with the color marshy water access into the lake. Episodic radiocesium activity concentration measurements of inflow into the Lake Tapeliai of colored water stream shows that these concentrations ranging within limits of 4–6.4 Bq·m-3 in 2006–2010.
1999.01.01
2001.01.01
2003.01.01
2005.01.01
2007.01.01
2009.01.01
2011.01.01
2013.01.010,5
1,0
1,5
2,0
2,5
3,0
3,5
4,0
4,5
5,0
137 C
s act
ivity
con
cent
ratio
n, B
q m
-3
Outflowing brookSurface water
Fig. 12 A course of radiocesium activity concentrations in
surface water of Lake Tapeliai and in the outflowing brook in 2000–2010
Radiocesium activity concentration data obtained during 2009-2010 is only one-third of the concentration activities measured in the outflowing stream from the lake. However, data show some increase in the radiocesium activity concentration during spring and autumn periods. Colored water in the lake depends on the direction of the wind; under
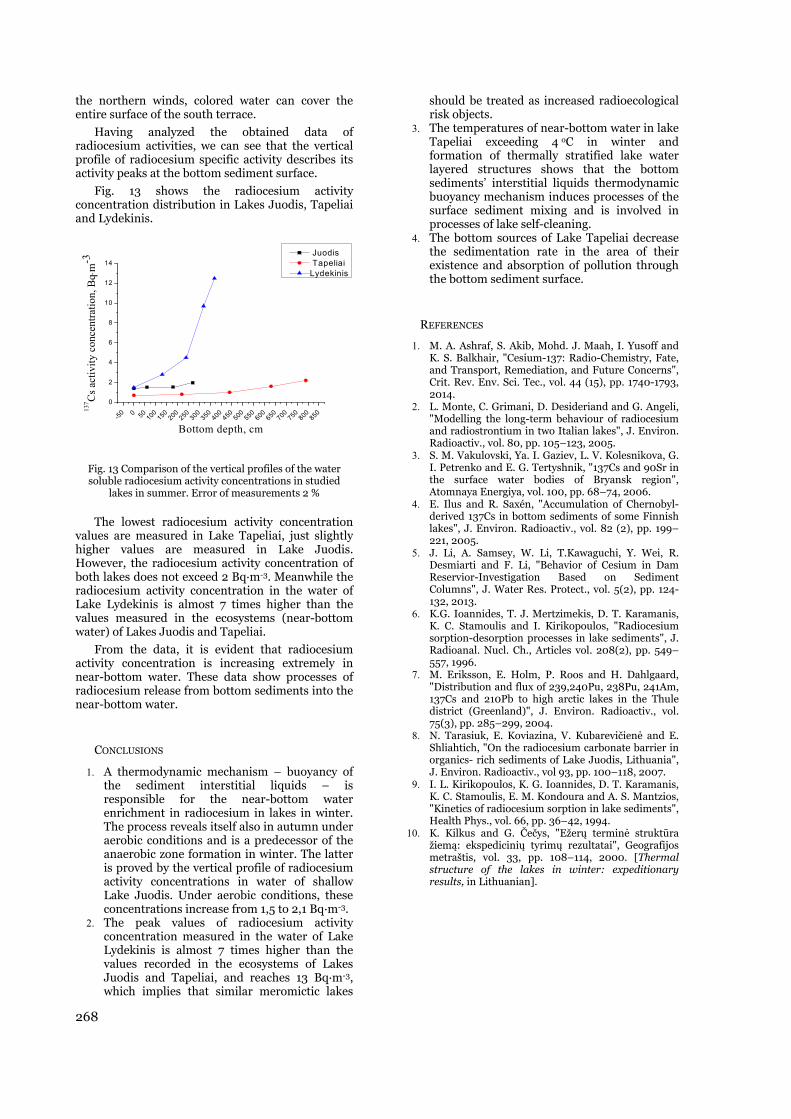
268
the northern winds, colored water can cover the entire surface of the south terrace.
Having analyzed the obtained data of radiocesium activities, we can see that the vertical profile of radiocesium specific activity describes its activity peaks at the bottom sediment surface.
Fig. 13 shows the radiocesium activity concentration distribution in Lakes Juodis, Tapeliai and Lydekinis.
-50 0 50 100
150
200
250
300
350
400
450 500
550
600
650
700
750
800 850
0
2
4
6
8
10
12
14
137 C
s act
ivity
con
cent
ratio
n, B
qm
-3
Bottom depth, cm
Juodis TapeliaiLydekinis
Fig. 13 Comparison of the vertical profiles of the water soluble radiocesium activity concentrations in studied
lakes in summer. Error of measurements 2 %
The lowest radiocesium activity concentration values are measured in Lake Tapeliai, just slightly higher values are measured in Lake Juodis. However, the radiocesium activity concentration of both lakes does not exceed 2 Bq·m-3. Meanwhile the radiocesium activity concentration in the water of Lake Lydekinis is almost 7 times higher than the values measured in the ecosystems (near-bottom water) of Lakes Juodis and Tapeliai.
From the data, it is evident that radiocesium activity concentration is increasing extremely in near-bottom water. These data show processes of radiocesium release from bottom sediments into the near-bottom water.
CONCLUSIONS
1. A thermodynamic mechanism – buoyancy of the sediment interstitial liquids – is responsible for the near-bottom water enrichment in radiocesium in lakes in winter. The process reveals itself also in autumn under aerobic conditions and is a predecessor of the anaerobic zone formation in winter. The latter is proved by the vertical profile of radiocesium activity concentrations in water of shallow Lake Juodis. Under aerobic conditions, these concentrations increase from 1,5 to 2,1 Bq·m-3.
2. The peak values of radiocesium activity concentration measured in the water of Lake Lydekinis is almost 7 times higher than the values recorded in the ecosystems of Lakes Juodis and Tapeliai, and reaches 13 Bq·m-3, which implies that similar meromictic lakes
should be treated as increased radioecological risk objects.
3. The temperatures of near-bottom water in lake Tapeliai exceeding 4 oC in winter and formation of thermally stratified lake water layered structures shows that the bottom sediments’ interstitial liquids thermodynamic buoyancy mechanism induces processes of the surface sediment mixing and is involved in processes of lake self-cleaning.
4. The bottom sources of Lake Tapeliai decrease the sedimentation rate in the area of their existence and absorption of pollution through the bottom sediment surface.
REFERENCES
1. M. A. Ashraf, S. Akib, Mohd. J. Maah, I. Yusoff and K. S. Balkhair, "Cesium-137: Radio-Chemistry, Fate, and Transport, Remediation, and Future Concerns", Crit. Rev. Env. Sci. Tec., vol. 44 (15), pp. 1740-1793, 2014.
2. L. Monte, C. Grimani, D. Desideriand and G. Angeli, "Modelling the long-term behaviour of radiocesium and radiostrontium in two Italian lakes", J. Environ. Radioactiv., vol. 80, pp. 105–123, 2005.
3. S. M. Vakulovski, Ya. I. Gaziev, L. V. Kolesnikova, G. I. Petrenko and E. G. Tertyshnik, "137Cs and 90Sr in the surface water bodies of Bryansk region", Atomnaya Energiya, vol. 100, pp. 68–74, 2006.
4. E. Ilus and R. Saxén, "Accumulation of Chernobyl-derived 137Cs in bottom sediments of some Finnish lakes", J. Environ. Radioactiv., vol. 82 (2), pp. 199–221, 2005.
5. J. Li, A. Samsey, W. Li, T.Kawaguchi, Y. Wei, R. Desmiarti and F. Li, "Behavior of Cesium in Dam Reservior-Investigation Based on Sediment Columns", J. Water Res. Protect., vol. 5(2), pp. 124-132, 2013.
6. K.G. Ioannides, T. J. Mertzimekis, D. T. Karamanis, K. C. Stamoulis and I. Kirikopoulos, "Radiocesium sorption-desorption processes in lake sediments", J. Radioanal. Nucl. Ch., Articles vol. 208(2), pp. 549–557, 1996.
7. M. Eriksson, E. Holm, P. Roos and H. Dahlgaard, "Distribution and flux of 239,240Pu, 238Pu, 241Am, 137Cs and 210Pb to high arctic lakes in the Thule district (Greenland)", J. Environ. Radioactiv., vol. 75(3), pp. 285–299, 2004.
8. N. Tarasiuk, E. Koviazina, V. Kubarevičienė and E. Shliahtich, "On the radiocesium carbonate barrier in organics- rich sediments of Lake Juodis, Lithuania", J. Environ. Radioactiv., vol 93, pp. 100–118, 2007.
9. I. L. Kirikopoulos, K. G. Ioannides, D. T. Karamanis, K. C. Stamoulis, E. M. Kondoura and A. S. Mantzios, "Kinetics of radiocesium sorption in lake sediments", Health Phys., vol. 66, pp. 36–42, 1994.
10. K. Kilkus and G. Čečys, "Ežerų terminė struktūra žiemą: ekspedicinių tyrimų rezultatai", Geografijos metraštis, vol. 33, pp. 108–114, 2000. [Thermal structure of the lakes in winter: expeditionary results, in Lithuanian].
THE ACCUMULATION PROCESS OF 137CS AND 90SR IN THE CELL OF NITELLOPSIS OBTUSA ALGAE
Marčiulionienė E.D. 1,*, Jefanova O.1,2, Sakalauskas V. 3, Sevriukova O.4
1 State Research Institute, Nature Research Centre, Akademijos 2, LT-08412 Vilnius, Lithuania, *[email protected] 2 Vytautas Magnus University, Vileikos 8, LT-44404 Kaunas, Lithuania, [email protected]
3 Vilnius University, M.K.Čiurlionio 21/27, LT-03101 Vilnius, Lithuania, [email protected] 4 Radiation Protection Centre, Kalvarijų 153, LT-08221 Vilnius, Lithuania, [email protected]
Abstract. In the present study, we investigated the accumulation of 137Cs and 90Sr in compartments of the Nitellopsis obtusa cells. The effect of Sr2+, Cs+ and Ca2+, K+, which are chemical analogues of 90Sr and 137Cs, to the bioelectric parameters of these algae were studied simultaneously. The aim of this work was studying the penetration of 137Cs and 90Sr through regulating membrane barriers in the cells of starry stonewort (Nitellopsis obtusa). 137Cs and 90Sr are accumulated mainly in the cell membrane (75% to 92%) of these algae. The cell membrane as a cation exchanger regulates ion flow through the first cells diffusion barrier – its thick outer cytomembrane (the complex consisting of the cell wall and plasmalemma). Significantly, smaller amounts of 137Cs and 90Sr enter into the cytoplasm than in the cytomembrane, 10-20% and 3-10%, respectively. Analysis of the accumulation levels of 137Cs and 90Sr in the compartments of the Nitellopsis obtusa cells show their accumulation in the cell membrane as well as their active transport through outer and inner cytoplasmic membranes. Membrane potentials determined mainly by the gradient of the K+ ions are doing an important regulatory function in this process. From the obtained data it results that cells of Nitellopsis obtusa algae can be a convenient radioecological model for the study of the accumulation of radionuclides in plants at the cellular level.
Key words: Accumuliation, 137Cs, 90Sr, Nitellopsis obtusa, cell compartments.
1. INTRODUCTION
It is known that pecto-cellulosis cell wall affects the process of the entering of mineral substances into a plant especially from low concentration solutions [1]. The cell membrane is a subacid cation-exchanger whose matrix has a certain amount of carboxyl groups linking cations [2]. The highest cation specificity of cell membrane is signified for Ca 2+ [3].
The properties of the cell membrane as a barrier may occur when radionuclides are entering into the plants’ cells. In order to ascertain these “barrier” properties, the data about the accumulation of radionuclides in the cell membrane is needed. A series of radionuclides 65Zn 144Ce 210Pb 90Sr 137Cs established by the levels of accumulation in the membrane represents the ability to adsorb mainly 3- and 2-valent cations La3+ Ca2+ Na+ K+ [4]. The faster saturation of 2-valent cations than 1-valent is probably caused by Ca2+ binding and its chemical and biological analogue Sr2+ in membrane with negative electrical charges of pectins. This process for 144Ce, 65Zn и 210Pb was longer because there is a gradual displacement of
other cations (Ca2+ and Mg2+) from fixed sites and formation of stronger bonds [5].
It should be noted that the accumulation of 65Zn decreased 3 times in the cell membrane treated with detergent Triton X-100, while the accumulation of 144Ce, on the contrary, increased 2 times in comparison with the variants of untreated membrane [6]. This indicates that the accumulation processes of these radionuclides are different. Apparently 65Zn is being preferentially bound by a polysaccharide-protein matrix in the membranes and 144Ce is accumulated mainly in the free space between membrane’s phospholipidic layers [7].
Nowadays a topical radioecological problem is determining the effect of radionuclides on biological objects, especially at low specific activity level, as well as in both separately and in conjunction with various environmental factors, including the anthropogenic origin pollution. It is common knowledge that the cells of algae Nitellopsis obtusa (Charophyta division) have a quick and sensitive response to the impact of various chemical agents by modulation of its membrane bioelectrical parameters. The cells of these algae are widely used in studying the toxicity of heavy metals as well as determining
270
water quality [8, 9]. Here emerges the question if it is possible to apply electrophysiological methods for studying the processes of radionuclides transference into plant cells N. obtusa as well as the biological effect on these cells of low specific activity level. However, this matter has not been sufficiently studied.
The aim of this study was to research the entering process of 137Cs and 90Sr into the cells of N. obtusa and to determine the role of plant cell membrane as a barrier involved in penetration of radionuclides into cellular compartments.
2. OBJECT AND METHODS
Algae Nitellopsis obtusa (Desv.) J. Groves collected in two Lithuanian (Žuvintas and Dusia) lakes was used for this research. Both lakes are located in the south part of Lithuania. The area of Žuvintas lake is 9.65 km2. It is the shallowest lake in Lithuania with the greatest depth being 3 m and average only 0.6 m. Water in lake Žuvintas is 6.5-7.0 pH, cations concentration in water: 4*10-5 mol/L for K+, 3*10-4 mol/L for Na+, and 1*10-3 mol/L for Ca2+. The area of Dusia lake is 23.17 km2. Its greatest depth is 32 m and average depth is 15 m. Water in lake Dusia is 8.4 pH, cations concentration in water: 5*10-5 mol/L for K+, 2*10-4 mol/L for Na+, and 1*10-3 mol/L for Ca2+.
The experiments were performed in aquariums containing 1.5 L of filtered Žuvintas lakes water adding the cesium and strontium solutions, which were turned into the basic radionuclides chlorides form of the 105 Bq/L activity concentration. The water temperature was 24-25 оС. The duration of the experiments was 8 days. Algal cells which length was up to 21 cm were dissevered into the cell membrane, the protoplasm and the vacuolar sap by the Hampson’s method [10].
These algae cells contain big central vacuole surrounded by a cytoplasmic membrane – the tonoplast. The cytoplasm surrounding the vacuole is separated from external environment with the plasmalemma and the cell wall. The accumulation coefficient (AC) comprises the ability to accumulate radionuclides in cells compartments. AC is determined as the ratio of radionuclide concentration in compartments of cells (wet weight) and in the water.
The cells of N. obtusa were separated mechanically, because the cells are large (about 21 cm in length and 1.5 mm in diameter) have regular cylindrical shape and pronounced differentiation of compartments. Vacuolar sap was removed by cutting off one end of the cell. The vacuolar sap usually flows out itself or by a light push of tweezers along the cell. It is important to watch at this moment that the cytoplasm does not flow out together with
vacuolar sap. This can be seen in color and consistency of the preparation. The vacuolar sap is clear and watery; and general fraction of cytoplasm is green and viscous. Further, the cytoplasm was extruded out with tweezers. The admixture of the cytoplasm in the vacuolar sap is not more than 15 per cent; and the admixture of the residue of the vacuolar sap in the cytoplasm preparation is insignificant. The cell wall was obtained by cutting off both ends of the cell and removing the cytoplasm by strong pressure of the tweezers along the entire cell.
The method used for separation of cellular compartments is not very accurate, but has several advantages. It is simple, allows quickly preparing several preparations for measurement, and allows measuring the radioactivity in each compartment of the plant cell.
Preparations of the cell wall, the cytoplasm, the vacuolar sap, and the water were sampled at the same time after 3 h, 2 and 8 days. 6 parallel samples of cell wall, 4 parallel samples of the cytoplasm, 4 parallel samples of the vacuolarsap, and 4 parallel samples of the water (each 1 ml) were collected for each experimental point. Measurement of 137Cs and 90Sr content were performed in accordance with conventional radioecological methods [6, 11, and 12].
Conventional intracellular methods of microelectrodes ant voltage clamp technique were applied to investigate the impact of 137Cs and 90Sr on the plasma membrane bioelectrical properties of N. obtusa cell. During the experiments N. obtusa internodal cells of about 10 cm length and 0.6 mm diameter was placed into a plexiglass chamber and continuously bathed in artificial pound water or experimental solution. The reference electrode was immersed into the experimental solution near the cell and the microelectrode was inserted into the cell to measure electrical potential differences between outside and inside the intermodal cell. The details of experimental procedures, parameters and specifications of the experimental techniques were thoroughly described in previous studies [13-15].
3. RESULTS AND DISCUSSION
The obtained data indicated the two-phase kinetics of the 137Cs and 90Sr accumulation in the cell membrane of Nitellopsis obtusa algae. The first is a fast nonlinear lasting for hours. The second phase lasting several days is slow and linear. Particularly rapid saturation was noticed for 90Sr (< 1.5 h) during the nonlinear phase of accumulation. The kinetics of accumulation of the studied radionuclides was mostly linear in the cytoplasm and the vacuolar sap.
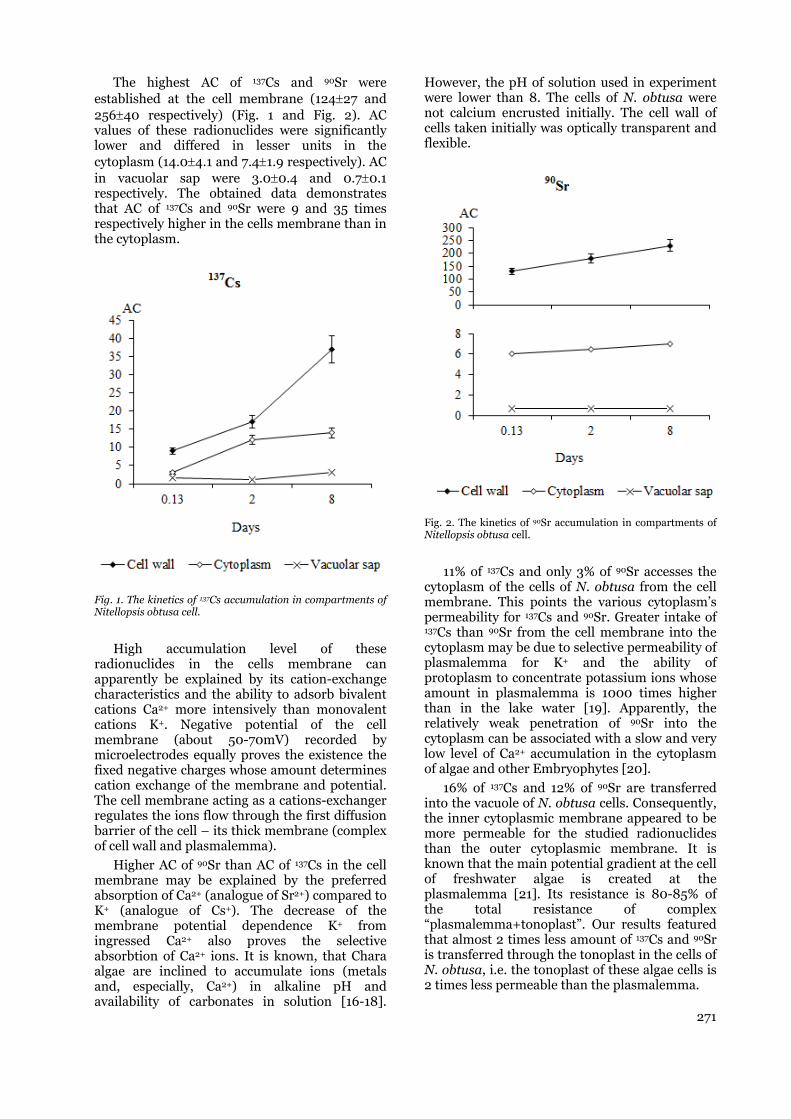
271
The highest AC of 137Cs and 90Sr were established at the cell membrane (12427 and 25640 respectively) (Fig. 1 and Fig. 2). AC values of these radionuclides were significantly lower and differed in lesser units in the cytoplasm (14.04.1 and 7.41.9 respectively). AC in vacuolar sap were 3.00.4 and 0.70.1 respectively. The obtained data demonstrates that AC of 137Cs and 90Sr were 9 and 35 times respectively higher in the cells membrane than in the cytoplasm.
Fig. 1. The kinetics of 137Cs accumulation in compartments of Nitellopsis obtusa cell.
High accumulation level of these radionuclides in the cells membrane can apparently be explained by its cation-exchange characteristics and the ability to adsorb bivalent cations Ca2+ more intensively than monovalent cations K+. Negative potential of the cell membrane (about 50-70mV) recorded by microelectrodes equally proves the existence the fixed negative charges whose amount determines cation exchange of the membrane and potential. The cell membrane acting as a cations-exchanger regulates the ions flow through the first diffusion barrier of the cell – its thick membrane (complex of cell wall and plasmalemma).
Higher AC of 90Sr than AC of 137Cs in the cell membrane may be explained by the preferred absorption of Ca2+ (analogue of Sr2+) compared to K+ (analogue of Cs+). The decrease of the membrane potential dependence K+ from ingressed Ca2+ also proves the selective absorbtion of Ca2+ ions. It is known, that Chara algae are inclined to accumulate ions (metals and, especially, Ca2+) in alkaline pH and availability of carbonates in solution [16-18].
However, the pH of solution used in experiment were lower than 8. The cells of N. obtusa were not calcium encrusted initially. The cell wall of cells taken initially was optically transparent and flexible.
Fig. 2. The kinetics of 90Sr accumulation in compartments of Nitellopsis obtusa cell.
11% of 137Cs and only 3% of 90Sr accesses the cytoplasm of the cells of N. obtusa from the cell membrane. This points the various cytoplasm’s permeability for 137Cs and 90Sr. Greater intake of 137Cs than 90Sr from the cell membrane into the cytoplasm may be due to selective permeability of plasmalemma for K+ and the ability of protoplasm to concentrate potassium ions whose amount in plasmalemma is 1000 times higher than in the lake water [19]. Apparently, the relatively weak penetration of 90Sr into the cytoplasm can be associated with a slow and very low level of Ca2+ accumulation in the cytoplasm of algae and other Embryophytes [20].
16% of 137Cs and 12% of 90Sr are transferred into the vacuole of N. obtusa cells. Consequently, the inner cytoplasmic membrane appeared to be more permeable for the studied radionuclides than the outer cytoplasmic membrane. It is known that the main potential gradient at the cell of freshwater algae is created at the plasmalemma [21]. Its resistance is 80-85% of the total resistance of complex “plasmalemma+tonoplast”. Our results featured that almost 2 times less amount of 137Cs and 90Sr is transferred through the tonoplast in the cells of N. obtusa, i.e. the tonoplast of these algae cells is 2 times less permeable than the plasmalemma.

272
The analysis of the accumulation levels of 137Cs and 90Sr in the compartments of the Nitellopsis obtusa cells denote that the accumulation in the cell membrane is also being actively transported through outer and inner cytoplasmic membranes. Membrane potentials are mainly determined by electrical gradient across the plasma membrane for the K+ ions performing a significant regulatory function in this process. It is known that membranes are the most labile and is initial part in the mechanism of active reaction of the plant organism to external influences [22, 23].
The study of comparatively low specific activity (7, 15, 30 and 65 kBq/L) of tritium effect on membrane bioelectrical parameters of algae N. obtusa cells shows that 15 kBq/L specific activity concentration increased the specific resistance of N. obtusa cells membrane, reduced current densities of Cl- and Ca2+ in the depolarization phase of the action potential, and decelerated the recovery of the membrane action potential in the fast repolarization phase [24].
Tendencies in changes of pattern of bioelectrical response of N. obtusa as well as in transmembrane fluxes of chloride and potassium ions during the action potential were observed due to exposure of algae cell to 137Cs of comparatively low specific activity. Estimated cesium-induced alterations in electrical activity of giant alga cell membrane could result in further impairment of the electrogenesis, signal transduction and finally cell dysfunction, therefore more extensive electrophysiologycal investigations of radionuclides’ impact on plant cell are required.
4. CONCLUSIONS
The analysis of kinetics and accumulation levels of radionuclides in the cell compartments of algae N. obtusa indicated that the process of accumulation of 137Cs and 90Sr in the cellulose-pectin cell wall is unlimited in time and can last for days. The accumulation of these radionuclides in the cells of algae N. obtusa depends on their accumulation in the ion exchange complex (the cell membrane and the plasmalemma) regulating the entrance of the radionuclides into the cytoplasm. Membrane potentials are mainly determined by the gradient of the potassium ions and electronic active transport complete an important regulatory function in the transport of 137Cs and 90Sr through the outer and inner cytoplasmic membrane.
Using the obtained data it can be clearly seen that N. obtusa cells can be a convenient radioecological model for the investigations of radionuclides’ accumulation and it’s toxicity for plants’ bioelectricity within the single cell.
Therefore N. obtusa cells can be applied for the evaluation the effect of radionuclides to plants.
REFERENCES
1. E. Epstein ”Mechanisms of ion transport through plant cell membraner”, Int. Rev. Cytol., 1973, vol. 34, pp 123-168.
2. R. Nagai and U. Kishimoto “Cell wall potencial in Nitella”, Plant cell physcol., 1964, vol. 3, pp 323-334.
3. M. Demarty, C. Morwan, and M. Thellien 1978. “Exchange properties of isolated cell walls of Lemna mino L.”, Plant Physcol., 1978, vol. 62(5), pp 477-481.
4. L. N. Vorobyov and G.A. Kurella “The part of cell membranes in selective accumulation of ions by cells Netelle mucronata”, Biophys., 1965, vol. 10(5), pp 788-793. [in Russian]
5. A. I. Leonov “The valence of the cerium in synthetic and natural aluminate and cerium silicates”, Bull. Of Phys. Sciences of the USSR. Series Chemistry, 1963, vol. 1, pp 8-13. [in Russian]
6. D. Marciulioniene, R. Dusauskiene-Duz, E. Moteyunene, R. Svabiene “The radiochemoecological situation in lake Drukshiai – cooler-pond of the Ignalina NPP”, Academia, Vilnius, 1992. [in Russian]
7. M.A. Hampson “Uptake of radioactivity by aquatic plants and lokation in the cells”, J. Exp. Botany. 1967, vol. 18(54), pp 17-33.
8. S.J. Lambert and A.J. Davy “Water quality as a threat to aquatic plants: discriminating between the effects of nitrate, phosphate, boron and heavy metals on charophytes”, The Newphytologist, 2011, vol. 189(4), pp 1051-1059.
9. T. Asaeda and T. Zaman „Heavy Metal Uptake and Tolerance of Charophytes” In P. J. Gupta DK, Corpas FJ, eds. Heavy Metal Stress in Plants, Springer-Verlag, Berlin Heidelberg, 2013, pp 111–120.
10. M. A. Hampson M.A. “Uptake of radioactivity by aquatic plants and location in the cells”, J. Exp. Botany. , 1967, vol. 18(54), pp 17-33.
11. D. D. Ryndina and A. Ya. Sasenko А.Я. “Methods of experimental study of accumulation of radionuclides in soils and aquatic organisms” in Marine radioecology, Naukova Dumka, Kiev, 1970. [in Russian]
12. V. Schulz and F. Wicker “Radiological methods“, Mir, Moscow, 1985. [in Russian]
13. E. B. Motejuniene, I. Trainauskaite, and L.N. Vorobyov “Electrophysiological properties of some species of Charophyta”, Botanical journal, 1975, vol. 60, pp 1011-1016. [in Russian]
14. V. Kisnierienė, V. Sakalauskas, A. Pleskačiauskas, V. Yurin, and O. Rukšėnas “ The combined effect of Cd2+ and ACh on action potentials of Nitellopsis obtusa cells”, Central European Journal of Biology, 2009, vol. 4(3), pp 343–350.
15. O. Sevriukova, A. Kanapeckaitė, I. Lapeikaitė, V. Knisnierėnė, R. Ladygienė, V. Sakalauskas “Charophyte Elektrogenesis as a Biomarker for Assessing the Risk from Low-Dose Ionizing Radiation to a single Plant Cell”, J. of Environ. Radioactiv., 2014, vol. 136, pp 10-15.
16. S. Y. Lee, K. Jung, J. E. Lee, K. A. Lee, S. Lee, J. Y. Lee, J. K. Lee, J. T. Jeong, and S. Lee “Photosynthetic biomineralization of radioactive Sr via microalgal CO2 absorption”, Bioresource Technology, 2014, vol. 172, pp 449-452.
17. T. Asaeda, M. D. H. J. Senavirathna, Y. Kaneko, and M. H. Rashid “Effect of calcium and magnesium on the growth and calcite encrustation of Chara fibrosa”, Aquat. Bot., 2014, vol. 113(0), pp 100-106.
18. K. Siong and T. Asaeda “Calcite encrustation in macro-algae Chara and its implication to the formation of

273
carbonate-bound cadmium”, J. Hazard. Mater., 2009, vol. 167(13), pp 1237-1241.
19. Yu. A. Chitrov and L.N. Vorobyov “Determination of the activity of potassium ions in the cytoplasm and vacuoles of cells of Nitella K+ by new type sensitive microelectrode”, Plant Physiology, 1971, vol. 18(6), pp 1169-1173. [in Russian]
20. N. Higinbotham “Electropotencials of plant cells”, Ann. Rev. Plant Physcol., 1973, vol. 24(2), pp 25-46.
21. M. J. Beilby and M.T. Casanova “The Physiology of Characean Cells”, Springer Berlin Heidelberg, Berlin, Heidelberg, 2014.
22. L.N. Vorobyov “Electrochemical parameters of plant cells as integrated physiological indicators of sustainability”, Environmental Physiology and
Biogeocenology, MSU, Moscow, 1979. pp 5-26. [in Russian]
23. E. Rosick, K. Stadlander, and J. Ahlers “Environmental chemicals on biomembranes”, Chemosphere, 1985, vol. 14(5), pp 529-544.
24. O. Sevriukova, A. Kanapeckaitė, V. Knisnierienė, R. Ladygienė, I. Lapeikaitė, and V. Sakalauskas “Modifying action of tritium on the charophytes bioelectrical response to anthropogenic pollution”, Trace Elements and Electrolytes, 2014, vol. 31(2), pp 60-66.

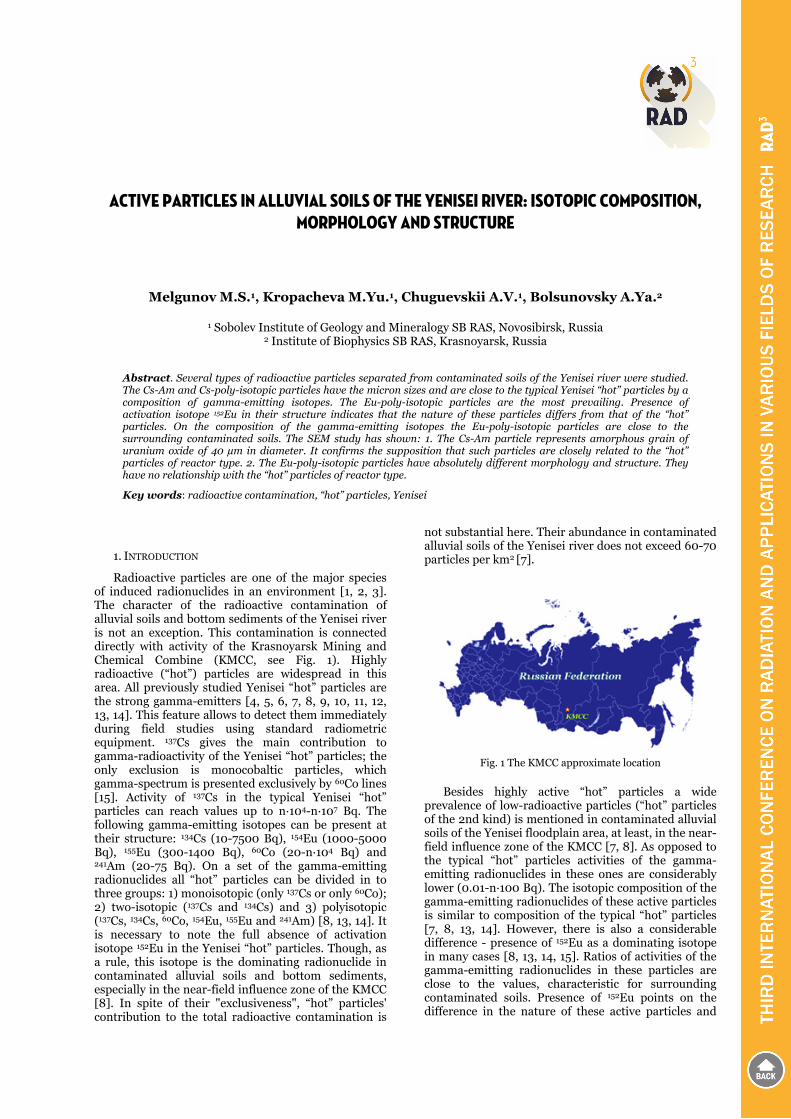
ACTIVE PARTICLES IN ALLUVIAL SOILS OF THE YENISEI RIVER: ISOTOPIC COMPOSITION, MORPHOLOGY AND STRUCTURE
Melgunov M.S.1, Kropacheva M.Yu.1, Chuguevskii A.V.1, Bolsunovsky A.Ya.2
1 Sobolev Institute of Geology and Mineralogy SB RAS, Novosibirsk, Russia 2 Institute of Biophysics SB RAS, Krasnoyarsk, Russia
Abstract. Several types of radioactive particles separated from contaminated soils of the Yenisei river were studied. The Cs-Am and Cs-poly-isotopic particles have the micron sizes and are close to the typical Yenisei “hot” particles by a composition of gamma-emitting isotopes. The Eu-poly-isotopic particles are the most prevailing. Presence of activation isotope 152Eu in their structure indicates that the nature of these particles differs from that of the “hot” particles. On the composition of the gamma-emitting isotopes the Eu-poly-isotopic particles are close to the surrounding contaminated soils. The SEM study has shown: 1. The Cs-Am particle represents amorphous grain of uranium oxide of 40 µm in diameter. It confirms the supposition that such particles are closely related to the “hot” particles of reactor type. 2. The Eu-poly-isotopic particles have absolutely different morphology and structure. They have no relationship with the “hot” particles of reactor type.
Key words: radioactive contamination, “hot” particles, Yenisei
1. INTRODUCTION
Radioactive particles are one of the major species of induced radionuclides in an environment [1, 2, 3]. The character of the radioactive contamination of alluvial soils and bottom sediments of the Yenisei river is not an exception. This contamination is connected directly with activity of the Krasnoyarsk Mining and Chemical Combine (KMCC, see Fig. 1). Highly radioactive (“hot”) particles are widespread in this area. All previously studied Yenisei “hot” particles are the strong gamma-emitters [4, 5, 6, 7, 8, 9, 10, 11, 12, 13, 14]. This feature allows to detect them immediately during field studies using standard radiometric equipment. 137Cs gives the main contribution to gamma-radioactivity of the Yenisei “hot” particles; the only exclusion is monocobaltic particles, which gamma-spectrum is presented exclusively by 60Co lines [15]. Activity of 137Cs in the typical Yenisei “hot” particles can reach values up to n·104-n·107 Bq. The following gamma-emitting isotopes can be present at their structure: 134Cs (10-7500 Bq), 154Eu (1000-5000 Bq), 155Eu (300-1400 Bq), 60Co (20-n·104 Bq) and 241Am (20-75 Bq). On a set of the gamma-emitting radionuclides all “hot” particles can be divided in to three groups: 1) monoisotopic (only 137Cs or only 60Co); 2) two-isotopic (137Cs and 134Cs) and 3) polyisotopic (137Cs, 134Cs, 60Co, 154Eu, 155Eu and 241Am) [8, 13, 14]. It is necessary to note the full absence of activation isotope 152Eu in the Yenisei “hot” particles. Though, as a rule, this isotope is the dominating radionuclide in contaminated alluvial soils and bottom sediments, especially in the near-field influence zone of the KMCC [8]. In spite of their "exclusiveness", “hot” particles' contribution to the total radioactive contamination is
not substantial here. Their abundance in contaminated alluvial soils of the Yenisei river does not exceed 60-70 particles per km2 [7].
Fig. 1 The KMCC approximate location
Besides highly active “hot” particles a wide prevalence of low-radioactive particles (“hot” particles of the 2nd kind) is mentioned in contaminated alluvial soils of the Yenisei floodplain area, at least, in the near-field influence zone of the KMCC [7, 8]. As opposed to the typical “hot” particles activities of the gamma-emitting radionuclides in these ones are considerably lower (0.01-n·100 Bq). The isotopic composition of the gamma-emitting radionuclides of these active particles is similar to composition of the typical “hot” particles [7, 8, 13, 14]. However, there is also a considerable difference - presence of 152Eu as a dominating isotope in many cases [8, 13, 14, 15]. Ratios of activities of the gamma-emitting radionuclides in these particles are close to the values, characteristic for surrounding contaminated soils. Presence of 152Eu points on the difference in the nature of these active particles and
276
the typical Yenisei “hot” particles. Occurrence of the active particles in the near-field influence zone of the KMCC is very wide. For the contaminated alluvial soils of Atamanovsky island (7 km downstream from a discharge point of the KMCC) the concentration of the active particles is estimated up to the value of 1010 particles per km2 in a 0.5 m layer of soil [7]. The contribution of active particles to the total contamination of the alluvial soils and bottom sediments in the near-field influence zone can reach 45% for 137Cs, 75% for 152Eu, 154Eu and 60Co, and 100% for 241Am [7, 8, 13, 14, 15]. In spite of their wide abundance, active particles are studied insufficiently completely. For assessment of mobility level of the radionuclides, ingressed in the structure of the radioactive particles, it is very important to have information on morphology, structure, and element composition of matrixes of these particles, and their ability to the weathering in natural conditions [1, 2, 3]. All earlier studies [7, 8] were only about of the isotopic composition of the active particles, their activity and contribution to the total contamination of the floodplain alluvial soils of the Yenisei river. Gritchenko et al. [7] say about localization (isolation) of the “hot” particles of the 2nd kind from the soils of Atamanovsky island, but it was noted, that “preliminary microscopic studies have not revealed any difference between these particles and a material of ambient soil. At present there is no sufficient reliable information about appearance and structural performances of the “hot” particles of the 2nd kind”. Sukhorukov et al. [8] fix presence of the fine-dispersed active particles by significant growth of specific activities of radionuclides in small aliquots (1-0.5 g) of the contaminated soils and bottom sediments. Preliminary results of the study of the Yenisei active particles have been obtained in 2009 [15]. The objective of this work is to present the results of the complementary studies of nature of the localized Yenisei active particles, their isotopic composition, morphology and structure.
2. MATERIAL AND METHODS
2.1. Samples description
Three samples of the contaminated alluvial soils were chosen for the study: P10A2, P12A1, and P12A2. According to granulometric and mineral composition they are close to the typical alluvial soils of periodically inundated areas of the Yenisei islands in this region. They represent a fine-grained sand with a small addition of a clayey component and organic matter.
Specific activities of the gamma-emitting radionuclides in the chosen samples at the moment of measuring in 2001 were equal, accordingly (Bq/kg): 152Eu - 8596, 9492 and 10560; 154Eu - 2156, 3075 and 2965; 155Eu - 468, 759 and 454; 137Cs - 939, 1388 and 994, and 60Co - 648, 1338 and 663 [8]. Localization of the active particles and their subsequent isolation from the material of soils were made by sequential quartering method. The direct isolation of the active particles was carried out by means of a binocular microscope. As a result 36 active particles of various radionuclide composition were reliably separated and studied.
2.2. Analytical procedures
The majority of analytical procedures connected with the study of the Hot and active particles, were carried out in the IGM SB RAS.
Definition of the isotopic composition and activities of the gamma-emitting radionuclides was carried out by the gamma-spectrometric method using a EURISYS MEASURES low background well-type HPGe detector EGPC192-P21-R with an active volume of 220 cm3, relative efficiency—50%, FWHM (1,332 keV)—2.1 keV. The counting time was in the range of 12-24 hours for each sample. It was depended on the level of radionuclides activity and was chosen in order to obtain a statistical error of measurement not worse than 5% for the major part of analytical gamma-lines. The detection limits for 137Cs, 152Eu, 154Eu, 60Co and 241Am in the measured samples were of the order of 0.01 Bq.
The study of morphology, phase and chemical composition of the “hot” particles was carried out by the scanning electron microscope (SEM) LEO1430VP supplied with an energy-dispersion analysis spectrometer “OXFORD”.
Active particles were characterized using a Zeiss EVO 50 variable pressure Environmental Scanning Electron Microscope (ESEM) at high vacuum conditions. Energy Dispersive X-ray analysis including spot measurements, X-ray mapping and X-ray linescans were performed using an Inca EDX analytical system (Oxford Instruments, Oxford, UK) including a Si(Li) detector attached to the ESEM. This study was performed in the Radioisotope Laboratory of the Norwegian University of Life Sciences.
3. RESULTS AND DISCUSSION
3.1. Active particles of the Yenisei river: radionuclides composition
The results of the activity determination of the induced radionuclides, obtained for 36 preliminarily isolated active particles, are presented in Table 1. It is possible to mark out three types of active particles according to their gamma-emitting radionuclides composition: 1) the caesium-americium, containing 137Cs and 241Am (Ch8, Ch13, Ch32, Ch33); 2) caesium-polyisotopic (137Cs, 154Eu, 155Eu, 60Co and 241Am - Ch19) and 3) europium-polyisotopic (152Eu, 154Eu, 155Eu, 137Cs, 60Co and 241Am - rest 31 particles). The third type differs from the second one by presence of the activation isotope 152Eu. Besides, there are signs of presence of the cobaltic particles containing only 60Со. However, due to their trace activity and very small sizes their isolation and analysis was not performed. As well as cobaltic, the particles of the 1st and the 2nd type have small sizes. Their localization was possible only as a part of a group of the particles of surrounding soil. Direct isolation of these particles by visual methods was very difficult and demanded application of more fine research techniques, including SEM. Activities of 137Cs in the particles of the 1st type vary from 0.03 Bq (Ch13) to 66.5 Bq (Ch8), 241Am - 0.66 Bq (Ch32) to 4.09 Bq (Ch8). The 137Cs/241Am ratio for the particles Ch32 and Ch33 is close to 1. For Ch8 it is equal 16.3, and for Ch13 - 0.04. In the 2nd type particle (Ch19)

277
137Cs (135 Bq) is the dominating radionuclide. According to the gamma-emitting radionuclide composition the active particles of the 1st and the 2nd type are very close to the typical Yenisei “hot” particles [8, 13, 14]. Their low activity can be connected, apparently, with their rather small sizes.
Table 1. Induced gamma-emitting radionuclides composition of the Yenisei active particles.
P-cle Activity1), Bq num 152Eu 154Eu 155Eu 137Cs 60Co 241Am
P10A2 Ch7 9.2 2.7 0.23 0.03 0.09 0.02 Ch19 - 0.3 0.07 135 0.07 0.05 Ch20 68.8 11.5 0.99 0.05 1.17 0.03 Ch23 9.5 2.1 0.23 0.07 0.08 0.01 Ch24 11.3 1.5 0.09 0.05 0.51 0.02 Ch25 53.6 10.8 1.03 0.09 3.60 0.05 Ch26 9.4 2.2 0.26 0.04 0.08 0.01 Ch27 21.9 2.7 0.15 0.05 0.91 0.02 Ch28 8.7 1.9 0.23 0.02 0.08 0.02 Ch29 46.2 10.0 1.01 0.10 1.50 0.06 Ch30 95.3 19.7 2.08 0.09 3.00 0.07 Ch31 10.3 2.4 0.28 0.03 0.11 0.02 Ch32 - - - 0.82 - 0.66 Ch33 - - - 2.9 - 2.73 Ch34 34.8 6.2 0.60 0.01 1.37 0.03 Ch35 16.6 3.3 0.32 0.03 1.22 0.01 Ch36 19.9 4.7 0.54 0.03 0.63 0.02
P12A1 Ch1 315 52.5 3.46 0.53 7.65 0.14 Ch2 153 45.0 5.44 0.36 1.54 0.20 Ch3 77 22.7 2.72 0.18 0.71 0.11 Ch4 13 6.5 0.99 0.05 0.31 0.04 Ch8 - - - 66.5 - 4.09 Ch13 - - - 0.03 - 0.69 Ch15 12.7 4.0 0.52 0.04 0.15 0.03 Ch22 16.1 3.0 0.32 0.09 0.21 0.02
P12A2 Ch5 26 4.1 0.28 0.09 1.03 0.01 Ch6 4.4 1.4 0.13 0.00 0.02 0.00 Ch9 38 12.2 1.17 0.13 0.44 0.08 Ch10 21 8.0 0.84 0.12 0.26 0.05 Ch11 8.2 2.4 0.22 0.03 0.07 0.01 Ch12 23 6.3 0.59 0.11 0.18 0.03 Ch14 22.9 3.8 0.26 0.03 0.81 0.01 Ch16 3.5 1.8 0.22 0.02 0.08 0.02 Ch17 29.3 6.1 0.47 0.07 0.76 0.02 Ch18 14.1 4.1 0.38 0.05 0.12 0.02 Ch21 10.2 3.0 0.28 0.06 0.07 0.03 1) The date of measuring is the end of 2008.
As it was noted earlier, the basic difference of the active particles of the 3rd type is the presence of 152Eu. This isotope is completely absent in the typical “hot”
particles. The contribution of 152Eu in the total activity of the particles of the 3rd type is dominating (62-86 %). It should be noted that 31 particles, among 36 isolated, correspond to this type. So it is possible to say about their wide occurrence in the studied area.
In appearance all active particles of the 3rd type have similar structure (see Fig. 2).
Fig. 2 The active particles of the 3rd type
Particles have sharp flat shapes without signs of weathering and rounding. Their thickness is 10-30 µm. Geometrical dimensions can reach 1750 µm (Ch1). These particles a very fragile and can be easily broken. Their surface colour can be black, grey-brown, yellowy-brown. The inner layers of these particles have semi-transparent, glassy structure. The particles of the 3rd type can be easily isolated from surrounding soil not only because of their large sizes, but also due to their essential external difference from the soil minerals.
The activity of 152Eu in the particles of the 3rd type is proportional to their geometrical size and varies in the range from 3.5 (Ch16) to 315 Bq (Ch1). Besides 152Eu these particles include all gamma-emitting radionuclides, typical for the surrounding contaminated soils. This fact indirectly confirms a supposition about a uniform source for these particles and contaminated material of soils. It is necessary to note that intervals of variations of ratios of the main radionuclides (152Eu/154Eu and 154Eu/155Eu) in these particles are sufficiently narrow. With some exceptions the 152Eu/154Eu ratio in the particles from the P12A1 and P12A2 samples lays in the range of 3-3.6, and for the P10A2 sample - 4.2-5. The ratio 154Eu/155Eu: 8.2-10.9 and 8.6-11.6 respectively.
3.2. Active particles of the Yenisei river: morphology and structure
The study carried out by means of the scanning electronic microscopy technique, shows:
1. The caesium-americium active particle of the 1st type (Ch-8, see Fig. 3) represents amorphous grain of uranium oxide with the size approximately 40х30 µm. This fact is in a good agreement with assumption that these particles have the direct relation to the typical Yenisei “hot” particles of reactor type.

278
Fig. 3 The 1st type caesium-americium active particle (Ch8). Photo was done by SEM back-scattered electron technique.
Fig. 4 The 3rd type europium-polyisotopic active particle (Ch30). Photo was done by SEM technique
2. The europium-polyisotopic active particles of the 3rd type have absolutely different morphology and structure. The study of the particle number Ch30 shows, that it represents the plane, multilayered object, which size is 200х400 µm (see Fig. 4). The total thickness of this particle is 30-35 µm. The inner vitriform layer, which thickness is 20-25 µm, consists generally of compounds of aluminium and iron. The inner layer surface is overlying by multilayered 5-15 µm cover. It consists of compounds of iron, chromium, titanium, calcium, phosphorus and silicon. There is no any presence of uranium in this particle. The particle is very fragile. During preparation for the analysis the initial large particle was disintegrated on many pieces with sizes from hundreds to unities of micron. This fact
can explain wide occurrence of the particles of of the 3rd type in studied contaminated soils. The element composition of the matrix of these particles assumes their week solubility in natural conditions.
The genesis of the europium-polyisotopic active particles of the 3rd type is not clear so far. At the same time the origin of "uranium" active particles of the 1st and the 2nd type can be related to gradual destruction of the large typical "hot" particles. This fact can be confirmed by the data obtained for the radionuclide composition of the soils, circumadjacent the "hot" particles (see Table 2).
Table 2. Activity of induced radionuclides in some typical Yenisei “hot” particles (HPl, Bq) and
circumadjacent soils (CSoil, Bq/kg).
152Eu 137Cs 241Am
1 HPl 13280 1284
CSoil 100 2987 177
2 HPl 30530 2124
CSoil 48 4134 219
3 HPl 61090
CSoil 62 2693
4 HPl 613000
CSoil 183 1344
5 HPl 41210 1865
CSoil 42 1877 123
6 HPl 101700
CSoil 77 19085
All particles were isolated from the upper (5-15 cm) layer of soil. They are characterized by high activity of 137Cs and the complete absence of 152Eu. Particles 3 and 4 belong to the mono-isotopic group. Particles 1, 2, 5 and 6 are polyisotopic. There is a significant amount of 241Am in particles 1, 2, and 5. The results of 137Cs and 241Am activities determinaton in the "hot" particle are presented in Table 2. In the circumadjacent soils 152Eu is present in amount, typical to studied area. Activity of 137Cs in all cases substantially exceeds the value typical for the ordinary contaminated soils (at 6-60 times). It is possible to draw the same conclusion for 241Am. Allowing the fact, that the total amount of soil samples from which the particles have been isolated, is small (100-200 сm3), it is possible to guess the influence of "hot" particles on the radionuclide composition of soils circumadjacent them. Apparently, in the processes of transportation and deposition of the "hot" particles as a part of suspended material incoming with water stream, and their further burial in soils, a destruction of the particles structure take place as a result of chemical dissolution, or by mechanical way. Thus the redistribution of the induced radionuclides, entering into the structure of the "hot" particles, may take place between particles and circumadjacent soils. The photograph of the "hot" particle containing multiple active inclusions in its structure is presented on Fig. 5.
These active inclusions are the grains of uranium oxide and very similar to the active microparticle demonstrated on Fig. 3. The most part of these active inclusions represent conglomerates of numerous spherical formations of very small size (microns and less). Under certain conditions this structure can be destroyed, and uranium micro-and nano-particles can migrate to circumadjacent soils.
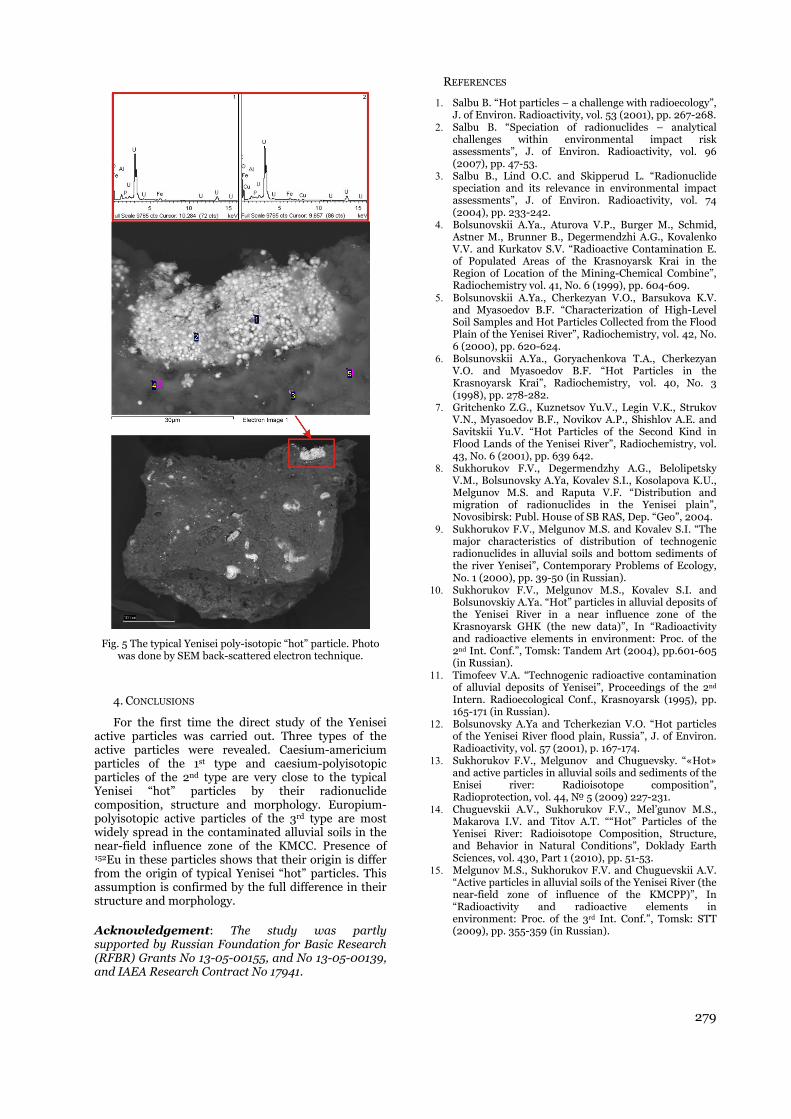
279
Fig. 5 The typical Yenisei poly-isotopic “hot” particle. Photo was done by SEM back-scattered electron technique.
4. CONCLUSIONS
For the first time the direct study of the Yenisei active particles was carried out. Three types of the active particles were revealed. Caesium-americium particles of the 1st type and caesium-polyisotopic particles of the 2nd type are very close to the typical Yenisei “hot” particles by their radionuclide composition, structure and morphology. Europium-polyisotopic active particles of the 3rd type are most widely spread in the contaminated alluvial soils in the near-field influence zone of the KMCC. Presence of 152Eu in these particles shows that their origin is differ from the origin of typical Yenisei “hot” particles. This assumption is confirmed by the full difference in their structure and morphology.
Acknowledgement: The study was partly supported by Russian Foundation for Basic Research (RFBR) Grants No 13-05-00155, and No 13-05-00139, and IAEA Research Contract No 17941.
REFERENCES
1. Salbu B. “Hot particles – a challenge with radioecology”, J. of Environ. Radioactivity, vol. 53 (2001), pp. 267-268.
2. Salbu B. “Speciation of radionuclides – analytical challenges within environmental impact risk assessments”, J. of Environ. Radioactivity, vol. 96 (2007), pp. 47-53.
3. Salbu B., Lind O.C. and Skipperud L. “Radionuclide speciation and its relevance in environmental impact assessments”, J. of Environ. Radioactivity, vol. 74 (2004), pp. 233-242.
4. Bolsunovskii A.Ya., Aturova V.P., Burger M., Schmid, Astner M., Brunner B., Degermendzhi A.G., Kovalenko V.V. and Kurkatov S.V. “Radioactive Contamination E. of Populated Areas of the Krasnoyarsk Krai in the Region of Location of the Mining-Chemical Combine”, Radiochemistry vol. 41, No. 6 (1999), pp. 604-609.
5. Bolsunovskii A.Ya., Cherkezyan V.O., Barsukova K.V. and Myasoedov B.F. “Characterization of High-Level Soil Samples and Hot Particles Collected from the Flood Plain of the Yenisei River”, Radiochemistry, vol. 42, No. 6 (2000), pp. 620-624.
6. Bolsunovskii A.Ya., Goryachenkova T.A., Cherkezyan V.O. and Myasoedov B.F. “Hot Particles in the Krasnoyarsk Krai”, Radiochemistry, vol. 40, No. 3 (1998), pp. 278-282.
7. Gritchenko Z.G., Kuznetsov Yu.V., Legin V.K., Strukov V.N., Myasoedov B.F., Novikov A.P., Shishlov A.E. and Savitskii Yu.V. “Hot Particles of the Second Kind in Flood Lands of the Yenisei River”, Radiochemistry, vol. 43, No. 6 (2001), pp. 639 642.
8. Sukhorukov F.V., Degermendzhy A.G., Belolipetsky V.M., Bolsunovsky A.Ya, Kovalev S.I., Kosolapova K.U., Melgunov M.S. and Raputa V.F. “Distribution and migration of radionuclides in the Yenisei plain”, Novosibirsk: Publ. House of SB RAS, Dep. “Geo”, 2004.
9. Sukhorukov F.V., Melgunov M.S. and Kovalev S.I. “The major characteristics of distribution of technogenic radionuclides in alluvial soils and bottom sediments of the river Yenisei”, Contemporary Problems of Ecology, No. 1 (2000), pp. 39-50 (in Russian).
10. Sukhorukov F.V., Melgunov M.S., Kovalev S.I. and Bolsunovskiy A.Ya. “Hot” particles in alluvial deposits of the Yenisei River in a near influence zone of the Krasnoyarsk GHK (the new data)”, In “Radioactivity and radioactive elements in environment: Proc. of the 2nd Int. Conf.”, Tomsk: Tandem Art (2004), pp.601-605 (in Russian).
11. Timofeev V.A. “Technogenic radioactive contamination of alluvial deposits of Yenisei”, Proceedings of the 2nd Intern. Radioecological Conf., Krasnoyarsk (1995), pp. 165-171 (in Russian).
12. Bolsunovsky A.Ya and Tcherkezian V.O. “Hot particles of the Yenisei River flood plain, Russia”, J. of Environ. Radioactivity, vol. 57 (2001), p. 167-174.
13. Sukhorukov F.V., Melgunov and Chuguevsky. “«Hot» and active particles in alluvial soils and sediments of the Enisei river: Radioisotope composition”, Radioprotection, vol. 44, № 5 (2009) 227-231.
14. Chuguevskii A.V., Sukhorukov F.V., Mel’gunov M.S., Makarova I.V. and Titov A.T. ““Hot” Particles of the Yenisei River: Radioisotope Composition, Structure, and Behavior in Natural Conditions”, Doklady Earth Sciences, vol. 430, Part 1 (2010), pp. 51-53.
15. Melgunov M.S., Sukhorukov F.V. and Chuguevskii A.V. “Active particles in alluvial soils of the Yenisei River (the near-field zone of influence of the KMCPP)”, In “Radioactivity and radioactive elements in environment: Proc. of the 3rd Int. Conf.”, Tomsk: STT (2009), pp. 355-359 (in Russian).


MEASUREMENTS OF HEAVY METALS IN RIVER SITNICA SEDIMENTS WITH AAS AND ICP/OES TECHNIQUES
Mentor Ismaili, Kaltrina Jusufi, Tahir Arbneshi, Fitim Sopjani, Avni Berisha, Jeton Halili
University of Prishtina “Hasan Prishtina”, Faculty of Natural Sciences and Mathematics, Departament of Chemistry, str. “Nëna Terezë”, Nr. 5; 10000 Prishtina, Kosovo.
Abstract. The aquatic system is the most prone environment to pollution, especially sediments. This is largely due to the contaminants in the air, soil or land, which eventually find their way to the aquatic systems via either air or rainfall. Sewage, industrial wastes and agricultural chemicals, such as fertilizers and pesticides, in addition to mineral and petroleum exploration, as well as exploitation are nonetheless, the largest contributors to the surface water pollution. It is not particularly difficult for the burned ashes to penetrate to a river via air or other atmospheric deposits. Once they enter the water system, they lead to permanent damage. In our research we measured heavy metals; Pb, Cu, Zn and Cd through the Atomic Absorption Spectroscopy (AAS) and inductively coupled plasma optical emission spectrometry (ICP/OES) technique, in the river Sitnica which is exposed to coal fired power plants. This study presents detailed data of the pollution of the river Sitnica in Kosovo, which is located near Kosovo’s only two power plants.
Key words: sediment river pollution, water, contaminants.
1. INTRODUCTION
The quality of ground water in a certain area is a function of chemical and physical parameters, which the geological formations and anthropogenic activities have abundant impact on [1][2].
Heating systems which are coal-powered have the ability to trigger negative effects on the environment, as well as on health. During the process of coal burning, a number of hazardous substances are released; these include acidic gases, benzene, dioxins and furans; formaldehyde, lead, arsenic, mercury; polycyclic aromatic hydrocarbons (PAH) and radioactive materials [3].
The Kosovo Energy Corporation (abbreviated as KEK in Albanian) is the largest corporation which is responsible for addressing Kosovo’s electricity needs. In order to do so, it produces energy through two power plants: Kosovo A and Kosovo B, both of which are coal-powered. During our study, we monitored the heavy metals that are released in the water from the coal burning, as an energy producer.
The power plants are located in the area of Kastriot, which is 10 kilometers away from the capital, Prishtina. The Sitnica river, which flows near the power plants, is very sensitive to all contaminants that are released during the burning of coal.
Contamination with heavy metals is shown to have serious consequences. Some of the heavy metals
considered as micronutrients become detrimental to human health when their concentrations exceed the permissible level of drinking water [4].
2. MATERIALS AND METHODS
2.1. Area of study
The Sitnica River flows into the Ibër river in Mitrovica; it is the longest river which flows entirely within the borders of Kosovo. Figure 1 shows Sitnica encircled in red next to the map of Kosovo, with Kastriot highlighted and encircled in black.
Fig. 1 Study zone with river Sitnica highlighted and its location within Kosovo
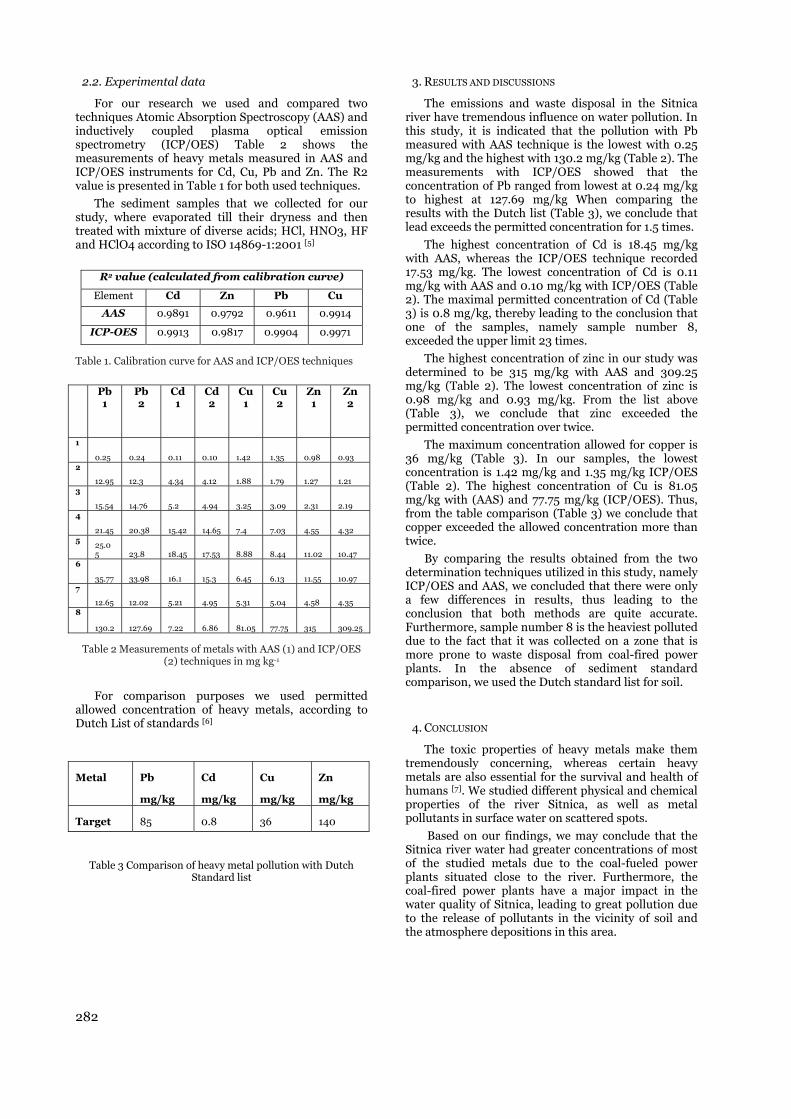
282
2.2. Experimental data
For our research we used and compared two techniques Atomic Absorption Spectroscopy (AAS) and inductively coupled plasma optical emission spectrometry (ICP/OES) Table 2 shows the measurements of heavy metals measured in AAS and ICP/OES instruments for Cd, Cu, Pb and Zn. The R2 value is presented in Table 1 for both used techniques.
The sediment samples that we collected for our study, where evaporated till their dryness and then treated with mixture of diverse acids; HCl, HNO3, HF and HClO4 according to ISO 14869-1:2001 [5]
R2 value (calculated from calibration curve)
Element Cd Zn Pb Cu
AAS 0.9891 0.9792 0.9611 0.9914
ICP-OES 0.9913 0.9817 0.9904 0.9971
Table 1. Calibration curve for AAS and ICP/OES techniques
Pb 1
Pb 2
Cd 1
Cd 2
Cu 1
Cu 2
Zn 1
Zn 2
1
0.25 0.24 0.11 0.10 1.42 1.35 0.98 0.93 2
12.95 12.3 4.34 4.12 1.88 1.79 1.27 1.21 3
15.54 14.76 5.2 4.94 3.25 3.09 2.31 2.19 4
21.45 20.38 15.42 14.65 7.4 7.03 4.55 4.32 5
25.05 23.8 18.45 17.53 8.88 8.44 11.02 10.47
6
35.77 33.98 16.1 15.3 6.45 6.13 11.55 10.97 7
12.65 12.02 5.21 4.95 5.31 5.04 4.58 4.35 8
130.2 127.69 7.22 6.86 81.05 77.75 315 309.25
Table 2 Measurements of metals with AAS (1) and ICP/OES (2) techniques in mg kg-1
For comparison purposes we used permitted allowed concentration of heavy metals, according to Dutch List of standards [6]
Table 3 Comparison of heavy metal pollution with Dutch Standard list
3. RESULTS AND DISCUSSIONS
The emissions and waste disposal in the Sitnica river have tremendous influence on water pollution. In this study, it is indicated that the pollution with Pb measured with AAS technique is the lowest with 0.25 mg/kg and the highest with 130.2 mg/kg (Table 2). The measurements with ICP/OES showed that the concentration of Pb ranged from lowest at 0.24 mg/kg to highest at 127.69 mg/kg When comparing the results with the Dutch list (Table 3), we conclude that lead exceeds the permitted concentration for 1.5 times.
The highest concentration of Cd is 18.45 mg/kg with AAS, whereas the ICP/OES technique recorded 17.53 mg/kg. The lowest concentration of Cd is 0.11 mg/kg with AAS and 0.10 mg/kg with ICP/OES (Table 2). The maximal permitted concentration of Cd (Table 3) is 0.8 mg/kg, thereby leading to the conclusion that one of the samples, namely sample number 8, exceeded the upper limit 23 times.
The highest concentration of zinc in our study was determined to be 315 mg/kg with AAS and 309.25 mg/kg (Table 2). The lowest concentration of zinc is 0.98 mg/kg and 0.93 mg/kg. From the list above (Table 3), we conclude that zinc exceeded the permitted concentration over twice.
The maximum concentration allowed for copper is 36 mg/kg (Table 3). In our samples, the lowest concentration is 1.42 mg/kg and 1.35 mg/kg ICP/OES (Table 2). The highest concentration of Cu is 81.05 mg/kg with (AAS) and 77.75 mg/kg (ICP/OES). Thus, from the table comparison (Table 3) we conclude that copper exceeded the allowed concentration more than twice.
By comparing the results obtained from the two determination techniques utilized in this study, namely ICP/OES and AAS, we concluded that there were only a few differences in results, thus leading to the conclusion that both methods are quite accurate. Furthermore, sample number 8 is the heaviest polluted due to the fact that it was collected on a zone that is more prone to waste disposal from coal-fired power plants. In the absence of sediment standard comparison, we used the Dutch standard list for soil.
4. CONCLUSION
The toxic properties of heavy metals make them tremendously concerning, whereas certain heavy metals are also essential for the survival and health of humans [7]. We studied different physical and chemical properties of the river Sitnica, as well as metal pollutants in surface water on scattered spots.
Based on our findings, we may conclude that the Sitnica river water had greater concentrations of most of the studied metals due to the coal-fueled power plants situated close to the river. Furthermore, the coal-fired power plants have a major impact in the water quality of Sitnica, leading to great pollution due to the release of pollutants in the vicinity of soil and the atmosphere depositions in this area.
Metal Pb
mg/kg
Cd
mg/kg
Cu
mg/kg
Zn
mg/kg
Target 85 0.8 36 140
283
REFERENCES
1. Bishnoi, M. and R. Malik: Ground water quality in environmentally degraded localities of Panipat city, India. J. Environ. Biol., 29, 881-886 (2007).
2. Subramani, T., I. Elango and S.R. Damodarasamy: Groundwater quality and its suitability for drinking and agricultural use in chithar river basin, Tamil nadu, India. Environ. Geol., 47, 1099-1110 (2005)
3. American Lung Association, Toxic Air: The Case for Cleaning Up Coal-fired Power Plants, p.1-8, 2011(http://www.lung.org/assets/documents/healthy-air/toxic-air-report.pdf)
4. Prasanna MV, Chitambaram S, Hameed AS, Srinivasamoorthy K (2011) Hydrogeochemical analysis and evaluation of groundwater quality in the Gadilam river basin, Tamil Nadu, India. J Earth Syst Sci 120(1):85–98
5. Soil quality - Dissolution for the determination of total element content - Part 1: Dissolution with hydrofluoric and perchloric acids, ISO 14869-1:2001
6. Dutch standard list, 2000, www.esdat.net/Environmental%20Standards/Dutch/annexS_I2000Dutch%20Environmental%20Standards.pdf
7. Amir Waseem, Jahanzaib Arshad, Farhat Iqbal, Ashif Sajjad, Zahid Mehmood, and Ghulam Murtaza; Pollution Status of Pakistan: A Retrospective Review on Heavy Metal Contamination of Water, Soil, and Vegetables, BioMed Research International Volume 2014 (2014),ArticleID 813206,29 pages http://dx.doi.org/10.1155/2014/813206


APPLICATION OF REMOTE SENSING TECHNIQUE FOR PRESERVATION OF PLANT ECOSYSTEMS
Dora Krezhova1, Svetla Maneva2, Nikolay Petrov2
1Space Research and Technology Institute, Bulgarian Academy of Sciences 2Institute of soil science, agrotechnology and plant protection, Bulgarian Agricultural Academy
Abstract. In this study a biophysical approach for estimation of the physiological state and stress reactions of plants based on remote sensing technique - the measured optical signals reflected from the leaf surface - was used. The investigations were focused on the detection of a biotic stress (viral infection) on plum trees caused by Plum pox virus (sharka disease). Spectrometric measurements of leaf reflectance were carried out in the visible and near infrared spectral ranges (450-850 nm) by means of a multichannel fibre-optics spectrometer. Statistical significance of the differences in hyperspectral data was established at a number of wavelengths (p<0.05, Student t-test) in the green and near infrared spectral ranges. First derivative analyses showead a shift to the lower wavelengths of the red edge position of the spectral curves of infected leaves (about 1 nm and 5 nm for two of the three investigated groups) that is an indicator for presence of changes in the plant health. Several vegetation indices (normalized difference vegetation index - NDVI, simple ratio, photochemical reflectance index, and disease vegetation index - fD) were analysed and best results for separating the healthy from infected leaves gave NDVI and fD. The serological test DAS-ELISA was applied for assessment of the presence of PPV in plum leaves. The comparative analyses on the evidence from the spectral response and the DAS-ELISA findings revealed the strong relationship between the results and this indicates the possibilities of hyperspectral remote sensing for screening for diseases in plants.
Key words: hуperspectral reflectance, remote sensing, vegetation indices, sharka disease, viral infection
1. INTRODUCTION
Recent researches in biophysical remote sensing and its applications to climate and land change science includes both empirical and theoretical approaches [1]. Their common aim is the use of novel techniques and modeling approaches to measure biophysical and land surface properties with remote sensing [2]. These properties are governed by biological and physical processes, vegetation type, amount, distribution, and associated functional attributes. The empirical studies involve observation and analysis of the land with satellite remote sensing systems and various ground-based instruments [3]. The theoretical approaches involve computer-based simulation of both the remote sensing system and landscape conditions [4, 5].
Remote sensing technique based on hyperspectral reflectance data may be very useful tool for a rapid and non-destructive preliminary screening of presence of a stress and diseases in the plants [6, 7]. The contemporary sensors and technologies improve significantly the capability to gather information by measuring the reflected and emitted electromagnetic radiation from the ultraviolet up to microwave spectral ranges [8]. This innovative technology will be extremely helpful to greatly spatialize diagnostic results and provide exceptional tools to monitoring of plant ecosystems and to render agriculture more sustainable and safe, avoiding expensive use of pesticides in crop protection [9].
The photosynthetic apparatus of plants is a sensitive indicator of their state due to rapid changes of chlorophyll content induced by variations of environmental conditions [10]. Chlorophyll presence causes the specific shape of the reflectance spectrum of vegetation that allows for the use of spectra for remote assessment of plant status [11, 12].
Plant diseases influence and change the optical properties of the plants in different ways. Depending on the host pathogen system and disease specific symptoms, different regions of the reflectance spectrum are affected, resulting in specific spectral signatures of diseased plants [13, 14].
Plant diseases caused by viral infections are responsible for major economic losses in the agricultural industry worldwide. Plum pox or sharka is the most destructive and most feared viral disease of stone fruit trees (genus Prunus) such as plums, peaches, apricots, nectarines, almonds and cherries [15, 16]. Distribution of Plum pox has been known as a serious disease on stone fruit since the early 1900’s. The symptoms of the disease were first observed in plums by plum growers in Bulgaria between 1915 and 1918. Some reports specify that symptoms were observed in Macedonia as early as 1910. Between 1932 and 1960 the disease spread to the north and east from Bulgaria. The disease was observed mainly in plums and apricots until the 1960’s and was never observed in peaches in Bulgaria, or Yugoslavia until the 1980’s and only then in peaches which had come from Hungary [17].
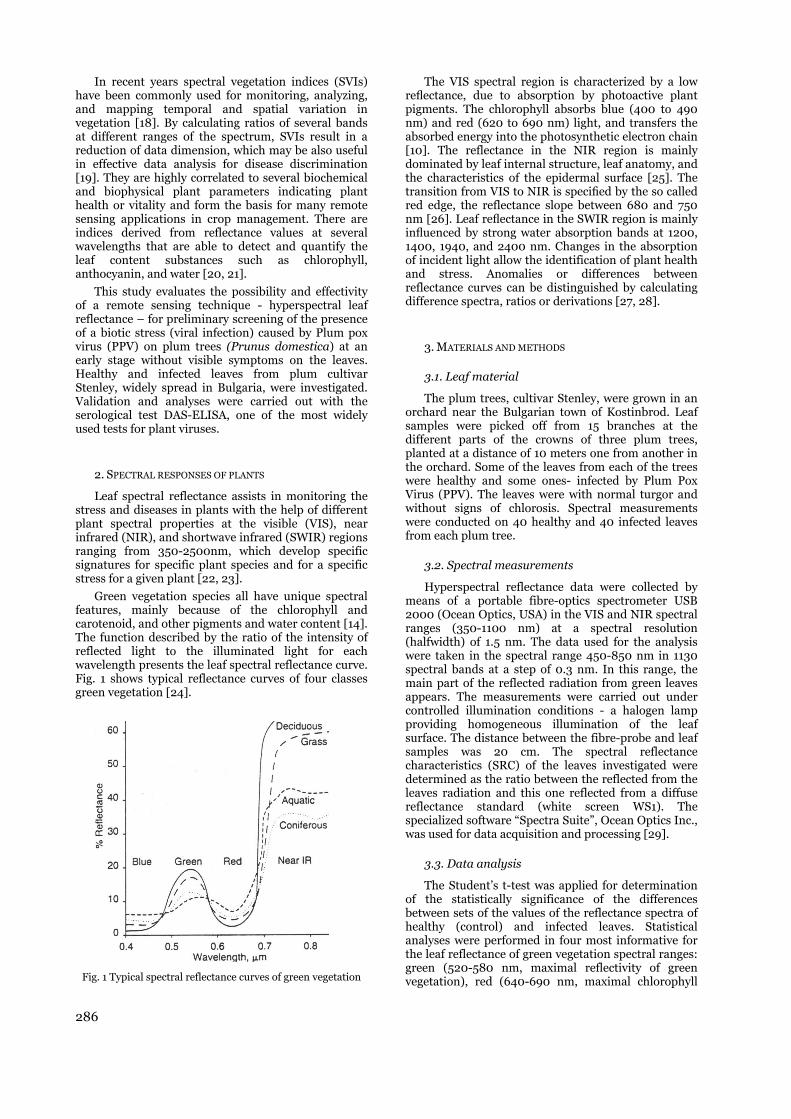
286
In recent years spectral vegetation indices (SVIs) have been commonly used for monitoring, analyzing, and mapping temporal and spatial variation in vegetation [18]. By calculating ratios of several bands at different ranges of the spectrum, SVIs result in a reduction of data dimension, which may be also useful in effective data analysis for disease discrimination [19]. They are highly correlated to several biochemical and biophysical plant parameters indicating plant health or vitality and form the basis for many remote sensing applications in crop management. There are indices derived from reflectance values at several wavelengths that are able to detect and quantify the leaf content substances such as chlorophyll, anthocyanin, and water [20, 21].
This study evaluates the possibility and effectivity of a remote sensing technique - hyperspectral leaf reflectance – for preliminary screening of the presence of a biotic stress (viral infection) caused by Plum pox virus (PPV) on plum trees (Prunus domestica) at an early stage without visible symptoms on the leaves. Healthy and infected leaves from plum cultivar Stenley, widely spread in Bulgaria, were investigated. Validation and analyses were carried out with the serological test DAS-ELISA, one of the most widely used tests for plant viruses.
2. SPECTRAL RESPONSES OF PLANTS
Leaf spectral reflectance assists in monitoring the stress and diseases in plants with the help of different plant spectral properties at the visible (VIS), near infrared (NIR), and shortwave infrared (SWIR) regions ranging from 350-2500nm, which develop specific signatures for specific plant species and for a specific stress for a given plant [22, 23].
Green vegetation species all have unique spectral features, mainly because of the chlorophyll and carotenoid, and other pigments and water content [14]. The function described by the ratio of the intensity of reflected light to the illuminated light for each wavelength presents the leaf spectral reflectance curve. Fig. 1 shows typical reflectance curves of four classes green vegetation [24].
Fig. 1 Typical spectral reflectance curves of green vegetation
The VIS spectral region is characterized by a low reflectance, due to absorption by photoactive plant pigments. The chlorophyll absorbs blue (400 to 490 nm) and red (620 to 690 nm) light, and transfers the absorbed energy into the photosynthetic electron chain [10]. The reflectance in the NIR region is mainly dominated by leaf internal structure, leaf anatomy, and the characteristics of the epidermal surface [25]. The transition from VIS to NIR is specified by the so called red edge, the reflectance slope between 680 and 750 nm [26]. Leaf reflectance in the SWIR region is mainly influenced by strong water absorption bands at 1200, 1400, 1940, and 2400 nm. Changes in the absorption of incident light allow the identification of plant health and stress. Anomalies or differences between reflectance curves can be distinguished by calculating difference spectra, ratios or derivations [27, 28].
3. MATERIALS AND METHODS
3.1. Leaf material
The plum trees, cultivar Stenley, were grown in an orchard near the Bulgarian town of Kostinbrod. Leaf samples were picked off from 15 branches at the different parts of the crowns of three plum trees, planted at a distance of 10 meters one from another in the orchard. Some of the leaves from each of the trees were healthy and some ones- infected by Plum Pox Virus (PPV). The leaves were with normal turgor and without signs of chlorosis. Spectral measurements were conducted on 40 healthy and 40 infected leaves from each plum tree.
3.2. Spectral measurements
Hyperspectral reflectance data were collected by means of a portable fibre-optics spectrometer USB 2000 (Ocean Optics, USA) in the VIS and NIR spectral ranges (350-1100 nm) at a spectral resolution (halfwidth) of 1.5 nm. The data used for the analysis were taken in the spectral range 450-850 nm in 1130 spectral bands at a step of 0.3 nm. In this range, the main part of the reflected radiation from green leaves appears. The measurements were carried out under controlled illumination conditions - a halogen lamp providing homogeneous illumination of the leaf surface. The distance between the fibre-probe and leaf samples was 20 cm. The spectral reflectance characteristics (SRC) of the leaves investigated were determined as the ratio between the reflected from the leaves radiation and this one reflected from a diffuse reflectance standard (white screen WS1). The specialized software “Spectra Suite”, Ocean Optics Inc., was used for data acquisition and processing [29].
3.3. Data analysis
The Student’s t-test was applied for determination of the statistically significance of the differences between sets of the values of the reflectance spectra of healthy (control) and infected leaves. Statistical analyses were performed in four most informative for the leaf reflectance of green vegetation spectral ranges: green (520-580 nm, maximal reflectivity of green vegetation), red (640-690 nm, maximal chlorophyll

287
absorption), red edge (690-720 nm, maximal slope of the reflectance spectra) and the NIR (720-770 nm).
The statistical significance of the differences between SRC of control and infected leaves was examined in ten wavelength bands (λ1 = 475.22 nm, λ2= 489.37 nm, λ3 = 524.29 nm, λ4 = 539.65 nm, λ5 = 552.82 nm, λ6 = 667.33 nm, λ7 = 703.56 nm, λ8 = 719.31 nm, λ9 = 724.31 nm, and λ10 = 758.39 nm) suggested to be disposed uniformly over the investigated ranges [30]. First derivatives of the averaged SRCs over all measured areas of the healthy and infected leaves were calculated for assessing the red edge position of the curves serving as an indicator for plant health.
Four SVIs that represent the physiological stress in plants were selected and computed. Narrow-band vegetattion indices used in this study are:
- NDVI - normalized difference vegetation index;
redNIR
redNIR
RR
RRNDVI
, (1)
where: NIR=755 nm, red=685 nm
- Df - disease index;
690550
550
RR
RfD
(2)
- PRI- photochemical reflectance index;
570551
570531
RR
RRPRI
(3)
- SR - simple ratio index;
NIR
red
R
RSR
(4)
where: NIR=755 nm, red=670 nm
3.4. Serological analyses
The most common serological technique for routine diagnosis of viruses DAS-ELISA (double antibody sandwich enzyme-linked immunosorbent assay) was applied to assess the presence of PPV in plum leaves. The analysis was conducted by the method of Clark and Adams [31]. The test was realized by using a commercial kit of Loewe Biochemica GmbH (Sauerlach, Germany) with polyclonal IgG for Plum pox virus broad range. Stone fruits leaf sap was used as an antigen. Absorption was measured with a Multimode Detector DTX880 (Beckman, USA) at the wavelength of λ=405 nm.
4. RESULTS AND DISCUSSION
The averaged SRC of healthy and infected with PPV leaves from three plum trees, cultivar Stenley, are shown in Fig. 3, Fig. 4, and Fig. 5. The trees were marked as Stenley 1, Stenley 2, and Stenley 3. The differences in the SRC were expressed more significantly in the green, red, and NIR spectral ranges.
The SRC values of infected leaves increased in the green (green peak, 550 nm) and the first part of the red (680 nm) regions for the three trees investigated. Most
Fig. 3 Averaged spectral reflectance characteristics of control and infected with PPV leaves from plum tree Stenley 1
0
10
20
30
40
50
60
70
80
90
450 550 650 750 850
Wavelength, nm
Spe
ctra
l ref
lect
ance
, %
Control Stenley 2
PPV Stenley 2
Fig. 4 Averaged spectral reflectance characteristics of control and infected with PPV leaves from plum tree Stenley 2
significant are the differences between SRC of the healthy leaves and those infected in the case of Stenley 3. These differences indicated decreasing of the chlorophyll absorption in the infected leaves. In the NIR region the SRC values of infected leaves decreased with the exception of the case of Stenley 2. These differences appeared due to the changes occurred in leaf cell structures and water content.
Statistical significance of the differences between SRC of control and infected leaves was established by means of the Student’s t-test. It was applied on the sets of spectral data at the 10 above listed wavelengths. P-values and the sets of means are shown in Table 1. The number of statistically significant differences is the smallest (5) for Stenley 1 and is increased for the next two cases. For Stenley 2 it is 6 and for Stenley 3 – 8.
First derivatives of the averaged SRCs of healthy and infected leaves were calculated and analyses were performed to evaluate the red edge position of the SRCs of infected leaves.
0
10
20
30
40
50
60
70
80
450 550 650 750 850
Wavelength, nm
Spe
ctra
l ref
lect
ance
, %
Control Stenley 1
PPV Stenley 1

288
Table 1. p-values and set of means of the Student’s t-test of SRC pairs of control and infected with PPV plum leaves from three trees
Pairs compared
Stenley 1 Stenley 2 Stenley 3 Control
P< PPV Control
P< PPV Control
P< PPV
mean mean mean mean mean mean λ1 / λ1c 4.14 ns 4.42 5.09 ** 3.99 3.28 ** 4.22 λ2 / λ2c 4.67 ns 5.12 5.75 ns 5.13 4.37 ** 5.11 λ3 / λ3c 10.88 * 12.40 13.56 ns 14.04 9.82 *** 12.06 λ4 / λ4c 14.44 * 16.09 17.32 * 18.64 12.51 *** 15.20 λ5 / λ5c 15.28 * 16.97 18.30 ** 20.10 13.21 *** 16.08 λ6 / λ6c 5.03 ns 5.67 6.32 ns 5.86 5.14 ** 5.97 λ7 / λ7c 17.25 ** 19.51 20.31 ns 22.85 14.76 *** 18.91 λ8 / λ8c 40.81. ns 41.05 40.04 *** 49.75 33.38 *** 36.19 λ9 / λ9c 48.15 ns 47.24 46.88 *** 57.38 39.33 ns 40.94 λ10 / λ10c 68.21 ** 63.07 61.69 *** 77.55 55.91 ns 53.00
ns – no significance (p>0.05); * - p<0.05; ** - p<0.01;*** - p<0.001
0
10
20
30
40
50
60
450 550 650 750 850
Wavelength, nm
Spe
ctra
l ref
lect
ance
, %
Control Stenley 3
PPV Stenley 3
Fig. 5 Averaged spectral reflectance characteristics of control and infected with PPV leaves from plum tree Stenley 3
Fig.6. a) and b) show the maximum of SRC derivatives for control and PPV infected leaves for the cases of Stenley 2 and Stenley 3 where the differences in reflectance spectra were more expressed. Shifts to lower wavelengths of the two maximums of PPV infected leaves (about 1 nm and 5 nm, respectively) were observed, an indicator for presence of changes in the physiological stage of the infected leaves.
The analyses by DAS-ELISA test yielded a positive result for presence of viral infection in the infected leaves from the three plum trees investigated, Fig.7. For positive were considered samples having optical density (OD) at a wavelength of 405 nm over the threshold (Cut-off = 0.462) which was three times the value of the negative control (K-). The samples (1), (3) and (6) were negative for PPV infection and they were used as control groups for spectral measurements. The values of the OD for positive leaf samples (2) and (4) from plum trees Stenley 1 and Stenley 2 were close: 0.6966 and 0.7569, respectively
a)
b)
Fig.6 First derivatives on SRC of control (green line) and infected with PPV (dash line) leaves for plum trees:
a) Stenley 2 and b) Stenley 3
The SRC changes of these two samples in comparison with the control SRCs are similar in VIS range. For the positive sample (5), Stenley 3, the OD value is by a factor of 2.5 higher than the samples (2) and (4) and changes in VIS were most significant. In NIR region the spectral behavior of the infected leaves of the three plum trees was different and indicated that the physiological condition of the plants was changed and especially the leaf tissues (leaf cell structures) and water content.
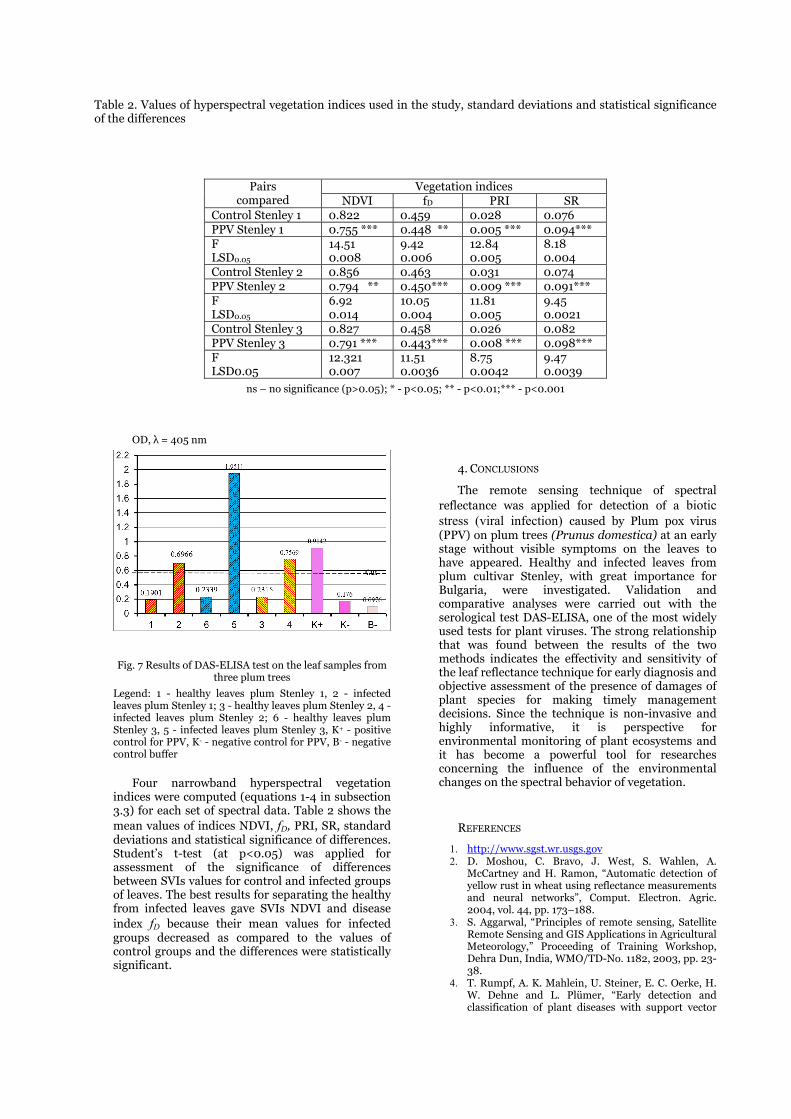
Table 2. Values of hyperspectral vegetation indices used in the study, standard deviations and statistical significance of the differences
Pairs compared
Vegetation indices NDVI fD PRI SR
Control Stenley 1 0.822 0.459 0.028 0.076 PPV Stenley 1 0.755 *** 0.448 ** 0.005 *** 0.094*** F LSD0.05
14.51 0.008
9.42 0.006
12.84 0.005
8.18 0.004
Control Stenley 2 0.856 0.463 0.031 0.074 PPV Stenley 2 0.794 ** 0.450*** 0.009 *** 0.091*** F LSD0.05
6.92 0.014
10.05 0.004
11.81 0.005
9.45 0.0021
Control Stenley 3 0.827 0.458 0.026 0.082 PPV Stenley 3 0.791 *** 0.443*** 0.008 *** 0.098*** F LSD0.05
12.321 0.007
11.51 0.0036
8.75 0.0042
9.47 0.0039
ns – no significance (p>0.05); * - p<0.05; ** - p<0.01;*** - p<0.001
OD, λ = 405 nm
Fig. 7 Results of DAS-ELISA test on the leaf samples from three plum trees
Legend: 1 - healthy leaves plum Stenley 1, 2 - infected leaves plum Stenley 1; 3 - healthy leaves plum Stenley 2, 4 - infected leaves plum Stenley 2; 6 - healthy leaves plum Stenley 3, 5 - infected leaves plum Stenley 3, K+ - positive control for PPV, K- - negative control for PPV, B- - negative control buffer
Four narrowband hyperspectral vegetation indices were computed (equations 1-4 in subsection 3.3) for each set of spectral data. Table 2 shows the mean values of indices NDVI, fD, PRI, SR, standard deviations and statistical significance of differences. Student’s t-test (at p<0.05) was applied for assessment of the significance of differences between SVIs values for control and infected groups of leaves. The best results for separating the healthy from infected leaves gave SVIs NDVI and disease index fD because their mean values for infected groups decreased as compared to the values of control groups and the differences were statistically significant.
4. CONCLUSIONS
The remote sensing technique of spectral reflectance was applied for detection of a biotic stress (viral infection) caused by Plum pox virus (PPV) on plum trees (Prunus domestica) at an early stage without visible symptoms on the leaves to have appeared. Healthy and infected leaves from plum cultivar Stenley, with great importance for Bulgaria, were investigated. Validation and comparative analyses were carried out with the serological test DAS-ELISA, one of the most widely used tests for plant viruses. The strong relationship that was found between the results of the two methods indicates the effectivity and sensitivity of the leaf reflectance technique for early diagnosis and objective assessment of the presence of damages of plant species for making timely management decisions. Since the technique is non-invasive and highly informative, it is perspective for environmental monitoring of plant ecosystems and it has become a powerful tool for researches concerning the influence of the environmental changes on the spectral behavior of vegetation.
REFERENCES
1. http://www.sgst.wr.usgs.gov 2. D. Moshou, C. Bravo, J. West, S. Wahlen, A.
McCartney and H. Ramon, “Automatic detection of yellow rust in wheat using reflectance measurements and neural networks”, Comput. Electron. Agric. 2004, vol. 44, pp. 173–188.
3. S. Aggarwal, “Principles of remote sensing, Satellite Remote Sensing and GIS Applications in Agricultural Meteorology,” Proceeding of Training Workshop, Dehra Dun, India, WMO/TD-No. 1182, 2003, pp. 23-38.
4. T. Rumpf, A. K. Mahlein, U. Steiner, E. C. Oerke, H. W. Dehne and L. Plümer, “Early detection and classification of plant diseases with support vector
290
machines based on hyperspectral reflectance”, Comput. Electron. Agric. 2010, vol. 74, pp. 91–99.
5. A. D. Meigs, L. J. Otten and T. Y. Cherezova, “Ultraspectral imaging: a new contribution to global virtual presence”, IEEE Aerosp. Electron. Syst. Mag., 2008, vol. 23, pp. 11–17.
6. K. Usha and B. Singh, “Potential applications of remote sensing in horticulture - A review”, Sci. Horticul., 2013, vol. 153, pp. 71–83.
7. S. Sankaran, A. Mishra, R. Ehsani and C. Davis, “A review of advanced techniques for detecting plant diseases”, Comput. Electron. Agric., 2010, vol. 72, pp. 1–13; doi:10.1016/j.compag.2010.02.007
8. J. R. Jensen, “Digital Image Processing: a Remote Sensing Perspective”, 3rd ed., New Jersey: Prentice Hall, 2004, ISBN-1:0131453610
9. M. Meroni, M. Rossini and R. Colombo, “Characterization of leaf physiology using reflectance and fluorescence hyperspectral measurements”, In: Maselli F, Menenti M, Brivio PA (eds) Optical observation of vegetation properties and characteristics. Research Signpost, Trivandrum, 2010, pp 165–187.
10. D. A. Sims and J. A Gamon, “Relationships between leaf pigment content and spectral reflectance across a wide range of species, leaf structures and developmental stages“, Remote Sens. of Environ., 2002, vol. 81, pp. 337-354.
11. I. Filella, A. Porcar-Castell, S. Munne-Bosch, J. Back, M. Garbulsky and J. Penuelas, “PRI assessment of long-term changes in carotenoids/chlorophyll ratio and short-term changes in de-epoxidation state of the xanthophyll cycle“, Int. J. Remote Sens., 2009, vol. 30, pp. 4443-4455.
12. R. B. Smith, “Introduction to remote sensing of the environment”, 2001, www.microimages.com
13. C. Hillnhütter, A. K. Mahlein, R. A. Sikora and E. C. Oerke, “Remote sensing to detect plant stress induced by Heterodera schachtii and Rhizoctonia solani in sugar beet fields”, Field Crops Res. 2011, vol. 122, pp. 70–77.
14. D. D. Krezhova, N. M. Petrov and S. N. Maneva, “Hyperspectral remote sensing applications for monitoring and stress detection in cultural plants: viral infections in tobacco plants“, Proc. of Remote Sensing for Agriculture, Ecosystems, and Hydrology Conf., Edinburgh, UK, XIV, 2012, vol. 8531, pp. 24-27.
15. L. Levy, V. Damsteegt, R. Scorza, and M. Kolber, “Plum pox – potyvirus disease of stone fruits“, The American Phytopathological Society, 2000, http://www.apsnet.org/online/feature/PlumPox/Top.html
16. M. Cambra, N. Capote, A.Myrta and G.Llácer, “Plum pox virus and the estimated costs associated with sharka disease”, Bulletin OEPP/EPPO, 2006, Bulletin 36, pp. 202-204.
17. D. Atanasoff, “Plum pox. A new virus disease” Yearbook University of Sofia, Faculty of Agriculture, 1932, vol. 11, pp. 49-69.
18. A. K. Mahlein, T. Rumpf, P. Welke, H. W. Dehne, L. Plümer, U. Steiner and E. C. Oerke, “Development of spectral indices for detecting and identifying plant diseases”, Remote Sens. Environ., 2013, vol. 128, pp. 21–30; doi:10.1016/j.rse.2012.09.019.
19. S. Delalieux, B. Somers, W. W Verstraeten, J. A. N. Aardt, W. Keulemans and P. Coppin, “Hyperspectral indices to diagnose leaf biotic stress of apple plants considering leaf phenology“, Int. J. Remote Sens., 2009, vol. 30, pp. 1887–1912.
20. S. T. Prasad, B. S. Ronald and E. D. Pauw, “Hyperspectral vegetation indices and their relationships with agricultural crop characteristics“, Remote Sens. Environ., 2000, vol. 71, pp. 158-182.
21. K. L. Smith, M. D. Steven and J. J. Colls, “Use of hyperspectral derivative ratios in the red-edge region to identify plant stress responses to gas leaks“, Remote Sens. Environ., 2004, vol. 92, pp. 207-217.
22. D. D. Krezhova, “Hyperspectral remote sensing of eflected and emitted radiation as a means for preservation of terrestrial ecosystems,” Proc. of 1st Int. Conference on Radiation and Dosimetry in Various Fields of Research, RAD 2012, Niš, Serbia, 2012, pp. 71-74.
23. J. Zhang, R. Pu, W. Huang, L. Yuan, J. Luo and J. Wang, “Using in-situ hyperspectral data for detecting and discriminating yellow rust disease from nutrient stresses”, Field Crops Res. 2012, vol. 134, pp. 165–174.
24. http://www.geog.ucsb 25. M. R. Slaton, E. R. Hunt and W. K. Smith,
“Estimating near-infrared leaf reflectance from structural characteristics”, Amer. J. of Bot., 2001, vol. 88, pp. 278-284.
26. H. R. Xu, Y. B. Ying, X. P. Fu and S. P. Zhu, “Near-infrared spectroscopy in detecting leaf miner damage on tomato leaf”, Biosyst. Eng. 2007, vol. 96, pp. 447–454.
27. Y. M. Govaerts, S. Jacquemoud, M. Verstraete and S. L. Ustin, ”Threedimensional radiation transfer modeling in a dicotyledon leaf” Appl. Opt., 1996, vol. 35, pp. 6585–6598.
28. P. S.Thenkabail, E. A. Enclona, M. S. Ashton and B. Van Der Meer, “Accuracy Assessments of Hyperspectral Waveband Performance for Vegetation Analysis Applications,” Remote Sens. of Environm., 2004, vol. 91, pp. 354-376.
29. http://www.oceanoptics.com 30. D. Krezhova, T. Yanev, St. Lukov, P. Pavlova, V.
Aleksieva, D. Hristova and S. Ivanov, “Method for detecting stress induced changes in leaf spectral reflectance,” Compt. Rend. Acad. bulg. Sci., 2005, vol. 58(5), pp. 517-522.
31. M. F. Clark and A. N. Adams, “Characteristics of the micro plate virus titer in the treated plants was slightly reduced unlike virus method of enzyme-linked-immunosorbent-assay for the detection of symptoms and damages on the fruits which were significantly plant viruses“, J. Gen. Virol., vol. 34, pp. 475-483.

CALIBRATION OF HPGE DETECTORS FOR ENVIRONMENTAL SAMPLES USING GEANT4 SIMULATION
Jelena Nikolic 1, Milica Rajacic 1, Dragana Todorovic 1, Marija Jankovic 1, Natasa Sarap 1, Gordana Pantelic 1
1 University of Belgrade Institute for Nuclear Sciences Vinča , Mike Petrovića Alasa 12-16 11001 Belgrade tel/fax +381116308467
Abstract. Determination of full energy peak efficiency is one of the most important tasks that have to be performed before gamma spectrometry. Calibration of the measurement system for measuring environmental samples poses a special challenge to the laboratory. Many different approaches to this task have been developed and examined. One of the most detailed is GEANT4, a Monte Carlo simulation toolkit developed for wide variety of applications. The aim of this paper is to apply GEANT4 simulation for calibration of three HPGe detectors, for measurement of aerosol, plant and coal-like environmental samples. The detectors were modeled using the certificate provided by the manufacturer. The samples chosen for the simulation were secondary reference materials produced in the Laboratory for the purpose of experimental calibration. The efficiencies obtained using a simulation were compared with experimental results, in order to evaluate the trueness of the results. Measurement uncertainties for both simulation and experimental values were estimated in order to see whether the results of the realistic measurement fall within acceptable limits.
Key words: HPGe, calibration, GEANT4
1. INTRODUCTION
One of the main problems in quantitative gamma-ray spectroscopy is the determination of detection efficiency for different energies, different source-detector geometries and different composition of voluminous sources. Experimental approach utilizes standard sources with composition, density and geometry as close to the samples of interest, as possible. The direct measurement of different calibration sources containing isolated γ-ray emitters within the energy range of interest, and their subsequent fitting to a parametric function, yields the best results. However, when the energy interval is broad, it requires a large number of primary standards, implying a high financial cost, a long counting time and much work in preparing samples. This problem is especially pronounced when environmental samples are of interest due to their diversities in composition and structure [1]. This problem has been partially solved by using procedures based on the Monte Carlo simulations, developed in order to complement the experimental calibration procedures used in gamma-ray measurements of environmental samples [1]. Monte Carlo methods are based on determining full energy peak (FEP) efficiency by simulating all relevant physical processes taking place along the path of a photon emitted by the source. Since no approximations
are needed, there is no limitation on the source–detector configuration. The best known and the most sophisticated Monte Carlo simulation kit is the CERN GEANT4. Monte Carlo simulation, based on GEANT4 simulation package has been developed to obtain the response of germanium detectors, with the aim to reproduce experimental spectra of detectors in wide range of applications in gamma spectroscopy measurements [2].
The aim of this paper is to apply GEANT4 simulation for calibration of three HPGe detectors, for measurement of aerosol, plant and coal-like environmental samples. The detectors were modeled using the certificate provided by the manufacturer. The samples chosen for the simulation were secondary reference materials produced in the Laboratory for the purpose of experimental calibration. The efficiencies obtained using the simulation were compared with the experimental results, in order to evaluate the trueness of the results. Measurement uncertainties for both simulated and experimental values were estimated in order to see whether the results agree within the acceptable limits.
2. MATERIALS AND METHODS
The detectors considered for the Monte Carlo simulations were the ones commonly used in our
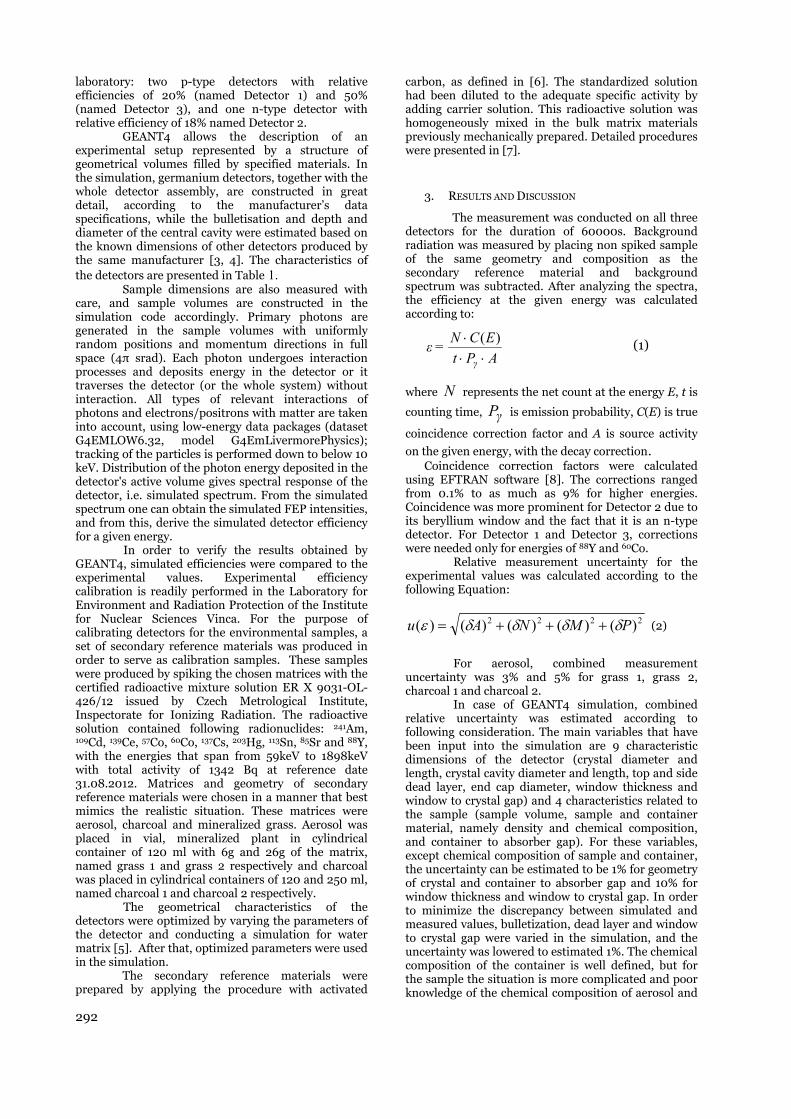
292
laboratory: two p-type detectors with relative efficiencies of 20% (named Detector 1) and 50% (named Detector 3), and one n-type detector with relative efficiency of 18% named Detector 2.
GEANT4 allows the description of an experimental setup represented by a structure of geometrical volumes filled by specified materials. In the simulation, germanium detectors, together with the whole detector assembly, are constructed in great detail, according to the manufacturer’s data specifications, while the bulletisation and depth and diameter of the central cavity were estimated based on the known dimensions of other detectors produced by the same manufacturer [3, 4]. The characteristics of the detectors are presented in Table 1.
Sample dimensions are also measured with care, and sample volumes are constructed in the simulation code accordingly. Primary photons are generated in the sample volumes with uniformly random positions and momentum directions in full space (4π srad). Each photon undergoes interaction processes and deposits energy in the detector or it traverses the detector (or the whole system) without interaction. All types of relevant interactions of photons and electrons/positrons with matter are taken into account, using low-energy data packages (dataset G4EMLOW6.32, model G4EmLivermorePhysics); tracking of the particles is performed down to below 10 keV. Distribution of the photon energy deposited in the detector's active volume gives spectral response of the detector, i.e. simulated spectrum. From the simulated spectrum one can obtain the simulated FEP intensities, and from this, derive the simulated detector efficiency for a given energy.
In order to verify the results obtained by GEANT4, simulated efficiencies were compared to the experimental values. Experimental efficiency calibration is readily performed in the Laboratory for Environment and Radiation Protection of the Institute for Nuclear Sciences Vinca. For the purpose of calibrating detectors for the environmental samples, a set of secondary reference materials was produced in order to serve as calibration samples. These samples were produced by spiking the chosen matrices with the certified radioactive mixture solution ER X 9031-OL-426/12 issued by Czech Metrological Institute, Inspectorate for Ionizing Radiation. The radioactive solution contained following radionuclides: 241Am, 109Cd, 139Ce, 57Co, 60Co, 137Cs, 203Hg, 113Sn, 85Sr and 88Y, with the energies that span from 59keV to 1898keV with total activity of 1342 Bq at reference date 31.08.2012. Matrices and geometry of secondary reference materials were chosen in a manner that best mimics the realistic situation. These matrices were aerosol, charcoal and mineralized grass. Aerosol was placed in vial, mineralized plant in cylindrical container of 120 ml with 6g and 26g of the matrix, named grass 1 and grass 2 respectively and charcoal was placed in cylindrical containers of 120 and 250 ml, named charcoal 1 and charcoal 2 respectively.
The geometrical characteristics of the detectors were optimized by varying the parameters of the detector and conducting a simulation for water matrix [5]. After that, optimized parameters were used in the simulation.
The secondary reference materials were prepared by applying the procedure with activated
carbon, as defined in [6]. The standardized solution had been diluted to the adequate specific activity by adding carrier solution. This radioactive solution was homogeneously mixed in the bulk matrix materials previously mechanically prepared. Detailed procedures were presented in [7].
3. RESULTS AND DISCUSSION
The measurement was conducted on all three detectors for the duration of 60000s. Background radiation was measured by placing non spiked sample of the same geometry and composition as the secondary reference material and background spectrum was subtracted. After analyzing the spectra, the efficiency at the given energy was calculated according to:
APt
ECN=ε
γ )( (1)
where N represents the net count at the energy E, t is
counting time, γP is emission probability, C(E) is true
coincidence correction factor and A is source activity
on the given energy, with the decay correction. Coincidence correction factors were calculated
using EFTRAN software [8]. The corrections ranged from 0.1% to as much as 9% for higher energies. Coincidence was more prominent for Detector 2 due to its beryllium window and the fact that it is an n-type detector. For Detector 1 and Detector 3, corrections were needed only for energies of 88Y and 60Co.
Relative measurement uncertainty for the experimental values was calculated according to the following Equation:
2222 )()()()()( PMNAu (2)
For aerosol, combined measurement
uncertainty was 3% and 5% for grass 1, grass 2, charcoal 1 and charcoal 2.
In case of GEANT4 simulation, combined relative uncertainty was estimated according to following consideration. The main variables that have been input into the simulation are 9 characteristic dimensions of the detector (crystal diameter and length, crystal cavity diameter and length, top and side dead layer, end cap diameter, window thickness and window to crystal gap) and 4 characteristics related to the sample (sample volume, sample and container material, namely density and chemical composition, and container to absorber gap). For these variables, except chemical composition of sample and container, the uncertainty can be estimated to be 1% for geometry of crystal and container to absorber gap and 10% for window thickness and window to crystal gap. In order to minimize the discrepancy between simulated and measured values, bulletization, dead layer and window to crystal gap were varied in the simulation, and the uncertainty was lowered to estimated 1%. The chemical composition of the container is well defined, but for the sample the situation is more complicated and poor knowledge of the chemical composition of aerosol and
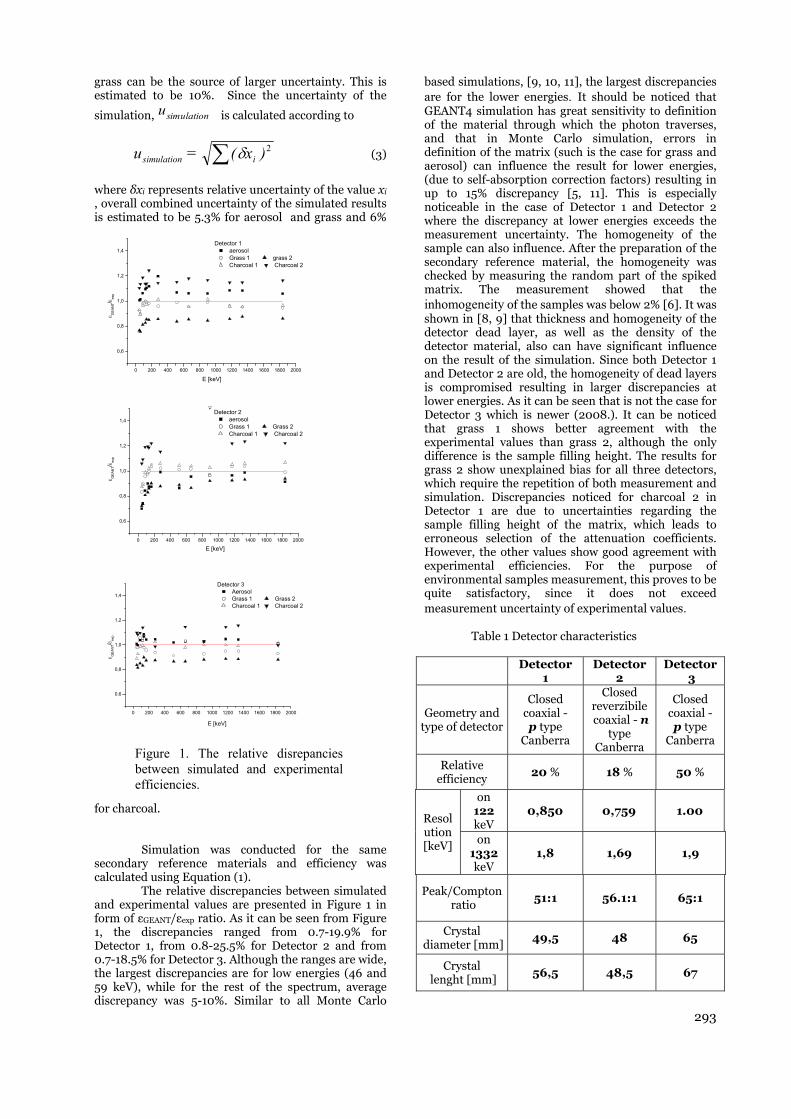
293
grass can be the source of larger uncertainty. This is estimated to be 10%. Since the uncertainty of the
simulation, usimulation is calculated according to
2)x(=u isimulation (3)
where δxi represents relative uncertainty of the value xi , overall combined uncertainty of the simulated results is estimated to be 5.3% for aerosol and grass and 6%
for charcoal. Simulation was conducted for the same
secondary reference materials and efficiency was calculated using Equation (1).
The relative discrepancies between simulated and experimental values are presented in Figure 1 in form of εGEANT/εexp ratio. As it can be seen from Figure 1, the discrepancies ranged from 0.7-19.9% for Detector 1, from 0.8-25.5% for Detector 2 and from 0.7-18.5% for Detector 3. Although the ranges are wide, the largest discrepancies are for low energies (46 and 59 keV), while for the rest of the spectrum, average discrepancy was 5-10%. Similar to all Monte Carlo
based simulations, [9, 10, 11], the largest discrepancies are for the lower energies. It should be noticed that GEANT4 simulation has great sensitivity to definition of the material through which the photon traverses, and that in Monte Carlo simulation, errors in definition of the matrix (such is the case for grass and aerosol) can influence the result for lower energies, (due to self-absorption correction factors) resulting in up to 15% discrepancy [5, 11]. This is especially noticeable in the case of Detector 1 and Detector 2 where the discrepancy at lower energies exceeds the measurement uncertainty. The homogeneity of the sample can also influence. After the preparation of the secondary reference material, the homogeneity was checked by measuring the random part of the spiked matrix. The measurement showed that the inhomogeneity of the samples was below 2% [6]. It was shown in [8, 9] that thickness and homogeneity of the detector dead layer, as well as the density of the detector material, also can have significant influence on the result of the simulation. Since both Detector 1 and Detector 2 are old, the homogeneity of dead layers is compromised resulting in larger discrepancies at lower energies. As it can be seen that is not the case for Detector 3 which is newer (2008.). It can be noticed that grass 1 shows better agreement with the experimental values than grass 2, although the only difference is the sample filling height. The results for grass 2 show unexplained bias for all three detectors, which require the repetition of both measurement and simulation. Discrepancies noticed for charcoal 2 in Detector 1 are due to uncertainties regarding the sample filling height of the matrix, which leads to erroneous selection of the attenuation coefficients. However, the other values show good agreement with experimental efficiencies. For the purpose of environmental samples measurement, this proves to be quite satisfactory, since it does not exceed measurement uncertainty of experimental values.
Table 1 Detector characteristics
Detector
1 Detector
2 Detector
3
Geometry and type of detector
Closed coaxial - p type
Canberra
Closed reverzibile coaxial - n
type Canberra
Closed coaxial - p type
Canberra
Relative efficiency
20 % 18 % 50 %
Resolution [keV]
on 122 keV
0,850 0,759 1.00
on 1332 keV
1,8 1,69 1,9
Peak/Compton ratio
51:1 56.1:1 65:1
Crystal diameter [mm]
49,5 48 65
Crystal lenght [mm]
56,5 48,5 67
0 200 400 600 800 1000 1200 1400 1600 1800 2000
0,6
0,8
1,0
1,2
1,4Detector 1
aerosol Grass 1 grass 2 Charcoal 1 Charcoal 2
GEA
NT/
exp
E [keV]
0 200 400 600 800 1000 1200 1400 1600 1800 2000
0,6
0,8
1,0
1,2
1,4
Detector 2 aerosol Grass 1 Grass 2 Charcoal 1 Charcoal 2
GEA
NT/
exp
E [keV]
0 200 400 600 800 1000 1200 1400 1600 1800 2000
0,6
0,8
1,0
1,2
1,4
GE
ANT/
exp
E [keV]
Detector 3 Aerosol Grass 1 Grass 2 Charcoal 1 Charcoal 2
Figure 1. The relative disrepancies between simulated and experimental efficiencies.
294
Crystal to window
Distance [mm] 5,5 5 5
Entry window
Al Be Be
Central void (diameter x
lenght) [mm] 10 x 40 10 x 40 10 x 55
4. CONCLUSION
This paper presents the results of efficiency calibration of three HPGe detectors using GEANT4 simulation. The efficiencies obtained by simulation were compared to the experimental values, obtained by measuring different secondary reference materials. The results showed good agreement with the experimental results, with the discrepancies ranging from <1% to about 20%. The largest discrepancies were noticed for low energies, for all investigated secondary reference materials. Also, the discrepancies are larger for grass 2 and charcoal 2 in case of p-type detectors. This suggests that the definition of the sample chemical composition and geometry have to be revised. Most of the results were within the uncertainty limits proving that simulated efficiencies can be utilized for measurement of the environmental samples.
Acknowledgement: The paper is a part of the research done within the project III43009 supported by the Ministry of Education, Science and Technological Development of Republic of Serbia.
REFERENCES
1. M. J. Vargas, A. F. Timon, N. C. Diaz, D. P. Sanchez Influence of the geometrical characteristics of an HPGe
detector on its efficiency Jour. Radioanal. Nucl. Chem. 253, p. 439-443, 2002.
2. D. Joković, A. Dragić, V. Udovičić, R. Banjanac, J. Puzović, I. Aničin, Monte Carlo simulations of the response of a plastic scintilaor and an HPGe spectrometer in coincidence Applied Radiation and Isotopes, 67, p.719-722, 2009.
3. P. Dryak, P. Kovar Experimental and MC determination of HPGe detector efciency In the 40 – 2754 keV energy range for measuring point source Geometry with the source-to-detector distance of 25cm Appl. Radiat. Isot . 64, p.1346 – 1349, 2006.
4. T. Vidmar, A. Likar, Automated construction of detector models for efficiency interpolation in gamma-ray spectrometry Appl. Radiat. Isot. 56, p.99-103. 2002.
5. J. D. Nikolić, D. Joković, D. Todorović and M. Rajačić, Application of GEANT4 simulation on calibration of HPGe detectors for cylindrical environmental samples, Journal of Radiological Protection, Volume 34, No.2 N47-N55, 2014.
6. M. Taskaeva, E. Taskaev, I. Penev, On the preparation of efficiency standards for gamma-ray spectrometers. Appl. Radiat. Isot. 47 (9) p.981–990, 1996.
7. I. Vukanac, M. Djurasevic, A. Kandic, D. Novkovic, L. Nadjerdj, Z. Milosevic, Experimental determination of the HPGe spectrometer efficiency curve, Appl. Radiat. Isotop. 66, p.792-795, 2008.
8. Vidmar et al., An Intercomparison of Monte Carlo Codes Used in Gamma-Ray Spectrometry Applied Radiation and Isotopes 66, p. 764-768, 2008.
9. O. Sima, D. Arnold, On the Monte Carlo simulation of HPGe gamma – spectrometry systems, Applied Radiation and Isotopes 67, p. 701-705, 2009.
10. J.-M.Laborie, G.Le Petit, D. Abt, M. Girard, Monte Carlo calculation of the efficiency calibration curve and coincidence-summing corrections in low-level gamma-ray spectrometry using well-type HPGe detectors, Applied Radiation and Isotopes 53, p.57-62, 2000.
11. J. Saegusa, K. Kawasaki, A. Mihara, M. Ito, M. Yoshida Determination of detection efficiency curves of HPGe detectors on radioactivity measurement of volume samples Appl. Radiat. Isot. 61, p.1383-1390, 2004.
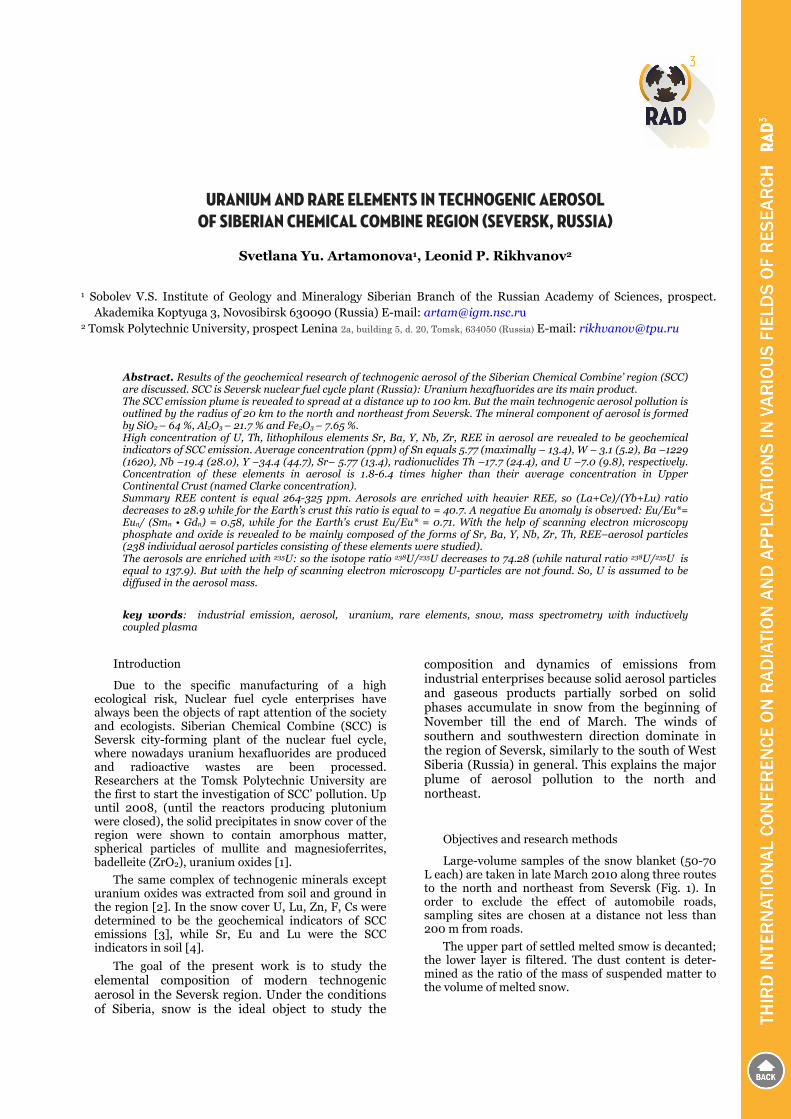
URANIUM AND RARE ELEMENTS IN TECHNOGENIC AEROSOL OF SIBERIAN CHEMICAL COMBINE REGION (SEVERSK, RUSSIA)
Svetlana Yu. Artamonova1, Leonid P. Rikhvanov2
1 Sobolev V.S. Institute of Geology and Mineralogy Siberian Branch of the Russian Academy of Sciences, prospect. Akademika Koptyuga 3, Novosibirsk 630090 (Russia) E-mail: [email protected]
2 Tomsk Polytechnic University, prospect Lenina 2а, building 5, d. 20, Tomsk, 634050 (Russia) E-mail: [email protected]
Abstract. Results of the geochemical research of technogenic aerosol of the Siberian Chemical Combine’ region (SCC) are discussed. SCC is Seversk nuclear fuel cycle plant (Russia): Uranium hexafluorides are its main product. The SCC emission plume is revealed to spread at a distance up to 100 km. But the main technogenic aerosol pollution is outlined by the radius of 20 km to the north and northeast from Seversk. The mineral component of aerosol is formed by SiO2 – 64 %, Al2O3 – 21.7 % and Fe2O3 – 7.65 %. High concentration of U, Th, lithophilous elements Sr, Ba, Y, Nb, Zr, REE in aerosol are revealed to be geochemical indicators of SCC emission. Average concentration (ppm) of Sn equals 5.77 (maximally – 13.4), W – 3.1 (5.2), Ba –1229 (1620), Nb –19.4 (28.0), Y –34.4 (44.7), Sr– 5.77 (13.4), radionuclides Th –17.7 (24.4), and U –7.0 (9.8), respectively. Concentration of these elements in aerosol is 1.8-6.4 times higher than their average concentration in Upper Continental Crust (named Clarke concentration). Summary REE content is equal 264-325 ppm. Aerosols are enriched with heavier REE, so (La+Ce)/(Yb+Lu) ratio decreases to 28.9 while for the Earth’s crust this ratio is equal to = 40.7. A negative Eu anomaly is observed: Eu/Eu*= Eun/ (Smn • Gdn) = 0.58, while for the Earth's crust Eu/Eu* = 0.71. With the help of scanning electron microscopy phosphate and oxide is revealed to be mainly composed of the forms of Sr, Ba, Y, Nb, Zr, Th, REE–aerosol particles (238 individual aerosol particles consisting of these elements were studied). The aerosols are enriched with 235U: so the isotope ratio 238U/235U decreases to 74.28 (while natural ratio 238U/235U is equal to 137.9). But with the help of scanning electron microscopy U-particles are not found. So, U is assumed to be diffused in the aerosol mass.
key words: industrial emission, aerosol, uranium, rare elements, snow, mass spectrometry with inductively coupled plasma
Introduction
Due to the specific manufacturing of a high ecological risk, Nuclear fuel cycle enterprises have always been the objects of rapt attention of the society and ecologists. Siberian Chemical Combine (SCC) is Seversk city-forming plant of the nuclear fuel cycle, where nowadays uranium hexafluorides are produced and radioactive wastes are been processed. Researchers at the Tomsk Polytechnic University are the first to start the investigation of SCC’ pollution. Up until 2008, (until the reactors producing plutonium were closed), the solid precipitates in snow cover of the region were shown to contain amorphous matter, spherical particles of mullite and magnesioferrites, badelleite (ZrO2), uranium oxides [1].
The same complex of technogenic minerals except uranium oxides was extracted from soil and ground in the region [2]. In the snow cover U, Lu, Zn, F, Cs were determined to be the geochemical indicators of SCC emissions [3], while Sr, Eu and Lu were the SCC indicators in soil [4].
The goal of the present work is to study the elemental composition of modern technogenic aerosol in the Seversk region. Under the conditions of Siberia, snow is the ideal object to study the
composition and dynamics of emissions from industrial enterprises because solid aerosol particles and gaseous products partially sorbed on solid phases accumulate in snow from the beginning of November till the end of March. The winds of southern and southwestern direction dominate in the region of Seversk, similarly to the south of West Siberia (Russia) in general. This explains the major plume of aerosol pollution to the north and northeast.
Objectives and research methods
Large-volume samples of the snow blanket (50-70 L each) are taken in late March 2010 along three routes to the north and northeast from Seversk (Fig. 1). In order to exclude the effect of automobile roads, sampling sites are chosen at a distance not less than 200 m from roads.
The upper part of settled melted smow is decanted; the lower layer is filtered. The dust content is deter-mined as the ratio of the mass of suspended matter to the volume of melted snow.
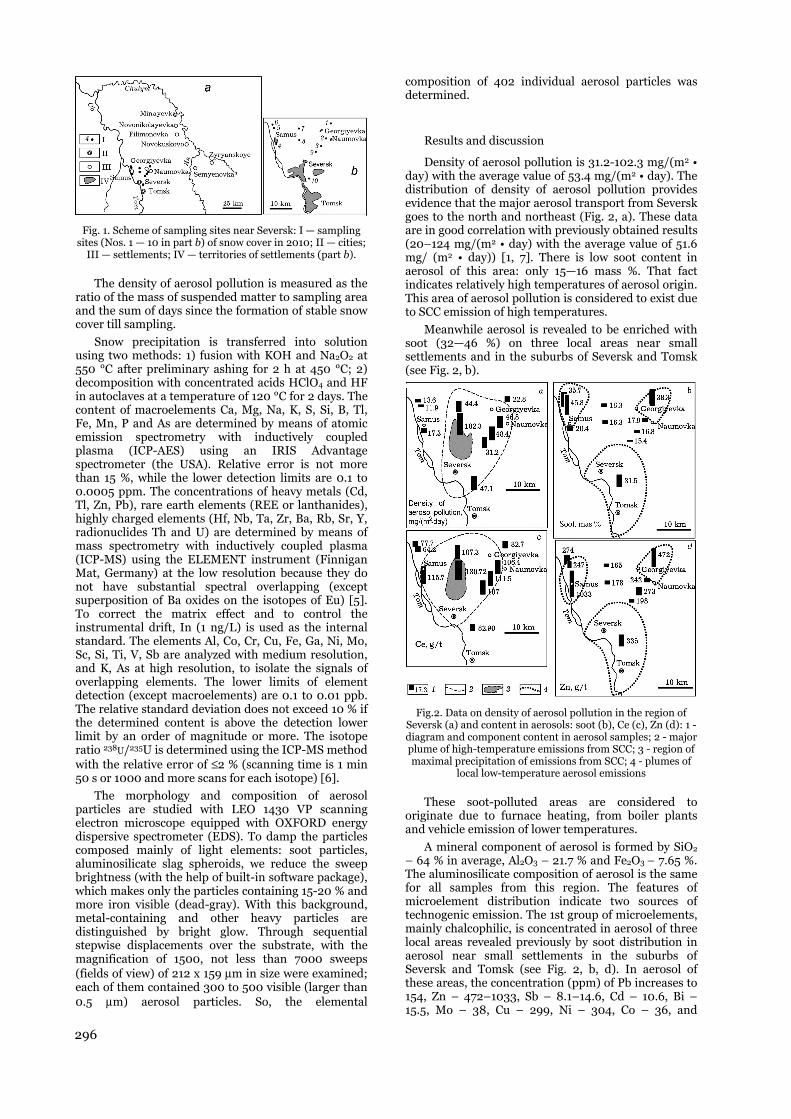
Fig. 1. Scheme of sampling sites near Seversk: I — sampling sites (Nos. 1 — 10 in part b) of snow cover in 2010; II — cities;
III — settlements; IV — territories of settlements (part b).
The density of aerosol pollution is measured as the ratio of the mass of suspended matter to sampling area and the sum of days since the formation of stable snow cover till sampling.
Snow precipitation is transferred into solution using two methods: 1) fusion with KOH and Na2O2 at 550 °C after preliminary ashing for 2 h at 450 °C; 2) decomposition with concentrated acids HClO4 and HF in autoclaves at a temperature of 120 °C for 2 days. The content of macroelements Ca, Mg, Na, K, S, Si, B, Tl, Fe, Mn, P and As are determined by means of atomic emission spectrometry with inductively coupled plasma (ICP-AES) using an IRIS Advantage spectrometer (the USA). Relative error is not more than 15 %, while the lower detection limits are 0.1 to 0.0005 ppm. The concentrations of heavy metals (Cd, Tl, Zn, Pb), rare earth elements (REE or lanthanides), highly charged elements (Hf, Nb, Ta, Zr, Ba, Rb, Sr, Y, radionuclides Th and U) are determined by means of mass spectrometry with inductively coupled plasma (ICP-MS) using the ELEMENT instrument (Finnigan Mat, Germany) at the low resolution because they do not have substantial spectral overlapping (except superposition of Ba oxides on the isotopes of Eu) [5]. To correct the matrix effect and to control the instrumental drift, In (1 ng/L) is used as the internal standard. The elements Al, Co, Cr, Cu, Fe, Ga, Ni, Mo, Sc, Si, Ti, V, Sb are analyzed with medium resolution, and K, As at high resolution, to isolate the signals of overlapping elements. The lower limits of element detection (except macroelements) are 0.1 to 0.01 ppb. The relative standard deviation does not exceed 10 % if the determined content is above the detection lower limit by an order of magnitude or more. The isotope ratio 238U/235U is determined using the ICP-MS method with the relative error of ≤2 % (scanning time is 1 min 50 s or 1000 and more scans for each isotope) [6].
The morphology and composition of aerosol particles are studied with LEO 1430 VP scanning electron microscope equipped with OXFORD energy dispersive spectrometer (EDS). To damp the particles composed mainly of light elements: soot particles, aluminosilicate slag spheroids, we reduce the sweep brightness (with the help of built-in software package), which makes only the particles containing 15-20 % and more iron visible (dead-gray). With this background, metal-containing and other heavy particles are distinguished by bright glow. Through sequential stepwise displacements over the substrate, with the magnification of 1500, not less than 7000 sweeps (fields of view) of 212 x 159 μm in size were examined; each of them contained 300 to 500 visible (larger than 0.5 μm) aerosol particles. So, the elemental
composition of 402 individual aerosol particles was determined.
Results and discussion
Density of aerosol pollution is 31.2-102.3 mg/(m2 • day) with the average value of 53.4 mg/(m2 • day). The distribution of density of aerosol pollution provides evidence that the major aerosol transport from Seversk goes to the north and northeast (Fig. 2, a). These data are in good correlation with previously obtained results (20–124 mg/(m2 • day) with the average value of 51.6 mg/ (m2 • day)) [1, 7]. There is low soot content in aerosol of this area: only 15—16 mass %. That fact indicates relatively high temperatures of aerosol origin. This area of aerosol pollution is considered to exist due to SCC emission of high temperatures.
Meanwhile aerosol is revealed to be enriched with soot (32—46 %) on three local areas near small settlements and in the suburbs of Seversk and Tomsk (see Fig. 2, b).
Fig.2. Data on density of aerosol pollution in the region of Seversk (a) and content in aerosols: soot (b), Ce (c), Zn (d): 1 - diagram and component content in aerosol samples; 2 - major plume of high-temperature emissions from SCC; 3 - region of maximal precipitation of emissions from SCC; 4 - plumes of
local low-temperature aerosol emissions
These soot-polluted areas are considered to originate due to furnace heating, from boiler plants and vehicle emission of lower temperatures.
A mineral component of aerosol is formed by SiO2 – 64 % in average, Al2O3 – 21.7 % and Fe2O3 – 7.65 %. The aluminosilicate composition of aerosol is the same for all samples from this region. The features of microelement distribution indicate two sources of technogenic emission. The 1st group of microelements, mainly chalcophilic, is concentrated in aerosol of three local areas revealed previously by soot distribution in aerosol near small settlements in the suburbs of Seversk and Tomsk (see Fig. 2, b, d). In aerosol of these areas, the concentration (ppm) of Pb increases to 154, Zn – 472–1033, Sb – 8.1–14.6, Cd – 10.6, Bi – 15.5, Mo – 38, Cu – 299, Ni – 304, Co – 36, and
296
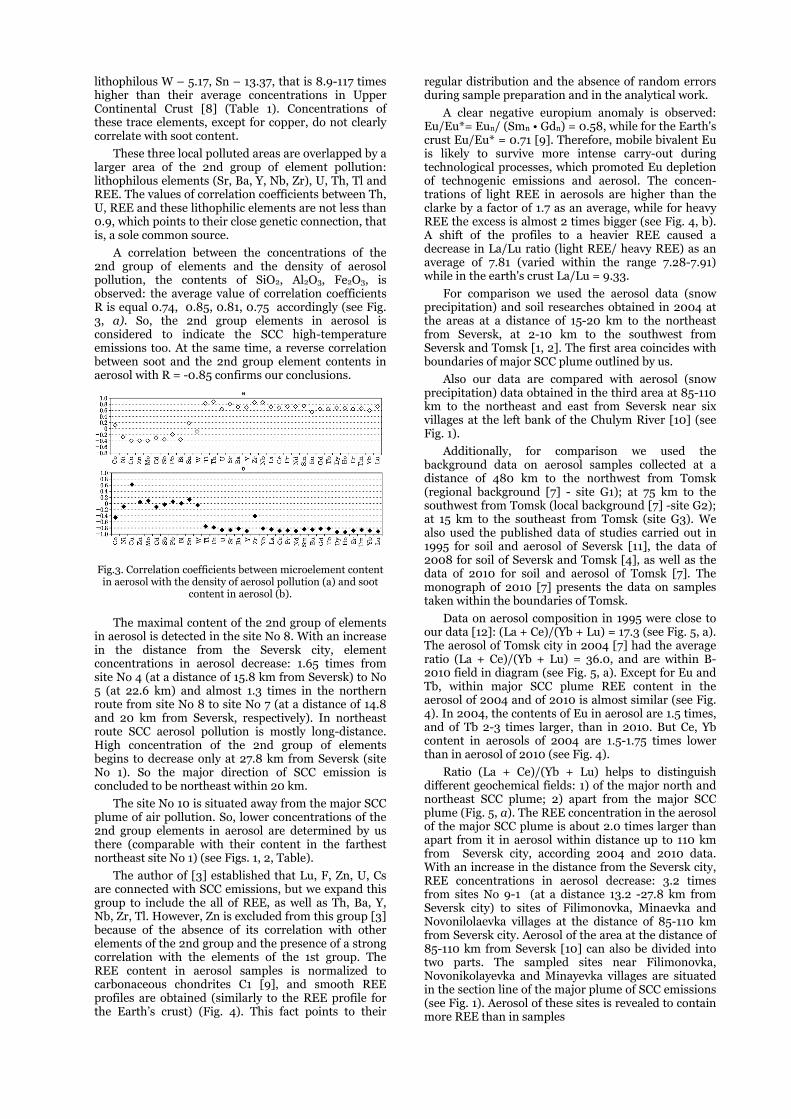
lithophilous W – 5.17, Sn – 13.37, that is 8.9-117 times higher than their average concentrations in Upper Continental Crust [8] (Table 1). Concentrations of these trace elements, except for copper, do not clearly correlate with soot content.
These three local polluted areas are overlapped by a larger area of the 2nd group of element pollution: lithophilous elements (Sr, Ba, Y, Nb, Zr), U, Th, Tl and REE. The values of correlation coefficients between Th, U, REE and these lithophilic elements are not less than 0.9, which points to their close genetic connection, that is, a sole common source.
A correlation between the concentrations of the 2nd group of elements and the density of aerosol pollution, the contents of SiO2, Al2O3, Fe2O3, is observed: the average value of correlation coefficients R is equal 0.74, 0.85, 0.81, 0.75 accordingly (see Fig. 3, a). So, the 2nd group elements in aerosol is considered to indicate the SCC high-temperature emissions too. At the same time, a reverse correlation between soot and the 2nd group element contents in aerosol with R = -0.85 confirms our conclusions.
Fig.3. Correlation coefficients between microelement content in aerosol with the density of aerosol pollution (a) and soot
content in aerosol (b).
The maximal content of the 2nd group of elements in aerosol is detected in the site No 8. With an increase in the distance from the Seversk city, element concentrations in aerosol decrease: 1.65 times from site No 4 (at a distance of 15.8 km from Seversk) to No 5 (at 22.6 km) and almost 1.3 times in the northern route from site No 8 to site No 7 (at a distance of 14.8 and 20 km from Seversk, respectively). In northeast route SCC aerosol pollution is mostly long-distance. High concentration of the 2nd group of elements begins to decrease only at 27.8 km from Seversk (site No 1). So the major direction of SCC emission is concluded to be northeast within 20 km.
The site No 10 is situated away from the major SCC plume of air pollution. So, lower concentrations of the 2nd group elements in aerosol are determined by us there (comparable with their content in the farthest northeast site No 1) (see Figs. 1, 2, Table).
The author of [3] established that Lu, F, Zn, U, Cs are connected with SCC emissions, but we expand this group to include the all of REE, as well as Th, Ba, Y, Nb, Zr, Tl. However, Zn is excluded from this group [3] because of the absence of its correlation with other elements of the 2nd group and the presence of a strong correlation with the elements of the 1st group. The REE content in aerosol samples is normalized to carbonaceous chondrites C1 [9], and smooth REE profiles are obtained (similarly to the REE profile for the Earth’s crust) (Fig. 4). This fact points to their
regular distribution and the absence of random errors during sample preparation and in the analytical work.
A clear negative europium anomaly is observed: Eu/Eu*= Eun/ (Smn • Gdn) = 0.58, while for the Earth's crust Eu/Eu* = 0.71 [9]. Therefore, mobile bivalent Eu is likely to survive more intense carry-out during technological processes, which promoted Eu depletion of technogenic emissions and aerosol. The concen-trations of light REE in aerosols are higher than the clarke by a factor of 1.7 as an average, while for heavy REE the excess is almost 2 times bigger (see Fig. 4, b). A shift of the profiles to a heavier REE caused a decrease in La/Lu ratio (light REE/ heavy REE) as an average of 7.81 (varied within the range 7.28-7.91) while in the earth's crust La/Lu = 9.33.
For comparison we used the aerosol data (snow precipitation) and soil researches obtained in 2004 at the areas at a distance of 15-20 km to the northeast from Seversk, at 2-10 km to the southwest from Seversk and Tomsk [1, 2]. The first area coincides with boundaries of major SCC plume outlined by us.
Also our data are compared with aerosol (snow precipitation) data obtained in the third area at 85-110 km to the northeast and east from Seversk near six villages at the left bank of the Chulym River [10] (see Fig. 1).
Additionally, for comparison we used the background data on aerosol samples collected at a distance of 480 km to the northwest from Tomsk (regional background [7] - site G1); at 75 km to the southwest from Tomsk (local background [7] -site G2); at 15 km to the southeast from Tomsk (site G3). We also used the published data of studies carried out in 1995 for soil and aerosol of Seversk [11], the data of 2008 for soil of Seversk and Tomsk [4], as well as the data of 2010 for soil and aerosol of Tomsk [7]. The monograph of 2010 [7] presents the data on samples taken within the boundaries of Tomsk.
Data on aerosol composition in 1995 were close to our data [12]: (La + Ce)/(Yb + Lu) = 17.3 (see Fig. 5, a). The aerosol of Tomsk city in 2004 [7] had the average ratio (La + Ce)/(Yb + Lu) = 36.0, and are within B-2010 field in diagram (see Fig. 5, a). Except for Eu and Tb, within major SCC plume REE content in the aerosol of 2004 and of 2010 is almost similar (see Fig. 4). In 2004, the contents of Eu in aerosol are 1.5 times, and of Tb 2-3 times larger, than in 2010. But Ce, Yb content in aerosols of 2004 are 1.5-1.75 times lower than in aerosol of 2010 (see Fig. 4).
Ratio (La + Ce)/(Yb + Lu) helps to distinguish different geochemical fields: 1) of the major north and northeast SCC plume; 2) apart from the major SCC plume (Fig. 5, a). The REE concentration in the aerosol of the major SCC plume is about 2.0 times larger than apart from it in aerosol within distance up to 110 km from Seversk city, according 2004 and 2010 data. With an increase in the distance from the Seversk city, REE concentrations in aerosol decrease: 3.2 times from sites No 9-1 (at a distance 13.2 -27.8 km from Seversk city) to sites of Filimonovka, Minaevka and Novonilolaevka villages at the distance of 85-110 km from Seversk city. Aerosol of the area at the distance of 85-110 km from Seversk [10] can also be divided into two parts. The sampled sites near Filimonovka, Novonikolayevka and Minayevka villages are situated in the section line of the major plume of SCC emissions (see Fig. 1). Aerosol of these sites is revealed to contain more REE than in samples
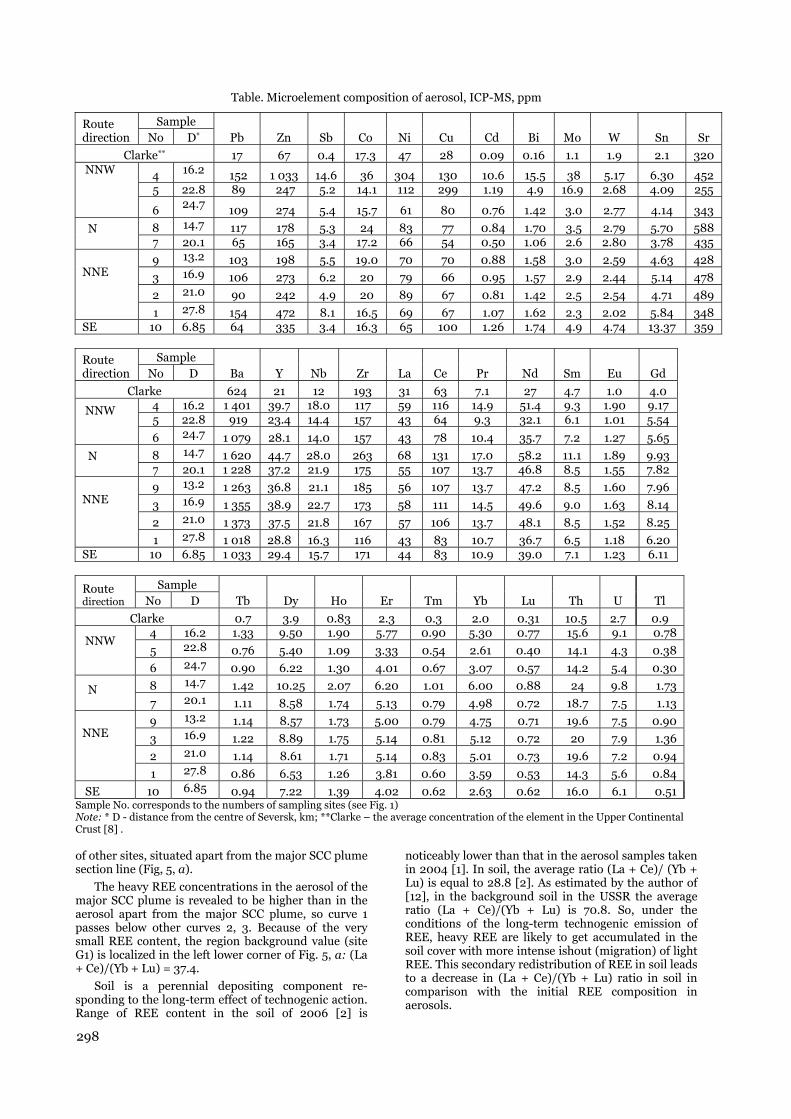
Table. Microelement composition of aerosol, ICP-MS, ppm
Route direction
Sample Pb Zn Sb Co Ni Cu Cd Bi Mo W Sn Sr No D*
Clarke** 17 67 0.4 17.3 47 28 0.09 0.16 1.1 1.9 2.1 320 NNW
4 16.2 152 1 033 14.6 36 304 130 10.6 15.5 38 5.17 6.30 452 5 22.8 89 247 5.2 14.1 112 299 1.19 4.9 16.9 2.68 4.09 255
6 24.7 109 274 5.4 15.7 61 80 0.76 1.42 3.0 2.77 4.14 343
N
8 14.7 117 178 5.3 24 83 77 0.84 1.70 3.5 2.79 5.70 588 7 20.1 65 165 3.4 17.2 66 54 0.50 1.06 2.6 2.80 3.78 435
NNE
9 13.2 103 198 5.5 19.0 70 70 0.88 1.58 3.0 2.59 4.63 428
3 16.9 106 273 6.2 20 79 66 0.95 1.57 2.9 2.44 5.14 478
2 21.0 90 242 4.9 20 89 67 0.81 1.42 2.5 2.54 4.71 489
1 27.8 154 472 8.1 16.5 69 67 1.07 1.62 2.3 2.02 5.84 348 SE 10 6.85 64 335 3.4 16.3 65 100 1.26 1.74 4.9 4.74 13.37 359
Route direction
Sample Ba Y Nb Zr La Ce Pr Nd Sm Eu Gd No D
Clarke 624 21 12 193 31 63 7.1 27 4.7 1.0 4.0
NNW
4 16.2 1 401 39.7 18.0 117 59 116 14.9 51.4 9.3 1.90 9.175 22.8 919 23.4 14.4 157 43 64 9.3 32.1 6.1 1.01 5.54
6 24.7 1 079 28.1 14.0 157 43 78 10.4 35.7 7.2 1.27 5.65
N
8 14.7 1 620 44.7 28.0 263 68 131 17.0 58.2 11.1 1.89 9.93 7 20.1 1 228 37.2 21.9 175 55 107 13.7 46.8 8.5 1.55 7.82
NNE
9 13.2 1 263 36.8 21.1 185 56 107 13.7 47.2 8.5 1.60 7.96
3 16.9 1 355 38.9 22.7 173 58 111 14.5 49.6 9.0 1.63 8.14
2 21.0 1 373 37.5 21.8 167 57 106 13.7 48.1 8.5 1.52 8.25
1 27.8 1 018 28.8 16.3 116 43 83 10.7 36.7 6.5 1.18 6.20 SE 10 6.85 1 033 29.4 15.7 171 44 83 10.9 39.0 7.1 1.23 6.11
Route direction
Sample Tb Dy Ho Er Tm Yb Lu Th U Tl No D
Clarke 0.7 3.9 0.83 2.3 0.3 2.0 0.31 10.5 2.7 0.9
NNW
4 16.2 1.33 9.50 1.90 5.77 0.90 5.30 0.77 15.6 9.1 0.78
5 22.8 0.76 5.40 1.09 3.33 0.54 2.61 0.40 14.1 4.3 0.38
6 24.7 0.90 6.22 1.30 4.01 0.67 3.07 0.57 14.2 5.4 0.30
N
8 14.7 1.42 10.25 2.07 6.20 1.01 6.00 0.88 24 9.8 1.73
7 20.1 1.11 8.58 1.74 5.13 0.79 4.98 0.72 18.7 7.5 1.13
NNE
9 13.2 1.14 8.57 1.73 5.00 0.79 4.75 0.71 19.6 7.5 0.90
3 16.9 1.22 8.89 1.75 5.14 0.81 5.12 0.72 20 7.9 1.36
2 21.0 1.14 8.61 1.71 5.14 0.83 5.01 0.73 19.6 7.2 0.94
1 27.8 0.86 6.53 1.26 3.81 0.60 3.59 0.53 14.3 5.6 0.84
SE 10 6.85 0.94 7.22 1.39 4.02 0.62 2.63 0.62 16.0 6.1 0.51Sample No. corresponds to the numbers of sampling sites (see Fig. 1) Note: * D - distance from the centre of Seversk, km; **Clarke – the average concentration of the element in the Upper Continental Crust [8] . of other sites, situated apart from the major SCC plume section line (Fig, 5, a).
The heavy REE concentrations in the aerosol of the major SCC plume is revealed to be higher than in the aerosol apart from the major SCC plume, so curve 1 passes below other curves 2, 3. Because of the very small REE content, the region background value (site G1) is localized in the left lower corner of Fig. 5, a: (La + Ce)/(Yb + Lu) = 37.4.
Soil is a perennial depositing component re-sponding to the long-term effect of technogenic action. Range of REE content in the soil of 2006 [2] is
noticeably lower than that in the aerosol samples taken in 2004 [1]. In soil, the average ratio (La + Ce)/ (Yb + Lu) is equal to 28.8 [2]. As estimated by the author of [12], in the background soil in the USSR the average ratio (La + Ce)/(Yb + Lu) is 70.8. So, under the conditions of the long-term technogenic emission of REE, heavy REE are likely to get accumulated in the soil cover with more intense ishout (migration) of light REE. This secondary redistribution of REE in soil leads to a decrease in (La + Ce)/(Yb + Lu) ratio in soil in comparison with the initial REE composition in aerosols.
298
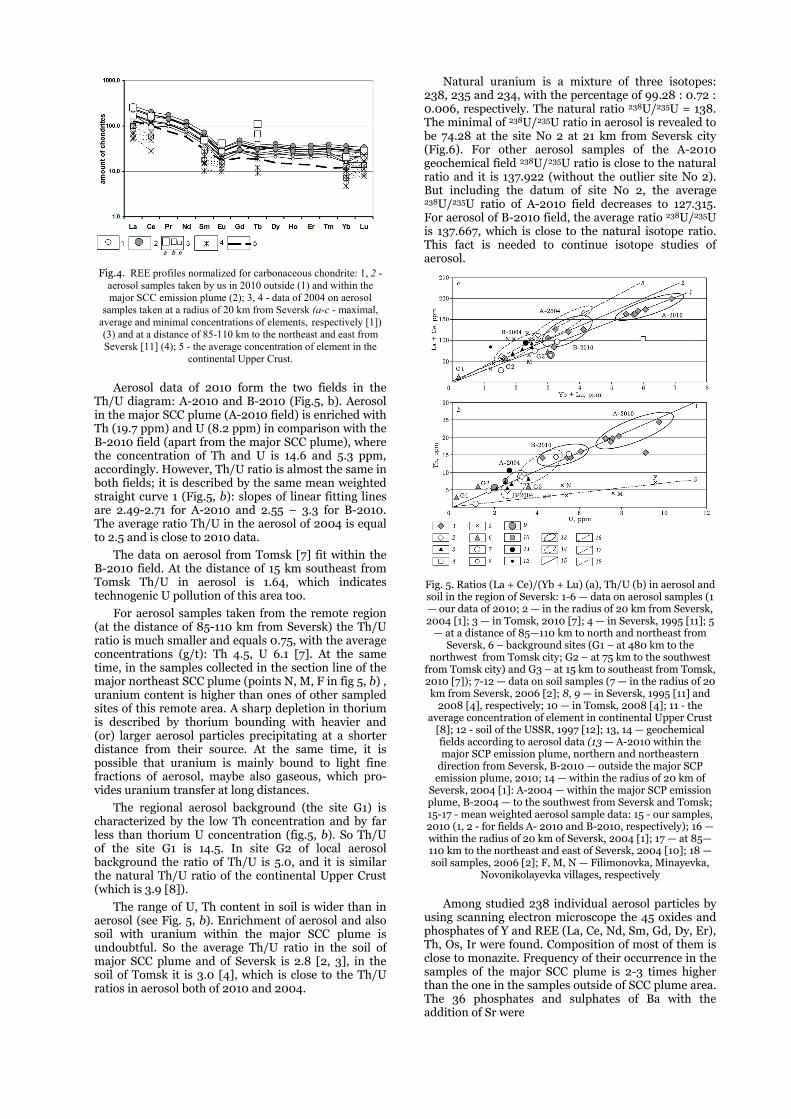
Fig.4. REE profiles normalized for carbonaceous chondrite: 1, 2 - aerosol samples taken by us in 2010 outside (1) and within the major SCC emission plume (2); 3, 4 - data of 2004 on aerosol
samples taken at a radius of 20 km from Seversk (a-c - maximal, average and minimal concentrations of elements, respectively [1]) (3) and at a distance of 85-110 km to the northeast and east from Seversk [11] (4); 5 - the average concentration of element in the
continental Upper Crust.
Aerosol data of 2010 form the two fields in the Th/U diagram: A-2010 and B-2010 (Fig.5, b). Aerosol in the major SCC plume (A-2010 field) is enriched with Th (19.7 ppm) and U (8.2 ppm) in comparison with the B-2010 field (apart from the major SCC plume), where the concentration of Th and U is 14.6 and 5.3 ppm, accordingly. However, Th/U ratio is almost the same in both fields; it is described by the same mean weighted straight curve 1 (Fig.5, b): slopes of linear fitting lines are 2.49-2.71 for A-2010 and 2.55 – 3.3 for B-2010. The average ratio Th/U in the aerosol of 2004 is equal to 2.5 and is close to 2010 data.
The data on aerosol from Tomsk [7] fit within the B-2010 field. At the distance of 15 km southeast from Tomsk Th/U in aerosol is 1.64, which indicates technogenic U pollution of this area too.
For aerosol samples taken from the remote region (at the distance of 85-110 km from Seversk) the Th/U ratio is much smaller and equals 0.75, with the average concentrations (g/t): Th 4.5, U 6.1 [7]. At the same time, in the samples collected in the section line of the major northeast SCC plume (points N, M, F in fig 5, b) , uranium content is higher than ones of other sampled sites of this remote area. A sharp depletion in thorium is described by thorium bounding with heavier and (or) larger aerosol particles precipitating at a shorter distance from their source. At the same time, it is possible that uranium is mainly bound to light fine fractions of aerosol, maybe also gaseous, which pro-vides uranium transfer at long distances.
The regional aerosol background (the site G1) is characterized by the low Th concentration and by far less than thorium U concentration (fig.5, b). So Th/U of the site G1 is 14.5. In site G2 of local aerosol background the ratio of Th/U is 5.0, and it is similar the natural Th/U ratio of the continental Upper Crust (which is 3.9 [8]).
The range of U, Th content in soil is wider than in aerosol (see Fig. 5, b). Enrichment of aerosol and also soil with uranium within the major SCC plume is undoubtful. So the average Th/U ratio in the soil of major SCC plume and of Seversk is 2.8 [2, 3], in the soil of Tomsk it is 3.0 [4], which is close to the Th/U ratios in aerosol both of 2010 and 2004.
Natural uranium is a mixture of three isotopes: 238, 235 and 234, with the percentage of 99.28 : 0.72 : 0.006, respectively. The natural ratio 238U/235U = 138. The minimal of 238U/235U ratio in aerosol is revealed to be 74.28 at the site No 2 at 21 km from Seversk city (Fig.6). For other aerosol samples of the A-2010 geochemical field 238U/235U ratio is close to the natural ratio and it is 137.922 (without the outlier site No 2). But including the datum of site No 2, the average 238U/235U ratio of A-2010 field decreases to 127.315. For aerosol of B-2010 field, the average ratio 238U/235U is 137.667, which is close to the natural isotope ratio. This fact is needed to continue isotope studies of aerosol.
Fig. 5. Ratios (La + Ce)/(Yb + Lu) (a), Th/U (b) in aerosol and soil in the region of Seversk: 1-6 — data on aerosol samples (1 — our data of 2010; 2 — in the radius of 20 km from Seversk, 2004 [1]; 3 — in Tomsk, 2010 [7]; 4 — in Seversk, 1995 [11]; 5
— at a distance of 85—110 km to north and northeast from Seversk, 6 – background sites (G1 – at 480 km to the
northwest from Tomsk city; G2 – at 75 km to the southwest from Tomsk city) and G3 – at 15 km to southeast from Tomsk, 2010 [7]); 7-12 — data on soil samples (7 — in the radius of 20
km from Seversk, 2006 [2]; 8, 9 — in Seversk, 1995 [11] and 2008 [4], respectively; 10 — in Tomsk, 2008 [4]; 11 - the
average concentration of element in continental Upper Crust [8]; 12 - soil of the USSR, 1997 [12]; 13, 14 — geochemical fields according to aerosol data (13 — A-2010 within the major SCP emission plume, northern and northeastern
direction from Seversk, B-2010 — outside the major SCP emission plume, 2010; 14 — within the radius of 20 km of
Seversk, 2004 [1]: A-2004 — within the major SCP emission plume, B-2004 — to the southwest from Seversk and Tomsk; 15-17 - mean weighted aerosol sample data: 15 - our samples, 2010 (1, 2 - for fields A- 2010 and B-2010, respectively); 16 — within the radius of 20 km of Seversk, 2004 [1]; 17 — at 85—110 km to the northeast and east of Seversk, 2004 [10]; 18 — soil samples, 2006 [2]; F, M, N — Filimonovka, Minayevka,
Novonikolayevka villages, respectively
Among studied 238 individual aerosol particles by using scanning electron microscope the 45 oxides and phosphates of Y and REE (La, Ce, Nd, Sm, Gd, Dy, Er), Th, Os, Ir were found. Composition of most of them is close to monazite. Frequency of their occurrence in the samples of the major SCC plume is 2-3 times higher than the one in the samples outside of SCC plume area. The 36 phosphates and sulphates of Ba with the addition of Sr were
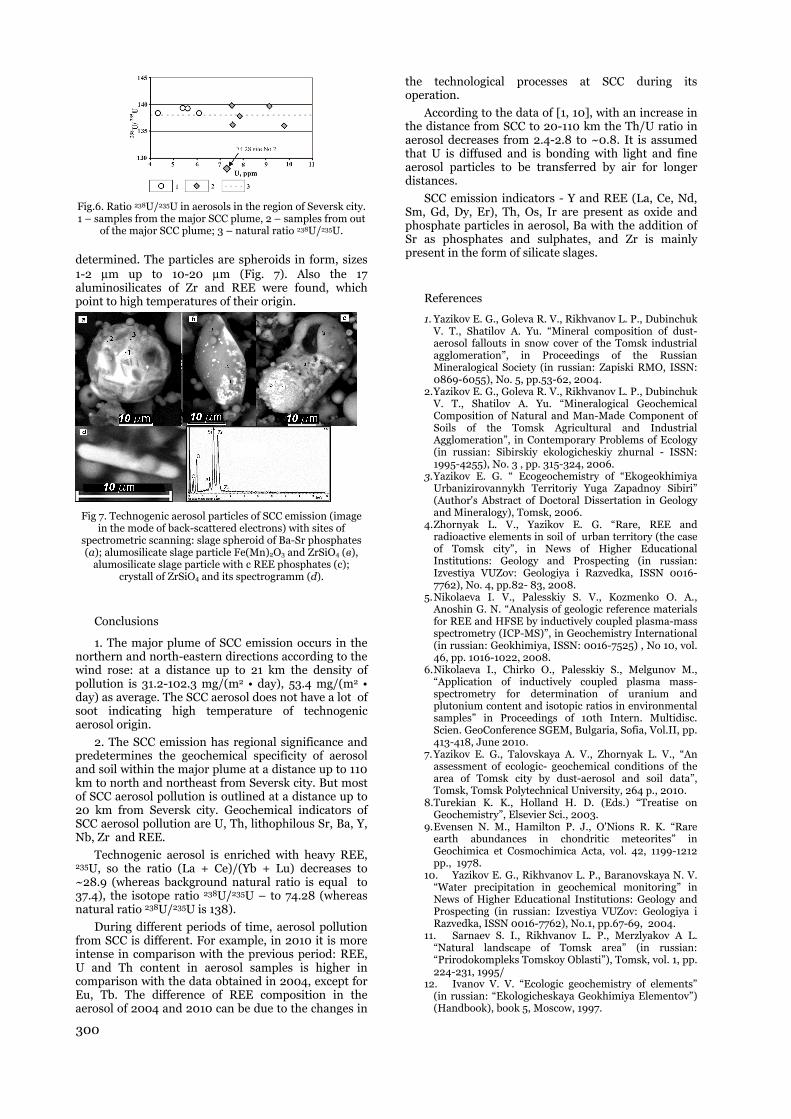
Fig.6. Ratio 238U/235U in aerosols in the region of Seversk city. 1 – samples from the major SCC plume, 2 – samples from out
of the major SCC plume; 3 – natural ratio 238U/235U.
determined. The particles are spheroids in form, sizes 1-2 μm up to 10-20 μm (Fig. 7). Also the 17 aluminosilicates of Zr and REE were found, which point to high temperatures of their origin.
Fig 7. Technogenic aerosol particles of SCC emission (image in the mode of back-scattered electrons) with sites of
spectrometric scanning: slage spheroid of Ba-Sr phosphates (a); alumosilicate slage particle Fe(Mn)2O3 and ZrSiO4 (в),
alumosilicate slage particle with с REE phosphates (c); crystall of ZrSiO4 and its spectrogramm (d).
Conclusions
1. The major plume of SCC emission occurs in the northern and north-eastern directions according to the wind rose: at a distance up to 21 km the density of pollution is 31.2-102.3 mg/(m2 • day), 53.4 mg/(m2 • day) as average. The SCC aerosol does not have a lot of soot indicating high temperature of technogenic aerosol origin.
2. The SCC emission has regional significance and predetermines the geochemical specificity of aerosol and soil within the major plume at a distance up to 110 km to north and northeast from Seversk city. But most of SCC aerosol pollution is outlined at a distance up to 20 km from Seversk city. Geochemical indicators of SCC aerosol pollution are U, Th, lithophilous Sr, Ba, Y, Nb, Zr and REE.
Technogenic aerosol is enriched with heavy REE, 235U, so the ratio (La + Ce)/(Yb + Lu) decreases to ~28.9 (whereas background natural ratio is equal to 37.4), the isotope ratio 238U/235U – to 74.28 (whereas natural ratio 238U/235U is 138).
During different periods of time, aerosol pollution from SCC is different. For example, in 2010 it is more intense in comparison with the previous period: REE, U and Th content in aerosol samples is higher in comparison with the data obtained in 2004, except for Eu, Tb. The difference of REE composition in the aerosol of 2004 and 2010 can be due to the changes in
the technological processes at SCC during its operation.
According to the data of [1, 10], with an increase in the distance from SCC to 20-110 km the Th/U ratio in aerosol decreases from 2.4-2.8 to ~0.8. It is assumed that U is diffused and is bonding with light and fine aerosol particles to be transferred by air for longer distances.
SCC emission indicators - Y and REE (La, Ce, Nd, Sm, Gd, Dy, Er), Th, Os, Ir are present as oxide and phosphate particles in aerosol, Ba with the addition of Sr as phosphates and sulphates, and Zr is mainly present in the form of silicate slages.
References
1. Yazikov E. G., Goleva R. V., Rikhvanov L. P., Dubinchuk V. T., Shatilov A. Yu. “Mineral composition of dust-aerosol fallouts in snow cover of the Tomsk industrial agglomeration”, in Proceedings of the Russian Mineralogical Society (in russian: Zapiski RMO, ISSN: 0869-6055), No. 5, pp.53-62, 2004.
2. Yazikov E. G., Goleva R. V., Rikhvanov L. P., Dubinchuk V. T., Shatilov A. Yu. “Mineralogical Geochemical Composition of Natural and Man-Made Component of Soils of the Tomsk Agricultural and Industrial Agglomeration”, in Contemporary Problems of Ecology (in russian: Sibirskiy ekologicheskiy zhurnal - ISSN: 1995-4255), No. 3 , pp. 315-324, 2006.
3. Yazikov E. G. “ Ecogeochemistry of “Ekogeokhimiya Urbanizirovannykh Territoriy Yuga Zapadnoy Sibiri” (Author's Abstract of Doctoral Dissertation in Geology and Mineralogy), Tomsk, 2006.
4. Zhornyak L. V., Yazikov E. G. “Rare, REE and radioactive elements in soil of urban territory (the case of Tomsk city”, in News of Higher Educational Institutions: Geology and Prospecting (in russian: Izvestiya VUZov: Geologiya i Razvedka, ISSN 0016-7762), No. 4, pp.82- 83, 2008.
5. Nikolaeva I. V., Palesskiy S. V., Kozmenko O. A., Anoshin G. N. “Analysis of geologic reference materials for REE and HFSE by inductively coupled plasma-mass spectrometry (ICP-MS)”, in Geochemistry International (in russian: Geokhimiya, ISSN: 0016-7525) , No 10, vol. 46, pp. 1016-1022, 2008.
6. Nikolaeva I., Chirko O., Palesskiy S., Melgunov M., “Application of inductively coupled plasma mass-spectrometry for determination of uranium and plutonium content and isotopic ratios in environmental samples” in Proceedings of 10th Intern. Multidisc. Scien. GeoConference SGEM, Bulgaria, Sofia, Vol.II, pp. 413-418, June 2010.
7. Yazikov E. G., Talovskaya A. V., Zhornyak L. V., “An assessment of ecologic- geochemical conditions of the area of Tomsk city by dust-aerosol and soil data”, Tomsk, Tomsk Polytechnical University, 264 p., 2010.
8. Turekian K. K., Holland H. D. (Eds.) “Treatise on Geochemistry”, Elsevier Sci., 2003.
9. Evensen N. M., Hamilton P. J., O'Nions R. K. “Rare earth abundances in chondritic meteorites” in Geochimica et Cosmochimica Acta, vol. 42, 1199-1212 pp., 1978.
10. Yazikov E. G., Rikhvanov L. P., Baranovskaya N. V. “Water precipitation in geochemical monitoring” in News of Higher Educational Institutions: Geology and Prospecting (in russian: Izvestiya VUZov: Geologiya i Razvedka, ISSN 0016-7762), No.1, pp.67-69, 2004.
11. Sarnaev S. I., Rikhvanov L. P., Merzlyakov A L. “Natural landscape of Tomsk area” (in russian: “Prirodokompleks Tomskoy Oblasti”), Tomsk, vol. 1, pp. 224-231, 1995/
12. Ivanov V. V. “Ecologic geochemistry of elements” (in russian: “Ekologicheskaya Geokhimiya Elementov”) (Handbook), book 5, Moscow, 1997.
300

ASSESSMENT OF RADIONUCLIDES IN ENVIRONMENT OF LATVIA
D. Riekstina 1, J. Berzins 1, T. Krasta 1, O. Skrypnik 2, J. Rudzitis 2, J. Alksnis 2
1 Institute of Solid State Physics, University of Latvia, Kengaraga str. 8, LV-1063, Riga, Latvia 2 Institute of Chemical Physics, University of Latvia, Raina Blvd. 19, LV-1586, Riga, Latvia
Abstract. Paper presents results of the long-term study of radionuclide content in Latvian environment. Data include contamination levels of various samples with artificial radionuclides (Cs-137, and H-3), as well as the accumulation and migration of these radionuclides in the soil and ground waters in the vicinity of the decommissioned Salaspils nuclear reactor; the H-3 content in industrial and communal water sources in all Latvian regions; and the concentration of natural radionuclides (K-40 and the decay products of the Th-232, U-238 (Ra-226) decay chains) in building materials used in Latvia and produced from local resources (mostly clay).
Key words: environment, artificial radionuclides, Cs-137, H-3, natural radionuclides, building materials
1. INTRODUCTION
Assessment of radionuclide content in environment and radiation hazards for population is a topic attracting growing attention both from governments and population. Therefore, it is of utmost importance to obtain and publish actual reliable data about content of artificial and natural radionuclides in environment.
The now decommissioned Salaspils nuclear research reactor (SNR) was in operation from 1961 up to 1998. It could cause a pollution of the closest surrounding territory with artificial radionuclides: products of activation or fission. One of the objectives of present work was to provide an overview of the content of artificial radionuclides (mostly Cs-137, and H-3) in soils and ground water of the three kilometer radius area around SNR after its shutdown. The obtained results are compared with the background radioactivity level in the rest of Latvian territory [1].
Other objectives of presented work are related with the assessment of possible radiation hazards for the entire Latvian population. In 2003, the Latvian Cabinet of Ministers adopted regulations provisioning the entry in force of the EU Council Directive 98/83/EC on the quality of water [2]. This directive prohibits the use of drinking water with tritium content exceeding 100 Bq/l. In order to check the compliance of Latvian water sources with that directive, we have performed the analysis of industrially used drinking water samples obtained from the Latvian food manufacturers, and the communal drinking water sources of all Latvian regions.
Since nowadays people spend more than 80 % of their lifetime indoors [3], building materials, containing naturally occurring radionuclides (NORMs) K-40, and the decay products of the Th-232, U-238 (Ra-226) decay chains, can be a major potential source
of indoor gamma-irradiation. Therefore, we have carried out a representative study of natural radioactivity level in various building materials used for construction in Latvia. Especial attention is given to raw clay and clay ceramic made of natural resources available in Latvia.
Radiation safety requirements, provisioned in the EU Council Directive 96/29/EURATOM [4] and the Latvian Cabinet of Ministers regulations [5], state the maximal permissible level of natural radionuclide activity concentration in building materials using the activity index I (in Bq/kg):
I = CK/3000 + CRa/300 + CTh/200,
where
CK – the concentration of potassium-40 (Bq/kg);
CRa - the concentration of radium-226 (Bq/kg);
CTh – the concentration of thorium-232 (Bq/kg).
The maximal permissible level is set so that the annual gamma-radiation dose for the exposed population does not exceed 0.3-1.0 mSv.
The study presents results of two groups of environmental measurements: 1) the long-term environment monitoring of the SNR vicinity for the presence of artificial radionuclides (Cs-137, H-3), and 2) the study of radionuclide presence in Latvian communal and industrial water supply and building materials. Sect. 2 describes employed sampling and measurement methods. Sect. 3 presents the obtained results. Radiation hazards for the Latvian population are assessed in Sec.3 and conclusions. The standard methods [6-8] were used for the determination of radionuclides, and the quality assurance system based on the ISO/IEC 17025:2008 standard [9] requirements have been implemented at all stages of research work.
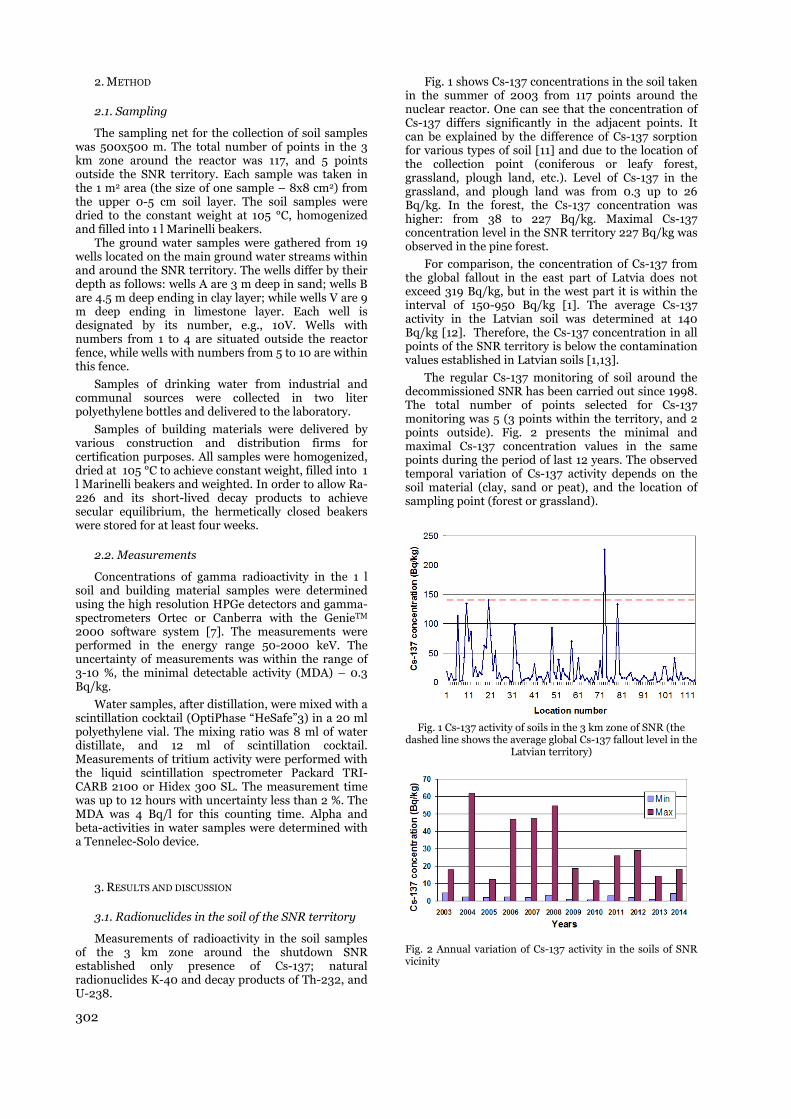
302
2. METHOD
2.1. Sampling
The sampling net for the collection of soil samples was 500x500 m. The total number of points in the 3 km zone around the reactor was 117, and 5 points outside the SNR territory. Each sample was taken in the 1 m2 area (the size of one sample – 8x8 cm2) from the upper 0-5 cm soil layer. The soil samples were dried to the constant weight at 105 °C, homogenized and filled into 1 l Marinelli beakers.
The ground water samples were gathered from 19 wells located on the main ground water streams within and around the SNR territory. The wells differ by their depth as follows: wells A are 3 m deep in sand; wells B are 4.5 m deep ending in clay layer; while wells V are 9 m deep ending in limestone layer. Each well is designated by its number, e.g., 10V. Wells with numbers from 1 to 4 are situated outside the reactor fence, while wells with numbers from 5 to 10 are within this fence.
Samples of drinking water from industrial and communal sources were collected in two liter polyethylene bottles and delivered to the laboratory.
Samples of building materials were delivered by various construction and distribution firms for certification purposes. All samples were homogenized, dried at 105 °C to achieve constant weight, filled into 1 l Marinelli beakers and weighted. In order to allow Ra-226 and its short-lived decay products to achieve secular equilibrium, the hermetically closed beakers were stored for at least four weeks.
2.2. Measurements
Concentrations of gamma radioactivity in the 1 l soil and building material samples were determined using the high resolution HPGe detectors and gamma-spectrometers Ortec or Canberra with the GenieTM 2000 software system [7]. The measurements were performed in the energy range 50-2000 keV. The uncertainty of measurements was within the range of 3-10 %, the minimal detectable activity (MDA) – 0.3 Bq/kg.
Water samples, after distillation, were mixed with a scintillation cocktail (OptiPhase “HeSafe”3) in a 20 ml polyethylene vial. The mixing ratio was 8 ml of water distillate, and 12 ml of scintillation cocktail. Measurements of tritium activity were performed with the liquid scintillation spectrometer Packard TRI-CARB 2100 or Hidex 300 SL. The measurement time was up to 12 hours with uncertainty less than 2 %. The MDA was 4 Bq/l for this counting time. Alpha and beta-activities in water samples were determined with a Tennelec-Solo device.
3. RESULTS AND DISCUSSION
3.1. Radionuclides in the soil of the SNR territory
Measurements of radioactivity in the soil samples of the 3 km zone around the shutdown SNR established only presence of Cs-137; natural radionuclides K-40 and decay products of Th-232, and U-238.
Fig. 1 shows Cs-137 concentrations in the soil taken in the summer of 2003 from 117 points around the nuclear reactor. One can see that the concentration of Cs-137 differs significantly in the adjacent points. It can be explained by the difference of Cs-137 sorption for various types of soil [11] and due to the location of the collection point (coniferous or leafy forest, grassland, plough land, etc.). Level of Cs-137 in the grassland, and plough land was from 0.3 up to 26 Bq/kg. In the forest, the Cs-137 concentration was higher: from 38 to 227 Bq/kg. Maximal Cs-137 concentration level in the SNR territory 227 Bq/kg was observed in the pine forest.
For comparison, the concentration of Cs-137 from the global fallout in the east part of Latvia does not exceed 319 Bq/kg, but in the west part it is within the interval of 150-950 Bq/kg [1]. The average Cs-137 activity in the Latvian soil was determined at 140 Bq/kg [12]. Therefore, the Cs-137 concentration in all points of the SNR territory is below the contamination values established in Latvian soils [1,13].
The regular Cs-137 monitoring of soil around the decommissioned SNR has been carried out since 1998. The total number of points selected for Cs-137 monitoring was 5 (3 points within the territory, and 2 points outside). Fig. 2 presents the minimal and maximal Cs-137 concentration values in the same points during the period of last 12 years. The observed temporal variation of Cs-137 activity depends on the soil material (clay, sand or peat), and the location of sampling point (forest or grassland).
Fig. 1 Cs-137 activity of soils in the 3 km zone of SNR (the
dashed line shows the average global Cs-137 fallout level in the Latvian territory)
Fig. 2 Annual variation of Cs-137 activity in the soils of SNR vicinity
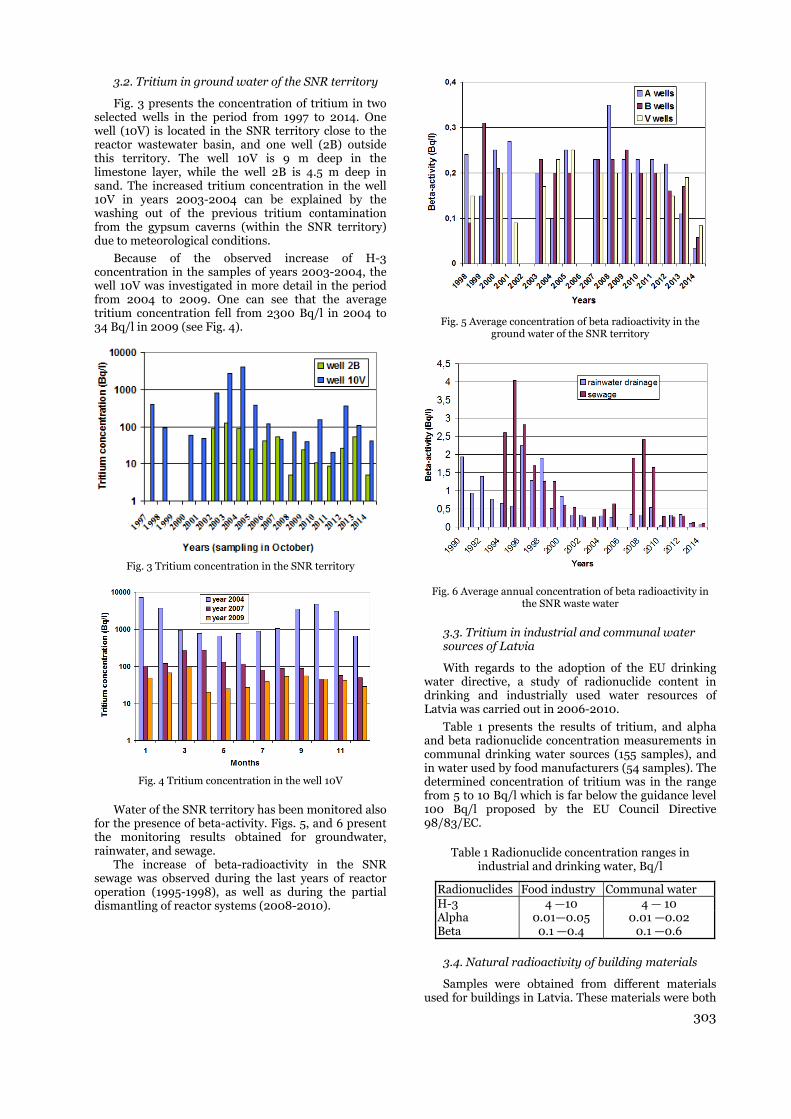
303
3.2. Tritium in ground water of the SNR territory
Fig. 3 presents the concentration of tritium in two selected wells in the period from 1997 to 2014. One well (10V) is located in the SNR territory close to the reactor wastewater basin, and one well (2B) outside this territory. The well 10V is 9 m deep in the limestone layer, while the well 2B is 4.5 m deep in sand. The increased tritium concentration in the well 10V in years 2003-2004 can be explained by the washing out of the previous tritium contamination from the gypsum caverns (within the SNR territory) due to meteorological conditions.
Because of the observed increase of H-3 concentration in the samples of years 2003-2004, the well 10V was investigated in more detail in the period from 2004 to 2009. One can see that the average tritium concentration fell from 2300 Bq/l in 2004 to 34 Bq/l in 2009 (see Fig. 4).
Fig. 3 Tritium concentration in the SNR territory
Fig. 4 Tritium concentration in the well 10V
Water of the SNR territory has been monitored also for the presence of beta-activity. Figs. 5, and 6 present the monitoring results obtained for groundwater, rainwater, and sewage.
The increase of beta-radioactivity in the SNR sewage was observed during the last years of reactor operation (1995-1998), as well as during the partial dismantling of reactor systems (2008-2010).
Fig. 5 Average concentration of beta radioactivity in the ground water of the SNR territory
Fig. 6 Average annual concentration of beta radioactivity in the SNR waste water
3.3. Tritium in industrial and communal water sources of Latvia
With regards to the adoption of the EU drinking water directive, a study of radionuclide content in drinking and industrially used water resources of Latvia was carried out in 2006-2010.
Table 1 presents the results of tritium, and alpha and beta radionuclide concentration measurements in communal drinking water sources (155 samples), and in water used by food manufacturers (54 samples). The determined concentration of tritium was in the range from 5 to 10 Bq/l which is far below the guidance level 100 Bq/l proposed by the EU Council Directive 98/83/EC.
Table 1 Radionuclide concentration ranges in industrial and drinking water, Bq/l
Radionuclides Food industry Communal water H-3 4 —10 4 — 10 Alpha 0.01—0.05 0.01 —0.02 Beta 0.1 —0.4 0.1 —0.6
3.4. Natural radioactivity of building materials
Samples were obtained from different materials used for buildings in Latvia. These materials were both
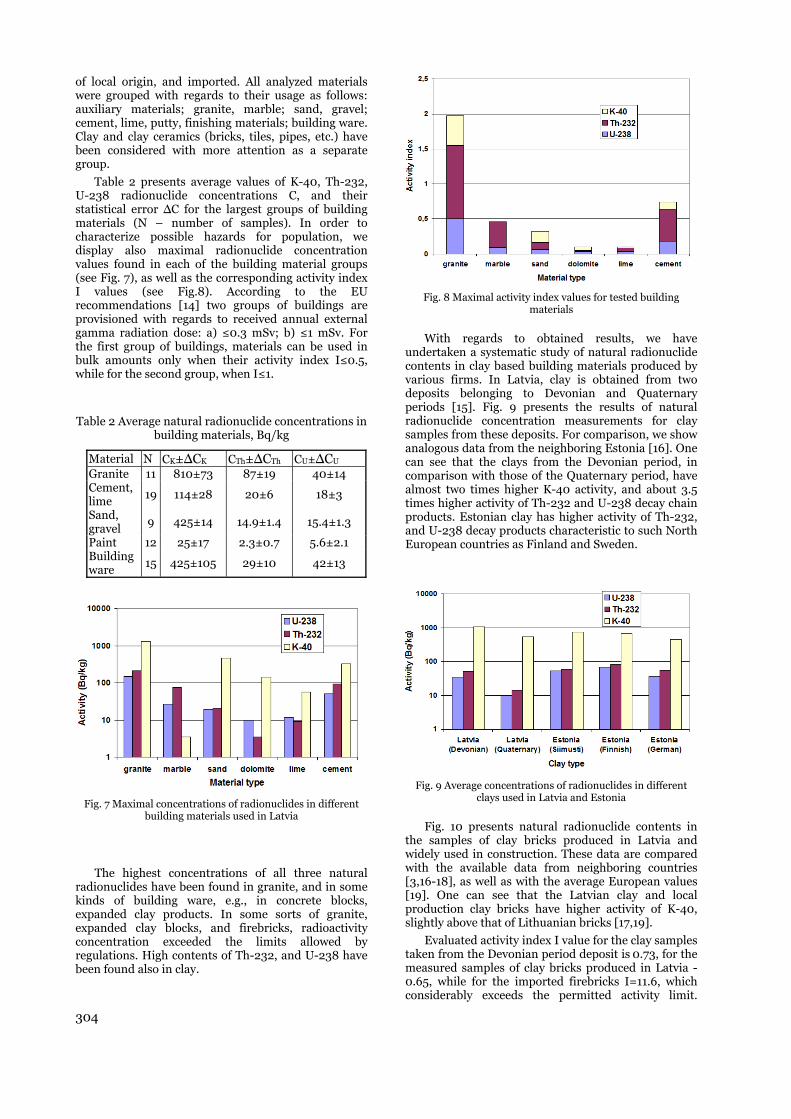
304
of local origin, and imported. All analyzed materials were grouped with regards to their usage as follows: auxiliary materials; granite, marble; sand, gravel; cement, lime, putty, finishing materials; building ware. Clay and clay ceramics (bricks, tiles, pipes, etc.) have been considered with more attention as a separate group.
Table 2 presents average values of K-40, Th-232, U-238 radionuclide concentrations C, and their statistical error ΔC for the largest groups of building materials (N – number of samples). In order to characterize possible hazards for population, we display also maximal radionuclide concentration values found in each of the building material groups (see Fig. 7), as well as the corresponding activity index I values (see Fig.8). According to the EU recommendations [14] two groups of buildings are provisioned with regards to received annual external gamma radiation dose: a) ≤0.3 mSv; b) ≤1 mSv. For the first group of buildings, materials can be used in bulk amounts only when their activity index I≤0.5, while for the second group, when I≤1.
Table 2 Average natural radionuclide concentrations in building materials, Bq/kg
Material N CK±ΔCK CTh±ΔCTh CU±ΔCU Granite 11 810±73 87±19 40±14 Cement, lime
19 114±28 20±6 18±3
Sand, gravel
9 425±14 14.9±1.4 15.4±1.3
Paint 12 25±17 2.3±0.7 5.6±2.1 Building ware
15 425±105 29±10 42±13
Fig. 7 Maximal concentrations of radionuclides in different building materials used in Latvia
The highest concentrations of all three natural radionuclides have been found in granite, and in some kinds of building ware, e.g., in concrete blocks, expanded clay products. In some sorts of granite, expanded clay blocks, and firebricks, radioactivity concentration exceeded the limits allowed by regulations. High contents of Th-232, and U-238 have been found also in clay.
Fig. 8 Maximal activity index values for tested building materials
With regards to obtained results, we have undertaken a systematic study of natural radionuclide contents in clay based building materials produced by various firms. In Latvia, clay is obtained from two deposits belonging to Devonian and Quaternary periods [15]. Fig. 9 presents the results of natural radionuclide concentration measurements for clay samples from these deposits. For comparison, we show analogous data from the neighboring Estonia [16]. One can see that the clays from the Devonian period, in comparison with those of the Quaternary period, have almost two times higher K-40 activity, and about 3.5 times higher activity of Th-232 and U-238 decay chain products. Estonian clay has higher activity of Th-232, and U-238 decay products characteristic to such North European countries as Finland and Sweden.
Fig. 9 Average concentrations of radionuclides in different clays used in Latvia and Estonia
Fig. 10 presents natural radionuclide contents in the samples of clay bricks produced in Latvia and widely used in construction. These data are compared with the available data from neighboring countries [3,16-18], as well as with the average European values [19]. One can see that the Latvian clay and local production clay bricks have higher activity of K-40, slightly above that of Lithuanian bricks [17,19].
Evaluated activity index I value for the clay samples taken from the Devonian period deposit is 0.73, for the measured samples of clay bricks produced in Latvia - 0.65, while for the imported firebricks I=11.6, which considerably exceeds the permitted activity limit.

305
Therefore, clay bricks produced in Latvia are not suitable for construction of buildings with higher radiation safety standards. Imported firebricks cannot be used for construction even on the restricted basis allowing I≤6 for the second group of buildings [14].
It is interesting to note that, while the natural radionuclide level in Latvian and Estonian clays is similar, the activity index I for bricks differs almost two times. Possible explanation can be that the bricks measured in [16] were either imported or produced from imported clay.
Fig. 10 Average concentrations of radionuclides in clay bricks used in Latvia and their comparison with the data
from other Baltic region countries
4. CONCLUSIONS
1. The obtained results present the dynamics of artificial radionuclide concentration in soils and ground waters in the vicinity of the SNR in dependence on years and locations.
The tritium activity shows variation within a wide range (5 — 8000 Bq/l) for particular years. Seasonal changes of activity were established as well. Concentration of tritium in the wells outside the SNR territory was below the level permitted for drinking water in Latvia. However, due to the high concentration of tritium in some wells within the SNR territory, the monitoring of H-3 should be continued.
The results of Cs-137 monitoring in soils show that the activity concentration varies in different places of the SNR territory. However, it doesn't exceed the average Cs-137 concentration value in Latvian soils due to the impact of the global and Chernobyl fallout.
General conclusion: the amount of radionuclides produced by SNR has little impact on the total radionuclide content in the environment of Latvia.
2. Tritium activity in communal and industrially used water sources of Latvia is below 10 Bq/l which is much lower that the 100 Bq/l level permitted by the EC Directive 98/83/EC. Therefore, the use of these waters is safe for population.
3. Activity of all tested building materials, except imported granite, and firebricks, is below radionuclide concentration level permissible in Latvia [5]. The use of these materials for construction is safe for the inhabitants.
Average concentrations of natural radionuclides and activity index values for clay and clay bricks used in Latvia are on the same level as in other Baltic and North European countries, except Sweden. However, radionuclide content in different period clay deposits of Latvia can differ more than two times, and up to five times in different clay products. Therefore, clay products should be subjected to more stringent control.
REFERENCES
1. O. Veveris, D. Riekstina, I. Taure, A. Skujina, "Forest ecosystem as accumulator of radionuclides", Ecology, No. 2, pp. 53-55, 2003.
2. EU Council Directive 98/83/EC of 3 November 1998 on the quality of water intended for human consumption. European Commission, Luxembourg, 1998.
3. UNSCEAR, Sources and effects of ionizing radiation. Report to General Assembly. Vol.1, Annex B. United Nations, New York, 2000.
4. EU Council Directive 96/29/EURATOM, European Commission, Luxembourg, 1996.
5. Latvian Cabinet of Ministers, Regulation of protection against ionizing radiation, Regulations No.149, adopted 09.04.2002, Riga.
6. LVS ISO 9698:2011 Water quality – Determination of tritium activity concentration – Liquid scintillation counting method. Latvian State Standard, 2011.
7. LVS ISO 10703:2008 Water quality – Determination of the activity concentration of radionuclides – Method by high resolution gamma-ray spectroscopy. Latvian State Standard, 2008.
8. LVS ISO 257:2000 Building material quality – Determination of radionuclides and specific activity of radionuclides in building materials by gamma spectrometry. Latvian State Standard, 2000.
9. ISO/IEC 17025:2005 General requirements for the competence of testing and calibration laboratories. International Organization for Standardization, 2008.
10. Canberra Industries. GENIE-2000, Basic Spectroscopy (Standalone) VI.2A Copyright (c).
11. S. Stauton, M. Raunbaud, "Adsorption of Cs-137 on montmorillonite and illite: effect of charge compensating cation, ionic strength, concentration of Cs, K and fulfic acid", Clay and clay minerals, vol. 45, No. 2, pp. 251-260, 1997.
12. K. Rissanen, J. Ylipieti, R. Salminen, K. That, A. Giliucis, V. Gregorauskiene, “Cs-137 concentrations in the uppermost humus layer in the Baltic countries in 2003”, INIS, vol. 36, issue 47, Ref. No. 36109090, 2005.
13. D. Riekstina, O. Veveris, P. Zalitis, "Forest litter as indicator of radioactive pollution", Baltic Forestry, vol. 3, pp. 35-40, 1997.
14. Radiological protection principles concerning the natural radioactivity of building materials. Radiation Protection 112. European Commission, Luxembourg, 1999.
15. L.Dabare, R. Svinka, V. Svinka, “Sorption of inorganic substances on the porous Latvian clay ceramic”, Latvian Journal of Chemistry, No. 4, pp. 383-389, 2012.
16. M. Lust, E. Realo, “Assessment of natural radiation exposure from building materials in Estonia”, Proceedings of the Estonian Academy of Sciences, vol. 61, No. 2, pp. 107-112, 2012.
17. M. Peciuliene, D. Jasaitis, A.Girgzdys, “Natural radionuclides in the soil of the Vilnius city and assessment of their hazard”, Geologia, vol. 55, pp. 9-14, 2006.

306
18. M. Zalewski, M. Tomczak, J. Kapata, “Radioactivity of building materials available in Northeastern Poland”, Polish Journal of Environmental Studies, vol. 10, No. 3, pp. 183-188, 2001.
19. R. Trevisi, S. Risica, M. D'Alessandro, D. Paradiso, C. Nuccetelli, “Natural radioactivity in building materials in the European Union: a database, and an
estimate of radiological significance”, Journal of Environmental Radioactivity, vol. 105, pp. 11-20, 2012.
INVESTIGATION OF LEAD-210 AND CAESIUM-137 CHRONOLOGY OF LACUSTRINE SEDIMENTATION
R. Mikalauskienė 1,*, J. Mažeika1, O. Jefanova1, P. Szwarczewski2
1 Laboratory of Nuclear Geophysics and Radioecology, State Research Institute Nature Research Centre, Akademijos str. 2, Vilnius, Lithuania * - [email protected]
2 Department of Geomorphology, Faculty of Geography and Regional Studies, University of Warsaw, Krakowskie Przedmiescie 30, 00-927 Warsaw, Poland
Abstract. Lakes are dynamic response systems that integrate environmental, climatic and tectonic forcing into a continuous, high-resolution archive of local and regional changes. These changes are studied basing on palaeolimnological approach with the key goal of constructing the reliable chronology for coupling numerous proxies of environmental changes. Results of investigation of sedimentation processes in a few lakes located in the Baltic Uplands, the western part of the East European Plain (East Lithuania, East Latvia and North East Poland) are presented. The various gravity corers were used for taking short (up to 80 cm in length) sediment cores. The sliced and dried samples were examined for Pb-210 and Cs-137 specific activity. Pb-210 dating of cores (taking into account the peaks of specific activity of Cs-137) was performed according to constant rate of supply (CRS) model with some modification using gamma ray assay for determination of radionuclide activity and estimating dating uncertainty by first-order-analysis. The activity of radionuclides of interest was determined using HPGe coaxial well photon detector system (GWL-series). The well-type detector can accommodate small samples in the well with effective volume up to 4 cubic centimeters. The gamma ray spectra were calculated using Gamma Vision (ORTEC®) software. The gamma-ray spectrometric system has been calibrated against standard radioactive sources with known Pb-210 and Cs-137 activities and other radionuclides with clear full-energy peaks. The measuring container filling height and sample density was taken into account during both efficiency calibration and actual sample measurements. A number of naturally occurring radioisotopes from the U and Th decay series were also determined. The estimated parameters for the lacustrine sedimentary records were mean sediment mass accumulation rate, derived linear rate of accumulation of wet bulk sediment layer, percentage of components of sedimentary matrix.
Key words: 210Pb, 137Cs, sediment, accumulation rate, chronology, CRS model.
1. INTRODUCTION
The use of the natural 210Pb and artificial 137Cs isotopes as a dating tool appears to offer considerable potential for information on physical, chemical and biotic properties of lake sedimentation within the context of a changing environment [1]. Natural fallout radionuclides are particularly useful as a sediment tracers because is effectively independent of soil type and substratum properties [7]. The basic principal of radiometric dating is to derive the number of half-lives that have passed since decay began [2]. The main advantage of 210Pb age dating is that it can be done using low background gamma spectrometry. As a consequence of nuclear weapons testing, 137Cs began to be detectable on a global scale from 1954 onward. The intensification of nuclear tests in 1958–1959 produced an initial peak of activity, and in 1963 there was a second peak that was responsible for the greater part of the activity of 137Cs found in the natural environment [6]. The profile of 137Cs in the columns of sediment should demonstrate the
incorporation of this radionuclide in the medium, and the peaks of its concentration just mentioned can be employed as a method of dating, for recent sediments [5]. The isotopes method techniques has been used widely for dating recent horizons in lake sediments cores over the past 100-150 years through application of the CRS (constant rate of supply) model [3;4]. This paper presents a part of the results of chronology investigation about recent lacustrine sedimentation rates in a few lakes located in the Baltic Uplands. The principal focus of this paper is to illustrate the use of fallout radionuclides (210Pb and 137Cs) as chronometers of the lake sediment mass accumulation trend.
2. OBJECTS AND METHODS
We present here examples of radionuclide dating from a few lakes located in the Baltic Uplands (Fig. 1), the western part of the East European Plain. Drūkšiai is the largest lake in Lithuania, located in the north-eastern part, an area with

the greatest number of lakes, at the border with Latvia and Belarus. The size of the lake is 4900 ha, its greatest depth is 33.3 m and the average depth is 7.5 m. Sejny is a small lake in Poland located in the north-eastern part of the country near the border with Lithuania. The lake covers an area of approximately 64.3 ha, its greatest depth is 3.8 m and the average depth is 1.8 m. Sventes is a lake located in the south-eastern part of Latvia near the border with Lithuania. The lake covers an area of 734.8 ha, its greatest depth is 38 m and the average depth is 7.8 m.
Fig. 1 The sediment cores collection places: I – Lake Sventes (Latvia); II – Lake Drukšiai (Lithuania), and III – Lake Sejny (Poland).
Gamma-ray spectrometric analytical technique has main advantage being fast, nondestructive, relatively simple sample preparation with no need of preliminary chemical separation. The samples were processed applying coring, cutting and preparation techniques described by authors [10]. The columns of sediment were extracted using gravity corer up to 80 cm in length. The sediment cores were sectioned into slices of 1-5 cm thickness, labeled and transported to laboratory for further processing. Later, each sample was weighed and dried at 105 0C to constant weight and then were manually homogenized. After dried, the sample bulk density was determined and filed to measuring containers (mini beaker 3 ml). Gamma spectrometry analysis and chronological model The total 210Pb activity in lacustrine sediment samples can be determined directly by gamma spectrometry. However, because of the low energy of 210Pb gamma emission difficulties like self-adsorption, the total radionulides activities in sediment samples were
determined by means of gamma spectrometer with HPGe (high purity germanium) well-type detector designed for low-volume samples at the Nature Research Centre (Lithuania). With HPGe detector it is possible to separate low-energy gamma quanta with resolution not less than 1.5 keV. The gamma transmissions used for activity calculations were 46.5 keV for 210Pb, 661.7 keV for 137Cs and 351.9 keV gamma rays emitted by 214Pb as a short-lived granddaughter of 226Ra. The gamma spectra processing software GammaVision-32 identifies the radionuclides in the sample and calculate their specific activities. Prior to measuring the radionuclide activity in the sample, the gamma spectrometer was calibrated by using the standards of radionuclides sources. The unsupported 210Pb activity was calculated as the difference between the 210Pb and 214Pb activities measured from each sediment sample. Chronology reconstruction included the series of radiometric dates. Sequential isotopes data were processed to obtain lake sediment ages using an appropriate CRS (Constant Rate of Supply) model. CRS model is known to produce reasonable results for most environments, including lake sediment.
3. RESULTS AND DISCUSSION
The results of the 137Cs activity variations in the lakes sediment cores taken from three collection sites (Fig. 1) are presented in Fig.2-5. The detailed primary measurement results of lakes sediment cores are shown in Table 1-2. To validate CRS age-depth model's results, we use the nuclear fallout radionuclide 137Cs. The dating of sediments by means of 137Cs can be performed by identifying peaks in the profile of activity and then assigning the corresponding historical dates to the peaks [6]. 137Cs measurements can be used to determine a relatioships between the pattern of sediment mass accumulations rates, atmospheric fallouts and the vertical distribution of 137Cs in the sediment profile [7]. Given that 137Cs accumulates in superficial sediments and is below detection limit beyond a certain depth, in function of different variables that depend on the location of each sampling site, the number of layers analysed in each column was varied. Usually sediment containing 137Cs can be observed up to depth of 40 cm, although in some cores (from Lake Sejny and Lake Drūkšiai) this was increased up to 58 cm depth.
308
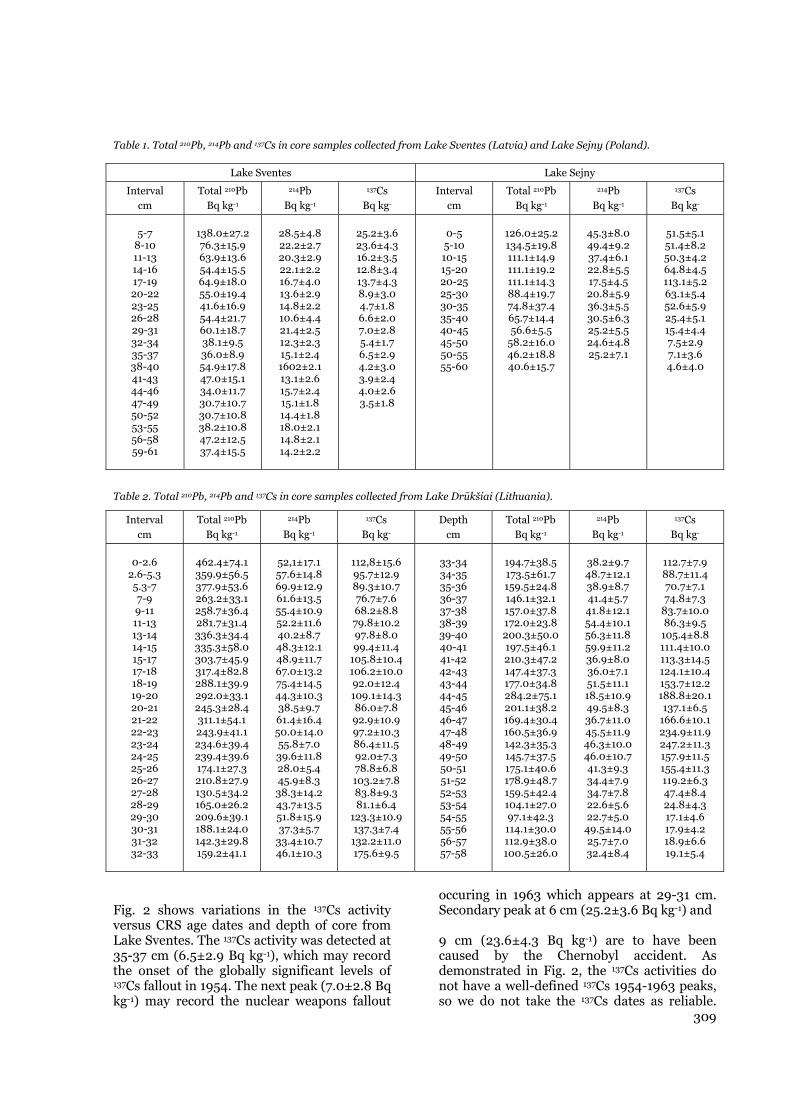
309
Table 1. Total 210Pb, 214Pb and 137Cs in core samples collected from Lake Sventes (Latvia) and Lake Sejny (Poland).
Lake Sventes Lake Sejny
Interval cm
Total 210Pb Bq kg-1
214Pb Bq kg-1
137Cs Bq kg-
Interval cm
Total 210Pb Bq kg-1
214Pb Bq kg-1
137Cs Bq kg-
5-7
8-10 11-13 14-16 17-19 20-22 23-25 26-28 29-31 32-34 35-37 38-40 41-43 44-46 47-49 50-52 53-55 56-58 59-61
138.0±27.2 76.3±15.9 63.9±13.6 54.4±15.5 64.9±18.0 55.0±19.4 41.6±16.9 54.4±21.7 60.1±18.7 38.1±9.5 36.0±8.9 54.9±17.8 47.0±15.1 34.0±11.7 30.7±10.7 30.7±10.8 38.2±10.8 47.2±12.5 37.4±15.5
28.5±4.8 22.2±2.7 20.3±2.9 22.1±2.2 16.7±4.0 13.6±2.9 14.8±2.2 10.6±4.4 21.4±2.5 12.3±2.3 15.1±2.4 1602±2.1 13.1±2.6 15.7±2.4 15.1±1.8 14.4±1.8 18.0±2.1 14.8±2.1 14.2±2.2
25.2±3.6 23.6±4.3 16.2±3.5 12.8±3.4 13.7±4.3 8.9±3.0 4.7±1.8 6.6±2.0 7.0±2.8 5.4±1.7 6.5±2.9 4.2±3.0 3.9±2.4 4.0±2.6 3.5±1.8
0-5 5-10 10-15 15-20 20-25 25-30 30-35 35-40 40-45 45-50 50-55 55-60
126.0±25.2 134.5±19.8 111.1±14.9 111.1±19.2 111.1±14.3 88.4±19.7 74.8±37.4 65.7±14.4 56.6±5.5
58.2±16.0 46.2±18.8 40.6±15.7
45.3±8.0 49.4±9.2 37.4±6.1 22.8±5.5 17.5±4.5 20.8±5.9 36.3±5.5 30.5±6.3 25.2±5.5 24.6±4.8 25.2±7.1
51.5±5.1 51.4±8.2 50.3±4.2 64.8±4.5 113.1±5.2 63.1±5.4 52.6±5.9 25.4±5.1 15.4±4.4 7.5±2.9 7.1±3.6 4.6±4.0
Table 2. Total 210Pb, 214Pb and 137Cs in core samples collected from Lake Drūkšiai (Lithuania).
Interval cm
Total 210Pb Bq kg-1
214Pb Bq kg-1
137Cs Bq kg-
Depth cm
Total 210Pb Bq kg-1
214Pb Bq kg-1
137Cs Bq kg-
0-2.6 2.6-5.3 5.3-7 7-9 9-11 11-13 13-14 14-15 15-17 17-18 18-19 19-20 20-21 21-22 22-23 23-24 24-25 25-26 26-27 27-28 28-29 29-30 30-31 31-32 32-33
462.4±74.1 359.9±56.5 377.9±53.6 263.2±33.1 258.7±36.4 281.7±31.4 336.3±34.4 335.3±58.0 303.7±45.9 317.4±82.8 288.1±39.9 292.0±33.1 245.3±28.4 311.1±54.1 243.9±41.1 234.6±39.4 239.4±39.6 174.1±27.3 210.8±27.9 130.5±34.2 165.0±26.2 209.6±39.1 188.1±24.0 142.3±29.8 159.2±41.1
52,1±17.1 57.6±14.8 69.9±12.9 61.6±13.5 55.4±10.9 52.2±11.6 40.2±8.7 48.3±12.1 48.9±11.7 67.0±13.2 75.4±14.5 44.3±10.3 38.5±9.7 61.4±16.4 50.0±14.0 55.8±7.0 39.6±11.8 28.0±5.4 45.9±8.3 38.3±14.2 43.7±13.5 51.8±15.9 37.3±5.7
33.4±10.7 46.1±10.3
112,8±15.6 95.7±12.9 89.3±10.7 76.7±7.6 68.2±8.8 79.8±10.2 97.8±8.0 99.4±11.4
105.8±10.4 106.2±10.0 92.0±12.4 109.1±14.3 86.0±7.8 92.9±10.9 97.2±10.3 86.4±11.5 92.0±7.3 78.8±6.8 103.2±7.8 83.8±9.3 81.1±6.4
123.3±10.9 137.3±7.4 132.2±11.0 175.6±9.5
33-34 34-35 35-36 36-37 37-38 38-39 39-40 40-41 41-42 42-43 43-44 44-45 45-46 46-47 47-48 48-49 49-50 50-51 51-52 52-53 53-54 54-55 55-56 56-57 57-58
194.7±38.5 173.5±61.7 159.5±24.8 146.1±32.1 157.0±37.8 172.0±23.8 200.3±50.0 197.5±46.1 210.3±47.2 147.4±37.3 177.0±34.8 284.2±75.1 201.1±38.2 169.4±30.4 160.5±36.9 142.3±35.3 145.7±37.5 175.1±40.6 178.9±48.7 159.5±42.4 104.1±27.0 97.1±42.3 114.1±30.0 112.9±38.0 100.5±26.0
38.2±9.7 48.7±12.1 38.9±8.7 41.4±5.7 41.8±12.1 54.4±10.1 56.3±11.8 59.9±11.2 36.9±8.0 36.0±7.1 51.5±11.1 18.5±10.9 49.5±8.3 36.7±11.0 45.5±11.9 46.3±10.0 46.0±10.7 41.3±9.3 34.4±7.9 34.7±7.8 22.6±5.6 22.7±5.0
49.5±14.0 25.7±7.0 32.4±8.4
112.7±7.9 88.7±11.4 70.7±7.1 74.8±7.3
83.7±10.0 86.3±9.5
105.4±8.8 111.4±10.0 113.3±14.5 124.1±10.4 153.7±12.2 188.8±20.1 137.1±6.5
166.6±10.1 234.9±11.9 247.2±11.3 157.9±11.5 155.4±11.3 119.2±6.3 47.4±8.4 24.8±4.3 17.1±4.6 17.9±4.2 18.9±6.6 19.1±5.4
Fig. 2 shows variations in the 137Cs activity versus CRS age dates and depth of core from Lake Sventes. The 137Cs activity was detected at 35-37 cm (6.5±2.9 Bq kg-1), which may record the onset of the globally significant levels of 137Cs fallout in 1954. The next peak (7.0±2.8 Bq kg-1) may record the nuclear weapons fallout
occuring in 1963 which appears at 29-31 cm. Secondary peak at 6 cm (25.2±3.6 Bq kg-1) and 9 cm (23.6±4.3 Bq kg-1) are to have been caused by the Chernobyl accident. As demonstrated in Fig. 2, the 137Cs activities do not have a well-defined 137Cs 1954-1963 peaks, so we do not take the 137Cs dates as reliable.
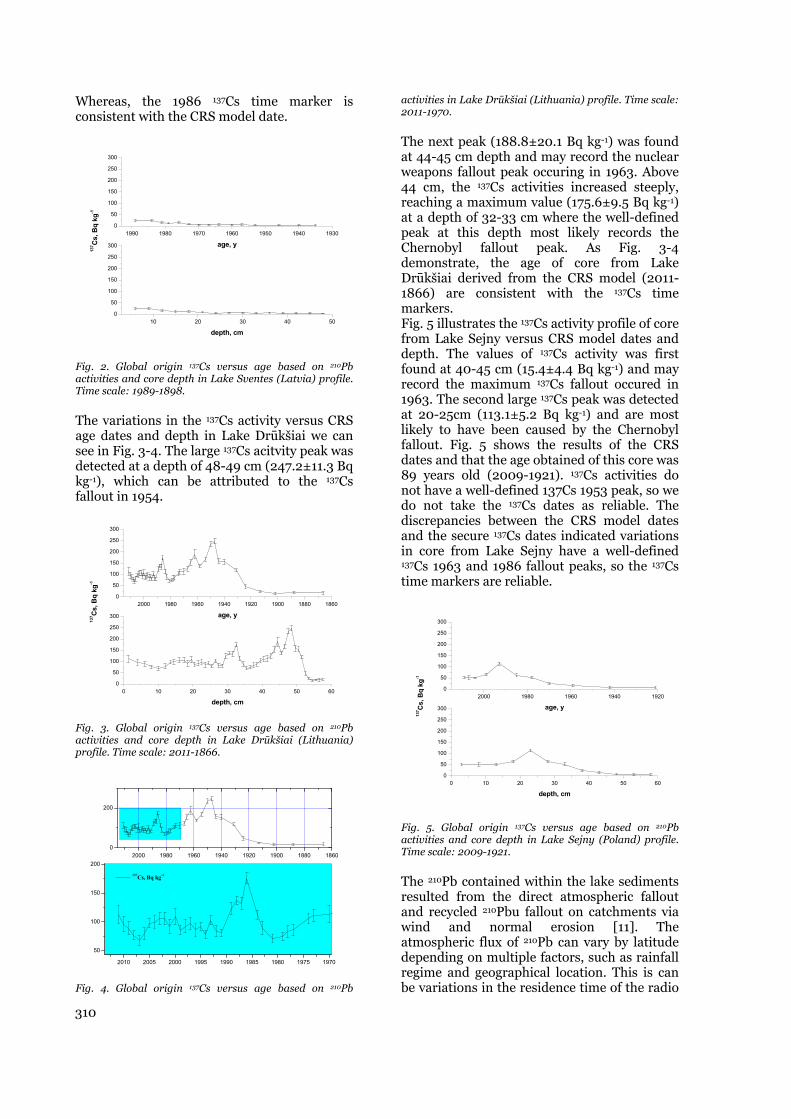
Whereas, the 1986 137Cs time marker is consistent with the CRS model date.
10 20 30 40 500
50
100
150
200
250
300
depth, cm
1990 1980 1970 1960 1950 1940 19300
50
100
150
200
250
300
137 C
s, B
q kg
-1
age, y
Fig. 2. Global origin 137Cs versus age based on 210Pb activities and core depth in Lake Sventes (Latvia) profile. Time scale: 1989-1898.
The variations in the 137Cs activity versus CRS age dates and depth in Lake Drūkšiai we can see in Fig. 3-4. The large 137Cs acitvity peak was detected at a depth of 48-49 cm (247.2±11.3 Bq kg-1), which can be attributed to the 137Cs fallout in 1954.
0 10 20 30 40 50 600
50
100
150
200
250
300
depth, cm
2000 1980 1960 1940 1920 1900 1880 18600
50
100
150
200
250
300
137 C
s, B
q kg
-1
age, y
Fig. 3. Global origin 137Cs versus age based on 210Pb activities and core depth in Lake Drūkšiai (Lithuania) profile. Time scale: 2011-1866.
2000 1980 1960 1940 1920 1900 1880 18600
200
2010 2005 2000 1995 1990 1985 1980 1975 1970
50
100
150
200
137Cs, Bq kg-1
Fig. 4. Global origin 137Cs versus age based on 210Pb
activities in Lake Drūkšiai (Lithuania) profile. Time scale: 2011-1970.
The next peak (188.8±20.1 Bq kg-1) was found at 44-45 cm depth and may record the nuclear weapons fallout peak occuring in 1963. Above 44 cm, the 137Cs activities increased steeply, reaching a maximum value (175.6±9.5 Bq kg-1) at a depth of 32-33 cm where the well-defined peak at this depth most likely records the Chernobyl fallout peak. As Fig. 3-4 demonstrate, the age of core from Lake Drūkšiai derived from the CRS model (2011-1866) are consistent with the 137Cs time markers. Fig. 5 illustrates the 137Cs activity profile of core from Lake Sejny versus CRS model dates and depth. The values of 137Cs activity was first found at 40-45 cm (15.4±4.4 Bq kg-1) and may record the maximum 137Cs fallout occured in 1963. The second large 137Cs peak was detected at 20-25cm (113.1±5.2 Bq kg-1) and are most likely to have been caused by the Chernobyl fallout. Fig. 5 shows the results of the CRS dates and that the age obtained of this core was 89 years old (2009-1921). 137Cs activities do not have a well-defined 137Cs 1953 peak, so we do not take the 137Cs dates as reliable. The discrepancies between the CRS model dates and the secure 137Cs dates indicated variations in core from Lake Sejny have a well-defined 137Cs 1963 and 1986 fallout peaks, so the 137Cs time markers are reliable.
0 10 20 30 40 50 600
50
100
150
200
250
300
depth, cm
2000 1980 1960 1940 19200
50
100
150
200
250
300
137 C
s, B
q kg
-1
age, y
Fig. 5. Global origin 137Cs versus age based on 210Pb activities and core depth in Lake Sejny (Poland) profile. Time scale: 2009-1921.
The 210Pb contained within the lake sediments resulted from the direct atmospheric fallout and recycled 210Pbu fallout on catchments via wind and normal erosion [11]. The atmospheric flux of 210Pb can vary by latitude depending on multiple factors, such as rainfall regime and geographical location. This is can be variations in the residence time of the radio
310
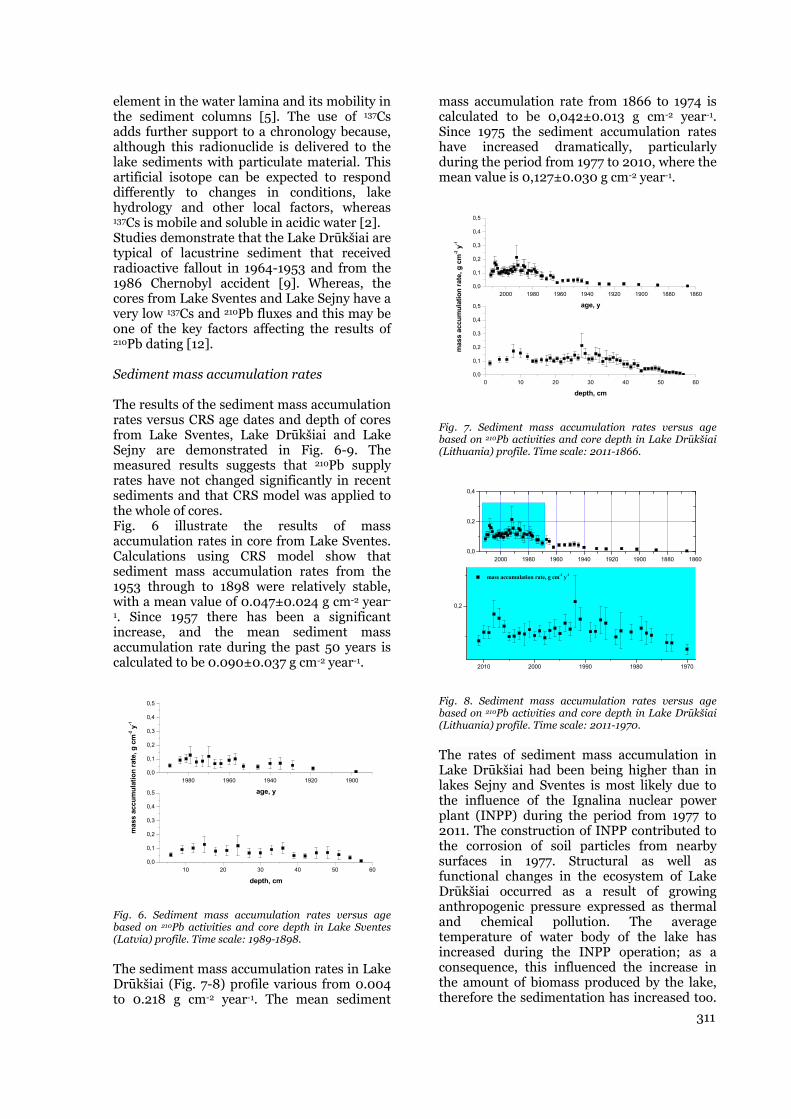
element in the water lamina and its mobility in the sediment columns [5]. The use of 137Cs adds further support to a chronology because, although this radionuclide is delivered to the lake sediments with particulate material. This artificial isotope can be expected to respond differently to changes in conditions, lake hydrology and other local factors, whereas 137Cs is mobile and soluble in acidic water [2]. Studies demonstrate that the Lake Drūkšiai are typical of lacustrine sediment that received radioactive fallout in 1964-1953 and from the 1986 Chernobyl accident [9]. Whereas, the cores from Lake Sventes and Lake Sejny have a very low 137Cs and 210Pb fluxes and this may be one of the key factors affecting the results of 210Pb dating [12]. Sediment mass accumulation rates The results of the sediment mass accumulation rates versus CRS age dates and depth of cores from Lake Sventes, Lake Drūkšiai and Lake Sejny are demonstrated in Fig. 6-9. The measured results suggests that 210Pb supply rates have not changed significantly in recent sediments and that CRS model was applied to the whole of cores. Fig. 6 illustrate the results of mass accumulation rates in core from Lake Sventes. Calculations using CRS model show that sediment mass accumulation rates from the 1953 through to 1898 were relatively stable, with a mean value of 0.047±0.024 g cm-2 year-
1. Since 1957 there has been a significant increase, and the mean sediment mass accumulation rate during the past 50 years is calculated to be 0.090±0.037 g cm-2 year-1.
10 20 30 40 50 600,0
0,1
0,2
0,3
0,4
0,5
depth, cm
1980 1960 1940 1920 19000,0
0,1
0,2
0,3
0,4
0,5
mas
s ac
cum
ulat
ion
rate
, g c
m-2 y
-1
age, y
Fig. 6. Sediment mass accumulation rates versus age based on 210Pb activities and core depth in Lake Sventes (Latvia) profile. Time scale: 1989-1898.
The sediment mass accumulation rates in Lake Drūkšiai (Fig. 7-8) profile various from 0.004 to 0.218 g cm-2 year-1. The mean sediment
mass accumulation rate from 1866 to 1974 is calculated to be 0,042±0.013 g cm-2 year-1. Since 1975 the sediment accumulation rates have increased dramatically, particularly during the period from 1977 to 2010, where the mean value is 0,127±0.030 g cm-2 year-1.
0 10 20 30 40 50 600,0
0,1
0,2
0,3
0,4
0,5
depth, cm
2000 1980 1960 1940 1920 1900 1880 18600,0
0,1
0,2
0,3
0,4
0,5
mas
s ac
cum
ulat
ion
rate
, g c
m-2 y
-1
age, y
Fig. 7. Sediment mass accumulation rates versus age based on 210Pb activities and core depth in Lake Drūkšiai (Lithuania) profile. Time scale: 2011-1866.
2000 1980 1960 1940 1920 1900 1880 18600,0
0,2
0,4
2010 2000 1990 1980 1970
0,2
mass accumulation rate, g cm-2 y-1
Fig. 8. Sediment mass accumulation rates versus age based on 210Pb activities and core depth in Lake Drūkšiai (Lithuania) profile. Time scale: 2011-1970.
The rates of sediment mass accumulation in Lake Drūkšiai had been being higher than in lakes Sejny and Sventes is most likely due to the influence of the Ignalina nuclear power plant (INPP) during the period from 1977 to 2011. The construction of INPP contributed to the corrosion of soil particles from nearby surfaces in 1977. Structural as well as functional changes in the ecosystem of Lake Drūkšiai occurred as a result of growing anthropogenic pressure expressed as thermal and chemical pollution. The average temperature of water body of the lake has increased during the INPP operation; as a consequence, this influenced the increase in the amount of biomass produced by the lake, therefore the sedimentation has increased too.
311

Aqueous medium must to recover after decommissioning of the INPP (in 2009), and the data show a decrease of sediment mass accumulation rate from 2011.
0 10 20 30 40 50 60
0,0
0,1
0,2
0,3
0,4
0,5
depth, cm
2000 1980 1960 1940 1920
0,0
0,1
0,2
0,3
0,4
0,5
mas
s ac
cum
ulat
ion
rate
, g c
m-2 y
-1
age, y
Fig. 9. Sediment mass accumulation rates versus age based on 210Pb activities and core depth in Lake Sejny (Poland) profile. Time scale: 2009-1921.
The average of sediment mass accumulation rates in Lake Sventes profile (Fig. 9) for the whole core is 0.052±0.024 g cm-2 year-1. The mean value of sediment accumulation rates during from 1921 to 1960 were relatively stable - 0,031±0.019 g cm-2 year-1, while since 1970 till 2009 slightly increased, and the mean sediment mass accumulation rate during the past 40 years is calculated to be 0,059±0.026 g cm-2 year-1.
4. CONCLUSIONS
Evaluation of sediment accumulation parameters by radioisotope methods are shown on the example of Lake Sventes (Latvia), Lake Drūkšiai (Lithuania) and Lake Sejny (Poland) sediments. The 210Pb and 137Cs depth distributions in sediment cores have been used to derive estimates of accumulation rates for these sites, assuming a different sediment deposition rate. Positive results have been obtained by combining 210Pb dating method with validating 137Cs nuclear weapons dates. In general, highest sediment accumulation rates occur closest to the bottom sediment surface and values decrease with depth. From the 19th century the sediments accumulated on the bottom of the lakes are characterized by the continuous increase of selected trace elements content of such as Cd, Cu, and Zn For last 20-30 years the concentrations of heavy metals (decrease due to the more efficient sewerage and smaller atmospheric supply. This proxy could be one of
additional options for the improvement of the sediments dating in the following studies.
Acknowledgement: This research was supported by the Open Access to research infrastructure of the Nature Research Centre under Lithuanian open access network initiative.
REFERENCES
1. J. Mažeika, "Use of lead-210 and carbon-14 in investigations of peat accumulation in Aukštumala raised bog, western Lithuania". Baltica, 2006, vol. 19 (1), pp. 30–37.
2. G. Le Roux, W.A. Marshal, "Constructing recent peat accumulation chronologies using atmospheric fall-out radionuclides", Mires and Peat, vol. 7 (2010/11), Article 08, pp. 1–14.
3. P.G. Appleby, F. Oldfield, "The calculation of 210Pb dates assuming a constant rate of supply of unsupported 210Pb to the sediment", Catena, 1978, vol. 5, pp. 1–8.
4. F. Oldfield, P.G. Appleby, 1984. "Empirical Testing of 210Pb dating models for lake sediments". In: Lake Sediments and Environmental History, E. Y. Haworth and J. W. G. Lund (Eds.), Leicester University Press, 1984, pp. 93-114.
5. R.A. Ligero, M. Barrera, M. Casas-Ruiz, "Levels of 137Cs in muddy sediments of the seabed of the Bay of Ca´ diz, Spain. Part I. Vertical and spatial distribution of activities", J. Environ. Radioact., 2005, vol. 80, pp. 75-86.
6. R.A. Ligero, M. Barrera, M. Casas-Ruiz. "Part II. Model of vertical migration of 137Cs", J. Environ. Radioact., 2005, vol. 80, pp. 87–103.
7. W. Froehlich, D. E. Walling, "The use of fallout radionuclides in investigations of sediment sources and overbank sedimentation within the Teesta river basin, Sikkim Himalaya and Ganga-Brahmaputra Plain, India", in: Communications Kick-off Workshop of the IAHS Decade on Prediction in Ungauged Basins–Hydrological Sciences on Mission, P. Hubert, D. Schertzer, K. Takeuchi, S. Koide (Eds.), International Association of Hydrological Sciences, University of Brasilia, Brazil, 2002, pp. 1-11.
8. D. J. Lowe, A. G. Hogg, "Tephrostratigraphy and chronology of the Kaipo Lagoon, and 11,500 years old montane peat bog in Urewera Nacional Park, New Zealand", J. of the Roayl Society of New Zealand, 1986, vol. 16 (1), pp. 25-41.
9. UNSCEAR, 2000. In: Sources and Effects of Ionizing Radiation, Report, Vol. I. United Nations Scientific Committee on the Effects of Atomic Radiation, New York.
10. D.Marčiulionienė, J. Mažeika, B. Lukšienė, O. Jefanova, R. Paškauskas, R. Mikalauskienė, " Anthropogenic Radionuclide Fluxes and Distribution in Bottom Sediments of the Cooling Basin of the Ignalina Nuclear Power", J. of Environ. Radioactivity (in press), DOI: 10.1016/j.jenvrad.2015.03.07.
11. P. G. Appleby. Sediment records of fallout radionuclides and their application to studies of sedimentewater interactions. Water Air and Soil Pollution 99, 1997, pp 573-586.
12. S. Liu, Narentuy, B. Xia, G. Chu M. Tian. Using 210Pbuns and 137Cs to date recent sediment cores from the Badain Jaran Desert, Inner Mongolia, China, Quaternary Geochronology, 12, 2012, pp 30-39.
312
RADIOACTIVITY CONCENTRATIONS IN SPA WATERS – DOSE ASSESSMENT
Nataša B. Sarap 1, Marija M. Janković 1, Ivan Panić 2, Dragana J. Todorović 1
1 University of Belgrade, Vinča Institute of Nuclear Sciences, Radiation and Environmental Protection Department, Belgrade, Serbia
2 Jaroslav Černi Institute for Development of Water Resources, Belgrade, Serbia
Abstract. In this study 6 different spa water samples from Serbia, Hungary and Czech Republic were investigated in order to determine their radioactivity concentrations. These waters have been used on a large scale for medical and bathing purposes; for therapy, rehabilitation and recreation and also used for drinking, which is the most important. The obtained results showed that natural activity concentrations of alpha emitting radionuclides was within World Health Organization recommended levels and Serbian applicable regulations, but the gross beta activity exceed 1 Bq L-1 for some of the samples. Considering the fact that gross beta activity in four samples was higher than recommended levels, gamma spectrometric measurements were performed, in order to identify radionuclides which caused increase of the gross beta activity. It was found that 40K was responsible for the elevated gross beta activity. Based on the obtained results the annual effective dose was calculated.
Key words: spa water, gross alpha, gross beta, gamma spectrometry, dose assessment
1. INTRODUCTION
Many thermal and mineral spring waters contain relatively high concentrations of naturally occuring radionuclides, alpha emitters (238U, 232Th, 226Ra) and beta emitters derived from the natural series uranium, thorium and actinium, 40K and artificial isotopes, 90Sr and 137Cs. However, these radioactive substances, even in small accounts, may produce a damaging biological effect, and ingested and inhaled radiation can be a serious health problem [1,2].
Determination of the gross alpha and beta activity is widely used as the first step of the radiological characterization of drinking waters and it makes it possible to screen samples for relative levels of radioactivity [3]. The recommended levels of gross alpha and gross beta radioactivity concentration in drinking water are below 0.5 and 1.0 Bq L-1, respectively [4,5]. If one of the recommended values is exceeded, radionuclides have to be identified by alpha and/or gamma spectrometry, and their individual activity concentrations need to be measured. These guidelines ensure an exposure lower than 0.1 mSv y-
1 assuming a water consumption rate of 2 L d-1. If the estimated dose is higher than 0.1 mSv y-1 the reduction in consumption or radionuclide concentration is necessary [4,5].
Spa Junaković is located in the northwest of Bačka, 4 km away from Apatin of Serbia. Water
belongs to alkali-muriatic, bromine iodine waters with temperature of 25 0C. In Spa Junaković it is about well-mineralized water with large amount of
sodium, chloride, important amount of iodine, hydro carbonates and hydrogen-sulphide [6].
Vrnjačka Spa is located in central Serbia, 200 km south of Belgrade. Mineral water of Vrnjačka Spa falls into two categories: warm mineral water (36.5 0C) is one of the alkaline carbonic acid homeothermic and cold mineral water (14 0C, 17 0C, 25 0C) belongs to the group of alkaline-earth achrotopegae.
Spa Selters is located in central Serbia, 46 km south of Belgrade. The mineral waters issue from two springs. The older one provides alkaline-muriatic acidic water (31-32 0C), rich with sodium bicarbonate and chlorine. The other spring, in use since 1978, issues the water that belongs to the group of alkaline muriatic carbon-acidic hyper-thermal (50 0C).
Mataruška Spa is located in central Serbia, situated on the right bank of the river Ibar, 160 km from Belgrade. Mineral water from Mataruška Spa is hypothermal (48-52 0C), with the highest concentration of sulfur in the south of Europe (127 mg L-1).
Spa Saint Erzsebet in Morahalom (near Szeged) is located in the south-east of Hungary, 12 km away from the border with Serbia. Alkaline thermal water with hydrocarbon, chlorides and iodine comes from
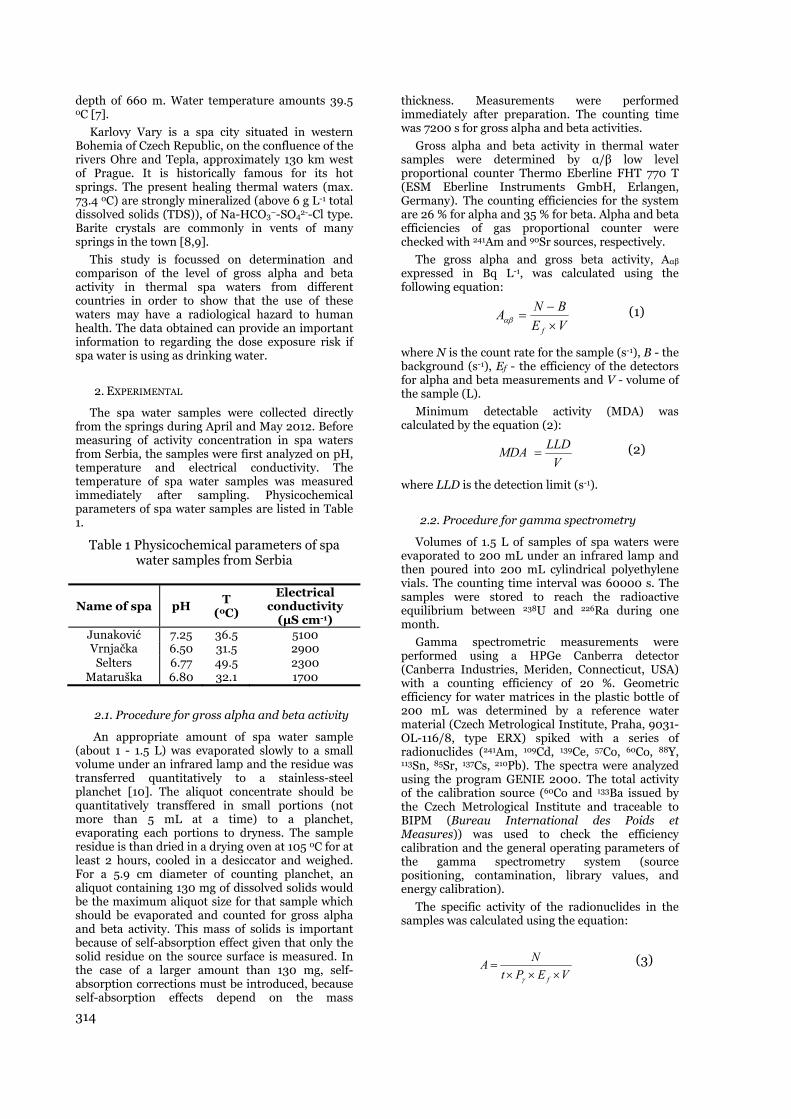
314
depth of 660 m. Water temperature amounts 39.5 0C [7].
Karlovy Vary is a spa city situated in western Bohemia of Czech Republic, on the confluence of the rivers Ohre and Tepla, approximately 130 km west of Prague. It is historically famous for its hot springs. The present healing thermal waters (max. 73.4 0C) are strongly mineralized (above 6 g L-1 total dissolved solids (TDS)), of Na-HCO3−-SO42--Cl type. Barite crystals are commonly in vents of many springs in the town [8,9].
This study is focussed on determination and comparison of the level of gross alpha and beta activity in thermal spa waters from different countries in order to show that the use of these waters may have a radiological hazard to human health. The data obtained can provide an important information to regarding the dose exposure risk if spa water is using as drinking water.
2. EXPERIMENTAL
The spa water samples were collected directly from the springs during April and May 2012. Before measuring of activity concentration in spa waters from Serbia, the samples were first analyzed on pH, temperature and electrical conductivity. The temperature of spa water samples was measured immediately after sampling. Physicochemical parameters of spa water samples are listed in Table 1.
Table 1 Physicochemical parameters of spa water samples from Serbia
Name of spa
pH
T (0C)
Electrical conductivity
(μS cm-1) Junaković 7.25 36.5 5100 Vrnjačka 6.50 31.5 2900 Selters 6.77 49.5 2300
Mataruška 6.80 32.1 1700
2.1. Procedure for gross alpha and beta activity
An appropriate amount of spa water sample (about 1 - 1.5 L) was evaporated slowly to a small volume under an infrared lamp and the residue was transferred quantitatively to a stainless-steel planchet [10]. The aliquot concentrate should be quantitatively transffered in small portions (not more than 5 mL at a time) to a planchet, evaporating each portions to dryness. The sample residue is than dried in a drying oven at 105 0C for at least 2 hours, cooled in a desiccator and weighed. For a 5.9 cm diameter of counting planchet, an aliquot containing 130 mg of dissolved solids would be the maximum aliquot size for that sample which should be evaporated and counted for gross alpha and beta activity. This mass of solids is important because of self-absorption effect given that only the solid residue on the source surface is measured. In the case of a larger amount than 130 mg, self-absorption corrections must be introduced, because self-absorption effects depend on the mass
thickness. Measurements were performed immediately after preparation. The counting time was 7200 s for gross alpha and beta activities.
Gross alpha and beta activity in thermal water samples were determined by α/β low level proportional counter Thermo Eberline FHT 770 T (ESM Eberline Instruments GmbH, Erlangen, Germany). The counting efficiencies for the system are 26 % for alpha and 35 % for beta. Alpha and beta efficiencies of gas proportional counter were checked with 241Am and 90Sr sources, respectively.
The gross alpha and gross beta activity, Aαβ expressed in Bq L-1, was calculated using the following equation:
VE
BNA
f
(1)
where N is the count rate for the sample (s-1), B - the background (s-1), Ef - the efficiency of the detectors for alpha and beta measurements and V - volume of the sample (L).
Minimum detectable activity (MDA) was calculated by the equation (2):
V
LLDMDA (2)
where LLD is the detection limit (s-1).
2.2. Procedure for gamma spectrometry
Volumes of 1.5 L of samples of spa waters were evaporated to 200 mL under an infrared lamp and then poured into 200 mL cylindrical polyethylene vials. The counting time interval was 60000 s. The samples were stored to reach the radioactive equilibrium between 238U and 226Ra during one month.
Gamma spectrometric measurements were performed using a HPGe Canberra detector (Canberra Industries, Meriden, Connecticut, USA) with a counting efficiency of 20 %. Geometric efficiency for water matrices in the plastic bottle of 200 mL was determined by a reference water material (Czech Metrological Institute, Praha, 9031-OL-116/8, type ERX) spiked with a series of radionuclides (241Am, 109Cd, 139Ce, 57Co, 60Co, 88Y, 113Sn, 85Sr, 137Cs, 210Pb). The spectra were analyzed using the program GENIE 2000. The total activity of the calibration source (60Co and 133Ba issued by the Czech Metrological Institute and traceable to BIPM (Bureau International des Poids et Measures)) was used to check the efficiency calibration and the general operating parameters of the gamma spectrometry system (source positioning, contamination, library values, and energy calibration).
The specific activity of the radionuclides in the samples was calculated using the equation:
VEPt
NA
f
(3)

315
where N is the count rate of the sample, Pγ - probability of gamma decay (%), Ef - the efficiency of the detector and V - volume of the sample (L).
Minimum detectable activity was calculated by the equation (4):
V
LLDMDA (4)
where LLD is the detection limit,
BLLD 65.471.2 and B - background. The combined measurement uncertainty of results was calculated at the 95 % level of confidence (k=2).
3. RESULTS AND DISCUSSION
The gross alpha and gross beta activity concentrations in thermal spa waters taken from different countries are given in Table 2. It can be seen from Table 2 the gross beta activities are higher than the corresponding the gross alpha activities. For 4 spa water samples the gross alpha activity was lower than the minimum detectable activity (MDA). The activity values of the rest two samples were higher than MDA but below than recommended level of 0.5 Bq L-1 for gross alpha activity [4,5]. The gross beta activity ranged between 0.13 and 4.3 Bq L-1. The values of gross beta activity only for 2 spa water samples are lower than recommended upper limit value of 1 Bq L-1 [4,5]. On the other hand, if these thermal waters are used for drinking, the criteria of radiological safety have been met only for water samples from Mataruška Spa and Spa Saint Erzsebet. Table 2 The gross alpha and gross beta activity
concentrations of spa waters (Bq L-1)
Name of spa Gross alpha
activity Gross beta
activity Junaković 0.18 ± 0.05 1.8 ± 0.3 Vrnjačka < 0.13 1.7 ± 0.3 Selters < 0.41 1.5 ± 0.2
Mataruška < 0.07 0.50 ± 0.05 Saint Erzsebet < 0.04 0.13 ± 0.02 Karlovy Vary 0.36 ± 0.09 4.3 ± 0.5
Comparison the results of the gross alpha and gross beta activity concentrations in spa water samples obtained in this study with the values obtained in the other studies is presented in Table 3. The obtained values are in good agreement with those obtained in other studies.
Table 3 Literature data of gross alpha and gross beta activity concentrations (Bq L-1)
Due to the fact that the gross beta activity in 4 spa water samples (Junaković, Vrnjačka, Selters and Karlovy Vary) was higher than the recommended level of 1 Bq L-1 [4,5], it was necessary to performed gamma spectrometry. Table 4 presents the results of gamma spectrometric measurements. As can be seen from Table 4, the activitiy concentrations of the investigated radionuclides are lower than MDA, except for 40K. Comparison the gross beta activity with the results of gamma spectrometric determination of 40K and the fact that the 40K is included in the gross beta activity (89 %), we can say that the gross beta activity in spa waters is derived only from natural radionuclide 40K.
Table 4 The results of gamma spectrometry for spa water samples (Junaković-1, Vrnjačka-2,
Selters-3, Mataruška-4, Saint Erzsebet-5, Karlovy Vary-6) expressed in Bq L-1
Spa 226Ra 235U 238U 232Th 40K 137Cs
1 < 0.5 < 1.8 < 2.9 < 0.3 1.5 ± 0.6 < 0.2 2 < 0.08 < 1.3 < 0.2 <0.06 1.6 ± 0.3 < 0.04 3 < 0.8 < 2.1 < 0.4 < 0.4 1.3 ± 0.2 < 0.03 4 < 0.1 < 0.9 < 0.1 < 0.01 0.5 ± 0.1 < 0.05 5 < 0.8 < 0.3 < 4.7 < 0.7 < 0.5 < 0.2 6 < 0.5 < 2.4 < 2.9 < 0.3 3.2 ± 1.1 < 0.2
If these spa waters are used for drinking, it is necessary to evaluate the annual effective dose. It was assumed that the gross alpha and beta activities originate from 226Ra and 228Ra concentration [16]. The annual effective dose rate (D) can be calculated using the following Equation [17]:
WNSvD (5)
where N is volume which adults drink (our assumption is 200 mL per day or 73 L per year), W - the concentration of the radioisotope (Bq L-1), -
the age dependent dose conversion factor (Sv Bq-1). For calculation, we used the dose conversion factors [18]: 2.8×10⁻⁷ Sv Bq-1 for 226Ra and 6.9×10⁻⁷ Sv Bq-1 for 228Ra. Results for calculated annual effective doses from 226Ra and 228Ra for adults are given in Table 5.
The annual effective dose values due to the ingestion of 226Ra in the spa waters varied from < 0.82 to < 8.38 μSv and from 6.5 to 217 μSv for 228Ra. The calculated values of the annual effective doses are below the WHO recommended reference level of 0.1 mSv, except for the ingestion of 228Ra for Karlovy Vary spa water.
Origin Gross alpha activity
Gross beta activity
Spain (spa water) [11]
0.07 - 2.42 0.1 - 5.8
Turkey (thermal water) [12,13]
0.060 - 3.909 0.12 - 2.097
Hungary (spring water) [3]
0.032 - 1.749 0.033 - 2.02
Brazil (spring water) [14]
0.001 - 0.428 0.12 - 0.86
USA (spring water) [15]
< 0.037 - 31 0.110 - 18.9
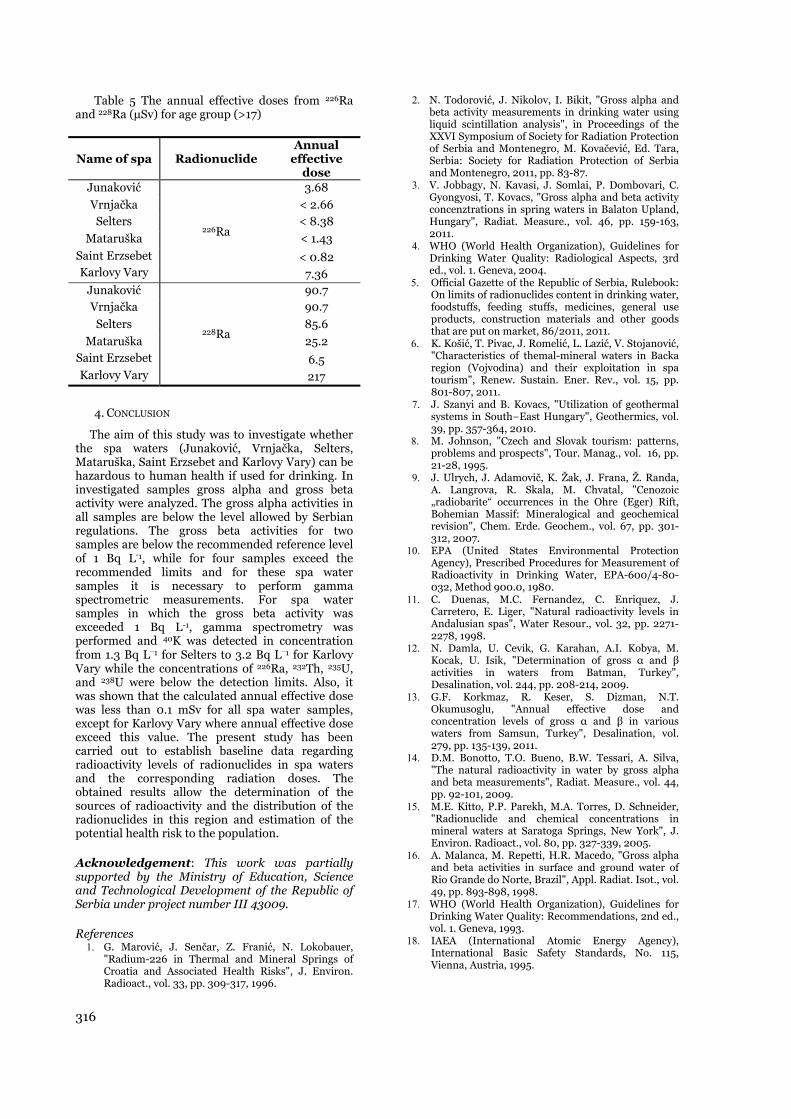
316
Table 5 The annual effective doses from 226Ra and 228Ra (μSv) for age group (>17)
Name of spa Radionuclide Annual
effective dose
Junaković
226Ra
3.68
Vrnjačka < 2.66 Selters < 8.38
Mataruška < 1.43
Saint Erzsebet < 0.82 Karlovy Vary 7.36
Junaković
228Ra
90.7 Vrnjačka 90.7
Selters 85.6
Mataruška 25.2 Saint Erzsebet 6.5 Karlovy Vary 217
4. CONCLUSION
The aim of this study was to investigate whether the spa waters (Junaković, Vrnjačka, Selters, Mataruška, Saint Erzsebet and Karlovy Vary) can be hazardous to human health if used for drinking. In investigated samples gross alpha and gross beta activity were analyzed. The gross alpha activities in all samples are below the level allowed by Serbian regulations. The gross beta activities for two samples are below the recommended reference level of 1 Bq L-1, while for four samples exceed the recommended limits and for these spa water samples it is necessary to perform gamma spectrometric measurements. For spa water samples in which the gross beta activity was exceeded 1 Bq L-1, gamma spectrometry was performed and 40K was detected in concentration from 1.3 Bq L‒1 for Selters to 3.2 Bq L‒1 for Karlovy Vary while the concentrations of 226Ra, 232Th, 235U, and 238U were below the detection limits. Also, it was shown that the calculated annual effective dose was less than 0.1 mSv for all spa water samples, except for Karlovy Vary where annual effective dose exceed this value. The present study has been carried out to establish baseline data regarding radioactivity levels of radionuclides in spa waters and the corresponding radiation doses. The obtained results allow the determination of the sources of radioactivity and the distribution of the radionuclides in this region and estimation of the potential health risk to the population.
Acknowledgement: This work was partially supported by the Ministry of Education, Science and Technological Development of the Republic of Serbia under project number III 43009.
References 1. G. Marović, J. Senčar, Z. Franić, N. Lokobauer,
"Radium-226 in Thermal and Mineral Springs of Croatia and Associated Health Risks", J. Environ. Radioact., vol. 33, pp. 309-317, 1996.
2. N. Todorović, J. Nikolov, I. Bikit, "Gross alpha and beta activity measurements in drinking water using liquid scintillation analysis", in Proceedings of the XXVI Symposium of Society for Radiation Protection of Serbia and Montenegro, M. Kovačević, Ed. Tara, Serbia: Society for Radiation Protection of Serbia and Montenegro, 2011, pp. 83-87.
3. V. Jobbagy, N. Kavasi, J. Somlai, P. Dombovari, C. Gyongyosi, T. Kovacs, "Gross alpha and beta activity concenztrations in spring waters in Balaton Upland, Hungary", Radiat. Measure., vol. 46, pp. 159-163, 2011.
4. WHO (World Health Organization), Guidelines for Drinking Water Quality: Radiological Aspects, 3rd ed., vol. 1. Geneva, 2004.
5. Official Gazette of the Republic of Serbia, Rulebook: On limits of radionuclides content in drinking water, foodstuffs, feeding stuffs, medicines, general use products, construction materials and other goods that are put on market, 86/2011, 2011.
6. K. Košić, T. Pivac, J. Romelić, L. Lazić, V. Stojanović, "Characteristics of themal-mineral waters in Backa region (Vojvodina) and their exploitation in spa tourism", Renew. Sustain. Ener. Rev., vol. 15, pp. 801-807, 2011.
7. J. Szanyi and B. Kovacs, "Utilization of geothermal systems in South−East Hungary", Geothermics, vol. 39, pp. 357-364, 2010.
8. M. Johnson, "Czech and Slovak tourism: patterns, problems and prospects", Tour. Manag., vol. 16, pp. 21-28, 1995.
9. J. Ulrych, J. Adamovič, K. Žak, J. Frana, Ž. Randa, A. Langrova, R. Skala, M. Chvatal, "Cenozoic „radiobarite“ occurrences in the Ohre (Eger) Rift, Bohemian Massif: Mineralogical and geochemical revision", Chem. Erde. Geochem., vol. 67, pp. 301-312, 2007.
10. EPA (United States Environmental Protection Agency), Prescribed Procedures for Measurement of Radioactivity in Drinking Water, EPA-600/4-80-032, Method 900.0, 1980.
11. C. Duenas, M.C. Fernandez, C. Enriquez, J. Carretero, E. Liger, "Natural radioactivity levels in Andalusian spas", Water Resour., vol. 32, pp. 2271-2278, 1998.
12. N. Damla, U. Cevik, G. Karahan, A.I. Kobya, M. Kocak, U. Isik, "Determination of gross α and β activities in waters from Batman, Turkey", Desalination, vol. 244, pp. 208-214, 2009.
13. G.F. Korkmaz, R. Keser, S. Dizman, N.T. Okumusoglu, "Annual effective dose and concentration levels of gross α and β in various waters from Samsun, Turkey", Desalination, vol. 279, pp. 135-139, 2011.
14. D.M. Bonotto, T.O. Bueno, B.W. Tessari, A. Silva, "The natural radioactivity in water by gross alpha and beta measurements", Radiat. Measure., vol. 44, pp. 92-101, 2009.
15. M.E. Kitto, P.P. Parekh, M.A. Torres, D. Schneider, "Radionuclide and chemical concentrations in mineral waters at Saratoga Springs, New York", J. Environ. Radioact., vol. 80, pp. 327-339, 2005.
16. A. Malanca, M. Repetti, H.R. Macedo, "Gross alpha and beta activities in surface and ground water of Rio Grande do Norte, Brazil", Appl. Radiat. Isot., vol. 49, pp. 893-898, 1998.
17. WHO (World Health Organization), Guidelines for Drinking Water Quality: Recommendations, 2nd ed., vol. 1. Geneva, 1993.
18. IAEA (International Atomic Energy Agency), International Basic Safety Standards, No. 115, Vienna, Austria, 1995.
PREDICTABILITY OF LEAD-210 IN SURFACE AIR BASED ON MULTIVARIATE ANALYSIS
Jelena Ajtić 1,*, Dimitrije Maletić 2, Đorđe Stratimirović 3,*, Suzana Blesić 4,*, Jelena Nikolić 5, Vladimir Đurđević 6, and Dragana Todorović 5
1 University of Belgrade, Faculty of Veterinary Medicine, Belgrade, Serbia * Institute for Research and Advancement in Complex Systems, Belgrade, Serbia
2 University of Belgrade, Institute of Physics, Belgrade, Serbia 3 University of Belgrade, Faculty of Dental Medicine, Belgrade, Serbia
4 University of Belgrade, Institute of Medical Research, Belgrade, Serbia 5 University of Belgrade, Vinča Institute of Nuclear Sciences, Belgrade, Serbia
6 University of Belgrade, Faculty of Physics, Institute of Meteorology, Belgrade, Serbia
Abstract. Dependence of the lead-210 activity concentration in surface air on meteorological variables and teleconnection indices is investigated using multivariate analysis, which gives the Boosted Decision Trees method as the most suitable for variable analysis. A mapped functional behaviour of the lead-210 activity concentration is further obtained, and used to test predictability of lead-210 in surface air. The results show an agreement between the predicted and measured values. The temporal evolution of the measured activities is satisfactorily matched by the prediction. The largest qualitative differences are obtained for winter months.
Key words: lead-210, surface air, meteorological variables, teleconnection indices, multivariate analysis, wavelet transform analysis
1. INTRODUCTION
Lead-210 is a naturally occurring radionuclide with a half-life of 22.23 years. The main source of 210Pb in surface air is its radioactive parent radon-222 that emanates from the soil. After formation, 210Pb attaches to aerosols whose fate is governed by atmospheric circulation and removal processes.
A number of studies that looked into the 210Pb activity concentrations at different measuring sites have shown a uniform radionuclide distribution, both in the vertical and horizontal. For example, [1] showed no significant variations in the 210Pb activity concentration at three locations over distance of approximately 200 km, and still noted a case in which the 210Pb activity concentration rapidly changed due to a passage of a cold front. Similarly, [2] investigated differences in the 210Pb activity concentration between two measurement sites at a distance of 12 km in the horizontal and of 800 m in the vertical. Their results also showed that over longer periods of time, the radionuclide was well mixed within the atmosphere. Further, [3] found good correlation between the 210Pb activity concentrations across two sites 100 km apart, which were influenced by different local conditions, including different prevalent winds.
On the other hand, the vertical profile of the 210Pb activity concentration in the atmosphere has been shown to reflect the fact that the radionuclide
source is in the lowermost layer - surface air masses are richer in 210Pb than air masses from higher altitudes, with the sharpest decrease in activity concentration between the ground and an altitude of 3 km [4, 5]. Further, the 210Pb activity concentration is higher in continental air masses than in air masses originating over a body of water [2, 6, 7], which results in the radionuclide activity concentration variations in the horizontal, and also explains temporal differences in a location under influence of interchangeable winds of either continental or maritime origin [2].
The above mentioned studies, however, did not include an analysis of 210Pb relation with large-scale atmospheric circulation. The North Atlantic Oscillation (NAO) index is one of the most commonly used teleconnection indices to describe a large-scale circulation pattern over the North Atlantic Ocean and surrounding land masses [8]. The two oscillation phases of NAO induce changes in large-scale circulation patterns [9], which further reflect on local weather conditions especially over eastern North America and across Europe, including Serbia [10]. The Polar/Eurasia pattern [8] is another teleconnection that has an impact on weather in Europe [11]. Further, the East Atlantic/Western Russia pattern [8] influences the amount of precipitation in southeast part of Europe [12], and can thus be a contributing factor in the amount of 210Pb in surface air.
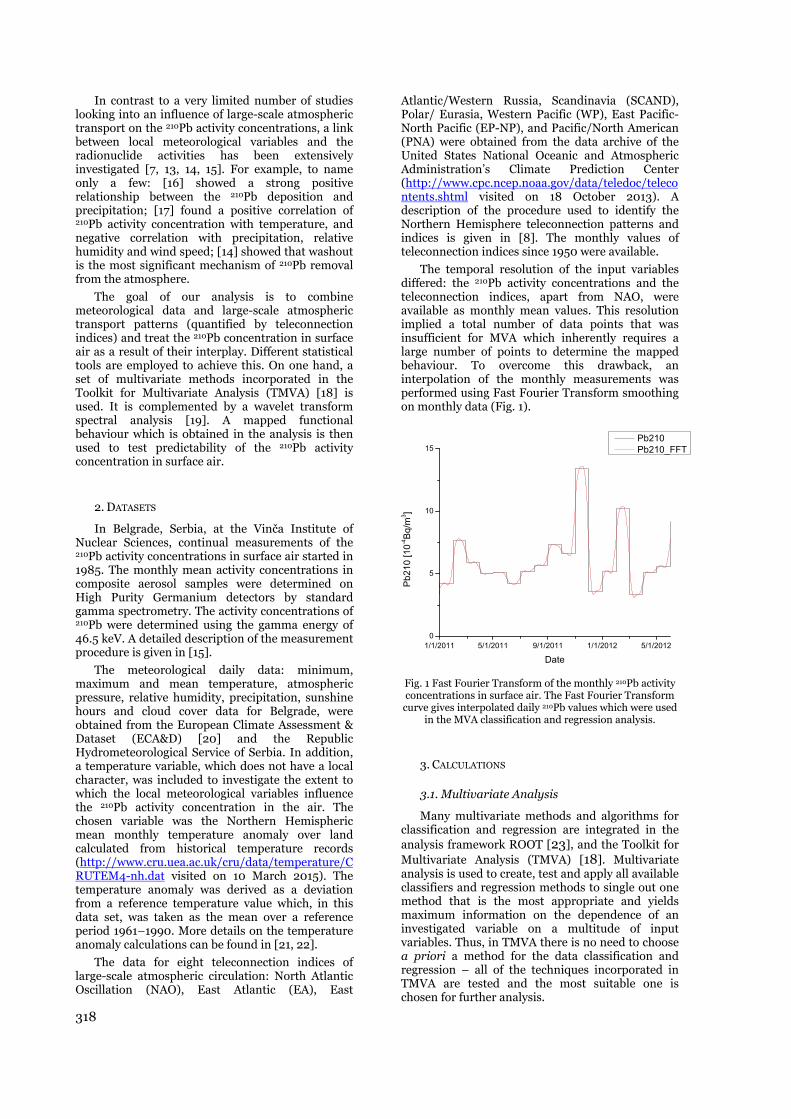
318
In contrast to a very limited number of studies looking into an influence of large-scale atmospheric transport on the 210Pb activity concentrations, a link between local meteorological variables and the radionuclide activities has been extensively investigated [7, 13, 14, 15]. For example, to name only a few: [16] showed a strong positive relationship between the 210Pb deposition and precipitation; [17] found a positive correlation of 210Pb activity concentration with temperature, and negative correlation with precipitation, relative humidity and wind speed; [14] showed that washout is the most significant mechanism of 210Pb removal from the atmosphere.
The goal of our analysis is to combine meteorological data and large-scale atmospheric transport patterns (quantified by teleconnection indices) and treat the 210Pb concentration in surface air as a result of their interplay. Different statistical tools are employed to achieve this. On one hand, a set of multivariate methods incorporated in the Toolkit for Multivariate Analysis (TMVA) [18] is used. It is complemented by a wavelet transform spectral analysis [19]. A mapped functional behaviour which is obtained in the analysis is then used to test predictability of the 210Pb activity concentration in surface air.
2. DATASETS
In Belgrade, Serbia, at the Vinča Institute of Nuclear Sciences, continual measurements of the 210Pb activity concentrations in surface air started in 1985. The monthly mean activity concentrations in composite aerosol samples were determined on High Purity Germanium detectors by standard gamma spectrometry. The activity concentrations of 210Pb were determined using the gamma energy of 46.5 keV. A detailed description of the measurement procedure is given in [15].
The meteorological daily data: minimum, maximum and mean temperature, atmospheric pressure, relative humidity, precipitation, sunshine hours and cloud cover data for Belgrade, were obtained from the European Climate Assessment & Dataset (ECA&D) [20] and the Republic Hydrometeorological Service of Serbia. In addition, a temperature variable, which does not have a local character, was included to investigate the extent to which the local meteorological variables influence the 210Pb activity concentration in the air. The chosen variable was the Northern Hemispheric mean monthly temperature anomaly over land calculated from historical temperature records (http://www.cru.uea.ac.uk/cru/data/temperature/CRUTEM4-nh.dat visited on 10 March 2015). The temperature anomaly was derived as a deviation from a reference temperature value which, in this data set, was taken as the mean over a reference period 1961–1990. More details on the temperature anomaly calculations can be found in [21, 22].
The data for eight teleconnection indices of large-scale atmospheric circulation: North Atlantic Oscillation (NAO), East Atlantic (EA), East
Atlantic/Western Russia, Scandinavia (SCAND), Polar/ Eurasia, Western Pacific (WP), East Pacific-North Pacific (EP-NP), and Pacific/North American (PNA) were obtained from the data archive of the United States National Oceanic and Atmospheric Administration’s Climate Prediction Center (http://www.cpc.ncep.noaa.gov/data/teledoc/telecontents.shtml visited on 18 October 2013). A description of the procedure used to identify the Northern Hemisphere teleconnection patterns and indices is given in [8]. The monthly values of teleconnection indices since 1950 were available.
The temporal resolution of the input variables differed: the 210Pb activity concentrations and the teleconnection indices, apart from NAO, were available as monthly mean values. This resolution implied a total number of data points that was insufficient for MVA which inherently requires a large number of points to determine the mapped behaviour. To overcome this drawback, an interpolation of the monthly measurements was performed using Fast Fourier Transform smoothing on monthly data (Fig. 1).
Fig. 1 Fast Fourier Transform of the monthly 210Pb activity concentrations in surface air. The Fast Fourier Transform
curve gives interpolated daily 210Pb values which were used in the MVA classification and regression analysis.
3. CALCULATIONS
3.1. Multivariate Analysis
Many multivariate methods and algorithms for classification and regression are integrated in the analysis framework ROOT [23], and the Toolkit for Multivariate Analysis (TMVA) [18]. Multivariate analysis is used to create, test and apply all available classifiers and regression methods to single out one method that is the most appropriate and yields maximum information on the dependence of an investigated variable on a multitude of input variables. Thus, in TMVA there is no need to choose a priori a method for the data classification and regression – all of the techniques incorporated in TMVA are tested and the most suitable one is chosen for further analysis.

319
The TMVA package includes various techniques, such as multi-dimensional likelihood estimation, linear and nonlinear discriminant analysis, artificial neural networks, support vector machine, and boosted/bagged decision trees. All the techniques in TMVA belong to the family of "supervised learning" algorithms. They make use of training events, for which the desired output is known, to determine the mapping function that either describes a decision boundary (classification) or an approximation of the underlying functional behaviour defining the target value (regression). All MVA methods see the same training and test data.
The multivariate methods are compared within the procedure in order to find one which, on the basis of input variables, gives a result satisfactorily close to the observed values of the output variable. More details on calculation procedure are given in [24].
In our analysis, the output variable was the activity concentration of 210Pb in surface air, while the input variables were the nine meteorological variables, one derived variable, and eight teleconnection indices, adding to 18 input variables in total. A multivariate method that gave the best regression results in our study was the Boosted Decision Trees method.
3.1.1. Boosted Decision Trees
Boosted Decision Trees (BDT) is a method in which a decision is reached through a majority vote on a result of several decision trees. A decision tree consists of successive decision nodes which are used to categorise the events in a sample, while BDT represents a forest of such decision trees. The (final) classification for an event is based on a majority vote of the classifications done by each tree in the forest, which ultimately leads to a loss of the straightforward interpretation in a decision tree. More detailed information on training in BDT can be found in [24].
An importance of an input variable is measured by a “variable rank”. In BDT, this measure is derived by counting the number of times a specific variable is used to split decision tree nodes, and then weighting each split occurrence by the separation gain-squared it achieved and by the number of events in the node [18].
3.2. Wavelet Transform Analysis
Wavelet transform (WT) is a standard analytical tool in investigation of time series with nonstationarities at different frequencies [19]. In WT analysis, a calculated global wavelet power spectrum (which corresponds to Fourier power spectrum) is smooth and can therefore be used to estimate characteristic periods in the data sets. To detect these characteristic periods, a standard peak analysis was performed by searching the maximum and saddle (for hidden peaks) points in the global wavelet power spectra of the 210Pb activities.
4. RESULTS AND DISCUSSION
The WT analysis showed a number of characteristic periods in the 210Pb activity concentration in surface air (Fig. 2). The periods are given by the time coordinates of the local maxima in the 210Pb activity concentration power spectrum. Three short characteristic periods were found, with a seasonal one (at 2.6 months) most pronounced. The annual cycle (at 11.8 months) was also evident, as well as a longer period of approximately three years (at 36.5 months). Apart from the annual cycle [2, 14, 15], the other 210Pb periodicities have not been studied in detail.
months
Fig. 2 Power spectrum of the 210Pb activity concentration in surface air. Positions of the maximum and saddle points
are marked with the assigned values of characteristic time in months.
To allow for the prominent annual cycle in the 210Pb activity concentration in surface air, another input variable, called MonthDay, was introduced in the analysis. The MonthDay variable is purely mathematical – its values represent a sum of the month number (1 to 12) and the day number in a month divided by the total number of days in the given month. For example, a MonthDay value for 10 January is 1+10/31. This variable has an annual cycle and thus serves as a proxy of any contributing variable which is not specified in the analysis but also exhibits an annual cycle.
Prior to the multivariate analysis, the Pearson’s linear correlation coefficients for the input variables and 210Pb activity concentrations were calculated (Tab. 1) using the monthly means. The strongest correlation was found with temperature anomaly. However, that correlation was not significant at the 0.05 level. Statistically significant linear correlation was obtained only for atmospheric pressure and three teleconnection indices: EP-NP, East Atlantic/Western Russia, and Polar/Eurasia.
The calculated correlation coefficients describe the measure of linear correlation between the 210Pb activity concentrations and the input variables. However, apart from linear, other types of dependance between variables could exist. Each method incorporated in the MVA gives its own ranking (as one of the results), which does not necessarily coincide with a ranking of another method, or with the order given by the linear correlation coefficients.

320
Table 1. Pearson’s linear correlation coefficients (r) of the input variables and the 210Pb activity concentration in
surface air, and the BDT variable ranking. The correlation coefficients significant at the 0.05 level are given in bold.
Variable r BDT rank
Temperature anomaly -0.47 1 Precipitation -0.22 18 Atmospheric pressure +0.21 15 EP-NP +0.19 6 Cloud cover -0.16 17 East Atlantic/Western Russia +0.14 8 Polar/Eurasia +0.12 7 NAO +0.10 4 SCAND +0.08 9 Mean temperature -0.08 11 Minimum temperature -0.08 12 Maximum temperature -0.07 14 Relative humidity +0.07 16 Sunshine hours -0.07 13 PNA +0.04 5 WP +0.03 3 EA +0.008 10 MonthDay value N/A 2
4.1. Regression Analysis
A result of MVA regression method training is an approximation of the underlying functional behaviour that defines the dependence of the target value, the 210Pb activity concentrations in our analysis, on the input variables. This set of calculations was based on the measurements performed during the training period, which was from 1985 to 2010 in our case. Predictability of the 210Pb activity concentration in surface air was tested in the ensuing calculations, in which the measurements for 2011 and 2012 were used.
The analysis indicated that the best regression method, in which the output values (evaluated, or predicted, 210Pb activity concentrations) were closest to the measured concentrations, was BDT. In an ensemble of multivariate methods, the average quadratic deviation between the evaluated and measured values was the least for BDT (Fig. 3). The BDT output deviation from the measurements over the training period was close to zero for the majority of data points (Fig. 4), which confirmed the good quality of the regression method.
MethodPDERS KNN LD FDA_GA MLP SVM BDT BDTG
Devia
tio
n f
rom
targ
et
-110
1
10
Training Sample, Average DeviationTraining Sample, truncated Average Dev. (best 90%)Test Sample, Average DeviationTest Sample, truncated Average Dev. (best 90%)
1/2 )2)target - fMVA f
(∑Average Deviation = (
Average Quadratic Deviation versus Method for target 0
Fig. 3 Average quadratic deviation for multivariate
regression methods. The deviation was the least for BDT.
Pb2100 5 10 15 20 25 30
tru
e -
Pb
210
reg
ressio
nP
b210
-4
-3
-2
-1
0
1
2
3
0
20
40
60
80
100
120
140
160
180
200
Output deviation for method: MVA_BDT (test sample)
Fig. 4 Difference between the BDT evaluated and the
measured 210Pb activity concentrations. The colour bar on the right gives the number of data points.
One of the results given by the BDT method is a variable ranking (Table 1). Apart from temperature anomaly (rank 1), all other meteorological variables were ranked as less important than the teleconnection indices. The influence of the large-scale circulation is not well understood, but the local 210Pb activity concentration could be significantly influenced by mesoscale and synoptic scale variations in atmospheric pressure (as quantified by the teleconnection indices). The local variations in atmospheric pressure, on the other hand, could play a minor role (low BDT rank in Table 1).
Similarly, a high rank obtained for temperature anomaly (Table 1) may imply that the 210Pb activity concentration in surface air is to a certain extent insensitive to relatively fast variations in local temperature.
The high rank of the MonthDay variable could indicate an existence of another contributing factor with a strong annual cycle.
4.2. 210Pb activity concentration prediction
The final step in our analysis was an evaluation of the 210Pb activity concentration outside the training period for which the mapped functional behaviour was obtained. In other words, the input variables for 2011 and the first half of 2012 were used to calculate the output variable which was then compared to the measured 210Pb activity concentration over that period (Fig. 5).
The standard deviation of all the absolute and relative differences between the BDT evaluated and measured 210Pb values were 0.6410-4 Bq/m3 and 0.12, respectively.
The temporal evolution of the 210Pb activity concentration was satisfactorily captured by the regression method (Fig. 5). However, the regression was not able to quantitatively predict the observed values in winter periods, when the radionuclide activity concentration reached maximum values. Thus, during January and February 2011, the evaluated values were conspicuously higher than the measured ones, while in November and December of the same year, the evaluation first underestimated and then overestimated the 210Pb
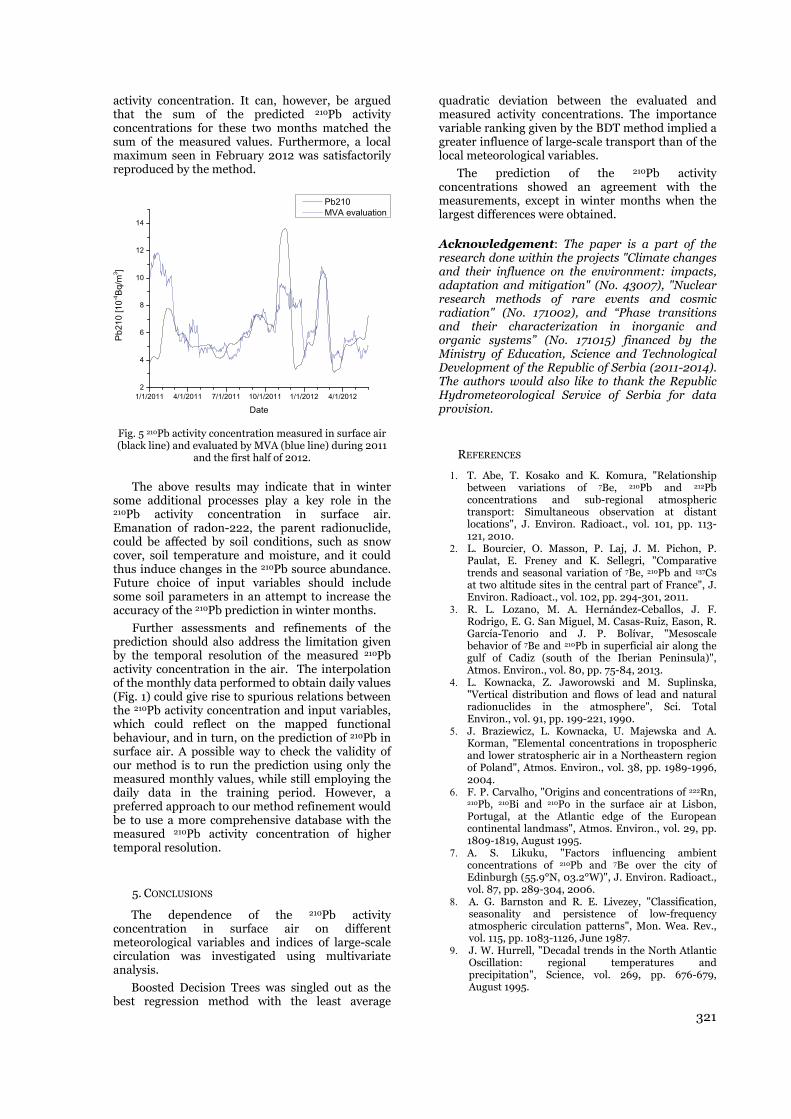
321
activity concentration. It can, however, be argued that the sum of the predicted 210Pb activity concentrations for these two months matched the sum of the measured values. Furthermore, a local maximum seen in February 2012 was satisfactorily reproduced by the method.
Fig. 5 210Pb activity concentration measured in surface air (black line) and evaluated by MVA (blue line) during 2011
and the first half of 2012.
The above results may indicate that in winter some additional processes play a key role in the 210Pb activity concentration in surface air. Emanation of radon-222, the parent radionuclide, could be affected by soil conditions, such as snow cover, soil temperature and moisture, and it could thus induce changes in the 210Pb source abundance. Future choice of input variables should include some soil parameters in an attempt to increase the accuracy of the 210Pb prediction in winter months.
Further assessments and refinements of the prediction should also address the limitation given by the temporal resolution of the measured 210Pb activity concentration in the air. The interpolation of the monthly data performed to obtain daily values (Fig. 1) could give rise to spurious relations between the 210Pb activity concentration and input variables, which could reflect on the mapped functional behaviour, and in turn, on the prediction of 210Pb in surface air. A possible way to check the validity of our method is to run the prediction using only the measured monthly values, while still employing the daily data in the training period. However, a preferred approach to our method refinement would be to use a more comprehensive database with the measured 210Pb activity concentration of higher temporal resolution.
5. CONCLUSIONS
The dependence of the 210Pb activity concentration in surface air on different meteorological variables and indices of large-scale circulation was investigated using multivariate analysis.
Boosted Decision Trees was singled out as the best regression method with the least average
quadratic deviation between the evaluated and measured activity concentrations. The importance variable ranking given by the BDT method implied a greater influence of large-scale transport than of the local meteorological variables.
The prediction of the 210Pb activity concentrations showed an agreement with the measurements, except in winter months when the largest differences were obtained.
Acknowledgement: The paper is a part of the research done within the projects "Climate changes and their influence on the environment: impacts, adaptation and mitigation" (No. 43007), "Nuclear research methods of rare events and cosmic radiation" (No. 171002), and “Phase transitions and their characterization in inorganic and organic systems” (No. 171015) financed by the Ministry of Education, Science and Technological Development of the Republic of Serbia (2011-2014). The authors would also like to thank the Republic Hydrometeorological Service of Serbia for data provision.
REFERENCES
1. T. Abe, T. Kosako and K. Komura, "Relationship between variations of 7Be, 210Pb and 212Pb concentrations and sub-regional atmospheric transport: Simultaneous observation at distant locations", J. Environ. Radioact., vol. 101, pp. 113-121, 2010.
2. L. Bourcier, O. Masson, P. Laj, J. M. Pichon, P. Paulat, E. Freney and K. Sellegri, "Comparative trends and seasonal variation of 7Be, 210Pb and 137Cs at two altitude sites in the central part of France", J. Environ. Radioact., vol. 102, pp. 294-301, 2011.
3. R. L. Lozano, M. A. Hernández-Ceballos, J. F. Rodrigo, E. G. San Miguel, M. Casas-Ruiz, Eason, R. García-Tenorio and J. P. Bolívar, "Mesoscale behavior of 7Be and 210Pb in superficial air along the gulf of Cadiz (south of the Iberian Peninsula)", Atmos. Environ., vol. 80, pp. 75-84, 2013.
4. L. Kownacka, Z. Jaworowski and M. Suplinska, "Vertical distribution and flows of lead and natural radionuclides in the atmosphere", Sci. Total Environ., vol. 91, pp. 199-221, 1990.
5. J. Braziewicz, L. Kownacka, U. Majewska and A. Korman, "Elemental concentrations in tropospheric and lower stratospheric air in a Northeastern region of Poland", Atmos. Environ., vol. 38, pp. 1989-1996, 2004.
6. F. P. Carvalho, "Origins and concentrations of 222Rn, 210Pb, 210Bi and 210Po in the surface air at Lisbon, Portugal, at the Atlantic edge of the European continental landmass", Atmos. Environ., vol. 29, pp. 1809-1819, August 1995.
7. A. S. Likuku, "Factors influencing ambient concentrations of 210Pb and 7Be over the city of Edinburgh (55.9°N, 03.2°W)", J. Environ. Radioact., vol. 87, pp. 289-304, 2006.
8. A. G. Barnston and R. E. Livezey, "Classification, seasonality and persistence of low-frequency atmospheric circulation patterns", Mon. Wea. Rev., vol. 115, pp. 1083-1126, June 1987.
9. J. W. Hurrell, "Decadal trends in the North Atlantic Oscillation: regional temperatures and precipitation", Science, vol. 269, pp. 676-679, August 1995.

322
10. M. Unkašević and I. Tošić, "Trends in temperature indices over Serbia: relationships to large-scale circulation patterns", Int. J. Climatol., vol. 33, pp. 3152–3161, December 2013.
11. C. S. Wedgbrow, R. L. Wilby, H. R. Fox and G. O’Hare, "Prospects for seasonal forecasting of summer drought and low river flow anomalies in England and Wales", Int. J. Climatol., vol 22, pp. 219–236, February 2002.
12. M. Ionita, "The Impact of the East Atlantic/Western Russia Pattern on the Hydroclimatology of Europe from Mid-Winter to Late Spring", Climate, vol. 2, pp. 296-309, 2014.
13. D. McNeary and M. Baskaran, "Residence times and temporal variations of 210Po in aerosols and precipitation from southeastern Michigan, United States", J. Geophys. Res., vol. 112, D04208, 2007.
14. M. K. Pham, M. Betti, H. Nies and P. P. Povinec, "Temporal changes of 7Be, 137Cs and 210Pb activity concentrations in surface air at Monaco and their correlation with meteorological parameters", J. Environ. Radioact., vol. 102, pp. 1045-1054, November 2011.
15. J. Ajtić, D. Todorović, J. Nikolić and V. Djurdjević, "A multi-year study of radioactivity in surface air and its relation to climate variables in Belgrade, Serbia", Nucl. Technol. Radiat., vol. 28, pp. 381-388, December 2013.
16. R. Winkler and G. Rosner, "Seasonal and long-term variation of 210Pb concentration in air, atmospheric deposition rate and total deposition velocity in south Germany", Sci. Total Environ., vol. 263, pp. 57-68, 2000.
17. C. Dueñas, M. C. Fernández, J. Carretero, S. Cañete and M. Pérez, "7Be to 210Pb concentration ratio in ground level air in Málaga (36.7°N, 4.5°W)", Atmos. Res., vol. 92, pp. 49-57, 2009.
18. A. Hoecker, P. Speckmayer, J. Stelzer, J. Therhaag, E. von Toerne, and H. Voss, “TMVA - Toolkit for Multivariate Data Analysis”, PoS ACAT 040, arXiv:physics/070303, 2007.
19. J. Lewalle, M. Farge and K. Schneider, "Wavelet transforms", in Handbook of Experimental Fluid Mechanics, C. Tropea, A. L. Yarin and J. F. Foss, Eds., Springer, 2007, pp 1378-1398.
20. A. M. G. Klein Tank et al., "Daily dataset of 20th-century surface air temperature and precipitation series for the European Climate Assessment", Int. J. Climatol., vol. 22, pp. 1441-1453, 2002.
21. P. D. Jones, D. H. Lister, T. J. Osborn, C. Harpham, M. Salmon and C. P. Morice, "Hemispheric and large-scale land surface air temperature variations: An extensive revision and an update to 2010", J. Geophys. Res., vol. 117, D05127, doi:10.1029/2011JD017139, 2012.
22. J. Osborn and P. D. Jones, " The CRUTEM4 land-surface air temperature data set: construction, previous versions and dissemination via Google Earth ", Earth System Science Data, vol. 6, pp. 61-68, 2014.
23. R. Brun and F. Rademakers, "ROOT - An Object Oriented Data Analysis Framework", Nucl. Instr. Meth. in Phys. Res. A, vol. 389, pp. 81-86, April 1997.
24. D. M. Maletić, V. I. Udovičić , R. M. Banjanac, D. R. Joković, A. L. Dragić, N. B. Veselinović and J. Z. Filipović, "Comparison of multivariate classification and regression methods for the indoor radon measurements", Nucl. Technol. Radiat., vol. 29, pp. 17-23, March 2014.

Milica
AbsNis, cosmspecrangand
Key
1.
Beproduinteraand otroposrate iswith aincreaberylldiameatmosnaturaessentthe st[5]. Pa7 has enviroand ptimes velociconcerainwIn wefrom tresideproceswhen troposearth’betwewhichand gr
CORR
M. Rajačić
Univers
tract. Activity Vranje, Zajeca
mogenic radionctrometry methge 1.8 - 233 Bq/ its value range
y words: beryll
INTRODUCTI
eryllium-7 is auced by sactions of galoxygen in the sphere (~30%s high in the uatmospheric dase with altitlium-7 is prometer of 0.3-0.6sphere is aroual radionucltial, because tudy of atmosarticle reactiv been used as onmental prorecipitation [6 in the tropoities [10-13] anentration of water is affecteet deposit, prethe upper tropent time of bss usually occ air transporsphere is easi’s surface. Teen 7Be activityh means dust fround level air
RELATION BAND GRO
ć , Dragana
sity of Belgrad
y density of berar, Zlatibor, Panuclide berylliuod. Activity den/m2. Based on t
ed from 0.15 to 0
lium-7, gamma
ION
a naturally occspallation ractic cosmic stratosphere
%) [1,2]. Produupper troposp
depth and its ctude [3]. Folmptly attache
6 µm whose reund 20 days [4lide concentthis informa
spheric circulave radionuclide atmospheric cesses such a6,7], aerosol trosphere [8,9], nd the fate of
beryllium-7 ed by both dryecipitation tranposphere to th
beryllium-7 is curs in the sprt from the sily induced by
This paper py density in atfallout by dryr.
BETWEEN BOUND LEVE
a J. TodorovSarap,
e, Vinča InstitDepartm
yllium-7 in atmalic) in Serbia wm-7 was deternsity of berylliuthe obtained re0.59.
a spectrometry,
curring radionreactions th
rays with nit (~70%) and ction of beryll
phere and decconcentrationlowing produ
ed to aerosolsesidence time
4]. The knowleration in ation contribuation of air me such as berytracers for stu
as cloud scaveransit and resi aerosol depopollutants [14 in surfacey and wet procnsports beryll
he ground whe 10 days [15]pring and sumstratosphere ty the heating resents corretmospheric de
y and wet proc
BERYLLIUMEL AIR IN SE
vić, Marija Gordana K
tute of Nucleament, 11001 Bel
mospheric depowere determin
rmined on HPGum-7 in aerosoesults correlatio
deposit, ground
nuclide hrough trogen upper lium-7
creases n in air uction, s with in the
edge of air is utes to masses yllium-udying enging idence osition 4]. The e and cesses. lium-7 ere the ]. This mmer, to the of the elation eposit, cesses,
M-7 IN ATMOERBIA FOR
M. JankovK. Pantelić
r Sciences, Ralgrade, Serbia
sit and in groued during the pG detectors (Cals were in rang
on coefficient be
d level air, corr
2. EXP
Activitielevel air weradioactivity(Nis, VranjRadiation Laboratory,coordinateslocations ar
Table 1 G
Location
Nis Vranje ZajecarZlatibor
Palic
Samplesdeposit collon a monthlfilter papersrelative effconstant flobelow 400°formed.
The actidetectors (
OSPHERIC D2014 YEAR
vić, Jelena D
adiation and E
und level air at period Januaryanberra, relatige 0.5 - 9.8 mBetween aerosols
elation coefficie
PERIMENTAL
es of berylliumere monitoredy monitoring e, Zlatibor, Z
and En Vinča Institut and altitudee given in the
GPS coordinasamplin
n N
43°20' 42°32'
r 43°56' r 43°44'
46°06'
s of deposit wector (0.1 or 0ly basis. Samps (technical chficiency for
ow rate samplC and a mont
ivities of 7Be wCanberra, wi
DEPOSIT R
D. Nikolić,
Environmental
t five monitorinry-December 20ive efficienty 2
Bq/m3 and in des and deposits
ent
L
m-7 in deposid in 2014 yea
g at 5 locatioZajecar and
nvironmental ute of Nuclear es of each of Table 1.
ates and altitung stations
E
21°54' 21°54' 22°18' 19°43' 19°46'
were obtained 0.2 m2) and wples of air werharacteristics
deposited dlers, ashed at thly composit
were determinwith 18%, 20
Nataša B.
l Protection
ng stations (MS014. Activity of0%.) by gamaeposits were in was calculated
it and groundar, as part ofons in SerbiaPalic) by the
ProtectionSciences. GPSthe sampling
udes of the
Altitude (m) 201 432 144
1028 102
using an areawere collectedre collected on Whatman 41,dust80%) by temperatureste sample was
ned on HPGe0% and 50%
S f a n d
d f a e n S g
a d n , y s s
e %
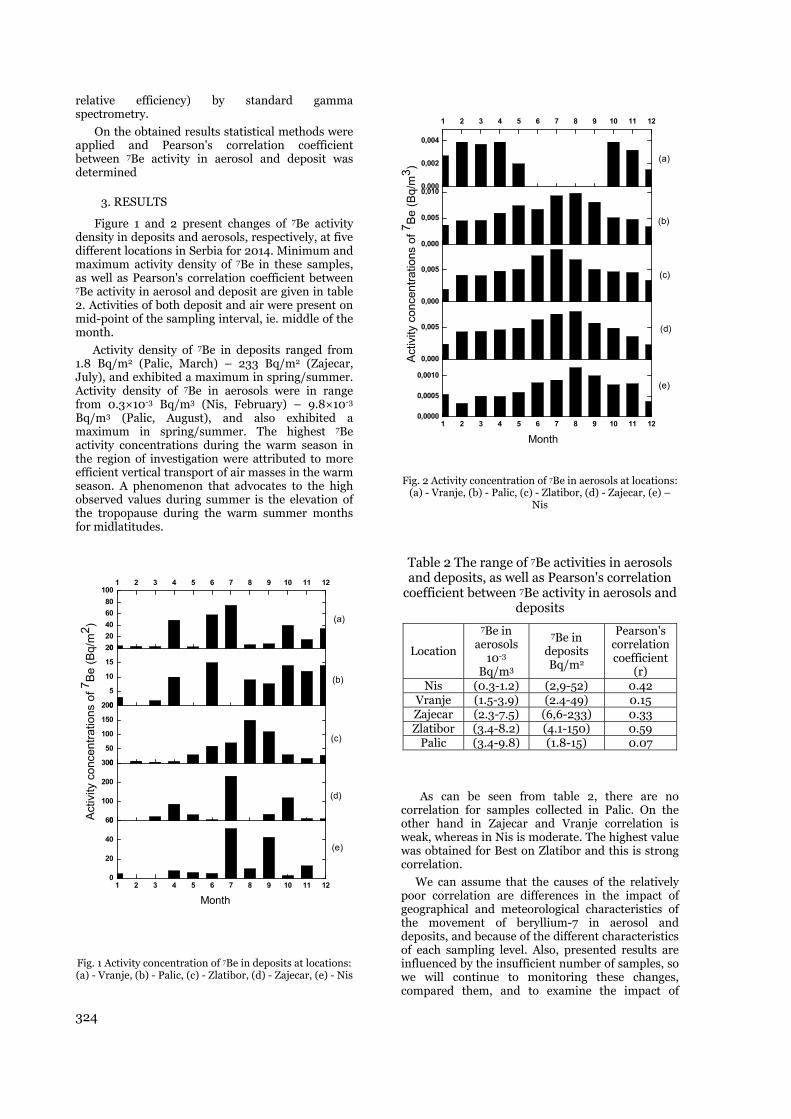
324
relative efficiency) by standard gamma spectrometry.
On the obtained results statistical methods were applied and Pearson's correlation coefficient between 7Be activity in aerosol and deposit was determined
3. RESULTS
Figure 1 and 2 present changes of 7Be activity density in deposits and aerosols, respectively, at five different locations in Serbia for 2014. Minimum and maximum activity density of 7Be in these samples, as well as Pearson's correlation coefficient between 7Be activity in aerosol and deposit are given in table 2. Activities of both deposit and air were present on mid-point of the sampling interval, ie. middle of the month.
Activity density of 7Be in deposits ranged from 1.8 Bq/m2 (Palic, March) – 233 Bq/m2 (Zajecar, July), and exhibited a maximum in spring/summer. Activity density of 7Be in aerosols were in range from 0.3×10⁻³ Bq/m3 (Nis, February) – 9.8×10⁻³ Bq/m3 (Palic, August), and also exhibited a maximum in spring/summer. The highest 7Be activity concentrations during the warm season in the region of investigation were attributed to more efficient vertical transport of air masses in the warm season. A phenomenon that advocates to the high observed values during summer is the elevation of the tropopause during the warm summer months for midlatitudes.
1 2 3 4 5 6 7 8 9 10 11 120
20
40
600
100
200
3000
50
100
150
2000
5
10
15
20020406080
1001 2 3 4 5 6 7 8 9 10 11 12
(a)
(e)
Month
(b)
(c)
(d)
Activ
ity c
once
ntra
tions
of 7 B
e (B
q/m
2 )
Fig. 1 Activity concentration of 7Be in deposits at locations: (a) - Vranje, (b) - Palic, (c) - Zlatibor, (d) - Zajecar, (e) - Nis
1 2 3 4 5 6 7 8 9 10 11 120,0000
0,0005
0,0010
0,000
0,005
0,000
0,005
0,000
0,005
0,0100,000
0,002
0,004
1 2 3 4 5 6 7 8 9 10 11 12
(d)
(e)
(a)
Month
Act
ivity
con
cent
ratio
ns o
f 7 Be
(Bq/
m3 )
(b)
(c)
Fig. 2 Activity concentration of 7Be in aerosols at locations: (a) - Vranje, (b) - Palic, (c) - Zlatibor, (d) - Zajecar, (e) –
Nis
Table 2 The range of 7Be activities in aerosols and deposits, as well as Pearson's correlation
coefficient between 7Be activity in aerosols and deposits
Location
7Be in aerosols
10-3
Bq/m3
7Be in deposits Bq/m2
Pearson's correlation coefficient
(r) Nis (0.3-1.2) (2,9-52) 0.42
Vranje (1.5-3.9) (2.4-49) 0.15 Zajecar (2.3-7.5) (6,6-233) 0.33 Zlatibor (3.4-8.2) (4.1-150) 0.59
Palic (3.4-9.8) (1.8-15) 0.07
As can be seen from table 2, there are no correlation for samples collected in Palic. On the other hand in Zajecar and Vranje correlation is weak, whereas in Nis is moderate. The highest value was obtained for Best on Zlatibor and this is strong correlation.
We can assume that the causes of the relatively poor correlation are differences in the impact of geographical and meteorological characteristics of the movement of beryllium-7 in aerosol and deposits, and because of the different characteristics of each sampling level. Also, presented results are influenced by the insufficient number of samples, so we will continue to monitoring these changes, compared them, and to examine the impact of

325
different geographical and meteorological characteristics of individual sampling places.
CONCLUSION
The knowledge of natural radionuclide concentration in air is essential, because this information contributes to the study of atmospheric circulation of air masses. In this paper, changes of activity density of cosmogenic 7Be in atmospheric deposit and ground level air at different locations in Serbia were investigated. The obtained results are used to do a linear correlation between 7Be activity in aerosol and deposit.
The typical pattern of seasonal variations was observed for 7Be. The obtained values of 7Be activity density show a fluctuation which has oscillatory characteristics with enhanced activity in spring-summer months. This fluctuation likely relates to the seasonal thinning of tropopause, which facilitates and enhances the stratosphere – troposphere vertical air mass mixing.
Acknowledgement: The paper is a part of the research done within the project III43009 supported by the Ministry of Education and Science of the Republic of Serbia.
REFERENCES
1. Y. Narazaki, Fujitaka, S. Igarashi, Y. Ishikawa and N. Fujinami “Seasonal variation of 7Be deposition in Japan”, Journal of Radioanalytical and Nuclear Chemistry, 256(3), 2003, pp 489-496.
2. M. Yoshimori,”Beryllium 7 radionuclide as a tracer of vertical air mass transport in the troposphere”, Advances in Space Research, 36,2005, pp 828-832.
3. M. M. Janković, D. J. Todorović, J. D. Nikolić, M. M. Rajačić, G. K. Pantelić and N. B. Sarap, “Temporal changes of beryllium-7 and lead-210 in ground level air in Serbia”, Hemijska industrija, 68 (1), 2014, pp 83-88.
4. J. S. Gaffney, N. A. Marley and M. M. Cunningham, "Natural radionuclides in fine aerosols in the Pittsburgh Area", Atmos. Environ., 38, 2004, pp 3191-3200
5. E. Gomez, F. Garcias, M. Casas and V. Cerda, “Determination of natural gamma emitters in surfaces air”, J. Environ. Anal. Chem., 56, 1994, pp 327-335.
6. D. M. Koch, D. J. Jacob and W. C. Graustein, “Vertical transport of tropospheric aerosols as indicated by 7Be and 210Pb in a chemical tracer model”, J. Geophys. Res., 101, 1996, pp 18651–18666.
7. H. Liu, D. Jacob, I. Bey and R. Yantosca, “Constraints from 210Pb and 7Be on wet deposition and transport in a global three-dimentional chemical tracer model driven by assimilated meteorological fields”, J. Geophys. Res., 106, 2001, pp 12109–12128.
8. C. Papastefanou, A. Ioannidou, S. Stoulos and M. Manolopoulou, “Atmospheric deposition of cosmogenic 7Be and 137Cs from fallout of the Chernobyl accident”, The Science of the Total Environment, 170, 1995, pp 151-156.
9. R. Winkler, F. Dietl, G. Frank and J. Tschiersch, “Temporal variations of 7Be and 210Pb size
distributions in ambient aerosol”, Atmos. Environ. 32, 1998, pp 983–991.
10. J. A. Young and W. B. Silker, “Aerosol deposition velocities on the Pacific and Atlantic Oceans calculated from 7Be measurements”, Earth. Planet. Sci. Lett., 50 (1980) 92–104.
11. E. A. Crecelius, “Prediction of marine atmospheric deposition rates using 7Be deposition velocities”, Atmos. Environ., 15, 1981, pp 579–582.
12. K. K. Turekian, L. K. Benninger and E. P. Dioan, “7Be and 210Pb total deposition fluxes at New Haven”, Connecticut and at Bermuda, J. Geophys. Res. 88, 1983, pp 5411–5415.
13. G. Lujaniene, “Study of removal processes of 7Be and 137Cs from the atmosphere”, Chechoslovak, J. Phys.,53, 2003, pp S57–S65.
14. C. Papastefanou and A. Ioannidou, “Influence of air pollutants in the 7Be size distribution of atmospheric aerosols”, Aerosol Sci.Technol. 24, 1996, pp 102–106.
15. N. Alegrıa, M. Herranz, R. Idoeta and F. Legarda, “Study of 7Be activity concentration in the air of northern Spain”, Journal of Radioanalytical and Nuclear Chemistry, 286, 2010, pp 347-351

INVESTIGATION OF THE TRITIUM CONTENT IN UNDERGROUND BRINES OF THE “UDACHNAYA” DIAMOND PIPE
E.A. Shchukina1, V.Y. Osipov1, K.A. Naumova1, E.I. Nogovitsyna1, V.E. Stepanov1
1 North-Eastern Federal University n.a. MK Ammosov Physicotechnical Institute, e-mail: [email protected], [email protected]
Abstract. It is proved that in the drainage brines of the "Udachnaya" diamond pipe, geological tritium is present. Long-distance migration of artificial radionuclides from the cavity of the "Crystal" underground nuclear explosion (UNE) does not exist.
Key words: tritium, quarry of the "Udachnaya" diamond pipe, liquid scintillation spectrometry, drainage brines, distillate.
In works [1,2,4] and others in 2011-2012 the problem of long-distance migration of artificial radionuclides with groundwater from the cavity of the underground nuclear explosion (UNE) "Crystal" was investigated and the works have shown the fact of tritium receipt in the drainage brines coming in the quarry of "Udachnaya" diamond pipe. If their conclusions are valid, then the “Udachnaya” diamond tube has an environmental emergency situation that threatens to stop the commercial production of diamonds.
In this paper the possibility of long-distance migration of artificial radionuclides from the cavity UNE "Crystal" studied by precision liquid scintillation spectrometry (sensitivity threshold is 1 Bq/l for tritium).
Hydrogen is oxidized by two oxygen atoms forming ordinary water, which is also called protium water. Tritium, respectively, produces tritium water. Tritium is formed by the decay of nitrogen in the upper atmosphere as a result of collisions with protons and neutrons from the solar wind. The average content in water bodies is about 10 Bq/l. In ocean waters a tritium concentration is equal to 0.11 Bq/l due to a dilution of atmospheric deposition by seawater. However, there is a latitudinal effect. On northern latitudes, a tritium content increases as the Earth's magnetosphere causes increased loss of charged particles in the North Pole, which is observed in the form of aurora. According to the results of North-Eastern Federal University (NEFU) laboratory of radiation ecology in the Lena-Aldan interfluve, the tritium content changes within 2-10 Bq/l, on the Mirny–Udachniy road, the tritium contents are 2, 18, 74, 202 Bq/l, which can be explained by a
manifestation of the latitudinal effect of natural cosmic tritium (table 1).
The biological half-life of tritium is equal to 12 years. The maximum allowable concentration (MAC) of tritium content in Russia is 7600 Bq/l. Natural variations can reach the largest values, which are 37 times smaller than the MAC.
Researches which were carried out in winter allowed the investigation of underground water without impurities of cosmic tritium, which comes to the surface from atmospheric deposition. In winter precipitation has a frozen form of ice and snow, therefore it does not migrate. If the tritium concentration corresponds to background levels, having cosmic origin, this circumstance will prove the receipt absence of artificial radionuclides with drainage brines to the quarry of "Udachnaya" tube.
According to the work [3], the background content of tritium in ocean water is equal to 0.11 Bq/l. According to the methodological guidelines for the measurement of tritium [6], this content should be measured in the distillate of the sample. Tritium was released into the distillate in the last stages of the evaporation of wet samples. In the dry residue of brines from the quarry of "Udachnaya" tube, a large content of radium-226 was found. It follows that the radium in brine leads to the two alpha decay of radium and radon. Therefore, in the waters of brines, a relatively high content of tritium is observed due to the growing number of scintillations from double alpha decay of radium-226. On the other hand, in the groundwater, a tritium was formed by an interaction of lithium-6 existing in rocks with neutrons produced by the decay of uranium-238 and uranium-235. They are
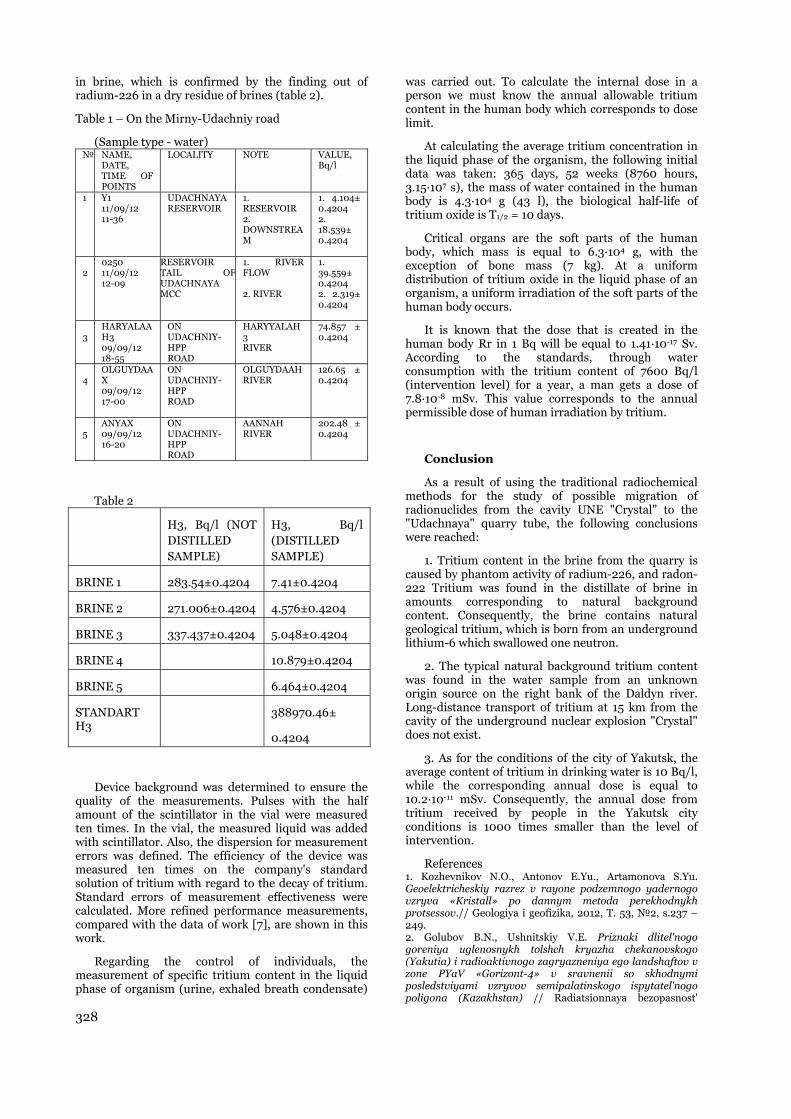
328
in brine, which is confirmed by the finding out of radium-226 in a dry residue of brines (table 2).
Table 1 – On the Mirny-Udachniy road
(Sample type - water) № NAME,
DATE, TIME OF POINTS
LOCALITY NOTE VALUE, Bq/l
1 Y1 11/09/12 11-36
UDACHNAYA RESERVOIR
1. RESERVOIR 2. DOWNSTREAM
1. 4.104± 0.4204 2. 18.539± 0.4204
2 0250 11/09/12 12-09
RESERVOIR TAIL OFUDACHNAYA MCC
1. RIVER FLOW 2. RIVER
1. 39.559± 0.4204 2. 2.319± 0.4204
3 HARYALAAH3 09/09/12 18-55
ON UDACHNIY-HPP ROAD
HARYYALAH 3 RIVER
74.857 ± 0.4204
4 OLGUYDAAX 09/09/12 17-00
ON UDACHNIY-HPP ROAD
OLGUYDAAH RIVER
126.65 ± 0.4204
5 ANYAX 09/09/12 16-20
ON UDACHNIY-HPP ROAD
AANNAH RIVER
202.48 ± 0.4204
Table 2
H3, Bq/l (NOT DISTILLED SAMPLE)
H3, Bq/l (DISTILLED SAMPLE)
BRINE 1 283.54±0.4204 7.41±0.4204
BRINE 2 271.006±0.4204 4.576±0.4204
BRINE 3 337.437±0.4204 5.048±0.4204
BRINE 4 10.879±0.4204
BRINE 5 6.464±0.4204
STANDART H3
388970.46±
0.4204
Device background was determined to ensure the quality of the measurements. Pulses with the half amount of the scintillator in the vial were measured ten times. In the vial, the measured liquid was added with scintillator. Also, the dispersion for measurement errors was defined. The efficiency of the device was measured ten times on the company's standard solution of tritium with regard to the decay of tritium. Standard errors of measurement effectiveness were calculated. More refined performance measurements, compared with the data of work [7], are shown in this work.
Regarding the control of individuals, the measurement of specific tritium content in the liquid phase of organism (urine, exhaled breath condensate)
was carried out. To calculate the internal dose in a person we must know the annual allowable tritium content in the human body which corresponds to dose limit.
At calculating the average tritium concentration in the liquid phase of the organism, the following initial data was taken: 365 days, 52 weeks (8760 hours, 3.15·107 s), the mass of water contained in the human body is 4.3·104 g (43 l), the biological half-life of tritium oxide is T1/2 = 10 days.
Critical organs are the soft parts of the human body, which mass is equal to 6.3·104 g, with the exception of bone mass (7 kg). At a uniform distribution of tritium oxide in the liquid phase of an organism, a uniform irradiation of the soft parts of the human body occurs.
It is known that the dose that is created in the human body Rr in 1 Bq will be equal to 1.41·10-17 Sv. According to the standards, through water consumption with the tritium content of 7600 Bq/l (intervention level) for a year, a man gets a dose of 7.8·10-8 mSv. This value corresponds to the annual permissible dose of human irradiation by tritium.
Conclusion
As a result of using the traditional radiochemical methods for the study of possible migration of radionuclides from the cavity UNE "Crystal" to the "Udachnaya" quarry tube, the following conclusions were reached:
1. Tritium content in the brine from the quarry is caused by phantom activity of radium-226, and radon-222 Tritium was found in the distillate of brine in amounts corresponding to natural background content. Consequently, the brine contains natural geological tritium, which is born from an underground lithium-6 which swallowed one neutron.
2. The typical natural background tritium content was found in the water sample from an unknown origin source on the right bank of the Daldyn river. Long-distance transport of tritium at 15 km from the cavity of the underground nuclear explosion "Crystal" does not exist.
3. As for the conditions of the city of Yakutsk, the average content of tritium in drinking water is 10 Bq/l, while the corresponding annual dose is equal to 10.2·10-11 mSv. Consequently, the annual dose from tritium received by people in the Yakutsk city conditions is 1000 times smaller than the level of intervention.
References 1. Kozhevnikov N.O., Antonov E.Yu., Artamonova S.Yu. Geoelektricheskiy razrez v rayone podzemnogo yadernogo vzryva «Kristall» po dannym metoda perekhodnykh protsessov.// Geologiya i geofizika, 2012, T. 53, №2, s.237 – 249. 2. Golubov B.N., Ushnitskiy V.E. Priznaki dlitel'nogo goreniya uglenosnykh tolshch kryazha chekanovskogo (Yakutia) i radioaktivnogo zagryazneniya ego landshaftov v zone PYaV «Gorizont-4» v sravnenii so skhodnymi posledstviyami vzryvov semipalatinskogo ispytatel'nogo poligona (Kazakhstan) // Radiatsionnaya bezopasnost'
329
Respubliki Sakha (Yakutia), materialy 3-y respublikanskoy nauch.-prakt. konf., 18-20 oktyabrya 2011. – Yakutsk, 2012. s. 260-293 3. Nikolin O.A. Tritiy v vodnykh ekosistemakh Ural'skogo regiona.// Dissertatsiya na soiskanie uchenoy stepeni kandidata biologicheskikh nauk, Ekaterinburg 2008. 4. Artamonova S.Yu., Antonov E.Yu., Kozhevnikov N.O., Bondareva L.G. Sovremennaya geoekologicheskaya obstanovka v rayone ob''ekta mirnogo PYaV «Kristall» // Radiatsionnaya bezopasnost' Respubliki Sakha (Yakutia), materialy 3-y respublikanskoy nauch.-prakt. konf., 18-20 oktyabrya 2011. – Yakutsk, 2012. s. 211-238.
5. Rudyk A.F., Kazimirov A.S. Opredelenie aktivnosti estestvennykh radionuklidov v ob''ektakh okruzhayushchey sredy. MNPP «AKP», Kiev, 1992g. 35 s. 6. Charl'z Dzh. P., Gordon T. K. Rukovodstvo po spektrometrii prob okruzhayushchey sredy metodom zhidkikh stsintillyatorov. PACKARD, A Canberra Company, 800 Research Parkway, Meriden, CT U.S.A. 06 7. Stepanov V.E., D'yachkovskiy E.E., Osipov V.Yu., Shchukina E.A., Naumova K.A., Filatov-Rozhin V.M. Issledovanie vozmozhnosti dal'ney migratsii iskusstvennykh radionuklidov iz polosti podzemnogo yadernogo vzryva “Kristall” v kar'yer almaznoy trubki “Udachnaya” v Mirninskom rayone Yakutii // Materialy Vserossiyskoy 56 konferentsii MFTI, 2013.


RADON LEVELS IN PORTUGUESE THERMAL SPAS
A.S. Silva 1,2, M.L. Dinis 1,2, A.J.S.C. Pereira 3, A. Fiúza 1
1 CERENA, FEUP/UPorto - Centre for Natural Resources and the Environment, 2 PROA/LABIOMEP - Research Laboratory on Prevention of Occupational and Environmental Risks,
Faculty of Engineering, University of Porto, Porto, Portugal 3 CEMUC, Department of Earth Sciences, University of Coimbra, P-3030 290 Coimbra, Portugal
Abstract. Radon concentration measurements were performed in indoor air and in natural mineral waters in seventeen Portuguese thermal spas used for therapy, drinking and irrigation purposes. The gamma doses rates were also assessed in different workplaces of the considered thermal spas. The radon concentration was measured in water samples taken from different sampling points: boreholes, springs, inhalator chambers (ORL’s) and swimming pools, and in the indoor air of different treatment rooms: ORL’s, swimming pools, vapours areas and Vichy shower. Radon concentration in water ranged from 26 to 6949 Bq/L and in the indoor air ranged from 73 Bq/m3 to 3479 Bq/m3. The indoor gamma dose rates ranged from 0,148 µSv/h to 0,644 µSv/h and the annual dose rate was estimated ranging from 0,30 to 1,29 mSv/y, for 2000 working hours per year, which is far below the effective dose limit for workers (20 mSv/y). Nevertheless, the great contribution for the annual effective dose will result from radon inhalation which is not included in this estimation. The remedial action level for drinking water of 1000 Bq/L (2001/928/ EURATOM) was exceeded in 23% of the selected thermal spas and about 80% of the total measurements of the indoor radon concentration exceeded the previous reference level of 200 Bq/m3 for new buildings and about 63% exceeded the new reference level of 300 Bq/m3 as established in the Directive 2013/59/EURATOM for indoor radon concentration in workplaces. Therefore, as the recommended limits for radon concentration in water and in indoor air were exceeded, appropriate actions should be taken in order to reduce the hazard to health from radon indoors and the potential resulting occupational exposure.
Key words: radon, thermal spa, dose rate, occupational exposure
1. INTRODUCTION:
Radon gas is recognized as the most significant natural source of human exposure and the leading cause of lung cancer incidence, with the exception of tobacco [1, 2, 3, 4, 5, 6]. Thermal spas have been identified as one of the professional activities with potentially higher exposure to radon mostly due to the inhalation of radon released from thermal waters [7].
Radon concentration in groundwater varies considerably (1 - 10 000 Bq/L) depending mostly on the uranium concentration in the surrounding rock and on the water circulation [8]. Radon’s solubility in water increases with decreasing temperatures and therefore much attention has been given to thermal water sources due to the potential risk to the public health. Moreover, radon concentration levels in groundwater are generally higher than in surface water [3].
Human exposure to 222Rn and its decay products in water supplies can occur in two ways: by ingestion (drinking water) or by inhalation due to the release of radon into the air when using thermal waters for health purposes [9]. The risk of radon exposure is mostly associated with high radon concentrations in confined environments, and the subsequent inhalation, increasing the risk of damaging the organ cells where radon short-life products are deposited.
Several studies have been conducted worldwide to measure the concentration of radon in the water and in the air of thermal spas in order to estimate the exposure doses both for workers and for users [8, 10, 11, 12, 13, 14, 15]. Recently, a study carried out in thermal spas from Ischia Island showed that the average annual effective dose to workers due to radon exposure (3,52 mSv/y; range 0,01-7,03 mSv/y) was higher than the dose limit imposed by Italian legislation (3 mSv) [16].
The health effects of exposure to radon in indoor environments (indoor air), and in particular, in thermal spas, depend mainly on the concentration of inhaled radon, the ventilation rate of the place, freq uency and duration of the exposure [7, 17]. In Portugal, the monitoring of radon concentration is compulsory only in buildings constructed in granite areas, particularly in the districts of Braga, Vila Real, Porto, Guarda, Viseu and Castelo Branco, due to the geological characteristics of these regions. This obligation came into force in 2006 within the new regulations for indoor air quality imposed by the Portuguese legislation [18].
The purpose of this work was to measure the radon concentrations in indoor air and in natural mineral water as well as to evaluate the gamma doses rates in different workplaces of Portuguese thermal spas.

332
2. METHODS
Seventeen thermal spas participated in this study, representing about 46% of all thermal spas existing in Portugal (Fig. 1). For each studied thermal spa, the radon concentrations were measured in the natural mineral water from different sampling points: boreholes (BH), springs (SG), inhalator chambers (ORL´s) and swimming pools (SP) and in the indoor air of different rooms: ORL’s, swimming pools (SP), vapours areas (VA) and Vichy shower (VS). The measurements were carried out between November 2013 and September 2014. The assessment of radon concentration included measurements in two different periods (summer and winter) in the indoor air of the selected thermal spas. Regarding the assessment of radon concentration in water a single measurement was carried out directly in the water from the borehole and in the water used in the treatment rooms. Measurements of gamma radiation doses were also assessed in some of the previous locations.
Fig. 1 Location of the Portuguese thermal spas
Radon concentration in water was measured by liquid scintillation. The samples were sent to the Natural Radioactivity Laboratory of the Department of Earth Sciences, University of Coimbra, Portugal, for measurement by a liquid scintillation counter. The radionuclide activity was measured by liquid scintillation counting techniques (LSC) using an ultra-low-level spectrometer (Quantulus 1220). For radon measurements the samples were collected in glass containers of 20 mL previously filled with 10 mL of a water immiscible scintillation cocktail, with sealed opening and security mechanisms to avoid gas-leakage during transport. With this protocol radon was measured through the double-phase method [19].
Radium and uranium isotopes were measured in water samples, previously filtered, acidified with HNO3
to pH less than 2 and, only in the former isotope, pre-concentrated by evaporation. The 226Ra activity was measured through the indirect method based on radon accumulation in a lipophylic scintillation cocktail during a minimum of 21 days (secular equilibrium). Before LSC counting a selective extraction of uranium was performed using an “extractive cocktail” (bis-2-etilhexyl-ortophosphoric acid) and a non-water soluble scintillation cocktail. After phase separation the cocktail, collected in polyethylene vials, is measured from the peaks of 238U and 234U. This method has been tested by comparison with other methods (like ICP-MS) and the results shows good agreement [20].
The uncertainties depend on the activities but, for the range of values measured, were generally lower than 15%. For a more detailed description about the LSC techniques, see [21]. Efficiency was evaluated by measuring several standard solutions and participation in intercomparison exercises.
Radon concentration measurements in air were performed using CR-39 detectors enclosed in small cylindrical (5-cm height, 3-cm diameter) diffusion chambers for periods between 25 and 45 days. This detector is a small piece of plastic that is sensitive to tracks of highly ionizing particles such as alpha particles. The CR-39 detectors were placed in each room at approximately 2 meters from the floor (breathing zone) [22]. After a period of exposure between 25 and 45 days, the detectors were retrieved and sent to the Natural Radioactivity Laboratory of the Department of Earth Sciences, University of Coimbra, Portugal.
Indoor gamma dose rates were performed by a Geiger counter (Gamma Scout) which is a calibrated measurement instrument for alpha, beta and gamma rays. This device was used for the measurement of gamma doses rates which was hourly acquired and stored for a time period between 25 and 45 days. Since this system acquires the dose continuously the variation of dose during different periods of time is averaged out. Therefore, long-term integrated measurements of gamma dose may be taken.
3. RESULTS AND DISCUSSION
3.1. Radon concentration in natural mineral water
The results of radon concentration in natural mineral water samples taken from each one of the studied thermal spas (TS) are presented in Fig. 2 and Fig. 3. Radon concentrations in natural mineral water from ORL’s range between 26 Bq/L and 5325 Bq/L (Fig. 1). About 33% of the water samples taken in ORL’s from the considered thermal spas exceeded the action level for radon concentration recommended by the European Commission 2001/928/EURATOM, establishing for concentrations in excess of 1000 Bq/L, remedial action is deemed to be justified on radiological protection grounds. In what concerns to water samples taken from the ORL’s of TS7, the values of radon concentration are very different: 2624 Bq/L (ORL 7.1) and 1461 Bq/L (ORL 7.2). This can be explained by the different type of treatment (water utilization) in each one of these ORL’s. In addition, another important variable is that TS7 has an operating ventilation system which may function in
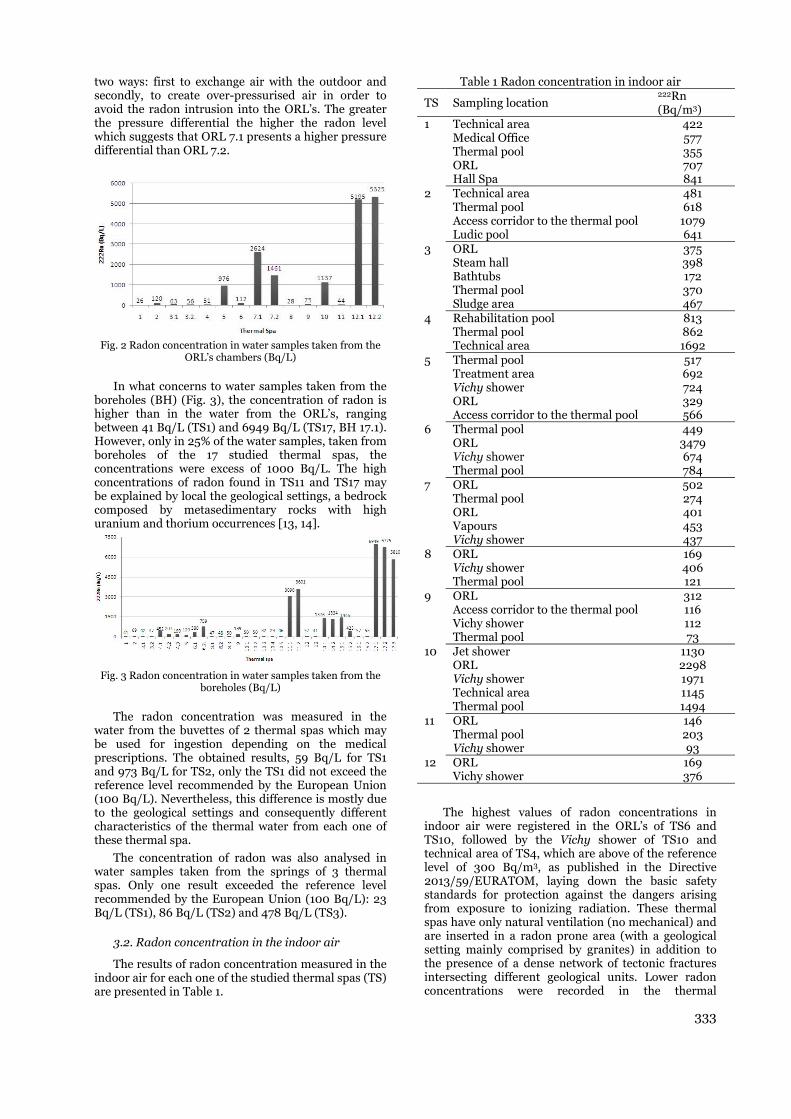
333
two ways: first to exchange air with the outdoor and secondly, to create over-pressurised air in order to avoid the radon intrusion into the ORL’s. The greater the pressure differential the higher the radon level which suggests that ORL 7.1 presents a higher pressure differential than ORL 7.2.
Fig. 2 Radon concentration in water samples taken from the
ORL’s chambers (Bq/L)
In what concerns to water samples taken from the boreholes (BH) (Fig. 3), the concentration of radon is higher than in the water from the ORL’s, ranging between 41 Bq/L (TS1) and 6949 Bq/L (TS17, BH 17.1). However, only in 25% of the water samples, taken from boreholes of the 17 studied thermal spas, the concentrations were excess of 1000 Bq/L. The high concentrations of radon found in TS11 and TS17 may be explained by local the geological settings, a bedrock composed by metasedimentary rocks with high uranium and thorium occurrences [13, 14].
Fig. 3 Radon concentration in water samples taken from the
boreholes (Bq/L)
The radon concentration was measured in the water from the buvettes of 2 thermal spas which may be used for ingestion depending on the medical prescriptions. The obtained results, 59 Bq/L for TS1 and 973 Bq/L for TS2, only the TS1 did not exceed the reference level recommended by the European Union (100 Bq/L). Nevertheless, this difference is mostly due to the geological settings and consequently different characteristics of the thermal water from each one of these thermal spa.
The concentration of radon was also analysed in water samples taken from the springs of 3 thermal spas. Only one result exceeded the reference level recommended by the European Union (100 Bq/L): 23 Bq/L (TS1), 86 Bq/L (TS2) and 478 Bq/L (TS3).
3.2. Radon concentration in the indoor air
The results of radon concentration measured in the indoor air for each one of the studied thermal spas (TS) are presented in Table 1.
Table 1 Radon concentration in indoor air
TS Sampling location 222Rn (Bq/m3)
1 Technical area 422 Medical Office 577 Thermal pool 355 ORL 707 Hall Spa 841
2 Technical area 481 Thermal pool 618 Access corridor to the thermal pool 1079 Ludic pool 641
3 ORL 375 Steam hall 398 Bathtubs 172 Thermal pool 370 Sludge area 467
4 Rehabilitation pool 813 Thermal pool 862 Technical area 1692
5 Thermal pool 517 Treatment area 692 Vichy shower 724 ORL 329 Access corridor to the thermal pool 566
6 Thermal pool 449 ORL 3479 Vichy shower 674 Thermal pool 784
7 ORL 502 Thermal pool 274 ORL 401 Vapours 453 Vichy shower 437
8 ORL 169 Vichy shower 406 Thermal pool 121
9 ORL 312 Access corridor to the thermal pool 116 Vichy shower 112 Thermal pool 73
10 Jet shower 1130 ORL 2298 Vichy shower 1971 Technical area 1145 Thermal pool 1494
11 ORL 146 Thermal pool 203 Vichy shower 93
12 ORL 169 Vichy shower 376
The highest values of radon concentrations in indoor air were registered in the ORL’s of TS6 and TS10, followed by the Vichy shower of TS10 and technical area of TS4, which are above of the reference level of 300 Bq/m3, as published in the Directive 2013/59/EURATOM, laying down the basic safety standards for protection against the dangers arising from exposure to ionizing radiation. These thermal spas have only natural ventilation (no mechanical) and are inserted in a radon prone area (with a geological setting mainly comprised by granites) in addition to the presence of a dense network of tectonic fractures intersecting different geological units. Lower radon concentrations were recorded in the thermal

334
swimming pool of TS9 and Vichy shower of TS11. In spite of these thermal spas being located in a geological setting favourable to the radon generation these have mechanical ventilation which may be the main reason for the lower values of radon concentration.
3.3. Indoor gamma dose rates
The indoor gamma dose rate was measured every hour (µSv/h) in different areas of 13 thermal spas: Medical Office (MO), Technical Area (TA), ORL, Thermal Pool (TP) and Steam Area (SA).
The dose rates were registered for periods between 25 and 45 days. The basic statistic parameters are presented in Fig. 4 for average (AV), median (MD), standard deviation (SD), minimum (Min) and maximum (Max).
Fig. 4 Indoor gamma dose rates (µSv/h)
The average of gamma dose rates ranged between 0,148 µSv/h (TS2) and 0,645 µSv/h (TS3). This reflects the very different geological settings, in particular for the thermal spa with the highest dose rate (SP3) and for the thermal spa with the lowest dose rate (SP2), which are located in a zone comprised predominantly of granitic rock and in a geological framing comprised mostly of metasedimentary rock, respectively.
The gamma dose rates ranged between 0,15 µSv/h and 0,65 µSv/h. The annual dose rate was estimated varying between 0,30 and 1,29 mSv/y, for 2000 working hours per year, which is far below the effective dose limit for workers (20 mSv/y) (Directive 43/EURATOM). However the great contribution for the annual effective dose will result from radon inhalation which is not included in this estimation.
4. CONCLUSIONS
The results showed that the recommended limit for drinking water of 100 Bq/L (2001/928/ EURATOM) was exceeded in 51% of the selected thermal spas. About 80% of the total measurements of indoor radon concentration exceeded the previous EU reference level of 200 Bq/m3 for new buildings and about 63% exceeded the new reference level of 300 Bq/m3 (Directive 2013/59/EURATOM). Therefore, as the recommended limits for radon concentration in water and in indoor air were exceeded, appropriate actions should be taken in order to reduce the hazard to health from radon indoors and the potential resulting occupational exposure.
REFERENCES
1. Alberigi S, Pecequilo BRS, Lobo HAS, Campos MP (2011), Assessment of effective doses from radon levels for tour guides at several galleries of Santana cave, southern Brazil, with CR-39 detectors: preliminary results. Radiation Protection Dosimetry 145:252–255.
2. Yarar Y, Gunaydi T, Celebi N (2006), Determination of radon concentrations of the dikili geothermal area in western Turkey. Radiation Protection Dosimetry 118:78–81.
3. Erdogan M, Ozdemir F, Eren N (2013), Measurements of radon concentration levels in thermal waters in the region of Konya, Turkey. Isotopes in Environmental and Health Studies 49, 567–574.
4. Santos TO, Rocha Z, Cruz P, Gouvea VA, Siqueira JB, Oliveira AH (2014), Radon dose assessment in underground mines. Radiation Protection Dosimetry 160:1-3.
5. Nikolopoulos D, Vogiannis E, Petraki E, Zisos A, Louizi (2010), Investigation of the exposure to radon and progeny in the thermal spas of Loutraki (Attica-Greece): Results from measurements and modelling. Science of the Total Environment 408:495–504.
6. Vaupotic T, Streil T, Tokonami S, Zunic ZS (2013), Diurnal variations of radon and thoron activity concentrations and effective doses in dwellings in Niska in Banja, Serbia. Radiation Protection Dosimetry 157: 375-382.
7. Ana Sofia Silva, Maria de Lurdes Dinis, António Fiúza (2014). Research on Occupational Exposure to Radon in Portuguese Thermal Spas, Book chapter in: Occupational Safety and Hygiene II, ed. P. Arezes, J. S. Baptista, M. Barroso, P. Carneiro, P. Cordeiro, N. Costa, R. Melo, A. S. Miguel, G. Perestrelo, pp. 323 -328. ISBN: 978-1-138-00144-2, London: Taylor & Francis.
8. Nikolov J, Todorovic N, Bikit I, Pantic TP, Forkapic S, et al. (2014), Radon in thermal waters in south-east part of Serbia. Radiation Protection Dosimetry 160: 1-3.
9. Koray A, Akkaya G, Kahraman A, Kaynak G (2013), Measurements of radon concentrations in waters and soil gas of Zonguldak. Radiation Protection Dosimetry 162: 1-7.
10. Ziane MA, Lounis-Mokrani Z, Allab M (2014), Exposure to indoor radon and natural gamma radiation in somo workplaces at Algiers, Algeria. Radiation Protection Dosimetry 160: 1-3.
11. Kávási N, Kobayashi Y, Kovács T, Somlai J, Jobbágy V, et al. (2011), Effect of radon measurement methods on dose estimation. Radiation Protection Dosimetry 145: 2-3.
12. Oner F, Yigitoglu I, Yalim A (2013), Measurements of radon concentration in spa waters in Amasya, Turkey. Radiation Protection Dosimetry 157: 2.
13. Jilek K, Slezákova M, Thomas J (2014), Diurnal and seasonal variability of outdoor radon concentration in the area of the NRPI Prague (2014). Radiation Protection Dosimetry 160: 1-3.
14. Moldovan M, Benea V, Nitã DC, Papp B, Burghele BC, et al. (2014), Radon and radium concentration in water from north-west of Romania and the estimates doses. Radiation Protection Dosimetry 162: 1-2.
15. Tradidou G and Florou H (2010), Estimation of doses rates to humans exposed to elevated natural radioactivity through different Pathways in the Islan of Ikaria, Greece. Radiation Protection Dosimetry 142: 2-4.
16. Pugliese, M., Quarto, M. & Roca, V. (2013), Radon concentrations in air and water in the thermal spas of Ischia Island. Indoor and Built Environment, doi: 10.1177/1420326X13480053 ibe.sagepub.com.
17. Labidi, S., Essafi, F. and Mahjoubi, H. (2006), Estimation of the radiological risk related to the presence of radon 222 in a hydrotherapy centre in Tunisia. Journal of Radiological Protection, vol. 26, no. 3, p. 309.

335
18. Ana Sofia Silva, Maria de Lurdes Dinis (2015). The presence of radon in thermal spas and their occupational implications – a review, Book chapter in: Occupational Safety and Hygiene III, ed. P. Arezes, J. S. Baptista, M. Barroso, P. Carneiro, P. Cordeiro, N. Costa, R. Melo, A. S. Miguel, G. Perestrelo, pp. 59 - 65. ISBN: 978-1-138-02765-7, London: Taylor & Francis.
19. ASTM D5072-09e1, Standard Test Method for Radon in Drinking Water, ASTM International, West Conshohocken, PA, 2009,www.astm.org
20. Forte, M., Rusconi, R.; Badalamenti, P.; Bellinzona, S.; Gollini, R.; Maltese, S.; Romeo, C.; Sgorbati, G. (2004) – The monitoring of tap waters in Milan: planning methods and results. Radiation Protection Dosimetry, 111(4), 373-376.
21. Gonçalves, C.V.M., Pereira, A.J.S.C., (2007) - Radionuclides in groundwater of the Serra do Buçaco region (Central Portugal). Proceedings of the XXXV Congress of the International Association of Hydrogeologists, Lisbon, 6p.
22. LOURO, A., PERALTA, L., SOARES, S., PEREIRA, L., CUNHA,G., BELCHIOR, A., FERREIRA, L., MONTEIRO GIL, O., LOURO, H., PINTO, P., RODRIGUES, A.S. RODRIGUES, SILVA, M.J. E TELES, P. (2013) - Human exposure to indoor radon: a survey in the region of Guarda, Portugal. Radiation Protection Dosimetry, pp-1-8: 154(2):237-244.
Abstcontdemradomeaslopeshowin coexpotechnorigiasseslead in thconcstratdwel
Key
1. INTR
Analyresults consideracorrect sea non-biaeffect (ininfluencinof case astatus arstudies(1 –
correct stage, smokeffect demeasuremof currenyears prioinevitablyevaluation"exposurebeginningappropriaeffect of example the starepidemioof the effthe result
A.
tract. The postrol study has bonstrated that
on concentratiosurement resule factor of the
wn that the expeomparison wit
osure-effect slopnique and SIMinal unbiased vssment of expec
d to the undereshe radon epidemcentration in dtification by sllings and lung
y words: radon
RODUCTION
ysis of epidemof epidemio
ably depend oelection of conased assessmn our case lng factor (radand control gre typically us
– 4). It should btratification ofking and otheependence is ment errors ont measuremeor to the time y have an in of the e-effect" depeg of epidemate to conducerrors on theof such work
rt of large-sology in dwellifect of errors its of epidemio
ERROOF NA
Onishchen
Insti
ssible influence een analyzed. Ithe classical m
on ranges. At lt should be condependence of ected level of rath the original pe coefficient u
MEX extrapolativalue of exposurcted value of thtimation of the
miological studidwellings. The moking status cancer inciden
n, case-control s
miological datological cas
on the quality ntrol group is ent of depenung cancer i
don exposure)roups by sex,sed at most cbe noted that, f case and con
er factors, the affected by
r errors in asnts to exposuof risk assess
impact on thcoefficients,
endence. Themiological stct a preliminae results of plis the paper(5
scale studiesings in Northin the evaluat
ological studies
R ASSESSMATIONAL R
nko, A. Var
itute of Indust
of errors of raIt is demonstratmultiplicative e
low radon cnsidered. The mlung cancer in
adon exposure evalue for erro
under the influeion method. Rere-effect slope che slope of expo
real value of sles is the influenmodeling resuand other po
ce.
study, errors inf
ta shows thae-control stof initial datarequired to o
dence of obsincidence) on. The stratific, age and smocase-control reven at comp
ntrol groups byresulted expothe influenc
ssigning the reure interval 5 ment. These ehe results of
describing erefore, beforetudies, it sary analysis olanned studie5), published bs on the r
America. Anion of exposus has been ma
MENT ON THRADON CAS
raksin, I.Ya
trial Ecology U
adon exposure ted that, in gene
errors of radonconcentrations, modeling of the ncidence on raderrors can reduor-free study. Tence of measuregression calibrcoefficient. The Sosure-effect deplope coefficient
nce of smoking aults demonstratossible factors
fluence, regress
at the tudies a. The obtain erved n the cation oking radon
pletely y sex,
osure-ce of esults – 30
errors f the
the e the seems of the es. An before radon alysis
ure on ade. It
isbaywminphcrthcacpeae
dccsC
cqp
HE PLANNINE-CONTRO
armoshenk
UB RAS, Yekat
assessment oneral, the errors
n concentrationthe additionainfluence of er
don concentratiouce the observedThe correction rement errors wration method SIMEX method
pendence, but itt. An additionaland the correlatted that maximsimultaneously
sion calibration
s assumed thbiologically sigan exposure pyears before thwas importanmeasurement ndividual exp
published dataheterogeneity conclusion aboradon in dwellhat, due to
concentrationsa single studcancer risk estprocedures toerrors in the analyses of sterrors.
At presentdwellings and cancer are cocombined anastudies (4), 13 China (3).
The latest sconsideration quality of the mparticular, the
NG STAGE L STUDY
o, M. Zhuk
terinburg
n the results of are classical mmeasurement
al influence of rrors of radon eon in dwellings
d value of slope of the results
was realized bygives the best also allows the
t should be noteand the most p
tion between smmum attention y influencing r
n, SIMEX
hat, in the ignificant perioeriod of 25 yehe risk assess
nt to make aerrors and er
posure. In papa on case-cont
and do notout the relatiolings and lungerrors in th
s and the estimdy cannot prtimates. It wa
estimate thedesign of in
udies should
t, three combits influence
mpleted in thalysis of 7 No
studies in E
study (China) due to reas
measurementsere were high
kovsky
f planned natiomultiplicative er
are not constaf Poisson erroexposure assess was conductecoefficient at leof linear assesy regression caresults in rest
e obtainment ofed that this metpowerful sourcemoking status a should be paradon concent
initiation of od of exposur
years, ranging sment. It was a distinction rrors in the aper(5), it is n
trol studies hat allow an
onship betweeg cancer. It w
he measurememation of radrovide unambas recommende distributionndoor radon
be adjusted
bined studies e on the incidthe world. Thorth AmericanEurope (1) and
was excludedsonable doubs of radon conh concentratio
onal case-rrors. It is ant in all r on the sment on
ed. It was east twice ssment of alibration oring the f the good thod may e of error
and radon id to the ration in
lung cancer,re to radon isfrom 5 to 30stated that itbetween the
assessment ofoted that the
ave substantialunambiguous
en exposure towas concludedent of radonon exposures,biguous lung
ded to includen of exposure
studies, andfor exposure
on radon indence of lunghey include an case-controld 2 studies in
d from furtherbts about thencentration. Inons of radon-
, s 0 t e f e l s o d n ,
g e e d e
n g a l
n
r e n -
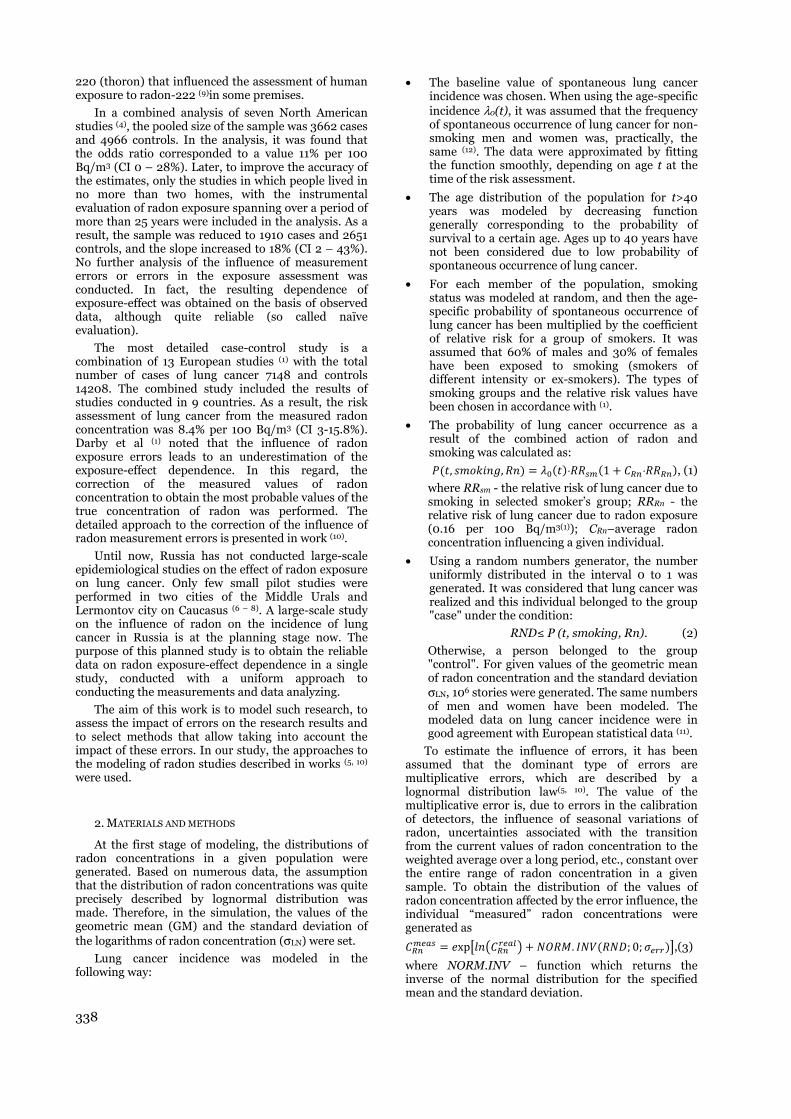
338
220 (thoron) that influenced the assessment of human exposure to radon-222 (9)in some premises.
In a combined analysis of seven North American studies (4), the pooled size of the sample was 3662 cases and 4966 controls. In the analysis, it was found that the odds ratio corresponded to a value 11% per 100 Bq/m3 (CI 0 – 28%). Later, to improve the accuracy of the estimates, only the studies in which people lived in no more than two homes, with the instrumental evaluation of radon exposure spanning over a period of more than 25 years were included in the analysis. As a result, the sample was reduced to 1910 cases and 2651 controls, and the slope increased to 18% (CI 2 – 43%). No further analysis of the influence of measurement errors or errors in the exposure assessment was conducted. In fact, the resulting dependence of exposure-effect was obtained on the basis of observed data, although quite reliable (so called naïve evaluation).
The most detailed case-control study is a combination of 13 European studies (1) with the total number of cases of lung cancer 7148 and controls 14208. The combined study included the results of studies conducted in 9 countries. As a result, the risk assessment of lung cancer from the measured radon concentration was 8.4% per 100 Bq/m3 (CI 3-15.8%). Darby et al (1) noted that the influence of radon exposure errors leads to an underestimation of the exposure-effect dependence. In this regard, the correction of the measured values of radon concentration to obtain the most probable values of the true concentration of radon was performed. The detailed approach to the correction of the influence of radon measurement errors is presented in work (10).
Until now, Russia has not conducted large-scale epidemiological studies on the effect of radon exposure on lung cancer. Only few small pilot studies were performed in two cities of the Middle Urals and Lermontov city on Caucasus (6 – 8). A large-scale study on the influence of radon on the incidence of lung cancer in Russia is at the planning stage now. The purpose of this planned study is to obtain the reliable data on radon exposure-effect dependence in a single study, conducted with a uniform approach to conducting the measurements and data analyzing.
The aim of this work is to model such research, to assess the impact of errors on the research results and to select methods that allow taking into account the impact of these errors. In our study, the approaches to the modeling of radon studies described in works (5, 10) were used.
2. MATERIALS AND METHODS
At the first stage of modeling, the distributions of radon concentrations in a given population were generated. Based on numerous data, the assumption that the distribution of radon concentrations was quite precisely described by lognormal distribution was made. Therefore, in the simulation, the values of the geometric mean (GM) and the standard deviation of the logarithms of radon concentration (σLN) were set.
Lung cancer incidence was modeled in the following way:
• The baseline value of spontaneous lung cancer incidence was chosen. When using the age-specific incidence λ0(t), it was assumed that the frequency of spontaneous occurrence of lung cancer for non-smoking men and women was, practically, the same (12). The data were approximated by fitting the function smoothly, depending on age t at the time of the risk assessment.
• The age distribution of the population for t>40 years was modeled by decreasing function generally corresponding to the probability of survival to a certain age. Ages up to 40 years have not been considered due to low probability of spontaneous occurrence of lung cancer.
• For each member of the population, smoking status was modeled at random, and then the age-specific probability of spontaneous occurrence of lung cancer has been multiplied by the coefficient of relative risk for a group of smokers. It was assumed that 60% of males and 30% of females have been exposed to smoking (smokers of different intensity or ex-smokers). The types of smoking groups and the relative risk values have been chosen in accordance with (1).
• The probability of lung cancer occurrence as a result of the combined action of radon and smoking was calculated as: ( , , ) = ( ) (1 + ), (1)
where RRsm - the relative risk of lung cancer due to smoking in selected smoker’s group; RRRn - the relative risk of lung cancer due to radon exposure (0.16 per 100 Bq/m3(1)); CRn–average radon concentration influencing a given individual.
• Using a random numbers generator, the number uniformly distributed in the interval 0 to 1 was generated. It was considered that lung cancer was realized and this individual belonged to the group "case" under the condition:
RND≤ P (t, smoking, Rn). (2)
Otherwise, a person belonged to the group "control". For given values of the geometric mean of radon concentration and the standard deviation σLN, 106 stories were generated. The same numbers of men and women have been modeled. The modeled data on lung cancer incidence were in good agreement with European statistical data (11).
To estimate the influence of errors, it has been assumed that the dominant type of errors are multiplicative errors, which are described by a lognormal distribution law(5, 10). The value of the multiplicative error is, due to errors in the calibration of detectors, the influence of seasonal variations of radon, uncertainties associated with the transition from the current values of radon concentration to the weighted average over a long period, etc., constant over the entire range of radon concentration in a given sample. To obtain the distribution of the values of radon concentration affected by the error influence, the individual “measured” radon concentrations were generated as = xp + . ( ; 0; ) ,(3)
where NORM.INV – function which returns the inverse of the normal distribution for the specified mean and the standard deviation.

SeparPoisson ethe numbanalyzed.cases wheexposure tracks regcomparissignificanexposure to be lowof the errmeasurem
For detectorsby CR-39counting.radonε=220 kBq⋅mtrack denrelative Pout as:
where Tinfluenceindividuain correskind of er
In theranges ofselect a ra
• approxicase grou
• approxithe case a
• manual
Odds calculatedInstitute not a trivsituationshas its owit, a numof OR founcertaineach randof exposuoverall cestimated
3. RES
3.1. Thgroup
As it group at mistake analysis. factor at selection
rately, the efferror associateber of tracks r. This error en the radon c
of the detectgistered by traon with the
nt concentratto radon, im
w. Neverthelesror having diffments is neces
modeling pu were chosen 9 material an. These det2.1 (track⋅cm-2
m-3⋅h (13–15) thnsity Nbgr=41
Poisson error f
=Texp – duratioe of Poissonal radon concepondence wit
rrors (Equatio
e calculation of exposures tange of calcula
imately the saup in each of th
imately the saand control gro
settings of int
ratios for d using a specof Industrial vial task for s where the odwn asymmetri
merical methodfor all intervnties and distrdomly generaure-effect depeconfidence ind.
SULTS AND DISC
he influence ofp on exposure-
is well knowepidemiologi
in the interpFor an assesimitating moof control gro
fect of the eed with a ranregistered by is more stroconcentrationtor is short aack detector isbackground
tions of radpact of this u
ss, the assessmferential influessary.
urposes, NRPfor detection
nd an opticaltectors have )/(kBq⋅m-3⋅h) at, in averag
1 track⋅cm-2. Cfor the track d
on of detectn errors whientration was th the approa
on 3).
of odds ratioso radon, seveations were us
ame number ohe intervals;
ame total numoups in each o
tervals.
different opcialized prograEcology. An the slope of
dds ratio in eaical confidenced of generatinvals, taking iribution law hted set of oddendence were ntervals for
CUSSION
of the selection-effect depend
wn, incorrectlical studies bpretation of tssment of theodeling, four oups were cons
error caused ndom dispersi
track detectorongly expresse
is low, duratiand the numbs relatively smtrack density
don or prolouncertainty is ment of the imence in the ran
PB and Radn of alpha parl system of t
a sensitivitwith a backgr
ge, correspondCalculation oetector was ca
,
tor exposure. ich dependedtaken into acc
ach used for
(OR) for differal approachsed:
of members o
mber of membeof the intervals
ptions have am designed ierror estimatithe dose-effe
ch of the sub re interval. To g Monte Carlonto account has been usedds ratio, the s
calculated anthe slope
n of the controdence
ly selected cobrings the grethe results oe influence ofvarious optiosidered:
by a ion of r was ed in ion of ber of
mall in y. For onged likely
mpact nge of
doSys rticles tracks ty to round ds to
of the arried
(4)
The d on count other
ferent hes to
of the
ers of s;
been in the ion is ect in range solve
o sets their
d. For slopes nd the
were
ol
ontrol eatest
of the f this
ons of
•
•
•
•
rsawasmoanss
incBg~dfocoF““tha
F
• control gdistributiogeneral pocontrol);
• control grratio of msmoking) the distr(standardi
• control grand age(standardi
• for each mby sex, agpair stand
At the firstradon levels asamples did noand smoking swith the experaverage radonsmokers was nmay have an eof the dwellingand in differennonsmokers (smokers is higstatus), which
Eight modn each were
concentration Bq/m3, the σLN
group ~800 lu~200 cases difference wasfor females ancancer rate. Tobtained by mFig.1. Later, controls” wpopulation”. Dhe number o
always was 1 :
Fig. 1. The nummodeling fo
average radonsmo
group correson by sex, ageopulation exp
oup is alignedmen and wom
are not standribution of ization by sex)
oup is aligned; smoking ization by age
member of the ge and smokindardization).
t stage of modaffecting the ot correlate wtatus. In generimentally obsn concentratnoted in varioexplanation bogs (perhaps, mnt socio-econo(it is knowngher in groupmay affect the
el groups of pgenerated. T
were set in tN– in the rangung cancer caamong fema
s explained bynd a smaller The number odeling for dif
for all moere selectedDuring the mf members o2.
mber of cases or different samn concentratioking and rado
sponds to e and smokingposed to radon
d with the casemen; other facdardized and c
the general);
d with the casestatus is
e and sex);
case group, ang status is se
deling, it was population in
with factors sueral, it is not fuserved facts, btion in the ous sources (16
oth in changinmore frequenomic status ofn that the pps with low soe quality of ho
population wiThe GM valuthe range froge from 0.8 tases among thales were oby a different slevel of sponof cases of
fferent sampleodeled “case
d than for modeling, the of case and co
of lung canceamples in depeon (no correlaton concentrati
339
the averageg status of then (population
e group by thetors (age andcorrespond tol population
e group by sexnot aligned
pair matchedelected (copy-
believed thatn each of thech as sex, age
ully consistentbecause lowerdwellings of
6, 17). This factng the regimet ventilation),f smokers andpercentage ofocio-economicousing.
ith 106 peopleues of radon
om 20 to 100o 1.2. In eachhe males andbserved. Thesmoking level
ntaneous lunglung cancer
es is shown ines”, different
the otherratio betweenontrol groups
r obtained by endence on tion between ion)
9
e e n
e d o n
x d
d -
t e e t r f t e ,
d f c
e n 0 h d e l g r n t r n s

340
The nummales in ddescribed wregression (st
Nm = (
In fact, inobserve that dependence corresponds the smallerdependence fwas not statis
The anaconcentration
• Even in 1600 – 1of randdistributvalue concentr0.27 perdifferent
• In indivislope canin depencalculati
• For a co16408 cois in the(averageto initiabig caseexposureused for
• For the sradon csignificaperformof the coby sex, copy-pai
The mosanalysis of tconcentrationsmoking staexposure-effegroup selectiof a correlatidwellings anlung cancer changes in twith any metcan be expconcentrationidentical to tfrom the gen
So, in epifind and takinfluencing concentrationthe only factcancer incideAccording tconcentrationsmoker’s d
mber of expectdependence owith statistictandard error
(670±28) + (0
n the modelinthe slope of ton the averato the origina
r number ofor females wstically signifi
alysis of ORn demonstrate
the studies 1800 controls,dom charactetion on lung dependences rations were r 100 Bq/m3 t samples.
idual samplesn be unpredic
ndence on the ion of OR valu
ombined groupontrols, the vae range from e value 0.16±0ally establishede and contre-effect slope calculation of
slope of the odconcentration,ant differenceed for differeontrol group:control by seir.
st important the groups wn with other
atus) is the ect slope coeffon. In fact, thion between th
nd the factors (sex, age, smothe slope of tthod of selectiplained by n distributionthe one in anyeral populatio
idemiological ke into accouboth lung can in dwellingstor simultaneence and radoto the datan was approx
dwellings tha
ted cases of lon radon cocal significanr shown):
0.0014±0.0003
ng of a cohortthe lung canc
age radon leveally specified leof cases ob
was 0.0035 ± 0cant.
R dependened a set of feat
with 800 – , there is signier of radon
cancer incidon the
in the range(at the given
, the value of ctably changed
number of intues.
p containing 8alue of exposu0.13 to 0.17 p
0.01). This vald value 0.16.
rol groups, don the numb
f OR values ca
dds ratios dep, there are
es between thent methods o population c
ex and age, a
result obtainwith no correl
factors (suchabsence of
fficient on the is means, thathe concentratinfluencing th
oking), we cathe function ion of the contthe fact th
n in the cony group obtai
on.
study, it is vunt the confoancer incidens. As it was meeously influenon concentratia (16), the aximately 10 % an in the
lung cancer fooncentrationnce by linea
3) ⋅ (5
t study, we cacer incidence iels, in generaevel. Because bserved, slop0.0016 Bq-1 an
nce on radotures:
900 cases anficant influenc
concentratiodence. The O
“real” radoe from 0.09 t value 0.16) i
exposure-effed ~1.5 – 2 timetervals used fo
8204 cases anure-effect slopper 100 Bq/mue correspondEven for suc
dependence ber of intervaan be observed
pendence on thno statisticalhe calculationof stratificatiocontrol, contrand the contr
ned during thation of rado as sex, age odependence type of contr
t in the absenction of radon ihe incidence nnot watch thexposure-effetrol group. That the radontrol group ined at random
ery essential tounding factonce and radoentioned abov
ncing both lunion is smokinaverage rado
smaller in thdwellings
or is ar
5).
an in al, of pe nd
on
nd ce on
OR on to in
ect es or
nd pe m3 ds ch of
als d.
he lly ns on rol rol
he on or of
rol ce in of he ect his on is m
to ors on ve, ng
ng. on he of
nonsage erado
Taveraschecons“nonindivand the modvalueThe mod
Figmod
radon
Tmaledesc
Fon t0.00modthe statueffeccorre
Isampessengrougrouper u
Taco
Sele
PopStanStanStan
smokers. For oetc. there are n
on concentratio
To take into aage concentrame of the mo
sidered individnsmoker”, thvidual’s dwelluniformly disinitial conc
deling, 8 groues of GM of rnumber of
deling for diffe
g. 2. The numbdeling for diffen concentration
The number oes, like in tribed by regre
Nm = (689±For females, ththe average r021 Bq-1 and deling of the co
case of negaus and radon cct dependenceelation.
n the case-cple, it was fontially depen
up. The improvup increases tunit of radon c
able 1. Odds raoncentrations
ection of contr
pulation contrndardization bndardization bndardization c
other influencno data on theon in dwelling
account the efation of radonodel experimedual had a smhe radon cing was redutributed in th
centration. Lps in 106 indradon concentcases of lungrent samples i
er of cases of lurent samples, in
n (correlation -1radon concentr
of expected cathe previous ession (standa
±26) + (0.001he observed sradon concenwas not stat
ohort study, it ative correlatconcentratione is less than
control analyound that theds on the sevement of the he growth of
concentration
atio dependen for different k
control gro
rol group
olby sexby age and sexcopy-pair
cing factors, sueir influence ogs.
ffect of smokin in the dwe
ent was modifmoking status o
concentration uced in value he range 0 – 2Like in the dividuals with tration were gg cancer, obis shown in Fi
ung cancer, obtn dependence o10% between smration)
ases of lung ccase, is sig
ard error is sho
1±0.0004) ⋅slope of the dentration was tistically signit can be observtion between
n, the slope of n in case of a
ysis of the e slope exposelection of th
e selection of tf lung cancer (Table 1).
nce on the “reakinds of selec
oup
Slope coeffi100 Bq-1 (95
0.038 ± 0.079 ±
x 0.070 ± 0.120 ±
uch as sex, on average
ing on the llings, the
fied. If the other than
in the randomly
20 % from previous
the same generated.
btained by ig. 2.
tained by on average moking and
cancer for gnificantly own):
(6). ependence 0.0028 ± ificant. In ved that in
n smoking exposure-
absence of
combined sure-effect he control the control
incidence
al” radon ction of
cient per 5% CI) 0.014 0.020 0.010 0.012
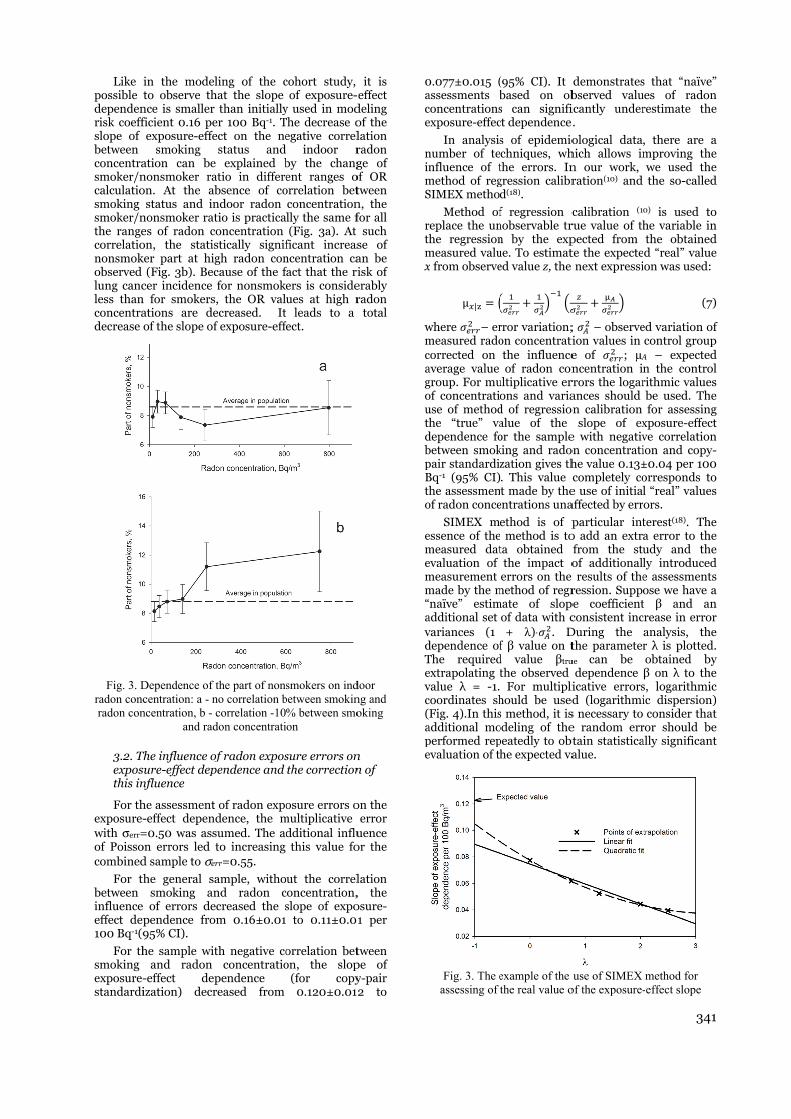
Like possible dependenrisk coeffslope of between concentrasmoker/ncalculatiosmoking smoker/nthe rangecorrelationonsmokobserved lung cancless thanconcentradecrease
Fig. 3. Dradon concradon con
3.2. Texposthis in
For thexposure-with σerr=of Poissocombined
For thbetween influenceeffect dep100 Bq-1(9
For thsmoking exposure-standardi
in the modelto observe th
nce is smallerficient 0.16 peexposure-effe
smoking ation can benonsmoker raon. At the ab
status and innonsmoker rates of radon con, the statisker part at hi
(Fig. 3b). Beccer incidence
n for smokersations are deof the slope of
Dependence of centration: a - nncentration, b -
and rad
The influence ofsure-effect depnfluence
he assessment-effect depen=0.50 was asson errors led d sample to σe
he general sasmoking an
e of errors dependence fro95% CI).
he sample witand radon
-effect depization) decr
ling of the chat the slope r than initiallyer 100 Bq-1. Tect on the ne
status ande explained batio in differebsence of condoor radon tio is practica
concentration stically signifgh radon concause of the ffor nonsmok
s, the OR valecreased. Itf exposure-eff
the part of nonno correlation bcorrelation -10don concentrati
of radon expospendence and
t of radon expondence, the msumed. The adto increasing
err=0.55.
ample, withond radon cecreased the som 0.16±0.01
th negative coconcentratio
pendence reased from
cohort study, of exposure-
y used in modThe decrease oegative correl
indoor rby the changent ranges o
orrelation betconcentrationlly the same f(Fig. 3a). At
ficant increasncentration cafact that the riers is consideues at high r leads to a
fect.
smokers on indbetween smokin% between smoon
sure errors onthe correction
osure errors omultiplicative
dditional influthis value fo
ut the correlconcentration,slope of expo to 0.11±0.0
orrelation beton, the slop
(for copy0.120±0.01
it is effect
deling of the lation radon ge of
of OR tween n, the for all
such se of an be isk of
erably radon
total
door ng and oking
n n of
on the error
uence or the
lation , the osure-1 per
tween pe of y-pair 2 to
0ace
ninmS
rthmx
wmcagouthdbpBtho
ememm“avdTevc(ape
0.077±0.015 (assessments bconcentrationsexposure-effec
In analysisnumber of tenfluence of t
method of regSIMEX method
Method ofreplace the unhe regression
measured valux from observe
μ | =where – ermeasured radocorrected on average value group. For muof concentratiouse of methodhe “true” va
dependence fobetween smokpair standardizBq-1 (95% CI)he assessmen
of radon conce
SIMEX messence of themeasured datevaluation of measurement made by the mnaïve” estim
additional set variances (1 dependence ofThe requiredextrapolating tvalue λ = -1. coordinates shFig. 4).In this
additional moperformed repevaluation of th
Fig. 3. The eassessing of
(95% CI). It based on obs can significt dependence
s of epidemiochniques, whthe errors. Ingression calibrd(18).
f regression cnobservable trn by the expue. To estimated value z, the
+rror variation;on concentratithe influenceof radon con
ultiplicative erons and varia
d of regressioalue of the or the sampleking and radozation gives th. This value ct made by the
entrations una
ethod is of pmethod is to
ta obtained the impact oerrors on the
method of regrmate of slop
of data with c+ λ)⋅ . D
f β value on td value βtru
the observed For multipli
hould be useds method, it isodeling of thepeatedly to obthe expected va
example of the the real value o
demonstratesbserved valuicantly under
e.
ological data,hich allows imn our work, ration(10) and
calibration (1
rue value of thpected from te the expecte next expressi
+
; – observeion values in e of ; µA
ncentration inrrors the logarances should
on calibration slope of ex
e with negativon concentratihe value 0.13±completely coe use of initialaffected by err
particular into add an extrafrom the stuof additionall
e results of theression. Suppo
pe coefficientconsistent inc
During the the parameterue can be
dependence icative errorsd (logarithmi
s necessary to e random err
btain statisticaalue.
use of SIMEX of the exposure-
341
s that “naïve”ues of radonrestimate the
, there are amproving thewe used thethe so-called
0) is used tohe variable inthe obtainedd “real” value
ion was used:
(7)
ed variation ofcontrol group
A – expectedn the controlrithmic valuesbe used. Thefor assessing
xposure-effectve correlationion and copy-±0.04 per 100orresponds tol “real” valuesors.
terest(18). Thea error to theudy and thely introducede assessmentsose we have at β and ancrease in erroranalysis, ther λ is plotted.obtained byβ on λ to thes, logarithmicic dispersion)consider that
ror should beally significant
method for
-effect slope
1
” n e
a e e d
o n d e
)
f p d l s e g t
n -0 o s
e e e d s a n r e . y e c ) t e t

342
In general, the SIMEX method also allows obtaining the good assessment of expected value of the slope of exposure-effect dependence. The quadratic or cubic extrapolations give better results than linear extrapolation but it should be noted that SIMEX method leads to the underestimation of the real value of the slope coefficient.
4. CONCLUSIONS
The analysis allows making the following conclusions. When planning a large-scale national or international epidemiological study to detect the lung cancer incidence due to exposure to radon in the dwellings, the researchers should focus on the following issues:
• Thorough identification of factors affecting both the concentration of radon in homes and lung cancer. Identify, if possible, the numerical values of the coefficients of proportionality for these factors.
• Comprehensive assessment of the factors influencing the error of radon exposure assessment and numerical evaluation of all errors.
• The analysis of the possible impact of errors on the observed values of the exposure-effect dependence and the choice of optimal techniques to obtain undistorted value of the desired parameter.
• Results of exposure-effect dependence essentially associated with the choice of intervals in which the odds ratios are calculated. In this regard, the critical rule for choosing such intervals should be worked out.
• Decrease in the slope of the exposure-effect dependence at presence of negative correlation between smoking and radon should be taken into account. It should be noted that this effect was observed when the "real" values of radon concentration were used. The influence of such factors on the results of the studies should be examined very carefully.
• The modeling demonstrated that to obtain an acceptable statistical accuracy (~15% at 95% CI), the planned study should be comparable in scale to the combined European radon study, i.e. the number of cases should be within 6000 - 8000 and the number of controls 12000 – 16000. In planning such study, the quality of selection of the control group should initially be at a high possible level. The detailed analysis of the numerical values of different errors influencing the radon exposure assessment are also very important due to the fact that error values will inevitably be used for the correction of naïve evaluations of exposure-effect dependence.
Acknowledgement: This work was supported by the Ural Branch of Russian Academy of Science (project 15-3-2-10).
REFERENCES
1. S.Darby, D.Hill, A.Auvinen, J.M. Barros-Dios et al. “Residential radon and lung cancer: detailed results of a
collaborative analysis of individual data on 7148 subjects with lung cancer and 14208 subjects without lung cancer from 13 epidemiologic studies in Europe”, Scand. J. Work. Environ. Health, vol. 32,suppl. 1: pp. 1-83, 2006.
2. S.X.Yao, J. H.Lubin, Y.L.Qiao, et al., “Exposure to radon progeny, tobacco use and lung cancer in a case–control study in southern China”, Radiat. Res., vol. 138, pp. 326–336, 1994.
3. Lubin J.H., Wang Z.Y., Boice J.D. et al. “Risk of lung cancer and residential radon in China: pooled results of two studies”, Int J Cancer. vol. 109, pp. 132–137, 2004.
4. Krewski D., Lubin J.H., Zielinski J.M. et al. “Residential Radon and Risk of Lung Cancer: A Combined Analysis of 7 North American Case-Control Studies” Epidemiology, vol. 16, pp.137-145, 2005.
5. Lubin J. H., Boice J. D., Jr., Samet J. M. “Errors in Exposure Assessment, Statistical Power and the Interpretation of Residential Radon Studies”, Radiat. Res., vol. 144, pp. 329–341, 1995.
6. E. V.Polzik, V. L. Lezhnin, V. S.Kazantsev “To the issue of evaluating the radon effects on lung cancer”, Radiation Biology Radioecology.; vol. 44, No 2, pp. 207-15, 2004. In Russian.
7. V. L. Lezhnin, E. V. Polzik, V. S. Kazantsev, M. V. Zhukovsky, O. A. Pakholkina “A multifactorial assessment of carcinogenic risks of radon for the population residing in a Russian radon hazard zone”, Arch. Oncol. vol. 19, No 1-2,pp. 3-8, 2011.
8. M.Zhukovsky, A.Varaksin, O.Pakholkina “Statistical analysis of observational study of the influence of radon and other risk factors on lung cancer incidence”, Radiation Protection Dosimetry, vol. 160, No 1-3, pp. 108-111, 2014.
9. Yuji Yamada, Quanfu Sun, Shinji Tokonami et. al., “Radon–thoron discriminative measurements in Gansu province, China, and their implication for dose estimates”, Journal of Toxicology and Environmental Health, Part A, vol. 69, pp. 723–734, 2006.
10. T. Fearn, D.C. Hill and S.C. Darby “Measurement error in the explanatory variable of a binary regression: regression calibration and integrated conditional likelihood in studies of residential radon and lung cancer”, Research Report No. 280, Department of Statistical Science, University College London, October 2007.
11. European Detailed Mortality Database (DMDB). World Health Organization Regional Office for Europe. http://data.euro.who.int/dmdb/, 2014.
12. R.Peto, A. Lopez, J.Boreham, M. Thun, C. Heath “Mortality from tobacco in developed countries: indirect estimation from national vital statistics”, Lancet, vol. 339, pp. 1268-1278, 1992.
13. C.B. Howarth “Results of the 2006 Health Protection Agency Intercomparison of Passive Radon Detectors”, HPA-RPD-053. Health Protection Agency Chilton. 2007.
14. C.B. Howarth“Results of the 2007 Health Protection Agency Intercomparison of Passive Radon Detectors”, HPA-RPD-060. Health Protection Agency Chilton. 2009.
15. Z.Daraktchieva, C.B.Howarth, R. Algar “Results of the 2011 HPA Intercomparison of Passive Radon Detectors”, HPA-CRCE-033. Health Protection Agency. Chilton. 2012.
16. B.S. Cohen “Variation of radon levels in U.S. homes correlated with house characteristics, location, and socioeconomic factors”, Health Phys., vol.60, No 5, pp.631-642, 1991.
17. Z.S. Zunic, I.V. Yarmoshenko, A. Birovljev et.al. “Radon survey in the high natural radiation region of Niska Banja, Serbia”, Journal of Environmental Radioactivity, vol. 92, pp. 165 – 174, 2007.
18. J. R. Cook, L. A. Stefansky “Simulation-extrapolation simulation in parametric measurement error models”, J. American Statistical Association, vol. 89, No. 428, pp. 1314-1328, 1994.

Abstconvdosimdosebeenthe athe rexpodiffe
Key
1. INTR
Whensources othe corremeasure Internatio(ICRP) usexternal approach
• calcuand tdosim
• calcuweigh
• calcuweigh
This akind of raexposurebehavior respiratordirect radapproachradiation decay procalled “suggested
The comparisexposure radiationexposure result, it factor (DWLM or B
RADO
tract. Two genversion conventmetric models.
e conversion con calculated for age at exposurerange from 6.1 tosure. For lifetierent rates of sp
y words: radon
RODUCTION
n comparing on the humanect universal
of radiationonal Commissses an effectivand internal
h is applied:
ulation of avertissues using metric models
ulation of equhting factors w
ulation of efhting factors w
approach was adiation expos. Due to inof short live
ry tract and mdiation risk froh was not reco
doses in casoducts. In IC
“dose converd.
dose conveon of radiatioand whole bo. If detrimentequal then this possible
DCF) from radBq⋅h⋅m-3 to eff
ON EXPOSUR
1 Institut
neral approachetion and calculTo calculate do
onvention approdifferent scena
e and 15.1 mSv/to 19.9 mSv/WLime exposure thpontaneous lung
n, effective dose,
impact of ds, it is very iml quantity, wn detriment. sion on Radio
ve dose as suchradiation ex
rage absorbeddifferent kind
s;
ivalent dose uwR;
ffective dose wT.
recommendesure with the
nsufficient infed radon decamore or less goom radon expommended tose of inhalatioCRP Publicatiorsion conven
ersion conveon induced d
ody external exts at different
he effective dosto obtain the
don exposure fective dose ex
RE AND DO
M. Zhuk
te of Industria
es were used bylations of absorose conversion foach, radiation
arios. For male m/WLM at uniforLM for males anhe DCF are 7.8g cancer inciden
radiation risk,
different radimportant to chwhich can be
Traditionallyological Prote
h measure. Botxposures, stan
dose DT in ords of biokineti
using the radi
using the t
ed by ICRP foexception of rformation onay products inood informatio
posure, the clao the calculation intake of ron 65 (1) apprntion” has
ention uses detriment at rxposure to low
kinds of radises also equale dose conveexpressed in
xpressed in Sv
OSE CALCUL
kovsky, I.Ya
al Ecology UB
y ICRP to the corbed, equivalenfactors (DCF) f
n risks from whminers DCF we
rm radon exposnd from 1.3 to 3
8 and 1.5 mSv/nce.
, dose conversio
iation hoose e the
y, the ection th for ndard
rgans ic and
iation
tissue
or any radon n the n the on on
assical ion of radon roach been
the radon
w LET iation l. As a ersion
units v.
imcedwin
amdocdodecine
dwwrgvbomroPthbtha
LATION: PR
armoshenk
RAS, Ekaterin
onversion from nt and effectivefrom radon exphole body gamere in range frosure from age 23.3 mSv/WLM fWLM, correspo
on convention,
Later, sucmproper in
calculations ofeffective dosedosimetric moweighting facnternally depo
It should advantages amethods useddosimetric appobtained by dconsidered asdetriment andonly to compadose limits orexposure, the considerably ndividuals (m
etc.).
The dose cdirect connectwith detrimenwhole body raradiation. Thegroups can givalues will cobetter. It shouobtained by thmore difficultreference leveloptimization Publication 65he considerab
both at radon his work, diff
are considered
ROBLEMS O
ko
nburg, Russia
radon exposuree doses, using rosure to the effma exposure am 11.8 to 19.4 m0 to 60. For popfor females in dondingly. Such
ch approach Publication
f absorbed, eqe, using the odels with spectors were reosited radionu
be noted, thand limitatiod for internal proach. Never
direct dosimets the universd should be uarison of radir reference levsame effectivdifferent d
males or female
conversion cotion of the det at more or ladiation expo
comparison ive different orrespond to
uld be pointedhe dose convet at compars but will bettof radiologic
5 (1), the DCF bly averaged daand at externferent approac
d and compare
OF CHOICE
e to effective doreference biokinfective dose accand radon expomSv/WLM depeopulation, the Ddependence on t
difference aris
has been n 115 ICRP
quivalent andreference bi
ecified radiatiecommended
uclides.
hat both appons. The un
dosimetry prtheless, the tric calculatiosal measure
used, as ICRPiation exposurvels. In the c
ve doses will cdetriments fes, smokers o
onvention alloetriment at raless homogen
osure by low of detrimentsvalues of DC
o the expected out, that thersion convenring with doter correspondcal protectiovalue was calata on radiatio
nal whole bodyaches to estimed.
ose – dose netic and ording to
osure had ending on
DCF are in the age at ses due to
reported as(2). Direct
d, as a result,iokinetic andon and tissue
as for any
roaches haveniversality ofersists in theeffective dose
ons cannot beof radiation
P recommend,re levels withcase of radoncorrespond tofor differentr nonsmokers
ows obtainingdon exposure
neous externalLET gamma
s for differentCF but theseed detriment
he use of DCFntion could beose limits ord to process ofon. In ICRPlculated usingon detrimentsy exposure. In
mation of DCF
s t ,
d e y
e f e e e n ,
h n o t s
g e l a t e t
F e r f
P g s n F

344
2. MATERIALS AND METHODS
To calculate the radiation risks of solid cancer incidence at low LET radiation exposure, the risk extrapolation models as follow were used:
1. BEIR VII (3) excess relative risk (ERR) and excess absolute risk (EAR) models;
2. UNSCEAR 2006 (4) models: ERR linear model adjusted for age at exposure, ERR linear and linear-quadratic models adjusted for sex, attained age, and years since exposure, EAR linear and linear-quadratic models adjusted for attained age, and years since exposure;
3. RERF models: linear model from Report 13 (5), linear and linear-quadratic models from Report 14 (6).
To estimate the complete detriment at whole body exposure, radiation risks of leukemia incidence were additionally calculated using:
1. BEIR VII EAR and ERR linear-quadratic models (3);
2. UNSCEAR 2006 EAR and ERR linear-quadratic models (4) (quadratic risk assessment models were excluded from consideration because of their inapplicability at low doses);
3. RERF linear-quadratic models (7).
To calculate the radiation risks at radon exposure the following models based on the epidemiology of uranium miners have been used:
1. BEIR VI model (time since exposure, age, concentration), based on the epidemiology of 11 miners cohorts (8);
2. WISMUT models based on epidemiology of cohort of German uranium miners (9 – 10) (modification of BEIR VI models using original epidemiological data);
3. Model based on the analysis of cohorts of French and Czech uranium miners (11), which takes into account the modifying effect of time since exposure and age at exposure;
4. WISMUT models based on the epidemiology of cohort of German uranium miners (10, 12) (modification of model (11) using original epidemiological data);
5. Tomasek model (13) based on the epidemiology of 11 underground miners studies (modification of model (11) using another data);
6. Two-stage mutation cancer models based on the epidemiology of French-Czech (14) or German (15) cohorts;
7. Model, analogical BEIR VI model, based on data in mortality and lung cancer incidence in cohort of Eldorado uranium miners (16);
8. Model, suggested by Environmental Protection Agency (17) (modification of BEIR VI model).
The direct use of results of the miners studies for radiation risk assessment at indoor radon exposure is impossible. The main reasons are the differences between:
• characteristics of occupational and population cohorts (age and sex distribution, smoking prevalence etc.);
• atmosphere conditions in mines and dwellings (ventilation rate, aerosols concentrations etc.).
While the risk assessment at external gamma radiation exposure is based on the data for both males and females (3 - 7), the risk assessments at radon exposure is based on the models developed with the use of the male miner’s epidemiological data (8 – 16). For females, there are no data about the dependencies of radiation risk on the age of exposure or time since exposure. The only reason to the using of the same risk assessment models for males and females at radon exposure is the fact, that excess relative risks, observed in collaborative analysis of European case-control studies (18), were approximately equal for both sexes.
The model for indoor radon exposure can be based on time and age dependences obtained from miners studies, but should be normalized by results of the epidemiological studies in dwellings. One of such models suggested in work (19) as a transformation of WISMUT model (9) was normalized by results of the combined European study (18). To make the radiation risks assessment for population at radon exposure more detailed, some different miners models have been normalized on results of combined European study. Like in work (19), the ERR = 0.16 per 100 Bq/m3 was considered as corresponding to lifetime radon exposure at normalization. The values of coefficients of proportionality in models were fitted to obtain the lifetime ERR = 0.16 at continuous radon exposure 100 Bq/m3 from the birth to the age 95 years (maximum attained age in European study) under the use of revised model. In assessing of radiation risks from radon in general population, the modified models as follow were used together with model (19):
1. EPA model (17);
2. Model based on cohorts of French and Czech uranium miners (11);
3. Models, based on the analysis of German uranium miners (10, 12), which takes into account the modifying effect of time since exposure and age at exposure;
4. Two-stage mutation cancer models based on the epidemiology of German (14) cohort.
At the fitting procedure, the dependences of spontaneous lung cancer rate λ0(t) on attained age t for both sexes and the probabilities of survival p0(t) to age t typical to European countries were used (20).
During the radiation risk assessment, lifetime probabilities R of solid tumors in general, leukemia or lung cancer mortality for different radiation exposure scenarios were calculated as: = ( , , ) ( )( ) exp(− ( ′, , ) ′)
(1)
where ( , , ) – is radiation cancer mortality depended on time of exposure te, attained age t and radiation dose d. The statistically expected reduction in life expectancy was calculated as: Δ = ( )( ) −− ( )( ) − ( , , ) . (2)
The ratio = Δ / gives the assessment of average value of years of life lost at realization of radiation
345
induced case of cancer. In classical approach to dose conversion convention, comparing of total detriments taking into account not only risks but other factors is needed. Therefore the average weighted between solid tumors and leukemia values of were calculated. The detriment DetT for each model of radiation risk assessment at radon exposure was calculated according to ICRP Publication 103 (21) = + (1 − )( + (1 − )) , (3)
where kT is the lethality fraction and qmin is the minimum weight for non-lethal cancers (value of qmin was set equal to 0.1 (21)). For whole body exposure detriment was calculated from the averaged values and . Because UNSCEAR and RERF models are completely based on the data of Hiroshima and Nagasaki cohorts we used the value of DDREF factor 1.5 recommended by BEIR VII report (3).
The DCF values between radon exposure and effective dose were determined as = // , (4)
where PRn – radon progeny exposure (WLM); Dγ – dose of homogeneous whole body exposure by low LET radiation (Sv).
3. RESULTS AND DISCUSSION
At the initial stage, the comparison of risk assessments of whole body exposure with non-modified models of risk assessment for miners radon exposure (non-modified models of risk assessment) was conducted. Both single exposure at different ages and prolonged radiation exposure were considered. In some models of risk assessment, the dependence dose-effect is not linear (3, 4, 6, 7, 14, 15). Therefore, the DCF assessment for different levels of radiation exposure was conducted. In spite of the using miners models, calculations of detriment and DCF values were conducted both for males and females. The results of DCF assessment with the use of miners models presented in Table 1 and 2. The results of DCF calculations for general populations with the use of modified models of risk assessment at radon exposure are presented in Table 3. The variation coefficient for DCF values obtained by pair combination of different risk assessment models is ~0.53 for general population and ~0.82 for miners.
The significant difference between DCF values for males and females is observed. With the use of miner models, ratio DCFm/DCFf is in the range from 4.0 to 5.7, at the use of modified models of risk assessment at radon exposure, this ratio is in the range from 4.5 to 7.0.The main reasons of such significant differences are:
• radiation detriment for females at external gamma radiation exposure is approximately 1.5 times higher in comparison with males;
• radiation detriment for males at radon exposure is approximately 3 – 4 times higher in comparison with females due to a significant difference in the spontaneous incidence of lung cancer between the sexes.
Table 1. Dose conversion factors for high levels radiation exposure (single exposure 300 mSv and 50 WLM or prolonged exposure 20 mSv/year and
4 WLM/year)
Age at exposure
Sex mSv/WLM nSv/(Bq⋅h m-3)
20 Males 11.8 18.5Females 3.1 4.8
25 Males 11.6 18.2Females 3.1 4.8
30 Males 12.1 19.0Females 3.3 5.1
35 Males 13.3 20.8Females 3.5 5.6
40 Males 15.1 23.8Females 3.7 5.9
45 Males 16.5 25.9Females 3.7 5.8
50 Males 16.7 26.1Females 3.3 5.2
60 Males 13.8 21.7Females 2.6 4.1
70 Males 10.1 15.8Females 2.2 3.4
80 Males 7.9 12.4Females 1.8 2.9
20-60 Males 14.7 23.1Females 3.7 5.7
0-100 Males 12.4 19.5Females 3.2 5.1
Table 2. Dose conversion factors for low levels radiation exposure (single exposure 5 mSv and
1 WLM or prolonged exposure 1 mSv/year and 0.2 WLM/year)
Age at exposure
Sex mSv/WLM nSv/(Bq⋅h m-3)
20 Males 13.3 20.8Females 3.3 5.2
25 Males 13.0 20.4Females 3.3 5.2
30 Males 13.6 21.4Females 3.6 5.6
35 Males 15.2 23.8Females 3.9 6.2
40 Males 17.4 27.3Females 4.1 6.5
45 Males 18.9 29.7Females 4.1 6.4
50 Males 19.4 30.4Females 3.7 5.8
60 Males 17.0 26.6Females 3.0 4.8
70 Males 13.9 21.8Females 2.9 4.5
80 Males 12.1 19.1Females 2.7 4.2
20-60 Males 15.1 23.7Females 3.6 5.6
0-100 Males 12.4 19.5Females 2.9 4.6

346
Table 3populations
assessment aand 1 WLM
Age at exposure 20 M F25 M F30 M F35 M F40 M F45 M F50 M F60 M F70 M F80 M F20-60 M F0-100 M F
The datdemonstratesexposure, obwhich take different valuthe possible cto recommenational deriin dwellingsequilibrium corresponds different ageannual effectfor males themSv. Average10.4 mSv cinequality in than exposur
The speciof calculationand direct caeffective dosvalues from WLM to absmGy was gethe data froeffective doswT=0.12 wermine atmospindoor exposdoses for lun
D=(0.5DBBbas
(Fig. 1a and F
. Dose convers with the use at radon expos
M or prolonge0.2 WL
Sex mS
Males Females Males Females Males Females Males Females Males Females Males Females Males Females Males Females Males Females Males Females Males Females Males Females
ta presented s that the btained by dinto account
ues for males consequencesendation of ived references should notfactor 0.4 anto radon exp
e groups of tive dose in the doses are ined by lifetime
correspondentthe situations
re to radon.
ial interest is tns of DCF by alculations of tses. The array
radon progsorbed doses enerated by Mom the worksses the weig
re used. The rephere are pressure presente
ng were calcula
s+0.5DBBsec)0.
Fig. 2a), or
rsion factors fof modified m
sure (single exd exposure 1 mLM/year)
Sv/WLM nS
6.11.36.71.47.01.6
10.92.414.52.916.83.017.62.7
18.32.619.93.2
18.83.311.02.17.81.5
in the Taeffective do
dose conversiot radiation dand females.
s of such situaICRP Public
e level of radont exceed 300nd occupancyposure 1.33 Wfemales, it c
he range from n the range fre exposure valutly. There is s of radiation
the comparisodose convers
the absorbed, y of conversieny exposurein lung tissue
Monte-Carlo tes (22, 23). In ghting factoresults of DCF ented in Fig. 1ed in Fig. 2. ated either as:
333+0.333Db
for general models of riskxposure 5 mSmSv/year and
Sv/(Bq⋅h m-3)
9.6 2.0 10.6 2.3
10.9 2.4 17.1 3.8
22.8 4.5
26.4 4.7
27.6 4.3
28.7 4.2 31.2 5.1
29.6 5.2 17.2 3.3 12.2 2.3
ables 1 –oses at radoon conventioetriment, havLet us considetion. Accordincation 115 (2
n concentratio0 Bq/m3. Foy factor 0.8, WLM/year. Focorresponds t1.5 to 4.4 mS
rom 7.6 to 26ues are 2.0 an
no such seexposure othe
on of the resulsion conventio
equivalent anion coefficiene expressed ies expressed iechnique usincalculations
rs wR=20 anassessment fo
1, modelling foThe absorbe
b+0.333DAI (5
k v
d
3 on n, ve er ng 2), on or it
or to
Sv, 6.5 nd ex er
lts on nd nts
in in ng of
nd for for ed
5)
D=(0
(Fig.are tbronof lu
Idirecconvonly ICRPvaluemost
Ndiffeabovassesthe mepiddepeor timodusedcolla(18), possradosigniDCF
Athe uncewT uequiv(29, 30
relatconsweig
Fieffec
ven
0.5DBBbas+0.5D
. 1b and Fig. 2the absorbed nchial, bronchings, correspon
n general, thect dosimetric version conve
for males, esP summary one of DCF=12t situations of
Nevertheless, erence betweenve, unlike thessments at raminer’s modeemiological d
endencies of rime since ex
dels for males d because exaborative analy
were approxible differenc
on exposure bificant factor
F values assess
Additional soueffective dos
ertainties in thused for transivalent and ef
0) it was demontive biologicalsiderably less tghting factors w
ig. 1. DCF to cctive dose, minntilation (aver
DBBsec)0.80+0
2b), where DBB
doses on basaiolar and alvendently.
ere is good coapproach (23 –
ntion if the pecially for mn Sydney mee
mSv/WLM radon exposu
for femalesn these approa models for edon exposure
els. For femaldata, which radiation risk xposure. The
and females axcess relativysis of Europeimately equaces in radiatibetween male
influencing ment by dose
urces of uncerte by dosime
he values of wition from absffective dose. nstrated that, l effectivenessthan recommewR=20.
conversion frone atmospherrage values a –
22.3 mSv/WL
0.15Dbb+0.o5D
BBbas, DBBsec, Dal and secretoeolar-interstiti
orrespondenc– 27) and the ucomparison
miners (26). Theeting in Aprilwas recomm
ure (28).
s, there is saches. As we mexternal expo
e in general isles, there are
allows analyon the age ofsame risk a
at radon expove risks, obsean case-contral for both sion risk real
es and femalethe sex diffeconversion co
tainties at calcetric approach
weighting factosorbed dose inFor example,for radon exps of alpha pended by ICR
om radon expore, wet drilling– 15.2 mSv/W
WLM).
DAI , (6)
Dbb and DAI ory cells of ial regions
e between use of dose conducted erefore, in l 2015 the ended for
significant mentioned osure, risk s based on
no direct yzing the f exposure
assessment osure were served in rol studies
sexes. The lization at es can be erences in onvention.
culating of h are the ors wR and n organ to , in works
posure, the articles is
RP value of
osure to g, medium
WLM, b –
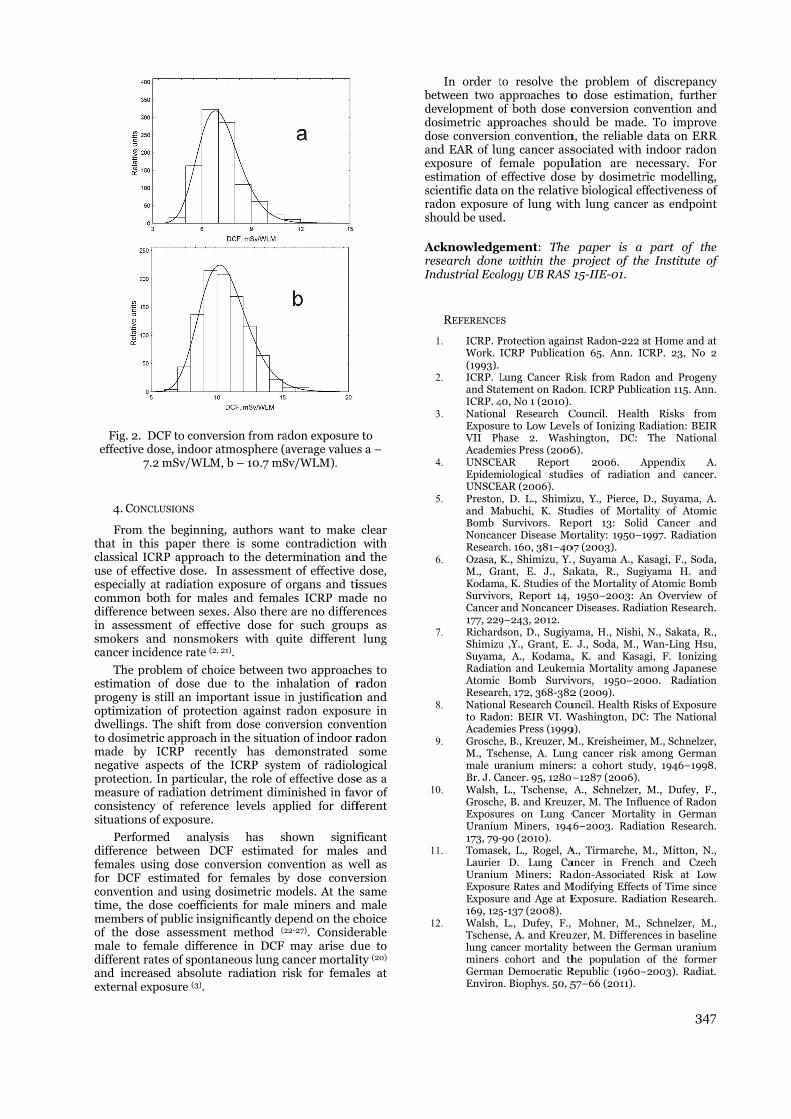
Fig. 2. effective
4. CON
From that in tclassical Iuse of effespeciallycommon differencein assesssmokers cancer inc
The pestimatioprogeny ioptimizatdwellingsto dosimemade bynegative protectionmeasure consistensituations
Perfordifferencefemales ufor DCF conventiotime, themembersof the domale to different and increexternal e
DCF to convee dose, indoor 7.2 mSv/WLM
NCLUSIONS
the beginninthis paper theICRP approacfective dose. y at radiation
both for male between sexsment of effe
and nonsmocidence rate (2
problem of choon of dose duis still an imption of protecs. The shift fretric approachy ICRP receaspects of th
n. In particulaof radiation d
ncy of referens of exposure.
rmed analye between Dusing dose co
estimated foon and using e dose coefficis of public insiose assessmefemale differerates of sponteased absolutexposure (3).
ersion from raatmosphere (a
M, b – 10.7 mS
ng, authors were is some ch to the deteIn assessmenexposure of
les and femalxes. Also thereective dose fookers with qu2, 21).
oice between ue to the in
portant issue iction against rom dose convh in the situatiently has dehe ICRP systear, the role ofdetriment dimnce levels app
ysis has shDCF estimateonversion conor females bydosimetric mients for maleignificantly deent method (2
ence in DCF taneous lung cte radiation r
adon exposureaverage values
Sv/WLM).
want to make contradiction
ermination annt of effective organs and tiles ICRP mad
e are no differor such groupuite different
two approachnhalation of rin justificationradon exposuversion conveion of indoor remonstrated em of radiolo
f effective doseminished in fav
plied for diff
hown signifed for malesvention as wy dose conveodels. At the
e miners and epend on the c22-27). Conside
may arise ducancer mortalirisk for femal
e to s a –
clear with
nd the dose,
issues de no rences ps as
lung
hes to radon n and ure in ention radon some
ogical e as a vor of ferent
ficant s and
well as ersion same male
choice erable ue to ity (20) les at
bdddaeesrs
ArI
In order tbetween two development odosimetric appdose conversioand EAR of luexposure of festimation of scientific data radon exposurshould be used
Acknowledgeresearch doneIndustrial Eco
REFERENCE
1. ICRP. PWork. (1993).
2. ICRP. Land StaICRP. 4
3. NationaExposuVII PhAcadem
4. UNSCEEpidemUNSCE
5. Prestonand MBomb NoncanResearc
6. Ozasa, M., GrKodamaSurvivoCancer 177, 229
7. RichardShimizuSuyamaRadiatioAtomic Researc
8. Nationato RadoAcadem
9. GroscheM., Tscmale urBr. J. C
10. Walsh, GroscheExposuUranium173, 79-
11. TomaseLaurierUraniumExposuExposu169, 125
12. Walsh, Tschenslung caminers GermanEnviron
to resolve theapproaches toof both dose cproaches shouon conventionung cancer assfemale populeffective doseon the relativ
re of lung witd.
ement: The e within the plogy UB RAS
S
Protection againICRP Publicati
Lung Cancer Ratement on Rado40, No 1 (2010). al Research Cre to Low Levelhase 2. Wash
mies Press (2006EAR Report miological studiEAR (2006). n, D. L., Shimizabuchi, K. StuSurvivors. Rep
ncer Disease Moch. 160, 381–40K., Shimizu, Y.ant, E. J., Saa, K. Studies of
ors, Report 14, and Noncancer
9–243, 2012. dson, D., Sugiyau ,Y., Grant, E.a, A., Kodama,on and Leukem
Bomb Survivch, 172, 368-382al Research Couon: BEIR VI. W
mies Press (1999e, B., Kreuzer, Mchense, A. Lungranium minersancer. 95, 1280L., Tschense,
e, B. and Kreuzres on Lung Cm Miners, 194-90 (2010). ek, L., Rogel, A
D. Lung Cam Miners: Rare Rates and Mre and Age at E5-137 (2008).
L., Dufey, F., se, A. and Kreuncer mortality bcohort and th
n Democratic Rn. Biophys. 50, 5
e problem ofo dose estimconversion co
ould be maden, the reliable sociated with lation are nee by dosimetr
ve biological efth lung cance
paper is a project of th15-IIE-01.
nst Radon-222 aion 65. Ann. IC
Risk from Radoon. ICRP Public
Council. Healthels of Ionizing Rhington, DC: 6).
2006. Aies of radiatio
zu, Y., Pierce, udies of Mortaeport 13: Solidortality: 1950–1
07 (2003). , Suyama A., K
akata, R., Sugf the Mortality o
1950–2003: Ar Diseases. Radi
ama, H., Nishi,. J., Soda, M., W, K. and Kasa
mia Mortality amvors, 1950–202 (2009). uncil. Health RisWashington, DC9). M., Kreisheimerg cancer risk a
s: a cohort stud–1287 (2006). A., Schnelzer,
zer, M. The InfluCancer Mortal
46–2003. Radia
A., Tirmarche, Mancer in Frenadon-AssociatedModifying EffectExposure. Radi
Mohner, M., uzer, M. Differen
between the Gehe population
Republic (1960–57–66 (2011).
347
f discrepancyation, further
onvention and. To improvedata on ERRindoor radon
ecessary. Forric modelling,ffectiveness ofr as endpoint
part of thee Institute of
at Home and atCRP. 23, No 2
on and Progenycation 115. Ann.
h Risks fromRadiation: BEIR
The National
Appendix A.on and cancer.
D., Suyama, A.ality of Atomicd Cancer and1997. Radiation
Kasagi, F., Soda,giyama H. andof Atomic BombAn Overview ofation Research.
N., Sakata, R.,Wan-Ling Hsu,
agi, F. Ionizingmong Japanese
000. Radiation
sks of ExposureC: The National
r, M., Schnelzer,among Germandy, 1946–1998.
M., Dufey, F.,uence of Radonity in Germanation Research.
M., Mitton, N.,ch and Czech
d Risk at Lowts of Time sinceation Research.
Schnelzer, M.,nces in baselineerman uraniumof the former
–2003). Radiat.
7
y r d e R n r , f t
e f
t 2
y .
m R l
.
.
. c d n
, d b f .
, , g e n
e l
, n .
, n n .
, h w e .
, e
m r .

348
13. Tomasek, L. Effect of age at exposure in 11 underground miners studies. Radiat. Prot. Dosim. 160, 120-123 (2014).
14. Brugmans, M. J. P., Rispens, S. M., Bijwaard, H., Laurier, D., Rogel, A., Tomasek, L. and Tirmarche, M. Radon-induced lung cancer in French and Czech miner cohorts described with a two-mutation cancer model. Radiat. Environ. Biophys. 43, 153–163 (2004).
15. van Dillen, T., Dekkers, F., Bijwaard, H., Kreuzer, M. and Grosche, B. Lung Cancer from Radon: A Two-Stage Model Analysis of the WISMUT Cohort, 1955–1998. Radiation Research. 175, 119-130 (2011).
16. Lane, R. S. D., Frost, S. E., Howe, G. R. and Zablotska, L. B. Mortality (1950–1999) and Cancer Incidence (1969–1999) in the Cohort of Eldorado Uranium Workers. Radiation Research. 174, 773–785 (2010).
17. EPA assessment of risks from radon in homes. Report EPA 402-R-03-003. US Environmental Protection Agency, Washington (2003).
18. Darby, S., Hill, D., Deo, H., Auvinen, A., Barros-Dios, J.M., Baysson, H., Bochicchio, F., Falk, R., Farchi, S., Figueiras, A. et al. Residential radon and lung cancer: detailed results of a collaborative analysis of individual data on 7148 subjects with lung cancer and 14208 subjects without lung cancer from 13 epidemiologic studies in Europe. Scand. J. Work. Environ. Health. 32, sup. 1, 1-83 (2006).
19. Zhukovsky, M., Demin, V., Yarmoshenko, I. The modified model of radiation risk at radon exposure. Radiat. Prot. Dosim. 160, 134-137 (2014).
20. European Detailed Mortality Database (DMDB). World Health Organization Regional Office for Europe. http://data.euro.who.int/dmdb/, assessed 30.03.2014.
21. ICRP. The 2007 Recommendations of the International Commission on Radiological Protection. ICRP Publication 103. Ann. ICRP. 37, No 2-4 (2007).
22. Marsh, J.W., Birchall, A. Uncertainty analysis of the absorbed dose to regions of the lung per unit exposure to radon progeny in a mine. Health
Protection Agency. Chilton. Report HPA-RPD-054 (2009).
23. Hofmann, W., Winkler-Heil, R. Radon lung dosimetry models. Radiat. Prot. Dosim.145, 206–212 (2011).
24. Al-Jundi, J., Li, W.B., Abusini M, Tschiersch, J., Hoeschen, C,, Oeh, U. Inhalation dose assessment of indoor radon progeny using biokinetic and dosimetric modeling and its application to Jordanian population. J Environ Radioact.; 102, 574-580 (2011).
25. Brudecki K, Li WB, Meisenberg O, Tschiersch J, Hoeschen C, Oeh U. Agedependent inhalation doses to members of the public from indoor short-lived radon progeny. Radiat Environ Biophys. 53, No 3, 535-549 (2014).
26. Harrison, J.D., Marsh, J.W. Effective dose from inhaled radon and its progeny. Proceedings of the First ICRP Symposium on the International System of Radiological Protection. Ann. ICRP 41 (3-4), 378-388.
27. Marsh, J.W, Harrison, J.D., Laurier, D., Birchall, A., Blanchardon, E., Paquet, F., Tirmarche, M. Doses and lung cancer risks from exposure to radon and plutonium International Journal of Radiation Biology 90, 1080–1087 (2014)
28. ICRP. Summary of April 2015 Main Commission Meeting in Sydney, Australia. (2015). http://www.icrp.org/news.asp, assessed 20.05.2015.
29. Yarmoshenko, I., Kirdin, I., Zhukovsky, M. Uncertainty Analysis of Relative Biological Effectiveness of Alpha-Radiation for Human Lung Exposure. J. Toxicol and Environ. Health, Part A. 69, No 7-8, 665-679 (2006).
30. Zhukovsky, M., Bastrikova, N., Vasilyev, A. Relative Biological Effectiveness of Alpha Particles at Radon Exposure. Radiat. Prot. Dosim. Published 15 April 2015. doi:10.1093/rpd/ncv334 (2015)
EMANATION CHARACTERISTICS OF WEATHERED ROCKS WITH HIGH CONTENT OF NATURAL RADIOACTIVE ELEMENTS
Timur Zhdanov 1, Mikhail Melgunov 2
1V.S. Sobolev Institute of Geology and Mineralogy SB RAS, 630090 Novosibirsk, Russia 2V.S. Sobolev Institute of Geology and Mineralogy SB RAS, 630090 Novosibirsk, Russia
Abstract. Measurements of the emanation properties were made for the <sooty> brown coals of the Kansko-Achinsk coal basin, which had a high concentration of natural radioactive elements. The measurements show that emanation coefficient for the dry and wet samples are very different and vary in the following range: calculated emanation coefficients for the dry samples vary from 15% to 29%, and for the wet ones vary from 30% to 41%.
Key words: radon, emanation, coals, volume activity, trace elements, emanation coefficient
1. INTRODUCTION.
The Kansko-Achinsk coal basin (Fig.1) is located mostly in the Krasnoyarsk region and partially in the Kemerovo and Irkutsk regions. The jurassic brown coals of the Kansko-Achinsk coal basin (Jurassic depositions of the southern edge of the Western-Siberian plate and the Siberian platform) are the operating source of combustible for thermal power stations and for house use by locals of Western Siberia. This coal basin is unique due to its immense dimensions and giant reserves of brown coal that are suitable for opencast mining. Its reserves down to 1800 m depth were estimated as 1220 billion tons [1–3]. The Lower-Middle Jurassic coal-bearing formations in the western part of the basin formed a great syncline with gently sloping northern and southern limbs (Figure 1). The thickness of the coal layers reaches 60–80 m. From west to east nine great coal deposits are distinguished: Tisul’, Uryup, Barandat, Beryezovo, Kibiten’, Altat, Nasarovo (southern limb of syncline), Itat, Bogotol (northern limb of syncline). The coal layers lay almost horizontally. Everywhere, they are recoated by quaternary sediments. Coal deposits here are very convenient for an opencast mining. The typical unaltered coals are characterized by low trace-element contents and have correspondingly a low radioactivity. According to known data, the average contents of uranium in unaltered coals for various deposits of the western part of the Kansko-Achinsk basin vary from 1 to 11 ppm (12–140 Bq/kg). The ash content of such coals is 6–16% [3–6]. Usually the upper part of the coal layers located directly under quaternary sediments is oxidized. The uppermost horizons of coal (0.5– 1.5 m) are most oxidized. They often become friable and have “sooty” structure. As the result of oxidation, geochemical barriers are distinguishable which promote the accumulation of
trace elements. Ash content increases here up to 25–35%. Oxidized and especially “sooty” coals are often strongly enriched by uranium and its decay products [3–5, 7, 8]. Uranium content in “sooty” coals can reach 2100 ppm (26000 Bq/kg). The radioactive anomalies connected with oxidized (“sooty”) coals localized in some brown coal deposits of the western part of the Kansko-Achinsk coal basin are studied in this work.
High radioactivity of «sooty» coals means that they can be a significant Rn source. A close vicinity to the surface and a frequent interaction with ground water makes them potentially dangerous for people, so far as the Rn released from coals can enter into their environment with water, by diffusion to the surface, or while using the coals in daily living needs.
In this paper the emanation coefficient is the ratio of the amount of radon emitted from the substance to the total amount of radon produced in a given substance for a certain period of time, i.e., the ratio of the speed selection emanations to the speed of its formation in the sample. Emanation rate is radon creation speed within coals.
Fig.1 Map of the coal-bearing Jurassic formation in the West Siberia (the western part of the Kansko-Achinsk brown
coal basin) and location of the sampling sites [8]
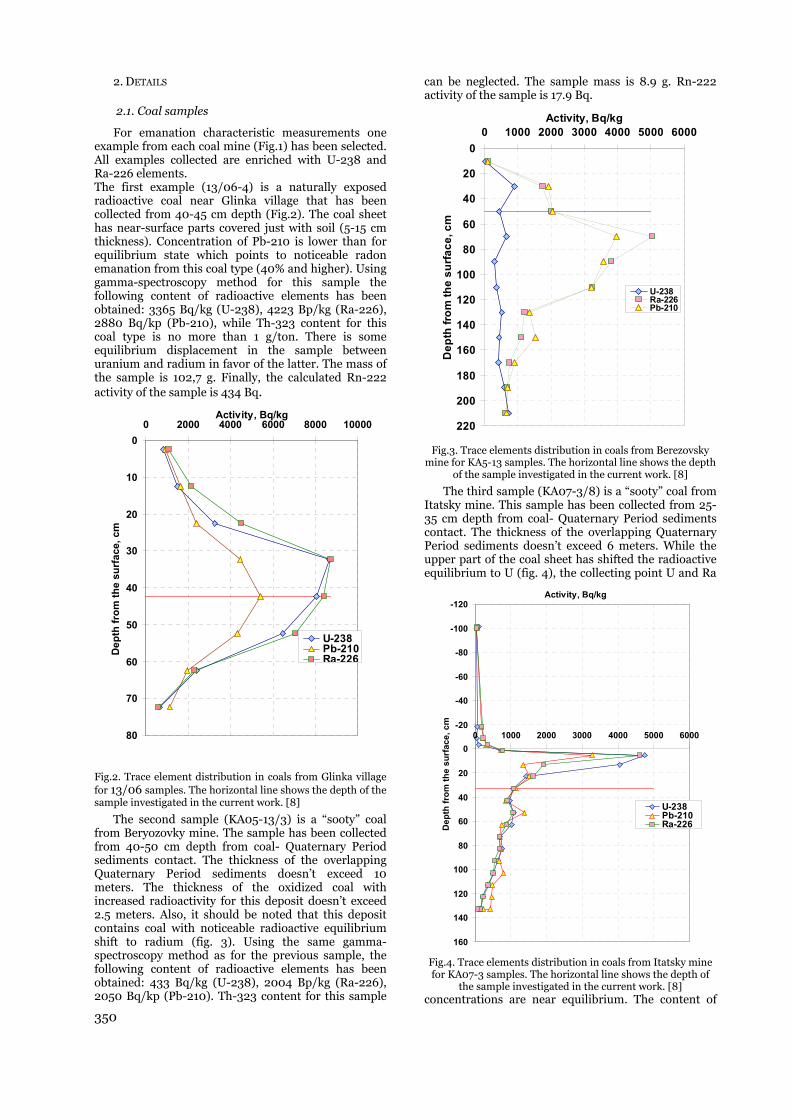
350
2. DETAILS
2.1. Coal samples
For emanation characteristic measurements one example from each coal mine (Fig.1) has been selected. All examples collected are enriched with U-238 and Ra-226 elements. The first example (13/06-4) is a naturally exposed radioactive coal near Glinka village that has been collected from 40-45 cm depth (Fig.2). The coal sheet has near-surface parts covered just with soil (5-15 cm thickness). Concentration of Pb-210 is lower than for equilibrium state which points to noticeable radon emanation from this coal type (40% and higher). Using gamma-spectroscopy method for this sample the following content of radioactive elements has been obtained: 3365 Bq/kg (U-238), 4223 Bp/kg (Ra-226), 2880 Bq/kp (Pb-210), while Th-323 content for this coal type is no more than 1 g/ton. There is some equilibrium displacement in the sample between uranium and radium in favor of the latter. The mass of the sample is 102,7 g. Finally, the calculated Rn-222 activity of the sample is 434 Bq.
0
10
20
30
40
50
60
70
80
0 2000 4000 6000 8000 10000Activity, Bq/kg
Dep
th fr
om th
e su
rfac
e, c
m
U-238Pb-210Ra-226
Fig.2. Trace element distribution in coals from Glinka village for 13/06 samples. The horizontal line shows the depth of the sample investigated in the current work. [8]
The second sample (KA05-13/3) is a “sooty” coal from Beryozovky mine. The sample has been collected from 40-50 cm depth from coal- Quaternary Period sediments contact. The thickness of the overlapping Quaternary Period sediments doesn’t exceed 10 meters. The thickness of the oxidized coal with increased radioactivity for this deposit doesn’t exceed 2.5 meters. Also, it should be noted that this deposit contains coal with noticeable radioactive equilibrium shift to radium (fig. 3). Using the same gamma-spectroscopy method as for the previous sample, the following content of radioactive elements has been obtained: 433 Bq/kg (U-238), 2004 Bp/kg (Ra-226), 2050 Bq/kp (Pb-210). Th-323 content for this sample
can be neglected. The sample mass is 8.9 g. Rn-222 activity of the sample is 17.9 Bq.
0
20
40
60
80
100
120
140
160
180
200
220
0 1000 2000 3000 4000 5000 6000Activity, Bq/kg
Dep
th fr
om th
e su
rface
, cm
U-238Ra-226Pb-210
Fig.3. Trace elements distribution in coals from Berezovsky mine for KA5-13 samples. The horizontal line shows the depth
of the sample investigated in the current work. [8]
The third sample (KA07-3/8) is a “sooty” coal from Itatsky mine. This sample has been collected from 25-35 cm depth from coal- Quaternary Period sediments contact. The thickness of the overlapping Quaternary Period sediments doesn’t exceed 6 meters. While the upper part of the coal sheet has shifted the radioactive equilibrium to U (fig. 4), the collecting point U and Ra
concentrations are near equilibrium. The content of
-120
-100
-80
-60
-40
-20
0
20
40
60
80
100
120
140
160
0 1000 2000 3000 4000 5000 6000
Activity, Bq/kg
Dep
th fr
om th
e su
rfac
e, c
m
U-238Pb-210Ra-226
Fig.4. Trace elements distribution in coals from Itatsky mine for KA07-3 samples. The horizontal line shows the depth of
the sample investigated in the current work. [8]

351
the radioactive elements in the third sample is: 1063 Bq/kg (U-238), 1083 Bp/kg (Ra-226), 1131 Bq/kp (Pb-210). Th-323 content doesn’t exceed 1 g/ton. The sample mass is 9.2 g. Rn-222 activity of the sample is 10 Bq.
2.2. Equipment
For radon volume activity measurements a specified apparatus has been constructed. The whole complex consists of Radon Radiometer PPA-01M-03 and a special sampler POU-4 (produced by NTM “Zaschita”) [9].
Measurements of volume activity are based on electrostatic sedimentation of Rn-222 decay products (positive Po-218 ions (RaA) on semiconductor detector from the collected air. Then, Rn-222 activity is calculated using alpha-spectroscopy methods by measuring number of alpha-particles from RaA decay.
2.3. Emanation characteristics
The main goal of all experiments was to obtain the dependence of samples’ volume activity value on radon exposition time in the collecting chamber. In order to fulfill this goal, the method of volumetric activity measurements in air has been used. A sample was, after being weighed, placed in powder into the collecting chamber (chamber’s volume is 2 liters), and after the chamber sealed Rn and its decay products were collected in the chamber. Then, the chamber’s content was moved into the measurements chamber by using a sampler. To reduce the inaccuracy of the radiometer, each measurement was repeated 5 times. After each measurement cycle, the whole system was cleared from Rn and its decay product. The resulting accuracy was 30%.
3. DISCUSSION
For the first sample (Fig.5), emanation coefficient measurements were made only for dry conditions. As the result of calculations, the obtained EC is 29% and the emanation rate was 127 Bq. The maximum measured radon volume activity value was 32657 Bq/m3. Also, for the site, the following parameters were measured: 1) radon volume activity in the soil air is 205000 Bq/m3; background radiation is 2000 Bq/m3 2) Rn activity flux is 1600 mBq/m2s; background radiation is 62 mBq/m2s. These indications confirm the emanation coefficient.
To fix the correlation between Rn emanation from rocks and moist content, measurements for the second sample (Fig.5) were made either for dry or moist states. For the first case, the following values were obtained: the maximum measured Rn volume activity is 2120 Bq/m3; EC is 22%; emanation rate 4 Bq. And for the second case, the maximum measured Rn volume activity is 4356 Bq/m3, EC is 41%, emanation rate is 8 Bq.
As mentioned above, the upper horizons of the coal are very oxidized. As a result, they have become friable with “sooty” structure. This structure supports Rn
emanation from these coals. As a consequence, we can see the radioactive equilibrium displacement.
As in the previous case, the measurements of the third sample (Fig.5) were made for both dry and wet states. The maximum value of radon volume activity in the accumulation chamber was: 1) for the dry sample 1673 Bq/m3 2) for the wet sample 3239 Bq/m3. The resulting emanation coefficients for the dry and the wet samples were 15% and 30%, respectively; the emanation rate was 3 Bq and 6 Bq, respectively. These results are quite consistent with the indications for sample KA05-13/3.
Similar results are confirmed by other authors [10-12].
0
1000
2000
3000
4000
5000
6000
0 100 200 300 400 500 600 700 800Accumulation time, hour
Rn
volu
me
activ
ity, B
q/m
^3
0
5000
10000
15000
20000
25000
30000
35000
40000
45000
KA05 - 13/3 dryKA05 -13/3 humidKA07 - 3/8 humidKA07 - 3/8 dryКА13/06-4 dry
Fig.5. The dependence of radon volume activity on the accumulation time in the chamber. For samples KA-
13/3 and CA-3/8 the left scale is used and for KA/06-4, the right scale.
4. CONCLUSIONS
In this work, coefficients of radon emanation have been obtained from several samples of sooty coal Kansk-Achinsk coal basin. The correlation between moisture content in the samples has been determined as well as the amount of radon released from the sample.
REFERENCES.
1. Burtsev M.P., Kansk-Achinsk coal basin. Geology and coal-bearing potential (Sov. Sci. Acad. Press, Moscow, 1961) p. 138 (In Russian).
2. Grigor’ev K.N., Kansk-Achinsk coal basin (Nedra Moscow 1968) p. 184 (In Russian).
3. Gavrilov K.V. and Ozersky A.Yu., Kansk-Achinsk coal basin. (Nedra, Moscow, 1996) p. 271 (In Russian).
4. Arbuzov S.I., Ershov V.V., Rikhvanov L.P et al., Rare-metal potential of Minusinsk basin coals (Publ SB RAS Branch Geo, Novosibirsk, 2003) p. 347 (In Russian).
5. Arbuzov S.I. and Ershov V.V., Geochemistry or rare elements in coals of Siberia (D-Print, Tomsk, 2007) p. 468 (In Russian).
6. Yudovich Ya.E. and Ketris M.P., Valuable trace elements in coal (UrO RAN, Ekaterinburg, 2006) p. 538 (In Russian).
7. Gavshin V.M. and Miroshnichenko L.V., Geostandards Newsletter 14 (2000) 241-246.
8. Melgunov M.S., Gavshin V.M., Lazareva E.V., “Uranium and its decay products in radioactive anomalies of the oxidized brown coals (the western part of the Kansko-Achinsk brown coal basin)”, Uranium, Mining and Hydrogeology, B.J. Merkel and A. Hasche-Berger Eds. (Springer, 2008) pp. 873-880.

352
9. Manual. Radon radiometer PPA-01M-03. MGFC 412124.003 ER, Moscow, 2004.
10. Kurguz S. A. Amnirana rocks. Classification in relation to humidity. http://conf.sfu-kras.ru/sites/mn2012/thesis/s010/s010-005.pdf.
11. Miklyaev P.F. Influence of humidity on amnirana sandy-clayey rocks / Miklyaev P., Petrova T. B. //HENRI, No. 1, 2009, S. 53-57.
12. Prutkin M And Shashkin C. L. Amnirana radon from uranium ores and minerals in the liquid. Atomic energy. 1967. So 22. Vol. 2.With.
RADON MEASUREMENTS IN KINDERGARTENS IN URAL RADON PRONE AREAS
A. Onishchenko 1, G. Malinovsky 1, A. Vasiliev 1, M. Zhukovsky 1.
1 Institute of Industrial Ecology, Ekaterinburg, Russia.
Abstract. Indoor radon concentrations have been measured in 80 kindergartens in villages and towns of the Ural region, Russia, using the LR-115 nuclear track detectors. Detectors were placed in 270 rooms for a 1-2 month during the winter and summer seasons. The arithmetic and geometric means of annual indoor radon concentrations are 57 and 39 Bq/m3 respectively, σLN=0.89. The measured levels of the indoor radon are relatively low. We have found only one kindergarten where radon concentration is above the national action level of 400 Bq/m3 for existing buildings. The statistically significant difference between mean radon concentrations in rooms located on the ground floor (64 Bq/m3) and the first floor (44 Bq/m3) was observed. No significant difference of radon concentrations depending on building materials (bricks or concrete) was found.
Key words: radon, kindergartens, track detectors.
1. INTRODUCTION
The screening study of radon concentrations in schools and kindergartens in the Ural region, Russia, was carried out in early 1990s [1]. The radon concentration measurements were conducted by track detectors in more than 300 schools and kindergartens in 15 districts and practically all big cities of Sverdlovsk oblast, Ural region, Russia. The map of radon potential for the territory of Sverdlovsk oblast is presented in work [1]. This region was divided to medium, elevated and high radon potential zones (Figure 1).
Figure. 1. The map of radon potential for the territory
of Sverdlovsk oblast (solid lines -high; dotted line - elevated; dash-dot lines - medium radon potential)
Within the Radon Program of Sverdlovsk oblast, local authorities recommended to conduct a radon survey of kindergartens in certain districts. The
kindergartens were selected for several reasons: they are easily accessible through the local authorities, buildings have a typical construction, and also, surveys using radon measurements in schools and kindergartens have been performed in a number of countries throughout the world and are still a point of interest [2-4].
This paper presents the first results of measurements in 80 kindergartens in villages and towns of Sverdlovsk oblast, Ural region.
2. MATERIALS AND METHODS
Passive integrating measurement technique using solid-state track detectors is the most suitable method for the purpose of long-term radon measurements. For our radon survey, the following measuring instruments and devices were used: track detectors based on Kodak LR-115 foil, diffusion chamber REI 4, automatic spark counter of tracks AIST-2 and etching equipment. The quality assurance programme of the survey was aligned with Russia’s national metrological system. All measurement devices passed through authorized metrological certification and additional calibration using radon chamber supplied with an AlphaGUARD PQ2000 PRO radon monitor calibrated by the NIST (USA) radium-226/radon-222 radioactivity standard. Total uncertainty of radon concentration measurement conducted by a single solid-state track detector was estimated as 30–40% (p = 0.95).
Also, a radon monitor device AlphaGUARD was used to continuously measure radon concentration during a short period of time in one of the kindergartens. The measurement interval was set to 60 minutes in diffusion mode.
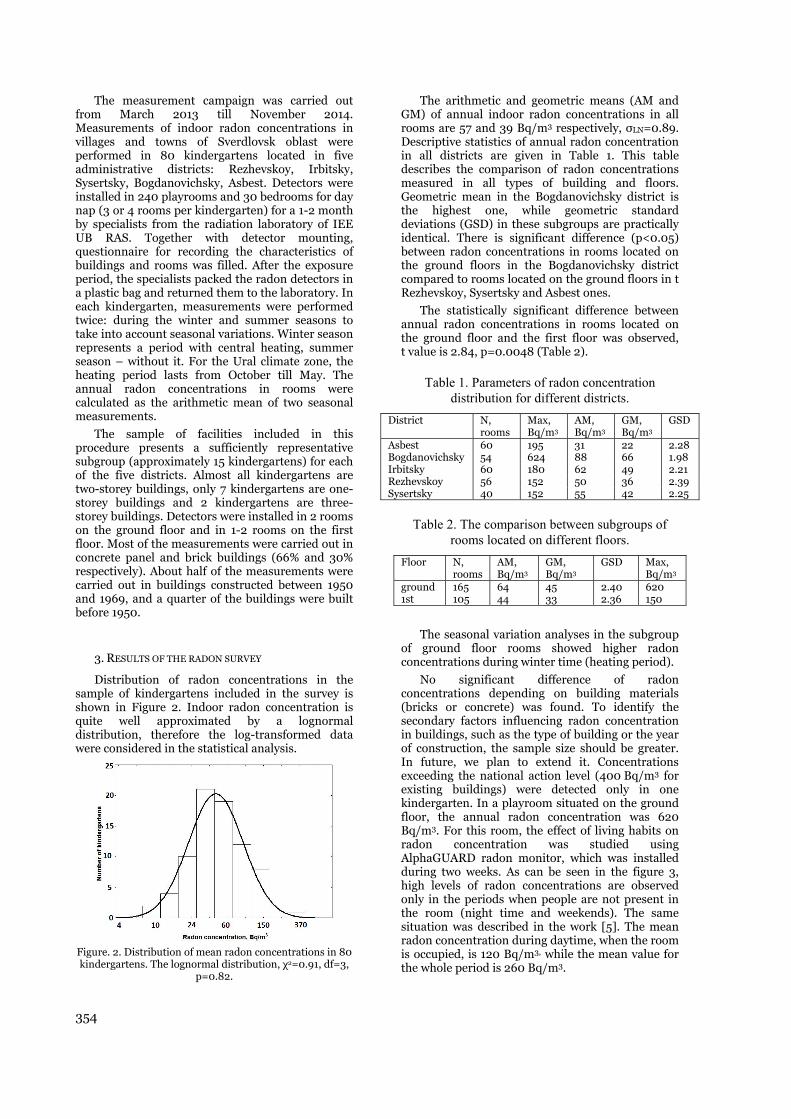
354
The measurement campaign was carried out from March 2013 till November 2014. Measurements of indoor radon concentrations in villages and towns of Sverdlovsk oblast were performed in 80 kindergartens located in five administrative districts: Rezhevskoy, Irbitsky, Sysertsky, Bogdanovichsky, Asbest. Detectors were installed in 240 playrooms and 30 bedrooms for day nap (3 or 4 rooms per kindergarten) for a 1-2 month by specialists from the radiation laboratory of IEE UB RAS. Together with detector mounting, questionnaire for recording the characteristics of buildings and rooms was filled. After the exposure period, the specialists packed the radon detectors in a plastic bag and returned them to the laboratory. In each kindergarten, measurements were performed twice: during the winter and summer seasons to take into account seasonal variations. Winter season represents a period with central heating, summer season – without it. For the Ural climate zone, the heating period lasts from October till May. The annual radon concentrations in rooms were calculated as the arithmetic mean of two seasonal measurements.
The sample of facilities included in this procedure presents a sufficiently representative subgroup (approximately 15 kindergartens) for each of the five districts. Almost all kindergartens are two-storey buildings, only 7 kindergartens are one-storey buildings and 2 kindergartens are three-storey buildings. Detectors were installed in 2 rooms on the ground floor and in 1-2 rooms on the first floor. Most of the measurements were carried out in concrete panel and brick buildings (66% and 30% respectively). About half of the measurements were carried out in buildings constructed between 1950 and 1969, and a quarter of the buildings were built before 1950.
3. RESULTS OF THE RADON SURVEY
Distribution of radon concentrations in the sample of kindergartens included in the survey is shown in Figure 2. Indoor radon concentration is quite well approximated by a lognormal distribution, therefore the log-transformed data were considered in the statistical analysis.
Figure. 2. Distribution of mean radon concentrations in 80 kindergartens. The lognormal distribution, χ2=0.91, df=3,
p=0.82.
The arithmetic and geometric means (AM and GM) of annual indoor radon concentrations in all rooms are 57 and 39 Bq/m3 respectively, σLN=0.89. Descriptive statistics of annual radon concentration in all districts are given in Table 1. This table describes the comparison of radon concentrations measured in all types of building and floors. Geometric mean in the Bogdanovichsky district is the highest one, while geometric standard deviations (GSD) in these subgroups are practically identical. There is significant difference (p<0.05) between radon concentrations in rooms located on the ground floors in the Bogdanovichsky district compared to rooms located on the ground floors in t Rezhevskoy, Sysertsky and Asbest ones.
The statistically significant difference between annual radon concentrations in rooms located on the ground floor and the first floor was observed, t value is 2.84, p=0.0048 (Table 2).
Table 1. Parameters of radon concentration distribution for different districts.
District N, rooms
Max, Bq/m3
AM, Bq/m3
GM, Bq/m3
GSD
Asbest 60 195 31 22 2.28 Bogdanovichsky 54 624 88 66 1.98 Irbitsky 60 180 62 49 2.21 Rezhevskoy 56 152 50 36 2.39 Sysertsky 40 152 55 42 2.25
Table 2. The comparison between subgroups of rooms located on different floors.
Floor N, rooms
AM, Bq/m3
GM, Bq/m3
GSD Max, Bq/m3
ground 165 64 45 2.40 620 1st 105 44 33 2.36 150
The seasonal variation analyses in the subgroup of ground floor rooms showed higher radon concentrations during winter time (heating period).
No significant difference of radon concentrations depending on building materials (bricks or concrete) was found. To identify the secondary factors influencing radon concentration in buildings, such as the type of building or the year of construction, the sample size should be greater. In future, we plan to extend it. Concentrations exceeding the national action level (400 Bq/m3 for existing buildings) were detected only in one kindergarten. In a playroom situated on the ground floor, the annual radon concentration was 620 Bq/m3. For this room, the effect of living habits on radon concentration was studied using AlphaGUARD radon monitor, which was installed during two weeks. As can be seen in the figure 3, high levels of radon concentrations are observed only in the periods when people are not present in the room (night time and weekends). The same situation was described in the work [5]. The mean radon concentration during daytime, when the room is occupied, is 120 Bq/m3, while the mean value for the whole period is 260 Bq/m3.
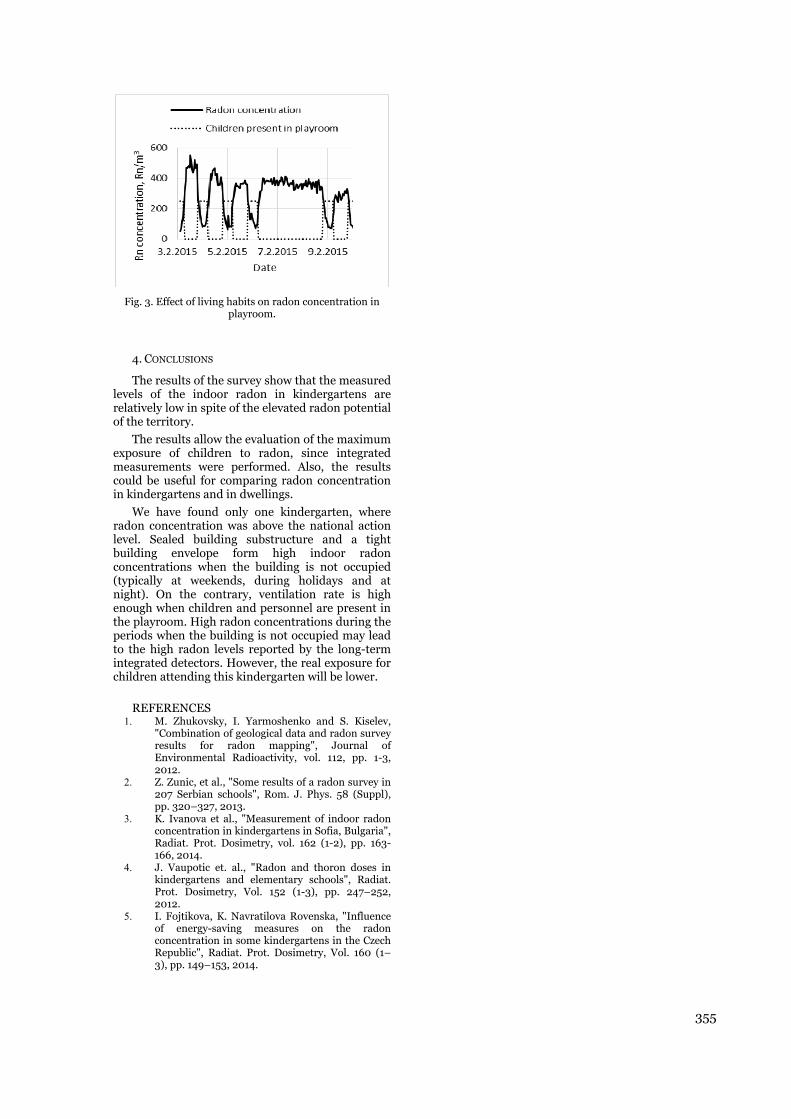
355
Fig. 3. Effect of living habits on radon concentration in
playroom.
4. CONCLUSIONS
The results of the survey show that the measured levels of the indoor radon in kindergartens are relatively low in spite of the elevated radon potential of the territory.
The results allow the evaluation of the maximum exposure of children to radon, since integrated measurements were performed. Also, the results could be useful for comparing radon concentration in kindergartens and in dwellings.
We have found only one kindergarten, where radon concentration was above the national action level. Sealed building substructure and a tight building envelope form high indoor radon concentrations when the building is not occupied (typically at weekends, during holidays and at night). On the contrary, ventilation rate is high enough when children and personnel are present in the playroom. High radon concentrations during the periods when the building is not occupied may lead to the high radon levels reported by the long-term integrated detectors. However, the real exposure for children attending this kindergarten will be lower.
REFERENCES
1. M. Zhukovsky, I. Yarmoshenko and S. Kiselev, "Combination of geological data and radon survey results for radon mapping", Journal of Environmental Radioactivity, vol. 112, pp. 1-3, 2012.
2. Z. Zunic, et al., "Some results of a radon survey in 207 Serbian schools", Rom. J. Phys. 58 (Suppl), pp. 320–327, 2013.
3. K. Ivanova et al., "Measurement of indoor radon concentration in kindergartens in Sofia, Bulgaria", Radiat. Prot. Dosimetry, vol. 162 (1-2), pp. 163-166, 2014.
4. J. Vaupotic et. al., "Radon and thoron doses in kindergartens and elementary schools", Radiat. Prot. Dosimetry, Vol. 152 (1-3), pp. 247–252, 2012.
5. I. Fojtikova, K. Navratilova Rovenska, "Influence of energy-saving measures on the radon concentration in some kindergartens in the Czech Republic", Radiat. Prot. Dosimetry, Vol. 160 (1–3), pp. 149–153, 2014.

RADON EMANATION CHARACTERISTICS IN CENTRAL YAKUTIA
Sardana E. Egorova1, Kristina A. Naumova1, Valery E. Stepanov1, Alexandra F. Kirillina1, Natalia A. Rafailova1
1North-Eastern Federal University, Yakutsk, Republic of Sakha (Yakutia)
Abstract: The content of radon-222 in living and commercial buildings in the territory of Yakutia was investigated. There is an altitudinal gradient of radon. Low temperatures in unventilated accommodations contribute to the accumulation of radon. In a nine-floor building with a maximum volumetric radon activity concentration of 45 Bq/m3 on the ninth floor, a person receives an effective dose of 1.935 mSv/year. According to the standards of the International Commission on Radiological Protection, an individual annual effective dose of radon should not exceed 10 mSv/year. According to these international standards, in this building a person gets a dose 5 times smaller than the threshold annual effective dose. According to Russian standards, the allowable radiation dose of radon should not exceed 3.34 mSv/year. Consequently, in the hostel a person receives an annual dose which is 1.7 times lower than the maximum allowable concentration (MAC) of Russian standards
Key words: radon, maximum allowable concentration, effective dose
Main text For the measurement of the volumetric radon
activity concentration in Central Yakutia, we used the AlphaGUARD device (GenitronInstrumentsGmbH, Germany) and the radon radiometer RRA-01M-03 (“NTM-protection", Moscow, Russia). The radiometer RRA-01M-03 allows the measurement of the volumetric content of radon in air, exhalation of radon from the soil, and radon content in water. The AlphaGUARD device has the biggest sensitivity compared to all other devices, and it is related to the arbitration class. With the help of this device, calibration and verification of all other measurements of radon were carried out.
The volumetric radon activity concentration in a nine-story stone building (student residence No. 6B) and a one-story wooden building near Yakutsk and in the Oy village in the Khangalass region of Yakutia has been investigated. Radon emanation from stone samples taken from the Èl′konskij uranium-ore field in the Aldan region of Yakutia has also been investigated. In October, in the nine-story stone building the maximum value of radon concentration was found on the first floor - Rn = 19 ± 7 Bq/m3, and the minimum concentration on the ninth floor - Rn = 4 ± 3 Bq/m3. In December, the maximum value was equal to 45 Bq/m3 and the minimum value was equal to 4 Bq/m3. According to Russian Federation standards, the maximum allowable concentration of radon in air is 200 Bq/m3. It means that the maximum value in the student residence No. 6B is 10 and is 4,5 times smaller than MAC-value in October and December respectively.
At 6 km away from Yakutsk, in the wooden house located at the range of the North-Eastern Federal University, there is a basement for meat storage. The volumetric radon activity concentration measured in the house in April at -25 ºС was equal to 497 ± 89 Bq/m3, which is 2,5 times greater than the maximum allowable concentration in the Russian Federation. In the wooden house basement a maximum of 312 ± 62 Bq/m3 at -25 ºС has been observed. It is 1,5 times greater than the maximum allowable concentration in Russia. Emanation from stone samples was investigated with the help of an AlphaGUARD device. The stones and the device were placed in the sealed measuring chamber. Each measurement was carried out in 2 hours. The maximum value was found in the sample No.2-5/3 - 122 Bq/m3, and the minimum was 6 Bq/m3 in the sample No.2-4/2. A new method of radiation quality estimation of building materials by emanation of radon inside a tight measuring chamber was offered. Also, a comparison of equilibrium concentrations of radon with MAC inside living under construction buildings was offered. This MAC is 200 Bq/m3 in accordance with the standards of the Russian Federation. Radon concentration of the sample No.2-5/3 was higher than the MAC-value so these stones cannot be used as materials for residential buildings, but if their specific effective activity of potassium-40, radium-226 and thorium-232 becomes smaller than MAC (740 Bq/l), their use in road construction work in settlements is possible. The test No.2-4/2 with the minimal volumetric radon activity concentration of 6 Bq/m3 is suitable for civil and road construction.
At 63 km away from Yakutsk city in the Oy village in the Khangalass region of Yakutia, the

358
measurements were carried out in October in an inhabited one-story wooden house. The device was near a gas boiler, and the results were recorded at the moment when the oven was turned on. The maximum value of the volumetric concentration of radon was 229 ± 45 Bq/m3, and the minimum was 33 ± 12 Bq/m3. Also, measurements were carried out in Hatyng-Yuryakhsk roadway, 5 km away from Yakutsk, in a cottage with gas heating. In November, the maximum volumetric radon activity concentration was 163 Bq/m3, and the minimum was 8 Bq/m3. In March, the maximum value was equal to 21 Bq/m3, and the minimum was equal to 2 Bq/m3.
Conclusion 1. There is an altitudinal gradient of radon,
which shows that it is higher on the first floor than on the ninth floor of the nine-story building.
2. Low temperatures in unventilated accommodations contribute to the accumulation of radon.
3. The results obtained showed that the MAC value is exceeded at several times.
4. In the nine-story building with a maximum volumetric radon activity concentration of 45 Bq/m3, on the ninth floor a person receives an effective dose of 1.935 mSv/year. According to Russian standards, the maximum allowable radiation dose from radon is 3.34 mSv/year. Consequently, in a hostel, a person receives an annual dose 1.7 times lower than the MAC of Russian standards.
In the basement used for meat storage, the volumetric radon activity concentration is 497 ± 89 Bq/m3, which corresponds to an effective dose of 21.371 mSv/year. This is 6 times higher than the established norm in the Russian Federation.
References 1. Bekman I.N. “Radon in the environment”. Moscow.
2003. 2. http://www.pereplet.ru/nauka/Soros/pdf/0003_073.p
df 3. Radiometer of radon RRA-01M-03. Instruction manual.
MGFK 412124.003 RE-M., 2004. 4. Radiation Safety Standards. SP 2.6.1.758-99. 5. Zhukovsky M., Yarmoshenko I. “Radon: measurement,
dose, risk assessment”. Ekaterinburg – 1997.

BURIED GRAPHITE PILLARS IN SINGLE CRYSTAL CVD DIAMOND:
SENSITIVITY TO ELECTRONS
G. Conte 1, P. Allegrini 1, M. Pacilli 1, S. Salvatori 2, D.M. Trucchi 3, T. K0nonenko 4,5, A. Bolshakov 4,5, V. Ralchenko 4,5, V. Konov 4,5
1 University Roma Tre, Dept of Sciences, Via Vasca Navale, 84 – 00146 Rome, Italy 2 University Niccolò Cusano, Via Don Gnocchi, 3 – 00166 Rome, Italy
3 Material Science Institute, CNR, 00016 Monterotondo Scalo, Italy 4 A.M. Prokhorov General Physics Institute, RAS, 38 Vavilova Str., 119991 Moscow, Russia
5 National Research Nuclear University “MEPhI”, Kashirskoye shosse 31, 115409 Moscow, Russia
Abstract. The charge collection performance of a diamond-graphite detector is reported. Buried graphite pillars with high aspect ratio were formed inside a single crystal synthetic diamond slab by using a femtosecond IR laser with 200 kHz of repetition rate. Grouped in two series and connected by graphite strips on the surface, eight independent 3D electrodes were used to collect the charge carriers generated by energy deposited in the detector. Collimated 90Sr,Y β-particles were used to test the charge collection in coincidence and self-triggering mode among pillars rows using different irradiation geometries. The charge collected by one pillar row saturates at 1.40±0.02 fC at ±0.67V/μm with electrons impinging orthogonally the rows demonstrating a high charge carrier collection efficiency.
Key words: CVD Diamond, Electric contacts, Graphite pillars, 3D sensors, β-particles
1. INTRODUCTION
Solid carbon shows very different mechanical properties depending on 3D or 2D carbon-carbon bond organization. The first case leads to crystalline diamond with a very tight lattice and the highest mechanical hardness; the latter refers to graphite with ordered planes able to slide one respect the other and leading to lubricant properties. Moreover, considering the high energy needed to displace a single atom from the very compact lattice (1.76×10²³ at/cm3), diamond shows also important electronic properties for the fabrication of devices suitable to detect electromagnetic radiation from UV to the X-ray region [1] and for charge particles detection in high luminosity/high energy physics experiments [2]. Besides, its wide band gap energy (5.47 eV) makes this solid transparent to VIS-IR radiation also assuring very low electrical conductivity in the dark (<10-15 S/cm). High mobility (up to 2400 cm2/Vs) and saturation velocity (∼2×107 cm/s) jointly with charge carriers lifetimes as high as 0.321 μs for electrons and 0.983 μs for holes have been demonstrated [3] in synthetic diamond samples deposited by CVD techniques. The very high thermal conductivity of single crystal diamond (22 W/cm K), concurrently with mechanical and electronic features, ensures power dissipation, temperature stability, charge collection efficiency, high signal sensitivity, fast transient response, possibility of real-time analysis, low noise and radiation hardness for diamond based devices. All such characteristics are fundamental for radiation detectors suitable to monitor intense pulsed sources like UV lasers, synchrotron radiation
beams and X-ray facilities. Detection and tracking of nuclear particles also require sensitive and fast detectors with low electronic noise, assured in this case by the small dielectric permittivity (~5.5) of diamond material. The other ordinate solid form of carbon, the graphite, thanks to its high electrical conductivity (~1.3×10³ S/cm) is suitable for the realization of bulk conductors even if good performances have been demonstrated in the form of thin layer for the fabrication also of conductive strips, array and pads in alternative to metallization [4,5] and for buried contacts in 3D detector architectures [6,7]. The fabrication of amorphous or nano-graphite pillars and micro-channels inside the bulk diamond volume has been already introduced together with the electrical characteristics using different graphitization approaches [8-10], although only laser writing with ultra-short pulses allows local graphitization of the diamond bulk at any depth and along arbitrary 3D trajectory [8,11]. Nevertheless, power density control, graphitization rate and aspect ratio are very critical items to avoid mechanical cracks along the graphite/diamond interface where electronic active defects, with strong charge carrier recombination capability, could be generated by thermal stress and volume expansion. Here we present a radiation detector with buried graphite pillars having a high aspect ratio, wired among them using surface graphite runners and without the need of more metallic pads. This 3D detector has been simulated, electrically characterized and tested with low activity radioactive sources demonstrating to be suitable for X-rays and electron spectroscopy.
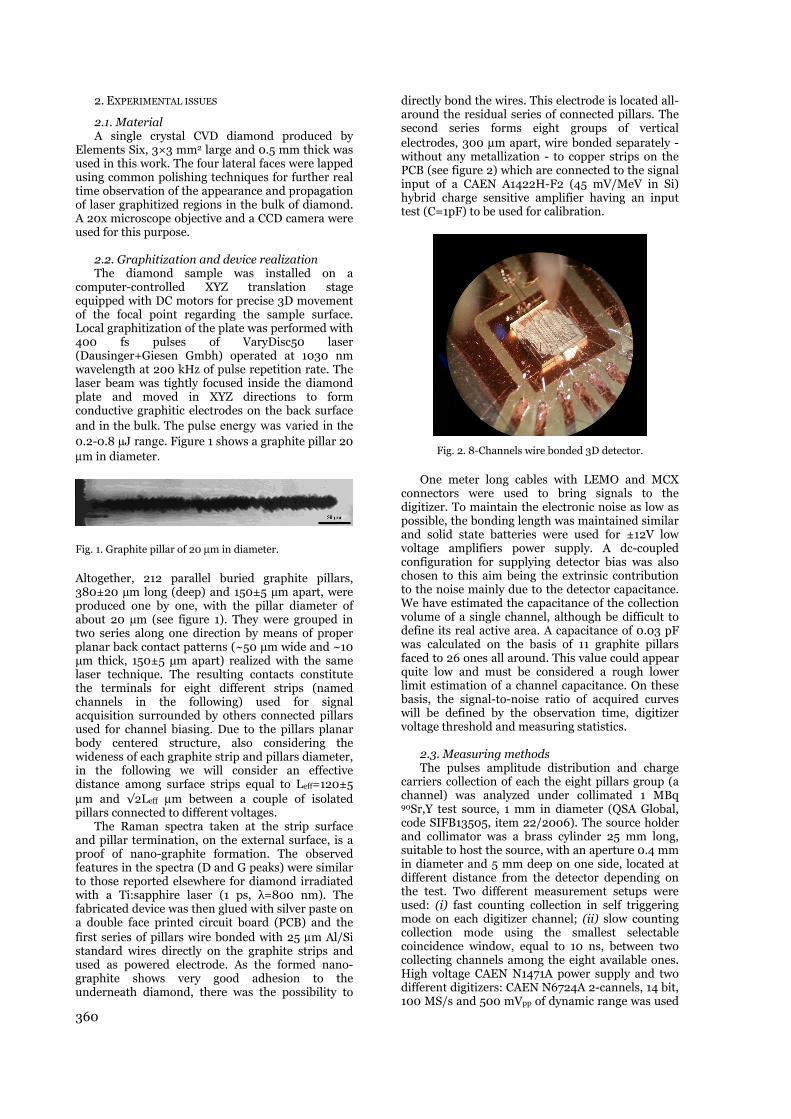
360
2. EXPERIMENTAL ISSUES
2.1. Material A single crystal CVD diamond produced by
Elements Six, 3×3 mm2 large and 0.5 mm thick was used in this work. The four lateral faces were lapped using common polishing techniques for further real time observation of the appearance and propagation of laser graphitized regions in the bulk of diamond. A 20x microscope objective and a CCD camera were used for this purpose.
2.2. Graphitization and device realization The diamond sample was installed on a
computer-controlled XYZ translation stage equipped with DC motors for precise 3D movement of the focal point regarding the sample surface. Local graphitization of the plate was performed with 400 fs pulses of VaryDisc50 laser (Dausinger+Giesen Gmbh) operated at 1030 nm wavelength at 200 kHz of pulse repetition rate. The laser beam was tightly focused inside the diamond plate and moved in XYZ directions to form conductive graphitic electrodes on the back surface and in the bulk. The pulse energy was varied in the 0.2-0.8 µJ range. Figure 1 shows a graphite pillar 20 μm in diameter.
Fig. 1. Graphite pillar of 20 μm in diameter.
Altogether, 212 parallel buried graphite pillars, 380±20 µm long (deep) and 150±5 µm apart, were produced one by one, with the pillar diameter of about 20 µm (see figure 1). They were grouped in two series along one direction by means of proper planar back contact patterns (~50 μm wide and ~10 μm thick, 150±5 μm apart) realized with the same laser technique. The resulting contacts constitute the terminals for eight different strips (named channels in the following) used for signal acquisition surrounded by others connected pillars used for channel biasing. Due to the pillars planar body centered structure, also considering the wideness of each graphite strip and pillars diameter, in the following we will consider an effective distance among surface strips equal to Leff=120±5 μm and √2Leff μm between a couple of isolated pillars connected to different voltages.
The Raman spectra taken at the strip surface and pillar termination, on the external surface, is a proof of nano-graphite formation. The observed features in the spectra (D and G peaks) were similar to those reported elsewhere for diamond irradiated with a Ti:sapphire laser (1 ps, λ=800 nm). The fabricated device was then glued with silver paste on a double face printed circuit board (PCB) and the first series of pillars wire bonded with 25 μm Al/Si standard wires directly on the graphite strips and used as powered electrode. As the formed nano-graphite shows very good adhesion to the underneath diamond, there was the possibility to
directly bond the wires. This electrode is located all-around the residual series of connected pillars. The second series forms eight groups of vertical electrodes, 300 μm apart, wire bonded separately - without any metallization - to copper strips on the PCB (see figure 2) which are connected to the signal input of a CAEN A1422H-F2 (45 mV/MeV in Si) hybrid charge sensitive amplifier having an input test (C=1pF) to be used for calibration.
Fig. 2. 8-Channels wire bonded 3D detector.
One meter long cables with LEMO and MCX connectors were used to bring signals to the digitizer. To maintain the electronic noise as low as possible, the bonding length was maintained similar and solid state batteries were used for ±12V low voltage amplifiers power supply. A dc-coupled configuration for supplying detector bias was also chosen to this aim being the extrinsic contribution to the noise mainly due to the detector capacitance. We have estimated the capacitance of the collection volume of a single channel, although be difficult to define its real active area. A capacitance of 0.03 pF was calculated on the basis of 11 graphite pillars faced to 26 ones all around. This value could appear quite low and must be considered a rough lower limit estimation of a channel capacitance. On these basis, the signal-to-noise ratio of acquired curves will be defined by the observation time, digitizer voltage threshold and measuring statistics.
2.3. Measuring methods The pulses amplitude distribution and charge
carriers collection of each the eight pillars group (a channel) was analyzed under collimated 1 MBq 90Sr,Y test source, 1 mm in diameter (QSA Global, code SIFB13505, item 22/2006). The source holder and collimator was a brass cylinder 25 mm long, suitable to host the source, with an aperture 0.4 mm in diameter and 5 mm deep on one side, located at different distance from the detector depending on the test. Two different measurement setups were used: (i) fast counting collection in self triggering mode on each digitizer channel; (ii) slow counting collection mode using the smallest selectable coincidence window, equal to 10 ns, between two collecting channels among the eight available ones. High voltage CAEN N1471A power supply and two different digitizers: CAEN N6724A 2-cannels, 14 bit, 100 MS/s and 500 mVpp of dynamic range was used

361
for data collection and spectroscopy analysis using CAEN DPP-PHA digital pulse processing package; V1724 8-channels, 14 bit, 100 MS/s and 500 mVpp for traces dumping - 10μs of acquisition time - using the N6724A coincidence output trigger. An Agilent 33250A waveform generator with suitable rise and decay built-in curves was used to produce a calibration curve to convert the pulse height distribution in the ADC channels to equivalent electrons and collected charge. The calibration curve was linear with slope b=2.66 aC/ADC channel and constant parameter a=16.3 aC.
3. RESULTS AND DISCUSSION
3.1. Current-Voltage characteristic The current versus voltage I(V) curve, in the
dark, up to ±100V of channel-n.8 is reported in figure 3. A Keithley 6517A picoammeter was used for this purpose at room temperature and with zero current correction. Before the measurement, aimed to remove possible adsorbed water from the surface, the device was heated at 250 °C in air for 300 s.
10-12
10-11
10-10
10-9
1 10 100
Graphite PillarsChannel n.8
Positive
Negative
Abs
olut
e C
urre
nt (
A)
Absolute Voltage (V)
Ohmic trend
Fig. 3. Channel n.8 Current vs Voltage I(V) characteristic.
The characteristic is symmetric reversing the voltage polarity and shows an Ohmic trend. In the explored voltage range, the resistance of probed volume corresponds to about 0.5 TΩ. The I(V) characteristics of other channels show the same features. This result evidences as none modification of force lines distribution takes place increasing the applied voltage. In other words, changing the applied voltage the electric field distribution remains constant at different depth in the bulk diamond. Indeed, at lower voltages, the conduction takes place mainly on the diamond surface between the graphitic strips connecting the pillars, 150 μm apart. Inside the bulk diamond, due to the body centered structure, two pillars biased at different voltage experience a higher electric field also if their relative distance is √2 times the distance between surface strips. As the voltage increases, the electric field force lines penetrate deeply into the bulk diamond contributing to the charge collection process. The electric field distribution is strongly asymmetric inside the bulk diamond and around a
pillar as demonstrates figure 4 where a zoom of a deep region between biased and grounded pillars is shown. The simulation has been carried out using FlexPDE 5.0.4, a finite element software package, on a structure reproducing the real fabricated device with proper material conductivity, dielectric permittivity, graphite strips on the surface and pillars immersed in the bulk diamond.
Fig. 4. Electric field 3D analysis of a buried graphite pillars detector. The picture shows a zoomed region deep inside the bulk diamond. Blue color indicates high electric field.
3.2. Response to 90Sr,Y β-particles Initially, aimed to evaluate the eight channels
collection features, the signal dependence on voltage was measured in self-triggering mode on all channels at parallel (vertical) incidence with respect to the pillars row showing their homogeneous response at constant voltage with the source aligned to the channel.
8Ch_Pillars100V, 1h
Inte
gral
Cou
nts
x10
3
Channel n.
81
81
10°
2
4
6
8
10
1 2 3 4 5 6 7 8
Fig. 5. Integral number of events measured by the eight channels, monitored two at a time with the source aligned as indicates the inset. With the source 1 cm apart the detector surface and aligned between Ch4 and Ch5, the integral number of events (green curve) acquired by each channel is reported in figure 5. The number of events follows a Gaussian distribution centered between Ch4 and Ch5. Two more dummy channels, having no counts, have been added. In the same figure it is also reported the integral number of events with an
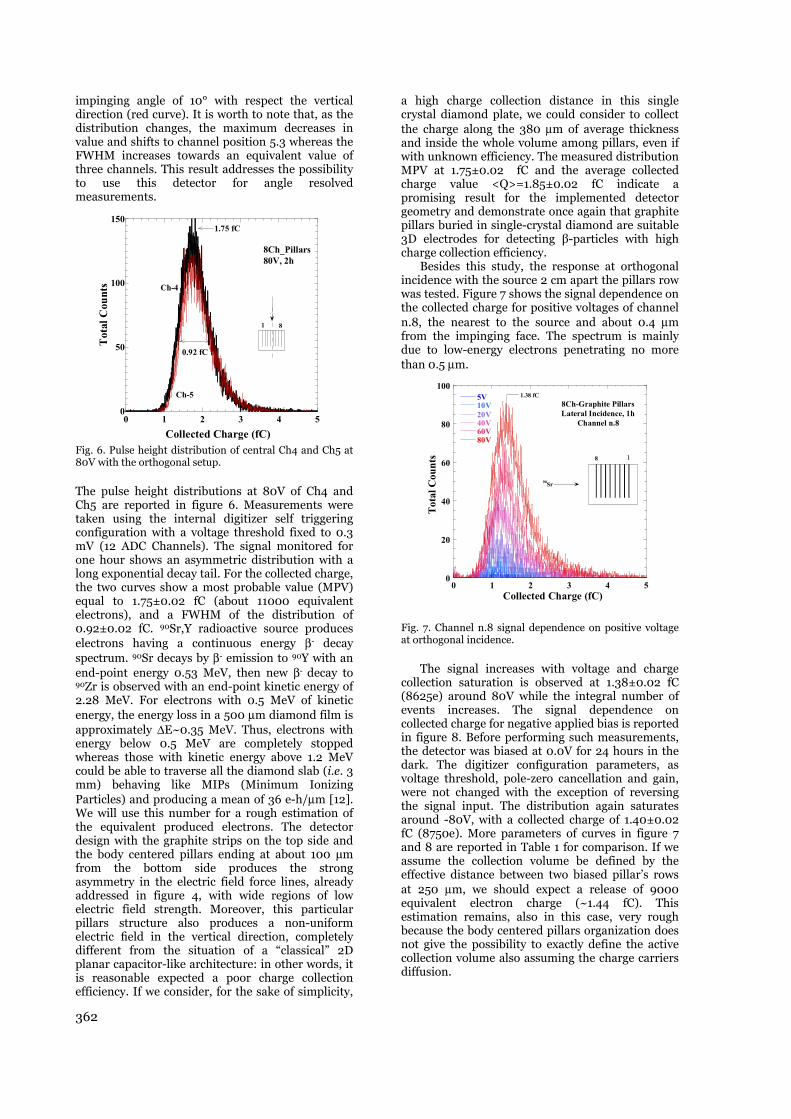
362
impinging angle of 10° with respect the vertical direction (red curve). It is worth to note that, as the distribution changes, the maximum decreases in value and shifts to channel position 5.3 whereas the FWHM increases towards an equivalent value of three channels. This result addresses the possibility to use this detector for angle resolved measurements.
0
50
100
150
0 1 2 3 4 5
Tot
al C
ount
s
Collected Charge (fC)
81
8Ch_Pillars80V, 2h
Ch-4
Ch-5
1.75 fC
0.92 fC
Fig. 6. Pulse height distribution of central Ch4 and Ch5 at 80V with the orthogonal setup.
The pulse height distributions at 80V of Ch4 and Ch5 are reported in figure 6. Measurements were taken using the internal digitizer self triggering configuration with a voltage threshold fixed to 0.3 mV (12 ADC Channels). The signal monitored for one hour shows an asymmetric distribution with a long exponential decay tail. For the collected charge, the two curves show a most probable value (MPV) equal to 1.75±0.02 fC (about 11000 equivalent electrons), and a FWHM of the distribution of 0.92±0.02 fC. 90Sr,Y radioactive source produces electrons having a continuous energy β- decay spectrum. 90Sr decays by β- emission to 90Y with an end-point energy 0.53 MeV, then new β- decay to 90Zr is observed with an end-point kinetic energy of 2.28 MeV. For electrons with 0.5 MeV of kinetic energy, the energy loss in a 500 μm diamond film is approximately ΔE~0.35 MeV. Thus, electrons with energy below 0.5 MeV are completely stopped whereas those with kinetic energy above 1.2 MeV could be able to traverse all the diamond slab (i.e. 3 mm) behaving like MIPs (Minimum Ionizing Particles) and producing a mean of 36 e-h/μm [12]. We will use this number for a rough estimation of the equivalent produced electrons. The detector design with the graphite strips on the top side and the body centered pillars ending at about 100 μm from the bottom side produces the strong asymmetry in the electric field force lines, already addressed in figure 4, with wide regions of low electric field strength. Moreover, this particular pillars structure also produces a non-uniform electric field in the vertical direction, completely different from the situation of a “classical” 2D planar capacitor-like architecture: in other words, it is reasonable expected a poor charge collection efficiency. If we consider, for the sake of simplicity,
a high charge collection distance in this single crystal diamond plate, we could consider to collect the charge along the 380 μm of average thickness and inside the whole volume among pillars, even if with unknown efficiency. The measured distribution MPV at 1.75±0.02 fC and the average collected charge value <Q>=1.85±0.02 fC indicate a promising result for the implemented detector geometry and demonstrate once again that graphite pillars buried in single-crystal diamond are suitable 3D electrodes for detecting β-particles with high charge collection efficiency.
Besides this study, the response at orthogonal incidence with the source 2 cm apart the pillars row was tested. Figure 7 shows the signal dependence on the collected charge for positive voltages of channel n.8, the nearest to the source and about 0.4 μm from the impinging face. The spectrum is mainly due to low-energy electrons penetrating no more than 0.5 μm.
0
20
40
60
80
100
0 1 2 3 4 5
8Ch-Graphite PillarsLateral Incidence, 1h
Channel n.8
5V10V20V40V60V80V
Tot
al C
oun
ts
Collected Charge (fC)
1.38 fC
18
90Sr
Fig. 7. Channel n.8 signal dependence on positive voltage at orthogonal incidence.
The signal increases with voltage and charge collection saturation is observed at 1.38±0.02 fC (8625e) around 80V while the integral number of events increases. The signal dependence on collected charge for negative applied bias is reported in figure 8. Before performing such measurements, the detector was biased at 0.0V for 24 hours in the dark. The digitizer configuration parameters, as voltage threshold, pole-zero cancellation and gain, were not changed with the exception of reversing the signal input. The distribution again saturates around -80V, with a collected charge of 1.40±0.02 fC (8750e). More parameters of curves in figure 7 and 8 are reported in Table 1 for comparison. If we assume the collection volume be defined by the effective distance between two biased pillar’s rows at 250 μm, we should expect a release of 9000 equivalent electron charge (~1.44 fC). This estimation remains, also in this case, very rough because the body centered pillars organization does not give the possibility to exactly define the active collection volume also assuming the charge carriers diffusion.
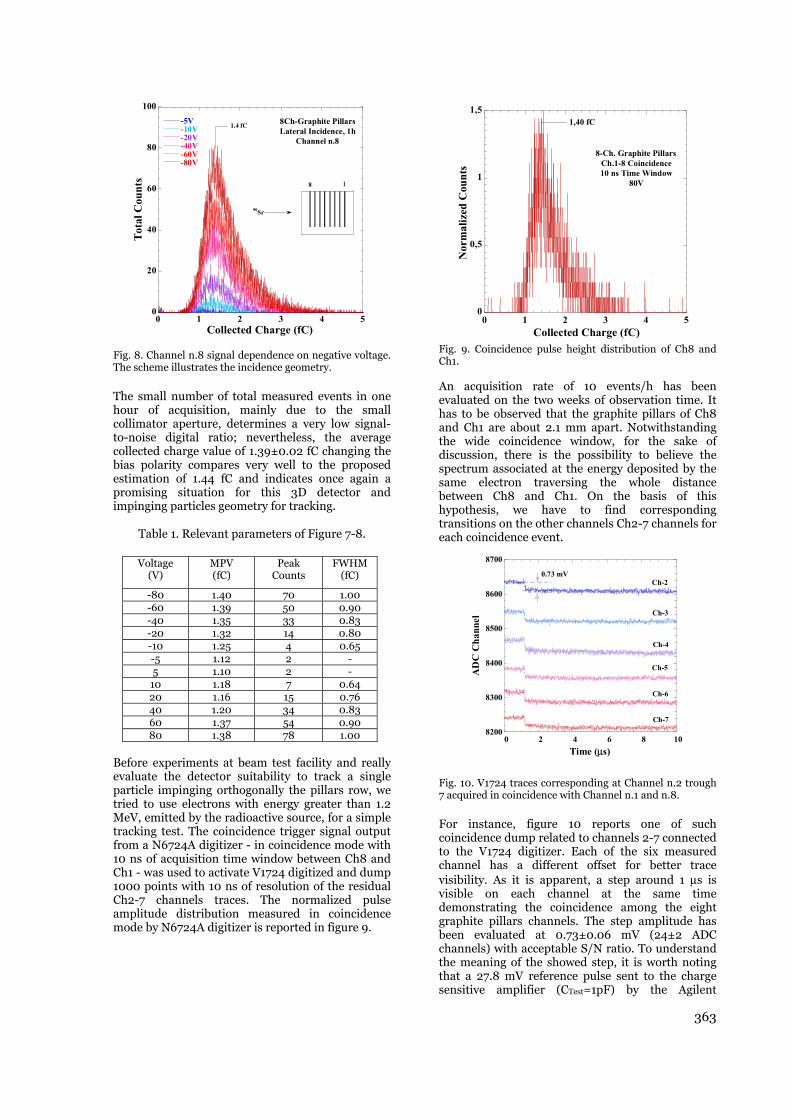
363
0
20
40
60
80
100
0 1 2 3 4 5
8Ch-Graphite PillarsLateral Incidence, 1h
Channel n.8
-5V-10V-20V-40V-60V-80V
Tot
al C
oun
ts
Collected Charge (fC)
18
90Sr
1.4 fC
Fig. 8. Channel n.8 signal dependence on negative voltage. The scheme illustrates the incidence geometry.
The small number of total measured events in one hour of acquisition, mainly due to the small collimator aperture, determines a very low signal-to-noise digital ratio; nevertheless, the average collected charge value of 1.39±0.02 fC changing the bias polarity compares very well to the proposed estimation of 1.44 fC and indicates once again a promising situation for this 3D detector and impinging particles geometry for tracking.
Table 1. Relevant parameters of Figure 7-8.
Voltage (V)
MPV (fC)
Peak Counts
FWHM (fC)
-80 1.40 70 1.00 -60 1.39 50 0.90 -40 1.35 33 0.83 -20 1.32 14 0.80 -10 1.25 4 0.65 -5 1.12 2 - 5 1.10 2 -
10 1.18 7 0.64 20 1.16 15 0.76 40 1.20 34 0.83 60 1.37 54 0.90 80 1.38 78 1.00
Before experiments at beam test facility and really evaluate the detector suitability to track a single particle impinging orthogonally the pillars row, we tried to use electrons with energy greater than 1.2 MeV, emitted by the radioactive source, for a simple tracking test. The coincidence trigger signal output from a N6724A digitizer - in coincidence mode with 10 ns of acquisition time window between Ch8 and Ch1 - was used to activate V1724 digitized and dump 1000 points with 10 ns of resolution of the residual Ch2-7 channels traces. The normalized pulse amplitude distribution measured in coincidence mode by N6724A digitizer is reported in figure 9.
0
0,5
1
1,5
0 1 2 3 4 5
8-Ch. Graphite PillarsCh.1-8 Coincidence10 ns Time Window
80V
Nor
mal
ized
Cou
nts
Collected Charge (fC)
1,40 fC
Fig. 9. Coincidence pulse height distribution of Ch8 and Ch1. An acquisition rate of 10 events/h has been evaluated on the two weeks of observation time. It has to be observed that the graphite pillars of Ch8 and Ch1 are about 2.1 mm apart. Notwithstanding the wide coincidence window, for the sake of discussion, there is the possibility to believe the spectrum associated at the energy deposited by the same electron traversing the whole distance between Ch8 and Ch1. On the basis of this hypothesis, we have to find corresponding transitions on the other channels Ch2-7 channels for each coincidence event.
8200
8300
8400
8500
8600
8700
0 2 4 6 8 10
AD
C C
han
nel
Time (μs)
Ch-2
Ch-3
Ch-4
Ch-5
Ch-6
Ch-7
0.73 mV
Fig. 10. V1724 traces corresponding at Channel n.2 trough 7 acquired in coincidence with Channel n.1 and n.8.
For instance, figure 10 reports one of such coincidence dump related to channels 2-7 connected to the V1724 digitizer. Each of the six measured channel has a different offset for better trace visibility. As it is apparent, a step around 1 μs is visible on each channel at the same time demonstrating the coincidence among the eight graphite pillars channels. The step amplitude has been evaluated at 0.73±0.06 mV (24±2 ADC channels) with acceptable S/N ratio. To understand the meaning of the showed step, it is worth noting that a 27.8 mV reference pulse sent to the charge sensitive amplifier (CTest=1pF) by the Agilent
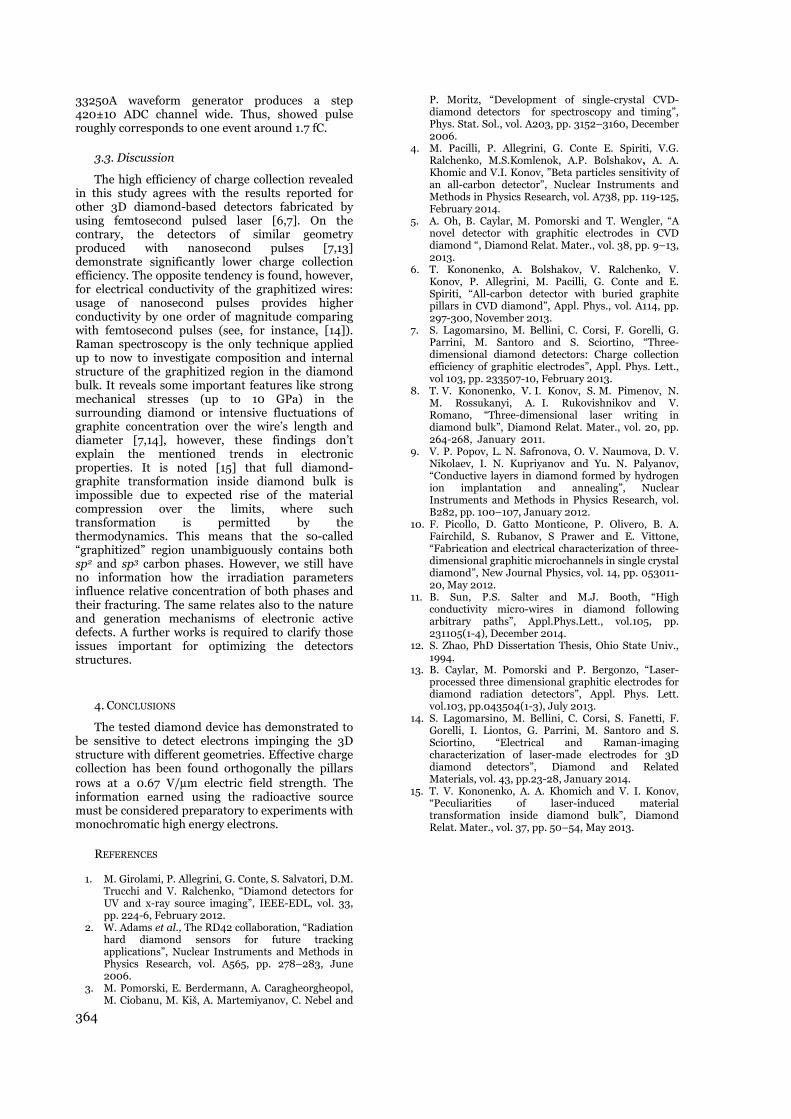
364
33250A waveform generator produces a step 420±10 ADC channel wide. Thus, showed pulse roughly corresponds to one event around 1.7 fC.
3.3. Discussion
The high efficiency of charge collection revealed in this study agrees with the results reported for other 3D diamond-based detectors fabricated by using femtosecond pulsed laser [6,7]. On the contrary, the detectors of similar geometry produced with nanosecond pulses [7,13] demonstrate significantly lower charge collection efficiency. The opposite tendency is found, however, for electrical conductivity of the graphitized wires: usage of nanosecond pulses provides higher conductivity by one order of magnitude comparing with femtosecond pulses (see, for instance, [14]). Raman spectroscopy is the only technique applied up to now to investigate composition and internal structure of the graphitized region in the diamond bulk. It reveals some important features like strong mechanical stresses (up to 10 GPa) in the surrounding diamond or intensive fluctuations of graphite concentration over the wire’s length and diameter [7,14], however, these findings don’t explain the mentioned trends in electronic properties. It is noted [15] that full diamond-graphite transformation inside diamond bulk is impossible due to expected rise of the material compression over the limits, where such transformation is permitted by the thermodynamics. This means that the so-called “graphitized” region unambiguously contains both sp2 and sp3 carbon phases. However, we still have no information how the irradiation parameters influence relative concentration of both phases and their fracturing. The same relates also to the nature and generation mechanisms of electronic active defects. A further works is required to clarify those issues important for optimizing the detectors structures.
4. CONCLUSIONS
The tested diamond device has demonstrated to be sensitive to detect electrons impinging the 3D structure with different geometries. Effective charge collection has been found orthogonally the pillars rows at a 0.67 V/μm electric field strength. The information earned using the radioactive source must be considered preparatory to experiments with monochromatic high energy electrons.
REFERENCES
1. M. Girolami, P. Allegrini, G. Conte, S. Salvatori, D.M. Trucchi and V. Ralchenko, “Diamond detectors for UV and x-ray source imaging”, IEEE-EDL, vol. 33, pp. 224-6, February 2012.
2. W. Adams et al., The RD42 collaboration, “Radiation hard diamond sensors for future tracking applications”, Nuclear Instruments and Methods in Physics Research, vol. A565, pp. 278–283, June 2006.
3. M. Pomorski, E. Berdermann, A. Caragheorgheopol, M. Ciobanu, M. Kiš, A. Martemiyanov, C. Nebel and
P. Moritz, “Development of single-crystal CVD-diamond detectors for spectroscopy and timing”, Phys. Stat. Sol., vol. A203, pp. 3152–3160, December 2006.
4. M. Pacilli, P. Allegrini, G. Conte E. Spiriti, V.G. Ralchenko, M.S.Komlenok, A.P. Bolshakov, A. A. Khomic and V.I. Konov, ”Beta particles sensitivity of an all-carbon detector”, Nuclear Instruments and Methods in Physics Research, vol. A738, pp. 119-125, February 2014.
5. A. Oh, B. Caylar, M. Pomorski and T. Wengler, “A novel detector with graphitic electrodes in CVD diamond “, Diamond Relat. Mater., vol. 38, pp. 9–13, 2013.
6. T. Kononenko, A. Bolshakov, V. Ralchenko, V. Konov, P. Allegrini, M. Pacilli, G. Conte and E. Spiriti, “All-carbon detector with buried graphite pillars in CVD diamond”, Appl. Phys., vol. A114, pp. 297-300, November 2013.
7. S. Lagomarsino, M. Bellini, C. Corsi, F. Gorelli, G. Parrini, M. Santoro and S. Sciortino, “Three-dimensional diamond detectors: Charge collection efficiency of graphitic electrodes”, Appl. Phys. Lett., vol 103, pp. 233507-10, February 2013.
8. T. V. Kononenko, V. I. Konov, S. M. Pimenov, N. M. Rossukanyi, A. I. Rukovishnikov and V. Romano, “Three-dimensional laser writing in diamond bulk”, Diamond Relat. Mater., vol. 20, pp. 264-268, January 2011.
9. V. P. Popov, L. N. Safronova, O. V. Naumova, D. V. Nikolaev, I. N. Kupriyanov and Yu. N. Palyanov, “Conductive layers in diamond formed by hydrogen ion implantation and annealing”, Nuclear Instruments and Methods in Physics Research, vol. B282, pp. 100–107, January 2012.
10. F. Picollo, D. Gatto Monticone, P. Olivero, B. A. Fairchild, S. Rubanov, S Prawer and E. Vittone, “Fabrication and electrical characterization of three-dimensional graphitic microchannels in single crystal diamond”, New Journal Physics, vol. 14, pp. 053011-20, May 2012.
11. B. Sun, P.S. Salter and M.J. Booth, “High conductivity micro-wires in diamond following arbitrary paths”, Appl.Phys.Lett., vol.105, pp. 231105(1-4), December 2014.
12. S. Zhao, PhD Dissertation Thesis, Ohio State Univ., 1994.
13. B. Caylar, M. Pomorski and P. Bergonzo, “Laser-processed three dimensional graphitic electrodes for diamond radiation detectors”, Appl. Phys. Lett. vol.103, pp.043504(1-3), July 2013.
14. S. Lagomarsino, M. Bellini, C. Corsi, S. Fanetti, F. Gorelli, I. Liontos, G. Parrini, M. Santoro and S. Sciortino, “Electrical and Raman-imaging characterization of laser-made electrodes for 3D diamond detectors”, Diamond and Related Materials, vol. 43, pp.23-28, January 2014.
15. T. V. Kononenko, A. A. Khomich and V. I. Konov, “Peculiarities of laser-induced material transformation inside diamond bulk”, Diamond Relat. Mater., vol. 37, pp. 50–54, May 2013.
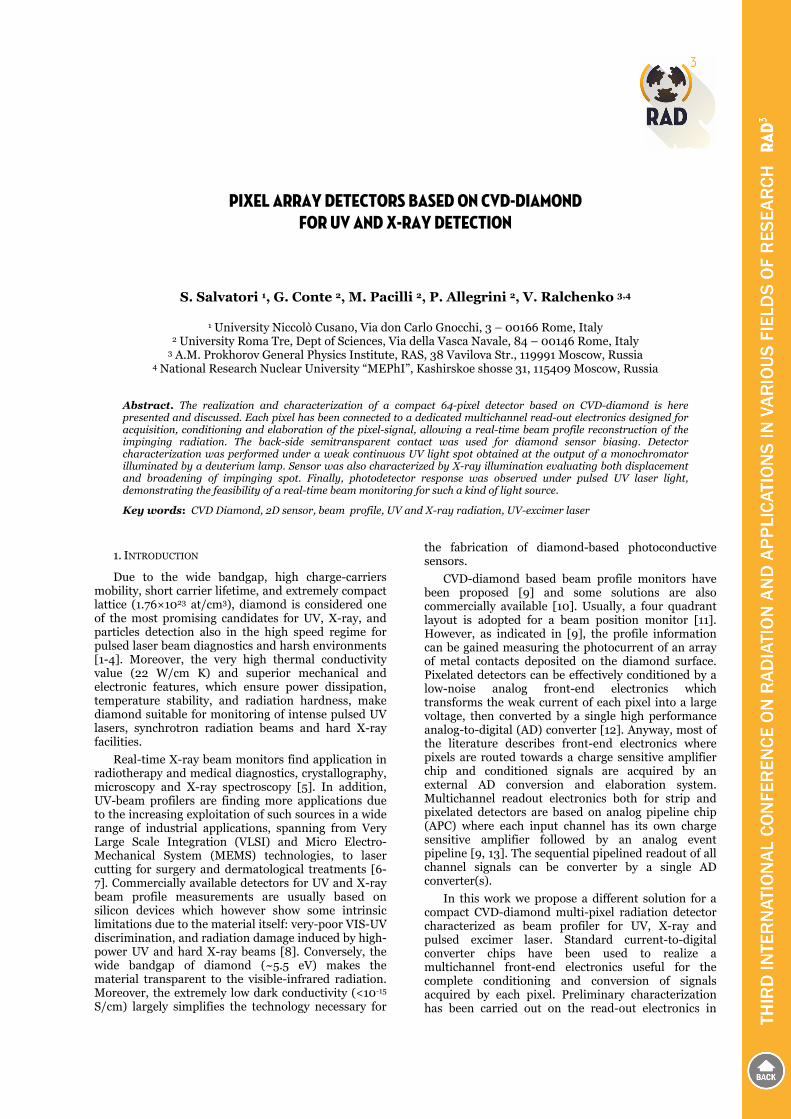
PIXEL ARRAY DETECTORS BASED ON CVD-DIAMOND FOR UV AND X-RAY DETECTION
S. Salvatori 1, G. Conte 2, M. Pacilli 2, P. Allegrini 2, V. Ralchenko 3,4
1 University Niccolò Cusano, Via don Carlo Gnocchi, 3 – 00166 Rome, Italy 2 University Roma Tre, Dept of Sciences, Via della Vasca Navale, 84 – 00146 Rome, Italy
3 A.M. Prokhorov General Physics Institute, RAS, 38 Vavilova Str., 119991 Moscow, Russia 4 National Research Nuclear University “MEPhI”, Kashirskoe shosse 31, 115409 Moscow, Russia
Abstract. The realization and characterization of a compact 64-pixel detector based on CVD-diamond is here presented and discussed. Each pixel has been connected to a dedicated multichannel read-out electronics designed for acquisition, conditioning and elaboration of the pixel-signal, allowing a real-time beam profile reconstruction of the impinging radiation. The back-side semitransparent contact was used for diamond sensor biasing. Detector characterization was performed under a weak continuous UV light spot obtained at the output of a monochromator illuminated by a deuterium lamp. Sensor was also characterized by X-ray illumination evaluating both displacement and broadening of impinging spot. Finally, photodetector response was observed under pulsed UV laser light, demonstrating the feasibility of a real-time beam monitoring for such a kind of light source.
Key words: CVD Diamond, 2D sensor, beam profile, UV and X-ray radiation, UV-excimer laser
1. INTRODUCTION
Due to the wide bandgap, high charge-carriers mobility, short carrier lifetime, and extremely compact lattice (1.76×10²³ at/cm3), diamond is considered one of the most promising candidates for UV, X-ray, and particles detection also in the high speed regime for pulsed laser beam diagnostics and harsh environments [1-4]. Moreover, the very high thermal conductivity value (22 W/cm K) and superior mechanical and electronic features, which ensure power dissipation, temperature stability, and radiation hardness, make diamond suitable for monitoring of intense pulsed UV lasers, synchrotron radiation beams and hard X-ray facilities.
Real-time X-ray beam monitors find application in radiotherapy and medical diagnostics, crystallography, microscopy and X-ray spectroscopy [5]. In addition, UV-beam profilers are finding more applications due to the increasing exploitation of such sources in a wide range of industrial applications, spanning from Very Large Scale Integration (VLSI) and Micro Electro-Mechanical System (MEMS) technologies, to laser cutting for surgery and dermatological treatments [6-7]. Commercially available detectors for UV and X-ray beam profile measurements are usually based on silicon devices which however show some intrinsic limitations due to the material itself: very-poor VIS-UV discrimination, and radiation damage induced by high-power UV and hard X-ray beams [8]. Conversely, the wide bandgap of diamond (~5.5 eV) makes the material transparent to the visible-infrared radiation. Moreover, the extremely low dark conductivity (<10-15 S/cm) largely simplifies the technology necessary for
the fabrication of diamond-based photoconductive sensors.
CVD-diamond based beam profile monitors have been proposed [9] and some solutions are also commercially available [10]. Usually, a four quadrant layout is adopted for a beam position monitor [11]. However, as indicated in [9], the profile information can be gained measuring the photocurrent of an array of metal contacts deposited on the diamond surface. Pixelated detectors can be effectively conditioned by a low-noise analog front-end electronics which transforms the weak current of each pixel into a large voltage, then converted by a single high performance analog-to-digital (AD) converter [12]. Anyway, most of the literature describes front-end electronics where pixels are routed towards a charge sensitive amplifier chip and conditioned signals are acquired by an external AD conversion and elaboration system. Multichannel readout electronics both for strip and pixelated detectors are based on analog pipeline chip (APC) where each input channel has its own charge sensitive amplifier followed by an analog event pipeline [9, 13]. The sequential pipelined readout of all channel signals can be converter by a single AD converter(s).
In this work we propose a different solution for a compact CVD-diamond multi-pixel radiation detector characterized as beam profiler for UV, X-ray and pulsed excimer laser. Standard current-to-digital converter chips have been used to realize a multichannel front-end electronics useful for the complete conditioning and conversion of signals acquired by each pixel. Preliminary characterization has been carried out on the read-out electronics in

366
order to evaluate the main features of the acquisition and conditioning system. The feasibility of a real-time beam monitoring of laser light is also discussed.
2. EXPERIMENTAL ISSUES
2.1. CVD-diamond sensor
Thick (500 μm) polycrystalline transparent (optical grade) diamond film was grown on silicon wafer by means of microwave plasma enhanced CVD technique. Silicon substrate was then chemically removed via wet etching in HF. Both the nucleation and the growth surfaces of diamond sample were mechanically polished, reducing the thickness by more than 100 μm. After the treatment the resulting surface roughness was between 2 and 8 nm. Moreover, by removing most of the nucleation material, the final specimen shows a well-defined columnar structure of grains having an average dimension on the growth surface around 100 μm. Details of growing and structural characterization of film used in this work are reported elsewhere [14]. Compared to unpolished films, treated CVD-diamond samples show superior optoelectronic properties in term of UV-VIS selectivity when a sandwich contact structure is adopted. Moreover, very low leakage currents (down to fraction of pA) are observed [15, 16]. Pixel contacts (8×8 array, 0.5×0.5 mm2 each, 200 μm apart, i.e. pixel pitch equal to 700 μm) on one CVD-diamond side have been realized by thermal evaporation of chromium (0.2 μm thick) and by means of standard photolithographic process. On the other side of the sample, a bottom contact was evaporated using the same metal but maintaining the thickness around 50 nm to ensure transparency to the incident light. As also reported elsewhere [17, 18], the current-to-voltage characteristics of each pixel showed an ohmic nature and the estimated dark resistivity was around 1011 Ωcm.
Fig. 1 Normalized quantum-yield of the CVD-diamond sample used in this work [19]
Normalized quantum efficiency as a function of the impinging photon energy (Figure 1 [19]) shows a very high UV-to-VIS discrimination (comparable to that of a IIa-type natural diamond), confirming the feasibility of
detectors useful for “solar blind” applications. In addition, the over-gap photoresponse indicates that polishing procedure is also able to reduce charge-carriers recombination at the surface compared to the behavior of non-polished natural diamonds [19].
2.2. Image sensor architecture
The block diagram of the sensor/front-end electronics is illustrated in Figure 2. Each pixel is connected to an integrator which performs the current-to-voltage conversion of the photogenerated signal, followed by multiplexed Σ-Δ Analog-to-digital converters. The number of Σ-Δ ADC is limited to one every two pixels. It has to be stated that the signal of each pixel is converted by a dedicated double-integrator so that the current-to-voltage conversion is performed continuously in time. Indeed, when the output of an integrator of one side is digitized, the other side integrator of the same pixel is in the integration mode.
Fig. 2 Block diagram of the 64-pixels sensor/front-end and acquisition electronics.
The results of two-pixels digitized integrations (per ADC) are stored in a serial-output shift register. With a 10 MHz system clock, a single Σ-Δ conversion is completed in less than 250 μs, so that data can be acquired with a throughput of more than 2000 samples per second.
The equivalent gain of each integrator can be programmed by changing either or both the TINT integration time and the CF feedback capacitance values. The former can be chosen in the 50 μs – 1 s wide range, whereas the latter can be selected as 12.5 × i pF (i=1..7) so that the full scale can range from 50 to 350 pC. ΣΔ-AD converters show 20 bits of resolution without missing code. Such values would theoretically guarantee a discrimination on the photogenerated charge carriers signal just between 0.05 and 0.33 fC, at a full scale of 50 and 350 pC, respectively. The former would correspond to only 300 electrons, whereas the latter to less than 2100 electrons. Anyway, such extremely high-performances will be strongly affected

367
by the unavoidable superimposed noise amplitude due to circuitry layout input stray capacitance.
Fig. 3 CVD-diamond detector glued on the PCB sample holder. Semitransparent back contact is used for sensor biasing. Pixels were wire bonded towards PCB contacts.
As shown in Figure 3, on its semitransparent back contact, the CVD-diamond sensor was glued with silver paste on a single-side printed circuit board (PCB). The presence of a 8×8 mm2 hole on the PCB sample-holder allowed detector illumination, whereas the realized contact on the same side was used for detector biasing (see the SMA connector visible on Figure 4).
Fig. 4 Front-end electronics, mounted on different PCBs, daisy-chain connected via a backplane circuit board also used for digital control signals distribution. The picture shows a half of the whole 64-channels electronics: the other 4 boards are interlaced to those shown in the figure.
Pixels were wire bonded with 25 μm Al/Si standard wires directly on PCB contact strips used as integrator-inputs connections. The conditioning electronics, based on standard integrated circuits, has been divided into different PCBs mounted on a backplane circuit board used for daisy-chain connection of AD converter outputs and digital control signals distribution. As depicted in Figure 4, each board of the realized prototype integrates the conditioning electronics of 8 channels. The total 8 boards, for the whole 64 integrators and converters, are interlaced to reduce the assembly depth. The resulting detector layout is
relatively compact (4×7×7 cm3) and the implemented architecture allows future engineering and miniaturization on a dedicated single-chip circuitry directly bump-bonded on the diamond sensor pixel-side as depicted in Figure 5.
Fig. 5 Single-chip front-end electronics bump bonded to CVD-diamond sensor pixels. Semitransparent contact allows detector biasing and pixel volumes irradiation.
3. ELECTRICAL CHARACTERIZATION
3.1. “Test-mode” measurements
Conditioning electronics has been equipped with a test-mode integration capability. When test mode is performed, input channel are grounded and fixed packets of “internally-generated” charge carriers are transferred to the integration capacitors. At the end of each integration period, the voltage at the integrator outputs is digitized. The test mode has been used to evaluate both the linearity and the noise performances of the overall integration-AD conversion circuitry. Figure 6 shows the very good linearity the system shows in the 13 – 350 pC input range. According to data reported for integrators and ADC, the estimated differential non linearity error was around 60 ppm of readings. In addition, a really low offset value, equivalent to less than 1 pC has been typically estimated for all the channels.
Fig. 6 In the test mode operation the system shows a very good linearity with a really low equivalent input offset charge carrier.
As illustrated in Figures 7 and 8, when a fixed charge carrier packet is injected into integrator

368
capacitor, a really low dispersion of output values is also observed at the ADC out. Figure 7 also shows the different response observed for the two integrators converted by the same ADC. The revealed difference, of about 70 counts (over the mean 88600 value) has to be attributed to tolerance on the values of the feedback capacitors of the two integrators. For data shown in Figure 8, the equivalent noise amplitude referred to integrator inputs can be evaluated as
(1)
where full scale was 350 pC, whereas 20 represents the ADC resolution. Such a result indicates that a 15 bits “noise-free” resolution would be allowed by the implemented read-out electronics.
Fig. 7 In the test mode operation the system shows very low dispersion of digitized output values.
System noise is expected to be lowered, having a corresponding increase on the system resolution, by proper design electronics layout and especially if a single-chip solution will be adopted.
Fig. 8 Histogram showing ADC output values distribution in a test mode acquisition of fixed packets. The low dispersion of digitized output values states a “noise-free” effective number of bits of 15 for the read-out electronics.
3.2. Read-out electronics characterization
The current-to-digital electronics has been preliminary characterized with a Keithley 6221 precision current source. The typical system trans-characteristics is reported in Figure 9 where ADC output is plotted as a function of the equivalent
“externally-injected” input charge carriers packets. The integration time of integrators for measurements like that shown in the figure was 50 μs. A good linearity is observed over more than three orders of magnitude in the 0.3 – 350 pC range and a differential non linearity error lower than 100 ppm of readings was evaluated for an input charge higher than 1 pC.
Fig. 9 Typical charge-to-digital conversion of front-end electronics where a precision Keithley 6221 represented the input-current source.
The observed non-linearity below 0.2 pC has to be attributed to the integrator input bias current (100 fA typical at 25°C). In addition, very good linearity is also observed at different integration times demonstrating the feasibility of a programmable-gain current-to-voltage converters. Mainly dues to tolerances in the integrators capacitor values, a ±0.5% of the full-scale range differences was observed between channels.
Fig. 10 The histogram shows a relatively high value for ADC output dispersion mainly induced by the equivalent capacitance of the current source connection which strongly increases the input-referred system noise.
Figure 10 shows the dispersion of output values when a fixed input current amplitude is concerned. If compared to results of Figure 8, the higher value of the equivalent noise referred to the input, estimated as
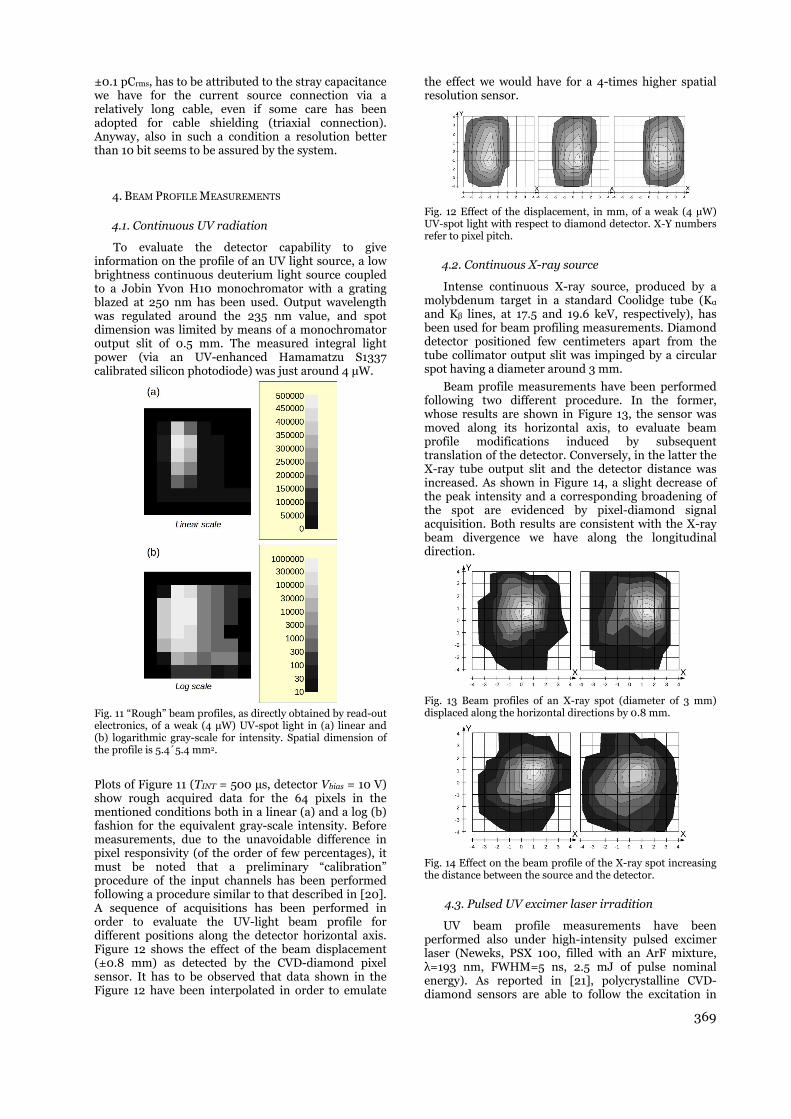
369
±0.1 pCrms, has to be attributed to the stray capacitance we have for the current source connection via a relatively long cable, even if some care has been adopted for cable shielding (triaxial connection). Anyway, also in such a condition a resolution better than 10 bit seems to be assured by the system.
4. BEAM PROFILE MEASUREMENTS
4.1. Continuous UV radiation
To evaluate the detector capability to give information on the profile of an UV light source, a low brightness continuous deuterium light source coupled to a Jobin Yvon H10 monochromator with a grating blazed at 250 nm has been used. Output wavelength was regulated around the 235 nm value, and spot dimension was limited by means of a monochromator output slit of 0.5 mm. The measured integral light power (via an UV-enhanced Hamamatzu S1337 calibrated silicon photodiode) was just around 4 μW.
Fig. 11 “Rough” beam profiles, as directly obtained by read-out electronics, of a weak (4 μW) UV-spot light in (a) linear and (b) logarithmic gray-scale for intensity. Spatial dimension of the profile is 5.4´5.4 mm2.
Plots of Figure 11 (TINT = 500 μs, detector Vbias = 10 V) show rough acquired data for the 64 pixels in the mentioned conditions both in a linear (a) and a log (b) fashion for the equivalent gray-scale intensity. Before measurements, due to the unavoidable difference in pixel responsivity (of the order of few percentages), it must be noted that a preliminary “calibration” procedure of the input channels has been performed following a procedure similar to that described in [20]. A sequence of acquisitions has been performed in order to evaluate the UV-light beam profile for different positions along the detector horizontal axis. Figure 12 shows the effect of the beam displacement (±0.8 mm) as detected by the CVD-diamond pixel sensor. It has to be observed that data shown in the Figure 12 have been interpolated in order to emulate
the effect we would have for a 4-times higher spatial resolution sensor.
Fig. 12 Effect of the displacement, in mm, of a weak (4 μW) UV-spot light with respect to diamond detector. X-Y numbers refer to pixel pitch.
4.2. Continuous X-ray source
Intense continuous X-ray source, produced by a molybdenum target in a standard Coolidge tube (Kα and Kβ lines, at 17.5 and 19.6 keV, respectively), has been used for beam profiling measurements. Diamond detector positioned few centimeters apart from the tube collimator output slit was impinged by a circular spot having a diameter around 3 mm.
Beam profile measurements have been performed following two different procedure. In the former, whose results are shown in Figure 13, the sensor was moved along its horizontal axis, to evaluate beam profile modifications induced by subsequent translation of the detector. Conversely, in the latter the X-ray tube output slit and the detector distance was increased. As shown in Figure 14, a slight decrease of the peak intensity and a corresponding broadening of the spot are evidenced by pixel-diamond signal acquisition. Both results are consistent with the X-ray beam divergence we have along the longitudinal direction.
Fig. 13 Beam profiles of an X-ray spot (diameter of 3 mm) displaced along the horizontal directions by 0.8 mm.
Fig. 14 Effect on the beam profile of the X-ray spot increasing the distance between the source and the detector.
4.3. Pulsed UV excimer laser irradition
UV beam profile measurements have been performed also under high-intensity pulsed excimer laser (Neweks, PSX 100, filled with an ArF mixture, λ=193 nm, FWHM=5 ns, 2.5 mJ of pulse nominal energy). As reported in [21], polycrystalline CVD-diamond sensors are able to follow the excitation in
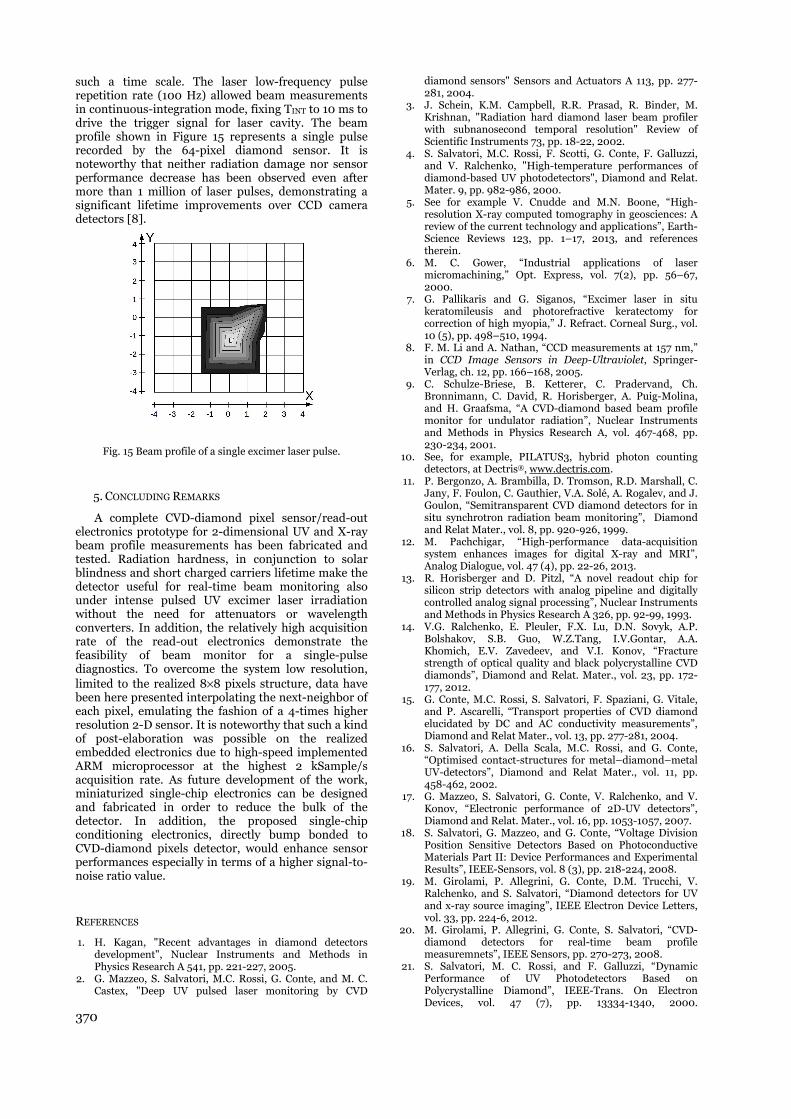
370
such a time scale. The laser low-frequency pulse repetition rate (100 Hz) allowed beam measurements in continuous-integration mode, fixing TINT to 10 ms to drive the trigger signal for laser cavity. The beam profile shown in Figure 15 represents a single pulse recorded by the 64-pixel diamond sensor. It is noteworthy that neither radiation damage nor sensor performance decrease has been observed even after more than 1 million of laser pulses, demonstrating a significant lifetime improvements over CCD camera detectors [8].
Fig. 15 Beam profile of a single excimer laser pulse.
5. CONCLUDING REMARKS
A complete CVD-diamond pixel sensor/read-out electronics prototype for 2-dimensional UV and X-ray beam profile measurements has been fabricated and tested. Radiation hardness, in conjunction to solar blindness and short charged carriers lifetime make the detector useful for real-time beam monitoring also under intense pulsed UV excimer laser irradiation without the need for attenuators or wavelength converters. In addition, the relatively high acquisition rate of the read-out electronics demonstrate the feasibility of beam monitor for a single-pulse diagnostics. To overcome the system low resolution, limited to the realized 8×8 pixels structure, data have been here presented interpolating the next-neighbor of each pixel, emulating the fashion of a 4-times higher resolution 2-D sensor. It is noteworthy that such a kind of post-elaboration was possible on the realized embedded electronics due to high-speed implemented ARM microprocessor at the highest 2 kSample/s acquisition rate. As future development of the work, miniaturized single-chip electronics can be designed and fabricated in order to reduce the bulk of the detector. In addition, the proposed single-chip conditioning electronics, directly bump bonded to CVD-diamond pixels detector, would enhance sensor performances especially in terms of a higher signal-to-noise ratio value.
REFERENCES
1. H. Kagan, "Recent advantages in diamond detectors development", Nuclear Instruments and Methods in Physics Research A 541, pp. 221-227, 2005.
2. G. Mazzeo, S. Salvatori, M.C. Rossi, G. Conte, and M. C. Castex, "Deep UV pulsed laser monitoring by CVD
diamond sensors" Sensors and Actuators A 113, pp. 277-281, 2004.
3. J. Schein, K.M. Campbell, R.R. Prasad, R. Binder, M. Krishnan, "Radiation hard diamond laser beam profiler with subnanosecond temporal resolution" Review of Scientific Instruments 73, pp. 18-22, 2002.
4. S. Salvatori, M.C. Rossi, F. Scotti, G. Conte, F. Galluzzi, and V. Ralchenko, "High-temperature performances of diamond-based UV photodetectors", Diamond and Relat. Mater. 9, pp. 982-986, 2000.
5. See for example V. Cnudde and M.N. Boone, “High-resolution X-ray computed tomography in geosciences: A review of the current technology and applications”, Earth-Science Reviews 123, pp. 1–17, 2013, and references therein.
6. M. C. Gower, “Industrial applications of laser micromachining,” Opt. Express, vol. 7(2), pp. 56–67, 2000.
7. G. Pallikaris and G. Siganos, “Excimer laser in situ keratomileusis and photorefractive keratectomy for correction of high myopia,” J. Refract. Corneal Surg., vol. 10 (5), pp. 498–510, 1994.
8. F. M. Li and A. Nathan, “CCD measurements at 157 nm,” in CCD Image Sensors in Deep-Ultraviolet, Springer-Verlag, ch. 12, pp. 166–168, 2005.
9. C. Schulze-Briese, B. Ketterer, C. Pradervand, Ch. Bronnimann, C. David, R. Horisberger, A. Puig-Molina, and H. Graafsma, “A CVD-diamond based beam profile monitor for undulator radiation”, Nuclear Instruments and Methods in Physics Research A, vol. 467-468, pp. 230-234, 2001.
10. See, for example, PILATUS3, hybrid photon counting detectors, at Dectris®, www.dectris.com.
11. P. Bergonzo, A. Brambilla, D. Tromson, R.D. Marshall, C. Jany, F. Foulon, C. Gauthier, V.A. Solé, A. Rogalev, and J. Goulon, “Semitransparent CVD diamond detectors for in situ synchrotron radiation beam monitoring”, Diamond and Relat Mater., vol. 8, pp. 920-926, 1999.
12. M. Pachchigar, “High-performance data-acquisition system enhances images for digital X-ray and MRI”, Analog Dialogue, vol. 47 (4), pp. 22-26, 2013.
13. R. Horisberger and D. Pitzl, “A novel readout chip for silicon strip detectors with analog pipeline and digitally controlled analog signal processing”, Nuclear Instruments and Methods in Physics Research A 326, pp. 92-99, 1993.
14. V.G. Ralchenko, E. Pleuler, F.X. Lu, D.N. Sovyk, A.P. Bolshakov, S.B. Guo, W.Z.Tang, I.V.Gontar, A.A. Khomich, E.V. Zavedeev, and V.I. Konov, “Fracture strength of optical quality and black polycrystalline CVD diamonds”, Diamond and Relat. Mater., vol. 23, pp. 172-177, 2012.
15. G. Conte, M.C. Rossi, S. Salvatori, F. Spaziani, G. Vitale, and P. Ascarelli, “Transport properties of CVD diamond elucidated by DC and AC conductivity measurements”, Diamond and Relat Mater., vol. 13, pp. 277-281, 2004.
16. S. Salvatori, A. Della Scala, M.C. Rossi, and G. Conte, “Optimised contact-structures for metal–diamond–metal UV-detectors”, Diamond and Relat Mater., vol. 11, pp. 458-462, 2002.
17. G. Mazzeo, S. Salvatori, G. Conte, V. Ralchenko, and V. Konov, “Electronic performance of 2D-UV detectors”, Diamond and Relat. Mater., vol. 16, pp. 1053-1057, 2007.
18. S. Salvatori, G. Mazzeo, and G. Conte, “Voltage Division Position Sensitive Detectors Based on Photoconductive Materials Part II: Device Performances and Experimental Results”, IEEE-Sensors, vol. 8 (3), pp. 218-224, 2008.
19. M. Girolami, P. Allegrini, G. Conte, D.M. Trucchi, V. Ralchenko, and S. Salvatori, “Diamond detectors for UV and x-ray source imaging”, IEEE Electron Device Letters, vol. 33, pp. 224-6, 2012.
20. M. Girolami, P. Allegrini, G. Conte, S. Salvatori, “CVD-diamond detectors for real-time beam profile measuremnets”, IEEE Sensors, pp. 270-273, 2008.
21. S. Salvatori, M. C. Rossi, and F. Galluzzi, “Dynamic Performance of UV Photodetectors Based on Polycrystalline Diamond”, IEEE-Trans. On Electron Devices, vol. 47 (7), pp. 13334-1340, 2000.

PENETRATION DEPTH OF X-RAYS IN CYLINDRICAL X-RAY COLLIMATORS
Karl Bernhardi
Ruhr Universität Bochum, AEPT, Building ID, D-44780 Bochum, Germany
Abstract. Compton-scattered radiation generated near the aperture of an X-ray collimator significantly distorts space- and energy- resolved X-ray bremsstrahlung measurements. A special shielding diaphragm added to a conventional collimator suppresses this kind of stray radiation. In “Shielding of an X-ray Collimator against interfering X-Radiation” contributed to this conference, the author gives a numerical estimation of the shielding efficiency achieved in this way. These calculations require the determination of the attenuation of X-rays by photo-absorption. For this purpose, the paper provides the necessary lower-bound estimations of distances along which X-rays travel within the solid parts of the shielding diaphragm.
Key words: X-ray bremsstrahlung, stray X-radiation, collimator, Compton scattering, shielding
1. INTRODUCTION
This presentation is an accompanying paper to the paper “Shielding of an X-ray Collimator against interfering X-Radiation” [2] on the topic of collimator arrangements suitable for X-ray bremsstrahlung diagnostics of plasmas. In [1], a collimator arrangement used for bremsstrahlung measurements in the low-energy region is described and an improved method for extending its measuring range to higher photon energies is given. In [2], a method to estimate the shielding efficiency of such a collimator arrangement is presented. Knowing the “penetration lengths” within the shielding diaphragm is necessary for determining the shielding efficiency of the collimator. However, many different X-ray propagation paths of the described kind are possible. Thus, calculating their individual lengths, albeit being a well-defined exercise from the pure geometrical point of view, is a very complicated task. This difficult problem is prevented by determining that path covering the smallest possible distance within the shielding material. Using them, one obtains easy-to-calculate lower-estimates of the X-ray attenuation values. They are needed for the main step in calculating the shielding efficiency. They are given as a function of the position P of the Compton scattering center and not of the incidence angle of the primary radiation. As described in [2], this is necessary to obtain a lower-estimate of the shielding efficiency that is independent of the spatial distribution of the X-ray source. In the following chapters, the geometric reasoning for identifying such paths of minimal length are outlined. In the second section, the symbols labeling the X-rays entering and leaving the shielding diaphragm and their propagation directions are specified. In the third and the fourth section, the propagation of incoming and
scattered rays within a longitudinal- symmetric plane is treated. In the fifth section, the 3-dimensional propagation case is considered. Cylindrical symmetry for the collimator and its parts is assumed.
2. DEFINITION OF TERMS DESCRIBING THE RAYS
The symbol ϒ denotes the plane spanned by a particular scattering center P and the longitudinal axis of symmetry of the collimator (it is called “longitudinal-symmetric plane”). Fig.1 shows Compton scattering of rays in Bpl at a fixed scattering center ( )P , ,r z χ . It illustrates the special case that incident and scattered rays propagate within ϒ or eventually cross the collimator’s axis of symmetry.
In this and the following two chapters the discussion is constrained on rays propagating within ϒ , i.e., within a plane including the collimator’s axis of symmetry. They are in this sense inherent to ϒ . Thus, in the following they are called “inherent rays”. Such incident rays entering the shielding diaphragm Bpl have several modes labeled with index 1,2,3,4μ = . The ray marked with 1 traverses the whole diameter of the diaphragm hole and enters Bpl just at the edge of its front opening. Ray 2 enters Bpl within the cross-sectional area of its aperture without touching the edges of the openings. Thus, ray 2 traverses only a fraction of the diameter of the collimator hole. Rays 3, 4 enter the solid part of Bpl at a side diametrical opposite to the scattering center P or at a position nearest to P respectively. The term “penetration length” specifies the distance that the incident or scattered rays covers only within the shielding medium of Bpl . This length is different from the total length that an incident or scattered ray covers within Bpl. The penetration length of a ray provides its experienced photo-absorption within Bpl.
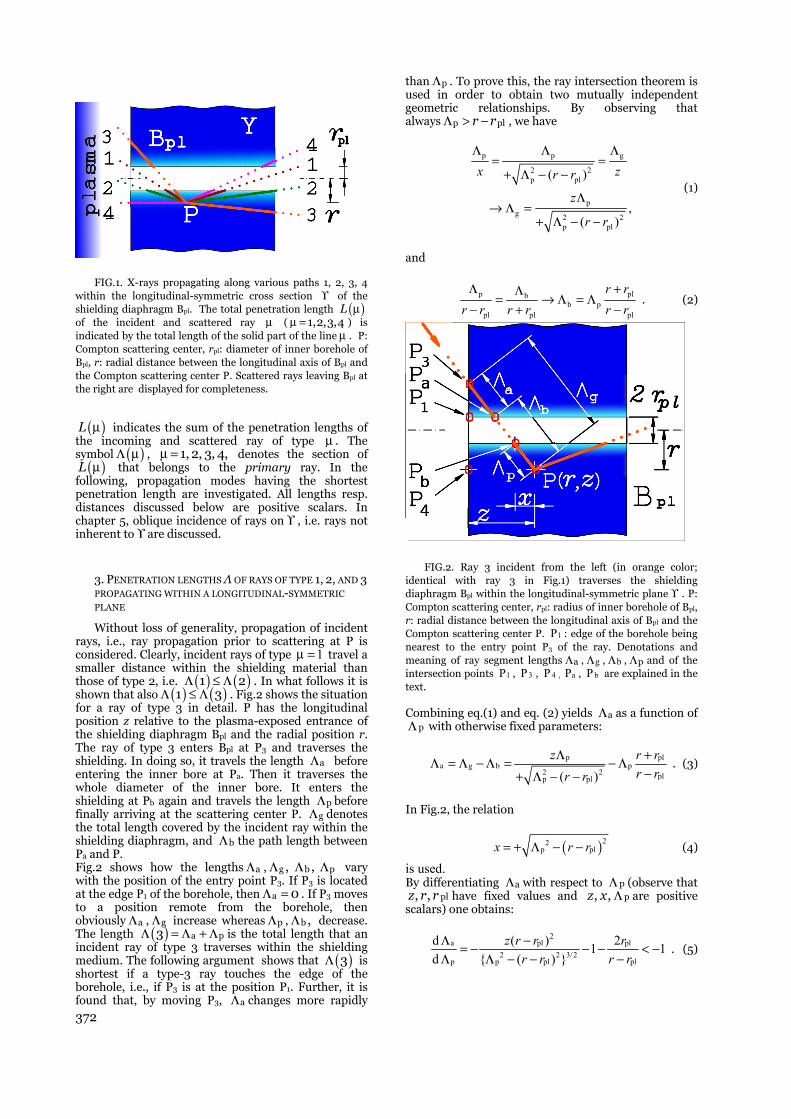
372
FIG.1. X-rays propagating along various paths 1, 2, 3, 4 within the longitudinal-symmetric cross section ϒ of the shielding diaphragm Bpl. The total penetration length ( )L μ of the incident and scattered ray μ ( 1,2,3,4μ = ) is indicated by the total length of the solid part of the line μ . P: Compton scattering center, rpl: diameter of inner borehole of Bpl, r: radial distance between the longitudinal axis of Bpl and the Compton scattering center P. Scattered rays leaving Bpl at the right are displayed for completeness.
( )L μ indicates the sum of the penetration lengths of the incoming and scattered ray of type μ . The symbol ( )Λ μ , 1, 2, 3, 4,μ = denotes the section of
( )L μ that belongs to the primary ray. In the following, propagation modes having the shortest penetration length are investigated. All lengths resp. distances discussed below are positive scalars. In chapter 5, oblique incidence of rays on ϒ , i.e. rays not inherent to ϒ are discussed.
3. PENETRATION LENGTHS Λ OF RAYS OF TYPE 1, 2, AND 3
PROPAGATING WITHIN A LONGITUDINAL-SYMMETRIC
PLANE
Without loss of generality, propagation of incident rays, i.e., ray propagation prior to scattering at P is considered. Clearly, incident rays of type 1μ = travel a smaller distance within the shielding material than those of type 2, i.e. ( ) ( )1 2Λ ≤ Λ . In what follows it is shown that also ( ) ( )1 3Λ ≤ Λ . Fig.2 shows the situation for a ray of type 3 in detail. P has the longitudinal position z relative to the plasma-exposed entrance of the shielding diaphragm Bpl and the radial position r. The ray of type 3 enters Bpl at P3 and traverses the shielding. In doing so, it travels the length Λa before entering the inner bore at Pa. Then it traverses the whole diameter of the inner bore. It enters the shielding at Pb again and travels the length Λp before finally arriving at the scattering center P. Λg denotes the total length covered by the incident ray within the shielding diaphragm, and Λb the path length between Pa and P. Fig.2 shows how the lengths Λa , Λg , Λb , Λp vary with the position of the entry point P3. If P3 is located at the edge P1 of the borehole, then Λ =a 0 . If P3 moves to a position remote from the borehole, then obviously Λa , Λg increase whereas Λp , Λb , decrease. The length ( )Λ = Λ + Λa p3 is the total length that an incident ray of type 3 traverses within the shielding medium. The following argument shows that ( )3Λ is shortest if a type-3 ray touches the edge of the borehole, i.e., if P3 is at the position P1. Further, it is found that, by moving P3, Λa changes more rapidly
than Λp . To prove this, the ray intersection theorem is used in order to obtain two mutually independent geometric relationships. By observing that always Λ > −p plr r , we have
p p g
2 2p pl
pg 2 2
p pl
( )
,( )
x zr r
z
r r
Λ Λ Λ= =
+ Λ − −
Λ→ Λ =
+ Λ − −
(1)
and
p plb
b ppl pl pl
r r
r r r r r r
Λ +Λ= → Λ = Λ
− + − . (2)
FIG.2. Ray 3 incident from the left (in orange color; identical with ray 3 in Fig.1) traverses the shielding diaphragm Bpl within the longitudinal-symmetric plane ϒ . P: Compton scattering center, rpl: radius of inner borehole of Bpl, r: radial distance between the longitudinal axis of Bpl and the Compton scattering center P. 1P : edge of the borehole being nearest to the entry point P3 of the ray. Denotations and meaning of ray segment lengths Λa , gΛ , bΛ , Λp and of the intersection points 1P , 3P , 4P , aP , bP are explained in the text. Combining eq.(1) and eq. (2) yields Λa as a function of
pΛ with otherwise fixed parameters:
p pl
a g b p2 2 plp pl( )
z r r
r rr r
Λ +Λ = Λ − Λ = − Λ−+ Λ − −
. (3)
In Fig.2, the relation
( )22p plx r r= + Λ − − (4)
is used. By differentiating Λa with respect to pΛ (observe that
pl, ,z r r have fixed values and p, ,z x Λ are positive scalars) one obtains:
2
a pl pl
2 2 3/2p plp pl
d ( ) 21 1
d { ( ) }
z r r r
r rr r
Λ −= − − − < −Λ −Λ − −
. (5)
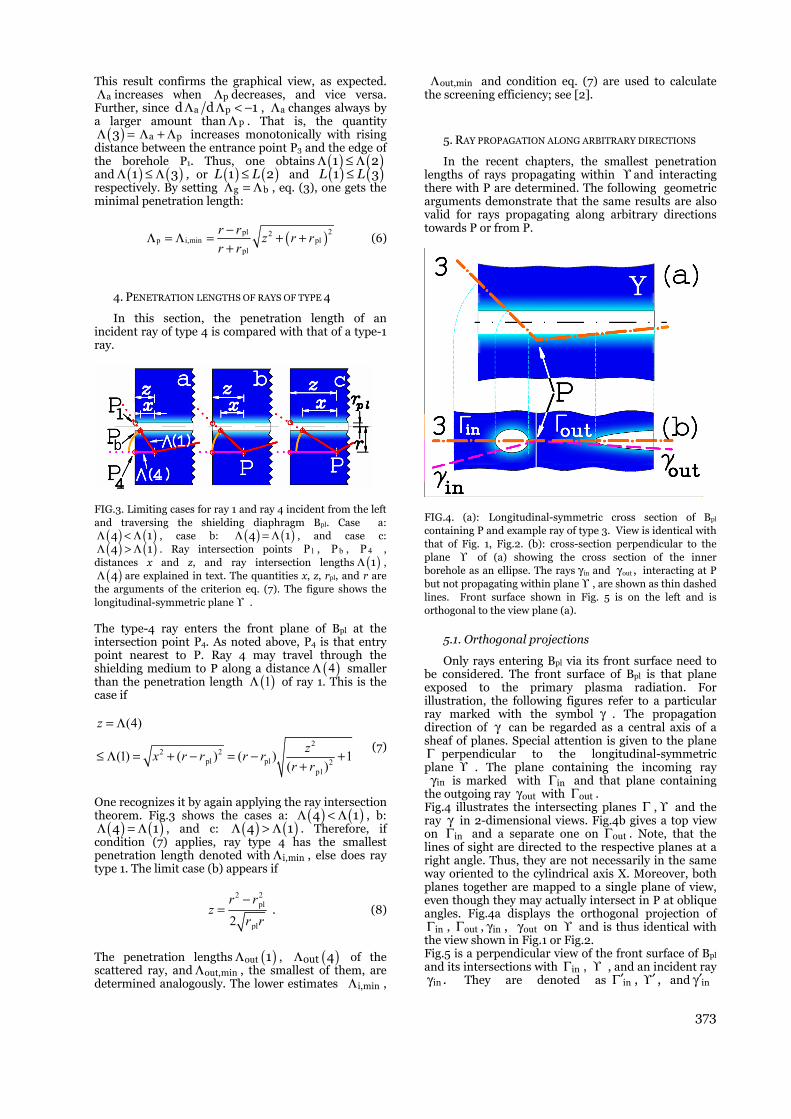
373
This result confirms the graphical view, as expected. Λa increases when Λp decreases, and vice versa. Further, since Λ Λ < −a pd d 1 , Λa changes always by a larger amount than Λ p . That is, the quantity
( )3Λ = Λ + Λa p
increases monotonically with rising distance between the entrance point P3 and the edge of the borehole P1. Thus, one obtains ( ) ( )1 2Λ ≤ Λ and ( ) ( )1 3Λ ≤ Λ , or ( ) ( )1 2L L≤ and ( ) ( )1 3L L≤ respectively. By setting Λ = Λg b , eq. (3), one gets the minimal penetration length:
( )2pl 2p i,min pl
pl
r rz r r
r r
−Λ = Λ = + ++
(6)
4. PENETRATION LENGTHS OF RAYS OF TYPE 4
In this section, the penetration length of an incident ray of type 4 is compared with that of a type-1 ray.
FIG.3. Limiting cases for ray 1 and ray 4 incident from the left and traversing the shielding diaphragm Bpl. Case a:
( ) ( )4 1Λ < Λ , case b: ( ) ( )4 1Λ = Λ , and case c: ( ) ( )4 1Λ > Λ . Ray intersection points 1P , bP , 4P ,
distances x and z, and ray intersection lengths ( )1Λ , ( )4Λ are explained in text. The quantities x, z, rpl, and r are
the arguments of the criterion eq. (7). The figure shows the longitudinal-symmetric plane ϒ . The type-4 ray enters the front plane of Bpl at the intersection point P4. As noted above, P4 is that entry point nearest to P. Ray 4 may travel through the shielding medium to P along a distance ( )4Λ smaller than the penetration length ( )1Λ of ray 1. This is the case if
22 2
pl pl 2pl
(4)
(1) ( ) ( ) 1( )
z
zx r r r r
r r
= Λ
≤ Λ = + − = − ++
(7)
One recognizes it by again applying the ray intersection theorem. Fig.3 shows the cases a: ( ) ( )4 1Λ < Λ , b:
( ) ( )4 1Λ = Λ , and c: ( ) ( )4 1Λ > Λ . Therefore, if condition (7) applies, ray type 4 has the smallest penetration length denoted with Λi,min , else does ray type 1. The limit case (b) appears if
2 2
pl
pl2
r rz
r r
−= . (8)
The penetration lengths ( )Λout 1 , ( )Λout 4 of the scattered ray, and Λout,min , the smallest of them, are determined analogously. The lower estimates Λi,min ,
Λout,min and condition eq. (7) are used to calculate the screening efficiency; see [2].
5. RAY PROPAGATION ALONG ARBITRARY DIRECTIONS
In the recent chapters, the smallest penetration lengths of rays propagating within ϒ and interacting there with P are determined. The following geometric arguments demonstrate that the same results are also valid for rays propagating along arbitrary directions towards P or from P.
FIG.4. (a): Longitudinal-symmetric cross section of Bpl containing P and example ray of type 3. View is identical with that of Fig. 1, Fig.2. (b): cross-section perpendicular to the plane ϒ of (a) showing the cross section of the inner borehole as an ellipse. The rays γ in and
γout , interacting at P
but not propagating within plane ϒ , are shown as thin dashed lines. Front surface shown in Fig. 5 is on the left and is orthogonal to the view plane (a).
5.1. Orthogonal projections
Only rays entering Bpl via its front surface need to be considered. The front surface of Bpl is that plane exposed to the primary plasma radiation. For illustration, the following figures refer to a particular ray marked with the symbol γ . The propagation direction of γ can be regarded as a central axis of a sheaf of planes. Special attention is given to the plane Γ perpendicular to the longitudinal-symmetric plane ϒ . The plane containing the incoming ray γin is marked with Γin and that plane containing
the outgoing ray γout with Γout . Fig.4 illustrates the intersecting planes Γ , ϒ and the ray γ in 2-dimensional views. Fig.4b gives a top view on Γin and a separate one on Γout . Note, that the lines of sight are directed to the respective planes at a right angle. Thus, they are not necessarily in the same way oriented to the cylindrical axis X. Moreover, both planes together are mapped to a single plane of view, even though they may actually intersect in P at oblique angles. Fig.4a displays the orthogonal projection of Γin , Γout , γin , γout on ϒ and is thus identical with the view shown in Fig.1 or Fig.2. Fig.5 is a perpendicular view of the front surface of Bpl and its intersections with Γin , ϒ , and an incident ray γin . They are denoted as ′Γ in , ,′ϒ and ′γ in

374
respectively. Γin , as stated above, and the front surface of Bpl are orthogonal to ϒ .
FIG.5 View of the plasma-exposed front surface and aperture of the shielding diaphragm Bpl. P’: projection of the scatter center P on the plane of view. X : cylindrical axis of Bpl. X and the longitudinal-symmetric plane ϒ are perpendicular to the plane of view. ′ϒ : intersection line of ϒ with the plane of view. ′Γ in : intersection line of Γ with the plane of view. 1P ,
3P : intersection points of incident rays propagating within the longitudinal-symmetric plane ϒ . Ray γ : incident ray with arbitrary propagation direction towards P. The figure shows the projection of the path of γ on the plane of view. γ inP : entry point of ray inγ at the front surface of Bpl. Hence, the projection of Γ onto ϒ remains orthogonal, even if it is restricted to the plane of view of Fig.5. The same projection maps the one-dimensional intersection ′Γ in of Γin and the zero-dimensional intersection point γ inP of γin to P3 on ′ϒ (confer Fig.4). This is in analogy to the projective mapping of Γin and γin onto ϒ .
5.2. Lower bound estimation of penetration lengths
As Fig.4 and Fig.5 illustrate, the orthogonal projection maps any arbitrary ray γin obliquely incident at P onto a ray inherent to ϒ . The latter is of one of the types discussed in the recent chapters. According to the aforementioned orthogonality, its total distance traversed within Bpl is shorter than that traversed by γin . This statement holds also for the respective penetration lengths. Fig.4 demonstrates this with an example. It shows the example ray γin , the associated plane Γin , and the line of intersection between Γin and ϒ (i.e., the inherent ray of type 3). All of them are crossing the borehole of Bpl. Obviously, as it follows from the discussion above, the inherent ray and thus Γin is tilted with respect to the collimator’s axis of
symmetry. Hence, the cross section between the inner borehole and Γin is not a circle, rather an ellipse. For symmetry reasons, the semi major axis of the ellipse
coincides with the longitudinal-symmetric plane ϒ , as shown in Fig.4a. Hence, the aforementioned inherent ray path propagates along the semi major axis of the ellipse. Thus this ray, compared with all rays travelling within Γin obliquely towards ϒ and P, traverses the shortest distance through the shielding medium. The same reasoning holds for scattered rays γout and their associated rays inherent to ϒ . The inherent rays are displayed as thick lines and the example rays γin , γout as thinner lines. Therefore, the conclusion made at end of chapter 4 holds also for arbitrary directions of ray paths.
6. SUMMARY AND CONCLUSION
The subject of this paper is the geometry of X-rays or γ -rays propagating within a cylindrical diaphragm and interacting there with a particular scattering center P. The location of ( )P , ,r zχ is supposed to be arbitrary but fixed. As stated above, P is presumed to be located on a longitudinal plane of symmetry. Hence,
0χ = can be assumed without loss of generality. The analysis in chapter 3 and chapter 4 identifies those rays traveling the smallest possible penetration lengths within the solid parts of the shielding diaphragm Bpl. The shortest penetration length ( ){ }P , ,L r zχ of rays interacting at P reveals to depend only on the position of P. Generally, there exist two alternatives for the shortest penetration lengths of rays. The condition
2 2
pl
pl2
r rz
r r
−< (8a)
or
2 2
plpl
pl
02
r rd z
r r
−< − < (8b)
defines the first case. Here, the coordinate z is the axial distance to its origin, i.e. the distance to the front of the diaphragm Bpl. Equations (8a, 8b) indicate that P is located in relative vicinity to the front or to the rear of Bpl. If the spatial coordinates of P fulfill one of these conditions, then
i,min zΛ = (9a)
or
out,min pld zΛ = − (9b)
respectively are the shortest possible penetration lengths of rays interacting at P. If otherwise, in the second case, both equations (8a, 8b) are not fulfilled, then the quantity
2 2i,min pl
2
pl 2pl
(1) ( )
( ) 1( )
x r r
zr r
r r
Λ = Λ = + −
= − ++
(9c)
or
( )2
pl
o,min pl 2pl
( ) 1( )
d zr r
r r
−Λ = − +
+ (9d)
375
is the shortest possible penetration length of rays interacting at P. As discussed in chapter 3, only rays propagating within the longitudinal-symmetric plane ϒ and touching the edge of the borehole at the front or at the rear of Bpl attain this length. The minimal penetration lengths given by eq. (9) or eq. (6a) respectively enable lower-bound estimations of the photo-absorption experienced by X- and γ -rays. The calculation of the shielding efficiency of the diaphragm Bpl performed in [2] utilizes these data.
Acknowledgements: The author is indebted to
Professor Dr. Peter Awakowicz, head of the AEPT Labs at Ruhr-University Bochum, for enabling him doing scientific work after retirement. He would like to thank Prof. Dr. Klaus Wiesemann at AEPT Labs at Ruhr University Bochum for his persistent interest in this research, for valuable discussions, and for the excellent cooperation.
REFERENCES
1. K. Bernhardi, K. Wiesemann, ”A collimator for hot plasma x-ray diagnostics in ion sources”, Rev. Sci. Instruments: vol.83, 2012, 02A337, February 2012.
2. K. Bernhardi, “Shielding of an X-ray Collimator against interfering X-Radiation”, this conference.


SHIELDING OF AN X-RAY COLLIMATOR AGAINST INTERFERING X-RADIATION
Karl Bernhardi
Ruhr Universität Bochum, AEPT, Building ID, D-44780 Bochum, Germany
Abstract. This article analyses the shielding capability of an advanced collimator system against interfering radiation. Emphasis is mainly on the plasma-exposed shielding diaphragm component of the collimator, the purpose of which is to shield the rear collimator parts and the detector against wide-angle high intensity wall bremsstrahlung. A numerical procedure determines the at least attainable shielding efficiency. The main geometric and photoelectric absorption parameters determining the shielding efficiency are identified. The analysis shows the needed minimum geometric sizes for the shielding diaphragm. These are a few cm for X-ray photon energies in the low 100 keV region to suppress the disturbing radiation by a factor ~10-4 or lower, 50 cm or more to suppress disturbing MeV radiation by a factor ~ 10-2.. 10-3. The method presented here may serve as a general design tool for X-ray bremsstrahlung detector and collimator systems.
Key words: X-ray bremsstrahlung, stray X-radiation, collimator, photo-absorption, Compton scattering, shielding
1. INTRODUCTION
X-ray bremsstrahlung diagnostics is a means for studying plasmas containing hot electrons with energies up to the low MeV region [1], [2], [3]. This paper considers “volume bremsstrahlung”, i.e., X-radiation produced by encounters of hot plasma electrons with neutral or ionized particles inside the plasma. The hot electron components of plasmas are spatially extended and thus behave like extended X-ray sources. Furthermore, the emitted photon energies are continuously distributed. The yielding volume-bremsstrahlung contains information about the electron energy distribution function of the highest available quality. Above cited references describe detectors and collimators that are suitable for such diagnostics. However, volume bremsstrahlung is accompanied by disturbing stray radiation like high-intense thick-target bremsstrahlung (“wall bremsstrahlung”) and radiation due to Compton-scattering. Hot electrons produce them when hitting structural components of the plasma experiment. They are likewise spatially extended and their photon energies are continuously distributed as well. Thus, both plasma X-radiation and high-intense thick-target bremsstrahlung arrive at the collimator’s aperture under a wide range of angles of incidence. They are called “primary radiation” and their photon current density at the front of the collimator is denoted as ij . Eventually, they enter the viewing cone of the detector via single Compton scattering. For photon energies
200 keV,K > such events deteriorate the collimating performance of the X-ray measuring system. Thus, measuring volume bremsstrahlung requires particular means for reducing these kinds of stray radiation.
The collimator system described in [4] in detail is designed to meet this requirement also for photon energies 200keVK > . The subject of this paper is the
collimator’s shielding efficiency, i.e., its ability to discriminate between the interfering radiation and the radiation to be measured. The next chapter summarizes the function principle of such a device. In the rest of the paper a method for estimating its shielding efficiency is described and some numerical results are presented.
2. COLLIMATOR DESIGN
A sketch of the collimator arrangement is shown in Fig.1b. The rear part of the cylindrical collimator encloses a scintillation radiation detector (SCD). The aperture ( dB ) defines its geometric view-cone. A lead cylinder encloses both components and the ray path between them.
FIG. 1a: Overview of the collimator system without shielding diaphragm plB . dB : aperture defining the geometric view cone of the radiation detector SCD. dr : radius of the borehole of dB . Small cone 1: geometric view- cone of the radiation detector. Wide cone 2 ( )iΩ : geometric view cone at the position of dB . scd : distance between the detector SCD and
dB . HE: hot electron component of the plasma. Wall: Structural component enclosing the plasma. As illustrated, a small part of the wall located inside the view-cone of dB is not hit by hot plasma electrons. Putting it far outside the range of the hot electrons is a method to keep wall
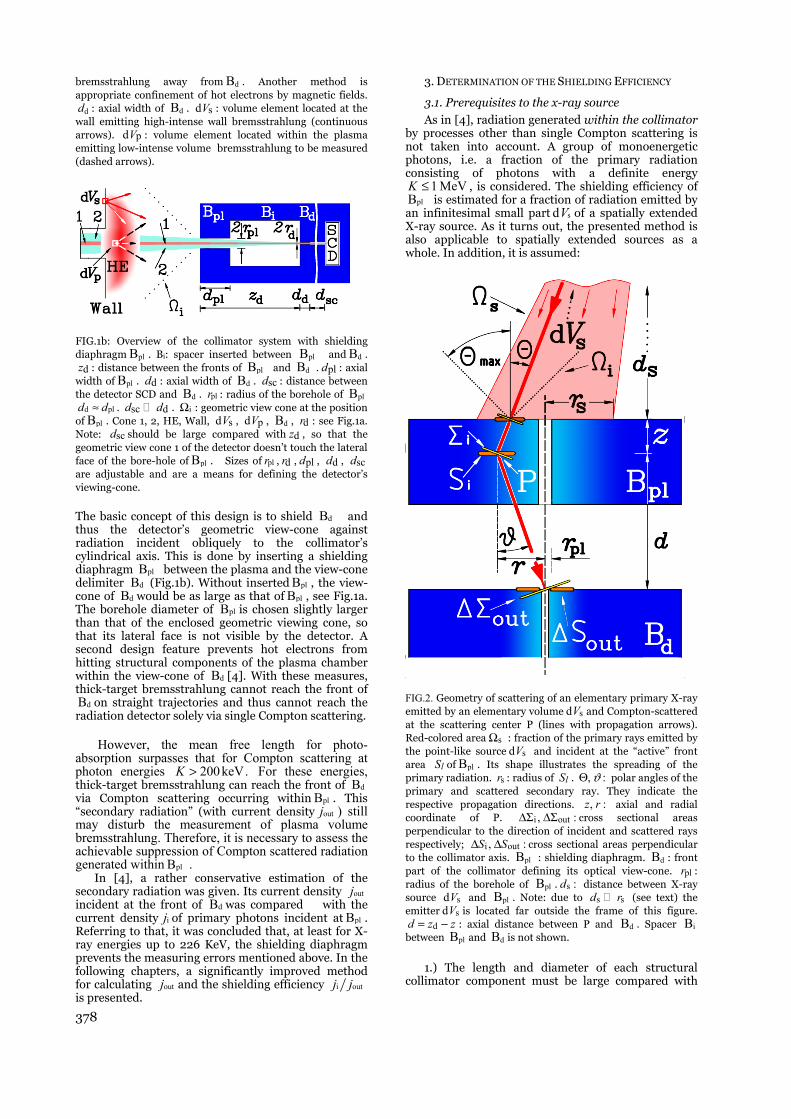
378
bremsstrahlung away from dB . Another method is appropriate confinement of hot electrons by magnetic fields.
dd : axial width of dB . sdV : volume element located at the wall emitting high-intense wall bremsstrahlung (continuous arrows). pdV : volume element located within the plasma emitting low-intense volume bremsstrahlung to be measured (dashed arrows).
FIG.1b: Overview of the collimator system with shielding diaphragm plB . Bi: spacer inserted between plB and dB .
dz : distance between the fronts of plB and dB . pld : axial width of plB . dd : axial width of dB . scd : distance between the detector SCD and dB . plr : radius of the borehole of plB
d pld d≈ . sc dd d . iΩ : geometric view cone at the position of plB . Cone 1, 2, HE, Wall, sdV , pdV , dB , dr : see Fig.1a. Note: scd should be large compared with dz , so that the geometric view cone 1 of the detector doesn’t touch the lateral face of the bore-hole of plB . Sizes of plr , dr , pld , dd , scd are adjustable and are a means for defining the detector’s viewing-cone.
The basic concept of this design is to shield dB and thus the detector’s geometric view-cone against radiation incident obliquely to the collimator’s cylindrical axis. This is done by inserting a shielding diaphragm plB between the plasma and the view-cone delimiter dB (Fig.1b). Without inserted plB , the view-cone of dB would be as large as that of plB , see Fig.1a. The borehole diameter of plB is chosen slightly larger than that of the enclosed geometric viewing cone, so that its lateral face is not visible by the detector. A second design feature prevents hot electrons from hitting structural components of the plasma chamber within the view-cone of dB [4]. With these measures, thick-target bremsstrahlung cannot reach the front of
dB on straight trajectories and thus cannot reach the radiation detector solely via single Compton scattering.
However, the mean free length for photo-absorption surpasses that for Compton scattering at photon energies 200 keV.K > For these energies, thick-target bremsstrahlung can reach the front of dB via Compton scattering occurring within plB . This “secondary radiation” (with current density outj ) still may disturb the measurement of plasma volume bremsstrahlung. Therefore, it is necessary to assess the achievable suppression of Compton scattered radiation generated within plB .
In [4], a rather conservative estimation of the secondary radiation was given. Its current density outj incident at the front of dB was compared with the current density ij of primary photons incident at plB . Referring to that, it was concluded that, at least for X-ray energies up to 226 KeV, the shielding diaphragm prevents the measuring errors mentioned above. In the following chapters, a significantly improved method for calculating outj and the shielding efficiency i outj j is presented.
3. DETERMINATION OF THE SHIELDING EFFICIENCY
3.1. Prerequisites to the x-ray source
As in [4], radiation generated within the collimator by processes other than single Compton scattering is not taken into account. A group of monoenergetic photons, i.e. a fraction of the primary radiation consisting of photons with a definite energy
1 MeVK ≤ , is considered. The shielding efficiency of plB is estimated for a fraction of radiation emitted by
an infinitesimal small part sdV of a spatially extended X-ray source. As it turns out, the presented method is also applicable to spatially extended sources as a whole. In addition, it is assumed:
FIG.2. Geometry of scattering of an elementary primary X-ray emitted by an elementary volume sdV and Compton-scattered at the scattering center P (lines with propagation arrows). Red-colored area sΩ : fraction of the primary rays emitted by the point-like source sdV and incident at the “active” front area lS of plB . Its shape illustrates the spreading of the primary radiation. sr : radius of lS . , :ϑΘ polar angles of the primary and scattered secondary ray. They indicate the respective propagation directions. , :z r axial and radial coordinate of P. i out, :ΔΣ ΔΣ cross sectional areas perpendicular to the direction of incident and scattered rays respectively; i out, :S SΔ Δ cross sectional areas perpendicular to the collimator axis. plB : shielding diaphragm. dB : front part of the collimator defining its optical view-cone. plr : radius of the borehole of plB . s :d distance between X-ray source sdV and plB . Note: due to s sd r (see text) the emitter sdV is located far outside the frame of this figure.
dd z z= − : axial distance between P and dB . Spacer iB between plB and dB is not shown.
1.) The length and diameter of each structural
collimator component must be large compared with
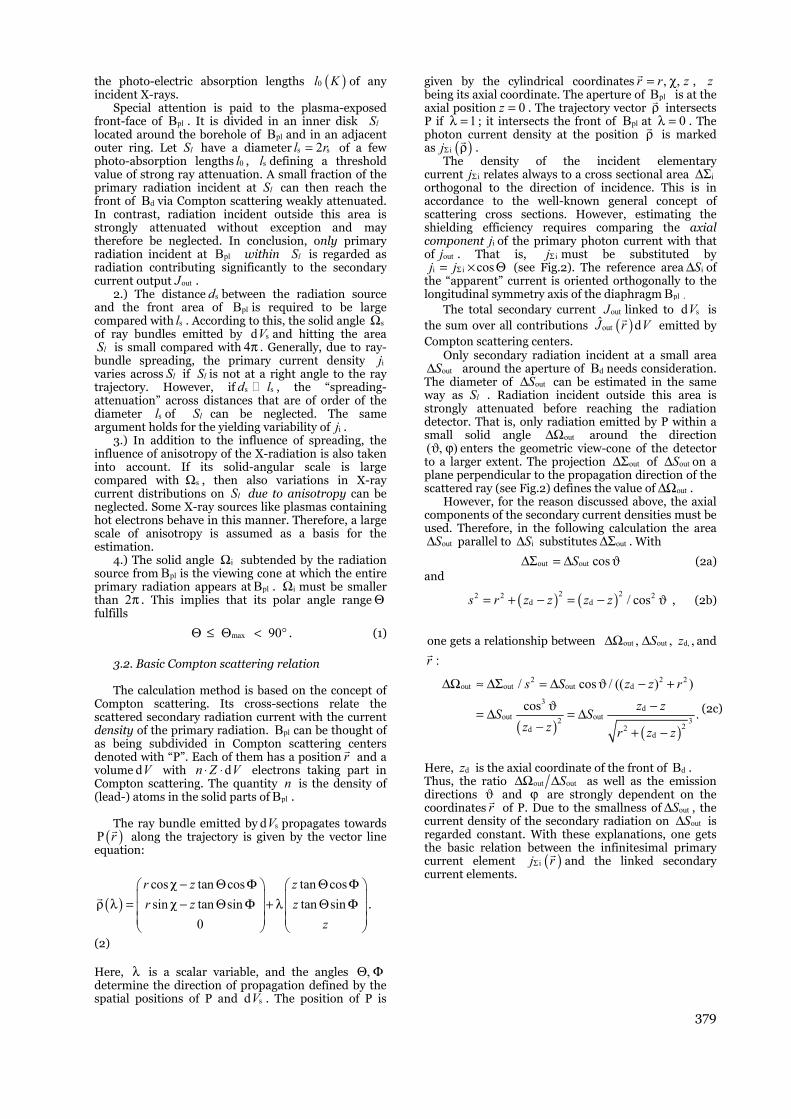
379
the photo-electric absorption lengths ( )0l K of any incident X-rays.
Special attention is paid to the plasma-exposed front-face of plB . It is divided in an inner disk lS located around the borehole of plB and in an adjacent outer ring. Let lS have a diameter s s2l r= of a few photo-absorption lengths 0l , sl defining a threshold value of strong ray attenuation. A small fraction of the primary radiation incident at lS can then reach the front of dB via Compton scattering weakly attenuated. In contrast, radiation incident outside this area is strongly attenuated without exception and may therefore be neglected. In conclusion, only primary radiation incident at plB within lS is regarded as radiation contributing significantly to the secondary current output outJ .
2.) The distance sd between the radiation source and the front area of plB is required to be large compared with sl . According to this, the solid angle sΩ of ray bundles emitted by sdV and hitting the area
lS is small compared with 4π . Generally, due to ray-bundle spreading, the primary current density ij varies across lS if lS is not at a right angle to the ray trajectory. However, if s sd l , the “spreading- attenuation” across distances that are of order of the diameter sl of lS can be neglected. The same argument holds for the yielding variability of ij .
3.) In addition to the influence of spreading, the influence of anisotropy of the X-radiation is also taken into account. If its solid-angular scale is large compared with sΩ , then also variations in X-ray current distributions on lS due to anisotropy can be neglected. Some X-ray sources like plasmas containing hot electrons behave in this manner. Therefore, a large scale of anisotropy is assumed as a basis for the estimation.
4.) The solid angle iΩ subtended by the radiation source from plB is the viewing cone at which the entire primary radiation appears at plB . iΩ must be smaller than 2π . This implies that its polar angle range Θ fulfills
max 90Θ ≤ Θ < ° . (1)
3.2. Basic Compton scattering relation The calculation method is based on the concept of
Compton scattering. Its cross-sections relate the scattered secondary radiation current with the current density of the primary radiation. plB can be thought of as being subdivided in Compton scattering centers denoted with “P”. Each of them has a position r
and a
volume dV with dn Z V⋅ ⋅ electrons taking part in Compton scattering. The quantity n is the density of (lead-) atoms in the solid parts of plB .
The ray bundle emitted by sdV propagates towards
( )P r
along the trajectory is given by the vector line equation:
( )cos tan cos tan cos
sin tan sin tan sin
0
r z z
r z z
z
χ − Θ Φ Θ Φ ρ λ = χ − Θ Φ + λ Θ Φ
.
(2) Here, λ is a scalar variable, and the angles ,Θ Φ determine the direction of propagation defined by the spatial positions of P and sdV . The position of P is
given by the cylindrical coordinates , ,r r z= χ, z
being its axial coordinate. The aperture of plB is at the axial position 0z = . The trajectory vector ρ intersects P if 1λ = ; it intersects the front of plB at 0λ = . The photon current density at the position ρ is marked as ( )ijΣ ρ .
The density of the incident elementary current ijΣ relates always to a cross sectional area iΔΣ orthogonal to the direction of incidence. This is in accordance to the well-known general concept of scattering cross sections. However, estimating the shielding efficiency requires comparing the axial component ij of the primary photon current with that of outj . That is, ijΣ must be substituted by
i i cosj jΣ= × Θ (see Fig.2). The reference area iSΔ of the “apparent” current is oriented orthogonally to the longitudinal symmetry axis of the diaphragm plB .
The total secondary current outJ linked to sdV is the sum over all contributions ( )outˆ dJ r V
emitted by
Compton scattering centers. Only secondary radiation incident at a small area outSΔ around the aperture of dB needs consideration.
The diameter of outSΔ can be estimated in the same way as lS . Radiation incident outside this area is strongly attenuated before reaching the radiation detector. That is, only radiation emitted by P within a small solid angle outΔΩ around the direction ( , )ϑ ϕ enters the geometric view-cone of the detector to a larger extent. The projection outΔΣ of outSΔ on a plane perpendicular to the propagation direction of the scattered ray (see Fig.2) defines the value of outΔΩ .
However, for the reason discussed above, the axial components of the secondary current densities must be used. Therefore, in the following calculation the area
outSΔ parallel to iSΔ substitutes outΔΣ . With
out out cosSΔ Δ=Σ ϑ (2a) and
( ) ( )2 22 2 2d d / coss r z z z z= + − = − ϑ , (2b)
one gets a relationship between out out, ,SΔΩ Δ d, ,z and
:r
( ) ( )
2 2 2out out out d
3d
out out2 322d
d
/ cos / (( ) )
cos.
s S z z r
z zS S
z z r z z
ΔΩ ≈ ΔΣ = Δ ϑ − +
ϑ −= Δ = Δ− + −
(2c)
Here, dz is the axial coordinate of the front of dB . Thus, the ratio out outSΔΩ Δ as well as the emission directions ϑ and ϕ are strongly dependent on the coordinates r
of P. Due to the smallness of outSΔ , the
current density of the secondary radiation on outSΔ is regarded constant. With these explanations, one gets the basic relation between the infinitesimal primary current element ( )ij rΣ
and the linked secondary
current elements.

380
( ) ( )
( ) ( )
( )( )
outout
out
i
outd3
22d
ˆ ( )ˆ ( )d dS
dd cos ,
cos d
exp ,
J rj r V V
j rnZ V K
K rz z
r z z
=Δ
σ= ηΘ Ω′−α Λ ϑ × −
+ −
. (3a)
Here, ( ), cosK K K′ η ≤ is the energy of the Compton-scattered photons and η is the angle of Compton scattering:
( )cos sin sin cos cos cosη = Θ ϑ Φ − ϕ + Θ ϑ . (3b)
( )K ′α is the linear photo absorption coefficient, and outΛ is the distance along which the scattered photons
travel within the solid part of plB . Some additional remarks are noteworthy:
Contributions to the secondary current outJ (or its density outj ) are measured at the entrance of dB . The primary current density ij is measured at the position r
of the scattering center P. The argument r
of the secondary current outĴ (or its density outĵ ) is actually the position argument of P. Hence, r
does not directly
stand for the spatial coordinates of the aperture of dB . Eq. (3) relates the secondary current density outĵ at dB to the primary current density ( )i , ,j r Θ Φ
expected at the position r
of P. However, determining
the shielding efficiency i outj j requires determining ( )ij ρ
at the aperture of plB , i.e., at ( )0ρ λ =
.
3.2. Estimates of photon currents
Estimating ( )ij r
at P by ( ) ( )( )i i0 0j j= ρ λ =at
the aperture of plB requires taking into account the attenuation of the primary radiation. The attenuation of X-ray bundles is caused firstly by their geometric spreading and secondly by photo-electric absorption. Both effects are treated separately by writing the photon current density as a product of two factors:
( ) ( ) ( )i i s iexpj jΣ Σρ = ρ × −αΛ ρ
. (6)
The exponential factor specifies the ray attenuation along the ray trajectory due to photo-absorption. It depends on the distance ( )iΛ ρ travelled by the ray within the solid parts of plB . On the other hand, the factor ( )i sjΣ ρ describes the pure geometric spreading of the ray bundle. The linear differential equation yielding the Lambert-Beer Law of photoelectric ray attenuation describes also the attenuation of the current density by spreading [6]. It yields just eq. (6), if it acts on the “effective attenuation coefficient”
eff sα = α + α (6a)
with the “spreading attenuation coefficient” sα :
( )( )
i ss
i s
j
j
Σ
Σ
′α = . (6b)
The derivative of i sjΣ is taken with respect to λ along the X-ray trajectory. Thus, eq. (6) is a reasonable approach for the current density of primary photons.
Furthermore, eq. (6) enables estimating the different attenuation mechanisms by separate means. In the considered case, the X-rays are emitted by the point-like source sdV . Thus, according to the inverse-square law, the photon current density decreases with increasing distance from sdV :
( ) ( )( )i s i s 0j r jΣ Σ≤ ρ . (6c)
The shielding efficiency refers to the photon current density ( )( )i 0j ρ at the front surface of plB (and not to
ij in close vicinity to the radiation source). Therefore, the photo-absorption along the trajectory between sdV and the aperture of plB is not taken into account. Thus
( ) ( )i s i0 0j jΣ Σρ λ = == ρ λ =
. (7a)
Here is
( )0ρ λ =cos tan cos
sin tan sin
0
r z
r z
χ − Θ Φ = χ − Θ Φ
(7b)
the intersection of the front-face of plB and the ray’s trajectory. The same holds for the current component parallel to the collimator axis:
( ) ( )i s i0 0j jρ λ = = ρ λ =
. (7b)
In order to estimate the attenuation of ray bundles due to photo-absorption, one needs the “penetration lengths” of the trajectories along which the photons travel within the solid parts of plB . However, it is difficult to determine them exactly. Thus, it is impossible to express the result of the integration in an analytic form. This problem is circumvented by using easy-to-calculate lower estimates i,minΛ and out,minΛ of the penetration lengths of primary and secondary rays respectively. They are presented in the accompanying paper [5]. In addition, the differential cross section
( )d d ,Kσ Ω η is replaced by its maximal value 2 26 28 10 cm srer −≈ × ( e :r classical electron radius) at
forward scattering. The incident primary energy K replaces the energy K K′ ≤ of the scattered radiation. Likewise, the photo absorption coefficient
( )Kα replaces the larger value ( )K ′α . With these measures, one single parameter, i.e., the total minimum penetration length min i,min out,minΛ = Λ + Λ , suffices to estimate the total photo-absorption of the incident and scattered ray. According to the requirements of chapter 2.1, ijΣ is assumed to be constant at the front of plB :
( )( ) ( )i i0 0j jΣ Σρ λ = = . (8a)
This holds also for the current component parallel to the collimator axis:
( )( ) ( )i i i0 0j j jρ λ = = ≡ . (8b)
By introducing all estimates in eq. (3), one obtains the final expression relating a secondary current density element to a primary current density element:
( ) ( )( )
( ) ( )
out
2i d
min 32max 2
d
i
ˆ ( )d
0d exp
cos
d 0
e
j r V
j nZr z zV r
r z z
V j q r
−≤ −αΛ Θ + −
≡
.(9)
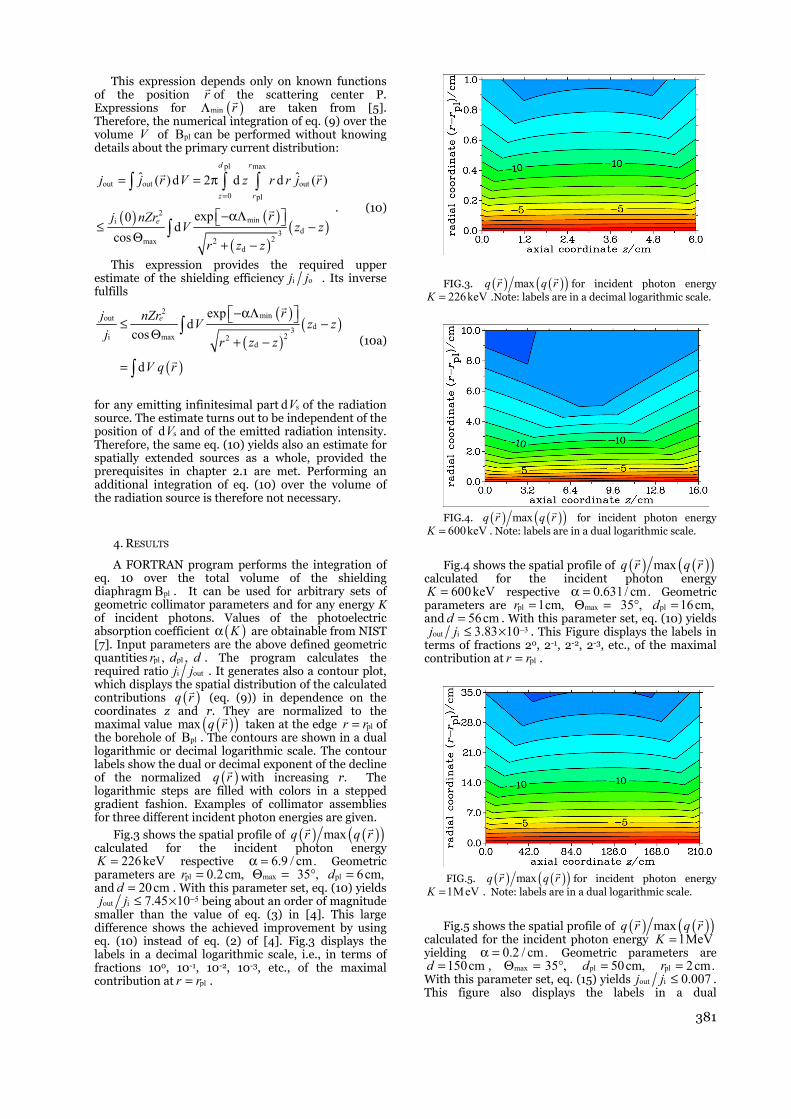
381
This expression depends only on known functions of the position r
of the scattering center P.
Expressions for ( )min rΛ are taken from [5].
Therefore, the numerical integration of eq. (9) over the volume V of plB can be performed without knowing details about the primary current distribution:
( ) ( )
( )( )
pl max
out out out
0 pl
2mini
d322max
d
ˆ ˆ( )d 2 d d ( )
exp0d
cos
d r
z r
e
j j r V z r r j r
rj nZrV z z
r z z
=
= = π
−αΛ ≤ −Θ + −
. (10)
This expression provides the required upper estimate of the shielding efficiency i oj j . Its inverse fulfills
( )
( )( )
( )
2 minoutd3
2i max 2d
expd
cos
d
e rj nZrV z z
jr z z
V q r
−αΛ ≤ −Θ + −
=
(10a)
for any emitting infinitesimal part sdV of the radiation source. The estimate turns out to be independent of the position of sdV and of the emitted radiation intensity. Therefore, the same eq. (10) yields also an estimate for spatially extended sources as a whole, provided the prerequisites in chapter 2.1 are met. Performing an additional integration of eq. (10) over the volume of the radiation source is therefore not necessary.
4. RESULTS
A FORTRAN program performs the integration of eq. 10 over the total volume of the shielding diaphragm plB . It can be used for arbitrary sets of geometric collimator parameters and for any energy K of incident photons. Values of the photoelectric absorption coefficient ( )Kα are obtainable from NIST [7]. Input parameters are the above defined geometric quantities pl ,r pl ,d d . The program calculates the required ratio i outj j . It generates also a contour plot, which displays the spatial distribution of the calculated contributions ( )q r
(eq. (9)) in dependence on the
coordinates z and r. They are normalized to the maximal value ( )( )max q r
taken at the edge plr r= of
the borehole of plB . The contours are shown in a dual logarithmic or decimal logarithmic scale. The contour labels show the dual or decimal exponent of the decline of the normalized ( )q r
with increasing r. The
logarithmic steps are filled with colors in a stepped gradient fashion. Examples of collimator assemblies for three different incident photon energies are given.
Fig.3 shows the spatial profile of ( ) ( )( )maxq r q r
calculated for the incident photon energy
226keVK = respective 6.9 / cm.α = Geometric parameters are pl 0.2cm,r = maxΘ = 35 ,° pl 6cm,d = and 20cmd = . With this parameter set, eq. (10) yields
5out i 7.45 10j j −≤ × being about an order of magnitude smaller than the value of eq. (3) in [4]. This large difference shows the achieved improvement by using eq. (10) instead of eq. (2) of [4]. Fig.3 displays the labels in a decimal logarithmic scale, i.e., in terms of fractions 100, 10-1, 10-2, 10-3, etc., of the maximal contribution at plr r= .
FIG.3. ( ) ( )( )max
q r q r for incident photon energy 226keV=K .Note: labels are in a decimal logarithmic scale.
FIG.4. ( ) ( )( )max
q r q r for incident photon energy
600keV=K . Note: labels are in a dual logarithmic scale.
Fig.4 shows the spatial profile of ( ) ( )( )maxq r q r
calculated for the incident photon energy
600keVK = respective 0.631/ cm.α = Geometric parameters are pl 1cm,r = maxΘ = 35 ,° pl 16cm,d = and 56cmd = . With this parameter set, eq. (10) yields
3out i 3.83 10j j −≤ × . This Figure displays the labels in terms of fractions 20, 2-1, 2-2, 2-3, etc., of the maximal contribution at plr r= .
FIG.5. ( ) ( )( )max
q r q r for incident photon energy
1MeVK = . Note: labels are in a dual logarithmic scale.
Fig.5 shows the spatial profile of ( ) ( )( )maxq r q r
calculated for the incident photon energy 1MeVK = yielding 0.2 / cm.α = Geometric parameters are
150cmd = , maxΘ = 35 ,° pl 50cm,d = pl 2cm.r = With this parameter set, eq. (15) yields out i 0.007j j ≤ . This figure also displays the labels in a dual

382
logarithmic scale. For fixed r, the contribution ( ) ( )( )maxq r q r
increases with increasing z, i.e., with decreasing distance between the scattering centers and dB due to increasing od Ω . This effect is very pronounced in the example shown in Fig. 5 for
1MeVK = for all r.
5. CONCLUSIONS
In this article, the minimum achievable shielding efficiency of an x-ray collimator against Compton stray radiation has been estimated. The collimator in combination with a scintillator detector is used to measure discrete and continuous X-ray spectra of hot-electron plasmas and to filter out disturbing stray radiation. A scintillator counter provides count-rate spectra for energy-resolved pulse height analysis. The secondary radiation turns out to be emitted mainly by a thin cylindrical layer adjoining the inner borehole of the shielding diaphragm. Thus, the obtained results reveal a much more efficient shielding than originally expected.
The outlined estimation method utilizes the photoelectric absorption properties of high-Z materials [7]. Insofar as the conditions stated in chapter 2.2 are met, the treatment does not depend on specific plasma properties. In particular, the resulting lower-estimated shielding efficiency does not depend on the way in which the hot electrons are spatially and energetically distributed. It provides a generally usable means for the x-ray collimator design for plasma diagnostics of hot electron energy distributions. It shows, in what follows, also its limits of applicability. An important constraint that one should pay attention to is that bremsstrahlung photons emitted by high energetic plasma electrons are not monoenergetic. Instead, they are continuously distributed over a broad energy interval. Photoelectric absorption is strongest at photon energies comparable to the binding energy of the k-shell electrons or lower. Thus, its strength and the shielding efficiency decrease strongly with increasing incident photon energy. This behavior implies that the specified conditions for applicability are met the less the higher the incident photon energy is. This is demonstrated with the examples shown above. Shielding of 1 MeV primary radiation requires much larger geometric sizes of the collimator than shielding of radiation in the low 100 keV region. This limits the applicability of x-ray collimators in the MeV region. For the same reason, the innermost layer of plB contributing significantly to the secondary radiation at
dB increases in size with photon energy K. Consequently, the higher K , the less the specified conditions can be achieved. Furthermore, the intensity of measured x-ray spectra decreases exponentially or like a power-law function with photon energy K (see
e.g. Ref [1], [2], [3]). Thus, the measured count-rates may extend over several orders of magnitude if the same collimator configuration is used for the whole photon energy range. In order to improve the resulting bad statistics, the measurements must be carried out separately in several adjacent energy sub-intervals. They are performed by using different collimator configurations with appropiate aperture sizes, as e.g. used in Fig. (3, 4, 5). However, collimators equipped with large aperture areas yield a wider geometric view cone of the detector and dB . As a consequence, the view cone of dB receives a higher amount of primary thick-target bremsstrahlung radiation. Precautions necessary to suppress increased thick-target radiation levels are more difficult to perform.
Acknowledgement: The author is indebted to Professor Dr. Peter Awakowicz, head of the AEPT Labs at Ruhr-Universität Bochum, for enabling him doing scientific work after retirement. He would like to thank Prof. Dr. Klaus Wiesemann at AEPT Labs at Ruhr University Bochum for his persistent interest in this research, for valuable discussions, and for the excellent cooperation.
REFERENCES
1. K. Bernhardi, and K. Wiesemann, “X-ray bremsstrahlung measurements on an ECR-discharge in a magnetic mirror”, Plasma Phys,iopscience.iop.org, vol. 24, pp 867-884, August 1982
2. J.Noland, J.Y.Benitez, D.Leitner, C.Lyneis, J.Verboncoeur, ”Measurement of radial and axial high energy x-ray spectra in electron cyclotron resonance ion source plasmas”, Rev. Sci. Instruments,aip.org, vol 81, 02A308, February 2010
3. S.Gammino, D.Mascali, L.Celona, F.Maimone, G.Ciavola, “Considerations on the role of the magnetic field gradient in ECR ion sources and build-up of hot electron component”, Plasma Sources Sci.Technol, iop.org, vol.18, 045016, September 2009
4. K. Bernhardi, K.Wiesemann, “A collimator for hot plasma x-ray diagnostics in ion sources”, Rev. Sci. Instruments, aip.org, vol 83, 02A337, February 2012
5. K. Bernhardi, “Penetration depth of x-rays in cylindrical x-ray collimators”, Proceedings RAD 2015
6. Charles L. Epstein, Introduction to the Mathematics of Medical Imaging, 2th ed. , SIAM 2008, page 60
7. M.J Berger, J.H. Hubbel, S.M. Seltzer, J. Chang, J.S. Coursey, R. Sukumar, D.S. Zucker, and K. Olsen: XCOM Photon Cross Sections Database (NBSIR 87-3597, NIST Standard Reference Database 8 (XGAM) ), http://www.nist.gov/pml/data/xcom/index.cfm
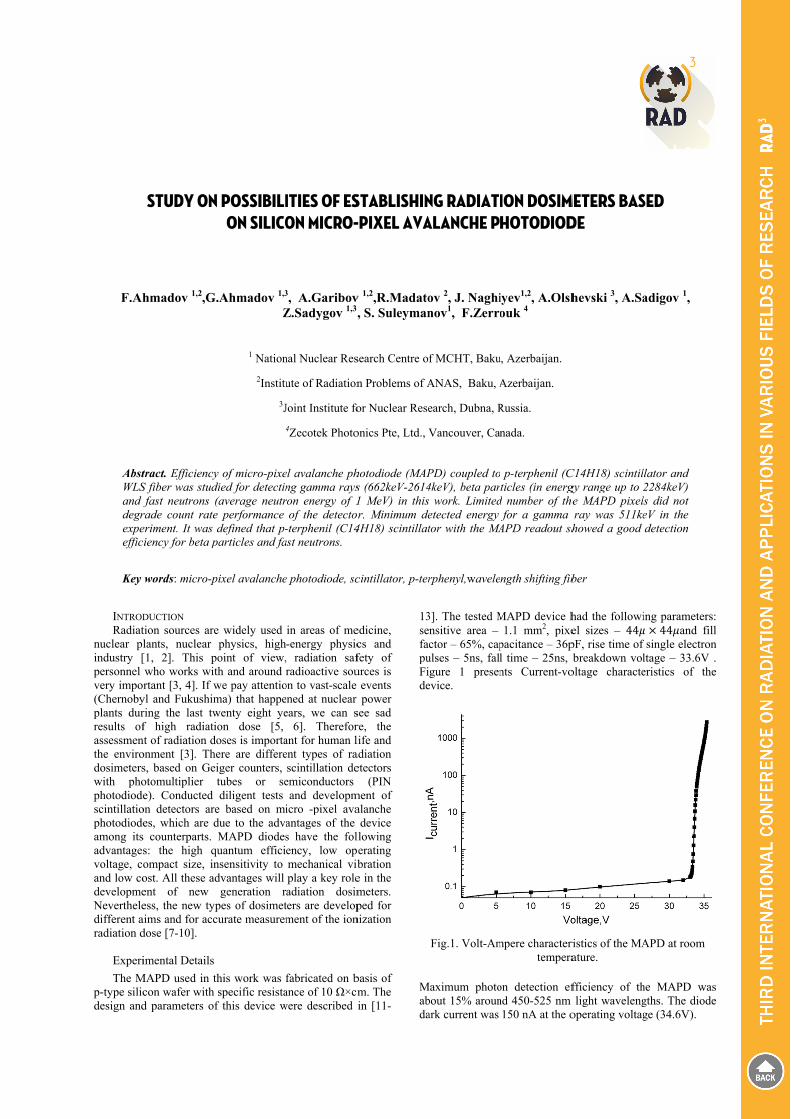
F.Ah
AbstWLSand degrexpeeffic
Key
INTRODRadiat
nuclear plindustry [personnel very impo(Chernobyplants durresults ofassessmenthe envirodosimeterswith phophotodiodescintillatiophotodiodeamong itsadvantagesvoltage, cand low codevelopmeNevertheledifferent aradiation d
ExperiThe M
p-type silicdesign and
STUDY ON
hmadov 1,2,G
tract. EfficiencyS fiber was stud
fast neutrons rade count rateeriment. It was ciency for beta p
words: micro-p
DUCTION tion sources arelants, nuclear [1, 2]. This pwho works witrtant [3, 4]. If w
yl and Fukushimring the last twf high radiati
nt of radiation donment [3]. Ths, based on Geotomultiplier e). Conducted
on detectors ares, which are d
s counterparts. s: the high qompact size, inost. All these aent of new ess, the new tyaims and for accdose [7-10].
imental Details MAPD used in t
con wafer with d parameters of
N POSSIBILION SILICO
G.Ahmadov 1,3
Z
1 Nation2Institu
3J4
y of micro-pixedied for detectin(average neutre performance defined that p-
particles and fa
pixel avalanche
e widely used physics, high
point of view,th and around we pay attentioma) that happewenty eight yeion dose [5,
doses is importahere are differeeiger counters,
tubes or sediligent tests
e based on midue to the advaMAPD diodes
quantum efficinsensitivity to dvantages will generation r
ypes of dosimetcurate measurem
this work was fspecific resista
f this device w
ITIES OF ESON MICRO-
3, A.GaribovZ.Sadygov 1,3,
nal Nuclear Res
ute of Radiation
Joint Institute fo4Zecotek Photo
el avalanche phng gamma raysron energy of 1
of the detecto-terphenil (C14
ast neutrons.
e photodiode, sc
in areas of me-energy physic, radiation safradioactive sou
on to vast-scale ened at nuclear ears, we can s
6]. Thereforant for human lent types of rascintillation de
emiconductors and developm
icro -pixel avaantages of the s have the folency, low opmechanical vibplay a key roleadiation dosimters are development of the ion
fabricated on bance of 10 Ω×cm
were described i
STABLISHIN-PIXEL AVA
v 1,2,R.Madato, S. Suleyman
search Centre o
n Problems of A
or Nuclear Rese
onics Pte, Ltd., V
hotodiode (MAPs (662keV-26141 MeV) in thisr. Minimum de
4H18) scintillat
cintillator, p-ter
edicine, cs and fety of urces is
events power
see sad re, the life and adiation etectors
(PIN ment of alanche device
llowing erating bration e in the meters. ped for
nization
basis of m. The in [11-
13sefapuFide
Mabda
NG RADIATIALANCHE P
ov 2, J. Naghinov1, F.Zerro
f MCHT, Baku
ANAS, Baku, A
earch, Dubna, R
Vancouver, Can
PD) coupled to4keV), beta par work. Limitedetected energy tor with the MA
rphenyl,wavele
3]. The tested Mnsitive area –ctor – 65%, cap
ulses – 5ns, fallgure 1 presen
evice.
Fig.1. Volt-Am
Maximum photobout 15% arounark current was
ION DOSIMHOTODIOD
iyev1,2, A.Olshouk 4
u, Azerbaijan.
Azerbaijan.
Russia.
nada.
p-terphenil (Cticles (in energ
d number of thefor a gamma
APD readout sh
ngth shifting fib
MAPD device h1.1 mm2, pixe
pacitance – 36pl time – 25ns, bnts Current-vo
mpere characteritempera
on detection efnd 450-525 nm 150 nA at the o
METERS BASDE
hevski 3, A.Sa
C14H18) scintilgy range up to 2e MAPD pixelray was 511kehowed a good
ber
had the followiel sizes – 44pF, rise time of breakdown vol
oltage characte
ristics of the MAature.
fficiency of thlight waveleng
operating voltag
SED
adigov 1,
llator and 2284keV) ls did not eV in the detection
ing parameters:44 and fillf single electronltage – 33.6V .eristics of the
APD at room
he MAPD wasgths. The diodege (34.6V).
: l n . e
s e

384
A low inteFig.2 (up)source haduration (2MAPD wdependenc
Fig.2 Lowdepende(gain=3
The pfrom Institas a targ11(200)M the plasticwas rectandecay timeyield of maximum terphenil cthe plastica WLS fibdeep groovof WLS fwas connein a specipossible tothe center preamplifiwas sent t
ensity photon re) at 34.6V. A aving a low in20ns) to measur
was 7.4×10⁵ at ce on bias volta
w intensity phoence (down)of t38) and convert
operating
plastic (p-terphtute for Scintill
get for ionizinfrom Kuraray
c to the diode ngular in shape e is 3.7 ns. Th
27000 photowavelength of
crystal was coatc crystal were trber (diameter 1mves cut in the scfiber was coverected using optiial holder. Theo the ionization
of the source.ier (gain=15). o DRS-4 evolu
esponse of the Mblue light-emis
ntensity was pure gain of the d
the operatingage was showed
oton response (uthe MAPD. Sigted via LeCroy g voltage was 34
henil (C18H14)ation Materials
ng radiation [was used to tra[16]. The p-tewith dimensio
he plastic scintions/MeV depof light emissioted with a tefloransmitted to thmm).The WLS cintillator by cired by reflectoical grease to the detector wasn radiation sour. The MAPD sThe signal fro
ution board digi
MAPD was shossion-diode (45ulsed for shortdiode. The gain g voltage. Thed in Fig.2 (down
up)and gain volgnal was amplif2249W ADC.T4.6V.
))scintillator sa, (Ukraine) was15].WLS fiberansmit the lighterphenil scintilns of 5x5x70mllator gives the
osited energy.n is 420 nm.T
on tape. Signalshe MAPD-Z thfibers rested inircular saw. Onr and the othehe MAPD-Z se placed as clo
rces, about 1cmsignal was senom the preampitizer module (
own in 50nm) t time of the
e gain n).
ltage fied The
ample s used rs Y-t from llator
mm. Its e light
The The p-s from hrough n 3mm ne side er side ecured ose as
m from nt to a plifier
(13-bit
reswemaThkBknscMgaligpubaThtim
Fr
ThbaMN35coanle
solution and 5 Gere carried out aterials (or boxhe gamma ray Bq), Eu-152 (4nown the gamintillators in th
MeV is dominatamma ray sourcght elements) aulse height specackground, Cf-2h-228 (275 Bq)me for each sou
Fig. 3. Pulse hewith WL
Fig. 4. The amprays, beta partic
he number of cackground, Cf-
Minimum detecta-22 source. T56 keV gamma ould be explainnd scintillators. aded to losing s
GS/s sampling at room tempe). sources were B.38 kBq) and
mma ray deteche energy regioted by a Comces are identifiand these diffectra in Fig.3. Th252 (143 kBq)are shown in F
urce was selecte
eight spectra of S scintillator co
plitude distributicle and neutrons
Cf-252 so
counts was 731-252, Sr/Y-90 able energy wahe scintillationrays from the B
ned due to air In addition thr
signals with low
rate) [17]. All erature and with
Ba-133, Na-22,Th-228 (275 Bction efficiencon between 10
mpton interactiofied with Comperences are pre
The pulse heigh), Sr/Y-90 (2.0Fig. 4, too. Theed 300 seconds.
f the p-terpheniloupled to the M
tions of backgros from Th-228, ources.
1, 15652, 6136and Th-228,
as 511keV gamn detector was Ba-133 source. gap between treshold of the Aw amplitudes. T
measurements hout shielding
Cs-137 (11.4 Bq). It is well y of organic
00 keV and 3 on. Therefore, pton edge (for esented in the t spectra from 036 kBq) and e measurement
lscintillator MAPD.
ound, gamma Sr/Y-90 and
and 3752 for respectively.
mma ray from insensitive to The light loss
he WLS fiber ADC (20 mV) The pulse
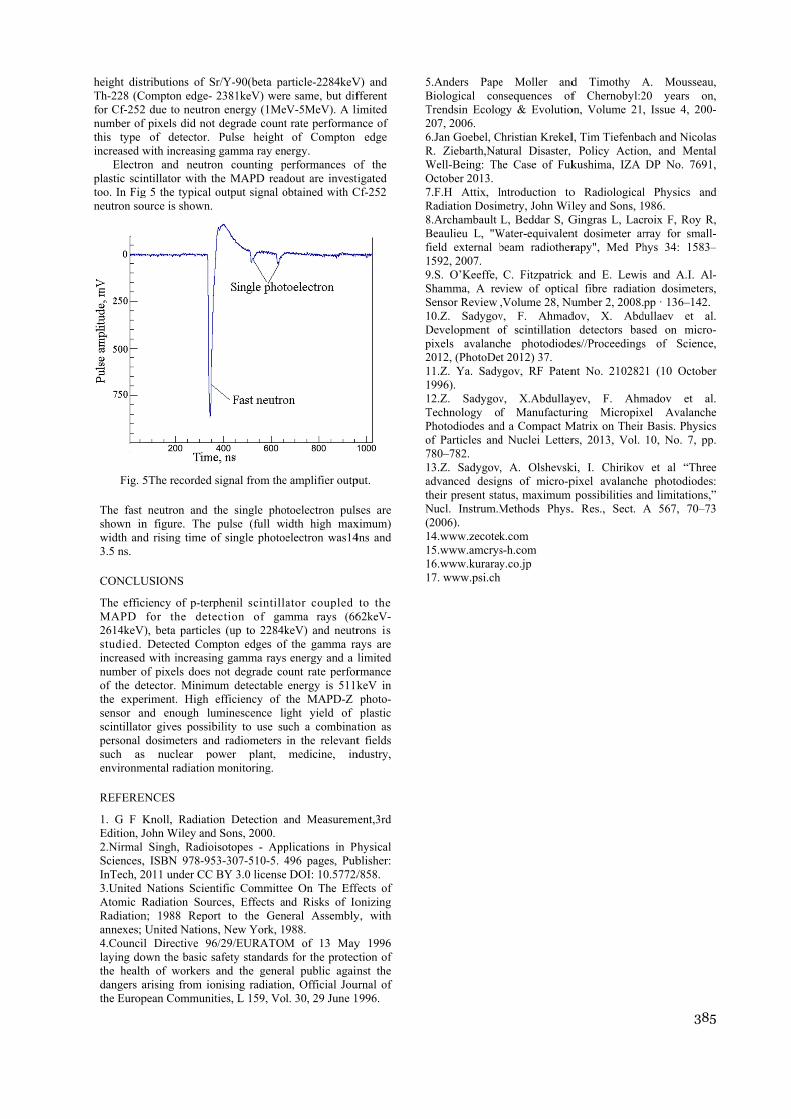
height distTh-228 (Cfor Cf-252number ofthis type increased w
Electroplastic scintoo. In Figneutron so
Fig. 5
The fast shown inwidth an3.5 ns.
CONCLU
The efficMAPD 2614keVstudied. increasednumber oof the dethe expesensor ascintillatopersonal such asenvironm
REFERE
1. G F KEdition, J2.Nirmal Sciences,InTech, 23.United Atomic RRadiationannexes; 4.Councilaying dothe healtdangers athe Europ
tributions of SCompton edge- 2 due to neutronf pixels did not
of detector. with increasingon and neutrontillator with thg 5 the typical ource is shown.
5The recorded
neutron and tn figure. The d rising time o
USIONS
ciency of p-terpfor the dete
V), beta particleDetected Com
d with increasinof pixels does etector. Minimueriment. High and enough luor gives possibdosimeters and
s nuclear pomental radiation
ENCES
Knoll, RadiatioJohn Wiley and
Singh, Radioi, ISBN 978-952011 under CC
Nations ScienRadiation Sourn; 1988 ReporUnited Nations
il Directive 96own the basic sth of workers arising from iopean Communit
Sr/Y-90(beta pa2381keV) wern energy (1Met degrade count
Pulse height g gamma ray enon counting phe MAPD readoutput signal o
signal from the
the single phopulse (full wi
of single photoe
phenil scintillaection of games (up to 2284kmpton edges ofng gamma raysnot degrade coum detectable efficiency of
uminescence libility to use sud radiometers ower plant,
n monitoring.
on Detection ad Sons, 2000. isotopes - App
53-307-510-5. 4BY 3.0 license
ntific Committerces, Effects anrt to the Gens, New York, 16/29/EURATOMsafety standardsand the gener
onising radiatioties, L 159, Vo
article-2284keVe same, but difV-5MeV). A lit rate performan
of Compton nergy.
erformances odout are investiobtained with C
e amplifier outp
toelectron pulsidth high maxelectron was14
ator coupled mma rays (66keV) and neutrf the gamma ra energy and a l
ount rate perforenergy is 511kthe MAPD-Z ight yield of uch a combinatin the relevantmedicine, in
and Measureme
plications in Ph496 pages, Pube DOI: 10.5772/ee On The Effend Risks of Io
neral Assembly988. M of 13 Mays for the protecal public againn, Official Joul. 30, 29 June 1
V) and fferent imited nce of
edge
of the igated
Cf-252
put.
ses are ximum) 4ns and
to the 62keV-rons is ays are limited rmance keV in photo-plastic tion as t fields
ndustry,
ment,3rd
hysical blisher: /858. fects of onizing y, with
y 1996 ction of nst the
urnal of 1996.
5BT26RWO7R8Bf19SS1Dp2111TPo71athN(1111
5.Anders PapeBiological conTrendsin Ecolo207, 2006. 6.Jan Goebel, CR. Ziebarth,NaWell-Being: ThOctober 2013. 7.F.H Attix, IRadiation Dosim8.Archambault Beaulieu L, "Wfield external b1592, 2007. 9.S. O’Keeffe, Shamma, A revSensor Review 10.Z. SadygovDevelopment opixels avalanc2012, (PhotoDe11.Z. Ya. Sady1996). 12.Z. SadygovTechnology oPhotodiodes andof Particles and780–782. 13.Z. Sadygov,advanced desigheir present sta
Nucl. Instrum.M2006).
14.www.zecotek15.www.amcrys16.www.kuraray17. www.psi.ch
e Moller andnsequences ofgy & Evolutio
Christian Krekeltural Disaster,
he Case of Fuk
Introduction tometry, John WilL, Beddar S, G
Water-equivalenbeam radiother
C. Fitzpatrick view of optica,Volume 28, Nuv, F. Ahmadof scintillation he photodiodet 2012) 37.
ygov, RF Paten
v, X.Abdullayf Manufacturd a Compact Md Nuclei Letter
, A. Olshevskgns of micro-patus, maximum Methods Phys.
k.com s-h.com y.co.jp
d Timothy Af Chernobyl:2
on, Volume 21
l, Tim TiefenbaPolicy Action
kushima, IZA
o Radiologicalley and Sons, 1Gingras L, Lacnt dosimeter arrapy", Med Ph
k and E. Lewisal fibre radiatiumber 2, 2008.
dov, X. Abddetectors bas
es//Proceedings
nt No. 210282
yev, F. Ahmring Micropix
Matrix on Theirrs, 2013, Vol.
ki, I. Chirikovpixel avalanche
possibilities an. Res., Sect. A
385
A. Mousseau,20 years on,, Issue 4, 200-
ach and Nicolasn, and MentalDP No. 7691,
l Physics and986. roix F, Roy R,rray for small-hys 34: 1583–
s and A.I. Al-on dosimeters,pp · 136–142.
dullaev et al.sed on micro-s of Science,
21 (10 October
madov et al.xel Avalanche
Basis. Physics10, No. 7, pp.
v et al “Threee photodiodes:nd limitations,”A 567, 70–73
5
, , -
s l ,
d
, -–
-,
. -,
r
. e s .
e : ” 3


Meh
2 Cuku3D
Abs
In thdiffecurvby upoinorde
Key
1. INTR
Thermolucrystal α-Al2
Urals Polytcomparing tsince the sentimes higherdetect very lTLD-500 is cto its high rbackground good reprodurange and relof α-Al2O3:C the heating maximum shfalls off stron
In studyindoses, the maas the dose behavior is coTL peaks. Thby the differecomponents the trapping peak is highrates (VHRcomputerized
THERMOL
hmet Yükse
1 Cukurova UniversDokuz Eylul U
tract
his paper, TL cerent methods aves of α-Al2O3:Csing computeri
nts (TP) methoder to compare w
y words: Therm
RODUCTION
uminescence 2O3:C (TLD-50technical Insto well-knownnsitivity of TLDr than TLD-1ow dose levelconsidered to radiation sensand dose thr
ucibility, simplatively low atstrongly deperate increa
hift to higher ngly on the hig
ng the glow cain TL glow pincreases, butonsistent with
he shift of the pential growth o[9,10]. There parameters fly isolated fro
R), peak shad glow curve
UMINESCEN
el1, Z. Gizem
kurova University, VocationaUniversity, Fac
characteristics aand softwares. TC chips have bized glow curv
ds. Furthermorewith the results o
moluminescence
(TL) detector00) developedstitute [1], n LiF TL deD-500 was rep00 which mals down to 30be very good
sitivity, simplreshold, low fple emission sptomic numberends on heati
ases not onlytemperatures
gh temperatur
curve of α-Al2Opeak shifts to lt not in a mo
h an overlap ofpeak maximumof the individuare various mfrom TL glowom the other
ape (PS), thdeconvolution
NCE GLOW
m Portakal
sity, Arts-Scieal School of Imculty of Engine
and glow curveThe effect of heabeen investigatee deconvolution
e, using Mathemof other method
e, TLD-500, dos
rs based on sd and produc
have advantectors (TLD
ported to be 3akes it possib00 nGy [2,3].
TL phosphorle glow curvefading in the pectrum, wider [4,5]. TL inteng rate [3,6-8y does the s but the intee side of the p
O3:C for increower tempera
onotonic way.f several first-m can be explual first-order
methods to evaw curves. If a s, variable he
hree points n (CGCD) [11]
CURVE PRO
l1, Tamer D
ences Faculty, mamoglu, Depeering, Depart
es of α-Al2O3:C ating rate (HR)ed after β-irran (CGCD), pea
matica softwareds and simulate
simeter, glow cu
single ced at ntages
D-100) 0–40
ble to Also,
rs due e, low
dark, e dose ensity 8]. As
peak ensity
peak.
easing atures . This order ained
r peak aluate
glow eating (TP), ] and
Maththemusedafter
mbshthmrL((tpw4apbgMk
OPERTIES O
Dogan2, Mus
Physics Depaartment of Cotment of Comp
dosimeter, kno) and low dose
adiation. TL kinak shape (PS), ve, all TL glow c
ed after exposed
urve, Mathema
hematica softwm. Therefore, id to determinr different dos
2. MATERIA
In this stumm thick and based on anisensitivity to rhas useful dohermal fadin
measurementsreader systemLaboratory, Dedose rate≈6.Hoya U-340ransmission)
photomultipliewere recorded400oC with a allowed to floprocesses to background reglow curves. TMathematica kinetic parame
OF TLD-500
stafa Topak
rtment, Adanaomputer Technputer Enginee
own as TLD-50(from 10 cGy upnetic parametevarious heating
curves of TLD-5d different beta d
tica.
ware are suitain the given stne the kinetice levels with b
ALS AND METHOD
udy, TLD-5005 mm in diam
on-defective adiation and h
ose range (0.ng 3% per s were carried
(model TL/Oenmark) with 689 Gy/min
0, 7.5 mm was used in f
er tube (PMT)d from room linear heating
ow into the ravoid any
eadouts wereThe CGCD, Psoftware we
eters of TLD-5
0 DOSIMET
ksu1, Emre
a, Turkey nologies, Adanering, Izmir, T
00, were analyzp to 50 cGy) on
ers were also cg rate (VHR) a500 were decomdoses.
able methods tudy, these tecc parameters beta (β) irradia
DS
0 chips (α-Al2
meter were ussingle crystahave simple T.05 μGy-10 G
year [12,13d out using a OSL-DA-20, R90Sr-90Y β irra
n). UV transthickness, ~
front of the ET). TL glow cum temperature
g rate of 2oC/reader during
y spurious e subtracted PS, VHR, TP ere used to 500.
TER
e Unsal3
na, Turkey Turkey
zed using n TL glow calculated and three mposed in
to determinechniques were
of α-Al2O3:Cation.
2O3:C) with 1sed. The chipsl show more
TL curve [1]. ItGy) and less
3]. All TLRisø TL/OSL
Risø Nationaladiator sourcemitting filter~290–370 nmEMI 9235 QAurves of chipse (RT) up to/s. N2 gas wasg all readoutsignals andfrom the TLmethods andcalculate TL
e e C
1 s e t s L L l e r
m A s o s t d L d L
388
3. RESULTS AND DISCUSSION
3.1. Dose response and dose equation
The TL low-dose responses were measured over the β dose range from 10 cGy up to 50 cGy and TL glow curves were recorded (see Fig.1). As seen from Fig.1, TL glow curve of TLD-500 shows an intense and well defined peak with the maximum on ~204oC and this TL peak is shifting towards to lower temperature with increasing dose level. This peak shifting is within the error limits. According to TL theory, the peak temperatures are expected to change only with heating rate for first order kinetics (b=1). Hence for a constant heating rate the peak maximum should not be affected by other experimental parameters and should thus be fairly constant within the limit of experimental errors [14]. Therefore, if the TL peak temperature shifts to the lower side with increasing dose levels the peak is not first order kinetics (b≠1), so this peak should be first (b=1) order kinetics.
0 50 100 150 200 250 300 350 4000,0
5,0x10⁵
1,0x10⁶
1,5x10⁶
2,0x10⁶
2,5x10⁶
3,0x10⁶
3,5x10⁶
4,0x10⁶
10 cGy 20 cGy 30 cGy 40 cGy 50 cGy
TL In
tens
ity (a
.u.)
Temperature (oC)
5oC
Fig. 1 TL low-dose glow curves of TLD-500 obtained with a linear heating rate of 2 °C s−1.
TL response and low-dose relationship of TLD-500 is illustrated in Fig. 2. As seen in Fig. 2, TLD-500 has a linear dose range between 10 cGy and 50 cGy, and beta radiation dose can be calculated using this equation;
( ) ≈ − 1.99 106.69 10
10 20 30 40 505,0x10⁵
1,0x10⁶
1,5x10⁶
2,0x10⁶
2,5x10⁶
3,0x10⁶
3,5x10⁶
TL In
tens
ity (a
.u.)
β Dose (cGy)
y=6.69x10⁴x+1.99x10⁵
R2=0.99
Fig. 2 Relationship between TL response and low-dose.
3.2. Heating rate effect
The heating rate effect on TL glow curves is a basic experimental variable in TL measurements [15]. The heating rate of the dosimetric materials influences the variation of their TL sensitivity and, hence, the trends of the dose curve [16]. In the application of TL dosimetry, TL glow peak (or curve) area and TL glow peak height are affected by changes in heating rate [17].
In order to determine the effect of heating rate on the TL glow curve and to calculate kinetic parameters (section 3.4.3) of TLD-500 dosimeter, three chips were irradiated with ~10 cGy β dose and then TL glow curves were recorded from RT to 400oC by using various heating rates of 1, 2, 3, 4, 5, 6, 7, 8, 9 and 10oC/s. TL glow curves of the chips are presented in Fig. 3a. As seen in Fig. 3a, the peak temperature of the glow peak is shifting to the higher temperature side as the heating rate rises and also peak intensity is continuously diminishing as expected in the TL theory. Results from the large number of studies showed a decrease in TL glow peak height (or area) intensity with increasing heating rate. This phenomenon has been explained to be due to thermal quenching, whose efficiency increases as temperature increases [18-23]. The maximum TL intensities of the glow peaks were normalized to lower heating rate (1°C/s) and it can be seen that the maximum TL intensity of peak decreases by about 65% (in Fig. 3b).
0 50 100 150 200 250 300 350 4000
2x10⁵
4x10⁵
6x10⁵
8x10⁵
1x10⁶
1oCs-1
2oCs-1
3oCs-1
4oCs-1
5oCs-1
6oCs-1
7oCs-1
8oCs-1
9oCs-1
10oCs-1TL In
tens
ity (a
.u.)
Temperature (oC)
(a)
1 2 3 4 5 6 7 8 9 1030
40
50
60
70
80
90
100
65%
59%
46%
26%
Nor
mal
ized
TL
Inte
nsity
(a.u
.)
Heating Rate (oCs-1)
(b)
Fig. 3 (a) The measured and (b) normalized TL glow curves after different heating rates (D≈10 cGy).

389
3.3. Reusability
Reusability is one of the most important properties for any dosimetric material [24] and TL sensitivity of a good dosimeter should not change with repeated TL readout cycle. In order to test reusability of TLD-500 dosimeter without annealing, it was irradiated with 10 cGy by β from 90Sr-90Y source and the TL glow curve was recorded. The cycle of irradiate-readout process was repeated ten times and TL measurement was carried out before irradiation to see that no TL signal was left after per readout. Normalized peak height intensities were obtained from maximum peak intensity. Fig. 4a shows the TL glow peaks of TLD-500 dosimeter for per readout cycle and the TL sensitivity of the TLD-500 after the different cycles of usage are shown in Fig 4b. As seen in Fig. 4a and Fig. 4b, TL sensitivity is decreasing per readout from 1 to 10 cycle and this decreasing is about 11% at tenth TL readout. Therefore, the best combination of time and temperature for an optimum annealing procedure should be determined and applied to obtain the highest reproducibility for TL signals. In previous studies, this procedure is defined as 1 hour at 400oC and then 16 hours at 80oC for TLD-500 [25].
0 50 100 150 200 250 300 350 4000
1x10⁵
2x10⁵
3x10⁵
4x10⁵
5x10⁵
6x10⁵
7x10⁵
TL In
tens
ity (a
.u.)
Temperature (oC)
Number of cyclic=10 (a)
1 2 3 4 5 6 7 8 9 100,0
0,2
0,4
0,6
0,8
1,0
1,2
1,4
1,6
1,8
2,0
11%10%8%
Nor
mal
ized
Pea
k H
eigh
t Int
ensi
ty (a
.u.)
Number of Cyclic
1%
(b)
Fig. 4 (a) TL glow curves and (b) TL sensitivity change of TLD-500 at repeated β-irradiation.
3.4. Kinetic parameters
The shape of a TL glow peak takes an important role in basic research and TL applications. In TL research, it is the basis of important and suitable methods for calculating the trapping parameters of different energy levels within the crystal. The complete description of the TL characteristics of TL material
requires the knowledge of these parameters. The TL glow curves are characterised by determining various factors like the activation energy (E), order of kinetics (b), and frequency factor (s) [26].
In this study, kinetic parameters of the main TL glow peaks of TLD-500 chips (i.e. order of kinetics (b), activation energies (E) and frequency factors (s)) were determined and evaluated by the method of computerized glow curve deconvolution (CGCD), peak shape (PS), various heating rate (VHR) and three points (TP) using the glow curve data. Furthermore, using Mathematica software, all TL glow curves of TLD-500 were decomposed in order to compare with the results of other methods.
3.4.1. Computerized Glow Curve Deconvolution (CGCD) Method
CGCD analysis has become very popular during the last two decades with the development of sophisticated glow curve deconvolution (GCD) techniques [27, 28]. The glow curves of dosimetric materials are in most cases complex curves consisting of many overlapping glow peaks. Hence, the deconvolution of complex glow curves into their individual components is widely applied for dosimetric purposes and for evaluating the kinetic parameters using curve fitting methods [28]. In addition, CGCD method is very important to decide correctly how many glow peaks there are in the complex glow curve and which of them have first, second or general order kinetics to obtain correct results [14].
There are many CGCD programs used by researchers, one of these programs have been TL Glow Curve Analyzer (TLanal) [29, 30]. TLanal is written in C# of the Visual Studio .Net and has been tested in the Microsoft Windows-based operating systems. It is possible to convert this program to an ActiveX control which can run in a web browser. In this program, a new method based on the general one-trap TL equation was adopted to analyze the TL glow curve with the traditional first-order, second-order and general-order kinetics model. The method described here, general approximation, generates TL glow peaks and interpolates the relevant TL parameters from the glow data [29, 30]. The accuracy of decomposing was tested with calculating the value of figure of merit (FOM) for all of the TL glow peaks.
In this study, the TL glow curve of TLD-500 dosimeter for the selected 50 cGy beta radiation dose was decomposed with TLanal software. Fig. 5 shows the analyzed TL glow curve of dosimeter. The analyzed TL glow curve as shown in the figure consist of two glow peaks at around 195 and 213oC (Fig. 5). The accuracy of these presented values is supportable with figure of merit (FOM) values. FOM values are 1.35% for TLD-500 dosimeter. Therefore, the TL kinetic parameters (E (eV), s (s-1) and b) associated with the glow peaks were obtained by CGCD method. The obtained kinetic parameters and peak temperatures at the maximum (Tm) were given in Table 1. As seen in Table 1, all of the samples have general order kinetic (b=1.30 for P1 and b=1.44 for P2 by calculated CGCD method).

390
0 50 100 150 200 250 300 3500
1x10⁶
2x10⁶
3x10⁶
4x10⁶
FOM:1.35
Tm=195oCTm=213oC
Main Peak Peak1 Peak 2
TL In
tens
ity (a
.u.)
Temperature (oC)
Tm=204oC
Fig. 5 Decomposed TL glow curves of TLD-500 (with TLanal software).
The TL glow curve of TLD-500 dosimeter was also decomposed for each heating rate values from 1 oC/s to 10 oC using TLanal software and different heating rate values versus activation energies were plotted for all peaks (Fig. 6). As seen in Fig. 6, average activation energy is 1.26±0.02 eV for peak 1 and 1.44±0.05 eV for peak 2. These results show that the obtained activation energies using CGCD and Mathematica software are compatible within the limit of experimental errors. The accuracy of these presented values is supportable with figure of merit (FOM) values. Many studies have shown that if the FOM value is between 0.0% and 2.5%, the fit is good [31-33]. In this study, average FOM values were calculated as 1.45% for TLD-500 dosimeter.
1 2 3 4 5 6 7 8 9 101,1
1,2
1,3
1,4
1,5
for P1
Act
ivat
ion
Ene
rgy
(eV
)
Heating Rate (oC/s)
Avarage E= 1.26 eVDevision: 0.02 eV
(a)
1 2 3 4 5 6 7 8 9 101,1
1,2
1,3
1,4
1,5
1,6
1,7
for P2Avarage E= 1.44 eVDevision: 0.05 eV
Act
ivat
ion
Ene
rgy
(eV
)
Heating Rate (oC/s)
(b)
Fig. 6 Graphs of different heating rate values versus activation energies (a) for peak 1 and (b) for peak 2.
3.4.2. Peak Shape (PS) Method
One way of analyzing a TL glow peak, obtained using a linear heating rate, is by considering its geometrical properties with peak shape method. PS method is generally called as Chen’s (1969) [34] method, which is used to determine the kinetic parameters of the main glow peak of the TL materials. This method is mainly based on the analysis of the glow-curve shape by using temperatures (Tm, T1 and T2). The second-order peaks are characterized by a symmetrical shape whereas the first-order peaks are asymmetrical in this method [35].
Geometrical shape parameters of TLD-500 were firstly determined with the help of TL glow curves readings for the selected 50 cGy beta radiation dose. Then PS method was applied to the main TL glow peaks at around 204oC. E, s and b (µg = 0.42) values were calculated (See Table 1). The kinetic parameters were calculated by using following expressions:
= 1.51 −
=
= = −−
3.4.3. Various Heating Rate (VHR) Method
This method essentially makes use of change in glow peak temperature Tm with respect to heating rate. When the heating rate changes the maximum temperature (Tm) of the TL glow peak also changes: at faster heating rates corresponds a shift temperature towards higher values of Tm. (see Fig. 3a) [35]. The kinetic parameters of dosimeters can be calculated by the following expressions for different sets of heating rates and their corresponding Tm, E and s [26]:
= −
= ( ) ( )
In this study, E and s were calculated by using
above equations. The values of Tm1 and Tm2 are selected 227oC and 264oC and the values of β1 and β2 are 4oC/s and 10oC/s, respectively. The calculated values are mentioned in Table 1.
3.4.4. Three Points (TP) Method
The trapping parameters of TLD-500 chip were calculated by the Rasheedy's [36] three points method (TPM) by using TL Parameters Calculator (TLPC) (Fig. 7) software that it is written in C# of the Visual Studio .Net [37]. The average values of the trapping parameters are given by E= 1.41±0.07 eV, s= 9.72x10¹³ s−1 and b= 1.03 (See Table 1).
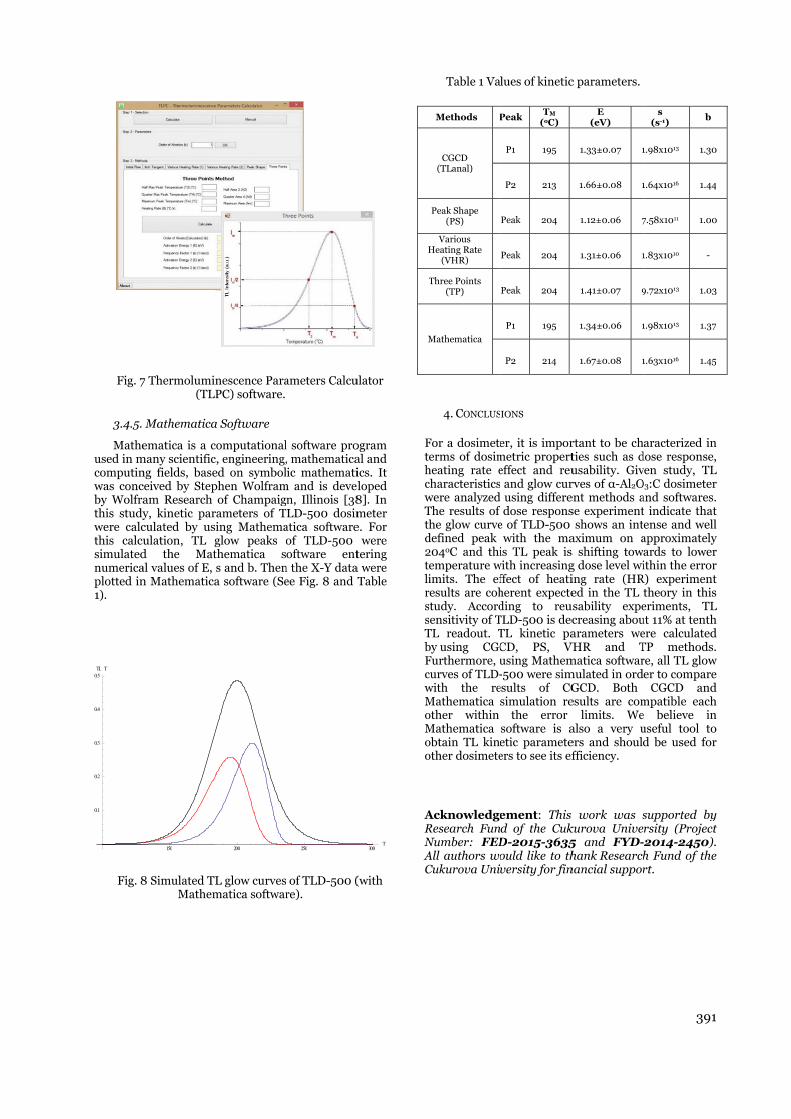
Fig. 7
3.4.5.
Matheused in mcomputinwas concby Wolfrathis studywere calcthis calcusimulatednumericaplotted in1).
Fig. 8
0.1
0.2
0.3
0.4
0.5TL�T�
7 Thermolumi(TL
Mathematica
ematica is a cmany scientificng fields, baseceived by Stepam Research y, kinetic parculated by usulation, TL d the Matal values of E, n Mathematica
8 Simulated TMathem
150
inescence ParaLPC) software.
a Software
computationalc, engineering,ed on symbolphen Wolfram
of Champaigrameters of Tsing Mathemaglow peaks thematica ss and b. Thena software (Se
L glow curvesmatica softwar
200
ameters Calcu
l software pro, mathematicalic mathemati
m and is develn, Illinois [38
TLD-500 dosimatica softwareof TLD-500 oftware ent
n the X-Y dataee Fig. 8 and T
of TLD-500 (re).
250
ulator
ogram al and ics. It loped 8]. In meter e. For
were tering
a were Table
(with
H
T
M
FthcwTthd2tlirssTbFcwMoMoo
ARNAC
300T
Table 1 Va
Methods P
CGCD (TLanal)
Peak Shape (PS)
Various Heating Rate
(VHR)
Three Points (TP)
Mathematica
4. CONCLUS
For a dosimeteerms of dosim
heating rate echaracteristicswere analyzedThe results of he glow curve
defined peak 204oC and thiemperature wimits. The ef
results are cohstudy. Accordsensitivity of TTL readout. Tby using CGCFurthermore, ucurves of TLD-with the reMathematica other within Mathematica obtain TL kineother dosimete
AcknowledgeResearch FunNumber: FEDAll authors woCukurova Univ
lues of kinetic
Peak TM
(oC)
P1 195
P2 213
Peak 204
Peak 204
Peak 204
P1 195
P2 214
IONS
er, it is impormetric properteffect and reu
and glow curusing differedose respons
e of TLD-500 with the ma
is TL peak is with increasingffect of heatiherent expecteding to reu
TLD-500 is decTL kinetic paCD, PS, Vusing Mathem-500 were simesults of CGsimulation re
the error software is aetic parameteers to see its ef
ement: This d of the CukD-2015-3635ould like to thversity for fin
c parameters.
E (eV)
1.33±0.07 1
1.66±0.08 1
1.12±0.06 7
1.31±0.06 1
1.41±0.07 9
1.34±0.06 1
1.67±0.08 1
rtant to be chties such as dusability. Givrves of α-Al2Oent methods ase experiment
shows an intaximum on as shifting towg dose level wiing rate (HRed in the TL
usability expecreasing abouarameters we
VHR and Tmatica softwarmulated in ord
GCD. Both esults are com
limits. Wealso a very uers and shouldfficiency.
work was skurova Unive5 and FYD-hank Research
nancial suppor
391
s(s-1)
b
1.98x10¹³ 1.30
1.64x10¹⁶ 1.44
7.58x10¹¹ 1.00
1.83x10¹⁰ -
9.72x10¹³ 1.03
1.98x10¹³ 1.37
1.63x10¹⁶ 1.45
aracterized indose response,ven study, TLO3:C dosimeterand softwares.t indicate thatense and well
approximatelyards to lowerithin the error
R) experimenttheory in thiseriments, TLut 11% at tenthere calculatedTP methods.re, all TL glower to compare
CGCD andmpatible eache believe inuseful tool tod be used for
supported byrsity (Project
-2014-2450).h Fund of thert.
1
0
4
0
3
7
5
n ,
L r . t l y r r t s L h d .
w e d h n o r
y t . e

392
REFERENCES
1. M.S. Akselrod, V.S Kortov, D.J. Kravetsky, and V.I. Gotlib, 1990. “Highly Sensitive Thermoluminescent Anion Defect α-Al2O3:C Single Crystal Detector”. Radiation Protection Dosimetry, 32:15–20.
2. H.Y. Göksu, E. Bulur and W. Wahl, 1999. “Beta Dosimetry Using Thin-Layer α-Al2O3:C TL Detectors”. Radiation Protection Dosimetry,. 84:451-455.
3. G. Kitis, J.G. Papadopoulos, S. Charalambous and J.W.N. Tuyn, 1994. “The Influence of Heating Rate on the Response and Trapping Parameters of Alpha-Al2O3:C”. Radiation Protection Dosimetry, 55:183-190.
4. M.S. Akselrod, S.W.S. McKeever, M. Moscovitch, D. Emfietzoglou, J.S. Durham and C.G.A. Soares, 1996. “Thin Layer Al2O3:C Beta TL Detector”. Radiation Protection Dosimetry, 66:105–110.
5. S.W.S. McKeever, M. Moscovitch and P.D. Townsend, 1995. “Thermoluminescence Dosimetry Materials: Properties and Uses”. Ashford: Nuclear Technology Publishing, pp. 117–160.
6. J.H. Musk, 1993. “Time-Dependent and Light-Induced Fading in Victoreen Model 2600-80 Aluminium Oxide Thermoluminescence Dosemeters”. Radiation Protection Dosimetry, 47:247-249.
7. V.S. Kortov, I.I. Milman, V.I. Kirpa and J. Lesz, 1994. “Some features of Al2O3:C dosimetric thermoluminescent crystals”. Radiation Protection Dosimetry, 55:279-283.
8. M. Moscovitch, M.M. Kaufman, J.E. Rodgers and A. Niroomand-Rad, 1993. “Ultra-Low Dose (100 nGy - 100 µGy) Response of Alpha-Al2O3:C”. Radiation Protection Dosimetry, 47:173-176.
9. A.J.J. Bos, 2001. “High Sensitivity Thermoluminescence Dosimetry”. Nuclear Instruments and Methods in Physics Research B, 184:3-28.
10. N.A. Larsen, L. Bøtter-Jensen and S.W.S. McKeever, 1999. “Thermally Stimulated Conductivity and Thermoluminescence from Al2O3:C”. Radiation Protection Dosimetry, 84:87-90.
11. V.E. Kafadar, R.G. Yildirim, H. Zebari and D. Zebari, 2014. “Investigation of Thermoluminescence Characteristics of Li2B4O7:Mn (TLD-800)”. Thermochimica Acta, 575:300-304.
12. V. Kortov, 2007. “Materials for thermoluminescent dosimetry: current status and future trends”. Radiation Measurements, Proceedings of the 6th European Conference on Luminescent Detectors and Transformers of Ionizing Radiation (LUMDETR 2006), 42(4-5): 576–581.
13. S.V. Nikiforov, V.S. Kortov, and M.G. Kazantseva, 2014. “Simulation of the Superlinearity of Dose Characteristics of Thermoluminescence of Anion-Defective Aluminum Oxide”. Physics of the Solid State, 56(3): 554-560.
14. A.N. Yazici, and M. Topaksu, 2003. “The analysis of thermoluminescence glow peaks of unannealed synthetic quartz”. Journal of Physics D: Applied Physics, 36:620-627.
15. V.E. Kafadar, A.N. Yazici, R.G. Yildirim, 2009. “The effects of heating rate on the dose response characteristics of TLD-200, TLD-300 and TLD-400”. Nuclear Instruments and Methods in Physics Research Section B: Beam Interactions with Materials and Atoms, 267(19):3337-3346.
16. D.L. Fehl, D.I. Muron, B.R. Suijka, D.W. Vehar, L.I. Lorence, R.L. Westfall, S.C. Jones, I.A. Sweet, 1994. “Characterization of a two‐dimensional, thermoluminescent, dose‐mapping system: Uniformity, reproducibility, and calibrations”. Review of Scientific Instruments, 65(10):3243.
17. G.C. Taylor and E. Lilley, 1982. “Rapid readout rate studies of thermoluminescence in LiF (TLD-100) crystals:III”. Journal of Physics D: Applied Physics, 15:2053.
18. N.A. Spooner, A.D. Franklin, 2002. “Effect of the heating rate on the red TL of quartz”. Radiation Measurements, 35(1):59-66.
19. F.O. Ogundare, F.A. Balogun, L.A. Hussain, 2005. “Heating rate effects on the thermoluminescence of fluorite”. Radiation Measurements, 40:60-64.
20. M. Yüksel, M. Topaksu, A.N. Yazici, Z. Yegingil, T. Dogan, 2010. “The effects of pre-irradiation heat treatment and heating rates on the thermoluminescence glow peaks of natural CaF2”. Radiation Effects and Deffects in Solids, 165(5):396-402.
21. V.E. Kafadar, K.F. Majeed, 2014. “The effect of heating rate on the dose dependence and thermoluminescence characteristics of CaSO4:Dy (TLD-900)”. Thermochimica Acta, 590:266-269.
22. A.S. Pradhan, 1996. “Thermal quenching and two peak method – influence of heating rates in TLDs”. Radiation Protection Dosimetry, 65(1-4):73-78.
23. G. Kitis, J.G. Papadopoulos, S. Charalambous, and J.W. Tuyn, 1994. “The influence of heating rate on the response and trapping parameters of alpha-Al2O3:C”. Radiation Protection Dosimetry, 55(3):183-190.
24. O. Annalakshmi, M.T. Jose, U. Madhusoodanan, J. Subramanian, B. Venkatraman, G. Amarendra, A.B. Mandal, 2014. “Thermoluminescence dosimetric characteristics of thulium doped ZnB2O4 phosphor.” Journal of Luminescence, 146:295-301.
25. C. Furetta, 2003. “Handbook of thermoluminescence”. World Scientific Publishing, Singapore.
26. R.A. Barve, N. Suriyamurthy, B.S. Panigrahi, B. Venkatraman, 2015. “Dosimetric investigations Tb3+-doped strontium silicate phosphor”. Radiation Protection Dosimetry, 163(4):430-438.
27. Y.S. Horowitz, and D. Yossian, 1995. “Computerised glow curve deconvolution: application to thermoluminescence dosimetry”. Radiation Protection Dosimetry, 60:1-114.
28. R. Chen, V. Pagonis, 2011. “Thermally and optically stimulated luminescence: A simulation approach”. Printed in Chichester, UK, John Wiley & Sons, Ltd., Publication.
29. K.S. Chung, H.S. Choe, J.I. Lee, J.L. Kim, and S.Y. Chang, 2005. “A computer program for the deconvolution of thermoluminescence glow curves”. Radiation Protection Dosimetry, 115:1-4.
30. K.S. Chung, H.S. Choe, J.I. Lee, J.L. Kim, 2007. “A new method for the numerical analysis of thermoluminescence glow curve”. Radiation Measurements, 42:731-734.
31. K. Mahesh, P.S. Weng C. Furetta, 1989. “Thermoluminescence in Solids and its Applications”. Nuclear Technology Publishing, Asford.
32. V. Pagonis, G. Kitis, C. Furetta, 2006. “Numerical and Practical Exercises in Thermoluminescence”. Springer, USA.
33. M. Puchalska, P. Bilski, 2006. “GlowFit—a new tool for thermoluminescence glow-curve deconvolution”. Radiation Measurements, 41:659-664.
34. R. Chen, 1969. “On the calculation of activation energies and frequency factors from glow curves”. Journal of Applied Physics, 40:570.
35. C. Furetta, P.S. Weng, 1998. “Operational thermoluminescence dosimetry”. World Scientific Publishing, Singapore.
36. M.S. Rasheedy, 2005. “A new evaluation technique for analyzing the thermoluminescence glow curve and calculating the trap parameters”. Thermochimica Acta, 429(2):143-147.
37. M. Yüksel, E. Unsal, 2013. “Mathematica Yazılımı Kullanılarak Benzetimi Yapılan Termolüminesans (TL) Işıma Tepelerinin TL Kinetiklerinin Hesaplanması”. Book of Abstracts, 7th National Luminescence Dosimetry Congress, Isparta, Turkey.
38. (http://en.wikipedia.org/wiki/Mathematica)(Accessed 9 March 2015)

THE INFLUENCE OF THE DEVICE GEOMETRY ON THE PARTIALLY DEPLETED SOI TRANSISTORS TID HARDNESS
Ivan Shvetsov-Shilovskiy 1,2, Anatoly Smolin 1,2, Pavel Nekrasov 1,2, Anastasia Ulanova 1,2, Alexander Nikiforov 1,2
1 Specialized Electronic Systems (SPELS), Moscow, Russia 2 National Research Nuclear University (NRNU) MEPhI, Moscow, Russia
Abstract. The research is focused on the differences in radiation behavior for transistors of different geometry, body tie contact types, device layer thickness and biasing.
Key words: CMOS SOI, TID Hardness, automated measurement system, body tie.
1. INTRODUCTION
Silicon on Insulator (SOI) process grants several benefits as compared to bulk silicon substrate. Active devices are formed in the silicon layer placed on buried SiO2 insulator layer. Fully isolated transistors have lower leakage current, less parasitic capacitance and therefore lower power consumption and higher switching speed.
SOI transistors can be fully and partially depleted. If the depletion region reaches buried oxide, the transistor is fully depleted, otherwise it is called partially depleted. Fully depleted transistors can control the channel more efficiently; however, they require precise thin silicon films, good process reproducibility and thus are more difficult to produce.
SOI process is successfully used in radiation hardness applications since the insulator layer reduces photocurrents and eliminates latch-up as a result of transient radiation effects (TRE) and single event effects (SEE).
At the same time SOI devices are relatively more vulnerable to total ionized dose (TID) effects because the buried oxide works like the gate oxide of the additional “bottom” transistor – parasitic structure specific to SOI process. Radiation induced threshold voltage shift of this structure leads to leakage current increase and can cause parametrical failure of the complex device due to increased current supply. Radiation hardness research of separate transistors can offer opportunity to evaluate complex devices’ hardness [1-11] or serve as the basis for the fundamental modeling of the separate transistor [12-18].
On the other side, one can use body ties that increase device’s TID hardness mitigating parasitic bipolar effect [19]. Some benefits can be gained by careful transistor type and process parameters
selection and suitable substrate biasing [20]. Prior theoretical conclusions on radiation hardness of SOI devices are difficult to draw, thus experiment needs to be carried out. Special set-up is needed to automatically measure single transistor parameters.
2. TEST HARDWARE AND SOFTWARE
The devices under test (DUT) were test chips containing mesa-isolated transistor structures of different gate length and width, body tie contacts and device layer thickness. The topologies of transistors are presented in figure 1.
LW
DrainSource
Body tie
Body tie
a) b)
c)
Fig. 1 The topologies of transistors: a) H-type transistor: Body ties are located on the each side of transistor; b) L-type

394
transistor: body is tied to source; c) T-type transistor: both external body contacts and body-tied-to-source blocks are presented.
Gate oxide has a thickness of 12 nm and the buried oxide is 0.4 μm thick. Device cross section is presented in figure 2.
Fig. 2 Cross section of NMOS transistor.
Test structures were irradiated under different bias conditions presented in table 1.
Table 1 Transistor’s bias conditions under irradiation
Mode Source Drain Main gate
Body Bottom
gate ON 0 0 5 0 0 OFF 0 5 0 0 0 TG_0 5 5 0 0 0 TG_-2 5 5 0 0 -2
Measurement set-up was based on National Instruments equipment that gives us possibility to acquire sets of transistor I-V curves during irradiation. Drain current was measured by NI PXI-4071 digital multimeter which has a resolution down to 1 pA. Measurements were automatized by means of program developed in LabVIEW 2010. Hardware was controlled by program designed in LabVIEW 2010 development environment. TID test were carried out with 137Cs MEPHI-SPELS facility and with “REIS-IE” X-ray tester [21]. The dose rate was 12 rad/sec.
3. EXPERIMENTAL RESULTS
The radiation-induced threshold voltage shift behavior of the main (top) and bottom transistor depends on channel type and dimensions, gate shape, device layer thickness and bias conditions.
One should mention that parasitic bottom transistor I-V curves alteration under irradiation is noticeably higher than one of the main transistors. This experimental fact is illustrated by figures 3 and 4 for the case of NMOS H-type transistor with dimensions L=0.6 μm and W=1.4 μm irradiated under TG_0 bias conditions.
These figures correspond with the above mentioned fact that regards leakage current increase to parasitic bottom transistor radiation-induced threshold voltage shift.
It was found that short channel transistors have higher threshold voltage shift than long channel ones. That dependence was caused by different field distribution in the buried oxide for short and long-channel devices under the TG bias as was shown in
[20]. For long gate, drain and source bias only enhance charge trapping in local areas around the source and drain, having little effect on the central area under the gate. Especially significant characteristic TID-degradation occurs in structures that combine short gate length and large gate width. Width dependence presumably is due to more significant effect of device edges on charge trapping in buried oxide area under the gate in narrow devices.
Vg, V
0 1 2 3 4 5Id
s
1 pA
1 nA
1 µA
1 mA
D = 0 krad(Si)D = 50 krad(Si)D = 100 krad(Si)D = 500 krad(Si)D = 900 krad(Si)
Fig. 3 Dependence of main transistor drain-source current on gate voltage at various total ionizing doses.
Vg, V
0 20 40 60 80
Ids
1 pA
1 nA
1 µA
1mA
D = 0 krad(Si)D = 50 krad(Si)D = 100 krad(Si)D = 500 krad(Si)D = 900 krad(Si)
Fig. 4 Dependence of bottom transistor drain-source current
on gate voltage at various total ionizing doses.
Bottom transistor threshold voltage dependences on total ionizing dose for different transistor’s channel length and width values and TG_0 bias during irradiation are shown in figure 5. Threshold voltage is measured as the voltage that corresponds to the current of 1 μA.
The same dependence evidently reveals itself on diagrams corresponding to L-type transistors of different channel dimensions presented in figure 6. These were irradiated in OFF mode. One should mention that L-type transistors are not able to work exactly in TG mode because of body-tied-to-source blocks.
The influence of bias conditions is interrelated to the transistor type. The most TID-sensitive bias conditions correspond with the “TG” bias mode. This effect is strongly pronounced for H-type transistors that have independent contacts to the body region. The worst bias case during irradiation for L-type

395
transistors that include body-tied-to-source (BTS) blocks was “OFF”.
Device layer thickness influences the main transistor threshold voltage shift more significantly than one of the bottom transistor. Transistor structures made on the wafer with the thickest device layer demonstrated higher characteristic’s degradation as compared to transistors with lower device layer thickness.
The substrate was grounded in most cases. Negative offset voltage applied to the substrate reduces the threshold voltage shift.
Threshold voltages’ shifts of the bottom NMOS transistors are summarized on figures 7-9 for structures with various channel widths and lengths that were irradiated in various bias conditions.
T-type transistors combine features of H- and L-type transistors: they have both independent body contacts and body-tied to source blocks. Under ON and OFF bias conditions T-type transistors showed behavior similar to that of H- and L-type transistors of the same channel size.
Total dose, krad(Si)
0 200 400 600 800
Vth,
V
0
10
20
30
40
50
60NMOS H-type L=0.6µm; W=1.4µmNMOS H-type L=0.6µm; W=4.8µmNMOS H-type L=4.8µm; W=1.4µmNMOS H-type L=4.8µm; W=4.8µm
Fig. 5 Dependence of bottom transistor drain-source current on total ionizing dose for different channel width and height.
Total dose, krad(Si)
Vth,
V
0
10
20
30
40
50
60NMOS L-type L=0.6µm; W=1.4µmNMOS L-type L=0.6µm; W=4.8µmNMOS L-type L=4.8µm; W=1.4µmNMOS L-type L=4.8µm; W=4.8µm
Fig. 6 Dependence of bottom transistor drain-source current on total ionizing dose for different transistor channel width
and height.
Fig. 7 Threshold voltages’ shifts of the bottom NMOS transistors for structures with different channel width and length. Device layer thickness is 0.2 µm.

Fig. 8 Threshold voltages’ shifts of the bottom NMOS transistors for structures with different channel width and length. Device layer thickness is 0.14 µm.
Fig. 9 Threshold voltages’ shifts of the bottom NMOS transistors for structures with different channel width and length. Device layer thickness is 0.3 µm.
4. CONCLUSION
The purpose of this paper was to estimate the influence of the device geometry on the partially depleted SOI transistors TID hardness. It was experimentally found out that TID-induced threshold voltage shifts are relatively higher for shorted and wider channels of test transistors and occur on lower dose. Transmission gate with ground potential applied to the substrate should be considered as the worst bias case.
The results can be used to determine the components of the complex IC that are most vulnerable to ionizing radiation based on analysis of used transistors’ geometry and their biasing.
Acknowledgement: The paper is a part of the research done within the government assignment #8.826.2014/K given by the ministry of education and science of Russian Federation.
The authors would also like to thank S.V. Shvedov and S.A. Soroka (JSC “INTEGRAL”) for their support and provision with test ICs and technical documentation
396

REFERENCES
1. A. V. Sogoyan, A. I. Chumakov, and A.Y. Nikiforov, “Method for predicting CMOS parameter degradation due to ionizing radiation with regard to operating time and conditions,” Russian Microelectronics, vol. 28, no. 4, pp. 224-235, 1999.
2. M. Li, Y.F. Li., Y. J. Wu, S. Cai, N.Y. Zhu, N. Rezzak, R.D. Schrimpf, D.M. Fleetwood, J.Q. Wang, X.X. Cheng, Y. Wang, D.L. Wang, and Y. Hao, “Including Radiation Effects and Dependencies on Process-Related Variability in Advanced Foundry SPICE Models Using a New Physical Model and Parameter Extraction Approach,” IEEE Trans. Nucl. Sci., vol. 58, no. 6, pp. 2876-2882, Dec. 2011.
3. K.O. Petrosyants, L.M. Sambursky, I.A. Kharitonov, and A.P. Yatmanov, “SOI/SOS MOSFET compact macromodel taking into account radiation effects,” Russian Microelectronics, vol. 40, no 7, pp. 457-462, Dec. 2011
4. K.O. Petrosyants, I.A. Kharitonov, L.M. Sambursky, V.N. Bogatyrev, Z.M. Povarnitcyna, and E.S. Drozdenko, “Simulation of total dose influence on analog-digital SOI/SOS CMOS circuits with EKV-RAD macromodel,” IEEE East-West Design & Test Symposium, pp.1-6, 27-30 Sept. 2013
5. A. V. Kirgizova, P. K. Skorobogatov, A.Y. Nikiforov, L. N. Kessarinskii, G. G. Davydov, and A. G. Petrov, “Simulating the response of SOS CMOS building blocks to pulsed ionizing irradiation,” Russian Microelectronics, vol. 37, no. 1, pp. 25-40, 2008.
6. O. A. Kalashnikov, and A.Y. Nikiforov, “TID behavior of complex multifunctional VLSI devices,” in Proc. 29th Int. Conf. on Microelectronics, MIEL 2014, Belgrade, Serbia, May 2014, pp. 455 458.
7. D. Boychenko, O. Kalashnikov, A. Nikiforov, A. Ulanova, D. Bobrovsky, P. Nekrasov, “Ionizing dose effects and radiation testing,” Facta universitatis series: Electronics and Energetics Vol 28, No 1, March 2015, pp. 153 – 164.
8. O. A. Kalashnikov, “Statistical variations of integrated circuits radiation hardness,” in Proc. 12th European Conf. on Radiation and its Effects on Components and Systems, RADECS-2011, Sevilla; Spain; Sept. 19 -23, 2011, pp. 661-664.
9. V.V. Belyakov, V.S. Pershenkov, G.I. Zebrev, A.V. Sogoyan, A.I. Chumakov, A.Y. Nikiforov, P.K. Skorobogatov. “Methods for the prediction of total-dose effects on modern integrated semiconductor devices in space: A review” Russian Microelectronics, 2003, 32 (1), pp. 25-38.
10. A.V. Sogoyan, A.S. Artamonov, A.Y. Nikiforov, D.V. Boychenko. “Method for integrated circuits total ionizing dose hardness testing based on combined gamma- and xray- irradiation facilities” Facta Univesitatis: series Electronics and Energetics, 2014, Vol. 27, No. 3, pp. 329-338.
11. A. Chumakov, A. Nikiforov, V. Telets et. al, “IC space radiation effects experimental simulation and estimation methods”, Radiation Measurements, v. 30 (5) , pp. 547-552.
12. B. Jianhui, B. Jinshun, L. Mengxin, and H. Zhengsheng “A total dose radiation model for deep submicron PDSOI NMOS,” Journal of Semiconductors, vol. 32., no 1, pp. 014002-1 – 014002-3, 2011.
13. L. Yanfeng, N. Rezzak, E.X. Zhang, R.D. Schrimpf, D.M. Fleetwood, J. Wang, d. Wang, Y. Wu, and S. Cai, “Including the Effects of Process-Related Variability on Radiation Response in Advanced Foundry Process Design Kits,” IEEE Trans. Nucl. Sci., vol. 57, no. 6, Dec. 2010.
14. V. Rusanovschi, M. Rusanovschi, P. Stoicev, “Dependencies of SPICE level 3 parameters on irradiation,” Meridian inginerescm, vol. 4, pp. 19-22, 2013Y. Wang, X. Wang, G. Zhao, Y. En, H. Luo, Q. Shi, X. Zhang, “Bias Dependence of Partially-Depleted SOI Transistor to Total Dose Irradiation,” IWJT '06, International Workshop on Junction Technology, pp. 233-235, 2006.
15. P. K. Skorobogatov, and A.Y. Nikiforov, “Simulation of bulk ionization effects in SOI devices,” Russian Microelectronics, vol. 27, no. 1, pp. 1-6, 1998.
16. A.Y. Nikiforov, P. K. Skorobogatov, A. I. Chumakov, A. V. Kirgizova, A. G. Petrov, P. P. Kutsko, A. V. Kuzmin, A. A. Borisov, V. A. Telets, V. T. Punin, and V. S. Figurov, “Experimental studies of the adequacy of laser simulations of dose rate effects in integrated circuits and semiconductor devices,” Russian Microelectronics, vol. 38, no. 1, pp. 2-16, 2009.
17. A. V. Kirgizova, P. K. Skorobogatov, A.Y. Nikiforov, L. N. Kessarinskii, G. G. Davydov, and A. G. Petrov, “Simulating the response of SOS CMOS building blocks to pulsed ionizing irradiation,” Russian Microelectronics, vol. 37, no. 1, pp. 25-40, 2008.
18. G.I. Zebrev, D.Y. Pavlov, V.S. Pershenkov, A.Y. Nikiforov, A.V. Sogoyan, D.V. Boychenko, V.N. Ulimov V.V. Emelyanov. “Radiation response of bipolar transistors at various irradiation temperatures and electric biases: Modeling and experiment” IEEE Transactions on Nuclear Science, 2006, 53 (4), art. no. 1684047, pp. 1981-1987.
19. J.R. Schwank, V. Ferlet-Cavrois, M.R. Shaneyfelt, P. Paillet, P.E. Dodd "Radiation Effects in SOI Technologies", IEEE Transactions on Nuclear Science, vol. 50, no.3, pp. 522-538, June 2003.
20. V. Ferlet-Cavrois, T. Colladant, P. Paillet, J.L. Leray, O. Musseau, J.R. Schwank, M.R. Shaneyfelt, J.L. Pelloie, J. du Port de Poncharra "Worst-Case Bias During Total Dose Irradiation of SOI Transistors", IEEE Transactions on Nuclear Science, vol. 47, no. 6, pp. 2183-2188, December 2000.
21. A. S. Artamonov, A. I. Chumakov, N. V. Eremin, V. S. Figurov, O. A. Kalashnikov, A.Y. Nikiforov, and A. V. Sogoyan, “REIS-IE' X-ray tester: description, qualification technique and results, dosimetry procedure,” in IEEE Radiation Effects Data Workshop, REDW 2012, Newport Beach, CA, USA; Jul.24, 1998, pp. 164-169, 1998.

THE EFFECT OF XE ION AND NEUTRON IRRADIATION ON THE PROPERTIES OF SIC AND SIC(N) FILMS PREPARED BY PECVD TECHNOLOGY
Jozef Huran1, Ladislav Hrubčín1,2, Pavel Boháček1, Sergey B. Borzakov2, Vladimir A. Skuratov2, Alexander P. Kobzev2, Angela Kleinová3, Vlasta Sasinková4
1 Institute of Electrical Engineering, Slovak Academy of Sciences, Dúbravská cesta 9, 84104 Bratislava, Slovakia 2 Joint Institute for Nuclear Research, Joliot-Curie 6, 141980 Dubna, Moscow Region, Russian Federation
3 Polymer Institute, Slovak Academy of Sciences, Dúbravská cesta 9, 84541 Bratislava, Slovakia 4 Institute of Chemistry, Slovak Academy of Sciences, Dúbravská cesta 9, 84538 Bratislava, Slovakia
Abstract. Silicon carbide (SiC) and nitrogen-doped silicon carbide (SiC(N)) films were deposited on p-type Si(100) substrates at various deposition conditions by means of plasma enhanced chemical vapor deposition (PECVD) technology using silane (SiH4) methane (CH4) and ammonium (NH3) gas precursors. The concentration of elements in films was determined by RBS and ERD analytical method simultaneously. Chemical compositions were analyzed by FT-IR and Raman spectroscopy. The current-voltage (I-V) characteristics of structures before and after Xe ion and neutron irradiation were measured.
Key words: SiC film, PECVD, Xe ion and neutron irradiation, structural and electrical characterization
1. INTRODUCTION
Silicon carbide is a versatile material utilized in a wide variety of applications. Amorphous silicon carbide is an excellent alternative passivation layer material for silicon solar cells especially for work in hard and space environment. Higher band gap (1.8 – 2.3 eV) of amorphous SiC layers (compared to a-Si:H) lead to a lower parasitic light absorption [1]. There are efforts to replace traditional passivating layers, such as SiO2 and SiN, by a-SiC [2]. The aim is a more efficient production process involving lower deposition temperatures and high throughput. New dielectric materials such as hydrogenated amorphous silicon carbide (a-SiC:H) show great potential as both etch stop and hard mask layers to assist nanoelectronic patterning, and as low dielectric constant (i.e., low-k) interlayer dielectric, Cu diffusion barrier, and pore sealants. Electronic transport, particularly transport related to time-dependent dielectric breakdown and stress induced leakage current, is of keen interest due to the relatively low breakdown strength of these films. a-SiC:H films with dielectric constants significantly less than a-SiN:H are particularly interesting [3]. Using a-SiC:H as a case study material, the authors utilized nuclear reaction analysis, Rutherford backscattering, nuclear magnetic resonance and transmission Fourier transform infrared spectroscopy measurements to determine the average coordination (⟨r⟩) for these materials. The correlations of ⟨r⟩ to Young's modulus, hardness, thermal conductivity, resistivity, refractive index, intrinsic stress, mass density and porosity show that an extremely wide range in material properties (in some cases several orders of magnitude) can be
achieved through reducing ⟨r⟩ via a controlled incorporation of terminal Si-Hx and C-Hx groups [4]. a-SiC:H thin films deposited by PECVD as protective coatings for harsh environment applications were investigated [5]. The effect of substrate temperature on the rate of remote microwave hydrogen plasma chemical vapor deposition of a-SiC:H thin films using dimethylsilane and trimethylsilane was reported [6]. Using resistivity, Raman scattering, and infrared transmission spectroscopy, the authors investigated the neutrons irradiation effect on the structure and properties of a-SiC:H films prepared by reactive sputtering method [7]. The aggregates of carbon interstitials in SiC were investigated and it was found that the formation of the carbon aggregates was energetically favored and all carbon clusters are electrically active [8].
In this paper, the PECVD technology was used for deposition of SiC and SiC(N) films using silane, methane and ammonium as reactants. Elements’ concentrations in the films were investigated by RBS and ERD method. FT-IR and Raman spectroscopy were used for chemical composition analysis. The effect of Xe ion and neutron irradiation on the films‘ electrical properties was studied by the measurement of the I-V characteristics.
2. EXPERIMENTS
A plasma reactor with parallel plate electrodes was used for the PECVD technology for the films preparation. A P-type silicon wafer with the resistivity of 6-10 Ωcm and (100) orientation was used as a substrate for the growth of SiC layers. Technological
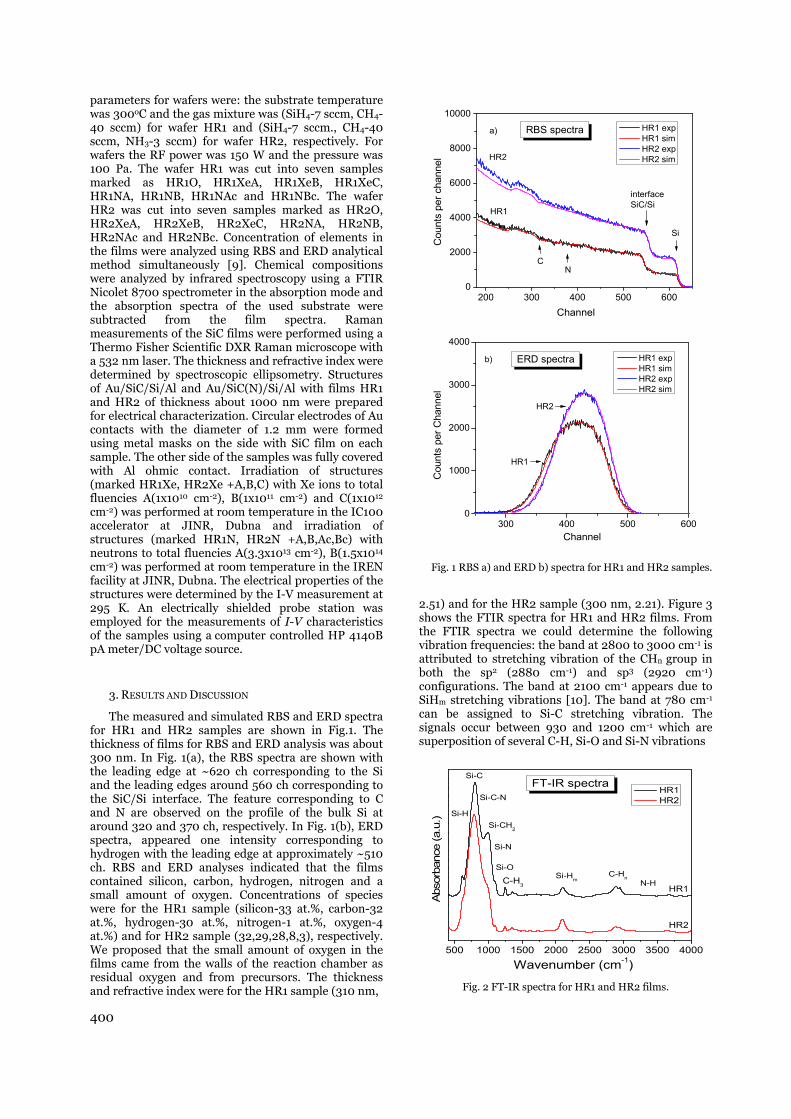
400
parameters for wafers were: the substrate temperature was 300oC and the gas mixture was (SiH4-7 sccm, CH4-40 sccm) for wafer HR1 and (SiH4-7 sccm., CH4-40 sccm, NH3-3 sccm) for wafer HR2, respectively. For wafers the RF power was 150 W and the pressure was 100 Pa. The wafer HR1 was cut into seven samples marked as HR1O, HR1XeA, HR1XeB, HR1XeC, HR1NA, HR1NB, HR1NAc and HR1NBc. The wafer HR2 was cut into seven samples marked as HR2O, HR2XeA, HR2XeB, HR2XeC, HR2NA, HR2NB, HR2NAc and HR2NBc. Concentration of elements in the films were analyzed using RBS and ERD analytical method simultaneously [9]. Chemical compositions were analyzed by infrared spectroscopy using a FTIR Nicolet 8700 spectrometer in the absorption mode and the absorption spectra of the used substrate were subtracted from the film spectra. Raman measurements of the SiC films were performed using a Thermo Fisher Scientific DXR Raman microscope with a 532 nm laser. The thickness and refractive index were determined by spectroscopic ellipsometry. Structures of Au/SiC/Si/Al and Au/SiC(N)/Si/Al with films HR1 and HR2 of thickness about 1000 nm were prepared for electrical characterization. Circular electrodes of Au contacts with the diameter of 1.2 mm were formed using metal masks on the side with SiC film on each sample. The other side of the samples was fully covered with Al ohmic contact. Irradiation of structures (marked HR1Xe, HR2Xe +A,B,C) with Xe ions to total fluencies A(1x1010 cm-2), B(1x1011 cm-2) and C(1x1012 cm-2) was performed at room temperature in the IC100 accelerator at JINR, Dubna and irradiation of structures (marked HR1N, HR2N +A,B,Ac,Bc) with neutrons to total fluencies A(3.3x1013 cm-2), B(1.5x1014 cm-2) was performed at room temperature in the IREN facility at JINR, Dubna. The electrical properties of the structures were determined by the I-V measurement at 295 K. An electrically shielded probe station was employed for the measurements of I-V characteristics of the samples using a computer controlled HP 4140B pA meter/DC voltage source.
3. RESULTS AND DISCUSSION
The measured and simulated RBS and ERD spectra for HR1 and HR2 samples are shown in Fig.1. The thickness of films for RBS and ERD analysis was about 300 nm. In Fig. 1(a), the RBS spectra are shown with the leading edge at ~620 ch corresponding to the Si and the leading edges around 560 ch corresponding to the SiC/Si interface. The feature corresponding to C and N are observed on the profile of the bulk Si at around 320 and 370 ch, respectively. In Fig. 1(b), ERD spectra, appeared one intensity corresponding to hydrogen with the leading edge at approximately ~510 ch. RBS and ERD analyses indicated that the films contained silicon, carbon, hydrogen, nitrogen and a small amount of oxygen. Concentrations of species were for the HR1 sample (silicon-33 at.%, carbon-32 at.%, hydrogen-30 at.%, nitrogen-1 at.%, oxygen-4 at.%) and for HR2 sample (32,29,28,8,3), respectively. We proposed that the small amount of oxygen in the films came from the walls of the reaction chamber as residual oxygen and from precursors. The thickness and refractive index were for the HR1 sample (310 nm,
200 300 400 500 6000
2000
4000
6000
8000
10000
Channel
Cou
nts
per c
hann
el
RBS spectra
C
Si
interfaceSiC/Si
HR1 exp HR1 sim HR2 exp HR2 sim
N
HR2
HR1
a)
300 400 500 6000
1000
2000
3000
4000
Cou
nts
per C
hann
el
Channel
ERD spectra HR1 exp HR1 sim HR2 exp HR2 sim
HR2
HR1
b)
Fig. 1 RBS a) and ERD b) spectra for HR1 and HR2 samples.
2.51) and for the HR2 sample (300 nm, 2.21). Figure 3 shows the FTIR spectra for HR1 and HR2 films. From the FTIR spectra we could determine the following vibration frequencies: the band at 2800 to 3000 cm-1 is attributed to stretching vibration of the CHn group in both the sp2 (2880 cm-1) and sp3 (2920 cm-1) configurations. The band at 2100 cm-1 appears due to SiHm stretching vibrations [10]. The band at 780 cm-1
can be assigned to Si-C stretching vibration. The signals occur between 930 and 1200 cm-1 which are superposition of several C-H, Si-O and Si-N vibrations
500 1000 1500 2000 2500 3000 3500 4000
C-HnSi-Hm
C-H3
Abs
orba
nce
(a.u
.)
Wavenumber (cm-1)
N-H
Si-O
Si-N
Si-CH2
Si-C
Si-H
FT-IR spectra HR1 HR2
HR1
HR2
Si-C-N
Fig. 2 FT-IR spectra for HR1 and HR2 films.
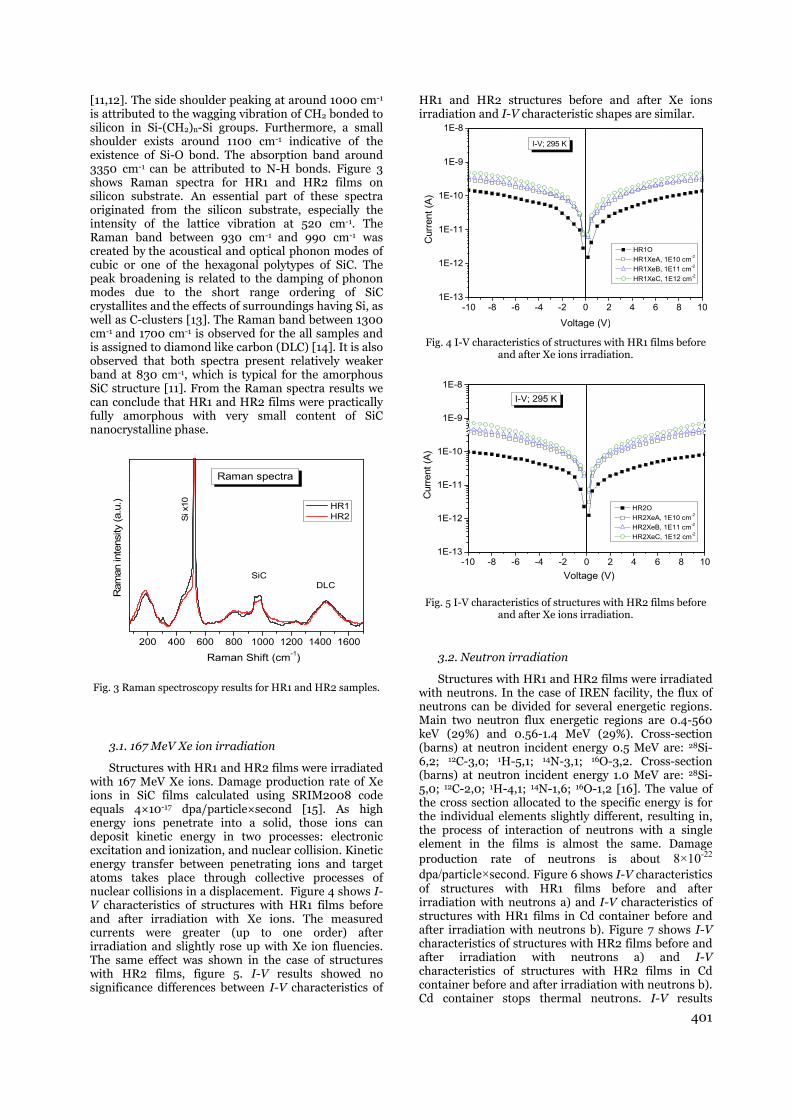
401
[11,12]. The side shoulder peaking at around 1000 cm-1 is attributed to the wagging vibration of CH2 bonded to silicon in Si-(CH2)n-Si groups. Furthermore, a small shoulder exists around 1100 cm-1 indicative of the existence of Si-O bond. The absorption band around 3350 cm-1 can be attributed to N-H bonds. Figure 3 shows Raman spectra for HR1 and HR2 films on silicon substrate. An essential part of these spectra originated from the silicon substrate, especially the intensity of the lattice vibration at 520 cm-1. The Raman band between 930 cm-1 and 990 cm-1 was created by the acoustical and optical phonon modes of cubic or one of the hexagonal polytypes of SiC. The peak broadening is related to the damping of phonon modes due to the short range ordering of SiC crystallites and the effects of surroundings having Si, as well as C-clusters [13]. The Raman band between 1300 cm-1 and 1700 cm-1 is observed for the all samples and is assigned to diamond like carbon (DLC) [14]. It is also observed that both spectra present relatively weaker band at 830 cm-1, which is typical for the amorphous SiC structure [11]. From the Raman spectra results we can conclude that HR1 and HR2 films were practically fully amorphous with very small content of SiC nanocrystalline phase.
200 400 600 800 1000 1200 1400 1600
R
aman
inte
nsity
(a.u
.)
Raman Shift (cm-1)
SiCDLC
Si x
10
Raman spectra
HR1 HR2
Fig. 3 Raman spectroscopy results for HR1 and HR2 samples.
3.1. 167 MeV Xe ion irradiation
Structures with HR1 and HR2 films were irradiated with 167 MeV Xe ions. Damage production rate of Xe ions in SiC films calculated using SRIM2008 code equals 4×10-17 dpa/particle×second [15]. As high energy ions penetrate into a solid, those ions can deposit kinetic energy in two processes: electronic excitation and ionization, and nuclear collision. Kinetic energy transfer between penetrating ions and target atoms takes place through collective processes of nuclear collisions in a displacement. Figure 4 shows I-V characteristics of structures with HR1 films before and after irradiation with Xe ions. The measured currents were greater (up to one order) after irradiation and slightly rose up with Xe ion fluencies. The same effect was shown in the case of structures with HR2 films, figure 5. I-V results showed no significance differences between I-V characteristics of
HR1 and HR2 structures before and after Xe ions irradiation and I-V characteristic shapes are similar.
-10 -8 -6 -4 -2 0 2 4 6 8 101E-13
1E-12
1E-11
1E-10
1E-9
1E-8
HR1O HR1XeA, 1E10 cm-2
HR1XeB, 1E11 cm-2
HR1XeC, 1E12 cm-2
Cur
rent
(A)
Voltage (V)
I-V; 295 K
Fig. 4 I-V characteristics of structures with HR1 films before and after Xe ions irradiation.
-10 -8 -6 -4 -2 0 2 4 6 8 101E-13
1E-12
1E-11
1E-10
1E-9
1E-8
HR2O HR2XeA, 1E10 cm-2
HR2XeB, 1E11 cm-2
HR2XeC, 1E12 cm-2
Cur
rent
(A)
Voltage (V)
I-V; 295 K
Fig. 5 I-V characteristics of structures with HR2 films before
and after Xe ions irradiation.
3.2. Neutron irradiation
Structures with HR1 and HR2 films were irradiated with neutrons. In the case of IREN facility, the flux of neutrons can be divided for several energetic regions. Main two neutron flux energetic regions are 0.4-560 keV (29%) and 0.56-1.4 MeV (29%). Cross-section (barns) at neutron incident energy 0.5 MeV are: 28Si-6,2; 12C-3,0; 1H-5,1; 14N-3,1; 16O-3,2. Cross-section (barns) at neutron incident energy 1.0 MeV are: 28Si-5,0; 12C-2,0; 1H-4,1; 14N-1,6; 16O-1,2 [16]. The value of the cross section allocated to the specific energy is for the individual elements slightly different, resulting in, the process of interaction of neutrons with a single element in the films is almost the same. Damage production rate of neutrons is about 8×10-22 dpa/particle×second. Figure 6 shows I-V characteristics of structures with HR1 films before and after irradiation with neutrons a) and I-V characteristics of structures with HR1 films in Cd container before and after irradiation with neutrons b). Figure 7 shows I-V characteristics of structures with HR2 films before and after irradiation with neutrons a) and I-V characteristics of structures with HR2 films in Cd container before and after irradiation with neutrons b). Cd container stops thermal neutrons. I-V results

402
showed no significance effect of the Cd container on the electrical characteristics.
-10 -8 -6 -4 -2 0 2 4 6 8 101E-13
1E-12
1E-11
1E-10
1E-9
1E-8
HR1O HR1NA, 3.3E13 cm-2
HR1NB, 1.5E14 cm-2
Cur
rent
(A)
Voltage (V)
I-V; 295 Ka)
-10 -8 -6 -4 -2 0 2 4 6 8 101E-13
1E-12
1E-11
1E-10
1E-9
1E-8
HR1O HR1NAc, 3.3E13 cm-2
HR1NBc, 1.5E14 cm-2
Cur
rent
(A)
Voltage (V)
I-V; 295 Kb)
Fig. 6 I-V characteristics of structures with HR1 films before and after irradiation with neutrons a), in Cd container b).
-10 -8 -6 -4 -2 0 2 4 6 8 101E-13
1E-12
1E-11
1E-10
1E-9
1E-8
HR2O HR2NA, 3.3E13 cm-2
HR2NB, 1.5E14 cm-2
Cur
rent
(A)
Voltage (V)
I-V; 295 Ka)
-10 -8 -6 -4 -2 0 2 4 6 8 101E-13
1E-12
1E-11
1E-10
1E-9
1E-8
HR2O HR2NAc, 3.3E13 cm-2
HR2NBc, 1.5E14 cm-2
Cur
rent
(A)
Voltage (V)
I-V; 295 Kb)
Fig. 7 I-V characteristics of structures with HR2 films before and after irradiation with neutrons a), in Cd container b).
The measured I-V characteristics of both sets of structures HR1 and HR2 are similar. I-V dependencies of all investigated structures before and after irradiation with Xe ions and neutrons have almost linear behavior for both polarity of the bias voltage ranging from 0.2 to 10 V. The structures HR1 and HR2 don’t exhibit any rectification ratio. The measured current increases approximately 3 times after irradiation with Xe ions at fluence of 1x1012 cm-2 and measured current increases 5-6 times after irradiation with neutrons at fluence of 1.5×1014 cm−2 at bias voltage of 10 V in case of samples HR1. For investigated samples HR2 the measured current increases about 8 times after irradiation with Xe ions at highest fluence and measured current increases 3-5 times after irradiation with neutrons at fluence of 1.5×1014 cm−2 at bias voltage of 10 V. Observable influence of the thermal neutron shielding at the irradiation of structures, using a Cd container is relatively small. The higher measured current after irradiation with Xe ions and neutrons might be due to breaking of the most slightly bonded Si-H, C-H and N-H bonds therefore creating more dangling bonds and so increasing number of defect centers in the films responsible for the higher conductivity [17]. It should be noted that difference in damage production rate for 167 MeV Xe ions and neutrons in SiC films is about 5×10⁴.
4. CONCLUSION
We have investigated the structural properties of SiC and SiC(N) films prepared by plasma enhanced chemical vapour deposition. The RBS and ERD results showed main concentrations of Si, C and H in the SiC films. The concentration of hydrogen was about 30 at.% and SiC(N) film contained 8 at.% nitrogen. The FT-IR results of the SiC films showed the presence of the Si-C, Si-H, C-H, Si-N, N-H and Si-O bonds. Raman spectroscopy results showed interesting band between 930 cm-1 and 990 cm-1 which was created by the acoustical and optical phonon modes of cubic or one of the hexagonal polytypes of SiC and band between 1300 cm-1 and 1700 cm-1 which was assigned to sp2 graphitic clusters that commonly exist in diamond like carbon films. Structures with metal contacts were irradiated with Xe ions and neutrons. Electrical results showed no rectifying effect in the measured I-V characteristics before and after irradiation with Xe ions and neutrons. I-V dependencies of all investigated structures before and after irradiation with Xe ions and neutrons have almost linear behavior for both polarity of the bias voltage ranging from 0.2 to 10 V. The measured currents of structures after irradiation are greater than the current before irradiation and rose up with a higher fluence of Xe ions and neutron irradiation for both polarities of the bias voltage. Observable influence of the thermal neutron shielding using a Cd container is relatively small. The higher measured current after irradiation might be caused by breaking Si-H, C-H and N-H bonds and so increasing the number of defect centers in the films responsible for the higher conductivity of films.
403
Acknowledgements This research has been supported by the Slovak Research and Development Agency under the contracts APVV-0443-12 and by the Scientific Grant Agency of the Ministry of Education of the Slovakia and Slovak Academy of Sciences, No. 2/0062/13; 2/0175/13; 2/0173/13.
REFERENCES
1. D. Pysch, J. Ziegler, J.-P. Becker, D. Suwito, S. Janz, S.W. Glunz, M. Hermle, 34th IEEE Photovoltaic Specialists Conference (PVSC)- Proceedings, 2009, pp. 794-799.
2. S. Janz, S. Reber, W. Glunz, Proceedings of the 21st EUPVSEC, 2006, pp. 660-663.
3. T.A. Pomorski, B.C. Bittel, C.J. Cochrane, P.M. Lenahan, J. Bielefeld, S.W. King, J. Appl. Phys. 114, 2013, 074501.
4. S.W. King, J. Bielefeld, G. Xu, W. A. Lanford, Y. Matsuda, R.H. Dauskardt, N. Kim, D. Hondongwa, L. Olasov, B. Daly, G. Stan, M. Liuh, D. Dutta, D. Gidley, Journal of Non-Crystalline Solids 379, 2013, pp. 67–79.
5. W. Daves, A. Krauss, N. Behnel, V. Häublein, A. Bauer, L. Frey, Thin Solid Films 519, 2011, pp 5892-5898.
6. A.M. Wrobel, A. Walkiewicz-Pietrzykowska, P. Uznanski, Thin Solid Films 564, 2014, pp. 222-231
7. G.A. Liu, E.Q. Xie, T.M. Wang, Qiangjiguang Yu Lizishu/High Power Laser and Particle Beams 15, 2003, pp. 271-274.
8. A. Gali, P. Deák, P. Ordejón, N. T. Son, E. Janzén, W. J. Choyke, Phys. Rev. B 68, 2003, 125201.
9. A.P. Kobzev, J. Huran, D. Maczka, M. Turek, Vacuum 83, 2009, pp. S124-S126.
10. S.F. Yoon and J.Ahn, J. Mater. Sci Technol. 13, 1997, pp. 189-193.
11. M.A. Fraga, M. Massi, I.C. Oliviera, H.S. Maciel, S.G.S. Filho, R.D. Mansano, J. Mater. Sci. 19, 2008, pp. 835-840.
12. M. Künle, T. Kaltenbach, P. Lӧper, A. Hartel, S. Janz, O. Eibl, K-G. Nickel, Thin Solid Films 519 (2010) 151-157.
13. J.K. Seo, Y-H. Joung, Y. Park, W.S. Choi, Thin Solid Films 519, 2011, pp. 6654–6657.
14. T. Chen, Y. Huang. D. Yang, R. Carius, F. Finger, Thin Solid Films 519, 2011, pp. 4523–4526.
15. V.I. Avramenko, Yu.V. Konobeev, A.M. Strokova. Atomnaja Energija, 36, 1984, pp. 139-141.
16. www.nndc.bnl.gov 17. M. Vetter, C. Voz, R. Ferre, I. Martín, A. Orpella, J.
Puigdollers, J. Andreu, and R. Alcubilla, Thin Solid Films 511-512, 2006, pp. 290-294.
MODELING AND PSPICE SIMULATION OF RADIATION STRESS INFLUENCE ON THRESHOLD VOLTAGE SHIFTS IN P-CHANNEL POWER VDMOS TRANSISTORS
Miloš Marjanović 1, Danijel Danković 1, Vojkan Davidović 1, Aneta Prijić 1, Ninoslav Stojadinović 1, Zoran Prijić 1, Nebojša Janković 1
1 Faculty of Electronic Engineering, University of Niš, Aleksandra Medvedeva 14, 18000 Niš, Serbia, e-mails: [email protected], [email protected], [email protected],
[email protected], [email protected], [email protected], [email protected]
Abstract. In this paper the results of modeling and simulation of radiation stress effects in p-channel power VDMOSFET transistor have been presented. Based on measured results, the threshold voltage shifts as a function of absorbed dose and gate voltage during radiation stress have been modeled and implemented in the PSPICE model of the IRF9520 transistor. The transfer characteristics of the transistor are simulated and compared to the experimental ones. Difference is in the range 0.16% to 23.35% which represents a good agreement.
Key words: radiation stress effect, modeling, PSPICE simulation, VDMOS transistor
1. INTRODUCTION
Different analytical models are used for characterization and PSPICE simulations of electronic devices. The extraction of the model parameters from experimental results is the crucial step in that procedure. By adding specific elements to basic circuit model, such as parametrically controlled voltage sources [1], external stress influence to operation of the device can be modeled.
The power vertical double-diffused MOSFETs (VDMOSFET) are suitable for use in electronics, which may operate in radiation environments, due to their high switching speed, simplified input drive requirements, low noise, etc. Power VDMOSFETs are attractive devices for high-frequency switching power supplies in communication satellites because of their high radiation tolerance during the years of communication satellite missions. This is the reason why many scientists nowadays express interest to the investigation of radiation stress effects in VDMOS transistors [2-4]. It should be noted that there is interest in analytical modeling of device characteristics under radiation, with the aim to predict the device behavior in real radiation environment. [5]
In this paper the procedure for PSPICE modeling of radiation stress effects in p-channel power VDMOS transistor IRF9520 is presented. In these devices, radiation stress effects occur when they are exposed to radiation sources. The proposed model can be used for simulation cases when devices are exposed to relatively small doses (0 – 75 Gy), for gate voltages during stress in the range from -10 V to +10 V. Influences of degradation effects on the threshold voltage values are considered here.
2. RADIATION STRESS EFFECTS ON THRESHOLD VOLTAGE
SHIFTS
2.1. Theoretical overview
When VDMOSFET is exposed to ionizing radiation, electrons and holes are created in the device as a result of ionization. Most of the free electrons eventually recombine and they do not contribute to the threshold voltage shift. The charge carriers providing the threshold voltage shift are the holes trapped in the gate oxide [6]. A certain number of induced holes also recombine immediately after generation. However, radiation-induced holes which do not recombine will be drifted by the influence of the electric field, and trapped on oxide defects leading to the creation of positive charge in the gate oxide. The hole traps exist as an intrinsic part of the gate oxide because of structural defects. Also, holes get trapped at the Si/SiO2 interface states precursors created positive interface charge. Both the positive charge generated in the SiO2 layer and the interface states increase the absolute value of the threshold voltage in p-channel VDMOSFETs.
The traps induced in the gate oxide are referred to as oxide or fixed traps, while the traps created near and at the oxide/substrate (SiO2/Si) interface are known as interface or switching traps. The interface traps created in the oxide, near the SiO2/Si interface, are called the slow switching traps and the interface traps created at this interface are called the fast switching traps. The fixed traps represent traps in the gate oxide that do not capture the carriers from the channel, while the switching traps represent the traps that do capture the carriers from the channel.
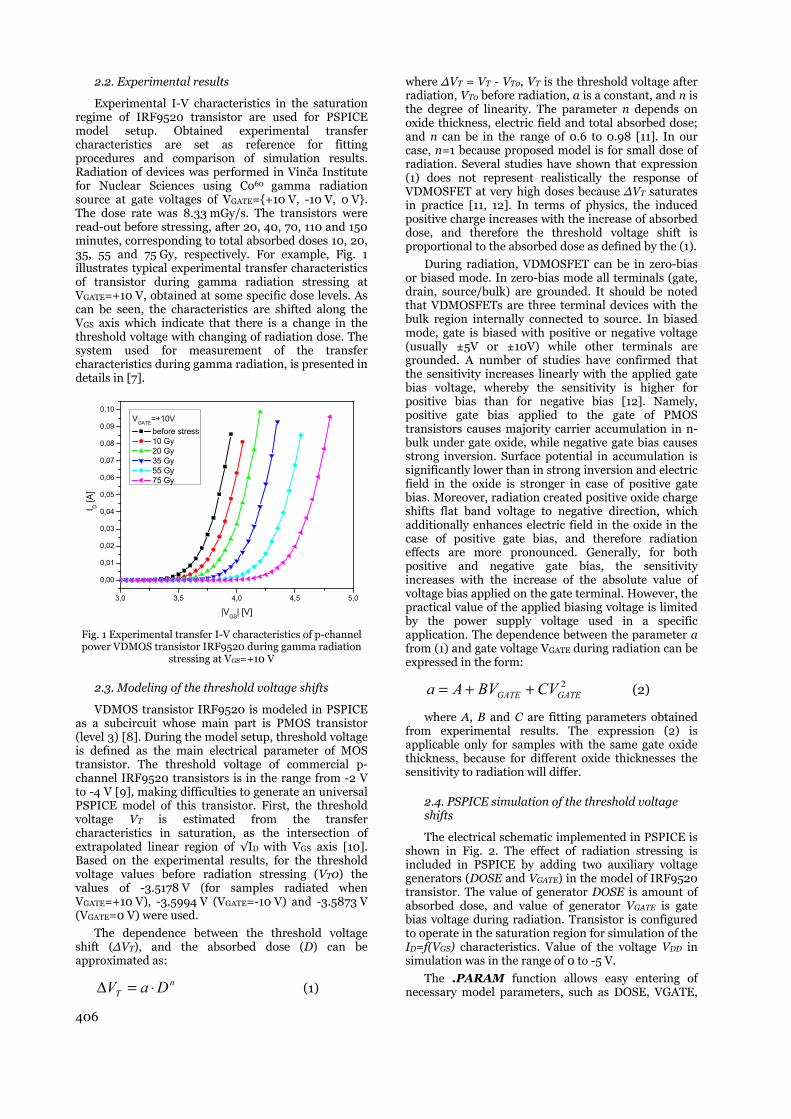
406
2.2. Experimental results
Experimental I-V characteristics in the saturation regime of IRF9520 transistor are used for PSPICE model setup. Obtained experimental transfer characteristics are set as reference for fitting procedures and comparison of simulation results. Radiation of devices was performed in Vinča Institute for Nuclear Sciences using Co60 gamma radiation source at gate voltages of VGATE={+10 V, -10 V, 0 V}. The dose rate was 8.33 mGy/s. The transistors were read-out before stressing, after 20, 40, 70, 110 and 150 minutes, corresponding to total absorbed doses 10, 20, 35, 55 and 75 Gy, respectively. For example, Fig. 1 illustrates typical experimental transfer characteristics of transistor during gamma radiation stressing at VGATE=+10 V, obtained at some specific dose levels. As can be seen, the characteristics are shifted along the VGS axis which indicate that there is a change in the threshold voltage with changing of radiation dose. The system used for measurement of the transfer characteristics during gamma radiation, is presented in details in [7].
3,0 3,5 4,0 4,5 5,0
0,00
0,01
0,02
0,03
0,04
0,05
0,06
0,07
0,08
0,09
0,10
I D [A
]
|VGS| [V]
VGATE=+10V before stress 10 Gy 20 Gy 35 Gy 55 Gy 75 Gy
Fig. 1 Experimental transfer I-V characteristics of p-channel power VDMOS transistor IRF9520 during gamma radiation
stressing at VGS=+10 V
2.3. Modeling of the threshold voltage shifts
VDMOS transistor IRF9520 is modeled in PSPICE as a subcircuit whose main part is PMOS transistor (level 3) [8]. During the model setup, threshold voltage is defined as the main electrical parameter of MOS transistor. The threshold voltage of commercial p-channel IRF9520 transistors is in the range from -2 V to -4 V [9], making difficulties to generate an universal PSPICE model of this transistor. First, the threshold voltage VT is estimated from the transfer characteristics in saturation, as the intersection of extrapolated linear region of √ID with VGS axis [10]. Based on the experimental results, for the threshold voltage values before radiation stressing (VT0) the values of -3.5178 V (for samples radiated when VGATE=+10 V), -3.5994 V (VGATE=-10 V) and -3.5873 V (VGATE=0 V) were used.
The dependence between the threshold voltage shift (ΔVT), and the absorbed dose (D) can be approximated as:
nT DaV ⋅=Δ (1)
where ΔVT = VT - VT0, VT is the threshold voltage after radiation, VT0 before radiation, a is a constant, and n is the degree of linearity. The parameter n depends on oxide thickness, electric field and total absorbed dose; and n can be in the range of 0.6 to 0.98 [11]. In our case, n=1 because proposed model is for small dose of radiation. Several studies have shown that expression (1) does not represent realistically the response of VDMOSFET at very high doses because ΔVT saturates in practice [11, 12]. In terms of physics, the induced positive charge increases with the increase of absorbed dose, and therefore the threshold voltage shift is proportional to the absorbed dose as defined by the (1).
During radiation, VDMOSFET can be in zero-bias or biased mode. In zero-bias mode all terminals (gate, drain, source/bulk) are grounded. It should be noted that VDMOSFETs are three terminal devices with the bulk region internally connected to source. In biased mode, gate is biased with positive or negative voltage (usually ±5V or ±10V) while other terminals are grounded. A number of studies have confirmed that the sensitivity increases linearly with the applied gate bias voltage, whereby the sensitivity is higher for positive bias than for negative bias [12]. Namely, positive gate bias applied to the gate of PMOS transistors causes majority carrier accumulation in n-bulk under gate oxide, while negative gate bias causes strong inversion. Surface potential in accumulation is significantly lower than in strong inversion and electric field in the oxide is stronger in case of positive gate bias. Moreover, radiation created positive oxide charge shifts flat band voltage to negative direction, which additionally enhances electric field in the oxide in the case of positive gate bias, and therefore radiation effects are more pronounced. Generally, for both positive and negative gate bias, the sensitivity increases with the increase of the absolute value of voltage bias applied on the gate terminal. However, the practical value of the applied biasing voltage is limited by the power supply voltage used in a specific application. The dependence between the parameter a from (1) and gate voltage VGATE during radiation can be expressed in the form:
2GATEGATE CVBVAa ++= (2)
where A, B and C are fitting parameters obtained from experimental results. The expression (2) is applicable only for samples with the same gate oxide thickness, because for different oxide thicknesses the sensitivity to radiation will differ.
2.4. PSPICE simulation of the threshold voltage shifts
The electrical schematic implemented in PSPICE is shown in Fig. 2. The effect of radiation stressing is included in PSPICE by adding two auxiliary voltage generators (DOSE and VGATE) in the model of IRF9520 transistor. The value of generator DOSE is amount of absorbed dose, and value of generator VGATE is gate bias voltage during radiation. Transistor is configured to operate in the saturation region for simulation of the ID=f(VGS) characteristics. Value of the voltage VDD in simulation was in the range of 0 to -5 V.
The .PARAM function allows easy entering of necessary model parameters, such as DOSE, VGATE,
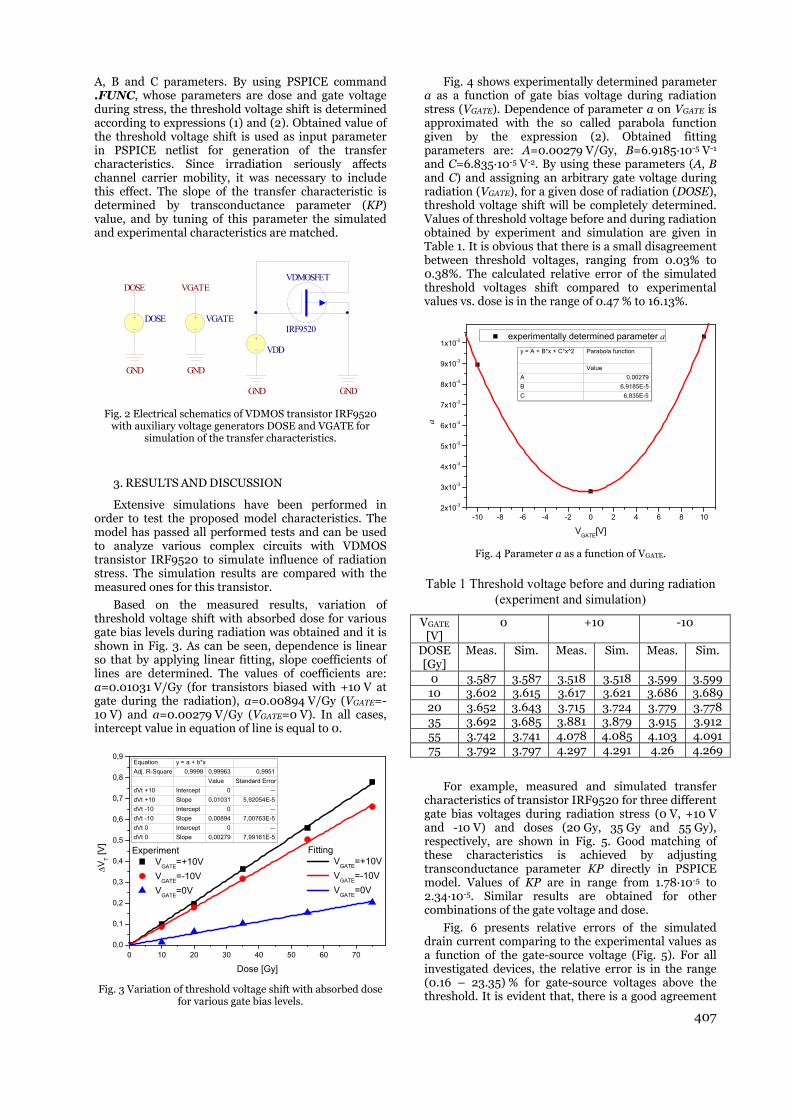
407
A, B and C parameters. By using PSPICE command .FUNC, whose parameters are dose and gate voltage during stress, the threshold voltage shift is determined according to expressions (1) and (2). Obtained value of the threshold voltage shift is used as input parameter in PSPICE netlist for generation of the transfer characteristics. Since irradiation seriously affects channel carrier mobility, it was necessary to include this effect. The slope of the transfer characteristic is determined by transconductance parameter (KP) value, and by tuning of this parameter the simulated and experimental characteristics are matched.
VDMOSFET
IRF9520
GND
VDD
GND
DOSE VGATE
GND GND
VGATEDOSE
Fig. 2 Electrical schematics of VDMOS transistor IRF9520
with auxiliary voltage generators DOSE and VGATE for simulation of the transfer characteristics.
3. RESULTS AND DISCUSSION
Extensive simulations have been performed in order to test the proposed model characteristics. The model has passed all performed tests and can be used to analyze various complex circuits with VDMOS transistor IRF9520 to simulate influence of radiation stress. The simulation results are compared with the measured ones for this transistor.
Based on the measured results, variation of threshold voltage shift with absorbed dose for various gate bias levels during radiation was obtained and it is shown in Fig. 3. As can be seen, dependence is linear so that by applying linear fitting, slope coefficients of lines are determined. The values of coefficients are: a=0.01031 V/Gy (for transistors biased with +10 V at gate during the radiation), a=0.00894 V/Gy (VGATE=-10 V) and a=0.00279 V/Gy (VGATE=0 V). In all cases, intercept value in equation of line is equal to 0.
0 10 20 30 40 50 60 700,0
0,1
0,2
0,3
0,4
0,5
0,6
0,7
0,8
0,9
Fitting VGATE=+10V VGATE=-10V VGATE=0V
ΔVT [V
]
Dose [Gy]
Equation y = a + b*xAdj. R-Square 0,9998 0,99963 0,9951
Value Standard ErrordVt +10 Intercept 0 --dVt +10 Slope 0,01031 5,92054E-5dVt -10 Intercept 0 --dVt -10 Slope 0,00894 7,00763E-5dVt 0 Intercept 0 --dVt 0 Slope 0,00279 7,99161E-5
Experiment VGATE=+10V VGATE=-10V VGATE=0V
Fig. 3 Variation of threshold voltage shift with absorbed dose
for various gate bias levels.
Fig. 4 shows experimentally determined parameter a as a function of gate bias voltage during radiation stress (VGATE). Dependence of parameter a on VGATE is approximated with the so called parabola function given by the expression (2). Obtained fitting parameters are: A=0.00279 V/Gy, B=6.9185·10-5 V-1 and C=6.835·10-5 V-2. By using these parameters (A, B and C) and assigning an arbitrary gate voltage during radiation (VGATE), for a given dose of radiation (DOSE), threshold voltage shift will be completely determined. Values of threshold voltage before and during radiation obtained by experiment and simulation are given in Table 1. It is obvious that there is a small disagreement between threshold voltages, ranging from 0.03% to 0.38%. The calculated relative error of the simulated threshold voltages shift compared to experimental values vs. dose is in the range of 0.47 % to 16.13%.
-10 -8 -6 -4 -2 0 2 4 6 8 102x10-3
3x10⁻³
4x10⁻³
5x10⁻³
6x10⁻³
7x10⁻³
8x10⁻³
9x10⁻³
1x10⁻²
a
VGATE[V]
experimentally determined parameter ay = A + B*x + C*x^2 Parabola function
ValueA 0,00279B 6,9185E-5C 6,835E-5
Fig. 4 Parameter a as a function of VGATE.
Table 1 Threshold voltage before and during radiation (experiment and simulation)
VGATE
[V] 0 +10 -10
DOSE [Gy]
Meas. Sim. Meas. Sim. Meas. Sim.
0 3.587 3.587 3.518 3.518 3.599 3.599 10 3.602 3.615 3.617 3.621 3.686 3.689 20 3.652 3.643 3.715 3.724 3.779 3.778 35 3.692 3.685 3.881 3.879 3.915 3.912 55 3.742 3.741 4.078 4.085 4.103 4.091 75 3.792 3.797 4.297 4.291 4.26 4.269
For example, measured and simulated transfer characteristics of transistor IRF9520 for three different gate bias voltages during radiation stress (0 V, +10 V and -10 V) and doses (20 Gy, 35 Gy and 55 Gy), respectively, are shown in Fig. 5. Good matching of these characteristics is achieved by adjusting transconductance parameter KP directly in PSPICE model. Values of KP are in range from 1.78·10-5 to 2.34·10-5. Similar results are obtained for other combinations of the gate voltage and dose.
Fig. 6 presents relative errors of the simulated drain current comparing to the experimental values as a function of the gate-source voltage (Fig. 5). For all investigated devices, the relative error is in the range (0.16 – 23.35) % for gate-source voltages above the threshold. It is evident that, there is a good agreement
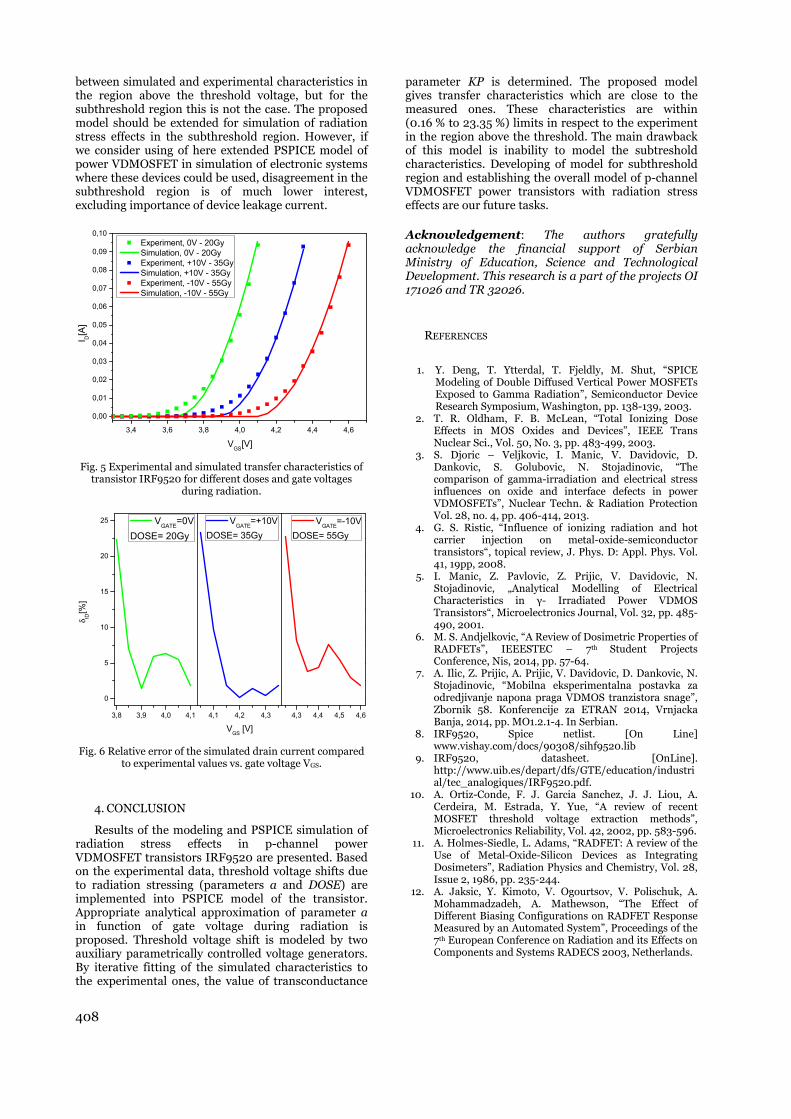
408
between simulated and experimental characteristics in the region above the threshold voltage, but for the subthreshold region this is not the case. The proposed model should be extended for simulation of radiation stress effects in the subthreshold region. However, if we consider using of here extended PSPICE model of power VDMOSFET in simulation of electronic systems where these devices could be used, disagreement in the subthreshold region is of much lower interest, excluding importance of device leakage current.
3,4 3,6 3,8 4,0 4,2 4,4 4,6
0,00
0,01
0,02
0,03
0,04
0,05
0,06
0,07
0,08
0,09
0,10
I D[A
]
VGS[V]
Experiment, 0V - 20Gy Simulation, 0V - 20Gy Experiment, +10V - 35Gy Simulation, +10V - 35Gy Experiment, -10V - 55Gy Simulation, -10V - 55Gy
Fig. 5 Experimental and simulated transfer characteristics of
transistor IRF9520 for different doses and gate voltages during radiation.
3,8 3,9 4,0 4,1
0
5
10
15
20
25
4,1 4,2 4,3 4,3 4,4 4,5 4,6
δ ID[%
]
VGATE=0VDOSE= 20Gy
VGS [V]
VGATE
=+10VDOSE= 35Gy
VGATE=-10VDOSE= 55Gy
Fig. 6 Relative error of the simulated drain current compared
to experimental values vs. gate voltage VGS.
4. CONCLUSION
Results of the modeling and PSPICE simulation of radiation stress effects in p-channel power VDMOSFET transistors IRF9520 are presented. Based on the experimental data, threshold voltage shifts due to radiation stressing (parameters a and DOSE) are implemented into PSPICE model of the transistor. Appropriate analytical approximation of parameter a in function of gate voltage during radiation is proposed. Threshold voltage shift is modeled by two auxiliary parametrically controlled voltage generators. By iterative fitting of the simulated characteristics to the experimental ones, the value of transconductance
parameter KP is determined. The proposed model gives transfer characteristics which are close to the measured ones. These characteristics are within (0.16 % to 23.35 %) limits in respect to the experiment in the region above the threshold. The main drawback of this model is inability to model the subtreshold characteristics. Developing of model for subthreshold region and establishing the overall model of p-channel VDMOSFET power transistors with radiation stress effects are our future tasks.
Acknowledgement: The authors gratefully acknowledge the financial support of Serbian Ministry of Education, Science and Technological Development. This research is a part of the projects OI 171026 and TR 32026.
REFERENCES
1. Y. Deng, T. Ytterdal, T. Fjeldly, M. Shut, “SPICE Modeling of Double Diffused Vertical Power MOSFETs Exposed to Gamma Radiation”, Semiconductor Device Research Symposium, Washington, pp. 138-139, 2003.
2. T. R. Oldham, F. B. McLean, “Total Ionizing Dose Effects in MOS Oxides and Devices”, IEEE Trans Nuclear Sci., Vol. 50, No. 3, pp. 483-499, 2003.
3. S. Djoric – Veljkovic, I. Manic, V. Davidovic, D. Dankovic, S. Golubovic, N. Stojadinovic, “The comparison of gamma-irradiation and electrical stress influences on oxide and interface defects in power VDMOSFETs”, Nuclear Techn. & Radiation Protection Vol. 28, no. 4, pp. 406-414, 2013.
4. G. S. Ristic, “Influence of ionizing radiation and hot carrier injection on metal-oxide-semiconductor transistors“, topical review, J. Phys. D: Appl. Phys. Vol. 41, 19pp, 2008.
5. I. Manic, Z. Pavlovic, Z. Prijic, V. Davidovic, N. Stojadinovic, „Analytical Modelling of Electrical Characteristics in γ- Irradiated Power VDMOS Transistors“, Microelectronics Journal, Vol. 32, pp. 485-490, 2001.
6. M. S. Andjelkovic, “A Review of Dosimetric Properties of RADFETs”, IEEESTEC – 7th Student Projects Conference, Nis, 2014, pp. 57-64.
7. A. Ilic, Z. Prijic, A. Prijic, V. Davidovic, D. Dankovic, N. Stojadinovic, “Mobilna eksperimentalna postavka za odredjivanje napona praga VDMOS tranzistora snage”, Zbornik 58. Konferencije za ETRAN 2014, Vrnjacka Banja, 2014, pp. MO1.2.1-4. In Serbian.
8. IRF9520, Spice netlist. [On Line] www.vishay.com/docs/90308/sihf9520.lib
9. IRF9520, datasheet. [OnLine]. http://www.uib.es/depart/dfs/GTE/education/industrial/tec_analogiques/IRF9520.pdf.
10. A. Ortiz-Conde, F. J. Garcia Sanchez, J. J. Liou, A. Cerdeira, M. Estrada, Y. Yue, “A review of recent MOSFET threshold voltage extraction methods”, Microelectronics Reliability, Vol. 42, 2002, pp. 583-596.
11. A. Holmes-Siedle, L. Adams, “RADFET: A review of the Use of Metal-Oxide-Silicon Devices as Integrating Dosimeters”, Radiation Physics and Chemistry, Vol. 28, Issue 2, 1986, pp. 235-244.
12. A. Jaksic, Y. Kimoto, V. Ogourtsov, V. Polischuk, A. Mohammadzadeh, A. Mathewson, “The Effect of Different Biasing Configurations on RADFET Response Measured by an Automated System”, Proceedings of the 7th European Conference on Radiation and its Effects on Components and Systems RADECS 2003, Netherlands.

IDENTIFICATION OF IC CHIPS BY IONIZATION RESPONSE COMPARISON ON THE EXAMPLE OF OP1177
Alexandra Demidova 1, Alexander Pechenkin 2, Alexey Borisov 1, Leonid Kessarinskiy 1, Dmitry Boychenko 1, Andrey Yanenko 2
1 National Research Nuclear University MEPhI (Moscow Engineering Physics Institute) ), Moscow, Russia 2 Specialized Electronic Systems (SPELS), Moscow, Russia
Abstract. Radiation hardness of different samples of the same ICs can vary greatly from lot to lot, depending on the year or the country of production. However, it is assumed that radiation hardness of the samples from the same lot is the same too. The new chip uniformity test method based on ionization response comparison is offered.
Key words: chips’ uniformity identification, operational amplifier, photo of crystals, crystal topology, ionization response, distinction of parts, laser test, OBIC
1. INTRODUCTION
The radiation test results for different lots of the same IC types, that were obtained for the last 25 years, show notable TID hardness dispersion from lot to lot. The main reason is that chips from the same COTS lot can be made at different foundries and have different topologies. The chips’ uniformity identification is the main way to decrease the number of radiation tests and confirm TID hardness without radiation experiments.
2. ANALYSIS
Comparing the external characteristics of chips is the simplest way of analysis. This is the identification by the sample's number and the casing type. X-ray photos are used for deeper checks.
For our example (OP1177ARZ), two parts are visually identical and have the SOIC-8 type of case. But these two samples differ in TID radiation hardness levels. X-ray photos of the samples don’t reveal internal distinctions in size or placement of the crystals.
Samples were decapsulated for crystal markings comparison (Fig. 1).
Fig. 1 Decapsulated chip of op-amp OP1177ARZ
2.1. Chips’ uniformity identification by surface photos
The first serious identification method is based on visual comparison of the chips’ high-resolution photos. The crystal analysis was carried out for all samples separately. Crystals are photographed in high resolution (Fig. 2).
After that, all technological marks are compared.
Fig. 2 Photo of OP1177ARZ crystal
For most of the different lots, distinctions are visible directly. In the case of op-amp OP1177ARZ, it isn't so simple. Marks are identical, but small distinctions (Fig. 3,4) still exist.
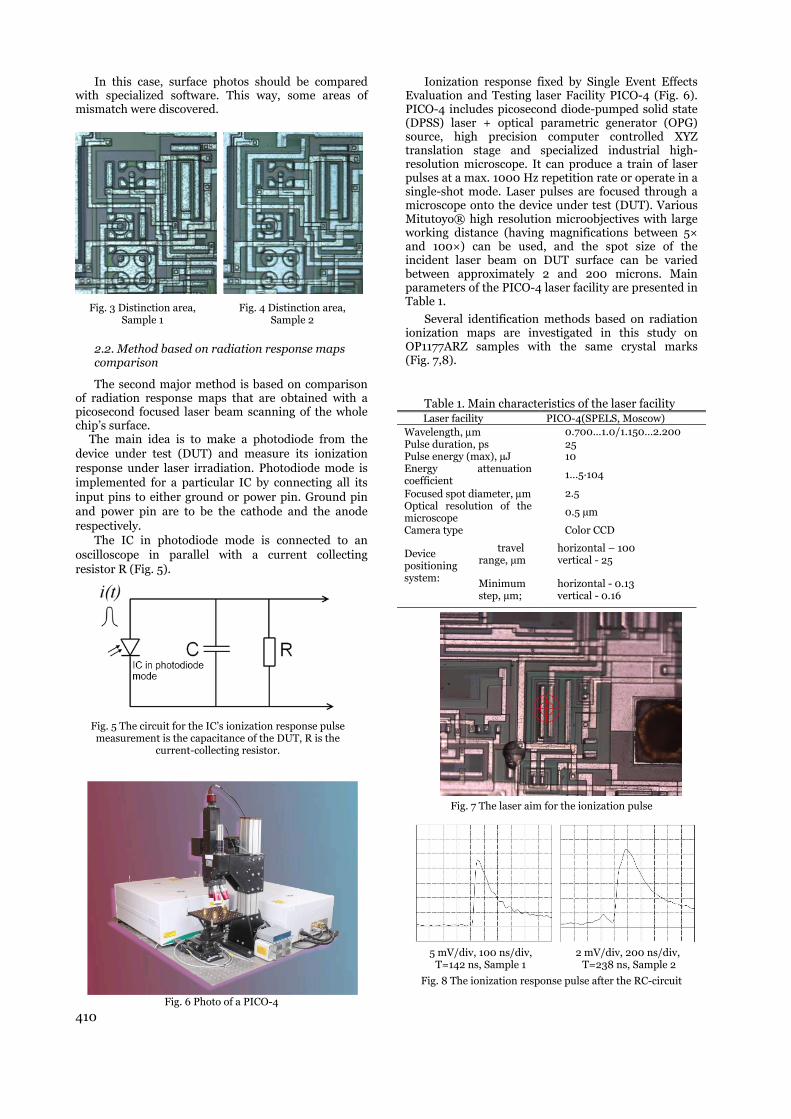
410
In this case, surface photos should be compared with specialized software. This way, some areas of mismatch were discovered.
Fig. 3 Distinction area, Sample 1
Fig. 4 Distinction area, Sample 2
2.2. Method based on radiation response maps comparison
The second major method is based on comparison of radiation response maps that are obtained with a picosecond focused laser beam scanning of the whole chip’s surface.
The main idea is to make a photodiode from the device under test (DUT) and measure its ionization response under laser irradiation. Photodiode mode is implemented for a particular IC by connecting all its input pins to either ground or power pin. Ground pin and power pin are to be the cathode and the anode respectively.
The IC in photodiode mode is connected to an oscilloscope in parallel with a current collecting resistor R (Fig. 5).
Fig. 6 Photo of a PICO-4
Ionization response fixed by Single Event Effects Evaluation and Testing laser Facility PICO-4 (Fig. 6). PICO-4 includes picosecond diode-pumped solid state (DPSS) laser + optical parametric generator (OPG) source, high precision computer controlled XYZ translation stage and specialized industrial high-resolution microscope. It can produce a train of laser pulses at a max. 1000 Hz repetition rate or operate in a single-shot mode. Laser pulses are focused through a microscope onto the device under test (DUT). Various Mitutoyo® high resolution microobjectives with large working distance (having magnifications between 5× and 100×) can be used, and the spot size of the incident laser beam on DUT surface can be varied between approximately 2 and 200 microns. Main parameters of the PICO-4 laser facility are presented in Table 1.
Several identification methods based on radiation ionization maps are investigated in this study on OP1177ARZ samples with the same crystal marks (Fig. 7,8).
Table 1. Main characteristics of the laser facility Laser facility PICO-4(SPELS, Moscow)
Wavelength, μm 0.700…1.0/1.150…2.200 Pulse duration, ps 25 Pulse energy (max), µJ 10 Energy attenuation coefficient
1…5·104
Focused spot diameter, μm 2.5 Optical resolution of the microscope
0.5 µm
Camera type Color CCD
Device positioning system:
travel range, µm
horizontal – 100 vertical - 25
Minimum step, µm;
horizontal - 0.13 vertical - 0.16
Fig. 7 The laser aim for the ionization pulse
5 mV/div, 100 ns/div, T=142 ns, Sample 1
2 mV/div, 200 ns/div, T=238 ns, Sample 2
Fig. 8 The ionization response pulse after the RC-circuit
Fig. 5 The circuit for the IC’s ionization response pulse measurement is the capacitance of the DUT, R is the
current-collecting resistor.

411
In case of OP1177 TID we found notable difference in radiation hardness levels for the chips from the same production lot. On the map provided in figure 9, brighter color corresponds to the increase in amplitude ionization response. The area noted earlier visually differs ten times (red area of a map of Sample 1). Slight surface difference was verified by visual comparison on decapsulated ICs. After that, lot unity was verified by picoseconds focused laser PICO-4 scan and comprising of ionization response maps.
x,y μm, Sample 1
x,y μm, Sample 2
Fig. 9 Map ionization response OP1177ARZ
3. RESULTS
Visual comparison of topologies and a full match of surface marks do not mean that ICs are really from same lot. Ionization response map method should be employed for lot unity confirmation.
Different effective capacitance of chips indicates actual topology divergence, which could be the reason
for the notable difference in TID radiation hardness levels for the chips from same production lot.
REFERENCES
[1] E. W. Enlow, R. L. Pease, W. E. Combs, R. D. Schrimpf, R. N. Nowlin, “Response of Advanced Bipolar Processes to Ionizing Radiation,” IEEE Trans. Nucl. Sci. vol. 38, pp.1342-1351, 1991.
[2] R. N. Nowlin, E. N. Enlow, R. D. Schrimpf, W. E. Combs, “Trends in the total-dose response of modern bipolar transistors,” IEEE Trans. Nucl. Sci., vol.39, pp. 2026-2035, 1992.
[3] Roche N.J.-H., Dusseau, L. ; Mekki, J. ; Perez, S. ; Vaille, J.-R. ; Gonzalez Velo, Y. ; Boch, J. ; Saigne, F. ; Marec, R. ; Calvel, P. ; Bezerra, F. ; Auriel, G. ; Azais, B. ; Buchner, S.P., “Impact of Switched Dose-Rate Irradiation on the Response of the LM124 Operational Amplifier to Pulsed X-Rays”, IEEE Trans. on Nucl. Sci., vol. 58, no. 3, pp. 960-968, 2011.
[4] Roig, F., Dusseau, L. ; Ribeiro, P. ; Auriel, G. ; Roche, N.J.-H. ; Privat, A. ; Vaillé, J.-R. ; Boch, J. ; Saigné, F. ; Marec, R. ; Calvel, P. ; Bezerra, F. ; Ecoffet, R. ; Azais, B., “Study and Modeling of the Impact of TID on the ATREE Response in LM124 Operational Amplifier”, IEEE Trans. on Nucl. Sci., vol. 61, no. 4, pp. 1603-1610, 2014.
[5] Pintelon, R., Rolain, Y. ; Vandersteen, G. ; Schoukens, Johan, “Experimental characterization of operational amplifiers: a system identification approach-part II: calibration and measurements”, IEEE Trans. on Nucl. Sci., vol. 53, no. 3, pp. 863-876, 2004.
[6] Boulghassoul, Y.; Massengill, L.W. ; Turflinger, T.L. ; Holman, W.T., “Frequency domain analysis of analog single-event transients in linear circuits”, IEEE Trans. on Nucl. Sci., vol. 49, no. 6, pp. 3142-3147, 2002.
[7] Andrey N. Egorov, Alexander I. Chumakov, Oleg B. Mavritskiy, Alexander A. Pechenkin, Dmitriy O. Koltsov, Andrey V. Yanenko, “PICO-4 single event effects evaluation and testing facility based on wavelength tunable picosecond laser”, 2012 IEEE Radiation Effects Data Workshop, REDW 2012, pp. 69-72
[8] Alexander. I. Chumakov, Alexander A. Pechenkin, Dmitry V. Savchenkov, Alexander S. Tararaksin, Alexey L. Vasil’ev and Andrey V. Yanenko, “Local Laser Irradiation Technique for SEE Testing of ICs”, Proceedings of 2011 12th European Conference on Radiation and Its Effects on Components and Systems. (RADECS 2011), pp. 449 – 453.
[9] Boychenko D., Kalashnikov O., Nikiforov A., Ulanova A., Bobrovsky D., Nekrasov P. “Total ionizing dose effects and radiation testing of complex multifunctional VLSI devices”, Facta Universitatis Series: Electronics and Energetics, Vol. 28, No. 1, 2015, pp. 153-164.
[10] Sogoyan A.V., Artamonov A.S., Nikiforov A.Y., Boychenko D.V. “Method for integrated circuits total ionizing dose hardness testing based on combined gamma- and x-ray irradiation facilities”, Facta Universitatis Series: Electronics and Energetics, Vol. 27, No. 3, 2014, pp. 329-338.
[11] P. K. Skorobogatov, “Laser simulation of volume ionization effects in submicron VLSI circuits,” Russian Microelectronics, vol. 42, no. 7, pp. 420-423, 2013.
[12] O. A. Kalashnikov, “Statistical variations of integrated circuits radiation hardness,” in Proc. 12th European Conf. on Radiation and its Effects on Components and Systems, RADECS-2011, Sevilla; Spain; Sept. 19 -23, 2011, pp. 661-664.


AbstThe possirrad
Key
1. I
In(tranencodthe LVDSextentransconverepeaetc. applithe ainfluecosm
ThbehavCAN,time tests manu
Inblock
- - -
LVDSCMO
- - -
typesTh
result
RADIA
Davydov G
tract. The commost sensitive
sible to identifydiation.
y words: transc
INTRODUCTION
ntegrated circsceivers) ding / decodindustrial sS, CAN, etc.nded data linsceiver ICs erters, code aters, signal
Using thecations assuabsence of ence of io
mic. his work invior features, RS-232 tranperiod fromof more than
ufactured in n the commoks on the tran Receiver (on Transmitter Voltage leve
S, TTL / CMOS <-> RS-23
The control Galvanic iso Data form
s). he comparatts allowed us
ATION BEHA
G.G., Koloso
Natio
mparative analyblocks of transc
y the productio
ceiver IC, radia
N
cuits of receiare wide
ing data sigstandards (R), as well as
nes. The nomincludes
converters, gamplifiers,
e transceivumes high
faults andonizing radi
ncludes the s of the RSnsceivers und
m 2010 to 20n 60 types ofRussia and on case, there
nsceiver's chine or more);r (one or morel converter (
MOS <-> RS32, etc.);
unit (for theolation (for that converter
tive analysiss to solve the
AVIOR FEAT
ova A.S., Ya
onal Research
ysis of radiationceiver ICs whic
on technology o
tion effects, sen
ivers-transmely used nals accordiRS-485, RSs for matchimenclature oa voltage
galvanic isolabuffer elem
vers in sprequirement
failures atiation, inclu
analysis o-485/422, Lder irradiatio14 we carrief the transce
overseas. e are the folloip:
re); (TTL / CMO
S-485/422, T
e certain typehe certain tyr (for the ce
s of the obte following ta
TURES OF T
anenko A.V
h Nuclear Univ
n behavior for mch cause the radof the transceiv
nsitive block of I
mitters for
ing to S-232, ing of of the
level ation,
ments, pecial ts for t the uding
of the LVDS, on. In ed out eivers,
owing
OS <-> TTL /
es); ypes); ertain
tained asks:
THE MODER
V., Boychen
versity (NRNU
more than 60 tydiation failures ver IC on the b
IC
- to revwhich causIC with HiDose (TID)
- to idtechnologybehavior u
2. THE S
EQUIPM
NRNU sources of of high doswith the “RADON-8electron acthe exposuwas invest"RIC" seripanorama as well aU31 / 33 insingle evenout using tU400M (Ras the facil3 and Pico136Xe, 207Bi
The syscontrol of implementInstrumenthe followsupply), NPPMU) NI
RN TRANSC
nko D.V., P
U) MEPhI
ypes of the tranwere identified
base of analysi
veal the mose the failureigh Dose Rat), Single Eve
dentify the ty on the bnder irradiat
SOURCES OF R
ENT
MEPhI faciionizing exp
se rate (HDRuse of lase
8” [1], as wccelerator ARure. Total ionigated using es [3], the iMEPhI" bas
as the linean X-ray modnt effects (Sthe heavy ion
Roscosmos, Jlities of focu-4 [7]. In moi ions were usstem for parthe device-u
ted on tsTMPXI(e) wing modu
NI-6556 (digI-7841R (DA
CEIVER ICs
Pechenkin A
nsceiver ICs is pd. It was shownis of its behavi
ost sensitive es and faults te (HDR), To
ent (SEE) effetransceiver's
basis of anation.
RADIATION AN
ilities were posure. The iR) effects waer sources “
well as the pRSA [2] for cnizing dose (
g the X-ray sisotopic soursed on Co60 aar electron de [5]. LocalSEE) tests wn acceleratorJINR, Dubnaused laser radost cases 20N
used. rametric anunder-test (
the platform an
ules: NI-41gital input/o
AC and ADC
A.A.
presented. n that it is ior under
componentsof the wholeotal Ionizingects; s productionalysis of its
ND TEST
used as theinvestigations carried out“RADON-5”,
pulsed linearcalibration of(TID) effectssources fromrce "Gammaand Cs137 [4]
acceleratorl effects andwere carrieds U-400 and
a) [6], as welldiation Pico-e, 40Ar, 86Kr,
d functionalDUT) [8] is
Nationalnd includes110 (poweroutput withprocessing),
s e g
n s
e n t , r f s
m a ] r d d d l -,
l s l s r h ,

414
NI-5105 (oscilloscope), NI-4071 (multimeter), NI-2529 (relay switch). The control of modules and devices, as well as the transfer of data is carried out with a personal computer. Specialized software developed in the programming environment NI LabVIEW 2012 with NI LabVIEW Real-Time and NI LabVIEW FPGA add-ons [9].
The DUT board does not contain any active elements, so it was possible to place the whole DUT board to exposure volume. DUT board is connected with control equipment by 2m multiwire shielded cable; this length in most cases is enough to organize protection of the equipment from ionizing radiation.
3. DEFINITION OF TRANSCEIVER IC'S BLOCKS THAT DETERMINE ITS RADIATION HARDNESS AT HDR EXPOSURE
Data format converter
The rarest are transceiver ICs with integrated converter of data format (for example, parallel-to-serial conversion). Analysis of tests results allows assuming that the conversion block is the most critical when assessing the level of radiation hardness to HDR exposure. It may be justified by the following:
1. Table 1 shows the levels of radiation hardness (in rel. units.) of several parameters for the SN65LVDS152functional analog. The radiation hardness on individual criterion is the maximum level of ionizing radiation at which this criterion is within the limits specified in datasheet. The lowest level (by the data loss criterion) has the block of data format conversion with output data FIFO.
Table 1.The levels of radiation hardness at HDR exposure of SN65LVDS152 functional
analog.
Parameter Radiation hardness at HDR, rad[Si]/s
Data loss in FIFO ~ 107 Output voltage levels ~108 Latch-up, irreversible
failure >~1011
2. The time of efficiency loss (the "dead"
time) tD of this IC depends on the frequency of the input data finin accordance with the equation:
≤ 2,0 × 10 + , (1)
where the first term is the “dead” time of the receiver's output buffers, and the second term is the frequency-depended data loss in FIFO.
Therefore, the "dead" time is determined
mainly by the errors in block of data format conversion if the input data frequency is reduced down to 1 MHz.
Galvanic isolation
Integrated galvanic isolation on the transceiver chip is usually realized by an optocouplers or optical relays. According to results of early studies, the level of radiation hardness of discrete optocoupler (optical relay) is determined by the internal photodetector. Radiation hardness of packaged optocouplers is usually ~107...~109rad[Si]/s and depends on the manufacturing process, as well as the maximum loading power.
The typical relaxation time of LED and photodiode (phototransistor) in discrete optocoupler is within the range of several μs after HDR exposure [10]. This value is comparable to the typical "dead" time duration for CMOS circuits [11]. Nevertheless, some studies indicate a relaxation time up to 2 ms for discrete optocouplers.
Thus, the presence of the galvanic isolation in the transceiver may lead to the increase of the "dead" time up to a few milliseconds. However, during the radiation tests of isolated transceivers, this effect was not detected.
Control unit
In most cases, the main function of the control unit is the connection / disconnection of the outputs of receiver and (or) transmitter from the data lines. It may be concluded that the role of this block in behavior of the whole IC at HDR exposure is relatively small.
Thus, the obtained results of the HDR tests
of more than 20 transceivers types, that were carried out from 2010 to 2014, allows us to make the following conclusions.
- at HDR exposure, radiation hardness of transmitter block is up to ~ 3 times less for RS-485/422 and LVDS transceivers than one of receiver block (Fig. 1);
- "dead" time duration for the studied receivers and transmitters differs within 2 ... 3 times, except RS-232 transceivers, where "dead" time of the transmitter up to 10...100 times exceeds one for the receiver.
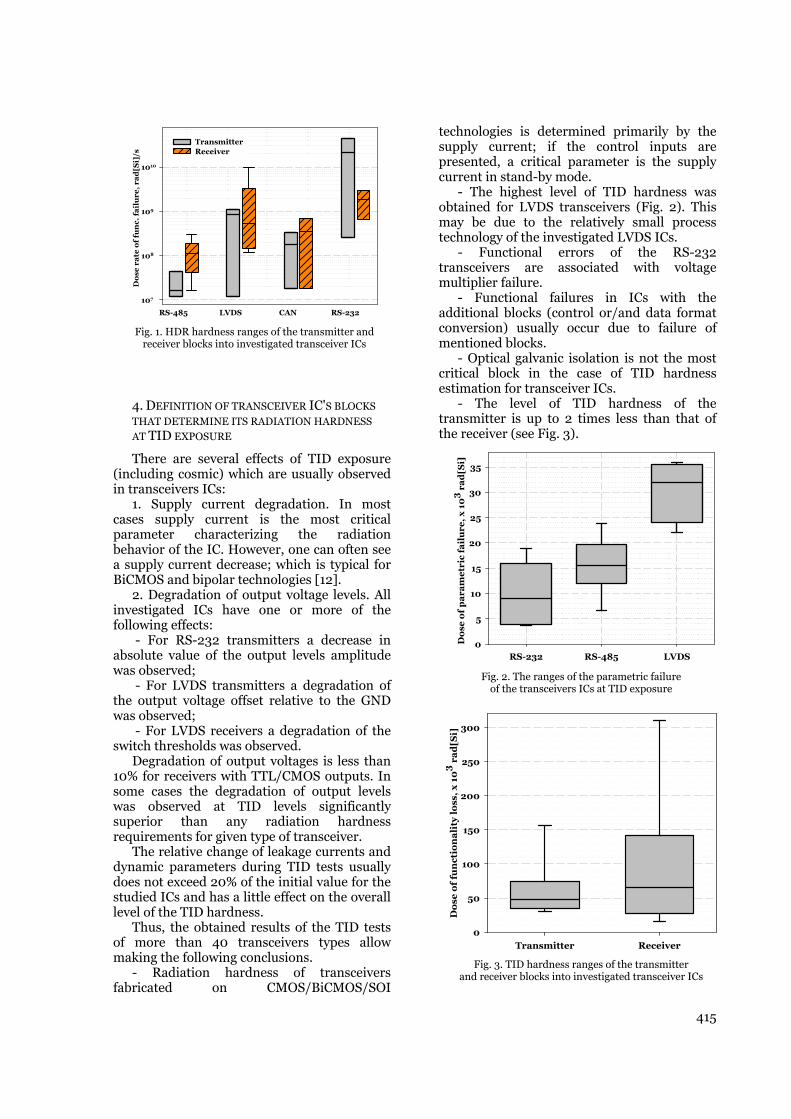
415
Fig. 1. HDR hardness ranges of the transmitter and receiver blocks into investigated transceiver ICs
4. DEFINITION OF TRANSCEIVER IC'S BLOCKS THAT DETERMINE ITS RADIATION HARDNESS AT TID EXPOSURE
There are several effects of TID exposure (including cosmic) which are usually observed in transceivers ICs:
1. Supply current degradation. In most cases supply current is the most critical parameter characterizing the radiation behavior of the IC. However, one can often see a supply current decrease; which is typical for BiCMOS and bipolar technologies [12].
2. Degradation of output voltage levels. All investigated ICs have one or more of the following effects:
- For RS-232 transmitters a decrease in absolute value of the output levels amplitude was observed;
- For LVDS transmitters a degradation of the output voltage offset relative to the GND was observed;
- For LVDS receivers a degradation of the switch thresholds was observed.
Degradation of output voltages is less than 10% for receivers with TTL/CMOS outputs. In some cases the degradation of output levels was observed at TID levels significantly superior than any radiation hardness requirements for given type of transceiver.
The relative change of leakage currents and dynamic parameters during TID tests usually does not exceed 20% of the initial value for the studied ICs and has a little effect on the overall level of the TID hardness.
Thus, the obtained results of the TID tests of more than 40 transceivers types allow making the following conclusions.
- Radiation hardness of transceivers fabricated on CMOS/BiCMOS/SOI
technologies is determined primarily by the supply current; if the control inputs are presented, a critical parameter is the supply current in stand-by mode.
- The highest level of TID hardness was obtained for LVDS transceivers (Fig. 2). This may be due to the relatively small process technology of the investigated LVDS ICs.
- Functional errors of the RS-232 transceivers are associated with voltage multiplier failure.
- Functional failures in ICs with the additional blocks (control or/and data format conversion) usually occur due to failure of mentioned blocks.
- Optical galvanic isolation is not the most critical block in the case of TID hardness estimation for transceiver ICs.
- The level of TID hardness of the transmitter is up to 2 times less than that of the receiver (see Fig. 3).
Fig. 2. The ranges of the parametric failure of the transceivers ICs at TID exposure
Fig. 3. TID hardness ranges of the transmitter and receiver blocks into investigated transceiver ICs
RS-485 LVDS CAN RS-232
Do
se r
ate
of
fun
c. f
ail
ure
, ra
d[S
i]/s
107
108
109
1010
TransmitterReceiver
RS-232 RS-485 LVDS
Do
se o
f p
ara
me
tric
fa
ilu
re,
x 1
03
ra
d[S
i]
0
5
10
15
20
25
30
35
Transmitter Receiver
Do
se o
f fu
nct
ion
ali
ty l
oss
, x
10
3 r
ad
[Si]
0
50
100
150
200
250
300

416
5. DEFIN
THAT DET
SEE
Single chrange of efffollowing significant:
- SEL - increasing sSEL is ofdamage andmay be carrpower supp
- SEU, reversible fparticle.
The typcircuits aftmicroseconfrequenciesare no mortransceivers0.5 μm and100 MHz [1[19-21]. HoLET value typical SEUthan 0.6 mi
SEU in functional bfig. 4 showsfocused lase30 nJ in pu0.35 um CMare marked
It was sSEU areas (transmitter4(a) and 4may providchip which receiver blo
NITION OF TRA
TERMINE ITS R
harged partifects [13]. Feffects are
single evensupply (or inften accomd irreversibleried out by b
ply and / or inSEFI - a
failure due t
pical recoveter SEU uds [14]. How in the cons
re than 10 Ms with proced operating f17] SEU may owever, acco
of SET is U LET whenicrons.
some casesblocks of ICs the transceer beam withulse. The D
MOS technol(fig. 4).
shown that tdepends on
r or receive4(b) respectide informatioare occupied
ocks.
(a
ANSCEIVER IC'RADIATION HA
icles producFor transceiv
most com
nt latch-up, nput) currenpanied by e failures; SE
briefly disconnput signals;
single or to exposure
ry durationusually is uwever, typicasidered trans
MHz [15, 16].ess technologfrequencies i
cause functiording to [1
much moren the technol
s allows locC chip. As aeiver chip afh 10 um in diDUT was fab
logy. The fie
the arrangemn the opera
er was disabively). Such on about th
d by the trans
a)
'S BLOCKS
ARDNESS TO
ce the wide vers ICs the mmon and
i.e. rapidly nt of the IC;
functional EL parrying nnecting the ;
functional of charged
n of linear up to few al operating sceivers ICs . For LVDS gy less than in excess of ional errors 18], typical e than the logy is less
calizing the n example,
fter scan by ameter and
bricated on elds of SEU
ment of the ation mode bled in fig.
SEU map he areas on smitter and
Fig. 4of S
by las(a)
Fovalue
3,trans
4,
Thof thtransFurththreshtechnone technknow
Fof SE
LET
SEtransproceconv
LE
T,
Me
V/c
m2
mg
1
10
. The SEU mapsSEU/SET sensitser beam with 2) - receiver is en
or the invees of the line,5 ± 1,2 smitter; ,5 ± 1,5 [MeV
hese results he receiver smitter blockhermore, the hold LET are
nology [18] (Fcan define
nology if the thwn.
Fig. 5. SEU LETEE tests for submTs for transmitte
chip
EFI effectsceivers ICs essing blo
version block
0,8
LETSEU ar
LETSET are
LETSEU of
LETSEU of
LETSEU of
LETSEU of
Average LE
(b)
s of the transceitivity were mark0 nJ in pulse anabled; (b) - tran
estigated chiar energy los
[MeV/(cm
V/(cm2·mg)]
show a greablock as c
k. obtained le
e typical for CFig. 5). Thus, the minimumhreshold LET
area [18] with tmicron ICs. Adder and receiver b(see fig. 4) are s
s may cwith additi
ock and/ork. By scannin
Technology, μm0,6
ea [18]
ea [18]
TI TLK2711 [19]
DS16F95 [20]
transmitter block
receiver block
ETSEU (MEPhI, 20
iver IC chip. Theked after single snd 30 μm in diansmitter is enab
hip, the follss were obtai
m2·mg)] for
for the recei
ater SEU harcompared t
evels of SEUCMOS 0.35 mfor transceive
m size of pT of the SEU/
the average resuditionally, the thblocks of investshown.
characterize ional informr data fng the chip
m0,0,4
k
010 - 2014)
e areas scan meter:
bled.
owing ined: r the
iver.
rdness o the
U/SET micron ers ICs process SET is
ults hreshold tigated
the mation format
using
2

the fothe S
ThtopolweakblockassumfunctbuffepoweleadsFig. SEL prote
6.
Thanalythan transa prradiaidentfunctbeen hardntimestrans"Deadtrans
ocused laser EU) can be the SEL effectlogy of the
kly dependenk (Fig. 6). Home that Stional faults ers. In fact, aerful transiss to addition7 shows wain the outp
ection.
Fig. 6. The arefor 2 type
CONCLUSION
his paper ysis results o60 types of
sceivers. The reliminary aation hardnetified. The rational blocksanalyzed. It
ness of the ts less in sceivers thand" time
smitter was m
beam, these topologically t is usually d
e chip, its nt on the tyowever, it m
SEL with tusually occu
a latch-up strstors in outal drop of th
aveforms of put stages
eas with manifeses of RS-485 tra
N
presents tof radiation b
RS-232, RS-several regu
assessment ess of the adiation behs of the trawas shown
transmitter bRS-485/4
n one of thduration o
more than th
blocks (similocalized.
determined bmanifestatio
ype of functmay be possib
the concomurs in the oructure shuntput stage, he output sigfunctioning
and in the
stations of SEL ansceivers
the comparbehavior for -485, CAN, L
ularities that for the levtransceiver avior of the
ansceiver ICthat the radi
block is up t22 and L
he receiver bof the RS
hat for the rec
ilar to
by the on is tional ble to
mitant output nts the
what gnals.
g with ESD
arative more
LVDS allow
vel of were main
Cs has iation to ~ 3 LVDS block. S-232 ceiver
up to 1 ... 2effect fortransceivercurrent deRS-232 traof voltage can definetechnologytransfer devaluation
Fig. 7. DUT ouwith
Acknow
to Sergey data. This agreement Education a14.578.21.00research RF
2 orders of mall fabric
r, except begradation. Aansceivers ismultiplier. F
e the minimy after threduring the .
(
(
utput signals afthout (b) mainta
wledgementMalyugin forwork was pe
between thand MEPhI o075 (a uniqFMEFI57814X
magnitude. Thcation techbipolar, is A functional s associated For transceiv
mum size ofeshold of lin
SEU/SET
(a)
(b)
ter SEL occurrenaining of functio
t: The authorsr providing erformed undhe Russian on Novemberque identifierX0075).
417
he main TIDnologies ofthe supplyerror of thewith failure
vers ICs onef fabricationnear energyregistration
nce: with (a) anoning.
s are gratefulexperimental
der the grantMinistry of24, 2014 №
r of applied
7
D f y e e e n y n
d
l l t f
№ d
418
REFERENCES
1. A.Y. Nikiforov, P. K. Skorobogatov, A. I. Chumakov, A. V. Kirgizova, A. G. Petrov, P. P. Kutsko, A. V. Kuzmin, A. A. Borisov, V. A. Telets, V. T. Punin, and V. S. Figurov, “Experimental studies of the adequacy of laser simulations of dose rate effects in integrated circuits and semiconductor devices,” Russian Microelectronics, vol. 38, no. 1, pp. 2–16, 2009.
2. S.I. Lobov, N.G. Pavlovskaya, S.P. Pukhov. “Nanosecond 1.5MV electron accelerator with sealed tube”. Instruments and Experimental Techniques,no. 2, pp. 35-38, 1991.
3. V. V. Belyakov, V. S. Pershenkov, G. I. Zebrev, A. V. Sogoyan, A. I. Chumakov, A.Y. Nikiforov, and P. K. Skorobogatov, “Methods for the prediction of total-dose effects on modern integrated semiconductor devices in space: A review,” Russian Microelectronics, vol. 32, no. 1, pp. 25–38, 2003.
4. A.S. Artamonov, A.A. Sangalov, A.Y. Nikiforov, V.A. Telets,D.V. Boychenko.“The New Gamma Irradiation Facility at the National Research Nuclear University MEPhI”. Radiation Effects Data Workshop (REDW), pp. 258–261, 2014.
5. A. Kuzmin, V.A. Dvornikov. “X-band Linear Accelerator U-31/33”, SAL MEPhI internal report.
6. G. Gulbekyan, B. Gikal, S.N. Dmitriev, S.L. Bogomolov, et al.“Development of flnrjinr heavy ion accelerator complex in the next 7 years. New dc-280 cyclotron project”. Proc. of 2nd International Particle Accelerator Conference IPAC, pp. 2700–2702, 2011, code 100156
7. A.N. Egorov, A.I. Chumakov, O.B. Mavritskiy,A.A. Pechenkin,etal.“Femtosecond Laser Simulation Facility for SEE IC Testing”. Radiation Effects Data Workshop (REDW), pp. 247–250, 2014
8. А.S. Kolosova, G.G. Davydov, L.N. Kessarinsky, D.V. Boychenko. “Automated test facility system for parametric and functional control of tranceiver IC’s”. Proc. of XIII Annual conference NI Days, pp. 15–17, 2014.
9. www.ni.com 10. A.H. Johnston, T.F. Miyahira. “Hardness assurance
methods for radiation degradation of optocouplers”. IEEETrans.Nucl. Sci.,vol.52 , no. 6, pp. 2649–2656, 2005.
11. A.Y. Nikiforov, A.V. Sogoyan. “Modeling of High-Dose-Rate Pulsed Radiation Effectsin the Parasitic MOS Structures of CMOS LSI Circuits”. Russian Microelectronics, vol. 33, no. 2, pp. 80-91, 2004.
12. R.N.Nowlin,E.W. Enlow,R.D. Schrimpf,W.E. Combs.“Trends in the total-dose response of modern bipolar transistors”. IEEE Trans. Nucl. Sci.,vol. 39, no. 6, pp. 2026 – 2035, 1992.
13. I. Chumakov, A. L. Vasil'ev, A. A. Pechenkin, D. V. Savchenkov, et al. “Single-event-effect sensitivity characterization of LSI circuits with a laser-based and a pulsed gamma-ray testing facilities used in combination,” Russian Microelectronics, vol. 41, no. 4, pp. 221-225, 2012.
14. Poivey,J.W. Howard,S. Buchner,K.A. LaBel, et al. “Development of a test methodology for single-event transients (SETs) in linear devices”. IEEE Trans. Nucl. Sci., vol. 48,no. 6, pp. 2180 – 2186, 2001.
15. EIA Standard RS-485. Washington: EIA. Engineering Dept. 1983. OCLC 10728525
16. EIA Standard RS-232-C. Washington: EIA. Engineering Dept. 1969.
17. ANSI/TIA/EIA-644-A Standard LVDS. Washington: EIA. Engineering Dept. 2001.
18. J. M. Benedetto, P. H. Eaton, D. G. Mavis,M. Gadlage, T. Turflinger. “Digital single event transient trends with technology node scaling”. IEEE Trans.Nucl. Sci., vol. 53, no. 6, pp. 3462–3465, 2006.
19. R. Koga, P. Yu, J. George. “Single Event Effects and Total Dose Test Results for TI TLK2711 Transceiver”, REDW 2008.
20. A.T. Kelly, P.R. Fleming, R.D. Brown, F. Wong. “Single Event and Low Dose-Rate TID Effects in the DS16F95 RS-485 Transceiver”, REDW 2010.
21. M. Hartwell, C. Hafer, P. Milliken, T. Farris. “Single Event Effects Testing of a PLL and LVDS in a RadHard-by-Design 0.25-micron ASIC”, REDW 2005.
NANO-OPTIC EFFECTS IN LASER DOSE RATE SIMULATION OF SUBMICRON MICROELECTRONIC DEVICES
P. K. Skorobogatov, G. G. Davydov, A. N. Egorov, A. V. Sogoyan, A.Y. Nikiforov
National Research Nuclear University (NRNU) MEPhI Specialized Electronic Systems Moscow, Russian Federation
Abstract. Pulsed laser sources are widely used for high dose rate effects modeling in modern ICs. In this research, a significant effect of optical beam polarization orientation on ionization response of ICs with design rules of less than the laser wavelength was demonstrated. This approach suggests taking into account the influence of a laser parameters on IC’s dose rate response.
Key words: laser radiation, polarization, ionization effects, integrated circuit
1. INTRODUCTION
Pulsed laser radiation (LR) is widely used for modeling of both dose rate [1-14] and single event [15-18] ionization effects in semiconductor devices and integrated circuits (ICs).
Process development and deep-submicron design rules may require taking into account the nano-optic effects such as optical beam polarization [19] while modelling LR penetration and absorption within a complex IC structure with multilayer metallization. In particular, the dependence of a submicron IC ionization response on the direction of polarization of local LR was demonstrated in [20]. It was found out that the difference in the amplitude of ionization response of ICs local area can increase to 3...4 times, depending on LR polarization direction.
Therefore, it is necessary to analyze the influence of LR polarization direction on the IC transient radiation effect response in order to improve laser simulation tests adequacy and stability.
The main objectives of the paper are to: - measure the actual unfocused LR
polarization of typical laser sources used in IC’s dose rate tests;
- analyze the impact of the unfocused LR polarization direction on IC electrical and functional transient failures, such as power supply and output responses, as well as functional failures and latch-up thresholds.
2. ACTUAL LR POLARIZATION OF RADON LASER
SOURCES
Laser sources of "Radon" series are widely used in ICs dose rate tests [21-23]. Laser test adequacy is assured by calibration-by-effect comparative experimental procedure using the reference pulsed radiation sources (such as flash X-ray machine).
Theoretically, LR polarization can affect the calibration accuracy in the case of sub-micron ICs. The angular dependence of LR intensity was measured to identify the polarization degree. This experiment was performed by "RADON-5E" [21,22] laser source using Ophir Vega (measuring head PE10-S). Glan prism was used as polarization analyzer.
Fig. 1(a) shows the obtained results. The red curve is the calculated angular dependence for 100% linearly polarized LR.
The measured LR polarization reaches 99.8%; the 0.2% depolarization may be due to the rotary mirror of a laser source.
The similar measurements were carried out for "RADON-8" laser source [23]. 99.99% degrees of polarization were found, and minor depolarization was introduced by the integrated smooth attenuator on the basis of Glan prisms.
In order to reduce LR non-uniformity on the irradiated area, the "RADON-5E" laser source contains built-in 1-side matted glass diffuser-homogenizer, which also reduces the degree of LR polarization. The measurement results indicate a significant reduction in LR polarization degree after homogenizer down to 69.4% (Fig.
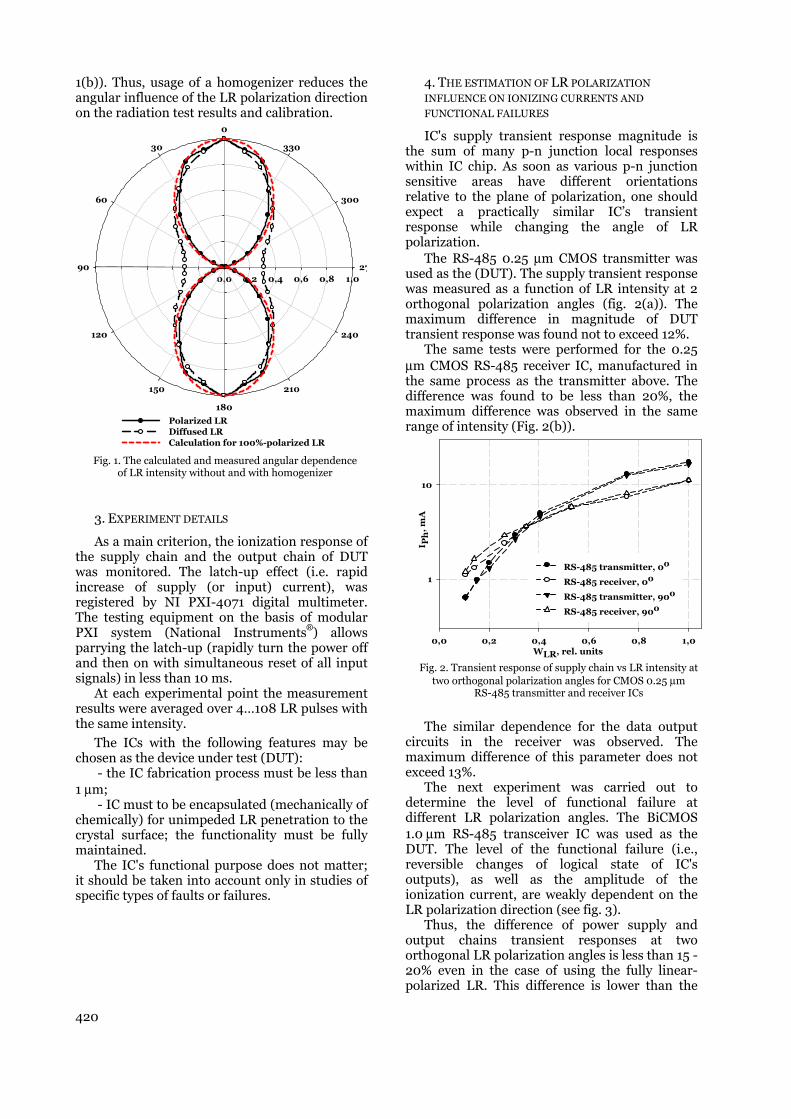
420
1(b)). Thus, usage of a homogenizer reduces the angular influence of the LR polarization direction on the radiation test results and calibration.
0,0 0,2 0,4 0,6 0,8 1,0
0
30
60
90
120
150
180
210
240
27
300
330
Polarized LRDiffused LRCalculation for 100%-polarized LR
Fig. 1. The calculated and measured angular dependence of LR intensity without and with homogenizer
3. EXPERIMENT DETAILS
As a main criterion, the ionization response of the supply chain and the output chain of DUT was monitored. The latch-up effect (i.e. rapid increase of supply (or input) current), was registered by NI PXI-4071 digital multimeter. The testing equipment on the basis of modular PXI system (National Instruments®) allows parrying the latch-up (rapidly turn the power off and then on with simultaneous reset of all input signals) in less than 10 ms.
At each experimental point the measurement results were averaged over 4…108 LR pulses with the same intensity.
The ICs with the following features may be chosen as the device under test (DUT):
- the IC fabrication process must be less than 1 μm;
- IC must to be encapsulated (mechanically of chemically) for unimpeded LR penetration to the crystal surface; the functionality must be fully maintained.
The IC's functional purpose does not matter; it should be taken into account only in studies of specific types of faults or failures.
4. THE ESTIMATION OF LR POLARIZATION
INFLUENCE ON IONIZING CURRENTS AND
FUNCTIONAL FAILURES
IC's supply transient response magnitude is the sum of many p-n junction local responses within IC chip. As soon as various p-n junction sensitive areas have different orientations relative to the plane of polarization, one should expect a practically similar IC’s transient response while changing the angle of LR polarization.
The RS-485 0.25 μm CMOS transmitter was used as the (DUT). The supply transient response was measured as a function of LR intensity at 2 orthogonal polarization angles (fig. 2(a)). The maximum difference in magnitude of DUT transient response was found not to exceed 12%.
The same tests were performed for the 0.25 μm CMOS RS-485 receiver IC, manufactured in the same process as the transmitter above. The difference was found to be less than 20%, the maximum difference was observed in the same range of intensity (Fig. 2(b)).
WLR, rel. units0,0 0,2 0,4 0,6 0,8 1,0
I Ph
, m
A
1
10
RS-485 transmitter, 0o
RS-485 receiver, 0o
RS-485 transmitter, 90o
RS-485 receiver, 90o
Fig. 2. Transient response of supply chain vs LR intensity at
two orthogonal polarization angles for CMOS 0.25 μm RS-485 transmitter and receiver ICs
The similar dependence for the data output circuits in the receiver was observed. The maximum difference of this parameter does not exceed 13%.
The next experiment was carried out to determine the level of functional failure at different LR polarization angles. The BiCMOS 1.0 μm RS-485 transceiver IC was used as the DUT. The level of the functional failure (i.e., reversible changes of logical state of IC's outputs), as well as the amplitude of the ionization current, are weakly dependent on the LR polarization direction (see fig. 3).
Thus, the difference of power supply and output chains transient responses at two orthogonal LR polarization angles is less than 15 - 20% even in the case of using the fully linear-polarized LR. This difference is lower than the
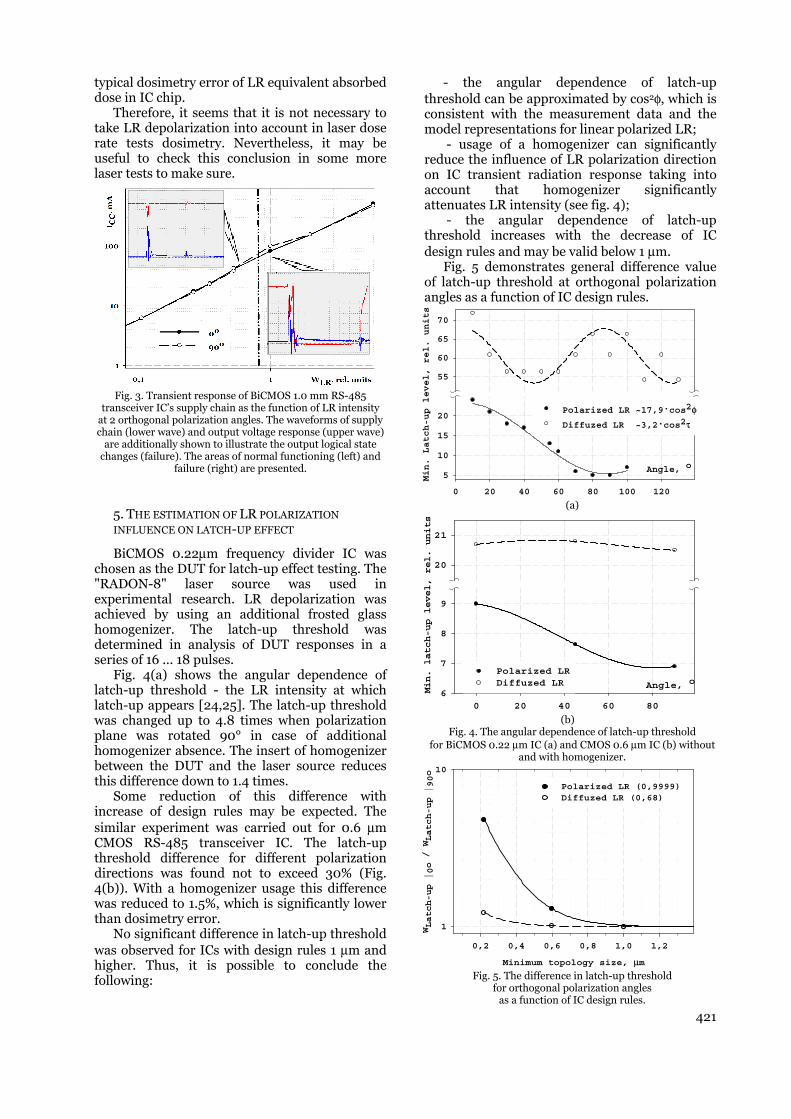
421
typical dosimetry error of LR equivalent absorbed dose in IC chip.
Therefore, it seems that it is not necessary to take LR depolarization into account in laser dose rate tests dosimetry. Nevertheless, it may be useful to check this conclusion in some more laser tests to make sure.
Fig. 3. Transient response of BiCMOS 1.0 mm RS-485 transceiver IC’s supply chain as the function of LR intensity
at 2 orthogonal polarization angles. The waveforms of supply chain (lower wave) and output voltage response (upper wave)
are additionally shown to illustrate the output logical state changes (failure). The areas of normal functioning (left) and
failure (right) are presented.
5. THE ESTIMATION OF LR POLARIZATION
INFLUENCE ON LATCH-UP EFFECT
BiCMOS 0.22μm frequency divider IC was chosen as the DUT for latch-up effect testing. The "RADON-8" laser source was used in experimental research. LR depolarization was achieved by using an additional frosted glass homogenizer. The latch-up threshold was determined in analysis of DUT responses in a series of 16 ... 18 pulses.
Fig. 4(a) shows the angular dependence of latch-up threshold - the LR intensity at which latch-up appears [24,25]. The latch-up threshold was changed up to 4.8 times when polarization plane was rotated 90° in case of additional homogenizer absence. The insert of homogenizer between the DUT and the laser source reduces this difference down to 1.4 times.
Some reduction of this difference with increase of design rules may be expected. The similar experiment was carried out for 0.6 μm CMOS RS-485 transceiver IC. The latch-up threshold difference for different polarization directions was found not to exceed 30% (Fig. 4(b)). With a homogenizer usage this difference was reduced to 1.5%, which is significantly lower than dosimetry error.
No significant difference in latch-up threshold was observed for ICs with design rules 1 μm and higher. Thus, it is possible to conclude the following:
- the angular dependence of latch-up threshold can be approximated by cos2φ, which is consistent with the measurement data and the model representations for linear polarized LR;
- usage of a homogenizer can significantly reduce the influence of LR polarization direction on IC transient radiation response taking into account that homogenizer significantly attenuates LR intensity (see fig. 4);
- the angular dependence of latch-up threshold increases with the decrease of IC design rules and may be valid below 1 μm.
Fig. 5 demonstrates general difference value of latch-up threshold at orthogonal polarization angles as a function of IC design rules.
Angle, o
0 20 40 60 80 100 120
Min. Latch-up level, rel. units
5
10
15
20
55
60
65
70
Polarized LR ~17,9.cos2φDiffuzed LR ~3,2.cos2τ
(a)
Angle, o
0 20 40 60 80
Min. latch-up level, rel. units
6
7
8
9
20
21
Polarized LRDiffuzed LR
(b) Fig. 4. The angular dependence of latch-up threshold
for BiCMOS 0.22 μm IC (a) and CMOS 0.6 μm IC (b) without and with homogenizer.
Minimum topology size, μm
0,2 0,4 0,6 0,8 1,0 1,2
WLatch-up |0o / WLatch-up |90o
1
10
Polarized LR (0,9999)Diffuzed LR (0,68)
Fig. 5. The difference in latch-up threshold for orthogonal polarization angles
as a function of IC design rules.
422
CONCLUSION
The influence of laser radiation polarization direction on transient radiation response was experimentally evaluated in laser simulation tests of various ICs.
It was found that the difference of the responses in supply and output chains for the different LR polarization directions is less than 20% for ICs with design rules down to 0.3 μm, that is in range of dosimetry error.
The angular dependence of the latch-up threshold was more pronounced in the deep-submicron processes. With the increase of design rule, the influence reduces and completely disappears for ICs with design rules of more than 1 micron.
It is strictly recommended to use a homogenizer at LR dose rate tests for less than 0.5 μm ICs and check the affect of the LR polarization direction on IC's ionization response.
Acknowledgement: This work was performed under the grant agreement between the Russian Ministry of Education and MEPhI on November 24, 2014 № 14.578.21.0075 (a unique identifier of applied research RFMEFI57814X0075)
REFERENCES
1. D.H. Habing. “Use of Laser to Simulate Radiation-Induced Transients in Semiconductor and Сircuits”, IEEE Trans. Nucl. Sci., vol. 15, no. 5, pp. 91-100, 1965.
2. M.N. Hardman, A.R. Edwards, “Exploitation of a Pulsed Laser to Explore Transient Effects on Semiconductor Devices”, IEEE Trans. Nucl. Sci., vol. 31, no. 6, pp. 1406-1410, 1984.
3. P.K. Skorobogatov, A.Y. Nikiforov, A.A. Demidov. “A way to improve dose rate laser simulation adequacy” IEEE Trans. Nucl. Sci., vol. 45, no. 6, pp. 2659-2664, 1998.
4. P.K. Skorobogatov, A.Y. Nikiforov, A.A. Demidov, V.V. Levin. “Influence of temperature on dose rate laser simulation adequacy” IEEE Trans. Nucl. Sci., vol. 47, no. 6, pp. 2442-2446, 2000.
5. A.Y. Nikiforov, P.K. Skorobogatov. “Physical principles of laser simulation for the transient radiation response of semiconductor structures. Active circuit elements, and circuits. A linear model”, Russian Microelectronics, vol. 33, no. 2, pp. 68-79, 2004.
6. A.Y. Nikiforov, P.K. Skorobogatov, “Physical principles of laser simulation for the transient radiation response of semiconductor structures, active circuit elements, and circuits: A nonlinear model“. Russian Microelectronics, vol. 35, no. 3, pp. 138-149, 2006.
7. P.K. Skorobogatov, A.Y. Nikiforov, O.B. Mavritsky, A.N.Egorov. “Influence of Wavelength on CMOS IC Dose Rate Laser Simulation Adequacy” Proc. of European Conf. "Radiation Effects on Components and Systems" (RADECS), pp. 153-155, 2004.
8. A.Y. Nikiforov, P.K. Skorobogatov. “Evaluating the effect of photogeneration nonuniformity on the accuracy of laser simulation of the transient radiation response in semiconductor devices and circuits”, Russian Microelectronics, vol. 37, no. 1, pp. 2-14, 2008.
9. A.Y. Nikiforov, P.K. Skorobogatov. “Evaluating the effect of temperature on the accuracy of laser simulation of the transient radiation response in semiconductor
devices and circuits” Russian Microelectronics, vol. 37, no. 1, pp. 15-24, 2008.
10. A.Y. Nikiforov, P. K. Skorobogatov, A. I. Chumakov, A. V. Kirgizova et al. “Experimental studies of the adequacy of laser simulations of dose rate effects in integrated circuits and semiconductor devices”, Russian Microelectronics, vol. 38, no. 1, pp. 2-16, 2009.
11. A.Y. Nikiforov, P.K. Skorobogatov, A.N. Egorov, D.V. Gromov. “Selection of optimal parameters of laser radiation for simulating ionization effects in silicon bulk-technology microcircuits” Russian Microelectronics, vol. 43, no. 2, pp. 133-138, 2014.
12. E.E. King, B. Ahlport, G. Tettemer, et al. “Transient Radiation Screening of Silicon Devices Using Backside Laser Irradiation”, IEEE Trans. Nucl. Sci., vol. 29, no. 5, pp. 1809-1815, 1982.
13. A.H. Johnston. “Charge Generation and Collection in p-n Junctions Excited with Pulsed Infrared Lasers”, IEEE Trans. Nucl. Sci., vol. 40, no. 6, pp. 1694-1702, 1993.
14. V.V.Belyakov, A.I. Chumakov, A.Y. Nikiforov, V.S. Pershenkov, et al. “IC's radiation effects modeling and estimation”. Microelectronics Reliability, vol. 40, no. 12, pp. 1997-2018, 1999.
15. A.I. Chumakov, A.N. Egorov, O.B. Mavritsky, A.Y. Nikiforov, A.V. Yanenko. “Comparison of IC upset thresholds under focused, local and uniform laser irradiation”. Proceedings of 5th International Workshop on Radiation Effects on Semiconductor Devices for Space Application, Takasaki, Japan, pp. 137-140, 2002.
16. A. I. Chumakov, A. N. Egorov, O. B. Mavritsky, A. V. Yanenko, “Evaluation of moderately focused laser irradiation as a method for simulating single-event effects”, Russian Microelectronics, vol. 33, no. 2, pp. 137-143, 2004.
17. A. Balasubramanian, D. McMorrow, S. A. Nation et al. “Pulsed Laser Single-Event Effects in Highly Scaled CMOS Technologies in the Presence of Dense Metal Coverage”, IEEE Trans. Nucl. Sci., vol. 55, no. 6, pp. 3401-3406, 2008.
18. A. I. Chumakov, A. A. Pechenkin, D. V. Savchenkov, A. S. Tararaksin et al. “Local laser irradiation technique for SEE testing of ICs”. Proceedings of the European Conference on Radiation and its Effects on Components and Systems, RADECS, pp. 449-453, 2012.
19. Zhe Sun, Qiang Li, Menghua Jiang, Hong Lei, Yongling Hui. “Improvement of the linearly polarized output power in Nd:YAG laser with [100]-cut rod”. Chinese Optics Letters, Beijing, art. no. S11402, pp. 1-5, 2012.
20. P.K. Skorobogatov, A.V. Sogoyan, G.G. Davydov, A.N.Egorov, D.V.Savchenkov. “The Impact of the Polarization Orientation on Laser SEE Modeling in Complex ICs” IEEE Trans. Nucl. Sci., vol. 62, is. 1, p. 2, pp. 195 – 201, 2015.
21. A.Y. Nikiforov, O.B. Mavritsky, A.N. Egorov et al. “ `RADON-5E' portable pulsed laser simulator: Description, qualification technique and results, dosimetry procedure” IEEE Radiation Effects Data Workshop, pp. 49-54, 1996.
22. A.Y. Nikiforov, O.B. Mavritsky, A.N. Egorov, A.I. Chumakov. “Upgrade design versions of RADON-5EM laser simulator”. Proc. of the European Conf. . "Radiation Effects on Components and Systems" (RADECS), pp. 300-304, 1998.
23. A.N. Egorov, A.Y. Nikiforov, A.I. Chumakov, A.V. Yanenko, O.B. Mavritskiy, A.A. Pechenkin. “Laser Facilities for Radiation Effects Simulation and Testing”. RADLAS-2011, Suresnes, France, 2011.
24. A.H. Jonston, M.P. Baze. “Mechanisms for the Latchup Window Effects in Integrated Circuits”, IEEE Trans. Nucl. Sci., vol. 32, no. 6, pp. 4018-4025, 1985.
25. P.K. Skorobogatov, A.Y. Nikiforov, B.A. Ahabaev. “Laser simulation adequacy of dose rate latch-up”. Proc. of the European Conf. . "Radiation Effects on Components and Systems" (RADECS), pp. 371-375, 1998.
SINGLE EVENT TRANSIENTS’ INVESTIGATION IN MODERN FPGA CIRCUITS
Sorokoumov G.S., Bobrovskiy D.V., Chumakov A.I.
Specialized Electronic Systems (SPELS), Russia National Research Nuclear University MEPhI, Moscow, Russia
Abstract. Experimental results of single event transients in FPGA under ion and focused laser beam irradiation are presented. Abnormal time duration of single event transients in FPGA under ion beam was observed.
Key words: heavy ions, laser, SET, SEE, TMR, chain of inverters, FPGA
1. INTRODUCTION
The paper presents new results about single event transients (SET) investigation in modern FPGA. FPGA was irradiated with focused laser and heavy ion beam. It’s necessary to investigate single event effects (SEE) in complex ICs to predict its behavior in a space environment using ground test results. As a rule, SEE sensitivity parameters are obtained from test procedure when the device under test (DUT) is irradiated by heavy ion accelerator or focused laser beam. The main goal of the test is to determine SEE cross section varying linear transfer energy (LET) of the incident ion [1].
Ordinary SEE test procedure is carried out on an ion accelerator. Heavy ion test results give a generalized data for all SEE in DUT, but it’s impossible to find the exact ion hit location in IC chip area.
Heavy ion accelerators can be used to calibrate focused laser data and additionally focused laser sources allow engineers to localize IC chip’s sensitive areas [2], [3]. Focused laser sources and ion accelerator test results are effective techniques to investigate SEE in VLSI and to develop effective methods to predict IC SEE rate in space environment.
In this paper we discuss abnormal SETs time duration in the FPGA test structures. Test structures were designed according to 180 nm CMOS FPGAs Antifuse-RAM process with two modes of configuration loading. FPGA configuration was stored in RAM for the first mode. This mode allowed multiple configurations rebooting which provided verification and debugging of the project. Antifuse cells were used for configuration storage in the second mode. Storing configuration information in the test structure FPGA operating in Antifuse mode was achieved by metal jumpers scraping and RAM power-down. SETs investigation in DUTs was carried out in Antifuse mode.
2. EXPERIMENTAL TECHNIQUE
2.1. Heavy ion irradiation
Heavy ion irradiations were performed using the U400M cyclotron at the Joint Institute for Nuclear Research (JINR, Dubna, Russia). Characteristics of the heavy ions are presented in Table 1 [4]. The experimental data were obtained using normally incident radiation. Ion flux dosimetry is obtained by polycarbonate terephthalate track detectors [5].
Table 1 Ions summary
Ion Energy of ions, MeV
LET, MeV·cm2/mg
Range (in Si), μm
20Ne 81 ≈ 6 45 40Ar 146 ≈ 15 38 84Kr 269 ≈ 40 35 136X
e 435 ≈ 69 37
Due to the short ion range, IC metal lid was removed before the experiments. Ion beam irradiation of the DUTs was carried out to the top side (IC element side).
2.2. Laser technique
Laser SET tests were performed using picosecond PICO-3 facility (Table 2). Laser facility consisted of the following major parts: laser source, variable attenuator, focusing unit (microscope) with illuminator, CCD camera, DUT positioning system (XYZ-stage) and control equipment.
The laser source PICO-3 is based on a diode-pumped solid state laser. PICO-3 generates focused laser pulses with 70 ps duration. Focused laser wavelengths are 532 nm and 1064 nm [6].
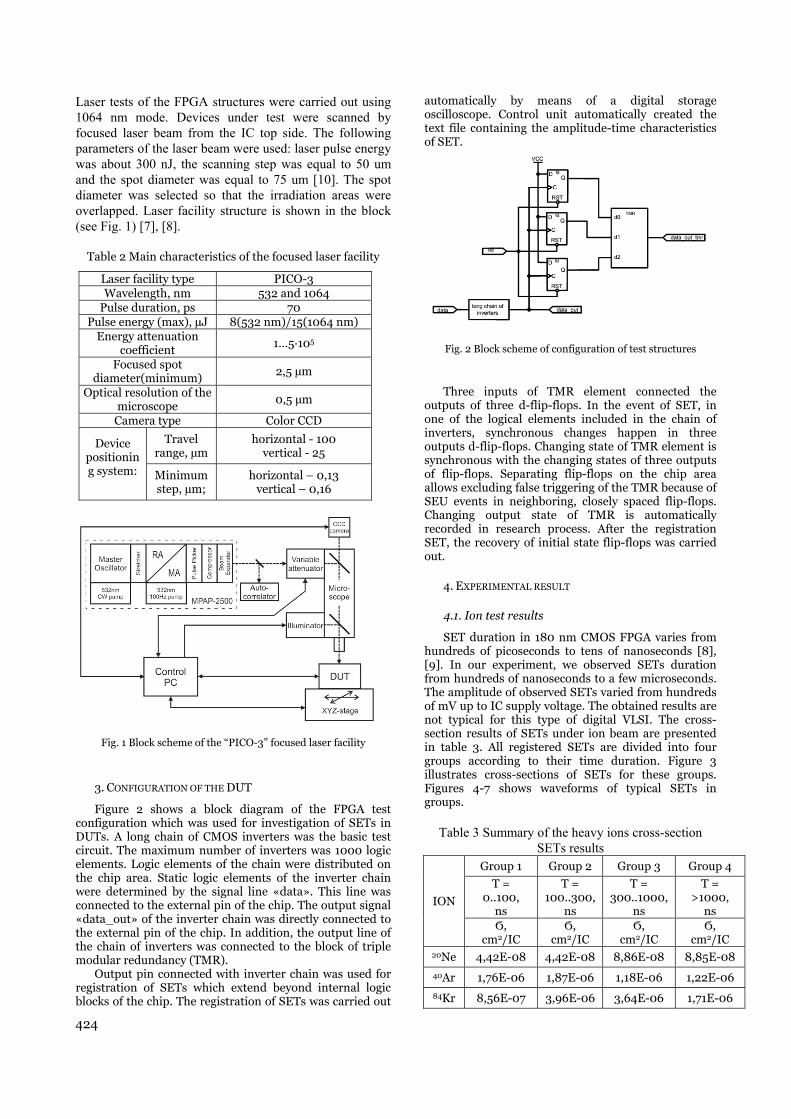
Laser tests of the FPGA structures were carried out using 1064 nm mode. Devices under test were scanned by focused laser beam from the IC top side. The following parameters of the laser beam were used: laser pulse energy was about 300 nJ, the scanning step was equal to 50 um and the spot diameter was equal to 75 um [10]. The spot diameter was selected so that the irradiation areas were overlapped. Laser facility structure is shown in the block (see Fig. 1) [7], [8].
Table 2 Main characteristics of the focused laser facility
Laser facility type PICO-3 Wavelength, nm 532 and 1064
Pulse duration, ps 70 Pulse energy (max), µJ 8(532 nm)/15(1064 nm)
Energy attenuation coefficient
1…5·105
Focused spot diameter(minimum)
2,5 µm
Optical resolution of the microscope
0,5 µm
Camera type Color CCD
Device positioning system:
Travel range, µm
horizontal - 100 vertical - 25
Minimum step, µm;
horizontal – 0,13 vertical – 0,16
Fig. 1 Block scheme of the “PICO-3” focused laser facility
3. CONFIGURATION OF THE DUT
Figure 2 shows a block diagram of the FPGA test configuration which was used for investigation of SETs in DUTs. A long chain of CMOS inverters was the basic test circuit. The maximum number of inverters was 1000 logic elements. Logic elements of the chain were distributed on the chip area. Static logic elements of the inverter chain were determined by the signal line «data». This line was connected to the external pin of the chip. The output signal «data_out» of the inverter chain was directly connected to the external pin of the chip. In addition, the output line of the chain of inverters was connected to the block of triple modular redundancy (TMR).
Output pin connected with inverter chain was used for registration of SETs which extend beyond internal logic blocks of the chip. The registration of SETs was carried out
automatically by means of a digital storage oscilloscope. Control unit automatically created the text file containing the amplitude-time characteristics of SET.
Fig. 2 Block scheme of configuration of test structures
Three inputs of TMR element connected the
outputs of three d-flip-flops. In the event of SET, in one of the logical elements included in the chain of inverters, synchronous changes happen in three outputs d-flip-flops. Changing state of TMR element is synchronous with the changing states of three outputs of flip-flops. Separating flip-flops on the chip area allows excluding false triggering of the TMR because of SEU events in neighboring, closely spaced flip-flops. Changing output state of TMR is automatically recorded in research process. After the registration SET, the recovery of initial state flip-flops was carried out.
4. EXPERIMENTAL RESULT
4.1. Ion test results
SET duration in 180 nm CMOS FPGA varies from hundreds of picoseconds to tens of nanoseconds [8], [9]. In our experiment, we observed SETs duration from hundreds of nanoseconds to a few microseconds. The amplitude of observed SETs varied from hundreds of mV up to IC supply voltage. The obtained results are not typical for this type of digital VLSI. The cross-section results of SETs under ion beam are presented in table 3. All registered SETs are divided into four groups according to their time duration. Figure 3 illustrates cross-sections of SETs for these groups. Figures 4-7 shows waveforms of typical SETs in groups.
Table 3 Summary of the heavy ions cross-section
SETs results
ION
Group 1 Group 2 Group 3 Group 4
T = 0..100,
ns
T = 100..300,
ns
T = 300..1000,
ns
T = >1000,
ns Ϭ,
cm2/IC Ϭ,
cm2/IC Ϭ,
cm2/IC Ϭ,
cm2/IC 20Ne 4,42E-08 4,42E-08 8,86E-08 8,85E-08
40Ar 1,76E-06 1,87E-06 1,18E-06 1,22E-06
84Kr 8,56E-07 3,96E-06 3,64E-06 1,71E-06
424

LET, MeV*cm2/mg
0 10 20 30 40 50
Sec
tion,
cm
2
1,0e-8
1,0e-7
1,0e-6
1,0e-5
Group 1Group 2Group 3Group 4
Fig. 3 SET cross-section curve for test structures of FPGA
Time, ns
1180 1200 1220 1240
Am
plitu
de, V
-1,0
-0,5
0,0
0,5
1,0
1,5
2,0
2,5
Fig. 4 Typical form of SET for group with duration in 0-100 ns range
Time, ns
1900 1950 2000 2050 2100 2150 2200
Am
plitu
de, V
0
1
2
3
4
Fig. 5 Typical form of SET for group with duration in 100-300 ns range
Time, ns
1000 1200 1400 1600 1800 2000
Am
plitu
de, V
0
1
2
3
4
Fig. 6 Typical form of SET for group with duration in 300-1000 ns range
Time, ns
1000 1500 2000 2500 3000
Am
plitu
de, V
0
1
2
3
Fig. 7 Typical form of SET for group with duration more than 1000 ns
4.2. Laser test results
An investigation of FPGA test structure on focused laser facility was performed to localize areas responsible for SETs. Laser irradiation of FPGA test structure was carried out from the top side (IC element side). Scanning of all ICs surfaces was carried out sequentially. During scanning, all registered SETs were logged. The coordinates of each SET was recorded in the log file. SET area coordinates make it possible to estimate IC structures responsible for transient generation.
Focused laser beam results could identify two places when the same SETs occurred under ion beam. Oscillogram of SET under laser irradiation is shown in figure 8. Figure 9 shows the localization of SET sensitive areas under focused laser beam. Places with SETs are marked on fig. 9 as crosshair with two circles. Unfortunately, we cannot observe all types of SETs induced ion beam. In our opinion, these sensitive areas are located under metallization layers and laser beam cannot induce SET in these areas.
425

Time, ns
800 1000 1200 1400 1600 1800 2000
Ampl
itude
, V
-2
-1
0
1
2
3
4
5 Laser facility ''PICO-3'Ion facility ''U400M'
Fig. 8 Laser and ion facilities SETs comparison
Fig. 9 Localization of places with SETs events
5. CONCLUSION
The investigation of SETs in test structures of FPGA IC under ion and focused laser beams was carried out. Four types of different SETs were registered under ion beam. Laser tests discovered two SET sensitive areas. Figure 8 illustrates good SETs waveforms correlation between heavy ion and laser irradiation.
After heavy ion and laser facilities data analyzing we can conclude that focused laser facilities are suitable not only for researching SEU effects [11], but also for SET investigations. Laser facilities allow us to define chip areas sensitive to SET and to investigate the process of the SET formation. Our experiment on the laser facility identified only one type of SETs observed on heavy ion facility. The difference is due to dense FPGA metallization. In some chip
areas laser irradiation doesn’t penetrate trough the metallization. Other types of SETs observed on heavy ion facility can be determined using laser irradiation from the chip’s back side. We are going to do this experiment, but it’s necessary to remove a part of the ICs’ package from the bottom side. SETs areas observed on laser facility correspond to FPGA I/O structures.
Abnormal duration of SETs is associated with discharging of the HCP’s induced charge through large resistance. The explanation is based on test structures’ schematic design. Large resistance is associated with the configuration of RAM’s cells. In antifuse mode, cells are disabled.
ACKNOWLEDGEMENT
Authors wish to thank Dr Alexander Pechenkin of the Specialized Electronic Systems, Russia for the laser irradiation.
REFERENCES 1. A. I. Chumakov, A. L. Vasil'ev, A. A. Kozlov, D. O.
Kol'tov, A. V. Krinitskii, A. A. Pechenkin, A. S. Tararaksin, and A. V. Yanenko, “Single-event-effect prediction for ICs in a space environment,” Russian Microelectronics, vol. 39, no. 2, pp. 74-78, 2010.
2. A. I. Chumakov, et al. Local Laser Irradiation Technique for SEE Testing of ICs. Proceedings of RADEC-2011, pp. 449-453.
3. Chumakov A.I., Interrelation of Equivalent Values for Linear Losses of Energy of Heavy Charged Particles and the Energy of Focused Laser Radiation. Russian Microelectronics, 2011, Vol. 40, No. 3, pp. 149–155.
4. V.A. Skuratov, et al Ion Beam Diagnostics for SEE Testing at U400M FLNR JINR Cyclotron. Proceedings of RADEC-2012.
5. Skuratov, V.A., et al. Roscosmos facilities for SEE testing at U400M FLNR JINR cyclotron. IEEE Radiation and Its Effects on Components and Systems (RADECS), 2011
6. A.N. Egorov, et al. Laser «PICO» Family Simulators for Testing Electronic Components for Resistance to HCP. Russia. Specialized Machinery and Communication, 2011, No. 4-5, pp. 8–13.
7. A.N. Egorov “PICO-4” Single Event Effects Evaluation and Testing Facility Based on Wavelength Tunable Picosecond Laser. IEEE Radiation Effects DataWorkshop 2012, pp. 69-72.
8. Evans A., Alexandrescu D.. SEE Test Report. Single Event Transient(SET) Measurement MicroSemi A3P3000L FPGAs. 2014, IROC Technologies. WTC POX 1510. Grenoble.
9. Berg M.. Field Programmable Gate Array (FPGA) Single Event Effect (SEE) Radiation Testing. 2012, NASA Electronic Parts and Packaging (NEPP); and Defense Threat Reduction Agency Under IACRO #11-4395I
10. P. K. Skorobogatov, A. Y. Nikiforov, and A.N. Egorov, “Optimization of laser irradiation parameters for simulation of a transient radiation response in thin-film silicon-based microcircuits,” Russian Microelectronics, vol. 44, no. 1, pp. 8-21, 2015.
11. A. I. Chumakov, A. A. Pechenkin, D. V. Savchenkov, A. S. Tararaksin, A. L. Vasil'ev, and A. V. Yanenko, “Local laser irradiation technique for SEE testing of ICs,”in Proc. 12th European Conf. on Radiation and its Effects on Components and Systems, RADECS-2011, Sevilla; Spain; Sept. 19 -23, 2011, pp. 449-453
426
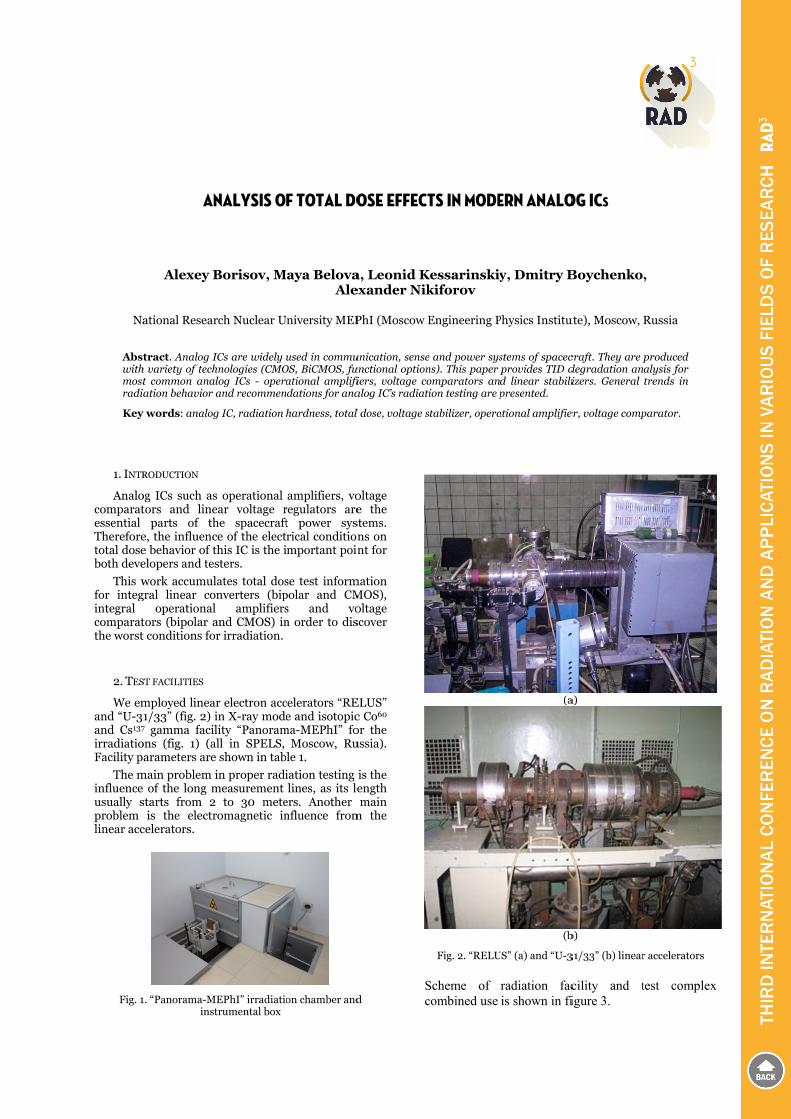
Na
Abstwithmostradi
Key
1. INTR
Analocomparatessential Thereforetotal doseboth deve
This wfor integintegral comparatthe worst
2. TES
We emand “U-3and Cs137
irradiatioFacility p
The minfluenceusually sproblem linear acc
Fig. 1
AN
Alexey B
ational Resear
tract. Analog Ih variety of techt common anaation behavior
y words: analog
RODUCTION
og ICs such astors and line
parts of the, the influence behavior of telopers and te
work accumulgral linear co
operationaltors (bipolar at conditions fo
ST FACILITIES
mployed linea1/33” (fig. 2)
7 gamma facilons (fig. 1) (aarameters are
main problem e of the long mstarts from 2
is the electrcelerators.
1. “Panorama-Minst
NALYSIS O
Borisov, M
rch Nuclear U
ICs are widely hnologies (CMO
alog ICs - operaand recommen
g IC, radiation
s operational ear voltage rhe spacecraftce of the electthis IC is the isters.
lates total dosonverters (bipl amplifiersand CMOS) in
or irradiation.
ar electron accin X-ray modelity “Panoram
all in SPELS, e shown in tab
in proper radimeasurement 2 to 30 meteromagnetic in
MEPhI” irradiatiotrumental box
F TOTAL DO
Maya BelovaAle
University MEP
used in commuOS, BiCMOS, fuational amplifi
ndations for ana
hardness, total
amplifiers, voregulators aret power sysrical condition
important poin
se test informpolar and CMs and von order to dis
celerators “REe and isotopic
ma-MEPhI” foMoscow, Ru
ble 1.
iation testing lines, as its le
ers. Anothernfluence from
on chamber and
OSE EFFECT
a, Leonid Kexander Nik
PhI (Moscow E
unication, senseunctional optionfiers, voltage coalog IC’s radiati
l dose, voltage s
oltage e the
stems. ns on nt for
mation MOS), oltage scover
ELUS” c Co60 or the ussia).
is the ength main
m the
d Sc
TS IN MODE
Kessarinskiykiforov
Engineering P
e and power sysns). This paper omparators anion testing are p
stabilizer, opera
Fig. 2. “RELU
Scheme of combined use
ERN ANALO
y, Dmitry B
Physics Institu
stems of spacecprovides TID dd linear stabilipresented.
ational amplifie
(a
(b
US” (a) and “U-3
radiation facis shown in fi
OG ICs
Boychenko
ute), Moscow,
craft. They are pdegradation anizers. General
er, voltage comp
a)
b)
31/33” (b) linear
cility and tigure 3.
,
Russia
produced alysis for trends in
parator.
r accelerators
test complex
x

428
Fig. 3. Schemeuse: 1 – radiatsoft-controlle
measuring
Table 1 C
Facility
RELUS
U-31/33
Panorama-MEPhI
3. OPERAT
COMPARAT
Modern othat are proTopology babehavior of offered, that Further paraexamples of ramplifier typcriteria set w
The opamThe opamp walso used to negative chanminimum ouout either byMC voltage currents seve[8].
Fig.
Based onwe can concldegraded par
e of radiation faction source; 2 –ed loads for volt
g box (hardwaresoftware o
Criterial paramcomp
Irradiation source
Braking radiation Braking radiation
Cs137 Co60
TIONAL AMPLIFI
TORS
operational amoduced by CMasis defines th
these ICs. Inallows to corr
ameters-criteriradiation behapes. After tha
will be defined.
mp applying cwas powered measure sup
nnels. Controutput voltage ay PXI-4071 m
or by PXI-5eral different c
7. Connection c
n the studies aude that, durirameters of op
cility and test co– board with testtage regulators a of test system);f test system)
meters of MAXparator
Irradiation energy, MeV
0,8
0,5
0,529 1,030
IERS AND VOLTA
mplifiers are MOS or Bipolhe main trendnformative parrectly define Tia set will be avior of differat, the optim
circuit is showby PXI-4110 u
pply current vl of maximum
and voltage offultimeter to m105 oscillosco
connection cir
circuit of IC und
and literature ing irradiationperational amp
omplex combineted samples; 3 –and DC-DC; 4 –; 5 – PC (with
X961 voltage
Length of measuring
lines, m
6
4
2 2
AGE
based on chiplar technologds in radiatiorameters set TID’s hardnesdiscussed wit
rent operationmal parameter
wn in figure unit which wa
via positive anm input voltagfset was carriemeasure outpuope. For inpu
rcuits were use
der test
data [4,5,8,16n, most severeplifier are thos
ed – –
ps gy. on is
ss. th
nal rs-
7. as nd ge, ed ut ut ed
6], ely se
suchand on th
Offs
et v
olta
ge, m
V
0
2
4
6
8
10
12
F
Inpu
t cur
rent
, μΑ
-10
-8
-6
-4
-2
0
2
Rmoddegrmaxiinpu
T
Sup
Shut
In
Of
Outp
Out
h as offset voloutput range. he operating a
0
0
2
4
6
8
0
2
ig. 4. Offset volt
0 10
8
6
4
2
0
2
Sample 1Sample 2Sample 3
Fig. 5.Input
Results of thede of an operatradation of thimum power s
ut.
Table 2 Criteria
Parameter
pply current, mA
tdown current, mA
nput current, uA
ffset voltage, mV
put high voltage, V
put low voltage, V
Functioning
ltage, input cuDependencies
amplifiers is sh
D, х
5 10
tage vs TID for A
Dos2 3
current vs TID f
e study show tional amplifi
he parameterssupply voltage
al parameters comparato
SymbolM
ICC
A ISHDN S
IB VIN
VOS
V VOH IS
V VOL I
FC
urrents, supps of criterial p
hown in figure
х103
0 15
1 (02 (63 (6
AD820 bipolar
se4
for OP1177 OpA
w that the moier, in terms os, is the onee and zero volt
of MAX961 vor
Measurement condition
lVCC = 5В VCC = 5В,
SHDN = 5В VCC = 5В
N+ = VIN- = 0В VCC = 5В
VCC = 5В SOURCE = 4мА
VCC = 5В ISINK = 4мА
VCC = 5В
ply current parameters es 4 and 5
20
0,032 rad(Si)/s)6,7 rad(Si)/s)6.7 rad(Si)/S)
OpAmp
5 6
Amp
ost critical of the dose e with the tage at the
voltage
RangeNot
lowerNot
higher- 11
- 0,5
-30 30
-4,5 4,5
4,48 -
- 0,52
Absence of failures and
faults

The coreoperationmain TID
4. VOL
Lineathe spaceof the elelinear redevelopercircuit is s
Fig. 6
4.1 L
The moutput vexperimeare presecorrelatiomost conhighest dpresented1.2...1.5 timaximumpresented
0
OU
TPU
T V
OLT
AG
E, V
0
2
4
6
8
10
12
14
16
Fig. 7. O
The Tconverterthan 1.2. main factload curreacceleratedecreases
es of modenal amplifiersD’s effects are t
LTAGE LINEAR S
r voltage reguecraft power syectrical condiegulators is rs and testersshown in figur
. Typical electri
Load Current
most importavoltage and tent results for ent in this pon between loaverters in cas
difference betd for hybrid imes less for
m load. TID ded in fig. 7.
10 2
№1 (№2 (№3 (№4 (№5 (
utput voltage vs
TID hardnessrs (CMOS, BiC
We suggestetor influence ent in CMOS es the tempes TID sensitivi
ern voltage s are almost the same.
STABILIZERS
ulators are theystems. There
itions on totaan importan. The voltage re 6.
ical application regulator
t
ant DC-DC pthe load curdifferent DC-
paper. There ad current ande of normal htween total dDC-DC convirradiations w
ependences of
Total dose, kr
20 30
(IOUT=33mA irradia(IOUT=33mA irradia(IOUT=134mA irradi(IOUT=134mA irradi(IOUT=33mA irradia
s TID for hybridNDL2415S
s level differeCMOS and bi
ed the temperof load currenand BiCMOS rature anneality.
comparators the same, so
e essential paefore, the influl dose behavi
nt point for regulator app
circuit of voltag
arameters arerrents. Total -DC’s load cur
is no signifd TID hardneeat extraction
dose hardnesserters, and it
with minimumf output voltag
rad
40 50
tion)tion)ation)ation)tion)
d DC-DC conver
ence of integipolar) is evenrature annealint. The increaintegral conveling and ther
and o the
arts of uence ior of
both plying
ge
e the dose
rrents ficant
ess for n. The s was t was
m and ge are
60
rters
grated n less ing is ase of erters refore
sthaisthEcisDsleds(M
cDcah
swgme
4.2 Shutd
Most of thsleeping (shuthree power co
active, and oths considered he reliability
Experimental converters revs the worst ca
DC-DC conversleeping modeevel can re
dependences oshutdown mohybrid DC-DC
Moreover, TID
Different converter LM2Different TIDconverter TPSapplying sleehardness.
0
OU
TPU
T V
OL
TA
GE
, V
4,75
4,80
4,85
4,90
4,95
5,00
Fig. 8.Outpu
0 5
Supp
ly c
urre
nt in
sle
epin
g m
ode,
mkA
0
5
10
15
20
25
30
Fig. 9. Output v
4.3 Unbia
There is ospacecraft syswith no powergradual inclusmission is the experimental
down Mode
he modern Dtdown) mode.onverters in hihers are in shuthat applyingand TID harnradiation dat
veals that irradase for most rters was drame irradiation. Dach up to
of output voltade irradiationC) and fig. 8
D degradation b
TID behavio2675M (CMO
behavior of 77833PWP is
eping-mode r
D10 20
№1№2№3№4
ut voltage vs TIDconverters
D,10 15
voltage vs TID fo
ased (Passive)
one more typtems – passir supplying osion of reservmethod of incresults show
DC-DC conve. Usually ther
high-reliable syutdown modeg reserve methrness of the sata of hybrid adiation in shu
circuits. TID’matically falliDifference in
3 times. Dage for active (ns are presen
(linear bipolabehavior can b
or of integrOS) is presenf integrated Cs presented inreserve can
D, krad30 40
D for bipolar lins LP2951A
, krad5 20 25
sample №sample №sample №sample №
for PWM-conver
) Irradiation
pe of reservaive (unbiased
of reserved corved devices creasing TID h
w that irradia429
erters providere are two orystems: one is(reserved). It
hod increasespace-systems.and integral
utdown modes hardness ofing in case ofTID hardness
Different TID(full load) andnted in fig. 7ar converter).be different.
rated PWM-ted in fig. 9.
CMOS linear-n fig. 10. Thus
reduce TID
50 60
near DC-DC
5 30 35
№1 (active)№2 (sleeping)№3 (sleeping)№4 (sleeping)
rter LM2675M
ation used ind) reservationonverters. The
during spacehardness. Ouration in such
9
e r s t s . l e f f s
D d 7 .
-. -s
D
n n e e r h

430
“power off mconverters. Ccurrent in slepassive (powfig. 11. TID may be 5 tiHardness of irradiation elTPS79533D, (passive or BiCMOS comicrocircuits
Fig. 10.Outp
0
SUPP
LY C
UR
REN
T IN
SH
DN
MO
DE,
mkA
0,01
0,1
1
10
100
1000
Fig. 11. Supply
Based oncriteria paradefined, whicon board of tparameters TPS70251, thof this chip in
Fig
0
Sup
ply
curr
ent i
n sl
eepi
ng m
ode,
mkA
0
20
40
60
80
100
120
140
mode” is the wConfirming Teeping mode f
wer off) mode fail level of imes lower cBiCMOS con
lectrical regimTPS79525D)
“cold”) reseonverters ans.
put voltage vs TTPS77
50 100
y current in sleep
n the results ameters of lich determinethe spacecraftof voltage
he figure shown studies.
g. 12. Measuring
2 4
sample №1 sample №2 sample №3 sample №4 sample №7
worst case foTID dependenfor active (minirradiations aunbiased bipo
compared witnverters slightme of converte). Thus applrve method
nd dangerous
TID for CMOS lin7833PWP
D, krad
150 200
№№№№
ping mode vs T
of studies, minear voltages the possibilt. Table 3 shoregulator ci
ws a diagram o
g circuit for TPS
D, krad6 8
(active)(active)(active)(active)(sleep)
r some bipolances of suppnimal load) anare presented iolar converteth active onetly differs fromer (for examplying unbiaseis useless fo
s for bipola
near converter
250 3
№1 (passive)№2 (active)№3 (active)№4 (active)
ID for LT1764E
minimum set e regulatorsity of their us
ows the criteriircuit exampof the inclusio
70251
10 1
ar ply nd in
ers es. m
ple ed for ar
300
EQ
of is se ial
ple on
Tconvinto Applharmrelia
Ivariounde
Ta
Ou
Ou
Line
Line
Quie
G
R
RES
Ackresea29-0scien
R
1.
2.
3.
4.
5.
6.
7.
8.
2
There is no “onverters. All su
account dulying shut-dow
mful for radiability without
n future it ious temperaerstanding of t
able 3 Criteria
Parameter
utput voltage 2, V
utput voltage 1, V
regulation of out 2mV
regulation of out mV
escent current, uA
GND current in shutdown, uA ESET threshold
voltage, V SET low voltage, V
Functioning
nowledgmearch done wit
09131 given bnce of Russian
REFERENCES
Keng C. Wu and Analysis. Drive, Suite 4051. Proton daJohnston A.H2000. – Vol. NA CompendiumData / LaBelNSREC 2000.56. E. W. EnSchrimpf, R. NProcesses to Iovol. 38, pp.134D.M. FleetwoSchrimpf, J. RWei, W.E. Cmechanisms degradation atvol.41, pp. 187Adell P.C., ScAttwood J.P., Single-Event Converters // 49. - № 6. – PAdell P.C., SchJ., Ribero P., and Single-EvCircuitry // IE- № 6. – PP. 18D.V. BoychenThe influence
ne for all” woruggested conduring TID hwn and unbiasiation space-sspecial confir
is planned toatures for the processes
al parameters oregulator
SymbolM
VO2 2,7
VO1 4,3
2, KU2 2,8
1, KU1 4,3
A IQ IO1 EN
II EN
VUVLO 2,7
V VRL V
FC 2,7
1 mA 1 mA
nt: The paphin the governby the minis
n Federation.
Switch-Mode PElsevier Acade
00, Burlington, mage in linear ., Rax B.G. //
NS-47. – PP. 675m of Recent Opl K.A., Kniffin
nlow, R. L. PeaN. Nowlin, “Responizing Radiatio42-1351, 1991. ood, S. L. KoR.A. Reber, M. Combs, and contributing tot low dose rates1-1883, 1994. chrimpf R.D., CCirba C.R., GallEffects in Sw
IEEE Trans. NuP. 3217-3221.
hrimpf R.D., HolSternberg A.,
vent Effects in EEE Trans. Nucl867-1872. ko, L.N. Kessaof the electrica
rst condition fditions shouldhardness invesed reserve mesystems hardrming experim
o carry out sa more
of degradation
of TPS70251 r
Measurement condition
l7 V ≤ VIN ≤ 6 V
IO1 = 1 mA 3 V ≤ VIN ≤ 6 V
IO2 = 1 mA 3
8 V ≤ VIN ≤ 6 V IO1 = 1 mA
3 V ≤ VIN ≤ 6 V IO2 = 1 mA VIN = 6 V
1 = IO2 = 1 mA N1 = EN2 = 0 V
N1 = EN2 = VIN
7 V ≤ VIN ≤ 6 V
VIN = 3,5 V 7 V ≤ VIN ≤ 6 V A ≤ IO1 ≤ 500 mA A ≤ IO2 ≤ 250 mA
per is a panment assignmstry of educa
Power Converteemic Press, 30USA, 2006, p. 4and digital optIEEE Trans. N
5-681. ptocoupler Rad
S.D., Reed R
ase, W. E. Componse of Advanon,” IEEE Tran
osier, R.N. NoDelaus, P. S. WR.L. Pease,
o enhanced bis”, IEEE Trans
Choi B.K., Holloway K.F. Tota
Switching DC/ucl. Sci. - 2002
olman W.T., BocGalloway K.F. DC-DC Converl. Sci. - 2003. - V
arinskiy, D.V. al conditions on
for DC-DC d be taken estigation. ethods are
dness and ments.
studies at complete
n.
voltage
RangeNot
lowerNot
higher
1,764 1,836
3,234 3,366
- 6
- 6
- 230
- 6
2,4 2,65
- 0,4 Absence of failures and
faults
rt of the ment #14-ation and
ers, Design 0 Corporate 409. ocouplers /
Nucl. Sci. –
diation Test R.A. etc. //
mbs, R. D. nced Bipolar s. Nucl. Sci.
owlin, R.D. Winokur, A. “ Physical ipolar gain . Nucl. Sci.,
lman W.T., al-Dose and DC Power
2. - Vol. NS-
ch J., Stacey Total-Dose
rter Control Vol. NS-50.
Pechenkina n total dose
431
behavior of the analog switches // Proc. of 12th European Conf. "Radiation and its Effects on Components and Systems" (RADECS 2011, Sept. 19-23, 2011, Spain, pp. 822-824.
9. L.N. Kessarinskiy, D.V. Boychenko, A.Y. Nikiforov An analysis of the radiation behavior of pulse voltage stabilizers // Russian Microelectronics, 2012, v. 41, pp. 251-258.
10. Kalashnikov O.A., Demidov A.A., Figurov V.S., Nikiforov A.Y., Polevich S.A., Telets V.A., Maljudin S.A., Artamonov A.S. Integrating analog-to-digital converter radiation hardness test technique and results// IEEE Transactions on Nuclear Science 45 (6 PART 1) , 1998, pp. 2611-2615
11. Gromov D.V., Elesin V.V., Chukov G.V., Repin V.V. / Radiation effects in bipolar transistors based on silicon-germanium heterostructures // CriMiCo - 2009 19th International Crimean Conference Microwave and Telecommunication Technology, Conference Proceedings, pp. 726-727.
12. Elesin V.V., Chukov G.V., Gromov D.V., Repin V.V., Vavilov V.A. / The effect of ionizing radiation on the characteristics of silicon-germanium microwave integrated circuits // Russian Microelectronics, 2010, 39 (2), pp. 122-133.
13. Boychenko D.V., Nikiforov A.Y., Skorobogatov P.K., Sogoyan A.V. / Radiation Effects in Piezoelectric Sensor // Proceedings of the European Conference on Radiation and its Effects on Components and Systems, RADECS, 2007, art. no. 5205522, pp. 95-96.
14. Zebrev G.I., Pavlov D.Y., Pershenkov V.S., Nikiforov A.Y., Sogoyan A.V., Boychenko D.V., Ulimov V.N., Emelyanov V.V. / Radiation response of bipolar transistors at various irradiation temperatures and electric biases: Modeling and experiment // Proceedings of the European Conference on Radiation and its Effects on Components and Systems, RADECS, 2005, art. no. 4365613 , pp. PG41-PG45
15. Pershenkov V.S., Savchenkov D.V., Bakerenkov A.S., Egorov A.S. / Calculation of surface recombination current in bipolar microelectronic structures subjected to ionizing radiation // Russian Microelectronics, 2009, Vol. 38, №1, pp. 17-29.
16. Chumakov A.I., Vasil'ev A.L., Kozlov A.A., Kol'tov D.O., Krinitskii A.V., Pechenkin A.A., Tararaksin A.S., Yanenko A.V. / Single-event-effect prediction for ICs in a space environment // Russian Microelectronics, 2010, Vol. 39, № 2, pp. 74-78.
17. Djoric-Veljkovic, S.A, Davidovic, V.B, Dankovic, D.B, Manic, I.B, Golubovic, S.B, Stojadinovic, N.B. Recovery treatment effects on gamma radiation response in electrically stressed power VDMOS transistors. Proceedings of the International Conference on Microelectronics, ICM, 2014 pp.293-296
18. Nikiforov A.Y., Skorobogatov P.K. / Physical principles of laser simulation for the transient radiation response of semiconductor structures, active circuit elements and circuit: A linear model // Russian Microelectronics, 2004, V. 33, № 2, pp. 68-79.
19. Dankovic, D. ,Stojadinovic, N., Prijic, Z., Manic, I., Prijic, A. Recoverable and permanent components of VT shift in pulsed NBT stressed p-channel power VDMOSFETs. Proceedings of the International Conference on Microelectronics, ICM, 2014, pp. 297-300
20. Epifantsev K.A., Gerasimchuk O.A., Skorobogatov P.K. / Simulating the exposure of ICs to voltage surges caused by nuclear explosions // Russian Microelectronics, 2009, V. 38, №4. pp. 260-272
21. Artamonov A.S., Chumakov A.I., Eremin N.V., Figurov V.S., Kalashnikov O.A., Nikiforov A.Y., Sogojan A.V. / 'REIS-IE' X-ray tester: description, qualification technique and results, dosimetry procedure // IEEE Radiation Effects Data Workshop, 1998, pp. 164-169
22. Chumakov A.I., Egorov A.N., Mavritsky O.B., Nikiforov A.Y., Yanenko A.V. / Single event latchup threshold estimation based on laser dose rate test results // IEEE Transactions on Nuclear Science, 1997, Vol. 44, №6, pp.2034-2039.

THE SPECIAL TRANS FUNCTIONS THEORY
FOR THE DEGREE OF THE NUCLEAR FUEL BURN-UP ESTIMATION
Slavica M Perovich1,2, Martin Calasan1
1University of Montenegro- Department of Electrical Engineering 2 University of Montenegro - Faculty of Maritime Studies
Abstract: The problem of finding an exact analytical closed form solution to the degree of the nuclear fuel burn-up simple transcendental equation is studied in some detail, by using the Special trans functions theory (STFT). Structure of the STFT solutions, derivations, numerical results and graphical simulations confirm the validity and base principle of the STFT
Key words: The degree of the nuclear fuel burn-up, The special trans functions theory-STFT, Analytical closed form solution, Advanced STFT iterative procedure, Special function
1. INTRODUCTION
The subject of our interest presented within this article is oriented towards determining of the degree of the nuclear fuel burn-up, for some simple cases, by using the Special trans functions theory (STFT). Namely, the modified Lambert nonlinear functional equation, which describes the degree of the nuclear fuel burn-up, is solved analytically in closed form (as a
special tran function, ( )t,λ,λ,α,Ntran 21NF
or, ( )d,Dtran NF ). Also, the Lambert equation is
solved by using an advanced iterative procedure, within the STF theory. Let us note that, for instance, this theoretical problem is defined in [1 -5]. Among firstly published methods available in literature, attention was focused on measuring the neutron radiation. In references, [1, 2], in some detail, the problem is described, as follows: The degree of the nuclear fuel burn-up is necessary parameter for the analysis of the following problems in nuclear energetic:
The optimal arrangement of spent fuel
structures in laying down and keeping basins; Insuring of the nuclear safety and control
while the nuclear fuel reprocessing, The Irradiation risk prognosis; Examining of the Irradiation behavior of the
material; The fulfillment of the agreement of the
nuclear weapons nonexttinslon, especially connected with the export of nuclear power plants;
Making possible the maximal generating of energy.
The advantage of this way of control (the method
based on the measurement of the neutron radiation) is reflected in high sensitivity, simplicity and reliability of the technical equipment, operability. In addition, the degree of the nuclear fuel burn-up is a parameter of
vital importance in the description of the irradiation behavior of the material.
In contrast to the gamma-spectrometry method, the neutron measurements can be performed, practically, immediately after the drawing of fuel structures out of the reactor, as it is enough to enable only the necessary irradiation stability of the detector on γ radiation. In spent fuel structures, as a source of neutrons, long living nuclides prevail over what permits the burn-up control at any laying down time which represents the practical interest. This also contributes to the role of the history of radiation on the interpretation of results, to be decreased. The dependence of the specific total neutron output on the burn-up degree in the diapason ω>15 MWd/kg is defined by the spontaneous fission of the curium nuclides Cm242 and Cm244 where the contribution
Cm242 is irrelevantly small at the laying down time t>3 years due to the short half - life (0.45 years). The contribution of the (α, n) reaction is essential only at small burn-up degrees (ω<10Mwd/kg), and if, at the same time, the laying down time is great (t>10 years). It becomes predominant due to Am241 formation. The dependence of the total neutron output on the burn-up degree is a very nonlinear function, what complicates the measurement of the mean burn-up degree according to the quantity of spent fuel structures in the neutron measurement order. Namely, the computer program processing of results of discrete or continual measurements of the neutron flux is necessary for the burn-up profile measurement. The processing algorithm is essentially simplified under the condition when spent fuel structures are laid down for more than three years (t>3 years), and when burn-up degree values are ω>15MWd/kg. In that case the counting speed of the detector is connected with the burn-up degree by the following relation
( )tλexpω
ωNN
n
00 −
=

434
where oN and oω are standardized constants; λ is
the decay constant Cm244 ; n = 4.1 – 4.3; t is the laying down time counted from the moment of the three years period of laying down. However, in a general case it is necessary to solve the transcendental equation of the type
tn
tn
ee
N
2
2
1
1
λ
445.0
λ
445.0 α272.0
ω
α266.3
ω −− ⋅
⋅+⋅
⋅
=
(1)
where the first term presents the contribution
Cm244 244 in the neutron radiation counting speed. The second term presents the contribution Cm242 .
1.1. Concerning the degree of the nuclear fuel burn-up transcendental equation
The subject of the theoretical analysis presented within this subsection is analytical in closed form solving of the Eq.(1), where N is the neutron radiation counting speed, ω denotes the burn-up degree, α is the
initial fuel enrichment in U235 , and t is the laying down time after taking fuel elements and structures out of the reactor (i.e. after finishing of irradiation).
Exponents 21 n,n are: 75.1n,1.4n 21 == , while
the decay constants are 0382.0λ1 = and 55.1λ 2 = ,
per year, respectively.
In addition, the empiric coefficients 3.266 and 0.272 take care of different specific neutron outputs for these nuclides as well as of the unit’s proportion and standardization.
After structural modification Eq. (1) takes the form
1ωBωA 21 nn =+ (2)
where
( )tλexpα266.3N
1A 1
n
445.0
1
−⋅
⋅⋅=
( )tλexpα272.0N
1B 2
n
445.0
2
−⋅
⋅⋅= .
Or, for given numeric parameters, we have
( )t0382.0expα266.3N
1A
1.4
445.0⋅−⋅
⋅⋅=
( )t55.1expα272.0N
1B
75.1
445.0⋅−⋅
⋅⋅= .
Analogically, from Eq. (2) after simple modifications, we have
1ψDψ d =+ (3)
where
d2
1n
B
AD,1
n
nd,ωBψ 2 =>== . (4)
Consequently, from Eq. (4), formula for burn-up degree takes the form:
75.1
11
ψω
ψω
2
=
=
Band
B
n . (5)
The modified Lambert nonlinear functional equation of transcendental type (Eq. (3)) is solvable using the Special Tran Function Theory [6-23]. Let us note that Perovich’s Special Tran Functions Theory (STFT), has been proved to be a very powerful theory for solving transcendental equations, some integral and integro-differential equations, and, obtaining exact analytical closed-form solutions. Examples of STFT application are shown in articles concerning the closed-form solution genesis in: the theory of neutron slowing down [[6],[7],[16]], the nonlinear circuit theory [[8],[16],[22]], the linear transport theory [[9],[16],[20]], the Hopfield neuron analysis [11], some families of transcendental equations analysis [[12],[16],[17]], the solar cell theoretical analysis [[13],[18],[22]], the Plutonium temperature estimation [14], the ambient temperature estimation [[15], [16]], the Lambert transcendental equations analysis [[16],[17],[23]], as well as in the problem in the engineering materials [19], [21],[22]], etc. Let us note that in more general cases Eq. (1) takes the form
( )tλexpαe
ωN k
n
445.0kk
M
1k
k
−⋅
⋅=
=
where M is number of nuclides. Determining analytical closed form solution to the above transcendental equation will be the subject of our further research. 2. OBTAINING AN ANALYTICAL CLOSED FORM
SOLUTION TO THE MODIFIED LAMBERT
TRANSCENDENTAL EQUATION (3) This section contains an analytical closed form solution to the Eq. (3), obtained by using the STFT. Namely, in several references [[16], [17], [23] et al], the modified Lambert transcendental Eq. (3) is solved by direct application of the STFT. Consequently, we have
( )d,Dtranψ NF=
where ( )d,Dtran NF is a new special function defined
as
( ) ( )( )
+
+−=∞→ 1d,D,xΦD
1d,D,1xΦDlimd,Dtranx
NF (6)
where functional series Φ(x, D, d) takes the form
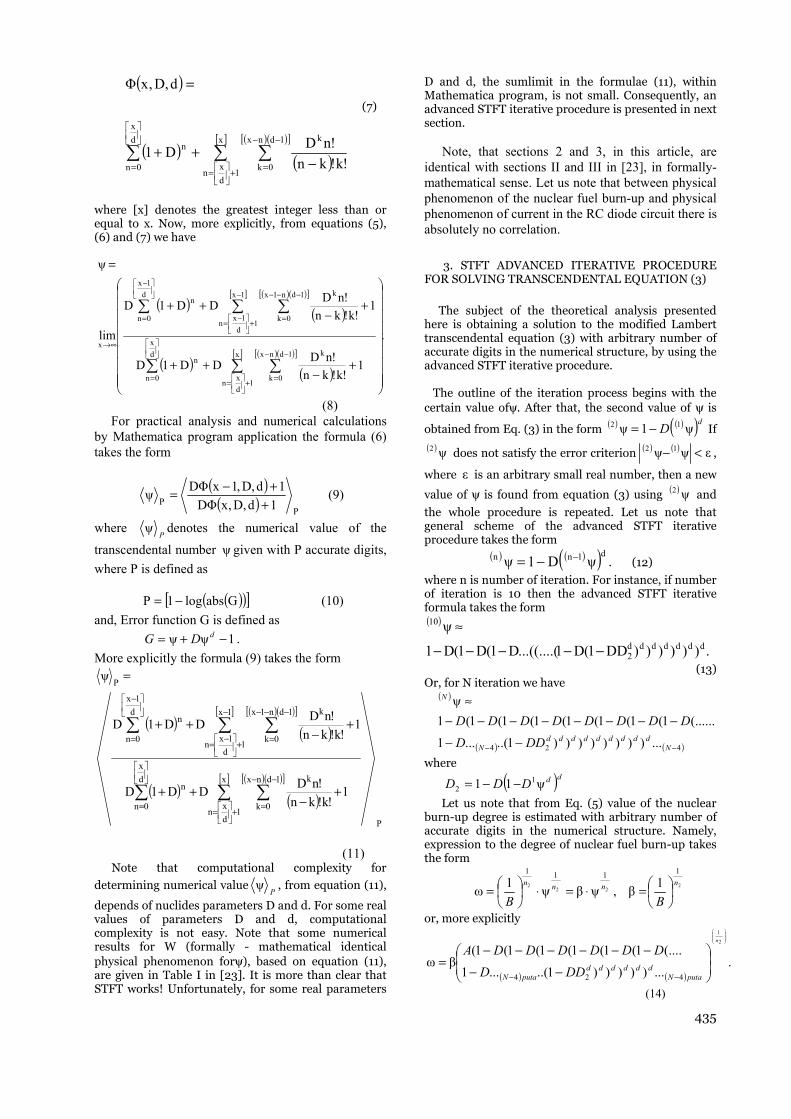
435
( )
( ) ( )( )( )[ ][ ]
+
=
−−
=
= −++
=
x
1d
xn
1dnx
0k
kd
x
0n
n
!k!kn
!nDD1
d,D,xΦ
(7)
where [x] denotes the greatest integer less than or equal to x. Now, more explicitly, from equations (5), (6) and (7) we have
( ) ( )( )( )[ ][ ]
( ) ( )( )( )[ ][ ]
.
1!k!kn
!nDDD1D
1!k!kn
!nDDD1D
lim
ψ
x
1d
xn
1dnx
0k
kd
x
0n
n
1x
1d
1xn
1dn1x
0k
kd
1x
0n
n
x
+−
++
+−
++
=
+
=
−−
=
=
−
+
−
=
−−−
=
−
=
∞→
(8) For practical analysis and numerical calculations by Mathematica program application the formula (6) takes the form
( )
( ) PP 1d,D,xΦD
1d,D,1xΦDψ
++−= (9)
where P
ψ denotes the numerical value of the
transcendental number ψ given with P accurate digits,
where P is defined as
( )( )[ ]Gabslog1P −= (10)
and, Error function G is defined as
1ψψ −+= dDG .
More explicitly the formula (9) takes the form
( ) ( )( )( )[ ][ ]
( ) ( )( )( )[ ][ ]
P
x
1d
xn
1dnx
0k
kd
x
0n
n
1x
1d
1xn
1dn1x
0k
kd
1x
0n
n
P
1!k!kn
!nDDD1D
1!k!kn
!nDDD1D
ψ
+
=
−−
=
=
−
+
−=
−−−
=
−
=
+−
++
+−
++
=
(11) Note that computational complexity for
determining numerical valueP
ψ , from equation (11),
depends of nuclides parameters D and d. For some real values of parameters D and d, computational complexity is not easy. Note that some numerical results for W (formally - mathematical identical physical phenomenon forψ), based on equation (11), are given in Table I in [23]. It is more than clear that STFT works! Unfortunately, for some real parameters
D and d, the sumlimit in the formulae (11), within Mathematica program, is not small. Consequently, an advanced STFT iterative procedure is presented in next section. Note, that sections 2 and 3, in this article, are identical with sections II and III in [23], in formally-mathematical sense. Let us note that between physical phenomenon of the nuclear fuel burn-up and physical phenomenon of current in the RC diode circuit there is absolutely no correlation.
3. STFT ADVANCED ITERATIVE PROCEDURE FOR SOLVING TRANSCENDENTAL EQUATION (3)
The subject of the theoretical analysis presented here is obtaining a solution to the modified Lambert transcendental equation (3) with arbitrary number of accurate digits in the numerical structure, by using the advanced STFT iterative procedure. The outline of the iteration process begins with the certain value ofψ. After that, the second value of ψ is
obtained from Eq. (3) in the form ( ) ( )( )dD ψ1ψ 12 −= If
( )ψ2 does not satisfy the error criterion ( ) ( ) εψψ 12 <− ,
where ε is an arbitrary small real number, then a new
value of ψ is found from equation (3) using ( )ψ2 and
the whole procedure is repeated. Let us note that general scheme of the advanced STFT iterative procedure takes the form
( ) ( )( )d1nn ψD1ψ −−= . (12)
where n is number of iteration. For instance, if number of iteration is 10 then the advanced STFT iterative formula takes the form ( )
.))))))DD1(D1...((....(D1(D1(D1
ψddddddd
2
10
−−−−−
≈
(13) Or, for N iteration we have
( )
( ) ( )424 ...))))))))1..(...1
(......1(1(1(1(1(1(1(1
ψ
−− −−
−−−−−−−−≈
Nddddddddd
N
N
DDD
DDDDDDDD
where
( )ddDDD ψ11 12 −−=
Let us note that from Eq. (5) value of the nuclear burn-up degree is estimated with arbitrary number of accurate digits in the numerical structure. Namely, expression to the degree of nuclear fuel burn-up takes the form
2
222
1111
1β,ψβψ
1ω
nnnn
BB
=⋅=⋅
=
or, more explicitly
( ) ( ).
...)))))1..(...1
(....1(1(1(1(1(1(βω
2
1
424
−−
−−−−−−=
−−
n
putaNdddddd
putaN DDD
DDDDDDA
(14)
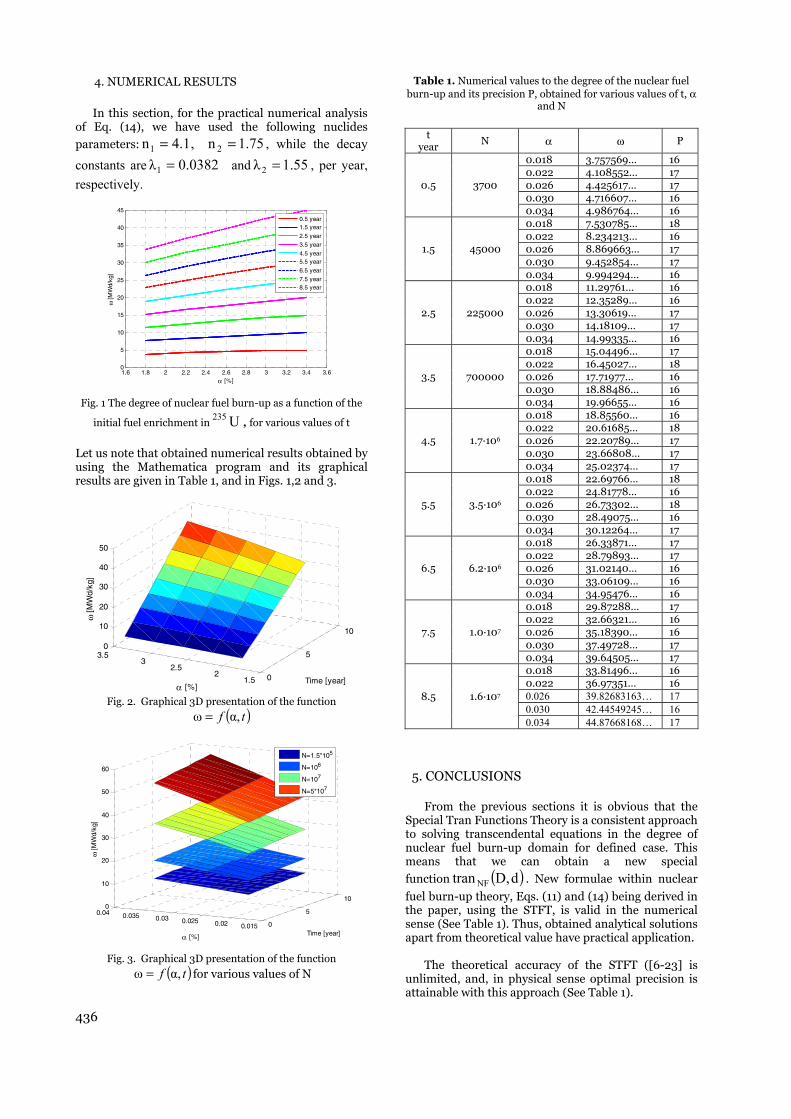
436
4. NUMERICAL RESULTS
In this section, for the practical numerical analysis of Eq. (14), we have used the following nuclides
parameters: 75.1n,1.4n 21 == , while the decay
constants are 0382.0λ1 = and 55.1λ 2 = , per year,
respectively.
1.6 1.8 2 2.2 2.4 2.6 2.8 3 3.2 3.4 3.60
5
10
15
20
25
30
35
40
45
α [%]
ω [M
Wd/
kg]
0.5 year1.5 year
2.5 year
3.5 year
4.5 year5.5 year
6.5 year
7.5 year8.5 year
Fig. 1 The degree of nuclear fuel burn-up as a function of the
initial fuel enrichment in U235 , for various values of t
Let us note that obtained numerical results obtained by using the Mathematica program and its graphical results are given in Table 1, and in Figs. 1,2 and 3.
0
5
10
1.52
2.53
3.50
10
20
30
40
50
Time [year]α [%]
ω [M
Wd/
kg]
Fig. 2. Graphical 3D presentation of the function
( )tf ,αω =
0
5
10
0.0150.020.0250.030.0350.040
10
20
30
40
50
60
Time [year]α [%]
ω [M
Wd/
kg]
N=1.5*105
N=106
N=107
N=5*107
Fig. 3. Graphical 3D presentation of the function
( )tf ,αω = for various values of N
Table 1. Numerical values to the degree of the nuclear fuel burn-up and its precision P, obtained for various values of t, α
and N
t year
N α ω P
0.5 3700
0.018 3.757569… 16 0.022 4.108552… 17 0.026 4.425617… 17 0.030 4.716607… 16 0.034 4.986764… 16
1.5 45000
0.018 7.530785… 18 0.022 8.234213… 16 0.026 8.869663… 17 0.030 9.452854… 17 0.034 9.994294… 16
2.5 225000
0.018 11.29761… 16 0.022 12.35289… 16 0.026 13.30619… 17 0.030 14.18109… 17 0.034 14.99335… 16
3.5 700000
0.018 15.04496… 17 0.022 16.45027… 18 0.026 17.71977… 16 0.030 18.88486… 16 0.034 19.96655… 16
4.5 1.7·106
0.018 18.85560… 16 0.022 20.61685… 18 0.026 22.20789… 17 0.030 23.66808… 17 0.034 25.02374… 17
5.5 3.5·106
0.018 22.69766… 18 0.022 24.81778… 16 0.026 26.73302… 18 0.030 28.49075… 16 0.034 30.12264… 17
6.5 6.2·106
0.018 26.33871… 17 0.022 28.79893… 17 0.026 31.02140… 16 0.030 33.06109… 16 0.034 34.95476… 16
7.5 1.0·107
0.018 29.87288… 17 0.022 32.66321… 16 0.026 35.18390… 16 0.030 37.49728… 17 0.034 39.64505… 17
8.5 1.6·107
0.018 33.81496… 16 0.022 36.97351… 16 0.026 39.82683163… 17 0.030 42.44549245… 16 0.034 44.87668168… 17
5. CONCLUSIONS
From the previous sections it is obvious that the Special Tran Functions Theory is a consistent approach to solving transcendental equations in the degree of nuclear fuel burn-up domain for defined case. This means that we can obtain a new special
function ( )d,Dtran NF . New formulae within nuclear
fuel burn-up theory, Eqs. (11) and (14) being derived in the paper, using the STFT, is valid in the numerical sense (See Table 1). Thus, obtained analytical solutions apart from theoretical value have practical application.
The theoretical accuracy of the STFT ([6-23] is
unlimited, and, in physical sense optimal precision is attainable with this approach (See Table 1).
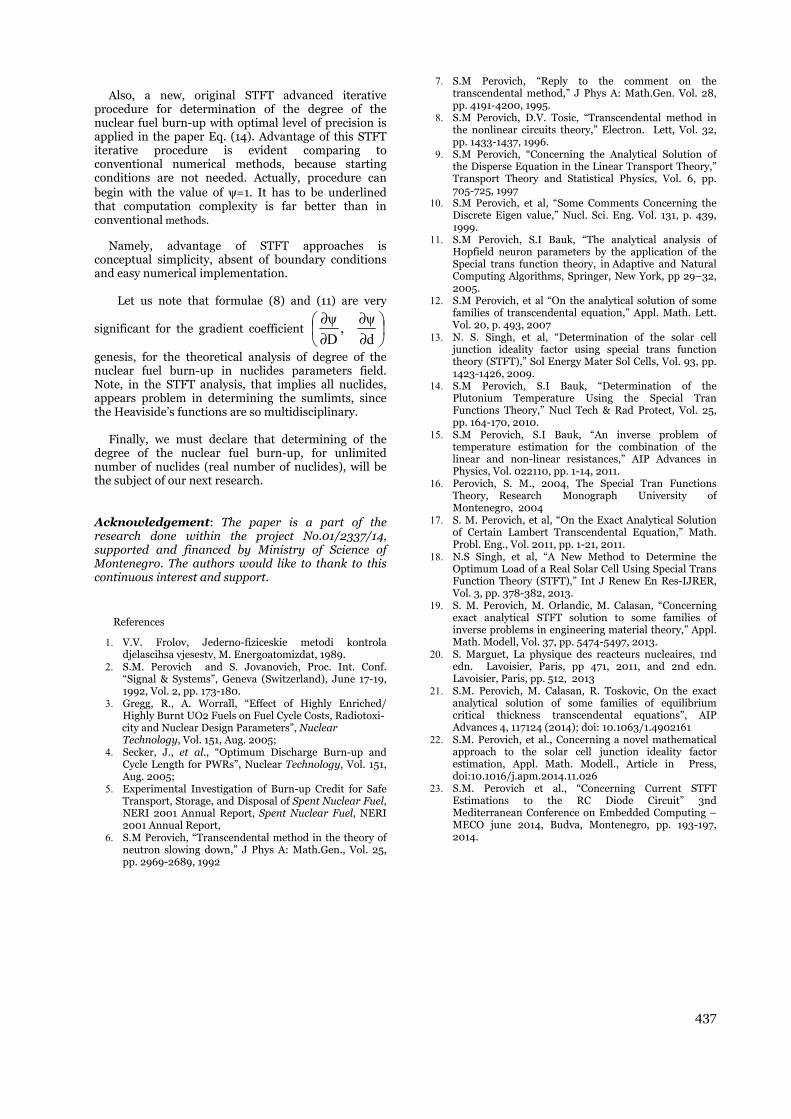
437
Also, a new, original STFT advanced iterative procedure for determination of the degree of the nuclear fuel burn-up with optimal level of precision is applied in the paper Eq. (14). Advantage of this STFT iterative procedure is evident comparing to conventional numerical methods, because starting conditions are not needed. Actually, procedure can begin with the value of ψ=1. It has to be underlined that computation complexity is far better than in conventional methods. Namely, advantage of STFT approaches is conceptual simplicity, absent of boundary conditions and easy numerical implementation. Let us note that formulae (8) and (11) are very
significant for the gradient coefficient
∂∂
∂∂
d
ψ,
D
ψ
genesis, for the theoretical analysis of degree of the nuclear fuel burn-up in nuclides parameters field. Note, in the STFT analysis, that implies all nuclides, appears problem in determining the sumlimts, since the Heaviside’s functions are so multidisciplinary. Finally, we must declare that determining of the degree of the nuclear fuel burn-up, for unlimited number of nuclides (real number of nuclides), will be the subject of our next research.
Acknowledgement: The paper is a part of the research done within the project No.01/2337/14, supported and financed by Ministry of Science of Montenegro. The authors would like to thank to this continuous interest and support.
References
1. V.V. Frolov, Jederno-fiziceskie metodi kontrola djelascihsa vjesestv, M. Energoatomizdat, 1989.
2. S.M. Perovich and S. Jovanovich, Proc. Int. Conf. “Signal & Systems”, Geneva (Switzerland), June 17-19, 1992, Vol. 2, pp. 173-180.
3. Gregg, R., A. Worrall, “Effect of Highly Enriched/ Highly Burnt UO2 Fuels on Fuel Cycle Costs, Radiotoxi-
city and Nuclear Design Parameters”, Nuclear Technology, Vol. 151, Aug. 2005;
4. Secker, J., et al., “Optimum Discharge Burn-up and Cycle Length for PWRs”, Nuclear Technology, Vol. 151, Aug. 2005;
5. Experimental Investigation of Burn-up Credit for Safe Transport, Storage, and Disposal of Spent Nuclear Fuel, NERI 2001 Annual Report, Spent Nuclear Fuel, NERI 2001 Annual Report,
6. S.M Perovich, “Transcendental method in the theory of neutron slowing down,” J Phys A: Math.Gen., Vol. 25, pp. 2969-2689, 1992
7. S.M Perovich, “Reply to the comment on the transcendental method,” J Phys A: Math.Gen. Vol. 28, pp. 4191-4200, 1995.
8. S.M Perovich, D.V. Tosic, “Transcendental method in the nonlinear circuits theory,” Electron. Lett, Vol. 32, pp. 1433-1437, 1996.
9. S.M Perovich, “Concerning the Analytical Solution of the Disperse Equation in the Linear Transport Theory,” Transport Theory and Statistical Physics, Vol. 6, pp. 705-725, 1997
10. S.M Perovich, et al, “Some Comments Concerning the Discrete Eigen value,” Nucl. Sci. Eng. Vol. 131, p. 439, 1999.
11. S.M Perovich, S.I Bauk, “The analytical analysis of Hopfield neuron parameters by the application of the Special trans function theory, in Adaptive and Natural Computing Algorithms, Springer, New York, pp 29–32, 2005.
12. S.M Perovich, et al “On the analytical solution of some families of transcendental equation,” Appl. Math. Lett. Vol. 20, p. 493, 2007
13. N. S. Singh, et al, “Determination of the solar cell junction ideality factor using special trans function theory (STFT),” Sol Energy Mater Sol Cells, Vol. 93, pp. 1423-1426, 2009.
14. S.M Perovich, S.I Bauk, “Determination of the Plutonium Temperature Using the Special Tran Functions Theory,” Nucl Tech & Rad Protect, Vol. 25, pp. 164-170, 2010.
15. S.M Perovich, S.I Bauk, “An inverse problem of temperature estimation for the combination of the linear and non-linear resistances,” AIP Advances in Physics, Vol. 022110, pp. 1-14, 2011.
16. Perovich, S. M., 2004, The Special Tran Functions Theory, Research Monograph University of Montenegro, 2004
17. S. M. Perovich, et al, “On the Exact Analytical Solution of Certain Lambert Transcendental Equation,” Math. Probl. Eng., Vol. 2011, pp. 1-21, 2011.
18. N.S Singh, et al, “A New Method to Determine the Optimum Load of a Real Solar Cell Using Special Trans Function Theory (STFT),” Int J Renew En Res-IJRER, Vol. 3, pp. 378-382, 2013.
19. S. M. Perovich, M. Orlandic, M. Calasan, “Concerning exact analytical STFT solution to some families of inverse problems in engineering material theory,” Appl. Math. Modell, Vol. 37, pp. 5474-5497, 2013.
20. S. Marguet, La physique des reacteurs nucleaires, 1nd edn. Lavoisier, Paris, pp 471, 2011, and 2nd edn. Lavoisier, Paris, pp. 512, 2013
21. S.M. Perovich, M. Calasan, R. Toskovic, On the exact analytical solution of some families of equilibrium critical thickness transcendental equations”, AIP Advances 4, 117124 (2014); doi: 10.1063/1.4902161
22. S.M. Perovich, et al., Concerning a novel mathematical approach to the solar cell junction ideality factor estimation, Appl. Math. Modell., Article in Press, doi:10.1016/j.apm.2014.11.026
23. S.M. Perovich et al., “Concerning Current STFT Estimations to the RC Diode Circuit” 3nd Mediterranean Conference on Embedded Computing – MECO june 2014, Budva, Montenegro, pp. 193-197, 2014.


WORKER’S HEALTH AWARENESS PROGRAM IN BELO HORIZONTE, BRAZIL: SUPPORTED BY NEUTRON ACTIVATION ANALYSIS
Maria Ângela de B. C. Menezes 1, Elene Cristina Pereira Maia 2, Radojko Jaćimović 3
1 Nuclear Technology Development Centre/Brazilian Commission for Nuclear Energy, CDTN/CNEN, Caixa Postal 941, CEP 30161-970, Belo Horizonte, Minas Gerais, Brazil
2 Federal University of Minas Gerais, Department of Chemistry, DQ/UFMG, Av. Presidente Antônio Carlos, 6.627, Campus UFMG, CEP 31270-901, Belo Horizonte, Minas Gerais, Brazil
3 Institute Jožef Stefan, Jamova cesta 39, P.O. Box 3000, SI-1001, Ljubljana, Slovenia
Abstract. Nuclear analytical techniques have been applied on prevention, diagnosis and treatment of diseases. This paper is about a support that, in practice, is not usual: application of neutron activation analysis in galvanising industry. An assessment related to several elements was carried out in two galvanising factories analysing hair and toenail samples as biomonitors. The goal was to give support to the Worker’s Health Awareness Program of the Municipal Department of Health of Belo Horizonte, capital of the Brazilian State of Minas Gerais. Studies concerning galvanising industrial process have usually been developed broaching many aspects including chromium contamination consequences. These studies have not pointed out the detection and measurement of arsenic so far. Therefore, this paper focuses on the arsenic determination in the galvanisings studied. The higher concentration results in the workers compared to individuals of Comparison Group alerted the health surveillance professionals for the need of arsenic monitoring in order to assess the influence of a long-term exposure. The k0-Instrumental Neutron Activation method was applied on elemental concentration determination using the TRIGA MARK I IPR-R1 research reactor located at CDTN/CNEN, Belo Horizonte. The nuclear analytical technique confirmed to be a suitable method on determination of arsenic in biological matrixes.
Key words: neutron activation analysis, k0-INAA, arsenic, biomonitor, galvinising industry
1. INTRODUCTION
In order to assess the exposure to several elements and consequently the contamination of workers hired by the galvanising industry in Belo Horizonte, a project [1-4] was developed. This project was giving analytical support to the Worker’s Health Awareness Program of the Secretaria Municipal de Saúde (Municipal Department of Health). The development of this project was approved by the Ethics Committee of the Federal University of Minas Gerais, COEP-UFMG.
This paper focuses on the arsenic determination in the galvanisings studied. This project was the first action in order to assess the elemental concentration level in this kind of industry in Brazil determining several elements not considered essential for human being such as arsenic. Studies concerning this galvanising industrial process [5,6] have usually been developed broaching many aspects including chromium [7,8] contamination consequences, but so far none has pointed out the detection and measurement of arsenic.
Numerous epidemiological studies have indicated a strong positive association between atmospheric levels of this element in copper smelters and the incidence of lung cancer due to prolonged and chronic arsenic exposure in industrial workplaces [9]. Skin cancer is
also associated with long-term arsenic exposure by dermal contact and by oral intake. Arsenic in most chemical forms is readily absorbed by the human gastrointestinal tract. Once absorbed, arsenic undergoes substantial metabolism and the distribution of this element in the body has been studied in both humans and animals. The toxic effects of arsenic as described in humans vary in accordance with the dose and duration of intake. Under conditions of chronic intake, concerning excretion pathways, the highest concentrations are found in hair, nail and skin. These all have high sulfhydryl concentrations, suggesting that this property accounts for their high affinity for arsenic [9-11].
Galvanisation [5,6] is an electroplating process for depositing a coating in a desirable form by means of electrolysis, involving the following steps: polishing with abrasives, washing the items with acids and sodium hydroxide, and electrodeposition of Cr, Cu, Au, Ni or Zn. But the workers are continuously dealing with several elements from metal items during the polishing stage and with other elements during plating stage.
The probability of arsenic presence among these elements is possible because during gold coating, arsenic or antimony salts are usually added aiming at improving gold deposition. Besides, the gold/arsenic bath is operated at 50°C and arsenic may volatize [6].

440
Exposure and contamination may also occur during the preparation of the items previously coated in gold, because the items are polished and the powder spreads in the air.
In order to assess the level of contamination, the biomonitors - scalp hair and toenail clippings - were donated both by workers, the Workers’ Group, and by individuals not exposed to the galvanising environment, the Comparative Group.
2. EXPERIMENTAL
2.1. Factories Studied
Two galvanisings working with the same procedure, i.e., “decorative chromium” - a kind of galvanisation whose main industrial process is to plate several metals over small items like taps, trays, decorative items - were chosen at random downtown according to the statistical planning [1-4]. Galvanising 1, did not plate gold and silver, Galvanising 2, plates gold.
2.2. Sampling Procedures: Biomonitors Hair and Toenail
At first the physicians explained to the workers the aims of the project and how it would be performed, according to the sampling strategy [1-4]. The volunteer workers donated their hair samples and also toenail clippings. A professional hairdresser collected the hair samples according to IAEA instructions [12,13]. The hair samples were washed following the IAEA procedure [12,13], dried at 40ºC and weighed afterwards. The toenail samples were washed using the procedure according to the literature [14]. In both procedures, deionized pure water and reagents p.a. were used. After washed, the samples were air dried and weighed in the irradiation container. The same procedures were applied to the samples donated by the non-exposed subjects. Only one sampling was carried out according to the sampling strategy. The biological material samples were donated by 18 volunteer workers, the Worker Group.
Another group, Comparative Group, was formed by 22 subjects non-exposed to the same workplace environment. By the way, this was the only aspect considered. No other aspect such as diet and personal habit was controlled. Because of that, this group was named Comparative Group and not Reference Group as it is usually found in the literature.
2.3. Applying Neutron Activation Analysis
The arsenic elemental concentrations in all matrixes were determined applying the k0 instrumental neutron activation analysis [4,15,16]. This standardization method utilizes a single comparator or neutron flux monitor/standard element, usually 198Au, to determine the concentration of each element within the sample. The method requires the characterization of certain reactor parameters. Among them, the deviation of the epithermal flux from the ideal 1/E relationship (α), and the relative neutron flux at each position (neutrons cm-2 s-1), which is needed to calculate the ratio of thermal neutrons to epithermal
neutrons (f), for accurate determinations of element concentrations.
The samples were irradiated simultaneously accompanied by neutron flux monitor/standard. The quality control was done using Human Hair Reference Certified Material, GBW 09101 [17] and replicates of samples, whenever possible.
The irradiation was carried out in the carousel of the TRIGA MARK I IPR-R1 research reactor located at CDTN/CNEN (Nuclear Technology Development Centre/Brazilian Commission for Nuclear Energy), Belo Horizonte, at 100 kW, under average thermal neutron flux 6.3 x 10¹¹ neutrons cm-2 s-1.
Arsenic was determined via its corresponding half-life radionuclide, 76As (T1/2 = 26.24 h). After suitable cooling time, the activity of the induced radionuclide was measured on an HPGe detector, 25% of efficiency, resolution of 1.85 keV for the 1332 keV peak of 60Co. The HyperLab program was used for peak area evaluation and for arsenic concentration calculations, the software package called KAYZERO/SOLCOI® was applied.
3. RESULTS AND DISCUSSIONS
Table 1 presents the elemental concentration determined in hair - Certified Reference Material [17]. For the non-exposed subjects, the Comparative Group, arsenic was not detected in both biomonitors. Galvanising G1 also did not present As in the samples either. All G2 workers presented As in their hair samples and the Platers and Polishers presented it also in toenail samples. The Platers were just the workers in charge of gold plating. Two Polishers sometimes also worked as platers dealing with gold. These workers were exactly the ones who presented arsenic in their hair and toenail samples. It is an interesting result because it suggests the influence of long-term exposure to arsenic during electroplating stage. The determination of As in the hair samples of the trainee and the owner points out the presence of the arsenic pollution everywhere in the industry.
4. CONCLUSIONS
The workers of Galvanising 1 did not present arsenic in their samples. It is relevant to mention that this factory does not plate gold.
Comparing the results of arsenic in the samples of workers of Galvanising 2 to the values for Comparative Group, it is possible to say that the workers may be contaminated, therefore, this galvanising offers more arsenic exposure and contamination risk due to the plating process per se combined with unsuitable distribution of processes inside the workplace [1-3]. Then, the results of As in biomonitors reflect the worker exposure and suggest endogenous contamination, once arsenic was not detected in the non-exposed individual samples.
This first assessment alerts for the need of assessing the influence of long-term exposure to arsenic in galvinisings that plate gold.
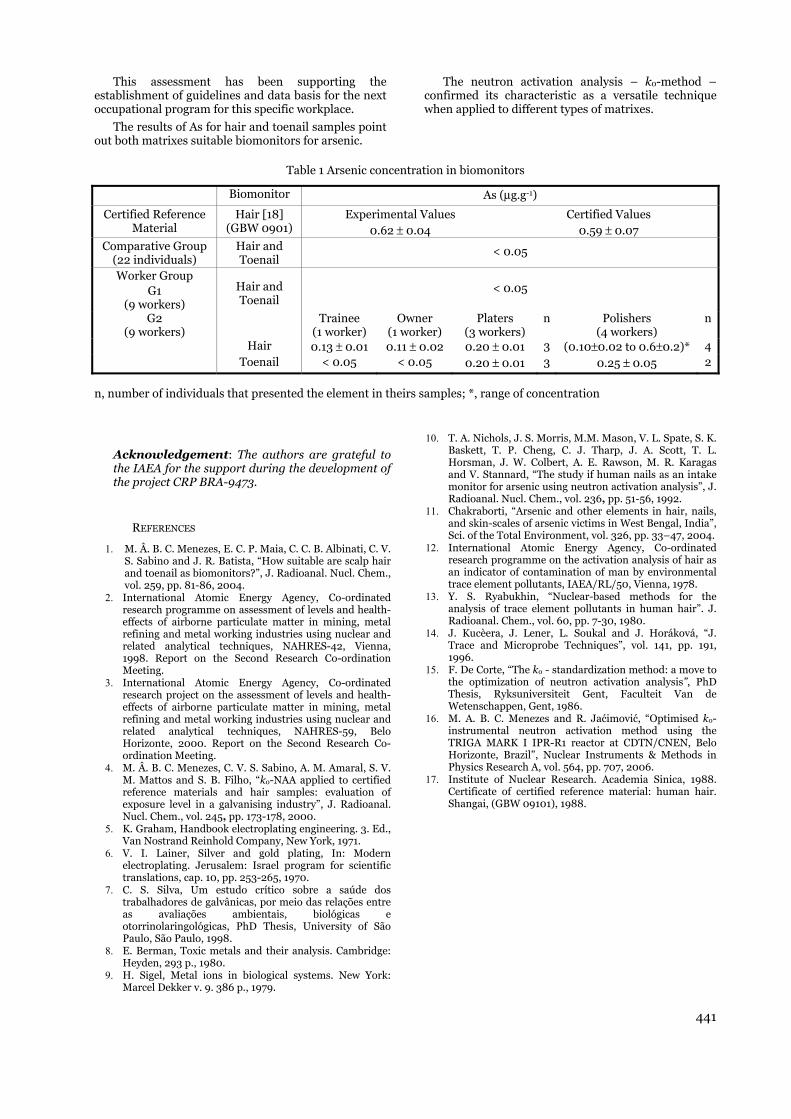
441
This assessment has been supporting the establishment of guidelines and data basis for the next occupational program for this specific workplace.
The results of As for hair and toenail samples point out both matrixes suitable biomonitors for arsenic.
The neutron activation analysis – k0-method – confirmed its characteristic as a versatile technique when applied to different types of matrixes.
Table 1 Arsenic concentration in biomonitors
Biomonitor As (μg.g-1)
Certified Reference Material
Hair [18] (GBW 0901)
Experimental Values 0.62 ± 0.04
Certified Values 0.59 ± 0.07
Comparative Group (22 individuals)
Hair and Toenail
< 0.05
Worker Group G1
(9 workers)
Hair and Toenail
< 0.05
G2 (9 workers)
Trainee (1 worker)
Owner (1 worker)
Platers (3 workers)
n Polishers (4 workers)
n
Hair 0.13 ± 0.01 0.11 ± 0.02 0.20 ± 0.01 3 (0.10±0.02 to 0.6±0.2)* 4Toenail < 0.05 < 0.05 0.20 ± 0.01 3 0.25 ± 0.05 2
n, number of individuals that presented the element in theirs samples; *, range of concentration
Acknowledgement: The authors are grateful to the IAEA for the support during the development of the project CRP BRA-9473.
REFERENCES
1. M. Â. B. C. Menezes, E. C. P. Maia, C. C. B. Albinati, C. V. S. Sabino and J. R. Batista, “How suitable are scalp hair and toenail as biomonitors?”, J. Radioanal. Nucl. Chem., vol. 259, pp. 81-86, 2004.
2. International Atomic Energy Agency, Co-ordinated research programme on assessment of levels and health-effects of airborne particulate matter in mining, metal refining and metal working industries using nuclear and related analytical techniques, NAHRES-42, Vienna, 1998. Report on the Second Research Co-ordination Meeting.
3. International Atomic Energy Agency, Co-ordinated research project on the assessment of levels and health-effects of airborne particulate matter in mining, metal refining and metal working industries using nuclear and related analytical techniques, NAHRES-59, Belo Horizonte, 2000. Report on the Second Research Co-ordination Meeting.
4. M. Â. B. C. Menezes, C. V. S. Sabino, A. M. Amaral, S. V. M. Mattos and S. B. Filho, “k0-NAA applied to certified reference materials and hair samples: evaluation of exposure level in a galvanising industry”, J. Radioanal. Nucl. Chem., vol. 245, pp. 173-178, 2000.
5. K. Graham, Handbook electroplating engineering. 3. Ed., Van Nostrand Reinhold Company, New York, 1971.
6. V. I. Lainer, Silver and gold plating, In: Modern electroplating. Jerusalem: Israel program for scientific translations, cap. 10, pp. 253-265, 1970.
7. C. S. Silva, Um estudo crítico sobre a saúde dos trabalhadores de galvânicas, por meio das relações entre as avaliações ambientais, biológicas e otorrinolaringológicas, PhD Thesis, University of São Paulo, São Paulo, 1998.
8. E. Berman, Toxic metals and their analysis. Cambridge: Heyden, 293 p., 1980.
9. H. Sigel, Metal ions in biological systems. New York: Marcel Dekker v. 9. 386 p., 1979.
10. T. A. Nichols, J. S. Morris, M.M. Mason, V. L. Spate, S. K. Baskett, T. P. Cheng, C. J. Tharp, J. A. Scott, T. L. Horsman, J. W. Colbert, A. E. Rawson, M. R. Karagas and V. Stannard, “The study if human nails as an intake monitor for arsenic using neutron activation analysis”, J. Radioanal. Nucl. Chem., vol. 236, pp. 51-56, 1992.
11. Chakraborti, “Arsenic and other elements in hair, nails, and skin-scales of arsenic victims in West Bengal, India”, Sci. of the Total Environment, vol. 326, pp. 33–47, 2004.
12. International Atomic Energy Agency, Co-ordinated research programme on the activation analysis of hair as an indicator of contamination of man by environmental trace element pollutants, IAEA/RL/50, Vienna, 1978.
13. Y. S. Ryabukhin, “Nuclear-based methods for the analysis of trace element pollutants in human hair”. J. Radioanal. Chem., vol. 60, pp. 7-30, 1980.
14. J. Kucèera, J. Lener, L. Soukal and J. Horáková, “J. Trace and Microprobe Techniques”, vol. 141, pp. 191, 1996.
15. F. De Corte, “The k0 - standardization method: a move to the optimization of neutron activation analysis”, PhD Thesis, Ryksuniversiteit Gent, Faculteit Van de Wetenschappen, Gent, 1986.
16. M. A. B. C. Menezes and R. Jaćimović, “Optimised k0-instrumental neutron activation method using the TRIGA MARK I IPR-R1 reactor at CDTN/CNEN, Belo Horizonte, Brazil”, Nuclear Instruments & Methods in Physics Research A, vol. 564, pp. 707, 2006.
17. Institute of Nuclear Research. Academia Sinica, 1988. Certificate of certified reference material: human hair. Shangai, (GBW 09101), 1988.


WAVELET ANALYSIS OF PERSONAL SOLAR UVR EXPOSURE
Đorđe Stratimirović 1,2, Suzana Blesić 2,3, Caradee Wright 4,5,6, Martin Allen 7, Jelena Ajtić 2,8
1 University of Belgrade, Faculty of Dental Medicine, Belgrade, Serbia 2 Institute for Research and Advancement in Complex Systems, Belgrade, Serbia
3 University of Belgrade, Institute for Medical Research, Belgrade, Serbia 4 South African Medical Research Council, Environment & Health Unit, Pretoria, South Africa
5 Climate Studies, Modelling and Environmental Health Research Group, Council for Scientific and Industrial Research, Pretoria, South Africa
6 Department of Geography, Geoinformatics and Meteorology, University of Pretoria, Hatfield, South Africa
7 University of Canterbury, Department of Electrical and Computer Engineering, Christchurch, New Zealand 8 University of Belgrade, Faculty of Veterinary Medicine, Belgrade, Serbia
Abstract. Scaling properties of personal solar ultraviolet radiation exposure (pUVR) recordings are investigated using the Wavelet Transform (WT) spectral analysis. Personal UVR recordings are collected by UVR monitors designed to measure erythemal UVR. Sun exposure recordings of a school child, farmer, marathon runner and outdoor worker in South Africa are analyzed. A scaling behavior in all analyzed pUVR datasets is found. The scaling behavior changes from uncorrelated to long-range correlated as duration of a person’s solar exposure increases. The slopes of calculated WT power vary from 0, in the uncorrelated case for persons with erratic activities in reference to their UVR exposure, to close to 1 in the case of long-range correlated pUVR data, for persons spending longer periods in the sun. Peaks in the WT power spectra are also found, pointing to the existence of characteristic times in sun exposure behavior. Characteristic peaks at approximately 15 minutes, half an hour and an hour are present in all pUVR data, while persons with longer sun exposure have additional peaks at longer periods.
Key words: personal UVR exposure, wavelet transform analysis, scaling, characteristic exposure times
1. INTRODUCTION
A wavelet-based analysis of data time series from a complex system gives information on statistical properties of the data – the average value, distribution and effect of fluctuations around the average value at different times (scales), as well as an existence of periodicities or trends of other kind, and a probability to reach extreme values over a period of interest. Hence, this kind of data dynamics analysis is an efficient additional tool to conventional methods [1, 2].
The methods used in this type of analysis have been developed in the field of statistical physics and later adjusted for use in real-life, at first mostly biological, complex systems [3, 4]. The method adjustments took into account the non-stationary and nonlinear characteristics of the data, which are important for understanding system dynamics. Over the years, out of various new techniques, the Wavelet Transform (WT) method, which was first proposed three decades ago [5], has become a widely used tool. It has been utilized on various complex systems that now form a field of modern physics. Further, it is very sensitive to detection of spurious results obtained by the conventional methods. For these reasons, WT is now considered a standard analytical tool for time series
analysis. It has had numerous variations developed over the time.
The traditional WT analysis allows quantification of the essential statistical features – correlations, scaling (long-time memory), and nonlinearity – in time series from a complex systems, and thus provides an understanding of the underlying dynamical processes in the system. The quantitative measure it provides – a scaling exponent β – describes a very important property of the system, its temporal memory. Unlike conventional measures, this exponent does not monitor the coincidence of values at each time step. Rather, it deduces, assesses and describes the typical behavior, or a long-range character of the analyzed data.
The scaling properties (behavior described by the scaling exponent) are present in the climate and atmospheric data [6, 7], and they can be regarded as a mark of the existence of memory in the system. A change in the system memory at a given time or time scale is reflected by a particular shape of the WT function, values of scaling exponents β at different time scales, and positions of crossovers in scaling. These functions, therefore, offer information on the existence of cycles, characteristic times, or trends in investigated datasets.

444
In this paper, recordings of personal solar ultraviolet radiation exposure (pUVR) are examined using the Wavelet Transform spectral analysis. The scaling properties are then applied in quantification of the dynamical behavior of the exposure records.
2. MATERIALS AND METHODS
2.1. Measurements and datasets
The datasets were collected using personal UVR dosimeter badges. The UVR dosimeter badges were developed to measure personal exposure to solar erythemal UVR (290-400 nm) and have been described in detail elsewhere [8, 9]. The UVR dosimeter badges are manufactured by the University of Canterbury Department of Electrical and Computer Engineering, Christchurch, New Zealand. The badges have been shown to be suitable instruments for use in large personal solar UVR exposure studies [10-13].
The main component of the dosimeter badge is a miniature solid-state detector which measures erythemally-weighted UVR. The detector response is electronically converted into a digital count (on a scale from 1 to 1024) that is proportional to the incident erythemally-weighted UVR irradiance. The detector is encased in a weatherproof polytetrafluoroethylene enclosure which also acts as a diffuser to ensure that the angular response of the instrument is close to the cosine response of human skin [14]. The badge is powered by a small lithium coin cell battery (CR 1616, 3 V) and has a diameter of 35 mm, thickness of 13 mm, and weighs approximately 20.7 g. The badges were set to record data every 60 seconds in day/night mode (programmed to record from 07h00 to 21h00) and they have enough on-board memory and battery capacity to store numerous days of data.
Since the dosimeter badges are inconspicuous and easy to forget or ignore, they are less likely to alter a person’s usual activities and thus their UVR exposure. In our study, the UVR badges were worn by human participants in a variety of outdoor settings and activities. Participant groups included a primary school child (UVR badge was worn in October 2013), an outdoor worker (October 2013), a farm worker (June 2014), and a marathon runner (February 2014). Research ethics clearance was granted by the Council for Scientific and Industrial Research of South Africa (Certificate number 64/2013).
2.2. Wavelet Transform Spectral Analysis
The wavelet transform was introduced in order to circumvent the non-linearity problems in classical signal analysis and to achieve good signal localization in both time and frequency that classical Fourier transform approach misses [5].
Namely, in the WT analysis, the window of examination length is adjusted to the frequency currently being analyzed, i.e. slow events are examined within a long window, whilst a short window is used for fast events. In such a way, an adequate time resolution for high frequencies and a good frequency resolution for low frequencies are achieved in a single transform [14].
The continuous wavelet transform of a discrete sequence U(k) is defined as the convolution of U(k) with wavelet functions )(, kbaψ in the following way:
),()(),(1
0
*, kkUbaW
N
kbaP
−
== ψ (1)
with a and b being the scale and translation-in-time (coordinate) parameters, N the total length of the data series (in this study, pUVR), and the asterisk stands for complex conjugate. The wavelet functions )(, kbaψ are
related to the scaled and translated version of the mother-wavelet )(0 kψ through
).(1
)( 0, a
bk
akba
−= ψψ (2)
To examine the existence of scaling, trends and cycles in the pUVR data, the wavelet scalegrams (the mean wavelet power spectra) EW(a), defined by
= dbbaWaE PW ),()( 2 (3)
are used. The scalegram EW(a) can be related [9] to the corresponding Fourier power spectrum EF(ω) via the formula
,)()()(2
ωωψω daEaEFW
∧
= (4)
where the caret symbol designates Fourier transforms. Equation (4) implies that if two spectra, EW(a) and EF(ω), exhibit power-law behavior, then they have the same power-law exponent β. If this is the case, the uncorrelated behavior is characterized by the values of exponent β close to 0, while the long-range correlations are characterized by 0 < β ≤ 1 (and, similarly, in anti-correlated case, 0 > β ≥ -1).
The meaning of the wavelet scalegram is the same as in the case of classical spectrum - it gives the contribution to the signal energy at the specific scale (time) parameter a. It thus enables us to view and estimate the peaks of wavelet spectra in the same way as in the classical Fourier approach.
In this paper, the standard set of Morlet wavelet functions is applied in the analysis. The Morlet wavelet [15] is proven to have the optimal joint time-frequency localization, and can therefore be used for detecting locations and spatial distribution of singularities in the signal [16].
The Morlet set is defined by
,)( 2/4/10
20 ηηωπηψ −−= eei (5)
with the corresponding Fourier transform
,)()( 2/)(4/10
20ωωωπωψ −−−= aeHa (6)
where H(ω) is the Heaviside step function, ω the Fourier circular frequency, and ω0 is the characteristic nondimensional parameter (a real number).
In our study, 40 =ω is used.
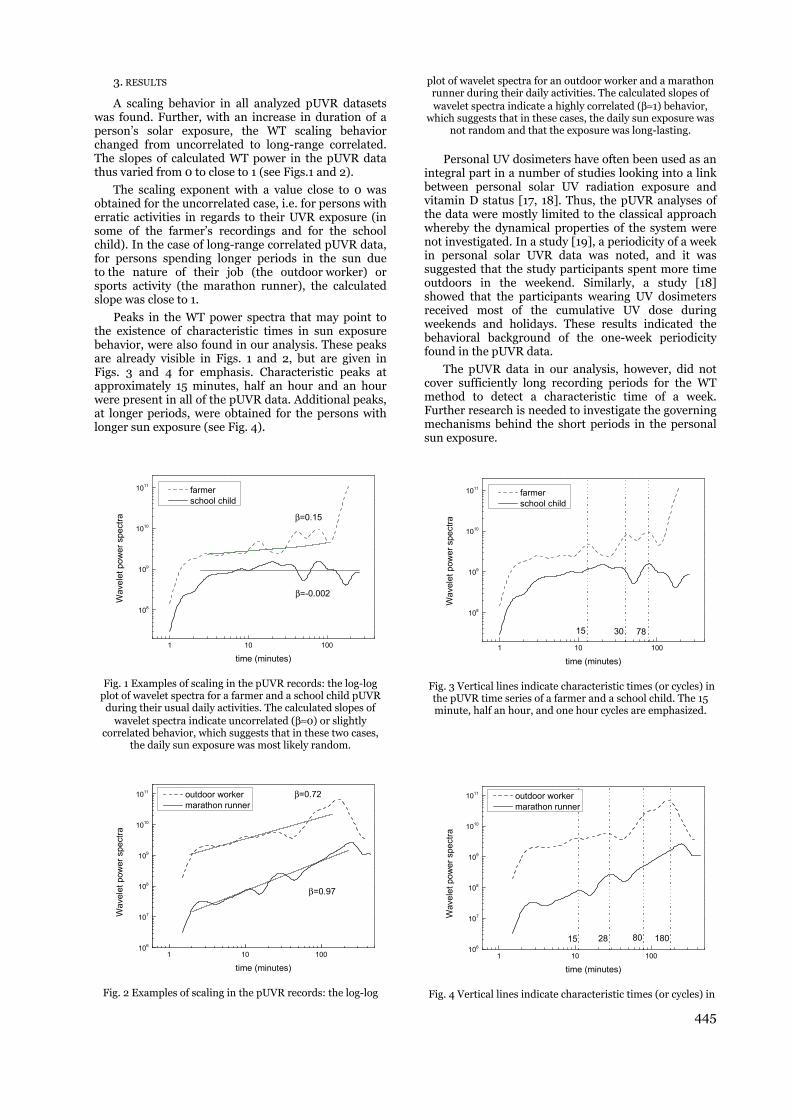
445
3. RESULTS
A scaling behavior in all analyzed pUVR datasets was found. Further, with an increase in duration of a person’s solar exposure, the WT scaling behavior changed from uncorrelated to long-range correlated. The slopes of calculated WT power in the pUVR data thus varied from 0 to close to 1 (see Figs.1 and 2).
The scaling exponent with a value close to 0 was obtained for the uncorrelated case, i.e. for persons with erratic activities in regards to their UVR exposure (in some of the farmer’s recordings and for the school child). In the case of long-range correlated pUVR data, for persons spending longer periods in the sun due to the nature of their job (the outdoor worker) or sports activity (the marathon runner), the calculated slope was close to 1.
Peaks in the WT power spectra that may point to the existence of characteristic times in sun exposure behavior, were also found in our analysis. These peaks are already visible in Figs. 1 and 2, but are given in Figs. 3 and 4 for emphasis. Characteristic peaks at approximately 15 minutes, half an hour and an hour were present in all of the pUVR data. Additional peaks, at longer periods, were obtained for the persons with longer sun exposure (see Fig. 4).
1 10 100
108
109
1010
1011
β=0.15
Wav
elet
pow
er s
pect
ra
time (minutes)
farmer school child
β=-0.002
Fig. 1 Examples of scaling in the pUVR records: the log-log plot of wavelet spectra for a farmer and a school child pUVR
during their usual daily activities. The calculated slopes of wavelet spectra indicate uncorrelated (β≈0) or slightly
correlated behavior, which suggests that in these two cases, the daily sun exposure was most likely random.
1 10 100106
107
108
109
1010
1011
β=0.97
Wav
elet
pow
er s
pect
ra
time (minutes)
outdoor worker marathon runner
β=0.72
Fig. 2 Examples of scaling in the pUVR records: the log-log
plot of wavelet spectra for an outdoor worker and a marathon runner during their daily activities. The calculated slopes of wavelet spectra indicate a highly correlated (β≈1) behavior,
which suggests that in these cases, the daily sun exposure was not random and that the exposure was long-lasting.
Personal UV dosimeters have often been used as an integral part in a number of studies looking into a link between personal solar UV radiation exposure and vitamin D status [17, 18]. Thus, the pUVR analyses of the data were mostly limited to the classical approach whereby the dynamical properties of the system were not investigated. In a study [19], a periodicity of a week in personal solar UVR data was noted, and it was suggested that the study participants spent more time outdoors in the weekend. Similarly, a study [18] showed that the participants wearing UV dosimeters received most of the cumulative UV dose during weekends and holidays. These results indicated the behavioral background of the one-week periodicity found in the pUVR data.
The pUVR data in our analysis, however, did not cover sufficiently long recording periods for the WT method to detect a characteristic time of a week. Further research is needed to investigate the governing mechanisms behind the short periods in the personal sun exposure.
1 10 100
108
109
1010
1011
Wav
elet
pow
er s
pect
ra
time (minutes)
farmer school child
15 30 78
Fig. 3 Vertical lines indicate characteristic times (or cycles) in the pUVR time series of a farmer and a school child. The 15 minute, half an hour, and one hour cycles are emphasized.
1 10 100106
107
108
109
1010
1011
Wav
elet
pow
er s
pect
ra
time (minutes)
outdoor worker marathon runner
15 28 80 180
Fig. 4 Vertical lines indicate characteristic times (or cycles) in
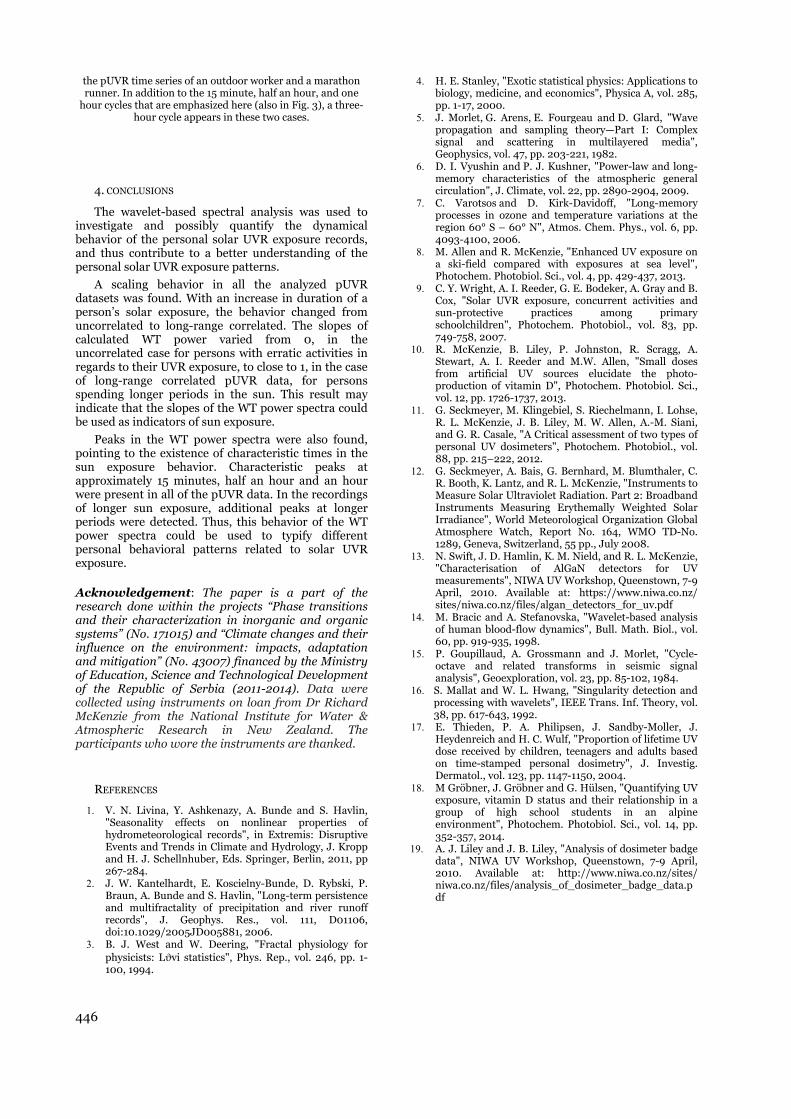
446
the pUVR time series of an outdoor worker and a marathon runner. In addition to the 15 minute, half an hour, and one
hour cycles that are emphasized here (also in Fig. 3), a three-hour cycle appears in these two cases.
4. CONCLUSIONS
The wavelet-based spectral analysis was used to investigate and possibly quantify the dynamical behavior of the personal solar UVR exposure records, and thus contribute to a better understanding of the personal solar UVR exposure patterns.
A scaling behavior in all the analyzed pUVR datasets was found. With an increase in duration of a person’s solar exposure, the behavior changed from uncorrelated to long-range correlated. The slopes of calculated WT power varied from 0, in the uncorrelated case for persons with erratic activities in regards to their UVR exposure, to close to 1, in the case of long-range correlated pUVR data, for persons spending longer periods in the sun. This result may indicate that the slopes of the WT power spectra could be used as indicators of sun exposure.
Peaks in the WT power spectra were also found, pointing to the existence of characteristic times in the sun exposure behavior. Characteristic peaks at approximately 15 minutes, half an hour and an hour were present in all of the pUVR data. In the recordings of longer sun exposure, additional peaks at longer periods were detected. Thus, this behavior of the WT power spectra could be used to typify different personal behavioral patterns related to solar UVR exposure.
Acknowledgement: The paper is a part of the research done within the projects “Phase transitions and their characterization in inorganic and organic systems” (No. 171015) and “Climate changes and their influence on the environment: impacts, adaptation and mitigation” (No. 43007) financed by the Ministry of Education, Science and Technological Development of the Republic of Serbia (2011-2014). Data were collected using instruments on loan from Dr Richard McKenzie from the National Institute for Water & Atmospheric Research in New Zealand. The participants who wore the instruments are thanked.
REFERENCES
1. V. N. Livina, Y. Ashkenazy, A. Bunde and S. Havlin, "Seasonality effects on nonlinear properties of hydrometeorological records", in Extremis: Disruptive Events and Trends in Climate and Hydrology, J. Kropp and H. J. Schellnhuber, Eds. Springer, Berlin, 2011, pp 267-284.
2. J. W. Kantelhardt, E. Koscielny-Bunde, D. Rybski, P. Braun, A. Bunde and S. Havlin, "Long-term persistence and multifractality of precipitation and river runoff records", J. Geophys. Res., vol. 111, D01106, doi:10.1029/2005JD005881, 2006.
3. B. J. West and W. Deering, "Fractal physiology for physicists: Lϑvi statistics", Phys. Rep., vol. 246, pp. 1-100, 1994.
4. H. E. Stanley, "Exotic statistical physics: Applications to biology, medicine, and economics", Physica A, vol. 285, pp. 1-17, 2000.
5. J. Morlet, G. Arens, E. Fourgeau and D. Glard, "Wave propagation and sampling theory—Part I: Complex signal and scattering in multilayered media", Geophysics, vol. 47, pp. 203-221, 1982.
6. D. I. Vyushin and P. J. Kushner, "Power-law and long-memory characteristics of the atmospheric general circulation", J. Climate, vol. 22, pp. 2890-2904, 2009.
7. C. Varotsos and D. Kirk-Davidoff, "Long-memory processes in ozone and temperature variations at the region 60° S – 60° N", Atmos. Chem. Phys., vol. 6, pp. 4093-4100, 2006.
8. M. Allen and R. McKenzie, "Enhanced UV exposure on a ski-field compared with exposures at sea level", Photochem. Photobiol. Sci., vol. 4, pp. 429-437, 2013.
9. C. Y. Wright, A. I. Reeder, G. E. Bodeker, A. Gray and B. Cox, "Solar UVR exposure, concurrent activities and sun-protective practices among primary schoolchildren", Photochem. Photobiol., vol. 83, pp. 749-758, 2007.
10. R. McKenzie, B. Liley, P. Johnston, R. Scragg, A. Stewart, A. I. Reeder and M.W. Allen, "Small doses from artificial UV sources elucidate the photo-production of vitamin D", Photochem. Photobiol. Sci., vol. 12, pp. 1726-1737, 2013.
11. G. Seckmeyer, M. Klingebiel, S. Riechelmann, I. Lohse, R. L. McKenzie, J. B. Liley, M. W. Allen, A.-M. Siani, and G. R. Casale, "A Critical assessment of two types of personal UV dosimeters", Photochem. Photobiol., vol. 88, pp. 215–222, 2012.
12. G. Seckmeyer, A. Bais, G. Bernhard, M. Blumthaler, C. R. Booth, K. Lantz, and R. L. McKenzie, "Instruments to Measure Solar Ultraviolet Radiation. Part 2: Broadband Instruments Measuring Erythemally Weighted Solar Irradiance", World Meteorological Organization Global Atmosphere Watch, Report No. 164, WMO TD-No. 1289, Geneva, Switzerland, 55 pp., July 2008.
13. N. Swift, J. D. Hamlin, K. M. Nield, and R. L. McKenzie, "Characterisation of AlGaN detectors for UV measurements", NIWA UV Workshop, Queenstown, 7-9 April, 2010. Available at: https://www.niwa.co.nz/ sites/niwa.co.nz/files/algan_detectors_for_uv.pdf
14. M. Bracic and A. Stefanovska, "Wavelet-based analysis of human blood-flow dynamics", Bull. Math. Biol., vol. 60, pp. 919-935, 1998.
15. P. Goupillaud, A. Grossmann and J. Morlet, "Cycle-octave and related transforms in seismic signal analysis", Geoexploration, vol. 23, pp. 85-102, 1984.
16. S. Mallat and W. L. Hwang, "Singularity detection and processing with wavelets", IEEE Trans. Inf. Theory, vol. 38, pp. 617-643, 1992.
17. E. Thieden, P. A. Philipsen, J. Sandby-Moller, J. Heydenreich and H. C. Wulf, "Proportion of lifetime UV dose received by children, teenagers and adults based on time-stamped personal dosimetry", J. Investig. Dermatol., vol. 123, pp. 1147-1150, 2004.
18. M Gröbner, J. Gröbner and G. Hülsen, "Quantifying UV exposure, vitamin D status and their relationship in a group of high school students in an alpine environment", Photochem. Photobiol. Sci., vol. 14, pp. 352-357, 2014.
19. A. J. Liley and J. B. Liley, "Analysis of dosimeter badge data", NIWA UV Workshop, Queenstown, 7-9 April, 2010. Available at: http://www.niwa.co.nz/sites/ niwa.co.nz/files/analysis_of_dosimeter_badge_data.pdf
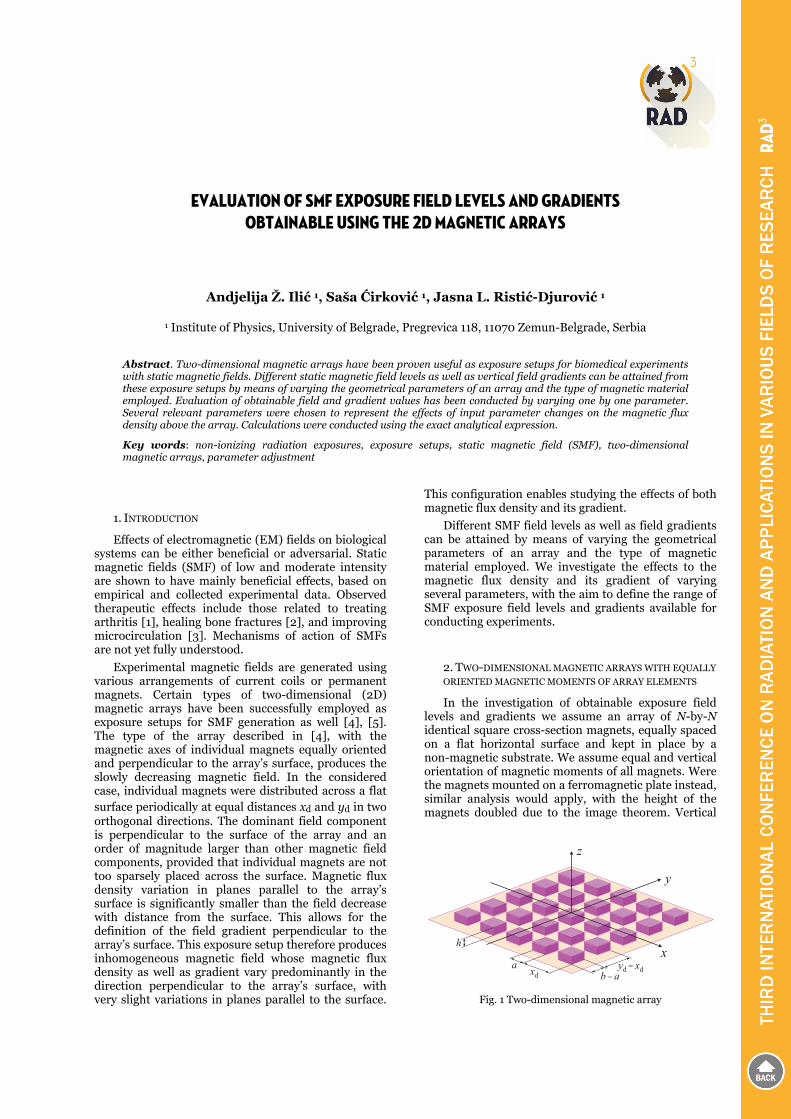
EVALUATION OF SMF EXPOSURE FIELD LEVELS AND GRADIENTS OBTAINABLE USING THE 2D MAGNETIC ARRAYS
Andjelija Ž. Ilić 1, Saša Ćirković 1, Jasna L. Ristić-Djurović 1
1 Institute of Physics, University of Belgrade, Pregrevica 118, 11070 Zemun-Belgrade, Serbia
Abstract. Two-dimensional magnetic arrays have been proven useful as exposure setups for biomedical experiments with static magnetic fields. Different static magnetic field levels as well as vertical field gradients can be attained from these exposure setups by means of varying the geometrical parameters of an array and the type of magnetic material employed. Evaluation of obtainable field and gradient values has been conducted by varying one by one parameter. Several relevant parameters were chosen to represent the effects of input parameter changes on the magnetic flux density above the array. Calculations were conducted using the exact analytical expression.
Key words: non-ionizing radiation exposures, exposure setups, static magnetic field (SMF), two-dimensional magnetic arrays, parameter adjustment
1. INTRODUCTION
Effects of electromagnetic (EM) fields on biological systems can be either beneficial or adversarial. Static magnetic fields (SMF) of low and moderate intensity are shown to have mainly beneficial effects, based on empirical and collected experimental data. Observed therapeutic effects include those related to treating arthritis [1], healing bone fractures [2], and improving microcirculation [3]. Mechanisms of action of SMFs are not yet fully understood.
Experimental magnetic fields are generated using various arrangements of current coils or permanent magnets. Certain types of two-dimensional (2D) magnetic arrays have been successfully employed as exposure setups for SMF generation as well [4], [5]. The type of the array described in [4], with the magnetic axes of individual magnets equally oriented and perpendicular to the array’s surface, produces the slowly decreasing magnetic field. In the considered case, individual magnets were distributed across a flat surface periodically at equal distances xd and yd in two orthogonal directions. The dominant field component is perpendicular to the surface of the array and an order of magnitude larger than other magnetic field components, provided that individual magnets are not too sparsely placed across the surface. Magnetic flux density variation in planes parallel to the array’s surface is significantly smaller than the field decrease with distance from the surface. This allows for the definition of the field gradient perpendicular to the array’s surface. This exposure setup therefore produces inhomogeneous magnetic field whose magnetic flux density as well as gradient vary predominantly in the direction perpendicular to the array’s surface, with very slight variations in planes parallel to the surface.
This configuration enables studying the effects of both magnetic flux density and its gradient.
Different SMF field levels as well as field gradients can be attained by means of varying the geometrical parameters of an array and the type of magnetic material employed. We investigate the effects to the magnetic flux density and its gradient of varying several parameters, with the aim to define the range of SMF exposure field levels and gradients available for conducting experiments.
2. TWO-DIMENSIONAL MAGNETIC ARRAYS WITH EQUALLY
ORIENTED MAGNETIC MOMENTS OF ARRAY ELEMENTS
In the investigation of obtainable exposure field levels and gradients we assume an array of N-by-N identical square cross-section magnets, equally spaced on a flat horizontal surface and kept in place by a non-magnetic substrate. We assume equal and vertical orientation of magnetic moments of all magnets. Were the magnets mounted on a ferromagnetic plate instead, similar analysis would apply, with the height of the magnets doubled due to the image theorem. Vertical
x
y
z
y xd = dxd b a=
a
h
Fig. 1 Two-dimensional magnetic array
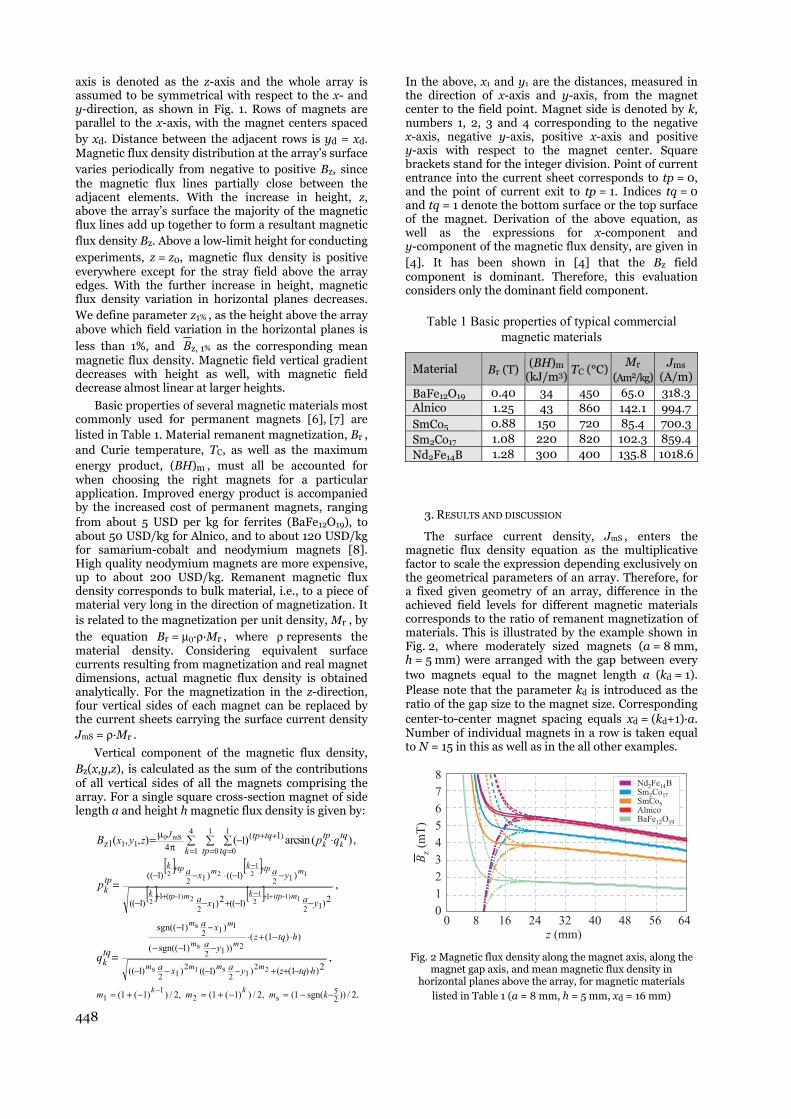
448
axis is denoted as the z-axis and the whole array is assumed to be symmetrical with respect to the x- and y-direction, as shown in Fig. 1. Rows of magnets are parallel to the x-axis, with the magnet centers spaced by xd. Distance between the adjacent rows is yd = xd. Magnetic flux density distribution at the array’s surface varies periodically from negative to positive Bz, since the magnetic flux lines partially close between the adjacent elements. With the increase in height, z, above the array’s surface the majority of the magnetic flux lines add up together to form a resultant magnetic flux density Bz. Above a low-limit height for conducting experiments, z = z0, magnetic flux density is positive everywhere except for the stray field above the array edges. With the further increase in height, magnetic flux density variation in horizontal planes decreases. We define parameter z1% , as the height above the array above which field variation in the horizontal planes is less than 1%, and Bz, 1% as the corresponding mean magnetic flux density. Magnetic field vertical gradient decreases with height as well, with magnetic field decrease almost linear at larger heights.
Basic properties of several magnetic materials most commonly used for permanent magnets [6], [7] are listed in Table 1. Material remanent magnetization, Br , and Curie temperature, TC, as well as the maximum energy product, (BH)m , must all be accounted for when choosing the right magnets for a particular application. Improved energy product is accompanied by the increased cost of permanent magnets, ranging from about 5 USD per kg for ferrites (BaFe12O19), to about 50 USD/kg for Alnico, and to about 120 USD/kg for samarium-cobalt and neodymium magnets [8]. High quality neodymium magnets are more expensive, up to about 200 USD/kg. Remanent magnetic flux density corresponds to bulk material, i.e., to a piece of material very long in the direction of magnetization. It is related to the magnetization per unit density, Mr , by the equation Br = μ0·ρ·Mr , where ρ represents the material density. Considering equivalent surface currents resulting from magnetization and real magnet dimensions, actual magnetic flux density is obtained analytically. For the magnetization in the z-direction, four vertical sides of each magnet can be replaced by the current sheets carrying the surface current density JmS = ρ·Mr .
Vertical component of the magnetic flux density, Bz(x,y,z), is calculated as the sum of the contributions of all vertical sides of all the magnets comprising the array. For a single square cross-section magnet of side length a and height h magnetic flux density is given by:
[ ] [ ][ ] [ ]
.
,
,
,)(niscra)()(
2/))sgn(1(,2/))1(1(,2/))1(1(
2))1(())1(())1((
))1(()))1sgn(((
))1sgn((
2))1((2))1((
))1(())1((
14z1
25
s21
1
212
s212
s
212
s
112
s
12
112
(1
1212
4
1
1
0
1
0
)(11
21
1)1(2
12)1
2
121
22
mS0 1μ
,,
−−=−+=−+=
⋅−++−−−−
⋅−+⋅−−−
−−
−−+−−
−−⋅−−
π
−
−++
−+
= = =
++
=
=
⋅=
−++−
+
−
kmmm
htqzyaxa
htqzya
xa
k
yaxa
yaxatpk
k tp tq
tqtptqtpJ
kk
mmmm
mm
mm
mtpkmtpk
mtpkmtpk
kk
tqq
p
qpB zyx
In the above, x1 and y1 are the distances, measured in the direction of x-axis and y-axis, from the magnet center to the field point. Magnet side is denoted by k, numbers 1, 2, 3 and 4 corresponding to the negative x-axis, negative y-axis, positive x-axis and positive y-axis with respect to the magnet center. Square brackets stand for the integer division. Point of current entrance into the current sheet corresponds to tp = 0, and the point of current exit to tp = 1. Indices tq = 0 and tq = 1 denote the bottom surface or the top surface of the magnet. Derivation of the above equation, as well as the expressions for x-component and y-component of the magnetic flux density, are given in [4]. It has been shown in [4] that the Bz field component is dominant. Therefore, this evaluation considers only the dominant field component.
Table 1 Basic properties of typical commercial magnetic materials
Material Br (T)(BH)m
(kJ/m3) TC (°C)
Mr
(Am2/kg) Jms
(A/m)BaFe12O19 0.40 34 450 65.0 318.3 Alnico 1.25 43 860 142.1 994.7SmCo5 0.88 150 720 85.4 700.3Sm2Co17 1.08 220 820 102.3 859.4Nd2Fe14B 1.28 300 400 135.8 1018.6
3. RESULTS AND DISCUSSION
The surface current density, JmS , enters the magnetic flux density equation as the multiplicative factor to scale the expression depending exclusively on the geometrical parameters of an array. Therefore, for a fixed given geometry of an array, difference in the achieved field levels for different magnetic materials corresponds to the ratio of remanent magnetization of materials. This is illustrated by the example shown in Fig. 2, where moderately sized magnets (a = 8 mm, h = 5 mm) were arranged with the gap between every two magnets equal to the magnet length a (kd = 1). Please note that the parameter kd is introduced as the ratio of the gap size to the magnet size. Corresponding center-to-center magnet spacing equals xd = (kd+1)·a. Number of individual magnets in a row is taken equal to N = 15 in this as well as in the all other examples.
Bz
(mT
)
8
7
6
5
4
3
2
1
0160 8 24 32 40 48 56 64
z (mm)
Nd Fe B2 14
Alnico
Sm Co2 17
BaFe O1 12 9
SmCo5
2 9
7
4
Fig. 2 Magnetic flux density along the magnet axis, along the
magnet gap axis, and mean magnetic flux density in horizontal planes above the array, for magnetic materials
listed in Table 1 (a = 8 mm, h = 5 mm, xd = 16 mm)
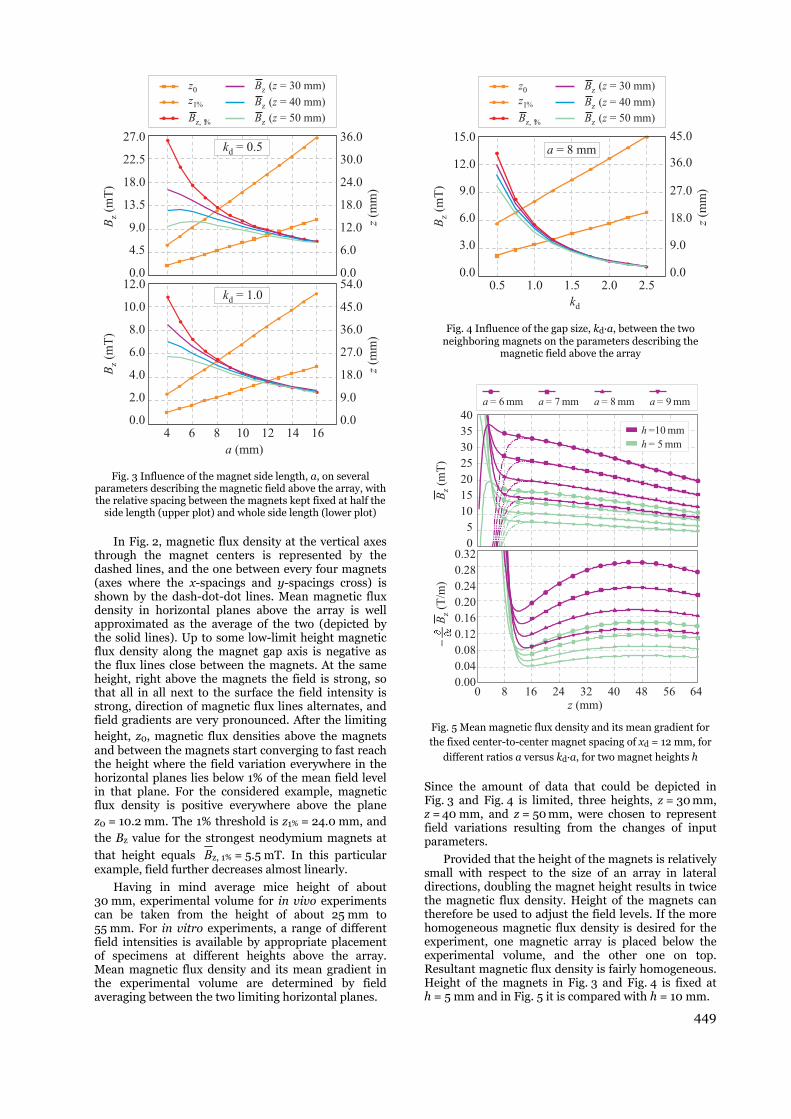
449
4 6 8 10 12 14 16
a (mm)
27.0
0.0
4.5
9.0
13.5
18.0
22.5
Bz
(mT
)
z(m
m)
36.0
0.0
6.0
12.0
18.0
24.0
30.0
12.0
10.0
8.0
6.0
4.0
2.0
0.0
Bz
(mT
)
z(m
m)
54.0
45.0
36.0
27.0
18.0
9.0
0.0
z0
z1
Bz, 1 Bz
Bz
Bz ( = 30 mm)z
( = 50 mm)z
( = 40 mm)z
%
%
kd = 0.5
kd = 1.0
Fig. 3 Influence of the magnet side length, a, on several
parameters describing the magnetic field above the array, with the relative spacing between the magnets kept fixed at half the
side length (upper plot) and whole side length (lower plot)
In Fig. 2, magnetic flux density at the vertical axes through the magnet centers is represented by the dashed lines, and the one between every four magnets (axes where the x-spacings and y-spacings cross) is shown by the dash-dot-dot lines. Mean magnetic flux density in horizontal planes above the array is well approximated as the average of the two (depicted by the solid lines). Up to some low-limit height magnetic flux density along the magnet gap axis is negative as the flux lines close between the magnets. At the same height, right above the magnets the field is strong, so that all in all next to the surface the field intensity is strong, direction of magnetic flux lines alternates, and field gradients are very pronounced. After the limiting height, z0, magnetic flux densities above the magnets and between the magnets start converging to fast reach the height where the field variation everywhere in the horizontal planes lies below 1% of the mean field level in that plane. For the considered example, magnetic flux density is positive everywhere above the plane z0 = 10.2 mm. The 1% threshold is z1% = 24.0 mm, and the Bz value for the strongest neodymium magnets at
that height equals Bz, 1% = 5.5 mT. In this particular example, field further decreases almost linearly.
Having in mind average mice height of about 30 mm, experimental volume for in vivo experiments can be taken from the height of about 25 mm to 55 mm. For in vitro experiments, a range of different field intensities is available by appropriate placement of specimens at different heights above the array. Mean magnetic flux density and its mean gradient in the experimental volume are determined by field averaging between the two limiting horizontal planes.
0.5 1.0 1.5 2.0 2.5
15.0
12.0
9.0
6.0
3.0
0.0
Bz
(mT
)
z(m
m)
45.0
27.0
36.0
18.0
9.0
0.0
z0
z1
Bz, 1 Bz
Bz
Bz ( = 30 mm)z
( = 50 mm)z
( = 40 mm)z
%
%
kd
a = 8 mm
Fig. 4 Influence of the gap size, kd·a, between the two neighboring magnets on the parameters describing the
magnetic field above the array
Bz
(T/m
)B
z(m
T)
0.32
40
0.28
35
0.24
30
0.20
25
0.16
20
0.12
15
0.08
10
0.04
15
0.00
10
160 8 24 32 40 48 56 64z (mm)
h =10 mm
h = 5 mm
a = 6 mm a = 7 mm a = 8 mm a = 9 mm
Fig. 5 Mean magnetic flux density and its mean gradient for the fixed center-to-center magnet spacing of xd = 12 mm, for
different ratios a versus kd·a, for two magnet heights h
Since the amount of data that could be depicted in Fig. 3 and Fig. 4 is limited, three heights, z = 30 mm, z = 40 mm, and z = 50 mm, were chosen to represent field variations resulting from the changes of input parameters.
Provided that the height of the magnets is relatively small with respect to the size of an array in lateral directions, doubling the magnet height results in twice the magnetic flux density. Height of the magnets can therefore be used to adjust the field levels. If the more homogeneous magnetic flux density is desired for the experiment, one magnetic array is placed below the experimental volume, and the other one on top. Resultant magnetic flux density is fairly homogeneous. Height of the magnets in Fig. 3 and Fig. 4 is fixed at h = 5 mm and in Fig. 5 it is compared with h = 10 mm.
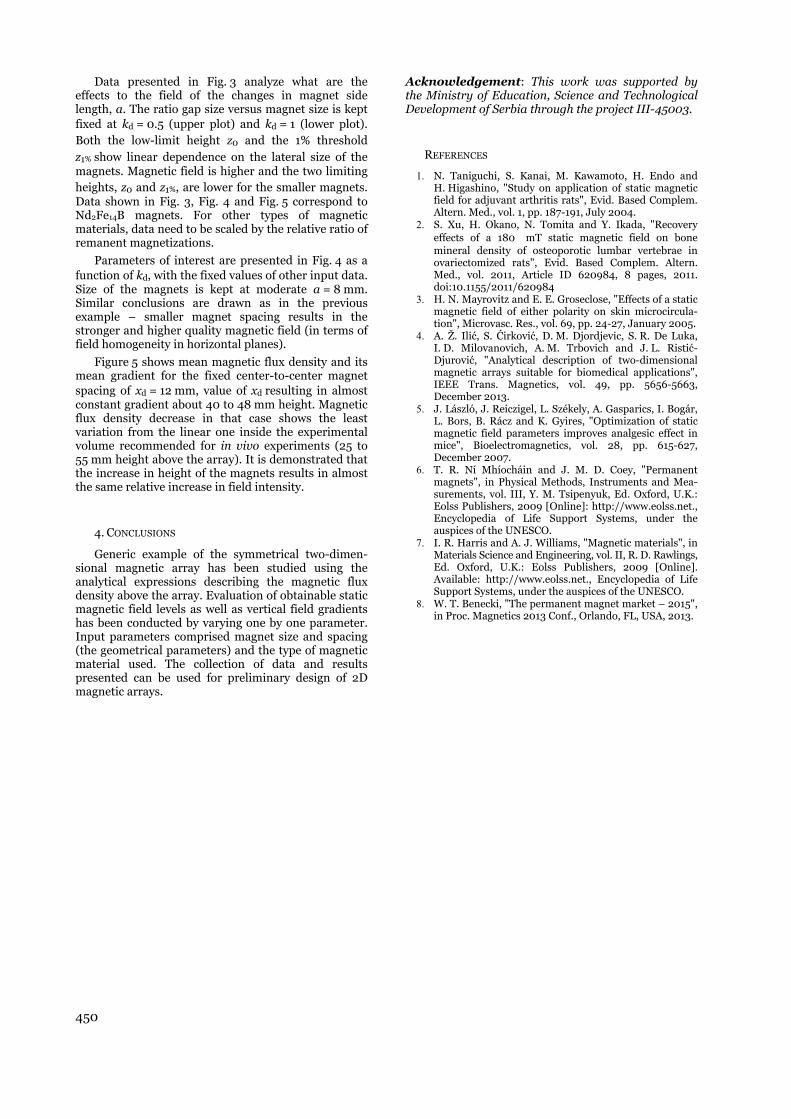
450
Data presented in Fig. 3 analyze what are the effects to the field of the changes in magnet side length, a. The ratio gap size versus magnet size is kept fixed at kd = 0.5 (upper plot) and kd = 1 (lower plot). Both the low-limit height z0 and the 1% threshold z1% show linear dependence on the lateral size of the magnets. Magnetic field is higher and the two limiting heights, z0 and z1%, are lower for the smaller magnets. Data shown in Fig. 3, Fig. 4 and Fig. 5 correspond to Nd2Fe14B magnets. For other types of magnetic materials, data need to be scaled by the relative ratio of remanent magnetizations.
Parameters of interest are presented in Fig. 4 as a function of kd, with the fixed values of other input data. Size of the magnets is kept at moderate a = 8 mm. Similar conclusions are drawn as in the previous example – smaller magnet spacing results in the stronger and higher quality magnetic field (in terms of field homogeneity in horizontal planes).
Figure 5 shows mean magnetic flux density and its mean gradient for the fixed center-to-center magnet spacing of xd = 12 mm, value of xd resulting in almost constant gradient about 40 to 48 mm height. Magnetic flux density decrease in that case shows the least variation from the linear one inside the experimental volume recommended for in vivo experiments (25 to 55 mm height above the array). It is demonstrated that the increase in height of the magnets results in almost the same relative increase in field intensity.
4. CONCLUSIONS
Generic example of the symmetrical two-dimen-sional magnetic array has been studied using the analytical expressions describing the magnetic flux density above the array. Evaluation of obtainable static magnetic field levels as well as vertical field gradients has been conducted by varying one by one parameter. Input parameters comprised magnet size and spacing (the geometrical parameters) and the type of magnetic material used. The collection of data and results presented can be used for preliminary design of 2D magnetic arrays.
Acknowledgement: This work was supported by the Ministry of Education, Science and Technological Development of Serbia through the project III-45003.
REFERENCES
1. N. Taniguchi, S. Kanai, M. Kawamoto, H. Endo and H. Higashino, "Study on application of static magnetic field for adjuvant arthritis rats", Evid. Based Complem. Altern. Med., vol. 1, pp. 187-191, July 2004.
2. S. Xu, H. Okano, N. Tomita and Y. Ikada, "Recovery effects of a 180 mT static magnetic field on bone mineral density of osteoporotic lumbar vertebrae in ovariectomized rats", Evid. Based Complem. Altern. Med., vol. 2011, Article ID 620984, 8 pages, 2011. doi:10.1155/2011/620984
3. H. N. Mayrovitz and E. E. Groseclose, "Effects of a static magnetic field of either polarity on skin microcircula-tion", Microvasc. Res., vol. 69, pp. 24-27, January 2005.
4. A. Ž. Ilić, S. Ćirković, D. M. Djordjevic, S. R. De Luka, I. D. Milovanovich, A. M. Trbovich and J. L. Ristić-Djurović, "Analytical description of two-dimensional magnetic arrays suitable for biomedical applications", IEEE Trans. Magnetics, vol. 49, pp. 5656-5663, December 2013.
5. J. László, J. Reiczigel, L. Székely, A. Gasparics, I. Bogár, L. Bors, B. Rácz and K. Gyires, "Optimization of static magnetic field parameters improves analgesic effect in mice", Bioelectromagnetics, vol. 28, pp. 615-627, December 2007.
6. T. R. Ní Mhíocháin and J. M. D. Coey, "Permanent magnets", in Physical Methods, Instruments and Mea-surements, vol. III, Y. M. Tsipenyuk, Ed. Oxford, U.K.: Eolss Publishers, 2009 [Online]: http://www.eolss.net., Encyclopedia of Life Support Systems, under the auspices of the UNESCO.
7. I. R. Harris and A. J. Williams, "Magnetic materials", in Materials Science and Engineering, vol. II, R. D. Rawlings, Ed. Oxford, U.K.: Eolss Publishers, 2009 [Online]. Available: http://www.eolss.net., Encyclopedia of Life Support Systems, under the auspices of the UNESCO.
8. W. T. Benecki, "The permanent magnet market – 2015", in Proc. Magnetics 2013 Conf., Orlando, FL, USA, 2013.
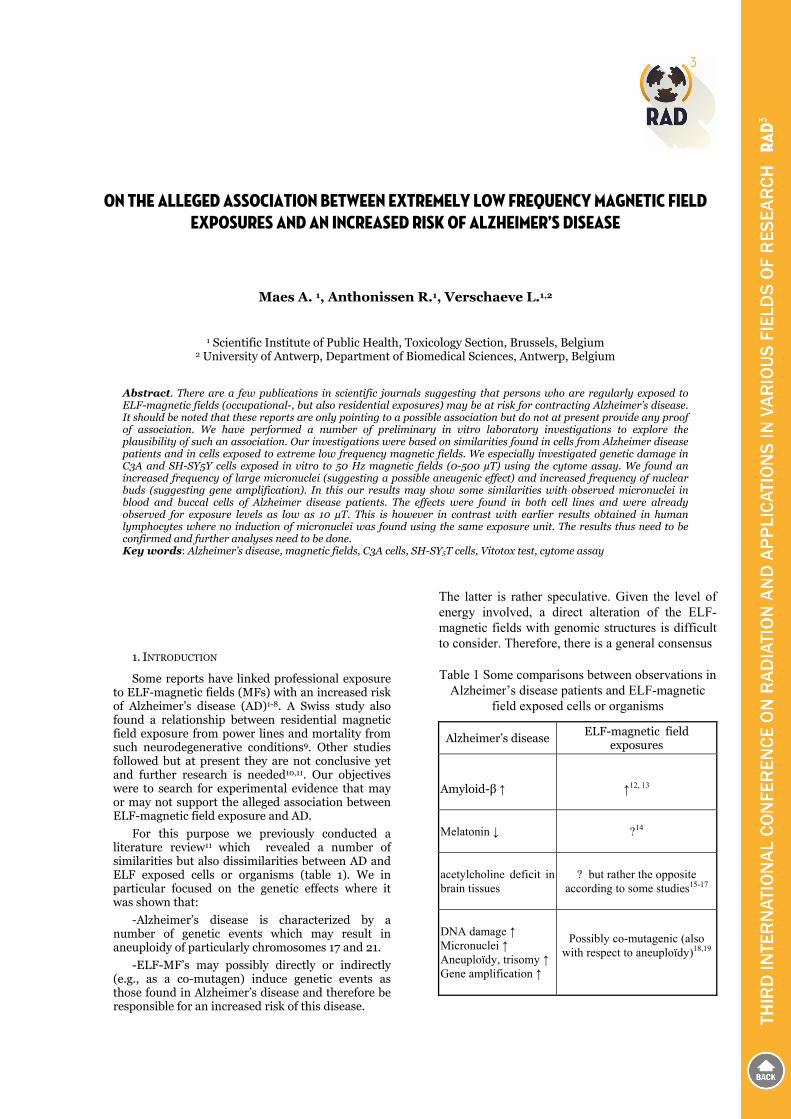
ON THE ALLEGED ASSOCIATION BETWEEN EXTREMELY LOW FREQUENCY MAGNETIC FIELD EXPOSURES AND AN INCREASED RISK OF ALZHEIMER’S DISEASE
Maes A. 1, Anthonissen R.1, Verschaeve L.1,2
1 Scientific Institute of Public Health, Toxicology Section, Brussels, Belgium 2 University of Antwerp, Department of Biomedical Sciences, Antwerp, Belgium
Abstract. There are a few publications in scientific journals suggesting that persons who are regularly exposed to ELF-magnetic fields (occupational-, but also residential exposures) may be at risk for contracting Alzheimer’s disease. It should be noted that these reports are only pointing to a possible association but do not at present provide any proof of association. We have performed a number of preliminary in vitro laboratory investigations to explore the plausibility of such an association. Our investigations were based on similarities found in cells from Alzheimer disease patients and in cells exposed to extreme low frequency magnetic fields. We especially investigated genetic damage in C3A and SH-SY5Y cells exposed in vitro to 50 Hz magnetic fields (0-500 µT) using the cytome assay. We found an increased frequency of large micronuclei (suggesting a possible aneugenic effect) and increased frequency of nuclear buds (suggesting gene amplification). In this our results may show some similarities with observed micronuclei in blood and buccal cells of Alzheimer disease patients. The effects were found in both cell lines and were already observed for exposure levels as low as 10 µT. This is however in contrast with earlier results obtained in human lymphocytes where no induction of micronuclei was found using the same exposure unit. The results thus need to be confirmed and further analyses need to be done. Key words: Alzheimer’s disease, magnetic fields, C3A cells, SH-SY5T cells, Vitotox test, cytome assay
1. INTRODUCTION
Some reports have linked professional exposure to ELF-magnetic fields (MFs) with an increased risk of Alzheimer’s disease (AD)1-8. A Swiss study also found a relationship between residential magnetic field exposure from power lines and mortality from such neurodegenerative conditions9. Other studies followed but at present they are not conclusive yet and further research is needed10,11. Our objectives were to search for experimental evidence that may or may not support the alleged association between ELF-magnetic field exposure and AD.
For this purpose we previously conducted a literature review11 which revealed a number of similarities but also dissimilarities between AD and ELF exposed cells or organisms (table 1). We in particular focused on the genetic effects where it was shown that:
-Alzheimer’s disease is characterized by a number of genetic events which may result in aneuploidy of particularly chromosomes 17 and 21.
-ELF-MF’s may possibly directly or indirectly (e.g., as a co-mutagen) induce genetic events as those found in Alzheimer’s disease and therefore be responsible for an increased risk of this disease.
The latter is rather speculative. Given the level of energy involved, a direct alteration of the ELF-magnetic fields with genomic structures is difficult to consider. Therefore, there is a general consensus
Table 1 Some comparisons between observations in Alzheimer’s disease patients and ELF-magnetic
field exposed cells or organisms
Alzheimer’s disease ELF-magnetic field
exposures Amyloid-β ↑
↑12, 13
Melatonin ↓
?14
acetylcholine deficit in brain tissues
? but rather the opposite
according to some studies15-17
DNA damage ↑ Micronuclei ↑ Aneuploïdy, trisomy ↑ Gene amplification ↑
Possibly co-mutagenic (also with respect to aneuploïdy)18,19

452
that ELF-MF’s, especially at normal (moderate) exposure levels are not directly mutagenic19,20. Some papers yet suggest that ELF-MF’s may make naturally-occurring free radicals available to interact with DNA, and that electric fields within tissues can possibly disrupt cellular processes and cause DNA damage in an indirect way. It is theoretically also possible that these fields can influence the incidence of aneuploidy synergistically. Effects were for example found when ELF’s were used as cofactors that modify cellular responses to other agents, e.g. static fields21, benzopyrene22, benzene,23, vinblastine24,25, and X-rays25. According to these studies ELF-magnetic fields are thus able to enhance, but not to start a mutagenic (DNA damaging) effect. The latter three examples are on increased aneuploidy and therefore of particular interest for the present research. It seems obvious that ELF and aneuploidy should be further investigated so as to see whether AD-related aneuploidies/trisomies are also induced by electromagnetic fields. At least according to some of the above mentioned papers EMF exposure may be able to promote the occurrence of aneuploidy caused by an aneugen via a mechanism involving the neuroendocrine system.
That the physiological state of the cells and cell type may be important in the occurrence or absence of ELF-effects was illustrated by Cadossi et al.26 and Scarfi et al.27. It was shown that cells from aged donors and leukemic patients do respond contrary to ‘other’ cells26 and that DNA damage was found in cells from Turner syndrome patients but not in healthy individuals27.
DNA damage was also found in vivo in rat brain cells by Lai and Singh28,29, Svendenstål et al.30,31 and Verschaeve and Maes (unpublished) showing that brain cells can be a possible target for genetic changes. Yokus et al. 32 found increased oxidative DNA damage in the plasma of rats and Udroiu et al.33 increased aneuploidy in liver and blood cells of mice exposed to 50 Hz electromagnetic fields.
These results show that ELF magnetic fields may, possibly in conjunction with (an)other agent(s), be associated with particular chromosome instabilities. Maybe they have the same nature as those found in cells of Alzheimer disease patients. Hence it is worthwhile being further investigated.
We have performed a number of in vitro genotoxicity tests aimed at investigating whether ELF-MF’s do have co-mutagenic properties and may induce effects as seen in AD patients, i.e. aneuploidy (cell division disturbances) and gene amplification. It should yet be realized that such effects do not prove the relationship between ELF-MF exposure and the disease. They only show that there are some similarities that merit further attention.
2. INVESTIGATIONS OF POTENTIAL DIRECT AND
INDIRECT GENETIC EFFECTS IN CELLS EXPOSED TO
ELF-MF’S
2.1. Exposure unit
Cells were exposed to the MF’s in a cylindrical exposure unit (380-turn coil, 42 cm long, 20 cm inner diameter). A detailed description of this exposure unit is given in Maes et al.34. Control measurements have revealed that the field is not perfectly sinusoidal and contains 50 Hz (100%) as well as harmonics (10% at 250 and 350 Hz and 5% at 550 and 650 Hz). The temperature within the coil remained unchanged during the entire exposure time (37°C ±0.5).
2.2. Co-mutagenic effect of ELF-MF’s
We previously reported on a co-exposure investigation using the bacterial Vitotox test35. This test uses two strains of engineered (TA104) Salmonella typhimurium bacteria. It is based on SOS-induction and light emission following DNA damage36. Bacteria were exposed for 1 and 2 h to magnetic fields of 100 and 500 µT in conjunction with the chemicals resorcinol, bleomycin, 4-nitroquinoline-oxide (-S9) and benzo[α]pyrene (+S9). We did not find any indication of an ELF-MF’s induced co-mutagenic effect.
2.2. Genotoxic effect of ELF-MF’s investigated by
the cytome assay
We also used the cytome assay in C3A (liver) and SH-SY5Y (neural) cells. In this assay we particularly paid attention to the presence of micronuclei (indicating structural or numerical chromosome aberrations), nuclear buds (gene amplification) and nucleoplasmic bridges (dicentric chromosomes). The Kastenbaum & Bowman tables37 were used for determining statistically significant deviations in aberration frequencies from exposed cells compared to (unexposed) control cells. This binomial test was found adequate for the purpose of this investigation. We found an increased frequency of especially large micronuclei (suggesting aneuploidy) and nuclear buds (gene amplification) in both cell lines which were statistically significant at all investigated field strengths (p<0.05 at 10 µT and p<0.001 at ≥ 50 µT). Figure 1 gives an example for micronuclei in C3A cells.
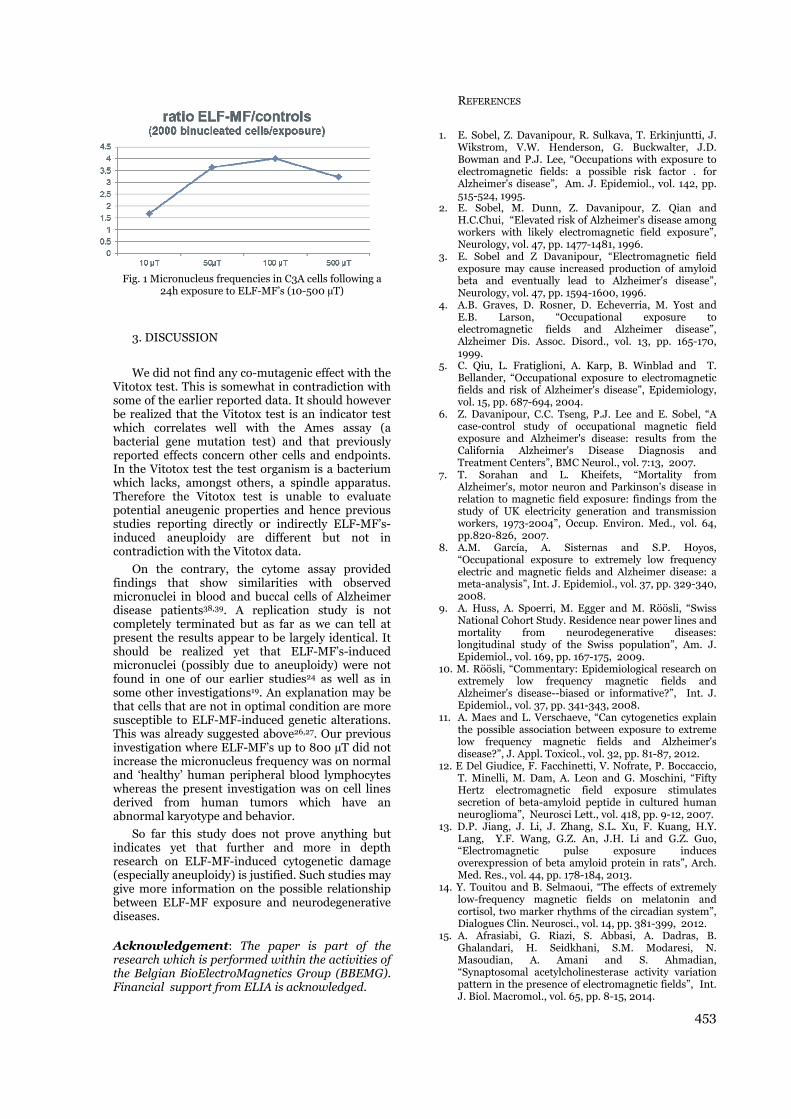
453
Fig. 1 Micronucleus frequencies in C3A cells following a 24h exposure to ELF-MF’s (10-500 µT)
3. DISCUSSION
We did not find any co-mutagenic effect with the Vitotox test. This is somewhat in contradiction with some of the earlier reported data. It should however be realized that the Vitotox test is an indicator test which correlates well with the Ames assay (a bacterial gene mutation test) and that previously reported effects concern other cells and endpoints. In the Vitotox test the test organism is a bacterium which lacks, amongst others, a spindle apparatus. Therefore the Vitotox test is unable to evaluate potential aneugenic properties and hence previous studies reporting directly or indirectly ELF-MF’s-induced aneuploidy are different but not in contradiction with the Vitotox data.
On the contrary, the cytome assay provided findings that show similarities with observed micronuclei in blood and buccal cells of Alzheimer disease patients38,39. A replication study is not completely terminated but as far as we can tell at present the results appear to be largely identical. It should be realized yet that ELF-MF’s-induced micronuclei (possibly due to aneuploidy) were not found in one of our earlier studies24 as well as in some other investigations19. An explanation may be that cells that are not in optimal condition are more susceptible to ELF-MF-induced genetic alterations. This was already suggested above26,27. Our previous investigation where ELF-MF’s up to 800 µT did not increase the micronucleus frequency was on normal and ‘healthy’ human peripheral blood lymphocytes whereas the present investigation was on cell lines derived from human tumors which have an abnormal karyotype and behavior.
So far this study does not prove anything but indicates yet that further and more in depth research on ELF-MF-induced cytogenetic damage (especially aneuploidy) is justified. Such studies may give more information on the possible relationship between ELF-MF exposure and neurodegenerative diseases.
Acknowledgement: The paper is part of the research which is performed within the activities of the Belgian BioElectroMagnetics Group (BBEMG). Financial support from ELIA is acknowledged.
REFERENCES
1. E. Sobel, Z. Davanipour, R. Sulkava, T. Erkinjuntti, J. Wikstrom, V.W. Henderson, G. Buckwalter, J.D. Bowman and P.J. Lee, “Occupations with exposure to electromagnetic fields: a possible risk factor . for Alzheimer's disease”, Am. J. Epidemiol., vol. 142, pp. 515-524, 1995.
2. E. Sobel, M. Dunn, Z. Davanipour, Z. Qian and H.C.Chui, “Elevated risk of Alzheimer's disease among workers with likely electromagnetic field exposure”, Neurology, vol. 47, pp. 1477-1481, 1996.
3. E. Sobel and Z Davanipour, “Electromagnetic field exposure may cause increased production of amyloid beta and eventually lead to Alzheimer's disease”, Neurology, vol. 47, pp. 1594-1600, 1996.
4. A.B. Graves, D. Rosner, D. Echeverria, M. Yost and E.B. Larson, “Occupational exposure to electromagnetic fields and Alzheimer disease”, Alzheimer Dis. Assoc. Disord., vol. 13, pp. 165-170, 1999.
5. C. Qiu, L. Fratiglioni, A. Karp, B. Winblad and T. Bellander, “Occupational exposure to electromagnetic fields and risk of Alzheimer's disease”, Epidemiology, vol. 15, pp. 687-694, 2004.
6. Z. Davanipour, C.C. Tseng, P.J. Lee and E. Sobel, “A case-control study of occupational magnetic field exposure and Alzheimer's disease: results from the California Alzheimer's Disease Diagnosis and Treatment Centers”, BMC Neurol., vol. 7:13, 2007.
7. T. Sorahan and L. Kheifets, “Mortality from Alzheimer's, motor neuron and Parkinson's disease in relation to magnetic field exposure: findings from the study of UK electricity generation and transmission workers, 1973-2004”, Occup. Environ. Med., vol. 64, pp.820-826, 2007.
8. A.M. García, A. Sisternas and S.P. Hoyos, “Occupational exposure to extremely low frequency electric and magnetic fields and Alzheimer disease: a meta-analysis”, Int. J. Epidemiol., vol. 37, pp. 329-340, 2008.
9. A. Huss, A. Spoerri, M. Egger and M. Röösli, “Swiss National Cohort Study. Residence near power lines and mortality from neurodegenerative diseases: longitudinal study of the Swiss population”, Am. J. Epidemiol., vol. 169, pp. 167-175, 2009.
10. M. Röösli, “Commentary: Epidemiological research on extremely low frequency magnetic fields and Alzheimer's disease--biased or informative?”, Int. J. Epidemiol., vol. 37, pp. 341-343, 2008.
11. A. Maes and L. Verschaeve, “Can cytogenetics explain the possible association between exposure to extreme low frequency magnetic fields and Alzheimer's disease?”, J. Appl. Toxicol., vol. 32, pp. 81-87, 2012.
12. E Del Giudice, F. Facchinetti, V. Nofrate, P. Boccaccio, T. Minelli, M. Dam, A. Leon and G. Moschini, “Fifty Hertz electromagnetic field exposure stimulates secretion of beta-amyloid peptide in cultured human neuroglioma”, Neurosci Lett., vol. 418, pp. 9-12, 2007.
13. D.P. Jiang, J. Li, J. Zhang, S.L. Xu, F. Kuang, H.Y. Lang, Y.F. Wang, G.Z. An, J.H. Li and G.Z. Guo, “Electromagnetic pulse exposure induces overexpression of beta amyloid protein in rats”, Arch. Med. Res., vol. 44, pp. 178-184, 2013.
14. Y. Touitou and B. Selmaoui, “The effects of extremely low-frequency magnetic fields on melatonin and cortisol, two marker rhythms of the circadian system”, Dialogues Clin. Neurosci., vol. 14, pp. 381-399, 2012.
15. A. Afrasiabi, G. Riazi, S. Abbasi, A. Dadras, B. Ghalandari, H. Seidkhani, S.M. Modaresi, N. Masoudian, A. Amani and S. Ahmadian, “Synaptosomal acetylcholinesterase activity variation pattern in the presence of electromagnetic fields”, Int. J. Biol. Macromol., vol. 65, pp. 8-15, 2014.

454
16. S. Stegemann, K. Altman, H. Mühlensiepen and L.E. Feinendegen, “Influence of a stationary magnetic field on acetylcholinesterase in murine bone marrow cells”, Radiat. Environ. Biophys., vol. 32, pp. 65-72, 1993.
17. K.R. Rajeswari, M. Satyanarayana, P.V. Narayan and S. Subrahmanyam, “Effect of extremely low frequency magnetic field on serum cholinesterase in humans and animals”, Indian J. Exp. Biol., vol. 23, pp. 194-197, 1985.
18. J.B. Mailhes, D. Young, A.A. Marino and S.N. London, “Electromagnetic fields enhance chemically-induced hyperploidy in mammalian oocytes”, Mutagenesis, vol.12, pp. 347-351, 1997.
19. U. Bergqvist, J. Brix, F. de Gruijl, R. de Seze, M. Hietanen, J.G.R. Jeffereys, I. Lagroye, G.W. Lotz, R.D. Owen, M.H. Repacholi, R. Saunders, T.S. Tenforde, L. Verschaeve and B. Veyret, “Review of experimental investigations of EMF biological effects (0-100 kHz) – ICNIRP Standing committee II”, in Exposure to static and low frequency electromagnetic fields, biological effects and health consequences, R. Matthes, A. McKinley, J. Bernhardt, P.Vecchia and B. Veyret, Eds. ICNIRP13/2003, 2003, pp. 121-398.
20. Vijayalaxmi and TJ. Prihoda, “Genetic damage in mammalian somatic cells exposed to extremely low frequency electromagnetic fields: A meta-analysis of data from 87 publications (1990–2007)”, Int. J. Radiat. Biol., vol. 85, pp. 196–213, 2009.
21. S. Tofani, A. Ferrara, L. Anglesio and G. Gilli, “Evidence for genotoxic effects of resonant ELF magnetic fields”, Bioelectrochem. Bioenerg., vol. 36, pp. 9-13, 1995.
22. Y.H. Cho and H.W. Chung, “The effect of extremely low frequency electromagnetic fields (ELF-EMF) on the frequency of micronuclei and sister chromatid exchange in human lymphocytes induced by benzo(a)pyrene”, Toxicol. Lett., vol. 143, pp. 37-44, 2003.
23. M. Moretti, M. Villarini, S. Simonucci, C. Fatigoni, G. Scassellati-Sforzolini, S. Monarca, R. Pasquini, M. Angelucci and M. Strappini, "Effects of co-exposure to extremely low frequency (ELF) magnetic fields and benzene or benzene metabolites determined in vitro by the alkaline comet assay”, Toxicol. Lett., vol. 157, pp. 119-128, 2005.
24. G. Verheyen, G. Pauwels, L. Verschaeve and G. Schoeters, "The effect of co-exposure of 50 Hz magnetic fields and an aneugen on human lymphocytes, determined by the cytokinesis-block micronucleus assay”, Bioelectromagnetics, vol. 24, pp. 160-164, 2003.
25. G.R. Ding, T. Nakahara and J. Miyakoshi, “Induction of kinetochore-positive and kinetochore-negative micronuclei in CHO cells by ELF magnetic fields and/or X-rays”, Mutagenesis, vol. 18, pp. 439-443, 2003.
26. R. Cadossi, F. Bersani, A. Cossarizza, P. Zucchini, G. Emilia, G. Torelli and C. Franceschi, “Lymphocytes and low-frequency electromagnetic fields”, FASEB J., vol. 6, pp. 2667-2674, 1992.
27. M.R. Scarfi, F. Prisco, M.B. Lioi, O. Zeni, M. Della Noce, R. Di Pietro, C. Franceschi, D. Iafusco, M. Motta and F. Bersani, “Cytogenetic effects induced by extremely low frequency pulsed magnetic fields in lymphocytes from Turner's syndrome subjects”, Bioelectrochem. Bioenergetics, vol. 43, pp. 221-226, 1997.
28. H. Lai and N.P. Singh, “Acute exposure to a 60 Hz magnetic field increases DNA strand breaks in rat brain cells”, Bioelectromagnetics, vol. 18, pp. 156-165, 1997.
29. H. Lai and N.P. Singh, “Magnetic-field-induced DNA strand breaks in brain cells of the rat”, Environ. Health Perspect, vol. 112, pp. 687-694, 2004.
30. B.M. Svedenstål, K.J. Johanson, M.O. Mattsson and L.E. Paulsson, “ DNA damage, cell kinetics and ODC activities studied in CBA mice exposed to electromagnetic fields generated by transmission lines”, In Vivo, vol. 13, pp. 507-513, 1999.
31. B.M. Svedenstål, K.J. Johanson and H.H. Mild, “DNA damage induced in brain cells of CBA mice exposed to magnetic fields”, In Vivo, vol. 13, pp. 551-552, 1999.
32. B. Yokus, D.U. Cakir, M.Z. Akdag, C. Sert and N. Mete, “Oxidative DNA damage in rats exposed to extremely low frequency electro magnetic fields”, Free Radic. Res., vol. 39, pp. 317-323, 2005.
33. Udroiu, M. Cristaldi, L.A. Ieradi, A. Bedini, L. Giuliani and C. Tanzarella, “Clastogenicity and aneuploidy in newborn and adult mice exposed to 50 Hz magnetic fields”, Int. J. Radiat. Biol., vol. 82, pp. 561-517, 2006.
34. A. Maes, M. Collier, S. Vandoninck, P. Scarpa and L. Verschaeve, "Cytogenetic effects of 50 Hz magnetic fields of different magnetic flux densities”, Bioelectromagnetics, vol. 21, pp. 589–596, 2000.
35. L. Verschaeve, R. Anthonissen, M. Grudniewska, J. Wudarski, L. Gevaert and A. Maes, “Genotoxicity investigation of ELF-magnetic fields in Salmonella typhimurium with the sensitive SOS-based VITOTOX test”, Bioelectromagnetics, vol. 32, pp. 580-584, 2011.
36. L. Verschaeve, “High-throughput bacterial mutagenicity testing: Vitotox™ assay”, in High Throughput Screening Methods in Toxicity Testing, P. Steinberg, Ed. Wiley, Publ., 2013, pp. 213-232.
37. M.A. Kastenbaum and K. O. Bowman, “Tables for determining the statistical significance of mutation frequencies”, Mutat. Res., vol. 9, pp. 527-549, 1970.
38. P. Thomas and M. Fenech, “A review of genome mutation and Alzheimer’s disease”, Mutagenesis, vol. 22, pp. 15–33, 2007.
39. P. Thomas and M. Fenech, “Chromosome 17 and 21 aneuploidy in buccal cells is increased with ageing and in Alzheimer’s disease”, Mutagenesis, vol. 23, pp. 57–65, 2008.
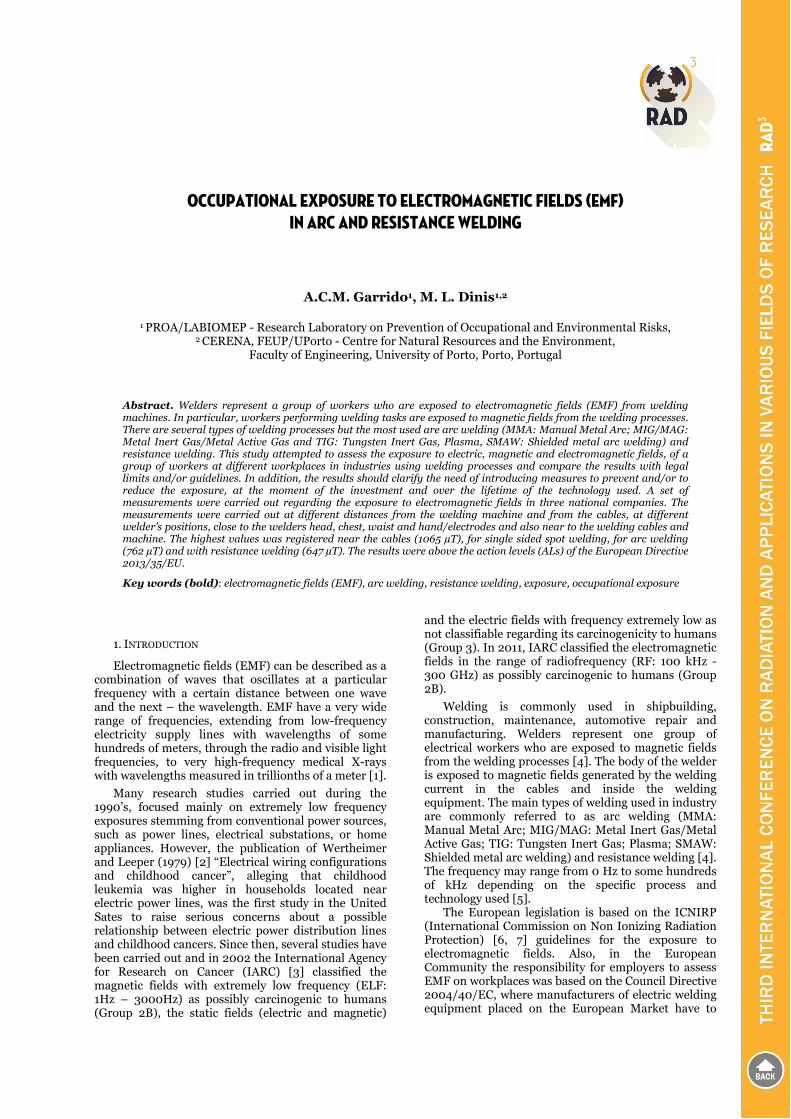
OCCUPATIONAL EXPOSURE TO ELECTROMAGNETIC FIELDS (EMF) IN ARC AND RESISTANCE WELDING
A.C.M. Garrido1, M. L. Dinis1,2
1 PROA/LABIOMEP - Research Laboratory on Prevention of Occupational and Environmental Risks, 2 CERENA, FEUP/UPorto - Centre for Natural Resources and the Environment,
Faculty of Engineering, University of Porto, Porto, Portugal
Abstract. Welders represent a group of workers who are exposed to electromagnetic fields (EMF) from welding machines. In particular, workers performing welding tasks are exposed to magnetic fields from the welding processes. There are several types of welding processes but the most used are arc welding (MMA: Manual Metal Arc; MIG/MAG: Metal Inert Gas/Metal Active Gas and TIG: Tungsten Inert Gas, Plasma, SMAW: Shielded metal arc welding) and resistance welding. This study attempted to assess the exposure to electric, magnetic and electromagnetic fields, of a group of workers at different workplaces in industries using welding processes and compare the results with legal limits and/or guidelines. In addition, the results should clarify the need of introducing measures to prevent and/or to reduce the exposure, at the moment of the investment and over the lifetime of the technology used. A set of measurements were carried out regarding the exposure to electromagnetic fields in three national companies. The measurements were carried out at different distances from the welding machine and from the cables, at different welder’s positions, close to the welders head, chest, waist and hand/electrodes and also near to the welding cables and machine. The highest values was registered near the cables (1065 µT), for single sided spot welding, for arc welding (762 µT) and with resistance welding (647 µT). The results were above the action levels (ALs) of the European Directive 2013/35/EU.
Key words (bold): electromagnetic fields (EMF), arc welding, resistance welding, exposure, occupational exposure
1. INTRODUCTION
Electromagnetic fields (EMF) can be described as a combination of waves that oscillates at a particular frequency with a certain distance between one wave and the next – the wavelength. EMF have a very wide range of frequencies, extending from low-frequency electricity supply lines with wavelengths of some hundreds of meters, through the radio and visible light frequencies, to very high-frequency medical X-rays with wavelengths measured in trillionths of a meter [1].
Many research studies carried out during the 1990’s, focused mainly on extremely low frequency exposures stemming from conventional power sources, such as power lines, electrical substations, or home appliances. However, the publication of Wertheimer and Leeper (1979) [2] “Electrical wiring configurations and childhood cancer”, alleging that childhood leukemia was higher in households located near electric power lines, was the first study in the United Sates to raise serious concerns about a possible relationship between electric power distribution lines and childhood cancers. Since then, several studies have been carried out and in 2002 the International Agency for Research on Cancer (IARC) [3] classified the magnetic fields with extremely low frequency (ELF: 1Hz – 3000Hz) as possibly carcinogenic to humans (Group 2B), the static fields (electric and magnetic)
and the electric fields with frequency extremely low as not classifiable regarding its carcinogenicity to humans (Group 3). In 2011, IARC classified the electromagnetic fields in the range of radiofrequency (RF: 100 kHz - 300 GHz) as possibly carcinogenic to humans (Group 2B).
Welding is commonly used in shipbuilding, construction, maintenance, automotive repair and manufacturing. Welders represent one group of electrical workers who are exposed to magnetic fields from the welding processes [4]. The body of the welder is exposed to magnetic fields generated by the welding current in the cables and inside the welding equipment. The main types of welding used in industry are commonly referred to as arc welding (MMA: Manual Metal Arc; MIG/MAG: Metal Inert Gas/Metal Active Gas; TIG: Tungsten Inert Gas; Plasma; SMAW: Shielded metal arc welding) and resistance welding [4]. The frequency may range from 0 Hz to some hundreds of kHz depending on the specific process and technology used [5].
The European legislation is based on the ICNIRP (International Commission on Non Ionizing Radiation Protection) [6, 7] guidelines for the exposure to electromagnetic fields. Also, in the European Community the responsibility for employers to assess EMF on workplaces was based on the Council Directive 2004/40/EC, where manufacturers of electric welding equipment placed on the European Market have to
456
show compliance with the Low Voltage Directive 73/23/EEC, which includes the protection from “radiation” for the mandatory CE marking. A review of the literature in this field [8] shows that the ICNIRP reference levels for magnetic fields may be exceeded in both arc and resistance welding, although for longer distances than the ones experienced in this work.
In 2013 the new Directive (2013/35/EU) on the minimum health and safety requirements regarding the exposure of workers to risks arising from physical agents (electromagnetic fields) was published revoking the previous Directive (2004/40/EC).
This study attempts to provide a satisfactory understanding of the magnetic fields generated in the immediate vicinity of some arc and resistance welding processes by measuring the occupational exposure to magnetic fields and comparing these values with the limits established in the EU Directive 2013/35/EU.
2. METHODS
In what concerns to the studied population the subjects were welders who have worked in the welding industry for at least 4 years. The welders who agreed to participate in the study were interviewed for basic information such as the duration of welding tasks performed per day and the number of years they have been working as welders.
Three different companies from different sectors of activity were selected to be part of the study. The first one is a small metalworking company (A) working with two similar MIG welding machines (ESAB MIG C280) with two welders; one has been working as welder for 24 years performing welding tasks with a duration of 4 h/day and the other has been working as welder for 10 years performing welding tasks with a duration of 1 h/day.
The second company (B) is a larger metalworking company, with 70 employees, of which 31 are welders working in three shifts of 8 h/day but performing welding tasks only for 6 h/day, with 11 similar MIG welding machines (ESAB MIG 5004i). Out of these 31 welders, 20 have been working as welders for 10 years, 3 started their professional work as welders 4 years ago and 4 were already welders when they joined this company.
Finally, the third company (C) is from the sector of vehicle repair and maintenance and the duration of the welding tasks in this sector are usually performed for a short period of time. Previously, the welding processes performed in this company used to be by arc welding (MIG/MAG, SMAW, plasma and oxyfuel) and resistance welding but currently the most used is MIG/MAG and spot welding. However, some of the MFs’ measurements carried out in the resistance welding machine of this company were done using a single sided spot weld and a “C” clamp (Blackhawk/CompuSpot WEL 750). This company has 8 welders performing welding tasks with duration of 1 h/day as follows: 10 minutes for resistance spot welding, 10 minutes for MIG/MAG, 10 minutes for oxyfuel and 30 minutes for small spot welder [4].
The MF data was acquired using an isotropic and triaxis magnetic sensor (Aaronia NF5035), between June and September 2013. This instrument measures
MFs between 0,1 nT and 2 mT, from 0 Hz to 30 MHz with an accuracy of 3% [4]. The EF’s were also measured.
The measurements were carried out in all cases at temperature ranging between 20 and 25ºC and relative humidity air between 50 and 60%. The measurements were first performed close to the cables for static magnetic fields (position where magnetic fields are higher). Then the measurements were performed at several bandwidth within the equipment recommendations: RBW – bandwidth should be 10 times higher than SPAN (FHIGH-FLOW); span < 20 RBW and SPAN > FLOW-0.
The independent measurements were performed in each company during five 8-hours shift. All measurements were carried out in the same real working conditions and the measurements were made at the waist and chest levels, close to the welders head and close to the hands/electrodes and also near the welding cables and machine with a minimum period of 1 minute. The duration of the measurement was variable according to the welder’s task but always more than 1 minute. The measurements were also carried out at distances of 20 cm, 50 cm, 1 m and 2 m from the welding cables and machine. The magnetic fields are generated by the current-flow at any location; however, the parts of the electric circuit closest to the welder are the predominating field sources.
The welders were observed for an 8-hours shift without disturbing their jobs to analyze the welding process, the type of pieces welded and to check the periods in which the welding tasks were performed. [4]. A total of 28 measurements were conducted in company A, 61 in company B and 41 in company C (32 using a “C” clamp and 9 using a single sided spot welding).
Although the European standards for evaluating worker exposure to EMF often use 20 cm as a standard measurement distance, in this study, only a very few measurements were conducted at distances equal or greater than 20 cm due to the fact that the welders are permanently in contact with the cables and, as there is a significant decrease of the exposure with the distance to the source, the exposure at 1 cm form the source is the most relevant situation.
3. RESULTS AND DISCUSSION
The results of the measurements for the magnetic fields conducted in the three studied companies are presented in the following tables (Table 1, Table 2, Table 3 and Table 4) for the peak magnetic field during an 8 hours shift. The EF’s were also measured, but the values were much below the action levels established by the Directive 2013/35/EU and, in this way, these results were disregarded.
The measurements were done in a range from 0 Hz to 30 MHz, according to the manufacture recommendations for band width. The magnetic fields were measured at several positions: near welding cables (1); welding machine (laterals without cables-2, lateral with cables-3); electrodes (4); welder head (5); and welder chest/waist (6). Some measurements were carried out at different distances from the welding cables and the machine: 20 cm, 50 cm, 1 m and 2 m.

457
The results of the measurements conducted in company (A) are presented in Table 1. The measurements were registered with a welding current of 140-175 A, a wire diameter of 0,8 mm, a wire speed of 9-10 m.min-1 and a shielding gas with 98% Argon + 2% CO2. The welding cables were 3 m long [4].
Table 1 Measurements of the magnetic field [µT] (A) Position
Nº Freq. [Hz]
Distance [cm] 1 20 50 100 200
1 0 760 464 141 79 76 53 226 - - - - 98 95 - - - - 204 49 - - - -
2 0 108 - - - - 3 0 496 478 72 62 - 4 0 480 - - - - 5 0 322 - - - - 6 0 231 - - - -
The results of the measurements from company (B) are presented in Table 2. The measurements were taken with a welding current of 265-285 A, a welding voltage of 26,2-29 V, a wire diameter of 1,2 mm, a wire speed of 10-12 m.min-1 and a shielding gas with 75% Argon + 25% CO2. The welding cables were 5 m long [4].
Table 2 Magnetic field [µT] (B)
Position Nº
Freq. [Hz]
Distance [cm] 1 20 50 100 200
1
0 762 185 105 76 66 45 133 - 71 - - 50 111 - - - - 53 116 78 - - - 56 104 - - - - 80 2 - - - - 98 6 - - - - 132 60 - - - - 154 49 - - - - 282 26 - - - -
2 0 215 - - - - 3 0 485 478 72 62 -
4 0 635 - - - - 53 82 - - - -
5 0 105 - - - - 6 0 495 - - - -
The results of the measurements performed in company (C), using a “C” clamp are given in Table 3. The measurements were taken with a welding current of 8100 A, a welding time of 300 ms and a welding pneumatic force of 400 daN. The cables and the torch were cooled with a fluid consisting of 50% ethyl glycol and 50% water. The welding cables were 2,5 m long [4].
Table 3 Magnetic field [µT] (C), with “C” clamp Position
Nº Freq. [Hz]
Distance [cm] 1 20 50 100 200
1 0 647 - - - - 54 95 - - - -
2 0 190 - - - - 54 116 - - - -
3 0 591 - - - -
4 0 590 - - - - 54 111 - - - -
5 0 95 - - - - 6 54 108 - - - -
The results of the measurements carried out in company (C) using a single point spot welding are given in Table 4. The measurements were performed with a welding current of 8600 A and a welding time of 70 ms. The cables were air cooled and were 2,5 m long [4].
Table 4 Magnetic field [µT] (C), single point spot
welding Position
Nº Freq. [Hz]
Distance [cm] 1 20 50 100 200
1 0 1064 510 494 - - 3 0 237 - - - - 4 0 376 247 - - -
The main variable that influences the obtained data
for the magnetic field is the distance to the cables: the results show that the magnetic field is higher near the cables, for all studied cases, and that the maximum value was registered for a single spot welding machine (1064 µT). This value was obtained with a current intensity of 8600 A. However, the maximum current of this spot machine is 12000 A which means that the generated magnetic field will be much higher if welders use higher welding current, as the magnetic field varies proportionally to the current intensity.
Although the measurements were carried out at different positions, the most relevant measurement is the one that usually presents higher values (near welding cables) for the occupational safety and health standards. Nevertheless, although the contact between the welder and the cables may be avoidable being prevented by technical measures, in practice, this rarely occurs. Therefore the compliance of the action levels (ALs) near the cables should ensure workers protection [4].
The exposure limit values (ELV’s) established by the Directive 2013/35/EU for static magnetic fields, applied to the sensory effects and health effects for external magnetic flux density (B0) were not exceeded, however, the action levels for magnetic flux density of static magnetic fields (ALs (B0)), concerning the interference with active implanted devices, e.g. cardiac pacemakers, were exceeded near the cables, in all cases [4].
The individual frequency of the magnetic field was compared with the action levels (ALs) published in the Directive 2013/35/EU. According to the ICNIRP [6, 7], the ratio of the measured value (Bn) and the reference level (Rn, which in this case is the action level ALn) must be calculated and the sum of these individual contributions should be less than or equal to 1.

458
The reference levels established by the Council Recommendation [9] concerning the exposure of the general public to electromagnetic fields (0 Hz to 300 GHZ) were exceeded for both high and low action levels, meaning that the access to these areas should be permitted only to welders.
The risk assessment concerning the welder’s exposure to a magnetic field (B) should consider the lifelong exposure (LE) for each individual, as the welders may perform the same task during different periods of time. In addition, different individuals may experience different exposure scenarios resulting in low levels of accumulated exposure to magnetic fields. The exposure to chemicals present in the fume may also be significant and contribute to an additional exposure scenario.
The lifelong exposure (LE) to magnetic fields (B) should be calculated considering the exposure time (ET) through the working life of each welder: LE = B [µT] x ET, [10]. This is a way of account for cumulative exposure’s effects and potential long-term effects. For an exposure scenario ranging between 4 and 25 years of welding tasks with duration between 1 h/day and 6 h/day, the resulting LE presents a huge variation between the minimum and the maximum exposure levels (1,15 x 10⁴ - 4,38 x 10¹⁰ μT-y) among the different companies (A, B, C) and consequently among the different processes. Therefore, it is possible to conclude that different levels of MF exposure can be found within the same group who perform the same type of tasks with a similar welding machine. In this way, welders may experience variable occupational exposure resulting in potential different health effects.
4. CONCLUSIONS
This study shows vast differences in the exposure to magnetic fields among welders. Besides the differing welding processes, the exposure received by the welders is dependent on the duration of welding tasks which is also very variable within the same company, with some welders performing welding tasks for most of the working time while others perform welding tasks occasionally.
Therefore, it is possible to stress out some of the important findings from this study. Different welding processes generate magnetic fields with different intensities. In some cases the action levels (ALs) of the Directive 2013/35/EU are likely to be exceeded, (NA (B0) is higher than the stipulated values in table B4 of this Directive) especially in welding tasks with high current intensity. Beside this, in some cases, the magnetic fields can be higher once several welding machines and processes that work with high current intensity may be used and simultaneously.
Also, the different levels of the generated magnetic fields showed that the access to welding areas should be restricted only to welders in addition to others measures of health and safety, regarding the exposure of workers to EMF. Moreover, further investigation should be carried out to assess the exposure if the action levels (ALs) of the Directive 2013/35/EU are exceeded. In particular, people with active implanted devices (e.g. pacemakers) should be kept away from the welding areas.
Acknowledgement: The authors would like to thank to Master in Occupational Safety and Hygiene Engineering (MESHO), of the Faculty of Engineering of the University of Porto (FEUP), all the support in the development and international dissemination of this work.
REFERENCES
1. European Commission, Health and Electromagnetic Fields, European Commission - Research Directorate-General - European Communities, 2005.
2. N. Wertheimer, R.E. Leeper, Electrical Wiring Configurations and Childhood Cancer, American journal of Epidemiology 109(3), 1979, pp. 273-284.
3. IARC, Working Group on the Evaluation of Carcinogenic Risks to Humans. Non-ionizing radiation, Part 1: static and extremely low-frequency (ELF) electric and magnetic fields, IARC Monographs on the Evaluation of Carcinogenic Risks to Humans, 2002, Vol. 80: 1-395.
4. A. Garrido, M.L. Dinis, Exposure Assessment to Electromagnetic Fields in Welding Processes, Book chapter in: Occupational Safety and Hygiene II, ed. P. Arezes, J.S. Baptista, M. Barroso, P. Carneiro, P. Cordeiro, N. Costa, R. Melo, A.S. Miguel, G. Perestrelo, 2014, pp. 381 -385. ISBN: 978-1-138-00144-2, London: Taylor & Francis.
5. K. Grassi, G. Spadacini, S.A Pignari, Human exposure in Arc-Welding Processes: Current versus Previous ICNIRP Basic Restrictions, IEEE, 2012.
6. ICNIRP, Guidelines for limiting exposure to time varying electric, magnetic and electromagnetic fields (up to 300 GHz), Health Physics, 1998, 74(4), pp. 494-522.
7. ICNIRP, Guidelines for limiting exposure to time varying electric, magnetic and electromagnetic fields (1 Hz to 100 kHz), Health Physics, 2010, 99(6), pp. 818-836.
8. Melton G.B., 2005. Measurement and analysis of magnetic fields from welding processes. TWI Ltd.
9. EC, Council Recommendation n.º 1999/519/EC on the limitation of exposure of the general public to electromagnetic fields (0Hz – 300 GHz), 1999.
10. A.K. Man, R. Shahidan, Variations in Occupational Exposure to Magnetic Fields among Welders in Malaysia. Radiation Protection Dosimetry, Vol. 128, No. 4, 2007, pp. 444-448.
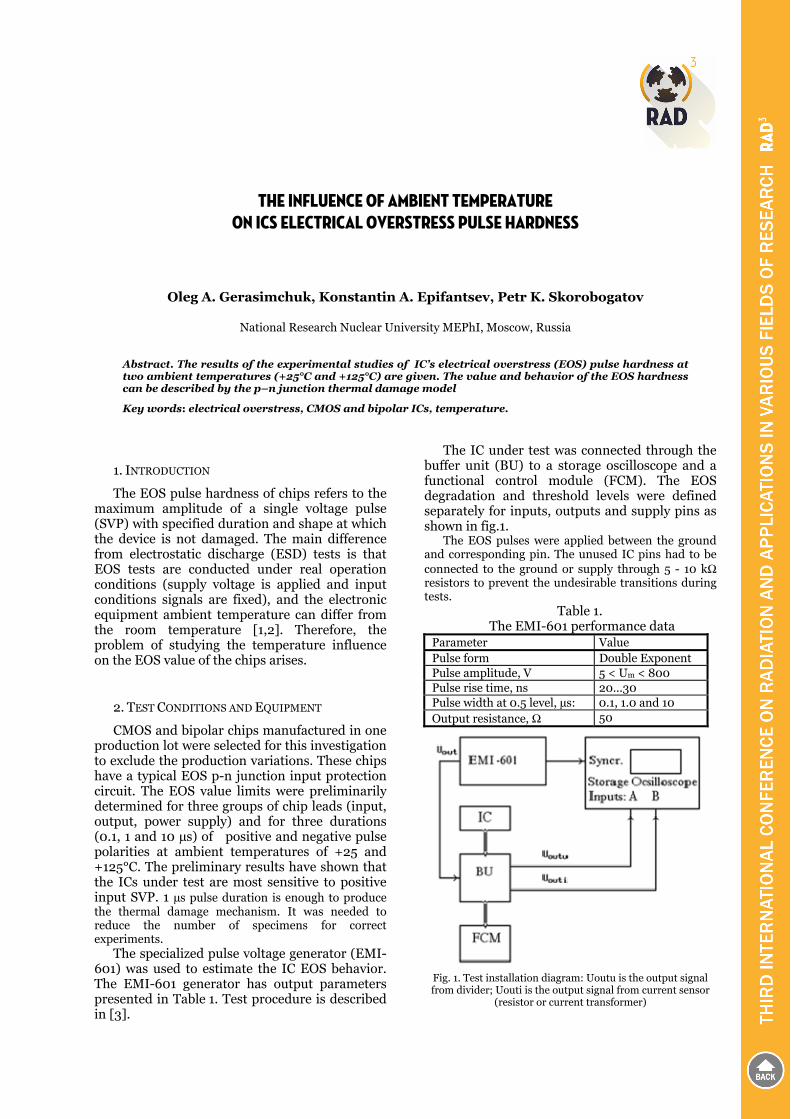
THE INFLUENCE OF AMBIENT TEMPERATURE ON ICs ELECTRICAL OVERSTRESS PULSE HARDNESS
Oleg A. Gerasimchuk, Konstantin A. Epifantsev, Petr K. Skorobogatov
National Research Nuclear University MEPhI, Moscow, Russia
Abstract. The results of the experimental studies of IC’s electrical overstress (EOS) pulse hardness at two ambient temperatures (+25°C and +125°C) are given. The value and behavior of the EOS hardness can be described by the p–n junction thermal damage model
Key words: electrical overstress, CMOS and bipolar ICs, temperature.
1. INTRODUCTION
The EOS pulse hardness of chips refers to the maximum amplitude of a single voltage pulse (SVP) with specified duration and shape at which the device is not damaged. The main difference from electrostatic discharge (ESD) tests is that EOS tests are conducted under real operation conditions (supply voltage is applied and input conditions signals are fixed), and the electronic equipment ambient temperature can differ from the room temperature [1,2]. Therefore, the problem of studying the temperature influence on the EOS value of the chips arises.
2. TEST CONDITIONS AND EQUIPMENT
CMOS and bipolar chips manufactured in one production lot were selected for this investigation to exclude the production variations. These chips have a typical EOS p-n junction input protection circuit. The EOS value limits were preliminarily determined for three groups of chip leads (input, output, power supply) and for three durations (0.1, 1 and 10 µs) of positive and negative pulse polarities at ambient temperatures of +25 and +125°C. The preliminary results have shown that the ICs under test are most sensitive to positive input SVP. 1 µs pulse duration is enough to produce the thermal damage mechanism. It was needed to reduce the number of specimens for correct experiments.
The specialized pulse voltage generator (EMI-601) was used to estimate the IC EOS behavior. The EMI-601 generator has output parameters presented in Table 1. Test procedure is described in [3].
The IC under test was connected through the buffer unit (BU) to a storage oscilloscope and a functional control module (FCM). The EOS degradation and threshold levels were defined separately for inputs, outputs and supply pins as shown in fig.1.
The EOS pulses were applied between the ground and corresponding pin. The unused IC pins had to be connected to the ground or supply through 5 - 10 kΩ resistors to prevent the undesirable transitions during tests.
Table 1. The EMI-601 performance data
Parameter Value Pulse form Double Exponent Pulse amplitude, V 5 < Um < 800 Pulse rise time, ns 20...30 Pulse width at 0.5 level, µs: 0.1, 1.0 and 10 Output resistance, Ω 50
Fig. 1. Test installation diagram: Uoutu is the output signal from divider; Uouti is the output signal from current sensor
(resistor or current transformer)
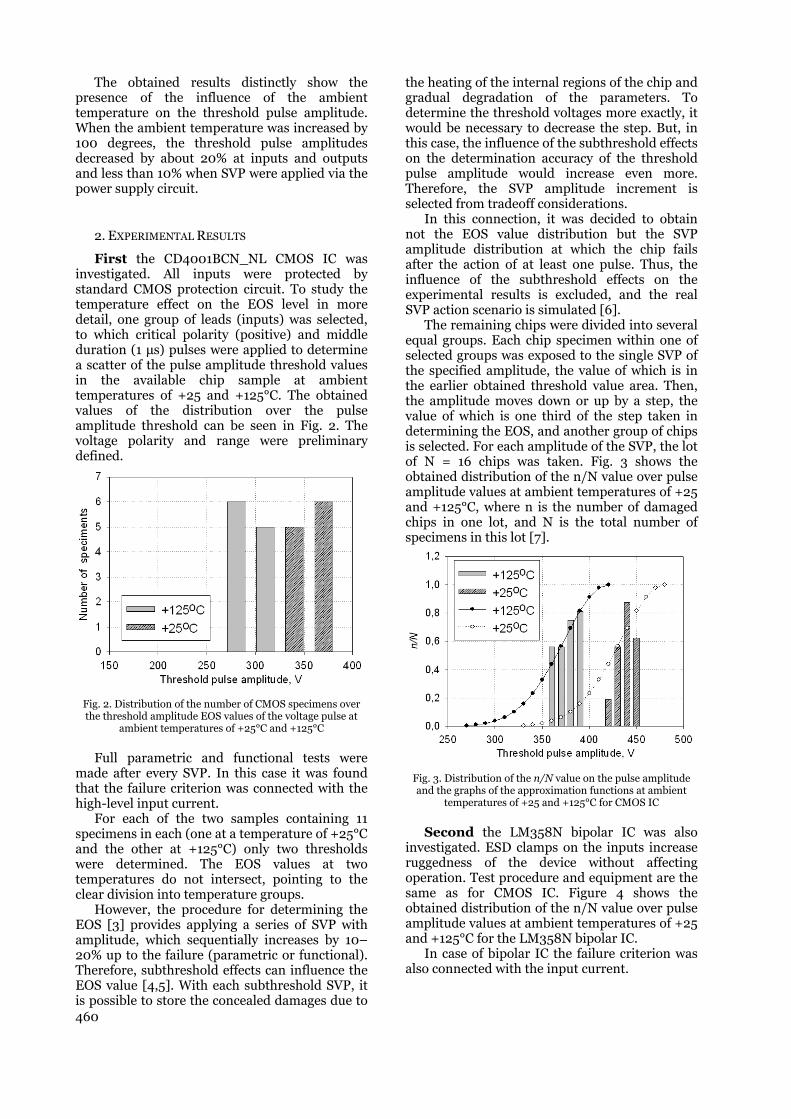
460
The obtained results distinctly show the presence of the influence of the ambient temperature on the threshold pulse amplitude. When the ambient temperature was increased by 100 degrees, the threshold pulse amplitudes decreased by about 20% at inputs and outputs and less than 10% when SVP were applied via the power supply circuit.
2. EXPERIMENTAL RESULTS
First the CD4001BCN_NL CMOS IC was investigated. All inputs were protected by standard CMOS protection circuit. To study the temperature effect on the EOS level in more detail, one group of leads (inputs) was selected, to which critical polarity (positive) and middle duration (1 μs) pulses were applied to determine a scatter of the pulse amplitude threshold values in the available chip sample at ambient temperatures of +25 and +125°C. The obtained values of the distribution over the pulse amplitude threshold can be seen in Fig. 2. The voltage polarity and range were preliminary defined.
Fig. 2. Distribution of the number of CMOS specimens over the threshold amplitude EOS values of the voltage pulse at
ambient temperatures of +25°C and +125°C
Full parametric and functional tests were made after every SVP. In this case it was found that the failure criterion was connected with the high-level input current.
For each of the two samples containing 11 specimens in each (one at a temperature of +25°C and the other at +125°C) only two thresholds were determined. The EOS values at two temperatures do not intersect, pointing to the clear division into temperature groups.
However, the procedure for determining the EOS [3] provides applying a series of SVP with amplitude, which sequentially increases by 10–20% up to the failure (parametric or functional). Therefore, subthreshold effects can influence the EOS value [4,5]. With each subthreshold SVP, it is possible to store the concealed damages due to
the heating of the internal regions of the chip and gradual degradation of the parameters. To determine the threshold voltages more exactly, it would be necessary to decrease the step. But, in this case, the influence of the subthreshold effects on the determination accuracy of the threshold pulse amplitude would increase even more. Therefore, the SVP amplitude increment is selected from tradeoff considerations.
In this connection, it was decided to obtain not the EOS value distribution but the SVP amplitude distribution at which the chip fails after the action of at least one pulse. Thus, the influence of the subthreshold effects on the experimental results is excluded, and the real SVP action scenario is simulated [6].
The remaining chips were divided into several equal groups. Each chip specimen within one of selected groups was exposed to the single SVP of the specified amplitude, the value of which is in the earlier obtained threshold value area. Then, the amplitude moves down or up by a step, the value of which is one third of the step taken in determining the EOS, and another group of chips is selected. For each amplitude of the SVP, the lot of N = 16 chips was taken. Fig. 3 shows the obtained distribution of the n/N value over pulse amplitude values at ambient temperatures of +25 and +125°C, where n is the number of damaged chips in one lot, and N is the total number of specimens in this lot [7].
Fig. 3. Distribution of the n/N value on the pulse amplitude and the graphs of the approximation functions at ambient
temperatures of +25 and +125°C for CMOS IC
Second the LM358N bipolar IC was also investigated. ESD clamps on the inputs increase ruggedness of the device without affecting operation. Test procedure and equipment are the same as for CMOS IC. Figure 4 shows the obtained distribution of the n/N value over pulse amplitude values at ambient temperatures of +25 and +125°C for the LM358N bipolar IC.
In case of bipolar IC the failure criterion was also connected with the input current.
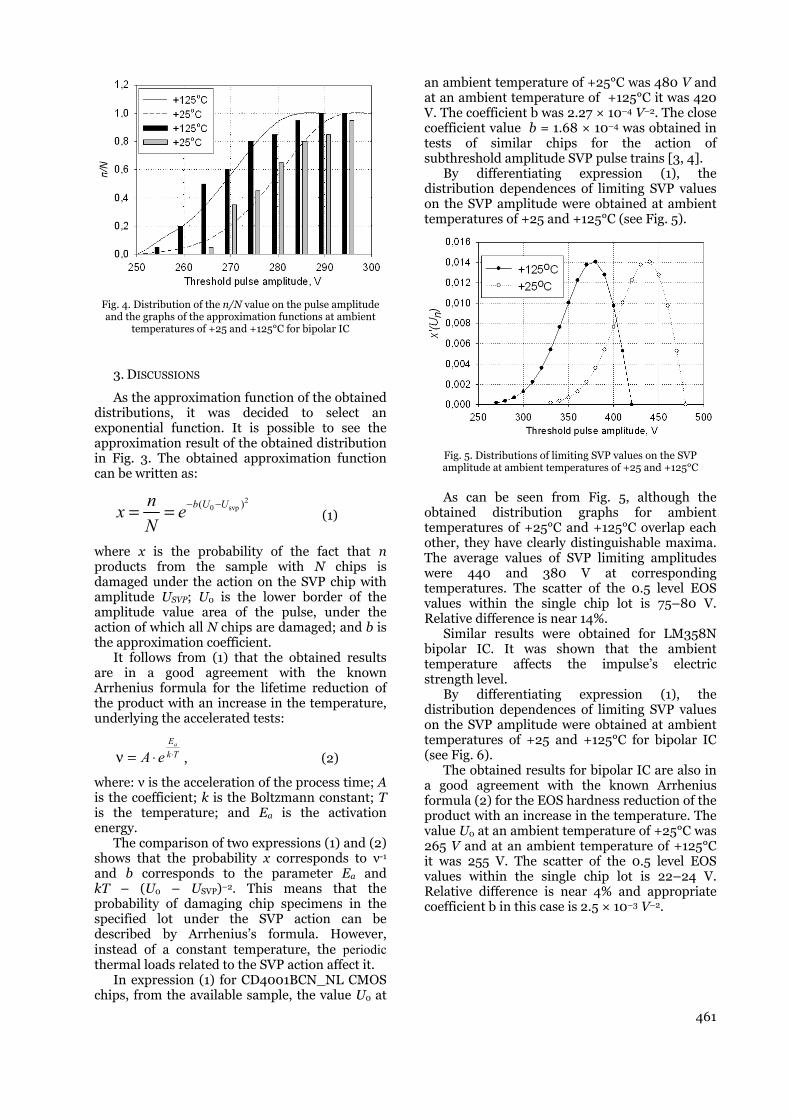
461
Fig. 4. Distribution of the n/N value on the pulse amplitude and the graphs of the approximation functions at ambient
temperatures of +25 and +125°C for bipolar IC
3. DISCUSSIONS
As the approximation function of the obtained distributions, it was decided to select an exponential function. It is possible to see the approximation result of the obtained distribution in Fig. 3. The obtained approximation function can be written as:
20 svp( )b U Un
x eN
− −= = (1)
where x is the probability of the fact that n products from the sample with N chips is damaged under the action on the SVP chip with amplitude USVP; U0 is the lower border of the amplitude value area of the pulse, under the action of which all N chips are damaged; and b is the approximation coefficient.
It follows from (1) that the obtained results are in a good agreement with the known Arrhenius formula for the lifetime reduction of the product with an increase in the temperature, underlying the accelerated tests:
Tk
Ea
eA ⋅⋅=ν , (2)
where: ν is the acceleration of the process time; A is the coefficient; k is the Boltzmann constant; T is the temperature; and Ea is the activation energy.
The comparison of two expressions (1) and (2) shows that the probability x corresponds to ν-1 and b corresponds to the parameter Ea and kT – (U0 – USVP)–2. This means that the probability of damaging chip specimens in the specified lot under the SVP action can be described by Arrhenius’s formula. However, instead of a constant temperature, the periodic thermal loads related to the SVP action affect it.
In expression (1) for CD4001BCN_NL CMOS chips, from the available sample, the value U0 at
an ambient temperature of +25°C was 480 V and at an ambient temperature of +125°C it was 420 V. The coefficient b was 2.27 × 10⁻⁴ V–2. The close coefficient value b = 1.68 × 10⁻⁴ was obtained in tests of similar chips for the action of subthreshold amplitude SVP pulse trains [3, 4].
By differentiating expression (1), the distribution dependences of limiting SVP values on the SVP amplitude were obtained at ambient temperatures of +25 and +125°C (see Fig. 5).
Fig. 5. Distributions of limiting SVP values on the SVP amplitude at ambient temperatures of +25 and +125°C
As can be seen from Fig. 5, although the obtained distribution graphs for ambient temperatures of +25°C and +125°C overlap each other, they have clearly distinguishable maxima. The average values of SVP limiting amplitudes were 440 and 380 V at corresponding temperatures. The scatter of the 0.5 level EOS values within the single chip lot is 75–80 V. Relative difference is near 14%.
Similar results were obtained for LM358N bipolar IC. It was shown that the ambient temperature affects the impulse’s electric strength level.
By differentiating expression (1), the distribution dependences of limiting SVP values on the SVP amplitude were obtained at ambient temperatures of +25 and +125°C for bipolar IC (see Fig. 6).
The obtained results for bipolar IC are also in a good agreement with the known Arrhenius formula (2) for the EOS hardness reduction of the product with an increase in the temperature. The value U0 at an ambient temperature of +25°C was 265 V and at an ambient temperature of +125°C it was 255 V. The scatter of the 0.5 level EOS values within the single chip lot is 22–24 V. Relative difference is near 4% and appropriate coefficient b in this case is 2.5 × 10⁻³ V–2.
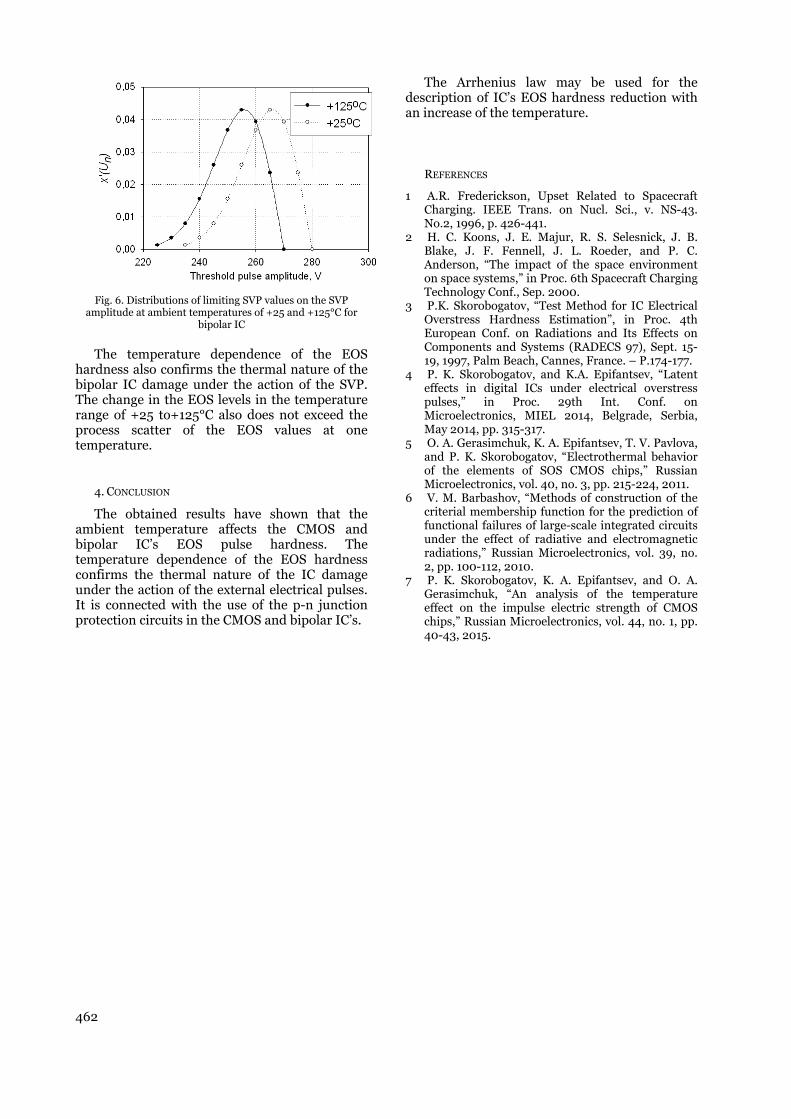
462
Fig. 6. Distributions of limiting SVP values on the SVP amplitude at ambient temperatures of +25 and +125°C for
bipolar IC
The temperature dependence of the EOS hardness also confirms the thermal nature of the bipolar IC damage under the action of the SVP. The change in the EOS levels in the temperature range of +25 to+125°C also does not exceed the process scatter of the EOS values at one temperature.
4. CONCLUSION
The obtained results have shown that the ambient temperature affects the CMOS and bipolar IC’s EOS pulse hardness. The temperature dependence of the EOS hardness confirms the thermal nature of the IC damage under the action of the external electrical pulses. It is connected with the use of the p-n junction protection circuits in the CMOS and bipolar IC’s.
The Arrhenius law may be used for the description of IC’s EOS hardness reduction with an increase of the temperature.
REFERENCES
1 A.R. Frederickson, Upset Related to Spacecraft Charging. IEEE Trans. on Nucl. Sci., v. NS-43. No.2, 1996, p. 426-441.
2 H. C. Koons, J. E. Majur, R. S. Selesnick, J. B. Blake, J. F. Fennell, J. L. Roeder, and P. C. Anderson, “The impact of the space environment on space systems,” in Proc. 6th Spacecraft Charging Technology Conf., Sep. 2000.
3 P.K. Skorobogatov, “Test Method for IC Electrical Overstress Hardness Estimation”, in Proc. 4th European Conf. on Radiations and Its Effects on Components and Systems (RADECS 97), Sept. 15-19, 1997, Palm Beach, Cannes, France. – P.174-177.
4 P. K. Skorobogatov, and K.A. Epifantsev, “Latent effects in digital ICs under electrical overstress pulses,” in Proc. 29th Int. Conf. on Microelectronics, MIEL 2014, Belgrade, Serbia, May 2014, pp. 315-317.
5 O. A. Gerasimchuk, K. A. Epifantsev, T. V. Pavlova, and P. K. Skorobogatov, “Electrothermal behavior of the elements of SOS CMOS chips,” Russian Microelectronics, vol. 40, no. 3, pp. 215-224, 2011.
6 V. M. Barbashov, “Methods of construction of the criterial membership function for the prediction of functional failures of large-scale integrated circuits under the effect of radiative and electromagnetic radiations,” Russian Microelectronics, vol. 39, no. 2, pp. 100-112, 2010.
7 P. K. Skorobogatov, K. A. Epifantsev, and O. A. Gerasimchuk, “An analysis of the temperature effect on the impulse electric strength of CMOS chips,” Russian Microelectronics, vol. 44, no. 1, pp. 40-43, 2015.

RADIOMETRIC DETERMINATION OF THYROTOXIC EFFECTS OF SOME XENOBIOTICS
Stanislav Pavelka1,2
1Department of Radiometry, Institute of Physiology, Czech Acad. Sci., Prague and 2Institute of Biochemistry, Faculty of Science, Masaryk University, Brno, Czech Republic
Abstract Recently, we have shown in the isolated rat thyroids marked effects of excessive exogenous bromide and perchlorate ions on the activity of thyroid peroxidase (TPO), the key enzyme in thyroid hormones (TH) metabolism. Here, we studied in more details, with the aid of several radioanalytical methods, effects of an enhanced bromide and/or perchlorate intake on various aspects of iodine metabolism and, consequently, on TH metabolism in the rat. Goitrogenic and thyrotoxic effects of excessive bromide and perchlorate ions were followed in adult male rats, maintained on diets with various iodine content, ensuring either sufficient iodine supply or mild to severe iodine deficiency. In rats administered with these xenobiotics we measured a consistent increase in relative weight of the thyroids with increasing time and concentration of applied bromide, and a sharp reduction of the 24-h uptake of [131I]-iodide by their thyroids. In these animals, we also determined a steady decline in serum total thyroxine concentration. At the molecular level, we found, unexpectedly, that the influence of exogenous bromide on the TPO enzyme activity in the rat thyroids was not simply inhibitory. It was more complex, biphasic with regard to the extent of bromide intake in the animals. With the use of several radioanalytical methods, including adapted radiometric determination of TPO enzyme activity, we therefore confirmed and quantified the presumed thyrotoxic effects of xenobiotics bromide and perchlorate ions.
Key words: bromide, perchlorate, thyroid hormones, radiometric determination, xenobiotics
INTRODUCTION
Iodine forms an irreplaceable part of thyroid hormones (TH) and is one of the essential substances inevitable for the proper development of young mammals. In contrast, not enough information is available on biological function and metabolism of similar halogen bromine. This ubiquitous trace element has not been conclusively shown to perform any essential function in animals, plants or microorganisms (for review see 1, 2). Bromide has been introduced in large amounts into the environment as a salt mining waste and a degradation product of bromine containing fumigants. The main origin of the observed pharmacological and toxicological effects of bromide ion appears to be some interference with the action of other halides, chloride and iodide. Interestingly, the biological behavior of bromide in the thyroid gland, in contrast with other organs and tissues, is more similar to the biological behavior of iodide, rather than of chloride (3). Therefore, goitrogenic effects of bromide may be assumed (4), similar to those of another inorganic goitrogenic agent perchlorate. However, the nature of the toxic effects of bromide on the thyroid gland and the
molecular mechanisms of its interference with the biosynthesis of TH has not been explained so far.
Recently, we have shown in the isolated rat thyroids (5) marked effects of exogenous bromide and perchlorate ions on the activity of the key enzyme in TH metabolism, on thyroid peroxidase (TPO). Here, we followed in more details, with the aid of several radioanalytical methods, including an improved radiometric enzyme assay for TPO, the influence of an enhanced bromide and/or perchlorate intakes in the animals, maintained on diets with diverse iodine content, on various aspects of iodine metabolism and, consequently, on TH metabolism in the rat.
EXPERIMENTAL
Radiometric determination of TPO specific enzyme activity
For studies at the molecular level, we adapted the radiometric enzyme assay for TPO (6). Firstly, we established proper assay conditions for determination of specific TPO activity in isolated thyroid glands of iodine-

deficient rats. The procedure of the radiometric assay for TPO in vitro (in isolated microsomal fractions of the rat thyroids) was based on the ability of TPO to oxidize [125I]- or [131I]-iodide in the presence of H2O2, which was the immediate oxidant for this reaction and was generated in situ by glucose oxidase. TPO further catalyzed subsequent iodination of specific tyrosyl residues bound in a large glycoprotein thyroglobulin, added in the incubated reaction mixtures (7).
Experiments performed at the level of whole organism
Presumed goitrogenic and thyrotoxic effects of excessive bromide and perchlorate ions were followed in adult Wistar rats, maintained under conditions of sufficient iodine supply (on a standard diet B) and of iodine deficiency (on a very low-iodine diet R). The animals were administered subchronicaly (in drinking water, for 7 up to 56 days) either with bromide alone (in solutions of Br- with concentrations of 1, 3 and 5 g L-1) or Br- in combination with perchlorate (in solution with concentration of 10 g L-1). The influence of an extremely high bromide intake (> 160 mg bromide per animal per day), and also of lower intakes, on the uptake of [131I]-iodide by the rat thyroids was determined by in vivo gamma-spectrometry (using Pb collimator). At the end of each experiment, after decapitation of the animals, relative weights of the isolated thyroids were measured. In blood sera of the rats, concentrations of total thyroxine (tT4) were determined with the use of commercial radioimmunoassay (RIA) kits.
RESULTS AND DISCUSSION
The influence of exogenous bromide and perchlorate on the TPO enzyme activity
Our improved radiometric enzyme assay for TPO employed as the measure of peroxidase activity in microsomal fractions of the rat thyroids the amount of radioiodine, incorporated into added pig thyroglobulin during the incubation of microsomes with [131I]-labeled iodide in the presence of hydrogen peroxide, produced in situ by glucose oxidase generating system. The incorporated portion of radioiodine was determined by the measurement of 131I radioactivity in the separated fractions: either after TLC separation of the unconsumed 131I-iodide in aliquots of the incubated reaction mixtures containing measured samples, by sophisticated quantification of the corresponding radio-chromatograms (see Fig. 1); or simply after
precipitation of radiolabeled thyroglobulin with an excess of 10% trichloroacetic acid and separation of the sediment by brief centrifugation. Practically the same results were obtained with the use of both procedures.
Fig. 1 A section of radiochromatogram of four different incubated reaction mixtures containing iodinated thyroglobulin and unconsumed [131I]-radioiodide.
Van Leeuwen et al. (8) stated that excessive exogenous bromide inhibited the TPO activity in the rat thyroid glands. With the aid of the described radiometric assay for TPO, we found that the influence of exogenous bromide on the TPO activity in the rat thyroids was biphasic, in relation to the extent of bromide intake in the animals. An increase (up to 3-fold) in TPO activity was measured in rats with a low or moderate bromide intake (below ca. 60 mg per animal per day), while in animals with very high bromide intake (over ca. 160 mg per animal per day) its thyrotoxic effects prevailed and TPO activity was reduced (Fig. 2).
Fig. 2 Thyroid peroxidase (TPO) specific enzyme activity (pkat/mg prot.), determined in microsomal fractions of the thyroid glands of rats maintained for up to 56 days on the iodine-sufficient diet B, in dependence on the extent of bromide intake. The rats permanently drank solutions of bromide with different concentrations of 0, 1, 3 or 5 g/l. The results are means ± SD for n = 6–8 male rats.
The inhibitory effect of bromide was markedly increased in animals maintained on very low-iodine diet R (Fig. 3). Interestingly, perchlorate administered subchronically in
0
400
800
1200
1600
2000
TP
O s
pec
. act
. (p
kat
/mg
pro
t.)
0 1 3 5Br- conc. (g/l)
Diet B
0
400
800
1200
1600
2000
TP
O s
pec
. act
. (p
kat
/mg
pro
t.)
0 1 3 5Br- conc. (g/l)
Diet B
464

even higher amounts than the highest quantity of bromide caused in all cases of the rat thyroids elevation of the TPO activity. If used in combination with bromide, perchlorate partially counteracted the effects of bromide (not shown).
Fig. 3 Thyroid peroxidase (TPO) specific enzyme activity (pkat/mg prot.), determined in microsomal fractions of the thyroid glands of rats maintained for up to 56 days on very low-iodine diet R, in dependence on the extent of bromide intake. The rats permanently drank solutions of bromide with concentrations of 0, 1, 2 or 3 g/l. The results are means ± SD for n = 6–8 male rats.
Goitrogenic and thyrotoxic effects of bromide and perchlorate ions
We measured a sharp reduction of the 24-h uptake of [131I]-iodide by the thyroids of rats administered with bromide and perchlorate ions. The suppressive effect of perchlorate on the uptake of radioiodide was much more pronounced (not shown). A consistent increase in relative weight of the rats’ thyroid glands with increasing time and concentration of applied bromide was observed (Fig. 4 and 5).
Fig. 4 Relative weight (mg/100 g b.w.) of the thyroid glands of rats maintained for up to 56
days on the iodine-sufficient diet B, in dependence on duration of the treatment. The rats drank permanently water containing bromide 5 g/l. The results are means ± SD for n = 8 male rats.
Fig. 5 Relative weight (mg/100 g b.w.) of the thyroid glands of rats maintained for up to 56 days on very low-iodine diet R, in dependence on duration of the treatment. The rats drank permanently water containing bromide 5 g/l. The results are means ± SD for n = 8 male rats.
This goitrogenic effect of bromide was much more pronounced in rats maintained on very low-iodine diet R (compare Fig. 4 vs. 5). In all animals, we also determined a steady decline in serum total thyroxine concentration. The inhibitory influence of subchronic administration of very high amounts of bromide and perchlorate, or their combination, on the production of TH in the rats is documented in Fig. 6 for animals maintained on the standard diet B and in Fig. 7 for animals maintained on the very low-iodine diet R. Again, the inhibitory effect of perchlorate alone was more pronounced in comparison with bromide.
Fig. 6 Serum total thyroxine concentrations (tT4, nmol/l) in rats maintained for up to 56 days on the iodine-sufficient diet B, and drinking water containing bromide, 0, 3 or 5 g/l (0; 3Br; 5Br) or perchlorate, 10 g/l (P), or their combination (5Br+P). The results are means ± SD for n = 6–8 male rats.
0
5
10
15
20
25
30
Days in experiment
Rel
. wei
ght
of G
T (
mg/
100
g b
.w.)
7 14 21 35 56
B/5Br
0
5
10
15
20
25
30
Days in experiment
Rel
. wei
ght
of G
T (
mg/
100
g b
.w.)
7 14 21 35 56
B/5Br
0
5
10
15
20
25
30
Days in experiment
Rel
. wei
ght
of G
T (
mg/
100
g b
.w.)
7 14 21 35 56
R/5Br
0
5
10
15
20
25
30
Days in experiment
Rel
. wei
ght
of G
T (
mg/
100
g b
.w.)
7 14 21 35 56
R/5Br
0
10
20
30
40
50
60
Seru
m t
T4
conc
. (nm
ol/l)
B/0 B/5Br B/P B/(5Br+P)
Diet
0
400
800
1200
1600
2000
2400
TP
O s
pec
. act
. (p
kat
/mg
pro
t.)
0 1 2 3Br- conc. (g/l)
Diet R
0
400
800
1200
1600
2000
2400
TP
O s
pec
. act
. (p
kat
/mg
pro
t.)
0 1 2 3Br- conc. (g/l)
Diet R
465
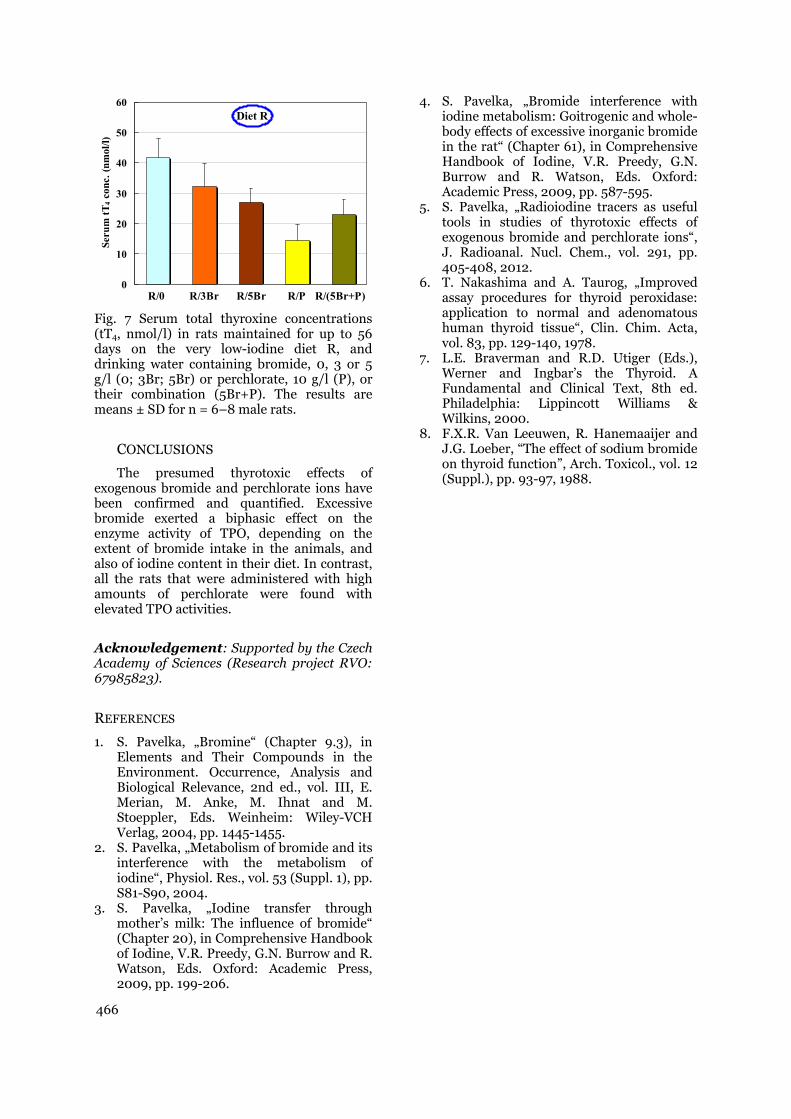
Fig. 7 Serum total thyroxine concentrations (tT4, nmol/l) in rats maintained for up to 56 days on the very low-iodine diet R, and drinking water containing bromide, 0, 3 or 5 g/l (0; 3Br; 5Br) or perchlorate, 10 g/l (P), or their combination (5Br+P). The results are means ± SD for n = 6–8 male rats.
CONCLUSIONS
The presumed thyrotoxic effects of exogenous bromide and perchlorate ions have been confirmed and quantified. Excessive bromide exerted a biphasic effect on the enzyme activity of TPO, depending on the extent of bromide intake in the animals, and also of iodine content in their diet. In contrast, all the rats that were administered with high amounts of perchlorate were found with elevated TPO activities.
Acknowledgement: Supported by the Czech Academy of Sciences (Research project RVO: 67985823).
REFERENCES
1. S. Pavelka, „Bromine“ (Chapter 9.3), in Elements and Their Compounds in the Environment. Occurrence, Analysis and Biological Relevance, 2nd ed., vol. III, E. Merian, M. Anke, M. Ihnat and M. Stoeppler, Eds. Weinheim: Wiley-VCH Verlag, 2004, pp. 1445-1455. 2. S. Pavelka, „Metabolism of bromide and its interference with the metabolism of iodine“, Physiol. Res., vol. 53 (Suppl. 1), pp. S81-S90, 2004. 3. S. Pavelka, „Iodine transfer through mother’s milk: The influence of bromide“ (Chapter 20), in Comprehensive Handbook of Iodine, V.R. Preedy, G.N. Burrow and R. Watson, Eds. Oxford: Academic Press, 2009, pp. 199-206.
4. S. Pavelka, „Bromide interference with iodine metabolism: Goitrogenic and whole- body effects of excessive inorganic bromide in the rat“ (Chapter 61), in Comprehensive Handbook of Iodine, V.R. Preedy, G.N. Burrow and R. Watson, Eds. Oxford: Academic Press, 2009, pp. 587-595. 5. S. Pavelka, „Radioiodine tracers as useful tools in studies of thyrotoxic effects of exogenous bromide and perchlorate ions“, J. Radioanal. Nucl. Chem., vol. 291, pp. 405-408, 2012. 6. T. Nakashima and A. Taurog, „Improved assay procedures for thyroid peroxidase: application to normal and adenomatous human thyroid tissue“, Clin. Chim. Acta, vol. 83, pp. 129-140, 1978. 7. L.E. Braverman and R.D. Utiger (Eds.), Werner and Ingbar’s the Thyroid. A Fundamental and Clinical Text, 8th ed. Philadelphia: Lippincott Williams & Wilkins, 2000. 8. F.X.R. Van Leeuwen, R. Hanemaaijer and J.G. Loeber, “The effect of sodium bromide on thyroid function”, Arch. Toxicol., vol. 12 (Suppl.), pp. 93-97, 1988.
0
10
20
30
40
50
60Se
rum
tT
4 co
nc.
(nm
ol/l)
R/0 R/3Br R/P R/(5Br+P)R/5Br
Diet RDiet R
0
10
20
30
40
50
60Se
rum
tT
4 co
nc.
(nm
ol/l)
R/0 R/3Br R/P R/(5Br+P)R/5Br
Diet RDiet R
466
ANTIOXIDANT ENZYMES IN WOMEN WITH HYPERPLASIA COMPLEX: RELATION WITH SEX HORMONES
Snežana Pejić, Ana Todorović, Vesna Stojiljković, Ljubica Gavrilović, Nataša Popović, Ivan Pavlović, Snežana Pajović
Laboratory of Molecular Biology and Endocrinology, "Vinča" Institute of Nuclear Sciences, University of Belgrade, Belgrade, Serbia
Abstract. Endometrial hyperplasia complex is gynecological disorder characterized by morphological irregularities of glands shape and size. Antioxidant enzymes (AOE), superoxide dismutase (SOD), catalase (CAT), glutathione peroxidase (GPx) and glutathione reductase (GR), have an essential role in preventing oxidative damage in cell caused by reactive oxygen species (ROS). In this study, we examined the AO status in hyperplastic tissue of patients in menstrual cycle (follicular and luteal phase) and in postmenopause, as well as the relationship between sex hormones and AO parameters. The phase-related activity of GPx and GR in examined patients was significantly different than in healthy women. A significant negative correlation between FSH/LH level and GPx activiy was observed. Endometrial hyperplasias are considered as precancerous lesions and are treated either conservatively or surgicaly, and also by radiation therapy. Since the effects of these therapies are associated with AO and hormonal changes, our results may contribute to the prediction of potential therapeutic efficacy and to selection of the most effective treatment for hyperplasia complex.
Key words: endometrial hyperplasia, antioxidant enzymes, steroid hormones
Introduction
According to WHO (World Health Organization) classification, hyperplasia complex is a type of endometrial hyperplasia and could be with atypical cytology or without atypia (1). The main features of this condition, as in the other types of endometrial hyperplasia, are morphological irregularities in endometrium caused by changes in the glands shape and size. This leads to rise in the gland to stroma ratio when compared with normal endometrium (2). Beside the age, obesity, hormone replacement therapy and diabetes are among the risk factors significant for hyperplasia development (3). Endometrial tissue is under a strong influence of sexual hormones and endometrium exposure to an excessive amount of estrogen unopposed by progesterone leads to abnormal proliferation (4). Therefore, hormones are considered as one of the key factors in the development of endometrial hyperplasia and endometrial cancer.
Reactive oxygen species (ROS) are produced during cell physiological activity. When ROS production overcomes the antioxidant capacity of the cell, the result is oxidative stress, which may lead to different pathological conditions including cancer. Antioxidant enzymes (AOE)
have an essential role in preventing oxidative damage in cell caused by reactive oxygen species. Superoxide dismutases (SODs) remove superoxide anion (O2.-), catalyzing its reduction to hydrogen peroxide (H2O2). Hydrogen peroxide becomes a substrate for two enzymes, catalase (CAT) and glutathione peroxidase (GPx) that reduce H2O2 into water (5). For its catalytic activity, GPx requires glutathione (GSH) as a hydrogen donor, coupling its oxidation to GSSG with reduction of H2O2. Glutathione itself acts as antioxidant by scavenging reactive oxygen species. Glutathione reductase (GR) converts GSSG into GSH (6).
The AO status and hormone influence were studied during the menstrual cycle and postmenopause in healthy women and in some gynaecological disorders. We have shown that AO enzymes activity and lipid hydroperoxide (LOOH) level in patients with endometrial polyps are influenced by the changes in sex hormones during the menstrual cycle and in menopause (7). In this study, we examined the AO status in menstrual cycle and postmenopause of women with endometrial hyperplasia complex and a relationship between sex hormones and AO parameters.

Methods
Subjects. The material used in this study consisted of 31 endometrial tissue specimens of women admitted to the Department of Gynecology and Obstetrics for gynecological evaluation within routine checkups or for abnormal uterine bleeding. Study was conducted prospectively and it was approved by the Human Studies Ethics Committee of the Clinical Center. The protocol was consistent with the World Medical Association Declaration of Helsinki. None of them had undergone hormone therapy or any other medical treatment in the last 6 months. Women were divided in three groups: women in proliferative (follicular phase, F), in secretory (luteal phase, L), and women in postmenopause (PM).
Endometrial samples were washed in saline solution and homogenized in phosphate buffer containing 0.05M KH2PO4 and 1 mM EDTA, pH 7.8 and frozen at -70ºC for 20 h in order to disrupt cell membranes. For SOD assay, thawed homogenates were vortexed 1 min and centrifuged at 8600 g, for 20 min at 4ºC. According to manufacturer’s recommendation, after addition of ethanol/chloroform extraction reagent (62.5/37.5 vol/vol) to completely remove hemoglobin interference, samples were centrifuged at 6000 g for 20 min, at 4ºC. Upper aqueous layer was collected and kept at -70ºC until assay. The enzyme activities and lipid hydroperoxide (LOOH) concentration were monitored spectrophotometrically using Oxis Bioxytech® Assays (Oxis International, Inc., Portland, OR, USA).
Assay of SOD activity. The method is based on SOD-mediated increase of autoxidation of 5,6,6a11b-tetrahydro-3,9,10-tryhydroxybenzo[c]fluorene in aqueous alkaline solution to yield a chromophore with maximum absorbance at 525 nm. The SOD activity is determined from the ratio of the autoxidation rates in the presence (Vs) and in the absence (Vc) of SOD. One SOD activity unit is defined as the activity that doubles the autoxidation rate of the control blank.
Assay of CAT activity. CAT activity was determined by the method of Beutler (8). The reaction is based on the rate of H2O2 degradation by catalase contained in the examined samples. The reaction was performed in an incubation mixture containing 1M Tris-HCl, 5mM EDTA, pH 8.0, and monitored at 230 nm. One unit of CAT activity is defined as 1 µmol of H2O2
decomposed per minute under the assay conditions.
Assay of GPX activity. GPx activity was assessed using the principle that oxidized glutathione (GSSG) produced upon reduction of an organic peroxide by GPx, is immediately recycled to its reduced form (GSH) with concomitant oxidation of NADPH to NADP+.
The oxidation of NADPH was monitored as a decrease in absorbance at 340 nm. One GPx unit is defined as 1 µmol of NADH oxidized per minute under the assay conditions.
Assay of GR activity. Assay is based on the oxidation of NADPH to NADP+ during the reduction of oxidized glutathione (GSSG), catalyzed by a limiting concentration of glutathione reductase. The oxidation of NADPH was monitored as a decrease in absorbance at 340 nm. One GR unit is defined as 1 µmol of NADH oxidized per minute under the assay conditions.
Lipid hydroperoxides. Concentration of LOOH measurement is based on the oxidation of ferrous (Fe2+) ions to ferric (Fe3+) ions by hydroperoxides under acidic conditions. Ferric ions then bind with the indicator dye, xylenol orange, and form a colored complex. The absorbance of the complex was measured at 560 nm. Since hydrogen peroxide content in many biological samples is much higher than that of other hydroperoxides, samples were pretreated with catalase to decompose the existing H2O2
and eliminate the interference. The specific enzyme activities were expressed as U or mU/mg protein. LOOH concentration was expressed as nmol/mg protein. Protein concentration was determined by the method of Lowry et al. (9) and expressed as mg/ml. Serum hormone levels were analysed in the hormone analysis laboratory. Estradiol (E) and progesterone (P) were determined by the RIA-CT technique used for quantitative determination of E or P in human serum or plasma. Follicle-stimulating hormone (FSH) and luteinizing hormone (LH) were determined by the IRMA FSH and LH test, which determines the quantity of immune-radiometric human FSH and LH in serum. Statistics. Statistical analysis was carried out by use of the Kruskal-Wallis test and the Dunn’s post hoc test, which considered the unequal and small sample sizes we used in this study. A linear regression model was used to evaluate associations between hormonal and antioxidant variables. Before plotting the data in the regression study, the normality test on the variables was performed and the values of estradiol and progesterone were log-transformed. Two-tailed p values are given throughout. All data were analyzed using GraphPad Prism software.
Results
Significant changes were observed for all hormone concentrations, FSH (H=5.99, p<0.05), LH (H=7.11, p<0.05), estradiol (H=8.10, p<0.05), and progesterone (H=6.42, p<0.05), (Table 1). We also found significant phase-related changes of GPx (H=7.84, p<0.05) and
468

GR activity (H=8.10, p<0.05). Both enzymes had similar activity pattern, which was higher in follicular phase compared to luteal phase and to postmenopause, (p<0.05). The phase-related activity of SOD and CAT as well as the LOOH level did not show any statistical difference (Table 2).
The linear regression analysis of individual hormonal variables against antioxidant parameters in endometrium showed a significant negative correlation between FSH/LH concentrations and GPx activity (r= -0.36; r= -0.47, p<0.05, respectively). Table 1. Hormone levels during follicular phase, luteal phase and in postmenopause (Data are expressed as mean ± SEM; * p<0.05).
Table 2. LOOH concentrations and AO enzyme activities in follicular phase (F), luteal phase (L) and postmenopause (PM) in hyperplasia complex tissue. Data are shown as mean ± SEM. P values refer to the results of the Dunn test.
Discussion
Previous studies of AO enzymes in endometrium pointed to hormone-dependent expression and activity. Ota et al. (10) have shown the phase-dependent changes of both forms of SODs (copper, zinc SOD and manganese SOD) in glandular and surface epithelia of healthy fertile women during the menstrual cycle. Specifically, their expression was lowest during the early and midproliferative phases, then gradually increased and was most pronounced in the early and mid-secretory phases. In women with endometriosis and adenomyosis, the expression of both SODs was constantly elevated. Some data also indicated that SOD activity was not different in postmenopausal women compared to fertile ones (11). Our recent findings in women with endometrial polyp showed the opposite pattern of LOOH concentration and SOD activity in polyp tissue than in women with hyperplasia complex. Both parameters were higher in the proliferative phase compared to the secretory phase or to the women in postmenopause (7). The results of this study showed that women with endometrial hyperplasia complex had similar SOD activity pattern like the healthy ones. Although it was not statistically significant, SOD activity slightly increased in luteal (secretory) phase.
Regarding GPx, the studies shown that in normal human endometrium the amount of this enzyme was low in the early proliferative phase, gradually increased and reached a maximum in the late proliferative/early secretory phases, and decreased thereafter (12). In this study, however, the GPx activity in hyperplastic tissue had the opposite pattern than in healthy women. The same variation of activity was observed for GR. Ohwada et al. (13) also found that GPx activity is significantly higher in endometrial cancer tissue with atypical or mixed atypical adenomatous hyperplasia than in endometrial cancer without hyperplasia, pointing to the role of AO status and ROS in hyperplastic changes that may lead to endometrial cancer.
In this study we recorded a negative correlation between GPx and gonadotropins in women with endometrial hyperplasia complex, which may indicate the important role of these hormones in hyperplastic changes. Our previous research also showed a modulatory effect of gonadotropins on AO enzymes in women with endometrial polyp (7). Endometrial hyperplasias are generally considered as precancerous lesions and are treated either conservatively or surgicaly, and also by radiation therapy (14). The regression of hyperplastic to normal endometrium is the main purpose of any conservative treatment which is based on the administration of agents, like progestagens (15)
F (n=10)
L
(n=10) PM
(n=11)
FSH (U/L)*
5.97±1.42
18.06±4.87
25.59±5.62
LH
(U/L)*
0.60±0.30
6.07±1.70
12.02±4.33
Estradiol (pg/ml)*
69.47±29.21
73.07±21.81
21.27±3.75
Progesterone
(nmol/l)*
1.10±0.10
5.97±0.68
4.83±0.84
F L PM
SOD (U/mg protein)
0.47 ± 0.05 0.54 ± 0.07 0.66 ± 0.07
CAT
70.18 ± 10.54
77.34 ± 10.73 67.52 ± 14.80
(U/mg protein) GPx (mU/mg protein)
37.44 ± 3.27*
21.48 ± 1.81
19.84 ± 1.60
GR (mU/mg protein)
5.96 ± 0.47* 3.41 ± 0.65 3.313 ± 0.42
LOOH (nm/mg protein)
0.32 ± 0.04 0.34 ± 0.03 0.35 ± 0.02
469
or gonadotropin-releasing hormone analogues (GnRHa) (16). Since the effects of these therapies are associated with AO and hormonal changes, our results may contribute to the prediction of potential therapeutic efficacy and to selection of the most effective treatment for hyperplasia complex.
Acknowledgement
This work was financially supported by the Ministry of Education, Science and Technological Development (Grants 41027, 41022, 173041).
Reference
1. M.M. Hannemann, H.M. Alexander, N. J. Cope, N.
Acheson and A.Phillips, “ Endometrial hyperplasia: a clinician's review“, Obstet. Gynaecol. Reprod. Med., vol.20, pp. 116-120, 2010.
2. L.C. Horn, A. Meinel, R. Handzel and J. Einenkel, “Histopathology of endometrial hyperplasia and endometrial carcinoma: an update“, Ann. Diagn. Pathol., vol. 11, pp. 297-311, 2007.
3. F. Linkov, R. Edwards, J. Balk, Z. Yurkovetsky, B. Stadterman, A. Lokshin and E. Taioli, “Endometrial hyperplasia, endometrial cancer and prevention: Gaps in existing research of modifiable risk factors“, Eur. J. Cancer Prev., vol. 44, pp. 1632-1644, 2008.
4. M.E. Sherman, “ Theories of endometrial carcinogenesis: a multidisciplinary approach“, Mod. Pathol., vol. 13. pp. 295-308, 2000.
5. T. Rahman, I. Hosen, M.T. Islam and H.U. Shekhar, “ Oxidative stress and human health“, Adv. Biosci. Biotechnol., vol. 3, p. 997, 2012.
6. G. Wu, Y. Z. Fang, S. Yang, J.R. Lupton and N.D. Turner, “ Glutathione metabolism and its implications for health“, J. Nutr., vol.134, pp.489-492, 2004.
7. S.A. Pejic, J.D. Kasapovic, A.U. Todorovic, V.R. Stojiljkovic, L.V. Gavrilovic, N.M. Popovic and S.B. Pajovic, “ Antioxidant enzymes in women with endometrial polyps: relation with sex hormones“, Eur. J. Obstet. Gynecol. Reprod. Biol., vol. 170(1), pp. 241-246, 2013.
8. E. Beutler, “Catalase“, in Red Cell Metabolism, a Manual of Biohemical Methods 3rd ed., E. Beutler, ed., New York: Grune and Stratton, 1982, pp. 105-106.
9. O.H. Lowry, N.J. Rosenbrough, A.L. Farr and R.J. Randall, “ Protein measurement with the Folin phenol reagent“, J. Biol. Chem., vol. 193, pp. 265-275, 1951.
10. H. Ota, S. Igarashi, J. Hatazawa and T. Tanaka, “ Immunohistochemical assessment of superoxide dismutase expression in the endometrium in endometriosis and adenomyosis“, Fertil. Steril., vol.72(1), pp.129-134, 1999.
11. F. Gürdöl, Y. Öner-Iyidoĝan, Ö. Yalçin, S. Genç and F. Buyru, “Changes in enzymatic antioxidant defense system in blood and endometrial tissues of women after menopause“, Res. Commun. Mol. Pathol. Pharmacol., vol. 97, pp. 38-46, 1997.
12. H. Ota, S. Igarashi, N. Kato and T. Tanaka, “ Aberrant expression of glutathione peroxidase in eutopic and ectopic endometrium in endometriosis and adenomyosis“, Fertil. Steril., vol. 74, pp. 313-318, 2000.
13. M. Ohwada, M. Suzuki, I. Sato, H. Tsukamoto and K. Watanabe, “ Glutathione peroxidase activity in endometrium: effects of sex hormones and cancer“, Gynecol. Oncol., vol. 60, pp. 277-282, 1996.
14. G.S. Silverberg, “Problems in the Differential Diagnosis of Endometrial Hyperplasia and Carcinoma“, Mod. Pathol., vol. 13 (3), pp. 309-327, 2000.
15. I.D. Gallos, M. Shehmar, S. Thangaratinam. T.K. Papapostolou, A. Coomarasamy, J.K. Gupta, “Oral progestogens vs levonorgestrel-releasing intrauterine system for endometrial hyperplasia: a systematic review and metaanalysis“, Am. J. Obstet. Gynecol., vol. 203 (6), pp. 547 e1-10, 2010.
16. G. Grimbizis, T. Tsalikis, V. Tzioufa, M. Kasapis and S. Manatalenakis, ” Regression of endometrial hyperplasia after treatment with the gonadotropin-releasing hormone analogue triptorelin: a prospective study“, Hum. Reprod., vol. 14. pp. 479-484, 1999.
EFFECTS OF FLUOXETINE ON THYROID HORMONES METABOLISM
Stanislav Pavelka1,2
1Department of Radiometry, Institute of Physiology, Czech Acad. Sci., Prague and 2Institute of Biochemistry, Faculty of Science, Masaryk University, Brno, Czech Republic
Abstract. In studies of the interaction of an antidepressant drug fluoxetine (Fluox) with the metabolism of thyroid hormones (TH) in the rat, we applied our newly developed radiometric assays for iodothyronine deiodinases (IDs) of types 1, 2 and 3 (D1, D2 and D3, respectively), using [125I]-labeled iodothyronines of high specific radioactivity as substrates. We followed in details the effects of administration during 25 days to adult Wistar rats of Fluox alone or in combination with triiodothyronine (T3) on the production and degradation of TH in the CNS and in different peripheral rat tissues. Surprisingly, administration of Fluox in combination with supraphysiological amounts of T3 caused a distinctive fall of non-physiologically high concentrations of serum total T3, which were reached by giving the animals the same amounts of T3 alone, to nearly normal levels. Profound changes in IDs enzyme activities were determined, especially in the pituitary and cerebellum of treated rats. In conclusion, the elaborated radiometric assays for IDs were found to be usable for the assessment of changes in these enzyme activities, caused by the administration of the studied drugs to the rats.
Key words: antidepressant fluoxetine, radiometric enzyme assays, thyroid hormones
INTRODUCTION
Thyroid hormones (TH) are potent modulators of cellular development, growth and differentiation and represent one of the major endocrine regulators of metabolism. These substances are essential for normal development and function of all organs and tissues. TH are also supposed to control the activity of some neurotransmitters (e.g., serotonin), which are hypothetically involved in the pathogenesis of depressive illness (1). On the other hand, many clinical studies indicated that various antidepressant treatments might influence the effects of hormones of hypothalamic-pituitary-thyroid axis in depressed patients (2, 3). For instance, Baumgartner et al. observed that subchronic administration to the rats of fluoxetine (Fluox) produced significant effects on the key enzymes of TH metabolism, on the enzyme activities of iodothyronine deiodinases (IDs) of types 1, 2 and 3 (D1, D2 and D3, respectively) in specific regions of the brain (4). Fluox is the most frequently used drug today for the treatment of episodic depression and belongs to the group of non-tricyclic antidepressants known as selective serotonine re-uptake inhibitors. It is important that inadequate activities of brain IDs can lead to local insufficient concentration of the 3,3´,5-
triiodo-L-thyronine (T3) and might be, therefore, one of the pathogenic factors of depression.
In the present studies, we followed the effects of administration during 25 days to Wistar rats of Fluox by itself, or in combination with T3, on the metabolism of TH in different rat tissues.
EXPERIMENTAL
Experimental design: animals and treatments
Pharmacological experiments were performed on 90 young growing male Wistar rats, fed ad libitum a standard pelleted diet. During 25-day experimental period, following 7-day adaptation period, the rats drank tap water with the addition of various amounts of fluoxetine (Ratiopharm), T3 (Sigma), or their combinations. The chosen doses were: Fluox by itself, 0.3 (low) or 3.0 (high) mg/100 g body weight; T3 by itself, 0.3 (low) or 3.0 (high) μg/100 g b.w.; Fluox+T3, all the possible combinations of these doses. Control rats drank tap water without any drug. After the treatment, rats were killed by decapitation under deep diethylether anaesthesia. The blood was collected and used for the preparation of sera. Serum total and free T3 and thyroxine (T4) levels

were determined using commercial radioimmunoassay (RIA) kits (Immunotech, Beckman Coulter Co., Prague, Czech Republic). The thyroid glands, pituitary, different parts of the brain, liver, kidney and several other tissues were also dissected and frozen. Samples of frozen tissues were used for the preparation of subcellular fractions – microsomes, cytosols or sub-mitochondrial supernatants, used in the following radiometric enzyme assays.
Radiometric enzyme assays for IDs
Enzyme activities of D1, D2 and D3 were measured in principle as we described previously (5), but with some modifications, e.g., of the TLC developing system and the way of radiochromatograms evaluation (6). These radiometric enzyme assays were based on i) the use of high-specific-radioactivity [125I]-labeled iodothyronines as substrates (obtained from PerkinElmer, Inc.) [preparations of L-3,3‘,5‘-[125I]-triiodothyronine ([125I]-rT3), s. a. 28–46 MBq/μg for D1 assay; L-3,3‘,5,5‘-[125I]-tetraiodothyronine ([125I]-thyroxine), s. a. 40–49 MBq/μg for D2 assay; and L-3,3‘,5-[125I]-triiodothyronine ([125I]-T3), s. a. 40–48 MBq/μg for D3 assay]; ii) TLC separation of radioactive products from the unconsumed substrates; iii) film-less autoradiography of radiochromatograms using storage phosphor screens (BAS-IP MS 2025, Fuji Photo Film Co., Japan); and iv) quantification of the separated compounds with a BAS-5000 laser scanner (Fujifilm Life Science Co., Japan), using AIDA software (Raytest Isotopenmessgeräte, GmbH, Germany). Duplicates of appropriate amounts of microsomal fractions, isolated from samples of various rat tissues (usually 2–200 μg of protein in a volume of 20 μl, in dependence on types of tissue and ID measured) were incubated for appropriate time (usually 30 minutes) under optimum concentration conditions in the presence of the respective labeled substrate, partly at 37 °C (samples) and partly at 0 °C (corresponding blanks). The reaction was stopped on ice by adding 10 μl of a solution containing 10 μM T3 and 10 μM T4 in concentrated ammonium hydroxide (stop mix), followed by 30 μl of methanol, vortexing and centrifugation. Aliquots (4 x 2 μl) of supernatant extracts were analyzed by TLC on a silica gel plate using an optimized solvent system (6). Separated products of the reactions containing ≥ 0.5% of the total radioactivity applied (corresponding to ≥ 25 cpm/spot) could be detected in this way. It means that our methodology enabled determination of IDs enzyme activities, in absolute terms, as low as 10 exp-18 katals.
RESULTS AND DISCUSSION
Effects of the administration of Fluox, T3, and their combination on TH levels in the rat sera
Administration of Fluox alone to the rats caused a slight decrease in serum total T4 (tT4) levels, but produced only a negligible effect on tT3 levels (cf. Fig. 1 and 2). These findings were in line with the literature data (3). The treatment of rats with supra-physiological amounts of T3 (ca. 10 μg per animal per day) caused very marked decline of serum tT4 levels (in agreement with the expectation), due to a feedback action of TH. Fluox given together with T3 did not change the effect of the administered T3 on tT4 levels (Table 1 and Fig. 1).
Table 1 The influence of the administration of fluoxetine, T3 and their combination on total T4 concentrations (nmol/l) in the rat sera
Control Fluox T3 Fluox+T3
62.8 42.0 5.8 12.577.4 51.3 10.2 8.174.6 54.7 7.6 4.270.4 52.7 5.8 12.569.3 48.9 8.2 10.469.7 45.4 6.7 5.151.9 63.5 7.5 9.754.9 66.9 5.1 6.2
Fig. 1 The influence of the administration of fluoxetine, T3 and their combination on total T4 (nmol/l) serum concentration
This finding was in sharp contrast with the effect of Fluox on serum tT3 levels. Surprisingly, administration of Fluox together with supraphysiological amounts of T3 caused a distinctive fall of non-physiologically high concentrations of serum tT3, which were reached by giving the animals the same amounts of T3 alone, to nearly normal levels (from 7.65 ± 3.18 to 1.70 ± 0.35 nmol L-1 vs. 1.29 ± 0.16 nmol L-1 in controls; means ± SD for n = 8) (Table 2 and Fig. 2).
472
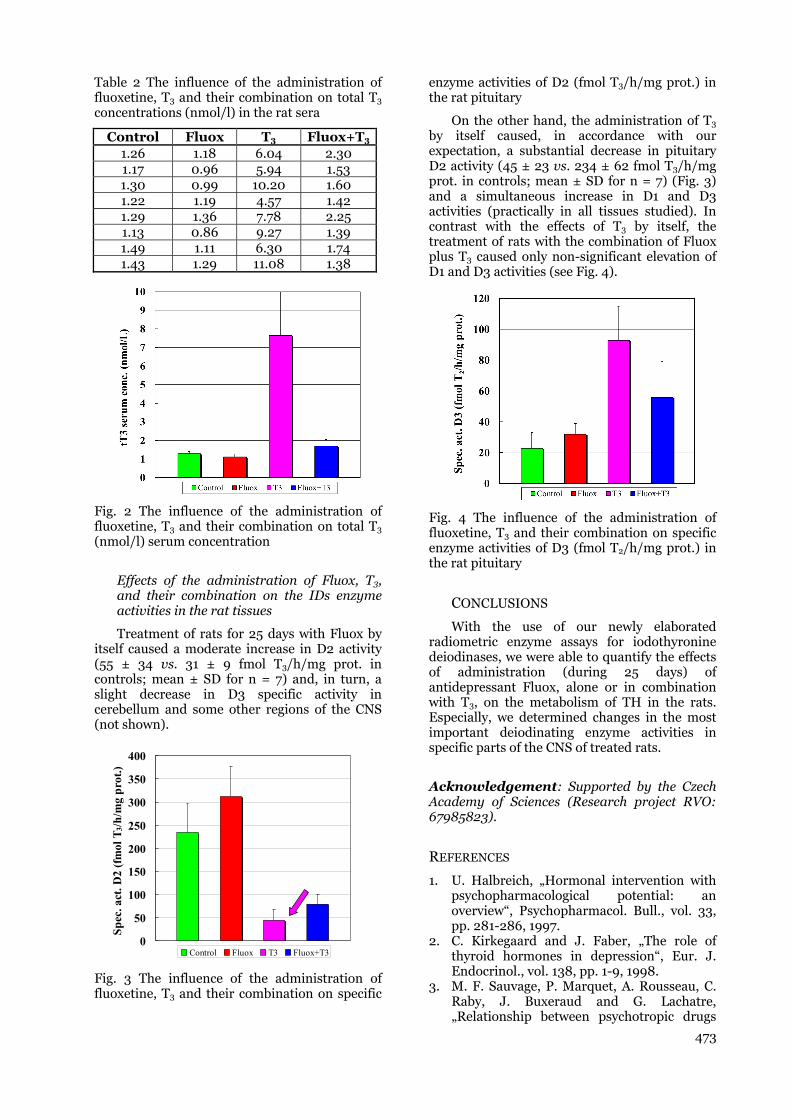
Table 2 The influence of the administration of fluoxetine, T3 and their combination on total T3 concentrations (nmol/l) in the rat sera
Control Fluox T3 Fluox+T3
1.26 1.18 6.04 2.301.17 0.96 5.94 1.531.30 0.99 10.20 1.601.22 1.19 4.57 1.421.29 1.36 7.78 2.251.13 0.86 9.27 1.391.49 1.11 6.30 1.741.43 1.29 11.08 1.38
Fig. 2 The influence of the administration of fluoxetine, T3 and their combination on total T3 (nmol/l) serum concentration
Effects of the administration of Fluox, T3, and their combination on the IDs enzyme activities in the rat tissues
Treatment of rats for 25 days with Fluox by itself caused a moderate increase in D2 activity (55 ± 34 vs. 31 ± 9 fmol T3/h/mg prot. in controls; mean ± SD for n = 7) and, in turn, a slight decrease in D3 specific activity in cerebellum and some other regions of the CNS (not shown).
Fig. 3 The influence of the administration of fluoxetine, T3 and their combination on specific
enzyme activities of D2 (fmol T3/h/mg prot.) in the rat pituitary
On the other hand, the administration of T3 by itself caused, in accordance with our expectation, a substantial decrease in pituitary D2 activity (45 ± 23 vs. 234 ± 62 fmol T3/h/mg prot. in controls; mean ± SD for n = 7) (Fig. 3) and a simultaneous increase in D1 and D3 activities (practically in all tissues studied). In contrast with the effects of T3 by itself, the treatment of rats with the combination of Fluox plus T3 caused only non-significant elevation of D1 and D3 activities (see Fig. 4).
Fig. 4 The influence of the administration of fluoxetine, T3 and their combination on specific enzyme activities of D3 (fmol T2/h/mg prot.) in the rat pituitary
CONCLUSIONS
With the use of our newly elaborated radiometric enzyme assays for iodothyronine deiodinases, we were able to quantify the effects of administration (during 25 days) of antidepressant Fluox, alone or in combination with T3, on the metabolism of TH in the rats. Especially, we determined changes in the most important deiodinating enzyme activities in specific parts of the CNS of treated rats.
Acknowledgement: Supported by the Czech Academy of Sciences (Research project RVO: 67985823).
REFERENCES
1. U. Halbreich, „Hormonal intervention with psychopharmacological potential: an overview“, Psychopharmacol. Bull., vol. 33, pp. 281-286, 1997. 2. C. Kirkegaard and J. Faber, „The role of thyroid hormones in depression“, Eur. J. Endocrinol., vol. 138, pp. 1-9, 1998. 3. M. F. Sauvage, P. Marquet, A. Rousseau, C. Raby, J. Buxeraud and G. Lachatre, „Relationship between psychotropic drugs
0
50
100
150
200
250
300
350
400
Sp
ec. a
ct. D
2 (f
mol
T3/
h/m
g p
rot.
)
Control Fluox T3 Fluox+T3
473
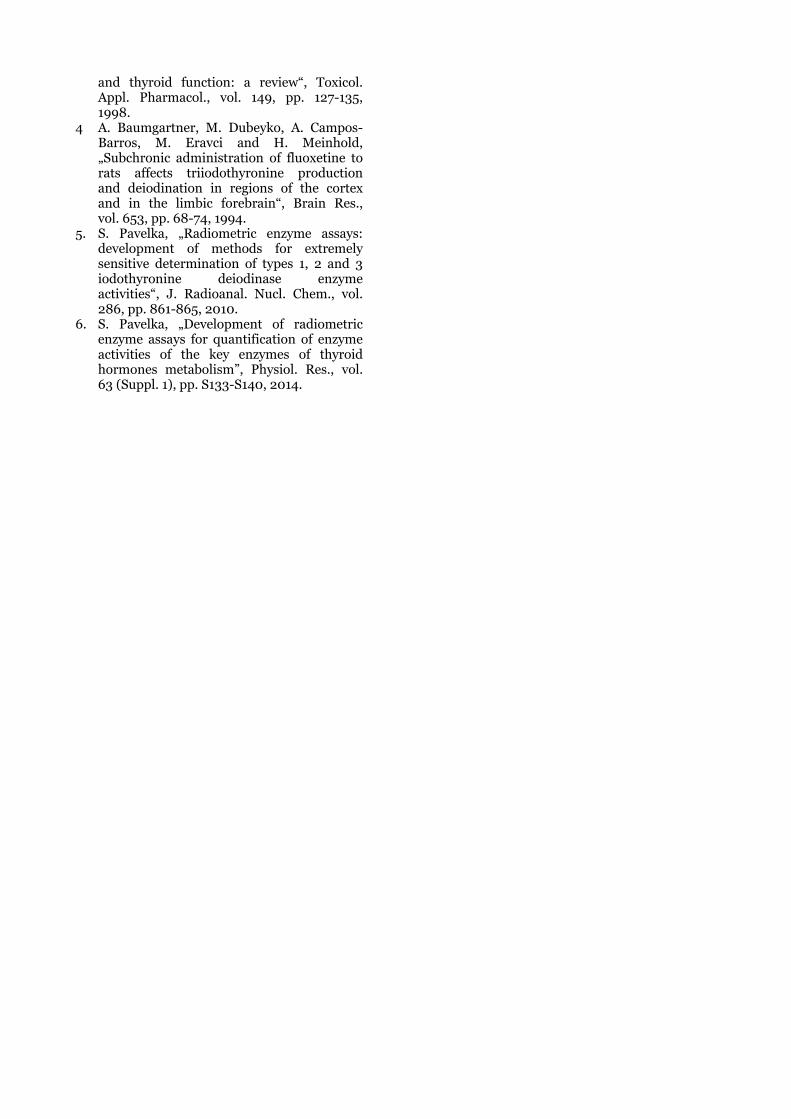
and thyroid function: a review“, Toxicol. Appl. Pharmacol., vol. 149, pp. 127-135, 1998. 4 A. Baumgartner, M. Dubeyko, A. Campos- Barros, M. Eravci and H. Meinhold, „Subchronic administration of fluoxetine to rats affects triiodothyronine production and deiodination in regions of the cortex and in the limbic forebrain“, Brain Res., vol. 653, pp. 68-74, 1994. 5. S. Pavelka, „Radiometric enzyme assays: development of methods for extremely sensitive determination of types 1, 2 and 3 iodothyronine deiodinase enzyme activities“, J. Radioanal. Nucl. Chem., vol. 286, pp. 861-865, 2010. 6. S. Pavelka, „Development of radiometric enzyme assays for quantification of enzyme activities of the key enzymes of thyroid hormones metabolism”, Physiol. Res., vol. 63 (Suppl. 1), pp. S133-S140, 2014.
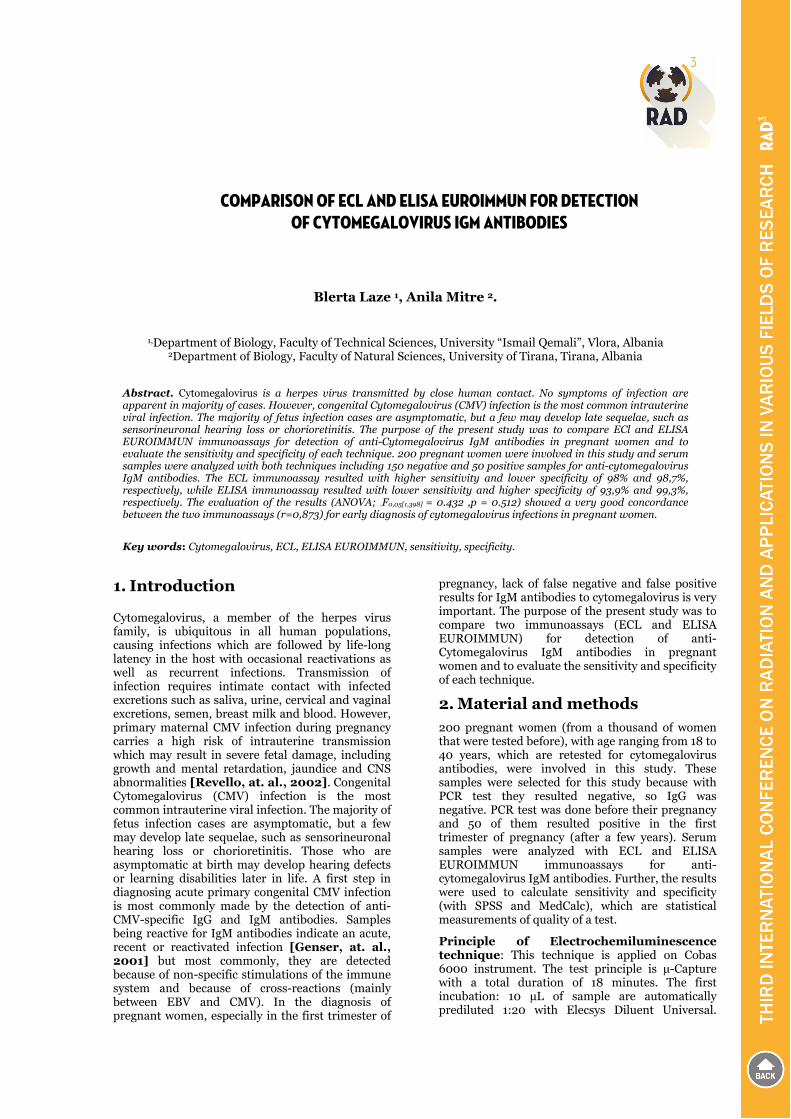
COMPARISON OF ECL AND ELISA EUROIMMUN FOR DETECTION OF CYTOMEGALOVIRUS IGM ANTIBODIES
Blerta Laze 1, Anila Mitre 2.
1,Department of Biology, Faculty of Technical Sciences, University “Ismail Qemali”, Vlora, Albania 2Department of Biology, Faculty of Natural Sciences, University of Tirana, Tirana, Albania
Abstract. Cytomegalovirus is a herpes virus transmitted by close human contact. No symptoms of infection are apparent in majority of cases. However, congenital Cytomegalovirus (CMV) infection is the most common intrauterine viral infection. The majority of fetus infection cases are asymptomatic, but a few may develop late sequelae, such as sensorineuronal hearing loss or chorioretinitis. The purpose of the present study was to compare ECl and ELISA EUROIMMUN immunoassays for detection of anti-Cytomegalovirus IgM antibodies in pregnant women and to evaluate the sensitivity and specificity of each technique. 200 pregnant women were involved in this study and serum samples were analyzed with both techniques including 150 negative and 50 positive samples for anti-cytomegalovirus IgM antibodies. The ECL immunoassay resulted with higher sensitivity and lower specificity of 98% and 98,7%, respectively, while ELISA immunoassay resulted with lower sensitivity and higher specificity of 93,9% and 99,3%, respectively. The evaluation of the results (ANOVA; .F0,05[1,398] = 0.432 ,p = 0.512) showed a very good concordance between the two immunoassays (r=0,873) for early diagnosis of cytomegalovirus infections in pregnant women.
Key words: Cytomegalovirus, ECL, ELISA EUROIMMUN, sensitivity, specificity.
1. Introduction
Cytomegalovirus, a member of the herpes virus family, is ubiquitous in all human populations, causing infections which are followed by life-long latency in the host with occasional reactivations as well as recurrent infections. Transmission of infection requires intimate contact with infected excretions such as saliva, urine, cervical and vaginal excretions, semen, breast milk and blood. However, primary maternal CMV infection during pregnancy carries a high risk of intrauterine transmission which may result in severe fetal damage, including growth and mental retardation, jaundice and CNS abnormalities [Revello, at. al., 2002]. Congenital Cytomegalovirus (CMV) infection is the most common intrauterine viral infection. The majority of fetus infection cases are asymptomatic, but a few may develop late sequelae, such as sensorineuronal hearing loss or chorioretinitis. Those who are asymptomatic at birth may develop hearing defects or learning disabilities later in life. A first step in diagnosing acute primary congenital CMV infection is most commonly made by the detection of anti-CMV-specific IgG and IgM antibodies. Samples being reactive for IgM antibodies indicate an acute, recent or reactivated infection [Genser, at. al., 2001] but most commonly, they are detected because of non-specific stimulations of the immune system and because of cross-reactions (mainly between EBV and CMV). In the diagnosis of pregnant women, especially in the first trimester of
pregnancy, lack of false negative and false positive results for IgM antibodies to cytomegalovirus is very important. The purpose of the present study was to compare two immunoassays (ECL and ELISA EUROIMMUN) for detection of anti-Cytomegalovirus IgM antibodies in pregnant women and to evaluate the sensitivity and specificity of each technique.
2. Material and methods 200 pregnant women (from a thousand of women that were tested before), with age ranging from 18 to 40 years, which are retested for cytomegalovirus antibodies, were involved in this study. These samples were selected for this study because with PCR test they resulted negative, so IgG was negative. PCR test was done before their pregnancy and 50 of them resulted positive in the first trimester of pregnancy (after a few years). Serum samples were analyzed with ECL and ELISA EUROIMMUN immunoassays for anti-cytomegalovirus IgM antibodies. Further, the results were used to calculate sensitivity and specificity (with SPSS and MedCalc), which are statistical measurements of quality of a test.
Principle of Electrochemiluminescence technique: This technique is applied on Cobas 6000 instrument. The test principle is µ-Capture with a total duration of 18 minutes. The first incubation: 10 µL of sample are automatically prediluted 1:20 with Elecsys Diluent Universal.
476
Biotinylated monoclonal anti-h-IgM-specific antibodies are added. The second incubation: CMV-specific recombination antigen labeled with a ruthenium complex and streptavidin-coated microparticles are added. Anti-CMV IgM antibodies present in the sample react with the ruthenium-labeled CMV-specific recombination antigen. The complex becomes bound to the solid phase via interaction of biotin and streptavidin. The reaction mixture is aspirated into the measuring cell where the microparticles are magnetically captured onto the surface of the electrode. Unbound substances are then removed with ProCell. Application of a voltage to the electrode then induces chemiluminescent emission which is measured by a photomultiplier. Results are determined automatically by the software by comparing the electrochemiluminescence signal obtained from the reaction product of the sample with the signal of the cutoff value previously obtained by CMV IgM calibration.
Description of the reagent: M: Streptavidin-coated-microparticles (transparent cap), 1 bottle, 6.5mL. R1: Anti-h-IgM-Ab-biotin (gray cap), 1 bottle, 9 mL. R2: CMV-Ag-Ru(bpy)32+ (black cap), 1 bottle, 9 mL.
Specimen type and collection: Human serum collected in separating tube gel. Samples can be stored at 2-8°C for up to 5 days; if longer storage is required, freeze at -25° ± 6 C.
Principle of ELISA EUROIMMUN technique:
Polystyrene microplate strips coated with purified,
biochemically characterized antigens are used as
solid phase containing bound antigens. If the
sample is positive, specific antibodies in the diluted
serum sample attach to the antigens coupled to the
solid phase. In a second step, the attached
antibodies are detected with peroxidase-labelled
anti-human antibodies. In a third step, the bound
antibodies are made visible using a
chromogen/substrate solution which is capable of
promoting a color reaction. The intensity of the
color produced is proportional to the concentration
of antibodies in the serum sample and is measured
by Tecan instrument.
Description of the CMVM reagent: • 96 microplates with purified
Cytomegalovirus antigens.
• Calibrators: Human defibrinilated plasma/serum (0.4 ml).
• Positive control: Human defibrinilated plasma/serum (0.4 ml) used to control positive limits.
• Negative control: Human defibrinilated plasma/serum (0.4 ml) used to control negative limits.
• Horseradish peroxidase (HRP) (16 ml): contain anti Cytomegalovirus IgM antibodies proclin and gentamycine.
• Diluent (2 bottles of 45 ml each): anti-human IgG antibodies and proclin.
• TBS and proclin (1 bottle of 50 ml).
• Chromogen substrate (TMB, 1 bottle of 15 ml).
• H2SO4 1N (1 bottle of 15 ml).
Specimen type and collection: Human serum collected in separating tube gel. Samples can be stored at 2-8°C for up to 5 days; if longer storage is required, freeze at -25° ± 6 C.
3. Results and Discussion
Results of anti-cytomegalovirus IgM antibodies measurements are presented in summary in table 1.
Table 1: Results of ECL and ELISA EUROIMMUN immunoassays for detection of anti-cytomegalovirus IgM antibodies.
Samples ECL (COBAS 6000) CMV M Positive Doubtful Negative
(Positive) N=50
49 0 1
(Negative) N=150
2 0 148
ELISA EUROIMMUN CMV M (Positive)
N=50 46 1 3
(Negative) N=150
1 0 149
Table 2: Results of sensitivity and specificity of ECL and ELISA EUROIMMUN immunoassays for detection of anti-cytomegalovirus IgM antibodies.
Cytomegalovirus IgM
Sensitivity (%)
Specificity (%)
ECL (COBAS 6000)
98 98.7
ELISA EUROIMMUN
93.9 99.3
According to the results of table 1, sensitivity and specificity for each technique are calculated (table 2). The ECL immunoassay resulted with high sensitivity of 98%, while ELISA EUROIMMUN immunoassay resulted with high specificity of 99,3%.

477
The evaluation of the results showed a good concordance between the two immunoassays r=0,873, (p< 0.01), expressed in the following scategrame (Fig 1).
Figure 1: Scategrame of ECL and ELISA EUROIMMUN immunoassays for detection of anti-cytomegalovirus IgM antibodies. The linear line is characterized by y=0.6*x equation. The scategrame is nonlinear, positive with few values that deviate the linear line. This means that ECL and ELISA EUROIMMUN immunoassays have a good concordance for detection of anti-cytomegalovirus IgM antibodies. In the diagnosis of pregnant women, especially in the first trimester of pregnancy, lack of false negative and false positive results for IgM antibodies to cytomegalovirus is very important. This relates to the fact that the existence of false negative results is associated with lack of diagnosis and treatment of acute infections in the fetus and newborn baby [Jean-Benjamin Murat et al., 2013]. Lack of false positive result is also very important because this is related to an unnecessary treatment of CMV infections. The ECL immunoassay resulted with high sensitivity 98% and lower specificity of 98,7%. The high values of sensitivity of COBAS 6000 system and ECL technique are attributed to some important features of this system: the use of two-dimensional barcode on all reagents to minimize possible errors and maintaining constant control of the calibration curve. ELISA immunoassay is recommended for detection of anti-cytomegalovirus IgM antibodies [Maria Grazia Revello and Giuseppe Gerna, 2002]. It resulted with lower sensitivity of 93,9% and high specificity of 99,3%. These values are comparable with those of ECL technique. Also, interference may occur in some samples. For this reason, the serum diluent is necessary to eliminate false positive or false negative results.
The evaluation of the results (ANOVA; .F0,05[1,398] = 0.432 ,p = 0.512) showed a very good concordance between the two immunoassays (r=0,873) for early diagnosis of cytomegalovirus infections in pregnant women. In conclusion, ECL and ELISA immunoassays are recommended in the diagnosis of
pregnant women, especially in the first trimester of pregnancy.
REFERENCES
1. Genser B, Truschnik-Wilders M, Stunzner D, et al. (2001): Evaluation of Five Commercial Enzyme Immunoassays for the Detection of Human Cytomegalovirus-Specific IgM Antibodies in the Absence of a Commercially Available Gold Standart. Clin Chem Lab Med;39(1): 62-70.
2. Jean-Benjamin Murat, Céline Dard, Hélène Fricker Hidalgo, Marie-Laure Dardé, Marie-Pierre, Brenier-Pinchart and Hervé Pelloux (Aug 2013). Comparison of the Vidas system and two recent fully automated assays for diagnosis and follow up of toxoplasmosis in pregnant woman and newborn. Clin Vaccine Immunol; 20(8): 1203–1212.
3. Lanari M, Lazzarotto T, Venturi V, Papa I, Gabrielli L, Guerra B, et al. (2006): Neonatal citomegalovirus blood load and risk of sequele in symptomatic and asymptomatic congenitally infected newborns. Pediatric ;117:76-83.
4. Lazzarato T, Gabrielli L, Lanari M, et al. (2004): Congenital Cytomegalovirus Infection: Recent Advances in the Diagnosis of Maternal Infection. Hum Immunol; 65:410-415.
5. Lazzarotto T1, Guerra B, Lanari M, Gabrielli L, Landini MP. (Mar 2008). New advances in the diagnosis of congenital cytomegalovirus infection. J Clin Virol.;41(3):192-7.
6. Leung J, Cannon MJ, Grosse SD, Bialek SR. (2012, Dec): Laboratory testing for cytomegalovirus among pregnant women in the United States: a retrospective study using administrative claims data. BMC Infect Dis; 12:334.
7. Ljungman P. (2004): Risk of cytomegalovirus transmission by blood products to immunocompromised patients and means for reduction. Brit J Haematol;125:107-116.
8. M. J. Binnicker and M. E. Espy. (November 2013): Comparison of Six Real-Time PCR Assays for Qualitative Detection of Cytomegalovirus in Clinical Specimens. J. Clin. Microbiol; 51:11 3749-3752.
9. M.Grazia Revello1, Elena Percivalle1, Marco Zannino2, Valdano Rossi2, Giuseppe Gerna (December 1991). Development and evaluation of a capture ELISA for IgM antibody to the human cytomegalovirus major DNA binding protein Journal of Virological Methods Volume 35, Issue 3, Pages 315–329.
10. Maria Grazia Revello and Giuseppe Gerna (2002). Diagnosis and Management of Human Cytomegalovirus Infection in the Mother, Fetus, and Newborn Infant. doi: 10.1128/CMR.15.4.680-715. Clin. Microbiol. Rev. vol. 15 no. 4 680-715.
11. Revello MG, Gerna G. (2002): Diagnosis and Management of Human Cytomegalovirus Infection in the Mother, Fetus and Newborn Infant. Clin Microbiol Rev;15(4):680-715.
12. Revello MG, Gorini G, Gerna G. (2004): Clinical evaluation of a chemiluminescence immunoassay for determination of immunoglobulin G avidity to human cytomegalovirus. Clin Diagn Lab Immunol ;11:801–5.


THE BI-SUBSTITUTED HYDROXYAPATITE AS RADIO-OPAQUE MATERIAL
Gabriela Ciobanu 1, Ana Maria Bargan 1, Constantin Luca 1, Octavian Ciobanu 2
1 ”Gheorghe Asachi” Technical University of Iasi, Faculty of Chemical Engineering and Environmental Protection, Department of Organic, Biochemical and Food Engineering, Prof. dr. docent Dimitrie Mangeron, no.63, zip 700050,
Iasi, Romania 2 “Grigore T. Popa” University of Medicine and Pharmacy, Faculty of Medical Bioengineering, Universitatii Str., no.
16, 700115, Iasi, Romania
Abstract. This study relates to a new apatite material which is biocompatible and exhibits radio-opacity enhancing its utility in the dental and medical fields. The bismuth-substituted hydroxyapatite was obtained by means of wet chemical method, respectively by co-precipitation reactions. The effects of the bismuth substitution for calcium on the morphology and optical proprieties of the resulting powder were investigated by scanning electron microscopy (SEM) coupled with X-ray analysis (EDX), X-ray powder diffraction (XRD) and X-ray photoelectron spectroscopy (XPS). Bi-substituted hydroxyapatite is radio-opaque, being detectable by X-rays and computed tomography.
Key words (bold): hydroxyapatite, bismuth, radio-opaque
1. INTRODUCTION
In dental and orthopedic applications, radio-opaque materials may be used as filler in the composition of the biocement paste in order to enhance absorption of X-rays, and therefore for improving the visibility of the cement under X-ray examination. Radio-opacity is important for uses of cements in dental filling and dental sealing.
Bismuth compounds, due to their radio-opacity, are added to various bone and dental implants, catheters and surgical instruments in order to make them detectable by X-rays and computed tomography [1].
The hydroxyapatite (HAp, Ca10(PO4)6(OH)2) is a calcium phosphate ceramic with important applications in the medicine and chemistry fields. The hydroxyapatite is a main mineral constituent of the hard tissues such as bones and teeth [2]. The hydroxyapatite has remarkable properties including biocompatibility, bioactivity and ability to form a direct chemical bond with human hard tissues [3-5].
The hydroxyapatite structure allows the incorporation of wide range of different ionic substitutions [6]. Numerous cations have been reported to substitute into the Ca sites in the hydroxyapatite structure [7,8]. Such ionic substitutions influences the properties (morphology, lattice parameters, surface characteristic, solubility, biological properties, etc.) and applications of these doped hydroxyapatite materials as biomaterials, catalysts, ion exchangers, etc. [9-12].
In this paper we present the preparation of new bismuth-substituted hydroxyapatite nanopowder, as
radio-opaque material, by means of wet chemical method, respectively by co-precipitation reactions.
2. EXPERIMENTAL
2.1. Materials and synthesizing methods
Calcium hydroxide Ca(OH)2, orthophosphoric acid H3PO4 (85 %), bismuth nitrate pentahydrate Bi(NO3)3·5H2O, ethanol CH3–CH2–OH and sodium hydroxide NaOH were purchased from Sigma-Aldrich (Germany). All chemicals were of analytical grade.
The hydroxyapatite and bismuth-substituted hydroxyapatite nanoparticles were synthesized by wet chemical precipitation method from Ca(OH)2, H3PO4 and Bi(NO3)3·5H2O as calcium, phosphorous and bismuth sources, respectively.
The pure hydroxyapatite powder was prepared by mixing appropriate amounts of Ca(OH)2 (0.1 M) and H3PO4 (0.1 M) aqueous solutions to achieve predetermined Ca/P atomic ratio of 1.67 [13]. The suspension obtained was aged for 3 h and then filtered and washed with ethanol and triply distilled water. The obtained powder was calcined 1 h at 800 ºC in an electrically heated furnace in order to increase its crystallinity.
The bismuth-substituted hydroxyapatite powder was prepared similarly to the pure hydroxyapatite powder, as described above. The Ca(OH)2 (0.1 M) aqueous solution was dispersed into an mixed aqueous solution of Bi(NO3)3·5H2O and H3PO4 (0.1 M). The (Bi+Ca)/P atomic ratio was kept at 1.67 value, while the Bi/(Bi+Ca) atomic ratio (denoted as XBi) in the solution was 0.1, as shown in Table 1. The
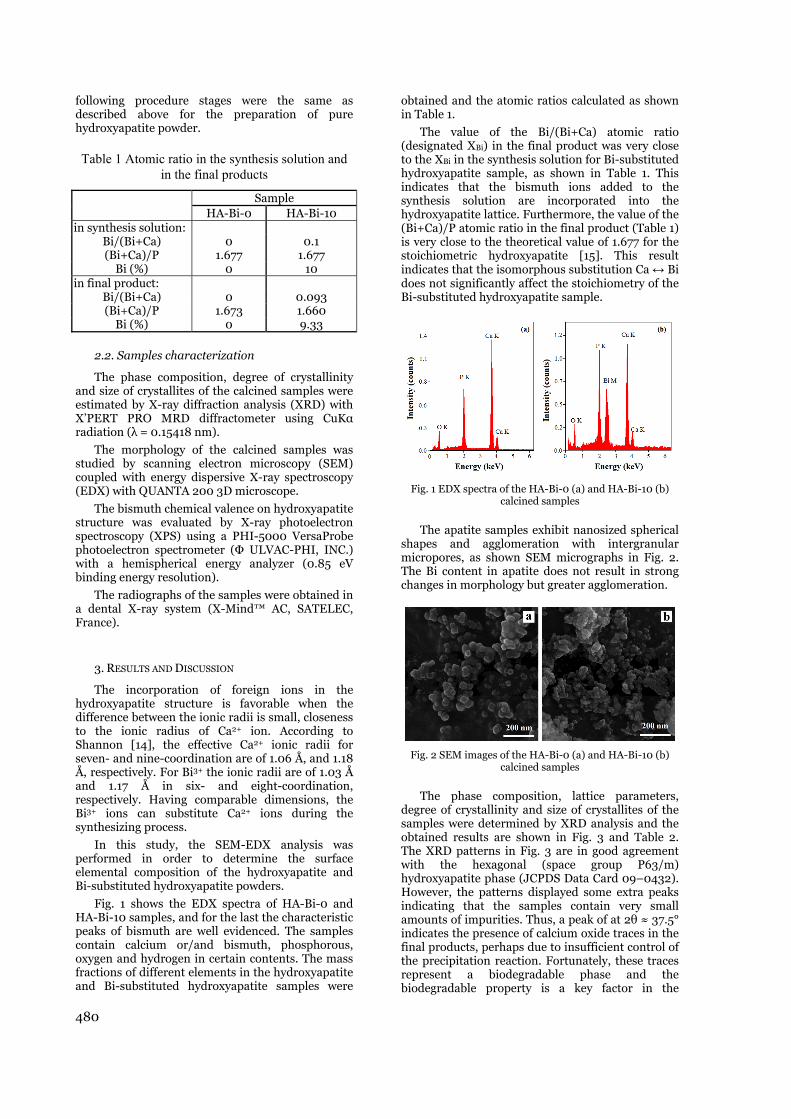
480
following procedure stages were the same as described above for the preparation of pure hydroxyapatite powder.
Table 1 Atomic ratio in the synthesis solution and in the final products
Sample
HA-Bi-0 HA-Bi-10 in synthesis solution:
Bi/(Bi+Ca) 0 0.1 (Bi+Ca)/P 1.677 1.677
Bi (%) 0 10 in final product:
Bi/(Bi+Ca) 0 0.093 (Bi+Ca)/P 1.673 1.660
Bi (%) 0 9.33
2.2. Samples characterization
The phase composition, degree of crystallinity and size of crystallites of the calcined samples were estimated by X-ray diffraction analysis (XRD) with X’PERT PRO MRD diffractometer using CuKα radiation (λ = 0.15418 nm).
The morphology of the calcined samples was studied by scanning electron microscopy (SEM) coupled with energy dispersive X-ray spectroscopy (EDX) with QUANTA 200 3D microscope.
The bismuth chemical valence on hydroxyapatite structure was evaluated by X-ray photoelectron spectroscopy (XPS) using a PHI-5000 VersaProbe photoelectron spectrometer (Φ ULVAC-PHI, INC.) with a hemispherical energy analyzer (0.85 eV binding energy resolution).
The radiographs of the samples were obtained in a dental X-ray system (X-Mind™ AC, SATELEC, France).
3. RESULTS AND DISCUSSION
The incorporation of foreign ions in the hydroxyapatite structure is favorable when the difference between the ionic radii is small, closeness to the ionic radius of Ca2+ ion. According to Shannon [14], the effective Ca2+ ionic radii for seven- and nine-coordination are of 1.06 Å, and 1.18 Å, respectively. For Bi3+ the ionic radii are of 1.03 Å and 1.17 Å in six- and eight-coordination, respectively. Having comparable dimensions, the Bi3+ ions can substitute Ca2+ ions during the synthesizing process.
In this study, the SEM-EDX analysis was performed in order to determine the surface elemental composition of the hydroxyapatite and Bi-substituted hydroxyapatite powders.
Fig. 1 shows the EDX spectra of HA-Bi-0 and HA-Bi-10 samples, and for the last the characteristic peaks of bismuth are well evidenced. The samples contain calcium or/and bismuth, phosphorous, oxygen and hydrogen in certain contents. The mass fractions of different elements in the hydroxyapatite and Bi-substituted hydroxyapatite samples were
obtained and the atomic ratios calculated as shown in Table 1.
The value of the Bi/(Bi+Ca) atomic ratio (designated XBi) in the final product was very close to the XBi in the synthesis solution for Bi-substituted hydroxyapatite sample, as shown in Table 1. This indicates that the bismuth ions added to the synthesis solution are incorporated into the hydroxyapatite lattice. Furthermore, the value of the (Bi+Ca)/P atomic ratio in the final product (Table 1) is very close to the theoretical value of 1.677 for the stoichiometric hydroxyapatite [15]. This result indicates that the isomorphous substitution Ca ↔ Bi does not significantly affect the stoichiometry of the Bi-substituted hydroxyapatite sample.
Fig. 1 EDX spectra of the HA-Bi-0 (a) and HA-Bi-10 (b)
calcined samples
The apatite samples exhibit nanosized spherical shapes and agglomeration with intergranular micropores, as shown SEM micrographs in Fig. 2. The Bi content in apatite does not result in strong changes in morphology but greater agglomeration.
Fig. 2 SEM images of the HA-Bi-0 (a) and HA-Bi-10 (b)
calcined samples
The phase composition, lattice parameters, degree of crystallinity and size of crystallites of the samples were determined by XRD analysis and the obtained results are shown in Fig. 3 and Table 2. The XRD patterns in Fig. 3 are in good agreement with the hexagonal (space group P63/m) hydroxyapatite phase (JCPDS Data Card 09–0432). However, the patterns displayed some extra peaks indicating that the samples contain very small amounts of impurities. Thus, a peak of at 2θ ≈ 37.5° indicates the presence of calcium oxide traces in the final products, perhaps due to insufficient control of the precipitation reaction. Fortunately, these traces represent a biodegradable phase and the biodegradable property is a key factor in the
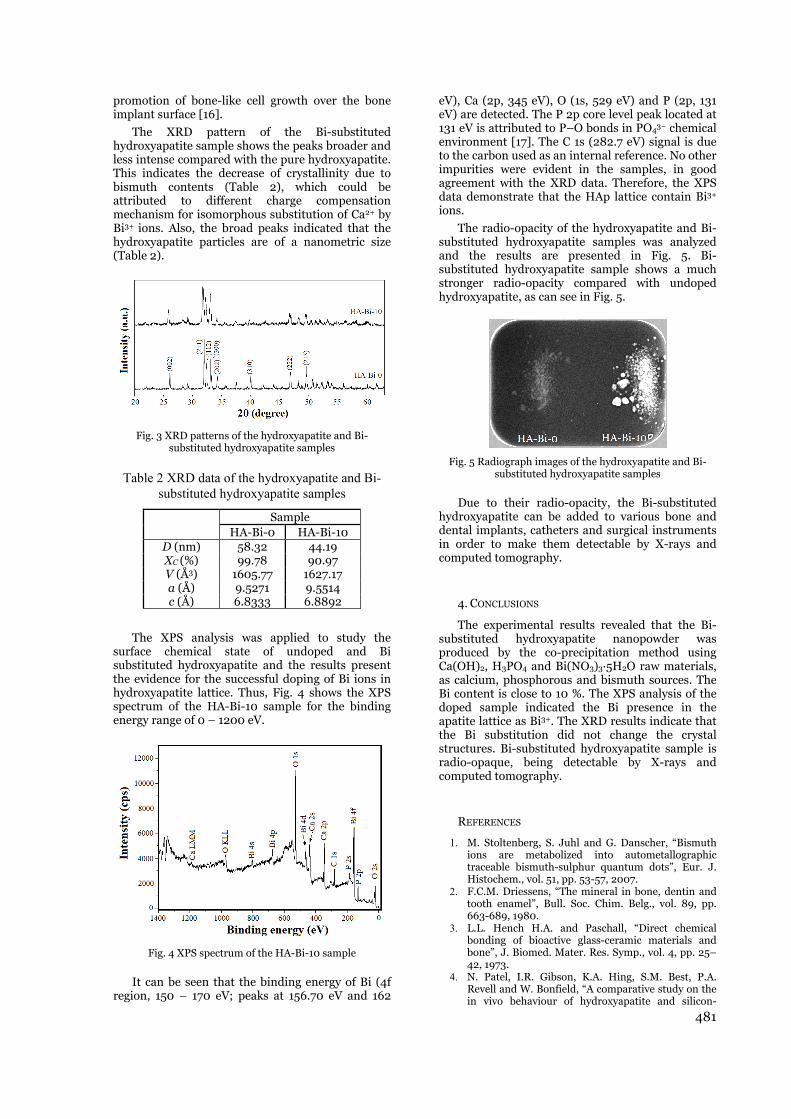
481
promotion of bone-like cell growth over the bone implant surface [16].
The XRD pattern of the Bi-substituted hydroxyapatite sample shows the peaks broader and less intense compared with the pure hydroxyapatite. This indicates the decrease of crystallinity due to bismuth contents (Table 2), which could be attributed to different charge compensation mechanism for isomorphous substitution of Ca2+ by Bi3+ ions. Also, the broad peaks indicated that the hydroxyapatite particles are of a nanometric size (Table 2).
Fig. 3 XRD patterns of the hydroxyapatite and Bi-
substituted hydroxyapatite samples
Table 2 XRD data of the hydroxyapatite and Bi-substituted hydroxyapatite samples
Sample
HA-Bi-0 HA-Bi-10 D (nm) 58.32 44.19 XC (%) 99.78 90.97 V (Å3) 1605.77 1627.17 a (Å) 9.5271 9.5514 c (Å) 6.8333 6.8892
The XPS analysis was applied to study the surface chemical state of undoped and Bi substituted hydroxyapatite and the results present the evidence for the successful doping of Bi ions in hydroxyapatite lattice. Thus, Fig. 4 shows the XPS spectrum of the HA-Bi-10 sample for the binding energy range of 0 – 1200 eV.
Fig. 4 XPS spectrum of the HA-Bi-10 sample
It can be seen that the binding energy of Bi (4f region, 150 – 170 eV; peaks at 156.70 eV and 162
eV), Ca (2p, 345 eV), O (1s, 529 eV) and P (2p, 131 eV) are detected. The P 2p core level peak located at 131 eV is attributed to P–O bonds in PO43− chemical environment [17]. The C 1s (282.7 eV) signal is due to the carbon used as an internal reference. No other impurities were evident in the samples, in good agreement with the XRD data. Therefore, the XPS data demonstrate that the HAp lattice contain Bi3+ ions.
The radio-opacity of the hydroxyapatite and Bi-substituted hydroxyapatite samples was analyzed and the results are presented in Fig. 5. Bi-substituted hydroxyapatite sample shows a much stronger radio-opacity compared with undoped hydroxyapatite, as can see in Fig. 5.
Fig. 5 Radiograph images of the hydroxyapatite and Bi-
substituted hydroxyapatite samples
Due to their radio-opacity, the Bi-substituted hydroxyapatite can be added to various bone and dental implants, catheters and surgical instruments in order to make them detectable by X-rays and computed tomography.
4. CONCLUSIONS
The experimental results revealed that the Bi-substituted hydroxyapatite nanopowder was produced by the co-precipitation method using Ca(OH)2, H3PO4 and Bi(NO3)3·5H2O raw materials, as calcium, phosphorous and bismuth sources. The Bi content is close to 10 %. The XPS analysis of the doped sample indicated the Bi presence in the apatite lattice as Bi3+. The XRD results indicate that the Bi substitution did not change the crystal structures. Bi-substituted hydroxyapatite sample is radio-opaque, being detectable by X-rays and computed tomography.
REFERENCES
1. M. Stoltenberg, S. Juhl and G. Danscher, “Bismuth ions are metabolized into autometallographic traceable bismuth-sulphur quantum dots”, Eur. J. Histochem., vol. 51, pp. 53-57, 2007.
2. F.C.M. Driessens, “The mineral in bone, dentin and tooth enamel”, Bull. Soc. Chim. Belg., vol. 89, pp. 663-689, 1980.
3. L.L. Hench H.A. and Paschall, “Direct chemical bonding of bioactive glass-ceramic materials and bone”, J. Biomed. Mater. Res. Symp., vol. 4, pp. 25–42, 1973.
4. N. Patel, I.R. Gibson, K.A. Hing, S.M. Best, P.A. Revell and W. Bonfield, “A comparative study on the in vivo behaviour of hydroxyapatite and silicon-
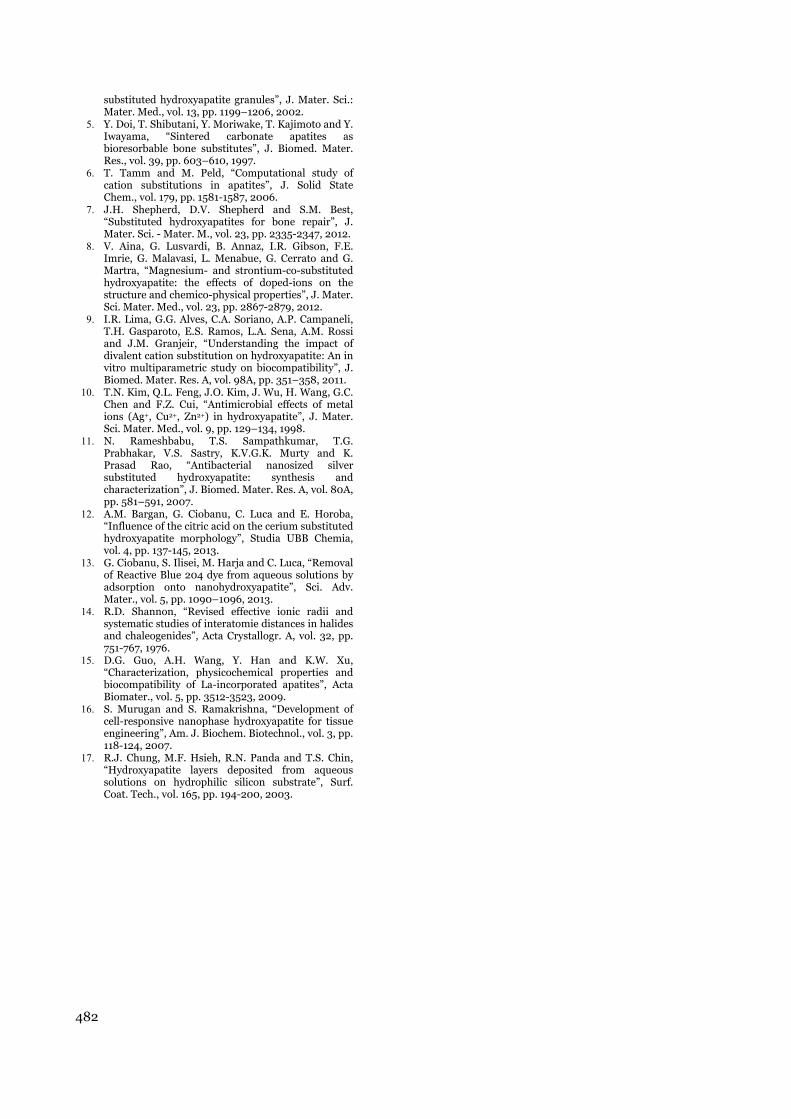
482
substituted hydroxyapatite granules”, J. Mater. Sci.: Mater. Med., vol. 13, pp. 1199–1206, 2002.
5. Y. Doi, T. Shibutani, Y. Moriwake, T. Kajimoto and Y. Iwayama, “Sintered carbonate apatites as bioresorbable bone substitutes”, J. Biomed. Mater. Res., vol. 39, pp. 603–610, 1997.
6. T. Tamm and M. Peld, “Computational study of cation substitutions in apatites”, J. Solid State Chem., vol. 179, pp. 1581-1587, 2006.
7. J.H. Shepherd, D.V. Shepherd and S.M. Best, “Substituted hydroxyapatites for bone repair”, J. Mater. Sci. - Mater. M., vol. 23, pp. 2335-2347, 2012.
8. V. Aina, G. Lusvardi, B. Annaz, I.R. Gibson, F.E. Imrie, G. Malavasi, L. Menabue, G. Cerrato and G. Martra, “Magnesium- and strontium-co-substituted hydroxyapatite: the effects of doped-ions on the structure and chemico-physical properties”, J. Mater. Sci. Mater. Med., vol. 23, pp. 2867-2879, 2012.
9. I.R. Lima, G.G. Alves, C.A. Soriano, A.P. Campaneli, T.H. Gasparoto, E.S. Ramos, L.A. Sena, A.M. Rossi and J.M. Granjeir, “Understanding the impact of divalent cation substitution on hydroxyapatite: An in vitro multiparametric study on biocompatibility”, J. Biomed. Mater. Res. A, vol. 98A, pp. 351–358, 2011.
10. T.N. Kim, Q.L. Feng, J.O. Kim, J. Wu, H. Wang, G.C. Chen and F.Z. Cui, “Antimicrobial effects of metal ions (Ag+, Cu2+, Zn2+) in hydroxyapatite”, J. Mater. Sci. Mater. Med., vol. 9, pp. 129–134, 1998.
11. N. Rameshbabu, T.S. Sampathkumar, T.G. Prabhakar, V.S. Sastry, K.V.G.K. Murty and K. Prasad Rao, “Antibacterial nanosized silver substituted hydroxyapatite: synthesis and characterization”, J. Biomed. Mater. Res. A, vol. 80A, pp. 581–591, 2007.
12. A.M. Bargan, G. Ciobanu, C. Luca and E. Horoba, “Influence of the citric acid on the cerium substituted hydroxyapatite morphology”, Studia UBB Chemia, vol. 4, pp. 137-145, 2013.
13. G. Ciobanu, S. Ilisei, M. Harja and C. Luca, “Removal of Reactive Blue 204 dye from aqueous solutions by adsorption onto nanohydroxyapatite”, Sci. Adv. Mater., vol. 5, pp. 1090–1096, 2013.
14. R.D. Shannon, “Revised effective ionic radii and systematic studies of interatomie distances in halides and chaleogenides”, Acta Crystallogr. A, vol. 32, pp. 751-767, 1976.
15. D.G. Guo, A.H. Wang, Y. Han and K.W. Xu, “Characterization, physicochemical properties and biocompatibility of La-incorporated apatites”, Acta Biomater., vol. 5, pp. 3512-3523, 2009.
16. S. Murugan and S. Ramakrishna, “Development of cell-responsive nanophase hydroxyapatite for tissue engineering”, Am. J. Biochem. Biotechnol., vol. 3, pp. 118-124, 2007.
17. R.J. Chung, M.F. Hsieh, R.N. Panda and T.S. Chin, “Hydroxyapatite layers deposited from aqueous solutions on hydrophilic silicon substrate”, Surf. Coat. Tech., vol. 165, pp. 194-200, 2003.

ANTIBIBIOM
AbstAnticompdirecPapelargeThis veryPerOweapeffec
Key
1.
Chavascusequethorouadditithere good defectantibiaccomdirectthe sitreatmdefect
Loinfectsurgerpolymresultosteomand tPMMAantibiintervbiofilm
Caosteocdoes n
IOTIC-LOADMATERIAL F
2 University
tract: biotic-loaded hpound is compctly to the site ofer is presentinge bone defect wpatient is a go
y high concentraOssal pellets. Thpon against the
cts of PerOssal a
y words: Chron
INTRODUC
hronic osteoular necrosis
estrums. In thugh surgical ion to the ant
are two taskoutcome. The
t. The second iotic concent
mplished by tht delivery of aite of infectionment, particults are in case.
ocal delivery oion has beery particula
methylmetacryts were repormyelitis [2,3]the main drA include poiotic as the cemvention to remm formation o
alcium sulphaconductive scanot need to be
DED HYDROFOR ONE ST
1
Clinic for Orth
hydroxyapatite letely absorbab
of infection. g one stage surg
which was filled ood example of ation of specifichis and the face most resistanare additional c
nic osteomyelitis
CTION
omyelitis is of bone and
he treatment sdebridement
tibiotic therapks that permee first task isone is to obtaitration whic
he parenteral aan active antn represents larly if the bo
of antibiotics n introducedarly by a
ylate (PMMA)rted in the tr. But, PMMArawbacks oossible thermment cures, th
move the PMMon the bone ce
ate (plaster oaffold for bone removed afte
OXIAPATITTAGE TREAT
N
1 School of Mehopaedic surg
and calcium ble biomaterial
gery of the extewith the PerOss
f the efficient wc antibiotic. Higct that the PerOnt infections andcontribution wh
s, Septic bone de
associated d formation osequestrectomt are necessapy. So, appareate to achiev to fill in thein the effective
ch is difficuadministrationimicrobial aga viable alterone sequester
in the site ofd into orthopantibiotic l) beads [1]. eatment of ch
A is not resorof antibiotic-lmal damage the need for a sA and even poment itself [4]
f Paris) acts e defects filliner implantatio
TE AND CALTMENT OF T
Nina Djordj
edicine, Univegery and Traum
sulphate (PerOable to deliver
ensive infected bsal pellets soake
way to treat extgh concentrationOssal is compled even in one shen the extensiv
defect, PerOssal,
with of the
my and ary in rently, ve the e bone ve local ult to n. The
gent to rnative rs and
f bone paedic loaded
Good hronic rbable loaded to the second ossible ],
as an ng and on due
LCIUM SULPTHE EXTEN
jevic
rsity of Nis, Sematology at th
Ossal, aap Biomr high concentr
bone defect. Dued in the high coensive septic bon is achieved duetely absorbabletage surgery. T
ve bone defect is
, One stage surg
to its biodepowder is pan antibiottreatment othere are tantibiotic pFirstly, therof calcium bone reactiappropriatepowder bprocedures
To overmaterial (Pewas developof calcium hydroxyapaGermany). Tdesigned steimpregnatedThe limitingcan absorb in a short pet al. are prwhile the minutes[10,released stecompletely r
PHATE COMNSIVE INFEC
erbia e Clinical Cen
materials Gmbration of an act
ring the operatoncetrated antione defect withue to the technole made this bio
The osteoinductin case.
gery
egradability [5preloaded withtic carrier wof the chrontwo major dipreloading of re is at least a
sulphate reson [7,8], and antibiotic i
before hardemay reduce it
rcome these erOssals; Coripped consistingsulphate and tite (HA) (OsThis compositerile pellets. Td in any antig factor is soluup to 4ml of a
period. The prroposing soak
others are,11]. The majadily within teresorbable in s
MPOSITE IS CTED BONE
nter of Nis, Ser
bH, Dieburg, Gtive antimicrob
tion seqestrectoibiotic of choiceh local administlogical characteomaterial a vetive and osteoco
5]. If the calch the antibiot
with good renic osteomyeldisadvantages f calcium sulp short-term cy
sulting in thed secondly, adin the calciening and ts activity [9].
disadvantagipharm, Diebug of a combinad 51,5 % of nastims; Osartiste is in the forThe PerOssal tibiotic in waution quantityantibiotic`s wroducers and king period of e xtending
ajority of the ten days [10,11six months.
A POTENT E DEFECT
rbia
Germany) bial agent
omy left a . tration of eristics of ry potent onductive
cium sulphatetic it becomesesults in theitis [6]. But,of the fixed
phate pellets.ytotoxic effecte inflamatoryddition of theium sulphate
sterilization
ges a carrierurg, Germany)ation of 48,5%anocrystallines, Obernburg,rm of speciallypellets can betery solution.y. Fifty pellets
watery solutionRauschmann
f one minute ,it to 3-4antibiotic is
1]. PerOssal is
e s e ,
d . t y e e n
r )
% e , y e . s n n ,
4 s s
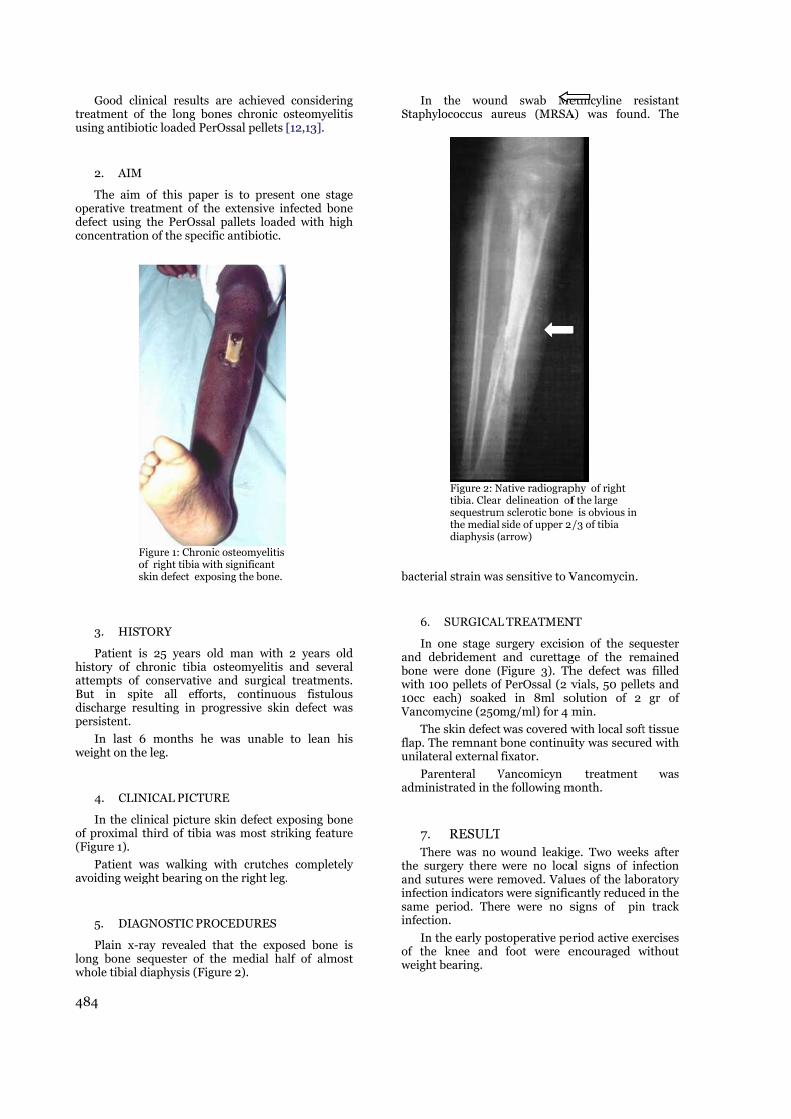
484
Fos
Good clintreatment ofusing antibio
2. AIM
The aim operative tredefect using concentration
3. HIST
Patient ishistory of chattempts of But in spidischarge repersistent.
In last 6weight on the
4. CLIN
In the cliof proximal t(Figure 1).
Patient wavoiding weig
5. DIAG
Plain x-rlong bone sewhole tibial d
Figure 1: Chroniof right tibia witkin defect expo
nical results f the long bootic loaded Per
of this papereatment of th
the PerOssaln of the specif
TORY
s 25 years olhronic tibia oconservative te all effortsulting in pro
6 months he e leg.
NICAL PICTUR
inical picture third of tibia
was walking wght bearing on
GNOSTIC PRO
ray revealed tequester of thdiaphysis (Figu
ic osteomyelitis th significant osing the bone.
are achieved nes chronic orOssal pellets
r is to presene extensive inl pallets loadefic antibiotic.
ld man with osteomyelitis and surgical
ts, continuouogressive skin
was unable
RE
skin defect exwas most stri
with crutchesn the right leg.
OCEDURES
that the expohe medial haure 2).
considering osteomyelitis [12,13].
nt one stage nfected bone ed with high
2 years old and several treatments.
us fistulous n defect was
to lean his
xposing bone iking feature
s completely .
osed bone is alf of almost
InStaph
bacte
6.
Inand bone with 10cc Vanco
Thflap. Tunilat
Paadmin
7.Th
the sand sinfectsame infect
Inof thweigh
Figure 2: Ntibia. Clearsequestrumthe medial diaphysis (
n the wounhylococcus au
erial strain was
. SURGICAL
n one stage sdebridement were done (
100 pellets ofeach) soaked
omycine (250
he skin defectThe remnant teral external
arenteral Vnistrated in th
. RESULThere was no urgery there
sutures were rtion indicators
period. Thetion.
n the early poshe knee and ht bearing.
Native radiograpr delineation ofm sclerotic bone
side of upper 2/arrow)
nd swab Meureus (MRSA
s sensitive to V
L TREATMEN
urgery excisioand curettagFigure 3). Th
f PerOssal (2 vd in 8ml somg/ml) for 4 m
was covered wbone continuifixator.
Vancomicyn he following m
wound leakigwere no loca
removed. Valus were significre were no s
stoperative pefoot were e
phy of right f the large
e is obvious in /3 of tibia
ethicyline reA) was found
Vancomycin.
NT
on of the seqge of the remhe defect wasvials, 50 pelleolution of 2 min.
with local softity was secure
treatment month.
ge. Two weekal signs of infues of the labocantly reducedsigns of pin
eriod active exencouraged w
esistant d. The
quester mained s filled ets and
gr of
t tissue ed with
was
ks after fection oratory d in the n track
ercises without
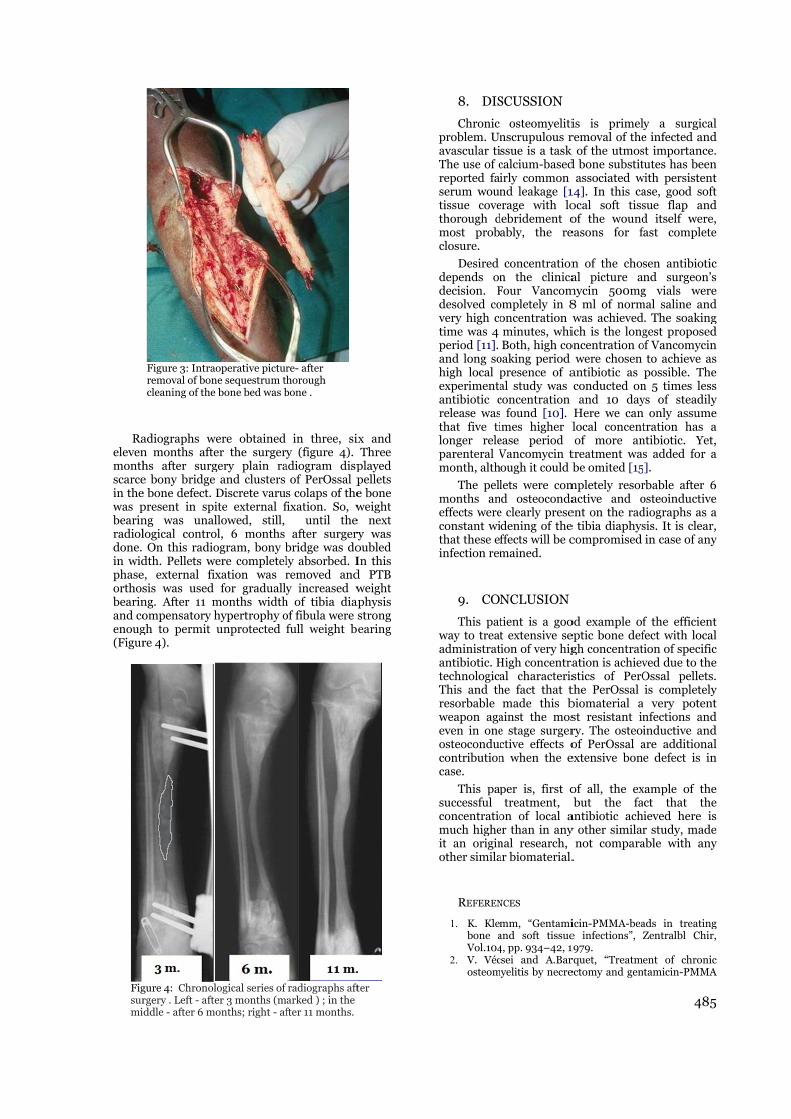
Figsurmi
Raelevenmonthscarcein thewas pbearinradioldone. in widphaseorthosbearinand coenoug(Figur
Figure 3: Intraremoval of boncleaning of the
gure 4: Chronolrgery . Left - aftddle - after 6 m
adiographs wn months aftehs after surge bony bridgee bone defect. present in sping was unallogical contro
On this radiodth. Pellets we, external fisis was used ng. After 11 mompensatory hgh to permit re 4).
aoperative picturne sequestrum te bone bed was b
logical series of er 3 months (m
months; right - af
were obtained er the surgergery plain rae and clusters Discrete varuite external fllowed, still,
ol, 6 months ogram, bony b
were completelixation was r
for graduallymonths widthhypertrophy ounprotected
re- after horough bone .
radiographs aftmarked ) ; in the
fter 11 months.
in three, sixry (figure 4). adiogram disp
of PerOssal ps colaps of thefixation. So, w
until theafter surgery
bridge was doly absorbed. Iremoved andy increased w
h of tibia diapof fibula were sfull weight b
ter
ix and Three
played pellets e bone weight
e next ry was oubled In this d PTB weight
aphysis strong earing
8. DIS
Chronic problem. Unavascular tiThe use of creported faiserum wountissue covethorough dmost probclosure.
Desired depends ondecision. Fdesolved covery high cotime was 4 period [11]. and long sohigh local pexperimentaantibiotic crelease wasthat five tilonger releparenteral Vmonth, alth
The pellmonths aneffects wereconstant withat these efinfection rem
9. CON
This patway to treatadministratantibiotic. HtechnologicaThis and thresorbable weapon agaeven in oneosteoconduccontributioncase.
This papsuccessful concentratiomuch higheit an originother simila
REFEREN
1. K. Klembone aVol.104
2. V. Vécosteom
SCUSSION
osteomyelitinscrupulous rssue is a task calcium-basedirly common nd leakage [1
erage with lodebridement oably, the re
concentrationn the clinicaFour Vancomompletely in 8oncentration wminutes, whiBoth, high co
oaking period presence of aal study was concentration found [10].
imes higher lease period Vancomycin tough it could b
lets were comd osteoconda
e clearly presedening of theffects will be cmained.
NCLUSION
tient is a goot extensive seion of very hig
High concentraal characterishe fact that tmade this b
ainst the mose stage surgerctive effects on when the e
per is, first otreatment,
on of local aer than in anynal research, ar biomaterial.
NCES
mm, “Gentamiand soft tissue4, pp. 934–42, 1csei and A.Bar
myelitis by necre
is is primelremoval of thek of the utmosd bone substit
associated w14]. In this caocal soft tissof the woundeasons for f
n of the chosal picture a
mycin 500mg8 ml of normwas achievedich is the long
oncentration owere chosen
antibiotic as conducted onand 10 day
Here we canlocal concentof more an
treatment wasbe omited [15
mpletely resoractive and oent on the rade tibia diaphyscompromised
od example ofeptic bone defgh concentratation is achievstics of PerOthe PerOssal biomaterial ast resistant inry. The osteoiof PerOssal a
extensive bon
of all, the exbut the fa
antibiotic achy other similar
not compara.
icin-PMMA-beae infections”, Z1979. rquet, “Treatmeectomy and gen
485
y a surgicale infected andst importance.tutes has been
with persistentase, good softsue flap andd itself were,fast complete
sen antibioticnd surgeon’sg vials were
mal saline and. The soakinggest proposed
of Vancomycinto achieve aspossible. The
n 5 times lessys of steadily only assumetration has a
ntibiotic. Yet,s added for a].
rbable after 6osteoinductivediographs as asis. It is clear,in case of any
f the efficientfect with localion of specificved due to theOssal pellets.is completely very potentnfections andinductive andare additionale defect is in
xample of thect that theieved here isr study, madeable with any
ads in treatingZentralbl Chir,
ent of chronictamicin-PMMA
5
l d .
n t t d , e
c s e d g d n s e s y e a , a
6 e a , y
t l c e . y t d d l
n
e e s e y
g ,
c A

486
beads”, Clin Orthop Relat Res, Vol.159, pp.:201-7, September 1981.
3. S.A. Majid, L.T. Lindberg, B. Gunterberg and M.S. Siddiki, “Gentamicin-PMMA beads in the treatment of chronic osteomyelitis”, Acta Orthop Scand, Vol. 56(3), pp. 265-8, Jun 1985.
4. K. Anagnostakos, P. Hitzler, D. Pape, D. Kohn and J. Kelm, “Persistence of bacterial growth on antibiotic-loaded beads: is it actually a problem?”, Acta Orthop, Vol.79, pp.302–307, 2008.
5. L. F. Peltier, “The use of plaster of paris to fill large defects in bone”, Am J Surg, Vol. 97 (3), pp. 311-315, 1959.
6. M. McKee, L. Wild, E. Schemitsch and J. Waddell, “ The use of an antibiotic-impregnated, osteoconductive, bioabsorbable bones ubstitute in the treatment of infected long bone defects: early results of a prospective trial”, J Orthop Trauma, Vol. 16, pp. 622–7, 2002.
7. G.H. Lee, J.G. Khoury, J.E. Bell and J.A. Buckwalter, “ Adverse reactions to OsteoSet bone graft substitute, the incidence in a consecutive series”, Iowa Orthop J, Vol.22, pp.35–8, 2002.
8. D. Robinson, D. Alk, J. Sandbank , R. Farber and N. Halperin, “Inflammatory reactions associated with a calcium sulfate bone substitute”, Ann Transpl, Vol. 4, pp.91–7, 1999.
9. V. Dacquet, A. Varlet, R.N. Tandogan, M.M. Tahon, L. Fournier, F. Jehl, H. Monteil and G. Bascoulergue, “ Antibiotic-impregnated Plaster of Paris beads—trials with teicoplanin” Clin Orthop, Vol. 282, pp. 241–9, 1992.
10. M. A. Rauschmann, T. A. Wichelhaus, V. Stirnal, E. Dingeldein, L. Zichner, R. Schnettler, and V. Alt, “Nanocrystalline hydroxyapatite and calcium sulphate as biodegradable composite carrier material for local delivery of antibiotics in bone infections”, Biomaterials, Vol. 26 (15), pp. 2677-84, 2005.
11. R. Kraus, U. Schiefer and R. Schnettler, “Local surgical treatment of osteomyelitis with a resorbable, osteoconductive antibiotic carrier”, In Septic bone and joint surgery, R. Schnettler and H.U. Steinau Eds. Stuttgart [Germany] ; New York : Thieme, 2010, pp. 126-32
12. C. L. Romanò, N. Logoluso, E. Meani, D. Romanò, E. De Vecchi, C. Vassena, L. Drago, “A comparative study of the use of bioactive glass S53P4 and antibiotic-loaded calcium-based bone substitutes in the treatment of chronic osteomyelitis”, Bone Joint J, Vol. 96-B, pp.845–50, 2014.
13. Drakou A, Karaliotas GI, Sakellariou V, K. Mazis, K. Starantzis, and S. Athanasia, “The use of a calcium hydroxyapatite antibiotic carrier (PerOssal*) in long bone chronic osteomyelitis”, J Bone Joint Surg [Br], Vol. 93-B Suppl.III, pp.323, 2011.
14. J. Geurts, J.J. Chris Arts and G.H. Walenkamp, “Bone graft substitutes in active or suspected infection. Contra-indicated or not?”, Injury, Vol.42(Suppl 2), pp.S82–S86, 2011.
15. C.G. Zalavras, M.J. Patzakis and P. Holtom, “Local antibiotic therapy in the treatment of open fractures and osteomyelitis”, Clin Orthop Relat Res, Vol.427, pp.86–93, 2004.
CORE-SHELL LAYERED MODELS OF NANOSTRUCTURED CARRIERS FOR A NANO-BIO-MEDICAL APPLICATIONS
Jovan P. Šetrajčić 1,*, Ana J. Šetrajčić – Tomić 2, Ljubiša D. Džambas 3, Ivana Gušić 3
1 University of Novi Sad, Faculty of Sciences, Department of Physics, Vojvodina –Serbia 2 University of Novi Sad, Medical Faculty, Department of Pharmacy, Vojvodina –Serbia 3 University of Novi Sad, Medical Faculty, Department of Dentistry, Vojvodina –Serbia
Abstract. In this paper we will analyze application of nanomaterials in biomedicine, that is to say we will present the recent accomplishments in basic and clinical nanomedicine. Achieving full potential of nanomedicine may be years of even decades away, however, potential advances in drug delivery, diagnosis, and development of nanotechnology-related drugs start to change the landscape of medicine. Site-specific targeted drug delivery (made possible by the availability of unique delivery platforms, such as dendrimers, nanoparticles and nanoliposomes) and personalized medicine (result of the advance in pharmacogenetics) is just a few concepts on the horizon of research. In this paper, especially, we have analyzed the changes in basic physical properties of spherical-shaped nanoparticles that can be made in several (nano)layers and have, at the same time, multiple applications in medicine. Based on our research in ultrathin crystal structures performed so far, superlattices, Q-wires and Q-dots, we will consider the materials that can act as carriers for medicines and tagged substances. For this purpose we established a shell-model of ultrathin molecular crystals and investigated their dielectric, particularly optic characteristics. We conducted this research with the help of two-time dependent Green's function method, adjusted to ultrathin crystalline structure analysis. It is shown that specific resonant absorption lines appear in these structures, the number of which depends on crystal layers position and on values of parameters on shell-structure boundary surfaces. The absorption of electromagnetic radiation declines in infrared part and its detection is a relatively easy process. The subject of the research in this paper includes modeling of nanomaterials in the field of pharmaceutical technology for biomedical application. This includes very precise encapsulated drug delivery, on exactly defined place in the human tissue or organ and disintegration of capsule – drug carrier, so that the medicament can start producing its effect. The goal of multidisciplinary researches with biocompatible molecular nanomaterials is to find the parameters and the possibilities to construct boundary surfaces that will, in interaction with biological environment, create such properties of nanolayers that are convenient for use for layers of drug carrier capsules, biochips and biomarkers. These layers should demonstrate controlled disintegration of structure, better dielectric properties, discrete luminescence and appropriate bioporosity as all these are the requirements of contemporary nanomedicine. This paper presents the preliminary results of the study optical properties of ultrathin shell with four layers, which are obtained using sealed his own software developed JOIG_S. Based on the appearance of discrete absorption peak in the IR region, it can be concluded that this layer may serve as a marker for monitoring temporal changes of position of core-layered shall nanocapsul during its travel through the body
Key words: Core-shell model, nano-structures, biomaterials, medicine, drug deliveries.
* Corresponding author: Trg D. Obradovića 4, 21000 Novi Sad, Phone/Fax: +381 21 455-318, E-mail: [email protected]
1. INTRODUCTION
Science is nowadays very interested in low-dimensional systems, the dimensions of order of even few nanometers, which, in practical appli-cation, demonstrate exceptional characteristics in various fields. The need to minimize dimensions was imposed by a number of inter-related and mutually dependent requests of modern civiliza-tion, probably key to its further survival and sustainable development, which can generally be categorized as belonging to the fields of energy, health and ecology. In that sense, the subject of the research in this work will include nano-materials in the field of biopharmaceutical technology for biomedical application [1]. This
includes the very precise encapsulated drug delivery, on exactly defined place in the human tissue or organ and disintegration of capsule – drug carrier, so that the medicament can start producing its effect.
The development of biomedical science is directly related to the development of natural and mathematical sciences, especially materials science. Enormous resources are invested in the research that would lead to the solutions for many deadly diseases and in the end it is not possible not to put a completely logical question: whether the results of modern research justify the invested resources [1, 2]?
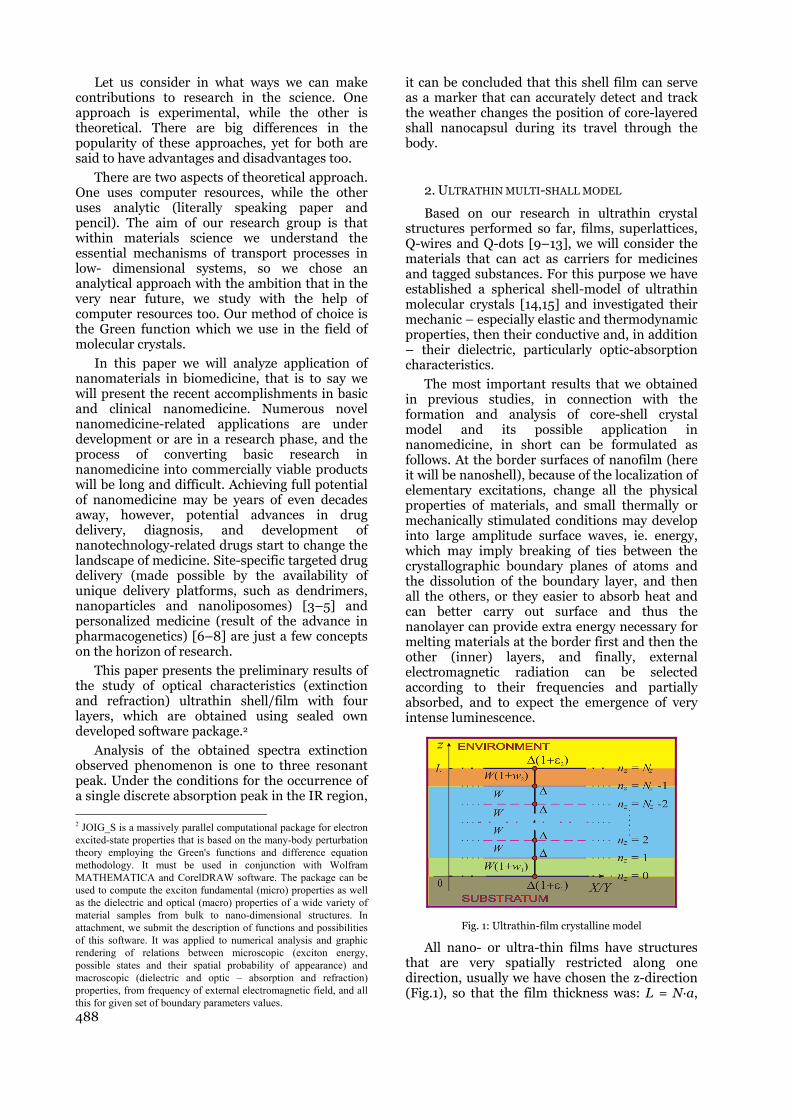
488
Let us consider in what ways we can make contributions to research in the science. One approach is experimental, while the other is theoretical. There are big differences in the popularity of these approaches, yet for both are said to have advantages and disadvantages too.
There are two aspects of theoretical approach. One uses computer resources, while the other uses analytic (literally speaking paper and pencil). The aim of our research group is that within materials science we understand the essential mechanisms of transport processes in low- dimensional systems, so we chose an analytical approach with the ambition that in the very near future, we study with the help of computer resources too. Our method of choice is the Green function which we use in the field of molecular crystals.
In this paper we will analyze application of nanomaterials in biomedicine, that is to say we will present the recent accomplishments in basic and clinical nanomedicine. Numerous novel nanomedicine-related applications are under development or are in a research phase, and the process of converting basic research in nanomedicine into commercially viable products will be long and difficult. Achieving full potential of nanomedicine may be years of even decades away, however, potential advances in drug delivery, diagnosis, and development of nanotechnology-related drugs start to change the landscape of medicine. Site-specific targeted drug delivery (made possible by the availability of unique delivery platforms, such as dendrimers, nanoparticles and nanoliposomes) [3–5] and personalized medicine (result of the advance in pharmacogenetics) [6–8] are just a few concepts on the horizon of research.
This paper presents the preliminary results of the study of optical characteristics (extinction and refraction) ultrathin shell/film with four layers, which are obtained using sealed own developed software package.2
Analysis of the obtained spectra extinction observed phenomenon is one to three resonant peak. Under the conditions for the occurrence of a single discrete absorption peak in the IR region, 2 JOIG_S is a massively parallel computational package for electron excited-state properties that is based on the many-body perturbation theory employing the Green's functions and difference equation methodology. It must be used in conjunction with Wolfram MATHEMATICA and CorelDRAW software. The package can be used to compute the exciton fundamental (micro) properties as well as the dielectric and optical (macro) properties of a wide variety of material samples from bulk to nano-dimensional structures. In attachment, we submit the description of functions and possibilities of this software. It was applied to numerical analysis and graphic rendering of relations between microscopic (exciton energy, possible states and their spatial probability of appearance) and macroscopic (dielectric and optic – absorption and refraction) properties, from frequency of external electromagnetic field, and all this for given set of boundary parameters values.
it can be concluded that this shell film can serve as a marker that can accurately detect and track the weather changes the position of core-layered shall nanocapsul during its travel through the body.
2. ULTRATHIN MULTI-SHALL MODEL
Based on our research in ultrathin crystal structures performed so far, films, superlattices, Q-wires and Q-dots [9–13], we will consider the materials that can act as carriers for medicines and tagged substances. For this purpose we have established a spherical shell-model of ultrathin molecular crystals [14,15] and investigated their mechanic – especially elastic and thermodynamic properties, then their conductive and, in addition – their dielectric, particularly optic-absorption characteristics.
The most important results that we obtained in previous studies, in connection with the formation and analysis of core-shell crystal model and its possible application in nanomedicine, in short can be formulated as follows. At the border surfaces of nanofilm (here it will be nanoshell), because of the localization of elementary excitations, change all the physical properties of materials, and small thermally or mechanically stimulated conditions may develop into large amplitude surface waves, ie. energy, which may imply breaking of ties between the crystallographic boundary planes of atoms and the dissolution of the boundary layer, and then all the others, or they easier to absorb heat and can better carry out surface and thus the nanolayer can provide extra energy necessary for melting materials at the border first and then the other (inner) layers, and finally, external electromagnetic radiation can be selected according to their frequencies and partially absorbed, and to expect the emergence of very intense luminescence.
Fig. 1: Ultrathin-film crystalline model
All nano- or ultra-thin films have structures that are very spatially restricted along one direction, usually we have chosen the z-direction (Fig.1), so that the film thickness was: L = N·a,
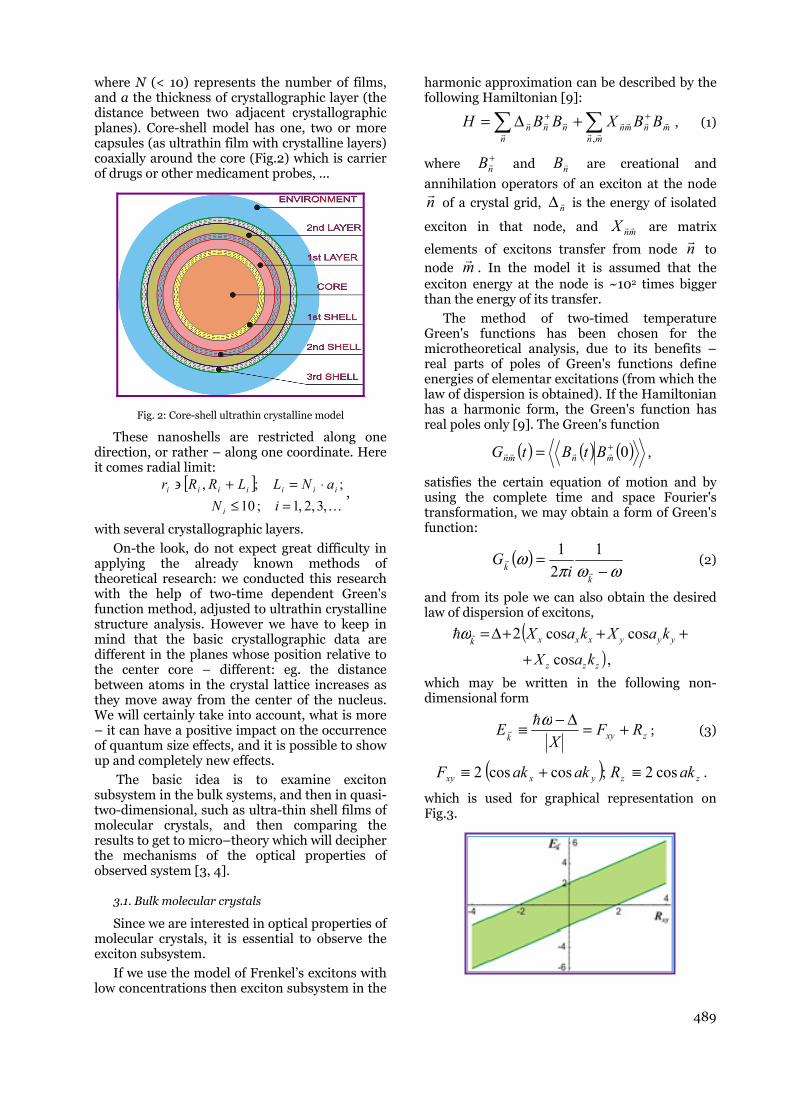
489
where N (< 10) represents the number of films, and a the thickness of crystallographic layer (the distance between two adjacent crystallographic planes). Core-shell model has one, two or more capsules (as ultrathin film with crystalline layers) coaxially around the core (Fig.2) which is carrier of drugs or other medicament probes, ...
Fig. 2: Core-shell ultrathin crystalline model
These nanoshells are restricted along one direction, or rather – along one coordinate. Here it comes radial limit:
[ ],3,2,1;10
;;,
=≤⋅=+∋
iN
aNLLRRr
i
iiiiiii ,
with several crystallographic layers.
On-the look, do not expect great difficulty in applying the already known methods of theoretical research: we conducted this research with the help of two-time dependent Green's function method, adjusted to ultrathin crystalline structure analysis. However we have to keep in mind that the basic crystallographic data are different in the planes whose position relative to the center core – different: eg. the distance between atoms in the crystal lattice increases as they move away from the center of the nucleus. We will certainly take into account, what is more – it can have a positive impact on the occurrence of quantum size effects, and it is possible to show up and completely new effects.
The basic idea is to examine exciton subsystem in the bulk systems, and then in quasi-two-dimensional, such as ultra-thin shell films of molecular crystals, and then comparing the results to get to micro–theory which will decipher the mechanisms of the optical properties of observed system [3, 4].
3.1. Bulk molecular crystals
Since we are interested in optical properties of molecular crystals, it is essential to observe the exciton subsystem.
If we use the model of Frenkel’s excitons with low concentrations then exciton subsystem in the
harmonic approximation can be described by the following Hamiltonian [9]:
++ +Δ=mn
mnmnn
nnn BBXBBH
,
, (1)
where +nB and nB are creational and
annihilation operators of an exciton at the node
n
of a crystal grid, nΔ is the energy of isolated
exciton in that node, and mnX are matrix
elements of excitons transfer from node n
to node m
. In the model it is assumed that the
exciton energy at the node is ~102 times bigger than the energy of its transfer.
The method of two-timed temperature Green's functions has been chosen for the microtheoretical analysis, due to its benefits – real parts of poles of Green's functions define energies of elementar excitations (from which the law of dispersion is obtained). If the Hamiltonian has a harmonic form, the Green's function has real poles only [9]. The Green's function
( ) ( ) ( )0+= mnmn BtBtG ,
satisfies the certain equation of motion and by using the complete time and space Fourier's transformation, we may obtain a form of Green's function:
( )ωωπ
ω−
=k
k iG
1
2
1 (2)
and from its pole we can also obtain the desired law of dispersion of excitons,
(),cos
coscos2
zzz
yyyxxxk
kaX
kaXkaX
+
+++Δ=ω
which may be written in the following non-dimensional form
zxykRF
XE +=Δ−≡ ω
; (3)
( ) zzyxxy akRakakF cos2;coscos2 ≡+≡ .
which is used for graphical representation on Fig.3.
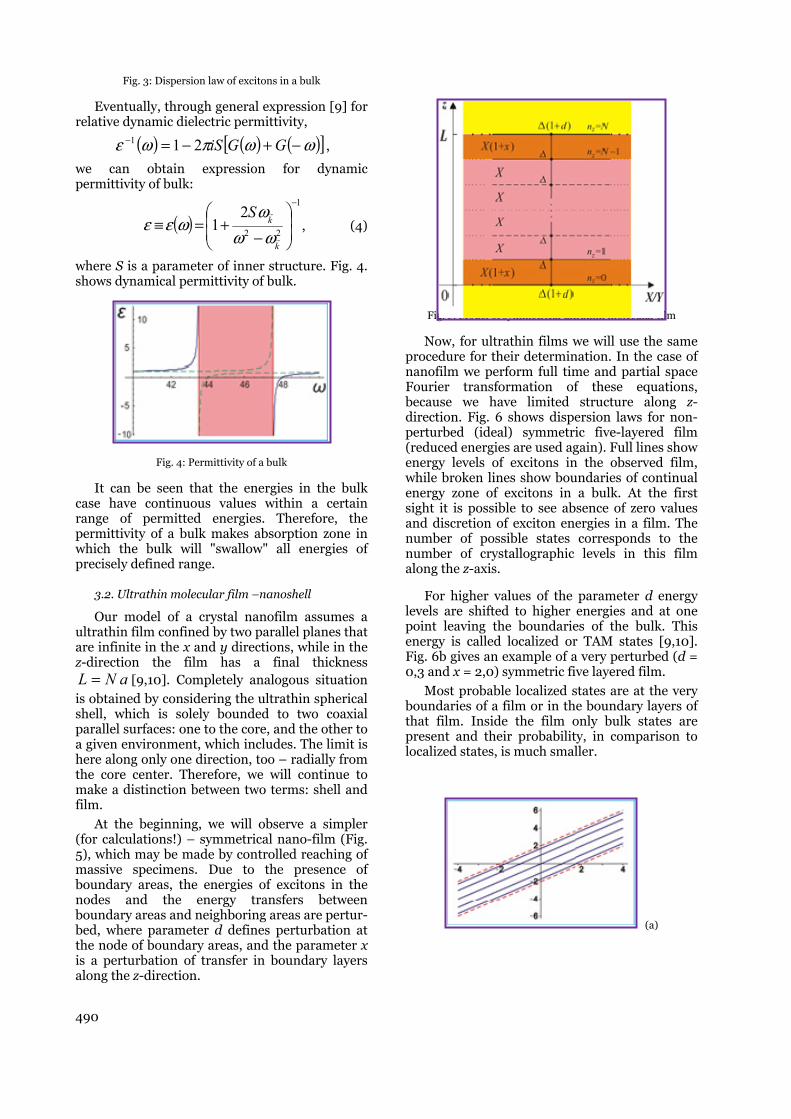
490
Fig. 3: Dispersion law of excitons in a bulk
Eventually, through general expression [9] for relative dynamic dielectric permittivity,
( ) ( ) ( )[ ]ωωπωε −+−=− GGiS211 ,
we can obtain expression for dynamic permittivity of bulk:
( )1
22
21
−
−+=≡
k
kS
ωωω
ωεε , (4)
where S is a parameter of inner structure. Fig. 4. shows dynamical permittivity of bulk.
Fig. 4: Permittivity of a bulk
It can be seen that the energies in the bulk case have continuous values within a certain range of permitted energies. Therefore, the permittivity of a bulk makes absorption zone in which the bulk will "swallow" all energies of precisely defined range.
3.2. Ultrathin molecular film –nanoshell
Our model of a crystal nanofilm assumes a ultrathin film confined by two parallel planes that are infinite in the x and y directions, while in the z-direction the film has a final thickness
aNL = [9,10]. Completely analogous situation is obtained by considering the ultrathin spherical shell, which is solely bounded to two coaxial parallel surfaces: one to the core, and the other to a given environment, which includes. The limit is here along only one direction, too – radially from the core center. Therefore, we will continue to make a distinction between two terms: shell and film.
At the beginning, we will observe a simpler (for calculations!) – symmetrical nano-film (Fig. 5), which may be made by controlled reaching of massive specimens. Due to the presence of boundary areas, the energies of excitons in the nodes and the energy transfers between boundary areas and neighboring areas are pertur-bed, where parameter d defines perturbation at the node of boundary areas, and the parameter x is a perturbation of transfer in boundary layers along the z-direction.
Fig. 5: Model of symmetrical ultrathin molecular film
Now, for ultrathin films we will use the same procedure for their determination. In the case of nanofilm we perform full time and partial space Fourier transformation of these equations, because we have limited structure along z-direction. Fig. 6 shows dispersion laws for non-perturbed (ideal) symmetric five-layered film (reduced energies are used again). Full lines show energy levels of excitons in the observed film, while broken lines show boundaries of continual energy zone of excitons in a bulk. At the first sight it is possible to see absence of zero values and discretion of exciton energies in a film. The number of possible states corresponds to the number of crystallographic levels in this film along the z-axis.
For higher values of the parameter d energy levels are shifted to higher energies and at one point leaving the boundaries of the bulk. This energy is called localized or TAM states [9,10]. Fig. 6b gives an example of a very perturbed (d = 0,3 and x = 2,0) symmetric five layered film.
Most probable localized states are at the very boundaries of a film or in the boundary layers of that film. Inside the film only bulk states are present and their probability, in comparison to localized states, is much smaller.
(a)

491
(b)
Fig. 6: Dispersion law of symmetrical films
After application of Green’s functions one can obtain expression which represents the relative dynamical permittivity as a function of the frequency of initial electromagnetic excitation. Again it is possible to change the values of perturbation parameters. Case example, when we have different values of perturbation parameters (e.g. x) we see in Fig. 7.
Fig. 7: Relative permittivity of highly perturbed
symmetrical five-layered film
In the observed film (N = 4) the number of resonant lines3 is different for different layers. Therefore, at least one and a maximum of three
3 Resonant peaks in the frequency dependence of dynamic permittivity are the positions resonant frequencies, where permittivity diverges into ±∞. Those are also energies (wavelengths) of such electromagnetic radiance that a model crystal "swallows" at the given place, i.e. energies that are absolutely absorbed there.
are present as much as there is allowed states along axis where of translation symmetry is violated, in this case along z-axis). Their number depends on the size of perturbation parameters at boundary areas, i.e. in the boundary layers of a crystalline film and this is in direct connection to the occurrence of localized states for some determined values of boundary parameters.
3.3. Optical characteristics of core shell layered models
In the last year or two our research has been continued and widened. Two basic optical characteristics have been defined: absorption index (extinction) and refraction index.
The refraction (n) and absorption (κ) indices are usually defined in the literature by permittivity term: ε1/2 = n + κ. Introducing the complex frequency: ω → ω + i ν in expression for permittivity, we get complex permittivity: ε = ε’ + i ε”. Based on this, we can find expressions for absorption and refraction indices [16–18] in the following forms:
( )
( ) .112
;112
2
2
+
′′′
+′
=
−
′′′
+′
=
z
zz
z
z
zz
z
n
nn
n
n
nn
n
nεεε
ω
εεε
ωκ
(5)
From these expressions one can see that dynamical absorption and refraction indices as well as relative permittivity depends on position of film-layer (nz) and on perturbation parameters at and within shall boundary layers. Graphics on Fig.8 shows some results for representative cases, which are analogous to the ones in permittivity.
Since the emission and absorption spectra can be experimentally recorded but only for the whole film, we have determined these optical characteristics (indices of absorption and refraction) not only for the particular layers but for the whole shall as well and in the normal direction on boundary surface of the shall (or radial from core center) where the changes of these values occur in relation to their bulk values.
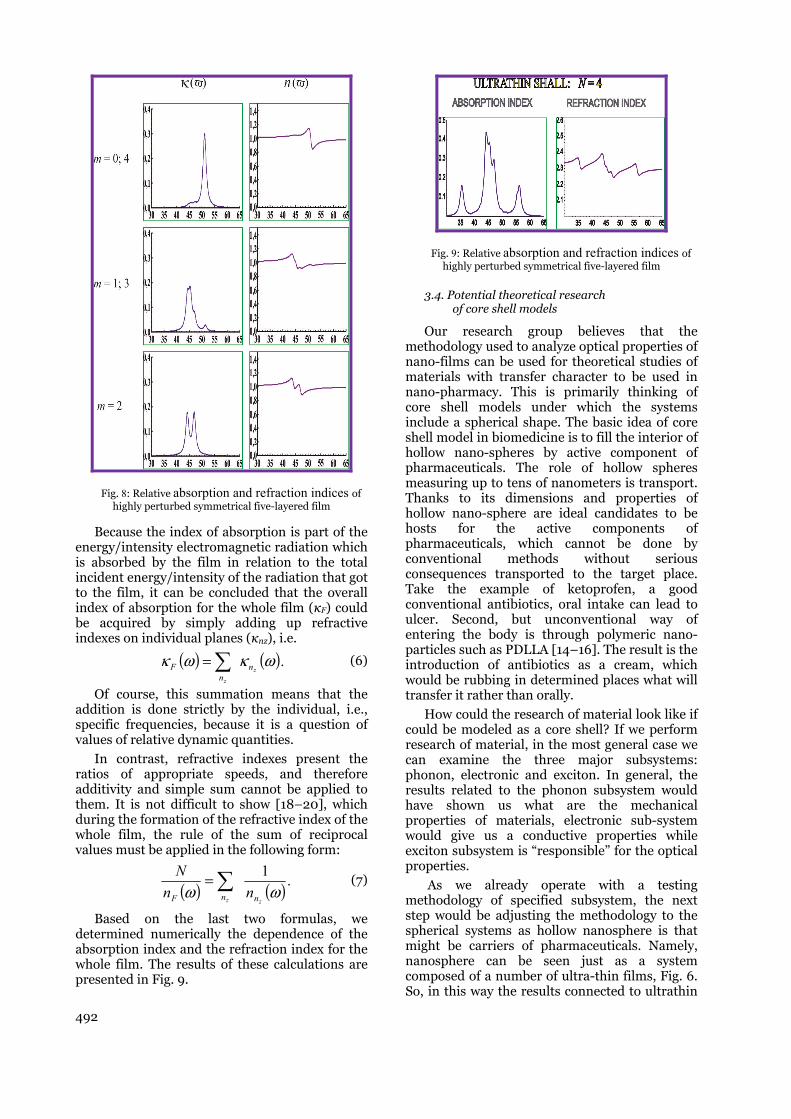
492
Fig. 8: Relative absorption and refraction indices of highly perturbed symmetrical five-layered film
Because the index of absorption is part of the energy/intensity electromagnetic radiation which is absorbed by the film in relation to the total incident energy/intensity of the radiation that got to the film, it can be concluded that the overall index of absorption for the whole film (κF) could be acquired by simply adding up refractive indexes on individual planes (κnz), i.e.
( ) ( ).ωκωκz
z
nn
F = (6)
Of course, this summation means that the addition is done strictly by the individual, i.e., specific frequencies, because it is a question of values of relative dynamic quantities.
In contrast, refractive indexes present the ratios of appropriate speeds, and therefore additivity and simple sum cannot be applied to them. It is not difficult to show [18–20], which during the formation of the refractive index of the whole film, the rule of the sum of reciprocal values must be applied in the following form:
( ) ( ) .1
ωωzz nnF nn
N = (7)
Based on the last two formulas, we determined numerically the dependence of the absorption index and the refraction index for the whole film. The results of these calculations are presented in Fig. 9.
Fig. 9: Relative absorption and refraction indices of highly perturbed symmetrical five-layered film
3.4. Potential theoretical research of core shell models
Our research group believes that the methodology used to analyze optical properties of nano-films can be used for theoretical studies of materials with transfer character to be used in nano-pharmacy. This is primarily thinking of core shell models under which the systems include a spherical shape. The basic idea of core shell model in biomedicine is to fill the interior of hollow nano-spheres by active component of pharmaceuticals. The role of hollow spheres measuring up to tens of nanometers is transport. Thanks to its dimensions and properties of hollow nano-sphere are ideal candidates to be hosts for the active components of pharmaceuticals, which cannot be done by conventional methods without serious consequences transported to the target place. Take the example of ketoprofen, a good conventional antibiotics, oral intake can lead to ulcer. Second, but unconventional way of entering the body is through polymeric nano-particles such as PDLLA [14–16]. The result is the introduction of antibiotics as a cream, which would be rubbing in determined places what will transfer it rather than orally.
How could the research of material look like if could be modeled as a core shell? If we perform research of material, in the most general case we can examine the three major subsystems: phonon, electronic and exciton. In general, the results related to the phonon subsystem would have shown us what are the mechanical properties of materials, electronic sub-system would give us a conductive properties while exciton subsystem is “responsible” for the optical properties.
As we already operate with a testing methodology of specified subsystem, the next step would be adjusting the methodology to the spherical systems as hollow nanosphere is that might be carriers of pharmaceuticals. Namely, nanosphere can be seen just as a system composed of a number of ultra-thin films, Fig. 6. So, in this way the results connected to ultrathin

493
films could be used. Of course, the transition from flat to spherical ultrathin films is not a trivial problem. The first step is to create an adequate Fourier transformation, but the real problem is the way how to include a flat deformation of a thin film that would emerge. Further research of some subsystem would follow, primarily phonon since the mechanical properties in terms of application are the most important. Research of conductive and optical properties may lead to knowledge of how the holders of pharmaceutical nanoparticles can be induced, i.e. how they can be manipulated (e.g. target more)
Fig. 10: Model of spherical ultrathin film layers
As to the analytical solutions related to the dynamics of subsystems are very hard to be reached, for the start a potential approach might be by the use of computer resources, i.e. creating a simulation that would lead to some general results that could indicate the solution.
4. CONCLUSION
Recent advances in creating nanomaterials have created new opportunities in biomedical research and clinical applications. High-quality nanomaterials, of well-controlled size and shape, are a new class of building blocks to enable the establishment of assays for monitoring molecular signals in biological systems and living organisms. Many of these new nanoassays have higher sensitivity, selectivity and throughput than conventional bioanalytical methods. On the one hand, these nanoassays will be capable of
detecting biochemical changes at the single-molecule level in living cells. Conversely, these assays will lead to low-cost, point-of-care devices for rapid diagnosis of pathogenic and genetic diseases (e.g., HIV and cancer). In addition, nanomaterials have been used as advanced contrast agents for clinical imaging technologies, such as MRI, computer tomography and ultrasound. Moreover, the use of nanomaterials will lead to the invention of ‘smart’ drug-delivery vehicles, new therapies and even new scalpel-free surgery methods.
These new opportunities stem primarily from the novel nature of nanomaterials. Owing to their size-dependent effects, nanomaterials exhibit new physical and chemical properties compared with conventional bulk and molecular materials. In general, nanomaterials include inorganic, organic and inorganic/organic composite nanostructures, such as nanoparticles, nanowires and nanopatterns.
Using nanotechnology, it may be possible to achieve: improved delivery of poorly water-soluble drugs, targeted delivery of drugs in a cell- or tissue-specific manner, transcytosis of drugs across tight epithelial and endothelial barriers, delivery of large macromolecule drugs to intracellular sites of action, co-delivery of two or more drugs or therapeutic modality for combination therapy, visualization of sites of drug delivery by combining therapeutic agents with imaging modalities and real-time read on the in vivo efficacy of a therapeutic agent. Additionally, the manufacturing complexity of nanotechnology therapeutics may also create a significant hurdle for generic drug companies to develop equivalent therapeutics readily. These are just a few of the many compelling reasons that nanotechnology holds enormous promise for drug delivery.
It is certain that a solution to problems of delivery and transport of pharmaceuticals in different parts of the body lies in the achievements of materials science. In this sense, nano-materials and hollow nano-spheres are materials for which will be given attention in the future even more than now. For positive results in this area much more experimental methods are used. Even those theoretical mainly represent the results obtained using the computing resources, as opposed to analytical methods.
Our goal is the use and adaptation of analytical methodology applied to flat ultrathin films on the spherical systems that looked as if composed of a certain number of ultrathin films.
Optical, i.e. absorption and refraction properties of observed nanostructures (ultrathin nanoshalls) demonstrate very narrow or discrete characteristics, where relative dielectric permittivity and optical indices dependence from
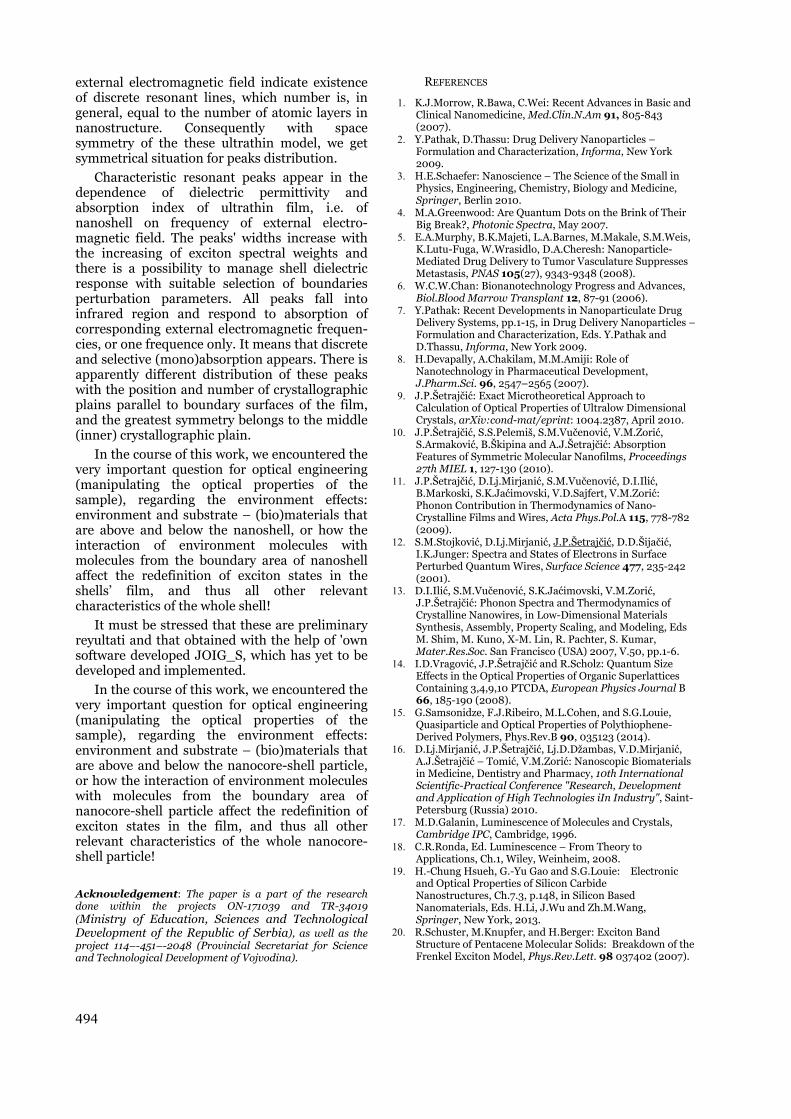
494
external electromagnetic field indicate existence of discrete resonant lines, which number is, in general, equal to the number of atomic layers in nanostructure. Consequently with space symmetry of the these ultrathin model, we get symmetrical situation for peaks distribution.
Characteristic resonant peaks appear in the dependence of dielectric permittivity and absorption index of ultrathin film, i.e. of nanoshell on frequency of external electro-magnetic field. The peaks' widths increase with the increasing of exciton spectral weights and there is a possibility to manage shell dielectric response with suitable selection of boundaries perturbation parameters. All peaks fall into infrared region and respond to absorption of corresponding external electromagnetic frequen-cies, or one frequence only. It means that discrete and selective (mono)absorption appears. There is apparently different distribution of these peaks with the position and number of crystallographic plains parallel to boundary surfaces of the film, and the greatest symmetry belongs to the middle (inner) crystallographic plain.
In the course of this work, we encountered the very important question for optical engineering (manipulating the optical properties of the sample), regarding the environment effects: environment and substrate – (bio)materials that are above and below the nanoshell, or how the interaction of environment molecules with molecules from the boundary area of nanoshell affect the redefinition of exciton states in the shells’ film, and thus all other relevant characteristics of the whole shell!
It must be stressed that these are preliminary reyultati and that obtained with the help of 'own software developed JOIG_S, which has yet to be developed and implemented.
In the course of this work, we encountered the very important question for optical engineering (manipulating the optical properties of the sample), regarding the environment effects: environment and substrate – (bio)materials that are above and below the nanocore-shell particle, or how the interaction of environment molecules with molecules from the boundary area of nanocore-shell particle affect the redefinition of exciton states in the film, and thus all other relevant characteristics of the whole nanocore-shell particle!
Acknowledgement: The paper is a part of the research done within the projects ON-171039 and TR-34019 (Ministry of Education, Sciences and Technological Development of the Republic of Serbia), as well as the project 114–-451–-2048 (Provincial Secretariat for Science and Technological Development of Vojvodina).
REFERENCES
1. K.J.Morrow, R.Bawa, C.Wei: Recent Advances in Basic and Clinical Nanomedicine, Med.Clin.N.Am 91, 805-843 (2007).
2. Y.Pathak, D.Thassu: Drug Delivery Nanoparticles – Formulation and Characterization, Informa, New York 2009.
3. H.E.Schaefer: Nanoscience – The Science of the Small in Physics, Engineering, Chemistry, Biology and Medicine, Springer, Berlin 2010.
4. M.A.Greenwood: Are Quantum Dots on the Brink of Their Big Break?, Photonic Spectra, May 2007.
5. E.A.Murphy, B.K.Majeti, L.A.Barnes, M.Makale, S.M.Weis, K.Lutu-Fuga, W.Wrasidlo, D.A.Cheresh: Nanoparticle-Mediated Drug Delivery to Tumor Vasculature Suppresses Metastasis, PNAS 105(27), 9343-9348 (2008).
6. W.C.W.Chan: Bionanotechnology Progress and Advances, Biol.Blood Marrow Transplant 12, 87-91 (2006).
7. Y.Pathak: Recent Developments in Nanoparticulate Drug Delivery Systems, pp.1-15, in Drug Delivery Nanoparticles – Formulation and Characterization, Eds. Y.Pathak and D.Thassu, Informa, New York 2009.
8. H.Devapally, A.Chakilam, M.M.Amiji: Role of Nanotechnology in Pharmaceutical Development, J.Pharm.Sci. 96, 2547–2565 (2007).
9. J.P.Šetrajčić: Exact Microtheoretical Approach to Calculation of Optical Properties of Ultralow Dimensional Crystals, arXiv:cond-mat/eprint: 1004.2387, April 2010.
10. J.P.Šetrajčić, S.S.Pelemiš, S.M.Vučenović, V.M.Zorić, S.Armaković, B.Škipina and A.J.Šetrajčić: Absorption Features of Symmetric Molecular Nanofilms, Proceedings 27th MIEL 1, 127-130 (2010).
11. J.P.Šetrajčić, D.Lj.Mirjanić, S.M.Vučenović, D.I.Ilić, B.Markoski, S.K.Jaćimovski, V.D.Sajfert, V.M.Zorić: Phonon Contribution in Thermodynamics of Nano-Crystalline Films and Wires, Acta Phys.Pol.A 115, 778-782 (2009).
12. S.M.Stojković, D.Lj.Mirjanić, J.P.Šetrajčić, D.D.Šijačić, I.K.Junger: Spectra and States of Electrons in Surface Perturbed Quantum Wires, Surface Science 477, 235-242 (2001).
13. D.I.Ilić, S.M.Vučenović, S.K.Jaćimovski, V.M.Zorić, J.P.Šetrajčić: Phonon Spectra and Thermodynamics of Crystalline Nanowires, in Low-Dimensional Materials Synthesis, Assembly, Property Scaling, and Modeling, Eds M. Shim, M. Kuno, X-M. Lin, R. Pachter, S. Kumar, Mater.Res.Soc. San Francisco (USA) 2007, V.50, pp.1-6.
14. I.D.Vragović, J.P.Šetrajčić and R.Scholz: Quantum Size Effects in the Optical Properties of Organic Superlattices Containing 3,4,9,10 PTCDA, European Physics Journal B 66, 185-190 (2008).
15. G.Samsonidze, F.J.Ribeiro, M.L.Cohen, and S.G.Louie, Quasiparticle and Optical Properties of Polythiophene-Derived Polymers, Phys.Rev.B 90, 035123 (2014).
16. D.Lj.Mirjanić, J.P.Šetrajčić, Lj.D.Džambas, V.D.Mirjanić, A.J.Šetrajčić – Tomić, V.M.Zorić: Nanoscopic Biomaterials in Medicine, Dentistry and Pharmacy, 10th International Scientific-Practical Conference "Research, Development and Application of High Technologies iIn Industry", Saint-Petersburg (Russia) 2010.
17. M.D.Galanin, Luminescence of Molecules and Crystals, Cambridge IPC, Cambridge, 1996.
18. C.R.Ronda, Ed. Luminescence – From Theory to Applications, Ch.1, Wiley, Weinheim, 2008.
19. H.-Chung Hsueh, G.-Yu Gao and S.G.Louie: Electronic and Optical Properties of Silicon Carbide Nanostructures, Ch.7.3, p.148, in Silicon Based Nanomaterials, Eds. H.Li, J.Wu and Zh.M.Wang, Springer, New York, 2013.
20. R.Schuster, M.Knupfer, and H.Berger: Exciton Band Structure of Pentacene Molecular Solids: Breakdown of the Frenkel Exciton Model, Phys.Rev.Lett. 98 037402 (2007).

DE
Dan
3
4Faculty
AbstThe windsourenvicondincreheliu
Key
1.
Aradiobexperireviewthis as comexplaipenetradiathigh punit msoft Xthe oxat 4.4contaithan thigh sampl“wateinvestat higwere ghowev
Rsourcebecauhigh-dpulsesunderbiologX-ray
ESIGN AND
niel Adjei*
1 Institut2Radiatio
3Institute of Nof Nuclear Sc
tract. A compasource is based
dow” spectral rrce chamber anronment. The
ditions. Single aeased with incrum condition m
y words: laser-p
. INTRODU
Application obiology has iments [1-17]
wed that the radiation, wa
mpared with hined by the hiration (as comtion in cells anproportion of
mass of the saX-rays in the xygen K-edge nm, called “wining proteinthe oxygen-conumber of ple. This maker window” sptigating the m
gh-dose loads. generated witver, the latter
Recently, applies in radiobio
use of the possdose loads ans emitted fromrstand the gical responseys sources for
CHARACTE
1,2,4, Anna WJanusz Lek
L
te of Optoelecton Protection
Nuclear Physiciences and En
act desk-top lasd on a double-srange at a fluennd about 2.60×1
source has beenand double str
reasing dose of tay be associate
produced plasm
UCTION
of soft X-rabeen demon]. A numberbiological dams found very o
hard X-rays [6igh absorptionmpared with hnd cellular cof the energy tmple. This paunique spectat 2.3 nm and
water window”s show muchontaining watphotons to bes the use of ectral region a
mechanisms o Radiations in
th X-ray tubessources have lication of lase
ology has attrasibility irradia
nd rates. Addim these sourc
mechanism e to radiationr radiobiology
ERIZATIONFOR RAD
Wiechec3, Pkki3, WojciLadislav Pin
tronics, MilitaInstitute, Gha
cs, Polish Acadngineering Phy
ser-produced pstream gas puffnce of about 4.2102 photon/µm2
n used to irradand breaks wethe “water wind
ed with damage
ma, soft X-rays,
ays (<12 keVstrated in vr of reports mage, producoften more eff6, 7, 14]. This cn and relativehard X-rays) mponents, allto be depositearticularly apptral region bed the carbon k”, where the cah larger absoter, thus allowe delivered t
f soft X-rays a useful methf radiation dan these experis and synchrolimited access
er plasma soft acted much ination of a samitionally, veryes may be use
underlying. Laser plasm
y experiments
N OF A DESKDIOBIOLOG
Przemyslawiech M. Kwna4, Henry
ary University ana Atomic Endemy of Sciencysics, Czech Te
plasma source off target and de23×103 photon/2 per pulse on
diate pBR322 plere quantified bdow” soft X-ray
e from water fre
, radiobiology, g
V) in various
have ced by ffective can be
ely low of the
lowing ed per
plies to etween k-edge arbon-
orption wing a to the in the
hod for amage iments otrons, s. t X-ray nterest, mple at y short eful to
g the ma soft s were
K-TOP LASEGY STUDIES
w Wachulawiatek3, Andyk Fiedorow
of Technologynergy Commisces, 152, Radziechnical Unive
of soft X-rays felivers nanoseco/µm2 per pulsea wet sample llasmid DNA boby gel electropys. The strand bee radicals.
gas puff target,
proposed msuch sourceinteracting wbased on scause degrasystem and target laserenergy sprradiation do
The deba double-strproposed aMilitary UnX-ray emisregion hasproduced uplasma softpuff target ilaser facilitradiobiologythe limited there is a stbased on a cused by mexperiments
Soft X-rthan 10% at[24]. Thuscondition. Ifor irradiatithe X-ray possible. On
ER PLASMAS
k1, Mesfin Gdrzej Bartnwicz1
y, 00-908 Wasion, Legon, Aikowskiego Stersity in Pragu
for radiobiologyond pulses of soon a sample plocated outside
oth in vacuum ahoresis. The nu
breaks of plasm
water window
more than 20 yes were basewith a solid taolid targets padation to ththe sample unplasma sour
read and those might be obris problem cream gas puffat the Instiiversity of Tec
ssion in the been demonssing the gas pt X-ray sourceirradiated witty has been y experimentsaccess to thi
trong need to compact laser
many users fs. rays photons at transmission, there are
In order to efing live or weattenuation i
ne of the possi
A X-RAY SO
Getachew Anik1,
arsaw, Poland Accra, Ghana tr., Cracow, Poue, Prague, Cz
y research is poft X-rays in thlaced inside thethe chamber in
and the He-envumber of stran
mid solution irra
w
years ago [18-ed on the usarget. Laser plproduce debrihe optical elender irradiatiorces emit X-rahe reproducibof a challenge [can be solved
ff target approitute of Opchnology [21].
“water windstrated from puff target [2
ce based on thth laser pulses
successfully s [23]. Howevis large scale develop a lab
r plasma X-rayfor potential
are easily atten path length o
useful in hffectively use et samples wilis prevented ible ways is to
OURCE
Ayele1,
oland zech Republic
presented. he “water e vacuum n the He-
vironment nd breaks adiated in
-19], however,se of a laserlasma sourcesis which mayments of theon. Also, solidays with highbility of the[20]
d by the use ofoach that wasptoelectronics,. Efficient softdow” spectral
laser plasma22]. The laserhe xenon gass at the PALSused in the
ver, because oflaser facility,
boratory setupy source to be
radiobiology
enuated to lessof ~1 cm of airhigh vacuumsuch photons
ll require thatas much as
o transmit the
, r s y e d h e
f s , t l a r s S e f ,
p e y
s r
m s t s e

496
X-ray beam tabout 99% tr
An appliX-ray sourceemission in range, for rastudy. The soexisting laserX-rays for ap
2. MAT
2.1. Deslaser plas
A compasample irraddeveloped fothe source previous papa laser (Nd~740 mJ mabeam onto avacuum-champuff target, wabsorbers gi“water windo
The sourcnew systemsirradiate biolHe-environmthe sample ma circular disin 360O and mThe layout alvacuum in orand venting During irradremaining sabeam by a 201 mm thick sample in themoving the controller. Tchamber coumounted on t
A vacuumachieved witbacked by acondition is argon for a ffilm spectraspecifically range. The chamber witallowed uniffilters. Thus,which mighton the filters
To allow second samoutside, on correctly aligthrough a 2×thick (Silson
through a plumransmission ofication of a “se, developed
the X-ray “adiobiology stuource has beer plasma sour
pplication in m
TERIALS AND
sign and devesma X-ray sou
act laser plasmdiation moun
or radiobiologydevelopment
per [25]. The sd:YAG laser,ximum energya double strember. Here, wwhich combinive maximumow” spectral w
ce has been as to mount logical sample
ment. To irradmounting systesc with 8 mmmounted on allowed eight srder to limit th
the chamberdiation of aamples are sh00 µm thick o
of plastic. Pe X-ray beam sample into
The sample uld be visualize
top of the cha
m of ~10-2 mbth the use of a rotary pum
relatively hifew cm path lal filters wthe X-ray “filters were
th a special hform pressure, it was possit be due to di.
irradiation ofmple mountin
top of the gned to allow ×2 mm2 silicon
Ltd, UK). Ano
me of helium wf such photonsstand alone” c
and optimis“water windoudies is presen developed brce of the „wa
microscopy [22
D METHODS
lopment of a nurce
ma system winting systemy experimentst are describource is based, 1.06 µm y and 4 ns puleam gas puff we have used
ned with differm emission inwavelength ran
additionally eqsamples to
es both in vacdiate samplesem was made
m diameter hoa motorized rosamples to be he time spent r to change t
a particular hielded from t
f aluminum foPrecise positio
was executedthe beam witplaced in t
ed through a gmber.
bar during opa turbo mole
mp. Though igh, the tranlengths is hig
were required“water windoe accommodahome-made he distributionible to avoid ifferent press
f wet biologicag system wa
vacuum chthe soft X-ray
n nitride windother unique f
which allows s. compact soft sed for high ow” spectral ented in this based on our ater window” 2].
nanosecond
ith a unique s has been
s. Aspects of bed in our d on focusing
wavelength, lse duration)
f target in a d Ar/He gas rent spectral n the X-ray
nge.
quipped with be able to
cuum and in in vacuum, in a form of
oles arranged otation stage. irradiated in on pumping
the samples. sample, the the radiation oil glued to a oning of the d by remotely th the stage the vacuum glass window
peration was ecular pump the vacuum
nsmission of h [24]. Thin
d to select ow” spectral ated in the holder which
around the any damage ure gradient
al samples, a as mounted amber, and ys to emerge
dow, 200 nm feature of the
sourcpositiHe-gaavoidby airseparand experoutsidin Fig
Fifor irr
2
ThoptimbackiwereSimilof thepowethe so25]. Toptim1.5 mlocateproviemiss
ThperfocondiphotoUSA)photoX-rayand respedistansilicofilter from detecquantmanuobtainaccoueach depenoperacouplDPO Techntime
ce is that samion. A plasticas, was moun
d the strong abr in the atmosrated by an Oprevent any
rimental arrande the vacuumg. 1.
ig. 1 Schematic vradiating biologi
2.2. Source ch
he use of themization of thing pressures
optimized tarly, the time e valve whichr supply was ource optimizThe position
mized to alignmm away from
ed in the cding optimumsion.
he photon flurmed for botitions using codiode (Intern with a 10 ×
on fluence meys were transm
Ti filters loectively, upstrnce between n filter was suby the plasmthe gas puf
ctor depends tum efficie
ufacturer) wened spectra. T
unt the normaspectral line b
ndent quantuated with revled to a 470404 Digita
nology, USA)integrated vol
mples are moc sealed contted directly abbsorption of tpheric conditi-ring to provi
damage to ngement for
m chamber is s
view of the expeical samples in h
haracterization
e gas puff targhe source par
of the argonto achieve hidelays of the was synchronoptimized. T
zation is descrof the electro
n it so that tm the focus of
center of thm gas density
uence measurth He environcalibrated AXUnational Radia
10 mm2 activeasurements imitted throughocated 30 meam of the sthe interacti
ufficient to prma shockwaveff target. Theon the X-ray encies (proere normalizThis was achialized transmiby the corresp
um efficiency.erse bias volt4 GHz banal Phosphor with impedan
ltage was conv
ounted in a vtainer, flushedabove the windthe soft X-rayion. The contaide a proper s
the windowirradiating sa
schematically
erimental arranhelium environm
n measureme
get required rameters. Hern and heliumhigher photon
opening and cnized with th
The basic concribed elsewheomagnetic valvthe nozzle is the laser beam
he chamber y for higher p
rements havenment and vUV-100 silicoation Detectorve area. Duriin vacuum, th
gh the silicon mm and 36source. The 3tion point anrevent damagive and the pr
e efficiency y energy; hencovided by zed accordinieved by takinission coefficieponding wave. The detectoltage of ~28 ndwidth Tekoscilloscope (nce of 50 ohm
nverted to the
vertical d with dow to y beam ainer is sealing
w. The amples shown
ngement ment
ents
proper re, the
m gases n flux. closing e laser cept of re [22, ve was
about m, and whiles
photon
e been acuum
on PIN rs Inc., ng the he soft nitride mm,
30 mm nd the ing the ressure of the ce, the
the ng the ng into ents of elength or was V and
ktronix (DPX® m. The stored
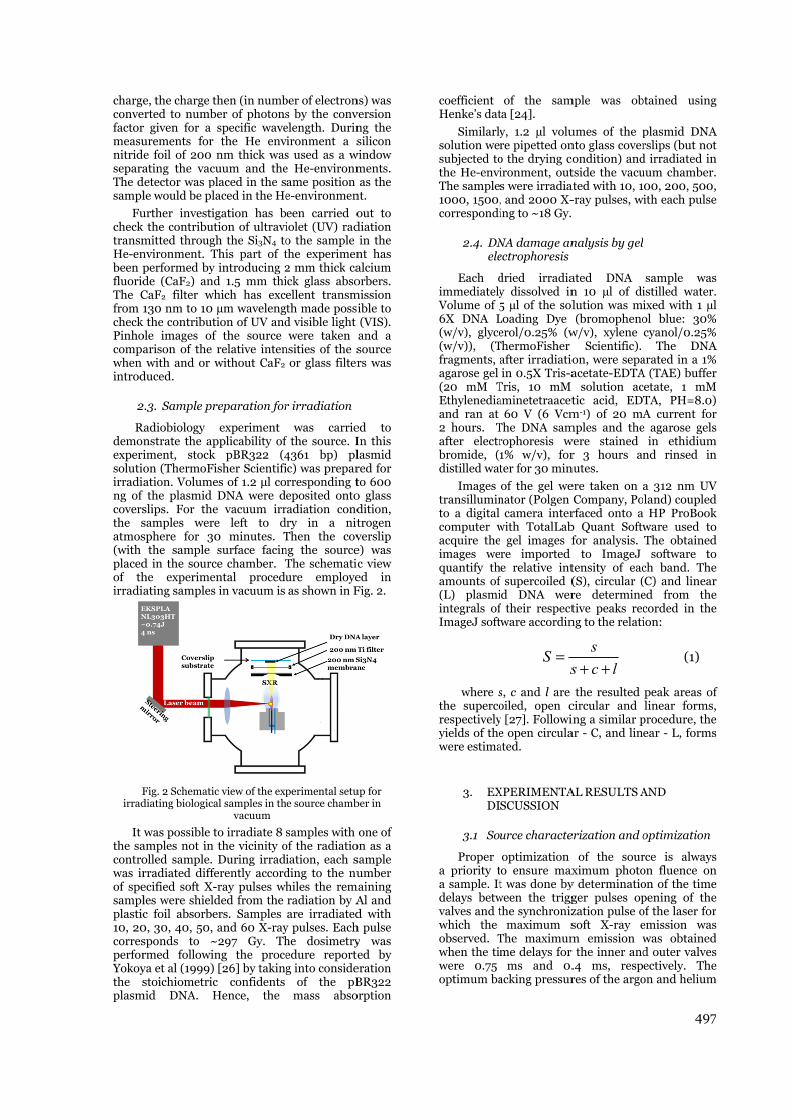
chargeconvefactormeasunitridseparaThe dsampl
FuchecktransmHe-enbeen pfluoridThe Cfrom checkPinhocompawhen introd
2
Rdemoexperisolutiirrading of coversthe satmos(with placedof thirradi
Firrad
It the sacontrowas irof spesamplplastic10, 20corresperforYokoythe splasm
e, the charge terted to numbr given for a urements for
de foil of 200 ating the vac
detector was ple would be pl
urther investik the contributmitted througnvironment. Tperformed byde (CaF2) andCaF2 filter wh130 nm to 10
k the contributole images ofarison of the with and or w
duced.
2.3. Sample pr
Radiobiology nstrate the apiment, stockon (ThermoFiation. Volumethe plasmid
slips. For thesamples weresphere for 30
the sample d in the sourche experimeating samples
Fig. 2 Schematidiating biologica
was possible tamples not in olled sample. rradiated diffeecified soft X-les were shieldc foil absorbe
0, 30, 40, 50, sponds to ~rmed followinya et al (1999) stoichiometric
mid DNA. H
then (in numbber of photons
specific wavethe He env
nm thick wascuum and theplaced in the slaced in the He
igation has btion of ultravi
gh the Si3N4 toThis part of ty introducing 2d 1.5 mm thihich has excµm waveleng
tion of UV andf the source relative intenwithout CaF2
reparation for
experiment pplicability of
k pBR322 (4isher Scientifies of 1.2 μl coDNA were d
e vacuum irre left to d0 minutes. Tsurface facin
ce chamber. Tental procedus in vacuum is
c view of the expal samples in th
vacuum
to irradiate 8 the vicinity oDuring irrad
erently accord-ray pulses whded from the ers. Samples and 60 X-ray
~297 Gy. Thng the proce [26] by takingc confidents Hence, the
ber of electrons by the convelength. Durinvironment a ss used as a we He-environmame position e-environmen
een carried oiolet (UV) rado the sample the experimen2 mm thick caick glass absoellent transmth made possid visible light were taken
nsities of the sor glass filter
r irradiation
was carrief the source. I4361 bp) plic) was preparrresponding teposited onto
radiation conddry in a nitThen the covng the sourceThe schematicure employeas shown in F
perimental setuhe source chamb
samples with of the radiatioiation, each sding to the nuhiles the remradiation by Aare irradiated
y pulses. Eachhe dosimetryedure reporteg into conside
of the pBmass abso
ns) was version ng the silicon
window ments. as the
nt.
out to diation in the
nt has alcium orbers.
mission ible to (VIS). and a source rs was
ed to In this lasmid red for to 600 o glass dition, trogen verslip e) was c view ed in Fig. 2.
up for ber in
one of on as a sample umber
maining Al and d with
h pulse y was ed by
eration BR322
orption
coefficient Henke’s dat
Similarlysolution wersubjected tothe He-enviThe sample1000, 1500,correspondi
2.4. DNele
Each dimmediatelyVolume of 56X DNA L(w/v), glyce(w/v)), (Tfragments, aagarose gel (20 mM TEthylenediaand ran at 2 hours. Tafter electrbromide, (1distilled wat
Images transilluminto a digital computer wacquire theimages wequantify thamounts of (L) plasmiintegrals ofImageJ soft
where s
the supercorespectivelyyields of thewere estima
3. EXDI
3.1 Sou
Proper a priority ta sample. Itdelays betwvalves and twhich the observed. Twhen the timwere 0.75optimum ba
of the samta [24].
y, 1.2 µl volure pipetted ono the drying coironment, outs were irradia, and 2000 X-ing to ~18 Gy.
NA damage anectrophoresis
dried irradiay dissolved in5 µl of the sol
Loading Dye erol/0.25% (w
ThermoFisher after irradiatioin 0.5X Tris-a
Tris, 10 mM aminetetraacet
60 V (6 VcmThe DNA samrophoresis w1% w/v), forter for 30 min
of the gel wenator (Polgen
camera interwith TotalLab
gel images fre imported e relative int
f supercoiled (d DNA wer
f their respectware accordin
sS =
s, c and l are oiled, open cy [27]. Followie open circulaated.
XPERIMENTASCUSSION
urce characte
optimization o ensure maxt was done by
ween the triggthe synchroniz
maximum sThe maximumme delays for
ms and 0.acking pressur
mple was ob
umes of the pnto glass covercondition) andtside the vacu
ated with 10, 1-ray pulses, w
nalysis by gel
ated DNA n 10 µl of dilution was mi(bromopheno
w/v), xylene Scientific).
on, were sepaacetate-EDTA solution actic acid, EDTm-1) of 20 mA
mples and thewere stained r 3 hours an
nutes.
ere taken on aCompany, Po
rfaced onto a b Quant Softwfor analysis.
to ImageJ tensity of eac(S), circular (re determinetive peaks rec
ng to the relati
lcs
s
++
the resulted circular and ing a similar par - C, and lin
AL RESULTS A
erization and o
of the sourximum photo
y determinatioger pulses opzation pulse osoft X-ray em emission wr the inner and.4 ms, respres of the argo
497
btained using
plasmid DNArslips (but notd irradiated inuum chamber.00, 200, 500,ith each pulse
sample wasistilled water.ixed with 1 µlol blue: 30%cyanol/0.25%
The DNAarated in a 1%A (TAE) buffercetate, 1 mMTA, PH=8.0)A current for
e agarose gelsin ethidium
nd rinsed in
a 312 nm UVland) coupledHP ProBook
ware used toThe obtained
software toch band. The(C) and lineared from thecorded in theion:
(1)
peak areas oflinear forms,
procedure, theear - L, forms
AND
optimization
rce is alwayson fluence onon of the timepening of theof the laser foremission waswas obtainedd outer valvesectively. The
on and helium
7
g
A t
n . , e
s . l
% % A % r
M ) r s
m n
V d k o d o e r e e
f , e s
s n e e r s d s e
m
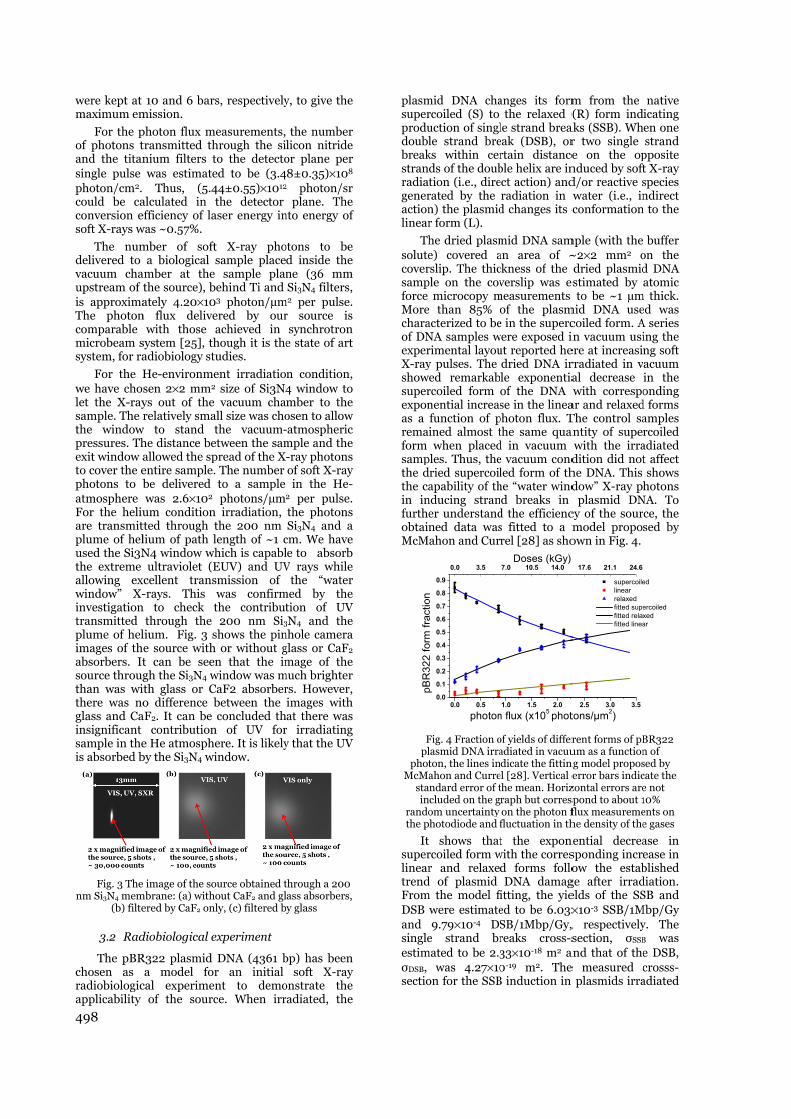
498
were kept at maximum em
For the pof photons tand the titansingle pulse photon/cm2. could be caconversion esoft X-rays w
The numdelivered to vacuum chaupstream of tis approximaThe photoncomparable microbeam ssystem, for ra
For the Hwe have cholet the X-raysample. The rthe windowpressures. Thexit window ato cover the ephotons to batmosphere For the heliuare transmitplume of helused the Si3Nthe extreme allowing exwindow” X-investigationtransmitted plume of helimages of thabsorbers. Itsource througthan was withere was noglass and Cainsignificant sample in theis absorbed b
Fig. 3 The
nm Si3N4 mem(b) filte
3.2 Rad
The pBRchosen as radiobiologicapplicability
10 and 6 barmission.
photon flux mtransmitted thnium filters twas estimate
Thus, (5.4alculated in efficiency of lawas ~0.57%.
mber of softa biological
amber at thethe source), bately 4.20×10
n flux delivewith those
system [25], thadiobiology st
He-environmesen 2×2 mm2
ys out of the relatively sma
w to stand the distance beallowed the spentire sample.be delivered was 2.6×10²
um conditiontted through tlium of path lN4 window wh
ultraviolet (Excellent trans-rays. This
n to check tthrough the
lium. Fig. 3 se source witht can be seegh the Si3N4 with glass or Co difference b
aF2. It can be contribution
e He atmosphby the Si3N4 wi
e image of the sombrane: (a) with
ered by CaF2 on
diobiological e
R322 plasmid a model for
cal experimeof the sourc
rs, respectively
measurements,hrough the sito the detectoed to be (3.444±0.55)×1012
the detector aser energy in
t X-ray phosample place
e sample planbehind Ti and 03 photon/µmered by ourachieved in hough it is thetudies.
ent irradiatio2 size of Si3N4 vacuum cha
all size was chothe vacuum-
etween the sampread of the X. The number to a sample photons/µm
n irradiation, the 200 nm length of ~1 chich is capablEUV) and UVsmission of was confirmthe contribut200 nm Si3
shows the pinh or without gn that the im
window was mCaF2 absorberbetween the concluded th
n of UV forere. It is likelyindow.
ource obtained thout CaF2 and glnly, (c) filtered b
experiment
DNA (4361 br an initial nt to democe. When irr
y, to give the
the number licon nitride or plane per 8±0.35)×108
2 photon/sr plane. The
nto energy of
otons to be d inside the ne (36 mm Si3N4 filters,
m2 per pulse. r source is synchrotron
e state of art
n condition, 4 window to mber to the osen to allow -atmospheric mple and the -ray photons of soft X-ray in the He-
2 per pulse. the photons Si3N4 and a
cm. We have le to absorb V rays while
the “water med by the
tion of UV 3N4 and the nhole camera glass or CaF2 mage of the
much brighter rs. However, images with at there was
r irradiating y that the UV
through a 200 lass absorbers, y glass
bp) has been soft X-ray
onstrate the radiated, the
plasmsuperprodudoublbreakstranradiatgeneractionlinear
Thsolutecoversampforce Morecharaof DNexperX-rayshowsuperexponas a remaiform sampthe dthe cain infurtheobtainMcM
pBR
322
form
fract
ion
Fpl
photMcMa
stain
randothe p
ItsuperlineartrendFromDSB and singleestimσDSB, sectio
mid DNA charcoiled (S) to uction of singlle strand bre
ks within cerds of the doubtion (i.e., direrated by then) the plasmidr form (L).
he dried plasme) covered arslip. The thicple on the cov
microcopy me than 85% oacterized to beNA samples wrimental layouy pulses. The ed remarkabrcoiled form nential increasfunction of pined almost twhen placed
ples. Thus, thedried supercoilapability of th
nducing straner understandned data wasahon and Cur
0.0 0.50.0
0.1
0.2
0.3
0.4
0.5
0.6
0.7
0.8
0.9
0.0 3.5
pBR
322
form
frac
tion
photon
Fig. 4 Fraction olasmid DNA irraton, the lines inahon and Currendard error of tcluded on the gom uncertainty hotodiode and f
shows thatrcoiled form wr and relaxe
d of plasmid m the model fi
were estimate9.79×10-4 DS
e strand brmated to be 2.3
was 4.27×10on for the SSB
anges its formthe relaxed (
le strand breaeak (DSB), orrtain distanceble helix are inect action) andradiation in w
d changes its c
mid DNA saman area of ~ckness of the verslip was e
measurements of the plasm
e in the supercwere exposed iut reported hedried DNA irle exponentiaof the DNA se in the linea
photon flux. Tthe same quad in vacuum e vacuum condled form of th
he “water windd breaks in
d the efficiencs fitted to a mrel [28] as sho
1.0 1.5 2.0
7.0 10.5 14.0Doses (kGy)
n flux (x105 phot
of yields of differadiated in vacuudicate the fittin
el [28]. Vertical ethe mean. Horizraph but correson the photon ffluctuation in th
t the exponwith the corresd forms folloDNA damag
itting, the yieed to be 6.03×SB/1Mbp/Gy,reaks cross-s33×10-18 m2 a0-19 m2. The
B induction in
m from the (R) form ind
aks (SSB). Whr two single e on the opnduced by softd/or reactive swater (i.e., inconformation
mple (with the ~2×2 mm2 odried plasmid
estimated by to be ~1 µm
mid DNA usecoiled form. Ain vacuum usiere at increasinrradiated in val decrease with correspo
ar and relaxedThe control saantity of super
with the irradition did nothe DNA. This dow” X-ray ph
plasmid DNcy of the sourmodel proposown in Fig. 4.
2.5 3.0 3.5
17.6 21.1 24.6
tons/µm2)
supercoile linear relaxed fitted supe fitted relax fitted linea
rent forms of pBum as a function
ng model proposerror bars indic
zontal errors arespond to about 1flux measuremehe density of the
nential decreasponding increow the estab
ge after irradelds of the SS×10-3 SSB/1M, respectivelysection, σSSB
and that of thee measured c plasmids irra
native icating en one strand
pposite t X-ray species ndirect
n to the
buffer on the d DNA atomic
m thick. ed was A series ing the ng soft acuum in the onding
d forms amples rcoiled adiated t affect shows
hotons NA. To
ce, the sed by
ed
ercoiledxedar
BR322 n of sed by cate the e not 10% ents on e gases
ase in ease in blished diation. SB and
Mbp/Gy y. The B was e DSB, crosss-adiated

499
was slightly lower than the cross-sections measured with monochromatized synchrotron radiation [29].
This may be explained by the difference in irradiation conditions, such as DNA concentration and the specific energies of photons delivered to the samples. From the cross-sections, it is expected that the photons are predominately absorbed by the K-shell electrons of the carbon, nitrogen and oxygen atoms in the DNA. Similarly, taking the ratio of the SSB to DSB gives an approximate value of 7 which is less than that observed by Yokoya et al (1999) [26]. Probably, in part, due to the plasmid DNA concentration but comparable with that observed by Eschenbrenner et al. [26], which varied between 4.4 and 6.4 when pBs and pSP plasmids were irradiated to 388, 435 and 573 eV soft X-rays from synchrotron source. The results show that the source, though in its initial stage of development, could be useful for prospective radiobiology experiments and could be added to the few laser plasma X-ray sources dedicated for radiobiology experiments. Similarly, the fraction of the different forms of the pBR322 plasmid DNA in TAE solution irradiated in He-environment is shown in Fig. 5.
0.0 0.5 1.0 1.5 2.0 2.5 3.0 3.5 4.0 4.5 5.0 5.5
0.00.10.20.30.40.50.60.70.80.91.0
0.0 3.5 6.9 10.4 13.8 17.3 20.8 24.2 27.7 31.2 34.6 38.1
supercoiled linear relaxed
Doses (kGy)
pBR
322
frac
tion
form
Photon flux (x105 photons/µm2
Fig. 5 Fraction of yields of different forms of pBR22
plasmid DNA irradiated in He-environment as a function of photon flux. The dashes lines are to guide an eye. Vertical error bars indicate the standard error of the mean. Horizontal errors are not included on the graph but correspond to about 10% random uncertainty on the photon flux measurements on the photodiode and fluctuation in the density of the gases.
The results show that there was growing amount of SSB DNA with a corresponding decrease in in the supercoiled form with the increasing dose of SXR radiation. Within experimental error, the fraction of the linear forms only increased at relatively few fluences of the soft X-rays (up to about 1.5×10⁵
photons/µm2) and then seems not to be monotonous in the helium condition irradiation at relatively pulses (i.e. higher photon fluence). The rapid increase in the linear form at relatively low photon fluence may be due to indirect damage from water radicals when the sample was much hydrated. At relatively longer exposure time, to achieve higher number of photons, the fraction of the linear form did not change much. Thus, the samples get dehydrated and may be the cause of the insignificant growth in the formation of the linear. It is therefore suspected that there might be the presence of free radicals formed by the irradiated plasmid in solution by the “water window” soft X-ray. This point can be further investigated by introducing radical scavengers to ascertain the presence of the
free radicals created to induce further damage to the plasmid DNA. It will be a thing of concern in our forth coming articles.
The induction ratio of SSB to DSB in the helium irradiation condition was ~5, a value slightly lower than was measured when the samples were irradiated in vacuum. This may be explained as a result of the low penetration of this type of radiation through the relatively thick hydrated sample solution. This means that a very thin solution or a fraction of the solution (and hence the DNA) absorbed the radiation. Double strand breaks are considered the most critical DNA lesions induced by ionizing radiation. The dependence of the amount of linear and relaxed forms of the plasmid DNA on amount of photons is shown for the soft X-rays. Thus, the compact laser plasma water window X-ray source induce exclusively radiation damage which provide an evidence for the ability of the water window X-ray radiation to induce both SSB and DSB. The demonstration of the source to induce DSBs and SSBs in irradiated plasmid DNA shows the potential of the source for radiobiological experiments. Quantitative analysis of the radiation damage and its systematic investigation in DNA, biomembranes and other organelles, and living cells represent a subject of forthcoming articles.
4. CONCLUSION
A compact desktop laser plasma soft X-ray source based on a double-stream gas puff target operating in the” water window” spectral region has been presented. The source delivers approximately 6.83×10¹³ photons/4π in the wavelength range of about 2.5-4 nm. The low penetration depth of this radiation in biological samples and pulsed character of the source lead to high local dose loads and dose rates, respectively. The design of the source allows samples to be irradiated both in vacuum and in He-environment. Doses in a single pulse of soft X-rays of about 300 Gy for irradiation in vacuum and about 20 Gy for the He-environment irradiation were measured. Initial irradiation experiments carried out with plasmid DNA demonstrate that the source can be used in systematic studies of soft X-ray radiation damage to biomacromolecular samples and other biological specimen.
Acknowledgement: The authors acknowledge the financial support from the EU FP7 Erasmus Mundus Joint Doctorate Programme EXTATIC under framework partnership agreement FPA-2012-0033 and the support from Ghana Atomic Energy Commission. Appreciated is also the support from the 7th Framework Programme’s Laserlab Europe project (No. 284464). PW greatly acknowledges the support by the National Centre for Science (Grant no. DEC-2011/03/D/ST2/00296) and the National Centre for Research and Development, LIDER programme (Grant no. LIDER/004/410/L-4/12/NCBR/2013). We also acknowledge Dr. B. Jankiewicz, Dr. P. Nyga and Mrs M. Gajda-Raczka for allowing us to use their chemistry laboratory for biological sample preparations.

500
REFERENCES
1. D.T. Goodhead and J. Thacker, “Inactivation and mutation of cultured mammalian cells by aluminium characteristic ultrasoft X-rays. I. Properties of aluminium X-rays and preliminary experiments with Chinese hamster cells”. Int. J. Radiat. Biol. Vol. 31, pp.541–559, 1977.
2. D.T. Goodhead, J. Thacker, and R. Cox, “Effectiveness of 0.3 keV carbon ultrasoft X-rays for inactivation and mutation of cultured mammalian cells”. Int. J. Radiat. Biol. vol. 36, pp. 101–114, 1979.
3. D.J. Brenner, R. P. Bird, M. Zaider, P. Goldhagen, P. J. Kliauga, and H. H. Rossi, “Inactivation of synchronized mammalian cells with low-energy X-rays—Results and significance”. Radiat. Res. vol. 110, pp. 413–427, 1987.
4. K.M. Prise, M. Folkard, S. Davies, and B. D. Michael, “Measurements of DNA damage and cell killing in Chinese hamster V79–4 cells irradiated with aluminum characteristic ultrasoft X- rays”. Radiat. Res. vol. 117, pp. 489–499, 1989.
5. D. T. Goodhead, “Soft X-ray radiobiology and synchrotron radiation”, in Synchrotron Radiation in the Biosciences, Eds. Chance, B. et al., Clarendon Press, Oxford, 1994, pp. 683-705.
6. D. Frankenberg, H. Kuehn, M. Frankenberg-Schwager, W. Lenhard, and S. Beckonert, ”0.3 keV carbon K ultrasoft X-rays are four times more effective than γ-rays when inducing oncogenic cell transformation at low doses”. Int. J. Radiat. Biol. vol. 68, pp. 593–601, 1995.
7. C.S. Griffin,D. L. Stevens, and J. R K. Savage, “Ultrasoft 1.5 keV aluminum K X rays are efficient producers of complex chromosome exchange aberrations as revealed by fluorescence in situ hybridization”. Radiat. Res. vol. 146, pp. 144–150, 1996.
8. B.E. Nelms, T. R. Mackie, J. F. MacKay, C. L. Hill, P. M. De Luca Jr., M. J. Lindstrom, J. Deasy, and M. N. Gould, “A comparison of cytotoxicity after whole- or partial-cell irradiation with synchrotron-produced ultrasoft X rays”. Radiat. Res. vol. 150, pp.521–527, 1998.
9. M.A. Herve du Penhoat, B. Fayard, F. Abel, A. Touati, F. Gobert, L. Despiney-Bailly, M. Ricoul, L. Sabatier, and A. Chetioui, “Lethal effect of carbon K-shell photoionizations in Chinese hamster V79 cell nuclei: Experimental method and theoretical analysis”. Radiat. Res. vol. 151, pp. 649–658, 1999.
10. M.N. Gould, B. E. Nelms, C. K. Hill, J. F. Mackay, M. J. Lindstrom, T. R. Mackie, and P. M. Deluca Jr. “Radiobiological studies using synchrotron-produced ultrasoft X-rays”. J. Radiat. Res. (Tokyo), vol. 40:Suppl. Pp. 66–73, 1999.
11. C.M. de Lara, M. A. Hill, T. J. Jenner, D. Papworth, and P. O'Neill, “Dependence of the yield of DNA double-strand breaks in Chinese hamster V79–4 cells on the photon energy of ultrasoft X rays”. Radiat. Res. vol. 155, pp. 440–448, 2001.
12. G. Schettino, M. Folkard, K. M. Prise, B. Vojnovic, K. D. Held, and B. D. Michael, “Low-dose studies of bystander cell killing with targeted soft X rays”. Radiat. Res. vol. 160, pp. 505–511, 2003.
13. R.B Hawkins, “Mammalian Cell Killing by Ultrasoft X Rays and High-Energy Radiation: An Extension of the MK Model”. Radiat. Res. vol. 166, pp. 431–442, 2006.
14. L. Chen, S. P. Jiang, L. B. Wan, X. D. Ma and M. F. Li, “Radiobiological investigations of soft X-rays near carbon, nitrogen, oxygen K-shell edges on Aspergillus oryzae spores”, Radiat. Prot. Dos., vol. 128(1), pp. 68–71, 2008.
15. C. Oven, P. M. Krawczyk, J. Stap, A. M. Melo, M.H.O. Piazzetta, A. L. Gobbi, H. A. Veen, J. Verhoeven, J. A.
Aten, “An ultrasoft X-ray multi-microbeam irradiation system for studies of DNA damage responses by fixed- and live-cell fluorescence microscopy”. Eur. Biophys.J.vol. 38, pp. 721-728, 2009.
16. T. Friedrich, M. Durante, and M. Scholz, “Modeling cell survival after irradiation with ultrasoft X rays using the giant loop binary lesion model”. Rad. Res. vol. 181, pp. 485-494, 2014.
17. E. Alizadeh, A. G. Sanz, G. S. Madugundu, G. García, J. R. Wagner and L. Sanche, “Thymidine decomposition induced by low-energy electrons and soft X rays under N2 and O2 atmospheres”, Rad. Res., vol. 181, pp. 629–640, 2014.
18. I. C. E. Turcu, G. J. Tallents, I. N. Ross, A. G. Michette, M. S. Schultz, R. A. Meldrum, C. W. Wharton, D. Batani, M. Martinetti and A. Mauri, “Optimisation of an excimer laser-plasma soft X-ray source for applications in biophysics and medical physics”, Phys. Med., vol. 10(3), pp. 93-99, 1994.
19. D. Batani, A. Conti, A. Masini, M. Milani, M. Costato, A. Pozzi, E. Turcu, R. Allot, N. Lisi, F. Musumeci and A. Triglia, “Biosystem response to soft-X-rays irradiation: non-monotonic effects in the relevant biological parameters of yeast cells”, Il Nuovo Cim. D, vol. 18(5), pp. 657–662, 1996.
20. M. Nishikino, K. Sato, N. Hasegawa, M. Ishino, S. Ohshima, Y. Okano, T. Kawachi, H. Numasaki, T. Teshima and H. Nishimura, “Note: Application of laser produced plasma K alpha x-ray probe in radiation biology”. The Rev. Sci. Instrum., vol. 81(2), 026107, 2010.
21. H. Fiedorowicz, A. Bartnik, R. Jarocki, R. Rakowski, M. Szczurek, “Enhanced X-ray emission in the 1-keV range from a laser-irradiated gas puff target produced using the double-nozzle setup”, Appl. Phys. B, vol. 70, pp. 305-308, 2000
22. P. W. Wachulak, A. Bartnik, H. Fiedorowicz, P. Rudawski, R. Jarocki, J. Kostecki and M. Szczurek, "Water window" compact, table-top laser plasma soft X-ray sources based on a gas puff target”, Nucl. Instr. & Meth. Phys. Res. B, vol. 268, pp. 1692-1700, 2010.
23. M. Davídková, L. Juha, M. Bittner, S. Koptyaev, V. Hájková, J. Krása, M. Pfeifer, V. Štísová, A. Bartnik, H. Fiedorowicz, J. Mikolajczyk, L. Ryc, L. Pína, M. Horváth, D. Babánková, J. Cihelka and S. Civiš, “A high-power laser-driven source of sub-nanosecond soft X-ray pulses for single-shot radiobiology experiments,” Rad. Res., vol. 168, pp. 382-387, 2007.
24. http://henke.lbl.gov/optical_constants/ 25. D. Adjei, M.G. Ayele, P. Wachulak, A. Bartnik,
L.Vyšín, H. Fiedorowicz, L. Juha, Ł. Wegrzynski, A. Wiechec, J. Lekki, W.M. Kwiatek, “Development of compact laser-produced plasma soft x-ray source for radiobiology experiments”, Nucl. Instr. & Meth. Phys. Res. (submitted)
26. A. Yokoya, R. Watanabe, and T. Hara, “Single- and double-strand breaks in solid pBR322 DNA induced by ultrasoft X-rays at photon energies of 388, 435 and 573 eV”. Rad. Res., vol. 40(2), pp. 145–158, 1999
27. K. Hempel and E. Mildenberger , “Determination of G-values for single and double strand break induction in plasmid DNA using agarose gel electrophoresis and curve-fitting procedure”, Int. J. Radiat. Biol., vol. 52(1), pp. 125-138, 1987
28. S. J. McMahon and F. J. Currel, “A robust curve-fitting procedure for the analysis of plasmid DNA strand breaks data from gel electrophoresis”, Radiat. Res. vol. 175, pp. 797-805, 2011.
29. A. Eschenbrenner, M. A. Herve Du Penhoat, A. Boissiere, G. Eot-Houllier, F. Abel, M.-F. Politis, A. Touati, E. Sage, and A. Chetioui, “Strand breaks induced in plasmid DNA by ultrasoft X-rays: influence of hydration and packing”, Int. J. Radiat. Biol., vol. 83(10), pp. 687–697, 2007.
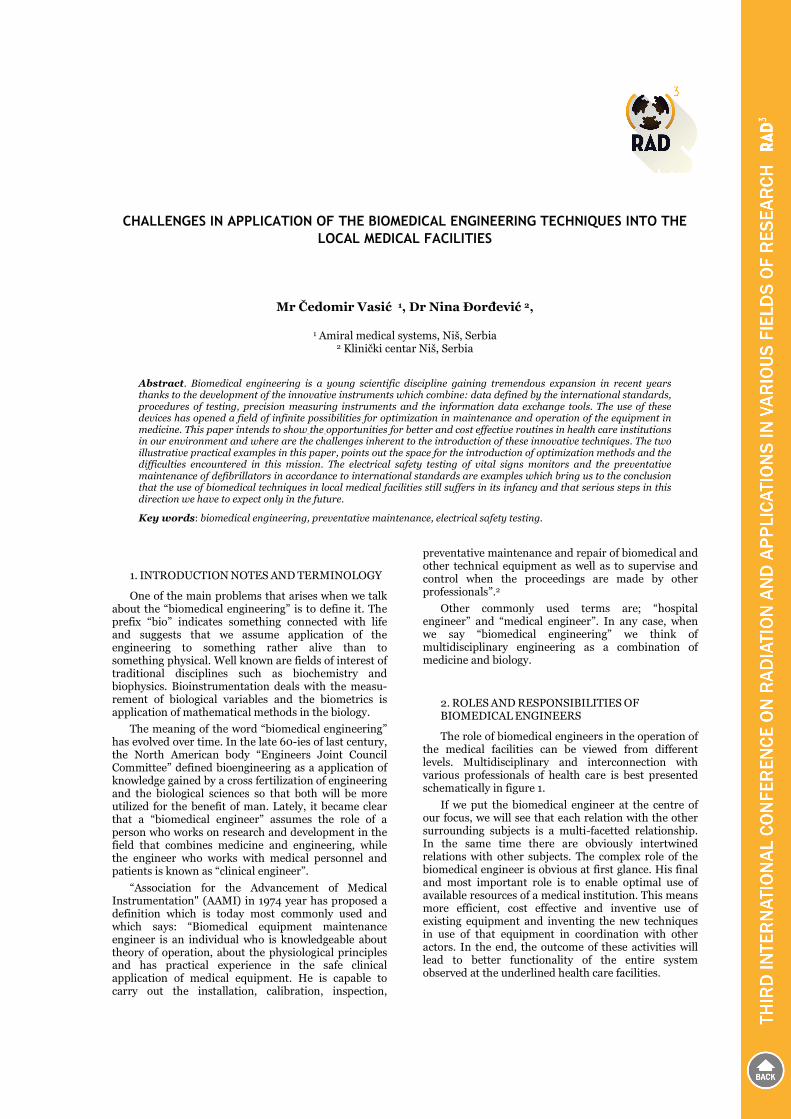
�
������������������ ����� ����������������������� ���������� � �������������������� ��
����������� ������������������������
����������������������������������� �� �!"���� ���������������
��������#� $�������� ��%�������%� ��� �� &�%� �������'��� ����(����� %�����%� ������ &�� �)(������ ��� ������� ������*��������*�� ����(�����'��*�����������������&������+*��*�������,� ���� �'��� ����*������������������� �� ���(��� &����'� ������%�� (������������&���%� �����&�������� � �*�� ��'������� �����)�*��%�� �����-*�� &���'� �*���� �������*���(��� ���'��� �'���'������(������������'��(����.���������������������� �(�������'��*���/&�(���������� �������-*���(�(�������� �����*+��*��((��&�������'����������� ������''��������&���������*����*������������&��������&��������������� �+*���������*���*�����%�����*���������*������ &�����'��*�����������������*��/&����-*���+����&���������(����������)��(��������*���(�(����(�����&���*���(����'���*������ &�����'�(����.��������* ���� ��*�� �''��&������ ���&����� � ��� �*����������� -*�� ����������� ��'��� ������%� '� ������ ��%���������� �� � �*�� (������������������������'� �'������������������ ������������������������ �� �������)��(����+*��*�����%�&�����*������&�����*����*��&���'����� ��������*��/&������������� �����'�����������������&''�������������'������ ��*�������&�����(������*��� ��������+��*�������)(�����������*��'&�&����
������������� � �����%�������%��(��������������������� ������ ��� �����'���������%��
�#�0��12�34�02���2�5�������51�0�26278�
2��������������������������������������������"�����������9����������������������:� ��������������#������������ 9���:� ��������� ��������� ���������� ����� ��������� ������ ����� ��� ����� ������������ ��� ���������������� ��� ��������� ������� ��� �� ����� �������������������#�;����"����������������������������������������� ���������� ���� �� ������������ ������������#� ��������������������������� ��������<������� ��� ����������� �������� ���� ���� ���������� ���������������������������������������������������#�
������������������������9����������������������:����� �� ���� �������#�0�����������=><����������������������� ������ ��������� ����� 95�������� ?����� 4�������4��������:�������������������������������������������"��������������������������������!������������������������� ���� ����������� ������� �� ����� ���������� �������������!��� ���� ���� ��������������#�6������� ��������������������� �� 9����������� ��������:� ����� ���� ����� ��� ���������������"������������������ ���������������������� ����� ����������������� ���� ������������� ���������� ��������� ���� ���"� ������������� ��������� ��������������"�������9�����������������:#�
9���������� ���� ���� �� ��������� ��� ��������0�������������@�A���0B� ����CDE������������������������������ ������ �� ������ ���� ��������� ���� ���������� ��� 9 ���������� �"�������� ��������������������� ����� ���� ���������� �� "���������������������������������������������� ������������������������������� ��� ���������� ����������� ��� ���� ���� ��������������������� ��� �������� �"�������#� F�� �� �������� ��������� ���� ���� ������������� ������������� �����������
��� ������ ������������������������������������������������� �����������"����������������� ������� ��������������� ����� ���� ����������� ���� ����� ��� ����������������:##�
2����� ��������� ���� ����� ���G� 9����������������:� ���� 9�������� ��������:#� 0�� ���� ������������� ��� 9����������� �����������:� ��� ����"� �������������������� ������������ �� �� ������������ �����������������������#�
##�1265������15�H2��0 060�05��2I� 02�5�04�6�5�70�551��
�������������������������������������������������������� �������� ���������� ���� ��� ������ ����� ������������ ��#� ����������������� ���� ���������������� ����� ������ ����������� ��� ������� ����� �� ���� ���������������������������������#�
0��������� ���� ����������������������� ���� ���������������������������������������������������������������������������� ��J���� �� �������<��������� �����������#�0�� ���� ���� ����� ������ ���� �� ������ �������������������������������� ��J���#����� �������� �������� ���������������������������� ������������������#�F���������������� ���������� ����� �� ��� ������� �������� ��� ���� ���������������������������������������#��������������� ����������� ���� ������� �� ���� �� ���� �� ��� ����������� �"�������� ���� �� ������� �������� ������"������ ��� ��� ����� �"�������� ��� ������������� ����� �����������#� 0�� ��������� ��������������� ��������� ��������������� ��� ������� �������������� ��� ���� ������� ��������� ������������������������������������������#�
�

�
�
I��#���1����������������������������
���� ���� ���������� ���������� �������������� ��������������������������������������
<� 4������� �� ������������ �� �� ���<��������������������� ��� ���������� ������ ��<��������������� ����� ��� ���������� ��� ������ �"��������� ������� �� ���� ��� ��"�����#� ���������� ������ ������������� �������� ����� ����� �� ���� ����<� �������������"�������������������� ������������������������������ ��� ����� ��� �������!��� ������� ��� ����<��������#�
�
I��#�#�1������������������������������������
<�H�� ������ �������������� ����������� ��������������������� ��� �"�������� ��� ������ ����� ����� ��������������� ���� ���������� �������� ��� �� ����#� 7������������� ���������� ��� ����������� ��� ����� ����� ����������������K� ������������#� H�� ������ �� �������<����������������������������J�������������������������"�������� ����� ����������#� ��������� ���� ������������ ��� ��������������� ��������������� ��������� ���������������������������������� ������������#�
<� 4��������� ���������� ���� ����������� ������<����� �� ���<� ������ ���� �� ������ ������������� ��� ����
����������� ��������#� ������ ��� ����� ��� �"����������������� ��� ��� �� ���������� ������������ ���<�� �����������������������������������������#�
<�5������������������������������������������������������������������������������#�H�������� �������������������������<�����������������"�������� �������������������������������������"������������������������������� ��� ����������� ���"� ��!���� ��� �������������������������������������������������#�
L#�0��51���02��6�������1���1�6��5���2� 02�5�04�6�5�70�5510�7�
;���� ���� ���� ���������� ���� ��"������������� ���������������������������������������������������� ���� �������������� �������� ������������������ ��������������� ������������ ���������#� ����� �� ������� �������������� ������ ����������� �� ���#� H������ ��� �����������������"�������������������������������������������� ���"#� �;���� ���� ���� ��� ��� ���� ����� ��������������������� ����� ���� �������� ��� ��"� ��� ��������������"���������������������������� ������������������������������������������#�I������������������������������� ����� ���� ��� ������� ����� ���� ��J���� ���� ����� �������������������������������������������������������������������"��������������������������������"�
054�=>=>�<���������E������������������CDD�������� ���� ��� ��� ��������� ��� � ������ ������������� ���������������"�������������������#�0���������������������������� ���� ��������� ���� ��"������ �������� ��� ���� ������J�������������������������"�������#������������������������ �������� ����������������������������������������#� F��� ���� ���� �������� ��� ���� ��J����������"�� ������ ����� ����� ��� �� ��������� ���������������#� ��������� ���� �������� ��������� ��������� �������� ����� ���� ���� ��� ���� �����������������������������������������������"������������������� ���� ����� ��� ���� ����������� ����#� ���� ������������������������ ������������ �������������� �� ����������������� ���� ����������� ��� ������ �� ���� ������ ����������� ����������� ���� ������!��� ������ ������ �����#������ ���� ���������� ���� ��������� ������ ��������� ������� 9��� ���� �����:� ������ ���� ������ �� ����������������������������������� ��������������� ��������"� �������������� � ������������ �������������������9��������������:#�������������� "��������������� ��������������������������� ��������������"������������M�9��������������:�����������������������������#�
054� =#LNL� �������N���� ��������� ��� ���� #>>D<���������������������I�����������#>>O�����������������0��������������#>>C�����#������������������������������������������������ ��������������������� ���������������� ���� ���������� ���� ������ ����������#������������� ��� ���� �������� �� �������������� ���� ������ �� ��������� ���� ���� 054� =>=>�<�� ��������� ���������� �������� ��������� ���� ������ �������� ����� �����������������#���������������������������������������������������������������#������������������������������� ���������� �������� ������������ ��� ���� ������ ����� �������� ������ ����� ��������� ��� ������� ��� ���������������� ������� ���������� ������ ��� ����"����� �������"���� �������#� 6��"���� �������� ���� �������� �������� ���"���� ����� ���� ����� ����� ��� ������ ������������ ���� �������� ����������#� �������� ��������"����������������������������������������������������
502
����� �#� 6��"���� �������� ������������ ����� ���������������������������������������������������������#�
0�����������������������������������������������������������5��������3���������������������� ����������������������������������������������������������������� ���� ���� 3���� 7�������� ?����� ���� �� ��#� �����������J�����������������$�5�>DN��A���������B�����P��Q�LNN��A���������B��F50CN�P������ �CO>�P#>>=�A��������������B��0H5��A��������������B���IH�CC����������#�
E#��$�06� 65��54F�0R35��0��5R30H�5����5��0�7�����$0��6��07���2�0�21�5S��H65�
����������"���� ��������������������������������������� �������� ��� ���� ��������� ���� ������������������������������� �������������������#������������������ ��� ���� �� ��� ��� � �������� ����� ������������������#� 6��� �� "���� ���� ���������� ��� ������������� �� �������� ��� ���� ����������� ������ ���������������������������"��������������������#�
0������� �� ���������������<�������������� ��"��������������� �� � �������� ��� ���� ����������� ���������� �������"���� ���������������������������� �������������� ������� ���"������ ������� �� ��"������ ��� =#LNLP=>=>������ �������� �� �� ��� �������� �������� 054�������� �������������������������������������������"������������������ ��� ����������� ��� ���� �������� ��� ����� ������������#��������������������������� ���"������������������� ��������� �� �� ��� ��� �������� ���� ��� ���� �������#�
���� ����� ���� ����������� ��� ���� ���"���� ���������������������������������������������������������������������� ��� ���� ��� 9������:� ����#� ��� ��� ���� ���9�������:� ����� ��� ���� ��� ������� ���� ���"������������ ����� 9�������:� ��� ������ ������������ �����������������������������������9�� �:�����������������"���#�
I��#�L������������������������"���������������������
���� ������ ���� �� �������� ��� ���"���� ����������������������������������������������������������������������L#�H���������������������������������������������������������������������������������������������������� ����#�2�������������L���������������������������������������� ���������������������������� ����4���00� A�������B������������������ ����� I� A����������������� ����������� ������� ��������� ���"�� ���� �������� ����������� �������� �����������B� �� J��� ���� ����� �������"�������������������#�
����������������� ������������� ��� ���� ���������� ��������������� ������ ��� �� �������� ��������� ������ ��"�����������������������������������������#�0������������������� ����� ��� ���� �"�������� ������� �� ���� �� �����������������������������������������������#�
������� ���������������������������������� ��� ������������� �� ���������� ��� ���� �������!��� ������������������� ���� ���� ���� ��������� ������#� ���� ���������
�������� ��� ����� ���������������� �����������!����� ���������� ����� ���� ���� ����� ��"������ ��� ������������������ �������#� ����������� ����� ��������������������� ��������� ���� ��� ������� ������ ��������������� ��� ��#� F�� ���� ��� ���������� ���� ���� ��� �����"�������� ������ �� ������ ������ ����� ���� ������ ������������� A4��� 0�� 4��� 00�� ###B=����� �������� ����"� ����������������������������������������A �� I��4I��###B=#���������������������������������������������������������� �����!��� ��������������� ���� ���� �����������#� 0������������������������������� �������������������������������� ���� �������� ����� ��� ���� ���������#� �����������������������������������������"��������������������� ��� ����������������� ������������������ ����������#� 0�� �� ������ ��� ���� ���!���� ��������������������� ��� ����� �����#� ���� ��������������������� �������� ���� ���� ���� ��� ������ ��������� ������������������������������������������9I��"�:�������������� ����� ��� ���� ���"��� �� ����� ��� ������������������� ���� ���� ��� ���� ������� ���� ���� ���� ��� ����������� ��������� �������� ��� ���� ����� ���� �� ����5��������������91������������:#�
I��#�E�1�����1#OO������������!���
2�� ������� E� �� ���� 91����� #OO:� ������ �����!��� ��������� ������������������� ���������������������������������� ������ ����������#� 0�� ��������� ��� 91�����#OO:� ������ �����!��� ��� �������"��� �� ���� ���� 91�����3�0��:�� ����� ���� ��������#� H�� ������ �������������� ��� ����� ���� �������� ����� ����� ����9�������� �������:� ���������� ������������ ������������������������������������ ������������#�
N#�H2�5��0�6� 5�5I0�������4F�665�75��M��542���5S��H65�
���� ����� ����������� ��� ���� ���"� ��� �������������������� ��� ���� �������� �� ��������� ��������"������ ��� ���� � ������ ��������� ���� ����������������� ��� ���� ������#� ���� ���������� ������ ������������������������������������������������������������� ��� ���� "���� ��� ����� ���� ��� ���� ��������"��� ��������� ���������������������������������#� 0��������������� ����������"���� ������ ���� ��������������� ��������� ����� ��� ���� �� �������� ����������� �������������� ���� J��� ���� ��� ���� ���� ������ �������������� ��� ���������� ��� �������� ����������#� ������������ ������� ��� ����� ������!��� ���� ���������������������� ��� ���� ����������� ������������ ��� ����������������� ���������������������������� ����������#����� ������� ��� �� ��������"��� ���� ������������ ��� �������������"����������������������"��������������������
503

�
���� �����������"��� ������������������ �������������������� �� �������� ����������� ��������� ���������������� ��������� ���� ���� � ������� �������#� ���� ������<����� ������� ���������� ��� �� ����� ���� ����������������� �� ������� ��� ���� ����� ������!��� ���������������������������������#�
0�� ���� ������!������ ��� �������� �� ���� �� ������������ ��������������������������� �������������������"����������������������������������9��������������:������������ �������������� ����� ���������������������������� ������������������������������#�
;�����������"������ ������������������������������������� ���� ����������� ��� ������� ��������� ��������������������������������������������T�6������������������������� ���������� ��� ���� ������������� �������� ��� ������������ ������� ������������� N><�>>� ���� ������ �������������� ��������� ���������� ���� ���������#� ����"������������������������ ����������#><L>����������������������������� ��� �������������� ��������� ���� ��� �������������� ������ ���� ��� ���� ���������� ���� ��� ����������� ������ �������� ���� ���� ��� ���������������������� ����������� ������������ �������� ���� ���� ����������������� ���� �� ���#� 5���� �������������� ��"�������� ������ ��������������������������������������������������� �������� M� ��������� ������� ��� ���� ��������������������������������������� ����������������� ����������� ���� �����������#� H�� ������ �������������� ����������� ���������������������������������������������� ����=������#�
I��#�N������������������������
���� �������������� ������ ��� ���� ��� ������ �������������� ���� ����� ������� ���� ��������� ��������������� ���� ����� ������ ���� ���#� ;���� ������� ����������������������T�$������ ��������� ��������� �������������������� ���� ���� �� ���� �������� ���� �� ���� �����������#�;��������� ��� ���������������� ���� �� ����� ������������������������ ��� ���� #><L>� �������������� ��������������T�;����������������������������������� ��������������� ��� ���� ��������� �������� ����� ���� ��������������������T� 0�� ���� ������ �� ��������� ������������������������������#� ������������ ���������������������������� �������� ������ ��� ���� ������� ������������������ �������� �������� ����� ���� �������� ���������"�������������������������� ������������� ����������������������������������������������������������������������������#�
����� �� ���� ���� ��� ������ �� ������������ ����������������� ������� �� ���� ��� ���� ���� ������������"��������������������������������������������#������� ���������� ������ ������� ������ ������������������������<�������� �������� ������ ������� ���������� �������������������������#�
���� ����������� ��������� �� ���� �������� ����� ������ ���� ���� ���� ������������ ��� ������� ������������
�"�������� ��"�� �������� ��������� ��������� �������������#� 1������ ������������������� ���� "���� ����"�������� �� ���������� ��� ���� ������ ��������� ��������� ������������!��������� ������ �������� ���� �����������������������������#�F��� ������������������������J���� ��� �������� ��� ���� ����������� ��� ����������������������#� ���������������������������������������������� ���������������������<�����������������������������������J������������������������������������#�
=#�42�463�02��
������������ ��� ���� ����������� ������������������"������������������������������������������������������������ ��������� ��� ����������������#�2�������������������� �� ������� ��� ������� ����� ���� ���������������� ���� ��� ������� ����������� �� ����� ��� ���������#� 0�� ���� ���������� ��� �� �� ��� ����� ����������"������������������������ ���������������#�
15I515�45��
1. ?#� 5�������� ?#� ���!����� @0������������ ��� ����������������������:�5�� ����0���2������2SN��7 ��3 ��#>�##�
2. �H42�������������5"�������������������95����������������������5��:�� ������ I����� ��� ND�>D��3����#>�#�����#���������#����
3. 1#����J��� �&�� 0#� 6��"� �&�� 9 ���������� 5����������� M�H����H�������I�����:����������"��N#A�B����#�N<����#>��#�
4. 0������������� 5��������������� 4��������� 7��������������� 054� =>=>�<�#��������� ����������� �"�������<H��������CDD�
5. 0������������� 5��������������� 4��������� 054� =#LNL�9��������������������"��������M�1�������� �������� ����������������������������������������"�������:�#>>D�
6. 10756� ��������� 91����� #OO� ���� 4���� H��������:�� ���"��� F����� 4������ �������� �1O� #�;�� 3 �� #>�E�����#������������#����
�
504
THE HORIZONTAL FUEL CHANNELS IN THE CANDU 6 NUCLEAR REACTOR
Gabi Rosca Fartat 1, Constantin Popescu 2, Constantin D. Stanescu 3
1 Polytechnic University, [email protected] 2,3 Polytechnic University, [email protected], [email protected]
Abstract. The scope of this study is to identify the fuel channel components and the reference plans based on which the installation into calandria is made in order to achieve a possible method for decommissioning of the horizontal fuel channels of calandria vessel and to present a possible device designing solution for the decommissioning of the horizontal fuel channels in the CANDU 6 nuclear reactor. The CANDU 6 is a 740 MW pressure tube reactor designed by Atomic Energy of Canada Limited (AECL) to provide safe and reliable nuclear power. It is an evolution of the previous CANDU reactor, and it is designed to be licensable internationally by ensuring its compliance with the latest Canadian nuclear regulations and the fundamental safety principles of the International Atomic Energy Agency (IAEA) Safety Standards. The fuel channel assembly is made according to the specific requirements of reference plans’ definition, reference plans’ measurements, tools and equipments, installation procedures and the quality assurance program. Defining reference plans, measurements reported to reference plans and installation procedures to a new fuel channel in the calandria CANDU nuclear reactor comply with the requirements described in the AECL (Atomic Energy of Canada Limited) specified documents. The decommissioning of fuel channels represents one of the last operations which are performed in the nuclear power decommissioning and it is the most important operation in the nuclear reactor dismantling. The design of the device and platform support is achieved according to the particular features of the fuel channel components to be dismantled in the program of nuclear reactor decommissioning according to all the safety aspects and environmental protection during the activities, resulting from the decommissioning plan developed.
Key words: Candu reactor, Zirconium alloy, plans reference, calandria tube, fuel channel, pressure tube, end fitting, annulus spacer, decommissioning, dismantling, radiation protection
1. INTRODUCTION
Nuclear reactors are designed and manufactured with respect to the specific requirements of codes and standards for the manufacture of components, equipment and systems required for the construction and operation of CANDU nuclear power plant.
The reactor assembly of the CANDU 6 nuclear reactor consists of the horizontal, cylindrical, low-pressure calandria and the end-shield assembly. This enclosed assembly contains the heavy water moderator, the 380 fuel channels assemblies and the reactivity mechanisms.
The 380 fuel channels of CANDU 6, with pressure tubes made of zirconium-niobium alloy, located inside the calandria tubes and chuck on end fitting, are connected by the pipes network to the supply feeders.
Defining reference plans, measurements reported to reference plans and installed operations to a new fuel channel in the calandria CANDU nuclear reactor comply with the requirements described in the AECL (Atomic Energy of Canada Limited) specified documents.
Fuel channels are one of the major distinguishing features of a CANDU reactor and their reliability is crucial for the performance of the reactor. Each fuel
channel consists of four major components: the pressure tube, the calandria tube, the annulus spacers and the end fittings. Fuel bundles are enclosed in the fuel channels that pass through the calandria and the end-shield assembly.
The dismantling operation stages of the fuel channel components should be repeated for each of all 380 channels of the reactor, starting from the front of calandria side and continuing with the rear side.
The decommissioning device assembly of the fuel channel components is composed of the device itself and moving platform support for coupling of the selected channel to be dismantled. The fuel channel decommissioning device is an autonomous device designed for dismantling and extraction of the channel closure plug and shield plug, extraction of the end fitting, cutting and extraction of the pressure tube.
2. FUEL CHANNEL COMPONENTS
The CANDU reactor design is based on the experience derived from preceding CANDU reactors and virtually every design feature of the latest CANDU reactor is identical to, or is an evolutionary improvement of, an earlier proven design.

506
The CANDU 6 reactors have the following general features of the fuel channels:
- 380 fuel channels; - pressure tube made of Zi 2,5% NB, diameter 103,4
mm, thickness 4,19 mm; - calandria tube made of Zircaloy 2, diameter 129,0
mm, thickness 1,37 mm; - annulus spacers made of Incon.X750, coil
diameter 4,83 mm, 4 pieces; The time life of the fuel channel is for 30 years at
80% of its capacity and 24 years for full capacity functioning.
2.1. General presentation of the fuel channel
The fuel channels are one of the major distinguishing features of a CANDU reactor, and their reliability is crucial for the performance of the reactor. The components of the fuel channel design are illustrated in Fig. 1.
Fig. 1 Schematic illustration of a CANDU fuel channel
1. Channel closure plug; 2. Closure seal insert; 3. Feeder coupling; 4. Liner tube; 5. End fitting body; 6. Outboard bearings; 7. Annulus spacer; 8. Fuel bundle; 9. Pressure tube; 10. Calandria tube; 11. Calandria tubesheet; 12. Inboard bearings; 13. Shield plug; 14. Endshield shielding balls; 15. Endshield lattice tube; 16. Fuelling tubesheet; 17. Channel annulus bellows; 18. Positioning assembly; 19. End fitting shielding sleeve; 20. Lattice tube shielding sleeve; 21. End fitting inner ring seal; 22. Elastic safety lock for end fitting inner ring seal; 23. Elastic safety lock for end fitting shielding sleeve; 24. Support ring for annulus bellows; 25. Annulus bellows outer ring seal; 26. Elastic safety lock for Annulus bellows outer ring seal; 27. Feeder coupling attachment; 28. Feeder gasket; 29. Rod positioning threaded part; 30. Rod positioning; 31. Right fastening piece for rod positioning; 32. Counter nut locking; 33. Safety lock for counter nut; 34. Lock pin for rod positioning; 35. Left fastening piece for rod positioning; 36. Crimping ring for calandria tube;
2.2. Calandria tube
A calandria tube surrounds each pressure tube. Calandria tubes have an internal diameter of about 129 mm and span the calandria vessel between the two end shields. The calandria tube is illustrated in Fig. 2.
Fig. 2 Schematic illustration of the calandria tube
These tubes provide access through the calandria for the pressure tube/end fitting assemblies. The calandria tubes (1) help to support the fuel channel pressure tubes (2) by means of four spacers (3) per channel and the fuel bundle (4), as is illustrated in Fig. 3. 4 3 2 1
Fig. 3 Schematic illustration of calandria tube with pressure
tube and fuel bundle
2.3. Pressure tube components
The pressure tubes are the most important part of the fuel channel as they pass through the calandria and contain the fuel bundles. They are zirconium alloy tubes (Zr-2.5% Nb) that are about 6 meters long, about 11 cm in diameter and have a wall thickness of about 4 mm.
The design of the pressure tube (1) consists primarily of the determination of the length, the inside diameter and the wall thickness of a simple thin-walled cylinder which is illustrated in Fig. 4.
Each pressure tube is separated from a calandria tube by means of four spacers (2). These spacers are positioned so that pressure tube sag will not allow a pressure tube to contact the calandria tube. The spacers are made by forming Inconel wire into a close coiled helical spring
1 2
Fig. 4 Schematic illustration of pressure tube
2.4. End fitting components
The end fitting (1) (Fig. 5), manufactured from a modified AISI 403 stainless steel, is an out of core extension of the pressure tube that provides the connection for on power fuelling, the connection to the feeders coupling (2) necessary for cooling system connection and the connection with the pressure tube (3). Each fuel channel is located axially within the reactor by a positioning assembly which is connected to one end shield. The positioning assembly (4) is mounted on the end fitting.
The annulus bellows (5) connects between an end fitting and the reactor end shield, allows axial motion
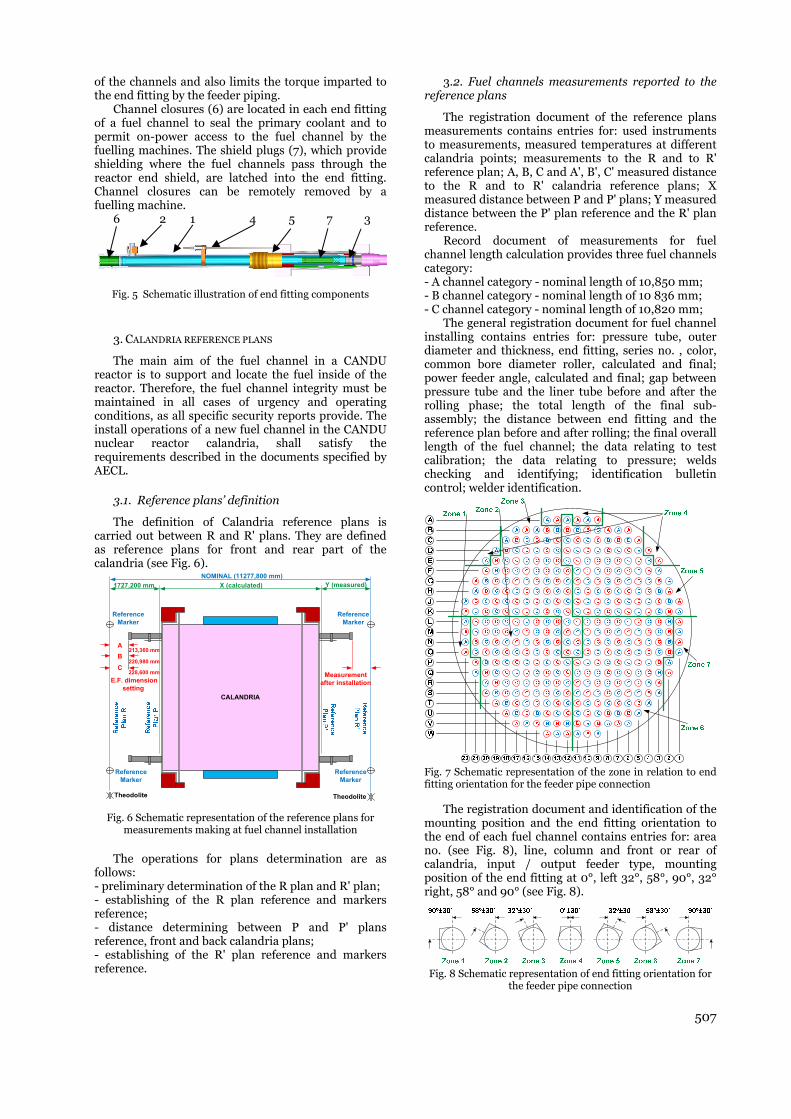
507
of the channels and also limits the torque imparted to the end fitting by the feeder piping.
Channel closures (6) are located in each end fitting of a fuel channel to seal the primary coolant and to permit on-power access to the fuel channel by the fuelling machines. The shield plugs (7), which provide shielding where the fuel channels pass through the reactor end shield, are latched into the end fitting. Channel closures can be remotely removed by a fuelling machine.
6 2 1 4 5 7 3
Fig. 5 Schematic illustration of end fitting components
3. CALANDRIA REFERENCE PLANS
The main aim of the fuel channel in a CANDU reactor is to support and locate the fuel inside of the reactor. Therefore, the fuel channel integrity must be maintained in all cases of urgency and operating conditions, as all specific security reports provide. The install operations of a new fuel channel in the CANDU nuclear reactor calandria, shall satisfy the requirements described in the documents specified by AECL.
3.1. Reference plans’ definition
The definition of Calandria reference plans is carried out between R and R' plans. They are defined as reference plans for front and rear part of the calandria (see Fig. 6).
CALANDRIA
Theodolite Theodolite
X (calculated) Y (measured)NOMINAL (11277,800 mm)
Measurement after installationE.F. dimension
setting
Reference Marker
1727,200 mm
228,600 mmC
BA
220,980 mm
213,360 mm
Reference Marker
Reference Marker
Reference Marker
Fig. 6 Schematic representation of the reference plans for measurements making at fuel channel installation
The operations for plans determination are as follows: - preliminary determination of the R plan and R' plan; - establishing of the R plan reference and markers reference; - distance determining between P and P' plans reference, front and back calandria plans; - establishing of the R' plan reference and markers reference.
3.2. Fuel channels measurements reported to the reference plans
The registration document of the reference plans measurements contains entries for: used instruments to measurements, measured temperatures at different calandria points; measurements to the R and to R' reference plan; A, B, C and A', B', C' measured distance to the R and to R' calandria reference plans; X measured distance between P and P' plans; Y measured distance between the P' plan reference and the R' plan reference.
Record document of measurements for fuel channel length calculation provides three fuel channels category: - A channel category - nominal length of 10,850 mm; - B channel category - nominal length of 10 836 mm; - C channel category - nominal length of 10,820 mm;
The general registration document for fuel channel installing contains entries for: pressure tube, outer diameter and thickness, end fitting, series no. , color, common bore diameter roller, calculated and final; power feeder angle, calculated and final; gap between pressure tube and the liner tube before and after the rolling phase; the total length of the final sub-assembly; the distance between end fitting and the reference plan before and after rolling; the final overall length of the fuel channel; the data relating to test calibration; the data relating to pressure; welds checking and identifying; identification bulletin control; welder identification.
Fig. 7 Schematic representation of the zone in relation to end fitting orientation for the feeder pipe connection
The registration document and identification of the
mounting position and the end fitting orientation to the end of each fuel channel contains entries for: area no. (see Fig. 8), line, column and front or rear of calandria, input / output feeder type, mounting position of the end fitting at 0°, left 32°, 58°, 90°, 32° right, 58° and 90° (see Fig. 8).
Fig. 8 Schematic representation of end fitting orientation for
the feeder pipe connection
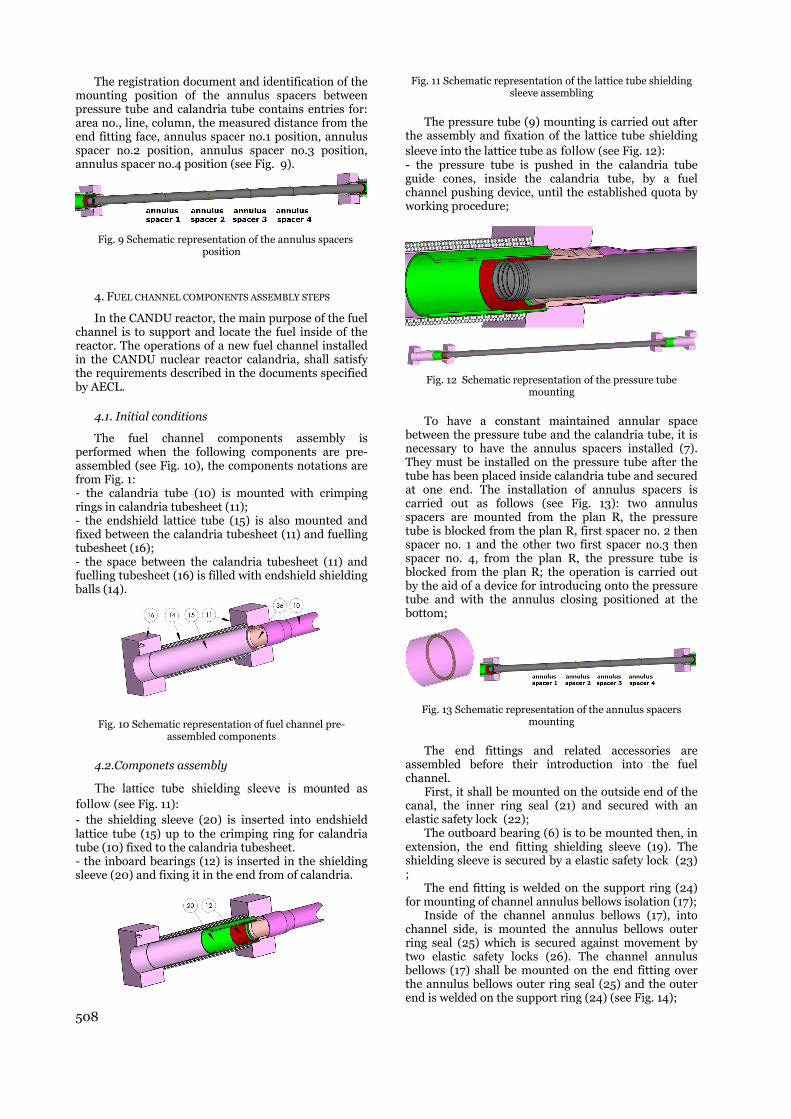
508
The registration document and identification of the mounting position of the annulus spacers between pressure tube and calandria tube contains entries for: area no., line, column, the measured distance from the end fitting face, annulus spacer no.1 position, annulus spacer no.2 position, annulus spacer no.3 position, annulus spacer no.4 position (see Fig. 9).
Fig. 9 Schematic representation of the annulus spacers position
4. FUEL CHANNEL COMPONENTS ASSEMBLY STEPS
In the CANDU reactor, the main purpose of the fuel channel is to support and locate the fuel inside of the reactor. The operations of a new fuel channel installed in the CANDU nuclear reactor calandria, shall satisfy the requirements described in the documents specified by AECL.
4.1. Initial conditions
The fuel channel components assembly is performed when the following components are pre-assembled (see Fig. 10), the components notations are from Fig. 1: - the calandria tube (10) is mounted with crimping rings in calandria tubesheet (11); - the endshield lattice tube (15) is also mounted and fixed between the calandria tubesheet (11) and fuelling tubesheet (16); - the space between the calandria tubesheet (11) and fuelling tubesheet (16) is filled with endshield shielding balls (14).
Fig. 10 Schematic representation of fuel channel pre-assembled components
4.2.Componets assembly
The lattice tube shielding sleeve is mounted as follow (see Fig. 11): - the shielding sleeve (20) is inserted into endshield lattice tube (15) up to the crimping ring for calandria tube (10) fixed to the calandria tubesheet. - the inboard bearings (12) is inserted in the shielding sleeve (20) and fixing it in the end from of calandria.
Fig. 11 Schematic representation of the lattice tube shielding sleeve assembling
The pressure tube (9) mounting is carried out after the assembly and fixation of the lattice tube shielding sleeve into the lattice tube as follow (see Fig. 12): - the pressure tube is pushed in the calandria tube guide cones, inside the calandria tube, by a fuel channel pushing device, until the established quota by working procedure;
Fig. 12 Schematic representation of the pressure tube mounting
To have a constant maintained annular space between the pressure tube and the calandria tube, it is necessary to have the annulus spacers installed (7). They must be installed on the pressure tube after the tube has been placed inside calandria tube and secured at one end. The installation of annulus spacers is carried out as follows (see Fig. 13): two annulus spacers are mounted from the plan R, the pressure tube is blocked from the plan R, first spacer no. 2 then spacer no. 1 and the other two first spacer no.3 then spacer no. 4, from the plan R, the pressure tube is blocked from the plan R; the operation is carried out by the aid of a device for introducing onto the pressure tube and with the annulus closing positioned at the bottom;
Fig. 13 Schematic representation of the annulus spacers mounting
The end fittings and related accessories are assembled before their introduction into the fuel channel.
First, it shall be mounted on the outside end of the canal, the inner ring seal (21) and secured with an elastic safety lock (22);
The outboard bearing (6) is to be mounted then, in extension, the end fitting shielding sleeve (19). The shielding sleeve is secured by a elastic safety lock (23) ;
The end fitting is welded on the support ring (24) for mounting of channel annulus bellows isolation (17);
Inside of the channel annulus bellows (17), into channel side, is mounted the annulus bellows outer ring seal (25) which is secured against movement by two elastic safety locks (26). The channel annulus bellows (17) shall be mounted on the end fitting over the annulus bellows outer ring seal (25) and the outer end is welded on the support ring (24) (see Fig. 14);
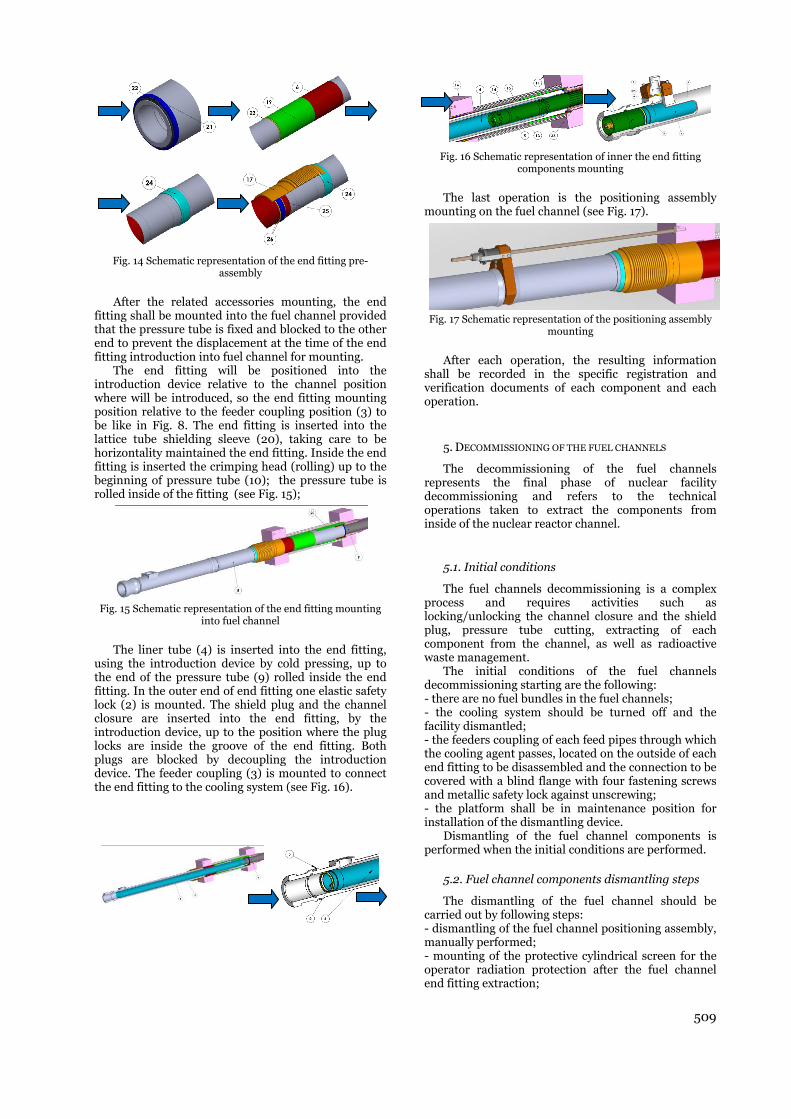
509
Fig. 14 Schematic representation of the end fitting pre-assembly
After the related accessories mounting, the end fitting shall be mounted into the fuel channel provided that the pressure tube is fixed and blocked to the other end to prevent the displacement at the time of the end fitting introduction into fuel channel for mounting.
The end fitting will be positioned into the introduction device relative to the channel position where will be introduced, so the end fitting mounting position relative to the feeder coupling position (3) to be like in Fig. 8. The end fitting is inserted into the lattice tube shielding sleeve (20), taking care to be horizontality maintained the end fitting. Inside the end fitting is inserted the crimping head (rolling) up to the beginning of pressure tube (10); the pressure tube is rolled inside of the fitting (see Fig. 15);
Fig. 15 Schematic representation of the end fitting mounting into fuel channel
The liner tube (4) is inserted into the end fitting, using the introduction device by cold pressing, up to the end of the pressure tube (9) rolled inside the end fitting. In the outer end of end fitting one elastic safety lock (2) is mounted. The shield plug and the channel closure are inserted into the end fitting, by the introduction device, up to the position where the plug locks are inside the groove of the end fitting. Both plugs are blocked by decoupling the introduction device. The feeder coupling (3) is mounted to connect the end fitting to the cooling system (see Fig. 16).
Fig. 16 Schematic representation of inner the end fitting components mounting
The last operation is the positioning assembly mounting on the fuel channel (see Fig. 17).
Fig. 17 Schematic representation of the positioning assembly
mounting
After each operation, the resulting information shall be recorded in the specific registration and verification documents of each component and each operation.
5. DECOMMISSIONING OF THE FUEL CHANNELS
The decommissioning of the fuel channels represents the final phase of nuclear facility decommissioning and refers to the technical operations taken to extract the components from inside of the nuclear reactor channel.
5.1. Initial conditions
The fuel channels decommissioning is a complex process and requires activities such as locking/unlocking the channel closure and the shield plug, pressure tube cutting, extracting of each component from the channel, as well as radioactive waste management.
The initial conditions of the fuel channels decommissioning starting are the following: - there are no fuel bundles in the fuel channels; - the cooling system should be turned off and the facility dismantled; - the feeders coupling of each feed pipes through which the cooling agent passes, located on the outside of each end fitting to be disassembled and the connection to be covered with a blind flange with four fastening screws and metallic safety lock against unscrewing; - the platform shall be in maintenance position for installation of the dismantling device.
Dismantling of the fuel channel components is performed when the initial conditions are performed.
5.2. Fuel channel components dismantling steps
The dismantling of the fuel channel should be carried out by following steps: - dismantling of the fuel channel positioning assembly, manually performed; - mounting of the protective cylindrical screen for the operator radiation protection after the fuel channel end fitting extraction;

510
- operations for the end fitting components dismantling; extraction of the channel closure and plug shield plug; - pressure tube cutting facilitates its removal from each fuel channel; - end fitting extracting operation; - extended channel closure plug mounting; - protective cylindrical screen removal; - protective cylindrical sleeve mounting; - extended channel closure plug removal; - pressure tube extracting operation; - extended channel closure plug mounting; - protective cylindrical sleeve removal.
After extraction of the components of the fuel channel, the final state of the channel is represented in Fig. 18.
Fig. 18 Schematic representation of the final state of the channel
The dismantling of fuel channels components is a complex process that requires piece by piece removal activities of components. All operations shall be performed by a remote controlled decommissioning device.
5.2. Decommissioning device presentation
The decommissioning device performs the movement in vertical and horizontal calandria plan and positioning in front of the fuel channel which shall be decommissioned.
The device assembly for fuel channel components decommissioning is composed of the device itself (1) and moving platform (2) that contains the device support assembly (3) for front alignment at the fuel channel (Fig. 19). 2 3 1
Fig. 19 Schematic representation of the device assembly components
The decommissioning device for fuel channel components decommissioning is intended for the following operations performed at the fuel channel: - the storage of the channel closure plug extracted from the end fitting; - the storage of the channel shield plug extracted from the fitting end;
- the storage of the pressure tube extracted from the fuel channel; - the storage of the end fitting.
The decommissioning device for fuel channel components decommissioning consists of the coupling and locking fuel channel module (1), the access valve assembly to the fuel channel (2), the storage tubes assembly for extracted components (3), the handling elements assembly (4), the cutting and extraction device (5) and the housing device (6), exemplified in Figure 20. 1 2 3 4 5 6
Fig. 20 Fuel channel decommissioning device components
The coupling and locking module is a stand-alone device, for coupling and fixing the device at the fuel channel for performing the dismantling operations (see Fig. 21). After module coupling, a protective cylindrical screen is mounted which covers the end fitting for the radiation protection of the operator.
Fig. 21 The coupling and locking module to the fuel channel
The access valve (Fig. 22), by opening, enables the access of the handling elements into the fuel channel to achieve the dismantling operations.
Figure 22 The access valve of the device
The storage tubes assembly (Fig. 23) is used to store the extracted components of the fuel channel, as a result of the dismantling operations.
The storage tubes are used as follows: - the Blue tube for storage of the pressure tube; - the Red tube for the fitting end storage; - the Yellow tube for storage of the channel closure plug and the channel shield plug; - the Green tube for storage of the extended channel closure plug.
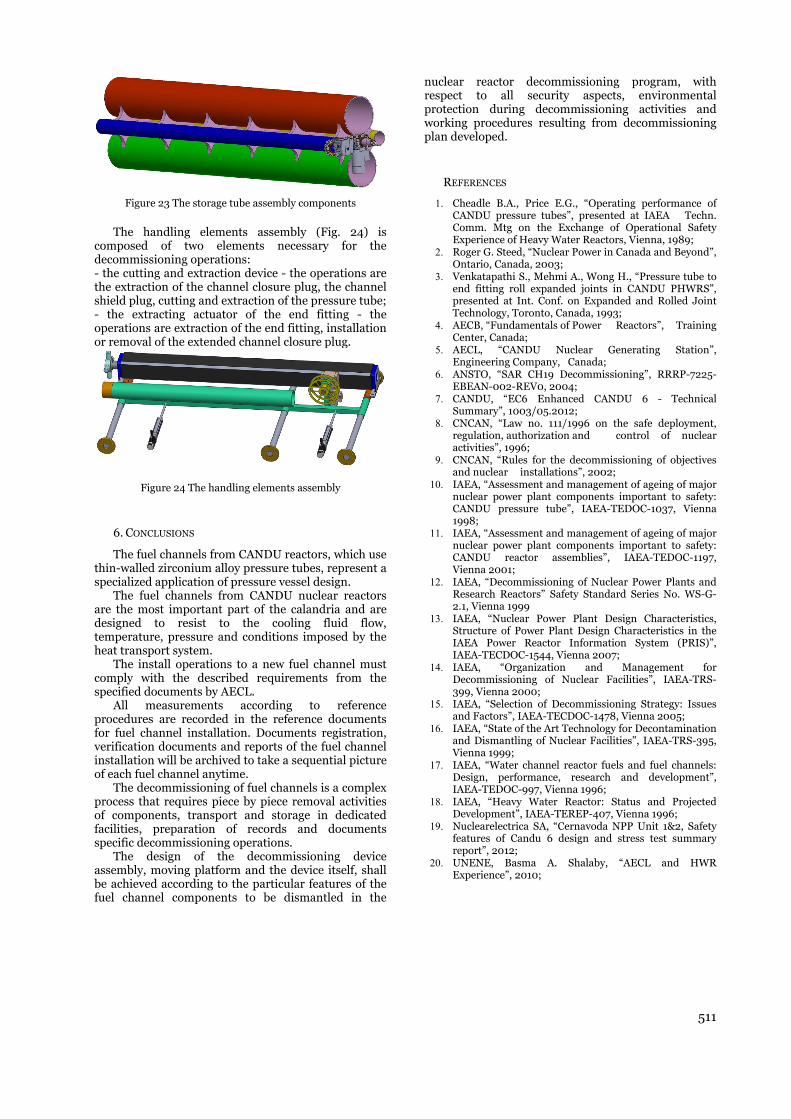
511
Figure 23 The storage tube assembly components
The handling elements assembly (Fig. 24) is composed of two elements necessary for the decommissioning operations: - the cutting and extraction device - the operations are the extraction of the channel closure plug, the channel shield plug, cutting and extraction of the pressure tube; - the extracting actuator of the end fitting - the operations are extraction of the end fitting, installation or removal of the extended channel closure plug.
Figure 24 The handling elements assembly
6. CONCLUSIONS
The fuel channels from CANDU reactors, which use thin-walled zirconium alloy pressure tubes, represent a specialized application of pressure vessel design.
The fuel channels from CANDU nuclear reactors are the most important part of the calandria and are designed to resist to the cooling fluid flow, temperature, pressure and conditions imposed by the heat transport system.
The install operations to a new fuel channel must comply with the described requirements from the specified documents by AECL.
All measurements according to reference procedures are recorded in the reference documents for fuel channel installation. Documents registration, verification documents and reports of the fuel channel installation will be archived to take a sequential picture of each fuel channel anytime.
The decommissioning of fuel channels is a complex process that requires piece by piece removal activities of components, transport and storage in dedicated facilities, preparation of records and documents specific decommissioning operations.
The design of the decommissioning device assembly, moving platform and the device itself, shall be achieved according to the particular features of the fuel channel components to be dismantled in the
nuclear reactor decommissioning program, with respect to all security aspects, environmental protection during decommissioning activities and working procedures resulting from decommissioning plan developed.
REFERENCES
1. Cheadle B.A., Price E.G., “Operating performance of CANDU pressure tubes”, presented at IAEA Techn. Comm. Mtg on the Exchange of Operational Safety Experience of Heavy Water Reactors, Vienna, 1989;
2. Roger G. Steed, “Nuclear Power in Canada and Beyond”, Ontario, Canada, 2003;
3. Venkatapathi S., Mehmi A., Wong H., “Pressure tube to end fitting roll expanded joints in CANDU PHWRS”, presented at Int. Conf. on Expanded and Rolled Joint Technology, Toronto, Canada, 1993;
4. AECB, “Fundamentals of Power Reactors”, Training Center, Canada;
5. AECL, “CANDU Nuclear Generating Station”, Engineering Company, Canada;
6. ANSTO, “SAR CH19 Decommissioning”, RRRP-7225-EBEAN-002-REV0, 2004;
7. CANDU, “EC6 Enhanced CANDU 6 - Technical Summary”, 1003/05.2012;
8. CNCAN, “Law no. 111/1996 on the safe deployment, regulation, authorization and control of nuclear activities”, 1996;
9. CNCAN, “Rules for the decommissioning of objectives and nuclear installations”, 2002;
10. IAEA, “Assessment and management of ageing of major nuclear power plant components important to safety: CANDU pressure tube”, IAEA-TEDOC-1037, Vienna 1998;
11. IAEA, “Assessment and management of ageing of major nuclear power plant components important to safety: CANDU reactor assemblies”, IAEA-TEDOC-1197, Vienna 2001;
12. IAEA, “Decommissioning of Nuclear Power Plants and Research Reactors” Safety Standard Series No. WS-G-2.1, Vienna 1999
13. IAEA, “Nuclear Power Plant Design Characteristics, Structure of Power Plant Design Characteristics in the IAEA Power Reactor Information System (PRIS)”, IAEA-TECDOC-1544, Vienna 2007;
14. IAEA, “Organization and Management for Decommissioning of Nuclear Facilities”, IAEA-TRS-399, Vienna 2000;
15. IAEA, “Selection of Decommissioning Strategy: Issues and Factors”, IAEA-TECDOC-1478, Vienna 2005;
16. IAEA, “State of the Art Technology for Decontamination and Dismantling of Nuclear Facilities”, IAEA-TRS-395, Vienna 1999;
17. IAEA, “Water channel reactor fuels and fuel channels: Design, performance, research and development”, IAEA-TEDOC-997, Vienna 1996;
18. IAEA, “Heavy Water Reactor: Status and Projected Development”, IAEA-TEREP-407, Vienna 1996;
19. Nuclearelectrica SA, “Cernavoda NPP Unit 1&2, Safety features of Candu 6 design and stress test summary report”, 2012;
20. UNENE, Basma A. Shalaby, “AECL and HWR Experience”, 2010;

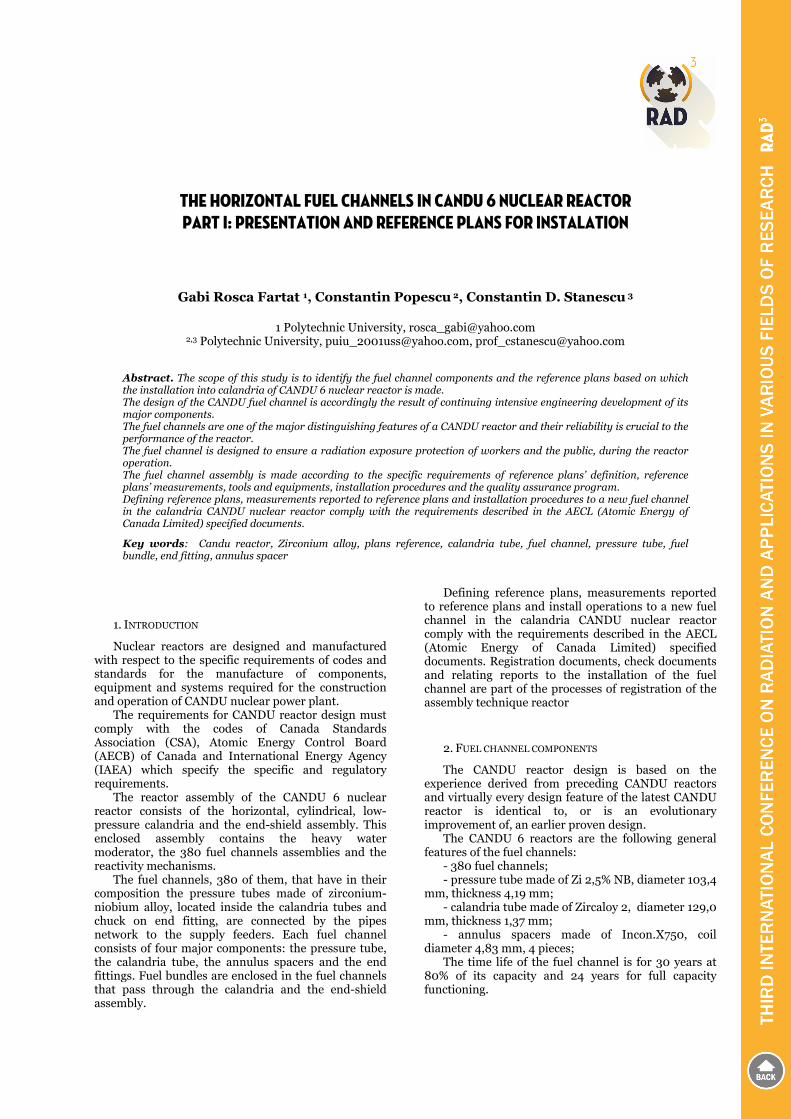
THE HORIZONTAL FUEL CHANNELS IN CANDU 6 NUCLEAR REACTOR PART I: PRESENTATION AND REFERENCE PLANS FOR INSTALATION
Gabi Rosca Fartat 1, Constantin Popescu 2, Constantin D. Stanescu 3
1 Polytechnic University, [email protected] 2,3 Polytechnic University, [email protected], [email protected]
Abstract. The scope of this study is to identify the fuel channel components and the reference plans based on which the installation into calandria of CANDU 6 nuclear reactor is made. The design of the CANDU fuel channel is accordingly the result of continuing intensive engineering development of its major components. The fuel channels are one of the major distinguishing features of a CANDU reactor and their reliability is crucial to the performance of the reactor. The fuel channel is designed to ensure a radiation exposure protection of workers and the public, during the reactor operation. The fuel channel assembly is made according to the specific requirements of reference plans’ definition, reference plans’ measurements, tools and equipments, installation procedures and the quality assurance program. Defining reference plans, measurements reported to reference plans and installation procedures to a new fuel channel in the calandria CANDU nuclear reactor comply with the requirements described in the AECL (Atomic Energy of Canada Limited) specified documents.
Key words: Candu reactor, Zirconium alloy, plans reference, calandria tube, fuel channel, pressure tube, fuel bundle, end fitting, annulus spacer
1. INTRODUCTION
Nuclear reactors are designed and manufactured with respect to the specific requirements of codes and standards for the manufacture of components, equipment and systems required for the construction and operation of CANDU nuclear power plant.
The requirements for CANDU reactor design must comply with the codes of Canada Standards Association (CSA), Atomic Energy Control Board (AECB) of Canada and International Energy Agency (IAEA) which specify the specific and regulatory requirements.
The reactor assembly of the CANDU 6 nuclear reactor consists of the horizontal, cylindrical, low-pressure calandria and the end-shield assembly. This enclosed assembly contains the heavy water moderator, the 380 fuel channels assemblies and the reactivity mechanisms.
The fuel channels, 380 of them, that have in their composition the pressure tubes made of zirconium-niobium alloy, located inside the calandria tubes and chuck on end fitting, are connected by the pipes network to the supply feeders. Each fuel channel consists of four major components: the pressure tube, the calandria tube, the annulus spacers and the end fittings. Fuel bundles are enclosed in the fuel channels that pass through the calandria and the end-shield assembly.
Defining reference plans, measurements reported to reference plans and install operations to a new fuel channel in the calandria CANDU nuclear reactor comply with the requirements described in the AECL (Atomic Energy of Canada Limited) specified documents. Registration documents, check documents and relating reports to the installation of the fuel channel are part of the processes of registration of the assembly technique reactor
2. FUEL CHANNEL COMPONENTS
The CANDU reactor design is based on the experience derived from preceding CANDU reactors and virtually every design feature of the latest CANDU reactor is identical to, or is an evolutionary improvement of, an earlier proven design.
The CANDU 6 reactors are the following general features of the fuel channels:
- 380 fuel channels; - pressure tube made of Zi 2,5% NB, diameter 103,4
mm, thickness 4,19 mm; - calandria tube made of Zircaloy 2, diameter 129,0
mm, thickness 1,37 mm; - annulus spacers made of Incon.X750, coil
diameter 4,83 mm, 4 pieces; The time life of the fuel channel is for 30 years at
80% of its capacity and 24 years for full capacity functioning.

514
2.1. General presentation
The fuel channels are one of the major distinguishing features of a CANDU reactor, and their reliability is crucial to the performance of the reactor. The components of the fuel channel design are illustrated in Fig. 1.
Fig. 1 Schematic illustration of a CANDU fuel channel
1. Channel closure; 2. Closure seal insert; 3. Feeder coupling; 4. Liner tube; 5. End fitting body; 6. Outboard bearings; 7. Annulus spacer; 8. Fuel bundle; 9. Pressure tube; 10. Calandria tube; 11. Calandria tubesheet; 12. Inboard bearings; 13. Shield plug; 14. Endshield shielding balls; 15. Endshield lattice tube; 16. Fuelling tubesheet; 17. Channel annulus bellows; 18. Positioning assembly; 19. End fitting shielding sleeve; 20. Lattice tube shielding sleeve; 21. End fitting inner ring seal; 22. Elastic safety lock for end fitting inner ring seal; 23. Elastic safety lock for end fitting shielding sleeve; 24. Support ring for annulus bellows; 25. Annulus bellows outer ring seal; 26. Elastic safety lock for Annulus bellows outer ring seal; 27. Feeder coupling attachment; 28. Feeder gasket; 29. Rod positioning threaded part; 30. Rod positioning; 31. Right fastening piece for rod positioning; 32. Counter nut locking; 33. Safety lock for counter nut; 34. Lock pin for rod positioning; 35. Left fastening piece for rod positioning; 36. Crimping ring for calandria tube;
2.2. Calandria tube
A calandria tube surrounds each pressure tube. Calandria tubes have an internal diameter of about 129 mm and span the calandria vessel between the two end shields. The calandria tube is illustrated in Fig. 2.
Fig. 2 Schematic illustration of the calandria tube
These tubes provide access through the calandria for the pressure tube/end fitting assemblies. The calandria tubes help to support the fuel channel pressure tubes by means of four spacers per channel, as is illustrated in Fig. 3.
Fig. 3 Schematic illustration of calandria tube with pressure tube, end fitting and fuel bundle
2.3. Pressure tube
The pressure tubes are the most important part of the fuel channel as they pass through the calandria and contain the fuel bundles. They are zirconium alloy tubes (Zr-2.5% Nb) that are about 6 meters long, about 11 cm in diameter and have a wall thickness of about 4 mm.
The design of the pressure tube consists primarily of the determination of the length, the inside diameter and the wall thickness of a simple thin-walled cylinder which is illustrated in Fig. 4.
Fig. 4 Schematic illustration of pressure tube
One of the main requirements of the pressure tube design is to optimize wall thickness and to minimize neutron absorption for radiation exposure protection of workers.
The product specification requires that the following tests and examinations also be carried out on each pressure tube before it can be accepted: hydrostatic pressure test, chemical analysis, tensile testing and corrosion testing.
2.4. End fitting
The end fitting, manufactured from a modified AISI 403 stainless steel, is an out of core extension of the pressure tube that provides the connection for on power fuelling, the connection to the feeders coupling and the connection with the pressure tube, which is illustrated in Fig. 5.
Fig. 5 Schematic illustration of end fitting
The outboard end contains a removable closure plug and provides facilities on which a fuelling machine can clamp and make a high pressure seal to allow on-power refuelling. Near the outer end of each end fitting is a side port for connection of a feeder pipe connection.
The inboard end of each end fitting is connected to one end of a pressure tube by a rolled joint, which is illustrated in Fig. 6.
Fig. 6 Schematic illustration of pressure tube rolled joint
2.5. Annulus spacer
Each pressure tube is separated from a calandria tube by means of four spacers. These spacers are

515
positioned so that pressure tube sag will not allow a pressure tube to contact the calandria tube. That is illustrated in Fig. 7.
Fig. 7 Schematic illustration of annulus spacers positioning on pressure tube
The spacers are made by forming Inconel wire into a close coiled helical spring, which is illustrated in Fig. 8.
Fig. 8 Schematic illustration of annulus spacer
The axial movement of the pressure tubes is allowed by a rolling motion of the annulus spacers, which results in almost no wear on the pressure and calandria tubes where they contract the spacers.
2.6. Feeder coupling
The feeder pipe connection located on the side of each end fitting is necessary for cooling system connection. The bolted feeder pipe connection has a metallic seal, as is illustrated in Fig. 9.
Fig. 9 Schematic illustration of feeder coupling
Four bolts pass thorough a flange into holes tapped into the end fitting body to tighten this connection. The flange holds a hub welded to each feeder pipe tightly against the metal seal ring.
2.7. Positioning assembly
Each fuel channel is located axially within the reactor by a positioning assembly which is connected to one end shield, as is illustrated in Fig. 10.
Fig. 10 Schematic illustration of position assembly
A second positioning assembly is installed at the other end of the fuel channel but it is not attached to the end shield so axial motion resulting from thermal expansion, as well as from pressure tube permanent elongation, is permitted.
2.8. Annulus bellows
The annulus bellows, which is illustrated in Fig. 11, connects between an end fitting and the reactor end shield, allows axial motion of the channels and also limits the torque imparted to the end fitting by the feeder piping. Each end of the bellows is welded to an end ring. One end ring is attached to the lattice tube/calandria tubesheet by welding and another is a shrink-fit onto the end fitting.
Fig. 11 Schematic illustration of annulus bellows
2.9. Channel closure plug
The channel closures, illustrated in Fig. 12, are located in each end fitting of a fuel channel to seal the primary coolant and to permit on-power access to the fuel channel by the fuelling machines. The channel closures can be remotely removed by a fuelling machine.
Fig. 12 Schematic illustration of channel closures
2.10. Shield plug
The shield plugs, which provide shielding where the fuel channels pass through the reactor end shield, are latched into the end fitting, which is illustrated in Fig. 13. They are also removed by the fuelling machine before the refuelling of a channel can occur.
Fig. 13 Schematic illustration of shield plugs

516
3. CALANDRIA REFERENCE PLANS
The main aim of the fuel channel in a CANDU reactor is to support and locate the fuel inside of the reactor. Therefore, the fuel channel integrity must be maintained in all cases of urgency and operating conditions, as all specific security reports provide. The install operations of a new fuel channel in the CANDU nuclear reactor calandria, shall satisfy the requirements described in the documents specified by AECL.
3.1. Reference plans’ definition
The definition of Calandria reference plans is carried out between R and R' plans. They are defined as reference plans for front and rear part of the calandria (see Fig. 14).
The operations for plans determination are as follows: - preliminary determination of the R plan; - preliminary determination of the R' plan; - establishing of the R plan reference and markers reference; - distance determining between P and P' planes reference, front and back calandria planes;
- establishing of the R' plan reference and markers reference.
Fig. 14 Schematic representation of the reference plans for measurements making at fuel channel installation
3.2. Fuel channels measurements reported to the reference plan
The registration document of the reference plans measurements contains entries for: used instruments to measurements, measured temperatures at different calandria points; measurements to the R and to R' reference plane; A, B, C and A', B', C' measured distance to the R and to R' calandria reference planes; X measured distance between P and P' plane; Y measured distance between the P' plan reference and the R' plan reference.
Record document of measurements for fuel channel length calculation provides three fuel channel categories: - A channel category - nominal length of 10,850 mm; - B channel category - nominal length of 10 836 mm; - C channel category - nominal length of 10,820 mm;
The recording document of distance measurements from the plan R or R' to end fitting for fuel channel type is prepared to:
- R-A / R'-A' = 213,36 mm; - R-B / R'-B' = 220,98 mm; - R-C / R'-C' = 228,60 mm.
Registration document of the fuel channel length calculation for each channel type contains information about channel elements length, shown in table 1.
Table 1 Channel elements length
Channel category
Pressure tube length
PT (mm)
Sub-assembly
length EF-PT (mm)
Final length of FC (mm)
A X-1496,57 X+765,61 X+3027,68 B X-1511,81 X+730,37 X+3012,44 C X-1527,05 X+735,13 X+2997,20
where EF is End Fitting, PT Pressure Tube, FC Fuel Channel and X measured distance between P and P' plane.
General registration document for fuel channel installing contains entries for: pressure tube, outer diameter and thickness, end fitting, series no. , color, common bore diameter roller, calculated and final; power feeder angle, calculated and final; gap between pressure tube and the liner tube before and after the rolling phase; the total length of the final sub-assembly; the distance between end fitting and the reference plan before and after rolling; the final overall length of the fuel channel; the data relating to test calibration; the data relating to pressure; welds checking and identifying; identification bulletin control; welder identification.
General registration document and identification of each fuel channel in report of the calandria aria contains entries for: aria no., the end fitting serial number from R plane, the end fitting serial number from R' plane, the identification code of the pressure tube.
A AA A A A
BA
DC
FE
HG
KJ
ML
ON
QP
SR
UT
WV
22 21 20 19 18 17 16 15 14 13 12 11 10 9 8 7 6 5 4 3 2 1
AA A A A AB BB B B B
BA B C B BC CB C C C B A
CC C C C CC CC C C C B AA B
CC C C C CC CC C C C B AC CA B
CC C C C BC CC C C C AA C CB C
CC C C C CC CC C C C B AC CC CA B
CC C C C BC CC C C C AA C CC CB C
CC C C C CC CC C C C C CC CC CA B B A
CC C C C CC CC C C C C BC CC CB C AA
CC C C C CC CC C C C C CC CC CA B B A
CC C C C CC CC C C C C BC CC CB C AA
CC C C C CC CC C C C C CC CC CA B B A
CC C C C CC CC C C C C BC CC CB C AA
CC C C C CC CC C C C B AC CC CA B
CC C C C BC CC C C C AA C CC CB C
CC C C C CC CC C C C B AC CA B
CC C C C BC CC C C C AA C CB C
CC C C C BC CC C C C AA B C
BB B B B BC CB C C C AA
BA A A AA B BB B B A
A AA A AA
Zone 6
Zone 7
Zone 5
Zone 4
Zone 3Zone 2
Zone 1
Fig. 15 Schematic representation of the zone in relation to end
fitting orientation for the feeder pipe connection Registration document and identification of the
mounting position and the end fitting orientation to the end of each fuel channel contains entries for: area no. (see Fig. 15), line, column and front or rear of calandria, input / output feeder type, mounting position of the end fitting at 0°, left 32°, 58°, 90°, 32° right, 58° and 90° (see Fig. 16).

517
Fig. 16 Schematic representation of end fitting orientation for
the feeder pipe connection
Registration document and identification of the mounting position of the annulus spacers between pressure tube P/T and calandria tube C/T contains entries for: area no., line, column, the measured distance from the end fitting face, annulus spacer no.1 position, annulus spacer no.2 position, annulus spacer no.3 position, annulus spacer no.4 position (see Fig. 17).
Fig. 17 Schematic representation of the annulus spacers position
4. CONCLUSIONS
The design and the configuration characteristics of the fuel channel from the CANDU nuclear reactor are essentially in the design of device components. The fuel channel design has increased margins with extended operating life and is considered a fundamental part of the CANDU system.
The install operations to a new fuel channel must comply with the described requirements from the specified documents by AECL. The fuel channels from CANDU reactors, which use thin-walled zirconium alloy pressure tubes, represent a specialized application of pressure vessel design.
All measurements according to reference procedures are recorded in the reference documents for fuel channel installation. Documents registration, verification documents and reports of the fuel channel installation will be archived to take a sequential picture of each fuel channel anytime.
The current CANDU 6 reactors have a design life of 40 years at an average of 85% capacity. The pressure tube design life is 25 years at the reactor's 85% capacity factor.
The fuel channels have made a significant contribution to the very high capacity factors attained in CANDU reactors since they allow on-power refuelling.
REFERENCES
1. Cheadle B.A., Price E.G., “Operating performance of CANDU pressure tubes”, presented at IAEA Techn. Comm. Mtg on the Exchange of Operational Safety Experience of Heavy Water Reactors, Vienna, 1989;
2. Roger G. Steed, “Nuclear Power in Canada and Beyond”, Ontario, Canada, 2003;
3. Venkatapathi S., Mehmi A., Wong H., “Pressure tube to end fitting roll expanded joints in CANDU PHWRS”, presented at Int. Conf. on Expanded and Rolled Joint Technology, Toronto, Canada, 1993;
4. AECB, “Fundamentals of Power Reactors”, Training Center, Canada;
5. AECL, “CANDU Nuclear Generating Station”, Engineering Company, Canada;
6. ANSTO, “SAR CH19 Decommissioning”, RRRP-7225-EBEAN-002-REV0, 2004;
7. CANDU, “EC6 Enhanced CANDU 6 - Technical Summary”, 1003/05.2012;
8. CNCAN, “Law no. 111/1996 on the safe deployment, regulation, authorization and control of nuclear activities”, 1996;
9. CNCAN, “Rules for the decommissioning of objectives and nuclear installations”, 2002;
10. IAEA, “Assessment and management of ageing of major nuclear power plant components important to safety: CANDU pressure tube”, IAEA-TEDOC-1037, Vienna 1998;
11. IAEA, “Assessment and management of ageing of major nuclear power plant components important to safety: CANDU reactor assemblies”, IAEA-TEDOC-1197, Vienna 2001;
12. IAEA, “Decommissioning of Nuclear Power Plants and Research Reactors” Safety Standard Series No. WS-G-2.1, Vienna 1999
13. IAEA, “Nuclear Power Plant Design Characteristics, Structure of Power Plant Design Characteristics in the IAEA Power Reactor Information System (PRIS)”, IAEA-TECDOC-1544, Vienna 2007;
14. IAEA, “Organization and Management for Decommissioning of Nuclear Facilities”, IAEA-TRS-399, Vienna 2000;
15. IAEA, “Selection of Decommissioning Strategy: Issues and Factors”, IAEA-TECDOC-1478, Vienna 2005;
16. IAEA, “State of the Art Technology for Decontamination and Dismantling of Nuclear Facilities”, IAEA-TRS-395, Vienna 1999;
17. IAEA, “Water channel reactor fuels and fuel channels: Design, performance, research and development”, IAEA-TEDOC-997, Vienna 1996;
18. IAEA, “Heavy Water Reactor: Status and Projected Development”, IAEA-TEREP-407, Vienna 1996;
19. Nuclearelectrica SA, “Cernavoda NPP Unit 1&2, Safety features of Candu 6 design and stress test summary report”, 2012;
20. UNENE, Basma A. Shalaby, “AECL and HWR Experience”, 2010;
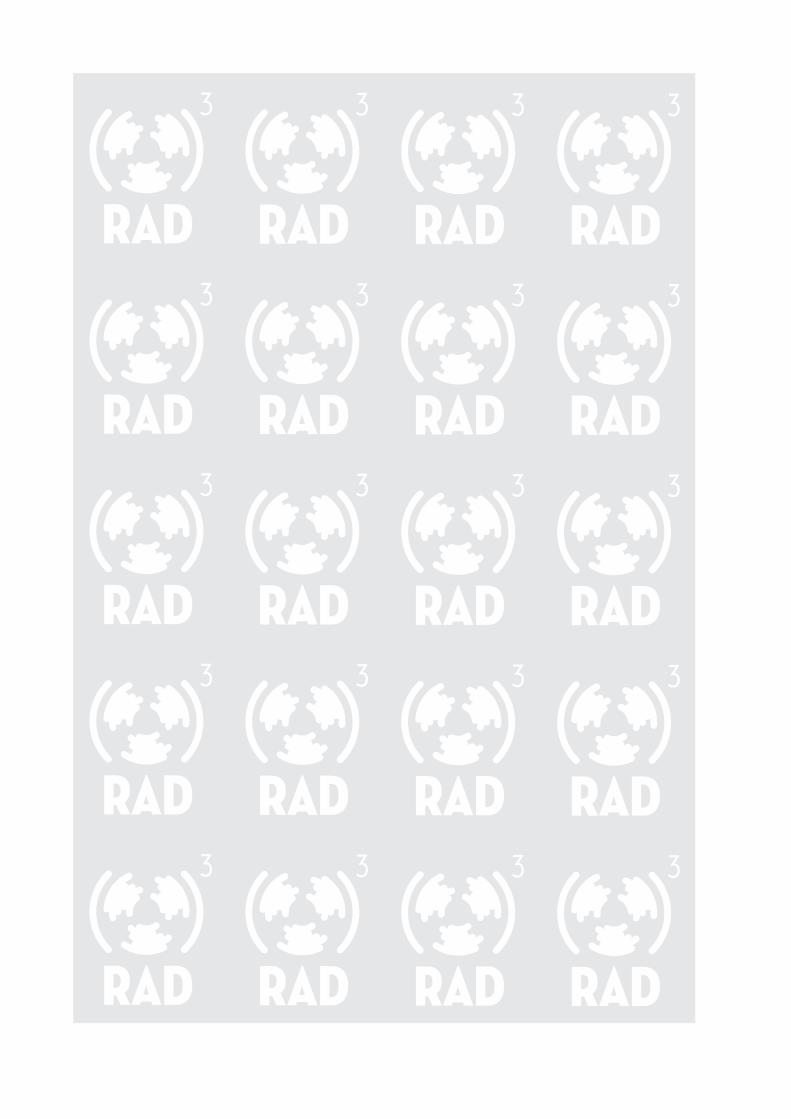

THE HORIZONTAL FUEL CHANNELS IN THE CANDU 6 NUCLEAR REACTOR PART II: ASSEMBLY MAIN STEPS
Gabi Rosca Fartat 1, Constantin Popescu 2, Constantin D. Stanescu 3
1 Polytechnic University, [email protected] 2,3 Polytechnic University, [email protected], [email protected]
Abstract. The scope of this paper is to present the fuel channel components and to obtain the needed information of necessary main steps to assemble the fuel channel into calandria of CANDU 6 nuclear reactor. The CANDU fuel channel is essentially the same in all CANDU reactors and it is considered a fundamental building block in the CANDU system and their reliability is crucial to the reactor performance. The installation operations to a new fuel channel must comply with the described requirements from the specified documents by AECL. After each operation, the resulting information must be recorded in the specific registration and verification documents of each component and each operation. The registration documents, the check documents and the related reports of the fuel channel installation are part of the processes records of the assembly history of the nuclear reactor. All these documents and reports will be archived in order to take a sequential picture of each fuel channel anytime. The radiological safety analyses are made by certified experts for the assessment of radiation exposure of workers and the public.
Key words: Calandria tube, fuel channel, pressure tube, end fitting, channel closure, shield plug, annulus spacer, positioning assembly.
1. INTRODUCTION
The fuel channels have a high importance for the operation of CANDU nuclear reactors because they allow new refueling while operating at full capacity.
The reactor assembly consists of a hollow cylindrical structure called the calandria assembly, fuel channels and control mechanisms of reactivity.
The 380 fuel channels are composed of pressure tubes, made of zirconium-niobium alloy, located inside the calandria tubes, with two end fittings mounted, that are connected by the pipes network of the cooling supply feeders.
Each CANDU fuel channel consists of four major components: the pressure tube, the calandria tube, the annulus spacers and the end fittings.
The install operations of a new fuel channel within a calandria CANDU reactor, must comply with the described requirements in the specified documents by AECL.
The required specifications of the install operations of a new fuel channel are defined by: - the fuel channel installation documentation requirements; - the general requirements for tools and equipments; - the welding procedures for structural welding of sealing rings; - the quality assurance program.
Before installing of a new component in the fuel channel, checks should be made of existing parts into the canal, to observe that they are in correct positions or if any non-compliances exist. Before installation, the cleaning and inspection of the component that will be installed and where will be mounted should be performed. Any lack of conformity shall be notified to the attention of the supervisor to remedy or replace the component.
After each operation, the resulting information must be recorded in the specific registration and verification documents of each component and each operation.
2. FUEL CHANNEL COMPONENTS ASSEMBLY STEPS
In the CANDU reactor, the main aim of the fuel channel is to support and locate the fuel inside of the reactor. The operations of a new fuel channel installation in the CANDU nuclear reactor calandria, shall satisfy the requirements described in the documents specified by AECL.
2.1. General considerations
The installation of each component is performed according to the design documentation and detailed diagram of a fuel channel from CANDU nuclear reactors, presented in Fig. 1.
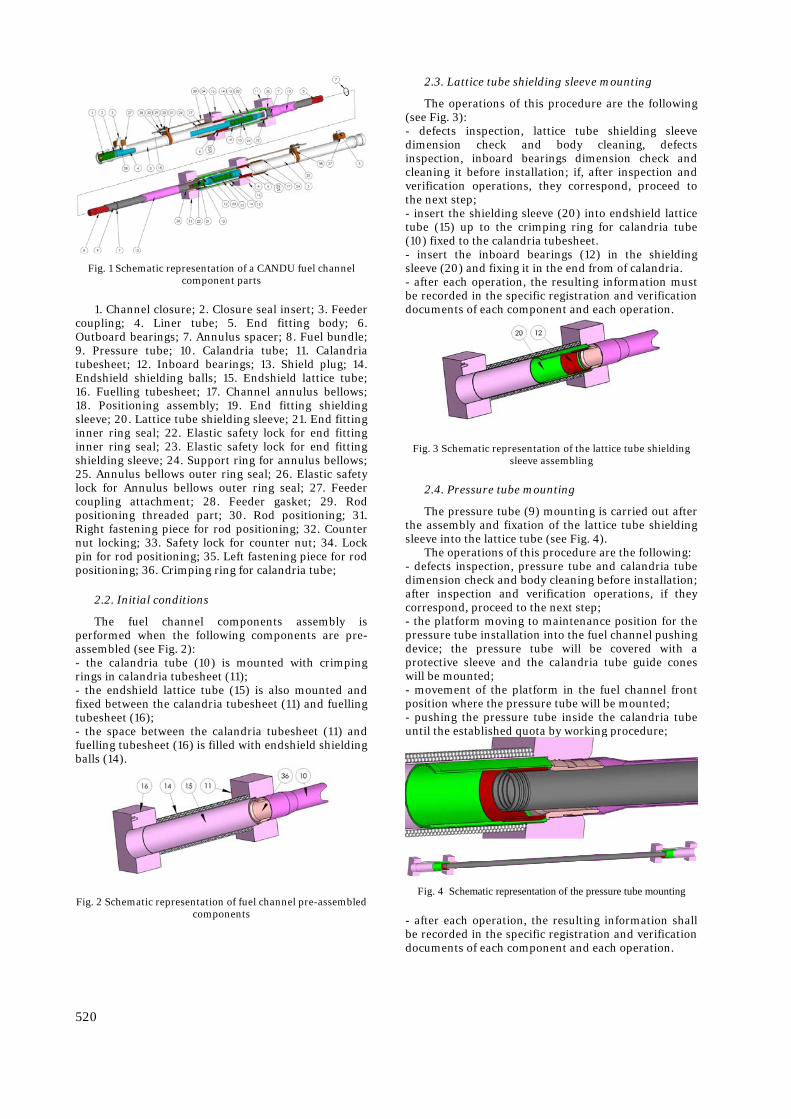
520
Fig. 1 Schematic representation of a CANDU fuel channel
component parts
1. Channel closure; 2. Closure seal insert; 3. Feeder coupling; 4. Liner tube; 5. End fitting body; 6. Outboard bearings; 7. Annulus spacer; 8. Fuel bundle; 9. Pressure tube; 10. Calandria tube; 11. Calandria tubesheet; 12. Inboard bearings; 13. Shield plug; 14. Endshield shielding balls; 15. Endshield lattice tube; 16. Fuelling tubesheet; 17. Channel annulus bellows; 18. Positioning assembly; 19. End fitting shielding sleeve; 20. Lattice tube shielding sleeve; 21. End fitting inner ring seal; 22. Elastic safety lock for end fitting inner ring seal; 23. Elastic safety lock for end fitting shielding sleeve; 24. Support ring for annulus bellows; 25. Annulus bellows outer ring seal; 26. Elastic safety lock for Annulus bellows outer ring seal; 27. Feeder coupling attachment; 28. Feeder gasket; 29. Rod positioning threaded part; 30. Rod positioning; 31. Right fastening piece for rod positioning; 32. Counter nut locking; 33. Safety lock for counter nut; 34. Lock pin for rod positioning; 35. Left fastening piece for rod positioning; 36. Crimping ring for calandria tube;
2.2. Initial conditions
The fuel channel components assembly is performed when the following components are pre-assembled (see Fig. 2): - the calandria tube (10) is mounted with crimping rings in calandria tubesheet (11); - the endshield lattice tube (15) is also mounted and fixed between the calandria tubesheet (11) and fuelling tubesheet (16); - the space between the calandria tubesheet (11) and fuelling tubesheet (16) is filled with endshield shielding balls (14).
Fig. 2 Schematic representation of fuel channel pre-assembled components
2.3. Lattice tube shielding sleeve mounting
The operations of this procedure are the following (see Fig. 3): - defects inspection, lattice tube shielding sleeve dimension check and body cleaning, defects inspection, inboard bearings dimension check and cleaning it before installation; if, after inspection and verification operations, they correspond, proceed to the next step; - insert the shielding sleeve (20) into endshield lattice tube (15) up to the crimping ring for calandria tube (10) fixed to the calandria tubesheet. - insert the inboard bearings (12) in the shielding sleeve (20) and fixing it in the end from of calandria. - after each operation, the resulting information must be recorded in the specific registration and verification documents of each component and each operation.
Fig. 3 Schematic representation of the lattice tube shielding sleeve assembling
2.4. Pressure tube mounting
The pressure tube (9) mounting is carried out after the assembly and fixation of the lattice tube shielding sleeve into the lattice tube (see Fig. 4).
The operations of this procedure are the following: - defects inspection, pressure tube and calandria tube dimension check and body cleaning before installation; after inspection and verification operations, if they correspond, proceed to the next step; - the platform moving to maintenance position for the pressure tube installation into the fuel channel pushing device; the pressure tube will be covered with a protective sleeve and the calandria tube guide cones will be mounted; - movement of the platform in the fuel channel front position where the pressure tube will be mounted; - pushing the pressure tube inside the calandria tube until the established quota by working procedure;
Fig. 4 Schematic representation of the pressure tube mounting
- after each operation, the resulting information shall be recorded in the specific registration and verification documents of each component and each operation.
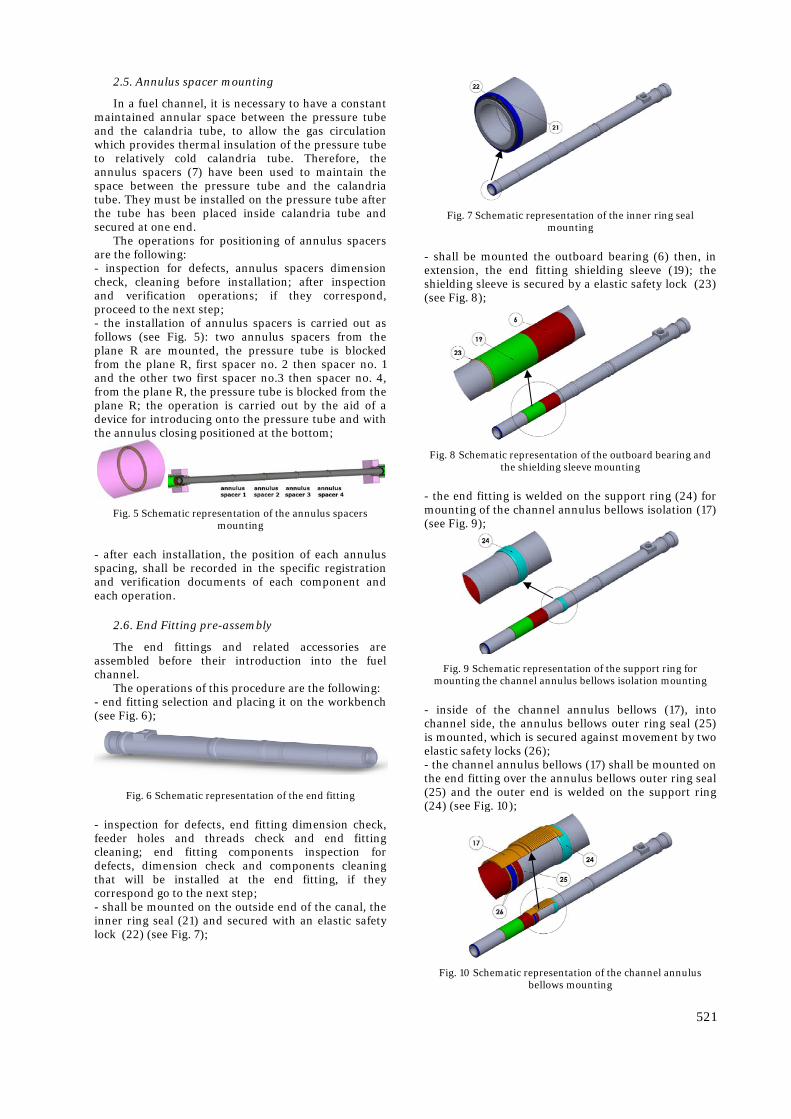
521
2.5. Annulus spacer mounting
In a fuel channel, it is necessary to have a constant maintained annular space between the pressure tube and the calandria tube, to allow the gas circulation which provides thermal insulation of the pressure tube to relatively cold calandria tube. Therefore, the annulus spacers (7) have been used to maintain the space between the pressure tube and the calandria tube. They must be installed on the pressure tube after the tube has been placed inside calandria tube and secured at one end.
The operations for positioning of annulus spacers are the following: - inspection for defects, annulus spacers dimension check, cleaning before installation; after inspection and verification operations; if they correspond, proceed to the next step; - the installation of annulus spacers is carried out as follows (see Fig. 5): two annulus spacers from the plane R are mounted, the pressure tube is blocked from the plane R, first spacer no. 2 then spacer no. 1 and the other two first spacer no.3 then spacer no. 4, from the plane R, the pressure tube is blocked from the plane R; the operation is carried out by the aid of a device for introducing onto the pressure tube and with the annulus closing positioned at the bottom;
Fig. 5 Schematic representation of the annulus spacers mounting
- after each installation, the position of each annulus spacing, shall be recorded in the specific registration and verification documents of each component and each operation.
2.6. End Fitting pre-assembly
The end fittings and related accessories are assembled before their introduction into the fuel channel.
The operations of this procedure are the following: - end fitting selection and placing it on the workbench (see Fig. 6);
Fig. 6 Schematic representation of the end fitting
- inspection for defects, end fitting dimension check, feeder holes and threads check and end fitting cleaning; end fitting components inspection for defects, dimension check and components cleaning that will be installed at the end fitting, if they correspond go to the next step; - shall be mounted on the outside end of the canal, the inner ring seal (21) and secured with an elastic safety lock (22) (see Fig. 7);
Fig. 7 Schematic representation of the inner ring seal mounting
- shall be mounted the outboard bearing (6) then, in extension, the end fitting shielding sleeve (19); the shielding sleeve is secured by a elastic safety lock (23) (see Fig. 8);
Fig. 8 Schematic representation of the outboard bearing and the shielding sleeve mounting
- the end fitting is welded on the support ring (24) for mounting of the channel annulus bellows isolation (17) (see Fig. 9);
Fig. 9 Schematic representation of the support ring for mounting the channel annulus bellows isolation mounting
- inside of the channel annulus bellows (17), into channel side, the annulus bellows outer ring seal (25) is mounted, which is secured against movement by two elastic safety locks (26); - the channel annulus bellows (17) shall be mounted on the end fitting over the annulus bellows outer ring seal (25) and the outer end is welded on the support ring (24) (see Fig. 10);
Fig. 10 Schematic representation of the channel annulus bellows mounting
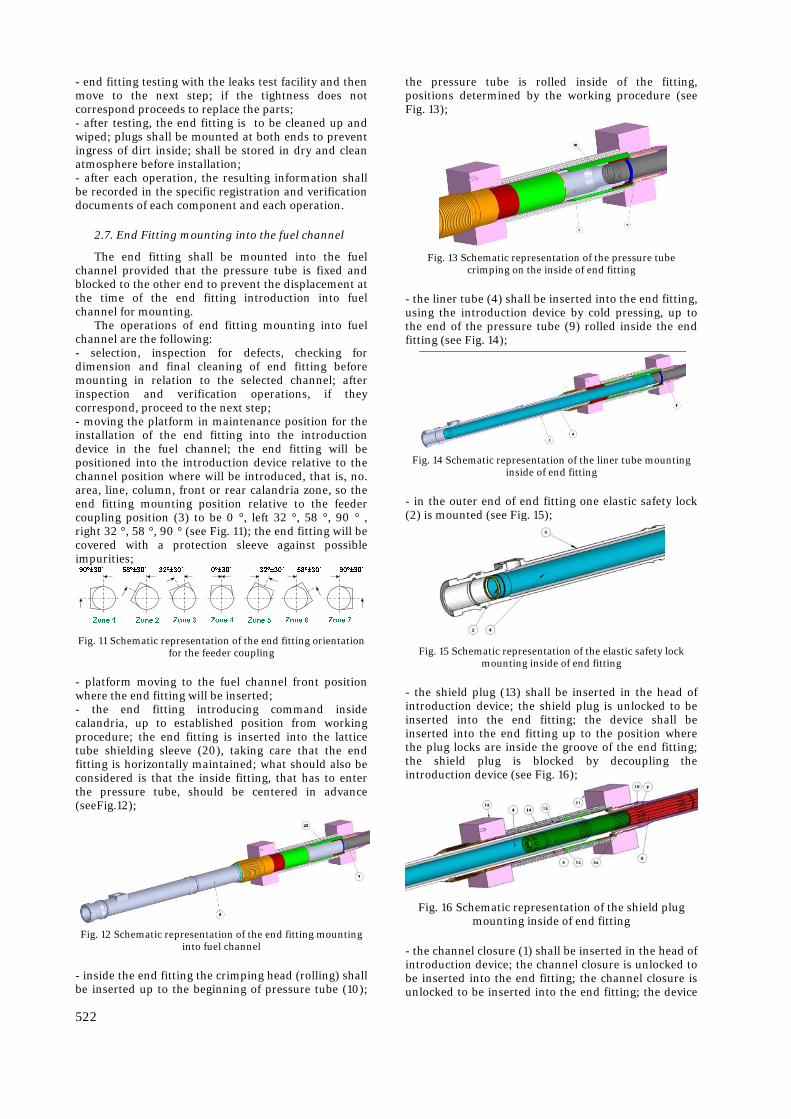
522
- end fitting testing with the leaks test facility and then move to the next step; if the tightness does not correspond proceeds to replace the parts; - after testing, the end fitting is to be cleaned up and wiped; plugs shall be mounted at both ends to prevent ingress of dirt inside; shall be stored in dry and clean atmosphere before installation; - after each operation, the resulting information shall be recorded in the specific registration and verification documents of each component and each operation.
2.7. End Fitting mounting into the fuel channel
The end fitting shall be mounted into the fuel channel provided that the pressure tube is fixed and blocked to the other end to prevent the displacement at the time of the end fitting introduction into fuel channel for mounting.
The operations of end fitting mounting into fuel channel are the following: - selection, inspection for defects, checking for dimension and final cleaning of end fitting before mounting in relation to the selected channel; after inspection and verification operations, if they correspond, proceed to the next step; - moving the platform in maintenance position for the installation of the end fitting into the introduction device in the fuel channel; the end fitting will be positioned into the introduction device relative to the channel position where will be introduced, that is, no. area, line, column, front or rear calandria zone, so the end fitting mounting position relative to the feeder coupling position (3) to be 0 °, left 32 °, 58 °, 90 ° , right 32 °, 58 °, 90 ° (see Fig. 11); the end fitting will be covered with a protection sleeve against possible impurities;
Fig. 11 Schematic representation of the end fitting orientation for the feeder coupling
- platform moving to the fuel channel front position where the end fitting will be inserted; - the end fitting introducing command inside calandria, up to established position from working procedure; the end fitting is inserted into the lattice tube shielding sleeve (20), taking care that the end fitting is horizontally maintained; what should also be considered is that the inside fitting, that has to enter the pressure tube, should be centered in advance (seeFig.12);
Fig. 12 Schematic representation of the end fitting mounting into fuel channel
- inside the end fitting the crimping head (rolling) shall be inserted up to the beginning of pressure tube (10);
the pressure tube is rolled inside of the fitting, positions determined by the working procedure (see Fig. 13);
Fig. 13 Schematic representation of the pressure tube crimping on the inside of end fitting
- the liner tube (4) shall be inserted into the end fitting, using the introduction device by cold pressing, up to the end of the pressure tube (9) rolled inside the end fitting (see Fig. 14);
Fig. 14 Schematic representation of the liner tube mounting inside of end fitting
- in the outer end of end fitting one elastic safety lock (2) is mounted (see Fig. 15);
Fig. 15 Schematic representation of the elastic safety lock mounting inside of end fitting
- the shield plug (13) shall be inserted in the head of introduction device; the shield plug is unlocked to be inserted into the end fitting; the device shall be inserted into the end fitting up to the position where the plug locks are inside the groove of the end fitting; the shield plug is blocked by decoupling the introduction device (see Fig. 16);
Fig. 16 Schematic representation of the shield plug mounting inside of end fitting
- the channel closure (1) shall be inserted in the head of introduction device; the channel closure is unlocked to be inserted into the end fitting; the channel closure is unlocked to be inserted into the end fitting; the device
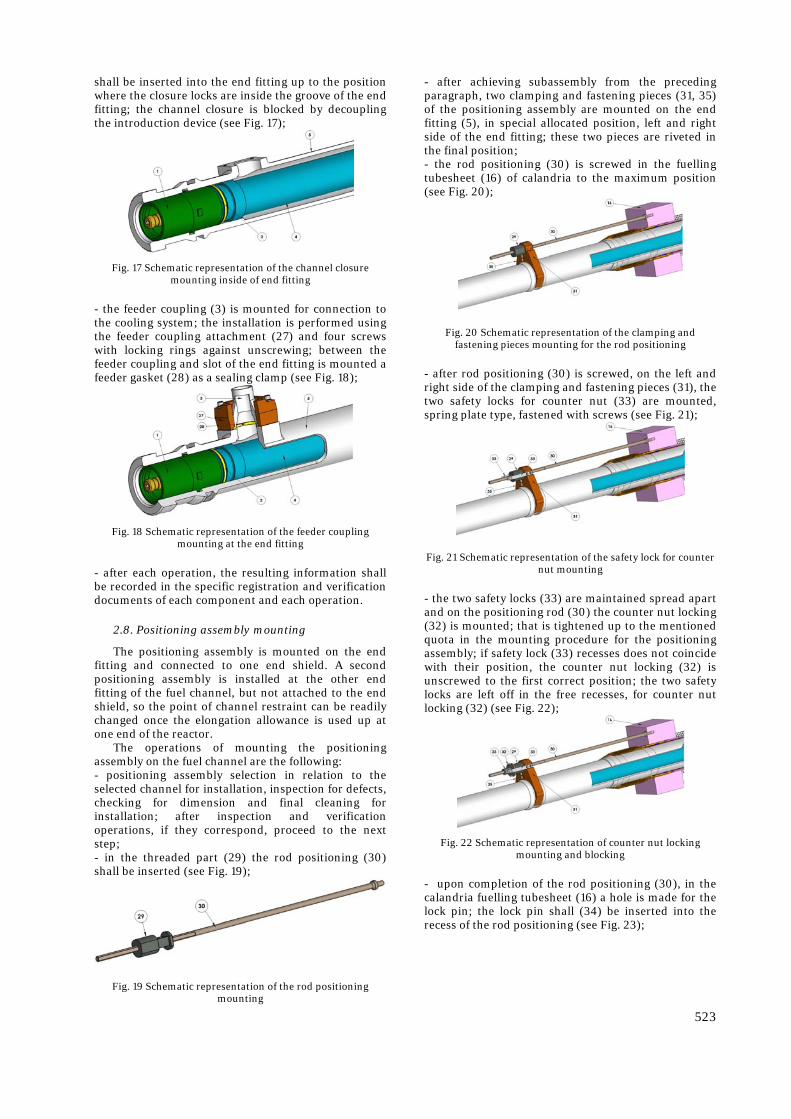
523
shall be inserted into the end fitting up to the position where the closure locks are inside the groove of the end fitting; the channel closure is blocked by decoupling the introduction device (see Fig. 17);
Fig. 17 Schematic representation of the channel closure mounting inside of end fitting
- the feeder coupling (3) is mounted for connection to the cooling system; the installation is performed using the feeder coupling attachment (27) and four screws with locking rings against unscrewing; between the feeder coupling and slot of the end fitting is mounted a feeder gasket (28) as a sealing clamp (see Fig. 18);
Fig. 18 Schematic representation of the feeder coupling mounting at the end fitting
- after each operation, the resulting information shall be recorded in the specific registration and verification documents of each component and each operation.
2.8. Positioning assembly mounting
The positioning assembly is mounted on the end fitting and connected to one end shield. A second positioning assembly is installed at the other end fitting of the fuel channel, but not attached to the end shield, so the point of channel restraint can be readily changed once the elongation allowance is used up at one end of the reactor.
The operations of mounting the positioning assembly on the fuel channel are the following: - positioning assembly selection in relation to the selected channel for installation, inspection for defects, checking for dimension and final cleaning for installation; after inspection and verification operations, if they correspond, proceed to the next step; - in the threaded part (29) the rod positioning (30) shall be inserted (see Fig. 19);
Fig. 19 Schematic representation of the rod positioning mounting
- after achieving subassembly from the preceding paragraph, two clamping and fastening pieces (31, 35) of the positioning assembly are mounted on the end fitting (5), in special allocated position, left and right side of the end fitting; these two pieces are riveted in the final position; - the rod positioning (30) is screwed in the fuelling tubesheet (16) of calandria to the maximum position (see Fig. 20);
Fig. 20 Schematic representation of the clamping and fastening pieces mounting for the rod positioning
- after rod positioning (30) is screwed, on the left and right side of the clamping and fastening pieces (31), the two safety locks for counter nut (33) are mounted, spring plate type, fastened with screws (see Fig. 21);
Fig. 21 Schematic representation of the safety lock for counter nut mounting
- the two safety locks (33) are maintained spread apart and on the positioning rod (30) the counter nut locking (32) is mounted; that is tightened up to the mentioned quota in the mounting procedure for the positioning assembly; if safety lock (33) recesses does not coincide with their position, the counter nut locking (32) is unscrewed to the first correct position; the two safety locks are left off in the free recesses, for counter nut locking (32) (see Fig. 22);
Fig. 22 Schematic representation of counter nut locking mounting and blocking
- upon completion of the rod positioning (30), in the calandria fuelling tubesheet (16) a hole is made for the lock pin; the lock pin shall (34) be inserted into the recess of the rod positioning (see Fig. 23);
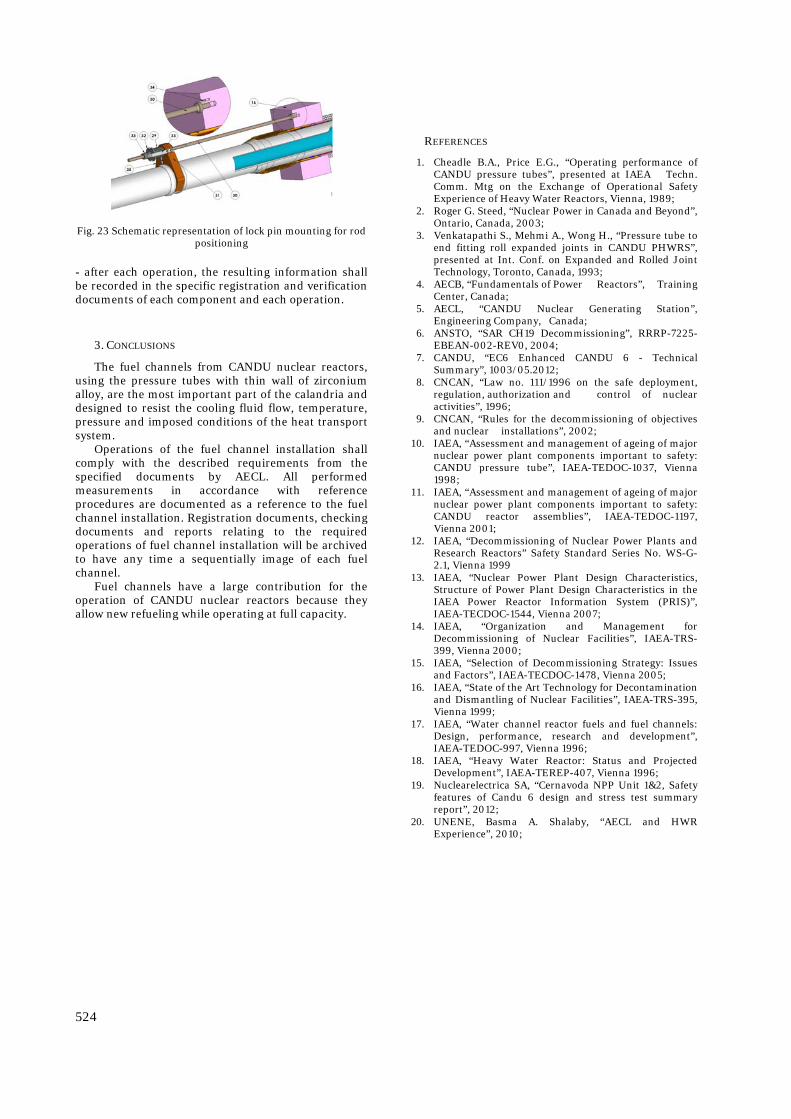
524
Fig. 23 Schematic representation of lock pin mounting for rod positioning
- after each operation, the resulting information shall be recorded in the specific registration and verification documents of each component and each operation.
3. CONCLUSIONS
The fuel channels from CANDU nuclear reactors, using the pressure tubes with thin wall of zirconium alloy, are the most important part of the calandria and designed to resist the cooling fluid flow, temperature, pressure and imposed conditions of the heat transport system.
Operations of the fuel channel installation shall comply with the described requirements from the specified documents by AECL. All performed measurements in accordance with reference procedures are documented as a reference to the fuel channel installation. Registration documents, checking documents and reports relating to the required operations of fuel channel installation will be archived to have any time a sequentially image of each fuel channel.
Fuel channels have a large contribution for the operation of CANDU nuclear reactors because they allow new refueling while operating at full capacity.
REFERENCES
1. Cheadle B.A., Price E.G., “Operating performance of CANDU pressure tubes”, presented at IAEA Techn. Comm. Mtg on the Exchange of Operational Safety Experience of Heavy Water Reactors, Vienna, 1989;
2. Roger G. Steed, “Nuclear Power in Canada and Beyond”, Ontario, Canada, 2003;
3. Venkatapathi S., Mehmi A., Wong H., “Pressure tube to end fitting roll expanded joints in CANDU PHWRS”, presented at Int. Conf. on Expanded and Rolled Joint Technology, Toronto, Canada, 1993;
4. AECB, “Fundamentals of Power Reactors”, Training Center, Canada;
5. AECL, “CANDU Nuclear Generating Station”, Engineering Company, Canada;
6. ANSTO, “SAR CH19 Decommissioning”, RRRP-7225-EBEAN-002-REV0, 2004;
7. CANDU, “EC6 Enhanced CANDU 6 - Technical Summary”, 1003/05.2012;
8. CNCAN, “Law no. 111/1996 on the safe deployment, regulation, authorization and control of nuclear activities”, 1996;
9. CNCAN, “Rules for the decommissioning of objectives and nuclear installations”, 2002;
10. IAEA, “Assessment and management of ageing of major nuclear power plant components important to safety: CANDU pressure tube”, IAEA-TEDOC-1037, Vienna 1998;
11. IAEA, “Assessment and management of ageing of major nuclear power plant components important to safety: CANDU reactor assemblies”, IAEA-TEDOC-1197, Vienna 2001;
12. IAEA, “Decommissioning of Nuclear Power Plants and Research Reactors” Safety Standard Series No. WS-G-2.1, Vienna 1999
13. IAEA, “Nuclear Power Plant Design Characteristics, Structure of Power Plant Design Characteristics in the IAEA Power Reactor Information System (PRIS)”, IAEA-TECDOC-1544, Vienna 2007;
14. IAEA, “Organization and Management for Decommissioning of Nuclear Facilities”, IAEA-TRS-399, Vienna 2000;
15. IAEA, “Selection of Decommissioning Strategy: Issues and Factors”, IAEA-TECDOC-1478, Vienna 2005;
16. IAEA, “State of the Art Technology for Decontamination and Dismantling of Nuclear Facilities”, IAEA-TRS-395, Vienna 1999;
17. IAEA, “Water channel reactor fuels and fuel channels: Design, performance, research and development”, IAEA-TEDOC-997, Vienna 1996;
18. IAEA, “Heavy Water Reactor: Status and Projected Development”, IAEA-TEREP-407, Vienna 1996;
19. Nuclearelectrica SA, “Cernavoda NPP Unit 1&2, Safety features of Candu 6 design and stress test summary report”, 2012;
20. UNENE, Basma A. Shalaby, “AECL and HWR Experience”, 2010;
THE HORIZONTAL FUEL CHANNELS IN THE CANDU 6 NUCLEAR REACTOR PART III: DECOMMISSIONING DEVICE
Gabi Rosca Fartat 1, Constantin Popescu 2, Constantin D. Stanescu 3
1 Polytechnic University, [email protected] 2,3 Polytechnic University, [email protected], [email protected]
Abstract. The objective of this paper is to present a possible method for decommissioning of the horizontal fuel channels of calandria vessel and to present a possible device designing solution for the decommissioning of the horizontal fuel channels in the CANDU 6 nuclear reactor. The decommissioning activities are dismantling, demolition, controlled removal of equipment, components, conventional or hazardous waste (radioactive, toxic) in compliance with the international basic safety standards on radiation protection. One of the most important operations in the final phase of the nuclear reactor dismantling is the decommissioning of the fuel channels. The dismantling of the fuel channel is performed by one device which shall provide radiation protection during the stages of decommissioning, ensuring radiation protection of the workers. The device shall be designed according to the radiation protection procedures. The design of the device and platform support is achieved according to the particular features of the fuel channel components to be dismantled in the program of nuclear reactor decommissioning according to all the safety aspects and environmental protection during the activities, resulting from the decommissioning plan developed.
Key words: Candu reactor, device, decommissioning, dismantling, radiation protection, fuel channel
1. INTRODUCTION
The decommissioning activities are dismantling, demolition, controlled removal of equipment, components, conventional or hazardous waste (radioactive, toxic) in compliance with the international basic safety standards on radiation protection.
The decommissioning activities performed are administrative, technical, and include the preparation, endorsement and approval of documents, obtaining permits and authorizations, providing financial resources, decontamination, dismantling, demolition, controlled removal of equipment, components, conventional or hazardous waste (radioactive, toxic), demonstrating the fulfillment of the radiological conditional or unconditional release of the facility and the ground, included in the decommissioning project.
For the fuel channels decommissioning, the following should be taken into account: the detailed description of the fuel channel and its components, the installation documents history, adequate radiological criteria for decommissioning guidance, safety and environmental impact assessment, including radiological and non-radiological analysis of the risks that can occur for workers, public and environment, the description of the proposed program for decommissioning the fuel channel and its components,
the description of the quality assurance program and of the monitoring program, the equipments and methods used to verify the compliance with the decommissioning criteria, the planning of performing the final radiological assessment at the end of the fuel channel decommissioning. These will also include a description of the proposed radiation protection procedures to be used during decommissioning.
The decommissioning device assembly of the fuel channel components is composed of the device itself and moving platform support for coupling of the selected channel to be dismantled. The fuel channel decommissioning device is an autonomous device designed for dismantling and extraction of the channel closure plug and shield plug, extraction of the end fitting, cutting and extraction of the pressure tube.
The dismantling of the fuel channel components is performed according to the detailed schematic documentation of the CANDU nuclear reactors fuel channel.
2. FUEL CHANNEL COMPONENTS DISASSEMBLY STEPS
The dismantling of the fuel channels represents the final phase of nuclear facility decommissioning and refers to the technical operations taken to extract the components from inside of the nuclear reactor channel. It is a complex process and requires activities such as assembly/disassembly of the decommissioning

526
device, locking/unlocking the channel closure and shield plug, pressure tube cutting, extraction of each component from the channel, as well as radioactive waste management.
2.1. Initial conditions
Initial conditions for fuel channels decommissioning starting are the following: - there are no fuel bundles in the fuel channels; - the cooling system should be turned off and the facility dismantled; - the feeders coupling of each feed pipes through which the cooling agent passes, located on the outside of each end fitting to be disassembled and the connection to be covered with a blind flange with four fastening screws and metallic safety lock against unscrewing; - the platform shall be in maintenance position for installation of the dismantling device.
Dismantling of the fuel channel components is performed when the initial conditions are performed. The fuel channel components are illustrated in Fig.1.
Fig. 1 Schematic representation of a CANDU fuel channel
component parts
1. Channel closure; 2. Closure seal insert; 3. Feeder coupling; 4. Liner tube; 5. End fitting body; 6. Outboard bearings; 7. Annulus spacer; 8. Fuel bundle; 9. Pressure tube; 10. Calandria tube; 11. Calandria tubesheet; 12. Inboard bearings; 13. Shield plug; 14. Endshield shielding balls; 15. Endshield lattice tube; 16. Fuelling tubesheet; 17. Channel annulus bellows; 18. Positioning assembly; 19. End fitting shielding sleeve; 20. Lattice tube shielding sleeve; 21. End fitting inner ring seal; 22. Elastic safety lock for end fitting inner ring seal; 23. Elastic safety lock for end fitting shielding sleeve; 24. Support ring for annulus bellows; 25. Annulus bellows outer ring seal; 26. Elastic safety lock for Annulus bellows outer ring seal; 27. Feeder coupling attachment; 28. Feeder gasket; 29. Rod positioning threaded part; 30. Rod positioning; 31. Right fastening piece for rod positioning; 32. Counter nut locking; 33. Safety lock for counter nut; 34. Lock pin for rod positioning; 35. Left fastening piece for rod positioning; 36. Crimping ring for calandria tube;
2.2. Positioning assembly dismantling
The dismantling operation procedure of the fuel channel positioning assembly is manually performed, the state before dismantling is illustrated in Fig.2, after removal in Fig. 3.. The components’ notations are from Fig. 1.
Fig. 2 Schematic representation before positioning assembly
dismantling
Fig. 3 Schematic representation after positioning assembly dismantling
2.3. End Fitting components dismantling
The first operation is to mount a protective
cylindrical screen which covers the end fitting for the radiation protection of the operator (see Fig. 4).
Fig. 4 The protective cylindrical screen mounting
The operations procedures for end fitting components’ dismantling are the following: - unlocking and extraction of the channel closure plug (1) (see Fig. 5);
Fig. 5 Schematic representation of the channel closure
removal
- unlocking and extraction of the shield plug (13) (see Fig. 6);
Fig. 6 Schematic representation of the shield plug removal

527
2.4. Pressure tube cutting
The cutting procedure facilitates the pressure tube removal and the removal of the fitting end for each fuel channel on each side of the calandria. The operation procedure of pressure tube cutting at middle, as well as the end from of end fitting (see Fig. 7).
Fig. 7 Schematic representation of cutting with rollers in the middle and to end of pressure tube
The cutting operations are monitored by video camera and pyrometers for recording the temperature in the cutting rollers area.
2.5. End Fitting extraction
The operation for end fitting dismantling is performed by extraction working head. After extraction of the end fitting from the fuel channel, the final state of the channel is represented in Fig. 8.
Fig. 8 Schematic representation of the channel state after end fitting extraction
After the extraction operation of the end fitting from the fuel channel, the extended channel closure plug should be inserted into the channel and it is possible to remove the protective cylindrical screen (see Fig. 9).
Fig. 8 Schematic representation of the channel state after extended channel closure plug mounting
2.6. Pressure tube extraction
This operation describes the procedure for the pressure tube (9) removal from fuel channel, performed by the working head (see Fig. 9). The operation is monitored by video camera mounted on top of working head.
Fig. 9 Schematic representation of the channel before and after pressure tube extracting
After extraction of the components of the fuel channel, the final state of the channel is represented in Fig. 10.
Fig. 10 Schematic representation of the final state of the channel
The dismantling of fuel channel components is a complex process that requires piece by piece removal activities of components. All operations shall be performed by a remote controlled decommissioning device.
3. GENERAL PRESENTATION OF THE DEVICE
Many of the decommissioning activities involve the remote devices coordination to prevent the contact or some removed components proximity, of the operators.
3.1. General considerations
Considering the fuel channel complexity, and that the designed operation life of a fuel channel is 30 years at 80% capacity and 24 years at maximum capacity, at the design of the channels fuel decommissioning device, the following shall be taken into account: - the detailed fuel channel description and its components; - the installation documents history from the operation period of the dismantled fuel channel; - adequate radiological criteria for decommissioning guidance; - safety and environmental impact assessment, including radiological and non-radiological analysis of the risks that can occur for workers, public and environment; - the proposed program description of the fuel channel decommissioning and its components; - the description of the quality assurance program; - the monitoring program, the equipments and methods used to verify the compliance with the decommissioning criteria; - the planning of performing the final radiological assessment at the end of the fuel channel decommissioning.
Initial conditions for fuel channels decommissioning starting are the following: - there are no fuel bundles in the fuel channels; - the cooling system should be turned off and the facility dismantled; - the feeders coupling of each feed pipes through which the cooling agent passes, located on the outside of each end fitting to be disassembled and the connection to be covered with a blind flange with four fastening screws and metallic safety lock against unscrewing; - the platform shall be in maintenance position for installation of the dismantling device.
Dismantling of the fuel channel components is performed when the initial conditions are carried out.
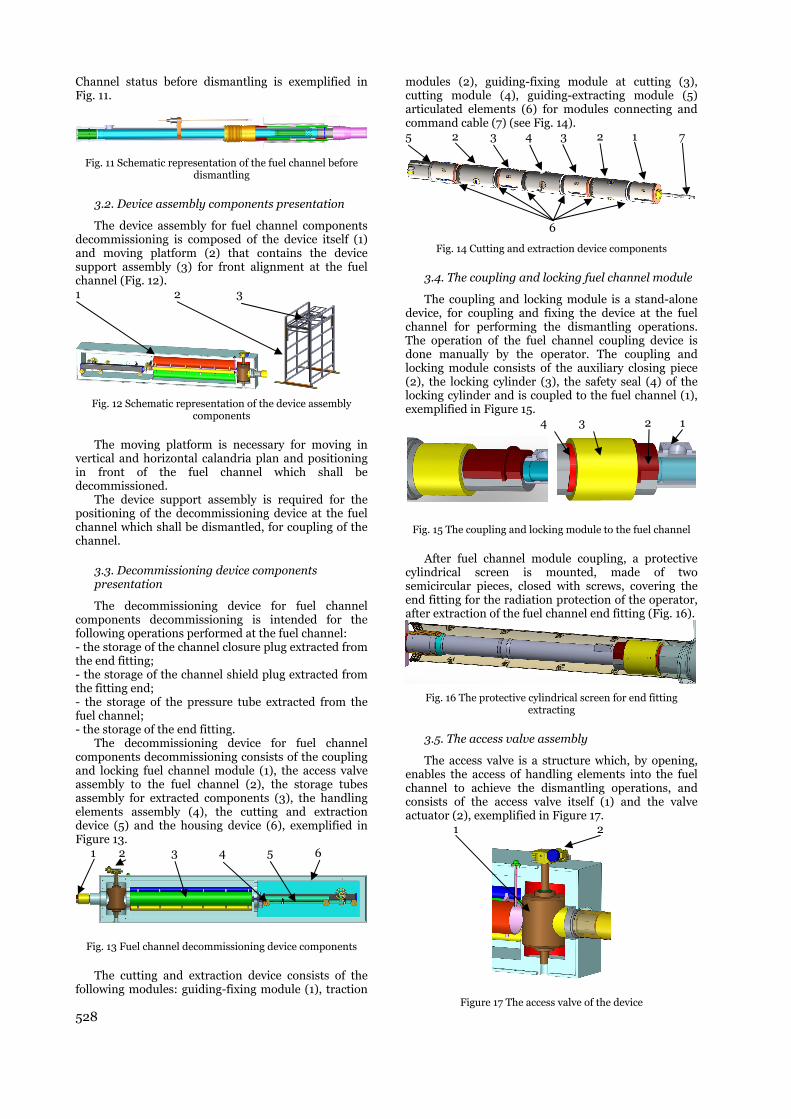
528
Channel status before dismantling is exemplified in Fig. 11.
Fig. 11 Schematic representation of the fuel channel before
dismantling
3.2. Device assembly components presentation
The device assembly for fuel channel components decommissioning is composed of the device itself (1) and moving platform (2) that contains the device support assembly (3) for front alignment at the fuel channel (Fig. 12). 1 2 3
Fig. 12 Schematic representation of the device assembly components
The moving platform is necessary for moving in vertical and horizontal calandria plan and positioning in front of the fuel channel which shall be decommissioned.
The device support assembly is required for the positioning of the decommissioning device at the fuel channel which shall be dismantled, for coupling of the channel.
3.3. Decommissioning device components presentation
The decommissioning device for fuel channel components decommissioning is intended for the following operations performed at the fuel channel: - the storage of the channel closure plug extracted from the end fitting; - the storage of the channel shield plug extracted from the fitting end; - the storage of the pressure tube extracted from the fuel channel; - the storage of the end fitting.
The decommissioning device for fuel channel components decommissioning consists of the coupling and locking fuel channel module (1), the access valve assembly to the fuel channel (2), the storage tubes assembly for extracted components (3), the handling elements assembly (4), the cutting and extraction device (5) and the housing device (6), exemplified in Figure 13. 1 2 3 4 5 6
Fig. 13 Fuel channel decommissioning device components
The cutting and extraction device consists of the following modules: guiding-fixing module (1), traction
modules (2), guiding-fixing module at cutting (3), cutting module (4), guiding-extracting module (5) articulated elements (6) for modules connecting and command cable (7) (see Fig. 14). 5 2 3 4 3 2 1 7
6
Fig. 14 Cutting and extraction device components
3.4. The coupling and locking fuel channel module
The coupling and locking module is a stand-alone device, for coupling and fixing the device at the fuel channel for performing the dismantling operations. The operation of the fuel channel coupling device is done manually by the operator. The coupling and locking module consists of the auxiliary closing piece (2), the locking cylinder (3), the safety seal (4) of the locking cylinder and is coupled to the fuel channel (1), exemplified in Figure 15. 4 3 2 1
Fig. 15 The coupling and locking module to the fuel channel
After fuel channel module coupling, a protective cylindrical screen is mounted, made of two semicircular pieces, closed with screws, covering the end fitting for the radiation protection of the operator, after extraction of the fuel channel end fitting (Fig. 16).
Fig. 16 The protective cylindrical screen for end fitting extracting
3.5. The access valve assembly
The access valve is a structure which, by opening, enables the access of handling elements into the fuel channel to achieve the dismantling operations, and consists of the access valve itself (1) and the valve actuator (2), exemplified in Figure 17. 1 2
Figure 17 The access valve of the device
529
3.6. The storage tubes assembly
The storage tubes assembly is used to store the extracted components of the fuel channel, as a result of the dismantling operations. This assembly consists of the radiation detector (1), the Blue tube (2), the Red tube (3), the Yellow tube (4), the Green tube (5) and the gearmotor drive (6), exemplified in Figure 18. 1 2 3 5 4 6
Figure 18 The storage tube assembly components
The storage tubes assembly is mounted on a shaft driven by a gearmotor to turning it in order to place a tube in front of the access valve for access to the fuel channel.
The storage tubes are used as follows: - the Blue tube for storage of the pressure tube; - the Red tube for the fitting end storage; - the Yellow tube for storage of the channel closure plug and the channel shield plug; - the Green tube for storage of the extended channel closure plug.
3.7. The handling elements assembly
The handling elements assembly is composed of the sleigh assembly (1), the sleigh travel actuator (2), the stationary tube of the cutting and extraction device (3), connecting cable roller of the cutting and extraction device (4), the extracting actuator of the end fitting (5), exemplified in Figure 19. 1 2 3 4 5
Figure 19 The handling elements assembly
The handling elements assembly can operate two positions in order to place one element front of the storage tube: - one position is when the stationary tube it is in working direction for the movement of the cutting and extraction device; cable roller realizes the cable progress or tightening of the cutting and extraction device in time of displacement; the operations are the extraction of the channel closure plug, the channel shield plug, cutting and extraction of the pressure tube; - the second position is when the extracting actuator is in working direction; the operations are extraction of the end fitting, installation or removal of the extended channel closure plug.
4. CONCLUSIONS
The decommissioning of the fuel channels is a complex process that requires piece by piece removal activities of components, transport and storage in dedicated facilities, preparation of records and documents of specific decommissioning operations.
The dismantling operation stages of the fuel channel components are repeated for all the 380 channels of the reactor, from the front of calandria side (plane R) as well as the rear side (plane R').
The presented device is a device that extracts the internal components of the horizontal fuel channels, ensuring a radiation protection during the stages of decommissioning.
The design of the device, moving platform and the device support assembly shall be achieved according to the particular features of the fuel channel components to be dismantled in the nuclear reactor decommissioning program, with respect of all security aspects, environmental protection during decommissioning activities and working procedures resulting from the decommissioning plan developed.

530
REFERENCES
1. Cheadle B.A., Price E.G., “Operating performance of CANDU pressure tubes”, presented at IAEA Techn. Comm. Mtg on the Exchange of Operational Safety Experience of Heavy Water Reactors, Vienna, 1989;
2. Roger G. Steed, “Nuclear Power in Canada and Beyond”, Ontario, Canada, 2003;
3. Venkatapathi S., Mehmi A., Wong H., “Pressure tube to end fitting roll expanded joints in CANDU PHWRS”, presented at Int. Conf. on Expanded and Rolled Joint Technology, Toronto, Canada, 1993;
4. AECB, “Fundamentals of Power Reactors”, Training Center, Canada;
5. AECL, “CANDU Nuclear Generating Station”, Engineering Company, Canada;
6. ANSTO, “SAR CH19 Decommissioning”, RRRP-7225-EBEAN-002-REV0, 2004;
7. CANDU, “EC6 Enhanced CANDU 6 - Technical Summary”, 1003/05.2012;
8. CNCAN, “Law no. 111/1996 on the safe deployment, regulation, authorization and control of nuclear activities”, 1996;
9. CNCAN, “Rules for the decommissioning of objectives and nuclear installations”, 2002;
10. IAEA, “Assessment and management of ageing of major nuclear power plant components important to safety: CANDU pressure tube”, IAEA-TEDOC-1037, Vienna 1998;
11. IAEA, “Assessment and management of ageing of major nuclear power plant components important to safety:
CANDU reactor assemblies”, IAEA-TEDOC-1197, Vienna 2001;
12. IAEA, “Decommissioning of Nuclear Power Plants and Research Reactors” Safety Standard Series No. WS-G-2.1, Vienna 1999
13. IAEA, “Nuclear Power Plant Design Characteristics, Structure of Power Plant Design Characteristics in the IAEA Power Reactor Information System (PRIS)”, IAEA-TECDOC-1544, Vienna 2007;
14. IAEA, “Organization and Management for Decommissioning of Nuclear Facilities”, IAEA-TRS-399, Vienna 2000;
15. IAEA, “Selection of Decommissioning Strategy: Issues and Factors”, IAEA-TECDOC-1478, Vienna 2005;
16. IAEA, “State of the Art Technology for Decontamination and Dismantling of Nuclear Facilities”, IAEA-TRS-395, Vienna 1999;
17. IAEA, “Water channel reactor fuels and fuel channels: Design, performance, research and development”, IAEA-TEDOC-997, Vienna 1996;
18. IAEA, “Heavy Water Reactor: Status and Projected Development”, IAEA-TEREP-407, Vienna 1996;
19. Nuclearelectrica SA, “Cernavoda NPP Unit 1&2, Safety features of Candu 6 design and stress test summary report”, 2012;
20. UNENE, Basma A. Shalaby, “AECL and HWR Experience”, 2010;
WHEN SCIENCE MEETS THE ART, AND HUMAN AWARENESS MEETS THE RESPONSIBILITY
Gordana Laštovička-Medin
Faculty of Natural Science and Mathematics, University of Montenegro, Podgorica, Montenegro
Abstract:, In this paper we discuss how science and technology products, such as Internet of Things radically shaped the human relationships and engagement to the nuclear disasters monitoring and shifting the responsibility from government to citizens. Developing strong awareness of hazard effects, and giving the tools to citizens, the radiation monitoring become more personalized and self-directed, self-motivated, changing the passive observation into active participation. As reference we used the case of Safecast which was possible due to efforts of tinkering hobbyists, like the members of the Tokyo Hacker space, who designed the way to feed information that was critical onto the Internet in real-time. It emerged from human choreography where science meets the art, and human awareness meets the responsibility. Using donated Geiger counters and connecting them with Arduino development boards, an open source electronics prototyping platform, they were able to do that. Using platforms like Cosmo (formerly Pachube), which connects people to devices, applications and the Internet of Things, it was easy to aggregate all the data in one easily accessible place, which sparked visualizations like Haiyan Zhangs which uses the information available and presents them in easily understandable form, giving meaning to the measurements gathered in Japan. This paper explores the impact of connected objects on future of radiation monitoring. We give brief review and own view how interplay of social situatedness and connectedness, together with movable lab on chips, including signal acquisition and visualization of the world, data collection and aggregation, and presentation in an understandable way, are at the heart of the Internet of Things which dramatically changed the social response and relation to the nuclear disasters. Key words: radiation, public awareness, open source platform, DIY scientists, Safecast, community lab
1. INTRODUCTION
Over centuries science becomes institutionalized. Firm boundaries were established: inside was professional scientist, outside were amateurs, enthusiast – those who did research on their own interest and their own term – freely, unconventionally and driven only by their curiosity and not by urge for publish paper. But now there is revolution. Teenagers are building robots while hacktivists are monitoring state surveillance. A new type of labs is created and new type of scientists is created. It reinvented what it means to be scientists. A new, “open” movement is generated. Mutually, a new cultural shift is created: citizen responsibility, awareness and citizen inspection oppositely to previously inferiority towards authority knowledge. Knowledge created through digital media and on volunteering base, disputes the methods and paradigm on which authorized agencies for radiation protection and measurement exists. Undoubtedly, enormous amount of money is spent each year, all around the world, for the purpose of radiation protection and measurements. Unquestionably, the jobs are done, but intriguingly, when comes to the nuclear accidents, it always appears uneasiness and unpreparedness. In a report on the Fukushima accident (reported after accident on the International Atomic Energy Agency (IAEA) ministerial conference), the Japanese government has recognized deficiencies
in preparedness and responses. And as usually, they insist that lessons will be learned from the accident. Nevertheless, intellectual authority of knowledge is over and over widely questioned.
Why did I decide to write this article? Because I was inspired by Safecast. Firstly I want to emphasize the fact that through social media, the Internet has put global –scale communication tools in the hands of individuals and changed the role of citizens in nuclear accidents. Secondly, digital media created physical tools and gave it into hands of individuals to inspect authorized knowledge, and to contribute with own involvement. Thirdly, I wanted to celebrate DIY self-styled scientists and tinkerers because their work influenced me as a teacher, and helped me to make more authentic and contextual teaching which empowered student’s learning and their intellectual growth. Undoubtedly, they inspired me to see citizen role in radiation measurement and protection from different perspective.
This paper shows an activity that emerged independently in the global civil society during the aftermath of the nuclear disaster. The activity of Safecast provides a very important suggestion for the civil activities concerning the radiation protection in the era of Internet

532
2. OUT OF THE LAB AND INTO THE STREET: FAB LABS AND
SELF-STYLED DIY SCIENTISTS
For a certain period I have been disturbed by the profound sense of intellectual disorientation that appears to afflict many of our cultural institutions. In particularly dumping down students at University and infantilizing the culture had an huge impact on me. I do not think anyone explicitly supports it, but it happens when institutions adapt a cavalier attitude towards standards. “The attitude of university management not only infantilizes students but also minimizes the role of reason and logic in intellectual debate. As consequence intellectual degradation of academic professionals arises”, as pointed out by Frank Furedi in his book “Where have all the intellectuals gone” which I found was very realistic. He pointed “Institutions do so, because they believe that people will feel aliened unless they engage with experiences that are deemed to be directly relevant to their lives and link to their personal experiences? Powerful ideas often have an abstract character and are developed through the assimilation of a range of conflicting experiences. Acquiring the objective knowledge cannot be confined to the process of reflecting on an individual’s life stories”.
Undoubtedly, emergencies and urgent calls for quick responses always shows intellectual disorientation. It is not an expert who is required to solve the problem, it is knowledge which can be ‘communicated’, disseminated and recreated and in emergency centralized. As it was shown in Fukushima case, “open scientists” did great job, even they had no expertise in the field of radiation measurement. Nevertheless, they accomplished the task – they build radiation sensor network and distributed it to citizens. Developing strong awareness of hazard effects, and giving the tools to citizens, the radiation monitoring become more personalized, more citizen-directed, citizen--motivated, it had changed the passive observation of the society and previously the inferior position into active participation. Furthermore, by giving tools and skills to citizens in order to enable them to control/monitor environmental hazard, for the first time citizens got chance to have control over expertise knowledge, namely knowledge of government agencies written and as such stamped in government agencies’ reports. DIY-hacker-networks have empowered resourcefulness: questioning, monitoring, marking links, imagining, reasoning. All of this was also possible due to social engineering movement with the imperative of the connection and recognition. Imperative to “connect” leads to a situations where cultural, educational, governmental institutions are less likely to be judged according to their criteria internal to themselves then on their relevance and accessibility to a wider public. Relevance has become a key concept of the contemporary ethos of social engineering. The interplay of “open” source code and hardware movement and social engineering, both empowered by the internet, and embedded into eco-system in which man is significantly connected to the machine, and machine/chips are dissolved in all artifacts of human lives making remarkable symbiotic relation, was illuminated by the nuclear accidents and urge for a response. When unpreparedness and weakness of authorized agencies become visible, an
early crowd-sourcing initiative was born in order to sponsor and assist in gathering, monitoring and disseminating radiation data from the affected areas. It was an opportunity to use technology to augment the government’s reports and to make the information widely available. The volunteering network of scientists, tech enthusiasts and residents of Japan collectively known as RDTN.org (later called Safe cast, which is an amalgam of “safety” and “broadcast”) had done a great job and their action has brought new paradigm in nuclear emergence: transparency.
To criticize or celebrate and respect circumstances we live in and cope with today we have to recall the past and to analyze public access to the radiation monitoring and the availability of data more than two decades ago.
Two nuclear accidents from our recent history, Chernobyl and Fukushima, belong to different ages: age of paper, and age of internet. Chernobyl accident happen in 1986, just around the time when chips, containing tens of millions of transistors, made possible personal computers that can fit inside a briefcase, but was accessible to only few. In 1990s the Internet connected hundreds of millions of computers into the single, global computer network. In 2000s ubiquitous computing freed the chip from the computer, so chips were dispersed into the environment; in other words, the Chernobyl accident happen around the time when personal computers were new, just beginning to penetrate people’s lives, and the internet was still largely the isolated tool even from many scientists. In more than 20 years after Chernobyl, we see enormous change in computing world and in access people have in their every-day life. The old paradigm (a single chip inside a desktop computer or laptop connected to a computer) is being replaced by a new paradigm (thousands of chips scattered inside every artifact, all communicating to one another and connected to the Internet).
Not surprisingly, in such circumstances a new kind of public involvement was born. Usually we consider the impact of citizens in big data online activities. But it is not all. There is another type of public involvement which we saw in particular in response to the Fukushima nuclear accident, in 2011, which underlined how much science can benefit from recognizing the value of inventive and interested enthusiasts. When we apply the self-organizing and innovative hacker mentality to scientific research as well, something new appears: the self-styled Do-It-Yourself (DIY) scientists. These are people doing science for their own sake, for their own curiosity, for themselves and on their own terms, and on their own speed – in a local community lab. Even the line between practice of citizens and DIY scientists is blurred; the result is science done outside university or lab walls. A lot of the DIY science work takes place in hacker spaces and fables, with the help of makers- people who tinker with physical objects. The first recognizable hacker space was C-base in Berlin, but the movement did not take really move until 2007, when it spread to US. Now there is over 1100 and the model has diversified gather to build everything from open-source scientific instrumentation for genome sequencing to satellites and parts for 3D printers. Perhaps the biggest groups of DIY scientists are bio-hackers – people who tinker with the stuff of life. DIY and tinkering movement

533
made great influence not only on science but also made impact in student’s classrooms. Young people become their own best self-assessors.
The philosophy behind open source platforms is promoted in its openness allowing to everyone to look into code or hardware, inspect it, criticize and improve. Putting the focus on improvement also reduces the emphasis on judgment. Cooperating with a peer in order to make work even better helps pupils appreciate others’ strengths and the value of another point of view, and can enhance learning autonomy by assisting the realization that it can be very useful to seek another person’s perspective. The citizen science has been projected as something special and valuable but what has to be done now is to link citizen science into science enquiry where people of different levels of scientific knowledge and experiences can input into the new interdisciplinary projects.
Undoubtedly, DIY and tinker- societies will have huge implications on the growth of the scientific mindset and the tinkering/making skills. By re-injecting an enthusiasm for tinkering the balance could shift away from theory and back towards experimentation. We hope that scientific institutions will see the value in involving the public research in new ways, with the Open Science lab leading the way. Bringing a new perspective to a discipline as fundamental to society as science has long been considered as a way to promote creativity and innovation. However, this new science is also a symptom of an important cultural shift. Not only are people educated in and engaged by science, the scientific institutions are opened up to a more progressive way of operating – one that recognize the power and value of bringing “amateurs” on board. Public response and activities of DIY “open” movement show and confirm that a crowd is more than the sum of its parts. Where we go from here is in our hands.
For readers we recommend to look into [1,2,3,4,5,6]. There are interesting points of view, and alternative viewing.
3. NUCLEAR HAZARD AND HUMAN CHOREOGRAPHY
WHERE SCIENCE MEETS THE ART AND HUMAN
AWARENERSS MEETS THE RESPONIBILITY
March, 11th, 2011 is a day Japanese’s pride and ignorance converged over the lives of more than 1500 living, breathing human beings, and only because of a few thought we, humans are invulnerable. The loss of life the human race experienced that day was not one created by human oppression or mass genocide. It was what nature gave in return to human race for being ignorant. A lack of existing information, a lack of government leadership, the suppression of data from those who are in position to provide it with accuracy, and a resulting ocean of disinformation.
The Fukushima nuclear crisis can be analyzed from the perspective of uses of social media. In this context the Fukushima nuclear crisis appears to be unprecedented of one looks “at the surface features of the role of social media in the unsettled crisis” as pointed out in [7]. The crisis showed that people living in Japan and beyond participated in knowledge production which was liberated and empowered by
digital technology, and by harnessing social media such as Twitter, Facebook and YouTube. In particular, as pointed out in [7], many people engaged in DIY (do-it-yourself)reporting of Geiger counter readings and distributed the collected data to those who were concerned about the level of nuclear radiation by using social media. The DIY reporting on pollution is unquestionably nothing new, but in this case it is remarkable the way how people widely produced, circulated, and consumed the collected data by using social media and moreover “used the data for their individual or collective ends”[7].
Importantly, it should be underlined that the collected data are not necessarily utilized as a resource for collective action. “Whether the data are collected and utilized for collective or individual ends depends on the participant’s background, previous commitments, and social capital”[7]. One of the example is Setagaya Kodomo o Mamorukai [8]. Established by mother and father living in Setagaya, Tokyo, Setagaya Kodomo o Mamorukai, or “The organization for Protection Our Kids (from Nuclear Radiation) in Setagaya”, is one division of the Tokyo Rengo Kodomo o Mamorukai. Setagaya Kodomo o Mamorukai is primarily involved in DIY reporting of nuclear radiation in schools, daycare canters, and parks where their kids are usually playing.
Fig. 1. Safecast: Radiation measurement equipment [11].
One distinctive feature of the organization is that as reported in [7], they use the data as a resource for lobbing for their local government. More importantly, their DIY reporting of Geiger counter readings is often developed in collaboration with local government and professional scientists. What these Geiger –reading communities share in common is that they all use the digital networks including social media, to connect people to produce collectively generated knowledge. It is “suggested that social media have provided tremendous, if not unprecedented, opportunities for people to participate in generating knowledge regarding the level of nuclear radiation. In practise, the knowledge on radiation risks has been shaped through the interaction between the distributed/circulated power of social media and the concentrated power of mass media (and scientists’ communities)”[7]. Undoubtedly, one should not overlook the meaning of uses of social media in the Fukushima nuclear crisis.
Some might consider that social media decisively determine the characteristic of DIY reporting and the feature of the generated knowledge [7]. I do not think so. Such a media – centric argument, which is often dismissed as a sort of “technological determinism”, is inherently ahistorical as agreed in [7]. Indeed, uses of social media need to be understood in cultural and

534
historical context. Importantly, woman activities and their role in Fukushima accident brought important attention to the relationship among gender, technology, and the emergence of voices in Japanese public discourse that have had comparably less political impact then earlier times.
The practice of citizen involvement in scientific projects as citizen scientists is not really new [9] in some fields , especially in environmental monitoring projects. The question is where does the DIY movement fit in to the longer history of Japan’s citizen protests and social movements in postwar Japan?
Studying the historical context should be a precondition for a better analysis of the DIY movement and their uses of social media as well. Additionally, one must not forget the role of citizen scientist in anti-nuclear movement. To have complete picture one has also to understand the social-state relation and the way nuclear industry reshaped the public opinion. Japan’s drive for nuclear power was the result of neither a bottom-up demand for nuclear power nor a natural inclination to adopt the newest technologies in energy production. Instead, the Japanese state sought to alter the preferences of citizens through a variety of means, ranging from coercion to economic incentives [7]. “Rather than waiting for shifts in public opinion to direct public policy, the state has sought to manipulate public opinion and to bring it in line with state goals”. It is also interesting that only nation to experienced first-hand horror of nuclear weapons created the world’s most advanced, closed-fuel-cycle commercial nuclear power program which actually was abandoned in US and France due to their expense and unproven nature. Anti-nuclear group have formed slowly, growing from primarily local opposition efforts in the 1960s and ‘70s to regional protest in the ‘80s, and finally to national level opposition in the late 1980.
One of the most active umbrella organizations today, the Citizen’s Nuclear Information Center (CNIC), was formed in 1975 which remarkable altered public perception of atomic energy. Jinzaburo Takagi, who founded Citizens' Nuclear Information Center in 1975 pointed out the important role of citizen scientists. The anti-nuclear activists as well as Takagi had built a network that made it possible to measure radiation in many points of Japan before Fukushima disaster. What is new? One may ask. What was the uniqueness of Safecast compared with the former civil activities that had been measuring radiation in Japan?
The difference is in different communication media. Social medias are changed. The internet and in particular the advent of web 2.0 broadband communications, smart mobile computing, cheap electronics, miniaturization of sensors, open source and crowd source, social networks, satellite position system (GPS, makes it possible for all of us to share knowledge in collaborative distributed “virtual” places. In [7] authors argue that the “do it yourself” movement sustained and is sustaining the “Open everything” and has been, indeed, fuelling computer science and electronics, “paving the way for the next steps for ‘citizen science’, and science for that matter. “Because of their, by design free format, they naturally appear as trans-disciplinary projects engaging in sciences, art and the law. Do-It-Yourself / DIY scientists are non –specialised, hobbyists and amateurs but also an increasing number of professional scientists [10,11],
doing science outside conventional university or lab settings, and instead in Makerspaces, Fablabs, Hackerspaces, Techshops, innovation and community-based labs, oreven in their homes, garages or schools. When there is interplay of citisen science with DIY, hacker or maker way of thinking, the DIY scientists appears as someone who tinkers, hacks, fixes, recreates and assembles objects and systems in creative and unexpected directions, usually using open-source tools and adhering to open paradigms to share knowledge and outputs with others. There is now a hype revolution around the DIY/maker movement and a next generation of craftspeople, tinkerers, hobbyists and inventers [12]
However according to data from Johns Hopkins Global Civil Society Index, the capacity, impact, and amount of voluntarism in Japan at the beginning of the 21st century fell below the levels in economically similar countries. Environmental protest movement in 60s and 70s might have been echoed in some of the DIY movement, including the heavy involvement of woman.
Another question we want to address is accuracy and reliability radiation reading data provided by DIY. Since there are people with limited or no technical training in nuclear physics or engeenring, could there be reporting errors that significantly overstate or understate the levels of radiation found? Even if the numbers are reported faithfully, the access to the raw data without training in how to interpret it could lead to faulty conclusions, which can have serious consequences. To scientifically answer this, one should never romanticize the DIY movements. Indeed, the accuracy and the reliability of DIY movement and the dissemination of information through social media are highly controversial issue. According to extensive research we did by browsing the web pages, the most of DIY projects show in details how to measure the level of nuclear radiation accurately. Partially to promote DIY and hacker mentality and partially as part of author’s research project to investigate the accuracy of DIY when used by those who are not yet trained in nuclear physics students were given task to gather information on the internet, order DIY kits and following instruction to assemble the kit and perform the measurements. The work in under progress. So far what we sow is the remarkable responsibility of participants mainly inspired by DIY scientists and Safecast story.
Another point we want to address in this paper is how does the role of scientific authority change with the democratization of technology and science. The government’s poor response to the Fukushima’s disaster seems to have tarnished its place as a source of authority and many of it’s findings are dismissed out of hand by protestors simply because they come from the government.
Do these DIY networks provide an alternative source of authority and are they a legitimate replacement to traditional avenues of scientific authority?
What was/is the role of the universities, particularly publicly funded ones? To answer this one has to keep in mind that many university professors are involved in nuclear industrial complex in Japan, and thus less independent. Does this leave interested,
535
but untrained, members of the public to choose their experts? If so, what role does confirmation bias play?
“Does this movement tend toward atomization of public opinion to the point where public policy debates about science become a matter of almost religions faith (like the US debates over global worming)?”[7]. To answer those questions which I partially retrieved from [7], one should not overlook the emotional meaning of stories and images via social media. It remain to be seen whether the DIY networks are replacing traditional avenues of scientific authority by providing an alternative source of authority, collective knowledge authority. For sure, the credibility of scientific authority seems to be more or less affected by uses of social media, nevertheless there might be lack of accuracy or reliability of reported/collected and transparently visualized data, due to unprofessional collectors. It is important to point out that Safecase use selected (reliable) data.
Examining the attitude and mentality of DIY scientists i do not think they are reengineering or will prevalent the role of scientific authority. They do their job in order to challenge themselves and solve the problem, they do not examine the skills and knowledge of scientific authority but do science for their own sake. Here awareness and responsibility do remarkable choreography. It was an interesting interface between society, politics and science. It also gets us thinking about the problem of technical standards in post-disaster environment. In this instance if the government ot TEPCO are unwilling to measure (or if their measurements aren’t trusted), citizen are making and logging the data themselves.
The case of Safecast was possible due to efforts of tinkering hobbyists, like the members of the Tokyo Hacker space, who designed the way to feed information that was critical onto the Internet in real-time. The RDTN.org (Safecast) was an early crowd-sourcing initiative to sponsor and assist in gathering, monitoring and disseminating radiation data from the affected areas [13]. RDTN intended their independent measurements to provide additional context for the radiation data reported by the official factors, to supplement and not to replace the data of the competent authorities [14]. RDTN successfully launched a micro patronage campaign to raise $33,000 in order to buy 100 Geiger counters to jumpstart their network [15]. In April hackers at tokyohackerspace prototyped an Arduino-based geiger counter shield to upload data from Geiger counters including from RDTN supplied counters [16,17] This prototype was later developed into Safecast mobile geo-tagged radiation sensors. In late April, one month after its start, RDTN folded itself into Safecast (org) with the joint announcement that RDTN was rebranded as Safecast. Using donated Geiger counters and connecting them with Arduino development boards, an open source electronics prototyping platform, they were able to do that. Using platforms like Cosmo (formerly Pachube), which connects people to devices, applications and the Internet of Things, it was easy to aggregate all the data in one easily accessible place, which sparked visualizations like Haiyan Zhangs which uses the information available and presents them in easily understandable form, giving meaning to the measurements gathered in Japan. There are other citizen-led projects to take radiation readings, but one
of the key features of Safecast is its way of measurement; by using their original hardware attached to a vehicle, they log radiation levels along with GPS data in motion. This approach has enabled high-speed collection of a massive amount of radiation data.
Safecast organization appears to be a case where a) citizen data are centralized and networked into academic research network that have been working on creating effective (i.e., policy influencing) visualization of the data, and b) social entrepreneurial and social networking strategies were invoked in order to create the organization (including technological innovation designed to interface Geiger counters with mobile devices that transmitted radiation readings to a central location. Joint efforts of partners such as International Medcom and Keio University, Safecasr helped building a radiation sensor network comprise of static and mobile sensors actively being deployed around Japan. Safecast releases data openly and is pushing the Japanese government as well as universities and researchers to share their sensor data. It is non profit group building Geiger counters, measuring radiation levels, and making data available to the public through the maps, a Web site and data feeds to citizens, scientists and the public.
According to [18], up to date, Safecast has accumulated almost 16 million data points on their radiation map spanning seven continents. Currently Safecast ‘s goals include a global radiation mao in an effort to “baseline the planet” [18]. To summarize, Safecast today acts through collaboration with memers of Tokyo Hackerspace, the Arduino community, RTDN.org, International Medcom, MIT Media Lab, and Keio Universe. Here we give brief description. “The Tokyo hackerSpsce imitative was created from discussions at TokyoBarCamp 2009. It is collective made up of programmers, engineers, IT administrators, artists, chefs, musicians and people interested in geek culture. The goal of the group is to converge technology, arts, crafts, and mysic”[ retrieved from Tokyo HackerSpace websites]Their focus is to learn and share knowledge. Arduino stated in 2005 as a project for students at the Interaction Design Institute Ivrea in Ivrea, Italy. Shortly thereafter a “global community of open source hardware hackers was formed around the technology, driven by curiosity, and creating the global community today. An Arduino board currently consists of an Atmel 8-bit AVR microcontroller with complementary components to facilitate programming and incorporating into other circuits. “Much akin to the Sccience Fair Electronics Project Kit of the 1980’s, Arduino brings open-source hardware hacking to a new generation of enthusiasts and professional alike”[18]. “Open source software has been deemed free speech, and in some educational circles, computer programming is even considered as second a language. Surely this must also apply to open hardware design as the competitive nature of the technology industry thrives because of it”[18].Launched on 2011, RTDRN.org allowed people to submit their own reads. International Medcom was lunched in 1986 and it is the manufacturer of high quality radiation measurement equipment which include the CRM-100, Onyx, and the Inspector Alert Geiger counter. The MIT Media Lab was founded in 1985 and its graduate concentration is media arts and science. According to their web site, the MIT Media
536
Lab “creates disruptive technologies”, ..., ”pioneering such areas as wearable computing, tangible interface, and affective computing”. Keio is Japan’s first private institutions of higher learning, which dates back to the formation of a school for Dutch studies in 1858 in Edo, present-day Tokyo, by founder Yukichi Fukuzawa. The “breaking it down with agile” is at heart of Safecast [18] (according to Wikipedia - ‘agile process’ is ‘a group of methods based on iterative and incremental development, where requirements and solutions evolve through collaboration between self-organizing, cross-functional teams”).
Developing strong awareness of hazard effects, and giving the tools to citizens, the radiation monitoring become more personalized and self-directed, self-motivated, changing the passive observation into active participation. Safecast case emerged in human choreography where science meets the art, and human awareness meets the responsibility.
4. CONCLUSION
Paper gives an insight into a phenomenon of increasing public control of government decisions and democratization of scientific knowledge and its applications (as in the field of radiation monitoring) due to digital communication and social media. Fukushima case shows that social media in digital world, driven by hacker mentality and DIY tinkering skills, are moving to another dimension, towards collective experimentation and rediscovering scientific diversity.
Acknowledgement: The paper is a part of the research done within the re-inventing and re-designing the course “Basic measurement in Physics” of the Faculty of science and mathematic at the University of Montenegro. The initiative is to bring hacker mentality and DIY tinkering skills into lab with aim to build wireless sensor network for radiation measurement in Montenegro.
REFERENCES
1. http://truthalliance.net/Archive/News/tabid/67/ID/7933/Japans-citizen-scientists-map-radiation-DIY-style.aspx
2. Susana Nascimento, Ângela Guimarães Pereira, Alessia Ghezzi, “An annotated account of an on-going movement From Citizen Science to Do It Yourself Science”, JRC93942, EUR 27095 EN, ISBN 978-92-79-45381-6 (print), ISBN 978-92-79-45380-9 (online)
3. Austin, Bill (28 March 2011). "IPhone Versus Soviet Subterfuge Make Fukushima No Chernobyl". Bloomberg Businessweek. Retrieved 11 April 2011.
4. "Citizen scientists help monitor radiation in Japan". BBC Programs. 8 April 2011. Retrieved 11 April 2011.
5. Courtland, Rachel (25 March 2011). "Radiation Monitoring in Japan Goes DIY". IEEE Spectrum Tech Talk. Retrieved 11 April 2011.
6. http://en.wikipedia.org/wiki/Open-source_movement 7. Yasuhito Abe, Analyzing the Fukushima Nuclear Crisis
through Uses of Social Media: A short Essey on a Work in Progress, retrieved from http://fukushimaforum.worldpress.com/, Interdisciplinary conversations about the 2011 Disaster Including the Fukshima Dai-ichi nuclear accident
8. http://setagaya-kodomomamoru.jimdo.com/ 9. J. P. Cohn, Citizen science: can volunteers do real
research?, Bioscience 58, 192-197 10. A. Griffitchs ‘DIY labs offer an agile alternative to
university based research’, The Guardian, 16 June,[Available http://www.theguardian.com/higher-education-network/blog/2014/jun/16/diy-labs-exciting-alternative-university-science-research
11. Susana Nascimento, Angela Guimara and Pereiraa Alessia Ghezzind, JRC Science and Policy Reports: From Citizen Science to Do It Yourself Science, JRC93942, ISBN 978-92-79-45381-6 (print), ISBN 2014, ISBN 978-92-79-45380-9 (online), 2014
12. D. P. Anderson, C. Christesen and B. Allen, Designing a runtime system for volunteer computing, in Proceedings of the 2006 ACM/IEEE conference on Supercomputers, p 126, 2006
13. "Study: Modeling Fukushima NPP Radioactive Contamination Dispersion Utilizing Chino M et al source terms". Progressive mind. 27 October 2011. Retrieved 20 March 2012.
14. "Crowd-sourcing aids Japan crisis". BBC News. 21 March 2011. Retrieved 11 April 2011.
15. Madrigal, Alexis (11 April 2011). "The Open-Source Project to Build a Citizen Radiation Detection Network in Japan". The Atlantic. Retrieved 12 April 2011.
16. Alvarez, Marcelino (May 7, 2011). "RDTN.org: Radiation Detection Hardware Network in Japan". Kickstarter.
17. "Tokyo Hackerspace/RDTN Geiger Shield - Dev History". April 11, 2011.
18. htttp://radiationprevention.com/crowdsourcing-radiation-measurement

AN ESSAY ON THE FUTURE OF PHYSICS AND SCANNING TECHNOLOGIES: LIMITS BY FOUR FUNDAMENTAL FORCES AND QUANTUM MECHANICS
Gordana Laštovička-Medin
Faculty of Natural Science and Mathematics, University of Montenegro, Podgorica, Montenegro
Abstract: The success of first generation of brain scans has been fantastic and spectacular. Just a small number of regions were known before. Now NMR machine opening up new frontiers for brain science. To understand the reasons why this radical new technology which offered window into the brain helped to decode thinking brain we have to turn our attention to basic principle of physics and that is the subject of the introduction of this article. Another question is what the future of physics is, or in another words, what the technology limits set down by the law of physics are; the scientific quest to enhance and empower the mind and technology. With so many new scanning technologies being introduced from physics just within the last fifteen years, one might wonder: are there any more? The answer is, yes, but they will be variations and refinements of the previous one, a new way of looking at something that brings to light an entirely new perspective, but not radically new technologies. This is because there are only four fundamental forces in nature: gravitational, electromagnetic, weak nuclear and strong nuclear. Furthermore, the quantum mechanics which rule the transistors set another limits to electronic power and computation. At present, the electromagnetic force is the source of almost all scanning technology except PET scan which is governed by the weak nuclear force. However, NMR size and access to people raises intriguing questions: will MRI machine fit soon into cell phone? What is the future of “hyper modal" imaging technologies that merging the results of multiple modalities (computed tomography (CT) scanning, positron emission tomography (PET) scanning, photoacoustic imaging, upconversion imaging and Cerenkov luminescence imaging)? How close we are to the artificial mind and silicon consciousness? Designing and fabricating miniaturized (lab-on-a-chip) devices is extremely challenging, but physicists and engineers are beginning to construct highly integrated and compact labs on chips with exciting functionality. Another question, which is highlighted these days, is the future of reverse engineering the brain. This article shows that no matter how spectacular the success of the past twenty years, they were just taste of the future.
Key words: NMR, CT, computing, physics laws, technology progress, nanotechnology
1. INTRODUCTION
This paper does not deal with radiation measurements itself, but rather tackle the present and future movement in imaging technologies, opening some questions on limitations imposed by physics law and give an insight into different perspective of radiation measurement. Digital world with electromagnetic radiation at its heart, brought wearable technologies, internet of things and nanorobotics. Cancer-fighting nannorobots are already getting life in its prototyping. The way to place drag into tiny boxes and keep it safe and away from healthy cells until the sensor compute the identity of a cancer cell and then the box is unlatched sound amazing and the most fascinating – it seems very possible. Shrinking technologies in digital world are challenged by limits imposed by physics law. The new century of brain enters the world, requiring more sophisticated technologies. Much of current excitement concerns subfield of a called “deep learning”, a modern refinement of “machine learning”, in which computers
teach themselves up against tasks by crunching large sets of data. Steady improvements in computer hardware have been supported by periodic doubling of transistor densities in integrated circuits over the past fifty years. Moore’s law requires increasing efforts, stimulating research in alternative hardware and stirring controversy. Are processors pushing up against the limits of physics – from the perspective of whether Moor’s law will hold, as well as whether it matters? What are limits on fundamental limits to computation? For sure, one question is what the physical limitations on technology design and computations are, but another one is how far the technology progress is from its “affordable” and “achievable” maximum which is defined by laws of nature. The only limit is human cleverness. The point is that new design will not work under inappropriate conditions, or under physical laws which are not suitable for those circumstances. We cannot expect either that old design, or old hardware structure work in new circumstances. We have to know not only what limits of design imposed by physics are, but importantly, we have to know what the design model is the best under the certain circumstances. It might be that the era of traditional transistor scaling
538
where we take the same basic structure and materials and make it smaller is ended. So it might be that emerging new design thinking will replace the old one.
This paper is organized in the following way. Firstly we discuss the basic ideas how science lights the way to an understanding of how the world’s most complex machine gives rise to our thoughts and emotions. We give an insight into diversity of future technologies which will relay on inter-disciplinary and multidisciplinary strategies. We also impose some questions and thoughts on limitations imposed by physics law and give an insight into different perspective of radiation measurement. The past and future of imaging is given in the last chapter.
2. INTERPLAY OF NATURE LAW, HUMAN AWARENESS
AND PATTERN RECOGNITION
All scanning technology and all information technology as well as any technology rely on the same laws as any living cells. All living creatures cannot function without electricity. Through electrical impulses our nerves alert our brain to pain but also convey the multitude of sensation captured by sight, sound, taste, touch and smell. Analyzing this limit, our brain then uses the same means of communications to tell our muscles movement but also the subconscious working of organs such as the heart. Unlike the slow-paced chemical communication of, say, hormones, electric impulses allow these important messages to be transmitted almost instantaneously. Another important feature of body is that body is full of small magnets, each charged particle while moving create magnetic field. Once we are exposed to magnets our body is “aligned” to the external field. These two features are used in scanning technologies, as interplay of common physical laws that rule the machine and human in an echoing interaction. The success of first generation of brain scans has been fantastic and spectacular. Just a small number of regions were known before. Now NMR machine opening up new frontiers for brain science. To understand the reasons why this radically new technology which offered window into the brain helped to decode thinking brain we have to turn our attention to basic principle of physics and that is the subject of the introduction of this article [4,5]. Another question is what the future of physics is, or in another words, what the technology limits set down by the law of physics are; the scientific quest to enhance and empower the mind and technology. With so many new scanning technologies being introduced from physics just within the last fifteen years, one might wonder: are there any more? “The answer is, yes, but they will be variations and refinements of the previous one, a new way of looking at something that brings to light an entirely new perspective, but not radically new technologies” [4]. This is because there are only four fundamental forces in nature: gravitational, electromagnetic, weak nuclear and strong nuclear. Furthermore, the quantum mechanics which rule the transistors set another limits to electronic power and computation. And energy consumption set another request. At present, the electromagnetic force, is the source of almost all scanning technology except PET scan which is governed by the weak nuclear force. Almost all
technologies are driven by Maxwell equations. Electromagnetic force was discovered 150 years ago, so, due to exceptionally long period of experiences working with electromagnetic force there is no secret in creating new electric and magnetic field, so any new brain-scanning technology will most likely be novel modifications of existing technologies, rather than being something entirely new. Actually the discovery of radio waves, a type of electromagnetic radiation, revolutionized the scanning technologies.
The MRI works on the following way. When the magnetic field is turned on, the nuclei of the atoms inside patient body act much like a compass needle. They align horizontally along the direction of the filed. Then a small pulse of radio energy is generated, which causes some of the nuclei in our body to flip upside down [4,5]. When the nuclei later revert back to their normal position, they emit a secondary pulse of radio energy, which is then analysed by the MRI machine. By analyzing these tiny “echoes” one can then reconstruct the location and nature of those atoms. Interestingly, there are some indications that might be possible to reduce the size of MRI into cell phones [4]. But for that purpose we have to solve the problem of uniformity of magnetic field which is essential for the MRI, in particular for its resolution on which is based how deep digging into brain can be performed[4,5]. The fundamental challenge of MRI is as previously said, the resolution, both spatial and temporal. At present, the resolution of MRI is few fractions of milometer [4]. The spatial resolution will increase as magnetic field become more uniform and as the electronics become more sophisticate and sensitive. The temporal resolution of MRI is also limited by slow flow of blood. Another useful tool to probe deep inside the brain is EEG, the electro encephalogram. It was introduced in 1924, but only recently has it been possible to employ computers to make sense out of all of data taken from each electrode. The helmet with electrodes is connected to the computer and helmet is placed on the head of patient. There are few important differences between EEG and MRI. The MRI scan, introduce radio pulses into the brain and then analyses the “echoes” that come back. This actually mean that the frequency of radio waves can be tuned, varied in order to select different atom for analyses, allowing location the specific part of the brain or body. The EEG is however strictly passive, it only analyse the pulse naturally emitted by brain. EEG was very useful in analysing the activity of brain, since EEG is capable to record the broad electromagnetic signals which allows to scientists to measure activity of brain as it sleeps, concentrates, relaxes, dreams. However, the main drawback to the EEG is its very poor spatial resolution. The EEG picks up electrical signals that have already been diffused after passing through the skull, making it difficult to detect abnormal activity wen it originates deep in the brain [4]. Looking at the computer it is almost impossible to properly with certainty locate which part of brain created it. A much more sensitive method is the fMRI (functional magnetic resonance imaging) scan. EEG and fMRI scans differ in important ways. The EEG scan is a passive device that simply picks up electrical signals from the brain, so we can not determine precisely the location of the source inside the brain [4]. An fMRI uses “echoes” created by radio waves to see inside living tissues. What important is that the whole process is harmless since the radiation
539
to patient body is non-ionizing and could not damage patient cells by ripping apart the atoms. Even suspended in a magnetic field thousands of times stronger than the earth’s we could not detect the slightest change of my body.
Another very useful tool from the world of physics is positron emission topography (PET) scan which calculates the flow of energy in the brain by locating the presence of glucose. PET scans make use of the subatomic particles emitted from sodium-22 within the glucose. Every time a sodium atom decays it emits a positive electrons, or positron, which is easily detective by sensors. PET scan share some properties of MRI, but does not fine spatial resolution as MRI. Another drawback is, unlike MRI and EEG scans, PET scans are slightly radioactive.
Beside above mentioned, many new high-tech devices appeared in neuroscience: the transcranial electromagnetic scanners (TES), magneto encephalography (MEG), near-infrared spectroscopy (NIRS, and optogenets, among others. The basic physics behind these new tools is that a rapidly changing electric field can create a magnetic field, and vise versa. MEGs passively measure magnetic fields produced by changing the electric fields. Like EEG they have very good time resolution, but pure spatial resolution. Oppositely to passive measurement of MEG, the TES generate a large pulse of electricity, which in turn creates a burst of magnetic energy.
One breakthrough imaging technology that can be used in addition to conventional imaging technologies is scientific CMOS (sCMOS) which has great resolution and fantastic noise to signal rates, but because the frames has to be read one after another, it has problem with getting speed up, since it affects resolution and distorts it. Another really fascinating thing is electron multiplied CCD (EMCCD) which is both ultrafast and ultrasensitive. This technique is very suitable for ultralow-light measurement, such as pinpointing individual molecules. Remarkable new method born from biology, in its interplay with physics and information technology, and broadly known as optogenetics involves genetically modifying “phitochromes” – lightsensitive signaling proteins founds in plants – so that they respond to different wavelength of light, say eing activated by light a wavelength of 650 nm, but inactivated by light above 750 nm. We will not go into details but mentioned it to provoke reader’s interest in biotechnology potential.
Undoubtedly, the future of NMR technology will be driven by software development and by science of new materials. the software. MRI resolution (crucial parameter) depends on uniformity of magnetic field, and to get uniform field the huge magnets are employed. If we want to shrink size of MRI then we have to develop software which will reconstruct uniformity of magnetic field and compensate the size of magnets. However the future of this is speculative.
3. LIMITS ON THE COMPUTATION
The technology innovations in digital world are
driven by “immortality” of computers. “Immortality” of computers is because they are re-programmable, and such machine is unique since it simulates any other
machine. Computers are programmable matter, “just a shuffler of symbols” They were born in the abstract field of pure mathematics as machines of the imaginations, but they turned out to be immensely practical devices. The limit on how small components can be made on a chip is determined by the procedure itself, namely by the light that is shone through the mask. In 1965, Gordon Moore, one of the founders of the American computer chip-market Intel, - pointed out that the computational power available at a particular price or, equivalently, the number of transistors on a chip – appears to double roughly every eighteen months[5,6]. Undoubtedly, Moore’s law will break down one day. There are physical limits set by the laws of nature, which are impossible to circumvent, that ultimately determine the limits on computers. The speed of a computer – the number of logical operations it can perform a second – turns out to be limited by the total energy available. The explanation for this is simple. It is the properly of wires as conductors. Empowering the computers by rapid increase of transistors that are built on chip will not work without fast and dense interconnects. However, metallic wires can be either fast or dense since decrease in wire cross section increase the resistance of conductor and consequently the increase in energy is performed. Regarding the limits in speeds of interconnects we have the fundamental limits derived from Maxwell equations such as maximum propagations speed of EM waves. There is one more interesting observation. Today’s laptop’s energy is totally dwarfed by the energy locked away in the mass of computer, which provides nothing more than the scaffolding to keep a computer stable. The ultimate laptop would have all of its available energy in processing and none of its energy in its mass. In order words, it would have its mass-energy converted into to light-energy, as permitted by Einstein’s famous E=mc2 formula. Chip-makers have made ever smaller components – packing in more and more transistors – by using light with a shorter wavelength, such as ultraviolet or X rays, which can squeeze through smaller holes. They have been replaced the light with beam of electrons since electrons have a shorter wavelength than light. The wavelength of UV light can not be smaller than a 10 nm, so we can use etching technology to carve out components that ore only thirty atoms across. But this cannot continue for ever from several reasons: firstly the temperature generated by powerful chip will eventually melt them. Using X-ray instead UV light to etch the circuits might work since X-ray has twice smaller wavelength than UV light (both are electromagnetic waves). But it also means that X-ray will have twice higher frequency, and beam use in production for etching the cave will have twice bigger energy and might destroy wafer. Another problem is related to the quantum physics, namely to the fact that size of chips cannot be forever reduced since the uncertainty principle, which says that we cannot know for certain the location and velocity of particle. Thus there is quantum limit to how small a silicon transistor can be. Solution might be to connect chips in parallel processing (the way our brain works) which is extremely complicated procedure. Recently a lot of attention was given to carbon tubes [7]. As mentioned before, we can only shrink silicon computers so far. As parts get smaller and more transistors can be packed on each chip, they waste more power and generate
540
more heat. But circuits based on carbon nanotube transistors have the potential to outperform silicon. They are so small that thousands could sit side by side in a human hair. They are made from grapheme, a single sheet of hexagonally arranged carbon atoms, rolled up into tubes. Carbon nanotubes (CNTs) are termally conductive, so heat passes quickly through them, and they’re electrically interesting, too. They can be conductive, insulting, or even semiconducting, meaning that it’s possible to control the flow of electricity through them. Because they are so thin, it takes very little energy to switch them off. A team from Stanford University in the US recently used these properties to great effect. They have developed the world’s first functioning computer prototype based on semiconducting CNT transistors.
4. FEYNMAN: ULTIMATE LOWER LIMIT TO THE SIZE OF
COMPUTER
Here we would like to refer to Richard’s Feynman book “The pleasure of finding things out”, Chapter 2 (Computing Machines in the Future) [3]. The talks ware delivered forty years to the day after the atomic bombarding of Nagasaki, and even these days occupies our sharpest minds: the future of the computing machine and the ultimate lower limit to the size of computers. Feynman discussed that the energy loss multiplied by the time it takes to operate is a product of several factors: (a) the thermal energy proportional to temperature kT; (b) the length of the transistor between source and drain, divided by the velocity of the electrons inside (the thermal velocity srt(3kT/m)); (c) the length of the transistor in units of the mean free path for collisions of electrons in the transistor; (d) the total number of the electrons that are inside the transistor when it operates. So by decreasing the size of transistor the energy is reduced. “We decrease the length between source and drain and we decrease the number of electrons and so use much less energy” [3]. It also turns out that smaller transistors are much faster, because electrons can cross it faster and make their decisions to switch faster. “But suppose we come to a circumstance in which the mean free path is longer than the size of the transistor; then we discover that the transistor does not work properly” [3]. As Feynman pointed out, the solution to any problem is design under right conditions. “You just have to know what the right laws are under the right circumstances, and design the device with the correct laws. You can not expect old designs to work in new circumstances. But new design can work in new circumstances, and I assert that it is perfectly possible to make transistors system, or more correctly, switching the system and computing devices in which the dimensions are smaller than the mean of path. This is of course consideration “in principle”.”[3] When we consider the reducing the size of transistors the first thing that we should worry when things get very small is Brownian motion – “everything is shaking and nothing stay in place”. How can you control the circuit then? Furthermore, if a circuit does work, doesn’t it now have a chance of accidentally jumping back? It seems we can be safe [3]. However much of it is in fact possible and I would like to refer to reader to an article (as well referred by Feynman) in Scientific American by C.H. Bennett and
R. Landauer, “The Fundamental Physical Limits on Computation.”. Another question imposed by Feynman was if we could make a computer in which the writing of bits is of atomic size, in which a bit is, for example the spin in the atom is up for 1 or down for 0. And, as he pointed out, our “transistors”, which changes the bits in different places, would correspond to some interaction between atoms which will change their state. As already said, the device won’t work right if we design it width the laws appropriate for large objects. We must apply the another law of physics, quantum mechanical laws, the laws that are appropriate to atomic motion. Feynman set the task “We have to ask whether the principle of quantum mechanics permit arrangements of atoms so small in number as a few times the number of gates in a computer that could operate as a computer. Feynman furthermore pointed out that this request has been studied and such an arrangement has been found. The key feature here is reversibility of quantum mechanical laws. As Feynman said and we recall it here for the completeness of consideration and for the sake of curiosity accomplishment of reader: “Since the laws of quantum mechanics are reversible, we must use the invention by Bennett and Fradkin of reversible logic gates. When this quantum mechanical situation is studied, it is found that quantum mechanics adds no further limitations to anything that Mr. Bennett has said from thermodynamic considerations”. Of course there are practical limitations that the bits must be of size of an atom and a transistor of 3 and 4 atoms. Feynman summed up the limitations as follows [3]: a) the limitations in size of atoms, b) the energy requirements depending on the time as worked out by Bennett, and c) the feature concerning the speed of light – signal can not be send faster than the speed of light. Once atomic size computer is available (with promising nanotechnology revolution) it would mean that the dimension, the linear dimension, is a thousand to ten thousand times smaller than those very tiny chips that we have now. It means that the volume of the computer is 100 billionth of the present volume, because the volume of the “transistors is smaller by a factor 10-11 than the transistors we make today. “So there is plenty of room for improvements in the computer and I leave it on you practical people who work on computer” [3], Feynman said. One question might rise from previous consideration: how information will be transformed from one atomic scale element to another one. Even more intriguing question is does such a device becomes very close to Nature itself? In other words, if we make computer simulation, a Monte Carlo simulation of a magnet to study critical phenomena, does atomic scaled computer become very close to magnet itself?, as Feynman was asked by audience. And the answer is – Yes, since it is “done to suite our purpose”.
5. PAST AND FUTURE OF IMAGES TECHNOLOGY
An extensive list of NMR publications is given in
[8]. As pointed by authors, ‘writing a review is an opportunity to challenge one’s understanding of a subject in a more general way than is done in writing a research paper, and in our view benefits not only the individual authors but also the research community in
541
general”. At early NMR developing stage, the articles were mainly concerned with reviewing the development of NMR: based on the theory and calculations of chemical shifts, coupling constants, and how molecular dynamics can be studied via relaxation rates. In 1973, Lauterbur and independently Mansfield and Grannel published the papers which introduced magnet resonance imaging (MRI). MRI continued to developed at a rapid rate with first reports of studies of limbs, organs and then of whole bodies being reported [first reports of studies of limbs, organs and then of whole bodies being reported [9). The quality of the images improved greatly following implementation of new techniques such as echo planar imaging [10] and spin-warp imaging [11] together with 3D projection reconstruction methods [12]. As pointed out in [8], the early 1970s saw the development of a completely new area of NMR application when Moon and Richards [13] demonstrated first time that high resolution NMR P-31 spectra could be obtained on cells and tissues. These so called MRS (magnetic resonance spectroscopy) methods were initially used to examine human muscle metabolism and later extended to include diagnostic studies of solid tumours and cancer cells [14]. In 1974, the spectacular developments in multidimensional NMR spectroscopy by Ernst e al. [15] triggered acceleration in NMR activity with a new possibility being further opened up by an avalanche of novel ideas from many laboratories. In the last 50 years there have been many more clever innovations in NMR and MRI, with the major developments being undoubtedly in the spectrometers and imaging systems (magnet, the radiofrequency generation, detection system, and acquisition system) [8]. NMR also benefit enormously from the advance computing. The development of gradient-selection pulse sequences also led to the revitalization of pulse field gradient spin-echo experiments [16]. Both NMR and MRI/MRS continue to develop, and to find new applications. To grasp the chronology of NMR milestones, following adequate reference article, we strongly recommend reader to look into Tables 1 and 2 in [8], covering period from 1924-2002.
However the years are coming will be devoted to the brain scanning. Scientists have been remarkable progress in an area once thought to be impossible: taking a snapshot of our memories and possibly our dreams. NMR opened the door into observing the activity of brain circuits that pass electrical signals along chains of thousands of neurons. Although philosophers have long pondered the origins of though, it was the invention of functional magnetic resonance imaging in 1991 that really sparked neuroscience. Functional MRI (fMRI) monitors processes such as blood flow in the brain in response to particular stimuli.
However to record cognitive process such as learning, thinking we need wholly new methods of measuring electrical activity that go beyond the existing technologies – which provide either a precise picture of the activity of relatively small groups of neurons or else sweeping imagery of large brain areas but without the resolution required to identify specific brain circuit switching on or off. To gain a picture of emergent patterns of brain activity, investigators need new sensing devices that can record from assemblages of thousands of neurons. Nanotechnology, with novel materials that sometimes measure less than the
dimensions of individual molecules, may assist in making large- scale recordings. Prototype arrays have been buit incorporate more than 100000 electrodes on a silicon base; such devices could record the electrical activity of tens of thousands of neurons in the retina. Further engineering of this technology will allow stacking of these arrays into 3D structures, shrinking the electrodes to avoid damage to tissue and lengthening shafts to penetrate deep within the cerebral cortex. Electrodes are only one way to track the activity of neurons. Biologists, borrowing from technological developed by physicists, chemists and geneticists are beginning to visualize living neurons in awake animals. The calcium imaging and voltage imaging are another promising techniques which are based on interplay of neuroscience, genetics, chemistry and physics and where the issue is to improve optical techniques that – instead of sensing calcium – record neuronal activity directly. Moreover, another imposing technical challenge to visualizing neuronal activity is the difficulty of delivering light to, and collect it from, neural circuits deep below the surface of the brain. To solve this problem neurotechnology developer are beginning to collaborate with researchers in computational optics material engineering and medicine. Investigation of opaque material in combination with optical technique including those used by astronomers to correct image distortion caused by atmosphere’s effects might bring promising technique. Problem here is that seeing deep with optical might not penetrate deep enough allowing to capture the brain structure. However, electrons and photons are not only (even the most obvious) candidates for recording brain activity. DNA technology could also play a critical point. As neurotechnologies grow in sophistication, investigations will need improved ways to manage and share enormous complications of data where bioinformatics will play important role. The ability to analyze petabytes of data will do more than bring order to floods of new information; new insight how nerves proceed learning, perception and memorising. Inevitably the technology has grown faster than the researcher’s ability to understand the results it produces. For example, in the field of genetics – personalized medicine – each individual’s genetic readout must be compared with lots and lots of other people’s readouts for doctors to understand which genetic pattern are important indicators of disease and which can be safely ignored. In addition, many diseases are caused by rare mutations that have not yet been identified.
What else? We might have soon very developed “hyper modal" imaging technologies that merging the results of multiple modalities (computed tomography (CT) scanning, positron emission tomography (PET) scanning, photoacoustic imaging and Cerenkov luminescence imaging. Designing and fabricating miniaturized (lab-on-a-chip) devices is extremely challenging, but physicists and engineers are beginning to construct highly integrated and compact labs on chips with exciting functionality. Another question, which is highlighted these days, is the future of reverse engineering the brain.
There are remarkable achievements in the field of biomedicine and bio-engineering. And that becomes the growing technology trend. Shrinking technology that can be wearable is taking role over equipments
542
that are heavy and locked into the hospitals or health centers. Nanotechnology – nanopartcles and nanorobots will change how we diagnose and treat diseases. Molecular machines are being developed to allow drugs to be delivered directly to cells.
The reduction in size is compromised with excellent apps installed into chips while wireless network allows remote control and communication to health services. Together with an open source hardware and software movement we are generating an open health system – the interplay of health and social care. For NMR data visualization, processing, and analysis on mobile devices we refer to [17]. The lab on chips and subsequently the data will be given into hands of patients and at the same time it will generate huge data set which will help to scientists to look for the patterns. The iPhone based health monitoring devices and other wearable things will for sure challenge the whole health system. AliveCor’s iPhone EEG, a plastic phone that is slated for US Food and drug Administration approval in early 2012, has two metal electrodes on the back of the case that record heart rhythms whenever users hold the device in both hands or press it against their chest. This real-time electrocardiography (EEG) data can be beamed wirelessly to patients, alerting them to any heart rhythm irregularities. Another remarkable product among others is recently created injectable fluorescent fibers that monitor blood glucose, done by scientist in Japan. Regarding molecular machine there are constraint but not by laws of physics but by the biology of cells: the size of nanoparticles used is very important: it can only pass harmlessly through the cell wall if its diameter falls below the critical size of roughly 10nm. Anything too large will damage the cell. As well as individual particles, molecular machines based on DNA molecules and known as “nubots” (which stands for nucleic acid robot) are being developed to allow drugs to be delivered directly to cells – perhaps even cancer cells. A different approach to cancer treatment would be to inject cancers with gold nanoparticles. Because gold is an excellent X-ray absorbent, if the cells are afterwards bombarded with X-rays, it will heat up and effectively ‘cook’ the cell. Such treatment with nano-particles and nano-machines will move treatment away from whole-body chemotherapy, which can damage healthy tissues s well.
It seems we are also moving to a radical shift in the radiation therapy. The radiation therapy might be monitored and implanted by sensors remotely controlled. Does it mean that doctor will soon start to prescribe the apps instead of antibiotics? And patients will be trained how to work with apps so they can control the data and medications given in their hands But what is reliability of data? In 2013, NewScientist published the paper “Hiadden depths” (12, Ocrober, 2013, pp. 33) by Ingfrei Chen. Edward Vul and Harold Pashler at the University of California, San Diego, in 2007, criticizing using just one data set for both the initial and final analysis, which allows the random noise to inflate an apparent link in brain regions and thus spoil link to behavioral response to trait. According to their research, “92% of scans examining the anatomy of conditions like autism might have missed the true answer, with many reporting links that weren’t really there”.
6. CONCLUSIONS
For many decades MRI and its modifications played important roles in our lives. We argue that the future of image technology is in interplay of material science, nanotechnology, neuroscience, genetic engineering, chemistry, physics, nanorobotics, and advance computing. In particular material science will play important role. Shrinking electronic components gives different dimension to NMR novelty and its applicability. The challenge for technology developers is not in braking the physics laws but in bending them. The limits imposed by physics on technology developers will be solved by bringing diversity into action and seeing problem alternatively, or the most promising – by borrowing ideas and technologies from different scientific areas, as well as by exploring biomimics in more extensive way.
It also seems that limits imposed by nature law on technology progress might in future dissolve through man-machine co-evolution making symbiotic relation that will furthermore together evolve. Will it be better or worse? The future will give the answer.
Some information reported in this paper might sound speculative. They are not given here for the matter of philosophical debate. They are given in order to emphasize that digital world and information communication technology give a new dimension to radiation measurement and imaging technologies.
But crucial question is: Where to go from here?
It is also not necessary to imitate the behavior of Nature in detail in order to engineer a device which can in many respects surpass Nature’s abilities.
REFERENCES
1. Richard Feynman, The meaning of it all, Pengin Books, 1998 2. Richard Feynman, The pleasure of findins things out,
published by Penguin Group, London, 2001 (first published in US by Perseus books in 1999)
3. Michio Kaku, Physics of the Future, Penguin Books, 2011 4. Michio Kaku, The future of mind, Penguin Books, 2014 5. George Johnson, A shortcut through time: the path to the
quantum computer, Vintage books, New York, 2003 6. Gordon E. Moore, Cramming more components into
integrated circuits, Electronics, Vol. 38, No. 8, pages 114 – 117, April 19, 1965
7. Ray H.. Baughman et al, Carbon Nanotubes: The route towards applications, Science, pp 787-792, 2002
8. J.W.Emsley and J.Feeney, Forty years of Progress in Nuclear Magnetic Resonance Spestroscopy, published in Progress in Nuclear Magnetiv Resonance Spectroscopy 50 (2007) 179-198, Elsevier
9. P. G. Morris, NMR Imaging in Medicine and Biology, Oxford University Press, 1986
10. P.Mansfield, I. L. Pykett, J. Magn. Reson. 29 (1978) 353 11. W. A. Edelstein, J. M. S. Hutchhinson, G. Johnson, T.
Redpath, Phys. Med. Biol. 25 (1980) 751 12. C. M. Lai, P.C. Lauterbur, J. Phys. E. Sci. Instrum. 13 (1980)
747 13. R. . Moon, J.II. Richards, J. Biol. Chem. 248 (1973) 7276]
and Hout et. al.[D. J. Hoult, S.J.W. busby, D. G. Gadian, G. K. Radds, R. E. Richards, P. J. Seeley, Nature 252 (1974) 285
14. R. A. Iles, A. N. Stevens, J. R. Griffiths, Prog. NMR Spectrosc. 15 (1982) 49
15. W. P. Aue, E. Bartholdi, R. R. Ernst, J. Chem. Phys. 64 (1976) 229
16. C. S. Johnson, Prog. NMR Spectrosc. 34 (1999) 203 17. Carlos Cobas, Isaac Iglesias, Felipe Seoane,NMR data
visualization, processing, and analysis on mobile devices., Magn. Reson. Chem. 2015. DOI: 10.1002/mrc.4234

MATTER IN EXTREME CONDITIONS
PhD Slavica Brkić, asst. prof.
1 University of Mostar, Faculty of Science and Education, Bosnia and Herzegovina
Abstract. The theory which currently best describes the creation of the Universe is called the Big Bang theory. To create conditions which ruled one billionth of a second after the Big Bang, it is necessary to heat and compact the nuclear matter. By varying the beam energy one may, within certain limits, map the phase diagram of matter in extreme conditions. When the particles collide at high energies, it leads to the conversion of particle collision participants into much heavier particles. This creates a little Big Bang in the laboratory. If the energy density is high enough, the formation of quark-gluon plasma occurs after a collision. At the beginning the plasma is in equilibrium condition. It can achieve equilibrium through secondary collisions. After further expansion and cooling the system gets hadronized again. Further expansion leads to free flow through the freeze-out. In the dense nuclear medium collective phenomena occur, such as increased production of strangeness, charmonium suppression and bulk motion of particles. In nuclear medium, individual collisions of quarks occur, which also hadronize. Using simulation package Pythia, we analyzed the reaction system that results in individual collisions of quarks and antiquarks, and emergence of collective phenomena.
Key words: extreme conditions, quark-gluon plasma, production of strange particles, suppression of charmonium, collective motion
Introduction
The goal of the research programs in the new
accelerators is the study of nuclear matter in extreme conditions. Extreme conditions include high temperature and low density or low temperature and high density. Nuclear matter, as well as water, can be found in different phases as a function of temperature and density. Phase diagram of strongly interacting matter can be displayed by varying the energy.
The quark-gluon plasma can occur in the initial stage of a collision, which hadronizes again. Various phenomena occur in the dense nuclear matter, such as increased production of strangeness, suppression of charmonium or collective movement of particles. Using Pythia simulation program, different quarks were collided and the mentioned phenomena were analyzed [1].
2. Phase diagram of nuclear matter
The phase diagram is explored better in the area of low densities and high temperatures than in the area of high densities and low temperatures. Explorations towards higher temperatures and lower baryonic densities are continued in future research in CERN LHC.
These conditions prevailed in the early Universe as it underwent aphase transition from quark-gluon matter to hadronic matter in the first microseconds after the
Big Bang. In GSI SIS18 accelerator, baryonic densities about three times higher than nucleus density are reached in heavy-ion collisions [2]. The highest baryonic density is expected for nuclear collisions in the energy range of 10 to 40 GeV/u. Matter in this form exists in neutron stars and in the center of a supernova explosion. In laboratory, the super dense nuclear matter can be formed by reaction of the collision of large amounts of relativistic heavy ions. Much of the energy beam is converted into the excited baryonic resonance which decays into pions and nucleons. This mixture of nucleons, baryonic resonance and mesons is called hadronic matter. At very high temperatures and/or densities hadrons melt and their constituents, quarks and gluons form a new phase of matter – a quark-gluon plasma. The phase diagram of strongly interacting matter is shown in Figure 1. "Liquid" phase is realized in the atomic nucleus at zero temperature and the density of 300 million tons/cm3. At low densities nucleons behave as a gas [1].
3. Collision dynamics along the collision axis
Different periods of heavy-ion collisions (HIC) are shown in Figure 2. Two energy nuclei move along the light cone and collide with each other, creating multipartonic system. In the initial collision, large amount of kinetic energy of colliding nuclei is used to create a large number of secondary particles in a small volume. These particles collide frequently enough to achieve a state of thermal equilibrium and the quark-gluon plasma can be formed. This is a transitional
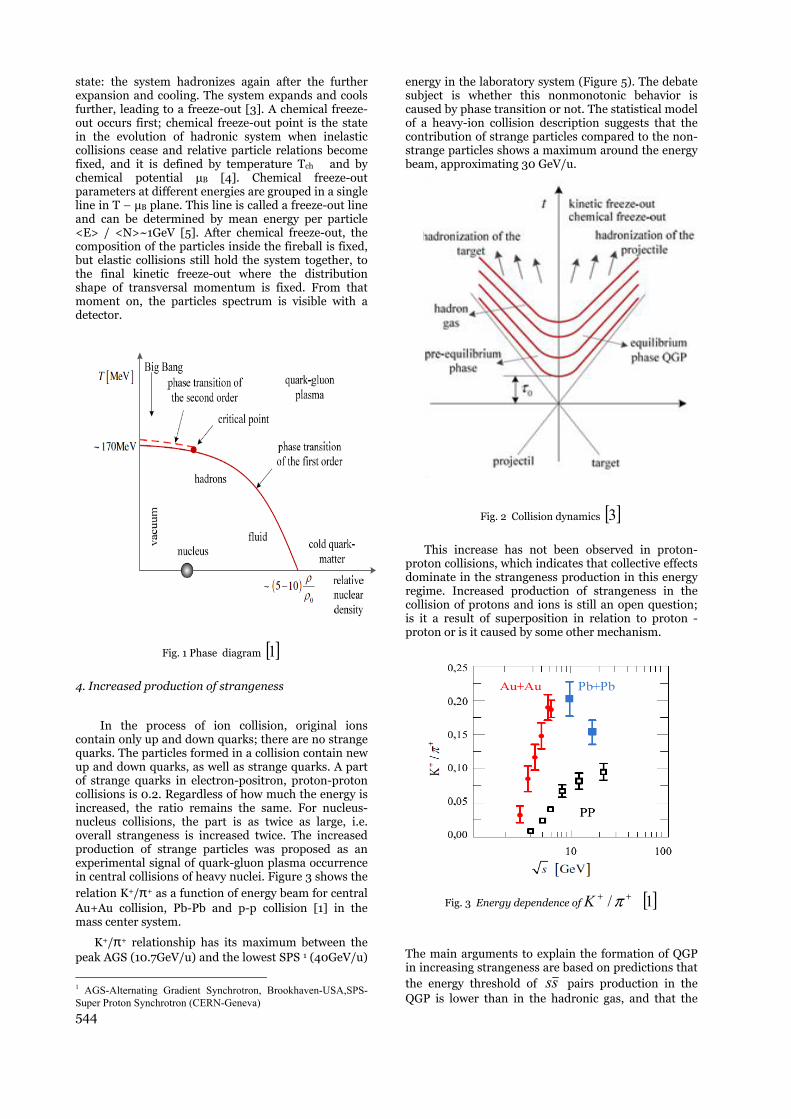
544
state: the system hadronizes again after the further expansion and cooling. The system expands and cools further, leading to a freeze-out [3]. A chemical freeze-out occurs first; chemical freeze-out point is the state in the evolution of hadronic system when inelastic collisions cease and relative particle relations become fixed, and it is defined by temperature Tch and by chemical potential μB [4]. Chemical freeze-out parameters at different energies are grouped in a single line in T – μB plane. This line is called a freeze-out line and can be determined by mean energy per particle <E> / <N>~1GeV [5]. After chemical freeze-out, the composition of the particles inside the fireball is fixed, but elastic collisions still hold the system together, to the final kinetic freeze-out where the distribution shape of transversal momentum is fixed. From that moment on, the particles spectrum is visible with a detector.
Fig. 1 Phase diagram [ ]1
4. Increased production of strangeness
In the process of ion collision, original ions contain only up and down quarks; there are no strange quarks. The particles formed in a collision contain new up and down quarks, as well as strange quarks. A part of strange quarks in electron-positron, proton-proton collisions is 0.2. Regardless of how much the energy is increased, the ratio remains the same. For nucleus-nucleus collisions, the part is as twice as large, i.e. overall strangeness is increased twice. The increased production of strange particles was proposed as an experimental signal of quark-gluon plasma occurrence in central collisions of heavy nuclei. Figure 3 shows the relation K+/π+ as a function of energy beam for central Au+Au collision, Pb-Pb and p-p collision [1] in the mass center system.
K+/π+ relationship has its maximum between the peak AGS (10.7GeV/u) and the lowest SPS 1 (40GeV/u)
1 AGS-Alternating Gradient Synchrotron, Brookhaven-USA,SPS-Super Proton Synchrotron (CERN-Geneva)
energy in the laboratory system (Figure 5). The debate subject is whether this nonmonotonic behavior is caused by phase transition or not. The statistical model of a heavy-ion collision description suggests that the contribution of strange particles compared to the non-strange particles shows a maximum around the energy beam, approximating 30 GeV/u.
Fig. 2 Collision dynamics [ ]3
This increase has not been observed in proton-proton collisions, which indicates that collective effects dominate in the strangeness production in this energy regime. Increased production of strangeness in the collision of protons and ions is still an open question; is it a result of superposition in relation to proton - proton or is it caused by some other mechanism.
Fig. 3 Energy dependence of++ π/K [ ]1
The main arguments to explain the formation of QGP in increasing strangeness are based on predictions that the energy threshold of ss pairs production in the QGP is lower than in the hadronic gas, and that the

545
production of pairs of strange quarks is preferred to the production of light quarks.
In individual collisions of quarks there is no increased production of strangeness, no matter how much the energy is increased (Figure 4). The ratio of strange and non-strange particles K+/π+ is 0.1 as in proton-proton collision [7].
Fig. 4 Energy dependence ++ π/K for dd
5. Charmonium Suppression
QGP signals are related to the production of J/Ψ mesons. J/Ψ particles are made of charm quark and
anti-quark cc . They are rare because charm quarks are very massive, and can be produced at an early stage immediately after the collision, while the nucleus constituents still have full energy. However the formation of J/Ψ mesons can be suppressed by the presence of QGP. Such a massive reduction in the number of J/Ψ particles leaving fireball, suggests that the hot QGP is formed in the initial stage of the collision [8]. The reduced production of charmonium was predicted decades ago. In 1986, Matsui and Satz suggested suppression of heavy mesons as a result of shadowing in the quark-gluon plasma. The shadowing reduces the attractive forces between heavy quarks and antiquarks, thus preventing their binding. Beyond the certain critical point, shadowing prevents the formation of bound states. J/Ψ suppression requires temperatures that are 30% above the color deconfinement temperature and energy density of about 3GeV/fm3. This is in accordance with the initial energy densities achieved in Pb-Pb collisions [9]. The collision of two light quarks, such as d-quark and d-antiquark fails to produce J/Ψ mesons regardless of the amount of energy. Collisions of heavy and light quarks (d-quark and b-quark) produce J/Ψ mesons with a threshold energy that is lower than in the collision of heavy quarks. Multiplicity of produced mesons is higher in the collision of heavy quarks compared to the collision of heavy and light quark. Analyzing our results and comparing the production of J/Ψ mesons in collisions of heavy ions, it is possible to observe that the multiplicity is less usual in collisions of heavy ions than in the collision of quarks.
6. Collective Flow
The collective flow of particles was theoretically predicted to occur in relativistic heavy-ion collisions
in the early seventies of the last century [10]. They were predicted for two signature flows: a) Deflection of compressed matter in the reaction plane, deflection to the side of the "spectator" fragments - "bounce off", known as a directed flow of nucleons from overlapping areas of colliding nuclei in the reaction plane [11]; b) leakage ("squeeze-out") of participants outside the reaction plane, called elliptic flow (Figure 6) .
0,00E+00
5,00E-03
1,00E-02
1,50E-02
2,00E-02
2,50E-02
3,00E-02
5,70E+
00 7 9 11 13 15 17 19 21
E (GeV)m
ulti
plic
itit
y
J/psi-1,5J/psi5,-5
Fig. 5 Energy dependent ψ/J multiplicity
It was first experimentally detected in the nucleus-nucleus collision by Plastic Ball Collaboration of the National Berkley Laboratory (NBL) in 1984 for charged particles [13], but it can also be present in the proton - proton collisions [14] . Various phenomena of the flow are observed at energies between 50 MeV/u and 160 GeV/u. Initial spatial anisotropy gives rise to final anisotropy of momentum, on account of multiple interparticle collisions (Figure 6). If one of two factors, namely the initial anisotropy or scattering, is omitted, then it is not the flow. Thus in the non-central collisions, the flow enables measurement of scattering. In other words, the flow is sensitive to the number of interactions and cross sections of parton-parton dispersion [15].
6.1 Transverzal Flow
Transversal flow is a collective movement in transversal plane. In central collisions between spherical nuclei, transverse pressure gradients are not dependent on the azimuth angle, and field of transverse flow is azimuthally isotropic. In non-central collisions between spherical nuclei, or central collisions between deformed nuclei (U + U), nuclear overlapping region is initially spatially deformed in the transverse plane, resulting in the azimuthal anisotropy of the pressure gradient and the final form of the source thus generated. Particles are produced in overlapping region which is called effective source (Figure 7) [16].
"Directed" and "elliptic" flows are two specific forms of anisotropy transverse flow of a region. The word "directed" comes from the fact that such flow has a direction, and the word "elliptic" is due to the fact
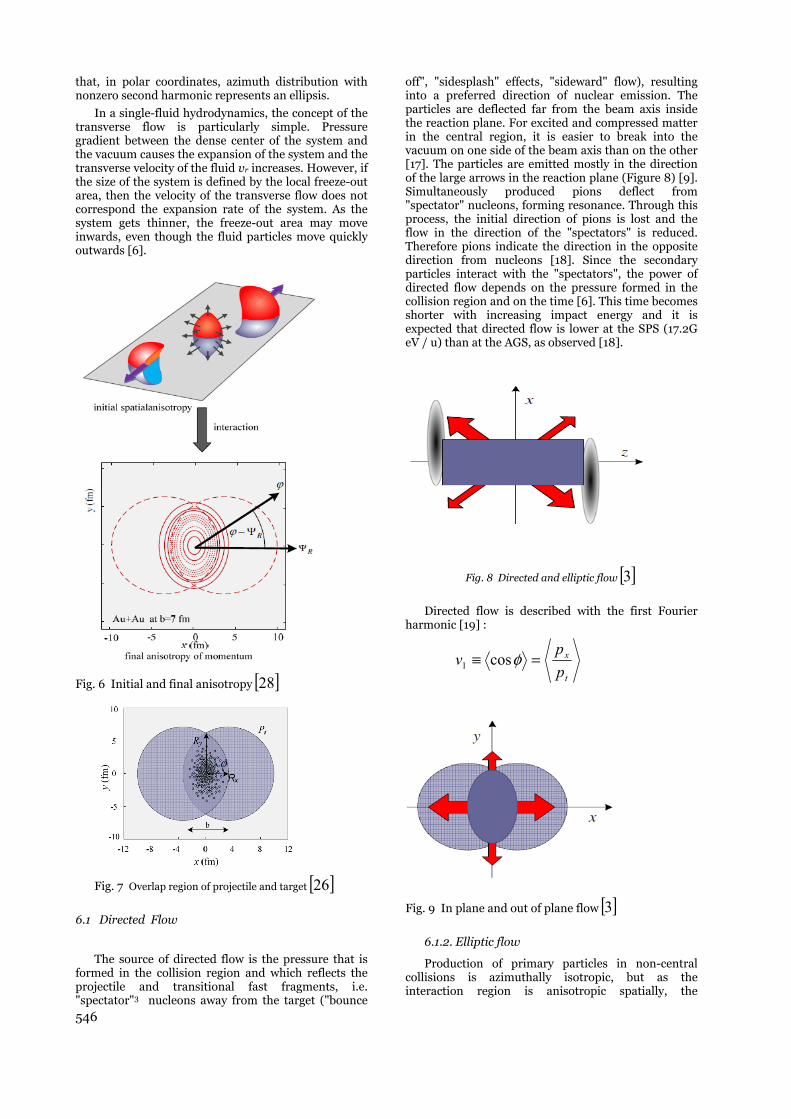
546
that, in polar coordinates, azimuth distribution with nonzero second harmonic represents an ellipsis.
In a single-fluid hydrodynamics, the concept of the transverse flow is particularly simple. Pressure gradient between the dense center of the system and the vacuum causes the expansion of the system and the transverse velocity of the fluid vr increases. However, if the size of the system is defined by the local freeze-out area, then the velocity of the transverse flow does not correspond the expansion rate of the system. As the system gets thinner, the freeze-out area may move inwards, even though the fluid particles move quickly outwards [6].
Fig. 6 Initial and final anisotropy [ ]28
Fig. 7 Overlap region of projectile and target [ ]26
6.1 Directed Flow
The source of directed flow is the pressure that is formed in the collision region and which reflects the projectile and transitional fast fragments, i.e. "spectator"3 nucleons away from the target ("bounce
off", "sidesplash" effects, "sideward" flow), resulting into a preferred direction of nuclear emission. The particles are deflected far from the beam axis inside the reaction plane. For excited and compressed matter in the central region, it is easier to break into the vacuum on one side of the beam axis than on the other [17]. The particles are emitted mostly in the direction of the large arrows in the reaction plane (Figure 8) [9]. Simultaneously produced pions deflect from "spectator" nucleons, forming resonance. Through this process, the initial direction of pions is lost and the flow in the direction of the "spectators" is reduced. Therefore pions indicate the direction in the opposite direction from nucleons [18]. Since the secondary particles interact with the "spectators", the power of directed flow depends on the pressure formed in the collision region and on the time [6]. This time becomes shorter with increasing impact energy and it is expected that directed flow is lower at the SPS (17.2G eV / u) than at the AGS, as observed [18].
Fig. 8 Directed and elliptic flow [ ]3
Directed flow is described with the first Fourier harmonic [19] :
t
x
p
pv =≡ φcos1
Fig. 9 In plane and out of plane flow [ ]3
6.1.2. Elliptic flow
Production of primary particles in non-central collisions is azimuthally isotropic, but as the interaction region is anisotropic spatially, the
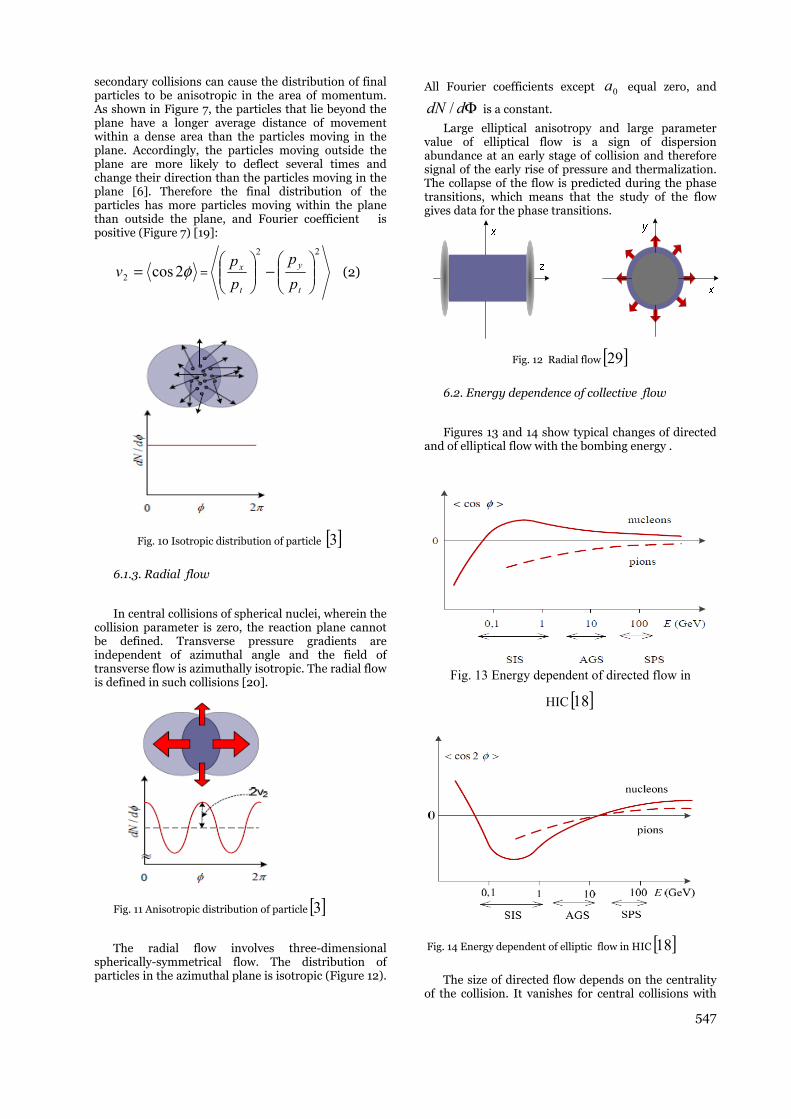
547
secondary collisions can cause the distribution of final particles to be anisotropic in the area of momentum. As shown in Figure 7, the particles that lie beyond the plane have a longer average distance of movement within a dense area than the particles moving in the plane. Accordingly, the particles moving outside the plane are more likely to deflect several times and change their direction than the particles moving in the plane [6]. Therefore the final distribution of the particles has more particles moving within the plane than outside the plane, and Fourier coefficient is positive (Figure 7) [19]:
φ2cos2 =v =
22
−
t
y
t
x
p
p
p
p (2)
Fig. 10 Isotropic distribution of particle [ ]3
6.1.3. Radial flow
In central collisions of spherical nuclei, wherein the collision parameter is zero, the reaction plane cannot be defined. Transverse pressure gradients are independent of azimuthal angle and the field of transverse flow is azimuthally isotropic. The radial flow is defined in such collisions [20].
Fig. 11 Anisotropic distribution of particle [ ]3
The radial flow involves three-dimensional spherically-symmetrical flow. The distribution of particles in the azimuthal plane is isotropic (Figure 12).
All Fourier coefficients except 0a equal zero, and
ΦddN / is a constant.
Large elliptical anisotropy and large parameter value of elliptical flow is a sign of dispersion abundance at an early stage of collision and therefore signal of the early rise of pressure and thermalization. The collapse of the flow is predicted during the phase transitions, which means that the study of the flow gives data for the phase transitions.
Fig. 12 Radial flow [ ]29
6.2. Energy dependence of collective flow
Figures 13 and 14 show typical changes of directed and of elliptical flow with the bombing energy .
Fig. 13 Energy dependent of directed flow in
HIC [ ]18
Fig. 14 Energy dependent of elliptic flow in HIC [ ]18
The size of directed flow depends on the centrality of the collision. It vanishes for central collisions with

548
symmetry and for extremely peripheral collisions where the compression effects are weak. Therefore the maximum directed flow is obtained with semi-central collisions, with the impact parameter of (5-6) fm for Au-Au collisions [24, 25]. The dependence of the collision parameter of elliptical flow is similar to that of directed flow. However, the maximum is at a slightly higher impact parameter, about 7 fm for Au-Au collisions.
The elliptical flow is higher for fragments than for protons [26]; as for directed flow, this is a sign of collective motion. However, the size of the directed flow is higher with a larger nucleus, which indicates that only partial equilibrium is established.
We analyzed the energy dependence of elliptical flow for the reaction system created as a result of high-energy collisions of individual quarks. The largest multiplicity of pions and nucleons is observed in collisions of quarks as well as in collisions of ions because they are made of light u-quarks and d-quarks. We observed energy dependence of elliptical flow of pions and nucleons just as of heavy ions. Figure 15 shows the energy dependence of elliptical flow at different energies in unsymmetrical collision of d-antiquark and b-quark. Energy dependence has no typical form, which indicates that collective phenomena are formed in the collision of heavy ions which are not a superposition of individual reaction systems. Conclusion
Super dense nuclear matter can be created in a laboratory in a collision of relativistic heavy ions. If the energy density is high enough, it leads to the formation of quark-gluon plasma. Further expansion results in free streaming through freeze-out. Unusual phenomena appear in the dense substance, such as increased production of strangeness, suppression of charmonium or collective motion of particles. We analyzed the reaction system created as a result of the collision of individual quarks and showed that these phenomena are collective phenomena which occur only in extreme conditions.
-6,00E+00
-5,00E+00
-4,00E+00
-3,00E+00
-2,00E+00
-1,00E+00
0,00E+00
1,00E+00
2,00E+00
0 5 10 15 20 25
E (GeV)
V2(
%)
v2p%-1,5
V2N%-1,5
Fig. 15 Energy dependent of elliptic flow in
qq collision [ ]18
References
1. P.Senger: The nucleus-nucleus collision research program, 2002.
2. P.Senger: The Compressed Baryonic Matter Experiment, GSI, Darmstadt
3. T.Hirano, N van der Kolk, A. Bilandzic: arXiv:0808.2684, 2008.
4. O. Ristea: Study of the chemical freeze-out in nucleus-nucleus collisions for BRAHMS Collaboration, 2004.
5. J.Cleymans and K.Redlich, Phys.Rev. Lett. 81,5284 (1998)
6. P.Huovinen:arXiv: nucl-th/0305064v1 2003. 7. www.gsi.de/GSI-future/cr/PDF/Nucleus-Nucleus
Collisions 8. http://newstate-matter.web.cern.ch/ 9. S.A.Bass et al. :arXiv-hep/ph/9810281 v2 1998.
10. H.Schied et al,//Phys.Rev.Lett.1968.V.21.P.1479.exp 11. Stocker H. Et al.//Phys.Rev. Lett.1980.V. 44.P.725. 12. Stocker H. Et al.//Phys.Rev. Lett.1984.V. 52.P.1594. 13. H. Gustafsson et al. Phys.Rev. Lett. 52 (1984) 1590 14. Awes et al., WA 80 Collaboration, Phys.
lett.B381(1996)29 15. P. Huovinen, arXiv:nucl-th/0210024 16. S.A.Voloshin, Phys.Rev.C.V.55N 4.1997. 17. P.Danielewicz:arXiv:nucl-th/9907098v1 18. J.Y. Ollitrault, Nucl. Phys. A 638(1998)195c-206c sis 19. S.Voloshin and Y.Zhang, Z.Phys. C70,665(1996);A 20. T.Hirano and K.Tsuda: ar Xiv:nucl-th/0205043v2
2002. 21. M.B.Tsang et al., Phys. Rev. Lett.57(1986)559. 22. W.K.Wilson et al. Phys.Rev. c41(1990) R1881. 23. D.Krofcheck et al., Phys.Rev. Lett.63 (1989)2028. 24. K.G.R.Doss et al., Phys.Rev. Lett. 57(1986)302 25. Ph.Crochet et al., Nucl.Phys. A627 (1997)522 26. N.Bastid et al., Nucl. Phys. 622(1997)573 27. K.Tamosiunos.Initial state an collective observables in
HIC 28. H.Appelshaeuser et al., arXiv:nucl-ex/9711001 29. S.G.Jeong et al (FOPI),prl 72 (1994) 3468

List of reviewers Proceedings of RAD 2015 Conference We would like to express our gratitude to all the reviewers for their help and for taking their time to review the papers for RAD 2015 Proceedings. A. A. Ajayi-Banji A. A. Antsiferova A. Elanique A. J. Solanki A. Sapozhnikov A. Yekta Özer A. Zarrouk Aarts Esther Abdullah Koray Abubakar Sadiq Aliyu Adrian Evans Agnieszka Syntfeld-Kazuch Ahmed S. Ouda Ahmet Gül Aimee L. McNamara Akihiro Sakoda Akira Asano Akira Kitamura Alberto J. Palma Alberto Signore Alessandro Drago Alexander Nikiforov Alexander Oh Alexander Yakushev Alison Vinall Amanda E. Schwint Amir Waseem Amir Zacarias Mesquita Andrew G. Ewing Andrii Sofiienko Anish Bhattacharya Anna Kelaranta Anna Lluveras Anna-Lisa Grund Anthony I. Reeder Antioco Franco Sedda Antoni Rucinski Ariel Roguin Arne Miller Arto Javanainen
Asim Shahzad Asta Gregoric Atef El-Taher Atsuyuki Sorimachi Barbara Basarabová Barbara Caccia Barbara Obryk Bengt Glimelius Benjamin Zorko Bernd Hoffmann Bertil R.R. Persson Bettina Willie Beverley Holman Boris Dehandschutter Borislava Petrović Botond Papp Brooke Buddemeier Bumsoo Han C. J. Eastoe C. Rangacharyulu C. Tsabaris Cagnazzo Marcella Camille Chapados Chao Peng Chris Allton Christoph van Wüllen Christophe Waterlot Christopher Wahl Claudia Mauricio Colin R. Ward Maria Concepcion Dueñas Buey D. Huic D. Shahbazi-Gahrouei Dagmara Struminska-Parulska Daniel Marcos Bonotto Daniele Margarone Danute Marciulioniene David Cox David Moreno-González Dean W. Broga Dejan Milić Dejan Raković Denis Flandre Des E. Walling Dina Lelić Dina Solatie Dogan Bor Dominique Laurier Dragan Stojanov
Dragana Todorović Đurđica Milković Dušan Sokolović E. P. Efstathopoulos E. Vano Eduard Gershkevitsh Edward J. Calabrese Elena Diacu Elena Gershtein Elizabeth A. Ainsbury Emanuele Calabro Eric Blanchardon Eric Hall Erzsébet Takács Etienne Testa Eugen Schwarz Evelise Gomes Lara Evgenyi Vasilenko Faidra Tzika Fancisco Cesar da Silva Fazilet Zumrut Biber Muftuler Francesca Fiorini Francesca Gorini Francisco Aguirre François Tondeur Frank Becker Fusheng Li Gabriel Paiva Fonseca Gaël Le Roux George Bereznai George Kabalka George Kitis George Panayiotakis George Plataniotis Gerald Matisoff Giorgia Cinelli Giovanni Baccolo Giovanni Fattori Gonzalo Martínez-Barrera Goran Nikolić Gorana Đorić Gordana Pantelić Gregor Kramberger Günseli Yaprak H. Nagabhushana Hajo Zeeb Halim Taskin Hanifi Binici Harri Tuomisto Hasan M. Khan

Haw-Ming Huang Heinz Graafsma Helio Yoriyaz Hiromitsu Haba Hironobu Yanagie Holger Stiel Hygreeva Kiran Namburi I. Lopes Ian Clark Igor Ostrovskiy Igor Pioro Ihsan Al-Affan Ilham Al-Qaradawi Ilka Engelmann Ines Krajcar Bronić Ioana Brie Ion E. Stamatelatos Ippokratis Hatzokos Isaac Karimi Ivan Jarić Ivana Kralik Iveta Waczulikova J. Zheng Jacinda Ginges Jacqueline Garnier-Laplace Jad Farah Jae Bum Park Jaewoo Kim Jan Hupka Jana Müllerová János Szanyi Jaroslav Šolc Javier Vila Jelena Krneta Nikolić Jelena Popić Ramač Jennyh Shepherd Jens Wölfelschneider Jim Malone Jim T. Smith Jin Kyu Kim Jinhua Wu Jiunn-Hsing Chao Jochen Tschiersch John Backes John E. Pinder John Mathews John Swanpalmer Jonathan P. Mathews Jordanka Semkova Joshua Landis
Josiane Daures Jovan Šetrajčić Jovana Nikolov Juan Pedro Bolívar Julien Marchal Justin P. Gwynn Kahtan S. Mohammed Kai Ni Kaja Rahu Karim T. Kaschani Karmen Stankov Katalin Szabo Katsutoshi Sato Kazimierz Rozanski Kerry McKenzie Kimihito Nakamura Kiril Krezhov Konstantin Ivanov Kristoffer Petersson Kurt Osterloh Kwang Pyo Kim L. K. H. Leung Laetitia Imbert Lajos Baranyai Lara Struelens Larry A. DeWerd László Wojnárovits Laura Tossiti Lawrence S. Chin Leena Korpinen Leonid V. Stoimenov Liliane Grangeot-Keros Liu Jie LiYi Xiao Liz Ainsbury Ljiljana Janković Mandić Ljubiša Nešić Lorenzo Uplegger Luca Pampuri Lucyna Kępka Ludwik Dobrzynski Luigi Monte M. E. Capoulat M. Garcia-Sciveres M. Pham M. Prabakaran Madhavi Tripathi Magdalena Đorđević Magdalena Stevanović Mahdi Sadeghi Mahsa Fatahi
Małgorzata Jurak Manoj G. Tyagi Marc Hou Marco Morreale Maria Pia Morigi Maria Ranogajec-Komor Maria Sahagia Maria Widel Marija M. Janković Marko Anđelković Marlies Luszik-Bhadra Martin Booth Marwat Matiullah Mary N. Mohankumar Marylène Bertrand Masayoshi Mizuta Massimo Mazzillo Matjaž Finšgar Matthias Müller Mauro Carrara Mayeen Uddin Khandaker Mehmet Erdogan Michael K. Lindell Michael Kitto Michael Zhukovsky Michel Bruggeman Michiel Steyaert Miguel Angel Carvajal Rodriguez Mikael Jensen Miklos Menyhard Milan J. Konstantinović Milan Tadić Milena Čukić Milena Furione Milica Matavulj Miloš Krstić Mirjana Đurašević Mohammad Mehrpouyan Monica Papeş Moreno Barbosa N. Karunakara Nadia Helal Nalan Kabay Nao Kamei-Ishikawa Natalia Alegría Gutierrez Nataša Todorović Neil McColl Nezahat Hunter Ngo Quang Huy Nils Reiche

Nina Bolotova Nina Chobanova Nistor Nicolaevici Norberto Scoccola Norikazu Kinoshita Norman J. Kleiman Oded Nir Okan Akhan Olga Brovkina Olga Pons-Llanas Oliver Jäkel Olivera Ciraj-Bjelac Olivera Nikolić Orhan Icelli Patricia Nicolucci Patrick Schaumont Pavel Kirillov Pawel Kukołowicz Pedro F. Zárate-del-Valle Pekka Pyykkö Peter Bossew Peter Schwerdtfeger Peter Wushou Chang R. Salghi R. Shweikani Raffaele Liuzzi Raj Kumar Panta Rajiv Gupta Ramon Fernández-Ruiz René Werner Rianne Stam Riccardo Ciolini Roberto Romero González Rohit Mehra Rolf Behrens Rolf Michel Rosaline Mishra Roshan S. Livingstone Ruby Kollerud Ruxi Chen Ruza Stevic Ryutaro Souda S. Niese S. Takagi S. V. Nikiforov Sachiko Yamaguchi-Sekino Saito Kimiaki Salvador Alandete Germán Sameer Naranje
Samer Alhajali Sanja Stojanović Santiago Hurtado Satoshi Kodaira Sauli Savolainen Saveta Miljanić Saviour Umoren Sean W. King See Khee Yee Seiichi Yamamoto Sema Erenturk Sergey Komarov Sergey V. Bozhokin Sergio Fabiani Serpil Aközcan Seung Yeop Lee Shamim A. Begum Shang-Lien Lo Shifeng Dai Shih-Yew Chen Shiliang Liu Shinji Tokonami Shinya Nagasaki Simon Adu Simonpietro Agnello Sofija Forkapić Stanislav Pavelka Stefanos Diamantopoulos Steven L. Simon Sule Aytas Susanta Lahiri Sven R. Suwijn Svetislav Savović Svetlana S. Žunić T. Christoudias Tadeusz Przylibski Takaki Hatsui Takashi Asaeda Takuro Shinano Tatiana Zotina Tatjana Nikolić Tatjana Paunesku Tetsufumi Hirano Tetsuo Ishikawa Thomas Andresen Tom Girard Tomoko Haraga Tore Tollefsen Tsutomu Suzuki Tsvetan Dachev Ugur Cevik
Umberto Gatti Uri Lachish Uwe Spetzger V. S. Kortov Valentin Golosov Valeria Pershina Veronique Ruban Vesna Gershan Vesna Spasić Jokić Vieri Scotti Vilmar Steffen Vinay Kumar Vincenzo Frascino Viorel Fugaru Vivianne Lúcia Bormann Souza Vladimir Jurišić Vladimir Kraz Vladimir. N. Nikiforov Vojka Gardić Vydmantas Atkocius Walter De Wever Weibo Li Weihai Zhuo William Bajjali William F. Morgan Wilson Otto Batista Xin Liu Yasemin Yildiz Yarar Yashwant Pathak Yonca Anik Yoneyoshi Kitagawa Yong Nam Kim Yoon Yeol Yoon Yoshihiro Shiraiwa Yuanrun Zheng Yumi Yasuoka Yunqi Zhang Yuri Lobach Zakaria Saâdi Željko Marković Zhengping Xu Zheng-Xuan Zhang Zoltan Sas Zoran Mijatović Zoran Mitrović Zoran Stamenković Zsuzsanna Szabo