Three-dimensional stochastic numerical breast phantoms for ...
12
1 Three-dimensional stochastic numerical breast phantoms for enabling virtual imaging trials of ultrasound computed tomography Fu Li, Umberto Villa, Seonyeong Park, and Mark A. Anastasio Abstract—Ultrasound computed tomography (USCT) is an emerging imaging modality for breast imaging that can produce quantitative images that depict the acoustic properties of tissues. Computer-simulation studies, also known as virtual imaging trials, provide researchers with an economical and convenient route to systematically explore imaging system designs and image reconstruction methods. When simulating an imaging technology intended for clinical use, it is essential to employ realistic nu- merical phantoms that can facilitate the objective, or task-based, assessment of image quality. Moreover, when computing objective image quality measures, an ensemble of such phantoms should be employed that display the variability in anatomy and object properties that is representative of the to-be-imaged patient co- hort. Such stochastic phantoms for clinically relevant applications of USCT are currently lacking. In this work, a methodology for producing realistic three-dimensional (3D) numerical breast phantoms for enabling clinically-relevant computer-simulation studies of USCT breast imaging is presented. By extending and adapting an existing stochastic 3D breast phantom for use with USCT, methods for creating ensembles of numerical acoustic breast phantoms are established. These breast phantoms will possess clinically relevant variations in breast size, composition, acoustic properties, tumor locations, and tissue textures. To demonstrate the use of the phantoms in virtual USCT studies, two brief case studies are presented that address the development and assessment of image reconstruction procedures. Examples of breast phantoms produced by use of the proposed methods and a collection of 52 sets of simulated USCT measurement data have been made open source for use in image reconstruction development. Index Terms—Ultrasound computed tomography, numerical breast phantoms, image reconstruction, virtual imaging trials I. I NTRODUCTION U LTRASOUND Computed Tomography (USCT) is an imaging technique that utilizes tomographic principles to obtain quantitative estimates of acoustic properties such as speed-of-sound (SOS), density, and acoustic attenuation (AA) [1]–[5]. Because it can produce high resolution and high contrast images of tissue properties, the development of USCT as a breast imaging modality has recieved significant attention [5]–[10]. It has several advantages over other breast imaging modalities, such as mammography, including low cost and being radiation- and breast-compression-free [11], [12]. While commercial systems for breast USCT are being actively F. Li, S. Park, and M. Anastasio are with the Department of Bioengineering, University of Illinois at Urbana-Champaign, Urbana, IL, 61801 USA e-mail: [email protected]. U. Villa is with the Electrical & Systems Engineering Department, Wash- ington University in St. Louis, St Louis, MO, 63130 USA. developed, USCT remains an emerging technology and a topic of active research [13]–[16]. When developing new breast USCT technologies, it is important to assess their clinical utility by use of objective measures of image quality (IQ). Given the large number of system parameters that can impact image quality and variabil- ity in the cohort of subjects to-be-imaged, a comprehensive assessment and refinement of modern imaging technologies such as breast USCT via clinical trials often is impossible. Furthermore, obvious ethical concerns preclude certain ex- perimental designs that otherwise would be of great benefit toward optimizing imaging systems for diagnostic tasks, such as tumor detection and characterization. As a surrogate for clinical trials, computer-simulation studies of medical imaging technologies, also known as virtual imaging trials (VITs), have been advocated for assessing and optimizing system and algorithm designs [17]–[20]. VITs provide a convenient, safe and cost-effective way to explore system and algorithm designs in the early stages of technology development [21], [22]. For use in computing objective, or task-based, measures of IQ that serve as figures-of-merit (FOM) for breast USCT designs, it is critical that VITs employ numerical breast phantoms (NBPs) that accurately convey the anatomical and acoustic properties of the female breast. Moreover, it is known that object variability (i.e., patient-to-patient differences in the breast anatomy and properties) can be viewed as a source of randomness present in image data that limits the per- formance of human or numerical observers on detection or estimation tasks [23]–[25]. It is therefore important to have the capability of producing ensembles of NBPs that possess prescribed statistical properties associated with a specified to- be-imaged subject cohort; these NBPs can each be virtually imaged and, subsequently, ensemble-averaged objective IQ measures can be computed for use in assessing and refining USCT imaging technologies. However, existing NBPs do not satisfy these requirements and are limited by factors that include oversimplified anatomical structures [2], [26]–[29] or are representative of healthy subjects only [30], [31]. NBPs derived from clinical magnetic resonance images are available [30] but are severely limited in number; as such, they do not accurately depict variability in breast anatomy or acoustic properties that will be present in a prescribed patient cohort. Other tools for generating NBPs [28], [29] rely on digital templates or segmented clinical images with simplified anatomical structures and consider only a limited number of tissue types. In summary, there remains an important need arXiv:2106.02744v1 [physics.med-ph] 4 Jun 2021
-
Upload
khangminh22 -
Category
Documents
-
view
0 -
download
0
Transcript of Three-dimensional stochastic numerical breast phantoms for ...
1
Three-dimensional stochastic numerical breastphantoms for enabling virtual imaging trials of
ultrasound computed tomographyFu Li, Umberto Villa, Seonyeong Park, and Mark A. Anastasio
Abstract—Ultrasound computed tomography (USCT) is anemerging imaging modality for breast imaging that can producequantitative images that depict the acoustic properties of tissues.Computer-simulation studies, also known as virtual imagingtrials, provide researchers with an economical and convenientroute to systematically explore imaging system designs and imagereconstruction methods. When simulating an imaging technologyintended for clinical use, it is essential to employ realistic nu-merical phantoms that can facilitate the objective, or task-based,assessment of image quality. Moreover, when computing objectiveimage quality measures, an ensemble of such phantoms shouldbe employed that display the variability in anatomy and objectproperties that is representative of the to-be-imaged patient co-hort. Such stochastic phantoms for clinically relevant applicationsof USCT are currently lacking. In this work, a methodologyfor producing realistic three-dimensional (3D) numerical breastphantoms for enabling clinically-relevant computer-simulationstudies of USCT breast imaging is presented. By extending andadapting an existing stochastic 3D breast phantom for use withUSCT, methods for creating ensembles of numerical acousticbreast phantoms are established. These breast phantoms willpossess clinically relevant variations in breast size, composition,acoustic properties, tumor locations, and tissue textures. Todemonstrate the use of the phantoms in virtual USCT studies,two brief case studies are presented that address the developmentand assessment of image reconstruction procedures. Examples ofbreast phantoms produced by use of the proposed methods anda collection of 52 sets of simulated USCT measurement datahave been made open source for use in image reconstructiondevelopment.
Index Terms—Ultrasound computed tomography, numericalbreast phantoms, image reconstruction, virtual imaging trials
I. INTRODUCTION
ULTRASOUND Computed Tomography (USCT) is animaging technique that utilizes tomographic principles
to obtain quantitative estimates of acoustic properties suchas speed-of-sound (SOS), density, and acoustic attenuation(AA) [1]–[5]. Because it can produce high resolution andhigh contrast images of tissue properties, the development ofUSCT as a breast imaging modality has recieved significantattention [5]–[10]. It has several advantages over other breastimaging modalities, such as mammography, including low costand being radiation- and breast-compression-free [11], [12].While commercial systems for breast USCT are being actively
F. Li, S. Park, and M. Anastasio are with the Department of Bioengineering,University of Illinois at Urbana-Champaign, Urbana, IL, 61801 USA e-mail:[email protected].
U. Villa is with the Electrical & Systems Engineering Department, Wash-ington University in St. Louis, St Louis, MO, 63130 USA.
developed, USCT remains an emerging technology and a topicof active research [13]–[16].
When developing new breast USCT technologies, it isimportant to assess their clinical utility by use of objectivemeasures of image quality (IQ). Given the large number ofsystem parameters that can impact image quality and variabil-ity in the cohort of subjects to-be-imaged, a comprehensiveassessment and refinement of modern imaging technologiessuch as breast USCT via clinical trials often is impossible.Furthermore, obvious ethical concerns preclude certain ex-perimental designs that otherwise would be of great benefittoward optimizing imaging systems for diagnostic tasks, suchas tumor detection and characterization. As a surrogate forclinical trials, computer-simulation studies of medical imagingtechnologies, also known as virtual imaging trials (VITs),have been advocated for assessing and optimizing system andalgorithm designs [17]–[20]. VITs provide a convenient, safeand cost-effective way to explore system and algorithm designsin the early stages of technology development [21], [22].
For use in computing objective, or task-based, measuresof IQ that serve as figures-of-merit (FOM) for breast USCTdesigns, it is critical that VITs employ numerical breastphantoms (NBPs) that accurately convey the anatomical andacoustic properties of the female breast. Moreover, it is knownthat object variability (i.e., patient-to-patient differences in thebreast anatomy and properties) can be viewed as a sourceof randomness present in image data that limits the per-formance of human or numerical observers on detection orestimation tasks [23]–[25]. It is therefore important to havethe capability of producing ensembles of NBPs that possessprescribed statistical properties associated with a specified to-be-imaged subject cohort; these NBPs can each be virtuallyimaged and, subsequently, ensemble-averaged objective IQmeasures can be computed for use in assessing and refiningUSCT imaging technologies. However, existing NBPs do notsatisfy these requirements and are limited by factors thatinclude oversimplified anatomical structures [2], [26]–[29]or are representative of healthy subjects only [30], [31].NBPs derived from clinical magnetic resonance images areavailable [30] but are severely limited in number; as such,they do not accurately depict variability in breast anatomy oracoustic properties that will be present in a prescribed patientcohort. Other tools for generating NBPs [28], [29] rely ondigital templates or segmented clinical images with simplifiedanatomical structures and consider only a limited number oftissue types. In summary, there remains an important need
arX
iv:2
106.
0274
4v1
[ph
ysic
s.m
ed-p
h] 4
Jun
202
1
2
for developing NBPs for use in VITs of breast USCT that 1)comprise realistic structures and acoustic properties; 2) includelesions and/or other pathologies; and 3) are representative ofthe stochastic variability in breast size, shape, composition,anatomy, and tissue properties observed in a specified cohortof to-be-imaged subjects.
Recently, the Virtual Imaging Clinical Trials for RegulatoryEvaluation (VICTRE) project [17], [18] of the Food and DrugAdministration (FDA) has validated and released softwaretools to generate realistic NBPs, as part of an end-to-end sim-ulation framework for virtual mammography imaging studies.The breast size, shape, location, density, and extent of differenttissues are tunable parameters, based on which stochastic andphysically realistic three-dimensional (3D) numerical phan-toms of tissue structures can be generated. The tool alsoallows to embed a variety of lesions (e.g., circumscribed orspiculated) at physiologically plausible locations.
In this work, a methodology for producing realistic 3Dnumerical acoustic breast phantoms for enabling clinically-relevant VITs of USCT breast imaging is presented. Thiswill be accomplished by extending the VICTRE NBPs foruse in USCT, which will permit virtually imaging of en-sembles of NBPs whose physical and statistical propertiesare representative of clinical cohorts. Modifications to theVICTRE NBPs include: the determination of breast shapeparameters consistent with a prone imaging position [32], [33],the stochastic assignment of tissue specific acoustic properties(density, SOS, and AA), as well as the modeling of acousticheterogeneity within fatty and glandular tissues.
To demonstrate the usefulness of the proposed computa-tional framework, two case studies are presented. Case study1 assesses the reconstructed SOS image quality using differentcompensation techniques to account for unknown AA. Casestudy 2 demonstrates the utility of the proposed frameworkfor generating large-scale ensembles of NBPs for the trainingof deep learning-based USCT reconstruction methods. Toaccompany this work, two datasets have been publicly releasedunder CC-0: The first consists of 52 2D breast phantom slicesand corresponding USCT measurement data [34]; The secondcontains 4 3D realizations of numerical breast phantoms [35].
The remainder of the paper is organized as follows. InSection II, background on USCT breast imaging and theFDA VICTRE project are provided. The stochastic generationof 3D anatomically and physiologically realistic numericalbreast phantoms for USCT virtual imaging trials is introducedin Section III. Several examples of NBPs generated withthe proposed tool is presented in Section IV. Section Vcontains the case studies that illustrate possible applicationsof the proposed phantoms to inform image reconstructiondevelopment. Finally, in Section VI, a discussion of the widerange of applications enabled by the proposed framework isprovided.
II. BACKGROUND
A. USCT breast imaging
In recent decades, a number of research groups have beendeveloping USCT imaging technologies for breast imaging
applications [3], [5], [36], [37]. In a typical breast USCTsystem, the patient lies prone on the imaging table and thebreast to be imaged is submerged in water. An array ofultrasound transducers surrounds the breast. Each transduceremits an acoustic pulse one by one until the breast is insonifiedfrom all directions. During each shot, all other transducers actas receivers, recording the transmitted, scattered, and reflectedwavefield data.
Three types of USCT images are conventionally produced:reflectivity, SOS, and acoustic attenuation (AA) [6]. Re-flectivity images can be reconstructed by use of integralgeometry-based approaches that are similar to the delay-and-sum methods widely employed in conventional B-modeimaging. The majority of the SOS and AA reconstructionmethods investigated to date are generally based on twocategories: approximated wave equation methods [16], [26],[38], and full-waveform inversion (FWI) methods [1], [2],[15], [27]. Because FWI methods take high-order refrac-tion and diffraction effects into account, they can produceimages that possess higher spatial resolution images thanthose produced by use of linearized or approximate methods[1], [2], [39]. However, FWI is computationally expensiveand memory burdensome, especially for 3D problems, thushampering the widespread application of FWI to USCT breastimaging. Moreover, FWI suffers of the so-called cycle skippingphenomenon [40], thus requiring an accurate initial estimateof the SOS map to ensure convergence to a useful solution.As a result, there is still an imperative need to systematicallyinvestigate and optimize USCT reconstruction methods bymeans of computer-simulation studies.
Fig. 1. (a) Volume rendering of fatty breast phantom: partial transparenciesare used to highlight anatomical structures, and cross-section view of this3D breast phantom. (b) Volume rendering of spiculated lesion phantom. andcross-section view of this 3D lesion phantom.
B. Description of VICTRE
The Virtual Imaging Clinical Trials for Regulatory Evalua-tion (VICTRE) project of the Food and Drug Administration(FDA) has recently released a series of software tools toprovide a complete simulated imaging chain for mammogra-phy and digital breast tomosynthesis [17]. The VICTRE soft-ware includes open source tools to generate three-dimensional
3
(3D) random anthropomorphic voxelized phantoms of thehuman female breast [41]. Using this tool, large ensemblesof anthropomorphic numerical breast phantoms (NBPs) withrealistic anatomical structures can be generated by specifyingdifferent virtual-patient characteristics that include breast type,shape, granularity, density, and size. By appropriate selectionof physical attributes and material coefficients, the VICTRENBPs can be customized for particular imaging tasks.
The VICTRE software generates NBPs corresponding to thefour different levels of breast density defined according to theAmerican College of Radiology’s (ACR) Breast Imaging Re-porting and Data System (BI-RADS) [42]: A) Breast is almostentirely fat, B) Breast has scattered areas of fibroglandulardensity, C) Breast is heterogeneously dense, and D) Breast isextremely dense. Each NBP is a 3D voxelized map consistingof ten tissue types: fat, skin, glandular, nipple, ligament,muscle, terminal duct lobular unit, duct, artery, and vein.Large ensembles of stochastic NBPs with realistic variabilityin breast volume, shape, fraction of glandular tissue, ligamentorientation, tissue anatomy, can be generated by controllinginput parameters and selecting the random seed number.
In addition, the VICTRE projects include tools to generate3D numerical lesions phantoms (NLPs), which can be insertedinto the NBPs at clinically plausible locations [43]. Two typesof lesions, microcalcification clusters and spiculated masses,can be generated. The size and shape of the lesions can becustomized. An example of anatomically realistic NBP andNLP generated using the VICTRE tools is shown in Fig. 1.
There exist several challenges that must be addressed inorder to extend the VICTRE project to produce NBPs for usein VITs of USCT technologies. These include determinationof breast shape parameters consistent with a prone imagingposition, the stochastic assignment of tissue specific acousticproperties (density, SOS, and acoustic attenuation), and themodeling of acoustic heterogeneity within fatty and glandulartissues.
III. METHODS
Several adaptations and customizations of the VICTREtools were developed that will enable the generation of largeensembles of acoustic NBPs that display clinically relevantvariability in both anatomical structures and acoustic prop-erties. The specific procedures for accomplishing this aredescribed below.
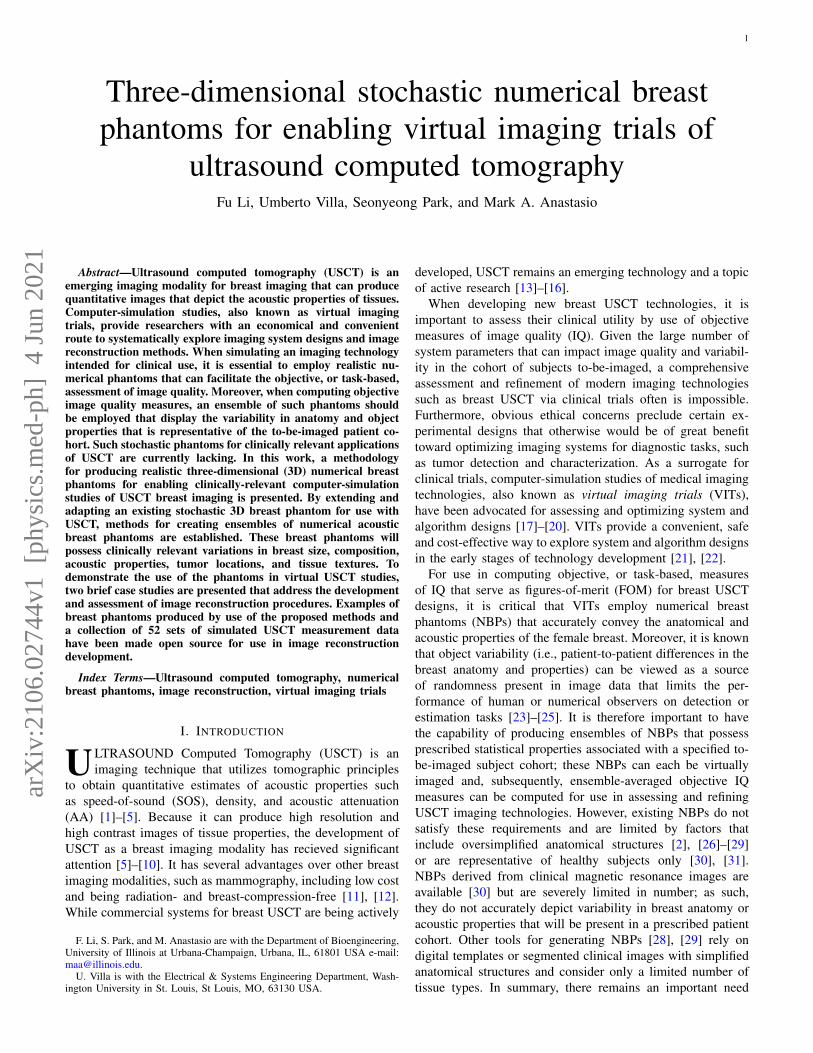
Fig. 2. Overview of size parameters: a1t, a1b, a2l, a2r, a3.
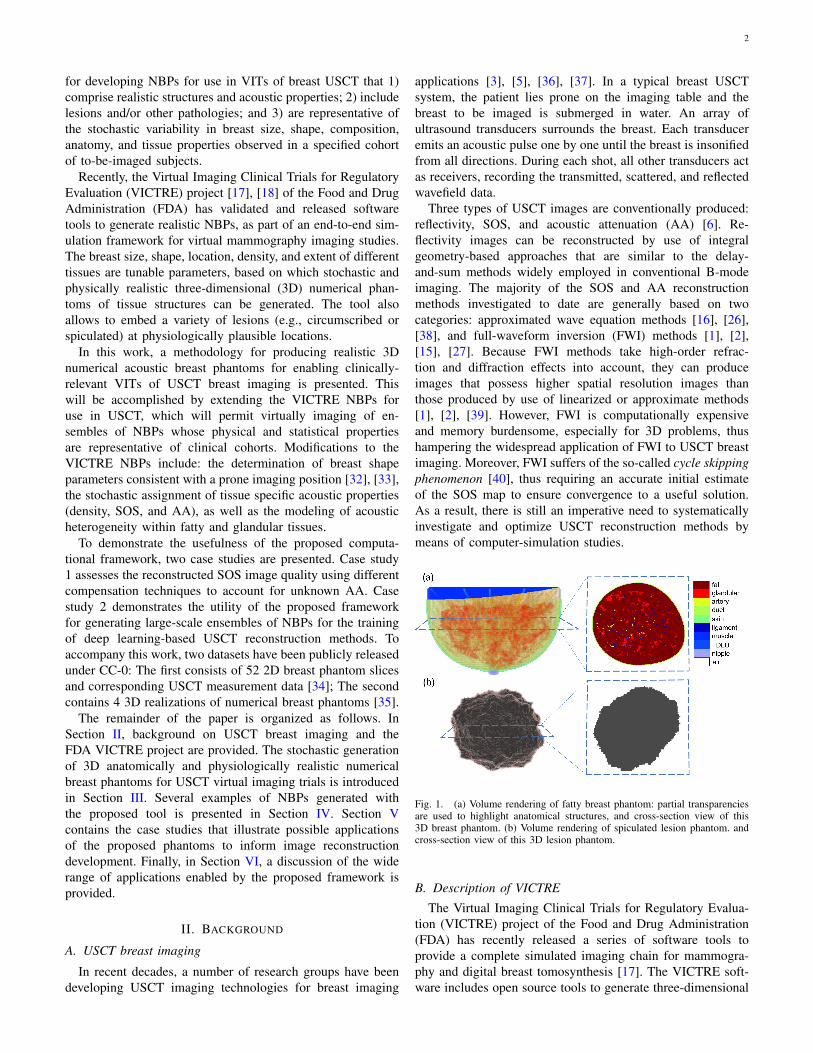
Fig. 3. Overview of deformation parameters. Red breast: hemispherical breastphantoms without deformation, yellow breast: deformed breast phantoms.Left: the effect of superquadric exponent deformation (𝜖1) in sagittal plane.Center: the effect of ptosis deformation (𝐵0, 𝐵1) in sagittal plane. Right: theeffect of turn top deformation (𝐻0, 𝐻1) in coronal plane.
TABLE ISHAPE AND SIZE PARAMETERS.
Parameters Types A-C Type D𝑎1𝑡 (cm) TN(5.85, 2.3275, 3.85, 7.70) TN(4.20,1.225,2.80,5.25)𝑎1𝑏/𝑎1𝑡 N(1, 0.02) N(1, 0.02)𝑎2𝑟/𝑎1𝑡 N(1, 0.05) N(1, 0.05)𝑎2𝑙/𝑎2𝑟 N(1, 0.05) N(1, 0.05)𝑎3/𝑎1𝑡 N(1.48, 0.18, 1, 1.6) N(1.22,0.1,0.75.1.5)
𝜖1 N(1, 0.1)𝐵0 TN(1, 0.1, -0.18, 0.18)𝐵1 TN(1, 0.1, -0.18, 0.18)𝐻0 TN(1, 0.15, -0.11, 0.11)𝐻1 TN(1, 0.25, -0.3, 0.3)
N(`, 𝜎2): Gaussian distribution with mean ` and variance 𝜎2.TN(`, 𝜎2, 𝑎, 𝑏): Truncated Gaussian distribution in interval (𝑎, 𝑏) .
A. Generation of anatomically realistic realizations of NBPsand lesion(s) insertion
The goal of this step is to generate large ensembles ofanatomically realistic NBPs representing four different typesof breast (extremely dense, heterogeneously dense, scatteredfibroglandular and fatty). Section III-A1 describes how shapeand deformation parameters in the VICTRE NBPs can beset to generate virtual patients with variable breast sizes thatare representative of a clinical population and shapes thatare consistent with USCT imaging protocols. Section III-A2describes adaptations to the internal anatomical structures ofthe NBP to exclude tissues that are not relevant for USCTapplications. Finally, Section III-A3 describes how one ormore lesions are optionally inserted into the NBPs.
1) Breast shape and deformation parameters: Appropriatedistributions of breast size parameters were determined foreach breast type based on clinical data [44]. In the VICTREsoftware, the shape of the breast is created by applying a seriesof transformations to a base superquadratic surface. A detaileddescription of the breast shape model was presented in [45].Here, the main parameters affecting size and shape of thebreast are discussed. As shown in Fig. 2, the parameters 𝑎1𝑏 ,𝑎1𝑡 , 𝑎2𝑟 , 𝑎2𝑙 adjust the breast volume in the top, bottom, left,right hemispheres, respectively. The parameter 𝑎3 adjusts thelength of the breast. Figure 3 illustrates how other parametersaffect the final shape of the breast. The parameter 𝜖1 is thequadric shape exponent along the polar angle. The ptosisdeformation parameters 𝐵0, 𝐵1 model the sagging that affectsa breast as a subject ages. Finally, the turn-pop deformation
4
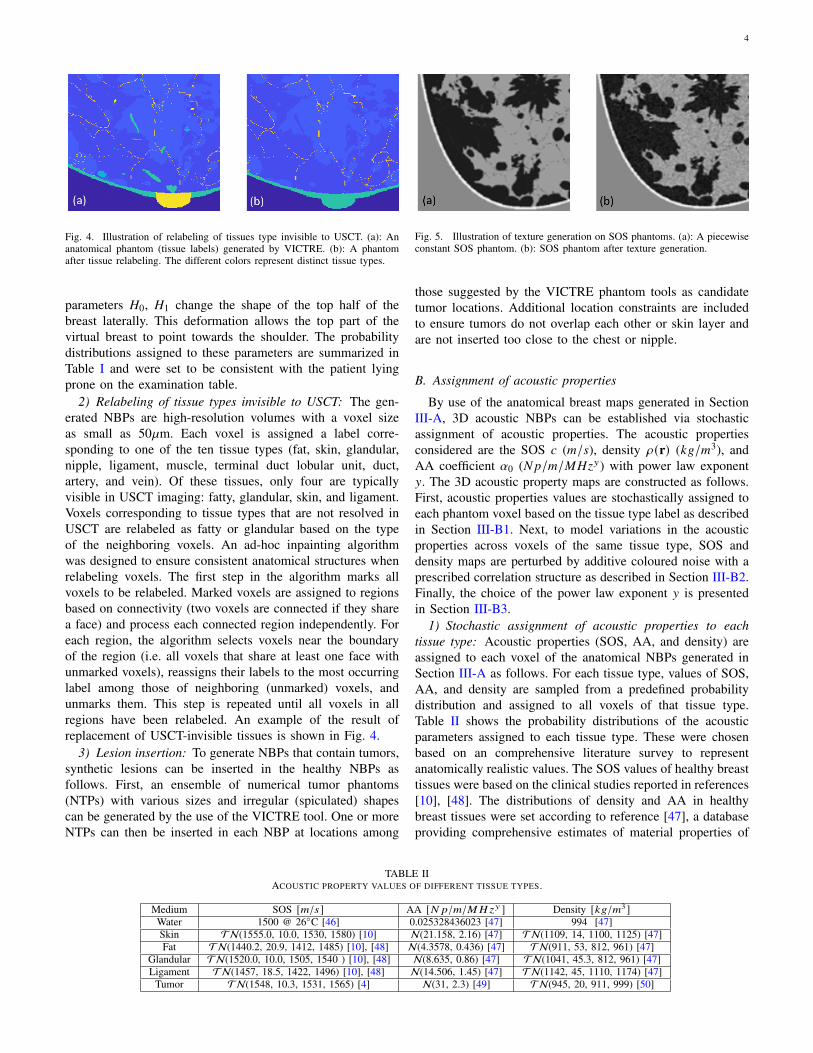
Fig. 4. Illustration of relabeling of tissues type invisible to USCT. (a): Ananatomical phantom (tissue labels) generated by VICTRE. (b): A phantomafter tissue relabeling. The different colors represent distinct tissue types.
parameters 𝐻0, 𝐻1 change the shape of the top half of thebreast laterally. This deformation allows the top part of thevirtual breast to point towards the shoulder. The probabilitydistributions assigned to these parameters are summarized inTable I and were set to be consistent with the patient lyingprone on the examination table.
2) Relabeling of tissue types invisible to USCT: The gen-erated NBPs are high-resolution volumes with a voxel sizeas small as 50`m. Each voxel is assigned a label corre-sponding to one of the ten tissue types (fat, skin, glandular,nipple, ligament, muscle, terminal duct lobular unit, duct,artery, and vein). Of these tissues, only four are typicallyvisible in USCT imaging: fatty, glandular, skin, and ligament.Voxels corresponding to tissue types that are not resolved inUSCT are relabeled as fatty or glandular based on the typeof the neighboring voxels. An ad-hoc inpainting algorithmwas designed to ensure consistent anatomical structures whenrelabeling voxels. The first step in the algorithm marks allvoxels to be relabeled. Marked voxels are assigned to regionsbased on connectivity (two voxels are connected if they sharea face) and process each connected region independently. Foreach region, the algorithm selects voxels near the boundaryof the region (i.e. all voxels that share at least one face withunmarked voxels), reassigns their labels to the most occurringlabel among those of neighboring (unmarked) voxels, andunmarks them. This step is repeated until all voxels in allregions have been relabeled. An example of the result ofreplacement of USCT-invisible tissues is shown in Fig. 4.
3) Lesion insertion: To generate NBPs that contain tumors,synthetic lesions can be inserted in the healthy NBPs asfollows. First, an ensemble of numerical tumor phantoms(NTPs) with various sizes and irregular (spiculated) shapescan be generated by the use of the VICTRE tool. One or moreNTPs can then be inserted in each NBP at locations among
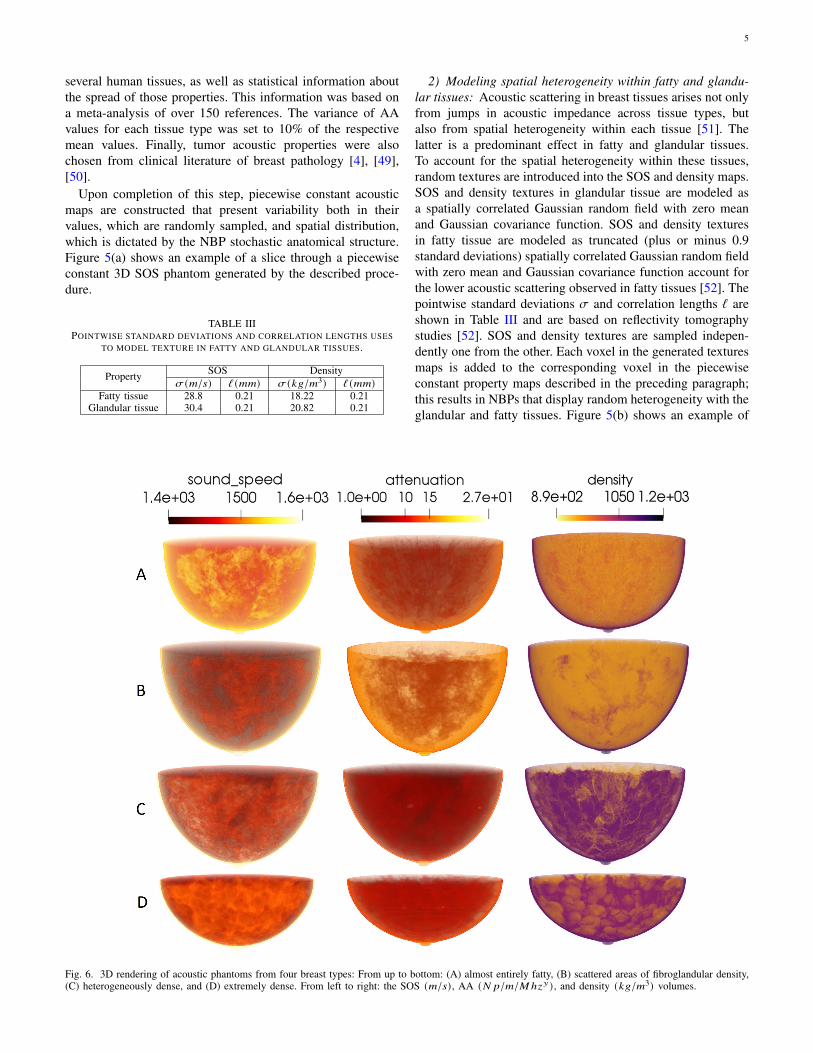
Fig. 5. Illustration of texture generation on SOS phantoms. (a): A piecewiseconstant SOS phantom. (b): SOS phantom after texture generation.
those suggested by the VICTRE phantom tools as candidatetumor locations. Additional location constraints are includedto ensure tumors do not overlap each other or skin layer andare not inserted too close to the chest or nipple.
B. Assignment of acoustic properties
By use of the anatomical breast maps generated in SectionIII-A, 3D acoustic NBPs can be established via stochasticassignment of acoustic properties. The acoustic propertiesconsidered are the SOS 𝑐 (𝑚/𝑠), density 𝜌(r) (𝑘𝑔/𝑚3), andAA coefficient 𝛼0 (𝑁𝑝/𝑚/𝑀𝐻𝑧𝑦) with power law exponent𝑦. The 3D acoustic property maps are constructed as follows.First, acoustic properties values are stochastically assigned toeach phantom voxel based on the tissue type label as describedin Section III-B1. Next, to model variations in the acousticproperties across voxels of the same tissue type, SOS anddensity maps are perturbed by additive coloured noise with aprescribed correlation structure as described in Section III-B2.Finally, the choice of the power law exponent 𝑦 is presentedin Section III-B3.
1) Stochastic assignment of acoustic properties to eachtissue type: Acoustic properties (SOS, AA, and density) areassigned to each voxel of the anatomical NBPs generated inSection III-A as follows. For each tissue type, values of SOS,AA, and density are sampled from a predefined probabilitydistribution and assigned to all voxels of that tissue type.Table II shows the probability distributions of the acousticparameters assigned to each tissue type. These were chosenbased on an comprehensive literature survey to representanatomically realistic values. The SOS values of healthy breasttissues were based on the clinical studies reported in references[10], [48]. The distributions of density and AA in healthybreast tissues were set according to reference [47], a databaseproviding comprehensive estimates of material properties of
TABLE IIACOUSTIC PROPERTY VALUES OF DIFFERENT TISSUE TYPES.
Medium SOS [𝑚/𝑠] AA [𝑁 𝑝/𝑚/𝑀𝐻𝑧𝑦 ] Density [𝑘𝑔/𝑚3 ]Water 1500 @ 26◦C [46] 0.025328436023 [47] 994 [47]Skin TN(1555.0, 10.0, 1530, 1580) [10] N(21.158, 2.16) [47] TN(1109, 14, 1100, 1125) [47]Fat TN(1440.2, 20.9, 1412, 1485) [10], [48] N(4.3578, 0.436) [47] TN(911, 53, 812, 961) [47]
Glandular TN(1520.0, 10.0, 1505, 1540 ) [10], [48] N(8.635, 0.86) [47] TN(1041, 45.3, 812, 961) [47]Ligament TN(1457, 18.5, 1422, 1496) [10], [48] N(14.506, 1.45) [47] TN(1142, 45, 1110, 1174) [47]
Tumor TN(1548, 10.3, 1531, 1565) [4] N(31, 2.3) [49] TN(945, 20, 911, 999) [50]
5
several human tissues, as well as statistical information aboutthe spread of those properties. This information was based ona meta-analysis of over 150 references. The variance of AAvalues for each tissue type was set to 10% of the respectivemean values. Finally, tumor acoustic properties were alsochosen from clinical literature of breast pathology [4], [49],[50].
Upon completion of this step, piecewise constant acousticmaps are constructed that present variability both in theirvalues, which are randomly sampled, and spatial distribution,which is dictated by the NBP stochastic anatomical structure.Figure 5(a) shows an example of a slice through a piecewiseconstant 3D SOS phantom generated by the described proce-dure.
TABLE IIIPOINTWISE STANDARD DEVIATIONS AND CORRELATION LENGTHS USES
TO MODEL TEXTURE IN FATTY AND GLANDULAR TISSUES.
Property SOS Density𝜎 (𝑚/𝑠) ℓ (𝑚𝑚) 𝜎 (𝑘𝑔/𝑚3) ℓ (𝑚𝑚)
Fatty tissue 28.8 0.21 18.22 0.21Glandular tissue 30.4 0.21 20.82 0.21
2) Modeling spatial heterogeneity within fatty and glandu-lar tissues: Acoustic scattering in breast tissues arises not onlyfrom jumps in acoustic impedance across tissue types, butalso from spatial heterogeneity within each tissue [51]. Thelatter is a predominant effect in fatty and glandular tissues.To account for the spatial heterogeneity within these tissues,random textures are introduced into the SOS and density maps.SOS and density textures in glandular tissue are modeled asa spatially correlated Gaussian random field with zero meanand Gaussian covariance function. SOS and density texturesin fatty tissue are modeled as truncated (plus or minus 0.9standard deviations) spatially correlated Gaussian random fieldwith zero mean and Gaussian covariance function account forthe lower acoustic scattering observed in fatty tissues [52]. Thepointwise standard deviations 𝜎 and correlation lengths ℓ areshown in Table III and are based on reflectivity tomographystudies [52]. SOS and density textures are sampled indepen-dently one from the other. Each voxel in the generated texturesmaps is added to the corresponding voxel in the piecewiseconstant property maps described in the preceding paragraph;this results in NBPs that display random heterogeneity with theglandular and fatty tissues. Figure 5(b) shows an example of
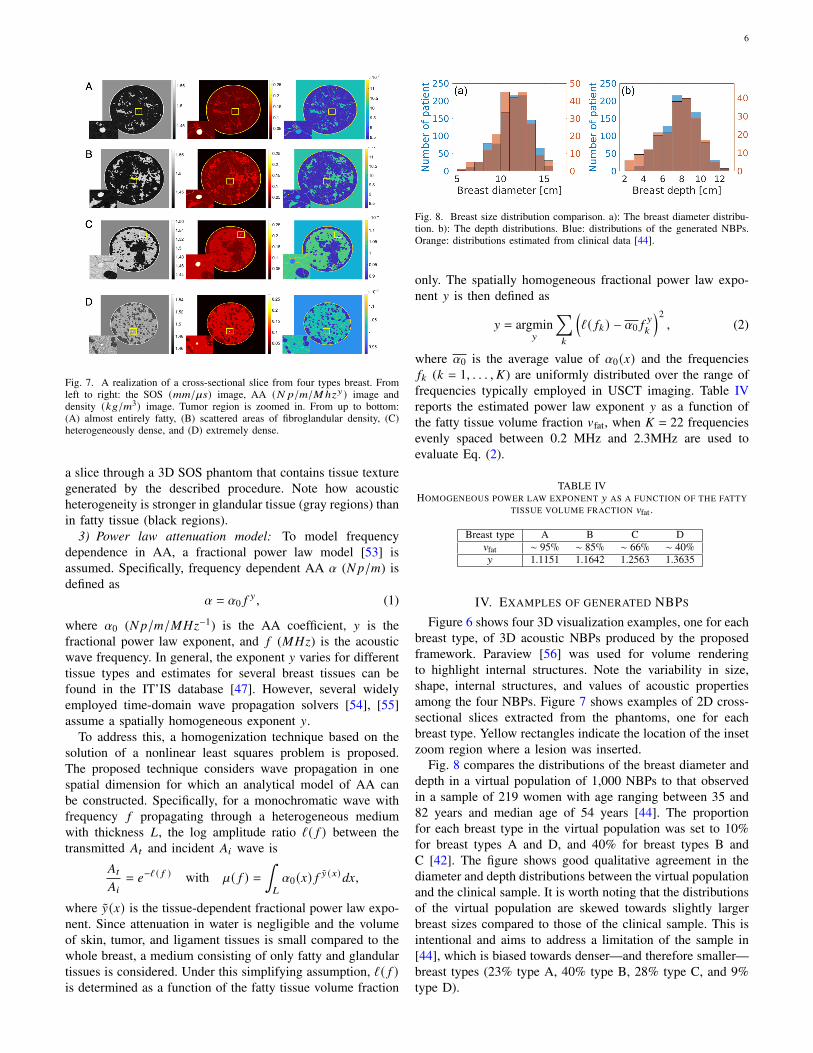
Fig. 6. 3D rendering of acoustic phantoms from four breast types: From up to bottom: (A) almost entirely fatty, (B) scattered areas of fibroglandular density,(C) heterogeneously dense, and (D) extremely dense. From left to right: the SOS (𝑚/𝑠) , AA (𝑁 𝑝/𝑚/𝑀ℎ𝑧𝑦) , and density (𝑘𝑔/𝑚3) volumes.
6
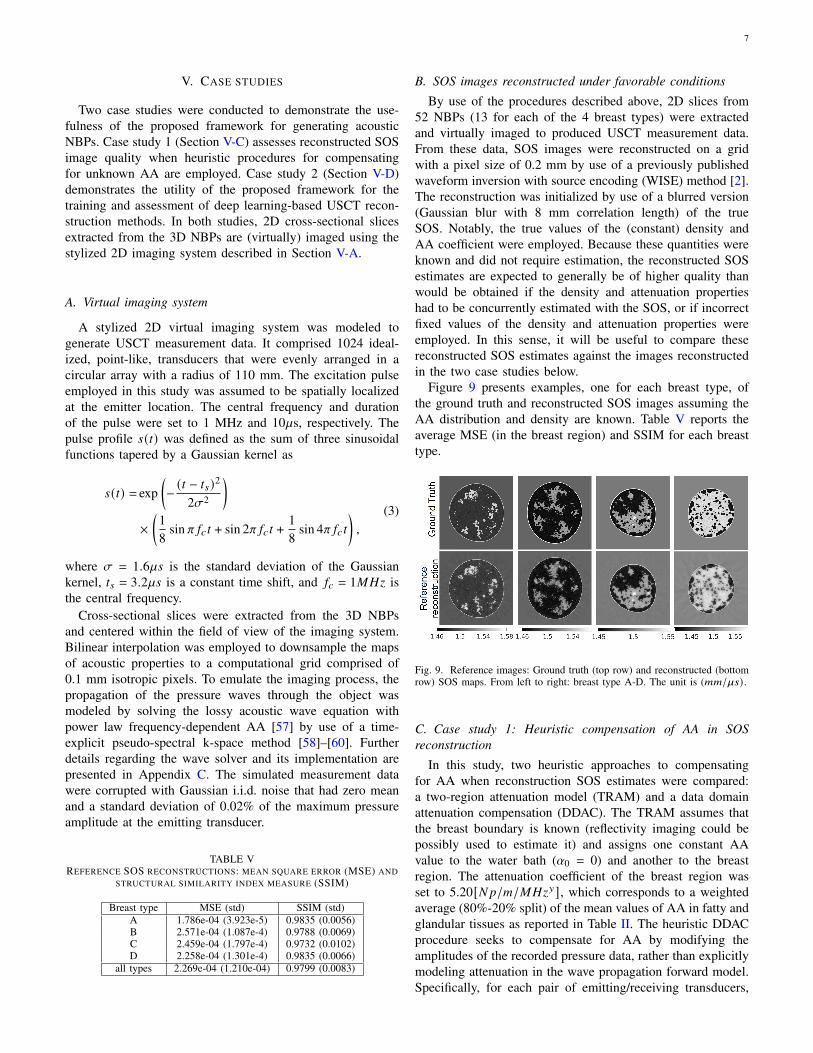
Fig. 7. A realization of a cross-sectional slice from four types breast. Fromleft to right: the SOS (𝑚𝑚/`𝑠) image, AA (𝑁 𝑝/𝑚/𝑀ℎ𝑧𝑦) image anddensity (𝑘𝑔/𝑚3) image. Tumor region is zoomed in. From up to bottom:(A) almost entirely fatty, (B) scattered areas of fibroglandular density, (C)heterogeneously dense, and (D) extremely dense.
a slice through a 3D SOS phantom that contains tissue texturegenerated by the described procedure. Note how acousticheterogeneity is stronger in glandular tissue (gray regions) thanin fatty tissue (black regions).
3) Power law attenuation model: To model frequencydependence in AA, a fractional power law model [53] isassumed. Specifically, frequency dependent AA 𝛼 (𝑁𝑝/𝑚) isdefined as
𝛼 = 𝛼0 𝑓𝑦 , (1)
where 𝛼0 (𝑁𝑝/𝑚/𝑀𝐻𝑧−1) is the AA coefficient, 𝑦 is thefractional power law exponent, and 𝑓 (𝑀𝐻𝑧) is the acousticwave frequency. In general, the exponent 𝑦 varies for differenttissue types and estimates for several breast tissues can befound in the IT’IS database [47]. However, several widelyemployed time-domain wave propagation solvers [54], [55]assume a spatially homogeneous exponent 𝑦.
To address this, a homogenization technique based on thesolution of a nonlinear least squares problem is proposed.The proposed technique considers wave propagation in onespatial dimension for which an analytical model of AA canbe constructed. Specifically, for a monochromatic wave withfrequency 𝑓 propagating through a heterogeneous mediumwith thickness 𝐿, the log amplitude ratio ℓ( 𝑓 ) between thetransmitted 𝐴𝑡 and incident 𝐴𝑖 wave is
𝐴𝑡
𝐴𝑖= 𝑒−ℓ ( 𝑓 ) with `( 𝑓 ) =
∫𝐿
𝛼0 (𝑥) 𝑓 �̃� (𝑥)𝑑𝑥,
where �̃�(𝑥) is the tissue-dependent fractional power law expo-nent. Since attenuation in water is negligible and the volumeof skin, tumor, and ligament tissues is small compared to thewhole breast, a medium consisting of only fatty and glandulartissues is considered. Under this simplifying assumption, ℓ( 𝑓 )is determined as a function of the fatty tissue volume fraction
Fig. 8. Breast size distribution comparison. a): The breast diameter distribu-tion. b): The depth distributions. Blue: distributions of the generated NBPs.Orange: distributions estimated from clinical data [44].
only. The spatially homogeneous fractional power law expo-nent 𝑦 is then defined as
𝑦 = argmin𝑦
∑︁𝑘
(ℓ( 𝑓𝑘 ) − 𝛼0 𝑓
𝑦
𝑘
)2, (2)
where 𝛼0 is the average value of 𝛼0 (𝑥) and the frequencies𝑓𝑘 (𝑘 = 1, . . . , 𝐾) are uniformly distributed over the range offrequencies typically employed in USCT imaging. Table IVreports the estimated power law exponent 𝑦 as a function ofthe fatty tissue volume fraction 𝑣fat, when 𝐾 = 22 frequenciesevenly spaced between 0.2 MHz and 2.3MHz are used toevaluate Eq. (2).
TABLE IVHOMOGENEOUS POWER LAW EXPONENT 𝑦 AS A FUNCTION OF THE FATTY
TISSUE VOLUME FRACTION 𝑣fat .
Breast type A B C D𝑣fat ∼ 95% ∼ 85% ∼ 66% ∼ 40%𝑦 1.1151 1.1642 1.2563 1.3635
IV. EXAMPLES OF GENERATED NBPS
Figure 6 shows four 3D visualization examples, one for eachbreast type, of 3D acoustic NBPs produced by the proposedframework. Paraview [56] was used for volume renderingto highlight internal structures. Note the variability in size,shape, internal structures, and values of acoustic propertiesamong the four NBPs. Figure 7 shows examples of 2D cross-sectional slices extracted from the phantoms, one for eachbreast type. Yellow rectangles indicate the location of the insetzoom region where a lesion was inserted.
Fig. 8 compares the distributions of the breast diameter anddepth in a virtual population of 1,000 NBPs to that observedin a sample of 219 women with age ranging between 35 and82 years and median age of 54 years [44]. The proportionfor each breast type in the virtual population was set to 10%for breast types A and D, and 40% for breast types B andC [42]. The figure shows good qualitative agreement in thediameter and depth distributions between the virtual populationand the clinical sample. It is worth noting that the distributionsof the virtual population are skewed towards slightly largerbreast sizes compared to those of the clinical sample. This isintentional and aims to address a limitation of the sample in[44], which is biased towards denser—and therefore smaller—breast types (23% type A, 40% type B, 28% type C, and 9%type D).
7
V. CASE STUDIES
Two case studies were conducted to demonstrate the use-fulness of the proposed framework for generating acousticNBPs. Case study 1 (Section V-C) assesses reconstructed SOSimage quality when heuristic procedures for compensatingfor unknown AA are employed. Case study 2 (Section V-D)demonstrates the utility of the proposed framework for thetraining and assessment of deep learning-based USCT recon-struction methods. In both studies, 2D cross-sectional slicesextracted from the 3D NBPs are (virtually) imaged using thestylized 2D imaging system described in Section V-A.
A. Virtual imaging system
A stylized 2D virtual imaging system was modeled togenerate USCT measurement data. It comprised 1024 ideal-ized, point-like, transducers that were evenly arranged in acircular array with a radius of 110 mm. The excitation pulseemployed in this study was assumed to be spatially localizedat the emitter location. The central frequency and durationof the pulse were set to 1 MHz and 10`s, respectively. Thepulse profile 𝑠(𝑡) was defined as the sum of three sinusoidalfunctions tapered by a Gaussian kernel as
𝑠(𝑡) = exp(− (𝑡 − 𝑡𝑠)2
2𝜎2
)×(18
sin 𝜋 𝑓𝑐𝑡 + sin 2𝜋 𝑓𝑐𝑡 +18
sin 4𝜋 𝑓𝑐𝑡),
(3)
where 𝜎 = 1.6`𝑠 is the standard deviation of the Gaussiankernel, 𝑡𝑠 = 3.2`𝑠 is a constant time shift, and 𝑓𝑐 = 1𝑀𝐻𝑧 isthe central frequency.
Cross-sectional slices were extracted from the 3D NBPsand centered within the field of view of the imaging system.Bilinear interpolation was employed to downsample the mapsof acoustic properties to a computational grid comprised of0.1 mm isotropic pixels. To emulate the imaging process, thepropagation of the pressure waves through the object wasmodeled by solving the lossy acoustic wave equation withpower law frequency-dependent AA [57] by use of a time-explicit pseudo-spectral k-space method [58]–[60]. Furtherdetails regarding the wave solver and its implementation arepresented in Appendix C. The simulated measurement datawere corrupted with Gaussian i.i.d. noise that had zero meanand a standard deviation of 0.02% of the maximum pressureamplitude at the emitting transducer.
TABLE VREFERENCE SOS RECONSTRUCTIONS: MEAN SQUARE ERROR (MSE) AND
STRUCTURAL SIMILARITY INDEX MEASURE (SSIM)
Breast type MSE (std) SSIM (std)A 1.786e-04 (3.923e-5) 0.9835 (0.0056)B 2.571e-04 (1.087e-4) 0.9788 (0.0069)C 2.459e-04 (1.797e-4) 0.9732 (0.0102)D 2.258e-04 (1.301e-4) 0.9835 (0.0066)
all types 2.269e-04 (1.210e-04) 0.9799 (0.0083)
B. SOS images reconstructed under favorable conditions
By use of the procedures described above, 2D slices from52 NBPs (13 for each of the 4 breast types) were extractedand virtually imaged to produced USCT measurement data.From these data, SOS images were reconstructed on a gridwith a pixel size of 0.2 mm by use of a previously publishedwaveform inversion with source encoding (WISE) method [2].The reconstruction was initialized by use of a blurred version(Gaussian blur with 8 mm correlation length) of the trueSOS. Notably, the true values of the (constant) density andAA coefficient were employed. Because these quantities wereknown and did not require estimation, the reconstructed SOSestimates are expected to generally be of higher quality thanwould be obtained if the density and attenuation propertieshad to be concurrently estimated with the SOS, or if incorrectfixed values of the density and attenuation properties wereemployed. In this sense, it will be useful to compare thesereconstructed SOS estimates against the images reconstructedin the two case studies below.
Figure 9 presents examples, one for each breast type, ofthe ground truth and reconstructed SOS images assuming theAA distribution and density are known. Table V reports theaverage MSE (in the breast region) and SSIM for each breasttype.
Fig. 9. Reference images: Ground truth (top row) and reconstructed (bottomrow) SOS maps. From left to right: breast type A-D. The unit is (𝑚𝑚/`𝑠) .
C. Case study 1: Heuristic compensation of AA in SOSreconstruction
In this study, two heuristic approaches to compensatingfor AA when reconstruction SOS estimates were compared:a two-region attenuation model (TRAM) and a data domainattenuation compensation (DDAC). The TRAM assumes thatthe breast boundary is known (reflectivity imaging could bepossibly used to estimate it) and assigns one constant AAvalue to the water bath (𝛼0 = 0) and another to the breastregion. The attenuation coefficient of the breast region wasset to 5.20[𝑁𝑝/𝑚/𝑀𝐻𝑧𝑦], which corresponds to a weightedaverage (80%-20% split) of the mean values of AA in fatty andglandular tissues as reported in Table II. The heuristic DDACprocedure seeks to compensate for AA by modifying theamplitudes of the recorded pressure data, rather than explicitlymodeling attenuation in the wave propagation forward model.Specifically, for each pair of emitting/receiving transducers,
8
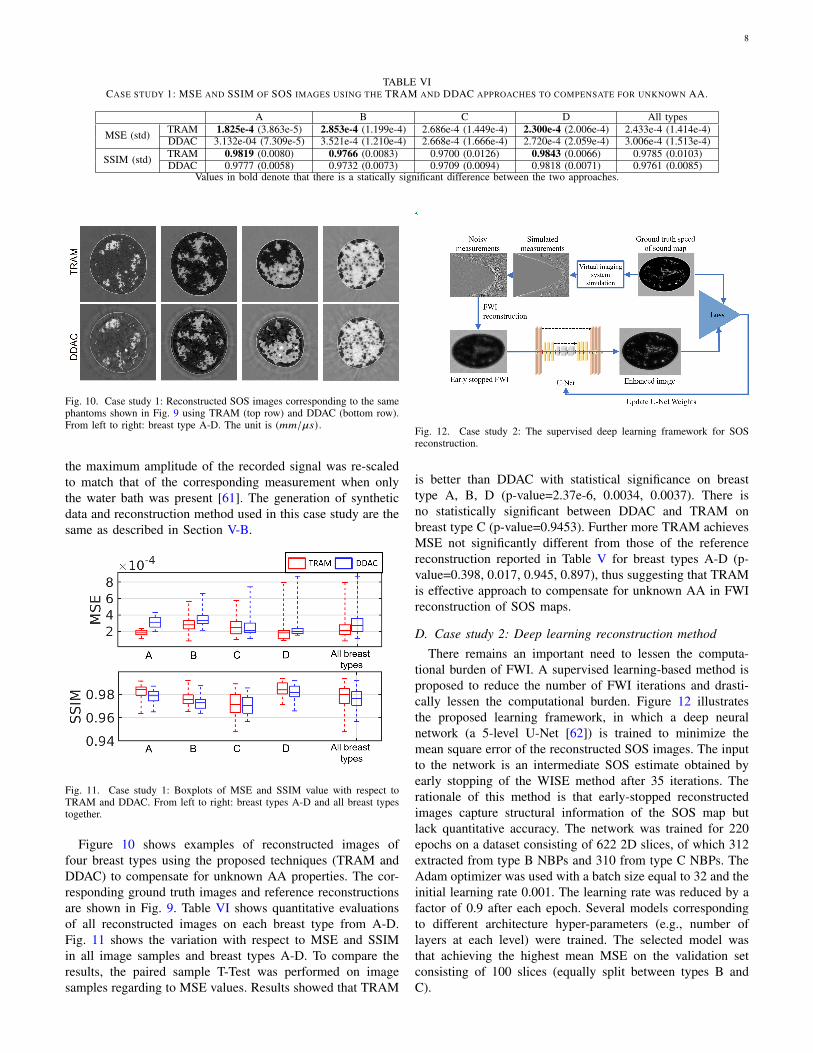
TABLE VICASE STUDY 1: MSE AND SSIM OF SOS IMAGES USING THE TRAM AND DDAC APPROACHES TO COMPENSATE FOR UNKNOWN AA.
A B C D All types
MSE (std) TRAM 1.825e-4 (3.863e-5) 2.853e-4 (1.199e-4) 2.686e-4 (1.449e-4) 2.300e-4 (2.006e-4) 2.433e-4 (1.414e-4)DDAC 3.132e-04 (7.309e-5) 3.521e-4 (1.210e-4) 2.668e-4 (1.666e-4) 2.720e-4 (2.059e-4) 3.006e-4 (1.513e-4)
SSIM (std) TRAM 0.9819 (0.0080) 0.9766 (0.0083) 0.9700 (0.0126) 0.9843 (0.0066) 0.9785 (0.0103)DDAC 0.9777 (0.0058) 0.9732 (0.0073) 0.9709 (0.0094) 0.9818 (0.0071) 0.9761 (0.0085)
Values in bold denote that there is a statically significant difference between the two approaches.
Fig. 10. Case study 1: Reconstructed SOS images corresponding to the samephantoms shown in Fig. 9 using TRAM (top row) and DDAC (bottom row).From left to right: breast type A-D. The unit is (𝑚𝑚/`𝑠) .
the maximum amplitude of the recorded signal was re-scaledto match that of the corresponding measurement when onlythe water bath was present [61]. The generation of syntheticdata and reconstruction method used in this case study are thesame as described in Section V-B.
Fig. 11. Case study 1: Boxplots of MSE and SSIM value with respect toTRAM and DDAC. From left to right: breast types A-D and all breast typestogether.
Figure 10 shows examples of reconstructed images offour breast types using the proposed techniques (TRAM andDDAC) to compensate for unknown AA properties. The cor-responding ground truth images and reference reconstructionsare shown in Fig. 9. Table VI shows quantitative evaluationsof all reconstructed images on each breast type from A-D.Fig. 11 shows the variation with respect to MSE and SSIMin all image samples and breast types A-D. To compare theresults, the paired sample T-Test was performed on imagesamples regarding to MSE values. Results showed that TRAM
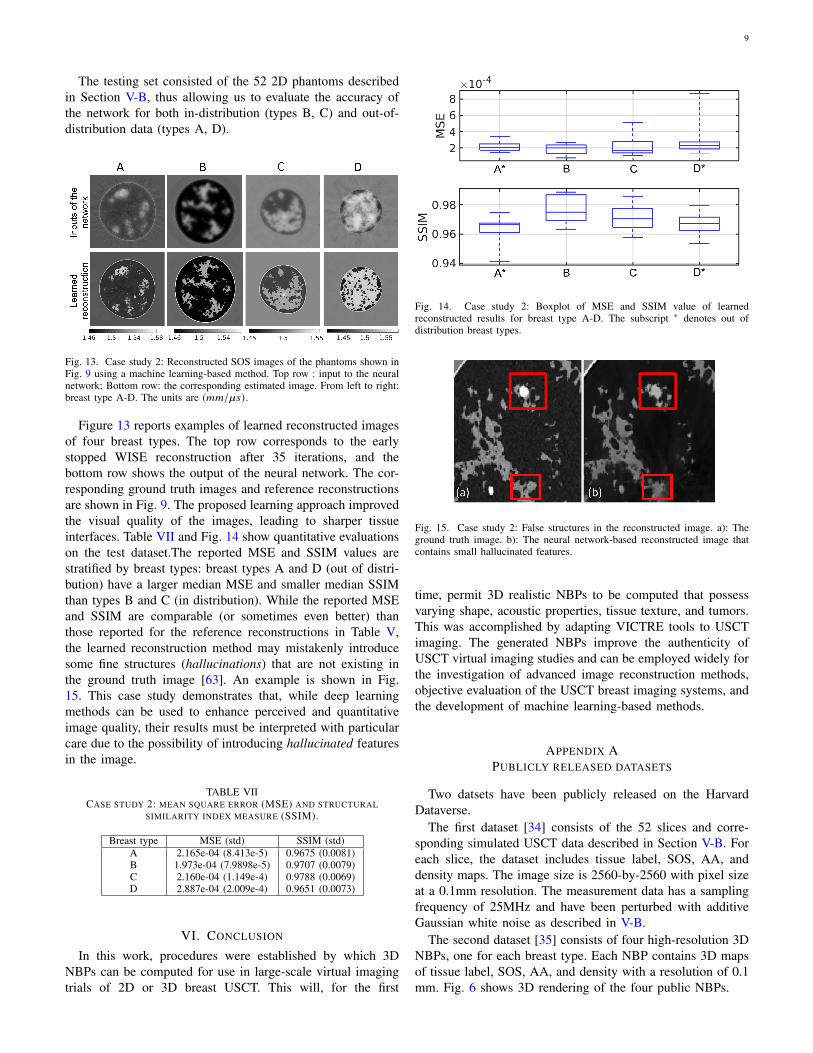
Fig. 12. Case study 2: The supervised deep learning framework for SOSreconstruction.
is better than DDAC with statistical significance on breasttype A, B, D (p-value=2.37e-6, 0.0034, 0.0037). There isno statistically significant between DDAC and TRAM onbreast type C (p-value=0.9453). Further more TRAM achievesMSE not significantly different from those of the referencereconstruction reported in Table V for breast types A-D (p-value=0.398, 0.017, 0.945, 0.897), thus suggesting that TRAMis effective approach to compensate for unknown AA in FWIreconstruction of SOS maps.
D. Case study 2: Deep learning reconstruction methodThere remains an important need to lessen the computa-
tional burden of FWI. A supervised learning-based method isproposed to reduce the number of FWI iterations and drasti-cally lessen the computational burden. Figure 12 illustratesthe proposed learning framework, in which a deep neuralnetwork (a 5-level U-Net [62]) is trained to minimize themean square error of the reconstructed SOS images. The inputto the network is an intermediate SOS estimate obtained byearly stopping of the WISE method after 35 iterations. Therationale of this method is that early-stopped reconstructedimages capture structural information of the SOS map butlack quantitative accuracy. The network was trained for 220epochs on a dataset consisting of 622 2D slices, of which 312extracted from type B NBPs and 310 from type C NBPs. TheAdam optimizer was used with a batch size equal to 32 and theinitial learning rate 0.001. The learning rate was reduced by afactor of 0.9 after each epoch. Several models correspondingto different architecture hyper-parameters (e.g., number oflayers at each level) were trained. The selected model wasthat achieving the highest mean MSE on the validation setconsisting of 100 slices (equally split between types B andC).
9
The testing set consisted of the 52 2D phantoms describedin Section V-B, thus allowing us to evaluate the accuracy ofthe network for both in-distribution (types B, C) and out-of-distribution data (types A, D).
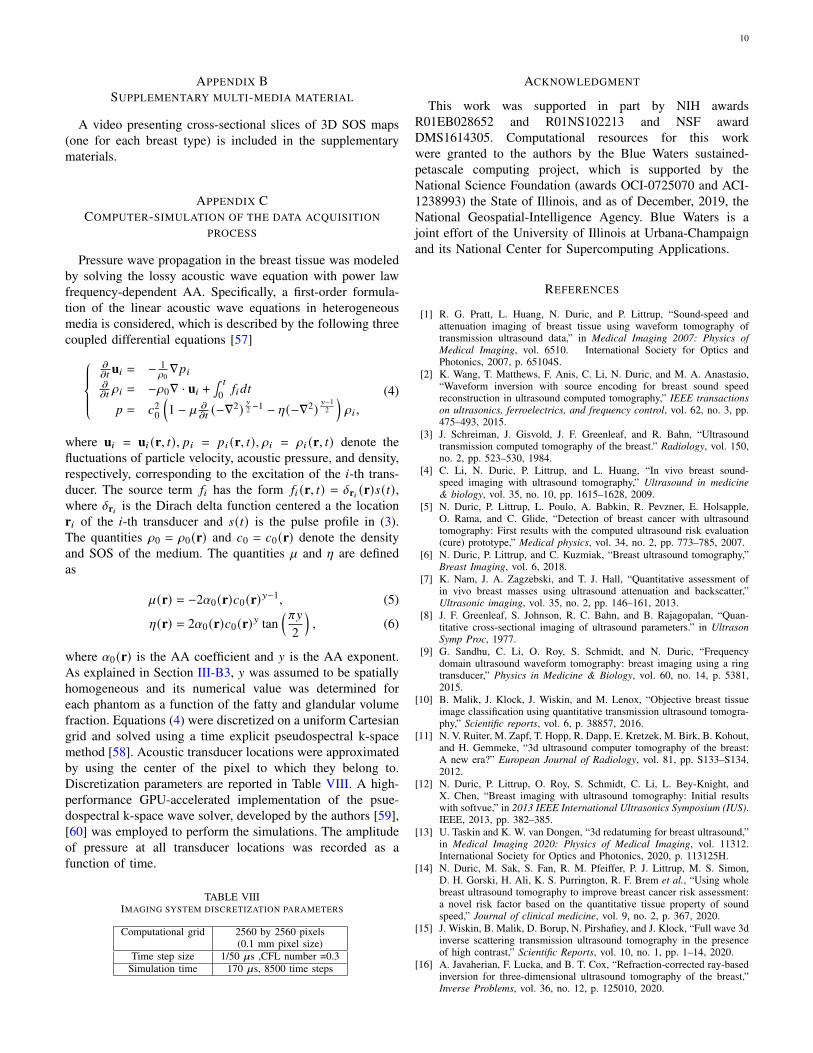
Fig. 13. Case study 2: Reconstructed SOS images of the phantoms shown inFig. 9 using a machine learning-based method. Top row : input to the neuralnetwork; Bottom row: the corresponding estimated image. From left to right:breast type A-D. The units are (𝑚𝑚/`𝑠) .
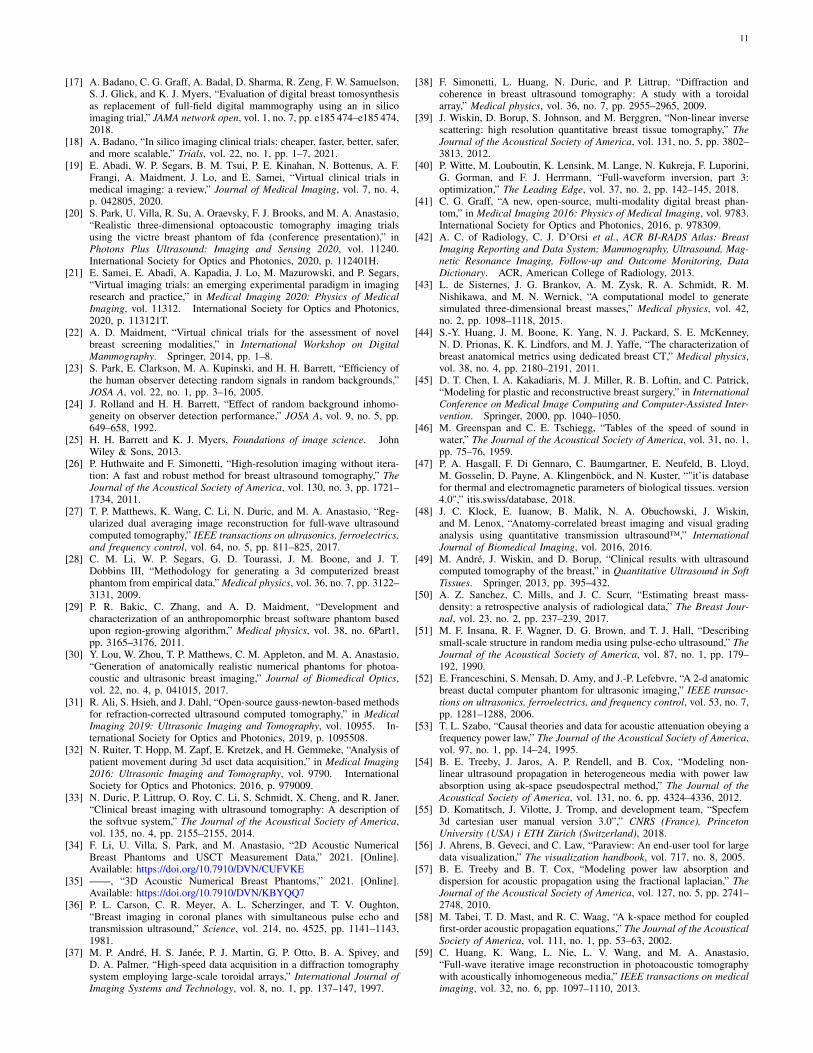
Figure 13 reports examples of learned reconstructed imagesof four breast types. The top row corresponds to the earlystopped WISE reconstruction after 35 iterations, and thebottom row shows the output of the neural network. The cor-responding ground truth images and reference reconstructionsare shown in Fig. 9. The proposed learning approach improvedthe visual quality of the images, leading to sharper tissueinterfaces. Table VII and Fig. 14 show quantitative evaluationson the test dataset.The reported MSE and SSIM values arestratified by breast types: breast types A and D (out of distri-bution) have a larger median MSE and smaller median SSIMthan types B and C (in distribution). While the reported MSEand SSIM are comparable (or sometimes even better) thanthose reported for the reference reconstructions in Table V,the learned reconstruction method may mistakenly introducesome fine structures (hallucinations) that are not existing inthe ground truth image [63]. An example is shown in Fig.15. This case study demonstrates that, while deep learningmethods can be used to enhance perceived and quantitativeimage quality, their results must be interpreted with particularcare due to the possibility of introducing hallucinated featuresin the image.
TABLE VIICASE STUDY 2: MEAN SQUARE ERROR (MSE) AND STRUCTURAL
SIMILARITY INDEX MEASURE (SSIM).
Breast type MSE (std) SSIM (std)A 2.165e-04 (8.413e-5) 0.9675 (0.0081)B 1.973e-04 (7.9898e-5) 0.9707 (0.0079)C 2.160e-04 (1.149e-4) 0.9788 (0.0069)D 2.887e-04 (2.009e-4) 0.9651 (0.0073)
VI. CONCLUSION
In this work, procedures were established by which 3DNBPs can be computed for use in large-scale virtual imagingtrials of 2D or 3D breast USCT. This will, for the first
Fig. 14. Case study 2: Boxplot of MSE and SSIM value of learnedreconstructed results for breast type A-D. The subscript ∗ denotes out ofdistribution breast types.
Fig. 15. Case study 2: False structures in the reconstructed image. a): Theground truth image. b): The neural network-based reconstructed image thatcontains small hallucinated features.
time, permit 3D realistic NBPs to be computed that possessvarying shape, acoustic properties, tissue texture, and tumors.This was accomplished by adapting VICTRE tools to USCTimaging. The generated NBPs improve the authenticity ofUSCT virtual imaging studies and can be employed widely forthe investigation of advanced image reconstruction methods,objective evaluation of the USCT breast imaging systems, andthe development of machine learning-based methods.
APPENDIX APUBLICLY RELEASED DATASETS
Two datsets have been publicly released on the HarvardDataverse.
The first dataset [34] consists of the 52 slices and corre-sponding simulated USCT data described in Section V-B. Foreach slice, the dataset includes tissue label, SOS, AA, anddensity maps. The image size is 2560-by-2560 with pixel sizeat a 0.1mm resolution. The measurement data has a samplingfrequency of 25MHz and have been perturbed with additiveGaussian white noise as described in V-B.
The second dataset [35] consists of four high-resolution 3DNBPs, one for each breast type. Each NBP contains 3D mapsof tissue label, SOS, AA, and density with a resolution of 0.1mm. Fig. 6 shows 3D rendering of the four public NBPs.
10
APPENDIX BSUPPLEMENTARY MULTI-MEDIA MATERIAL
A video presenting cross-sectional slices of 3D SOS maps(one for each breast type) is included in the supplementarymaterials.
APPENDIX CCOMPUTER-SIMULATION OF THE DATA ACQUISITION
PROCESS
Pressure wave propagation in the breast tissue was modeledby solving the lossy acoustic wave equation with power lawfrequency-dependent AA. Specifically, a first-order formula-tion of the linear acoustic wave equations in heterogeneousmedia is considered, which is described by the following threecoupled differential equations [57]
𝜕𝜕𝑡
u𝑖 = − 1𝜌0∇𝑝𝑖
𝜕𝜕𝑡𝜌𝑖 = −𝜌0∇ · u𝑖 +
∫ 𝑡
0 𝑓𝑖𝑑𝑡
𝑝 = 𝑐20
(1 − ` 𝜕
𝜕𝑡(−∇2)
𝑦
2 −1 − [(−∇2)𝑦−1
2
)𝜌𝑖 ,
(4)
where u𝑖 = u𝑖 (r, 𝑡), 𝑝𝑖 = 𝑝𝑖 (r, 𝑡), 𝜌𝑖 = 𝜌𝑖 (r, 𝑡) denote thefluctuations of particle velocity, acoustic pressure, and density,respectively, corresponding to the excitation of the 𝑖-th trans-ducer. The source term 𝑓𝑖 has the form 𝑓𝑖 (r, 𝑡) = 𝛿r𝑖 (r)𝑠(𝑡),where 𝛿r𝑖 is the Dirach delta function centered a the locationr𝑖 of the 𝑖-th transducer and 𝑠(𝑡) is the pulse profile in (3).The quantities 𝜌0 = 𝜌0 (r) and 𝑐0 = 𝑐0 (r) denote the densityand SOS of the medium. The quantities ` and [ are definedas
`(r) = −2𝛼0 (r)𝑐0 (r)𝑦−1, (5)
[(r) = 2𝛼0 (r)𝑐0 (r)𝑦 tan( 𝜋𝑦
2
), (6)
where 𝛼0 (r) is the AA coefficient and 𝑦 is the AA exponent.As explained in Section III-B3, 𝑦 was assumed to be spatiallyhomogeneous and its numerical value was determined foreach phantom as a function of the fatty and glandular volumefraction. Equations (4) were discretized on a uniform Cartesiangrid and solved using a time explicit pseudospectral k-spacemethod [58]. Acoustic transducer locations were approximatedby using the center of the pixel to which they belong to.Discretization parameters are reported in Table VIII. A high-performance GPU-accelerated implementation of the psue-dospectral k-space wave solver, developed by the authors [59],[60] was employed to perform the simulations. The amplitudeof pressure at all transducer locations was recorded as afunction of time.
TABLE VIIIIMAGING SYSTEM DISCRETIZATION PARAMETERS
Computational grid 2560 by 2560 pixels(0.1 mm pixel size)
Time step size 1/50 `s ,CFL number =0.3Simulation time 170 `s, 8500 time steps
ACKNOWLEDGMENT
This work was supported in part by NIH awardsR01EB028652 and R01NS102213 and NSF awardDMS1614305. Computational resources for this workwere granted to the authors by the Blue Waters sustained-petascale computing project, which is supported by theNational Science Foundation (awards OCI-0725070 and ACI-1238993) the State of Illinois, and as of December, 2019, theNational Geospatial-Intelligence Agency. Blue Waters is ajoint effort of the University of Illinois at Urbana-Champaignand its National Center for Supercomputing Applications.
REFERENCES
[1] R. G. Pratt, L. Huang, N. Duric, and P. Littrup, “Sound-speed andattenuation imaging of breast tissue using waveform tomography oftransmission ultrasound data,” in Medical Imaging 2007: Physics ofMedical Imaging, vol. 6510. International Society for Optics andPhotonics, 2007, p. 65104S.
[2] K. Wang, T. Matthews, F. Anis, C. Li, N. Duric, and M. A. Anastasio,“Waveform inversion with source encoding for breast sound speedreconstruction in ultrasound computed tomography,” IEEE transactionson ultrasonics, ferroelectrics, and frequency control, vol. 62, no. 3, pp.475–493, 2015.
[3] J. Schreiman, J. Gisvold, J. F. Greenleaf, and R. Bahn, “Ultrasoundtransmission computed tomography of the breast.” Radiology, vol. 150,no. 2, pp. 523–530, 1984.
[4] C. Li, N. Duric, P. Littrup, and L. Huang, “In vivo breast sound-speed imaging with ultrasound tomography,” Ultrasound in medicine& biology, vol. 35, no. 10, pp. 1615–1628, 2009.
[5] N. Duric, P. Littrup, L. Poulo, A. Babkin, R. Pevzner, E. Holsapple,O. Rama, and C. Glide, “Detection of breast cancer with ultrasoundtomography: First results with the computed ultrasound risk evaluation(cure) prototype,” Medical physics, vol. 34, no. 2, pp. 773–785, 2007.
[6] N. Duric, P. Littrup, and C. Kuzmiak, “Breast ultrasound tomography,”Breast Imaging, vol. 6, 2018.
[7] K. Nam, J. A. Zagzebski, and T. J. Hall, “Quantitative assessment ofin vivo breast masses using ultrasound attenuation and backscatter,”Ultrasonic imaging, vol. 35, no. 2, pp. 146–161, 2013.
[8] J. F. Greenleaf, S. Johnson, R. C. Bahn, and B. Rajagopalan, “Quan-titative cross-sectional imaging of ultrasound parameters.” in UltrasonSymp Proc, 1977.
[9] G. Sandhu, C. Li, O. Roy, S. Schmidt, and N. Duric, “Frequencydomain ultrasound waveform tomography: breast imaging using a ringtransducer,” Physics in Medicine & Biology, vol. 60, no. 14, p. 5381,2015.
[10] B. Malik, J. Klock, J. Wiskin, and M. Lenox, “Objective breast tissueimage classification using quantitative transmission ultrasound tomogra-phy,” Scientific reports, vol. 6, p. 38857, 2016.
[11] N. V. Ruiter, M. Zapf, T. Hopp, R. Dapp, E. Kretzek, M. Birk, B. Kohout,and H. Gemmeke, “3d ultrasound computer tomography of the breast:A new era?” European Journal of Radiology, vol. 81, pp. S133–S134,2012.
[12] N. Duric, P. Littrup, O. Roy, S. Schmidt, C. Li, L. Bey-Knight, andX. Chen, “Breast imaging with ultrasound tomography: Initial resultswith softvue,” in 2013 IEEE International Ultrasonics Symposium (IUS).IEEE, 2013, pp. 382–385.
[13] U. Taskin and K. W. van Dongen, “3d redatuming for breast ultrasound,”in Medical Imaging 2020: Physics of Medical Imaging, vol. 11312.International Society for Optics and Photonics, 2020, p. 113125H.
[14] N. Duric, M. Sak, S. Fan, R. M. Pfeiffer, P. J. Littrup, M. S. Simon,D. H. Gorski, H. Ali, K. S. Purrington, R. F. Brem et al., “Using wholebreast ultrasound tomography to improve breast cancer risk assessment:a novel risk factor based on the quantitative tissue property of soundspeed,” Journal of clinical medicine, vol. 9, no. 2, p. 367, 2020.
[15] J. Wiskin, B. Malik, D. Borup, N. Pirshafiey, and J. Klock, “Full wave 3dinverse scattering transmission ultrasound tomography in the presenceof high contrast,” Scientific Reports, vol. 10, no. 1, pp. 1–14, 2020.
[16] A. Javaherian, F. Lucka, and B. T. Cox, “Refraction-corrected ray-basedinversion for three-dimensional ultrasound tomography of the breast,”Inverse Problems, vol. 36, no. 12, p. 125010, 2020.
11
[17] A. Badano, C. G. Graff, A. Badal, D. Sharma, R. Zeng, F. W. Samuelson,S. J. Glick, and K. J. Myers, “Evaluation of digital breast tomosynthesisas replacement of full-field digital mammography using an in silicoimaging trial,” JAMA network open, vol. 1, no. 7, pp. e185 474–e185 474,2018.
[18] A. Badano, “In silico imaging clinical trials: cheaper, faster, better, safer,and more scalable,” Trials, vol. 22, no. 1, pp. 1–7, 2021.
[19] E. Abadi, W. P. Segars, B. M. Tsui, P. E. Kinahan, N. Bottenus, A. F.Frangi, A. Maidment, J. Lo, and E. Samei, “Virtual clinical trials inmedical imaging: a review,” Journal of Medical Imaging, vol. 7, no. 4,p. 042805, 2020.
[20] S. Park, U. Villa, R. Su, A. Oraevsky, F. J. Brooks, and M. A. Anastasio,“Realistic three-dimensional optoacoustic tomography imaging trialsusing the victre breast phantom of fda (conference presentation),” inPhotons Plus Ultrasound: Imaging and Sensing 2020, vol. 11240.International Society for Optics and Photonics, 2020, p. 112401H.
[21] E. Samei, E. Abadi, A. Kapadia, J. Lo, M. Mazurowski, and P. Segars,“Virtual imaging trials: an emerging experimental paradigm in imagingresearch and practice,” in Medical Imaging 2020: Physics of MedicalImaging, vol. 11312. International Society for Optics and Photonics,2020, p. 113121T.
[22] A. D. Maidment, “Virtual clinical trials for the assessment of novelbreast screening modalities,” in International Workshop on DigitalMammography. Springer, 2014, pp. 1–8.
[23] S. Park, E. Clarkson, M. A. Kupinski, and H. H. Barrett, “Efficiency ofthe human observer detecting random signals in random backgrounds,”JOSA A, vol. 22, no. 1, pp. 3–16, 2005.
[24] J. Rolland and H. H. Barrett, “Effect of random background inhomo-geneity on observer detection performance,” JOSA A, vol. 9, no. 5, pp.649–658, 1992.
[25] H. H. Barrett and K. J. Myers, Foundations of image science. JohnWiley & Sons, 2013.
[26] P. Huthwaite and F. Simonetti, “High-resolution imaging without itera-tion: A fast and robust method for breast ultrasound tomography,” TheJournal of the Acoustical Society of America, vol. 130, no. 3, pp. 1721–1734, 2011.
[27] T. P. Matthews, K. Wang, C. Li, N. Duric, and M. A. Anastasio, “Reg-ularized dual averaging image reconstruction for full-wave ultrasoundcomputed tomography,” IEEE transactions on ultrasonics, ferroelectrics,and frequency control, vol. 64, no. 5, pp. 811–825, 2017.
[28] C. M. Li, W. P. Segars, G. D. Tourassi, J. M. Boone, and J. T.Dobbins III, “Methodology for generating a 3d computerized breastphantom from empirical data,” Medical physics, vol. 36, no. 7, pp. 3122–3131, 2009.
[29] P. R. Bakic, C. Zhang, and A. D. Maidment, “Development andcharacterization of an anthropomorphic breast software phantom basedupon region-growing algorithm,” Medical physics, vol. 38, no. 6Part1,pp. 3165–3176, 2011.
[30] Y. Lou, W. Zhou, T. P. Matthews, C. M. Appleton, and M. A. Anastasio,“Generation of anatomically realistic numerical phantoms for photoa-coustic and ultrasonic breast imaging,” Journal of Biomedical Optics,vol. 22, no. 4, p. 041015, 2017.
[31] R. Ali, S. Hsieh, and J. Dahl, “Open-source gauss-newton-based methodsfor refraction-corrected ultrasound computed tomography,” in MedicalImaging 2019: Ultrasonic Imaging and Tomography, vol. 10955. In-ternational Society for Optics and Photonics, 2019, p. 1095508.
[32] N. Ruiter, T. Hopp, M. Zapf, E. Kretzek, and H. Gemmeke, “Analysis ofpatient movement during 3d usct data acquisition,” in Medical Imaging2016: Ultrasonic Imaging and Tomography, vol. 9790. InternationalSociety for Optics and Photonics, 2016, p. 979009.
[33] N. Duric, P. Littrup, O. Roy, C. Li, S. Schmidt, X. Cheng, and R. Janer,“Clinical breast imaging with ultrasound tomography: A description ofthe softvue system,” The Journal of the Acoustical Society of America,vol. 135, no. 4, pp. 2155–2155, 2014.
[34] F. Li, U. Villa, S. Park, and M. Anastasio, “2D Acoustic NumericalBreast Phantoms and USCT Measurement Data,” 2021. [Online].Available: https://doi.org/10.7910/DVN/CUFVKE
[35] ——, “3D Acoustic Numerical Breast Phantoms,” 2021. [Online].Available: https://doi.org/10.7910/DVN/KBYQQ7
[36] P. L. Carson, C. R. Meyer, A. L. Scherzinger, and T. V. Oughton,“Breast imaging in coronal planes with simultaneous pulse echo andtransmission ultrasound,” Science, vol. 214, no. 4525, pp. 1141–1143,1981.
[37] M. P. André, H. S. Janée, P. J. Martin, G. P. Otto, B. A. Spivey, andD. A. Palmer, “High-speed data acquisition in a diffraction tomographysystem employing large-scale toroidal arrays,” International Journal ofImaging Systems and Technology, vol. 8, no. 1, pp. 137–147, 1997.
[38] F. Simonetti, L. Huang, N. Duric, and P. Littrup, “Diffraction andcoherence in breast ultrasound tomography: A study with a toroidalarray,” Medical physics, vol. 36, no. 7, pp. 2955–2965, 2009.
[39] J. Wiskin, D. Borup, S. Johnson, and M. Berggren, “Non-linear inversescattering: high resolution quantitative breast tissue tomography,” TheJournal of the Acoustical Society of America, vol. 131, no. 5, pp. 3802–3813, 2012.
[40] P. Witte, M. Louboutin, K. Lensink, M. Lange, N. Kukreja, F. Luporini,G. Gorman, and F. J. Herrmann, “Full-waveform inversion, part 3:optimization,” The Leading Edge, vol. 37, no. 2, pp. 142–145, 2018.
[41] C. G. Graff, “A new, open-source, multi-modality digital breast phan-tom,” in Medical Imaging 2016: Physics of Medical Imaging, vol. 9783.International Society for Optics and Photonics, 2016, p. 978309.
[42] A. C. of Radiology, C. J. D’Orsi et al., ACR BI-RADS Atlas: BreastImaging Reporting and Data System; Mammography, Ultrasound, Mag-netic Resonance Imaging, Follow-up and Outcome Monitoring, DataDictionary. ACR, American College of Radiology, 2013.
[43] L. de Sisternes, J. G. Brankov, A. M. Zysk, R. A. Schmidt, R. M.Nishikawa, and M. N. Wernick, “A computational model to generatesimulated three-dimensional breast masses,” Medical physics, vol. 42,no. 2, pp. 1098–1118, 2015.
[44] S.-Y. Huang, J. M. Boone, K. Yang, N. J. Packard, S. E. McKenney,N. D. Prionas, K. K. Lindfors, and M. J. Yaffe, “The characterization ofbreast anatomical metrics using dedicated breast CT,” Medical physics,vol. 38, no. 4, pp. 2180–2191, 2011.
[45] D. T. Chen, I. A. Kakadiaris, M. J. Miller, R. B. Loftin, and C. Patrick,“Modeling for plastic and reconstructive breast surgery,” in InternationalConference on Medical Image Computing and Computer-Assisted Inter-vention. Springer, 2000, pp. 1040–1050.
[46] M. Greenspan and C. E. Tschiegg, “Tables of the speed of sound inwater,” The Journal of the Acoustical Society of America, vol. 31, no. 1,pp. 75–76, 1959.
[47] P. A. Hasgall, F. Di Gennaro, C. Baumgartner, E. Neufeld, B. Lloyd,M. Gosselin, D. Payne, A. Klingenböck, and N. Kuster, “"it’is databasefor thermal and electromagnetic parameters of biological tissues. version4.0",” itis.swiss/database, 2018.
[48] J. C. Klock, E. Iuanow, B. Malik, N. A. Obuchowski, J. Wiskin,and M. Lenox, “Anatomy-correlated breast imaging and visual gradinganalysis using quantitative transmission ultrasound™,” InternationalJournal of Biomedical Imaging, vol. 2016, 2016.
[49] M. André, J. Wiskin, and D. Borup, “Clinical results with ultrasoundcomputed tomography of the breast,” in Quantitative Ultrasound in SoftTissues. Springer, 2013, pp. 395–432.
[50] A. Z. Sanchez, C. Mills, and J. C. Scurr, “Estimating breast mass-density: a retrospective analysis of radiological data,” The Breast Jour-nal, vol. 23, no. 2, pp. 237–239, 2017.
[51] M. F. Insana, R. F. Wagner, D. G. Brown, and T. J. Hall, “Describingsmall-scale structure in random media using pulse-echo ultrasound,” TheJournal of the Acoustical Society of America, vol. 87, no. 1, pp. 179–192, 1990.
[52] E. Franceschini, S. Mensah, D. Amy, and J.-P. Lefebvre, “A 2-d anatomicbreast ductal computer phantom for ultrasonic imaging,” IEEE transac-tions on ultrasonics, ferroelectrics, and frequency control, vol. 53, no. 7,pp. 1281–1288, 2006.
[53] T. L. Szabo, “Causal theories and data for acoustic attenuation obeying afrequency power law,” The Journal of the Acoustical Society of America,vol. 97, no. 1, pp. 14–24, 1995.
[54] B. E. Treeby, J. Jaros, A. P. Rendell, and B. Cox, “Modeling non-linear ultrasound propagation in heterogeneous media with power lawabsorption using ak-space pseudospectral method,” The Journal of theAcoustical Society of America, vol. 131, no. 6, pp. 4324–4336, 2012.
[55] D. Komatitsch, J. Vilotte, J. Tromp, and development team, “Specfem3d cartesian user manual version 3.0”,” CNRS (France), PrincetonUniversity (USA) i ETH Zürich (Switzerland), 2018.
[56] J. Ahrens, B. Geveci, and C. Law, “Paraview: An end-user tool for largedata visualization,” The visualization handbook, vol. 717, no. 8, 2005.
[57] B. E. Treeby and B. T. Cox, “Modeling power law absorption anddispersion for acoustic propagation using the fractional laplacian,” TheJournal of the Acoustical Society of America, vol. 127, no. 5, pp. 2741–2748, 2010.
[58] M. Tabei, T. D. Mast, and R. C. Waag, “A k-space method for coupledfirst-order acoustic propagation equations,” The Journal of the AcousticalSociety of America, vol. 111, no. 1, pp. 53–63, 2002.
[59] C. Huang, K. Wang, L. Nie, L. V. Wang, and M. A. Anastasio,“Full-wave iterative image reconstruction in photoacoustic tomographywith acoustically inhomogeneous media,” IEEE transactions on medicalimaging, vol. 32, no. 6, pp. 1097–1110, 2013.
12
[60] T. P. Matthews, J. Poudel, L. Li, L. V. Wang, and M. A. Anastasio,“Parameterized joint reconstruction of the initial pressure and soundspeed distributions for photoacoustic computed tomography,” SIAMjournal on imaging sciences, vol. 11, no. 2, pp. 1560–1588, 2018.
[61] T. P. Matthews, “Image reconstruction of the speed of sound andinitial pressure distributions in ultrasound computed tomography andphotoacoustic computed tomography,” Ph.D. dissertation, WashingtonUniversity in St. Louis, 2017.
[62] O. Ronneberger, P. Fischer, and T. Brox, “U-net: Convolutional networksfor biomedical image segmentation,” in International Conference onMedical image computing and computer-assisted intervention. Springer,2015, pp. 234–241.
[63] S. Bhadra, V. A. Kelkar, F. J. Brooks, and M. A. Anastasio, “Onhallucinations in tomographic image reconstruction,” arXiv preprintarXiv:2012.00646, 2020.