THESIS AN ECONOMIC ANALYSIS OF THE CARNATION ...
137
THESIS AN ECONOMIC ANALYSIS OF THE CARNATION INDUSTRY IN THE UNITED STATES Submitted by Seward T. Besemer In partial fulfillment of the requirements for the Degree of Master of Science Colorado State University Fort Collins, Colorado August, 1966
-
Upload
khangminh22 -
Category
Documents
-
view
4 -
download
0
Transcript of THESIS AN ECONOMIC ANALYSIS OF THE CARNATION ...

THESIS
AN ECONOMIC ANALYSIS OF THE CARNATION INDUSTRY
IN THE UNITED STATES
Submitted by
Seward T. Besemer
In partial fulfillment of the requirements for the Degree of Master of Science
Colorado State University Fort Collins, Colorado
August, 1966

COLORADO STATE UNIVERSITY
August" 1966
WE HEREBY RECOMMEND THAT THE THESIS PREPARED UNDER
OUR SUPERVISION BY Seward T. Besemer -----------------------------------ENTITLED An Economic Analysis of the Carnation'
Industry in the United States
BE ACCEPTED AS FULFILLING THIS PART OF THE REQUIREMENTS
FOR THE DEGREE OF MASTER OF SCIENCE.
COMMITTEE ON GRADUATE WORK
EXAMINATION SATISFACTORY
any part of it Graduate School.

Abs.tract .of .Thesis
AN ECONOMIC ANALYSIS OF THE CARNATION INDUSTRY IN THE UNITED STATES
An economic analysis of the carnation industry in
the United States was conducted by mail questionnaires sur-
veying growers, shippers, and wholesalers.
Production costs, total revenues, investments, types
of greenhouses, methods of financing, plant densities,
flower yields, man~gement and other cultural problems, and
climatic factors were determined for seven production areas.
Western production areas, such as California and Colorado
were shown to have the advantages of higher production,
producing at relatively less cost per unit, and capabilities
of supplying all national markets by fast air and truck
freight. Older established eastern areas were shown to be
stabilizing or decreasing carnation production because of
western.area competitive advantages and improved transpor-
tation.
A general flow pattern of carnations during seasons
of the year was determined between production areas and
market areas. The western production areas supply the main
volume of carnations sold in all sections of the country,
except the Northeast. Shipping prices and wholesale market
prices were shown to vary with ge~graphical r~gion, being
somewhat lower on the west coast and in the New York area.
Essentially, carnation prices appear to be quite stable,
i1

there being a winter and spring price and a lower summer
price.
Problems of the industry, as reported by partici-
pants in the survey are many. Predominating was the need
for uniform, gradi~g, more consistent supply~ less transpor
tation delays~ better handling and less storage of flowers
for holidays.
The need for more economic information for manage-
ment decision making was emphasized.
iii
Seward T. Besemer Horticulture Department Colorado State University
August, 1966

ACKNOWLEDGEMENTS
The author wishes to thank the following members of
Colorado State University:
Professor W. D. Holley for his thoughtful under
standing and encouragement toward a difficult but interest
ing area of investigation useful to myself and the carnation
industry.
Dr. Henry J. Hudek for his patience and inspiration
toward the application of economic principles.
Dr. Joe J. Hanan for his keen observations and
suggestions for clear thought and expression.
Miss Flori K. Scott for outstanding secretarial
assistance in preparing survey materials and portions of
the manuscript.
Appreciation is also extended to the carnation
growers, shippers, and wholesale florists who contributed
to this study.
The author also thanks his dear friends, the San
Diego County Carnation growers for financial support of the
survey materials.
iv

TABLE OF CONTENTS
ABSTRACT OF THESIS • .
ACKNOWLEDGEMENTS . . . . LIST OF TABLES • •
LIST OF FIGURES
. . . . . . . . . . . . .
Chapter
I. INTRODUCTION. .. . . . . . . . . . The Problem . .. .. ..
Obj ectives ... • Definitions of Terms .
II. REVIEW OF LITERATURE • •
History of the Flower Industry in the United States • • . • •
Production Trends by Areas • • .. Characteristics of Production
Areas .. .. .. • • . . . • • • .. • Wholesale Marketing . • • • .. • Grading • . .. .. .. • • . . • • The Consumer Market ... . • • • Merchandising and Mass Markets . Economics and Management
Decisions .• .. ..
. .
. . . . .
III. METHODS AND MATERIALS . . . . . . . . . . General Design . .. . • .. .. . .. .. .. • Procurement' of Data .. ... .... .. .. • • • Time Schedule . .. • . . . • • • • • .. .. • • Summarization of Data . • .. Limitations • • • .. • .. ..
vi
Page ii
iv
ix
xii
1
1 2 3
4
4 5
6 11 13 13 14
15
18
18 19 21 21 22
Chapter
IV.
V.
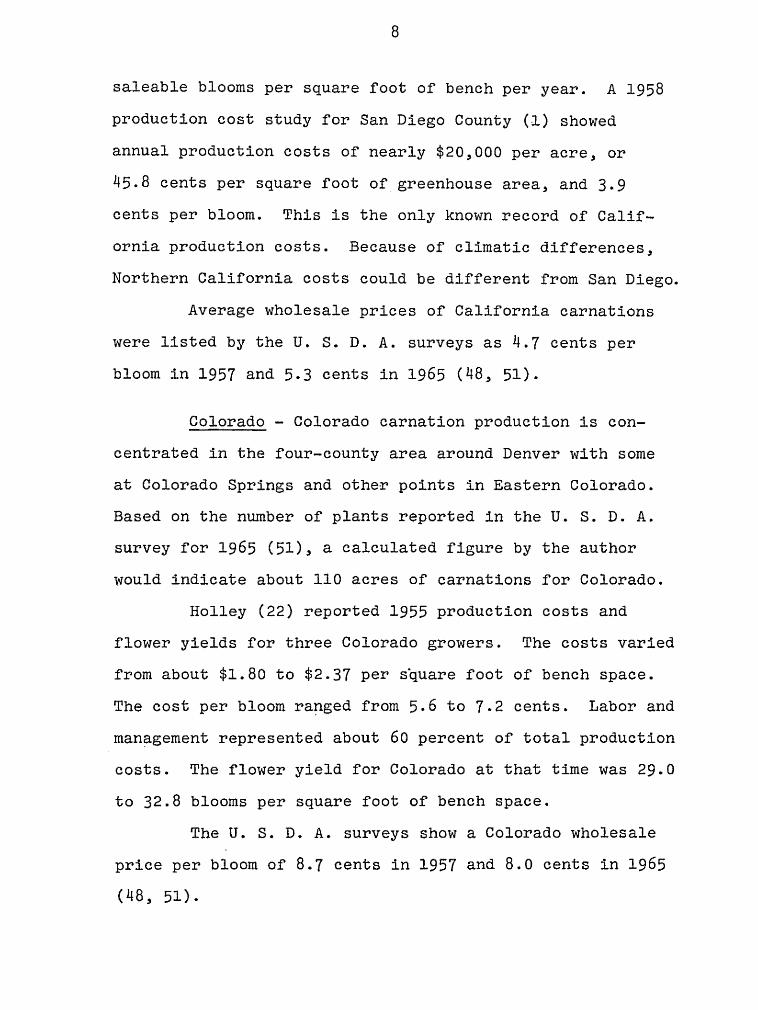
TABLE OF CONTENTS--Continued
RESULTS • • • • • • • • . • •
Change in Production Areas~ 1955-1965 . • • . . . . · . · · ·
Plant Density per Space Unit Types of Greenhouses Annual Production Costs . .'. . Average Annual Production
Costs per Unit . . . • • • • . . • • • . . Approximate Greenhouse and Land
Investments, 1955 and 1965 Average Capital Investments for
Equipment and Buildings,
. . . . Percent of Total . . • . . .
Average Equipment and Buildings Investment per Space Unit . . • •
Average Flower Production per Space Unit
Average Annual Gross Returns per Unit . • •
Marketing Methods • • • • . . Marketing Costs . • • .
. . .
Methods of Financing Production
. . .
Factors • • • . . . . • . • • • • • . . . . Production (cultural) Problems Outside (noncultural) Problems
Affecting Production • . • • Factors Important to
. . . Business Success • • • • • • • • • . .
Grower Opinions on Questions Important to the Industry •
Estimated Investments and Depreciation . • • • • . • •
Financial Summary per Carnation
. . .
Enterprise by Production Areas • • . . Financial Summary per Carnation
Enterprise by Size for the U. S.
RESULTS--SHIPPERS AND WHOLESALERS
Average Annual Percent of Carnations Shipped from Production Areas to
Page
23
24 25 25 27
27
29
30
31
31
33 34 36
37 39
39
42
42
45
47
49
51
Market Areas . • • . . . • . • • • • • •• 51 Percent of Total Volume Shipped
from Production Areas Each Month . • . . • . • . • • • • • . •. 52
Average Seasonal Shipping Prices from Production Areas . . • . • • • • • •• 53
vii

Chapter
TABLE OF CONTENTS--Continued
Primary Transportation Methods from Shipping Points to Market Areas . • • • . • . . • • • . • • .
Wholesale Volume of Carnations and Average Annual Percentage Received by Market Areas from Production Areas . . . . . . . • .. .. . . . . . . • ..
Percent of Carnations 'Received Seasonally by Market Areas from Production Areas . • . . • . . . • .
Average Seasonal Wholesale Prices for Market Areas . . ., . .
VI. RESULTS--ADDITIONAL PROBLEMS OF THE CARNATION INDUSTRY . . • • .. •
VII.
VIII.
Ad~itional Problems Expressed by Growers . • .. • . .. . • • •
Additional Problems Expressed by Shippers • • . • • . . . .
Additional Problems Expressed by Wholesalers • .. • . • . .. . . . . . . .
RESULTS--CLIMATIC FACTORS OF PRODUCTION AREAS . . . . • • .. . . . .
DISCUSSION AND CONCLUSIONS • .
Response to Survey .. .. • • • Factors Affecting Production
Changes •• . • . • . • . .. Economic Analysis of Carnation
Enterprises . . . • . • • . • • . Financing • . . ... • .. .. • .. .. Marketing Problems . Management • • • .. . . .. • • .. The Future .. •• • . . • . . .. ..
. .. . .
LITERATURE CITED •
APPENDIX .. • . • .
viii
Page
55
56
61
61
65
65
66
67
69
77
77
78
82 86 88 88 89
92
98

Table
1.
2.
3.
1+.
LIST OF TABLES
Acreage change indicated by the growers reporting from s~ven areas~ 1955-1965
Average number of plants per space unit for seven carnation production areas
Type of greenhouses used for carnation production by growers reporting from seven areas • . • • . • • • . • • . .
Production cost items, as a percent of total average annual production costs, for seven carnation production areas
Average annual production costs per specified unit, in dollars, for seven carnation production areas (depreciation not included) • • . • •
· . . .
· . . .
· . . .
· . 6. Approximate capital investments in dollars
for land and for greenhouses, 1955 and
Page
21+
25
26
28
29
1965 for seven carnation production areas 30
Average capital investment for equipment and buildings as a percent of total equipment and buildings investment, for five carnation production areas • 32
8. Average equipment investment in dollars
9.
10.
11.
for six carnation production areas . . • •• 33
Average flower yield reported by growers in seven carnation production areas • •
Average annual gross dollar returns per unit repdrted by growers from seven production areas • • . • • • • • • •
Marketing methods used by carnation producers in seven areas • • • •
ix
35
36

LIST OF TABLES--Continued
Table Page
12. Costs of marketing reported by carnation producers in seven areas . . • • " • • " ". 37
14.
15.
16.
Methods of financing land, equipment, supplies, and labor for seven carnation production areas (based on majority of growers reporting) .. • . . . • . . • ..
Production (cultural) problems for seven carnation producing areas ranked by importance . . " • • • • . . . • .. " "
Outside problems affecting business for six carnation production areas, ranked by importance " .. • . • .
Grower rating of factors important to business success . . • . • .. • .
17. Grower opinions on questions important
.. . " 38
40
41
43
to the industry . . .. • . . • . . • • . ... 44
18.
19.
20.
Estimated investments (current) and depreciation of greenhouses, benches, and other buildings per acre of seven U. S. carnation production areas •..
Average revenues, costs, and investments and return to land, capital, and investment for average enterprises in seven U. S. carnation production areas
Average revenues, costs, and investments and return to land, capital, and management for 42 U. S. carnation enterprises grouped by size
21. Percent of carnations shipped from production areas to market areas-average for seven demand periods
46
48
50
of the year • • . • • • . . . • • • • • •. 52
22. Percent of total volume shipped from production areas by months . • . . . . . •• 54
23. Average shipping prices, in cents per bloom, for seven periods of the year • · •• 55
x

Table
24.
LIST OF TABLES--Continued
Principle transportation methods from shipping points to market areas . .
25. Wholesale volume of carnations and average percent received by market areas from production areas . .
26. Percent of carnations received by market areas at seven periods from production areas ..•....
27.
28.
Average seasonal wholesale prices in cents/bloom for market areas • . . .
Cities used for temperature and percent sunshine records to represent seven carnation production areas . . . . .
29. Mean temperatures for seven U. S. carnation production areas. Average per month over 10 years (1956-1965) . . . . . . . . . • • .
30. Mean annual temperatures for seven U. S. carnation production areas for 10 years (1956-1965) • .. •••
31. Percent possible sunshine for seven U. S. carnation production areas. 10-year average by months (1956-1965) . . • . .
32. Percent possible sunshine for seven U. S. carnation production areas--average annual (1956-1965) ......... .
xi
Page
56
57
62
64
70
72
73
74
75

Figure
1.
2.
LIST OF FIGURES
Percent wholesale carnation receipts by eight market areas from production areas based on volume for seven demand periods
Relationship of average yields per acre and percent possible sunshine for seven carnation production areas . . . . . . •
xii
Page
60
76

Chapter I
INTRODUCTION
The Problem
Limited economic information is' available on pro
duction and marketing of carnations for the entire United
States. Since carnation production has expanded rapidly
in recent years, there are many questions concerning the
immediate future.
Rapid expansion and dynamic changes in competitive
production and marketing creates problems of decision
making by all segments of the industry. Carnations have
moved into second place in value among all cut flowers (55).
Shifts of production to more suitable climatic areas,
marked advances in transportation, cultural technology, and
aggressive merchandising are some of the key factors related
to this expansion of carnations.
Growers in older production areas are concerned
about how much longer they can compete with higher yields,
higher quality, and cheaper prices from the newer areas.
Growers in all areas are faced with problems of increasing
land values, taxes, production costs, and zoni~g restric
tions. In many areas the labor supply is critically short,
and facilities have been made obsolete because of rapid

2
changes in technol~gy.
Growers must make decisions on whether to stabilize
their operations, rebuild or expand at their present
locations, relocate in the same general area or a com
pletely different area, convert to another crop, or go out
of business alt~gether.
Competition between older carnation production
areas and new areas is becoming more intense. The future
of each area and their effects on each other are not fully
understood. Information is needed so growers, shippers,
and wholesalers may assess the factors causing changes in
each area. This knowle~ge could then be applied to the
management decisions that will have to be made for the best
interest of their future enterprises.
Objectives
The objectives of this research are to:
1. Determine and compare production costs, invest
ments, yields, and climatic factors of the major carnation
production areas of the United States.
2. Determine the seasonal flow pattern of
carnation blooms from the major production areas to market
areas, the methods of transportation, and the relationship
of prices received by. growers with prices at the wholesale
market.
3. Evaluate the major economic factors for each
production area and make predictions for future trends of

3
the industry.
4. Propose a method for producers to utilize know-
ledge of current economic factors in constructive manage-
ment decision making.
Definitions of Terms
For the purpose of this survey, the following terms
are defined:
Producer--a commercial grower of carnation blooms.
Shipper--a receiver of carnation blooms from producers for distribution to wholesalers.
Wholesaler--a receiver of carnation blooms from shippers or producers for distribution to retailers.
Production Area--a geographical region where a concentration of carnation blooms are produced.
Market Area--a geographical region which receives carnation blooms for consumption.
Bloom--a commercial cut carnation stem and flower.
Enterprise--a commercial carnation greenhouse production range.
Space Unit--square feet of bench, square feet of greenhouse, or acre.
Flow Pattern--movement of carnation blooms from production areas to market areas.
Flower Yield--amount of carnation blooms produced per space unit.
Gross Return or Total Revenue--amount of dollars a producer receives for sale of carnation blooms.
Management--the performance of directing or . administering the enterprise. .

Chapter II
REVIEW OF LITERATURE
History of the Flower Industry in the United States
Only crude information is available on greenhouse
crops prior to 1949. Fossum (12) attempted to consolidate
pertinent census facts prior to that year. He states that
in l890 there were less than 5,000 greenhouse establish
ments in the country, and by 1950 the number approached
19,000. Many of the greenhouses reporting produced vege
table crops and then converted to flowers, particularly
about the time of World War I and later. Apparently there
is no record of the area and value of specific flower crops
prior to 1950.
Fossum (13) using the 1950 census figures, showed
that wholesale value of carnations in the U. S. was about
$21 million in 1949. About 58 percent was produced by
specialized establishments reporti~g more than $25,000
annual business.
From 1949 to 1959, commercial production of all cut
flowers in the U. S. expanded at the rate of about l~ per
cent per year (8, 10). While wholesale prices of all
flowers remained nearly stable, the wholesale value
increased from $121 million in 1949 to $142 million in

5
1959 (8). Total wholesale value of carnations increased
from about $21 million in 1949 to $31 million in 1959, a 50
percent gain (8). Carnations are now the second most
important cut flower produced, with chrysanthemums first
(55). While the production of all cut flowers increased at
the rate of 1~ percent per year duri~g this decade, carna
tions increased at about 5 percent per year.
Production Trends by Areas
Carnation production has increased most rapidly in
California and Colorado (8). In 1949 these two states
accounted for less than 30 percent of U. S. production; in
1959, California and Colorado raised half of the nation's
carnations (8, 10). During this decade, the northeastern
states experienced a moderate increase of from 3 to 17 per
cent, while Illinois reported a 36 percent decrease (8, 10).
Colorado increased production by 151 percent and California,
169 percent (8). The first special cut flower survey of
selected states by the U. S. D. A. Crop Reporting Board for
1956 reported a wholesale value of carnations of $2 million
for California, $4.7 million for Colorado, and $1.6 million
for Illinois. That report also indicated individual
establishments were larger in California and Colorado (47).
The survey for 1957 showed California's wholesale
carnation value increased to $4.8 million; Colorado to
$5.1 million; while Illinois declined to $1.4 million.
Sales per producer also increased (48).
In 1961, California sales increased to $6.4 million,

6
surpassing Colorado now up to ~5.9 million, and Illinois
decreased further to $1.3 million (49). For 1964, Calif
ornia sales reached $9.2 million, Colorado $7.2 million,
and Illinois was down to $1 million (50)..
The latest report for 1965 produqtion shows
California well in the lead and still increasing with a
carnation production value of $10 • .5 million, Colorado at
$7.4 million, and Illinois still lower at $0.8 million.
Other states, now included in the survey, showing slight
increases from 1964 to 1965 were Massachusetts, Pennsyl
vania, and Ohio. Other states showing decreases along with
Illinois were New York, New Jersey, Indiana, and North
Carolina (51).
Consistently, in all surveys since 1956, California
has received the lowest price per bloom, while states such
as Colorado, OhiO, Indiana, Pennsylvania and North Carolina
are in the higher price category. IllinOiS, New Jersey,
New York, and Massachusetts tend to command a medium whole
sale price.
Characteristics of Production Areas
California - California is a surplus-produci~g
area. The proportion of cut flowers sold out of state
accounted for 68 percent of the total flower crop in 1950
(31). Flower production in Northern California is con
centrated in the San Francisco Bay area with new expansion
taking place south along the coast from Half Moon Bay to
Watsonville. In Southern California, areas of production

7
are situated at Los Angeles and San Diego County and also
near Ventura and Santa Barbara.
Parvin (personal communication) presented a report
at the American Carnation SOCiety meeting in 1966 showing
that present greenhouse carnations in California occupy 183
acres in the north and 150 acres for the south, for a state
total of 333 acres. From this total area an estimated
280.6 million blooms are produced per year at a value of
$14.7 million. These figures were compiled by county
agents in close contact with. growers.
Although the greatest expansion of carnation pro
duction has taken place in Northern California, a sub
stantial industry has developed in San Diego County in
Southern California. Besemer and Phelps (1) stated that
there was only one grower in San Diego County in 1949. By
1957 there were 25. growers with more than 40 acres. A 1964
Agricultural Crop Report (32) showed 48 acres producing
61.3 million blooms at a wholesale value of $3.4 million
for the San Diego Area.
Accurate flower yield figures are seldom reported.
Complications arise on whether the figures are related to
greenhouse or bench area and whether they are total blooms
produced or bloom~ sold. Based on Parvin's recent report,
Northern California growers produce about 20 saleable
blooms per square foot of greenhouse area or about 35
flowers per square foot of bench.
A study in San Diego County (2) showed about 48
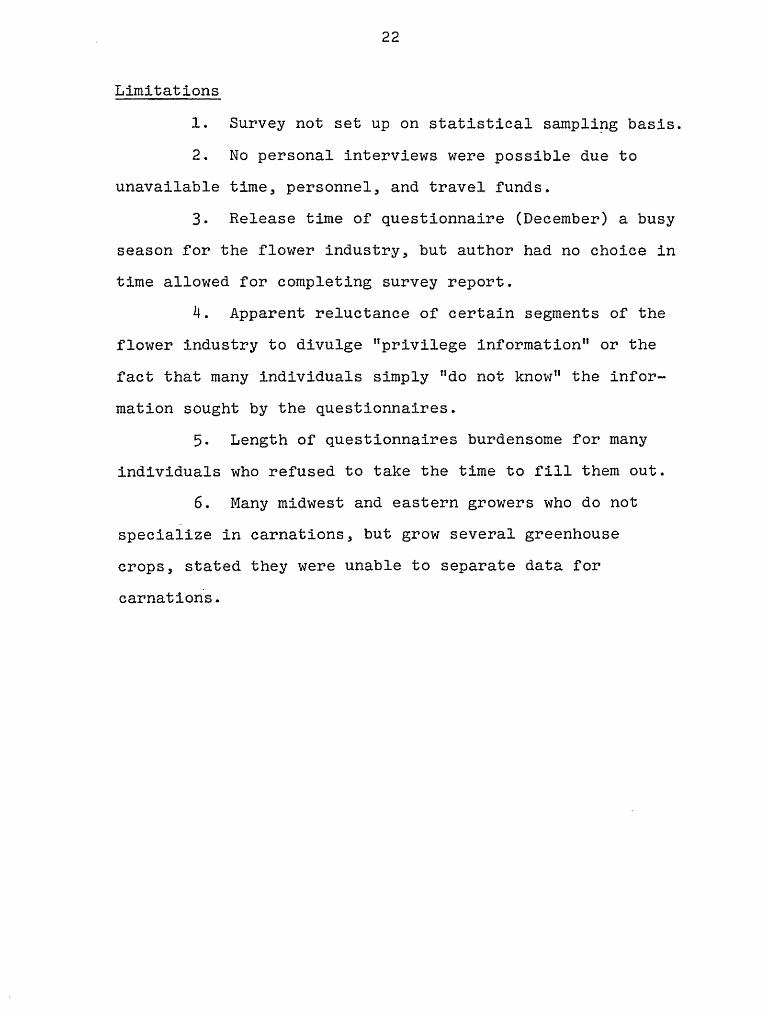
8
saleable blooms per square foot of bench per year. A 1958
production cost study for San Diego County (1) showed
annual production costs of nearly $20,000 per acre, or
45.8 cents per square foot of greenhouse area, and 3.9
cents per bloom. This is the only known record of Calif
ornia production costs. Because of climatic differences,
Northern California costs could be different from San Diego.
Average wholesale prices of California carnations
were listed by the U. S. D. A. surveys as 4.7 cents per
bloom in 1957 and 5.3 cents in 1965 (48, 51).
Colorado - Colorado carnation production is con
centrated in the four-county area around Denver with some
at Colorado Springs and othe~ points in Eastern Colorado.
Based on the number of plants reported in the U. S. D. A.
survey for 1965 (51), a calculated figure by the author
would indicate about 110 acres of carnations for Colorado.
Holley (22) reported 1955 production costs and
flower yields for three Colorado growers. The costs varied
from about $1.80 to $2.37 per square foot of bench space.
The cost per bloom ra~ged from 5.6 to 7.2 cents. Labor and
man~gement represented about 60 percent of total production
costs. The flower yield for Colorado at that time was 29.0
to 32.8 blooms per square foot of bench space.
The U. S. D. A. surveys show a Colorado wholesale
price per bloom of 8.7 cents in 1957 and 8.0 cents in 1965
(48, 51).

9
Pennsylvania - New York - New Jersey - .Pennsylvania
ranked 6th in carnation production among states in 1949.
Seeley (40) reported that of 331 growers only 6 were carna
tion specialists producing an average of 550,000 blooms per
year. The other 325 growers averaged 67,000 blooms per
grower per year. Pennsylvania ranked 4th in carnations by
1959, when ten counties produced more than a million blooms
each (54).
According to the U. S. D. A. survey for 1965 (51),
Pennsylvania and New Jersey showed a slight increase in
carnation production, while New York had a decrease.
Characteristic of these states are many small growers who
may grow several other greenhouse crops along with carna
tions. Many small growers retail a large percent of their
flowers while larger carnation establishments sell a
greater percent by wholesaling (30).
No flower yield figures are available, but Shanks
and Link (41) from nearby Maryland reported that 38.2 to
40.7 saleable blooms could be produced per square foot of
bench space per year.
Wholesale prices per bloom reported by the U. S.
D. A. survey for 1965 were 8.6 cents for Pennsylvania, 7.8
cents for New Jersey, 7.2 cents for upstate New York, and
6.5 cents for Long Island (51).
Massachusetts - Most Massachusetts carnations are
produced around Boston. Jarvesoo (24) stated that in 1949
Massachusetts was the leading state producing 19 percent of

10
the U. S. carnations. For 19.65, the U. S. D. A. survey
shows Massachusetts third in number of carnation plants but
fourth (behind Pennsylvania) in value of sales at wholesale
of $2.8 million (51).
Carnations are the leading flower crop in Massa
chusetts with about two-thirds being shipped out of the
state (25). The average greenhouse area for 89 growers was
about 34,000 square feet with an average yield of about
457,000 blooms per year (24). This indicates a yield of
about 25 blooms per year per square foot of bench area.
Koths (28) states that Connecticut growers need
about 36 blooms per square foot of bench per year to make a
good profit. White (56) reported that 1950 production
costs for Northeast carnation growers averaged $1.72 per
square foot of bench space and income $2.19. This study
showed 32 percent of costs for labor and a net profit of
13.7 percent. In another report (57), White surveyed 22
Massachusetts growers. Production costs were 86.5 percent
of income, providing a net profit of 13.5 percent on sales.
Midwest - There is no concentrated area of carna
tion production in the midwest. Growers are scattered over
several states and supply local markets only. Many of the
establishments are small, few specializing in carnations as
the sole crop produced.
The U. S. D. A. annual surveys have not consistently
included midwest states for reporting carnation production
and sales. Illinois has been used each year and has shown

11
a steady decline from a wholesale value of $1 .. 6 million in
1956 to $ 0 .. 8 million in 1965, a decrease of about 50 .per
cent (47,51). Indiana also shows a decrease from 1964 to
1965, while Ohio shows a slight increase (50, 51).
Wholesale price per carnation bloom in Illinois was
reported 7.0 .cents for 1956 and also for 1965 (47, 51). In
Ohio the price per bloom was 9.0 cents in 1964 and 9.6
cents in 1965 (51). In Indiana the price per bloom was
9.7 cents in 1964 and 10.8 cents in 1965 (51).
North Carolina - Virginia This is a small pro-
ducing area consisting of several growers who supply local
markets along the Atlantic seaboard. According to the
U. S. D. A. survey for 1964 and 1965, North Carolina ranks
9th among 11 states in wholesale value of carnations. An
increase was shown from $0.9 million in 1964 to the 1965
value of $1 million. The wholesale price per bloom was
listed at 9.3 cents in 1964 and 9.0 cents in 1965 (51).
The author has not been able to locate references on costs
and flower yields for North Carolina and Virginia.
Wholesale Marketing
Dewey (8) states: "That although 1949 to 1959 was
a period of rising production costs, the fact that the pro
duction of carnations and chrysanthemums increased sub
stantially, while their wholesale prices remained unchanged,
demonstrates the economic force of technol~gical inno
vations in the cut-flower industry_ Well-developed

12
wholesale marketing systems are indicated because flowers
have moved in increasing volumes from distant to urban
markets."
Moore (34) reported for 1955 that carnations
accounted for 10 percent of total wholesale dollar volume
in the New York market and 16 percent of flowers and pot
plants sold at wholesale in Chic~go. A second report (33)
indicated that over 50 percent of all flowers received in
these two cities came from within a 149 mile radius. Also,
85 percent of all flowers obtained by wholesalers were on
a consignment basis.
Fitzpatrick (11) found for the 1950 to 1954 period
an average wholesale price in New York City of 6.5 cents
per bloom and annual receipts averaging 22 million blooms.
Jarvesoo (26) indicated that Massachusetts whole
salers obtain virtually all of their carnations from local
growers, and that about 40 percent are used locally and
about 60 percent are shipped out-of-state, mainly on the
Atlantic seaboard, to up-state New York, Ohio and Michigan.
He further stated that carnations from California do appear
on holidays, but their volume represents only a fraction of
one percent. The Boston wholesale market handled about $8
million worth of floricultural products and supplies a
year (45). From 1954 to 1959, wholesalers in the North
eastern U. S. showed volume increases of 24 percent for
carnations (16).
Rada (38) reported on flower wholesaling in

13
Southern California using mostly 1956 data. He .stated
that at that time the wholesale value of floral crops in
Southern California amounted to $18 million and that 88
percent were produced locally and 12 percent were imported;
also, 68 percent were sold locally and 32 percent were sold
out of the area. Sales out of the, area were increasi~g
more rapidly than local sales.
DeWerth, et ale (6) gave the percent of flower and
pot plant imports from producing areas to_retail outlets in
Texas. California supplied 43.4 percent; Colorado, 30.2
percent; Florida, 24.5 percent; and Minnesota, 1.9 percent.
Grading
Due to the current mobility of cut flowers from
production areas to distant markets, grading standards have
become more important. Proposed U. S. Cut Carnation Grades
have been published (15). Two studies (18,21) in the
Northeast examined the economics of grading flowers with
the objective of raising grower income and establishing
common understandi~g on the wholesale markets.
The Consumer Market
The future of flower marketi~g is favorable. The
Census of Business Statistics indicates that retail sales
by florists have increased at a rate of 7 percent annually
since 1948. This is greater than the rate of growth by the
entire economy (29). One estimate (36) shows that sales by
retail florists should increase from the present $1.3

14
billion to $2. billion by 1975. Another report ·(53) con
cludes that retail florist sales have increased 60 percent
from 1960 ,to 1965. Proj ecti!lg a 5 percent annual increase
would bring retail sales to almost $2.3 billion in 1976
(29).
Buma (3) reports th~t California retail florist
sales gained at the rate of 5.8 percent per year since 1949
but failed to keep up with personal incomes which were ris
ing almost 8 percent per year. Per capita sales in con
stant dollars, although declining since 1949 to a low of
$2.52 in 1962, stabilized or rose slightly to $2.63 in
1964.
Several surveys of retail· florists have investi
gated various problems of financing, advertisi!lg, merchan
disi~g, and the effect of flower and pot plant sales by
non-florist type outlets (9, 17, 19, 20, 37, 35).
'Merchandising and Mass Markets
Surveys and tests on mass merchandising of flowers
in "nonflorist U outlets indicate a potential for even
greater expansion of carnations and other items (7, 14, 27,
35, 42). Consumer preference studies indicate a willing
ness to buy cut flowers and plants through mass market out
lets (43,44).
Over 18 years ago, $140 million of retail florist
sales were accounted for by nonflorist outlets. By 1963,
this increased to $300 million worth of flowers a year, or
27 percent of all flower sales (52). Rochester, New York,

15
nnonflorist U outlets. did 44 ,percent of the Easter pot
plant business in 1962 (5). A similar trend is apparently
developi~g with cut flowers.
Economics and Management Decisions
The author is not aware of a national study to
evaluate the economic factors for a major cut flower crop.
Several regional studies provide some information on pro
duction costs, wholesale prices, transportation, attitudes
Of. growers, location problems, and other factors (24, 25,
30, 34). These studies were undoubtedly helpful to a
local segment of the industry but have limited national
applications.
Trotter (46) stated: "A sound research pr~gram in
economics of floriculture is essential to the development
of a more effective and efficient marketing system." Hudek
(23) urged Colorado growers and wholesalers to set up a
research program to investigate costs, evaluate business
inputs, plant efficiencies, competition for markets, and
other factors needed for modern man~gement decisions.
At a recent floral industry meeting in Michigan,
Martin (29) said: "The management and investment decisions
and actions necessary to prepare for the 1970's require
more complete economic information about the floral
industry. Specifically, information is needed which would
give a better understandi~g of costs and returns for firms
at all levels of the industry--producing, wholesaling, and
retailing. Such cost information is needed on a commodity

16
basis in order to give some insight about the ~uture
location for roses~ carnations, chrysanthemums, and
gladiolus. The effect of scale of operation on net returns
also would be helpful. 1I
Martin continued: ItInformation on the character
istics of demand for major commodities--includi~g the
extent to which they substitute for each other--is needed
so that producers and shippers may work more effectively
with transportation agencies, wholesalers, and retailers
in developing sound marketing plans. Effective advertising,
promotion, and merchandising programs require more accurate
and timely information than is currently available with
sufficient lead time to be useful in the many decisions,
actions, and investments."
Wood (58), in discussing the California flower
industry stated: nOne of the major problems in cut flowers
• • • in California is the absence of good, accurate data
that will determine the extent of the industry and give
some indication as to possible directions for the future
.•• the absence of these data prohibit, or at least
restrict, those in the industry from making sound decisions
as to the future courses of action for the floriculture
industry. II
The cost of certain production factors, such as
land, is not clearly understood. De Loach (~) states:
"Land speculation is a factor of unknown importance in
maintaining flower and nursery crop production on land

17
adjacent to or in metropolitan areas lt• He also indicates
that growers can obtain long-time capital gains from hold
ing land in urban areas and that these gains may offset any
lack of income received from the greenhouse operations.
Reed (39) presented California. growers with a
formula to establish the agricultural value of land based
on the type of enterprise. From this calculation,_ growers
could determine when alternatives became necessary and take
steps toward relocation, if that appeared to be the best
alternative.

Chapter III
METHODS AND MATERIALS
General Design
To make comparisons and determine relationships o~
the economic factors of production~ seven major carnation
production areas were ·des~gnated. These areas were as
follows:
Southern California
Northern California
Colorado
Pennsylvania - New York - New Jersey
Massachusetts
North Carolina - Virginia
Midwest (Minnesota, Iowa~ Missouri~ Wisconsin,
Illinois, Michigan, Indiana, Ohio)
Except ~or the Midwest, the areas are reasonably
well de~ined, concentrated regions o~ specialized carnation
production which are competitive with each other.
For obtaining data on shipments of ~lowers by
shippers, the same production areas, as listed above, were
used as points of departure.
To establish a seasonal flow pattern of carnations
from producing areas to wholesale buyers, the United States

19
was divided into 9 geographical market areas as used by the
U. S. Census. The market areas were as follows:
1. Pacific - Washi~gton~ Oregon, California, Alaska, Hawaii
2. Mountain - Montana, Idaho, Wyoming, Nevada~ Utah, Colorado, Arizona, New Mexico
3. West North Central - North Dakota, Minnesota, Iowa, Kansas, Missou~i, South Dakota, Nebraska
4.- East North Central - Wisconsin, Michigan, Illinois, Indiana, Ohio
5. Middle Atlantic - New York, Pennsylvania, New Jersey
6. New England - Maine, Vermont~ New Hampshire, Massachusetts, Connecticut, Rhode Island
7. South Atlantic - Maryland, Delaware, District of Columbia, West Virginia, North Carolina, South Carolina, Georgia, Florida
8. East South Central - Kentucky, Tennessee, Alabama, Mississippi
9. West South Central - Oklahoma~ Arkansas, Louisiana, Texas
10. Outside the United States - Canada, Europe, and all other countries
Procurement or Data
Three mail questionnaires (see appendix) were used
to obtain data as follows: .
1. Producer's Questionnaire
a. Size of operation, number of plants
b. Type of greenhouse
c. Annual production costs
d. Capital investment costs
e. Flower yield

20
f' . Annual rev.enue
g. Marketing method
h. Marketing costs
i. Type of financing used
j. Production problems (cultural)
k. Production problems (community and government)
1. Growers opinions on questions important to the industry
2. Wholesalerts Questionnaire
a. Percent of carnations received from the 7 production areas at 7 demand periods of the year
b. Total unit receipts (boxes) each month
c. Average wholesale price at each of the 7 demand periods
d. Problems of wholesalers
3. Shipper's Questionnaire
a. Percent of carnations shipped to each of' the 10 market areas at 7 demand periods
b. Total units shipped (boxes) each month
c. Average shipping price at each of the 7 demand periods
d. Problems of shippers
The questionnaires were sent to as many producers,
wholesalers, and shippers for which addresses could be
obtained. Mailing addresses were compiled from all
potential sources, such as the American Carnation Society,
the Society of American Florists, local growers association
lists, and the Wholesale Florists Association of America.
The original maili~g included the questionnaire, plus a

21
cover letter (see appendix) of obj.ectives for the study and
explanation of the questionnaire, and a return addressed
envelope with postage.
Returns were identified only by a. geographical area
letter or numeral. No signature or return address was
required. Thus, the author had no way of identifying
individuals or firms which returned the questionnaires. It
was hoped that this confidential approach would increase
response to the survey_
Time Schedule
December 1, 1965
January 10, 1966
February 10, 1966
March 1, 1966
June 1, 1966
July 7, 1966
August 1, 1966
Summarization of Data
all questionnaires (830). mailed
post card reminder to producers
letter reminder to all contacts
deadline for return of questionnaire
data summarized
report written
report mailed to all contacts
The questionnaires were dated and catalogued upon
receipt by the author. The data were then transferred to
master sheets for each subject of the questionnaire and by
geographical areas. From these master sheets~ data were
totaled and averages developed for summary tables by which
areas could be compared and conclusions developed.
22
Limitations
1. Survey not set up on statistical sampli~g basis.
2. No personal interviews were possible due to
unavailable time, personnel, and travel funds.
3. Release time of questionnaire (December) a busy
season for the flower industry, but author had no choice in
time allowed for completing survey report.
4. Apparent reluctance of certain segments of the
flower industry to divulge "privilege information" or the
fact that many individuals simply lido not knowtl the infor
mation sought by the questionnaires.
5. Length of questionnaires burdensome for many
individuals who refused to take the time to fill them out.
6. Many midwest and eastern growers who do not
specialize in carnations, but grow several greenhouse
crops, stated they were unable to separate data for
carnations.
Chapter IV
RESULTS
Response to questionnaires varied between s~gments
of the industry and by geographical areas. Wholesalers
responded with a 31 percent return~ producers returned 26
percent~ and shippers 22 percent. Some of the returned
questionnaires were not useable for all items requested.
The response to the survey and the percent of useful
questionnaires is listed in appendix Tables A, B~ and C.
Incomplete questionnaires returned by producers
were generally deficient where production and equipment
costs were requested. Wholesaler and shipper question
naires were occasionally incomplete where actual volume of
flowers handled or estimated seasonal prices were wanted.
Incomplete questionnaires were utilized in the summaries
where data for an item were complete. Therefore~ the
summary tables used in the results are based on varying
numbers of producers, wholesalers, or shippers reporting
data for a particular item. This approach was used to
derive average figures based upon the greatest number of
participants.
As can be seen from Tables Band C, the percent of
questionnaires returned of those mailed varied between

24
geographical areas. No usei'ul questionnaires were returned
by shippers and wholesalers for the Mountain market area
which includes the Colorado production area. However,
excellent questionnaires were returned from Colorado pro-
ducers.
Change in Production Areas) 1955-1965
The net acreage of. greenhouses in production
increased i'rom 1955 to 1965 i'or the growers reporting from
each production area (Table 1). Northern California
tripled its acreage, Southern California doubled, and
Colorado increased by over 50 percent. Modest increases
were reported by the growers participating in the survey
i'or the eastern and midwestern areas.
Table 1. Acre~ge change indicated by the growers reporting
from seven areas, 1955-1965.
Production No. growers Acres Acres Percent area reporting 1955 1965 change
s. Calii'. 11 16.1 29.1 + 81
N. Calif. 13 5.7 20.8 +268
Colo. 21 12.5 18.8 + 51
Penn.-N.Y.-N.J .. 11 6.8 8·.1 + 18
Mass. 4 2.7 3.3 + 20
N. Caro.-Va. 2 2.0 2.7 + 30
Midwest 5 3.7 4.2 + 13

25
Plant Density. per Space Unit
The average number of plants per space unit varied
considerably from one area to another. Massachusetts has
the h~ghest density planting, averagi~g 3.8 plants per
square foot of bench or about 108,000 plants per acre.
Northern California reported the least dense planting of
2.3 plants per square foot of bench or about 61,000 plants
per acre (Table 2).
Table 2. Average number of plants "per space unit for seven
carnation production areas.
Plants
Per square Per square Production No. growers foot :foot bench Per
area reporting greenhouse space 1/ acre
S. Calif. 11 1.69 2.82 73-,830
N. Calif. 13 1.40 2.34 61,091
Colo. 21 1.80 2.76 78,212
Penn.-N.Y.-N .. J. 11 1.97 3.03 85,720
Mass. 4 2.47 3.80 107,669
N. Caro.-Va. 2 1.94 2.98 84,586
Midwest 5 1.72 2.65 75,000
1/60 percent" of total greenhouse space used as bench space
for California areas; 65 percent used :for other areas.
Types of Greenhouses-
The types o:f greenhouses prevalent in each

26
produci~g area are shown in Table 3. The types are based
primarily on types of covering: polyethylene film; rigid
plastic, such as fiberglass or polyvinylchloride~ and
glass. California is predominantly polyethylene, while
all other areas are typically. glass. The use of some rigid
plastic types is apparent in Colorado and North Carolina-
Virginia.
Table 3. Type of greenhouses used for carnation production
by growers reporting from seven areas.
Percent of each greenhouse type
Production No. o growers Poly- Rigid area reporting ethylene plastic Glass 1/
N. Calif. 11 82.6 0.0 17.4
s. Calif. 13 71.4 1.1 27.5
Colo. 21 .6 11.3 88.1
Penn.-N.Y.-N.J. 11 .. 6 0.0 99.4
Mass. 4 0.0 0.0 100.0
N. Caro.-Va. 2 6.0 20.0 74.0
Midwest 10 0.0 2.6 97.4
l/Most of the glass greenhouses in California and Colorado
are continuous ridge-and-furrow type, whereas many growers
in the eastern areas reported separate houses of the gable
type.

27
Annual Production Costs.
The annual production costs, consisti~g of 10 .items
each as a percentage of total production cost, are
indicated in Table 4.
Generally, the items follow a fairly consistent
relationship as percentages for each of the areas. The
combined labor and management cost is in the range of 55 to
60 percent of total costs for all areas except Massachu
setts. Fuel costs are less in California (3.0 to 3.6 per
cent) and range from 7.3 to 10.7 percent for the other
areas. Utilities, taxes, interest, and insurance are shown
to be modest costs compared to the major costs such as
labor, fuel, plants, supplies, and miscellaneous expenses.
Average Annual Production Costs Per Unit
The actual dollar figure for annual production
costs is represented for each producing area in Table 5.
Depreciation is not shown. Although asked for on the
questionnaires, the figure was too variable to be included
here. Depreciation is readmitted as a cost in the final
summary in Tables 19 and 20.
The production costs per acre are similar for all
areas except Northern and Southern' California, where they
are lower. However, costs related to plants and blooms
vary considerabl~, from one production area to another.

Table 4. Production cost items, as a percent of total average annual production costs,
for seven carnation production areas.
Percent of total annual production costs
Production Hired & area family Util. & Sup- Inter- Insur-
labor Mgmt. Fuel water Plants Taxes plies est ance Other
S. Calif. 53.4 8.8 3.0 3.1 5.3' 4.2 12.1 1.7 2·5 6.2
N. Calif. 48.3 16.6 3.6 3.0 7.5 2.9 12.5 2.2 1.7 1.6
Colo. 44.3 15.2 8.1 4.2 3.4 5.1 9·3 3.0 2.2 5.2 I\.)
co
Penn.-N.Y.-N.J. 43.7 15.2 8.0 2.9 8.1 3.4 9.6 1.1 2.2 5.9
Mass. 33.7 10.2 10·7 3.1 8.8 4.7 4.5 2.2 2.0 20.2
N. Caro.-Va. 33.4 23.4 7·3 3.1 6.7 3.8 6.1 3.3 2.1 10.7
Midwest 37.7 18.4 7.9 3.2 8.6 4.4 4.6 2.6 3.3 9.4

29
Table 5. Average annual production costs per specified
unit, in dollars, for seven carnation production
areas (depreciation not included).
Per square Per square Production foot foot Per Per Per
area greenhouse bench 1/ acre plant bloom
s. Calif. .592 .986 25,779 .342 .026
N. Calif .. .691 1.152 30,106 .493 .032
Colo. 1.245 1.915 54,214 .693 .057
Penn .. -N.Y.-N.J. 1.289 1.983 56,160 .655 .067
Mass. 1.275 1.962 55,609 .501 .083
N. Caro.-Va. 1.291 1.986 56,301 .666 .067
Midwest 1.321 2.032 57,543 .767 .081
1/60 percent of total greenhouse space used as bench space
for California; 65 percent used for other areas ..
AQQroximate Greenhouse and Land Investments 2 1955 and 1965
Difficulty was experienced in obtaining representa
tive figures for greenhouse and land values (Table 6).
Values reported varied considerably between growers in any
one area. General relationships can be noted, particularly
between California, where the land values appear to be
highest and greenhouse construction costs lowest, and the
rest of the country where land values tend to be somewhat
lower and greenhouse construction costs higher.

30
Table 6. Approximate capital investments in dollars for
land a~d for greenhouses, 1955 and 1965 II for
seven carnation production areas.
Land costs per acre
Greenhouse construction per square foot
Production area
1955
S. Calif. 5,000
N. Calif. 3,000
Colo. 2,000
Penn.-N.Y.-N.J. 1iOOO
Mass.
N. Caro.-Va. 200
Midwest 1,500
1965
10,000
10,000
5,000
3,000
3,000
300
4,000
1955
.10 - .15
1.00
2.50
3.00
2.50
.25 - .30
2.00
4.00
4.00
4.00
11Costs in this table are based on the most frequent or
typical costs reported by growers. Costs for Southern
California are for wooden structures and polyethylene film.
Costs for the other ,areas are for glass. greenhouses.
Average Capital Investments for Equipment and Buildings~ Percent of Total
Equipment costs, as percentages of total equipment
investment, appear to be more variable from area to area
than were production costs (Table 7). Heating equipment is
the major equipment item. Boiler costs are about 25 percent
of all equipment costs in each producing area. In addition
to the boiler, the heat distribution system cost varies from

31
11 to 19 percent of the total equipment costs. Fertilizer
injectors and tractors represent lesser equipment costs.
Grading sheds, other buildings, and other equipment, such as
fans, vehicles, and pumps make up most of the ba.lance of
capital investments.
Data were insufficient to obtain representative
equipment costs for Pennsylvania - New York - New Jersey and
North Carolina - Virginia.
Average Equipment and Buildings Investment per Space Unit
When total equipment investments are expressed in
dollars per acre or other space unit, there is considerable
variation between production areas (Table 8).
As with production costs, California areas have
smaller costs than midwestern and eastern production areas.
It is interesti~g to note that the equipment investments
per acre for California are approximately one-third to one
half of the equipment investment of the other areas.
Average Flower Production per Space Unit
Flower production is greatest in the three western
production areas as shown in Table 9. On an acre basis,
California and Colorado are nearly equal in productivity,
each area approachi~g a million blooms per acre annually.
Pennsylvania - New York - New Jersey and North Carolina -
Virginia are similar with over 800,000 blooms per acre.
The Midwest and Massachusetts produce at the lowest rates.

Table 7. Average capital investment for equipment and buildings as a percent of total
equipment and buildings investment, for five carnation production areas.
Production Fertilizer Trac- Heat Unit Water Grading Other Other1/ area injectors tors Boiler system heaters system shed bldgs. equip.
S. Calif. 2.4 4.3 21.4 17.8 13.3 16.3 12.2 12.2
N. Calif. 2/ 1.8 6.9 25.2 19.1 4.2 24.1 14.2 4.5
N. Calif. 3/ 4.6 9.1 2.4 28.8 3.7 17.7 18.8 14.9
Colo. 1.8 4.7 27.5 19.0 3.1 10.3 8.1 8.0 17.6
Penn.-N.Y.-N.J. 1.1 4.5 28.8 17.7 0.3 6.4 15.0 12.0 14.2
Midwest .54 3.4 22.8 10.9 0.4 4.8 13.9 36.5 6.8
110ther equipment most frequently included vehicles, fans, sprayers, dusters, pumps, CO2
equipment.
2/8 growers with boiler heating.
1/5 growers with unit-type heaters.
w I\)

33
Table 8. Average equipment investment in dollars ~or six
carnation production areas.
Production Per square fqot Per square foot Per area greenhouse area bench area
s. Cali~. 1/ .272 .453
N. Calif. 2/ .381 .635
N. Calif. 3/ .175 .291
Colo. .928 1.428
Penn.-N.Y.-N.J. 1.222 1.880
Mass. i/ .978 1.505
Midwest 4/ .6935 1.0670
1/Equipment investment about $6,000 when heating
included; only about one-hal~ of acreage in area
heated to date.
2/Boiler-type heating.
3/Unit heater type heating.
acre
11,832
16,589
8,385
40,451
53,185
42,682
30,228
not
is being
~/Some costs omitted in reports, causing figure to be lower
than would be expected.
Average Annual Gross Returns Per Unit
The average annual gross returns per unit are some-
what relative to the range of costs for each area (Table 10).
Southern California had the smallest production cost and
shows the smallest gross returns. This is followed by
Northern California. Co-lorado, Pennsylvania - New York -
New Jersey, and North Carolina - Virginia reported similar

34
Table 9. Average flower yield 11 reported by growers in
seven carnation production areas.
Per square Per square Production foot foot Per Per
area greenhouse bench acre plant area area
s. Calif. 21.33 35.54 929,411 12.76
N. Calif. 21.52 35.87 937,864 15.35
Colo. 21.71 33.40 945,612 12.09
Penn.-N.Y.-N.J. 19.28 29.66 839,287 9.79
Mass. 15.68 24.13 683,053 6.34
N. Caro.-Va. 19.40 29.84 845,864 10.00
Midwest 16.39 25.22 714,285 9.52
l/Yield primarily of blooms sold.
gross returns for all units. The Midwest with small per
acre returns and the highest production cost, reported
returns per bloom and. per plant nearly equal to Pennsylvania
- New York - New Jersey and North Carolina - Virginia.
Massachusetts reported the lowest returns per' acre, but on
a per bloom basis the return is consistent with other
eastern areas.
Marketing Methods
Of the growers reporti~g in the survey, there is
considerable variation as to how flowers are sold. However,
Table 11 indicates notable differences between areas. Both
California areas are similar in that about two-thirds of

35
Table 10. Average annual gross dollar returns per unit
reported by growers from seven production areas.
Per square Per square Production foot foot Per Per Per
area greenhouse bench acre plant bloom
s. Calif. ·902 1.504 39,323 .539 .048
N. Calif .. 1.094 1.824 47,682 .781 .051
Colo. 1.759 2.706 76,615 .980 .081
Penn.-N.Y.-N.J. 1.788 2.750 77,829 .908 .093
Mass. 1.422 2.187 61,928 .575 .091
N. Caro.-Va. 1.767 2.719 77,068 .911 .091
Midwest 1.511 2.324 65,833 .878 .092
the growers depend on shippers to market their flowers.
About one-fourth or one-third of the growers ship their own
flowers, and a small percent market flowers locally.
Colorado is distinctive from all other areas in
that the majority of growers market their flowers through
associations.
The majority of carnations are marketed wholesale
by the growers in Massachusetts and North Carolina -
Virginia. Massachusetts also relies strongly on wholesale
shippers and the local market. The Pennsylvania - New
York - New Jersey growers appear to market over a third of
their production by their own retailing. The Midwest
indicates a reliance on wholesale shippers and the local
markets.

36
Table ll. Marketing methods used by carnation producers in
seven areas.
Percent of growers
Production Ship own Sold by Local Coop or Retail area (wholesale) shipper market assoc. own
s. Calif. 25.0 62.5 12.5
N. Calif. 38.5 61.5 (some)
Colo. 47.6 1/ 52.4
Penn.-N.Y.-N.J. 27.0 27.0 9.0 37.0
Mass. 50.0 25.0 25.0 (some)
N. Caro.-Va. 70.0 30.0
Midwest 6.7 54.4' 33.3 5.6
l/Author suspects this figure might be high due to
possibility of growers confusing this method with "co-op o~
association. II Other figures also may be somewhat affected
by misunderstanding of terminology.
Marketing Costs
The data in Table 12 represent averages of estimates
by growers in the production areas on the cost to grade and
bunch the standard market unit of 25 blooms. Also included
in the table are average commissions paid to a shipper or
wholesaler for selling flowers, or estimated percentage
costs if growers sold through an association or sold their
own merchandise.
Considerable variation exists on estimated costs to

37
grade and bunch carnations. The majority of the estimates
indicate the cost at around 20 cents per bunch.
Some variation in selling commissions is apparent
between areas, the range indicated being from 16 percent in
Massachusetts to 22.5 percent in Southern California. The
av~rage cost to a grower selling his own flowers or
marketing through an association are consistently lower than
the cost where wholesalers or shippers perform this service.
Table 12. Costs of marketing reported by carnation producers
in seven areas.
Percent Dollars
Cost to sell Range of Production Commission own" or by Ave. cost to grading
area paid for coop or grade/bunch costs per selling assoc. 25 blooms bunch
S. Calif. 22.5 17.5 .198 .10 - .40
N. Calif. 20.8 12.0 .207 .10 - .65
Colo. 18.4 18.8 .163 .06 - .25
Penn.-N.Y.-N.J. 20.0 .161 .08 - .29
Mass. 16.0 15.0 .137 .05 - .30
N. Caro.-Va. 20.0 15.0 .135 .10 - .17
Midwest 18.7 .192 .08 - .35
Methods of Financing Production Factors
Table 13 presents the methods of financing pro
duction factors indicated by a majority of. growers reporting
for each area. Certain methods predominate in all areas.

Table 13. Methods II of financipg land, equipment, supplies, and labor for seven
carnation production areas (based on majority of growers reporting).
Plastic New Grading Production Large Small and green- shed' and Sup- Cut-
area Land equip. equip. Lumber glass houses refrig. plies tings Labor
S. Calif. B BGS G G G GS 8GB G G G
N. Calif. B B G G G BG GB G G G
Colo. B B G G G B GB G G G
Penn.-N.Y.-N.J. B B G G G B GB G G G
Mass. B B 8 S 8 B B S S G
N. Caro.-Va. G G G G G B G G G G
Midwest B EG G G G B GB G G G
liB = bank loans, S = Supplier carries cost, G = grower, P = personal loans (letters
placed in order of frequency where no clear majority)
w ex:>

39
Bank ~inancing is usually relied upon ~or purchasing land,
large equipment, new, greenhouses, and grading sheds or
refrigeration. Labor, supplies, plants and other items are
usually ~inanced by the grower.
Massachusetts growers indicated that suppliers were
frequently relied upon to carry costs of supplies, plants,
and other minor items, until paid ~or by the grower.
Production (cultural) Problems
Growers' opinions o~ the ranked importance of
cultural problems vary considerably. By totaling individual
point ratings, some indication o~ area problems could be
determined. In Table 14, there is general agreement for all
areas. Except for Southern Cali~ornia and Pennsylvania-
New York - New Jersey, low light during part of the year was
ranked first. All areas rated diseases and insects as being
foremost problems. Excessive greenhouse temperature was
generally ranked as an important problem; also, condensation
in the greenhouse. Smog,~nematodes, rodents, and birds were
rated as less critical problems. Insufficient data were
obtained from North Carolina - Virginia.
Outside (noncultural) Problems Affecting Production
The ranking of other problems affecting greenhouse
production of carnations, indicated in Table 15, illustrates
that,growers in all areas are particularly conscious of ris
ing costs. Labor'costs and property taxes ranked highest.
Labor quality and labor supply were also consistently rated

40
Table 14. Production (cultural) problems for seven
carnation producing areas ranked by importance1/.
Problems
Diseases
Insects
Water quality
Nematodes
Rodents, etc.
Smog
Soil drain~ge
Temp_ too high
Temp. too low
C.ondensation
Low light
Rank2/ Production areas
Rank2/ So. No. Penn.- Mid- all Cal. Cal. Colo. N.Y.-N.J. Mass. west areas
1
3
4
11
9
7
10
2
4
4
8
3
2
9
11
9
7
8
5
5
3
1
2
3
7
11
10
6
7
5
7
3
1
1
3
8
10
6
8
6
4
11
5
2
2
2
4
8
8
8
7
5
8
5
1
3
2
9
11
6
9
7
4
7
5
1
1
3
6
11
10
8
8
4
7
4
2
I/Growers rated each problem as 0 = no problem, 1 = some
times, 2 = serious. The aggregate of these ratings was used
to rank the problems by importance from 1 to 11.
2/Several problems rated equally in aggregate, hence were
given equal rank in the table.
high.
Rising supply costs and building restrictions were
rated as problems in some cases. No room for expansion,
vandalism, and complaints by neighbors were rated as the

41
least important problems. Insufficient data were .obtained
from North Carolina - Virginia.
Table 15. Outside problems affecting business for six
carnation production areas~ ranked by
importance 1/.
Rank 21 Production areas
------------------------------------~Rank21
So. No. Penn.- Mid- all Problems Cal. Cal. Colo. N.Y.-N.J. Mass. west areas
Rising property taxes
Building restrictions
Neighbors complain
Vandalism
No room for expansion
Rising supply costs
Labor supply
Labor quality
Rising labor costs
2
4
9
8
7
6
4
2
1
1
4
9
8
7
6
5
3
2
2
6
9
8
5
2
1
3
7
9
7
6
5
4
2
1
1
6
7
7
7
5
1
1
1
1
3
7
8
8
6
5
1
3
I/Growers rated each problem as 0 = no problem, 1 = some-
2
5
9
8
7
5
4
3
1
times, 2 = serious. The aggregate of these ratings was used
to rank the problems by importance from 1 to 9.
2/Several problems rated equally in aggr~gate, hence were
given equal rank in the table.

42
Factors Important to Business Success
Altho~gh some overlapping and misinterpretation may
exist in the six factors presented from which growers were
asked to make a choice of two, there are notable differences.
Again in Table 16 (as in Table 15) growers appear to place
emphasis on costs and-prices. Efficiency of production,
listed as Itincreased production per unit plus reduced costs"
rated as the leading factor likely to improve carnation
operations. "Higher flower prices" was rated a close second.
A "good advertising programtr was rated third for
improving-business. trLarger sales at current prices,1I
"cheaper and better transportation,n and "selling through an
association1f (if not already) were relatively unimportant to
growers in all areas.
Grower Opinions on Questions Important to the Industry
As shown in Table 17, the majority of western,
Midwest, and North Carolina - Virginia growers reporting in
the survey indicated they would be willing to relocate their
greenhouses if necessary. Massachusetts and Pennsylvania -
New York - New Jersey growers generally indicated unwilling
ness to move.
Western growers (California and Colorado) apparently
are optimistic that carnation expansion can continue in
their own areas and remain-profitable in the immediate
future. The two growers reporting from the North Carolina -
Vi~ginia area also indicated expansion of carnations there
was possible.

43
Table 16. Grower rating of factors important to business
success II.
Production areas
Penn.-So. No. N.Y.- N.Caro. Mid-
Factors Cal. Cai. Colo. N.J. Mass. -Va. west Total
Good adver-, tising pro-gram 1 7 3 2 1 1 2 17
Larger sales at current prices 2 1 3 2 o 1 1 10
Higher flower prices 7
Selling through an association 2
Cheaper and better trans-portation 1
Increased production per unit + reduced costs 7
6 13
2 1
2 5
8 13
5 3 1 6
2 o o 2
o 1 o 1
9 3 1 7
IIGrowers were asked to check 2 of the 6 listed factors.
Figures in table are total choices made for each factor.
About equally divided opinion was indicated about
local expansion in Pennsylvania - New York - New Jersey,
Massachusetts, and the Midwest. Growers in all areas
expressed stro~g optimism that carnation production could
continue to expand nationally. Reactions were mixed re
gardi~g competition between areas. Northern California
41
9
10
48

44
Table 17. Grower opinions on questions important to the
industry_
Production areas
Penn.-1/ &'0. No. N.Y.- N .Caro. Mid-
Questions Cal. Cal. Colo. N.J. Mass. -Va. west
1. Would you be willing to re-locate your yes 5 9 20 3 0 2 8 business? no 4 4 0 7 3 0 2
2. Do you think carnation pro-duction can expand in your area profit- yes 6 9 19 6 2 2 5 ably? no 0 3 1 5 1 0 4
3. Do you think carnations can be expanded yes 6 10 18 6 4 2 9 nationally? no 1 2 2 1 0 0 0
4. Do you feel your area is being hurt by competition from other carnation yes 6 2 15 9 3 1 8 areas? no 4 11 5 2 1 1 1
5. If yes (on 4), what areas are hurting yours?
Calif. 13 4 2 1 Colo. 1 No. Calif. 3 Cal. & Colo. 5 1
l/AII questions not answered in every report; thus totals
vary.
45
was the only area which did not ,strongly indicate that it
was being hurt by competition from other areas. Most
growers in all the other areas felt inter-area competition
was a factor affecting their particular situation. Colorado
listed California as competition. The Midwest and eastern
areas indicated that both Colorado and California were
stro~g competition.
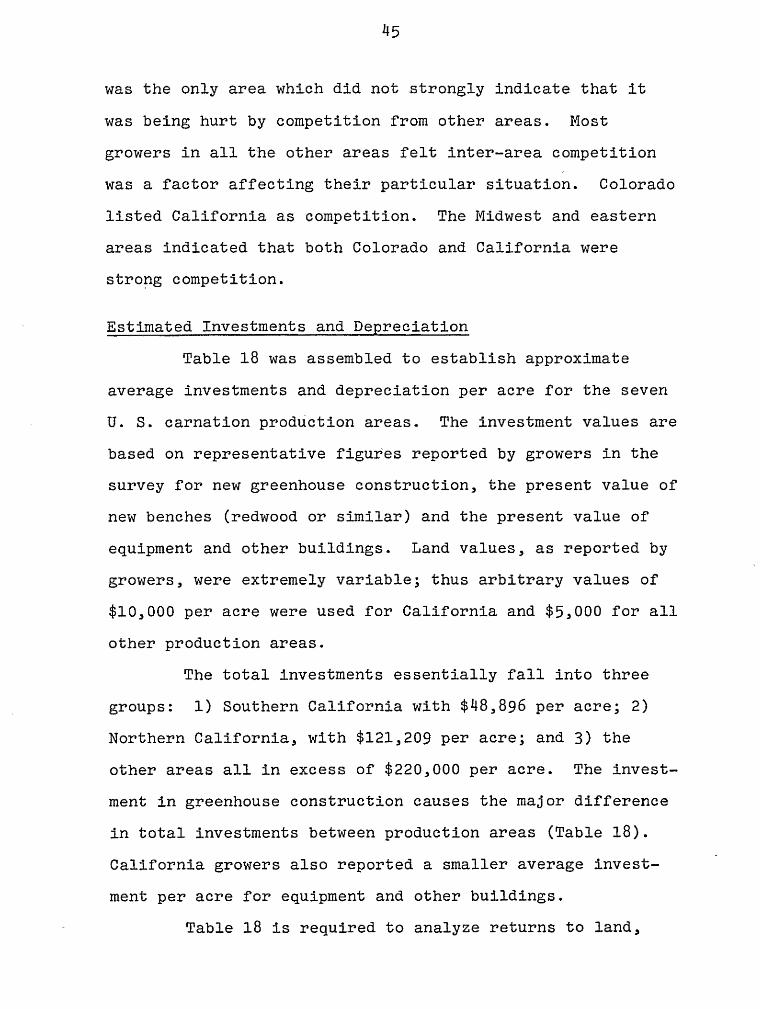
Estimated Investments and Depreciation
Table 18 was assembled to establish approximate
average investments and depreciation per acre for the seven
U. S. carnation production areas. The investment values are
based on representative figures reported by growers in the
survey for new greenhouse construction~ the present value of
new benches (redwood or similar) and the present value of
eqUipment and other buildings. Land values, as reported by
growers, were extremely variable; thus arbitrary values of
$10,000 per acre were used for California and $5,000 for all
other production areas.
The total investments essentially fall into three
groups: 1) Southern California with $48,896 per acre; 2)
Northern California, with $121,209 per acre; and 3) the
other areas all in excess of $220,000 per acre. The invest
ment in greenhouse construction causes the major difference
in total investments between production areas (Table 18).
California growers also reported a smaller average invest
ment per acre for equipment and other buildings.
Table 18 is required to analyze returns to land,

Table 18. Estimated investments (current) and depreciation of greenhouses, benches" and
other 'buildings per acre of seven U. S. carnation production areas.
Production areas
Penn.- N.Caro.-Investments and depreciation per acre S.Calif. N.Calif. Colo. N.Y.-N.J. Mass. Va. Midwest
Greenhouses l / depreciation
$21,780 2,178
$87,120 $174,240 $174,240 $174,240 $174,240 $174,240 4,356 8,712 8,712 '8,712 8,712 8,712
Benches 2/ depreciation
Equipment, other bui1dings3/ depreciation
Land~(
Total investment 5/
Total depreciation
7,500 750
9,616 481
10,000
48,896
3,409
7,500 750
16,589 829
10,000
121,209
5,935
7,500 750
40,451 2,023
5,000
227,191 11,485
7,500 750
53,185 2,659
5,000
239,925 12,121
7,500 7,500 7,500 750 ' 750 750
42,682 45,496 34,196 2,134 2,275 1,710
5,000 5,000 5,000
229,422 232,236 220,936 11,596 11,737 11,172
1/ - $.50/sq.ft. for S. Calif., $2.00/sq.ft. for N. Calif., $4.00/sq.ft. for other areas. Depreciation at 10% for S. Calif., 5% for all other areas. ~/$7,500/acre, depreciated at 10% for all areas. 3/Average equipment and other buildings investments per acre, reported by growers, depreciated at 5%. ~/$10,00o/acre for S. and N. Calif., $5,000/acre for all other areas. 5/Land , eqUipment, and all structures.
..t= 0\

47
capital~ and management as a per.cent of total investment
(Tables 19 and 20).
Financial Summary per Carnation Enterprise by Production Areas
Table 19 summarizes the financial situation of an
average enterprise for each of the seven U. S. carnation
production areas~ and also on a per acre basis for all items
and on a per bloom basis for total revenue, cash costs and
a return to fixed factors. The data used for the analysis
in this table were obtained from 42 selected growers who
reported complete data for all items necessary for the
summary.
California enterprises have the lowest revenues per
acre and per bloom and also the lowest costs and invest-
ments. California enterprises, however, show the highest
rates of return to land, capital, and management as a per-
cent of total investment. Colorado, Pennsylvania - New
York - New Jersey, and North Carolina - Virginia enter-
prises operate at a higher level of revenues, costs and
investments per unit. The rate of returns to land, capital,
and management vary primarily due to some~differences in
cash costs relative to revenue.
Massachusetts and Midwest enterprises had smaller
revenues per unit than other eastern areas and relatively
higher cash costs. Massachusetts shows no returns to land,
capital and management. No contribution is made to depre
ciation and only a partial return for family livipg. The

48
Table 19. Average revenues, costa. and investments and return to land, capital, and investment for average enterprises in seven U. S. carnation production areas.
Average for enterprise
Total revenue Total cash costaL!
Return to fiX~~ factors Fully living.!.!
Return to la?g. capital, mgmt. Depreciat:i.o~
Return to land, capital, mgmt. after depreciation
Value of total investmen~ 6X of total investment
Internal rate of retur~
Average per acre and per bloom
Total revenue, per acre p~r bloom
Total cash cost~. per acre per bloom
Return to fixed factors, per acre pet" bloom
Family livingL!. per acre
Return to land. capital. mgmt •• per acre
DepreciationLl. per acre
Return to land, capital, mgmt. after depreciation. per acre
Value of total investmen~, per acre
6; of total investment
Internal rate of returnL!
Number of growers reporting
Average acres per enterprise
So. No. Calif. CaUf.
Production areas
Penn.Colo. N.Y.-N.~
No. Ca.-Mass. Va.
Hidwest
$185,768 $ 83,878 $ 56,929 $ 65.043 $ 46.430 $102.500 $ 43.054 111.417 45.603 32,033 39.141 44.273 54,880 29.765
74.351 4,000
70,351 16,465
53,886
142,234 8.534
31.9'1
38.275 4,000
34.275 10.683
23,592
118,096 7,085
20.OX
24,896 4.000
20.896 8,269
12,627
83,589 5,016
15.1'1
25.902 4,000
2,151 4.000
21.902 negative 10,182 9,509
11.720 negative
102,868 6.172
96,113 5,767
11.4X negative
47,620 4.000
43.620 15.610
28,010
151,762 9,466
17.8'1
13.289 4,000
9,289 7.262
2,027
66,929 4,016
3.OX
$ 38.441 $ 46,599 $ 19,068 $ 77.432 $ 56,622 $ 77.068 $ 66.237 .0393 .0485 .0801 .0928 .1008 .0911 .0857
23.056 25.335 44.490 46,591 53,992 41,263 45,192 .0236 .0264 .0451 .0559 .0961 .0488 .0592
15.385 .0157
828
14,551 3,409
11.148
29,448
1,167
37.9'1
4
4.83
21,264 ,0221
2.222
19,042 5.935
13.107
65,609
3.936
20.0'%.
8
1.80
34.578 .0350
5.555
29,023 11,485
17,538
116,096
6,966
15.1;
16
.12
30.835 .0369
4.762 4,878
26.073 negative 12.121 11.596
13,952 negative
122,462 117.211
7,348 1,033
11.4; negative
1 2
.84 .82
35,805 .0423
3,008
32.791 11,737
21.060
118.618
2,117
17.81-
2
1.33
6,154
14.291 11,172
.3.119
102,968
6,178
3.OX
3
.65
~lred labor. fuel. utilities, plants. taxes, supplies. insurance, miscellaneous. J3~sumed. based on minimum standard per family of $4,000. --Sased on estimated investments and depreciation per acre (Table 18). converted to an enterprise basis for
Tables 19 and 20. ~nd valued at $10,000 ~er acre for California areas and $5,000 per acre for all other areas. The improve
ments are valued as in 11 but ass~d to be deprecIated by half. ~e return to land, capital, and management as a percent of total investment:

49
Midwest enterprises show a positive but small return to
land, capital, and management.
Financial Summary per Carnation Enterprise by Size for the U.S.
In addition to analyzing the financial situation per
enterprise and per acre or per bloom by production areas
(Table 19) the same 42 U. S. carnation growers were re-
grouped as small, medium, or large enterprises. Nearly
equal representation of growers from each production area
was achieved for each enterprise size group. This arrange
ment meant that a California grower placed in the tl small1t
group might be equal in size or larger than an eastern area
grower placed in the ularge" group, etc. The objective was
to analyze this cross section of U. S. carnation growers to
determine if relative size of enterprises caused differences
in financial success.
Table 20 summarizes the financial situation of the
three size. groups for an average enterprise, as well as on a
per acre basis for all items; and on a per bloom basis for
total revenue, cash costs, and a return to fixed factors.
The small and medium sized enterprises appear to produce
about the same returns to land, capital, and management as a
percent of total investment. It appears that little con-
tribution is made for management by these two. groups. The
l~rge enterprises indicate a substantial return on invest-
ment allowing for increased payments for man~gement or
family living.

50
Table 20. Average revenues. costs, and investments and return to land, capital, and management for 42 U. S. carnation enterprises grouped by size.
Average per enterprise
Total Total
Return to flX'2 factors Family UVing-
Return to land, capital, mgmt. DepreciationLl
Return to land, capital, mgmt. after depreciation
/4 Value of total invest~nt--61 of total investment
Internal rate of retur~
Average per acre and per bloom
Total revenue, per acre P1f bloom
Total cash coscs--, per acre per bloom
Return to fixed factors, per acre per bloom
Family llvin~. per acre
Return to la,g. capital, mgmt., per acre Depreciation--, per acre
Return to land, capital. mgmt. after depreCiation, per acre
Value of total investmen~. per acre
6' of total invest~nt
Internal rate of retur~
Number of growers reporting
Average acres per enterprise
12,230 4,000
8,230 4,703
3,527
48,701 2,922
7.2"1.
$60,989 .0776
36,075 .0459
24,914 .0317
8.148
16,166 9,580
1,186
99,209
5.952
7.27.
11
.49
Stze of enterprise
17 ,850 4.000
13,850 7,638
6,212
77,354 4,641
8.0"1.
$53,202 .0686
35,148 .0453
18,054 .0233
4.046
14,008 7,725
6.283
78,236
4,694
8.07.
Hi
.99
11 ~ired labor, fuel, utilities, plants, taxes, supplies, insurance. miscellaneous.
57,934 4,000
53,934 16,852
37,082
111,688 6,701
33.2%
$ 56,310 .0548
32,258 .0314
24,052 .0234
1.661
22,391 6,996
15,395
46,368
2.782
33.2'.
15
2.41
~sumed. based on minimum standard per family of $4,000. Llsased on estimated investments and depreciation per acre (Table 18), converted to an enterprLse
basis for Tables 19 and 20.
~and valued at $10.000 per acre for CalifornLa areas and $5,000 per acre for all other areas. The improvements are valued as in Ll but aS$umed to be depreciated by half.
~e return to land, capital, and manage~nt as a percent of total investment.

Chapter V
RESULTS--SHIPPERS AND WHOLESALERS
Shippers in five areas provided information on
volume of carnations and percentages shipped to market areas
as well as average shipping prices for each of seven demand
periods of the year.
Colorado did not respond to the survey_ The Midwest
area was not surveyed since it is believed that most
growers serve local markets.
Average Annual Percent of Carnations Shipped from Production Areas to Market Areas
Table 21 shows that California shipped carnations to
some extent to all marketing areas of the United States and
also outside the United States. Carnations produced in
Southern California are mainly exported to the East North
Central, Middle Atlantic, South Atlantic, and West South
Central market areas. About 12 percent of Southern
California production is sold within its own market area
(California, Oregon, and Washington). Northern California
shippers indicated that less than 2 percent of their volume
is sold within their own market area. The major markets for
Northern California are the West North Central, East South
Central and West South Central areas.

52
Table 21. Percent of carnations shipped from production
areas to market areas--average for seven demand
periods of the year.
Market area
s:: :s:: .r: (.) (.) ;::: ~ () .,.., .p.-f .;.3"'" .,-f 'd .,.., .pM .pr-i OJ
Shipping .,.., cd Mcd Mm (I).p s:: .p ::$m :::JctJ "t:1 ~ .p OM OM MS:: m .cc: OM OM .,.., .
area .,.., s:: z.p Z-P ttjm M .pm Cf.l.p CIJ.p CIlCf.l (J :::s c: s:: 'tj.-4 ~bO ::SM s:: s:: .p ctJ 0 • OJ • OJ
.,..,.p OJC O.p • OJ • OJ :::s . s:4 :E: ::=0 t::io ~« Z~ Cf.l« tzlo ::=0 0:::>
S. Calif. 11.9 7.9 4.5 23.8 17.7 1.4 10.5 5.2 16.0 1.1
N. Calif. 1.3 4.8 17.3 8.3 8.3 5.8 9.0 14.1 22.7 8.3
Penn.-N.Y.-N.J. 85.0 15.0
Itlass. 74.0 26.0
N. Caro.-Va. 100.0
Shippers in Pennsylvania - New York - New Jersey
indicated that they sold 85 percent of their carnations in
their own marketing area and shipped 15 percent into the
South Atlantic area.
Massachusetts shipped 74 percent into the Middle
Atlantic market area and sold 26 percent in their own market
(New England). North Carolina - Virginia shippers sold all
their flo;'lers in their own marketing area (South Atlantic).
Percent of Total Volume Shioned from Production Areas Each Month
The percentage of the annual volume of carnations

53
shipped monthly from the production areas can be compared in
Table 22. There is variation between areas as to high or
low volume months. The eastern production areas ship
carnations primarily by truck or bus and also by parcel
post. No information was reported from Colorado or the
Midwest.
Southern California ships its heaviest volume in
March, April, and May. Northern California ships heavily in
August, September, November, and December. Pennsylvania-
New York - New Jersey ships the most in May and June. This
is also true for Massachusetts. Maximum shipping months for
North Carolina - Virginia are April, May, and September.
Low volume shipping months are September and
October for Southern California; January, February, and
March for Northern California; August and September for
Pennsylvania - New York - New Jersey and Massachusetts; and
November and December for North Carolina - Virginia.
Average Seasonal Shipping Prices from Production Areas
The average shipping prices from production areas
(Table 23) indicate two main points. First, the California
areas ship at essentially the same prices, which are usually
lower than those of eastern shipping areas. Pennsylvania
New York - New Jersey area winter prices are about 40 per
cent higher than California's, while North Carolina -
Virginia prices are nearly twice that of California's.
Second, all shipping areas show a similar pattern for the

Table 22. Percent of total volume shipped from production areas by months.
Shipping area Jan Feb Mar Apr May Jun Jul Aug Sep Oct Nov Dec
S. Calif. 6.4 7.4 11.7 14.0 12.6 7.9 7.2 6.2 5.0 5.6 6.5 9.4
N. Calif. 4.6 5.0 5.8 6.8 9.3 9.0 7.8 10.1 10.1 9.4 10.3 11.8
Penn.-N.Y.-N.J. 9.2 9.9 7.9 8.2 10.3 11.9 9.9 4.9 5.3 6.1 7.1 9.2
Mass. 9.3 9.7 9.7 9.7 12.5 12.1 7.0 5.6 1.8 7.9 6.7 7.9 \.11
6.3 6.4 8.2 10.4 11.4 8.7 8.5 8.5 4.8 J:::o
N.Caro.-Va. 12.2 9.1 5.3

55
year--essentially a "hightr price during winter and spring
and a ulowu price from Memorial Day through summer. No data
were available for Colorado~ Massachusetts, and the Midwest.
Table 23. Average shipping prices, in cents per bloom, for
seven periods of the year.
Shipping
Period S. Calif. N. Calif.
Christmas 10.0 10.2
Valentine's Day 10.0 10.2
Easter 10.0 10.3
f40ther IS Day 10.0 10.3
Memorial Day 8.0 8.7
June 7.7 7.0
July-September 6.0 7.0
Percent shipped to wholesalers 98.3 83.3
Primary Transportation ltiethods from Shipping Points to Market Areas
areas
Penn.- N. Caro. N.Y.-N.J. -Va.
14.0 20.0
13.5 19.0
14.0 19.0
14.5 18.0
7.5 13.5
5.0 9.0
5.0 9.0
88.5 100.0
The primary transportation methods used to ship
carnations to market areas are shown in Table 24. The
Iflong-distance ll shippers in Northern and Southern California
rely primarily on air transportation.. Ho\tlever, trucks or
combinations of air and trucks are used into the southern
market areas such as East South Central, West South Central,

56
and parts of the Mountain area.
Table 2q. Principle transportation methods II from shipping
pOints to market areas.
Market area
s:: ..c:: .s:: C,) C,)
0 .,; +lr-t .pr-t .,; f'(j .,;
Shipping .,; ed Hed Hed OJ.p s:: +l fH .p OH OH r-iS:: ed .s::s::
area .,; s:: Z+l Z+l f'(jctl r-i .ped C,) ::;j s:: s:: f'(jr-i ~bO ::;jr-i ctl 0 • ID .. ID ";+l IDS:: O+l ~ :E: :=:0 filo :E:~ ZIJ:l CI)<l!
S. Calif. AT AT A A A A A
N. Calif. AT AT A A A A A
Penn.-N.Y.-N.J. T TB
Mass. TRP TRP
N. Caro.-Va. TB TB
l/A = air, T = truck, R = rail, B = bus, P
vlholesale Volume of Carnations and Average Annual Percentage Received by Market Areas from Production Areas
.s:: ..c:: +lr-i .pr-i OJ :::Sed ::;jed 'd OH OH .,; . CI)+l CI).p tIlCl)
s:: s:: .p • ID • ID ::;j .
1J:l0 :3:u 0:::>
A AT A
AT AT A
= parcel post.
Table 25 gives the number of boxes (about 600
flowers per box) of carnations received annually by the
wholesalers for each market area reporting in the survey_
The volume of boxes reported here does not represent the
total volume that the market areas receive. The percentages
of receipts from production areas are based on the reported
volume. The receipts of carnations by l'/holesalers corres-
ponds generally with the market areas shipped to by

Table 25. Wholesale volume of carnations and average percent received by market areas
from production areas.
Perc~nt received from production areas
Volume1/ Penn.-
Market S. N. N.Y.- N.Caro.- Local areas in boxes Calif. Calif. Colo. N.J. Mass. Va. Growers
Pacific 44,984 3.5 84.9 0.3 11.4
W. North Central 12,060 10.4 23.1 58.9 7.6
E. North Central 8,775 11.7 48.5 12.8 27.0 \J1 -l
Middle Atlantic 108,546 15.6 14.4 9.4 32.0 8.9 6.3 13.4
New England 2,020 3.9 1.8 91.1 3.2
South Atlantic 15,140 12.2 33.2 27.6 13.0 3.3 5.8 4.9
E. South Central 11,389 7 .. 4 48.2 27.9 0.1 16.4
W. South Central 9,751 18.3 38.8 42.7 0.2
1/Volume represents quantities received only by the wholesalers reporting in the survey.
Boxes average about 600 blooms each.

58
production areas. The percentages of volume shipped and
volume received cannot be compared directly. However,
receipts by wholesalers in market areas confirm most of the
major markets for the production areas. Each market area
receives a high percentage of total volume from its own
production area, if one exists within the market area. The
northeast areas receive a high percent of their carnations
from local growers and nearby producing areas.
The East North Central area, with Chicago as a hub,
receives over 25 percent of its carnation volume from local
growers, nearly 50 percent from Northern California, and
about 12 percent each from Southern California and Colorado.
The West North Central and West South Central areas receive
about 50 percent of their carnations from Colorado, with
the balance coming from Northern California, and to some
extent from Southern California. No data were available
from the Mountain area.

59

Figure 1. Percent wholesale carnation receipts by eight
market areas from production areas based on
volume for seven demand periods of the year.
The following letters have been used to represen"t
production areas received from in Figure 1:
A - Southern California
B - Northern California
C - Colorado
D - Pennsylvania - New York - New Jersey
E - Massachusetts
F - North Carolina - Virginia
G - Midwest

60

61
Percent of Carnations Received Seasonally by Iwlarket Areas from Production Areas
The market area receipts for seven periods of the
year are shown in Table 26 as a percentage of total
receipts. Two things are indicated by the table. First,
the market areas maintain a rather constant percentage of
receipts from a production area for the major holidays.
This would indicate reasonably stable channels of buying.
Second, if percentages received shift from one source to
another, it occurs frequently in July to September. North
ern California provides a higher percent of the July-
September flowers. In most cases a slight increase also
comes from Southern California during the summer period.
Local production for most market areas is lower during the
summer period.
Average Seasonal Ylholesale Prices for ftIarket Areas
The average wholesale price for each market area
(based on wholesalers responding to the survey) for seven
periods of the year is summarized in Table 27. Three con
ditions are evident from this table. First, wholesale
prices are similar for Christmas, Valentine's, Easter and
Mother's Day in anyone market. Second, prices generally
are lower in the Pacific, Mountain, and New England market
areas than they are in other areas. Third, there are
essentially tl'lO \'lholesale prices for the year--a higher
price in \,linter and spring, and a lower summer price. This

62
Table 26. Percent of carnations received by market areas
at seven periods from production areas.
Production areas
Penn.-So. No. N.Y.- N.Caro.-
Period Cal. Cal. Colo. N.J. Nass. Va. Local
Pacific ltiarket Area: Christmas 4.3 87.9 1.0 6.8 Valentine's Day 2.8 87.3 9.9 Easter 4.6 83.8 11.6 Mother's Day 4.1 86.5 9.4 f.lemorial Day 3.6 83.0 1.0 12.4 June 2.0 81.4 16.6 July-September 3.0 84.2 12.8
\-lest North Central f4arket Area: Christmas 10.6 22.1 58.7 8.6 Valentine's Day 7.6 19.0 62.1 11.3 Easter 12.9 20.5 56.8 9.8 Mother's Day 10.8 22.1 56.5 10.5 friemorial Day 10.3 21.8 58.6 9.2 June 9.5 26.9 60.1 3.5 July-September 11.1 29.2 59.5 0.2
East North Central Market Area: Christmas 13.3 49.8 15.2 21.7 Valentine's Day 14.6 46.6 13.3 25.5 Easter 13.8 45.8 15.4 25.0 140ther I s Day 12.9 49.6 16.2 21.3 Hemoria1 Day 10.4 45.8 10.0 33.8 June 7.9 48.3 10.0 33.8 July-September 8.8 53.7 9.2 28.3
Middle Atlantic ltIarket Area: Christmas 17 .. 6 12.8 10.5 32.5 9.6 6.It 10 .. 11 Valentine's Day 15.3 12.0 11.8 32.8 9.3 6.11 12.3 Easter lS.It 12.0 12.5 32.3 8 .. 9 6.4 12.5 Itlother 1 s Day 13.6 12.8 11.8 33.2 8.9 6.It 13.2 14emoria1 Day 11.4 12.5 6.8 35.4 9.6 6.4 17.8 June 17.5 14.6 6.8 32.1 8.6 6.4 13.9 July-September 18.2 23.9 S.4 25.7 7.5 5.4 13.9

63
Table 26. (Con't) Percent of carnations received by market
areas at seven periods from production areas.
Production areas
Penn.-So. No. N.Y.- N.Caro.-
Period Cal. Cal. Colo .. N.J. Mass. Va. Local
New England Market Area: Christmas 95.0 5.0 Valentine's Day 2.5 92.5 5.0 Easter 5.0 92.5 2.5 Mother's Day 5.0 92.5 2.5 It!emorial Day 5.0 90.0 5.0 June 5.0 5.0 87.5 2.5 July-September 5.0 7.5 81.5
South Atlantic Market Area: Christmas 11.3 29.4 30.2 14.0 5.3 4.4 5.3 Valentine's Day 10.9 29.0 25.B 16.3 4.6 6.7 6.1 Easter 12.1 29.2 27.8 14.9 4.3 6.3 5.3 ltiother 1 s Day 12.4 27.3 29.8 14.6 3.6 7.0 5.3 14emorial Day 12.5 33.2 21.4 17.8 2.8 1.0 5.3 June 11.8 36.0 29.6 10.3 1.6 6.3 4.4 July-September 14.6 48.2 28.2 3.0 1.1 2.6 2.2
East South Central Harket Area: Christmas 5.1 45.4 30.2 IB.7 Valentine's Day 4.6 41.1 31.5 22.1 Easter 6.9 42.8 28.7 21.5 r4:other I s Day 5.9 42.5 28.4 0.6 22.5 ItIemorial Day 6.4 46.8 26.4 20.4 June 10.0 55.4 25.3 9.3 July-September 12.4 62.1 24.5 0.3
"lest South Central lw1arket Area: Christmas 16.8 33.5 49.3 0.4 Valentine's Day 17.3 36.B 45.5 0.4 Easter 18.1 36.7 44.8 0.4 Mother's Day 18.8 39.1 41.7 0.4 14emorial Day 18.5 42.1 39.4 June 18.5 40.8 40.7 July-September 19.6 42.9 31.5

64
generally associates with shipping prices shown in Table 23.
Some areas maintain a higher summer price than others.
Market areas vlest North Central, East South Central and
West South Central show a more uniform price for all
periods. New England indicated the greatest price
fluctuation from summer to winter.
Table 27. Average seasonal wholesale prices in cents/bloom
for market areas.
Market areas
s:: ..c: ..c: 0 0 ..c: ..c: 0 "I"i .prl +>rl "I"i '0 "I"i .prl ..pM
Period "I"i ro Hro Hro (l).p s:: .p ~C'd ::jro Cf..i .p OH OH rls:! ro ..c:s:: OH ot.. -rl s::: Z-P Z-P 'Oed rl -Pro Cf.)..p tI)..p 0 ::j s:: s:: ron ~bO ::jrl s:! s:: ro 0 • Q) • Q) "I"i-P Q)S::: o.p • Q) • Q)
tlt :z :S:U lilU ~c:t: z~ tI)<2! ~o :S:O
Christmas 13.0 14.5 18.0 18.0 18.2 16.0 18.9 18.2 17.3
Valentine's Day 11.8 14.5 17.6 17.1 18.1 15.0 19.3 17.6 17.0
Easter
Mother's Day
Memorial Day
June
July-September
11.8 14.5 17.3 17.8 18.0 15.0 18.0 18.0 16.9
·12.3 14.5 17.4 18.3 15.9 16.0 18.0 17.9 17.2
10.2 10.0 13.1 13.2 11.3 9.0 14.5 13.6 15.5
9.1 10.0 13.1 12.1 10.0 6.0 12.9 13.5 14.5
8.6 9.0 13.2 10.8 8.8 6.0 12.5 13.6 14.0

Chapter VI
RESULTS--ADDITIONAL PROBLEMS OF THE CARNATION INDUSTRY
In addition to the choices of various problems for
ranking in the questionnaire~ several others were noted by
growers. An open listing section was provided for shippers
and wholesalers in their questionnaires. Many of these
written-in problems are realistic, and it is interesting to
note the recurrence of certain ones, especially from
shippers and wholesalers.
Additional Problems Expressed by Growers
1. Erratic market
2. Airline connections
3. Expansion in other areas
4. Expansion by "poorn growers in own area
5. Lack of good market for IIlower" quality flowers
6. Price of flowers too low
7. Smog-producing industry moving into area
8. Labor union activity
9. Distance from marketing center (of shipping
points)
10. Management--need for greater application
11. Retail florist (not trying to move enough
:flowers)
66
12. Double commissions--one wholesaler selling to
another
13. Cost of marketing
14. Difficulty in obtaining good bank loans
15. Price of flowers does not keep pace with the
economy
16. City complains (unsightliness of greenhouse)
17. Neighbors dumping trash on property
18. Taxes in general
19. Cost of new construction
One grower mentioned that New Jersey had passed a
law to assess land only at farm values, which lessened the
tax burden for growers.
An interesting comment coming from a Massachusetts
grower is quoted as follows: "We have taken all but 8,000
square feet out of carnation production. vie have opened a
wholesale and retail garden center business. Carnations are
no longer as profitable as what we are now doing."
Additional Problems Expressed by Shippers
Number in parenthesis represents the times item was
mentioned.
1. Transportation delays and lack of space (4)
2. Having quality carnations all year
3. Prices too low relative to costs (2)
4. Lack of production (quantity) at peak demand
periods
5. Poor handling by carriers

67
6. Lack of uniform grade standards and enforcement
7. Too much emphasis on increasing production and
not enough on marketing and advertising
8. Price differential too large between consumer
and grower
9. Trying to make a fair return on investment
plus salary
Additional Problems Expressed by Wholesalers
Number in parentheses represents the times item was
mentioned.
1. Lack of uniform grading (21)
2. Shortage of color selection, especially
holidays (19)
3. Storing flowers too long, especially
holidays (16)
4. Transportation delays (10)
5. Damage from poor packing and handling (9)
6. Lack of keeping quality (7)
7. Lack of consistent pricing by shippers (7)
8. Poor crop timing (5)
9. Direct selling to retailers and lack of
committments ~lith wholesalers (4)
10. Lack of communication and cooperation with
airlines (4)
11. Local (midwest and east) quality off in
summer (2)
12. Freight too high on western carnations (2)

68
13. Insufficient number of adequately trained,
responsible, capable personnel (1)
14. Large shippers rob airplane space from smaller
shippers (1)
15. Need more improved varieties (keeping) (1)

Chapter VII
RESULTS--CLIMATIC FACTORS OF PRODUCTION AREAS
Monthly records of percent possible sunshine and
mean temperature were tabulated (from the U. S. Weather
Bureau publication "Climatological Data for the United
States by Sections n ) for a ten-year period, 1956 to 1965.
The cities with available information to represent the
carnation production areas are given in Table 28.
The ten-year average of monthly temperatures for
production areas is given in Table 29. In order to estimate
when cooling or heating would generally be required for any
month, the mean temperatures were calculated for two
hypothetical Itideal carnation days". A ncool day" of 24
hourly temperatures ranges from a 10\,1 of 50°F. at night to
a high of 75° in the afternoon with a 24-hour mean of 62.4°.
A IIwarm dayfl ranges from a 10\,1 of 54 ° to a high of 82° with
a 24-hour mean of 67.9°.
Using the mean temperatures for the "ideal carnation
daysll a monthly mean temperature below 62.4° would be
expected to require heating. If the monthly mean exceeds
67.9°, cooling would be needed. Therefore, Table 29 also
indicates theoretical requirements for cooling or heating
for each month in a given production area. Daily temperature

Table 28. Cities used for temperature and percent sunshine records to represent
seven carnation production areas.
Production Elevation above Degrees Degrees area City sea level--reet latitude longitude
S. Calif. San Diego, Calif. 19 32.44 117.10
N. Calif. San Francisco, Calif. 8 37.37 122.23
Colo. Denver, Colo. 5,292 39.46 104.53
Penn.-N.Y.-N.J. Philadelphia, Pat 13 39.53 75.14
Mass. Boston, Mass. 15 42 .. 22 71.02
N. Caro.-Va. Greensboro, N. C. 891 36.05 79.57
Midwest Indianapolis, Ind. 793 39.44 86.16
'""""-l o

71
variations would demand cooling and heating within the same
day (24 hours) in many situations. The total annual heating
and cooling requirements explain part of the variation in
production costs for the areas.
Table 30 ShO\-lS the annual mean temperatures f'or the
ten years, 1956 to 1965, and the ten-year mean temperature
f'or each production area. The years are designated "warm"
(above average) or Itcool1t {below average).
Table 31 gives the average monthly percent possible
sunshine for the ten-year period, 1956 to 1965. The six
IIlightest tf and six ttdarkest" months are indicated for each
area. It is interesting to note that the "darkest" months
in the western areas are not much darker than the "lightest ll
months in the eastern areas.
The average annual percent possible sunshine for the
ten-year period, 1956 to 1965, is presented in Table 32.
The years are designated as above average or belol'1 average
for each area. A positive correlation of' .78 was found
between percent possible sunshine and mean carnation yield
for the production areas (Figure 2). Colorado has the
highest percent possible sunshine and the highest f'lower
production per acre. Second with production and sunshine
is Northern California, and third in both sunshine and pro
duction is Southern California. The eastern areas do not
associate production and sunshine as well; but as a group,
both their production and amount of sunshine are lOl'ler than
in the \-lest.

Table 29. Mean temperatures for seven U. S. Carnation production areas. Average per month
over 10 years (1956-1965).
Area Jan Feb Mar Apr May Jun Ju1 Aug Sep Oct Nov Dec
+ + + + + + S.Ca1if. 56.98 57.74 58.72 61.42 63.38 65.81 69.92 71.87 70.73 67.26 61.39 58.14
+ + + + + + + + + N.Ca1if. 48.62 52.14 53.02 55.93 57.85 61.12 62.14 63.87 64.18 61.45 54.66 49.29
+ + + + + + + + + Colo. 28.77 31.80 36.05 47.17 58.28 67.38 72.95 71.63 62.10 53.04 39.27 33.23
Penn + + + + + + + N.Y.~N.J.30.36 32.79 40.20 52.39 62.67 71.22 75.11 73.37 67.22 55.78 45.80 34.07
+ + + + + + + + Mass. 28.49 29.60 37.04 47.50 58.69 67.96 72.57 71.22 64.20 54.73 45.31 32.54
N C++ + + + + + V~.aro.- 36.91 40.14 45.85 57.74 67.54 73.44 76.23 75.96 69.18 58.28 49.40 39.65
+ + + + + + + Midwest 26.05 29.78 37.99 52.00 62.96 71.00 73.62 72.60 66.57 55.59 42.27 30.36
+ = months requiring heating
= months requiring cooling
-1 I\.)

Table 30. Mean annual temperatures for seven U. S. carnation production areas 10r 10
years (1956-1965).
Area '56 '57 '58 '59 '60 '61 '62 '63 '64 '65 10-year average
+ + + S.Calif. 63.13 64.20 65.48 65.711 63.61 63.50 62.10 63.60 62.15 62.58 63.61
+ + + N.Calif. 56.09 57.42 60.07 59.30 57.00 57.12 55.84 56.39 56.40 55.55 57.12
+ + + + Colo. 51.65 50.24 51.34 49.95 49.67 118.83 49.65 50.73 49.66 49.63 50.13
-l
+ + + + w Penn.- 54.18 55.15 52.62 55.54 52.81 52.74 52.10 51.91 511.08 52.99 53.41 N.Y.-N.J.
+ + + + + + Mass. 50.86 52.52 49.99 51.77 51.40 51.01 119.83 51.03 50.15 49.60 50.81
N.Caro.- + + + + + Va. 58.31 58.76 56.1 I 58.46 56.55 57.34 57.07 56.10 57.83 58.60 57.52
+ + + + + Midwest 52.89 52.50 50.13 52.65 50.114 51.17 51.54 50.05 53.12 52.80 51.73
+ = warm years (above average)
= cool years (below average)

Table 31. Percent possible sunshine for seven U. S. carnation production areas.
10-year average by months (1956-1965).
Area Jan Feb Mar Apr May Jun Ju1 Aug Sep Oct Nov Dec
S. Calif. 71.3 70.2 69.5 66.1 58.9 55.0 71.2 69.3 74.3 70.0 71.6 74.2 IIII IIII IIII IIII IIII IIII
N. Calif. 58.0 611.8 72.0 76.8 71.5 711.8 66.8 69.3 72.5 71.11 67.0 61.7 IIII IIII IIII IIII IIII IIII
Colo. 75.4 68.4 68.11 64.2 63.5 71.5 73.2 74.4 75.9 75.9 68.4 73.1 IIII IIII IIII IIII IIII IIII
Penn.- 55.7 49 .. 7 55 .. 4 57 .. 4 61.4 65 .. 6 60.5 62.2 62.5 63.9 54.4 51.3 -.:J
N.Y.-N.J. .t:-
IIII IIII IIII IIII IIII IIII Mass. 57.9 61.3 58.9 57.8 65.0 66.7 65.9 66.7 64.6 64.2 54.5 56.5
IIII IIII IIII IIII IIII IIII N. Caro.- 59.7 57.2 60.6 64.5 67.0 64.1 62 .. 9 68.2 65.2 67.7 61.0 60.1 Va. IIII IIII IIII IIII IIII IIII Midwest 49.0 50.6 53.6 58.8 65.8 70.1 68.9 73.0 71.5 65.3 50.1 45.1
IIII IIII IIII IIII IIII IIII
IIII = darkest months

Table 32. Percent possible sunshine for seven U. S. carnation production areas--
average annual (1956-1965).
10-year Area 156 157 '58 '59 '60 '61 '62 '63 '64 165 average
S. Calif. 70.4 63.1 72.4 69.1 70.6 68.5 63.6 70.0 68.4 68.0 68.46 IIII IIII IIII
N. Calif. 70.7 64.9 66.8 78.7 65.8 71.6 65.1 67.4 72.7 64.7 68.88 IIII IIII IIII IIII IIII IIII
Colo. 73.0 64.5 68.5 68.4 72.9 69.5 72.3 75.5 74.3 71.0 71.02 IIII IIII IIII IIII -:3
Penn.- \J1
54.0 56.9 59.2 58.7 60.3 61.1 56.4 60.6 59.5 56.3 58.33 N.Y.-N.J. IIII IIII IIII IIII Mass. 62.0 66.4 58.4 60.2 62.8 59.6 61.4 62.5 61.2 61.9 61.66
IIII IIII IIII IIII IIII N. Caro.- 64.5 63.8 69.5 68.4 67.6 64.0 55.4 61.6 57.0 58.8 63.18 Va. IIII IIII IIII IIII Midwest 58.0 55.5 60.5 60.3 63.5 55.9 59.5 65.5 62.2 60.3 60.15
IIII IIII IIII IIII
IIII = years below average

1000
'0 900 o o Q.)
"o o
~800 0-f/)
E o o -OJ
700
76
No .. California. • Colorado So. California •
No. Corolina-Virginia • • Penn.-N.Y. -N.J.
r = .78
• Midwest
• Massachusetts h _
60 65 70 75 Percent possible sunshine, 10 year average
Figure 2. Relatlonsh!p of average yields per acre and per-
cent possible sunshine for seven carnation
production areas.

Chapter VIII
DISCUSSION AND CONCLUSIONS
Response to Survey
A mail survey of the floriculture industry does not
produce exceptionally gratifying results. However, the
response to this survey was as good or better than others
that have been attempted. Apparently, members of the
industry are generally reluctant to divulge competitive or
private information, even \-lith the strict assurance of
confidential treatment.
Most of the participants that completed and returned
questionnaires provided what appeared to be accurate and
reliable information. It was apparent that some growers
kept excellent cost accounts, while others had only a
relative idea of their business transactions.
The author is of the opinion that many growers,
wholesalers, and shippers did not respond because (1) they
simply do not have accurate records, (2) it was too much
trouble to fill out a lengthy questionnaire, or (3) just
plain lack of interest or confidence that this type of sur
vey could produce useful information for their industry.
The author relied upon his \-lorking kno\,lledge of the
carnation industry to judge which questionnaires were most

78
vl0rthy for summary calculations, and he is confident that
the summarized results ShOlol reasonably accurate relation
ships of factors for the U. S. carnation industry at the
present time.
Factors Affecting Production Changes
National carnation production has increased and con
tinues to increase rapidly. Accounting for the consumption
of the larger supply of carnations leads to some surmise.
Since carnations have moved up to second place among all
florist crops, it appears that they might be taking some
sales avlay from other types of flo\'lers. Increased popu
lation is definitely a factor. However, the flower industry
is not making notable advances in increasing per capita
sales of fresh flowers.
Western areas, such as California and Colorado are
responsible for most of the increase in carnation production.
The U. S. D. A. cut flower survey shows that from 1956 to
1965 the value of California carnations increased 150 per
cent and Colorado 57 percent. For grovlers participating in
the report concerned here, 11 Southern California growers
increased their acreage 81 percent from 1955 to 1965, 13
Northern California grovlers increased acreage by 268 per
cent, and Colorado growers increased acreage by 51 percent.
These increases follow the pattern of the U. S. D. A. cut
flovler surveys.
California has the greatest production advantages of
any U. S. areas. The mild climate of coastal locations in

79
the vicinity of San Francisco, Santa Barbara~ Los Angeles~
and San Di~go are ideal for tlnatural lf carnation culture.
Growers in Southern California reported investments
averaging only $49,000 per acre for a plastic film type
greenhouse, benches, heating system, and other equipment.
Northern California growers reported investments per acre
which amount to about $121,000. These investments are one
fourth to one-half of those in all other carnation pro
duction areas, which exceed $220,000 per acre.
In relation to climate, light quantity determines
the productivity of flowers to a large extent. Figure 2 in
the results shows a significant correlation of percent
possible sunshine and yield of carnations in the various
areas. Colorado, reported the highest yield per acre and
receives the highest percent of sunshine, followed closely
by California. Productivity per unit is a key factor in
decreasing costs per unit and increasing income.
The average California carnation producing unit is
larger, newer, and frequently specialized in carnations
only. For those reasons, California producers can readily
take advantage of changes in technology, particularly labor
saving devices. New growers in expanding areas can con
struct their greenhouses according to latest designs and
plan for installation of automatic '\Itatering systems"
fertilizer injection, and more efficient heating and cooling.
Southern California carnation gro\'lers have a further
advantage of mobility. The Simple '\Ilooden frame, plastic

80
film covered greenhouse structures prevalent in that area
can be used for a few years and relocated or rebuilt on new
property. Relocation enables growers to make new land
investments and update their facilities.
Colorado carnation producers also have a climatic
advantage over eastern areas. As mentioned, a high percent
of possible sunshine is a key factor to increased produc
tivity per unit and flower quality throughout the year.
This is particularly true in winter when decreased pro
duction and quality occur in eastern areas. However,
Colorado producers must construct more substantial and
costly greenhouses, similar to eastern requirements. The
investments for equipment and other buildings are also
higher than in California and similar to the east. Colorado
growers have probably benefited more than any other group by
organizing into associations to coordinate both growing and
marketing functions and to support local research. As in
California, the majority of Colorado enterprises are newer
and often specialized in carnations, thus designed for the
latest technology and efficiency of production.
Rapid transportation, especially air and refrig
erated trucks, is undoubtedly the key factor to expansion of
carnations in Colorado and California. As indicated by per
centages of total receipts purchased by wholesalers from
producers, California and Colorado carnations are shipped to
all major markets of the United States. Based on whole
salers reporting in this survey, western carnations are the

81
main source or supply ror all market areas except the North
east. Furthermore, population growth in the west could also
improve the local markets for Colorado and California
carnations.
According to the U. S. cut flower surveys, and also
shown in the results of this report, California carnation
growers consistently obtain a lower average price per bloom.
This lower average price can be largely attributed to higher
transportation costs due to greater distance to markets.
Also, as indicated by wholesaler receipts from production
areas (Table 26), California tends to be the main source
of imported carnations in the summer season when market
prices are at their lowest.
Eastern carnation areas are, for the most part,
stabilizing or decreasing production because of competition
from t'/estern areas \-lith climatic and cost advantages.
Nevertheless, highly efficient eastern growers may continue
to compete t'lhere they have a \-lell-developed local market, or
are growing some carnations as an accommodation item to
satisry a market demand ror several cut flo\'ler and pot plant
items. Many growers may have overcome their capital invest
ments years ago and have a closer contact with their markets.
Disadvantages of many eastern growers are that technological
advances have made their facilities obsolete, and climatic
limitations restrict competition for quality and quantity
during certain seasons of the year. 1-1:any eastern gro\'lers
apparently have decided to convert to more profitable crops;

82
pot plants and bedding plants are good examples. Garden
centers are becoming popular throughout the country~ and
where location is ideal are natural extensions of a \,lhole
sale flower. growing operation.
Economic Analysis of Carnation Enterprises
An economic analysis of any single carnation pro
duction area presents numerous difficulties. Factors in
fluencing the comparison of financial situations for several
carnation enterprises are the many characteristics of
individual firms. The most notable variations are size and
relative efficiency~ loc~tion~ age of facilities~ age and
desires of the operator~ and surrounding economic forces.
There is al\,/ays some element of doubt on the ability or
sincerity of growers to contribute accurate data for a
survey analysis. Even if absolutely reliable data can be
obtained~ the researcher must cope \,/ith \'/ide variations in
land values, age and relative values of capital investment,
and depreciation rates. A realistic return to land, capital,
and management expressed as a percent of total investment in
land and improvements, is some\'lhat difficult to establish
for a single enterprise and even more difficult to obtain as
an average for several enterprises. HO\,lever ~ \'lhere economic
differences \'lere hypothesized bet\,leen carnation production
areas of the United States, this analysis of financial
situations for average enterprises in each area supports the
hypothesis.

83
Tables 19 and 20 illustrate the relative financial
differences per average enterprise and per acre or per bloom
between production areas and bet~leen sizes of enterprises.
The high internal rates of return of 37.9 percent for
Southern California and 20 percent for Northern California
carnation enterprises sUbstantiates the rapid expansion of
these areas.
The format of the summary tables is organized so
that the reader can make his O\,ln decisions as to what
portions of the internal rate of return can be regarded as
a payment for management or family living. For example, by
subtracting the 1texpectedlt return of 6 percent on total
investment of $1,767 per acre for Southern California
(Table 19) from the return to land, capital and management
after depreciation ($11,1~8) the resulting $9,381 represents
a return to management. Adding this to the family living
allowance of $828 per acre, the total of $10,209 may be
regarded as the "net income" per acre to the operator for
family living and management. Similarly, the "net income"
per acre per operator would be $11,393 for Northern
California; $17,127 for Colorado; $11,366 for Pennsylvania -
New York - New Jersey; and $16,951 for North Carolina -
Virginia.
The analysis of Massachusetts and Midwest enter
prises indicate a different financial situation. Massachu
setts, even if depreciation is considered not applicable as
a cost, still shows no contribution for family living or
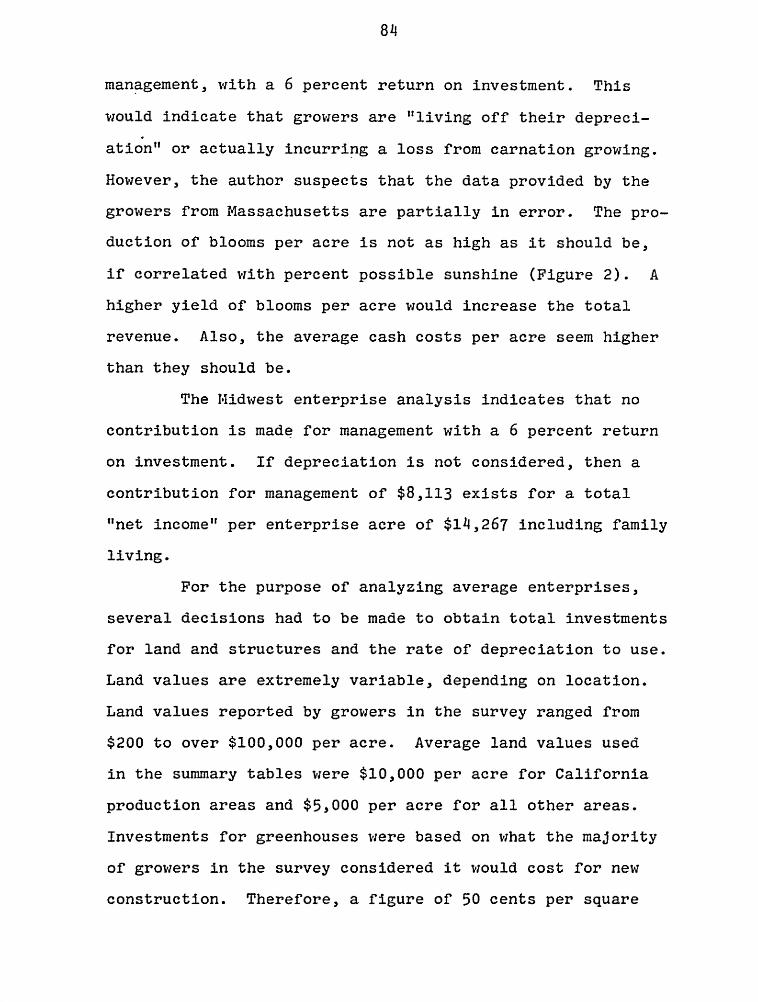
84
man~gement, with a 6 percent return on investment. This
would indicate that grovlers are Uliving off their depreci-.
ation" or actually incurripg a loss from carnation growing.
However, the author suspects that the data provided by the
growers from Massachusetts are partially in error. The pro
duction of blooms per acre is not as high as it should be,
if correlated with percent possible sunshine (Figure 2). A
higher yield of blooms per acre would increase the total
revenue. Also, the average cash costs per acre seem higher
than they should be.
The Midwest enterprise analysis indicates that no
contribution is mad~ for management with a 6 percent return
on investment. If depreciation is not considered, then a
contribution for management of $8,113 exists for a total
"net income" per enterprise acre of $14,267 including family
living.
For the purpose of analyzing average enterprises,
several decisions had to be made to obtain total investments
for land and structures and the rate of depreciation to use.
Land values are extremely variable, depending on location.
Land values reported by grovlers in the survey ranged from
$200 to over $100,000 per acre. Average land values used
in the summary tables were $10,000 per acre for California
production areas and $5,000 per acre for all other areas.
Investments for greenhouses were based on what the majority
of growers in the survey considered it would cost for new
construction. Therefore, a figure of 50 cents per square

85
foot of ground covered was used for Southern California,
$2 for Northern California, and $~ for the other areas. A
standard value of $7,500 per acre or $1 per linear foot for
a 42-inch-wide bench was used for all areas. The remaining
capital investments include equipment and other buildings
which were reported by growers.
Depreciation is one of the most difficult problems
to handle in a cost analysis. The rates used in the analysis
are realistic for very recent enterprises but not for older
operations. r·iany eastern and midwest gro't'lers possibly do
not have depreciation any longer unless it is considered as
a reserve for replacement of facilities.
The value of the total investment of land, and all
improvements used in the summary is reasonably realistic.
The new value of all improvements (greenhouses, benches,
equipment, and other buildings) was reduced by half to
represent an average condition of new and old enterprises.
Of course, the value of land remains at its full assumed
value.
Land value appreciation, particularly in encroach
ing urban areas, may possibly offset the depreciation of im
provements. This may be a factor to explain why growers in
some locations can continue to operate despite the fact that
their return on investments seems low. The value of land in
California, and possibly other areas too, could well be much
higher, and a carnation enterprise 1'10uld still ShO't'l a good
return on investment.
86
The size of a carnation enterprise appears to be
related to financial success. The analysis in Table 20
illustrates that small (one-half acre) and medium (one acre)
enterprises, as a cross-section of all U. S. production
areas, return between 7 and 8 percent of the investment to
land, capital, and management. If a 6 percent return to
land and improvements was acceptable, then the small enter
prises would make a contribution to management and family
living of about $4,605 and the medium enterprises $5,571.
The large enterprises (2.4 acres) return about 33 percent of
the investment to land, capital, and management. This
allow~ for a much larger contribution of $30,381 for manage
ment for large enterprises plus the $4,000 allowed for family
living.
Financing
Although the majority of growers reporting in this
survey indicated bank financing is used for major capital
items, the author 1 s knowledge of the industry leads to the
conclusion that bank financing for carnation growers needs
improvement.
Bankers frequently state their cases against invest
ment in carnations as follows:
1. Greenhouses have single-purpose use.
2. Management or business organization of many
greenhouse operations is not set up for
continuation.

87
3. Instability is due to annual fluctuation of
flo\'ler prices.
The bankers t ideas contain some \,lorthwhile instruc
tion for the carnation industry. Greenhouses are single
purpose in a sense of being designed only to grow plants.
However, a greenhouse business properly organized and
managed and in the right location can usually return a pro
fit on the investment comparable to or better than many
other normal business ventures. A greenhouse business can
frequently overcome the capital investments in 5 or 10
years, a shorter period of time than some types of busin
esses. Well managed, a greenhouse operation has many
-alternatives for various crops.
The bankers' strongest reason against financing may
be that of improper management or business organization for
continuation of the business. Growers might consider this
point and seek legal advice for corporate arrangements to
strengthen this position.
Instability due to annual fluctuation of flower
prices is only partially true. The nature of holiday
demands is not understood by many outside the flower
industry. Prices are very stable from year to year. Prices
of carnations are showing greater stability as \-lestern
production areas increasingly influence the market with more
consistent seasonal production, quality, and a tendency
tal-lard slightly lO\'ler but firm pricing.

88
The carnation industry and other phases of the total
flower industry must organize, publicize, and thereby
strengthen the relationships with bankers and other lending
sources on the potential of flower production.
Marketing Problems
Several problems needing solution for marketing
carnations were clearly indicated in this survey and have
also been mentioned by other ~lriters. Uniform grading, on
a national basis, was most frequently mentioned by whole
salers as a possible ~lay to improve marketing of carnations.
Crop timing and color assortment must also be improved by
growers so that the market demand can be met ffiore con
sistently ~lith a supply of fresh flo~lers. Cut flo~ler
storage is partially effective to regulate supply but cannot
be abused. Packing and handling carnations by all phases of
the industry from gro"'lers to consumers was also indicated as
needing further improvement. Transportation delays continue
to be a problem, but they "'Iill lessen as technology
improves. Increased communication and cooperation with
transportation firms should be undertaken by the carnation
industry_
l.fanagement
Cultural problems are no longer of primary concern
in carnation production. The author could cite several
examples of recently successful gro~lers ~Iho had little or
no background in cultural techniques but have exceptional

89
managerial ability. Management is becoming more important
in today's economy.
Management decisions frequently require records.
Carnation growers could improve their management by striving
to keep better records of investments, costs, returns,
flower yields, and cultural information.
Management requires constant reappraisal, projection
of future trends, and evaluation of alternatives. Time is a
factor related to selection of alternatives. Growers must
constantly determine their costs and profits. Alternatives
are numerous; sellout and reinvest capital in more lucra
tive enterprise, sellout and retire, change to a more
profitable crop, relocate in the same general area, modernize
the present facilities, relocate in a more progressive area
or climate, transform the business to some other form such
as a garden center, or hire a good manager, etc.
The Future
Forecasting the future is sometimes dangerous, but
challenging! It is reasonably safe to say that if the
carnation industry in the United States continues to expand
and thrive, it will be because many of the problems outlined
in this report are solved. Strong industry leadership and
organizational influences to promote marketing research and
the development of detailed economic information will
increase the potential.
All indications concerning technology in transporta
tion lead to the conclusion that movement of goods will

90
become .cheaper and \'lorldvlide. The U. S. carnation industry
must consider the possibility of competition not only within
the national boundaries but from the many other Ifnatural
carnation producing areas n of the world.
The time may come "Then world"lide production can be
systematically regulated so that unlimited supplies of
carnations and other :Clovlers can be imported at extremely
competitive costs and distributed through mass merchandising
outlets. Are U. S. growers going to be a part of this
economic system or sit by and "latch it happen?
If one thinks in space technology terms, carnation
production could conceivably reverse direction and be
accomplished right at the market center. Greenhouses of
today's concept may disappear and carnations might be pro
duced in multi-story flfactories,u under artificial light or
re:Clected natural light in a completely controlled environ
ment. Or, carnation cut flovlers could be harvested trtighttl
in distant areas, bulk-loaded into enormous "opening and
conditioning" chambers and sent to market agents for
packaging and distribution.
Only a progressive industry can survive in the
economy of today_ The members must think big and train and
utilize the best managerial talent possible.
Regardless of any deficiencies this survey and
report may contain, it is hoped that its attempt will
stimulate the carnation industry and allied floricultural
organizations to invest in time, money, and personnel to

91
undertake more thorough economic analyses of the f'lower
industry.

LITERATURE CITED

1.
2.
LITERATURE CITED
Besemer, S. T. and H. F. Phelps. carnations in San Diego County. Exten. Serv., San Diego.
1958. Gro'Vling Univ. Calif. Agric.
and D. H. Close. '"'::"::""---flower production study. 1964. Summary of carnation
Univ. Calif. Agric. Exten. Serv., San Diego.
3. Burna, H. L. 1965. The floral industry: a current status report. N.imeo of talk at Sales and Io1.anagement Rally for Retail Florists. Los Angeles. June 7.
4. DeLoach, D. B. 1959. The cut flower industry--an analysis of its growth and potential. Calif. Agr. Exp. Sta., Giannini Foundation, Mimeo Report No. 214.
5. De Rolf, L. D. and D. C. Goodrich, Jr. 1963. Easter plant sales by non-florist outlets. Cornell Univ. Agr. Exp. Sta., A. E. Res. 115.
6. De Werth, A. F., H. B. Sorensen and R. E. Odom. 1960. 14arketing and business management practices of Texas retail florists. Texas Agr. Exp. Sta. MP-407.
7.
8.
De\tley, A. products.
1959. Retail demands for floricultural Univ. of Conn. Agr. Exp. Sta. Bul. 343.
1961. Cut flower production in the 48 United ~S~t-a-t-e-s-.- Univ. of Conn. Agr. Exp. Sta. Bul. 358.
9. 1963. Marketing floriculture crops in the northeast, Part III. Retail florists. Univ. of Conn. Agr. Exp. Sta. Bul. 379.
10. 1963. Industry progress spotty in quantity,
11.
quality and variety of cut flowers. Southern Florist and Nurseryman. Dec. 13.
Fitzpatrick, R. A. in New York City.
1959. Carnation prices and receipts U. s. D. A. AI4S No. 320.
12. Fossum, M. T. 1953. Trade in horticultural specialties 1890-1950. A statistical compendum. U. S. D. A. l,larketing Research Report No. 33.

94
13. 1955. Commercial floriculture; size of establishment and crop specialization of growers. U. S. D. A. Marketing Research Report No. 97.
14. Gatty, R. and D. l'lolf. 1961. Merchandising prepackaged cut flowers in supermarkets. New Jersey Agr. Exp. Sta. Eul. 799.
15. Gaylord, F. C. and C. E. Hoxsie. 1960. Market grades for ornamentals--chrysanthemums and carnations. Purdue Univ. Agr. Exp. Sta. 14imeo HO 79-3.
16. Goodrich, D. C. and E. Jarvesoo. 1963. Marketing floricultural products in the northeast. Part II. Wholesalers. Cornell Univ. Agr. Exp. Sta. Bul. 978.
17. 1964. Retail florists in New York state. Cornell Univ. Agr. Exp. Sta. A. E. Res. 153.
18. 1965. Some economics of grading cut flowers. Cornell Univ. Agr. Exp. Sta. A. E. Res. 173.
19. Hampton, R. N. 1955. 14erchandising flov/ers in retail florist shops. Cornell Univ. Agr. Exp. Sta. A. E. 1004.
20. Havas, N. 1964. Profile of the retail florist industry. U. S. D. A. Marketing Research Report No. 741.
21. Hoffman, W. W. 1963. marketing carnations. A. E. Res. 116.
Grower costs and practices in Cornell Univ. Agr. Exp. Sta.
22. Holley, W. D. 1956. More on production costs. Colorado Flower Growers Assoc. Bul. 77.
23. Hudek, H. J. 1962. Business objectives for the flower industry. Colorado Flower Growers Assoc. Eul. 147.
24. Jarvesoo, E. and R. A. Fitzpatrick. 1959. Marketing Nevi England carnations. Univ. of Massachusetts Agr. Exp. Sta. Eul. 517.
25. 1965. Highlights of the Massachusetts flower grower survey. Univ. of Mass. Spec. Circ. 288.
26. 1966. rlholesa1e florist industry in Massa-chusetts. Univ. of Mass. Agr. Exp. Sta. Bul. 556.
27. Kiplinger, D. C. and R. W. Sherman. 1962. Florist crops for mass market outlets. Ohio Agr. Exp. Sta. Research Bul. 928.
28. Koths, J. S. 1961. Commercial carnation culture. Extension Reports, Univ. of Conn. No. 38c.

95
29. Martin, L. C. 1966. The economy during the next decade. Mimeo from talk at the Michigan State Florists Assoc. Meeting. January 23.
30. Metz, J. F. Jr. and C. E. Trotter. 1963. Marketing floricultural products in the northeast. Part I. Growers. Cornell Univ. Agr. Exp. Sta. Bul. 980.
31. Miklius, W. and D. B. De Loach. 1959. Cut flower production and consumption trends in California. California Agr. Exp. Sta. and Giannini Foundation. August.
32. Moon, J. M. 1964. Agricultural crop report, County of San Diego, Department of Agriculture (California).
33. Moore, E. J. 1957. Wholesaling commodities in the Chicago and New York City markets. U. S. D. A. Market Research Report No. 175.
34. 1959. Floral marketing by wholesale growers in New York and Chicago. U. S. D. A. Market Research Report No. 323.
35. Oppenfeld, H. Von, J. F. Schwartz and P. R. Krone. 1957. Merchandising in retail flower shops. Michigan State University Agr. Exp. Sta. Special BuI. 412.
36. Poesch, G. 1965. Floriculture in the space age. The Florist and Nursery Exchange. December 18.
37. Powell, J. V. and V. G. Edman. 1965. Marketing flowers; credit and financing problems of retail and wholesale florists in four Iowa cities. U. S. D. A. Marketing Research Report No. 704.
38. Rada, E. L. 1960. Flower wholesaling in Southern Ca1ifornia--an economic analysis. U. S. D. A. Marketing Research Report No. 406.
39. Reed, A. D. 1962. Economics of relocation. Mimeo of talk at Flower Growers Institute. Los Angeles. January 26.
40.
41.
Seeley, J. G. Pennsylvania.
1956. The carnation industry in Pennsylvania Flower Growers Bul. 63.
Shanks, J. B. and C. B. Link. 1954. direct benching and time of cropping. Florist No. 13.
Carnations-The Maryland

96
42. Sherman., R. W., D. _C •. Kiplinger and H •. C. Williams. 1956. Consumer pre.ferences· for cut roses., carnations, chrysanthemums. Ohio Agr. Exp. Sta. Research Circ. 31.
~ __ ~ __ , , __ ~~~. 1958. Flowers for every-day home decoration. Ohio ~gr. Exp. Sta. Research Circ. 60.
44. Sorensen, H. B., R. E. adorn and A. F. De Werth. 1961. Consumer preference for flowers and ornamental plants. Texas Agr. Exp. Sta. MP-489.
45. Taylor, E. G • ., K. L. Utter and A. B. Lowstuter. 1962. Wholesale florist facilities for Boston. U. S. D. A. Market Research Report No. 570.
46. Trotter, W. K. 1955. Problems in marketing florist crops. Cornell Univ. Agr. Exp. Sta. AE 983.
47. U. S. D. A. 1957. Crop Reporting Board. Sp Cr 6-1(57).
48. U. S. D. A. 1958. Crop Reporting Board. Sp Cr 6-1 (58) •
49. U. S. D. A. 1962. Statistical Reporting Service. Sp Cr 6-1(62).
50. U. S. D. A. 1965. Statistical Reporting Service. Sp Cr 6-1(65).
51. U. S. D. A. 1966. Statistical Reporting Service. Sp Cr 6-1(66).
52. Virginia-Carolina Chern. Corp. 1963. Scope. Vol. 1., No.4.
53. Voigt., A. o. 1965. Flo~ler Marketing Inrormation. The Pennsylvania State University. December.
54. 1965. A check on carnations. Flower Market-ing Information. The Pennsylvania State University. February.
55. 1966. Carnation critique. Flower Marketing Inrormation. The Pennsylvania State University. January.
56. White, J. J. 1951. Cost of production ror 1950. Massachusetts Flower Growers Assoc. Bul. 8.

97
57. 1954. Florist crop production costs. Pennsylvania Flower Growers Bul. 47.
58. Wood, W. W. Jr. 1965. Flowers: do we market or just sell? Mimeo of talk at California State Florists Assoc. Southern Growers Clinic, June 11.

APPENDIX

99
Table A. Response to questionnaires ror producers, whole-
salers and shippers.
Number Percent Percent userul mailed returned for summary
Producers 381 25.7 17.6
Wholesalers 376 30.8 24.7
Shippers J.J. 21.9 17.8
Total 830
Table B. Response to questionnaires ror producers and
shippers by production areas.
Producers Shippers
Number Number Percent Number Number Percent Area mailed useful useful mailed useful useful
s. Calif. 31 11 35.5 16 4 25.0
N. Calif. 97 13 13.4 22 3 13.6
Colo. 96 21 21.9 6 0 0.0
Penn.-N.Y.-N.J. 60 11 18.3 11 2 18.2
Mass. 28 4 llJ.3 12 2 16.7
N. Caro.-Va. 6 2 33.3 6 2 33.0
Midwest 63 5 7.9
Total 381 67 73 13

100
Table C. Response to questionnaires for wholesalers by
marketing areas.
Number Number Percent Area mailed useful useful
Pacific 3lt 10 29.lt
Mountain 18 0 0.0
N. West Central 3lt 13 38.2
N. East Central 72 12 16.7
Middle Atlantic 62 llt 22.6
New England 28 2 7.1
South Atlantic 53 18 34.0
s. East Central 3lt 11 32.4
s. West Central 41 13 31.7
Total 376 93
101
COL 0 R ADO S TAT E U N I V E R SIT Y
Fort Collins~ Colorado 80521
Department of Horticulture
Enclosed is a questionnaire which is being sent to carnation handlers in the major production areas in the United States. The objective is to obtain information on the economic factors that influence the carnation industry nationwide. This analysis is being undertaken as part of a Master's Degree program by me, Seward T. Besemer~ graduate student at Colorado State University.
I think you will agree that a better understanding of the economic factors of the carnation industry will enable growers, shippers, and wholesalers to make sound, future decisions. I hope you will take this analysis as seriously as I am.
Further elaboration of the objectives and methods of developing the data will follow in the introduction of the questionnaire.
You are not required to sign your name or in any way identify your questionnaires. I have no way of knowing who returns the questionnaires. The identity of your figures will be lost in totals and averages in the final report.
Please fill out your questionnaire and return by February 1, 1966 so I can achieve a representative sampling of the industry. A return addressed envelope with postage is enclosed for your convenience.
Thank you very much for your assistance.
Sincerely,
Seward T. Besemer
fs
Enclosures

102
AREA
PRODUCERIS QUESTIONNAIRE:
ANALYSES OF THE CARNATION CUT FLOWER INDUSTRY
INTRODUCTION:
The objective of this questionnaire is to determine economic factors that affect the activity of the greenhouse carnation cut flower industry in the United States. Factors to be evaluated include production costs~ investment costs~ yield of flowers~ and the seasonal flow pattern of carnation flowers from five major producing areas to ten marketing areas in the nation.
A complete report of results of this study will be available to all partiCipants in the fall of 1966. The quality of this report will depend on the cooperation of members of the flower industry to conscientiously provide the information requested and return all questionnaires.
This analysis is being completed as part of a Master's Degree program by Seward T. Besemer~ graduate student~ at Colorado State University.
THE QUESTIONNAIRE:
1. Three types of questionnaires will be used: (1) for producers, (2) for shippers, and (3) for wholesale houses. You will receive only one questionnaire.
2. The questionnaires have been designed as simply as possible for your convenience and also to obtain the necessary information to make the study useful to the industry_
3. The information requested in the questionnaires must be filled in completely and as accurately as is humanly possible.
4. The nearer to 100 percent return of the questionnaires, the more representative the study will be.
5. February 1, 1966 is the deadline for return of all questionnaires.
6. The questionnaires will be kept absolutely confidential. No code is being used to identify persons or firms returning questionnaires. The "AREAIt designation in the top, left-hand corner of the first page refers only to

103
a broad. geographical section of the United States.
7. Please answer all questions in the questionnaire. If you do not have definite answers in some cases, estimate to the best of your ability.
A. SIZE OF OPERATION (Greenhouse area in production)
1. Present size, 1965. Fill in blank for acres or number of square feet of
ground area, whichever is easier.
Ground area covered by greenhouses; 1965
2. Past size
Year
1960
1955
1950
1945
acres or -----
Acres OR
No. sq. ft.
No. sq. ft.
3. Present number of plants in production in your range.
-------- plants.

104
B. TYPE OF GREENHOUSE AT PRESENT
(If your range consists of more than one type of greenhouse, write areas of each in blank spaces.)
Check one (X)
1. Sawtooth, polyethylene plastic
2. Ridge and furrow, polyethylene plastic
3 .. Sawtooth, rigid plastic (PVC, fiberglass etc.)
4. Ridge and furrow, rigid plastic
5. Sawtooth, glass
6. Ridge and furrow, glass
7. Other materials or design (explain)

105
C. PRODUCTION COSTS (ANNUAL.)*
*NOTE: All costs for one year. List costs based on your total operation.
ITEM DOLLARS PER YEAR
1. Labor, per year a. Total hired labor $_------
b. Value of your personal labor $
c. Value of other family labor $
2. Fuel (for heating), per year $
Utilities (other than fuel), per year $
4. Plants (cuttings), per year $
5. Taxes (on greenhouse operation), per year $ ______________ _
6. Supplies (other than plants or water), per year. (fertilizers, fungicides, insecticides, string, Wire, repairs, etc. $ ______________ _
7. Depreciation, per year $
8. Interest, per year $
9. Insurance, per year $
10. Water, per year $
11. All other, per year $

106
D. CAPITAL INVESTMENT COSTS
1. Original investments (when you first built) YEAR
a. Land cost per acre
b. Greenhouse construction costs (use either by per acre or per sq. ft. ground covered)
Per Acre Per Square Foot
1. Labor $ ----- $_-------=
2. Materials $ ----- $_------
2. If you had to rebuild now in same area closeby:
a. What land price would you expect to pay now, per acre?
b. What greenhouse construction costs would you now expect to pay?
1.
2.
Per Acre Per Square Foot
Labor $ ----- $_------
Materials $ ----- $_------
3. Other capital equipment you own (fill in all blanks across)
How Many Equipment
Fertilizer injectors
Tractor, 4-wheel
Tractor, tiller type
Model, size, or make New Cost
Boiler, (steam or hot water)
Heat distribution system (pipes, valves, thermostats)
Unit heaters
Water system
Grading shed
Other buildings
$_--
$_--$_--
$_---
$_--
$_--
$_--
$_--$_---

107
E. FLOWER PRODUCTION RATE
Using sales receipts, plus estimate o~ ~lowers not sold, what is your estimate o~ the ~ollowing?
1. Total flowers produced per year (your operation)
2. Number of ~lowers per sq. ~t. o~ bench area per year
3. Number of ~lowers per plant per year
4. What is your normal plant spacing? by in. (Describe i~ necessary)
F. REVENUE
1. Based on your operation, what is your annual gross return (total sales) before costs? $
inches
-------------2. What is your estimate o~ average
price received per flower sold on an annual basis? ---- ¢
3. What is your estimate of the percentage of ~lowers sold of what you produced? %
G. MARKETING METHOD
How are most of your ~lowers sold?
1. Ship your own flowers
2. A shipper sells your ~lowers
3. Take to local city flower market
4. Cooperative organization or association
5. Other (explain)
Check One (X)
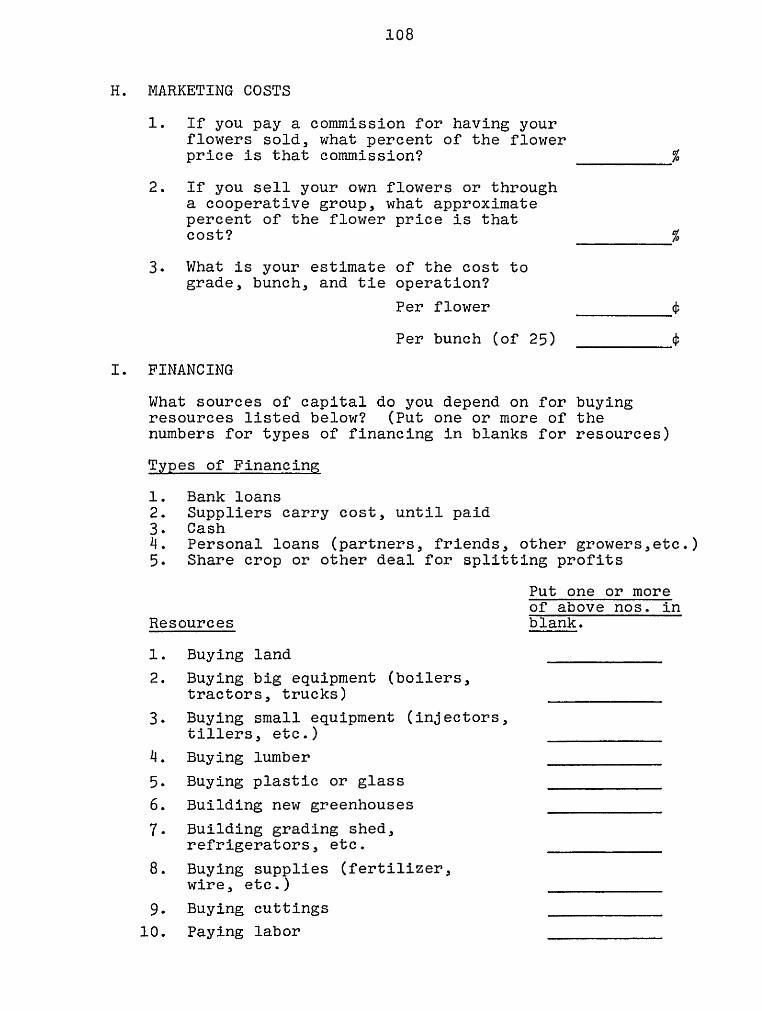
108
H. MARKETING COSTS
1. If you pay a commission for having your flowers sold, what percent of the flower price is that commission? ----_%
2. If you sell your own flowers or through a cooperative group, what approximate percent of the flower price is that cost?
3. What is your estimate of the cost to grade, bunch, and tie operation?
% -----
Per flower ----_¢
Per bunch (of 25) ----_¢
I. FINANCING
What sources of capital do you depend on for buying resources listed below? (Put one or more of the numbers for types of financing in blanks for resources)
Types of Financing
1. Bank loans 2. Suppliers carry cost, until paid 3. Cash 4. Personal loans (partners, friends, other growers,etc.) 5. Share crop or other deal for splitting profits
Resources
1. Buying land 2. Buying big equipment (boilers,
tractors, trucks) 3. Buying small equipment (injectors,
tillers, etc.) 4. Buying lumber 5. Buying plastic or glass
6. Building new greenhouses
7. Building grading shed, refrigerators, etc.
8. Buying supplies (fertilizer, Wire, etc.)
9. Buying cuttings 10. Paying labor
Put one or more of above nos. in blank.

109
J. PRODUCTION PROBLEMS (affectipg plant. growth)
Write ONE number only in the blanks as follows:
o - no problem; 1 - problem sometimes; 2 - serious problem.
1. Diseases
2. Insects
3. Water quality (salts)
4. Nematodes
5. Rodents, birds, etc.
6. Smog, or other air contaminant
7. Soil drainage
8. Greenhouse temperature too high
9. Greenhouse temperature too low
10. Condensation in greenhouse
11. Lack of light (part of year)

110
K. OUTSIDE PROBLEMS AFFECTING YOUR BUSINESS
There are usually several community or government type problems that make it difficult to do business with a greenhouse operation.
Consider the problems below that may affect your costs and profits, or even your attitude.
Write ONE number in the blanks as follows:
o - no problem; 1 - problem sometimes; 2 - serious problem
1. Rising property taxes
2. Building permit restrictions (greenhouse)
3. Neighbors complain about smells, noise, dust, unsightliness of greenhouse, etc.
4. Vandalism (theft and destruction)
5. No room left to expand operation
6. Rising supply costs (lumber plastic, wire, etc.
7. Labor
a. Supply of help
b. Quality of help
c. Rising labor costs (wage rate, insurance, etc.)
8. Others (you list)
a.
b.
c.
d.
e.

111
L. SOCIAL AND PSYCHOLOGICAL ATTITUDES (Answer yes or no)
1. Do you enjoy the flower business?
2. If you had to relocate your greenhouse business, would you be willing?
3. Do you think carnation production can expand in your area profitably?
4. Do you think carnations can be expanded nationally?
5. Do you feel your area is being hurt by competition from other carnation production areas?
If yes, what areas are hurting yours?
6. Which two factors below do you think would improve your own business most?
CHECK ONLY TWO OF THESE (X)
a. Good advertising program
b. Higher volume of sales at current flower prices
c. Higher flower prices
d. Selling through grower's association (if not already)
e. Cheaper and better transportation connections
f. Increased flower production per acre plus decreased production costs

112
AREA -----
SHIPPER'S QUESTIONNAIRE:
ANALYSES OF THE CARNATION CUT FLOWER INDUSTRY
INTRODUCTION:
The objective of this questionnaire is to determine economic factors that affect the activity of the greenhouse carnation cut flower industry in the United States. Factors to be evaluated include production costs, investment costs, yield of flowers, and the seasonal flow pattern of carnation flowers from five major producing areas to ten marketing areas in the nation.
A complete report of results of this study will be available to all participants in the fall of 1966. The quality of this report will depend on the cooperation of members of the flower industry to conscientiously provide the information requested and return all questionnaires.
This analysis is being completed as part of a Master's Degree program by Seward T. Besemer, graduate student, at Colorado State University.
THE QUESTIONNAIRE:
1. Three types of questionnaires will be used: (1) for producers, (2) for shippers, and (3) for wholesale houses. You will receive only ~ questionnaire.
2. The questionnaires have been designed as simply as possible for your convenience and also to obtain the necessary information to make the study useful to the industry.
3. The information requested in the questionnaires must be filled in completely and as accurately as is humanly possible.
4. The nearer to 100 percent return of the questionnaires, the more representative the study will be.
5. February 1, 1966 is the deadline for return of all questionnaires.
6. The questionnaires will be kept absolutely confidential. No code is being used to identify persons or firms returning questionnaires. The "Area" designation in the top, left-hand corner of the first page refers only to

113
a broad geographical section of the United States.
7. Please answer all questions in the questionnaire. If you do not have definite answers in some cases, estimate to the best of your ability.
PLEASE READ INSTRUCTIONS BELOW CAREFULLY.
I. PERCENT FLOWERS SHIPPED
In order to determine in this study the 1Jflow lt of cut carnations from producing areas to market areas, a system of geographical sections has been devised for the United States.
The letter after "AREA" in the upper, left corner of the first page indicates the section from which you are shipping carnations. This does not identify your firm. All information, when compiled, will lose complete firm or personal identity as there will be several questionnaires from each tlAREA".
Now, you, as a shipper, need to estimate the percentage C%) of carnations (not boxes or flowers, but percent) you ship to each of the ten (10) marketing areas listed for each seasonal period listed. Also, there is a section to indicate the usual type of transportation used for shipping to these areas.
Following is a list of the ten marketing areas. More than likely, you do not ship carnations to all areas; so, some answers may be Q percent.

114
MARKETING AREAS OF THE UNITED STATES
AREA
1. PACIFIC
Washington, Oregon, California, Hawaii, Alaska
2. MOUNTAIN
Montana, Idaho, Wyoming, Nevada, Utah, Colorado, Arizona, New Mexico
3. WEST NORTH CENTRAL
North Dakota, South Dakota, Minnesota, Nebraska, Iowa, Kansas, Missouri
4. EAST NORTH CENTRAL
Wisconsin, Michigan, Illinois, Indiana, Ohio
5. MIDDLE ATLANTIC
New York, Pennsylvania, New Jersey
6. NEW ENGLAND
Maine, Vermont, New Hampshire, Massachusetts, Connecticut, Rhode Island
7. SOUTH ATLANTIC
Maryland, Delaware, District of Columbia, West Virginia, Virginia, North Carolina, South Carolina, Georgia, Florida
8. EAST SOUTH CENTRAL
Kentucky, Tennessee, Alabama, Mississippi
9. WEST SOUTH CENTRAL
Oklahoma, Arkansas, Louisiana, Texas
10. FOREIGN COUNTRIES
Canada, Mexico, Europe, etc.

115
Below are listed the major flower-use seasons of the year. Under each "season" are listed the ten market areas by number (see page 3). Place in each blank to the right of each area number'the percentage (%.) of' carnation flowers you ship to that area for the particular season. The left top corner is an example. The total in each season must add up to 100 percent!
(Example) CHRISTMAS VALENTINE DAY EASTER
AREA % AREA % AREA % AREA %
1 5 1 1 1 2 2 2 2 2 3 10 3 3 3 4 2 4 4 4 5 0 5 5 5 6 0 6 6 6 7 1 7 7 7 8 12 8 8 8 9 68 9 9 9
10 0 10 10 10
TOTAL· 100
MOTHER'S DAY MEMORIAL DAY JUNE JULY-SEPTEMBER
AREA % AREA % AREA % AREA %
1 1 1 1 2 2 2 2 3 3 3 3 II Ii Ii Ii 5 5 5 5 6 6 6 6 7 7 7 7 8 8 8 8 9 9 9 9
10 10 10 10
TOTAL

116
II. TRANSPORTATION METHOD
Check below the main method of transportation used for the flowers you ship to the various marketing areas.
below. Place transportation method number after area blanks
TRANSPORTATION METHODS
1. Air 2. Truck 3. Rail 4. Air-truck combinations 5. Bus
Market Area
1
2
3
4
5
6
7
8
9
10
Transportation Method (by number above)

117
III. TOTAL UNITS SHIPPED
What are your firm1s total shipments. of carnations (to all areas) in standard carnation boxes by months? If no exact records are available~ estimate to your best ability.
Month
January
February
March
April
May
June
July
August
September
October
November
December
TOTAL FOR YEAR
Number of Boxes
What is the Itaverage fl number of carnation flowers
per standard box?

118
IV. AVERAGE SEASONAL SHIPPING PRICES
What is the "average" price at which you sell topgrade carnations to your customers (wholesale houses) during the seasons listed below?
Base your answers on Itnormal" years, or long-time averages.
Season Price per Carnation Flower
Christmas ¢
Valentine Day ¢
Easter ¢
Mother's Day ¢
Memorial Day ¢
June ¢
July-September ¢
(a) If you ship to both retailers and wholesalers, about what percent of your total shipments is to
retailers? %
wholesalers? % -----_. (b) Do you normally charge a higher price to retailers?
(yes or no) ------V. PROBLEMS OF SHIPPERS
List any problems you feel are vital in relation to carnation cut flower demand, quality, transportation problems, costs, etc., in general related to shipping to marketing areas.
1.
2.
3. 4. 5. 6. 7. 8.

119
AREA -----
WHOLESALER'S QUESTIONNAIRE:
ANALYSES OF THE CARNATION CUT FLOWER INDUSTRY
INTRODUCTION:
The objective of this questionnaire is to determine economic factors that affect the activity of the greenhouse carnation cut flower industry in the United States. Factors to be evaluated include production costs, investment costs, yield of flowers, and the seasonal flow pattern of carnation flowers from five major producing areas to ten marketing areas in the nation.
A complete report of results of this study will be available to all participants in the fall of 1966. The quality of this report will depend on the cooperation of members of the flower industry to conscientiously provide the information requested and return all questionnaires.
This analysis is being completed as part of a Master's Degree program by Seward T. Besemer, graduate student, at Colorado State University.
THE QUESTIONNAIRE:
1. Three types of questionnaires will be used: (1) for producers, (2) for shippers, and (3) for wholesale houses. You will receive only ~ questionnaire.
2. The questionnaires have been designed as simply as possible for your convenience and also to obtain the necessary information to make the study useful to the industry.
3. The information requested in the questionnaires must be filled in completely and as accurately as is humanly possible.
ij. The nearer to 100 percent return of the questionnaires, the more representative the study will be.
5. February 1, 1966 is the deadline for return of all questionnaires.
6. The questionnaires will be kept absolutely confidential. No code is being used to identify persons or firms returning questionnaires. The "AREA" designation in the top, left-hand corner of the first page refers only to

120
a broad. geographical section of the United States.
7. Please answer all questions in the questionnaire. If you do not have definite answers in some cases, estimate to the best of your ability.
PLEASE READ INSTRUCTIONS BELOW CAREFULLY.
I. PERCENT FLOWER RECEIPTS:
In order to determine in this study the uflowu of cut carnations from producing areas to marketing areas, a system of geographical sections has been devised for the United States.
The number after "AREAl! in the upper, left-hand corner of the first page indicates the marketing area in which you are located. This does not identify your firm. All information, when compiled, will lose complete firm or personal identity as there will be several questionnaires from each area.
Now, you as a wholesale buyer need to estimate the percentage (%) of carnations (not boxes or flowers, but percent) you buy, or receive from each of seven (7) producing areas listed for each seasonal period listed.
Following for carnations to (A, B, C, etc.). tions from all of percent.
is a list of the seven producing areas which you will have to refer by letter It is likely you may not receive carnathese areas, so some answers may be Q
PRODUCING AREAS:
A. SOUTHERN CALIFORNIA (Los Angeles, Encinitas, Santa Barbara, etc.)
B. NORTHERN CALIFORNIA (Mountain View, Redwood City, Salinas, etc.)
C. COLORADO
D. PENNSYLVANIA
E. MASSACHUSETTS
F. CAROLINAS - VIRGINIA
G. OTHER (Not described above)

121
Below are listed the major flower-use seasons of the year. Under each tfseasonlf is areas by letter (see page-2). right of each area letter the flowers you receive from that particular season. The left~ The total in each season must
(EXAMPLE) CHRISTMAS
AREA % AREA %
A 27
B 18
c 50
D a
E 4
F a
G 1
TOTAL 100
listed the seven producing Place in each blank to the
percentage (%) of carnation producing area for the top corner is an example. add up to 100 percent!
VALENTINE DAY EASTER
AREA % AREA %

122
MOTHER'S DAY MEMORIAL DAY JUNE JULY-SEPTEMBER
AREA % AREA % AREA % AREA %
A
B
C
D
E
F
G
TOTAL

123
II. TOTAL UNIT RECEIPTS
What are your firm's total receipts of carnations (from all areas) in standard carnation boxes by months? If no exact records are available, estimate to the best of your ability.
Month Number of Boxes
January
February
March
April
May
June
July
August
September
October
November
December
Total for year
What is the "average" number of carnation flowers per standard box?

124
III. AVERAGE SEASONAL WHOLESALE PRICES
What is the UaverageU price at which you sell topgrade carnations to your customers (retailers) during the seasons listed below? Base your answers on "normal lt
years or long-time averages.
Season Price per carnation flower
Christmas ------_¢ Valentine Day ------_¢ Easter -------_¢ Mother's Day ------_¢ Memorial Day ------_¢ June ------_¢ July-September -------_¢
IV. PROBLEMS OF WHOLESALERS
List any problems you feel are vital in relation to carnation cut flower supply, quality, transportation problems, costs, etc. in general or related to specific producing areas.
1.
2.
3.
lI.
5.
6.
7.
8.
9.
10.