Standardization of wrapping and packaging techniques to enhance the post harvest life of carnation
162
Print: ISSN-0970-3020 Online: ISSN-2249-5258 PROGRESSIVE HORTICULTURE Volume 45, No. 2 September, 2013 Indian Society of Horticultural Research and Development, Uttarakhand Online available at: www.indianjournals.com | E-mail: [email protected]
Transcript of Standardization of wrapping and packaging techniques to enhance the post harvest life of carnation

Print: ISSN-0970-3020 Online: ISSN-2249-5258
PROGRESSIVEHORTICULTURE
Volume 45, No. 2 September, 2013
Indian Society of Horticultural Research and Development, UttarakhandOnline available at: www.indianjournals.com | E-mail: [email protected]
INDIAN SOCIETY OF HORTICULTURAL RESEARCH AND DEVELOPMENT (ISHRD),Registered under the Societies Registration Act XXI, 1860, was established with a view to promote inter-disciplinary
research in the field of Horticulture and provide a forum for expressing views on policies and programmes relating to horticultural research and development. Progressive Horticulture, an official scientific publication of ISHRD, is apeer reviewed journalpublished since the year 1969. Presently the journal is published twice every year (in the month of March & September). Original contributions covering fundamental and applied research relating to various disciplines of horticultural crops, post harvest management, biotechnology, diversification, policy issues, trade, market, case studies related to horticultural field are considered for publication. Review articles, summarizing the existing state of knowledge in horticultural research, are published by invitation only.
PresidentR.K. Pathak, Former Director, CISH (ICAR), Lucknow
Vice PresidentGorakh Singh, Horticulture Commissioner, GOI, Deptt. of Ag. & Cooperation, New Delhi
General SecretaryS.S. Singh, G.B.P.U.A. & T., KVK, Dhakrani, Dehradun, Uttarakhand
Chief EditorI.A. Khan, Director, Horticulture & Food Processing, Uttarakhand.
EditorSanjai K. Dwivedi, DRDO (CEPTAM), Metcalf House, Delhi
Associate EditorsSandhya Gupta, NBPGR, New DelhiDeepa H. Dwivedi, BBA University, Lucknow
Advisory BoardH.S. Gupta, Director, IARI, Pusa, New DelhiK.R. Dhiman, Vice Chancellor, Dr. Y. S. Parmar UHF, Solan, H.P.A.S. Sidhu, Director, IIHR, BangaloreH. Ravishankar, Director, CISH, Lucknow, U.P.P.S. Naik, Director, IIVR, Varanasi,U.P.Nazeer Ahmad, Director, CITH, Srinagar, J&KRamesh Kumar, Director, DFR, New DelhiSanjeev Chopra, Director, NHM & MD, NHB, GurgaonB S Negi, Director,Hort. Mission-Uttarakhand, DehradunVishal Nath, Director, NRC for Litchi, Muzaffarpur, BiharP.L. Saroj, Director, Dte of Cashew Research, Puttur, KarnatakaA.K. Singh, Head, Div. of Fruits & Hort. Tech., IARI, New Delhi
Editorial boardR. A. Ram, CISH, Lucknow O.P. Awasthi, IARI, New Delhi,M. Gangadhara Nayak, DCR, Puttur, Karnatka Sudhakar Pandey, IIVR, Varanasi, U.P.Ajay K. Shrama, NRC for Grapes, Pune, Maharastra Jitendra Singh, MPUAT, Jhalawar, RajasthanBiswajit Das, ICAR Research Complex, (West)Tripura Feza Ahmed, BAU, Sabour, BiharVishal Singh Rana, UHF, Solan, H.P. Mayank K. Rai, SVBPUAT, KVK, Ghaziabad, U.P.T. Parimelazhagan, BU, Coimbatore, Tamil Nadu N.K. Hedau, VPKAS, Almora, UttarakhandPrabhat Kumar, IARI, New Delhi Surbhi Pandey,Deptt. of Hort., Govt. of Uttarakhand, Dehradun
TreasurerJanaki Rana, HREC, G.B.P.U.A.& T., Chaubattia, Almora, Uttarakhand
MEMBERSHIP (Upto December 2013) Inland ( ` ) Foreign (US $)Individual (Annual) 1000.00 80.00Life Membership 5000.00 450.00Institutional Online and Print (Annual) 2000.00 150.00Individual Online or Print (Annual) 1500.00 100.00
The payments should be made by bank draft in favour of Editor, Progressive Horticulture, payable at SBI, Ranikhet, Almora, and should be posted to Dr S. S. Singh, Secretary, ISHRD,C/o G.B.P.U.A. & T., KVK, Dhakrani, Dehradun, Uttarakhand Or may also be paid in cash to the Secretary or Editor in person.
Print: ISSN-0970-3020 Online: ISSN-2249-5258
ProgressiveHorticulture
Vol. 45, No. 2, September, 2013
Indian Society of Horticultural Research and Development, UttarakhandHorticultural Research and Extension Centre, Chaubattia-263651, Ranikhet, Almora (Uttarakhand)
Online available at: www.indianjournals.com | E-mail: [email protected]


Online version available at: www.indianjournals.com
Progressive Horticulture, Vol. 45, No. 2, September 2013© Copyright by ISHRD, Printed in India
[Review Article]
Bio-enhancers: A potential tool to improve soil fertility, plant health in organic production of horticultural crops
R.K. Pathak* and R.A. Ram *Ex Director, Central Institute for Subtropical Horticulture, Rehmankhera, Lucknow,Principal Scientist, Central Institute for Subtropical Horticulture, Rehmankhera, Lucknow-226 101 (UP)Email: [email protected]
ABSTRACTIndiscriminate use of agro-chemicals during the last 5-6 decades has adversely affected the soil fertility, crop
productivity, produce quality and particularly the environment. Annually India is loosing nearly 0.8 million tones of nitrogen, 1.8 millions tones of Phosphorus and 26.3 million tones of potassium (Annonymous, 2011). Soil organic carbon content in most of the Indian soils has been reduced to > 0.5 per cent. The green revolution is exhibiting second generation problem owing to over exploitation and mis management of soil. Under these cir-cumstances, maintenance of soil fertility and crop productivity are the major constraints in agriculture. Excessive mining of micronutrients have led to the deficiency of micro nutrients in one or the other parts of the country. As a result fertigation is becoming popular in most part of the states. It is pertinent to pinpoint that at present, most of the soluble fertilizers are imported in the country and these are very expensive, beyond the reach of the com-mon farmers. For number of nutrients, soluble fertilizers are not available. Hence, this requires change in mind set for addressing this issue. After closely working with Organic Farming Systems for over a decade, we are of the view that “Bio enhancers” could be a cheap and alternative tool to resolve many issues including cheap and effective alternative for fertigation. In organic production systems, there is always a challenge of how to improve soil fertility, crop productivity and management of pests by organic techniques. Use of organic liquid prepara-tions has been an age old practice in India. On farm produced Kunapajala, prepared by fermenting animal flesh along with herbal products used to be an established technique in ancient India. As an alternative, number of organic farmers devised organic boosters based on local experiences and gave specific names such as Amritpani, Panchagavya, Beejamrita, Jiwamrita etc. Similarly, in other organic farming systems, few effective preparations such as BD-500, BD-501, Cow Pat Pit, Biodynamic liquid manures and in Homa Organic Farming: Agnihotra ash enriched water and Biosol are effective tools being used by number of organizations. It is interesting to note that in all these preparations, the basic ingredients are cow based products. In order to give generic name, hence forth, these are named as “Bio enhancer” which is almost new to the world and scientific community. Review of avail-able literature with bio enhancer indicates that there is immense scope for its promotion in agriculture. Hence, we have tried to review the available information with objectives to communicate scientific community to initiate systematic research, extension agencies to promote these as cheap alternatives of agro chemicals and farmers to prepare their own products and utilize them as per requirement.
KEY wORDS: Bio-enhancers, soil fertility, soil health, organic productions.
Bio enhancers are organic preparations, obtained by active fermentation of animal and plant residues over specific duration. These are rich source of microbial con-sortia, macro, micronutrients and plant growth promot-ing substances including immunity enhancers. In gen-eral these are utilized to treat seeds/ seedlings, enhance
decomposition of organic materials thereby enrich soil and induce better plant vigour.
There is an urgent need to increase food production globally under shrinking land resources. To our mind, the only solution to address this problem is switching over to cow based Bio enhancers products instead of

238 Progressive Horticulture, 45 (2)
chemical led farming. Many organic farmers are review-ing age old practices of applying cow dung, cow urine, and their products in the form of pesticides. Cow are efficient consumers of roughages. We feed the cow with leftover products (straw, grasses, bran etc) and cow in turn feeds our crop. We take the oil, and the residual oil cakes are fed to the cow; so there is perfect harmony in nature’s plan. With the decline in animal population, constraints in availability of cow dung and urine in large quantities are matter of concern. Bio enhancers therefore, could be an effective tool to address multi nutrient defi-ciencies in most of soils in the country.
It is interesting to record that these can be prepared at the farm with some infrastructure facilities and skilled hands on training. These organisms (bacteria & moulds) improve the soil health by solubilzing the complex or-ganic substrates in to simple forms and make it available to the plant, resulting in increased productivity. It is per-tinent to mention that “Cow” plays key role in most of the organic farming systems prevalent in India and else where (Pathak, et al.’ 2010). Use of cow dung and cow urine as bio control agents for curing plant and human diseases has long history. Austen in as early as 1657as 1657 treated fresh pruned wounds with cow dung to prevent apple canker. Zhang et al. (1996) reported the control of Phythium root rot and anthracnose diseases of cucurbits by enriching soil with compost.
The five products of cow (dung, urine, milk, ghee and curd) are used in different organic systems. It is said that food that enters in cow’s intestine is partially as-similated by the organisms to develop its own dynamic forces. Most of these are excreted along with dung. It is unfortunate that with the advent of fertilizers, slowly Indian farmers have forgotten use of cow products in agriculture and thus facing the current crises. Now it is high time that the farming community and scientific fra-ternity realize the importance of cow for assuring sus-tainability in farming and try to bring the glory of cow again with our culture and agriculture.
Importance of cow in agriculture Livestock wealth is deemed as the oldest wealth re-
source for mankind. Cow represents the Vedic values of selfness service, strength, dignity and non–violence. The “Cow” occupies the highest place of honour in Indian civilization. She is supposed to fulfill all desires of hu-man beings, hence known as “Kamdhenu”. Owing to ig-norance, after stopping of milk production, they are left uncared and forced to live pathetic life and eat polythene and other wastes in towns and cities. After working for more than 15 years on Organic Farming, we have a firm conviction that we have to convince every citizen of country to respect “Mother Cow”. Organic farmers are
need to be conveyed that it is the dung and urine which are essential component in organic farming and these are made available by cow’s till her death. This message needs to be communicated to farmers so that all cows are cared till the last breath of their life.
The average size of land holding in India has de-clined to 1.32 ha in 2000-2001 from 2.30 ha in 1970-71. If this trend continues the average size of land holding would be about 0.68 ha in 2020 and would be further reduced to a low of 0.32 ha in 2030 (Annonymous, 2011). Thus Majority of them farmers in India today are small farmers and about 70% of the population has embraced agriculture as profession. With small holdings and small scale farming, there is no other better alternative than involving cattle in farming system. Few decades earlier farmers had been using oxen to plough, to pick and transport harvested crops and for number of farm-ing practices. Cow milk, curd, ghee for human health, manure as fertilizer for soil health, cow urine and but-ter milk for pest and diseases management used to be well established practice in each farming family. While ploughing, the oxen stride field with gentle pace, which does not harm the surface of the earth, unlike heavy ma-chines viz; tractors and combines. While ploughing the fields, oxen defecate and urinate and thus fertilize the land. Cow thus plays a key role in all the systems of or-ganic farming (Nane, 2003 and Pathak and Ram, 2003).
Aura energyLight emitting from animate and inanimate objec-
tives is known as Aura energy. It is now well established that every animate and inanimate objects emit energy of light can be measured through Kirlian photography. In fact, the Vedic people knew it since 3500 BC. It is found that every plant has some energy level. If the energy levels of plants get decreased, one can conclude that the plant is sick with some infection or deficiency. In fact cow products are potent source for enhancing the aura energy of plants and thus helping in boosting the plant vigour and managing pest problems as enumerated below.
Cow and aura energyAn electronic gadget named as Universal Thermo
Scanner instantly measures the bio energy field of ani-mate and inanimate objects (Murthy, 2005, portoworld@ gmail.com). This instrument works on the principle of Aura energy and wave length which are interrelated It is pertinent to mention that pests and diseases attack plants, when their Aura energy is depleted, plants show negative energy which can be quantified by using Uni-versal Scanner. In such cases cow urine and dung works as good remedy to supplement positive energy. Dr. Murthy has measured energies of cow products known

Progressive Horticulture, 45 (2) 239
as Panchagavya. Interestingly all the five products ob-tained from cow with hump similar to pyramid have higher Aura energy than other objects. He has got amaz-ing results to modern scientific world e.g. humans have positive energy of 2.5 to 2.8 m (m ‘Aura energy measured in meters). While the cow has Aura energy of 4.5 to 6.0 m’ and her products known as Panchagavya have Aura energy between 6-14 m’ as summarized in Table 1.
Table 1: Aura Energy of different cow products
S.No. Cow product Aura energy Effect
1 Cow milk 12-13 m’ I t i s an ef fec -tive alternative of mother’s milk
2 Cow curd 6.5-6.7m’ It removes toxins from the body
3 Cow ghee 14m’ B y b u r n i n g i t reduces air pollu-tion
4 Cow dung 6m’ By wiping of floor it protects from bacteria and on roof, it protects from atomic ra-diations
5 Cow urine 8-9.0m’ It is disinfectant and by regular use can cure many diseases
Since cow products are the major ingredients in preparation of bio enhancers, hence salient features of these cow products are enumerated as under:
Cow dungThe use of cow dung has been indicated since the time
of Kautilya (C. 300 BC). It was used for dressing seeds, plastering cut ends of vegetatively propagated materials such as sugar cane, cuttings of fruit/ornamental plants, dressing of wounds, sprinkling of diluted solution on crop since ancient times. There are more than 60 species of bacteria and over 100 species of protozoa encountered in the rumen of cow (Nene, 2003). A majority of the bac-teria are cellulose, hemicelluloses and pectin fermenters. The bile constituents are salts, acids and pigments. Cow dung is basically digested residue of herbivores bacte-ria that resides within the animal’s rumen. Feed given to cow passes through the intestine is enriched with the microbial load. Indian’s worship cow dung as “Lakshmi”, the goddess of wealth. In fact Gobar-dhan-puja, is literally worship of gobar (cow dung), dhan (wealth). Cow dung is
worshiped because it is the source of renewal of soil fer-tility and hence the sustainability of human society and key to the sustainability in agriculture. Walking on fresh cow dung painted floor used to be a healthy practice and had been traditional way of life in the Indian villages. Basically cow dung from cattle shed is mixture of dung and urine, generally in ratio of 3:1. It consists of crude fiber, crude protein, and other materials. Cellulose along with lignin makes up the crude fiber, hemicelluloses and pentosans (poly-saccharides based on pentose sugars) are also present. Bile salts confer hydrophilic coat to oth-erwise hydrophobic droplets, thus acting as emulsifying agents and have antiseptic properties.
Two chief bile pigments are bilirubin (reddish/golden yellow) and biliverdin (green). It is the biliver-din which is chiefly present in herbivorous animals and gives greenish colour to dung (Nene, 2007). Vibration of cow produces powerful healing effect in an around her place (Orion Transmission Prophecy by Parvati, USA, 2003). Scientists at Central Institute for Subtropical Hor-ticulture, Lucknow have identified presence of 4 potent strains of Bacillus subtilis, which have shown strong anti pathogencity against number of diseases in fruits like mango, guava, papaya rots (Pathak et al. 2009). They have also identified Actinomycetes as Streptosporangium pseudovulgare which has shown anti pathogenic potential against Colletotrichum gloeosporioides (anthracnose patho-gen) and L. theobromae (gummosis, stem end rot and die back pathogens, Garg et al. 2003, 2012).
Characteristics of cow dung• Digestive system of cow is a veritable cosmos in na-
ture, most refined on earth
• There are more than 60 species of bacteria and 100 species of protozoa encountered in rumen of cow
• Dung that comes after passing through intestine of cow has up to 25 % microbes
• Consists of crude fiber, crude protein, cellulose, lignin, hemi cellulose and pentose’s
• Contains plenty of Menthol, Ammonia, Phenol, Indol and Formalin, especially its bacteriophages eradicate pathogens
• At CISH identified an Actinomycete identified as Strep-tosporangium psedovulgare and four potential strains of Bacillus subtalis; Shown anti pathogenic potential against anthracnose, gummosis, stem end rot and dieback pathogens
• Cow dung is best soil conditioner
• Used in preparation of enriched compost, bio enhanc-
240 Progressive Horticulture, 45 (2)
ers, bio pesticides and tree paste.
• Cow horn is potential tool to prepare two potent BD-Preparations i.e. BD-500 & BD-501;
• Dung is basic component in Cow Pat Pit (CPP) and BD-500;
• Dung cake and ghee are basic components in Homa farming
Cow urine The use of cow urine is known for a long time in
India. Gaw-mutra (cow’s urine) has been described as a liquid with innumerable therapeutic values, capable of curing several incurable diseases in human beings and plants. Cow urine is rich source of macro, micronutrients and has disinfectant and prophylactic properties. It puri-fies the atmosphere and improves the soil fertility. Cow urine has amazing germicidal power to kill wide variet-ies of germs. It helps in the proper functioning of the liver which ensures supply of healthy and pure blood. It gives disease resistance power to the body which can be summarized.
Cow urine• It contains 95 % water, 2.5 % urea, 2.5 % others (min-
eral salts, hormones and enzymes)
• It contains amino acids, cytokinins, lactone, which play important role in immunity enhancement
• Cow urine has antibacterial, antifungal, antiviral properties; hence it is most effective secretion of ani-mal origin with innumerable therapeutic values
• The uric acid in the urine acts as fertilizer and hor-mone
• Cow urine contains copper, which transformed into gold in human body. Gold has power to destroy all diseases and is an antidote
• It contains iron, calcium, phosphorus, carbonic acid, potash and lactase and 24 types of salts
• The medicines made from the cow urine are used to cure several diseases
• It is disinfectant and prophylactic and purifies and improves soil fertility
• In organic farming, cow urine is used for prepara-tion of number of bio enhancers and bio-pesticides, which are effective in improving soil fertility, quick decomposition of organic wastes and management of large number of pests and diseases in varied group of crops.
Cow milkCow’s milk is called “Gorasa” or the juice excreted
from the body of the cow. Indigenous cow milk pos-sesses less cholesterol and high protein having high bio-logical and nutritional value. It is easily digestible and extensively used in Ayurvedic medicines for treatment of various ailments. Milk from indigenous breed of cow is known to have better therapeutic values. The milk has unique blending of 101 different substances containing nutritive values of its component parts. There are 19 amino acids in its proteins. Cow’s milk is essential for developing the finer tissues of the human brain so that one can understand the intricacies of the transcendental knowledge. In a systematic research Nautiyal (2007) ad-vocated that when cow milk is applied to a seedling, it enhances overall growth of the plant. Microbes like Lacto bacillus present in it, produce organic acids that promote crop growth and resists pathogens.
Cow milk and ghee are full of nutritive qualities and are ideal diet for heart patients suffering due to the pres-ence of excessive cholesterol in their blood. Its regular consumption, enhances physical and mental strength, keeps the body healthy and increases the potency. It also helps in flushing out the impurities from the body. The quercetin content in milk helps in improving the eye-sight. Cow curd and buttermilk are good appetizers and keep the digestive system normal through sustainable maintenance of pro-biotic bacteria. Salient features of milk are enumerated below.
Cow milk • The milk has unique blending of 101 different sub-
stances containing nutritive values of its component parts. There are 19 amino acids in its proteins.
• It is rich source of Vitamin B2 and B3 a natural anti oxidant.
• Microbes like Lacto bacillus present in it, produce organic acids that promote crop growth and resists pathogens and a biotic stresses
• Indigenous cow milk possesses less cholesterol, high protein having high biological and nutritional value
• Milk is easily digestible and extensively used in Ayurvedic medicines for the treatment of various ail-ments in human and plants
• It is a rich source of Omega-3 fatty acids with higher CLA (Conjugated Linoleic Acid) and MDgi –a protein that suppresses cancer.
• It is reported that glutamate, leucine and proline form
Progressive Horticulture, 45 (2) 241
about 40% of total amino acids in milk
• The amino acid proline has been found to systemati-cally induce resistance in plants.
• Milk spray on the crop, induces systematically ac-quired resistance in chilli against leaf curl (Kumar et al., 2002)
• Milk is also used for management of powdery mil-dews.
• High level of endogenous proline increases contents of cytokinins and auxins
Butter milkButter milk is byproduct obtained during process of
preparation of butter/ghee. It has lot of therapeutic val-ues for human health and agriculture. 2-3 weeks old fer-mented butter milk had been used for the management of pests and diseases since ancient times. In a study, 35 bac-terial and 21 yeast isolates have been isolated at HPKVV, Palampur, Himachal Pradesh. The use of organic inputs as probiotic in organic farming is a new concept to confer protection against plant pathogens. Preliminary studies on butter milk by Himankshi et al, 2011 has shown some interesting observations. In vitro tests, 11 bacterial and 8 yeast isolates exhibited pro biotic activities. Four sp. of Lacto coccus, 6 from Lacto bacillus and 1 from Bacillus were found effective against bacterial pathogens. Bacterial pro biotic were effective against selected plant pathogens with or without combination of cow urine
• Butter milk is a by product obtained in preparation of butter /ghee
• It has lot of therapeutic value in human health and agriculture
• Two-three weeks fermented butter milk had been in use for management of pests and diseases since ancient times
• In a study, 35 bacterial and 21 yeasts isolates have been isolated at HPKVV, Palampur
• In vitro tests, 11 bacterial isolates and 8 yeast isolates exhibited pro biotic activity
• Four sp of Lacto coccus, 6 from Lacto bacillus and 1 from Bacillus were found effective against antibiotic resistant human bacterial pathogens
• Bacterial pro biotic were effective against selected plant pathogens with or without combination of cow urine.
Cow gheeCow ghee (clarified butter) is a very special medici-
nal substance and used in preparations of some bio en-hancers viz; amritpani and panchagavya and when used in agnihotra fire, acts as a carrier agent for subtle ener-gies (Narang, 2007). Ghee is also rich source of energy among all the organic compounds, it comprises of glyc-erol, saturated and unsaturated fatty acids. On combus-tion and oxidation, it produces hydrocarbon, aldehides and formaldehydes. It also produces glycerol, acetone, pyruvic aldehyde, glyoxol, methyl and ethyl alcohol, ac-etaldehyde, formic acid and acetic acid. Ghee is power-ful vehicle for transport of energies which sustain life. Energies of Sun are captured through ghee and their impacts is spread over vast area which nourishes and strengthen every living being, where resonance point has been established.
• Ghee is richest source of energy among all organic compounds
• Special medicinal substance acts as carrier of subtle energies
• Helps in quick combustion of dung patties in Ho-mas
• On combustion and oxidation these form hydrocar-bon, aldehydes and formaldehydes;
• It also gives glycerol, acetone bodies, pyruvic alde-hyde and glyoxol, methyl and ethyl alcohol, acetal-dehyde, formic acid and acetic acid
• Ghee is powerful vehicle for energies which sustain life
• Energies coming from sun are captured through Ghee which nourishes and strengthen every living being
Preparation of bio enhancers and their role in organ-ic crop management practices are enumerated below.
Bio enhancers Concentrated manures, bio products in powder or
in liquid form, henceforth termed as Bio-enhancers are organic preparations, obtained by active fermentation of animal & plant residues over specific duration. These are rich source of microbial consortia, macro, micronutrients and plant growth promoting substances including im-munity enhancers. Utilized to treat seeds/ seedlings, enhance decomposition of organic materials thereby en-rich soil and induce better plant vigour. These could be a potent tool to utilize these in fertigation in various crops (Pathak and Ram, 2012).
Preparation of Kunapajala is an age old practice of organic liquid preparations. It involves boiling of flesh, fat and marrow of animals such as deer, pig, fish,

242 Progressive Horticulture, 45 (2)
sheep, goat in water, placing it in earthen pot, and add-ing milk, powders of sesame oil cake, black gram boiled in honey, decoction of pulses, ghee and hot water used to be the common booster of plant vigour (Nene, 2007). This fermented liquid manure is called as Kunapajala. It is sprayed on plant to enhance its vigour and produc-tion. Since research explanation and supporting data on implication of Kunapajala are not available to support their use in present scenario. Preparation of kunapajala is bit complex, and hence the other preparations which are easy to prepare and are in use by a large number of farmers, have been discussed as under:
Characteristics of bio enhancer• Potent source for macro and micro nutrients
• Presence of Plant Growth Promoting factors
• Immunity enhancer
• Pesticide & fungicidal property
• Efficacy is influenced by inputs used and method of preparation
• Used for seed/seedling treatment, enhancing decom-position, improving soil fertility and productivity
• An effective and potent tool for fertigation
These preparations can be applied with irriga-tion water, drenched on organic mulches, diluted and sprayed as foliar fertilizers (Frank et al; 2005). On the ba-sis of materials used in the preparation, impact on crops, these organic fertilizers/organic liquid manures have varying response. In general, these play an important role in quick decomposition of organic wastes, improve humus content of the soil which is essential to maintain the activity of microorganisms and other life forms in the soil. These are prepared locally, can resolve number of apprehensions, helpful in boosting production and miti-gating number of nutritional disorders in soils and crops. It is interesting to record that these can be produced at the farm with some infrastructure facilities and trained persons. These products belong to the Ayurvedic medi-cal tradition, where indigenous cow products (dung, urine, milk, ghee and curd) are central ingredients in ad-dition to few selected medicinal herbs. These are known to supplement major and minor nutrients acts as growth stimulants and provide other beneficial substances to the plants (Sebastain and Christopher, 2007). Salient features of bio enhancers are as under:
In general bio enhancers are of two types:
i) Plant based: are prepared from tender plants and leaves viz; sun hemp, dhaincha (Sesbania), Erythrina and other legumes as potent source of nitrogen, leaves
of neem, pongamia, subabul, gliricidia, lantana, calot-ropis and other local plants having pesticidal proper-ties, weeds viz; Parthenium, stinging nettle, Cassia tora etc.
ii) Animal based: are prepared with cattle dung, sheep and goat droppings, fish manures (FAO, 2006).
Combinations of plant and animal byproducts have better impacts on crop production. Liquid manures, liq-uid fertilizers, preparations are obtained by active fer-mentation of animal and plant residues over specific duration (FAO, 2006) are important. Organic liquid ma-nures play a key role in promoting growth and provid-ing immunity to the plant system (Sreenivasa et al; 2010). Effect of foliar sprays of few of the formulations have been observed to increase the plant growth, yield and quality of several crops (Subhashini et al., 2001; Natrajan, 2002; Sridhar, 2003; Venkataramana et al., 2009). In recent study by Gupta et al (2011) isolated 53 bacteria in vermin wash and 18 of these isolates were selected as efficient phosphate solublizers. Among these isolates, 14 pro-duced indol acetic acid in the range of 9.24 -77.23 micro g/ml and 8 isolates produced siderophores in the range of 8.5-65.48 % SU. In fact liquid manures are rich source of microbial consortia, macro and micronutrients and plant growth promoting substances. These are used to treat seeds/ seedlings, enrich soil and induce better plant vigour. In a comparative study with 8 sources of liquid fertilizers viz., Biosol, Jiwamrita, Bijamrita, Panchajavya, Matka khad, Compost tea, Vermi wash , vermin wash + Gomutra along with control were applied thrice in knol khol at 30, 60 and 90 DAT in 1:10 ratio. Results revealed that among all these treatment Vermiwash showed bet-ter response as compared to other treatments.
There is increasing trend for naturally derived for-mulations for sustainable production in organic farming system (Suthar, 2010). Many formulations of liquid ma-nures are being used by the farmers of different states. Few important and widely used formulations are dis-cussed as under. On the basis of preparation, bio enhanc-ers can be grouped as simple and special preparations. Brief account of these has been dealt below.
1. Simple bio enhancersFarmers of different regions are using many variants
of these liquid manures. Frank et al., 2005, recommended use of these in organic production of cotton, but these will also be equally effective for other crops.
i. Cow urine: It is cheap and effective preparation, which can be prepared and used for different purposes. Cow urine mixed in ratio of 1:10-15 and sprayed on the plants every two to three weeks during the crop growth. It can also be used for seed/seedlings treatment before

Progressive Horticulture, 45 (2) 243
sowing/transplanting.
ii. Biogas slurry: 10-15 kg biogas slurry tied in a piece of cloth and suspended in a drum of 100 liters water for 10-15 days, so that the water in the drum turns grey to blackish. Ready extract is very useful for spray on the crop in equal ratio of water at every 2-3 weeks interval till flowering.
iii. Matka khad: 15 kg cow dung, 15 liters cow urine and 250 g black jaggery are mixed and kept for fermenta-tion for 8 days in an earthen pot (matka), diluted in 200 li-ters of water. 2-3 spraying of the mixture has been found very effective in proper growth, flowering and fruiting of vegetables.
iv. Charota (Cassia tora): A leguminous weed very common during rainy season. 25 kg leaves of charota, fermented in 150 liters of water for 10-15 days, is effec-tive liquid manure for promotion of growth and flower-ing of seasonal crops.
2. Special bio enhancersNumbers of cow based bio enhancer alone or in com-
bination of few other products have been developed in different organic farming systems, and their impact has been recorded. Salient features of few of the selected bio enhancer and their impact has been discussed as under:
Cow horn manure (BD-500)It is basically fermented cow dung and is the basis
for soil fertility and renewal of degraded soils. Fresh cow dung filled in cow horns are buried in humus rich soil by integrating cosmic energies for specific period. These are buried in September - October and taken out in March - April when cosmic forces are more active underground. It is usually the first preparation used during the change over to organic/biodynamic system. This is fundamen-tal biodynamic field spray preparation. The cow is an earthy creature with a very strong digestive system. The cow horn has the ability to absorb life energies during decomposition of the dung being incubated in winter months.
Specially prepared manure is sprayed to vitalize the soil, enhance seed germination, root formation and de-velopment. If possible, it should be sprayed four times in a year. The best times are in autumn (October) and again in the spring (February and March). For spraying, 25g of BD-500 is dissolved in 13.5 liters of water in plas-tic bucket by making vortex in clock and anti-clockwise movement for one hour in the evening. The basic prin-ciple of stirring clock and anti clock wise is that while reverse process, chaos is created for a moment. During this process cosmic forces are absorbed and water be-
comes active and preparation gets oxygenated. Stirring small quantities of material in large quantity of water is called “dynamization”. This process transfers the forces of energy from the preparation to the water itself. The so-lution is sprayed with the help of natural brush. Spray-ing of BD-500 is done at the time of field preparation in the evening during descending period of the Moon. Thimmaiah (2003) and Garg et al. (2003) observed that microbial activities of BD-500 during stirring and record-ed observations on increase in microbial populations. It was interesting to observe that during stirring period, there was a corresponding increase in the number of cfu’s of bacteria, actinomycetes and fungi in one hour. With regular application of preparation 500 provide all the characteristics in the soil as summarized:
• Strong humus formation
• Improved crumb structure and soil tilth
• Increases bacterial population
• Increases rhizobacta activity (nodulation) in all le-gumes, e.g., gram, pea, moong, sun hemp etc.
• Increases phosphate solubilzing bacteria.
• Increases earthworm’s activity
• Enhances water absorption and retention power of the soil. ( International research has found that BD-500 applied in soils requires 25% less irrigation than conventional soils).
• Plants develop healthy root system.
Cow horn silica (BD 501)It is another BD preparation which is very effective
in enhancing the plant immune system and photosyn-thetic activity through increase in chlorophyll content in the leaves. For its preparation, fine ground mountain quartz crystal (silica) after proper incubation is sprayed to benefit plants. Its action is to strengthen the effect of light and warmth on the plants and promotes healthy growth. It improves protein and sugar (brix) level, me-tabolism, mechanical rigidity, growth, tolerance to en-vironmental stresses (frost, drought, salinity, mineral toxicity and deficiency) and resistance to fungal attack. It also improves the taste, colour and aroma and shelf life of produce. For maximum effect, the BD-501 should be applied once at the beginning of a plant’s life, at the four-leaf stage and again at the flowering stage or fruit matu-ration stage. BD-501 should be applied on the leaves in the form of fine mist in the morning at sunrise and the best response is obtained when constellation is Moon, opposite to Saturn.
Using cow horn for making horn manure and horn
244 Progressive Horticulture, 45 (2)
silica employs on ideal focal device to concentrate the earthly or cosmic stream of forces on the material filled in the horn.
Cow pat pit (CPP)It is a special biodynamic field preparation also
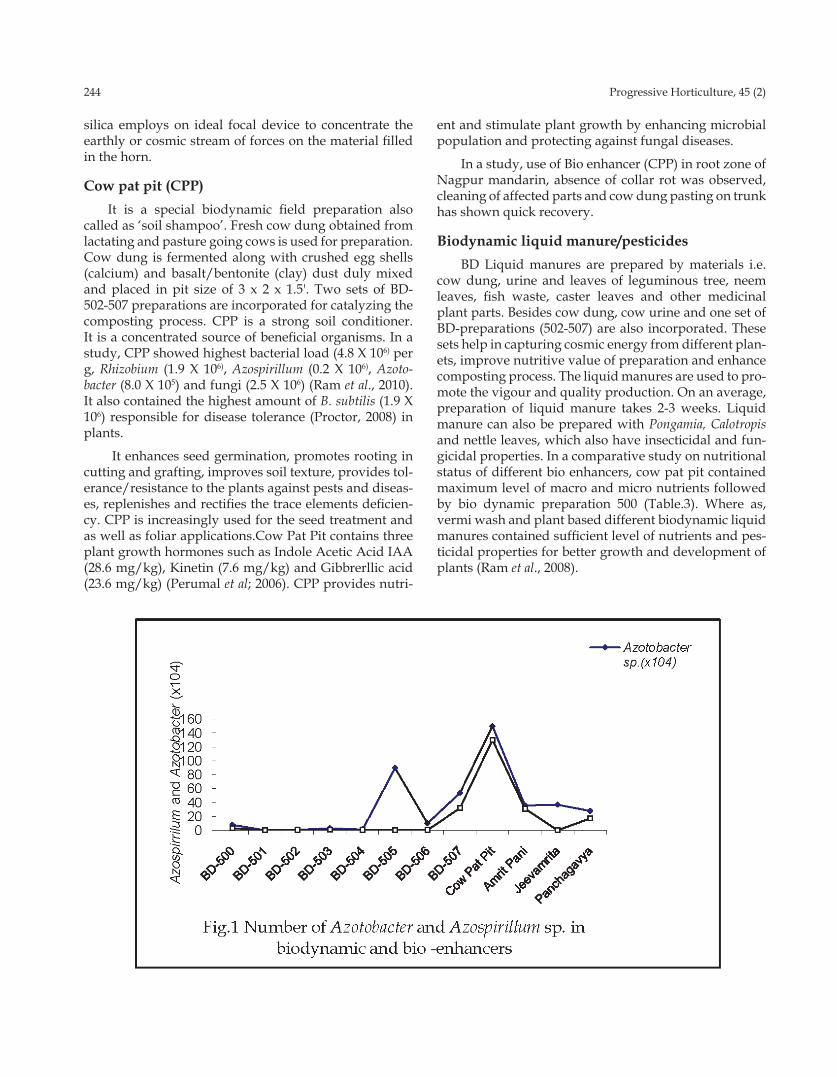
called as ‘soil shampoo’. Fresh cow dung obtained from lactating and pasture going cows is used for preparation. Cow dung is fermented along with crushed egg shells (calcium) and basalt/bentonite (clay) dust duly mixed and placed in pit size of 3 x 2 x 1.5'. Two sets of BD-502-507 preparations are incorporated for catalyzing the composting process. CPP is a strong soil conditioner. It is a concentrated source of beneficial organisms. In a study, CPP showed highest bacterial load (4.8 X 10⁶) per g, Rhizobium (1.9 X 10⁶), Azospirillum (0.2 X 10⁶), Azoto-bacter (8.0 X 10⁵) and fungi (2.5 X 10⁶) (Ram et al., 2010). It also contained the highest amount of B. subtilis (1.9 X 10⁶) responsible for disease tolerance (Proctor, 2008) in plants.
It enhances seed germination, promotes rooting in cutting and grafting, improves soil texture, provides tol-erance/resistance to the plants against pests and diseas-es, replenishes and rectifies the trace elements deficien-cy. CPP is increasingly used for the seed treatment and as well as foliar applications.Cow Pat Pit contains three plant growth hormones such as Indole Acetic Acid IAA (28.6 mg/kg), Kinetin (7.6 mg/kg) and Gibbrerllic acid (23.6 mg/kg) (Perumal et al; 2006). CPP provides nutri-
ent and stimulate plant growth by enhancing microbial population and protecting against fungal diseases.
In a study, use of Bio enhancer (CPP) in root zone of Nagpur mandarin, absence of collar rot was observed, cleaning of affected parts and cow dung pasting on trunk has shown quick recovery.
Biodynamic liquid manure/pesticidesBD Liquid manures are prepared by materials i.e.
cow dung, urine and leaves of leguminous tree, neem leaves, fish waste, caster leaves and other medicinal plant parts. Besides cow dung, cow urine and one set of BD-preparations (502-507) are also incorporated. These sets help in capturing cosmic energy from different plan-ets, improve nutritive value of preparation and enhance composting process. The liquid manures are used to pro-mote the vigour and quality production. On an average, preparation of liquid manure takes 2-3 weeks. Liquid manure can also be prepared with Pongamia, Calotropis and nettle leaves, which also have insecticidal and fun-gicidal properties. In a comparative study on nutritional status of different bio enhancers, cow pat pit contained maximum level of macro and micro nutrients followed by bio dynamic preparation 500 (Table.3). Where as, vermi wash and plant based different biodynamic liquid manures contained sufficient level of nutrients and pes-ticidal properties for better growth and development of plants (Ram et al., 2008).

Progressive Horticulture, 45 (2) 245
Table 2 : Nutrient analysis (% on dry weight basis) of different bio enhancers (liquid/ 50 ml)
S.No. Preparations N(%) P (%) K(%) Ca(%) Zn (ppm) Cu (ppm) Fe (ppm) Mn (ppm) Na (%)
1. CPP 2.10 3.85 0.42 4.25 160 62 2595 309 0.30
2. BD 500 1.26 1.32 0.57 0.45 100 55 1945 173 0.20
3. Vermi wash 0.27 0.64 1.73 0.69 60 31 485 28 0.75
4. Neem based 0.29 1.09 1.47 3.25 40 34 630 24 1.07 biodynamic pesticide
5. Castor based 2.10 1.83 5.87 2.06 50 37 530 57 1.00 biodynamic pesticide
6. Karanj based 2.04 2.06 5.95 6.57 70 44 2620 58 1.12 biodynamic pesticide
7. Calotropis based 2.25 1.86 6.30 6.76 65 50 2460 83 1.02 biodynamic pesticide
8. Lantana based 3.20 1.51 5.87 2.97 35 36 360 51 5.87 biodynami pesticide
9. Amritpani 2.37 4.91 6.45 3.35 65 33 1680 109 6.45
10. Panchagavya 0.007 0.01 0.06 - 2.9 2.4 1.7 25.8 trace
3. Amrit mittiThe first step of Natueco Farming is to develop the
Nursery Soil (Amrit mitti) using neighborhood resourc-es. Nursery Soil consists of 50% biomass and 50% acti-vated mineral top soil by volume. The biomass forms the organic part and the top soil forms the inorganic part of the Amrit mati. The nursery soil provides support and delivers water and nutrients to the plant in the most ef-ficient manner.
To obtain high quality nursery soil, it is most impor-tant to build its organic part through biomass addition. The well composted organic part of the nursery soil is called humus which contains ligno proteins. It is black in colour, light, and easily friable material that can be broken into small fragments or crumbs. It has good wa-ter holding capacity twice its own weight. Generally, the weight of such material per liter of its volume in fine crumb from is about 400 grams. It has a peculiar black luster and layers of dead colonies of the micro flora espe-cially in well composted (humidified) animal dung can be seen.
Process of preparing Amrit mittiThere are four steps of preparing Amrit mitti
• Preparing of Amrit Jal
• Preparing of heap
• Greening of heap
• Care of heap
Amrit JalIt is prepared by mixing one liter of cow urine with
one kg cow dung, 50 g black jaggary/12 bananas, sugar cane juice, mahua (Madhuca longifolia) flower or cashew apple is mixed and diluted with 100 liters of water.
Preparation of compost heap • A compost heap size of 10’ x 3’ x 1’ is prepared on
ground where water logging does not occur during raining season. For one heap on average 400-600 liters of Amrit Jal is required. Locally available organic wastes (leaves, straw, grasses, fodder wastes, lawn clippings etc.) are cut into small pieces and soaked for 24 hours in Amrit Jal. Alternate layers of scrapped ground soil and organic wastes are piled. 300 g seeds of various crops (grain, pulses, oil seeds, spices, vegetables, root crops, herbal and medicinal plants,

246 Progressive Horticulture, 45 (2)
perennials etc.) are sown at the top layer of the heap. Seeds of at least 6 types’ crops are to be mixed and sown after treatment with Amrit Jal and mulched for better germination. 10 g seed are to be sown per squire feet. It is pertinent to record that besides biodiversity, there is considerable variation in the availability of nutrients in different stages of plant foliage as sum-marized below:
• Tender leaves-rich in Zinc, phosphate, Boron and Molybdenum
• Green matured leaves – rich in Nitrogen, Magnesium and Potassium
• Dry leaves- rich in Calcium, Silica, Boron, Iron, and Manganese.
Precautions The heap should be mulched with locally available
organic wastes and kept moist by frequent sprinkling of water and alternatively with Amrit jal. After 21 days the upper 25% of portion of heap should be cut and laid over the heap. As the plants become 42 days, the upper por-tion 25 % again is cut and laid over the heap and after 63 days, leave ½ inch portion above the heap and cut the rest and lay on the heap. This process is to be completed at three stages to ensure availability of all nutrients which are available in tender, matured and old dry leaves. Af-ter 140 days, the whole heap is turned and it becomes ready for use. Rupela (2008) studied sample from differ-ent layers of heap and reported highest amount of avail-able phosphorus, total phosphorus, available N, trans-ferable potash, organic carbon. He has remarked that some samples of Amrit mitti had up to 100 million plant growth promoting bacteria (siderophore producers) in every gram of the compost-highest ever measured in any compost. ([email protected]).
4. PanchagavyaIt is a special bio enhancer prepared from five prod-
ucts obtained from cow, i.e. dung, urine, milk, curd and ghee. When these are properly mixed, incubated for rec-ommended period and ready fermented solution has miraculous effect on crops. Preparation is rich in nutri-ents, auxins, gibberellins, and microbial fauna and acts as tonic to enrich soil, induce plant vigour with quality production. In beginning, pioneer work has been done by a medical doctor Natrajan (2003), which was subse-quently studied by TNAU, Coimbatore, India and other institutes. Its positives effect on growth and productivity of crops has been reviewed and documented by many workers. Due to presence of macro (N,P,K and Ca) and micro (Zn, Fe, Cu, Mn) nutrients and bio agents such as Azospirillum, Azotobacter, Phosphobacteria and Pseudomo-
nas (Yadav and Lourduraj, 2005), growth promoting en-zymes along with essential plant nutrients (Vasumathi, 2001; Perumal, et al., 2006; Swaminathan, 2005., Sreeni-vas, et al., 2011). Panchagavya is now gaining attention as an efficient organic growth promoter (Naik, et al., 2009). Composition of panchagavya was investigated by Patnaik et al., (2012) and they observed the presence of aerobic heterotrophic bacteria, lactic acid bacteria, yeast, fungi and anaerobic bacteria. In a study, highest microbial load was recorded in 7 days old preparation. Though a gradual reduction in the microbial load was observed up to 50 days and population reduced signifi-cantly after 30 days.
The preparation is rich in nutrients, auxins, gib-berellins and microbial fauna and acts as tonic to enrich the soil to induce plant vigour with quality production. It is equally effective for all types of plants, milch ani-mals, goat, poultry, fish, and pet animals. Its remarkable effects have been demonstrated in fruits like mango, guava, acid lime, banana, spice turmeric, flower-jasmine and vegetables such as cucumber spinach etc. The spray of panchagavya on chilies produces dark green coloured leaves within 10 days and its role has been reported by Sreenivasa et al; 2009. The effective micro organisms in panchagavya were the mixed culture of naturally occur-ring, beneficial microbes, mostly lactic acid bacteria (Lac-tobacillus), yeast (Saccharomyces), actinomycetes (Strep-tomyces), photosynthetic bacteria (Rhodopsuedomonas) and certain fungi (Aspergillus). In view of the fact that panchagavya contains naturally occurring beneficial microorganisms (Swaminathan, 2005), some of which are nitrogen fixers and P-solubilizers (Sreenivas, et al., 2011), can be considered as an ideal organic growth pro-moter. However it is advisable to use within 30 days of its preparation to achieve better success (Patnaik et al., 2012). Application of panchagavya has been found more profitable than recommended fertilizer application and chemical sprays.
Chemical analysis revealed that panchagavya pos-sess almost all macro, micronutrients and growth pro-moting hormones (IAA, GA) required for plant growth (Selvaraj, et al.2006). Predominance of fermentative mi-croorganisms like yeast and Lacto bacillus are due to com-bined effect of low pH milk products and addition of jaggery/sugarcane juice as substrate for their growth. In general 3% solution (3 kg/100 liters) of panchagavya has been found effective for most of the crops. This solution can be mixed with irrigation water @ 50 liters per hectare either through drip or flow irrigation. This solution is also used to treat the seeds, seedlings or other plant parts before sowing/planting. Seed treatment with panchaga-vya before storage and its drying in shade is helpful to prolong storage life.

Progressive Horticulture, 45 (2) 247
Table 3 : Microbial load in Panchagavya
S.No. Microorganisms (cfu/ml)
1. Fungi 3.88 x 10³
2. Bacteria 1.88 x 10⁶
3. Lactobacillus 2.26 x 10⁵
4. anaerobes 1.0 x 10³
5. Acid formers 360
6. Methanogens 250
5. Dasagavya As name indicates Dasagavya is a mixture of ten
products, consisting of Panchagavya and certain plant extracts. The leaf extracts of five commonly available weed plants, viz., Artemisia nilagirica , Leucas aspera, Lan-tana camara, Datura metel and Phytolacca dulcamera are ob-tained by soaking the plant materials separately in cow urine in 1:1 ratio for ten days. The extracts are collected, mixed well with Panchagvaya and left for 25 days (Sel-varaj, 2012). For tropical region the recommended plants are neem (Azadirachta indica), akara/ milkweed (Calotro-pis gingatea), Arusa/Vasa (Adathoda vasica), karanj (Pon-gamia pinnata), Vitex (Vitex negundo), Ratan Jot (Jatropha curcas) etc.
Dasagavya has potential to promote growth and boost immunity in the plant system against pests and diseases. The fermentative bacteria, Lactobacillus, that develop in the solution, produce various beneficial me-tabolites such as organic acids, hydrogen peroxide and antibiotics, which are effective against other pathogenic microorganisms. The short chain aldehydes are involved in hypersensitive response of plants against pathogens. The fatty acids constitute embryo development and seed filling. Its regular use @ a concentration of three percent solution has been found very effective in large number of crops pests & diseases such as leaf spot, blight, mil-dew, and rust of vegetables. Besides this, treated plants were found to exhibit inhibitory effects against sucking pests like aphids, thrips, white flies and mites and also foliar caterpillar (Selvaraj, 2006).
6. JiwamritaJiwamrita is prepared by fermenting cow dung,
urine, jaggery, pulse flour and virgin soil by simple fa-cilities created in the village with minimum expenditure. Credit for development of recipes for Jeevamrita and its extensive use goes to Palekar (2006), a strong promoter of Natural Farming. Its can be used at 15 to 30 days in-terval through irrigation water coupled with mulching (green/dry {monocot + di-cot}) and proper soil aeration.
Jeevamrita is a rich bio-formulation contains consortia of beneficial microbes. This formulation is used within 3-7 days of preparation. Two hundred liters of Jeevamrita is enough for one acre of cropped area. In general 2-3 times application during crop period is recommended. It can be drenched on mulch either by drip irrigation or through spraying. It is also effective in quick decompo-sition of crop residues if applied with irrigation water given for field preparation. With micro irrigation, 3 to 4 times more area can be covered with 200 liter of Jeevam-rita.
7. AmritpaniIt is a special bio formulation, rich in nutrients and
beneficial microbes. Ingredients for preparation of am-ritpani and its intensive use were advocated by Desh-pandey (2003). It is used to improve seed germination, soil fertility and plant vigour.
8. Bio digester extractThe extract is prepared by fermenting crushed leaves
of plant along with cow dung and urine in a plastic con-tainer of suitable size known as Bio digester. In general green leaves of neem, Calotropis, Vitex, Adhatoda, Ipomea, custard apple, and agave (5 kg each) are mixed with little soil and 200 liters of water. The mixture is stirred thrice a day and gets ready for use in three weeks. The micro-bial load and nutrient status of Panchagavya, Beejamrita, Jeevamrita and bio digester extract has been estimated by Sreenivasa et al, (2009 and 2010). The data in table 4 in-dicates presence of micro flora especially nitrogen fixers and P-solubilizers in all liquid formulations in addition to both major and micro nutrients. Presence of naturally occurring beneficial microorganisms predominantly bacteria, actinomycetes, yeasts, photosynthetic bacteria and certain fungi are the major strength of these bio en-hancers.
The results of the study revealed that the nutrient status and microbial load present in the bio enhancers, which may differ with the type and quantity of material used, period of fermentation, environmental conditions etc. However the nutrients and micro flora present in bio-enhancers support the improvement in soil fertility and in turn better yield when these are used irrespective of any crop. It is because of microbial richness, formula-tions show dramatic impact on various attributes associ-ated with soil fertility and crop productivity.
From perusal of table-5, it is evident that these bio enhancers are also rich source of macro nutrients such as nitrogen, phosphorus, potassium, and micronutrients viz; Zn, Cu, Fe, Mn etc. As per recent estimate, Indian soils are showing multi nutritional deficiencies, hence
248 Progressive Horticulture, 45 (2)
regular use of bio enhances coupled with incorpora-tion of organic residue for recycling can provide a cheap and acceptable options. A simple and much affordable technique of bio feed has been successfully adopted by a group of organic mango growers in Unnao district of Uttar Pradesh. Ingredients of the same formulations are given in table 5.
Recently, Sreenivas et al., 2009 have estimated micro-bial load and nutrient status of few selected bio enhanc-ers. This indicates that regular use of these formulations can resolve many problems associated with soil fertility and crop productivity.
9. Vermi washVermi wash is a liquid leachate obtained by excess
water to saturate the vermi composting substrate. It is collection of excretory products and mucus recreations of earthworm along with nutrients from the soil organic molecules. In fact vermi wash is an enriched bio enhanc-er prepared from the heavy population of earthworms reared in earthen pots/plastic or cement container. It contains hormones (gibberellins, cytokinins) secreted by the earthworms (Zambare et al; 2008). Vermi wash micro flora contains Azotobacter, Agrobacterium, and Rhizobium and Phosphate solubilzing microbes. Presence of these microbes makes available inorganic nitrogen, amino ac-ids and inorganic phosphate to plants through amoni-fication and nitrification process. Besides these, Vermi wash contains total heterotrophs i.e; Nitrosomonas 10.1 X 10³, Nitrobacter 1.12 X 10³ and total fungi, 1.46 X 10³ (Eco science Research Foundation, 2006 www. erfindia.org).
Vermi wash can be used for better growth, yield and quality production. Recently microbial study of vermi wash revealed that it contains nitrogen-fixing bacteria like Azotobacter sp., Agrobacterium sp., Rhizobium sp., and phosphate solubilzing bacteria. Protease in soils helps in seed germination, while amylases help in availability of simple carbon source for enhancement of plant vigour and productivity. Soil born micro flora is essential for growth of plants because organic nitrogenous com-pounds and phosphorus are decomposed and mineral-ized by fixing and phosphate solubilzing bacteria. Pres-ence of large number of beneficial microorganisms helps in plant growth and protects from a number of patho-gen in the field. Repeated spray of vermi wash has been found effective even in management of thrips and mites in chilies (George et al; 2007). If needed, vermi wash may be mixed with cow urine (1:1:8 ratio, vermi wash, cow urine and water), and used as foliar spray for nutrients and pesticidal properties.
Extract diluted in the water 1: 5 - 10 ratios, can be used as foliar spray for any crop. Its impact is better than
chemical fertilizers.
In a comparative study on organic based foliar sprays viz., vermi wash, bio digester extract and panchagavya on mulberry, vermi wash @ 5 per cent was found most effective in stimulating the plant growth, leaf yield and a biochemical constituent over other and control. The silk-worm growth and silk traits increased correspondingly with foliar spray of vermi wash on mulberry (Uppar and Rayar, 2012).
10. Bio enhancers with agnihotra ashAgnihotra is a process of harnessing cosmic energy
through science of Pyramidology, biorhythm of nature (sunrise and sunset), sonic energy (science of vibration of specific mantras), burning of organic substances are duly amplified and energized through vaporization and its impact is extended in a given area through establish-ment of Resonance point (Jarek, 1999 and Paranjape, 1989). Interesting observations of Agnihotra ash has been reported by Punam et al. 2011). Agnihotra ash was found to be rich source of organic carbon, P, S, K, Ca, Mg, Fe, Mn, Cu, and Zn. Besides this in another study Punam et al. 2011 also reported that Homa environment conditions had adverse impact on the appearance and population build up of tomato fruit and shoot borer. Application of Agnihotra ash @3.5 mg/plant as dust in soil just at the time of transplanting and its further supplementation in the soil as drench at a regular interval of 15 days was found most suitable for the management of fruit borer and shoot borer. In fact it works on the principle that you heal the atmosphere and healed atmosphere will heal us. Agnihotra ash and Biosol are two potent bio for-mulations, are frequently used in Homa Organic Farm-ing. This negates the effects of polluting factors while in-creasing quality production. Agnihotra ash in fact is full of subtle energy and can be utilized for many purposes in agriculture and human health. Two bio enhancers i.e. Agnihotra enriched water and Biosol are prepared and used in agriculture by farmers.
Use of Agnihotra ash
Agnihotra ash is powerful input to organic farmeri) As potent source of energy and therapeutic values
ii) Agnihotra ash enriched water;
iii) Biosol a potent bio enhancer;
These are used in the following manner
• To store seeds;
• To treat seed, planting material before sowing and planting;

Progressive Horticulture, 45 (2) 249
• To enhance soil fertility;
• To treat water bodies for improving its quality and availability;
• To enhance soil fertility and plant vigour;
• To manage pest and diseases;
• To improve production and quality of produce;
• To enhance efficacy of composts, bio enhancers and bio pesticides.
Use of Agnihotra ash
• Mix Agnihotra ash with grains and seeds before there storage. It keeps the attack of pests at zero level. The grain can be used either for human consumption or as seed.
• One kg Agnihotra ash is spread over one acre land before crop sowing/planting. The ash not only helps to maintain soil fertility but also energies the soil, imparting subtle energies that aid in plant growth.
Agnihotra ash increases the moisture retaining capac-ity of the soil. It renders the nutrients and elements already existing in the soluble and easily available to plant in great extent. Agnihotra ash is found to release soluble phosphates from the soil and make them bio available. Thus it plays important role in the growth of plants
• For seed treatment place seeds fully covered in Cow urine for 20-30 minutes, drench urine and carefully cover it with dung powder and Agnihotra ash before sowing. Seeds with hard seed coat can be kept for 1-2 hours;
• Five gram of Agnihotra ash can be placed in hills before transplanting vegetable seedlings;
• In fruit plant, incorporate 25-50 g Agnihotra ash be-fore planting;
• Dust Agnihotra ash on leaves, flowers and fruits wherever insect infection is problem;
• Agnihotra ash can is mixed with organic mulch
Table 4 : Microbial load in different Bio enhancers
Microorganisms Population (cfu ml-1)
Panchagavya Jeevamrita Beejamrita Bio-gas slurry
Bacteria 26.1 x 10⁵ 15.4 x 10⁵ 20.4 x 10⁴ 12.9 x 10⁵
Fungi 18.0 x 10³ 10.5 x 10³ 13.8 x 10³ 9.2 x 10³
Actinomycetes 4.2 x 10³ 6.8 x 10³ 3.6 x 10³ 3 x 10³
P solublizers 5.7 x 10² 2.7 x 10² 4.5 x 10² 1.0 x 10²
Free living N2 fixers 2.7 x 10² 3.1 x 10² 5.0 x 10² 2.1 x 10²
Table 5 : Nutrient status of different organic liquid manures
Parameter Panchagavya Jeevamrita Beejamrita Bio-gas slurry
pH 6.82 8.2 7.07 7.29
Soluble salt (EC) 1.82 dsm1 5.5 dsm1 3.40 dsm1 1.09 dsm1
Total nitrogen 0.1 per cent 4.0 per cent 770 ppm 255 per cent
Total phosphorus 175.4 ppm 155.3 ppm 166 ppm 79 ppm
Total potassium 194.1 ppm 252 ppm 126 ppm 42 ppm
Total zinc 1.27 ppm 2.96 ppm 4.29 ppm 0.52 ppm
Total copper 0.83 ppm 0.52 ppm 1.58 ppm 1.24 ppm
Total iron 29.71ppm 15.35 ppm 282 ppm 9.60 ppm
Total manganese 1.81 ppm 3.32 ppm 10.7 ppm 8.30 ppm
250 Progressive Horticulture, 45 (2)
all-round the tree trunk. It will help in quick decom-position of mulches and provide desired nutrients required by the plants;
• In perennial fruits mulching can be done with its own dropped foliage. It is advisable that some legume is sown in orchard where some solar radiation is avail-able, mix with dropped foliage and make a thick mulch leaving tree trunk and drench it with Agni-hotra ash water/Biosol;
• An excellent plant food can be made by making a solution of Agnihotra ash+ cow urine and water. For this, incorporate one Kg Agnihotra ash+5 liters cow urine in 200 L water. Incubate the mixture for three days and stir it thrice a day. After filtration Agnihotra enriched water can be used in tree basin, drenching of mulches and as foliar spray.
• One liter of this solution can be drenched over a com-post heap of 5X1X 1M. The heap should be covered with gunny bag/ sugarcane trash/ coconut fronts or paddy straw. This will be helpful in quick decom-position of non decomposed material and improve nutritive value of compost.
• Agnihotra ash is placed in a gunny bag and kept at main water source used for irrigation of orchard or field;
• One kg Agnihotra ash is placed at weekly interval in wells used in irrigation of field. This will be helpful in improving in water quality and also availability.
• A thick tree paste can be prepared by incorporating cow dung+ cow urine+ Agnihotra and clay. In fruits like mango, guava, aonla, sapota the paste should be smeared on the trunk, if possible on main branches and cut ends.
• Twice pasting i.e. once immediately after fruit harvest and the other in spring –February-March helps in management of borers, gummosis and will help in better vascular activities.
• Use of Agnihotra ash in vermi composting- In process earthworms should be put in the compost material at the end of the afternoon and moistened with Ag-nihotra ash solution after sunset.
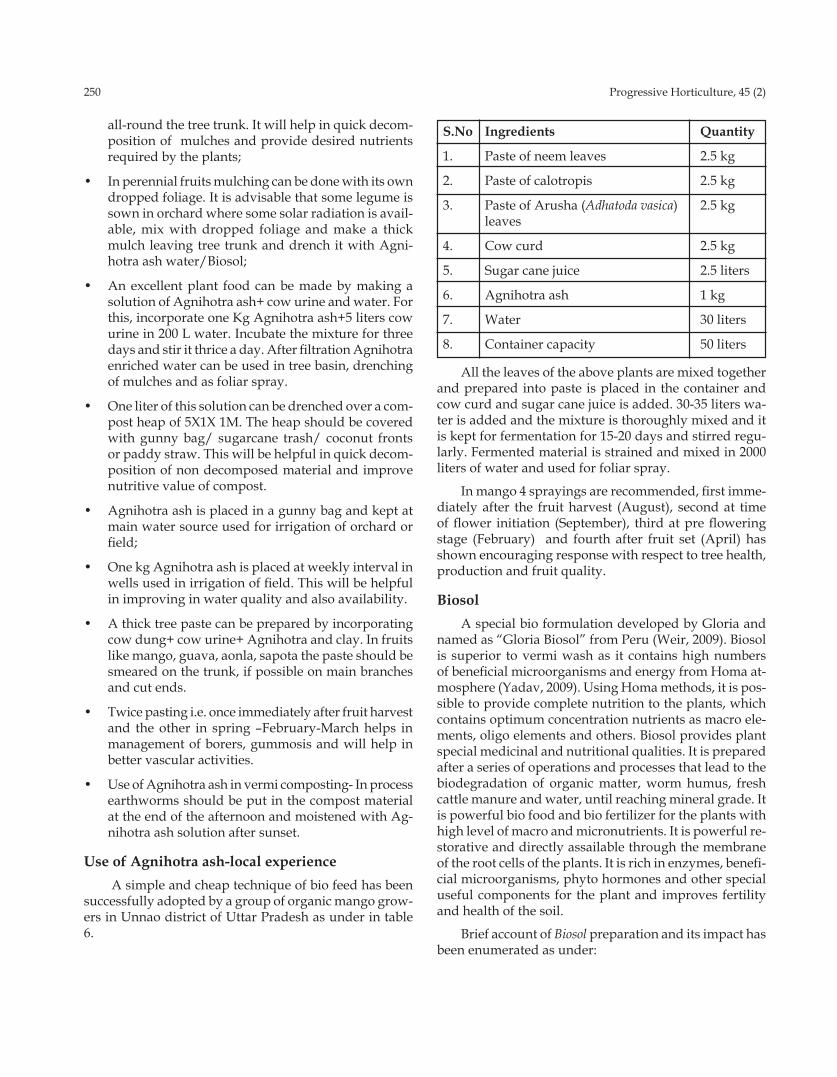
Use of Agnihotra ash-local experience A simple and cheap technique of bio feed has been
successfully adopted by a group of organic mango grow-ers in Unnao district of Uttar Pradesh as under in table 6.
S.No Ingredients Quantity
1. Paste of neem leaves 2.5 kg
2. Paste of calotropis 2.5 kg
3. Paste of Arusha (Adhatoda vasica) 2.5 kg leaves
4. Cow curd 2.5 kg
5. Sugar cane juice 2.5 liters
6. Agnihotra ash 1 kg
7. Water 30 liters
8. Container capacity 50 liters
All the leaves of the above plants are mixed together and prepared into paste is placed in the container and cow curd and sugar cane juice is added. 30-35 liters wa-ter is added and the mixture is thoroughly mixed and it is kept for fermentation for 15-20 days and stirred regu-larly. Fermented material is strained and mixed in 2000 liters of water and used for foliar spray.
In mango 4 sprayings are recommended, first imme-diately after the fruit harvest (August), second at time of flower initiation (September), third at pre flowering stage (February) and fourth after fruit set (April) has shown encouraging response with respect to tree health, production and fruit quality.
BiosolA special bio formulation developed by Gloria and
named as “Gloria Biosol” from Peru (Weir, 2009). Biosol is superior to vermi wash as it contains high numbers of beneficial microorganisms and energy from Homa at-mosphere (Yadav, 2009). Using Homa methods, it is pos-sible to provide complete nutrition to the plants, which contains optimum concentration nutrients as macro ele-ments, oligo elements and others. Biosol provides plant special medicinal and nutritional qualities. It is prepared after a series of operations and processes that lead to the biodegradation of organic matter, worm humus, fresh cattle manure and water, until reaching mineral grade. It is powerful bio food and bio fertilizer for the plants with high level of macro and micronutrients. It is powerful re-storative and directly assailable through the membrane of the root cells of the plants. It is rich in enzymes, benefi-cial microorganisms, phyto hormones and other special useful components for the plant and improves fertility and health of the soil.
Brief account of Biosol preparation and its impact has been enumerated as under:

Progressive Horticulture, 45 (2) 251
Bio digester for Biosol The bio digester tank may be of 200 - 1000 liters ca-
pacity. It can be cylindrical rigid plastic tank with air valve, liquid outlet and a lid. Care should be taken that after filling of material in proper proportion lid should be sealed to avoid any leakage. The diameter of air valve opening should be one and half inch. The air valve should be fixed properly. Outlet for Biosol liquid should be six inches in diameter and oriented so as to facilitate easily removal. Lid should be sealed with good quality adhesive and Teflon tape. In recent study Namrata et al., 2012 reported that soil application of biosol increased root nodulation in legumes, notable increase in soil or-ganic carbon, available N, P, K, Cu, Zn, Mn, Fe which are helpful in enhancing production and improvement in produce quality. Similar positive impact of Biosol as soil and foliar application has shown positive impact in cabbage and tomato production. The use of Biosol along with Homa ash, especially Agnihotra Homa ash provides a promising supplement at a very low cost af-fordable even by poor and marginal farmers. The study clearly indicates the usefulness and potential of ‘Homa organic farming’ (HOF) practices over conventional chemical methods of cultivation in soybean. Studies on other cereals, vegetables and fruits are in progress under integrated organic farming activities at CSK, Palampur, UAS, Dharwad and TANU, Ooty in systematic manner.
Strategy for promotion of bio enhancers• From the aforesaid information, it is clear that Bio
enhancer has immense potential to improve soil fer-tility, crop productivity and pest management
• It is paradox to record that most of information on these preparations has been experienced by Indian farmers since ancient times but number of apprehen-sions are persisting for use of bio enhancers which requires initiation of systematic research for further explanations.
• Comparative evaluation of bio enhancers prepared through ingredients from similar origin and there sci-entific explanation for their nutrient status, microbial consortia and other associated scientific information can resolve many apprehensions.
• Impact, role played in package of practices will help for their acceptance in promotion of organic farm-ing.
• These can be prepared with little support and skill up gradation trainings.
• There is need for delineation of nutrient status (macro and micro nutrients), plant growth promoting factors,
immunity enhancer ability etc. For their quick accep-tance by the scientific and farming community.
• After proper filtration, bio-enhancers can be used through drip/sprinkler as fertigation.
• Comparative evaluation of aforesaid bio enhancers for their nutritive value and impact will help for their preparation and use.
• There is need to work out its contribution in organic production and frequency of their use in different crops.
ConclusionFrom the above enumeration, it can be concluded
that bio enhancers could be a potent source to improve soil fertility, crop productivity and quality. This can also be a potential alternative for fertigation which is becom-ing common in most of the crops. However, care should be taken that bio enhancers which are used in limited quantities can not meet the entire nutrient requirement of the crops. These simply catalyze quick decomposition of organic wastes in to humus, hence incorporation of enough bio mass preferably combination of monocot and legumes duly supplemented with animal wastes will be helpful in quality production of humus, which is prerequisite for improving soil fertility and crop produc-tivity. Combined with manures and frequent use of bio enhancers can address many challenges of agriculture and will be pave way for sustainable agriculture through organic resources.
REFERENCESAnnonymous. 2011. ICAR, Vision 2030, p2-3
Anonymous, 2006. Training manual in organic agricul-ture, Prepared by Natura Agroconsultants Pvt. Ltd. Ministry of Agriculture (MOA) & Food and Agri-culture Organization (FAO), India under Technical Cooperation Program (TCP).
Austen, A. 1657. Treat fresh pruning wounds with cow dung and urine to prevent applecankerwww.agls.uidaho/ent547biocontrol/Lectures/W1a_Intro_Mi-crobial_Agents.ppt.
Deepak, S. 2012. Amrut Krushi Science, Malpani Trust, Khargaon, Dewas [email protected], web: www.natuecofarmingscience.com.
Deshpande, M. D. 2003. Organic Farming wrt. Cosmic energy, Non Violence Rishi – Krishi. Khede-Ajra, Kolhapur, Maharashtra, 65 P.
Frank, E; Saro, G.R. and Radhakrishnan, M.T. 2005. Or-

252 Progressive Horticulture, 45 (2)
ganic Cotton Crop Guide, a Manual for Practioners in the Tropics, FiBL, Switzerland, pp. 27-32.
Garg, N. 2012. Cow dung as source of bio agents. National Conference on Managing Threatening Diseases of Horticultural, Medicinal, Aromatic and Field Crops in Relation to Changing Climatic Situations & Zonal Meeting, Indian Phytopathological Society, Nov. 3-5, 2012. pp. 85-87.
Garg, N.; Om Prakash and Pathak, R.K. 2003. Cow Dung: A source of potent Bio control agents. National Semi-nar on Cow in Agriculture and human health. Agri History Society, Udaipur, Rajasthan, 82 P.
George, S.; Giraddi, R.S. and Patil. 2007. Utility of vermi wash for the management of thrips and mites in chili (Capsicum annum) amended by soil organics, Karna-taka, Jour. Agric. Sci.; 20: 657-659.
Gupta, M.K.; Thakur, S.; Madhu and Natasha 2011. Plant Growth Promoting Traits of Bacteria isolated from Vermiwash. by Abs. Presented Proc. of National Symposium cum Brainstorming Workshop on Or-ganic Agriculture, held at CSK Himachal Pradesh Krishi Vishwavidyalaya, Palamur, April, 19-20, 2011, pp. 117.
Himankshi, Kanwar; S.S., Sourabh' A. and Gupta, M.K. 2011. Probiotic Diversity of Buttermilk used as a Bio control agent in organic farming. Proc. of National Symposium cum Brainstorming Workshop on Or-ganic Agriculture, held at CSK Himachal Pradesh Krishi Vishwavidyalaya, Palamur, April, 19-20, 2011, pp. 88.
Jarek, B. 1999. Homa farming for the new age. A practical guide to Homa Farming based on ancient science of Agnihotra, Fundacja Agnihotra, Nad Lasem/Wysoka 151, Jordanow, Poland, pp. 34-785.
Kumar, A. and Mali, P.C. 2002. Response of bio control agents in relation to acquired resistance against leaf curl virus in chili. Asian Congress of Mycology and Plant Pathology, 1-4 October, 2002, pp. 266-67.
Murthy, M. 2005. Vedic Aura Energy – A Remedial Measure for Plant Diseases. Proc. of National Confer-ence on Bridging Gap between Ancient and Modern Technologies to Increase Agricultural Productivity. Organized by Asian Agri-History Foundation at Udaipur, Rajasthan, 129 P.
Namrata, K.; Bablad, H.P. and Basakar, P.W. 2012, Effect of Homa Organic Farming Practices on Soybean, Organic Farming News letter, 8 (1): 1-10.
Nane, Y.L. 2003. Cow and Agriculture, Paper presented in
National Seminar on Cow in Agriculture and human health. Agri History Society, Udiaipur, Rajasthan, pp. 55.
Narang, Ish 2007. The science of Agnihotra. Maharishi Dayanand Charitable Trust, Delhi.
Natarajan, K. 2003. Panchagvya- A Manual. Other India Press, Goa, India, 23 p.
Nene, Y.L. 2003. Crop diseases management practices in Ancient, Medieval and Modern India. Asian Agri-History, 7(3):185-2001.
Nene, Y.L. 2007. Utilizing traditional knowledge in ag-riculture, National Seminar on Organic Agriculture: Hope of Posterity, July, 13-14, 2007 organized by UPCAR and NCOF, pp. 6-10.
Niranjan, R. and Shetty, H.S. 2002. Proline a novel in-ducer resistance in pearl millet against downy mildew caused by Scleronpara gramicola Asian Congress of Mycology and Plant Pathology, 1-4 October, 2002, pp. 142-144.
Pankaj, P.; Chadha, S.; Punam, Upadhyyaya, R.G. and Paul, Y.S. 2011. Comparative Efficacy of Top Ap-plication of different liquid fertilizers in Knoll Khol (Brassica oleracea var. gongylodes) in mid hills of Himachal Pradesh, (Abs.) Presented in Proc. of Na-tional Symposium cum Brainstorming Workshop on Organic Agriculture, held at CSK Himachal Pradesh Krishi Vishwavidyalaya, Palamur, April, 19-20, 2011, pp. 94.
Palekar, S. 2006. The Philosophy of Spiritual Farming, (Zero budget of Natural Farming, Amrit Subash Palekar, Amravati, Maharashtra.
Paranjpe, V.V. 1989. Homa Therapy Our Last Chance, Five Fold Path Mission, Inc, Madison, U.S.A.
Parvati, 2003. Cow, Orion Transmissions Prophecy. Ancient Wisdom for New World, Vol. I, Fundacja Terapia Homa, Wysoka, 117 p.
Pathak, R.K. 2010. Plant Bio enhancers: potential and affordable source for fertigation. National Seminar on Precision Farming organized at College of Ag-riculture, Jhalawar, MPUAT, Udaipur. National Conference on Managing Threatening Diseases of Horticultural, Medicinal, Aromatic and Field Crops in Relation to Changing Climatic Situations & Zonal Meeting, Indian Phytopathological Society, Nov. 3-5, 2012, pp. 327-331.
Pathak, R.K. and Ram, R. A. 2009. Manual on Jaivik Krishi, CISH, Lucknow.

Progressive Horticulture, 45 (2) 253
Pathak, R.K. and Ram, R.A. 2003. Role of cow in agricul-ture, National Seminar on Cow in Agriculture and human health. Organized by Asian Agri-History Foundation, 59 P.
Pathak, R.K. and Ram, R.A. 2012. Bio enhancer: A Poten-tial tool to Enhance Soil Fertility and Crop Productiv-ity, In : International Conference on Organic Farming for Sustainable Horti-Agriculture and Trade Fair, organized by Jharkhand State Horticulture Mission, 8th - 9th, November, 2012, pp. 84-86.
Pathak, R.K. and Ram, R.A. 2012. Impact of indigenous organic farming technologies in environment and disease management of horticultural crops. In : Na-tional Conference on Managing Threatening Diseases of Horticultural, Medicinal, Aromatic and Field Crops in Relation to Changing Climatic Situation & Zonal Meeting Indian Phytopathological Society (Mid-Eastern Zone), November, 3-5 at pp. 64-74.
Pathak, R.K.; Ram, R.A.; Garg, N.; Kishun, R.; Bhrigu-vanshi, S.R.; Hasseb, M. and Sharma, S. 2010. Critical review of indigenous technologies for organic Farm-ing in horticultural crops. Organic Farming News letter, 6 (2): 3-16.
Patnaik, H.P.; Dash, S.K. and Shailaja, B. 2012. Microbial composition of Panchagavya, Eco-friendly Agriculture 7 (2): 101-103.
Perumal, K.V.; Varadarajan, S. and Murugappa, A. 2006. Production of Plant Growth Hormones and Subtilin from Organic Biodynamic Manures Organic Farm-ing - Advantages & Disadvantages for soils, water quality and sustainability. In : 18th World Congress of Soil Science, July, 9-15, 2006 held at Philipadaia, USA, 162:4. 1A.
Proctor, P. 2008. Biodynamic Farming and Gardening, Other India Press, Goa, India.
Punam; Sharma, S.K.; Kumari, R., Rameshwar and Atul 2011. Effect of different timings and pyramid on Prop-erties of Agnihotra ash. In : National Symposium cum Brainstorming Workshop on Organic Agriculture, April, 19-20, 2011 at CSH, Himachal Pradesh Krishi Vishwavidyalaya, Palampur, H.P. p 149.
Punam; Sharma, S.K.; Kumari Richa and Paul, Y.S. 2011. Impact of Homa Farming on the Insect Pests of to-mato (Solanum lycopersicum L.) plants in Himachal Pradesh. In: National Symposium cum Brainstorming Workshop on Organic Agriculture, April, 19-20, 2011 at CSK, Himachal Pradesh Krishi Vishwavidyalaya, Palampur, H.P., p 151.
Ram, R.A. and Bhriguvanshi, S.R. 2008. Annual Report,
Central Institute for Subtropical Horticulture, Luc-know, pp. 35-36.
Ram, R.A. Singha, A. and Bhriguvanshi, S.R. 2010. Annual Report, Central Institute for Subtropical Horticulture, Lucknow, 27 p.
Sebastain, P.S. and Christopher, L.A. 2007. Indigenous organic foliar sprays on crop yield. Ecobiology. 21: 201-207.
Selvaraj, N; Anita, B; Anusha, B. and Sarawathi, M.G. 2006. Organic Horticulture, Horticulture Research Station Tamil Nadu Agricultural University, Udhaga-mandalam, Tamil Nadu.
Selvaraj, N. 2012. Integrating various Vedic Farming Techniques (IVVFT) on yield and quality of Hor-ticultural Crops-A case study in the hilly district Nilgiris of Tamil Nadu, India. Souvenir & Abstracts in International Conference on Organic Farming for Sustainable Horti-Agriculture and Trade Fair. Orga-nized by Jharkhand State Horticulture Mission, 8th & 9th, November, 2012, pp. 93-99.
Sreenivasa, M.N.; Nagaraj, N. and Bhat, S.N. 2010, Organic Liquid Manures: Source for beneficial Microorgan-isms and Plant Nutrients, Organic Farming News letter, 6 (4), December, 2010, pp. 11-13.
Sreenivasa, M.N.; Nagaraj, N. and Bhat, S.N. 2009, Ben-eficial traits of microbial isolates of organic liquid manures – First Asian PGPR Congress for Sustainable Agriculture, 21-24 June, 2009, ANGARU, Hydera-bad.
Sreenivasa, M.N.; Nagaraj, N. and Bhat, S.N. 2010. Bee-jamrutha: A source for beneficial bacteria, Karnataka J, Agril. Sci. 17(4) 731-735.
Sreenivasa, M.N.; Naik, N. and Bhat, S. N. 2011. Nutrient status and microbial load of different organic liquid manures. Karnataka Agricultural Sci., 24: 583-584.
Sridhar, T. 2003. Effect of bio regulators on black night shade (Solanum nigrum L.) M.Sc. (Agri.) Thesis, Tamil Nadu Agriculture University, Coimbatore.
Subhashini, S.; Arumugasamy, A.; Vijayalakshmi, K. and Balasubramanian, A.V. 2001. Vrikshayurveda – Ayurveda and plants. Center for Indian Knowledge System, Chennai, 47 p.
Suthar, S. 2010. Evidence of plant hormone like substances in vermi wash: ecologically safe options of synthetic chemicals for sustainable farming. Ecology Engineer, 36: 339-342.
Swaminathan, C. 2005. Food Production through vriksh-

254 Progressive Horticulture, 45 (2)
ayurvedic way. In: Technology for Natural Farming. Agricultural College & Research Institute, Madurai, Tamil Nadu, India, pp. 18-22.
Thimmaiah, A. and Anjali, 2003. Biodynamic agriculture: Harmony in chaos, Proceedings on Organic Farming in Horticulture for Sustainable Production, organized by CISH, Lucknow, August 29-30, 2003, pp. 90-93.
Uppar, V.V. and Rayar, S.G. 2012. Use of organic formu-lations in enhancing mulberry productivity, J. Eco-friendly Agriculture, 7(2): 137-141.
Venkataramana, P.; Narasimhamurthy, Rao, B.K. and Kamble, C.K. 2009. Efficacy of foliar sprays of vermi wash and cow dung wash on biochemical and yield attributes in mulberry (Morus alba L.). Karnataka Ag-riculture Sci.. 22:921-923.
Weir, M.L. 2009. Preparation and application of Gloria Biosol: Proc. Brainstorming Conference on Bringing Homa Organic Farming into the mainstream of Indian Agriculture, Organized by Five Fold Path Mission
in collaboration with Planning Commission, GOI, pp. 95-96.
Yadav, A.K. 2009. Organic Farming System: An Integrated Approach, Prepared for National Horticulture Mis-sion, Department of Agriculture & Cooperation, Ministry of Agriculture, New Delhi.
Yadav, B.K. and Lourduraj, A.C. 2005. Use of Panchagavya as Growth Stimulant and Bio pesticide in Agriculture. In: Environment and Agriculture (ed. Arvind Kumar). APH Publishing Corporation, New Delhi.
Zambare, V.P.; Padul, M.V.; Yadav, A.A. and Shete, T.B. 2008. Vermi wash: Biochemical and Microbial Ap-proach as Eco friendly soil conditioner, ARPN J. Agric & Biol. Sci; 3(4): 1-4.
Zhang, W.; Dick, W.A. and Hoitnk, H.A.J. 1996. Compost induced systematic acquired resistance in cucumber to Phythium rot and Anthracnose. Phytopathology, 86: 1066-1070.
Received on 07 August, 2013 and accepted on 23 Sptember, 2013

Online version available at: www.indianjournals.com
Progressive Horticulture, Vol. 45, No. 2, September 2013© Copyright by ISHRD, Printed in India
[Research Article]
Studies on nut and kernel characters in some cultivars/selections of walnut
Chandra Pandey*, C.S.Tomar, R.L.Lal* and Pavan Shukla*Department of Fruit ScienceDr Y. S. Parmar University of Horticulture and Forestry, Nauni, Solan-173230, Himachal Pradesh.*Department of Horticulture, GBPUAT, Pantnagar.Email: [email protected]
ABSTRACTAn investigation was carried out to study the variation in nut and kernel characters of nine walnut cultivars/
selections. Comprehensive observations on nut and kernel characters of the nine cultivars/selections were made and considerable variations were found for nut and kernel characters among all the cultivars/selections. None of the cultivars/selections excelled in all the characters. The earliest harvesting was recorded in Paynee. Local Selec-tion 20 recorded maximum nut weight, kernel weight and kernel protein while Hartley had maximum oil content. Hartley and Paynee had light amber coloured kernels which is an important character from commercial point of view.
KEY wORDS: Walnut, kernel, characterstic.
Walnut (Juglans regia L.) is one of the most impor-tant fruit crops of temperate regions of the world belong-ing to the family Juglandaceae and is considered native to Persia and North Western Himalayas. The kernels are widely used in confectionaries and extracting oil. Nuts have high nutritive value. The major walnut producing countries are USA, China, France, Turkey and Italy. In India it is cultivated at an altitude of 1200-2200 metres above the mean sea level. The Western Himalayas region of India comprising of the states of Jammu & Kashmir, Himachal Pradesh and Uttarakhand are the country’s major walnut-producing region. Walnut cultivars in In-dia exhibit a wide variation in nut and kernel characters which need to be properly studied and characterized. Therefore the present studies were conducted to scien-tifically characterize walnut cultivars/selections on the basis of nut and kernel characters.
MATERIALS AND METHODSThe present studies on nut and kernel characters
in some cultivars of walnut (Juglans regia L.) were car-ried out in the experimental orchard of the Department of Fruit Science, Dr Y.S Parmar university of Horticul-ture and Forestry, Nauni-Solan (H.P.), India during the
year 2007-08. Uniform, healthy and disease free, bear-ing walnut cultivars/selections grafted/budded on seedling rootstock and of same age group of 4-5 years were selected for these investigations. The experimental trees were subjected to uniform cultural practices during the study. The experiment was laid out in Randomized Block Design (RBD) with nine treatments in three repli-cations. Three trees served as a unit of a treatment. The time of nut harvesting was recorded on the day of first signs of hull splitting and the nuts start falling down. For evaluation of nut and kernel characteristics, ten fruits were randomly collected from each tree under dif-ferent replications of treatment and the average nut and kernel weight were recorded. The weight of nuts, kernel and shells extracted from 10 selected nuts was measured with the help of digital weighing balance and the aver-age was expressed in grams (g). The length and breadth of kernels extracted from 10 selected nuts was measured with the help of Vernier Calipers and the averages were expressed in centimeters (cm). The intensity of colour of nuts and kernels was observed visually and charac-terized as light brown, medium brown, dark brown and very dark brown for nut colour, and light amber, medium amber, dark amber and extra dark amber for kernel colour. The kernel percentage was calculated by

256 Progressive Horticulture, 45 (2)
Table 1: Observations on nut characters
Cultivar/selection Time of harvesting Shell colour Shell thickness (mm) Nut weight (g)Hartley 3/9/08 Light brown 1.32 7.90Pieral Lara 18/8/08 Light brown 1.44 7.61Ronde de Montignac 14/8/08 Medium brown 1.36 8.85Kashmir Selection 13/8/08 Medium brown 1.26 7.64Local Selection 20 30/8/08 Dark brown 1.50 10.74Local Selection 11 2/9/08 Very Dark brown 1.28 9.83Local Selection 3 8/9/08 Medium brown 1.32 7.85Local Selection 2 9/9/08 Light brown 1.47 10.55Paynee 11/8/08 Light brown 1.29 7.10
MeanCD0.05 1.360.08 8.670.08
Table 2: Observations on kernel characters
Cultivar/ Ease of Kernel Kernel Kernel Kernel Shell to Kernel Kernel Kernel selection kernel colour weight(g) length breadth kernel percentage oil (%) protein removal (cm) (cm) ratio (%)Hartley Easy Light 3.47 2.44 2.01 1.27 44.01 (41.56)* 51.01 (45.58)* 10.64 amber Pieral Lara Moderate Medium 2.66 2.43 2.01 1.86 34.99 (36.27) 48.76 (44.29) 9.92 amberRonde de Moderate Medium 2.84 2.47 2.06 2.10 32.10 (34.51) 49.59 (44.77) 9.31 Montignac amberKashmir Easy Medium 2.26 2.26 1.92 2.38 29.59 (32.96) 46.02 (42.72) 8.66 Selection amberLocal Moderate Dark 4.23 2.51 2.06 1.53 39.44 (38.90) 50.50 (45.29) 11.02 Selection 20 amberLocal Difficult Extra 3.89 2.74 1.89 1.52 39.55 (38.97) 43.71 (41.39) 8.75 Selection 11 dark amberLocal Moderate Medium 2.41 2.53 1.86 1.81 30.70 (33.65) 41.01 (39.82) 8.16 Selection 3 amberLocal Difficult Medium 3.15 2.36 1.74 2.34 29.88 (33.14) 40.83 (39.72) 7.89 Selection 2 amberPaynee Moderate Light 2.34 2.27 2.13 2.02 33.02 (35.07) 50.39 (45.23) 10.51 amber
Mean 3.03 2.45 1.96 1.87 34.81 0.25 46.87 0.99 9.43 CD0.05 0.04 0.13 0.18 0.01 (36.11) (0.15) (43.20) (0.57) 0.42
* Figures in parentheses are arc sine transformed values
dividing the kernel weight with nut weight, and expressed in percentage. Shell kernel ratio was calculated by dividing shell weight with kernel weight and expressed in percentage. For the estimation of kernel protein the Kjeldahl’s method as described by Kanwar and Chopra (1967) for the estimation of crude protein in plant samples was followed. The nitrogen percentage obtained so was multiplied by a factor of 5.3 as
suggested for tree nuts by Khanizadeh et al., (1995) to calcu-late the crude protein percentage. Oil content of the kernels was determined on dry weight basis and expressed in per-centage. The nuts were oven dried at 60º C until they were moisture free. Petroleum ether was used as a solvent for oil extraction in a Soxhlet apparatus as per the method described by Ranganna (1997).

Progressive Horticulture, 45 (2) 257
RESULTS AND DISCUSSION
Nut charactersObservations regarding nut characters are depicted
in Table 1. Time of harvesting of nuts as indicated by hull splitting was observed to vary from 11thAugust in Paynee to 9th September in Local Selection 2. These find-ings are in confirmation with that of Rathore (1984) who also reported harvest dates varying from 11th August in cultivar Japan to 5th September in cultivars Blackmore, Tutle-16, Tutle- 31 and Neilson. In the present studies cultivar Paynee (11th August) had the earliest harvest date. These findings are in agreement with the findings of Lonnie (1997) who also reported early harvesting in Paynee. In earlier reports from India, nut harvest dates ranged from as early as the first week of August to as late as the third week of October by Pandey and Sinha (1984). Nut harvesting was a little early in the present studies which may be attributed to climatic and environ-mental factors. Shell colour in various cultivars/selec-tions varied from light brown, medium brown to dark and very dark brown. These results are in agreement with the findings of Sharma (2004) who also reported similar variations in shell colour. Shell thickness is an important characterstic which determine the crack qual-ity of walnut. In the present studies the shell thickness varied from 1.26-1.50 mm. These results are in close con-formity with the findings of Sen (1993) who reported the shell thickness in walnut to vary from 1.2-1.5 mm. As per the international standards an ideal nut should weigh between 12-18 g (Mc Granahan and Leslie, 1990). In the present study nut weight varied from 7.10 g (Paynee) to 10.74 g (Local Selection 20). Similar observations on two year old walnut trees were also recorded by Botu et al. (2001).
Kernel charactersLike nut characters kernel characters are equally im-
portant when kernels are sold in the market instead of in-shell nut. Kernel characters like weight, colour, size, oil and protein content varied considerably among the different cultivars/selections studied. The observations regarding kernel characters are depicted in Table 2. In the present studies kernel colour varied from light am-ber, medium amber to dark and very dark amber. Hart-ley and Paynee had light amber coloured kernels. Simi-lar variation in kernel colour were reported by Sharma (2004) and Gautam (2000). Ease of kernel removal in the studied cultivars/selections ranged from easy, moder-ate to difficult. These results are in agreement with the findings of Sharma (2004). Kernel length and breadth in the present studies varied from 2.27 cm (Paynee) to 2.74 cm (Local Selection 11). Almost similar variations
in kernel length (1.99-3.44cm) and kernel breadth (1.64-3.54cm) have been reported by Joolka and Sharma (2005) in walnut varieties. The difference in kernel size may be attributed to the difference in the genetic make up of the cultivars/selections studied. Shell kernel ratio in the present studies ranged from 1.27 (Hartley) to 2.38 g (Kashmir Selection). Pandey and Sinha (1984), however, reported a lower value of shell kernel ratio (1.0-1.8).
The higher values of shell kernel ratio obtained in some varieties in the present studies may be due to their comparatively low quality. In the present studies kernel percentage varied from 29.59 per cent (Kashmir selec-tion) to 44.01 per cent (Hartley). These results are in close conformity with the findings of Negi (2004) and Mehta et al., (2005) who reported kernel percentage in walnut va-rieties to vary from 28.57-48.28 per cent. All the nine cul-tivars/selections varied considerably for kernel oil and protein content. Oil and protein content in the present studies varied from 40.83-51.01 per cent and 7.89-11.02 per cent, respectively. Sharma (2004) reported almost similar variations in oil (40.00-55.00%) and protein con-tent (3.00-11.30%). Higher values of oil content as high as 70 per-cent and protein as high as 25.08 per cent have been reported by Pandey et al., (2006) and Miletic et al., (2003). This variation may be due to the variation in the age of plants, and the diverse germplasm of walnut stud-ied.
REFERENCESBotu, M.; Godeanu, I. and Baeiu, A. 2001. Behaviour of
some walnut cultivars and selections in the first years after planting. Acta Horti., 544: 141-145.
Gautam, D.R. 2000. Selection of persian walnut (Juglans re-gia L.) varieties in Shimla district of Himachal Pradesh . Indian Plant Genetic Resour. 13(3): 294-297.
Joolka, N.K. and Sharma, M.K. 2005. Selection of superior persian Walnut (Juglans regia L.) strains from a popu-lation of seedling origin. Acta Horti., 696: 75-78.
Kanwar, J.S. and Chopra, S.L. 1967. Analysis of Fertilizers and manures. In: Analytical Chemistry. S. Chand and Company, New Delhi, India, pp. 119-161.
Khanizadeh, S.; Buszard, D. and Zarkadas, C.G. 1995. Misuse of the Kjeldahl method for estimating protein content in plant tissues. Hort. Sci. 30(7): 1341-1342.
Lonnie, C.H. 1997. Cultivar choices for California walnut growers. Acta Horti. 442: 265-270.
McGranahan G.H. and Leslie C.1990. Walnut (Juglans regia L.). Acta Horti., 290(2): 907-951.
Mehta, K.; Sharma, O.C.; Kashyap, A.S. and Thakur, B.S.

258 Progressive Horticulture, 45 (2)
Received on 8 March, 2013 and accepted on 3 August, 2013
2005. Variability for various nut and kernel characters in some promising seedling walnuts (Juglans regia L.) in Himachal Pradesh. Acta Horti., 696: 85-89.
Miletic, R.; Zikic, M.; Mitic, N. and Nikolic, R. 2003. Bio-logical and pomological characteristics of superior walnut selections. Genetika, 35(2):123-130.
Negi, R.K. 2004. Studies on some wild fruits in Kalpa area of Kinnaur district. M.Sc. Thesis, Dr. Y.S. Parmar University of Horticulture and Forestry, Nauni, Solan (H.P.), India.
Pandey, D.; and Sinha, M.M. 1984. Some promising se-lection from Jaunsar-Bhabar area of Garhwal hills: morphological studies. Prog. Hort., 16(3-4): 183-187.
Pandey, G.; Tripathi, A.N. and Mandal, S. 2006. Promising Genotypes of persian walnut (Juglans regia L.) from
Uttaranchal. Indian Horti. 63(3): 155-158.
Ranganna, S. 1997. Handbook of Analysis and Quality control for fruits and vegetable products. 2nd edition. Tata McGraw Hill publishing Co. Ltd. New Delhi, India, 1112 p.
Rathore, D.S. 1984. Evaluation of genetic resources of walnut. In: Advances in genetic resources of temper-ate fruits. pp. 47-49.
Sen, S.M. 1993. A study on the selection of darande wal-nut. Acta Horti., 311: 57-59.
Sharma, S. 2004. Studies on characterization and variation in walnut germplasm of diverse origin. M.Sc. Thesis, Dr. Y.S. Parmar University of Horticulture and For-estry, Nauni, Solan (H.P.), India.

Online version available at: www.indianjournals.com
Progressive Horticulture, Vol. 45, No. 2, September 2013© Copyright by ISHRD, Printed in India
[Research Article]
Efficiency of weedicide (UPH 707) to control complex weed flora in thompson seedless grape vineyard
S.D. Ramteke , M.A. Bhange , R.G. Somkuwar and R. J. Kor National Research Center for Grapes P. B. no. 3, Manjri Farm Post, Solapur road, Pune - 412 307, INDIAE mail: [email protected]
ABSRACTA field experiment was conducted to evaluate the bio-efficacy of UPH 707 against the complex weed flora in
grapes during 2008 – 2009. The treatments included test chemicals as UPH 707 and applied @ 250, 500 and 750 g.a.i./ ha dosages along with parquat dichloride @ 500 g.a.i. / ha; weed check and manually weed control. All the treat-ments significantly reduced the total number of weeds recorded at 15 and 30 days after treatment over untreated weeds per sq m (3.5, 4.5) and followed by the treatment of UPH 707 at 750 g.a.i. / ha (41.5, 29.0), which was found at par with the treatment of UPH 707 at 500 g.a.i. / ha (48.5, 44.0) and it was found superior than weed check and par-quat dichloride at 500 g.a.i. /ha (89.5, 89.0) at 15 and 30 days after application. No phyto-toxicity signs or symptoms were observed at 1, 3, 7, 15, days after application with tested herbicides (UPH-707) at all the dosages including the higher dose of UPH- 707 at 1000 g.a.i. / ha. Weed control treatments with or without herbicides significantly increased the number of bunches per vine as compared to weed check. The berry yield was increased with UPH 707 at 750 g.a.i. /ha (24.7 t/ha) and this treatment was on par with each other and significantly superior and safe in use over rest of the treatments in grape vineyards.
KEY wORDS: Herbicides, grapes, weed flora, weed control efficiency, yield
Grape (Vitis vinifera L.) is one of the most important fruit crops of temperate zone, which has acclimatized to sub tropical and tropical agro-climatic conditions prevailing in the Indian sub-continent. In India, grapes are grown under different soil with cultural operations. Weed flora in vineyards general variable according to the climate and physico-chemical properties of the soil. In grape cultivation, irrespective of the agro climatic conditions, Parthenium (Parthenium parviflorum Linn.), hariyali (Cynodon dactylon (L.Pers.) and nut grass (Cyper-us rotundus L.) are the common weeds in the Indian vine-yards although, as many as 378 species of weeds have been reported to infest the cultivated lands in Karnataka (Sastry et al., 1980). The weed flora also differs with the cultural practices in the vineyards. The variety of weeds and their intensity is more in vineyards where vines are trained to vertical trellises such as T, V, Y or tatura due to availability of uninterrupted sunlight (Patil., 2005). Un-der drip-irrigation system, weeds grow mainly in the irri-gated area particularly during summer. Therefore, time-ly weeding reduces the crop-weed competition, which results in higher crop yields. Hand weeding though an
efficient method is laborious, costly, time consuming and unsuitable for large grape vineyards. This necessi-tates the use of herbicides for weed control in developing countries like India. In the past, majority of workers have tried either pre-emergent or post-emergent weedicides for the control of weeds in grape vineyard in developed countries. No single weedicide pre-emergence or post-emergence is seen to offer a long lasting control of weeds in vineyards since grapevines are irrigated and the soil moisture is maintained throughout the year, which helps the weeds to grow almost throughout the year. Considering this, the present investigation was carried out to evaluate bio-efficacy of UPH 707 (a product from united phosphorus Ltd. Mumbai) for control of grassy and broad leaf weeds in grapes.
MATERIALS AND METHODSThe Field experiment was conducted at the farm of
the National Research Centre for Grapes, Pune during the year of 2008-2009. Pune is situated in western part of Maharashtra in India (latitude 18.31 N, longitude 73.55
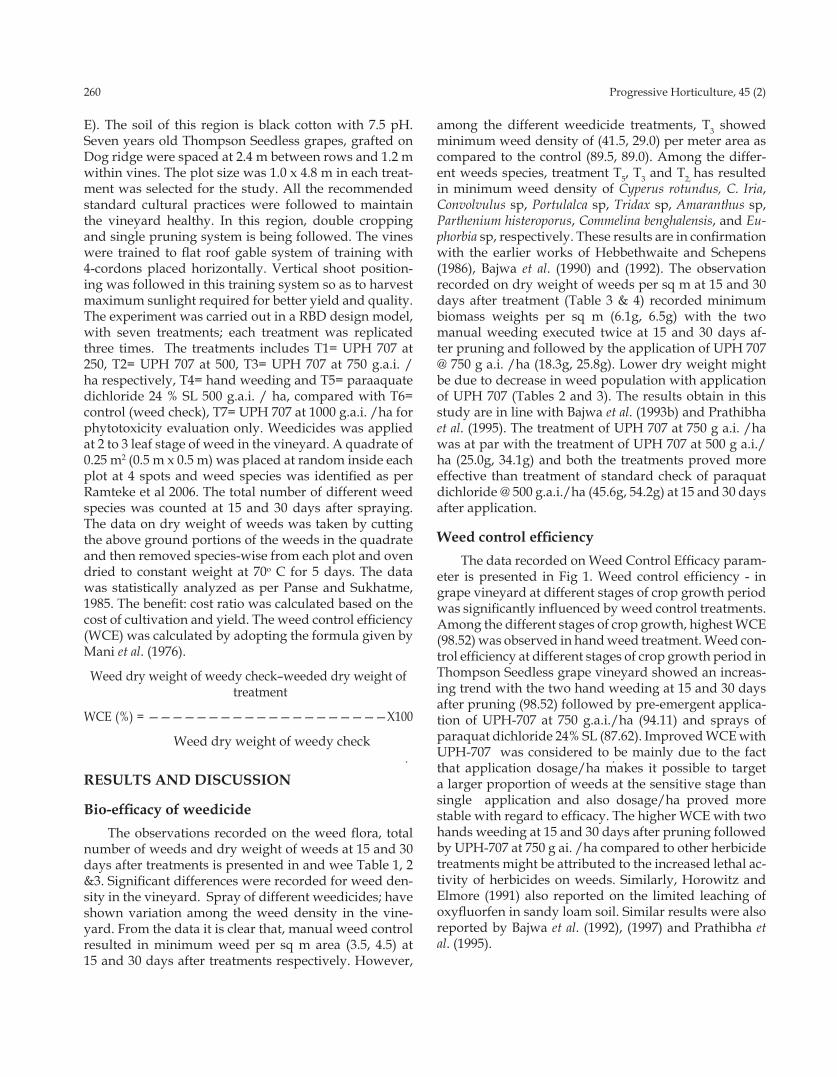
260 Progressive Horticulture, 45 (2)
E). The soil of this region is black cotton with 7.5 pH. Seven years old Thompson Seedless grapes, grafted on Dog ridge were spaced at 2.4 m between rows and 1.2 m within vines. The plot size was 1.0 x 4.8 m in each treat-ment was selected for the study. All the recommended standard cultural practices were followed to maintain the vineyard healthy. In this region, double cropping and single pruning system is being followed. The vines were trained to flat roof gable system of training with 4-cordons placed horizontally. Vertical shoot position-ing was followed in this training system so as to harvest maximum sunlight required for better yield and quality. The experiment was carried out in a RBD design model, with seven treatments; each treatment was replicated three times. The treatments includes T1= UPH 707 at 250, T2= UPH 707 at 500, T3= UPH 707 at 750 g.a.i. / ha respectively, T4= hand weeding and T5= paraaquate dichloride 24 % SL 500 g.a.i. / ha, compared with T6= control (weed check), T7= UPH 707 at 1000 g.a.i. /ha for phytotoxicity evaluation only. Weedicides was applied at 2 to 3 leaf stage of weed in the vineyard. A quadrate of 0.25 m2 (0.5 m x 0.5 m) was placed at random inside each plot at 4 spots and weed species was identified as per Ramteke et al 2006. The total number of different weed species was counted at 15 and 30 days after spraying. The data on dry weight of weeds was taken by cutting the above ground portions of the weeds in the quadrate and then removed species-wise from each plot and oven dried to constant weight at 70o C for 5 days. The data was statistically analyzed as per Panse and Sukhatme, 1985. The benefit: cost ratio was calculated based on the cost of cultivation and yield. The weed control efficiency (WCE) was calculated by adopting the formula given by Mani et al. (1976).
Weed dry weight of weedy check–weeded dry weight of treatment
WCE (%) = ————————————————————X100
Weed dry weight of weedy check
RESULTS AND DISCUSSION
Bio-efficacy of weedicideThe observations recorded on the weed flora, total
number of weeds and dry weight of weeds at 15 and 30 days after treatments is presented in and wee Table 1, 2 &3. Significant differences were recorded for weed den-sity in the vineyard. Spray of different weedicides; have shown variation among the weed density in the vine-yard. From the data it is clear that, manual weed control resulted in minimum weed per sq m area (3.5, 4.5) at 15 and 30 days after treatments respectively. However,
among the different weedicide treatments, T3 showed minimum weed density of (41.5, 29.0) per meter area as compared to the control (89.5, 89.0). Among the differ-ent weeds species, treatment T5, T3 and T2, has resulted in minimum weed density of Cyperus rotundus, C. Iria, Convolvulus sp, Portulalca sp, Tridax sp, Amaranthus sp, Parthenium histeroporus, Commelina benghalensis, and Eu-phorbia sp, respectively. These results are in confirmation with the earlier works of Hebbethwaite and Schepens (1986), Bajwa et al. (1990) and (1992). The observation recorded on dry weight of weeds per sq m at 15 and 30 days after treatment (Table 3 & 4) recorded minimum biomass weights per sq m (6.1g, 6.5g) with the two manual weeding executed twice at 15 and 30 days af-ter pruning and followed by the application of UPH 707 @ 750 g a.i. /ha (18.3g, 25.8g). Lower dry weight might be due to decrease in weed population with application of UPH 707 (Tables 2 and 3). The results obtain in this study are in line with Bajwa et al. (1993b) and Prathibha et al. (1995). The treatment of UPH 707 at 750 g a.i. /ha was at par with the treatment of UPH 707 at 500 g a.i./ha (25.0g, 34.1g) and both the treatments proved more effective than treatment of standard check of paraquat dichloride @ 500 g.a.i./ha (45.6g, 54.2g) at 15 and 30 days after application.
Weed control efficiencyThe data recorded on Weed Control Efficacy param-
eter is presented in Fig 1. Weed control efficiency - in grape vineyard at different stages of crop growth period was significantly influenced by weed control treatments. Among the different stages of crop growth, highest WCE (98.52) was observed in hand weed treatment. Weed con-trol efficiency at different stages of crop growth period in Thompson Seedless grape vineyard showed an increas-ing trend with the two hand weeding at 15 and 30 days after pruning (98.52) followed by pre-emergent applica-tion of UPH-707 at 750 g.a.i./ha (94.11) and sprays of paraquat dichloride 24% SL (87.62). Improved WCE with UPH-707 was considered to be mainly due to the fact that application dosage/ha makes it possible to target a larger proportion of weeds at the sensitive stage than single application and also dosage/ha proved more stable with regard to efficacy. The higher WCE with two hands weeding at 15 and 30 days after pruning followed by UPH-707 at 750 g ai. /ha compared to other herbicide treatments might be attributed to the increased lethal ac-tivity of herbicides on weeds. Similarly, Horowitz and Elmore (1991) also reported on the limited leaching of oxyfluorfen in sandy loam soil. Similar results were also reported by Bajwa et al. (1992), (1997) and Prathibha et al. (1995).
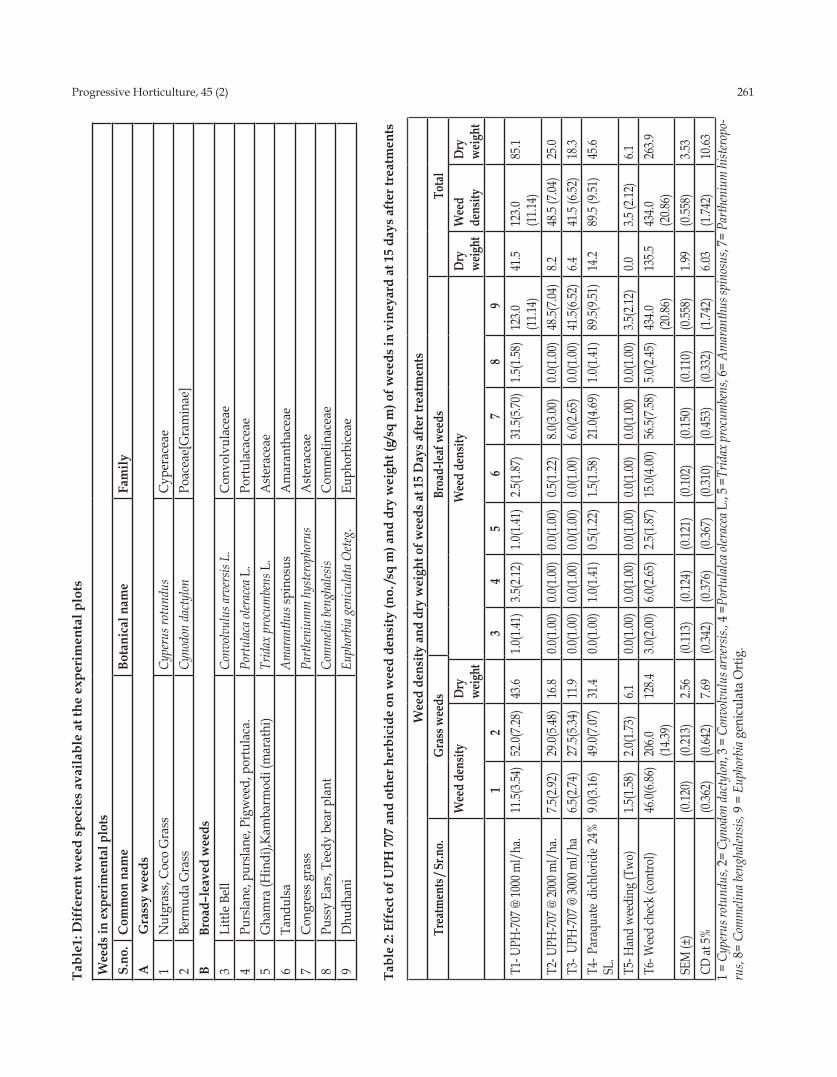
Progressive Horticulture, 45 (2) 261Ta
ble1
: Dif
fere
nt w
eed
spec
ies
avai
labl
e at
the
expe
rim
enta
l plo
ts
wee
ds in
exp
erim
enta
l plo
tsS.
no.
Com
mon
nam
eBo
tani
cal n
ame
Fam
ilyA
G
rass
y w
eeds
1N
utgr
ass,
Coco
Gra
ssCy
peru
s rot
undu
sCy
pera
ceae
2Be
rmud
a G
rass
Cyno
don
dact
ylon
Poac
eae[
Gra
min
ae]
B
Broa
d–le
aved
wee
ds3
Littl
e Bel
lCo
nvolv
ulus
arve
rsis
L.Co
nvol
vula
ceae
4Pu
rsla
ne, p
ursla
ne, P
igw
eed,
por
tula
ca.
Portu
laca o
lerac
ea L
.Po
rtula
cace
ae5
Gha
mra
(Hin
di),K
amba
rmod
i (m
arat
hi)
Trid
ax p
rocu
mbe
ns L
.A
ster
acea
e6
Tand
ulsa
Amar
anth
us sp
inos
usA
mar
anth
acea
e7
Cong
ress
gra
ssPa
rthen
ium
m h
yster
opho
rus
Ast
erac
eae
8Pu
ssy
Ears
, Tee
dy b
ear p
lant
Com
meli
a ben
ghale
sisCo
mm
elin
acea
e9
Dhu
dhan
iEu
phor
bia g
enicu
lata O
eteg.
Euph
orbi
ceae
Tabl
e 2:
Eff
ect o
f UPH
707
and
oth
er h
erbi
cide
on
wee
d de
nsity
(no.
/sq
m) a
nd d
ry w
eigh
t (g/
sq m
) of w
eeds
in v
iney
ard
at 1
5 da
ys a
fter
trea
tmen
ts
wee
d de
nsity
and
dry
wei
ght o
f wee
ds a
t 15
Day
s afte
r tre
atm
ents
Trea
tmen
ts / S
r.no.
Gra
ss w
eeds
Br
oad-
leaf
wee
dsTo
tal
wee
d de
nsity
Dry
we
ight
wee
d de
nsity
D
ry
weig
htw
eed
dens
ityD
ry
wei
ght
12
34
56
78
9T1
- UPH
-707
@ 10
00 m
l/ha
.11
.5(3.5
4)52
.0(7.2
8)43
.61.0
(1.41
)3.5
(2.12
)1.0
(1.41
)2.5
(1.87
)31
.5(5.7
0)1.5
(1.58
)12
3.0
(11.1
4)41
.512
3.0
(11.1
4)85
.1
T2- U
PH-7
07 @
2000
ml/
ha.
7.5(2
.92)
29.0(
5.48)
16.8
0.0(1
.00)
0.0(1
.00)
0.0(1
.00)
0.5(1
.22)
8.0(3
.00)
0.0(1
.00)
48.5(
7.04)
8.248
.5 (7
.04)
25.0
T3-
UPH
-707
@ 30
00 m
l/ha
6.5(2
.74)
27.5(
5.34)
11.9
0.0(1
.00)
0.0(1
.00)
0.0(1
.00)
0.0(1
.00)
6.0(2
.65)
0.0(1
.00)
41.5(
6.52)
6.441
.5 (6
.52)
18.3
T4- P
araq
uate
dich
lorid
e 24
%
SL.
9.0(3
.16)
49.0(
7.07)
31.4
0.0(1
.00)
1.0(1
.41)
0.5(1
.22)
1.5(1
.58)
21.0(
4.69)
1.0(1
.41)
89.5(
9.51)
14.2
89.5
(9.51
)45
.6
T5- H
and
wee
ding
(Tw
o)1.5
(1.58
)2.0
(1.73
)6.1
0.0(1
.00)
0.0(1
.00)
0.0(1
.00)
0.0(1
.00)
0.0(1
.00)
0.0(1
.00)
3.5(2
.12)
0.03.5
(2.12
)6.1
T6- W
eed
chec
k (co
ntro
l)46
.0(6.8
6)20
6.0
(14.3
9)12
8.43.0
(2.00
)6.0
(2.65
)2.5
(1.87
)15
.0(4.0
0)56
.5(7.5
8)5.0
(2.45
)43
4.0
(20.8
6)13
5.543
4.0
(20.8
6)26
3.9
SEM
(±)
(0.12
0)(0
.213)
2.56
(0.11
3)(0
.124)
(0.12
1)(0
.102)
(0.15
0)(0
.110)
(0.55
8)1.9
9(0
.558)
3.53
CD at
5%(0
.362)
(0.64
2)7.6
9(0
.342)
(0.37
6)(0
.367)
(0.31
0)(0
.453)
(0.33
2)(1
.742)
6.03
(1.74
2)10
.631 =
Cyp
erus
rotu
ndus
, 2=
Cyno
don
dact
ylon
, 3 =
Con
volv
ulus
arve
rsis.
, 4 =
Portu
lalca
oler
acea
L., 5
=Tr
idax
proc
umbe
ns, 6
= Am
aran
thus
spin
osus
, 7=
Parth
eniu
m hi
stero
po-
rus,
8= C
omm
elina
beng
halen
sis, 9
= E
upho
rbia
geni
cula
ta O
rtig.
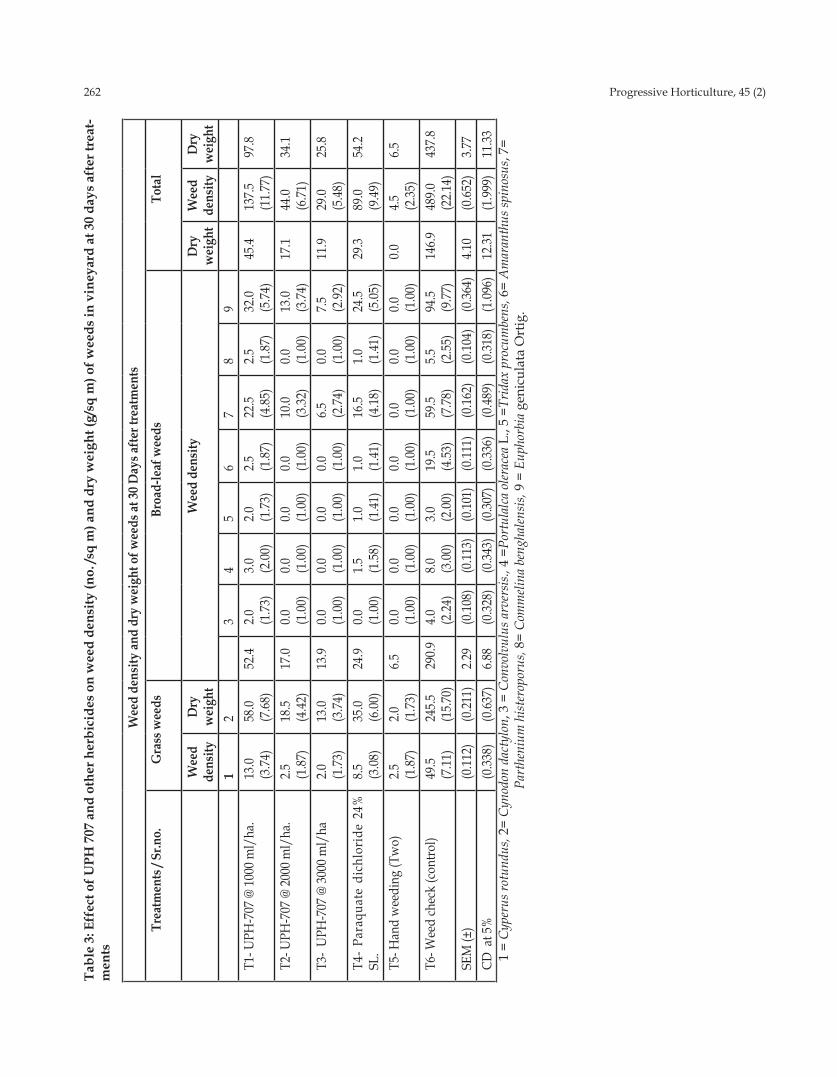
262 Progressive Horticulture, 45 (2)Ta
ble
3: E
ffec
t of U
PH 7
07 a
nd o
ther
her
bici
des
on w
eed
dens
ity (n
o. /s
q m
) and
dry
wei
ght (
g/sq
m) o
f wee
ds in
vin
eyar
d at
30
days
aft
er tr
eat-
men
ts
wee
d de
nsity
and
dry
wei
ght o
f wee
ds at
30 D
ays a
fter t
reat
men
ts
Trea
tmen
ts /
Sr.n
o.G
rass
wee
dsBr
oad-
leaf
wee
dsTo
tal
wee
d de
nsity
Dry
w
eigh
t w
eed
dens
ityD
ry
wei
ght
wee
d
dens
ityD
ry
wei
ght
12
34
56
78
9T1
- UPH
-707
@ 1
000
ml/
ha.
13.0
(3
.74)
58.0
(7
.68)
52.4
2.0
(1.7
3)3.
0 (2
.00)
2.0
(1.7
3)2.
5 (1
.87)
22.5
(4
.85)
2.5
(1.8
7)32
.0
(5.7
4)45
.413
7.5
(11.
77)
97.8
T2- U
PH-7
07 @
200
0 m
l/ha
.2.
5 (1
.87)
18.5
(4
.42)
17.0
0.0
(1.0
0)0.
0 (1
.00)
0.0
(1.0
0)0.
0 (1
.00)
10.0
(3
.32)
0.0
(1.0
0)13
.0
(3.7
4)17
.144
.0
(6.7
1)34
.1
T3-
UPH
-707
@ 3
000
ml/
ha2.
0 (1
.73)
13.0
(3
.74)
13.9
0.0
(1.0
0)0.
0 (1
.00)
0.0
(1.0
0)0.
0 (1
.00)
6.5
(2.7
4)0.
0 (1
.00)
7.5
(2.9
2)11
.929
.0
(5.4
8)25
.8
T4-
Para
quat
e di
chlo
ride
24%
SL
.8.
5 (3
.08)
35.0
(6
.00)
24.9
0.0
(1.0
0)1.
5 (1
.58)
1.0
(1.4
1)1.
0 (1
.41)
16.5
(4
.18)
1.0
(1.4
1)24
.5
(5.0
5)29
.389
.0
(9.4
9)54
.2
T5- H
and
wee
ding
(Tw
o)2.
5 (1
.87)
2.0
(1.7
3)6.
50.
0 (1
.00)
0.0
(1.0
0)0.
0 (1
.00)
0.0
(1.0
0)0.
0 (1
.00)
0.0
(1.0
0)0.
0 (1
.00)
0.0
4.5
(2.3
5)6.
5
T6- W
eed
chec
k (c
ontro
l)49
.5
(7.1
1)24
5.5
(15.
70)
290.
94.
0 (2
.24)
8.0
(3.0
0)3.
0 (2
.00)
19.5
(4
.53)
59.5
(7
.78)
5.5
(2.5
5)94
.5
(9.7
7)14
6.9
489.
0 (2
2.14
)43
7.8
SEM
(±)
(0.1
12)
(0.2
11)
2.29
(0.10
8)(0
.113)
(0.10
1)(0
.111
)(0
.162
)(0
.104
)(0
.364
)4.
10(0
.652
)3.
77CD
at 5
%
(0.3
38)
(0.6
37)
6.88
(0.32
8)(0
.343)
(0.30
7)(0
.336
)(0
.489
)(0
.318
)(1
.096
)12
.31
(1.9
99)
11.3
31
= Cy
peru
s rot
undu
s, 2=
Cyn
odon
dac
tylo
n, 3
= C
onvo
lvul
us a
rver
sis.,
4 =P
ortu
lalc
a ol
erac
ea L
., 5
=Trid
ax p
rocu
mbe
ns, 6
= A
mar
anth
us sp
inos
us, 7
= Pa
rthe
nium
hist
erop
orus
, 8=
Com
meli
na b
engh
alen
sis, 9
= E
upho
rbia
gen
icul
ata
Ort
ig.

Progressive Horticulture, 45 (2) 263
Fig. 1: Yield/vine, benefit cost ratio/ha and weed control efficiency (%) as influenced by treatments
Phytotoxicity studyThe phytotoxicity of herbicides was studied as per
CIB guidelines on 0-10 scale, by comparing the toxicity symptoms from the treated and untreated plots. It was observed that no phytotoxic signs or symptoms viz. leaf tip/surface injury, wilting, vein clearing, necrosis, epi-nasty and or hyponasty were observed even at 15 days after treatments even by application of the highest dose of UPH 707 1000 g a.i. /ha in the vineyard.
Effect on berry yieldAll the treatments recorded significantly higher
berry yield in comparison to untreated weedy check which are presented in (fig 1.). The maximum grape-berry yield (13.49kg/vines) was obtained with the two manual weeding executed twice at 15 and 30 days after pruning. Followed by UPH 707 @ 750 g a.i. /ha (12.67 kg/vine) which was however at par with the treatment of UPH 707 @ 500 g a.i. /ha (12.10 kg/vine) and both the treatments proved more effective than the treatment of paraquat dichloride 24 % SL @ 500 g a.i. /ha (10.62 kg/vine). Grape berry yield was significantly lower in control (7.33 kg/vine) compared to all other treatments studied. The increase in yield per vine with two manual weeding executed twice at 15 and 30 days interval after pruning might be due to availability of low weed den-sity that have resulted in to better utilization of water & nutrients from the soil, ultimately the higher number of bunches per vine. Increase in yield of grape with gly-phosate treatment was due to more number of bunches per vine (Pratibha et al., Bajawa., 1993b, 1997). Challa (1987) reported that oxyfluorfen controlled the weeds effectively in vineyard.
Benefit Cost ratio : The highest benefit cost ratio was obtain in hand weeded (twice) (1.497), followed by UPH 707 750 g.a.i. i.e 3000 ml/ha (1.405). Noticeable decrease in Benefit: Cost ratio in paraquate dichloride 24% SL (1.178) was recorded. Lowest ratio was recorded in (con-trol) weedy check (0.814).
ACKNOwLEDGEMENTSThe authors thankful to M/s United Phosphorus
Limited, Mumbai-400 018, for sponsoring this trial and the Director, National Research Center for Grapes, Pune-412 307, India, for providing all the facilities for smooth conduct of the research work.
REFERENCESBajawa, G.S.; Bal, J.S.; Brar, S.S. and Minhas, P.P.S. 1993a.
Chemical weed control in ber orchards. Proceedings of International Symposium of Indian Society of Weed Science, Hisar. Vol-III: 225.
Bajawa, G.S.; Bal, J.S.; Brar, S.S. and Minhas, P.P.S. 1993b. Efficacy of various herbicides to control weeds in the vineyards. Proceedings of International Symposium, Indian Society of Weed Science, Hisar, Vol-III: 222-224.
Bajawa, G.S.; Bal, J.S.; Brar, S.S. and Minhas, P.P.S. 1997. Studies on weed control in vineyards under different agro climatic conditions of Punjab. Indian J. Horti., 54: 50-52.
Bajawa, G.S.; Bal, J.S.; Brar, S.S.; Minhas, P.P.S. and Cheema, S.S. 1992. Efficacy of herbicides in controlling weeds in vineyards. Proceedings of the International

264 Progressive Horticulture, 45 (2)
Symposium on Recent Advances in Viticulture and Oenology, held at Hyderabad 14-17, Feb. 1992, pp. 289-293.
Bajwa, G.S. 1990. Weed management in vineyards. Paper presented in the National Seminar cum Workshop on Grapes for Northwest Plains held at Punjab Agricul-tural University, Ludhiana. p. 65.
Challa P. 1987. Chemical weed control in grape (Vitis vinifera L.) nurseries. Pesticides, 21: 27-29.
Hebbethwaite, J.F. and Schepens, G.R. 1986. Efficacy of glyphosate in Viticulture. Horticultural Abstract, 56: 170.
Horowitiz, M. and Elmore, C.L. 1991. Leaching of oxy-fluorfen in container media. Weed Technology, 5: 175-180.
Mani, M.; Balasubramaniam, S. and Duraipandan, A. 1976. Effect of certain herbicides in the control of nut grass in vineyards. Indian J. Plant Protection, 4: 123-124.
Patil, D.R. 2005. Studies on production technology in Thompson Seedless grapes (Vitis vinifera L.); Thesis submitted to the University of Agricultural Sciences, Dharwad, in partial fulfillment of the requirements for the Degree of Doctor of Philosophy in Horticul-ture. Department of Horticulture collage of Agricul-ture, Dharwad, University of Agricultural Science, Dharwad-580 005.
Prathiba, N.C.; Muniyappa T.V. and Muethy B.G. 1995. Studies on chemical weed control of Oxalis latifolia on growth, yield and quality of grapes. J. Maharashtra Agri. Univ., 20: 202-205.
Ramteke, S.D.; Dhumal, K.N.; Patil, H.S. and Taware, P.B. 2006. Weed management in grape vineyard. Godava krushi prakashan. Ist Edition: pp.1-56.
Sastry, K; Boraiah, K.S.G., Govindu, H.C. and Khakleel, T.F.1980. Weeds of Karnataka. UAS Text book Series No.2. University of Agricultural Sciences, Bangalore, 359 p.
Received on 09 October, 2012 and accepted on 17 March, 2013

Online version available at: www.indianjournals.com
Progressive Horticulture, Vol. 45, No. 2, September 2013© Copyright by ISHRD, Printed in India
[Research Article]
Effect of post harvest treatments of organic acid and polysaccharide on shelf life of litchi (Litchi chinensis Sonn.) cv. Rose Scented
Deepak Deval, N.K. Mishra and R.L. LalDepartment of Horticulture, G.B. Pant University of Agriculture and Technology, Pantnagar-263 145, Distt. U.S. Nagar (Uttarakhand)Email: [email protected]
ABSTRACTThe present study was conducted at Department of Horticulture, G.B. Pant University of Agriculture and
Technology, Pantnagar, during the year 2011 on Litchi cv. Rose Scented with an aim to increase the shelf life and retension of colour in litchi fruits after harvest. The experiment consisted of 8 treatments of organic acids and polysaccharide (control, Chitosan 1%, Citric acid 5%, Citric acid 10%, Ascorbic acid 5%, Ascorbic acid 10%, Oxalic acid 5% and Oxalic acid 10%). The fruits were stored at 2°C with RH 85-90%. Among all treatments, Chitosan 1% exhibited potential for shelf life extension of litchi fruits, while Oxalic acid 10% effectively controlled the pericarp browning of litchi fruit during storage study.
KEY wORDS: Litchi, post harvest treatments, organic acid, chitosan coating, shelf life
Litchi (Litchi chinensis Sonn.) is a tropical and sub-tropical fruit with a high market value for its white, translucent aril and attractive red colour. Litchi is very delicate in nature and highly perishable, which accounts for its low shelf life. The attractive bright red colour is lost within 48 hours of harvest (Underhill and Critch-ley, 1993). Pericarp browning in litchi is due to the in-volvement of several factors viz., enzymatic activities, desiccation, pH, microcracks, chilling injury, wounding or mechanical injury, pathogen and pests attack and se-nescence. All these factors contribute towards pericarp browning. Pericarp browning of harvested litchi fruit is believed to be a rapid degradation of anthocyanidin by polyphenol oxidase and peroxidase (Chen and Wang, 1989). Dehydration was another key factor leading to pericarp browning. Although, currently used bisulphite prevent browning but they can be dangerous to human health (Taylor and Bush, 1987). So alternative chemicals without toxic effect are needed. Chitosan, a cationic polysaccharide was used with intent to inhibit brown-ing of pericarp of litchi fruits (Zhang and Quantick, 1997). Thus, the present study was aimed to investigate the effects of organic acid and polysachride on pericarp browning and reduce aril decay of litchi fruits.
MATERIALS AND METHODSThe experiment was carried out at the Department of
Horticulture, College of Agriculture, G.B. Pant Univer-sity of Agriculture and Technology, Pantnagar, during 2011. Fruits were selected according to uniformity of size and colour and were randomly distributed into group of 30 fruits and for each treatment two replications were used. The stock solutions of citric acid, oxalic acid and ascorbic acid each of 5% and 10%, respectively, were pre-pared. To prepare 1 litre of chitosan 1% solutions, 10.0 g of chitosan was dispersed in 1000 ml of distilled water to which 2 g of citric acid was added, and the mixture was heated to dissolve the chitosan and then kept for cooling. Fruits were dipped for 10 minutes and allowed to dry for one hour after dipping. Fruits were placed in a perforat-ed polythene bags, maintained at 2% level of ventilation by piercing small holes in polythene bag and placed in cold store at 2° C. Observations on fruit length (cm) and fruit width (cm) were taken with the vernier caliper, fruit weight (g) with digital weighing machine, fruit volume (cc) with water displacement method; physiological loss in weight (%), decay percentage (%), total soluble solids (0B) with the help of hand refractometer; titratable acid-ity (%) and ascorbic acid (mg/100g) and sugars (%) as

266 Progressive Horticulture, 45 (2)
per method as described by Ranganna (1986), anthocya-nin content (mg/100g) according to method of Mazum-dar and Majumdar (2003) and pH was using pH meter. The data was analysed following Complete Randomise Block Design.
RESULTS AND DISCUSSION
Physical parametersThe slower decrease in fruit length, fruit width, fruit
volume and fruit weight was observed in Chitosan 1% treated fruits which may be due to retarded process of respiration and transpiration and also the rate of the moisture loss from the fruits. These results are in ac-cordance with finding as reported by Rattanapanone et al. (2007). Significantly less weight loss (5.39 %) was re-corded in Citric acid 10% treatment. The factors respon-sible for this can be understood as an increase in the ef-ficiency of the rind to absorb these anti-browning agents more effectively. This in turn could have an effect on lowering down the rate of respiration and transpiration and thereby reducing weight loss (Jiang and Fu, 1999). Chitosan 1% significantly showed minimum fruit decay (2.50 %) during storage might be due to inhibition of fun-gal growth on fruits and reduced rate of respiration and transpiration. Consequently, it also helped in limiting physiological activities of fungi including moulds (Ro-manazzi et al., 2002).
Chemical parametersSignificantly higher TSS (21.10°B) level was noticed
in Oxalic acid 5% treatment. The increase in TSS of fruit might be due to considerable loss of water from fruits (Ray et al., 2004) in which the concentration of sugars might have increased. No significant difference was ob-
served in acidity of fruits although maximum decline was observed in Chitosan 1% treatment. The lower levels of titratable acidity in the pulp of the litchi fruits coated with chitosan may be due to protective O2 barrier or reduction of oxygen supply on the fruit surface which might inhibited respiration (Yonemoto et al., 2002). The treatment Chitosan 1% was significantly effective to re-duce decreasing trend of ascorbic acid content in pulp of litchi. The factors responsible for the decreasing ascorbic acid content in pulp may be attributed to chitosan coat-ing which might reduced the respiration rate. The chito-san may form a protective barrier on the surface on the surface of the fruit and reduce oxygen supply (Yueming and Yuebiao, 2001). The minimum pH (7.21) was ob-served in Chitosan 1%. It may be contributed to highly acidic nature of chitosan solution due to which the there might had been weakening of cross-linkages in the cell wall which in turn perhaps favoured slight penetration of acid into aril. The above results are in conformity with the finding as reported by Underhill and Critch-ley (1994). The reducing and non-reducing sugar did not show significant difference. The highest reducing sugar (10.30 %) and non-reducing sugar (2.31 %) was recorded in Oxalic acid 10%. Total sugar (12.62 %) was highest in Oxalic acid 10%. It may be due to conversion of starch into simple sugar or may be due to conversion of certain cell wall material such as hemicelluloses into reducing substance during prolonged storage (Stahi and Camp, 1971). Maximum anthocyanin content (5.90 mg/100 g) was recorded in Oxalic acid 10%. Oxalic Acid 10% signif-icantly reduced loss of anthocyanin content in storage. It may be due to effect of oxalic acid in maintaining the level of anthocyanin, inhibiting increase in polyphenol oxidase and peroxidase activity, which are associated with pericarp browning. The results are in conformity with those as reported by Son et al.(2000).
Table 1: Effect of organic acid and polysaccharide treatments on physical parameters of litchi fruits at 10th day of storage
Treatments Fruit length (cm) Fruit width (cm) Fruit volume (cc) Fruit weight (g) PLw(%) Decay %
Control (H20) 3.54 3.24 20.65 21.22 5.77 7.45Chitosan 1% 3.48 3.09 22.42 20.12 6.60 2.50Ascorbic acid 5% 3.53 3.20 21.78 20.42 6.77 15.40Ascorbic acid 10% 3.46 3.06 19.92 20.32 6.46 17.65Citric acid 5% 3.48 3.16 20.59 21.47 6.99 7.10Citric acid 10% 3.41 3.11 19.88 22.35 5.39 6.20Oxalic acid 5% 3.41 3.26 20.82 20.39 6.59 7.45Oxalic acid 10% 3.27 3.44 19.92 20.12 7.95 8.15CD at 5% 0.67 0.51 0.60 0.29 0.41 0.94

Progressive Horticulture, 45 (2) 267
REFERENCESChen, Y.Z. and Wang, Y.R. 1989. Study on peroxidases in
litchi pericarp. Acta. Bot. Austro. Sin., 5: 47-52.
Jiang, Y.M. and Fu, J.R. 1999. Biochemical and physiologi-cal changes involved in browning of litchi fruit caused by water loss. J. Hort. Sci. and Biotech., 7: 43-46.
Mazumdar, B.C. and Majumdar, K. 2003. Methods of physio-chemical analysis of fruits. Daya Publishing House, Delhi, India. pp.137-138.
Ranganna, S. 1986. Handbook of Analysis and Quality Control for Fruits and Vegetable Products. 2nd ed. Tata McGraw Hill Publishing Co. Ltd., New Delhi, pp.1-24.
Rattanapanone, N.; Plotto, A. and Baldwin, E. 2007. Ef-fect of edible coatings and other surface treatments on pericarp colour of Thai litchi cultivars. Proc. Fla. State Hort. Soc., 120: 222-227.
Ray, P.K.; Rani, R. and Singh, S.K. 2004. Effect of tempera-ture and sulphur treatments on storage behavior of litchi fruits. Indian J. Hort., 61: 292-295.
Romanazzi, G.; Nigro, F.; Ippolito, A.; Di Venere, D. and Salerno, M. 2002. Effects of pre and postharvest chitosan treatments to control storage grey mold of
table grapes. J. Food Sci., 67: 1862–1867.
Son, S.M., Moon, K.D. and Lee, C.Y. 2000. Kinetic study of oxalic acid inhibition on enzymatic browning. Agri. Food Chem., 48: 2071-2074.
Stahi, A.L. and Camp, A.F., 1971. Citrus fruits. In: The Biochemistry of Fruits and their Products, vol. 2, (Ed. Hulme, A.C.), pp. 107-169.
Taylor, S.L. and Bush, R.K. 1987. Sulphites as food ingre-dient. Food Technol., 40: 47-52.
Underhill, S.J.R. and Critchley, C. 1993. Lychee peri-carp browning caused by heat injury. Hort Sci., 28: 721–722.
Yonemoto, Y.; Higuchi, H. and Kitano, Y. 2002. Effects of storage temperature and wax coating on ethylene pro-duction, respiration and shelf-life in cherimoya fruit. Journal of the Japanese Soci. Horti. Sci., 71: 643–650.
Yueming and Yuebiao. 2001. Effect of chitosan coating on postharvest life and quality of longan fruit. Food Chem., 73: 139-143.
Zhang, D.L. and Quantick; P.C. 1997. Effects of chitosan coating on enzymatic browning and decay during postharvest storage of litchi (Litchi chinensis Sonn.) fruit. Postharvest Biol. and Technol., 12: 195–202.
Received on 11 October, 2012 and accepted on 3 July, 2013
Table 2: Effect of organic acid and polysaccharide treatments on chemical parameters of litchi fruits at 10th day of storage
Treatments TSS Titratable Ascorbic Reducing Non reducing Total Anthocyanin (°B) acidity(%) acid pH sugar (%) sugar (%) sugar (%) content (mg/100g) (mg/100g)
Control (H20) 19.70 0.31 23.14 7.43 9.91 2.04 11.96 3.45
Chitosan 1% 19.35 0.41 24.29 7.21 10.29 2.28 12.58 5.25
Ascorbic acid 5% 20.30 0.37 22.74 7.37 10.00 2.31 12.19 4.60
Ascorbic acid 10% 20.50 0.37 24.52 7.71 10.16 2.13 12.31 4.65
Citric acid 5% 20.55 0.39 24.66 7.57 10.18 2.20 12.41 3.95
Citric acid 10% 20.85 0.39 23.40 7.54 10.22 2.26 12.46 4.05
Oxalic acid 5% 21.10 0.41 23.11 7.11 10.29 2.30 12.60 5.45
Oxalic acid 10% 19.70 0.48 23.83 7.82 10.30 2.31 12.62 5.90
CD at 5% 0.61 NS 1.00 0.17 NS NS 0.30 0.10

Online version available at: www.indianjournals.com
Progressive Horticulture, Vol. 45, No. 2, September 2013© Copyright by ISHRD, Printed in India
[Research Article]
Performance of mango varieties in Kymore platue of Madhya Pradesh
T.K. Singh, J. Singh and D.B. SinghJNKVV, College of Agriculture Rewa 486001(M.P.)Email: [email protected]
ABSTRACTThe present experiment was conducted at Fruit Research Station Kuthulia farm Rewa (M.P.). Twenty mango
varieties of different zones of India were tested in Randomized Block Design with four replications. The result revealed that the variety S.B. Chausa was vigorous in growth than other varieties. The maximum plant height (8.97 m), canopy height (7.54 m) and spread (11.59 m E->w and 15.1 m N->S) were recorded in S.B. Chausa followed by Langra. The Mallika variety of mango found at par with morphological characters. The maximum yield (116.15 kg/tree) was recorded in Bangalora followed by Langra (69.31 kg/tree), Dashehari (62.9 kg/tree), Mallika (59.48 kg/tree) and Bombay green (53.26 kg/tree). The physio-chemical properties like fruit weight varied from Vanraj (401.7 g/fruit) and Banglora(326.25 g/fruit).However fruit weight was lowest in Neelam (126.68 g). The total soluble solid content was maximum in Dashehari (23.6 B) followed by Langra (23.45 B), Mallika (22.1 B) and Bombay green (22.1 B). On the basis of cumulative mean of 8 years and quality parameters, the mango varieties Banglora, Langra,Mallika, Bmbai, Beneshan, Bombay green and Fazli were found most suitable for commercial plantation in Kymore plateau.
KEY wORDS : Mango, varieties, Madhya Pradesh, evaluation, preformance
Mango (Mangifera indica L.) is one of the most im-portant and popular commercial fruits of India which is being grown in all over country since ancient times. It’s belong to the family anacardiaceae. India ranks first in mango production of total world production and oc-cupies highest position in the world. It has great adopt-ability and the rives in a wide range of climatic and soil conditions. It’s fruit can be utilized at both immature and mature stages. It requires good rainfall for its growth (June to October) and rainless dry wheather from No-vember on words during the flowering and fruit setting. Mango is grown in all the districts of Madhya Pradesh but the maximum acreage is in Rewa, Satna and Jabalpur (Srivastava, 1987).The maximum average of mango pro-duction in vindhya regions of Madhya pradesh.Looking into the importance of mango, selection of superior va-rieties suitable for various agro climatic conditions has paramount importance. Therefore, a study was under taken to evaluate the early performance of twenty man-go varieties of different zones of India under Vindhya region of Madhya Pradesh.
MATERIALS AND METHODSA field experiment was c0nducted at Fruit Research
Station Kuthulia, Rewa (M.P.) during the year 2001 to 2008-09 on the 28 year old budded trees of mango va-rieties planted at the distance of 10 m in square system during 1982. The experiment was laid out in a random-ized block design having twenty varieties of mango i.e. Dashehari, Langra, Fazli, S.B. Chausa, Mallika, Be-neshan, Banglora, Mulgao, Neelam, Suvarnarekha, Zardalu, Bombai, Bombay Green, Himsagar, Krishnab-hog, Alphanso, Kesar, Mankurd, Fernandin and Vanraj which are replicated four times with two tree treatment-1 replication-1. Trees were maintained under uniform cul-tural practices. The data on trees height, canopy height, spread, girth of scion, tree volume and yield (kg/plant) were recorded by standard methods in during 2008-09. The percent data was angularly transformed before sta-tistical analysis and both original as well as transformed values are presented.

Progressive Horticulture, 45 (2) 269
Table 1(a) : Growth parameter of Mango varieties (2008-2009)
S. No. Treatments Height of plant (m) Circumference Spread Tree Date of (cm) (m) volume (M3) harvesting Plant Canopy height height Scion N-S E-w1. Dashehari 6.96 5.84 123.75 109.78 9.23 9.07 10 June2. Langra 7.98 6.66 143.5 135.8 10.92 10.95 6 June3. Fazli 7.87 6.55 133.55 11.85 9.47 9.57 15 July4. S.B.Chausa 8.97 7.54 167.75 151.0 11.59 10.95 30 June5. Mallika 7.86 6.87 134.25 115.25 10.17 10.25 20 June6. Alphanso 7.23 6.28 115.25 115.75 7.82 7.99 8 June7. Kesar 6.20 5.20 109.5 94.25 6.27 6.18 20 June8. Mankurad 5.60 4.69 94.50 85.9 6.65 6.45 12 June9. Fernadin 6.92 5.56 96.75 82.75 6.89 6.80 -10. Vanraj 7.05 6.39 109.5 103.25 8.62 8.34 25 June11. Beneshan 7.34 6.59 129.75 111.0 8.94 8.58 16 July12. Banglora 6.29 5.04 109.25 97.0 7.37 7.09 16 July13. Mulgoa 5.99 4.23 98.0 93.50 6.97 7.03 -14. Neelum 5.15 4.16 93.5 75.13 5.63 5.79 10 July15. Suvanrekha 6.23 4.91 105.25 93.25 7.25 7.29 5 July16. Zardalu 6.63 5.98 108.0 98.25 8.65 8.57 28 May17. Bombai 6.59 5.71 118.0 99.75 9.87 9.59 30 May18. Bombay green 5.84 5.16 109.5 109.75 7.55 7.41 30 May19. Himsagar 5.93 5.23 108.5 84.0 6.96 7.52 04 June20. Krishnbhog 6.76 5.43 125.25 105.25 8.31 8.13 06 June SEm ± 0465 0.352 8.26 7.91 0.704 0.689
CD at 5% 1.315 0.992 23.36 21.38 1.99 1.950
Table 1(b): Mean Yield of different Mango varieties (Kg/tree)
S.No. Treatments 2001 2002 2003 2004 2005 2006 2007 2008 Mean
1. Dashehari 99.64 23.24 76.58 37.05 69.63 37.8 106.5 104.9 62.94
2. Langra 217.90 15.70 100.47 10.20 64.5 41.03 64.13 107.65 69.31
3. Fazli 82.0 30.70 90.17 15.31 19.8 47.13 53.0 26.65 40.52
4. S.B.Chausa 74.99 21.08 74.22 16.88 96.3 47.70 7.88 42.98 42.79
5. Mallika 87.39 30.33 99.12 20.25 99.0 70.7 50.55 46.25 59.48
6. Alphanso 13.85 NIL NIL NIL 3.3 NIL NIL 44.18 6.817. Kesar 20.46 NIL 28.38 20.83 15.2 33.64 NIL 59.40 20.598. Mankurad 19.25 9.33 26.69 14.49 37.7 24.53 5.88 27.80 18.409. Fernadin NIL NIL NIL NIL NIL NIL NIL NIL NIL10. Vanraj 20.83 10.30 39.04 8.00 21.8 44.30 NIL 48.43 19.40
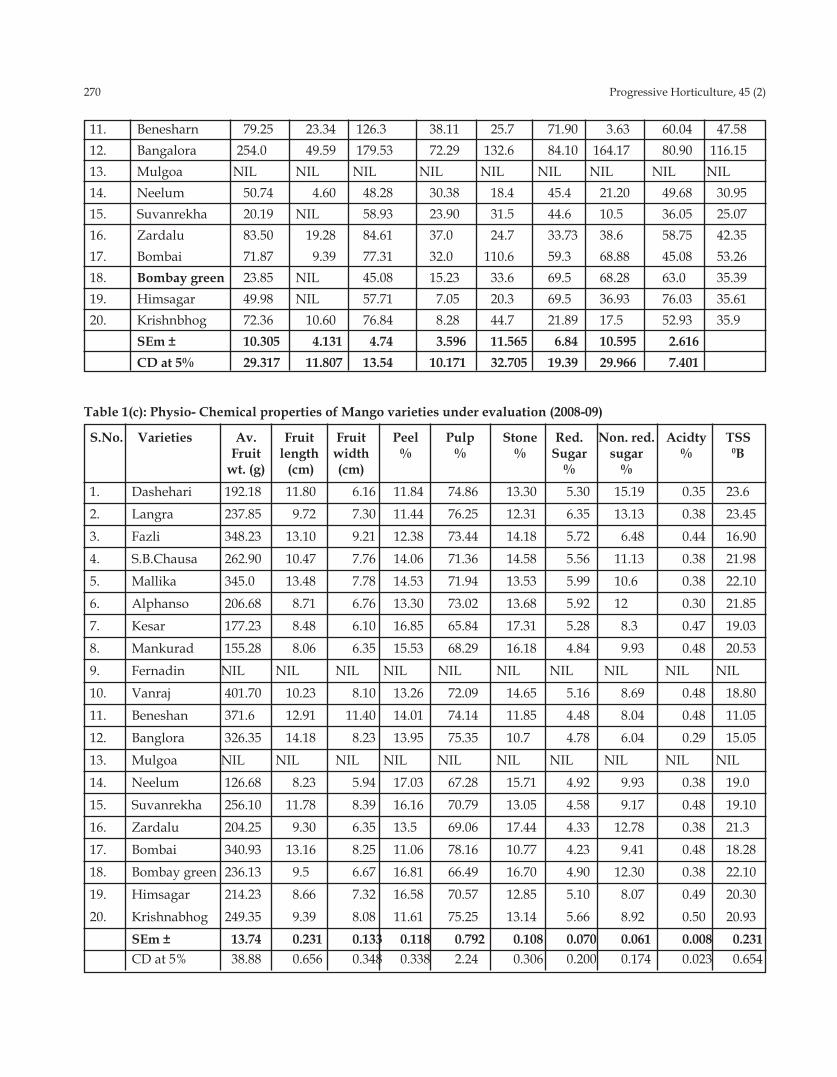
270 Progressive Horticulture, 45 (2)
11. Benesharn 79.25 23.34 126.3 38.11 25.7 71.90 3.63 60.04 47.5812. Bangalora 254.0 49.59 179.53 72.29 132.6 84.10 164.17 80.90 116.1513. Mulgoa NIL NIL NIL NIL NIL NIL NIL NIL NIL14. Neelum 50.74 4.60 48.28 30.38 18.4 45.4 21.20 49.68 30.9515. Suvanrekha 20.19 NIL 58.93 23.90 31.5 44.6 10.5 36.05 25.0716. Zardalu 83.50 19.28 84.61 37.0 24.7 33.73 38.6 58.75 42.3517. Bombai 71.87 9.39 77.31 32.0 110.6 59.3 68.88 45.08 53.2618. Bombay green 23.85 NIL 45.08 15.23 33.6 69.5 68.28 63.0 35.3919. Himsagar 49.98 NIL 57.71 7.05 20.3 69.5 36.93 76.03 35.6120. Krishnbhog 72.36 10.60 76.84 8.28 44.7 21.89 17.5 52.93 35.9 SEm ± 10.305 4.131 4.74 3.596 11.565 6.84 10.595 2.616 CD at 5% 29.317 11.807 13.54 10.171 32.705 19.39 29.966 7.401
Table 1(c): Physio- Chemical properties of Mango varieties under evaluation (2008-09)
S.No. Varieties Av. Fruit Fruit Peel Pulp Stone Red. Non. red. Acidty TSS Fruit length width % % % Sugar sugar % 0B wt. (g) (cm) (cm) % % 1. Dashehari 192.18 11.80 6.16 11.84 74.86 13.30 5.30 15.19 0.35 23.62. Langra 237.85 9.72 7.30 11.44 76.25 12.31 6.35 13.13 0.38 23.453. Fazli 348.23 13.10 9.21 12.38 73.44 14.18 5.72 6.48 0.44 16.904. S.B.Chausa 262.90 10.47 7.76 14.06 71.36 14.58 5.56 11.13 0.38 21.985. Mallika 345.0 13.48 7.78 14.53 71.94 13.53 5.99 10.6 0.38 22.106. Alphanso 206.68 8.71 6.76 13.30 73.02 13.68 5.92 12 0.30 21.857. Kesar 177.23 8.48 6.10 16.85 65.84 17.31 5.28 8.3 0.47 19.038. Mankurad 155.28 8.06 6.35 15.53 68.29 16.18 4.84 9.93 0.48 20.539. Fernadin NIL NIL NIL NIL NIL NIL NIL NIL NIL NIL10. Vanraj 401.70 10.23 8.10 13.26 72.09 14.65 5.16 8.69 0.48 18.8011. Beneshan 371.6 12.91 11.40 14.01 74.14 11.85 4.48 8.04 0.48 11.0512. Banglora 326.35 14.18 8.23 13.95 75.35 10.7 4.78 6.04 0.29 15.0513. Mulgoa NIL NIL NIL NIL NIL NIL NIL NIL NIL NIL14. Neelum 126.68 8.23 5.94 17.03 67.28 15.71 4.92 9.93 0.38 19.015. Suvanrekha 256.10 11.78 8.39 16.16 70.79 13.05 4.58 9.17 0.48 19.1016. Zardalu 204.25 9.30 6.35 13.5 69.06 17.44 4.33 12.78 0.38 21.317. Bombai 340.93 13.16 8.25 11.06 78.16 10.77 4.23 9.41 0.48 18.2818. Bombay green 236.13 9.5 6.67 16.81 66.49 16.70 4.90 12.30 0.38 22.1019. Himsagar 214.23 8.66 7.32 16.58 70.57 12.85 5.10 8.07 0.49 20.3020. Krishnabhog 249.35 9.39 8.08 11.61 75.25 13.14 5.66 8.92 0.50 20.93 SEm ± 13.74 0.231 0.133 0.118 0.792 0.108 0.070 0.061 0.008 0.231 CD at 5% 38.88 0.656 0.348 0.338 2.24 0.306 0.200 0.174 0.023 0.654

Progressive Horticulture, 45 (2) 271
Fig. 1: Yield (kg/plant) of different commercial varieties of mango
RESULTS AND DISCUSSIONThe data presented in table 1(a), table 1(b) and table
1.(c) revealed that the highest plant height (8.97m) and highest plant canopy height (7.54m) were observed in Chausa whereas, lowest plant height (5.15m), and lowest plant canopy height (4.16m) were recorded in Neelam. There was significant different in plant height and cano-py height among the various varieties. Maximum girth of scion (167.75cm) was noted in S.B. Chausa, followed by Langra (143.5cm) while minimum girth of scion (93.5cm) was obtained in Neelam. the highest plant spread N-S (151.0m) and E-W (11.59m) was obtained in S.B.Chausa whereas, the lowest plant spread Fazli N-S (11.85m) and E-W (5.63m) was recorded in Neelam. The highest tree volume (10.95m3) was obtained in Langra,followed by Mallika(10.25m3 ),while lowest tree volume Mulgoa (5.79m3) , the varietal as regard with height,girth of scion, spread and volume were also observed by chaudhary and Desai(1996) and Sharma et al,(2001).The maximum yield(116.15kg/tree) was recorded in Banglora fol-
lowed by Langra (69.3kg/tree),where as minimum yield Dashehari (62.94kg/tree) followed by Mallika (59.48kg/tree) and Bombai (53.26kg/tree). The physio-chemical properties like maximum fruit weight Vanraj (401.70g) followed by Beneshan (371.6g) and Fazli (348.23g), mini-mum fruit weight in Neelam (126.68g), the total soluble solid (TSS) was maximum in Dashehari (23.6B) Bombay green and followed by (22.1B) Mallika. On the basis of cumulative mean of 8 years and quality parameters, the mango varieties Banglora, Langra,Mallika, Bmbai, Bene-shan, Bombay green and Fazli were found most suitable for commercial plantation in Kymore plateau.
REFERENCESV. Suryanarayana; Reddy. H.B.; Lingaiah, K.S.; Kris-
hanappa, V.; Shankaranarayana, P.; Venkataramana and M.N. Narasimha Reddy 2011, Evaluation of Mango ‘Varieties for the Estern Dry Zone of Karna-taka. Mysore J. Agric., Sci., 45 (1): 107-110
272 Progressive Horticulture, 45 (2)
Dalal, S.R.; Jadhao, B.J.; Jogdande, N.D.; Anjali Mohariya 2005. Comparative performance of mango varieties under Vidarbha Region of Maharashtra. International J. Agri. Sci., 1: 1, 91-93.
Rao, K.D. Rao, D.S. K. 2007. Evaluation of mango variet-ies and hybrids performance in lataritic soils under rainfed conditions. Agri. Sci. Digest., 27: 4, 297-298.
Hoda, M.N. Sanjay Singh Jayant Singh 2003. Evaluation of mango (Mangifera indica) cultivars for quality at-tributes. Indian J. Agri. Sci., 73: 9, 504-506.
Syed, S.A. 2009, Evaluation of mango cultivars for produc-
tive and commercial plantation under Punjab condi-tions of Pakistan. Acta Horti., 820, 147-151.
Shrivastava, S.S.; Avasti, K.P.; Patel, M.P.; Tiwari, B.L. and Badoia, A.K. 1987. Evaluation of mango varieties in Madhya Pradesh. Indian J.Hort. 44(3/4):198-201.
Singh, M. and Singh, G.N., 1989. Performance of some mango cultivars in Central Gangetic plains. Act. Hort. 231: 117-120.
Uthaiah, B.C. and Lingaiah, H.B., 1990. Pre–bearing per-formance of mango cultivars under coastal Karnataka, Karnataka, J.agric. Sci., 3(1-2): 43-46.
Received on 27 July, 2012 and accepted on 13 February, 2013
Online version available at: www.indianjournals.com
Progressive Horticulture, Vol. 45, No. 2, September 2013© Copyright by ISHRD, Printed in India
[Research Article]
Effect of various storage conditions on physical characteristics of peach cv. Flordasun
Parshant Bakshi*, F.A. Masoodi, Rakesh Kumar and Amit Jasrotia Division of Fruit Science, Sher-e-Kashmir University of Agricultural Sciences & Technology-Jammu, Main Campus, Chatha, Jammu, J & K 180009, India*Email: [email protected]
ABSTRACTPeach fruit was stored in bags of different perforations under room temperature (24 + 20C) as well as refriger-
ated temperature (3-60C). The physiological loss in weight increased with the increase in storage but the loss was more under room temperature conditions. The fruits stored in un perforated bags showed minimum weight loss as compared to those stored in perforated bags under both the storage conditions. The radial diameter, axial diam-eter as well as volume also decreased with the increase in storage period and fruits stored in un perforated bags showed lower decline than those stored in perforated bags under both room temperature as well as refrigerated conditions.
KEY wORDS: Peach, storage, perforated bags, packaging, physical characteristics
Peach [Prunus persica (L.) Batsch] is basically a tem-perate fruit and grows well in temperate parts of J&K, U.P. and Himachal Pradesh. But, with better understand-ing of the physiology of the plant and advances in fruit breeding varieties have been evolved which have just 150-300 chilling hours requirement and can survive in sub-tropical areas of India (Nijjar, 1977). The sub-tropical varieties of peach behave differently than temperate and are harvested usually during last week of April or early May. During this period there are only few fruits to com-pete with it in the market, hence it fetches good returns. One of the major problems of peach cultivation is its lim-ited postharvest life. It has a shelf life of 3-5 days under ordinary environmental conditions (Tonini and Tura, 1998). However, the storage of fruits in perforated bags may extend their postharvest life. Luvisi and Som-mer (1960) reported that the rate of decay was reduced at higher CO2 levels that have shown to harm fruit qual-ity of peaches. Bakshi and Masoodi (2009) stated that on the basis of quality characteristics, peach fruits stored in perforated bags remained acceptable upto 12 days under room temperature and 18 days under refrigerated condi-tion. Thus, the major advantage of polythene films would be to control shrivelling during storage and transit. Pres-ent studies were therefore conducted to assess the effect of storage temperature and package perforations on the physical characteristics of peach cv. Flordasun.
MATERIALS AND METHODSThe study was carried out at the Division of Pomol-
ogy and Postharvest Technology, FOA Udheywalla, SKUAST-Jammu. The fruits of uniform shape, size, ma-turity and colour of cv. Flordasun were procured from the peach orchard of the University. The fruits were picked on 3rd of May i.e., 48 days after full bloom. Five fruits were packed in each bag and three bags were kept per treatment. The fruit were stored at room temperature (24 + 20C) as well as refrigerated temperature (3-60C) in bags of varying PC of 0, 251, 565 and 1006 mm holes/m2.
The desired PC was obtained by making 0, 8, 12 and 16 perforations of 5 mm diameter each. The PC was calcu-lated by formula given by Robertson (1993).
PC = ¼ π d3 k2 10-4 (mm holes/ m2)
Where d = perforation hole diameter.
k = number of perforations per sq. mt.
Each treatment was triplicated and observations were taken at 3 days interval. Physiological loss in weight (PLW) was measured by weighing the fruits at regular intervals using a digital electronic balance. The radial and axial diameter was measured with the help of digital vernier caliper. The radial diameter was mea
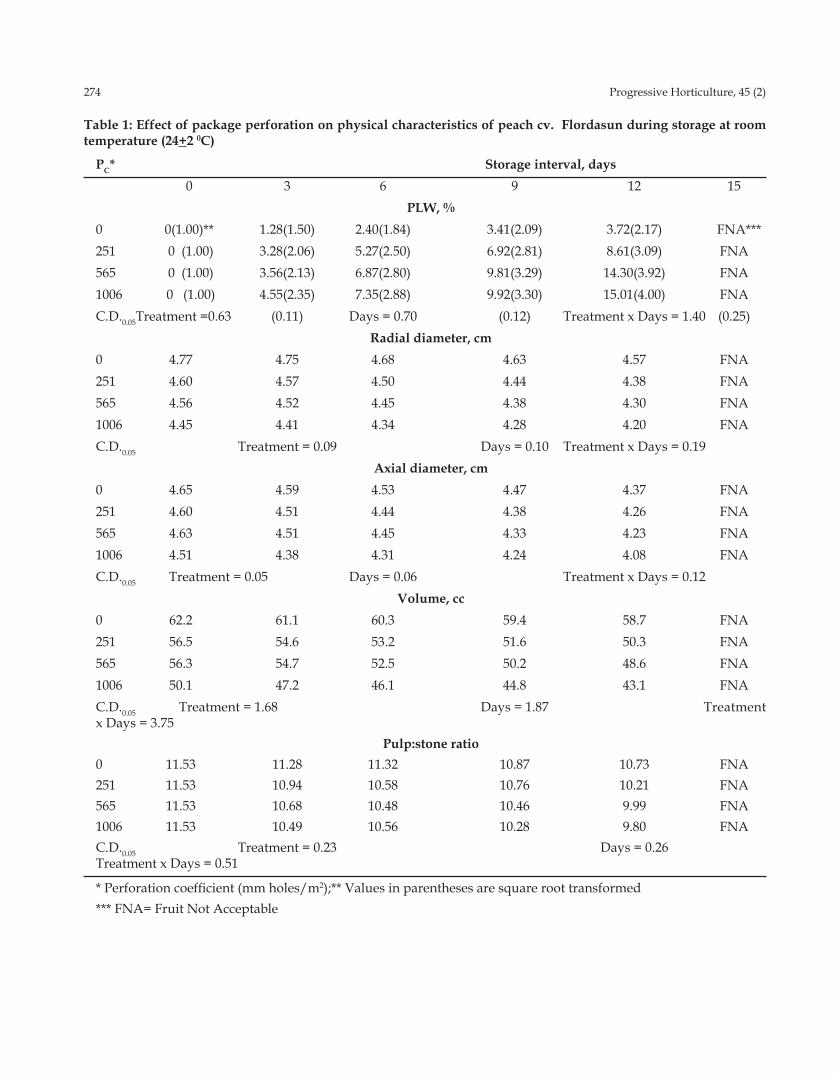
274 Progressive Horticulture, 45 (2)
Table 1: Effect of package perforation on physical characteristics of peach cv. Flordasun during storage at room temperature (24+2 0C)
PC* Storage interval, days 0 3 6 9 12 15
PLw, %0 0(1.00)** 1.28(1.50) 2.40(1.84) 3.41(2.09) 3.72(2.17) FNA***251 0 (1.00) 3.28(2.06) 5.27(2.50) 6.92(2.81) 8.61(3.09) FNA565 0 (1.00) 3.56(2.13) 6.87(2.80) 9.81(3.29) 14.30(3.92) FNA1006 0 (1.00) 4.55(2.35) 7.35(2.88) 9.92(3.30) 15.01(4.00) FNAC.D.0.05 Treatment =0.63 (0.11) Days = 0.70 (0.12) Treatment x Days = 1.40 (0.25)
Radial diameter, cm0 4.77 4.75 4.68 4.63 4.57 FNA251 4.60 4.57 4.50 4.44 4.38 FNA565 4.56 4.52 4.45 4.38 4.30 FNA1006 4.45 4.41 4.34 4.28 4.20 FNAC.D.0.05 Treatment = 0.09 Days = 0.10 Treatment x Days = 0.19
Axial diameter, cm0 4.65 4.59 4.53 4.47 4.37 FNA251 4.60 4.51 4.44 4.38 4.26 FNA565 4.63 4.51 4.45 4.33 4.23 FNA1006 4.51 4.38 4.31 4.24 4.08 FNAC.D.0.05 Treatment = 0.05 Days = 0.06 Treatment x Days = 0.12
Volume, cc0 62.2 61.1 60.3 59.4 58.7 FNA251 56.5 54.6 53.2 51.6 50.3 FNA565 56.3 54.7 52.5 50.2 48.6 FNA1006 50.1 47.2 46.1 44.8 43.1 FNAC.D.0.05 Treatment = 1.68 Days = 1.87 Treatment x Days = 3.75
Pulp:stone ratio0 11.53 11.28 11.32 10.87 10.73 FNA251 11.53 10.94 10.58 10.76 10.21 FNA565 11.53 10.68 10.48 10.46 9.99 FNA1006 11.53 10.49 10.56 10.28 9.80 FNAC.D.0.05 Treatment = 0.23 Days = 0.26 Treatment x Days = 0.51
* Perforation coefficient (mm holes/m2); ** Values in parentheses are square root transformed*** FNA= Fruit Not Acceptable
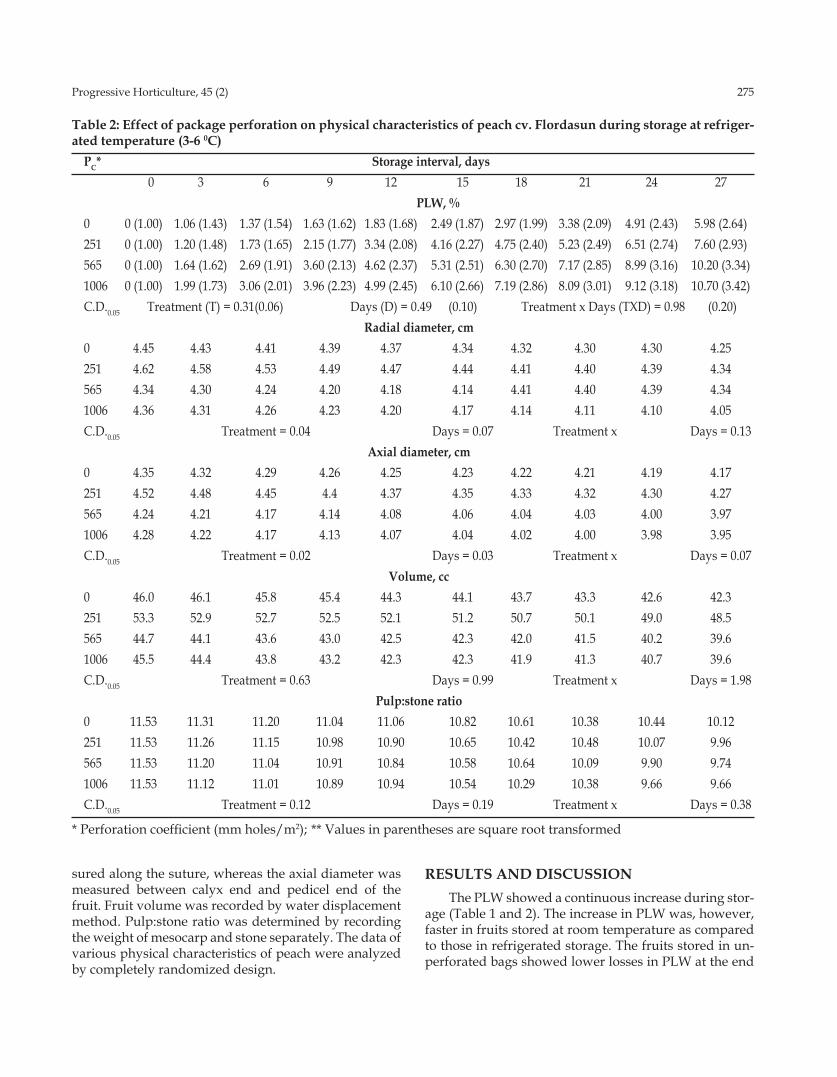
Progressive Horticulture, 45 (2) 275
Table 2: Effect of package perforation on physical characteristics of peach cv. Flordasun during storage at refriger-ated temperature (3-6 0C)
PC* Storage interval, days 0 3 6 9 12 15 18 21 24 27 PLw, %0 0 (1.00) 1.06 (1.43) 1.37 (1.54) 1.63 (1.62) 1.83 (1.68) 2.49 (1.87) 2.97 (1.99) 3.38 (2.09) 4.91 (2.43) 5.98 (2.64)251 0 (1.00) 1.20 (1.48) 1.73 (1.65) 2.15 (1.77) 3.34 (2.08) 4.16 (2.27) 4.75 (2.40) 5.23 (2.49) 6.51 (2.74) 7.60 (2.93)565 0 (1.00) 1.64 (1.62) 2.69 (1.91) 3.60 (2.13) 4.62 (2.37) 5.31 (2.51) 6.30 (2.70) 7.17 (2.85) 8.99 (3.16) 10.20 (3.34)1006 0 (1.00) 1.99 (1.73) 3.06 (2.01) 3.96 (2.23) 4.99 (2.45) 6.10 (2.66) 7.19 (2.86) 8.09 (3.01) 9.12 (3.18) 10.70 (3.42)C.D.0.05 Treatment (T) = 0.31 (0.06) Days (D) = 0.49 (0.10) Treatment x Days (TXD) = 0.98 (0.20)
Radial diameter, cm0 4.45 4.43 4.41 4.39 4.37 4.34 4.32 4.30 4.30 4.25251 4.62 4.58 4.53 4.49 4.47 4.44 4.41 4.40 4.39 4.34565 4.34 4.30 4.24 4.20 4.18 4.14 4.41 4.40 4.39 4.341006 4.36 4.31 4.26 4.23 4.20 4.17 4.14 4.11 4.10 4.05C.D.0.05 Treatment = 0.04 Days = 0.07 Treatment x Days = 0.13
Axial diameter, cm0 4.35 4.32 4.29 4.26 4.25 4.23 4.22 4.21 4.19 4.17251 4.52 4.48 4.45 4.4 4.37 4.35 4.33 4.32 4.30 4.27565 4.24 4.21 4.17 4.14 4.08 4.06 4.04 4.03 4.00 3.971006 4.28 4.22 4.17 4.13 4.07 4.04 4.02 4.00 3.98 3.95C.D.0.05 Treatment = 0.02 Days = 0.03 Treatment x Days = 0.07
Volume, cc0 46.0 46.1 45.8 45.4 44.3 44.1 43.7 43.3 42.6 42.3251 53.3 52.9 52.7 52.5 52.1 51.2 50.7 50.1 49.0 48.5565 44.7 44.1 43.6 43.0 42.5 42.3 42.0 41.5 40.2 39.61006 45.5 44.4 43.8 43.2 42.3 42.3 41.9 41.3 40.7 39.6C.D.0.05 Treatment = 0.63 Days = 0.99 Treatment x Days = 1.98
Pulp:stone ratio0 11.53 11.31 11.20 11.04 11.06 10.82 10.61 10.38 10.44 10.12251 11.53 11.26 11.15 10.98 10.90 10.65 10.42 10.48 10.07 9.96565 11.53 11.20 11.04 10.91 10.84 10.58 10.64 10.09 9.90 9.741006 11.53 11.12 11.01 10.89 10.94 10.54 10.29 10.38 9.66 9.66C.D.0.05 Treatment = 0.12 Days = 0.19 Treatment x Days = 0.38
* Perforation coefficient (mm holes/m2); ** Values in parentheses are square root transformed
sured along the suture, whereas the axial diameter was measured between calyx end and pedicel end of the fruit. Fruit volume was recorded by water displacement method. Pulp:stone ratio was determined by recording the weight of mesocarp and stone separately. The data of various physical characteristics of peach were analyzed by completely randomized design.
RESULTS AND DISCUSSIONThe PLW showed a continuous increase during stor-
age (Table 1 and 2). The increase in PLW was, however, faster in fruits stored at room temperature as compared to those in refrigerated storage. The fruits stored in un-perforated bags showed lower losses in PLW at the end
276 Progressive Horticulture, 45 (2)
of storage under both the storage conditions. The PLW increased with the increase in PC and maximum losses were observed in fruits stored in bags with PC 1006 mm holes/m2 under both room temperature as well as refrig-erated temperature conditions. This difference in loss during storage may be attributed to the build up of high humid conditions with in the bag which might resulted in reduced vapour pressure deficit and consequently lower moisture loss. Water loss from fruits and vegeta-bles is mainly due to transpiration although some of it may be lost by respiration and evaporation (Wilkinson, 1965). Depleted O2 and/or enriched CO2 levels reduce respiration and decrease ethylene production, inhibit or delay enzymatic reactions, alleviate physiological disor-ders and preserve the product from quality losses (Day, 1994). However, exposure to O2 or CO2 levels outside the limits of tolerance may lead to anaerobic respira-tion with the production of undesirable metabolites and other physiological disorders (Zagory and Kader, 1988; Soliva-Fortuny et al., 2002).
The fruit size gradually decreased with the increase in storage period. The per cent decline in radial diam-eter increased with the increase in PC (Table 1 and 2). The loss in radial diameter was more in perforated bags as compared to unperforated bags. The axial diameter decreased with the increase in storage period. Minimum decline in axial diameter of 6.02 % and 4.14 % was ob-served in fruits stored in unperforated bags, while it was maximum 9.53 % and 7.71 % in fruits stored in bags of 1006 PC after 12 days under room temperature and 27 days under refrigerated temperature, respectively. Thus, the fruits stored under room temperature showed more decline in axial diameter as compared to those stored under refrigerated conditions. The losses in axial diam-eter are more than that in radial diameter. These losses in radial diameter and axial diameter might be due to moisture loss which perhaps resulted in loss in fruit size. These results of decreased radial and axial diameter are in consonance with those as obtained by Pruthi et al. (1960) and Parihar and Bajpai (1982) in apples.
The per cent decline in fruit volume continuously increased with the increase in PC (Table 1 and 2). Maxi-mum decline (13.97 %) was observed in fruits stored in bags with 1006 PC, while minimum decline (5.63 %) in fruits stored in unperforated bags after 12 days at room temperature. Similar results were obtained in fruits stored under refrigerated conditions. The decline was less under refrigerated conditions than that under room temperature storage. The losses in radial and axial di-ameter are reflected as decline in volume of fruit. As PC increased, the loss in volume also increased. Bakshi et al. (2006) also reported a significant decrease in volume
with the increase in storage period of peach after pre-storage heat treatment. The pulp:stone ratio gradually decreased with the increase in storage period (Table 1 and 2). The decline was less in fruits stored in unperfo-rated bags which increased with the increase in PC. The decrease in pulp:stone ratio might be due to decrease in pulp weight of the fruit by moisture loss but at the same time the stone weight remained constant. The results are in confirmation with those as observed by Gangwar and Tripathi (1972) in peaches who reported decline in flesh:seed ratio as the stage of fruit proceeded from im-mature to ripe.
REFERENCESBakshi, P. and Masoodi, F.A. 2009. Effect of various stor-
age conditions on chemical and processing charac-teristics of peach cv. Flordasun. J. Food Sci. Technol. 46(3): 271-274.
Bakshi, P.; Masoodi, F.A. and Singh, A.K. 2006. Effect of pre-storage heat treatment on peach quality. I. Physi-cal characteristics. Indian J. Hort., 63(4): 365-367.
Day, B.P.F. 1994. Modified atmosphere packaging and active packaging of fruits and vegetables. In: Mini-mal Processing of Foods. Ahvenainen, R; Mattila-Sandholm, T. and Ohlsson, I. (eds.) (VTT Symposium series 142), Majvik, 14-15 April.
Gangwar, B.M. and Tripathi, R.S. 1972. A study on bio-chemical changes during ripening and storage of peach. Punjab Hort. J., 12(2&3): 89-92.
Luvisi, D.A. and Sommer, N.F. 1960. Polyethylene liners and fungicides for peaches and nectarines. Proc. Amer. Soc. Hort. Sci., 76: 146-155.
Nijjar, G.S. 1977. New peach introductions in Punjab. In: Fruit breeding in India. Oxford and ISH Publications, New Delhi, pp.70-74.
Parihar, M.C. and Bajpai, P.N. 1982. Storage losses in apple (Malus pumila Mill.). The Punjab Hort. J., 22: 95-98.
Pruthi, J.S.; Parekh, C.M. and Lal, G. 1960. Varietal differ-ence in the physico-chemical characteristics of Indian apples. Food Sci., 9: 363.
Robertson, G.L. 1993. Packaging of horticultural products. In: Food Packaging: Principles and Practices, Marcel Dekker, Inc. NewYork, U.S.A, pp. 481-482.
Soliva-Fortuny, R.C.; Oms-Oliu, G. and Martin-Belloso, O. 2002. Effects of ripeness stages on the storage atmo-sphere, colour and textural properties of minimally processed apple slices. J. Food Sci., 67: 1958-1963.

Progressive Horticulture, 45 (2) 277
Tonini, G. and Tura, E. 1998. Influence of storage and shelf-life time on rots of peaches and nectarines. Acta Hort., 464: 364-367.
Wilkinson, B.G. 1965. Some effects of storage under differ-
ent conditions of humidity on the physical properties of apple. J. Hort. Sci., 40: 58-65.
Zagory, D. and Kader, A.A. 1988. Modified atmosphere packaging of fresh produce. Food Technol., 42: 70-77.
Received on 03 September, 2012 and accepted on 14 March, 2013

Online version available at: www.indianjournals.com
Progressive Horticulture, Vol. 45, No. 2, September 2013© Copyright by ISHRD, Printed in India
[Research Article]
Effect of time and methods of budding in multiplication of guava cv. Allahabad Safeda under valley conditions of Garhwal Himalaya
B.B. Bhatt, Y.K. Tomar and S.S. RawatDepartment of Horticulture, HNB Garhwal University, Srinagar Garhwal (U. K.) -246 174E-mail: [email protected]
ABSTRACTIn an experiment as regard to multiplication of guava through budding, least time to bud sprout and leaf emer-
gence was recorded with ‘T’ budding during mid July whereas, patch budding during mid June showed better response with respect to number of sprouted buds (7.49), survival percentage (73.33%), average length of sprout (50.27cm), average length of leaves on new growth (6.67 cm), average width of leaves (3.71 cm) and leaf area (53.86 cm2). Therefore, patch budding during the month of June is recommended for commercial multiplication of guava cv. ‘Allahabad Safeda’ under subtropical valley conditions of Garhwal Himalaya.
KEY wORDS: Guava, multiplication, budding, Allahabad Safeda.
Guava (Psidium guajava L.) is highly cross pollinated (35.6 %) fruit crop and true to type status cannot be main-tained through seed propagation (Soubihe and Gurgel 1962). Therefore, economically viable vegetative meth-ods need to be investigated for its mass multiplication to perpetuate the desirable genotype. Various investiga-tors have been made as regard to vegetative methods of propagation of the plant (Samson 1986) but many of them are not economical and beneficial (Mitra and Bose 1990). However, inarching has been found most widely adopt-ed method in the north and air layering in the south (Ah-mad 1966) for multiplication of guava. The other most common option with regard to vegetative propagation is budding. Budding has gained importance because of its manifold advantages over other vegetative methods. Through this method, one can prepare several plants propagules from a single bud stick. However, budding appears easier in operation and cheaper than inarching or air-layering (Srivastava, 1964; Moti et al. 1976).
In view of these, the present investigation was un-dertaken to find out the exact time with suitable budding method in guava cultivar ‘Allahabad Safeda’ during the year 2005 and 2006 at Horticultural Research Centre and Department of Horticulture, HNB Garhwal University, Srinagar (Garhwal), Uttarakhand.
MATERIALS AND METHODSThe experiment was conducted at the Horticultur-
al Research Centre (HRC), Chauras Campus of H N B Garhwal University, Srinagar (Garhwal) under Srinagar Valley exhibiting subtropical climate. Geographically the valley lies between 300 12’ to 30013’ north latitude and 780 45’ to 78 50’ East longitude while, altitudinally located at 570 msl showing wide range of temperature variation ranging from 20C in winter to a maximum of 400C during summer. The relative humidity varies from 39.24 to 79.83% and mean annual rainfall from 2.50 to 235.24 mm. About one year-old seedlings of uniform size having stem of pencil thickness were used as rootstocks. Scion shoots were taken from 8-10 year-old guava trees by clipping 10-15cm terminal growth 20 days prior to operation. Stem buds were taken from two- month old vegetative summer sprouts. Budding operations were carried out at monthly interval starting from mid June to mid August during two consecutive years viz., 2005 and 2006. Three budding methods viz.‘T’ budding (M1), patch budding (M2) and chip budding (M3) were prac-tised during three different months, viz. mid June (T1), mid July (T2) and mid August (T3). The experiment was laid out in a factorial randomized block design with 3 replications, consisting of 10 seedlings per treatment.
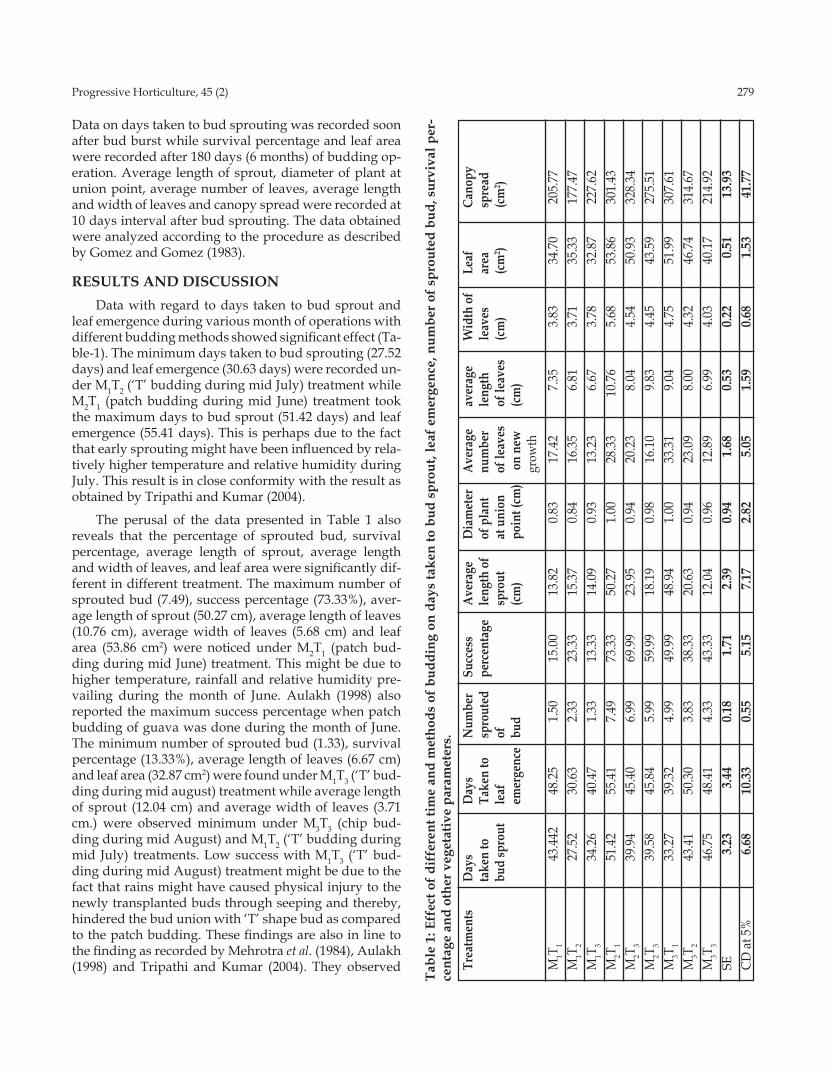
Progressive Horticulture, 45 (2) 279
Data on days taken to bud sprouting was recorded soon after bud burst while survival percentage and leaf area were recorded after 180 days (6 months) of budding op-eration. Average length of sprout, diameter of plant at union point, average number of leaves, average length and width of leaves and canopy spread were recorded at 10 days interval after bud sprouting. The data obtained were analyzed according to the procedure as described by Gomez and Gomez (1983).
RESULTS AND DISCUSSIONData with regard to days taken to bud sprout and
leaf emergence during various month of operations with different budding methods showed significant effect (Ta-ble-1). The minimum days taken to bud sprouting (27.52 days) and leaf emergence (30.63 days) were recorded un-der M1T2 (‘T’ budding during mid July) treatment while M2T1 (patch budding during mid June) treatment took the maximum days to bud sprout (51.42 days) and leaf emergence (55.41 days). This is perhaps due to the fact that early sprouting might have been influenced by rela-tively higher temperature and relative humidity during July. This result is in close conformity with the result as obtained by Tripathi and Kumar (2004).
The perusal of the data presented in Table 1 also reveals that the percentage of sprouted bud, survival percentage, average length of sprout, average length and width of leaves, and leaf area were significantly dif-ferent in different treatment. The maximum number of sprouted bud (7.49), success percentage (73.33%), aver-age length of sprout (50.27 cm), average length of leaves (10.76 cm), average width of leaves (5.68 cm) and leaf area (53.86 cm2) were noticed under M2T1 (patch bud-ding during mid June) treatment. This might be due to higher temperature, rainfall and relative humidity pre-vailing during the month of June. Aulakh (1998) also reported the maximum success percentage when patch budding of guava was done during the month of June. The minimum number of sprouted bud (1.33), survival percentage (13.33%), average length of leaves (6.67 cm) and leaf area (32.87 cm2) were found under M1T3 (‘T’ bud-ding during mid august) treatment while average length of sprout (12.04 cm) and average width of leaves (3.71 cm.) were observed minimum under M3T3 (chip bud-ding during mid August) and M1T2 (‘T’ budding during mid July) treatments. Low success with M1T3 (‘T’ bud-ding during mid August) treatment might be due to the fact that rains might have caused physical injury to the newly transplanted buds through seeping and thereby, hindered the bud union with ‘T’ shape bud as compared to the patch budding. These findings are also in line to the finding as recorded by Mehrotra et al. (1984), Aulakh (1998) and Tripathi and Kumar (2004). They observed
Tabl
e 1:
Eff
ect o
f dif
fere
nt ti
me
and
met
hods
of b
uddi
ng o
n da
ys ta
ken
to b
ud s
prou
t, le
af e
mer
genc
e, n
umbe
r of s
prou
ted
bud,
sur
viva
l per
-ce
ntag
e an
d ot
her v
eget
ativ
e pa
ram
eter
s.
Trea
tmen
ts
Day
s D
ays
Num
ber
Succ
ess
Ave
rage
D
iam
eter
A
vera
ge
aver
age
wid
th o
f Le
af
Cano
py
ta
ken
to
Take
n to
sp
rout
ed
perc
enta
ge
leng
th o
f of
pla
nt
num
ber
leng
th
leav
es
area
sp
read
bud
spro
ut
leaf
of
spro
ut
at u
nion
of
leav
es
of le
aves
(c
m)
(cm
2 ) (c
m2 )
emer
genc
e bu
d
(cm
) po
int (
cm)
on
new
(c
m)
gr
owth
M1T 1
43.4
42
48.2
5 1.
50
15.0
0 13
.82
0.83
17
.42
7.35
3.
83
34.7
0 20
5.77
M1T 2
27.5
2 30
.63
2.33
23
.33
15.3
7 0.
84
16.3
5 6.
81
3.71
35
.33
177.
47M
1T 3 34
.26
40.4
7 1.
33
13.3
3 14
.09
0.93
13
.23
6.67
3.
78
32.8
7 22
7.62
M2T 1
51.4
2 55
.41
7.49
73
.33
50.2
7 1.
00
28.3
3 10
.76
5.68
53
.86
301.
43M
2T 3 39
.94
45.4
0 6.
99
69.9
9 23
.95
0.94
20
.23
8.04
4.
54
50.9
3 32
8.34
M2T 3
39.5
8 45
.84
5.99
59
.99
18.1
9 0.
98
16.1
0 9.
83
4.45
43
.59
275.
51M
3T 1 33
.27
39.3
2 4.
99
49.9
9 48
.94
1.00
33
.31
9.04
4.
75
51.9
9 30
7.61
M3T 2
43.4
1 50
.30
3.83
38
.33
20.6
3 0.
94
23.0
9 8.
00
4.32
46
.74
314.
67M
3T 3 46
.75
48.4
1 4.
33
43.3
3 12
.04
0.96
12
.89
6.99
4.
03
40.1
7 21
4.92
SE
3.23
3.
44
0.18
1.
71
2.39
0.
94
1.68
0.
53
0.22
0.
51
13.9
3CD
at 5
%
6.68
10
.33
0.55
5.
15
7.17
2.
82
5.05
1.
59
0.68
1.
53
41.7
7

280 Progressive Horticulture, 45 (2)
that the length of sprout got decreased with decreasing temperature. Better nutrient uptake and ample growing period must have favoured higher growth in this treat-ment (Pathak, 1991). Good success with patch budding may be attributed to greater contact area between matrix of stock and scion as compared to ‘T’ budding and chip budding methods of propagation. Better performance under the treatment M2T1 (patch budding during June) in respect to length of leaves, width of leaves and leaf area, might be due to the favourable atmospheric conditions for the vegetative growth during the month of June. The diameter of plant at union point showed non-significant effect. The maximum diameter of plant at union point (1.00 cm.) was observed same under M2T1 (patch bud-ding during mid June) and M3T1 (chip budding during mid June) treatments while minimum diameter of plant at union point (0.83 cm) was recorded under M1T1 (‘T’ budding during mid June) treatment. Aulakh (1998) and Moti et al. (1976) also obtained better girth of plant dur-ing the month of June with patch budding as compared to budding done in the month of July and August. This might be due to the less bark area with the ‘T’ shape scion bud, leading to poor combination of scion-rootstock ‘and ultimately in slow and thin growth of the bud sprout. The minimum diameter under ‘T’ budding was also re-ported by Tripathi and Kumar (2004) in bael propaga-tion. With respect to number of leaves on new growth, significant differences were observed at different time of budding with various budding methods. Number of leaves on new growth got decreased with advancement of the time under different budding methods. Highest average number of leaves on new growth (33.31) was no-ticed under M3T1 (chip budding during mid June) treat-ment while, minimum average number of leaves on new growth (12.89) was observed under M3T3 (chip budding during mid August) treatment. In term of canopy spread treatment M2T2 (patch budding during mid July) was found significantly superior over all other treatments. Maximum canopy spread was produced under the treat-ment M2T2 (patch budding during mid July) with 328.34 cm2 whereas, minimum canopy spread (177.47 cm2) was recorded under M1T2 (‘T’ budding during mid July) treatment. It may be due to favourable atmospheric con-ditions which might favoured canopy spread during the
month of July with patch budding.
REFERENCESAhmad, I. 1966. Some studies on the vegetative propaga-
tion of guava (Psidium gujava L) West Pakistan. J. Agric. Res., 4: 68-79.
Aulakh, P.S. 1998. Standardization of patch budding time in guava under rainfed conditions in the lower foot-hills shiwalik of Punjab- A note. Prog. Hort., 30(3&4): 221-222.
Gomez, K.A. and Gomez, A.A. 1983. Statistical procedure for Agriculture Research. 2nd Edn. John Widely and Sons, New York.
Mehrotra, N.K. and Gupta, M.R. 1984. A note on vegeta-tive propagation of guava cv. L-49. Haryana J. Hort. Sci., 13 (3&4): 135-136.
Mitra, S.K. and Bose, T.K. 1990. Guava. In: Fruits of India: Tropical and Subtropical (Eds. Base T. K., Mitra, S.K and sadhu, M.K.), Naya prokashan, Kolkatta.
Moti L.; Dhar and Chatuvedi, O.P. 1976. Propagating some tropical and Subtropical fruits by budding. Punjab Hort. 16(1&2): 33- 38.
Pathak, R.K. 1991. Phalvrikshon ka pravardhan (in hindi), ICAR, New Delhi.
Samson, J.A. 1986. Tropical Fruits. 2nd Edn. Longman Scientific and Tech. Longman Group UK Ltd., Long-man House, Burnt Mill Harlow, ESSEX CM 20 2JE England. 270 p.
Soubihe, J.S. and Gurgel J.T.A. 1962. The extend of natu-ral cross pollination in guava (Psidium guajava L.). Bragantia, 21: 15- 20.
Srivastava, R.P. 1964. Propagating guava by budding method. Indian Horti. 8(2): 6-8.
Tripathi, A. and Kumar, R. 2004. Studies on the effect of method and time of budding in bael. Haryana J. Hort. Sci. 33 (3&4): 195-198.
Received on 21November, 2012 and accepted on 03 August, 2013

Online version available at: www.indianjournals.com
Progressive Horticulture, Vol. 45, No. 2, September 2013© Copyright by ISHRD, Printed in India
[Research Article]
Studies on biochemical changes in aonla (Emblica officinalis Gaertn.) squash under storage condition
M. L. Choudhary1, I.M. Verma2, Jitendra Singh3, Atul Chandra4 and S. L. Godara5
1Krishi Vigyan Kendra (SURE), Danta, P. O. Marudi, Barmer-344001 (Rajasthan)2Land Scape Cell (Horticulture), S K RAU, Bikaner-334006 (Rajasthan)3Department of Fruit Science, CH&F, MPUAT, Jhalawar-326023 (Rajasthan)4Department of Horticulture, COA, S K RAU, Bikaner-334006 (Rajasthan)5Department of Plant pathology, COA, S K RAU, Bikaner-334006 (Rajasthan)
ABSTRACTSquash samples were prepared using fruits of NA-6, NA-7 and Chakaiya for storage studies. The prepared
squash samples were kept under ambient condition for storage study. The squash remained acceptable upto 240 days. The aonla squash prepared from the cultivar NA-7 had the highest content of ascorbic acid, pH and also scored maximum organoleptic value than NA-6 and Chakaiya at the time of preparation. During storage period of squash, the acidity, TSS, total sugar, reducing sugar and microbial examination (bacterial, yeast and mould counts) showed an increasing trend, and ascorbic acid, pH and organoleptic evaluation decreasing trend with advance-ment of storage period upto 240 days under ambient condition. The squash prepared from fruits of cultivar NA-7 had the maximum B : C ratio, good sensory evaluation and high nutritional quality which could be considered suitable for developing squash beverage for commercialization.
KEY wORDS: Indian gooseberry, squash, preparation, biochemical composition, microbial examination and orga-noleptic evaluation
Aonla being hardy, amenable to cultural practices, remunerative, nutritious, prolific bearer, finds due im-portance in horticultural scenario of the country. Its stress tolerance mechanism makes it suitable to grow even under stress environment over wasteland. Aonla is a quite hardy, prolific bearer and highly remunerative even without much care. The trees thrive well through-out the tropical and subtropical parts of Indian and is found growing wild or in cultivated from in different parts of the country. It can be grown easily under odd conditions where other fruit crops do not thrive well. It is the richest source of ascorbic acid among fruit ex-cept Barbados cherry. The fruit has important place as a source of mineral, carbohydrate, B-carotene, thiamine, riboflavin. The stability of ascorbic acid accounted to the presence of polypohenols adds special value of to aonla fruits in human health. The gallic acid present in aonla fruit has antioxidant property. Value addition and pro-cessing would be the effective tool for economic utili-zation of increased production of aonla in future. This will favour minimizing glut of aonla fruits during the
season and will definitely favour the profitable farming of aonla. Information is limited on processing into aonla squash. Therefore, the present investigation was neces-sitated so as to standardize cultivar for processing aonla into squash while studying biochemical attributes under the influence of storage environment.
MATERIALS AND METHODSThe present study was carried out at the Depart-
ment of Horticulture, College of Agriculture, SKRAU, Bikaner (Rajasthan) during the year 2006-07. Mature fruits of the cultivars NA-7, NA-6 and Chakaiya were selected for the preparation of squash. The fruits were washed in running water to add- adhering dirt and dust particles. These were sliced into small pieces and seeds were removed by using Hand Carrot Crusher. The slices were blended by adding necessary amount of warm water in a waring blender. The whole mass was obtained in the form of fine aonla fruit juice. After juice extraction, required quantities of juice i.e., 35 per cent
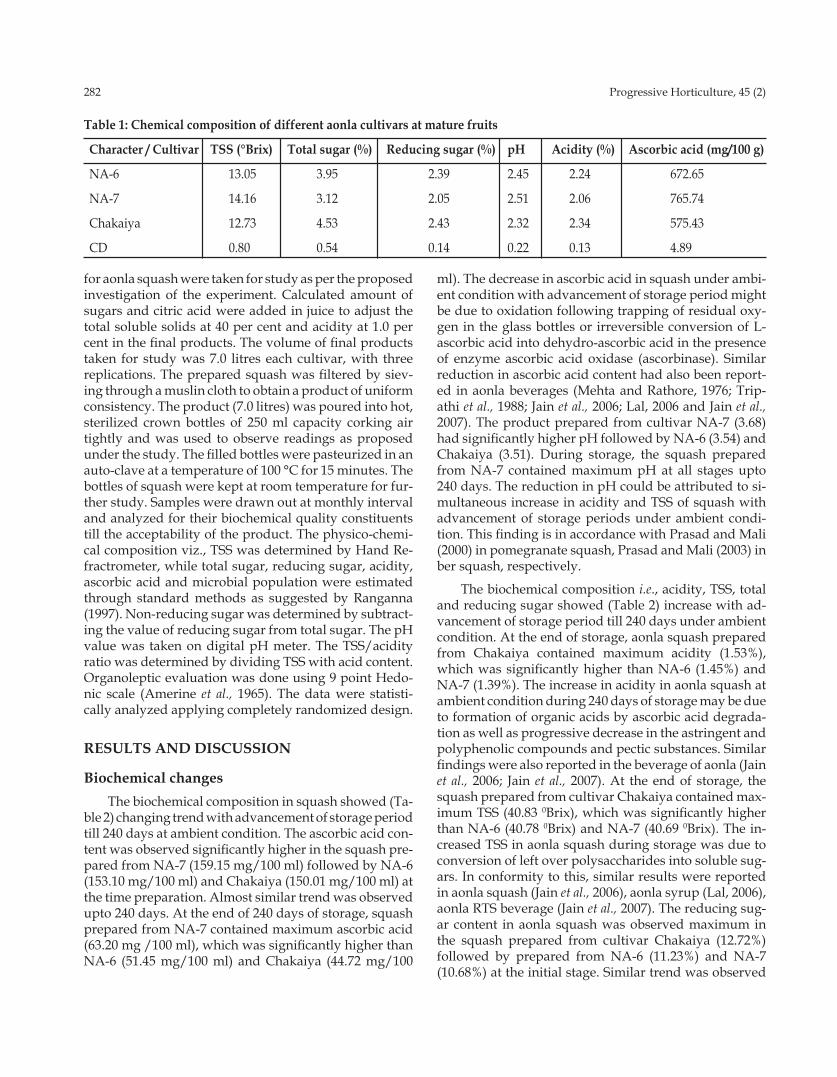
282 Progressive Horticulture, 45 (2)
for aonla squash were taken for study as per the proposed investigation of the experiment. Calculated amount of sugars and citric acid were added in juice to adjust the total soluble solids at 40 per cent and acidity at 1.0 per cent in the final products. The volume of final products taken for study was 7.0 litres each cultivar, with three replications. The prepared squash was filtered by siev-ing through a muslin cloth to obtain a product of uniform consistency. The product (7.0 litres) was poured into hot, sterilized crown bottles of 250 ml capacity corking air tightly and was used to observe readings as proposed under the study. The filled bottles were pasteurized in an auto-clave at a temperature of 100 °C for 15 minutes. The bottles of squash were kept at room temperature for fur-ther study. Samples were drawn out at monthly interval and analyzed for their biochemical quality constituents till the acceptability of the product. The physico-chemi-cal composition viz., TSS was determined by Hand Re-fractrometer, while total sugar, reducing sugar, acidity, ascorbic acid and microbial population were estimated through standard methods as suggested by Ranganna (1997). Non-reducing sugar was determined by subtract-ing the value of reducing sugar from total sugar. The pH value was taken on digital pH meter. The TSS/acidity ratio was determined by dividing TSS with acid content. Organoleptic evaluation was done using 9 point Hedo-nic scale (Amerine et al., 1965). The data were statisti-cally analyzed applying completely randomized design.
RESULTS AND DISCUSSION
Biochemical changesThe biochemical composition in squash showed (Ta-
ble 2) changing trend with advancement of storage period till 240 days at ambient condition. The ascorbic acid con-tent was observed significantly higher in the squash pre-pared from NA-7 (159.15 mg/100 ml) followed by NA-6 (153.10 mg/100 ml) and Chakaiya (150.01 mg/100 ml) at the time preparation. Almost similar trend was observed upto 240 days. At the end of 240 days of storage, squash prepared from NA-7 contained maximum ascorbic acid (63.20 mg /100 ml), which was significantly higher than NA-6 (51.45 mg/100 ml) and Chakaiya (44.72 mg/100
ml). The decrease in ascorbic acid in squash under ambi-ent condition with advancement of storage period might be due to oxidation following trapping of residual oxy-gen in the glass bottles or irreversible conversion of L-ascorbic acid into dehydro-ascorbic acid in the presence of enzyme ascorbic acid oxidase (ascorbinase). Similar reduction in ascorbic acid content had also been report-ed in aonla beverages (Mehta and Rathore, 1976; Trip-athi et al., 1988; Jain et al., 2006; Lal, 2006 and Jain et al., 2007). The product prepared from cultivar NA-7 (3.68) had significantly higher pH followed by NA-6 (3.54) and Chakaiya (3.51). During storage, the squash prepared from NA-7 contained maximum pH at all stages upto 240 days. The reduction in pH could be attributed to si-multaneous increase in acidity and TSS of squash with advancement of storage periods under ambient condi-tion. This finding is in accordance with Prasad and Mali (2000) in pomegranate squash, Prasad and Mali (2003) in ber squash, respectively.
The biochemical composition i.e., acidity, TSS, total and reducing sugar showed (Table 2) increase with ad-vancement of storage period till 240 days under ambient condition. At the end of storage, aonla squash prepared from Chakaiya contained maximum acidity (1.53%), which was significantly higher than NA-6 (1.45%) and NA-7 (1.39%). The increase in acidity in aonla squash at ambient condition during 240 days of storage may be due to formation of organic acids by ascorbic acid degrada-tion as well as progressive decrease in the astringent and polyphenolic compounds and pectic substances. Similar findings were also reported in the beverage of aonla (Jain et al., 2006; Jain et al., 2007). At the end of storage, the squash prepared from cultivar Chakaiya contained max-imum TSS (40.83 0Brix), which was significantly higher than NA-6 (40.78 0Brix) and NA-7 (40.69 0Brix). The in-creased TSS in aonla squash during storage was due to conversion of left over polysaccharides into soluble sug-ars. In conformity to this, similar results were reported in aonla squash (Jain et al., 2006), aonla syrup (Lal, 2006), aonla RTS beverage (Jain et al., 2007). The reducing sug-ar content in aonla squash was observed maximum in the squash prepared from cultivar Chakaiya (12.72%) followed by prepared from NA-6 (11.23%) and NA-7 (10.68%) at the initial stage. Similar trend was observed
Table 1: Chemical composition of different aonla cultivars at mature fruits
Character / Cultivar TSS (°Brix) Total sugar (%) Reducing sugar (%) pH Acidity (%) Ascorbic acid (mg/100 g)
NA-6 13.05 3.95 2.39 2.45 2.24 672.65
NA-7 14.16 3.12 2.05 2.51 2.06 765.74
Chakaiya 12.73 4.53 2.43 2.32 2.34 575.43
CD 0.80 0.54 0.14 0.22 0.13 4.89
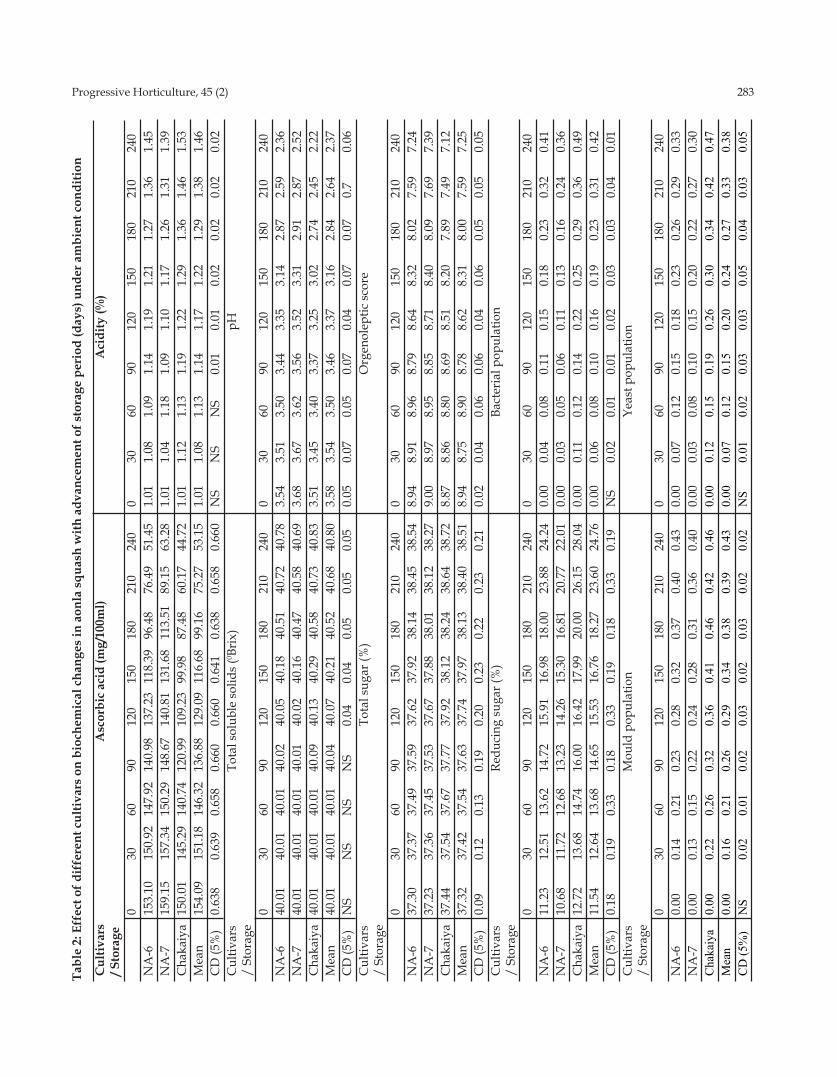
Progressive Horticulture, 45 (2) 283Ta
ble
2: E
ffec
t of d
iffe
rent
cul
tivar
s on
bio
chem
ical
cha
nges
in a
onla
squ
ash
with
adv
ance
men
t of s
tora
ge p
erio
d (d
ays)
und
er a
mbi
ent c
ondi
tion
Cul
tivar
s
Asc
orbi
c ac
id (m
g/10
0ml)
A
cidi
ty (%
) / S
tora
ge
0 30
60
90
12
0 15
0 18
0 21
0 24
0 0
30
60
90
120
150
180
210
240
NA
-6
153.
10
150.
92
147.
92
140.
98
137.
23
118.
39
96.4
8 76
.49
51.4
5 1.
01
1.08
1.
09
1.14
1.
19
1.21
1.
27
1.36
1.
45N
A-7
15
9.15
15
7.34
15
0.29
14
8.67
14
0.81
13
1.68
11
3.51
89
.15
63.2
8 1.
01
1.04
1.
18
1.09
1.
10
1.17
1.
26
1.31
1.
39C
haka
iya
150.
01
145.
29
140.
74
120.
99
109.
23
99.9
8 87
.48
60.1
7 44
.72
1.01
1.
12
1.13
1.
19
1.22
1.
29
1.36
1.
46
1.53
Mea
n 15
4.09
15
1.18
14
6.32
13
6.88
12
9.09
11
6.68
99
.16
75.2
7 53
.15
1.01
1.
08
1.13
1.
14
1.17
1.
22
1.29
1.
38
1.46
CD
(5%
) 0.
638
0.63
9 0.
658
0.66
0 0.
660
0.64
1 0.
638
0.65
8 0.
660
NS
NS
NS
0.01
0.
01
0.02
0.
02
0.02
0.
02C
ultiv
ars
To
tal s
olub
le so
lids (
0 Bri
x)
pH
/ St
orag
e
0 30
60
90
12
0 15
0 18
0 21
0 24
0 0
30
60
90
120
150
180
210
240
NA
-6
40.0
1 40
.01
40.0
1 40
.02
40.0
5 40
.18
40.5
1 40
.72
40.7
8 3.
54
3.51
3.
50
3.44
3.
35
3.14
2.
87
2.59
2.
36N
A-7
40
.01
40.0
1 40
.01
40.0
1 40
.02
40.1
6 40
.47
40.5
8 40
.69
3.68
3.
67
3.62
3.
56
3.52
3.
31
2.91
2.
87
2.52
Cha
kaiy
a 40
.01
40.0
1 40
.01
40.0
9 40
.13
40.2
9 40
.58
40.7
3 40
.83
3.51
3.
45
3.40
3.
37
3.25
3.
02
2.74
2.
45
2.22
Mea
n 40
.01
40.0
1 40
.01
40.0
4 40
.07
40.2
1 40
.52
40.6
8 40
.80
3.58
3.
54
3.50
3.
46
3.37
3.
16
2.84
2.
64
2.37
CD
(5%
) N
S N
S N
S N
S 0.
04
0.04
0.
05
0.05
0.
05
0.05
0.
07
0.05
0.
07
0.04
0.
07
0.07
0.
7 0.
06C
ultiv
ars
Tota
l sug
ar (%
)
Org
enol
eptic
scor
e /
Stor
age
0
30
60
90
120
150
180
210
240
0 30
60
90
12
0 15
0 18
0 21
0 24
0N
A-6
37
.30
37.3
7 37
.49
37.5
9 37
.62
37.9
2 38
.14
38.4
5 38
.54
8.94
8.
91
8.96
8.
79
8.64
8.
32
8.02
7.
59
7.24
NA
-7
37.2
3 37
.36
37.4
5 37
.53
37.6
7 37
.88
38.0
1 38
.12
38.2
7 9.
00
8.97
8.
95
8.85
8.
71
8.40
8.
09
7.69
7.
39C
haka
iya
37.4
4 37
.54
37.6
7 37
.77
37.9
2 38
.12
38.2
4 38
.64
38.7
2 8.
87
8.86
8.
80
8.69
8.
51
8.20
7.
89
7.49
7.
12M
ean
37.3
2 37
.42
37.5
4 37
.63
37
.74
37.9
7 38
.13
38.4
0 38
.51
8.94
8.
75
8.90
8.
78
8.62
8.
31
8.00
7.
59
7.25
CD
(5%
) 0.
09
0.12
0.
13
0.19
0.
20
0.23
0.
22
0.23
0.
21
0.02
0.
04
0.06
0.
06
0.04
0.
06
0.05
0.
05
0.05
Cul
tivar
s
Redu
cing
suga
r (%
)
Bact
eria
l pop
ulat
ion
/ St
orag
e
0 30
60
90
12
0 15
0 18
0 21
0 24
0 0
30
60
90
120
150
180
210
240
NA
-6
11.2
3 12
.51
13.6
2 14
.72
15.9
1 16
.98
18.0
0 23
.88
24.2
4 0.
00
0.04
0.
08
0.11
0.
15
0.18
0.
23
0.32
0.
41N
A-7
10
.68
11.7
2 12
.68
13.2
3 14
.26
15.3
0 16
.81
20.7
7 22
.01
0.00
0.
03
0.05
0.
06
0.11
0.
13
0.16
0.
24
0.36
Cha
kaiy
a 12
.72
13.6
8 14
.74
16.0
0 16
.42
17.9
9 20
.00
26.1
5 28
.04
0.00
0.
11
0.12
0.
14
0.22
0.
25
0.29
0.
36
0.49
Mea
n 11
.54
12.6
4 13
.68
14.6
5 15
.53
16.7
6 18
.27
23.6
0 24
.76
0.00
0.
06
0.08
0.
10
0.16
0.
19
0.23
0.
31
0.42
CD
(5%
) 0.
18
0.19
0.
33
0.18
0.
33
0.19
0.
18
0.33
0.
19
NS
0.02
0.
01
0.01
0.
02
0.03
0.
03
0.04
0.
01C
ultiv
ars
M
ould
pop
ulat
ion
Yeas
t pop
ulat
ion
/ St
orag
e
0 30
60
90
12
0 15
0 18
0 21
0 24
0 0
30
60
90
120
150
180
210
240
NA
-6
0.00
0.
14
0.21
0.
23
0.28
0.
32
0.37
0.
40
0.43
0.
00
0.07
0.
12
0.15
0.
18
0.23
0.
26
0.29
0.
33N
A-7
0.
00
0.13
0.
15
0.22
0.
24
0.28
0.
31
0.36
0.
40
0.00
0.
03
0.08
0.
10
0.15
0.
20
0.22
0.
27
0.30
Chak
aiya
0.
00
0.22
0.
26
0.32
0.
36
0.41
0.
46
0.42
0.
46
0.00
0.
12
0.15
0.
19
0.26
0.
30
0.34
0.
42
0.47
Mea
n 0.
00
0.16
0.
21
0.26
0.
29
0.34
0.
38
0.39
0.
43
0.00
0.
07
0.12
0.
15
0.20
0.
24
0.27
0.
33
0.38
CD (5
%)
NS
0.02
0.
01
0.02
0.
03
0.02
0.
03
0.02
0.
02
NS
0.01
0.
02
0.03
0.
03
0.05
0.
04
0.03
0.
05

284 Progressive Horticulture, 45 (2)
upto 240 days of storage. At the end of 240 days of stor-age, squash prepared from Chakaiya contained maxi-mum reducing sugar (28.04%), which was significantly higher than prepared from NA-6 (24.24%) and NA-7 (22.01%). The squash prepared from fruits of Chakaiya contained maximum total sugar (38.72%), which was significantly higher than prepared from cultivar NA-6 (38.54%) and NA-7 (38.27%) at 240 day of storage. The increase in reducing sugar as well as total sugars and decrease in non-reducing sugar in aonla squash could be because of responsive varietal biochemical constituents. The variation in different fractions of sugar was due to hydrolysis of polysaccharides like pectin and starch and inversion of non-reducing sugar into reducing sugar, as increase in reducing sugar was correlated with the de-crease in non-reducing sugars. The increased level of total sugars was due to conversion of starch and pectin into simple sugars. Similar findings were reported by in aonla beverages by Jain et al., 2006 and Jain et al., 2007.
Microbial examinationThe microbial examination indicated an increase
with advancement of storage period till 240 days under ambient condition (Table 2). The bacterial population was observed to be the maximum in the squash prepared from cultivar Chakaiya (0.11X10⁻³ cfu/ml) followed by NA-6 (0.07X10⁻³ cfu/ml) and NA-7 (0.03X10⁻³ cfu/ml) at the 30 days of storage period. A similar trend was ob-served upto 240 days of storage. At the end of 240 days of storage, squash prepared from Chakaiya had maxi-mum bacterial population (0.49X10⁻³ cfu/ml), which was higher than NA-6 (0.41X10⁻³ cfu/ml) and NA-7 (0.36X10⁻³ cfu/ml). The level of yeast population was found to be higher in the squash prepared from Chakaiya (0.12X10⁻³ cfu/ml) followed by NA-6 (0.07X10⁻³ cfu/ml) and NA-7 (0.03X10⁻³ cfu/ml) at the 30 days of storage period. Al-most same trend was observed upto 240 days of storage. At the end of 240 days of storage, aonla squash prepared from Chakaiya had maximum yeast population (0.47X10⁻³ cfu/ml), which was maximum than NA-6 (0.33X10⁻³ cfu/ml) and NA-7 (0.30X10⁻³ cfu/ml). The mould population in aonla squash was observed to be higher in the squash prepared from Chakaiya (0.46X10⁻³ cfu/ml) followed by NA-6 (0.43X10⁻³ cfu/ml) and NA-7 (0.40X10⁻³ cfu/ml) at the 240 days of storage. The variations observed in total microbial population might be due to some contamina-tions might occurred during preparation and examina-tions. Increase in microbial population mainly depends upon the environment available to the microbes and the storage temperature. Similar findings were reported in aonla juice (Jain et al., 2003).
Organoleptic evaluationThe organoleptic evaluation of aonla squash pre-
pared from three cultivars and stored under room tem-perature was done at 30 days interval by a panel of five judges. The scores are presented in Table 2. The squash prepared from the cultivar NA-7 scored significantly higher (8.90) followed by those prepared from NA-6 (8.84) and Chakaiya (8.76) at initial stage. Thereafter, a similar trend was observed upto 240 days of storage. It was also observed that squash prepared from cultivar NA-7 was highly acceptable for consumption upto 240 days of storage period. There was considerable decrease in sensory mean score for taste, flavour and overall ac-ceptability during storage. Panelists recorded a consid-erable loss of flavour in aonla squash upon prolonged storage. This may be due to degradation of flavour con-stituents and unstable nature of volatile substances upon storage time and temperature. The present findings are in accordance with the view of Jain et al. (2006) in aonla squash beverage, Lal (2006) in aonla syrup beverage, Jain et al. (2007) in aonla RTS beverage, Jain and Khur-diya (2007) in aonla RTS beverage and Premi et al., (1999) in aonla juice.
Economics analysis The squash beverage prepared from cultivar NA-7
had the maximum B : C ratio (2.16 : 1) followed by NA-6 (1.91 : 1) and Chakaiya (1.81 : 1). The low input cost of aonla and high returns of its products with good sen-sory, nutritional quality and shelf life established it into recognized fruit for preparation of squash.
REFERENCESAmerine, M.A., Pangbom, R.M. and Rosseler, E.B. 1965.
Principle of Sensory Evaluation of Food. Academic Press, London.
Jain, S.K. and Khurdiya, D.S. 2007. Ascorbic acid loss, microbial spoilage and sensory changes in aonla juice during storage. Indian. J. Arid Horti., 2(2): 36-39.
Jain, S.K.; Khurdiya, D.S.; Gaur, Y.D. and Ladha, M. L. 2003. Thermal processing of aonla (Emblica officinalis Gaertn.) juice. Indian Food Packer. 57 (1): 46-49.
Jain, V.; Singh, P. and Singh, A.K. 2007. Evaluation of aonla cultivars for RTS beverage. The Horticulture J., 20 (1): 11-13.
Jain, V.; Singh, P. and Singh, A.K. 2006. Screening of aonla cultivars for making squash. Indian. J. Arid Horti., 1(1): 44-46.
Progressive Horticulture, 45 (2) 285
Lal, G. 2006. Studies on the effect of sugar and citric acid treatments on quality attributes of aonla syrup during storage. Prog. Hort., 38(1): 109-113.
Mehta, U. and Rathore, H. 1976. Storage studies of pressed juice from Amla (Phyllanthus emblica L.). Indian Food Packer, 30(1): 9-11.
Prasad, R.N. and Mali, P.C. 2000. Changes in physico-chemical characteristics of pomegranate squash dur-ing storage. Indian. J. Hort., 57(1): 18-20.
Prasad, R.N. and Mali, P.C. 2003. Changes in physico-chemical characteristics of ber squash during storage.
Prog. Hort., 35(2): 170-172.
Premi, B.R.; Sethi, V. and Maini, S.B. 1999. Effect of steep-ing preservation on the quality of aonla (Emblica officinalis Gaertn.) fruits during storage. J. Food Sci. Technol., 36(3): 244-247.
Ranganna, S. 1997. Handbook of Analysis and Qual-ity Control for Fruit and Vegetable Products. Tata McGraw Hill Publishing Co. Ltd., New Delhi.
Tripathi, V.K.; Singh, M.B. and Singh, S. 1988. Studies on comparative composition changes in different pre-served products of aonla var. Banarasi. Indian Food Packer, 42(4): 60-66.
Received on 07 October, 2012 and accepted on 16 August, 2013
Online version available at: www.indianjournals.com
Progressive Horticulture, Vol. 45, No. 2, September 2013© Copyright by ISHRD, Printed in India
[Research Article]
Evaluation of nutritional quality of aonla during freeze-drying
D. K. Tandon and Rekha Chaurasia Division of Post Harvest Management, Central Institute for Subtropical Horticulture,Rehmankhera, P.O. Kakori, Lucknow -227 107, U.P.Email : [email protected]
ABSTRACTFreeze-drying of aonla for achieving maximum retention of nutrients was attempted in the present study.
Three commercial varieties of aonla, viz. Krishna, Chakaiya and NA-7, were freeze-dried in the form of shreds, pieces (supari) and segments. The samples were first pre-freezed at –18°C in a deep freezer and then subjected to drying in a freeze drier. The temperature of the drying trays was maintained at 30°C, while the temperature of the chamber was kept at –55°C. The drying time of the shreds was least (3 h to 3 h 15 min), while segments took maximum time (9 h to 9 h 30 min). All the varieties behaved similarly during freeze-drying. The quality in terms of moisture, TSS, acidity, ascorbic acid and polyphenols was evaluated in fresh fruits as well as in freeze-dried samples at zero time and after 90 days of storage under ambient conditions. A slight decrease in the nutrients was noticed during freeze-drying of aonla. The retention of ascorbic acid and polyphenols was maximum in freeze-dried segments, in all the varieties tried, after 90 days of storage. Krishna was found to be least suitable for freeze-drying among the varieties tested.
KEY wORDS: Aonla, freeze drying, quality
Aonla (Emblica officinalis Gaertn), the Indian goose-berry, is one of the important indigenous medicinal fruit also known as “Amrit Phal” (Anon., 1952). It is nutri-tionally and medicinally important due to its very high ascorbic acid and polyphenols contents and antioxidant properties (Kalra, 1988). Because of its significant medic-inal and nutritive value, it finds a prominent place in an-cient Indian mythological literatures like Vedas, Askandh-puran, Shivpuran, Ramayana, etc. It is extensively used in Ayurvedic and Unani systems of medicines for sound health as Chyavanprash, Trifla, Amrit Kalash and Churan (Pathak et al., 2003). It is used as a juice with honey or capsule or tablet in curing chronic dysentery, tubercu-losis, asthma, bronchitis, anaemia, cold and diabetes. A number of processed products are prepared from aonla and one of them is dry powder. The aonla fruit is usu-ally dried in open sun or in dehydrators and powder is prepared. Spray-drying of juice is also being attempted to prepare quality product. Freeze-drying is another im-portant way of dehydrating food to preserve the deli-cious taste and better nutrition. In freeze-drying process water is removed from a substance by direct evaporation (sublimation) from frozen state to vapour state without
the water passing through an intermediate liquid state. It produces one of the highest quality food products ob-tainable by any drying methods (Hanson, 1961; Sadiko-glu and Ozdemir, 2003). Dried products have their own natural odour, flavour and colour. The dried particles are porous and very light in weight so the storage sta-bility is better. Since aonla has important nutraceutical value, it has a demand in overseas market in the dried powder form. Therefore, in the present investigation an attempt has been made to freeze dry aonla and study the nutrient retention until three months of storage under ambient conditions.
MATERIALS AND METHODSFully mature and uniform size fruits of three com-
mercial cultivars of aonla, viz. Krishna, Chakaiya and NA-7, were procured from the experimental farm of CISH, Lucknow. The fruits were thoroughly washed with tap water and bruised and blemished fruits were sorted out. The fruits of each variety were divided into three lots. One lot was shredded with a hand grater. In rest of the fruits segments were separated by stainless steel knife by hand. One lot of the segments was used for

Progressive Horticulture, 45 (2) 287
drying as such, while segments of other lot were cut into 3-4 pieces (supari). All the three prepared samples were pre-freezed at –18°C in a deep freezer. After pre-freezing, the samples were transferred to freeze-dryer (Heto LYO-LAB 3000, Denmark) @ 100g / tray (5 trays of 25 cm dia.) at a set tray temperature of 30°C and vacuum chamber temperature was kept at –55 ± 2°C. After freeze-drying, the products were stored in clean, dry and airtight pet bottles. The bottles were then wrapped with aluminium foil and stored in dark at room temperature (18-25°C) for 90 days. The percentages of shreds, pieces (supari) and segments were worked out in each of the varieties. The moisture in the fruits was obtained by drying the samples at 60°C to a constant weight. Total soluble sol-ids (TSS) were measured by hand refractometer (Erma, Japan). Titratable acidity was estimated by titrating the fruit extract against 0.1N NaOH solution using phenol-phthalein as an indicator (Ranganna, 1986). For ascorbic acid estimation, samples were macerated with 3.0 per cent metaphosphoric acid and titrated against standard 2,6-dichlorophenol indophenol dye solution (Ranganna, 1986). Polyphenols were measured by Folin Ciocalteu’s phenol reagent method as described in AOAC (1984). The data are reported on dry weight basis (dwb) and subjected to statistical analysis (Panse and Sukhatme, 1951).
RESULTS AND DISCUSSIONThe data on recovery per cent of different aonla sam-
ples are presented in Table 1. The minimum recovery was noted in shreds, i.e., 64 to 67 per cent, while maxi-mum was recorded in aonla segments, i.e., 84.0 to 86.3 per cent, in different cultivars of aonla. The recovery of shreds from aonla fruits was less because lot of pulp re-mained adhered to stone, which was difficult to grate due to the uneven shape of its stone. The data on proxi-mate composition of fresh fruit is presented in Table 2. The moisture content in fresh aonla fruits ranged from 87.1 to 88.1 per cent. The minimum moisture content was noticed in shredded samples of all the varieties, while moisture content was more or less the same in aonla pieces and segments. The total soluble solids (TSS) and titratable acidity were more or less the same in seg-ments and pieces as compared to shreds. The maximum TSS content was recorded in cv. Krishna followed by NA-7 and Chakaiya in all the samples. Minimum titrat-able acidity was noticed in cv. Krishna, while maximum was observed in cv. Chakaiya. Regarding ascorbic acid content, significant differences were recorded in differ-ent samples of aonla varities. The maximum amount (3796 mg/100 g dwb) of ascorbic acid was found in seg-ments of cv. Krishna. Aonla shreds showed minimum amount of ascorbic acid in all varieties (3450, 2148 and
2513 mg/100g in Krishna, Chakaiya and NA-7, re-spectively). Polyphenols were also minimum in shreds of all the varieties as compared to other samples. The maximum polyphenols were found in the segments of cv. Krishna (18.4% dwb). The chemical composition in fresh fruits reported here is in conformity with those reported earlier (Singh et al., 1993; Tandon et al., 2003; Singh et al., 2005). The results indicated that all the sol-uble chemical components were lower in aonla shreds irrespective of the variety. It was due to the fact that lot of exudates leached during grating, which resulted in
Table 1: Recovery per cent of different samples from aonla fruits
Variety Segments(%) Pieces(%) Shreds(%)Krishna 84.0 81.5 64.0Chakaiya 86.3 83.6 68.0NA-7 85.4 83.0 67.0
Table 2: Chemical parameters of fresh aonla fruits (dry weight basis)
Sample Moisture TSS Acidity Ascorbic Polyphenols (%) (°B) (%) acid (%) (mg/100 g)KrishnaSegments 87.5 68.0 14.4 3796 18.4Pieces 87.9 69.1 14.0 3772 18.2Shreds 87.1 63.1 12.8 3450 16.5ChakaiyaSegments 88.1 54.8 16.9 2412 14.2Pieces 88.1 54.0 16.8 2272 14.0Shreds 87.4 49.0 16.2 2148 13.7NA-7Segments 88.1 68.0 15.8 2629 14.8Pieces 88.0 68.0 15.8 2602 14.6Shreds 87.6 62.4 14.6 2513 14.0CD at 5% 0.5 0.9 0.2 27.6 0.4
No. of samples analysed : 3 for each product of each va-riety
Table 3: Drying time of different aonla samples in the freeze-drier
Variety Segments Pieces ShredsKrishna 9 h 15 min 6 h 15 min 3 hChakaiya 9 h 30 min 6 h 30 min 3 h 15 minNA-7 9 h 30 min 6 h 15 min 3 h 10 min.
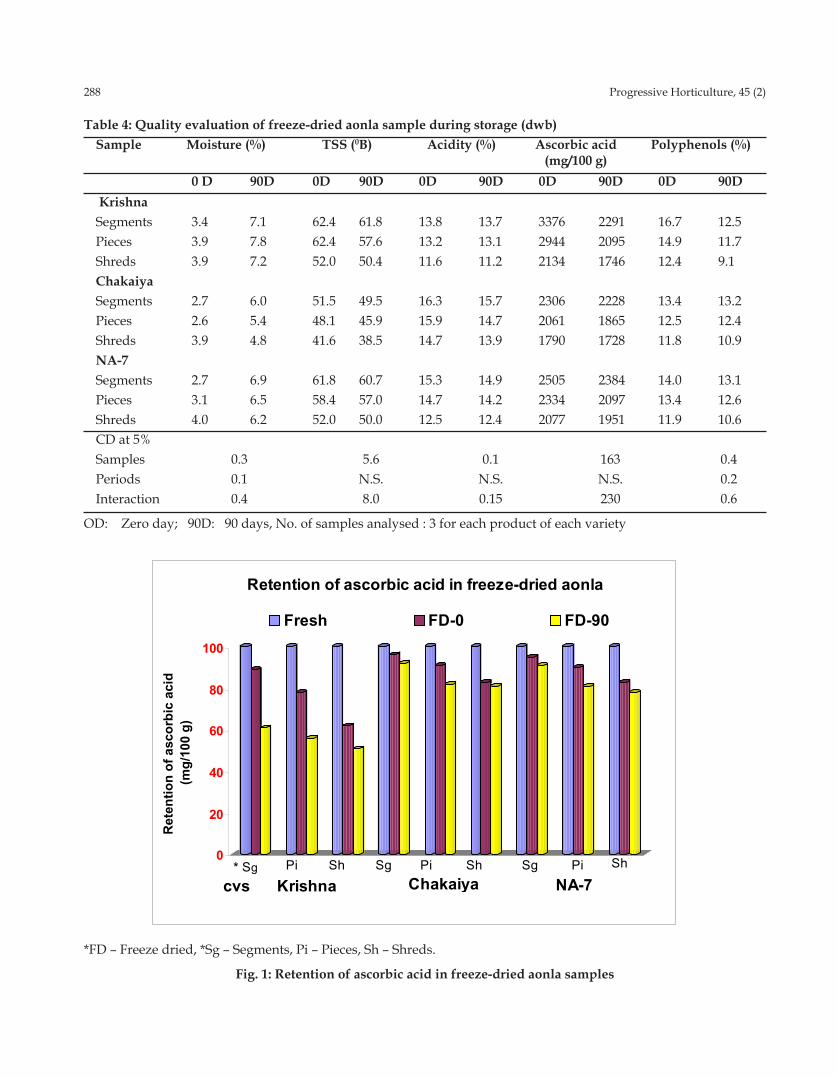
288 Progressive Horticulture, 45 (2)
Table 4: Quality evaluation of freeze-dried aonla sample during storage (dwb)Sample Moisture (%) TSS (0B) Acidity (%) Ascorbic acid Polyphenols (%) (mg/100 g) 0 D 90D 0D 90D 0D 90D 0D 90D 0D 90D KrishnaSegments 3.4 7.1 62.4 61.8 13.8 13.7 3376 2291 16.7 12.5Pieces 3.9 7.8 62.4 57.6 13.2 13.1 2944 2095 14.9 11.7Shreds 3.9 7.2 52.0 50.4 11.6 11.2 2134 1746 12.4 9.1ChakaiyaSegments 2.7 6.0 51.5 49.5 16.3 15.7 2306 2228 13.4 13.2Pieces 2.6 5.4 48.1 45.9 15.9 14.7 2061 1865 12.5 12.4Shreds 3.9 4.8 41.6 38.5 14.7 13.9 1790 1728 11.8 10.9NA-7Segments 2.7 6.9 61.8 60.7 15.3 14.9 2505 2384 14.0 13.1Pieces 3.1 6.5 58.4 57.0 14.7 14.2 2334 2097 13.4 12.6Shreds 4.0 6.2 52.0 50.0 12.5 12.4 2077 1951 11.9 10.6CD at 5%Samples 0.3 5.6 0.1 163 0.4Periods 0.1 N.S. N.S. N.S. 0.2Interaction 0.4 8.0 0.15 230 0.6
OD: Zero day; 90D: 90 days, No. of samples analysed : 3 for each product of each variety
0
20
40
60
80
100
Ret
enti
on
of
asco
rbic
aci
d
(mg
/100
g)
Retention of ascorbic acid in freeze-dried aonla
Fresh FD-0 FD-90
Sg
Krishna Chakaiya NA-7* Sg Pi Sh Sg Pi Sh Pi Sh
cvs
*FD – Freeze dried, *Sg – Segments, Pi – Pieces, Sh – Shreds.
Fig. 1: Retention of ascorbic acid in freeze-dried aonla samples

Progressive Horticulture, 45 (2) 289
0
20
40
60
80
100
Ret
enti
on
of
Po
lyp
hen
ols
(%
)
Retention of Polyphenols in freeze-dried aonla
Fresh FD- 0 FD-90
Krishna Chakaiya NA-7* Sg Pi SgSgSh Pi Sh Pi Sh
cvs
*FD – Freeze dried, *Sg – Segments, Pi – Pieces, Sh – Shreds.
Fig. 2: Retention of polyphenols in freeze-dried aonla samples
nutrition losses. The decrease in the contents of ascorbic acid and polyphenols in aonla products has also been reported (Agarwal and Chopra, 2004). The drying time of different aonla samples depended upon the surface area exposed in the freeze dryer. Aonla shreds took less duration of time (3 h to 3 h 15 min) in drying, while seg-ments dried in more than 9 h irrespective of the variety (Table 3). The pieces (supari) took around 6 h to dry. The shreds dried fastest, as the drying surface was maximum and the sample thickness was least, whereas segments had minimum exposed area as well as maximum thick-ness and took longest time to dry in the freeze dryer. In the preliminary trial of freeze-drying of aonla pulp (blanched or unblanched), a foaming was observed and the product was found to be sticky. The blanched aonla segments also behaved similarly to that of aonla pulp. Hence, blanching of the fruit samples was not found suitable for freeze-drying (data not reported).
The freeze-dried samples were evaluated for various parameters at zero time and after 90 days of storage un-der ambient conditions (Table 4). The moisture content in freeze-dried samples varied from 2.6 to 4.0 per cent, which invariably increased after 90 days of storage in all the samples. The increase in moisture content of all the samples of cv. Krishna was higher, while those of cv. Chakaiya was least during storage. The TSS content of fresh fruits decreased during freeze-drying which further decreased upon storage. The TSS content in shreds of all
the varieties was least. Titratable acidity of fresh fruits also decreased during freeze-drying and storage. The contents of soluble solids (TSS) and acid in fresh fruits decreased during freeze drying, which further deterio-rated upon storage, though non-significantly. The loss in the values of these parameters might be due to the leach-ing at the time of freezing of the samples and oxidation during storage. The highest level of acidity was recorded in all the samples of cv. Chakaiya and lowest in those of cv. Krishna. The ascorbic acid content decreased during freeze-drying and storage. Its content was maximum in all the samples at zero day in cv. Krishna, but after 90 days of storage the maximum ascorbic acid content was recorded in all the samples of cv. NA-7. The loss in ascor-bic acid content in freeze-dried samples was more where increase in moisture content was more during storage. Gagas et al. (2003) have also reported that vitamin-C degradation was more pronounced at higher moisture content level due to its high solubility in freeze-dried prunes. It has been demonstrated by Lester et al. (2004) that antioxidant enzymes showed significant changes in freeze-dried samples during storage. Damame et al. (2002) have observed a loss in ascorbic acid content in aonla products stored under ambient conditions. The contents of polyphenols also decreased due to freeze-drying and storage. The higher amounts of polyphenols were noted in all the samples of cv. Krishna at zero day, which decreased faster after 90 days of storage. The loss

290 Progressive Horticulture, 45 (2)
in polyphenols during storage might be due to oxida-tion.
The retention of ascorbic acid content in freeze-dried samples is presented in Fig 1. The results indicated that the segments retained maximum ascorbic acid content after freeze-drying and upon storage in all the variet-ies. In cv. Krishna, the ascorbic acid content was found maximum in fresh fruits but after freeze-drying and storage minimum retention of ascorbic acid was noticed. The retention of polyphenols was more prominent in cv. Chakaiya followed by cvs NA-7 and Krishna (Fig 2). The freeze-dried aonla segments showed maximum re-tention of polyphenols in all the cultivars, while shreds showed the minimum retention. Despite the fact that ascorbic acid and polyphenols contents were higher in fresh fruits of cv. Krishna, the loss in their contents was also higher during freeze-drying and subsequent stor-age. Cultivar Chakaiya has been found most suitable in preserving the colour of the samples during freeze-dry-ing and storage. Mishra et al. (2009) have also reported that freeze-dried powder prepared from Chakaiya vari-ety showed better retention of colour and nutrients than wild variety. At zero day no browning was observed in any of the samples. However, slight browning was ob-served in all the samples of cvs NA-7 and Krishna dur-ing storage, though the samples of cv. NA-7 were better than those of cv. Krishna. The experimental results have thus revealed that cv. Krishna is not suitable for freeze-drying, as retention of nutrient was least as compared to other two varieties. Aonla shreds dried faster but the loss of nutrient was also maximum.
REFERENCESAgarwal, S. and Chopra, C.S. 2004. Studies on changes
in ascorbic acid and total phenols in making aonla products. Bev. Food World, 31: 32-34.
Anonymous 1952. Raw materials. In: Wealth of India, Vol. 1. CSIR, New Delhi.
A.O.A.C. 1984. Official methods of analysis. Association of Official Analytical Chemists, Washington D.C., USA.
Damame, S.V.; Gaikwad, R.S.; Patil, S.R. and Masalkar, S.D. 2002. Vitamin –C content of various aonla prod-
ucts during storage. Orissa J. Hort., 30: 19-22.
Gagas, A.L.; Telis-Romero, J. and Menegalli, F.C. 2003. Kinetic of ascorbic acid degradation in freeze dried Prunes. Cienciae Technologia de Alimentors, 23: 66-70.
Haanson, S.W.F. 1961. The accelerated freeze drying (AFD) method for preservation. Ministry of Fisheries & Food, London.
Kalra, C.L. 1988. The chemistry and technology of aonla (Phyllantus emblica) –a resume, Indian Food Packer, 42: 67-82.
Lester, G.E.; Hodges, D.M.; Meyer, R.D. and Munro, K.D. 2004. Pre-extraction preparation (fresh, frozen, freeze dried, or acetone powder) and long-term storage of fruit and vegetable tissues: Effect on antioxidant en-zyme activity. J. Agric. Food Chem. 52: 2167-2173.
Mishra, P.; Srivastava, V.; Verma, D.; Chauhan, O.P. and Rai, G.K. 2009. Physico-chemical properties of Cha-kiya variety of amla (Emblica officinalis) and effect of different dehydration methods on quality of powder. Afr. J. Food Sci., 3: 303-306.
Panse,V.G. and Sukhatme, P.V. 1951. Statistical methods for agricultural workers. ICAR, New Delhi.
Pathak, R.K.; Pandey, D.; Mishra, A.K.; Haseeb, M. and Tandon, D.K. 2003. The Aonla, CISH, Lucknow, pp. 32.
Ranganna, S. 1986. Handbook of analysis and quality con-trol for fruit and vegetable products, Second Edition, Tata McGraw-Hill Publishing Co. Ltd., New Delhi.
Sadikoglu, H. and Ozdemir, M. 2003. Freeze-drying tech-nology and its stages. Gida, 28: 643-649.
Singh. B.P.; Pandey, G.; Sarolia, D.K.; Pandey, M.K. and Pathak, R.K. 2005. Shelf life evaluation of aonla cul-tivars. Indian J. Hort., 62: 137-140.
Singh, I.S.; Pathak, R.K.; Diwedi, R. and Singh, H.K. 1993. Aonla production and post harvest technology. Tech. Bull. NDUA&T Faizabad.
Tandon, D.K.; Yadav, R.C.; Sood, S.; Kumar, S. and Dik-shit, A. 2003. Effect of blanching and lye peeling on the quality of aonla candy. Indian Food Packer, 57: 147-150.
Received on 17 November, 2012 and accepted on 06 June, 2013

Online version available at: www.indianjournals.com
Progressive Horticulture, Vol. 45, No. 2, September 2013© Copyright by ISHRD, Printed in India
[Research Article]
Storability of aonla (Emblica officinalis Gaertn.) fruits in liquid medium at ambient temperature
R.C. Gupta and Bhagwan DeenDepartment of Horticulture, Narendra Deva University of Agriculture and Technology, Kumarganj, Faizabad-224 229 (Uttar Pradesh)Email: [email protected]
ABSTRACT The six liquid mediums consisting of different concentration of glacial acetic acid and NaCl in water were
used to control the post harvest decay in aonla fruits of Chakaiya cultivar. The fruits were dipped into liquid me-diums in plastic buckets and stored at ambient temperature varying from 8.75 to 23.50 C. Following the treatment, fruits could be stored into water containing 10% NaCl and 1% acetic acid up to 85 days at ambient temperature of 8.75 to 23.50 C without any post harvest decay.
KEY wORDS: Emblica officinalis, storage, Aonla, NaCl, acetic acid, postharvest loss
Aonla or Indian gooseberry (Emblica officinalis Gaertn) is one of the most important indigenous fruits of India. It is very hardy and can be successfully grown in various agro-climatic and soil conditions on which com-mon fruit crops normally do not yield well. In addition to India wild aonla trees have also been reported from Ceylon, Cuba, Hawaii, Florida, Iran, Iraq, Java, West-Indies, Trinidad, Pakistan, Malaya and China. Aonla fruit is one of the richest sources of vitamin ‘C’ (500-700 mg100 g-1 pulp), minerals and phenolic compounds and well known for its nutraceutical, harmacological and an-tioxidant properties. It is an important component of the famous Indian Ayurvedic medicines Chyavanprash and Trifla. Aonla fruits demand is increasing in processing, pharmaceutical and cosmetic industries due to its nutri-tive, medicinal and antioxidant properties subsequently the area under aonla cultivation is getting expansion in Indian states like Uttar Pradesh, West Bengal, Rajasthan, Gujarat, Haryana, Maharashtra, Chhatisgarh and even in Tamil Nadu. The fruits cannot be stored for longer periods at ambient temperature due to its perishable nature while cold storage is not a cost effective means of storage. Acetic acid (Sholberg and Gaunce, 1995) and NaCl (Nath, 1990) are reported to be effective to control post harvest decay in fruits. The present research work is conducted to find out suitable liquid medium containing acetic acid and NaCl for energy saving ambient storage of aonla unit.
MATERIALS AND METHODS The fruits for experiment were collected from seven-
teen years old trees of aonla cv. Chakaiya planted under sodic soil conditions at Main Experiment Station of Hor-ticulture Department, N. D. University of Agriculture & Technology, Kumarganj, Faizabad, Uttar Pradesh, dur-ing 2009-10. Mature fruits weighing 30 kg from every tree were harvested by hand and mixed together. Out of 90 kg fruits, 15 kg fruits per treatment were used in the study. The experiment consisted of six treatments viz.- T1-Control (water), T2-15% NaCl solution,T3-10% NaCl + 0.5% Acetic acid solution,T4 -5% NaCl + 0.5% Acetic acid solution, T5-10% NaCl + 1.0% Acetic acid solution and T6-5% NaCl + 1.0% Acetic acid solution. The solu-tions were prepared by dissolving the calculated quan-tity of common salt and glacial acetic acid in tap water of drinking quality. The fruits were washed with water then kept into plastic bucket and prepared liquid me-dium was poured and level was maintained 10cm above the fruits. The buckets were put in PHT laboratory at am-bient temperature that varied from 8.75 to 23.50C during studies. The observations were recorded at an interval of five days. Total soluble solids of fruit juice was recorded by ERMA Hand Refractometer of 0-32% range and cor-rected at 200C with the help of correction table (Ran-ganna, 2010), acidity was determined by titration using 0.1 N NaOH solutions and phenolphthalein indicator. To estimate Vitamin C, samples were titrated against 2,

292 Progressive Horticulture, 45 (2)
6 dichlorophenol indophenols dye to end point (A.O. A. C., 1970). The sugars were estimated using Fehling’s so-lutions A and B (Lane and Eynon, 1923) and following the procedure as described by Ranganna (2010). Total phenols were extracted by crushing 1 g pulp with 20 ml 80% ethyl alcohol which was centrifuged at 1000 rpm for 10 minutes and 1 ml phenol reagent and 2 ml sodium carbonate solution were added to each ml clear aliquot to develop colour. The developed colour was measured at 750nm using ELICO brand Spectrophotometer model SL-160. The total phenols were calculated by the stan-dard curve drawn with graded concentration of Gallic acid (Swan and Hills, 1959). The fruits started decaying were isolated from the lot, weighted and per cent decay loss was calculated against the initial weight of the lot. The experiment was laid out in Completely Randomized Block design with three replications.
RESULTS AND DISCUSSIONInitially uptill 20 days, increasing changes in total
soluble solids (TSS) were observed in all treatments ex-cept in control. Thereafter, TSS content showed decreas-ing trend (Fig. 1). The initial increase in TSS of treated fruits might be due to breakdown of complex polymers into soluble substances by hydrolytic enzymes and ex-osmosis of water from the fruits, utilization of sugars in metabolic activities of fruits probably decreased the TSS
content in latter period of storage. In control decreasing trend in TSS was estimated since the beginning to end of storage that might be due to continuous utilization of soluble solids in metabolic activities and absorption of water. The findings is supported by the observation as made by Antunes et al. (2008) who observed that TSS content of fig cv. Lampa Preta treated with 1% acetic acid solution by dipping for 2 minutes registered the higher values during its 20 days storage at 20C and 85-90% RH.
The trend of acidity change was almost similar to TSS (Fig.2).The fruits dipped into 10% NaCl + 1% Acetic acid solution (T-5) retained highest acidity. The shift in balance between anabolic and catabolic reactions in the fruits might be the reason of initial increasing followed by decreasing trend in acidity content. The ascorbic acid content in the all treatments showed decreasing trend from beginning to the end of storage, however, treated fruits retained higher ascorbic acid than control (Fig.3) and T-5 (10% NaCl +1% Acetic acid solution) treatment retained highest ascorbic acid in comparison to other treatments. The loss in ascorbic acid in prolonged storage could be attributed to the rapid conversion of L-ascorbic acid into dehydro ascorbic acid in the presence of ascor-binase enzyme (Mapson, 1970). The reducing (Fig.4), non-reducing (Fig.5) and total sugars (Fig.6) increased initially in all treatments, thereafter, decreased gradually till the end of storage. The sugar content was
Table 1: Effects of liquid medium on postharvest decay loss (%) of aonla fruits cv. Chakaiya
Treatments Days of storage
0 to 60 65 70 75 80 85
T 1-Control 0.0 2.5 7.9 14.13 22.12 30.93 (1.73) (2.90) (3.82) (4.76) (5.61)
T 2-15% NaCl solution 0.0 0.0 0.0 0.0 2.2 6.12 (0.71) (0.71) (0.71) (1.64) (2.57)
T 3-10% NaCl+0.5% 0.0 0.0 0.0 0.0 0.0 2.17 Acetic acid solution (0.71) (0.71) (0.71) (0.71) (1.63)
T 4-5% NaCl+0.5% 0.0 0.0 0.0 0.0 2.26 6.6 Acetic acid solution (0.71) (0.71) (0.71) (1.66) (2.66)
T 5-10% NaCl+1.0% 0.0 0.0 0.0 0.0 0.0 0.0 Acetic acid solution (0.71) (0.71) (0.71) (0.71) (0.71)
T 6-5% NaCl+1.0% 0.0 0.0 0.0 0.0 0.0 2.75 Acetic acid solution (0.71) (0.71) (0.71) (0.71) (1.80)
SEM ± - 0.008 0.015 0.011 0.018 0.042
CD at 5% - 0.03 0.05 0.04 0.06 0.13
Note- In parenthesis transformed data (21x Y += )

Progressive Horticulture, 45 (2) 293
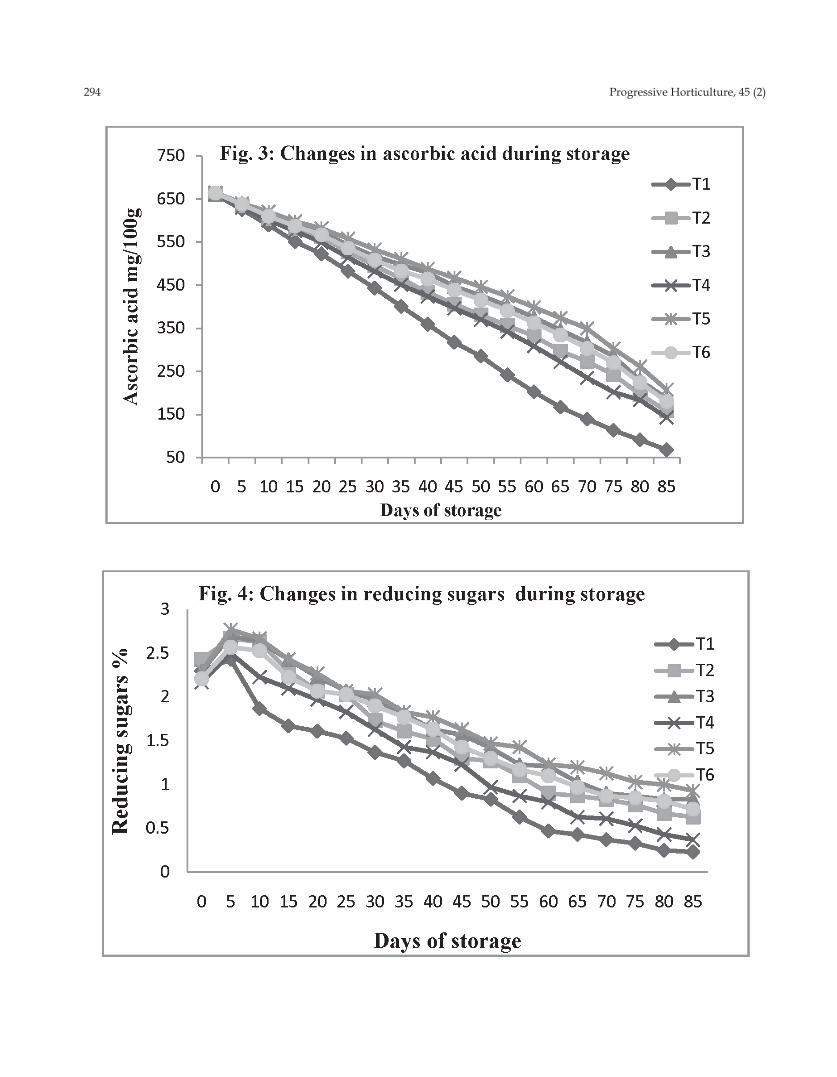
294 Progressive Horticulture, 45 (2)
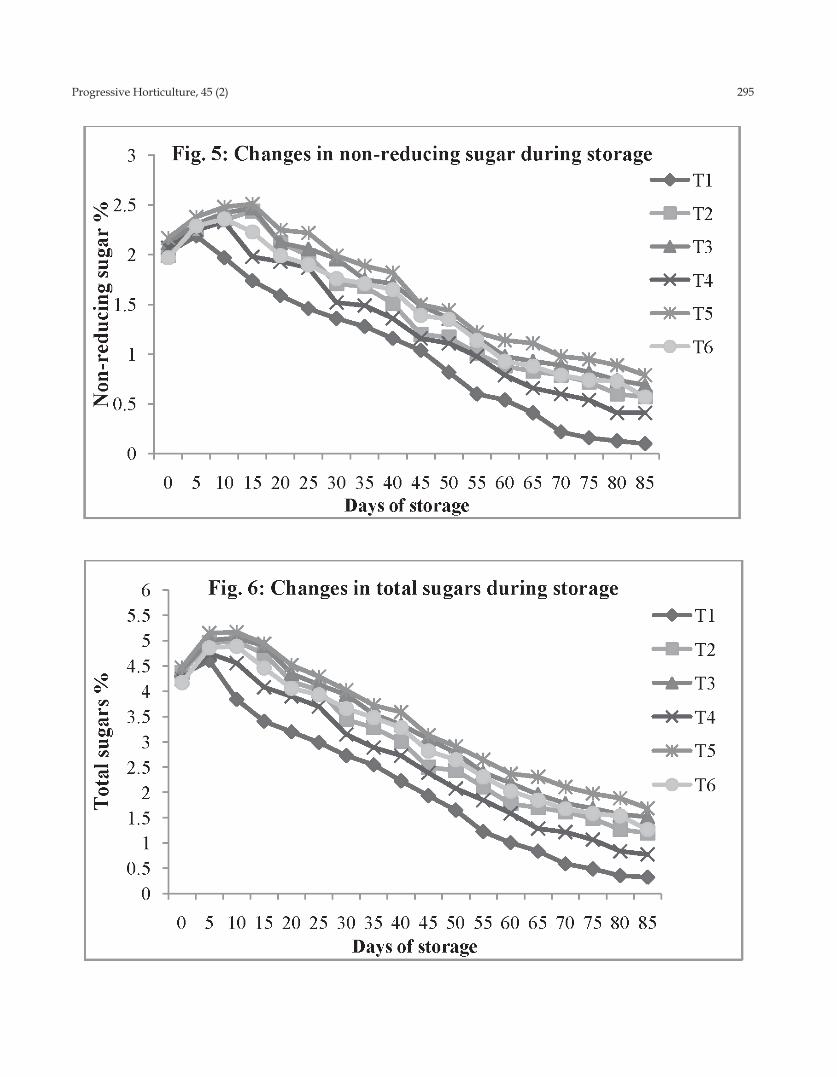
Progressive Horticulture, 45 (2) 295

296 Progressive Horticulture, 45 (2)
highest in fruits dipped into T-5 treatment. The increase in sugars content during initial period of storage might be due to conversion of starch into simple sugars and lat-er on reduction in content was due to utilization of sug-ars in catabolic process of fruits. Similar trend in changes of sugars was also reported in mango (Kapse et al., 1977) and citrus fruits (Reig-Feliu and Bernal, 1966).
Total phenol content decreased continuously in all treatments (Fig.7) but retention was highest in T-2 (15% NaCl solution) treatment. It might be due to the effect of higher concentration of NaCl. This result is in conformi-ty to the earlier reports as made by Hamauzu and Kume (2005) in fresh prunes and by Patthamakanokporn et al. (2008) in guava. There was no post harvest decay loss in all six treatments including control up to 60 days of storage. Afterwards, decay loss was observed during subsequent days of storage (Table-1). Significant differ-ence in post harvest decay loss was recorded among all treatments and fruits stored into 10% NaCl + 1% Acetic acid solution did not decayed till the end of 85 days of storage. The comparison of different treatments confirm that acetic acid is more effective than NaCl in control-ling fruit decay. The acetic acid fumigation was found effective in controlling post harvest decay in citrus, kiwi, grapes and tomato (Sholberg and Gaunce, 1995) and strawberry (Morsy et al., 1999). Similarly, vinegar va-
pour was also reported to be effective in reducing the post harvest decay in harvested fruits (Sholberg et al., 2000). The findings are in conformity to those as reported by Nath (1990) as well as Saini and Singh (2002) who reported that NaCl solution minimized decay loss and increased the shelf life of aonla fruits. The findings of present studies suggest that shelf life of aonla fruits can be prolonged by dipping the fruits in liquid medium consisting of 10% NaCl, 1% acetic acid and water up to 85 days at ambient temperature at 8.75 to 23.50C without any decay loss.
REFERENCESA.O.A.C. 1970. Official methods of analysis. Association
of official analytical chemists, Washington D.C.
Antunes, M.D.C.; Costa, P.; Miguel, M.G.; Martins, D.; Neves, M.A.; Martins, M.A. and Gomes, C. 2008.The effect of postharvest treatments with sodium bicar-bonate or acetic acid on storage ability and quality of fig fruit. Acta Hort., 798: 279-284.
Hamauzu, Y. and Kume, C. 2005. Changes in fruit quality, phenolic compounds and antioxidant capacity of fresh prunes during storage. Acta Hort. 682: 557-564.
Kapse, M.B.; Ravana, D.A.; Kulkarni, D.N. and Ingle,

Progressive Horticulture, 45 (2) 297
V.M. 1977. Biochemical changes in Totapari mangoes during ripening and storage. South India Hort., 25(3): 119-120.
Lane, J.H. and Eynon, L. 1923. Determination of reducing sugars by Fehling’s solution with methylene blue as an indicator. J.Soci. Chemical Industry, 42: 32-7.
Mapson, L.W. 1970. Vitamins in fruits- stability of L-ascorbic acid. In: A.C. Hulme, (Ed.) Biochemistry of Fruits and their Products. Academic Press, London, pp. 376-377.
Morsy, A.A.; Abd-El-Kareem, F. and Abd-Alla, M.A. 1999. Effect of acetic acid on postharvest decay of straw-berry fruits. Egypt. J. Phytopathol., 27: 117-126.
Nath, V. 1990. Studies on storage of aonla (Emblica officina-lis Gaertn) fruits. M.Sc. (Ag.) Thesis, N.D. University of Agriculture & Technology, Faizabad, U.P.
Patthamakanokporn O.; Puwastien P.; Nitithamyang A. and Sirichakwal P.P. 2008. Changes of total phenolic compounds during storage of selected fruits. J.Food
Composition Analysis, 21(3): 241-248.
Ranganna, S. 2010. In: Handbook of Analysis and Qual-ity control for Fruit and Vegetable Products. Tata McGraw-Hill Pvt. Ltd., New Delhi, pp. 12-15.
Reig-Feliu, A. and Bernal A. 1966. Cold storage of citrus. II Cold storage of orange variety Navelate. Ame. Inst. Rac. Invest. Agron. Midrid., 15: 93-108.
Saini, R.S. and Singh, S. 2002. Effect of salt solution on the aonla fruit during storage in liquid medium. Haryana J. Hort. Sci., 31(1/2): 66-67.
Sholberg, P.; Haag, P.; Hocking, R. and Bedford, K. 2000. The use of vinegar vapour to reduce post harvest decay of harvested fruit. Hort Sci., 35(5): 898-903.
Sholberg, P.L. and Gaunce, A.P. 1995. Fumigation of fruit with acetic acid to prevent post-harvest decay. Hort Sci., 30(6): 1271-1275.
Swain, T. and Hillis, W.E. 1959. The phenolic constituents of Prunus domestica-I. The quantitative analysis of phenolic constituents. J.Sci. Food Agri., 10: 63-68.
Received on 02 November, 2012 and accepted on 28 August, 2013

Online version available at: www.indianjournals.com
Progressive Horticulture, Vol. 45, No. 2, September 2013© Copyright by ISHRD, Printed in India
[Research Article]
Evaluation of anthocyanin content in the fruits of different Russian olive (Elaeagnus angustifolia) genotypes of Ladakh
Anup Raj1 and Faizan Ahmad2
1Mountain Agriculture Research and Extension Station2Krishi Vigyan KendraSher-e-Kashmir University of Agricultural Sciences and Technology of Kashmir, Kargil (J&K)Email: [email protected]
ABSTRACTFive different fruit colour variants of Russian olive (Elaeagnus angustifiloia) collected from Kargil, Ladakh
were tested for anthocyanin content in their fruit epicarp. The anthocyanin pigments were extracted with acidified methanol. Absorption spectra and OD530 readings were recorded using spectrophotometer and the anthocyanin content was expressed as cyanidin-3-glucoside equivalent. The values ranged from 115.45 to 260.52 mg equivalent of cyanidin-3-glucoside/100 g fresh weight of fruit epicarp and these values varied significantly among the five varieties.
KEY wORDS: Russian olive, Ladakh, anthocyanin
Russian olive (E. angustifolia L.) is a small tree which is distributed from Spain in the west to China in the east through western and central Asia (Hooker, 1890). It is a multipurpose actinorhizal plant belonging to oleaster family (Elaeagnaceae), one of the few non-leguminous families which can fix atmospheric nitrogen. In India, the species is confined to Ladakh region of western Trans Himalaya, where it is known as sersing (Anup Raj et al., 2010). Though the plant grows throughout Ladakh it thrives well in relatively warmer climate of District Kargil within an altitudinal range of 2650-2900 m above mean sea level. Since long the plants of Russian olive has been an inseparable part of the folk medicine of the people of central and southeastern Asia, trans-Caucas-sus and Mediterranean regions. Almost every part of the plant including fruits, flowers, leaves, flowering branches, bark of stem, root and runner has its role in the traditional system of medicines. Fruits have been used against disorders of gastrointestinal tract and as cholegogics, anthelmintics, hypotensive and analgesic (Abizov et al., 2008; Gürbüz et al., 2003).
Considering its ethnomedicinal importance, the spe-cies has been studied extensively for its nutraceutical properties. Fruits of the species are reported to be rich sources of vitamins (B1, C and E), minerals and carotene
(Boudraa et al., 2010; Abizov et al., 2007). They also con-tain lipids including tocopherols, carotenoids, unsatu-rated fatty acids (Kusova and Lukyanchikov, 1989) and â-sitosterol (Goncharova and Glushenkova, 1990). There have been reports of other bioactive phytochemicals fla-vonoids (Kushova et al., 1988) and phenolic acids (Ayaz and Bertoft, 2001) present in its fruits. However presence of anthocyanin has not been reported so far in this spe-cies. This communication is the first report of presence of anthocyanin pigment in the fruits of Russian olive. An-thocyanins are a group of water soluble pigments found in fruits, vegetables and flowers that give them attractive colours. In addition to their colourful characteristics, an-thocyanins are also bioactive compounds. Epidemiolog-ic studies suggest that the consumption of anthocyanins lowers the risk of cardiovascular disease, diabetes, arthri-tis and cancer (Prior and Wu, 2006) that may be related to its antioxidant, anti-inflammatory, anticarcinogenic, and antidiabetic properties (Wang et al. 1997; Kang et al., 2003). These have also been reported to protect against DNA damage (Lazze et al., 2003) and to induce apoptosis of human leukemia and human colon carcinoma cells in vitro (Strack and Wray, 1994). Anthocyanins have also found considerable potential in the food industry as safe and effective food colorants (Francis, 1989).

Progressive Horticulture, 45 (2) 299
MATERIALS AND METHODSFruits of five different varieties (viz., bee, balti, ring-
mo, marpo and chapacha) of Russian olive (Fig 1) were col-lected from Kargil and were analysed at the Molecular and Structural Biology (MSB) Laboratory at the Central Institute of Medicinal and Aromatic Plants (CIMAP), Lucknow. 0.5 g of fruit epicarp (coloured portion) was macerated in 5 mL of 5% acidified methanol (5 mL conc. hydrochloric acid + 95 mL methanol) using mortar and pestle. The extraction was done thrice until a faintly coloured solution is obtained. The extracts were pooled together and centrifuged for 10 min in centrifuge tubes at 7000 × g. The supernatant was kept overnight in cool dark place for proper colour development. Absorption spectra and the absorbance (OD) readings of the extract were obtained using spectrophotometer (SpectraMax, Molecular Devices Inc.).
As the identity of the anthocyanin pigment was unknown, it was expressed as cyanidin-3-glucoside equivalent, since that is the most abundant anthocyanin in nature (Francis 1989). Concentration of anthocyanin pigment (mg/L) = (A*MW*DF*1000)/(å*1) where A is the absorbance, MW is the molecular weight, DF is the dilution factor (it is 10 in this case; 0.5 g in 5 ml), å is the molar absorptivity, and 1 is for a standard 1 cm path length. The molecular weight (MW = 449.2 gmol-1) and molar absorptivity (å = 26,900 Lcm-1 mol-1) for cyanidin-3-glucoside was used following Truong et al. (2012) and total anthocyanin was reported as milligrams per 100 g fresh weight (mg cyanidin-3-glucoside equivalent/100 g
fresh weight). The data were statistically analysed using SPSS 16.0 software.
RESULTS AND DISCUSSIONAs a preliminary test the fruit extract was treated
with sodium hydroxide (NaOH) solution. A colour change from red to green indicated the presence of an-thocyanin. A secondary absorption peak at 530 nm (Fig. 2) was further confirmation of anthocyanin in the fruit sample. Maximum OD530 was recorded at 5% acidified methanol which has relatively higher acid concentration than the standard method. The standard methodology used to measure colour density was developed for fruit juices, which naturally have an acidic pH. If the material to be measured has a pH in the neutral or alkaline range, the pH of the solution should be lowered with a weak acid (Giusti and Wrolstad, 2001). The pH of fruit extract in this case was found to be in neutral range. A wide range of anthocyanin contents among the varieties was observed. The values ranged from 115.45 to 260.52 mg equivalent of cyanidin-3-glucoside/100 g fresh weight of fruit epicarp (Table 1). A standard one way between-varieties ANOVA confirmed a significant (F-ratio=8.27; P=0.006) reduction of within-variety variance of actho-cyanin concentration with reference to total variance across the varieties. The variety chapacha had the lowest and marpo the highest content of anthocyanin which cor-responded to the variation in fruit colour intensity visu-ally observed among the different varieties of Russian olive (Fig. 2).
Chapacha Bee Ringmo Balti Marpo
Fig. 1: Fruits of five different varieties of Russian olive from Ladakh

300 Progressive Horticulture, 45 (2)
Wavelength (nm)
340 360 380 400 420 440 460 480 500 520 540 560 580 600 620 640 660 680 7000
0.1
0.2
0.3
0.4
0.5
0.6
0.7
0.8
0.9
1
1.1
1.2
1.3
1.4
1.5
1.6
1.7
1.8
1.9
2
Cuvette A1Lambda at Maximum 410.00
Fig. 2: Absorption spectrum of fruit extract of Russian olive (secondary absorption at 530 nm)
Results of this study provide a conclusive evidence, for the first time, of the presence of anthocyanin, a very important bioactive compound in the fruits of Russian olive grown in Ladakh. This gives an additional dimen-sion to the wide spectrum of phytochemicals reported in this species and imparting nutraceutical properties to its fruits.
Table 1: Anthocyanin content in the fruits of Russian olive (mg/100 g of fresh weight)
Replication R1 R2 R3 Mean
Varieties
Marpo 321.72 219.85 239.99 260.52
Chapacha 122.88 115.65 115.27 117.93
Ringmo 136.38 90.26 119.72 115.45
Balti 138.26 236.15 164.27 179.56
Bee 213.69 221.68 215.69 217.02
CD0.05 71.43
ACKNOwLEDGEMENTSWe express a deep sense of gratitude to Dr RS Sang-
wan, HOD, MSB Laboratory, CIMAP for extending an unfettered access to the laboratory facilities for this study.
The first author is indebted to SKUAST-K, for granting him sabbatical for this study. He is also grateful to the Indian Academy of sciences, Bangalore for providing fi-nancial assistance under Summer Research Fellowship Programme.
REFERENCESHooker, J.D. 1890. The Flora of British India, Vol V.L.
Reeve, London.
Anup Raj, Mehdi, M., Sharma, O.C. and Sharma, P.K. 2010. Five fruit morphotypes of Russian olive (Elae-agnus angustifolia L.) from Ladakh, India. Plant Gent. Res., 8(2): 159-161.
Abizov, E.A.; Tolkachev, O.N.; Mal’tsev and Abizova. E.V. 2008. Composition of biologically active substances isolated from the fruits of Russian olive (Elaeagnus angustifolia) introduced in the European part of Rus-sia. Pharmaceutical Chem. J., 42(12): 696-98.
Gürbüz , I.; Stun, O.; Yesilada, E.; Sezik, E. an; Kutsal, O. 2003. Anti-ulcerogenic activity of some plants used as folk remedy in Turkey. J. Ethnopharm., 88: 93-97.
Boudraa, S.; Hambaba, L.; Zidani, S. and Boudraa, H. 2010. Mineral and vitamin composition of fruits of five underexploited species in Algeria: Celtis australis

Progressive Horticulture, 45 (2) 301
L., Crataegus azarolus L., Crataegus monogyna Jacq., Elaeagnus angustifolia L. and Zizyphus lotus L. Fruits, 65(2): 75–84.
Abizov, E.A.; Abizova, E.V. and Tolkachiev, E.N. 2007. The analysis of the chemical composition of fruits Elaeagnus angustifolis nonconventional culture for European Russia. RANS Moscow, 15: 171-177.
Kusova, R.D. and Luk’yanchikov, M.S. 1989. Fatty acid composition of the fruit oil of Elaeagnus angustifolia. Chem. Nat. Comp., 25(6): 718.
Goncharova, N.P. and Glushenkova, A.I. 1990. Lipids of Elaeagnus fruit. Chem. Nat. Comp., 26(1): 12-15.
Kushova, R.D., Kazakoz, A.L. and Lukyanshikov, M.S. 1988. Phenolic compounds from fruit of Elaeagnus angustifolia. Chem. Nat. Comp., 24(3): 392-393.
Ayaz, F.A. and Bertoft, E. 2001. Sugar and phenolic acid composition of stored commercial oleaster fruits. J. Food Comp. Anal., 14(5): 505-511.
Prior, R.L. and Wu, X. 2006. Anthocyanins: structural characteristics that result in unique metabolic pat-terns and biological activities. Free Radic. Res., 40: 1014–1028.
Wang, H.; Cao, G. and Prior, R.L. 1997. The oxygen radi-cal absorbing capacity of anthocyanins. J. Agric. Food
Chem., 45: 304–309.
Kang, S.Y.; Seeram, N.P.; Nair, M.G. and Bourquin, L.D. 2003. Tart cherry anthocyanins inhibit tumor develop-ment in Apc(Min) mice and reduce proliferation of human colon cancer cells. Cancer Lett., 194(1): 13–19.
Lazze, M.C.; Pizzala, R.; Savio, M.; Stivala, L.A.; Propseri E., et al. 2003. Anthocyanins protect against DNA damage induced by tert-butyl-hydroperoxide in rat smooth muscle and hepatoma cells. Mutat. Res., 535: 103–115.
Strack, D. and Wray, V. 1994. The anthocyanins. In: The ûavonoids (ed. Harborne J. B.), Chapman and Hall, London.
Francis, F.J. 1989. Food colorants: Anthocyanins. Crit. Rev. Food Sci. Nutr., 28: 273-314.
Truong, V.D.; Hu, Z.; Thompson, R.L.; Yencho, G.C. and Pecota, K.V. 2012. Pressurized liquid extraction and quantiûcation of anthocyanins in purple-ûeshed sweet potato genotypes. J. Food Comp. Anal., 26: 96–103.
Giusti, M.M. and Wrolstad, R.E. 2001. Characterization and Measurement of Anthocyanins by UV-Visible Spectroscopy. In: Current Protocols in Food Analyti-cal Chemistry (eds. Wrolstad R.E. et al.), John Wiley & Sons, NY. F1.2.1- F1.2.13.
Received on 10 January, 2013 and accepted on 26 August, 2013

Online version available at: www.indianjournals.com
Progressive Horticulture, Vol. 45, No. 2, September 2013© Copyright by ISHRD, Printed in India
[Research Article]
Integrated nutrient management in Isabgol (Plantago ovata Forsk.)
V.K. Tripathi, Sanjeev Kumar*, P.N. Katiyar and Md. Abu NayyerDepartment of Horticulture,C.S. Azad University of Agriculture and Technology, Kanpur-208 002 (U.P.), India*U.P. Council of Agricultural Research, Lucknow-226 010 (U.P.), IndiaE-mail: [email protected]
ABSTRACTAn experiment was carried out in the Department of Horticulture, Chandra Shekhar Azad University of Ag-
riculture and Technology, Kanpur (U.P.), India on “Integrated nutrient management in Isabgol (Plantago ovata Forsk.)”, during two subsequent years i.e. 2009-10 and 2010-11. For this seeds were sown in the beds of 1.0 x 1.0 m dimension and after germination plant spacing was maintained by 20 X 10 cm. There were seven treatments comprising RDF (50 kg N + 25 kg P + 25 kg K), vermicompost 2 t/ha alone, vermicompost 2 t/ha + 75% RDF, vermi-compost 2 t/ha + 50% RDF, Azotobacter 6 kg/ha + 75% RDF, Azotobacter 6 kg/ha + 50% RDF along with one control, replicated thrice in randomized block design. Ten t/ha of FYM was applied as a basal dose in all the treatments including control. Full dose of FYM (farm yard manure), Azotobacter, vermicompost, phosphorus (P), potash (K) and 50 per cent of nitrogen (N) as per the treatment dose were applied in each plot at 8-10 cm depth in the lines just before sowing of seeds and remaining 50 per cent of the nitrogen was applied as top dressing 35 days after sow-ing. Data of both the years of experiment were analyzed statistically and it is clearly revealed that application of vermicompost 2 t/ha + 75% RDF significantly increase the plant height (30.50 and 28.40 cm, respectively), number of leaves per plant (9.55 and 9.00, respectively), number of tillers per plant (28.70 and 27.30, respectively), number of spikes per plant (25.75 and 25.00, respectively), length of spike (4.25 and 4.10 cm, respectively), number of seed per spike (82.55 and 81.00, respectively) with minimum number of days taken to maturity (106.50 and 105 days, respectively). Same treatment i.e. application of vermicompost 2 t/ha + 75% RDF also produced higher unhusked seed yield (10.20 and 10.16 q/ha, respectively) as well as husk yield (2.92 and 2.90 q/ha, respectively) during both the years of investigation in the plains of Central Uttar Pradesh.
KEY wORDS: Isabgol, Azotobacter, vermicompost, vegetative growth, flowering, yield
Isabgol (Plantago ovata Forsk.) is one of the impor-tant medicinal crops belonging to the family Plantag-inaceae. It is mostly cultivated for its husk and seeds, which have medicinal importance because of its muci-laginous properties. It is well known that for obtaining higher yield of quality seeds and husk, balanced nutri-tion is very important. So, present experiment was car-ried out to know the efficacy of applying optimum dose of organic and inorganic fertilizers to get higher yield of quality seeds and husk in isabgol. Modern day inten-sive crop cultivation results with the huge application of chemical fertilizers which are not only in short supply but also expensive and pollute the environment, soil and water too. Nitrogen fixing bacteria, phosphate solubuliz-ers and vermicompost are main bio-fertilizers for hor-
ticultural crops. These bio-fertilizers having micro-or-ganisms which are either free living in soil or symbiotic with plants and contribute directly or indirectly towards nitrogen and phosphorus nutrition of plants. They also produce hormones, vitamins and other growth factors required for the growth and development of plants.
MATERIALS AND METHODSAn experiment was carried out in the Department
of Horticulture, C.S. Azad University of Agriculture and Technology, Kanpur (U.P.), India, to study the efficacy of integrated nutrient management in isabgol (Plantago ovata Forsk.) during two subsequent years i.e., 2009-10 and 2010-11. For this seeds were sown in the beds of 1.0

Progressive Horticulture, 45 (2) 303
x 1.0 m dimension and after germination plant spacing was maintained by 20 X 10 cm. There were seven treat-ments comprising RDF (50 kg N + 25 kg P + 25 kg K), vermicompost 2 t/ha alone, vermicompost 2 t/ha + 75% RDF, vermicompost 2 t/ha + 50% RDF, Azotobacter 6 kg/ha + 75% RDF, Azotobacter 6 kg/ha + 50% RDF along with one control, replicated thrice in randomized block design. Ten t/ha of FYM was applied as a basal dose. Full dose of FYM (farm yard manure), Azotobacter, ver-micompost and phosphorus (P) in the form of single super phosphate, potash (K) in the form of potassium sulphate and 50 per cent of nitrogen (N) in the form of urea as per the treatment dose were applied in each plot at 8-10 cm depth in the lines just before sowing of seeds and remaining 50 per cent of the nitrogen was ap-plied as top dressing 35 days after sowing. The crop was harvested manually when more than 85 per cent spikes were matured and colour of spikes changed to reddish brown. Data on different vegetative growth and yield parameters were recorded using ten plants, which were selected randomly in the each plot and data were statisti-cally analyzed.
RESULTS AND DISCUSSION
Plant height and number of leavesOn the basis of data presented in Table-1, it is clear
that the plant height and number of leaves per plant were increased significantly in all treatments as com-pared to control. The maximum plant height (30.50 and 28.40 cm, respectively) and number of leaves per plant (9.55 and 9.00, respectively) were obtained with the ap-plication of vermicompost 2 t/ha + 75% RDF. The plant height and number of leaves per plant get reduced in RDF and all other treatments of Azotobacter and ver-micompost, whereas minimum plant height (24.00 and 23.00 cm, respectively) and number of leaves per plant (6.05 and 5.90, respectively) were obtained under con-trol during both the years of investigation. This increase in plant height and number of leaves might be due to the production of more chlorophyll content with the ap-plication of balanced nutrition in the form of NPK and vermicompost. The other reason for increased vegetative growth may be the production of plant growth regula-tors by bacteria in rhizosphere, which are absorbed by the roots. The increase in plant height and number of leaves per plant with the application of vermicompost 2 t/ha + 75% RDF has also been reported by Yadav et al. (2003) in isabgol, Ingle et al. (2008) in okra and Nazir et al. (2006) in strawberry.
Number of tillers and days to maturity During the present investigation the number of til-
lers per plant and days to maturity were significantly in-fluced with the application of RDF, Azotobacter and ver-micompost at different levels alone and in combinations (Tables-1). The maximum number of tillers per plant (28.70 and 27.30, respectively) and reduced number of days to maturity (106.50 and 105.00 days, respectively) were recorded in the plants treated with vermicompost 2 t/ha + 75% RDF, whereas the minimum number of til-lers per plant (22.00 and 20.00, respectively) and more number of days to maturity (113.49 and 111.00 days, respectively) were noted under control during both the years of experimentation. These findings are in confor-mity with that of Nazir et al. (2006), who narrated highest runners per plant in strawberry with poultry manure + Azotobacter + wood ash + vermicompost + oil cake appli-cation. Increased number of tillers per plant and reduced number of days to maturity might be due to increased growth of plant in the form of height and number of leaves, which accumulated more photosynthates and thereby increase number of tillers per plant.
Number and length of spikes During the entire course of investigation it was
also observed that the maximum number of spikes per plant (25.75 and 25.00, respectively) and length of spikes (4.25 and 4.10 cm, respectively) were recorded in ver-micompost 2 t/ha + 75% RDF treated plants, whereas, the minimum number of spikes per plant (19.20 and 18.80, respectively) and length of spikes (2.85 and 2.80 cm, respectively) were observed in untreated (control) plants (Table-1) during both the years of experimenta-tion. It may also be due to the fact that NPK and vermi-compost application accelerated the development of leaf number in autumn, which are positively correlated with the number of spikes and length of spikes in the follow-ing spring. Increased number and length of spikes might have also resulted because of increase in number of til-lers per plant. Similar observations were also reported by Mohanty and Sharma (1979) in ginger.
Number of seeds per spikes From the Table 2, it is observed that during both the
years of investigation, the maximum number of seeds per spike (82.55 and 81.00, respectively) were observed when the plants were treated with vermicompost 2 t/ha + 75% RDF, followed by RDF (80.05 and 79.00, re-spectively), whereas, the least number of seeds per spike were produced from untreated (control) plants (70.40 and 70.20, respectively) during both the years of investi-gation. These results are in conformity with the finding of Nadukeri et al. (2007) in coleus. Vermicompost is ex-pected to hasten plant development; hence an increase in fruit set in present study is due to the cumulative effect of balanced nutrition and vermicompost application.

304 Progressive Horticulture, 45 (2)Ta
ble
1: I
nflue
nce
of b
io-f
ertil
izer
s an
d or
gani
c m
anur
e al
one
and
in c
ombi
natio
n w
ith N
PK o
n ve
geta
tive
grow
th p
aram
eter
s of
isab
gol
Trea
tmen
ts
Plan
t hei
ght (
cm)
Num
ber o
f N
umbe
r of
Day
s to
le
aves
/ pl
ant
tille
rs /
plan
t m
atur
ity (
days
)
20
09-1
0 20
10-1
1 20
09-1
0 20
10-1
1 20
09-1
0 20
10-1
1 20
09-1
0 20
10-1
1
Con
trol
(N0 +
P 0 +
K0)
24
.00
23.0
0 6.
05
5.90
22
.00
20.0
0 11
3.49
11
1.00
RDF
(50
kg N
+ 2
5 kg
P +
25
kg K
) 29
.00
28.1
0 9.
00
8.50
28
.33
26.8
3 10
8.80
10
7.10
Ver
mic
ompo
st 2
t/ha
alo
ne
24.5
0 23
.20
6.53
6.
12
23.0
0 21
.51
112.
90
110.
80
Ver
mic
ompo
st 2
t/ha
+ 7
5% R
DF
30.5
0 28
.40
9.55
9.
00
28.7
0 27
.30
106.
50
105.
00
Ver
mic
ompo
st 2
t/ha
+ 5
0% R
DF
27.4
0 26
.70
7.59
7.
10
25.8
0 24
.67
109.
50
108.
15
Azo
toba
cter
6 k
g/ha
+ 7
5% R
DF
28.2
0 27
.60
8.15
7.
69
26.9
0 25
.00
108.
90
107.
85
Azo
toba
cter
6 k
g/ha
+ 5
0% R
DF
26.0
0 25
.15
7.00
6.
30
24.7
0 23
.60
110.
45
108.
80
C.D
. at 5
%
1.34
1.
28
1.73
1.
70
0.82
0.
78
1.90
1.
82
Tabl
e 2:
Influ
ence
of b
io-f
ertil
izer
s an
d or
gani
c m
anur
e al
one
and
in c
ombi
natio
n w
ith N
PK o
n re
prod
uctiv
e an
d yi
eld
para
met
ers
of is
abgo
l
Trea
tmen
ts
No.
of s
pike
s Le
ngth
of
No.
of
Unh
uske
d
Hus
ked
/pla
nt
spik
e (c
m)
seed
/spi
ke
seed
yie
ld (q
/ha)
yi
eld
(q/h
a)
20
09-1
0 20
10-1
1 20
09-1
0 20
10-1
1 20
09-1
0 20
09-1
0 20
10-1
1 20
09-1
0 20
10-1
1 20
09-1
0C
ontr
ol (N
0 +
P 0 +
K0)
19
.20
18.8
0 2.
85
2.80
70
.40
70.2
0 7.
50
7.45
1.
85
1.81
RDF
(50
kg N
+
25 k
g P
+ 25
kg
K)
25.3
0 24
.90
3.86
3.
75
80.0
5 79
.00
9.70
9.
65
2.75
2.
72V
erm
icom
post
2
t/ha
alo
ne
20.4
0 19
.95
3.00
2.
80
73.0
0 71
.00
8.00
7.
96
1.98
1.
95V
erm
icom
post
2
t/ha
+ 7
5% R
DF
25.7
5 25
.00
4.25
4.
10
82.5
5 81
.00
10.2
0 10
.16
2.92
2.
90V
erm
icom
post
2
t/ha
+ 5
0% R
DF
22.7
0 21
.95
3.45
3.
25
75.2
0 74
.00
8.65
8.
60
2.30
2.
27A
zoto
bact
er 6
kg
/ha
+ 75
% R
DF
23.8
5 23
.05
3.65
3.
48
78.5
0 77
.10
9.10
9.
06
2.55
2.
53A
zoto
bact
er 6
kg/
ha
+ 50
% R
DF
21.6
0 21
.00
3.20
3.
00
74.1
5 73
.95
8.25
8.
21
2.15
2.
13C
.D. a
t 5%
1.
77
1.65
0.
62
0.59
2.
66
2.50
1.
54
1.52
0.
51
0.50

Progressive Horticulture, 45 (2) 305
Received on 18 February, 2012 and accepted on 10 January, 2013
Husk yield and unhusked seed yieldData presented in Table-2 clearly revealed that RDF,
Azotobacter and vermicompost have given remarkable increase in the husk yield and unhusked seed yield during both the years of investigation i.e. 2009-10 and 2010-11. The maximum husk yield (2.92 and 2.90 q/ha, respectively) and unhusked seed yield (10.20 and 10.16 q/ha, respectively) were recorded in the plants treated with vermicompost 2 t/ha + 75% RDF, whereas the min-imum husk yield (1.85 and 1.81 q/ha, respectively) and unhusked seed yield (7.50 and 7.45 q/ha, respectively) were recorded from the untreated (control) plants dur-ing both the years of investigation. Higher yield might be due to combined application of FYM, Azotobacter, and vermicompost along with the combination of chemical fertilizers. Hence, the FYM enhances the uptake of N, P and K, the vermicompost helps in releasing humus forming microbes, nitrogen fixers and some growth regulators results in the production of more vegetative growth of the plants (Despande, 2004). Ultimately, these characters had beneficial effect on higher yields. These findings are in accordance with the findings of Nadukeri et al. (2007) in coleus.
REFERENCESDeshpande, M.S. 2004. Organic farming and cosmic en-
ergy. Rishi Krishi. In http://www.organic farming.org.
Ingle, V.G.; Tatar, P.G. and Pant, U.A. 2008. Effect of bio-fertilizers with reduced doses of nitrogen on growth of okra. Ann. Plant Physio., 22 (2) : 255-258.
Mohanty, D.C. and Sharma,Y.N. 1979. Genetic variability and correlation for yield and other variables in ginger germplasm. Indian J. Agri. Sci., 49: 250-252.
Nadukeri, S.; Kattimani, K.N. and Rokhade, A.K. 2007. Integrated nutrient management in coleus (Coleus forskohlii (Wild) Briq). In: National seminar on pro-duction, processing and marketing of medicinal, aro-matic and dye yielding crops, 22-23 Feb. at Arabhavi, Karnataka, pp.34.
Nazir, N.; Singh, S.R.; Aroosa, K.; Masarat, J. and Sha-beena, M. 2006. Yield and growth of strawberry cultivar Senga Sengana as influenced by integrated organic nutrient management system. Envi. and Eco., 243 (3): 651-654.
Yadav, R.D.; Keshwa, G.L. and Yadav, S.S. 2003. Effect of integrated use of FYM, urea and sulphur on growth and yield of isabgol (Plantago ovata Forsk.). J. Medi. Arom. Plants, 25:668-671.
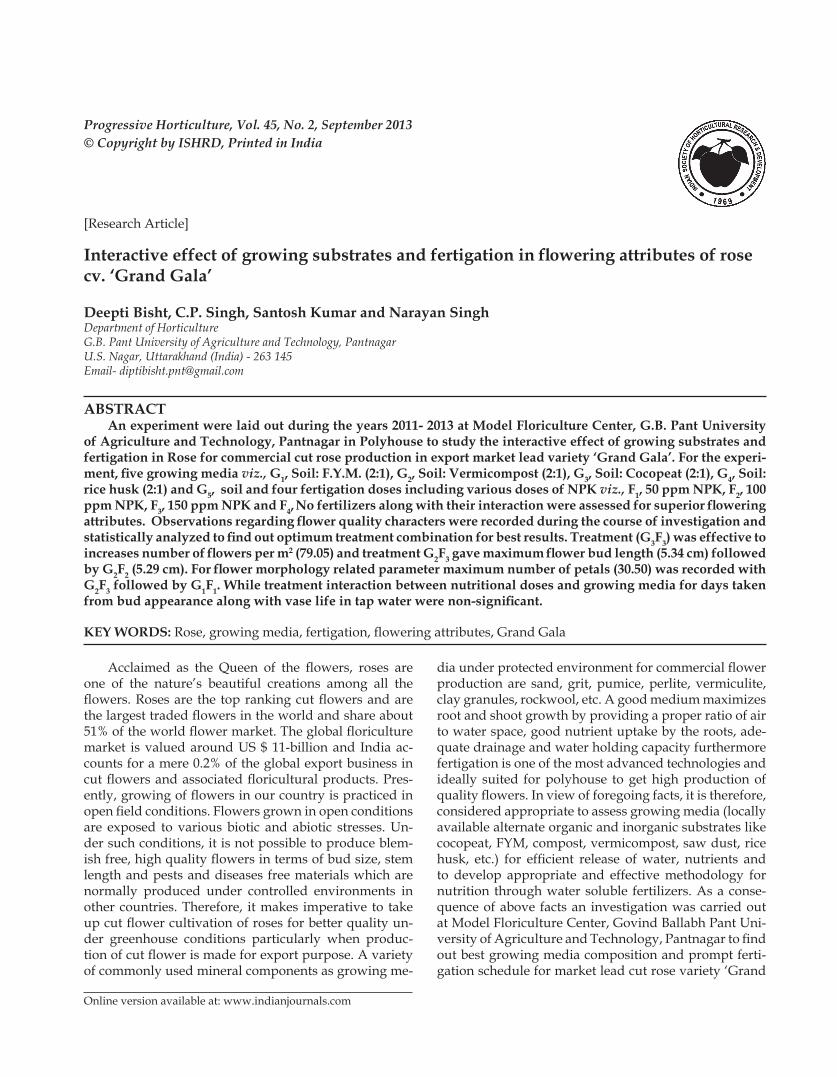
Online version available at: www.indianjournals.com
Progressive Horticulture, Vol. 45, No. 2, September 2013© Copyright by ISHRD, Printed in India
[Research Article]
Interactive effect of growing substrates and fertigation in flowering attributes of rose cv. ‘Grand Gala’
Deepti Bisht, C.P. Singh, Santosh Kumar and Narayan Singh Department of HorticultureG.B. Pant University of Agriculture and Technology, PantnagarU.S. Nagar, Uttarakhand (India) - 263 145Email- [email protected]
ABSTRACTAn experiment were laid out during the years 2011- 2013 at Model Floriculture Center, G.B. Pant University
of Agriculture and Technology, Pantnagar in Polyhouse to study the interactive effect of growing substrates and fertigation in Rose for commercial cut rose production in export market lead variety ‘Grand Gala’. For the experi-ment, five growing media viz., G1, Soil: F.Y.M. (2:1), G2, Soil: Vermicompost (2:1), G3, Soil: Cocopeat (2:1), G4, Soil: rice husk (2:1) and G5, soil and four fertigation doses including various doses of NPK viz., F1, 50 ppm NPK, F2, 100 ppm NPK, F3, 150 ppm NPK and F4, No fertilizers along with their interaction were assessed for superior flowering attributes. Observations regarding flower quality characters were recorded during the course of investigation and statistically analyzed to find out optimum treatment combination for best results. Treatment (G3F3) was effective to increases number of flowers per m2 (79.05) and treatment G2F3 gave maximum flower bud length (5.34 cm) followed by G2F2 (5.29 cm). For flower morphology related parameter maximum number of petals (30.50) was recorded with G2F3 followed by G1F1. while treatment interaction between nutritional doses and growing media for days taken from bud appearance along with vase life in tap water were non-significant.
KEY wORDS: Rose, growing media, fertigation, flowering attributes, Grand Gala
Acclaimed as the Queen of the flowers, roses are one of the nature’s beautiful creations among all the flowers. Roses are the top ranking cut flowers and are the largest traded flowers in the world and share about 51% of the world flower market. The global floriculture market is valued around US $ 11-billion and India ac-counts for a mere 0.2% of the global export business in cut flowers and associated floricultural products. Pres-ently, growing of flowers in our country is practiced in open field conditions. Flowers grown in open conditions are exposed to various biotic and abiotic stresses. Un-der such conditions, it is not possible to produce blem-ish free, high quality flowers in terms of bud size, stem length and pests and diseases free materials which are normally produced under controlled environments in other countries. Therefore, it makes imperative to take up cut flower cultivation of roses for better quality un-der greenhouse conditions particularly when produc-tion of cut flower is made for export purpose. A variety of commonly used mineral components as growing me-
dia under protected environment for commercial flower production are sand, grit, pumice, perlite, vermiculite, clay granules, rockwool, etc. A good medium maximizes root and shoot growth by providing a proper ratio of air to water space, good nutrient uptake by the roots, ade-quate drainage and water holding capacity furthermore fertigation is one of the most advanced technologies and ideally suited for polyhouse to get high production of quality flowers. In view of foregoing facts, it is therefore, considered appropriate to assess growing media (locally available alternate organic and inorganic substrates like cocopeat, FYM, compost, vermicompost, saw dust, rice husk, etc.) for efficient release of water, nutrients and to develop appropriate and effective methodology for nutrition through water soluble fertilizers. As a conse-quence of above facts an investigation was carried out at Model Floriculture Center, Govind Ballabh Pant Uni-versity of Agriculture and Technology, Pantnagar to find out best growing media composition and prompt ferti-gation schedule for market lead cut rose variety ‘Grand
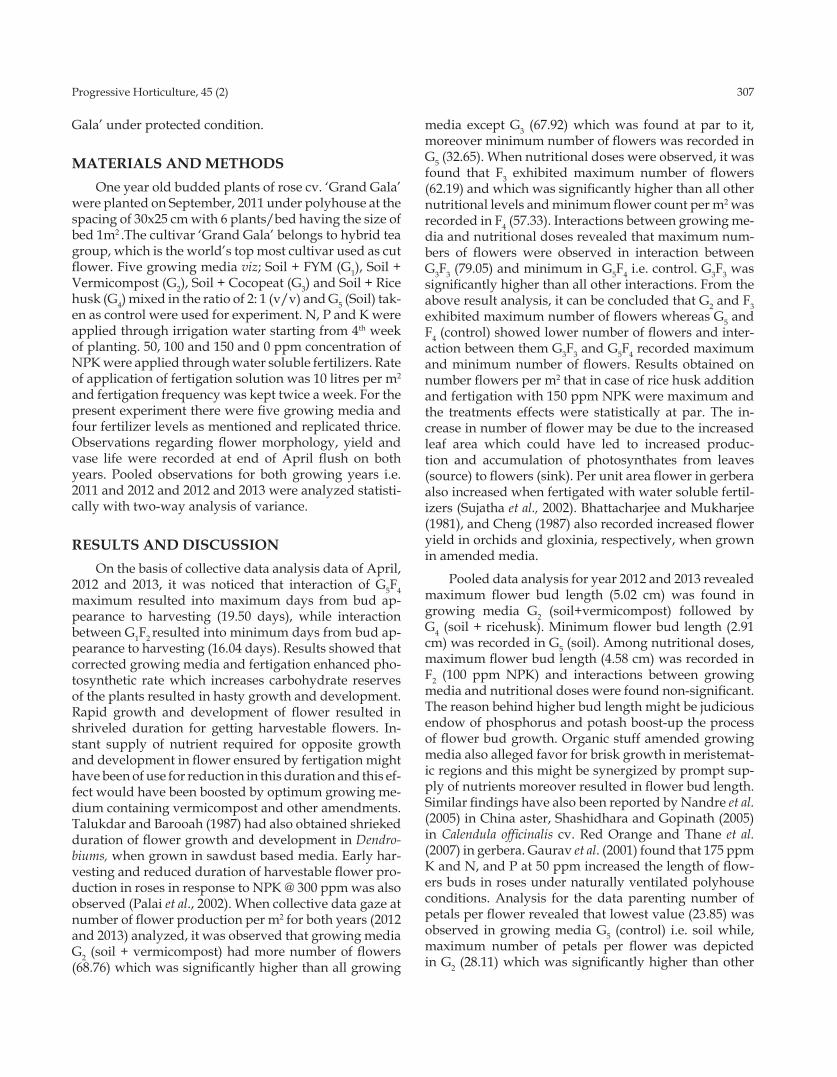
Progressive Horticulture, 45 (2) 307
Gala’ under protected condition.
MATERIALS AND METHODS One year old budded plants of rose cv. ‘Grand Gala’
were planted on September, 2011 under polyhouse at the spacing of 30x25 cm with 6 plants/bed having the size of bed 1m2 .The cultivar ‘Grand Gala’ belongs to hybrid tea group, which is the world’s top most cultivar used as cut flower. Five growing media viz; Soil + FYM (G1), Soil + Vermicompost (G2), Soil + Cocopeat (G3) and Soil + Rice husk (G4) mixed in the ratio of 2: 1 (v/v) and G5 (Soil) tak-en as control were used for experiment. N, P and K were applied through irrigation water starting from 4th week of planting. 50, 100 and 150 and 0 ppm concentration of NPK were applied through water soluble fertilizers. Rate of application of fertigation solution was 10 litres per m2
and fertigation frequency was kept twice a week. For the present experiment there were five growing media and four fertilizer levels as mentioned and replicated thrice. Observations regarding flower morphology, yield and vase life were recorded at end of April flush on both years. Pooled observations for both growing years i.e. 2011 and 2012 and 2012 and 2013 were analyzed statisti-cally with two-way analysis of variance.
RESULTS AND DISCUSSION On the basis of collective data analysis data of April,
2012 and 2013, it was noticed that interaction of G5F4 maximum resulted into maximum days from bud ap-pearance to harvesting (19.50 days), while interaction between G1F2 resulted into minimum days from bud ap-pearance to harvesting (16.04 days). Results showed that corrected growing media and fertigation enhanced pho-tosynthetic rate which increases carbohydrate reserves of the plants resulted in hasty growth and development. Rapid growth and development of flower resulted in shriveled duration for getting harvestable flowers. In-stant supply of nutrient required for opposite growth and development in flower ensured by fertigation might have been of use for reduction in this duration and this ef-fect would have been boosted by optimum growing me-dium containing vermicompost and other amendments. Talukdar and Barooah (1987) had also obtained shrieked duration of flower growth and development in Dendro-biums, when grown in sawdust based media. Early har-vesting and reduced duration of harvestable flower pro-duction in roses in response to NPK @ 300 ppm was also observed (Palai et al., 2002). When collective data gaze at number of flower production per m2 for both years (2012 and 2013) analyzed, it was observed that growing media G2 (soil + vermicompost) had more number of flowers (68.76) which was significantly higher than all growing
media except G3 (67.92) which was found at par to it, moreover minimum number of flowers was recorded in G5 (32.65). When nutritional doses were observed, it was found that F3 exhibited maximum number of flowers (62.19) and which was significantly higher than all other nutritional levels and minimum flower count per m2 was recorded in F4 (57.33). Interactions between growing me-dia and nutritional doses revealed that maximum num-bers of flowers were observed in interaction between G3F3 (79.05) and minimum in G5F4 i.e. control. G3F3 was significantly higher than all other interactions. From the above result analysis, it can be concluded that G2 and F3 exhibited maximum number of flowers whereas G5 and F4 (control) showed lower number of flowers and inter-action between them G3F3 and G5F4 recorded maximum and minimum number of flowers. Results obtained on number flowers per m2 that in case of rice husk addition and fertigation with 150 ppm NPK were maximum and the treatments effects were statistically at par. The in-crease in number of flower may be due to the increased leaf area which could have led to increased produc-tion and accumulation of photosynthates from leaves (source) to flowers (sink). Per unit area flower in gerbera also increased when fertigated with water soluble fertil-izers (Sujatha et al., 2002). Bhattacharjee and Mukharjee (1981), and Cheng (1987) also recorded increased flower yield in orchids and gloxinia, respectively, when grown in amended media.
Pooled data analysis for year 2012 and 2013 revealed maximum flower bud length (5.02 cm) was found in growing media G2 (soil+vermicompost) followed by G4 (soil + ricehusk). Minimum flower bud length (2.91 cm) was recorded in G5 (soil). Among nutritional doses, maximum flower bud length (4.58 cm) was recorded in F2 (100 ppm NPK) and interactions between growing media and nutritional doses were found non-significant. The reason behind higher bud length might be judicious endow of phosphorus and potash boost-up the process of flower bud growth. Organic stuff amended growing media also alleged favor for brisk growth in meristemat-ic regions and this might be synergized by prompt sup-ply of nutrients moreover resulted in flower bud length. Similar findings have also been reported by Nandre et al. (2005) in China aster, Shashidhara and Gopinath (2005) in Calendula officinalis cv. Red Orange and Thane et al. (2007) in gerbera. Gaurav et al. (2001) found that 175 ppm K and N, and P at 50 ppm increased the length of flow-ers buds in roses under naturally ventilated polyhouse conditions. Analysis for the data parenting number of petals per flower revealed that lowest value (23.85) was observed in growing media G5 (control) i.e. soil while, maximum number of petals per flower was depicted in G2 (28.11) which was significantly higher than other
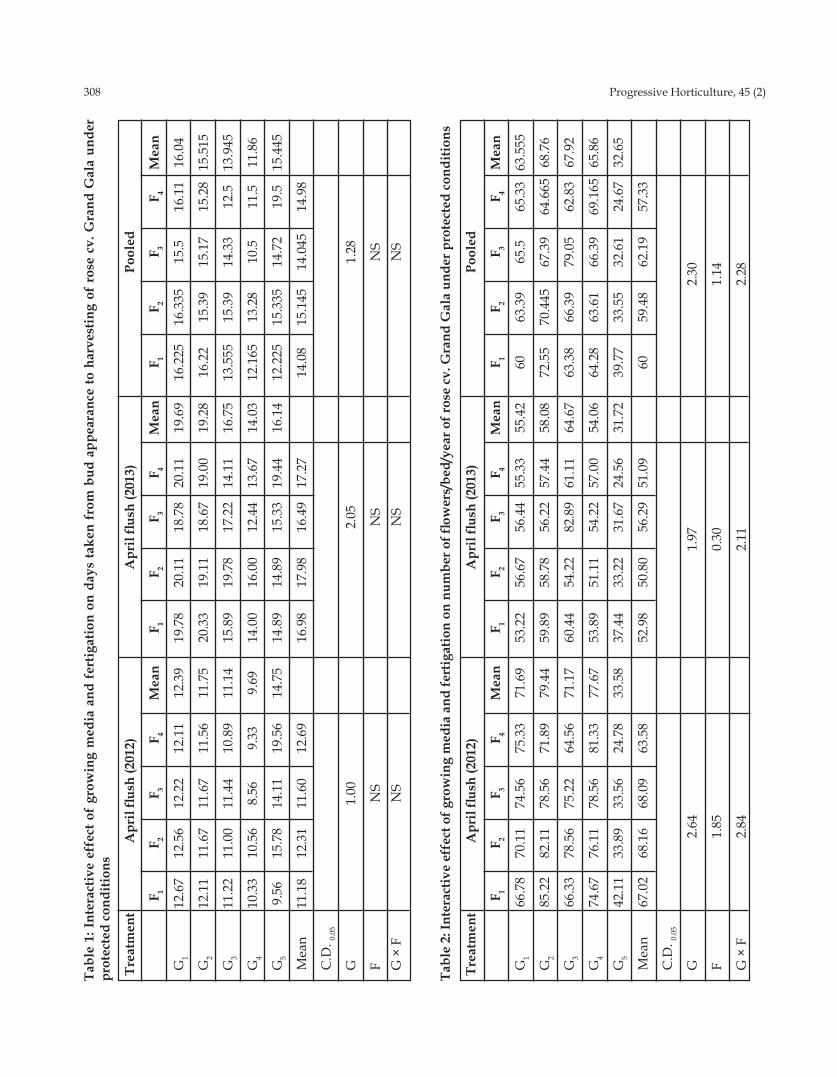
308 Progressive Horticulture, 45 (2)Ta
ble
1: I
nter
activ
e ef
fect
of
grow
ing
med
ia a
nd f
ertig
atio
n on
day
s ta
ken
from
bud
app
eara
nce
to h
arve
stin
g of
ros
e cv
. Gra
nd G
ala
unde
r pr
otec
ted
cond
ition
s
Trea
tmen
t
Apr
il flu
sh (2
012)
A
pril
flush
(201
3)
Po
oled
F 1
F 2 F 3
F 4 M
ean
F 1 F 2
F 3 F 4
Mea
n F 1
F 2 F 3
F 4 M
ean
G1
12.6
7 12
.56
12.2
2 12
.11
12.3
9 19
.78
20.1
1 18
.78
20.1
1 19
.69
16.2
25
16.3
35
15.5
16
.11
16.0
4
G2
12.1
1 11
.67
11.6
7 11
.56
11.7
5 20
.33
19.1
1 18
.67
19.0
0 19
.28
16.2
2 15
.39
15.1
7 15
.28
15.5
15
G3
11.2
2 11
.00
11.4
4 10
.89
11.1
4 15
.89
19.7
8 17
.22
14.1
1 16
.75
13.5
55
15.3
9 14
.33
12.5
13
.945
G4
10.3
3 10
.56
8.56
9.
33
9.69
14
.00
16.0
0 12
.44
13.6
7 14
.03
12.1
65
13.2
8 10
.5
11.5
11
.86
G5
9.56
15
.78
14.1
1 19
.56
14.7
5 14
.89
14.8
9 15
.33
19.4
4 16
.14
12.2
25
15.3
35
14.7
2 19
.5
15.4
45
Mea
n 11
.18
12.3
1 11
.60
12.6
9
16.9
8 17
.98
16.4
9 17
.27
14
.08
15.1
45
14.0
45
14.9
8
C.D
. 0.05
G
1.00
2.
05
1.28
F
N
S
N
S
N
S G
× F
N
S
N
S
N
S
Tabl
e 2:
Inte
ract
ive
effe
ct o
f gro
win
g m
edia
and
fert
igat
ion
on n
umbe
r of fl
ower
s/be
d/ye
ar o
f ros
e cv
. Gra
nd G
ala
unde
r pro
tect
ed c
ondi
tions
Trea
tmen
t
Apr
il flu
sh (2
012)
A
pril
flush
(201
3)
Po
oled
F 1
F 2 F 3
F 4 M
ean
F 1 F 2
F 3 F 4
Mea
n F 1
F 2 F 3
F 4 M
ean
G1
66.7
8 70
.11
74.5
6 75
.33
71.6
9 53
.22
56.6
7 56
.44
55.3
3 55
.42
60
63.3
9 65
.5
65.3
3 63
.555
G2
85.2
2 82
.11
78.5
6 71
.89
79.4
4 59
.89
58.7
8 56
.22
57.4
4 58
.08
72.5
5 70
.445
67
.39
64.6
65
68.7
6
G3
66.3
3 78
.56
75.2
2 64
.56
71.1
7 60
.44
54.2
2 82
.89
61.1
1 64
.67
63.3
8 66
.39
79.0
5 62
.83
67.9
2
G4
74.6
7 76
.11
78.5
6 81
.33
77.6
7 53
.89
51.1
1 54
.22
57.0
0 54
.06
64.2
8 63
.61
66.3
9 69
.165
65
.86
G5
42.1
1 33
.89
33.5
6 24
.78
33.5
8 37
.44
33.2
2 31
.67
24.5
6 31
.72
39.7
7 33
.55
32.6
1 24
.67
32.6
5
Mea
n 67
.02
68.1
6 68
.09
63.5
8
52.9
8 50
.80
56.2
9 51
.09
60
59
.48
62.1
9 57
.33
C.D
. 0.05
G
2.
64
1.97
2.
30
F
1.85
0.
30
1.14
G ×
F
2.
84
2.11
2.
28

Progressive Horticulture, 45 (2) 309Ta
ble
3: In
tera
ctiv
e ef
fect
of g
row
ing
med
ia a
nd fe
rtig
atio
n on
bud
leng
th (c
m) o
f ros
e cv
. Gra
nd G
ala
unde
r pro
tect
ed c
ondi
tions
Trea
tmen
t
Apr
il flu
sh (2
012)
A
pril
flush
(201
3)
Po
oled
F 1
F 2 F 3
F 4 M
ean
F 1 F 2
F 3 F 4
Mea
n F 1
F 2 F 3
F 4 M
ean
G1
4.80
5.
09
4.69
4.
12
4.68
4.
40
4.69
4.
29
4.77
4.
54
4.6
4.89
4.
49
4.44
5 4.
61
G2
5.46
5.
49
5.54
3.
81
5.08
5.
06
5.09
5.
14
4.57
4.
96
5.26
5.
29
5.34
4.
19
5.02
G3
4.77
5.
23
5.20
3.
56
4.69
4.
37
4.83
4.
80
4.76
4.
69
4.57
5.
03
5.00
4.
16
4.69
G4
4.86
5.
11
5.27
4.
86
5.02
4.
46
4.71
4.
87
5.46
4.
87
4.66
4.
91
5.07
5.
16
4.94
5
G5
2.81
2.
56
2.66
2.
53
2.64
3.
97
2.99
3.
07
2.70
3.
18
3.39
2.
775
2.86
5 2.
615
2.91
Mea
n 4.
54
4.70
4.
67
3.78
4.45
4.
46
4.43
4.
45
4.
495
4.58
4.
55
4.11
5
C.D
. 0.05
G
0.29
0.35
0.29
F
0.
33
N
S
0.34
G ×
F
NS
N
S
NS
Tabl
e 4:
Inte
ract
ive
effe
ct o
f gro
win
g m
edia
and
fert
igat
ion
on n
umbe
r of p
etal
s pe
r flow
er o
f ros
e cv
. Gra
nd G
ala
unde
r pro
tect
ed c
ondi
tions
Trea
tmen
t
Apr
il flu
sh (2
012)
A
pril
flush
(201
3)
Po
oled
F 1
F 2 F 3
F 4 M
ean
F 1 F 2
F 3 F 4
Mea
n F 1
F 2 F 3
F 4 M
ean
G1
26.5
6 24
.89
28.7
8 25
.22
26.3
6 25
.89
28.3
3 29
.22
25.4
4 27
.22
26.2
25
26.6
1 29
.00
25.3
3 26
.79
G2
28.2
2 24
.78
28.8
9 27
.44
27.3
3 28
.78
26.5
6 32
.11
28.1
1 28
.89
28.5
25
.67
30.5
27
.775
28
.11
G3
28.2
2 28
.44
26.8
9 26
.56
27.5
3 28
.00
25.7
8 26
.56
28.7
8 27
.28
28.1
1 27
.11
26.7
2 27
.67
27.4
0
G4
28.2
2 28
.11
29.7
8 25
.89
28.0
0 28
.22
28.3
3 28
.11
28.1
1 28
.19
28.2
2 28
.22
28.9
4 27
.00
28.0
9
G5
25.2
2 25
.33
25.4
4 19
.22
23.8
1 24
.78
25.6
7 25
.78
19.3
3 23
.89
25
25.5
25
.61
19.2
7 23
.85
Mea
n 27
.29
26.3
1 27
.96
24.8
7
27.1
3 26
.93
28.3
6 25
.96
27
.21
26.6
2 28
.16
25.4
1
C.D
. 0.05
G
1.96
1.
89
1.
95
F
1.
65
1.47
1.48
G ×
F
NS
2.36
2.96

310 Progressive Horticulture, 45 (2)
growing media. Highest number of petals per flower were recorded in F3 (28.16) which were significantly high-er than F2 and F4 but were at par with F1 and F3. Observa-tions in terms of interactions revealed that lowest petals number (19.27) was recorded in G5F4 control (soil and no fertilizer). Maximum number was observed in G2F3 (30.5) which was the interaction of soil + vermicompost and 150 ppm NPK and were found significantly higher to all interactions. More petals were produced by bal-anced fertigation along with optimally fortified growing media by vermicompost and this increase may be due to more number of branches produced by this treatment which resulted in more carbohydrate synthesis which increased number of petals. Maximum number of petals (25.41) in rose cv. First Red was also reported by Ashok and Rengasamy (2000) who studied the effect of ferti-gation with ammonium nitrate @150 mg per liter along with use of 20 percent vermicompost in growing media.
Data as regards vase life in ordinary tap water exhibited that maximum vase life was found in growing media G4 (10.32 days) and minimum was found in G5 (8.14 days). Maximum value for vase life (10.32 days), it was signifi-cantly higher than all other growing media. Effect of nutritional doses and interactions did not show any sig-nificant effect on vase life. Like to above all flower char-acters, combination of growing substrates and fertiga-tion doses, some improvement in vase life were also re-ported. It might be due to overall food nutrient status of flowers under these substrates combinations and proper nutrient supplement. These findings are matching with those of Kathiresan and Venkatesha (2002) in gladiolus and Barreto et al. (2002) in gerbera. NPK Application in the form of fertigation and growing media modification with mortal organic stuff increased flower yield (number of flowers per m2) of Rose cv. ‘Garand Gala’. Moreover these treatments were also effective to increase flower size (flower bud length) and number of petals per flow-er. Treatments were also effective to reduce the duration from bud appearance to harvesting and vase life of flow-ers in ordinary tap water. Best results were observed with NPK fertigation @ 150 ppm and use of vermicompost in growing media although synergetic effect of these treat-ments were also most effective to improve growth, yield and quality of rose cv. ‘Grand Gala’.
REFERENCESAshok, A. and Rengasamy, P. 2000. Effect of N fertigation
at different levels and sources on the growth of cut rose cv. “First Red” under greenhouse conditions. South Indian Hort., 48: 139-141.
Barreto, M.S.; Jagtap, K.B.; Misra, R.L. and Misra, S. 2002. Studies on polyhouse gerbera substrate. In: Proceed-Ta
ble
5: In
tera
ctiv
e ef
fect
of g
row
ing
med
ia a
nd fe
rtig
atio
n on
Vas
e lif
e in
ord
inar
y ta
p w
ater
in d
ays
of ro
se c
v. G
rand
Gal
a un
der p
rote
cted
co
nditi
ons
Trea
tmen
t
A
pril
flush
(201
2)
A
pril
flush
(201
3)
Po
oled
F 1
F 2 F 3
F 4 M
ean
F 1 F 2
F 3 F 4
Mea
n F 1
F 2 F 3
F 4 M
ean
G1
7.33
7.
89
7.56
9.
78
8.14
10
.56
10.0
0 10
.89
7.89
9.
83
8.94
5 8.
945
9.22
5 8.
835
8.98
5
G2
7.56
7.
33
7.89
9.
33
8.03
10
.89
11.2
2 11
.44
12.1
1 11
.42
9.22
5 9.
275
9.66
10
.72
9.72
5
G3
8.22
8.
56
8.56
8.
44
8.44
12
.00
11.7
8 12
.11
11.8
9 11
.94
10.1
1 10
.17
10.3
3 10
.165
10
.19
G4
8.22
8.
44
8.33
11
.89
9.22
11
.11
11.6
7 11
.00
11.8
9 11
.42
9.66
5 10
.05
9.66
11
.89
10.3
2
G5
7.89
8.
89
7.22
7.
56
7.89
9.
78
9.11
7.
89
6.78
8.
39
8.83
5 9
7.55
5 7.
17
8.14
Mea
n 7.
84
8.22
7.
91
9.40
10.8
7 10
.76
10.6
7 10
.11
9.
355
9.49
9.
29
9.75
5
C.D
. 0.05
G
0.43
N
S
0.41
F
N
S
N
S
NS
G ×
F
NS
NS
N
S

Progressive Horticulture, 45 (2) 311
ings of National Symposium on Indian Floriculture in the New Millennium, Bangalore, pp. 173-176.
Bhattacharjee, S.K. and Mukharjee, T. 1981. Effect of potting media on growth and flowering of some epiphytic and terrestrial orchids. Haryana J. Horti. Sci., 25: 7-10
Cheng, B.T. 1987. Sawdust as a greenhouse growing me-dium. J. Plant Nutrition, 10(9-16): 1437-1446.
Gurav, S.; Katwate, S.; Patel, S.; Patel, M.; Singh, B.; Mirra, R. and Missa, S. 2002. Fertigation of roses under natural ventilated polyhouse conditions. Floriculture Research Trend in India, pp. 222-223.
Kathiresan, C. and Venkatesha, J. 2002. Effect of biofertiliz-ers with levels of N and P on gladiolus. In: Floriculture Research Trend in India. Proc. of National Sympo-sium on Indian Floriculture in the New Millennium, Bangalore, pp. 118-121.
Nandre, D.R.; Jogdande, N.D.; Dalal, S.R.; Bansode, A.B. and Chaudhale, B.S. 2005. Effect of Azotobacter on growth and yield of China aster under reduced nitro-
gen levels. Advances in Plant Sci., 18(1): 87-89.
Palai, S.K.; Mishra, M. and Mishra, H.N. 2002. Response of rose cv. Montezuma to different levels of N, P and K fertigation. Orissa J. Horti., 30(1): 51-53.
Shashidhara, G.R. and Gopinath, G. 2005. Growth, flower-ing, yield, quality and economics of calendula (Calen-dula officinalis Linn.) as influenced by nutrients and bioinoculants. J. Orn. Horti., 8(4): 249-253.
Sujatha, K., Gowda, J.V.N. and Khan, M.M. 2002. Effects of different fertigation levels on gerbera under low cost greenhouse. J. Orn. Horti., New series. 5(1): 54-59.
Talukdar, M. and Barooah, S. 1987. Effect of post mixture on flowering in Dendrobium densiflorum. Acta Horti., 205: 145-148.
Thane, S.R.; Shembekar, R.Z.; Bhongle, S.A. and Badge, S.A. 2007. Effect of integrated nutrient management on flower quality, yield and vase life of gerbera (Gerbera jamesonii H. Bolus) grown under shade net conditions. Plant Archives, 7(2): 679-680.
Received on 18 July, 2012 and accepted on 10 April, 2013

Online version available at: www.indianjournals.com
Progressive Horticulture, Vol. 45, No. 2, September 2013© Copyright by ISHRD, Printed in India
[Research Article]
Study on the performance of some varieties of China aster (Callistephus chinensis Ness.) in Andhra Pradesh
J.H. Zosiamliana1, G.S.N. Reddy1 and H. Rymbai2*1College of Horticulture, Andhra Pradesh Horticultural University, Hyderabad - 500 079, Andhra Pradesh2 Division of Horticulture, ICAR Research Complex for NEH Region, Umiam – 393 103, Meghalaya*E-mail: [email protected]
ABSTRACTAn experiment was conducted to identify suitable variety(s) of China aster under open-conditions at the Ag-
ricultural Research Institute, APHU, Hyderabad during the year 2008-09. The results revealed a highly significant variation for various growths, floral, and flower yield parameters among the seven varieties. The maximum plant height, number of primary and secondary branches, plant spread and number of leaves at all stage of plant growth was noted in Phule Ganesh Violet. With regards to flowering traits, Phule Ganesh Pink recorded minimum num-ber of days for first flower bud initiation (57.20), first flowering (66.73), 50 % flowering (85.67) and flowering dura-tion (60.96). Phule Ganesh White produced maximum flower diameter (7.37 cm), stalk length (34.78 cm) and vase life both as cut (9.13 days) and loose (4.73 days) flower. Phule Ganesh White also gave maximum number of flower per plant (36.73) and yield both per plant (208.81 g) and per hectare (23.20 t / ha). The minimum values for all these characters was recorded by cv. Local, except flowering duration, days to first flower bud initiation and their open-ing. Therefore, Phule Ganesh white can be adopted for commercial cultivation under Hyderabad conditions.
KEY wORDS: Callistephus chinensis, varieties, performance, open conditions
China aster (Callistephus chinensis L. Ness) of the ‘Asteraceae’ family, a native of china (Navalinskien et al., 2005) is one of the most preference flower crops cultivated widely due to its wide spectrum of attractive colours and comparatively longer vase life (Chaitra and Patil, 2007). This crop ranks third among annual flowers, next only to Chrysanthemum and Marigold (Sheela, 2008). Vari-eties like Violet Cushion, Kamini, and Local are being cultivated to a limited extent in and around Hyderabad. However, the Phule Ganesh series, in spite of their supe-rior yield and quality traits, have not been tried under Hyderabad conditions. Although, there are existing of several number of varieties under cultivation, however their performance are region specific, which varies with location and climate. Improve yield and quality of flow-ers is an important objective to be reckoned in commer-cial flower production. . Yield and quality of flowers is mainly governed by a varietalfeatures. In additional, nu-tritional and climatic conditions that prevail during the growing period also determined the flowers characters (Boodley, 1975). Study the performance of desirable va-rieties with respect to specific areas, is therfore essential
before recommending for adoption in commercial scale. Hence, this experiment was conducted to find out the most suitable varietie(s) of China aster under Hyderabad conditions for growth, flowering and yield characters.
MATERIALS AND METHODSThe experiment was conducted under the All In-
dia Coordinated Research Project on Floriculture at Agricultural Research Institute, Rajendranagar, APHU, Hyderabad during the year 2008-09. The study consisted of seven varieties, viz, Violet Cushion, Kamini, Phule Ga-nesh Purple, Phule Ganesh White, Phule Ganesh Violet, Phule Ganesh Pink and Local. All these cultivars were grown and maintained as per the recommended cultural practices. The observations for vegetative parameters in-cluding plant height (cm), plant spread (cm), number of leaves, primary and secondary branches were recorded at 30, 60 and 90 days after transplanting (DAT). Floral parameters recorded were days taken for first flowering, days taken to 50 per cent flowering, duration of flower-ing, number of flowers per plant, stalk length, flower di-

Progressive Horticulture, 45 (2) 313
ameter, flower yield per plant (g/plant) and per hectare (tones/ha), vase life of cut and loose flower. The experi-ment was laid out in Randomized Block Design (RBD) and the data on different parameters were analysed for analysis of variance (ANOVA) by using Statistical Pack-age for Agricultural Workers (STAT OP Sheoran).
RESULTS AND DISCUSSION
Varietiess variation on vegetative growth param-eters of China aster
A significant (pd”0.05) variation in growth char-acters of China aster varieties was observed (Table 1). Among all the varieties, the ‘Phule Ganesh’ series were vigorous in growth in terms of plant height. At 30 days after transplanting (DAT), ‘Phule Ganesh Violet’ pro-duced the highest plant height (10.47 cm) while ‘Local’ recorded the minimum (6.09 cm). Similarly, ‘Phule Ga-nesh Violet’ revealed maximum plant height at 60 DAT (43.89 cm) and 90 DAT (66.50 cm). While at all stages minimum was observed in Local i.e. both at 60 DAT (32.56 cm) and 90 DAT (43.13 cm). This variation in the plant height might be to genetically factors. The variation in plant height among various varieties has also been re-ported by Poornima et al. (2006) in china aster and Singh et al. (2004) in marigold.
Regarding to number of branches per plant, ‘Phule Ganesh Violet’ produced maximum number of primary branches at 30 DAT (4.86), 60 DAT (15.73) and 90 DAT (21.40) while the minimum was observed in Local at all stages. As far as secondary branches are concerned, ‘Phule Ganesh Violet’ recorded the maximum at 60 DAT (33.73) and 90 DAT (32.80) while ‘Phule Ganesh Pink’ produced the minimum at both 60 DAT (8.67) and 90 DAT (16.80). The difference in number of branches among the variet-ies is in accordance to previous in China aster (Poornima et al., 2006) and chrysanthemum (Baskaran et al., 2004). This variation among varieties might be influenced by the genetical make up of thegenotypes.
At different stages of plant growth, China aster va-rieties differ significantly (pd”0.05) for plant spread. The maximum plant spread was recorded in ‘Phule Ganesh Violet’ at 30 DAT (174.53 cm2), 60 DAT (437.73 cm2) and 90 DAT (1294.33 cm2). Interestingly, ‘Local’ recorded the minimum plant spread at 30 DAT (108.47 cm2) and at 60 DAT (194.40 cm2), while at 90 DAT, ‘Kamini’ recorded the minimum plant spread (458.27 cm2). The difference in plant spread is a varietal trait and similar result was obtained by Kulkarni and Reddy (2006) in China aster.
Leaf production was again highest in ‘Phule Ganesh Violet’ at 30 DAT (15.80), 60 DAT (44.27) and 90 DAT (192.73). The production of more number of leaves in
these varieties may be due to vigorous growth, more number of primary and secondary branches and more plant spread, which in turn facilitates better harvest of sunshine by the plant leading to production of more number of leaves. The leaves production was minimum in ‘Local’ and ‘Kamini’ at all stages of growth. This may due to less number of primary and secondary branches and plant spread, which resulted in less growth and less production of leaves. Similar results were observed in China aster (Swaroop et al. 2004), in gerbera (Kumar and Yadav, 2005) and in marigold (Singh and Singh, 2005).
Varieties variation on flower parameters of China aster
The observation on flower characters showed varia-tion in the varieties (Table 2). The minimum number of days taken to floral bud initiation was recorded in ‘Phule Ganesh Pink’ (57.20) and ‘Phule Ganesh White’ (61.33), while ‘Local’ variety recorded the maximum number of days (65.93). Regarding the days take to flower open-ing, ‘Phule Ganesh Pink’ (66.73 days) and ‘Phule Ga-nesh White’ (69.80 days) were early to initiate the flower opening, while ‘Local’ (77.13 days) and ‘Violet Cushion’ (76.13 days) took maximum number of days for flower opening. The early flower bud initiation of ‘Phule Ga-nesh Pink’ and ‘Phule Ganesh White’ might have re-sulted in early opening of the flower. The variations in flower bud initiation and flower opening may be due to genetic trait. Similar result has also been observed by Kumar and Yadav (2003). With respect to days taken for 50% flowering, ‘Phule Ganesh Pink’ (85.67 days) and ‘Phule Ganesh White’ (88.00 days) showed significantly (pd”0.05) minimum number of days taken to reach 50% flowering while the maximum was observed in ‘Local’ (106.33 days). Similar variations due to varietal trends were also observed in China aster (Dilta et al., 2005). As far as flowering duration was concerned, the vari-ety ‘Kamini’ recorded maximum (71.02 days) duration of flowering, whereas ‘Phule Ganesh Pink’ recorded the minimum (60.96 days). This finding of variations in flowering character was coincided with the reports of Poornima et al. (2006) in China aster and Kumar and Ya-dav (2005) in gerbera. In relation to flower diameter, the variety ‘Phule Ganesh White’ (7.37 cm) recorded maxi-mum while the ‘Local’ (4.79 cm) recorded the minimum. This variation may be due to differences in the genetic makeup of varieties. Similar variations were reported previously in China aster (Poornima et al., 2006), mari-gold (Singh and Singh, 2005) and chrysanthemum (Dilta et al., 2005). Regarding stalk length, it was observed that ‘Phule Ganesh White’ (34.78 cm) give maximum stalk length and minimum in ‘Local’ (20.45 cm). The varia-tions in stalk length among the varieties had also been reported in China aster (Poornima et al., 2006).

314 Progressive Horticulture, 45 (2)Ta
ble
1: G
row
th c
hara
cter
s of
som
e va
riet
ies
of C
hina
ast
er
Var
ietie
s Pl
ant h
eigh
t (cm
) N
umbe
r of b
ranc
hes p
er p
lant
Pl
ant S
prea
d (c
m2 )
Num
ber o
f lea
ves p
er p
lant
Prim
ary
Seco
ndar
y
30
DA
T 60
DA
T 90
DA
T 30
DA
T 60
DA
T 90
DA
T 60
DA
T 90
DA
T 30
DA
T 60
DA
T 90
DA
T 30
DA
T 60
DA
T 90
DA
T
Vio
let C
ushi
on
9.21
26
.54
58.8
9 3.
60
12.1
3 16
.93
13.8
7 30
.33
145.
80
317.
73
548.
07
12.1
3 36
.47
180.
80
Kam
ini
8.00
28
.19
47.3
5 3.
33
11.3
3 17
.20
11.8
0 22
.20
122.
37
232.
53
458.
27
11.7
3 31
.60
149.
53
Phul
e G
anes
h Pu
rple
8.6
9 34
.33
62.9
9 4.
33
14.7
3 18
.13
21.9
3 31
.60
124.
53
431.
60
1019
.53
14.4
7 34
.47
185.
73
Phul
e G
anes
h W
hite
9.
87
38.6
3 65
.75
4.47
15
.67
19.4
7 28
.47
32.1
3 15
3.47
43
2.80
12
57.6
0 13
.80
42.8
7 18
4.67
Phul
e G
anes
h V
iole
t 10.
47
43.8
9 66
.50
4.86
15
.73
21.4
0 33
.73
32.8
0 17
4.53
43
7.73
12
94.3
3 15
.80
44.2
7 19
2.73
Phul
e G
anes
h Pi
nk
9.33
32
.56
46.7
3 4.
13
13.0
7 19
.07
8.67
16
.80
140.
20
339.
13
791.
33
13.2
7 36
.80
179.
27
Loca
l 6.
09
21.7
7 43
.13
2.60
7.
00
15.9
3 10
.07
21.9
3 10
8.47
19
4.40
59
8.40
10
.87
33.5
3 14
6.67
S.Em
± 0.
36
2.02
0.
73
0.23
0.
28
0.29
0.
61
0.35
8.
05
19.0
7 30
.34
0.47
1.
03
3.67
C.D
. (0.
05)
1.13
6.
24
2.26
0.
72
0.87
0.
90
1.89
1.
09
25.0
7 59
.412
94
.52
1.45
3.
21
11.4
4
DA
T, d
ays
afte
r tra
nspl
antin
g
Tabl
e 2:
Flo
wer
ing
char
acte
rs o
f som
e va
riet
ies
of C
hina
ast
er
Var
ietie
s D
ays
for fi
rst
Day
s fo
r firs
t D
ays
for 5
0%
Flow
erin
g
Flow
er
Stal
k
flo
wer
bud
flo
wer
ing
flow
erin
g du
ratio
n di
amet
er
leng
th
in
itiat
ion
(day
s)
(cm
) (c
m)
Vio
let C
ushi
on
64.6
7 76
.13
97.0
0 68
.80
6.02
30
.88
Kam
ini
62.0
7 70
.07
90.3
3 71
.02
5.71
20
.51
Phul
e G
anes
h Pu
rple
62
.87
70.9
3 90
.67
64.7
4 6.
12
27.4
1
Phul
e G
anes
h W
hite
61
.33
69.8
0 88
.00
68.4
5 7.
37
34.7
8
Phul
e G
anes
h V
iole
t 61
.87
70.6
7 91
.33
64.4
1 6.
06
32.5
8
Phul
e G
anes
h Pi
nk
57.2
0 66
.73
85.6
7 60
.96
6.90
25
.57
Loca
l 65
.93
77.1
3 10
6.33
67
.15
4.79
20
.45
S.Em
± 1.
42
1.27
1.
49
0.87
0.
08
0.45
C.D
. (0.
05)
4.43
3.
92
4.63
2.
71
0.25
1.
41
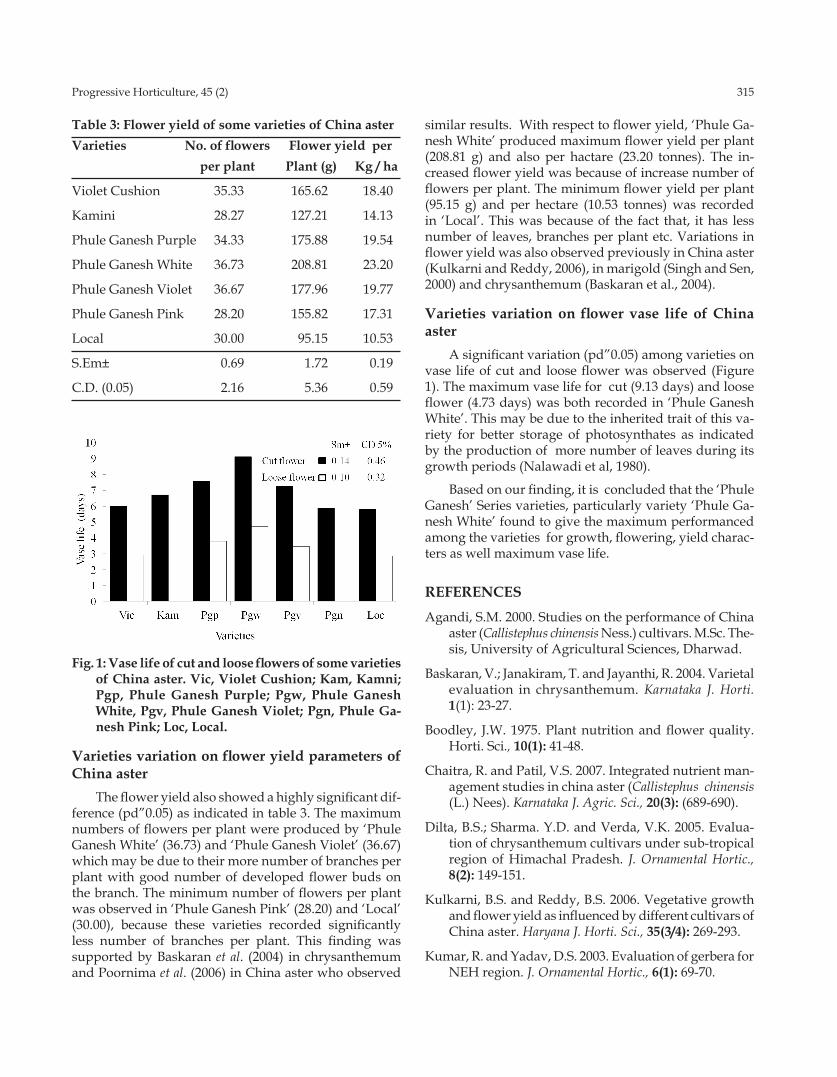
Progressive Horticulture, 45 (2) 315
Table 3: Flower yield of some varieties of China asterVarieties No. of flowers Flower yield per per plant Plant (g) Kg / ha
Violet Cushion 35.33 165.62 18.40
Kamini 28.27 127.21 14.13
Phule Ganesh Purple 34.33 175.88 19.54
Phule Ganesh White 36.73 208.81 23.20
Phule Ganesh Violet 36.67 177.96 19.77
Phule Ganesh Pink 28.20 155.82 17.31
Local 30.00 95.15 10.53
S.Em± 0.69 1.72 0.19
C.D. (0.05) 2.16 5.36 0.59
Fig. 1: Vase life of cut and loose flowers of some varieties of China aster. Vic, Violet Cushion; Kam, Kamni; Pgp, Phule Ganesh Purple; Pgw, Phule Ganesh white, Pgv, Phule Ganesh Violet; Pgn, Phule Ga-nesh Pink; Loc, Local.
Varieties variation on flower yield parameters of China aster
The flower yield also showed a highly significant dif-ference (pd”0.05) as indicated in table 3. The maximum numbers of flowers per plant were produced by ‘Phule Ganesh White’ (36.73) and ‘Phule Ganesh Violet’ (36.67) which may be due to their more number of branches per plant with good number of developed flower buds on the branch. The minimum number of flowers per plant was observed in ‘Phule Ganesh Pink’ (28.20) and ‘Local’ (30.00), because these varieties recorded significantly less number of branches per plant. This finding was supported by Baskaran et al. (2004) in chrysanthemum and Poornima et al. (2006) in China aster who observed
similar results. With respect to flower yield, ‘Phule Ga-nesh White’ produced maximum flower yield per plant (208.81 g) and also per hactare (23.20 tonnes). The in-creased flower yield was because of increase number of flowers per plant. The minimum flower yield per plant (95.15 g) and per hectare (10.53 tonnes) was recorded in ‘Local’. This was because of the fact that, it has less number of leaves, branches per plant etc. Variations in flower yield was also observed previously in China aster (Kulkarni and Reddy, 2006), in marigold (Singh and Sen, 2000) and chrysanthemum (Baskaran et al., 2004).
Varieties variation on flower vase life of China aster
A significant variation (pd”0.05) among varieties on vase life of cut and loose flower was observed (Figure 1). The maximum vase life for cut (9.13 days) and loose flower (4.73 days) was both recorded in ‘Phule Ganesh White’. This may be due to the inherited trait of this va-riety for better storage of photosynthates as indicated by the production of more number of leaves during its growth periods (Nalawadi et al, 1980).
Based on our finding, it is concluded that the ‘Phule Ganesh’ Series varieties, particularly variety ‘Phule Ga-nesh White’ found to give the maximum performanced among the varieties for growth, flowering, yield charac-ters as well maximum vase life.
REFERENCESAgandi, S.M. 2000. Studies on the performance of China
aster (Callistephus chinensis Ness.) cultivars. M.Sc. The-sis, University of Agricultural Sciences, Dharwad.
Baskaran, V.; Janakiram, T. and Jayanthi, R. 2004. Varietal evaluation in chrysanthemum. Karnataka J. Horti. 1(1): 23-27.
Boodley, J.W. 1975. Plant nutrition and flower quality. Horti. Sci., 10(1): 41-48.
Chaitra, R. and Patil, V.S. 2007. Integrated nutrient man-agement studies in china aster (Callistephus chinensis (L.) Nees). Karnataka J. Agric. Sci., 20(3): (689-690).
Dilta, B.S.; Sharma. Y.D. and Verda, V.K. 2005. Evalua-tion of chrysanthemum cultivars under sub-tropical region of Himachal Pradesh. J. Ornamental Hortic., 8(2): 149-151.
Kulkarni, B.S. and Reddy, B.S. 2006. Vegetative growth and flower yield as influenced by different cultivars of China aster. Haryana J. Horti. Sci., 35(3/4): 269-293.
Kumar, R. and Yadav, D.S. 2003. Evaluation of gerbera for NEH region. J. Ornamental Hortic., 6(1): 69-70.

316 Progressive Horticulture, 45 (2)
Received on 07 December, 2012 and accepted on 19 May, 2013
Kumar, R. and Yadav, D.S. 2005. Evaluation of gerbera (Gerbera jamesonii Bolus ex Hooker F.) cultivars under the tropical hills of Meghalaya. J. Ornamental Horti., 8(3): 212-215.
Nalawadi, U.G., Narayana Gowda, J.V., Ahmed, I.M. and Sulladmath, U.V. 1980. Vase life studies in some cultivars of gerbera (Gerbera jamesonii). Lalbaugh, 25(4): 14-15.
Navalinskien, M.; Samuitien, M. and Jomantiene, R. 2005. Molecular detection and characterisation of phytoplasma infecting Callistephus chinensis plants in Lithuania. Phytopathology Pol., 35: 109–112.
Panse, V.G. and Sukhatme, P.V. 1978. Statistical methods for agricultural workers. Indian Council of Agricul-tural Research, New Delhi. 67 p.
Poornima, G.; Kumar, D.P. and Seetharamu, G.K. 2006. Evaluation of China aster (Callisthephus chinensis (L.)
Ness) genotypes under the hills zone of Karnataka. J. Ornamental Horti., 9(3): 208-211.
Sheela, V. L. 2008. China aster. Flowers for Trade: Vol.10. Horticultural Science Series. 113 p.
Singh, D. and Sen, N.L. 2000. Genetic variability, herita-bility and genetic advance in Marigold. J. Ornamental Horti., 36(2): 75-78.
Singh, D., Sen, N.L. and Sindhu, S.S. 2004. Evaluation of marigold germplasm under semi arid conditions of Rajasthan. Haryana J. Hortic. Sci. 32(3/4): 206-209.
Singh, D.; and Singh, A.K. 2005. Evaluation of French marigold (Tagetes patula Linn.) and Wild marigold (Tagetes minuta Linn.) under submountianous tarai conditions. J. Ornamental Horti.; 8(2): 134-136.
Swaroop, K.; Kanwar, S.P.; Saxena, N.P. and Singh, K.P. 2004. Evaluation of China aster cultivars under Delhi condition. J. Ornamental Horti.; 7(1): 127-128.

Online version available at: www.indianjournals.com
Progressive Horticulture, Vol. 45, No. 2, September 2013© Copyright by ISHRD, Printed in India
[Research Article]
Screening of gerbera (Gerbera jamesonii ) cultivars for quality, vase life and stem bending
R. Kumar, N. Ahmed, O. C. Sharma, G. Mahendiran and S. LalCentral Institute of Temperate Horticulture, Srinagar-190 007, Jammu and KashmirE-mail: [email protected]
ABSTRACTThe present study was conducted to evaluate the post harvest performance of ten commercial gerbera cultivars
for quality, vase life and stem bending. There were significant differences among different cultivars with respect to floral traits, water relation parameters, and vase life. The maximum stalk length was observed in Dune (65.85 cm), while maximum stalk diameter was recorded in Sunway (8.13 mm). The highest flower diameter (13.17 cm) was recorded in Sunway while numbers of ray florets were found maximum in Rosalin (75.20). The length of ray florets was recorded highest in Salvadore (4.60 cm). In vase life study, maximum fresh weight change was recorded in Kayak (124.29 %) on 8th day and minimum fresh weight change (87.92 %) in Scope on 16th day. Among all the cultivars, Dune recorded maximum water uptake (50.24 g/flower) and water loss (38.84 g/flower). The water bal-ance exhibited significant differences among the cultivars and recorded maximum (11.40 g/flower) in Dune. The longest vase life exhibited by Dune (15.67 days) followed by winter Queen (14.47 days) and Dana Ellen (14.40 days). The minimum stem bending incidence (0°- 15°) was recorded in cultivars Cacharell and winter Queen. Based on performance cultivars Dune, winter Queen, Dana Ellen, Carambola and Cacharell were found promis-ing for commercial quality cut flower production.
KEY wORDS: Gerbera jamesonii, floral traits, water relations, vase life
Gerbera (Gerbera jamesonii Bolus ex. Hooker F.), a stemless perennial herb belongs to family Asteraceae. It is native to South Africa and Asia, also known as Trans-vaal, Barberton or African daisy (Das et al., 2003). It occu-pies 5th position in the international flower trade (Hedau et al., 2012) owing to its wide range of bewitching colours, forms and attractive geometrical shape. It is suitable for wide range of floral arrangements, bouquet and dry flower crafts and also used for beds, borders, pot culture and rock gardens. It is grown throughout the world in a wide range of agro-climatic conditions. About seven species were reported to be distributed in temperate Hi-malayas from Kashmir to Nepal at an altitude of 1300 to 3200 meters in India (Bhattacharjee and De, 2003). Ger-bera have more than 300 cultivars with different floral traits, vase life and stem bending (Ferrante et al., 2007). In cut flowers trade, floral quality traits like stalk length and flower diameter are important parameters along with uniformity in size, thickness, straightness, colour, vase life and bending incidence. Post harvest quality and vase life are phenomenon of physiological process
which depends upon water uptake, transpirational loss, water balance, respiration and varietal difference. The stem bending which occurs 10 cm below capitulam is the main disorder besides flower wilting. The stem bending is affected by genetic makeup, phytohormones, miner-als, water imbalance caused by bacterial activity in xy-lem vessels, preharvest conditions and storage tempera-ture after harvesting (Javed et al., 2011). There is meager information available on these quality traits in gerbera which leads to loss of grade and quality as well as re-turns to the growers. Therefore, considering above facts an attempt has been made to screen the gerbera cultivars having improved postharvest floral quality traits, maxi-mum vase life and minimum stem bending incidence for commercial cut flower production.
MATERIALS AND METHODSThe present study was carried out at Laboratory of
Post Harvest Technology, CITH, Srinagar (J&K) during 2009-2010. Ten different commercial cultivars Cacharell,

318 Progressive Horticulture, 45 (2)
Salvadore, Scope, Dana Ellen, Sunway, Kayak, Caram-bola, Dune, Rosalin and Winter Queen were grown in polyhouse using recommended growing practices and it was laid out in Randomized Block Design (RBD) rep-licated thrice. Flowers were harvested in early morn-ing when outer floret fully opened and perpendicular to stalk and precooled for 1 hour at 5°C temperature. Post harvest floral quality traits i.e., flower stalk length and diameter, flower size, flower disc diameter, number and length of ray floret, flower fresh weight and colour were recorded. Flower colour was identified by the RHS colour chart (Anon., 2007). In vase life study, flower of uniform stalk length were placed in preservative solu-tion of 4% sucrose plus 20 ppm silver nitrate (Nair et al., 2003) in Completely Randomized Design (CRD) with three replications. Vase life was considered to be termi-nated when petal start wilting and colour fading. Data were recorded on fresh weight change (% of initial fresh weight), water uptake, water loss, water balance, vase life and stem bending. The stem bending was classified based on Celikel and Reid methods (2002). The stalk cur-vature was measured and categorized based on 0° - 15°, 15°-25°, 25°-65°, 65°-90° and >90° stalk curvature. Data were analyzed statistically using standard methodology as suggested by Gomez and Gomez (1984).
RESULTS AND DISCUSSION
Floral traitsIt is evident from Table 1 that there were Significant
differences for floral traits among different cultivars. The maximum stalk length was observed in Dune (65.85 cm) followed by Rosalin (58.44 cm) and minimum stalk
length was measured in Scope (46.31 cm). The variation in stalk length may be owing to their genetic character (Halevy and Mayak, 1981). Stalk length was found to be positively correlated with flower diameter (Rao and Vasudevan, 2009) which is important quality trait in ger-bera. The maximum stalk diameter was recorded in Sun-way (8.13 mm) and minimum was recorded in Cacharell (5.84 mm). The highest flower diameter (13.17 cm) was observed in Sunway while lowest flower diameter was noticed in Kayak (10.02 cm). The flower disc diameter was found maximum in Scope (2.20 cm) and minimum in Sunway (0.90 cm). Similar variation in stalk length, thickness and disc diameter was also reported by Barua and Bordoloi (2012) in gerbera. The maximum flower fresh weight was recorded in Dune (37.60 g) while Kayak exhibited lowest value for fresh weight of flower (24.60 g). Number of ray florets varied from 54.60 in Winter Queen to 75.20 in Rosalin. The longest ray florets were recorded in Salvadore (4.60 cm) and smallest in Dana El-len (2.40 cm). The cultivars Sunway and Cacharell pro-duced flower having highest (6.09 mm) and lowest (3.64 mm) flower neck diameter, respectively. Flower colour in different cultivars varied from different shades of red purple, yellow, orange, yellow orange, white and red. Similar type of variation in different floral traits were also observed by Singh and Srivastava (2008); and Ba-rooah and Talukdar (2009) in gerbera cultivars evalua-tion. This difference can be attributed to genetic makeup of cultivars.
water relation parametersAnalysis of data revealed that fresh weight and
water relation parameters varied significantly (Table 2)
Fig. 1: Vase life of different gerbera cultivars in preservative solution

Progressive Horticulture, 45 (2) 319
Table 1: Morphometric floral quality traits of different gerbera cultivars
Cultivars Stalk Stalk Flower Flower Flower No. of Length Flower Flower length diameter diameter disc fresh ray of ray neck colour (cm) (mm) (cm) diameter weight floret florets diameter (cm) (g) (cm) (mm)
Cacharell 55.56 5.84 12.11 1.80 32.60 65.40 4.50 3.64 Red Purple 67 C
Salvadore 51.93 7.71 10.26 1.90 33.80 54.70 4.60 5.72 Red 43 A
Scope 46.31 7.43 11.33 2.20 29.50 60.70 4.00 5.20 Yellow 13 A
Dana Ellen 55.11 6.37 12.57 1.50 31.70 57.10 2.40 4.87 Yellow 12 A
Sunway 55.22 8.13 13.17 0.90 35.50 72.20 2.80 6.09 Orange N25 B
Kayak 48.14 8.11 10.02 1.40 24.60 70.30 3.50 6.01 Yellow Orange 14 B
Carambola 57.93 7.41 11.86 1.80 33.70 55.40 4.30 5.23 Red 46 A
Dune 65.85 6.58 12.87 1.60 37.60 73.60 2.80 5.06 Orange 25 A
Rosalin 58.44 7.40 10.80 1.70 34.76 75.20 3.20 5.26 Red Purple 62 D
Winter Queen 48.24 7.82 12.38 2.10 35.45 54.60 4.50 5.52 White 155 B
CD at 5% 7.49 0.61 1.23 0.10 2.46 3.19 0.21 0.14
Table 2: Study of water relations attributes in different gerbera cultivars
Cultivars Fresh weight change during different days water water water (% of initial fresh weight) uptake loss balance
2 4 6 8 10 12 14 16 (g/flower) (g/flower) (g/flower)
Cacharell 108.66 110.19 111.27 115.19 106.92 103.20 99.67 92.97 38.42 30.1 8.32
Salvadore 107.89 109.55 110.25 114.11 106.50 102.35 99.24 92.42 37.51 29.35 8.16
Scope 105.27 107.41 108.10 112.98 103.56 99.781 94.65 87.92 30.28 25.96 4.32
Dana Ellen 112.59 113.80 115.45 119.22 110.70 107.03 102.5 97.37 46.37 36.51 9.86
Sunway 106.00 107.67 108.23 111.97 104.71 100.68 96.95 91.16 33.29 26.72 6.57
Kayak 115.57 117.52 119.11 124.29 113.31 108.58 102.6 95.48 42.09 32.85 9.24
Carambola 111.38 112.65 113.84 117.60 109.65 106.30 102.08 97.25 43.15 33.66 9.49
Dune 111.82 113.56 114.46 117.52 110.02 107.10 103.76 101.7 50.24 38.84 11.40
Rosalin 106.04 107.35 108.36 112.30 104.21 100.45 96.24 90.65 33.01 26.6 6.41
Winter Queen 111.42 112.58 114.11 117.45 109.71 106.57 102.9 98.05 48.25 38.05 10.20
CD at 5% 2.67 2.52 1.69 2.89 2.14 1.96 2.60 2.53 1.94 2.37 0.58
among the cultivars. Fresh weight was increased up to 8th day in all cultivars, thereafter decline in fresh weight was observed. Maximum fresh weight change was re-corded in Kayak (124.29 %) on 8th day and minimum fresh weight change (87.92 %) in Scope on 16th day. The cultivar Dune sustained highest increase in fresh weight over initial up to 16th day, while cultivars Winter Queen, Carambola, Kayak and Dana Ellen recorded increase in
fresh weight over initial up to 14th day. Whereas cultivars Rosalin, Sunway, Salvadore and Cacharell observed in-creased fresh weight over initial up to 12th day and Scope maintained shortest increase in fresh weight over initial up to 10th day only. Increase in fresh weight can happen only when the rate of water absorption is greater than transpiration rate (Rogers, 1973).
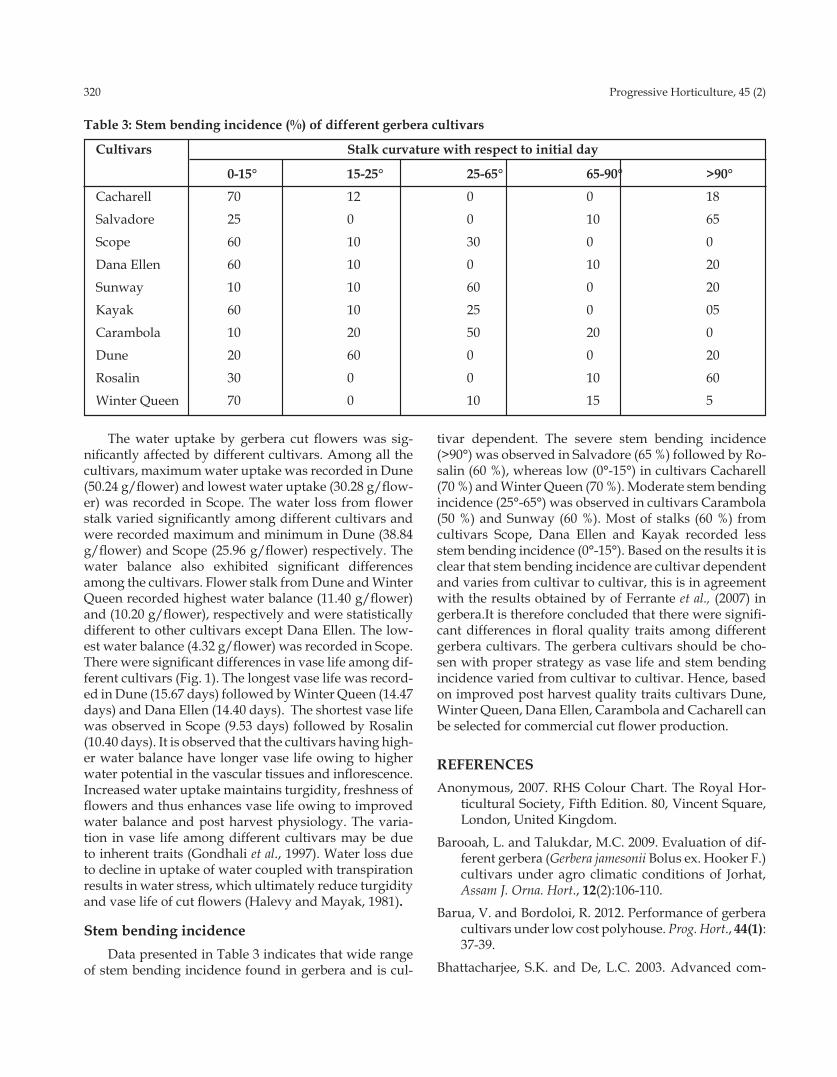
320 Progressive Horticulture, 45 (2)
Table 3: Stem bending incidence (%) of different gerbera cultivars
Cultivars Stalk curvature with respect to initial day
0-15° 15-25° 25-65° 65-90° >90°
Cacharell 70 12 0 0 18
Salvadore 25 0 0 10 65
Scope 60 10 30 0 0
Dana Ellen 60 10 0 10 20
Sunway 10 10 60 0 20
Kayak 60 10 25 0 05
Carambola 10 20 50 20 0
Dune 20 60 0 0 20
Rosalin 30 0 0 10 60
Winter Queen 70 0 10 15 5
The water uptake by gerbera cut flowers was sig-nificantly affected by different cultivars. Among all the cultivars, maximum water uptake was recorded in Dune (50.24 g/flower) and lowest water uptake (30.28 g/flow-er) was recorded in Scope. The water loss from flower stalk varied significantly among different cultivars and were recorded maximum and minimum in Dune (38.84 g/flower) and Scope (25.96 g/flower) respectively. The water balance also exhibited significant differences among the cultivars. Flower stalk from Dune and Winter Queen recorded highest water balance (11.40 g/flower) and (10.20 g/flower), respectively and were statistically different to other cultivars except Dana Ellen. The low-est water balance (4.32 g/flower) was recorded in Scope. There were significant differences in vase life among dif-ferent cultivars (Fig. 1). The longest vase life was record-ed in Dune (15.67 days) followed by Winter Queen (14.47 days) and Dana Ellen (14.40 days). The shortest vase life was observed in Scope (9.53 days) followed by Rosalin (10.40 days). It is observed that the cultivars having high-er water balance have longer vase life owing to higher water potential in the vascular tissues and inflorescence. Increased water uptake maintains turgidity, freshness of flowers and thus enhances vase life owing to improved water balance and post harvest physiology. The varia-tion in vase life among different cultivars may be due to inherent traits (Gondhali et al., 1997). Water loss due to decline in uptake of water coupled with transpiration results in water stress, which ultimately reduce turgidity and vase life of cut flowers (Halevy and Mayak, 1981).
Stem bending incidenceData presented in Table 3 indicates that wide range
of stem bending incidence found in gerbera and is cul-
tivar dependent. The severe stem bending incidence (>90°) was observed in Salvadore (65 %) followed by Ro-salin (60 %), whereas low (0°-15°) in cultivars Cacharell (70 %) and Winter Queen (70 %). Moderate stem bending incidence (25°-65°) was observed in cultivars Carambola (50 %) and Sunway (60 %). Most of stalks (60 %) from cultivars Scope, Dana Ellen and Kayak recorded less stem bending incidence (0°-15°). Based on the results it is clear that stem bending incidence are cultivar dependent and varies from cultivar to cultivar, this is in agreement with the results obtained by of Ferrante et al., (2007) in gerbera.It is therefore concluded that there were signifi-cant differences in floral quality traits among different gerbera cultivars. The gerbera cultivars should be cho-sen with proper strategy as vase life and stem bending incidence varied from cultivar to cultivar. Hence, based on improved post harvest quality traits cultivars Dune, Winter Queen, Dana Ellen, Carambola and Cacharell can be selected for commercial cut flower production.
REFERENCESAnonymous, 2007. RHS Colour Chart. The Royal Hor-
ticultural Society, Fifth Edition. 80, Vincent Square, London, United Kingdom.
Barooah, L. and Talukdar, M.C. 2009. Evaluation of dif-ferent gerbera (Gerbera jamesonii Bolus ex. Hooker F.) cultivars under agro climatic conditions of Jorhat, Assam J. Orna. Hort., 12(2):106-110.
Barua, V. and Bordoloi, R. 2012. Performance of gerbera cultivars under low cost polyhouse. Prog. Hort., 44(1): 37-39.
Bhattacharjee, S.K. and De, L.C. 2003. Advanced com-
Progressive Horticulture, 45 (2) 321
Received on 03 October, 2012 and accepted on 11August, 2013
mercial floriculture. Avishkar publication, Jaipur, pp. 299-308.
Celikel, F.G. and Reid, M.S. 2002. Storage temperature affects the quality of cut flowers from the Asteraceae. Hort Sci., 37(1):148-150.
Das, P.; Samanta, P.K.S. and Parthasarathy, V.A. 2003. Gerbera. In: Commercial Flowers, Vol 2 Eds. Bose T.K., Yadav L.P., Pal P., Parthasarathy V.A. and Das. P., Naya Udyog, Kolkata, pp. 163-202.
Ferrante, A.; Alberici, A.; Antonacci, S. and Serra, G. 2007. Effect of promoter and inhibitor of phenylalanine ammonia-lyase enzyme on stembending of cut ger-bera flowers. Acta Hort., 755: 471-476.
Gomez, K.A. and Gomez, A.A. 1984. Statistical procedures for agricultural research. Second edition. John Wiley and Sons. Inc., New York, USA.
Gondhali, B.V.; Yadav, E.D. and Dhemre, J.K. 1997. Evalu-ation of chrysanthemum for cut flowers. Orissa J. Hort., 25: 10-13.
Halevy, A.H. and Mayak, S. 1981. Senescence and post harvest physiology of cut flowers, Part-II, Hort. Rev.,
3:59-143.
Hedau, N.K.; Singh, B. and Mishra, P. 2012. Evaluation of gerbera genotypes under protected conditions. Progressive Hort., 44(2): 336-337.
Javed , N.D.M.; Ahmad, K.; Mostafa, A. and Roya., K. 2011. Post harvest evaluation of vase life, stem bend-ing and screening of cultivars of cut gerbera (Gerbera jamesonii Bolus ex. Hook f.) flowers. Afr. J. Biotechnol. 10(4): 560-566.
Nair, S.A.; Singh, V. and Sharma, T.V.R.S. 2003. Effect of chemical preservatives on enhancing vase life of gerbera flowers. J. Tropical Agri., 41: 56-58.
Rao, V.K. and Vasudevan, V. 2009. Correlation studies in gerbera (Gerbera jamesonii Bolus ex. Hook f.) geno-types. Progressive Hort., 41(1): 43-45.
Rogers, M.N. 1973. A historical and critical review of post harvest physiology research on cut flowers. Hort Sci., 8:189-194.
Singh, B. and Srivastava, R. 2008. Varietal evaluation of gerbera as influenced by growing conditions. J. Orna. Hort, 11(2): 143-147.

Online version available at: www.indianjournals.com
Progressive Horticulture, Vol. 45, No. 2, September 2013© Copyright by ISHRD, Printed in India
[Research Article]
Effect of foliar feeding of nitrogen and GA3 on vegetative growth, flowering behavior and yield of calendula (Calendula officinalis L.)
Ashok Kumar and Yashpal Singh Department of Floriculture & Landscaping, College of Horticulture & Forestry,N. D. University of Agriculture & Technology, Faizabad 224229, (U.P.), India.Email: [email protected].
ABSTRACTA field experiment was carried out to study the effect of foliar feeding of nitrogen and GA3 on vegetative
growth, flowering behavior and yield of calendula (calendula officinalis L.). Results revealed that nitrogen (Urea 3%) increased plant height (27.01 cm), plant spread (27.07 cm), number of leaves (125.62), number of primary branches (17.57), number of flower per plant (89.10), flower diameter (4.94 cm) and weight of flower (1.22 g), dura-tion (45.00 days) and yield of flowers per plant (109.69 g), however significantly maximum flower yield 146.25 q/ha was recorded with 3% urea spraying. Similarly GA3 at 150 ppm influenced plant height (26.45 cm), plant spread (26.55 cm), number of leaves (125.28), number of primary branches (17.63), number of flower per plant (82.48), flow-er diameter (5.08 cm) and weight of flower (1.23 g) and yield of flower per plant (102.87 g) and per hectare (137.16 q), however it reduced the days taken to first flowering and 50% flowering. The interaction effect of nitrogen and GA3 levels were showed significantly maximum in flower yield per plant and per hectare. Maximum yield of flower was recorded 184.42 q/ha with 3% urea and 150 ppm GA3 spraying.
KEY wORDS: Calendula, nitrogen, GA3, urea
Calendula (calendula officinalis L.) is one of the impor-tant winter seasons belonging to the family Asteraceae (Compositae). It is very popular amongst gardener on account of its easy culture, early to bloom and profuse flowering habits. It is highly suitable for pot culture, bed-ding and window boxes. Calendula is very hardy winter season flowers of which are sold in the market as loose or after making garland and are gaining popularity as a cut flower. They are traditionally used in ceremonies, festivals, beautification as landscape plans. Nitrogen af-fects plant growth and flowering behavior. The foliar ap-plication of nitrogen enhances the absorption in shorter time and recovers the deficiency quickly, besides it also reduces the cost of input. GA3 is most important growth promoter which promotes growth by accelerating the cell elongation and cell division in the sub-apical meristem region and increases the length of internodes. Keeping in view the importance and uses of calendula and the role of nitrogen and GA3, the present experiment was conducted to assess the effect of nitrogen and GA3 levels on vegeta-tive growth, flowering behavior and yield of calendula.
MATERIALS AND METHODSAn experiment was conducted during winter season
of 2011-12 at Main Experiment Station (Horticulture), Narendra Deva University of Agriculture and Technol-ogy, Faizabad in Factorial Randomized Block Design. There were sixteen treatment combinations involving four level of nitrogen as urea spraying (0%, 1%, 2%, and 3%) and four levels of GA3 (0 ppm, 50 ppm, 100 ppm, and 150 ppm). Experiment was conducted on single va-riety (Golden Emperor) of calendula (Calendula officinalis L.) with three replications. The data were recorded on vegetative characters (plant height and spread, number of primary branches and leaves per plant at bud initia-tion stage) and flowering character (days taken to first flowering and 50% flowering, length of flower stalk, diameter of flower, duration of flowering, number and weight of flower per plant and yield of flower quintal per hectare). Data were analyzed by method as suggested by Gomez and Gomez (1984).

Progressive Horticulture, 45 (2) 323Ta
ble
1: E
ffec
t of f
olia
r fee
ding
of n
itrog
en, G
A3 a
nd th
eir i
nter
actio
ns o
n ve
geta
tive
grow
th, fl
ower
ing
beha
viou
r and
yie
ld o
f Cal
endu
la (C
a-le
ndul
a of
ficin
alis
L.)
Trea
tmen
ts
Plan
t Pl
ant
No.
of
No.
of
Day
s Le
ngth
of
Day
s D
urat
ion
N
o. o
f Fl
ower
Fl
ower
Fl
ower
Fl
ower
heig
ht
spre
ad
prim
ary
leav
es/
take
n Fl
ower
ta
ken
of
flo
wer
/ w
eigh
t di
amet
er
Yiel
d/
Yiel
d
(cm
) (c
m)
bran
ches
pl
ant
to fi
rst
stal
k
to 50
%
flow
erin
g pl
ant
(g)
(cm
) pl
ant
(q)/h
a
/pla
nt
flo
wer
ing
(cm
) flo
wer
ing
(day
s)
(g
) N
0 (0%
) 20
.82
24.3
0 13
.87
108.
54
53.4
9 4.
36
72.8
9 43
.18
50.8
3 1.
06
4.46
54
.00
71.9
9N
1 (1%
) 23
.50
24.6
1 14
.23
111.
91
55.5
8 4.
60
68.8
1 44
.30
59.9
6 1.
11
4.72
67
.51
90.0
0N
2 (2%
) 25
.22
24.6
5 16
.19
117.
97
58.1
6 5.
01
67.7
3 44
.77
81.9
0 1.
16
4.78
96
.03
128.
03N
3 (3%
) 27
.01
27.0
7 17
.57
125.
62
59.4
4 5.
24
61.1
3 45
.00
89.1
0 1.
22
4.94
10
9.69
14
6.25
S.Em
. 00
.38
0.28
00
.35
001.
54
00.8
3 0.
07
01.0
8 00
.24
01.1
9 0.
01
0.09
01
.38
01.8
5C
D(P
=0.0
5)
01.1
0 0.
81
01.0
0 00
4.40
02
.37
0.20
03
.10
00.7
0 03
.41
0.03
0.
26
03.9
6 05
.27
GA
0 (0p
pm)
21.6
1 23
.52
13.2
0 10
5.87
59
.20
4.38
75
.14
42.3
5 56
.49
1.04
4.
31
59.1
6 78
.87
GA
1 (50
ppm
) 23
.37
24.8
0 14
.81
113.
54
57.7
3 4.
66
73.2
8 43
.83
67.8
2 1.
11
4.65
76
.10
101.
46G
A2 (
100p
pm)
25.1
2 25
.75
16.2
1 11
9.24
56
.07
4.92
71
.16
45.0
3 75
.00
1.17
4.
84
89.0
9 11
8.78
GA
3 (15
0ppm
) 26
.45
26.5
5 17
.63
125.
28
53.6
7 5.
26
68.1
1 46
.04
82.4
8 1.
23
5.08
10
2.87
13
7.16
S.Em
. 00
.38
0.28
00
.35
001.
54
00.8
3 0.
07
01.0
8 00
.24
01.1
9 0.
01
0.09
01
.38
01.8
5C
D(P
=0.0
5)
01.1
0 0.
81
01.0
0 00
4.40
02
.37
0.20
03
.10
00.7
0 03
.41
0.03
0.
26
03.9
6 05
.27
N0 G
0 19
.91
22.2
7 11
.67
099.
67
57.4
3 3.
89
72.8
9 41
.40
40.8
0 0.
99
3.95
40
.25
53.6
6N
0 G1
19.3
2 24
.03
12.7
3 10
6.60
55
.00
4.11
68
.81
42.1
3 50
.53
1.03
4.
48
51.8
9 69
.18
N0 G
2 21
.71
25.1
3 15
.00
109.
97
53.3
7 4.
59
67.7
3 43
.87
54.8
7 1.
08
4.65
59
.15
78.8
6N
0 G3
24.3
4 25
.77
16.0
7 11
7.90
48
.17
4.85
61
.13
45.3
3 57
.13
1.13
4.
75
64.7
0 86
.25
N1 G
0 22
.13
22.7
3 12
.53
102.
80
58.1
3 4.
15
73.7
8 41
.47
46.9
6 1.
03
4.32
48
.20
64.2
6N
1 G1
22.7
6 24
.60
13.9
0 11
2.63
56
.80
4.50
72
.09
44.2
0 53
.40
1.09
4.
70
58.3
6 77
.81
N1 G
2 23
.95
25.2
5 14
.53
114.
33
54.8
7 4.
63
69.6
4 45
.20
65.6
7 1.
15
4.81
75
.66
100.
88N
1 G3
25.1
7 25
.83
15.9
3 11
7.87
52
.50
5.10
66
.63
46.3
3 73
.80
1.19
5.
03
87.8
0 11
7.06
N2 G
0 23
.08
23.1
3 14
.00
108.
87
59.7
0 4.
59
75.7
7 43
.27
66.4
7 1.
07
4.44
70
.84
94.4
5N
2 G1
24.9
3 24
.07
15.6
7 11
5.33
58
.60
4.88
74
.38
44.5
0 79
.87
1.12
4.
71
89.4
2 11
9.22
N2 G
2 25
.97
25.1
3 17
.00
120.
33
57.6
7 5.
16
73.1
9 45
.40
85.0
0 1.
21
4.83
10
3.19
13
7.58
N2 G
3 26
.89
26.2
7 18
.10
127.
33
56.6
7 5.
41
71.9
2 45
.90
96.2
7 1.
25
5.13
12
0.67
16
0.89
N3 G
0 23
.31
25.9
3 14
.60
112.
13
61.8
3 4.
87
78.1
0 43
.27
71.7
3 1.
08
4.54
77
.35
103.
12N
3 G1
26.4
6 26
.50
16.9
3 11
9.60
60
.53
5.15
76
.83
44.5
0 87
.47
1.20
4.
72
104.
73
139.
64N
3 G2
28.8
7 27
.47
18.3
0 13
2.73
58
.36
5.29
74
.04
45.6
3 94
.47
1.25
5.
06
118.
37
157.
82N
3 G3
29.3
9 28
.33
20.4
3 13
8.00
57
.33
5.67
72
.77
46.6
0 10
2.73
1.
35
5.42
13
8.32
18
4.42
S. E
m.
00.7
7 00
.57
0.70
00
3.08
01
.66
0.15
02
.17
00.4
9 02
.39
0.02
0.
18
02.7
7 03
.70
CD
(P=0
.05)
N
S N
S N
S N
S N
S N
S N
S N
S N
S N
S N
S 07
.92
10.5
5
N 0
= 0%
Ure
a, N
1 =
1% U
rea,
N2=
2%
Ure
a, N
3= 3
% U
rea,
GA
0 = (0
ppm
GA
3), G
A1 =
(50
ppm
GA
3), G
A2=
(100
ppm
GA
3), G
A3 =
(15
0 p
pm
GA
3 )

324 Progressive Horticulture, 45 (2)
RESULTS AND DISCUSSION
Growth characterAll the growth parameters were found influenced
significantly due to various nitrogen treatments. The data recorded in Table-1, clearly indicate that plant height at bud initiation stage significantly increased in plant height at bud initiation stage (27.01 cm. Increased vegetative growth might be with increase in N levels be-cause it is very important constituents of nucleic acid, protoplasm and its might have increased carbohydrate synthesis and amino acid. These results are in close con-formity with those of Sharma et al. (2006) and Shreeka-nth et al. (2008) in marigold, and Chauhan and Kumar (2007) in calendula. Similarly GA3 at 150 ppm influenced plant height (26.45 cm), plant spread (26.55 cm), num-ber of leaves (125.28) and number of primary branches (17.63). The promotive effect of GA3 on growth may be due to increasing auxin level of tissues which probably enhanced the conversion of tryptophan might through, causes cell division and cell elongation. Similar findings have also been reported by Gautam et al. (2006) and Patel et al. (2010) in chrysanthemum and Sandeep Tyagi et al. (2008) in calendula. Interaction effect between nitrogen and GA3 on growth character were found non significant.
Flowering characterData presented on flowering characters in Table -1 showed significant response to different treatments of nitrogen levels as urea spraying. Days taken to first flower were delayed significantly with N3 (3% urea) followed by N2 (2% urea). Similar results were also re-ported by Sharma et al. (2006) and Kundu et al. (2010) in marigold. Nitrogen significantly increased flower stalk length (5.24 cm), and duration of flowering. Maximum numbers of flowers per plant (89.10) and yield of flower (146.25 q/ha) were recorded with N3 (3% urea) followed by N2 (2% urea). This might be due to the fact that receiv-ing more N perhaps increased leaf area vis-a vis photo-synthesis and allowed higher lateral branches which is in turn led to development of more flower. Similar results have also been observed by Agrawal et al. (2002) and Baboo and Singh (2005) in marigold. Nitrogen has also influenced number of flower per plant (89.10), flower di-ameter (4.94 cm) and weight of flower (1.22 g), duration (45.00 days) and yield of flowers per plant (109.69 g) with higher levels. Similar findings are reported by Shree-kanth et al. (2007) in marigold. It is evident from data presented in Table -1 showed that different treatments of GA3 had significant influence on flowering character. First flowering and 50% flowering took minimum days with application of GA3 at 150 ppm. It may be due to termination of juvenile phase and apical meristems in-
stead of producing vegetative growth.. Similar findings have also been reported by Patel et al. (2010) and Dahia and Raha (2001) in chrysanthemum. Flower stalk length (5.26 cm), duration of flowering (46.04 days), number of flowers per plant (82.48), diameter and weight of flower (5.08 cm and 1.23 g) and yield of flower per plant (102.87 g) and per hectare (137.16 q) were recorded maximum with GA3 at 150 ppm. These results may be due to cell division and cell enlargement by promotion of protein synthesis coupled with higher dry matter of apical domi-nance. The results are in conformity with the findings of Tyagi et al. (2006) in marigold, Sandeep Tyagi et al. (2008) in calendula and Patel et al. (2010) in chrysanthemum. Interaction between nitrogen and GA3 significantly influ-enced yield of flower however maximum flower yield (138.32 g/plant and 184.42 q/ha) was recorded with N3GA3 (3% urea and 150 ppm GA3). It may be due to fact that perhaps nitrogen could help more nutrients to the plants and GA3 might produce maximum number of branches. Results are in close conformity to those as reported by Nagarjuna et al. (1988) in chrysanthemum and Singh et al. (2009) in tuberose.
REFERENCESAgrawal, S.; Agrawal, N.; Dixit, A. and Yadav, R.N. 2002.
Effect of nitrogen and potash on African marigold in Chhattishgarh region. J. Orn. Hort., New Series, 5(1): 86.
Baboo, R.; Ahmad, N. and Singh, D. 2005. Growth and flowering of African marigold (Tagetes erecta L.) as affected by nitrigen and phosphorus under varying intra-row spacing. J. Orn. Hort., 8(4): 312-313.
Chauhan, A. and Kumar, V. 2007. Effect of graded levels of nitrogen and VAM on growth and flowering in calendula (Calendula officinalis L.) J. Orn. Hort., 10(1): 61-63.
Dahia, D.S. and Raha, G.S. 2001. Regulation of flower-ing in chrysanthemum as influenced by GA3 and shade house of different intensities. S. Ind. Hort. 49: 313-314.
Gautam, S.K.; Sen, N.L.; Jain, M.C.; Dashora, L.K. 2006. Effect of plant regulators on growth, flowering and yield of chrysanthemum (Chrysanthemum morifolium Ram.) cv.Nilima. Orissa. J. Hort. 34(1): 36-40.
Gomez, K.K. and Gomez, A.A. 1984. Statistical proceedure for Agriculture Research. A Wiley Int. Pub., John Wiley and Sons, New York, 680 p.
Kundu, Manoj; Joon, M.C.; Beniwal, B.S. and Mehta, P.K. 2010. Effect of nitrogen and phosphorus application on flowering and yield of African marigold (Tagetes

Progressive Horticulture, 45 (2) 325
Received on 08 June, 2012 and accepted on 16 April, 2013
erecta L.). National Seminar on Recent Trends in Horti-cultural Crops- Issues and Strategies for Research and Development, March, 22-24, CCS HAU., Hissar: 88.
Nagarjuna, P.; Reddy, B.V.; Rao, M.R. and Reddy, E.N. 1988. Effect of growth regulators and potassium nitrate on growth, flowering and yield of chrysan-themum. S. Ind. Hort., 36: 136-140.
Patel, S.R.; Parekh, N.S.; Parmar, A.B. and Patel, H.C. 2010. Effect of growth regulators on growth, flowering and yield of chrysanthemum (Chrysanthemum morifolium Ramat.) cv. IIHR-6, under middle Gujarati condition. Int. J. Agri. Sci., 6(1): 243-245.
Tyagi, Sandeep; Tyagi, A.K.; Kumar,Vijay and Nitin Ku-mar.2008. Effect of GA3 and IAA on growth, flowering and yield of calendula (Calendula officinalis L.). Prog. Agri., 8(1): 118-120.
Sharma, D.P.; Patil, M. and Gupta, N. 2006. Influence of nitrogen, phosphorus and pinching on vegetative growth and floral attributes in African marigold (Tagetes erecta L.) .J. Orn. Hort., 9(1): 25-28.
Singh, Jitendra Kumar and Pal, A.K. Krishan. 2009. Effect of GA3 and urea on growth and flowering in tuberose (Polianthus tuberosa L.) cv. Pearl Double. Ann. Hort., 2(2): 201-203.
Shreekanth, P. Padma, M., Chandraskekhar, R. and Mad-hulety, T.Y. 2008. Effect of planting time, spacing and nitrogen levels on flowering of African marigold (Tagetes erecta L.) cv. Sierra orange. J. Res. ANGRAV, 35(1): 15-21.
Tyagi, A.K. and Kumar, Vijay 2006. Effect of gibberelic acid and vermicompost on vegetative growth and flowering in African marigold (Tagetes erecta Linn). J. Orn. Hort., 9(2): 150-151.

Online version available at: www.indianjournals.com
Progressive Horticulture, Vol. 45, No. 2, September 2013© Copyright by ISHRD, Printed in India
[Research Article]
Effect of pinching, disbudding and foliar spray of cytozyme on growth and flowering behaviour of annual chrysanthemum (Chrysanthemum carinatum Schousb)
Sandeep Kumar, Sanjay Kumar1 and N.C. Pushkar*Department of Floriculture & Landscaping, College of Horticulture & Forestry, Narendra Deva University of Agriculture & Technology,Faizabad- 224229 (U.P.) India1Department of Horticulture, BBA University,Lucknow-226025 (U.P.)*Email: [email protected]
ABSTRACTChrysanthemum is native to the northern hemisphere closely Europe and Asia with a few in other areas.
Chrysanthemum belongs to family Asteraceae or Compositae. Chrysanthemum is next to rose an importance and it is grown both for aesthetic and commercial purposes. Therefore, there is a strong need to boost the production of this flower crop. The aim of present investigation was to study the “Effect of Pinching, Disbudding and foliar spray of cytozyme on growth and flowering behaviour of annual chrysanthemum (Chrysanthemum carinatum Schousb)”.The experiment was conducted at Horticultural Research Farm of Department of Applied Plant sci-ences (Horticulture), Baba Sahib Bhim Rao Ambedkar University Lucknow, (Uttar Pradesh) during winter season of 2007-08. Among the three different stage of pinching and disbudding of chrysanthemum viz. neither pinching nor disbudding, pinching at 30 days after transplanting and disbudding (as and when needed) and foliar spray of 0.2% cytozyme (no application, 10, 20 , 30 days after transplanting).All among the factors was found promising in improving the different vegetative growth and flowering characters of chrysanthemum.
KEY wORDS: Pinching, disbudding, cytozyme, annual chrysanthemum
Chrysanthemum (Chrysos = Golden; Anthos = Flower) is a popular flower crop of commercial importance. Chry-santhemum is the most popular florists flower, known as the “Queen of East”. Chrysanthemum shows draw big-gest crowds everywhere is an ample proof of the popu-larity of this flower. In India, chrysanthemum occupies a place of pride both as a commercial flower crop and as a popular exhibition flower. Chrysanthemum is next to rose in importance and it is grown both for aesthetic and commercial purposes. In India, it has been recognized as one among the five important commercially potent flower crops by the All India Co-ordinated Floriculture Improvement Project of the ICAR. Chrysanthemum is a versatile plant and it can be planted in the bed and cul-tures in the pot. They thrive well in open sunny situa-tion with comparatively little care. However, it is grown country-over under arbitrary agro-practices both for cut flowers and landscape effects. Pinching term refers the removal of apex part of well established plant. It is an important operation to encourage the side branches
and to make plant bushy and dense, but it should be done at an appropriate stage when the plants are well established to a height nearly 15-20 cm (6-8 inch) with 3-4 pairs of leaves. This is the time when first pinching may be done to prevent the formation of bud break but a second pinching is done to make plants with straggled and lean growth. Disbudding of spray cultivars also var-ies with the type of spray produced. In this experiment only the large apical bud is removed and the auxiliary buds are allowed to develop. If disbudding is not fol-lowed, many branches may be produced and bear the flowers ultimately affecting the quality of blooms. Cy-tozyme is a unique biological nutritional product among the photosynthesis improvers having a mixture of long chain aliphatic alcohols varying in chain from 22-32 which on foliar spray to crop plant or broadcasting in the field brings about 25 to 50 percent increase the plant vigour and promotes rooting, CO2 fixation and chloro-phyll content of leaves. It improves the photosynthesis source and sinks relationship and efficiency of fertiliz-

Progressive Horticulture, 45 (2) 327
ers. It reduces photorespiration losses thereby improv-ing the photosynthesis rate. Cytozyme also increase leaf area and its contents of chlorophyll and carbotenoids, besides controlling stomatal opening. However, very minute information is available on the effect of cytozyme on ornamental crops.
MATERIALS AND METHODSThe present research work entitled “effect of pinch-
ing, disbudding and foliar spray of cytozyme on growth and flowering behaviour of annual chrysanthemum (Chrysanthemum carinatum Schousb)” was conducted at Horticultural Research Farm of the Department of Ap-plied Plant Science (Horticulture), Babasaheb Bhimrao Ambedkar University (A Central University), Lucknow-226 025 (U.P.), India, during winter season in the year 2007-08. The climate of this region is subtropical with maximum temperature ranging from 22.30C to 450C in summer, minimum temperature ranging from 3.50C to 150C in winter and relative humidity (RH) of 60-80% in different seasons of the year. Lucknow is characterized by subtropical climate with hot dry summer and cold winter. Nearly 85% of the total annual rainfall 750 mm annual rainfall is received during the monsoon The soil type of the experimental site was saline-alkaline, low in organic matter, nitrogen, phosphorus and potash in the soil. The seeds of annual chrysanthemum were sown in the nursery area in the beds on October 28, 2007. The seedlings were lifted from nursery bed by a transplant-ing trowel and transplanted in the afternoon on Decem-ber 03, 2007. The seedlings were planted at a distance of 50 x 50 cm and the first irrigation was applied on the same day soon after transplanting. Application of fertil-izer was done in the experimental area to supply nitro-gen through urea at the rate of 5 g/m2 before transplant-ing. Also top dressing was done with urea to supply N at the rate of 5 g/m2, 45 days after transplanting to promote growth and flowering of the plant. Pinching was done after 30 days of transplanting in case of P1. This opera-tion was carefully carried out by a new shaving blade. About 2.0 cm of apical ends of plants under P1 were topped away.
Disbudding was done as and whenever it was need-ed according to plant growth and development. In this experiment large apical bud was removed from the main stem with the help of a shaving blade, whenever stem apical flower buds appeared on the main stem of plants under P2. Timely irrigation, weeding and hoeing were done after transplanting up to last picking of flowers. The crop plants were free from major insect, pests and dis-eases. However, Malathion Powder (0.1%) was dusted to protect the plants from rabbits. Top dressing with urea was done to supply N, at the rate of 5 g/m2, 45 days after
transplanting to promote growth and flowering of the plant. Harvesting observations on the flowering aspects were recorded in five plants of each plot (row) individu-ally on March 10, 2008. The experiment was conducted in a Randomized Block Design (RBD) with four replica-tions and number of treatment is 12.These treatments are control of (neither pinching nor disbudding), pinching 30 DAT, disbudding (as and when needed) and foliar spray of 0.2% cytozyme (0,10, 20 , 30 days after transplanting). Five plants were randomly selected from each plot/row for recording observation. The observations were recorded for characters viz., plant height (cm), spread of plant along the row and across the row (cm), height of point of origin of first primary branch from ground surface (cm), number of secondary branches on the lon-gest primary branch, number of leaves on the longest primary branch, duration (days) required for blooming after transplanting, number of flowers and flower buds on the whole plant, number of flowers and flower buds on the longest primary branch and dry matter content in the plant bio-mass (%).
RESULTS AND DISCUSSION
Effect of pinching and disbuddingThe results of the experiment, on effect of pinching,
disbudding and foliar spray of cytozyme on growth and flowering behaviour of annual chrysanthemum (Chry-santhemum carinatum Schousb) characters are presented in Table-1. Among pinching and disbudding treatment the plant height was retard with pinching at 30 days af-ter transplanting (98.86 cm) such variation may be due to the fact that this operation (pinching) overcomes api-cal dominance of the main stem, which checks in turn the vertical growth of the pinched plant similar results were reported by Patil and Arora (1983) in Carnation cv. Margurite white carnation, spread of the plant (76.00cm) was recorded with pinching at 30 days after transplant-ing, the height of point of origin of first primary branches from ground surface (7.96cm) was obtained with dis-budding. The number of secondary branch on the lon-gest primary branch (7.05) and number of leaves on the longest primary branches (69.90) were observed under in control (no pinching or no disbudding). The most sig-nificant result got from this experiment was that pinch-ing and disbudding delayed the duration required for blooming. Days required for blooming after transplant-ing for un-pinched plants were 78.53 whereas the dura-tion required for blooming of 82.80 and 82.80 days was noted with the pinching at 30 days after transplanting and disbudded plants; respectively. Similar results were obtained by Khanna et al. (1986) when they conducted an experiment on carnation (Dianthus caryophyllus).The
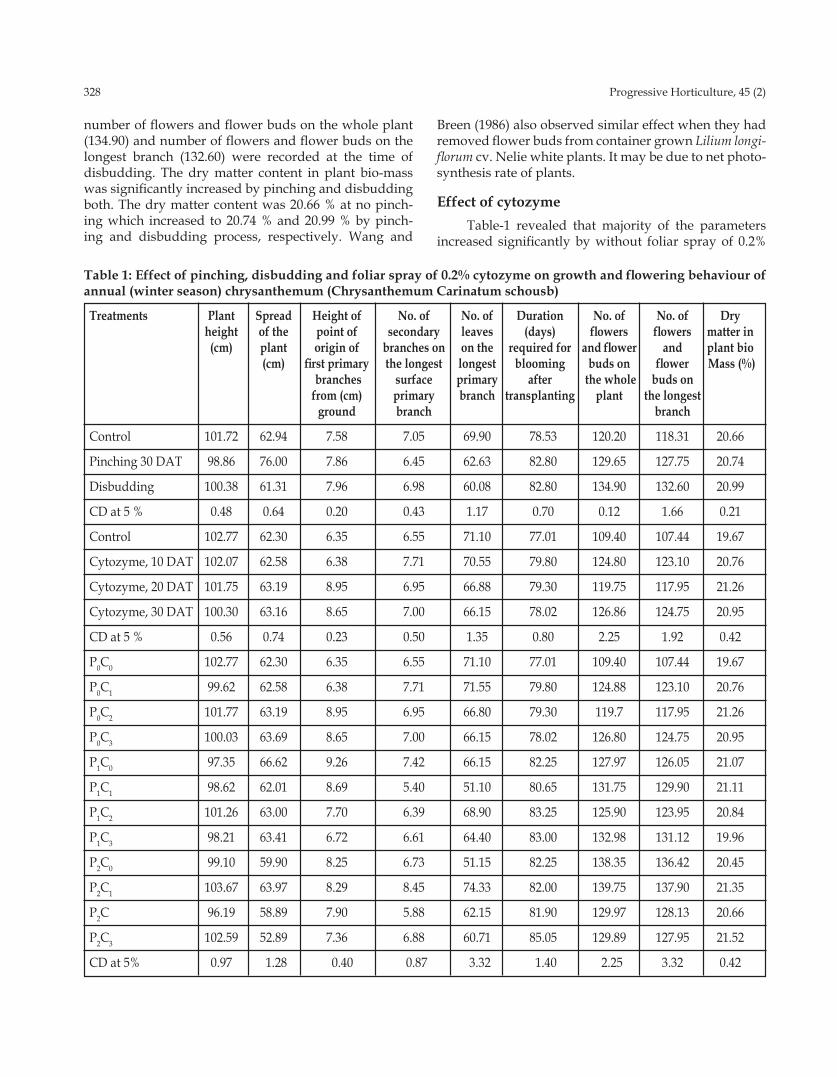
328 Progressive Horticulture, 45 (2)
number of flowers and flower buds on the whole plant (134.90) and number of flowers and flower buds on the longest branch (132.60) were recorded at the time of disbudding. The dry matter content in plant bio-mass was significantly increased by pinching and disbudding both. The dry matter content was 20.66 % at no pinch-ing which increased to 20.74 % and 20.99 % by pinch-ing and disbudding process, respectively. Wang and
Breen (1986) also observed similar effect when they had removed flower buds from container grown Lilium longi-florum cv. Nelie white plants. It may be due to net photo-synthesis rate of plants.
Effect of cytozyme Table-1 revealed that majority of the parameters
increased significantly by without foliar spray of 0.2%
Table 1: Effect of pinching, disbudding and foliar spray of 0.2% cytozyme on growth and flowering behaviour of annual (winter season) chrysanthemum (Chrysanthemum Carinatum schousb)
Treatments Plant Spread Height of No. of No. of Duration No. of No. of Dry height of the point of secondary leaves (days) flowers flowers matter in (cm) plant origin of branches on on the required for and flower and plant bio (cm) first primary the longest longest blooming buds on flower Mass (%) branches surface primary after the whole buds on from (cm) primary branch transplanting plant the longest ground branch branch
Control 101.72 62.94 7.58 7.05 69.90 78.53 120.20 118.31 20.66
Pinching 30 DAT 98.86 76.00 7.86 6.45 62.63 82.80 129.65 127.75 20.74
Disbudding 100.38 61.31 7.96 6.98 60.08 82.80 134.90 132.60 20.99
CD at 5 % 0.48 0.64 0.20 0.43 1.17 0.70 0.12 1.66 0.21
Control 102.77 62.30 6.35 6.55 71.10 77.01 109.40 107.44 19.67
Cytozyme, 10 DAT 102.07 62.58 6.38 7.71 70.55 79.80 124.80 123.10 20.76
Cytozyme, 20 DAT 101.75 63.19 8.95 6.95 66.88 79.30 119.75 117.95 21.26
Cytozyme, 30 DAT 100.30 63.16 8.65 7.00 66.15 78.02 126.86 124.75 20.95
CD at 5 % 0.56 0.74 0.23 0.50 1.35 0.80 2.25 1.92 0.42
P0C0 102.77 62.30 6.35 6.55 71.10 77.01 109.40 107.44 19.67
P0C1 99.62 62.58 6.38 7.71 71.55 79.80 124.88 123.10 20.76
P0C2 101.77 63.19 8.95 6.95 66.80 79.30 119.7 117.95 21.26
P0C3 100.03 63.69 8.65 7.00 66.15 78.02 126.80 124.75 20.95
P1C0 97.35 66.62 9.26 7.42 66.15 82.25 127.97 126.05 21.07
P1C1 98.62 62.01 8.69 5.40 51.10 80.65 131.75 129.90 21.11
P1C2 101.26 63.00 7.70 6.39 68.90 83.25 125.90 123.95 20.84
P1C3 98.21 63.41 6.72 6.61 64.40 83.00 132.98 131.12 19.96
P2C0 99.10 59.90 8.25 6.73 51.15 82.25 138.35 136.42 20.45
P2C1 103.67 63.97 8.29 8.45 74.33 82.00 139.75 137.90 21.35
P2C 96.19 58.89 7.90 5.88 62.15 81.90 129.97 128.13 20.66
P2C3 102.59 52.89 7.36 6.88 60.71 85.05 129.89 127.95 21.52
CD at 5% 0.97 1.28 0.40 0.87 3.32 1.40 2.25 3.32 0.42

Progressive Horticulture, 45 (2) 329
cytozyme except the maximum plant height at the con-trol stage was recorded (102.77 cm). The spray of cy-tozyme at20 days after transplanting significantly in-creased the Spread of the plant (63.19 cm) and the height of point of origin of first primary branches from ground surface (8.95cm), due to spray of cytozyme might be due to the fact that cytozyme having cytokine’s acceler-ates photosynthetic activity of the treated crop. Conse-quently, the spread plants in results into fast initiation of meristematic process in them and therefore, these re-sults are in close conformity with those of who reported that cytozyme Wediastoely (1987) application increases the plant spread positively. The number of secondary branches per plant(7.71) were increased significantly with the application of cytozyme at 20 days might also be due to the fact that cytozyme increased photosyn-thetic efficiency on account stabilization of chlorophyll and higher production of photosynthates resulting in increased secondary branches simultaneously. Similar results were also reported by Singh et al., (1981) and Rana and Vashistha (1988).The number of leaves on the longest primary branches (71.10) was recorded with con-trol. The days required for blooming after transplanting (79.80 days) was spray of 0.2% cytozyme at 10 days af-ter transplanting. The delay in the duration required for blooming might be due to stabilization of chlorophyll and higher production of photosynthates due to invigo-rated vegetative growth which delays flowering. Similar delay was noted earlier by Khurana and Pandita (1986) in tuber crops.The number of flowers and flower buds on the longest branch (124.86) and number of flowers and flower buds on the whole plant (126.86) were re-corded with foliar spray of 0.2% cytozyme at 30 days af-ter transplanting. The increase in number of flowers and flower buds on the longest branch and whole plant with the spray of cytozyme might be due to the fact that mo-bilization of movement of nutrients into flowers by cy-tozyme application. The other possible reasons for better flowering with foliar sprays of cytozyme are increased endogenous auxins contents of flowers which improves the populations of flower. Similar effects of cytozyme have been reported earlier by Hooda et al., (1983), Weidi-astosty et al., (1988) and Singh et al., (1992) dry matter in plant bio mass (21.26 %) was recorded with foliar spray of 0.2% cytozyme at 20 days after transplanting and in-crease in dry matter content might be due to the fact that cytozyme increases CO2 fixation and Chlorophyll and Carbotenoids contents of leaves and improves leaf area. It also controls stomatal opening and reduces photo-respiration losses, there by improving the rate of photo-synthesis. Another probable reason of improvement of ongoing characters may be attributed to increases num-ber of leaves, secondary branches and the height of point of origin of first primary branches from ground surface,
urged earlier in relation to after effect of cytozyme. The results are in consonance with the findings of Pandita et al., (1983), Rana and Vashistha (1988) and Subramanian and Janardhanan (1992).
Interaction effect of pinching disbudding and cytozyme
The experimental results presented in Table-1 re-vealed that interaction of different levels of pinching ,disbudding and 0.2% cytozyme at 0,10,20,30 days after transplanting significantly affected growth and flower-ing characters of chrysanthemum excepting the maxi-mum plant height (103.67 cm), number of secondary branches on the longest primary branch (8.45) and num-ber of leaves on the longest primary branch (74.33) were recorded at disbudding (as and when needed) with 0.2% cytozyme spry at10 days after transplanting The results are in consonance with the findings of Subramanian and Janardhanan (1992).The maximum spread of the plant (66.62 cm) and height of point of origin of first primary branches from ground surface (9.26cm) were found at pinching 30 days after transplanting and without spray-ing of cytozyme. The maximum duration required for blooming after transplanting (83.25days) recorded un-der pinching 30 days after transplanting with foliar spray of 0.2% cytozyme at 20 days after transplanting on chrysanthemum. The highest number of flowers and flower buds on the whole plant (139.75) and number of flowers and flower buds on the longest branch (137.90) were obtained disbudding (as and when needed) with 0.2% cytozyme spry at10 days after transplanting. High-er dry-matter in plant bio mass (21.52%) was recorded disbudding (as and when needed) with foliar spray of 0.2% cytozyme at 10 days after transplanting of chrysan-themum plants.
REFERENCESArora, J.S. and Khanna, K. 1986. Effect of nitrogen and
pinching on growth and flower production of Mari-gold (Tagetes erecta). Indian J. Hort., 43(3-4): 291-294.
Hooda, R.S.; Pandita M.L. and Sidhu, A.S. 1983. Effect of seed treatment and foliar application of cytozyme on seed yield and yield attributes of Okra (Abelmo-schus escutentus L.), Haryana J. Horti.Sci., 1983, 12(2): 135-38.
Khanna, K.; Arora, J.S.; Singh, J. and Singh, J. 1986. Ef-fect of spacing and pinching on growth and flower production of Canation (Dianthus Caryophyllus) cv Marguesite Scarlet. Indian J. Hort., 43(1-2): 148-152.
Khurana S.C. and Pandita M.L. 1986. Shoot emergence studies in four commercial potato cultivars in rela-
330 Progressive Horticulture, 45 (2)
Received on 16 May, 2013 and accepted on 28 March, 2013
tion to cytozyme. Haryana Agri.Univ. J. Res., 16(4): 367-70.
Pandita, M.L., Hooda R.S. and Sidhu, A.S.; 1983. Effect of seed treatment and foliar application of cytozyme on growth and green pod yield of okra (Albelmoschus es-culentus L.) Haryana Agri. J. Res., 1983. 13(2): 245-48.
Patil, K.S. and Arora J.S. (1983). Effect of pinching, sources and doses of N on the growth and flower production of carnation (Dianthius Caryophyllus L.). cv Margueritu White. Indian j. of Hort. Vol., 40:72-75
Rana, B.S. and Vashistha, R.N. 1998. Effect of various chemical on growth and yield characteristics of rad-ish (Raphanus Sativus L.). Haryana J. Hort. Sci., 14(1-2): 97-101.
Singh, G.; Kaur, M. and Singh, G. 1981. Effect of cytozyme on potato. J. Indian Potato Asso., 8(1): 9-14.
Singh, S.; Mangal, S.L. and Srivastava, V.K. 1992. A note on the effect of sowing seed rate and chemical treat-ment on germination flowering maturity and yield of vegetable pea under rainfed of vegetable condition. Haryana J. of Hort. Sci., 21(1-2): 96-8.
Subramanian, V.K. and Janardhanan, K. 1992. Effect of cytozyme on seed germination early seedling growth and chloroplast pigments content in certain pulse crops. Madras Agric. J., 79(1): 9-11.
Wang, Y.T. and Breen, P.J. 1986. Growth and Photosyn-thesis of early lily in response to flower bud removal. J. American Soc. Horti. Sci., 111(3): 442-46.
Widiastoety, D.; Soebijanto and Suwanda 1988. Effect of treatment with cytozyme crop on Oncidium cultivar Golden Shower. Buletin Penelitian Horticultura, 16(1): 105-109.
Online version available at: www.indianjournals.com
Progressive Horticulture, Vol. 45, No. 2, September 2013© Copyright by ISHRD, Printed in India
[Research Article]
Use of plastics in agriculture in Nw Himalayan region of Uttarakhand: Present status and scope
Manoranjan Kumar1 and N.K. Hedau2
1Central Research Institute for Dryland Agrculture, Santosh Nagar, Hyderabad – 500059, AP, India2VPKAS (ICAR), Almora – 263601, UK, IndiaEmail : [email protected]
ABSTRACTStatus and scope of use of plastics use in the Nw Himalayan agriculture with particular reference to Ut-
taranchal needs to be analyzed. Data which was collected from 87 respondents in 15 blocks of 5 districts were analyzed. An index based on 0 to 1 scale was used to determine the extent of the constraint in the adoptability of plastics in agriculture in the region. It was found that use of plastics can be popularized in the region where per capita irrigated land holding is less. The study also suggests that the use of plastic in agriculture is well accepted in the region. The study further quantifies the gaps that existed between farmers’ interest and material availability, skilled labour and technical know-how.
KEY wORDS: Plastics in agriculture, Uttrakhand, Himalayan region
The hill people face difficulties in farming to meet their food requirement even at subsistence level since the per capita arable land holding is below 50 % of the national average (0.14 ha). In North-Western Himalaya mid-hills (600 – 1800 m above msl), cultivation is most-ly done on the terraces. Majority of the farmer’s family produces only 4-5 months of sustenance food from its cultivated terraces (Ved Prakash, 2002). Thus, increase in the productivity of the terraces is a major thrust area for food security in the hills. Extreme climatic variables present one of the several constraints in the hill farm-ing. The possibilities of environmental control measures involve the methods to control the climatic variables, which play crucial role in agricultural production. Plas-tic can be successfully used to create congenial environ-ment, which can result in improved agricultural produc-tion. The quantum of agricultural production depends greatly on climate, water and soil. Agriculture in the region faces major problem of the water resources and its management as 90 % of the area is rainfed. The prob-lem further gets aggravated due to slopy terrains and shallow soil depth, which allow major portion of the rain water to be lost as runoff (Singh et al 2001). The undu-lating topography and small and scattered land holding (<0.5 ha) of the region, does not permit for the large scale water resources development. Thus, small water storage
tanks are the most suited water storage structure in the region. The use of LDPE film as lining material reduces the storage cost substantially and is easy to construct at agricultural field compared to the traditional cemented tanks (Srivastava, 1983, 84, 85 and 88).
In the hilly regions, where winter witnesses the fre-quent hazes causing the catastrophical failures of crops. The greenhouse technology, prevent such failure by controlling the inside environment. Moreover, it can produce the ideal climatic condition for plant growth. Several types of greenhouses have been reported. Low tech and low cost greenhouse is a structure which is con-structed using local material without much expenditure. It has been seen as most ideal in the hills.
The greenhouse also known as facilitating surface covered cultivation, protect the crops from the extreme climatic conditions ensuring the round the year agricul-ture. In the hilly regions of Uttaranchal, the temperature during winter drops to -3 to -4 O C, much below the plant tolerance limits. The optimal growing condition can be obtained using the greenhouse. The utility of the green-house particularly in vegetable cultivation has been well understood by the concern developing agencies. These agencies are involved in supporting the farmers by vari-ous means in which the technical support on greenhouse
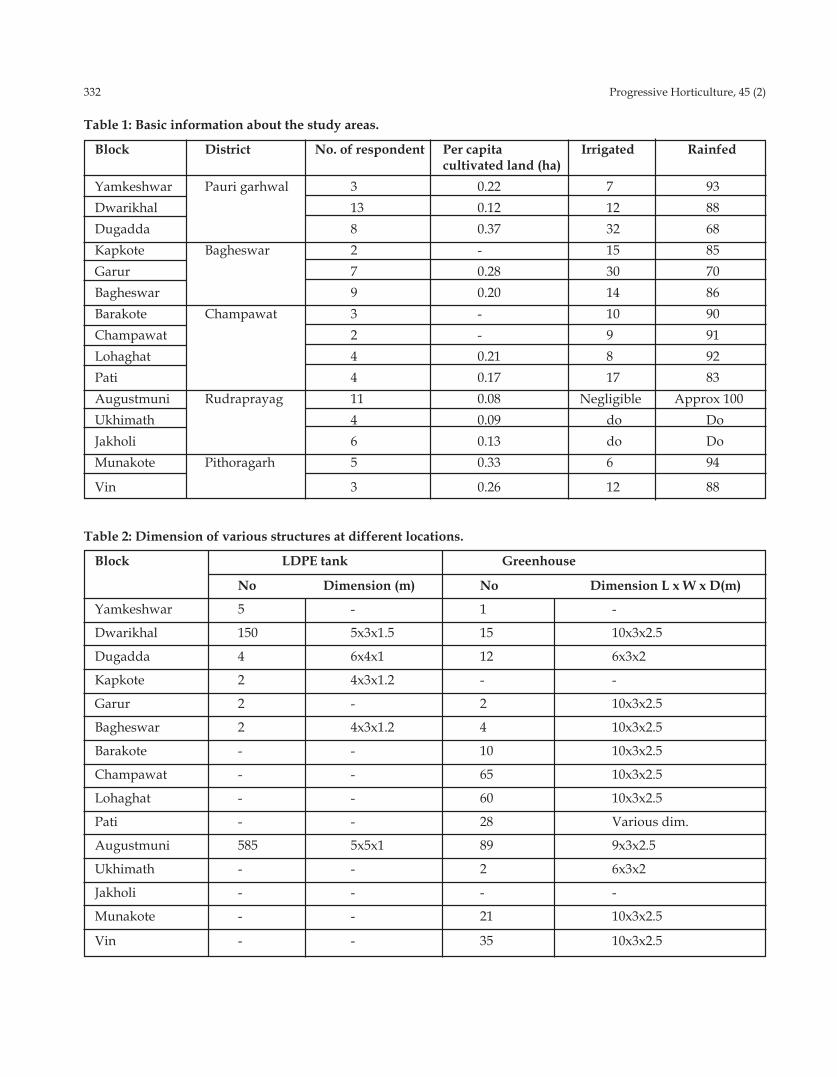
332 Progressive Horticulture, 45 (2)
Table 1: Basic information about the study areas.
Block District No. of respondent Per capita Irrigated Rainfed cultivated land (ha) Yamkeshwar Pauri garhwal 3 0.22 7 93Dwarikhal 13 0.12 12 88Dugadda 8 0.37 32 68Kapkote Bagheswar 2 - 15 85Garur 7 0.28 30 70Bagheswar 9 0.20 14 86Barakote Champawat 3 - 10 90Champawat 2 - 9 91Lohaghat 4 0.21 8 92Pati 4 0.17 17 83Augustmuni Rudraprayag 11 0.08 Negligible Approx 100Ukhimath 4 0.09 do DoJakholi 6 0.13 do DoMunakote Pithoragarh 5 0.33 6 94
Vin 3 0.26 12 88
Table 2: Dimension of various structures at different locations.
Block LDPE tank Greenhouse
No Dimension (m) No Dimension L x w x D(m)
Yamkeshwar 5 - 1 -
Dwarikhal 150 5x3x1.5 15 10x3x2.5
Dugadda 4 6x4x1 12 6x3x2
Kapkote 2 4x3x1.2 - -
Garur 2 - 2 10x3x2.5
Bagheswar 2 4x3x1.2 4 10x3x2.5
Barakote - - 10 10x3x2.5
Champawat - - 65 10x3x2.5
Lohaghat - - 60 10x3x2.5
Pati - - 28 Various dim.
Augustmuni 585 5x5x1 89 9x3x2.5
Ukhimath - - 2 6x3x2
Jakholi - - - -
Munakote - - 21 10x3x2.5
Vin - - 35 10x3x2.5

Progressive Horticulture, 45 (2) 333
construction are the major concern. This study addresses the present status of use of plastics in NW Himalayan region of Uttaranchal. The constraints in proliferation of the use of plastics have also been discussed.
MATERIALS AND METHODSThe study area included 15 blocks of 5 districts
namely Pauri-Garhwal, Rudraprayag, Bageshwar, Champawat, and Pithoragarh of Uttaranchal for data collection. The former two districts come under Garhwal region and later three under Kumaon region. A total of 97 persons working for various development agencies in the study area have been contacted during 2007-08. The information collected were grouped into three categories namely general description of the area, present plastic use in agriculture and their nature and constraints in further adoptability. The incomplete information from 10 respondents was not included in analysis. Thus 87 re-sponses were included in further analysis.
The information grouped under second category involved nature of plastic use, type and mode of con-struction and whether they are operational to gauge the effectiveness of the technology. In the third group the in-formation on constraints were gathered. The constraints were availability of material, availability of skilled labour, farmer interest and the technical know-how. An index was developed to determine the extent of the problem. The acute problem was given value of 1, similarly value of 0.5 and 0.0 has been given to cases under somewhat problem and no problem. Afterwards the values from different respondent under one block were added and mean was determined.
RESULTS AND DISCUSSION
General description of the areaThe per capita cultivated land varies from 0.08 to
0.37 ha for Augustmuni in Rudraprayag district and Du-gadda in Pauri-Garhwal district respectively (Table 1). The irrigated land percentage varies from negligible to as high as of 32 %. The area in Rudraprayag district is almost completely rainfed.
Present use of plastic in agricultureIn Augustmuni block of Rudraprayag district, high-
est numbers of LDPE filmed lined tank and greenhouse were constructed. However, the per capita land holding is less and area is completely under rainfed. This sug-gests that the polyhouses and polytanks can be popular-ized in the region where per capita irrigated land hold-ing is less. In contrast to table 1 where Dugadda block
Table 3: Present status of plastic structures
Block LDPE tank Greenhouse
No Operational No OperationalYamkeshwar 5 5 1 1Dwarikhal 150 130 15 12Dugadda 4 4 12 12Kapkote 2 2 - -Garur 2 2 2 2Bagheswar 2 2 4 4Barakote - - 10 10Champawat - - 65 65Lohaghat - - 60 58Pati - - 28 26Augustmuni 585 585 89 85Ukhimath - - 2 2Jakholi - - - -Munakote - - 21 21
Vin - - 35 32
Table 4: Constraint in plastic application at farmers’ field
Block Problems Material Availability Farmers’ Lack of availability of skilled interest technical labour know-howYamkeshwar 0.34 0.34 0.17 0.50Dwarikhal 0.39 0.28 0.22 0.72Dugadda 0.38 0.50 0.50 0.50Kapkote 0.50 0.50 0.50 0.50Garur 1.00 1.00 0.25 1.00Bagheswar 0.80 0.25 0.25 0.19Barakote 1.00 1.00 0.00 1.00Champawat 1.00 1.00 0.00 1.00Lohaghat 0.75 0.50 0.25 1.00Pati 1.00 0.84 0.17 0.67Augustmuni 0.46 0.18 0.14 0.64Ukhimath 1.00 0.63 0.13 0.50Jakholi 1.00 1.00 0.17 0.75Munakote 0.88 0.88 0.50 0.50Vin 0.90 0.94 0.67 0.67
Mean 0.76 0.66 0.26 0.68
334 Progressive Horticulture, 45 (2)
of Pauri Garhwal district had higher irrigated land and per capita land holding, low level of plastic application was observed. This may be due to the choice of cereal cultivation over vegetables by the farmer. However, similar condition existing in Ukhimath and Jakholi, but due to ban on plastic, meager application of plastic was observed.
Almost all the polyhouses and polytunnels were ob-served to be made from the departmental support. The main reason was the departmental subsidy for construc-tion of these structures. However, in Dwarikhal and Yamkeshwar, farmers keen interest was observed as considerably higher number of LDPE filmed lined struc-tures were constructed by the farmers themselves par-ticularly in Yamkeshwar. In all three blocks of the Pauri-garhwal, water seems to be the major problem as farmer had shown their keen interest in construction tanks themselves than the greenhouse. This suggested that the farmer interest is mainly depends upon the external sup-port. This statement is well supported by fact that the dimensions of different structures were found almost similar (Table 2). The technology used in construction of plastic structure was found viable and useful as most of the structures are operational (Table 3).
Constraints in adaptability of plastic application in agriculture
The various problems in plastic application such as material availability, availability of skilled labour, farm-ers’ interest and lack of technical know-how has been quantified in table 4. In most of the blocks the problem of farmers’ interest was found to be less than the other prob-lems. However, some block like dugadda farmer interest was lower. This fact is well justified because the most of the cultivated area was irrigated where farmers choice is cereal crops than vegetables. In case of Dwarikhal lack of technical support is the major problem than the other constraints. The farmers’ keen interest was observed at Garur, Barakote, Champawat, Lohaghat, Pati and Jak-holi but these areas faces the other constraints severely. The overall analysis suggested that there is higher de-gree of gap existed between the farmers’ interest and availability of material, and skill. The adaptability can be enhanced significantly if the efforts made in fulfilling the gap by making the material available and providing training and technical assistance to the local personals. The study reveals that wide scope of plastic application in agriculture is existed in most of the blocks except Du-
gadda, Kapkote, Munakote and Vin.
Present study deals with the status of plastic use in agriculture in NW Himalayan region of Uttaranchal state. The study reveals that almost all the plastic struc-tures at farmers field were constructed by the various developing agencies working in locality. The technical-ity involved in such construction has proven its sound-ness as most of the structures are operational. The farmer interest is higher in insuring water for irrigation than surface covered cultivation. The study also revealed that farmers’ interest in surface covered cultivation is least in the irrigated area.
The farmers’ interest in the study area was found as the least problem in propagation of plastic use in agri-culture. The study envisaged that material availability, skilled labour and technical know-how are the major problem. Further it was suggested that suitable measure are required to be adopted for dissemination of plasti-culture technology. Those include training of farmers and development officials working at grass root level. Insurance of material availability within the reach is also required.
REFERENCESSingh, R.D.; Chandra, S.; Bhatnagar, V.K.; Bhatnagar,
P. R.; Srivastava, R.C. and Gupta, H.S. 2001. Water Management Strategies of Important Hill Crops. Technical bulletin no 18 (1/2001), VPKAS, Almora, Uttaranchal.
Srivastava, R.C. 1983. Providing Irrigation in Hills, A Right Approach. Indian J. Soil Conservation, 11(2,3): 31-38.
Srivastava, R.C. 1984. Design of LDPE film lined tank for hilly terrain Proc. ISAE convention, New Delhi.
Srivastava, R.C. 1985. LDPE Film Lined Mini Tanks - A Practical Way for Resource Management in Hills. Proc. National seminar on soil conservation and watershed management, New Delhi.
Srivastava, R.C. 1988. LDPE Film Lined Tanks. Technical bulletin no. 2/88, VPKAS, Almora, Uttaranchal.
Ved Prakash 2002. Remunerating Cropping Systems for Rainfed and Irrigated Hill Ecosystem. summer school on sustainable production from agricultural watersheds in hills. (ed.) A K Srivastava. VPKAS, Almora, Uttaranchal.
Received on 05 July, 2012 and accepted on 10 January, 2013

Online version available at: www.indianjournals.com
Progressive Horticulture, Vol. 45, No. 2, September 2013© Copyright by ISHRD, Printed in India
[Research Article]
Increasing yield and quality of indigenous melons by combining intraspecific group of Cucumis melo
A.K. Singh, Aastik Jha, N.P.S. Dhillon and Sudhakar Pandey*
Indian Institute of Vegetable Research, Varanasi-221305 (Uttar Pradesh)AVRDC - The World Vegetable Center, Headquarters - Taiwan*E-mail: [email protected]
ABSTRACTGenetics and heterosis for quality and yield attributes in indigenous melon was studied by involving 28 cross
combination obtained from crossing eight divers inbred of different intraspecific group of Cucumis melo in half- diallel fashion. The studies indicated that the additive as well as dominant component of variance were significant of most of the characters. The estimates of dominance component ($1 and $2) were higher than those of additive ( ∧
D ) component for all the characters except vine length and days to maturity. Overall evaluation indicates that parent-3, parent-6 and parent-7 were best general combiner for yield and other characters. Among the three best combination, hybrid combination P-7 x P-8 was considered best due to its maximum consumer preference in the present investigation.
KEY wORDS: Cucumis melo, infraspecific crosses, heterosis, yield, ascorbic acid
Cucumis melo and its varietal form constitute impor-tant group in the family cucurbitaceae. These are includes dessert type and non-dessert type. The dessert type in-clude muskmelon C. melo var. melo) and snammelon (C. melo var. momordica) and non-dessert type species of C. melo eaten as salad in India are ´Vellari´ (var. acidulus), ´Arya´ (var. chate) and ´Wanga´ (unknown botanical va-riety) (Sheshadri and More, 2002). Besides, Tibishmelon (var. tibish) in Sudan is eaten raw in salad (Mohamed and Pitrat, 1999). Another wild form of is Cucumis melo var. callosus. Except muskmelon, others are considered as a minor cucurbit and grown in pockets in India. In In-dia, the main states cultivating these melons are Rajast-han, U.P., Bihar, Delhi, Haryana, Punjab and Kerala. The variation in morphological characters i.e., growth habit, maturity, fruit shape and size, colour and external skin texture (Dhillon et al., 2007) of different species of C. melo in India as well as other part of world provide relatively broad phenotypic variation. However, only one report (Pandey et al., 2010) on exploitation of heterosis utilizing different intraspecific group of melo has been published. Till date, not a single high yielding F1 hybrid has emerged in the market utilizing these groups. Therefore, hybrid-ization between different intraspecific group of Cucumis melo including snapmelon (var. momordica, P1), wanga
(unknown botanical species, P2), longmelon (var. flexuo-sus, P3), arya (var. chat, P4), kachari (var. callosus, P5), conomon (var. conomon, P6), ´Vellari´ (var. acidulous, P7) and Tibishmelon (var. tibish P8) with aim to improve the yield and nutrition levels were attempted to exploit the heterosis and evaluate the performance of F1 hybrids.
MATERIALS AND METHODSEight diverse inbred of different intraspecific group
of Cucumis melo including snapmelon (var. momordica, P1), wanga (P2), longmelon (var. flexuosus, P3), arya (var. chat, P4), kachari (var. callosus, P5), conomon (var. con-omon, P6), ´Vellari´ (var. acidulous, P7) and Tibishmelon (var. tibish P8) were selected and crossed with all possi-ble combinations (28 F1
s) excluding reciprocals. Morpho-logical observations and productivity evaluation of the breeding materials (parents and F1s) was carried out in at Indian Institute of Vegetable Research (IIVR), Varanasi, UP, India. These eight parents and their 28 F1s hybrids were sown in pro-trays using vermiculite and coco-peat as germinating media to raise the healthy seedlings. The 25 days old seedlings at the three true leaf stage were transplanted to the field on raised bed with a row spac-ing of 2m and 60 cm between plants. The experiment

336 Progressive Horticulture, 45 (2)Ta
ble
1: G
enet
ic p
aram
eter
s D
ˆ,Fˆ,H
ˆ 1, H
ˆ 2, hˆ
2 and
Ê a
nd th
eir r
elat
ed s
tatis
tics
in d
ialle
l for
nin
e ch
arac
ters
Gen
etic
D
ays t
o
Vin
e N
umbe
r Fr
uit
Frui
t Fr
uit
No.
of
Asc
orbi
c Yi
eld/
pa
ram
eter
s ed
ible
le
ngth
of
prim
ary
wei
ght
leng
th
brea
dth
frui
t ac
id
vine
&
rela
ted
m
atur
ity
(cm
) br
anch
es
(g)
(cm
) (c
m)
vine
(m
g/10
0mg)
(K
g)
stat
istic
s
2
3 4
5 6
7 8
10
11
Dˆ
0.07
5 10
81.1
0**
1.37
**
661.
32**
50
.56*
* 0.
30**
41
.25*
* 16
8179
.61
0.89
±
0.71
±2
23.1
5 ±0
.12
±154
.39
±7.1
2 ±0
.07
10.1
9 ±1
7510
5.87
±0
.74
Fˆ
1.77
17
3.06
1.
86**
67
3.75
27
.81
0.26
54
.20
2895
49.1
1 1.
32
±1
.68
±527
.28
±0.2
9 ±3
64.8
0 ±1
6.82
±0
.17
±24.
09
±413
759.
02
±1.7
5
Hˆ 1
6.14
**
1667
.58
1.58
**
2487
.73*
* 55
.11*
* 0.
68**
11
5.55
**
1599
909.
35**
6.
05**
±1
.64
1512
.98
±0.1
2 ±3
54.9
1 ±1
6.37
±0
.16
±23.
44
±402
542.
53
±1.7
1
Hˆ 2
4.70
14
88.1
5 0.
75**
19
89.9
4**
42.5
2**
0.46
**
84.3
8**
1354
318.
23**
4.
700*
*
±1
.42
±446
.29
±0.2
4 ±3
08.7
8 ±1
4.24
±0
.14
±20.
39
3502
11.7
5 ±1
.48
hˆ2
0.32
75
1.26
**
0.92
**
663.
77**
6.
44
0.18
10
.28
4294
93.6
0 0.
14
±0
.95
±299
.30
±0.1
6 ±2
07.0
8 ±9
.55
±0.1
0 ±1
3.67
±2
3486
6.85
±1
.00
Ê 0.
14
7.28
0.
09
21.1
4 0.
54
0.03
0.
39
5726
.43
0.00
±0
.24
±74.
38
±0.0
4 ±5
1.46
±2
.37
±0.0
2 ±3
.40
±583
68.6
2 ±0
.25
H1/D
0.05
=F1
2.86
1.
24
1.07
1.
94
1.04
1.
50
1.67
3.
08
2.61
$ 2//4
$ 1 0.
19
0.22
0.
12
0.20
0.
19
0.17
0.
18
0.21
0.
19
KD/K
R 2.
40
1.14
4.
43
1.71
1.
72
1.81
2.
29
1.77
1.
79
$2 /$2
0.07
0.
50
1.22
0.
34
0.15
0.
39
0.12
0.
31
0.23
R -0
.210
0 0.
4235
0.
7586
0.
2007
0.
6975
0.
2565
0.
3665
0.
1111
-0
.055
8
t 2 2.
2567
1.
2946
1.
2393
2.
5736
0.
0734
3.
3583
0.
2772
7.
6496
3.
1472
*, **
, Sig
nific
ant a
t 5 a
nd 1
per
cent
leve
l of p
roba
bilit
y, re
spec
tivel
y

Progressive Horticulture, 45 (2) 337Ta
ble
2: E
stim
ate
of g
ener
al co
mbi
ning
abi
lity
(gca
) eff
ects
of p
aren
ts in
dia
llel p
opul
atio
n fo
r nin
e ch
arac
ters
Pare
nts
Day
s to
Vin
e le
ngth
N
umbe
r of
Frui
t Fr
uit
Frui
t N
o. o
f A
scor
bic
Yiel
d/
ed
ible
(c
m)
prim
ary
w
eigh
t le
ngth
br
eadt
h
frui
t /
acid
(mg/
vi
ne
m
atur
ity
br
anch
es
(g)
(cm
) (c
m)
vine
10
0mg)
(k
g)
2 3
4 5
6 7
8 10
11
P-1
-0.1
6 8.
84**
0.
41**
4.
12**
-1
.66*
* 0.
11
-2.1
2**
-147
.20*
* -0
.30*
*P-
2 0.
01
28.3
5**
0.12
-2
.37
-1.1
9**
0.10
-0
.24
-9.4
9**
-0.6
5**
P-3
-0.5
9**
13.9
9**
-0.4
4**
4.74
**
5.87
**
-0.4
3**
-0.1
6 13
.52*
* 0.
84**
P-4
0.08
-7
.44*
* -0
.06
3.99
**
2.24
**
-0.2
5**
-1.2
2**
-60.
74**
-0
.02*
*P-
5 0.
12
-7.2
5**
0.23
**
-9.1
0**
-2.0
0**
-0.0
2 4.
96**
26
5.69
**
-0.0
6**
P-6
0.30
* -2
4.18
**
-0.3
7**
16.3
6**
0.15
0.
18**
-0
.73*
* 95
.98*
* 0.
11**
P-7
0.17
-4
.03*
* 0.
36**
-1
9.19
**
-3.9
9**
0.34
**
-0.4
6*
-235
.31*
* 0.
00P-
8 0.
07
-8.2
7**
-0.2
6**
1.44
0.
59
-0.0
2 -0
.03
77.5
3**
0.09
**SE
(Gi)
0.11
0.
798
0.09
0 1.
360
0.21
7 0.
053
0.18
4 22
.38
0.00
5SE
(GIG
J) 0.
167
1.20
6 0.
136
2.05
6 0.
328
0.08
0 0.
279
33.8
42
0.00
85Be
st p
aren
ts b
ased
on
per s
e P-
3 P-
2P-3
P-
7P-5
P-
3P-6
P-
3P-6
P-
7P-1
P-
7 P-
6P-5
P-
6P-3
perfo
rman
ce a
nd g
ca ef
fect
s *,
**, S
igni
fican
t at 5
and
1 p
erce
nt le
vel o
f pro
babi
lity,
resp
ectiv
ely
was laid out in a complete randomized block design (CRBD) with three replications, each of the three replica-tions had ten plants. Plants were furrow irrigated and recommended fertilizer dose, cultural practices along with plant protection measures (De et al., 2003) were fol-lowed to raise a good crop. Five central plants of each parent and hybrids were chosen for taking observations in each replication. The data were recorded on 9 quan-titative i.e., (i) days to maturity (ii) vine length (cm) (iii) number of primary branches per vine, (iv)fruit weight (g) (v) fruit breadth (cm) (vi) fruit length (cm) (vii) num-ber of fruits per vine (viii) ascorbic acid (mg/100g) and (ix) marketable fruit yield per plant (g). Fruits were har-vested at marketable maturity (immature fruit for salad) for recording the data related to fruits. The vine length was measured at the stage of 3rd fruit harvest with the help of a meter tape. Five fruits harvested at marketable maturity of each entry in each replication for ascorbic acid analysis (Bajaj and Kaur, 1981). The combing ability variances and their effects were worked out according to Griffing (1956) and heterosis was worked out over better parent.
RESULTS AND DISCUSSIONThe t2 value is non-significant for all the characters, in-dicating the validity of hypothesis pertaining to diallel cross analysis except fruit weight, fruit breathe, ascor-bic acid and yield per vine. The estimate of H1 and H2 were significant for all characters, except vine length and days to edible maturity and higher than that of ∧
D for all the characters. The estimate of ∧
F and E component was positive and non-significant except number of primary branches indicating excess of recessive gene. The esti-mated H2 was positive and non-significant except vine length, number of primary branches and fruit weight. The (H1/D)0.5 showed over dominance for all charac-ters (Pandey and Rai, 2006). The ratio H2/4H1 indicated asymmetrical distribution of positive and negative gene among the parents (Hayman, 1954). The proportion of KD/KR was more than unity indicating excess of domi-nant gene to controlling these characters. The ratio of h2/H2 indicating one gene group controlling character and exhibiting dominance for all traits except number of pri-mary branches (Table 1).
The information regarding gca effect of the parent is of prime importance as it helps in successful predica-tion of genetic potentiality of crosses. Estimates of gca effect showed that it is difficult to pickup good general combiner for all the characters. Together as the combin-ing ability effect were not consistent for the yield. How-ever, overall evaluation indicates that parent-3, parent-6 and parent-7 were best general combiner for yield and ascorbic acid on the basis of per se performance and sig-

338 Progressive Horticulture, 45 (2)
Table 3: Best three hybrids selected separately on the basis of heterosis over better parents and sca effects
Character Crosses % Heterosis Crosses sca effects Heterosis/ Positive Negative range over BP significant significant
Days to edible P-2 x P-7 -19.56** P-2 x P-7 -1.98** -19.56 - 35.39 20 7 maturity P-3 x P-8 -16.16** P-7 x P-8 -1.87** P-7 x P-8 -15.06** P-3 x P-8 -1.69**
Vine length(cm) P-4 x P-6 44.89** P-4 x P-6 48.27** 24.41-44.89 11 3 P-6 x P-8 33.48** P-2 x P-4 34.40** P-6 x P-7 32.41** P-3 x P-6 28.50**
Number of P-2 x P-7 41.05** P-1 x P-6 0.58 -56.06-41.05 4 22 Primary branches P-4 x P-5 30.11** P-5 x P-8 0.42 P-2 x P-8 20.92** P-1 x P-4 0.31
Fruit weight (g) P-5 x P-8 60.67** P-1 x P-5 45.32** -41.15-60.67 9 10 P-2 x P-8 57.51** P-5 x P-8 41.06** P-5 x P-7 55.65** P-4 x P-6 40.54**
Fruit length (cm) P-5 x P-7 149.21** P-3 x P-6 9.90** -65.87-149.21 11 16 P-1 x P-5 85.43** P-5 x P-7 6.18** P-2 x P-6 44.38** P-1 x P-5 5.62**
Fruit breadth(cm) P-2 x P-6 56.53** P-2 x P-4 0.94 -23.47-56.33 12 16 P-6 x P-8 29.35** P-2 x P-6 0.82** P-2 x P-4 27.66** P-6 x P-8 0.69*
No. of fruit /vine P-3 x P-8 222.69** P-2 x P-7 8.164** -111.89-222.69 14 13 P-2 x P-3 151.76** P-5 x P-8 7.37** P-2 x P-8 90.75** P-4 x P-6 5.67**
Ascorbic acid P-2 x P-8 318.23* P-7 x P-8 24823** 88.72-318.23 1 0 (mg/100mg) P-2 x P-7 223.51 P-5 x P-8 1600.09** P-3 x P-8 219.15 P-1 x P-8 925.39**
Yield/vine (Kg) P-5 x P-7 755.77** P-5 x P-7 0.23** -90.36-755.77 12 15 P-7 x P-8 350.00** P-3 x P-6 1.14** P-4 x P-8 275.86** P-3 x P-8 1.49**
** Significant at 1% level of probability, BP – Better parent
nificant gca effects (Table 2). Similar findings were re-ported by Pandey et al., (2005) in cucumber and Pandey et al., (2010) and Jha et al., (2009) in pumpkin and Singh (2009) in snakmelon. On the basis of per se performance and significant gca effects parent-3 and parent-6 were good general combiner for days to edible maturity, vine length, fruit weight, fruit length, ascorbic acid and yield per vine. The parent P-7 was best general combiner for number of primary branches, fruit breadth and number of fruit per vine. Among 28 hybrids, hybrid P-2 x P-7 was best specific combiner for days to edible maturity and number of fruit per vine, hybrid P-5 x P-8 for num-ber of primary branches, fruit weight, number of fruit per vine, ascorbic acid, hybrid P-3 x P-6 for vine length, fruit length and yield par vine and hybrid P-2 x P-4 and hybrid P-2 x P-6 were good for fruit breadth on the basis
of per se performance and gca effects (Table 3). Similar finding were reported by Pandey et al., (2010) in pump-kin and Singh et al., 2009 in Indian melons. The range of heterosis over better parent varied between -19.56 to 35.39 % for days to edible maturity and 24.41 to 44.89 % for vine length, -56.06 to 41.05 % for number of pri-mary branches, -41.15 to 60.67 % for fruit weight, -65.87 to 149.2 % for fruit length, -23.47 to 56.35 % for fruit breadth, -11.89 to 222.69 % for number of fruit per vine, 88.72 to 318.23 % for ascorbic acid and -90.36 to 755.77 % for yield per vine.
The highest magnitude of heterosis over better par-ent was recorded in hybrid P-2 x P-7 (19.56 %) for days to edible maturity and hybrid P-4 x P-6 had 44.89 % more vine length than the better parent. More number of pri-

Progressive Horticulture, 45 (2) 339
mary branches were recorded in hybrid P-2 x P-7 (41.05 %). The maximum heterosis over better parent was found in hybrid P-5 x P-8 (60.67 %) for fruit weight and hybrid P-5 x P-7 had maximum heterosis for fruit length. More than 200 % heterosis was recorded in hybrid P-3 x P-8 for number of fruits per vine. The content of ascorbic acid was found in hybrid P-2 x P-8 and had more than 315 % heterosis over better parent. The highest heterosis (755.77 %) was recorded in hybrid P-5 x P-7 over better parent followed by hybrid P-7 x P-8 (350 %) for yield per vine. In the earlier reports maximum heterosis over bet-ter parent was reported for yield in, cucumber (33%), in pumpkin (65%; Jha et al., 2009) and in ash gourd (90%; Pandey et al., 2005). The maximum heterosis in the hy-brids derived among the Indian melon was due to more heterosis in number of fruits/plant. Among the three best combination, hybrid combination P-7 x P-8 was considered best due to its maximum consumer prefer-ence in the present investigation. The hybrids derived from cross combination between intera-specific groups of melons may be a substitute of cucumber as number of fruits and total marketable yield is comparable with cucumber. These hybrids may be tested further for yield and quality traits under different agro-climatic condition for commercial exploitation.
REFERENCESBajaj, L.K. and Kaur, G. 1981. Spectrophotometric deter-
mation of L-ascorbic acid in vegetables and fruits. Analyst., 106: 17-120.
De, N.; Pandey, S. and Singh, K.P. 2003. Integrated De-velopment of Gourds and Melons. Technical Bull. 13, Indian Institute of Vegetable Research, Varanasi., pp. 57.
Dhillon, N.P.S.; Ranjana, R.; Singh, K.; Eduardo, I.; Mon-fort, A.J.; Pitrat, M.; Dhillon, N.K. and Singh, P.P. 2007. Diversity among landraces of Indian snapmelon (Cucumis melo var. momordica). Genet. Resour. Crop Evol., 54: 1267-1283.
Griffing, B. 1956. Concept of general and specific com-
bining ability in relation to diallel crossing systems. Australian J. Bio. Sci., 9: 463-493.
Hayman, B.I. 1954. The analysis of variance of diallel tables. Biometrics., 10: 235-244.
Jha, A.; Pandey, S.; Rai, M.; Yadav, D.S. and Singh, T.B. 2009. Heterosis in relation to combining ability for flowering behaviours and yield parameters in pump-kin. Veg. Sci., 36(3): 332-335.
Mohamed, E.T. and Pitrat, M. 1999. Tibish, a melon type from Sudan. Cucurbit Genet. Crop. Repo., 22: 21-23.
Panday, S.; Rai, M.; Singh, B. and Pandey, A.K. 2005. Het-erosis and combining ability in ash gourd [Benincasa hispida (Thunb.) Cogn.]. Veg. Sci., 32(1): 33-36.
Panday, S.; Singh, B.; Singh, M. and Rai, M. 2005. Hetrosis in cucumber. Veg. Sci., 32(2): 143-145.
Pandey, S. and Rai, M. 2006. Inheritance of yield and its components in pumpkin (Cucurbita moschata Duch. ex Poir.) Indian J. Genet., 66 (4): 355-356.
Pandey, S.; Jha, A.; Kumar, S. and Rai, M. 2010. Genet-ics and heterosis of quality and yield of pumpkin (Cucurbita moschata Duch. ex Poir.). Indian J. Hort., 67(3): 333-338.
Pandey, S.; Dhillon, N.P.S.; Sureja, A.K.; Singh, D. and Malik, A.A. 2010. Hybridization for increased yield and nutritional content of snakmelon (Cucumis melo L. var. flexuosus). Plant Genet. Res. : Character. Utiliz., 8(2): 127-131.
Pitrat, M.; Enlet, P. and Hammer, K. 2000. Some com-ments on infraspecific classification of melon. Acta Hort., 510: 29-36.
Singh, A.K. 2009. Genetic analysis of yield and its compo-nents in snakmelon (Cucumis melo var. utilissimus). M. Sc. Thesis, U.P. Autonomous collage, Varanasi.
Singh, H.P.; Rai, M.; Pandey, S. and Kumar, S. 2009. Vegetable Varieties of India. Stadium Press (India) Pvt. Ltd. 325 p.
Received on 07 January, 2013 and accepted on 13 August, 2013

Online version available at: www.indianjournals.com
Progressive Horticulture, Vol. 45, No. 2, September 2013© Copyright by ISHRD, Printed in India
[Research Article]
Impact of micro-irrigation practices on farmers economy of Kullu district in Himachal Pradesh
Dhanbir Singh and Vinod Sharma*CSK HPKV Krishi Vigyan Kendra, Kangra Himachal Pradesh- 176001*CSK HPKV Krishi Vigyan Kendra Bajaura (Kullu) Himachal Pradesh- [email protected]
ABSTRACTMicro-irrigation is introduced primarily to save water and increase the water use efficiency in agriculture. The
reduction in water losses in micro-irrigation system over the flood and furrow irrigation method varies from 30-80 per cent and productivity gain by 20-90 per cent in different crops. Keeping in view the present studies were con-ducted in rain-fed areas under “Farmers Participatory Action Research Programme” (FPARP) during 2008 and 2009 at farmers fields in different locations of Kullu district, Himachal Pradesh, India. The purpose was to compare the impact of conventional methods of irrigation (flood/furrow /ring basin) and micro irrigation techniques (sprinkler and drip) on crop yield and economy of farmers. At 6 different locations, five sprinklers and one drip irrigation system were installed. Cauliflower crop was grown at 3 locations while capsicum, tomato and pomegranate were grown at remaining 3 locations. Results of the study revealed that in fields where micro-irrigation systems were installed, the yield of cauliflower I, II, III, capsicum, tomato and pomegranate increased by 93.11, 78.50, 87.23, 17.80, 35.87 and 41.52 per cent, respectively. Likewise, net returns of the farmers from the respective crops increased by 122.34, 92.30, 110.60, 24.54, 22.91 and 38.09 per cent when compared to the conventional methods of irrigation. It can be concluded from the results that the micro-irrigation system not only saves water but also increases yield of the crops and eventually the net returns of the farmers from the same unit of area as compared to conventional methods of irrigation.
KEY wORDS: Benefit cost ratio, micro-irrigation, net returns, yield
The availability of adequate, timely and assured sup-ply of water is an important determinant of agricultural productivity. Irrigation raises cropping intensity and crop yields besides facilitating shift in cropping patterns. In India, irrigation alone contributes 60 per cent growth in the agricultural productivity. However, the available water for irrigation purpose has been continuously di-minishing even when India is blessed with abundant water resources. About 78 per cent of India’s water re-sources are used for agriculture, out of which only 50 per cent is actually used by the plants and remaining water resources are wasted either as deep percolation or evaporation. The scarcity of water means less irrigation to crop plants and consequently lower yields. However, sometimes water is available in plenty. In that case, farm-ers generally carry out conventional i.e. flood and furrow methods of irrigation. These methods cause excess irriga-tion that reduces crop production, damages soil fertility,
cause water logging and salinity. Besides, there is loss of water due to evaporation and transpiration. A study by International Water Management Institute has shown that about 50 per cent of increase in demand for water by the year 2025 can be met by increasing the effectiveness of irrigation (Seckler et al., 1998). Therefore, the selection and adoption of irrigation appropriate technology is of prime importance for efficient and economic utilization of water so that optimum productivity is achieved as both scarce and excess irrigation hamper agricultural production.
One such modern technology of irrigation is micro-irrigation which includes sprinkler and drip irrigation. India stands 27th in terms of degree of adoption of mi-cro-irrigation devices and has a total of 9.185 lac ha of cropped area under micro-irrigation of which 2.6 lac ha are under drip irrigation. Drip irrigation is economically

Progressive Horticulture, 45 (2) 341
viable for horticultural crops viz., grapes, banana, or-ange, coconut, sugarcane and pomegranate etc. whereas sprinklers are viable for agricultural crops viz., wheat, pearl millet, maize, sorghum, alfalfa, tomato, brinjal, gourds, chilly, cabbage, cauliflower, vanilla, cumin etc. (Narayanamurthy, 1997, Dahake et al., 1998, Dhawan, 2000). This system of irrigation has a number of merits over the conventional methods of irrigation viz., flood, furrow, ring basin etc. It saves up to 50 per cent of water by reducing the loss of the water due to transpiration and evaporation. The weeding operation is almost nil, since most of the weeds grow very less or not at all so labour is also saved. Fertilizers and pesticides are used through pipes mixed with water flow; therefore, no extra labour is required for its application. The micro-irrigation is especially well adapted for undulating terrain, shallow soils, porous soils and water-scarce areas and in regions having low water holding capacity (Muralidhara et al., 1994). Using this technology, the yield of many crops has reportedly increased from the same unit of the area (Si-vanappan, 1994, Shiyani et al., 1999, Palanichamy et al., 2002, Wayker et al., 2003 and Singh et al., 2009).
Keeping the above facts into consideration, present study was undertaken under rainfed hilly areas of Kul-lu district in Himachal Pradesh, India. The purpose was to compare the impact of micro-irrigation techniques (sprinkler and drip-irrigation system) and conventional methods of irrigation on the yield of crops and economy of some selected farmers of district.
MATERIALS AND METHODSThe present studies were conducted for two years
viz. 2008 and 2009 under “Farmers Participatory Action Research Programme” (FPARP) in collaboration with Department of Agricultural Engineering, CSKHPKV, Palampur, H.P. at six selected farmers fields in differ-ent locations in hilly areas of district Kullu, Himachal Pradesh, India to assess the impact of micro-irrigation techniques on the economy of the farmers. The farm-ers under the programme were selected on the basis of their willingness to adopt this technology, availability of the land, water source/water tanks and who could con-tribute to some extent in this participatory scheme. Five sprinklers and one drip irrigation system were installed in the farmers fields and their use was demonstrated to them. At 3 locations, the farmers had grown cauliflower crop while in the remaining 3 locations, capsicum, to-mato and pomegranate crops were grown. Area selected under cauliflower, capsicum, tomato and pomegranate was 0.48 ha, 0.16 ha, 0.16 ha and 0.32 ha, respectively. Ob-servations were taken on total marketable yield (q ha-1) of each crop under study in fields where micro-irrigation systems were installed. This yield was compared to the
yield obtained from the control fields in which farmers had grown the same crops in the same unit of area using conventional methods of irrigation (all other agricultural practices remaining similar). The per cent change (in-crease/decrease) in yield and per cent change in income of the farmers after adoption of micro-irrigation system were calculated on the basis of cost of inputs and net re-turns obtained by the sale of yield harvested from crops in two years before and after adoption of MI. The data so obtained was pooled for two years and the benefit cost ratio (BCR) was also calculated in each case.
RESULTS AND DISCUSSIONThe yield data (pooled for two years) of the crops
under study revealed that when the farmers carried out irrigation by the conventional methods of irrigation i.e. flood/furrow/ring basin methods then the total market-able yield of cauliflower I, II, III, capsicum, tomato and pomegranate was 71.85, 70.00, 70.50, 75.00, 262.00 and 157.00 q ha-1, respectively (Table 1). It is a general practice carried out by farmers of India to carry out irrigation in their crops by conventional methods i.e. flood/furrow/ and ring basin etc. These methods not only waste water through percolation, evaporation and transpiration but sometimes the plants get excess water at one time than required. Moreover, in water scarce areas, particularly in hilly regions of the country, where the farmers depend on rain water or seasonal sources of water for irrigation purpose, they are not able to give enough water to their crops. As a result the crops get less water even at critical stages consequently resulting in lower yields. But after installation of micro-irrigation systems viz. sprinkler and drip in farmers fields (all other agricultural practices re-maining similar), the yield from the respective crops in-creased by 93.11, 78.50, 87.23, 17.80, 35.87 and 41.52 per cent.
The net returns per hectare were also calculated for each crop (Table 2). It is clearly evident from the data that the net returns from cauliflower I, II, III, capsicum, tomato and pomegranate when conventional methods of irrigation were carried out was Rs. 27480, 26000, 26400, 77500, 96000 and 264000, respectively. But, after instal-lation of sprinkler/ drip systems of irrigation, the per cent increase in net returns of the farmers from the re-spective crops was 122.34, 92.30, 110.60, 24.54, 22.91 and 38.09 from the same unit of area. The benefit cost ratio of cauliflower I, II, III, capsicum, tomato and pomegranate before adoption of the micro-irrigation system was 1.96, 1.86, 1.88, 3.21, 3.74 and 6.28, respectively. However, after the adoption of micro-irrigation systems, the ben-efit cost ratio of the respective crops was 2.22, 2.00, 2.11, 2.36, 2.96 and 5.35. These results clearly indicated that the type of irrigation technology used has a pronounced

342 Progressive Horticulture, 45 (2)Ta
ble
1: Im
pact
of m
icro
-irri
gatio
n te
chni
ques
on
crop
yie
ld (q
ha-1
) of f
arm
ers
of K
ullu
Dis
tric
t in
Him
acha
l Pra
desh
(poo
led
data
of 2
008
and
2009
)
Farm
er
Cro
ps g
row
n A
rea
unde
r Ty
pe o
f irr
igat
ion
Yi
eld
unde
r Yi
eld
unde
r %
incr
ease
in
un
der a
ctio
n st
udy
befo
re
syst
em u
sed
conv
entio
nal
actio
n
yiel
d af
ter
re
sear
ch
adop
tion
&
(spr
inkl
er/d
rip)
m
etho
d re
sear
ch
adop
tion
of
pr
ogra
mm
e af
ter a
dopt
ion
(q h
a-1)
prog
ram
me
te
chno
logy
of
MI(
ha)
(q h
a-1)
I C
aulifl
ower
0.
16
Spri
nkle
r 71
.85
138.
75
93.1
1
II
Cau
liflow
er
0.16
Sp
rink
ler
70.0
0 12
5.00
78
.50
III
Cau
liflow
er
0.16
Sp
rink
ler
70.5
0 13
2.00
87
.23
IV
Cap
sicu
m
0.16
Sp
rink
ler
75.0
0 88
.35
17.8
0
V
Tom
ato
0.16
Sp
rink
ler
262.
00
356.
00
35.8
7
VI
Pom
egra
nate
0.
32
Dri
p
157.
00
222.
20
41.5
2
Tabl
e 2:
Impa
ct o
f mic
ro-ir
riga
tion
tech
niqu
es o
n ec
onom
y of
farm
ers
of K
ullu
Dis
tric
t in
Him
acha
l Pra
desh
, (po
oled
dat
a of
200
8and
200
9)
Con
vent
iona
l sys
tem
A
ctio
n re
sear
ch p
rogr
amm
e
(Irr
igat
ion
by fl
ood/
furr
ow/r
ing
basi
n m
etho
ds)
(Irr
igat
ion
by s
prin
kler
s an
d dr
ip s
yste
ms)
Farm
er
Cro
ps
Are
a un
der
Gro
ss
Net
B:
C
Gro
ss
Net
B:
C
% i
ncre
ase
st
udy
befo
re
retu
rns
retu
rns
re
turn
s re
turn
s
in n
et
adop
tion
&
(Rs.
ha-1
) (R
s. h
a-1)
(R
s. h
a-1)
(Rs.
ha-1
)
retu
rns
afte
r ado
ptio
n
of M
I(ha
)
I C
aulifl
ower
0.
16
5748
0 27
480
1.96
11
1100
61
100
2.22
12
2.3
II
Cau
liflow
er
0.16
56
000
2600
0 1.
86
1000
00
5000
0 2.
00
92.3
0
III
Cau
liflow
er
0.16
56
400
2640
0 1.
88
1056
00
5560
0 2.
11
110.
6
IV
Cap
sicu
m
0.16
11
2500
77
500
3.21
13
2525
96
525
2.36
24
.50
V
Tom
ato
0.16
13
1000
96
000
3.74
17
8000
11
8000
2.
96
22.9
0
VI
Pom
egra
nate
0.
32
3140
00
2640
00
6.28
44
4400
36
4400
5.
35
38.1
0

Progressive Horticulture, 45 (2) 343
effect on the yield component of crops. The yield after installation of the micro-irrigation systems probably in-creased because it gives neither less nor more but appro-priate quantity of water to the crop plants as needed by them especially during critical stages of growth. These results convinced the farmers that micro-irrigation sys-tem of irrigation not only saved the irrigation water but also increased the crops yield and consequently their in-come. The farmers also realized the importance of the water storage structures in situations where rain water or seasonal sources is the only source for irrigation. Apart from this, farmers agreed that in water scarce areas, this system of irrigation is quite advantageous as it uses minimum water for the growth of plants and by adopt-ing this technology, they can shift from cereal-cereal based cropping system to cereals-vegetable/vegetable, based cropping systems for getting higher returns. The increase in the yield of crops (ash gourd, bottle gourd, brinjal, potato, tomato, sugarcane, cotton, coconut, capsicum, chilly, cabbage, papaya, lemon, sweet lime, pomegranate, kinnow, cashew, mango and banana) after the installation of micro-irrigation systems in the fields has been reported by number of researchers in the past (Jadhav et al., 1990, Reddy and Thimmegowda, 1997, Raina et. al.,1999, Luhach et al., 2003, Agrawal et al., 2005, Yadukumar and Balasimha, 2006, Namara et. al., 2007, Joshi et al., 2011, Kaushal and Singh, 2011, Singh et al., 2011 and Pawar and Dingre, 2013). It can be rightly said that micro-irrigation contributes significantly to ground water resources development, agricultural productiv-ity, economic growth and environmental sustainability (Kumar and Palanasami, 2010). However, the major con-straint in the adoption of this technology is its high initial investment cost (Muralidhara et al., 1994) and most of the farmers are not able to bear this cost. Nevertheless, in Himachal Pradesh, the state government through De-partment of Agriculture is helping the farmers in this direction by providing 80 per cent subsidy for the instal-lation of MI systems (sprinkler/drip systems) in open field conditions under Pandit Deen Dyal Kissan Bagwan Samridhi Yojna (PDDKBSY-II). So, the farmers can avail this golden opportunity and get micro-irrigation sys-tems installed in their fields which will make them more financially sound and sustain their families better than earlier by getting higher crop yields and net returns from the same unit of area.
REFERENCESAgrawal, N.; Dixit, A. and Agrawal, S. 2005. Effect of drip
irrigation with black plastic mulch on the yield and quality of mango. Prog. Hort., 37(2): 316-322.
Dahake, S.G.; Lambe, S.P.; Kalpande, H.V.; Nikhade,
D.M. and Kalpande, V.V. 1998. Utility perception of orange growers about drip irrigation system. J. Soils Crops., 8(2): 154-156.
Dhawan, B.D. 2000. Drip irrigation: evaluating returns. Economic and Political Weekly, Oct. 14, pp. 3775-3780.
Jadhav, S.S.; Gutal, G.B. and Chougale, A.A. 1990. Cost economics of the drip irrigation system for tomato crop. In: Proceedings of first International Con-gress on the use of plastics, Feb 26 to March 3, New Delhi.
Joshi, G.; Singh, P.K.; Singh, S.K. and Srivastava, P.C. 2011. Effect of drip irrigation and mulching on water requirement, yield and economics of high density litchi. Prog. Hort., 43(2): 237-242.
Kaushal, A. and Singh, G. 2011. Field evaluation of drip ir-rigation for kinnow crop. Prog. Hort., 43(2): 302-306.
Kumar, S.D. and Palanisami, K. 2010. Impact of drip ir-rigation on farming system: evidence from Southern India. Agril. Econ. Res. Rev. 23: 265-272.
Luhach, M.S.; Khatkar, R.K. and Malik, D.P. 2003. Eco-nomic viability of sprinkler irrigation: an empirical analysis. Indian J. Agril. Econ., 58(3): 489.
Muralidhara, H.R.; Gundurao, D.S.; Sarpeshkar, A.M. and Ramaiah, R. 1994. Is drip irrigation viable for mulberry cultivation: an economic analysis. Mysore J. Agril. Sci., 28(3): 256-260.
Namara, R.E.; Nagar, R.K. and Upadhyay, B. 2007. Economics, adoption determinants, and impacts of micro-irrigation technologies: empirical results from India. Irrigation Sci., 25:283–297.
Narayanamurthy, A. 1997. Economic viability of drip irrigation: An empirical analysis from Maharashtra. Indian J. Agril. Econ., 52(4): 728-739.
Palanichamy, N.V.; Palanisamy, K. and Chanmuyam, T.R. 2002. Economic performance of drip irrigation on coconut farmers in Coimbatore. Agril. Econ. Res. Rev. Conference issue, pp.40-48.
Pawar, D.D and Dingre, S.K. 2013. Influence of fertiga-tion scheduling through drip on growth and yield of banana in western Maharastra. Indian J. Hort., 70(2): 200-205.
Raina, J.N.; Thakur, B.C. and Verma, M.L. 1999. Effect of drip irrigation and polyethylene mulch on yield, quality and water-use efficiency of tomato. Indian J. Agric. Sci., 69: 430-433.
Reddy, D.V.S. and Thimmegowda 1997. Economic
344 Progressive Horticulture, 45 (2)
analysis of different drip irrigation systems on main and ratoon hybrid cotton. Mysore J. Agril. Sci., 31(1): 17-22.
Seckler, D.; Amarasinghe, U.; Molden, D.; Radhika and Barker, R. 1998. World water demand and supply, 1990 to 2025: Scenarios and Issues, Research Re-port 19, International Water Management Institute, Columbo, Sri Lanka.
Shiyani, R.L.; Kuchhadiya, D.B. and Patel, M.V. 1999. Economic impact of drip irrigation technology on cotton growers of Saurashtra region. Agri. Situation in India, 56(7): 407-412.
Singh, R.; Kumar, S.; Nangare D.D. and Meena, M.S. 2009. Drip irrigation and black polyethylene mulch
influence on growth, yield and water-use efficiency of tomato. African J. Agril. Res., 4(12): 1427-1430.
Singh, S.; Sharda, R.; Lubana, P.P.S. and Singla, C. 2011. Economic evaluation of drip irrigation system in bell pepper (Capsicum annuum L. var. grossum). Prog. Hort., 43(2): 289-293.
Sivanappan, R.K. 1994. Prospects of micro-irrigation in India. Irrigation and Drainage Systems. 8(1): 49-58.
Waykar, K.R.; Mali, B.K.; Sale, Y.C. and Bhosale, A.B. 2003. Drip irrigation system: A sustainable way for sugar production. Indian J. Agril. Econ., 58(3): 498-499.
Yadukumar, N. and Balasimha, D. 2006. Effect of drip irrigation and fertilizer levels on photosynthesis in cashew. Indian J. Hort., 63(3): 310-315.
Received on 24 July, 2012 and accepted on 21 January, 2013
Online version available at: www.indianjournals.com
Progressive Horticulture, Vol. 45, No. 2, September 2013© Copyright by ISHRD, Printed in India
[Research Article]
Effect of plant bioregulators on seed yield, germination and vigour in okra [Abelmoschus esculentus (L.) Moench]
S. H. Khan*, M. A. Chattoo and Shahnaz MuftiDivision of Olericulture Sher-e-Kashmir University of Agricultural Sciences & Technology Shalimar, J&K - 191 121*E-mail: [email protected]
ABSTRACTThis trial aims to study the effect of growth regulators on seed yield, germination and vigour of okra. Data
reveals that use of NAA @ 100 ppm is effective in enhancing germination (94.67%) and also results in increasing seed yield (29.78 q/ha) as compared to control which recorded only 79.50% germination and 23.15 q/ha seed yield. But as the concentration of NAA was increased beyond 100 ppm it had negative effect reducing both germination and seed yield. Similar trend was also observed for other quality traits.
KEY wORDS: Okra, seed germination, plant bioregulator, vigours
For success in vegetable growing enterprise, high quality seed is not only highly desirable but also statu-tory requirement. The expected returns from any im-proved variety could not be realized unless quality seeds of such variety are made available in adequate quantities to farmers in right time and at optimum price. The com-mercial seed yield in okra depends on the length, thick-ness and number of fruits produced per plant (Baruah & Paul, 1997). Also okra is known for seed germination difficulties and optimum stage of harvest has great im-pact on seed yield, vigour and germinability (Chauhan & Bhandari, 1971 and Singh et al 2003). Plant growth regulators are known to have direct impact on various physiological processes in plants. Growth regulators affect seed germination, vegetative growth, flowering, fruit and seed development, fruit ripening and seed yield. Hence, use of growth regulators was taken up to overcome such difficulties to ensure maximum commer-cial seed yields, seed viability and vigour.
MATERIALS AND METHODSThe present investigation was carried out with okra
variety ‘SKBS-11’ suitable for cultivation under temper-ate conditions of Kashmir valley. The seeds were sown in a Randomized Block Design with seven treatments viz., NAA @ 50 ppm, NAA @ 100 ppm, NAA @ 150 ppm, GA @ 50 ppm, GA @ 100 ppm, GA@ 150 ppm and Control
(no growth regulators applied) replicated thrice at Veg-etable Research Farm, Division of Olericulture SKUAST, Shalimar, Srinagar (J&K) during Kharif season of the years 2006 & 2007. Growth regulators are applied at two stages, first at 30 days after sowing and 2nd at 50 days after sowing. All standard packages of practices were followed to raise a healthy crop. Seeds were sown in plot size of 2.4 x 2.1 m, spaced 45 x 30 cm apart. The ob-servations were recorded on 10 randomly selected com-petitive plants from each treatment and replication by following standard procedures. Data of both the years were pooled and analyzed. The percent germination was estimated as per ISTA (1999). The seedling vigour index was calculated as per Baki and Anderson (1973).
Germination percentage = No. of Normal seedlings x 100
Total No. of Seeds germinated
Seedling Vigour Index = Germination (%) x Seedling length (cm)
100
RESULTS AND DISCUSSIONThe findings of the study clearly indicated impact
of growth regulators on yield and vigour over control. There was appreciable increase in seed yield with the use of NAA but seed yield declined when its concentration

346 Progressive Horticulture, 45 (2)
Table 1: Effect of different treatments on seed yield, quality and vigour in okra
S.No. Treatments Seed yield/ Seed yield 100seed Germination Seedling Vigour plant (g) (q/ha) wt. (g) (%) length (cm) Index
1. Control 33.42 23.15 7.37 79.50 29.05 2309.43
2. NAA @ 50 ppm 42.38 29.40 8.06 85.00 28.39 2413.15
3. NAA @ 100 ppm 43.06 29.78 8.50 94.67 27.39 2593.01
4. NAA @ 150 ppm 41.08 28.36 7.75 89.83 27.07 2431.69
5. GA @ 50 ppm 38.99 27.06 7.76 87.50 27.63 2417.75
6. GA @ 100 ppm 36.68 25.40 7.51 87.50 26.34 2304.75
7. GA @ 150 ppm 31.60 21.89 7.30 84.83 25.41 2325.19
CD at 5% 1.72 1.36 0.94 5.02 3.67 155.05
was increased to 150 ppm. This may be due to toxic effect of growth regulators resulting in decline of seed yield. Highest seed yield of 29.78 q/ha was recorded with ap-plication of NAA @100 ppm followed by NAA @ 50 ppm recording seed yield of 29.40 q/ha. These results are in conformity with Ewette (1980). Similar trend was ob-served for 100 seed weight. Highest 100 seed weight of 8.50 g was recorded with application of NAA @ 100 ppm but as the concentration was increased to 150 ppm the seed weight got reduced. In okra germination is usually poor due to hard seed coat, so pre-sowing treatments are given to improve germination. But by use of growth regulators total germinability (percent seed germination & vigour) has increased tremendously without giving any pre-sowing treatments. Results showed that maxi-mum germination of 94.67% was recorded by the appli-cation of NAA @ 100 ppm as compared to control which recorded only 79.50% germination. Similar results are reported by Chauhan & Bhandari (1971), Ewette (1980) and Manohar (1969). Use of growth regulators showed increased seed vigour with highest seedling vigour in-dex. Seeds become more viable and vigorous due to proper development of embryo and endosperm by pro-portionate use of growth regulators. Maximum vigour index (2593.01) was recorded with application of NAA @ 100 ppm as compared to control which recorded least vigour index (2309.48). These results are in conformity with that of Baruah & Paul (1997), Demir (1994) and Ve-lumani & Ramaswamy (1977). On the basis of above, it can be concluded that application of NAA @ 100 ppm results in maximum commercial seed yield with maxi-mum germination and vigour.
REFERENCESBaki, A. and Anderson, A.A. 1973. Is change in cellular
organelles or membranes related to vigour loss in seeds? Seed Sci. & Technol., 1: 39-125.
Baruah, G.K.S. and Paul, S.R. 1997. Seed development and maturation studies in okra. Ann. Agric. Res., 18: 367-368.
Chauhan, K.S. and Bhandari, V.M. 1971. Pod development and germination studies in okra (Abelmoschus esculen-tus (L.) Moench). Indian J. Agric. Sci., 41:852.
Demir, I. 1994, Development of seed quality during seed development in okra. Acta Horti., 362:125-131.
Ewette, F.K. 1980. Quality seed production in okra. (Abel-moschus esculentus (L.) Moench). Vegetables for Hort. Humid Tropics, No. 5: 39-44.
Manohar, M.S. 1969. Pod development and germination of bhindi (Abelmoschus esculentus (L.) Moench), Exp. Agric., 5: 249-55.
Singh, B.; Yadav, R.C.; Pal, A. K.; Rao, R.G.S. and Rai, M. 2003. Fruit and seed development in okra (Abelmo-schus esculentus (L.) Moench). Veg. Sci., (30): 60-63.
Velumani, N.P. and Ramaswamy, R.R. 1977. Studies on fruit development and maturation in okra. (Abel-moschus esculentus (L.) Moench). Indian J. Horti., 283-285.
Received on 26 April, 2012 and accepted on 12 February, 2013

Online version available at: www.indianjournals.com
Progressive Horticulture, Vol. 45, No. 2, September 2013© Copyright by ISHRD, Printed in India
[Research Article]
Energy utilisation pattern in tomato production under dry-land conditions of Jammu & Kashmir (J&K)
Sanjay Khar, Pawan Sharma, Neerja Sharma, Rakesh Sharma, Punit Choudhary, and Manoj KumarSher – e – Kashmir University of Agricultural Sciences and Technology -Jammu,R.S.Pura, Jammu,J&K. E-mail: [email protected]
ABSTRACTThe aim of this study was to estimate the amount of input and output energy per unit area of tomato production under
dry-land conditions of Jammu in India. A village was selected to assess the resource availability, its utilization pattern of raising tomato crop. The data such as energy inputs in the form of seed, fertilizers, chemicals, irrigation, human, animal etc and output in the form of yield were collected periodically on the pre-tested proforma by a combination of recall method and by taking actual measurements for farmers in the village. The observations on the energy consumption and inputs used for various field activities were collected and the results showed that human labour constituting 65.60% of total energy from different sources was the chief source of power, while Picking, packaging and grading utilized highest operation energy of 2038MJ/ha. The amount of commercial and non-commercial energy consumed was 2837 and 6507 MJ/ha respectively .The benefit: cost ratio was found to be 3.9:1.Based on the findings, it is concluded that it is profitable to raise the crop with the present technology and resource utilizations pattern
KEY wORDS: Energy inputs, energetics, dry land, human power, energy productivity, Jammu, tomato
India is the third largest producer of tomato in the world having 4.97 lakh hectares with annual production of 86 lakh tons which is about 73% of the total cropped area under vege-tables. Tomato mostly considered as “protective foods” based on nutritive value (antioxidant molecules such as carotenoids, particularly lycopene, ascorbic acid, vitamin E and phenol compounds, particularly flavonoids (Sepat et. al., 2013). Jam-mu & Kashmir (J&K) is basically an agricultural state and the agriculture is in transition from low-energy using methods of farming to more energy-intensive agricultural methods. To cope with the food requirement of the states growing popu-lation, self-sufficiency in food production is required, which can be achieved through prudent use of available energy re-sources. Knowledge of the availability of energy and energy use pattern are essential for planning in village energy man-agement. With conventional energy sources depleting at a fast rate on account of increasing demand, energy has emerged as one of the most important considerations in design and man-agement of agricultural operations in recent times.
Several studies have been conducted to determine energy use patterns at the farm level in J&K (Khar et al. 2006 and Lidhoo and Sharma, 1998). But, no study has been conducted to assess energy-use pattern for vegetable cultivation in dry
land belt of J&K. Energy utilization under dry land farming conditions of Jammu is limited due to undulating topogra-phy, small land holdings and poor economic conditions of the farmers. Stabilizing and elevating production in these areas will not only help the farmers, but also generate more em-ployment opportunities. Therefore, future technologies need to take care of the rain-fed agriculture. Moreover, energy ef-ficiency can be greatly improved when the flow of energy through the system is understood (Pimentel and Pimentel, 2005). It was, therefore, postulated that a study should be con-ducted to determine the energy needs for the production of tomato crop grown in Jammu under dry land conditions.
MATERIALS AND METHODSThe village Mawa Brahmna in block Akhnoor of Jammu
district representing the sub-mountain undulating agro-climatic conditions in the state of J&K was selected for the study. The village represents the dry land region of J&K state and the main reasons for selecting this village were the co-operation of farmers, non-existence of urban effect and the number of farm families thus making a reasonable sample. The data such as energy inputs in the form of seed, fertiliz-ers, chemicals, irrigation, human, animal etc and output in

348 Progressive Horticulture, 45 (2)
Table 1: Energy coefficient of various agricultural inputs and output used in the study
Particulars Unit Energy equivalent (MJ unit-1) Reference
A. Inputs
1. Human labour h 1.95 Canakci et al.2005
2. Machinery h 62.7 Canakci et al.2005
3. Diesel fuel L 56.31 Mohammadi et al.2008
4. Chemical fertilizers
4 a) Nitrogen (N) kg 75.46 Taylor et al.1993
4 b) Phosphate (P2O5) kg 13.07 Taylor et al.1993
4 c) Potassium (K2O) kg 11.15 Mohammadi et al.2008
4 d) Sulphur (S) kg 1.12 Mohammadi et al.2008
4 e) mixed micro nutrients kg 120 Alam et al.2005
5. Farmyard manure kg 0.3 Canakci et al.2005
6. Chemicals kg or L
6 (a) Herbicides 238.3 Esengun et al.2007
6 (b) Pesticides 101.2 Esengun et al.2007
6 (c) Fungicides 181.9 Esengun et al.2007
7. Electricity kWh 3.6 Mohammadi et al.2008
8. Water for irrigation m3 1.02 Mohammadi et al.2008
9. Seeds kg 1.0 Esengun et al.2007
B. Outputs
1. Fruit yield kg 0.8 Esengun et al.2007
2. Foilage yield kg 7.5 Esengun et al.2007
Table 2: Use of power sources for cultivation of To-matoes
Operation weighted Mean
Human h/ha 3127
Animal h/ha 30
Nitrogen kg/ha 36
Phosphorus kg/ha 46
Plough h/ha 30
Khurpa h/ha 256
Knap-sack h/ha 60
Farm yard manure kg/ha 250
Table 3: Operation-wise energy use for cultivation of Tomato crop
Operation weighted Mean(MJ/ha)Seedbed preparation 377Nursery preparation 80 & Nursery sowingIrrigation 735Transplanting 628Weeding 502Fertilizers application 10Spraying 118Picking, Packing and Grading 2038Transportation 2000Total 6488

Progressive Horticulture, 45 (2) 349
Table 4: Source-wise energy use (MJ/ha) for cultivation of Tomato crop
Sources weighted Mean(MJ/ha)Human 6129Animal 303Farm yard manure 75Fertilizers 2692Chemicals 120Machinery 25Total 9344
Table 5: Energy sources grouped under different catego-ries of energy for cultivation of Tomatoes
Sources weighted Mean (MJ/ha)Direct energy 6432Indirect energy 2912Renewable energy 6507Non- Renewable energy 2837Direct Renewable energy 6432Indirect Renewable energy 75Indirect Non-Renewable energy 2837Commercial energy 2837Non-commercial energy 6507
the form of yield were collected periodically on the pre-tested proforma by a combination of recall method and by taking actual measurements for farmers in the village. The data col-lected belonged to the production period of 2009–2011and Punjab Chuhara variety. Inputs in the tomato production are human labour, machinery, diesel fuel, chemical fertilizers, farmyard manure, chemicals and irrigation water; and output was tomato fruit yield. The energy equivalences of unit inputs are given in Mega Joule (MJ) unit by mul-tiplying inputs with the coefficient of energy equivalent. Energy equivalents coefficients were calculated based on previous studies. Table 1 show energy equivalents were used for estimating inputs and output energies in tomato production systems (Ghorbani et al., 2011). The physical data collected in the village survey were con-verted by multiplying them with the appropriate energy coefficients (Singh et al. 1998). In agriculture viz., direct, indirect, renewable and non-renewable energies are con-sumed to produce economic yields (Ozkan et al., 2004). Indirect energy consists of energy embodied by fertil-izers, farmyard manure, chemical, seed and machinery. Direct energy includes human labour, diesel fuel, and water for irrigation used in tomato production. Non-re-newable energy consists of diesel, chemicals, fertilizers
and machinery energies and renewable energy includes human labour, seeds, farmyard manure and water for irrigation energies (Sepat et. al., 2013). The economic in-puts of tomato production systems consisted of fixed and variable costs. The fixed costs of production include land value, water value, cost of construction of green house, rent of equipments and depreciation of properties. The variable costs of production consist of current costs such as chemicals, fuel, human labour and electricity. The eco-nomic output of tomato production systems was fruit. The economic output of tomato production systems was fruit. The gross value of production, gross and net re-turns, total cost of production, benefit to cost ratio and productivity indices were calculated by using following formula (Mohammadi et al.2008; Mrini et al.2001).
Gross value of production = Tomato yield (kg ha-1) × Tomato price (‘ ha-1)
Gross return = Gross value of production (‘ ha-1) -Variable cost of production (‘ ha-1)
Net return = Gross value of production (‘ ha-1) -To-tal cost of production (‘ ha-1)
Total cost of production = Variable cost of produc-tion (‘ ha-1) + Fixed cost of production (‘ ha-1)
Benefit to cost ratio = Gross value of production (‘ ha-1) / Total cost of production (‘ ha-1)
RESULTS AND DISCUSSIONThe cultivation of tomato required 3127 man-h/ha for various farm activities and 30 animals-hours/ha in seed bed preparation (Table 2). The vegetable growers have used 36kg/ha of nitrogen and 46 kg/ha of phosphorus, which was less than the recommended dosage of fertiliz-ers. Consequently the average yield of the crop was less. Farm yard manure (FYM) @250kg/ha was also used and was spread manually in the field as such non-uniformity of spreading was observed. The use of less dosage may be attributed to non-availability of sufficient FYM locally and also lack of knowledge about the requirements of FYM in tomato cultivation. FYM. Energy used in vari-ous operations for cultivation of tomato was 6488 MJ/ha (Table 3). Picking, packing and grading alone required 31.41% energy in operations followed by transportation (30.86%), irrigation (11.32%), transplanting (9.68%) and weeding.
Cultivation of tomato required 9344 MJ/ha from dif-ferent sources (Table 4). Human energy accounted for 6129 MJ/ha alone amounting to 65.60% of the total input energy. Energy used in fertilizers was 2692MJ/ha which constituted 28.80% of the total input energy. Animals, chemicals and FYM constituted 5.60 % of the total energy

350 Progressive Horticulture, 45 (2)
input. The DAP was mainly used for seed bed prepara-tion and was not subsequently used indicating its under-utilization. If some of the 3127 hours of human labour are replaced with the animal power which is available in the village, than the drudgery in the human labour can be drastically reduced and also break even may be achieved in maintaining the animal pair. Energy input through machinery was only 0.26 percent. Therefore, even slight-est increase in the energy input through machinery will drastically reduce the energy through human source and make the farm operation more effective and in time. There can also be increase in labour productivity using labour saving and drudgery reducing devices.
The amount of commercial and non-commercial en-ergy consumed was 2837 and 6507 MJ/ha respectively (Table-5). The commercial energy efficiency was found to be 4.51. The same was calculated as given by Dahiya and Vasudevan (1986). The energy required to produce one kg tomato crop was 0.59 MJ while the energy pro-ductivity of 1.70 kg/MJ was found. The studies by Esen-gun (2007) in Turkey showed that the amount of energy consumed in tomato production was 96967 MJ/ha with input-output ratio as 0.8 and energy productivity as 1.00 kg MJ/ha. Economics of the tomato production in the selected village indicated that the profit recorded by the farmers in the selected village was Rs 234400/ha. The tomato crop fetched a price of Rs 294400/ha indicating a benefit-cost ratio of 3.9:1. Therefore tomato production was a cost effective business based on the data of the 2009-2011 production season. It is, thus, inferred that with better management granted through improved technology, the village has potential to increase yields and profits significantly.
In this study, the level of energy input and output in tomato production system was investigated in dry-land conditions of Jammu, Jammu and Kashmir of India. The results indicated that human labour was the chief source of power for raising the tomato crop thus implying that tomato production operation in this region are labour intensive and there is a good scope to save energy by using suitable improved implements for various opera-tions. Human energy utilization was highest for picking; packaging and grading followed by transportation and together accounted for 62.27% of the total operational energy while fertilizer application consumed least ener-gy (0.15%). Present study showed that with the present technology and energy utilization pattern, it is profitable to raise the tomato in the selected village.
REFERENCESAlam, M.S.; Alam, M.R.and Islam, K.K. 2005. Energy flow
in agriculture: Bangladesh. American.J . Env. Sci., 1(3): 213-220.
Canakci, M.; Topakci. M.; Akinci, I. and Ozmerzi, A. 2005. Energy use pattern of some field crops and vegetable production: case study for Antalya Region, Turkey, Ener. Conver. Manag., 46: 655-666.
Dahiya, A.K. and Vasudevan. P. 1986. A Field study of energy consumption pattern on small farms. Energy, 7: 685-689.
Esengun, K.; Erdal, G.; Gundugumas, O. and Erdal, H. 2007. An Economic analysis and energy use in stake-tomato production in Tokat province of Turkey. Renw. Ener., 32(11): 1873-1881
Ghorbani, R.; Mondani, F.; Amirmoradi, S.; Feizi, H.; Khorramdel, S.;Teimouri, M.;Sanjani, S.; Anvarkhah, S. and Aghel, H. 2011. A case study of energy use and economical analysis of irrigated and dryland wheat production systems. Appl. Ener., 88: 283-288.
Khar, S.; Dhar, L.N.; Thusoo,R. and Dhar, S. 2006. Energy consumption pattern of agricultural sector in Jammu and Kashmir on small farms. Environ. Ecolo., 24(S): 687-689.
Lidhoo, C.K. and Sharma, S. 1998. Energy utilization pat-tern in a typical dryland village of Jammu region- A case study. Inst.Engg.Ind.J., 79: 25-28.
Mohammadi, A.; Tabatabaeefar, A.; Shahin, S.; Rafiee, S. and Keyhani, A. 2008. Energy use and economical analysis of potato production in Iran, a case study: Ar-dabil province. Ener. Conver. Manag., 49: 3566-3570.
Mrini, M.; Senhaji, F., and Pimentel, D. 2001. Energy analysis of sugarcane production in Morocco. Env. Develop. Susta., 3:109-126.
Pimentel, D. and Pimentel, M. 2005. Energy use in agricul-ture: an overview. LEISA India, INDIA., 7(1): 5-7.
Sepat, N.K.; Sepat, S.R.; Sepat, S. and Kumar, A. 2013. Energy use efficiency and cost analysis of tomato under greenhouse and open field production system at Nubra valley of Jammu and Kashmir. International J. Environ. Sci., 3(4): 1233-1241.
Singh, S.; Bakshi, R. and Singh, M.P. 1998. Research digest on energy requirements in agricultural sector in the state of Punjab, FPM/ERAS/88-1, Department of Farm, Power and Machinery, Punjab Agricultural University, Ludhiana.
Taylor, E.B.; Callaghan, P.W.and Probert, S.D.1993. Energy audit of an English farm. Appl. Ener., 44(4): 315-335.
Received on 13 November, 2012 and accepted on 28 April, 2013

Online version available at: www.indianjournals.com
Progressive Horticulture, Vol. 45, No. 2, September 2013© Copyright by ISHRD, Printed in India
[Research Article]
Estimation of biological divergence in cabbage (Brassica oleracea var. capitata L.)
M.L. Meena, R.B. Ram, Deepa. H. Dwivedi and Navaldey Bharti Department of Applied Plant Science (Horticulture),School for Biosciences and Biotechnology Babasaheb Bhimrao Ambedkar University, Vidya Vihar, Rae Bareli Road, Lucknow, Uttar Pradesh-226025, IndiaE-mail: [email protected]
ABSTRACTGenetic divergence study was conducted by using 30 diverse genotypes of cabbage for 11 characters. Based
on Mahalanobis D2 analyses using to tocher’s method the genotypes were grouped into 3 clusters. For morphol-ogy and yield characters, intra-cluster average ranged from 2.241 to 5.304 the intra-cluster value was maximum in cluster II (3.057) and minimum in cluster III (2.241). The maximum inter-cluster distance was obtained between cluster I and II (5.304) while the minimum distance was found between clusters I and III (2.241).Cluster II showed superiority for certain morphological and horticultural traits. The cluster-wise mean performance suggested that genotypes Pusa Ageti, 1923, KK-3, KK-2 and RRM of cluster-II, in cabbage respectively, could be utilized ef-fectively in hybridization programme for getting desirable segregants. In the present study five characters con-tributed 78.09 % of divergence, namely, five characters contributed % of divergen viz, days to maturity (38.19%), number of non-wrapper leaves (12.05%), core length (11.31 %), stalk length (9.01%) and leaf width (7.53 %), of the total divergence.
KEY wORDS: Cabbage, genetic diversity, divergence, D2 analysis, hybridization
Cabbage (Brassica oleracea var. capitata L) a mem-ber of brassicaceae family, is an economically and nu-tritionally important Cole crop being grown in more than ninety countries and consumed widely around the globe (Chaing et al, 1993 and Singh et al, 2009) . It is ex-tensively cultivated for its heads, and a good source of phosphorus, calcium, iron proteins, vitamins A and C (Munger, 1988). It provides a wide range of variability, diversity with a tremendous scope for genetic studies and improvement by breeding. Therefore, breeding and development of high yielding superior varieties through hybridization requires prior quantification of genetic divergence in the gene available and more so of the pa-rental line to be involved in crossing program. More diverse the parents; greater are the chance of obtaining high heterotic F1s and broad spectrum of recombination’s and transgressive segregants in the segregating genera-tions (Murty and Arunachalam, 1966). Improvement in yield and quality is normally achieved by selecting genotypes with desired character combinations existing in the nature or hybridization. Mahalanobis’s statistical
distance is a powerful tool for quantitative a assessment of genetics diversity (Bhattacharya et al, 1979 and Das and Borthakur, 1973). The qualification of genetic diver-sity through biometrical procedures has made it possible to choose genetically diverse parents for a successful hy-bridization programme. Hence, the present investiga-tion was planned to generate information on the genetic diversity present in 30 diverse genotypes of cabbage and to select the suitable genotypes for further utilization in breeding programme.
MATERIALS AND METHODSThe experimental materials comprised of 30 cabbage
genotypes of tropical and subtropical origin belongings to white, red and savoy types. Each genotype was plant-ed in a plot having 3.0×2.7 m area in randomized block design, with three replications. There were 25 plants in each plot planted at row and plant spacing of 60×45 cm. All the standard package of practices and plant protec-tion measures were timely adopted to raise the crop suc-
352 Progressive Horticulture, 45 (2)
cessfully. Five randomly selected plants from each repli-cation were utilized for recording observations viz., days to maturity, number of non-wrapper, core length (cm), stalk length(cm), equatorial length(cm), leaf length(cm), leaf width(cm),polar length (cm), gross weight(kg), head weight(kg) and yield (t/ha) at the Horticultural Research Farm of the Department of Applied Plant Sci-ence (Horticulture), BBAU, Lucknow during the winter season of 2006 to 2008. The mean values obtained from two years data were use for estimating the analysis of variance by Panse and Sukhatme (1978). Genetic diver-sity between groups was estimated by using D2 statistics given by Mahalanobis’s (1936) following the procedure given by Rao (1952). All the 8 variables were correlated and transformed into uncorrelated linear combinations through pivotal condensation method using the error variance–covariance dispersion matrix. The mean value of the uncorrelated liner combinations where comput-ed to calculated D2 values between all possible pairs of genotypes. The grouping of genotypes was done using Tocher’s methods as described by Rao (1952).
RESULTS AND DISCUSSIONThe analysis of variance revealed significance differ-
ences among the genotypes of cabbage for the characters indicating the existence of high genetic variability among the genotypes. The D2 values raged form 2.292 to 5.304 and principal component scores also indicated a high degree of genetic diversity among the genotypes. Based on the relative magnitude of the D2 values the 30 geno-types were grouped into three clusters in pooled over year (Table-1). It was observed that cluster -1 consists of ten genotypes, cluster – II with five genotypes, while cluster-III consisted of fifteen genotypes. The grouping pattern of genotypes was observed to be random indicat-ing the geographical diversity and genetic divergences were unrelated. Further, it was observed that genotypes belonging to the same origin not only appeared in the same cluster but many of them were also distributed in different clusters, which may be due to preferential selection of ideotypes suitable for various vegetable purposes. The findings clearly demonstrated that there was no parallelism between the geographic origin and genetic diversity in cabbage. Therefore, the selection of genotypes for hybridization should be based on genetic divergence rather than geographical diversity. The inter-cluster and intra-cluster distance of 30 diverse genotypes are presented in (Table-2). Highest inter-cluster distance was observed between cluster-I and II (5.304). Similarly, maximum intra-cluster divergence varied from 3.057 to 2.292 the vide highest being in cluster-II, suggesting diversity between the groups. Hybridization between parental lines selected for these clusters are likely to pro-
duce most variable progenies through a systemic breed-ing for high economic yield and quality recombinants.
The cluster means of 30 genotypes (Table -3) showed that the mean values of the clusters varied in magnitude for all the characters. Cluster II showed the highest values of almost all the important morphological traits except days to maturity like days to maturity (86.14 %) , num-ber of non-wrapper leaves ( 16.63 ), core length ( 11.31 ) , stalk length (9.01) and leaf width (32.79 ), leaf length (32.68), equatorial length(26.63), polar length (20.90), gross weight(2.94), head weight(1.81) and yield (41.44 ), respectively, the genotypes Pusa Ageti, 1923, KK-3,KK-2 and RRM of cluster-II, which showed the highest cluster mean values of all the morphological traits. Its can be used as donor parent in back cross breeding programme for improving the quality traits in cabbage. Assessment days to maturity (38.19 %) had contributed highest to-wards to total divergence. Five characters contributed 78.09 % of divergen viz. Five characters contributed % of divergen viz, days to maturity (38.19%), number of non-wrapper leaves (12.05%), core length (11.31 %), stalk length (9.01%) and leaf width (7.53 %). Similar reports of clustering means were also mentioned earlier by Ghe-bralk, 2004 and Meena et al, 2010 in cabbage. So, it may be concluded in cabbage, there is a vast scope to develop new varieties with more yield and economic importance by using this elite germplasm collection. To develop ear-ly varieties with superior quality, selection from cluster
Table 1: Cluster pattern of 30 cabbage genotypes for morphological characters.
Clusters Genotypes Number of included genotypes
1. C-1,C-3,C-4,C-5,C-16,C-17, 10 Early Drum Head, Red Cabbage and Pusa Synthetic
2. Pusa Ageti, 1923, 5 KK-3,KK-2 and RRM
3. C-2, C-6, C-7,C-8,C-9, C-10 15 C-11, C-12C-13,C-14, C-15 Pusa Mukta, MR-1, Pride of India and Prem Nath
Table 2: Inter and intra-cluster distances (D2values) genotypes for morphological characters.
1 2 31 2.594 5.304 2.2412 3.057 4.1703 2.292
Figures under lined are intra-cluster average divergence (D2values).

Progressive Horticulture, 45 (2) 353
Table 3: Cluster-wise means performance of cabbage genotypes for different morphological characters.
Clusters Days to Non Core Salk Leaf Leaf Equatorial Polar Gross Head Yield maturity wrapper length length width length length length weight weight (t/ha) leaves (cm) (cm) (cm) (cm) (cm) (cm) (kg) (kg)
1 81.70 13.02 6.20 6.39 24.12 23.78 18.80 17.73 1.73 1.02 21.08
2 86.14 16.63 11.31 4.16 32.79 32.68 26.63 20.90 2.94 1.81 41.44
3 90.74 16.10 8.00 3.92 26.34 24.27 18.70 20.41 2.07 1.20 21.70
Range Min. 71.28 5.40 2.31 2.36 14.35 15.95 12.10 12.43 1.20 0.49 11.10
Range Max. 110.53 23.70 13.85 9.46 42.75 46.02 31.10 27.40 3.55 2.33 56.60
Mean 86.96 15.16 7.95 4.78 26.68 25.49 20.05 19.60 2.10 1.24 24.78
SE m ± 2.94 0.75 0.46 0.27 0.63 0.55 0.47 0.40 0.16 0.08 0.56
CV (%) 5.86 8.56 10.19 9.83 4.07 3.78 4.19 3.57 13.08 11.43 3.90
Contribution 38.19 12.05 11.31 9.01 7.53 6.76 4.39 4.22 2.72 2.21 1.61 towards total divergence
III will be more effective and to develop high yielding va-rieties having high quality traits, selection could be made from cluster II. To breed early varieties with high quality traits, the hybridation between genotypes of cluster III and II followed by selection in segregating generation can be made. In general, the pattern of distribution of genotypes from different regions in to different clusters was random. Similar observations were also reported by (Quamruzzaman et al, 2007) in cauliflower. One of the possible reasons may be the fact that it is very difficult to establish the actual location of origin of a genotype. The free and frequent exchange of genetic material among the farmers and breeders in the country makes it very difficult to maintain the real identity of genotype. The absences of relationship between genetic diversity and geographical distance indicates that forces other than geographical origin such as exchange of genetic stock, genetic drift spontaneous variation, natural and artifi-cial selection are responsible for genetic diversity. It may also be possible that causes of clustering pattern were much influenced by environment and genotype × en-vironment interaction resulting in different expression .Another possibility may be that estimates of diversity based on the characters used in the present investigation might not have been sufficient to account for the vari-ability caused by some other traits of physiological or biochemical nature which might have been important in depiciting the total genetic diversity in population. There-fore, selection of genotypes for hybridization should be based on genetic diversity rather than geographic diver-gence (Mehta et al, 2004 in brinjal and Dey et al, 2004 in bitter gourd A number of workers have observed that
diverse the parents within it’s over all limits of fitness, the greater are the chance of heterotic expression in F1s and broad spectrum of variability in segregating genera-tions (Arunachalam, 1981). The result of this investiga-tion also suggested that crossing of the genotypes hav-ing high mean yield and high inter-cluster distance may lead to express greater heterotic expression and broad spectrum of favourable genetic variability in segregat-ing generations for improvement of morphological traits in cabbage. On the basis of Inter-cluster distance, cluster means and character with high combination of D2 values, genotypes viz., Pusa Ageti, 1923, KK-3, KK-2 and RRM in cabbage respectively, could be utilized effectively in hybridization programme for getting desirable seg-regants. Thus, information on genetic diversity will help in utilizing the exploitation of hybrid vigour for cabbage.
ACKNOwLEDGEMENTAuthors are grateful to the Head & Principal Sci-
entist IARI, Regional Research Station, Katrain, Kullu Valley (H.P.) for providing research materials, evincing keen interest and continuous guidance during the course of investigation.
REFERENCES
Arunachalam, V. 1981. Genetic distance in plant breeding. Indian J. Genet., 41: 226-236.
Bhattacharya, M.K.; Nandupri, K.S. and Singh, S. 1979. Genetic divergence in tomato (Lycopersicon esculentum

354 Progressive Horticulture, 45 (2)
Mill). Acta Hort., 95: 289-300.
Chaing, M.S.C.; Landry, B.S. and Crete, R. 1993. Cabbage (Brassica oleracea var. capitata L.) In: Genetic improve-ment in Vegetable Crops (G. Kalloo and B.O.Berg Ed.), Paragamon Press, New York.
Das, G.R. and Borthakur, D.N. 1973. Genetic divergence in rice. Indian J. Genet., 33: 436-443.
Dey, S.S., Behera, T.K., Munshi, A.D. and Sirohi, P.S. 2007. Studies on genetic divergence in bitter gourd (Mo-mordica charantia L.). Indian J. Horti., 64(1): 53- 57.
Ghebramlak, A.M. 2004. Genetic variability in cabbage (Brassica oleracea var. capitata L.). M.Sc. thesis sub-mitted to P.G. School, Indian Agricultural Research Institute, New Delhi.
Meena, M.L.; Ram, R.B. and Lata, Rubee 2010. Genetic divergence for certain quality traits in cabbage (Bras-sica oleracea var. capitata L.) genotypes. Environment Ecology, 28(4A): 2572-2575.
Quamruzzaman, A.K.; M.Rahman M.M.; Uddin, M.N.; Siddiky, M.A. and Prodhan, M.D.H. (2007). Genetic diversity in cauliflower (Brassica oleracea var. botrytis L.). Indian J. Horti., 64(1): 50-52.
Mahalanobis, P.C. 1936. On the generalized distance in statistics. Proc. Nat. Inst. Sci. India, 2: 49-55.
Mehta, D.R.; Golani, I.J.; Pandya, H.M.; Patel, R.K. and Naliyadhara, M.V. 2004.Genetic diversity in brinjal (Solanum melongena L.). Veg. Sci., 31: 142-145.
Munger, H. 1988. Adaptation and Breeding of Vegetable Crops for Improved Human Nutrition .In: Horti-culture and Human Health (B. Quebedeaux and F.A. Bliss eds.) Prentice Hall Englewood Cliffs, NJ. pp.177-184.
Murti, B.R. and Arunchalam, V. 1966. The nature of genetic divergence in relation to breeding system in crop plants. Indian J. Genet., 26: 188-198.
Panse, V.G. and Sukhatme, P.V. (1978). Statistical methods for agricultural workers, Indian Council of Agricul-tural Research, New Delhi. 108 p.
Rao, C.R. 1952. Advanced Statistical Methods in Biometri-cal Research, John Wiley and Sons, Inc. New York.
Singh, B.K.; Sharma, S.R. and Singh, B. 2009. Heterosis for mineral elements in single cross- hybrids of cab-bage (Brassica oleracea var. capitata L.). Scientia Horti., 122(1): 32-36.
Received on 16 October, 2012 and accepted on 11 May, 2013
Online version available at: www.indianjournals.com
Progressive Horticulture, Vol. 45, No. 2, September 2013© Copyright by ISHRD, Printed in India
[Review Article]
Influence of growing condition, spacing and calcium sprays on seed quality parameters of tomato (Solanum lycopersicum L.)
S. Harish1*, N. K. Biradarpatil2
1Department of Seed Science and Technology, CCSHAU, Hisar, Haryana2Department of Seed Science and Technology, UAS, Dharwad, Karnataka* E-mail : [email protected]
ABSTRACTExperiment was conducted to find out the effect of growing condition, spacing and calcium sprays on seed
quality parameters of tomato in National Seed Unit, UAS, Dharwad. Experiment consist of two growing condi-tions viz., open field and naturally ventilated polyhouse condition with three levels of spacing viz., 60 x 45, 60 x 60 and 60 x 75 cm and four stages of calcium sprays viz. control, weekly, fortnightly and monthly spray. Between two growing condition, polyhouse grown condition recorded significantly higher values for seed quality param-eters such as 1000 seed weight (2.57 g), seed germination (87.91 %), root length (3.74 cm), shoot length (9.35 cm), dry weight of seedlings (15.22 mg) and seedling vigour index (1149) compared to open field condition. 60 x 60 cm spacing recorded significantly higher values for 1000 seed weight (2.53 g), seed germination (88.04 %), root length (3.81 cm), shoot length (9.60 cm), dry weight of seedlings (15.95 mg) and seedling vigour index (1160) compared to S1 and S3. The fortnightly calcium spray recorded consistently higher values for 1000 seed weight (2.53 g), seed germination (87.14 %), root length (3.82 cm), shoot length (9.50 cm), dry weight of seedlings (15.98 mg) and seedling vigour index (1142).
KEY wORDS: Polyhouse, spacing, calcium spray, germination, seedling vigour
Tomato (Solanum lycopersicum L.) belongs to the family Solanaceae (also known as the nightshade fam-ily) having chromosome number (2n=24). It is one of the most popular self pollinated and widely grown annual vegetable crops second to potato. It occupies a distinct place in the realm of vegetables, because of its high nutritive value and commercial cultivation. Indian contribution towards the world’s production is 16.82 million tonnes and crop is grown in an area of 0.86 mil-lion hectare yielding 19.5 tonnes ha-1. In Karnataka, the crop is grown in an area of 0.05 million hectare with a production of 1.75 million tonnes and the average yield is of 34.3 tonnes ha-1 (Anon, 2011). The search for new avenues has led to the development of Hi-Tech preci-sion agricultural systems. Green house, the latest word in Indian agriculture is one such means, where the plants are grown under controlled or partially controlled en-vironment resulting in higher yields than that is pos-sible under open condition. Greenhouse is an important structure to minimize biotic and abiotic stress on crops, which could be grown round the year, during off-season
and also under extreme climatic conditions. It provides a controlled environment inherently free from pest and diseases problems that increases the fruit and seed yield production and productivity per unit area as compared to open field condition. Microclimate control in green-house implies superior quality fruit yield, free from pathogens, insect bites and insecticidal residues (Singh et al., 2004). Standardization of techniques like spacing under polyhouse is one of the aspects which may in-crease the seed yield. One of the main factors affecting crop productivity is plant population which is mainly governed by the plant architecture, soil fertility, time of planting etc. Maintenance of optimum plant density es-pecially under cover assumes greater importance since it accounts for manyfold increase in yield when other factors are non-limiting.
Calcium plays a key role in plant growth and fruit development and it is involved in many biochemical and physiological processes (Saure, 2005). Calcium is in-volved in cell division and cell elongation (Ashraf, 2004).

356 Progressive Horticulture, 45 (2)
Calcium treatments delays ripening and senescence and improves fruit and vegetable quality. Many physiologi-cal disorders of storage organs, such as bitter pit in ap-ples, cork spot in pears, blossom end rot in tomatoes, tip burn in lettuce and hollow heart in potatoes are related to calcium content of the tissue (Sharma et al., 1996). Cal-cium sprays are beneficial in correcting blossom end rot, calcium absorbed through the leaves cannot move into the fruit. Hence, only the Ca that lands on the fruit sur-face are utilized (Adams, 1999). Calcium content in the plant system is involved in enhancing the seed develop-ment, test weight, enzyme activity and hormonal activ-ity in the seed (Hepler and Wayne, 1985). Therefore, an attempt has been made in present study to find out the suitable growing condition, optimum spacing and cal-cium sprays on seed quality parameters in tomato.
MATERIALS AND METHODSAn investigation was carried out at Seed Quality
and Research Laboarch Laboratory of National Seed Unit, UAS, Dharwad during kharif 2010-11. The seeds of tomato variety cv. DMT-2 were used for conducting the storage experiment. The experiment consisted of 24 treatment combination comprising of two growing con-dition viz., naturally ventilated polyhouse (G1) and open field condition (G2) and three levels of spacing viz., 60 x 45 (S1) , 60 x 60 (S2) and 60 x 75 cm (S3) and four levels of calcium sprays viz., No calcium spray (Control) (C1), weekly calcium spray (C2), fortnightly calcium spray (C3) and monthly calcium spray (C4). The laboratory ex-periment was conducted in the completely randomized design with factorial concept and was replicated four times.
Four replications of 1000 seeds from each treatment were taken at random and weighed. The mean weight of 1000 seeds was expressed in grams. Germination test was conducted using four replicates of 100 seeds each by adopting “Top of paper method” as described by ISTA (Anon., 2007). The germination cabinet was maintained at 25 ± 10C temperature and 90 ± 2 per cent relative hu-midity. At the end of 14th day of germination test, the number of normal seedlings in each replication was counted and the germination was calculated and ex-pressed in percentage. The root and shoot length was measured from the tip of the primary root to base of hy-pocotyl and from the base of primary leaf to the base of the hypocotyls, respectively and was expressed in centi-meters. Ten normal seedlings used for measuring root and shoot length were kept in butter paper and dried in a hot-air oven maintained at 75 ± 10C temperature for 24 hours. Then the seedlings were removed and allowed to cool in a desiccator for 30 minutes before weighing in an electronic balance. The average weight was calculated
and expressed as dry weight of seedlings in milligrams (Anon., 2007). The seedling vigour index was computed by adopting the method suggested by Abdul Baki and Anderson (1973). The data collected in respect to vari-ous parameters on seed quality attributes were analyzed statistically as described by Gomez and Gomez (1984). The critical difference (CD) values were calculated at 5 per cent (P=0.05) probability level where ‘F’ test was significant. The data on percentage of germination was transformed into arcsine square root percentage values and transferred data was used for statistical analysis (Snedecor and Cochran, 1967).
RESULTS AND DISCUSSIONSEnvironment is the aggregate of all external condi-
tions which influence the growth and development of crop, which play dominant role in crop production. Gen-erally, crops are not profitable unless they are adapted to the region in which they are produced. Raising a crop successfully means the crop must be productive and economical to grow under prevailing conditions (Red-dy, 1999). Fruit setting in tomato is good in the plains as well as hills but its seed setting is very poor under plains as compared to hills because of spread of viral diseases (Sharma, 1999). Its seed production is highly remunera-tive, but because of lower seed yield and seed quality, it is not being taken up by the farmers. Taking up the tomato seed production under polyhouse leads to higher seed yield and seed quality, inturn better profit compared to open field condition. The favourable microclimate of greenhouse favours the fruit and seed production in turn high quality seeds. Seed quality parameters such as 1000 seed weight, germination per cent, root length, shoot length, dry weight of seedlings and vigour index were found to differ significantly between the growing condi-tion, irrespective of the spacing and calcium sprays. On an average, all the seed quality parameters showed con-sistently more values (2.57 g, 87.91 %, 3.74 cm, 9.35 cm, 15.22 mg and 1149, respectively) under naturally venti-lated polyhouse condition compared to open condition (2.42 g, 84.61 %, 3.58 cm, 9.26 cm, 9.26 mg and 1077, respectively) (Table 1). This may be due to the better de-velopment of seeds and more assimilation and transloca-tion of photosynthates from source to sink relationship in the plant system. Hence, it was observed higher 1000 seed weight in naturally ventilated polyhouse condition which inturn might have influenced on other seed qual-ity parameters.
One of the main factors affecting crop productivity is plant population which is mainly governed by the plant architecture, soil fertility, time of planting etc. Mainte-nance of optimum plant density especially under cover assumes greater importance since it accounts for many

Progressive Horticulture, 45 (2) 357
Table 1: Effect of growing condition, spacing and calcium sprays on seed quality parameters in tomato
Treatments 1000 seed Germination Root length Shoot Dry weight Seedling weight (g) (%) (cm) length of seedlings vigour (cm) (mg) indexGrowing condition (G) G1- Open field condition 2.42 84.61 (66.93) 3.58 9.26 14.9 1077G2- Naturally ventilated polyhouse condition 2.57 87.91 (69.68) 3.74 9.35 15.22 1149S. Em ± 0.00 0.60 0.04 0.12 0.09 10.19CD at 5% 0.03 3.65 NS NS NS 62.01Spacing (S) S1- 60 cm x 45 cm 2.44 85.12 (67.34) 3.52 9.11 14.27 1077S2- 60 cm x 60 cm 2.53 88.04 (69.80) 3.81 9.6 15.95 1160S3- 60 cm x 75 cm 2.51 85.63 (67.75) 3.64 9.2 14.96 1102S. Em ± 0.01 0.45 0.02 0.05 0.14 7.04CD at 5% 0.05 1.47 0.08 0.18 0.46 22.95Calcium sprays (C) C1- No calcium spray 2.46 85.04 (67.27) 3.55 9.16 14.32 1080C2- Weekly calcium spray 2.5 86.81(68.74) 3.65 9.32 15.2 1121C3- Fortnightly calcium spray 2.53 87.14 (69.01) 3.82 9.5 15.98 1142C4- Monthly calcium spray 2.48 86.05 (68.10) 3.61 9.23 14.73 1109S. Em ± 0.01 0.30 0.02 0.04 0.12 3.93CD at 5% 0.02 0.85 0.05 0.11 0.34 11.26Interaction (GxS) G1S1 2.39 82.82 (65.54) 3.48 8.95 14.26 1026G1S2 2.43 86.83 (68.75) 3.71 9.59 15.61 1129G1S3 2.43 84.19 (66.60) 3.55 9.21 14.82 1075G2S1 2.49 87.42 (69.25) 3.56 9.27 14.28 1128G2S2 2.63 89.25 (70.89) 3.91 9.62 16.28 1191G2S3 2.58 87.07 (68.96) 3.74 9.19 15.09 1128S. Em± 0.02 0.64 0.03 0.08 0.2 9.95CD at 5% NS NS NS NS NS NSInteraction (GxC) S. Em ± 0.02 0.73 0.04 0.09 0.29 9.62CD at 5% NS NS NS NS NS NSInteraction (CxS) S. Em ± 0.02 0.89 0.05 0.12 0.36 11.78CD at 5% NS NS NS NS NS NSInteraction (GxSxC) Mean 2.49 86.26 (68.27) 3.66 9.30 15.06 1113S. Em ± 0.03 1.26 0.08 0.16 0.51 16.66CD at 5% NS NS NS NS NS NS
NS- Non significant *The figures in the parenthesis are the arcsine transformed values

358 Progressive Horticulture, 45 (2)
fold increase in yield when other factors are non-limiting. The present study has revealed significant differences on seed quality parameters with three levels of spacing. All the seed quality parameters viz. germination per cent, root length, shoot length, dry weight of seedlings and vigour index showed significantly higher values (2.53 g, 88.04 %, 3.81 cm, 9.60 cm, 15.95 mg and 1160, respec-tively) with 60 cm x 60 cm spacing (Table 1). Better seed quality attributes with medium spacing might be due to better plants nourishment resulting in proper develop-ment of seed, which reflected in higher 1000 seed weight and other seed quality parameters. Similar results are also reported by Kalappa (1982), Dharmatti and Kulkar-ni (1988), Sharma and Peshin (1994) in bell pepper.
Calcium plays a key role in plant growth and fruit de-velopment and it is involved in many biochemical and physiological processes (Saure, 2005). Calcium is a chief constituent of biomembranes and is involved in main-tenance of membrane integrity. Calcium is involved in cell membrane stability and permeability in addition to its involvement in cell division and cell elongation (Ashraf, 2004). The study has revealed significant dif-ferences on seed quality parameters with three levels of calcium sprays. Seed quality parameters viz. 1000 seed weight, germination per cent, root length, shoot length, dry weight of seedlings and vigour index differed sig-nificantly among the calcium sprays, irrespective of growing condition and spacing. Among the sprays fort-nightly calcium spray recorded significantly higher 1000 seed weight (2.53 g) compared to weekly calcium spray (2.50 g) . Excess calcium application on plants observed negative effect on 1000 seed weight reported by (Shar-ma, 1999) in bell pepper. Calcium is involved in enhanc-ing seed development, test weight, enzyme activity and hormonal levels in seed reported by Hepler and Wayne (1985). Similar results were observed with Sharma (1995), Hamsaveni et al., (2003) in tomato. Significantly germi-nation per cent, root length, shoot length, dry weight of seedlings and vigour index was recorded higher in fort-nightly calcium spray (87.14 %, 3.82 cm, 9.50 cm, 15.98 mg and 1142) (Table 1). The increase in germination per cent might be due to increased 1000 seed weight which might have supplied adequate food reserves to resume embryo growth. The application of calcium reported to increase calcium content in seed which inturn as benefi-cial effect on seed membrane integrity leading to higher germination in groundnut (Sandhya and Singh, 1995). Hamsaveni et al., (2003) reported that higher germina-tion in tomato might be due to greater accumulation of calcium in the seeds thus resulting in better seed qual-ity parameters. These results were in conformity with Sharma (1995) in tomato and Sharma (1999) in bell pep-per. The two and three way interaction between grow-
ing condition, spacing and calcium sprays did not show significant differences for seed quality parameters.
REFERENCESAbdul-Baki, A.A. and Anderson, J.D. 1973. Vigour deter-
mination of soybean seeds by multiple criteria. Crop Sci., 13: 630-633.
Adams, P. 1999. plant nutrition demystified. Acta Horti., 481: 341-344.
Anonymous, 2007. International Rules for Seed Testing. Seed Sci. and Technol., 29(Supl.): 1-348.
Anonymous, 2011. Indian Horticulture Database-2011. National Horticulture Board, Government of India. pp. 181-182.
Ashraf, M. 2004. Some important physiological selec-tion criteria for salt tolerance in plants. Flora, 199: 361-376.
Dharmatti, P.R. and Kulkarni, G.N. 1988, Effect of nutri-tion, spacing and pickings on seed yield and seed quality in bell pepper. Seed Res., 16(2): 148-151.
Gomez, K.A. and Gomez, A.A. 1984 “Statistical Proce-dures for Agricultural Research”. John Wiley and Sons, New York, pp. 168.
Hamsaveni, M.R.; Kurdikeri, M.B.; Shekhargouda, M.; Shashidhara, S.D. and Dharmatti, P.R. 2003. Effect of gypsum and boron on seed yield and quality on tomato cv. Megha. Karnataka J. Agric. Sci., 16(3): 457-459.
Hepler, P.K. and Wayne, R.O. 1985, Calcium and plant development. Annual Review of Plant Physiology, 36: 397-439.
Kalappa, V.P. 1982. Seed production studies in selection-16 sweet pepper (Capsicum annuum L. Grossum sendt). M.Sc. (Agri.) Thesis. Univ. of Agric. Sci., Bangalore, Karnataka, India.
Reddy, S.V. and Reddy, M.B. 1994, Effect of seed pro-tectants on storability of egg plant (Solanum melongena L.). Seed Res., 22: 181-183.
Sandhya, K. P. and Singh, B. G. 1994, Effect of pre sowing seed treatment with calcium containing compounds on emergence index in groundnut (Arachis hypogeal L.). Seed Res., 22: 170-171.
Saure, M.C. 2005. Calcium translocation to fleshy fruit: its mechanism and endogenous control. Sci Horti., 105: 65-89.

Progressive Horticulture, 45 (2) 359
Sharma, S.K. 1995. Response of boron and calcium nutri-tion on plant growth, fruit and seed yield of tomato. Veg. Sci., 22(1): 27-29.
Sharma, S.K. 1999. Effect of boron and calcium on seed production of bell-pepper (Capsicum annuum L.). Veg. Sci., 26(1): 87-88.
Sharma, S.K. and Peshin, S.N. 1994. Influence of nitrogen and spacing on plant growth, fruit and seed yield of
sweet pepper. Indian J. Hort., 51(1):100-105.
Singh, A.K.; Singh, A.K.; Gupta, M.J. and Shrivastava, R. 2004. Effect of variety and spacing on growth, yield and economics of capsicum under greenhouse condi-tion. Prog. Horti., 36(2): 321-330.
Snedecor, G. and Cochran, W.G. 1967. Statistical Methods, Oxford and IBH Publishing Company, Bombay, pp. 135-197.
Received on 26 February, 2013 and accepted on 11 August, 21013
Online version available at: www.indianjournals.com
Progressive Horticulture, Vol. 45, No. 2, September 2013© Copyright by ISHRD, Printed in India
[Research Article]
Standardization of wrapping and packaging techniques to enhance the post harvest life of carnation
S. Karthikeyan,1 and M. Jawaharlal2
Department of Floriculture & Landscaping, Horticultural College & Research Institute,Tamil Nadu Agricultural University, Coimbatore - 641 003, Tamil Nadu, India.E-mail: [email protected]
ABSTRACTCarnation is a highly sensitive cut flower, needs to be transported without exposure to ethylene and to prevent
the build up of ethylene concentration above the threshold level in boxes, ventilation holes are provided in the sides of boxes which help in free exchange of air. The studies on the wrapping up of the flowers with polyethylene sleeves of 50 gauge thickness, butter paper, newspaper and packed in corrugated fibre board boxes with differ-ent percentage of ventilations are important for determining the suitable packaging techniques during transport of flowers to markets. Wrapping in polyethylene sleeves of 50 gauge thicknesses and placing in corrugated fibre board boxes having 4 % ventilation is the best packaging method for transporting carnation flowers to distance market. This packaging would ensure minimum physical damage, physiological loss in weight and membrane integrity and would extend the vase life to 11.67 days when compared with control (newspaper wrapping and CFB boxes with 2 % ventilation) wherein flowers remain fresh for 6.00 days only.
KEYwORDS: Wrapping, packaging, polyethylene, vase life, ventilation
Carnation is one of the most important cut flower in the domestic and international markets. Wrapping and packaging are two important aspects in the post harvest handling of cut flowers since they form the final steps in the post harvest handling sequence just before reaching the customers. The post harvest life of flowers can be ex-tended by delaying the senescence of flowers after pack-ing. Generally, the post harvest problems arise when the flowers are being continuously loaded and unloaded while transporting to market. Market loss of cut flow-ers due to inefficient post harvest handling and packag-ing is estimated to be around 20 to 40 % in our country. Airfreight costs are highly prohibitive when compared to flowers export by sea. Hence, the vase life of the flow-ers must be extended to provide the consumer with equivalent flower quality when exported by sea (Rit and Hinsch, 1972). Packaging procedures and techniques vary amongst different exporting countries, especially in respect of use of ice, vapour barriers, flower bunch sleeves and number of holes (Laurie and Laurie, 1973). Packaging must ensure protection of flowers against flower damage, water loss and external conditions, which are detrimental to flowers in transit (Sivasamy et
al., 1999). Packaging is an important factor responsible for improving the quality of saleable products (Pandey et al., 1983). Adequate packaging protects the produce from physiological, pathological and physical deteriora-tion in the marketing channels and retains their fresh-ness and attractiveness (Maini et al., 1993). The flowers are normally covered with polyethylene sleeves and the stem ends are tied together with rubber bands. The poly-ethylene sleeves extend the longevity of the flowers by controlling the environment and aid in viewing of the products by the buyers without disturbing the cartons and thus, losses due to abusive handling are minimized (Bhattacharjee, 1997). The present study was taken up to standardize the wrapping and packaging techniques for carnation flowers.
MATERIALS AND METHODSThe present investigation was conducted at the De-
partment of Floriculture and Landscaping, Tamil Nadu Agricultural University, Coimbatore during February, 2011. The flowers of carnation were harvested at paint brush stage during early morning hours and brought to

Progressive Horticulture, 45 (2) 361
laboratory for experimental studies. Carnation cv. Mal-aga were subjected to wrapping and packaging treat-ments using Factorial Completely Randomized Design (FCRD) with nine treatments and three replications.
Treatment detailsTreatment Particulars
W1 P1 Polyethylene sleeves + CFB 2 % vent
W1 P2 Polyethylene sleeves + CFB 4 % vent
W1 P3 Polyethylene sleeves + CFB 6 % vent
W2 P1 Butter paper + CFB 2 % vent
W2 P2 Butter paper + CFB 4 % vent
W2 P3 Butter paper + CFB 6 % vent
W3 P1 Newspaper + CFB 2 % vent (control)
W3 P2 Newspaper + CFB 4 % vent
W3 P3 Newspaper + CFB 6 % vent
* CFB - Corrugated Fibre Board boxes (Size: 100 X 40 X 30 cm)
W - Wrapping; P - Packaging
Immediately after harvest, the flower stalks were placed in a bucket containing water. The leaves from the lower one-third portion of the flower stalks were removed. A bunch of 20 flowers were wrapped by us-ing polyethylene sleeves of 50 gauge thickness, butter paper, newspaper and packed in 5 ply Corrugated Fibre Board boxes of standard dimension with 100 X 40 X 30 cm. 2 %, 4 %, 6 % of ventilation has been worked out in the box and combined with wrapping materials and the flowers were kept inside the boxes. The boxes were placed in the cool chamber for 24 hours to simulate tran-sit. After the simulated transit, the flower stalks were taken out. The basal portions were recut and the flower stalks were rehydrated by dipping in water for 30 min-utes. The vase life parameters were evaluated in distilled water at ambient temperature. The physical parameters viz., Transpirational loss of water [g/flower] (TLW), Wa-ter uptake (g/flower stem) – (Wu) = [C + S]1 - [C + S]2 [where C - Weight of container (g); S - Weight of solution (g)], Water balance (WB – [g/flower]), Fresh weight change [%] (FWC) were taken at alternate days interval. Flower bud opening was expressed in days. Freshness and Colour fading were taken at 4, 8 and 12th day and expressed in terms of score. [Score 5 (A grade) - Origi-nal colour; Score 3 (B grade) - Slightly faded; Score 1 (C grade) - Completely faded]. The vase life of cut flower was evaluated daily by counting the number of days taken for the symptom of shrivelling and wilting. Physi-ological parameters viz., Physiological loss in weight (%)
(PLW), Membrane integrity (%) and Biochemical param-eters viz., Total carbohydrate (mg/g), Peroxidase activ-ity (change in OD/g/min) (POD), Anthocyanin content and Carotenoid content (mg/g) were observed during 1, 6 and 12 th day of treatment for the studies. The statistical analysis was done by adopting the standard procedures of Panse and Sukhatme (1985).
RESULTS AND DISCUSSIONWrapping provides modified atmosphere for flow-
ers and slows down the respiration, transpiration and cell division process, but these conditions remains only up to a specific period of time (Bhattacharjee, 1997) and the wrapping materials may tend to retain the moisture, reduce the transpirational loss of water, aid in retain-ing the freshness of flower and protect the flower from mechanical damage. Carnation flowers are generally packed and transported to market in telescopic type of boxes made of corrugated fibre board with 5 ply thick-ness which are light in weight and have isothermic prop-erties, and are internationally accepted for packaging. Boxes with a standard size of 100 X 40 X 30 cm are used for packaging the flowers and each box holds about 13 kg of weight with a volume of 700 to 800 standard carna-tion flower stems i.e., 35 to 40 bunches depending on the flower size. The present investigation was taken up to standardize the ideal per cent of vents to be made in the boxes and to identify accurate wrapping material for the packing of flowers and assessed for the physical, physi-ological and biochemical parameters.
Physical Parameters The physical parameters namely water uptake, tran-
spirational loss of water, water balance and fresh weight change are considered important to keep the flowers in a fresh condition. The highest water uptake was recorded in the treatment interaction W1P2 (polyethylene sleeves + CFB 4 % vent) with 6.40, 8.98, 14.20, 16.33, 12.32 g/stalk during 2, 4, 6, 8 and 12 days after treatment respectively throughout the vase life period with an increasing trend upto 8 days after treatment and showed decreasing trend towards the end of the vase life i.e after 10 and 12 days of treatment. (Fig.1). This increased water uptake might be due to reduced damage in the conducting vessels en-suring continuous water uptake as reported by Waters (1966) and Jeeva and Balakrishnamoorthy (1999) in rose. The decreased water uptake by the stalk in later stages i.e., on day 10 and 12 after treatment was mainly due to plugging of xylem vessels caused by bacteria as reported by Doorn et al. (1986). Transpirational loss of water has been observed lowest in the treatment interaction W1P2 (polyethylene sleeves + CFB 4 % vent) upto 8 days after treatment and then decreases after 10th and 12th day (Ta-

362 Progressive Horticulture, 45 (2)
Tabl
e 1:
Eff
ect o
f wra
ppin
g an
d pa
ckag
ing
mat
eria
ls o
n tr
ansp
irat
iona
l los
s of
wat
er (g
)
wra
ppin
g
Pa
ckag
ing
D
ay 2
Day
4 D
ay 6
Day
8 D
ay 10
D
ay 12
P 1
P 2 P 3
Mea
n P 1
P 2 P 3
Mea
n P 1
P 2 P 3
Mea
n P 1
P 2 P 3
Mea
n P 1
P 2 P 3
Mea
n P 1
P 2 P 3
Mea
n
W1
2.08
1.
30
1.50
1.
63
4.40
3.
20
3.55
3.
72
7.45
6.
20
6.60
6.
75
9.02
8.
02
8.15
8.
40
8.20
7.
50
7.68
7.
79
7.22
5.
80
6.20
6.
41
W2
2.18
1.
75
1.90
1.
94
4.65
3.
80
4.02
4.
16
7.52
6.
78
6.95
7.
08
9.10
8.
35
8.60
8.
68
8.26
7.
85
7.98
8.
03
7.36
6.
45
6.58
6.
80
W3
2.30
1.
85
1.96
2.
04
4.72
4.
12
4.20
4.
35
7.68
7.
20
7.35
7.
41
9.20
8.
88
8.96
9.
01
8.45
8.
05
8.12
8.
21
7.46
6.
92
7.10
7.
16
Mea
n 2.
19
1.63
1.
79
4.
59
3.71
3.
92
7.
55
6.73
6.
97
9.
11
8.42
8.
57
8.
30
7.80
7.
93
7.
35
6.39
6.
63
*W3P
1 - C
ontr
ol; W
3 –
New
spap
er; P
1 –
CFB
box
2 %
ven
t
D
ay 2
D
ay 4
D
ay 6
D
ay 8
D
ay 1
0 D
ay 1
2
SE
(d)
CD
5%
SE
(d)
CD
5%
SE
(d)
CD
5%
SE
(d)
CD
5%
SE
(d)
CD
5%
SE
(d)
CD
5%
W
0.09
7 0.
209
0.19
0 0.
372
0.19
7 0.
396
0.21
3 0.
427
0.20
4 0.
403
2.18
2 0.
375
P 0.
118
0.24
9 0.
247
0.51
0 0.
265
0.53
3 0.
270
0.55
2 0.
227
0.47
5 0.
226
0.46
0
W X
P
0.20
5 0.
432
0.34
0 0.
684
0.34
8 0.
696
0.41
0 0.
826
NS
NS
NS
NS
ble.1). The increased transpiration loss of water occurs towards the senescence in all the treatment combina-tions. The increased transpirational loss may be due to the increased water uptake exhibited leading to better maintenance of the water balance. This is in line with the findings of Beura and Ranvir Singh (2003) in gladiolus. Maintenance of favourable water balance is an essential requirement for flower longevity (Van Meeteron, 1978). The water balance is higher in the treatment combina-tion W1P2 (polyethylene sleeves + CFB 4 % vent) with 5.10, 5.78, 8.00, 8.31, 7.65 and 6.52 g/stalk and lowest in treatment combination with W3P1 (Newspaper + CFB 2 per cent vent) with 2.72, 2.30, 4.34, 4.60, 4.88 and 1.99 g/stalk during 2, 4, 6, 8, 10 and 12 days after treatment respectively (Table.2). This may be due to ef-fect of polyethylene sleeves and better ventilation pro-vided in the boxes. It must however be cautioned that prolonged wrapping in polyethylene sleeves could lead to increased microbial growth on the buds due to high moisture retention as reported by Rajni et al. (2000).
The fresh weight recorded was the highest in treat-ment W1P2 (polyethylene sleeves + CFB 4 % vent) with 117.60, 141.72, 163.05, 139.56, 118.66 and 106.14 per cent during 2, 4, 6, 8, 10 and 12 days after treatment respective-ly and fresh weight change was minimum in W3 (112.26, 132.45, 154.16, 131.89, 110.74 and 93.75 per cent during 2, 4, 6, 8, 10 and 12 days after treatment respectively). This might be due to the higher turgor and lower moisture loss during storage. Increased water uptake might also be the reason for maintenance of fresh weight. This is in line with the work of Divya (2003) in rose. Packaging plays an important role in improving the appearance as well as opening ability in cut flowers as opined by Singh et al. (2007). The treatment combination with polyeth-ylene sleeves + CFB 4 % vent (W1P2) registered earlier flower bud opening (Fig.2).
This might be due to the flower turgor, reduced moisture loss during storage and improved opening ability of the flowers covered with moisture proof wrap-ping materials. Sufficient levels of ventilation might have ensured superior quality, as well as increased the bud opening and also maintained high fresh weight along with high percentage of original weight after transfer-ring to water, as reported earlier by Waters (1966). The freshness and colour are maintained in treatment with polyethylene sleeves and butter paper combined with 4 per cent ventilation. This might be due the fact that polyethylene sleeves protect the flowers from water loss, permit gas exchange, and maintains fresh weight and turgidity of flowers and also sufficient free exchange of gases through the vents. This is in accordance with the finding of Som Dutt (1998). Maximum vase life was no-ticed in treatment with polyethylene sleeves + CFB 4 %

Progressive Horticulture, 45 (2) 363Ta
ble
2: E
ffec
t of w
rapp
ing
and
pack
agin
g m
ater
ials
on
wat
er b
alan
ce (g
)
wra
ppin
g
Pa
ckag
ing
D
ay 2
D
ay 4
D
ay 6
D
ay 8
D
ay 1
0 D
ay 1
2
P 1 P 2
P 3 M
ean
P 1 P 2
P 3 M
ean
P 1 P 2
P 3 M
ean
P 1 P 2
P 3 M
ean
P 1 P 2
P 3 M
ean
P 1 P 2
P 3 M
ean
W1
3.92
5.
10
4.75
4.
59
3.12
5.
78
5.17
4.
69
5.32
8.
00
7.42
6.
91
5.61
8.
31
8.00
7.
30
5.80
7.
65
7.57
6.
93
3.18
6.
52
5.85
5.
18W
2 3.
22
4.57
4.
28
4.02
2.
53
4.60
4.
16
3.76
5.
08
6.67
6.
25
6.00
5.
10
7.65
6.
85
6.54
5.
34
7.32
6.
22
6.38
2.
84
5.35
4.
90
4.36
W3
2.72
4.
25
4.02
3.
66
2.30
3.
78
3.58
3.
22
4.34
5.
84
5.60
5.
26
4.60
6.
22
5.89
5.
57
4.88
6.
30
5.93
5.
70
1.99
4.
16
3.80
3.
32M
ean
3.29
4.
64
4.35
2.65
4.
72
4.31
4.91
6.
83
6.42
5.10
7.
39
6.91
5.34
7.
17
6.49
2.67
5.
34
4.85
*W
3P1 - C
ontr
ol; W
3 –
New
spap
er; P
1 –
CFB
box
2 %
ven
t
D
ay 2
D
ay 4
D
ay 6
D
ay 8
D
ay 1
0 D
ay 1
2
SE (d
) C
D 5
%
SE (d
) C
D 5
%
SE (d
) C
D 5
%
SE (d
) C
D 5
%
SE (d
) C
D 5
%
SE (d
) C
D 5
%W
0.
080
0.16
4 0.
215
0.44
1 0.
250
0.49
5 0.
262
0.51
9 0.
213
0.43
1 0.
179
0.37
2P
0.20
0 0.
408
0.29
7 0.
621
0.38
2 0.
768
0.39
3 0.
803
0.30
9 0.
640
0.26
1 0.
534
W X
P
0.30
3 0.
595
0.45
5 0.
956
0.52
5 1.
098
0.64
0 1.
300
0.49
1 0.
970
0.39
2 0.
815
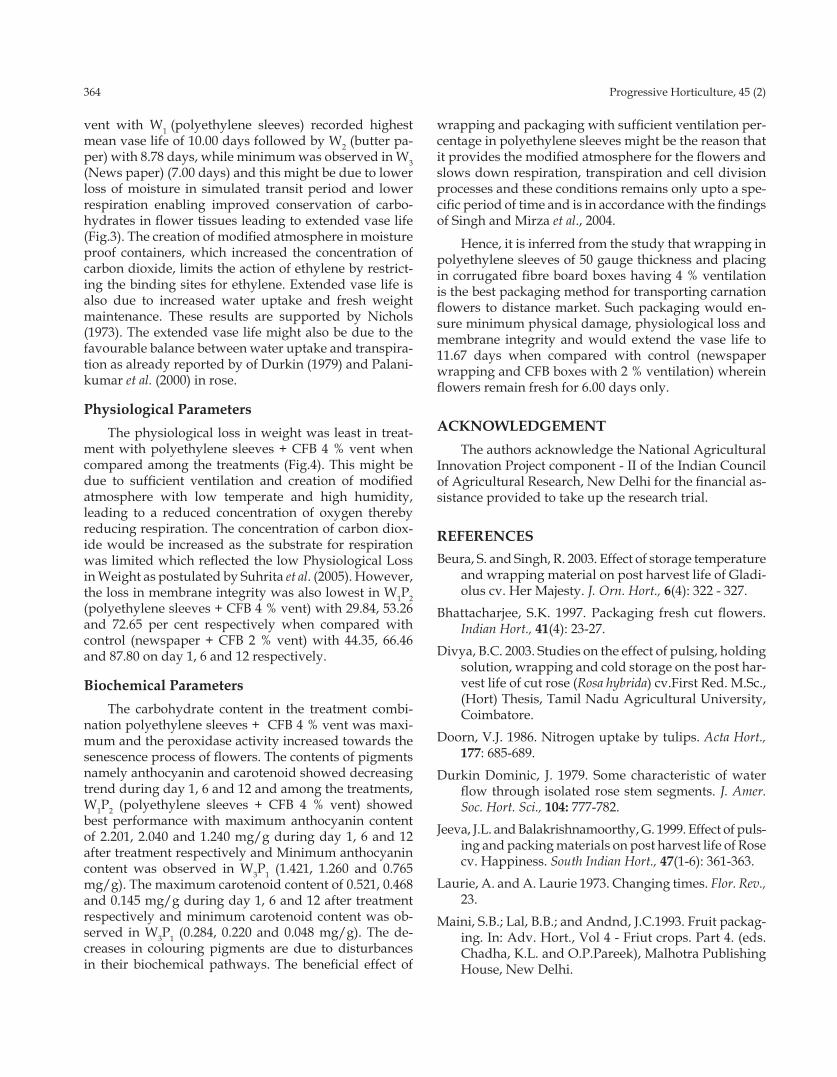
364 Progressive Horticulture, 45 (2)
vent with W1 (polyethylene sleeves) recorded highest mean vase life of 10.00 days followed by W2 (butter pa-per) with 8.78 days, while minimum was observed in W3 (News paper) (7.00 days) and this might be due to lower loss of moisture in simulated transit period and lower respiration enabling improved conservation of carbo-hydrates in flower tissues leading to extended vase life (Fig.3). The creation of modified atmosphere in moisture proof containers, which increased the concentration of carbon dioxide, limits the action of ethylene by restrict-ing the binding sites for ethylene. Extended vase life is also due to increased water uptake and fresh weight maintenance. These results are supported by Nichols (1973). The extended vase life might also be due to the favourable balance between water uptake and transpira-tion as already reported by of Durkin (1979) and Palani-kumar et al. (2000) in rose.
Physiological ParametersThe physiological loss in weight was least in treat-
ment with polyethylene sleeves + CFB 4 % vent when compared among the treatments (Fig.4). This might be due to sufficient ventilation and creation of modified atmosphere with low temperate and high humidity, leading to a reduced concentration of oxygen thereby reducing respiration. The concentration of carbon diox-ide would be increased as the substrate for respiration was limited which reflected the low Physiological Loss in Weight as postulated by Suhrita et al. (2005). However, the loss in membrane integrity was also lowest in W1P2 (polyethylene sleeves + CFB 4 % vent) with 29.84, 53.26 and 72.65 per cent respectively when compared with control (newspaper + CFB 2 % vent) with 44.35, 66.46 and 87.80 on day 1, 6 and 12 respectively.
Biochemical Parameters The carbohydrate content in the treatment combi-
nation polyethylene sleeves + CFB 4 % vent was maxi-mum and the peroxidase activity increased towards the senescence process of flowers. The contents of pigments namely anthocyanin and carotenoid showed decreasing trend during day 1, 6 and 12 and among the treatments, W1P2 (polyethylene sleeves + CFB 4 % vent) showed best performance with maximum anthocyanin content of 2.201, 2.040 and 1.240 mg/g during day 1, 6 and 12 after treatment respectively and Minimum anthocyanin content was observed in W3P1 (1.421, 1.260 and 0.765 mg/g). The maximum carotenoid content of 0.521, 0.468 and 0.145 mg/g during day 1, 6 and 12 after treatment respectively and minimum carotenoid content was ob-served in W3P1 (0.284, 0.220 and 0.048 mg/g). The de-creases in colouring pigments are due to disturbances in their biochemical pathways. The beneficial effect of
wrapping and packaging with sufficient ventilation per-centage in polyethylene sleeves might be the reason that it provides the modified atmosphere for the flowers and slows down respiration, transpiration and cell division processes and these conditions remains only upto a spe-cific period of time and is in accordance with the findings of Singh and Mirza et al., 2004.
Hence, it is inferred from the study that wrapping in polyethylene sleeves of 50 gauge thickness and placing in corrugated fibre board boxes having 4 % ventilation is the best packaging method for transporting carnation flowers to distance market. Such packaging would en-sure minimum physical damage, physiological loss and membrane integrity and would extend the vase life to 11.67 days when compared with control (newspaper wrapping and CFB boxes with 2 % ventilation) wherein flowers remain fresh for 6.00 days only.
ACKNOwLEDGEMENTThe authors acknowledge the National Agricultural
Innovation Project component - II of the Indian Council of Agricultural Research, New Delhi for the financial as-sistance provided to take up the research trial.
REFERENCES Beura, S. and Singh, R. 2003. Effect of storage temperature
and wrapping material on post harvest life of Gladi-olus cv. Her Majesty. J. Orn. Hort., 6(4): 322 - 327.
Bhattacharjee, S.K. 1997. Packaging fresh cut flowers. Indian Hort., 41(4): 23-27.
Divya, B.C. 2003. Studies on the effect of pulsing, holding solution, wrapping and cold storage on the post har-vest life of cut rose (Rosa hybrida) cv.First Red. M.Sc., (Hort) Thesis, Tamil Nadu Agricultural University, Coimbatore.
Doorn, V.J. 1986. Nitrogen uptake by tulips. Acta Hort., 177: 685-689.
Durkin Dominic, J. 1979. Some characteristic of water flow through isolated rose stem segments. J. Amer. Soc. Hort. Sci., 104: 777-782.
Jeeva, J.L. and Balakrishnamoorthy, G. 1999. Effect of puls-ing and packing materials on post harvest life of Rose cv. Happiness. South Indian Hort., 47(1-6): 361-363.
Laurie, A. and A. Laurie 1973. Changing times. Flor. Rev., 23.
Maini, S.B.; Lal, B.B.; and Andnd, J.C.1993. Fruit packag-ing. In: Adv. Hort., Vol 4 - Friut crops. Part 4. (eds. Chadha, K.L. and O.P.Pareek), Malhotra Publishing House, New Delhi.

Progressive Horticulture, 45 (2) 365
Nichols, R.1973. Senescence of the cut carnation flower - respiration and sugar status. J. Hort. Sci., 48: 111 - 121.
Palanikumar, S.; Madam Pal and Bhattacharjee, S.K. (2000). Influence of precooling on post harvest life and respiration rate of Raktagandha cut roses. Indian J. Plant Physio. 5(2): 203 -204.
Pandey, U.B.; Singh, B.; Bhonde, J.R.; Singh, V.K. and Gupta, R.P. 1983. Studies on sorting, grading and packaging on onion. Proc. Nat. Workshop on Onion, 17-18 Dec.1983. Nasik, NAFE and Min.of Agri., Govt.of India.
Panse, V.G. and Sukhatme, P.V. 1967. Statistical methods for agricultural workers. ICAR, New Delhi.
Rajni, S., Sharma, S.R.; Ghuman, B.S.G. and Singh, K. 2000. Packaging and transportation of cut roses for export markets. J. Res. Punjab Agric. Univ., 37(3-4): 218-23.
Rit, R.E. and Hinsch, R.T. 1972. New shipping containers for cut roses- costs and performance. U.S. Dept. Agric. Res. Ser. Pub. 52: 11.
Singh, A.; Kumar, J. and Kumar, P. 2007. Effects of pack-
Received on 06 March, 2013 and accepted on 28 August, 2013
aging films for modified atmosphere storage at low temperature on petal senescence in gladiolus cut spikes. Indian J.Crop Sci., 2(1): 86-91.
Singh, P. and Mirza, A.A. 2004. Post Harvest life and quality of cut Rose cv. Super star as influenced by packaging material. J. Orn. Hort., 7(1): 58-63.
Sivasamy, N.; Sujatha, A.N.; Attri, B.L. and Sharma, T.V.R.S. 1999. Post harvest technology of cut flowers. Agro India., 4: 12-13.
Som Dutt. 1998. Packaging for garden-fresh flower qual-ity. Agriculture Today, 1(5): 46-49.
Suhrita, C.; Mitra. S.; Dhua, R.S. and Biswal, B. 2005. Influence of pulsing, wrapping and storage on the vase life of Gladiolus cv. Little prince. Orissa J. Hort., 33(1): 58-60.
Van Meeteren, U. Van 1978. Water relations and keeping quality of cut gerbera flowers; the cause of stem break. Scientia Hort., 8: 65-74.
Waters, W. 1966. Toxicity of certain Florida waters to cut flowers. Proc. Fla. State. Hort. Soc., 79: 456-459.

Online version available at: www.indianjournals.com
Progressive Horticulture, Vol. 45, No. 2, September 2013© Copyright by ISHRD, Printed in India
[Research Article]
Effect of irrigation and fertigation levels on cabbage (Brassica oleracea var. Capitata L.)
P. Kumar and R.L. SahuDepartment of Soil science and Agricultural Chemistry, Indira Gandhi Krishi Vishwavidyalaya, Raipur- 492006 (C.G.) IndiaEmail: [email protected]
ABSTRACTThe experiment was conducted in rabi season during the year 2007-08 at Horticultural Research Farm, IGKV,
Raipur (C.G.). There were 25 treatment combinations involving 5 irrigation levels (Furrow irrigation at 1.2 Iw/CPE, drip irrigation at 100, 80, 60 & 40 per cent PE) and 5 nitrogen levels (50, 75, 100, 125 & 150 per cent of recommended dose of nitrogen) through fertigation. Results indicate that all the growth parameters were significantly influenced by irrigation and fertigation with nitrogen levels. Higher plant height and more number of leaves plant-1 were observed with drip irrigation at 100 per cent PE and fertigation applied @ 150 per cent of recommended dose of nitrogen. Increasing the irrigation and nitrogen levels increased the yield significantly and highest yield (30.60 ton
ha-1) was obtained with drip irrigation at 100 per cent PE and fertigation with 150 per cent of recommended dose of nitrogen (29.71 ton ha-1). Total uptake of nitrogen (287.93 kg ha-1), phosphorus (25.30 kg ha-1) and potassium (297.11 kg ha-1) were maximum at drip irrigation at 100 per cent PE. Similarly the maximum uptake of nitrogen (296.22 kg ha-1), Phosphorus (26.90 kg ha-1) and potassium (309.74 kg ha-1) were observed at fertigation with 150 per cent of recommended dose of nitrogen. water use efficiency (WUE) was found higher under drip irrigation at 40 per cent PE (9.80 q ha-1 cm-1) over furrow irrigation at 1.2 Iw/CPE (8.08 q ha-1 cm-1).
KEY wORDS: Cabbage, drip Irrigation, fertigation, nutrient uptake, WUE, soil fertility.
India is poised to play a major role in increasing the utility of land water and other natural resources to compete with the increasing rate of population. Farmers today are faced with the challenge of meeting an ever- increasing demand for a wide range of high quality and safe food. But these demands must be satisfied in eco-nomically viable ways whilst safeguarding natural re-sources and protecting the environment. Intensification of agriculture by irrigation and enhanced used of fertil-izers may generate pollution by increased levels of nutri-ents in underground and surface waters. Therefore judi-cious management of plant nutrients available through different fertilizers need be catered. The fertilizers are becoming costly input day by day. Hence, it is felt nec-essary to study the efficient use of this input. A higher efficiency is possible with the help of pressurized irriga-tion system is placed around the plant roots uniformly and allow for rapid uptake of nutrient by plant. Ferti-gation is the technique of supplying dissolved fertilizer to crop through an irrigation system. Small application of soluble nutrients saves labour, reduces compaction in
the field, thereby enhancing productivity. Cabbage be-ing a high yielding & a highly nutrient responsive crop requires large dose of nutrients. Drip irrigation and fer-tigation is a better way for maximizing its production through efficient use of irrigation water and applied nu-trients.
MATERIALS AND METHODSA field experiment was conducted in the Horticulture
farm, Indira Gandhi Krishi Vishwa Vidyalaya, Raipur (C.G.) on clay loam soil during rabi season of 2007-08. The treatments comprised of five irrigation levels viz., furrow irrigation at 1.2 IW/CPE (control), where CPW is Cumulative Pan Evaporation and IW is Irrigation Wa-ter drip irrigation at 100, 80, 60 and 40 per cent PE (Pan Evaporation) as main plots and five nitrogen levels viz., 50, 75, 100, 125 and 150 per cent of recommended dose of nitrogen as sub plots. The experiment was laid out in split-plot design with three replications. In order to eval-uate the nutrient status of the soil, plot wise samples
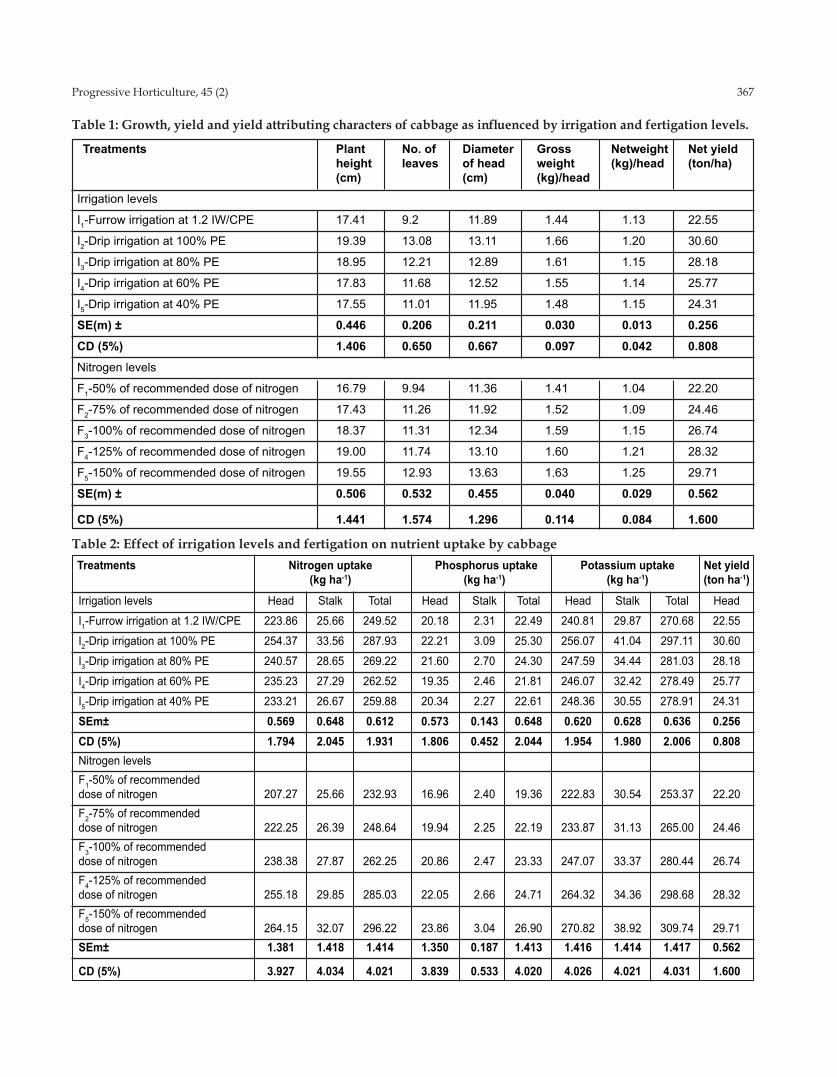
Progressive Horticulture, 45 (2) 367
Table 1: Growth, yield and yield attributing characters of cabbage as influenced by irrigation and fertigation levels.
Treatments Plant No. of Diameter Gross Netweight Net yield height leaves of head weight (kg)/head (ton/ha) (cm) (cm) (kg)/head
Irrigation levels
I1-Furrow irrigation at 1.2 IW/CPE 17.41 9.2 11.89 1.44 1.13 22.55
I2-Drip irrigation at 100% PE 19.39 13.08 13.11 1.66 1.20 30.60
I3-Drip irrigation at 80% PE 18.95 12.21 12.89 1.61 1.15 28.18
I4-Drip irrigation at 60% PE 17.83 11.68 12.52 1.55 1.14 25.77
I5-Drip irrigation at 40% PE 17.55 11.01 11.95 1.48 1.15 24.31
SE(m) ± 0.446 0.206 0.211 0.030 0.013 0.256
CD (5%) 1.406 0.650 0.667 0.097 0.042 0.808
Nitrogen levels
F1-50% of recommended dose of nitrogen 16.79 9.94 11.36 1.41 1.04 22.20
F2-75% of recommended dose of nitrogen 17.43 11.26 11.92 1.52 1.09 24.46
F3-100% of recommended dose of nitrogen 18.37 11.31 12.34 1.59 1.15 26.74
F4-125% of recommended dose of nitrogen 19.00 11.74 13.10 1.60 1.21 28.32
F5-150% of recommended dose of nitrogen 19.55 12.93 13.63 1.63 1.25 29.71
SE(m) ± 0.506 0.532 0.455 0.040 0.029 0.562
CD (5%) 1.441 1.574 1.296 0.114 0.084 1.600
Table 2: Effect of irrigation levels and fertigation on nutrient uptake by cabbageTreatments Nitrogen uptake Phosphorus uptake Potassium uptake Net yield (kg ha-1) (kg ha-1) (kg ha-1) (ton ha-1)
Irrigation levels Head Stalk Total Head Stalk Total Head Stalk Total Head
I1-Furrow irrigation at 1.2 IW/CPE 223.86 25.66 249.52 20.18 2.31 22.49 240.81 29.87 270.68 22.55
I2-Drip irrigation at 100% PE 254.37 33.56 287.93 22.21 3.09 25.30 256.07 41.04 297.11 30.60
I3 -Drip irrigation at 80% PE 240.57 28.65 269.22 21.60 2.70 24.30 247.59 34.44 281.03 28.18
I4 -Drip irrigation at 60% PE 235.23 27.29 262.52 19.35 2.46 21.81 246.07 32.42 278.49 25.77
I5 -Drip irrigation at 40% PE 233.21 26.67 259.88 20.34 2.27 22.61 248.36 30.55 278.91 24.31
SEm± 0.569 0.648 0.612 0.573 0.143 0.648 0.620 0.628 0.636 0.256CD (5%) 1.794 2.045 1.931 1.806 0.452 2.044 1.954 1.980 2.006 0.808Nitrogen levelsF1-50% of recommended dose of nitrogen 207.27 25.66 232.93 16.96 2.40 19.36 222.83 30.54 253.37 22.20F2-75% of recommended dose of nitrogen 222.25 26.39 248.64 19.94 2.25 22.19 233.87 31.13 265.00 24.46F3-100% of recommended dose of nitrogen 238.38 27.87 262.25 20.86 2.47 23.33 247.07 33.37 280.44 26.74F4-125% of recommended dose of nitrogen 255.18 29.85 285.03 22.05 2.66 24.71 264.32 34.36 298.68 28.32F5-150% of recommended dose of nitrogen 264.15 32.07 296.22 23.86 3.04 26.90 270.82 38.92 309.74 29.71SEm± 1.381 1.418 1.414 1.350 0.187 1.413 1.416 1.414 1.417 0.562
CD (5%) 3.927 4.034 4.021 3.839 0.533 4.020 4.026 4.021 4.031 1.600
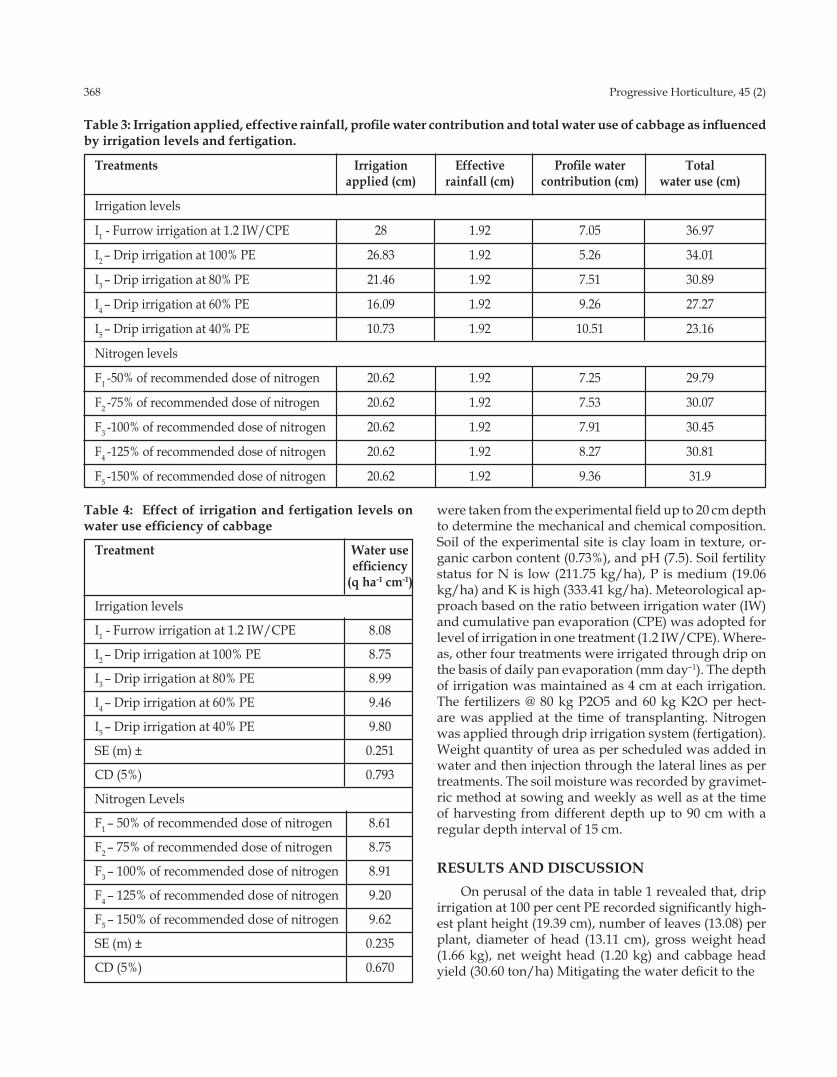
368 Progressive Horticulture, 45 (2)
Table 3: Irrigation applied, effective rainfall, profile water contribution and total water use of cabbage as influenced by irrigation levels and fertigation.
Treatments Irrigation Effective Profile water Total applied (cm) rainfall (cm) contribution (cm) water use (cm)
Irrigation levels
I1 - Furrow irrigation at 1.2 IW/CPE 28 1.92 7.05 36.97
I2 – Drip irrigation at 100% PE 26.83 1.92 5.26 34.01
I3 – Drip irrigation at 80% PE 21.46 1.92 7.51 30.89
I4 – Drip irrigation at 60% PE 16.09 1.92 9.26 27.27
I5 – Drip irrigation at 40% PE 10.73 1.92 10.51 23.16
Nitrogen levels
F1 -50% of recommended dose of nitrogen 20.62 1.92 7.25 29.79
F2 -75% of recommended dose of nitrogen 20.62 1.92 7.53 30.07
F3 -100% of recommended dose of nitrogen 20.62 1.92 7.91 30.45
F4 -125% of recommended dose of nitrogen 20.62 1.92 8.27 30.81
F5 -150% of recommended dose of nitrogen 20.62 1.92 9.36 31.9
Table 4: Effect of irrigation and fertigation levels on water use efficiency of cabbage
Treatment water use efficiency (q ha-1 cm-1)
Irrigation levels
I1 - Furrow irrigation at 1.2 IW/CPE 8.08
I2 – Drip irrigation at 100% PE 8.75
I3 – Drip irrigation at 80% PE 8.99
I4 – Drip irrigation at 60% PE 9.46
I5 – Drip irrigation at 40% PE 9.80
SE (m) ± 0.251
CD (5%) 0.793
Nitrogen Levels
F1 – 50% of recommended dose of nitrogen 8.61
F2 – 75% of recommended dose of nitrogen 8.75
F3 – 100% of recommended dose of nitrogen 8.91
F4 – 125% of recommended dose of nitrogen 9.20
F5 – 150% of recommended dose of nitrogen 9.62
SE (m) ± 0.235
CD (5%) 0.670
were taken from the experimental field up to 20 cm depth to determine the mechanical and chemical composition. Soil of the experimental site is clay loam in texture, or-ganic carbon content (0.73%), and pH (7.5). Soil fertility status for N is low (211.75 kg/ha), P is medium (19.06 kg/ha) and K is high (333.41 kg/ha). Meteorological ap-proach based on the ratio between irrigation water (IW) and cumulative pan evaporation (CPE) was adopted for level of irrigation in one treatment (1.2 IW/CPE). Where-as, other four treatments were irrigated through drip on the basis of daily pan evaporation (mm day–1). The depth of irrigation was maintained as 4 cm at each irrigation. The fertilizers @ 80 kg P2O5 and 60 kg K2O per hect-are was applied at the time of transplanting. Nitrogen was applied through drip irrigation system (fertigation). Weight quantity of urea as per scheduled was added in water and then injection through the lateral lines as per treatments. The soil moisture was recorded by gravimet-ric method at sowing and weekly as well as at the time of harvesting from different depth up to 90 cm with a regular depth interval of 15 cm.
RESULTS AND DISCUSSIONOn perusal of the data in table 1 revealed that, drip
irrigation at 100 per cent PE recorded significantly high-est plant height (19.39 cm), number of leaves (13.08) per plant, diameter of head (13.11 cm), gross weight head (1.66 kg), net weight head (1.20 kg) and cabbage head yield (30.60 ton/ha) Mitigating the water deficit to the

Progressive Horticulture, 45 (2) 369
Fig. 1: Soil moisture depletion pattern
Treatment I1(1.2 IW/CPE)
0 0.5 1 1.5 2 2.5
75-90
60-75
45-60
30-45
15-30
0-15
So
il D
epth
(cm
)
Soil Moisture Depletion (cm)
Treatment I2 (100% PE)
0 0.5 1 1.5
75-90
60-75
45-60
30-45
15-30
0-15
So
il D
epth
(cm
)
Soil Moisture Depletion (cm)
Treatment I3(80% PE)
0 0.5 1 1.5 2
75-90
60-75
45-60
30-45
15-30
0-15
So
il D
epth
(cm
)
Soil Moisture Depletion (cm)

370 Progressive Horticulture, 45 (2)
Treatment I4 (60% PE)
0 0.5 1 1.5 2 2.5
75-90
60-75
45-60
30-45
15-30
0-15
So
il D
epth
(cm
)
Soil Moisture Depletion (cm)
Treatment I5 (40% PE)
0 0.5 1 1.5 2 2.5 3
75-90
60-75
45-60
30-45
15-30
0-15
So
il D
epth
(cm
)
Soil Moisture Depletion (cm)
level of pan evaporation demand through drip irrigation improved the availability of applied water through the es-tablishment of relatively moist condition in the root zone and also increase the availability of nutrients throughout the crop growth period. Such an effect was responsible for significant improvement in growth parameters, yield attributes and yield of cabbage (Sharanappa and Gowda, 1995; Deolankar et al., 2004; Pandey et al., 2001 and Lin-gaiyah et al., 2005).
Fertigation with 150 per cent of recommended dose of nitrogen resulting in the higher yield of cabbage head (29.71 ton/ha) over other nitrogen levels. This increase in yield might be attributed to higher plant height (19.55 cm), gross weight (1.63 kg), net weight (1.25 kg). Higher yield and yield attributes of cabbage in 150 per cent of recommended dose of nitrogen may be due to complete solubility, mobilization and availability of nutrients at regular interval in required quantity due to split applica-
tion (Singh et al., 2004; Mal et al., 2005; Singla and Chetan, 2011; Dingre et al., 2012 and Rubeiz et al., 1989).
Nutrient uptakeThe data pertaining to nutrient uptake by cabbage
head and stalk as affected by irrigation levels and ferti-gation presented in table 2 reveals that total uptake of ni-trogen (287.93 kg ha-1), phosphorus (25.30 kg ha-1) and po-tassium (297.11 kg ha-1) was significantly superior under drip irrigation at 100 per cent PE as compared to furrow irrigation at 1.2 IW/CPE. It may be due to approaching towards meeting the daily evaporation demand through drip irrigation, increased the availability of moisture re-sulting in higher nutrient uptake through its influence on biomass production and on the availability of nutrients. Preferential uptake of water from the sufficiently moist soil promoted the movement of nutrient ions towards roots and their uptake (Sanchez et al., 2001).

Progressive Horticulture, 45 (2) 371
Maximum uptake of nitrogen (296.22 kg ha-1), Phos-phorus (26.90 kg ha-1) and potassium (309.74 kg ha-1) was associated with fertigation at 150 per cent of recom-mended dose of nitrogen. Increase in uptake of nitrogen, phosphorus and potassium with increasing fertigation level might be due to the fact that nitrogen increases the cation exchange capacity of plant roots and these make them more efficient in absorbing other nutrient ions like phosphorus and potassium. Higher nitrogen uptake at higher fertigation level was due to increased availability of nitrogen in soil with higher rate of application (Shinde et al., 2006); Salo et al., 2002 and Marsic and Osvald, 2004).
Total water use (cm)The data on total water applied including irrigation
and rainfall, profile water contribution, and total water used under different irrigation and nitrogen levels have been tabulated and presented in Table 3. The data re-vealed that the drip irrigation at 40 per cent PE resulted in the lowest total water applied (10.73 cm), total water used (23.16 cm), and highest profile water contribution (10.51 cm). While, highest total water applied (28 cm), to-tal water used (36.97 cm) and lower profile water contri-bution (7.05 cm) was recorded in furrow irrigation at 1.2 IW/CPE. Drip irrigation at 100 per cent PE showed the lowest profile water contribution (5.26 cm). Fertigation with different nitrogen levels did not influence profile water contribution in total water used.
Water use efficiency (q ha-1 cm-1)WUE was significantly affected by irrigation levels
(Table 4). Drip irrigation at 40 per cent PE resulted in significantly higher WUE (9.46 q ha-1 cm-1) over furrow irrigation at 1.2 IW/CPE (8.08 q ha-1 cm-1). Different ni-trogen levels resulted in significant variation in WUE. Highest WUE recorded with fertigation @ 150 per cent of recommended dose of nitrogen (9.62 q ha-1 cm-1). Higher WUE at drier regimes (40 per cent PE) may be attributed to reduced total water use in comparison to moist and get regimes and comparatively higher head yield. The lower WUE at 1.2 IW/CPE and 100 per cent PE might be due to a greater expense of water use and comparatively lower head yield (Sharma and Arora, 1987; Prabhakar and Srinivas, 1995). Higher WUE at higher level of nitro-gen through fertigation may be attributed to higher yield and constant water use (Shinde et al., 2006 and Sharma et al., 2012).
Soil moisture depletion patternComparative soil moisture depletion under differ-
ent irrigation levels was observed with higher depletion under drip irrigation at 40 per cent PE, followed by drip
irrigation at 60 per cent PE (fig. 1). The higher soil mois-ture depletion under different levels of irrigation was observed from upper most soil layers (0-15 cm) than the lower layers (45-90 cm), which declined gradually with increase in the soil depth. The soil moisture depletion from lower layers (45-90 cm) was higher with drip irri-gation at 60 per cent PE followed by drip irrigation at 40 and 80 per cent PE.
Drip irrigation method was superior over furrow method of irrigation in respect of growth parameters and yield attitudes which resulted in highest yield (30.60 ton ha–1). These attributes were found significantly high-er under drip irrigation at 100 per cent PE and fertiga-tion with 150 per cent of recommended dose of nitrogen. Thus drip irrigation at 100 per cent PE and fertigation @ 150 per cent of recommended dose of fertilizer may be efficiently utilized for getting higher yield. Water use efficiency was higher under drier regimes and higher fertigation levels and maximum WUE was observed at drip irrigation at 40 per cent PE (9.80 q ha–1 cm–1) and fertigation @ 150 per cent of recommended dose of fertil-izer (9.62 q ha–1 cm–1).
REFERENCESDeolankar, K.P.; Firake, N.N. and Ingale, D.O. 2004. Effect
of irrigation methods, forms and levels of NPK on movement and uptake of NPK in Entisols. J. Maha-rastra Agir. Univ., 29(3): 325-327.
Dingre, S.K.; Pawar, D.D. and Lokre, V.A. 2012. Drip fertigation scheduling for enhancing productivity of onion seed in western Maharashtra. Prog. Hort., 44(2): 271-275
Lingaiah, D.; Katti, G.S. and Shaik, Mohammad. 2005. Influence of drip irrigation on crop growth, yield and water use efficiency in cabbage (Brassica oleraceae). International J. Agri. Sci., 1(1): 110-111.
Marsic, N.K. and J. Osvald 2004. The effect of fertigation on yield and quality of four white cabbage. (Brassica oleracea var. capitata L.). Vegetable Crops Research Bul-letin., 34(3): 213-219.
Mal, Kajod; Yadav, R.L. and Paliwal, R. 2005. Effect of weed control and nitrogen levels in cauliflower. Indian J. Hort., 62(3): 257-259.
Pandey, S.D.; Jeyabaskaran, K.J.; Laxman, R.H.; Mustaffa, M.M., 2001: Effect of different moisture regimes and N fertigation on growth, yield and quality of Poovan banana. Prog. Hort., 33(2): 130-133
Prabhakar, M. and Srinivas K. 1995. Effect of soil matric potential and irrigation methods on plant water rela-tions, yield and water use of cauliflower. J.Maharashtra

372 Progressive Horticulture, 45 (2)
Received on 16 July, 2012 and accepted on 26 April, 2013
Agri. Univ., 20(2): 229-233.
Rubeiz, I.G.; Obekar, N.F. and Strochlein, J.L. 1989. Sub-surface drip irrigation and urea phosphate fertigation for vegetable on calcareous soil. J. Plant Nutri., 12(12): 1457-1465.
Salo, T.; Soujala, T. and Kallela, M. 2002. The effect of fertigation on yield and nutrient of cabbage, carrot and onion. Acta Horti., 57(1): 235-241.
Sanchez, R; Botia, P.; Sironi, A.; Crespo, P.; Marin, A. and Nartinez, C. 2001. Vegetative growth and nutrient absorption in cauliflower. Investigation Agraria, Pro-duction Y Proteccion Vegetable, 16(1): 119-130.
Sharanappa, Jangandi and Gowda, M.C. 1995. Study of frequency of drip irrigation for cabbage production. Current Res. Agri. Sci. Bangalore, 24(11): 199-200.
Shinde, P.P.; Chavan, M.G. and Newase, V.B. 2006. Studies on fertigation in cabbage. J. Maharastra Agril, Univ., 31(3): 255-257.
Sharma, R.P. and Arora, P.N. 1987. Response of mid season cauliflower to irrigation, nitrogen and age of seedlings. Vegetable Sci., 14(1): 1-6.
Sharma, S.; Halder, A; Patra, S.K. and Ray, R. 2012. Effect of drip irrigation and nitrogen fertigation on water use efficiency and cost economics of guava cv. Khaja. Prog. Hort., 44(1): 136-141.
Shikhamany, S.D. and. Srinivas, K. 1999. Growth, yield and water use of Thompson seedless grapes under basin and drip irrigation. Indian J. Hort., 56(2): 117-123.
Singh, K.; Dhaka, R.S. and Fageria, M.S. 2004. Response of cauliflower cultivators to row spacing and nitrogen fertilization. Prog. Hort., 36(1):171-173.
Singla, Chetan and Singh, S.K. 2011. Crop water require-ment and fertigation options for early drip irrigated cauliflower(Brassica oleracea var. botrys L.) grown in a green house. Prog. Hort., 43(1): 99-101.

Online version available at: www.indianjournals.com
Progressive Horticulture, Vol. 45, No. 2, September 2013© Copyright by ISHRD, Printed in India
[Research Article]
Effect of integrated nutrient management on growth, yield and quality of onion (Allium cepa L.)
S. Jamir, V.B. Singh, S.P. Kanaujia and A.K. Singh1 Department of Horticulture, School of Agricultural Sciences and Rural Development, Medziphema campus, Nagaland University, Nagaland -797106, India1Department of Agril. Chemistry and Soil Science, School of Agricultural Sciences and Rural Development, Medziphema campus, Nagaland University,Nagaland – 797106Email: sp.kanaujia @yahoo.co.in
ABSTRACTThe field experiment was conducted in 2009 at the Experimental Farm of School of Agricultural Sciences and
Rural Development, Medziphema campus, Nagaland University, Nagaland to study the effect of integrated nutri-ent management on growth, yield and quality of onion cv. Agrifound Dark Red under foothills of Nagaland. The experiment was laid out in a randomized block design with three replications. The treatments consisted of T1 - Control, T2 – 100 % NPK, T3 – 75 % NPK + Azospirillum, T4 – 75 % NPK + Phosphotica, T5 – 75 % NPK + Azospirillum + Phosphotica, T6- 50 % NPK + 50 % Pig manure, T7 - 50 % NPK + 50 % FYM, T8 - 50 % NPK + 50 % Pig manure + Azospirillum, T9 - 50 % NPK + 50 % FYM + Azospirillum, T10 - 50% NPK + 50 % Pig manure + Phosphotica, T11 - 50 % NPK + 50 % FYM + Phosphotica, T12 – 50 % NPK + 50 % Pig manure + Azospirillum + Phosphotica, T13 - 50 % NPK + 50 % FYM + Azospirillum + Phosphotica. Results revealed that application of different levels of fertilizers, organic manures and biofertilizers either alone or in combination significantly increased the growth, yield and quality of onion as compared to control. The maximum bulb yield (18.06 t ha-1), TSS (13.18 º brix) and dry matter (15.89%) were recorded with 50% NPK + 50% FYM. The same treatment also produced the highest net return of Rs 1,29,260 ha-1 with cost-benefit ratio of 1:3.5.
KEY wORDS: Onion, integrated nutrient management, chemical fertilizers, organic manures, biofertlizers, growth, yield, quality and economics
Onion (Allium cepa L.) is commercially important bulb crop used by both vegetarians and non-vegetarians due to its nutritional and flavouring properties. Onion is stimulant, diuretic and having expectorant and anti bac-terial properties. It prevents heart disease by lowering blood cholesterol and lipid level (Sharangi and Datta, 2005). Onion is not cultivated commercially in north-eastern region due to unfavourable climatic conditions. Hence, entire requirement of north-eastern region is be-ing meet by procurement from outside the region. Pre-liminary trials envisaged the scope of growing off season onion through bulblets during kharif under foothills of Nagaland (Ngullie et al., 2008). Among various factors responsible for low production of onion, nutrition is of prime importance. Onion responds very well to added nutrients in the soil. Application of chemical fertilizer
alone increased the crop yield in the initial year but ad-versely affected the sustainability at a later stage. The cost of chemical fertilizers is also increasing day by day. To reduce dependence on chemical fertilizers along with sustainable production are vital issues in modern agri-culture which is only possible through integrated plant nutrient supply system (IPNS). Integrated nutrient man-agement serve as the effective source of manuring to ob-taining sustainable productivity without causing detri-mental effects of soil in an eco-friendly manner. Besides fertilizers, there are several sources of plant nutrients like organic manures and biofertilizers. Use of organic ma-nures help in mitigating multiple nutrient deficiencies. Application of organic manures to acidic soil reduces the soluble and exchangeable Al temporarily by forming complex and provides better environment for growth

374 Progressive Horticulture, 45 (2)
and development by improving in physical, chemical and biological properties of soil (Avitoli et al., 2012). Biofertilizers have emerged promising components of nutrient supply system. Application of biofertilizers which is environment friendly and low cost input, with organic and inorganic fertilizers as part of an integrated nutrient management strategy and play significant role in plant nutrition. The role of biofertilizers is perceived as growth regulators besides biological nitrogen fixation collectively leading to much higher response on various growth and yield attributing characters. Biofertilizers inoculations of onion increased the yield and saved the fertilizer requirement by 25%, thereby reducing the cost of cultivation (Devi and Ado, 2005). But no information is available on this aspect in north eastern region as well as in Nagaland. Keeping the above facts in view, the present investigation was conducted to study the effect of integrated nutrient management on the growth, yield and quality of onion under foothills of Nagaland.
MATERIALS AND METHODSA field experiment was conducted in 2009 at the Ex-
perimental Farm of SASRD, Medziphema campus, Na-galand University, Nagaland. The field is located at the altitude of 304.8 m above mean sea level with geographi-cal location at 20º 45' 43'’ N latitude and 93 º 53' 04'’ E lon-gitudes. The soil of the experimental site is sandy loam having soil pH 4.4, organic carbon 1.98% and available NPK is 274.15, 12.18 and 188.16 kg ha-1 , respectively. The experiment was laid out in a randomized block design with three replications. Plot size measured 1.5 m x 1.5 m and spacing was maintained at 10 x 15 cm. The bulblets were planted on 2 nd September. The treatments consist-ed of T1 – control, T2- 100% NPK (120:60:60 kg ha-1), T3 – 75 % NPK + Azospirillum, T4 – 75 % NPK + Phosphotica, T5 – 75 % NPK + Azospirillum + Phosphotica, T6- 50 % NPK + 50 % Pig manure (10 t ha-1), T7 - 50 % NPK + 50 % FYM (20 t ha-1), T8 - 50 % NPK + 50 % Pig manure (10 t ha-1) + Azospirillum, T9 - 50 % NPK + 50 % FYM (20 t ha-1) + Azospirillum, T10 – 50 % NPK + 50 % Pig manure (10 t ha-1) + Phosphotica, T11 - 50 % NPK + 50 % FYM (20 t ha-1) + Phosphotica, T12 – 50 % NPK + 50 % Pig manure (10 t ha-1) + Azospirillum + Phosphotica, T13 - 50 % NPK + 50 % FYM (20 t ha-1)+ Azospirillum + Phosphotica. N, P and K were given through Urea, SSP and MOP, respectively. Full dose of P and K and half dose of N were applied at the time of planting of bulblets and remaining dose of nitrogen was applied at 30 days after planting (DAP). Manures viz., FYM and pig manure were incorporated as per treatment at the final stage of field preparation. Biofertilizers (Azospirillum and Phosphotica) were inocu-lated as per treatment prior to planting of bulblets as a soil treatment @ 5 kg ha-1.
Observations on plant height, number of leaves plant-1, neck thickness, doubling, bolting, diameter of bulb, weight of bulb, bulb yield, TSS and dry matter were recorded at harvesting. Total soluble solid was determined by using hand refractometer and results ex-pressed in ºBrix. The oven dried sample of both bulbs and leaves were ground and sieved for determination of NPK contents. Nitrogen, phosphorus and potas-sium in leaves and bulbs were determined by Kjeldhal method, Vanado molybdate yellow colour method and flame photometery method, respectively (Jackson, 1973) and nutrient uptake was worked out. Soil samples were collected before and after harvest of crop from differ-ent locations of the experimental plot to a depth of 15 cm with the help of screw type auger. The collected soil samples were mixed and reduced into 500 g and then dried under shade, ground and sieved through 2 mm sieve size. Soil samples were analysed for pH, organic carbon, available nitrogen, phosphorus and potassium which were determined by Digital pH meter, Walkley and Black Rapid titration method, Alkaline potassium permanganate method, Olsen’s method, flame photom-eter method, respectively (Jackson, 1973). The statistical analysis was carried out as per procedure given by Panse and Sukhatme (1978). Economics of the treatments were also calculated as per prevailing market price of input and output. Treatment wise economics was carried out by calculating the cost of cultivation based on prevailing rate of input and outputs. Gross income was calculated by yield multiplied with whole sale rate of onion (Rs. 10,000 tones-1). Net income was estimated by deducting the total cost of cultivation (fixed cost + treatment cost) from gross income of the particular treatment. Cost-ben-efit ratio was worked out by dividing net return from total cost of cultivation.
RESULTS AND DISCUSSION
Growth charactersPerusal of the data clearly indicated that applica-
tion of NPK fertilizers organic manures and biofertiliz-ers alone or in combination were found to have signifi-cant positive effect on growth characters as compared to control (Table-1). Application of 50% NPK + 50% FYM (T7) recorded maximum plant height (55.38 cm), num-ber of leaves plant-1(9.80) and neck thickness (1.52 cm). The lowest values of growth characters were recorded in control. The highest values of growth characters were recorded by the combined application of NPK and FYM might be due to higher absorption of nutrients especially nitrogen which enhanced cell division and cell elonga-tion resulted in increased metabolic activity. The added organic manures in term of FYM would have improved

Progressive Horticulture, 45 (2) 375Ta
ble
1: E
ffec
t of i
nteg
rate
d nu
trie
nt m
anag
emen
t on
grow
th, y
ield
and
qua
lity
of o
nion
Tr.
Trea
tmen
ts
Plan
t N
umbe
r N
eck
D
oubl
ing
Bolti
ng
Dia
met
er
wei
ght
Yiel
d
TSS
Dry
N
o.
he
ight
of
leav
es
thic
knes
s
(%)
(%)
of b
ulb
of b
ulb
(t
ha-1)
(o Br
ix)
mat
ter
(cm
) pl
ant-1
(c
m)
(cm
) (g
)
(%
)
T 1 C
ontr
ol
31.8
6 5.
75
1.07
4.
33
2.00
4.
32
36.8
0 7.
83
11.1
0 10
.88
T 2 10
0 %
NPK
44
.50
6.73
1.
28
4.77
3.
66
4.70
51
.20
9.85
12
.46
13.0
3
T 3 75
% N
PK +
40
.24
8.86
1.
28
4.44
4.
66
5.02
49
.33
12.7
0 12
.12
13.0
2
Azo
sipril
lum
T 4 75
% N
PK +
46
.12
9.40
1.
38
3.55
3.
00
5.37
62
.13
14.3
4 12
.05
15.4
3
Phos
phot
ica
T 5 75
% N
PK +
48
.75
8.73
1.
32
3.33
2.
33
5.28
58
.00
14.7
0 12
.64
15.5
7
Azo
spiri
llum
+
Ph
osph
otic
a
T 6 50
% N
PK +
42
.72
9.60
1.
29
6.00
5.
00
5.03
52
.73
11.5
0 11
.98
13.3
8
50 %
Pig
man
ure
T 7 50
% N
PK +
55
.38
9.80
1.
52
3.44
3.
33
5.58
64
.40
18.0
6 13
.18
15.8
9
50 %
FYM
T 8 50
% N
PK +
42
.82
8.40
1.
33
5.33
2.
66
4.92
54
.86
16.2
0 12
.40
15.8
3
50 %
Pig
man
ure
+
A
zosp
irillu
m
T 9 50
% N
PK +
50
%
38.2
7 7.
13
1.14
4.
44
1.00
4.
48
41.2
0 10
.75
12.2
8 12
.23
FY
M +
Azo
spiri
llum
T 10
50 %
NPK
+ 5
0 42
.72
6.33
1.
09
4.22
3.
00
4.54
39
.33
11.8
3 12
.34
12.9
3
% P
ig m
anur
e +
Phos
phot
ica
T 11
50 %
NPK
+ 5
0 45
.40
7.46
1.
08
3.11
2.
66
4.43
42
.80
10.9
7 11
.30
12.0
2
% F
YM +
Phos
phot
ica
T 12
50 %
NPK
+ 5
0 %
34
.12
6.33
1.
10
5.22
2.
00
4.42
40
.13
11.0
0 12
.38
13.5
5
Pig
+ A
zosp
rillu
m +
Phos
phot
ica
T 13
50 %
NPK
+ 5
0 %
38
.24
6.80
1.
15
3.66
0.
00
4.41
45
.13
11.3
2 12
.45
14.4
3
FYM
+ A
zosp
irillu
m
+
Phos
phot
ica
CD
(P =
0.0
5)
9.00
3.
37
0.27
N
S N
S 0.
69
9.87
3.
08
0.70
1.
88

376 Progressive Horticulture, 45 (2)Ta
ble
2: E
ffec
t of t
he in
tegr
ated
nut
rien
t man
agem
ent o
n N
PK c
onte
nt in
leav
es a
nd b
ulbs
and
NPK
upt
ake
by th
e cr
op
Tr.N
o.
Trea
tmen
ts
NPK
con
tent
in le
aves
(%)
NPK
con
tent
in b
ulbs
(%)
NPK
upt
ake
by th
e
crop
(kg
ha-1)
N
P K
N
P
K
N
P K
T 1 C
ontr
ol
0.93
0.
16
0.81
1.
02
0.16
1.
90
72.1
1 11
.75
128.
82
T 2 10
0 %
NPK
1.
21
0.17
1.
58
1.44
0.
20
2.60
10
7.90
15
.66
195.
84
T 3 75
% N
PK +
Azo
spiri
llum
1.
40
0.20
1.
30
1.07
0.
20
2.54
12
9.13
23
.85
293.
78
T 4 75
% N
PK +
Phos
phot
ica
1.35
0.
19
1.30
1.
35
0.19
2.
64
171.
77
26.3
3 34
2.32
T 5 75
% N
PK +
Azo
spiri
llum
+
Ph
osph
otic
a 1.
35
0.17
1.
63
1.54
0.
19
2.37
21
1.78
27
.07
320.
14
T 6 50
% N
PK +
50 %
Pig
man
ure
1.44
0.
21
1.86
1.
54
0.20
2.
98
182.
05
22.6
8 32
2.50
T 7 50
% N
PK +
50
% F
YM
1.54
0.
22
2.22
1.
68
0.24
3.
14
285.
03
31.5
4 47
0.86
T 8 50
% N
PK +
50
% P
ig
m
anur
e +
Azo
sipril
lum
1.
21
0.20
1.
28
1.26
0.
19
2.49
18
7.56
30
.32
381.
34
T 9 50
% N
PK +
50
%
FY
M +
Azo
spiri
llum
1.
26
0.20
1.
79
1.07
0.
19
2.68
10
7.26
19
.80
305.
72
T 10
50 %
NPK
+ 5
0 %
Pig
man
ure
+ Ph
osph
otic
a 1.
12
0.18
1.
34
1.54
0.
21
2.38
11
9.04
17
.53
184.
03
T 11
50 %
NPK
+ 5
0 %
FYM
+ P
hosp
hotic
a 1.
21
0.19
2.
02
1.54
0.
20
2.44
13
9.38
18
.33
184.
83
T 12
50 %
NPK
+ 5
0 %
Pig
+
A
zosp
rillu
m +
Pho
sphi
tica
1.35
0.
18
1.48
1.
21
0.21
2.
70
97.5
5 17
.52
229.
41
T 13
50 %
NPK
+ 5
0 %
FYM
+
A
zosp
irillu
m +
Phos
phot
ica
1.40
0.
21
1.98
1.
35
0.20
2.
70
123.
06
18.6
8 24
1.58
CD
(P =
0.0
5)
0.59
0.
06
1.12
0.
39
0.05
0.
65
35.0
3 7.
34
43.8
3

Progressive Horticulture, 45 (2) 377
the soil physical conditions and increased nutrient avail-ability resulting in better plant growth. These results are in conformity with the finding of Kenisetto et al. (2009) who observed that the application of 50% NPK + 50% FYM gave the highest plant height and number of leaves and neck thickness in onion. However, the different combinations of treatment did not have any significant influence on the doubling and bolting.
Yield and yield attributing charactersApplication of chemical fertilizers, organic manures
and biofertilizers alone or in combination significantly increased yield and yield attributing characters of tomato compared to control (Table-1). Application of 50 % NPK + 50 % FYM (T7) recorded maximum yield attributing characters such as bulb diameter (5.58 cm) and weight of bulb (64.40 g). The lowest diameter of the bulb (4.32 cm) and weight of bulb (36.80 g) were recorded with control. This result indicates positive effects of integrating NPK with manures. Higher vegetative growth might have helped in synthesis of greater amount of photosynthates which was letter translocated into developing bulbs re-sulted in increased diameter of the bulb and weight. This might be due to favourable effect of organic manures in INM in supplying essential nutrient in balanced ratio and improvement in physical, chemical and biological properties of soil, which helps in better nutrient absorp-tion and utilization by plant resulting better yield attrib-uting characters. These results are in conformity with the finding of Kenisetto et al. (2009) who observed that the application of 50% NPK + 50% FYM gave the higher diameter and weight of bulb in onion. The highest bulb yield (18.06 t ha-1) was recorded in treatment 50 % NPK + 50 % FYM followed by 50 % NPK + 50 % pig manure + Azosprillum (16.20 t ha-1) which was significantly higher over 100% NPK. This might be due to corresponding re-sponse to increased yield attributing characters attained previously under this treatment. Application of organic manure in combination with NPK were found more ef-fective in enhancing the bulb yield of onion in comparion to application of NPK alone. These findings is in agree-ment with Yadav and Yadav (2001) and Kenisetto et al. (2009) they obtained the highest bulb yield of onion by combined application of 50% NPK + 50% FYM.
Quality of onion is usually evaluated by TSS and dry matter. Maximum values of TSS (13.18º Brix) and dry matter (15.89%) were recorded with 50 % NPK + 50 % FYM and was found significantly superior over 100% NPK treatment (Table-1). The increase in quality char-acters may be due to the enhancement of steady supply of nutrients by FYM and fertilizers, hence better nutrient uptake and accumulation in onion. These results are in conformity with the finding of Kenisetto et al. (2009) who
observed that the application of 50% NPK + 50% FYM gave the highest values of TSS and dry matter in onion. Singh et al. (1997) also reported that the application of FYM @ 25 t ha-1 + NPK (100:50:20 kg ha-1) recorded high-est TSS and dry matter.
Nutrients uptake by the cropNitrogen, phosphorus and potassium content in
leaves and bulbs of onion as well as its uptake increased significantly with the application of NPK fertilizers, vari-ous organic manures, alone or in combination and with biofertilizers as compared to control (Table 2). The high-est N content in leaves (1.54%) and bulb (1.68%) were recorded in the treatment 50 % FYM + 50 % NPK. Simi-larly, the maximum phosphorus and potassium content in leaves and bulbs were recorded in the same treatment. The maximum N (285.03 kg ha-1), P (31.54 kg ha-1) and K (470.86 kg ha-1) uptake was recorded from treatment T7 (50 % FYM +50 % NPK). This might be due to better absorption and growth performance due to more avail-ability of these nutrients and its effective utilization by the crop. This might also be due to improvement in the physical property of soil by application of FYM and suf-ficient supply of nutrients in sufficient amount to the plants in comparison to other treatments. This finding is in corroboration with the findings of Singh et al. (1997) who reported that the application of FYM @ 25 t ha-1 + NPK (100:50:20 kg ha-1) recorded maximum N P K up-take in onion. Mallangouda et al. (1995) also found the highest uptake of N (62.68 kg ha-1) and P (8.36 kg ha-1) and K (37.28 kg ha-1) in the treatment 50 % recommended dose of NPK + FYM in chilli.
Fertility status of the soil after harvestSustainability of a cropping system is being evaluat-
ed on the basis of crop yield as well as nutrient status of the soil after harvest of the crop. Available NPK, organic carbon and pH in soil after harvest were significantly influenced by application of NPK fertilizers, organic manures and biofertilizers alone or in combination over control (Table-3). Maximum available nitrogen (299.24 kg ha-1), P2O5 (16.37 kg ha-1) and K2O (219.52 kg ha-1) were recorded with treatment 100% NPK which might be due to poor soil physical structure, lack of organic manures and microbial activities, thus resulted in poor utilization of NPK by plants. Sentiyangla et al. (2010) reported that maximum available nitrogen (419.15 kg ha-1) in soil was recorded from the treatment 100% NPK. Organic carbon of soil acts as a sink and source of nutrients for microbial population, which regulates the availability of different nutrients through microbial transformation. The net in-crease in organic carbon was much higher with organic manures alone or in combination with fertilizers over 100%

378 Progressive Horticulture, 45 (2)Ta
ble
3: E
ffec
t of i
nteg
rate
d nu
trie
nt m
anag
emen
t on
nutr
ient
sta
tus
of s
oil a
fter
har
vest
Tr.N
o.
Trea
tmen
ts
Ava
ilabl
eN
Ava
ilabl
e P 2O
5 A
vaila
bleK
2O
Org
anic
So
ilpH
(k
g ha
-1)
(kg
ha-1)
(kg
ha-1)
carb
on(%
)
T 1 C
ontr
ol
255.
52
10.4
7 17
0.24
1.
37
4.4
T 2 10
0 %
NPK
29
9.24
16
.37
219.
52
1.89
4.
6
T 3 75
% N
PK +
Azo
spiri
llum
29
0.87
15
.01
192.
64
1.95
4.
7
T 4 75
% N
PK +
Pho
spho
tica
279.
97
15.5
4 20
1.60
1.
93
5.2
T 5 75
% N
PK +
Azo
spiri
llum
+ Ph
osph
otic
a 29
0.87
14
.06
215.
04
1.96
4.
7
T 6 50
% N
PK +
50
% P
ig m
anur
e 29
0.87
15
.60
206.
08
2.13
5.
0
T 7 50
% N
PK +
50
% F
YM
272.
06
14.3
2 19
4.88
2.
33
5.4
T 8 50
% N
PK +
50
% P
ig
m
anur
e +
Azo
spiri
llum
27
8.42
14
.71
217.
28
2.13
4.
8
T 9 50
% N
PK +
50
% F
YM
+
Azo
spiri
llum
28
6.69
14
.72
201.
60
2.11
4.
7
T 10
50 %
NPK
+ 5
0 %
Pig
man
ure
+ Ph
osph
otic
a 29
5.05
14
.71
207.
84
2.09
4.
7
T 11
50 %
NPK
+ 5
0 %
FYM
+ Ph
osph
otic
a 28
1.33
15
.24
210.
56
2.13
4.
5
T 12
50 %
NPK
+ 5
0 %
Pig
+
A
zosp
irillu
m +
Pho
spho
tica
286.
53
15.3
6 20
8.32
2.
23
5.0
T 13
50 %
NPK
+ 5
0 %
FYM
+
A
zosp
irillu
m +
Pho
spho
tica
295.
06
14.6
2 19
6.97
2.
16
4.7
CD
(P =
0.0
5)
36.2
3 1.
45
32.3
1 0.
22
0.43

Progressive Horticulture, 45 (2) 379Ta
ble
4: E
ffec
t of i
nteg
rate
d nu
trie
nt m
anag
emen
t on
the
econ
omic
s of
trea
tmen
ts
Tr.
Trea
tmen
ts
Fixe
d co
st
Trea
tmen
t To
talc
ost o
f
Yiel
d
Gro
ss
Net
C
ost
No.
(Rs
ha-1)
cost
cu
ltiva
tion
(t ha
-1)
inco
me
inco
me
be
nefit
(Rs
ha-1)
(Rs
ha-1)
(R
s ha
-1)
(Rs
ha-1)
-rat
io
T 1 C
ontr
ol
41,0
00
- 41
,000
7.
83
78,3
20
37,3
20
1:1.
9
T 2 10
0 %
NPK
41
,000
5,
820
46,8
20
9.85
98
,520
52
,240
1:
2.1
T 3 75
% N
PK +
Azo
spiri
llum
41
,000
4,
475
45,4
75
12.7
0 1,
20,0
70
74,1
45
1:2.
6
T 4 75
% N
PK +
Pho
spho
tica
41,0
00
4,47
5 45
,475
14
.34
1,43
,480
97
,555
1:
3.1
T 5 75
% N
PK +
Azo
spiri
llum
+ Ph
osph
otic
a 41
,000
4,
585
45,5
85
14.7
0 1,
47,0
40
1,01
,005
1:
3.2
T 6 50
% N
PK +
50
%
Pi
g m
anur
e 41
,000
6,
400
47,4
00
11.5
0 1,
15,0
90
67,6
90
1:2.
4
T 7 50
% N
PK +
50
% F
YM
41,0
00
10,4
00
51,4
00
18.0
6 1,
80,6
70
1,29
,260
1:
3.5
T 8 50
% N
PK +
50
% P
ig
m
anur
e +
Azo
spiri
llum
41
,000
6,
510
47,5
10
16.2
0 1,
63,0
10
1,15
,500
1:
3.4
T 9 5
0 %
NPK
+ 5
0 %
FYM
+ A
zosp
irillu
m
41,0
00
10,5
10
51,4
00
10.7
5 10
7500
55
,980
1:
2.1
T 10
50 %
NPK
+ 5
0 %
Pig
man
ure
+ Ph
osph
otic
a 41
,000
6,
510
47,5
10
11.8
3 1,
18,3
20
70,8
10
1:2.
5
T 11
50 %
NPK
+ 5
0 %
FYM
+ Ph
osph
otic
a 41
,000
10
,510
51
,400
10
.97
1,09
,740
58
,340
1:
2.1
T 12
50 %
NPK
+ 5
0 %
Pig
+
A
zosp
irillu
m +
Pho
spho
tica
41,0
00
6,62
0 47
,620
11
.00
1,10
,050
62
,430
1:
2.3
T 13
50 %
NPK
+ 5
0 %
FYM
+
A
zosp
irillu
m +
Pho
spho
tica
41,0
00
10,6
20
51,6
20
11.3
2 1,
13,2
50
61,6
30
1:2.
2
380 Progressive Horticulture, 45 (2)
NPK due to supply of organic manures through differ-ent types of manures. Application of 50% NPK + 50 % FYM (T7) recorded significantly higher organic carbon (2.33 %) and pH (5.4) over other treatments. Sentiyangla et al. (2010) reported that application of 50% NPK + 50 % FYM + biofertilizers recorded higher organic carbon (2.93 %) in soil after harvest.
Economics of treatmentsIt is evident from table-4 that the integration of 50%
NPK + 50 % FYM(T7) was found to be the most profit-able treatment in onion exhibiting highest net return of Rs. 1,29,260 with cost - benefit ratio of 1:3.5 followed by Rs. 1,15,500 in the treatment 50 % NPK + 50 % Pig ma-nure + Azospirillum. This might be due to lower cost of input and higher yield. Similar result was also recorded with Deepika et al. (2010) who obtained the highest net return in the treatment 50% NPK + 50% poultry manure in capsicum. Khate et al. (2008) also recorded the highest net return with 50% NPK + 50% pig manure in cucum-ber.
REFERENCESAvitoli, K.; Singh, A.K.; Kanaujia, S.P. and Singh, V.B.
2012. Quality production of Kharif onion (Allium cepa L.) in response to biofertilizers inoculated organic manures. Indian Journal of Agri. Sci., 82: 236-240.
Deepika, A.; Singh, A.K.; Kanaujia, S.P and Singh, V.B. 2010. Effect of integrated nutrient management on growth, yield and economics of capsicum (Capsicum annum L.) cv. California Wonder. J. Soil Crops, 20: 33-38.
Devi, A.K.B. and Ado, L. 2005. Effect of fertilizers and biofertilizers on physiological growth parameters of multiplier onion (Allium cepa var. aggregatum). Indian J. Agric. Sci., 75: 352-354.
Jackson, M.L. 1973. Soil Chemical Analysis. Prentice Hall
of India Pvt. Ltd., New Delhi.
Khate, A.; Kanaujia, S.P.; Singh, V.B. and Singh, M. 2008. Effect of integrated nutrient management on growth, yield and quality of cucumber (Cucumis sativus). Na-galand Univ. Res. J., 5: 69-73.
Keniseto. C.; Kanaujia, S.P.; Singh, V.B. and Singh, A.K. 2009. Effect of integrated nutrient management on growth, yield and quality of Kharif onion under ter-raced condition of Nagaland. Environ. and Ecol., 27: 1511-1513.
Mallangouda, B.; Sulikeri, G.S.; Hulamani, N.C.; Murthy, B.G. and Pratibha, N.C. 1995. Effect of NPK and com-panion crops on growth, yield andcomponent of chilli (Capsicum annum L.). Advances in Agricultural Research in India, 3: 58-59.
Ngullie, E.; Singh, A.K. and Singh, V.B. 2008. Effect organic manures and biofertilizers on growth, yield and quality of onion. Environ.and Ecol., 27: 313-315
Panse, V.G. and Sukhatme, P.V. 1978. Statistical Methods for Agricultural Workers. ICAR, New Delhi.
Sharangi, A.B. and Datta, S. 2005. Medicinal proper-ties of spices. Indian J. Arecanut, Spices and Medicinal Plants, 7: 42-49.
Sentiyangla; Kanaujia, S.P.; Singh, V. B. and Singh, A.K. 2010. INM for quality production of radish in acid Alfisol. J. Soil and Crops, 20: 1-9.
Singh, L.; Bhonde, S.R. and Mishra, V.K. 1997. Effect of different organic manures and inorganic fertilizers on yield and quality of onion. Newsletter-National Horticultural Research and Development Founda-tion, 17: 1-3.
Yadav, V.S. and Yadav, B. D. 2001. Effect of NICAST (organic manures) in comparison to recommended doses of manures and fertilizers in onion. South Indian Horti., 49: 160-161.
Received on 27 April, 2013 and accepted on 08 July, 2013

Online version available at: www.indianjournals.com
Progressive Horticulture, Vol. 45, No. 2, September 2013© Copyright by ISHRD, Printed in India
[Report]
Report on vivipary in mango (Mangifera indica L.)
Jitendra Singh* and P.S. ChauhanCollege of Horticulture and Forestry,Maharana Pratap University of Agriculture and Technology Campus,Jhalarapatan, Jhalawar-326 023, Rajasthan, India*Email: [email protected]
ABSTRACTVivipary is of unusual occorrence in mango. In viviparic fruits, seeds germinate inside while still they remain
attached with fruits. Such fruits hold normal appeal. If cut exposed, the germinated seeds inside the fruit look very clearly. It has adverse influence on marketing of the fruits. There is need to manage teh environemt to curtail the occurrence of vivipary.
KEY wORDS: Mango, seed, vivipary
Mango (Mangifera indica L.) belongs to the family anacardiaceae. Its fleshy fruits are relished much as a dessert fruit in many countries of the world. It s fruits remain available in the market during February till Aug-September in Indian market in various part of the coun-try. The mango fruit is very rich in nutrients especially carbohydrate and vitamins. It contains 80% moisture, 0.6% protein, 0.1% fat, 11.8% carbohydrate, 0.01% cal-cium, 0.02% phosphorus, 0.8mg/100g iron, 50mg/ 100g Riboflavin, 13mg/ 100g Vit. C., 4800 IU Vitamin A and has 74 calorific value (Radha and Mathew, 2007). The ripe fruits of mango possses irresistible taste and capti-vating flavour. It dominates over other fruits grown in the country and it bears the sobrequet “king of fruit”. The Mogul Emperor Akbar was very fond of mango. He planted Lakh-Bagh in Darbhanga in erstwhile Bihar state. Literatures are replete of mango highlighting the util-ity and nobility of fruits. In India, mango occupies 2.3 million hectares area and produces 15.02 million tonnes having average productivity of 6.5 tonnes/ha (Anon., 2011.. The fruit shares 36.5 per cent of the total area 21 % of total fruit production in the country (Anon., 2011). It is grown commercially at the largest acreage in Andhra Pradesh, Andhra Pradesh, Maharashtra, UP, Orissa, etc.
METERIALS AND METHODSDuring August 2012, a mango fruit of the cultivar
Chausa purchased for dessert purpose, was found hav-ing germinated seeds inside. It became a curiosity to
observe as to how mango fruit turned viviparic? The lit-erature pertaining to vivipary was stuffed into. The com-prehensive account of inferences drawn is accordingly presented hereunder under the present study.
ViviparyIt is a condition in which germination of seed takes
place inside the fruits while still attached to the mother plant. Viviary is noticed naturally in some species of mangrove like Rhizophora mangle, R. Mucronata, Bruguiera gymnorhiza, Kandelia reedi, K. candel, Ceriops decandra ( all brlonging to Rhizophoraceae) in which it is considered as an aid to adaptation in wet ecosystem where germinated seeds after falling in mud establish itself and grow as a plant ( Anon,2001). It is very often noted in Avicennia sp (Verbenaceae); Aegialitis rotundifolia (Plumbaginaceae); Aegiceras majus (Myrsinaceae); Cocos nucifera (Arecaceae) ; Cucumis melo, Sechium edule (both Cucurbitaceae plants); Oryza sativa, Triticum aestivum), Zea mays ( Graminae) etc. For most plant species, vivipary is considered undesir-able. This holds especially true in case of cultivated types which are grown mainly for their edible fruits. Mango fruits as usual remain free from viviparous seeds. In contrary, while cutting the fruits for consumption, an unusual occurrence of vivipary was observed. The fruit was having a weight of 200 g. It was having greenish yellow colour and was slightly smaller in size. As ap-peared physically, it was not tree ripened fruit and was purchased from local market. Usually mango fruits
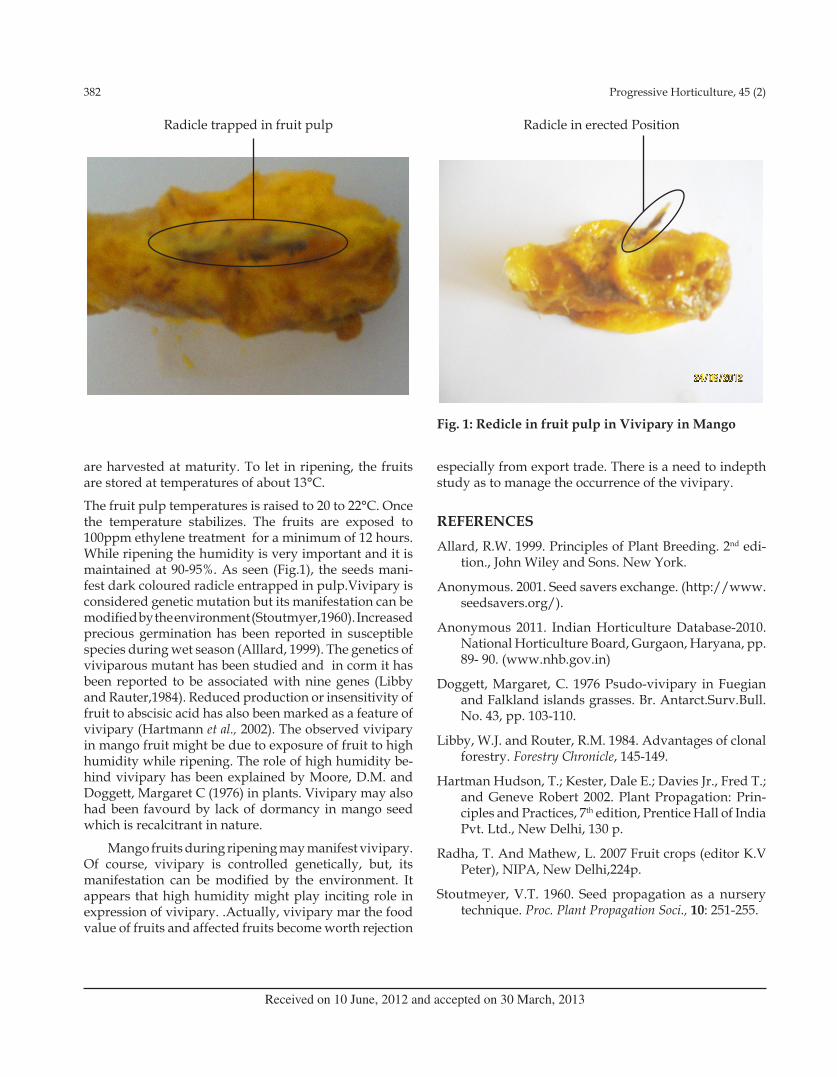
382 Progressive Horticulture, 45 (2)
Radicle trapped in fruit pulp Radicle in erected Position
Fig. 1: Redicle in fruit pulp in Vivipary in Mango
are harvested at maturity. To let in ripening, the fruits are stored at temperatures of about 13°C.
The fruit pulp temperatures is raised to 20 to 22°C. Once the temperature stabilizes. The fruits are exposed to 100ppm ethylene treatment for a minimum of 12 hours. While ripening the humidity is very important and it is maintained at 90-95%. As seen (Fig.1), the seeds mani-fest dark coloured radicle entrapped in pulp.Vivipary is considered genetic mutation but its manifestation can be modified by the environment (Stoutmyer,1960). Increased precious germination has been reported in susceptible species during wet season (Alllard, 1999). The genetics of viviparous mutant has been studied and in corm it has been reported to be associated with nine genes (Libby and Rauter,1984). Reduced production or insensitivity of fruit to abscisic acid has also been marked as a feature of vivipary (Hartmann et al., 2002). The observed vivipary in mango fruit might be due to exposure of fruit to high humidity while ripening. The role of high humidity be-hind vivipary has been explained by Moore, D.M. and Doggett, Margaret C (1976) in plants. Vivipary may also had been favourd by lack of dormancy in mango seed which is recalcitrant in nature.
Mango fruits during ripening may manifest vivipary. Of course, vivipary is controlled genetically, but, its manifestation can be modified by the environment. It appears that high humidity might play inciting role in expression of vivipary. .Actually, vivipary mar the food value of fruits and affected fruits become worth rejection
especially from export trade. There is a need to indepth study as to manage the occurrence of the vivipary.
REFERENCESAllard, R.W. 1999. Principles of Plant Breeding. 2nd edi-
tion., John Wiley and Sons. New York.
Anonymous. 2001. Seed savers exchange. (http://www.seedsavers.org/).
Anonymous 2011. Indian Horticulture Database-2010. National Horticulture Board, Gurgaon, Haryana, pp. 89- 90. (www.nhb.gov.in)
Doggett, Margaret, C. 1976 Psudo-vivipary in Fuegian and Falkland islands grasses. Br. Antarct.Surv.Bull. No. 43, pp. 103-110.
Libby, W.J. and Router, R.M. 1984. Advantages of clonal forestry. Forestry Chronicle, 145-149.
Hartman Hudson, T.; Kester, Dale E.; Davies Jr., Fred T.; and Geneve Robert 2002. Plant Propagation: Prin-ciples and Practices, 7th edition, Prentice Hall of India Pvt. Ltd., New Delhi, 130 p.
Radha, T. And Mathew, L. 2007 Fruit crops (editor K.V Peter), NIPA, New Delhi,224p.
Stoutmeyer, V.T. 1960. Seed propagation as a nursery technique. Proc. Plant Propagation Soci., 10: 251-255.
Received on 10 June, 2012 and accepted on 30 March, 2013

Online version available at: www.indianjournals.com
Progressive Horticulture, Vol. 45, No. 2, September 2013© Copyright by ISHRD, Printed in India
[Report]
Colletotrichum leaf spot of holy basil (Ocimum tenuiflorum L.)- A new report from Kerala
Malini Nilamudeen*, V.K. Girija1 and C. NandakumarDepartment of Entomology, 1Department of Plant PathologyCollege of Agriculture, Vellayani, Thiruvananthapuram 695522, Kerala, India. *Email: [email protected]
ABSTRACTCommercial cultivation of tulsi demands the development of improved crop husbandry practices. In agro
ecosystems, when the area under a crop increases, the potential for pest problems also increases. Hence it goes without saying that the pest problems have to be identified and contained to obtain good quality produce.A fungal leaf spot caused by Colletotrichum gloeosporioides Penz. was recorded for the first time.
KEY wORDS: Leaf spot, Colletotrichum gleosporioides, holy basil
India is one of the richest repositories of medicinal and aromatic plants in the world. Kerala is one of the most advanced states with respect to the use of me-dicinal plants, especially in Ayurveda. Tulsi, meaning ‘the incomparable one’ is an important medicinal plant which is in demand. The medicinal properties of tulsi were known since antiquity. This herb is mentioned in Charaka Samhita and Rig Veda. It is used for the treat-ment of problems related to heart, blood, intestine and snake bite. Eugenol, the important chemical constituent of tulsi is useful for the synthesis of vanillin. In Kerala, tulsi has been an ubiquitous member of the homestead farming system.
Tulsi leaves were observed with circular, white coloured spots, which later coalesced and resulted in ne-crosis of leaves causing severe reduction in yield (Fig.1 and Fig.2). Leaves showing symptoms of leaf spot were collected from the field. The affected parts were cut into bits and surface sterilized with 0.10 per cent mercuric chloride. The surface sterilized parts were then washed twice with sterile water and were placed on Potato Dex-trose Agar medium (PDA) for initiating fungal growth. Pathogenicity and confirmation of disease were tested by inoculating mycelia on fresh healthy leaves. Three days after inoculation on healthy leaves, lesions devel-oped which were identical to the symptoms observed
earlier in the field.
In culture plates fungal colonies produced white mycelium within four days after inoculation, which later turned light pink due to the production of pinkish spore mass. The conidia were straight and bullet shaped with an oil globule at the centre, which measured 3x1.5 mm. Based on the cultural and microscopic characters, the pathogen was identified as Colletotrichum gloeosporioides Penz.
Fig. 1: Initial symptoms of leaf spot

384 Progressive Horticulture, 45 (2)
Fig.2: Leaf necrosis during later stages
The leaf spot caused by C. gloeosporioides was the first report of a fungal disease of tulsi from Kerala. The leaf blight of O.basilicum by Colletotrichum capsici V. was reported from India by Alam and Janardhanan (1994). C. gloeosporioides is a common organism causing leaf spot disease (anthracnose) in a wide array of fruit trees, spices and medicinal plants in Kerala. This has to be taken note of in the context of cultivating tulsi in farming systems with susceptible crops.
REFERENCEAlam, M. and Janardhanan, K.K. 1994. A new leaf blight
of French basil caused by C.capsici in India. J Mycol Pl Pathol,10(2): 99.
Received on 11 December, 2012 and accepted on 03 June, 2013
Online version available at: www.indianjournals.com
Progressive Horticulture, Vol. 45, No. 2, September 2013© Copyright by ISHRD, Printed in India
[Short Communication]
Response of integrated nutrient management in aonla (Embalica officinalis Gaertn) under medium black soil
Md. Mustafa1, S.K. Pandey2, S. Katare3, Dinesh Pandey4, Ajeet Singh5
KVK, Ratlam (M.P.) 1 2&3, KVK Masudha (U.P.)4 ,KVK Burhanpur (M.P.)5
Email : [email protected]
ABSTRACTAn investigation was carried out to optimize dose of the of the nutrient requirement of Aonla Cv.NA-7
through integrated use of Organic manure, Inorganic fertilizer, Vermi-compost, Neem cake and Micronutrient in the form of different combinations. Observation revealed that application of 25kg F.Y.M.+ ½ NPK+ ZnSo4 +Cuso4+Feso4 (T4) produced maximum fruit yield (47.75Kg), fruit size as well as nutrient content also. Fertility of experimental soil restore due to application of 25kg FYM+ ½ NPK+ ZnSo4+ Cuso4+ Feso4(T4).
KEY wORDS : Aonla, INM, fruit yields & quality
Aonla or Indian Gooseberry (Embalica officinalis gaertn) is the important fruit crop of arid and semi-arid region of the country. Its hardy nature makes it suitable to grow in varied edepho climatic condition of such re-gions. It has high medicinal & nutritional value and hav-ing vast potential to grow under diverse soils and agro-climate condition. It is native of tropical south eastern Asia mainly Peninsular of Central and Southern India. Aonla is becoming as important fruit of 21st century. Crop nutrition is one of the most essential factor, which greatly affect the yield and quality of Aonla. Majority of the Farmers are using imbalance fertilization as the work done on nutritional requirement of Aonla is very limited. It is therefore, highly important to work out the precise requirement of different nutrient in organic, inorganic and bio dynamic form to sustained the pro-ductivity of Aonla under medium black soil. Hence ,the present experiment was carried out to standardize the requirement of nutrient and their sources for optimum productivity.
MATERIALS AND METHODS The investigation was under taken at K.V.K.Farm,
Ratlam (M.P.) during 2009-10 in plot no. 07 under medium black soil. The experiment was laid out in Randomized Block Design having 16 treatment combination of differ-ent organic, inorganic fertilizers, with three replication. The 12 years old Aonla Cv. Narendra Aonla – 7, were
planted at 9 x 9 meter distance having 2.5 x 2.5 m2 basin size. The calculated amounts of nutrients were applied into two split dose accordingly treatment. Fruit yield per plant was measured with physical balance at the time of harvesting. Where as, fruit size was measured with the help of verneer calipers. Total soluble solids (TSS) was measured with hand refractometer of 0 to 30% range at 20oc. The physico chemical properties of soil were ana-lyzed by standard method Jackson (1973). The details of treatment combination are given below :T1 - 15 kg FYM + NPK + ZnSO4
T2 - 15 kg FYM + NPK + CuSO4
T3 - 15 kg FYM + NPK + FeSO4
T4 - 15 kg FYM + ½NPK + ZnSO4 + CuSO4 + FeSO4
T5 - 5 kg Vermi Compost + NPK + ZnSO4
T6 - 5 kg Vermi Compost + NPK + CuSO4
T7 - 5 kg Vermi Compost + NPK + FeSO4
T8 - 10 kg Vermi Compost + ½NPK + Zn + Cu + FeT9 - 30 kg FYM + Neem Cake based application (500 g/
plant)T10 - 35 kg FYM T11 - 10 kg Vermi Compost + Neem cake basel application
(500 g/plant)T12 - 10 kg Vermi Compost T13 - 15 kg FYM + NPK (Control )

386 Progressive Horticulture, 45 (2)
Table 1: Effect of treatment on fruit yield and quality of aonla
Treatment Yield Fruit Avt. Fruit TSS % (kg/ diameter Fruit length plant) (cm) wt. (gm) (cm) T1 39.25 4.01 29.50 3.90 8.90T2 38.25 4.00 28.50 3.76 8.56T3 38.25 3.98 29.00 3.86 8.65T4 47.75 4.38 32.00 4.15 10.75T5 45.75 4.20 31.25 4.10 10.15T6 43.25 4.20 31.25 4.17 9.90T7 41.25 4.17 30.50 4.05 9.65T8 47.05 4.30 31.50 4.12 9.40T9 42.25 4.15 30.00 4.04 10.40T10 39.50 3.83 29.50 3.95 9.15T11 38.40 3.84 29.50 3.75 9.05T12 38.25 3.82 28.39 3.75 8.25T13 39.00 3.83 28.30 3.70 8.15T14 37.25 3.85 28.25 3.74 8.35T15 37.50 3.81 28.00 3.70 8.25T16 37.25 3.80 28.00 3.70 8.40CD at 5% 4.15 0.78 4.23 2.43 1.86
Table 2: Effect of treatments on physico- chemical prop-erties of soil aonla
Treatment Nitrogen Phosphorus Potassium pH EC (kg/ha) (kg/ha) (kg/ha) (dsm-1)T1 149.68 9.94 323.05 7.97 0.41T2 149.58 10.06 322.90 8.02 0.40T3 149.63 10.05 322.95 7.98 0.42T4 150.53 10.09 324.80 7.84 0.30T5 150.13 10.07 324.30 7.88 0.34T6 150.03 10.07 323.80 7.92 0.37T7 149.88 10.04 323.55 7.93 0.38T8 150.38 10.08 324.55 7.84 0.32T9 149.78 9.89 323.55 7.89 0.33T10 149.73 9.84 323.30 8.06 0.43T11 149.53 9.79 322.80 8.08 0.42T12 149.58 9.74 323.65 8.04 0.44T13 149.56 9.49 322.30 8.09 0.44T14 149.55 9.55 321.80 8.14 0.45T15 148.53 9.78 321.30 8.19 0.46T16 148.53 9.59 320.80 8.29 0.46CD at 5% 1.17 1.10 45.75 0.096 N.S.
T14 - 5 kg Vermi Compost + NPK T15 - 10 kg FYM (Alone)T16 - 10 kg Vermi Compost (Alone)
Note: doses of NPK and FeSo4 is 1000, 400,400, & 200 gm respectably per plant per year as soil application while Znso4 and Cuso4 as spring @ 0.5 and 0.4 per-cent respectively.
RESULTS AND DISCUSSION
Fruit yield and qualityThe data observed in Table 2 clearly indicated that
fruits yield and physico- chemical quality were increased significantly due to application of nutrients as given in different treatment. The maximum fruits yield (37.75 kg/tree), fruit size (length 4.15 cm & diameter 4.38 cm), per fruit weight (32 gram) were recorded under T4 treatment (15kg FYM + ½ NPK + ZnSO4 + CuSO4 + FeSO4) followed by T8 (10 kg Vermi Compost + ½ NPK + Zn + Cu + Fe ). The highest TSS (10.75% was founds in T4 treatment.
However the minimum yield and inferior quality fruits were found under treatment T16 (10 kg vertmicompoost (Alone)). The results obtained in the present investiga-tion are inconformity to those reported by Pereira and Mitra (1999).
Physico – chemical properties of soil The physico-chemical properties of experimental
soil was increased markedly due to application of differ-ent nutrients combination. The lowest soil pH (7.84) and EC(0.30) were found in soil of T4 treatment (15kg FYM + ½ NPK + ZnSO4 + CuSO4 + FeSO4) followed by T8 (10 kg Vermi Compost + ½ NPK + Zn + Cu + Fe). The highest concentration of nitrogen (150.53 kg/ha), phosphorus (10.09 kg/ha) and potassium (324.30 kg/ha) were found in treatment T4, followed by T8, whereas, inferior soil was recorded under T16 treatment. Improvement in the soil properties as well as nutrient content might be due to balance dose of nutrient combined with organic mat-ter and micronutrients. The findings are in accordance to earlier observation of Babu & Sharma (2005).
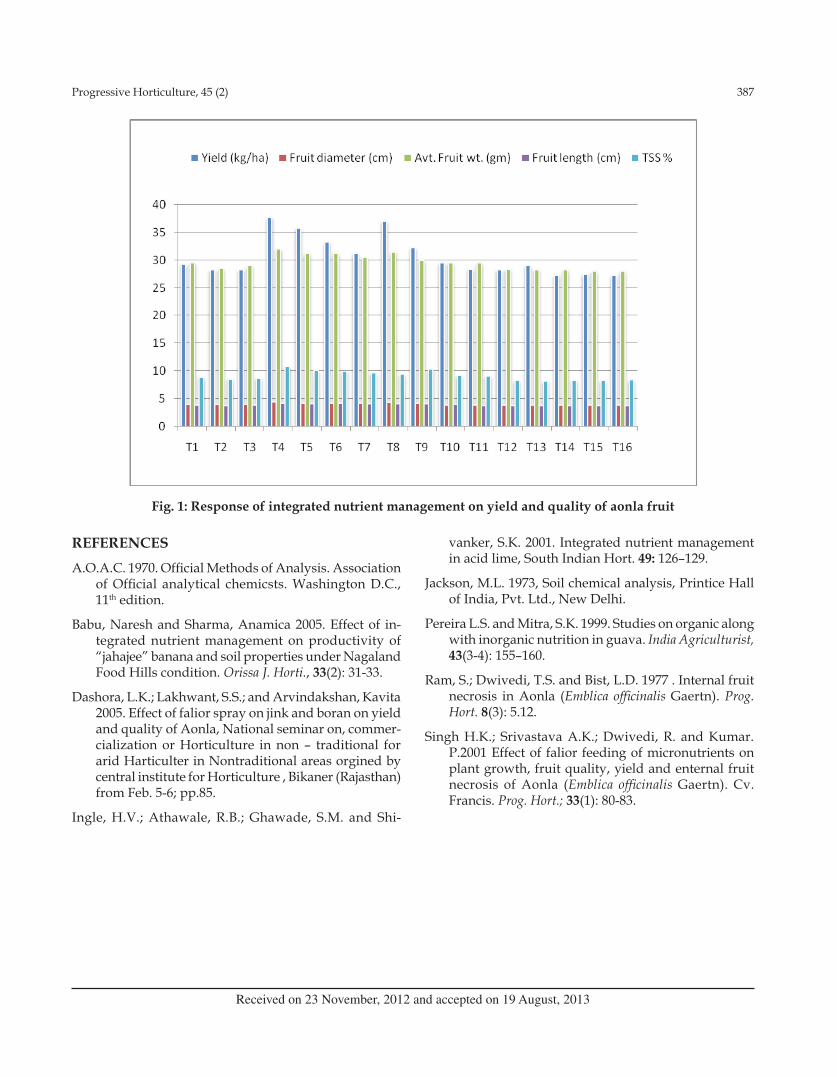
Progressive Horticulture, 45 (2) 387
REFERENCES A.O.A.C. 1970. Official Methods of Analysis. Association
of Official analytical chemicsts. Washington D.C., 11th edition.
Babu, Naresh and Sharma, Anamica 2005. Effect of in-tegrated nutrient management on productivity of “jahajee” banana and soil properties under Nagaland Food Hills condition. Orissa J. Horti., 33(2): 31-33.
Dashora, L.K.; Lakhwant, S.S.; and Arvindakshan, Kavita 2005. Effect of falior spray on jink and boran on yield and quality of Aonla, National seminar on, commer-cialization or Horticulture in non – traditional for arid Harticulter in Nontraditional areas orgined by central institute for Horticulture , Bikaner (Rajasthan) from Feb. 5-6; pp.85.
Ingle, H.V.; Athawale, R.B.; Ghawade, S.M. and Shi-
vanker, S.K. 2001. Integrated nutrient management in acid lime, South Indian Hort. 49: 126–129.
Jackson, M.L. 1973, Soil chemical analysis, Printice Hall of India, Pvt. Ltd., New Delhi.
Pereira L.S. and Mitra, S.K. 1999. Studies on organic along with inorganic nutrition in guava. India Agriculturist, 43(3-4): 155–160.
Ram, S.; Dwivedi, T.S. and Bist, L.D. 1977 . Internal fruit necrosis in Aonla (Emblica officinalis Gaertn). Prog. Hort. 8(3): 5.12.
Singh H.K.; Srivastava A.K.; Dwivedi, R. and Kumar. P.2001 Effect of falior feeding of micronutrients on plant growth, fruit quality, yield and enternal fruit necrosis of Aonla (Emblica officinalis Gaertn). Cv. Francis. Prog. Hort.; 33(1): 80-83.
Received on 23 November, 2012 and accepted on 19 August, 2013
Fig. 1: Response of integrated nutrient management on yield and quality of aonla fruit

Online version available at: www.indianjournals.com
Progressive Horticulture, Vol. 45, No. 2, September 2013© Copyright by ISHRD, Printed in India
[Short Communication]
Effect of IBA and NAA on stool layering in apple clonal rootstock Merton 793
P.C. Khatik and D.D. SharmaDepartment of Fruit Science, College of Horticulture, Dr. Y.S. Parmar University of Horticulture and Forestry, Nauni, Solan (H.P.)E-Mail: [email protected]
ABSTRACTThe investigation to find out the effect of IBA (1500 ppm, 2000 ppm and 2500 ppm), NAA (3000 ppm, 4000
ppm and 5000 ppm) and its combination (1500 ppm IBA + 3000 ppm NAA) on rooting and growth of stool shoots of apple clonal rootstock Merton 793 through stool layering were carried out under open field conditions. There were eight treatments with randomized block design. The results revealed that highest percentage of rooted stool shoot (84.57 %), number of rooted stool shoots (7.23/stool), number of adventitious roots per stool shoot (17.71), total root length (4.80 m), linear growth of stool shoot (127.76 cm), stool shoot diameter (12.03 mm), leaf area (11.31 cm2), root to shoot ratio (0.088), and total biomass in terms of fresh (110.38 g) and dry weight (67.08 g) was recorded in the stool shoots treated with IBA 2500 ppm. whereas, the number of leaves per stool shoot (78.99) and average root diameter (1.64 mm) was recorded in IBA 1500 ppm + NAA 3000 ppm treatments.
KEY wORDS: Merton 793, stool layering, root to shoot ratio.
Apple (Malus x domestica Borkh.) is the most impor-tant fruit crop of the temperate region of the world. In In-dia, apple is produced predominantly in North-Western Himalayan region with a production of 28.91 lakh metric tones from an area of *PhD Scholar, Rajasthan College of Agriculture, MPUAT, Udaipur (Raj.) about 2.89 lakh hectares (Anon., 2011). In recent years, the demand for fruit nursery plants has increased significantly because of the introduction of the new cultivars and re-plantation of old unproductive orchards. Merton 793 (M 2 x North-ern Spy) has been proved to be an excellent propagating stock because it is adapted to a wider range of soil, pre-cocious and heavier cropper than other rootstocks, pro-duces a medium tree, is resistant to woolly apple aphid, collar rot and suitable for replanting apple orchard at old sites (Jindal & Gautam, 2001). Nursery plants of fruits on seedling rootstocks are usually sold as one to three years old and cause the loss of time and cost. Apple tree produced through seed are now becoming unacceptable from the economic point of view as well as production and quality of fruits.
Stool layering is most convenient and cheap method of obtaining a fully developed stronger stock in consid-erably less time. Some clonal rootstocks are difficult to root such as MM 109, M 4, M 9, crab apple, M 26, M 27,
M 11, MM 111 and Merton 793. The exogenous applica-tions of auxins promote root initiation and their devel-opment. Synthetic auxin that is IBA is widely used due to its ability to increase rooting and to induce a fibrous root system. It is highly desirable to build up a healthy and well developed root system for enabling better field establishment of stock plant. Keeping above in view the present studies were conduct to see the effect of IBA and NAA application on stool shoots to produce a good and healthy root system of apple clonal rootstock under field conditions.
MATERIALS AND METHODSThe present investigation was carried out during
2009-2010 at the nursery area of Department of Fruit Sci-ence, Dr Y S Parmar University of Horticulture and For-estry, Nauni, Solan (HP). The experiment was laid out in the randomized block design with three replications having ten mother stools in each replication. There were eight treatments in different concentrations of IBA and NAA viz. (i) 1500 ppm IBA; (ii) 2000 ppm IBA; (iii) 2500 ppm IBA; (iv) 3000 ppm NAA; (v) 4000 ppm NAA; (vi) 5000 ppm NAA; (vii) 1500 ppm IBA + 3000 ppm NAA and (viii) only lanolin paste as control. Source of plant-ing material was 4 years old mother stools of Merton 793

Progressive Horticulture, 45 (2) 389
rootstocks established at spacing of 2.00 x 0.45 m and headed back at 5 cm height above ground level in Janu-ary, 2009. All the treatments applied with lanolin paste by wounding at the base of stool shoots in late June, 2009 when the stool shoots have reached approximately 45 cm of height and their after treated stool shoots were covered up with field soil to 20 cm above ground level manually. The shoot tip was removed at the height of one meter of stool shoots from ground. Observations on the shoot characteristics were taken at regular intervals. At the end of the experiment (The rooted stool shoots were detached in late winter), 4 stool shoots from each replication were randomly selected and observations on the root characters were recorded. The data collected on various parameters were subjected to statistical ana-lyzed by using Assex Software (Statistix PC Dos Version 2.0 NH Analytical Software).
RESULTS AND DISCUSSION The IBA, NAA and their combination at various
concentrations showed significant influence on root pa-rameters of stool shoots of apple rootstock Merton 793 (Table 1) compared to control. Stool shoots treated with IBA 2500 ppm recorded the highest percentage of root-ed stool shoot (84.57 %), number of rooted stool shoots (7.23/stool), number of adventitious roots per stool shoot (17.71), total root length (4.80 m), whereas all these parameters were found minimum under control. These results indicated that the application of 2500 ppm IBA had a direct influence on the movement or the action of auxin which in turn stimulated root initiation. In addi-tion, exogenous application of auxin break starch in to simple sugars, which is needed to a greater extent for the production of new cells and for the increased respi-ratory activity in the regenerating tissues at the time of initiation of new root primordia (Nanda, 1975). Higher response of some genotypes may have attributed to high availability of endogenous natural auxin in plant tissue (Salisbury and Ross, 2005). The principal role of IBA is to favour the conjugation between endogenous IAA and amino acids which leads to the synthesis of the specific proteins necessary for formation of root ini-tials (Ryugo and Breen, 1974). Quamme and Brownlee (1990) observed that the rooting in apple rootstock can be increased by wounding and use of growth regulators such as IBA. Further, the result are also in agreement with Joshi et al. (1987) who also observed highest root-ing percentage and maximum number of roots per stool shoot of various rootstocks of apple with the application of IBA 2500 ppm in lanolin paste to ringed stool shoots. Srivastava et al. (2006) obtained the maximum number of rooted shoots with treatment ringing of shoot bases + IBA 2500 ppm in apple rootstock MM 106 through trench
layering. Similarly, Chand (1999) recorded maximum number of rooted stool shoots per stool (11.08) through mound layering in M 7 rootstocks of apple treated with IBA at 2500 ppm.
Wada et al., (1998) reported that IBA promotes root length by influencing the synthesis of enzymes con-cerned in cell enlargement. The enzymes involved in cell enlargement processes are triggered by the auxins. Better effects of IBA on root elongation as compared to NAA which might be due to the several factors, such as its preferential uptake, transport and metabolization (Muller, 2000) and application of IBA may have trig-gered the early anticlinal cell division and root primor-dia formation than NAA (Ali et al.,2009). Whereas, the average root diameter (1.64 mm) was recorded in IBA 1500 ppm + NAA 3000 ppm treatment, which was fol-lowed by NAA 5000 ppm. The mixtures of root promot-ing substances (IBA and NAA) are sometimes more ef-fective than either component alone, have greater chemi-cal stability and low mobility in plants (Hartmann et al., 2007). Among shoot parameters (Table 2) linear growth of stool shoot (127.76 cm), stool shoot diameter (12.03 mm), leaf area (11.31 cm2), root to shoot ratio (0.088), and total biomass in terms of fresh (110.38 g) and dry weight (67.08 g) was recorded in the stool shoots treated with IBA 2500 ppm. The effect of auxin in vascular dif-ferentiation is well established and it is also known to stimulate both cambial activity and xylem development in many woody species and it is required for formation of the primordium initial cell (Davis and Hassig, 1990). the findings of Chand (1999) who recorded highest av-erage linear growth (132.10 cm) in M 7 and diametric growth of stool shoot in M 9 rootstocks of apple treated with 2500 ppm IBA.
Leaves are one of the production sites of natural auxin in the plants beside the main activities of photo-synthesis, respiration and transpiration. The increased roots in the cuttings due to auxins application may have necessitated the increased activity of photosynthesis and other activities carried out in the leaves, which in turn may have resulted in the increase of leaves in the cut-tings (Taiz and Zeiger, 2006). Plants with a higher pro-portion of roots can compete more effectively for soil nu-trients, while those with a higher proportion of shoots can collect more light energy. Roots allow a plant to ab-sorb water and nutrients from the surrounding soil, and a healthy root system is a key to healthy plant. The roots shoot ratio parameter help to assess the overall health of the plants. Any changes from this normal level (either up or down) would be an indication of a change in the over-all health of the plant. These results are in accordance with the findings of Joshi et al. (1987) who reported maxi-mum roots per stool shoot of Merton 793 rootstock. The

390 Progressive Horticulture, 45 (2)
Table 1: Effect of IBA and NAA on root characteristics in apple clonal rootstock Merton 793 stool shootsTreatments Rooted stool Average number Average number Average root Total root Root shoot shoots(%)* of rooted stool of adventitious diameter(mm) length(m) ratio (Dry shoots per stool roots per stool shoot weight basis)
T1 - IBA-1500 ppm 67.71 (55.37) 4.77 10. 23 1.14 3.10 0.061
T2 - IBA-2000 ppm 78.31 (62.25) 6.77 15.88 1.18 3. 57 0.074
T3- IBA-2500 ppm 84.57 (66.88) 7.23 17.71 1.48 4.80 0.088
T4- NAA-3000 ppm 54.89 (47.81) 3.78 10. 04 1.24 2.40 0.040
T5- NAA-4000 ppm 56.60 (48.80) 3.81 11.69 1.37 2.43 0.057
T6- NAA-5000 ppm 67.66 (55.34) 4.74 13.50 1.52 2.55 0.059
T7- IBA (1500 ppm) 70.56 (57.14) 5.59 14.05 1.64 3. 43 0.074 +NAA (3000 ppm)
T8- Control 45.50 (42.42) 3.15 8.16 1.03 2.33 0.027
Mean 65.72 (54.50) 5.18 12.65 1.23 3.07 0.060
CD (0.05) 2.00 (1.26) 0.67 0.85 0.17 0.60 0.010
Table 2: Effect of IBA and NAA on shoot characteristics in apple clonal rootstock Merton 793 stool shoots
Treatments Average linear Average stool Number of Average Total biomass growth per stool shoot leaves per leaf area shoot (cm) diameter (mm) stool shoot (cm2) Freshweight(g) Dry weight(g)
T1 - IBA-1500 ppm 117.56 11.62 70.95 9.39 105.39 63.34
T2 - IBA-2000 ppm 125.48 12.02 72.12 11.25 108.72 65.78
T3- IBA-2500 ppm 127.76 12.03 78.71 11.31 110.38 67.08
T4- NAA-3000 ppm 109.90 10.38 64.95 9.21 97.42 53.18
T5- NAA-4000 ppm 117.10 11.47 67.41 9.28 100.39 53.33
T6- NAA-5000 ppm 124.29 11.66 75.45 9.47 105.24 62.45
T7- IBA (1500 ppm) 125.36 11.69 78.99 10.09 106.23 64.27 +NAA (3000 ppm)
T8- Control 108.55 10.32 61.47 8.19 94.83 51.26
Mean 120.25 11.47 71.25 9.77 103.41 59.27
CD (0.05) 4.48 0.44 6.10 0.45 1.69 1.85
treatment of IBA 2500 ppm results highest total biomass in the stool shoots of apple clonal rootstock Merton 793, which directly corresponds to more root numbers, root length, length of shoots and shoot diameter per stool shoot as compare to other treatments. Simultaneously it was followed by the IBA 2000 ppm.
Whereas, the number of leaves per stool shoot (78.99) was recorded in IBA 1500 ppm + NAA 3000 ppm treat-ments. This may be due to the utilization of foods in
development of new sprouts instead of development of root and short internodal length of stem and more num-ber of axillary buds gave two to three leaves on each bud. Bud sprouting is mainly attributed to the stored carbohy-drate in the cuttings, used for sprouting, however, with auxins application to the cutting and subsequent increase in the rooting, as the hypothesis of the study was, may resulted in the increase of sprouting, this indirect effect of auxin on sprouting highlights the role of certain mate-
Progressive Horticulture, 45 (2) 391
rials produced in the roots, responsible for sprouting. On the basis of results obtained from the present research work, it may be concluded that among the different con-centrations of IBA and NAA alone or in combination, the IBA 2500 ppm was found best treatment for inducing better root system in apple clonal rootstock-Merton 793 in terms of rooting percentage, number of roots, root to shoot ratio, total root length and total biomass.
REFERENCES
Ali, A.; Touqeer A.; Nadeem, A.A. and Ishfaq, A.H. 2009. Effect of different concentrations of auxins on in vitro rooting of olive cultivar ‘Moraiolo’ Pakistan J. Botany, 41(3): 1223-1231.
Anon. 2011. NHB Statistical Database.
Chand, R. 1999. Clonal propagation of some Malling and Malling Merton apple rootstocks through stool layer-ing. M.Sc. Thesis, Department of Fruit science, Dr. Y. S. Parmar University of Horticulture and Forestry, Solan, H.P.
Davis, T.D. and Hassig, B.E. 1990. Chemical control of adventitious root formation in cuttings. Plant Growth Regulators Soc. Amer. Quart., 18(1): 1-17.
Hartmann, H.T.; Kester, D.E.; Davies, F.T. and Geneve, R.L. 2007. In: Plant propagation: principals and practices. Prentice Hall of India. New Delhi. pp. 277-403.
Jindal, K.K. and Gautam, D.R. 2001. Enhancement of productivity of temperate fruits In: Compendium of winter school on Enhancement of productivity of temperate fruits, September 16 – 8 October, Dr. Y.S.
P. U. H. & F, Solan, pp.43-54.
Joshi, K.R.; Mishra, R.S. and Seth, J.N. 1987. A note on clonal multiplication of apple rootstocks through stool layering. Prog. Horti., 19(1-2): 143-144.
Muller, J.L. 2000. Indole-3-butyric acid in plant growth and development. Plant Growth Regulators. 32(2-3): 219-230.
Nanda, K.K. 1975. Physiology of adventitious root forma-tion. Indian journal of Plant Physiol., 18: 80-90.
Quamme, H.A. and Brownlee, R.T. 1990. Stool layering ability of thirty-one apple rootstock cultivars. Ameri-can Pomological Soci., 44(3): 165-168.
Ryugo, K. and Breen, P.J. 1974. Indoleacetic acid me-tabolism in cuttings of plum (Prunus ceracifera x P. munsonina cv. Marianna 2624). American Soci.Horti. Sci., 99(3): 247-251.
Salisbury, F.B. and Ross, C.W. 2005. In: Plant Physiology. 3rd ed. CBS Publishers and Distributors, Delhi. pp. 309-329.
Srivastava, K.K.; Bhat, K.M.; Sharma, M.K. and Nazki, T.T. 2006. Studies on multiplication of MM 106 rootstock of apple through trench layering in Kashmir Valley. Research on Crops, 7(1): 311-312.
Taiz, L. and Zeiger, E. 2006. In: Plant Physiology. 4th ed. Sinauer Associates Inc Publisher, pp. 84-86.
Wada, S.; Tanimoto, E. and Masuda, Y. 1998. Cell elonga-tion and metabolic turnover of the cell wall as affected by auxin and cell wall degrading enzymes. Plant Cell Physiol., 9(2): 369-376.
Received on 26 June, 2012 and accepted on 11 March, 2013

MEMBERSHIP FORMProgressive Horticulture
Indian Society of Horticultural Research and Development
1. Name (In capital letters): ____________________________________________________________________2. Designation: _____________________________________________ Date of birth: _____________________3. Academic and professional qualification: _________________________________________________________________________________________________________________________________________________4. Institute/ organization where employed: _____________________________________________________5. Address for correspondence: ____________________________________________________________________________________________________________________________________________________________City: ________________________________________ State: __________________________________________PIN Code: ___________________________ Telephone No. with STD code ____________________________Office: ___________________________________ Residence: ________________________________________Mobile No: _______________________________ E-mail: ___________________________@_______________6. Permanent address: ____________________________________________________________________________________________________________________________________________________________________City: ________________________________________ State: __________________________________________PIN Code: _____________________________ Telephone No. STD code _______________________________
DECLARATIONI wish to become the life annual member of Indian Society of Horticultural Research and Development (ISHRI) and if enrolled, agreed to abide by its rules and regulations.
Date: ___________________ Signature: __________________
Place: ___________________
MEMBERSHIP FEES FOR THE YEAR 2013Category India ( ` ) Overseas (US$)
Parton 50,000.00 and above --Life Membership 5,000.00 450.00Annual Membership 1,000.00 80.00
• Membership can be deposited by draft (in favour of Editor, Progressive horticulture, payable at SBI-Ranikhet-Almora) Or cash or bank transfer to the Editor's account in consultation with Secretary or Editor with transac-tion number and date of deposits. Please mail the draft/transaction details alongwith this form, by post to Dr Sanjai K Dwivedi, (Editor), CEPTAM, DRDO, Metcalfe House, Delhi-110054.
• You can also use Photo copy of this form.

GUIDELINES FOR THE AUTHORSThe Progressive Horticulture is a peer reviewed Journal published half-yearly since 1969 by Indian Society of Horticultural Research & Development (ISHRD). Original contributions covering every aspect of fundamental and applied research relating to various disciplines of horticultural crops (fruit, vegetable, ornamental crops, medicinal and aromatic plants, spices, condiments and tuber/plantation crops), post harvest management, biotechnology, diversification, policy issues, trade, market, case studies related to horticultural field are considered for publication. It may contain review articles summarizing the existing state of knowledge in horticultural research only as invita-tion papers. Thesis research, book reviews, notifications, events, etc. can also be submitted for publication. The manuscript of reviews, research articles and short communications should not exceed 15, 8 and 4 typed pages including tables and illustrations, respectively. Preference will be given to the thesis research publications in each issue. One copy of the manuscript and illustrations should be prepared. The manuscript should preferably pertain to the research work carried out during the last five years. The scientific norms and ethics should be followed while preparing the manuscripts. The manuscript submitted for publication in Progressive Horticulture, it will assumed that manuscript has not been submitted, accepted, under consideration for publication or published elsewhere, or other-wise rejected. Necessary permission has been obtained from the competent authority for publication and due credit has been given to all concerned. As per policy of the journal authors should be member of the society. No printed reprints will be supplied to the authors. Acceptance/ publication of article in Progressive Horticulture shall transfer the copy right to the ISHRD. The editorial board takes no responsibility for the facts or views/opinion expressed in the journal which rests entirely with author(s) thereof.
PREPARATION OF MANUSCRIPTThe text should be typed in double space on one side of A4 size bond paper (21 x 29 cm) with 3 cm margin on all sides and in clear and concise English. The format for original research articles and short communications will be the same except that the latter require no headed sections.TITLE: The title of the article and authors name should be bold and in Sentence case, with full address of each author in running and email address of corresponding author. Any change of address should be given as a foot note. ABSTRACT: The abstract should not exceed 200 words in full paper and 50 words in short communication. It should be an informative digest of significant contents and conclusions. It should be suitable for indexing and abstracting.KEY WORDS: Immediately after the abstract, provide a maximum of 5 keywords in alphabetic order. Repetition of words used in the title should be avoided. INTRODUCTION: The introductory part should be brief and to the point. It contain aim & importance of research work and pertinent updated review of literature. MATERIALS AND METHODS:The materials and methods should include important materials used, place and period of work and details of experimental techniques employed includ-ing statistical techniques. When the methods are well known, citation of standard work is sufficient. RESULTS AND DISCUSSION:The results and discussion should be combined to avoid repetition. It must include latest/ updated information/ references on the subject and proper discussion of the finding is essentially required.Tables: Each table should be on a separate sheet at the end of the paper, numbered in the order in which it appears in the text. Table should carry a short title and be numbered in Arabic numerals. All data reported must be subjected to ap-propriate statistical analysis. ILLUSTRATIONS/ GRAPHS/ PHOROGRAPHS: Illustrations should be relevant to the article and referred to in the text. Line drawings should be in Indian ink or laser print, of 10x15 cm dimension including legends and captions. Metric units of weights and measures should be used. ACKNOWLEDGEMENTS: If required, the acknowledgements should come after Results and Discussion. The authors need not acknowledge authorities for providing facilities for research work. REFERENCES: References should be cited in the text in the form: (Saroj and Awasthi, 2006). The term etalico, should be used when there are more than two authors. The let-ters a, b, c, should be used following the year, to distinguish between two or more papers by the same author in one year. References at the end of the text should be arranged alphabetically and presented strictly as per the format of the journal.
MODE OF SUBMISSIONThe manuscript, as per the format of the journal (with text and tables in one file only) is required to be submitted to our Email: [email protected] .Separate email submission is required for each manuscript. After submission, MS number is allotted and thereafter one copy of the printed manuscript (Mentioning MS number and Date of submission to email in RED ink at first page of the paper) must be posted to Dr Sanjai K. Dwivedi, Editor, Progressive Horticulture,C/o CEPTAM, DRDO, Metcalfe House, Delhi-110054. No action is initiated, till hard copy of the paper is received.

394 Progressive Horticulture, 45 (2)CONTENTS
PROGRESSIVE HORTICULTURE, Vol. 45, No. 2, September, 2013
The Progressive Horticulture is cited by Horticultural Abstracts (CABI), Indian Science Abstracts (INSDOC) and Indian Citation Index
Printed at SPS Printways, Delhi, Mob. : +919871891318
Bio-enhancers: A potential tool to improve soil fertility, plant health in organic production of horticultural crops-R.K. Pathak and R.A. Ram
Studies on nut and kernel characters in some cultivars/selec-tions of walnut-Chandra Pandey, C.S.Tomar, R.L. Lal and Pavan Shukla
Efficiency of weedicide (UPH 707) to control complex weed flora in Thompson Seedless grape vineyard-S.D. Ramteke , M.A. Bhange , R.G. Somkuwar and R. J. Kor
Effect of post harvest treatments of organic acid and polysac-charide on shelf life of litchi (Litchi chinensis Sonn.) cv. Rose Scented-Deepak Deval, N.K. Mishra and R.L. Lal
Performance of mango varieties in Kymore plataue of Madhya Pradesh-T.K. Singh, J. Singh and D.B. Singh
Effect of various storage conditions on physical characteristics of peach cv. Flordasun- Parshant Bakshi, F.A. Masoodi, Rakesh Kumar and Amit Jasrotia
Effect of time and methods of budding in multiplication of guava cv. Allahabad Safeda under valley conditions of Garh-wal Himalaya -B.B. Bhatt, Y.K. Tomar and S.S. Rawat
Studies on biochemical changes in aonla (Emblica officinalis Gaertn.) squash under storage condition-M. L. Choudhary, I.M. Verma, Jitendra Singh, Atul Chandra and S. L. Godara
Evaluation of nutritional quality of aonla during freeze-drying -D. K. Tandon and Rekha Chaurasia
Storability of aonla (Emblica officinalis Gaertn) fruits in liquid medium at ambient temperature- R.C. Gupta and Bhagwan Deen
Evaluation of anthocyanin content in the fruits of different Russian olive (Elaeagnus angustifolia) geno types of Ladakh.-Anup Raj and Faizan Ahmad
Integrated nutrient management in Isabgol (Plantago ovata Forsk.)-V.K. Tripathi, Sanjeev Kumar, P.N. Katiyar and Md. Abu Nayyer
Interactive effect of growing substrates and fertigation in flowering attributes of rose cv. ‘Grand Gala’- Deepti Bisht, C.P. Singh, Santosh Kumar and Narayan Singh
Study on the performance of some varieties of China aster (Callistephus chinensis Ness.) in Andhra Pradesh-J.H. Zosiamliana, G.S.N. Reddy and H. Rymbai
Screening of gerbera (Gerbera jamesonii ) cultivars for quality, vase life and stem bending-R. Kumar, N. Ahmed, O. C. Sharma, G. Mahendiran and S. Lal
Effect of foliar feeding of nitrogen and GA3 on vegetative growth, flowering behavior and yield of calendula (Calendula officinalis L.)- Ashok Kumar and Yashpal Singh
Effect of pinching, disbudding and foliar spray of cytozyme on growth and flowering behaviour of annual chrysanthemum (chrysanthemum carinatum schousb)-Sandeep Kumar, Sanjay kumar and N.C. Pushkar
Use of plastics in agriculture in Nw Himalayan region of Uttarakhand: Present status and scope- Manoranjan Kumar
and N.K. Hedau
Increasing yield and quality of indigenous melons by combining intraspecific group of Cucumis melo- A.K. Singh, Aastik Jha, N.P.S. Dhillon and Sudhakar Pandey
Impact of micro-irrigation practices on farmers economy of Kullu district in Himachal Pradesh- Dhanbir Singh and Vinod Sharma
Effect of Plant Bio regulators on seed yield, germination and vigour in Okra (Abelmoschus esculentus (L.) Moench)-S. H. Khan, M. A. Chattoo and Shahnaz Mufti
Energy utilisation pattern in tomato production under dry-land conditions of Jammu & Kashmir (J&K)-Sanjay Khar, Pawan Sharma, Neerja Sharma, Rakesh Sharma, Punit Choudhary, and Manoj Kumar
Estimation of biological divergence in cabbage (Brassica oleracea var. capitata L.) -M.L. Meena, R.B. Ram, Deepa. H. Dwivedi and Navaldey Bharti
Influence of growing condition, spacing and calcium sprays on seed quality parameters of tomato (Solanum lycopersicum L.)- S. Harish, N. K. Biradarpatil
Standardization of wrapping and packaging techniques to enhance the post harvest life of carnation-S. Karthikeyan,
and M. Jawaharlal
Effect of irrigation and fertigation levels on cabbage (Brassica oleracea var. Capitata L.) -P. Kumar and R.L. Sahu
Effect of integrated nutrient management on growth, yield and quality of onion (Allium cepa l.)- S. Jamir, V.B. Singh, S.P. Kanaujia and A.K. Singh
Report on vivipary in mango (Mangifera indica L.)- Jitendra Singh and P.S. Chauhan
Colletotrichum leaf spot of holy basil (Ocimum tenuiflorum L.)- A new report from Kerala-Malini Nilamudeen, V.K. Girija and C. Nandakumar
Response of integrated nutrient management in aonla (Embalica officinalis Gaertn) under medium black soil-Md. Mustafa, S.K. Pandey, S. Katare, Dinesh Pandey, Ajeet Singh
Effect of IBA & NAA on stool layering in apple clonal rootstock Merton 793- P.C. Khatik and D.D. Sharma
237
255
259
265
268
273
278
281
286
291
298
302
306
312
317
322
326
331
335
340
345
347
351
355
360
366
373
381
383
385
388