THÈSE pour obtenir le grade de Docteur de l'Université Paris ...
213
Ecole Doctorale : MSTIC THÈSE pour obtenir le grade de Docteur de l’Université Paris-Est Spécialité : Electronique, Optronique et Systèmes présentée et soutenue publiquement par Chee Teck PHUA Soutenue le 21 septembre 2012 Développement d’une nouvelle méthode de mesure du rythme cardiaque et du débit sanguin fondée sur les perturbations localisées d’un champ magnétique. Directrice de thèse Prof. Gaëlle LISSORGUES Jury Rapporteur Latifa BOUCHET-FAKRI Professeur Univ. Lyon 1, UMR CNRS 5220 CREATIS Rapporteur Souhil MEGHERBI Professeur Univ. Paris 11, UMR CNRS 8622 IEF Examinateur Patrick POULICHET Maître de Conférences ESIEE, EA 2552 ESYCOM Examinateur Fabrice VERJUS Docteur, Société BodyCap Directrice de thèse Gaëlle LISSORGUES Professeur ESIEE, Univ. Paris Est, EA 2552 ESYCOM Invité Bruno MERCIER Ingénieur ESIEE © UPE
-
Upload
khangminh22 -
Category
Documents
-
view
1 -
download
0
Transcript of THÈSE pour obtenir le grade de Docteur de l'Université Paris ...
Ecole Doctorale : MSTIC
THÈSE
pour obtenir le grade de
Docteur de l’Université Paris-Est
Spécialité : Electronique, Optronique et Systèmes
présentée et soutenue publiquement par
Chee Teck PHUA
Soutenue le 21 septembre 2012
Développement d’une nouvelle méthode de mesure du rythme cardiaque et du débit
sanguin fondée sur les perturbations localisées d’un champ magnétique.
Directrice de thèse
Prof. Gaëlle LISSORGUES
Jury
Rapporteur Latifa BOUCHET-FAKRI Professeur Univ. Lyon 1, UMR CNRS 5220 CREATIS
Rapporteur Souhil MEGHERBI Professeur Univ. Paris 11, UMR CNRS 8622 IEF
Examinateur Patrick POULICHET Maître de Conférences ESIEE, EA 2552 ESYCOM
Examinateur Fabrice VERJUS Docteur, Société BodyCap
Directrice de thèse Gaëlle LISSORGUES Professeur ESIEE, Univ. Paris Est, EA 2552 ESYCOM
Invité
Bruno MERCIER Ingénieur ESIEE
© UPE

Page I
Résumé
L’objectif principal de cette thèse est la conception, la réalisation puis la mise en œuvre d’un
dispositif de mesure pour l’acquisition du rythme cardiaque et du débit de circulation sanguine sans
aucun contact ni électrique ni optique avec le patient, ces paramètres étant représentatifs
physiologiquement pour évaluer la condition de santé d’un individu.
Ce travail s’appuiera sur une nouvelle méthode de mesure appelée MMSB (Modulated Magnetic
Signature of Blood), fondée sur les perturbations localisées d’un champ magnétique rémanent au
passage du flux sanguin. En effet, l’uniformité du champ magnétique généré par un aimant
permanent de 0,1 – 0,2 Tesla placé à proximité de la peau d’un patient est perturbée par la
circulation naturelle du sang suite aux propriétés ferromagnétiques des globules rouges. Cette
perturbation est alors extraite sous la forme d’une tension électrique à l’aide d’un capteur GMR
classique. L’originalité du dispositif repose sur une méthode d’acquisition non invasive et sans
contact, permettant donc l’acquisition des signaux à travers les vêtements, la transpiration, les
salissures ou autres polluants dans l’environnement proche du capteur, contrairement aux
dispositifs commerciaux disponibles en début de thèse.
Un état de l’art détaillé des différentes techniques non-invasives liées à la mesure du rythme
cardiaque (électrique, optique, micro-ondes, acoustique, mécanique et magnétique) est proposé en
début de thèse, mettant en avant les avantages et inconvénients de chacune. Une présentation
similaire est proposée pour comparer les méthodes connues et utilisées dans le cas de l’analyse du
débit sanguin (dilution, thermo-dilution, par ultrasons…). Cette première partie permet de préciser
ensuite les orientations et motivations vers une méthode de mesure magnétique.
Le manuscrit présente ensuite la méthode originale développée ici pour la mesure du rythme
cardiaque et du flux sanguin de manière autonome (faible consommation), et non invasive, à savoir
la méthode appelée MMSB. Une première étude permet la validation in vitro du phénomène MMSB
avec la mise en œuvre d’un banc expérimental comprenant un aimant permanent couplé à un
capteur GMR, un module d’acquisition et de traitement des signaux et un système de visualisation
des données. Le dispositif d’étude in vitro est constitué d’un tube de verre rigide au travers duquel
circule une solution d’oxyde de fer (Fe2O3) avec différentes concentrations correspondant à
Page II
quelques exemples possibles de quantité d'hémoglobine dans le sang parmi ceux rapportés dans la
littérature. Cette étude se poursuit par une validation in vivo de l’exploitation du phénomène MMSB
à l’aide d’une étude comparative de la forme d'onde obtenue à l’aide du capteur GMR et de
l’amplitude MHV sur 20 sujets sains. L’analyse statistique des résultats montre une bonne
concordance (erreur inférieure à 5%) sur les pics relatifs aux activités du cœur, les courbes de
références étant obtenues avec une mesure étalon par ECG. Cette partie démontre ainsi les
potentialités de la méthode MMSB proposée comme une alternative à l’ECG pour la mesure de la
fréquence cardiaque chez les sujets sains, dans une situation de repos ou dans le cas
d’environnements particuliers (ex : cas d’un corps dans l’eau tel que des nageurs ou plongeurs).
En parallèle, une étude multi physique est proposée pour étudier le phénomène MMSB. La
construction d’un modèle est réalisée en deux étapes :
- modélisation bidimensionnelle du flux sanguin en présence d'un champ magnétique,
- modélisation du système d'écoulement fluidique de l’oxyde de fer F2O3 dans un champ
magnétique faible.
Des simulations sous le logiciel commercial multi physique COMSOL utilisent ce modèle, avec
comme paramètres les valeurs relatives au banc expérimental ou des valeurs issues de la littérature.
Ce modèle permet d’estimer la sensibilité de la méthode MMSB et d’optimiser la distance entre
l’aimant permanent et le capteur. La comparaison entre les mesures et les résultats de simulation
sous COMSOL montrent une bonne corrélation sur la valeur de cette distance optimale.
Pour aller plus loin, le phénomène MMSB est exploité non plus pour mesurer le rythme cardiaque,
mais pour acquérir le débit sanguin en mesurant la variation de l’amplitude du signal après une
période dite d’occlusion. En effet, l’amplitude du signal MMSB diminue pendant une occlusion
correspondant à une chute du débit sanguin. Cette mesure a été comparée quantitativement et
qualitativement en utilisant la technique de référence PORH (Post Occlusive Reactive Hypermaemia).
Pour l’analyse qualitative, il s’agit d’évaluer le temps de transit entre la phase d’occlusion et le flux
maximum détecté, qui est également mesurable par Laser Doppler. Une forte corrélation a été
obtenue.
Pour l’analyse quantitative, une campagne de mesure sur 6 sujets sains montre une dispersion de
moins de 4% entre la méthode de référence DRT4 et la méthode MMSB.
Page III
Ensuite, dans le cas de la surveillance continue de signes physiologiques tels que la pression
artérielle, les travaux comparent l'application de la méthode MMSB pour l’acquisition du temps de
transit impulsionnel (PPT) au niveau du poignet par rapport à l’acquisition au niveau du doigt à l’aide
de photoplethysmogram (PPG) issues d’un appareil de référence OMRON.
Enfin, la description de l’implémentation matérielle est donnée, qui comprend l’électronique
d’acquisition et de traitement, ainsi que l’encapsulation dans un dispositif portable faible
consommation et autonome. Cette implémentation aboutit à la mise en œuvre d’une plate-forme de
détection et d’analyse du rythme cardiaque à l’aide d’un réseau sans fil de type ad-hoc. Deux
exemples d’application sont présentés, et deux dispositifs ont été entièrement développés lors de
cette thèse et sont en cours de commercialisation, pour des applications de vie quotidienne, après
avoir été préalablement brevetés.
Page IV
Summary
The state of the art technologies and techniques to acquire heart or pulse rate and blood flow
monitoring can be generally classified into electrical, optical, microwave, acoustic, mechanical and
magnetic. The advantages and disadvantages for each these methods to acquire blood pulse and
flow measurements will be discussed in this dissertation. Through these discussions, it was found
that a novel method, capable of field deployability, is required to support the continuous monitoring
of blood pulse and flow through fabric, body fluid and environment contaminants. Such a method
must be small, capable of operations at low electrical power and is able to operate at room
temperature. In addition, in order to support long period of usage, this method must also be able to
operate without the need of a good electrical or optical contact.
This dissertation presents a novel and patented method of blood pulse and flow monitoring that is
low power, small and capable of operations at room temperature. The method of blood pulse and
flow monitoring is termed Modulated Magnetic Signature of Blood (MMSB) where a uniform
magnetic field is applied on the skin, in a non-invasive manner, within close proximity of a major
blood vessel and a Giant-Magneto-Resistance (GMR) based magnetic sensor of dimensions 6mm
(length) x 5mm (width) x 1.8mm (height). The uniform magnetic field generated from a small
permanent magnet, of dimensions 6mm (diameter) x 3mm (height), has a magnetic field strength of
0.1 - 0.2 Tesla. The applied magnetic field will create a uniform magnetic field encompassing the
GMR based magnetic sensor, skin, fabric and blood vessel. The uniform magnetic field, when
undisturbed, will produce a fixed DC output voltage from the magnetic sensor. However, due to the
pulsatile nature of blood flow in the arteries, the uniform magnetic field will be disturbed
periodically where the GMR based sensor will translate this magnetic disturbance as an output
electrical voltage.
To demonstrate the MMSB phenomenon, an experimental setup was developed in this research
using the flow of using iron (II) oxide (Fe2O3) fluid with air-gaps in a rigid glass tube. The sensor and
magnet were placed at 2-3mm below the glass tube. Measurements were successfully conducted
using different levels of Fe2O3 concentrations for each experiment, where each level Fe2O3
concentrations is selected based on published results on the amount of haemoglobin in blood. The
results obtained from these experiments substantiated the MMSB phenomenon where
measurements were subsequently conducted on human subjects successfully.
Page V
The MMSB phenomenon is thoroughly explored through physical measurements on locations where
the major arteries are near to the skin. Each of these locations, such as the temple, neck, wrist and
heel, was used for the verification of the MMSB phenomenon. Results obtained for measurements
at all these locations were encouraging as the MMSB waveforms obtained were repeatable and are
highlight correlated to the activities of the heart.
The heart rate obtained using the MMSB phenomenon is quantitatively assessed with respect to the
pulse and heart rate acquired by lifestyle (i.e. pulse oximeter) and clinical device (i.e. ECG
measurement equipment) capable of supporting heart rate monitoring. The instantaneous heart or
pulse rate obtained from the ECG and MMSB waveforms shows + 2*Standard Deviation (SD) of 0.48
blood pulse per minute (bpm), which is not significant for measurement of resting HR (typically 70
bpm) with variations of at least +1 bpm. Together with statistical tools used for validation of
biomedical instruments, results presented in this dissertation support the use of MMSB as a viable
alternative to ECG for measuring resting HR for healthy individuals.
The MMSB waveform was qualitatively analysed with respect to published results on activities of the
heart. From these results, it was established that the peaks of the MMSB waveform have good
correlations to the physical activities of the heart. As such, it is concluded that the MMSB
phenomenon is qualitatively and quantitatively correlated to the physical and electrical heart
activities; and is capable of reliable and accurate heart rate measurements.
Further to the physical measurements, the MMSB phenomenon is also modelled mathematically and
simulated in a multi-physics simulation environment, COMSOL. Simulations for this model were
successfully completed using parameters extracted from published information on blood.
Based on the results obtained from the model developed in COMSOL, it was concluded that the
simulated waveform from the GMR sensor is a function of the pulsatile flow of blood. In order to
compare the physical measurements with the simulated output, the distance between the magnet
and the GMR sensor was varied in both physical measurements and simulation model. From these
comparisons, it was established that the amplitudes are highly correlated and it was concluded the
model is capable of modelling the MMSB measurements on human subjects.
To demonstrate the application of MMSB phenomenon for blood flow, a measurement setup was
developed in this dissertation to correlate the changes on the amplitude of the MMSB pulse
acquired on the wrist with respect to an occlusion on the upper limb. In this measurement, it was
established that the amplitude of the MMSB pulse (both DC offset and pulsatile waveform) reduces
Page VI
as the occlusion pressure increases. The direct correlation between the occlusion pressure and the
amplitude of MMSB pulse substantiates the ability of MMSB in measuring blood flow.
The occlusion measurement using MMSB phenomenon was further developed for the post-occlusive
reactive hyperaemia (PORH) measurements. The medical instrument capable of laser Doppler
perfusion monitoring was used as the reference measurements. Qualitative and quantitative analysis
were performed for the PORH measurements, using both MMSB and laser Doppler method, on six
healthy subjects. Qualitative results obtained from these experiments demonstrated the ability of
the MMSB phenomenon in acquiring the PORH waveform. Quantitative results obtained from the
MMSB and laser Doppler method for PORH measurements were found to have errors of 4% or less.
As such, the PORH measurement substantiates the capability of the MMSB phenomenon in both
qualitative and quantitative blood flow measurements.
In addition, this dissertation established a MMSB experiment capable of delivering a feasibility study
on using MMSB waveforms for the measurement of Pulse Transit Time (PTT). Using the measured
pulse transit time and physical parameters obtained during the experiment, the Mean Arterial
Pressure (MAP) of each subject can be calculated. For this experiment, Diastolic and Systolic blood
pressure measured using commercial Automatic Blood Pressure (ABP) meters, MMSB and ECG data
were collected for 10 subjects. These data were quantitatively assessed using the mean arterial
pressure and were found to be correlated with less than 8% error. This error was found to be
contributed by the uncertainties on the measurement parameters. With the exclusion of the
uncertainties contributed by these measured parameters, it was mathematically estimated that the
computed uncertainty can be reduced to 2%. As such, it was concluded that the use of MMSB and
ECG data for PTT measurements, leading to the determination of the MAP data, has been
successfully demonstrated.
Finally, in the application chapter of this dissertation, the physical implementation, including
electronics design and packaging method, of the proposed MMSB method as a wearable device
capable for supporting remote monitoring of blood pulse was presented. Together with the physical
implementation, two applications of the MMSB phenomenon were also described. In both
applications, the method of packaging applied is based on a second patent filed where the novelty in
the method of packaging to achieve the robustness in deploying the MMSB phenomenon for end-
user applications.
The first application is the funded development (S$350,000 by Singapore Totalisator Board) for a
wearable, wrist based, wireless pulse sensing solution, where the MMSB phenomenon is integrated

Page VII
with a low cost wireless ad-hoc network for continuous pulse rate monitoring. The system
developed is capable of concurrent pulse rate monitoring of multiple users. This development had
also won the SILVER award for the prestigious national level competition held in Singapore for
innovative products and solutions. Further to the wireless pulse sensing, this development was
enhanced with embedded processing to support localized display of measured heart rate on the
Liquid Crystal Display (LCD) for health monitoring.
The second application of MMSB is the development of a lifestyle solution for measurement of
changes in blood volume pulse for relaxation assessment. In this development, the MMSB
phenomenon is embedded into an existing lifestyle solution capable of massaging the subject to
make him/her relax. A statistical based algorithm was developed to extract the changes in blood
volume pulse where the results were compared to the laser Doppler medical instrumentation for
blood perfusion measurements. A trial on 40 subjects was conducted where the blood perfusion
data was obtained before and after the massage using both the laser Doppler medical
instrumentation and MMSB integrated product. The MMSB integrated product was able to produce
measured results with 98% correlations to the laser Doppler measurements.
In addition, heart rate variability (HRV) was implemented as part of the algorithm to assess the well-
being of the subject. The successful implementation and validation using statistical tools
demonstrated the feasibility of using MMSB for HRV and is currently being developed as a lifestyle
product.
Both applications described in the last chapter of the dissertation had attracted interest from
companies and institutes in various countries such as Singapore (OSIM International, HuttCab
Consulting and DSO), United States (JawBone and George Washington University), England
(Swimnovate) and India (Amrita School of Engineering). At the point of writing this dissertation,
development of commercialization prototypes has been completed for a Singapore based Multi-
National Company (MNC) for a lifestyle product. At the same time, measurements were successfully
duplicated in the laboratory of JawBone in California, United States and DSO in Singapore.
With the successful development of the novel sensing and packaging method using MMSB for blood
pulse, flow and pressure analysis, this research has resulted in the filing of four patents and scientific
publications of results in seven international conferences and journal. Research is on-going on new
applications of MMSB for health management where future advances in the system architecture
design, circuit design and signal processing can broaden the application potentials of physiological
assessment for military, clinical or medical research. In addition, the unique capability of MMSB to

Page VIII
achieve continuous blood pulse, flow and pressure sensing through fabric, blood and light bandages
can be exploited in future development to support the needs of commercial and medical research
applications.

Page IX
Acknowledgment
I wish to acknowledge the many people who have helped to make this work possible, by
contributing their technical intellect or time to support the repeated physical measurements and
verifications.
First, I would like to thank my principal advisor, Professor Gaëlle Lissorgues. She has always provided
enthusiastic support for my research and had spent her precious time reading and discussing with
me on my work. Most important of all, she has relentlessly helped to make my research focused and
practical by redirecting me when I had gotten sidetracked on a tangential or impractical research
interest.
Secondly, I would like to thank Nanyang Polytechnic of Singapore and ESIEE-ESYCOM, France for the
opportunity to work on this development. In particular, I would like to express their gratitude to the
School of Engineering (Electronics), Nanyang Polytechnic (Singapore) for the usage of facilities and
financial support that made this work possible.
Finally, I would like to thank all the human testing subjects for either wanting to advance science or
wanting to help in my research enough to devote many hours of their personal time to make this
study possible.
I dedicate this dissertation to my family and friends whose unwavering support gave me the
perseverance in my pursuit of a doctorate.
Page X
List of Tables
Table 1 Comparison on existing well established methods of heart or pulse rate acquisition .............. 8 Table 2 Comparison of DC and AC Blood flow meter [22] .................................................................... 13 Table 3 Measurement result for Fe2O3 fluidic flow in constant magnetic field .................................... 30 Table 4 Instantaneous Heart Rate data collected for 40 measurements ............................................. 50 Table 5 Correlation test between Gold Reference and MMSB Sensor ................................................. 51 Table 6 Illustration on quantification of ranking for Wilcoxon Matched-Pairs Signed-Ranks Test ...... 56 Table 7 Critical Values of ±Zw [33] ......................................................................................................... 57 Table 8 Expressions used for simulation model.................................................................................... 73 Table 9 Summary of parameters used to model blood flow in the simulation model ......................... 75 Table 10 Summary of parameters used to model magnet in the simulation model ............................ 76 Table 11 Table of values used to described the sensor characteristics in the simulation environment .............................................................................................................................................................. 77 Table 12 Simulation result for Fe2O3 fluidic flow in constant magnetic field ....................................... 78 Table 13 Summary of parameters used to model blood in the simulation model ............................... 81 Table 14 Tabulated results for simulated and measured data ............................................................. 88 Table 15 Comparison of transit time from occlusions to MF for PORH measurements using MMSB and Moor’s Instrument, DRT4 ............................................................................................................ 103 Table 16 Possible diseases which can be diagnosed based on the different types of cardiovascular pulse shapes [1] .................................................................................................................................. 107 Table 17 Measurement results for BP and MAP using BP-meter ....................................................... 111 Table 18 Measurement results for distance from heart to wrist, PTT and PWV with MAP estimated using MMSB measured data ............................................................................................................... 115 Table 19 Tabulated results for measured MAP using BP meter with estimated MAP using PTT with MMSB measurements ........................................................................................................................ 116 Table 20 Pin functions and associated pin numbers and commands for the XBee RF Modules ........ 123 Table 21 Estimation of average current for Scenarios A (unbuffered), B (2 seconds buffer) and C (4 seconds buffer) using the power estimator provided for XBEE transceiver ....................................... 124 Table 22 Tabulation of heart rate measurements for MMSB device and Pulse Oximeter ................. 133 Table 23 Comparison of critical specifications for INA118 and INA321 ............................................. 134 Table 24 Tabulation of heart rate measurements for MMSB Embedded device and Pulse Oximeter ............................................................................................................................................................ 136 Table 25 Typical data collected based on each trial ........................................................................... 152 Table 26 Results obtained for two-tailed Z-test using MMSB and Moors Instrument ....................... 154 Table 27 An exemplary classifications of DHRV as stress, neutral and relaxation ............................. 165 Table 28 Interpretation of the measured Kappa value ....................................................................... 165 Table 29 Kappa statistics – Proportion agreement observed ............................................................. 166 Table 30 Kappa statistics – Probability of proportion agreement observed (Po) ............................... 166 Table 31 Kappa statistics – Probability of proportion agreement by chance (Pc) .............................. 167 Table 32 Subject perceived score with BioS-HRV measured score .................................................... 167 Table 33 Kappa statistics – Probability of proportion agreement observed (Po) ............................... 167

Page XI
Table 34 Kappa statistics – Probability of proportion agreement by chance (Pc) .............................. 167 Table 35 Distance measurement based on Kappa statistics ............................................................... 168 Table 36 Weighted Kappa statistics (Quadratic) ................................................................................. 168 Table 37 Kappa statistics – Weighted probability of proportion agreement observed (Po) .............. 168 Table 38 Kappa statistics – Weighted probability of proportion agreement by chance (Pc) ............. 168
Page XII
List of Figures Figure 1 Definition of waves, segments and intervals in the normal ECG waveform ............................ 3 Figure 2 Association of different waveforms for each of the specialized cells found in the heart ........ 3 Figure 3 Block diagram of a typical pulse oximeter implementation ..................................................... 4 Figure 4 Illustration on operations of heart and blood flow during each step ..................................... 10 Figure 5 Typical block diagram of a square wave electromagnetic blood-low meter [22] .................. 13 Figure 6 Impedance plethysmography system for limb blood flow measurement .............................. 15 Figure 7 Strength of magnetic signals produced by various sources [1] .............................................. 20 Figure 8 Comparison of GMR, Hall and AMR based magnetic sensor .................................................. 22 Figure 9 Plot of resistance vs applied magnetic field for an antiferromagnetically pinned spin valve GMR device with magnetic field applied parallel (a) and perpendicular (b) to the magnetization of the pinned layer [16] ............................................................................................................................. 23 Figure 10 Plot of resistance vs. applied field for a 2 mm wide strip of anti-ferromagnetic coupled multilayer GMR material [16] ............................................................................................................... 24 Figure 11 Cross-sectional view illustrating the two-dimensional concept for the experimental setup to acquire MMSB .................................................................................................................................. 25 Figure 12 Typical characteristics of GMR sensor (in Oersteds) used in this experiment...................... 25 Figure 13 Illustration of magnetic field vector calculations based on [21] ........................................... 26 Figure 14 Iron (II) oxide (Fe2O3) fluidic flow experiment ...................................................................... 27 Figure 15 Illustration on flow of Fe2O3 fluids separated by pockets of air-bubbles ............................. 28 Figure 16 Experimental setup used in laboratory ................................................................................. 29 Figure 17 Position of magnet and sensor with respect iron fluidic flow channel ................................ 29 Figure 18 Waveform obtained when Fe2O3 fluid flow pass the sensor with air-pockets ..................... 30 Figure 19 Precipitation of Fe2O3 above magnet .................................................................................... 30 Figure 20 Flow of iron fluid with air-bubbles ........................................................................................ 31 Figure 21 Signal acquired during iron fluid flow as shown in Figure 20 ............................................... 31 Figure 22 Illustrations of example locations where MMSB can be acquired easily on the Human Blood Circulatory system ................................................................................................................................ 32 Figure 23 Illustration of sensor and magnet mounting near temple for MMSB signal acquisition ...... 33 Figure 24 Illustration of sensor and magnet mounting on the heel for MMSB signal acquisition ....... 33 Figure 25 Illustration of sensor and magnet mounting on the wrist for MMSB signal acquisition ...... 33 Figure 26 Illustrations of the relative position of the magnet(1), sensor(2) and a major blood vessel 34 Figure 27 System Block Diagram used for MMSB signal acquisition .................................................... 35 Figure 28 Circuit used for MMSB signal conditioning ........................................................................... 35 Figure 29 Waveform captured from the amplifier output using oscilloscope ..................................... 37 Figure 30 Illustration of blood pulse acquisition through light bandages ............................................ 38 Figure 31 Schematic of MMSB signal acquisition, conditioning, sampling and transmission circuit ... 38 Figure 32 Block diagram of blood pulse signal acquisition and transmission back to base-station ..... 38 Figure 33 Illustration of blood pulse acquisition through blood stains ................................................ 39 Figure 34 Illustration of blood pulse acquisition in water .................................................................... 40 Figure 35 Blood pulse acquisition through plastic ruler placed in between sensor and wrist ............. 40 Figure 36 Illustration of blood pulse acquisition setup through air-gap .............................................. 41 Figure 37 Sample MMSB waveform obtained using setup shown in Figure 36 ................................... 41
Page XIII
Figure 38 Block diagram of the MATLAB Simulink setup for MMSB signal acquisition on the wrist with ECG and pulse plethysmography using the USBamplifier from Guger Technologies ........................... 42 Figure 39 Amplifier circuit used for measurements of MMSB signal ................................................... 43 Figure 40 Illustration of MMSB signal collected together with ECG and pulse plethysmography using USBamplifier from Guger Technologies (gtec) ..................................................................................... 44 Figure 41 Illustration of MMSB signal collected together with pulse plethysmography using USBamplifier from Guger Technologies (gtec) ..................................................................................... 44 Figure 42 Zoom-in view of MMSB and pulse plethysmography signal acquired using the USBamplifier from Guger Technologies (gtec) ........................................................................................................... 45 Figure 43 Illustration on the generation of the x component of the MCG signal with respect to the heart activities [1] ................................................................................................................................. 46 Figure 44 Vector MCG (VMCG) of a human subject obtained through the MCGx, MCGy and MCGz vector plots acquired using the corrected uni-positional lead system ................................................. 46 Figure 45 Simultaneous plots of the magnitude curves of the VECG (dashed curve) and the VMCG (solid curve) with MMSB plot during the QRS complex [1] .................................................................. 47 Figure 46 Illustration of MMSB and the activities related to the heart ................................................ 48 Figure 47 Concurrent HR acquisition using ECG and MMSB................................................................. 49 Figure 48 Extraction of instantaneous HR from ECG and MMSB waveforms....................................... 49 Figure 49 Plot of Correlation of HR obtained from MMSB and ECG waveforms in bpm ..................... 52 Figure 50 Mean and standard deviation of HR measured with the ECG and MMSB sensors (P = 0.24) .............................................................................................................................................................. 54 Figure 51 Plot of Bland and Altman test on HR obtained from MMSB and ECG waveforms ............... 59 Figure 52 Illustration of the interaction forces between red blood cells and the vessel walls ............ 67 Figure 53 Illustration of laminar flow of blood in straight and large blood vessels ............................. 74 Figure 54 Diagrammatic representation of normal laminar flow in comparison with turbulent flow that results in whirls and eddies of many different velocities [39] ...................................................... 74 Figure 55 Illustration of arteries on the wrist ....................................................................................... 75 Figure 56 Input sinusoidal emulating the heart beat ........................................................................... 76 Figure 57 Two-dimension simulation model for iron fluidic flow ......................................................... 78 Figure 58 Illustration of the 2-dimensional simulation model geometry ............................................. 79 Figure 59 Meshing results for 2D MMSB model using multi-physics simulation software COMSOL ... 84 Figure 60 Detailed view of meshing results near sensor and magnet using multi-physics simulation software COMSOL ................................................................................................................................. 85 Figure 61 Simulation results for 2 seconds based on a distance of 20mm between magnet and sensor .............................................................................................................................................................. 85 Figure 62 Waveform captured from the sensor output using oscilloscope for comparison with simulation ............................................................................................................................................. 86 Figure 63 Plot of simulation results with varying distance between sensor and magnet .................... 87 Figure 64 Plots of distance vs measured voltage based on measured data from 20 subjects ............. 88 Figure 65 Comparison of simulated and measured voltage (normalized) with varying distance between sensor and magnet ................................................................................................................ 89 Figure 66 Typical PORH response of a healthy subject [1] ................................................................... 94 Figure 67 Analysis of typical PORH-recordings, from a healthy person (a) and a PAOD-patient (b) [7] .............................................................................................................................................................. 95

Page XIV
Figure 68 Signal captured using MMSB with blood flow restriction created with the use of the digital monitor for blood pressure measurements ......................................................................................... 96 Figure 69 Simulated MMSB output voltage using modified equation for inflow velocity of blood ..... 98 Figure 70 Illustrations of typical measurement setup for PORH using DRT4, Moor Instrument ....... 100 Figure 71 Typical results obtained using the laser Doppler Flowmetry method for PORH measurements .................................................................................................................................... 100 Figure 72 Illustration of blood flow acquisition on the wrist .............................................................. 101 Figure 73 Typical results obtained using the MMSB for PORH measurements .................................. 102 Figure 74 Waveform obtained using MMSB before occlusion ........................................................... 102 Figure 75 Waveform obtained using MMSB after occlusion .............................................................. 102 Figure 76 Typical normalized plot of MMSB with Laser Doppler measurements .............................. 104 Figure 77 Different types of cardiovascular pulse shapes [1] ............................................................. 108 Figure 78 Illustration of PTT Definition [6] .......................................................................................... 109 Figure 79 Experiment setup using OMRON Intellisense Blood Pressure Monitor - Arm Model IA1/IA1B .............................................................................................................................................. 110 Figure 80 Experimental setup used for PTT measurements using MMSB and ECG ........................... 113 Figure 81 Waveform for MMSB and ECG signal with PTT measurement ........................................... 114 Figure 82 Illustrations of distance measurements from heart to wrist .............................................. 114 Figure 83 Plot of Measured MAP and Estimated MAP using PTT measured from MMSB method ... 117 Figure 84 Illustration of wireless pulse sensing system for monitoring of heart rate using MMSB ... 121 Figure 85 Illustration of System Architecture of Wireless Pulse Sensing System ............................... 121 Figure 86 Signal conditioning circuit WiPS .......................................................................................... 123 Figure 87 Program developed using LabVIEW to extract data from the ZigBee receiver and processed for pulse rate measurements ............................................................................................................. 126 Figure 88 Concurrent display of pulse rate for multiple users ........................................................... 127 Figure 89 Architecture of filter design peak discrimination ............................................................... 127 Figure 90 Illustration of a typical Direct Form FIR filter ...................................................................... 128 Figure 91 Illustration of Low Pass 17-tap Filter (without scaling) using MATLAB Filter Design Manager ............................................................................................................................................................ 129 Figure 92 Plot of Magnitude versus Frequency Response for 17-Tap FIR Low-Pass Filter (gain factor of 500) ..................................................................................................................................................... 129 Figure 93 Illustration of High Pass 17-tap FIR Filter using MATLAB Filter Design Manager ............... 130 Figure 94 Plot of Magnitude versus Frequency Response for 17-Tap FIR High-Pass Filter ................ 130 Figure 95 Output waveform of peak discriminator design ................................................................. 131 Figure 96 Illustration of packaging of MMSB blood pulse detection as a wearable device ............... 132 Figure 97 Final configuration of wearable device with wireless transmission ................................... 132 Figure 98 MMSB amplifier circuit and voltage reference feedback design ........................................ 135 Figure 99 Block diagram of standalone pulse rate monitoring design ............................................... 136 Figure 100 Schematic design of the standalone wearable pulse rate monitoring ............................. 137 Figure 101 PCB design for standalone wearable pulse rate monitoring ............................................ 137 Figure 102 Summary on the frequency of non-invasive methods used to assess the mental state .. 140 Figure 103 Illustration of the circuit configurations for BVP analysis on massage chair .................... 142 Figure 104 Illustration on the potential locations to acquire MMSB signal on the massage chair .... 143 Figure 105 Illustration on mounting of sensors and magnet on OSIM massage chair ....................... 144 Figure 106 Illustration of sensor mounting on OSIM iDesire Massage Chair ..................................... 145

Page XV
Figure 107 Illustration of sensor and magnets position ..................................................................... 145 Figure 108 Typical signal acquired on by MMSB sensor on OSIM iDesire Massage Chair ................. 146 Figure 109 Architecture of a simple 2nd order IIR filter ..................................................................... 146 Figure 110 IIR filter design using LabVIEW ......................................................................................... 147 Figure 111 Implementation of the IIR filter for MMSB signal filtering ............................................... 148 Figure 112 Typical signal output comparison between filtered and unfiltered signal ....................... 148 Figure 113 Typical response of the IIR filter in removing DC drift and impulsive EM noise ............... 149 Figure 114 Inclination of OSIM massage chair during trial ................................................................. 150 Figure 115 Illustration of mounting for laser probe during trial......................................................... 150 Figure 116 Typical LDF signal acquired using Moors Instrument ....................................................... 151 Figure 117 Illustration of peak to valley measurements of MMSB data for BVP data extraction ...... 152 Figure 118 Typical statistical data obtained before and after massage ............................................. 153 Figure 119 Sensors and magnets concealment on wrist structure .................................................... 156 Figure 120 Placement of user wrist on wrist structure for MMSB acquisition ................................... 157 Figure 121 Steps for recording and processing MMSB signal for frequency domain HRV analysis ... 159 Figure 122 Derivation of RR interval from MMSB signals ................................................................... 160 Figure 123 Plotting of RR interval tachogram and interpolation of the RR series for HRV derivation ............................................................................................................................................................ 160 Figure 124 Segmentation of the N data sample source ..................................................................... 162 Figure 125 Example of a PSD plot for a typical RR data ...................................................................... 163 Figure 126 Illustration on directional change on HRV due to external stimuli ................................... 164 Figure 127 Illustration on directional change on HRV due to external stimuli ................................... 165

Page XVI
Table of Contents Résumé .................................................................................................................................................. I
Summary .............................................................................................................................................. IV
Acknowledgment ................................................................................................................................. IX
List of Tables ......................................................................................................................................... X
List of Figures ...................................................................................................................................... XII
Chapter 1: Introduction and Technology Overview .............................................................................. 1
1 Introduction ............................................................................................................................. 1
2 Pulse rate ................................................................................................................................. 1
2.1 Methods of non-invasive heart or pulse rate measurements .......................................... 2
2.1.1 Electrical method of heart rate acquisition .............................................................. 2
2.1.2 Optical method of heart rate acquisition ................................................................. 4
2.1.3 Microwave method of heart rate acquisition ........................................................... 5
2.1.4 Acoustic method of heart rate acquisition ............................................................... 5
2.1.5 Mechanical method of heart rate acquisition .......................................................... 6
2.1.6 Magnetic method of heart rate acquisition .............................................................. 6
2.2 Summary on methods of non-invasive heart or pulse rate acquisition ............................ 7
2.3 Motivation of a non-invasive pulse rate acquisition using magnetic means .................... 8
3 Blood flow ................................................................................................................................ 8
3.1 Methods of blood flow measurements ............................................................................ 9
3.1.1 Indicator-dilution Method ...................................................................................... 11
3.1.2 Thermo-dilution Method ........................................................................................ 12
3.1.3 Electromagnetic flow meters .................................................................................. 12
3.1.4 Ultrasonic flow meters ............................................................................................ 13
3.1.5 Plethysmography .................................................................................................... 14
3.2 Summary on methods of non-invasive blood flow signal acquisition ............................ 15
3.3 Motivation of a non-invasive blood flow signal acquisition using magnetic means ...... 16
4 Conclusions ............................................................................................................................ 17
5 References .............................................................................................................................. 18
Chapter 2: Principle description of Modulated Magnetic Signature of Blood.................................... 20
1 Introduction ........................................................................................................................... 20
2 Microelectronic overview on sensor ...................................................................................... 21
2.1 Introduction .................................................................................................................... 21
Page XVII
2.2 Materials, structure and magnetic characteristics of GMR sensor ................................ 22
2.3 Selection of GMR sensor for research ............................................................................ 24
3 Basic principles on Modulated Magnetic Signature of Blood (MMSB) .................................. 24
3.1 Applications of GMR sensor for magnetic blood sensing ............................................... 25
3.2 Experimental setup to demonstrate MMSB using iron oxide fluidic flow ...................... 27
3.3 Measurement results for Fe2O3 fluidic flow experiment ................................................ 29
3.4 Acquisition of magnetic disturbance of blood ................................................................ 31
4 Experimental setup for MMSB signal acquisition and analysis .............................................. 34
4.1 Experimental setup to measure blood pulse through fabric .......................................... 37
4.2 Experimental setup to measure blood pulse through blood .......................................... 39
4.3 Experimental setup to measure blood pulse underwater .............................................. 39
4.4 Experimental setup to measure blood pulse through a plastic ruler ............................. 40
4.5 Experimental setup to measure blood pulse through air-gap ........................................ 41
5 Comparison of MMSB with ECG and pulse plethysmography waveform .............................. 42
6 Comparison of measured waveform with Magnetocardiogram (MCG) ................................ 45
7 Statistical validation of MMSB as a viable alternative to ECG ............................................... 48
7.1 Measurement setup with data acquisition ..................................................................... 48
7.2 Statistical validation - assessing agreement between two methods of measurement .. 51
7.2.1 Pearson Correlation and Coefficient of Determination .......................................... 51
7.2.2 Paired Student’s t-test ............................................................................................ 53
7.2.3 Wilcoxon Matched-Pairs Signed-Ranks Test ........................................................... 54
7.2.4 Bland and Altman Test ............................................................................................ 57
8 Conclusions ............................................................................................................................ 60
9 References .............................................................................................................................. 61
Chapter 3: Modelling and simulation of MMSB ................................................................................. 63
1 Introduction ........................................................................................................................... 63
2 Two-dimensional model of blood flow in the presence of a constant magnetic field .......... 64
2.1 Transformation of coordinate systems ........................................................................... 64
2.2 Motion of Fluid-Solid Flow in the Deformed Mesh System ............................................ 66
2.3 Numerical results using multiphysics simulation software............................................. 71
2.4 Modelling of blood flow in blood circulatory system ..................................................... 73
2.5 Modelling of constant magnetic field ............................................................................. 76
2.6 Modelling of the sensor .................................................................................................. 76
3 System modelling of iron oxide fluidic flow in a weak magnetic field ................................... 77

Page XVIII
3.1 Modelling the multiphase flow of air and iron oxide fluid ............................................. 77
4 System modelling of MMSB ................................................................................................... 78
4.1 Modelling the characteristics of human blood ............................................................... 79
4.1.1 Magnetic properties of blood ................................................................................. 80
4.1.2 Physical properties of blood ................................................................................... 81
4.1.3 Summary ................................................................................................................. 81
4.2 Modelling of the human skin .......................................................................................... 81
4.2.1 Skin thickness on the wrist ...................................................................................... 82
4.2.2 Magnetic properties of the skin .............................................................................. 82
5 Coupling between ferro-fluidic volume force equation with applied magnetic field ............ 83
6 Numerical solutions of 2D model for MMSB simulations ...................................................... 84
7 Blood pulse measurements using MMSB for 20 subjects ...................................................... 87
8 Comparison of measured and simulated results ................................................................... 88
9 Conclusions ............................................................................................................................ 89
10 References .............................................................................................................................. 90
Chapter 4 Measurement of blood flow using MMSB ......................................................................... 93
1 Introduction ........................................................................................................................... 93
2 Experimental setup for blood flow measurements using MMSB .......................................... 96
3 Simulation of blood flow using MMSB ................................................................................... 97
4 PORH measurements setup using laser Doppler medical instrument ................................... 99
5 PORH measurements setup using MMSB acquired on the wrist......................................... 100
6 Discussions of results ........................................................................................................... 103
7 Conclusions .......................................................................................................................... 105
8 References ............................................................................................................................ 106
Chapter 5: Measurement of blood pulse transit time using MMSB ................................................. 107
1 Introduction ......................................................................................................................... 107
2 Setup for blood pressure measurement using oscillometric based BP meters ................... 110
3 Experimental setup for blood pressure measurement using MMSB ................................... 111
4 Discussions of results ........................................................................................................... 115
5 Conclusions .......................................................................................................................... 117
6 References ............................................................................................................................ 118
Chapter 6: Applications of MMSB ..................................................................................................... 119
1 Introduction ......................................................................................................................... 119
2 Wireless Pulse Sensing ......................................................................................................... 119

Page XIX
2.1 Introduction .................................................................................................................. 120
2.2 System design ............................................................................................................... 121
2.2.1 Signal Conditioning ............................................................................................... 122
2.2.2 Analog-to-Digital converter .................................................................................. 123
2.2.3 Data interface to wireless module ........................................................................ 124
2.3 Data processing for heart rate measurements ............................................................. 125
2.4 Packaging of MMSB blood pulse detection as a wearable device ................................ 132
2.5 Standalone pulse rate monitoring ................................................................................ 134
2.6 Conclusions ................................................................................................................... 138
3 Relaxation assessment using blood volume pulse ............................................................... 139
3.1 Introduction .................................................................................................................. 140
3.2 Experimental overview ................................................................................................. 141
3.2.1 System setup for trial ............................................................................................ 142
3.2.2 Mounting of sensor on the massage chair ............................................................ 142
3.2.3 Selection of a stimulus for relaxation assessment ................................................ 145
3.2.4 Filtering of EM noise and DC drift ......................................................................... 145
3.3 Setup and procedure used in trial ................................................................................. 149
3.4 Data extraction for MMSB signals ................................................................................ 152
3.5 Statistical analysis of trial .............................................................................................. 153
3.6 Conclusions ................................................................................................................... 154
4 Relaxation assessment using heart rate variability.............................................................. 155
4.1 Introduction .................................................................................................................. 155
4.2 Experimental overview ................................................................................................. 156
4.2.1 System setup for human trial ................................................................................ 156
4.3 Setup and procedure used in trial ................................................................................. 157
4.4 HRV analysis using MMSB signals ................................................................................. 158
4.4.1 Pre-processing of HRV time series ........................................................................ 160
4.4.2 FFT of HRV time series .......................................................................................... 161
4.4.3 Power Spectral Density (PSD) analysis of HRV time series ................................... 163
4.5 Qualification on effect of an external stimuli ............................................................... 164
4.6 Statistical analysis of trial .............................................................................................. 165
5 Conclusions on applications of MMSB ................................................................................. 169
6 References ............................................................................................................................ 170
Chapter 7: Conclusions, contributions and future work ................................................................... 172

Page XX
1 Conclusions .......................................................................................................................... 172
2 Contributions ....................................................................................................................... 173
3 Future Work ......................................................................................................................... 174
4 References ............................................................................................................................ 175
Annex A – Datasheets ........................................................................................................................... A
Annex B – Comparison of methods to assess stress ............................................................................. K
RESUME .................................................................................................................................................. L

Page 1
Chapter 1: Introduction and Technology Overview
1 Introduction
With the advancement of bioelectronics, portable health monitoring devices are getting popular to
provide continuous monitoring of an individual’s health condition with ease of use and comfort. The
portable health monitoring devices are increasingly used at places such as home, ambulance and
hospital, and at situations military training and sports. Amongst the various physiological vital signs,
heart or pulse rate and blood flow are two common parameters that are frequently monitored as
they can be used to represent the normal operations of the heart. This chapter will present the state
of the art technologies and techniques to acquire pulse rate and blood flow.
2 Pulse rate
Pulse rate is a measurement of the number of times the heart beats per minute. Typically, a normal
resting heart rate in adults is 50 to 90 beats per minute [1] and the measurement of pulse amplitude
and contour is a function of the pulsatile motion of the heart, which pushes blood through the
arteries. This will result in the expansion and contraction of the blood vessels allowing blood to flow.
Pulse amplitude and contour, such as a small, weak pulse, a large rebounding pulse, or an irregularly
shaped pulse has been reported to be indicative of a pathophysiologic state [1]. In addition, pulse
diagnosis is also one of four kinds of diagnostic methods used in Traditional Chinese medicine (TCM)
clinical practice to determine the physiological condition of patient [2]. Therefore, heart or pulse
rate is an important physiological vital sign subject to continuous monitoring because they are
representative in assessing the physical health condition of an individual. Healthcare institutes such
as the hospitals and elderly care centres can use this information to monitor the health conditions of
their patients. This is of particularly importance for patients with cardiac arrhythmia where heart
rate variability needs to be monitored closely for early detection of cardiac complications.
Furthermore, pulse rate information of individuals subjected to mentally or physically stressful
conditions may be utilized to trigger alert for immediate attention when large changes in heart rate
variability potentially indicate fatal events such as heat stroke, cardiac disorder and mental break

Page 2
down. Finally, it is also important to monitor pulse rate of personnel working in dangerous
environments such as deep sea condition (divers), high temperature (fire-fighters), and deep
underground (coal miners). Such monitoring together with other physiological vital signs, such as
blood pressure and respiration rate, will minimize occupational risk and facilitate rescue operations
in the event of any mishap.
2.1 Methods of non-invasive heart or pulse rate measurements
The use of electrical probes to measure heart rate (electrocardiogram or ECG) was discovered in
1872 by Alexander Birmick Muirhead. Alexander was reported to have attached wires to a feverish
patient's wrist to obtain a record of the patient's heartbeat while studying for his Doctor of Science
(in electricity) in 1872 at St Bartholomew's Hospital. This was directly recorded and visualized using a
Lippmann capillary electrometer by the British physiologist John Burdon Sanderson. Following the
successful recordings and visualization, Augustus Waller was the first to systematically approach the
heart from an electrical point-of-view.
After the discovery of ECG, many methods of heart or pulse rate measurements had been developed.
To-date, methods of heart or pulse rate acquisition can be classified into electrical[3],[4], optical
[5],[6], microwave [7], acoustic [8],[10],[13], mechanical [9],[11] or magnetic [12],[14],[15] means.
2.1.1 Electrical method of heart rate acquisition
The commonly used electrical method of heart rate acquisition is the electrocardiogram (ECG or
EKG). It is a recording of the electrical activity of the heart over time, usually in a noninvasive
manner via skin electrodes. The name electrocardiogram is made of the following parts: electro,
because it is related to electrical activity, cardio, Greek for heart, gram, a Greek root meaning "to
write". Such a method requires good electrical contact with the human skin and the performance is
subjective to human body fluids (e.g. blood, perspiration, skin-oil) and environmental contaminants
(e.g. mud, water, etc).
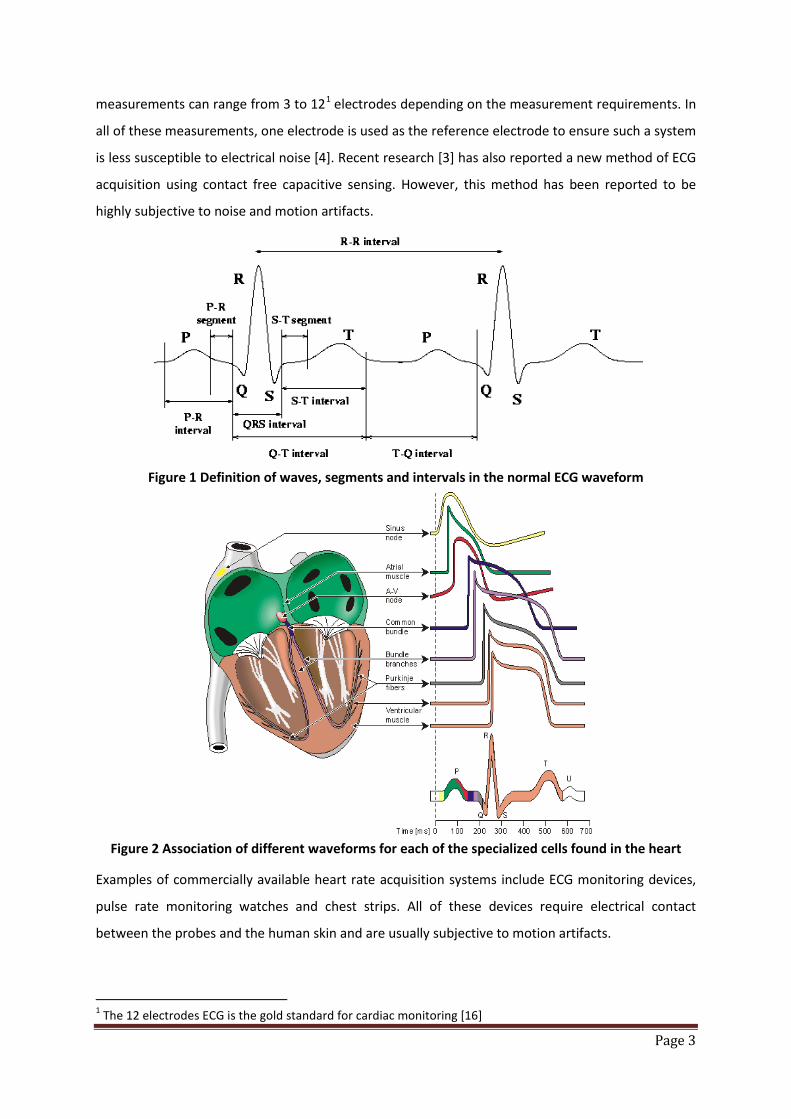
In 1901, Willem Einthoven invented the string galvanometer and assigned the letters P, Q, R, S and T
to the various deflections of the ECG as shown in Figure 1. Using these assigned letters, he was able
to describe the electrocardiographic features of a number of cardiovascular disorders by associating
the different waveforms for each of the specialized cells found in the heart with the ECG signal as
shown in Figure 2. Since then, many researches had been conducted and to-date, ECG
Page 3
measurements can range from 3 to 121 electrodes depending on the measurement requirements. In
all of these measurements, one electrode is used as the reference electrode to ensure such a system
is less susceptible to electrical noise [4]. Recent research [3] has also reported a new method of ECG
acquisition using contact free capacitive sensing. However, this method has been reported to be
highly subjective to noise and motion artifacts.
Figure 1 Definition of waves, segments and intervals in the normal ECG waveform
Figure 2 Association of different waveforms for each of the specialized cells found in the heart
Examples of commercially available heart rate acquisition systems include ECG monitoring devices,
pulse rate monitoring watches and chest strips. All of these devices require electrical contact
between the probes and the human skin and are usually subjective to motion artifacts.
1 The 12 electrodes ECG is the gold standard for cardiac monitoring [16]

Page 4
2.1.2 Optical method of heart rate acquisition
Pulse oximetry2 was developed in 1972, by Aoyagi at Nihon Kohden using the ratio of red to infrared
light absorption of pulsating components at the measuring site. It was commercialized by Biox in
1981 and Nellcor in 1983. Since then, the use of optical sensors in pulse oximetry [5],[6] is getting
popular due to its compact nature and the ability to concurrently acquire SpO2 concentration in
blood and pulse rate. The basic operating principle of such a system requires a light source and a
sensor with signal processing as shown in Figure 3. There are two methods to measure the light
content where one method measures the reflected light while another measures the transmitted
light. Both methods of measurements are able to determine the pulse rate and SpO2 concentration
in blood as a change in oxygen concentration in the blood will result in a change in light permittivity.
Through the measurement of the change in light permittivity, the pulse rate and SpO2 concentration
in blood can be determined.
Figure 3 Block diagram of a typical pulse oximeter implementation
As the optical transmittance of the human skin is important to ensure signal quality, such a device is
typically worn on the tip of the fingers or toes or on the earlobes allowing both the light
transmittance and reflection methods to work.
To-date all of these devices require optical contact between the optical probes and the human skin.
Motion artifacts are usually the cause of measurement noise and numerous algorithms had been
developed to reduce such noise.
2 Pulse oximetry is a non-invasive method allowing the monitoring of the oxygenation of a patient's hemoglobin through optical means.

Page 5
2.1.3 Microwave method of heart rate acquisition
Microwave Doppler radar has been used to sense physiological movement since the early 1970s [17].
The original equipment was bulky, heavy and expensive. However, recent advances in micro-
fabrication and wireless technology have led to the development of compact, lightweight and
inexpensive microwave Doppler radar for measurements of physiological signs. The physiological
signs are usually presented to the Doppler radar as periodic motion, such as that resulting from
respiration and cardiopulmonary activities. In such systems, motion is measured as phase
modulation and measurement sensitivity is significantly affected by phase noise and amplitude
modulation sidebands in the local oscillator. Experimental results of heart rate measurements [6]
under various signal output power conditions, with consideration for the impact of respiration had
been reported for non-invasive detection of heart rate. However, typical systems based on the
Doppler radar method have been reported to be subjective to motion artifacts, clothing and human
body fluids [17].
2.1.4 Acoustic method of heart rate acquisition
The acoustic method of acquiring heart sound using an invention, called stethoscope, on the human
chest was invented in France in 1816 by René-Théophile-Hyacinthe Laennec at the Necker-Enfants
Malades Hospital in Paris. The stethoscope is an acoustic medical device for auscultation, or listening
to the internal sounds of an animal body. It acquires the heart sounds, which are noises generated
by the beating of the heart and the resultant blood flowing through the valves. In healthy adults,
there are normally two heart sounds often described as a lub and a dub (or dup), that occur in
sequence with each heartbeat. These are the first heart sound (S1) and second heart sound (S2),
produced by the turbulent flow against the closed atrioventricular (AV) valves and semilunar valves
of the heart respectively. Over the years, the stethoscope was progressively improved by Arthur
Leared (1851), George Cammann (1852) and finally, Rappaport and Sprague designed a new
stethoscope in the 1940s which became the standard by which other stethoscopes are subsequently
developed.
In the recent years, scientist integrated electronics with the stethoscope and the electronic
stethoscope (or stethophone) was created to overcome the low sound levels by electronically
amplifying body sounds. However, amplification of stethoscope contact artifacts, and component
cutoffs (frequency response thresholds of electronic stethoscope microphones, pre-amps, amps, and
speakers) limit electronically amplified stethoscopes' overall utility by amplifying mid-range sounds,
while simultaneously attenuating high- and low- frequency range sounds [17]. Through the years,
Page 6
innovative signal acquisition and processing methods were developed to improve on the quality of
the signal acquired [8],[10],[13] and the stethophone is now available with wireless and storage
capabilities [17]. However, typical stethoscope or stethophone are known to be subjective to noise
due to motion artifacts, clothing and environmental auditory noise.
2.1.5 Mechanical method of heart rate acquisition
Mechanical methods to acquire heart or pulse rate varies from the use of pressure cuff to piezo-
electric materials worn over the limbs or body [9],[11]. Typical mechanical methods to measure
pulse rate can be applied on blood pressure equipment using the oscillometric methods. This
method comprises of an inflatable (Riva-Rocci) cuff placed around the upper arm at roughly the
same vertical height as the heart. An electronic pressure sensor (transducer) is fitted in the cuff to
detect blood flow. The cuff is inflated to a pressure initially in excess of the systolic arterial pressure,
and then reduces to below diastolic pressure over a period of about 30 seconds. When blood flow is
blocked (cuff pressure exceeding systolic pressure) or unimpeded (cuff pressure below diastolic
pressure), cuff pressure will be essentially constant. Typically, both the blood pressure and pulse
rate are acquired during this period. However, such mechanical methods to acquire heart or pulse
rate requires the application of localized pressure through the cuff on the human subject and are not
well suited for continuous signal acquisition.
2.1.6 Magnetic method of heart rate acquisition
Biomagnetic signal from the heart was detected in 1963 by Baule and McFee. The basic principle
involves the mapping of the magnetic field around the thorax while the heart magnetic vector is
acquired and is commonly known as magnetocardiogram (MCG). Typically, such a method requires
highly sensitive magnetic sensors, such as SQUID (Superconduct-ing QUantum Interference Device),
and a magnetically shielded room to ensure minimum magnetic disturbance, including earth
magnetic field. As such, SQUID is usually deployed in hospital while ECG is commonly found in
clinical applications as it is proven to be more reliable, convenient and less expensive. However,
there are still many potential clinical applications of the MCG. For instance, based on published data
[12], with the combined use of the ECG and the MCG, called electromagnetocardiogram, (EMCG),
the number of incorrectly diagnosed patients, for some cardiac diseases, can be decreased by one
half of that when only the ECG is used.
The pulse rate can also be obtained by applying a magnetic field on the human blood and measuring
using induced voltage using the Hall Effect [12],[15]. Such system applies a uni- or bi-directional
Page 7
magnetic field on the human body to create polarization of blood molecules. Electrodes are placed
on the human skin near the applied magnetic field to pick up the potential difference (i.e. Voltage)
created by the polarized blood molecules. Such method, when applied invasively can also be used to
measure blood flow during clinical surgery. When used in a non-invasive manner, this method
requires good electrical contact between the skin and the electrodes and therefore, it is not a
common method used for pulse rate acquisition.
2.2 Summary on methods of non-invasive heart or pulse rate acquisition
Each of the methods for heart or pulse rate acquisition outlined in this section has its strength and
limitations. The strength and limitations are dependent on the applications. Based on the application
of the methods listed in this section for lifestyle products, a comparison table is shown in Table 1.
Based on Table 1, it can be observed that all methods of heart or pulse rate acquisition listed are
subjective to motion artifacts. In addition, all methods, except mechanical, are able to support
continuous measurements of pulse rate acquisition. However, the magnetic method is the only
method that is able to acquire heart or pulse rate through fabric, body fluid and environmental
contaminants. However, this method requires a special room and it is bulky, heavy and expensive. As
such, this method is only used for clinical research and in hospital.

Page 8
Electrical Optical Microwave Acoustic Mechanical Magnetic (SQUID)
Electrical contact with human skin
X
Optical access to blood vessel
X
Motion artefacts X X X X X X
Relatively higher power consumption
X X X
Large (not wearable) X X
Signal dependent on electrical noise
X X X
Able to measure through fabric, body fluid and environmental contaminants
X
Continuous measurements
X X X X X
Table 1 Comparison on existing well established methods of heart or pulse rate acquisition
2.3 Motivation of a non-invasive pulse rate acquisition using magnetic means
The capability of acquiring pulse rate through fabric, body fluid and environmental contaminants is a
differentiating feature for lifestyle products. As such, the magnetic method of pulse rate acquisition
motivated my research on a compact, lightweight and inexpensive means to acquire blood pulse.
3 Blood flow
Blood flow is the flow of blood in the cardiovascular system and is typically measured by observing
blood flowing through a section of the blood circulatory system. It is a physiological vital sign that is
dependent on the heart pushing blood into the arteries and the resistance presence in the arteries,
which will expand and contract allowing blood to flow [18]. Mathematically, blood flow is described
by Darcy's law (which can be viewed as the fluid equivalent of Ohm's law) and approximately by
Hagen-Poiseuille equation [19]. Details of the mathematical model for blood flow will be presented
in Chapter 3 of this dissertation.

Page 9
Blood flow is an important physiological vital sign subject to continuous monitoring because it is
representative in assessing the physical health condition of an individual. It is an important
parameter to monitor for individuals subjected to crowded and cramped conditions with limited
physical activity where an alert may be triggered for immediate attention when blood flow
anomalies, such as deep vein thrombosis, are detected. For paraplegic patients, it is important for
blood flow anomalies to be detected early to avoid medical complications, such as pressure sores
(decubitus) and thrombosis, as a result of limited decreased movement. In addition, monitoring of
blood flow anomalies for patients after major surgeries is important to ensure smooth recovery.
3.1 Methods of blood flow measurements
Circulatory flow of blood originates due to the muscle contraction of the heart as illustrated in Figure
4. Since blood is an incompressible fluid, the conversation of mass (volume) in a closed hydraulic
system is known as the principle of continuity. The stroke output of the heart is the principal
determinant of circulatory blood flow and as illustrated in Figure 4, the stoke output of the heart
occurs when the ventricles contract and blood is pumped to the lungs and body. The measurement
parameter for the stroke output of the heart is the Stroke Volume (SV). SV is the volume of blood
pumped by the right or left ventricle of the heart in one contraction. Specifically, it is the volume of
blood ejected from the right or left ventricle during systole and the value is typically obtained by
subtracting the end-systolic volume (ESV) from end-diastolic volume (EDV) for the right or left
ventricle respectively [20].

Page 10
Figure 4 Illustration on operations of heart and blood flow during each step
On average, men have higher SV compared to women due to the larger size of their hearts. However,
SV depends on several factors such as heart size, contractility, duration of contraction, preload (end-
diastolic volume), and after-load. Typically, for most people, prolonged aerobic exercise training may
increase stroke volume, which will, usually, results in a lower (resting) heart rate. This is because a
reduction in heart rate prolongs ventricular diastole (filling), increases end-diastolic volume, and
ultimately allows more blood to be ejected.
To quantify the volume of blood being pumped by the heart (ventricle) in a minute, the parameter
used is the cardiac output, measured in L.min-1. Typically, an average cardiac output for human male
is 5 L.min-1 and for human female is 4.5 L.min-1[21].
To-date, there are a number of clinical methods for the measurement of the cardiac output. These
methods range from invasive measurement using direct intra-cardiac catheterization to non-invasive
measurement of the arterial pulse. Each method has its strengths and weaknesses where relative
comparison is limited by the absence of a widely accepted “gold standard”. Therefore, the following
sections will discuss a few of the specialized techniques developed to measure blood flow and
Page 11
changes in blood volume. Each of these techniques differs in the measurement aspects of blood flow
such as: the average flow; the instantaneous pulsatile flow; the flow profile; and changes in blood
volume. These measurements are all unique and provide valuable information to physicians and
medical researchers in clinical and research applications.
3.1.1 Indicator-dilution Method
Indicator-dilution method measures the averaged flow of blood in a vessel over a number of heart
beats invasively. This method applies the concept of indicator, such as colored dyes and radioisotope,
insertion into the blood stream and allowing it to flow in the blood circulatory system. Typically, the
rate at which blood carries the indicator downstream is measured and two types of indicator-
dilution methods that are clinically practice are: continuous infusion and rapid injection.
3.1.1.1 Continuous infusion techniques
The continuous infusion technique involves the continuous addition of an indicator into a flowing
stream. For a fixed change in indicator concentration, ∆C; at a known rate of injection, 𝑑𝑚𝑑𝑡
; the
average flow, F, can be calculated by Equation 1.
Equation 1 𝑭 = 𝒅𝑽𝒅𝒕
=
𝒅𝒎𝒅𝒕∆𝑪
where V = volume of injectate (ml)
Many different indicators have been tried but the most successful indicator has been the
indocyanine green, whose concentration curve can be measured in blood by light absorption.
However, the main disadvantage of this method is the recirculation of most indicators where the
indicator flows through the blood circulatory system and returns back to the injection point,
affecting the maximum values of the cardiac output [22].
3.1.1.2 Rapid injection
In clinical use, continuous infusion has largely been replaced by rapid injection due to its clinical
simplicity and reliability. Rapid or bolus injection method typically involves a bolus of indicator, such
as a dye or radioisotope, being rapidly injected into the large vein or preferably into the right side of
the heart [22]. The variation in downstream concentration of indicator, C(t), is measured until the
bolus has passed. The average flow is then obtained by Equation 2.
Page 12
Equation 2 𝑭 = 𝒎
∫ 𝑪(𝒕)𝒅𝒕𝒕𝟏𝟎
where m = quantity of indicator injected
t1 = time after which the indicator has completely passed.
3.1.2 Thermo-dilution Method
The invasive measurement method for cardiac output using temperature changes is thermo-dilution
[22]. A bolus of cold saline is rapidly injected into the right or left atrium. The blood and saline mix in
the right ventricle and the temperature difference is recorded in the pulmonary artery using a
Thermistor. The Swan-Ganz Catheter is a four-lumen catheter clinically used for this procedure. It
can stay within the patient’s body for up to 24 hours; this allows a series of cardiac output
measurements to be recorded based on the Equation 3.
Equation 3 𝑪𝒂𝒓𝒅𝒊𝒂𝒄 𝑶𝒖𝒕𝒑𝒖𝒕 ∝ (𝒃𝒍𝒐𝒐𝒅 𝒕𝒆𝒎𝒑 − 𝒊𝒏𝒋𝒆𝒄𝒕𝒂𝒕𝒆 𝒕𝒆𝒎𝒑)
3.1.3 Electromagnetic flow meters
The electromagnetic blood flow meter is an important tool with both medical research and clinical
applications. It is based on the fact that blood is a conductor of electricity, so that the imposition of a
magnetic field produces a difference of voltage across its diameter. Measuring this voltage using
electrodes on the walls of the blood vessel will allow the measurement of the mean blood velocity
or the instantaneous pulsatile flow of blood. The pulsation can be averaged with respect to time
indicating average blood flow over a number of heart beats.
Typical electromagnetic flow meters provide measurement output for both the instantaneous
pulsatile flow of blood and the average flow. For the instantaneous pulsatile flow of blood, the flow
meter measures the induced electromagnetic field, e, depending on the fact that blood is flowing
with velocity, u, through a magnetic field, B. This is given by Equation 4 [23].
Equation 4 𝒆 = ∫ (𝒖 × 𝑩)𝒅𝑳𝒕𝟏𝟎
where L is the length between the recording electrodes.
For a uniform magnetic field and uniform velocity profile, the induced electromagnetic field is e = B x
L x u.
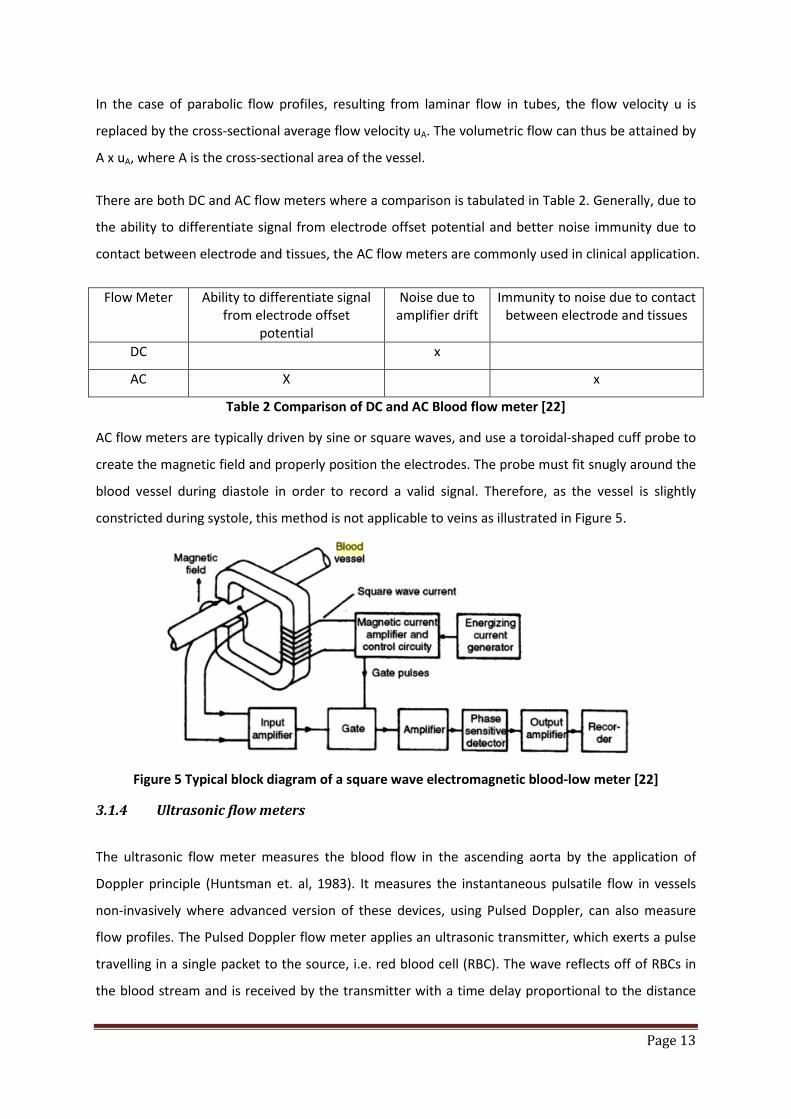
Page 13
In the case of parabolic flow profiles, resulting from laminar flow in tubes, the flow velocity u is
replaced by the cross-sectional average flow velocity uA. The volumetric flow can thus be attained by
A x uA, where A is the cross-sectional area of the vessel.
There are both DC and AC flow meters where a comparison is tabulated in Table 2. Generally, due to
the ability to differentiate signal from electrode offset potential and better noise immunity due to
contact between electrode and tissues, the AC flow meters are commonly used in clinical application.
Flow Meter Ability to differentiate signal from electrode offset
potential
Noise due to amplifier drift
Immunity to noise due to contact between electrode and tissues
DC x
AC X x
Table 2 Comparison of DC and AC Blood flow meter [22]
AC flow meters are typically driven by sine or square waves, and use a toroidal-shaped cuff probe to
create the magnetic field and properly position the electrodes. The probe must fit snugly around the
blood vessel during diastole in order to record a valid signal. Therefore, as the vessel is slightly
constricted during systole, this method is not applicable to veins as illustrated in Figure 5.
Figure 5 Typical block diagram of a square wave electromagnetic blood-low meter [22]
3.1.4 Ultrasonic flow meters
The ultrasonic flow meter measures the blood flow in the ascending aorta by the application of
Doppler principle (Huntsman et. al, 1983). It measures the instantaneous pulsatile flow in vessels
non-invasively where advanced version of these devices, using Pulsed Doppler, can also measure
flow profiles. The Pulsed Doppler flow meter applies an ultrasonic transmitter, which exerts a pulse
travelling in a single packet to the source, i.e. red blood cell (RBC). The wave reflects off of RBCs in
the blood stream and is received by the transmitter with a time delay proportional to the distance
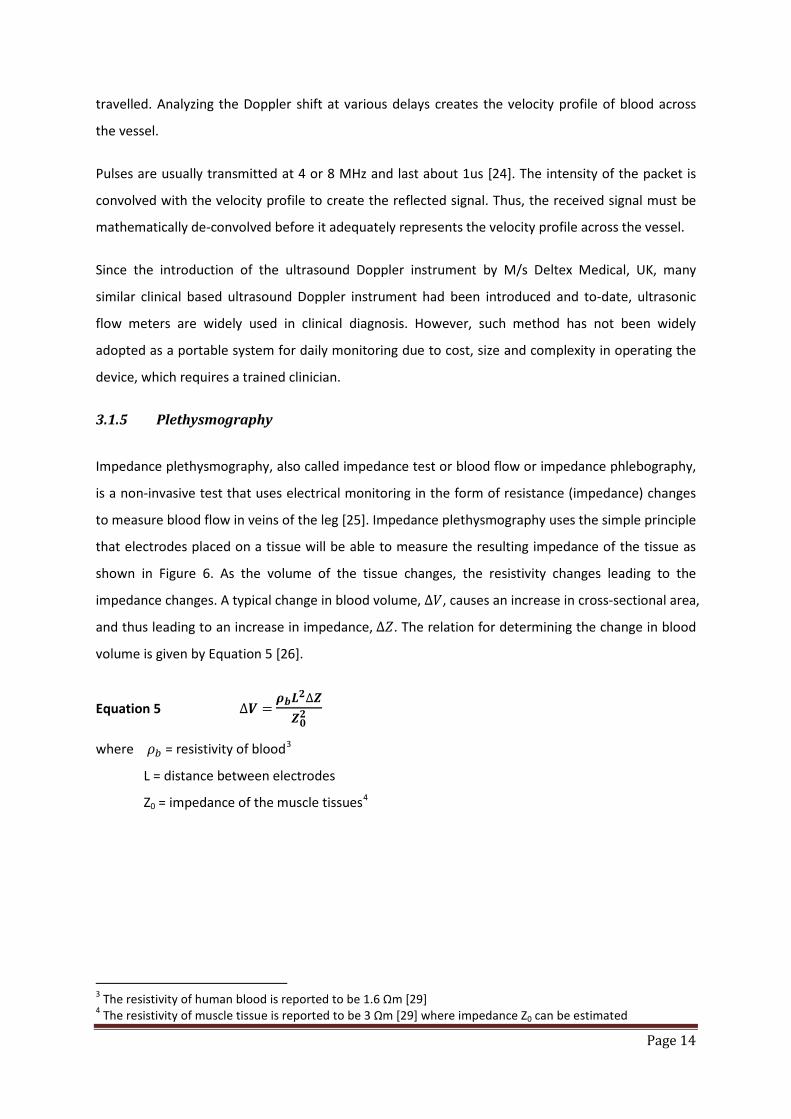
Page 14
travelled. Analyzing the Doppler shift at various delays creates the velocity profile of blood across
the vessel.
Pulses are usually transmitted at 4 or 8 MHz and last about 1us [24]. The intensity of the packet is
convolved with the velocity profile to create the reflected signal. Thus, the received signal must be
mathematically de-convolved before it adequately represents the velocity profile across the vessel.
Since the introduction of the ultrasound Doppler instrument by M/s Deltex Medical, UK, many
similar clinical based ultrasound Doppler instrument had been introduced and to-date, ultrasonic
flow meters are widely used in clinical diagnosis. However, such method has not been widely
adopted as a portable system for daily monitoring due to cost, size and complexity in operating the
device, which requires a trained clinician.
3.1.5 Plethysmography
Impedance plethysmography, also called impedance test or blood flow or impedance phlebography,
is a non-invasive test that uses electrical monitoring in the form of resistance (impedance) changes
to measure blood flow in veins of the leg [25]. Impedance plethysmography uses the simple principle
that electrodes placed on a tissue will be able to measure the resulting impedance of the tissue as
shown in Figure 6. As the volume of the tissue changes, the resistivity changes leading to the
impedance changes. A typical change in blood volume, ∆𝑉, causes an increase in cross-sectional area,
and thus leading to an increase in impedance, ∆𝑍. The relation for determining the change in blood
volume is given by Equation 5 [26].
Equation 5 ∆𝑽 = 𝝆𝒃𝑳𝟐∆𝒁𝒁𝟎𝟐
where 𝜌𝑏 = resistivity of blood3
L = distance between electrodes
Z0 = impedance of the muscle tissues4
3 The resistivity of human blood is reported to be 1.6 Ωm [29] 4 The resistivity of muscle tissue is reported to be 3 Ωm [29] where impedance Z0 can be estimated
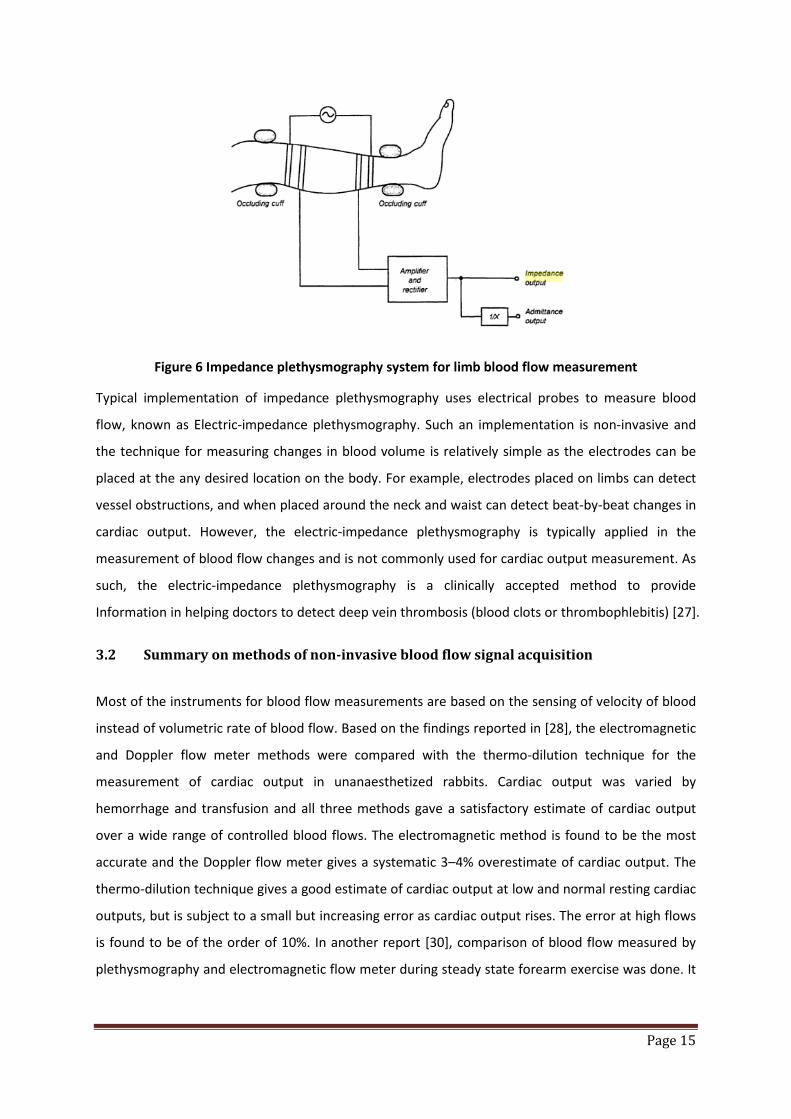
Page 15
Figure 6 Impedance plethysmography system for limb blood flow measurement
Typical implementation of impedance plethysmography uses electrical probes to measure blood
flow, known as Electric-impedance plethysmography. Such an implementation is non-invasive and
the technique for measuring changes in blood volume is relatively simple as the electrodes can be
placed at the any desired location on the body. For example, electrodes placed on limbs can detect
vessel obstructions, and when placed around the neck and waist can detect beat-by-beat changes in
cardiac output. However, the electric-impedance plethysmography is typically applied in the
measurement of blood flow changes and is not commonly used for cardiac output measurement. As
such, the electric-impedance plethysmography is a clinically accepted method to provide
Information in helping doctors to detect deep vein thrombosis (blood clots or thrombophlebitis) [27].
3.2 Summary on methods of non-invasive blood flow signal acquisition
Most of the instruments for blood flow measurements are based on the sensing of velocity of blood
instead of volumetric rate of blood flow. Based on the findings reported in [28], the electromagnetic
and Doppler flow meter methods were compared with the thermo-dilution technique for the
measurement of cardiac output in unanaesthetized rabbits. Cardiac output was varied by
hemorrhage and transfusion and all three methods gave a satisfactory estimate of cardiac output
over a wide range of controlled blood flows. The electromagnetic method is found to be the most
accurate and the Doppler flow meter gives a systematic 3–4% overestimate of cardiac output. The
thermo-dilution technique gives a good estimate of cardiac output at low and normal resting cardiac
outputs, but is subject to a small but increasing error as cardiac output rises. The error at high flows
is found to be of the order of 10%. In another report [30], comparison of blood flow measured by
plethysmography and electromagnetic flow meter during steady state forearm exercise was done. It

Page 16
was found that the plethysmography method tends to overestimate (up to 1.7 times) the blood flow
of the subject in this experiment.
All these methods are either invasive or requires good electrical or optical contact with the skin
limiting its deployment as a portable device for blood flow measurements. Therefore, to apply blood
flow measurements beyond clinical deployment, research in blood flow signal acquisitions and
analysis have been on-going to enhance these methods for a portable solution.
3.3 Motivation of a non-invasive blood flow signal acquisition using magnetic means
The potential application of the portable magnetic method for blood flow acquisition motivated the
research of a compact, lightweight and inexpensive means to acquire blood flow. In order to achieve
this, a mathematical model of the magnetic method of blood flow acquisition is derived, consisting
of nonlinear partial differential equations obtained based on the application of Maxwell’s Equation.
The modelled equations are solved in a multiphysics simulation environment, which enables reliable
predictive simulation of the underlying physical phenomena. The simulation results are compared
with the corresponding experimental results and checked on their physical soundness.
In addition, research and development work presented in this dissertation will also outline
experimental setups developed to demonstrate the application of the magnetic method for blood
flow acquisition in a small and robust form. These experiments aim to provide the proof-of-concept
for new lifestyle and medical products capable of non-invasive acquisition of blood flow signal
through fabric, body fluid and environmental contaminants.

Page 17
4 Conclusions
A technology review is presented in this chapter highlighting the advantages and disadvantages of
each method used for blood pulse and flow measurements. It can be concluded that there is a lack
of a portable system capable of measuring blood pulse and flow through fabric, body fluid and
environment contaminants. Therefore, the motivation of this research is to develop a novel method
of blood pulse and flow acquisition that is capable of deployment, in a robust manner, as a portable
physiological monitoring system. Such a method will support the acquisition of both blood pulse and
blood flow without the need for a good electrical or optical contact and can be used over a
prolonged period of time on the limbs.
As such, one of the objectives of this project will be the development of a non-invasive magnetic
based blood flow acquisition system that applies commercially available magnetic sensors in place of
SQUID or electrodes. This will allow the system to operate at room temperature, be reliable,
compact (small size), cheap, and convenient for daily usage.
Using this novel method to detect blood pulse and blood flow, systems can be developed for
applications such as lifestyle or health monitoring device at home, ambulance and hospital, and at
situations, including military training and sports.
Page 18
5 References
[1] D. L. Gorgas, “Vital signs and patient monitoring techniques” in Clinical Procedures in Emergency Medicine: 4th edition (J. R. Roberts and J. R. Hedges, Eds), Philadephia, Saunders, 2004, pp 3-28
[2] Fu, S. E.; Lai, S. P., “A system for pulse measurement and analysis of Chinese medicine”, Proceedings of IEEE Engineering in Medicine & Biology Society’s 11th Annual International Conference 1989, pp. 1695-1696
[3] Akinori Ueno, Yasunao Akabane, Tsuyoshi Kato, Hiroshi Hoshino, Sachiyo Kataoka, Yoji Ishiyama (2007) Capacitive Sensing of Electrocardiographic Potential Through Cloth from the Dorsal Surface of the Body in a Supine Position: A Preliminary Study, IEEE Transactions on Biomedical Engineering, Vol. 54, No. 4, April 2007
[4] S. Bowbrick, A. N. Borg. Edinburgh (2006) ECG complete, New York, Churchill Livingstone [5] S. M. Burns (2006) AACN protocols for practice: noninvasive monitoring, Jones and Bartlett
Publishers [6] M.N. Ericson, E.L Ibey, G.L. Cote, J.S. Baba, J.B. Dixon (2002) In vivo application of a minimally
invasive oximetry based perfusion sensor, Proceedings of the Second Joint EMBS/BMES Conference
[7] Shuhei Yamada, Mingqi Chen, Victor Lubecke (2006) Sub-uW Signal Power Doppler Radar Heart Rate Detection, Proceedings of Asia-Pacific Microwave Conference
[8] G. Amit, N. Gavriely, J. Lessick, N. Intrator (2005) Automatic extraction of physiological features from vibro-acoustic heart signals : correlation with echo-doppler, Computers in Cardiology, Issue September 25-28, pp 299-302
[9] J.L. Jacobs, P. Embree, M. Glei, S. Christensen, P.K. Sullivan (2004) Characterization of a Novel Heart and Respiratory Rate Sensor, Proceedings of the 26th Annual International Conference of the IEEE EMBS
[10] Luis Torres-Pereira, Cala Torres-Pereira, Carlos Couto (1997) A Non-invasive Telemetric Heart Rate Monitoring System based on Phonocadiography, ISIE’97
[11] J. Kerola, V. Kontra, R. Sepponen (1996) Non-invasive blood pressure data acquisition employing pulse transit time detection, Engineering in Medicine and Biology Society, Volume 3, Issue 31 Oct-3 Nov, pp 1308 – 1309
[12] J.Malmivuo, R. Plonsey (1995) Bioelectromagnetism – Principles and Applications of Bioelectric and Biomagnetic Fields, New-York, Oxford University Press
[13] Yasuaki Noguchi, Hideyuki Mamune, Suguru sugimoto, Jun Yoshida, Hidenori Sasa, Hisaaki Kobayashi, Mitsunao Kobayashi (1994) Measurement characteristics of the ultrasound heart rate monitor, Engineering in Medicine and Biology Society, Engineering Advances: New Opportunities for Biomedical Engineers. Proceedings of the 16th Annual International Conference of the IEEE Vol. 1, Issue , 3-6 Nov 1994 Page(s):670 - 671
[14] J.R. Singer (1980) Blood Flow Measurements by NMR of the intact body, IEEE Transactions on Nuclear Science, Vol. NS-27, No. 3 June 1980
[15] Hiroshi Kanai, Eiki Yamano, Kiyoshi Nakayama, Naoshige Kawamura, Hiroshi Furuhata (1974) Transcutaneous Blood Flow Measurement by Electromagnetic Induction, IEEE Transaction on Biomedical Engineering, Vol. BME-21, No. 2, Mar 1974
[16] A. L. Goldberger, Clinical Electrocardiography: A Simplified Approach, Chicago: Mosby, 1999
Page 19
[17] J. C. Lin, “Microwave sensing of physiological movement and volume change: A review”, Bioelectromagnetics, vol. 13, no. 6, pp 557-565, 1992
[18] John J. Bray, Patricia A. Cragg, Anthony D. C. Macknight, “Lecture notes on human physiology”, Wiley-Blackwell, Chapter 14.
[19] Sisir K Majumdar, “History of the stethoscope an overview”, Bulletin of the Indian Institute of History of Medicine (Hyderabad). 32(2):137-50.
[20] Paul L. Marino, Kenneth M. Sutin, “The ICU book”, Published by Lippincott Williams & Wilkins [21] Dawn M. Hudson, “Human Anatomy & Physiology”, Walch Publishing, Chapter on “The
Cardiovascular System”. [22] Raghbir Singh Khandpur, Biomedical Instrumentation, McGraw-Hill Professional, 2004,
Chapter 12. [23] Webster, John G., Medical Instrumentation Application and Design, Chapter 8, pages 338-340,
Third Ed, John Wiley & Sons, Inc.,1998 [24] S Ananthi , A Textbook of Medical Instruments, 1st edition, New Age International, Chapter 3. [25] William R. Milnor, Cardiovascular Physiology, Oxford University Press US, 1990, Chapter 14. [26] Tatsuo Togawa, Toshiyo Tamura, P. Ake Oberg, P., “Biomedical transducers and instruments”,
Published by CRC Press [27] Impedance Plethysmography, http://www.enotes.com/nursing-encyclopedia/impedance-
plethysmography [28] S. W. White , R. J. McRitchie, W. L. Porges, “A comparison between thermodilution,
electromagnetic and Doppler methods for cardiac output measurement in the rabbit”, Clinical and Experimental Pharmacology and Physiology, Volume 1 Issue 3, Pages 175 – 182
[29] Reported resistivity of muscle tissues, fats, bone and human fluids such as blood and cerebrospinal, www.maths.manchester.ac.uk/bl/theses/cdenyer/th3ch03.ps
[30] John Longhurst et al, “Comparison of Blood Flow Measured by Plethysmograph and Flowmeter During Steady State Forearm Exercise”, Journal of American Heart Association, http://circ.ahajournals.org/cgi/content/abstract/49/3/535

Page 20
Chapter 2: Principle description of Modulated Magnetic Signature of Blood
1 Introduction
Based on the known methods discussed in Chapter 1 for blood pulse acquisition, it can be concluded
that there is a need for a novel method of blood pulse sensing that is low power, small and is able to
acquire blood pulse independent of the electrical or optical contact with the skin. Such a method will
support the development of pulse sensing devices that can be embedded in lifestyle devices such as
massage chairs, watches and furniture for continuous acquisition of physiological vital signs.
In order to achieve blood pulse sensing that is independent of the electrical or optical contact with
the skin, sensing of the bio-magnetic field generated from the blood circulatory system is one of the
potentially solutions. However, such bio-magnetic fields are generally weak and will require
magnetic sensors, such as SQUID, that are highly sensitive. In addition, environmental and earth
magnetic field isolation are necessary. Therefore, there are challenges for such a system to achieve
portability and low power (Figure 7).
Biomagnetic signals: MCG = magnetocardiogram, MMG = magnetomyogram, MEG = magnetoencephalogram, MOG = magneto-oculogram Noise fields: static field of the Earth, geomagnetic fluctuations, laboratory noise, line frequency noise, radio frequency noise Equivalent input noise: commercial flux-gate magnetometer, ring-core flux-gate (NASA), induction coil magnetometer, SQUID-magnetometer Thermal noise fields: eddy current shield, the human body
Figure 7 Strength of magnetic signals produced by various sources [1]
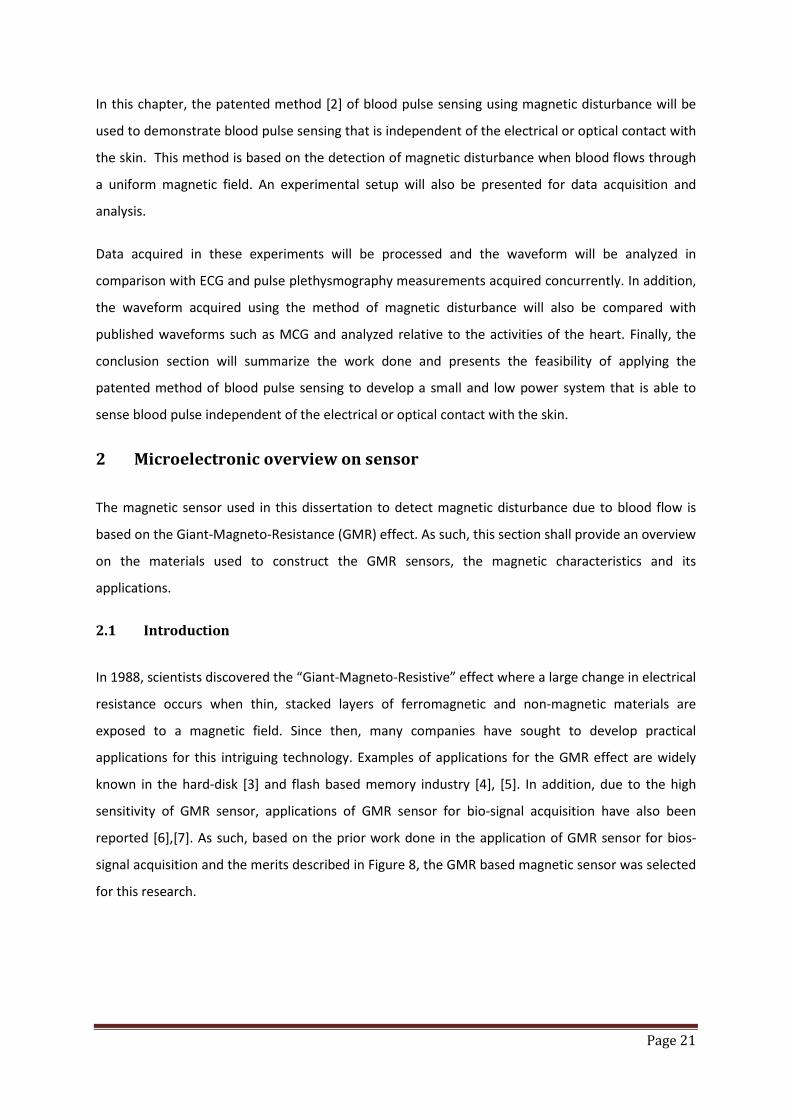
Page 21
In this chapter, the patented method [2] of blood pulse sensing using magnetic disturbance will be
used to demonstrate blood pulse sensing that is independent of the electrical or optical contact with
the skin. This method is based on the detection of magnetic disturbance when blood flows through
a uniform magnetic field. An experimental setup will also be presented for data acquisition and
analysis.
Data acquired in these experiments will be processed and the waveform will be analyzed in
comparison with ECG and pulse plethysmography measurements acquired concurrently. In addition,
the waveform acquired using the method of magnetic disturbance will also be compared with
published waveforms such as MCG and analyzed relative to the activities of the heart. Finally, the
conclusion section will summarize the work done and presents the feasibility of applying the
patented method of blood pulse sensing to develop a small and low power system that is able to
sense blood pulse independent of the electrical or optical contact with the skin.
2 Microelectronic overview on sensor
The magnetic sensor used in this dissertation to detect magnetic disturbance due to blood flow is
based on the Giant-Magneto-Resistance (GMR) effect. As such, this section shall provide an overview
on the materials used to construct the GMR sensors, the magnetic characteristics and its
applications.
2.1 Introduction
In 1988, scientists discovered the “Giant-Magneto-Resistive” effect where a large change in electrical
resistance occurs when thin, stacked layers of ferromagnetic and non-magnetic materials are
exposed to a magnetic field. Since then, many companies have sought to develop practical
applications for this intriguing technology. Examples of applications for the GMR effect are widely
known in the hard-disk [3] and flash based memory industry [4], [5]. In addition, due to the high
sensitivity of GMR sensor, applications of GMR sensor for bio-signal acquisition have also been
reported [6],[7]. As such, based on the prior work done in the application of GMR sensor for bios-
signal acquisition and the merits described in Figure 8, the GMR based magnetic sensor was selected
for this research.
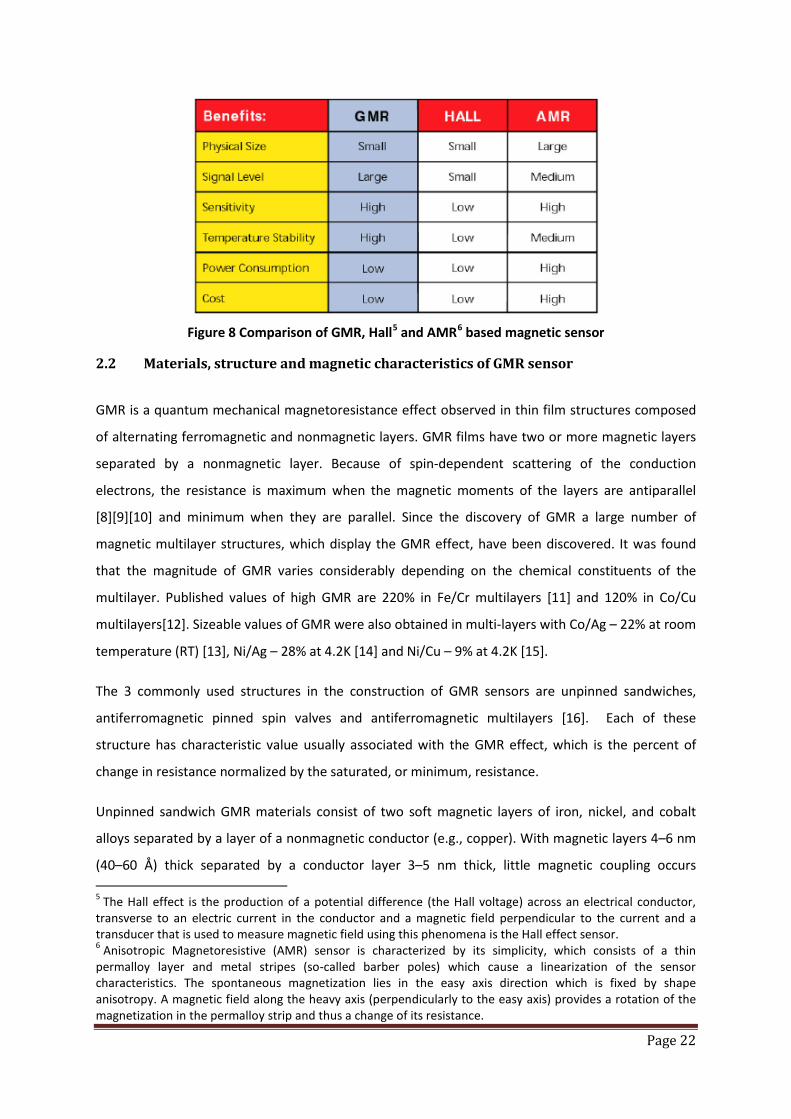
Page 22
Figure 8 Comparison of GMR, Hall5 and AMR6 based magnetic sensor
2.2 Materials, structure and magnetic characteristics of GMR sensor
GMR is a quantum mechanical magnetoresistance effect observed in thin film structures composed
of alternating ferromagnetic and nonmagnetic layers. GMR films have two or more magnetic layers
separated by a nonmagnetic layer. Because of spin-dependent scattering of the conduction
electrons, the resistance is maximum when the magnetic moments of the layers are antiparallel
[8][9][10] and minimum when they are parallel. Since the discovery of GMR a large number of
magnetic multilayer structures, which display the GMR effect, have been discovered. It was found
that the magnitude of GMR varies considerably depending on the chemical constituents of the
multilayer. Published values of high GMR are 220% in Fe/Cr multilayers [11] and 120% in Co/Cu
multilayers[12]. Sizeable values of GMR were also obtained in multi-layers with Co/Ag – 22% at room
temperature (RT) [13], Ni/Ag – 28% at 4.2K [14] and Ni/Cu – 9% at 4.2K [15].
The 3 commonly used structures in the construction of GMR sensors are unpinned sandwiches,
antiferromagnetic pinned spin valves and antiferromagnetic multilayers [16]. Each of these
structure has characteristic value usually associated with the GMR effect, which is the percent of
change in resistance normalized by the saturated, or minimum, resistance.
Unpinned sandwich GMR materials consist of two soft magnetic layers of iron, nickel, and cobalt
alloys separated by a layer of a nonmagnetic conductor (e.g., copper). With magnetic layers 4–6 nm
(40–60 Å) thick separated by a conductor layer 3–5 nm thick, little magnetic coupling occurs 5 The Hall effect is the production of a potential difference (the Hall voltage) across an electrical conductor, transverse to an electric current in the conductor and a magnetic field perpendicular to the current and a transducer that is used to measure magnetic field using this phenomena is the Hall effect sensor. 6 Anisotropic Magnetoresistive (AMR) sensor is characterized by its simplicity, which consists of a thin permalloy layer and metal stripes (so-called barber poles) which cause a linearization of the sensor characteristics. The spontaneous magnetization lies in the easy axis direction which is fixed by shape anisotropy. A magnetic field along the heavy axis (perpendicularly to the easy axis) provides a rotation of the magnetization in the permalloy strip and thus a change of its resistance.

Page 23
between the layers. Typically, sandwich materials have GMR values of 4%–9% and saturate with 2.4–
5 kA/m (30–60 Oe) applied field [16].
Spin valves, or antiferromagnetically pinned spin valves, are somewhat similar to unpinned spin
valves or sandwich materials. An additional layer of antiferromagnetic material is added at the top or
the bottom. The antiferromagnetic material (e.g., FeMn or NiO) couples with the adjacent magnetic
layer and pins it in a fixed direction. The other magnetic layer is free to rotate. If the external
magnetic field is applied in a direction parallel to the magnetization of the pinned layer, there is a
change in sheet resistance from its high level for one field direction to a low level for the opposite
field direction (see Figure 9(a)). If the field is applied perpendicular to the pinned layer, the sheet
resistance is minimum at zero field and increases for both positive and negative applied fields (see
Figure 9(b)). The maximum change in sheet resistance in this configuration is only one half the total
possible values. The free magnetic layer rotates from parallel to the pinned layer to perpendicular to
it rather than from parallel to anti-parallel. GMR values based on this structure are typically 4%–20%,
and the saturation fields are 0.8–6 kA/m (10–80 Oe) [16].
(a) Parallel field applied (b) Perpendicular field applied Figure 9 Plot of resistance vs applied magnetic field for an antiferromagnetically pinned spin valve GMR device with magnetic field applied parallel (a) and perpendicular (b) to the magnetization of
the pinned layer [16]
Antiferromagnetic multilayers of GMR material consist of repetitions of alternating conducting
magnetic layers and conducting nonmagnetic layers. Because multilayers have more interfaces than
do sandwiches, the GMR effect is greater. The thickness of the nonmagnetic layers is less than that
of the sandwich material (which is typically 1.5–2.0 nm), and the thickness is critical. The polarized
conduction electrons cause anti-ferromagnetic coupling between the magnetic layers only when the
spacers are a certain thickness. In the absence of an external magnetic field, each magnetic layer has
its magnetic moment anti-parallel to the moments of the magnetic layers on each side--exactly the
condition needed for maximum spin-dependent scattering. A large external field can overcome the
Magnetic Field (Oe) Magnetic Field (Oe)
Resis
tanc
e (k
Ω)
Resis
tanc
e (k
Ω)
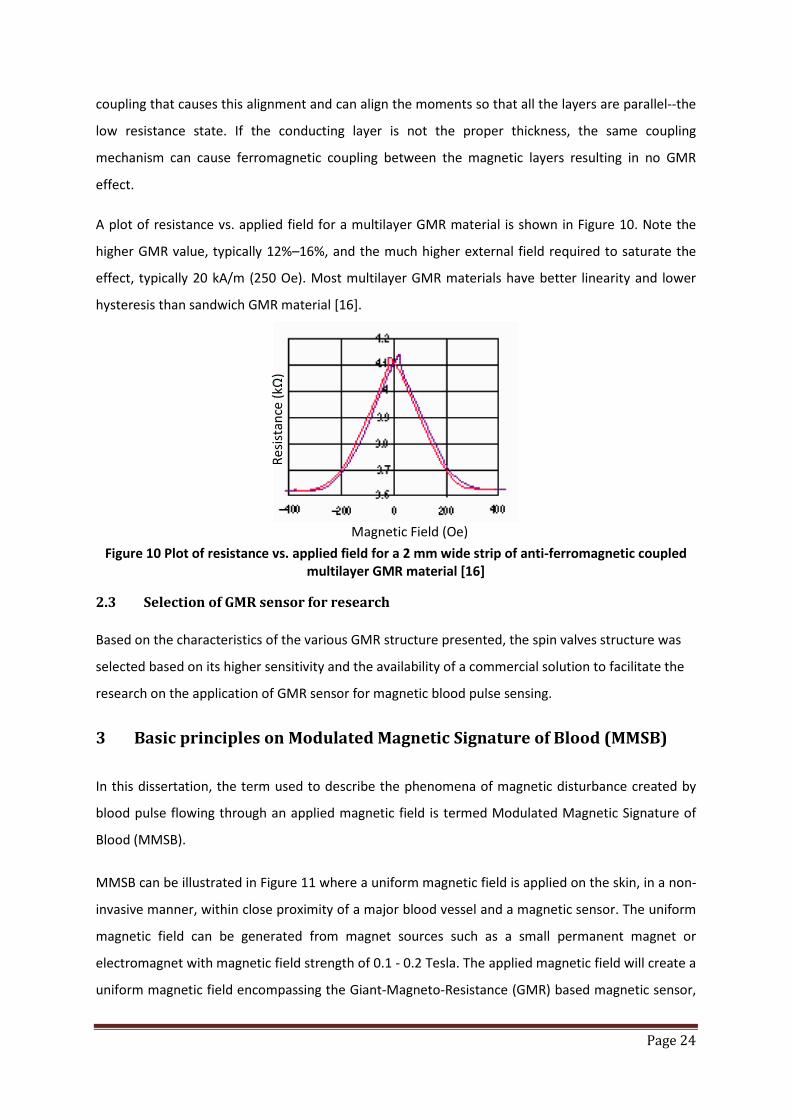
Page 24
coupling that causes this alignment and can align the moments so that all the layers are parallel--the
low resistance state. If the conducting layer is not the proper thickness, the same coupling
mechanism can cause ferromagnetic coupling between the magnetic layers resulting in no GMR
effect.
A plot of resistance vs. applied field for a multilayer GMR material is shown in Figure 10. Note the
higher GMR value, typically 12%–16%, and the much higher external field required to saturate the
effect, typically 20 kA/m (250 Oe). Most multilayer GMR materials have better linearity and lower
hysteresis than sandwich GMR material [16].
Figure 10 Plot of resistance vs. applied field for a 2 mm wide strip of anti-ferromagnetic coupled multilayer GMR material [16]
2.3 Selection of GMR sensor for research Based on the characteristics of the various GMR structure presented, the spin valves structure was
selected based on its higher sensitivity and the availability of a commercial solution to facilitate the
research on the application of GMR sensor for magnetic blood pulse sensing.
3 Basic principles on Modulated Magnetic Signature of Blood (MMSB)
In this dissertation, the term used to describe the phenomena of magnetic disturbance created by
blood pulse flowing through an applied magnetic field is termed Modulated Magnetic Signature of
Blood (MMSB).
MMSB can be illustrated in Figure 11 where a uniform magnetic field is applied on the skin, in a non-
invasive manner, within close proximity of a major blood vessel and a magnetic sensor. The uniform
magnetic field can be generated from magnet sources such as a small permanent magnet or
electromagnet with magnetic field strength of 0.1 - 0.2 Tesla. The applied magnetic field will create a
uniform magnetic field encompassing the Giant-Magneto-Resistance (GMR) based magnetic sensor,
Magnetic Field (Oe)
Resis
tanc
e (k
Ω)
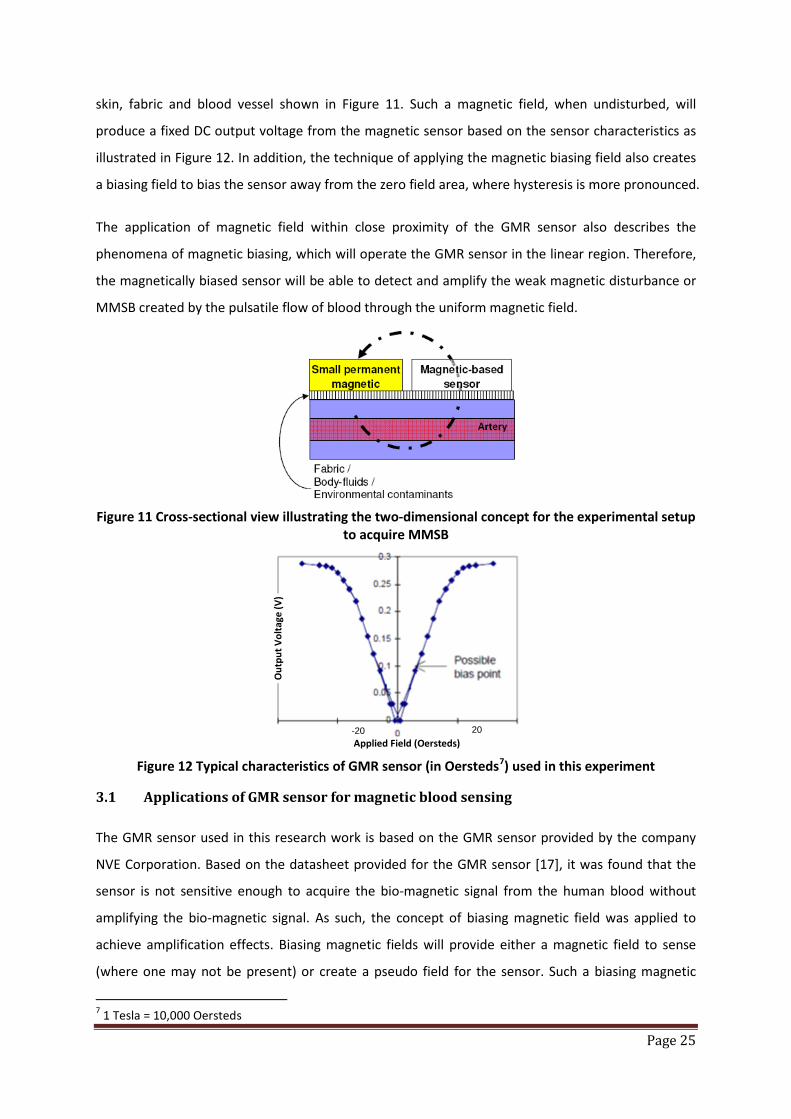
Page 25
skin, fabric and blood vessel shown in Figure 11. Such a magnetic field, when undisturbed, will
produce a fixed DC output voltage from the magnetic sensor based on the sensor characteristics as
illustrated in Figure 12. In addition, the technique of applying the magnetic biasing field also creates
a biasing field to bias the sensor away from the zero field area, where hysteresis is more pronounced.
The application of magnetic field within close proximity of the GMR sensor also describes the
phenomena of magnetic biasing, which will operate the GMR sensor in the linear region. Therefore,
the magnetically biased sensor will be able to detect and amplify the weak magnetic disturbance or
MMSB created by the pulsatile flow of blood through the uniform magnetic field.
Figure 11 Cross-sectional view illustrating the two-dimensional concept for the experimental setup
to acquire MMSB
Figure 12 Typical characteristics of GMR sensor (in Oersteds7) used in this experiment
3.1 Applications of GMR sensor for magnetic blood sensing The GMR sensor used in this research work is based on the GMR sensor provided by the company
NVE Corporation. Based on the datasheet provided for the GMR sensor [17], it was found that the
sensor is not sensitive enough to acquire the bio-magnetic signal from the human blood without
amplifying the bio-magnetic signal. As such, the concept of biasing magnetic field was applied to
achieve amplification effects. Biasing magnetic fields will provide either a magnetic field to sense
(where one may not be present) or create a pseudo field for the sensor. Such a biasing magnetic
7 1 Tesla = 10,000 Oersteds
20 -20
Out
put V
olta
ge (V
)
Applied Field (Oersteds)

Page 26
field typically describes the application of a magnetic field through the sensor package without
influencing the sensor operations. An example of a commercially available application using
magnetic biasing technique is to detect the ferrous material of currencies so as to identify and
differentiate the notes automatically [18], [19].
To estimate the distance between the permanent magnetic and the GMR sensor to achieve the
desired effect of magnetic biasing, the magnetic field at the sensor location will be estimated. In
order to achieve this estimate, the permanent magnet is assumed to be a point source and the
magnetic field, B along its axis, at distance d away from the magnet can be calculated using Equation
6 (reference [20]).
Equation 6 𝑩 = 𝝁𝟎𝟒𝝅
𝝁𝒅𝟑
(𝒂𝑹𝟐𝒄𝒐𝒔𝜽 + 𝒂𝜽𝒔𝒊𝒏𝜽)
where μ0 = permeability constant (4π×10–7 T m/A8)
d = distance from the center of the magnet in meters
aR and aѳ = spherical unit vectors from centre of magnet (Figure 13)
μ = magnetic moment of a magnet (A.m2).
Figure 13 Illustration of magnetic field vector calculations based on [21]
Applying Equation 6 with ѳ = 90o, the magnetic field B can be simplified to Equation 7.
Equation 7 𝑩 = 𝝁𝟎𝟒𝝅
𝝁𝒅𝟑
(𝒂𝜽)
Using Equation 7 and applying the physical data where d = 0.02m, magnetic moment of the magnet
≈ 0.05 Am2, the magnetic field strength at the sensor d away from the magnet can be calculated as
6.25 Oe, where 1 Oe is approximated as 1 Gauss (or 1x10⁻⁴ T). This will produce the effect of
8 Where A is a vector magnetic potential with units Wb/m
R ѳ
z
y
x
P(R, ѳ, 𝜋2
)
Sensor Magnet d
ar
aѳ

Page 27
magnetic biasing where the sensor is always operating in the linear region of its characteristic curve
as shown in Figure 12.
3.2 Experimental setup to demonstrate MMSB using iron oxide fluidic flow To demonstrate the existence of a magnetic disturbance when blood flows through a constant
magnetic field, an experimental setup will be described in this section to verify the MMSB
phenomenon using iron (II) oxide (Fe2O3) fluid as shown in Figure 14.
Figure 14 Iron (II) oxide (Fe2O3) fluidic flow experiment
The experimental setup on Figure 14 is designed to make use of gravitational force to allow the
Fe2O3 fluid to flow through the rigid glass tube, which is placed at 2-3mm above the sensor and
magnet. However, continuous flow of Fe2O3 fluid lacks the ability to demonstrate the effect of
MMSB, which is primarily observed when pulsatile blood flows through a constant magnetic field.
Therefore, an extra funnel is used in Figure 14 to support inlet of air into the fluidic flow so that
pockets of air-bubbles can be infused between the Fe2O3 fluids as it flows through the system. This is
illustrated in Figure 15, where the effect of magnetic disturbance is tested through flow of Fe2O3
fluids that is separated by pockets of air-bubbles.
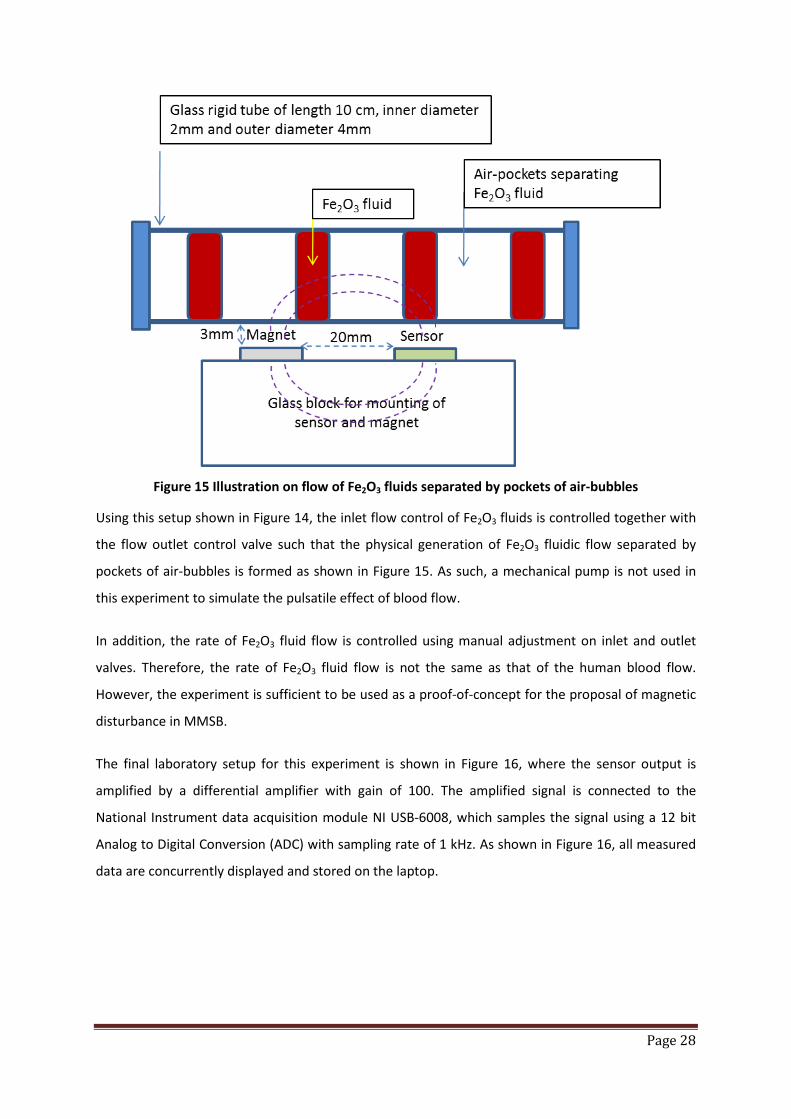
Page 28
Figure 15 Illustration on flow of Fe2O3 fluids separated by pockets of air-bubbles
Using this setup shown in Figure 14, the inlet flow control of Fe2O3 fluids is controlled together with
the flow outlet control valve such that the physical generation of Fe2O3 fluidic flow separated by
pockets of air-bubbles is formed as shown in Figure 15. As such, a mechanical pump is not used in
this experiment to simulate the pulsatile effect of blood flow.
In addition, the rate of Fe2O3 fluid flow is controlled using manual adjustment on inlet and outlet
valves. Therefore, the rate of Fe2O3 fluid flow is not the same as that of the human blood flow.
However, the experiment is sufficient to be used as a proof-of-concept for the proposal of magnetic
disturbance in MMSB.
The final laboratory setup for this experiment is shown in Figure 16, where the sensor output is
amplified by a differential amplifier with gain of 100. The amplified signal is connected to the
National Instrument data acquisition module NI USB-6008, which samples the signal using a 12 bit
Analog to Digital Conversion (ADC) with sampling rate of 1 kHz. As shown in Figure 16, all measured
data are concurrently displayed and stored on the laptop.
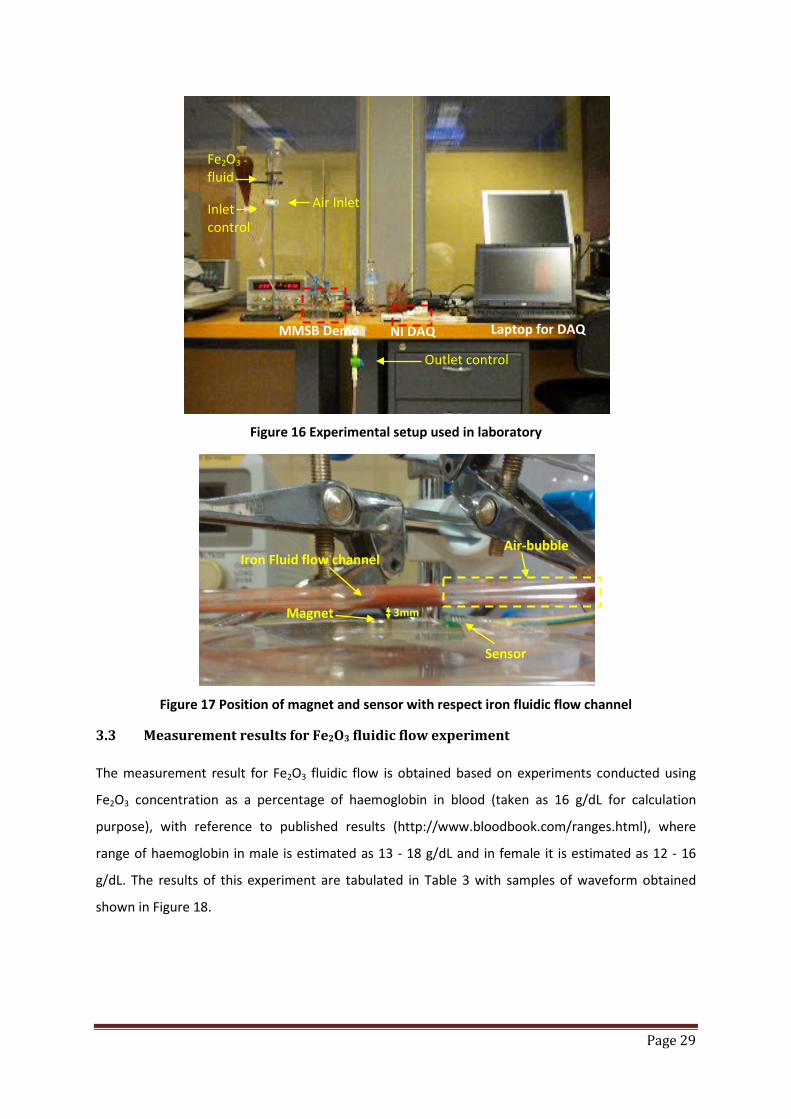
Page 29
Figure 16 Experimental setup used in laboratory
Figure 17 Position of magnet and sensor with respect iron fluidic flow channel
3.3 Measurement results for Fe2O3 fluidic flow experiment The measurement result for Fe2O3 fluidic flow is obtained based on experiments conducted using
Fe2O3 concentration as a percentage of haemoglobin in blood (taken as 16 g/dL for calculation
purpose), with reference to published results (http://www.bloodbook.com/ranges.html), where
range of haemoglobin in male is estimated as 13 - 18 g/dL and in female it is estimated as 12 - 16
g/dL. The results of this experiment are tabulated in Table 3 with samples of waveform obtained
shown in Figure 18.
Outlet control
Inlet control
Air Inlet
Fe2O3 fluid
NI DAQ MMSB Demo Laptop for DAQ
Sensor
Magnet 3mm
Iron Fluid flow channel Air-bubble
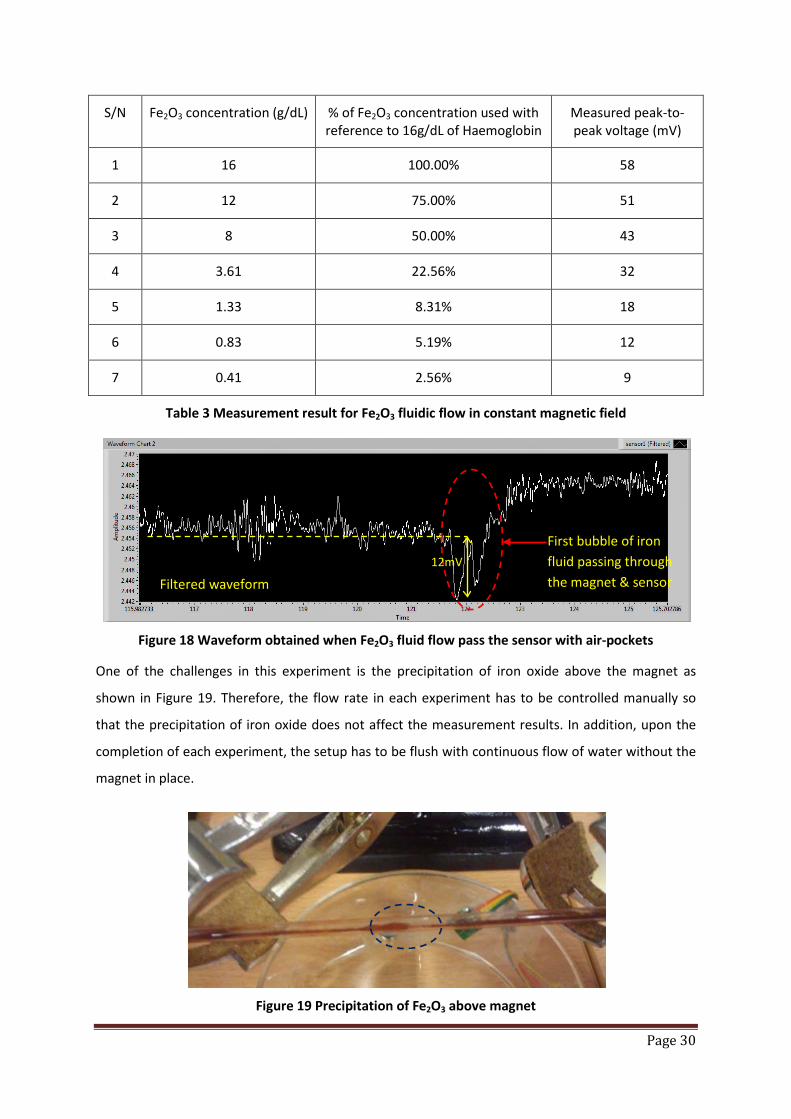
Page 30
S/N Fe2O3 concentration (g/dL) % of Fe2O3 concentration used with reference to 16g/dL of Haemoglobin
Measured peak-to-peak voltage (mV)
1 16 100.00% 58
2 12 75.00% 51
3 8 50.00% 43
4 3.61 22.56% 32
5 1.33 8.31% 18
6 0.83 5.19% 12
7 0.41 2.56% 9
Table 3 Measurement result for Fe2O3 fluidic flow in constant magnetic field
Figure 18 Waveform obtained when Fe2O3 fluid flow pass the sensor with air-pockets
One of the challenges in this experiment is the precipitation of iron oxide above the magnet as
shown in Figure 19. Therefore, the flow rate in each experiment has to be controlled manually so
that the precipitation of iron oxide does not affect the measurement results. In addition, upon the
completion of each experiment, the setup has to be flush with continuous flow of water without the
magnet in place.
Figure 19 Precipitation of Fe2O3 above magnet
Filtered waveform
First bubble of iron fluid passing through the magnet & sensor
12mV

Page 31
The experiments were successfully carried out using the manual control of the inlet and outlet valves
to achieve iron fluid flow with air bubbles as shown in Figure 20. A typical sample of the signal
acquired is shown in Figure 21, where magnetic disturbance can be observed during iron fluid flow
with air-bubble.
Figure 20 Flow of iron fluid with air-bubbles
Figure 21 Signal acquired during iron fluid flow as shown in Figure 20
With the successful completion of these experiments, the measured results demonstrate the
presence of magnetic disturbance when iron oxide fluid flows through a constant magnet field. As
such, the basis of MMSB was demonstrated successfully through the use of a laboratory setup using
Fe2O3 fluid. The following sections will describe experiments conducted on humans to measure the
magnetic disturbance when blood flows through a constant magnet field.
3.4 Acquisition of magnetic disturbance of blood
With the successful demonstration of the existence of a magnetic disturbance due to the flow of a
ferrous fluid, this section will outline the experiment to acquire the magnetic disturbance created
due to the pulsatile blood flow of blood. The magnetic disturbance will be amplified by the
magnetically biased GMR sensor allowing MMSB to be measured at room temperature.
Based on the principle of applying an external magnetic field to penetrate a thin layer of material
(example: human skin) that is non-magnetic, MMSB can be measured non-invasively. In addition,
this layer of non-magnetic material may also include fabric, bodily fluids and environmental
Filtered waveform
9mV

Page 32
contaminants (Figure 11), allowing MMSB to have unique advantage over existing heart rate
measurement systems.
Using the blood circulatory system for human as shown in Figure 22, it can be observed that there
are many locations where MMSB signal acquisition is possible. These locations are characterized
with major blood vessels (particularly blood vessels with oxygenated blood), easily accessible (with
minimum hair) and have minimum human tissues such as fats and muscles. Examples of such
locations where MMSB can be easily acquired are the wrist, heel, temple and neck as shown in
Figure 22.
Figure 22 Illustrations of example locations where MMSB can be acquired easily on the Human Blood Circulatory system
Experiments were setup and carried out on the locations labeled in Figure 22 to verify the
hypothesis of MMSB. Based on measured results, MMSB data was successfully collected on all these
locations. However, during the experiment, it was found that measurement on the temple is not
feasible for trials on human subjects. This is because the GMR sensor and magnet needs to be
mounted vertically on the subject’s face (as shown in Figure 23) using adhesive tapes and each trial
will result in the hair of the subject being removed.
During the experiment to collect MMSB data on the heel, it was concluded that the heel is not a
comfortable location for extensive MMSB measurement. This is because the heel is not easily
assessable without the subject feeling uncomfortable (as shown in Figure 24).
Locations where MMSB can be easily acquired

Page 33
Finally, experiment work to collect MMSB data on the wrist was found to be most appropriate. This
is because the wrist has minimum hair and most subjects are able to rest their arm comfortably
during the experiment. As such, the following sections will describe experimental setup and results
based on MMSB acquired on the wrist (as shown in Figure 25). Using experimental results obtained
from measurements on the wrist, the optimal distance between the sensor and magnet is found to
be applicable on other locations such as the heel, neck and temple.
Figure 23 Illustration of sensor and magnet mounting near temple for MMSB signal acquisition
Figure 24 Illustration of sensor and magnet mounting on the heel for MMSB signal acquisition
Figure 25 Illustration of sensor and magnet mounting on the wrist for MMSB signal acquisition
Magnet
Sensor
Magnet Sensor
Magnet Sensor
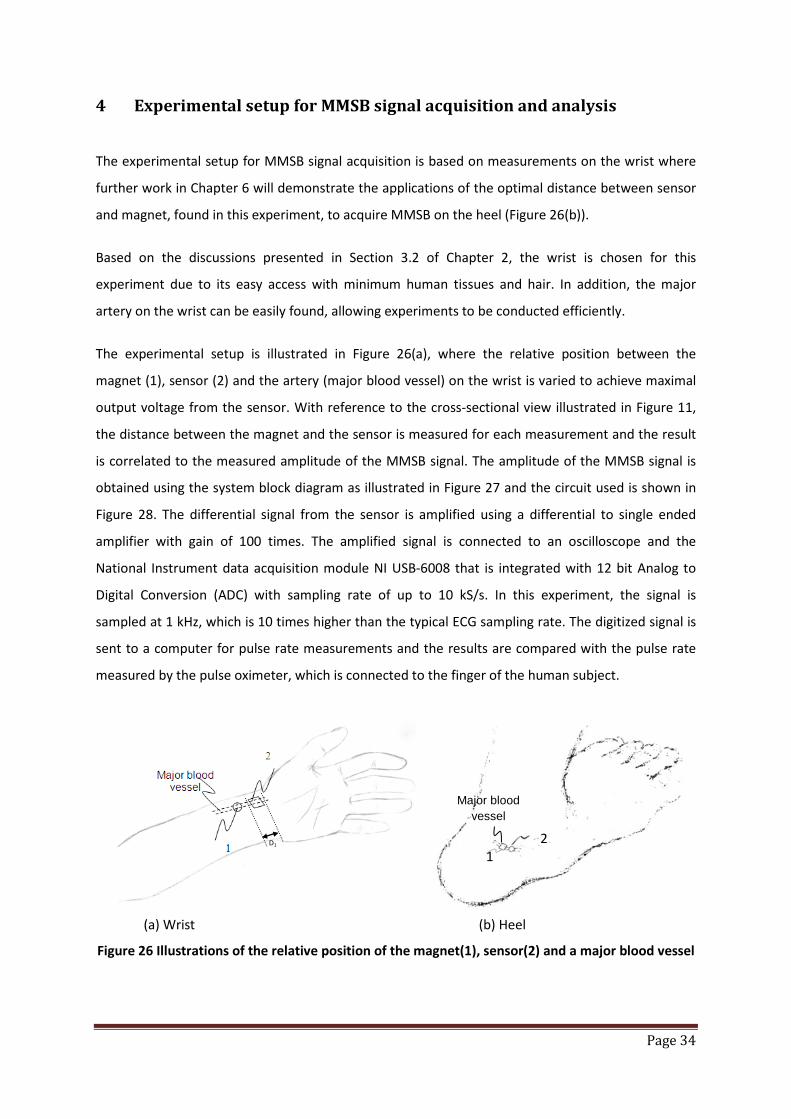
Page 34
4 Experimental setup for MMSB signal acquisition and analysis
The experimental setup for MMSB signal acquisition is based on measurements on the wrist where
further work in Chapter 6 will demonstrate the applications of the optimal distance between sensor
and magnet, found in this experiment, to acquire MMSB on the heel (Figure 26(b)).
Based on the discussions presented in Section 3.2 of Chapter 2, the wrist is chosen for this
experiment due to its easy access with minimum human tissues and hair. In addition, the major
artery on the wrist can be easily found, allowing experiments to be conducted efficiently.
The experimental setup is illustrated in Figure 26(a), where the relative position between the
magnet (1), sensor (2) and the artery (major blood vessel) on the wrist is varied to achieve maximal
output voltage from the sensor. With reference to the cross-sectional view illustrated in Figure 11,
the distance between the magnet and the sensor is measured for each measurement and the result
is correlated to the measured amplitude of the MMSB signal. The amplitude of the MMSB signal is
obtained using the system block diagram as illustrated in Figure 27 and the circuit used is shown in
Figure 28. The differential signal from the sensor is amplified using a differential to single ended
amplifier with gain of 100 times. The amplified signal is connected to an oscilloscope and the
National Instrument data acquisition module NI USB-6008 that is integrated with 12 bit Analog to
Digital Conversion (ADC) with sampling rate of up to 10 kS/s. In this experiment, the signal is
sampled at 1 kHz, which is 10 times higher than the typical ECG sampling rate. The digitized signal is
sent to a computer for pulse rate measurements and the results are compared with the pulse rate
measured by the pulse oximeter, which is connected to the finger of the human subject.
(a) Wrist (b) Heel
Figure 26 Illustrations of the relative position of the magnet(1), sensor(2) and a major blood vessel
1 2
Major blood vessel
D1

Page 35
Figure 27 System Block Diagram used for MMSB signal acquisition
Figure 28 Circuit used for MMSB signal conditioning
This experiment is setup to operate at room temperature using a button-sized permanent magnet
such as the Sola 1000 [22] or the Assemtech - M1219-4 [23] or any equivalent magnet with
approximately 1000 Gauss and a diameter of 6mm. The magnetic field strength of the permanent
magnet has to be controlled to be within the safety range for human beings as described by The
International Commission on Non-Ionizing Radiation Protection (ICNIRP) Guidelines [24].
Based on the ICNIRP guidelines, the human continuous exposure to occupational static magnetic
fields should be limited to be less than 0.2 Tesla. For short-term whole-body exposure, the
recommended magnetic field strength must be less than 2 Tesla. Finally, for short-tem arms and legs
exposure, the recommendations are to limit the magnetic field to less than 5 Tesla. However, for
persons with pacemakers and other implanted devices, ICNIRP recommends the magnetic field
exposure to be limited to a much lower level at 0.5 milliTesla (or 5 Gauss). This level is not related to
biological effects but rather to possible effects on electrical or electronic devices (particularly reed-
relays) or metal prosthesis.
Correlations of pulse rate measured using MMSB (computer post-processing) with readings from pulse oximeter
Sensor and Magnet on limbs of human subject
Electronics Amplifications
Oscilloscope to show MMSB waveform
Computer for data acquisitions and post-
processing
Commercially available pulse oximeter being placed on finger of
human subject
ADC of NI USB-6008
Computer for post-processing
USB

Page 36
Therefore, the magnetic field strength selected for this experiment is less than 0.2 Tesla (i.e. magnet
≈ 1000 Gauss). This will facilitate both long and short-term measurements allowing continuous
measurements of blood pulse for human subject.
The magnet selected is placed on the major arteries on the wrist with a commercially available Giant
Magneto-Resistor (GMR) magnetic sensor [17] placed in close proximity on the human skin. The
measurements will depend on several aspects: the distance between the sensor and the magnet
(approximately 20 mm) providing a uniform magnetic field that ensures proper biasing, the magnet
strength that does not saturate the sensor, and the appropriate penetration of the magnetic field
into the skin tissues.
Using the experimental setup described above, measurements are conducted on more than 20
human subjects where MMSB waveforms were measured from all subjects. A typical MMSB
waveform is shown in Figure 29 and it can be observed that the waveform is highly periodic. The
periodicity of the waveform is found to be similar to the heart rate measured by the
electrocardiogram or pulse plethysmography.
The characteristics of the waveform and its pulse width will be further analysed in later sections
where comparison to published results will be presented with correlations to the activities of the
human heart.
Having successfully setup the experiment to acquire MMSB on human subjects, the following
sections will include experimental setups used to demonstrate the ability of MMSB to acquire blood
pulse through fabric, blood and underwater. The successful demonstrations of these measurements
will allow MMSB to be deployable for various applications including some of those described in
Chapter 6.

Page 37
Figure 29 Waveform captured from the amplifier output using oscilloscope
4.1 Experimental setup to measure blood pulse through fabric
The objective of this experiment is to demonstrate the ability of MMSB in acquiring heart rate of
measurement subject who have light bandage.
Using the basic principle shown in Figure 11, the experimental setup is illustrated in Figure 30 where
the subject is lightly bandaged on the wrist (approximately 3mm thickness) with the GMR sensor and
magnet mounted on top of the bandages using a strip-on configuration. Data is sampled at 10Hz
with 10 bit resolutions and sent through the XBee® ZB ZigBee® PRO Radio Modems [26]. This
modem is based on the ZigBee protocol and has an integrated Analog-to-Digital convertor (ADC) to
sample the signal. However, the maximum sampling rate supported is 1 kHz and the memory
available for storage before transmission is 46 samples. As such, in order to optimize the RF
bandwidth, the ADC output is stored before transmission. Therefore, for this experiment, a sampling
rate of 10 Hz is chosen and the schematic used for the transmitter is shown in Figure 31.
Using the ZigBee based wireless transmission system, data is received from the transmitter,
processed and displayed on the computer using the block diagram shown in Figure 32.
Based on the data acquired using the MMSB phenomena and concurrent acquisition of pulse rate
using the pulse plethysmography, the pulse rate of the subject is found to be similar for both
methods of measurements. Therefore, it can be concluded that MMSB has been successfully
demonstrated to acquire blood pulse through opaque objects (i.e. bandage) without the need of
direct electrical or optical contact with the human skin.
Instantaneous Heart rate
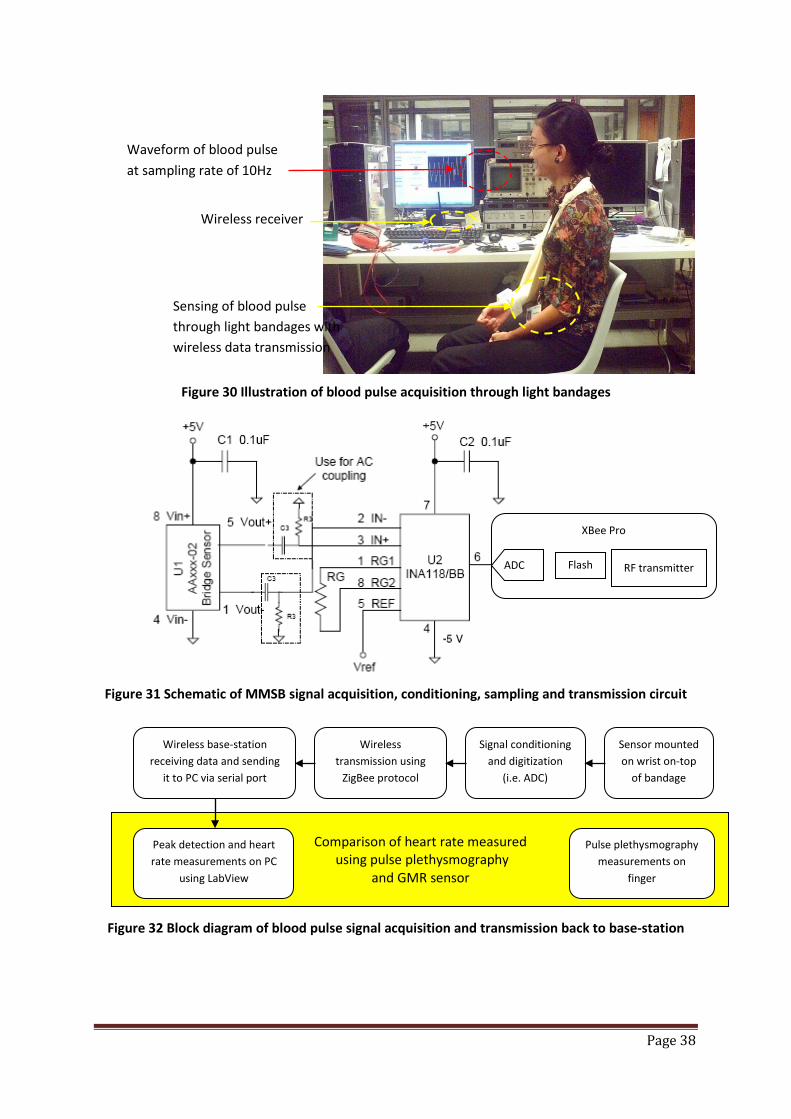
Page 38
Figure 30 Illustration of blood pulse acquisition through light bandages
Figure 31 Schematic of MMSB signal acquisition, conditioning, sampling and transmission circuit
Figure 32 Block diagram of blood pulse signal acquisition and transmission back to base-station
XBee Pro
Waveform of blood pulse at sampling rate of 10Hz
Wireless receiver
Sensing of blood pulse through light bandages with wireless data transmission
ADC Flash RF transmitter
Comparison of heart rate measured using pulse plethysmography
and GMR sensor
Sensor mounted on wrist on-top
of bandage
Signal conditioning and digitization
(i.e. ADC)
Wireless transmission using
ZigBee protocol
Wireless base-station receiving data and sending
it to PC via serial port
Pulse plethysmography measurements on
finger
Peak detection and heart rate measurements on PC
using LabView

Page 39
4.2 Experimental setup to measure blood pulse through blood
The objective of this experiment is to demonstrate the ability of MMSB in acquiring heart rate of the
subject who are injured and are bleeding. Heart rate for the injured person is an important
physiological vital signs allowing the risk for any rescue operations to be assessed objectively.
The experimental setup is shown in Figure 33 where Figure 33(a) illustrates the procedure where
blood is first smeared on the wrist of the subject. This is accompanied by Figure 33(b), where the
sensor and magnet are mounted onto the blood stains. The oscilloscope in Figure 33(b) shows the
successful acquisition of MMSB waveform from the subject. Therefore, it can be concluded that the
MMSB phenomena is able to detect the heart rate through blood stain.
(a) Blood stain using human blood (b) Sensor placed over blood stain
Figure 33 Illustration of blood pulse acquisition through blood stains
4.3 Experimental setup to measure blood pulse underwater
The objective of this experiment is to demonstrate the ability of MMSB in acquiring heart rate of
subjects who are underwater or swimming. Heart rate for the divers or competitive swimmers is an
important physiological vital sign allowing the risk for divers to be assessed continuously or the
assessment of the athletic performance for swimmers.
The experimental setup is shown in Figure 34 where the subject’s arm is immersed in a tank of water
with the GMR sensor and magnet on the wrist (Figure 34(a)). Data is sampled at 10Hz with 10 bit
resolutions and sent through a wireless transmission system using similar configurations as shown in
Figure 31. Data collection, analysis and display are completed the computer with the results shown
in Figure 34(b).
Based on the data acquired using the MMSB phenomena and pulse plethysmography, the heart rate
of the subject was found to be similar. Therefore, this experiment concludes the successful
acquisition of using the MMSB phenomena to measure the heart rate of subjects who are in the rain
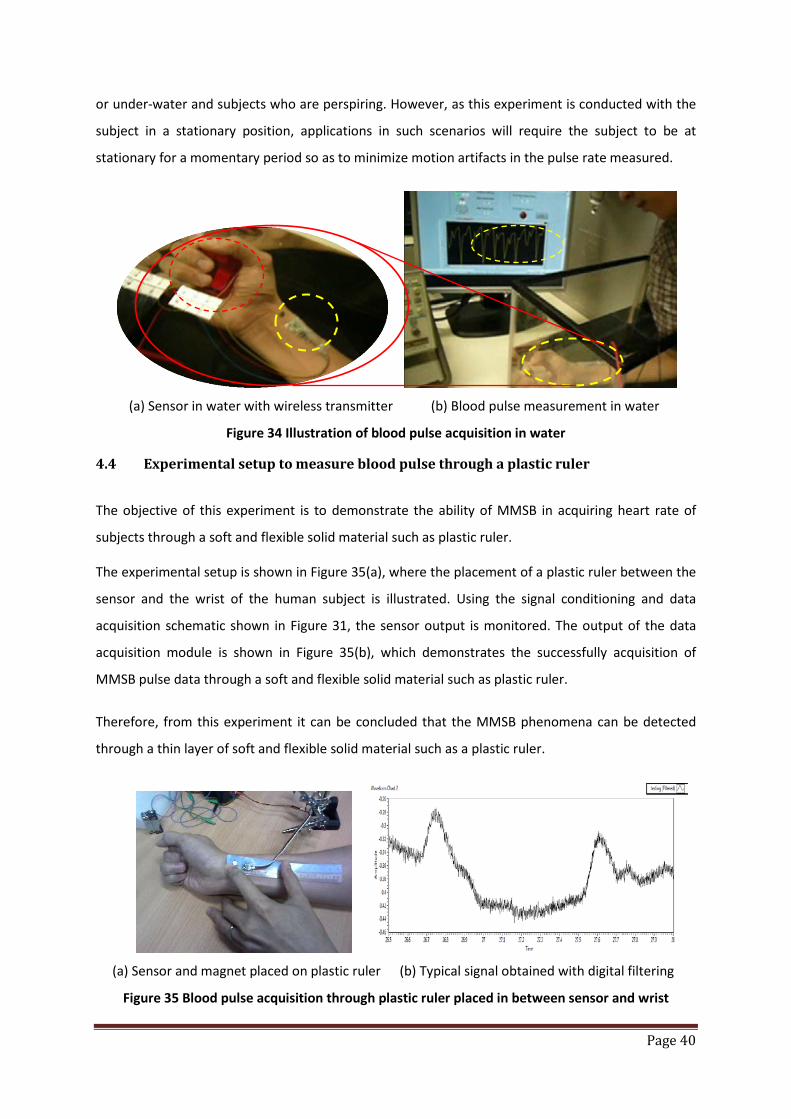
Page 40
or under-water and subjects who are perspiring. However, as this experiment is conducted with the
subject in a stationary position, applications in such scenarios will require the subject to be at
stationary for a momentary period so as to minimize motion artifacts in the pulse rate measured.
(a) Sensor in water with wireless transmitter (b) Blood pulse measurement in water
Figure 34 Illustration of blood pulse acquisition in water
4.4 Experimental setup to measure blood pulse through a plastic ruler
The objective of this experiment is to demonstrate the ability of MMSB in acquiring heart rate of
subjects through a soft and flexible solid material such as plastic ruler.
The experimental setup is shown in Figure 35(a), where the placement of a plastic ruler between the
sensor and the wrist of the human subject is illustrated. Using the signal conditioning and data
acquisition schematic shown in Figure 31, the sensor output is monitored. The output of the data
acquisition module is shown in Figure 35(b), which demonstrates the successfully acquisition of
MMSB pulse data through a soft and flexible solid material such as plastic ruler.
Therefore, from this experiment it can be concluded that the MMSB phenomena can be detected
through a thin layer of soft and flexible solid material such as a plastic ruler.
(a) Sensor and magnet placed on plastic ruler (b) Typical signal obtained with digital filtering
Figure 35 Blood pulse acquisition through plastic ruler placed in between sensor and wrist
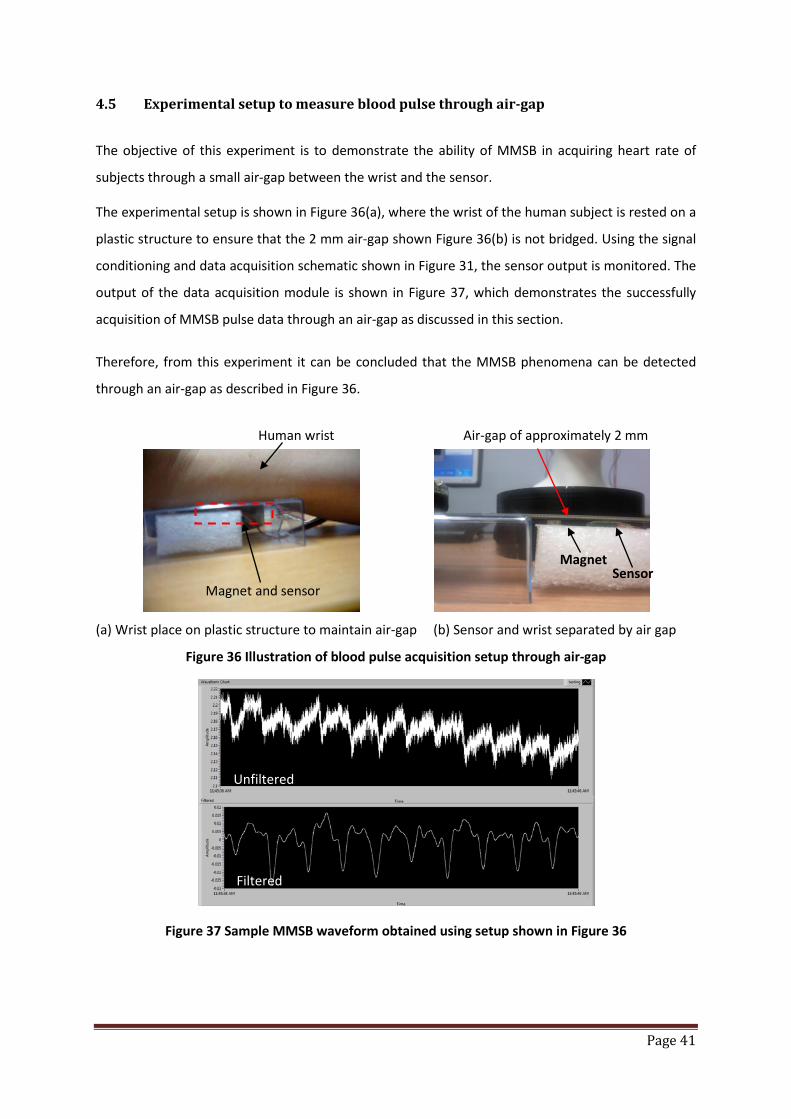
Page 41
4.5 Experimental setup to measure blood pulse through air-gap
The objective of this experiment is to demonstrate the ability of MMSB in acquiring heart rate of
subjects through a small air-gap between the wrist and the sensor.
The experimental setup is shown in Figure 36(a), where the wrist of the human subject is rested on a
plastic structure to ensure that the 2 mm air-gap shown Figure 36(b) is not bridged. Using the signal
conditioning and data acquisition schematic shown in Figure 31, the sensor output is monitored. The
output of the data acquisition module is shown in Figure 37, which demonstrates the successfully
acquisition of MMSB pulse data through an air-gap as discussed in this section.
Therefore, from this experiment it can be concluded that the MMSB phenomena can be detected
through an air-gap as described in Figure 36.
(a) Wrist place on plastic structure to maintain air-gap (b) Sensor and wrist separated by air gap
Figure 36 Illustration of blood pulse acquisition setup through air-gap
Figure 37 Sample MMSB waveform obtained using setup shown in Figure 36
Human wrist Air-gap of approximately 2 mm
Magnet and sensor
Magnet Sensor
Unfiltered
Filtered

Page 42
5 Comparison of MMSB with ECG and pulse plethysmography waveform
The experimental setup for MMSB signal acquisition on the wrist is simultaneously acquired with the
ECG and the pulse plethysmography using the USBamplifier from Guger Technologies (g.tec). The
USBamplifier will digitize and display the waveform using MATLAB Simulink. The block diagram of
the MATLAB Simulink setup used in this experiment is shown in Figure 38 with ECG, pulse
plethysmography and MMSB signals being sampled and displayed. The measured waveforms are
shown in Figure 40 using similar sampling rate and filter settings.
Figure 38 Block diagram of the MATLAB Simulink setup for MMSB signal acquisition on the wrist with ECG and pulse plethysmography using the USBamplifier from Guger Technologies
Based on the data acquired in Figure 40, it can be observed that the signal acquired from all the
three methods produce similar periodicity with distinct waveform characteristics. The periodicity of
the waveform indicates the heart rate of the subject while the characteristics of the waveform
acquired are dependent on the method of signal acquisition.
The ECG is the golden method used for the medical industry for heart rate measurements. This is
because ECG is a direct measurement of the electrical activity of the heart and is based on electrical
signals acquired from the triangulation of electrodes placed around the heart. Therefore, the
similarity in periodicity of the waveform acquired using the GMR sensor and ECG electrodes
conclude the reliability and accuracy of the MMSB phenomena to measure heart rate.
In addition to the periodicity, it can also be observed that there is a phase difference between the
waveform acquired using the GMR sensor and ECG electrodes. This is due to the difference in the
method of measurements where the ECG measures the electrical activity of the heart (electrical
activity of the heart before it pumps) while the GMR sensor measures the magnetic disturbance of
Pulse plethysmography
MMSB
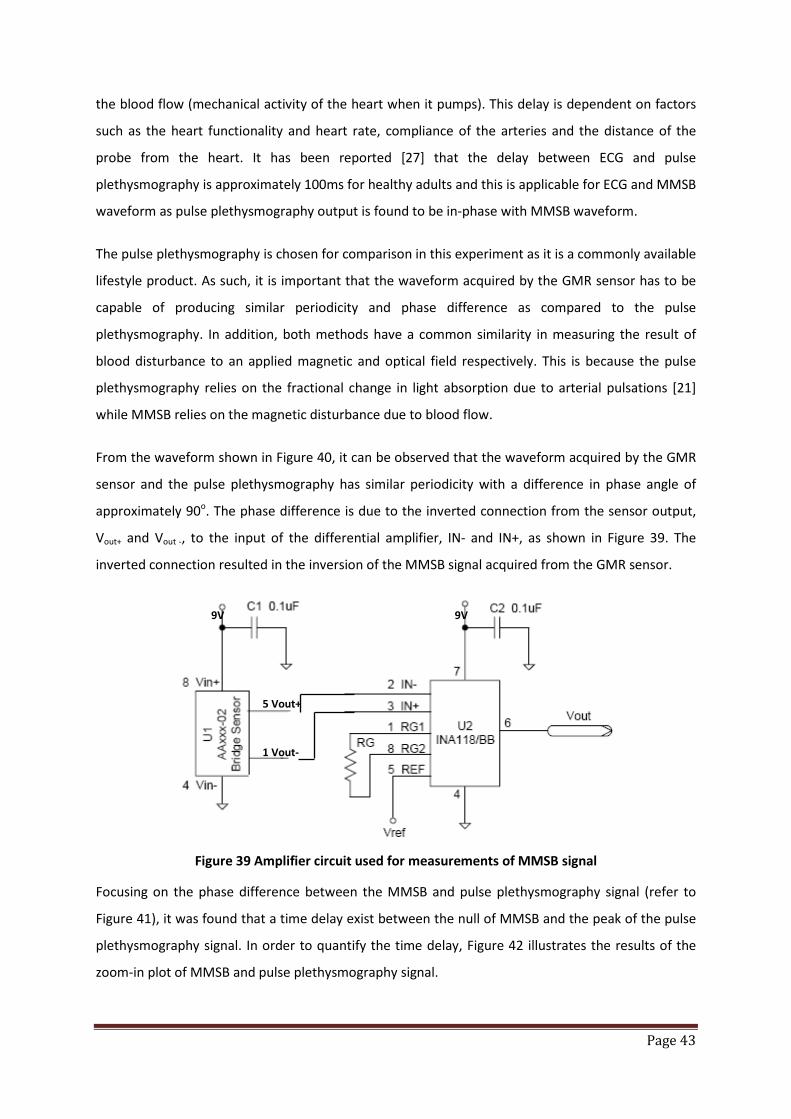
Page 43
the blood flow (mechanical activity of the heart when it pumps). This delay is dependent on factors
such as the heart functionality and heart rate, compliance of the arteries and the distance of the
probe from the heart. It has been reported [27] that the delay between ECG and pulse
plethysmography is approximately 100ms for healthy adults and this is applicable for ECG and MMSB
waveform as pulse plethysmography output is found to be in-phase with MMSB waveform.
The pulse plethysmography is chosen for comparison in this experiment as it is a commonly available
lifestyle product. As such, it is important that the waveform acquired by the GMR sensor has to be
capable of producing similar periodicity and phase difference as compared to the pulse
plethysmography. In addition, both methods have a common similarity in measuring the result of
blood disturbance to an applied magnetic and optical field respectively. This is because the pulse
plethysmography relies on the fractional change in light absorption due to arterial pulsations [21]
while MMSB relies on the magnetic disturbance due to blood flow.
From the waveform shown in Figure 40, it can be observed that the waveform acquired by the GMR
sensor and the pulse plethysmography has similar periodicity with a difference in phase angle of
approximately 90o. The phase difference is due to the inverted connection from the sensor output,
Vout+ and Vout -, to the input of the differential amplifier, IN- and IN+, as shown in Figure 39. The
inverted connection resulted in the inversion of the MMSB signal acquired from the GMR sensor.
Figure 39 Amplifier circuit used for measurements of MMSB signal
Focusing on the phase difference between the MMSB and pulse plethysmography signal (refer to
Figure 41), it was found that a time delay exist between the null of MMSB and the peak of the pulse
plethysmography signal. In order to quantify the time delay, Figure 42 illustrates the results of the
zoom-in plot of MMSB and pulse plethysmography signal.
5 Vout+
1 Vout-
9V 9V
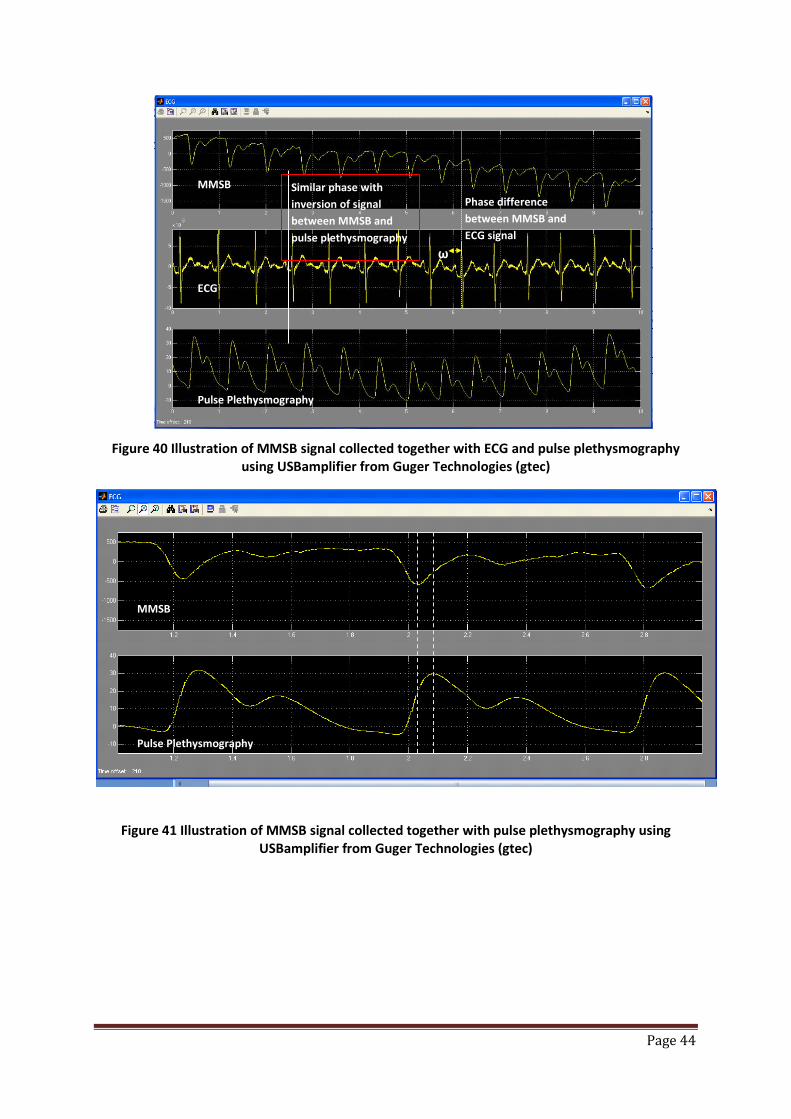
Page 44
Figure 40 Illustration of MMSB signal collected together with ECG and pulse plethysmography using USBamplifier from Guger Technologies (gtec)
Figure 41 Illustration of MMSB signal collected together with pulse plethysmography using USBamplifier from Guger Technologies (gtec)
Similar phase with inversion of signal between MMSB and pulse plethysmography
Phase difference between MMSB and ECG signal
ω
MMSB
ECG
Pulse Plethysmography
MMSB
Pulse Plethysmography

Page 45
Figure 42 Zoom-in view of MMSB and pulse plethysmography signal acquired using the USBamplifier from Guger Technologies (gtec)
From Figure 42, it can be observed that a delay of 0.05 seconds exist between the two signals. This
can be attributed to the difference in signal acquisition point where pulse plethysmography is
acquired on the fingertip while MMSB is acquired on the wrist. The distance from the fingertip (pulse
plethysmography) to the wrist (MMSB) was measured to be 24cm. Using the pulse wave velocity of
5m/s for healthy adult [28], the time delay from the fingertip (pulse plethysmography) to the wrist
(MMSB) can be calculated as 0.048 seconds. As such, it can be concluded that the time delay
between the MMSB and pulse plethysmography is due to the difference in location for signal
acquisition.
In conclusion, this experimental setup has successfully demonstrated the accuracy of MMSB in
acquiring the heart rate of the human subject with periodicity and phase comparison made to ECG
and pulse plethysmography acquisition.
6 Comparison of measured waveform with Magnetocardiogram (MCG)
In this section, the waveform obtained in Figure 29 using the GMR sensor is compared with the MCG
signal reported in [1]. Many studies of MCG have been made by mapping the vector content of the
normal component of the magnetic field of the heart around the thorax. As the source of the MCG
signal is the electric activity of the heart, the generation of the MCG signal from the progress of the
activation front in the heart can be sketched with respect to the electrical activity of the heart as
MMSB
Pulse Plethysmography
0.05s
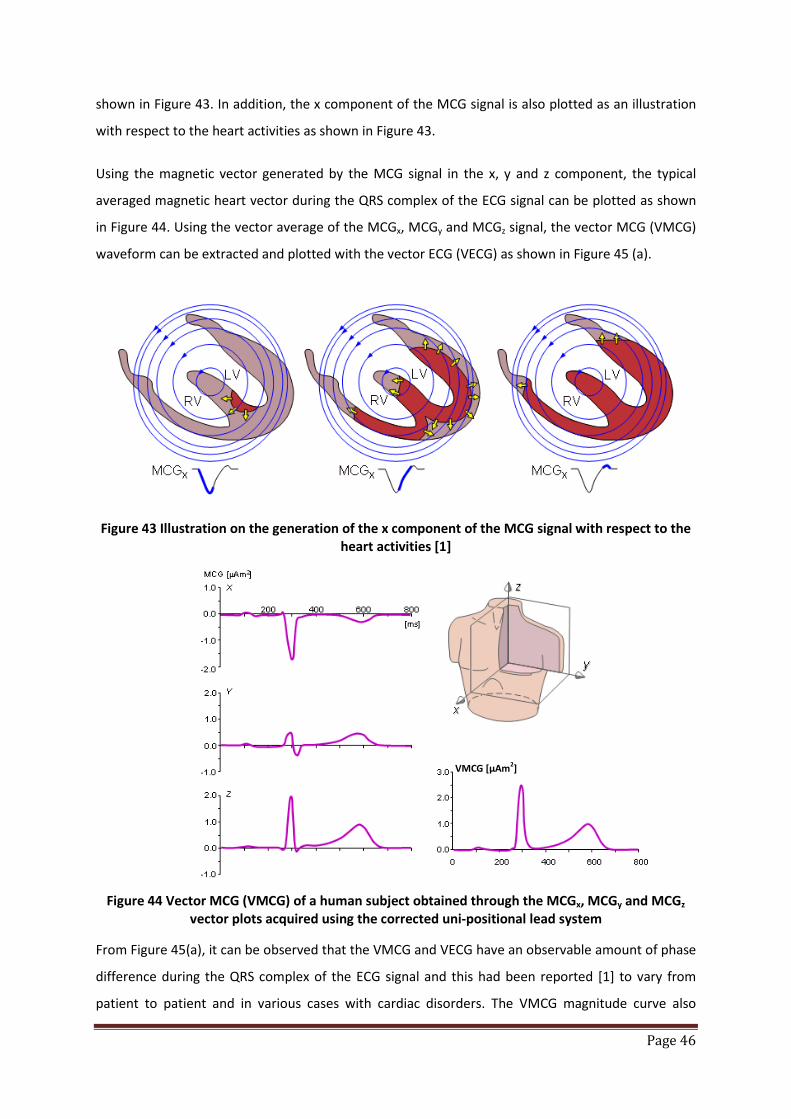
Page 46
shown in Figure 43. In addition, the x component of the MCG signal is also plotted as an illustration
with respect to the heart activities as shown in Figure 43.
Using the magnetic vector generated by the MCG signal in the x, y and z component, the typical
averaged magnetic heart vector during the QRS complex of the ECG signal can be plotted as shown
in Figure 44. Using the vector average of the MCGx, MCGy and MCGz signal, the vector MCG (VMCG)
waveform can be extracted and plotted with the vector ECG (VECG) as shown in Figure 45 (a).
Figure 43 Illustration on the generation of the x component of the MCG signal with respect to the
heart activities [1]
Figure 44 Vector MCG (VMCG) of a human subject obtained through the MCGx, MCGy and MCGz
vector plots acquired using the corrected uni-positional lead system
From Figure 45(a), it can be observed that the VMCG and VECG have an observable amount of phase
difference during the QRS complex of the ECG signal and this had been reported [1] to vary from
patient to patient and in various cases with cardiac disorders. The VMCG magnitude curve also
VMCG [µAm2]

Page 47
exhibits three different peaks during the QRS-complex of the electric heart vector: M1, M2 and M3.
M1 appears to be generated by radial electric forces, M2 by radial and tangential electric forces, and
M3 mainly by tangential electric forces.
Comparing the waveform characteristics acquired from the GMR sensor in Figure 45(b) with the
peaks M1, M2 and M3 shown in Figure 45(a), similar peaks Mx, My and Mz can also be identified in
Figure 45(b). Therefore, it can be concluded that the waveform acquired from the GMR sensor
exhibits high correlations with the MHV magnitude curve during QRS-complex.
(a) VMCG and VECG plot during QRS complex (b) MMSB plot during QRS complex
Figure 45 Simultaneous plots of the magnitude curves of the VECG (dashed curve) and the VMCG (solid curve) with MMSB plot during the QRS complex [1]
In addition to the comparison with the peaks in VMCG, on the basis of magnetic disturbance of the
pulsatile blood flow on a uniform magnetic field, MMSB can be used to describe the activities of the
heart as illustrated in Figure 46. For example, an increase in the measured magnetic disturbance can
only be created by an increase in blood flow due to the compression of the heart ventricles. As the
ventricles compress to their maximum, the peak of the waveform is reached. Without further
mechanical force from the heart on the blood flow in the artery, the blood flow rate will reduce as
illustrated in the decreasing amplitude of the waveform. With the relaxation of the ventricles, a
back-flow of blood is present in the artery. Finally, the atrium will simultaneously compress,
resulting in a small forward flow of blood as shown in the second peak detected in MMSB.
M2
M3
M1
My
Mz
Mx
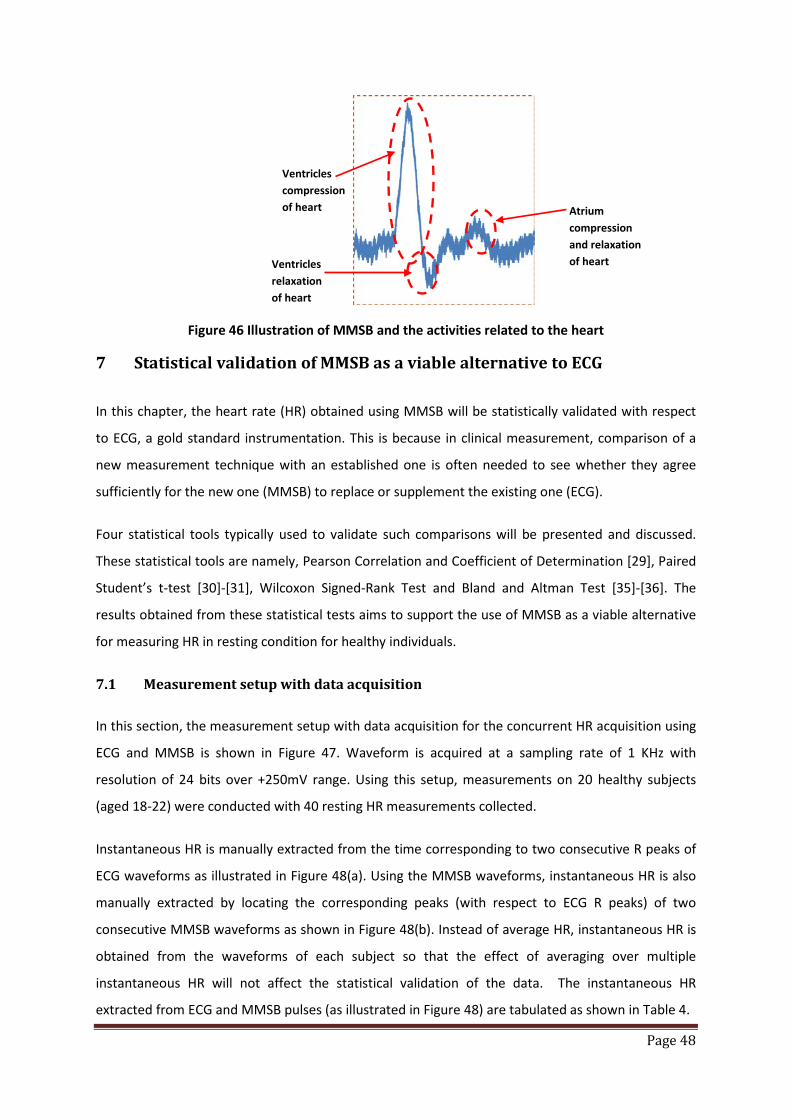
Page 48
Figure 46 Illustration of MMSB and the activities related to the heart
7 Statistical validation of MMSB as a viable alternative to ECG
In this chapter, the heart rate (HR) obtained using MMSB will be statistically validated with respect
to ECG, a gold standard instrumentation. This is because in clinical measurement, comparison of a
new measurement technique with an established one is often needed to see whether they agree
sufficiently for the new one (MMSB) to replace or supplement the existing one (ECG).
Four statistical tools typically used to validate such comparisons will be presented and discussed.
These statistical tools are namely, Pearson Correlation and Coefficient of Determination [29], Paired
Student’s t-test [30]-[31], Wilcoxon Signed-Rank Test and Bland and Altman Test [35]-[36]. The
results obtained from these statistical tests aims to support the use of MMSB as a viable alternative
for measuring HR in resting condition for healthy individuals.
7.1 Measurement setup with data acquisition
In this section, the measurement setup with data acquisition for the concurrent HR acquisition using
ECG and MMSB is shown in Figure 47. Waveform is acquired at a sampling rate of 1 KHz with
resolution of 24 bits over +250mV range. Using this setup, measurements on 20 healthy subjects
(aged 18-22) were conducted with 40 resting HR measurements collected.
Instantaneous HR is manually extracted from the time corresponding to two consecutive R peaks of
ECG waveforms as illustrated in Figure 48(a). Using the MMSB waveforms, instantaneous HR is also
manually extracted by locating the corresponding peaks (with respect to ECG R peaks) of two
consecutive MMSB waveforms as shown in Figure 48(b). Instead of average HR, instantaneous HR is
obtained from the waveforms of each subject so that the effect of averaging over multiple
instantaneous HR will not affect the statistical validation of the data. The instantaneous HR
extracted from ECG and MMSB pulses (as illustrated in Figure 48) are tabulated as shown in Table 4.
Ventricles compression of heart Atrium
compression and relaxation of heart Ventricles
relaxation of heart
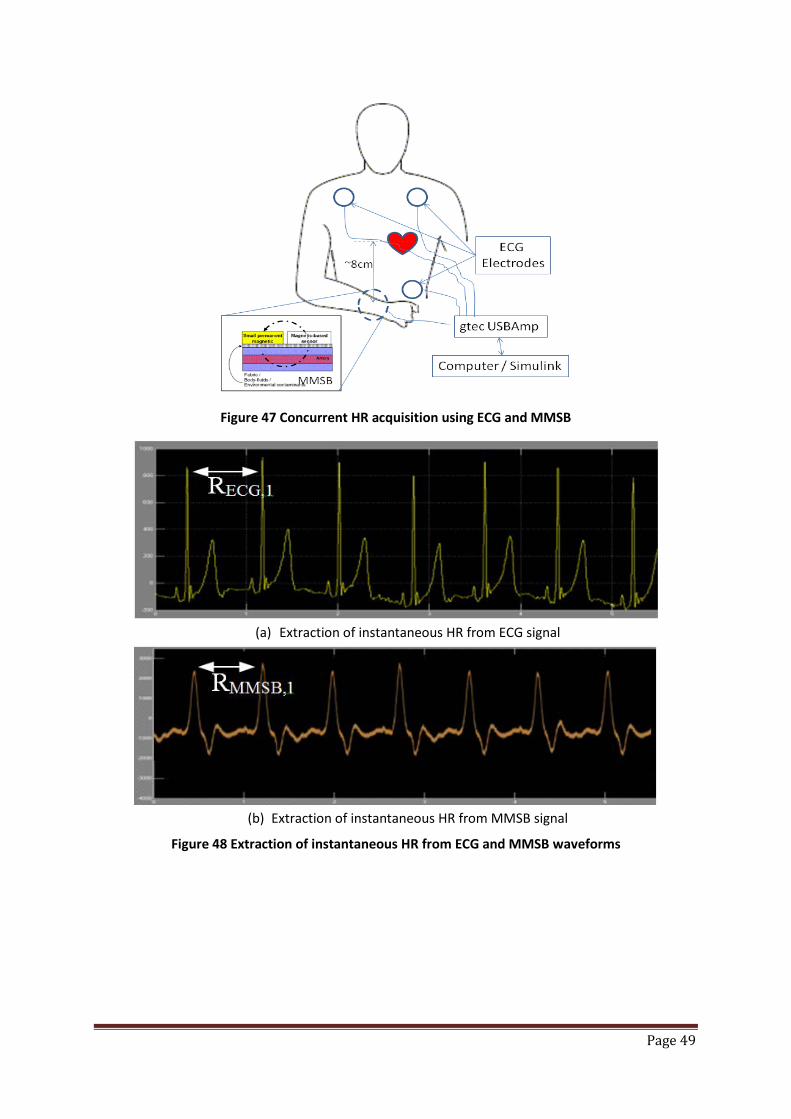
Page 49
Figure 47 Concurrent HR acquisition using ECG and MMSB
(a) Extraction of instantaneous HR from ECG signal
(b) Extraction of instantaneous HR from MMSB signal
Figure 48 Extraction of instantaneous HR from ECG and MMSB waveforms
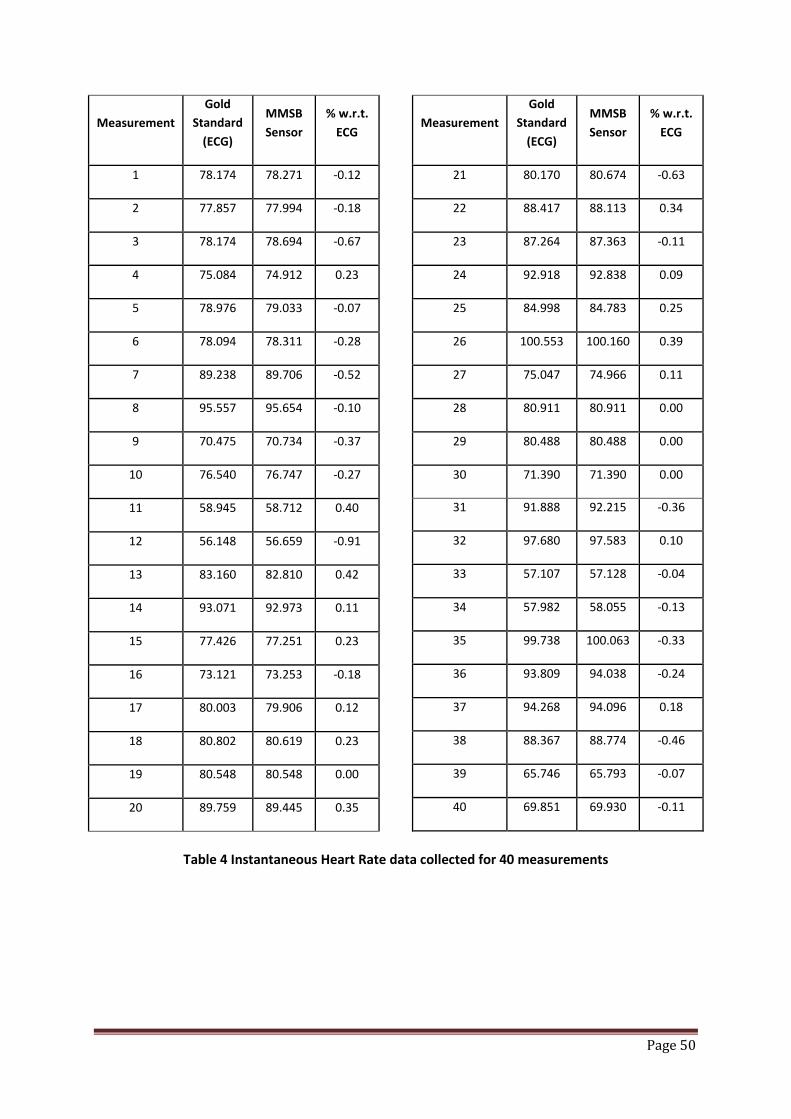
Page 50
Measurement Gold
Standard (ECG)
MMSB Sensor
% w.r.t. ECG
1 78.174 78.271 -0.12
2 77.857 77.994 -0.18
3 78.174 78.694 -0.67
4 75.084 74.912 0.23
5 78.976 79.033 -0.07
6 78.094 78.311 -0.28
7 89.238 89.706 -0.52
8 95.557 95.654 -0.10
9 70.475 70.734 -0.37
10 76.540 76.747 -0.27
11 58.945 58.712 0.40
12 56.148 56.659 -0.91
13 83.160 82.810 0.42
14 93.071 92.973 0.11
15 77.426 77.251 0.23
16 73.121 73.253 -0.18
17 80.003 79.906 0.12
18 80.802 80.619 0.23
19 80.548 80.548 0.00
20 89.759 89.445 0.35
Measurement Gold
Standard (ECG)
MMSB Sensor
% w.r.t. ECG
21 80.170 80.674 -0.63
22 88.417 88.113 0.34
23 87.264 87.363 -0.11
24 92.918 92.838 0.09
25 84.998 84.783 0.25
26 100.553 100.160 0.39
27 75.047 74.966 0.11
28 80.911 80.911 0.00
29 80.488 80.488 0.00
30 71.390 71.390 0.00
31 91.888 92.215 -0.36
32 97.680 97.583 0.10
33 57.107 57.128 -0.04
34 57.982 58.055 -0.13
35 99.738 100.063 -0.33
36 93.809 94.038 -0.24
37 94.268 94.096 0.18
38 88.367 88.774 -0.46
39 65.746 65.793 -0.07
40 69.851 69.930 -0.11
Table 4 Instantaneous Heart Rate data collected for 40 measurements

Page 51
7.2 Statistical validation - assessing agreement between two methods of
measurement
7.2.1 Pearson Correlation and Coefficient of Determination
Pearson correlation coefficient (direction of relationship) and the Coefficient of Determination tests
(strength of relationship) is used in the validation of the measurement outputs (i.e. instantaneous
HR) of an alternative instrument (i.e. MMSB) against a “gold standard” (i.e. ECG) to ascertain the
nature of relationship between two sets of scores [29].
The expression for Pearson’s Correlation Coefficient is shown in Equation 8.
Equation 8 𝑟𝑋𝑌 = Σ𝑋𝑌 − (Σ𝑋)(ΣY) 𝑛⁄ (𝑆𝑆𝑋)(𝑆𝑆𝑌)
where rXY = Pearson correlation coefficient
X = instantaneous HR for MMSB
Y = instantaneous HR for ECG
n = number of pairs of data (i.e. 40)
𝑆𝑆𝑋 = Σ𝑋2 − ((Σ𝑋)2 𝑛⁄ )
𝑆𝑆𝑌 = Σ𝑌2 − ((ΣY)2 𝑛⁄ )
Using the formula for Pearson’s Correlation Coefficient (reference Equation 8), rXY and the
Coefficient of Determination (rXY2) were calculated as shown in Table 5.
Regression Statistics
Multiple R 0.99978
R Square 0.99956
Standard Deviation (SD) 0.24397
2xSD 0.48794
Table 5 Correlation test between Gold Reference and MMSB Sensor
From the results shown in Table 5, it can be observed that the HR data between MMSB and ECG are
positively correlated (i.e. rXY = +0.9998). The corresponding coefficient of determination (rXY
2) is
0.9996. These results (i.e. rXY=0.9998 and rXY2 = 0.9998) indicate that the relationship between the
instantaneous HR measured by both the MMSB and ECG methods was almost perfectly linear***.
***If r = 1.00 there is a perfect positive relationship between the HR obtained from MMSB and ECG waveform (i.e. perfect match).

Page 52
More importantly, the results highlight that < 1% of scores in the HR data from MMSB and ECG is
due to error between the two measurements.
Using the instantaneous HR measured concurrently using the MMSB and an electrocardiogram
system (g.USBamp, g.tec Medical Engineering GMBH, Austria), the instantaneous HR results are
plotted as shown in Figure 49. To understand the direction of relationship, a linear regression is
approximated based on the instantaneous HR results from the two measurements as shown in
Figure 49. The linear equation obtained is shown in Equation 9 with regression ratio R2 = 0.9996
obtained between Equation 9 and the data. The R2 value being almost 1 indicates an almost perfect
positive relationship between the measured data and the Equation 9.
Equation 9 Y = 0.9971X + 0.2845
where X = instantaneous HR for MMSB
Y = instantaneous HR for ECG
Based on the results obtained from this correlation study, it was concluded that the reproducibility
of the HR measurement between the 2 devices is almost 1:1. The minute differences observable in
this test was made possible through the resolution (i.e. up to 3 decimal places) provided by the
sampling frequency of 1 KHz.
Figure 49 Plot of Correlation of HR obtained from MMSB and ECG waveforms in bpm†††
††† Bpm = Beats per minute

Page 53
7.2.2 Paired Student’s t-test
The Paired Student’s t-test is used as part of the scientific validation on the measurement outputs
(refer to Table 4) to establish the statistical significance of the differences in the means between the
two sets of scores [30].
From the instantaneous HR obtained in Table 4, the paired t-test determines whether HR measured
from MMSB and ECG differ from each other in a significant way under the assumptions that the
paired differences are independent and follows a normal distribution (i.e. P‡‡‡ < 0.05).
The equation for obtaining the probability of obtaining the test statistic for the Paired Student t-test
is shown in Equation 10.
Equation 10 𝑃 = 𝑋 − 𝑌 (𝑠12 𝑛1⁄ + 𝑠22 𝑛2⁄ )
where P = probability of obtaining a test statistic
𝑋 = instantaneous HR obtained from MMSB
𝑌 = instantaneous HR obtained from ECG
𝑋 = mean of instantaneous HR obtained from MMSB
𝑌 = mean of instantaneous HR obtained from ECG
n1 = n2 = number of paired HR obtained from MMSB and ECG
𝑠12 = variance of instantaneous HR obtained from MMSB = Σ𝑋𝑖 − 𝑋2𝑛1
𝑠22 = variance of instantaneous HR obtained from MMSB = Σ𝑌𝑖 − 𝑌2𝑛2
The mean (i.e. 𝑋 and 𝑌 ≈ 80 bpm) and standard deviation (i.e. s1 and s2) were calculated and plotted
as shown in Figure 50. Using Equation 10, the equation for Paired Student t-test, P was calculated as
0.24 (i.e. P > 0.05 which means the acceptance of the hypothesis). This result shows that there was
no significant difference between the means of the HR measured by both devices (reference Figure
50).
‡‡‡ P-value is the probability of obtaining a test statistic at least as extreme as the one that was actually observed, assuming that the null hypothesis is true. In this case a P-value less than 0.05 would result in the rejection of the null hypothesis at the 5% (significance) level. It means that if the HR is sampled on numerous occasions and interval estimates are made on each occasion, the resulting intervals would show the true HR parameter in approximately 95% of the cases. This is sufficient for typical clinical validation.

Page 54
In addition, this result of the statistical test suggests the difference between the two sets of
measurement is statistically not significant. Therefore, the results obtained from the Paired Student
t-test supports the use of MMSB as a viable alternative to ECG for HR measurement.
Figure 50 Mean and standard deviation of HR measured with the ECG and MMSB sensors (P = 0.24)
7.2.3 Wilcoxon Matched-Pairs Signed-Ranks Test
The Wilcoxon Signed-Rank Test is used as part of the scientific validation to determine whether
there is a statistical significance on the difference in the median between paired samples [31][32].
The Wilcoxon Signed-Rank test was applied on the instantaneous HR measurement from Table 4
The Null Hypothesis for the Wilcoxon Signed-Rank Test (W) states that there was no difference
between the paired samples at 95% limits of agreement (i.e. P < 0.05 for two-tailed non-directional
test). The limit of agreement is selected to be similar to the Paired Student’s t-test for consistency in
the statistical validation of mean and median of HR measured.
In order to obtain the value of W, the difference between MMSB and ECG in Table 4 was calculated.
These differences were ranked without regard to the sign of the difference (i.e., rank order the
absolute differences). All zero differences were ignored (i.e., pairs with equal members). For
differences with equal absolute values (i.e. ties), the same rank was assigned by taking the mean of
the rank numbers that would had been assigned if they are different.
Upon completion of the ranking, the original signs on the differences were affix to the rank numbers.
All positive ranks (W+) and all negative ranks (W-) were summed separately. At the same time, the
total number of non-zero pairs (n) is recorded as shown in Table 6.
0
10
20
30
40
50
60
70
80
90
100
1
ECG BioS TechnologyMMSB
Method of HR Measurement
Rest
ing
Hear
t Rat
e (b
pm)
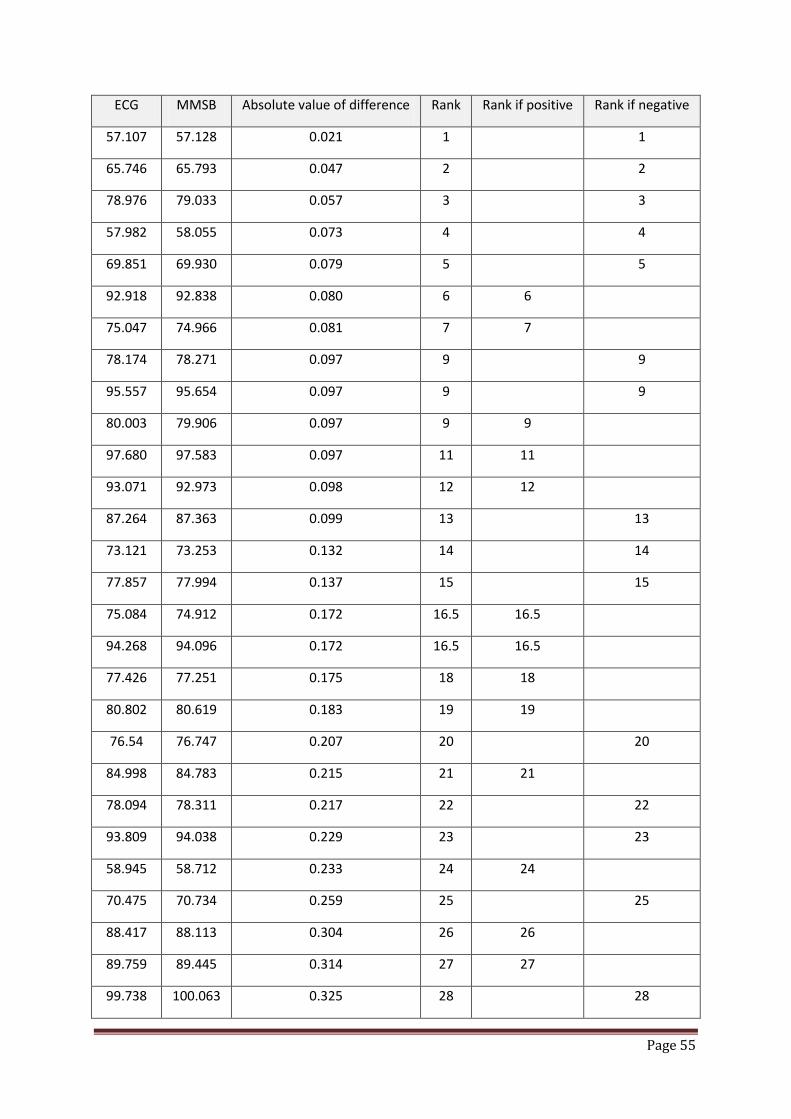
Page 55
ECG MMSB Absolute value of difference Rank Rank if positive Rank if negative
57.107 57.128 0.021 1 1
65.746 65.793 0.047 2 2
78.976 79.033 0.057 3 3
57.982 58.055 0.073 4 4
69.851 69.930 0.079 5 5
92.918 92.838 0.080 6 6
75.047 74.966 0.081 7 7
78.174 78.271 0.097 9 9
95.557 95.654 0.097 9 9
80.003 79.906 0.097 9 9
97.680 97.583 0.097 11 11
93.071 92.973 0.098 12 12
87.264 87.363 0.099 13 13
73.121 73.253 0.132 14 14
77.857 77.994 0.137 15 15
75.084 74.912 0.172 16.5 16.5
94.268 94.096 0.172 16.5 16.5
77.426 77.251 0.175 18 18
80.802 80.619 0.183 19 19
76.54 76.747 0.207 20 20
84.998 84.783 0.215 21 21
78.094 78.311 0.217 22 22
93.809 94.038 0.229 23 23
58.945 58.712 0.233 24 24
70.475 70.734 0.259 25 25
88.417 88.113 0.304 26 26
89.759 89.445 0.314 27 27
99.738 100.063 0.325 28 28

Page 56
ECG MMSB Absolute value of difference Rank Rank if positive Rank if negative
91.888 92.215 0.327 29 29
83.160 82.810 0.350 30 30
100.553 100.16 0.393 31 31
88.367 88.774 0.407 32 32
89.238 89.706 0.468 33 33
80.170 80.674 0.504 34 34
56.148 56.659 0.511 35 35
78.174 78.694 0.520 36 36
80.548 80.548 0.000 -
80.911 80.911 0.000 -
80.488 80.488 0.000 -
71.390 71.390 0.000 -
Table 6 Illustration on quantification of ranking for Wilcoxon Matched-Pairs Signed-Ranks Test
From the sum of the positive and negative ranks obtained in Table 6, the variation of the median for
the sum of the positive difference was W+ = 274 and the sum of the negative difference was W- =
392. The test statistic W was obtained from the minimum of W+ and W- (i.e. W = 274).
The standard deviation Equation 11 for the measured pairs was used together with the mean, µw (=0
for n > 30[33]) for the Zw score as shown in Equation 12.
Equation 11 𝜎𝑊 = 𝑛 ∗ (𝑛 + 1) ∗ (2𝑛 + 1) 6⁄
where 𝜎𝑊 = standard deviation for the sampling distribution of W (i.e. 𝜎𝑊 = 127.30)
n = number of pairs of non-zero difference between MMSB and ECG measurements (i.e. n =
36)
Equation 12 𝑍𝑊 = (𝑊 − 𝜇𝑊) ± 0.5 𝜎𝑊⁄ = ((𝑊 ± 0.5) 𝜎𝑊⁄ )
where 𝑍𝑊 = standard deviation for the sampling distribution of W (i.e. Zw = 2.148, 2.141)
To test for the Level of Significance, the table of critical values of Zw (i.e. Table 7[33]) was used and it
can be observed that the value of Zw = 2.148, 2.141 was significant just a shade beyond the 0.025

Page 57
level for a directional test. For a two-tailed non-directional test, it would be significant just beyond
the 0.05 level (i.e. 95% limits of agreement).
Level of Significance for
Directional Test
0.05 0.025 0.01 0.005 0.0005
Non-Directional Test
-- 0.05 0.02 0.01 0.001
Zw, critical
1.645 1.960 2.326 2.576 3.291
Table 7 Critical Values of ±Zw [33]
In conclusion, the Wilcoxon Signed-Rank test shows that there was no significant difference at 95%
limits of agreement (i.e. two-tailed non-directional test) between the median of the HR measured by
both MMSB and ECG methods. This result suggests that the difference between the two sets of
measurement was statistically significant. As such, the Wilcoxon Signed-Rank test supports the use
of MMSB as a viable alternative to ECG for HR measurement.
7.2.4 Bland and Altman Test
The Bland and Altman test (a.k.a. Limits of Agreement) is used in scientific validation on the
measurement outputs of an alternative instrument (MMSB) against a “gold standard” (ECG) to
determine the limits of agreement for the errors between the two sets of data. This analysis is
recommended [35]-[36] when comparing the data between a “gold standard” and an alternative
biomedical instrument.
The Bland and Altman method calculates the mean difference between MMSB and ECG methods of
measurement (the ‘bias’), and 95% limits of agreement as the mean difference using Equation 13 (or
2*Standard Deviation - SD) [or more precisely (1.96*SD)]. It is expected that the 95% limits include
95% of differences between the two measurement methods.
Equation 13 𝑆𝐷 = Σ𝐷𝑖 − 𝐷2
(𝑁 − 1)
where 𝐷 = difference between instantaneous HR obtained from MMSB and ECG
𝐷 = mean of the difference between HR obtained from MMSB and ECG
𝑁 = total number of HR measurement samples (i.e. n = 40)

Page 58
The plot obtained from this analysis is commonly called a Bland–Altman plot and the associated
method is usually called the Bland–Altman method. Applying the Bland and Altman method on the
measurements in Table 4, the Bland-Altman plot is shown in Figure 51. This analysis plots the
difference (error) between the two HR measurements with respect to the means between the two
scores.
Most of the errors should fall between ± 2 SD§§§ of the mean difference between the two HR
measurement systems. Such a plot allows the assessment for systematic bias in the scores between
the two systems. More importantly, the magnitude of the error at ± 2 SD is used to determine the
clinical and practical significance of the measurement errors between the two systems. The
magnitude of error should not be clinically or practically significant before the alternative device is
accepted as a possible replacement for the Gold standard measurement device.
In the current analysis, the mean of the difference in HR measured between the ECG and the MMSB
systems is −0.05. The SD in HR measured between the ECG and the MMSB is ± 0.24 bpm (i.e. ± 0.48
bpm for ± 2 SD). The error data points are also evenly distributed across the range of heart rate
measured, suggesting that there is no systematic error in the measurement. The ± 2 SD of 0.48 bpm
is practically not significant for measurement of resting HR, suggesting that the MMSB system is a
suitable alternative for the ECG system for HR measurement. For example, a resting HR of 70 bpm
measured with the ECG system, would range between 69 bpm and 71 bpm in the HR measured by
the MMSB system. Such a variation (± 1 bpm) is within the normal range of variation in HR
measured in healthy individuals.
§§§ SD = Standard Deviation
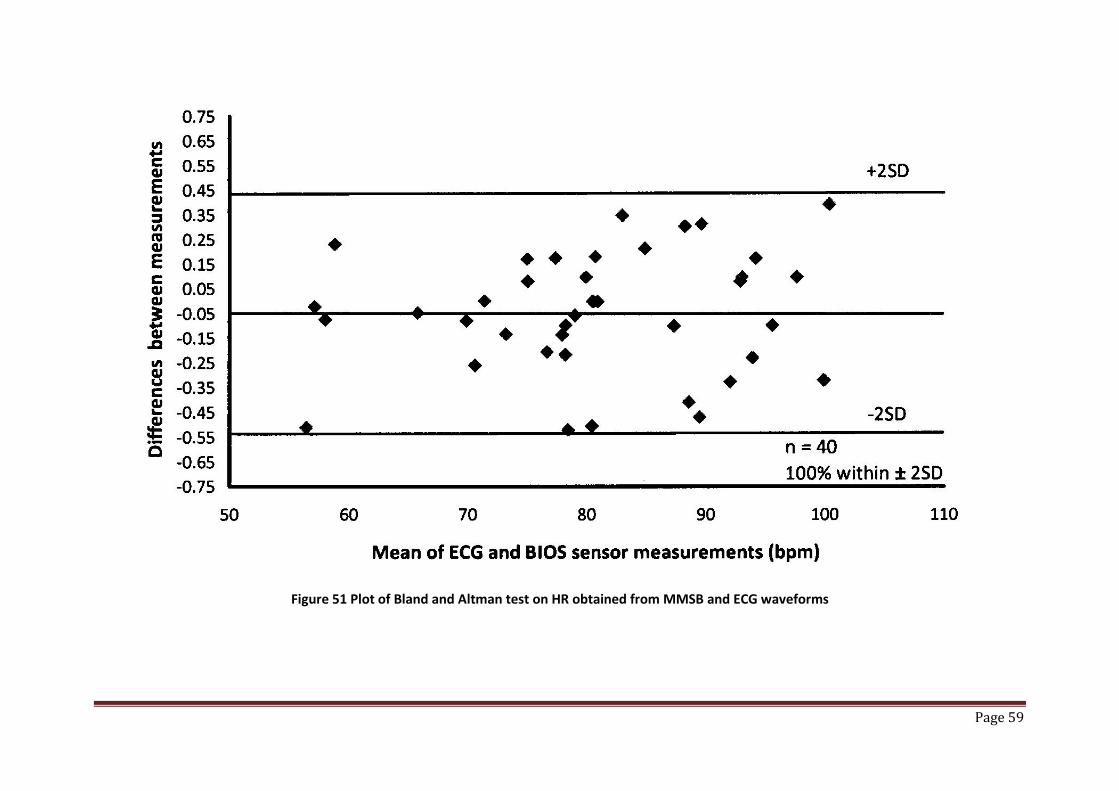
Page 59
Figure 51 Plot of Bland and Altman test on HR obtained from MMSB and ECG waveforms
Page 60
8 Conclusions
In this chapter, the experiment using Iron (II) Oxide (Fe2O3) fluidic flow has successfully
demonstrated the presence of magnetic disturbance when a ferrofluid flows through a constant
magnet field. This experiment provides the proof-of-concept for MMSB and forms the basis for
further experiments on human subjects.
In addition, the experiments conducted on human subjects have successfully demonstrated the
proof-of-operation of modulated magnetic signature of blood (MMSB) on human beings. Each of
these experiment is designed to demonstrate the acquisition of heart rate using the magnetic
disturbance measured through varying environmental conditions such as fabric, blood and
underwater. Moreover, the waveform obtained using the GMR sensor is compared with ECG and
pulse plethysmography where periodicity is concluded to be similar with known phase differences
[27].
The waveform obtained using the GMR sensor was also compared to the MHV magnitude curve with
good correlations on the waveform peaks related to the activities of the heart.
Finally the concurrent acquisition of HR using a gold standard (ECG) and MMSB on 20 subjects had
been successfully completed with statistical analyses done. The results of the statistical analyses
indicate that HR measured by the MMSB is almost perfectly correlated with HR measured with the
ECG and there is a very good agreement between HR measured by the two devices. These data
establish the use of the MMSB as a viable alternative to ECG in measuring HR healthy individuals
under resting conditions.
Therefore, it is conclusive that MMSB is a feasible alternative to existing solutions of heart rate
measurements with unique capability in sensing the pulse rate with direct electrical or optical
contact with the human skin. Most important of all, the waveform acquired is proven to be accurate
and reliable in measuring heart rate and qualifying its related activities.
Work in the next chapter of this dissertation will focus on the modelling of the MMSB phenomena in
a multiphysics simulation software environment so as to allow the experimental setup to be
optimised for implementation with high reliability and good sensitivity. In addition, the result
obtained from the model will also support design size reduction allowing the sensing module (i.e.
sensor and magnet) to be deployed as a wearable device.
Page 61
9 References
[1] J. Malmivuo, R. Plonsey (1995) Bioelectromagnetism – Principles and Applications of Bioelectric and Biomagnetic Fields, New-York, Oxford University Press
[2] PHUA, Chee Teck, YING, Ming Hua, KAM, See Hoon, GOOI, Boon Chong, Apparatus and method for non-invasively sensing pulse rate and blood flow anomalies, WO/2007/097713; PCT/SG2006/000409
[3] IBM Research, The Giant Magnetoresistive Head: A giant leap for IBM Research, http://www.research.ibm.com/research/gmr.html
[4] Pohm, A.V.; Daughton, J.M.; Brown, J.; Beech, R., “The architecture of a high performance mass store with GMR memorycells”, Magnetics, IEEE Transactions on Volume 31, Issue 6, Nov 1995 Page(s):3200 – 3202
[5] NVE corporation, MRAM Overview, http://www.nve.com/mram.php [6] Carl H. Smith, Robert W. Schneider, and Mark Tondra, “Magnetic Biosensors”, Sensor Magazine,
December 1999 Vol. 16 No.12. [7] D.R. Baselt et al. 1998. "A Biosensor Based on Magneotoresistance Technology," Biosensors &
Bioelectronics, Vol 13:731-739 [8] Carl H. Smith and Robert W. Schneider, "Expanding the Horizons of Magnetic Sensing: GMR,"
1997 Proc Sensors Expo Boston:139-144 [9] J. Daughton and Y. Chen, "GMR Materials for Low Field Applications," 1993 IEEE Trans Magn, Vol.
29:2705-2710 [10] J. Daughton et al, "Magnetic Field Sensors Using GMR Multilayer," 1994 IEEE Trans Magn, Vol.
30:4608-4610 [11] R. Schad, C. D. Potter, P. Belién, et al., “Giant Magnetoresistance in Fe/Cr Superlattices with Very
Thin Fe Layers,” Appl. Phys. Lett. 64, 3500–3502 (1994) [12] S. S. P. Parkin, R. Bhadra, K. P. Roche, “Oscillatory magnetic exchange coupling through thin
copper layers”, Phys. Rev. Lett. 66, 2152–2155 (1991) [13] S.Araki, “Magnetism and transport properties of evaporated Co/Ag multilayers”, J. Appl. Phys. 73,
3910 (1993); doi:10.1063/1.352879 [14] B. Rodmacq, G. Palumbo, P. Gerard, “Magnetrresistive properties and thermal stability of Ni-
Fe/Ag multilayers”, Journal of Magnetism and Magnetic Materials, Volume 118, Issue 1, Pages L11-L16
[15] Kobayashi , H Sato , Y Aoki, A Kamijo, “The giant magnetoresistance and the anomalous Hall effect in molecular-beam-epitaxy grown Co/Cu superlattices”, Journal of Physics: Condensed Matter Volume 6, Number 36
[16] Robert W. Schneider, Carl H. Smith, “Low Magnetic Field Sensing with GMR Sensors, Part 1:The Theory of Solid-State Magnetic Sensing” 1999 Sensors Magazine
[17] NVE Corporation, GMR sensor datasheet, http://www.nve.com/analogSensors.php [18] NVE Corporation, Application notes for GMR sensors, http://www.nve.com/SensorApps.php [19] Carl H. Smith and Robert W. Schneider, “Low Magnetic Field Sensing with GMR Sensors, Part 2:
GMR Sensors and Their Applications”, Sensors Magazine, October 1999 Vol. 16 No.10 [20] David K Cheng, Fundamentals of Electromagnetics, Chapter 5, Addison Wesley, ISBN 0-207-
56611-7
Page 62
[21] Bronzino, Joseph D. IEEE Biomedical Engineering Handbook: CRC Press, IEEE Press, 1995, 0-8493-8346-3
[22] Bongo International, Datasheet on magnet, http://www.lhasaoms.com/Sola_Magnets-66-95-page.html
[23] Assemtech Europe Limited, Datasheet on magnet (Part number M1219-4), http://www.farnell.com/datasheets/40538.pdf
[24] Exposure to Static and Low Frequency Electromagnetic Fields, Biological Effects and Health Consequences (0-100 kHz) - Review of the Scientific Evidence and Health Consequences. Munich: International Commission on Non-Ionizing Radiation Protection; 2003. ISBN 978-3-934994-03-4
[25] Ziemssen T, Gasch J, Ruediger H. “Influence of ECG sampling frequency on spectral analysis of RR intervals and baroreflex sensitivity using the EUROBAVAR data set”, PMID: 18368501 [PubMed - indexed for MEDLINE]
[26] Digi, Datasheet on Zigbee based wireless transceiver, http://www.digi.com/products/wireless/zigbee-mesh/xbee-zb-module.jsp#specs
[27] John G. Webster, Design of Pulse Oximeters, Chapter 8, CRC Press [28] O’Rourke M F, Kelly R P & Avolio A P (1992) The Arterial Pulse. Lea & Febiger, Pennsylvania, USA. [29] Kelly H. Zou, Kemal Tuncali, Stuart G. Silverman, Correlation and Simple Linear Regression,
Radiology 2003; 227:617–628 [30] Elise Whitley, Jonathan Ball, Statistics review 6: Nonparametric methods, Critical Care 2002,
6:509-513 (DOI 10.1186/cc1820) [31] Ella Zomer, Alice Owen, Dianna J Magliano, Danny Liew and Chris Reid, Validation of two
Framingham cardiovascular risk prediction algorithms in an Australian population: the ‘old’ versus the ‘new’ Framingham equation, European Journal of Cardiovascular Prevention & Rehabilitation 18(1) 115–120, The European Society of Cardiology 2011
[32] Machin D, Campbell M, Fayers, P, Pinol A (1997) Sample Size Tables for Clinical Studies. Second Ed. Blackwell Science IBSN 0-86542-870-0 p. 71-72
[33] Richard Lowry, Concepts & Applications of Inferential Statistics, Subchapter 12a: The Wilcoxon Signed-Rank Test, http://faculty.vassar.edu/lowry/webtext.html
[34] Armitage, P., 1971. Statistical methods in medical research. Blackwell Scientific Publications, Oxford (Chapter 7)
[35] J. Martin Bland, Douglas G. Altman, Statistical methods for assessing agreement between two methods of clinical measurement, International Journal of Nursing Studies, 47 (2010) pp 931–936
[36] Altman, D.G., Bland, J.M., 1983. Measurement in medicine: the analysis of method comparison studies. Statistician 32, 307–317

Page 63
Chapter 3: Modelling and simulation of MMSB
1 Introduction
Current methods of heart or pulse rate acquisition have been classified in Chapter 1 into electrical
[1][2], optical[3][7], microwave [1], acoustic [5][8][11], mechanical [6][9] or magnetic [10][12][13]
means. Each of these methods has been studied in detail and its limitations have been well
published and known.
In this chapter we will model first the experimental setup to demonstrate MMSB using iron oxide
fluidic flow (described in Chapter 2, section 3.2). This is followed by the modelling of the magnetic
method to acquire blood pulse using MMSB as proposed in this dissertation. In order to achieve
these, the flow of the iron oxidic fluid and biomagnetic fluid (i.e. blood) in a weak magnetic field
strength (0.1-0.2 Tesla) will be investigated.
With advancement in bioengineering and medical applications, extensive research work had been
done and published on the fluid dynamics of biological fluids in the presence of magnetic field [14]-
[16]. In order to examine the flow of a biomagnetic fluid under the action of an applied magnetic
field, Haik et al [17] had developed a mathematical model for the Biomagnetic Fluid Dynamics (BFD),
where the saturation or static magnetization is given by the Langevin magnetization equation. BFD
differs from MagnetoHydroDynamics**** (MHD) in that BFD deals with no electric current and the
fluidic flow is primarily affected by the magnetization of the fluid in the applied magnetic field.
In BFD, the behaviour of the biomagnetic fluid when it is exposed to magnetic field (magnetized) is
described by the magnetization property M. Magnetization is the measure of how much the
magnetic field is affecting the magnetic fluid and is a function of the magnetic field intensity H and
the temperature T. However, in this chapter, the model will be developed with the assumption that
the temperature of the system is a constant, where flow of blood in a weakly coupled magnetic field
is affected purely by its magnetization properties.
**** MHD deals with the mathematical model of conducting fluids, which ignores the effect of polarization and magnetization.

Page 64
2 Two-dimensional model of blood flow in the presence of a constant magnetic field
This model is based on the referred model [18] where bio-fluidic flow is coupled with magnetic
particle flow (in this case, red blood cell) using the Arbitrary Lagrangian Eulerian (ALE) formulation.
In this formulation, the governing equations for bio-fluidic flow are the continuity equation and the
Navier-Stokes equations. For red blood cell movement, Newton's law is applied. The complete
model includes the governing equations for the bio-fluidic flow, the governing equations for the
motion of red blood cells, the interaction conditions between bio-fluidic and red blood cells at the
interfaces, and boundary conditions.
To study the motion of red blood cell in bio-fluidic flow (i.e. blood flow), the red blood cells are
assumed to be solid particles immersed in the bio-fluid or blood. In this case, the fluid-solid particle
system occupies a bounded domain Ω in ℝ3. At a typical instant of time t, Q particles occupy Q
closed connected subsets ∑ Ω𝑞𝑄𝑞=1 ⊂ ℝ3, which is surrounded by a viscous homogeneous fluid
filling the domain Ω − ∑ Ω𝑞𝑄𝑞=1 called the flow-channel area.
In this study the two coordinate systems used are:
1. A reference system, Ω, where the model is drawn and the particle movement is solved.
2. A moving mesh system, Ωdef, corresponding to the deformed mesh of the flow channel,
where we simulate the fluid flow.
The time evolution of the domain Ωdef is determined by means of an Arbitrary Lagrangian-Eulerian
(ALE) mapping x: Ω × ℝ3 ↦ Ω𝑑𝑒𝑓 which maps any point (X,t) to its image x(X,t) .
2.1 Transformation of coordinate systems
In the flow-channel area, the two coordinate systems, (X,Y,Z)∈Ω and (x,y,z)∈Ωdef are connected
through a transformation T . At the initial state at t = 0 , the two mesh systems are assumed to
coincide. The transformation T maps the point initially located at (X ,Y, Z) to the point (x, y, z) at time
t as shown in Equation 14.
Equation 14 𝑻:𝒙 = 𝒙(𝑿,𝒀,𝒁, 𝒕)𝒚 = 𝒚(𝑿,𝒀,𝒁, 𝒕)𝒛 = 𝒛(𝑿,𝒀,𝒁, 𝒕)

Page 65
Solving Equation 14 at a particular instant of time, we can simplify Equation 14 to be independent of
time t, as shown in Equation 15.
Equation 15 𝑻:𝒙 = 𝒙(𝑿,𝒀,𝒁)𝒚 = 𝒚(𝑿,𝒀,𝒁)𝒛 = 𝒛(𝑿,𝒀,𝒁)
Suppose that the functions x, y, and z are continuous differentiable with respect to X, Y, Z. Then the
infinitesimals dX , dY , dZ transform of Equation 15 into dx , dy , dz according to Equation 16.
Equation 16
𝒅𝒙 = 𝒙,𝑿𝒅𝑿+ 𝒙,𝒀𝒅𝒀+ 𝒙,𝒁𝒅𝒁
𝒅𝒚 = 𝒚,𝑿𝒅𝑿+ 𝒚,𝒀𝒅𝒀+ 𝒚,𝒁𝒅𝒁
𝒅𝒛 = 𝒛,𝑿𝒅𝑿+ 𝒛,𝒀𝒅𝒀 + 𝒛,𝒁𝒅𝒁
where x,X denotes differentiation with respect to X.
Equation 16 can be written in the matrix form as shown in Equation 17 where the 3x3 matrix of
partial derivatives is called the Jacobian matrix of the transformation, denoted by J in Equation 18.
Equation 17 𝒅𝒙𝒅𝒚𝒅𝒛 =
𝒙,𝑿 𝒙,𝒀 𝒙,𝒁𝒚,𝑿 𝒚,𝒀 𝒚,𝒁𝒛,𝑿 𝒛,𝒀 𝒛,𝒁
𝒅𝑿𝒅𝒀𝒅𝒁
Equation 18 |𝐉| = 𝒙,𝑿𝒚,𝒀𝒛,𝒁 − 𝒚,𝒁𝒛,𝒀 − 𝒙,𝒀𝒚,𝑿𝒛,𝒁 − 𝒚,𝒁𝒛,𝑿 + 𝒙,𝒁𝒚,𝑿𝒛,𝒀 − 𝒚,𝒀𝒛,𝑿
For |𝐉| ≠ 0, the transformation is invertible and there exists an inverse transformation at time t as
shown in Equation 19.
Equation 19 𝐓−𝟏:𝑿 = 𝑿(𝒙,𝒚, 𝒛)𝒀 = 𝒀(𝒙,𝒚, 𝒛)𝒁 = 𝒁(𝒙,𝒚, 𝒛)
Re-writing Equation 19 in the matrix form, we have Equation 20, which can be denoted by J as
shown in Equation 21.
Equation 20 𝒅𝑿𝒅𝒀𝒅𝒁
= 𝑿,𝒙 𝑿,𝒚 𝑿,𝒛𝒀,𝒙 𝒀,𝒚 𝒀,𝒛𝒁,𝒛 𝒁,𝒛 𝒁,𝒛
𝒅𝒙𝒅𝒚𝒅𝒛
Equation 21 𝒅𝑿𝒅𝒀𝒅𝒁
= 𝐉−𝟏 𝒅𝒙𝒅𝒚𝒅𝒛
where J−1 = 𝐼𝑋𝑥 𝐼𝑋𝑦 𝐼𝑋𝑧𝐼𝑌𝑥 𝐼𝑌𝑦 𝐼𝑌𝑧𝐼𝑍𝑥 𝐼𝑍𝑦 𝐼𝑍𝑧
= 1|𝐉|𝐊,

Page 66
K =
𝑦,𝑌𝑧,𝑍 − 𝑦,𝑍𝑧,𝑌 𝑥,𝑍𝑧,𝑌 − 𝑥,𝑌𝑧,𝑍 𝑥,𝑌𝑦,𝑍 − 𝑥,𝑍𝑦,𝑌
𝑦,𝑍𝑧,𝑋 − 𝑦,𝑋𝑧,𝑍 𝑥,𝑋𝑧,𝑍 − 𝑥,𝑍𝑧,𝑋 𝑦,𝑋𝑥,𝑍 − 𝑦,𝑍𝑥,𝑋
𝑦,𝑋𝑧,𝑌 − 𝑦,𝑌𝑧,𝑋 𝑥,𝑌𝑧,𝑋 − 𝑥,𝑋𝑧,𝑌 𝑥,𝑋𝑦,𝑌 − 𝑥,𝑌𝑦,𝑋
in which the I syntax is used to highlight the computation of the Jacobian of the inverse
transformation from the inverse of the original Jacobian.
Equating Equation 20 and Equation 21, we have the relations described in Equation 22, which are
crucial in transforming the calculation results from Ωdef to Ω.
Equation 22
𝑿.𝒙 = 𝒚,𝒀𝒛,𝒁 − 𝒚,𝒁𝒛,𝒀 |𝐉|⁄
𝑿.𝒚 = 𝒙,𝒁𝒛,𝒀 − 𝒙,𝒀𝒛,𝒁 |𝐉|⁄
𝑿.𝒛 = 𝒙,𝒀𝒚,𝒁 − 𝒙,𝒁𝒚,𝒀 |𝐉|⁄
𝒀.𝒙 = 𝒚,𝒁𝒛,𝑿 − 𝒚,𝑿𝒛,𝒁 |𝐉|⁄
𝒀.𝒚 = 𝒙,𝑿𝒛,𝒁 − 𝒙,𝒁𝒛,𝑿 |𝐉|⁄
𝒀.𝒛 = 𝒚,𝑿𝒙,𝒁 − 𝒚,𝒁𝒙,𝑿 |𝐉|⁄
𝒁.𝒙 = 𝒚,𝑿𝒛,𝒀 − 𝒚,𝒀𝒛,𝑿 |𝐉|⁄
𝒁.𝒙 = 𝒙,𝒀𝒛,𝑿 − 𝒙,𝑿𝒛,𝒀 |𝐉|⁄
𝒁.𝒙 = 𝒙,𝑿𝒚,𝒀 − 𝒙,𝒀𝒚,𝑿 |𝐉|⁄
These relations are used in the software COMSOL for the calculation of numerical results through
the transforming from Ωdef to Ω.
2.2 Motion of Fluid-Solid Flow in the Deformed Mesh System
To study the motion of red blood cell in the blood vessels (i.e fluid flow channel), we assume that the
gravitational force can be neglected and the red blood cell movement is governed by Newton's
second law as shown in Equation 23.
Equation 23 𝒎𝒒
𝝏𝑽𝒒𝝏𝒕
= 𝑭𝒗 + 𝑭𝒒 + 𝑭𝒎𝒂𝒈, 𝒒 = 𝟏,𝟐,𝟑, … ,𝑸
𝑽𝒒𝒕=𝟎 = 𝟎, 𝐢𝐧𝐢𝐭𝐢𝐚𝐥 𝐜𝐨𝐧𝐝𝐢𝐭𝐢𝐨𝐧𝐬
where Vq = velocity vector of the qth red blood cell
mq = mass of the qth red blood cell
Fv = drag force
Fq = collision force
Fmag = magnetic force
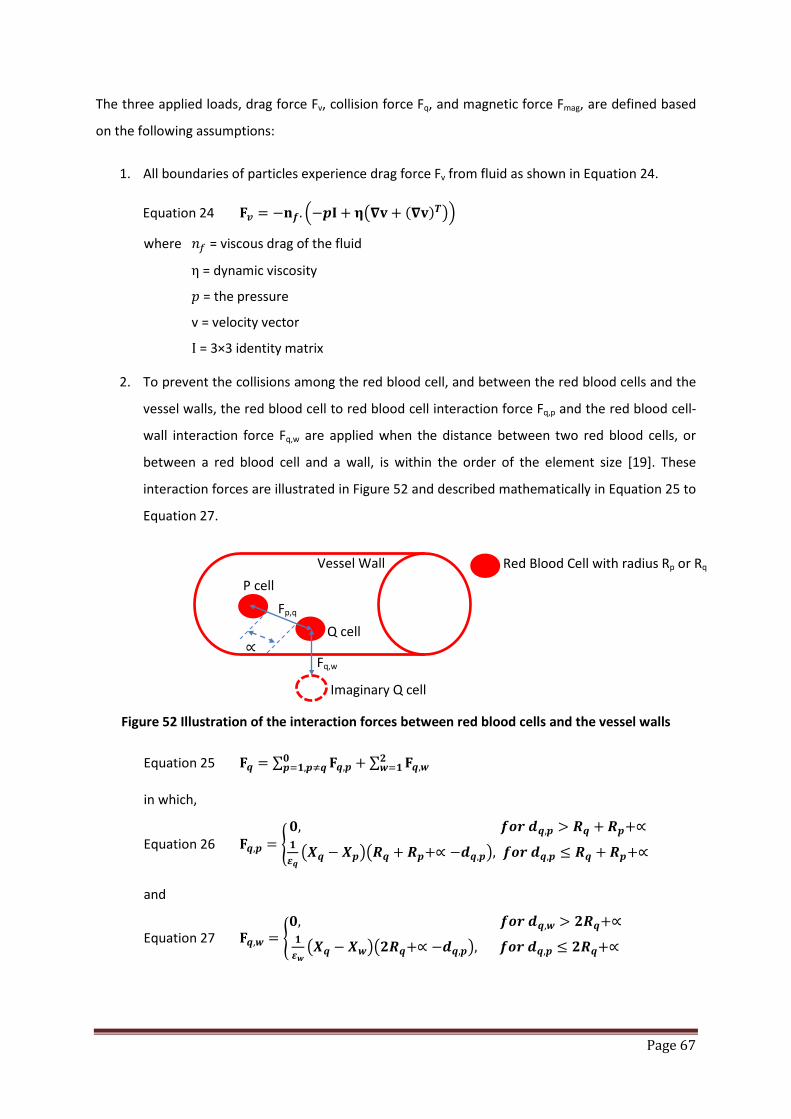
Page 67
The three applied loads, drag force Fv, collision force Fq, and magnetic force Fmag, are defined based
on the following assumptions:
1. All boundaries of particles experience drag force Fv from fluid as shown in Equation 24.
Equation 24 𝐅𝒗 = −𝐧𝒇. −𝒑𝐈 + 𝛈𝛁𝐯+ (𝛁𝐯)𝑻
where 𝑛𝑓 = viscous drag of the fluid
η = dynamic viscosity
𝑝 = the pressure
v = velocity vector
I = 3×3 identity matrix
2. To prevent the collisions among the red blood cell, and between the red blood cells and the
vessel walls, the red blood cell to red blood cell interaction force Fq,p and the red blood cell-
wall interaction force Fq,w are applied when the distance between two red blood cells, or
between a red blood cell and a wall, is within the order of the element size [19]. These
interaction forces are illustrated in Figure 52 and described mathematically in Equation 25 to
Equation 27.
Figure 52 Illustration of the interaction forces between red blood cells and the vessel walls
Equation 25 𝐅𝒒 = ∑ 𝐅𝒒,𝒑 + ∑ 𝐅𝒒,𝒘𝟐𝒘=𝟏
𝟎𝒑=𝟏,𝒑≠𝒒
in which,
Equation 26 𝐅𝒒,𝒑 = 𝟎, 𝒇𝒐𝒓 𝒅𝒒,𝒑 > 𝑹𝒒 + 𝑹𝒑+∝𝟏𝜺𝒒𝑿𝒒 − 𝑿𝒑𝑹𝒒 + 𝑹𝒑+∝ −𝒅𝒒,𝒑, 𝒇𝒐𝒓 𝒅𝒒,𝒑 ≤ 𝑹𝒒 + 𝑹𝒑+∝
and
Equation 27 𝐅𝒒,𝒘 = 𝟎, 𝒇𝒐𝒓 𝒅𝒒,𝒘 > 𝟐𝑹𝒒+∝𝟏𝜺𝒘𝑿𝒒 − 𝑿𝒘𝟐𝑹𝒒+∝ −𝒅𝒒,𝒑, 𝒇𝒐𝒓 𝒅𝒒,𝒑 ≤ 𝟐𝑹𝒒+∝
Fp,q
Fq,w
Vessel Wall Red Blood Cell with radius Rp or Rq
P cell
Q cell ∝
Imaginary Q cell

Page 68
where dq,p denotes the distance between the centres of the qth and pth red blood cell, dq,w
denotes the distance between the centres of the qth red blood cell and the imaginary red
blood cell on the other side of the wall, Xq and Rq are centre and radius of the qth red blood
cell, α is the distance between the pth and qth red blood cell where the force is non-zero,
and εq and εw are small positive stiffness parameters of the particle and wall respectively.
3. To model the magnetic disturbance of the blood at the measurement site, an external
magnetic field is applied to generate magnetic force acting on the red blood cell. This force,
which is composed of 3 components, is governed by the equations:
Equation 28 𝐅𝒎𝒂𝒈 = 𝟏𝝁𝒓
(𝐌.𝛁)𝐁
where µr is the relative permeability of the red blood cell
M = (Mx, My, Mz) is the magnetic moment of the red blood cell
B = (Bx, By, Bz) is the magnetic flux density in 3-dimensional space
To determine the drag force Fv in Equation 24, blood is assumed to be an isotropic, homogeneous
incompressible fluid. The motion of the blood is described by the continuity Equation 29 and the
Navier-Stokes Equation 30.
Equation 29 𝛁.𝐯 = 𝟎
Equation 30 𝝆𝒇 𝛛𝐯𝛛𝐭
+𝝆𝒇(𝐯.𝛁)𝐯 − 𝛁.𝛔 = 𝐅
where ρf denotes the blood density
v = [u, v, w]T represents the 3D velocity vector
F is the volume force acting on the fluid
For this model, we neglect the effect of gravitational force and thus, F = 0. The quantity σ in Equation
30 is the stress tensor given by Equation 31.
Equation 31 𝛔 = −𝒑𝐈 + 𝛈𝛁𝐯+ (𝛁𝐯)𝑻
where η = blood viscosity
v = velocity vector
𝑝 = blood pressure
I = 3x3 identity matrix

Page 69
On the wall, the no-slip condition is applied. On the inflow boundary Γin, the velocity is assumed to
be constant, whereas on the outflow boundary Γout, the stress-free condition as described by
Equation 32.
Equation 32 𝐯 = 𝐯𝟎 𝐨𝐧 𝚪𝒊𝒏𝝈.𝐧 = 𝟎 𝐨𝐧 𝚪𝒐𝒖𝒕
For static condition in stationary bodies, the magnetic flux density B is governed by the Maxwell-
Ampere’s law for the magnetic field H (A/m) and the current density J (A/m2) in Equation 33 can be
applied (where J = 0 for non-conducting fluid). In addition, using the Gauss’ law for the magnetic flux
density B (Vs/m2) stated in Equation 34, this will result in the constitutive equations describing the
relationships between B and H in the different parts of the modelling domain in Equation 35.
Equation 33 𝛁 × 𝑯 = 𝑱 = 𝟎
Equation 34 𝛁 × 𝑩 = 𝟎
Equation 35 𝑩 =
𝝁𝒐𝝁𝒓,𝒎𝒂𝒈𝑯 + 𝑩𝒓𝒆𝒎 𝒑𝒆𝒓𝒎𝒂𝒏𝒆𝒏𝒕 𝒎𝒂𝒈𝒏𝒆𝒕
𝝁𝟎 𝑯 + 𝑴𝒇𝒇(𝑯) 𝒓𝒆𝒅 𝒃𝒍𝒐𝒐𝒅 𝒄𝒆𝒍𝒍 𝒊𝒏 𝒃𝒍𝒐𝒐𝒅 𝒔𝒕𝒓𝒆𝒂𝒎𝝁𝟎𝑯 𝒕𝒊𝒔𝒔𝒖𝒆 𝒂𝒏𝒅 𝒂𝒊𝒓
where μ0 = magnetic permeability of vacuum (Vs/(A·m))
μr,mag = relative magnetic permeability of the permanent magnet
𝐵𝑟𝑒𝑚 = residual magnetic flux (A/m)
Mff = magnetization vector†††† in the blood stream (A/m), which is a function of magnetic
field, H
Defining a magnetic vector potential A such that B = ∇xA, ∇.A = 0 and substituting this into Equation
33 through Equation 35, the equations can be simplified to a 2D problem with no perpendicular
currents as shown in Equation 36.
Equation 36 𝛁 × 𝟏𝝁𝟎𝛁 × 𝑨 −𝑴𝒇𝒇 = 𝑱
where J = 0 for 2D with no perpendicular currents
Using the identity in Equation 37 and the Coulomb gauge ∇.𝐴 = 0, the Equation 36 takes the form
as shown in Equation 38.
Equation 37 𝛁 × (𝛁 × 𝑨) = 𝛁(𝛁.𝑨) − 𝛁𝑨 †††† Magnetization is the measure of how much the magnetic field affects the magnetic fluid. In this case, it is the behaviour of the biomagnetic fluid (blood) when it is exposed to magnetic field (magnetized).

Page 70
Equation 38 𝛁𝑨 = −𝛁 × 𝝁𝟎𝑴𝒇𝒇
Due to the movement of the coordinate system, the mesh velocity Ψ = (Ψx; Ψy; Ψz) is introduced in
the deformed domain Ωdef , as explained in the introduction on page 64. To guarantee a smoothly
varying distribution of the nodes, we assume that the nodes on 𝜕Ωq move with the red blood cell (no
slip) and that each component of the mesh velocity in the fluid channel is governed by a Laplace
equation as shown in Equation 39.
Equation 39 𝛁𝟐𝚿 = 𝟎,∀𝒙 ∈ Ω𝒅𝒆𝒇
The above equation is used to smooth gradient of the mesh velocity over the domain so as to reduce
mesh distortion. Once the mesh velocity components are determined, we can determine the
smoothed deformed mesh for the flow channel at each time instant by updating the coordinates of
the nodes according to the following formulae:
Equation 40 𝐱 = 𝑿 + ∫ 𝚿𝒙𝒅𝒕𝒕𝟎
Equation 41 𝐲 = 𝒀 + ∫ 𝚿𝒚𝒅𝒕𝒕𝟎
Equation 42 𝐳 = 𝒁 + ∫ 𝚿𝒛𝒅𝒕𝒕𝟎
Another condition that needs to be specified is that the fluid, red blood cell and mesh move with the
same velocity on the particle boundaries, i.e.,
Equation 43 𝚿 = 𝐯 = 𝐕𝒒 𝒐𝒏 𝝏Ω𝒒
We now have the strong coupled problem for the fluid-red blood cell flow in the blood circulatory
system. These equations are solved to yield Vq in Ω and the velocity v, the pressure p, the magnetic
potential A and the mesh velocity Ψ, in Ωdef .
The formulation of the fluid flow problem is to find (v, p, A, Ψ) ∈ ℑ in the deformed mesh system at
each time instant such that all the Dirichlet Boundary conditions are satisfied and ∀𝐯,𝐩,𝐀,𝚿 ∈
ℑ0 ≡ 𝐯,𝐩,𝐀,𝚿 ∈ ℑ0𝐯 = 𝟎 𝒐𝒏 𝜕Ω𝑑𝑒𝑓 ,𝐩 = 𝟎 𝒐𝒏 𝜕Ω𝑑𝑒𝑓 ,𝐀 = 𝟎 𝒐𝒏 𝜕Ω𝑑𝑒𝑓 ,𝚿 = 𝟎 𝒐𝒏 𝜕Ω𝑑𝑒𝑓 .
Equation 44 ∫ 𝐩(𝛁.𝐯)Ω𝒅𝒆𝒇𝒗𝒅Ω = 𝟎
Equation 45 ∫ 𝛒𝒇𝐯. 𝝏𝐯𝝏𝒕
+ 𝜼𝛁𝐯:𝛁𝐯+ 𝝆𝒇𝐯. (𝐯.𝛁)𝐯 − 𝛒𝛁. 𝐯Ω𝒅𝒆𝒇𝝆𝒅Ω = ∫ 𝐯(𝛔.𝒏)𝝏Ω𝒅𝒆𝒇
𝒅𝒔
Equation 46 ∫ 𝛁𝐀:𝛁𝐀 − 𝐀.𝛁 × 𝝁𝟎𝐌𝒇𝒇Ω𝒅𝒆𝒇𝑨𝒅Ω = 𝟎
Equation 47 ∫ 𝛁𝚿 :𝛁𝚿Ω𝒅𝒆𝒇𝚿𝒅Ω = 𝟎

Page 71
where Ω𝑑𝑒𝑓𝑣 , 𝜕Ω𝑑𝑒𝑓𝜌 , 𝜕Ω𝑑𝑒𝑓𝐴 and 𝜕Ω𝑑𝑒𝑓Ψ are the parts of boundary where the velocity, the
pressure, the magnetic potential and the mesh velocity are specified. It should also be addressed
that various surface integral terms, arising in the formulation, vanish as the test functions involved in
the terms in are zero on the boundary.
Since the computations are conducted in the reference coordinates, Ω, we need to transform
Equation 43 - Equation 47 in the deformed coordinates to those equations in the reference
coordinates. Through this and using Equation 32, we will obtain Equation 48- Equation 51.
Equation 48 ∫ 𝐩(𝛁.𝐯)Ω |𝐉|𝒅Ω = 𝟎
Equation 49 ∫ 𝛒𝒇𝐯. 𝝏𝐯𝝏𝒕
+ 𝜼𝛁𝐯:𝛁𝐯+ 𝝆𝒇𝐯. (𝐯.𝛁)𝐯 − 𝛒𝛁.𝐯 |𝐉|Ω 𝒅Ω = 𝟎
Equation 50 ∫ 𝛁𝐀:𝛁𝐀 − 𝐀.𝛁 × 𝝁𝟎𝐌𝒇𝒇 |𝐉|Ω 𝒅Ω = 𝟎
Equation 51 ∫ 𝛁𝚿 :𝛁𝚿Ω𝒅𝒆𝒇|𝐉|𝒅Ω = 𝟎
where the derivatives of the unknown functions Ψ𝑖(𝑖 = 𝑥,𝑦, 𝑧) are determined by the following
expressions:
Equation 52
𝚿𝒊,𝒙 = 𝚿𝒊,𝑿𝐈𝑿,𝒙 + 𝚿𝒊,𝒀𝐈𝒀,𝒙 + 𝚿𝒊,𝒁𝐈𝒁,𝒙
𝚿𝒊,𝒚 = 𝚿𝒊,𝑿𝐈𝑿,𝒚 + 𝚿𝒊,𝒀𝐈𝒀,𝒚 + 𝚿𝒊,𝒁𝐈𝒁,𝒚
𝚿𝒊,𝒛 = 𝚿𝒊,𝑿𝐈𝑿,𝒛 + 𝚿𝒊,𝒀𝐈𝒀,𝒛 + 𝚿𝒊,𝒁𝐈𝒁,𝒛
and for the test functions:
Equation 53
𝚿𝒊,𝒙 = 𝚿𝒊,𝑿𝐈𝑿,𝒙 + 𝚿𝒊,𝒀𝐈𝒀,𝒙 + 𝚿𝒊,𝒁𝐈𝒁,𝒙
𝚿𝒊,𝒚 = 𝚿𝒊,𝑿𝐈𝑿,𝒚 + 𝚿𝒊,𝒀𝐈𝒀,𝒚 + 𝚿𝒊,𝒁𝐈𝒁,𝒚
𝚿𝒊,𝒛 = 𝚿𝒊,𝑿𝐈𝑿,𝒛 + 𝚿𝒊,𝒀𝐈𝒀,𝒛 + 𝚿𝒊,𝒁𝐈𝒁,𝒛
The derivatives of other unknown functions u, v, w, Ax, Ay and Az are defined in the same way as
those of the Ψ𝑖 functions.
2.3 Numerical results using multiphysics simulation software
In a two dimension case, the magnetic potential is assumed to have a nonzero component only in
the direction Az, perpendicular to the (x,y) plane (i.e. A = (0, 0, Az)). On 𝜕Ωq and 𝜕Ω, the magnetic
potential is set to zero, that is, Az = 0.
As such, the magnetization vector in the blood stream can be expressed as shown in Equation 54.

Page 72
Equation 54 𝑴𝒇𝒇𝒙 = 𝟏𝝁𝟎
𝝏𝑨𝒛𝝏𝒚
, 𝑴𝒇𝒇𝒚 = 𝟏𝝁𝟎
𝝏𝑨𝒛𝝏𝒙
Based on the results presented [41], the magnetization curves for a soft magnetic material‡‡‡‡, can
be approximated by simple two-parameter arctangent functions of the form M = α*arctan(β*Mff),
where the arctangent expression includes two material parameters α (A/m), saturation
magnetization, and β (m/A). Using the notation of magnetization in the (x,y) axis as Mx and My
respectively, the induced magnetization of blood can be expressed as shown in Equation 55.
Equation 55 𝑀𝑥 = 𝛼𝑡𝑎𝑛−1 𝛽𝜇0
𝜕𝐴𝑧𝜕𝑦 , 𝑀𝑦 = 𝛼𝑡𝑎𝑛−1 𝛽
𝜇0
𝜕𝐴𝑧𝜕𝑥
Linearizing Equation 55 for analysis of magnetization in weak magnetic field where 𝛽𝜇0
𝜕𝐴𝑧𝜕𝑥
and 𝛽𝜇0
𝜕𝐴𝑧𝜕𝑦
are numerically small (i.e. <<1), the arctangent function in Equation 55 can be simplified as Equation
56.
Equation 56 𝑴𝒙 = 𝝌𝝁𝟎
𝝏𝑨𝒛𝝏𝒚
, 𝑴𝒚 = 𝝌𝝁𝟎
𝝏𝑨𝒛𝝏𝒙
where χ = αβ is the magnetic susceptibility
With the assumption that the red blood cells in the blood fluid do not interact, the magnetic force F
= (Fx, Fy) on the blood for relatively weak fields is given by 𝐹 = 𝑚 .∇𝐻 [42] which can be simplified
to a 2D problem with no perpendicular currents. As such, for a 2D problem, the operator ∇ can be
simplified as ∇= 𝚤 𝜕𝜕𝑥
+ 𝚥 𝜕𝜕𝑦
and the magnetic flux density 𝐵 can be expressed as H = 1𝝁𝒐𝝁𝒓
B =
1𝝁𝒐𝝁𝒓
𝚤 𝜕𝐴𝑧𝜕𝑦
− 𝚥 𝜕𝐴𝑧𝜕𝑥.
Re-writing the results in Equation 56 as a vector form, m = 𝚤 𝝌𝝁𝟎
𝜕𝐴𝑧𝜕𝑦
+ 𝚥 𝝌𝝁𝟎
𝜕𝐴𝑧𝜕𝑥
.
Therefore, 𝐹 = 𝑚 .∇𝐻
𝐹 = 𝜒𝜇0
𝜕𝐴𝑧𝜕𝑦
+ 𝚥 𝜒𝜇0
𝜕𝐴𝑧𝜕𝑥 . 𝚤 𝜕
𝜕𝑥+ 𝚥 𝜕
𝜕𝑦 𝚤 𝜕𝐴𝑧
𝜕𝑦− 𝚥 𝜕𝐴𝑧
𝜕𝑥 1𝝁𝒐𝝁𝒓
= 𝚤 𝜒𝝁𝒓𝝁𝒐𝟐
𝜕𝐴𝑧𝜕𝑦
𝜕2𝐴𝑧𝜕𝑦𝜕𝑥
+ 𝜒𝝁𝒓𝝁𝒐𝟐
𝜕𝐴𝑧𝜕𝑥
𝜕2𝐴𝑧𝜕𝑦2
− 𝚥 𝜒𝝁𝒓𝝁𝒐𝟐
𝜕𝐴𝑧𝜕𝑦
𝜕2𝐴𝑧𝜕𝑥2
+ 𝜒𝝁𝒓𝝁𝒐𝟐
𝜕𝐴𝑧𝜕𝑥
𝜕2𝐴𝑧𝜕𝑥𝜕𝑦
Equation 57 𝑭𝒙 = 𝝌𝝁𝒓𝝁𝒐𝟐
𝝏𝑨𝒛𝝏𝒙
𝝏𝟐𝑨𝒛𝝏𝒚𝟐
+ 𝝏𝑨𝒛𝝏𝒚
𝝏𝟐𝑨𝒛𝝏𝒚𝝏𝒙
, 𝑭𝒚 = 𝝌𝝁𝒓𝝁𝒐𝟐
𝝏𝑨𝒛𝝏𝒙
𝝏𝟐𝑨𝒛𝝏𝒙𝝏𝒚
+ 𝝏𝑨𝒛𝝏𝒚
𝝏𝟐𝑨𝒛𝝏𝒙𝟐
‡‡‡‡ Material that attains magnetization easily and reaches saturation at relatively low magnetic field. At the same time, loses magnetization quickly as the external field diminishes.
Page 73
The final expression for the volume force in the blood stream can be obtained by multiplying
Equation 57§§§§ by the ferrofluid mass fraction, K_ff. This will result in the expressions shown in Table
8 allowing the magnetic field at the sensor location to be solved in COMSOL environment.
The solved magnetic field will be translated to voltage output based on the sensor response
characteristics as shown in Table 11, which will be verified with experimental measurements at
latter part of this chapter.
Name Expression Description Mu0 Mu0_qa Permeability of vacuum M_ffx k_ff*(chi_ff/mu0)*Azy Induced ferrofluid magnetization, x-component M_ffy -k_ff*(chi_ff/mu0)*Azx Induced ferrofluid magnetization, y-component F_ffx k_ff*(Azx*Azyy+Azy*Azxy)*
chi_ff/((mu0) ^2*(1+chi_ff)) Ferrofluid volume force, x-component
F_ffy k_ff*(Azx*Azxy+Azy*Azxx)* chi_ff/((mu0) ^2*(1+chi_ff))
Ferrofluid volume force, y-component
where notations in COMSOL are Azy = 𝝏𝑨𝒛𝝏𝒚
, Azx = 𝝏𝑨𝒛𝝏𝒙
, Azxx = 𝝏𝑨𝒛𝝏𝒙𝟐
, Azxy = 𝝏𝑨𝒛𝝏𝒙𝝏𝒚
and Azyy = 𝝏𝑨𝒛𝝏𝒚𝟐
Table 8 Expressions used for simulation model
2.4 Modelling of blood flow in blood circulatory system
Blood flow is the movement of blood through the vessels and is pulsatile in the large arteries,
diminishing in amplitude as it approaches the capillaries. In the veins blood flow is typically non-
pulsatile.
The flow of blood in arteries is the result of ventricular ejection where in the veins; it is the result of
a number of factors including respiratory movement, muscle compression and the small residuum of
arterial pressure.
The flow of blood in large and straight vessels, like the flow of liquid in narrow rigid tubes, is
normally laminar for healthy people [38]. Laminar flow is characterized by concentric layers of blood
moving in parallel down the length of a blood vessel as shown in Figure 53. The highest velocity (Vmax)
is found in the centre of the vessel. The lowest velocity (V=0) is found along the vessel wall. The flow
profile is parabolic once laminar flow is fully developed. This usually occurs in long, straight blood
vessels, under steady flow conditions.
§§§§ Equation 17 is different from the model used in the COMSOL reference design titled “Magnetic Drug Targeting in Cancer Therapy” in the COMSOL software. The difference had been feedback to COMSOL and engineers from COMSOL had agreed that the equation derived in this dissertation is correct.
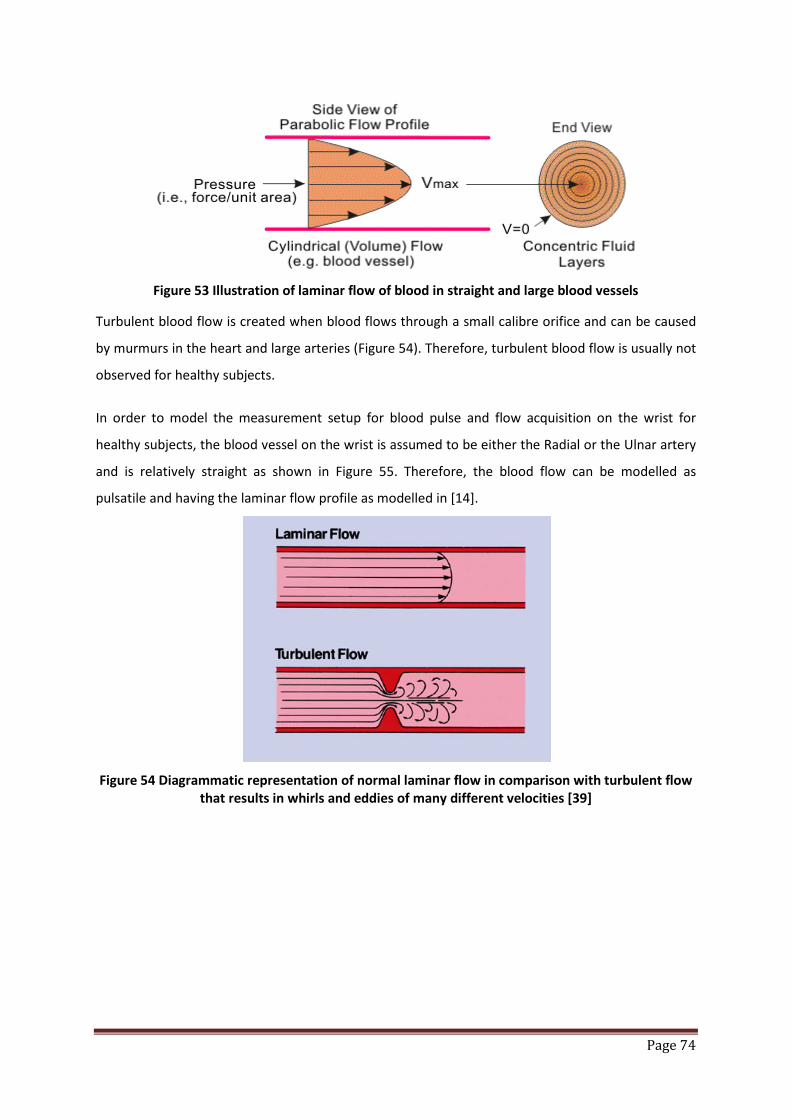
Page 74
Figure 53 Illustration of laminar flow of blood in straight and large blood vessels
Turbulent blood flow is created when blood flows through a small calibre orifice and can be caused
by murmurs in the heart and large arteries (Figure 54). Therefore, turbulent blood flow is usually not
observed for healthy subjects.
In order to model the measurement setup for blood pulse and flow acquisition on the wrist for
healthy subjects, the blood vessel on the wrist is assumed to be either the Radial or the Ulnar artery
and is relatively straight as shown in Figure 55. Therefore, the blood flow can be modelled as
pulsatile and having the laminar flow profile as modelled in [14].
Figure 54 Diagrammatic representation of normal laminar flow in comparison with turbulent flow
that results in whirls and eddies of many different velocities [39]
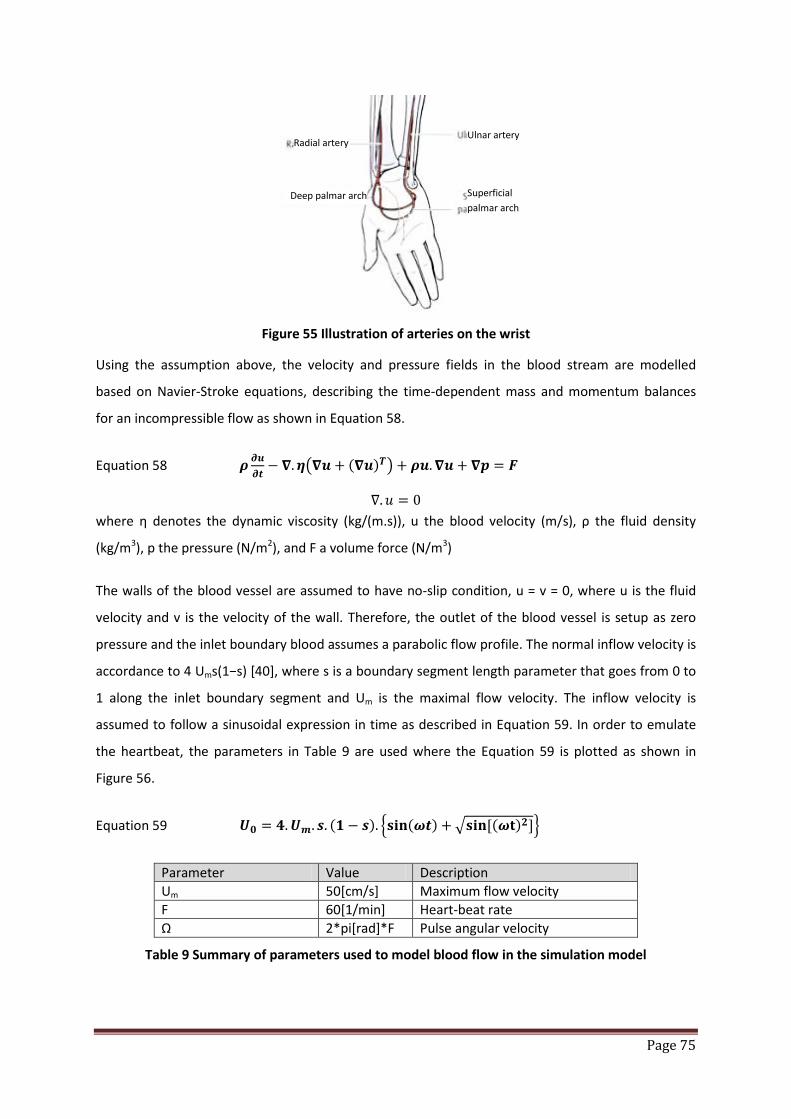
Page 75
Figure 55 Illustration of arteries on the wrist
Using the assumption above, the velocity and pressure fields in the blood stream are modelled
based on Navier-Stroke equations, describing the time-dependent mass and momentum balances
for an incompressible flow as shown in Equation 58.
Equation 58 𝝆 𝝏𝒖𝝏𝒕− 𝛁.𝜼𝛁𝒖 + (𝛁𝒖)𝑻 + 𝝆𝒖.𝛁𝒖 + 𝛁𝒑 = 𝑭
∇.𝑢 = 0 where η denotes the dynamic viscosity (kg/(m.s)), u the blood velocity (m/s), ρ the fluid density
(kg/m3), p the pressure (N/m2), and F a volume force (N/m3)
The walls of the blood vessel are assumed to have no-slip condition, u = v = 0, where u is the fluid
velocity and v is the velocity of the wall. Therefore, the outlet of the blood vessel is setup as zero
pressure and the inlet boundary blood assumes a parabolic flow profile. The normal inflow velocity is
accordance to 4 Ums(1−s) [40], where s is a boundary segment length parameter that goes from 0 to
1 along the inlet boundary segment and Um is the maximal flow velocity. The inflow velocity is
assumed to follow a sinusoidal expression in time as described in Equation 59. In order to emulate
the heartbeat, the parameters in Table 9 are used where the Equation 59 is plotted as shown in
Figure 56.
Equation 59 𝑼𝟎 = 𝟒.𝑼𝒎. 𝒔. (𝟏 − 𝒔). 𝐬𝐢𝐧(𝝎𝒕) +𝐬𝐢𝐧[(𝝎𝐭)𝟐]
Parameter Value Description Um 50[cm/s] Maximum flow velocity F 60[1/min] Heart-beat rate Ω 2*pi[rad]*F Pulse angular velocity
Table 9 Summary of parameters used to model blood flow in the simulation model
Ulnar artery Radial artery
Deep palmar arch Superficial palmar arch
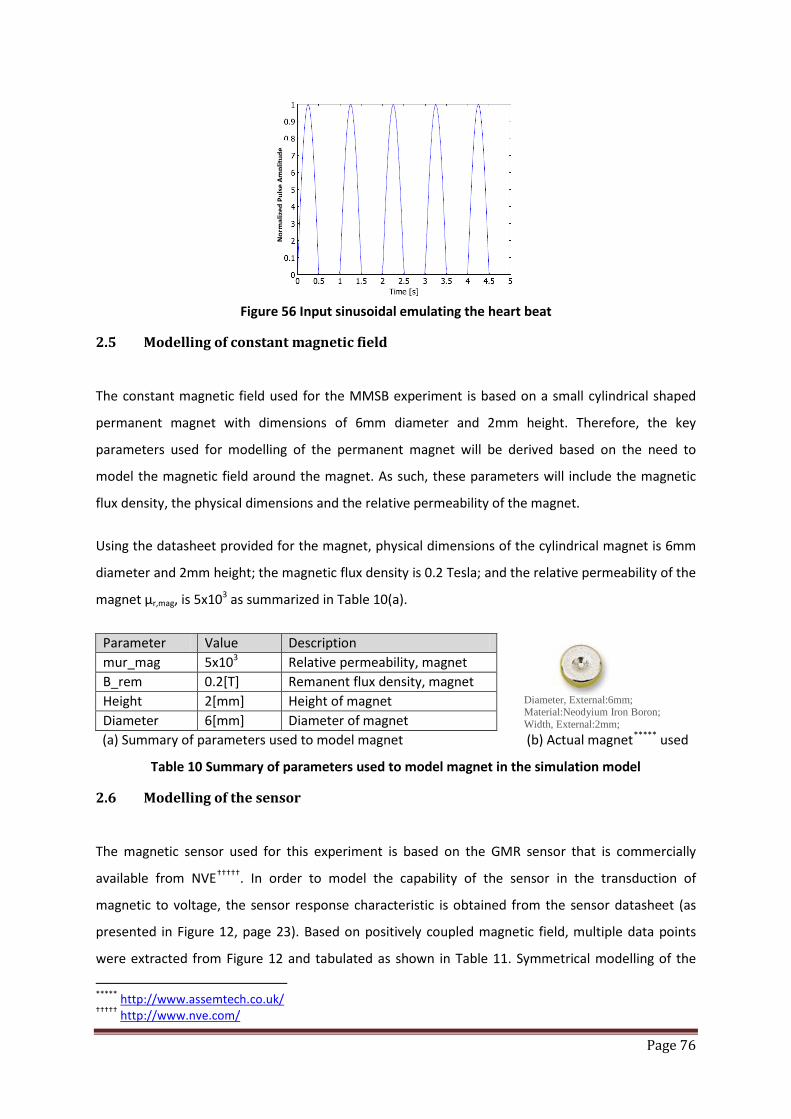
Page 76
Figure 56 Input sinusoidal emulating the heart beat
2.5 Modelling of constant magnetic field
The constant magnetic field used for the MMSB experiment is based on a small cylindrical shaped
permanent magnet with dimensions of 6mm diameter and 2mm height. Therefore, the key
parameters used for modelling of the permanent magnet will be derived based on the need to
model the magnetic field around the magnet. As such, these parameters will include the magnetic
flux density, the physical dimensions and the relative permeability of the magnet.
Using the datasheet provided for the magnet, physical dimensions of the cylindrical magnet is 6mm
diameter and 2mm height; the magnetic flux density is 0.2 Tesla; and the relative permeability of the
magnet µr,mag, is 5x10³ as summarized in Table 10(a).
Parameter Value Description mur_mag 5x10³ Relative permeability, magnet B_rem 0.2[T] Remanent flux density, magnet Height 2[mm] Height of magnet Diameter 6[mm] Diameter of magnet
(a) Summary of parameters used to model magnet (b) Actual magnet***** used
Table 10 Summary of parameters used to model magnet in the simulation model
2.6 Modelling of the sensor
The magnetic sensor used for this experiment is based on the GMR sensor that is commercially
available from NVE†††††. In order to model the capability of the sensor in the transduction of
magnetic to voltage, the sensor response characteristic is obtained from the sensor datasheet (as
presented in Figure 12, page 23). Based on positively coupled magnetic field, multiple data points
were extracted from Figure 12 and tabulated as shown in Table 11. Symmetrical modelling of the
***** http://www.assemtech.co.uk/ ††††† http://www.nve.com/
Nor
mal
ized
Pul
se A
mpl
itude
Diameter, External:6mm; Material:Neodyium Iron Boron; Width, External:2mm;

Page 77
sensor characteristics in the negatively coupled magnetic field is not necessary as the MMSB model
is based on stationary magnet with uni-directional application of magnetic field (i.e. north-south
pole is not changed) and blood is flowing in one direction (i.e. back flow of blood is not modelled).
Applied Field (10-4 T) 0 5 10 15 20 25 30 Voltage (V) 0 0.075 0.15 0.23 0.275 0.285 0.29
Table 11 Table of values used to described the sensor characteristics in the simulation environment
In addition, the magnetizations of the ferromagnetic layers of the GMR sensor are reoriented
relative to one another under the application of an external magnetic field. This reorientation of the
magnetic moments alters both the electronic structure and the scattering of the conduction
electrons in these systems, which causes the change in the resistance. As such, the GMR sensor does
not generate a reactive magnetic field when an external field is applied and the final simulation
environment is setup with the sensor capable of translating magnetic field into potential difference
output (i.e. voltage) without the generation of reactive field.
3 System modelling of iron oxide fluidic flow in a weak magnetic field
The modelling of iron oxide fluidic flow in a weak magnetic field is based on a 2-dimensional
geometry, which includes air, glass tube, permanent magnet and GMR sensor. The model, created in
the multiphysics software COMSOL, will serve to present a 2-dimensional topology used in the
experimental setup to demonstrate MMSB using iron oxide fluidic flow (described in Chapter 2,
section 3.2).
3.1 Modelling the multiphase flow of air and iron oxide fluid
In this model, the glass tube is modelled with two inlets each with a periodic force generating a
pulsatile flow of iron oxide liquid and air. At the junction where the iron oxide liquid and air mix,
turbulence is generated, allowing pockets of air bubbles and iron fluid to be formed as shown in
Figure 57. Using this model with sensor and coupling equations to be described in Section 2 of this
chapter, the simulation was done using varying concentration of iron fluid with simulated output
voltage as shown in Table 12.
Comparing simulated and measured results, the difference is found to be less than 3mV. The error
can be attributed to the estimation of measured voltage, height of magnet and sensor to the glass
tube and concentration of iron oxide used.
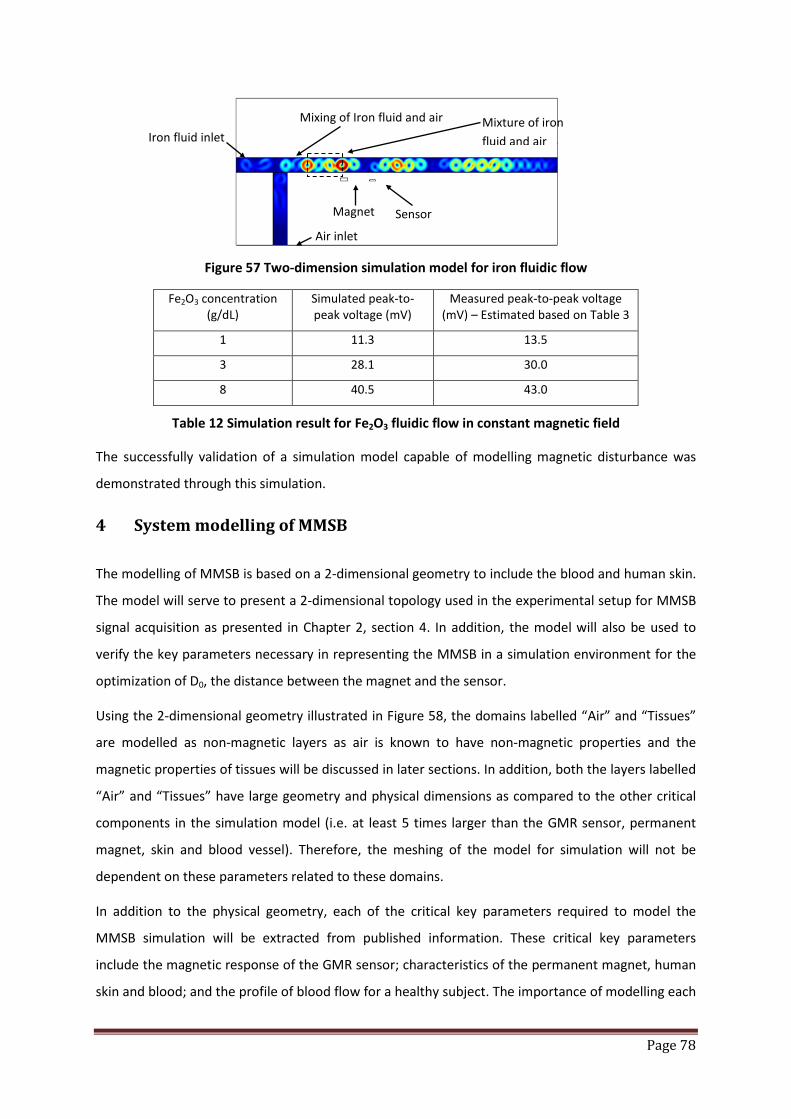
Page 78
Figure 57 Two-dimension simulation model for iron fluidic flow
Fe2O3 concentration (g/dL)
Simulated peak-to-peak voltage (mV)
Measured peak-to-peak voltage (mV) – Estimated based on Table 3
1 11.3 13.5
3 28.1 30.0
8 40.5 43.0
Table 12 Simulation result for Fe2O3 fluidic flow in constant magnetic field
The successfully validation of a simulation model capable of modelling magnetic disturbance was
demonstrated through this simulation.
4 System modelling of MMSB
The modelling of MMSB is based on a 2-dimensional geometry to include the blood and human skin.
The model will serve to present a 2-dimensional topology used in the experimental setup for MMSB
signal acquisition as presented in Chapter 2, section 4. In addition, the model will also be used to
verify the key parameters necessary in representing the MMSB in a simulation environment for the
optimization of D0, the distance between the magnet and the sensor.
Using the 2-dimensional geometry illustrated in Figure 58, the domains labelled “Air” and “Tissues”
are modelled as non-magnetic layers as air is known to have non-magnetic properties and the
magnetic properties of tissues will be discussed in later sections. In addition, both the layers labelled
“Air” and “Tissues” have large geometry and physical dimensions as compared to the other critical
components in the simulation model (i.e. at least 5 times larger than the GMR sensor, permanent
magnet, skin and blood vessel). Therefore, the meshing of the model for simulation will not be
dependent on these parameters related to these domains.
In addition to the physical geometry, each of the critical key parameters required to model the
MMSB simulation will be extracted from published information. These critical key parameters
include the magnetic response of the GMR sensor; characteristics of the permanent magnet, human
skin and blood; and the profile of blood flow for a healthy subject. The importance of modelling each
Magnet Sensor
Iron fluid inlet
Air inlet
Mixing of Iron fluid and air Mixture of iron fluid and air

Page 79
of these key parameters will be discussed in the following sections, where values for each parameter
will be extracted or substantiated using published results.
Figure 58 Illustration of the 2-dimensional simulation model geometry
4.1 Modelling the characteristics of human blood
Blood is composed of fluid plasma, formed elements, and other elements either being carried to or
away from cells. Blood plasma is a liquid that serves as the extracellular environment for all the cells
in the body. Total volume and concentration of plasma is important in the regulation of blood
pressure. The sodium ion is the major solute in plasma, and its concentration is what determines the
amount of plasma water, and thus blood volume.
The formed elements of the blood are erythrocytes, leukocytes, and platelets. Erythrocytes, or red
blood cells (RBCs), are flattened discs with a depressed centre, about 2.5 µm thick and 7.5 µm wide
[20]. The depressed centre provides increased surface area for the diffusion of gases. RBCs contain
no nuclei or mitochondria, but they do contain the ferromagnetic particle, haemoglobin. It is the
haemoglobin which binds to oxygen and allows the RBCs to transport oxygen to cells. As such, the
magnetic property of blood is primarily formed by the haemoglobin, a form of iron oxides, which is
present at a uniquely high concentration in the mature RBCs, while its magnetic property is affected
by factors such as the state of oxygenation [21].
Therefore, blood is usually referred as the most characteristics type of biomagnetic fluid that exists
in a living creature and its flow is influenced by the presence of a magnetic field. As such, in order to
model blood flow in the presence of a weakly coupled magnetic field, the key magnetic parameters
required are the magnetic susceptibility and permeability of blood and ferrofluidic mass content. In

Page 80
addition, the conductivity, viscosity and density of the blood are also key physical parameters
necessary in modelling of physical resistance to blood flow under the influence of an applied
magnetic field. As such, this section will present the research done in the extraction and
substantiation of these parameters through published results.
4.1.1 Magnetic properties of blood
Blood can be considered as a magnetic fluid because the red blood cell contains haemoglobin
molecules, which is a form of iron oxides. About 30% of the red blood cell is haemoglobin. In each
litre, a healthy human blood contains 3.5 x 10¹² red blood cells, 4-10 x 109 white blood cells. [22]. In
diseased blood the ratio of red blood cells to platelets can be much larger than 30:1.
The measure of the extent to which a material is susceptible to induce magnetization is called the
magnetic susceptibility. The magnetic susceptibility is also the measure to distinguish between the
types of magnetized materials. Generally speaking, a material is ferromagnetic, ferromagnetic or
paramagnetic if it is attracted by a magnetic and is diamagnetic if it is repelled. Due to the difference
in oxygen content in the blood, blood is reported to possess the property of diamagnetic material
when oxygenated and paramagnetic when deoxygenated [23]. Measurements had been performed
to estimate the magnetic susceptibility of blood and there are published reports measuring the
magnetic susceptibility of blood to be 3.5x10⁻⁶ (i.e. weakly paramagnetic) and −6.6x10⁻⁷ (i.e.
diamagnetic) for the venous and arterial blood respectively [14][24].
The ferrofluidic content of blood is typically referred to the amount of nanometer sized pieces of
iron or various iron oxides, suspended in a liquid. In blood, the red blood cells are packed with
haemoglobin and acts as the ferrofluidic content of blood. Red blood cells dominate the particular
matter in blood, occupying on average about 40-45 per cent by volume of the whole blood. The
percentage of red blood cells is normally given in terms of haematocrit or packed cell volume. It
varies with the number and size of the red cells in the blood. The haematocrit can be defined as the
volume percentage of red blood cells in the whole blood. It has been reported that the normal HCT
for men 42-54% and for women, it is 38%-46% [34]. As such, the value of 0.4 is assigned to the
parameter k_ff (or ferrofluid mass fraction in blood stream) for this model.
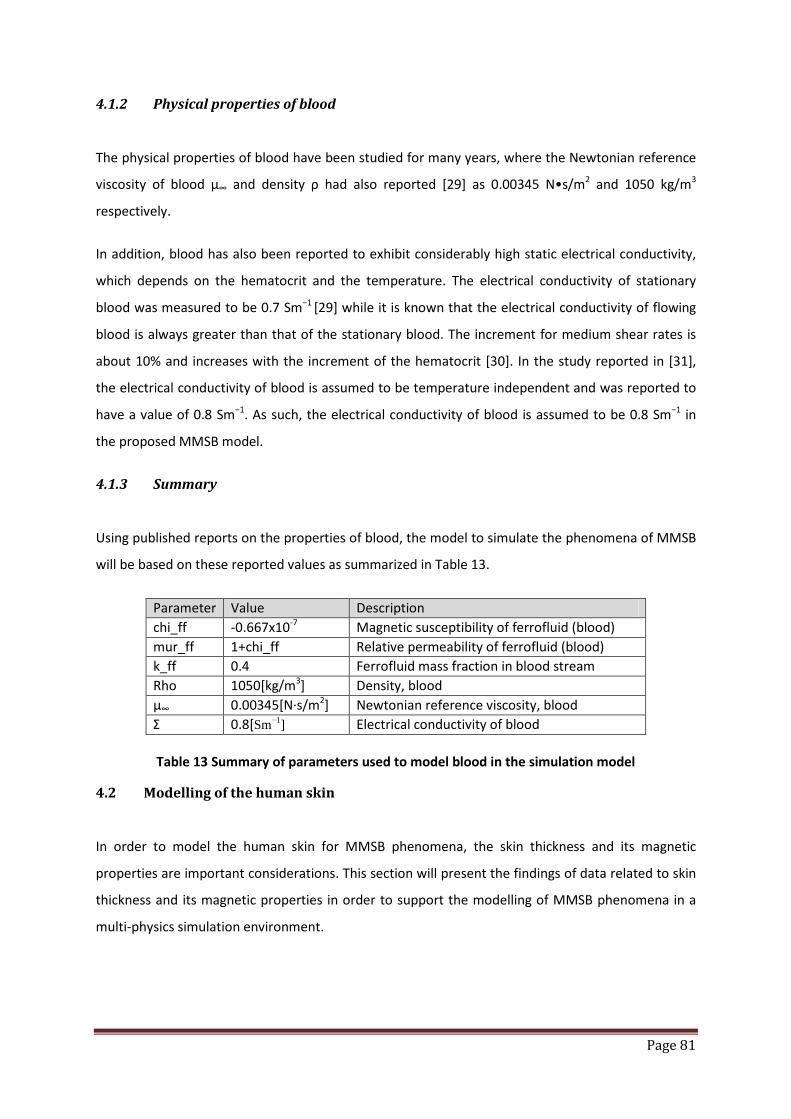
Page 81
4.1.2 Physical properties of blood
The physical properties of blood have been studied for many years, where the Newtonian reference
viscosity of blood μ∞ and density ρ had also reported [29] as 0.00345 N•s/m2 and 1050 kg/m3
respectively.
In addition, blood has also been reported to exhibit considerably high static electrical conductivity,
which depends on the hematocrit and the temperature. The electrical conductivity of stationary
blood was measured to be 0.7 Sm−1 [29] while it is known that the electrical conductivity of flowing
blood is always greater than that of the stationary blood. The increment for medium shear rates is
about 10% and increases with the increment of the hematocrit [30]. In the study reported in [31],
the electrical conductivity of blood is assumed to be temperature independent and was reported to
have a value of 0.8 Sm−1. As such, the electrical conductivity of blood is assumed to be 0.8 Sm−1 in
the proposed MMSB model.
4.1.3 Summary
Using published reports on the properties of blood, the model to simulate the phenomena of MMSB
will be based on these reported values as summarized in Table 13.
Parameter Value Description chi_ff -0.667x10⁻⁷ Magnetic susceptibility of ferrofluid (blood) mur_ff 1+chi_ff Relative permeability of ferrofluid (blood) k_ff 0.4 Ferrofluid mass fraction in blood stream Rho 1050[kg/m3] Density, blood μ∞ 0.00345[N·s/m2] Newtonian reference viscosity, blood Σ 0.8[Sm−1] Electrical conductivity of blood
Table 13 Summary of parameters used to model blood in the simulation model
4.2 Modelling of the human skin
In order to model the human skin for MMSB phenomena, the skin thickness and its magnetic
properties are important considerations. This section will present the findings of data related to skin
thickness and its magnetic properties in order to support the modelling of MMSB phenomena in a
multi-physics simulation environment.

Page 82
4.2.1 Skin thickness on the wrist
Standard skin thickness measurements are meant to describe the thickness of the epidermis and
dermis. These layers are firmly adhered between the papillary layers of the dermis and strum
germinativum of the epidermis. The thickness varies from 0.5 – 4mm. Skin is generally divided in
terms of thickness into thin skin and thick skin. Thick skin is found on the palms of the hand and
soles of the feet (4mm) with thin skin covering the remainder of the body, thinnest skin is eyelid
0.5mm. The variations in skin thickness within the body are due almost entirely to the variation in
thickness of the dermis with the dermis of the extensor surfaces (back of the forearm – posterior
surface) generally being thicker than the flexor surfaces (front of the forearm anterior surface).
According to several authors (example: Becker 1939; Southwood 1955), the thickness of the skin on
the palmer forearm varies from 1.2 – 1.7mm [35]. However, the skin on the wrist should be slightly
thinner as we move away from the palm towards the arm. Therefore, in order to account for the
deviation of the skin thickness reported on the palmer forearm and the wrist, the thickness of the
skin layer used for modelling of MMSB will be based on 1mm.
4.2.2 Magnetic properties of the skin
It has been reported [36],[37] for DC magnetic (H) field, the magnetic permeability µ of most
biological materials is practically equal to the magnetic permeability µo of free space. However, time-
varying H field may interact with living organisms and slightly modify this property.
Since MMSB signal variation is primarily based on the position of a permanent magnet with close
proximity to the blood vessel and GMR sensor, the applied field is a stationary H field and the human
skin will be modelled with the magnetic permeability of free space, µo (i.e. 4πx10-7 H/m).

Page 83
5 Coupling between ferro-fluidic volume force equation with applied magnetic field
Magnetic transport of red blood cell in the vascular system is governed by several factors including
(a) the magnetic force, (b) viscous drag, (c) red blood cells interactions, (d) inertia, (e) buoyancy, (f)
gravity, (g) thermal kinetics (Brownian motion), (h) red blood cells / bio-fluid interactions
(perturbations to the flow field), and (i) inter-red blood cell effects such as magnetic dipole
interactions. In this section, it is assumed that the dominant factors are magnetic and viscous forces,
which will be taken into account to explain the coupling between ferro-fluidic volume force and
magnetization force in COMSOL simulation.
The induced magnetization of a ferro-fluid in the x and y axes had been derived in Equation 56. Using
the magnetization Mx as an example, it can be observed that a red blood cell moving in the x-axis will
induce a magnetization of 𝑀𝑥 = 𝜒𝜇0
𝜕𝐴𝑧𝜕𝑦
. As such, the magnetic field generated by the red blood cell
will produce a magnetic field that is dependent on the magnetic field Az, which is applied
perpendicularly to the direction of blood flow using the permanent magnet.
To model the movement of the red blood cell under the ferro-fluidic volume force, Equation 57 is
derived. Each of these ferromagnetic red blood cell will experience the ferro-fluidic volume force in
the x-axis 𝐹𝑥 = 𝜒𝜇𝑟𝜇𝑜2
𝜕𝐴𝑧𝜕𝑥
𝜕2𝐴𝑧𝜕𝑦2
+ 𝜕𝐴𝑧𝜕𝑦
𝜕2𝐴𝑧𝜕𝑦𝜕𝑥
, which is a function of the applied magnetic field and the
displacement in the blood vessel.
The rate of displacement for the red blood cell into the blood vessel is modelled by Equation 59,
which defines the inlet pressure. The distribution of the red blood cell in the blood vessel will follow
the Navier-Stroke Equation 58, which models the velocity and pressure fields in the blood stream
under no-slip and non-turbulence condition.
Coupling Equation 59, Equation 58, Equation 57 and Equation 56 in COMSOL for simulation, the
magnetization is solved for each time step, where the ferromagnetic red blood cell is displaced into
the blood vessel, generating a measurable magnetic disturbance at the sensor location through the
magnetization vector, as a result of the applied perpendicular magnetic field by the permanent
magnet. The simulated result from COMSOL, based on these coupling, will be described in the
section 6 of this chapter.

Page 84
6 Numerical solutions of 2D model for MMSB simulations
In order to simulate the model created in COMSOL, a numerical solution is required where non-
linear meshing of the model is necessary to provide the resolution at the location near the sensor
and magnetic while most of the other parts of the model can be meshed using larger meshing
dimensions. This can be achieved using the triangular meshing element, or the equivalent of
tetrahedral edge elements for 3-D models.
The triangular meshing element is selected for its ease of convergence [43] and ability to achieve
non-linear meshing of the gaseous (air), solid (skin and tissues) and liquid (blood) domains with
magnetic coupling. In addition, it has been reported in [44], that the numerical dispersion error is
very low for meshes composed of well-shaped tetrahedral edge elements in electromagnetic
modelling using the finite-element method. Therefore, using the non-linear triangular meshing
element, the 2-D model of Figure 58 is meshed as shown in Figure 59 and Figure 60.
Figure 59 Meshing results for 2D MMSB model using multi-physics simulation software COMSOL
Magnet Sensor
Detailed view of mesh in Figure 59
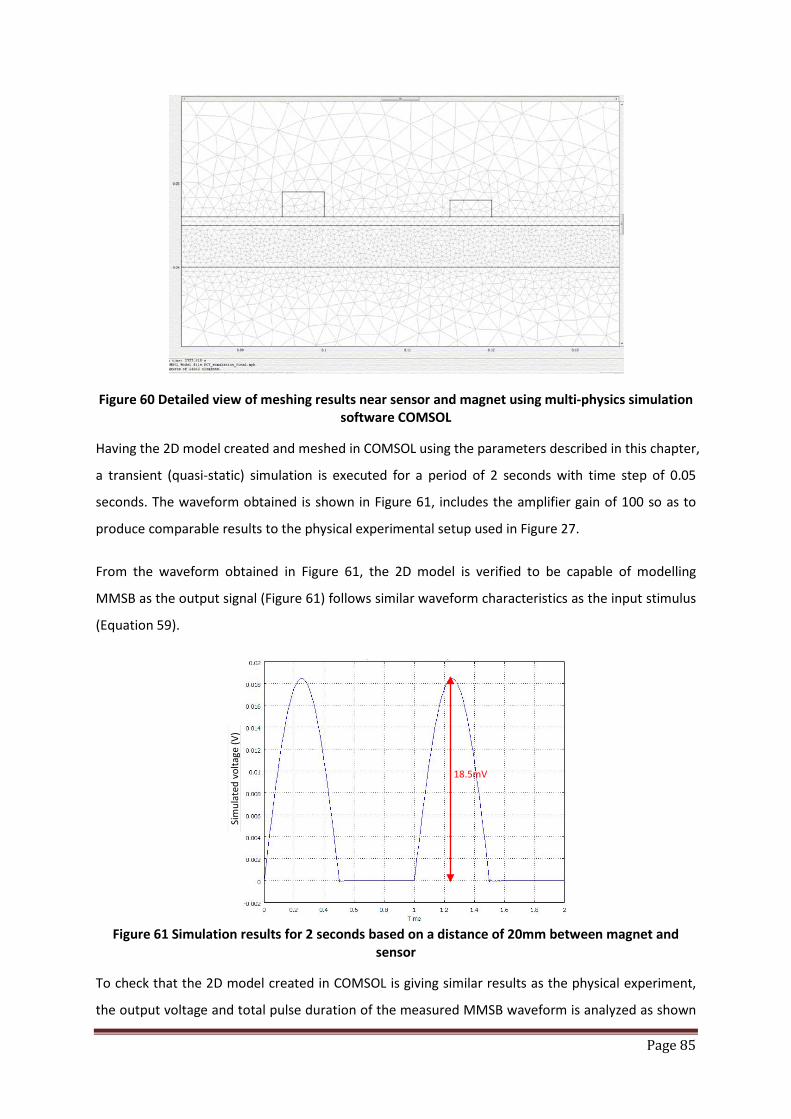
Page 85
Figure 60 Detailed view of meshing results near sensor and magnet using multi-physics simulation software COMSOL
Having the 2D model created and meshed in COMSOL using the parameters described in this chapter,
a transient (quasi-static) simulation is executed for a period of 2 seconds with time step of 0.05
seconds. The waveform obtained is shown in Figure 61, includes the amplifier gain of 100 so as to
produce comparable results to the physical experimental setup used in Figure 27.
From the waveform obtained in Figure 61, the 2D model is verified to be capable of modelling
MMSB as the output signal (Figure 61) follows similar waveform characteristics as the input stimulus
(Equation 59).
Figure 61 Simulation results for 2 seconds based on a distance of 20mm between magnet and
sensor
To check that the 2D model created in COMSOL is giving similar results as the physical experiment,
the output voltage and total pulse duration of the measured MMSB waveform is analyzed as shown
Sim
ulat
ed v
olta
ge (V
)
18.5mV
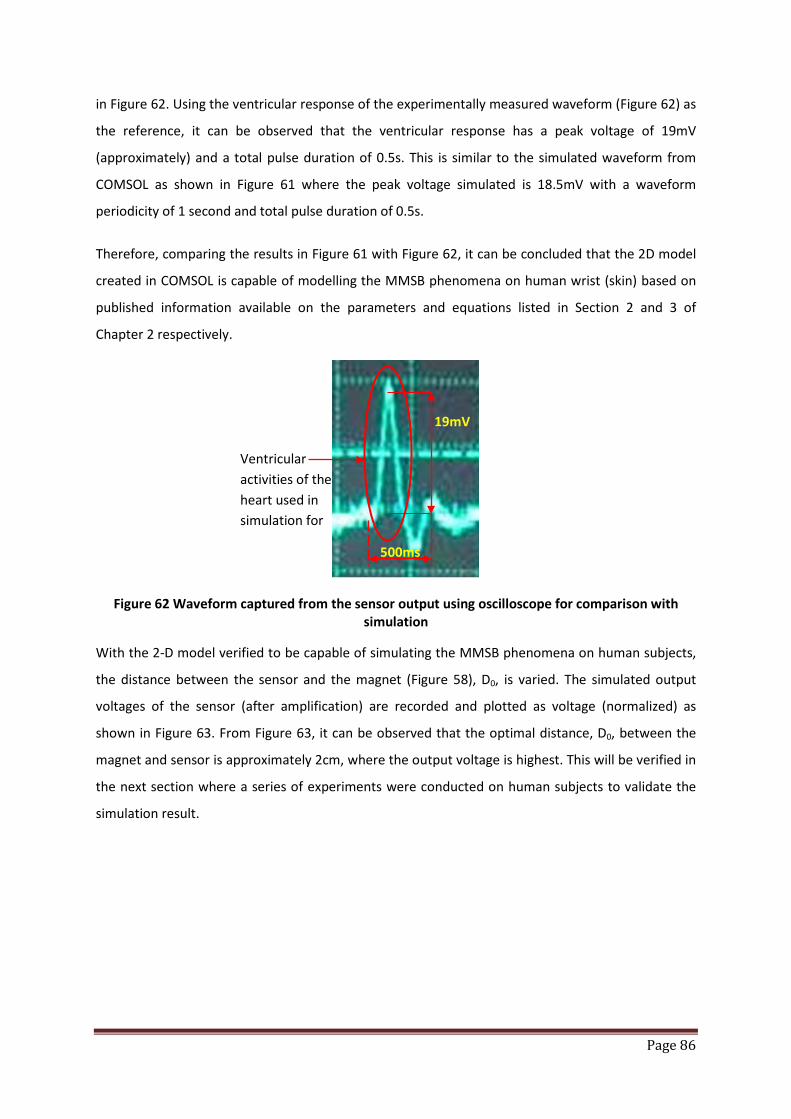
Page 86
in Figure 62. Using the ventricular response of the experimentally measured waveform (Figure 62) as
the reference, it can be observed that the ventricular response has a peak voltage of 19mV
(approximately) and a total pulse duration of 0.5s. This is similar to the simulated waveform from
COMSOL as shown in Figure 61 where the peak voltage simulated is 18.5mV with a waveform
periodicity of 1 second and total pulse duration of 0.5s.
Therefore, comparing the results in Figure 61 with Figure 62, it can be concluded that the 2D model
created in COMSOL is capable of modelling the MMSB phenomena on human wrist (skin) based on
published information available on the parameters and equations listed in Section 2 and 3 of
Chapter 2 respectively.
Figure 62 Waveform captured from the sensor output using oscilloscope for comparison with simulation
With the 2-D model verified to be capable of simulating the MMSB phenomena on human subjects,
the distance between the sensor and the magnet (Figure 58), D0, is varied. The simulated output
voltages of the sensor (after amplification) are recorded and plotted as voltage (normalized) as
shown in Figure 63. From Figure 63, it can be observed that the optimal distance, D0, between the
magnet and sensor is approximately 2cm, where the output voltage is highest. This will be verified in
the next section where a series of experiments were conducted on human subjects to validate the
simulation result.
Ventricular activities of the heart used in simulation for
19mV
500ms
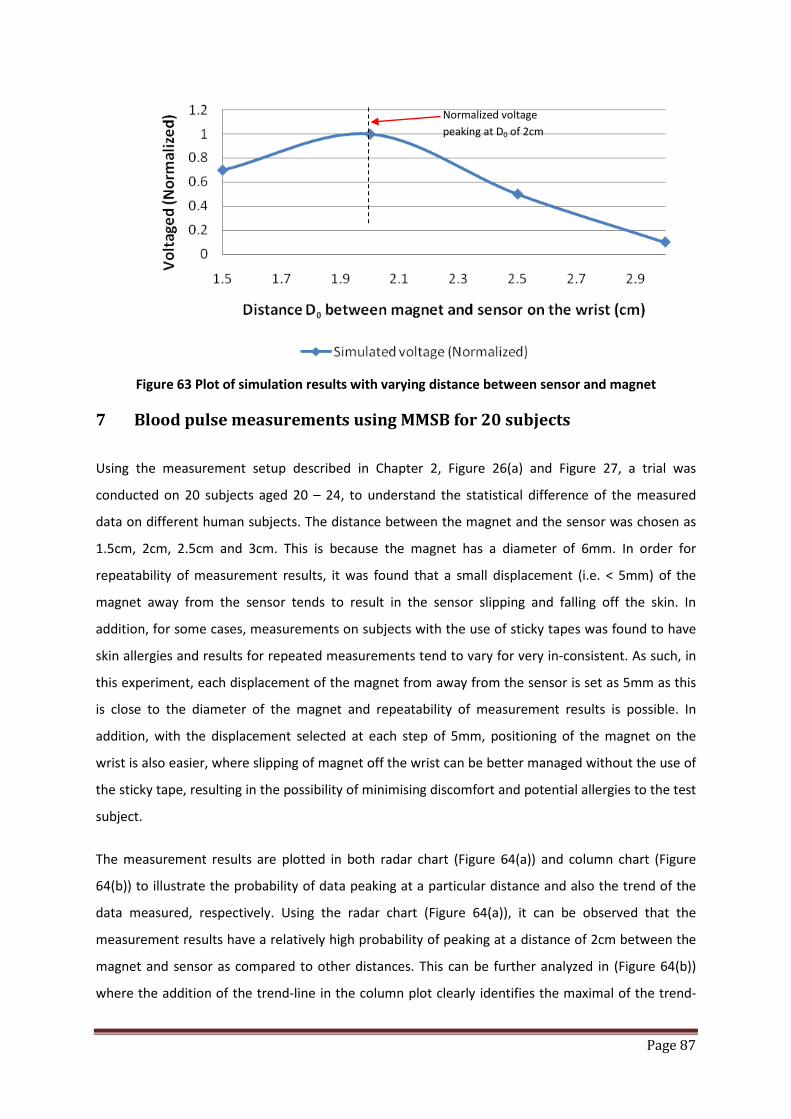
Page 87
Figure 63 Plot of simulation results with varying distance between sensor and magnet
7 Blood pulse measurements using MMSB for 20 subjects
Using the measurement setup described in Chapter 2, Figure 26(a) and Figure 27, a trial was
conducted on 20 subjects aged 20 – 24, to understand the statistical difference of the measured
data on different human subjects. The distance between the magnet and the sensor was chosen as
1.5cm, 2cm, 2.5cm and 3cm. This is because the magnet has a diameter of 6mm. In order for
repeatability of measurement results, it was found that a small displacement (i.e. < 5mm) of the
magnet away from the sensor tends to result in the sensor slipping and falling off the skin. In
addition, for some cases, measurements on subjects with the use of sticky tapes was found to have
skin allergies and results for repeated measurements tend to vary for very in-consistent. As such, in
this experiment, each displacement of the magnet from away from the sensor is set as 5mm as this
is close to the diameter of the magnet and repeatability of measurement results is possible. In
addition, with the displacement selected at each step of 5mm, positioning of the magnet on the
wrist is also easier, where slipping of magnet off the wrist can be better managed without the use of
the sticky tape, resulting in the possibility of minimising discomfort and potential allergies to the test
subject.
The measurement results are plotted in both radar chart (Figure 64(a)) and column chart (Figure
64(b)) to illustrate the probability of data peaking at a particular distance and also the trend of the
data measured, respectively. Using the radar chart (Figure 64(a)), it can be observed that the
measurement results have a relatively high probability of peaking at a distance of 2cm between the
magnet and sensor as compared to other distances. This can be further analyzed in (Figure 64(b))
where the addition of the trend-line in the column plot clearly identifies the maximal of the trend-
Normalized voltage peaking at D0 of 2cm
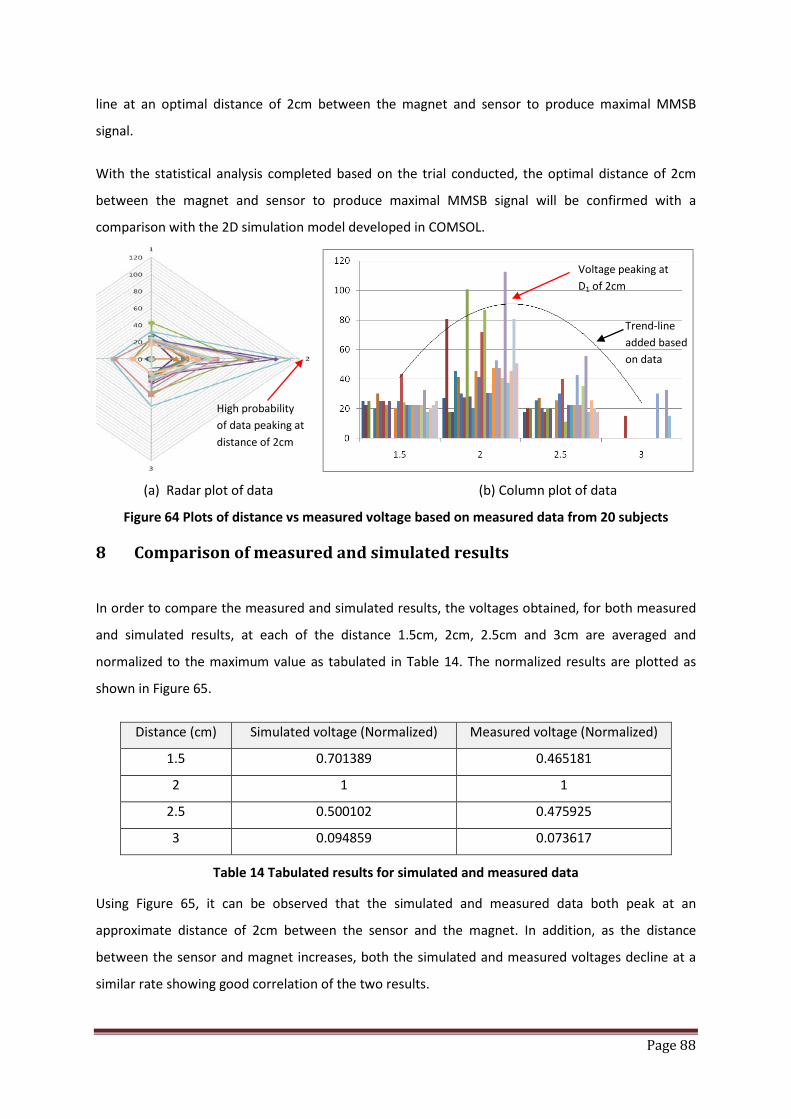
Page 88
line at an optimal distance of 2cm between the magnet and sensor to produce maximal MMSB
signal.
With the statistical analysis completed based on the trial conducted, the optimal distance of 2cm
between the magnet and sensor to produce maximal MMSB signal will be confirmed with a
comparison with the 2D simulation model developed in COMSOL.
(a) Radar plot of data (b) Column plot of data
Figure 64 Plots of distance vs measured voltage based on measured data from 20 subjects
8 Comparison of measured and simulated results
In order to compare the measured and simulated results, the voltages obtained, for both measured
and simulated results, at each of the distance 1.5cm, 2cm, 2.5cm and 3cm are averaged and
normalized to the maximum value as tabulated in Table 14. The normalized results are plotted as
shown in Figure 65.
Distance (cm) Simulated voltage (Normalized) Measured voltage (Normalized)
1.5 0.701389 0.465181
2 1 1
2.5 0.500102 0.475925
3 0.094859 0.073617
Table 14 Tabulated results for simulated and measured data
Using Figure 65, it can be observed that the simulated and measured data both peak at an
approximate distance of 2cm between the sensor and the magnet. In addition, as the distance
between the sensor and magnet increases, both the simulated and measured voltages decline at a
similar rate showing good correlation of the two results.
Trend-line added based on data
Voltage peaking at D1 of 2cm
High probability of data peaking at distance of 2cm

Page 89
However, the measured and simulated results at the distance of 1.5 cm between the sensor and
magnet are not the same. This can be attributed to errors in the measurement setup where at close
proximity between the sensor and magnet, the accuracy in maintaining the smaller distance is lower.
Nevertheless, the results at 1.5cm are still lower than the results at 2cm confirming the optimal
distance between the sensor and magnet is 2cm based on the measurement configurations used.
Figure 65 Comparison of simulated and measured voltage (normalized) with varying distance
between sensor and magnet
9 Conclusions
The simulation model presented in this chapter is based on the MMSB phenomena proposed in this
dissertation. The simulation model is found to be highly correlated with experimental results and it
can be concluded that the simulation model has successfully modelled the MMSB phenomena. Such
a model will allow the sensitivity of the MMSB method to be assessed for different human subjects
and different parts of the body. In addition, the model can also be used to achieve design
optimization of the distance Do, between the sensor and the magnet, so as to achieve robustness in
the physical implementation of MMSB as a wearable device for pulse rate measurements.
With the completion of MMSB modelling in a simulation environment, the next chapter will present
the findings on the applications of MMSB for blood flow. In addition, the blood flow result is verified
using the post-occlusive reactive hyperaemia (PORH) test with an instrument capable of Laser
Doppler Flowmetry.

Page 90
10 References
[1] Akinori Ueno, Yasunao Akabane, Tsuyoshi Kato, Hiroshi Hoshino, Sachiyo Kataoka, Yoji Ishiyama (2007), “Capacitive Sensing of Electrocardiographic Potential Through Cloth from the Dorsal Surface of the Body in a Supine Position: A Preliminary Study”, IEEE Transactions on Biomedical Engineering, Vol. 54, No. 4, April
[2] S. Bowbrick, A. N. Borg. Edinburgh (2006), “ECG complete”, New York, Churchill Livingstone [3] S. M. Burns (2006), “AACN protocols for practice: noninvasive monitoring”, Jones and Bartlett
Publishers [4] Shuhei Yamada, Mingqi Chen, Victor Lubecke (2006), “Sub-uW Signal Power Doppler Radar Heart
Rate Detection”, Proceedings of Asia-Pacific Microwave Conference [5] G. Amit, N. Gavriely, J. Lessick, N. Intrator (2005), “Automatic extraction of physiological features
from vibro-acoustic heart signals : correlation with echo-doppler”, Computers in Cardiology, Issue September 25-28, pp 299-302
[6] J.L. Jacobs, P. Embree, M. Glei, S. Christensen, P.K. Sullivan (2004), “Characterization of a Novel Heart and Respiratory Rate Sensor”, Proceedings of the 26th International Conference of the IEEE EMBS
[7] M.N. Ericson, E.L Ibey, G.L. Cote, J.S. Baba, J.B. Dixon (2002), “In vivo application of a minimally invasive oximetry based perfusion sensor”, Proceedings of the Second Joint EMBS/BMES Conference
[8] Luis Torres-Pereira, Cala Torres-Pereira, Carlos Couto (1997), “A Non-invasive Telemetric Heart Rate Monitoring System based on Phonocadiography”, ISIE’97
[9] J. Kerola, V. Kontra, R. Sepponen (1996), “Non-invasive blood pressure data acquisition employing pulse transit time detection”, Engineering in Medicine and Biology, Vol 3, Issue 31 Oct-3 Nov, pp 1308 – 1309
[10] J.Malmivuo, R. Plonsey (1995), “Bioelectromagnetism – Principles and Applications of Bioelectric and Biomagnetic Fields”, New-York, Oxford University Press
[11] Yasuaki Noguchi, Hideyuki Mamune, Suguru sugimoto, Jun Yoshida, Hidenori Sasa, Hisaaki Kobayashi, Mitsunao Kobayashi (1994), “Measurement characteristics of the ultrasound heart rate monitor”, Engineering in Medicine and Biology Society, Engineering Advances: New Opportunities for Biomedical Engineers. Proceedings of the 16th International Conference of the IEEE Vol. 1, Issue 3-6 Nov Pg 670 - 671
[12] J.R. Singer (1980), “Blood Flow Measurements by NMR of the intact body”, IEEE Transactions on Nuclear Science, Vol. NS-27, No. 3
[13] Hiroshi Kanai, Eiki Yamano, Kiyoshi Nakayama, Naoshige Kawamura, Hiroshi Furuhata (1974), “Transcutaneous Blood Flow Measurement by Electromagnetic Induction”, IEEE Transaction on Biomedical Engineering, Vol. BME-21, No. 2
[14] Haik, Y., Pai, V. and Chen C.J., Development of magnetic device for cell Journal of Magnetism and Magnetic Materials, 194,254-261 (1999).
[15] Ruuge, E. K. and Rusetski, A.N., Magnetic fluid as Drug Carriers: Targeted Transport of Drugs by a Magnetic Field, Journal of Magnetism and Magnetic Materials, 122, 335-339 (1993)
[16] Plavins, J. and Lauva, M., Study of Colloidal Magnetite Binding Erythrocytes: Prospects for Cell Separation, Journal of Magnetism and Magnetic Materials, 122, 349-353 (1993)
[17] Y. Haik, V. Pai, and C. J. Chen (1999), ‘‘Biomagnetic fluid dynamics,’’ in Fluid Dynamics at Interfaces, edited by W. Shyy and R. Narayanan Cambridge University Press, Cambridge, pp. 439–452
[18] B. Wiwatanapataphee, K. Chayantrakom, and Y. H. Wu, “Mathematical Modelling and Numerical Simulation of Fluid-Magnetic Particle Flow in a Small Vessel”, International Journal of Mathematical Models and Methods in Applied Sciences, Issue 3, Volume 1, 2007

Page 91
[19] P. Singh, D. D. Joseph, T. I. Hesla, R. Glowinski, and T. W. Pan, "A distributed Lagrange multiplier/fictitious domain method for viscoelastic particulate flows," J. Non-Newtonian Fluid Mechanic, vol. 91, pp. 165-188, 2000.
[20] Van De Graaff, Kent M., Stuart Ira Fox, Karen M. LaFleur, Synopsis of Human Anatomy and Physiology, Wm. C. Brown Publishers, 1997
[21] T. Higashi, A. Yamagishi, T. Takeuchi, N. Kawaguchi, S. Sagawa, S. Onishi, and M. Date (1993), “Orientation of erythrocytes in a strong static magnetic field,” J. Blood 82, 1328
[22] H. Rapson, The Circulation of Blood, Frederick Muller Limited, 1982 [23] L. Pauling, and C. D. Coryell (1936), “The magnetic properties and structure of hemoglobin,
oxyhemoglobin and carbonmonoxy hemoglobin,” in Proc. Natl. Acad. Sci. U.S.A. 22, 210 [24] Haik, Y., Pai, V. and Chen C.J., Development of magnetic device for cell separation, Journal of
Magnetism and Magnetic Materials, 194,254-261 (1999) [25] Ruuge, E. K. and Rusetski, A.N., Magnetic fluid as Drug Carriers: Targeted Transport of Drugs by a
Magnetic Field, Journal of Magnetism and Magnetic Materials, 122, 335-339 (1993) [26] Plavins, J. and Lauva, M., Study of Colloidal Magnetite Binding Erythrocytes: Prospects for Cell
Separation, Journal of Magnetism and Magnetic Materials, 122, 349-353 (1993) [27] Higashi, T., Y amagishi, A., Takeuchi, T., Kawaguchi, N., Sagawa, S., Onishi, S. and Date, M.,
Orientation of Erythrocytes in a strong static magnetic field, J. Blood, 82(4), 1328-1334 (1993) [28] M. Motta, Y. Haik, A. Gandhari, and C. J. Chen (1998), “High magnetic field effects on human
deoxygenated hemoglobin light absorption,” Bioelectrochem. Bioenerg. 47, 297 [29] Khalil M. Khanafer, Prateek Gadhoke, Ramon Berguer and Joseph L. Bull (2006), “Modelling
pulsatile flow in aortic aneurysms: Effect of non-Newtonian properties of blood”, Biorheology, 43(5): 661-679
[30] R. A. Frewer, “The electrical conductivity of flowing blood,” Biomed. Eng. 9, 552 1974 [31] E. E. Tzirtzilakis, “A mathematical model for blood flow in magnetic field”, Physics of Fluids 17,
2005 [32] S B Baumann, D R Wozny, S K Kelly, F M Meno, ” The electrical conductivity of human
cerebrospinal fluid at body temperature”, IEEE transactions on bio-medical engineering. 01/04/199704/1997; 44(3):220-3.
[33] http://www.lenntech.com/water-conductivity.htm [34] “Hematocrit”, Medically reviewed by William C. Shiel, Jr., MD, FACP, FACR,
http://www.medicinenet.com/hematocrit/article.htm [35] Hans-Martin Schmidt, Ulrich Lanz, “Surgical Anatomy of the Hand”, Published by Thieme, page
9-10 [36] S. Gabriel, R. W. Lau, and C. Gabriel, “The dielectric properties of biological tissues: III.
Parametric models for the dielectric spectrum of tissues,” Phys. Med. Biol. 41 2271 1996 [37] Charles Polk, Elliot Postow, “Handbook of Biological Effects of Electromagnetic Fields”, Published
by CRC Press, page 7 [38] William F. Ganong, “Review of Medical Physiology”, McGraw-Hill Professional, page 582-585 [39] http://www.echoincontext.com/doppler01/doppler01_02.asp [40] P.A. Voltairas, D.I. Fotiadis, and L.K. Michalis (2002), “Hydrodynamics of Magnetic Drug
Targeting,” J. Biomech., vol. 35, pp. 813–821 [41] C.M. Oldenburg, S.E. Borglin, and G.J. Moridis, “Numerical Simulation of Ferrofluid Flow for
Subsurface Environmental Engineering Applications,” Transport in Porous Media, vol. 38, pp. 319–344, 2000
[42] K. H. J. Buschow, “Handbook of magnetic materials”, Chapter 3, pg 147, Published by Elsevier, 1 edition (April 5, 2006), ASIN: B00139BQ8M
[43] Zhimin Zhang and Ahmed Naga, “Natural Superconvergent Points of Equilateral Triangular Finite Elements – A Numerical Example”, http://www.math.wayne.edu/~zzhang/paper/equi-tri.pdf

Page 92
[44] Jo-Yu Wu; Lee, R., “The advantages of triangular and tetrahedral edge elements for electromagnetic modelling with the finite-element method”, Antennas and Propagation, IEEE Transactions on Volume 45, Issue 9, Sep 1997 Page(s):1431 – 1437
Page 93
Chapter 4 Measurement of blood flow using MMSB
1 Introduction
Blood flow refers to the flow of blood in the cardiovascular system and is typically measured by
observing blood flowing through a section of the blood circulatory system. It is a physiological sign
that is dependent on the heart pushing blood into the arteries and the resistance present in the
arteries, which will expand and contract allowing blood to flow.
Blood flowing in the skin is one of such physiological signs, which varies from individual to individual,
is site dependent and is affected by a combination of systemic, local and disease-related factors.
Endothelial function may also be a determinant of skin perfusion. If a decrease of blood flow occurs,
the increase of waste products or decrease of oxygen levels will induce vasodilatation that will
enhance blood flow until the normal situation is reached again. In healthy subjects, their regulation
system is able to increase the blood perfusion at least ten-fold compared to typical resting flow
conditions [1]. However, in the case of patients with Peripheral Arterial Obstructive Disease (PAOD),
the presence of stenosis in proximal arteries will decrease the available pressure at the level of the
arterioles. In this type of cases, distal vasodilatation is an appropriate reaction to prevent an
increased concentration of waste products (i.e. carbon dioxide) and to supply enough oxygen in
order to maintain the necessary metabolic condition.
In order to assess the microvascular function of human, the post-occlusive reactive hyperaemia
(PORH) test using laser Doppler perfusion monitoring has been proposed in [2]. The local blood
perfusion, e.g. at a distal extremity, is measured before, during and after performing arterial
occlusion to record the response upon releasing the occlusion. The measurement is typically
performed by the means of a Laser Doppler Perfusion Monitor (LDPM) and a typical signal output is
illustrated in Figure 66 [3].

Page 94
BZ = biological zero, Occl. = occlusion period, RF = resting flux, MF = maximum flux, HF = half flux decrease between maximum and resting flux, tRF = time of cross point with RF, tHF = time to half
return to resting flux after maximum, measured from time of cuff release
Figure 66 Typical PORH response of a healthy subject [1]
Upon occlusion, a PORH tracing shows that the blood perfusion drops from its resting flux values to
the biological zero (BZ) level [4]. After releasing the cuff the blood perfusion will return to the resting
flux (RF) value with an overshoot. The magnitude and time regime of that overshoot are clinically
relevant diagnostic variables [5][6].
In normal (healthy) cases, immediately after cuff release the flux will quickly rise to a maximum (MF)
followed by a slower decrease to initial (resting flux) values as shown in Figure 67(a) [7]. The reason
for the increased flux after cuff release is mostly the vasodilatation due to the ischemia produced by
the occlusion. Both endothelium-dependent and –independent effects might modulate the degree
of vasodilatation. In the presence of proximal stenosis or obstruction (atherosclerosis), the peak
perfusion value that occurs after occlusion will be relatively lower. In case of critical ischemia, the
maximum vasodilatation has already been reached in the resting period, before occlusion, and the
PORH response will not show a higher response than that resting flux level. Also the increase of flux
after occlusion will be smaller because of the presence of stenosis in the larger arteries, which will
inhibit a rapid refilling of the arterial segments.
The rate of flux increase (tRF) just after cuff release is another important parameter, which is much
lower in the case of PAOD. After the occurrence of the maximum flow, the oxygenation of the tissue
normalizes, and the need for the hyperaemic response vanishes. At that time, the vasodilatation will
decrease and be stabilised back to resting flow (RF) as illustrated in Figure 67(b) [7]. Typical result for
healthy subjects has been reported [2], at the 95% confidence interval for the mean of tRF, was found
tHF
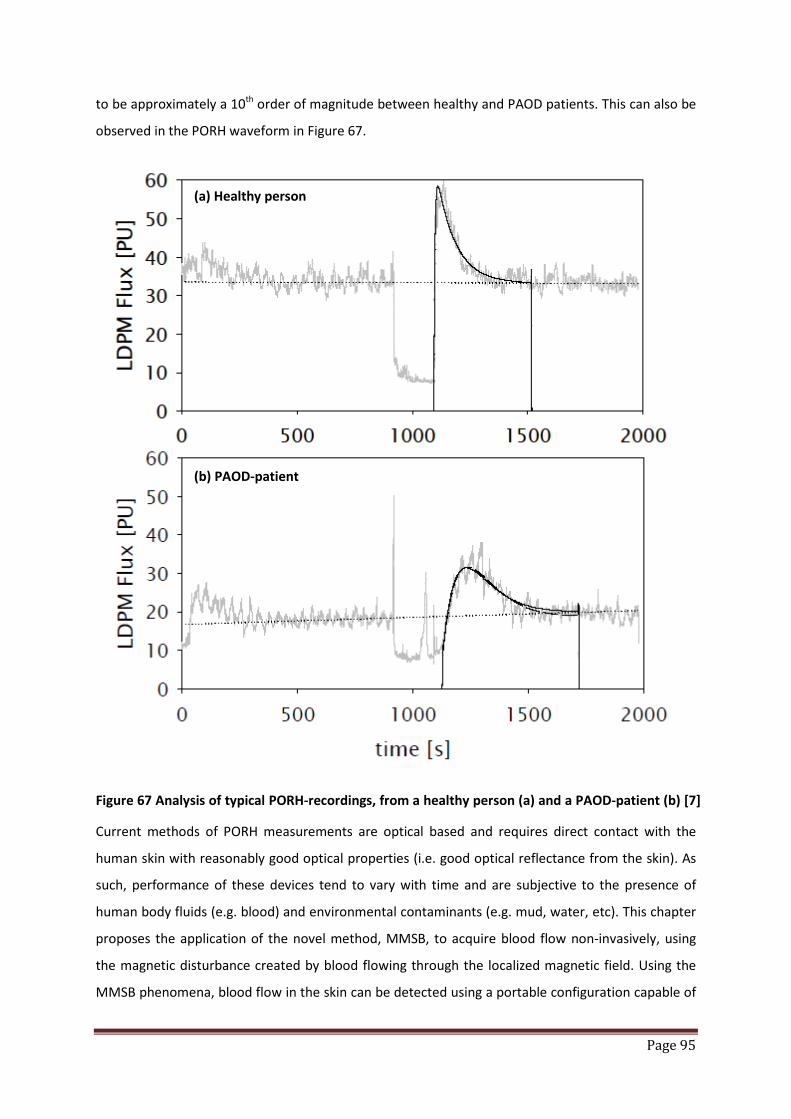
Page 95
to be approximately a 10th order of magnitude between healthy and PAOD patients. This can also be
observed in the PORH waveform in Figure 67.
Figure 67 Analysis of typical PORH-recordings, from a healthy person (a) and a PAOD-patient (b) [7]
Current methods of PORH measurements are optical based and requires direct contact with the
human skin with reasonably good optical properties (i.e. good optical reflectance from the skin). As
such, performance of these devices tend to vary with time and are subjective to the presence of
human body fluids (e.g. blood) and environmental contaminants (e.g. mud, water, etc). This chapter
proposes the application of the novel method, MMSB, to acquire blood flow non-invasively, using
the magnetic disturbance created by blood flowing through the localized magnetic field. Using the
MMSB phenomena, blood flow in the skin can be detected using a portable configuration capable of
(a) Healthy person
(b) PAOD-patient
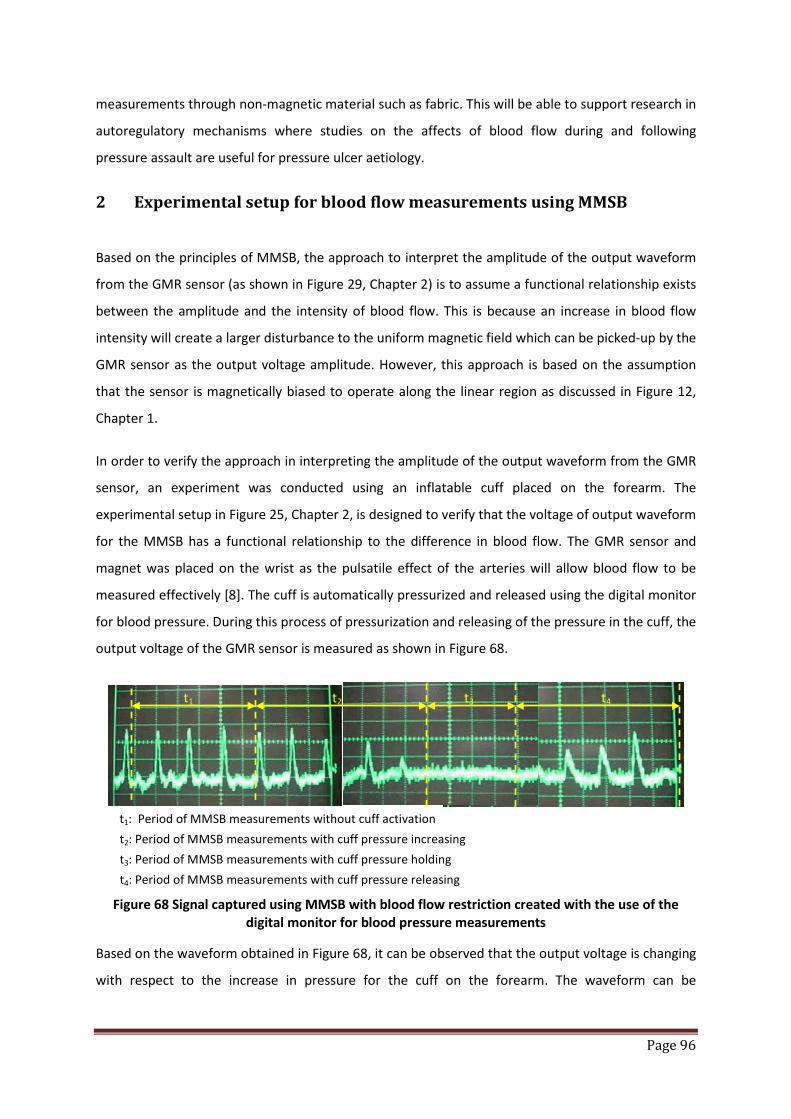
Page 96
measurements through non-magnetic material such as fabric. This will be able to support research in
autoregulatory mechanisms where studies on the affects of blood flow during and following
pressure assault are useful for pressure ulcer aetiology.
2 Experimental setup for blood flow measurements using MMSB
Based on the principles of MMSB, the approach to interpret the amplitude of the output waveform
from the GMR sensor (as shown in Figure 29, Chapter 2) is to assume a functional relationship exists
between the amplitude and the intensity of blood flow. This is because an increase in blood flow
intensity will create a larger disturbance to the uniform magnetic field which can be picked-up by the
GMR sensor as the output voltage amplitude. However, this approach is based on the assumption
that the sensor is magnetically biased to operate along the linear region as discussed in Figure 12,
Chapter 1.
In order to verify the approach in interpreting the amplitude of the output waveform from the GMR
sensor, an experiment was conducted using an inflatable cuff placed on the forearm. The
experimental setup in Figure 25, Chapter 2, is designed to verify that the voltage of output waveform
for the MMSB has a functional relationship to the difference in blood flow. The GMR sensor and
magnet was placed on the wrist as the pulsatile effect of the arteries will allow blood flow to be
measured effectively [8]. The cuff is automatically pressurized and released using the digital monitor
for blood pressure. During this process of pressurization and releasing of the pressure in the cuff, the
output voltage of the GMR sensor is measured as shown in Figure 68.
t1: Period of MMSB measurements without cuff activation t2: Period of MMSB measurements with cuff pressure increasing t3: Period of MMSB measurements with cuff pressure holding t4: Period of MMSB measurements with cuff pressure releasing
Figure 68 Signal captured using MMSB with blood flow restriction created with the use of the digital monitor for blood pressure measurements
Based on the waveform obtained in Figure 68, it can be observed that the output voltage is changing
with respect to the increase in pressure for the cuff on the forearm. The waveform can be
t1 t2 t3 t4

Page 97
segmented into four sections, namely t1, t2, t3 and t4 each signifying a section of the waveform
critical in the analysis of the use of MMSB for blood flow measurements.
During the period of t1, the amplitude of the voltages of each pulse is similar signifying the
consistency of blood flow with no changes of the pressure on the cuff.
However, in the period marked as t2, the pressure in the cuff starts to increase. At the same time, it
can be observed that the pulse amplitude also starts to decrease. This continues till the pressure in
the cuff is sufficient to limit the flow of blood in the arm resulting in a non-measurable output
voltage by the GMR sensor. With this decrease in amplitude due to the increase in pressure in the
cuff, it can be concluded that the decrease in blood flow due to the increase in pressure in the cuff
has resulted in the weakening of the MMSB phenomena resulting in the decrease in the pulse
amplitude measured.
With the cuff pressure increased to its maximum in the period t3, the blood flow will reduce to
minimum resulting in minimal or non-detectable MMSB. This is another conclusive observation that
the MMSB phenomenon is correlated to the blood flow.
Finally, during the period of t4, the pressure on the cuff starts to release and blood starts to flow
again into the forearm and the wrist. With the increase of blood flow due to the release of the
pressure in the cuff, the output voltage for the pulse detected using the MMSB becomes observable
again and is increasing in amplitude with respect to the rate of the pressure release in the cuff.
From this experiment, it can be concluded that the amplitude of the voltage measured from the
GMR sensor using the MMSB phenomena is correlated to the amount of blood flowing in the
arteries in an inversely proportional manner. In order to verify this inverse proportionality, the
following section will enhance the model created in Chapter 3 by including an exponential
decreasing component in the blood flow equation, where the voltage output of the GMR sensor will
be plotted with respect to time.
Upon verification of the correlation between MMSB and blood flow analysis, the rest of Chapter 4
will apply the MMSB and Laser Doppler method for PORH measurements.
3 Simulation of blood flow using MMSB
Using the simulation model created in Chapter 3, the normal inflow velocity model for blood was
described by Equation 59 in Chapter 3. This equation is modified in this section to simulate the

Page 98
change in blood flow due to the application of occlusions through the pressured cuff. The increase in
applied pressure will reduce the blood flow in the lower arm. This phenomenon can be modelled as
a decrease in amplitude of the normal inflow velocity of the blood over time.
In order to describe the reduction of blood flow over time, an exponential decay term is applied to
Equation 59 as shown in Equation 60. The exponential decay term, 𝒆−𝟎.𝟏𝒕, in Equation 60 models the
rate of decay based on the measured MMSB amplitude in Figure 68. The measured MMSB peak
amplitude was observed to decrease at an approximate rate of 10% between each MMSB peak.
Therefore, the inclusion of the exponential decay term will simulate the effect of the pressurized cuff
inflating and thus, reduction in blood flow.
Equation 60 𝑼𝟎 = 𝟒.𝒆−𝟎.𝟏𝒕 𝑼𝒎. 𝒔. (𝟏 − 𝒔). 𝐬𝐢𝐧(𝝎𝒕) + 𝐬𝐢𝐧[(𝝎𝐭)𝟐]
Using Equation 60 as the enhanced blood flow model of Equation 59, the MMSB simulation was
executed for a period of 10 seconds. In this simulation, the output voltage of the GMR sensor was
recorded with respect to time and shown in Figure 69.
From Figure 69, it can be observed that the simulated output voltage of the GMR sensor decreases
in amplitude with time at a proportion of 10% from the previous peak. This is similar to the
measured MMSB waveform in Figure 68 demonstrating the proportional reduction of magnetic
disturbance with respect to an increase in the applied pressure. As such, it can be concluded that the
enhanced blood flow model is capable of simulating the reduction in blood flow due to an externally
applied pressure (e.g. pressurized cuff).
Figure 69 Simulated MMSB output voltage using modified equation for inflow velocity of blood
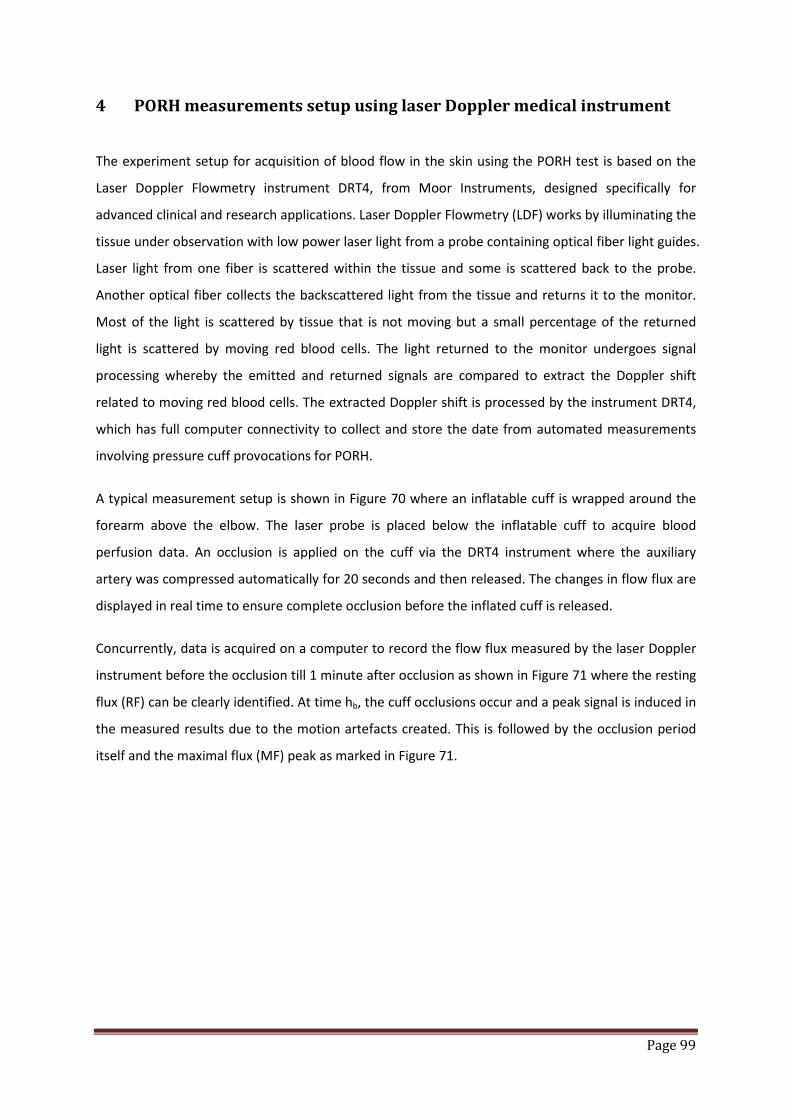
Page 99
4 PORH measurements setup using laser Doppler medical instrument
The experiment setup for acquisition of blood flow in the skin using the PORH test is based on the
Laser Doppler Flowmetry instrument DRT4, from Moor Instruments, designed specifically for
advanced clinical and research applications. Laser Doppler Flowmetry (LDF) works by illuminating the
tissue under observation with low power laser light from a probe containing optical fiber light guides.
Laser light from one fiber is scattered within the tissue and some is scattered back to the probe.
Another optical fiber collects the backscattered light from the tissue and returns it to the monitor.
Most of the light is scattered by tissue that is not moving but a small percentage of the returned
light is scattered by moving red blood cells. The light returned to the monitor undergoes signal
processing whereby the emitted and returned signals are compared to extract the Doppler shift
related to moving red blood cells. The extracted Doppler shift is processed by the instrument DRT4,
which has full computer connectivity to collect and store the date from automated measurements
involving pressure cuff provocations for PORH.
A typical measurement setup is shown in Figure 70 where an inflatable cuff is wrapped around the
forearm above the elbow. The laser probe is placed below the inflatable cuff to acquire blood
perfusion data. An occlusion is applied on the cuff via the DRT4 instrument where the auxiliary
artery was compressed automatically for 20 seconds and then released. The changes in flow flux are
displayed in real time to ensure complete occlusion before the inflated cuff is released.
Concurrently, data is acquired on a computer to record the flow flux measured by the laser Doppler
instrument before the occlusion till 1 minute after occlusion as shown in Figure 71 where the resting
flux (RF) can be clearly identified. At time hb, the cuff occlusions occur and a peak signal is induced in
the measured results due to the motion artefacts created. This is followed by the occlusion period
itself and the maximal flux (MF) peak as marked in Figure 71.

Page 100
Figure 70 Illustrations of typical measurement setup for PORH using DRT4, Moor Instrument
Figure 71 Typical results obtained using the laser Doppler Flowmetry method for PORH measurements
5 PORH measurements setup using MMSB acquired on the wrist
The alternative and new experiment for acquisition of blood flow in the skin utilizes the concept of
placing a magnetic field in the vicinity of the major artery where the blood flowing through the
magnetic field will disturb the magnetic field, thus creating a magnetic disturbance.
Using the optimal distance of 2cm obtained in Chapter 3 for the distance between the magnet and
sensor, the set-up for the PORH measurement is shown in Figure 72. The sensor output is sufficiently
amplified and then connected to an oscilloscope. Data is acquired using the National Instrument
data acquisition card (NI USB-6008) with 12 bit Analog-to-Digital resolution at a sampling rate of 1
kHz using Figure 28 in Chapter 2.
The occlusion is simulated using the pressure cuff from the Moor Instrument DRT4 and concurrent
measurements are done, in-parallel, using MMSB setup and laser Doppler probe as shown in Figure
72. The waveform obtained using the MMSB sensor is shown in Figure 73 where the pulse amplitude
RF
Occul.
MF
Artefacts due to pressure cuff activation
Laser probe
Inflatable cuff
Time
Flux
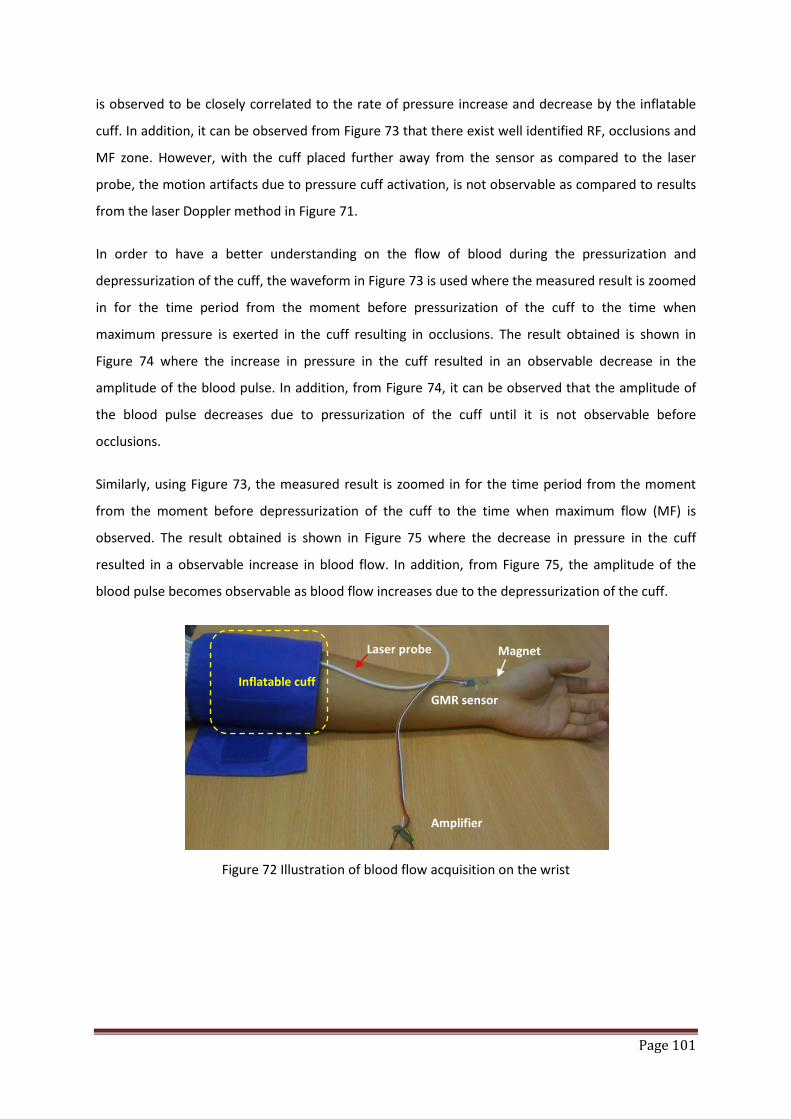
Page 101
is observed to be closely correlated to the rate of pressure increase and decrease by the inflatable
cuff. In addition, it can be observed from Figure 73 that there exist well identified RF, occlusions and
MF zone. However, with the cuff placed further away from the sensor as compared to the laser
probe, the motion artifacts due to pressure cuff activation, is not observable as compared to results
from the laser Doppler method in Figure 71.
In order to have a better understanding on the flow of blood during the pressurization and
depressurization of the cuff, the waveform in Figure 73 is used where the measured result is zoomed
in for the time period from the moment before pressurization of the cuff to the time when
maximum pressure is exerted in the cuff resulting in occlusions. The result obtained is shown in
Figure 74 where the increase in pressure in the cuff resulted in an observable decrease in the
amplitude of the blood pulse. In addition, from Figure 74, it can be observed that the amplitude of
the blood pulse decreases due to pressurization of the cuff until it is not observable before
occlusions.
Similarly, using Figure 73, the measured result is zoomed in for the time period from the moment
from the moment before depressurization of the cuff to the time when maximum flow (MF) is
observed. The result obtained is shown in Figure 75 where the decrease in pressure in the cuff
resulted in a observable increase in blood flow. In addition, from Figure 75, the amplitude of the
blood pulse becomes observable as blood flow increases due to the depressurization of the cuff.
Figure 72 Illustration of blood flow acquisition on the wrist
Laser probe
Inflatable cuff GMR sensor
Magnet
Amplifier
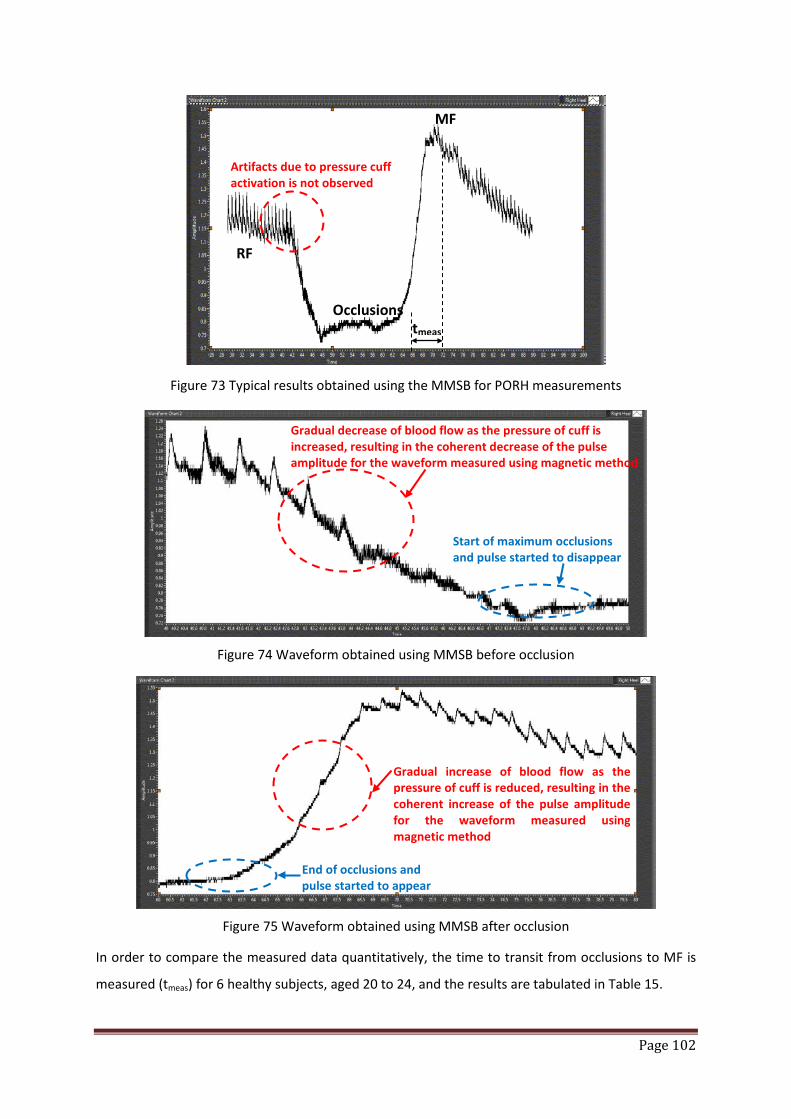
Page 102
Figure 73 Typical results obtained using the MMSB for PORH measurements
Figure 74 Waveform obtained using MMSB before occlusion
Figure 75 Waveform obtained using MMSB after occlusion
In order to compare the measured data quantitatively, the time to transit from occlusions to MF is
measured (tmeas) for 6 healthy subjects, aged 20 to 24, and the results are tabulated in Table 15.
RF
Occlusions
MF
Artifacts due to pressure cuff activation is not observed
tmeas
Gradual increase of blood flow as the pressure of cuff is reduced, resulting in the coherent increase of the pulse amplitude for the waveform measured using magnetic method
End of occlusions and pulse started to appear
Start of maximum occlusions and pulse started to disappear
Gradual decrease of blood flow as the pressure of cuff is increased, resulting in the coherent decrease of the pulse amplitude for the waveform measured using magnetic method

Page 103
Based on the tabulated results, it can be observed that the measurements of PORH using MMSB are
similar as those using the DRT4 instrument with less than 5% difference between the two measured
values.
DRT4 (Estimated) MMSB (Actual) % difference
Subject 1 5 sec 5.2 sec 4.00%
Subject 2 6 sec 6.1 sec 1.67%
Subject 3 5 sec 5.2 sec 4.00%
Subject 4 3 sec 3.1sec 3.33%
Subject 5 4 sec 4.1 sec 2.50%
Subject 6 5 sec 5.1 sec 2.00%
Table 15 Comparison of transit time from occlusions to MF for PORH measurements using MMSB and Moor’s Instrument, DRT4
6 Discussions of results
From the waveform obtained using MMSB for PORH, Figure 73, it can be observed that the occlusion
period has no observable pulse waveform as blood flow is largely reduced resulting in non-
observable magnetic disturbance. However, as the inflatable cuff releases its pressure at the end of
the occlusion period, blood starts to flow with flow-rate relative to the rate of pressure released by
the inflatable cuff. Therefore, the amplitude of the measured magnetic disturbance also increases
with respect to the flow-rate. Therefore, from this experiment, it can be shown that MMSB is
capable in measuring the changes in blood flow due to occlusion.
The experimental results obtained for PORH measurement using MMSB and laser Doppler are
shown in Figure 71 and Figure 73 respectively. The similarity in the waveform characteristics in both
figures for RF, occlusions and MF demonstrates the successful application of the MMSB method to
acquire PORH data. This can be further compared using Figure 76 where both the MMSB and Laser
Doppler data are normalized and plotted together. As shown, the characteristics response of a
typical PORH measurement can be observed.
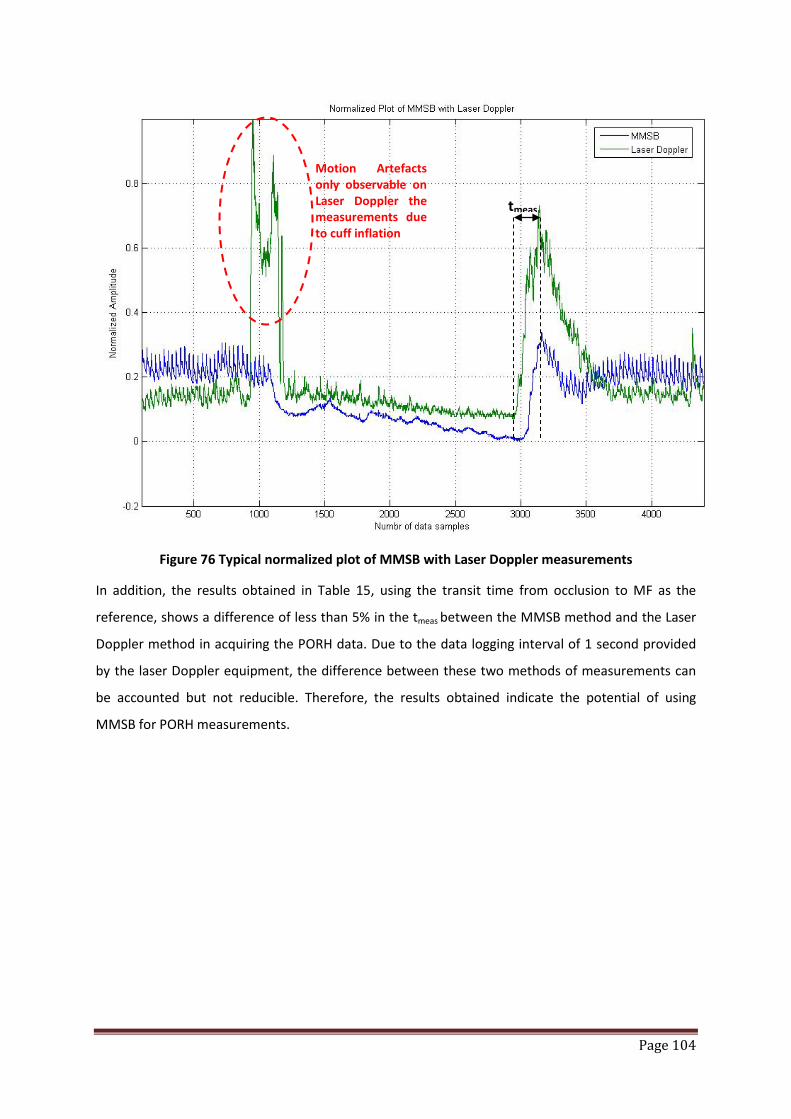
Page 104
Figure 76 Typical normalized plot of MMSB with Laser Doppler measurements
In addition, the results obtained in Table 15, using the transit time from occlusion to MF as the
reference, shows a difference of less than 5% in the tmeas between the MMSB method and the Laser
Doppler method in acquiring the PORH data. Due to the data logging interval of 1 second provided
by the laser Doppler equipment, the difference between these two methods of measurements can
be accounted but not reducible. Therefore, the results obtained indicate the potential of using
MMSB for PORH measurements.
tmeas
Motion Artefacts only observable on Laser Doppler the measurements due to cuff inflation
Page 105
7 Conclusions
The application of MMSB to acquire blood flow in the skin through the measurement on the change
in amplitude of pulse signal at the end of the occlusion period is successfully demonstrated.
In addition, the PORH test has further supported the accuracy of MMSB through qualitative and
quantitative analysis.
For qualitative analysis, the waveform obtained shows highly correlated results between laser
Doppler and MMSB methods for signal acquisition of blood flow in the skin, where RF, occlusion and
MF are clearly identified.
For quantitative analysis, the measured transit time from occlusions to MF for PORH measurements
using MMSB and DRT4 for six healthy subjects have also proven the accuracy and reliability of the
MMSB method for PORH measurements.
In conclusion, the application of MMSB for PORH measurements has proven to be a reliable and low
cost approach in achieving PORH measurements. In addition, the benefit of non-invasive PORH
measurement using MMSB method can provide useful alternative to clinical applications where
good optical contact is not possible.
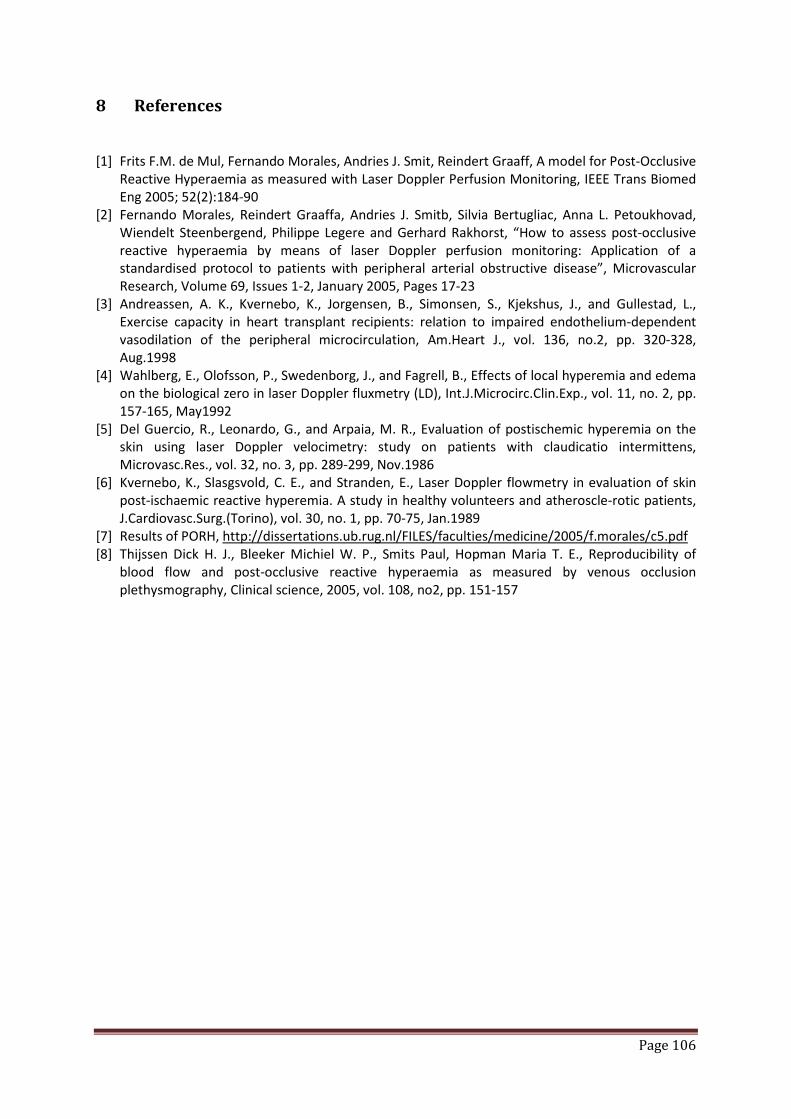
Page 106
8 References
[1] Frits F.M. de Mul, Fernando Morales, Andries J. Smit, Reindert Graaff, A model for Post-Occlusive Reactive Hyperaemia as measured with Laser Doppler Perfusion Monitoring, IEEE Trans Biomed Eng 2005; 52(2):184-90
[2] Fernando Morales, Reindert Graaffa, Andries J. Smitb, Silvia Bertugliac, Anna L. Petoukhovad, Wiendelt Steenbergend, Philippe Legere and Gerhard Rakhorst, “How to assess post-occlusive reactive hyperaemia by means of laser Doppler perfusion monitoring: Application of a standardised protocol to patients with peripheral arterial obstructive disease”, Microvascular Research, Volume 69, Issues 1-2, January 2005, Pages 17-23
[3] Andreassen, A. K., Kvernebo, K., Jorgensen, B., Simonsen, S., Kjekshus, J., and Gullestad, L., Exercise capacity in heart transplant recipients: relation to impaired endothelium-dependent vasodilation of the peripheral microcirculation, Am.Heart J., vol. 136, no.2, pp. 320-328, Aug.1998
[4] Wahlberg, E., Olofsson, P., Swedenborg, J., and Fagrell, B., Effects of local hyperemia and edema on the biological zero in laser Doppler fluxmetry (LD), Int.J.Microcirc.Clin.Exp., vol. 11, no. 2, pp. 157-165, May1992
[5] Del Guercio, R., Leonardo, G., and Arpaia, M. R., Evaluation of postischemic hyperemia on the skin using laser Doppler velocimetry: study on patients with claudicatio intermittens, Microvasc.Res., vol. 32, no. 3, pp. 289-299, Nov.1986
[6] Kvernebo, K., Slasgsvold, C. E., and Stranden, E., Laser Doppler flowmetry in evaluation of skin post-ischaemic reactive hyperemia. A study in healthy volunteers and atheroscle-rotic patients, J.Cardiovasc.Surg.(Torino), vol. 30, no. 1, pp. 70-75, Jan.1989
[7] Results of PORH, http://dissertations.ub.rug.nl/FILES/faculties/medicine/2005/f.morales/c5.pdf [8] Thijssen Dick H. J., Bleeker Michiel W. P., Smits Paul, Hopman Maria T. E., Reproducibility of
blood flow and post-occlusive reactive hyperaemia as measured by venous occlusion plethysmography, Clinical science, 2005, vol. 108, no2, pp. 151-157

Page 107
Chapter 5: Measurement of blood pulse transit time using MMSB
1 Introduction
Use of cardiovascular pulsation, or commonly named as blood pulse, as one of the traditional
indicators on the condition of the human body can diagnose different types cardiovascular diseases
depending on the shape, amplitude and rhythm of this pulsation. Some of the possible diseases
which can be diagnosed from different types of cardiovascular pulsation are listed in Table 16 [1]. A
more detailed description of pulse shapes and the causes for abnormal pulse shapes are also listed
in [2]. Factors that affect cardiovascular pulsation are the stroke volume of the heart, the
compliance of the cardiovascular network and the character of the systolic heart ejection [1].
Different types of abnormal cardiovascular pulses are illustrated in Figure 77. From this, a sensor or
sensing method that can detect the pulse, measure the pulse shape and the pulse transit time
accurately; and further evaluate the elastic properties of the arterial wall, has great potential in
medical and lifestyle applications.
Pulse Type Physiological cause Possible disease
Small and weak Decreased stroke volume
Increased peripheral resistance
Heart failure, hypovolemia, severe aortic stenosis
Large and bounding Increased stroke volume
Decreased peripheral resistance
Decreased compliance
Fever, anaemia, hyperthyroidism, aortic regurgitation, bradycardia,
heart block, atherosclerosis
Bisferiens Increased internal pulse with double systolic peak
Aortic regurgitation, aortic stenosis and regurgitation, hypertropic
cardiomyopathy
Pulsus alternans Pulse amplitude varies from peak to peak, rhythms basically regular
Left ventricular failure
Table 16 Possible diseases which can be diagnosed based on the different types of cardiovascular pulse shapes [1]

Page 108
Figure 77 Different types of cardiovascular pulse shapes [1]
To study the cardiovascular pulsation, blood pressure is one of the widely used indicators in both
medical and lifestyle applications. With the increase in popularity of blood pressure measurement
devices in the last decade, prices of these measurement devices have sunk to an appropriate level
for ordinary consumers. The incorporation of automatic measurement features and ease of use have
also contributed to the growing popularity of blood pressure measurement devices as a lifestyle
devices. However, such measurement devices are typically cuff based and rely on indirect Blood
Pressure (BP) measuring method using the detection of Korotkov-sounds [3]. This method had been
used for more than 100 years and has two major deficiencies. First, the cuff grossly intervene the
measured parameter and second, it determines the pressure only at a single point of time.
Oscillometric method [4], applied in automatic home BP-meters, apart from the aforementioned
insufficiencies has also a great built-in uncertainty: it empirically calculates the systolic and diastolic
value from the measured mean pressure.
Tonometry [5] is, however, a very different approach. Although a pressure is applied to the artery to
press it against the bone, the pressure is not as strong as to completely occlude the artery. Rather,
the pressure is maintained at a level that counteracts the circumferential tension of the arterial wall.
Therefore, it is sometimes named the “vascular unloading” technique [6]. Since tonometry is to be
applied to the peripheral circulation, an algorithm is often used to estimate arterial BP from the
recorded pressure.
Although these automatic BP (ABP) meters can provide objective BP readings, all of them, like the
conventional mercury sphygmomanometer, incorporate the use of a cuff in their working principles.
Page 109
In addition, the size of the cuff must not be too small since overestimation of BP by using an
inappropriately small cuff has been well documented [7]. Thus, this renders the reduction of size,
cost and power consumption in these devices very difficult. Moreover, the occlusion of the artery
increases the workload of the heart and causes circulatory interference at the measurement site.
Therefore, they are not preferred to be used frequently. Compared to the cuff-based approaches, a
cuff-less technique using pulse transit time is more desirable [8].
Researchers have long reported that pulse transit time (PTT) is directly related to ABP and can be
used as an index for the beat-to-beat BP estimation [8]-[11]. Typical PTT is the measure using the
time difference between the R-wave peak of electrocardiogram (ECG) and maximum slope of the
finger photoplethysmogram (PPG) as shown in Figure 78. However, the use of the finger PPG will
require continuous optical contact with the skin on the finger and is restrictive for daily activities as
the finger is typically covered for optimal signal acquisition by the PPG [12].
In this chapter, the magnetic method of blood pulse acquisition is applied on the wrist in place of the
finger PPG leading to the development of a device that is capable of continuous PTT measurement
leading to the measurement of ABP in an unrestrictive manner suitable for daily activities.
Figure 78 Illustration of PTT Definition [6]

Page 110
2 Setup for blood pressure measurement using oscillometric based BP meters
There are many commercially available cuff based blood pressure monitoring devices which are
designed for lifestyle applications. In this experimental setup, the OMRON Intellisense Blood
Pressure Monitor - Arm Model IA1/IA1B is used for acquisition of blood pressure using the setup as
shown in Figure 79.
Using this setup, 10 young subjects aged 21 to 25 are recruited as voluntarily test subjects for this
experiment. The results obtained from this measurement are shown in Table 17. The measured
Systolic (SYS) and Diastolic (DIA) pressure can be associated to the heart activities where during
heart contraction, the blood pressure in the artery increases and diastolic blood pressure changes to
systolic blood pressure. The difference of these pressures is called pulse pressure. Normal blood
pressure occurs when systolic pressure is less than 130 mmHg and diastolic blood pressure is less
than 80 mmHg for adults [1].
Mean arterial pressure (MAP) is the mean pressure over one cardiac cycle. Using the Equation 61
[13], the MAP can be calculated and is tabulated in Table 17 for comparison with measurements in
the next section.
Equation 61 𝑴𝑨𝑷 = 𝑷𝑫𝑰𝑨 + 𝑷𝑺𝒀𝑺−𝑷𝑫𝑰𝑨𝟑
where PDIA = Diastolic pressure in mmHg
PSYS = Systolic pressure in mmHg
Figure 79 Experiment setup using OMRON Intellisense Blood Pressure Monitor - Arm Model IA1/IA1B

Page 111
Name Distance from heart to wrist (cm)
Pulse Transit Time (sec)
MAP (mmHg)
Subject 1 81.0 0.22 86.67
Subject 2 75.0 0.21 81.33
Subject 3 77.0 0.21 84.67
Subject 4 85.0 0.22 91.33
Subject 5 75.0 0.22 75.67
Subject 6 74.0 0.20 86.33
Subject 7 78.0 0.21 86.67
Subject 8 71.0 0.17 113.67
Subject 9 84.0 0.21 97.00
Subject 10 77.5 0.22 76.67
Table 17 Measurement results for BP and MAP using BP-meter
3 Experimental setup for blood pressure measurement using MMSB
The experimental setup is shown in Figure 80 where the signals acquired from the ECG electrodes
and MMSB are concurrently being sampled and processed using the gTEC USBAmp. The data post-
processing is completed in MATLAB Simulink and the typical waveform obtained is shown in Figure
81.
Using Figure 81, the PTT is measured from the peak of the R-wave to the maximum slope of the
MMSB signal and tabulated in Table 18. In addition, the distance between the heart and the wrist
(where the MMSB signal is acquired) is also measured as illustrated in Figure 82 and tabulated in
Table 18. The pulse wave velocity (PWV) of blood is calculated based on the measured distance and
PTT values. From research data available [2], typical values of PWV range from 5 m/s, with young
people in central arteries, to 15 m/s, in peripheral and old arteries. Using this as the basis of
comparison, the cardiovascular performance of the 10 young subjects is found to be within the
acceptable range of 5m/s confirming the measured values for PTT and distance between heart and
wrist is reasonable.
The work done by the pulse wave can be expressed in terms of the kinetic energy of the wave and
the gravitational potential energy as shown in Equation 62.

Page 112
Equation 62 𝑭.𝒅 = 𝟏𝟐𝒎𝒗𝟐 + 𝒎𝒈𝒉
where F = force exerted on blood
d = distance from heart to wrist (or fingertip)
m = mass of blood
v = pulse wave velocity
g = 9.81m/s2
h = height difference between heart and wrist (or fingertip)
The force exerted on blood can also be written in terms of pressure difference as shown in Equation
63:
Equation 63 𝑭 = ∆𝑩𝑷.𝒂
where a = cross section area of the artery
∆𝐵𝑃 = pressure difference between the two sites, the heart and the wrist or fingertip
Substituting Equation 62 into Equation 63 and rearranging the variables:
Equation 64 ∆𝑩𝑷 = 𝟏𝟐𝒎𝒂.𝒅𝒗𝟐 + 𝒎
𝒂.𝒅𝒈𝒉
Replacing ma.d
= ρ (density of blood) and 𝑣 = dPTT
(pulse wave velocity of blood), Equation 64 can be
expressed as shown in Equation 65:
Equation 65 ∆𝑩𝑷 = 𝟏𝟐𝝆 𝒅𝟐
𝑷𝑻𝑻𝟐+ 𝝆𝒈𝒉
The distance d can be approximated using measurements of the distance between subject’s heart
and wrist as illustrated in Figure 82. In addition, PTT is the measured pulse transit time in seconds
with reference to the ECG signal as illustrated in Figure 78. Furthermore, the average blood density ρ
is reported to be 1050 kg/m3 [14]. Therefore, using the values obtained for these parameters, ∆𝐵𝑃
in Equation 65 can be numerically estimated.
Based on research findings [15], it had been reported that the pressure drop in the arterial side of
circulation accounts for roughly 70% of the total pressure drop in the body. Therefore the subject’s
average change in the blood pressure or mean arterial pressure, MAP, can be approximated using
Equation 66[15].
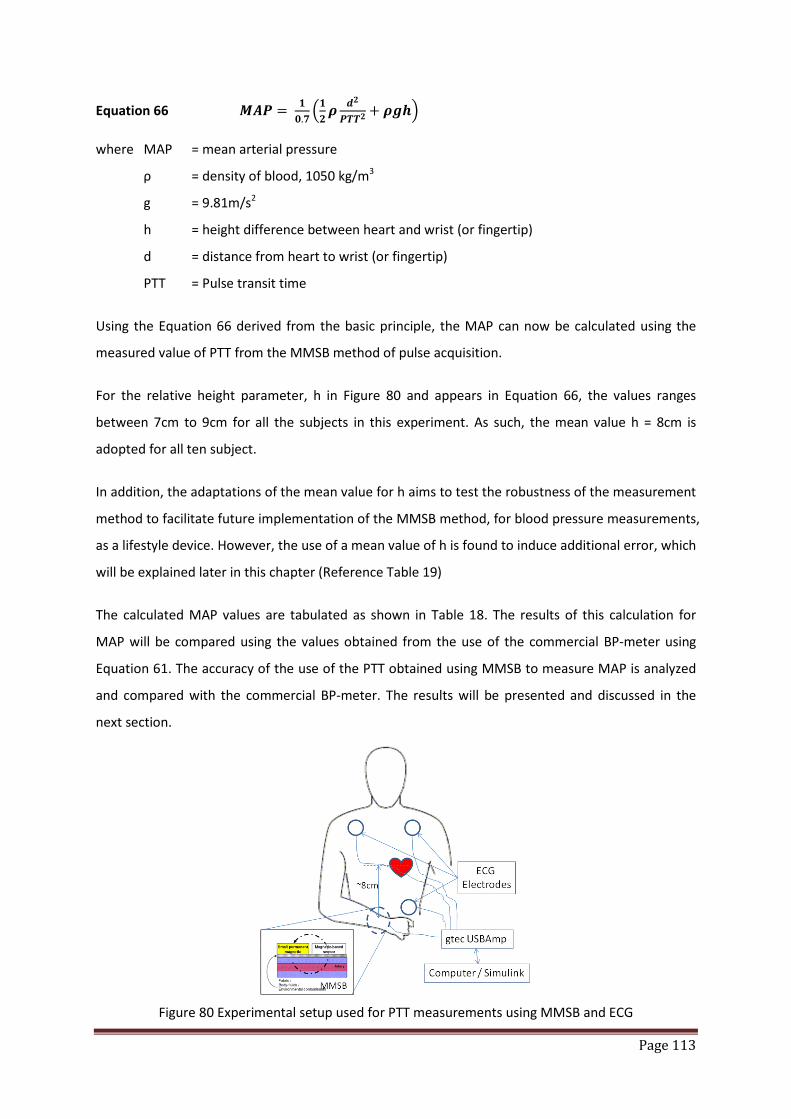
Page 113
Equation 66 𝑴𝑨𝑷 = 𝟏𝟎.𝟕𝟏𝟐𝝆 𝒅𝟐
𝑷𝑻𝑻𝟐+ 𝝆𝒈𝒉
where MAP = mean arterial pressure
ρ = density of blood, 1050 kg/m3
g = 9.81m/s2
h = height difference between heart and wrist (or fingertip)
d = distance from heart to wrist (or fingertip)
PTT = Pulse transit time
Using the Equation 66 derived from the basic principle, the MAP can now be calculated using the
measured value of PTT from the MMSB method of pulse acquisition.
For the relative height parameter, h in Figure 80 and appears in Equation 66, the values ranges
between 7cm to 9cm for all the subjects in this experiment. As such, the mean value h = 8cm is
adopted for all ten subject.
In addition, the adaptations of the mean value for h aims to test the robustness of the measurement
method to facilitate future implementation of the MMSB method, for blood pressure measurements,
as a lifestyle device. However, the use of a mean value of h is found to induce additional error, which
will be explained later in this chapter (Reference Table 19)
The calculated MAP values are tabulated as shown in Table 18. The results of this calculation for
MAP will be compared using the values obtained from the use of the commercial BP-meter using
Equation 61. The accuracy of the use of the PTT obtained using MMSB to measure MAP is analyzed
and compared with the commercial BP-meter. The results will be presented and discussed in the
next section.
Figure 80 Experimental setup used for PTT measurements using MMSB and ECG
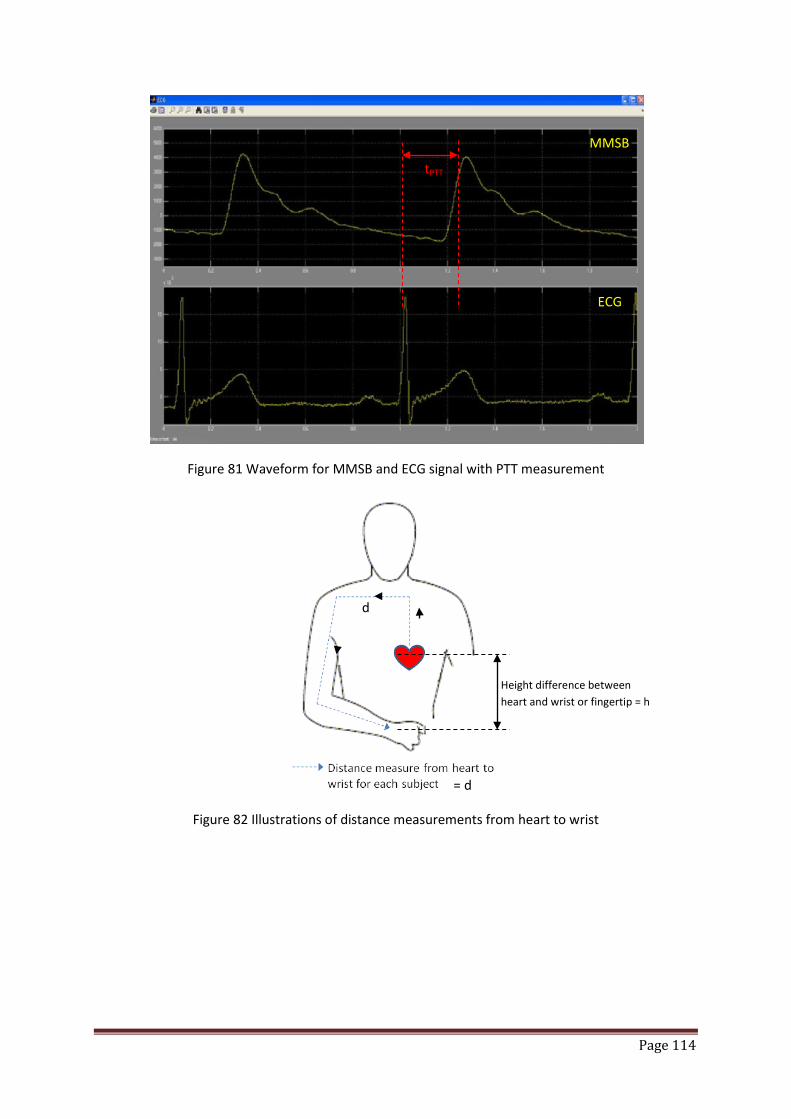
Page 114
Figure 81 Waveform for MMSB and ECG signal with PTT measurement
Figure 82 Illustrations of distance measurements from heart to wrist
tPTT
MMSB
ECG
d
= d
Height difference between heart and wrist or fingertip = h
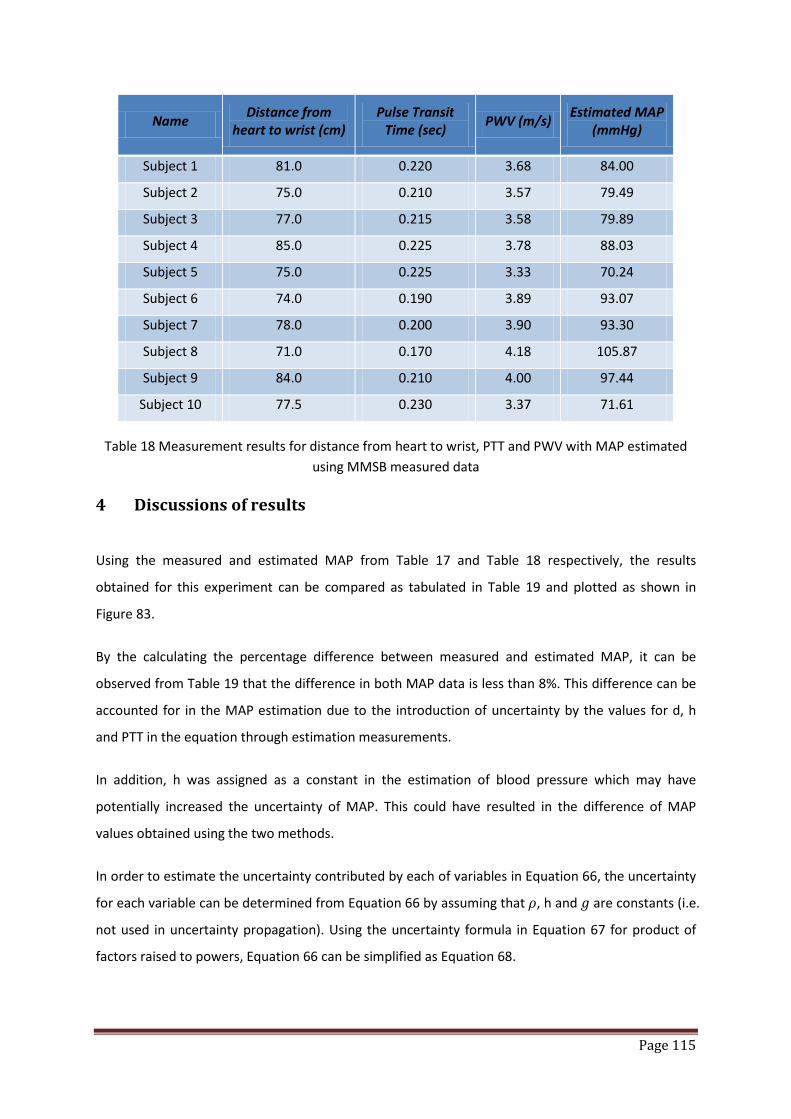
Page 115
Name Distance from heart to wrist (cm)
Pulse Transit Time (sec) PWV (m/s) Estimated MAP
(mmHg)
Subject 1 81.0 0.220 3.68 84.00
Subject 2 75.0 0.210 3.57 79.49
Subject 3 77.0 0.215 3.58 79.89
Subject 4 85.0 0.225 3.78 88.03
Subject 5 75.0 0.225 3.33 70.24
Subject 6 74.0 0.190 3.89 93.07
Subject 7 78.0 0.200 3.90 93.30
Subject 8 71.0 0.170 4.18 105.87
Subject 9 84.0 0.210 4.00 97.44
Subject 10 77.5 0.230 3.37 71.61
Table 18 Measurement results for distance from heart to wrist, PTT and PWV with MAP estimated using MMSB measured data
4 Discussions of results
Using the measured and estimated MAP from Table 17 and Table 18 respectively, the results
obtained for this experiment can be compared as tabulated in Table 19 and plotted as shown in
Figure 83.
By the calculating the percentage difference between measured and estimated MAP, it can be
observed from Table 19 that the difference in both MAP data is less than 8%. This difference can be
accounted for in the MAP estimation due to the introduction of uncertainty by the values for d, h
and PTT in the equation through estimation measurements.
In addition, h was assigned as a constant in the estimation of blood pressure which may have
potentially increased the uncertainty of MAP. This could have resulted in the difference of MAP
values obtained using the two methods.
In order to estimate the uncertainty contributed by each of variables in Equation 66, the uncertainty
for each variable can be determined from Equation 66 by assuming that 𝜌, h and 𝑔 are constants (i.e.
not used in uncertainty propagation). Using the uncertainty formula in Equation 67 for product of
factors raised to powers, Equation 66 can be simplified as Equation 68.
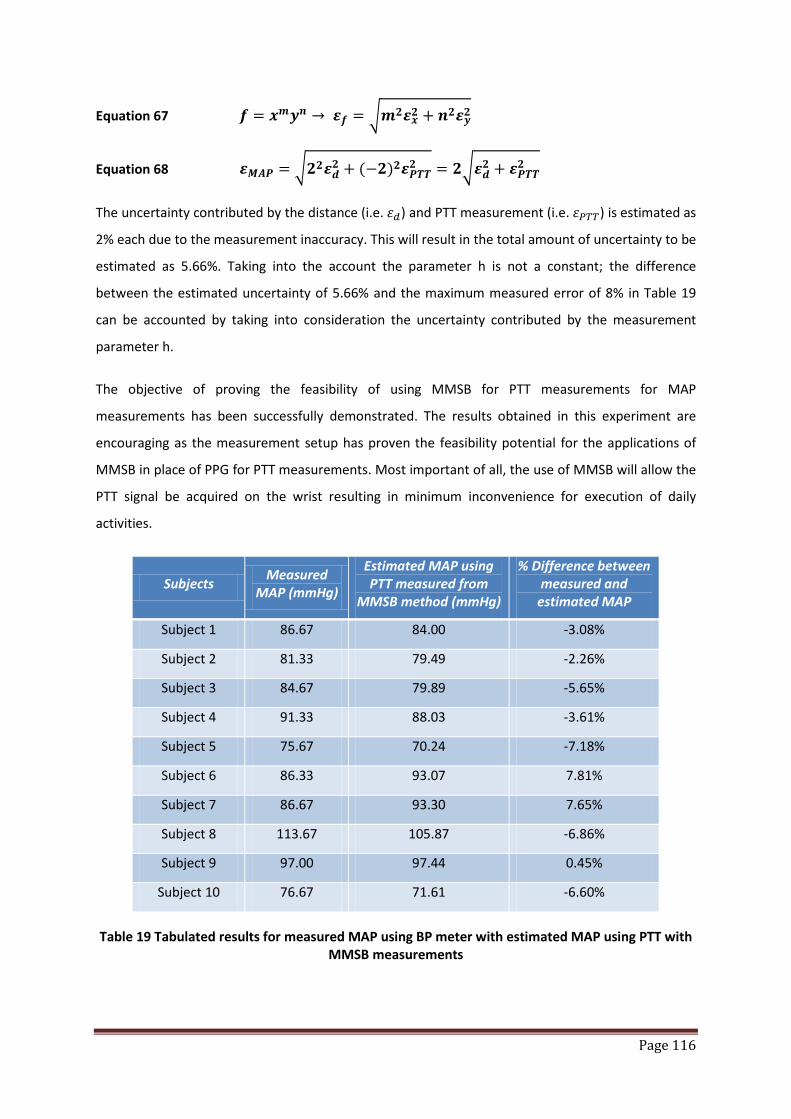
Page 116
Equation 67 𝒇 = 𝒙𝒎𝒚𝒏 → 𝜺𝒇 = 𝒎𝟐𝜺𝒙𝟐 + 𝒏𝟐𝜺𝒚𝟐
Equation 68 𝜺𝑴𝑨𝑷 = 𝟐𝟐𝜺𝒅𝟐 + (−𝟐)𝟐𝜺𝑷𝑻𝑻𝟐 = 𝟐𝜺𝒅𝟐 + 𝜺𝑷𝑻𝑻𝟐
The uncertainty contributed by the distance (i.e. 𝜀𝑑) and PTT measurement (i.e. 𝜀𝑃𝑇𝑇) is estimated as
2% each due to the measurement inaccuracy. This will result in the total amount of uncertainty to be
estimated as 5.66%. Taking into the account the parameter h is not a constant; the difference
between the estimated uncertainty of 5.66% and the maximum measured error of 8% in Table 19
can be accounted by taking into consideration the uncertainty contributed by the measurement
parameter h.
The objective of proving the feasibility of using MMSB for PTT measurements for MAP
measurements has been successfully demonstrated. The results obtained in this experiment are
encouraging as the measurement setup has proven the feasibility potential for the applications of
MMSB in place of PPG for PTT measurements. Most important of all, the use of MMSB will allow the
PTT signal be acquired on the wrist resulting in minimum inconvenience for execution of daily
activities.
Subjects Measured MAP (mmHg)
Estimated MAP using PTT measured from
MMSB method (mmHg)
% Difference between measured and
estimated MAP
Subject 1 86.67 84.00 -3.08%
Subject 2 81.33 79.49 -2.26%
Subject 3 84.67 79.89 -5.65%
Subject 4 91.33 88.03 -3.61%
Subject 5 75.67 70.24 -7.18%
Subject 6 86.33 93.07 7.81%
Subject 7 86.67 93.30 7.65%
Subject 8 113.67 105.87 -6.86%
Subject 9 97.00 97.44 0.45%
Subject 10 76.67 71.61 -6.60%
Table 19 Tabulated results for measured MAP using BP meter with estimated MAP using PTT with MMSB measurements

Page 117
Figure 83 Plot of Measured MAP and Estimated MAP using PTT measured from MMSB method
5 Conclusions
The application of MMSB to acquire PTT at the wrist in place of the PPG at the finger is more
convenient for the continuous monitoring of physiological signs such as the blood pressure. The
result of such an acquisition is qualitatively and quantitatively assessed using the waveform (Figure
81) and MAP measurement (Table 19) respectively. From the waveform, the ease of identifying the
measurable PTT value with respect to PPG method is illustrated. In addition, the measured and
calculated MAP data shows good correlations with errors of less than 8% with respect to the
measurements obtained from the use of the lifestyle OMRON BP-meter. Therefore, it can be
concluded that the use of MMSB for PTT measurements leading to the determination of the MAP
has been successfully demonstrated.
With the completion of MMSB for blood pulse transit time indicating the measurable parameter,
MAP, the following chapter will focus on the development of devices based on MMSB for heart rate
and relaxation analysis.
Page 118
6 References
[1] Bates B (1995) A Guide to Physical Examination, 6th edition, J.B. Lippingcott Company, Philadelphia, USA.
[2] O’Rourke M F, Kelly R P & Avolio A P (1992) The Arterial Pulse. Lea & Febiger, Pennsylvania, USA. [3] Narasimhan Ranganathan, Vahe Sivaciyan, Franklin B. Saksena, The art and science of cardiac
physical examination, Chapter 3, Published by Humana Press, 2006 ISBN 1588297764, 9781588297761
[4] Rank, N.; Groza, V.; Leca, R., “Characterization of Blood Pressure Oscillometric Waveforms”, ICSNC 2007, Volume , Issue , 25-31 Aug. 2007 Page(s):79 – 79
[5] Drzewiecki GM, MelbinJ, Noordergraaf A, “Arterial tonometry: Review and analysis”, J Biomech Chapter 16, pages 141-152, 1983
[6] J. Penáz, “Photo-electric measurement of blood pressure, volume and flow in the finger,” Digest of the 10-th Int. Conf. on Medical and Biol. Eng., pp. 104, 1973.
[7] The Sixth Report of the Joint National Committee on Prevention, Detection, Evaluation, and Treatment of High Blood Pressure. National Institutes of Health, the U.S.A., Publication No. 98-4080, Nov. 1997.
[8] C.C.Y. Poon and Y.T. Zhang, “Cuff-less and noninvasive measurements of arterial blood pressure by pulse transit time,” in Proc. 27th Annu. Int. Conf. IEEE Engineering in Medicine and Biology Society, Shanghai, P.R.C., 1-4 Sept., pp. 5877-5880, 2005.
[9] B. Gribbon, A. Steptoe and P. Sleight, “Pulse wave velocity as a measure of blood pressure change,” Psychophysiology, vol 13, pp. 36-90, 1976.
[10] L. A. Geddes, M. H. Voelz, C. F. Babbs, J. D. Bourland and W. A. Tacker, “Pulse transit time as an indicator of arterial blood pressure,” Psychophysiology, vol. 18; pp.71-74, 1981.
[11] W. Chen, T. Kobayashi, S . Ichikawa, Y. Takeuchi and T. Togawa, “Continuous estimation of systolic blood pressure using the pulse arrival time and intermittent calibration,” Med. & Bio. Eng. Computing, vol. 38, pp. 569 -574.
[12] Parry Fung, Guy Dumont, Craig Ries, Chris Mott, Mark Ansermino, “Continuous Noninvasive Blood Pressure Measurement by Pulse Transit Time”, Proceedings of the 26th Annual International Conference of the IEEE EMBS, Sept 1-5, 2004.
[13] Yinbo Liu, Y.T. Zhang, “Pulse Transit Time and Arterial Blood Pressure at Different Vertical Wrist Positions”, ITAB 2006
[14] Khalil M. Khanafer, Prateek Gadhoke, Ramon Berguer and Joseph L. Bull (2006), “Modelling pulsatile flow in aortic aneurysms: Effect of non-Newtonian properties of blood”, Biorheology, 43(5): 661-679
[15] J. Keener and J. Sneyd, Mathmatical Physiology. New York, USA: Springer-Verlag, 1998.
Page 119
Chapter 6: Applications of MMSB 1 Introduction
The design and development of the MMSB in a laboratory setup has been proven in the previous
chapters. In this chapter, two applications of the MMSB will be developed to achieve an advanced
next generation bio-monitoring of physiological vital signs. To achieve this objective, a wireless
deployable platform for pulse rate sensing will be developed using the wireless ad-hoc network for
concurrent and continuous monitoring of blood pulse in a multi-user environment. This
development is termed “Wireless Pulse Sensing” and in this development, a wearable low power
wireless system will be developed with signal acquisition for remote monitoring of pulse rate. This is
followed by the development of a standalone pulse rate monitoring device with LCD for local display
and self-monitoring.
In the second development for this chapter, MMSB will be integrated into an existing lifestyle
product for relaxation assessment using blood flow information collected before and after massage.
In this section, the project will be termed “Relaxation assessment using MMSB” where algorithms
were developed to statistically compare the changes in blood flow before and after a massage. The
changes in blood flow and heart rate variability (HRV) will be used to assess the mental state of
being stressed or relaxed for the subject based on published results.
Finally, this chapter will conclude on the results obtained from these two developments and discuss
on future development of applications of MMSB.
2 Wireless Pulse Sensing
As discussed in Chapter 1, there are many commercially available heart rate measurement devices
and systems where each of these solutions has its associated advantages and disadvantages. The
advantages of using MMSB as the pulse sensing method to measure heart rate has been
comprehensively presented in this dissertation. This section will describe the integration of MMSB
with a wireless ad-hoc network as a wearable device on the wrist to continuously monitor heart rate
of subjects. This work is funded by the Totaliser Board of Singapore at S$350,000.
Page 120
2.1 Introduction
The wireless ad-hoc network required to support this development work has to be low power and
scalable for applications such as mass run and military trainings. Therefore, the various wireless ad-
hoc networks available are reviewed and the 2.4GHz ZigBee / IEEE 802.15.4 standard was selected
due to its low power and scalability.
With the network protocol selected, existing commercial products that provide the ZigBee solution
were reviewed and the XBee and XBee-PRO ZigBee™ 802.15.4 OEM RF Modules by MaxStream, Inc.
is found to be the most suitable due to the followings:
1. Low cost < USD$21
2. Small footprint – 2.438 cm x 2.761 cm
3. Scalability – able to support multiple users with ad-hoc network forming and hopping
4. Ease of integration – integrated 10 bit ADC; on-board chip antenna; data interface available
5. Wide operating input voltage range – 2.1-3.6V
6. Low current – transmit current of 35mA; receive current of 40mA; sleep current <1 µA at
25°C
7. RF range – Indoor/Urban up to 133 ft (40 m); Outdoor/RF line-of-sight up to 400 ft (120 m)
8. Configurability of the RF modules – same RF module can be configured as repeater or base
or remote device with 65,000 network addresses available for each channel
The intended use of the ZigBee™ based wireless ad-hoc network is to support the concurrent
monitoring of multiple users, where the wireless network is to be configured for Point-to-Point,
Point-to-Multipoint, Peer-to-Peer and Mesh configurations. Based on this intent, the system
overview of the final design system is shown in Figure 84 where base station can remotely receive
data (pulse rate) through the ad-hoc mesh network automatically formed during deployment.
For the purpose of this development, the data acquired by the ADC is wirelessly transmitted back to
the base station for processing by the PC using the graphical development tool, LabView 8.0 from
National Instruments. Upon successful implementation of the PC based processing, the algorithm
developed will be implemented onto an embedded processor with LCD display to function as a
standalone wearable pulse rate monitoring device.
Page 121
Figure 84 Illustration of wireless pulse sensing system for monitoring of heart rate using MMSB
2.2 System design
The system architectural design can be classified into two main frameworks as illustrated in Figure
85. The framework on the right of Figure 85 will address the many challenging aspects of the
development of user node with wireless interface to support multi-user environment where a
significant amount of work is devoted to the configuration of the ZigBee™ 802.15.4 OEM RF Modules
by MaxStream, Inc. to support the wireless ad-hoc network and the software development for the
base station node to support concurrent monitoring of multiple users. The framework on the left of
Figure 85 will focus on the end-user node development which includes the MMSB signal
conditioning, data acquisition and network interface.
Figure 85 Illustration of System Architecture of Wireless Pulse Sensing System
Wireless interface module
Remote base station
Wireless Ad-hoc Network
Single-user module design for pulse rate acquisition and
interface with wireless module
Multi-user wireless ad-hoc network design

Page 122
2.2.1 Signal Conditioning
The MMSB signal derived from the GMR based magnetic sensor is typically 0.2 mV peak-peak.
Therefore, an amplification of about 100 times is necessary to render this signal usable for signal
processing via a 10 bit Analog-to-Digital Converter (ADC) to achieve heart-rate detection. Realizing
clean amplification of the MMSB signal with such high gain is no easy task given that the human
body moves and motion artifacts causes a lot of noise to the MMSB sensing design. As such, the
MMSB signal has to be filtered by a strong post filter after amplification. Unfortunately, any
amplification will also amplify the noise voltages in addition to the desired MMSB signal. In certain
situations, the noise can completely override the MMSB signal and render the amplified signal
useless.
In order to minimize the effects of common mode noise due to motion artifacts, the use of
differential signal conditioning is implemented. Since the output of the GMR sensor is based on the
differential output of a Wheatstone bridge, an ideally matched differential amplifier is selected
where common mode noise from the GMR sensor can be automatically cancelled out. Therefore, the
differential amplifier used in the front end of this application is the INA118 instrumentation amplifier
(Reference ANNEX A) that has perfectly matched and balanced integrated gain resistors.
The final signal conditioning circuit used for this development is shown in Figure 86, where the
output voltage can be described using Equation 69. The high-performance Instrumentation Amplifier
(IA) INA118 has greatly simplified the design of bridge preamplifiers while adding significant
advantages in noise, size, and performance over op amp implementations.
Equation 69 𝑉𝑜𝑢𝑡 = 1 + 50𝐾𝑅𝐺 (𝑉𝑜𝑢𝑡+ − 𝑉𝑜𝑢𝑡−)
where the frequency 3dB point is given by 𝑓 = 1
2𝜋𝑅3𝐶3
The frequency response of circuit is designed to acquire the heart rate (typically around 1Hz).
However, due to the low amplitude of the MMSB signal, the filter was found to be inappropriate as
it will attenuate the desired signal significantly. As such, the components R3 and C3 are bypassed,
where the MMSB signal is directly amplified and sampled by the ADC for wireless transmission.

Page 123
Figure 86 Signal conditioning circuit WiPS
2.2.2 Analog-to-Digital converter
The XBee RF Modules used for this development has an integrated support for a 10 bit Analog-to-
digital conversion (ADC) and is sharing similar ports for the digital Input / Output (I/O) line passing as
shown in Table 20. The XBee has 6 usable A/D pins that will allow the user to utilize one (sampling
rate of up to 1KHz) or all (assuming sufficiently slow sample rates when all ADCs are used i.e. 1KHz/6
= 167Hz) of these ADCs. However, in this development, only one ADC channel will be used at a
sampling rate of 10Hz to minimize bandwidth required for transmission of ADC data. The signal
processing for heart rate measurements will be done at the base-station so as to simplify the design
of the wearable device and reduce the power consumption.
Table 20 Pin functions and associated pin numbers and commands for the XBee RF Modules
Using Table 20, the ADC channel is configured to sample the analog signal at 10 Hz and store the
sampled signal as a digital format for transmission over the wireless network. With the XBee
Magnetic
sensor
9V 9V
C3
C3
R3
R3

Page 124
integrated ADC, it will simplify the circuit design allowing the XBEE wireless module to be connected
directly to the output of the amplifier where data will be sent in a serial form, wirelessly to the base
station.
In order to minimize power due to RF transmission, the buffering feature of the XBee module is also
implemented. The XBee module has a total buffer of up to 93 bytes and using this buffer size, it will
allow the user to set the number of samples stored before the data is transmitted. With the 10 bits
ADC integrated in the XBee module, each sample will utilize two bytes. This will lead to a maximum
buffer size of 46 samples before transmission. With one ADC configured to operate at a sampling
rate of 10Hz (i.e. 10 times over sampling for typical heart rate of 1Hz), data is configured to be
buffered up to 4 seconds before each RF transmission. This will allow significant power saving as
compared to continuous monitoring as shown in the reduction of average current in Table 21.
Table 21 Estimation of average current for Scenarios A (unbuffered), B (2 seconds buffer) and C (4
seconds buffer) using the power estimator provided for XBEE transceiver
2.2.3 Data interface to wireless module
Once the data buffer is full, the XBEE will package the ADC data with the data overhead, such as the
delimiter, length of bytes and source address, for transmission over the RF channel. This is
automatically done by the integrated processor within the XBEE module and the base-station will
have to decode the ADC data for signal processing to calculate heart rate. A typical data packet sent
over the RF channel with the buffer size set to 2 is illustrated below.
Page 125
7E 00 10 83 56 78 22 00 05 06 00 00 00 03 FF 77
where the serial data stream can be broken down as:
7E Start Delimiter
00 10 Length Bytes
83 API Identifier Byte for 16bit A/D data (82 is for 64bit A/D data)
56 78 Source Address Bytes
22 RSSI Value Bytes
00 Option Byte
05 Sample Quantity Byte
06 00 00000110 00000000 Channel Indicator *
00 00 1st Sample Data ADC (min value for ADC is 00 00)
03 FF 2nd Sample Data ADC (max value for A/D is 03 FF)
77 Check Sum
2.3 Data processing for heart rate measurements
The sampled MMSB waveform is transmitted over the RF channel to the base-station PC for signal
processing. Data is received using the ZigBee receiver and processed using the LabView
programming interface where the pulse rates for multiple users are measured and displayed as
shown in Figure 87 and Figure 88 respectively.
In Figure 87, data received from the ZigBee module is first processed to extract the header and
concatenate the data together. The concatenated data will be passed to the pulse rate
measurements module as shown in Figure 87.
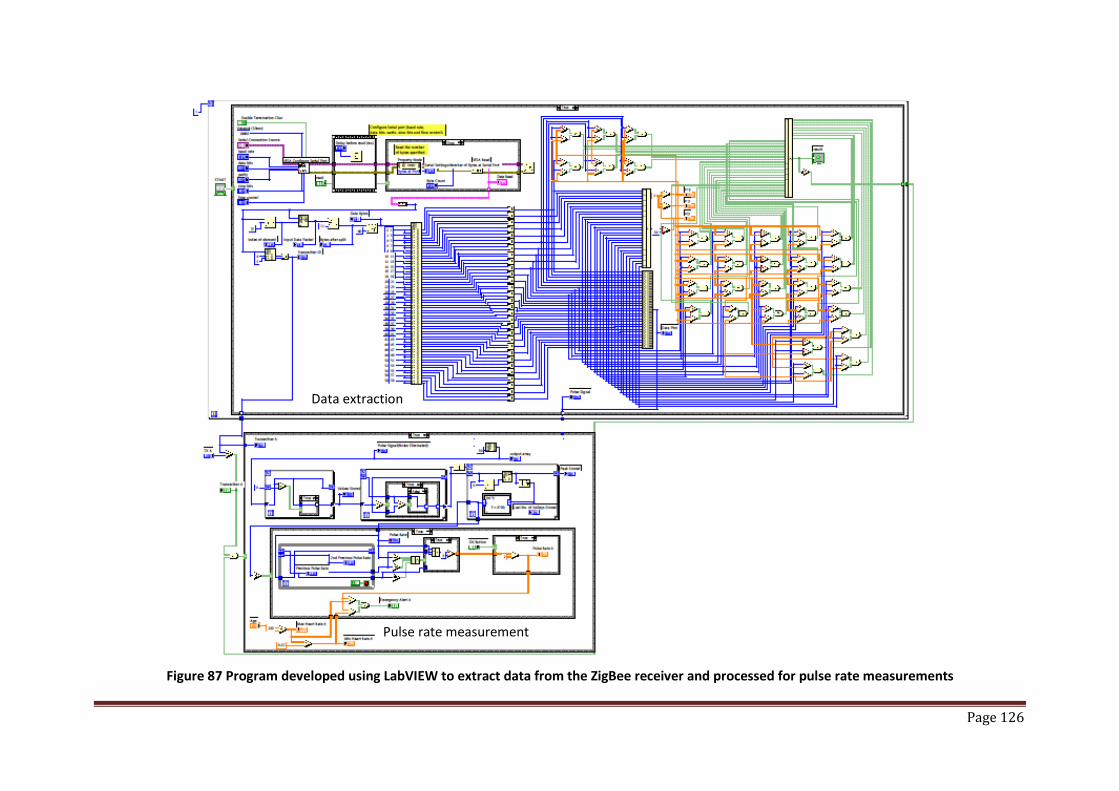
Page 126
Figure 87 Program developed using LabVIEW to extract data from the ZigBee receiver and processed for pulse rate measurements
Data extraction
Pulse rate measurement
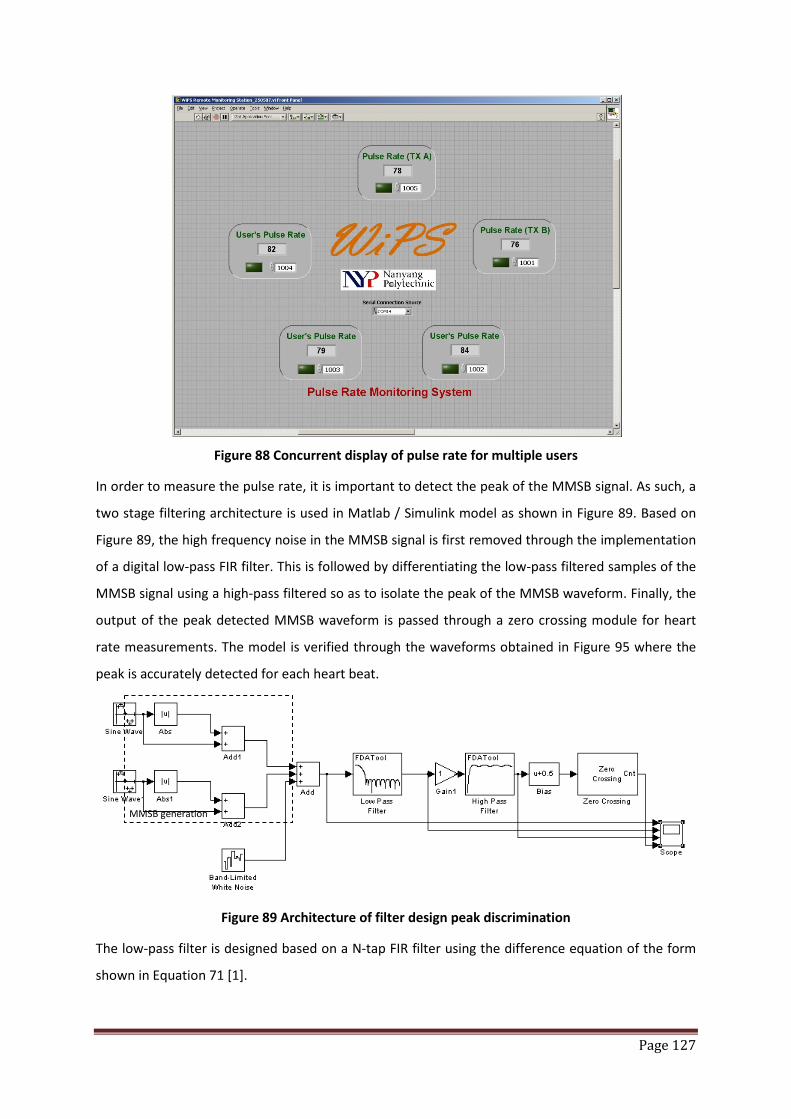
Page 127
Figure 88 Concurrent display of pulse rate for multiple users
In order to measure the pulse rate, it is important to detect the peak of the MMSB signal. As such, a
two stage filtering architecture is used in Matlab / Simulink model as shown in Figure 89. Based on
Figure 89, the high frequency noise in the MMSB signal is first removed through the implementation
of a digital low-pass FIR filter. This is followed by differentiating the low-pass filtered samples of the
MMSB signal using a high-pass filtered so as to isolate the peak of the MMSB waveform. Finally, the
output of the peak detected MMSB waveform is passed through a zero crossing module for heart
rate measurements. The model is verified through the waveforms obtained in Figure 95 where the
peak is accurately detected for each heart beat.
Figure 89 Architecture of filter design peak discrimination
The low-pass filter is designed based on a N-tap FIR filter using the difference equation of the form
shown in Equation 71 [1].
MMSB generation
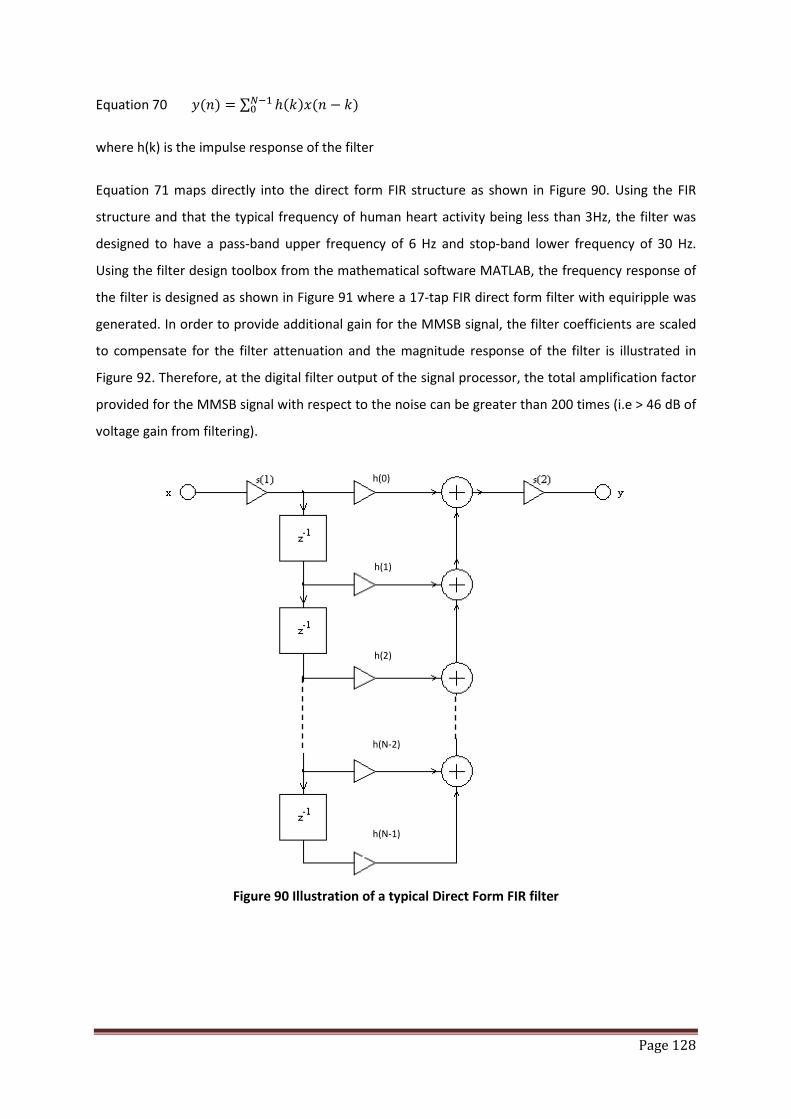
Page 128
Equation 70 𝑦(𝑛) = ∑ ℎ(𝑘)𝑥(𝑛 − 𝑘)𝑁−10
where h(k) is the impulse response of the filter
Equation 71 maps directly into the direct form FIR structure as shown in Figure 90. Using the FIR
structure and that the typical frequency of human heart activity being less than 3Hz, the filter was
designed to have a pass-band upper frequency of 6 Hz and stop-band lower frequency of 30 Hz.
Using the filter design toolbox from the mathematical software MATLAB, the frequency response of
the filter is designed as shown in Figure 91 where a 17-tap FIR direct form filter with equiripple was
generated. In order to provide additional gain for the MMSB signal, the filter coefficients are scaled
to compensate for the filter attenuation and the magnitude response of the filter is illustrated in
Figure 92. Therefore, at the digital filter output of the signal processor, the total amplification factor
provided for the MMSB signal with respect to the noise can be greater than 200 times (i.e > 46 dB of
voltage gain from filtering).
Figure 90 Illustration of a typical Direct Form FIR filter
h(0)
h(N-1)
h(N-2)
h(2)
h(1)
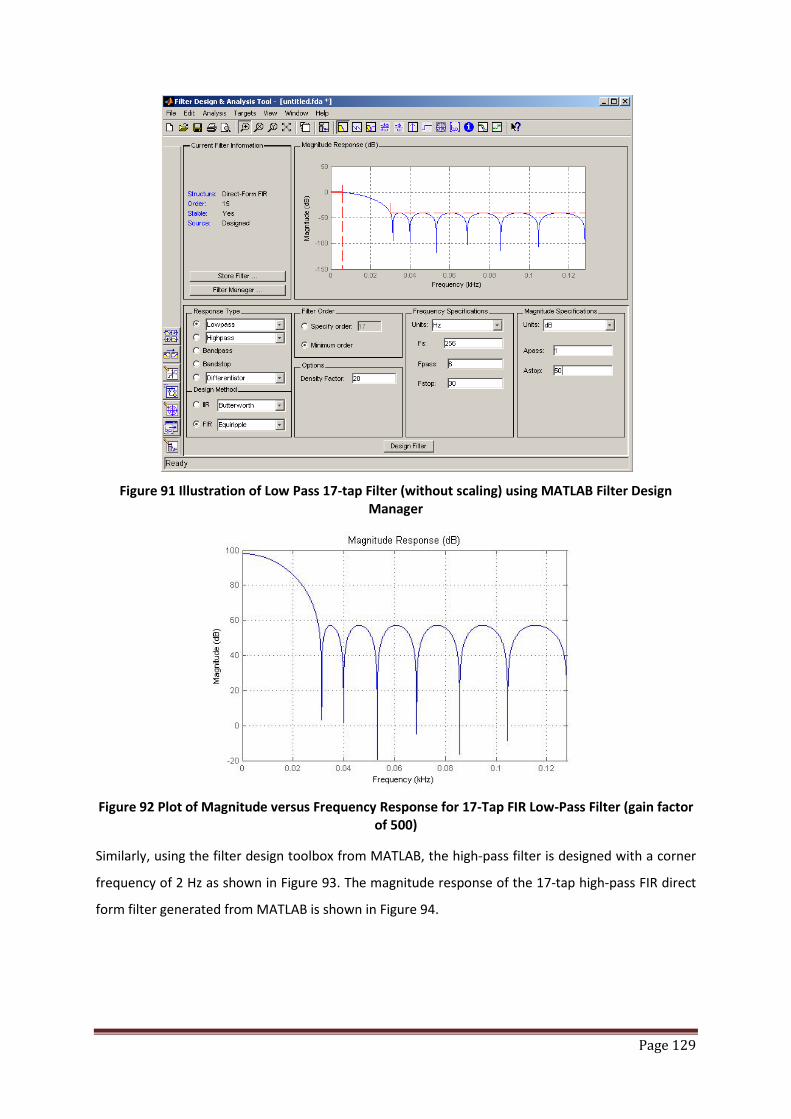
Page 129
Figure 91 Illustration of Low Pass 17-tap Filter (without scaling) using MATLAB Filter Design
Manager
Figure 92 Plot of Magnitude versus Frequency Response for 17-Tap FIR Low-Pass Filter (gain factor
of 500)
Similarly, using the filter design toolbox from MATLAB, the high-pass filter is designed with a corner
frequency of 2 Hz as shown in Figure 93. The magnitude response of the 17-tap high-pass FIR direct
form filter generated from MATLAB is shown in Figure 94.

Page 130
Figure 93 Illustration of High Pass 17-tap FIR Filter using MATLAB Filter Design Manager
Figure 94 Plot of Magnitude versus Frequency Response for 17-Tap FIR High-Pass Filter
The filtered output is further processed by subtracting a fixed threshold from the filtered output.
This cuts off the unwanted disturbances caused by the movement-related artifacts. Using this
method, the peak of the MMSB signal can be discriminated from the complete MMSB waveform
through the zero crossing detection. Using the model illustrated in Figure 89, the peak detection
functionality is verified to work correctly through the waveforms as shown in Figure 95. In Figure 95,
it can be observed that the peak of the simulated MMSB signal can accurately detected for each
heart beat through the digital pulse output of the zero crossing detection block as shown in the
bottom waveform.

Page 131
Figure 95 Output waveform of peak discriminator design
With the successful implementation of the peak detection architecture in Figure 89 using MATLAB /
Simulink, the coefficients for the low pass and high pass filters are implemented in the hardware
interface development software LabVIEW. In addition, in order to minimize error due to motion
artifacts, the number of heart beats per minute is calculated using a three beat average. A C-function
is implemented in LabVIEW where two variables in the C main function, counter and pulse_period,
accurately track the time scale. Each output sample from the MMSB peak discriminator is compared
against a set threshold to detect the presence of a beat. Pulse_period is incremented by one during
every sample period. Because each sample occurs every 0.1 second, it is easy to track the time scale
based on the number of counts in the pulse_period variable. A 4-sample time window is used as a
debounce time using counter. Every time a beat is detected, counter is reset and an icon is turned on
to represent the heartbeat. If a beat is not detected for 4 consecutive samples, a separation
between successive beats is identified and the icon is turned off. The pulse_period is accumulated
for three consecutive beats. On the third beat, pulse_period is used for the calculation of heart-rate
per minute as shown in Equation 71 and reset for the next calculation.
Equation 71 𝐻𝑒𝑎𝑟𝑡𝑏𝑒𝑎𝑡 𝑝𝑒𝑟 𝑚𝑖𝑛𝑢𝑡𝑒 = 1
𝑝𝑢𝑙𝑠𝑒_𝑝𝑒𝑟𝑖𝑜𝑑3𝑥10𝑥60
= 1800𝑝𝑢𝑙𝑠𝑒_𝑝𝑒𝑟𝑖𝑜𝑑
Time (s)

Page 132
2.4 Packaging of MMSB blood pulse detection as a wearable device
In order to package sensor and magnet as a wrist wearable device to measure pulse rate without
degradation of the MMSB sensitivity and system performance, a novel packaging method was
developed and patented [9]. The novelty in the method of packaging relies on the use of air-bubble
to achieve a constant air-gap separation between the magnet and the synthetic leader belt. This will
allow the magnetic field coupling to be independent of the material used for the belt and at the
same time, the belt will also provide physical conformity of blood vessel and the air-bubble as shown
in Figure 96. In addition, the air-bubble will also minimize the pressure applied on the blood vessels
resulting in a constriction of the blood vessel due to the wrist strip pressing against it.
Figure 96 Illustration of packaging of MMSB blood pulse detection as a wearable device
Applying the method of packaging described in Figure 96, the final configuration for a wearable
device applying the MMSB method of pulse rate measurements is shown in Figure 97.
Figure 97 Final configuration of wearable device with wireless transmission
With the completion of the wearable device with wireless transmission, it was tested on 20 healthy
users aged 20-25 and it was able to acquire their pulse rate where monitoring is achieved at the base
Sensor
Air-bubble with magnet
Battery compartment
Electronics compartment
Air-bubble package

Page 133
station. Using finger based pulse oximeter as the measurement reference, the pulse rate difference
between the MMSB method and the pulse oximeter is tabulated in Table 22, where the maximum
percentage difference is found to be less than 5%.
Subject MMSB device Pulse oximeter Percentage difference
Subject 1 60 62 3.33%
Subject 2 78 77 -1.28%
Subject 3 68 70 2.94%
Subject 4 72 74 2.78%
Subject 5 89 91 2.25%
Subject 6 77 74 -3.90%
Subject 7 73 70 -4.11%
Subject 8 56 55 -1.79%
Subject 9 69 66 -4.35%
Subject 10 75 72 -4.00%
Subject 11 78 80 2.56%
Subject 12 82 85 3.66%
Subject 13 86 82 -4.65%
Subject 14 76 75 -1.32%
Subject 15 78 80 2.56%
Subject 16 69 72 4.35%
Subject 17 71 74 4.23%
Subject 18 79 80 1.27%
Subject 19 92 90 -2.17%
Subject 20 86 85 -1.16%
Table 22 Tabulation of heart rate measurements for MMSB device and Pulse Oximeter
In addition, this development was tested by the scientists in the medical research laboratory of the
defense organization in Singapore and was found to be working well within the accepted tolerance
[8].
To enhance this development for applications such as a personal lifestyle pulse rate monitoring
device without wireless transmission, the algorithms developed in this section were implemented
into an embedded signal processing system with an integrated LCD display. This will allow the PC
based processing to be implemented into a standalone wearable pulse rate monitoring device.
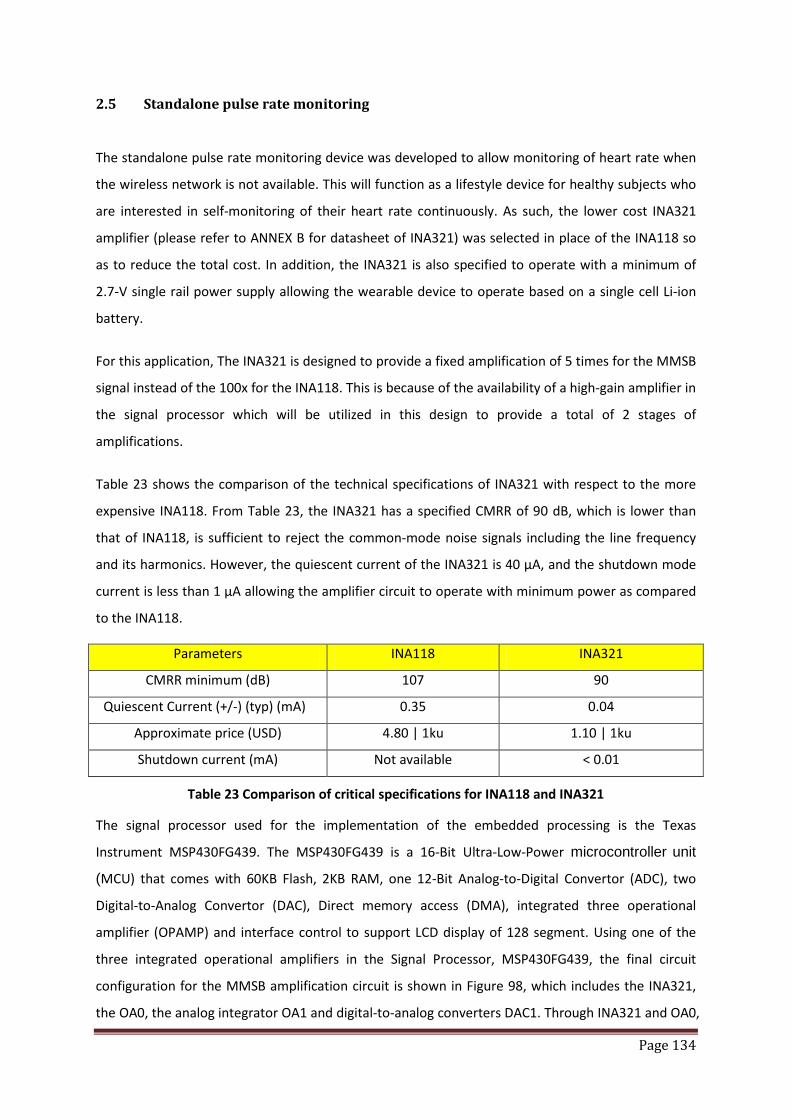
Page 134
2.5 Standalone pulse rate monitoring
The standalone pulse rate monitoring device was developed to allow monitoring of heart rate when
the wireless network is not available. This will function as a lifestyle device for healthy subjects who
are interested in self-monitoring of their heart rate continuously. As such, the lower cost INA321
amplifier (please refer to ANNEX B for datasheet of INA321) was selected in place of the INA118 so
as to reduce the total cost. In addition, the INA321 is also specified to operate with a minimum of
2.7-V single rail power supply allowing the wearable device to operate based on a single cell Li-ion
battery.
For this application, The INA321 is designed to provide a fixed amplification of 5 times for the MMSB
signal instead of the 100x for the INA118. This is because of the availability of a high-gain amplifier in
the signal processor which will be utilized in this design to provide a total of 2 stages of
amplifications.
Table 23 shows the comparison of the technical specifications of INA321 with respect to the more
expensive INA118. From Table 23, the INA321 has a specified CMRR of 90 dB, which is lower than
that of INA118, is sufficient to reject the common-mode noise signals including the line frequency
and its harmonics. However, the quiescent current of the INA321 is 40 μA, and the shutdown mode
current is less than 1 μA allowing the amplifier circuit to operate with minimum power as compared
to the INA118.
Parameters INA118 INA321
CMRR minimum (dB) 107 90
Quiescent Current (+/-) (typ) (mA) 0.35 0.04
Approximate price (USD) 4.80 | 1ku 1.10 | 1ku
Shutdown current (mA) Not available < 0.01
Table 23 Comparison of critical specifications for INA118 and INA321
The signal processor used for the implementation of the embedded processing is the Texas
Instrument MSP430FG439. The MSP430FG439 is a 16-Bit Ultra-Low-Power microcontroller unit
(MCU) that comes with 60KB Flash, 2KB RAM, one 12-Bit Analog-to-Digital Convertor (ADC), two
Digital-to-Analog Convertor (DAC), Direct memory access (DMA), integrated three operational
amplifier (OPAMP) and interface control to support LCD display of 128 segment. Using one of the
three integrated operational amplifiers in the Signal Processor, MSP430FG439, the final circuit
configuration for the MMSB amplification circuit is shown in Figure 98, which includes the INA321,
the OA0, the analog integrator OA1 and digital-to-analog converters DAC1. Through INA321 and OA0,

Page 135
the MMSB signal will be amplified with a total gain of 500. As the gain is very high, slight imbalances
in the sensor differential outputs will cause the common-mode signal to offset, resulting in noise at
the OA0O output. In addition, the output will also be sensitive to the variations in positional
alignment between blood vessel and sensor. This will result in a variation of the dc content of the
amplified differential signal and manifests itself as a drift in the baseline of the MMSB, commonly
known as baseline wandering.
To manage the baseline wondering, an analog integrator scheme is designed with the use of OA1,
the second of the three integrated operational amplifiers in the Signal Processor, MSP430FG439
(reference Figure 98). The integrator integrates the DC content of the 5 times amplified MMSB and
feeds it back to the INA321. The feedback allows the INA321 to maintain a constant DC level at the
output.
In addition, the digital baseline wandering scheme is implemented through the use of the DAC1, one
of the two integrated DAC12 12-bit digital-to-analog converters in the Signal Processor,
MSP430FG439 (reference Figure 98). Using DAC1 allows the user to implement a digital baseline
wandering scheme through software implementation of digital integration.
Figure 98 MMSB amplifier circuit and voltage reference feedback design
The final block diagram of the standalone pulse rate monitoring design is shown in Figure 99 where
the final schematic and PCB of size 3.5cm x 3cm are shown in Figure 100 and Figure 101 respectively.
Using the algorithm developed and tested in the LABVIEW environment (described in section 2.3 of
this Chapter), the C-code is re-targeted for implementation on the Signal Processor, MSP430FG439.
The pulse rate was measured for 20 healthy subjects age 20-25 using the MMSB embedded device
and a commercially available pulse oximeter as tabulated in Table 24. Results from this comparison

Page 136
show both devices measures similar heart rate for all subjects with a maximum difference of less
than 5%.
Subject MMSB Embedded device Pulse oximeter Percentage difference
Subject 1 61 63 3.28%
Subject 2 75 77 2.67%
Subject 3 66 68 3.03%
Subject 4 75 74 -1.33%
Subject 5 91 91 0.00%
Subject 6 75 76 1.33%
Subject 7 73 71 -2.74%
Subject 8 60 58 -3.33%
Subject 9 70 66 -5.71%
Subject 10 75 74 -1.33%
Subject 11 78 80 2.56%
Subject 12 80 82 2.50%
Subject 13 90 88 -2.22%
Subject 14 76 75 -1.32%
Subject 15 75 76 1.33%
Subject 16 67 70 4.48%
Subject 17 71 74 4.23%
Subject 18 76 73 -3.95%
Subject 19 93 90 -3.23%
Subject 20 80 82 2.50%
Table 24 Tabulation of heart rate measurements for MMSB Embedded device and Pulse Oximeter
Figure 99 Block diagram of standalone pulse rate monitoring design

Page 137
Figure 100 Schematic design of the standalone wearable pulse rate monitoring
Figure 101 PCB design for standalone wearable pulse rate monitoring
Signal Processor
LCD
Amplifier
Filter
Connector
Signal Processor
LCD
Connector for programming the
processor
Sensor input and amplifier (back of PCB)

Page 138
2.6 Conclusions
With the successful implementation of the wearable pulse rate monitoring device with either
wireless or local LCD display of results, the algorithm developed is proven to be able to acquire the
heart rate using MMSB signal. In addition, the successful comparison of the measured pulse rate
with commercially available pulse plethysmogram demonstrates the feasibility of the application of
MMSB as a lifestyle device.
In the next section, the development will be focused on the application of MMSB to acquire blood
volume pulse to assess the mental state of being relaxed or stressed of human subjects. This
development is in collaboration with a commercial company where the outcome will be
implemented into a commercial product.
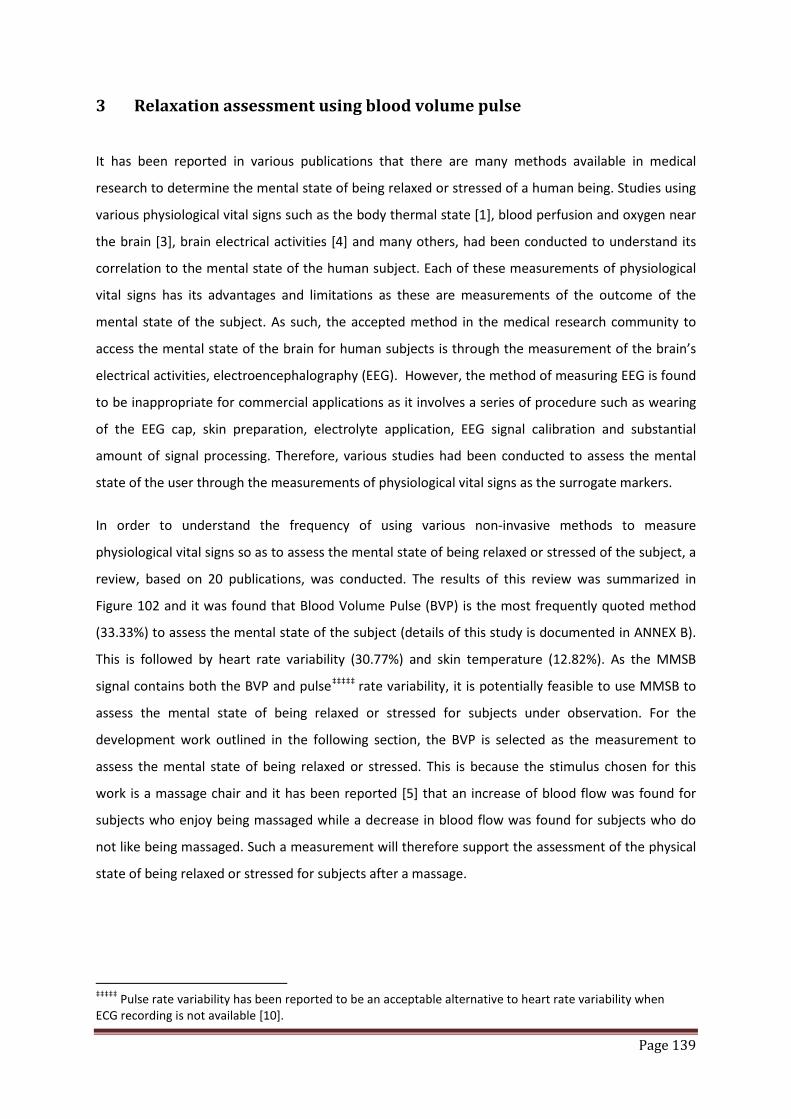
Page 139
3 Relaxation assessment using blood volume pulse
It has been reported in various publications that there are many methods available in medical
research to determine the mental state of being relaxed or stressed of a human being. Studies using
various physiological vital signs such as the body thermal state [1], blood perfusion and oxygen near
the brain [3], brain electrical activities [4] and many others, had been conducted to understand its
correlation to the mental state of the human subject. Each of these measurements of physiological
vital signs has its advantages and limitations as these are measurements of the outcome of the
mental state of the subject. As such, the accepted method in the medical research community to
access the mental state of the brain for human subjects is through the measurement of the brain’s
electrical activities, electroencephalography (EEG). However, the method of measuring EEG is found
to be inappropriate for commercial applications as it involves a series of procedure such as wearing
of the EEG cap, skin preparation, electrolyte application, EEG signal calibration and substantial
amount of signal processing. Therefore, various studies had been conducted to assess the mental
state of the user through the measurements of physiological vital signs as the surrogate markers.
In order to understand the frequency of using various non-invasive methods to measure
physiological vital signs so as to assess the mental state of being relaxed or stressed of the subject, a
review, based on 20 publications, was conducted. The results of this review was summarized in
Figure 102 and it was found that Blood Volume Pulse (BVP) is the most frequently quoted method
(33.33%) to assess the mental state of the subject (details of this study is documented in ANNEX B).
This is followed by heart rate variability (30.77%) and skin temperature (12.82%). As the MMSB
signal contains both the BVP and pulse‡‡‡‡‡ rate variability, it is potentially feasible to use MMSB to
assess the mental state of being relaxed or stressed for subjects under observation. For the
development work outlined in the following section, the BVP is selected as the measurement to
assess the mental state of being relaxed or stressed. This is because the stimulus chosen for this
work is a massage chair and it has been reported [5] that an increase of blood flow was found for
subjects who enjoy being massaged while a decrease in blood flow was found for subjects who do
not like being massaged. Such a measurement will therefore support the assessment of the physical
state of being relaxed or stressed for subjects after a massage.
‡‡‡‡‡ Pulse rate variability has been reported to be an acceptable alternative to heart rate variability when ECG recording is not available [10].
Page 140
Figure 102 Summary on the frequency of non-invasive methods used to assess the mental state
3.1 Introduction
Blood volume pulse is a psycho physiological index showing the activation of the autonomic nervous
system. Its simple recording, simple waveform and skin application make this index appealing for
psycho physiological studies. Investigation of the direct effects of neck massages using blood volume
pulse was performed in [5] and concluded that short-term massage on the neck has a direct
influence on blood volume pulse and indeed tends to increase its value. In addition, one of the
important observations concluded in this experiment is the result of neck massage bringing about a
general relaxation to the subjects.
In a separate study conducted at Florida International University, four signals: Blood Volume Pulse
(BVP), Galvanic Skin Response (GSR), Pupil Diameter (PD) and Skin Temperature (ST) were
concurrently acquired and analyzed to differentiate affective states in the user [6]. In this
experiment, several signal processing techniques are applied to the signals collected to extract the
most relevant features in the physiological responses and feed them into learning systems, to
accomplish the affective state classification. Three learning algorithms are applied to this
classification process and their performance is compared. Results in this experiment indicate that

Page 141
the physiological signals monitored do, in fact, have a strong correlation with the changes in
emotional state of the experimental subjects.
Finally, a medical research was conducted [7] on patients with coronary artery disease (CAD) to
determine if mental stress may provoke ischemic electrocardiograph changes and abnormalities in
regional and global left ventricular function. This study stress the both healthy and CAD patients
using mathematic subtractions in a progressively challenging sequence and concluded that CAD
patients exhibit an attenuated blood flow response to mental stress that may contribute to mental
stress induced ischemic episodes in daily life.
For both of the above experiments conducted in United State [6][7], it was documented that the
Laser Doppler Blood perfusion measurement was used. Therefore, this section of development work
will outline the study and implementation conducted using the OSIM iDesire Massage chair as the
relaxation stimulus where the change in blood volume pulse was concurrently assessed using MMSB
based sensing system embedded in the OSIM iDesire Massage Chair and the Laser Doppler Blood
perfusion equipment. The change in blood volume pulse was correlated to the relaxation state of the
muscle providing the provision to infer the mental state (e.g. relax or stress) of the subject.
3.2 Experimental overview
The design of a system to assess the mental state of being relaxed or stressed of a human subject
has to be able to acquire the MMSB signal with minimum interference to the relaxation or stress
stimulus and minimum discomfort to the subject. As such, the system design for this section will first
explore the optimal locations to mount the sensor and magnet in order to acquire MMSB on the
massage chair. This is followed by the verifications of the reliability of the measured signal through
measurements of the MMSB signal on 5 subjects with different demography. With the reliability
measured, the location with the best reliability will be selected and signal processing will be
implemented to remove the noise from the massage chair. Finally, the experiment stimulus for
relaxation will be selected and repeated measurements will be done on each of the 5 subjects to
ensure repeatability of experiment. Finally, a statistical approach will be developed to determine the
change in BVP. The BVP obtained using the statistical analysis will also be compared with
measurements using the medical research instrument that applies the laser Doppler method to
measure blood volume flow. Once the system design is verified to be reliable and repeatable, a trial,
consisting 40 subjects, was conducted using the developed system to assess the mental state of
being relaxed or stressed after the application of the massage as the stimulus.
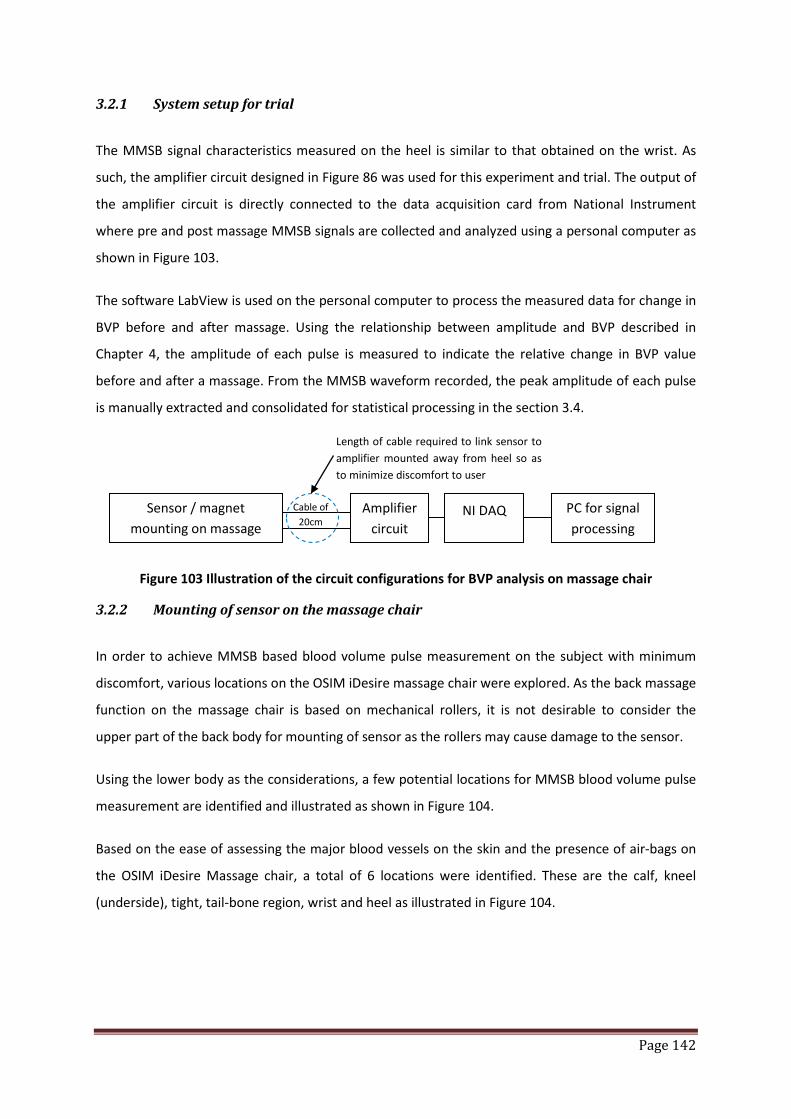
Page 142
3.2.1 System setup for trial
The MMSB signal characteristics measured on the heel is similar to that obtained on the wrist. As
such, the amplifier circuit designed in Figure 86 was used for this experiment and trial. The output of
the amplifier circuit is directly connected to the data acquisition card from National Instrument
where pre and post massage MMSB signals are collected and analyzed using a personal computer as
shown in Figure 103.
The software LabView is used on the personal computer to process the measured data for change in
BVP before and after massage. Using the relationship between amplitude and BVP described in
Chapter 4, the amplitude of each pulse is measured to indicate the relative change in BVP value
before and after a massage. From the MMSB waveform recorded, the peak amplitude of each pulse
is manually extracted and consolidated for statistical processing in the section 3.4.
Figure 103 Illustration of the circuit configurations for BVP analysis on massage chair
3.2.2 Mounting of sensor on the massage chair
In order to achieve MMSB based blood volume pulse measurement on the subject with minimum
discomfort, various locations on the OSIM iDesire massage chair were explored. As the back massage
function on the massage chair is based on mechanical rollers, it is not desirable to consider the
upper part of the back body for mounting of sensor as the rollers may cause damage to the sensor.
Using the lower body as the considerations, a few potential locations for MMSB blood volume pulse
measurement are identified and illustrated as shown in Figure 104.
Based on the ease of assessing the major blood vessels on the skin and the presence of air-bags on
the OSIM iDesire Massage chair, a total of 6 locations were identified. These are the calf, kneel
(underside), tight, tail-bone region, wrist and heel as illustrated in Figure 104.
Sensor / magnet mounting on massage
Amplifier circuit
NI DAQ Cable of 20cm
PC for signal processing
Length of cable required to link sensor to amplifier mounted away from heel so as to minimize discomfort to user
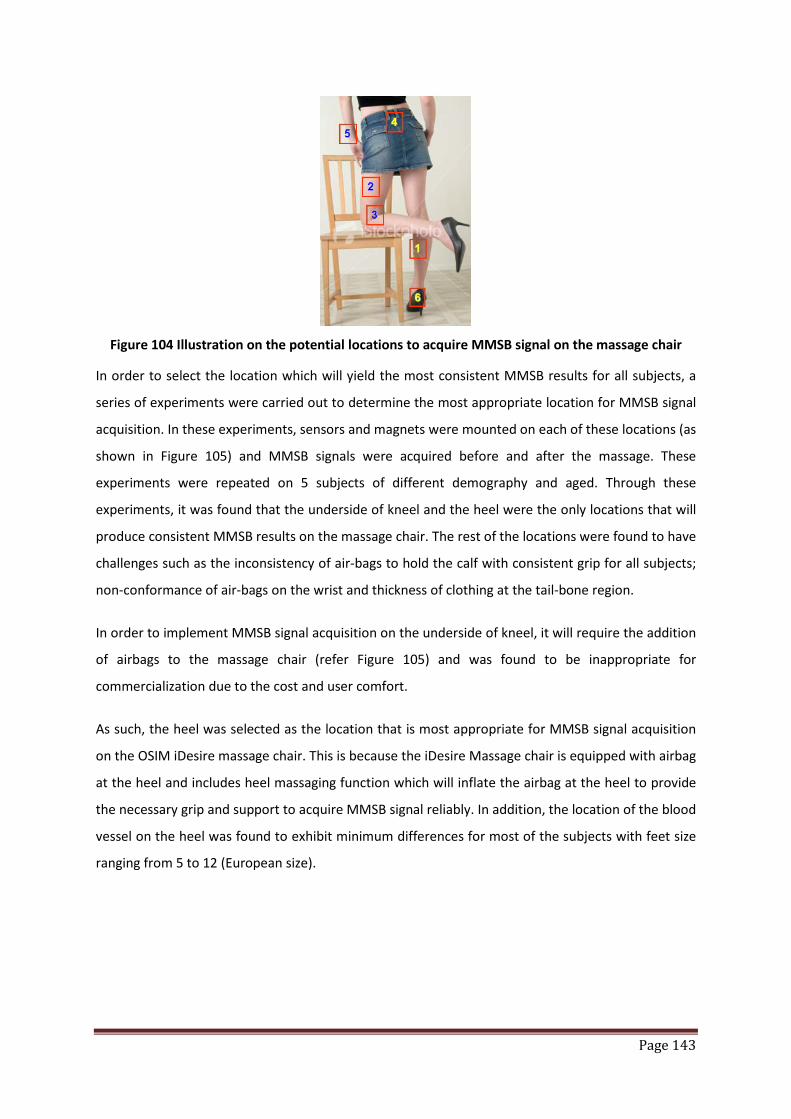
Page 143
Figure 104 Illustration on the potential locations to acquire MMSB signal on the massage chair
In order to select the location which will yield the most consistent MMSB results for all subjects, a
series of experiments were carried out to determine the most appropriate location for MMSB signal
acquisition. In these experiments, sensors and magnets were mounted on each of these locations (as
shown in Figure 105) and MMSB signals were acquired before and after the massage. These
experiments were repeated on 5 subjects of different demography and aged. Through these
experiments, it was found that the underside of kneel and the heel were the only locations that will
produce consistent MMSB results on the massage chair. The rest of the locations were found to have
challenges such as the inconsistency of air-bags to hold the calf with consistent grip for all subjects;
non-conformance of air-bags on the wrist and thickness of clothing at the tail-bone region.
In order to implement MMSB signal acquisition on the underside of kneel, it will require the addition
of airbags to the massage chair (refer Figure 105) and was found to be inappropriate for
commercialization due to the cost and user comfort.
As such, the heel was selected as the location that is most appropriate for MMSB signal acquisition
on the OSIM iDesire massage chair. This is because the iDesire Massage chair is equipped with airbag
at the heel and includes heel massaging function which will inflate the airbag at the heel to provide
the necessary grip and support to acquire MMSB signal reliably. In addition, the location of the blood
vessel on the heel was found to exhibit minimum differences for most of the subjects with feet size
ranging from 5 to 12 (European size).
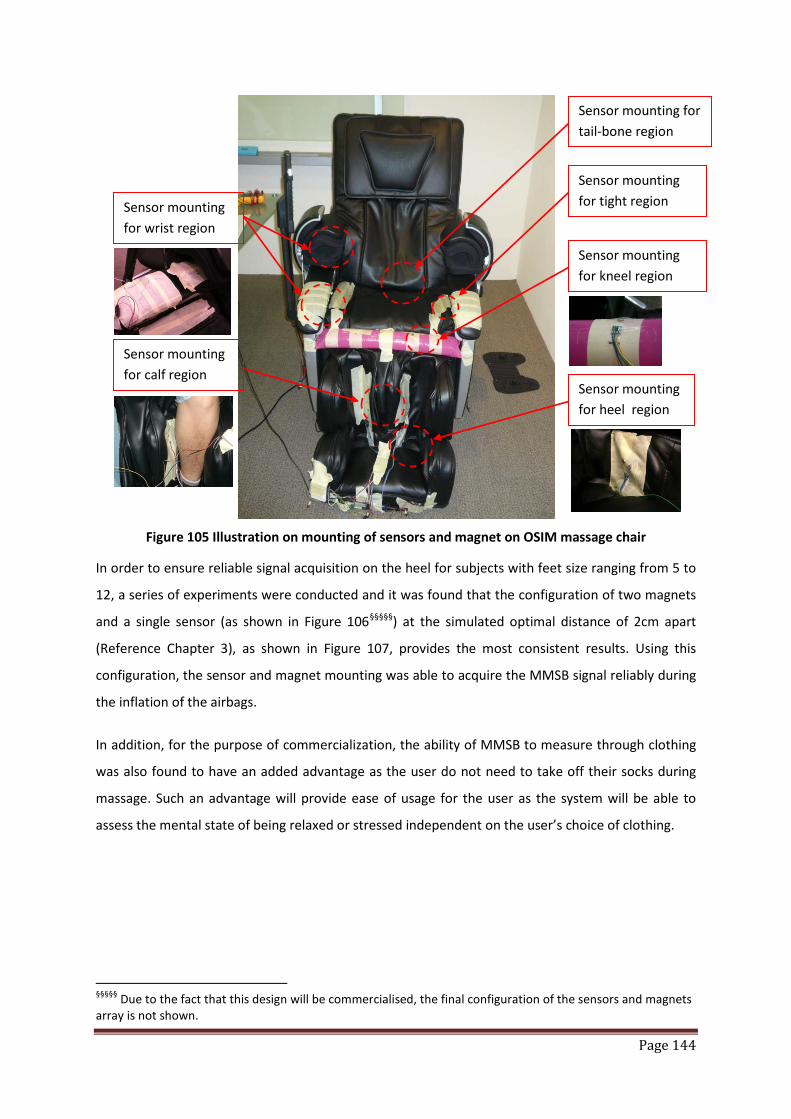
Page 144
Figure 105 Illustration on mounting of sensors and magnet on OSIM massage chair
In order to ensure reliable signal acquisition on the heel for subjects with feet size ranging from 5 to
12, a series of experiments were conducted and it was found that the configuration of two magnets
and a single sensor (as shown in Figure 106§§§§§) at the simulated optimal distance of 2cm apart
(Reference Chapter 3), as shown in Figure 107, provides the most consistent results. Using this
configuration, the sensor and magnet mounting was able to acquire the MMSB signal reliably during
the inflation of the airbags.
In addition, for the purpose of commercialization, the ability of MMSB to measure through clothing
was also found to have an added advantage as the user do not need to take off their socks during
massage. Such an advantage will provide ease of usage for the user as the system will be able to
assess the mental state of being relaxed or stressed independent on the user’s choice of clothing.
§§§§§ Due to the fact that this design will be commercialised, the final configuration of the sensors and magnets array is not shown.
Sensor mounting for tight region
Sensor mounting for heel region
Sensor mounting for wrist region
Sensor mounting for calf region
Sensor mounting for tail-bone region
Sensor mounting for kneel region
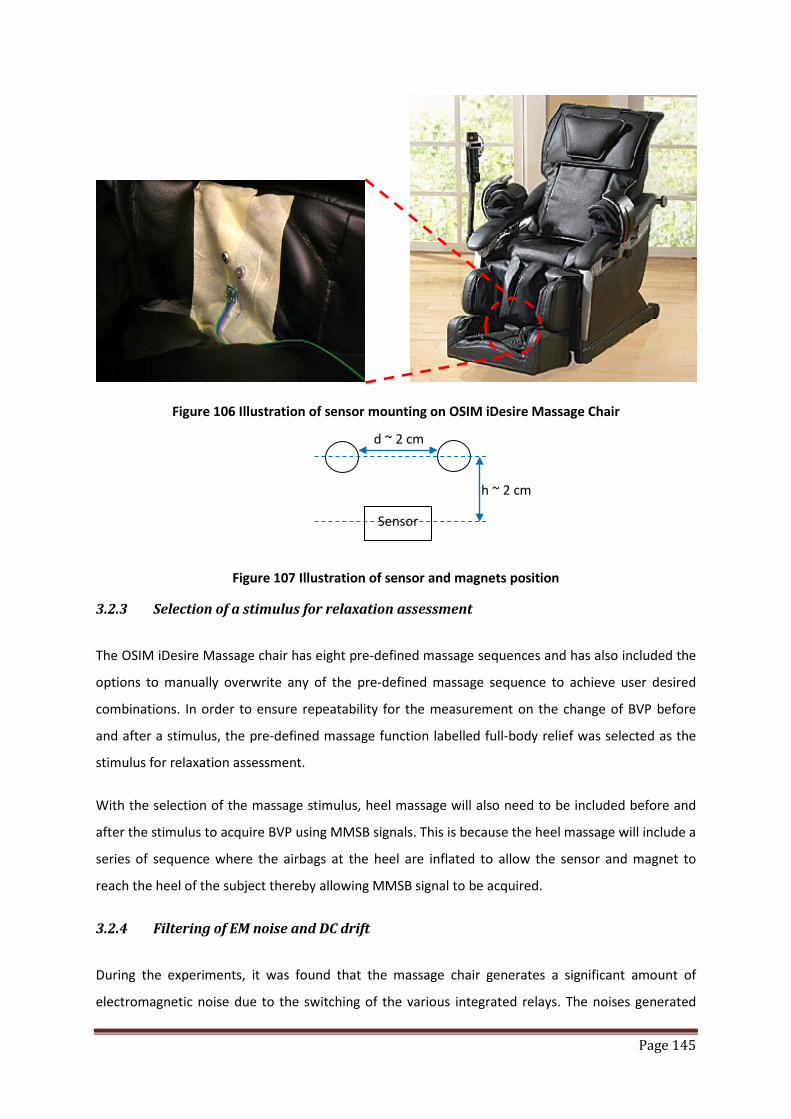
Page 145
Figure 106 Illustration of sensor mounting on OSIM iDesire Massage Chair
Figure 107 Illustration of sensor and magnets position
3.2.3 Selection of a stimulus for relaxation assessment
The OSIM iDesire Massage chair has eight pre-defined massage sequences and has also included the
options to manually overwrite any of the pre-defined massage sequence to achieve user desired
combinations. In order to ensure repeatability for the measurement on the change of BVP before
and after a stimulus, the pre-defined massage function labelled full-body relief was selected as the
stimulus for relaxation assessment.
With the selection of the massage stimulus, heel massage will also need to be included before and
after the stimulus to acquire BVP using MMSB signals. This is because the heel massage will include a
series of sequence where the airbags at the heel are inflated to allow the sensor and magnet to
reach the heel of the subject thereby allowing MMSB signal to be acquired.
3.2.4 Filtering of EM noise and DC drift
During the experiments, it was found that the massage chair generates a significant amount of
electromagnetic noise due to the switching of the various integrated relays. The noises generated
Sensor
h ~ 2 cm
d ~ 2 cm
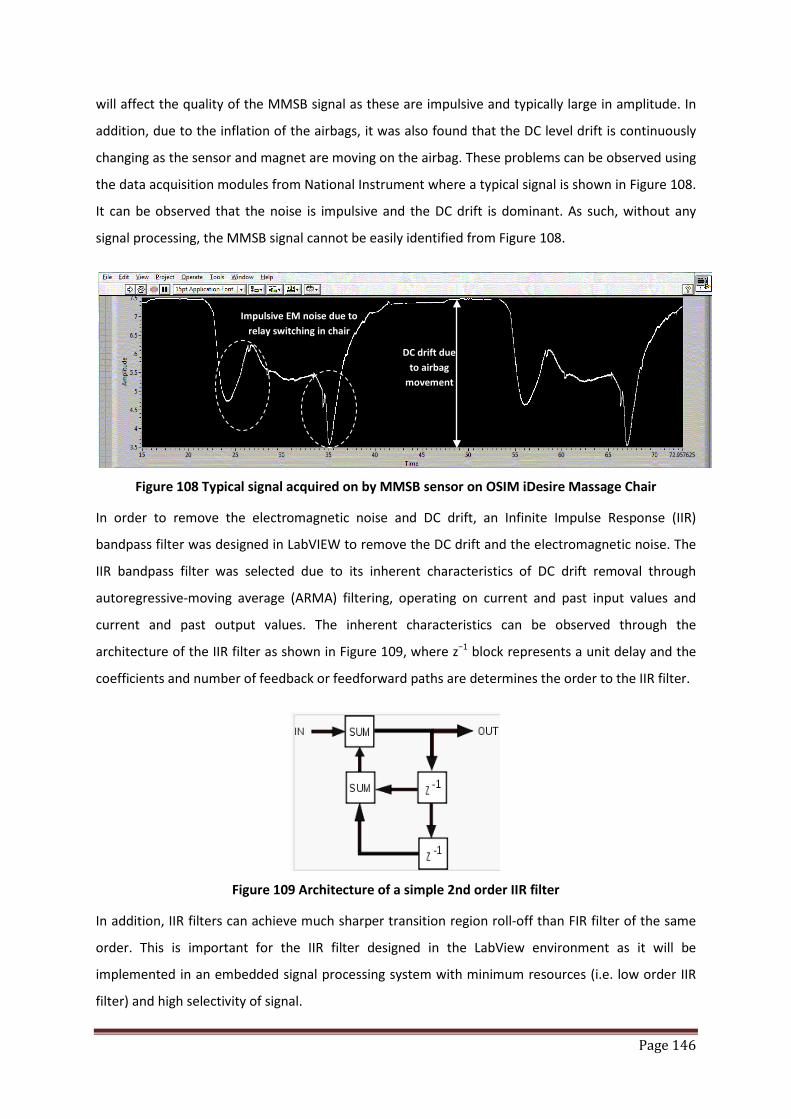
Page 146
will affect the quality of the MMSB signal as these are impulsive and typically large in amplitude. In
addition, due to the inflation of the airbags, it was also found that the DC level drift is continuously
changing as the sensor and magnet are moving on the airbag. These problems can be observed using
the data acquisition modules from National Instrument where a typical signal is shown in Figure 108.
It can be observed that the noise is impulsive and the DC drift is dominant. As such, without any
signal processing, the MMSB signal cannot be easily identified from Figure 108.
Figure 108 Typical signal acquired on by MMSB sensor on OSIM iDesire Massage Chair
In order to remove the electromagnetic noise and DC drift, an Infinite Impulse Response (IIR)
bandpass filter was designed in LabVIEW to remove the DC drift and the electromagnetic noise. The
IIR bandpass filter was selected due to its inherent characteristics of DC drift removal through
autoregressive-moving average (ARMA) filtering, operating on current and past input values and
current and past output values. The inherent characteristics can be observed through the
architecture of the IIR filter as shown in Figure 109, where z−1 block represents a unit delay and the
coefficients and number of feedback or feedforward paths are determines the order to the IIR filter.
Figure 109 Architecture of a simple 2nd order IIR filter
In addition, IIR filters can achieve much sharper transition region roll-off than FIR filter of the same
order. This is important for the IIR filter designed in the LabView environment as it will be
implemented in an embedded signal processing system with minimum resources (i.e. low order IIR
filter) and high selectivity of signal.
DC drift due to airbag
movement
Impulsive EM noise due to relay switching in chair
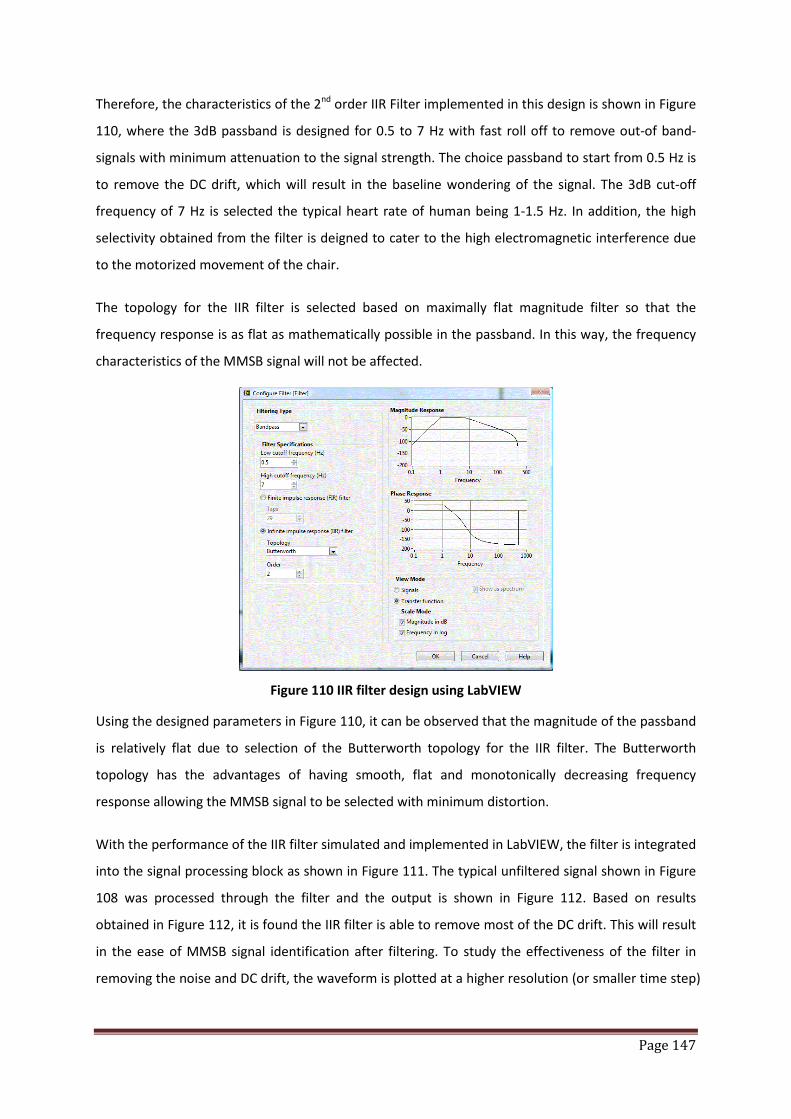
Page 147
Therefore, the characteristics of the 2nd order IIR Filter implemented in this design is shown in Figure
110, where the 3dB passband is designed for 0.5 to 7 Hz with fast roll off to remove out-of band-
signals with minimum attenuation to the signal strength. The choice passband to start from 0.5 Hz is
to remove the DC drift, which will result in the baseline wondering of the signal. The 3dB cut-off
frequency of 7 Hz is selected the typical heart rate of human being 1-1.5 Hz. In addition, the high
selectivity obtained from the filter is deigned to cater to the high electromagnetic interference due
to the motorized movement of the chair.
The topology for the IIR filter is selected based on maximally flat magnitude filter so that the
frequency response is as flat as mathematically possible in the passband. In this way, the frequency
characteristics of the MMSB signal will not be affected.
Figure 110 IIR filter design using LabVIEW
Using the designed parameters in Figure 110, it can be observed that the magnitude of the passband
is relatively flat due to selection of the Butterworth topology for the IIR filter. The Butterworth
topology has the advantages of having smooth, flat and monotonically decreasing frequency
response allowing the MMSB signal to be selected with minimum distortion.
With the performance of the IIR filter simulated and implemented in LabVIEW, the filter is integrated
into the signal processing block as shown in Figure 111. The typical unfiltered signal shown in Figure
108 was processed through the filter and the output is shown in Figure 112. Based on results
obtained in Figure 112, it is found the IIR filter is able to remove most of the DC drift. This will result
in the ease of MMSB signal identification after filtering. To study the effectiveness of the filter in
removing the noise and DC drift, the waveform is plotted at a higher resolution (or smaller time step)

Page 148
as shown in Figure 113, where it can be observed that the DC drift was removed completely and the
impact of the impulsive EM noise on the signal quality is minimized.
Figure 111 Implementation of the IIR filter for MMSB signal filtering
Figure 112 Typical signal output comparison between filtered and unfiltered signal
Unfiltered signal
Filtered signal MMSB signal
observed

Page 149
Figure 113 Typical response of the IIR filter in removing DC drift and impulsive EM noise
3.3 Setup and procedure used in trial
Using the typical heart rate of a healthy adult as 1 to 1.3Hz (i.e. 60 to 80 pulses/minute), the heel
massage will have to acquire MMSB signal for at least 5 minutes so as to ensure that there is enough
BVP pulses available for analysis. This is because the heel massage is based on the pre-programmed
sequence which will inflate the airbag at the heel in intervals of twice per minute and each grip will
typically yield 3 to 5 detectable pulses for BVP analysis. Therefore, a total of 30 to 50 pulses will be
collected during the heel massage for the statistical analysis of the BVP to assess the change in BVP
before and after the full-body relief massage.
In addition, as the blood volume pulse is dependent on the position of the subject on the massage
chair, the massage chair was adjusted to a pre-defined inclination (of approximately 60 degrees) as
shown in Figure 114 for all subjects, after they are comfortably seated on the massage chair. With
the subject at the recommended inclination angle, the heel and calf will also be well rested on the
massage chair, which will be supporting most of the weight on the lower body. Thus, this setup will
reduce error
in BVP measurements that can be introduced during the trial due to muscle tension related to the
sitting position of the subject.
DC drift
Impulsive EM noise minimized
Removal of DC drift
Unfiltered signal
Filtered signal

Page 150
Figure 114 Inclination of OSIM massage chair during trial
In addition, the MMSB measurement is also compared with the laser Doppler measurements using
the medical research gold standard, Moors Instruments. The objective of this comparison is to
ensure that MMSB measurement is calibrated with the medical research gold standard.
Typical mountings of the laser probes are shown in Figure 115, where the massage chair will not
damage the probes during the experiment. With this mounting, the typical measured result using
the blood laser Doppler instrument is shown in Figure 116.
Figure 115 Illustration of mounting for laser probe during trial
60°
60°
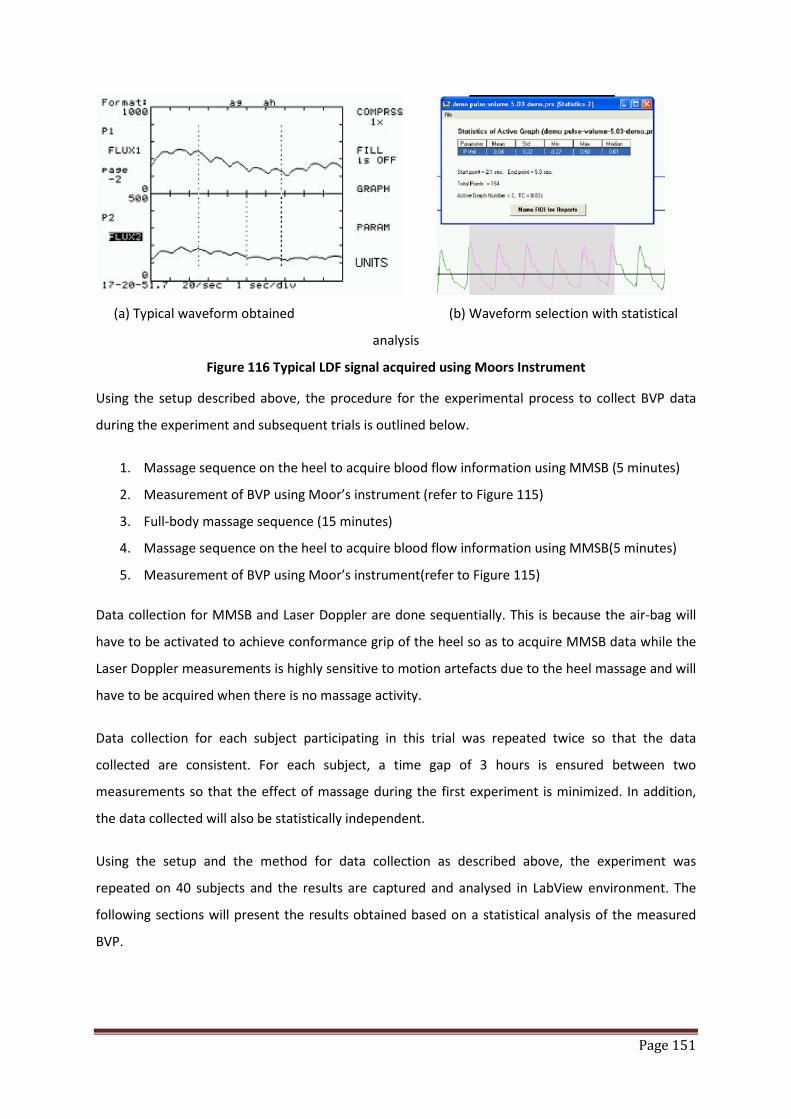
Page 151
(a) Typical waveform obtained (b) Waveform selection with statistical
analysis
Figure 116 Typical LDF signal acquired using Moors Instrument
Using the setup described above, the procedure for the experimental process to collect BVP data
during the experiment and subsequent trials is outlined below.
1. Massage sequence on the heel to acquire blood flow information using MMSB (5 minutes)
2. Measurement of BVP using Moor’s instrument (refer to Figure 115)
3. Full-body massage sequence (15 minutes)
4. Massage sequence on the heel to acquire blood flow information using MMSB(5 minutes)
5. Measurement of BVP using Moor’s instrument(refer to Figure 115)
Data collection for MMSB and Laser Doppler are done sequentially. This is because the air-bag will
have to be activated to achieve conformance grip of the heel so as to acquire MMSB data while the
Laser Doppler measurements is highly sensitive to motion artefacts due to the heel massage and will
have to be acquired when there is no massage activity.
Data collection for each subject participating in this trial was repeated twice so that the data
collected are consistent. For each subject, a time gap of 3 hours is ensured between two
measurements so that the effect of massage during the first experiment is minimized. In addition,
the data collected will also be statistically independent.
Using the setup and the method for data collection as described above, the experiment was
repeated on 40 subjects and the results are captured and analysed in LabView environment. The
following sections will present the results obtained based on a statistical analysis of the measured
BVP.
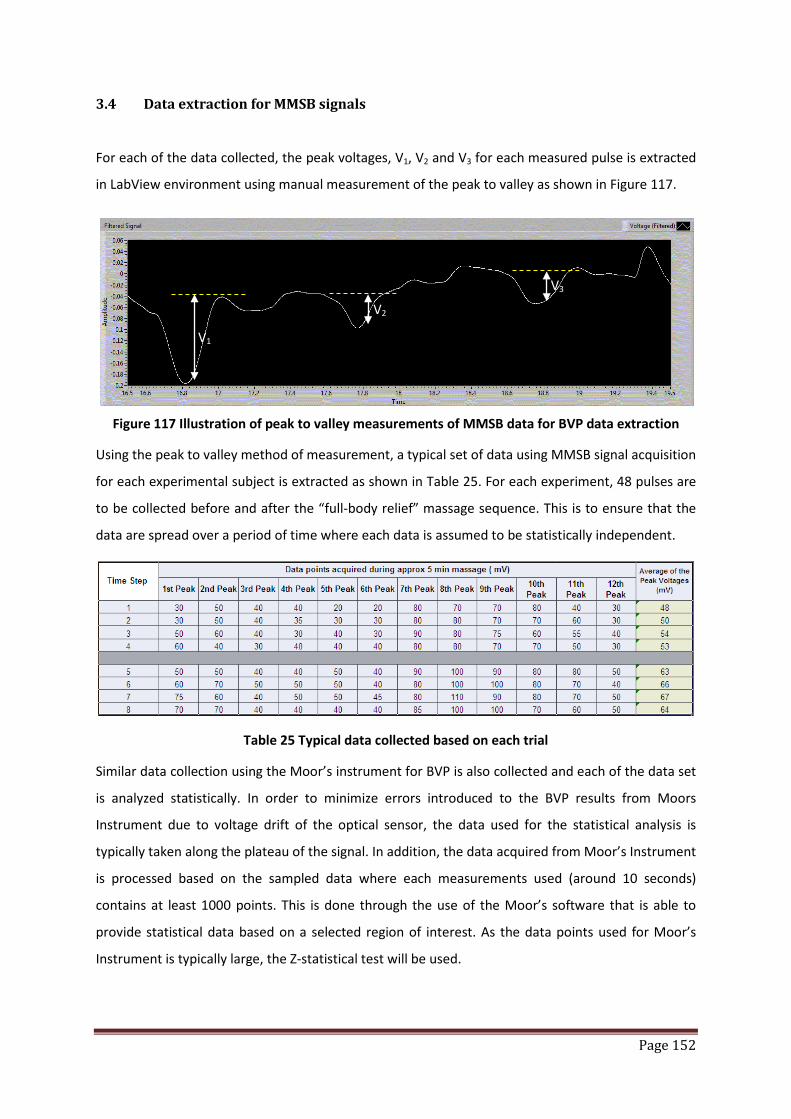
Page 152
3.4 Data extraction for MMSB signals
For each of the data collected, the peak voltages, V1, V2 and V3 for each measured pulse is extracted
in LabView environment using manual measurement of the peak to valley as shown in Figure 117.
Figure 117 Illustration of peak to valley measurements of MMSB data for BVP data extraction
Using the peak to valley method of measurement, a typical set of data using MMSB signal acquisition
for each experimental subject is extracted as shown in Table 25. For each experiment, 48 pulses are
to be collected before and after the “full-body relief” massage sequence. This is to ensure that the
data are spread over a period of time where each data is assumed to be statistically independent.
Table 25 Typical data collected based on each trial
Similar data collection using the Moor’s instrument for BVP is also collected and each of the data set
is analyzed statistically. In order to minimize errors introduced to the BVP results from Moors
Instrument due to voltage drift of the optical sensor, the data used for the statistical analysis is
typically taken along the plateau of the signal. In addition, the data acquired from Moor’s Instrument
is processed based on the sampled data where each measurements used (around 10 seconds)
contains at least 1000 points. This is done through the use of the Moor’s software that is able to
provide statistical data based on a selected region of interest. As the data points used for Moor’s
Instrument is typically large, the Z-statistical test will be used.
V1
V2
V3

Page 153
A Z-statistical test is the statistical test that is using the distribution of the test statistic under the null
hypothesis where the data is assumed to approximate to a normal distribution. As the data from
Moor’s instrument and MMSB both contains a relatively large sample (> 30 data points each), the Z-
statistical test will be applicable. In this test, the means between two samples will be analysed using
Equation 72.
Equation 72 𝒁 = 𝑿𝟐−𝑿𝟏
𝑺𝒕𝒅𝟐𝟐
𝑵𝟐+𝑺𝒕𝒅𝟏
𝟐
𝑵𝟏
where X2, X1 = means of data before and after massage respectively
Std2, Std1 = standard deviation of data before and after massage respectively
N2, N1 = sample size of data collected before and after massage respectively
3.5 Statistical analysis of trial
The statistical data analysed from the BVP measured using MMSB is compared with the statistical
data obtained using the laser Doppler medical instrument to measure BVP. A typical set of data
obtained for this trial is shown in Figure 118. With the statistical data tabulated for both the Moor
Instrument and MMSB, the two-tailed Z-test is used as inference to determine if the difference
between the statistical values obtained for each of the measurement is either sufficiently small or
sufficiently large.
Figure 118 Typical statistical data obtained before and after massage
The results obtained for the two-tailed Z-test at 95% and 99% confidence interval (CI) for both the
Moors Instrument and MMSB are tabulated in Table 26. Based on the results obtained, it can be
observed that the MMSB and Moors data have a 93.3% correlation (i.e. similar) at 95% confidence
MoorParameters Mean Std Min Max Median N
F1 3.07 0.33 2.33 4.01 3.05 1691
SpintronicsParameters Mean Std Min Max Median N
F1 26.8125 4.936431 24 29.00 25.00 48
MoorParameters Mean Std Min Max Median N
F1 4.03 0.48 3 5.47 3.98 1492
SpintronicsParameters Mean Std Min Max Median N
F1 34.45833 9.624787 28 39 35 48
Before
After
Before
After
MMSB
MMSB

Page 154
interval. However, at 99% confidence interval, the data was found to have 91.3% correlation (i.e.
similar).
The two-tailed Z-test at 99% CI produces a lower correlation due to the fact that the test is more
stringent at 99% CI as compared to 95% CI.
In addition, the results obtained were also analyzed for the average number of cases where the
subject’s BVP improves after massage through the use of the Z-test. For cases where a positive
significant was found, it can be concluded that the subject’s BVP improves significantly after the
massage. Therefore, using MMSB as the method of BVP measurements, at both 95% and 99% CI, the
average number of measured cases with improved BVP is 61.25%. Comparing this to the 63%
percent of cases reported to have improved BVP after massage [5], the results are concluded to be
comparable.
Moors@95% CI MMSB@95% CI Moors@99% CI MMSB@99% CI
Positive Significant 30 cases 28 cases 23 cases 21 cases
Negative or No Significant 10 cases 12 cases 17 cases 19 cases
Table 26 Results obtained for two-tailed Z-test using MMSB and Moors Instrument
3.6 Conclusions
The results obtained in this study were found to be repeatable and the MMSB data correlates well
with the measurements using laser Doppler method (Table 26). In addition, the number of cases
with improved BVP correlates well with published results. As such, it was concluded that the use of
MMSB sensing system embedded in OSIM iDesire massage chair is feasible in assessing the change in
BVP.
With the success of this study, this development has also been implemented onto an embedded
processor platform to automate the signal acquisition, filtering, signal recognition and statistical
analysis. The developed product was found to produce measured results with 98% correlations to
the laser Doppler measurements. Currently, the production prototype based on this development
has been completed.

Page 155
4 Relaxation assessment using heart rate variability
4.1 Introduction
Heart rate variability (HRV) is the change in the period between consecutive heartbeats over time.
Such a change is predominantly dependent on the extrinsic regulation of the heart rate (HR). For
healthy adult, the normal variability in HR is due to autonomic neural regulation of the heart and the
circulatory system [11]. Due to external predictable and unpredictable stimuli, HRV is used as a
measure of the ability of the heart to adapt to these changing circumstances. As such, analysis of
HRV will allow the assessment on the overall cardiac health and the state of the autonomic nervous
system (ANS), which is responsible for regulating cardiac activity. The ANS consist of the sympathetic
nervous system (SNS) and parasympathetic nervous system (PNS) branches. The balancing action of
the SNS and PNS branches of the ANS controls the HRV. Increased SNS or diminished PNS activity
results in cardio-acceleration. Conversely, a low SNS activity or a high PNS activity causes cardio-
deceleration. The degree of variability in the HR provides information about the functioning of the
nervous control on the HR and the heart’s ability to respond to stressors.
Stressors are often associated with an increase in sympathetic cardiac control, a decrease in
parasympathetic control, or both. Associated with these reactions is a frequently reported increase
in low frequency (LF, centred around 0.1 Hz, or 0.04–0.15 Hz) heart rate variability, a decrease in
high frequency (HF, 0.12 or 0.15–0.4 Hz) power, and/or an increase in the LF/HF ratio. Aspects of this
general response pattern have been reported for: (a) acute laboratory psychological or cognitive
stressors such as mental arithmetic, reaction time tasks, Stroop interference task [12], or speech
stress [13]-[17]; (b) real-life acute stressors such as college examinations [18], earthquakes [19], as
well as typical day-to-day hassles [20]; and even (c) the level of chronic perceived stress associated
with trait anxiety [21]. The study on the autonomic effects of acute laboratory stressors [13], for
example, reported a stress-related decrease in HF heart rate variability (LF was not quantified),
associated with a significant reduction in parasympathetic cardiac control and an in sympathetic
control, as revealed by selective pharmacological blockades of the autonomic branches.
In this section, research and development on the use of HRV for relaxation assessment will be
discussed together with implementation of an embedded system to quantify the relax level of a
subject after going through a massage. In this experiment, the stimulus is the OSIM iDesire Massage
chair and HRV is acquired using MMSB based sensing system. The directional change in HRV will be
correlated to the SNS and PNS response to the stimulus and will be used as a surrogate marker to
indicate the mental state (e.g. relax level) of the subject.

Page 156
4.2 Experimental overview
Using the optimal sensor mounting on the heel and signal filtering outlined in section 3.2 of Chapter
6, this section of the research work will focus on the acquisition of HR data for HRV analysis on the
heel. In addition, design and implementation of optimal sensor mounting for MMSB acquisition on a
wrist structure / strip will be discussed. This work is part of the commercialization development
based on the needs of the commercial company. As such, an overview of the sensors and magnets
mounting will be discussed where limited details will only be presented in this section due to
disclosure limitations.
4.2.1 System setup for human trial
In the system setup used for the trial, a wrist structure is designed as shown in Figure 119. An array
of 3 sensors and 6 magnets are configured such that the magnets will produce a uniform magnetic
field around the wrist. The sensors array will pick up the magnetic disturbance of the blood flowing
through the uniform magnetic field as described by the principle of MMSB.
Figure 119 Sensors and magnets concealment on wrist structure
Using the sensors and magnets configuration as shown in Figure 119, once the wrist is aligned to the
edge of the wrist structure, MMSB signals can be acquired for varying sizes of the wrist profile as
shown in Figure 120. As such, MMSB signal acquisition is reliable and is independent on the user’s
familiarity of the system. The locking mechanism implemented in the wrist structure will help to
keep the alignment of the sensors and magnets allowing MMSB signals to be acquired reliably for 2
minutes with minimum motion artefacts. The amount of time required for MMSB signal acquisition
Magnet array
Sensor array
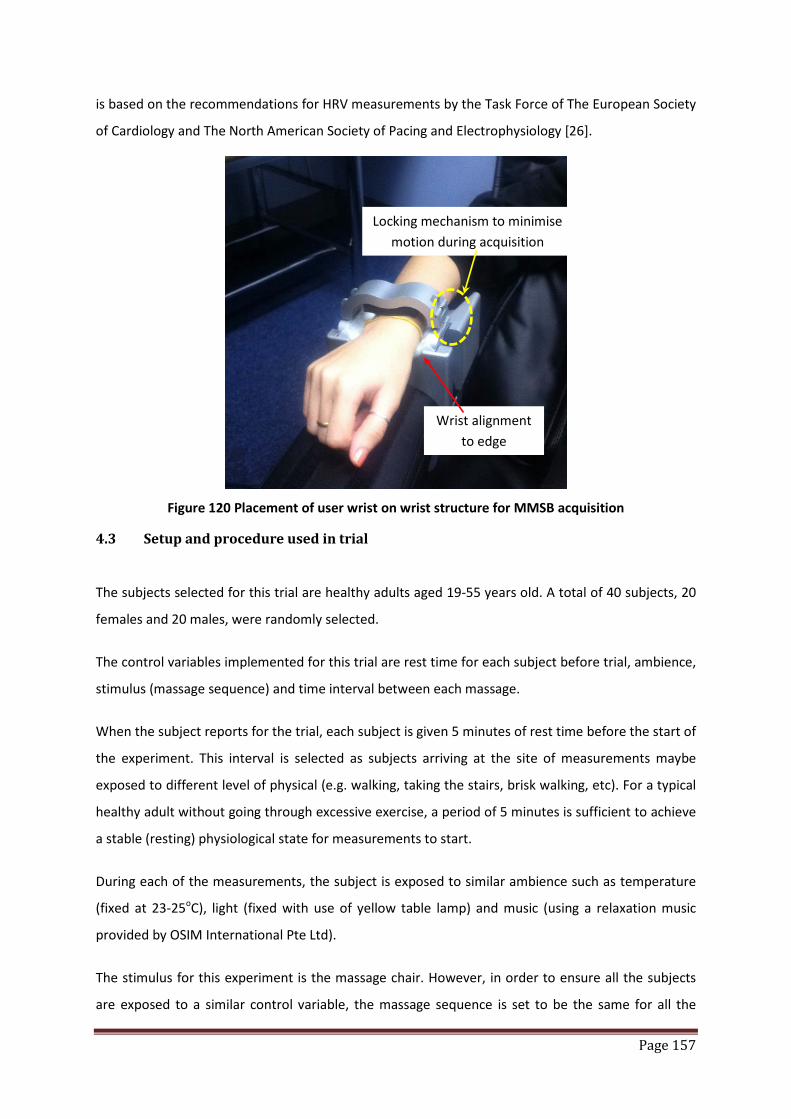
Page 157
is based on the recommendations for HRV measurements by the Task Force of The European Society
of Cardiology and The North American Society of Pacing and Electrophysiology [26].
Figure 120 Placement of user wrist on wrist structure for MMSB acquisition
4.3 Setup and procedure used in trial
The subjects selected for this trial are healthy adults aged 19-55 years old. A total of 40 subjects, 20
females and 20 males, were randomly selected.
The control variables implemented for this trial are rest time for each subject before trial, ambience,
stimulus (massage sequence) and time interval between each massage.
When the subject reports for the trial, each subject is given 5 minutes of rest time before the start of
the experiment. This interval is selected as subjects arriving at the site of measurements maybe
exposed to different level of physical (e.g. walking, taking the stairs, brisk walking, etc). For a typical
healthy adult without going through excessive exercise, a period of 5 minutes is sufficient to achieve
a stable (resting) physiological state for measurements to start.
During each of the measurements, the subject is exposed to similar ambience such as temperature
(fixed at 23-25oC), light (fixed with use of yellow table lamp) and music (using a relaxation music
provided by OSIM International Pte Ltd).
The stimulus for this experiment is the massage chair. However, in order to ensure all the subjects
are exposed to a similar control variable, the massage sequence is set to be the same for all the
Locking mechanism to minimise motion during acquisition
Wrist alignment to edge

Page 158
subjects with similar intensity. In addition, each measurement is not repeated on the same subject
within a 24 hours interval. In this way, the measured variables will be independent of the each trial.
The measured parameters for this experiment are average Heart Rate (Pre and Post Massage),
Relaxation Level (Pre and Post Massage using HRV) and the general state of health (e.g. fever, body
aches, etc).
The experiment begins with the subject comfortably rested on the massage chair inclined at an angle
of 30-40 degrees from the floor horizon. The temperature, light and music ambience are fixed as
described above. Data acquisition is done using the wrist structure for a period of 2 minutes or 120
heart pulses. Using the acquired data, the pre-massage indication is computed together with the
heart rate of the subject. Both measured variables are recorded for analysis in latter section.
Maintaining the same ambience, the stimulus of the experiment (i.e. massage) is applied on the
subject for a period of 15 minutes. Upon the completion of the massage, data acquisition is
completed using the wrist structure for a period of 2 minutes or 120 heart pulses. Using the
acquired data, the post-massage indication is computed together with the heart rate of the subject.
4.4 HRV analysis using MMSB signals
In Chapter 2, section 7, instantaneous HR acquired using MMSB has been statistically validated to be
accurate with reference to a gold instrumentation heart rate acquisition system, ECG. In this section,
instantaneous HR will be extracted from MMSB signals for HRV analysis.
Based on the guidelines provided by the Task Force of The European Society of Cardiology and The
North American Society of Pacing and Electrophysiology [26], HRV can be analysed using both the
time-domain and frequency-domain approach.
Time domain HRV analysis are statistical measurements based on HR data collected over 24 hours
(at least 20 minutes is recommended). In a continuous electrocardiographic (ECG) recording, each
QRS complex is detected, and the so-called normal-to-normal (NN) intervals (that is all intervals
between adjacent QRS complexes resulting from sinus node depolarisations), or the instantaneous
heart rate is determined. Parameters that standard deviation of all NN intervals (SDNN) in seconds,
square root of the mean of the sum of the squares of differences between adjacent NN interval
(RMSSD) in milliseconds (ms), number of adjacent NN intervals differing more than 50 ms. (NN50
count), percentage of difference between adjacent NN intervals differing more than 50 ms.
(pNN50 %), the integral of sample density distribution of RR intervals divided by the maximum of the
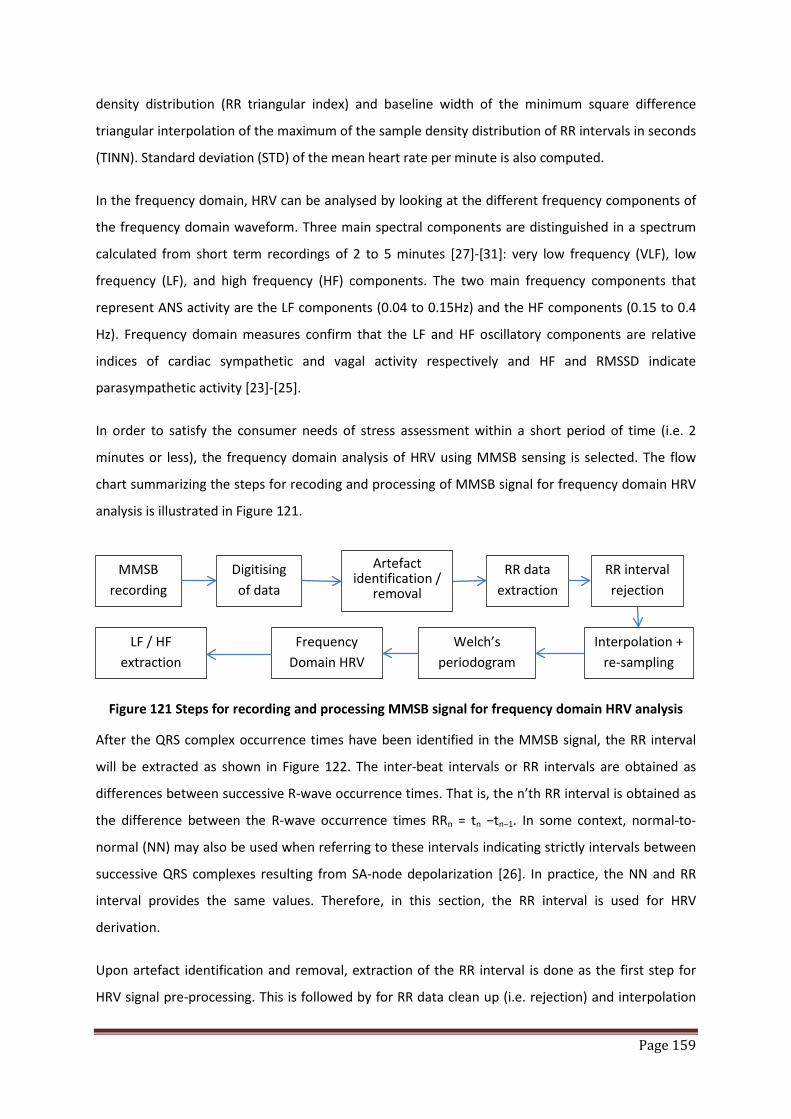
Page 159
density distribution (RR triangular index) and baseline width of the minimum square difference
triangular interpolation of the maximum of the sample density distribution of RR intervals in seconds
(TINN). Standard deviation (STD) of the mean heart rate per minute is also computed.
In the frequency domain, HRV can be analysed by looking at the different frequency components of
the frequency domain waveform. Three main spectral components are distinguished in a spectrum
calculated from short term recordings of 2 to 5 minutes [27]-[31]: very low frequency (VLF), low
frequency (LF), and high frequency (HF) components. The two main frequency components that
represent ANS activity are the LF components (0.04 to 0.15Hz) and the HF components (0.15 to 0.4
Hz). Frequency domain measures confirm that the LF and HF oscillatory components are relative
indices of cardiac sympathetic and vagal activity respectively and HF and RMSSD indicate
parasympathetic activity [23]-[25].
In order to satisfy the consumer needs of stress assessment within a short period of time (i.e. 2
minutes or less), the frequency domain analysis of HRV using MMSB sensing is selected. The flow
chart summarizing the steps for recoding and processing of MMSB signal for frequency domain HRV
analysis is illustrated in Figure 121.
Figure 121 Steps for recording and processing MMSB signal for frequency domain HRV analysis
After the QRS complex occurrence times have been identified in the MMSB signal, the RR interval
will be extracted as shown in Figure 122. The inter-beat intervals or RR intervals are obtained as
differences between successive R-wave occurrence times. That is, the n’th RR interval is obtained as
the difference between the R-wave occurrence times RRn = tn −tn−1. In some context, normal-to-
normal (NN) may also be used when referring to these intervals indicating strictly intervals between
successive QRS complexes resulting from SA-node depolarization [26]. In practice, the NN and RR
interval provides the same values. Therefore, in this section, the RR interval is used for HRV
derivation.
Upon artefact identification and removal, extraction of the RR interval is done as the first step for
HRV signal pre-processing. This is followed by for RR data clean up (i.e. rejection) and interpolation
MMSB recording
Digitising of data
Artefact identification /
removal
RR data extraction
RR interval rejection
Interpolation + re-sampling
Welch’s periodogram
Frequency Domain HRV
LF / HF extraction
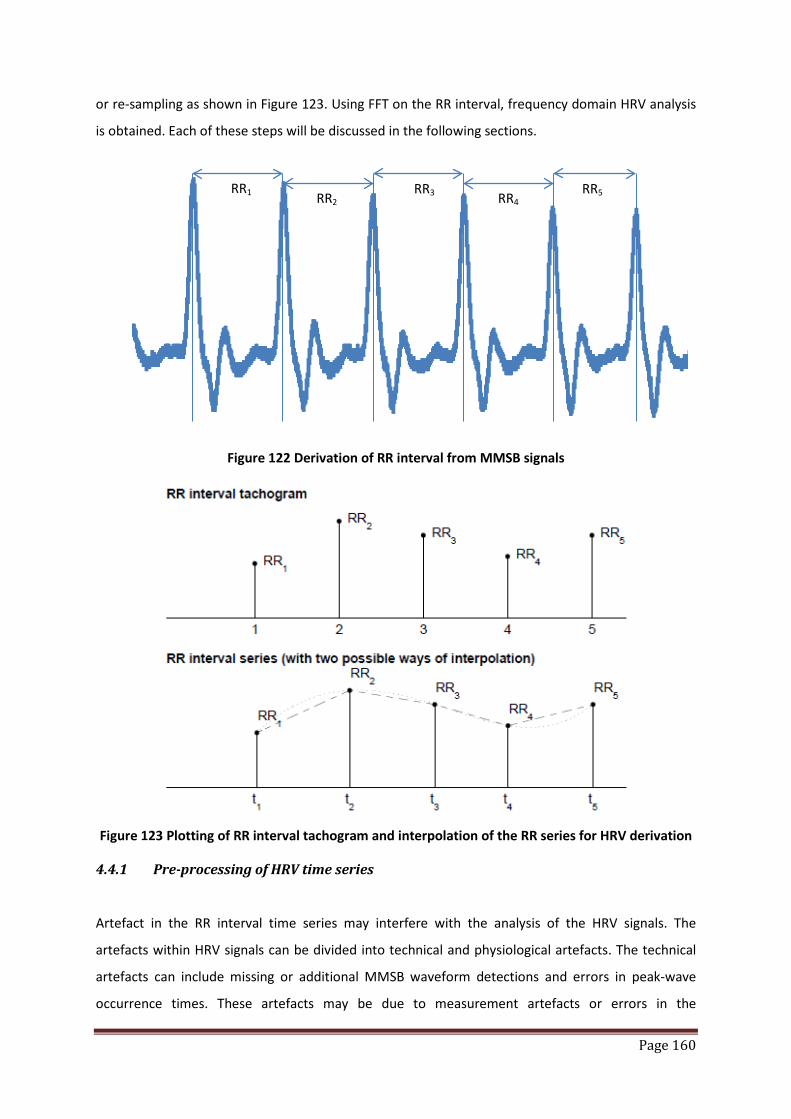
Page 160
or re-sampling as shown in Figure 123. Using FFT on the RR interval, frequency domain HRV analysis
is obtained. Each of these steps will be discussed in the following sections.
Figure 122 Derivation of RR interval from MMSB signals
Figure 123 Plotting of RR interval tachogram and interpolation of the RR series for HRV derivation
4.4.1 Pre-processing of HRV time series
Artefact in the RR interval time series may interfere with the analysis of the HRV signals. The
artefacts within HRV signals can be divided into technical and physiological artefacts. The technical
artefacts can include missing or additional MMSB waveform detections and errors in peak-wave
occurrence times. These artefacts may be due to measurement artefacts or errors in the
RR1 RR2 RR3 RR4
RR5

Page 161
computational algorithm for MMSB recognition and peak extraction. The physiological artefacts, on
the other hand, include ectopic beats and arrhythmic events. Such artefact is more difficult to
remove and is mitigated through the selection of young and healthy adults for the trial.
In order to avoid the interference of such artefacts, the MMSB recording and the corresponding
event series, sections of the MMSB waveform will be manually checked for artefacts to ensure that
the analysis period are artefact-free [26]. In the event that the amount of artefact-free data is
insufficient, the nonlinear predictive interpolation method is used to reduce these artefacts [33]-[35].
Another common feature that can alter the HRV analysis significantly is the slow linear or more
complex trends within the analysed time series. Such slow non-stationaries are characteristic for
HRV signals and should be understood before the analysis. The origins of such non-stationaries in
HRV are discussed in [36]. The slow non-stationary trends from the HRV signal is removed using first
order de-trending [37][38] model so as to provide smoothness prior to HRV PSD extraction. In this
measurement, the moving average method is implemented to remove the slow non-stationary trend
in HRV signal.
4.4.2 FFT of HRV time series
In the frequency-domain methods, a power spectrum density (PSD) estimate is calculated for the RR
interval series. The regular PSD estimators implicitly assume equidistant sampling and, thus, the RR
interval series is converted to equidistantly sampled series by interpolation methods prior to PSD
estimation. In this section, a cubic spline interpolation method is used [32]. This is followed by the
Fast Fourier Transform (FFT) using the Welch periodogram for PSD estimation.
The Welch periodogram is a method by which a large time-sampled waveform can be frequency-
transformed by partitioning the data into shorter segments, transforming each segment, then,
averaging the results over all the segments to create a composite frequency-space waveform.
The reasons for using the periodogram are as follows:
• the averaging of the individual PSDs allows for the reduction of variance errors
• it is logarithmically more efficient to take many shorter FFTs than one longer one which
makes this technique attractive for processing long runs of data [39]
To properly create a PSD profile, values for three parameters must be judiciously selected:
• Window size or data segment
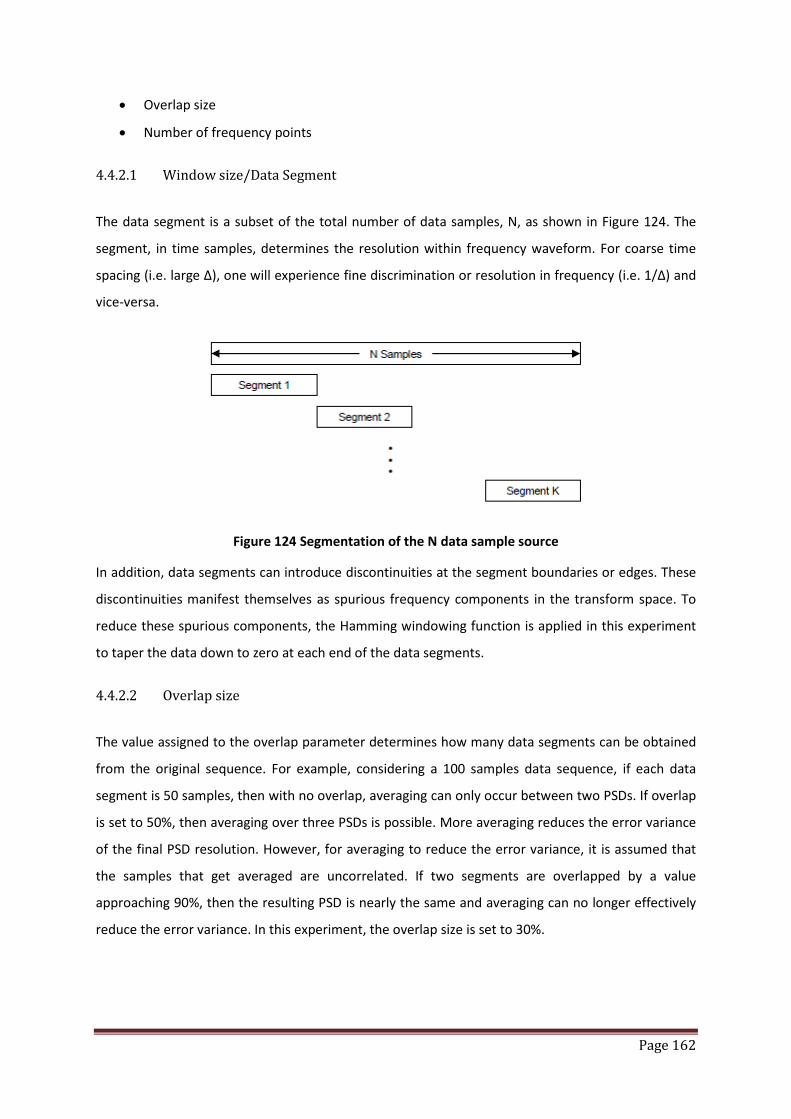
Page 162
• Overlap size
• Number of frequency points
4.4.2.1 Window size/Data Segment
The data segment is a subset of the total number of data samples, N, as shown in Figure 124. The
segment, in time samples, determines the resolution within frequency waveform. For coarse time
spacing (i.e. large Δ), one will experience fine discrimination or resolution in frequency (i.e. 1/Δ) and
vice-versa.
Figure 124 Segmentation of the N data sample source
In addition, data segments can introduce discontinuities at the segment boundaries or edges. These
discontinuities manifest themselves as spurious frequency components in the transform space. To
reduce these spurious components, the Hamming windowing function is applied in this experiment
to taper the data down to zero at each end of the data segments.
4.4.2.2 Overlap size
The value assigned to the overlap parameter determines how many data segments can be obtained
from the original sequence. For example, considering a 100 samples data sequence, if each data
segment is 50 samples, then with no overlap, averaging can only occur between two PSDs. If overlap
is set to 50%, then averaging over three PSDs is possible. More averaging reduces the error variance
of the final PSD resolution. However, for averaging to reduce the error variance, it is assumed that
the samples that get averaged are uncorrelated. If two segments are overlapped by a value
approaching 90%, then the resulting PSD is nearly the same and averaging can no longer effectively
reduce the error variance. In this experiment, the overlap size is set to 30%.

Page 163
4.4.2.3 Number of frequency points (NFFT)
Increasing the number of frequency points affects the grid points on which the spectrum is
evaluated. This parameter does not enhance physical resolution of the frequency spectrum but
provides a finer grid on the frequency axis to observe the spectrum. Therefore, the higher the
number of frequency points, the finer is the axis grid.
In choosing the NFFT parameter the following should be considered:
• For NFFT > data segment, the FFT transform is zero-padded and all the samples of the data
segment are applied to the transform
• NFFT < data segment, some data samples are not applied to the FFT transform, which
implies loss of frequency resolution
Therefore, in this experiment, the NFFT is set to 256 so that all the data samples collected over 2-3
minutes (i.e. 140-210 RR interval based on HR of 70bpm) are applied to the FFT transform without
any loss of frequency resolution.
4.4.3 Power Spectral Density (PSD) analysis of HRV time series
The PSD plot obtained from the FFT by taking the absolute square sum of the complex FFT output.
An example of the PSD plot is shown in Figure 125.
Figure 125 Example of a PSD plot for a typical RR data
The power for each frequency band (i.e. VLF, LF and HF) is calculated by taking the sum of all the
points in the PSD plot for the specific band of frequency.
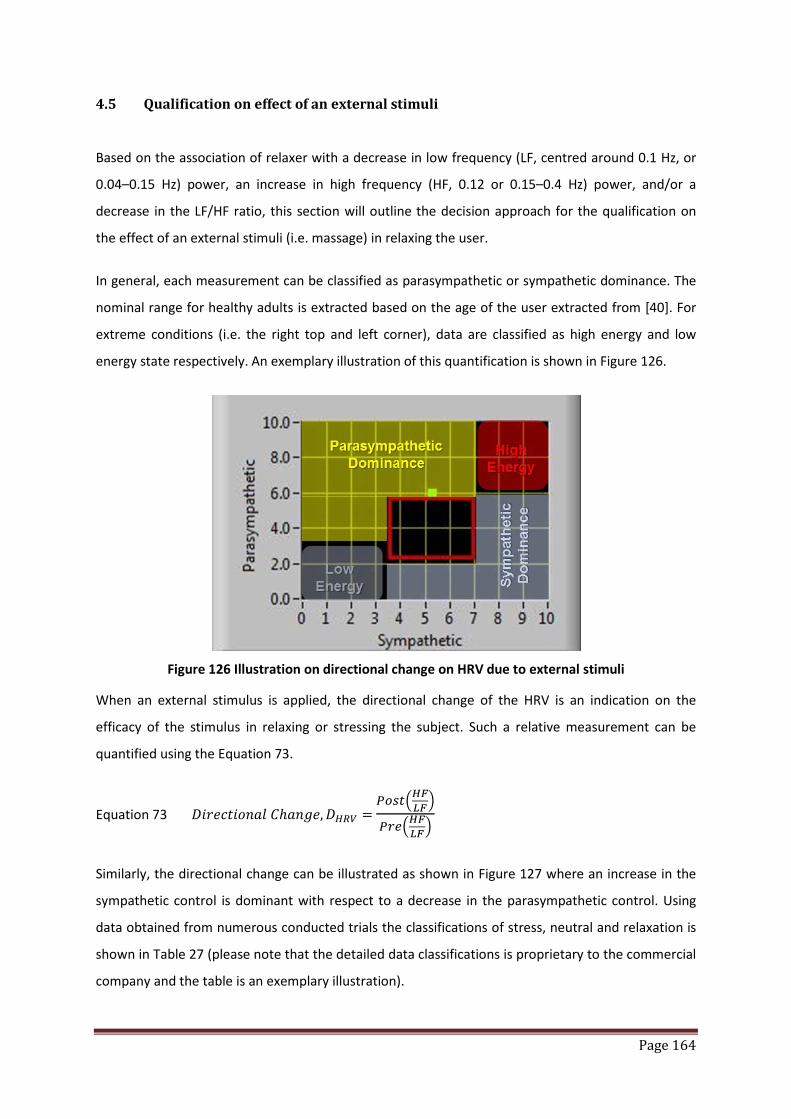
Page 164
4.5 Qualification on effect of an external stimuli
Based on the association of relaxer with a decrease in low frequency (LF, centred around 0.1 Hz, or
0.04–0.15 Hz) power, an increase in high frequency (HF, 0.12 or 0.15–0.4 Hz) power, and/or a
decrease in the LF/HF ratio, this section will outline the decision approach for the qualification on
the effect of an external stimuli (i.e. massage) in relaxing the user.
In general, each measurement can be classified as parasympathetic or sympathetic dominance. The
nominal range for healthy adults is extracted based on the age of the user extracted from [40]. For
extreme conditions (i.e. the right top and left corner), data are classified as high energy and low
energy state respectively. An exemplary illustration of this quantification is shown in Figure 126.
Figure 126 Illustration on directional change on HRV due to external stimuli
When an external stimulus is applied, the directional change of the HRV is an indication on the
efficacy of the stimulus in relaxing or stressing the subject. Such a relative measurement can be
quantified using the Equation 73.
Equation 73 𝐷𝑖𝑟𝑒𝑐𝑡𝑖𝑜𝑛𝑎𝑙 𝐶ℎ𝑎𝑛𝑔𝑒,𝐷𝐻𝑅𝑉 = 𝑃𝑜𝑠𝑡𝐻𝐹𝐿𝐹
𝑃𝑟𝑒𝐻𝐹𝐿𝐹
Similarly, the directional change can be illustrated as shown in Figure 127 where an increase in the
sympathetic control is dominant with respect to a decrease in the parasympathetic control. Using
data obtained from numerous conducted trials the classifications of stress, neutral and relaxation is
shown in Table 27 (please note that the detailed data classifications is proprietary to the commercial
company and the table is an exemplary illustration).

Page 165
Figure 127 Illustration on directional change on HRV due to external stimuli
Level classifications Indicative DHRV
Stress DHRV < 1.1
Neutral 0.9 < DHRV < 1.1
Relax 0.9 < DHRV
Table 27 An exemplary classifications of DHRV as stress, neutral and relaxation
4.6 Statistical analysis of trial
The trial conducted for this section was to test for the concordance or inter-observer agreement (agreement of user perceived and BioS-HRV measured states). The statistical test used for the analysis of the results obtained is called Kappa correlation test [41] where Interpretation of the measured Kappa value can be summarized in Table 28. A value of 0 implies no agreement beyond chance, whereas a value of 1 corresponds to a perfect agreement between the two observers.
Concordance or inter-observer agreement Kappa value
Poor agreement = less than 0.20
Fair agreement = 0.20 to 0.40
Moderate agreement = 0.40 to 0.60
Good agreement = 0.60 to 0.80
Very good agreement = 0.80 to 1.00
Table 28 Interpretation of the measured Kappa value
There are situations where disagreements between observers may not all be equally
important. For example, on an ordinal scale, a greater "penalty" will be applied if the two
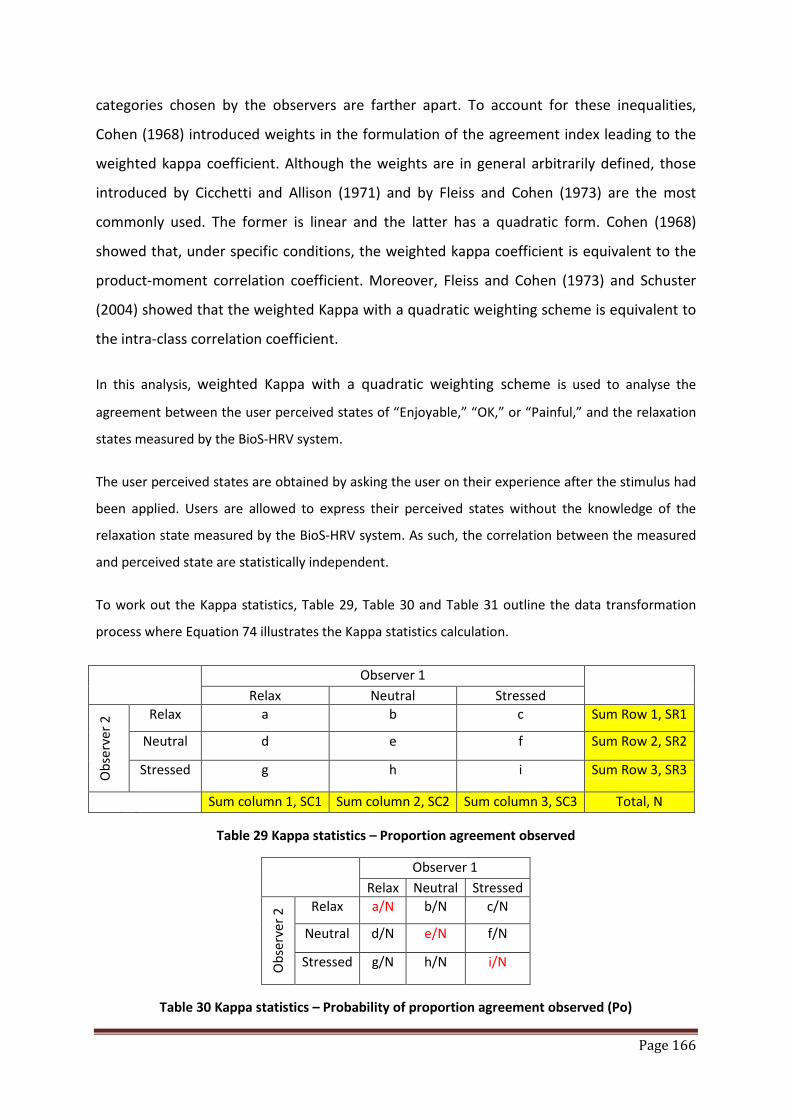
Page 166
categories chosen by the observers are farther apart. To account for these inequalities,
Cohen (1968) introduced weights in the formulation of the agreement index leading to the
weighted kappa coefficient. Although the weights are in general arbitrarily defined, those
introduced by Cicchetti and Allison (1971) and by Fleiss and Cohen (1973) are the most
commonly used. The former is linear and the latter has a quadratic form. Cohen (1968)
showed that, under specific conditions, the weighted kappa coefficient is equivalent to the
product-moment correlation coefficient. Moreover, Fleiss and Cohen (1973) and Schuster
(2004) showed that the weighted Kappa with a quadratic weighting scheme is equivalent to
the intra-class correlation coefficient.
In this analysis, weighted Kappa with a quadratic weighting scheme is used to analyse the
agreement between the user perceived states of “Enjoyable,” “OK,” or “Painful,” and the relaxation
states measured by the BioS-HRV system.
The user perceived states are obtained by asking the user on their experience after the stimulus had
been applied. Users are allowed to express their perceived states without the knowledge of the
relaxation state measured by the BioS-HRV system. As such, the correlation between the measured
and perceived state are statistically independent.
To work out the Kappa statistics, Table 29, Table 30 and Table 31 outline the data transformation
process where Equation 74 illustrates the Kappa statistics calculation.
Observer 1 Relax Neutral Stressed
Obs
erve
r 2 Relax a b c Sum Row 1, SR1
Neutral d e f Sum Row 2, SR2
Stressed g h i Sum Row 3, SR3
Sum column 1, SC1 Sum column 2, SC2 Sum column 3, SC3 Total, N
Table 29 Kappa statistics – Proportion agreement observed
Observer 1 Relax Neutral Stressed
Obs
erve
r 2 Relax a/N b/N c/N
Neutral d/N e/N f/N
Stressed g/N h/N i/N
Table 30 Kappa statistics – Probability of proportion agreement observed (Po)

Page 167
Observer 1 Relax Neutral Stressed
Obs
erve
r 2 Relax (SC1/N )*(SR1/N) (SC2/N)*(SR1/N) (SC3/N)*(SR1/N)
Neutral (SC1/N )*(SR2/N) (SC2/N)*(SR2/N) (SC3/N)*(SR2/N)
Stressed (SC1/N )*(SR3/N) (SC2/N)*(SR3/N) (SC3/N)*(SR3/N)
Table 31 Kappa statistics – Probability of proportion agreement by chance (Pc)
Equation 74 Kappa statistics = 𝑃𝑜−𝑃𝑐1−𝑃𝑐
where Po = Σ 𝑎𝑁
, 𝑒𝑁
, 𝑖𝑁, Pc = Σ 𝑆𝐶1∗𝑆𝑅1
𝑁2, 𝑆𝐶2∗𝑆𝑅2
𝑁2, 𝑆𝐶3∗𝑆𝑅3
𝑁2
The results obtained from the trial are tabulated as shown in Table 32, where the Po and Pc can be
obtained using Table 33 and Table 34.
Subject Perceived Score
BioS-HRV Measured Score
Relax Norm Stress
Enjoyable 6 6 0
Ok 2 6 0
Painful 0 5 15
Table 32 Subject perceived score with BioS-HRV measured score
Relax Neutral Stress
Relax 0.15 0.15 0
Ok 0.05 0.15 0
Painful 0 0.125 0.375
Table 33 Kappa statistics – Probability of proportion agreement observed (Po)
Relax Neutral Stress
Relax 0.06 0.1275 0.1125
Ok 0.04 0.085 0.075
Painful 0.1 0.2125 0.1875
Table 34 Kappa statistics – Probability of proportion agreement by chance (Pc)

Page 168
Using weighting based on seriousness of error (i.e. agreement expected by chance), the distance
measurement is obtained in Table 35 with linear weightage as shown in in Table 36.
Relax Norm Stress
Enjoyable 0 1 2
Ok 1 0 1
Painful 2 1 0
Table 35 Distance measurement based on Kappa statistics
Relax Norm Stress
Enjoyable 1 0.75 0
Ok 0.75 1 0.75
Painful 0 0.75 1
Table 36 Weighted Kappa statistics (Quadratic)
Applying the product-moment correlation of Table 36 on the tabulated results for Po (Table 33)
and Pc (Table 34), Table 37 and Table 38 are obtained respectively.
Relax Neutral Stress
Relax 0.15 0.1125 0
Ok 0.0375 0.15 0
Painful 0 0.09375 0.375
Table 37 Kappa statistics – Weighted probability of proportion agreement observed (Po)
Relax Neutral Stress
Relax 0.06 0.095625 0
Ok 0.03 0.085 0.05625
Painful 0 0.159375 0.1875
Table 38 Kappa statistics – Weighted probability of proportion agreement by chance (Pc)
Using the quadratic weightage for Kappa statistics, the observed Kappa value is calculated
as 0.751. With reference to the qualification of Kappa value as shown in Table 29, the Kappa
tests showed that there is “good” agreement between perceived state and stress state
indicated by the BioS-HRV measurements. The “good” agreements indicate that the
algorithm implemented in the Bio-HRV measurements is able to measure the perceived
state of the user with sufficient accuracy as referred to the statistical tools used.
Page 169
In conclusion, this section has demonstrated the ability of MMSB in providing HRV
quantifications using statistical approach. The results on the statistical test to ascertain the
concordance of user perceived state and MMSB acquired HRV state shows highly positive
outcomes. Such positive demonstrates has demonstrated the accuracy of HRV in measuring
the state of relaxation of the subject and is being developed as a commercial lifestyle
product.
5 Conclusions on applications of MMSB
In this chapter, two applications were described and successfully developed using the MMSB as the
method of measuring blood pulse information.
The remote heart rate monitoring application, titled Wireless Pulse Sense (WiPS), participated and
won in the prestigious Tan Kah Kee Young Inventors Award 2007, Defence Science Category, in
Singapore. WiPS was demonstrated to a panel of doctors and defence scientists. In addition, a short
trial was conducted with the witness of the interview panel on 3 healthy subjects and the result was
highly positive. With these success, WiPS was awarded the Silver Award [8], which is the highest
award being given in this category of the competition for the past 8 years. The conferment of this
award demonstrated the acceptance by the panel of doctors and defence scientists on the
innovativeness and novelty of MMSB in acquiring blood pulse information. In addition, this
development work was awarded S$350,000 of funding to develop for deployment on a wireless ad-
hoc network.
The application of MMSB in assessing the relaxation level of a subject using blood volume pulse and
heart rate variability were implemented with the support of the needs of a commercial company.
The success of this implementation has led to the development of the production model, which was
completed at the point of this writing.
Through the applications developed in this chapter, the acceptance of MMSB, as a novel means to
acquire blood pulse information, by the medical, defense and lifestyle industry were demonstrated.
As MMSB describes a platform for pulse rate, blood flow and pulse transit time measurement,
numerous lifestyle applications can be developed as MMSB is able to acquire signal through fabric,
environmental contaminants and blood. Depending on the needs of the user of this technology,
future applications such as energy expenditure and blood pressure measurements can also be
developed for medical or research applications.
Page 170
6 References
[1] C. Britton Rorabaugh, DSP primer, McGraw-Hill, ISBN 0-07-054004-7, Chapter 11, page 215-216. [2] "Psychophysiology And The Quantification Of Human Stress Levels Based Upon Second-Law
Thermodynamic Modelling ", Life Sciences & Biotechnology Update Jan 2001. [3] “Stress sensor aids in man-machine interface research”, EE-times Asia, 09 Oct 2007. [4] Iwata Kazuki (Tohoku Univ., Graduate School of Information Sci., JPN), Saito Yuki (Tohoku Univ.,
Graduate School of Medicine, JPN), Yamamoto Mitsuaki (Tohoku Univ., Graduate School of Information Sci., JPN), Munakata Masanori (Labor Welf. Crop., Tohoku Rosai Hospital), “Effects of Mental Task on Blood Pressure and EEG Activity in Normal Subjects”, Ther Res, VOL.23, NO.9, PAGE. 1873-1876 (2002).
[5] D. Sfetsioris, S. Papapetrou, G. Papadatos, “NECK MASSAGE EFFECTS ON BLOOD VOLUME PULSE IN HEALTHY SUBJECTS” , http://e-jst.teiath.gr/issue_2_2006/sfetsioris_abs.htm
[6] Jing Zhai and Armando Barreto, “Stress Recognition Using Non-invasive Technology”, Electrical and Computer Engineering Department, Biomedical Engineering Department, Florida International University
[7] Schoder et al., “Effect of Mental Stress on Myocardial Blood Flow and Vasomotion in Patients with Coronary Artery Disease”, Department of Molecular and Medical Pharmacology, Division of Nuclear Medicine, School of Medicine, University of California, Los Angeles; and Laboratory of Structural Biology and Molecular Medicine, University of California, Los Angeles, California
[8] http://www.tkk.wspc.com.sg/tkk/data/awards/2007/D070639.pdf [9] PHUA, Chee Teck, LIM Chin Leng, Peter, GOOI, Boon Chong, Packages of apparatus for non-
invasively detection of pulse rate and blood flow anomalies, WO/2008/033099; PCT/SG2007/000180
[10] Isabelle CONSTANT, Dominique LAUDE, Isabelle MURAT, Jean-Luc ELGHOZI, “Pulse rate variability is not a surrogate for heart rate variability”, The Biochemical Society and the Medical Research Society, 1999.
[11] Saul JP (1990) Beat-to-beat variations of heart rate reflect modulation of cardiac autonomic outflow. News Physiol Sci 5:32–37
[12] Stroop, John Ridley (1935). "Studies of interference in serial verbal reactions". Journal of Experimental Psychology 18 (6): 643–662. doi:10.1037/h0054651.
[13] Berntson, G.G., Cacioppo, J.T. & Quigley, K.S. (1993) Cardiac psychophysiology and autonomic space in humans: empirical perspectives and conceptual implications. Psychological Bulletin, 114, 296–322.
[14] Friedman, B.H., Thayer, J.F. & Tyrrell, R.A. (1996) Spectral characteristics of heart period variability during cold face stress and shock avoidance in normal subjects. Clinical Autonomic Research, 6, 147–152.
[15] Delaney, J.P. & Brodie, D.A. (2000) Effects of short-term psychological stress on the time and frequency domains of heart-rate variability. Perceptual and Motor Skills, 91, 515–524.
[16] Hughes, J.W. & Stoney, C.M. (2000) Depressed mood is related to high-frequency heart rate variability during stressors. Psychosomatic Medicine, 62, 796–803.
[17] Jain, D., Joska, T., Lee, F.A., Burg, M., Lampert, R. & Zaret, B.L. (2001) Day-to-day-reproducibility of mental stress-induced abnormal left ventricular function response in patients with coronary artery disease. Journal of Nuclear Cardiology, 8, 347–355.
[18] Lucini, D., Norbiato, G., Clerici, M. & Pagani, M. (2002) Hemodynamic and autonomic adjustments to real life stress conditions in humans. Hypertension, 39, 184–188.
[19] Lin, L-Y., Wu, C-C., Liu, Y-B., Ho, Y-L., Liau, C-S. & Lee, YT. (2001) Derangement of heart rate variability during a catastrophic earthquake: a possible mechanism for increased heart attacks. Journal of Pacing and Clinical Electrophysiology, 24, 1596–1601.
Page 171
[20] Sloan, R.P., Shapiro, P.A., Bagiella, E. et al. (1994) Effect of mental stress throughout the day on cardiac autonomic control. Biological Psychology, 37, 89–99.
[21] Dishman, R.K., Nakamura, Y., Garcia, M.E., Thompson, R.W., Dunn, A.L. & Blair, S.N. (2000) Heart rate variability, trait anxiety, and perceived stress among physically fit men and women. International Journal of Psychophysiology, 37, 121–133.
[22] Akihito Uehara, Chinori Kurata, Toshihiko Sugi, Tadashi Mikami, and Sakae Shouda, “Diabetic cardiac autonomic dysfunction: parasympathetic versus sympathetic,” Annals of Nuclear Medicine, 13 (2), 1999, pp. 95-100.
[23] P. Cugini, M. Curione, C. Cammarota, F. Bernardini, D. Cipriani, R. De Rosa, P. Francia, T. De Laurentis, E. De Marco, A. Napoli, and F. Falluca, “Is a Reduced Entropy in Heart Rate Variability an Early Finding of Silent Cardiac Neurovegitative Dysautonomia in Type 2 Diabetic Mellitus ?,” Journal of Clinical and Basic Cardiology, 4 (4), 2001, pp. 289-294.
[24] Herbert Jelinek, Allyson Flynn, and Paul Warner, “Automated assessment of cardiovascular disease associated with diabetes in rural and remote health care practice,” The national SARRAH conference, 2004, pp. 1-7.
[25] Lijun Tian, and Willis J. Tompkins, “Time domain based algorithm for detection of Ventricular Fibrillation,” IEEE Proceedings, 19th international conference, Nov. 1997, pp. 374-377.
[26] Task Force of The European Society of Cardiology and The North American Society of Pacing and Electrophysiology, “Guidelines: Heart Rate Variability Standards of measurement, physiological interpretation, and clinical use”, European Heart Journal (1996) 17, 354–381.
[27] Sayers BM. Analysis of heart rate variability. Ergonomics 1973; 16: 17–32. [28] Hirsh JA, Bishop B. Respiratory sinus arrhythmia in humans; how breathing pattern modulates
heart rate. Am J Physiol 1981; 241: H620–9. [29] Akselrod S, Gordon D, Ubel FA, Shannon DC, Barger AC, Cohen RJ. Power spectrum analysis of
heart rate fluctuation: a quantitative probe of beat to beat cardiovascular control. Science 1981; 213: 220–2.
[30] Pagani M, Lombardi F, Guzzetti S et al. Power spectral analysis of heart rate and arterial pressure variabilities as a marker of sympatho-vagal interaction in man and conscious dog. Circ Res 1986; 59: 178–93.
[31] Malliani A, Pagani M, Lombardi F, Cerutti S. Cardiovascular neural regulation explored in the frequency domain. Circulation 1991; 84: 1482–92.
[32] Charles O’Neill, Cubic Spline Interpolation, lecture notes for MAE 5093, 28 May 2002. [33] N. Lippman, K.M. Stein, and B.B. Lerman. Nonlinear predictive interpolation: a new method for
the correction of ectopic beats for heart rate variability analysis. J Electrocardiol, 26:S14–S19, 1993.
[34] N. Lippman, K.M. Stein, and B.B. Lerman. Comparison of methods for removal of ectopy in measurement of heart rate variability. Am J Physiol, 267(1):H411–H418, July 1994.
[35] J. Mateo and P. Laguna. Analysis of heart rate variability in the presence of ectopic beats using the heart timing signal. IEEE Trans Biomed Eng, 50(3):334–343, March 2003.
[36] G.G. Berntson, J.T. Bigger Jr., D.L. Eckberg, P. Grossman, P.G. Kaufmann, M. Malik, H.N. Nagaraja, S.W. Porges, J.P. Saul, P.H. Stone, and M.W. Van Der Molen. Heart rate variability: Origins, methods, and interpretive caveats. Psychophysiol, 34:623–648, 1997.
[37] D.A. Litvack, T.F. Oberlander, L.H. Carney, and J.P. Saul. Time and frequency domain methods for heart rate variability analysis: a methodological comparison. Psychophysiol, 32:492–504, 1995.
[38] I.P. Mitov. A method for assessment and processing of biomedical signals containing trend and periodic components. Med Eng Phys, 20(9):660–668, November-December 1998.
[39] Numerical Recipes in C - The Art of Scientific Computing, Cambridge University Press, Chapter 12 [40] Nunan et al. A quantitative systematic review of normal values for short-term heart rate
variability in healthy adults. PACE 1 - 11, 2010 [41] Anthony J. Viera, MD; Joanne M. Garrett, PhD, Understanding Interobserver Agreement: The
Kappa Statistic, Fam Med 2005;37(5):360-3
Page 172
Chapter 7: Conclusions, contributions and future work
1 Conclusions
The feasibility of achieving pulse rate[1]-[5], blood pressure[7] and blood flow[8] monitoring that is
independent of the electrical or optical contact has been demonstrated in this dissertation. The
MMSB phenomenon has been proven both practically[2] and mathematically[6][9] through physical
measurements and simulations in a multi-physics environment respectively. In addition, physical
measurements are also validated with comparison to other measurement devices such as pulse
plethysmography, ECG[10][11], Laser Doppler Method and oscillometric blood pressure
measurement[7].
Quantifications of MMSB measurements were successfully performed between gold standard
medical instrumentation such as clinical Laser Doppler and ECG measurement instruments. For
blood flow, PORH measurements were conducted on 6 healthy subjects using Laser Doppler and
MMSB. Waveforms obtained from both measurement methods are highly correlated with
differences of less than 4%. For heart rate (HR), 40 resting HR measurements were collected from 20
healthy subjects (aged 18-22) using concurrently ECG and MMSB acquisition with differences of < 1%.
Statistical tests were used to study these measurements and it was concluded that this study
supports the use of MMSB as a viable alternative to ECG for measuring resting HR for healthy
individuals.
In addition, the mean arterial pressure (MAP) study was performed on 10 healthy subjects using the
oscillometric based blood pressure lifestyle measurement device and the MMSB method. This study
concluded the high correlation between the two methods of measurements with differences
quantified to be < 8%.
In addition, two applications were developed to demonstrate the capability of MMSB in supporting
low-cost lifestyle products, where ease of use and deployment can be incorporated into devices or
integrated into furniture or beddings.
Page 173
2 Contributions
This research has led to discovery of a novel sensing method of blood pulse and flow that is able to
support measurements through fabric, environmental contaminants and body-fluids. Two major
patents[1][2] and two divisional patents[3][4] were filed in the USA, Canada, Europe, India, China,
Asia (Japan, Korea, Malaysia, Singapore) and Australia. All these patents were successfully defended
in the Patent Cooperation Treaty (PCT) application with each receiving an International Preliminary
Report on Patentability (IPRP) that has resulted in the grant of these patents in Singapore. In
addition, the patent outlining the fundamental principle of MMSB[1] was granted by the USPTO in
May 2012.
Together with these four patents are scientific publications made at six international conferences
[5][6][7][8][9][10] and one international journal[11]. These publications are namely focused on the
phenomena and science describing Modulated Magnetic Signature of Blood (MMSB); MMSB
modelling in multi-physics software; measurements of blood flow using MMSB and; measurements
of blood pressure using pulse transit time acquired using MMSB and ECG signals; validation of
accuracy of MMSB in measuring heart rate with respect to a gold instrumentation using ECG.
Finally, two applications were successfully conceived and developed for continuous monitoring of
pulse rate, HRV and blood flow. At the time of writing this dissertation, the production model for
commercialization on the application of stress and relaxation measurements using blood flow and
HRV had been successfully completed as a lifestyle product.
Page 174
3 Future Work
There are two main areas of future work. First, the study of MMSB to acquire Mean Arterial Pressure
(MAP) without the assistance of ECG signal will continue. This will enhance the existing work to
support non-invasive; cuffless and occlusion free; electrical; and optical contact independent
measurement of blood pressure possible. The potential of such a device will lead to the
development of blood pressure monitoring devices that can be integrated into furniture and
beddings for continuous monitoring with comfort and ease of usage. In addition, research and
development on non-invasive measurement of pulse wave velocity (PWV) using MMSB is also in
progress to assess the arterial stiffness and well-being of the subject.
Secondly, the application of the pulse rate obtained using the MMSB method for Energy Expenditure
(EE) measurements. There are many researches being carried out to assess the EE of a subject.
However most of the published work requires the measurement of VO2 and VO2max******. Other
published work applies heart rate measured from ECG or pulse oximetry for Energy expenditure
measurement. This research work aims to develop a reliable EE measurement system using MMSB
technology and physiological data from the subject.
In general, MMSB phenomenon offers promising possibilities of electrical or optical contact
independent measurement of blood pulse, pressure and flow. This dissertation has presented the
fundamental research and validation of the results, which is meant as the basis for broadening of
potential application areas related to this technology.
****** VO2max is the maximum amount of oxygen in millilitres, one can use in one minute per kilogram of body weight.
Page 175
4 References
[1] (WO/2007/097713 and IPOS/200601301-5) Apparatus and Method for Non-invasively Sensing Pulse Rate and Blood Flow Anomalies
[2] (WO/2008/033099 and IPOS/200606459-6) Packages of Apparatus for Non-invasive detection of Pulse Rate and Blood Flow Anomalies
[3] (IPOS/201008172-7) Packages of Apparatus for Non-invasive detection of Pulse Rate and Blood Flow Anomalies (divisional patent 1 of [2])
[4] (IPOS/200806056-8) Packages of Apparatus for Non-invasive detection of Pulse Rate and Blood Flow Anomalies (divisional patent 2 of [2])
[5] Chee Teck Phua, Gaëlle Lissorgues, Bruno Mercier, Non-invasive acquisition of Blood Pulse using magnetic disturbance technique, Internation Conference on Biomedical Engineering Dec 2008
[6] Chee Teck Phua, Gaëlle Lissorgues, Modelling and Simulations of Pulsatile Blood flow in a weak magnetic field, International Conference on Medical Informatics and Biomedical Engineering June 2009
[7] Chee Teck Phua, Gaëlle Lissorgues, Measurement of blood pressure using magnetic method of blood pulse acquisition, IEEE-Nanomed Oct 2009
[8] Chee Teck Phua, Gaëlle Lissorgues, Non-invasive measurement of blood flow using magnetic disturbance method, International Conference on Biomedical and Pharmaceutical Engineering Dec 2009
[9] Phua CT and Lissorgues G., Mathematical modelling with experimental verifications of non-invasive blood acquired using the method of magnetic disturbance, 6th World Congress on Biomechanics, Singapore, 2010
[10] Chee Teck Phua, Gaëlle Lissorgues, Boon Chong Gooi and Bruno Mercier, Statistical validation of magnetic blood pulse as a viable alternative to electrocardiogram for heart rate measurements, Proceedings of International Conference on Bioinformatics and Biomedical Technology, 2012
[11] Chee Teck Phua, Gaëlle Lissorgues, Boon Chong Gooi and Bruno Mercier, Statistical validation of heart rate measurement using Modulated Magnetic Signature of Blood with respect to Electrocardiogram, International Journal of Bioscience, Biochemistry and Bioinformatics (IJBBB), Volume 2, Number 2, March 2012

Page A
Annex A – Datasheets

Page B
Annex A1 - Datasheet of INA118

Page C
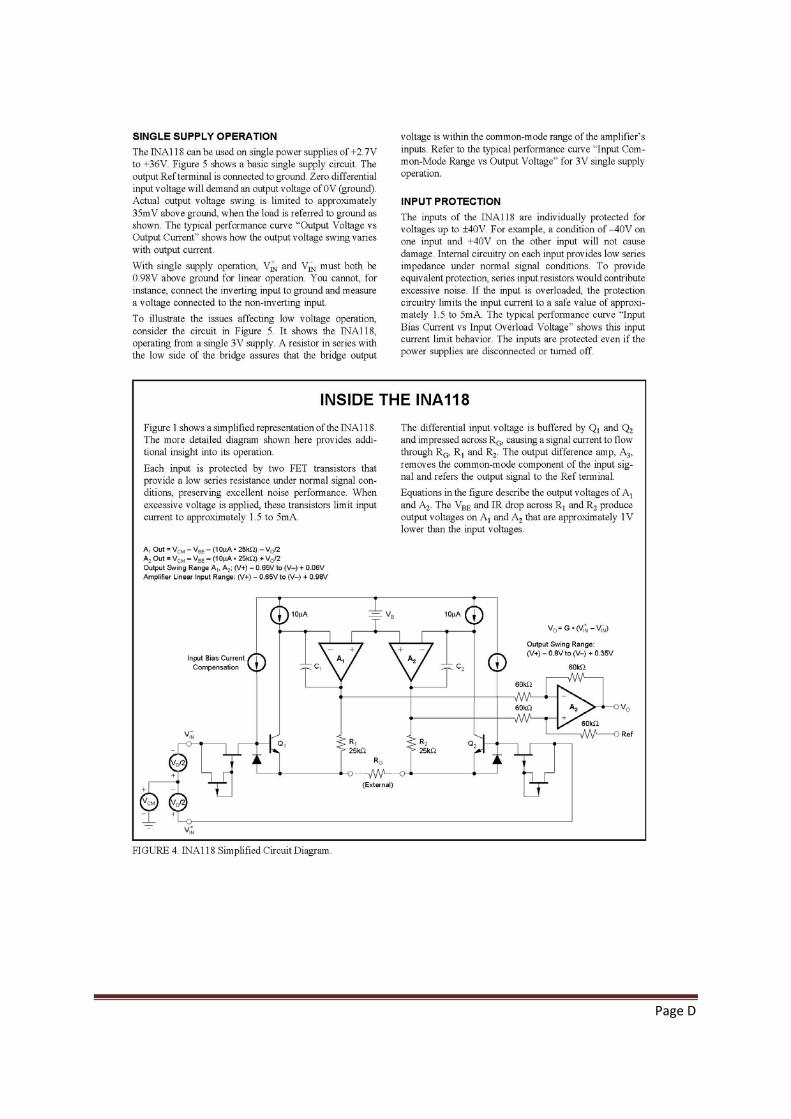
Page D

Page E
Annex A2 - Datasheet of INA321
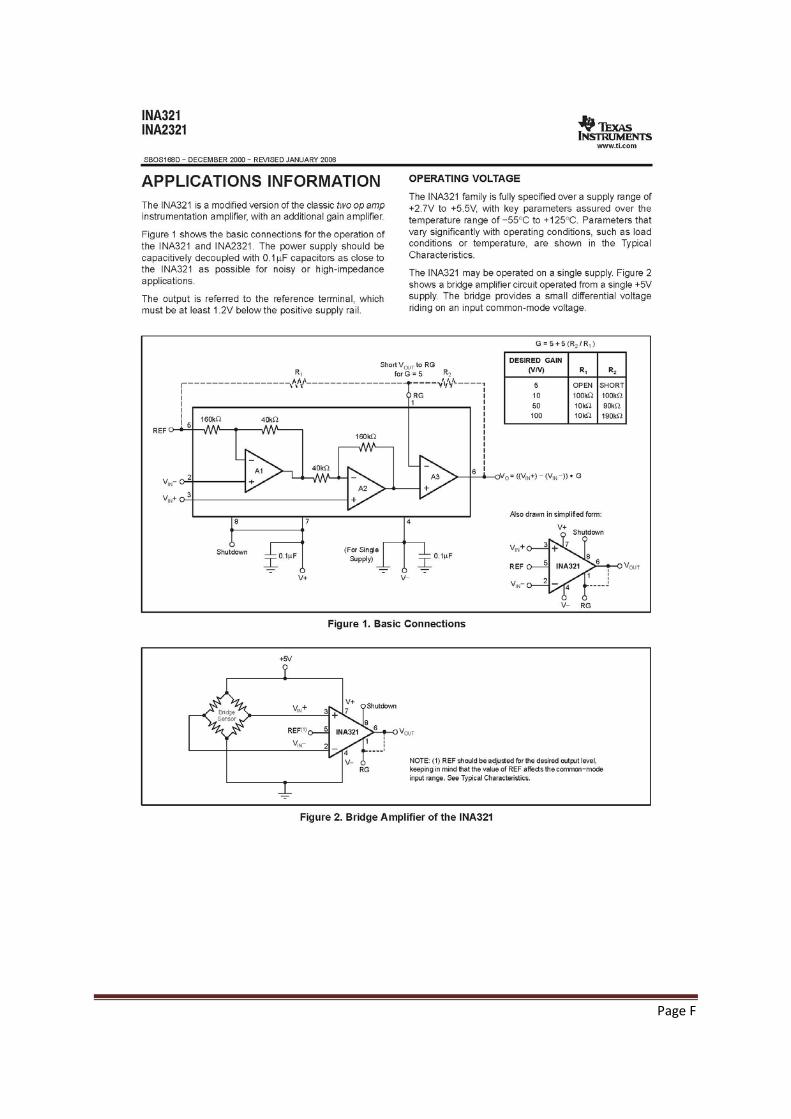
Page F
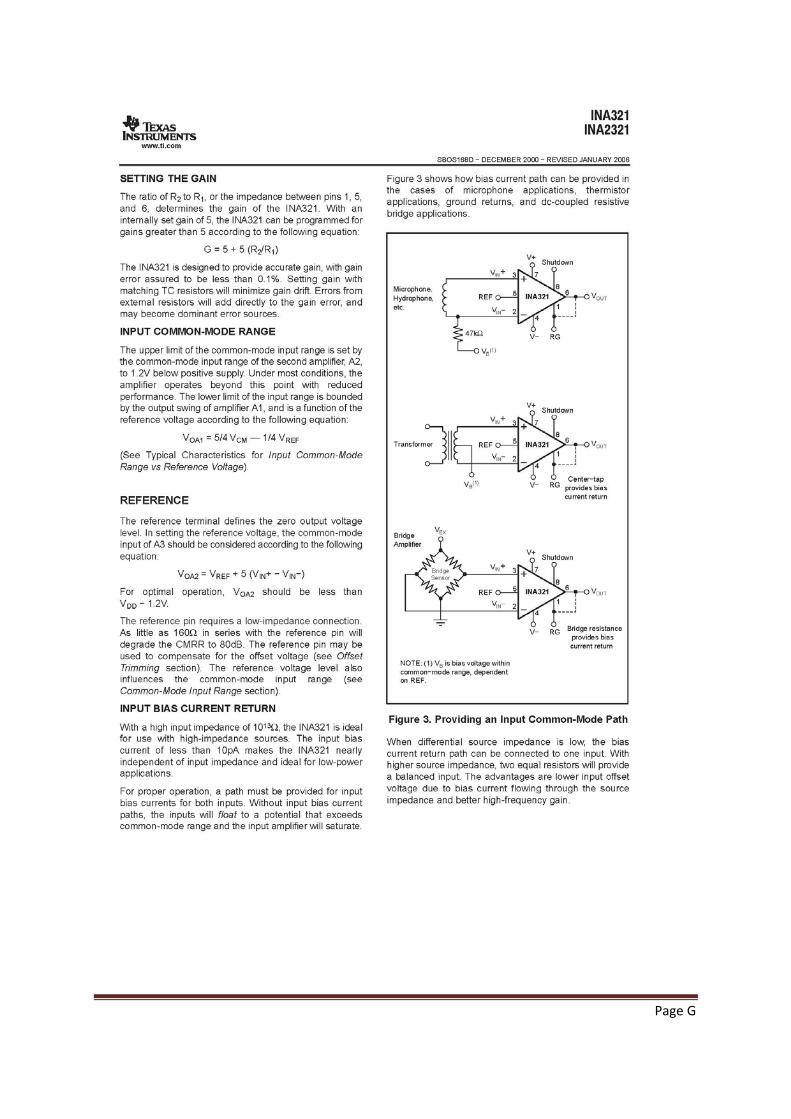
Page G
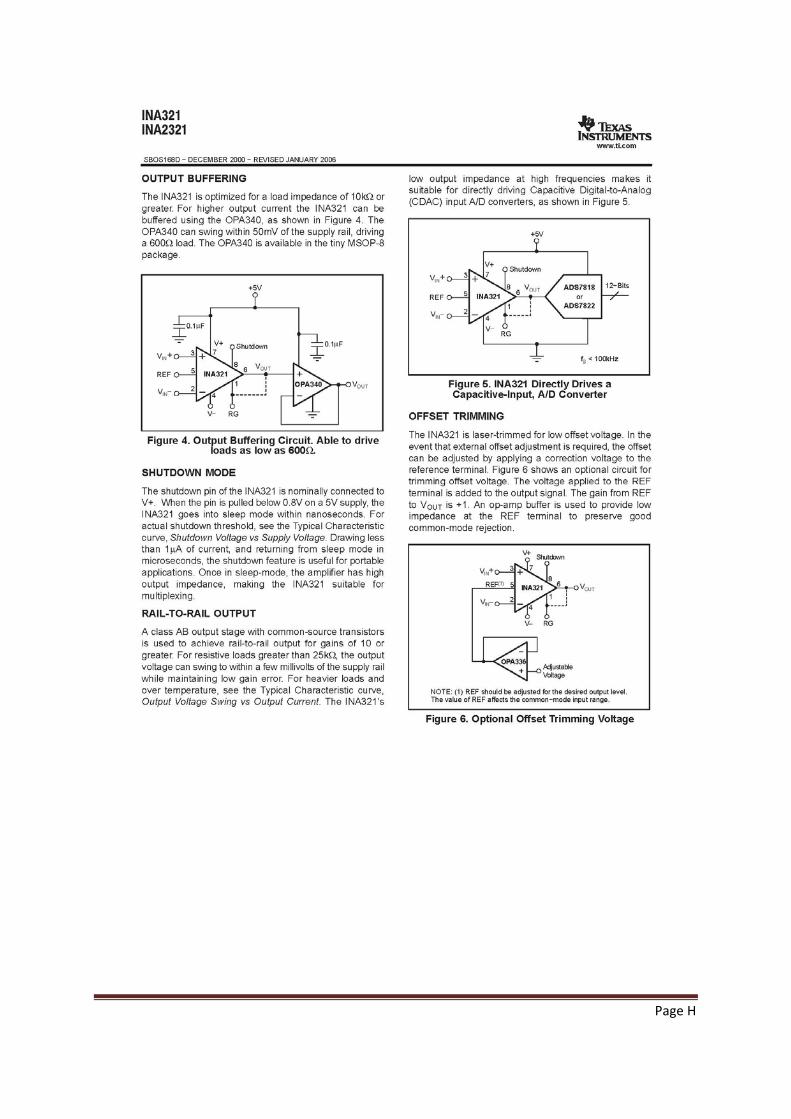
Page H

Page I
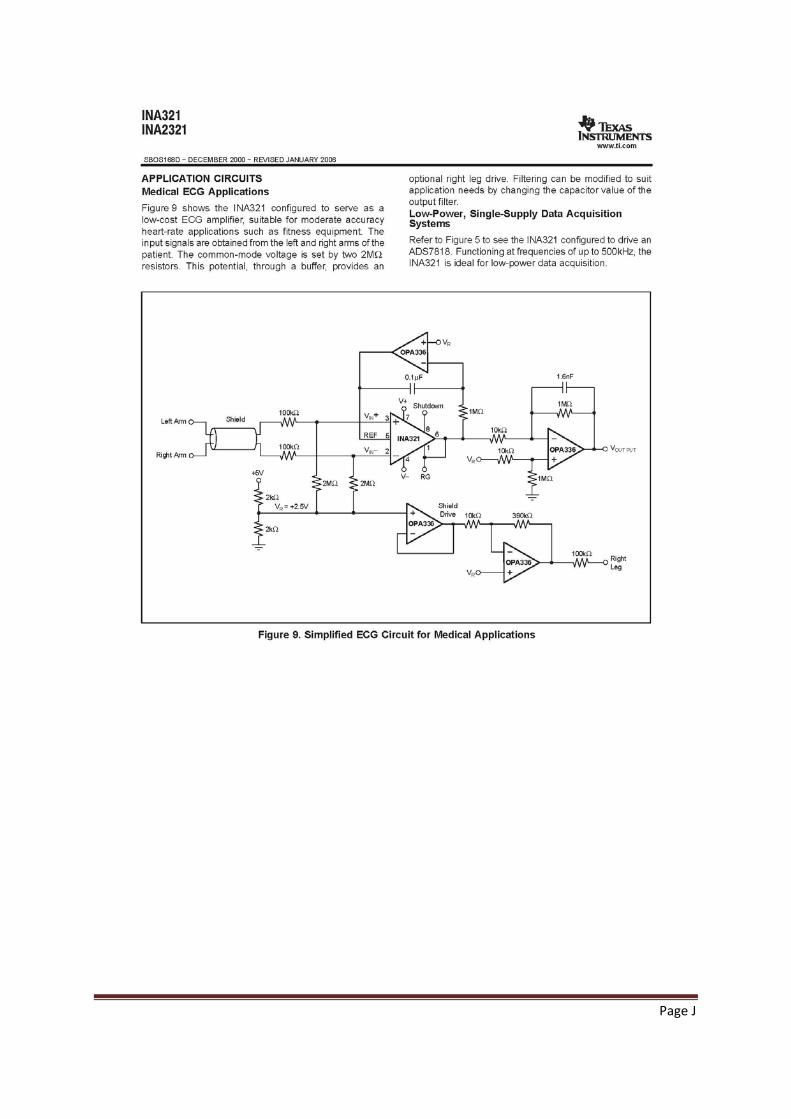
Page J

Page K
Annex B – Comparison of methods to assess stress

Page L
Annex B-1: Table of Comparison on different methods of stress measurements Title of Article EEG* Blood
Flow Heart Rate (HR) / HR Variability
Skin Temperature
Galvanic Skin
Response
Blood Pressure
Pupil Diameter
Respiration Rate
1. Effect of Mental Stress on Coronary Flow Velocity Reserve in Healthy Men
X
2. Measurement of Anxiety of Forearm Blood Flow
X
3. Regulation of myocardial blood flow response to mental stress in healthy individuals
X
4. Vasoconstriction and blood flow responses in visceral arteries to mental task in humans
X
5. Flow dependence of forearm noradrenaline overflow, as assessed during mental stress and sodium nitroprusside infusion
X
6. Head Level Blood perfusion under Acceleration
X
7. Stress Detection in Computer Users Based on DSP of Noninvasive Physiological Variables
X X X X
8. Stress Recognition Using Non-invasive Technology
X X X X
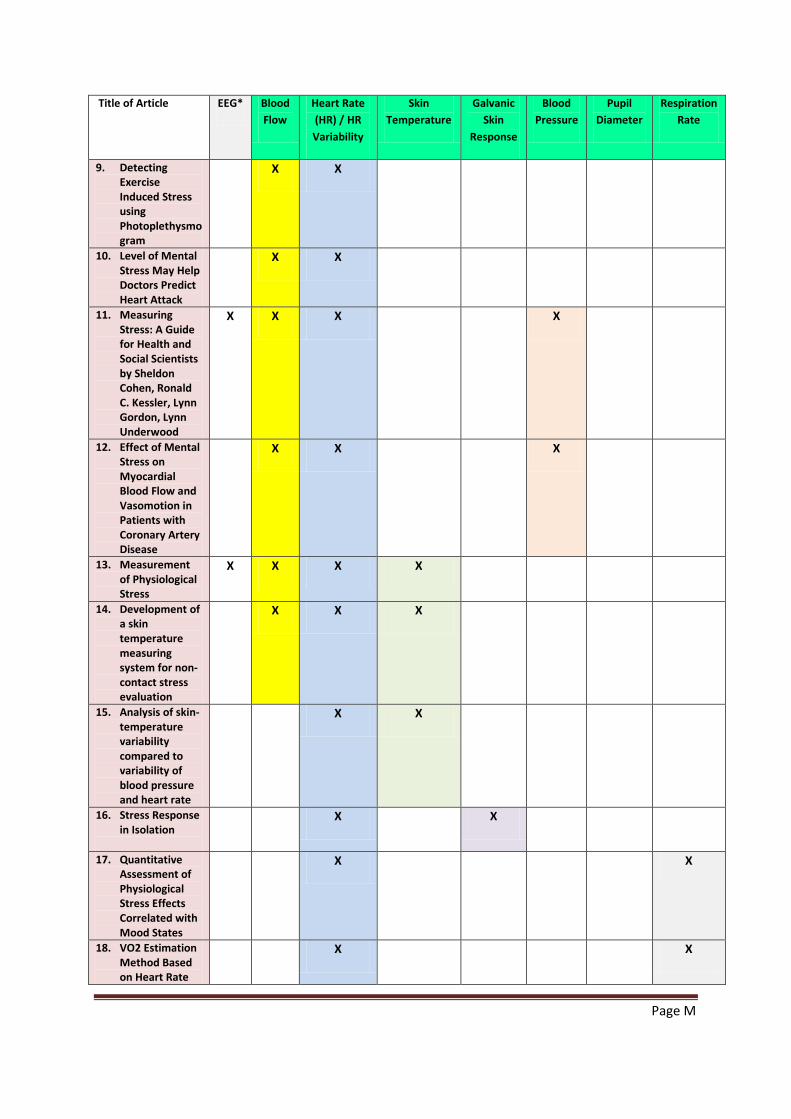
Page M
Title of Article EEG* Blood Flow
Heart Rate (HR) / HR Variability
Skin Temperature
Galvanic Skin
Response
Blood Pressure
Pupil Diameter
Respiration Rate
9. Detecting Exercise Induced Stress using Photoplethysmogram
X X
10. Level of Mental Stress May Help Doctors Predict Heart Attack
X X
11. Measuring Stress: A Guide for Health and Social Scientists by Sheldon Cohen, Ronald C. Kessler, Lynn Gordon, Lynn Underwood
X X X X
12. Effect of Mental Stress on Myocardial Blood Flow and Vasomotion in Patients with Coronary Artery Disease
X X X
13. Measurement of Physiological Stress
X X X X
14. Development of a skin temperature measuring system for non-contact stress evaluation
X X X
15. Analysis of skin-temperature variability compared to variability of blood pressure and heart rate
X X
16. Stress Response in Isolation
X X
17. Quantitative Assessment of Physiological Stress Effects Correlated with Mood States
X X
18. VO2 Estimation Method Based on Heart Rate
X X
Page N
Title of Article EEG* Blood Flow
Heart Rate (HR) / HR Variability
Skin Temperature
Galvanic Skin
Response
Blood Pressure
Pupil Diameter
Respiration Rate
Measurement
19. On Spectral Analysis of Heart Rate Variability during very slow yogic breathing
X
20. The Analysis of Mental Stress using Time-frequency distribution of Heart Rate Variability Signal
X
Percentage (%) of research using each
technique to measure stress
33.33 30.77 12.82 7.69 5.13 5.13 5.13
* EEG is the accepted standard for stress measurement. Statistics shown indicates its usage as a reference for comparing with other methods for stress measurement
Page O
Annex B-2: References [1] R . Hasegawa , M . Daimon , T . Toyoda , K . Teramoto , T . Sekine , T . Kawata , H . Watanabe , Y .
Kuwabara , K . Yoshida , I . Komuro, " Effect of Mental Stress on Coronary Flow Velocity Reserve in Healthy Men ", The American Journal of Cardiology , Volume 96 , Issue 1 , Pages 137 - 140.
[2] D. H. W. KELLY M.D., M.R.C.P., D.P.M, “Measurement of Anxiety by Forearm Blood Flow”, http://bjp.rcpsych.org/cgi/content/abstract/112/489/789.
[3] Heiko Schöder, Daniel H. Silverman, Roxana Campisi, James W. Sayre, Michael E. Phelps, Heinrich R. Schelbert, and Johannes Czernin, “Regulation of myocardial blood flow response to mental stress in healthy individuals”, http://ajpheart.physiology.org/cgi/content/full/278/2/H360.
[4] Naoyuki Hayashi, Nami Someya, Masako Yamaoka Endo, Akira Miura and Yoshiyuki Fukuba, “Vasoconstriction and blood flow responses in visceral arteries to mental task in humans”, http://ep.physoc.org/cgi/content/full/91/1/215.
[5] LINDQVIST M., MELCHER A., HJEMDAHL P., “Flow dependence of forearm noradrenaline overflow, as assessed during mental stress and sodium nitroprusside infusion”, Journal of hypertension, 1999, vol. 17, no1, pp. 91-97 (35 ref.)
[6] Kulcu, E.; Cammarota, “Head level blood perfusion under acceleration “, J.P. Engineering in Medicine and Biology Society, 1997. Proceedings of the 19th Annual International Conference of the IEEE Volume 5, Issue , 1997 Page(s):2168 - 2171 vol.5
[7] Zhai, Jing Barreto, Armando, “Stress Detection in Computer Users Based on Digital Signal Processing of Noninvasive Physiological Variables”, Engineering in Medicine and Biology Society, 2006. EMBS '06. 28th Annual International Conference of the IEEE
[8] Jing Zhai, Armando Barreto, “Stress Recognition Using Non-invasive Technology”, http://dsplab.eng.fiu.edu/DSP/Publications/Pubfiles/pub162.pdf
[9] Stephen Paul Linder, Suzanne Wendelken, Jeffrey Clayman, “Detecting Exercise Induced Stress using the Photoplethysmogram”, http://www.ists.dartmouth.edu/library/277.pdf
[10] http://www.webmd.com/news/19991209/mental-stress-level-predicts-heart-attack?page=2 [11] Sheldon Cohen, Ronald C. Kessler, Lynn Gordon, Lynn Underwood, “Measuring Stress: A Guide
for Health and Social Scientists” [12] Effect of Mental Stress on Myocardial Blood Flow and Vasomotion in Patients with Coronary
Artery Disease, http://jnm.snmjournals.org/cgi/reprint/41/1/11.pdf [13] Reisman, S. New Jersey Inst. of Technol., Newark, NJ, “Measurement of physiological stress”,
Bioengineering Conference, 1997, 21-22 May 1997 On page(s): 21-23 [14] Kataoka, H.; Kano, H.; Yoshida, H.; Saijo, A.; Yasuda, M.; Osumi, M, “Development of a skin
temperature measuring system for non-contact stress evaluation”, Engineering in Medicine and Biology Society, 1998. Proceedings of the 20th Annual International Conference of the IEEE Volume 2, Issue 29, Oct-1 Nov 1998 Page(s):940 - 943 vol.2
[15] Barnea, O.; Shusterman, V., “Analysis of skin-temperature variability compared to variability of blood pressure and heart rate”, Engineering in Medicine and Biology Society, 1995., IEEE 17th Annual Conference Volume 2, Issue , 20-23 Sep 1995 Page(s):1027 - 1028 vol.2
[16] “Stress Response in Isolation”, http://www.psychosomaticmedicine.org/cgi/reprint/26/3/250.pdf
[17] SOGA Chie, WADA Chikamune, “Quantitative assessment of physiological stress effects correlated with mood states”, http://cat.inist.fr/?aModele=afficheN&cpsidt=18004088
[18] White paper by Firstbeat Technologies Ltd, “VO2 Estimation Method Based on Heart Rate Measurement”, http://www.firstbeattechnologies.com/files/VO2_Estimation.pdf

Page P
[19] E. Jovanov Electrical and Computer Engineering Department, “On Spectral Analysis of Heart Rate Variability during Very Slow Yogic Breathing”, http://www.ece.uah.edu/~jovanov/papers/embs05_HRV2.pdf
[20] Seong, H.M.; Lee, J.S.; Shin, T.M.; Kim, W.S.; Yoon, Y.R., “The analysis of mental stress using time-frequency distribution of heart rate variability signal”, Engineering in Medicine and Biology Society, 2004. IEMBS apos;04. 26th Annual International Conference of the IEEE, Volume 1, Issue , 1-5 Sept. 2004 Page(s): 283 - 285 Vol.1
RESUME La mesure et le contrôle du pouls et du flux sanguin en continu sont d’importants paramètres pour l'évaluation de signes essentiels physiologiques sur la condition de santé d'un individu. Les dispositifs commerciaux existants, ainsi que les méthodes de recherche ou utilisées dans le milieu médical exigent un bon contact électrique ou optique pour obtenir cette mesure en continu. Pendant ces travaux de recherche, une méthode originale non invasive de mesure du rythme cardiaque fondée sur la perturbation localisée d’un champ magnétique au passage du flux sanguin a été développée, permettant l’acquisition des signaux à travers les vêtements, la transpiration, les salissures ou autres polluants dans l’environnement proche du capteur. Cette méthode est appelée la Signature Sanguine par Modulation Magnétique (MMSB) et les mesures ont été accomplies sur de multiples individus. Le système a été modélisé mathématiquement et simulé dans un environnement multiphysique, puis validé par l'utilisation des données expérimentales. Les résultats de mesure, en utilisant la méthode MMSB, pour le pouls et le flux sanguin ont été comparés et se trouvent bien corrélés, avec les résultats obtenus grâce à d’autres instruments. De plus, deux dispositifs ont été développés et sont en cours de commercialisation, pour des applications de vie quotidienne. Mots Clés : pouls sanguin, pression sanguine, flux sanguin, bioMEMS, perturbations magnétiques
ABSTRACT
Continuous pulse rate, blood pressure and blood flow monitoring are important for the assessment of physiological vital signs as these are able to provide continuous feedback on the health condition of an individual. Existing commercial, medical and research methods to continuously acquire these physiological vital signs require good electrical or optical contact. During this research, a magnetic based sensing method, at room temperature, for blood pulse, flow and pressure is developed to achieve data acquisition through fabric, environmental contaminants and body-fluids. This method is named Modulated Magnetic Signature of Blood (MMSB) and physical measurements were conducted on multiple subjects, mathematically modelled and simulated in a multi-physics environment with verification through use of measurement data. Measurement results, using MMSB, for blood pressure and blood flow were compared, and found to be well correlated, with lifestyle device and medical research instruments respectively. In addition, two devices are developed, and are in the midst of commercialization, to support lifestyle applications. Keywords : Blood pulse, pressure, blood flow, bioMEMS, magnetic disturbance