
L'UNIVERSITÉ BORDEAUX I DOCTEUR
222
N° d'ordre : 4464 THÈSE DE DOCTORAT PRESENTEE A L'UNIVERSITÉ BORDEAUX I ECOLE DOCTORALE DES SCIENCES CHIMIQUES Par Rumi TAMOTO POUR OBTENIR LE GRADE DE DOCTEUR SPÉCIALITÉ : CHIMIE-PHYSIQUE ************************************************** Nano/Micro Auto-Assemblages Chiraux de Tensioactifs Cationiques: du comportement dynamique des architectures supramoléculaires jusqu’aux nanomatériaux hybrides ************************************************** Chiral Nano/Micro Self-Assemblies of Cationic Surfactants: from dynamic behavior of supramolecular architectures towards hybrid nanomaterials ************************************************** Soutenue le : 19 décembre 2011 Après avis de : M. N. AVARVARI Directeur de Recherche, CNRS, Université Angers Rapporteur M. C. TRIBET Directeur de Recherche, CNRS, École Normale Supérieure Rapporteur Devant la commission d’examen formée de : Mme M.-H. DELVILLE Directeur de Recherche, CNRS, Université Bordeaux I Examinateur M. K. KINBARA Professeur, Université Tohoku Examinateur Mme S. LECOMTE Chargé de Recherche, CNRS, Université Bordeaux I Examinateur Mme R. ODA Directeur de Recherche, CNRS, Université Bordeaux I Directrice de thèse – 2011 –
-
Upload
khangminh22 -
Category
Documents
-
view
0 -
download
0
Transcript of L'UNIVERSITÉ BORDEAUX I DOCTEUR

N° d'ordre : 4464
THÈSE DE DOCTORAT
PRESENTEE A
L'UNIVERSITÉ BORDEAUX I
ECOLE DOCTORALE DES SCIENCES CHIMIQUES
Par Rumi TAMOTO
POUR OBTENIR LE GRADE DE
DOCTEUR
SPÉCIALITÉ : CHIMIE-PHYSIQUE
**************************************************
Nano/Micro Auto-Assemblages Chiraux de Tensioactifs Cationiques: du comportement dynamique des architectures supramoléculaires jusqu’aux
nanomatériaux hybrides
**************************************************
Chiral Nano/Micro Self-Assemblies of Cationic Surfactants: from dynamic behavior of supramolecular architectures towards hybrid nanomaterials
**************************************************
Soutenue le : 19 décembre 2011
Après avis de :
M. N. AVARVARI Directeur de Recherche, CNRS, Université Angers Rapporteur
M. C. TRIBET Directeur de Recherche, CNRS, École Normale Supérieure Rapporteur
Devant la commission d’examen formée de :
Mme M.-H. DELVILLE Directeur de Recherche, CNRS, Université Bordeaux I Examinateur
M. K. KINBARA Professeur, Université Tohoku Examinateur
Mme S. LECOMTE Chargé de Recherche, CNRS, Université Bordeaux I Examinateur
Mme R. ODA Directeur de Recherche, CNRS, Université Bordeaux I Directrice de thèse
– 2011 –


A Timothée


- Acknowledgement -
I would like to show my sincere gratitude to my advisor Dr. Reiko Oda in CBMN,
Université Bordeaux 1 for leading my thesis. It is great opportunity of working with her
scientific instructions, considerations and positive attitude. During these four years in France,
when I have encountered many problems not only in scientific field but also in French life, it
is difficult to overcome without her help. I am really honored to work with her.
This PhD thesis is created in Chimie et Biologie des Membranes et des Nanoobjets
(CBMN). I would like to thanks for Dr. Erick Dufourc, who is the director of institute.
I am deeply grateful to rapporteurs: Dr. Narcis Avarvari (Université Angers) and
Dr. Christophe Tribet (École Normale Supérieure) who are spent a lot of time for reading and
preparing the review of this manuscript, as well as Prof. Kazushi Kinbara (Tohoku
University) who accepted the jury immediately before the defense.
My heartfelt appreciation goes to Dr. Marie-Hélène Delville (ICMCB). Her kind
and patient mentorship in inorganic studies allows me to learn more scholarly knowledge and
techniques. Similarly, I would like to show my deeply appreciation to Dr. Sophie Lecomte
(CBMN) who instructed me about Raman experiment.
This thesis is consisted by numerous helps, therefore I am fortunate to work with
many collaborators from different groups. I would like to thank Dr. Bernard Desbat, Dr.
Axelle Grélard, Dr. Thierry Buffeteau, Dr. Yannick Chollet, Dr. Brice Kauffmann, Dr.
Joséphine Lai-Kee-Him, Dr. Pierre Bonnafous, Dr. Sisareuth Tan, Dr. Olivier Lambert, Prof.
Alain Brisson, and Dr. Satyabrata Si.
I want to thank my coworkers: Dr. Carole Aimé, Dr. Sabine Manet, Dr. Roni
Kiagus-Ahmad, Dr. Wissam Yassine, Dr. Zahia Fezoua, Dr. Ren-Wei Chang, Dima
Dedovets, Dr. Rajat Kumar Das, Dr. Sylvan Nalte, Dr. Emilie Pouget, Dr. Marie-Christiane
Durrieu, Dr. Céline Chollet, Dr. Loic Pichavant, Dr. Omar F. Zouani, Yifeng Lei and Alla
Malinenko.

I would like to thank my family and friends’ support and care. Especially I am
fortunate with my boyfriend Timothée’s bracing during these years. Without their kind
suport and encouragement, I cannot finish these tough works.
Finally, I would like to show my appliciation to previous supervisor Prof. Hirotaka
Ihara in Kumamoto University for introducing me to Dr. Reiko Oda.

- Outline -
General introduction p 1
Chapter I : Supramolecular structures by self-assembled amphiphiles:
Bibliographic study
I.1 Introduction p 5
I.2 Aggregation behaviour of amphiphiles in solution p 7
I.2.1 Phase behaviors of the assemblies of amphiphilic molecules p 7
I.2.2 Various self-assembled morphologies p 10
I.2.3 Counter-ion effect for micellization p 11
I.2.4 Various amphiphilic molecules which form bilayer structures p 14
I.3 Aggregation behaviour of amphiphiles in solution p 17
I.3.1 Chirality transfer p 18
I.3.2 Chiral fibers formed in aqueous system p 19
I.3.3 Chiral fibers formed in non-polar organic media p 23
I.3.4 Twisted, helical ribbons and tubes p 25
I.3.5 Morphology control p 26
I.4 Study of in situ dynamic morphology transition through the out-of-equilibrium
process p 30
I.4.1 Dynamic motion in biological systems p 30
I.4.2 Artificial morphology transformation by supramolecular self-assembly p 31
I.5 Conclusion p 36
References p 37

Chapter II : Micrometric helical structures from nucleolipids
II.1 Introduction p 43
II.1.1 Study of nucleotide p 43
II.1.2 Complexation of a surfactant by nucleolipids p 46
II.2 In situ kinetics of chirality transfer p 50
II.2.1 Experimental description p 50
II.2.2 Kinetics study at macroscopic level p 51
II.2.3 In situ transition of morphologies p 52
II.2.4 TEM observation at nanometric scale in the difference systems p 55
II.2.5 Direct observation of morphology transition and helix growth p 56
II.3 Study of kinetics of molecular reorganization during helix formation p 59
II.3.1 Study of chirality transfer using CD spectra p 59
II.3.2 1H-NMR p 61
II.3.3 pH measurement p 65
II.3.4 Protonation site of nucleotide followed by IR measurement p 66
II.3.5 Kinetics of molecular reorganization followed by IR measurement p 67
II.4 Summary p 71
II.5 Study of stoichiometry effect on the morphology of the aggregates p 73
II.5.1 Mesoscopic kinetics followed by OM observation p 73
II.5.2 Self-assembly kinetics followed by IR measurement p 75
II.6 Conclusion P 77
II.7 Experimental session P 79
II.8 Annex p 81
II.8.1 Study of morphology transition by inducing the nucleotide to vesicle solution
p 81
II.8.2 Study of complexation between gemini surfactant and nucleotide trimer p 83

References p 86
Chapter III : In situ helicity inversion of self-assembled nano-helix
III.1 Introduction p 91
III.2 Non equilibrium in situ Counter-Anion exchange in Gel Network: effect on the
Morphology of Aggregates p 96
III.2.1 Experimental description p 96
III.2.2 Morphologies transitions followed by TEM observation p 97
III.2.3 Pitch variation p 101
III.3 Investigation of chirality inversion by CD spectroscopy p 102
III.4 Molecular and supramolecular kinetics of morphology transition p 106
III.4.1 Study of molecular orientation followed by attenuated total reflectance (ATR)
spectroscopy p 106
III.4.2 Supramolecular organization studied by Small Angle X-ray Scattering (SAXS)
p 110
III.5 Summary p 114
III.6 In situ Counter-Anion exchange in Gel Network at equilibrium: effect on the
Morphology of Aggregates p 115
III.6.1 Morphologies transitions followed by TEM observation p 116
III.6.2 Pitch variation p 120
III.6.3 The chirality transfer followed by CD spectra p 121
III.7 Conclusion p 123
III.8 Experimental session p 125
References p 128

Chapter IV : Mineralization through bio-inspired materials: Bibliographic
study
IV.1 Introduction p 133
IV.2 Study of biomineralization p 134
IV.3 Study of biomimetic mineralization p 138
IV.3.1 Nucleation and process of crystallization p 138
IV.3.2 Study of organic template towards morphological control of minerals p 140
IV.4 Chiral silica via sol-gel polycondensation from self-assembled organic template
P 143
IV.4.1 Polymerized silica by sol-gel polycondensation method p 143
IV.4.2 Morphology control of chiral silica nanofibers p 144
IV.5 Conclusion p 150
References p 152
Chapter V : Gold nanoparticles deposition on silica nanohelices: A novel
3D substrate for optical sensing
V.1 Introduction p 157
V.2 Surface modification of silica nanohelices p 162
V.2.1 Preparation of silica-nanohelices p 162
V.2.2 Silica-nanohelices modified by APTES p 164
V.3 GNPs adsorbed on silica-nanohelices p 165 1
V.3.1 CIT-stabilized GNPs p 165
V.3.2 THPC-stabilized GNPs p 170
V.3.3 CTAB-stabilized GNPs p 170
V.3.4 Summary of GNPs adsorption on silica-nanohelices p 176

V.4 The growth of small THPC-stabilized GNPs at the surface of silica-nanohelices and
study of optical properties p 178
V.4.1 The particle growth promoted by replacement of solvents p 178
V.4.2 The particle growth on the surface of silica-helices by addition of gold salt and
reducing agent p 181
V.5 Larger GNPs deposited on the silica nanohelices p 184
V.6 GNP/silica nanohelices used as SERS substrate p 185
V.6.1 SERS study of chemical compound p 185
V.6.2 SERS study of medical agents as bioactive molecules p 188
IV.7 Conclusion p 192
IV.8 Experimental session p 195
References p 198
General conclusion p 203


1
- General introduction -
Molecular self-assembly is ubiquitous in nature, which can provide attractive
architectures. Self-assembly describes the spontaneous association of numerous individual
entities into a coherent organization and well-defined structure to maximize the benefit of the
individual without external instruction. This is an extremely powerful tool to engineer
functional materials through the construction of complex structures starting from smaller,
simpler subunits, avoiding tricky synthetic manipulations. These self-assembled structures
mainly results from non-covalent and weak interactions, which can build up the hierarchically
controlled structures over a wide size dimension ranging from 0.1 nm ~ macroscopic scales.
Due to the non-covalent bonding, the formation of these self-assembled structures is reversible
in nature. This is an advantage, since the process can be in principle designed to be controlled
by external stimuli. However, this also presents a disadvantage, since the self-assembled
architectures can be fragile in nature, and their lack of robustness can limit their practical
applications. To counter this problem, these structures can be mineralized to impart stability
and strength, still retaining the complexity of the original assembly. This approach combines
the advantages of the 'bottom-up' self-assembly approach with the durability of inorganic
nanostructures.
In this thesis, we first give a comprehensive introduction on the general aspects of the
self-assembly of amphiphilic molecules. We investigate how the amphiphiles can define to
organize the morphology in chapter I of bibliographical study. Particularly, we focus on the
control of various chiral fibrous morphologies obtained by chiral amphiphile. In addition, we
have interests about “out-of-equilibrium” process in chiral supramolecular aggregates,
especially in situ morphology transition caused by external factors.
Oda’s group has been working on the self-assembly of non-chiral cationic surfactants,
with chiral counterions, wherein, the chirality of the anion introduces chirality in the
self-assembled amphiphile membrane. In continuation of this work, in Chapters II and III,

2
utilizing the fact that the counterions regulate the organization of this self-assembly system, we
demonstrate that these chiral morphologies can be controlled by the exchange of the
counterions. In particular, in situ achiral (vesicle, micelle) to chiral (helix), or handedness
transition are performed at constant temperature.
In chapter IV, we study mineralization; especially we focus on the chiral silica, which
was obtained by self-assembled chiral amphiphiles as organic template via sol-gel
polycondensation. We show that the organic structures (generated from amine based gemini
amphiphiles) can be successfully transcribed, generating twisted ribbons, helices and nanotubes
of silica
In the last chapter, we discuss the functionalization of these silica nanostructures, and
the subsequent organization of gold NPs on these nanofibers, and demonstrate the viability of
these materials as SERS substrates.

3
Chapter I
Supramolecular structures by self-assembled
amphiphiles: Bibliographic study

4

5
I.1 Introduction
Self-assembly is the driving force for the formation of numerous nanometric to
micrometric scale structures from a broad diversity of building blocks. Understanding
self-assembly is important both from scientific and technological point of view, in particular
comprehending a number of systems in nature.1,2
For example, the cell contains an amazing
range of complex structures such as lipid membrane, folded proteins, protein aggregates,
molecular machines, and various structures of biological molecules are designed by
self-assembly.3 Molecular self-organization has been emerged as a discrete field of synthetic
strategy.
Since several decades, various structures derived from molecular self-assembly have
been reported. These include monolayers,4 lipid bilayers,
5 molecular crystals,
6 but also phase
separated polymers,7 folding the polypeptide chains into proteins,
8 as well as the association of
a ligand with a receptor.9
The study of self-assembled supramolecular systems is an attractive approach for the
construction of complex in chemistry, material science and biology. 10
Supramolecular
architectures have largely capitalized on non-covalent and weak interactions, such as
coordinate bonding, ionic interactions, stacking, van der Waals binding, hydrophobic
effect, and particularly hydrogen bonding.11 , 12
An example of stepwise process of
supramolecular structures based on molecular process are shown in Figure I.1; the monomeric
building block is stacked and self-assemble to a supramolecular structure.

6
Figure I.1 Schematic illustrations of building block process via molecular self-assembly.
Among the self-assembled supramolecular systems, amphiphilic molecules represent
particularly common behavior. Molecular amphiphilicity (amphi : from the Greek amphi- : on
both sides : of both kinds, phile : from Greek–philos–philous: lover: one having an affinity for
or strong attraction (Merriam-Webster’s Collegiate® Dictionary, Tenth Edition)) can be defined
as chemical character of molecules to have two or more parts with each part having different
affinities for solvents that do not mix with each other, among which, the most common example
will be those having both hydrophilic headgroup (polar) and hydrophobic tail (non-polar)
(Figure I.2).13
This character is the origin of aggregation processes.
Figure I.2 Schematic illustration of structure of amphiphilic molecule.
The head groups of amphiphilic molecules can be charged (cationic or anionic) or
neutral (non-ionic or zwitterionic). Non-ionic head group is generally composed by sugar, or
oxyethylene, etc. The most general hydrophobic chains are formed by hydrocarbons with 5-22

7
carbon atoms. In the aqueous medium, these molecules are self-assembled with each other such
that their hydrophobic parts are laterally-directed, and their hydrophilic parts show inward
direction.
Amphiphilic molecules are generally categorized five groups (Figure I.3):
monomeric amphiphiles which have one hydrophilic head group and one hydrophobic chain
(A), the bulky amphiphiles which are typified by lipid have one hydrophilic head group and two
hydrophobic chain (B), gemini or molecules which have spacers between two or more head
groups and each having a hydrophobic tails (C), the cationic or anionic amphiphiles (D) and
bola amphiphile (E).
Figure I.3 Schematic illustration of 5 classified amphiphilic molecules.
In this chapter, we will present the bibliography of self-assembled supramolecular
structures, which can form particularly chiral nano to micrometric fibers. At first, we will
describe the various supramolecular morphologies depending on the amphiphilic molecules,
and then present some examples of chiral fibers. In the next step, we will present the effect of
counter-anion on the construction of such fibers. One section of this chapter will also be
devoted to the out-of-equilibrium system in natural self-assembled structures.
I.2 Aggregation behaviour of amphiphiles in solution
I.2.1 Phase behaviors of the assemblies of amphiphilic molecules
The properties of amphiphiles are widely used for the detergents, wetting agents,
dispersing agents or bubble with numerous applications. In biological systems, the amphiphiles
+ -
A B C D E

8
are also crucial factors because an important part of cell membranes is composed by
phospholipids aggregation of which leads to the formation of lipid bilayer.
When amphiphilic molecules are dissolved in water, their hydrophobic groups are
directed away from the water and the free energy of the solution is minimized.14
This effect is
called “hydrophobic effect”. Figure I.4 summarizes several mechanisms of self-assembled
amphiphiles in order to limit the increasing of free energy.
Figure I.4 Schematic illustrations of typical aggregations and adsorption by self-assembled
amphiphiles at the surface and interface.
In aqueous solutions, the amphiphiles are oriented with a hydrophobic tail inside
(away from water), and hydrophilic head outside; the smallest structure of this kind is called
“micelle”. To form micelles, the concentration and temperature are particularly important
Monomers
Liquid-Gas Interface
Water
Air
Crystallization
H2O
Micelle Formation
Hydrophilic substrate
or
Adsorption on
Solid-Liquid Interface
Formation of
Bilayers
Formation of
Liquid Phase Crystal
Adsorption on
Liquid-Liquid Interface
Hydrophobic substrate
Hydrophobic solvent
Hydrophilic solvent

9
parameters. These two physicochemical parameters are typically used for describing the
micelle formation (Figure I.5).
Critical micelle concentration (cmc) is the minimum concentration from which the
surfactant changes from soluble monomeric state to soluble aggregation (micelles or lamellar
phases) states in water. Furthermore, micelles are only formed above specific temperature,
Kraft point. The micellisation is a spontaneous phenomenon in the aspect of thermodynamics,
which leads to a significant increase in the solubility of the surfactant.
Krafft temperature (Tk) is the minimum temperature at which surfactants form
micelles. There is no value for the CMC below the Krafft temperature whereas the solubility of
surfactant increases constantly after leaching Krafft point because the dominant species in
solution is no longer the surfactant monomer, but the micelle. When the temperature is lower
than Tk, the amphiphiles form precipitate/gel instead of solubilizing in water.
Figure I.5 Diagram of aggregation of amphiphiles in solution. The functions are depending on the
concentration and temperature.
Just above cmc, micelle is formed by around 50 to a hundred amphiphiles. When the
concentration of surfactants in water is increased, the aggregation number of micelles increases

10
gradually and they transform to rod-like micelle, vesicles, then, liquid crystal structures such as
cubic phase, hexagonal phase or lamellar phase.
I.2.2 Various self-assembled morphologies
Israelachvili proposed the packing parameter p of amphiphilic molecules, which
describes the relationship between the molecular architecture of the amphiphilic molecules
based on the molecular structure and the shape of aggregate structures formed in solution.15
This parameter is defined as follows: p = a0l (a0 is the area per head group, l is the effect
length of hydrophobic chain(s), and is the volume of the hydrophobic chain(s)). With a very
simple approximation, one can approximate l as the area per hydrophobic chain. Therefore, p
is the ratio of area per chain over area per head group of amphiphilic molecules at interface. As
shown schematically in Figure I.6, the value of p is closely related to the morphologies of the
amphiphile aggregates.
Figure I.6 Packing parameter of amphiphilic molecules as defined by Israelachvili,15
showing different
morphologies of amphiphilic aggregates.
These aggregation are held together principally by non-directional hydrophobic
effects, and the molecular structures of amphiphilic molecules (lipids, surfactants, amphipatic

11
peptides or copolymers) as well as various physical-chemical parameters such as temperature,
pH, ionic force, molecular concentration and salinity, have strong effect on p value and the
resulting aggregation morphology., Indeed, small variations in such parameters can easily
induce significant morphology changes. Other than the most commonly observed structures
such as spherical micelles (p < 1/3), cylindrical micelles (1/3 < p < 1/2) vesicles (1/2< p < 1)
and lamellar phases (p = 1), structures such as ribbons, tubules, hexagonal, cubic phase, etc. are
observed. Due to their amphiphilicity, sometimes they can form reversed phases such as
inverted micelles or lamellar phases in organic solvents containing trace of water (p > 1).
While this parameter is conceptually useful for describing why a given family of
molecules assemblies to certain morphology of aggregation, it is still very difficult to predict
the morphology that will be formed by a particular molecule in solution.
I.2.3 Counter-ion effect for micellization
Among the various parameters sited above, counterions of charged surfactants play
crucial roles determining the morphologies of the aggregation behaviors of the amphiphilic
molecules. The solubility of amphiphilic molecules depends on the hydrophilic, hydrophobic
and charged counter-ions. The study of counter-ion is particularly important issue in many
fields. Since the work by Hofmeister,16
the ionic specificity has been widely studied in the
biological context.17,18
At the end of 19th century, Hofmeister proposed the influence of ions on the
precipitation of proteins in salt solutions which led establishment of a classification, commonly
called "Hofmeister series". This classification is also observed in many physico-chemical
mechanisms including the phenomena of micellization of charged surfactants.19
Gregory Warr has reported a series of this study to the evaluation of the affinity of
some anions (Br-, Cl
-, I
-, NO3
-) for gemini cationic structure.
20 The order of affinity for gemini
surfactant descends I- > NO3
- > Br
- > Cl
-, which follows to the Hofmeister series. In fact, the
stronger or weaker ability of an ion to associate with cationic surfactant is responsible for
affecting the values of cmc and Tk.

12
More recently, our group has suggested the counter-anion effect complexed with
gemini surfactants, dicationic bis-quaternary ammonium n-2-n on micellization (Figure I.7).
Figure I.7 Molecular structure of gemini surfactant developed in our group.
As a part of her PhD,21
Sabine Manet studied systematically the influence of
counterions to aggregation properties of gemini surfactant. She has shown the ionic specificity
of counterions on the behavior of micellization, as well as the morphologies of the molecular
assemblies.
She has synthesized 14-2-14 gemini surfactants complexed with more than 30
different counter-ions which are divided into 4 categories (Figure I.8): (1) small counterions,
which are principally ions taken from the Hofmeister series, (2) aliphatic carboxylate
counterions, in which the hydrophobicity of the anion can be tailored by modifying the alkyl
group, while keeping the same ionic nature, (3) aromatic carboxylate counterions with which
the effect of substitutions can be examined, and (4) those which do not belong to the first three
family but which allow comparisons based on particular properties (“orphan” counterions).22
The results obtained show the complex aggregation behavior on charged molecules.
The hydrophilicity of ions is the primary effect determining micellization. The high
hydrophilicity of counterions leads to high cmc. This order evolves following to Hofmeister
series; I < NO3 ~ Br < Cl < F ~ C2 < PH.

13
Figure I.8 Structures of 31 there are 10 counterions with alkylcarboxylate counter-anions complexed
with gemini surfactant.22
Various physicochemical parameters (polarizability, ion radius, intra/intermolecular
hydrogen bonds, and steric hindrance) have also influence for micellization and the propensity
of the counterions to form ion pairs with the amphiphiles headgroups. In terms of Tk, the
determining factor is stability of solid state, mainly determined by the polarizability of
counterion. Thus, the higher the polarizability leads the stronger interaction with the gemini
surfactant, and the higher Tk (Figure I.9).

14
Figure I.9 Schematic illustrations of properties of self-assembly in the presence of counterion complex.
An ion confined to the highly hydrophobic surface of the aggregate is responsible for
the decrease in surface charge density, which reduces the curvature of interface. This promotes
the bilayers formation compared to the micelle formation.
This study shows the specific complexation effects of ions resulting from the
cooperativity of various parameters and the importance of nature of counter-anion on the
aggregation behavior of cationic gemini surfactant. Thus, an appropriate selection of
counterion allows designing of specific supramolecular architecture and control the
morphologies of self-assembly of ionic amphiphilic molecules.
I.2.4 Various amphiphilic molecules which form bilayer structures
A variety of single-chain and double-chain amphiphiles assembled spontaneously to
form stable monolayers and bilayers. In 1977, Toyoki Kunitake has reported the first example
of totally synthetic membrane obtained by self-assembly of monocationic amphiphilic

15
molecules consisting of a polar head and hydrophobic double alkyl chains (didodecyl dimethyl
ammonium bromide) in water (Figure I.10).23
Figure I.10 (a) Structure of amphiphilic molecule and this vesicles observed by electron micrograph
with (b) lower and (c) higher magnifications.23
Following this work, Kunitake has presented numerous studies suggesting that the
diversities of morphologies are accessed from amphiphilic molecules with different
structures.24
The aggregates obtained by double-chain amphiphiles usually are self-assembled
to form vesicles and lamellae of the bilayer.25
They have also reported that bilayer strictures are
obtained with single-chain tail amphiphiles which have rigid segment in the tail.26
Furthermore,
the single-chain tail with double-head ammonium amphiphiles can provide rod-like and tubular
aggregates, as well as vesicles and lamellae (Figure I.11).27,28
Figure I.11 Schematic illustrations of various amphiphilic molecules which can form bilayer
structures. The amphiphiles are composed by single-head with double alkyl chain, single-chain
containing rigid segment, and double-head single chain containing rigid segment structures.
The variation of each molecular structure and their aggregated morphologies are
shown in Figure I.12. For example, the amphiphile 1 does not form vesicles in water. However,
the amphiphile 2, the homologue to amphiphile 1 with longer hydrophobic alkyl chain (from 4

16
to 12 carbons), forms multi-walled vesicles (Figure I.12 a). In addition, the nature of rigid
segments is particularly an important factor to determine the self-assembled morphology in this
type of molecular structures. If the presence of rigid segments such as oligophenyl is required,
the nature of the spacer connecting these two or three cycles is also decisive. Indeed the
amphiphile 3, consisting of a triple cycle of phenyl group, self-assembles to form the stacked
disk-like aggregates, 4 and 5 produce tubular and rodlike fibers, respectively (Figure I.12 b-d).
The surfactant 6 consisted by hydrophilic two-headed with single chain containing rigid
segment in center can be self-assembled to form lamellar sheets in water (Figure I.12 e). Such
surfactants with two headgroups at the extremities of a hydrophobic chain are called as
bola-amphiphiles. Interestingly, when this amphiphile 6 is mixed with cholesterol (3 : 1 molar
mixture), morphology transition occurs to vesicle with about 1000-3000 Å in diameter and
60-70 Å in membrane thickness (Figure I.12 f).
Figure I.12 Examples of amphiphilic molecules developed by Kunitake and the electron microscope
images presented by self-assembled amphiphiles (a) 2, (b) 3, (c) 4, (d) 5, (e) 6, and (f) 6 : cholesterol (3 :
1).27,28

17
Other than these double chained surfactants or single chain surfactants with rigid
segments and bola-form surfactants, cationic surfactants, gemini surfactants are also known to
form bilayer structures.
Among the various assemblies formed by amphiphilic molecules,29 ,30 ,31 ,32
chiral
supramolecular structures such as helical structures, which result from the self-organized
surfactants with an asymmetric chiral center in the molecules, have attracted the interest of
many research groups.
I.3 Self-assembled surfactant with chiral supramolecular
morphologies33,34
The chirality is ubiquitous in biological systems. A double-helical structure of DNA
or tertiary structure of proteins are particularly good examples of the chiral structures in nature.
Many artificial self-assembled nanofibers have also been reported. Most of their root
compounds were serendipitously discovered to form self-assembled nanofibers.23
Various
chiral morphologies are classified as helices, tubes, ribbon-like and rod-like (including achiral
formation) structures (Figure I.13), these morphologies have been visually identified by optical,
electron, and probe microscopic observations. The potential applications of such original
molecular assemblies include mechanical, physical, and chemical field such as nano to
micrometric springs,35
low molecular mass gelators,36
enantioselective catalysts,37
and organic
templates with controllable shape38
etc., but also at more fundamental level, the understanding
the mechanism of these self-assemblies can shed light on the comprehension of biological
functional systems.

18
Figure I.13 Classification of nanometric fibrous structures by (a) rope-like fiber, (b,c) multistrand
fiber, (d) twisted ribbon, (e) helical ribbon, and (f) tubular fiber. 33
I.3.1 Chirality transfer
The molecular chirality (~ Å) can sometimes transfer to a much larger scale
(supramolecular scale; nm ~ µm) in the morphology of self-assembled fibers. This chirality
transfer results in the formation of nano to micrometric helical morphology (Figure I.14)
Figure I.14 Schematic illustration of chirality transfer from molecular level to supramolecular level.
Numerous studies have reported the chirality transfer from molecular level to
supramolecular level since the first observations using natural lipids such as sodium
deoxycholate39
and deoxycholic acid40
.
For example, group of Kunitake41 , 42
or Fuhrhop29, 43 , 44 , 45 , 46
demonstrated the
self-assembled chiral superstructures by amphiphilic molecules. (Figure I.15).

19
Figure I.15 Molecular structures of chiral amphiphiles and electron microscope observation of
self-assembled chiral superstructures consisting with bilayer membranes. (a) Twisted ribbons
obtained by amphiphile 7 [41], (b) helical ribbon obtained by amphiphile 8 [43], and (c) tubes obtained
by amphiphile 9 [45].
I.3.2 Chiral fibers formed in aqueous system
The self-assembled nano to micrometric fibers can be obtained by simple preparation
methods that the compounds are dispersed into media with heat above the Tk or sonication, and
then allowing them to rest at a given temperature for a few minutes to several days. Some
amphiphiles can form gel network of chiral fibers in solution. Either aqueous or organic solvent
can be used as a media, and the amphiphiles are classified “hydrogelators” or “organogelators”
respectively. In this section, we will first present the group of hydrogelators.
The natural lipids such as phospholipids can form bilayer membrane structures
spontaneously in water.47
As it has been mentioned above, bilayer membrane structures can be

20
formed not only by double alkyl chains, but also single chain which has rigid segments. In case
of hydrogelator, the hydrophobic effect of tail(s) and the hydrogen bond of head group are
important roles to self-assemble the supramolecular structures.
Since 1980's, a large number of hydrogelators have been synthesized as listed in
Figure I.16, and these chiral superstructures are also shown in Figure I.17.
The chiral structures consisted bilayer membrane are observed by using synthetic
lipids such as amino acids based48
(10,49
11, and 1250
), and nucleo-based (13)
51 lipids which
have one hydrophilic head group and hydrophobic two tails.
Chiral superstructures can also be form by induce the chirality from counter-ion.
Most of these works have been developed in Oda's group. For example, non-chiral cationic
bis-quaternary diammonium gemini surfactant in the presence of tartrate (14)52,53
and peptide
(15)54,55,56
counter-anion can form nano or submicrometric twist, helical and tubular structures.
Peptide counter-anion complexed with dimethyl-dialkylammonium (16)54,55,56
or
trimethyl-alkylammonium (17)57
surfactant can also form chiral structures.
This list also includes some other chiral amphiphiles such as asymmetric sugar-based
bolaamphiphiles (1858
and 1959
) and single chain amphiphiles such as glydolipid including
phenyl moiety (20)60
or amide moiety (21),61
and peptide based amphiphile (22).62
Some of amphiphiles can form micrometric chiral structures, however, the majority
of them report nanometer scale fibers.

21
Figure I.15 Molecular structures of chiral amphiphiles which can form chiral fibrous structures
consisted bilayer membrane in aqueous solution.

22
Figure I.16 Various chiral fibular aggregates from lipid bilayers membrane system in aqueous
solution. The chiral fibers are corresponding to amphiphile (a) 10, (b) 11, (c) 12, (d) 13, (e) 14, (f, g) 16,
(h) 17, (i) 18, (j) 19, (k, l, m) 20, (n) 21, and (o) 22.

23
I.3.3 Chiral fibers formed in non-polar organic media
Other amphiphiles (these are the majorities) can form gel network with chiral
supramolecular structure in non-polar organic media. These can be referred to as
organogelators.
From the late 1980’s to the early 1990’s, many researchers discovered oganogelators
based on low molecular weight compounds. The classical organogelators are listed in Figure
I.17.63,64,65,66
These molecules can form nano-sized architectures to develop molecular devices
for sensitive sensors, high-density memory storage, and so on.
Figure I.17 Molecular structures of chiral amphiphiles of classical organogelators developed in the late
1980’s to early 1990’s (Ref; 23 [63], 24 [64], 25 [65], and 26 [66]).
Figure I.18 shows more recent examples of chiral organogelators, and these chiral
superstructures are shown in Figure I.19.
The hydrophobic effect is the most essential driving force for molecular aggregates in
aqueous solution systems. In organic media, on the other hand, intermolecular interactions such
as hydrogen bond, ionic interaction, and stacking play important roles in molecular
aggregation.67
For example, gemini-shaped hexa-peri-hexabenzocoronene (HBC) amphiphiles
containing stereogenic center into hydrophilic side chain (27) form helical-rolled bilayer tapes

24
in 2-methyltetrahydrofuran solution derived from bilaterally coupled columns of stacked
HBC units.68,69
Cholesterol-based amphiphiles can also produce the chiral fiber network in organic
media. Cholesterol derivative linked to diphenylbutadine organogelator (28) can form
nanometric twist ribbons as a result of their slipped-stack arrangement of stacking
interaction of diphenyl butadiene core.70
Crown-appended cholesterol-based organogelators
(29) can also self-assemble to form micrometric helical ribbons to tubules.71
Oligothiophenes are well known for their excellent stacking tendency and the
ability of providing a conductive pathway for charge transport.72
When oligothiophene is
complexed with amphiphilic molecules such as peptide-based compounds (30), interaction
and hydrogen bonding affect the balance of intermolecular forces that lead to self-assembled
nanometric twisted structures.73
Figure I.18 Molecular structures of organogelators promoted by chiral amphiphiles.

25
Figure I.19 Various chiral fibular aggregates from lipid bilayers membrane system in organic media.
The chiral fibers are corresponding to amphiphile (a, b) 27, (c) 28, (d) 29, and (e) 30.
I.3.4 Twisted, helical ribbons and tubes
Among the variety of chiral fibrous structures, helical and twisted shapes are most
commonly described in many literatures, and these morphologies are generally promoted by
single or multiple bilayers. These morphologies are characterized by inherent curvature (Figure
I.20). Twisted membrane is associated by “saddle-like curvature”, in contrast, helical
membrane is associated by “cylindrical curvature”.53,74,75

26
Figure I.20 Schematic illustrations of the formation of twisted ribbon with saddle-like curvature and
helical ribbon with cylindrical curvature.
Furthermore, tubular structures are often observed from self-assemblies derived from
chiral molecules.76
The precursor structures to forming tubes are generally helical ribbons, and
there are two routes for nanotube formation. The first route proceeds with the shortening of
helical pitch and maintaining a constant tape width of ribbon (Figure I.21 a), whereas the
second involves widening of tape width and maintaining a constant helical pitch (Figure I.21
b).77
Actually, when the tube is just formed, the closed edges of helical ribbon are still visible
and indicated the chirality of the tubular structure (Figure I.21 c).78
Figure I.12 (a, b) Schematic illustrations of the tubular formation mechanism from helical ribbon
precursor. Tube are formed through (a) shortening helical pitch or (b) widening tape width. (c) TEM
images of helical formation (upside) and tubular formation keeping with the helical edges (bottom).78
I.3.5 Morphology control
These chiral morphologies obtained by self-assemblies of amphiphilic molecules can
be controlled in different ways, either by varying the environmental parameters, or by changing
the molecular structure of amphiphiles. Some of the key parameters of morphological control

27
are the length of hydrophobic tails, the nature of the solvent, the gelation concentration,
temperature, or the aging time of samples. Indeed, the formation of these chiral assemblies is
often strongly controlled by kinetics.
For example, mixture of a short-chain (31) and a long-chain (32) diacetylenic
phospholipid self-assemble to form either nanotube or twisted ribbon depending on the gelation
temperature (Figure I.22).79,80
In this case, tubular structures can be obtained with lower (4 °C)
and higher (more than 34 °C) temperature (containing vesicles at 34 °C), however at 27 °C,
only twisted ribbons are observed.
Figure I.22 Example of morphology control by different temperature between tubes to twisted ribbons
of self-assembled mixture of 24 and 25. The samples stored at (a) 4 ˚C to form tubes, (b) 27 ˚C to form
twisted ribbon, and (c) 34 ˚C to form tubes containing vesicles.80
The concentration is also important factor to produce the chiral morphology. Cui et al.
have reported that controllable shapes are produced by different concentration of alkylated
peptide amphiphiles (33) in aqueous solution.81
Amphiphile 33 can form twisted multiple liner
structures at lower concentration of 0.01 wt % (Figure I.23 a). These morphologies are
transformed from nanoribbons to nanobelts with broom morphology (Figure I.23 b), then flat
and wide nanobelts (Figure I.23 c) upon increase the concentration to 0.1 wt %.

28
Figure I.23 Example of morphology control by different concentration. Electron microscope images of
(a) twisted nanoribbons at 0.01 wt %, (b) intermediate broom morphology of nanobelts transforming
into twisted nanoribons at 0.05 wt %, and (c) uniformed nanobelts morphologies at 0.1 wt %. (d)
Schematic illustration of morphological transitions with a change in concentration.81
More recently, Ziserman et al. have reported the growing steps of chiral morphologies
by aging evolution using amino acid amphiphile (34) (Figure I.24).82
The morphology
transition until forming the chiral twisted ribbons occurred rapidly, however their
transformation to tubular structures are slower.

29
Figure I.24 Example of morphology control by aging variation. (a) The molecular structure of chiral
amphiphile, (b) schematic illustration of qualitative description of the time-dependent assembly, and
(c) electron microscope images of morphology transitions from thin fibers to tubes.82
The specific enantiomers (D and L) of chiral molecules are also important factor to
determine the direction of helicity of chiral structures (right-handed or left-handed forms).
Mixing of an equivalent amphiphile of each enantiomer generally leads to form
racemic structure which means that no chirality is expressed in the aggregate. For example, the
amphiphile 8 (D-glu) can self-assemble to form left-handed helix, on the other hand,
right-handed helix can be obtained by opposite chiral amphiphile 35 (L-glu). If these
amphiphiles are mixed with the molecular ratio 1 : 1, chirality is balanced and racemic platelets
are observed (Figure I.25).43

30
Figure I.25 Molecular structures of opposite enantiomers and electron micrograph of (a) left-handed
twist ribbon (8), (b) right-handed twist ribbon (35), and (c) racemic flat fibers from amphiphile 8 + 35
(molecular ratio 1 : 1).
However, some exceptions have been reported in the literature. The coexistence of
right and left handed ribbons are sometimes observed with the population of each representing
the ratio of the two enantiomers.83,84,85
I.4 Study of in situ dynamic morphology transition through the
out-of- equilibrium process
1.4.1 Dynamic motion in biological systems
In nature, they are many phenomena of in situ dynamical behaviors which are caused
by external stimuli. Biomembranes are particularly good example to understand the mechanism
of morphology transformation caused by the out-of-equilibrium process. In membrane systems,
the proteins show various biological functions, for example, transport proteins play the
maintenance of ion concentration resulted from the spontaneously conformation change such as
unfolding and folding of their structures when they receive and release the ions.86

31
Some proteins are responsible for the diseases due to their denaturation caused by
morphological transition. Prion protein is well-known as a factor to course spongiform
encephalopathy. Normal prion contains mainly -helical conformations. If these -helices
transform to -sheets, diseases develop.87,88,89
Swietnicki et al. have reported that this transition
of -helix to -sheet rich oligomers is occurred under the acidic conditions (pH 5 or below) in
the presence of guanidine hydrochloride.90
Furthermore, addition of urea and sodium chloride
at acidic pH also trigger a self-association or a conversion to -sheet structure.91
Figure I.26
shows clearly in situ morphology transition from -helix to -sheet proceeded with time by
addition of urea and NaCl using circular dichroism spectroscopy. This transition occurs
concomitantly with oligomerization of protein.
Figure I.26 (a) Model of -helix-rich (normal) to -sheet-rich (abnormal) morphology transition of
prion. (b) CD spectra of time-dependent transition to -sheet structure and (c) kinetics of
conformational transition in ellipticity at 222 nm.90
The designs and investigations of modeling morphology transitions are critically
important target for elucidating the structural and dynamic parameters governing functions of
biomolecules. The designs of dynamic supramolecular structures from self-assembled
amphiphilic molecules are also contributed to the mimic of biological functions.
1.4.2 Artificial morphology transformation by supramolecular
self-assembly
Inspired from biological functions, artificial systems are also performed for in situ
structural changes by external factors.

32
Many researchers have approached in situ morphology transitions such as
helix-sheet, random coil-sheet or helix, coil-globule, micelle-fiber, and helix-helix handedness
transition etc. by using synthetic molecules such as polymer,92 , 93 , 94 , 95
oligomer,96 , 97 , 98
dendrimer,99,100
and helicen.101,102,103
Especially, supramolecular structures obtained by self-assembled amphiphilic
molecules have great advantages since in these systems, we can control morphologies at the
mesoscopic level (nm ~ m scale) due to their intermolecular non-covalent bonding.
The equilibrium of stable structures from self-assembled amphiphiles can be easily
shifted by external stimuli such as temperature, pH control, and sometimes additive as well.
Temperature is the most common control parameter to produce the morphology
transition. In 1999, Thomas et al. have reported the direct observation of in situ morphology
transformation from multilamellar vesicles to helical ribbons by 1,2-bis(10,12-tricosadiynoyl)
-sn-glycero-3-phosphocholine [DC(8,9)PC, amphiphile 32] under conditions of very slow
cooling (Figure I.27).104
In this system, the transition temperatures from isotropic-to-vesicle
(TL1) and vesicle-to-fiber (TL2) are 37 °C and 57 °C, respectively. The samples are heated to ~
40 °C to form the vesicle structure, and then cooled down with the rate at 0.25 °C/h. While
cooling, the helical ribbons grow from nucleating at a nodule (white arrow) at the edge of
spherical vesicle.
Figure I.27 Direct observation (DIC microscopy) of morphology transition from vesicle to helical
ribbons obtained while cooling at 0.25 °C/h.104
This system is reversible upon heating to above TL2.

33
The pH is also important to control the structures. For example, pH sensitive peptide
or amino acid based amphiphilic molecules show fiber-micelle/vesicle morphology transition
upon adjusting the pH environment.105
Recently, Wang et al. have described that self-assembled structure of bolaamphiphiles
with L-glutamic acid headgroups and hybrid linkers (36) is controllable upon pH change from 3
(chiral fiber with monolayer membrane) to 12 (giant micellar fibers) (Figure I.28).106
Figure I.28 Example of pH-responsible amphiphile 26. (a)TEM image of chiral fiber with monolayer
structure at pH 3, (b) AFM image of giant micellar fibers at pH 12, and (c) schematic illustration of
self-assembly in pH 3 and pH 12.106
In 2002, Kobayashi et al. have reported the first experiment of vesicle-fiber transition
as well as sol-gel transition using chiral bolaamphiphiles consisting of sugar head group and
azobenzene segment (amphiphile 37) upon addition of boronic acid-appended poly(L-lysine) as
additive agent (Figure I.27).107

34
Figure I.27 The molecular structures of bolaamphiphile and boronic acid-appended poly(L-lysine)
additive agent, and TEM images of fiber-vesicle transition upon addition of additive agent. The chiral
fiber obtained with concentration 1.0 × 10⁻²
mol/dm3 in mixture of DMSO/water.
107
Amphiphile 37 alone self-assemble to form gel by creating extended networks of
nanometric twisted fibers in DMSO/water solution. When boronic acid-appended
poly(L-lysine) is added, the gel phase was changed into the sol phase in the macroscopic level
and the fibrous aggregates are changed into the vesicular aggregates in the microscopic level.
This kind of transformation is usually demonstrated by a temperature change, but in this case, it
is induced due to the specific boronic acid–sugar interaction at constant temperature. When
D-fructose which shows high affinity with the boronic acid group is added to the vesicle
solution, the sol phase and the vesicular aggregate are transformed back to the gel phase and the
fibrous aggregate, respectively. This means that the phase and morphological changes in the
sugar-integrated bolaamphiphiles can be controlled reversibly.
More recently, Lin et al. have designed a functional amphiphile bearing a sugar
moiety, azobenzene group and butyl chain (38) which can self-assemble to form a
double-stranded helical nanofiber in aqueous solution (Figure I.28 b).108
This double helix is
transformed to globule micelles upon addition of acid because the amino atom in 38 is
protonated (Figure I.28 a). This process is reversible by addition of base.

35
Furthermore, when ionic surfactant such as sodium dodecylbenzene sulfonate
(SDBS) adds to suspension of helical fibers, the shapes can be transformed into fragmentized
unfolded nanofibers (Figure I.28 c). These phenomena are rationalized that ionic surfactant
penetrate into helical aggregate owing to hydrophobic effect and impart electrostatic repulsion
to the adjacent helix, which can result into the unfolding of the double helix. Upon further
addition of SDBS, these fibers transform into global vesicles (Figure I.28 d).
Figure I.28 (a) Structural change of amphiphile (38) with addition of acid or base. TEM images of (b)
double-stranded helices. Morphology transition in the presence of ionic surfactant; (c) fragmentized
unfolded nanofibers, and (c) global vesicles.108
The finding imply that these systems are applicable as new functional soft materials
triggered by external stimuli expanding for e.g., switching devises, actuators, nanopipettes, as
well as drug delivery systems.

36
I.5 Conclusion
In this bibliography chapter, we have presented the supramolecular structures
obtained by self-assembled amphiphilic molecules. Initially, we focused on structural
parameters, how amphiphiles can self-organize to the various structures under the different
environment. The driving force responsible for the self-assembly of surfactants in aqueous
solution is mainly the hydrophobic effect of nonpolar tails, combined sometimes with hydrogen
bonds of polar head groups. The shape and stability of self-assembled supramolecular
structures are strongly affected by nature of counterions.
Among the various self-assembled structures, chiral supramolecular structures
represent a very interesting group of nano-assemblies. A rich variety of chiral structures such as
twisted or helical ribbons as well as tubules have been observed and their size varies from
nanometers to microns, that shapes and chirality are tunable by adjusting the environment.
Sometimes these chiral supramolecular structures show in situ transformation to
different morphologies (e.g. vesicle, micelle) by addition of external stimuli. Many literatures
have published about morphology transition from chiral to achiral structure, however less
examples have reported for achiral to chiral structural transformation, particularly the condition
is at constant temperature.
We have therefore asked ourselves, if 1) it is possible to promote in situ
morphology transformation from achiral to chiral supramolecular structure, or 2) can the
opposite chirality be induced a posteriori in chiral aggregate to design the in situ reversible
helical structures, IF the chirality can be induced by the counterion to stable aggregates of
non-chiral surfactant.
Answers to these questions will be proposed later in this manuscript.

37
References
1 D. Philip, J. F. Stoddart, Angew. Chem. Int. Ed. Engl., 1996, 35, 1155-1196.
2 J. M. Lehn, P. Ball, in The New Chemistry, ed. N. Hall, Cambridge Univ. Press, Cambridge, U. K., 2000,
300-351.
3 B. Alberts, D. Bray, J. Lewis, M. Raff, K. Roberts, J. D. Watson, Molecular Biology of the Cell, Garland,
New York, 1994.
4 A. Kumar, N. A. Abbott, E. Kim, H. A. Biebuyck, G. M. Whitesides, Acc. Chem. Res., 1995, 28, 219-226.
5 M. N. Jones, D. Chapman, Micelles Monolayers and Biomembranes, Wiley-Liss, Bew York, 1995.
6 G. R. Desiraju, Crystal Engineering: The Design of Organic Solids, Elsevier, New York, 1989.
7 E. L. Thomas, Science, 1999, 286, 1307-1309.
8 V. Grantcharova, E. J. Alm, D. Baker, A. L. Horwich, Curr. Opin. Struct. Biol., 2001, 11, 70-82.
9 P. Bongrand, Rep. Prog. Phys., 1999, 62, 921-968.
10 (a) J. M. Lehn, Angew. Chem. Int. Ed. Engl., 1988, 27, 89-112. (b) J. M. Lehn, Angew. Chem. Int. Ed. Engl.,
1990, 29, 1304-1319. (c) J. M. Lehn, Pure & Appl. Chem., 1994, 66, 1961-1966.
11 B. Olenyuk, J. A. Whiteford, A. Fechtenkotter, P. J. Stang, Nature, 1999, 398, 796-799.
12 J. M. Lehn, NATO ASI Ser. Ser. E, 1996, 320, 511-524.
13 R. Oda, Molecular Gels, Kluwer Academic Publishers, Dordrecht, Netherlands, 2005.
14 M. J. Rosen, Surfactant and interfacial phenomena, Wiley, New York, 2004.
15 J. Israelachvili, Intermolecular & Surface Forces, 2
nd ED., Academic Near, London, 1992.
16 F. Hofmeister, Arch. Exp. Pathol. Pharmacol., 1888, 24, 247-260.
17 I. A. Shkel, J.D. Ballin, M. T. Jr. Record, Biochemistry, 2006, 45, 8411-8426.
18 D. M. Huang, C. Cottin-Bizonne, C. Ybert, L. Bocquet, Phys. Rev. Lett., 2007, 98, 177801.
19 A. Renoncourt, N. Vlachy, P. Bauduin, M. Drechsler, D. Touraud, J. M. Verbavatz, M. Dubois, W. Kunz,
B. W. Ninham, Langmuir, 2007, 23, 2376-2381.
20 (a) J. D. Morgan, D. H. Napper, G. G. Warr, S. K. Nicol, Langmuir, 1994, 10, 797-801. (b) M. A. Cassidy,
G. G. Warr, Aust. J. Chem., 2003, 56, 1065-1070. (c) B. Thalody, G. G. Warr, Aust. J. Chem., 2004, 57,
193-196.
21 S. Manet, Effet de contre ion sur les propriétés d’amphiphiles cationique, Thesis of Doctrante, Bordeaux 1
Unversity, 2007.
22 S. Manet, Y. Karpichev, D. Bassani, R. Kiagus-Ahmad, R. Oda, Langmuir, 2010, 26, 10645-10656.
23 T. Kunitake, Y. Okahata, J. Am. Chem. Soc., 1977, 99, 3860-3861.
24 (a) T. Kunitake, N. Kimizuka, N. Higashi, N. Nakashima, , J. Am. Chem. Soc., 1984, 106, 1978-1983. (b) T.
Kunitake, Amgew. Chem. Ed. Int. Engl., 1992, 31, 709-717.
25 (a) T. Kunitake, J. Macromol. Sci. Chem., 1979, A13, 587-602. (b) J. H. Fendler, ACC. Chem. Res., 1980,
13, 7-13.
26 (a) T. Kunitake, Y. Okahata, J. Am. Chem. Soc., 1980, 102, 549-553. (b) Y. Okahata, T. Kunitake, Ber.

38
Bunsenges. Phys. Chem., 1980, 84, 550-556.
27 T. Kunitake, Y. Okahata, M. Shimomura, S. Yasunami, K. Takarabe, J. Am. Chem. Soc., 1981, 103,
5401-5413.
28 Y. Okahata, T. Kunitake, J. Am. Chem. Soc., 1979, 101, 5231-5234.
29 J. F. MacCrea, S. Angerer, Biochim. Biophys. Acta, 1960, 42, 357-359.
30 N. Ramanathan, A. L. Currie, J. R. Colvin, Nature, 1961, 190, 779-871.
31 J. H. Fuhrhop, P. Schnieder, J. Rosenberg, E. Boekema, J. Am. Chem. Soc., 1987, 109, 3387-3390.
32 W. Helfrich, J. Prost, J. Phys. Rev. A, 1988, 38, 3065-3068.
33 H. Ihara, M. Takafuji, T. Sakurai, Encyclopedia of Nanoscience and Nanotechnology, American Scientific
Publishers, California, 2004, 9, 473-495.
34 A. Brizard, R. Oda, I. Huc, Top Curr. Chem., 2005, 256, 167-218.
35 (a) B. A. Korgel, Science, 2005, 309, 1683–1684. (b) A. F. Fonseca, C. P. Malta, D. S. Galvao,
Nanotechnology, 2007, 18, 435606. (c) A. L. Elias, K. D. Harris, C. W. M. Bastiaansen, D. J. Broer, J.
Brett,M, J. Micromech. Microeng., 2005, 15, 49–54.
36 L. A. Estroff, A. D. Hamilton, Chemical Reviews, 2004, 104, 1201-1217.
37 F. A. Luzzio, Tetrahedron, 2001, 57, 915–945.
38 Y. Yan, Y. Lin, Y. Qiao, J. Huang, Soft Matter., 2011, 7, 6385-6398.
39 J. F. McCrea, S. Angerer, Biochim. Biophys. Acta, 1960, 42, 355-357.
40 N. Ramanathan, A. L. Currie, J. R. Colvin, Nature, 1961, 190, 779-781.
41 N. Nakashima, S. Asakuma, J. M. Kim, T. Kunitake, Chem. Lett., 1984, 1079-1712.
42 N. Nakashima, S. Asakuma, T. Kunitake, J. Am. Chem. Soc., 1985, 107, 509-510.
43 J. H. Fuhrhop, P. Schnieder, E. Boekema, W. Helfrich, J. Am. Chem. Soc., 1988, 110, 2861-2867.
44 J. H. Fuhrhop, C. Boettcher, J. Am. Chem. Soc., 1987, 112, 1768-1776.
45 J. H. Fuhrhop, P. Blumtritt, C. Lehmann, P. Luger, J. Am. Chem. Soc., 1991, 113, 7437-7439.
46 J. H. Fuhrhop, W. Helfrich, Chem. Rev., 1993, 93, 1565-1582.
47 A. D. Bungham, M. M. Standish, J. C. Watkins, J. Mol. Biol., 1965, 13, 238-252.
48 K. Yamada, H. Ihara, T. Ide, T. Fukumoto, C. Hirayama, Chem. Lett., 1984, 1713-1716.
49 H. Ihara, T. Fukumoto, C. Hirayama, K. Yamada, Polym Commum., 1986, 27, 282-285.
50 C. Cescato, P. Walde, P. L. Luisi, Langmuir, 1997, 13, 4480-4482.
51 H. Yanagawa, Y. Ogawa, H. Furuta, K. Tasuno, J. Am. Chem. Soc., 1988, 111, 4567-4570.
52 R. Oda, I. Huc, M. Schmutz, S. J. Candau, F. C. MacKintosh, Nature, 1999, 399, 566-569.
53 R. Oda, I. Huc, S. J. Candau, Angew. Chem. Int. Ed. Engl., 1998, 37, 2689-2691.
54 A. Brizard, C. Dolain, I. Huc, R. Oda, Langmuir, 2006, 22, 3591-3600.
55 Roni Ahamad, Oligo-peptide confined on the membrane surface of cationic amphiphiles, Thesis of
Doctrante, Bordeaux 1 Unversity, 2008.
56 R. Kiagus-Armad, A. Brizard, C. Tang, R. Blatchly, B. Desbat, R. Oda, Chem. Eur. J., 2011, 17,
9999-10009.

39
57
B. V. Shankar, A. Patnaik, J. Phys. Chem. B, 2007, 111, 9294-9300.
58 (a) T. Shimizu, M. Masuda, J. Am. Chem. Soc., 1997, 119, 2812-2818. (b) M. Masuda, T. Shimizu, J.
Carbohydr. Chem., 1998, 17, 405-416. (c) I. Nakagawa, M. Masuda, Y. Okada, T. Hanada, K. Yase, M.
Asai, T. shimizu, Langmuir, 1999, 15, 4757-4764. (d) I. Nakagawa, S. Suda, M. Asai, T. Shimizu, Chem.
Commun., 2000, 881-882.
59 M. Masuda, T. Shimizu, Langmuir, 2004, 20, 5969-5977.
60 G. John, M. Masuda, Y. Okada, K. Yase, T. Shimizu, Adv. Mater., 2001, 13, 715-718.
61 S. Kamiya, H. Minamikawa, J. H. Jung, B. Yang, M. Matsuda, T. shimizu, Langmuir, 2005, 21, 743-750.
62 T. Muraoka, H. Cui, S. I. Stupp, J. Am. Chem. Soc., 2008, 130, 2946-2947.
63 Y. C. Lin, R. G. Weiss, Macromolecules, 1987, 20, 414-417.
64 N. Ide, T. Fukuda, T. Miyamoto, Bull. Chem. Soc. Jpn., 1995, 68, 3423-3428.
65 H. Ihara, H. Hachisako, C. Hirayama, K. Yamada, J. Chem. Soc. Chem. Commun., 1992, 1244-1245.
66 Y. Ishikawa, H. Kuwahara, T. Kunitake, J. Am. Chem. Soc., 1989, 111, 8530-8531.
67 L. Lu, D. L. Cocker, R. E. Bachman, R. G. Weiss, Langmuir, 2000, 16, 20-34.
68 W. Jin, T. Fukushima, M. Niki, A. Kosaka, N. Ishii, T. Aida, PNAS, 2005, 102, 10801–10806.
69 W. Jin, T. Fukushima, A. Kosaka, M. Niki, N. Ishii, T. Aida, J. Am. Chem. Soc., 2005, 127, 8284–8285.
70 S. Abraham, K. Vijayaraghavan, S. Das, Langmuir, 2009, 25, 8507-8513.
71 J. H. Jung, H. Kobayashi, M. Masuda, T. Shimizu, S. Shinkai, J. Am. Chem. Soc., 2001, 123, 8785-8789.
72 S. Kawano, N. Fujita, S. Shinkai, Chem. Eur. J., 2005, 11, 4735–4742.
73 W. W. Tsai, L. Li, H. Cui H. Jiang, S. I. Stupp, Tetrahedron, 2008, 64, 8504-8514.
74 J. V. Selinger, M. S. Spector, J. M. Schnur, J. Phs. Chem. B, 2001, 105, 7158-7169.
75 G. John, J. H. Jung, H. Minamikawa, K. Yoshida, T. Shimizu, Chem. Eur. J., 2002, 8, 5494-5500.
76 J. M. Schnur, Science, 1993, 262, 1669-1676.
77 T. Shimizu, M. Masuda, H. Minamikawa, Chem. Rev. 2005, 105, 1401-1443.
78 J. H. Jung, G. John, K. Yoshida, T. Shimizu, J. Am. Chem. Soc. 2002, 124, 10674-10675.
79 S. Svenson, P. B. Messersmith Langmuir, 1999, 15, 4464-4471.
80 M. S. Spector, A. Singh, P. B. Messersmith, J. M. Schnur, Nano Letters, 2001, 1, 375-78.
81 H. Cui, T. Muraoka, A. G. Cheetham, S. I. Stupp, Nano Letters, 2009, 9, 945-951.
82 L. Ziserman, H. Y. Lee, S. R. Raghavan, A. Mor, D. Danino, J. Am. Chem. Soc., 2011, 133, 2511-2517.
83 Y.V. Zastavker, N. Asherie, A. Lomakin, J. Pande, J. M. Donovan, J. M. Schnur, G. B. Benedek, Proc.
Natl. Acad. Sci., 1999, 96, 7883-7887.
84 B. N. Thomas, C. M. Lindemann, R. C. Corcoran, C. L. Cotant, J. E. Kirsch, P. J. Persichini, J. Am. Chem.
Soc., 2002, 124, 1227-1233.
85 T. Gulik-Krzywicki, C. Fouquey, J. M. Lehn, Proc. Natl. Acad. Sci., 1993, 90, 163-167.
86 V. Vogel, M. Sheetz, Nature Reviews, 2006, 7, 265-275.
87 S. B. Prusiner, Proc. Natl. Acad. Sci. U.S.A., 1998, 95, 13363-13383.
88 C. Weismann, FEBS Lett., 1997, 389, 3-11.

40
89
N. Stahl, M. A. Baldwin, M. A. McKinley, K. A. Bowman, M. B. Braunfeld, R. A. Barry, S. P. Prusiner,
Biochemistry, 1993, 1991-2002.
90 W. Sweitnicki, M. Morillas. S. Chen, P. Gambetti, W. K. Surewicz, Biochemistry, 2000, 39, 424-431.
91 M. Morillas, D. L. Vanik, W. K. Surewicz, Biochemistry, 2001, 40, 6982-6987.
92 G. Tuchscherer, A. Chandravarkar, M. S. Camus, J. Bérard, K. Murat, A. Schmid, R. Mimna, H. A.
Lashuel, M. Mutter, Peptide Science, 2007, 88, 239-252.
93 O. A. Gus’kova, P. G. Khalatur, A. R. Khokhlov, Nanotechnologies In Russia, 2008, 3, 481-493.
94 Y. Jeong, M. K. Joo, K. H. Bahk, Y. Y. Choi, H. T. Kim, W. K. Kim, H. J. Lee, Y. S. Sohn, B. Jeong, J.
Control. Release, 2009, 137, 25-30.
95 C. Tsitsilianis, Soft Matter., 2010, 6, 2372–2388
96 C. Tie, J. C. Gallucci, J. R. Parquette, J. Am. Chem. Soc., 2006, 128, 1162-1171.
97 Y. Wang, H. D. Tran, L. Liao, X. Duan, R. B. Kaner, J. Am. Chem. Soc., 2010, 132, 10365–10373.
98 T. B. Schuster, D. de B. Ouboter, C. G. Palivan, W. Meier, Langmuir, 2011, 27, 4578–4584.
99 X. Jiang, Y. K. Lim, B. J. Zhang, E. A. Opsitnick, M. H. Baik, D. Lee, J. Am. Chem. Soc., 2008, 130,
16812–16822.
100 P. Duan, L. Qin, X. Zhu, M. Liu, Chem. Eur. J., 2011, 17, 6389 – 6395
101 I. Stary, I. G. Stara, Z. Alexandrova, P. Sehnal, F. Teply, D. Saman, L. Rulisek, Pure Appl. Chem., 2006,
78, 495–499.
102 R. Amemiya, M. Ymaguchi, The Chemical Record, 2008, 8, 116–127.
103 R. Amemiya, M. Mizutani, M. Yamaguchi, Angew. Chem. Int. Ed., 2010, 49, 1995 –1999.
104 B. N. Thomas, C0 M. Lindemann, N. A. Clark, Physical Review E, 1999, 59, 3040-3047.
105 Y. Jin, X. D. Xu, C. S. Chen, S. Cheng, X. Z. Zhang, R. X. Zhuo, Macromol. Rapid. Commun., 2008, 29,
1726-1731.
106 T. Wang, J. Jiang, Y. Liu, Z. Li, M. Liu, Langmuir, 2010, 26, 18694-18700.
107 H. Kobayashi, K. Koumoto, J. H. Jung, S. Shinkai, J. Chem. Soc., Perkin Trans., 2002, 2, 1930–1936.
108 Y. Lin, A. Wang, Y. Qiao, C. Gao, M. Drechsler, J. Ye, Y. Yan, J. Huang, Soft Matter, 2010, 6, 2031–
2036.

41
Chapter II
Micrometric helical structures from nucleolipids

42

43
II.1 Introduction
The supramolecular assemblies are well defined as complexes of molecules which are
linked with non-covalent and weak interactions. The supramolecular structures are easily
perturbed with out-of-equilibrium process by external factors, which can result in in situ
morphology transformation at constant temperature. In this chapter, we will discuss in situ
vesicle to helix transformation produced by interaction between non-chiral cationic vesicles
and chiral anion nucleotide.
II.1.1 Study of nucleotide
Using bio-inspired self-assembly systems based on building blocks which mimic
biomolecules, one can develop biomimetice systems. The DNA and RNA are good examples in
which their double helical structures result from multiple interactions of nucleobases based on
specific hydrogen bonds (Watson-Crick configuration) between complementary bases: adenine
and thymine/uracil; cytosine and guanosine (Figure II.1) along with unspecific stacking
interactions.1
Figure II.1 The formation of hydrogen bonds between complementary nucleobases (A-T and G-C)
following the rule of Watson Crick pairing.
The nucleobases are made either of purine base for guanine (G) and adenine (A), and
pyrimidine base for cytosine (C), thymine (T), and uracil (U). Each of these bases has multiple
sites of acceptors (A) and donors (D) from hydrogen bonds (Figure II.2). Nucleic acids are
composed of a nucleobase (nitrogenous base), a five-carbon sugar (either ribose or

44
2'-deoxyribose) and a phosphate group connecting in position 3’ or 5’ of sugar (Figure II.3 and
Table II.1).
Figure II.2 Molecular structures of nucleobases presenting the site positions of acceptors (A) and
donors (D) from hydrogen bonds. G : guanine, A : adenine, C : thymine, and U : uracil.
Figure II.3 Molecular structure of a nucleobase (example is adenine), a nucleoside (example is
adenosine), and a nucleotide (example is adenosine 5’-monophosphate).
Table II.1 Classification of nucleic acids, nucleosides, and nucleotides.
A
AA
DD
N
N N
N
N
HH
N
N N
N
O
H
NH
HA
A
A
D
D
D
N
N
N
HH
OA
A
DD
N
N
O
H
OA
D
AN
N
O
H
OA
D
A
G A C T U
O
N
N
N
N
NH2
OH OH
OH
NH
N
N
N
NH2
O
N
N
N
N
NH2
OH OH
OP
O
OH
O
Adenine Adenosine Adenosine 5’-monophosphate
12
345
6
9
78
12
345
6
9
78
1’2’3’
4’
5’
12
345
6
9
78
1’2’3’
4’
5’
Base Nucleoside Nucleotide
Adenine Adenosine Adenosine 5'-monophophate (AMP)
Cytosine Cytidine Cytidine 5'-monophosphate (CMP)
Guanosine Guanosine Guanosine 5'-monophosphate (GMP)
Thymine Thymidine Thymidine 5'-monophophate (TMP)
Uracile Uridine Uridine 5'-monophophate (UMP)

45
The pKa of each nucleotide is an important factor to determine the molecular
conformation based on the protonation. The pKas of nucleosides and nucleotides vary from 3.5
to 10.5 (about 0.5 units higher for nucleoside than nucleotide (Table II.2)2 (Figure II.4)
3). As for
these nucleotides, the monoester phosphate group has 3 different pKa values, 2.5, 7.2 and 12.4
(Figure II.5).
Table II.2 pKa of nucleosides and nucleotides. These values are from issues of Saenger, 1984.2
Figure II.4 Intrinsic pKa values ionisable guanosine, adenosine, cytidine, and uridine in aqueous
solution. 3
Composition Nucleoside 5'-phophate
Adenosine 3.52 3.88
Cytidine 4.17 4.54
Guanosine 9.42 10
Uridine 9.38 10.06
Desoxythimidine 9.93 10.47
N
N N
N
O
H
NH
H
N
N N
N
O
NH2
N
N N
NH
O
NH2
H+
pKa1
3.2-3.3
pKa2
9.2-9.6
Guanosine
N
N N
N
NH2
H+ N
N N
N
NH2
pKa1
3.5
Adenosine
N
N
NH2
O
H+
Cytidine
pKa1
4.2N
N
NH2
O N
NH
O
O
N
N
O
O
pKa1
9.4
Uridine

46
Figure II.5 The protonation sites of AMP. The first ionization of phosphate group is completed around
pH 2. Adenine becomes neutral beyond pH 3.8. Secondary protonation of phosphate group occurs at
pH 6.8, and then sugar is ionized at pH 12.5.
II.1.2 Complexation of a surfactant by nucleolipids
In the field of self-assemblies, the nucleo-amphiphilic molecules are particularly
interesting because of the combination of molecular recognition (e.g., specific hydrogen bond,
-stacking, electrostatics etc.) and molecular assembly properties.4 A variety of synthetic
strategies have been used to prepare nucleotide-based amphiphiles.5
Figure II.6 shows examples of nucleolipids and their supramolecular morphologies.
Barthélémy et al. have reported the structure of nucleolipids with fatty esters (1) or
fluorocarbon chains (2) on the 2’ and 3’ ribose positions of uridine moiety, which can form
multilayer micrometric vesicle.6,7
Simizu et al. have developed hydrogelators obtained by
nucleotide-appended bolaamphiphile, in which two 3’-phosphorylated thymidine moieties are
connected to both end of a long alkyl chain spacer (3). This nucleolipid can form nanofibers
expending to the gel network in water.8 Cholesterol-modified nucleoside, which is attached to
the 2’ position of uridine, can self-assemble to form microtubes in the presence of
O
N
N
N
N
NH2
O O
OP
O
O
O
H H
H
H+
H+
HO
N
N
N
N
NH2
O O
OP
O
O
O
H H
H
H+
O
N
N
N
N
NH2
O O
OP
O
O
O
H H
O
N
N
N
N
NH2
O O
OP
O
O
O
H H
HpH
< 2.5
O
N
N
N
N
NH2
O O
OP
O
O
O
H
pH
3.8
pH
12.5
pH 6.8

47
phospholipid.9 Chiral nanostructure can be also obtained by nucleo lipid. Adenosine-based
phosphatidyl nucleoside (5) can form twisted nanoribbons.10
All systems involve that the
hydrophobic chain is connected directly to nucleic acid via covalent bonding. Few
non-covalent systems of nucleoamphiphiles have been developed in the field of supramolecular
self-assembly.
Figure II.6 Examples of various nucleoamphiphiles: molecular structures and their aggregates.
The self-assembly of nucleo-amphiphile provides the containment nucleotides at the
surface of aggregates and promote inter-nucleotide interaction (Figure II.7). The mainly driving
forces of building blocks are hydrogen bonding and - stacking of nucleo-bases.

48
Figure II.7 Schematic illustration of cooperative effect in charge of self-assembly of
nucleo-amphiphiles in aqueous solution.
Among various approaches, the group of Oda has proposed the chirality induce by
chiral nucleotide as counter-anion complexed with non-chiral cationic surfactant via
non-covalent bonding.
Carole Aimé has studied complex between lipid-type cationic surfactant with anionic
nucleotide by electrostatic interactions in her PhD thesis.11
The molecules she has developed
are made from a monocationic surfactant having two hydrophobic chains of 12 and 14 carbons
(C12 and C14) complexed with monoanionic nucleotides. It was observed that particularly the
complex with adenosine 5’-monophosphate (AMP) and guanosine 5’-monophosphate (GMP)
had stronger tendency to form gel in water. This was probably because these nucleic bases are
more hydrophobic and form stronger stacking than CMP and UMP.12
The complex are noted
hereafter C14AMP (Figure II.8 a), C12GMP (Figure II.8 b), and C14GMP (Figure II.8 c). She has
shown that these nucleoamphiphiles can be self-assembled to form micrometric fibers and
left-handed helices in pure water.
+-
+-
+-
+-
+-
Hydrophobic
effect
Inter-nucleotide
interactions

49
Figure II.8 Formula of the nucleamphiphiles and each optical microscope (OM) images of chiral fibers
and helices formation in pure water resulting from self-assembly of (a) C14AMP, (b) C12GMP, and (c)
C14GMP.
More recently, the direct observations of morphology transition of self-assembled
nucleoamphiphilic systems in aqueous solution are followed with a mesoscopic aspect by
optical microscopy.13
Carole Aimé also reported in her PhD thesis that anionic AMP can
interact with cationic vesicles, exchange with the counter-anions of the amphiphiles in situ, and
organize themselves at the membrane surface.11
When a solution of AMP in its acid form is
added to the suspension of Non-chiral cationic vesicle obtained by C14 amphiphile in the
presence of non-chiral acetate counter-anion (noted as C14Ac), these vesicles are transformed to
helices via counter-anion exchange (Figure II.9). This system emphasizes the importance of ion
exchange kinetics and AMP reorganization in the morphologies of aggregates.
Figure II.9 (a) Scheme of the counter-anion exchange process.
O
N
N
N
N
OH OH
OP
O
OH
O
O
NH2
N+
C12
H25
C12
H25
C12GMP
(b)
O
N
N
N
N
OH OH
OP
O
OH
O
O
NH2
N+
C14
H29
C14
H29
C14GMP
(c)
C14AMP
O
N
N
N
N
NH2
OH OH
OP
O
OH
O
N+
C14
H29
C14
H29
(a)
O
N
N
N
N
NH2
OH OH
OP
O
OH
O
N+
C14
H29
C14
H29
N+
C14
H29
C14
H29
O O
+O
N
N
N
N
NH2
OH OH
OP
O
OH
O
H+ H
+O O
+

50
In this chapter, following Aimé’s results, we have developed the study on the kinetic
aspect of this system. A part of these studies have already initiated Carole Aimé during her PhD
thesis, hereafter we have clearly marked when the data are taken from her PhD thesis.
We also reveal another vesicle to helix morphology transition from vesicle to helix
formation in CnAc + GMP systems, and compare both the kinetics at macroscopic, mesoscopic
and molecular aspect depending on the different nucleotides. The kinetics of chirality transfer is
investigated on the mesoscopic level by optical microscopy observation (OM), on the
supramolecular scale by circular dichroisms (CD) studies and on the molecular scale by
1H-NMR and infrared (IR) studies.
II.2 In situ kinetics of chirality transfer
As we discussed in the paragraph II.1.2, micrometric helical structures are obtained
by the complex of monocationic non-chiral surfactant in the presence of adenosine
5’-monophosphate (AMP) or guanosine 5’-monophosphate (GMP) counter-monoanion.12
These structures were also observed by morphology transition from vesicles via counter-anion
exchange from non-chiral acetate ion to chiral AMP at constant temperature. Herein, we
demonstrate the in situ structural transformation from vesicle solution to helices by addition of
GMP.
II.2.1 Experimental description
The vesicles solution was formed by solubilizing dialkyldimethylammonium acetate
(CnAc, n = 12, 14) in water. A 15 mM CnAc aqueous solution was heated up to about 40 ˚C to
solubilize the powder, and then kept at room temperature (Figure II.10). After cooling, vesicles
are formed and solution become clear and fluid (Figure II.11 a).

51
Figure II.10 OM images of vesicles of 15 mM C12Ac self-assembled in water.
A solution of acid form of AMP or GMP was added to this vesicles solution. Different
behaviors were observed depending on the nucleotide, hydrophobic chain length of the
surfactant, and their concentrations. Hereafter, unless explicitly noted, 1 equivalent of
nucleotide was added with respect to CnAc.
II.2.2 Kinetics study at macroscopic level
First, we considered the different kinetics of morphology transformation depending
on the different nucleotides at macroscopic aspect.
When the solution of C14Ac was mixed with AMP solution at a final concentration of
15 mM for each reagent, the white precipitates were observed after few hours (Figure II.11 b).
On the other hand, after the addition of GMP to C14Ac solution at a final
concentration of 15 mM, the viscosity of mixture increased immediately and the suspension
turned into a gel. The kinetics of gel formation was much faster than the precipitation observed
with C14Ac + AMP system at the same concentration.
The same study with the C12Ac system showed that the kinetics of the gel formation
for C12Ac + GMP system was slightly slower than that with C14Ac, but still much faster than the
kinetics of precipitation observed with C14Ac + AMP system. When C12Ac and GMP are mixed
at a final concentration of 15 mM, the viscosity of the solution increased immediately. After 1
day, we observed a hard gel, which was continuously shrinking and dewatered for 7 to 10 days
(Figure II.11 c).
10 m

52
Figure II.11 Scheme of the counter-anion exchange process and sample photographs of (a) solution of
CnAc, (b) precipitate of C14AMP, and (c) shrinking gels of C12GMP. From the PhD thesis of Carole
Aimé.11
II.2.3 In situ transition of morphologies
The formation of chiral structure results from the addition of nucleotides to non-chiral
vesicles. Upon addition of nucleotide AMP or GMP, ion exchange occurred in situ: nucleotide
replaced acetate counterions because the pKa of phosphate group in water is lower than that
acetate (2 vs 4.76).
In the following study, we followed the structural transformation of aggregates using
optical microscopy (OM).
C14Ac + AMP
The case of C14Ac + AMP system is shown in Figure II.12. When the AMP was added
to the vesicle solution of C14Ac, vesicles ruptured immediately to form denser structures
AMP
Acetate ion
GMP
Acetate ion
White precipitate
CnAc (n = 12, 14)
Gel which shrinks
CnH2n+1H2n+1Cn
C14AMP
C12GMP
(a)
(b)
(c)

53
(Figure II.12 a). From denser cores, fibers started growing and chiral helices formed along with
needles for 30 min (Figure II.12 b-d). All of denser structures were disappeared after 3 h, and
the helix formation continued to grow up with time for a day (Figure II.12 e, f). Finally, the
width of helical fibers was 1.5 ~ 2.5 m and length was 10 ~ 50 m.
Figure II.12 OM images of helix formation observed with C14Ac + AMP system. The scale bars are 10
m.
Interestingly, the formation of micrometric helices was limited in the surfactant
concentration range of 10-15 mM. At 5 mM, no needles and no fibers were observed, and at 20
mM, mainly needles that did not show apparent chiral structure were observed under OM.
C14Ac + GMP
The case of C14Ac + GMP system is shown in Figure II.13. Right after mixing, the
vesicles transformed to continuous thin membranes (Figure II.13 a). These membranes became
denser and turned to chiral fibers within 10 min (Figure II.13 b). These chiral fibers continued
to grow for about a day (Figure II.13 b-f). As previously, the formation of micrometric helices
was limited to 5 – 15 mM surfactant solutions.
Just after mixing 10 min 30 min
1 h 3 h 1 day
(a)
(d)
(b)
(e)
(c)
(f)

54
Figure II.13 OM images of helix formation observed with C14Ac + GMP system. The scale bars are 10
m.
It is noteworthy that the kinetics with C14Ac + GMP was too fast to capture the
morphology transition not only at a supramolecular level, but also at molecular level.
Therefore, we studied the transition with C12Ac + GMP system as below.
C12Ac + GMP
In the case of C12Ac + GMP system, morphology transition occurred more slowly
than that with C14Ac. Right after mixing, the vesicles transformed into continuous thin
membranes (Figure II.14 a). Some parts of these membranes became fibers and aggregated into
denser structures. After about half an hour, these fibers tuned into chiral left-handed helices,
and continued to grow (Figure II.14 b-e) for about a week (Figure II.14 f). Finally, the width of
helical fibers was 1.5 ~ 3 m and length was 20 ~ 70 m. The formation of micrometric helices
was limited to 5 – 15 mM surfactant solutions.
Just after mixing 10 min 30 min
1 h 3 h 1 day
(a)
(d)
(b)
(e)
(c)
(f)

55
Figure II.14 OM images of helix formation observed with C12Ac + GMP system. The scale bars are 10
m.
II.2.4 TEM observation at nanometric scale in the difference systems
We then observed the details of these micrometric helices with transmission electron
microscope. For both cases, (C14Ac + AMP and C12Ac + GMP) small fibers with the diameter
of about 100 nm appeared initially before the formation of micrometric helices (Figure II.15 b,
d).
These fibers clearly showed left-handed helical structure with helical pitches of the
order of a few 100 nm. For the case of C14Ac + AMP, rigid cigar-like fibers were observed
(Figure II.15 b). On the other hand, more flexible helical fibers were observed in the case of
C12Ac + GMP (Figure II.15 d)
The differences in the aspect of these elementary nanometric fibers are probably
reflected by the differences between precipitate (C14Ac + AMP) and gel formation (C12Ac +
GMP).
Just after mixing 30 min 1 h
4 h 1 day 1 week
(a)
(d)
(b)
(e)
(c)
(f)

56
Figure II.15 Kinetics of (a, c) OM and (b, d) TEM presented the formation of chiral fibers over the gel
from (a, b) C14Ac + AMP (15 mM) and (c, d) C12Ac + GMP (15 mM). The helical formation observed
after 1 day.
II.2.5 Direct observation of morphology transition and helix growth
We then observed in detail how these helices grew.
Figure II.16 shows the monitoring of morphology transformation. In the case of
C14Ac + AMP, the vesicles first ruptured to form dense structures, and the fibers grew from
dense cores for 5 min, and after 30 min (Figure II.16 a), chirality was expressed and helices
continuously grew up. On the other hand, in the case of C12Ac + GMP, continuous films were
first formed before helices growth (Figure II.16 b).
500 nm
(c) (d)
10 m10 m500 nm
(a) (b)

57
Figure II.16 Kinetics monitoring of morphology transformation observed with (a) C14Ac + AMP and
(b) C12Ac + GMP systems.
The step by step of helix growth was followed by OM in both cases (Figure II.17).
The helix growth seems to occur at their extremities with a coiling motion (Figure II.17 a, d).
As the helices grew, the denser structures/cores deflated and finally disappeared (Figure II.17
b).

58
Figure II.17 Step by step helix formation of (a, b) C14Ac + AMP and (d) C12Ac + GMP followed by OM.
(a, b) global growth from vesicles and (d) thin films, respectively. (c) Schematic representation of
helices’ growth from vesicles.
In the following sections, we investigated the changes in molecular environment due
to the counter-anion exchange and the change in the molecular organization of CnAc +
nucleotide systems in order to correlate them with the morphological changes of aggregates
observed above.
For this purpose, we have coupled different techniques: CD, NMR, IR spectroscopy
2 h
30 min
(a)
(b)
(c)
Chiral amplification
90 min
50 min
(d)

59
and pH measurements.
II.3 Study of kinetics of molecular reorganization during helix
formation
II.3.1 Study of chirality transfer using CD spectra
We first followed the chirality transfers derived from chirality inducing from
nucleotide counter-anion to CnAc amphiphile using Circular Dichroism (CD) measurement.
CD spectroscopy is the most versatile tool for the study of assemblies of chiral
molecules, it measures the variation of absorption of P and M circularly polarized light. CD
spectra are generally recorded in the UV-vis range, but measurements in the short-UV and
infrared are also possible. The CD spectra amount to the subtraction of two slightly different
spectra, consequently, CD bands are very weak compared to those of the corresponding
absorption spectra. However, the intensity and sign of CD bands are extremely sensitive to
change in the conformation of the molecules in the close chromophores to which they are allied.
Upon aggregation of chiral molecules into fibrous objects, large changes in CD spectra are
commonly observed, although the changes are sometimes limited to a simple increase of band
intensity.14,15,16
The UV-vis and CD spectra of C14Ac + AMP and C12Ac + GMP systems are shown in
Figure II.18. The absorptions of both nucleotides were dominated by strong → * transition
of nucleobase, and each band was a sum of two or more transitions.17
The n → * transitions
were much weaker than → * transition.
C14Ac + AMP
The UV absorption of AMP aqueous solution (15 mM) was observed at 255 nm

60
(Figure II.18 a, top). When the AMP and C14Ac were mixed, this band increased in intensity.
After 30 min, the band became broad and slightly blue-shifted.
In the CD measurement, we observed the weak negative band at 255 nm derived from
AMP monomers until 15 min. After 30 min, strongly positive CD signal was observed
corresponding to the supramolecular aggregate of amphiphiles. This result was well accorded
with the apparition of the expression of chirality in the result of OM observation. This CD sign
became continuously strong for 2 h (Figure II.18 a, bottom).
Figure II.18 UV-vis (top) and CD (bottom) spectra of (a) C14Ac + AMP, and (b) C12Ac + GMP systems.
C12Ac + GMP
The absorption of GMP aqueous solution (15 mM) was observed at 279 nm and 253
nm (Figure II.18 a, top). When the GMP and C12Ac were mixed, these two bands decreased

61
(about a half) immediately in intensity and no variation was observed afterwards.
In the CD measurements, owing to chirality transfer occurred very fast,
positive-negative Cotton coupling was observed just after mixing. Especially, the CD peak at
253 nm became continuously strong and red-shifted slightly to 257 nm within about 6 h (Figure
II.18 b, bottom).
For both cases, the characteristic CD curves of supramolecular aggregates were
clearly different from that of monomer. These phenomena were probably assigned to the
intermolecular association of nucleobases,18
corresponding that the amphiphiles were
self-assembled supramolecular aggregates and then expressed the supramolecular chirality. The
positions of both of nucleoamphiphiles corresponded well to the UV-vis absorption maximums.
II.3.2 1H-NMR
We followed the kinetics of molecular reorganization using 500 MHz 1H-NMR
measurements. We indicated time evolution under the molecular environment by the
high-resolution magic angle spinning technique (HR-MAS) to have well-resolved resonances.
HR-MAS is performed using a specialized probe which is configured with a Z-gradient aligned
along the magic angle. This technique can provide highly resolved structural information on
small inhomogeneous samples (5–100 mg).19
For all measurements, both systems were in
H2O/D2O (80/20 v/v).
We focused on three chemical shift domains of NMR signals corresponding to two
non-exchangeable protons of the adenine base and to the three equivalent protons of the methyl
group of acetate ion (black triangle, Figure II.19 and 20), in order to investigate the role of
added AMP or GMP and their effects on the acetate complexation.
C14Ac + AMP (15 mM) Data obtained by Carole Aimé11
For this system, the evolution of NMR signals of protons of adenosine base are
described below; H8 with white square and H2 with black circle (Figure II.19).

62
Figure II.19 Kinetics of chemical shifts variation by 500 MHz 1H-NMR in C14Ac + AMP system. (a)
Spectra of C14Ac + AMP. Parts of the NMR spectra of protons (b) H2 and (c) H8 of the adenosine base
and (d) the methyl group of acetate ion. Kinetics of chemical shifts variation for (e) H2 and (f) H8 of the
adenosine base and (g) methyl group of acetate ion.
O
N
N
N
N
NH2
OH OH
OP
O
OH
O
N+
C14
H29
C14
H29
8.36 8.34 8.32
H(2) (ppm)
10 min150 min
8.008.02 7.98
H(8) (ppm)
8.04
10 min150 min
1.92 1.881.90
Acetate ion (ppm)
1.86
10 min
2468(ppm)
1.82
N+
C14
H29
C14
H29
O O
61
32
54
7
98
(a)
(b) (c) (d)
8.34
8.345
8.35
8.355
H(2
) (p
pm
)
0 1000 2000 3000 4000Time (min)
1.816
Ace
tate
pro
ton (p
pm
)
0 1000 2000 3000 4000
Time (min)
1.818
1.901
1.902
1.904
Acetate ion
8.005
8.01
8.015
8.02
8.025
H(8
) (p
pm
)
0 1000 2000 3000 4000
Time (min)
(e)
(f)
(g)

63
Right after mixing, the NMR signal at 1.816 ppm from the acetate ion disappeared.
This peak was replaced by the peak characteristic of acetic acid at 1.902 ppm (Figure II.19 d, g).
This indicates that ion exchange had occurred rapidly after mixing AMP and C14Ac. AMP had
replaced the acetate counter-anion at the cationic membrane, leading to the formation of acetic
acid. At this stage (about 10 minutes after mixing), OM studies show that no helix is formed.
We have then followed the chemical shifts evolution of the two peaks corresponding
to the protons of adenosine nucleobase. Whereas the acetate ion peak quickly reached the final
value after about 40 min (half-life is about 3 min) (Figure II.19 d, g) indicating that total ion
exchange is very fast, the protons of the nucleobase showed much slower downfield chemical
shift evolution (0.02 ppm for H2 and 0.035 ppm for H8) during a few thousand minutes with a
half-life of 150-200 min (Figure II.19 b, c, e, f). This shows that the reorganization of
nucleobases still evolves after a few hours. The chemical shift reached a plateau after 3 days.
This corresponds to the kinetics of helix formation as observed by OM.
C12Ac + GMP (7.5 mM)
In the case of C12Ac + GMP, the measurements were done for a final concentration of
7.5 mM for each reagent because the kinetics was too fast at a 15 mM concentration to
investigate the chemical shift.
In this system, ion exchange occurred faster than AMP system, the peak of acetate ion
reached final value in less than 10 min (half-life ~2 min). This acetate ion’s signal at 1.633 ppm
was replaced by the peak characteristic of acetic acid at1.796 ppm (Figure II.20 d, g).
The protons of the guanosine base also showed downfield chemical shift variation
from GMP acid solution upon complexation with the surfactant, 0.04 ppm shifted for HN2
(black circle) and 0.08 ppm shifted for H8 (white square) (Figure II.20 b, c). In spite of shorter
alkyl chain and the lower concentration, the transition was much faster than C14Ac + AMP and
this molecular reorganization was completed within about 20 min after mixing C12Ac and GMP
(half-life ~5 min) (Figure II.20 e, f).

64
Figure II.20 Kinetics of chemical shifts variation by 500 MHz 1H-NMR in C12Ac + GMP system. (a)
Spectra of C12Ac + GMP. Parts of the NMR spectra of protons (b) HN2 and (c) H8 of the adenosine base
and (d) the methyl group of acetate ion. Kinetics of chemical shifts variation for (e) H N2 and (f) H8 of
the adenosine base and (g) methyl group of acetate ion.

65
II.3.3 pH measurement
Prior to investigating the IR measurements, we studied pH changes of both systems
because the molecular structure of protonated/deprotonated nucleotide is strongly dependent on
the pH (see Figure II.5).
The pH values of each reagent in aqueous solution (15 mM) are shown in Table II.3.
When C14Ac and AMP were mixed, the pH value became 4.15, and it increased to around 5 for
2 h. After several hours, the pH started decreasing to around 3.9 (Figure II.21 a).
In the case of C12Ac + GMP, on the other hand, pH was 3.7 when they were mixed,
then it increased to around 3.95 after 2 h stayed at this value (Figure II.21 b).
Table II.3 The pH value of monocationic surfactant and nucleotide in aqueous solution (15 mM).
Figure II.21 The pH measurement of (a) C14Ac + AMP and (b) C12Ac + GMP systems in aqueous
solution (15mM).
Reagent (15 mM) pH
C14Ac 7.1
AMP 2.55
C12Ac 5.86
GMP 2.5

66
II.3.4 Protonation site of nucleotide followed by IR measurement
We then investigated the molecular formation of protonated/deprotonated nucleotide
with different pH by IR study (Figure II.22).
Figure II.22 IR spectra and protonation sites of (a) AMP and (b) GMP with different pH.
The IR bands of AMP and GMP can be measured in the 1750-1450 cm-1
region.
For the case of AMP solution, these spectral regions were characteristic of aromatic
nucleobase at 1623 and 1666 cm-1
(Figure II.22 a). When the pH was 2 ~ 3, we observed a
strong band at 1666 cm-1
, but this band disappeared by increasing the pH. On the other hand, the

67
band at 1623 cm-1 appeared when pH was 3 and this absorbance became strong from a pH 4
solution. This phenomenon suggested that the band at 1666 cm-1
was attributed to the
protonated N(1)-H and N(7)-H bending vibrations, and 1623 cm-1
was corresponding to C=N
(C(2)=N(3), C(6)=N(1), and C(8)=N(7)) stretching vibrations with contributions from N-D bending
vibrations.20
In the case of GMP, the bands around 1690-1560 were characteristic of the guanosine
nucleobase (Figure II.22 b). The band at 1690 cm-1
associated with C=O stretching vibration
was shifted to 1667 cm-1
, whereas the band at 1608 cm-1
disappeared and new band at 1568 cm-1
appeared when the pH changed from 2 to 3. The band at 1568 cm-1
was probably attributed to
the protonated N(7)-H bending vibrations, and 1580 and 1568 cm-1
were associated with C=C
and C=N stretching vibrations with contributions from N-D bending vibrations.
The pH of the bulk solution can be directly correlated to the pH at the interface of
nucleoamphiphiles. These results indicate that upon addition of nucleotide to CnAc, AMP was
deprotonated at first, but after a day, it was protonated in position 1. In another system, GMP
was deprotonated.
II.3.5 Kinetics of molecular reorganization followed by IR measurement
C14Ac + AMP (15 mM)
The frequencies of the antisymmetric (aCH2) and symmetric (sCH2) stretching
vibration (at 2924 cm-1
and 2854 cm-1
, respectively) of the hydrophobic chains indicated that
the nucleoamphiphiles were in fluid phase with a high rate of gauche conformations (Figure
II.23 a).
No variation in hydrophobic chain organization was observed even 7 days after
mixing AMP and C14Ac. This indicated that the reorganization of hydrophobic part did not
occur during the vesicle-helix morphological transition. This result is particularly interesting
that such structural transitions are generally accompanied by an increasing of trans

68
conformations reflecting the alkyl chains organizations.21,22,23
Figure II.23 (a) Kinetics study of alkyl chain reorganization by IR spectroscopy in C14Ac + AMP
system (15 mM). (Carole Aimé’s data) (b) Comparison of IR spectra obtained with AMP at pH 4 (15
mM), C14Ac (15 mM), and C14Ac + AMP (15 mM) samples. (c) Kinetics study of AMP organization by
IR spectroscopy in C14Ac + AMP system (15 mM). (Carole Aimé’s data)
Indeed, this was what happened to the hydrophobic chains of gemini-tartrate or
gemini-oligo-alanine forming chiral conformation. The fact that the molecules are less
organized than the other cases is possibly the origin of much larger-scale assemblies observed
with these molecules compared to the two systems mentioned above (a few micrometers
compared to tens to hundred nanometers). However, important variations are observed
concerning the IR bands characteristic of the complexed counter-anions.

69
Figure II.23 b shows the FT-IR signals of AMP at pH4, C14Ac, and C14Ac + AMP
system. The white and black arrows (at 1570 and 1711 cm-1
) represent the characteristic bands
of acetate ion and acetic acid, respectively.
The band at 1711 cm-1
(acetic acid) was not observed with C14Ac without any addition
of AMP. This confirmed that its presence in C14Ac + AMP resulted from the exchange of the
acetate counter-anion by AMP and consecutive acetic acid formation. In addition, the band at
1570 cm-1
corresponding to acetate counter-anion disappeared upon addition of AMP to C14Ac.
This rapid kinetics of counter-anion exchange as observed in Figure II.23 c supports
the NMR data discussed above: ion exchange occurred less than 10 min after mixing AMP and
C14Ac. AMP was complexed with the surfactant, and acetic acid was formed.
The black and white stars (at 1623 and 1666 cm-1
, Figure II.23 b,c) were characterized
by aromatic nucleobase as mentioned above (in Figure II.23 a). The origin of the band at 1623
cm-1
can be associated with C=N (C(2)=N(3), C(6)=N(1), C(8)=N(7)) stretching vibrations with
contributions from N-D bending vibrations. The intensity of this band decreased with time
along with the increase of the intensity of the band at 1666 cm-1
. This band at 1666 cm-1
may be
attributed to the formation of hydrogen bonds between neighboring bases.a Indeed, this band
has previously been reported as a marker of double helix formation of polyAMP through
hydrogen bonds.24
The increase in intensity stabilized after 2 days, exhibiting again, kinetics
similar to helix formation observed by OM.
In summary, ion exchange occurred a few minutes after mixing AMP and C14Ac,
allowing confinement of the nucleotides at the cationic membrane surface. However, the
reorganization of the nucleotides, as a result of hydrogen bonding between neighbouring
nucleobases at the membrane surface, took much longer as revealed by the behavior of the band
at 1666 cm-1
, and on the macroscopic scale, helices were formed after only 2 days.
a This increase could be associated with the protonation of the nucleobase. However, in our case, the sample
exhibits a pH of about 4. At this pH, the nucleotide bears a single anionic charge.

70
C12Ac + GMP (10 mM)
Figure II.24 shows the infrared spectra of C12Ac, GMP, and C12Ac+GMP at
10mM.Again, we choose a concentration lower than 15 mM because the reaction at this
concentration was too fast in the presence of GMP.
Figure II.24 (a) Kinetics study of alkyl chain reorganization by IR spectroscopy in C12Ac + GMP
system (10 mM). (b) Comparison of IR spectra obtained with GMP at pH 4 (10 mM), C12Ac (10 mM),
and C12Ac + GMP (10 mM) samples. (c) Kinetics study of AMP organization by IR spectroscopy in
C12Ac + GMP system (10 mM), and (d) intensity evolution of the band at 1667 cm-1
(top) and 1555 cm-1
(bottom).
The frequencies for aCH2 and sCH2 stretching vibrations of the methylene groups in

71
the case of C12Ac + GMP also indicated no variation in absorbance accompanied with the
organization of hydrophobic alkyl chain even after 2 days (Figure II.24 a).
The white and black arrows (at 1570 and 1711 cm-1), which represent the
characteristic bands of the acetate ion and acetic acid, respectively, again confirm the rapid
exchange of counterions.
The band at 1667, 1580, and 1568 cm-1
were characteristic of guanine nucleobase
(Figure II.24 b, black triangle, dashed line). The band at 1670 cm-1
is associated with C=C and
C=N (C(2)=N(3), C(6)=N(1), C(8) =N(7)) stretching vibrations with contributions from N-D bending
vibrations. When C12Ac and GMP were mixed, the bands at 1580 cm-1
and 1568 cm-1
disappeared rapidly and new bands at 1587 cm-1
and 1556 cm-1
were observed. These important
shifts may be associated to the ordering of G residues in the supramolecular structures as
previously reported.25
Meanwhile in this case, the nature of the interaction (hydrogen bonds or
stacking) between the G residues is not straightforward to understand. In addition, this
transition was again too fast for kinetics investigation, confirming the NMR measurements.
After this transition, the intensities of these bands showed very little variation with
time. Their intensity all decreased rapidly initially but after 2 hours it started to increase again
(Figure II.24 c), reaching a stationary value after 2 days. This initially rapid (10 minutes)
transition followed by much slower (2 days) and slight modifications also confirms the NMR
observations as well as the helix formation kinetics observed with OM.
II.4 Summary
In the systems investigated above, helix formation is simply induced by the addition
of nucleotides AMP or GMP. This process involves different transition steps at the macroscopic
level (fluid solution to gel or precipitate), the mesoscopic level (vesicle to helix transition),
supramolecular level (chirality transfer), and the molecular level as summarized in Table II.4.

72
Table II.4 Summary of the kinetics of CnAc + nucleotides at different levels in the bulk (macroscopic),
in aggregate (mesoscopic), at the supramolecular level, and at the molecular level.
The kinetics of molecular organization and chirality transfer at supramolecular aspect
are quite different and much faster for the C12Ac + GMP system than for the C14Ac + AMP
system. Starting from similar (or even identical) amphiphiles, this underlines the importance
and specificity of the counterion nature in ionic assemblies’ properties. Particularly, while
adenine and guanine have similar stacking propensities, guanine nucleobase exhibits edges
having self-complementary hydrogen-bond donors and acceptors, responsible for the higher
degree of intermolecular interactions between GMP than between AMP.26
These factors may
account for the very fast kinetics observed with GMP-amphiphiles in spite of their shorter
hydrophobic chains. Despite these differences, in both systems helix formation occurs through
similar molecular organization mechanism as evidenced by CD, NMR and IR. First, ion
exchange occurs in a few minutes, leading to confinement of nucleotides, followed by their
reorganization through cooperative inter-nucleotides interactions at the membrane surface.
Sequentially, the chirality in supramolecular aggregates is expressed to form the chiral
structure.
The helix formation and growth as observed by OM followed much slower kinetics
after ion exchange, indicating that it is a cooperative process due to molecular reorganization.
Macroscopic aspect Mesoscopic aspect (OM)
right after the nucleotides addition
gel formation/ precipitate
helix: formation beginning
helix: end of the growth
C12Ac + GMP viscosity increase 1 day (gel) 30 min 1 week
C14Ac + AMP no immediate change 1 h (precipitate)30 min (needles)
1 day1 h (helices)
Supramolecular kinetics (CD) Molecular kinetics (IR, MNR)
chirality expressionend of the chirality
amplificationacetate to nucleotide
ion exchangenucleotide
organization
C12Ac + GMP < 1 min ~ 3 h ~ 2 min (half-life) ~ 10 min
C14Ac + AMP 30 min ~ 2 h ~ 4 min (half-life) ~ 2.5 h

73
II.5 Study of stoichiometry effect on the morphology of the
aggregates
We considered the molecular kinetics with different ratio such as CnAc : nucleotide
for 1 : 1 and 1 : 4 followed by OM observation and IR spectroscopy .
II.5.1 Mesoscopic kinetics followed by OM observation
We have then varied the AMP or GMP to CnAc ratio from 0.25 to 1.5. The
concentration of added AMP or GMP was varied with a constant amphiphile (C14 or C12) final
concentration of 15 mM. Figure II.25 and 26 show the macroscopic aspect of the samples as
well as their OM images.
C14Ac + AMP (15 mM) by Carole Aimé11
Depending on the AMP to C14Ac ratio, the macroscopic aspect of samples varied
from solution to precipitate (Figure II.25 a). Macroscopically, we obtained more opaque
solutions with higher ratios. The morphologies of vesicles, helices, and needles were strongly
depended on the AMP/C14Ac ratio, and could roughly be separated into three phases.
For AMP/C14Ac ratios lower than 0.50, C14Ac + AMP solutions remained almost
clear and only vesicles were observed (Figure II.25 b). Due to the large presence of acetate
counterions, the formation of inter-base interaction between neighbouring nucleotides was
prevented. In the 0.75-1.25 range, precipitation and opacity increased with the ratio. Within this
range, micrometric helices were observed along with needles (Figure II.25 c) and proportion of
needles relative to helices increased with the ratio. Finally, with excess amounts of AMP such
as higher ratio than 1.50, only needles were observed by OM (Figure II.25 d).

74
Figure II.25 (a) Photographs of showing the macroscopic aspect of C14Ac (15 mM) + AMP samples
with different AMP/C14Ac ratios, from 0.25 to 1.50. OM images of the samples: (b) ratios from 0.25 to
0.50, (c) ratios from 0.75 to 1.25, and (d) ratios above 1.50 with inserting the TEM image of nanometric
scale chiral structure.
TEM images showed nanometric chiral cigar-like structure at the nanometric scale.
These microneedles could be viewed as nanohelices. Depending on the stoichiometry, the
formation of either microhelices or nanohelices was favoured. Precipitation occurred more
rapidly in samples with increasing the AMP/C14Ac ratios. The presence of excess AMP
resulting in a higher density of needles could account for the faster precipitation.
C12Ac + GMP (15 mM)
For a GMP/C12Ac ratio up to 0.25, C12Ac + GMP remained a clear solution: in
contrast to the AMP system, no vesicles were observed at such low ratio and thin films and
fibers were observed (Figure II.26 a, b). For a ratio between 0.5 and 0.75, the solutions were
still fluid, but micrometric helices appeared along with fibers (Figure II.26 c). For the ratios
between 1.00 and 1.50, the solutions became gels and did not flow when the bottles were
inverted. Within this range, micrometric helices grew in diameter (Figure II.26 d), and helix
density increased with the ratio. Moreover, the formation of helices was much more rapid for a
higher ratio of GMP to surfactant (about 3 min for a ratio of 1.5 whereas about 30 min was

75
required for a ratio of 1).
Figure II.26 (a) Photographs of showing the macroscopic aspect of C12Ac (15 mM) + GMP samples
with different GMP/C12Ac ratios, from 0.25 to 1.50. OM images of the samples: (b) ratios less 0.25, (c)
ratios from 0.50 to 0.75, and (d) ratios above 1.00.
II.5.2 Self-assembly kinetics followed by IR measurement
We then compared the molecular kinetics between vesicles solution (Nuc : CnAc =
0.25) and helix suspensions (Nuc : CnAc = 1) We observed complete dispersion of the bands at
1666 cm-1
(for C14Ac + AMP, white star in Figure II.27 a), at 1580 and 1568 cm-1
(for C12Ac +
GMP, black star in Figure II.27 b). This suggested that AMP/GMP molecules were confined
approximately to the membranes surface when the concentration ratio CnAc : nucleotides was
1 : 1 (Figure II.28 a).
10 m10 m 10 m
(a)
(b) (c) (d)
0.25 0.50 0.75 1.00 1.25 1.50

76
Figure II.27 Comparison of IR spectra obtained by the different concentrations of samples with (a)
C14Ac (15 mM) + AMP (15 mM) vs C14Ac (40 mM) + AMP (10 mM) (Carole Aimé’s data) , (b) C12Ac
(10 mM) + GMP (10 mM) vs C12Ac (40 mM) + GMP (10 mM) in the range of bands characteristic of
the counterions.
In contrast, the interactions of inter-bases were absented if the huge excess of acetate
amphiphiles existed in mixture solution (Figure II.28 b). Accordingly, this is the evidence that
the bands at 1666 cm-1
(for C14Ac + AMP) and at 580 and 1568 cm-1
(for C12Ac + GMP) can be
considered to be a marker for supramolecular helical structure formation through
intermolecular interactions such as hydrogen bonds or stacking derived from the closely
packed nucleotide in aggregates. In fact, no helical structures were observed on OM in both
cases with the ratio CnAc : nucleotide for 4 : 1 as hereinafter study.
Figure II.28 Schematic illustrations of intermolecular interaction of nuclebases observed by IR
spectra. (a) The nucleotides exist in proximate each other (ratio of concentration for each reagent is 1 :
1). (b) Interactions are absented by existe the excess acetate amphiphiles (CnAc + nucleotide, 4 : 1).
+
-+
-+
-+
-+
-+
-+
-+
-+
-+
-+ + +
-+ + + + +
-+ +
Ac- Ac- Ac- Ac- Ac- Ac- Ac- Ac-
(a) (b) Absence of intermolecular interactionIntermolecular interaction by nucelobase

77
II.6 Conclusion
The weak interactions between nucleic acids AMP or GMP confined at the
membranes surface of self-assembled amphiphiles could induce chiral supramolecular
structures. This cooperative interaction between nucleotides counter-anions and cationic
amphiphiles was much stronger than the ionic interaction between acetate ions and the
amphiphiles. This allowed us to directly follow the formation of micrometric chiral structures
when nucleotides solution was added to the vesicles solution of cationic non chiral amphiphiles
CnAc. We have observed in situ that vesicles were ruptured at first, to form large aggregates
(AMP) or continuous films (GMP), and then chiral fibers grew up to form micrometric helices.
Detailed microscopy observation showed the growth of these helices with coiling motion from
tip of a helix.
Spectroscopic measurements indicated that micrometric helical structures of
nucleoamphiphiles resulted from cooperative effects in the molecular organization of
nucleobases. Ion exchange is the important step, which can induce the confinement of
nucleotides at cationic membrane surfaces. This process occurred within minutes after mixing
the two molecules CnAc and nucleotides. Subsequently the nucleotides confined at membrane
surfaces and reorganized themselves through weak interactions such as H bonds and
stacking on nucleobases. The chirality transfer to supramolecular structures also occurred at the
same time of nucleotide reorganization. This reorganization and the formation of directional
intermolecular interaction is the driving force for helix formation.
CnAc to nucleotides ratio was also an important factor which determines the helix
dimensions, i.e. micro to nanometric helices.
The main difference between AMP and GMP systems is allowing the solution
properties as precipitate vs gel. Once confined at the cationic membrane surfaces, GMP
organizes much more rapidly (~minutes) than AMP (~100 minutes). This could be attributed to

78
the nature of intermolecular interactions between GMP and between AMP. The formation of
supramolecular chiral structures clearly requires fine matching between surfactant structures
and their counterions. The control of the nature and kinetics of the interactions between
counterions gives access to the morphological tuning of the self-assembly of these new helical
bioarchitectures.

79
II.7 Experimental session
Synthesis of CnAc
Dialkyldimethylammonium acetate was obtained by ion exchange form complex of amphiphile
and boromide counter anion. The cationic surfactant with bromide counter-anion as starting material was
obtained by Fuluka and used any further purification.
Dialkyldimethylammonium bromide (n = 12, 14) was mixed with silver acetate (1.5 equivalents) in
methanol. The mixture was stirred for 30 min at 50 ˚C until the formation of black precipitate of silver
bromide, whereas the acetate surfactant was soluble in methanol. Silver bromide was filtered on Celite to
obtain a colorless solution. After evaporation of methanol, the product was dissolved in a mixture of
chloroform/methanol (9/1, v/v), made precipitate with acetone, filtered, and dried under the vacuum.
Preparation of the Samples
Guanosine 5’-monophosphate and adenosine 5’-monophosphate were purchased from Fluka and
Acros Organics, respectively, and used without any further purification. A vesicle solution of CnAc (n = 12,
14) was added to a solution GMP and AMP with the final concentration of each reagent being 15 mM. The
samples were not heated but as mixed. Deionized water was used to perform analysis by OM and TEM, and
D2O (Eurisotop CEA Saclay, France) was used for NMR and IR studies. OM was used to ensure that no
morphological various occurred by exchanging H2O for D2O.
The following notation was used for 1H NMR splitting patterns: singlet (s), doublet (d), triplet (t),
multiplet (m), and double of doublets (dd).
Typical example of C12GMP 1H NMR (400 MHz, CD3OD, 25 ˚C, ppm): 8.08 (1H, s), 5.85 (1H,
dd, 3J = 5.14 Hz,
3J = 6.36 Hz), 4.38 (1H, dd,
3J = 2.45 Hz,
3J = 5.14 Hz), 4.18 (1H, m), 4.14 (1H, m), 4.07
(1H, m), 3.28 (4H, m), 3.05 (6H, s), 1.74 (4H, m), 1.38 (4H, m), 1.29 (32H, m), 0.90 (6H, t, 3J = 6.85 Hz).
13C
NMR (100 MHz, CD3OD, 25 ˚C, ppm): 138.45, 89.25, 75.05, 72.36, 65.85, 65.22, 51.20, 49.64, 49.42,
49.21, 48.99, 48.79, 48.57, 48.36, 48.27, 48.11, 48.06, 47.9, 47.82, 47.88, 33.08, 30.75, 30.63, 30.52, 30.48,
30.20, 27.37, 23.74, 23.49, 14.43.
Typical example of C14AMP 1H NMR (400 MHz, CD3OD, 25 ˚C, ppm): 8.56 (1H, s), 8.21 (1H,
s), 6.09 (1H, dd, 3J = 6.11), 4.67 (1H, m), 4.234(1H, m), 4.12 (2H, m), 3.28 (4H, m), 3.05 (6H, s), 1.73 (4H,
m), 1.38 (4H, m), 1.29 (40H, m), 0.89 (6H, t, 3J = 13.36 Hz).
13C NMR (100 MHz, CD3OD, 25 ˚C, ppm):
152.76, 141.46, 141.43, 123.10, 123.08, 121.08, 107.86, 88.89, 86.14, 86.10, 76.35, 72.44, 65.96, 65.91,
65.86, 65.20, 51.21, 49.64, 49.42, 49.32, 49.21, 48.99, 48.79, 48.57, 48.36, 48.15, 48.08, 48.00, 47.95, 47.90,

80
47.84, 47.80, 47.76, 47.70, 47.64, 47.59, 33.09, 30.77, 30.63, 30.49, 30.18, 27.35, 25.62, 23.74, 23.48, 14.44.
Optical microscopy with differential interferential contrast (DIC)
Samples sealed between a slide glass and cover glass were observed with a Nikon Eclipse
PhysioStation E600FN with adequate condensers and a prism for DIC observations.
Circular dichroism measurement
The circular dichroism measurement was performed on a JASCO J-815 CD spectrometer with data
pitch of 0.1 nm, scanning speed of 100 nm/min, and quartz cuvette with optical path length of 0.1 mm were
used. The spectra were measured for 15 mM of each reagent.
Kinetic NMR measurement on aggrefates
1H NMR experiments were performed on a Bruker Avance 500 spectrometer operating at 500.13
MHz and equipped with solid-state NMR facilities. Samples were enclosed in 4 mm diameter Zirconia rotors
(50 l internal volume). Magic-angle sample spinning (MAS) was performed at 8 kHz. A H2O/D2O (80/20
v/v) mixture was used for sample preparation. A D2O lock was used, and the temperature was regulated to
290 K (heating due to air friction when spinning is taken into account). Acquisition was performed using a
classical one-pulse sequence with water suppression (presaturation of 50 dB) on a spectral width of 5 kHz.
Typically, 32 scans were recorded with a repetition time of 3 s. This leaded to an acquisition time per
experiment of 96 s. Spectra were obtained by the application of a Lorentzian filtering of 1 Hz and Fourier
transformation of time-dependent signals.
Infrared measurement
IR spectra were performed on a ThermoNicolet Nexus 670 FTIR spectrometer. The samples were
prepared in a D2O, and held in a demountable cell with CaF2 windows with a 50 mm Teflon spacer. Generally,
the spectra were registered during 50 scans at resolution of 4 cm-1
. Baseline corrections for absorption spectra
were made by subtracting the absorption of D2O solvent. The pH of nucleotide solution was controlled by
addition of DCl and NaOD.

81
II.8 Annex
II.8.1 Study of morphology transition by inducing the nucleotide to vesicle
solution
We have also investigated systems for which that the nucleotides were added to the
vesicles formed with dimethylditetradecylammonium chloride C14Cl.
15 mM of C14Cl aqueous solution were heated up about 40 ˚C for melting the
precipitates, and then kept at room temperature (Figure II.29 a). After cooling, the amphiphiles
self-assemble to form vesicle structure and the solution became slightly opaque and fluid.
These vesicles showed much higher stability than the system of C14Ac because chloride
counter-anion shows much more hydrophobic properties than acetate ion.27
When the AMP solution was mixed with vesicle solution of C14Cl, some of vesicles
transformed to denser structures, but chiral fibrous structures were never observed (Figure II.29
b). On the other hand, the mixing of C14Cl and GMP presented the vesicle to helical fiber
transition under the OM observation (Figure II.29 c).
Figure II.29 OM images of (a) vesicles of 15 mM C14Cl, (b) denser structures of C14Cl + AMP (15 mM),
and (c) helical ribbons of C14Cl + GMP (15 mM). Bars are 10 m.
Such differences of morphology transition between GMP and AMP systems are
probably referable to their solubility and pKa;, and the pKa1 value of AMP is higher than that of
GMP whilst AMP is more soluble in water than GMP. Thus, GMP could interact more easily
(a) (b) (c)C14Cl C14Cl + AMP C14Cl + GMP

82
with cationic vesicle membrane than AMP system.
Now we will look more closely on the kinetics of from the transformation upon
addition of GNP to the solution of C14Cl. Right after mixing C14Cl and GMP, small amounts of
vesicles ruptured to form the denser structures (Figure II.30 a). Form these cores, micrometric
chiral fibers started growing after 10 min (Figure II.30 b). After 1 h, we observed helical
structures, and these fibers continuously grew for a week (Figure II.30 c-f). For the
macroscopic aspect, white precipitates were observed after few hours.
Figure II.30 OM images of helix formation observed with C14Cl + GMP system. The scale bars are 10
m.
Compared to the C12Ac + GMP system discussed above, the morphology transition of
C14Cl + GMP sample occurred much more slowly and furthermore the vesicles of C14Cl
remained until a day, indicating that the ion-exchange form chloride to GMP also occurred
much more slowly than the system of acetate counter-anion. In fact, the pKa value of chloride
counter-anion (-7) is much lower than acetate ion (4.76) and the interaction between chloride
and cationic vesicle membrane is strong, so that ion exchange to nucleotide does not occur as
easy as acetate counter-anion. On the other hand, it is interesting that chloride ions are
(a) (b) (c)
(d) (e) (f)
Just after mixing 10 min 1 h
2 h 1 day 1 week

83
exchanged by phosphate the pka of which is around 2. In this case, the hydrophilicity of
nucleotide is lower than that of chloride and that nucleotides easily form intermolecular
interaction either by hydrogen bond or stacking, and cooperatively, the interaction between
nucleotides and surfactants become stronger than the interaction with chloride. As a result we
could observe the vesicle-helix transition by addition of GMP system. Further investigation
about their kinetics with different aspects is necessary to fully understand this phenomenon.
II.8.2 Study of complexation between gemini surfactant and nucleotide
trimer
The above mentioned study investigated nucleoamphiphiles composed by cationic
surfactant having two hydrophobic chains complexed with monoanionic AMP and GMP, In
these cases, the interaction between nucleotide of amphiphiles and nucleoside are driven
mainly by non-Watson-Crick type hydrogen bonding and stacking without any paring.
Herein, we studied assembling behavior between gemini amphiphiles complexed with trimeric
nucleotide (tridNuc) and nucleoside.
In order to have similar distances between the cationic charges of gemini
complexation with the negative charges of phosphate groups of tridNuc, the spacer length of
geminiwas chosen to be 4 (Figure II.31).
Figure II.31 Molecular structures of gemini surfactant complexed with nucleotide trimer.
O
O
OH
O P
O
OO
Base
Base
OP
O
OO
OBase
OH
N
N N
NH
O
NH2
N
NH
O
O
N
N N
N
NH2
Base =
N
N
NH2
O
A T
G C
N+ N
+
C16
H33
C16
H33CnH2n+1
CnH2n+1
n = 12, 14, 16

84
The molecular recognition between tridNuc complexed with gemini surfactant and
nucleoside was followed by UV-vis measurement. Figure II.32 shows the effect of additive
nucleoside on aggregates behaviors of the gemini-tridNuc (tridAMP, tridCMP and tridTMP)
aqueous solution using UV-vis spectra. The concentrations of each reagent are 0.5 mM.
Figure II.32 UV-vis spectra of (a) 12-4-12 tridAMP + nucleoside, (b) 12-4-12 tridCMP + nucleoside, (c)
14-4-14 tridCMP + nucleoseide, and (d) 16-4-16 tirdTMP + nucleoside. Concentrations of each reagent
were 0.5 mM. (e) Plot of peak at maximum absorbance (max) for the gemini-tridNuc + nucleoseide.
In the case of 12-4-12 trdAMP, strong → * transition of nucleobase was observed
at 257 nm. When guanine (G) or adenine (A) was added to this sample, the adsorption showed
no shift whereas adsorption bands obtained by mixture of cytosine (C) or thymine (T) exhibited
red-shift (267 nm for C and 264 nm for T) (Figure II.32 a).
When nucleosides were added to 12-4-12 tridCMP, the band at 272 nm was strongly
blue-shifted upon adding A (to 261 nm) and T (266 nm), for longer alkyl chain (C = 14) only
addition of A (peak maximum at 267 nm) showed visible blue shift(Figure II.32 b, c). For
+ C
+ A
+ G
Alone
+ T
(d) 16-4-16 tridTMP
0
0,05
0,1
0,15
0,2
0,25
200 220 240 260 280 300 320
Wavelength (nm)
(c) 14-4-14 tridCMP
+ C
+ A
+ G
Alone
+ T0
0,05
0,1
0,15
0,2
0,25
200 220 240 260 280 300 320
Wavelength (nm)
(b) 12-4-12 tridCMP
+ C
+ A
+ G
Alone
+ T0
0,05
0,1
0,15
0,2
0,25
200 220 240 260 280 300 320
Wavelength (nm)
+ C
+ A
+ G+ T
Alone(a) 12-4-12 tridAMP
(f)
0
0,05
0,1
0,15
0,2
0,25
200 220 240 260 280 300 320
Wavelength (nm)
250
255
260
265
270
275
280
0 1 2 3 4 5 6
m
ax(n
m)
alone + G + A + C + T
Added nucloside
12-4-12 tridCMP
12-4-12 tridAMP
14-4-14 tridCMP16-4-16 tridTMP

85
16-4-16 tridTMP, the adsorption bands at 267 nm showed slightly blue-shift upon addition of G
and A (at 264 nm), and red-sift upon addition of C (at 268 nm) (Figure II.32 d).
These results indicate that molecular recognition is strongly depending on the alkyl
chain length of gemini amphiphile: longer alkyl chain provides lower interaction because
gemini surfactant with longer alkyl chain show more hydrophobicity, in contrast high solubility
nucleoside (A, C, and T) is responsible for the lack of interaction on the aggregate in water.
Within the object of interactions of trimeric nucleotide and nucleoside, assemblage between
12-4-12 tridAMP and C or 12-4-12 tridCMP and A resulted in strong interactions. However we
have not yet succeeded in clarifying the driving force of specific interaction provide by base
pair.

86
References
1 E. T. Kool, Annu. Rev. Biophys.Biomol. Struct., 2001, 30, 1-22.
2 W. Saenger, Principals of Nucleic Acid Structure, Springer-Verlag, New-York, 1984.
3 (a) T. K. Harris, G. J. Turner, IUBMB Life,2002, 53, 85-98. (b) V. Verdolino, R. Cammi, B. H. Munk, H. B.
Schlegel, J. Am. Chem. Soc., 2008, 112, 16860-16873. (c) P. Acharya, P. Cheruku, S. Chatterjee, S.
Acharya, J. Chattopadhyaya, J. Am. Chem. Soc., 2004, 126, 2862-2869. (d) D. R. Lide, CRC Handbook of
Chemistry and Physics, 80th ed.; CDC Press: Boca Raton, 1999-2000. (e) R. M. C. Dawson, D. C. Elliott,
W. H. Elliott, K. M. Jones, Data for Biochemical Research, 3rd
ed.; Oxford University Press: Oxford, 1986.
(f) G. D. Fasman, CRC Handbook of Biochemistry and Molecular Biology, Nucleic Acids, 3rd
ed.; CRC
Press: Cleveland, OH, 1975; Vol. 1. (g) P. O. P. Ts’o, Basic Principles in Nucleic Acid Chemistry; Academic
Press: New York, 1974. (h) D. O. Jordan, The Chemistry of Nucleic Acids; Butterworth and Co.: WA, 1960.
(i) E. Chargaff, J. N. Davidson, The Nucleic Acids Chemistry and Biology; Academic Press: New York,
1955. (j) S. Bundari, The Merck Index, 12th ed.; Merck and Company: Whitehouse Station, NJ, 1996. (k)
D. Shugar, J. J. Fox, Biochim. Biophys. Acta, 1952, 9, 199-218.
4 (a) C. Xu, P. Taylor, P. D. I. Fletcher, V. N. Paunov, J. Mater. Chem., 2005, 15, 394–402. (b) P. Barthélémy,
S. J. Lee, M. W. Grinstaff, Pure Appl. Chem., 2005, 77, 2133–2148. (c) D. Berti, P. Baglioni, S. Bonaccio,
G. Barsacchi-Bo, P. L. Luisi, J. Phys. Chem. B, 1998, 102, 303–308. (d) M. Onda, K. Yoshihara, H.
Koyano, K. Ariga, T. Kunitake, J. Am. Chem. Soc., 1996, 118, 8524–8530. (e) P. Baglioni, D. Berti, Curr.
Opin. Colloid Interface Sci., 2003, 8, 55–61. (f) L. Moreau, P. Barthelemy, M. El Maataoui, M. W.
Grinstaff, J. Am. Chem. Soc., 2004, 126, 7533–7539.
5 (a) T. Tanaka, K. Nakayama, K. Machida, M. Taniguchi, Microbiology, 2000, 146, 377-384. (b) G. M. van
Wijik, K.Y. Hostetler, H. van den Bosch, Biochim. Biophys. Acta., 1991, 1084, 307-310. (c) C. I. Hong, A.
J. Kirisits, A. Nechaev, D. J. Buchheit, C. R. West, J. Med. Chem., 1985, 28, 171-177. (d) C. Heiz, U.
Radler, P. L. Luisi, J. Phys. Chem. B, 1998, 102, 8686-8691. (e) N .Campins, P. Dieudonné, M. W.
Grinstaff, P. Barthélémy, New J. Chem., 2007, 31, 1928-1934.
6 (a) P. Chabaud, M. Camplo, D. Payet, G. Serin, L. Moreau, P. Barthélémy, M. W. Grinstaff, Bioconjugate
Chem., 2006, 17, 466-472. (b) A. Gissot, M. Camplo, M. W. Grinstaff, P. Barthélémy, Org. Biomol. Chem.,
2008, 6, 1324–1333. (c) C. Ceballos, C. A. H. Prata, S. Giorgio, F. Garzino, D. Payet, P. Barthélémy, M. W.
Grinstaff, M. Camplo, Bioconjugate Chem., 2009, 20, 193–196.
7 P. Barthélémy, C. R. Chimie., 2009, 12, 171-179
8 R. Iwata, K. Yoshida, M. Masuda, K. Yase, T. Shimizu, Chem. Mater., 2002, 14, 3047-3053. (f) R. Iwata, K.
Yoshida, M. Masuda, M. Ohnishi-Kameyama, M. Yoshida, T. Shimizu, Angew. Chem. Int. Ed., 2003, 42,
1009-1012.
9 P. Pescador, N. Brodersen, H. A. Scheidt, M. Loew, G. Holland, N. Bannert, J. Liebscher, A. Herrmann, D.
Huster, A. Arbuzova, Chem. Commun., 2010, 46, 5358–5360.

87
10
(a) P. Baglioni, D. Berti, Current Opinion in Colloid & Interface Science, 2003, 8, 55-61. (b) F. Baldelli
Bombelli, D. Berti, M. Almgren, G. Karlsson, P. Baglioni, J. Phys. Chem. B, 2006, 110, 17627-.17637.
11 Carole Aimé, Auto-Assemblages Chiraxu d’Asmphiphiles Cationique., Thesis of Doctrante, Bordeaux 1
Unversity, 2007.
12 C. Aimé, S. Manet, T. Satoh, H. Ihara, K .Y. Park, F. Godde, R. Oda, Langmuir, 2007, 23, 12875-128885.
13 C. Aimé, R. Tamoto, T. Satoh, A. Grelard, E. J. Dufourc, T. Buffeteau, H. Ihara, R. Oda, Langmuir, 2009,
25, 8489-8496.
14 B. Xing, C. W. Yu, K. H. Chow, P. L. Ho, D. Fu, B. Xu, J. Am. Chem. Soc., 2002, 124, 14846-14847.
15 S. Mukhopadhyay, U. Maitra, G. Ira Krishnamoorthy, J. Schmidt, Y. Talmon, J. Am. Chem. Soc., 2004,
126, 15905-15914.
16 A. Brizard, R. Oda, I. Huc, Top. Curr. Chem., 2005, 256, 167-218.
17 (a) S. B. Nielsen, T. Chakraborty, S. V. Hoffmann, ChemPhysChem, 2005, 6, 2619-2624. (b) C. A.
Sprecher, W. C. Johonson, Jr., Biopolymers, 1997, 16, 2243-2264. (c) P. R. Callis, Photochem. Photobiol.,
1986, 44, 315-321. (d) S. Ullrich, T. Schultz, M. Z. Zgierski, A. Stolow, Phys. Chem. Chem. Phys., 2004,
6, 2796-2801.
18 M .Ikehara, S. Uesugi, K. Yoshida, Biochemistry, 1972, 11, 836-842.
19 A. J. Simpson, W. L. Kingery, D. R. Shaw, M. Spraul, E. Humpfer, P. Dvortsak, Environ. Sci. Technol.,
2001, 35, 3321-3325.
20 B. Hernandez, R. Navaro, A. Hernanz, G. Vergotten, Biopolymers, 2002, 67, 440-455.
21 B. N. Thomas, C.R. Safinya, R. J. Plano, N. A. Clark, Science, 1995, 267, 1635-1638.
22 A. Brizard, C. Aimé, T. Labrot, I. Huc, D. Berthier, F. Artzner, B. Desbat, R. Oda, J. Am. Chem. Soc., 2007,
129 ̧3754-3762.
23 A. Brizard, R. Kiagus Ahmad, R. Oda, Chem. Commun., 2007, 2275-2277.
24 A. G. Petrovic, P. L. Polavarapu, J. Phys. Chem. B, 2005, 109, 23698-23705.
25 (a) V. Setnicka, M. Urbanova, K. Volka, S. Nampally, J. M. Lehn, Chem. Eur. J., 2006, 12, 8737-8743. (b)
F. B. Howard, J. Frazier, T. Miles, Biopolymers, 1977, 16, 791-809.
26 J. T. Davis, G. P. Spada, Chem. Soc. Rev., 2007, 36, 296-313.
27 S. Manet, Y. Karpichev, D. Bassani, R. Kiagus Ahmad, R. Oda, Langmuir, 2010, 26, 10645-10656.

88

89
Chapter III
In situ helicity inversion of self-assembled nano-helix

90

91
III.1 Introduction
In the previous chapter, we introduced in situ vesicle to helix morphology transition
upon addition of chiral nucleotide counter-anion to achiral vesicles formed by cationic
surfactants at constant temperature. In this chapter, we will present the in situ handedness
inversion of chiral self-assemblies by addition of opposite chiral acid.
As we have seen in the bibliographic chapter, chiral amphiphilic molecules often
self-assemble in solution to form aggregates with high aspect ratio such as rods, twisted and
helical ribbons, and tubes, suggesting that chirality is intricately associated with the growth and
stability of self-assembled fibers of small organic molecules or polymers. Often chirality is
expressed in the structure of these fibers at a supramolecular scale of nanometer to micrometer,
and their structures may be coiled, twisted, or wound around one another and exist as a
right-handed or a left-handed form.
A specific handedness in a helical conformation (right-handed P, or left-handed M) of
these biological or synthetic macromolecules or supramolar assemblies ranges from a
molecular level to several hundred nanometers,1 and in the majority of the cases, the driving
force for the helical structures comes from inter/intramolecular -stacking interaction or
hydrogen bonding.2
Most naturally occurring biological macromolecules such as proteins and nucleic
acids are optically active and adopt a one-handed helix as right-handed -helix and
double-helix, respectively. Their structure play important role in the functions of these
biomolecules. For example, the formation of coiled-coil superhelix in collagen is instrumental
to provide it tensile strength, important for a structural protein.
Recently, there are many reports about synthetic helical structure obtained by
foldamers, oligomers, polymers and self-assembled low molecular weight molecules. The
primary advantage of these synthetic structures lies in the controllability of the expressed
chirality. The controllable helicity is quite attractive not only to mimic nature, but also for their
wide variety of possible applications in materials sciences, chemical and biomaterial sensing,
and enantioselective catalysis.3
The problematics of controlling chirality and thereby

92
generating specific structures for achieving specific functions continues to be a challenging and
rapidly expanding area in the field of foldamers, oligomers, polymers and supramolecular
chemistry.
The chirality inversions in helical structures are known both in nature as well as in the
synthetic systems. For example, a right-handed helical protein chain can organize into a
left-handed helical superstructure,4 right-handed polymer chains can organize into left-handed
superhelical structures.5
There are also some examples which demonstrate that macromolecules and
supramolecular aggregates can change their helicity between P and M in a so-called helix-helix
transition by applying an external stimulus such as light,6 solvent (example in Figure III.1 a),
7
temperature (Figure III.1 b),8 pH value,
9 and chiral additives.
10
Figure III.1 Examples of reversal helicity inversion driven by (a) solvent exchange,7(d)
and (b)
temperature control. 10(c)

93
Most of these examples of chirality inversion concern the molecular or
supramolecular level helical organization of macromolecules/foldamers, and the chirality is
expressed at nanometer level. These molecules with controllable helicity can exhibit the optical
activity and inversion steps are normally demonstrated by spectroscopic method. Because of
the present resolution limit of microscopy technique, very little examples exist as to the direct
visualization of these helix-helix transitions. Also, only a few examples can be found in the
literature about helical inversion on molecular assembly systems,7(e),9
and the kinetic aspects of
these inversion are rarely discussed.7(e)
Herein, we will present the system we have developed in order to directly visualize
step by step, the in situ helicity inversion of chiral supramolecular structures at mesoscopic
level (20 nm – microns).
In the last decade, a number of reports from our laboratory have demonstrated that
supramolecular nanostructures with controllable chirality can be achieved from non-chiral
cationic surfactants by the influence of chiral counter anions.
The complex of non-chiral cationic bis-quaternary ammonium gemini surfactants in
the presence of chiral tartrate counter-anion can expand to the gel network of chiral ribbons in
water or organic solvent.11,12
This ambivalent behavior results from the formation of bilayers in
both solvents of aqueous and organic.13
In contrast to the polymers, the gel formation from
gemini tartrate is based on non-covalent interaction. Additionally, the self-assembly of gemini
tartrate amphiphiles, particularly gemini 16-2-16a, promote chiral supramolecular structure: the
twisted, helical, and tubular formations are observed (Figure III.2). This study has been part of
doctoral work of Damien Berthier,14
Aurélie Brizard,15
and Carole Aimé.16
a A gemini with two symmetrical 16 carbon chain attached hydrophilic heads connected by an ethylene
spacer (2 carbons) that is denoted 16-2-16.

94
Figure III.2 Transmission electron microscopy (TEM) image of the morphologies obtained From
achiral cationic gemini surfactant, with chiral tartrate as the counter ion. The morphologies are (a)
twisted, (b) helical and (c) tubular structures.
It has previously been reported from our lab that the supramolecular morphologies of
chiral ribbons from 16-2-16 L-tartrate amphiphiles were controlled by several parameters such
as modifying the temperature, inducing the small amounts of additives and enantiomeric excess
with opposite counter anions which were induced by 16-2-16 D-tartrate.12,17,18
Particularly,
controlling the enamtiomeric excess can produce various morphologies with finely tunable
shapes. For example, in the case of racemic mixture of L-tartrate : D-tartrate (1 : 1), flat ribbons
were observed. (Figure III.3 a). When the ee was increased, the morphology gradually
transforms to twisted (Figure III.3 b, c), helical ribbon (Figure III.3 d), and finally to tubular
structure (Figure III.3 e).
Figure III.3 TEM image of the morphologies variation obtained by different ee function.17
500 nm 500 nm 200 nm 200 nm 100 nm
50 50 100
ee = 0 ee = 1Enantiomeric excess
(a) ee = 0 (b) ee = 0.2 (c) ee = 0.6 (d) ee = 0.8 (e) ee = 1

95
As the chiral center in these molecules are not covalently attached to the
membrane-forming molecules, i.e. gemini surfactants, but they originate from their
counterions, if opposite chiral acid (for example, D-tartaric acid) is added to the gel network
formed with nanometric tubules of 16-2-16 L-tartrate, is it possible to induce in situ helicity
inversion (Figure III.4)? In our approach towards controlling the helicity of chiral fibers,
tartaric acid with opposite chirality (e.g., D-) was directly introduced into a pre-formed gel of
the amphiphile with L-tartrate. In the process, helicity inversion was induced by the in situ
counter anion exchange at ambient temperature.
Figure III.4 Schematic illustration of in situ helicity inversion from P tube to M ribbon upon addition
of opposite chiral acid.
We attempted to visualize direct helicity inversion using transmission electron
microscopy (TEM) observation. The process of chirality transfer was followed by circular
dichroism (CD) spectroscopy. In addition, the kinetics of the process was followed by is also
followed by polarized attenuated total reflectance (ATR) spectroscopy and small angle X-ray
scattering (SAXS) measurement.

96
III.2 Non equilibrium in situ Counter-Anion exchange in Gel
Network: effect on the Morphology of Aggregates
III.2.1 Experimental description
The right-handed (P) tubular gels networks were formed by 16-2-16 L-tartrate
amphiphiles (ee = 1) in water (Figure III.5). 10 mM solution was prepared by heating 16-2-16
L-tartrate powder in water to 50 °C, which was allowed to cool at RT. While cooling, the clear
and fluid solution became increasingly opaque and viscous, then became gel with P tubular
structures after a few hours. When the D-tartaric acid as opposite chirality was filtered through
these gel networks, The excess amounts of L- or D-tartaric acid were immediately washed away
by a large amount of water after filtration of D-tartaric acid solution. All these procedures were
performed under the constant temperature at 21 ˚C.
Figure III.5 The structure of 16-2-16 L-tartrate. TEM image of right-handed tubes from 16-2-16
L-tartrate with pure enantiomer (ee = 1). The character P is significant right-handed helical structure.
The Figure III.6 schematically shows this procedure. Through the gel network of 10
mM 16-2-16 L-tartrate, the D-tartaric acid solution with a various equivalence of D-tartrate
such as 1 eq, 2 eq, 4 eq, and 20 eq is passed through. This gel was immediately washed by large
amounts of water to remove the excess of D- and L-tartaric acid, and final concentration was
adjusted to 10 mM for each reagent.

97
Figure III.6 Schematic illustration of gel preparation method.
III.2.2 Morphologies transitions followed by TEM observation
Variation of the morphology of aggregates with time after the addition of 1
equivalent D tartaric acid. (expected ee = "0").
At first, we prepared a 16-2-16 L-tartrate gel to which an equivalent amount of
D-tartaric acid solution (ee = “0”) was filtered through.
Initially, the tubular fibers slowly unwound to helical structure (Figure III.7 a). After
30 min, these nanometric P helical structures were further unwound and twist ribbons were
observed (Figure III.7 b-c).
With time, their twist pitches increased to micrometric scale. After 4 h, flat ribbons
and M twist ribbons were also observed, and the ratio of P and M were 3:2, (Figure III.7 d).
After a day, most of the fibers were transformed to flat ribbons (Figure III.7 e), but interestingly
we observed a mixture of flat ribbons and P twist ribbons after 1 week (Figure III.7 f) this can
be described as follows. Because we washed right after passing through the D tartrate solution,
the counter-anion exchange was not completed and in the final mixture, the ratio of L-tartrate
counter-anions remained slightly higher.

98
Figure III.7 TEM images of pitch elongation steps of tubular network from 16-2-16 tartrate
amphiphiles after the addition of an equivalent of opposite chiral D-tartaric acid. The characters P
and M are significant right-handed and left-handed helical structure, respectively.
Variation of the morphology of aggregates with time after the addition of 2
and 4 equivalent D tartaric acid (expected ee = -0.3 and -0.6 respectively).
When two equivalents of D-tartartic acid in solution (ee = “-0.33”) were added,
initially unfolded P helical ribbons were observed (Figure III.8 a, b). After 1 hour, these P
helical ribbons abruptly reversed to M helices (Figure III.8 c), and then they transformed into
twisted ribbons with increasing twist pitch until about a week (Figure III.8 d-f).

99
Figure III.8 TEM images of helicity inversion and pitch elongation steps of tubular network from
16-2-16 tartrate amphiphiles by ee changes from 1 to “-0.33” in the case of addition of 2 equivalents
opposite chiral D-tartaric acid. The characters P and M are significant right-handed and left-handed
helical structure, respectively.
On the other hand, when 4 equivalents of D-tartaric acid in solution were added, the
tubular fibers immediately transformed to M helical ribbons (0 min). The chirality inversion
occurred very fast replacing the counter anion from L- to D-tartrate on the gemini surfactant
(Figure III.9 a). These M helical structures transformed into twisted ribbons after 1 day (Figure
III.9 d, e). The twist pitches of these helical were a few hundred nanometers (Figure III.9 f). On
the macroscopic aspect, initially both samples were translucent solution, and then turned into
clouded gel after about 1 hour.

100
Figure III.9 TEM images of helicity inversion and pitch elongation steps of tubular network from
16-2-16 tartrate amphiphiles by ee changes from 1 to “-0.60” in the case of addition of 4 equivalents
opposite chiral D-tartaric acid. The characters M are significant right-handed and left-handed helical
structure.
Variation of the morphology of aggregates with time after the addition of 20
equivalents D tartaric acid (expected ee = -0.9).
When a large excess of D-tartaric acid such as 20 equivalents were passed through the
16-2-16 L-tartrate gel, immediately the fiber structures collapsed to form vesicle-like structures
(Figure III.10 a). And then they reassembled to chiral ribbons after about 30 min (Figure III.10
b). After 1 hour, these ribbons transformed into M helical structures (Figure III.10 c), they
eventually formed tubular structure after a week (Figure III.10d-f).

101
Figure III.10 TEM images of re-assemblies steps of tubular network from 16-2-16 tartrate
amphiphiles by ee changes from 1 to “-0.90” in the case of addition of 20 equivalents opposite chiral
D-tartaric acid. The characters M are significant right-handed and left-handed helical structure.
III.2.3 Pitch variation
We investigate the time-dependent variation of the average twist pitch and their
standard deviations as a function of ee.
The helical pitch of the original helices by 16-2-16 L tartrate (ee = 1), was 30 nm ± 5
nm.
- After the filtration of 1eq D-tartaric acid (ee = “0”), the twist pitch was elongated to 60
nm ± 16 nm 30 minutes and after 1 h, it increased to 90 nm ± 40 nm, 200 nm ± 130 nm after 2 h.
At 4 h, both P and M fibers were observed and the twist pitches were 590 nm ± 300 nm for P
twist ribbons and 790 nm ± 340 nm for M. After 6h, 2830 ± 2000 nm for P twist ribbons and
1970 nm ± 1100 nm for M. After a day, only P twist ribbons were observed and their twist pitch

102
was 3330 nm ± 2000 nm. Finally after a week the pitch shortened a little to 1470 nm ± 600 nm.
- Immediately after the filtration of 2eq D-tartaric acid (ee = “-0.33”), the twist pitch of
P helical ribbon became 200 nm ± 80 nm, 380 nm ± 200 nm for 30 min, then 1 h later M helical
ribbons were observed that twist pitch was 62 nm ± 30 nm. After 2h, they were 340 nm ± 140
nm, 520 nm ± 260 nm after 4 h, 770 nm ± 430 nm for 6 h, 1430 nm ± 720 nm for 1day, 1150 nm
± 800 nm for 1 week and finally twist pitch reached 870 nm ± 440 nm from 3 weeks.
- After the filtration of 4 eq D-tartaric acid (ee = “-0.66”), the M helical ribbons were
observed from the moment D-tartaric acid passed through the gels and their twist pitch was 85
nm ± 40 nm. They evolved to 50 nm ± 15 nm after 30 min, 65 nm ± 20 nm after 2 h, 75 nm ± 20
nm after 6 h, 110 nm ± 60 nm after 1 day, 170 nm ± 100 nm for 2 days, 650 ± 300 nm for 1
week, then twist pitch was stable at 480 nm ± 300 nm.
- After the filtration of 20 eq D-tartaric acid (ee = “-0.9”), all fibers collapsed to
undefined structure, then after 1 h M helical fibers were re-assembled with their twist pitch
being 50 nm ± 10 nm, 70 nm ± 30 nm after 2 h, 60 nm ± 20 nm after 1day, 50 nm ± 10 nm after
1 week, then pitch values reached to 40 nm ± 5 nm.
These results suggest that simple filtration of tartaric acid with opposite chirality can
induce the chirality inversion of the self-assembled ribbons, and the final morphologies of the
ribbons and the speed of chirality inversion depend strongly on the total amount of D tartaric
acid: the chirality inversion occurred much quicker with a larger amount of D tartaric acid.
III.3 Investigation of chirality inversion by CD spectroscopy
In order to obtain more insights into the helix inversion phenomenon, the process was
monitored by CD.
Berthier et al. have reported the conformation of tartrate ions in the chiral bilayers of
gemini amphiphiles (n-2-n with n > 14) with ee = 1 using CD spectrum which were in the
absorption region of cotton coupling of carboxylate chromophores at 190-250 nm in aqueous

103
solution.19
A strong exciton coupling between carboxylates was observed with a positive peak
at 201 nm and negative peak at 219 nm for 16-2-16 L-tartrate. Brizard et al. has also shown the
effect of enantiomeric excess on chiroptical properties by synthesized gels.20
Decreasing ee
caused a decrease of the intensity of the cotton coupling between the carboxylates.
In this section, we study the variation of chiroptical properties during counter-anion
exchange process.
Figure III.11 shows the variation of CD signals after filtration of various amount of
D-tartaric acid into the 10 mM 16-2-16 Ltartrate gels.
Figure III.11 CD spectra of 16-2-16 tartrate amphiphiles with different ee changes: (a) from 1 to “0”,
(b) 1 to “-0.33”, (c) 1 to “-0.60”, and (d) 1 to “-0.90” by addition of opposite chiral D-tartaric acid
solution through the 16-2-16 L-tartrate gel.
As it is clearly seen from the Figure III 11, the CD signals change immediately after
filtration of D tartrate for all cases.

104
For the case of ee = “0”, both bands at 201 nm and 219 nm were drastically decreased
just after filtration of D-tartaric acid solution to 16-2-16 L-tartrate gel. The CD peak
continuously decreased with the time, and their cotton coupling finally disappeared after 4 h
(Figure III.11 a). It is important to note here that at this point, the TEM images show the
presence of some twisted ribbons with long pitch (≥ 1000 nm). This means that the presence of
long pitch ribbons is not reflected to the CD signals.
For the case of ee = “-0.3”, the signs of CD bands at 201 nm and 219 nm were
inversed just after filtration of 2 equivalents of D-tartaric acid through the 16-2-16 L-tartrate
gel. The CD peak decreased with time until 6 h, but from 1 day, the shape in the CD spectrum
changed and a strong positive signal appeared at low wavelength. This phenomenon was
accompanied by the growth of ribbons with a large pitch (> 1000 nm). This is therefore
probably caused by the strong scattering of large chiral ribbons (Figure III.11 b).
For ee = “-0.60”, the sign of CD spectrum were inversed just after filtration of
D-tartaric acid solution. The peak hight remained the same until 6 h, during this time, the
ribbons kept helical shapes. After 1day, the CD peaks at 219 nm gradually decreased to about
40 % of the initial hight, whereas peak at 201 nm showed slightly decrese to 61 % of the initial
hight. This may correspond to the morphology transition from helical ribbons to twisted
ribbons with elongation of pitch value (Figure III.11 c).
Figure III.11 d shows the case of ee = “-0.90”. In this case, only the peaks of
D-tartaric acid were observed during the first 30 min because too much excess of D-tartaric acid
still remained around the gel with micelle or vesicle structure. The inversed peak appeared at
around 1 hour and the peak at 219 nm kept the hight after 1week with re-assembling the chiral
fibers.

105
Figure III.12 Aging variation of (a) inversed twist pitches and (b) CD intensities at []200nm with
different ee.
Figure III.12 compares the variation of the twist pitch and CD intensities at 201 nm
with time for different ees. This figure clearly shows the strong correlation between the
morphologies of chiral fibers as observed by TEM image, with the supramolecular chirality
observed with CD signals. This confirms the previous results published by our group (Figure
III.13).20
Meanwhile, a detailed analysis describes that the kinetics of the two data sets shows
that the variation of the CD signal is much more rapid than the morphology variation. For
example, the case of ee = “0.33”, also CD does not see the residual chirality observable with
TEM.
Figure III.13 (a) ECD spectra of various mixtures of the two enantiomers of16-2-16 tartrate. (b)
Variation of the inverse of the pitch period (left) and the normalized CD data (right) as a function of
enantiomeric excess.20

106
III.4 Molecular and supramolecular kinetics of morphology
transition
III.4.1 Study of molecular orientation followed by attenuated total
reflectance (ATR) spectroscopy
We then probed the time evolution of the molecular environment during morphology
transition using polarized attenuated total reflectance (ATR) spectroscopy. ATR spectroscopy is
a very effective technique for using in conjunction with infrared spectroscopy which enables
samples to be examined directly in the solid, liquid or gas state without further preparation. One
of the features of polarized ATR measurement is that the information of samples can be
obtained in relation to the orientation of the molecules with respect to the X, Y and Z axis. The
dichroic ratio RATR for a selected vibrational mode is determined by calculating the ratio of the
absorbance measured with the infrared radiation polarized parallel (p) and perpendicular (s) to
the plane of incidence (RATR = Ap/As). Here, parallel polarized light has vector in the X and Z
directions, and the perpendicular polarized light has a vector in the Y direction (see Figure
III.14).21
Therefore, if the molecular orientation of chiral fibers from 16-2-16 tartrate gels is
completely isotropic, the RATR should be 2, conversely the molecular orientation is anisotropic,
such as the molecules are oriented planner direction, Ap becomes weak and the value of RATR
approaches 1.
Figure III.14 Schematic illustrations of directions of polarized light and evanescent wave.
We focused on the ATR signals of 16-2-16 tartrate gels in the range of wavenumber
E
Ey
E
Ez
Ex
Infrared light Infrared light
Perpendicular Polarized Light Parallel Polarized Light

107
1800-1250 cm-1
and 3000-2800 cm-1
. These spectral regions are characterized by the strong
antisymmetric (aCO2-) and symmetric (sCO2
-) stretching modes of the carboxylate groups of
the tartrate at 1606 and 1349 cm-1
, respectively; by the bending modes of methyl (aCH3,
s’CH3andsCH3) and methylene (CH2) groups of amphiphilic cations in the 1500-1410 cm-1
region, and by the antisymmetric (aCH2) and symmetric (sCH2) stretching vibration of the
methylene groups of gemini amphiphiles at 2918 and 2850 cm-1
. The dichroic ratio between
two polarizations was evaluated by aCH2 stretching vibration of hydrocarbon group ay 2918
cm-1
and sCO2- stretching vibration of the carboxylate group of tartrate counter-anion at 1349
cm-1
.
Figure III.15 shows ATR spectrum of chiral tubules with ee = 1 corresponding to the
pure 16-2-16 L-tartrate gel. The value RATR of at aCH2 band showed RATR = 1.5, RATR at aCO2-
and sCO2- band showed 2.2 and 1.9, indicating that the alkyl chains of gemini amphiphiles are
oriented perpendicular to the X-Y plane, whereas the carboxylate groups of tartrate were
oriented isotropically.
Figure III.15 ATR spectra of 16-2-16 L-tartrate amphiphiles (ee = 0).
Figure III.16 describes ATR spectra of the time evolution in molecular environment
correlated to the morphological changes by different ee.

108
Figure III.16 ATR spectra of molecular kinetics from 16-2-16 tartrate amphiphiles with different ee
changes (a) from 1 to “0”, (b) 1 to “-0.33”, (c) 1 to “-0.60”, and (d) 1 to “-0.90” by addition of opposite
chiral D-tartaric acid solution through the 16-2-16 L-tartrate gel.
When ee = “0”, the aCH2 band and the sCO2- band from p polarization decreased
with the time, whereas aCO2- band increased. Here, we focus on the variation of the RATR
values, at first RATR of aCH2 band is 1.46 corresponding to helical morphology, then the RATR
decreased to 1.18 after 4 h. For the RATR at sCO2- band also decreased from 1.81 to 1.49,
however the RATR at aCO2- band increased from 2.30 to 3.00 (Figure III.16 a). These results
indicate that the hydrophobic chains of bilayers and antisymmetric vibration of CO2- of tartrate
ions become more and more oriented parallel to z direction in the Figure III 13 with time
(bilayer is oriented parallel to the ATR window).
For the case of ee = -0.33, the decreasing of RATR value at aCH2 band was much
slower than ee = 0, and finally RATR reached 1.26 after 6 h, while corroborate with the increase
in the twist pitch. The RATR value of sCO2- band did not show an important variation (1.81 to
1.75). But RATR value at aCO2- band increased from 2.30 to 3.10 within 6 h (Figure III.16 b).

109
For ee = -0.60 or -0.90, once the RATR value at aCH2 band decreased to around 1.3 for
several hours, then increased again to RATR > 1.5 within 1 week, the RATR value of sCO2- band
showed final value RATR = 1.8 ~ 1.9 after 1 day. The RATR value of aCO2- band did not show
notable change and remained around 2.3 (Figure III.16 c, d). Globally, the orientation of gemini
tartrate remained close to isotropic organization before and after the morphological transition.
Figure III.17 shows the plot of RATR values of aCH2 and sCO2- and aCO2
- as a
function of time for the different ee. These data showed that for ee = “0” and “-0.33”, the RATR
value of aCH2 band decrease to approximate 1.1 - 1.3 with time, which indicates that the
morphologies of chiral fibers transform from chiral tubules to twisted ribbons or flat ribbons
these bilayers gets more and more oriented parallel to the ATR window, and consequently, the
alkyl chains gets more oriented perpendicular to the ATR window.
Figure III.17 The aging variation of RATR with different value of ee changes at (a) aCH2, (b) sCO2-,
and (c) aCO2-.
For ee = -0.66 and -0.9, RATR values for both aCH2 and sCO2-
went through a
minimum at around 1h, then returned to values close to initial ones (1.5 for aCH2 and 1.8-1.9
for sCO2-).
Figure III.18 describes the relation between kinetics of bilayer orientation (RATR at
CH2) and morphology transition at the surface of ATR crystal. For lower ee (“0” and “-0.33”),
isotropic oriented alkyl chains of bilayers were gradually oriented perpendicular to the X-Y
plane with decreasing the RATR value to approximate 1. This phenomenon is caused by

110
morphology transition to flat ribbon or twist ribbon with long twist pitch, suggesting that these
bilayers tend to orient parallel to the surface of ATR crystal.
Figure III.18 The Schematic illustration of the summarized relation between kinetics of alkyl chains
orientation (RATR) and morphology transition.
For higher ee (“-0.60” and “-0.90”), once RATR value decreased during morphology
transition/re-organization, but finally return back to initial value, because these bilayers rolled
up to twisted and helical ribbons with nanometric twist pitch and alkyl chains were oriented
more isotropically than the case of lower ee.
III.4.2 Supramolecular organization studied by Small Angle X-ray
Scattering (SAXS)
We then studied the kinetics of suparmolecular organization of the 16-2-16 gemini
tartrate amphiphiles during the helicity inversion with ee changes under the hydrated state (100
mM) using Small Angle X-ray Scattering (SAXS) in order to obtain the complementary

111
information.
SAXS is a useful technique for the determination of microscale or nanoscale
structures of several aggregate such as particles, fibers, sheets in terms of such parameters as
size, shape, distribution, and surface-to-volume ratio. SAXS can also give the information of
molecular packing in the bilayers of self-assembled structures, expanding to provide the
information of hierarchical relationship between molecular organization and (~ Å) and
supramolecular structures (nm ~ mm). The average distance (d) between bilayers is roughly
calculated by measurement of the scattering intensities as a radial wave vector q = 4 sin ,
here is the angle between the incident X-ray beam and the detector measuring the scattered
intensity, and is the wavelength of the X-rays which can be expressed by = 2d sin ,
therefore d = 2 q. The scattered intensity I(q) is the product of the form factor P(q) and the
structure factor S(q). The form factor gives the shape of electron density in the aggregates of
amphiphiles, and the structure factor takes into account interactions between the aggregates.
One can write for the SAXS intensity: I(q) = P(q) S(q). When the intensities are from low
concentrations of molecular packing of bilayer in aggregate, the structure factor is equal to 1
and no longer disturbs the detection of the form factor P(q).22
Previously, our group reported the detailed molecular organization of racemic or
enantiomeric 16-2-16 tartrate self-assembled multi-bilayer ribbons in the hydrated state by
X-ray powder diffraction and molecular modeling.23
This study represented the first
demonstration of detailed molecular organisation of a hydrated gel at atomic level. Essential
features of this study include interdigitation of alkyl-chains within each bilayer and networks of
ionic interaction and hydrogen bonds between cations, anions, and water molecules between
bilayers, the repeat distance of which is 30.7 Å (Figure III.17 a, b). The dications in the head
group of gemini amphiphiles are intrinsically achiral but adopt two mirror-image
conformations at their head groups. According to the planar chiral shape of the ethylene spacer
from a top view, these conformations will be noted Z and backward-Z, and both conformations
are found in the ribbons.24
In the racemate (ee = 0) structure, the infinite alternation of domains
between bilayers having D(backward-Z)D(backward-Z) and LZLZ arrays of head groups and

112
tartrate ion is possible without chirality frustration which leads to multi-bilayer ribbons (Figure
III.19 b). In contrast, in the case of a pure enantiomer, only two bilayers can stack, separated by
a domain with a LZLZ array of head groups and tartrate ions.
Figure III.19 (a) Schematic illustrations of molecular packing, (b) the best fitness of organization from
racemic 16-2-16 DL-tartrate and (c) the contact layer between two consecutive gemini bilayers in the
racemate structure (left) and pure enantiomeric structure (right). 24
Figure III.20 shows the SAXS spectra of in situ supramolecular kinetics from 16-2-16
tartrate corresponding to helicity inversion with ee changes by counter-anion exchange. For a
pure enantiomer (ee = 1), we observed broad peak at q ~ 0.185 Å-1
. When ee = “0”, the peak
became much narrower (Bragg peak), i.e., q = 0.17-0.20 Å-1
for 30 min, , then this peak
increased and became sharper with time, suggesting that structure factor appeared strongly as
the enantiomeric double-bilayer tubules transformed to multi-bilayer racemic ribbons (Figure
III.20 a). Finally, the repeat distance of molecular packing was 33.0 Å.
When ee = “-0.33”, the broad band attributed to the form factor was observed until 1 h
corresponding to double-bilayer helical structures. After around 1.5 h the peak attributed to the
structure factor was observed around q = 0.17-0.21 Å-1
, and then this peak became stronger and
narrower for 1 day corresponding multi-bilayer twisted ribbon (Figure III.20 b). Finally, the
repeat distance of molecular packing was 33.4 Å.
For the case of ee = -0.90, no peaks were observed until 1 h. This is probably because
L
D
(a) (c)(b)

113
just after mixing, assembled chiral structures collapsed to non-defined structure accompanying
that the gels became solution. When the amphiphiles were re-assembled to chiral fibers gel
network after 1.5 h, we observed broad peak attributed to the form factor around q = 0.13-0.24
Å-1
, and this peak kept the shape and intensity with time (Figure III.20 c).
Figure III.20 SAXS scattering of in situ supramolecular kinetics from 16-2-16 tartrate amphiphiles
with different ee changes (a) from 1 to 0, (b) 1 to -0.33, and (d) 1 to -0.90 by addition of opposite chiral
D-tartaric acid solution through the 16-2-16 L-tartrate gel.
Figure III.21 The quantified plot of peak sharpness from SAXS signals by full width at half maximum.
Figure III.21 shows the plot of peak sharpness, i.e. full width at half maximum
(FWHM), of SAXS signals as a function of time. The FWHM value decreased much more with
the smaller value of ee, which were strongly depending on the molecular packing of final
morphologies. The finaly FWHM values were reached after 2 h for ee = 0, 4 h for ee = -0.33,

114
and 1.5 h for ee = -0.90.
III.5 Summary
In situ helicity inversion and morphology transition at constant temperature can be
induced simply by the addition of opposite chiral D-tartaric acid solution to tubular gel network
of 16-2-16 L-tartrate. These processes with different ee involve different steps, at the
mesoscopic level (morphology transformation from P to M chiral ribbon), and molecular level
as summarized in Table III.1.
Table III.1 Summary of the kinetics of morphology transitions with different final ee values at
different levels in molecular, supramolecular organization, and at the mesoscopic level.
The kinetics of the variation in molecular orientation of alkyl chains depend on the
final ee. The lower ee shows faster kinetics of bilayer orientation and stacking in molecular
organization. In case of the ee = “0” and “-0.33”, ATR signals showed that the bilayers
orientation changed gradually from parallel to planner direction upon addition of D-tartaric
acid. This phenomenon is cursed by in situ morphology transition: when helical ribbons were
transformed to flat ribbon or twisted ribbon with long twist pitch (> 1000 nm), their alkyl chains
were oriented to perpendicular to the X-Y plane, resulting the bilayers were well attached on the
ATR window. On the other hand, ATR signals of higher ee (“-0.60” and “-0.90”) showed the

115
bilayers were oriented more isotropically than lower ee, which corresponded that these bilayers
rolled up to twisted and helical ribbons with nanometric twist pitch.
From the SAXS results, the case of lower ee showed clear process of periodic
stacking formation, whereas the case of ee = “-0.90”, periodic stacking formation were not
observed. Indeed, the case of ee = “-0.90”, once SAXS signals were disappeared which resulted
from the disappearance of chiral bilayers upon addition of a large excess of D-tartaric acid, and
then, broad peak attributed to the form factor were observed when the amphiphiles
self-assembled chiral structure. On the other hand, for other ees, bilayers existed all the time
and they were spontaneously stacked with in situ transition from helical ribbons to twisted
and/or flat ribbons. The kinetics of bilayer stacking was faster for higher opposite ee (e.g.
“-0.9”).
The different kinetics existed in this system of in situ helix-helix morphology
transition, that is the bilayer stacking and helicity inversion.
In the mesoscopic aspect, the helicity inversion occurs much faster with the higher ee,
indicating that counter-anion exchange occurs much more rapidly with increasing the
additional amounts of opposite chiral acid solution. The faster helicity inversion promoted
much slower increase of twist pitch, which also produced the different final morphologies.
Actually, during nanometric twisted ribbons (pitch < 1000 nm), weak SAX signals of bilayer
stacking were observed.
III.6 In situ Counter-Anion exchange in Gel Network at
equilibrium: effect on the Morphology of Aggregates
We have then investigated the cases for which the gel network of 16-2-16 tartrate was
in contact with residual D and L-tartaric acid solution after counter-anion exchange. The
solution of D-tartaric acid was added to the 10 mM 16-2-16 L-tartrate gel such that their final
quantities were 1, 2, 4 and 20 equivalent with respect to L tartrate in the gel. In this system, the

116
excess of D- and L-tartaric acid solution were kept in samples, and then they were washed away
only just before the TEM and CD measurement at different times (Figure III.22).
Figure III.22 Schematic illustration of gel preparation method.
III.6.1 Morphologies transitions followed by TEM observation
ee = 0
Figure III.18 shows the morphology transition observed by TEM when excess of
tartaric acid solution was added to the gel such that the final ee was 0. The unfolding and pitch
elongation of P-tubular structures also occurred just after addition of D-tartaric acid solution,
after an hour, we also observed inversed M-helical ribbons (Figure III.23 a, b). These P and M
helical ribbons were then transformed to twist ribbons with long pitches (Figure III.23 c-e).
After 4 hours, only M twist ribbons were observed. The pitches of these ribbons continued to
increase and at one week, mostly non-chiral flat ribbons were observed (Figure III.23 f).

117
Figure III.23 TEM images of helicity inversion and pitch elongation steps of tubular network from
16-2-16 tartrate amphiphiles by ee changes from 1 to 0 in the case of 1 equivalent opposite chiral
D-tartaric acid added and stayed in the gel network.
ee = -0.33
Immediately after the addition of D-tartaric acid, tubules transformed to twist
ribbons. After 30 minutes, we observed the mixture of P- and M-twisted ribbons (Figure III.24
a). After an hour, only M-twisted ribbons were observed, the twist pitches increased
continuously from nanometric to micrometric scale around 2 m with time (Figure III.24 b-d).

118
Figure III.24 TEM images of helicity inversion and pitch elongation steps of tubular network from
16-2-16 tartrate amphiphiles by ee changes from 1 to -0.33 in the case of 2 equivalents opposite chiral
D-tartaric acid added and stayed in the gel network.
ee = -0.60
In this case, we observed only M twisted ribbons just after the addition of D-tartaric
acid solution. Again, the twist pitch increased with time, but this increase occurred more slowly
than the case of ee = -0.33 (Figure III.25 a-c). After 1 day, M-twisted ribbon were observed
(Figure III.23 d), but surprisingly, these fibers were aggregated in 2 days, and then only flat
sheet-like structures were obtained (Figure III.25 e, f).

119
Figure III.25 TEM images of helicity inversion and pitch elongation steps of tubular network from
16-2-16 tartrate amphiphiles by ee changes from 1 to -0.60 in the case of 4 equivalents opposite chiral
D-tartaric acid added and stayed in the gel network.
ee = -0.90
For the case of ee = -0.90, chiral fibers re-assembled more quickly than the
non-equilibrium (filteration) case, M-twist ribbons were observed for already at 30 min after
the addition of D-tartaric acid (Figure III.26 a, b). After 6 hours, the morphology of the chiral
ribbons reached final states (Figure III.26 b-d). Their final twist pitches were around 50 nm.

120
Figure III.26 TEM images of helicity inversion steps of tubular network from 16-2-16 tartrate
amphiphiles by ee changes from 1 to -0.90 in the case of 20 equivalents opposite chiral D-tartaric acid
added and stayed in the gel network.
III.6.2 Pitch variation
Figure III.27 shows the plot of variations of twist pitch elongation and helicity
inversion obtained with this system. Comparing to the previous system, the helicity inversion
occurred more quickly but final pitch lengths were simillar. This indicated the counterion
exchange occurred very quickly and even with the “filteration method” the ratios of the two
enantiomers were very close to those obtained with the “equilibrium” method. The case of ee =
-0.60 was a particular case, which showed transformation of ribbons to sheet-like plate
structure after several days. Oda's group has recently shown that the expression of chirality at
mesoscopic level is intimately related to the crystallinity of the system. A certain amount of
flexibility/disorganisation is needed for the chirality expression at tens or hundreds of
nanometer level.25
If the organisation of the molecules is too cristalline, then the expression of
chirality is prohibited. As the gel formation is an out of equilibrium phenomenon, It may rearch

121
the precipitates with platelets directly. Each final pitches of fibers were > 3300 nm ± 2200 nm
for ee = 0, 1700 nm ± 900 nm for ee = -0.33, and 58 nm ± 5 nm for ee = -0.90.
Figure III.27 The aging variation of twist pitches inversion with different value of ee changes.
III.6.3 The chirality transfer followed by CD spectra
The chirality transfer was also followed by CD measurements.
For ee = 0 and -0.33, the CD signals indicated a similar pattern as filtered system
(Figure III.28 a, b) at the beginning, the sign of CD bands from cotton coupling at 201 and 219
nm decreased with time. In the case of ee = -0.33 system (both at equilibrium and
non-equilibrium), the shape of spectrum changed after sometime, and a positive signal
appeared in the range of 190-220 nm due to the scattering by the large ribbons. In the filtered
(non-equilibrium) system, the residual chirality for ee = “0” system was expressed as large P
twist ribbons appeared and a small negative signal was observed at 190-220 nm, whereas in the
equilibrium case with ee = 0, a small quantity of M-twist ribbons were observed along with the
small positive signal at 190-220 nm.
In the case of ee = -0.60 and -0.90 some differences were observed with the filtered
systems. For the case of ee = -0.60, the cotton coupling of CD signs decreased with time as it
was observed with filtered case above, but after about two days, a strong positive signal

122
appeared in 190-220 nm range when the chiral fibers were transformed from nanometric
flexible ribbons to micrometric rigid plate (Figure III.28 c). When ee = -0.90, the CD sign
continuously decreased until about a week.
Figure III.28 CD spectra of 16-2-16 tartrate amphiphiles with different ee changes (a) from 1 to 0, (b) 1
to -0.33, (c) 1 to -0.60, and (d) 1 to -0.90 by addition of opposite chiral D-tartaric acid solution in the
16-2-16 L-tartrate gel, and excess of counter-anion stayed in suspension just before CD measurement.
The variations of CD intensities at = 200 nm with time for different ees are shown in
Figure III.29.
-10
-5
0
5
10
15
20
190 200 210 220 230 240 250
Wavelength (nm)
-10
-5
0
5
10
190 200 210 220 230 240 250
Wavelength (nm)
-10
-5
0
5
10
190 200 210 220 230 240 250
Wavelength (nm)
-10
-5
0
5
10
190 200 210 220 230 240 250
Wavelength (nm)
ee = 0(a)
(c) (d)
ee = -0.33
ee = -0.90ee = -0.60
2 day
ee = 10 min30 min1 h2 h4 h6 h1 day
1 week
2 day
ee = 10 min30 min1 h2 h4 h6 h1 day
1 week
2 day
ee = 10 min30 min1 h2 h4 h6 h1 day
1 week
2 day
ee = 10 min30 min1 h2 h4 h6 h1 day
1 week
(b)

123
Figure III.29 Aging value of CD intensities of []200nm with different ee.
The results of CD measurements in this system also show different behavior from the
filtered systems. The intensities of cotton coupling derived from flexible helical structures are
slightly smaller than the previous systems. On the other hand, the intensities at range of
190-220 nm are stronger. However, it is not yet clear why these different phenomena occur
when the gels are rinsed for different time periods after counter-anion exchange.
III.7 Conclusion
In situ right (P) to left-handed (M) helicity transition in supramolecular aggregates
was observed by counter-anion exchange from L-tartrate to D-tartrate upon introducing the
opposite chiral acid filtered through the pure enantiomeric fiber network at constant
temperature.
The final morphologies were strongly depending on the value of ee changes,
nanometric P tubules (obtained with ee = 1) transformed to micrometric P twisted ribbons
containing flat ribbons (from ee = 1 to “0”), micrometric M twisted ribbons (to ee = “-0.33”),
nanometric M twisted ribbons (to ee = “-0.60”), and nanometric M tubules (to ee = “-0.90”).

124
There are different processes as to how the helicity inversion occurred: from ee = “0” to
“-0.60”, the tubular structures were unwound to helical ribbons at first, which transformed to
twisted ribbons, and then formed flat ribbons (for ee = “0”) then continuously ribbons with
opposite helicity were formed. On the other hand, in the case of ee = “-0.90”, once the fiber
network disappeared first, then re-assembled to form tubules with opposite helicity. In addition,
the speeds of helicity and morphology transitions showed difference of depending on the final
ee.
The ATR and SAXS measurement showed detailed molecular orientation and
packing condition. The ATR signals showed that the bilayers oriented quickly parallel to
planner direction upon addition of D tartaric acid, for ee = “0” and “-0.33”, they formed flat
ribbons or ribbons with long twist pitch, therefore, they remained mainly oriented parallel to the
surface whereas for ee = “0.60” and “-0.90”, these bilayers rolled up to re-form twisted and
helical ribbons. The SAXS signals showed that during the chirality decrease and inversion
observed with ee = “0”, “-0.33”, “-0.60”, bilayer structures remained, (as concluded by the
form factor) whereas for the system with ee = “-0.90”, these bilayers disappeared right after the
addition of D tartaric acid, then re-formed after about an hour. The kinetics of bilayer stacking
is quicker for ee = “0” systems.
Whilst the twist pitches after chirality inversion were similar for the non equilibrium
(filtered) and equilibrium cases, the final morphologies show differences for ee = -0.66 and
-0.9. These in situ morphology transformation is clearly a kinetically controlled phenomenon.
This system shows the first direct visualization of in situ chirality inversion of chiral
supramolecular structures at mesoscopic level (20 nm - microns) basesd on the direct
counterion exchange in solution of the supramolecular (and not macromolecular) chiral fibrous
structures.

125
III.8 Experimental session
Synthesis
The weighing is measured with a balance of precision Metler-Toledo of an accuracy of 0.01 mg
under the air-conditioned part at 22 ˚C. Ultrapure water (18.2 M cm) was obtained from Purelab ultra
ELGA system.
Synthesis of 16-2-16 Br2
The synthesis of 16-2-16 amphiphile with bromide counterion, which is developed by R. Zana et
al., had been proposed via the alkylation of alkanedil--bis (dimethylamine) by alkyl bromides.26
This
synthesis was done by nucleophilic substitution of tetramethylethylenediamine (TMEDA) with a 1-bromo
hexadecane (scheme 2-1).27
The reaction was carried out in the acetonitrile at 80 ˚C under stirring for 48 hours, with refluxing
under inert atmosphere in an assembly with cooling condenser. In order to obtain the surface-active
dialkylated compound without monoalkyl impurity, excess of 1-bromo hexadecan was introduced: the
stoichiometry of the 1-bromo hexadecan starting material must be three times of TMEDA (M = 116.21
g.mol-1
, d = 0.77). In the end of the reaction, the product was filtered to eliminate the excess of 1-bromo
hexadecane, then recrystallized several times by dissolution with a minimum volume of
chloroform/methanol (9/1, v/v) mixture solvent and precipitation with acetone. The successive
recrystallization was carried out until obtaining a white product which will be washed with acetone, then
dried with the high vacuum. The NMR analysis confirmed that the peaks of the gemini (16-2-16) product,
without remaining any more 1-bromo hexadecane intermediate.
Typical example of 16-2-16 Br2 1H NMR (400 MHz, CDCl3, 25 ˚C, ppm): 4.81 (4H, s), 3.72
(4H, s), 3.51 (12H, s), 1.81 (4H, m), 1.25 (m), 0.88 (6H, t, 3J=6.59 Hz)
13C NMR (100 MHz, CDCl3, 25 ˚C,
ppm): 65.98, 56.79, 51.14, 31.98, 29.79, 29.75, 29.66, 29.62, 28.44, 29.42, 26.36, 23.13, 22.75, 14.19
Scheme 2.1 Synthesis of gemini 16-2-16 bromide.28
NN Br C
16H
33 N+
N+
C16
H33
C16
H33
BrBr
+ 2Acetonitrile
48 h, 80 ˚C

126
Synthesis of 16-2-16 L-tartrate
16-2-16 L-tartrate amphiphiles was obtained by ion exchange from complex of bromide counter
anion after in situ formation of silver salt with tartrate in methanol solution (scheme 2-2).11,12,16
The cationic
surfactant with bromide counter-anion as starting compound was synthesized from bromoalkane with
tetramethylethylenediamine.
The L-tartaric acid was mixed with silver carbonate (1 equiv.) to prepare silver L-tartrate in
methanol and the mixture was stirred for 1 h at 25 ˚C. 16-2-16 bromide was added to the solution of silver
L-tartrate and stirred for 30 min at 40 ˚C and filtered on Celite to obtain a colorless solution. After
evaporation of methanol, the product was dissolved in a mixture of chloroform/methanol (9/1, v/v), made
precipitate with acetone, filtered, and dried.
Typical example of 16-2-16 L-tartrate 1H NMR (400 MHz, CDCl3, 25 ˚C, ppm): 4.23 (2H, s),
3.92 (4H, dm), 3.30 (4H, m), 3.10 (12H, d) 1.64 (4H, m), 1.22 (50H, m), 0.81 (6H, t) 13
C NMR (100 MHz,
CDCl3, 25 ˚C, ppm): 178.01, 66.10, 51.30, 32.47, 30.70, 30.53, 30.26, 30.20, 30.02, 29.90, 26.75, 23.23,
14.60
Scheme 2.1 Synthesis of gemini 16-2-16 tartrate.
Transmission electron microscope
A small drop of 16-2-16 tartrate samples in water was deposited on 400-mesh carbon-coated
copper grid. After a few minutes, the excess liquid was blotted with filter paper. These air-dried specimens
were stained by applying a small drop of a 0.2 wt% uranylacetate aqueous solution and removed the excess
solution with a filter paper. The samples were then metallized by platinum (at an angle 10 ˚) using vacuum
chamber (Balzers). The replication was done for 20 sec. TEM observation were performed using a Philips
EM 120 electron microscope operating at 120 kV and the images were collected by 2k × 2k Gatan ssCCD
camera.
N+
N+
C16
H33
C16
H33
BrBr
OHOH
COOHHOOC
+ Ag2CO
3
CH3OH
1 h, 25 ˚C
OHOH
COOOOC Ag+
Ag+ - -
N+
N+
C16
H33
C16
H33
OHOH
COOOOC
CH3OH
1 h, 25 ˚C
- -
+ 2 AgBr

127
Circular dichroism measurement
The circular dichroism measurement was performed on a JASCO J-815 CD spectrometer with data
pitch of 0.1 nm, scanning speed of 100 nm/min, and quartz cuvette with optical path length of 0.1 mm for
nucleoamphiphiles and 1 mm for 16-2-16 tartrate amphipihles were used. The spectra were measured for 10
mM gels.
Attenuated Total Reflection Spectroscopy measurement
The ATR spectra were performed on a NICOLET 6700 FT-IR. The samples were prepared in
Millipore water, at a final concentration of 10 mM. After washing the excess of D and L-tartrate, the liquid of
gels were immediately blotted with filter paper on the ATR plate. The spectra were recorded with parallel (p)
and perpendicular (s) polarization of the incident light with respect to the ATR plate. Generally, the spectra
were registered during 800 scans at resolution of 8 cm-1
and a two-level zero filling. All the orientation
information is then contained in the dichroic ratio RATR = Ap/As, where A represents the absorbance of the
considered band for the p or s polarization of the incident light, respectively.
Small-Angle X-ray Scattering
The experiments were performed on a Rigaku Nanoviewer (Micro-souce generator, MicroMax
007, 800 W rotating anode coupled with a Confocal Maxflux Mirror). The X-ray diffraction patterns were
collected on an intensified CCD (Chip Charge-coupled Device) with a sample to detector distance of 422
mm, at exposure times of 30-45 min. The samples were prepared in Millipore water, at a concentration of 100
mM for 16-2-16 L-tartrate and D-tartaric acid solution were filtered through the gel network such a way that
final ee’s are 0, -0.33, -0.60, and -0.90. These samples were washed by water and removed the water
immediately. Gels were put between two Mylar windows with spacer of 1 mm. The temperature of the
samples was regulated at 20 ˚C unless indicated differently.

128
References
1 (a) D.A. Frankel, D. F. O’Brien, J. Am. Chem. Soc., 1994, 116, 10057-10069. (b) E. Yashima, T.
Matsushima, Y. Okamoto, J. Am. Chem. Soc., 1997, 119, 6345-6359. (c) A. E. Rowan, R. J. M. Nolte,
Angew. Chem., 1998, 110, 65-71; Angew. Chem., 1998, 78, 63-68. (d) J. J. L. M. Cornelissen, M. Fischer,
N. A. J. M. Sommerdijk, R. J. M. Nolte, Science, 1998, 280, 1427-1430. (e) J. H. K. K. Hirschberg, L.
Brunsveld, A. Ramzi, J. A. J. M. Vekemans, R. P. Sijbesma, E. W. Meijer, Nature, 2000, 407, 167-170. (f)
M. Fujiki, Macromol. Rapid Commun., 2001, 22, 539-563.
2 (a) J. P. Hill, W. Jin, A. Kosaka, K. Fukushima, H. Ichihara, T. Shimomura, K. Ito, K. Hashizume, N. IshIII,
T. Aida, Science, 2004, 304, 1481-1483. (b) F. J. M. Hoeben, P. Jonkheijm, E. W. Meijer, A. P. H. J.
Schenning, Chem.Rev., 2005, 105, 1491-1546. (c) W. Jin, T. Fukushima, M. Niki, A. Kosaka, N. IshIII, T.
Aida, Proc. Natl. Acad. Sci. USA, 2005, 102, 10801-10806. (d) A. Ajayaghosh, R. Varghese, S. J. George,
C. Vijayakumar, Angew. Chem., 2006, 118, 1159-1162.; Angew. Chem. Int. Ed., 2006, 45, 1141-1144. (e) Y.
Yan, K. Deng, Z. Yu, Z. Wei, Angew. Chem., 2009, 121, 2037-2040.
3 E. Yashima, Analytical Sciences, 2002, 18, 3-6.
4 V. N. Malashkevidh, R.A. Kammerer, V. P. Efimov, T. Schulthess, J. Engel, Science, 1996, 274, 761-765.
5 J. J. L. M. Cornelissen, M. Fischer, N. A. J. M. Sommerdijik, R. J. M. Nolte, Science, 1998, 280, 1427-1430.
6 (a) G. Maxein, R. Zentel, Macromolecules, 1995, 28, 8438-8440. (b) Q. Li, L. Green, N. Venkataraman, I.
Shiyanovskaya, A. Khan, A. Urbas, J. W. Doane, J. Am. Chem. Soc., 2007, 129, 12908-12909.
7 (a) B. M. W. Langeveld-Voss, M. P. T. Christiaans, R. A. J. Janssen, E. W. Meijer, Macromolecules, 1998,
31, 6702-6704. (b) H. Goto, Y. Okamoato, E. Yashima, Macromolecules, 2002, 35, 4590-4601. (c) W.
Peng, M. Motonaga, J. R. Koe, J. Am. Chem. Soc., 2004, 126 ̧13822-13826. (d) S. Sakurai, K. Okoshi, J.
Kumaki, E. Yashima, J. Am. Chem. Soc., 2006, 128 ̧ 5650-5651. (e) R. S. Johnson, T. Yamazaki, A.
Kovalenko, H. Fenniri, J. Am. Chem. Soc., 2007, 129 ̧5735-5743.
8 (a) J. R. Koe, M. Fujiki, M. Motonaga, H. Nakashima, Chem. Comm., 2000, 389-390. (b) M. Fujiki, J. Am.
Chem. Soc., 2000, 122 ̧3336-3343. (c) T. Hasegawa, K. Morino, Y. Tanaka, H. Katagiri, Y. Furusho, E.
Yashima, Macromolecules, 2006, 39, 482-488. (d) K. Nagai, K. Maeda, Y. Takeyama, T. Sato, E. Yashima,
Chem Aian J., 2007, 129, 12908-12909. (e) N. Delsuc, T. Kawanami, J. Lefeuvre, A. Shundo, H. Ihara, M.
Takafuji, I. Huc, ChemPhysChem, 2008, 9, 1882-1890.
9 Y. Li, H. Wang, L. Wang, F. Zhou, Y. Chen, B. Li, Y. Yang, Nanotechnology, 2011, 22, 135605.
10 (a) E. Yashima, Y. Maeda, Y. Okamoto, J. Am. Chem. Soc., 1998, 120 ̧ 8895-8896. (b) K. Morino, K.
Maeda, E. Yashima, Macromolecules, 2003, 36, 1480-1486. (c) E. Yashima, K. Maeda, Y. Furusho, Acc.
Chem. Res., 2008, 41, 1166-1180.
11 R. Oda, I. Huc, S. J. Candau, Angew. Chem. Int. Ed., 1998, 37, 2689-2691.
12 R. Oda, I. Huc, M. Schmuts, S. J. Candau, F. C. Mackintosh, Nature, 1999, 399, 566-569.
13 R. Oda, Molecular Gels Kluwer Academic Publishers, Dordrecht, The Netherlands 2005.

129
14
Damien Berthier, Chiralité, Amphiphiles et Polymères., Thesis of Doctrante, Bordeaux 1 Unversity, 2002.
15 Aurélie Brizard, Confinement de Contre Ions Tartrate et Oligo-Peptidiques sur des Membranes
Cationiques., Thesis of Doctrante, Bordeaux 1 Unversity, 2005.
16 Carole Aimé, Auto-Assemblages Chiraxu d’Asmphiphiles Cationique., Thesis of Doctrante, Bordeaux 1
Unversity, 2007.
17 A. Brizard, C. Aimé, T. Labrot, I. Huc, D. Berthier, F. Artzner, B. Desbat, R. Oda, J. Am. Chem. Soc., 2007,
129 ̧3754-3762. 18
Carole Aimé, Auto-Assemblages Chiraxu d’Asmphiphiles Cationique., Thesis of Doctrante, Bordeaux 1
Unversity, 2007.
19 D. Berthier, T. Buffeteau, J. M. Léger, R. Oda, I. Huc, J. Am. Chem. Soc., 2002, 124, 13486-13494.
20 A. Brizard, D. Berthier, C. Aimé, T. Buffeteau, D. Cavagnat, L. Ducasse, I. Huc, R. Oda, Chiraliy, 2009,
21, 153-162.
21 (a) N. J. Everall, A. Bibby, Appl. Spectrosc, 1997, 51, 1083-1091. (b) I. Cornut, B. Desbat, J. M. Turlet, J.
Dufourcq, Biophysical Journal, 1996, 70, 305-312. (c) F. Picard, T. Buffeteau, B. Desbat, M. Auger, M.
Pézolet, Biophysical Journal, 1999, 76, 539-551. (d) T. Buffeteau, E. Le Calvez, B. Desbat, I. Pelletier, M.
Pézolet, J. Phys. Chem. B, 2001, 105, 1464-1471. (e) E. Hutter, K. A. Assiongbon, J. H. Fendler, D. Roy,
J. Phys. Chem. B, 2003, 107, 7812-7819.
22 (a) A. Guinier, G. Fournet, Small Angle Scattering of X-rays, Wiley, New York, 1995. (b) C. Petit, A. Taleb,
M. P. Pileni, J. Phys. Chem. B, 1999, 103, 1805-1810.
23 R. Oda, F. Artzner, M. Laguere, I. Huc, J. Am. Chem. Soc., 2008, 130, 14705-14712.
24 A. Brizaed, C. Aimé, T. Labrot, I. Huc, D. Berthier, F. Artzner, B. Desbat, R. Oda, J. Am. Chem. Soc., 2002,
129, 3754-3762.
25 R. Kiagus-Armad, A. Brizard, C. Tang, R. Blatchly, B. Desbat, R. Oda, Chem. Eur. J., 2011, 17,
9999-10009.
26 R. Zana, M. Benrraou, R. Rueff, Langmuir, 1991, 7, 1072-1075.
27 R.Oda, I. Huc, S. J. Candau, Chem. Commun., 1997, 2105-2016.
28 J. Israelachvili, Intermolecular & Surface Forces, 2
nd.; Academic Press : London, 1992.

130

131
Chapter IV
Mineralization through bio-inspired materials:
Bibliographic study

132

133
IV.1 Introduction
In nature, there are numerous examples of exceptionally strong building materials
formed by organic-inorganic assemblies. This organization widely exists in the skeletons of
animals or plants, and plays a key role in expressing the biological functions. These materials
often show the complex hierarchical organization from the nanometric to macroscopic scales.1,2
For example, the deepwater sponge Pheronema raphanus gives on the macro-, micro- and
nanoscle of the hierarchical organization composited with organic matrix and silicon oxide
(Figure IV.1).
Figure IV.1 Example of hierarchy of organization. Deepwater sponge Pheronema raphanus gives
different aspect. Macroscale: (a) common view of sponge, (b) fragment of surface sponge body, and (c)
pentactinal spicule. Microscale: (d) ringlike structure of the transversal cut of spicule after treatment
to remove the organic matrices and (e) local area. Nanoscale: (f) Silicon oxide nanoparticles.3

134
These types of structures are well known examples of biomineralization formed by
organic template. However, the influence of the template morphologies on the mechanism of
structure formation is not well understood.
In recent years, much effort has been directed towards developing organic/inorganic
hybrid materials to mimic and understand the complex structure-property relationship of their
natural counterparts. The biomimetic mineralization from synthesized organic template has a
possibility to engineer complex architectures starting from nanometric regime (“bottom-up”
fabrication). One such method is inspired from the self-assembled organic systems, which can
form various structures, which can be used as templates for inorganic nanomaterials formation.
Particularly, there have been many reports of silica based materials with controllable shapes and
porosity, generated from organic templates.
In this chapter, we will first discuss about mineralization observed in nature followed
by representative examples of biomimetic mineralizations to show the present advances in the
design of functional nanomaterials. In the context of our work on silica based mineralization
studies, we shall put special emphasis on the literature on sol-gel silicification onto
self-assembled organic templates, which can produce tunable shapes.
IV.2 Study of biomineralization
Biominerals are composites of hard materials (inorganic minerals) and soft materials
(organic macromolecules) that perform a variety of roles in organisms of protection, skeletal
support, and sensory detection.4 These specialized structures are the products of cooperative
interactions between biomolecules and mineral-forming ions secreting into a
membrane-delineated or extracellular space.5

135
Figure IV.2 shows selected examples of the diversity of inorganic materials present in
the living world.
Figure IV.2 Examples of biological mineralization. (a) Seashell and SEM image of flat polygonal
crystals of aragonite that make up gastropod nacre,6 (b) TEM image of fractured section of cuttlefish
bone showing lamellar and columnar-structure containing aragonite crystals,8 (c) lobster homarus
americanus and SEM image of exoskeleton composed by chitin layer and CaCO3,10 (d) TEM image of
cell of a typical magnetotactic bacterium containing the chain of magnetic crystals,12
and (e) TEM
image of extracellular lorica formed by the unicellular choanoflagellate with the basket consists of
curved silica rods.16
Calcium carbonate is one of the most common minerals as a component of many
inorganic/organic hybrid materials in nature. For example, the inner shell layer of mollusks
shows iridescent luster (Figure IV.2 a). This luster results from specific inorganic-organic
crystalline structures, which is called nacre as well-known as mother of pearl. Nacre is
composited by arranged layers of polygonal aragonitic platelets (CaCO3) with around 5-15 m
in wide and 0.5 m in thickness, which are separated by sheets of interlamellar organic matrices
such as chitin, lustrin, and proteins.6 , 7
Cuttlefish bones are also composed primarily of
aragonite, that micrometric structure consists of narrow layers connected by numerous upright
pillars (Figure IV.2 b).8 The exoskeleton of crustacean is also a multiphase biological
(b)
(a) (c)
(d) (e)

136
composite material which consists of an organic matrix (crystalline a-chitin fibers and
non-crystalline proteins) and CaCO3 minerals (typically crystalline calcite and amorphous
CaCO3) (Figure IV.2 c).9,10
Another example, magnetotactic bacteria have unique intracellular structures called
magnetosomes11
, which comprise magnetic mineral crystals surrounded by a lipid bilayer
membrane about 3-4 nm thickness (Figure IV.2 d).12
These bacteria usually mineralize either
iron oxide magnetosomes, which contains crystals of magnetite (Fe3O4)13
or iron sulphide
magnetosomes, which contain crystals of greigite (Fe3S4)14
. Overall, magnetosome crystals
show high chemical purity, narrow size ranges, specific crystal morphologies and exhibits
specific arrangements within the cell.15
These magnetic crystals have often been playing the
natural sensors within the cell.
Silicon dioxide (SiO2) is also an important mineral for building the functional hybrid
structures. For example, the baschoanoflagellate has extracellular basket-like cage, called a
lorica, comprised of a two-layered arrangement of siliceous costae made up of rod-shaped units
of approximately equal length (Figure IV.2 e).16
This structure is sufficiently bulky to resist the
locomotory effects of flagellar activity.17
As illustrated through the examples shown above, biomineralization produces
organic/inorganic composite materials, which are used by biological organisms to carry out
different functions. The inorganic/organic composite materials from various minerals have
important functions in biological organism. Table IV.1 shows the main inorganic minerals that
participate in the biomineralization and can express the biological functions in organism.18
Calcium carbonate (CaCO3) is commonly known minerals which has three different
crystal formations, calcite, aragonite, and vaterite, and also has amorphous formation.
Especially, two crystals (calcite and aragonite) are the main components for biomineralization
in the organism (such as some animal bones, seashell, trilobite, etc…), that can be applied to the
function such as extraneous protection, skeleton support, and eye lens.

137
Calcium phosphate and calcium oxalate are also distributed widely in biological
organism with expressing the numerous functions such as exoskeletons and calcium store. The
skeleton support is also deposited by silicon oxide that forms amorphous glass.
Other examples, minerals are also put to special uses as gravity balance device
(CaCO3, CaSO4, and BaSO4), cellular support (SrSO4), magnetic sensor in magnetotactic
bacteria (Fe3O4) and iron storage and mobilization (Fe2O3 · nH2O).
Table IV.1 The organism and function of the main inorganic materials found in biological systems.
According to the review by Mann (1988).18
Mineral Formula Organism Function
Calsium carbonate
Calcite CaCO3
Algae Exoskeletons
Trilobites Eye lens
Aragonite CaCO3
Fish Gravity device
Molluscs Exoskeletons
Vaterite CaCO3 Ascidians Spicules
Amrphous CaCO3 • nH2O Plants Ca store
Ca phosphateHydroxyapatite Ca10(PO4)6(OH)2
Vertebrates Endoskeletons
Teeth Ca store
Octa-calcium Ca8H2(PO4)6 Vertebrates Precursor
Calcium OxalateWhewellite CaC2O4 •H2O Plants Ca store
Weddellite CaC2O4 • 2H2O Plants Ca store
Group IIA metal sulphates
Gypsum CaSO4 Jellyfish larvae Gravity device
Barite BaSO4 Algae Gravity device
Celestite SrSO4 Acantharia Cellular support
Silicon dioxide Silica SiO2 • nH2O Algae Exoskeletons
Iron oxides
Magnetite Fe3O4
Bacteria Magnetotaxis
Chitons Teeth
Goethite -FeOOH Limpets Teeth
Lepidocrocite g-FeOOH Chitons (Mollusca) Teeth
Ferrihydrite 5Fe2O3 • 9H2O Animals and plants Fe storage proteins

138
The organic macromolecules play an important role in the control of mineral growth,
such as crystal morphology and aggregation. However, the most of molecular interactions in
hierarchy levels of growth of mineralization are not well understood.
IV.3 Study of biomimetic mineralization19
For the design of inorganic/organic biomimetic materials, the main aim is not only to
simply emulate a particular biological architectures and systems, but also to elucidate the
mechanistic intricacy involved in these processes, ideas, and use such knowledge for the
preparation of new synthetic materials and devices.20,21
The exploration and application of
bio-inspired synthetic strategies have resulted in the generation of complex materials with
specific size, shape, orientation, composition, aggregation and hierarchical organization.
The control of crystallization in biomimetic mineralization relies on nucleation and
tuning of crystal shapes by morphological control of soft materials as template.
IV.3.1 Nucleation and process of crystallization
The control of nucleation plays an important role as the first step for building up the
inorganic/organic complex structures in biomineralization.
The typical theory of nucleation process is the spontaneous formation of spherical
molecular clusters that continue to grow only when the size-depending free energies is larger
than the threshold value of critical radius.22
This model shows the possibility to predict the size
of critical nucleus, associated activation energy, nucleation rate, and dependence on
supersaturation. The structure and composition of nucleation are considered to bulk crystalline
phase, the formation of subcritical supramolecular complexes and multi-step assembly of large
unit cell structures.23
Recently, Jiang et al. reported the nucleation mechanism of hydroxyapatite (HAP,
Ca10(PO4)6(OH)2) nanocrystals in the presence of chondroitin sulphate (ChS) from the view

139
point of kinetics, interfacial structure, and properties of strong interaction between ChS and
calcium.24
By adsorption of ChS on the surface of substrate, highly oriented HAP crystals can
be obtained. This work contributes to an understanding of the fundamental mechanism of
biomineralization on self-assembled structures.
Figure IV.3 shows the classical and non-classical crystallization process. In the
classical process, nucleation clusters grow to form primary nanoparticles which are amplified
to a single crystal (Figure IV.3 a). This particle can also assemble with mesoscale to form an
iso-oriented crystal, where the nanocrystalline building units can fuse to form a single crystal
(Figure IV.3 b). If primary nanoparticles are modified by polymer or other additives before
amplification or assembly, they can form the mesocrystal which can even form from pure
nanoparticles (Figure IV.3 c). There is also a possibility that amorphous particles are formed,
which can transform before or after their assembly to complex morphologies (Figure IV.3 d).
Figure IV.3 Schematic illustration of crystallization pathway with (a, b) classical and (c, d)
non-classical method.19,25

140
IV.3.2 Study of organic template towards morphological control of minerals
In this section, we shall stress upon the role of the organic template in the control of
the crystallization of the inorganic mineral. The performance of soft materials (organic part) as
a template is important factor in order to design the mineral formation to mimic the
biomineralization process. There are many reports in the literature on this study, for example,
metal nanostructures (e.g. Ag, Ni, Co, Au nanowires) on peptide nanotubes26,27,28,29
or amyloid
fibers,30
and Pr particle chains on DNA.31
Even whole self-assembled bacterial superstructures
can be applied to template superstructures of organic/inorganic hybrids such as silica,
magnetite, and cadmium sulfate which are incorporated into the bacterial structures.32
Similarly, pollen grains can be used as the biotemplates for complex with inorganic replications
such as calcium carbonate and phosphate, ailica, and titanina via sol-gel condensation.33,34
Self-assembled Langmuir monolayers obtained by amphiphilic molecules are also
important template because the molecular density of a monolayer is easily controlled at
air-water interface with a Langmuir film balance.
Volkmer et al. have reported that controlled precipitation of CaCO3 obtained by the
monolayers of calixarenes and resorcarenes.35
This method describes that higher charge density
of Langmuir monolayer produce the polymorph and crystal orientation under the monolayer,
rather than the geometrical arrangement of the ionic group of monolayers.
In 1986, Mann et al. have demonstrated the use of phospholipid unilamellar vesicles
as the organic template for the membrane-mediated growth of iron oxide crystals.36
They found
that the lipid vesicles not only acted as passive hosts to enclose mineralization reactions, but
also strongly influenced the growing mineral phase through the molecular recognition of
chemical, electrostatic, and chiral complementarity. However, the mineral formation inside of
vesicles was still quite difficult.
More recently, Yang et al. performed the crystallization process of CaCO3 on a
negatively charged stearic acid monolayer37
or phospholipid monolayer38
at air-water interface

141
where final calcite crystals were obtained by the direct transformation from amorphous CaCO3
particle precursor. By adjusting the surface pressure of lipid monolayers, the shape and size of
crystals can be controlled (example in Figure IV.4).
Figure IV.4 SEM images of CaCO3 particles collected under the phospholipid monolayer at different
surface pressures (a) 0 mN/m, (b) 2 mN/m, (c) 25 mN/m, and (d) 40 mN/m.38
In 2009, Pouget et al. have directly visualized development of crystal formation that
nanoscopic prenucleation clusters of amorphous calcium carbonate (ACC) could organize
spontaneously to polycrystalline structure.39
They have developed template-directed ACC
formation by using cryotransmission electron microscopy (cryo-TEM). The mineralization was
performed on organic template of stearic acid monolayer.40
In the beginning of few minutes, prenucleation clusters with 0.6 ~ 1.0 nm diameters
were observed (Figure IV.5 a, step 0). These clusters were immediately organized to nucleation
of amorphous nanoparticles (around 30 nm) (Figure IV.5 b, step 1). Those particles were
adsorbed on the surface of organic template, continuously the ACC particles grew and clustered
at the surface of organic media (Figure IV.5 c, step 2). Next, randomly oriented nanocrystalline
domains were formed inside of amorphous particles (step 3, 4), then crystalline domains were
oriented at the interface of monolayer (step 5) and develop into a single crystal with critical size
with 300-500 nm (Figure IV.5 d, step 6).
Diffraction patterns of particles also showed the development of crystallinity during
mineralization. As increasing the crystalline domains, the amorphous parts gradually
disappeared.

142
Figure IV.5 (a-d) Cryo-TEM images of the early, intermediate, and mature stages, and (e) diffraction
patterns marked in (b) to (d). (f) Schematic illustration of the mineralization steps on the interface of
organic matrix.39
By stabilization of nucleation of amorphous particles at the interface of organic
templates, template-directed mineral formation provides possibility to control the size and
shapes of inorganic materials in biological as well as in synthetic systems.
In the next section, we will mention the demonstration that self-assembly protocol of
small organic molecules is an extremely powerful tool to generate mineralized structures with
controllable shapes, and, possibly, with engineered functions.

143
IV.4 Chiral silica via sol-gel polycondensation from self-assembled
organic template
The self-assembled structures of amphiphilic molecules are attractive candidates for
utilization as organic templates due to their various shapes and controllable kinetics in their
supramolecular aggregates (studied above in chapter I). Especially, the formation of amorphous
silicon oxide has been reported through the sol-gel polycondensation from chiral
supramolecular structures of amphiphiles as template. In this section, we will present the
silicification method and some examples.
In 1998, Shinkai reported that sol-gel polycondensation of TEOS in the presence of
cholesterol could transcribe to replica of silica fibrous structure.41
Since this work, Shinkai has
made a particularly important contribution to this field using the gels as a medium to the design
of various silica morphologies, such as fiber-linear,42
the lamella,43
helical fibers44
and
spherical structures.45
In this section, we focus on the chiral silica architectures obtained by organic template
from self-assembled chiral supramolecular structures via sol-gel polycondensation and
developing the control of inorganic shapes.
IV.4.1 Polymerized silica by sol-gel polycondensation method
Silicon alkoxides (Si(OR)4) are ideal chemical precursor for sol-gel synthesis because
they react readily with water. The polymerization has several steps, the first reaction is called
hydrolysis, because a hydroxyl ion becomes attached to the silicon atom as follows:
Si(OR)4 + H2O → HO-Si(OR)3 + R-OH
Continuously, (OH)–Si-(OR)3 would be polymerized to link together in a
condensation reaction to form a siloxane (Si–O–Si) bond:

144
(RO)3-Si-OH + HO-Si-(OR)3 → (RO)3-Si-O-Si-(OR)3 + H2O
or
(RO)3-Si-OR + HO-Si-(OR)3 → (RO)3-Si-O-Si-(OR)3 + R-OH
Thus, polymerization is associated with the formation of a 1, 2, or 3- dimensional
network of siloxane (Si–O–Si) bonds accompanied by the production of H-O-H and R-O-H
species.
Tetraethoxysilane (TEOS) is the most common chemical precursor for sol-gel
polycondensation, which is negatively charged after prehydrolysis step. Sol-gel process
requires the presence of an acceptor site links hydrogen, or positive charges. Thus, the cationic
surfactants based on quaternary ammonium have been frequently used as organic template.46
The driving force of organization is the presence of cationic charges on the amphiphiles,
resulting in the containment of anionic silica precursors on contact with the surface of bilayer.
By addition of aminosilane or quaternized aminosilane as a co-structure-directing agent,
anionic surfactant can be also used for the organic templates.47
IV.4.2 Morphology control of chiral silica nanofibers
Chiral silica morphologies based on the organic template of self-assembled chiral
amphiphiles can be tuned by various factors such as mechanical strength, and control of
kinetics of sol-gel transcription process by physical or chemical properties.
In 2004, Che has presented the mesoporous silica structure with twisted hexagonal
rod-like morphology by using amino acid-based surfactant as template, TEOS and aminosilane
as inorganic sources (Figure IV.6).47

145
Figure IV.6 (a) SEM and (b, c) TEM images of chiral mesoporous silica.47
More recently, Che and his co-workers have demonstrated how to control the
morphology of this inorganic architecture. The shape and size control were produced by various
stirring rates during sol-gel polycondensation under the various stirring rates (Figure IV.7).48
Figure IV.7 TEM images of chiral mesoporous silica synthesized at various stirring rates (a) 200 rpm,
(b) 400 rpm. (c) 600 rpm, and (d) 800 rpm.48
When the starring rate was lower than 300 rpm, the sample showed various twisted
ribbon-like structures that the length of hexagonal rods ranged from several micrometers to 20
µm and outer diameters varied from 50 to few hundred nanometers. By increasing the stirring
rates, the morphologies became uniformly twisted rod-like with a hexagonal cross-section and
the length of the rods decreased whilst their diameter increased, respectively. This method
suggests that stirring can be used as a convenient tool for controlling not only the size and shape
of chiral particles but also the chiral structure and helical pitch length for preparation of
inorganic architectures.

146
The shapes and size are also controlled by the different reaction condition of solvent.
For example, Yang et al. constructed different shapes of mesoporous silica nanofibers based on
cationic surfactant as template and TEOS as silica precursor in the presence of ammonia as
catalyst. The shapes of these nanofibers could be tuned by tunable by changing the solvent ratio
(2-propanol/water) as well as the concentration of NH3 (Figure IV.8).49
Figure IV.8 (a, b, c, d, f) FESEM and (e) TEM images of calcined nanostructured silica prepared in a
mixture of NH3aq. and 2-propanol.49
On increasing the volume ratio of 2-propanol to water, helical silica morphologies
transformed from worm-like to straight fibers with decrease of helicity (Figure IV.8 a, c, d).
This phenomenon was probably due to the high solubility of surfactant in alcohol which
probably promoted the less chirality in supramolecular assembly during transcription. On
increasing the NH3 concentration, the morphological shapes of silica changed from
single-stranded helical nanofibers (Figure IV.8 d, e) to twisted ribbons (Figure IV.8 f).

147
More recently, Yang et al. have also reported the preparation of tunable morphology
of chiral biphenylene-silica by different ratio of ethanol/water solvent.50
The chiral silica
obtained by using amino acid-based surfactant as template and
4,4’-bis-(triethoxysilyl)-1,1’-biphenyl as silica precursor. In this case, the lower ethanol/water
volume ratio (1 : 4) provided twisted ribbons, whereas higher ratio (1 : 1.5) provided helical
ribbons (Figure IV.9).
Figure IV.9 (a, c) FESEM and (b, d) TEM images of chiral biphenylene-silica prepared in a mixture of
ethanol/water solution: (a, b) 1 : 4 and (c, d) 1 : 1.5.50
Hung et al. have successfully fabricated single and double helical silica nanofibers by
using single-chain amphiphile composed by butyl, azobenzene group, and sugar moiety
(C4AG) as organic template and TEOS silica precursor.51
Generally C4AG can form double
helices, therefore, double helical silica nanofibers were obtained via sol-gel polycondensation
(Figure IV.10 a, b). Interestingly, upon decoupling the double helices of C4AG system with
cationic surfactant such as cetyltrimethylammonium bromide (CTAB), single helical silica
nanoribbons could be obtained (Figure IV.10 c, d). In the later case, the silica source might be
adsorbed to the single helical organic template by electrostatic force between the positively
charged CTAB (Figure IV.10 e).

148
Figure IV.10 TEM images of (a, b) double helical and (c, d) single-stranded silica nanofiber. (e)
Possible scheme of helical silica formation in the system of C4AG/CTAB.51(a)
The work on sol-gel transcription of silica morphologies obtained by gel network of
cationic bis-quaternary ammonium gemini surfactants with tartrate counter-anion began early
2000, the project was a collaboration between Oda's group and the group of Shinkai. They have
successfully transcribed the chiral ribbons based on self-assemblies for which the chirality was
controlled by enantiomeric excess (ee) of organic molecules (ee = 1 means pure enantiomer
with gemini L-tartrate). The replication protocol used in this work consisted in mixing the
gemini and the silica precursor (TEOS, 4.6%) in the presence of benzylamine (2.3%) as catalyst
in mixture of water/pyridine (1 : 1). When the ee was decreased from 1 to 0.2, the twist pitches
of inorganic fibers increased (Figure IV.8).52
However, these twist pitches were smaller than
those organic twisted ribbons because shrinkage of silica fibers may have occurred during the
calcination process.

149
Figure IV.8 SEM images of chiral silica fibers with different helical pitch obtained by varying ee of
gemini tartrate gel as organic templates.52
Few years later, Delclos, Aimé et al. have reported the detailed study on the
morphological control of the hybrid gemini-tartrate system. They have shown that not only the
twist pitch of these hybrid nanosystems can be controlled by ee, their shapes are tunable
between twisted, helical ribbons or tubes. Various parameters such as temperature, solvent or
reactant concentrations can have distinct and opposite effects on their structures.
They have also shown that the relative kinetics of the organic assembly formation on
one hand and the inorganic polycondensation on the other hand have remarkable effects on the
final morphologies of the inorganic nanostructures.53
As an example, Figure IV.9 shows the
transmission electron microscopy (TEM) image of the organic tubes and their silica
nanoreplicates illustrating how the morphologies of silica replicates strongly depend on the
aging time of the organic template. Even if only 3 days are needed for the organic gels to form
organic nanotubules, it should be noted that 5 day aged organic gel transcribed into twisted
ribbons whereas 21 day aged ones underwent a morphological change to helical silica ribbons.
It was only when the gels were aged for longer than 45 days that the resulting inorganic fibers
kept their tubular structures. The average diameter of an inorganic helix is 25 nm, and the length
is of the order of micrometer.

150
Figure IV.9 TEM images of the morphology of inorganic ribbons obtained by transcription of organic
16-2-16 L-tartrate gels obtained after various parameters, particularly aging times of organic gels can
promote the tunable shape such as twisted (5 days), helical ribbons (21 days), and tubes (45 days).53
IV.5 Conclusion
In nature, there exist numerous examples of bioominerals, which are usually
composites of hard inorganic and soft organic materials in highly organized formation with
attractive shapes, structures, and functions. These biomineralized structures perform important
functions in the organisms. Scientists have long been inspired to mimic these processes, in
order to design new hybrid materials with easy synthetic access, and possibly to achieve new
functions, alongside the ones already displayed in the natural world. The natural
organic/inorganic hybrid structures provide numerous inspirations for designing of noble
synthesized hybrid materials.
Numerous organic templates have been studied, among them, self-assembled
supramolecular structures from amphiphilic molecules are particularly fascinating organic
templates due to their easily tunable shape, size and kinetics.
In recent years, many researchers have demonstrated chiral inorganic structures based
on the chiral surfactants as organic template and tetraethoxysilane as silica precursor via sol-gel

151
polycondensation. The shape and size of chiral silica are controlled in the process of
transcription from organic template by several parameters such as mechanical stress, solvent,
temperature, purity, enantiomeric excess etc.
Our group has demonstrated that chiral silica structures with selective formations can
be successfully transcribed from organic gel network of gemini tartrate amphiphiles. The
shapes, such as twisted, helical ribbon to tubular structure, are controlled by simply changing
the temperature of replication, the presence of additives, ee control, gel concentration, and
kinetics of mineralization depending on the gel aging time. These inorganic architectures can
find potential applications as enantioselective catalyst, as well as attractive immobilization
supports for biomolecules, chemicals, and inorganic nanoparticles.
In the next chapter, we will discuss the organization of noble metal nanoparticles
using chiral silica structure as inorganic template, and their optical properties.

152
References
1 J. Aizenberg, J. C. Weaver, M. S. Thanawala, V. C. Sundar, D. E. Morse, P. Frattzl, Science, 2005,309,
275-278.
2 S. S. Voznesenskiy, Y. N. Kul’chin, A. N. Galkina, Nanotechnologies in Russia, 2011, 6, 43-78.
3 S. S. Voznesenskii, A. N. Galkina, Yu. N. Kul’chin, A. A. Sergeev, Nanotechnologies in Russia, 2010, 5,
142–152.
4 H. A. Lowenstam, Science, 1981, 211, 1126-1131.
5 S. Mann, Biomineralization: Principles and concepts in bioinorganic materials chemistry, Oxford
University Press, 2001.
6 L. Addadi, S. Weiner, Nature, 1997, 389, 912-915.
7 (a) F. Nudelman, B. A. Gotliv, L. Addadi, S. Weiner, J. Struct. Bio., 2006, 153, 176-187. (b) B. J. F. Bruet,
H. J. Qi, M. C. Boyce, R. Panas, K. Tai, L. Frick, C. Ortiz, J. Mater. Res., 2005, 20, 2400-2419.
8 S. Mann, Nature, 1993, 365, 499-505.
9 (a) H.A. Lowenstam, Science, 1981, 211, 1126–1131. (b) S. Weiner, L. Addadi, J. Mater. Chem., 1997, 7,
689–702. (c) S. Mann, J. Mater. Chem., 1995, 5, 935-946. (d) G. Falini, S. Albech, S. Weiner, L. Addadi,
Science, 1996, 271, 67-69.
10 D. Raabe, P. Romano, C. Sachs, H. Fabritus, A. Al-Sawalmih, S. B. Yi, G. Servos, H. G. Hartwig, Mater.
Sci. Eng. A, 2006, 421, 143-153.
11 D. L. Balkwill, D. Maratea, R. P. Blakemore, J. Bacteriol., 1980, 141, 1399–1408.
12 D. A. Bazylinski, R. B. Frankel, Nature Reviews Microbiology, 2004, 2, 217-230.
13 R. B. Frankel, R. P. Blakemore, R. S. Wolfe, Science, 1979, 203, 1355–1356.
14 (a) M. Farina, D. M. Esquivel, H. G. P. Lins de Barros, Nature, 1990, 343, 256–258. (b) S. Mann, N. H. C.
Sparks, R. B. Frankel, D. A. Bazylinski, H. W. Jannasch, Nature, 1990, 343, 258–260. (c) B. R. Heywood,
D. A. Bazylinski, A. J. Garratt-Reed, S. Mann, R. B. Frankel, Naturwiss., 1990, 77, 536–538.
15 D. A. Bazylinski, ASM News, 1995, 61, 337–343.
16 B. S. C. Leadbeater, Protoplasma, 1979, 98, 311-328.
17 (a) P. Andersen, Mar. Microbial. Food Webs, 1989, 3, 35–50. (b) B. S. C. Leadbeater1,Y. QiBin Yu, J.
Kent, D. J. Stekel, Proc. R. Soc. B, 2009, 276, 3-11.
18 S. Mann, Nature, 1988, 332, 119-124.
19 A. W. Xu, Y. Ma, H. Colfen, J. Mater. Chem., 2007, 17, 415-449.
20 E. Dujardin, S. Mann, Adv. Mater., 2002, 39, 3392-3406.
21 C. Sanchez, H. Arribat, M. M. Giraud-Guille, Nature Mater., 2005, 4, 277-288.
22 (a) D. H. Everett, Basic Principles of Colloid Science, Royal Society of Chemistry, London, 1988. (b) O.
Sohnel, J. Garside, Precipitation, Butterworth-Heinemann, Oxford, 1992.
23 H. Colfen, H. Schnablegger, A. Fischer, F. C. Jentoft, G. Weinberg, R. Schlogl, Langmuir, 2002, 18,

153
3500-3509.
24 H. D. Jiang, X. Y. Liu, G. Zhang, Y. Li, J. Biol. Chem., 2005, 280, 42061-42066.
25 H. Colfen, S. Mann, Angew. Chem., Int. Ed., 2003, 42, 2350-2365.
26 T. Klaus, R. Joerger, E. Olsson, C. G. Granqvist, Proc. Natl. Acad. Sci. U. S. A., 1999, 96, 13611-13614.
27 M. Knez, A. M. Bittner, F. Boes, C. Wege, H. Jeske, E. Maiss, K. Kern, Nano Lett., 2003, 3, 1079–1082.
28 R. Djali, Y. Chen, H. Matsui, J. Am. Chem. Soc., 2002, 124, 13660-13661.
29 M. Reches, E. Gazit, Science, 2003, 300, 625-627.
30 T. Scheibel, R. Pharthasarathy, G. Sawicki, X. M. Lin, H. Jager, S. L. Lindquist, Proc. Natl. Acad. Sci. U.
S. A., 2003, 100, 4527-4532.
31 M. Mertig, L. Colombi Ciacchi, R. Seidel, W. Pompe, A. DeVita, Nano Lett., 2002, 2, 841-844.
32 S. A. Davis, S. L. Burkett, N. H. Mendelson, Nature, 1997, 385, 420-423.
33 S. R. Hall, H. Bolger, S. Mann, Chem. Commun., 2003, 2784-2785.
34 S. R. Hall, V. M. Swinerd, F. N. Newby, A. M. Collins, S. Mann, Chem. Mater., 2006, 18, 598-600.
35 D. Volkmer, M. Fricke, C. Agena and J. Mattay, J. Mater. Chem., 2004, 14, 2249-2259.
36 S. Mann, J. P. Hannington, R. J. P. Williams, Nature, 1986, 324, 565–567.
37 Y. J. Chen, J. W. Xiao, Z. N. Wang, S. Yang, Langmuir, 2009, 25, 1054–1059.
38 J. Xiao, Z. Wang, Y. Tang, S. Yang, Langmuir, 2010, 26, 4977–4983.
39 E. M. Pouget, P. H. H. Bomans, J. A. C. M. Goos, P. M. Frederik, G. de With, N. A. J. M. Sommerdijk,
Science, 2009, 323, 1455-1458.
40 S. Mann, B. R. Heywood, S. Rajam, J. D. Birchall, Nature, 1988, 334, 692-695.
41 Y. Ono, K. Nakashima, M. Sano, K. Kanekiyo, K. Inoue, J. Hojo, S. Shinkai, Chem. Comm., 1998,
1477-1478.
42 Y. Ono, Y. Kanekiyo, K. Inoue, J. Hojo, S. Shinkai, Chem. Lett., 1999, 28, 23-24.
43 (a) J. H. Jung, Y. Ono, S. Shinkai, Langmuir, 2000, 16, 1643-1649. (b) J. H. Jung, Y. Ono, S. Shinkai,
Angew. Chem., Int. Ed., 2000, 39, 1862-1865.
44 J. H. Jung, H. Kobayashi, M. Masuda, T. Shimizu, S. Shinkai, J. Am. Chem. Soc., 2001, 123, 8785-8789.
45 J. H. Jung, Y. Ono, K. Sakurai, M. Sano, S. Shinkai, J. Am. Chem. Soc., 2000, 122, 8648-8653.
46 J. S. Beck, J. C. Vartuli, W. J. Roth, M. E. Leonowicz, C. T. Kresge, K. D. Schmitt, C. T-W. Chu, D. H.
Olson, E. W. Sheppard, S. B. McCullen, J. B. Higgins, J. L. Schlenker, J. Am. Chem. Soc., 1992, 114,
10834-10843.
47 S. Che, Z. Liu, T. Ohsuna, K. Sakamoto, O. Tersarki, T. Tatsumi, Nature, 2004, 429, 281-284.
48 H. Jin, Z. Liu, T. Ohsuna, O. Terasaki, Y. Inoue, K. Sakamoto, T. Nakanishi, K. Ariga, S. Che, Adv. Mater.,
2006, 18, 593–596.
49 Y. Yang, M. Suzuki, S. Owa, H. Shirai, K. Hanabusa, J. Mater. Chem., 2006, 16, 1644–1650.
50 B. Li, Z. Xu, W. Zhuang, Y. Chen, S. Wang, Y. Li, M. Wang, Y. Yang, Chem. Commun., 2011, 47, 11495–
11497

154
51
(a) Y. Y. Lin, Y. Qiao, C. Gao, P. F. Tang, Y. Liu, Z. B. Li, Y. Yan, J. B. Huang, Chem. Mater., 2010, 22,
6711–6717. (b) Y. Y. Lin, Y. Qiao, J. B. Huang, Soft Mater., 2011, 7, 6358–6398.
52 K. Sugiyasu, S. Tamaru, M. Takeuchi, D. Berthier, I. Huc, R. Oda, S. Shinkai, Chem. Commun., 2002,
1212–1213.
53 T. Delclos, C. Aimé, E, Pouget, A. Brizard, I. Huc, M. H. Delville, R. Oda, Nano Letters, 2008, 8,
1929-1935.

155
Chapter V
Gold nanoparticles deposition on silica nanohelices:
A novel 3D substrate for optical sensing

156

157
V.1 Introduction
Recently, the organization of metal nanoparticles on 1D and 2D surfaces has attracted
a great deal of attention, due to its potential applications in nanoscale integrated photonics.1,2,3
In general, arranged nanoparticles are obtained by constructing the hybrid nanostructures in
which nanoparticles are self-assembled on the surface of organic/inorganic substrate such as
nanotubes, wires, and fibers. Such composite materials may combine the unique mechanical
and electronic properties of the substrates with the rich size- and shape-dependent optical
properties from metal nanoparticles. Nanoparticles that have been used to produce
nanoparticles/substrate hybrid nanostructures include metal nanoparticles, such as Au4 Pt,
5 or
semiconductor nanocrystals such as CdSe.6
Especially, noble metal nanoparticles such as Au (noted here as GNPs) and Ag have
great advantages due to the unique optical properties such as surface plasmon resonance,
electron properties, and molecular recognition properties. For example, GNPs have found
widespread use as contrast agents for immunogold labeling of biomolecules (Figure V.1).7
Figure V.1 TEM images of GNPs assembled on (a) tobacco mosaic virus nonawires,7 (b) peptide
twisted nanoribbons,8 and (c) DNA origami.
9

158
One of the most important aspects of the noble metal NPs (Au, Ag, Cu) that will be
discussed here in some detail is that they exhibit rich surface-plasmon-related light absorption
and scattering properties which cover the visible and IR spectral regions. When the GNPs are
assembled closely with each other, their surface plasmon resonances are coupled together,
resulting in the enhancement of the electric field in the gap between neighboring
nanoparticles.10
Such systems, therefore, are attractive candidates for the amplification of
optical signals, including fluorescence,11
Raman scattering,12
and second-harmonic
generation.13
Especially the amplification of Raman scattering, called surface enhanced Raman
Spectroscopy (SERS), is useful for the detection of biological compounds at very low
concentrations. SERS provides rich spectral and structural information of molecules on
gaseous, liquid, and solid samples adsorbed on the noble metal substrate, such as fluids, blood,
tissues and dye molecules and is considered to have a large potential application for biomedical
sensing, immunoassays,14
optically triggered drug delivery15
and simultaneous cancer
imaging.16
The optical property induced by the localized surface plasmon resonance (LSPR)
strongly depends on the local environment (particle size, shape, composition and surface
coating).
SERS substrates have typically been assembled novel metal nanoparticles on planar
surface (Figure V.2).10,17,18,19

159
Figure V.2 Examples of SERS substrate. (a) GNPs film self-assembled on the indium tin oxide upon
deposition of GNPs in the alumina template (right) and after removal of template (left).17
(b)
Double-line arrays of GNPs on the glass slide upon confinement of a monodisperse gold colloid with
wrinkled stamps.18
(c) Silver-air-silver nanogap structures obtained from Ag film over nanosphere
substrate.19
More recently, substrates having morphologies other than two dimensional surfaces
have been developed. Among various structures, hybrid structures based on silica nanofibers
have attracted interest20 , 21
as they can be used as bases for alignment of nanoparticles.
Meanwhile, much fewer approaches are reported using 3D helical structures. Indeed, compared
to traditional 1D nanostructures (flat ribbons or wires), the great advantage for 3D
morphologies (helices and twisted ribbons, tubules) is the extremely high surface to volume
ratio for the development of inorganic nanomaterials. In particular, nanohelices exhibit
unconventional physical properties due to their periodic helical structure and flexibility, which
is ideal for inducing polarization effects under mechanical stress.22
Therefore, these
nanoobjects are useful building blocks for functional nanodevices.23,24
A few years ago, our group reported the synthesis of chiral nanometric silica ribbons
and tubes with tunable shapes based on self-assembled amphiphilic molecules.25
The
(c)
500 nm500 nm

160
amphiphiles were cationic bis-quaternary ammonium gemini surfactants in the presence of
tartrate counter-anions, which formed extended networks of nanometric twisted or helical
ribbons with tunable shapes and sizes, leading to gelation of water.26
These organic
nanoassemblies were successfully transcribed to inorganic 3D helical nanostructures (detail of
procedure has mentioned above in Chapter IV).
In order to achieve organization of GNPs on the surface of silica-nanohelices, it is
important to exploit the bonding between silane coupling agent and GNPs’ stabilizing agent.
GNPs are adsorbed on the surface of silica through the organic linkers. Table V.1 shows the
typically organosilanes (X) and coupling agent of GNPs (Y).
Table V.1 Enumeration of typically silane coupling agent and GNPs’ stabilizing agent.
Groups with various linkages can be readily introduced to the surface of silica
substrate by means of organosilane and to the GNPs stabilized by thiol or amino groups.
Appropriate modifications and reactions of functionalized silica-nanohelices and GNPs have
allowed the utilization of a variety of interactions between silica surface and GNPs such as
electrostatic or covalent bonding (Figure V.3 and Table V.2).

161
Figure V.3 Schematic composition of electrostatically and cobalently bonded GNPs/silcananohelices
composites.
Table V.2 Ligand and bonding types employed between GNPs and surface of silica composite.
X Y Bonding Reference
APTES MUA Electrostatic 27, 28
APTES THPC Covalent 29
MPTES THPC Covalent 28
APTES CIT Electrostatic 30
AEAPS CIT Electrostatic 31
MPTES CIT Covalent 32
MPTES CTAB Covalent 33, 34
APTES CTAB Covalent 33, 34
Comparing the anchoring groups of amine (-NH2) and thiol (-SH), these functional
groups bind to the GNPs via different strength. Commonly -SH has been known to form strong
S-Au covalent bonds, whereas the binding of amino to gold surface is described by a weak
covalent binding.34,35
But if APTES functionalized SiO2 are in solution within range of pH
6-9.5, the amino groups are protonated and generally the bonding is described to form
electrostatic interaction between –NH3+ and GNPs when capped by anionic agent such as citric
acid.36
In this study, we describe new methods to prepare GNPs/silica-nanohelices hybrid
nanostructures which form 3D gel network in liquid phase. Gold nanoparticles (GNPs) with
various sizes (1 ~ 20 nm) are assembled on the surface of functionalized nanometric silica
Si SH
Si NNH
2
H
Si NH2
X
SiO2
Si Si Si Si Si SiSi
Si
SiSiSiSiSiSiSi
Si
Si
X X X X X XX
X
X
X
X
X X X X X X
SiXSi
X
SiSi
X
Y
Au
YYYY
YYY
YYY
Y
Y
Au
YYYY
YYY
YYY
Y
Y
Au
YYYY
YYY
YYY
Y
Y
Au
YYYY
YYY
YYY
Y
Y
Au
YYYY
YYY
YYY
Y
Y
Au
YYYY
YYY
YYY
YY
Au
YYYY
YYY
YYY
Y
Y
Au
YYYY
YYY
YYY
Y
Y
Au
YYYY
YYY
YYY
Y
X Y
S(CH2)10
CO2H
OH
OO
O O
O O Na+
Na+
Na+
P+
OH
OH
OH
OH
Cl
(CH2)15
N+
Br
AEAPS
MPTES / MPTMS
APTES
MUA
CIT
THPC
CTAB

162
helices with controllable shape and pitch. The functionalization of the silica helices has been
performed using (3-aminopropyl)triethoxysilane (APTES) or
(3-mercaptopropyl)triethoxysilane (MPTES). GNPs have been prepared by different methods
using different “shape-inducing” agents such as sodium citrate (CIT),
tetrakis(hydroxymethyl)phosphonium chloride (THPC), and cetyltrimethylammonium
bromide (CTAB). The morphology of GNPs/silica-nanohelices hybrid nanostructure has been
investigated by transmission electron microscope (TEM), and optical properties have been
studied by UV-vis spectroscopy and Raman scattering experiments.
V.2 Surface modification of silica nanohelices
V.2.1 Preparation of silica-nanohelices
Silica-nanohelices were prepared by sol-gel transcription from 3D gel network which
were obtained from cationic bis-quaternary ammonium gemini surfactants having the formula
C2H4-1,2-((CH3)2N+C16H33)2) (noted as 16-2-16) in the presence of tartrate counter-anions as
organic template in aqueous solution.25
Figure V.4 shows the TEM image of the organic tube
and silica nanofibers with tunable shapes between twisted, helical ribbons or tubes. When the
gels are aged for more than 45 days, the resulting inorganic fibers show tubular structures
whereas when aged for 21 days, the nanotubules undergo a morphological change back to the
helical ribbons upon transcription. When the even younger gels (5 days) are transcribed, the
tubules transform to twisted ribbons. The average diameter of inorganic helix is 25 nm, and the
length is of the order of micrometer.

163
Figure V.4 TEM images of the morphology of inorganic nanostructures obtained by transcribing
organic 16-2-16 L-tartrate gels after various aging times. (a) Organic gel forms nanotubules after two
days. Interestingly, the subsequent formations of chiral inorganic ribbons are controlled by different
aging times of organic gel before the transcription: (b) twisted ribbons are observed with gels aged for
5 days, (c) helices with gels aged for 21 days, and (d) nanotubes after 45 days.
We have also observed silica-nanohelices in 3D nature by using Scanning Electron
Microscopy (SEM) and Atomic Force Microscopy (AFM) (Figure V.5). The SEM and AFM
images clearly showed the unwounded 3D helicoidal structures. The periodicity of helical pitch
is around 50 nm (Figure V.5 c).
Figure V.5 (a) HRSEM and (b) AFM image of nanometric helical ribbons showing the 3D nature of the
objects and its pitch. (c) The helical pitch obtained by AFM measurement.
The limited concentration of initial organic gels was 1-10 mM in order to
transcription of nanometric silica-helices. In majority of the cases, we have chosen to use dilute
organic gel concentration (< 2 mM), since at this concentration, fewer intersection knocks were
observed.

164
Silica-nanohelices were functionalized via a surface chemical modification with
silane coupling agent. As beginning, silica-nanohelices were modified by amino group using
APTES or thiol group using MPTES via secondary sol-gel polycondensation. Actually, APTES
and (3-mercaptopropyl)trimethoxysilane (MPTMS) are the most common silane coupling
agents which can induce the functional group (-NH2 and -SH) to silica materials promoting the
specific bonding with Au. But MPTMS is too high reactive to stimulate the polymerization in
water, so that we select MPTES as coupling agent of –SH group.
V.2.2 Silica-nanohelices modified by APTES
At first, the reaction was performed under stirring, but silica-helices were cut down to
shorter fibers and aggregated (Figure V.6 a). Therefore, APTES was dispersed homogeneously
in silica-helices suspension under the ultra sonication for an hour, and then the suspension was
kept in hot bath (85 ˚C) for 12 h; accordingly we could obtain less-aggregated longer
silica-nanohelices with amino-functionalization (Figure V.5 b). Finally, we obtained
functionalized 0.12 wt % of silica-nanohelices from 1 mM of organic gel, and 0.35 wt %
silica-helices from 5 mM organic gel.
Figure V.6 TEM images of the amino-functionalized silica-nanohelices. The modification performed
under (a) stirring (60 rpm.) vs (b) ultra sonication.

165
V.3 GNPs adsorbed on silica-nanohelices
Two approaches were adopted to synthesise GNPs with various sizes (1 ~15 nm)
depending on the targeted size. The first one consisted in preparing gold nanoparticles of the
desired size in the bulk solution using citrate (CIT) or cetyltrimethylammonium bromide
(CTAB) as stabilizers and performing their further deposition on the modified helices. The
second one aimed at generating very small GNPs (1.1 nm) via a stabilisation with
tetrakis(hydroxymethyl)phosphonium chloride (THPC) whose sizes could be increased after
deposition on the silica helices.
V.3.1 CIT-stabilized GNPs
In this section, we describe the adsorption of CIT-stabilized Au NPs on modified
silica surface.
Au NPs of different sizes were synthesized following the method of Frens et al.37
GNPs having different sizes within the range of 8-70 nm can be prepared by varying reactant
concentrations of [Au3+
]/[CIT] ratio (e. g. 0.17 for 10 nm, 0.28 for 12 nm, and 0.37 for 14
nm).38,39
When GNPs of 10 nm in diameter were synthesized, the concentration of Au salts
were 0.5 mM in aqueous solution. The colloid solution color was dark red (Figure V.7).
Figure V.7 (a) TEM images of CIT-stabilized GNPs, (b) GNPs colloidal solution, and (c) particle size
distribution.

166
GNPs adsorbed on silica nanohelices
In order to obtain the homogeneous adsorption of GNPs on silica-naohelices, three
different factors are important. In the following study 10 nm diameter GNPs were used along
with the amino functionalized silica-nanohelices.
The first factor is the order of mixing; in the fist case, GNPs suspension are put into
the silica-nanohelices suspension whereas in the second case, silica-nanohelices suspension are
put into GNPs suspension (Figure V.8). When 1 ml of GNPs (0.5 mM, 0.098 mg/ml) of Au salt)
were added to 50 µl (0.175 mg) of silica-nanohelices (0.35 wt %, 3.5 mg/ml,) suspension under
ultrasonication, GNPs were adsorbed inhomogeneously and locally-aggregated on the
silica-nanohelices (Figure V.8 a). On the other hand, when 50 µl of silica-nanohelices
suspension were added to the 1 ml of GNPs, more homogeneous and less aggregated GNPs
adsorption was observed (Figure V.8 b). Note that the concentration of GNPs and silica
nanohelices are fixed as the values shown above hereafter.
Figure V.8 TEM images of (a) CIT-stabilized GNPs added to silica-nanohelices, and (b)
silica-nanohelices added to GNPs.
The other factors are summarized in Table V.3.

167
Table V.3 Summary of various conditions that CIT-GNPs (1 ml) adsorbed on the surface of
silica-nanohelices modified by APTES.
The ratio between the quantity of GNPs and silica-nanohelices suspension is a also
important factor. From TEM observation, when the amount of silica-helices is decreased (~ 50
µl silica added to 1 ml GNPs), GNPs coated more homogeneously on the surface of silica.
However, when the quantity of silica suspension was decreased to 10 µl, too much GNPs were
adsorbed on the silica surfaces.
The most important factor is the number of functionalization by APTES. Comparison
of single and double amino modification (the upper and the lower parts in Table V.3,
respectively), GNPs could be adsorbed much more homogeneously on silica surface with
double modification. With the silica surface modified once, GNPs showed aggregation along
with inhomogeneous adsorption. This may be because the surface density of amine group is not
high enough and the interaction between the GNPs is stronger than the GNPs/silica nanohelices
interaction, therefore GNPs may prefer to aggregate with each other than to adsorp to the silica
surface.

168
From these results, the best condition can be summarized by 50 ~ 200 µl of double
amino-functionalized silica suspension (0.35 wt %, 3.5 mg/ml ) added to the 1 ml of GNPs
colloid solution (0.5 mM, 0.098 mg/ml).
In terms of macroscopic aspect, dark red colloid solution tuned to dark blue
precipitate upon addition of single amino-modified silica-nanohelices, whereas in the case of
double modification, the suspension tuned to red precipitate (Figure V.9).
Figure V.9 Comparison of macroscopic aspect: dark blue precipitate obtained by single
amino-modified silica-nanohelices and red precipitate obtained by double amino-modified
silica-nanohelices.
Effect of organic gel concentration
Finally, we also compared the concentration of organic gel before transcription. We
compared between 5 mM and 1 mM gels. After transcription, they yielded 0.35 and 0.12 wt %
of silica-nanohelices suspension in water respectively. Better adsorption was shown with lower
concentration of silica-nanohelices which is probably because lower the concentrations of gels
are, less intersections are present (to which GNPs tend to accumulate) (Figure V.10).

169
Figure V.10 TEM images of GNPs adsorbed on different concentration of silica-nanohelices with (a)
0.35 wt % and (b) 0.12 wt %.
Effect of citric acid concentration on the GNPs adsorption
We also attempted the GNPs adsorption on surface of –SH functionalized
silica-nanohelices. However, in this case GNPs were adsorbed on silica with strongly
inhomogeneous aggregation (Figure V.11 a). In order to investigate the effect of the
concentration of citric acid (CIT), excess CIT was rinsed out from the GNP suspension with
water using strong centrifugation (10000 rpm, 30 min). The suspension of GNPs with lower
concentration of CIT is then obtained. When the suspention of –SH functionalized silica (50 µl)
was then added to the 1 ml of washed GNPs suspension as obtained above, much better
adsorption was observed, but GNPs showed still localized aggregation (Figure V.11 b).
Figure V.11 TEM images of GNPs adsorption on the surface of –SH group modified silica-nanohelices;
(a) without rinse and (b) rinse of excess CIT coupling agent.

170
V.3.2 THPC-stabilized GNPs
The smaller Au nanoparticles with the diameter of around 1 ~ 2 nm were prepared by
reduction of KAuCl4 with tetrakis(hydroxymethyl)phosphonium chloride (THPC) using
modification reported by Duff et al.40
The obtained particle diameter was 1.4 nm and the
concentration of Au salts were 0.97 mM in aqueous solution. The colloid solution color was
brown (Figure V.12 a-c).
Figure V.12 (a) TEM images of THPC-stabilized GNPs, (b) GNPs colloidal solution, and (c) particle
size distribution. (d) Precipitate of GNPs/silica-nanohelices suspension and (e) that TEM image of
after adsorption.
It was much easier to obtain homogeneous adsorption of THPC-stabilized GNPs on
the silica surface. These GNPs could be adsorbed on silica surface functionalized by both
APTES and MPTES. For the volume ratio, the much higher quantity of silica helices can be
used; up to ~200 µl of 0.12 wt% silica for 200 µl GNP solution. After adsorption of GNPs,
brownish yellow precipitates were observed (Figure V.12 d). All of silica-helices were coated
by small GNPs (Figure V.12 e).
V.3.3 CTAB-stabilized GNPs
The positively charged nanoparticles were synthesized by using a seed-mediated
growth method in the presence of cetyltrimethylammonium bromide (CTAB) as cationic
capping agent.38,41
The preparation process consisted of several steps: at first, the small seeds

171
within 3.5 nm diameter were synthesized by chemical reduction of gold salt with a strong
reducing agent (sodium borohydride) in the presence of a capping agent (CIT), then these seeds
were added to the seed growth solution containing more metal salt, a weak reducing agent (e. g.,
ascorbic acid) and surfactant-directing agent (CTAB). The obtained particle diameter was 8.8
nm and the concentration of Au salts were 0.25 mM in aqueous solution. The color of the
colloid solution was reddish violet (Figure V.13).
Figure V.13 (a) TEM images of CTAB-stabilized GNPs, (b) GNPs colloidal solution, and (c) particle
size distribution.
CTAB-stabilized GNPs were well immobilized on MPTES functionalized
silica-helices. On the contrary the GNPs stabilized by CTAB showed poor adsorption on the
APTES functionalized one. This is probably because CTAB bilayer as coupling agent acts as
cationic surfactants and there is consequent charge repulsion with amino functionalized silica
surface.
In fact, the immobilisation of CTAB-stabilized GNPs on the MPTES-functionalized
silica-nanohelices was not straight forward. As a beginning, suspension of silica-nanohelices
functionalized twice by MPTES were put into CTAB-GNPs solution, but GNPs could not be
immobilized on the surface because CTAB formed thick bilayer around the particles and this
bilayers prevented the covalent bonding between –SH group and Au. Therefore, it was
necessary to break closely packed bilayers adsorbed on the GNP during immobilization on the
silica surface. This was done by the addition of ethanol in order to break the CTAB bilayer

172
adsorbed on the GNPs and to allow them to bind to the surface of silica through the thiol group,
therefore allowing GNPs to be adsorbed on the surface of silica-nanohelices through the thiol
group.
Effect of the quantity of silica vs GNPs in suspension
The 5 to 100 l of MPTES-functionalized silica-nanohelices suspension (0.12 wt%)
were dispersed into 500 l of GNPs suspension (0.25 mM of Au salt) under the ultrasonication.
500 l of ethanol was then added to the suspension in order to break the CTAB bilayer adsorbed
on the GNPs and to allow them to bind to the surface of silica through the thiol group. The
sonication was continued for 10 min, and solution color tuned to pink. The
GNPs/silica-nanohelices samples were collected by centrifugation. Due to the concentration of
these CTAB stabilized GNPs following the above described method is lower than the
CIT-stabilized GNPs. Furthermore, the suspension was diluted twice by ethanol, therefore the
final concentration of particles is 0.25 mM with respect to 0.5 mM of KAuCl4 in the case of
GNPs stabilized by citrate. Therefore, we have investigated the range of the quantity of
silica-helices between 5 µl -100 µl instead of 10 µl - 1 ml with CIT-stabilized GNPs (Figure
V.14).
When 100 l of MPTES-functionalized silica-nanohelices suspension (0.12 wt%)
were dispersed into 500 l of GNPs suspension (0.25 mM) under the ultrasonication. 500 l of
ethanol was then added to the suspension. The sonication was continued for 10 min, and
solution color tuned to pink. As the quantity of silica was deceased, the solution color tuned
violet (10-50 µl of silica suspension) (Figure V.14 a) and particles became non-spherical shapes
and/or formed aggregates (5 µl of silica suspension) (Figure V.14 e). Therefore, the better
condition was addition of silica-nanohelices with the range of 10-25 l for 500 l of GNPs
suspension. Interestingly, the aspect of these silica/GNPs suspensions were quite different from
those obtained with silica/GNPs(citrate). CIT-GNPs easily tuned to precipitate upon addition of
silica-nanohelices in water as well as alcohol, whereas the CTAB-GNPs/silica-nanohelics
showed much better dispersion in ethanol. This may be because CTAB acts as dispersion
stabilizer for GNPs as well as silica helices caused by adsorption of alkyl chains of amphiphiles

173
on the both surface of GNPs and silica fibers.
Figure V.14 (a) Macroscopic aspect of GNPs/silica-nanohelices suspension prepared by different
volume of silica. (b-e) TEM images of CTAB-stabilized GNPs immobilized on the various amounts of
silica- nanohelices. The volumes of silica-nanohelices suspension were (b) 50 l, (c) 25 l, (d) 10 l, and
(e) 5 l.
In order to remove the excess CTAB, the GNPs/silica-nanohelices samples were
washed by centrifugation (6500 rpm) and dispersion in ethanol before the preparation of TEM
grids.
Step by Step GNPs adsorption
When the adsorption process was repeated, it promoted more GNPs immobilizing
onto the silica surface while keeping the spherical shapes (Figure V.15). When 100 µl of

174
silica-helices (0.12 wt %) suspension was mixed with 500 l of GNPs, few GNPs could be
immobilized on the silica surface (Figure V.15 a). After the suspension was submitted to
centrifugation and the upper phase became transparent. This was removed and replaced by,
another 500 l of GNPs solution. As this process was repeated several times, more and more
GNPs were adsorbed on silica surface (Figure V.15 b-d). and the solution color became darker.
Figure V.15 (a-d) TEM images of CTAB-stabilized various amounts of GNPs immobilized on the 100
l silica-nanohelices. The various amounts of GNPs were (a) 500l, (b) 1ml, (c) 1.5 ml, and (d) 2 ml. (e)
Macroscopic aspect of GNPs/silica-nanohelices suspension prepared by varying amounts of GNPs for
100 l of silica-nanohelices.
Comparing the single step and several steps of adsorption GNPs, the latter case could
provide more consistent shape and less aggregation, but less coating of GNPs than the case of
single step.
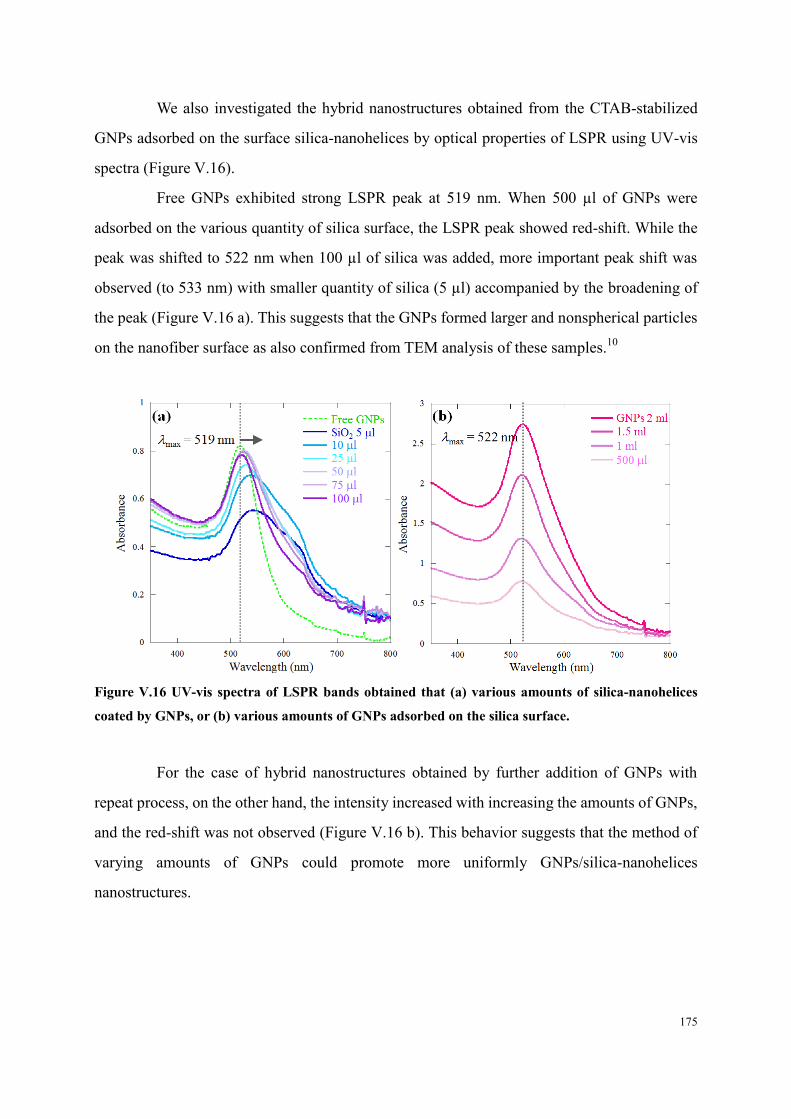
175
We also investigated the hybrid nanostructures obtained from the CTAB-stabilized
GNPs adsorbed on the surface silica-nanohelices by optical properties of LSPR using UV-vis
spectra (Figure V.16).
Free GNPs exhibited strong LSPR peak at 519 nm. When 500 µl of GNPs were
adsorbed on the various quantity of silica surface, the LSPR peak showed red-shift. While the
peak was shifted to 522 nm when 100 µl of silica was added, more important peak shift was
observed (to 533 nm) with smaller quantity of silica (5 µl) accompanied by the broadening of
the peak (Figure V.16 a). This suggests that the GNPs formed larger and nonspherical particles
on the nanofiber surface as also confirmed from TEM analysis of these samples.10
Figure V.16 UV-vis spectra of LSPR bands obtained that (a) various amounts of silica-nanohelices
coated by GNPs, or (b) various amounts of GNPs adsorbed on the silica surface.
For the case of hybrid nanostructures obtained by further addition of GNPs with
repeat process, on the other hand, the intensity increased with increasing the amounts of GNPs,
and the red-shift was not observed (Figure V.16 b). This behavior suggests that the method of
varying amounts of GNPs could promote more uniformly GNPs/silica-nanohelices
nanostructures.

176
V.3.4 Summary of GNPs adsorption on silica-nanohelices
In this section, we demonstrated the adsorption of various GNPs stabilized by
different capping agents on the silica-nanohelices. The results of various conditions as
described above are summarized in Table V.4.
Table V.4 Summary of condition of various GNPs adsorbed on the surface of silica-nanohelices. (a, b)
GNPs/silica-nanohelices suspension kept in water, and (c) in ethanol.
Results from Table V.3 show that the homogeneity of the adsorption of GNPs was
size dependent: for 1-2 nm size THPC-stabilized nanoparticles, there was no difference
in-between the nature of the silica functional groups (-SH or NH2). Both silica were well
covered by THPC-stablized small nanoparticles.
For bigger size nanoparticles, there seem to be a competition between the different
potential ligands and the process leading to the maximum decrease in the surface energy
prevails. With respect to the energy difference due to stabilization, the processes can be ordered
depending on the chemical bond strength: S-Au interaction > N-Au interaction >
Carboxylate-Au interaction.

177
The competition between electrostatic (CIT) and donor ± acceptor (APTES)
stabilization in these conditions gave rise to a nice distribution of the GNPs along the silica
helices with a good compromise between the two stabilizations probably due to stabilizers of
opposite charges (ammonium and citrate). On the other hand, in the presence of MPTES
functionalized silica, these GNPs showed strong local aggregation and did not show
homogeneous distribution over the silica surfaces. As a result, there were domains where GNPs
showed thick aggregations and others where no GNPs adsorption was observed.
The GNPs stabilized by CTAB showed poor adsorption in water both for APTES
functionalized and MPTES functionalized silica (data not shown). This is probably because the
bilayers formed by CTAB at the surface of GNPs prohibit their adsorption on silica surfaces. In
the case of APTES functionalized silica, there may also be charge repulsion between
ammonium from amine groups (APTES) and quaternary ammonium (CTAB). Upon addition of
ethanol, the solubility of CTAB increases, breaking their aggregates on GNPs. This can
promote stronger interaction between GNPs with silica surfaces. In the case of MPTES
functionalized silica, CTAB-GNPs showed relatively good adsorption with silica. In the
presence of APTES functionalized silica, however, these GNPs still did not show good
adsorption, instead, GNPs aggregated among themselves. In this case, the addition of ethanol
destabilized the GNPs and provoked their aggregation. Globally, however, the
CTAB-stabilized GNPs showed less homogenous adsorption than CIT- and THPC-stabilized
GNPs.
Several other factors are also crucial for the quality of GNP covered silica helices.
The first one is the addition order of the reactants in the reaction medium; we have indeed
observed that in all cases, the coverage was much more homogeneous when the silica
nanohelices were added into the GNPs solution rather than when the GNPs solution was added
to the suspension of silica nanohelices. The concentration of organic gel is also a key point.
Using dilute suspensions of helices (< 2 mM) allowed to obtain silica helices with very little

178
quantities of intersection knots in which the GNPs tend to be trapped and form inhomogeneous
distribution.
V.4 The growth of small THPC-stabilized GNPs at the surface of
silica-nanohelices and study of optical properties
V.4.1 The particle growth promoted by replacement of solvents
The hybrid nanostructure obtained by THPC-stabilized GNPs and silica-nanohelices
exhibit interesting property.
Such hybrid nanohelices were generally stable even after a week in water. They grew
to 2 nm after a month. Interestingly, when these nanocomposite structures were put into polar
organic solvent such as alcohol (ethanol, methanol, hexafluoroisopropanol (HFIP)) or
acetonitrile, the size of the particles on the surface of the helices increased to a few nanometers
after a day (Figure V.17).
Figure V.17 TEM images of THPC stabilized GNPs immobilized on the surface of silica-nanhelices.
GNPs/silica-nanohelices hybrid structures were kept in water (a), in ethanol (b), and acetonitrile (c)
after 1 day.
Figure V.18 illustrates this growing process in HFIP. While kept in HFIP, the color of
precipitate was slowly tuned from brownish yellow to reddish brown for red-brown for a week
20 nm 20 nm 20 nm
(a) (b) (c)

179
(Figure V.18 a1-a3). The GNPs immobilized on the surface of silica-nanohelices grew quickly
to ~ 2 nm after 2 h (Figure V.18 c1), ~3 nm after 1 day (Figure V.18 d1), then to about 5 nm after
1 week (Figure V.18 e) in suspension of HFIP, alongside with a decrease of their number
observed per silica helix, indicating that the particles coalesce and show an Ostwald ripening
process.42,43
Such a growth could be stopped as soon as the solvent was exchanged by water
(Figure V.18 b2, c2, d2). The size of these GNPs then remained identical even after a week
(Figure V.18 e).
Figure V.18 (a) Macroscopic aspect of precipitate of GNPs/silica-nanohelices hybrid structures. (b-e)
TEM images of growth process of GNPs at the surface of silica-nanohelices. (b1) GNPs with 1.5 nm
diameter were immobilized on the surface of silica-helices. (c1, d1, e) GNPs grew up to around 5 nm in
suspension of HFIP. (b2) GNPs kept their diameter in water for a week. (c2, d2) The samples were
replaced in water, the growth of GNPs were stopped. Bars are 20 nm.
Figure V.19 shows the variation of the particle diameter with time. The free GNPs
alone as well as the GNPs/nanosilica nanocomposite suspension in water did not show the
growth process (Figure V19, black square and open circle respectively).
(a7)
Kept in Alcohol
HFIP
Kept in HFIP
2 h 1 day
Stop growth Stop growth
1 week 6 days
Kept in water
1 week
Kept in HFIP
1 week
(b1)
(b2)
(c1)
(c2)
(d1)
(d2)
(a1) (a2)
(a3)
(e)

180
Figure V.19 The time evaluation vs diameter change by GNPs growth. Diameter measurements were
performed on an average of 500 particles.
In general, small GNPs (< 2 nm) do not show localized surface plasmon resonance
(LSPR) band (Figure V.20) owing to the onset of quantum size effects observed for NP < 3
nm.44
The color of the suspension of such GNPs as well as those adsorbed at the surface of
nanohelices is brown. When the GNPs/nanosilica samples are kept in water, no LSPR peak
appeared even after one week, it took 3 weeks to see a weak band appear (Figure V.20 a).
However, when the samples were kept in HFIP, a broad LSPR band appeared at 526 nm after
only 2h (Figure V.20 b). As the GNPs grew larger (~ 5 nm), this LSPR band increased in
intensity, became sharper, and the color of the suspension turned to red.45,46
In the literature,
some examples have shown that small GNPs could grow on fiber or particle surface.47,48,49
However, in these cases, the authors used polar organic solvent as a reducing agent capable of
reducing the free metallic cations which were still present in solution.50,51
In the present case, at
the condition in which the nanohelices are stored, no free gold ions are present because excess
of GNPs and Au salt were completely washed away by water before solvent replacement.
Clearly the growth of GNPs is due to the coalescence of smaller GNPs.
The resonant frequency of the plasmon absorption band of the metal nanoparticle due
collective oscillation of the free electrons confined to the surface is sensitive to changes in the
size of the particle and as the diameter gets higher the energy required to collectively excite the

181
motion of the surface plasmon electrons decreases. For free GNPs with diameters from 3.5 to
37 nm, the energy required to excite the surface plasmon corresponds to a maximum
absorbance around 524 nm.45
This process also depends on the shape of GNPs, chemical nature,
as well as the surrounding medium.52 ,53 ,54
Upon adsorption on the helix surface and by
consequence placed in close proximity to one another on the helix surface, the LSPR of the
GNPs did not show notable shift and remains located at 525 nm.55
Figure V.20 UV-vis spectra of the GNPs/silica-nanohelices suspension kept in (a) water and (b) kept in
HFIP.
V.4.2 The particle growth on the surface of silica-helices by addition of gold
salt and reducing agent
The particle growth on the surface of silica-helices was also promoted by addition of
a growth solution containing both a gold salt and a reducing agent. Various volumes (10-100
l) of 1 mM KAuCl4 solution and 4.8 mM L-ascorbic acid (LAA) solution were added at once
to 500 µl silica-nanohelices suspension coated with THPC-GNPs. After sonication of the
suspension composed of the mixture of silica nanohelices and KAuCl4, a 1:1 equivalent of LAA
solution (10-100 µl) was added. The color of the solution immediately turned to reddish brown.

182
As increasing the addition of mixture volume, the suspension color became more erubescent
(Figure V.21).
Figure V.21 Macroscopic aspect of GNPs growth on the surface of silica-nanohelices obtained by
addition of fresh gold salt and reducing agent (10 ~ 200l for each solution).
TEM images of these silica-nanohelices are shown in Figure V.22 a. The size of the
GNPs increased homogeneously and continuously, keeping spherical shape with the increasing
quantity of added 1:1 volume mixture of gold salt and LAA solution up to around 5 nm. At this
point, the volume of the added solution is 100 µl. Upon further addition of the solutions, the size
of the particles became extremely heterogeneous leading to highly non spherical particles.
Figure V.22 (a1) to (a4) TEM images of growth process of GNPs at the surface of silica-nanohelices;
the volumes of growth solution used for GNPs growth were (a1) 10 l, (a2) 50 l, (a3) 100 l, and (a4)
200 l. (b) Variation of the GNPs diameter with the added volume of growth solution (diameter
measurements were performed on an average of 500 particles).

183
UV-vis. spectra of GNPs on the silica substrate for different Au3+
salt concentrations
are shown in Figure V.23. No LSPR peaks are observed for the silica suspension without added
salt solution (GNPs diameter ~1 nm). This corresponds indeed to the brown color of the
suspension. Upon addition of 10 to 25 l salt solutions, a broad LSPR peak appeared at 530 nm.
This peak became more pronounced and blue-shifted to 523 nm with further increase of the
added salt solution (50 and 100 µl).
Figure V.23 UV-vis spectra of LSPR bands derived from GNPs growth at the surface of
silica-nanohelices upon addition of salt solutions.
This method therefore provides an easy control of the size of ultra-small GNPs
(USGNPS) on silica substrates.
It was also clearly observed that this growth is a kinetically controlled phenomenon.
Figure V.24 shows comparison of the method of addition of gold salt and reducing agent in
several steps (a-c) and in single step (d). Upon addition of 10 l of growth solution into 100l
GNPs/silica suspension, GNPs grew up to 2.4 ± 0.7 nm (Figure V.24 a). When another 20l of
growth solution was added to this suspension, GNPs grew up to 3.5 ± 1.0 nm (Figure V.24 b).
Further addition of 20 l of growth solution resulted in the growth of GNPs to 4.3 ± 1.2 nm
(Figure V.24 c). Addition of growth solution in several steps led to poor and inhomogeneous
adsorption. On the other hand, when 50l of growth solution was added to suspension at once,

184
we could observe the homogeneous adsorption of larger sized GNPs with diameter 4.4 ± 1.2 nm
(Figure V.24 d). The latter showed relatively homogeneous adsorption of larger size GNPs
whereas the former showed separation between helices covered heavily by large GNPs and
those which were poorly covered.
Figure V.24 Comparison of the particle growth upon addition of gold salt and reducing agent in (a-c)
several steps or (d) single step. The volumes of growth solution added; (a) 10 l, (b) 20 l of second
addition, (c) 20 l of third addition, and (d) 50 l in single step.
V.5 Larger GNPs deposited on the silica nanohelices
As we observed above, small GNPs show too moderate LSPR peaks. We then
investigated how the confinement of larger GNPs on silica nanohelices could affect the LSPR
signals.
For this study, we used CIT-stabilized GNPs (size range ~ 10-20 nm) in the presence
of silica nanohelices functionalized with APTES. Figure V.25 shows silica nanohelices with
GNPs of various sizes (10, 12, 14 nm) and their corresponding SPR peaks.
As we observed above, small GNPs show moderate LSPR peaks. We then
investigated how the confinement of larger GNPs at silica nanohelices can affect the LSPR
signals. CIT-stabilized GNPs adsorbed on silica exhibit much more pronounced LSPR bands
than those obtained with GNPs stabilized with THPC.

185
Figure V.25 silica nanohelices with GNPs, (a) 10 nm, (b) 12 nm, (c) 14 nm. (d) UV-vis
spectra of GNPs adsorbed on the surface of silica nanohelices.
V.6 GNP/silica nanohelices used as SERS substrate
V.6.1 SERS study of chemical compound
As it has frequently been demonstrated, the localized SPR exhibited by noble metal
nanoparticles beyond a certain size can be exploited in the context of surface enhanced Raman
scattering (SERS). It has also been demonstrated that the gold surface morphology has an
important effect on the enhancement of the Raman signal.56 Figure V.26 shows the SERS
spectra of benzenethiol (BT) used as molecular probe adsorbed on hybrid nanostructures containing
various diameters of spherical GNPs. The SERS spectrum is characteristic of BT adsorbed on

186
Au substrate.57,58,59
The main bands are observed at 1075 cm-1
, 1025 cm-1
, 1000 cm-1
, assigned
to 1, 18a and 12 ring modes, respectively. The intensity of 1 mode at 1000 cm-1
was used to
calculate the enhancement factors (EF) according to EF = (ISERS×CBT)/(IBT×CSERS), where ISERS
is the surface-enhanced Raman intensity of BT whereas IBT is obtained by a free BT solution,
CSERS and CBT are the molecular concentrations of BT in aqueous solution in the presence and
in the absence of GNPs/silica-nanohelices respectively.
Figure V.26 Raman and SERS spectra of Benzenethiol. (a) Comparing the Raman signals of 10-2
M BT
aqueous solution, SERS spectrum of 10-6
M BT molecules adsorbed on GNPs colloid solution, and
SERS spectrum of 10-6
M BT molecules adsorbed on GNPs/silica-nanohelices hybrid structures. (b)
SERS spectrum of 10-6
M BT molecules adsorbed on GNPs/silica-nanohelices hybrid structures with
different diameters (10, 12, 14 nm).
The Raman spectrum obtained for a 10-2
M BT solution in water and the SERS
spectra of 10-6
M BT with GNPs colloid solution and with GNPs/silica-nanohelices hybrid
structures are shown in Figure V.26 a. In the absence of GNPs, no signal was detected with BT
solution even at concentrations as high as 10-2
M. Indeed, the lowest detection limit for the
concentration of BT by Raman scattering is 10-1
M. Meanwhile, highly enhanced Raman
signals were observed when BT was adsorbed on the GNPs surface. Furthermore, when these
GNPs were adsorbed and organized on the surface of silica-nanohelices a dramatic
enhancement of Raman signal was observed. This enhancement factor strongly depended on

187
the particle size (Figure V.26 b); the EF of the nanohybrid with 10, 12 and 14 nm GNPs is
8.6×10⁴, 2.0×10
5, 5.7×10
5 respectively. The EF in the presence of free GNPs is 8.5×10
4 (12 nm)
and 1.2 ×10⁵ (14 nm). This indicates that GNPs organized at the surface of silica-nanohelices
lead to an enhancement of the signal by a factor of 5 as compared to those free in solution.
We then investigated the effect of the BT concentration for different GNPs sizes.
Figure V.27 (a) shows the variation of the enhancement factor deduced from the intensity of the
band at 1000 cm-1
vs. the BT concentration. We observe a general trend indicating that the EF
increases with decreasing concentration. This phenomenon seems to be even more efficient for
the biggest nanoparticles.
The SERS intensity is lower for high concentration; this could be explained by a
Langmuir like process leading to saturation of the adsorption sites. The decrease of the SERS
signal would reflect the staking of the adsorbed molecules and a reabsorption of the scattered
light. Alternatively, an increase of the aggregation state of the GNPs nanoparticle for large BT
concentration could also decrease the Raman signals.
In order to understand such phenomena on the variation of SERS intensity as a
function of BT concentration, we compared them with TEM images of the systems (Figure V.27
b-e). As it is clearly visible, smaller GNPs (10 nm) show much more homogeneous adsorption
on the surface of silica nanohelices at all studied concentration (10-7
- 10-4
M) compared to 14
nm GNPs. Indeed, the larger GNPs seem to show desorption from the silica and to aggregates
separately at high concentration (10-4
M), which will probably explain the decrease in SERS
intensity in the presence of high concentration of BT (Figure V.27 c). This is probably because
the preparation of smaller particle uses higher concentration of sodium citrate as reducing
agent, which gives more anionic feature to the smaller particles than to the larger particle.
Furthermore, it is much easier to fit on the curve of a silica helix with the smaller particles (10
nm) because of their less bulky space. Consequently, the smaller particles adsorb better on the
surface of amine functionalized silica-nanohelices even at high concentration of BT.

188
Figure V.27 (a) Variation of the enhancement factor at 1000 cm-1
vs. concentration of BT. TEM images
of different concentrations of BT 10-5
M and 10-6
M with two different GNPs sizes 10 nm and 14 nm.
(b) 14 nm, 10-6
M; (c) 14 nm, 10-5
M; (d) 10 nm, 10-6
M and f) 10 nm, 10-5
M GNPs/silica-nanohelices.
Desorption and aggregation of GNPs (14 nm) is clearly seen for high concentration of BT (c). Scale bar
50 nm.
V.5.2 SERS study of medical agents as bioactive molecules
We then investigated several bioactive molecules. Thiamine is well known as Vitamin
B1, which exists in nature.
Figure V.28 shows the SERS signals of thiamine aqueous solution. The observed
SERS signals were characterized by the intense peak at 1650 cm-1
due to the N4’H2 bending
vibration, pyridine ring stretching mode at 1633 cm-1
,1601 cm-1
, 1564 cm-1
and 1373 cm-1
, C-H
(CH2-CH2 + CbH2) deformation mode and thiazole ring stretching mode at 1272 cm-1
and 1301
cm-1
, and strong pyridine ring deformation mode at 754 cm-1
.60,61
The limited concentration of
thiamine for detection of Raman signal is 10-1
M. When thiamine was adsorbed on the
GNPs/silica-nanohelices hybrids structure, and the Raman signals could be detected below 10-6
M, which means the EF can be up to around 105. Comparison between 12 nm and 14 nm of
GNPs, indeed bigger GNPs showed stronger intensity, however these differences were slight.

189
Figure V.28 Molecular structure of thiamine (upside) and SERS spectra of 10
-6 M thiamine adsorbed
on the 12 nm and 14 nm GNP/silica-helices suspension.
However, we also compared the SERS spectra from 14 nm free GNPs and 14 nm
GNPs/silica-nanohelices in the presence of thiamine (Figure V.29). The concentration of
thiamine molecule was 10-6
M. Enhanced Raman signals were obtained in both cases, no
differences of enhancement were obtained. In this case, the presences of silica helices do not
enhance the Raman signals because positive charged amine in thiazole group of thiamine
showed charge repulsion to amine functionalized silica surface.
Figure V.29 SERS spectra of 10-6
M thiamine adsorbed on the 14 nm colloid solution and 14 nm
GNP/silica-helices suspension.

190
We have also studied SERS systems of various medical agents such as aspirin,
acetaminophen, ibuprophen and salicylic acid. Upon addition of these molecules, the GNPs
remained adsorped on the silica nanohelices, but none of them showed SERS effects. This is
probably because the interaction between –NH or –COOH of target molecules and the GNPs is
not strong enough to be adsorbed around the GNPs.
We have also studied mono, oligo and polynucleotide. First we investigated the
solution of polyadenosine (pA). A solution of 10-5
M pA was prepared in the presence of 0.5
mM MgCl2. When pA was added to the solution of free GNPs colloid, the color of the solution
remained red indicating a homogeneous suspension of GNPs even in the presence of pA. At this
point, a weak signal of pA appeared (Figure V.30). When pA was added to the suspension of
GNPs/silica suspension, the color turned immediately from red to blue, and the signal of pA
decreased. TEM image of this solution showed that GNPs were still adsorbed on silica fibers
but these silica fibers were strongly aggregated.
Figure V.30 SERS spectra of 10-5
M pA adsorbed on the 12 nm GNPs colloid solution, and on the 12 nm
GNP/silica-helices suspension.
We also investigated adenosine 5’-monophosphate (AMP). When AMP solution was
added to the free GNPs solution, the enhanced Raman signal of AMP appeared. On the other
hand, when it was added to the suspension of GNPs/silica-nanohelices, the signal of AMP

191
became almost non detectable (Figure V.31). It is likely that AMP was on functionalized silica
surface due to the interaction between phosphate (AMP) and amine group of silica surface.
Figure V.31 SERS spectra of 10-5
M AMP adsorbed on the 12 nm GNPs colloid solution, and on the 12
nm GNP/silica-helices suspension.
The results obtained with pA indicate that the interaction between GNPs and the
interaction between anionic polynucleotide and APTES functionalized silica nanohelices
maybe stronger than the interaction with GNPs resulting the extinction of Raman signals of
polynucleotide. Hence, we performed SERS experiment using CTAB-stabilized GNPs
adsorbed on mercapto functionalized silica-nanohelices. In this case, the GNPs are covalently
attached to the silica helices. However, CTAB stabilized GNPs exhibits strong LSPR band of
CTAB themselves, which hinders the detection of the targeting molecules. Therefore we could
not use this system for SERS substrate.
Therefore, we tried another strategy. We designed binder molecules which can be
substituted from ester to amide upon addition of molecules with amine group (Figure V.32).
Here, we used trimeric AMP (tridAMP). First, binder molecules were reacted with the GNPs
adsorbed on silica helices, then tridAMP was added to the solution. From the ATR results, the
band at 1720 cm-1
(white arrow) characteristic of ester group disappeared and the band at 1650
cm-1
(black arrow) characteristic of amide group appeared upon addition of tridAMP,
suggesting that tridAMP could be immobilized on the GNPs/silica-nanohelices structures.

192
Figure V.32 (a) Binder molecule and ATR spectra of (a) before and (c) after addition of tridAMP.
However, these systems did not demonstrate SERS effect. It is probably because the
distance between GNP and target molecule is too long to induce the signal enhancement due to
the long alkyl chain of binder molecules. Meanwhile, using the same principle with shorter
binder molecule, this approach may give a promising alternative which provides the possibility
to detect the various molecules by injecting the small binder molecules.
V.6 Conclusion
We developed the procedure for synthesizing new systems which consist of the
various kinds of Au nanoparticles adsorbed on the surface of helical silica nanofibers.
Promoting the size and surface charge of an Au nanoparticle is strongly depended on the
stabilizing agent.

193
Helical silica nanofibers synthesized from the organic self-assemblies of 16-2-16
L-tartrate amphiphiles by sol-gel transcription were functionalized with APTES or MPTES and
GNPs/silica-nanohelices hybrid structures were obtained with GNPs having various sizes. The
quantity of adsorped GNPs as well as their homogeneity depended on various factors such as
the GNPs size, silica surface function (APTES or MPTES), as well as the stabilization agents of
GNPs.
When the nanohybrid structures based on THPC stabilized GNPs with 1 ~ 2 nm
diameter were kept in some of the organic solvents such as alcohol, GNPs at the surface of
silica-nanohelices grew to 5 ~ 6 nm with time whereas such a growth was not observed with
hybrid helices suspension in water. Such a growth was also observed by addition of gold
solution to the suspension of silica adsorbed with THPC-GNPs: the diameter of GNPs
increased with the concentration of gold salt also up to around 5 nm. Beyond this concentration,
the size of the particles became extremely heterogeneous leading to highly non spherical
particles.
The surface plasmon resonance of the nanohybrid systems increased with particle
sizes. For the GNPs with 10 to 14 nm diameter, these hybrid systems clearly showed surface
enhanced effect on Raman spectroscopy. The enhancement factor obtained on the surface of
hybrid nanostructure was 5.7×10⁵ for benzenethiol.
Using the functionalized 3D silica nanohelices, we designed novel SERS substrate
based on 3D gel network of GNPs/silica-nanohelices hybrid nanostructures. The 3D network of
these GNPs/silica-nanohelices hybrid structures can potentially be used as ultra-sensitive
chemical and biological sensors for liquid phase. Indeed, typical SERS substrates reported in
the literature are made from novel metal nanopaticles assembled on planar surfaces or patterned
surface.17,18,19,56,62
Thus, novel GNPs/silica-nanohelices is a promising system for the powerful
SERS substrate to detect dilute solution of molecules. Meanwhile only the model molecule
benzenthiol showed the SERS effect with the present GNPs/silica-nanohelices hybrid

194
nanostructures, For other molecules that we have investigated, Au did not show strong enough
binding (typically amino or carboxyl groups). In order to overcome this problem, we can
modify of the surface of GNPs by active functionalized groups such as amino or carboxyl
groups. Other molecules which show specific binding such as sugar, nucleobase, or urea groups
can be considered. This opens up the possibility that various molecules can be adsorbed on
GNPs and hence detected by SERS. The problem can also be addressed by the reverse
approach. Direct immobilization of target molecules (e.g., peptide, DNA) on silica-nanohelix
can also be attempted. These silica can then be further coated by GNPs and used as SERS
substrates.
Compared to the commonly used 2D SERS substrates, the use of such 3D network
systems can open a totally new perspective towards high detection of molecules of interest
through accumulation under flow.

195
V.7 Experimental session
Preparation and Functionalization of Silica-Nanohelices
Once adequate ageing time of the gels is reached, these organic self-assemblies were used as
templates to prepare silica nanostructures through a sol-gel transcription procedure.24
In a typical
preparation, 500l of 5 wt% tetraethylorthosilicate (TEOS) was prehydrolyzed in water (pH 6) for 12 hours
at room temperature before each run, and then added to 500l of 1 or 5 mM organic gels with various aging
times (typically, 20 days or >45 days). The reaction mixture was vortexed (2000 rpm) for a few seconds, and
then kept at 20°C for more than 36 hours. The samples were then thoroughly washed with ethanol to remove
all organic components and excess TEOS. Finally the yields were 1.2 mg for 1 mM and 3.5 mg for 5 mM of
initial organic gels in 1 ml suspension.
Functionalization of Silica-Nanohelices
The silica-nanohelices were then functionalized via a surface chemical modification with
(3-aminopropyl)triethoxysilane (APTES) or (3-mercaptopropyl)triethoxysilane (MPTES). The washed
silica-nanohelices were re-dispersed in water (pH 6), and 15 mol/m2 of APTES (0.48 l for 1 mM or 2.4 l
for 5 mM initial organic gel) or MPTES (0.5 l for 1 mM or 2.5 l for 5 mM initial organic gel) was added.
The amounts of APTES/MPTES were calculated as below.
In order to calculate the surface area of silica-nanohelices (S), density was assumed 1 in 5 mM of
organic gels. S was calculated by
l = VR2-r
2, with R = 15×10
-7 cm, r = 10×10
-7 cm, V = 1.8×10
-3 cm
3
l =4.60×10⁶ m
S = 2R+rl
S = 0.72 m2
Generally, silane coupling agent was induced at least 15 mol/m2.
VAPTES/MPTES = 15S×MAPTES/MPTES, (dAPTES/MPTES 1)
VAPTES = 2.4 l and VMPTES = 2.5 l
The reaction mixture was submitted to ultrasonication for 2 hours, and then kept in water
overnight at 85 ˚C. After washing with ethanol, the step of functionalization by APTES or MPTES could be
repeated. This procedure led us to in the average 0.12 wt% of silica-helices from 1 mM of organic gel, and 3.5
wt% silica-helices from 5 mM initial organic gel.

196
Synthesis of GNPs
In order to get various sizes of GNPs between 2 to 14 nm, three types of stabilizers were used:
trisodium citrate (CIT), Cetyltrimethylammonium bromide (CTAB) and
tetrakis(hydroxymethyl)phosphonium chloride (THPC).
CIT-stabilized GNPs
The Au particles of about 10 nanometers were synthesized according to the method reported by
Frens et al.37-39
All the glassware which was used in these experiments was cleaned by 1 : 2 mixture of
concentrated nitric acid and hydrochloric acid, and then immediately rinsed with ultra pure water. In a typical
preparation, 40 ml of ultra pure water was boiled in advance and 10 ml of 0.1 wt % potassium
tetrachloroaurate (KAuCl4) aqueous solution was added to the boiling water. As the gold solution reached
100 ˚C, 5 ml of 0.9 wt % of trisodium citrate solution was added under vigorous stirring. After the addition of
citrate in the gold solution, the color turned to blue, dark purple, and finally tuned to dark red in 20 min
indicating the formation of GNPs. If bigger GNPs are needed, the size can be controlled by varying the
[Au3+
]/[citrate] ratio (0.17 for 10 nm, 0.28 for 12 nm and 0.37 for 14 nm).
THPC-stabilized GNPs
The smaller Au nanoparticles with the diameter of around 1 ~ 2 nm were prepared by reduction of
KAuCl4 with tetrakis(hydroxymethyl)phosphonium chloride (THPC) using a modification of the work
reported by Duff et al.40
An aqueous solution of sodium hydroxide (36 ml, 6.6 mM) and 0.8 ml of a THPC solution (67.0
mM) were mixed in a flask and vigorously stirred for 25 min. The aqueous solution of KAuCl4 (1.35 ml, 1
wt %) was quickly added to the mixture under stirring for 30 min. The color of the solution rapidly changed
from colorless to brown.
CTAB-stabilized GNPs
The positively charged nanoparticles have been synthesized by using a seed-mediated growth
method in the presence of cetyltrimethylammonium bromide (CTAB) as cationic capping agent.38,41
The
preparation process has several steps: at first, the small seeds within 3.5 nm diameter are synthesized by
chemical reduction of gold salt with a strong reducing agent (sodium borohydride) in the presence of a
capping agent (citrate), then these seeds are added to the seed growth solution containing more metal salt, a
weak reducing agent (e. g., ascorbic acid) and surfactant-directing agent (CTAB).

197
For the gold seeds synthesis, 0.25 mM HAuCl4 and 0.25 mM trisodium citrate were dissolved in
20 ml ultra pure water. Ice cold NaBH4 aqueous solution (0.6 ml, 0.1 M) was added to the mixture under
stirring. The solution immediately tuned to red-orange indicating the formation of GNPs with the diameter of
3.5 ± 0.7 nm.63
The seeds were stored at 25 ˚C for 3 h before use to allow excess borohydride to be
decomposed by water.
For the preparation of spherical GNPs, the growth solution were prepared by 18 ml mixture
containing 0.25 mM HAuCl4 and 0.08 M CTAB, and the solution was heated up with stirring, then it was
cooled to room temperature. 100 l of 0.1 M ascorbic acid solution and growth solution were mixed, and 2 ml
of 3.5 nm seed solution was added to the mixture under vigorous stirring for 10 min. The final color was dark
red, and the particle size was 9 ± 1.5 nm. These GNPs could be used soon after the synthesis and were stable
for a month due to the presence of bilayer of CTAB acting as stabilizer.
UV-vis spectroscopy
The study of localized surface plasmon resonance was recorded by Cary 300 UV-vis
spectroscopy. The data were recorded with 1.0 nm data interval and 600 nm/min scan rate. The quartz cuvette
with optical path length of 10 mm was used for the measurement.
TEM observation
TEM was performed at room temperature on a Philips EM 120 electron microscope operating at
120 kV and the images were collected by 2k × 2k Gatan ssCCD camera. Drops of diluted dispersions of the
hybrids were deposited on carbon films coated 400-mesh copper grids. The excess liquid was blotted with
filter paper.
Raman scattering and SERS spectroscopy
Benzenethiol (BT, from Sigma-Aldrich) was used as probe to quantify the enhancement of Raman
scattering by the new 3D helical structures coated by gold nanoparticles. BT diluted solutions were prepared
in water from a stock solution at 10-3
M. The ratio of SERS substrate and BT was 9/1 (vol/vol). Raman and
SERS spectra of BT were recorded with a Labram HR800 (Horiba JobinYvon) using a 633 nm excitation of a
Helium/Neon ion laser. The laser beam was focused on the sample using an objective 10x. The laser power
was fixed at 5 mW. The accumulation time were 5 s and 120 s for pure BT and diluted BT, respectively.

198
References
1 M. Quinten, A. Leitner, J. R. Krenn, F. R. Aussenegg, Opt. Lett., 1998, 23, 1331-1333.
2 (a) S. A. Maier, M. L. Brongersma, P. G. Kik, S. Meltzer, A. A. G. Requicha, H. A. Atwater, Adv. Mater.,
2001, 13, 1501-1505. (b) S. A. Maier, P. G. kik, H. A. A. Atwater, S. Meltzer, Nat. Mater., 2003, 2, 229-232.
(c) E. Ozbay, Science, 2006, 311, 189-193.
3 S. I. Bozhevolnyi, V. S. Volkov, E. Devaux, J. Y. Laluet, T. W. Ebbesen, Nature, 2006, 440, 508-511.
4 (a) S. Fullam, D. Cottell, H. Rensmo, D. Fitzmaurice, Adv. Mater., 2000, 12, 1430-1432. (b) K. Y. Jiang, A.
Eitan, L. S. Schadler, P. M. Ajayan, R. W. Siegel, Nano Lett., 2003, 3, 275-277. (c) A. V. Ellis, K.
Vijayamohanan, R. Goswami, N. Chakrapani, L. S. Ramanathan, P. M. Ajayan, G. Ramanath, Nano Lett.,
2003, 3, 279-282.
5 H. C. Choi, M. Shim, S. Bangsaruntip, H. J. Dai, J. Am. Chem. Soc., 2002, 124, 9058-9059.
6 (a) S. Banerjee, S. S. Wong, Nano Lett., 2002, 2, 195-200. (b) J. M. Haremza, M. A. Hahn, T. D. Krauss, S.
Chen, J. Calcines, Nano Lett., 2002, 2, 1253-1258.
7 (a) E. Dujardin, C. Peet, G. Stubbs, J. N. Culver, S. Mann, Nano Lett., 2003, 3, 413-417. (b) K. M. Bromley,
A. J. Patil, A. W. Perriman, G. Stubbs, S. Mann, J. Mater. Chem., 2008, 18, 4896-4801.
8 C. L. Chen, P. Zhang, N. L. Rosi, J. Am. Chem. Soc., 2008, 130, 13555–13557.
9 A. Kuzyk, R. Schreiber, Z. Fan, G Pardatscher, E. M. Roller, A. Hogele, F. C. Simmel, A. O. Govorov, T.
Liedl. DNA-Based self-Assembly of Chiral Plasmonic Nanostructures with Tailored Optical Response,
Mesosclae and Nanoscale Phyics 2011, arXiv:1108.3752.
10 S. Zhang, W. Ni, X. Kou, M. H. Yeung, K. Sun, J. Wang, C. Yan, Adv. Funct. Mater., 2007, 17, 3258-3266.
11 (a) K. Aslan, Z. Leonenko, J. R. Lakowicz, C. D. Geddes, J. Phys. Chem. B 2005, 109, 3157-3162. (b) K.
Aslan, J. R. Lakowicz, C. D. Geddes, J. Phys. Chem. B 2005, 109, 6247-6251.
12 (a) R. G. Freeman, K. C. Grabar, K. J. Allison, R. M. Bright, J. A. Davis, A. P. Guthrie, M. B. Hommer, M.
A. Jackson, P. C. Smith, D. G. Walter, M. J. Natan, Science, 1995, 267, 1629-1632. (b) B. Nikoobakht, M.
A. El-Sayed, J. Phys. Chem. A, 2003, 107, 3372-3378. (c) A. Tao, F. Kim, C. Hess, J. Goldberger, R. R. He,
Y. G. Sun, Y. N. Xia, P. D. Yang, Nano Lett., 2003, 3, 1229-1233. (d) C. J. Orendorff, A. Gole, T. K. Sau, C.
J. Murphy, Anal. Chem., 2005, 77, 3261-3266.
13 T. Hayakawa, Y. Usui, S. Bharathi, M. Nogami, Adv. Mater. 2004, 16, 1408-1412.
14 L. R. Hirsch, J. B. Jackson, A. Lee, N. J. Halas, J. L. West, Anal. Chem., 2003, 75, 2377-2381.
15 S. R. Sershen, S. L. Westcoott, N. J. Halas, J. L. West, J. Biomed. Mater. Res., 2000, 51, 293-298.
16 C. Loo, A. Lowery, N. Halas, J. West, R. Drezek, Nano Lett., 2005, 5, 709-711.
17 G. Duan, W. Cai, Y. Luo, Y. Li, Y. Lei, Applied Physics Letters, 2006, 89, 181918 (3 pages).
18 N. Pazos-Pérez, W. Ni, A. Schweikart, R. A. Alvarez-Peubla, A. Fery, L. M. Liz-Marzán, Chem. Sci. 2010,
1, 174-178.
19 H. Im, K. C. Bantz, N. C. Lindquist, C. L. Haynes, S. H. Oh, Nano Letters, 2010, 10, 2231-2236.
20 M. S. Hu, H. L. Chen, C. H. Shen, L. S. Hong, B. R. Huang, K. H. Chen, L. C. Chen, Nat. Mater., 2006, 5,

199
102-106.
21 S. Zhang, W. Ni, X. Kou, M. H. Yeung, K. Sun, J. Wang, C. Yang, Adv. Funct. Mater., 2007, 17,
3258-3266.
22 J. P. Singh, D. L. Liu, D. X. Ye, R. C. Picu, T. M. Lu, G. C. Wang, Appl. Phys.Lett., 2004, 84, 3657-3659.
23 B. A. Korgel, Science, 2005, 309, 1683-1689.
24 P. X. Gao, W. Mai, Z. L. Wang , Nano Lett. 2006, 6 (11), 2536-2543.
25 T. Delclos, C. Aimé, E. Pouget, A. Brizard, I. Huc, M. H. Delville, R. Oda, Nano letters, 2008, 8,
1929-1935.
26 (a) A. Brizard, C. Aimé, T. Labrot, I. Huc, D. Berthier, F. Artzner, B. Desbat, R. Oda, J. Am. Chem. Soc.,
2007, 129, 3754-3762. (b) R. Oda, I. Huc, M. Schmutz, S. J. Candau, F. C. Mackintosh, Nature, 1999, 399,
566-569. c) R. Oda, M. Laguerre, I. Huc, F. Artzner, J. Am. Chem. Soc., 2008, 130, 14705-14712.
27 H. Hiramatsu, F. E. Osterloh, Langmuir, 2003, 19, 7003-7011.
28 T. H. Galow, A. K. Boal, V. M. Rotello, Adv. Mater., 2000, 12, 576-579.
29 S. L. Westcott, S. J. Oldenburg, T. R. Lee, N. J. Halas, Langmuir, 1998, 14, 5396-5401.
30 B. Sadtler, A. Wei, Chem. Commun., 2002, 1604-1605.
31 F. Osterloh, H. Hiramatsu, R. Porter, T. Guo, Langmuir, 2004, 20, 5553-5558.
32 M. S. Fleming, D. R. Walt, Langmuir, 2001, 17, 4836-4843.
33 I. Pastoriza-Santos, J. Pérez-Juste, L. M. Liz-Marzan, Chem. Mater., 2006, 18, 2645-2647.
34 F. Chen, X. Li, J. Hihath, Z. Huang, N. Tao, J. Am. Chem. Soc., 2006, 128, 15874-15881.
35 (a) D. V. Leff, L. Brandt, J. R. Heath. Langmuir, 1996, 12, 4723-4730. (b) E. Podstawka, Y. Ozaki, L. M.
Proniewicz, Appl. Spectrosc, 2005, 59, 1516-1526.
36 R. R. Bhat, J. Genzer, Nanotechnology, 2007, 18, 025301.
37 G. Frens, Nature Physical Science, 1973, 241, 20-22.
38 S. Basu, S. K. Ghosh, S. Kundu, S. Panigrahi, S. Praharaj, S. Pande, S. Jana, T. Pal, J. Colloid Interface Sci.
2007, 313, 724-734.
39 S. Pramanik, P. Banerjee, A. Sarkar, S. C. Bhattacharya, J. Luminescence 2008, 128, 1969-1974.
40 (a) D. G. Duff, A. Baiker, Langmuir 1993, 9, 2301-2309. (b) D. G. Duff, A. Baiker, Langmuir 1993, 9,
2310-2317.
41 (a) B. Nikoobakht, M. A. El-Sayed, Chem. Mater., 2003, 15, 1957-1962. (b) A. Gole, C. J. Murphy, Chem.
Mater., 2004, 16, 3633-3640.
42 L. Ratke, P. W. Voorhees, Growth and Coarsening: Ostwald Ripening in Material Processing. Springer, New
York, 2002, pp. 117–118.
43 R. Heinz, A. Stabel, F. C. De Schryver, J. P. RabeJ. Phys. Chem., 1995, 99, 505–507.
44 Daniel, M.-C.; Astruc, D. Chem. ReV. 2004, 104, 293.
45 McLean, J. A.; Stumpo, K. A.; Russell, D. H. J. Am. Chem. Soc., 2005, 127, 5304.
46 M. N. Martin, J. I. Basham, P. Chando, S. K. Eah, Langmuir 2010, 26, 7410.
47 Patzke, G. R.; Krumeich F.; Nesper, R. Angew. Chem. Int. Ed., 2002, 41, 2446-2461.

200
48 J.P. Singh, D. L. Liu, D. X. Ye, R. C. Picu, T. M. Lu, G. C. Wang, Appl. Phys.Lett. 2004, 84, 3657.
49 K. T. Yong, M. T. Swihart, H. Ding, P. N. Prasad, Plasmonics 2009, 4, 79.
50 J. H. Kim, W. W. Bryan, T. R. Lee, Langmuir 2009, 24 (19), 11147.
51 C. Radloff, R. A. Vaia, Nano Letters 2005, 5 (6), 1187.
52 Barbic, M.; Mock, J. J.; Smith, D. R.; Schultz, S. J. J. Appl. Phys.2002, 91, 9341.
53 Kottman, J. D.; Martin, O. J. F.; Smith, D. R.; Schultz, S. Chem.Phys. Lett. 2001, 341, 1.
54 Mock, J. J.; Smith, D. R.; Schultz, S. Nano. Lett. 2003, 3, 485.
55 I. Hussain, S. Graham, Z. Wang, B. Tan, D. C. Sherrington, S. P. Rannard, A. I. Cooper, M. Brust, J. Am. Chme.
Soc., 2005, 127, 16398.
56 Y. Shen, J. Wang, U. Kuhlmann, P. Hildebrandt, K. Ariga, H. Moehwald, D. G. Kurth, T. Nakanishi, Chem.
Eur. J. 2009, 15, 2763-2767
57 K. T. Carron, L. G. Hurley, J. Phys. Chem. 1991, 95, 9979.
58 C. A. Szafranski, W. Tanner, P. E. Laibinis, R. L. Garrell, Langmuir 1998, 14, 3570.
59 B. Ren, G. Picardi, B. Pettinger, R. Schuster, G. Ertl, Angew. Chem. Int. Ed. 2005, 44, 139.
60 G. Socrate, Infrared and Raman Characteristic Group Frequencies: Tables and Charts, third ed. Wiley
Chichester, England, 2001, 173.
61N. Leopold, S. Cînta-pînzaru, M. baia, E. Antonescu, O. Cozar, W. Kiefer, J. Popp, Vibrational
Spectroscopy, 2005, 39, 169-176.
62 E. Hutter, J. H. Fendler, Adv. Mater., 2004, 16, 1685-1706.
63 N. R. Jana, L. Gearheart, C. J. Murphy, J. Phys. Chem. B, 2001, 105, 4065-4067.

201
General Conclusion

202

203
General conclusion
In this work, we have presented the dynamic self-assembly systems obtained by
amphiphilic molecules. Particularly, we have developed in situ morphology transformation
caused by “out-of- equilibrium” process.
Chapter I described bibliographical study on various chiral supramolecular structures
expanding to morphological control, and in situ transformation to different morphologies. A
number of literature report morphology transition from chiral to achiral structure, however
achiral to chiral transformation, especially at constant temperature, have not yet reported.
In chapter II, we demonstrated the vesicle to helix in situ transformation. The cationic
amphiphile based on quaternary ammonium headgroups with acetate counter-anion (CnAc) we
have used stronger affinity with anionic nucleotides due to their cooperative interaction than
with acetate anions. As a result, upon addition of nucleotide solution into the vesicle solution
formed by non-chiral CnAc surfactant, acetate is exchanged in situ to nucleotide and the
nucleo-lipids are formed. This allowed us to directly follow the morphology transition from
spherical vesicles to micrometric helices in situ via counter-anion exchange. On the molecular
aspect, ion exchange occurred very quickly in few minutes. These nucleotides which were
confined at the membrane surface reorganized themselves through the H bond and
stacking. Subsequently, the chirality transfer to supramolecular aggregation occurred, along
with the nucleotide reorganization. The kinetics of such a chirality expression at
supramolecular level occurred more slowly than the ion exchange (few hours). This suggests
that the control of kinetics of counter-anion interactions gives possibility to design tunable
morphology of self-assembled new helical architectures.
In chapter III, we reported the in situ right (P) to left-handed (M) helicity transition in
supramolecular aggregates by counter-anion exchange from L-tartrate to D-tartrate.
Gemini-tartrate amphiphile form chiral nanometrical fibers with various shapes such as flat,
twisted, helical ribbons and tubules as a function of various parameters such as enantiomeric

204
excess, temperature and composition. In this study we particularly focused on the in situ
enantiomeric excess control, which was produced by filtration/addition of opposite chiral acid
solution with the various equivalents. The final morphologies were strongly dependent on the
final ee value: lower ee (ee = “0” and “-0.33”) provided twist ribbons with long twist pitches.
The helicity inversion occurred much rapidly with higher ee value (ee = “-0.60” and “-0.90”).
This system shows the first direct visualization of in situ chirality inversion of chiral
supramolecular structures at mesoscopic level (20 nm – microns).
We then used these chiral organic assemblies as templates to form chiral inorganic
hybrid nanostructures. Chiral nanoribbons of gemini-tartrate can be transcribed to 3D silica
nanohelices via sol-gel polycondensation. By functionalizing them with amino or mercapto
group, gold nanoparticle with various size (1 ~ 15 nm) can be organized on silica-nanohelices.
Depending on the coupling agent, GNPs showed unique behavior in suspension: small particle
(1 ~ 2 nm) showed growth at the surface of silica, and larger particle (> 10 nm) showed strong
SPR peaks. Especially, the 3D network of novel GNPs/silica-nanohelices composites based on
CIT-stabilized GNPs can potentially be used for SERS-based sensing applications such as
ultra-sensitive chemical and biological sensors in liquid phase. Compared to the traditional 2D
SERS substrate, our 3D network system can open a totally new perspective towards high
detection of molecules of interest through accumulation under flow.

205


Nano/Micro Auto-Assemblages Chiraux de Tensioactifs Cationiques:
du comportement dynamique des architectures supramoléculaires jusqu’aux
nanomatériaux hybrides
Nous avons étudié les comportements dynamiques d'auto-assemblage des tensioactifs
cationiques non-chiral en présence du contre-anion chiral.
Lorsque le nucléotide anionique chiral est ajouté à des vésicules cationiques, la transition
morphologique se produit et transforme in situ des vésicules sphériques en hélices
micrométriques.
D'autres types de Gemini tensioactifs cationiques forment des rubans nanométriques
hélicoïdaux, en présence de tartrate contre-anions. La forme et l'hélicité de ces rubans peuvent
être contrôlés in situ par la variation de l'excès énantiomérique.
En outre, les nanohélices organiques peuvent être transcrite en nanohélices 3D de silice via
une polycondensation sol-gel.
Ces nanohelices de silice fonctionnalisées avec des groupes aminés peuvent interagir
fortement avec des nanoparticules d'or (GNPs; 1 ~ 20 nm). Le réseau 3D de -nanohélices
GNPs/silice sont potentiellement utilisables pour des applications de capteurs basée sur les
SERS comme ceux chimiques et biologiques ultra-sensibles en phase liquide.
Chiral Nano/Micro Self-Assemblies of Cationic Surfactants:
from dynamic behavior of supramolecular architectures towards hybrid nanomaterials
We have studied the dynamic self-assembly behaviors of non-chiral cationic surfactants in the
presence of chiral counter-anion.
When the chiral anionic nucleotides are added to cationic vesicles, morphology transition
occurs and spherical vesicles transform in situ to micrometric helices.
Other types of cationic surfactant, gemini surfactants form nanometric helical ribbons in the
presence of tartrate counter-anion. The shape and helicity of these self-assembled structures
can be controlled in situ by the variation of enantiomeric excess.
In both cases, they form gels in water by creating extended networks of nanometric to
micrometric chiral fibers.
Additionally, the organic nanohelices can be transcribed to 3D silica nanostructures via sol-
gel polycondensation. These silica nanohelices functionalized with amino group can interact
strongly with gold nanoparticles (1 ~ 20 nm). The 3D network of GNPs/silica-nanohelices can
potentially be used for SERS-based sensing applications such as ultra-sensitive chemical and
biological sensors in liquid phase.