
DOCTEUR DE L'UNIVERSITÉ DE BORDEAUX
250
THÈSE PRÉSENTÉE POUR OBTENIR LE GRADE DE DOCTEUR DE L’UNIVERSITÉ DE BORDEAUX ÉCOLE DOCTORALE DES SCIENCES CHIMIQUES SPÉCIALITÉ : Chimie Organique Par Susanne Julia KOCH Dendritic surface modification of photocatalytic nanoparticles for tumour therapy Sous la direction de : Karine HEUZÉ Soutenue le 12 Octobre 2017 Membres du jury : M. TOUPANCE, Thierry Professeur, Université de Bordeaux Président Mme. GLINEL, Karine Professeur, Université catholique de Louvain (Belgique) Rapporteur M. SEXTL, Gerhard Professeur, University of Würzburg (Allemagne) Rapporteur Mme. DEMBSKI, Sofia Chercheur, Fraunhofer Institute for Silicate Research (Allemagne) Invitée M. HACKENBERG, Stephan Professeur associé, University Clinic Würzburg (Allemagne) Invité Mme. HEUZÉ, Karine Chargée de Recherche, CNRS, Université de Bordeaux Directrice
-
Upload
khangminh22 -
Category
Documents
-
view
1 -
download
0
Transcript of DOCTEUR DE L'UNIVERSITÉ DE BORDEAUX

THÈSE PRÉSENTÉE
POUR OBTENIR LE GRADE DE
DOCTEUR DE
L’UNIVERSITÉ DE BORDEAUX
ÉCOLE DOCTORALE DES SCIENCES CHIMIQUES
SPÉCIALITÉ : Chimie Organique
Par Susanne Julia KOCH
Dendritic surface modification of photocatalytic nanoparticles for tumour therapy
Sous la direction de : Karine HEUZÉ
Soutenue le 12 Octobre 2017 Membres du jury :
M. TOUPANCE, Thierry Professeur, Université de Bordeaux Président
Mme. GLINEL, Karine Professeur, Université catholique de Louvain (Belgique) Rapporteur
M. SEXTL, Gerhard Professeur, University of Würzburg (Allemagne) Rapporteur
Mme. DEMBSKI, Sofia Chercheur, Fraunhofer Institute for Silicate Research (Allemagne) Invitée
M. HACKENBERG, Stephan Professeur associé, University Clinic Würzburg (Allemagne) Invité
Mme. HEUZÉ, Karine Chargée de Recherche, CNRS, Université de Bordeaux Directrice

Modification dendritique de surface des nanoparticules
photocatalytiques pour le traitement des tumeurs
Résumé : L'apparition d’un développement cancérigène est souvent caractéristique des tumeurs de la région de la tête et du cou. En raison des altérations prémalignes et malignes fréquentes, il n'est souvent pas possible de supprimer complètement la tumeur par chirurgie. Il en résulte un risque élevé de récidive tumorale. Par conséquent, cette recherche de doctorat vise à développer des nanoparticules photocatalytiques (NPs) qui seront utilisées localement en complément de la thérapie tumorale traditionnelle. Ces NPs, une fois absorbées par les cellules tumorales induiront la mort des cellules photocatalytiques par activation de lumière UV. Des NPs de TiO2 ayant des propriétés photocatalytiques et une taille moyenne inférieure à 20 nm étaient donc synthétisées. La biocompatibilité des NPs, leur absorption dans les cellules et un ciblage tumoral efficace devraient être garantis par une modification de surface des particules avec des molécules organiques dendritiques permettant un contrôle précis de la charge de surface des particules ainsi que la possibilité de couplage avec des anticorps. Un autre objectif était la combinaison de propriétés thérapeutiques et diagnostiques dans le système de NPs par exemple réalisé par incorporation d'agent luminescent. Cette recherche était menée à l'Université de Bordeaux (synthèse des molécules organiques pour la fonctionnalisation des particules) en coopération avec l'Institut Fraunhofer de recherche en silicate ISC à Würzburg, Allemagne (synthèse des nanoparticules).
Mots clés : Nanoparticules, TiO2, photocatalyse, traitement des tumeurs, dendrons, fonctionnalisation de surface
Dendritic surface modification of photocatalytic nanoparticles for
tumour therapy
Abstract : The occurrence of field cancerization is characteristic for tumours of the head and neck region. Due to these widespread premalignant and malignant alterations, it is frequently not possible to entirely remove the tumour by surgery. This results in a high risk of tumour recurrence. Therefore, this PhD research aimed to develop photocatalytic nanoparticles (NPs) as completion of the traditional tumour therapy. These NPs are supposed to be incorporated by tumour cells and to induce photocatalytic cell death by UV light activation. TiO2 with convincing photocatalytic properties and an average size smaller than 20 nm should therefore be synthesized. NP biocompatibility, their uptake into cells and an efficient tumour targeting should be guaranteed by surface modification of the particles with dendritic organic molecules that allow a precise control of the surface charge of the particles as well as antibody coupling. A further objective was the combination of therapeutic and diagnostic properties within the NP system realized for example via introduction of a luminescent dye. This research was carried out at the University of Bordeaux (synthesis of organic molecules for particle functionalization) in cooperation with the Fraunhofer Institute for Silicate Research ISC in Würzburg, Germany (nanoparticle synthesis).
Keywords : Nanoparticles, TiO2, photocatalysis, tumour therapy, dendrons, surface functionalization
ISM, UMR 5255, 351 cours de la liberation, 33405 Talence Cedex


Acknowledgements
“Theranostic nanoagents possess the potential to greatly enhance the diagnosis and treatment of disease, as they provide for the incorporation of multiple functionalities, including those utilized for targeting, imaging and therapy, within one nanoscaffold. Yet, a number of questions must be answered before the field can move beyond its infancy […]. Most importantly, there is a need for the scientists formulating the nanoparticle preparations to reconcile their synthetic methodologies with the ultimate clinical utility of the nanoagents. This can only be achieved through the development of fruitful collaborations with scientists and clinicians outside of their chosen fields. Given these challenges, the field of theranostics is rapidly growing, and, like a child, is bound to experience a number of bumps and bruises as it finds its way.“*
When I read this text during my literature study, I felt it was an apt description of my PhD project. Undertaking it has been both an academically and personally challenging experience for me and it would not have been possible without the support and guidance that I received from many people.
First, I would like to thank my supervisor Dr. Karine Heuzé (C2M, University Bordeaux) for giving me the chance to carry out this research project even though I was not an organic chemist but “something else“. Thanks to Dr. Sofia Dembski who supervised my work carried out at Fraunhofer ISC, Würzburg and who worked hard to ensure this international collaboration. Thanks also to Dr. Stefan Hackenberg (University Hospital Würzburg) for his guidance with the biomedical part of my research work. He always took the time to carefully answer my emails and to accompany me at the ICONAN in Paris. I am grateful for the support I received from the above mentioned scientists and for the interest they showed in my PhD project.
I gratefully acknowledge the funding received towards my PhD from Ministère de l’Enseignement Supérieur et de la Recherche (MESR), Fraunhofer “TALENTA start” and EU COST action MP1202.
Many thanks go to Dr. Karl Mandel (ISC) for helping me to publish my scientific work and teaching me so much about writing, while always being open for a vivid discussion. I really admire his scientific enthusiasm, self-confidence and presentation skills. I also greatly appreciated the support I received from Dr. Emilie Genin (C2M), answering my endless questions and filling several gaps in my organic chemistry knowledge. I would like to thank her for believing in me when I was not able to do it myself. For me as a women, she is a model scientist combining family and work life without ever losing the dedication for both. I also would like to acknowledge my gratitude to Dr. Luc Vellutini (C2M) for taking time to participate in the meetings regarding the organic chemistry of my PhD and to Dr. Thierry Toupance (C2M) for the discussions concerning XRD and photocatalysis results.
I would like to further thank Michael Kessler (University Hospital Würzburg) for all his fast and reliable cell culture work. Thanks to Dr. Aleksey Shmeliov (Trinity College Dublin) for HRTEM studies, Dr. Wojciech Szczerba (BAM, Berlin) for XANES analysis and Shun Kashiwaya (C2M, TU Darmstadt) for XPS measurements. Thanks also to Dr. Gwénaëlle Le Bourdon for her
*J. R. McCarthy, Nanomed., 2009, 4, 693–695.

guidance with IR measurements. I really appreciated the long discussions, amazing results and the great collaborations. I am equally grateful for the experiments conducted by several students (Rebecca Weidner, Stephan Späth, Lena Mungenast, Medine Eyili, Sébastien Zeballos) as well as for the analyses carried out by many colleagues at ISC and C2M (Odile Babot, Benedikt Schug, Peter Löschke, Sabine Rupp, Katalin Pápai and Dr. Alexander Reinhold).
During more than 1.5 years in Bordeaux, all permanent and non-permanent staff at C2M helped me to learn French, get to know the French culture and enjoy France. A special thanks to Yannick Mousli, not only for sharing the office and lab with me but also all the 2nd and 3rd year frustrations and a lot of Haribo. Thank you for also sharing your knowledge in organic chemistry with me! I will certainly miss my international familiy of C2M and CiVi, including Juan-Angel Moreno, Imane Barbara, Camille Bertrand, Martin Palazzolo, Jessie Ringo, Dieuwertje Schrijvers, Sheavon Lee, Yannick Hermans and many others. I really have to send a special thanks to Caroline Ball; without meeting her and becoming her friend, I may have not survived the first months in France. I am grateful for our great friendship and for her proof-readings of many of my scientific texts. She really helped me to improve my English.
Especially, being far from the ISC, I realized how much this research institute became my home over the last years. Thanks to all my awesome colleagues, making it a special place and creating a perfect research environment. I would like to acknowledge my gratitude to the entire OE290, OE280 and the former AWZ group but also to Johanna Fischer, Luisa Kuhn, Manuel Röder and many others. I have to thank my dear comrads-in-arms Benedikt Schug, Michael Schneider, Marion Straßer and all other OE290/280 PhD students for endless scientific discussions and emotional support. Undertaking this PhD only seemed to be half as hard, having you on my side. Thanks to my office colleagues Kirsten Langguth, Silke Gholami-Toll and Gabriele Ulm; it was a pleasure to spend time with you.
I would like to thank all my friends from my home town, school and university in Germany, for not forgetting me while I was “far away”. I am deeply grateful for the help and support my family (especially my parents Gabriele and Dieter Koch as well as my sister Judith Koch) gave me throughout my PhD thesis, living abroad and organizing my wedding in the meantime. Thanks for understanding when I missed yet another anniversary, wedding or funeral because of being abroad.
Finally, I really would like to thank my husband Andreas Wintzheimer who is always there for me in good and bad times, brightening every single day of my life!


Résumé
Résumé
R1
En 2016, plus de 48 000 nouveaux cas de cancers des voies aérodigestives supérieures
(VADS) ont été diagnostiqués aux États-Unis, ce qui représente 3% de tous les nouveaux cas
de cancer.1 Il est l'un des dix cancers les plus courants au niveau mondial.2 Les régions du
corps humain qui peuvent être affectées sont la cavité buccale, y compris les lèvres, les parties
de la langue ou le plancher de la bouche, et le pharynx qui est un tube musculaire entre le nez
et l'œsophage. En outre, il peut également apparaitre dans le larynx (boîte vocale), les glandes
salivaires, la cavité nasale et les sinus para nasaux qui sont des espaces creux dans les os
entourant le nez. Le plus couramment, la lésion ou la tumeur maligne qui se développe dans
les cellules de la peau ou des muqueuses est un carcinome épidermoïde.2 Les principaux
facteurs de risque pour ce type de cancer sont le tabagisme, la consommation d'alcool, le
tabac à mâcher et les infections par le virus du papillome humain (VPH). En outre, la
combinaison du tabagisme et de la consommation excessive d'alcool a un effet synergique.3,4
La chirurgie et la radiothérapie sont les traitements standards pour les patients atteints de cette
maladie aux premiers stades avec des taux de réussite de 60% à 90% selon la localisation et
l'étendue de la tumeur. Néanmoins, ces patients ont un risque élevé de développer une
récidive locale ou un second cancer en raison du caractère cancéreux des tissus.2 Un cancer
étendu se produit lorsque la tumeur n'est pas située dans un endroit bien défini mais largement
répandue dans les tissus. Habituellement, ces formations sont un mélange de manifestations
superficielles pré-malignes et malignes avec certaines régions ayant des fractions tumorales
profondément invasives. Cette étendue mal définie de la tumeur rend une élimination
chirurgicale très difficile. La chimiothérapie est utilisée dans des cas avancés ou récurrents en
association avec la radiothérapie comme traitement curatif ou seul comme traitement palliatif.
Les chimiothérapies couramment utilisées sont des analogues du platine comme le cis-platine
qui peuvent se coordiner avec l'ADN ou bien les taxanes comme le paclitaxel et le docétaxel
qui favorisent l'assemblage microtubulaire.2 Ces deux actions conduisent à la mort cellulaire.
Néanmoins, les traitements de chimiothérapies sont limités en durée et en intensité en raison
de leur toxicité non spécifique.2 Au cours des dernières années, des agents ciblés ont été
étudiés, comme des anticorps monoclonaux tels que le cetuximab ayant une activité
extracellulaire ou des inhibiteurs de la tyrosine kinase ayant une action intracellulaire.2 Ils
promettent un traitement tumoral plus spécifique réduisant ainsi les effets secondaires
indésirables des médicaments. Au cours de la dernière décennie, malgré les progrès dans les
procédures thérapeutiques et une amélioration significative du taux de survie à 5 ans, ce taux
reste de 66% (aux États-Unis1), y compris avec un risque élevé de récidive tumorale ainsi que
l'apparition de problèmes de cancers étendus difficiles à traiter.2 Ainsi, de nouvelles stratégies
thérapeutiques doivent être développées pour améliorer les traitements standard actuels.

Résumé
R2
Les nanoparticules (NPs) sont des matériaux de taille inférieure à 100 nm qui présentent des
propriétés physiques et chimiques uniques par rapport aux matériaux massifs en raison de
leurs dimensions. Leur petite taille leur permet traverser les barrières des cellules ou des tissus
tout en étant assez grands pour être conjugués à des anticorps ou des médicaments. C'est
pourquoi ces nanoparticules ont un grand potentiel en tant qu'outils pour l'imagerie cellulaire
ou l'analyse biologique et comme supports de médicaments ou agents thérapeutiques.5
Concernant les carcinomes à cellules épithéliales, les NPs photocatalytiques (PC) peuvent
fournir une nouvelle approche thérapeutique complémentaire.6 La thérapie photodynamique
utilisant des molécules photosensibles telles que les porphyrines ou les chlorines sont une
alternative non invasive bien connue et établie dans le traitement des malignités cutanées.7–9
Grâce à leurs propriétés uniques, l'utilisation de NPs PC pour le traitement de la tumeur
photodynamique est de plus en plus reconnue comme une stratégie prometteuse et les études
initiales ont déjà été mis en avant en soulignant leur potentiel.5,9,10 Dans cette approche, les
NPs PC sont appliquées sur un tissu cancéreux et sont absorbées par des cellules malignes.
L'application de lumière ultraviolette (UV) excite les particules PC (Figure Résumé - 1) en
raison de leurs propriétés semi-conductrices et de l’écart de bande approprié dans la gamme
d'énergie de la lumière UV.
Figure Résumé - 1. La destruction des cellules tumorales par photocatalyse induite par la lumière par des nanoparticules semi-conductrices.
Ainsi, des paires électron-trous sont créées qui vont ou bien se recombiner ou bien migrer vers
la surface de la particule, pour réagir avec l'oxygène et l'eau environnants et créer des radicaux
hautement réactifs. Ces radicaux sont alors responsables de la destruction cellulaires
conduisant à l'apoptose.6,11–13 Par rapport aux chimiothérapies, les particules appliquées sont
Résumé
R3
normalement non toxiques dans l'état non activé et donc moins toxiques pour les organes non-
affectés, ou les tissus non-traités aux rayons UV.13 Comme la transmission de la lumière dans
les tissus est limitée, l'application de la lumière UV et la photocatalyse initiée n'influent que sur
le tissu superficiel qui est la région d'intérêt lors du traitement des cancers diffus.
En raison de leur activité PC élevée, les NPs de dioxyde de titane (TiO2) semblent être un
choix approprié pour la thérapie photodynamique. Bien que la destruction des cellules
cancéreuses par les UV ait été démontrée, le traitement est en général dépourvu de spécificité
vis-à-vis de ces cellules.5 En outre, les particules commerciales utilisées sont souvent mal
caractérisées et ne présentent pas toutes les propriétés requises. Les propriétés des particules
telles que la charge superficielle sur l'absorption cellulaire et les mécanismes menant à
l'apoptose cellulaire n'ont pas été étudiés suffisement. Il est par conséquent indispensable de
préparer des systèmes de nanoparticules TiO2 bien caractérisés et d’affiner leurs propriétés
de surface, par exemple par une fonctionnalisation spécifique. Si les particules possèdent des
propriétés de luminescence, alors l'absorption cellulaire peut être étudiée ou, dans des
applications comme agent antitumoral, leur position exacte dans le tissu peut être déterminée
avant l'application de lumière UV. En outre, la charge de surface de ces particules peut être
modulée par une fonctionnalisation organique pouvant améliorer l'absorption cellulaire. Si ces
particules sont également bioconjugées, fournissant des ligands spécifiques pour le ciblage
de tumeur, un diagnostic de cancer ou une chirurgie guidée par luminescence peut être
envisageable. L'application d'un tel système optimisé de particules luminescentes et PC dans
le traitement du cancer buccal est représenté ci-dessous (Figure Résumé - 2).
Dans ce contexte, le premier objectif de cette thèse était la synthèse et la caractérisation des
NPs photocatalytiques de TiO2, plus précisément des NPs d’anatases. Deux systèmes de
particules avec différents types d'agents complexants et des paramètres d'autoclavage variés
devaient être synthétisés par un procédé hydrothermique sol-gel. Parmi ces échantillons, il
fallait sélectionner le plus approprié et le plus prometteur pour le traitement PC de la tumeur.
Leur application pour les tests de culture cellulaire était l’objectif principal, y compris la
stabilisation dans les milieux de culture cellulaire et la réalisation de tests de cytotoxicité. Par
la suite, les surfaces des particules ont été modifiées par des molécules organiques
appropriées afin de faciliter leur absorption cellulaire et éventuellement fournir un meilleur état
de dispersion dans les milieux de culture cellulaire. Des molécules organiques linéaires et
dendritiques avec des fonctions amines terminales ont été synthétisées afin d’induire une
charge positive favorable à une interaction des particules avec les membranes cellulaires. Les
structures dendritiques ont été choisies pour augmenter la quantité de fonctionnalités
terminales sans augmenter le nombre d'ancrages de surface. Ceci était crucial car l'activité
PC des particules inorganiques doit être préservée malgré l’ancrage de molécules à la surface.

Résumé
R4
Le greffage des molécules organiques a été réalisé par une fonction alcoxysilane. Un objectif
supplémentaire a été l'introduction de propriétés de luminescence des particules afin de
combiner les applications thérapeutiques et diagnostiques. La luminescence des particules est
un atout supplémentaire pour l’études de l'absorption des particules par les cellules dans les
tests de culture cellulaire. Cet objectif devait être atteint soit par la modification des particules
inorganiques, par exemple par dopage ou par intégration d'un chromophore dans les agents
de surface organiques. Enfin, l'objectif final a été alors de prouver que l'activité PC des
systèmes de particules fonctionnelles développés est maintenue, ainsi que d'examiner leur
cytotoxicité et leur potentiel comme agents antitumoraux.
Figure Résumé - 2. Application de nanoparticules photocatalytiques et luminescentes complétant la thérapie du cancer buccal.
En ce qui concerne les synthèses inorganiques des NPs réalisées dans ce travail, deux types
différents des NPs d’anatase ont été synthétisés avec succès. Elles ont été soigneusement
analysées par DRX, MET, mesures du potentiel zêta, DLS, ATG, sorption d'azote et
spectroscopie infrarouge (IR). Alors que la morphologie (forme ovale) et la taille (entre 5 nm
et 6 nm) des deux types de cristaux d'anatase semblent être très similaires, elles diffèrent
principalement dans les fonctions de surface introduites lors de la synthèse. Alors que le AA-
TiO2 porte des groupes acétonate d'acétyle et acide paratoluènesulfonique, le MEEAA-TiO2
comporte des fonctions acide 2-[2-(2-méthoxyéthoxy)éthoxy]acétique à sa surface. L'activité
PC plus élevée du MEEAA-TiO2 par rapport au AA-TiO2 est donc principalement liée aux
différents groupes de surface ou plus précisément à la plus grande quantité de groupes
fonctionnels sur le AA-TiO2. Dans la Figure Résumé - 3, les groupes de surface des deux
systèmes de particules AA-TiO2 et MEEAA-TiO2 sont représentés, ainsi que l'activité PC des

Résumé
R5
deux systèmes par rapport aux NPs P25 TiO2 commercialles présentées comme matériau de
référence.
Figure Résumé - 3. Les groupes de surface des deux systèmes de particules a) AA-TiO2 et b) MEEAA-TiO2 et leur activité photocatalytique par rapport aux NPs commerciaux P25. (DCA = acide dichloracétique)
A la vue de ces résultats, l’étude de l'influence des conditions de traitement hydrothermique
sur les propriétés des NPs a été réalisée avec le système MEEAA-TiO2 le plus prometteur.
Ainsi, si le temps ou la température de l'autoclave augmente lors de la synthèse, alors la taille
des cristallites augmente de 4,8 nm à 7,7 nm (1h, 160 ° C à 4h, 200 ° C). Ceci a été vérifié par
RDX, MET, DLS et des mesures de sorption d'azote. Alors que les propriétés des groupes de
surface ne sont que marginalement influencées par des changements dans le temps et / ou la
durée du traitement (comme le montrent les mesures IR, ATG et potentiel zêta), l'activité PC
de l'échantillon est significativement améliorée avec l'augmentation de la taille des particules.
Cela contrastait avec l'attente initiale qui était que l'activité des échantillons aurait dû diminuer
avec la taille croissante des particules du fait de l’accroissement de leur surface spécifique.
Les performances accrues en photocatalyse avec une surface spécifique décroissante est le
résultat d'une modification de la morphologie des cristaux (Figure Résumé - 4). Alors que les
petites cristallites montrent la morphologie bipyramidale tétragonale tronquée à l'état
d'équilibre typique, la croissance des cristaux conduit à la formation de cristaux en forme de
tige avec des vacances d'oxygène provoquées par une fixation orientée de particules simples
(comme le montrent les analyses XAFS, RDX et HR-MET). Le caractère plus anisotrope des
cristaux et l'augmentation des vacances en oxygène améliorent l'activité PC des échantillons

Résumé
R6
- probablement en raison d'une séparation plus efficace du support de charge. La croissance
des cristaux par l’émergence des facettes {011} est vraisemblablement causée par les
conditions aqueuses de traitement hydrothermique et l'adsorption préférentielle de l'acide
carboxylique utilisé (MEEAA) sur les facettes {001} de haute énergie.
Figure Résumé - 4. L’activité photocatalytique croissante conjointement avec la diminution de la surface spécifique est expliquée par un changement de morphologie des nanoparticules et une augmentation de défauts en oxygène.
Après avoir synthétisé et caractérisé avec succès les NPs PC de TiO2, l'incorporation de
propriétés luminescentes a ensuite été étudiée. Pour introduire les propriétés de luminescence
dans les particules de TiO2, la synthèse de NPs de type cœur-coquille TiO2@SiO2 dopées
Rhodamine B luminescente a été réalisée avec succès. La formation homogène d'une coquille
de silice autour du TiO2 a été prouvée par des mesures de MET, DLS et zêta potentiel.
L'incorporation de Rhodamine B dans la coquille de silice était une méthode de choix en raison
de la luminescence résultante des particules finales. Malheureusement, on a montré que
l'activité PC des particules diminuait progressivement avec l'augmentation de l'épaisseur de la
coquille de silice. Aussi, en raison de l’auto-extinction du colorant dans la coquille, le dopage
de la coquille de silice par la Rhodamine B est limité par la concentration de colorant. Cela
signifie que, plus la photoluminescence souhaitée est élevée, plus la coquille de silice doit être
épaisse et moins l'activité PC du système de particules TiO2@SiO2 est importante. La synthèse
d'un système ZnO-TiO2 reste encore difficile. Nous avons synthétisé avec succès des NPs
ZnO luminescentes, cependant, leur stabilité dans l'eau acide n'était pas suffisante pour la
synthèse d'une coque TiO2. Néanmoins, il a été possible de prouver la faisabilité d'une
formation de coque TiO2 autour des NPs inorganiques telles que les NP d'oxyde de fer. Cela

Résumé
R7
signifie que, si l'on trouve un système de particules inorganiques luminescentes suffisamment
stable à l'acide, on pourrait envisager la formation de coquille TiO2 à leurs surfaces. Pour cela,
il faut tenir compte du fait que l'excitation du matériau du cœur doit être supérieure aux
longueurs d'onde d'absorption de l'enveloppe de TiO2 pour assurer l'arrivée de la longueur
d'onde d'excitation au noyau. En outre, il faut garder à l'esprit que l'activité PC de l'enveloppe
pourrait être aussi influencée négativement par le noyau. Pour conclure sur les tentatives de
synthèse des particules de cœur/coquille luminescentes, on peut affirmer que les deux
systèmes n'ont pas été jugés suffisamment actifs pour être utilisés en photocatalyse. C'est la
raison pour laquelle il fallait trouver une autre façon d'intégrer les propriétés de luminescence
dans le système NPs.
L'intégration d'un colorant organique dans les agents de couplage a été identifiée comme la
voie la plus prometteuse. Elle est décrite dans la partie suivante de ce travail, dans laquelle
des agents de couplage organiques ont été synthétisés et ensuite greffés sur les NPs TiO2.
En ce qui concerne les synthèses organiques, quatre structures dendritiques ou linéaires
luminescentes ou non luminescentes ont été conçues comme indiqué dans le Schème
Résumé - 1. Les trois premiers agents de couplage contiennent tous le colorant rhodamine.
L'agent de couplage I, molécule linéaire sans groupe aminé terminal, a été obtenu avec
succès et a prouvé la stabilité de l'agent de luminescence pendant toutes les étapes de
synthèse et de lavage. L'agent de couplage II est une molécule linéaire portant un groupe
amine terminal et une fonction Rhodamine. Plusieurs étapes de synthèse ont été menées avec
succès jusqu'au couplage des composants non luminescents de l'agent de couplage au
colorant par la formation d’une liaison thiourée. Cependant, cette liaison thiourée sur la position
alpha de la lysine a donné lieu à un réarrangement de la molécule dans des conditions acides.
La labilité de la liaison amide à côté du thiourée n'a jamais été rapportée dans la littérature
dans le cas de la lysine dans les conditions réactionnelles utilisées (acides forts, température
ambiante). Dans ce contexte, le clivage du groupe de protection Boc et Z n'a pas été possible
et la voie synthétique n'a pas été poursuivie.

Résumé
R8
Schème Résumé - 1. Des agents de couplage organiques synthétisés dans ce travail.
Néanmoins, les connaissances acquises lors des étapes de synthèse de l'agent de couplage
II ont contribué à synthétiser l'agent de couplage III (molécule dendritique de 1ère génération
luminescente et porteuse de fonctions amines). Ce travail de synthèse a été le plus complexe
car nous avons rencontré plusieurs obstacles à surmonter. Par exemple, nous avons dû faire
face à la formation de dipeptides lors de la protection Fmoc de la Z-lysine. Ce problème a été
contourné par l'utilisation de DMF comme solvant organique (au lieu de THF ou dioxane).
L'instabilité de la liaison ester due à des réactions de trans-estérification (en présence d'un
alcool) a également été inattendue et a initié d'autres études de la stabilité de cette liaison.
Ceci qui nous a permis d’établir que ces liaisons ester sont sensibles aux réactions de
transestérification en milieu aqueux-alcoolique basique. L’utilisation d’un amide au lieu d’un
ester, a fourni une structure moléculaire plus stable jusqu'à l'étape de réaction finale. Ainsi, du
NHS-rhodamine a été utilisé dans l’étape finale de formation de l’agent de couplage III à la
place de l'isothiocyanate de rhodamine (qui avait été utilisé dans le cas de l’agent de couplage
Résumé
R9
II). Nous avons ainsi garanti la stabilité de la structure moléculaire pour les étapes de réaction
ultérieures. L'agent de couplage III a donc été obtenu avec succès. L'agent de couplage IV
(molécule dendritique analogue non luminescent de l'agent de couplage III). Ce composé a
également été obtenu avec succès. Alors que la quantité d'agent de couplage III était trop
faible pour procéder à la réaction de greffage, les agents de couplage I et IV ont pu être
synthétisés en quantité suffisante pour procéder à leur greffage sur les NPs TiO2.
Dans l’étape de greffage, la procédure a été mise au point avec des silanes commerciaux ([3-
(2-aminoethylamino)propyl]-trimethoxysilane, N1-(3-trimethoxysilylpropyl)diethylenetriamine).
Les conditions basiques de greffage hydroalcoolique semblent être plus efficaces que dans
un milieu acide, même si les deux procédures ont conduit à une modification des particules.
La charge de surface des particules a été effectivement modifiée comme indiqué par les
mesures du potentiel zêta, tandis que l'activité PC des particules de TiO2 a été légèrement
réduite (une réduction de 20 à 40 % a été généralement enregistrée). Dans le cas de MEEAA-
TiO2 (4 h, 200 °C), une quantité de 1 à 4 μmol de silane ajouté par mg de NPs a donné des
résultats similaires concernant la charge de surface et l'activité de PC. Une quantité minimale
de silane de 1 μmol/mg est nécessaire pour obtenir une monocouche sur les particules. Ceci
est en accord avec la quantité théorique calculée de 1,09 μmol/mg (pour MEEAA-TiO2). L'ajout
de quantités de silane considérablement plus élevées (testé avec AA-TiO2) conduit
vraisemblablement à la croissance de couches moléculaires supplémentaires autour des NPs.
La quantité optimale pour le greffage des agents de couplage synthétisés I et IV sur MEEAA-
TiO2 (4h, 200 °C) a été fixée 2 μmol de silane par mg de NPs. Le greffage de l'agent de
couplage I a été confirmé par plusieurs les méthodes d'analyse utilisées (IR, DLS, potentiel
zêta). Le potentiel de surface des NPs a été significativement modifié, ce qui a conduit à une
charge superficielle considérablement plus négative, à pH physiologique. Dans le contexte
des applications de tests de culture cellulaire, une charge de surface positive est souhaitée et,
par conséquent, ces NPs ne sont pas adéquates en l’état pour de telles applications.
Egalement, l'état de dispersion des particules modifiées dans l'eau était relativement mauvais,
ce qui n'est pas surprenant, car on sait que la rhodamine a une faible solubilité. Ainsi,
l’introduction de groupements amine à la surface des NPs devrait améliorer la dispersibilité de
celles-ci en milieu aqueux. Les NPs modifiées ont montré également une photoluminescence
très élevée (Figure Résumé - 5 a) et une excellente activité PC (Figure Résumé - 5 b), allant
même au-delà des propriétés des NPs non modifiées. Ce phénomène inattendu est sans doute
dû à la charge superficielle significativement modifiée qui favorise l'adsorption des molécules
prenant part aux réactions PCs.

Résumé
R10
Figure Résumé - 5. A) Spectre de photoluminescence de MEEAA-TiO2 pur (bleu) et fonctionnalisé (noir) (avec l’agent de couplage I); Excité à 556 nm (c'est-à-dire au maximum d'absorption du système de particules fonctionnalisées). En outre, des photos des deux échantillons de particules comme dispersion dans l'eau à pH = 10 sont représentées. b) Activité photocatalytique de MEEAA-TiO2 fonctionnalisé avec l'agent de couplage I (noir) par rapport au MEEAA-TiO2 non modifié (bleu). (DCA = acide dichloracétique)
Le greffage réussi de l'agent de couplage IV a été confirmé par IR même si les bandes
d'absorption caractéristiques détectées étaient de faible intensité. L'IEP de l'échantillon n'a pas
été modifié de manière significative, ce qui peut être dû à l'absence de groupes ioniques dans
l'agent de couplage. Les tentatives qui ont été réalisées pour cliver le groupement protecteur
phtalimide des agents de couplage IV greffés n'ont pas été concluantes à ce jour.
En résumé, la synthèse des agents de couplage dendritiques luminescents et non
luminescents ainsi que leur greffage sur les TiO2 NPs précédemment synthétisés ont été
démontrés avec succès. Les avancées ainsi que les obstacles rencontrés lors des synthèses
organiques et les procédures de greffage de ces agents de couplage ont été clairement
montrés. Pour les études futures, la synthèse des agents de couplage luminescents (en
particulier) devrait être étudiée et optimisée. En outre, le clivage du groupe protecteur du
phtalimide des agents de couplage greffés doit encore être développé.
Avant les premiers essais de culture cellulaire sur les NPs synthétisés, les échantillons doivent
être transférés dans des milieux de culture cellulaire. Pour éviter l'agglomération et la
sédimentation, un agent de stabilisation approprié pour les NPs TiO2 doit être recherché. La
stabilisation des NPs TiO2 avec du sérum fœtal de veau (FBS) et des éthers de
polycarboxylate Melpers® V4343 ou Sika® ViscoCrete®-10110178 a amélioré la dispersion des
NPs dans divers milieux de culture cellulaire. L’éther de polycarboxylate Melflux® 4930 F
(Melflux) semble être l'agent stabilisant le plus approprié dans cette étude car on observe une
absence d'agglomération et de sédimentation jusqu’à 24 h dans les trois milieux de culture

Résumé
R11
cellulaire testés. La stabilisation assure un dosage précis des particules pour les tests de
culture cellulaire et des études fiables de l'absorption de particules par les cellules en fonction
de la concentration car les particules ne sédimentent pas. Dans la Figure Résumé - 6, la
sédimentation d'un échantillon stabilisé avec Melflux est comparée à un échantillon non
stabilisé et à un échantillon stabilisé par FBS.
Figure Résumé - 6. Etude de la sédimentation de AA-TiO2 (0,5 mg/ml) stabilisé avec FBS (1 mg NP: 100 mg FBS) ou Melflux (1 mg NP: 0,4 mg Melflux) et non stabilisé: a) pourcentage de particules non-sédimentées déterminées par mesure d'absorbance et b) photographies des échantillons à 0 h et 24 h après l'addition du stabilisateur à la dispersion des NPs (* particules sédimentées).
Contrairement au FBS, qui est couramment utilisé comme stabilisant dans la littérature,
Melflux n'a pas d'influence sur la cytotoxicité des particules. Par conséquent, il est approprié
en tant qu'agent stabilisant de NPs TiO2 et peut être d'un intérêt particulier pour les études sur
la toxicité ou le potentiel thérapeutique de ces NPs. De plus, ce travail de recherche a mis en
évidence que les systèmes testés AA-TiO2 et MEEAA-TiO2 se sont tous deux révélés non
toxiques contre les cellules malignes et non malignes dans leur état non activé - à la fois
particules bien stabilisées et agglomérats non stabilisés. Cela ouvre une voie prometteuse
pour leur application en tant qu'agent de traitement tumoral car leur non-toxicité peut permettre
un traitement spécifique de la tumeur spécifique à la lumière UV.
L'activité antitumorale détectée des échantillons de MEEAA-TiO2 pré-activés pendant 24h par
lumière UV est probablement causée par la dégradation par PC du MEEAA en composés
toxiques pour les cellules. Ce travail, d'une part, a fourni des résultats impressionnants
concernant un traitement spécifique de la tumeur, et d'autre part, il a souligné que le transfert
de composés commerciaux et chimiques dans des applications biomédicales peut provoquer
des obstacles inattendus concernant la toxicité des impuretés non identifiées. Cependant, pour
Résumé
R12
les NPs modifiées par les agents de couplage synthétisés dans ce travail, cette toxicité n'est
pas pertinente car les particules sont purifiées pendant la procédure de fonctionnalisation.
A terme, ce travail devrait inclure l'évaluation de la cytotoxicité des échantillons fonctionnalisés
de MEEAA-TiO2 ainsi que le développement du traitement tumoral par PC par l'application de
lumière UV sur des cellules traitées avec les échantillons deNPs PC.
Une avancée majeure de ce travail de recherche a été le développement de systèmes de NPs
fonctionnalisées pour les applications biomédicales à partir de particules fonctionnalisées par
des agents de couplage organiques. Ainsi, ce travail a aboutit au greffage des particules, à
leur test en culture cellulaire et à l’étude de cytotoxicité. Bien que la plupart des recherches se
concentrent uniquement sur une seule de ces étapes, nous avons mené à bien toutes ces
étapes au sein d’un même projet. Ceci a permis de mieux comprendre l’influence de chaque
étape entre elles et la possibilité de résoudre les problèmes antérieurs qui se produisent. Des
travaux récents ont montré que la morphologie des cristaux influence la performance PC des
NPs anatase. Il est donc possible d’optimiser les croissances cristallines lors des synthèses
sol-gel hydrothermales des TiO2 NPs pour les rendre hautement actifs en photocatalyse. La
stabilisation de ces NPs dans les milieux de culture cellulaire avec Melflux® 4930 F peut être
transposée aux autres systèmes de particules et peut donc être particulièrement intéressante
pour les études sur la toxicité ou le potentiel thérapeutique des NPs en général. La preuve de
la faisabilité du greffage des organo-silanes sur les particules de TiO2 synthétisées ouvre la
voie à leur utilisation dans une large gamme d'applications, du fait de leurs propriétés de
surface modulables. Elles pourraient éventuellement être utilisés comme additifs, par exemple
dans des revêtements plastiques ou fonctionnels, comme supports de médicaments ou dans
des cellules solaires. Le développement de nouveaux agents de couplage dendritiques
luminescents n'est pas seulement d'une grande importance pour la fonctionnalisation des NPs
PC utilisées pour le traitement des tumeurs, mais aussi pour la modification de surfaces de
drug-carriers, par exemple. En outre, la caractérisation de l'internalisation des particules par
les cellules pourrait être facilitée par la fonctionnalisation des NPs avec ces agents de
couplage luminescents, car ils pourraient permettre la détection des NPs par luminescence.
En conclusion, les systèmes de NPs TiO2 PC fonctionnalisés ou non modifiés qui ont été
développés dans ce travail sont d'un grand intérêt pour la thérapie tumorale photodynamique.
Mise en pratique, cette approche thérapeutique consisterait en l'application de particules sur
le tissu d'intérêt puis elles seraient l'internaliser par les cellules. Par la suite, une irradiation UV
serait appliquée sur la zone à traitée pour activer les NPs et induire la photolcatalyse des
composants cellulaires conduisant à l'apoptose cellulaire et à la destruction de la tumeur. En
raison de la non toxicité des NPs, les zones qui ne sont pas traitées avec de la lumière UV ne

Résumé
R13
seront pas endommagées et la photocatalyse du TiO2. Nous visons donc à détruire
spécifiquement les cellules tumorales. En plus du traitement photodynamique de la tumeur,
les systèmes de NPs développés pourraient être appliqués à la purification photocatalytique
de l’eau ou pour le développement de dispositifs photoniques et optoélectroniques. Dans le
cas de la purification de l'eau, les échantillons NPs dispersées pourraient être utilisés pour
décomposer les contaminants organiques dans les eaux usées comme les pesticides ou les
médicaments. Pour le développement de dispositifs photoniques et optoélectroniques, les NPs
d'anatase semi-conductrices à larges bandes interdites sont idéales pour la conversion
d'énergie lumineuse. Ainsi, la possibilité de fonctionnaliser leur surface donne la possibilité de
coupler des sensibilisateurs tels que par exemple des colorants pour construire des cellules
solaires à colorant.

Résumé
R14
References :
1 R. L. Siegel, K. D. Miller and A. Jemal, CA. Cancer J. Clin., 2016, 66, 7–30. 2 S. Purohit, R. Bhise, D. Lokanatha and K. Govindbabu, Indian J. Surg. Oncol., 2013, 4, 19–26. 3 L. A. Torre, F. Bray, R. L. Siegel, J. Ferlay, J. Lortet-Tieulent and A. Jemal, CA. Cancer J. Clin., 2015, 65, 87–
108. 4 M. Marron, P. Boffetta, Z.-F. Zhang, D. Zaridze, V. Wunsch-Filho, D. M. Winn, Q. Wei, R. Talamini, N. Szeszenia-
Dabrowska, E. M. Sturgis, E. Smith, S. M. Schwartz, P. Rudnai, M. P. Purdue, A. F. Olshan, J. Eluf-Neto, J. Muscat, H. Morgenstern, A. Menezes, M. McClean, E. Matos, I. N. Mates, J. Lissowska, F. Levi, P. Lazarus, C. L. Vecchia, S. Koifman, K. Kelsey, R. Herrero, R. B. Hayes, S. Franceschi, L. Fernandez, E. Fabianova, A. W. Daudt, L. D. Maso, M. P. Curado, G. Cadoni, C. Chen, X. Castellsague, S. Boccia, S. Benhamou, G. Ferro, J. Berthiller, P. Brennan, H. Moller and M. Hashibe, Int. J. Epidemiol., 2010, 39, 182–196.
5 Z. Fei Yin, L. Wu, H. Gui Yang and Y. Hua Su, Phys. Chem. Chem. Phys., 2013, 15, 4844. 6 S. Hackenberg, A. Scherzed, W. Harnisch, K. Froelich, C. Ginzkey, C. Koehler, R. Hagen and N. Kleinsasser,
J. Photochem. Photobiol. B, 2012, 114, 87–93. 7 T. Hasan, B. Ortel, N. Solban and B. Pogue, Cancer Med., 2003, 7, 537–48. 8 S. B. Brown, E. A. Brown and I. Walker, Lancet Oncol., 2004, 5, 497–508. 9 P. Agostinis, K. Berg, K. A. Cengel, T. H. Foster, A. W. Girotti, S. O. Gollnick, S. M. Hahn, M. R. Hamblin, A.
Juzeniene, D. Kessel, M. Korbelik, J. Moan, P. Mroz, D. Nowis, J. Piette, B. C. Wilson and J. Golab, CA. Cancer J. Clin., 2011, 61, 250–281.
10 F. U. Rehman, C. Zhao, H. Jiang and X. Wang, Biomater. Sci., 2015, 4, 40–54. 11 S. Hackenberg, A. Scherzed, A. Gohla, A. Technau, K. Froelich, C. Ginzkey, C. Koehler, M. Burghartz, R. Hagen
and N. Kleinsasser, Nanomed., 2014, 9, 21–33. 12 S. Hackenberg, F.-Z. Zimmermann, A. Scherzed, G. Friehs, K. Froelich, C. Ginzkey, C. Koehler, M. Burghartz,
R. Hagen and N. Kleinsasser, Environ. Mol. Mutagen., 2011, 52, 582–589. 13 Kleinsasser, Int. J. Oncol., 2010, 37, 1538–1590.


Contents

Contents
General Introduction…………………………………………………………………………... - 1 -
I. Bibliographic study………………………………………………………………………….. - 9 -
I.1. Titanium dioxide particles……………………………………………………………….. - 11 -
I.1.1. TiO2 nanoparticle synthesis………………………………….………………........ - 12 -
I.1.2. Photocatalytic activity…………………………………………………….............. - 15 -
I.1.3. Photocatalytic tumour therapy with TiO2 particles………..……………………... - 19 -
I.1.4. Luminescent TiO2 nanoparticles…...…………………………………………….. - 21 -
I.2. Surface modification of nanoparticles for biotechnological applications……………. - 24 -
I.2.1. Surface modification of TiO2 particles…………………………………..……...… - 26 -
I.2.2. Surface modification of particles with dendrons……………………………….... - 28 -
I.3. Conclusion……………………………………………………………………………..… - 33 -
II. Inorganic syntheses: Titanium dioxide nanoparticles……………………………….. - 43 -
II.1. Influence of the coordinating agent on TiO2 nanoparticles………………………….. - 45 -
II.1.1. Size and morphology……………………………………………………………… - 45 -
II.1.2. Surface moieties…………………………………………………………………... - 48 -
II.1.3. Photocatalytic activity…………………………………………………………….. - 53 -
II.2. Influence of hydrothermal processing parameters on MEEAA-TiO2 particles……. - 56 -
II.2.1. Size and morphology……………………………………………………………… - 56 -
II.2.2. Surface moieties…………………………………………………………………... - 62 -
II.2.3. Photocatalytic activity……………………………………………………………... - 65 -
II.3. Luminescent TiO2 based core/shell structured nanoparticles…………………….... - 71 -
II.3.1. Luminescent TiO2/SiO2 core/shell nanoparticles……………………………..... - 71 -
II.3.2. ZnO/TiO2 core/shell nanoparticles……………………………………………..... - 76 -
II.4. Conclusion………………………………………………………………………………. - 83 -
III. Synthesis of organic coupling agents and their grafting onto TiO2 nanoparticles - 89 -
III.1. Synthesis of functional coupling agents……………………………………………… - 91 -
III.1.1. Synthesis of linear and dendritic fluorescent coupling agents………………... - 94 -
III.1.2. Synthesis of dendritic non-fluorescent coupling agents………………………. - 111 -
III.2. Grafting of organic molecules onto particles………………………………………… - 115 -
III.2.1. Optimization of grafting protocols with commercial silanes…………………... - 116 -
III.2.2.Grafting of synthesized coupling agents onto MEEAA-TiO2 (200 °C, 4 h)….. - 123 -
III.3. Conclusion……………………………………………………………………………… - 133 -

Contents
IV. Cell culture examinations of synthesized TiO2 particle systems………………..... - 141 -
IV.1. Stabilization of TiO2 nanoparticles in cell culture media……………………………. - 144 -
IV.2. Cytotoxicity of TiO2 nanoparticles…………………………………………………….. - 151 -
IV.3. Tumor treatment effect of MEEAA particles…………………………………………. - 154 -
IV.4. Conclusion……………………………………………………………………………… - 164 -
General Conclusion…………………………………………………………………………… - 167 -
Experimental part……………………………………………………………………………… - 173 -
1. Materials, equipment and experimental set-ups……………………………………….. - 175 -
1.1. Solvents, reagents and materials for cell culture experiments…………………... - 175 -
1.2. Equipment and experimental set-ups……………………………………………… - 175 -
2. Inorganic nanoparticle synthesis protocols……………………………………………... - 179 -
2.1. Synthesis of TiO2 nanoparticles……………………………………………………. - 179 -
2.2. Synthesis of luminescent TiO2 based core/shell nanoparticles…………………. - 180 -
3. Organic coupling agent synthesis protocols……………………………………………….. - 182 -
4. Grafting protocols…………………………………………………………………………….. - 206 -
4.1. Optimization of grafting protocols with commercial silanes……………………… - 206 -
4.2. Grafting of synthesized coupling agents onto MEEAA-TiO2 (200 °C, 4 h)……… - 206 -
5. Cell culture tests………………………………………………………………………………. - 208 -
Appendices…………………………………………………………………………………...… - 213 -
Appendix I Influence of hydrothermal processing parameters on AA-TiO2 particle….. - 214 -
Appendix II Cleavage of the phthalimide protecting group of the coupling agent IV grafted onto MEEAA-TiO2 (200 °C, 4 h)……………………………………..
- 218 -
Appendix III Stabilization of MEEAA-TiO2 in cell culture media with FBS, BSA, Melflux, Melpers or Sika ViscoCrete………………………………………..
- 219 -
List of appreviations…………………………………………………………………………... - 221 -


- 1 -
General introduction

General introduction
- 2 -
In 2016, over 48,000 new cases of head and neck cancer were estimated in the USA which
represents 3% of all new cancer cases.1 This cancer counts as one of the ten most common
cancers globally.2 Regions of the human body that can be affected by head and neck cancer
are the oral cavity, including the lips, parts of the tongue or the floor of the mouth, and the
pharynx which is a muscular tube between the nose and oesophagus. In addition, it can also
occur in the larynx (voicebox), salivary glands, nasal cavity and paranasal sinuses which are
hollow spaces in the bones surrounding the nose. The most common entity of head and neck
cancer is the squamous cell carcinoma.2 Major risk factors for this type of cancer are smoking,
alcohol consumption, smokeless tobacco use and human papillomavirus infections.
Furthermore the combination of smoking and excessive alcohol consumption has a synergistic
effect.3,4 Surgery and radiotherapy are the standard treatments for patients with this disease
in the early stages with success rates of 60 % to 90 % depending on the tumour localization
and extent. Nevertheless, these patients have a high risk of developing a local recurrence or
a second primary due to field cancerization.2 Field cancerization occurs when the tumour is
not situated in a well-defined location but widely spread over the tissue. Usually these
formations are a mixture of pre-malignant and malignant superficial manifestations with some
regions having deeply invasive tumour fractions. This unclear extent of the tumour makes a
surgical removal very difficult. Chemotherapy is used in advanced or recurrent cases in
combination with radiotherapy as a curative regime or alone as a palliative treatment. Common
chemotherapeutics are platinum analogues like cisplatin that act by forming covalent bonds
with the DNA or taxanes like paclitaxel and docetaxel that promote microtubular assembly.2
Both of these actions lead to cell death. Nevertheless, the chemotherapeutic treatments are
limited in duration and intensity due to their non-specific toxicity.2 In recent years, targeted
agents have come to the research fore, including monoclonal antibodies such as cetuximab
possessing an extracellular domain activity and small tyrosine kinase inhibitors acting
intracellularly.2 They promise a more specific tumour treatment thereby reducing unwanted
side-effects of drugs. Despite the advances in therapy procedures and a significant
improvement in the 5-year survival rate during the last decade, the rate remains at 66 % (in
the USA1) including a high risk of tumour recurrence as well as the appearance of difficult-to-
treat field cancerization.2 Thus, novel therapy strategies need to be developed to enhance the
current standard treatments.
Nanoparticles (NPs), materials smaller than 100 nm in size, exhibit unique physical and
chemical properties compared to bulk material due to their dimensions. Their small size makes
them ideal to cross cell or tissue barriers while being large enough to be conjugated to
antibodies or drugs. This is why they have a great potential as tools for cell imaging or biological
analysis and as drug carriers or therapeutic agents.5 Concerning squamous cell carcinomas,

General introduction
- 3 -
photocatalytic NPs can provide a novel, complementary therapy approach.6 The photodynamic
therapy using photosensitive molecules such as porphyrins or chlorins is a well-known and
established non-invasive alternative in the treatment of dermal malignancies.7–9 Thanks to their
unique properties, the use of photocatalytic NPs for photodynamic tumour treatment is
increasingly recognized as a promising strategy and initial studies have already been carried
out stressing their potentials.5,9,10 For this approach, photocatalytic NPs are applied onto
carcinogenic tissue to be taken up by malignant cells. Ultraviolet (UV) light application excites
the photocatalytic particles (Figure Intro - 1) because of their semiconductor properties,
including an appropriate band-gap within the energy-range of UV light. Thus, electron-hole
pairs are created which either recombine or migrate to the particle surface, react with
surrounding oxygen and water and create highly reactive radicals. These radicals are then
responsible for the destruction of cell components leading to apoptosis.6,11–13 Compared to
chemotherapeutics, the applied particles are normally non-toxic in the non-activated state and
therefore less toxic towards non-affected organs or non-UV light treated tissue.13 As the
transmission of light within tissue is limited, the UV light application and the initiated
photocatalysis will only affect superficial tissue which is the region of interest when treating
field cancerization.
Figure Intro - 1. Tumour cell destruction via light-induced photocatalysis by semiconductor nanoparticles.
Due to their high photocatalytic activity, titanium dioxide (TiO2) NPs seem to be an appropriate
choice for the photodynamic therapy. Though the killing of cancer cells by UV light activated
General introduction
- 4 -
TiO2 NPs has been demonstrated, the treatment is in general lacking specifity towards these
cells.5 Furthermore, the particles used are often not well characterized and do not show well-
tailored properties as they were commercially obtained. In addition, the dependency of particle
properties such as surface charge on the cellular uptake and mechanisms leading to cell
apoptosis have not been studied thoroughly. Hence, in order to make advances in this research
area, it is indispensable to prepare well-characterized TiO2 nanoparticle systems and to be
able to finely tune their surface properties, for example by functionalization. If the particles
additionally possess luminescence properties, cellular uptake can be studied or, in later
applications as an anti-tumour agent, their exact position in the tissue can be confirmed prior
to UV light application. Additionally, a fine manipulation of the surface charge of these particles
by organic functionalization may enhance the cellular uptake. If these particles are also
bioconjugated, providing specific ligands for tumour targeting, even cancer diagnosis or
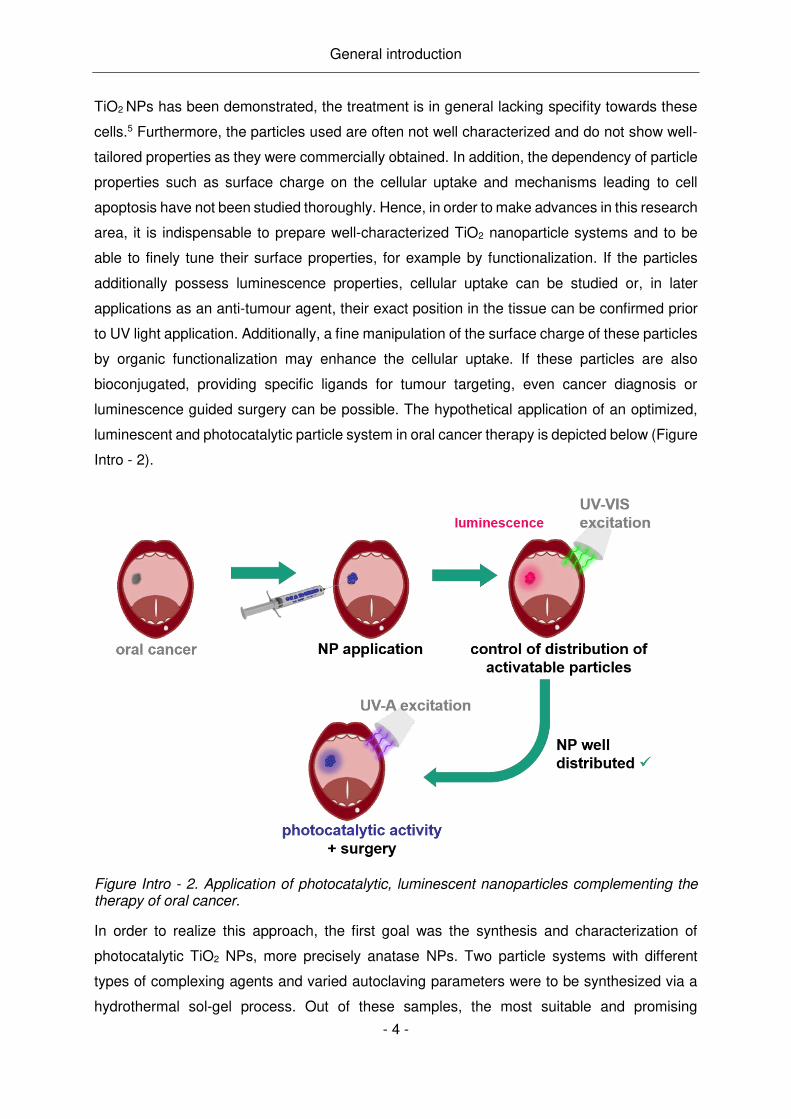
luminescence guided surgery can be possible. The hypothetical application of an optimized,
luminescent and photocatalytic particle system in oral cancer therapy is depicted below (Figure
Intro - 2).
Figure Intro - 2. Application of photocatalytic, luminescent nanoparticles complementing the therapy of oral cancer.
In order to realize this approach, the first goal was the synthesis and characterization of
photocatalytic TiO2 NPs, more precisely anatase NPs. Two particle systems with different
types of complexing agents and varied autoclaving parameters were to be synthesized via a
hydrothermal sol-gel process. Out of these samples, the most suitable and promising

General introduction
- 5 -
candidate for photocatalytic tumour treatment had to be selected. Furthermore, their transfer
to cell culture tests was a main objective, including their stabilisation in cell culture media and
the realization of cytotoxicity tests. Subsequently, the particle surfaces were then to be
modified with suitable organic molecules to facilitate their cellular uptake and possibly provide
a better dispersion state in cell culture media. The task was to synthesize linear and dendritic
organic molecules with terminal amine functions as their positive charge is favourable for an
interaction of the particles with cell membranes. Dendritic structures were chosen to increase
the amount of terminal functionalities while not increasing the number of surface anchors. This
was crucial as the photocatalytic activity of the inorganic particles should be inhibited as little
as possible by the molecules anchored to the surface. For the grafting of the organic molecule
with an alkoxysilane serving as an anchor group, suitable grafting procedures were to be
developed. This also includes proving the feasibility of grafting onto the developed TiO2 NPs.
An additional goal was the introduction of luminescence properties into the particle system in
order to combine the therapeutic with diagnostic applications. Luminescence would also
facilitate cell culture studies on the particle behaviour such as the particle uptake by cells. This
objective was meant to be achieved either by the modification of the inorganic particles e.g.
via doping or by the integration of a chromophore into the organic surface agents. The final
objective was then to prove the maintained photocatalytic activity of the developed functional
particle systems, as well as to examine their cytotoxicity and potential as possible anti-tumour
agents.
The following work is structured into four main chapters:
The first chapter comprises a bibliographic study, which includes an introduction to TiO2 NPs,
their synthesis, photocatalytic activity and potential as tumour treatment agents. Additionally,
different approaches to obtain luminescent TiO2 NPs are presented. For the surface-
modification of TiO2 NPs, possible anchoring moieties are first introduced, followed by the
description of dendritic surface agents for NP functionalization. Subsequently, a short overview
of the introduction of luminescent moieties into dendritic structures is given.
The second chapter deals with the synthesis and characterisation of anatase NPs. First, two
particle systems synthesized with different coordinating agents are compared in their size and
morphology, their surface moieties and their photocatalytic activity. Next, the influence of
processing parameters, such as hydrothermal treatment time and temperature, on the particle
characteristics (including size, morphology, surface moieties and photocatalytic activity) are

General introduction
- 6 -
described. The last part of the chapter presents two approaches in order to obtain luminescent
inorganic particle systems via core-shell strategies.
In the third chapter, the synthesis of organic coupling agents for the particle functionalization
is described, including the development of dendritic non-luminescent molecules and the
synthesis approach of linear and dendritic structures incorporating the dye rhodamine.
Subsequently, the grafting of coupling agents is treated. After optimizing the grafting procedure
with the help of commercial silanes, the grafting of synthesized molecules is described. These
steps also include the analytical characterization of the functionalized NPs.
The fourth chapter reports the transfer of the synthesized particle systems into cell culture
tests. The stabilisation of the as-synthesized TiO2 NPs in cell culture media with the help of
stabilising agents is presented. Furthermore, cytotoxicity tests of these particles are discussed.
Finally, a detected anti-tumour activity of one of the synthesized particle systems is
investigated.

General introduction
- 7 -
References:
1 R. L. Siegel, K. D. Miller and A. Jemal, CA. Cancer J. Clin., 2016, 66, 7–30.
2 S. Purohit, R. Bhise, D. Lokanatha and K. Govindbabu, Indian J. Surg. Oncol., 2013, 4, 19–26.
3 L. A. Torre, F. Bray, R. L. Siegel, J. Ferlay, J. Lortet-Tieulent and A. Jemal, CA. Cancer J. Clin., 2015, 65, 87–
108.
4 M. Marron, P. Boffetta, Z.-F. Zhang, D. Zaridze, V. Wunsch-Filho, D. M. Winn, Q. Wei, R. Talamini, N.
Szeszenia-Dabrowska, E. M. Sturgis, E. Smith, S. M. Schwartz, P. Rudnai, M. P. Purdue, A. F. Olshan, J. Eluf-
Neto, J. Muscat, H. Morgenstern, A. Menezes, M. McClean, E. Matos, I. N. Mates, J. Lissowska, F. Levi, P.
Lazarus, C. L. Vecchia, S. Koifman, K. Kelsey, R. Herrero, R. B. Hayes, S. Franceschi, L. Fernandez, E.
Fabianova, A. W. Daudt, L. D. Maso, M. P. Curado, G. Cadoni, C. Chen, X. Castellsague, S. Boccia, S.
Benhamou, G. Ferro, J. Berthiller, P. Brennan, H. Moller and M. Hashibe, Int. J. Epidemiol., 2010, 39, 182–
196.
5 Z. Fei Yin, L. Wu, H. Gui Yang and Y. Hua Su, Phys. Chem. Chem. Phys., 2013, 15, 4844.
6 S. Hackenberg, A. Scherzed, W. Harnisch, K. Froelich, C. Ginzkey, C. Koehler, R. Hagen and N. Kleinsasser,
J. Photochem. Photobiol. B, 2012, 114, 87–93.
7 T. Hasan, B. Ortel, N. Solban and B. Pogue, Cancer Med., 2003, 7, 537–48.
8 S. B. Brown, E. A. Brown and I. Walker, Lancet Oncol., 2004, 5, 497–508.
9 P. Agostinis, K. Berg, K. A. Cengel, T. H. Foster, A. W. Girotti, S. O. Gollnick, S. M. Hahn, M. R. Hamblin, A.
Juzeniene, D. Kessel, M. Korbelik, J. Moan, P. Mroz, D. Nowis, J. Piette, B. C. Wilson and J. Golab, CA. Cancer
J. Clin., 2011, 61, 250–281.
10 F. U. Rehman, C. Zhao, H. Jiang and X. Wang, Biomater. Sci., 2015, 4, 40–54.
11 S. Hackenberg, A. Scherzed, A. Gohla, A. Technau, K. Froelich, C. Ginzkey, C. Koehler, M. Burghartz, R.
Hagen and N. Kleinsasser, Nanomed., 2014, 9, 21–33.
12 S. Hackenberg, F.-Z. Zimmermann, A. Scherzed, G. Friehs, K. Froelich, C. Ginzkey, C. Koehler, M. Burghartz,
R. Hagen and N. Kleinsasser, Environ. Mol. Mutagen., 2011, 52, 582–589.
13 Kleinsasser, Int. J. Oncol., 2010, 37, 1538–1590.

- 8 -

- 9 -
I. Bibliographic study
I. Bibliographic study
- 10 -
Contents
I. Bibliographic study ................................................................................................... - 11 - I.1. Titanium dioxide particles .................................................................................. - 11 -
I.1.1. TiO2 nanoparticle synthesis ........................................................................ - 12 - I.1.2. Photocatalytic activity ................................................................................. - 15 - I.1.3. Photocatalytic tumour therapy with TiO2 particles ....................................... - 19 - I.1.4. Luminescent TiO2 nanoparticles ................................................................. - 21 -
I.2. Surface modification of nanoparticles for biotechnological applications ............. - 24 - I.2.1. Surface modification of TiO2 particles ......................................................... - 26 - I.2.2. Surface modification of particles with dendrons .......................................... - 28 -
I.3. Conclusion ........................................................................................................ - 33 -
- 11 -
I. Bibliographic study
I.1. Titanium dioxide particles
Since its first commercial production in the beginning of the twentieth century,1 titanium dioxide
(TiO2) has been widely used in sunscreens2,3 or as a pigment,4–6 for example in paints.7,8
Nowadays it is utilized for a variety of applications including: hydrogen sensing, storage and
separation; lithium batteries and photovoltaic technologies, as an additive in food, and
cosmetic; and as a catalyst or coating for medical implants.9–12 The wide range of applications
is thanks to the fact that TiO2 not only provides semiconductor properties but also has an
excellent chemical stability.9,13 Its four natural crystal structures are rutile (tetragonal), anatase
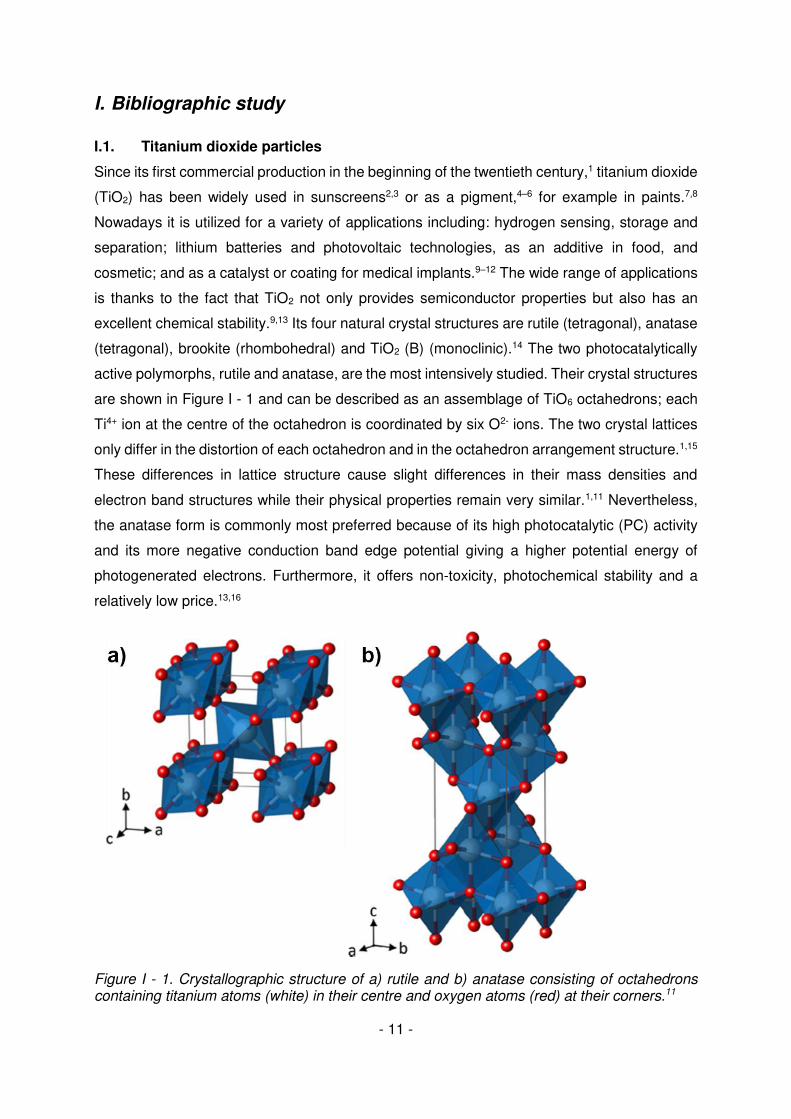
(tetragonal), brookite (rhombohedral) and TiO2 (B) (monoclinic).14 The two photocatalytically
active polymorphs, rutile and anatase, are the most intensively studied. Their crystal structures
are shown in Figure I - 1 and can be described as an assemblage of TiO6 octahedrons; each
Ti4+ ion at the centre of the octahedron is coordinated by six O2- ions. The two crystal lattices
only differ in the distortion of each octahedron and in the octahedron arrangement structure.1,15
These differences in lattice structure cause slight differences in their mass densities and
electron band structures while their physical properties remain very similar.1,11 Nevertheless,
the anatase form is commonly most preferred because of its high photocatalytic (PC) activity
and its more negative conduction band edge potential giving a higher potential energy of
photogenerated electrons. Furthermore, it offers non-toxicity, photochemical stability and a
relatively low price.13,16
Figure I - 1. Crystallographic structure of a) rutile and b) anatase consisting of octahedrons containing titanium atoms (white) in their centre and oxygen atoms (red) at their corners.11

I. Bibliographic study
- 12 -
In recent decades the synthesis of TiO2 nanostructures, which are structures possessing
between one and three dimensions smaller than 100 nm, has become an important field of
research. As TiO2 is a semiconductor material, in its nano form (1 to 25 nm) its electronic and
optical properties deviate substantially from those of bulk materials due to the quantum
confinement effect.17–19 This effect describes the fact that if the diameter of a particle is smaller
than the exciton Bohr radius, its energy levels are discrete instead of continuous. As the
particle size is varied, the energy levels shift, with an increasing separation of valence and
conduction bands with decreasing radius. As the confining dimension decreases and reaches
a certain limit, typically in nanoscale, the energy spectrum becomes discrete. As a result, the
bandgap becomes size-dependent which results for example in a blue shift in light emission
with decreasing particle size.17 Nanomaterials also possess a very high surface area and
surface-to-volume ratio which increases the efficiency in applications that are based on surface
or interface interactions between the TiO2 device and an interacting medium.1
I.1.1. TiO2 nanoparticle synthesis
Titanium dioxide nanostructures can be synthesized via a vast variety of reactions1,16 such as
sol-gel reactions,20,21 micelle and reverse micelle methods22–24 and solvo- and hydrothermal
processing,25,26 as well as chemical and physical vapour deposition.27,28 Further synthesis
methods are flame hydrolysis (commercial Degussa P25),16 sonochemical29,30 and microwave-
assisted31,32 reactions or a combination of various methods.33 A combined sol-gel and
hydrothermal processing is frequently chosen34–37 as it unites the advantages of sol-gel
reactions with hydrothermal treatments. Typical characteristics due to the sol-gel process are
a controlled stoichiometry and excellent reproducibility,34 while a high density of the particles,
high crystallinity with a minimum of defects and controlled morphology are due to the
hydrothermal treatment.1,34,35 The resulting nanostructures are of high purity, with narrow size
distributions and can carry organic surface moieties of the synthesis, hence ensuring a high
reactivity for further treatments.
Sol-gel reactions are characterized by the hydrolysis and condensation of metal alkoxide
precursors (Scheme I - 1) resulting in colloidal suspensions or sols. In the case of titanium
dioxide synthesis, the hydrolysis is often acid-catalysed.1,35,38–40

I. Bibliographic study
- 13 -
Scheme I - 1. Hydrolysis and condensation reactions of a titanium alkoxide precursor.
Transition metals like titanium are commonly not fully coordinated in the molecular precursor
state for example in metal alkoxides. This is why a chemical modification with chelating ligands
is needed to retard hydrolysis and condensation rates preventing uncontrolled precipitation
and mediating the formation of smaller titanium-oxo species.41–43 Possible chelating agents
can be alkoxy- and aminoalcohols, beta-diketons, beta-ketoester, carboxylic and phosphonic
acids.41–43 Furthermore these ligands can have positive effects on the formation of non-
aggregated nanoparticles (NPs), as well as their growth behavior.44,45 Examples for the
complex formed by titanium alkoxide and beta-diketon46 or carboxylic acid47 are shown in
Scheme I - 2.
Scheme I - 2. Titanium alkoxide complexed with chelating agents: a) acetyl acetone and b) 2-[2-(2-methoxyethoxy)ethoxy]acetic acid. Hydrolysis (Scheme I - 1, 1st reaction equation) of the alkoxy ligands (Ti-OR) of these
precursors, leading to hydroxyl groups (Ti-OH), is achieved by the addition of water while the
hydrolytically stable chelating agents remain unmodified.45 Condensation (Scheme I - 1, 2nd
and 3rd reaction equation) can start as soon as Ti-OH groups are present. Two competitive
mechanisms can occur depending mainly on the experimental conditions: oxolation and
olation. Olation is the formation of hydroxo bridges between two titanium atoms while water or
an alcohol is released (Scheme I - 3 a). For this nucleophilic substitution reaction, the OH
ligand represents the nucleophile which only changes its coordination from a terminal to a
bridging ligand. The reaction is kinetically controlled by the lability of the M-OHR bond (with a
metal M or in this case M = Ti) which is usually rather high. This is why without complexing
ligands or steric effects, olation is fast and diffusion-controlled.48,49 In contrast to olation,
oxolation is the formation of “oxo” bridges (M-O-M) between two metals that do not possess
aquo ligands (Scheme I - 3 b). It usually proceeds via a 2-step SN2 associative mechanism;
first, a nucleophilic addition forming an “ol” (M-OH-M) bridge takes place, followed by the
proton transfer from the “ol” bridge to a terminal OH ligand, which results later on in the removal

I. Bibliographic study
- 14 -
of the aquo ligand. The reaction rate is mainly dependent on the acidity of the medium.48,49
Continuous polycondensation reactions (either olation or oxolation) lead first to polymeric
chains and rings before the formation of an amorphous Ti-O-Ti network. Depending on the
presence and ratio of water and titanium precursors, the resulting TiO2 appears as a 3D
polymeric skeleton or (either loosely or closely packed) first-order particle sols. Complete
condensation of the precursor and loss of solvent leads to the conversion of the sol to a solid
gel.1
Scheme I - 3 : Condensation via a) olation and b) oxolation (with R = H or organic group of alkoxy ligand).
However, to obtain TiO2 nanocrystals the solution must be heated in order to favour ion
diffusion and crystallization rate.43,50 In the case of titanium stabilised by complexing ligands,
heating also helps to remove the ligands, thus allowing the formation of further Ti-O-Ti bonds.43
The formation of either anatase or rutile crystals (without addition of strong complexing agents)
can be explained by taking into account the first stage (of olation) which is the formation of the
dimer [Ti2(OH)8(OH)2]0.48 This is a structure of two octahedrons sharing an edge as depicted
in Figure I - 2. This “embryo” grows by olation with further monomers forming nuclei and
subsequent condensation of these nuclei by oxolation is likely to result in rutile or anatase
crystals. Considering that the TiO6 octahedrons in anatase only share edges while in rutile both
edges and corners are shared, it is more likely that anatase is formed. The probability that the
“embryo” grows through edge sharing only in the same plane is smaller than in different planes.
This is why curved or bent edge sharing chains are formed, inhibiting the sharing of corners
between different planes. Nevertheless, rutile as the thermodynamically stable phase is said
to be formed based on Ostwald ripening (dissolution/crystallization mechanisms).48 For the
heating to produce crystal structures, hydrothermal treatment is ideal as the synthesis is
conducted in a steel pressure vessel and the reaction temperature can exceed the boiling point
of water, reaching the pressure of vapour saturation. The temperature and the filling grade of
the autoclave with solution determines the internal pressure produced.1,51 In contrast to
calcination or thermal annealing,52 this method does not lead to unwanted phase
transformation, sintering or grain growth of the particles and therefore loss of surface area.50
Additionally, it is less energy consumptive and an environmentally friendly process. Moreover,

I. Bibliographic study
- 15 -
with hydrothermal treatment the crystallization temperature for anatase phase is below 200
°C.44
In conclusion, the properties of the final TiO2 particles, such as the degree of crystallization,
crystal phase composition, size, morphology and surface chemical properties, are controlled
by the type and concentration of the precursors, solvent, additives, catalysts, pH and
hydrothermal reaction conditions.44,50
Figure I - 2. Ongoing growth via olation of the first formed dimer during condensation.48
I.1.2. Photocatalytic activity*
TiO2, especially in its nano-form, is often used for photocatalysis as it efficiently catalyses a
broad variety of reactions if activated by light.53 Applications include waste water treatment,53,54
catalysis of chemical reactions,55 disinfection56 and tumour therapy.56 Anatase has an energy
band gap of 3.2 eV with an absorption edge at 386 nm, while rutile possesses a band gap of
3.02 eV with an absorption edge at 416 nm.11 Both forms can be activated by light with an
energy equal to or greater than the band gap; in general ultraviolet (UV) light with wavelengths
from 280 to 400 nm. This provokes the elevation of an electron (e-) from the valence band to
the conduction band. A hole (h+) in the valence band is therefore created resulting in a so-
called electron-hole pair:11,57,58
TiO2 + hν → e- + h+.
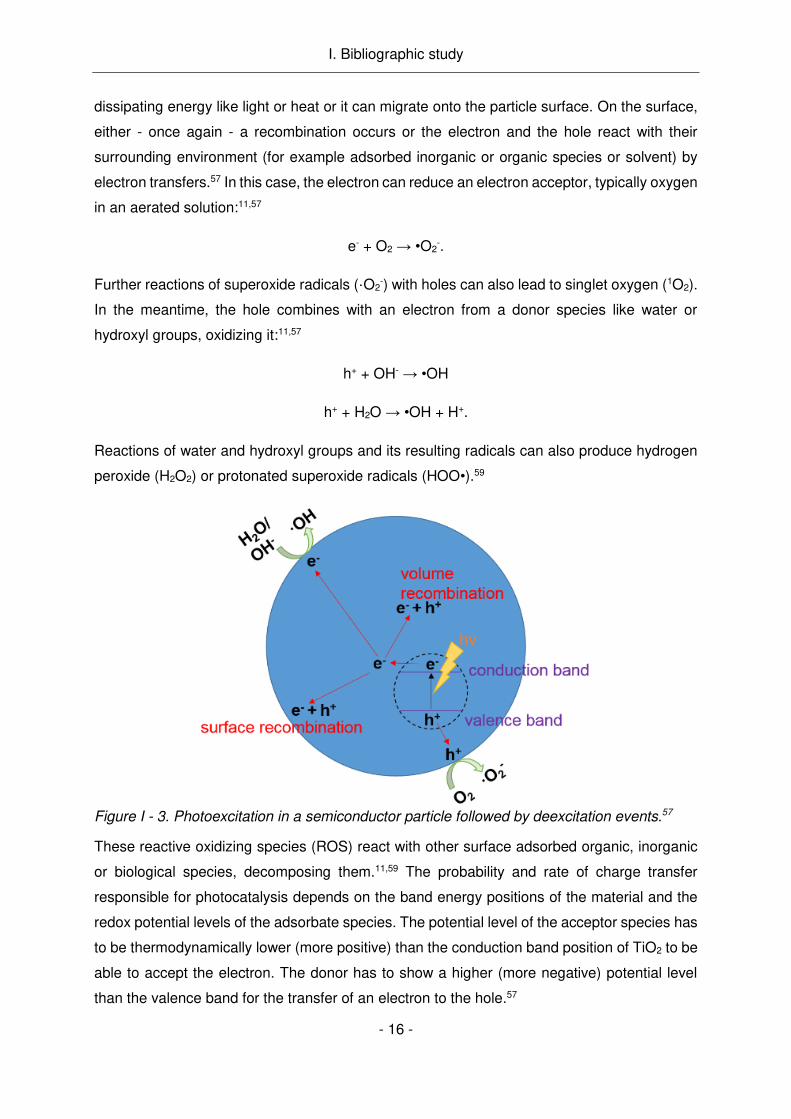
After excitation there are different processes taking place that compete with each other (Figure
I - 3); the separated electron-hole pair can either recombine within the volume of the particle
* Parts of this chapter have been submitted to Nanoscale for publication. The submitted title is “Discovering the determining parameters for the photocatalytic activity of TiO2 colloids based on an anomalous dependence on the specific surface area”.
I. Bibliographic study
- 16 -
dissipating energy like light or heat or it can migrate onto the particle surface. On the surface,
either - once again - a recombination occurs or the electron and the hole react with their
surrounding environment (for example adsorbed inorganic or organic species or solvent) by
electron transfers.57 In this case, the electron can reduce an electron acceptor, typically oxygen
in an aerated solution:11,57
e- + O2 → •O2-.
Further reactions of superoxide radicals (·O2-) with holes can also lead to singlet oxygen (1O2).
In the meantime, the hole combines with an electron from a donor species like water or
hydroxyl groups, oxidizing it:11,57
h+ + OH- → •OH
h+ + H2O → •OH + H+.
Reactions of water and hydroxyl groups and its resulting radicals can also produce hydrogen
peroxide (H2O2) or protonated superoxide radicals (HOO•).59
Figure I - 3. Photoexcitation in a semiconductor particle followed by deexcitation events.57
These reactive oxidizing species (ROS) react with other surface adsorbed organic, inorganic
or biological species, decomposing them.11,59 The probability and rate of charge transfer
responsible for photocatalysis depends on the band energy positions of the material and the
redox potential levels of the adsorbate species. The potential level of the acceptor species has
to be thermodynamically lower (more positive) than the conduction band position of TiO2 to be
able to accept the electron. The donor has to show a higher (more negative) potential level
than the valence band for the transfer of an electron to the hole.57

I. Bibliographic study
- 17 -
As recombination and electron transfer processes are competing which each other, it is evident
that the efficiency of a photocatalyst increases, when the recombination of the photoexcited
electron-hole pair is retarded. This is achieved by charge carrier trapping which suppresses
recombination and increases the lifetime of the separated pair. Traps can be provided by
(surface) defect sites in the crystal lattice naturally created during the synthesis but also by
manipulations like the creation of heterojunctions or doping with ions.57–59 The presence of a
certain concentration of oxygen vacancies in the TiO2 crystal lattice can on the one hand
improve the PC performance due to enhancement of the charge carrier separation (e- and h+).
On the other hand, if the amount of oxygen vacancies is too high, they act as recombination
centres and therefore decrease the PC activity.60–62 The PC performance of TiO2 NPs not only
depends on their defect concentration but also on their crystallite size, surface area,
morphology and phase structure.16,44 Concerning the phase of TiO2, the anatase phase is said
to be more active than rutile because of its superior mobility of electrons and holes and a higher
surface hydroxyl density.11,59 Regarding the size, monodispersed particles with small crystallite
size are favoured as they benefit from a high surface area and a reduced bulk recombination
of electrons and holes. Nevertheless, the particle should not be too small in order to avoid
increased surface recombination and low crystallinity. The perfect particle size for a high PC
activity cannot be generally identified as it depends on several factors such as the synthesis
or the photocatalysis test chosen.53,58
Recently, the type and ratio of exposed facets of anatase crystals was also found to influence
the PC performance of TiO2 NPs.61,63–73 Under equilibrium conditions, anatase has the shape
of a slightly truncated tetragonal bipyramid enclosed with eight {101} facets (which contribute
94% of the surface area) and two {001} facets (according to the Wulff construction).64,68,69 This
seems logical as the {101} facet is the thermodynamically most stable one with a calculated
surface energy (0.44 J m-2) lower than that of the {001} (0.90 J m-2) and {100} (0.53 J m-2)
facets.70,74 Nevertheless, under certain reaction conditions, the appearance of a “belt”
consisting of {100} is also predicted.75,76 Both morphologies are depicted in Figure I - 4. The
main difference between these facets is their surface atomic structure and therefore their Ti-
coordination; both {001} and {100} facets expose 100% 5-fold-coordinated titanium atoms (5c-
Ti) as compared to 50% 5c-Ti (and 50% 6-fold-coordinated Ti; 6c-Ti) on the {101} surface
(Figure I - 5).60,68 Due to their surface structure, the high energy facets with 100% 5c-Ti allow
a dissociative adsorption of water molecules while {101} facets only permit a molecular
adsorption.68,73,77,78 As for PC reactions, the pre-adsorption of molecules on the catalyst surface
is a determining step, the increase in 100% Ti5c surface area, i.e. the enhancement of pre-
adsorption of water molecules, results in a higher PC performance.68,73,77,78

I. Bibliographic study
- 18 -
Figure I - 4. Equilibrium shape anatase exposing {101} and {001} facets and anatase additionally exposing {100} facets appearing as a belt around the centre of the crystal.
Figure I - 5. Surface atomic structures of anatase {101} and {001} facets.60
Thus, numerous approaches have already been carried out to obtain TiO2 nanoparticles with
well determined exposed facets to increase their PC performance using appropriate solvents
or additives.65,66,68–73,78–87 The solvent-solute interactions along different orientations of a crystal
vary significantly because of the surface atomic arrangements. This results in different surface
affinities of the solvent or additive towards each facet. A high affinity of either the solvent or
additive to a certain facet results in their stabilisation as it for example lowers the surface
energy or changes the surface tension of the bound plane.68,76,80
To determine the PC activity of particle samples, various degradation tests have been
developed such as the degradation of organic dyes (e.g. crystal violet, methylene blue,
orangeG or methyl orange)88,89 or phenols.90 Most of these methods follow the degradation
process with the help of the absorption or luminescence of these substances and for this, the
particles have to be removed from the measurement to avoid errors caused by NP absorption,
luminescence or scattering.90 This is why the PC decomposition of dichloroacetic acid (DCA)
into CO2 and Cl- (HCl) has been frequently preferred over other test methods as an in-situ

I. Bibliographic study
- 19 -
measurement is possible with the help of a chloride ion sensitive electrode.90–93 Furthermore,
the DCA does not degrade with UV light application alone, which is a concern when using dyes
as this can falsify the measurement results.90 The behaviour of DCA and influence of testing
parameters on the degradation results have been intensively studied.91–93 The main
degradation mechanisms of this substance are shown in Figure I - 6. While the interaction of
the photogenerated electrons with DCA on the surface of TiO2 is seen as very unlikely, the
reaction of photogenerated holes (h+) with the organic molecule (photo-Kolbe reaction, Figure
I - 6 bottom; anticlockwise reaction pathway), freeing CO2 and initiating further degradation
steps seems to be the main degradation pathway.92,94,95 Additionally, hydroxyl radicals can
abstract the proton from the α-carbon in the initial step of the degradation of DCA (Figure I - 6
top; clockwise reaction pathway). These radicals are generated through the trapping of
photogenerated holes by surface OH- ions or adsorbed water, or by the reaction of H2O2 with
photogenerated electrons. The dominant reaction is most likely dependent on the catalyst
material (as it is documented in detail for acetate degradation).92,94–97
Figure I - 6. Main photocatalytic degradation mechanisms of dichloroacetic acid (DCA): primary H-abstraction leading to the reaction pathway on the top and photo-Kolbe reaction leading to the reaction pathway on the bottom.92,98–100
I.1.3. Photocatalytic tumour therapy with TiO2 particles
Because of their unique properties NPs are often considered for biomedical applications.101 In
particular their small size makes them ideal to cross cell or tissue barriers while being large
enough to be conjugated to antibodies or drugs. TiO2 NPs have already been used as drug
delivery systems, carriers for cell imaging, biosensors in biological assays and for genetic
engineering. In addition to these uses, PC tumour therapy is also a potential application field.102
PC tumour therapy with TiO2 NPs is a form of the so-called photodynamic therapy.10,102,103 For
this treatment, a photosensitizer, a light source and the presence of oxygen (and/or water) are
required. The photosensitizer, i.e. a macromolecule, an organic or an inorganic NP,102,104–106 is
introduced into living tissue, for example into a tumour. They have to be non-toxic and excitable
by photons (of the light source). After excitation they transfer their energy (i.e. electron-hole

I. Bibliographic study
- 20 -
pairs) to the surrounding oxygen or water creating highly reactive radicals. Those species
readily destroy cell components leading to apoptosis. This therapy form seems to be a
promising alternative to conventional cancer therapies thanks to a high safety record, minimal
invasiveness, low cost and high localization.10,107 Photodynamic therapy is ideal for dermal
illnesses and exposed body cavities such as the oral cavity, vagina, rectum or bladder. Small
and superficial tumours located above or just below the skin tissue can be easily treated via
this method.10 In contrast, for deeply infiltrating tumours or tumours located inside the body
photodynamic therapy is not applicable as most photosensitizers are excited by UV light (≤
400 nm). This wavelength range lies outside the phototherapeutic window (600-1300 nm)108,109
and therefore does not deeply penetrate the tissue. Furthermore, DNA damage by UV light is
an unwanted side effect.10 Up to now the research concerning photodynamic therapy with TiO2
is still in its early days. This mainly includes in vitro studies to examine the PC killing of cancer
cells by UV light activated TiO2 NPs.110–114 One study even indicated the preferential
destruction of tumour cells while non-malignant cells were less affected.115 A few in vivo studies
were able to confirm the anticancer effect, stressing the potential of TiO2 as a potential cancer
treatment agent.13,116
Nevertheless, future applications of NPs in human bodies always cause concern about the
potential toxicity. In the last decade, the toxicity and biodistribution of (non-activated) TiO2
particles has been controversially discussed.10,117–123 In order to understand contradicting
outcomes of studies, one has to consider that the toxicity is strongly dependent on the TiO2
crystal phase, morphology and size, NP number and mass concentration. Also the
agglomeration state, charge and added functional groups or impurities influence the NP
toxicity. Therefore toxicological results can be different for every synthesized NP system.118,124
Additionally, the exposure routes and dose greatly influence the toxicity of the applied
particles.118,120 This is why, on one hand inhalation of TiO2 NPs is proven to cause
inflammation, lung damage and may cause cancer.118,120 This initiated the International Agency
for Research on Cancer (IARC) to classify it as possibly carcinogenic to humans (Group 2B).118
On the other hand, TiO2 NPs in sunscreens and cosmetics have been applied on the skin for
years and are considered non-toxic as they cannot penetrate through skin.118,120 Moreover, in
1969 the Joint FAO/WHO Expert Committee on Food Additives (JECFA) approved TiO2 as an
ingredient in human food as no significant absorption or tissue storage was found.117 For other
organs besides the lungs and skin, toxicological data is still too limited for a reliable
assessment of TiO2 risks.118 Nevertheless, it is assumed that if they enter circulation, they
could translocate in organs such as the spleen, liver, and kidney117,125 while the rate of such
translocation remains undetermined.122 This is why the possible toxicity of TiO2 should be kept

I. Bibliographic study
- 21 -
in mind if used for biomedical applications and should be evaluated for every newly developed
particle system.
I.1.4. Luminescent TiO2 nanoparticles
In the last decades, the combination of therapy and diagnosis within one tool (also called
theranostics), for example within a NP system, has really come to the fore in research. The
clear advantage of theranostics is the simultaneous diagnosis and treatment of a disease.
Additionally, the release or efficacy of a therapeutic agent and its biodistribution may be
monitored.126,127 The theranostic approach is especially promising for tumour diagnosis and
therapy128: Particle systems targeting malignant cells or cumulating in the pathologic tissue,
can indicate the location and degree of the disease. This is visualized via an imaging method
including resonance imaging, x-ray computed tomography, ultrasound, bioluminescence or
fluorescence imaging, and single photon emission computed or positron emission
tomography.129 Then, therapy can be conducted thanks to specific particle properties like
hyperthermia or photocatalysis but also drug-conjugates on the particle surface or incorporated
into the NP system. Typical examples for inorganic theranostic NP systems are gold130,131 and
superparamagnetic NPs132 which can be used for surface plasmon resonance or resonance
imaging, while both offer the possibility of hyperthermal cancer therapy. Polymeric particle
systems incorporating for example luminescent dyes or paramagnetic complexes and drug-
conjugates are promising approaches as well.133,134
In the case of TiO2 NPs, photoluminescence (PL) properties for imaging in later applications
as a treatment agent but also in cell culture studies are widely discussed in literature. While
bulk TiO2 does not exhibit PL, small NPs show band-band PL. This light emission is caused
by the electron transition from the conduction band to the valence band, emitting radiation with
an energy (in general) equal to the band gap energy (Figure I - 7). Due to the band gap energy
of TiO2, this PL is in the blue wavelength range. Anatase NPs with sizes around 4 to 6 nm
synthesized by hydrolysis, nonhydrolytic preparations or hydrothermal synthesis were reported
to exhibit under excitation at 300 to 365 nm a blue light emission (400-450 nm) visible by eye,
which was in all cases assigned to band-band PL of the anatase NPs.135–139 Because of the
band-band transition, the higher the PL intensity, the higher the recombination rate of excited
electron-hole pairs and therefore the lower the PC activity of the sample.140 Another possibility
to obtain luminescent TiO2 materials is the introduction of dopants into the crystal lattice. The
doping of TiO2 crystals has already been widely explored for a large range of elements, mainly
to increase the PC activity of the samples. As the excitation of electron-hole pairs depends on
the TiO2 band gap, dopants in the crystal lattice have been used to modify it, for example to

I. Bibliographic study
- 22 -
enable photocatalysis under visible light excitation which also increases the efficiency of the
catalyst.141–143 It is also known that the photoreactivity of TiO2 is related to its defect disorder
which is why introducing new defect sites through doping can be used to increase the PC
activity.142,144–146 Additionally, the doping of TiO2 can result in luminescence in the visible
wavelength range (as mentioned before).147,148 In this case, the radiation is normally caused
by surface oxygen vacancies or defects and can be identified as excitonic photoluminescence
processes: the excited electrons first transit from the conduction band to a different sub-band
or surface state without radiation (Figure I - 7). Subsequently, radiative transition from this state
to the valence band occurs.140 The emitted energy is lower than the band gap energy. The
introduction of a dopant impacts all listed properties of the semiconductor material and
therefore the properties of the two components can either compete or intensify each other.
This means that an increasing luminescence of the doped TiO2 can result in a higher or lower
PC activity of the sample, depending on the dopant species.140
Figure I - 7. Simplified main photophysical processes of a semiconductor excited by light with equal to band gap energy. Photoexcitation results in electron/hole (e-/h+) pair formation and is followed by the 3 competing recombination processes of band-band photoluminescence (PL), excitonic PL and non-radiative transition.140
Elements most often used to create materials with visible luminescence properties are rare
earth elements due to their sharp luminescence bands and visible transition of the triply
charged ions; examples include erbium, europium, terbium or cerium in the red, green or blue
region of the light spectrum.149,150 There are already several reports on TiO2 NPs doped with
europium (showing red light emission),151–153 with erbium (red and/or green emission)154,155 and
with lanthanum (blue emission).140,156 Nanofibers with visible luminescence have also been
shown thanks to praseodymium and cerium doping.157 In addition, visible light emitting
europium-samarium co-doped nanocrystalline TiO2 microspheres158 and thin films with
luminescence between 400 to 600 nm caused by terbium doping159 have been developed. For
all given examples, calcination or annealing was necessary to induce photoluminescence

I. Bibliographic study
- 23 -
properties or to obtain high enough intensities for later applications.148,151,153,154,160,161 The only
exception was a rutile film prepared with very high amounts of europium which resulted in
strong red luminescence without annealing.147 In general, the particle samples aggregated
during calcination which resulted in larger particle sizes and a decrease in specific surface
area.137,152 An example for calcinated, europium (Eu3+) doped anatase NPs in their aggregated
powder form is shown in Figure I - 8.
Figure I - 8. Luminescence of anatase nanoparticles, doped with europium (Eu3+; 5 mol-%) and calcinated at 200 °C or 400 °C; excited at 365 nm.
Another method to obtain luminescent particle systems, is the functionalization of the inorganic
particles with an organic dye. This strategy was so far primarily used for the production of dye-
sensitized solar cells162–164 which did not focus on the fluorescence of the system but on a more
efficient light-activation of the TiO2 catalyst. Nevertheless, labelling of TiO2 NPs with dopamine-
modified dyes (1-pyrenemethylamine, piperazinyl-4-chloro-7-nitrobenzo-furazane, TexasRed
or tetramethylrhodamine) has been realized and examined by confocal laser scanning
microscopy.165,166 Adsorption of a conjugate of rhodamine B and phenylphosphonic acid onto
TiO2 particles was carried out for stem cell labelling.110 In one study, these semiconductor
particles were first functionalized with 3-glycidoxypropyl tri-methoxylsilane and then reacted
with dyes such as xanthene dye rhodamine B, 4-phenylazo-phenol and 4-phenylazoaniline.167
Adsorption of a perylene diimide dye onto TiO2 also resulted in fluorescent samples applicable
for finger-mark detection.168 All the herein cited examples for a functionalization of particle
systems with a dye imply their surface modification causing significant changes to their
properties. How this enables the fine manipulation and tuning of the particle behaviour
depending on the desired application is discussed in the following chapter.

I. Bibliographic study
- 24 -
I.2. Surface modification of nanoparticles for biotechnological applications†
There are several reasons why the surface of synthesized particles is modified. First, particles
in a colloidal dispersion agglomerate and sediment if they are not electrostatically (between
equally charged particles)169 or sterically stabilised (for example by hydrocarbon chains/bulky
polymers adsorbed or grafted onto the particles)170. These two types of particle repulsions are
shown in Figure I - 9. Electrostatic stabilisation is always limited to a certain pH range as at a
particular concentration of OH− or H3O+, these ions may neutralize the surface charge of the
particles up to their isoelectric point resulting in flocculation.171 In the same way, an increase
in ionic strength of the solution, for example caused by dissolved salts, results in destabilisation
of the colloidal dispersion, which is well described by the DLVO theory.172 By contrast, steric
stabilisation − in a very simple picture − keeps NPs apart due to the space taken up by the
organic molecules that are attached to the NP surfaces. For entropic reasons, distance is
maintained between the chains of different particles. In theory this stabilisation mechanism is
therefore indifferent to pH changes or varying salt concentrations.173,174 However, when
particles are used in the biomedical field and applied in a physiological environment, they tend
to agglomerate and sediment in physiological solutions because of their pH and salt
content.175–177 This issue needs to be addressed in order to ensure a consistent assessment
of the therapeutic and diagnostic potential of NPs in cell culture experiments or animal testing.
Studies concerning particle concentrations are only reliable when carried out with stable
dispersions that guarantee an accurate dosing. The effect of different sized particles on cells
can only be studied if the particles do not form large agglomerates.175,178,179 Furthermore,
agglomeration leads to a reduction in accessible surface area. If TiO2 NPs are applied as
therapeutic photosensitizing agents13, a decrease in surface results in a lower PC efficiency of
the particles.175,180
Figure I - 9. a) Electrostatic repulsion between equally charged particles and b) steric repulsion of particles.
† Parts of this chapter have been published and are reused in this work by courtesy of Elsevier, original article: S. Koch et al., Colloids Surf., B, 2016, 143, 7–14.

I. Bibliographic study
- 25 -
Second, in the last decade studies focused more and more on the influence of particle surface
charges on their uptake by cells. Apart from the particle size, shape, dispersion state and
composition, the surface charge was determined to be a crucial particle property for this.181–184
Numerous studies examined particles with sizes from below 10 nm up to 500 nm consisting of
various materials185 such as chitosan,181 PLGA186, hydroxyapatite,187 zinc sulphide,188 cerium
oxide,189 silica,190,191 titanium dioxide,192,193 magnetite194–198 or gold.182 The particle surface
charge or hydrophilicity was manipulated with the help of surface groups, for example
hydroxyls,189,190 thiols,190,194,196 amines,182,187,188,190,192,194 carboxylic acids,181,187,188,190,192,194–196
glucans,194,196,197 alkanes,188,192 as well as polymethylsiloxane,193 glycerol,193 polyvinyl
alcohol186,198 or polyethylenglycol chains.188,195 The uptake of these surface modified particles
was tested with a variety of non-malignant cells, malignant cells and macrophages. In the first
instance the studies indicated that the particle uptake is cell type dependent.181,191 It was also
stated that the adsorption of components of the cell culture medium onto the particles often
makes the analysis challenging as it covers the surface and changes the surface charge and
properties.182,188,189 Hydrophobic particles and those with very high positive or negative charges
or sizes over 150 nm are taken up by macrophages,181 while no or less uptake by other cell
types is detected for hydrophobic particles.188,192 If the particles provide neutral surface charge,
no internalization takes place192,194 due to lower particle-cell membrane interaction.185
Negatively charged particles can be taken up by cells even if their charge is unfavourable for
interaction with the negatively charged cell membranes. It is believed that internalization
occurs through binding of the particles on scarce cationic sites on the membrane and
subsequent endocytosis.185 Logically, positively charged particles are taken up better than
negatively charged ones because of their increased interactions with the cell
membrane.182,185,187,190,192,194,197
Third, surfaces can be modified via bioconjugation with agents that fulfil a special purpose like
targeting an organ or cell type of interest or mediating the cellular uptake.183 Especially for
tumour therapies, this is a powerful tool; targeting ligands or antibodies specifically bind to cell-
surface antigens or receptors that are, for example, exclusively expressed on tumour cells
(Figure I - 10).199 In this way, the drug or particle conjugated to the targeting moiety is directed
to the place of interest and then internalized into the targeted cell by receptor-mediated
endocytosis. As a target, the folate receptor is often used as it is expressed in tumour tissue
and can bind vitamin folate but also folate-particle or folate-drug conjugates.200–206 Transferrins
which are non-heme iron-binding glycoproteins and bind to the transferrin receptors, are also
considered as targeting agents for tumours as the transferrin receptor is overexpressed by
them.207 Similarly, the epidermal growth factor receptor is overexpressed by many types of
epithelial tumours and can therefore be targeted by anti-epidermal growth factor receptor

I. Bibliographic study
- 26 -
monoclonal antibodies.208 Lectins are proteins which bind to glycans present on the cell
membrane. As the glycans expressed by tumour cells are often different to those of their non-
malignant counterparts, lectins can be used as cancer targeting agents.209 Furthermore,
aptamers which are olignucleic acids like DNA or RNA with unique 3-D conformations, can
bind specifically to target antigens and are therefore interesting as targeting agents bound to
particles or drugs.210–214
Figure I - 10. Nanoparticles with ligands targeting a receptor which is overexpressed by malignant cells.
Due to these three above mentioned purposes, particle surfaces usually have to be
functionalized for their intended biomedical applications. The modification of the surface for
example with targeting agents will always influence the other particle properties such as the
dispersion state in physiological media and their cellular uptake. Additionally, the surrounding
liquid medium and its composition strongly influences the particle behaviour. This is why the
functionalization of NPs is very complex and has to be studied intensively to avoid unwanted
side effects caused by the modification.
I.2.1. Surface modification of TiO2 particles
In literature, the surface of TiO2 particles has already been modified for several decades. For
example as photosensitizers for optoelectronic and photonic devices, the particles (as electron
acceptors) were decorated with organic structures serving as electron donors.162,215 The
particles were functionalized with organic dyes for several biological and non-biological related
applications as mentioned in I.1.4. For biomedical uses, TiO2 was also modified with DNA-
oligonucleotides for potential gene therapy216 or with PEG-ligands113 and carboxylic acids217 to
improve their biocompatibility. Anti-body linked NPs were developed for active tumour
targeting115 or polymer-NP conjugates as a versatile toolbox for molecule immobilization.165

I. Bibliographic study
- 27 -
TiO2 NPs can either be surface modified during particle synthesis (in situ modification) or by
grafting of organic groups onto the NPs (post-synthesis modification). The advantage of in situ
functionalization lies in the double function of the organic ligand controlling the particle growth
and/or morphology and serving as functional surface group.218 Post-synthesis modification has
the benefit of an easy processing and the organic molecule can be chosen depending on the
specific demands of later applications without considering the requirements for particle
synthesis.219 Most of the examples for the functionalization of TiO2 particles (mentioned in this
chapter) are post-synthesis modifications.110,115,163,166–168,216,220–223 However, in the case of sol-
gel syntheses a coordinating agent is often used to control the hydrolysis and condensation
reactions and after NP synthesis this agent serves always a functional surface molecule as
well.165,218,224,225 The surface groups obtained by in situ modification can sometimes be
transformed by a ligand exchange which still provides a certain flexibility in the modification of
the NPs independent of the synthesis procedure.112,217
Irrespective of the aimed application area and the chosen modification procedure, the
modification of TiO2 particles requires an adequate anchoring group that attaches the
functional molecule onto the surface via direct linkage of the anchoring group with the hydroxyl
groups of the oxide surface.215 One possible group are phosphonic acids (P(O)(OH)2) that can
bind via a phosphonate ester linkage (Scheme I - 4 a) onto the TiO2 surface;215,226 examples
include phenylphosphonic acid,226 rhodamine-phosphonic acid110 or 2,2-bipyridine-4-
phosphonic acid.215 Another commonly used class of ligands are carboxylic acid derivatives
that can attach to TiO2 with both the oxygen and hydroxyl moiety (Scheme I - 4 b).
Mercaptosuccinic acid,112,217 ascorbic acid,227 oleic acid,225 thiolactic acid,223 maleic acid,113
anthracene acetic acids164 and various others215,217 have already been utilized as surface
functionalities. Furthermore, enediol ligands such as dopamine,163,165,166,216,220 cyanidin 3-
glucoside,163 catechol,221,222 gallic acid221 or pyrogallol221 can also modify TiO2 surfaces as they
covalently link to the surface with both hydroxyl groups (Scheme I - 4 c). A salycilate binding
type has been shown for ligands like 2-hydrobenzoic acid and 2,5- or 2,3-dihydrobenzoic acid
(Scheme I - 4 d).222 Finally, silanes have been readily applied onto TiO2 NPs,228 for example
3-glycidoxypropyl tri-methoxylsilane,167 N-(Tri-methoxysilylpropyl) ethylene diamine triacetic
acid,229 tetraethoxysilane114,230–233 or 4-(trichlorosilylethyl)-4-methyl-2,2-bipyridin.215 They react
with the surface hydroxyl groups to form a silyl bond (Scheme I - 4 e). The binding of anchoring
groups is in general reversible, this is why in aqueous solutions of higher pH values, hydrolysis
and de-chelation from the surface can occur.162,215 As well as the anchoring group, the structure
and properties of functional groups of the ligand are very important as they dictate the later
particle behaviour and allow tailoring for specific applications.

I. Bibliographic study
- 28 -
Scheme I - 4. Possible binding modes of the anchoring groups onto TiO2: a) Phosphonate ester linkage215, bidentate binding of a carboxyl group162, c) binding of enediol ligands shown with catechol as example222, d) binding of 2-hydrobenzoic acid222 and e) silyl linkage on TiO2
215.
I.2.2. Surface modification of particles with dendrons
Whilst linear ligands162,215 are most commonly applied, since 2001, the substitution of linear
coupling agents by dendrons has been increasingly studied in the field of NP surface
modification. The concept of such dendritic molecules compared to a linear one is shown in
Figure I - 11.
Figure I - 11. Concept of dendritic molecules: a) linear (one branch), b) 1st generation (2 branches) and c) 2nd generation (4 branches).
The amount of functional terminal groups is increased via symmetric branching of the
molecule, while one focal point is maintained. Dendrons typically possess a precise
architecture and low polydispersity as they are synthesized by increasing the generation of the
branches step by step.234 Additionally, in contrast to polymer synthesis purification during their
growth at intermediate steps is in general possible.234 This allows the control and manipulation
of the size, branching points and number or type of terminal functions.221 In comparison to
linear molecules or polymers, dendritic structures show very unique physicochemical
properties which are due to the so-called “dendritic effect” caused by the multiplicity of
functional groups, architectural steric effects and a differing nature in the internal dendritic
structure.235 While the multiplicity of the functional terminal groups is mainly responsible for the
solubility or chemical reactivity of these molecules, the first linear and with increasing
generations 2D or even 3D architecture results in eminent changes in the shape and
flexibility.234,235 Because of terminal groups and several branch generations, the inner core of
dendritic structures is sterically protected from the outside environment which provides the
possibility of hosting other organic, inorganic or metallic compounds and protecting them from
solvent effects of the outside.235

I. Bibliographic study
- 29 -
The synthesis of these molecules can be carried out via either a divergent or convergent
approach (Figure I - 12).234
Figure I - 12. a) Divergent and b) convergent synthesis of dendritic molecules.234
Both procedures consist of coupling and activation steps; during coupling the number of
branches is increased while side reactions between other functionalities of the reactants are
disabled, then a subsequent activation of either the peripheral points or the focal points of the
molecules enables a further coupling step. The divergent synthesis produces growth starting
from the focal point and forming the branches stepwise by repeated coupling and activation of
the peripheral groups (Figure I - 12 a).234 For a convergent synthesis the dendritic growth
begins from the exterior molecules and proceeds via reactions at the focal point of each branch
(Figure I - 12 b).234
In order to modify NP surfaces with dendrons, the focal points of these molecules also need
to represent the anchoring groups. As both anchor and core of the dendron, various ligands
have already been studied236 including siloxanes,237–241 thiols,242–252 amines,253,254
enediols,255,256 phosponates257–259 and carboxylates.260,261 The nature of the anchor mainly
depended on the studied NP type which was most commonly Au242–246,248–251 or iron
oxide.238,253,255–257,259,260,262–264 Additionally, a few other inorganic particle types have been
studied: silica,241 TiO2,240 Pd,265,266 ZnO,237 CdSe/ZnS,254 CdSe/CdS247,261 and CdSe252,258 NPs.

I. Bibliographic study
- 30 -
The increase in functionalities by dendritic surface agents (compared to linear molecules)
results in a better NP colloidal stability enhanced by their conical structure and allows the
coupling of more biofunctions. Additionally, their cone-like structure is appropriate for the
functionalization of ultrasmall NPs which possess a high curvature, as the density of radial
functional groups decreases to a lesser extent with increasing distance from the surface. This
guarantees a dense surface functionalization. Furthermore, the dendritic framework is suitable
for the adsorption and encapsulation of small molecules such as drugs or pollutants providing
opportunities for applications such as drug release or waste water treatment.267 Even if the
synthesis of dendrons is more difficult and time consuming compared to (hyperbranched)
polymers,268 the precise control of the molecule architecture allows a better tailoring of the
properties, which can be crucial for later uses and reproducibility. These can not only be
tailored by the increase of generations and therefore terminal groups, but also by the structure
of the spacer itself. The most studied dendritic structure for particle functionalization clearly is
poly(amidoamine).237,239,241,244,262,265 Although, the functionalization of particles with various
other structures has been studied; for example poly(ester amine)s,238 lysine based
structures,243,269 poly(benzyl ether)s,266 poly(oxymethylphenylene)s,250 polycarbazoles,245 as
well as Newkome-type248 and Frechet-type dendrons.242
Particle functionalization with dendrons has been carried out after NP synthesis in most of the
before mentioned references. There are only a few exceptions in which the dendritic molecules
have already been applied during synthesis.240,243,245,264,266 This was mainly to combine later
tasks as surface groups with the function as capping agents for size and morphology control
during synthesis.236,243 Moreover, the dendron has usually been grafted as an entire molecule
onto the particle surface which allows the complete characterization of the dendron before
grafting. Additionally, the perfect integrity of the applied molecules is ensured as defective
structures like incomplete branches can be separated before grafting and the formation of
rather polymer-like disordered structures is avoided.270 This functionalization procedure can
be called “grafting onto” while “grafting from” means the building of the dendron onto the NP
after anchoring of the focal point.260 The latter method was suitable in a few cases to prevent
the occurrence of NP clusters since possible reactions of one dendritic molecule with two
particles at the same time are avoided.238,239,241,260 The disadvantages of both the “grafting
onto” and “grafting from” approaches are also depicted in Figure I - 13.
In the last two decades, the unique properties of dendrons have been used for the design of
NPs for applications such as catalysis239,253,255,265,266 and water purification.241 Redox-active
dendron-functionalized NPs were synthesized for future nanoelectronics or sensors.242,246,250
Systems with switchable solubility in various solvents244,248 or temperature induced NP
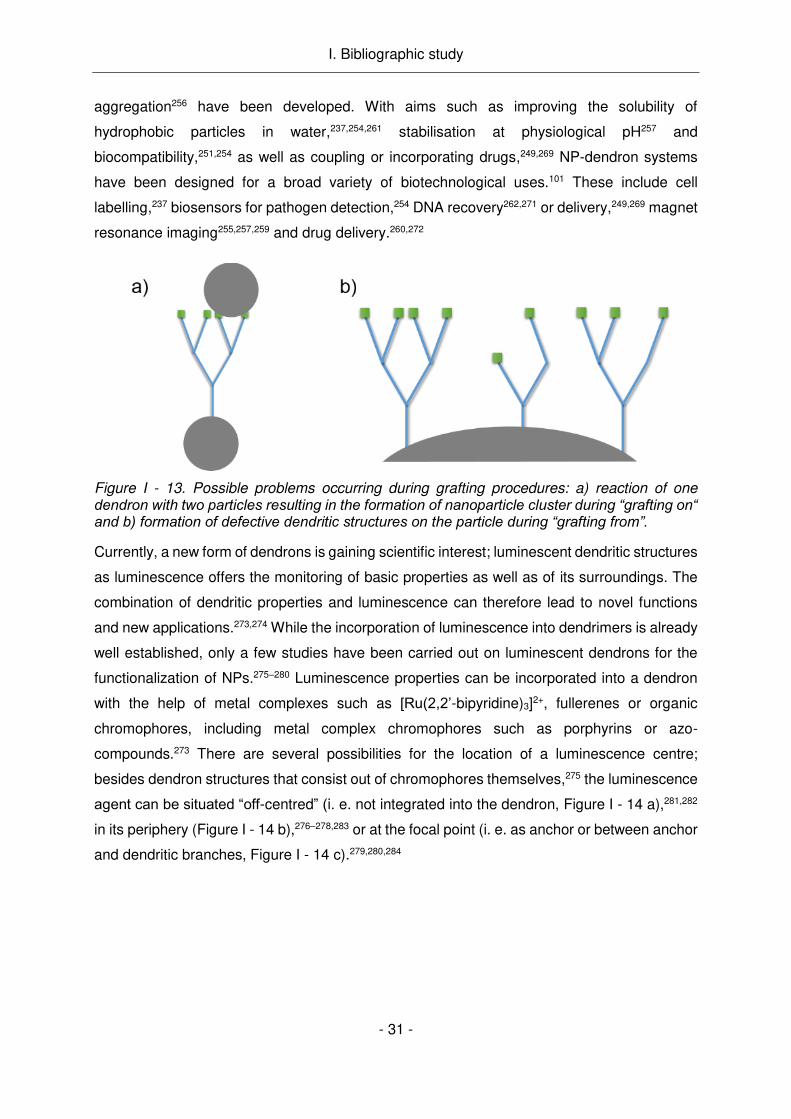
I. Bibliographic study
- 31 -
aggregation256 have been developed. With aims such as improving the solubility of
hydrophobic particles in water,237,254,261 stabilisation at physiological pH257 and
biocompatibility,251,254 as well as coupling or incorporating drugs,249,269 NP-dendron systems
have been designed for a broad variety of biotechnological uses.101 These include cell
labelling,237 biosensors for pathogen detection,254 DNA recovery262,271 or delivery,249,269 magnet
resonance imaging255,257,259 and drug delivery.260,272
Figure I - 13. Possible problems occurring during grafting procedures: a) reaction of one dendron with two particles resulting in the formation of nanoparticle cluster during “grafting on“ and b) formation of defective dendritic structures on the particle during “grafting from”.
Currently, a new form of dendrons is gaining scientific interest; luminescent dendritic structures
as luminescence offers the monitoring of basic properties as well as of its surroundings. The
combination of dendritic properties and luminescence can therefore lead to novel functions
and new applications.273,274 While the incorporation of luminescence into dendrimers is already
well established, only a few studies have been carried out on luminescent dendrons for the
functionalization of NPs.275–280 Luminescence properties can be incorporated into a dendron
with the help of metal complexes such as [Ru(2,2’-bipyridine)3]2+, fullerenes or organic
chromophores, including metal complex chromophores such as porphyrins or azo-
compounds.273 There are several possibilities for the location of a luminescence centre;
besides dendron structures that consist out of chromophores themselves,275 the luminescence
agent can be situated “off-centred” (i. e. not integrated into the dendron, Figure I - 14 a),281,282
in its periphery (Figure I - 14 b),276–278,283 or at the focal point (i. e. as anchor or between anchor
and dendritic branches, Figure I - 14 c).279,280,284
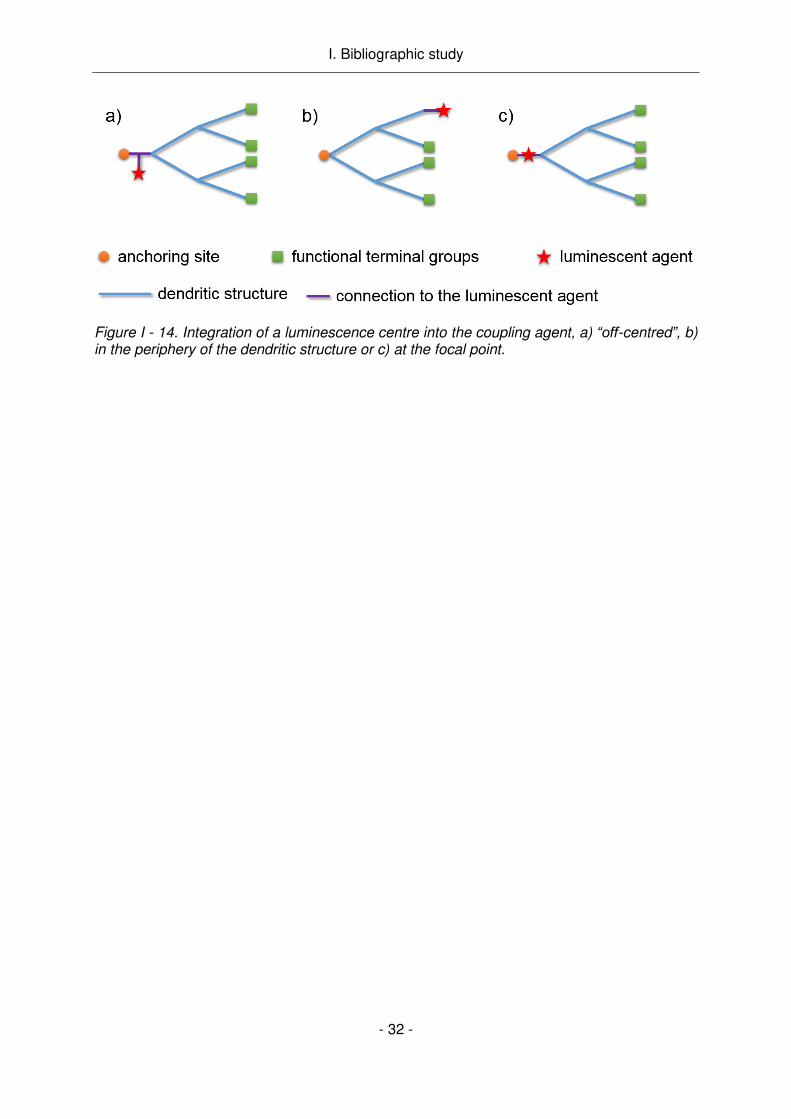
I. Bibliographic study
- 32 -
Figure I - 14. Integration of a luminescence centre into the coupling agent, a) “off-centred”, b) in the periphery of the dendritic structure or c) at the focal point.

I. Bibliographic study
- 33 -
I.3. Conclusion
In this chapter, titanium dioxide was introduced, including its crystal structures, main physical
properties and benefits in its nano form. The hydrothermal sol-gel synthesis was explained,
stating its advantages and the mechanisms that are responsible for the nanocrystal formation.
After this the PC properties of TiO2 were described comprising the principles of photocatalysis
and factors influencing the PC performance such as defects, exposed facets and surface area.
While the synthesis of TiO2 NPs is already well developed, their PC properties still require
further study to understand the basic mechanisms and factors that influence their performance.
The connection between its PC properties and applications in tumour therapy were
established, giving a short overview of the treatment and its pros and cons. The use of TiO2
NPs as anti-tumour agents is still in its infancy, giving rise to a lot of controversial discussions
debating their potential as nano-medicine against their possible toxicity. As a final point, a
possible integration of luminescence properties into TiO2 nanosystems was discussed
including the intrinsic luminescence, excitonic luminescence via doping or the particle
functionalization with organic dyes. While several studies on luminescent TiO2 have been
carried out, no general concept for an efficient luminescence incorporation into the crystals
without compromises to their PC performance was found. Nevertheless, the particle
modification with an organic dye seems to be the most feasible approach.
This led to the next topic, namely the surface modification of NPs for biotechnological
applications. First, the main reasons for such a modification were stated: stabilisation in
physiological media, enhancement of cellular uptake and bioconjugation. Then surface
modifications of TiO2 for various uses were cited and possible anchoring groups presented.
Similar to other NPs, the surface modification of TiO2 is crucial for their adaption to high
application requirements. This is why several approaches have been carried out using a vaste
variety of anchoring groups and organic molecules. However, the influence of these surface
agents on the PC performance of TiO2 was generally neglected. Finally, the NP
functionalization with dendritic structures was introduced, including their basic concept,
grafting methods, state of the art applications and luminescent dendritic structures. In contrast
to other NPs such as iron oxide or gold, TiO2 NPs have not readily been functionalized with
dendritic structures. Interestingly, the advantages of luminescent dendritic structures are
already frequently studied in the case of dendrons but particle functionalization with them is
still scarce.
This bibliographic study confirmed prevailing motivations for this work, as many research
issues have not been addressed yet and give opportunities for new outcomes as well as
controversial discussions.

I. Bibliographic study
- 34 -
References:
1 X. Chen and S. S. Mao, Chem. Rev., 2007, 107, 2891–2959.
2 A. P. Popov, A. V. Priezzhev, J. Lademann and R. Myllylä, J. Phys. Appl. Phys., 2005, 38, 2564–2570.
3 C. Contado and A. Pagnoni, Anal. Chem., 2008, 80, 7594–7608.
4 O. B. Willcox, US2591988 A, 1952.
5 G. M. Sheehan, G. Leathwhite Roberts, P. Montgomery Dupree, US 3769255, 1973.
6 G. Wiederhoft, G. Lailach, US5094834 A, 1992.
7 A. W. Harrison and M. R. Walton, Sol. Energy, 1978, 20, 185–188.
8 S. Guo, Z. Wu and W. Zhao, Chin. Sci. Bull., 2009, 54, 1137–1142.
9 D. V. Bavykin, J. M. Friedrich and F. C. Walsh, Adv. Mater., 2006, 18, 2807–2824.
10 F. U. Rehman, C. Zhao, H. Jiang and X. Wang, Biomater. Sci., 2015, 4, 40–54.
11 Y. Lan, Y. Lu and Z. Ren, Nano Energy, 2013, 2, 1031–1045.
12 M. Kulkarni, A. Mazare, E. Gongadze, š. Perutkova, V. Kralj-Iglič, I. Milošev, P. Schmuki, A Iglič and M.
Mozetič, Nanotechnology, 2015, 26, 062002.
13 A. Fujishima, T. N. Rao and D. A. Tryk, J. Photochem. Photobiol. C Photochem. Rev., 2000, 1, 1–21.
14 O. Carp, Prog. Solid State Chem., 2004, 32, 33–177.
15 A. Fahmi, C. Minot, B. Silvi and M. Causa, Phys. Rev. B, 1993, 47, 11717.
16 D. P. Macwan, P. N. Dave and S. Chaturvedi, J. Mater. Sci., 2011, 46, 3669–3686.
17 X. Xue, W. Ji, Z. Mao, H. Mao, Y. Wang, X. Wang, W. Ruan, B. Zhao and J. R. Lombardi, J. Phys. Chem. C,
2012, 116, 8792–8797.
18 H. Peng, J. Li, S.-S. Li and J.-B. Xia, J. Phys. Chem. C, 2008, 112, 13964–13969.
19 W. F. Zhang, M. S. Zhang, Z. Yin and Q. Chen, Appl. Phys. B, 2000, 70, 261–265.
20 J. Yu, X. Zhao, J. Du and W. Chen, J. Sol-Gel Sci. Technol., 2000, 17, 163–171.
21 M. Zhang, Y. Bando and K. Wada, J. Mater. Sci. Lett., 2001, 20, 167–170.
22 K. T. Lim, H. S. Hwang, W. Ryoo and K. P. Johnston, Langmuir, 2004, 20, 2466–2471.
23 E. Stathatos, P. Lianos, D. Levy, D. Tsiourvas and F. Del Monte, Langmuir.
24 P. D. Moran, J. R. Bartlett, G. A. Bowmaker, J. L. Woolfrey and R. P. Cooney, J. Sol-Gel Sci. Technol., 1999,
15, 251–262.
25 J. Reszczyńska, T. Grzyb, Z. Wei, M. Klein, E. Kowalska, B. Ohtani and A. Zaleska-Medynska, Appl. Catal. B
Environ., 2016, 181, 825–837.
26 H. G. Yang, G. Liu, S. Z. Qiao, C. H. Sun, Y. G. Jin, S. C. Smith, J. Zou, H. M. Cheng and G. Q. (Max) Lu, J.
Am. Chem. Soc., 2009, 131, 4078–4083.
27 H. Yoshitake, T. Sugihara and T. Tatsumi, Chem. Mater., 2002, 14, 1023–1029.
28 D. Byun, Y. Jin, B. Kim, J. Kee Lee and D. Park, J. Hazard. Mater., 2000, 73, 199–206.
29 Y. Wang, X. Tang, L. Yin, W. Huang, Y. Rosenfeld Hacohen and A. Gedanken, Adv. Mater., 2000, 12, 1183–
1186.
30 J. C. Yu, L. Zhang and J. Yu, Chem. Mater., 2002, 14, 4647–4653.
31 Q. Xiang, J. Yu, B. Cheng and H. C. Ong, Chem. – Asian J., 2010, 5, 1466–1474.
32 K. Ding, Z. Miao, Z. Liu, Z. Zhang, B. Han, G. An, S. Miao and Y. Xie, J. Am. Chem. Soc., 2007, 129, 6362–
6363.
33 H.-W. Wang, C.-H. Kuo, H.-C. Lin, I.-T. Kuo and C.-F. Cheng, J. Am. Ceram. Soc., 2006, 89, 3388–3392.
34 C.-C. Wang and J. Y. Ying, Chem. Mater., 1999, 11, 3113–3120.
35 J. Zhu, F. Chen, J. Zhang, H. Chen and M. Anpo, J. Photochem. Photobiol. Chem., 2006, 180, 196–204.
36 S. Ito, S. Yoshida and T. Watanabe, Chem. Lett., 2000, 29, 70–71.

I. Bibliographic study
- 35 -
37 S. Valencia, J. M. Marín and G. Restrepo, Open Mater. Sci. J., 2010, 4, 9–14.
38 G. Oskam, A. Nellore, R. L. Penn and P. C. Searson, J. Phys. Chem. B, 2003, 107, 1734–1738.
39 J. Livage, M. Henry and C. Sanchez, Prog. Solid State Chem., 1988, 18, 259–341.
40 D. Biskupski, B. Herbig, G. Schottner and R. Moos, Sens. Actuators B Chem., 2011, 153, 329–334.
41 U. Schubert, J. Mater. Chem., 2005, 15, 3701.
42 L. G. Hubert-Pfalzgraf, Inorg. Chem. Commun., 2003, 6, 102–120.
43 J. Livage, Bull. Mater. Sci., 1999, 22, 201–205.
44 J. Jitputti, S. Pavasupree, Y. Suzuki and S. Yoshikawa, J. Solid State Chem., 2007, 180, 1743–1749.
45 A. Leaustic, F. Babonneau and J. Livage, Chem. Mater., 1989, 1, 248–252.
46 M. W. Jung, H. J. Oh, J. C. Yang and Y. G. Shul, Bull. Korean Chem. Soc., 1999, 20, 1394–1398.
47 D. Amans, C. Malaterre, M. Diouf, C. Mancini, F. Chaput, G. Ledoux, G. Breton, Y. Guillin, C. Dujardin, K.
Masenelli-Varlot and P. Perriat, J. Phys. Chem. C, 2011, 115, 5131–5139.
48 J.-P. Jolivet, Metal Oxide Chemistry and Synthesis: From Solution to Solid State, John Wiley & Sons, Inc.,
Chichester, 2000.
49 M. Henry, J. P. Jolivet and J. Livage, in Chemistry, Spectroscopy and Applications of Sol-Gel Glasses,
Springer, 1992, pp. 153–206.
50 P. D. Cozzoli, A. Kornowski and H. Weller, J. Am. Chem. Soc., 2003, 125, 14539–14548.
51 A. Rabenau, Angew. Chem. Int. Ed. Engl., 1985, 24, 1026–1040.
52 J. Lin, Y. Lin, P. Liu, M. J. Meziani, L. F. Allard and Y.-P. Sun, J. Am. Chem. Soc., 2002, 124, 11514–11518.
53 D. Beydoun, R. Amal, G. Low and S. McEvoy, J. Nanoparticle Res., 1999, 1, 439–458.
54 E. Stathatos, D. Tsiourvas and P. Lianos, Colloids Surf. Physicochem. Eng. Asp., 1999, 149, 49–56.
55 D. I. Enache, J. K. Edwards, P. Landon, B. Solsona-Espriu, A. F. Carley, A. A. Herzing, M. Watanabe, C. J.
Kiely, D. W. Knight and G. J. Hutchings, Science, 2006, 311, 362–365.
56 D. M. Blake, P.-C. Maness, Z. Huang, E. J. Wolfrum, J. Huang and W. A. Jacoby, Sep. Purif. Rev., 1999, 28,
1–50.
57 A. L. Linsebigler, G. Lu and J. T. Yates Jr, Chem. Rev., 1995, 95, 735–758.
58 M. Pelaez, N. T. Nolan, S. C. Pillai, M. K. Seery, P. Falaras, A. G. Kontos, P. S. M. Dunlop, J. W. J. Hamilton,
J. A. Byrne, K. O’Shea, M. H. Entezari and D. D. Dionysiou, Appl. Catal. B Environ., 2012, 125, 331–349.
59 V. Etacheri, C. Di Valentin, J. Schneider, D. Bahnemann and S. C. Pillai, J. Photochem. Photobiol. C
Photochem. Rev., 2015, 25, 1–29.
60 J. Yan, G. Wu, N. Guan, L. Li, Z. Li and X. Cao, Phys. Chem. Chem. Phys., 2013, 15, 10978.
61 Z. Zhao, X. Zhang, G. Zhang, Z. Liu, D. Qu, X. Miao, P. Feng and Z. Sun, Nano Res., 2015, 8, 4061–4071.
62 X. Jiang, Y. Zhang, J. Jiang, Y. Rong, Y. Wang, Y. Wu and C. Pan, J. Phys. Chem. C, 2012, 116, 22619–
22624.
63 J. Zhu, S. Wang, Z. Bian, S. Xie, C. Cai, J. Wang, H. Yang and H. Li, CrystEngComm, 2010, 12, 2219.
64 J. Yu, J. Low, W. Xiao, P. Zhou and M. Jaroniec, J. Am. Chem. Soc., 2014, 136, 8839–8842.
65 H. G. Yang, C. H. Sun, S. Z. Qiao, J. Zou, G. Liu, S. C. Smith, H. M. Cheng and G. Q. Lu, Nature, 2008, 453,
638–641.
66 B. Wu, C. Guo, N. Zheng, Z. Xie and G. D. Stucky, J. Am. Chem. Soc., 2008, 130, 17563–17567.
67 F. Tian, Y. Zhang, J. Zhang and C. Pan, J. Phys. Chem. C, 2012, 116, 7515–7519.
68 N. Roy, Y. Sohn and D. Pradhan, ACS Nano, 2013, 7, 2532–2540.
69 J. Pan, G. Liu, G. Q. M. Lu and H.-M. Cheng, Angew. Chem. Int. Ed., 2011, 50, 2133–2137.
70 J. Pan, X. Wu, L. Wang, G. Liu, G. Q. (Max) Lu and H.-M. Cheng, Chem. Commun., 2011, 47, 8361–8363.
71 X. Y. Ma, Z. G. Chen, S. B. Hartono, H. B. Jiang, J. Zou, S. Z. Qiao and H. G. Yang, Chem. Commun., 2010,
46, 6608.

I. Bibliographic study
- 36 -
72 X. Han, Q. Kuang, M. Jin, Z. Xie and L. Zheng, J. Am. Chem. Soc., 2009, 131, 3152–3153.
73 G. Liu, J. C. Yu, G. Q. (Max) Lu and H.-M. Cheng, Chem. Commun., 2011, 47, 6763.
74 C. Chen, G. A. Sewvandi, T. Kusunose, Y. Tanaka, S. Nakanishi and Q. Feng, CrystEngComm, 2014, 16,
8885–8895.
75 A. S. Barnard, P. Zapol and L. A. Curtiss, Surf. Sci., 2005, 582, 173–188.
76 A. S. Barnard and L. A. Curtiss, Nano Lett., 2005, 5, 1261–1266.
77 A. Vittadini, A. Selloni, F. P. Rotzinger and M. Grätzel, Phys. Rev. Lett., 1998, 81, 2954–2957.
78 A. Selloni, Nat. Mater., 2008, 7, 613–615.
79 W. Q. Fang, X.-Q. Gong and H. G. Yang, J. Phys. Chem. Lett., 2011, 2, 725–734.
80 J. Li and D. Xu, Chem. Commun., 2010, 46, 2301–2303.
81 G. Liu, C. Sun, H. G. Yang, S. C. Smith, L. Wang, G. Q. (Max) Lu and H.-M. Cheng, Chem Commun, 2010,
46, 755–757.
82 S. Liu, J. Yu and M. Jaroniec, Chem. Mater., 2011, 23, 4085–4093.
83 M. M. Maitani, K. Tanaka, D. Mochizuki and Y. Wada, J. Phys. Chem. Lett., 2011, 2, 2655–2659.
84 J.-W. Shiu, C.-M. Lan, Y.-C. Chang, H.-P. Wu, W.-K. Huang and E. W.-G. Diau, ACS Nano, 2012,
121106142518005.
85 C. Z. Wen, H. B. Jiang, S. Z. Qiao, H. G. Yang and G. Q. (Max) Lu, J. Mater. Chem., 2011, 21, 7052.
86 N. Wu, J. Wang, D. N. Tafen, H. Wang, J.-G. Zheng, J. P. Lewis, X. Liu, S. S. Leonard and A. Manivannan, J.
Am. Chem. Soc., 2010, 132, 6679–6685.
87 X. Zhao, W. Jin, J. Cai, J. Ye, Z. Li, Y. Ma, J. Xie and L. Qi, Adv. Funct. Mater., 2011, 21, 3554–3563.
88 Y. Li, W. Xie, X. Hu, G. Shen, X. Zhou, Y. Xiang, X. Zhao and P. Fang, Langmuir, 2010, 26, 591–597.
89 C. M. Teh and A. R. Mohamed, J. Alloys Compd., 2011, 509, 1648–1660.
90 A. Mills, C. Hill and P. K. J. Robertson, J. Photochem. Photobiol. Chem., 2012, 237, 7–23.
91 S. Sakthivel, M. C. Hidalgo, D. W. Bahnemann, S.-U. Geissen, V. Murugesan and A. Vogelpohl, Appl. Catal.
B Environ., 2006, 63, 31–40.
92 M. Lindner, Univ. Hann., 1997.
93 D. W. Bahnemann, S. N. Kholuiskaya, R. Dillert, A. I. Kulak and A. I. Kokorin, Appl. Catal. B Environ., 2002,
36, 161–169.
94 Y. Mao, C. Schoeneich and K. D. Asmus, J. Phys. Chem., 1991, 95, 10080–10089.
95 B. Kraeutler and A. J. Bard, J. Am. Chem. Soc., 1977, 99, 7729–7731.
96 Y. Nosaka, K. Koenuma, K. Ushida and A. Kira, Langmuir, 1996, 12, 736–738.
97 A. Chemseddine and H. P. Boehm, J. Mol. Catal., 1990, 60, 295–311.
98 C. von Sonntag and H.-P. Schuchmann, Angew. Chem. Int. Ed. Engl., 1991, 30, 1229–1253.
99 W. F. Chan and R. A. Larson, Water Res., 1991, 25, 1539–1544.
100 W. F. Chan and R. A. Larson, Water Res., 1991, 25, 1529–1538.
101 G. Chen, I. Roy, C. Yang and P. N. Prasad, Chem. Rev., 2016, 116, 2826–2885.
102 Z. Fei Yin, L. Wu, H. Gui Yang and Y. Hua Su, Phys. Chem. Chem. Phys., 2013, 15, 4844.
103 P. Agostinis, K. Berg, K. A. Cengel, T. H. Foster, A. W. Girotti, S. O. Gollnick, S. M. Hahn, M. R. Hamblin, A.
Juzeniene, D. Kessel, M. Korbelik, J. Moan, P. Mroz, D. Nowis, J. Piette, B. C. Wilson and J. Golab, CA.
Cancer J. Clin., 2011, 61, 250–281.
104 Z. Lu, X. Zhang, Y. Zhao, Y. Xue, T. Zhai, Z. Wu and C. Li, Polym Chem, 2015, 6, 302–310.
105 C. S. Shemesh, C. W. Hardy, D. S. Yu, B. Fernandez and H. Zhang, Photodiagnosis Photodyn. Ther., 2014,
11, 193–203.
106 S. Hackenberg, A. Scherzed, W. Harnisch, K. Froelich, C. Ginzkey, C. Koehler, R. Hagen and N. Kleinsasser,
J. Photochem. Photobiol. B, 2012, 114, 87–93.
I. Bibliographic study
- 37 -
107 H. S. Qian, H. C. Guo, P. C.-L. Ho, R. Mahendran and Y. Zhang, Small, 2009, 5, 2285–2290.
108 R. R. Anderson and J. A. Parrish, J. Invest. Dermatol., 1981, 77, 13–19.
109 F. Scholkmann, S. Kleiser, A. J. Metz, R. Zimmermann, J. Mata Pavia, U. Wolf and M. Wolf, NeuroImage,
2014, 85, Part 1, 6–27.
110 I. eho , V. Vilímová, P. Jendelová, V. Kubíček, D. Jirák, V. Herynek, M. Kapcalová, J. Kotek, J. Černý, P.
Hermann and I. Lukeš, J. Med. Chem., 2011, 54, 5185–5194.
111 K. T. Thurn, E. M. B. Brown, A. Wu, S. Vogt, B. Lai, J. Maser, T. Paunesku and G. E. Woloschak, Nanoscale
Res. Lett., 2007, 2, 430–441.
112 J. Seo, H. Chung, M. Kim, J. Lee, I. Choi and J. Cheon, Small, 2007, 3, 850–853.
113 S. Yamaguchi, H. Kobayashi, T. Narita, K. Kanehira, S. Sonezaki and Y. Kubota, Photochem. Photobiol., 2010,
86, 964–971.
114 X. Feng, S. Zhang and X. Lou, Colloids Surf. B Biointerfaces, 2013, 107, 220–226.
115 J. Xu, Y. Sun, J. Huang, C. Chen, G. Liu, Y. Jiang, Y. Zhao and Z. Jiang, Bioelectrochemistry, 2007, 71, 217–
222.
116 R. Cai, Y. Kubota, T. Shuin, H. Sakai, K. Hashimoto and A. Fujishima, Cancer Res., 1992, 52, 2346–2348.
117 B. Jovanović, Integr. Environ. Assess. Manag., 2015, 11, 10–20.
118 I. Iavicoli, V. Leso and A. Bergamaschi, J. Nanomater., 2012, 2012, 1–36.
119 G. E. Schaumann, A. Philippe, M. Bundschuh, G. Metreveli, S. Klitzke, D. Rakcheev, A. Grün, S. K. Kumahor,
M. Kühn, T. Baumann, F. Lang, W. Manz, R. Schulz and H.-J. Vogel, Sci. Total Environ., 2015, 535, 3–19.
120 K. Schilling, B. Bradford, D. Castelli, E. Dufour, J. F. Nash, W. Pape, S. Schulte, I. Tooley, J. van den Bosch
and F. Schellauf, Photochem. Photobiol. Sci., 2010, 9, 495.
121 B. Sha, W. Gao, X. Cui, L. Wang and F. Xu, J. Appl. Toxicol., 2015, 35, 1086–1101.
122 H. Shi, R. Magaye, V. Castranova and J. Zhao, Part Fibre Toxicol, 2013, 10, 15.
123 X. Zhang, W. Li and Z. Yang, Arch. Toxicol., 2015, 89, 2207–2217.
124 A. Chompoosor, K. Saha, P. S. Ghosh, D. J. Macarthy, O. R. Miranda, Z.-J. Zhu, K. F. Arcaro and V. M. Rotello,
Small, 2010, 6, 2246–2249.
125 E. Fröhlich, B. J. Teubl and E. Roblegg, BioNanoMaterials, 2013, 14, 25-35.
126 J. R. McCarthy, Nanomed., 2009, 4, 693–695.
127 A. Fernandez-Fernandez, R. Manchanda and A. J. McGoron, Appl. Biochem. Biotechnol., 2011, 165, 1628–
1651.
128 K. Young Choi, G. Liu, S. Lee and X. Chen, Nanoscale, 2012, 4, 330–342.
129 S. M. Janib, A. S. Moses and J. A. MacKay, Adv. Drug Deliv. Rev., 2010, 62, 1052–1063.
130 Z. Zhang, L. Wang, J. Wang, X. Jiang, X. Li, Z. Hu, Y. Ji, X. Wu and C. Chen, Adv. Mater., 2012, 24, 1418–
1423.
131 Y. Xia, W. Li, C. M. Cobley, J. Chen, X. Xia, Q. Zhang, M. Yang, E. C. Cho and P. K. Brown, Acc. Chem. Res.,
2011, 44, 914–924.
132 D. Yoo, J.-H. Lee, T.-H. Shin and J. Cheon, Acc. Chem. Res., 2011, 44, 863–874.
133 T. Krasia-Christoforou and T. K. Georgiou, J. Mater. Chem. B, 2013, 1, 3002–3025.
134 S.-M. Lee, Y. Song, B. J. Hong, K. W. MacRenaris, D. J. Mastarone, T. V. O’Halloran, T. J. Meade and S. T.
Nguyen, Angew. Chem. Int. Ed., 2010, 49, 9960–9964.
135 Y. Zhu, C. Ding, G. Ma and Z. Du, J. Solid State Chem., 1998, 139, 124–127.
136 Y. C. Zhu and C. X. Ding, J. Solid State Chem., 1999, 145, 711–715.
137 M. Niederberger, M. H. Bartl and G. D. Stucky, Chem. Mater., 2002, 14, 4364–4370.
138 D. Pan, N. Zhao, Q. Wang, S. Jiang, X. Ji and L. An, Adv. Mater., 2005, 17, 1991–1995.
139 S. Biswas, V. Sundstrom and S. De, Mater. Chem. Phys., 2014, 147, 761–771.

I. Bibliographic study
- 38 -
140 J. Liqiang, Q. Yichun, W. Baiqi, L. Shudan, J. Baojiang, Y. Libin, F. Wei, F. Honggang and S. Jiazhong, Sol.
Energy Mater. Sol. Cells, 2006, 90, 1773–1787.
141 Z. Zhao and Q. Liu, J. Phys. Appl. Phys., 2008, 41, 085417.
142 S. Bingham and W. A. Daoud, J Mater Chem, 2011, 21, 2041–2050.
143 U. G. Akpan and B. H. Hameed, Appl. Catal. Gen., 2010, 375, 1–11.
144 M. K. Nowotny, L. R. Sheppard, T. Bak and J. Nowotny, J. Phys. Chem. C, 2008, 112, 5275–5300.
145 W. Zhou, Y. Zhou and S. Tang, Mater. Lett., 2005, 59, 3115–3118.
146 L. Xing, J. Jia, Y. Wang and S. Dong, Environ. Prog. Sustain. Energy, 2013, 32, 302–306.
147 N. V. Gaponenko, I. S. Molchan, G. E. Thompson, P. Skeldon, A. Pakes, R. Kudrawiec, L. Bryja and J.
Misiewicz, Sens. Actuators Phys., 2002, 99, 71–73.
148 H. R. Kim, T. G. Lee and Y.-G. Shul, J. Photochem. Photobiol. Chem., 2007, 185, 156–160.
149 A. J. Kenyon, Prog. Quantum Electron., 2002, 26, 225–284.
150 H. Liu, L. Yu, W. Chen and Y. Li, J. Nanomater., 2012, 2012, 1–9.
151 Y. Wang, H. Cheng, L. Zhang, Y. Hao, J. Ma, B. Xu and W. Li, J. Mol. Catal. Chem., 2000, 151, 205–216.
152 W. Zhou, Y. Zheng and G. Wu, Appl. Surf. Sci., 2006, 253, 1387–1392.
153 Q. G. Zeng, Z. M. Zhang, Z. J. Ding, Y. Wang and Y. Q. Sheng, Scr. Mater., 2007, 57, 897–900.
154 J. Zhang, X. Wang, W.-T. Zheng, X.-G. Kong, Y.-J. Sun and X. Wang, Mater. Lett., 2007, 61, 1658–1661.
155 A. Patra, C. S. Friend, R. Kapoor and P. N. Prasad, Chem. Mater., 2003, 15, 3650–3655.
156 J. Liqiang, S. Xiaojun, X. Baifu, W. Baiqi, C. Weimin and F. Honggang, J. Solid State Chem., 2004, 177, 3375–
3382.
157 H. Wang, Y. Wang, Y. Yang, X. Li and C. Wang, Mater. Res. Bull., 2009, 44, 408–414.
158 L. Li, C.-K. Tsung, Z. Yang, G. D. Stucky, L. D. Sun, J. F. Wang and C. H. Yan, Adv. Mater., 2008, 20, 903–
908.
159 D. Kaczmarek, J. Domaradzki, A. Borkowska, A. Podhorodecki, J. Misiewicz and K. Sieradzka, Opt. Appl.
160 C.-C. Ting, S.-Y. Chen, W.-F. Hsieh and H.-Y. Lee, J. Appl. Phys., 2001, 90, 5564–5569.
161 C. W. Jia, E. Q. Xie, J. G. Zhao, Z. W. Sun and A. H. Peng, J. Appl. Phys., 2006, 100, 023529.
162 E. Galoppini, Coord. Chem. Rev., 2004, 248, 1283–1297.
163 N. J. Cherepy, G. P. Smestad, M. Grätzel and J. Z. Zhang, J. Phys. Chem. B, 1997, 101, 9342–9351.
164 I. Martini, J. H. Hodak and G. V. Hartland, J. Phys. Chem. B, 1998, 102, 9508–9517.
165 M. N. Tahir, M. Eberhardt, P. Theato, S. Faiß, A. Janshoff, T. Gorelik, U. Kolb and W. Tremel, Angew. Chem.
Int. Ed., 2006, 45, 908–912.
166 K. T. Thurn, T. Paunesku, A. Wu, E. M. B. Brown, B. Lai, S. Vogt, J. Maser, M. Aslam, V. Dravid, R. Bergan
and G. E. Woloschak, Small, 2009, 5, 1318–1325.
167 J. Lin, J. A. Siddiqui and R. M. Ottenbrite, Polym. Adv. Technol., 2001, 12, 285–292.
168 M. J. Choi, T. Smoother, A. A. Martin, A. M. McDonagh, P. J. Maynard, C. Lennard and C. Roux, Forensic Sci.
Int., 2007, 173, 154–160.
169 N. Mandzy, E. Grulke and T. Druffel, Powder Technol., 2005, 160, 121–126.
170 J. L. Deiss, P. Anizan, S. El Hadigui and C. Wecker, Colloids Surf. Physicochem. Eng. Asp., 1996, 106, 59–
62.
171 A.-H. Lu, E. L. Salabas and F. Schüth, Angew. Chem. Int. Ed., 2007, 46, 1222–1244.
172 W. B. Russel, D. A. Saville and W. R. Schowalter, Colloidal Dispersions, Cambridge University Press, 1989.
173 G. Fritz, V. Schädler, N. Willenbacher and N. J. Wagner, Langmuir, 2002, 18, 6381–6390.
174 D. H. Napper and A. Netschey, J. Colloid Interface Sci., 1971, 37, 528–535.
175 Z. E. Allouni, M. R. Cimpan, P. J. Høl, T. Skodvin and N. R. Gjerdet, Colloids Surf. B Biointerfaces, 2009, 68,
83–87.

I. Bibliographic study
- 39 -
176 Z. Ji, X. Jin, S. George, T. Xia, H. Meng, X. Wang, E. Suarez, H. Zhang, E. M. V. Hoek, H. Godwin, A. E. Nel
and J. I. Zink, Environ. Sci. Technol., 2010, 44, 7309–7314.
177 P. Bihari, M. Vippola, S. Schultes, M. Praetner, A. G. Khandoga, C. A. Reichel, C. Coester, T. Tuomi, M.
Rehberg and F. Krombach, Part. Fibre Toxicol., 2008, 5, 14.
178 E. C. Cho, Q. Zhang and Y. Xia, Nat. Nanotechnol., 2011, 6, 385–391.
179 C. Guiot and O. Spalla, Environ. Sci. Technol., 2013, 47, 1057–1064.
180 N. Lakshminarasimhan, W. Kim and W. Choi, J. Phys. Chem. C, 2008, 112, 20451–20457.
181 C. He, Y. Hu, L. Yin, C. Tang and C. Yin, Biomaterials, 2010, 31, 3657–3666.
182 T. S. Hauck, A. A. Ghazani and W. C. W. Chan, Small, 2008, 4, 153–159.
183 M. L. Amin, J. Y. Joo, D. K. Yi and S. S. A. An, J. Controlled Release, 2015, 207, 131–142.
184 L. Hu, Z. Mao and C. Gao, J. Mater. Chem., 2009, 19, 3108.
185 A. Verma and F. Stellacci, Small, 2010, 6, 12–21.
186 K. Yin Win and S.-S. Feng, Biomaterials, 2005, 26, 2713–2722.
187 L. Chen, J. M. Mccrate, J. C.-M. Lee and H. Li, Nanotechnology, 2011, 22, 105708.
188 M. J. D. Clift, B. Rothen-Rutishauser, D. M. Brown, R. Duffin, K. Donaldson, L. Proudfoot, K. Guy and V. Stone,
Toxicol. Appl. Pharmacol., 2008, 232, 418–427.
189 S. Patil, A. Sandberg, E. Heckert, W. Self and S. Seal, Biomaterials, 2007, 28, 4600–4607.
190 R. Kumar, I. Roy, T. Y. Ohulchanskyy, L. N. Goswami, A. C. Bonoiu, E. J. Bergey, K. M. Tramposch, A. Maitra
and P. N. Prasad, ACS Nano, 2008, 2, 449–456.
191 T.-H. Chung, S.-H. Wu, M. Yao, C.-W. Lu, Y.-S. Lin, Y. Hung, C.-Y. Mou, Y.-C. Chen and D.-M. Huang,
Biomaterials, 2007, 28, 2959–2966.
192 W.-K. Oh, S. Kim, M. Choi, C. Kim, Y. S. Jeong, B.-R. Cho, J.-S. Hahn and J. Jang, ACS Nano, 2010, 4, 5301–
5313.
193 B. J. Teubl, C. Schimpel, G. Leitinger, B. Bauer, E. Fröhlich, A. Zimmer and E. Roblegg, J. Hazard. Mater.,
2015, 286, 298–305.
194 A. Villanueva, M. Cañete, A. G. Roca, M. Calero, S. Veintemillas-Verdaguer, C. J. Serna, M. del Puerto Morales
and R. Miranda, Nanotechnology, 2009, 20, 115103.
195 Y. Zhang, N. Kohler and M. Zhang, Biomaterials, 2002, 23, 1553–1561.
196 C. Wilhelm, C. Billotey, J. Roger, J. N. Pons, J.-C. Bacri and F. Gazeau, Biomaterials, 2003, 24, 1001–1011.
197 D. L. J. Thorek and A. Tsourkas, Biomaterials, 2008, 29, 3583–3590.
198 A. Petri-Fink and H. Hofmann, IEEE Trans. NanoBioscience, 2007, 6, 289–297.
199 K. Cho, X. Wang, S. Nie, Z. Chen and D. M. Shin, Clin. Cancer Res., 2008, 14, 1310–1316.
200 C. Leamon, Adv. Drug Deliv. Rev., 2004, 56, 1127–1141.
201 C. P. Leamon and P. S. Low, Drug Discov. Today, 2001, 6, 44–51.
202 Y. Lu and P. S. Low, Adv. Drug Deliv. Rev., 2012, 64, 342–352.
203 A. Quintana, E. Raczka, L. Piehler, I. Lee, A. Myc, I. Majoros, A. K. Patri, T. Thomas, J. Mulé and J. R. Baker
Jr, Pharm. Res., 2002, 19, 1310–1316.
204 N. F. Saba, X. Wang, S. Müller, M. Tighiouart, K. Cho, S. Nie, Z. (Georgia) Chen and D. M. Shin, Head Neck,
2009, 31, 475–481.
205 J. Sudimack and R. J. Lee, Adv. Drug Deliv. Rev., 2000, 41, 147–162.
206 X. Zhao, H. Li and R. J. Lee, Expert Opin. Drug Deliv., 2008, 5, 309–319.
207 Z. M. Qian, H. Li, H. Sun and K. Ho, Pharmacol. Rev., 2002, 54, 561–587.
208 J. J. Huang, Y. B. Ye, Z. Q. Lei, X. J. Ye, M. Z. Rong and M. Q. Zhang, Phys. Chem. Chem. Phys., 2014, 16,
5480.
209 C. Bies, C.-M. Lehr and J. F. Woodley, Adv. Drug Deliv. Rev., 2004, 56, 425–435.

I. Bibliographic study
- 40 -
210 V. Bagalkot, L. Zhang, E. Levy-Nissenbaum, S. Jon, P. W. Kantoff, R. Langer and O. C. Farokhzad, Nano
Lett., 2007, 7, 3065–3070.
211 O. C. Farokhzad, S. Jon, A. Khademhosseini, T.-N. T. Tran, D. A. LaVan and R. Langer, Cancer Res., 2004,
64, 7668–7672.
212 O. C. Farokhzad, J. Cheng, B. A. Teply, I. Sherifi, S. Jon, P. W. Kantoff, J. P. Richie and R. Langer, Proc. Natl.
Acad. Sci., 2006, 103, 6315–6320.
213 L. Zhang, A. F. Radovic-Moreno, F. Alexis, F. X. Gu, P. A. Basto, V. Bagalkot, S. Jon, R. S. Langer and O. C.
Farokhzad, ChemMedChem, 2007, 2, 1268–1271.
214 B. J. Hicke, A. W. Stephens, T. Gould, Y.-F. Chang, C. K. Lynott, J. Heil, S. Borkowski, C.-S. Hilger, G. Cook,
S. Warren and others, J. Nucl. Med., 2006, 47, 668–678.
215 K. Kalyanasundaram and M. Grätzel, Coord. Chem. Rev., 1998, 177, 347–414.
216 T. Paunesku, T. Rajh, G. Wiederrecht, J. Maser, S. Vogt, N. Stojićević, M. Protić, B. Lai, J. Oryhon, M.
Thurnauer and G. Woloschak, Nat. Mater., 2003, 2, 343–346.
217 R. W. Cheyne, T. A. Smith, L. Trembleau and A. C. Mclaughlin, Nanoscale Res. Lett., 2011, 6, 1–6.
218 M. Niederberger, G. Garnweitner, F. Krumeich, R. Nesper, H. Cölfen and M. Antonietti, Chem. Mater., 2004,
16, 1202–1208.
219 H. Kamiya and M. Iijima, Sci. Technol. Adv. Mater., 2010, 11, 044304.
220 L. de la Garza, Z. V. Saponjic, N. M. Dimitrijevic, M. C. Thurnauer and T. Rajh, J. Phys. Chem. B, 2006, 110,
680–686.
221 I. A. Janković, Z. V. Šaponjić, E. S. Džunuzović and J. M. Nedeljković, Nanoscale Res. Lett., 2010, 5, 81–88.
222 I. A. Janković, Z. V. Šaponjić, M. I. Čomor and J. M. Nedeljković, J. Phys. Chem. C, 2009, 113, 12645–12652.
223 M. C. Thurnauer, T. Rajh and D. M. Tiede, Acta Chim. Scandiavica, 1997, 51, 610–618.
224 M. N. Tahir, P. Theato, P. Oberle, G. Melnyk, S. Faiss, U. Kolb, A. Janshoff, M. Stepputat and W. Tremel,
Langmuir, 2006, 22, 5209–5212.
225 R. Comparelli, E. Fanizza, M. Curri, P. Cozzoli, G. Mascolo, R. Passino and A. Agostiano, Appl. Catal. B
Environ., 2005, 55, 81–91.
226 P. H. Mutin, G. Guerrero and A. Vioux, J. Mater. Chem., 2005, 15, 3761.
227 T. Rajh, J. M. Nedeljkovic, L. X. Chen, O. Poluektov and M. C. Thurnauer, J. Phys. Chem. B, 1999, 103, 3515–
3519.
228 K. E. Sapsford, W. R. Algar, L. Berti, K. B. Gemmill, B. J. Casey, E. Oh, M. H. Stewart and I. L. Medintz, Chem.
Rev., 2013, 113, 1904–2074.
229 Y. Qin, L. Sun, X. Li, Q. Cao, H. Wang, X. Tang and L. Ye, J. Mater. Chem., 2011, 21, 18003.
230 A. M. El-Toni, S. Yin and T. Sato, J. Colloid Interface Sci., 2006, 300, 123–130.
231 A. Jaroenworaluck, W. Sunsaneeyametha, N. Kosachan and R. Stevens, Surf. Interface Anal., 2006, 38, 473–
477.
232 E. Jimenez-Villar, V. Mestre, P. C. de Oliveira and G. F. de Sá, Nanoscale, 2013, 5, 12512.
233 O. K. Park and Y. S. Kang, Colloids Surf. Physicochem. Eng. Asp., 2005, 257–258, 261–265.
234 S. M. Grayson and J. M. J. Fréchet, Chem. Rev., 2001, 101, 3819–3868.
235 D. A. Tomalia, New J. Chem., 2012, 36, 264–281.
236 L. M. Bronstein and Z. B. Shifrina, Chem. Rev., 2011, 111, 5301–5344.
237 R.-O. Moussodia, L. Balan, C. Merlin, C. Mustin and R. Schneider, J Mater Chem, 2010, 20, 1147–1155.
238 M. Li, L. Qun Xu, L. Wang, Y. P. Wu, J. Li, K.-G. Neoh and E.-T. Kang, Polym. Chem., 2011, 2, 1312–1321.
239 R. Abu-Reziq, H. Alper, D. Wang and M. L. Post, J. Am. Chem. Soc., 2006, 128, 5279–5282.
240 Y. Nakanishi and T. Imae, J. Colloid Interface Sci., 2006, 297, 122–129.
241 C.-C. Chu, N. Ueno and T. Imae, Chem. Mater., 2008, 20, 2669–2676.

I. Bibliographic study
- 41 -
242 Y. Komine, I. Ueda, T. Goto and H. Fujihara, Chem. Commun., 2006, 0, 302–304.
243 C. S. Love, V. Chechik, D. K. Smith and C. Brennan, J. Mater. Chem., 2004, 14, 919–923.
244 K. Satoh, T. Yoshimura and K. Esumi, J. Colloid Interface Sci., 2002, 255, 312–322.
245 C. Danda, R. Ponnapati, P. Dutta, P. Taranekar, G. Patterson and R. C. Advincula, Macromol. Chem. Phys.,
2011, 212, 1600–1615.
246 M.-C. Daniel, J. Ruiz, S. Nlate, J. Palumbo, J.-C. Blais and D. Astruc, Chem. Commun., 2001, 0, 2000–2001.
247 W. Guo, J. J. Li, Y. A. Wang and X. Peng, J. Am. Chem. Soc., 2003, 125, 3901–3909.
248 T. J. Cho, R. A. Zangmeister, R. I. MacCuspie, A. K. Patri and V. A. Hackley, Chem. Mater., 2011, 23, 2665–
2676.
249 D.-H. Tsai, T. Joon Cho, S. R. Elzey, J. C. Gigault and V. A. Hackley, Nanoscale, 2013, 5, 5390–5395.
250 S. Nakao, K. Torigoe, K. Kon-No and T. Yonezawa, J. Phys. Chem. B, 2002, 106, 12097–12100.
251 S. Deol, N. Weerasuriya and Y.-S. Shon, J. Mater. Chem. B, 2015, 3, 6071–6080.
252 Y. A. Wang, J. J. Li, H. Chen and X. Peng, J. Am. Chem. Soc., 2002, 124, 2293–2298.
253 D. Rosario-Amorin, X. Wang, M. Gaboyard, R. Clérac, S. Nlate and K. Heuzé, Chem. – Eur. J., 2009, 15,
12636–12643.
254 Y. Liu, R. Brandon, M. Cate, X. Peng, R. Stony and M. Johnson, Anal. Chem., 2007, 79, 8796–8802.
255 C. Duanmu, I. Saha, Y. Zheng, B. M. Goodson and Y. Gao, Chem. Mater., 2006, 18, 5973–5981.
256 T. Gillich, C. Acikgöz, L. Isa, A. D. Schlüter, N. D. Spencer and M. Textor, ACS Nano, 2013, 7, 316–329.
257 B. Basly, D. Felder-Flesch, P. Perriat, C. Billotey, J. Taleb, G. Pourroy and S. Begin-Colin, Chem. Commun.,
2010, 46, 985–987.
258 J. Young Park, Y. Park and R. C. Advincula, Soft Matter, 2011, 7, 5124–5127.
259 A. Walter, A. Garofalo, A. Parat, J. Jouhannaud, G. Pourroy, E. Voirin, S. Laurent, P. Bonazza, J. Taleb, C.
Billotey, L. V. Elst, R. N. Muller, S. Begin-Colin and D. Felder-Flesch, J. Mater. Chem. B, 2015, 3, 1484–1494.
260 X. He, X. Wu, X. Cai, S. Lin, M. Xie, X. Zhu and D. Yan, Langmuir, 2012, 28, 11929–11938.
261 Y. Liu, M. Kim, Y. Wang, Y. A. Wang and X. Peng, Langmuir, 2006, 22, 6341–6345.
262 T. Tanaka, K. Shibata, M. Hosokawa, K. Hatakeyama, A. Arakaki, H. Gomyo, T. Mogi, T. Taguchi, H. Wake,
T. Tanaami and T. Matsunaga, J. Colloid Interface Sci., 2012, 377, 469–475.
263 M. Kim, Y. Chen, Y. Liu and X. Peng, Adv. Mater., 2005, 17, 1429–1432.
264 S. M. George, I.-S. Hong and J.-K. Kim, Bull. Korean Chem. Soc., 2008, 29, 1545–1553.
265 T. Mizugaki, M. Murata, S. Fukubayashi, T. Mitsudome, K. Jitsukawa and K. Kaneda, Chem. Commun., 2008,
0, 241–243.
266 K. Torigoe, Y. Watanabe, T. Endo, K. Sakai, H. Sakai and M. Abe, J. Nanoparticle Res., 2010, 12, 951–960.
267 S. Svenson, Eur. J. Pharm. Biopharm., 2009, 71, 445–462.
268 X. Hu, L. Zhou and C. Gao, Colloid Polym. Sci., 2011, 289, 1299–1320.
269 B. Singh, N. Hussain, T. Sakthivel and A. T. Florence, J. Pharm. Pharmacol., 2003, 55, 1635–1640.
270 N. Tsubokawa, H. Ichioka, T. Satoh, S. Hayashi and K. Fujiki, React. Funct. Polym., 1998, 37, 75–82.
271 Y. Maeda, T. Toyoda, M. Tanaka, T. Mogi, T. Taguchi, T. Tanaami, T. Matsunaga and T. Tanaka,
Electrochimica Acta, 2015, 168, 308–312.
272 C.-H. Lai, T.-C. Chang, Y.-J. Chuang, D.-L. Tzou and C.-C. Lin, Bioconjug. Chem., 2013, 24, 1698–1709.
273 V. Balzani, P. Ceroni, M. Maestri, C. Saudan and V. Vicinelli, in Dendrimers V, eds. C. A. Schalley and F.
Vögtle, Springer Berlin Heidelberg, Berlin, Heidelberg, 2003, vol. 228, pp. 159–191.
274 M. Kawa, in Dendrimers V, eds. C. A. Schalley and F. Vögtle, Springer Berlin Heidelberg, Berlin, Heidelberg,
2003, vol. 228, pp. 193–204.
275 S. Buathong, D. Ung, T. J. Daou, C. Ulhaq-Bouillet, G. Pourroy, D. Guillon, L. Ivanova, I. Bernhardt, S. Bégin-
Colin and B. Donnio, J. Phys. Chem. C, 2009, 113, 12201–12212.
I. Bibliographic study
- 42 -
276 K. Heuzé, D. Rosario-Amorin, S. Nlate, M. Gaboyard, A. Bouter and R. Clérac, New J. Chem., 2008, 32, 383–
387.
277 G. M. Stewart and M. A. Fox, J. Am. Chem. Soc., 1996, 118, 4354–4360.
278 M. Alexander Bissett, I. Köper, J. Scott Quinton and J. George Shapter, J. Mater. Chem., 2011, 21, 18597–
18604.
279 C. Hirano, T. Imae, M. Tamura and Y. Takaguchi, Chem. Lett., 2005, 34, 862–863.
280 N. Seob Baek, J.-H. Yum, X. Zhang, H. Kyu Kim, M. K. Nazeeruddin and M. Grätzel, Energy Environ. Sci.,
2009, 2, 1082–1087.
281 C. M. Cardona, J. Alvarez, A. E. Kaifer, T. D. McCarley, S. Pandey, G. A. Baker, N. J. Bonzagni and F. V.
Bright, J. Am. Chem. Soc., 2000, 122, 6139–6144.
282 C. M. Cardona, T. Wilkes, W. Ong, A. E. Kaifer, T. D. McCarley, S. Pandey, G. A. Baker, M. N. Kane, S. N.
Baker and F. V. Bright, J. Phys. Chem. B, 2002, 106, 8649–8656.
283 H. Liu, J. Guo, L. Jin, W. Yang and C. Wang, J. Phys. Chem. B, 2008, 112, 3315–3321.
284 P. Du, W.-H. Zhu, Y.-Q. Xie, F. Zhao, C.-F. Ku, Y. Cao, C.-P. Chang and H. Tian, Macromolecules, 2004, 37,
4387–4398.

- 43 -
II. Inorganic syntheses:
Titanium dioxide
nanoparticles

II. Inorganic syntheses: Titanium dioxide nanoparticles
- 44 -
Contents
II. Inorganic syntheses: Titanium dioxide nanoparticles ................................................ - 45 - II.1. Influence of the coordinating agent on TiO2 nanoparticles ................................. - 45 -
II.1.1. Size and morphology.................................................................................. - 45 - II.1.2. Surface moieties ........................................................................................ - 48 - II.1.3. Photocatalytic activity ................................................................................. - 53 -
II.2. Influence of hydrothermal processing parameters on MEEAA-TiO2 particles ..... - 56 - II.2.1. Size and morphology.................................................................................. - 56 - II.2.2. Surface moieties ........................................................................................ - 62 - II.2.3. Photocatalytic activity ................................................................................. - 65 -
II.3. Luminescent TiO2 based core/shell structured nanoparticles............................. - 71 - II.3.1. Luminescent TiO2/SiO2 core/shell nanoparticles ......................................... - 71 - II.3.2. ZnO/TiO2 core/shell nanoparticles .............................................................. - 76 -
II.4. Conclusion ........................................................................................................ - 83 -

- 45 -
II. Inorganic syntheses: Titanium dioxide nanoparticles
Various photocatalytically active nanomaterials have already been studied in the last decades,
including CdS, SnO2, ZnO, Nb2O3 or ZrO2. Nevertheless, nano-TiO2 remains one of the most
well-known and widely-used photocatalysts due to its high efficiency, low cost, physical and
chemical stability, widespread availability, and noncorrosive properties.1 Due to these
properties combined with their non-toxicity, TiO2 nanoparticle (NP) systems are very promising
candidates for medical applications such as photodynamic therapy for cancer, cell imaging,
biological analysis, genetic engineering or drug delivery.2 To synthesize them, hydrothermal
sol-gel synthesis is the preferred method due to its excellent reproducibility, high particle
density and crystallinity, as well as a controlled morphology and narrow size distribution of the
obtained NPs. Additionally, depending on the chosen reactants the obtained NPs carry
characteristic organic surface moieties which for example ensure a perfect particle
dispersibility.3–6 II.1. Influence of the coordinating agent on TiO2 nanoparticles
Two synthesis approaches characterized by different coordinating agents have been selected.
The first TiO2 NPs were synthesized in the presence of acetyl acetone (AA) and para-toluene
sulfonic acid (PTSA). This system has already been intensively studied for the use of
photocatalytic (PC) coating materials in terms of their organic surface properties with TGA,
crystal structure with x-ray diffraction (XRD) and PC activity mainly after coating onto surfaces
and annealing.7–10 Therefore, in this particle case its suitability as a PC material has already
been proven and the objective was mainly to determine its properties as a colloid. The second
TiO2 NP system was chelated by 2-[2-(2-methoxyethoxy)ethoxy]acetic acid (MEEAA). It has
been chosen as this acid has a polyethylene glycol like structure which may be favourable for
cellular uptake and may only show a low cytotoxicity. This particle system has not yet been
studied in detail.
For studying the differences of these two particle types, here named AA-TiO2 and MEEAA-
TiO2, samples with a hydrothermal treatment time of 4 h at 160 °C were selected. First their
sizes and morphologies, then their surface moieties and PC activities are discussed in the
following.
II.1.1. Size and morphology
To determine differences in their size and morphology due to the chelating ligands of the
synthesis, XRD, TEM, N2 sorption and DLS measurements were conducted. The XRD patterns

I. Inorganic syntheses: Titanium dioxide nanoparticles
- 46 -
for both particles types are shown in Figure II - 1. They are typical for NPs as their signals are
very broad in contrast to well-defined sharp signals caused by bulk materials.11
Figure II - 1. Powder X-ray diffraction (XRD) patterns of AA-TiO2 and MEEAA-TiO2 assigned to anatase crystal phase. (*background signal due to measurement set-up).
Their patterns were both assigned to the anatase phase; all signals were attributed to hkl
indices of this crystal phase. It had already been expected to obtain the anatase phase as in
general it can be easily formed at low temperatures as used in these syntheses, while the rutile
phase is usually obtained at elevated temperatures of 400 – 1200 °C.10,12 Furthermore, the
formation of the anatase phase in the case of AA-TiO2 has already been reported.8,10 The XRD
patterns of both TiO2 NP types do not show any differences and even their crystallite sizes
determined using the Scherrer equation (using the diffraction peak from the anatase (101)
plane) were in both cases between 5 nm and 6 nm (5.5 nm for MEEAA-TiO2 and 5.6 nm for
AA-TiO2 respectively). TEM images of both particles samples (Figure II - 2) also showed
average particle sizes around 5 to 6 nm with slight variances (5.7 ± 1.0 nm for MEEAA-TiO2
and 6.3 ± 1.5 nm for AA-TiO2 respectively). This indicates that the obtained NPs are
monocrystals. Furthermore, the particles exhibit a prolate spheroidic morpholoy. Like the XRD
spectra, the TEM images do not reveal significant differences between both particle types.
Nevertheless, the size of the NPs of the AA-TiO2 sample seems to vary slightly more as larger
particles (e.g. 10 nm) were also found on occasion.

I. Inorganic syntheses: Titanium dioxide nanoparticles
- 47 -
Figure II - 2. Transmission electron microscopy (TEM) of AA-TiO2 a) and MEEAA-TiO2 b) and their size distribution, obtained from counting at least 100 particles per sample.
To further examine the particle properties the specific surface area (according to Brunauer
Emmet Teller (BET)13) was determined by N2 sorption measurements. The AA-TiO2 shows a
specific surface area of 207.5 m²/g while the surface area of MEEAA-TiO2 is slightly higher
with 231.2 m²/g. This difference may be due to the marginally smaller crystallite size. The
obtained experimental surface areas can be compared to the theoretic specific surface
area 𝑆𝑐𝑎 𝑐 = of a TiO2 sample. For the calculation one expects ρ = 3.9 g/cm3 as the density
of anatase14 and the particle shape is simplified to a perfect sphere with the volume 𝑣 = ,
surface = 4 (r = radius) and the mass 𝑚 = ∗ 𝑣. From this, the obtained theoretic
surface area 𝑆𝑐𝑎 𝑐 = = ∗𝑣 = ∗ = ∗ is 275 m²/g for MEEAA-TiO2 and 280 m²/g for
MEEAA-TiO2 if the crystallite sizes obtained from the XRD measurements are utilized for the
calculation. These values are higher than the experimentally determined specific surface
areas. The discrepancies between measured and calculated values are not surprising, if taken
into consideration that the specific surface area (determined via BET) and the theoretic
calculation can differ up to ± 20 % due to errors such as a wide particle size distribution or
particle morphology.15 Therefore, this measurement confirms the measured particle sizes by
XRD and TEM.
While the last 3 methods only analysed the particles as dried powder, dynamic light scattering
(DLS) measurements allowed the examination of particle behaviour in dispersions. For this,
the hydrodynamic diameter was determined using the so-called Z-Average size which is the
primary and therefore most stable parameter produced by this technique. The hydrodynamic
diameter displays the diameter of a hypothetical hard sphere showing the same translational
diffusion coefficient as the examined particle with an assumed hydration layer.16 Depending
on the agglomeration state of the sample, this value shows the size of an agglomerated group

I. Inorganic syntheses: Titanium dioxide nanoparticles
- 48 -
of particles plus hydration layer instead of the size of a single particle. Therefore, this method
indicates the dispersion state of the sample or the agglomerate size of the particles, rather
than the real particle size. The following Table II - 1 represents the hydrodynamic diameters
after synthesis and after an ultrasonic (US) treatment to optimize their dispersion. After
synthesis, both particle systems were dispersed in water at pH 2 to 3. This pH is caused by
remaining unbound organic acids from the synthesis (i.e. MEEAA or acetic acid which is
discussed in detail in II.1.2). Right after synthesis, the hydrodynamic diameter is around 80 nm
for both samples. This value can be significantly decreased by dispersion of the particles with
US treatment (Branson Sonifier 450, 4 min, duty cycle 30%, strength 7). Therefore, one can
assume that after synthesis, the sample is already well dispersed, but small agglomerates can
be measured. After US treatment the agglomerates are separated and the particles may even
be dispersed as single particles with a hydration layer as the hydrodynamic diameters are only
about four times larger than the determined crystallite size of the particles. The polydispersity
index (PDI) given shows the width of the measured particle size distribution. The scale ranges
from 0 (monodisperse sample) to 1 (polydisperse sample).17 If the measured PDI is smaller
than 0.15 (0.3), the sample is considered to be monodisperse (relatively monodisperse).18
Thus, the measurement confirms the small particle size distribution of the samples that had
already been observed via TEM studies. The (indeed very small) differences in agglomerate
sizes between AA-TiO2 and MEEAA-TiO2 may be due to the diverse character of the surface
ligands.
Table II - 1. Agglomerate sizes of AA-TiO2 and MEEAA-TiO2 dispersions at pH = 2 – 3; determined via dynamic light scattering measurements directly after synthesis and after ultrasonic treatment.
after synthesis after US treatment
hydrodynamic diameter [nm]
PDI [-] hydrodynamic diameter [nm]
PDI [-]
AA-TiO2 79.4 ± 1.5 0.2 22.5 ± 0.8 0.2
MEEAA-TiO2 84.1 ± 1.2 0.2 25.5 ± 0.9 0.2
II.1.2. Surface moieties
While no significant differences in size and morphology were detected for AA-TiO2 and
MEEAA-TiO2, IR studies revealed discrepancies in their surface functionalities due to the
educts utilized for their synthesis. All potential organic surface moieties of both systems are
shown in Figure II - 3. Beside hydroxyl groups which are typical for TiO2 NPs, AA-TiO2 is
coordinated by sulfonate and acetyl acetonate groups which decompose into acetates due to
heat treatment during their synthesis (Figure II - 3 a). MEEAA-TiO2 bears MEEAA derivatives
on its surface (Figure II - 3 b).

I. Inorganic syntheses: Titanium dioxide nanoparticles
- 49 -
Figure II - 3. Scheme of potential surface molecules of AA-TiO2 a) and MEEAA-TiO2 b).
For the IR studies, the particle samples were washed with ethanol via centrifugation to remove
water and unbound organic molecules from synthesis. Both DRIFT (diffuse reflectance infrared
Fourier transform) spectra (Figure II - 4a) show signals caused by the carboxylate (both NP
types) or acetylacetonate (AA-TiO2) groups coordinated onto the particle surface such as their
asymmetric stretching vibration19 at 1529 cm-1 (AA-TiO2) and 1554 cm-1 (MEEAA-TiO2).
Figure II - 4. IR (DRIFT) spectra a) of AA-TiO2 and MEEAA-TiO2 (with * marking a background signal) and scheme b) of the 3 different possible coordination modes of carboxylates onto TiO2.
The carboxylate groups can be bound onto the particle surface via three different coordination
types (Figure II - 4b): bridging, unidentate and bidentate coordination. While in the asymmetric
stretching vibration the coordination modes cannot be distinguished, the symmetric vibrations
show bands at different wavenumbers: The symmetric stretching of their bridging coordination
can be found at 1442 cm-1 (AA-TiO2) and 1456 -1423 cm-1 (MEEAA-TiO2).19 Unidentate and

I. Inorganic syntheses: Titanium dioxide nanoparticles
- 50 -
bidentate coordinations cause signals at 1348 cm-1 (AA-TiO2, only weak) and 1327 cm-1
(MEEAA-TiO2) due to symmetric stretching vibrations.19 MEEAA-TiO2 additionally shows the
symmetric C-O-C vibration at 1126 cm-1 20, while for AA-TiO2 the stretching vibration of C-CH3
(1236 cm-1)21 is seen as a signal. The spectrum of AA-TiO2 also proved the presence of
sulfonates due to vibration bands at 1159 cm-1 and 1124 cm-1 (symmetric stretching of SO2).20
The signals at 1045 cm-1 and 1012 cm-1 may also be caused by sulfonate groups (asymmetric
stretching vibrations).20 The stretching vibration of the Ti-O-Ti bond (400 – 900 cm-1)22 can be
detected for both NP systems as expected. Furthermore, the stretching and bending vibrations
of the hydroxyl groups of the particles produce signals at about 3200 cm-1 and 1620 cm-1,
respectively.23 Those might cover eventual signals caused by other organic groups such as
CH2 and CH3 (2900 cm-1)20 vibrations.
The isoelectric points (IEPs) of AA-TiO2 and MEEAA-TiO2 in dispersion (as synthesized) were
determined by zeta potential measurements as a function of pH. Figure II - 5 shows both
determined curves which exhibit typical zeta potential progressions for TiO2 NPs. Their IEPs
were found at a pH of around 6.3 (AA-TiO2) and 6.7 (AA-TiO2), respectively. These values
coincide with the general literature values for titanium dioxide NPs (pH(IEP) = 3-7).24
Furthermore, the isoelectric point also explains the fact that the NP dispersions after synthesis
are very stable and mainly without agglomerates as at pH 2 to 3 the particles are highly
electrostatically stabilised due to highly positive zeta potentials. It is generally accepted that
zeta potentials over ± 30 mV indicate a stable particle dispersion.25–27
Figure II - 5. Zeta potential titrations of AA-TiO2 and MEEAA-TiO2 water dispersions as a function of pH.

I. Inorganic syntheses: Titanium dioxide nanoparticles
- 51 -
To complete the analysis of the surface groups of both particle systems, thermogravimetric
(TGA) and differential thermal analyses (DTA) of the (first washed and then dried) particle
samples were carried out. The results are shown in Figure II - 6. AA-TiO2 shows a mass loss
of 13 % and MEEAA-TiO2 of 9 % when heated up to 800 °C (Figure II - 6 a). As at this
temperature all organic material is supposed to be eliminated while TiO2 remains, one can
conclude that an AA-TiO2 particle bears 13 mass-% of organic groups while a MEEAA-TiO2
particle only 9 mass-%. DTA reveals a broad exothermic signal over the entire measured
temperature range for both sample (Figure II - 6 b). MEEAA-TiO2 shows a maximum between
300 and 400 °C, compared to between 400 and 500 °C for AA-TiO2.
Figure II - 6. Simultaneous thermogravimetric (TGA, a) and differential thermal analysis (DTA, b) performed on dried AA-TiO2 and MEEAA-TiO2 particle samples.
The TGA curve of AA-TiO2 can be divided into 3 sections: under 500 °C there is a fast and
almost continuous mass loss, from 500 to 700 °C only a slight mass loss and over 700 °C a
second phase of strong mass loss. Comparing these observations to the evolved gas analysis
via mass spectroscopy (MS) during the experiment (Figure II - 7), it can be seen that in the
first section mainly adsorbed water or hydroxyl groups on the particle surface (because of ionic
mass fragments: OH+, OH2+) and only small amounts of organics (C3H5+, CO2/C2H4O+) are
released around 100 °C. This is followed by a degradation of PTSA (SO2+, SO+, CH3, C2H6+)
and acetate as well as acetylacetonate groups (C2H5O+, C2H5OH+, C2H4O2+, CO2/C2H4O+)
around 200 °C. Finally there is only a release of CO2/C2H4O+ probably due to further
degradation of acetate and acetylacetonate around 300 to 400 °C. The low degradation in the
second part is confirmed by the MS data as from 500 to 700 °C, there is only a minimal amount
of CO2/C2H4O+ detected which indicates that all organic components of the surface groups are
eliminated. The mass loss in the last section is due to a further decomposition of the inorganic
parts of PTSA (SO2+, SO+) over 700 °C.

I. Inorganic syntheses: Titanium dioxide nanoparticles
- 52 -
Figure II - 7. Evolved gas analysis by mass spectrometry during TGA/DTA experiments on dried AA-TiO2 particle sample.
In the case of MEEAA-TiO2 the TGA curve (Figure II - 6) can also be divided into characteristic
decomposition zones and compared to the evolved gas analysis (Figure II - 8). Under 250 °C
a first continuous mass loss can be observed, which slows down nearing temperatures close
to 250 °C. During this phase, mainly liberated water or hydroxyl groups on the particle surface
and only small amount of organics (C3H5+, CO2/C2H4O+) can be detected around 100 °C,
followed by the main decomposition of the MEEAA (C2H5O+, C2H5OH+, C2H4O2+, CH3, some
CO2/C2H4O+, and small amounts of C+). Between 250 and 450 °C, the mass loss increases
again, while only small organic fragments are evolved (CO2/C2H4O+ and C+). Above 450 °C,
there is almost no mass loss indicating that all organic components are already eliminated
(only small amounts of evolved CO2/C2H4O+ can be still detected).

I. Inorganic syntheses: Titanium dioxide nanoparticles
- 53 -
Figure II - 8. Evolved gas analysis by mass spectrometry during TGA/DTA experiments on dried MEEAA-TiO2 particle sample.
II.1.3. Photocatalytic activity
After having analysed the size, morphology, dispersion state, surface properties and organic
surface groups of both particle systems, their PC activity was examined due to its importance
for later applications. For the photocatalysis test, dichloroacetic acid (DCA, 1 g/l) was added
into the NP (100 mg/l) water dispersion and compressed air was bubbled into the experimental
set-up. When UV light was applied, DCA was photocatalytically degraded into CO2 and Cl-
(HCl) as already discussed in Chapter I.1.2. and the produced chloride ions were measured
in-situ. The in-situ measurement was chosen as other degradation tests require the removal
of the NPs. This would especially be challenging for the particles examined here as they are
very small and in a very good dispersion state, making removal by centrifugation difficult and
time consuming. The results of the PC degradation tests with AA-TiO2 and MEEAA-TiO2
compared to commercial P25 TiO2 NPs (from Degussa/Evonik) are shown in Figure II - 9. P25
particles were chosen as reference samples as these particles are the best analysed
commercial TiO2 particles, showing an superior PC activity and have therefore often been used
as the benchmark system.28–31 These particles consist of 80 to 90 % anatase and 10 to 20 %
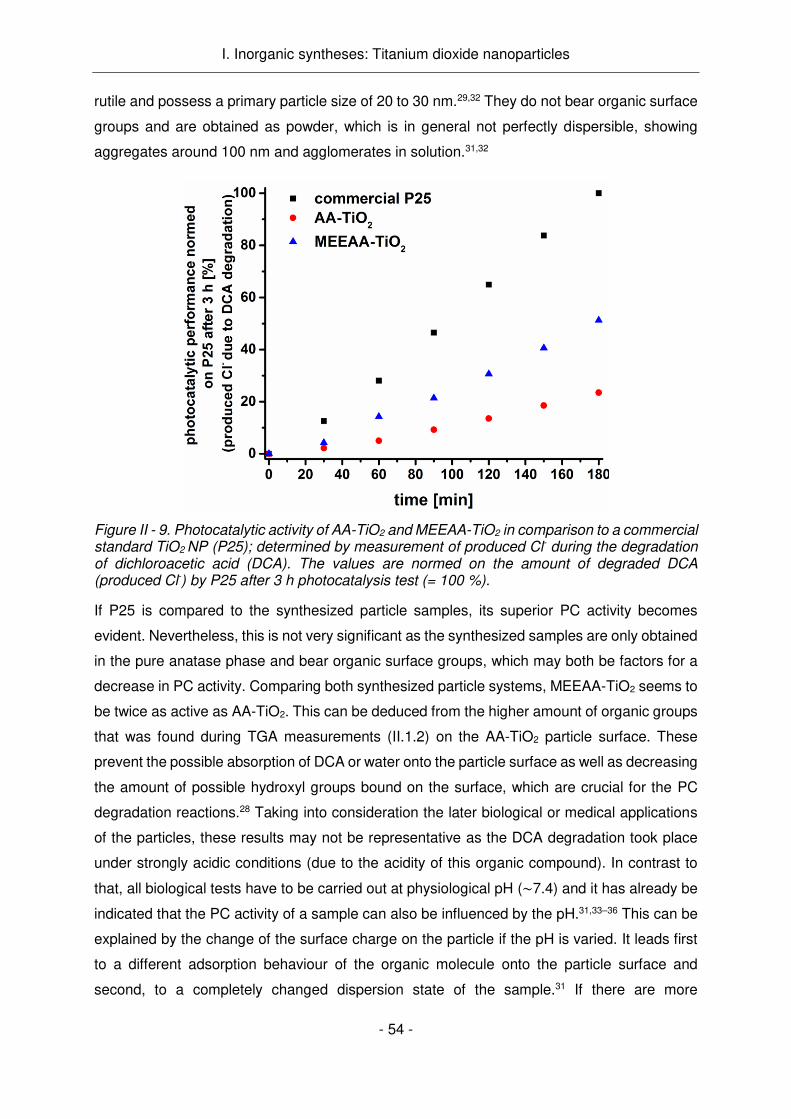
I. Inorganic syntheses: Titanium dioxide nanoparticles
- 54 -
rutile and possess a primary particle size of 20 to 30 nm.29,32 They do not bear organic surface
groups and are obtained as powder, which is in general not perfectly dispersible, showing
aggregates around 100 nm and agglomerates in solution.31,32
Figure II - 9. Photocatalytic activity of AA-TiO2 and MEEAA-TiO2 in comparison to a commercial standard TiO2 NP (P25); determined by measurement of produced Cl- during the degradation of dichloroacetic acid (DCA). The values are normed on the amount of degraded DCA (produced Cl-) by P25 after 3 h photocatalysis test (= 100 %).
If P25 is compared to the synthesized particle samples, its superior PC activity becomes
evident. Nevertheless, this is not very significant as the synthesized samples are only obtained
in the pure anatase phase and bear organic surface groups, which may both be factors for a
decrease in PC activity. Comparing both synthesized particle systems, MEEAA-TiO2 seems to
be twice as active as AA-TiO2. This can be deduced from the higher amount of organic groups
that was found during TGA measurements (II.1.2) on the AA-TiO2 particle surface. These
prevent the possible absorption of DCA or water onto the particle surface as well as decreasing
the amount of possible hydroxyl groups bound on the surface, which are crucial for the PC
degradation reactions.28 Taking into consideration the later biological or medical applications
of the particles, these results may not be representative as the DCA degradation took place
under strongly acidic conditions (due to the acidity of this organic compound). In contrast to
that, all biological tests have to be carried out at physiological pH (∼7.4) and it has already be
indicated that the PC activity of a sample can also be influenced by the pH.31,33–36 This can be
explained by the change of the surface charge on the particle if the pH is varied. It leads first
to a different adsorption behaviour of the organic molecule onto the particle surface and
second, to a completely changed dispersion state of the sample.31 If there are more

I. Inorganic syntheses: Titanium dioxide nanoparticles
- 55 -
agglomerates in the dispersion, less free surface area is offered for photocatalysis resulting in
a decreased activity. Furthermore, the PC efficiency of a material can also depend on the
nature of the degradable compound which means that the success of the degradation of
biological cell components can be significantly different from what was measured for
DCA.31,36–38 This is first due to the absorption properties of the compound onto the particle
surface and second, due to functional groups of the molecule that facilitate OH radical
attacks.31 Still, this PC activity test is a promising, first indicator for the efficiency of the
synthesized particle samples.
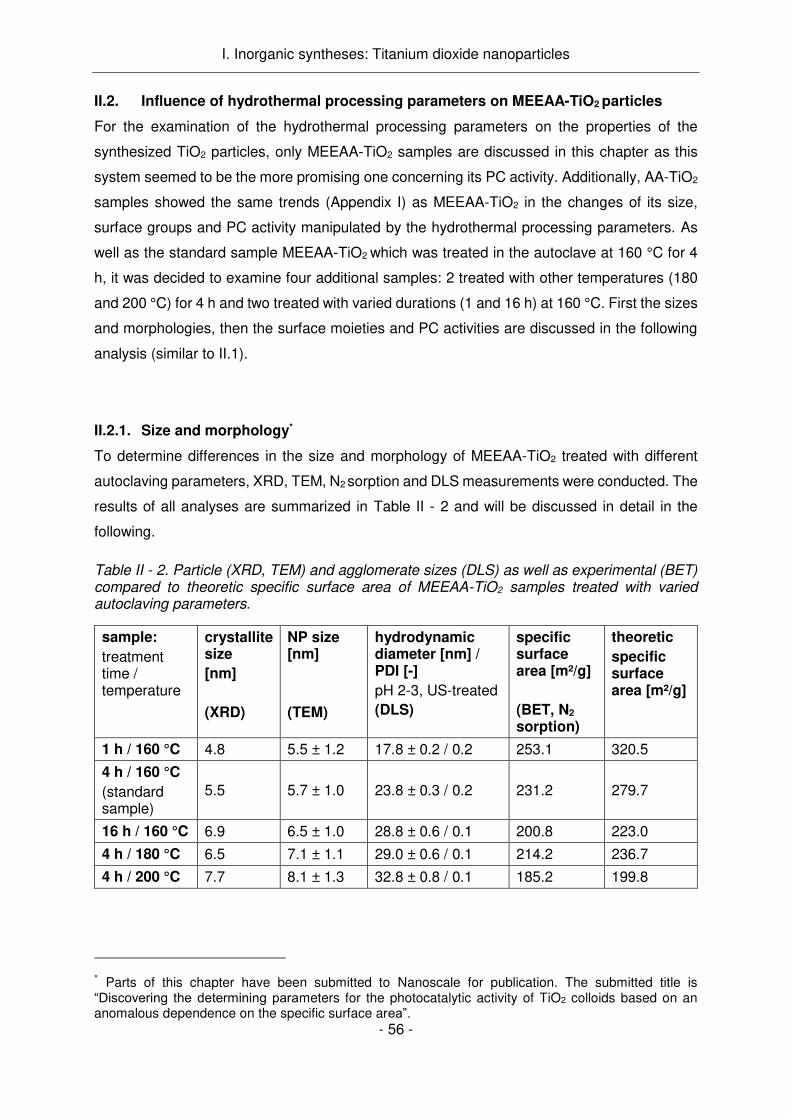
I. Inorganic syntheses: Titanium dioxide nanoparticles
- 56 -
II.2. Influence of hydrothermal processing parameters on MEEAA-TiO2 particles
For the examination of the hydrothermal processing parameters on the properties of the
synthesized TiO2 particles, only MEEAA-TiO2 samples are discussed in this chapter as this
system seemed to be the more promising one concerning its PC activity. Additionally, AA-TiO2
samples showed the same trends (Appendix I) as MEEAA-TiO2 in the changes of its size,
surface groups and PC activity manipulated by the hydrothermal processing parameters. As
well as the standard sample MEEAA-TiO2 which was treated in the autoclave at 160 °C for 4
h, it was decided to examine four additional samples: 2 treated with other temperatures (180
and 200 °C) for 4 h and two treated with varied durations (1 and 16 h) at 160 °C. First the sizes
and morphologies, then the surface moieties and PC activities are discussed in the following
analysis (similar to II.1).
II.2.1. Size and morphology*
To determine differences in the size and morphology of MEEAA-TiO2 treated with different
autoclaving parameters, XRD, TEM, N2 sorption and DLS measurements were conducted. The
results of all analyses are summarized in Table II - 2 and will be discussed in detail in the
following.
Table II - 2. Particle (XRD, TEM) and agglomerate sizes (DLS) as well as experimental (BET) compared to theoretic specific surface area of MEEAA-TiO2 samples treated with varied autoclaving parameters.
sample:
treatment time / temperature
crystallite size
[nm]
(XRD)
NP size [nm]
(TEM)
hydrodynamic diameter [nm] / PDI [-]
pH 2-3, US-treated
(DLS)
specific surface area [m²/g]
(BET, N2 sorption)
theoretic
specific surface area [m²/g]
1 h / 160 °C 4.8 5.5 ± 1.2 17.8 ± 0.2 / 0.2 253.1 320.5
4 h / 160 °C
(standard sample)
5.5 5.7 ± 1.0 23.8 ± 0.3 / 0.2 231.2 279.7
16 h / 160 °C 6.9 6.5 ± 1.0 28.8 ± 0.6 / 0.1 200.8 223.0
4 h / 180 °C 6.5 7.1 ± 1.1 29.0 ± 0.6 / 0.1 214.2 236.7
4 h / 200 °C 7.7 8.1 ± 1.3 32.8 ± 0.8 / 0.1 185.2 199.8
* Parts of this chapter have been submitted to Nanoscale for publication. The submitted title is “Discovering the determining parameters for the photocatalytic activity of TiO2 colloids based on an anomalous dependence on the specific surface area”.

I. Inorganic syntheses: Titanium dioxide nanoparticles
- 57 -
XRD measurements (Figure II - 10) confirmed for all samples a pure anatase crystal phase
without any detectable amorphous TiO2.
Figure II - 10. Powder X-ray diffraction (XRD) patterns of MEEAA-TiO2 samples treated with varied autoclaving parameters.
In Table II - 2, the crystallite sizes calculated from XRD, using the Scherrer equation, are
compared to the particle sizes determined on TEM images (Figure II - 11). The TEM
micrographs show the same size range for the NPs as obtained from XRD, while their average
size is slightly larger. This is not significant, however, as the size determination of particles on
TEM images yields a large standard deviation due to difficulties to measure the diameter of
slightly oval shaped particles uniformly and correctly. Both methods indicate the expected39,40
particle growth with increasing treatment time or temperature. The measured specific surface
area of the samples Sexp, done via gas sorption, confirms the increase in size by declining
surface area. It can be compared to the theoretic, calculated specific surface area Scalc of a
TiO2 sample. Scalc for each sample is listed as well in Table II - 2. These values are close to
the experimental ones, confirming the reliability and quality of all experimental measurements.
The slight discrepancy between measured and calculated values is not surprising, keeping in
mind the unavoidable errors such as a wider particle size distribution and the particle
morphology deviation, which are made upon the simplification of assuming a perfect sphere to
represent the NPs. To complete the analysis of the influence of processing parameters on the
particle size and morphology, dynamic light scattering measurements were carried out (Table

I. Inorganic syntheses: Titanium dioxide nanoparticles
- 58 -
II - 2). The measurements confirm in all cases monodisperse or almost monodisperse samples
with probably no agglomerates as already stated for the standard sample in II.1.1.
Figure II - 11. Transmission electron microscopy (TEM) of MEEAA-TiO2 samples treated with varied hydrothermal processing parameters and their particle size distributions, obtained from counting at least 100 particles per sample: a) 1 h, 160 °C; b) 4 h, 160 °C; c) 16 h, 160 °C; d) 4 h, 180 °C; e) 4 h, 200 °C.
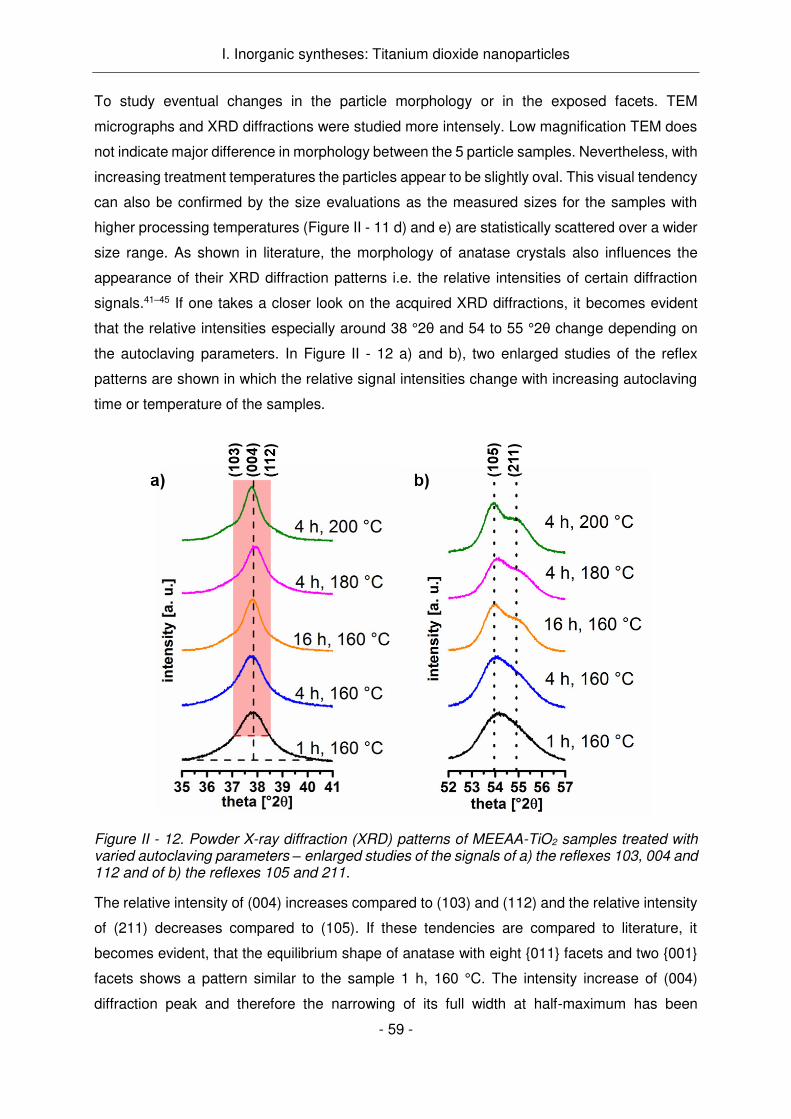
I. Inorganic syntheses: Titanium dioxide nanoparticles
- 59 -
To study eventual changes in the particle morphology or in the exposed facets. TEM
micrographs and XRD diffractions were studied more intensely. Low magnification TEM does
not indicate major difference in morphology between the 5 particle samples. Nevertheless, with
increasing treatment temperatures the particles appear to be slightly oval. This visual tendency
can also be confirmed by the size evaluations as the measured sizes for the samples with
higher processing temperatures (Figure II - 11 d) and e) are statistically scattered over a wider
size range. As shown in literature, the morphology of anatase crystals also influences the
appearance of their XRD diffraction patterns i.e. the relative intensities of certain diffraction
signals.41–45 If one takes a closer look on the acquired XRD diffractions, it becomes evident
that the relative intensities especially around 38 °2θ and 54 to 55 °2θ change depending on
the autoclaving parameters. In Figure II - 12 a) and b), two enlarged studies of the reflex
patterns are shown in which the relative signal intensities change with increasing autoclaving
time or temperature of the samples.
Figure II - 12. Powder X-ray diffraction (XRD) patterns of MEEAA-TiO2 samples treated with varied autoclaving parameters – enlarged studies of the signals of a) the reflexes 103, 004 and 112 and of b) the reflexes 105 and 211.
The relative intensity of (004) increases compared to (103) and (112) and the relative intensity
of (211) decreases compared to (105). If these tendencies are compared to literature, it
becomes evident, that the equilibrium shape of anatase with eight {011} facets and two {001}
facets shows a pattern similar to the sample 1 h, 160 °C. The intensity increase of (004)
diffraction peak and therefore the narrowing of its full width at half-maximum has been

I. Inorganic syntheses: Titanium dioxide nanoparticles
- 60 -
observed for the crystal growth along [001] direction.41,44,46 This sharpening of the signal at
37.9 °2θ was both shown for crystals exposing 4 additional facets, namely {010},42,47–49 and for
rod-like morphologies without this type of facets.50 A higher intensity of (105) compared to
(211) is obtained for rod-like crystals while disc-like morphologies with a high percentage of
{001} facets would lead to a lower intensity of (105).44,50 Therefore, the XRD analysis suggests
an elongation of the crystals with increasing hydrothermal treatment time or temperature i.e.
with decreasing specific surface area.
In order to gain further insights, high resolution TEM studies were carried out on the two
samples 1 h, 160 °C and 4 h, 200 °C showing the largest differences in their specific surface
area. All below discussed images are shown along [100] zone-axis as determined from FFT
(see Figure II - 13).
Figure II - 13. Equilibrium shape anatase nanocrystal; a) Structural and corresponding FFT model along [100] view direction as well as 3D sketch with named exposed facets. b) High resolution TEM image and corresponding FFT along [100] view direction.
In the sample 1 h, 160 °C only truncated bipyramidal crystals with {011} and {001} facets were
identified (Figure II - 14 a1, a2) which confirm the findings of XRD analysis. In addition, several
unexpected crystal morphologies were found, formed by the attachment of at least two primary
crystals at the {011} facets (Figure II - 14 a3). This phenomenon has already been reported for
hydrothermally coarsened anatase particles in acidic water.51 Nevertheless, these
morphologies are not considered to have a high impact on the properties of the examined
sample due to their rare appearance. The sample 4 h, 200 °C contains, in addition to truncated
bipyramidal crystals (Figure II - 13), several other morphologies (Figure II - 14 b). The
nanoparticle in Figure II - 14 b1 shows the standard set of {011} and {001} facets, however,
elongation is along [011] direction. The crystal in Figure II - 14 b2 shows a similar rod-like
morphology, however, this time it is joined with another nanocrystal near the end of {011} facet.
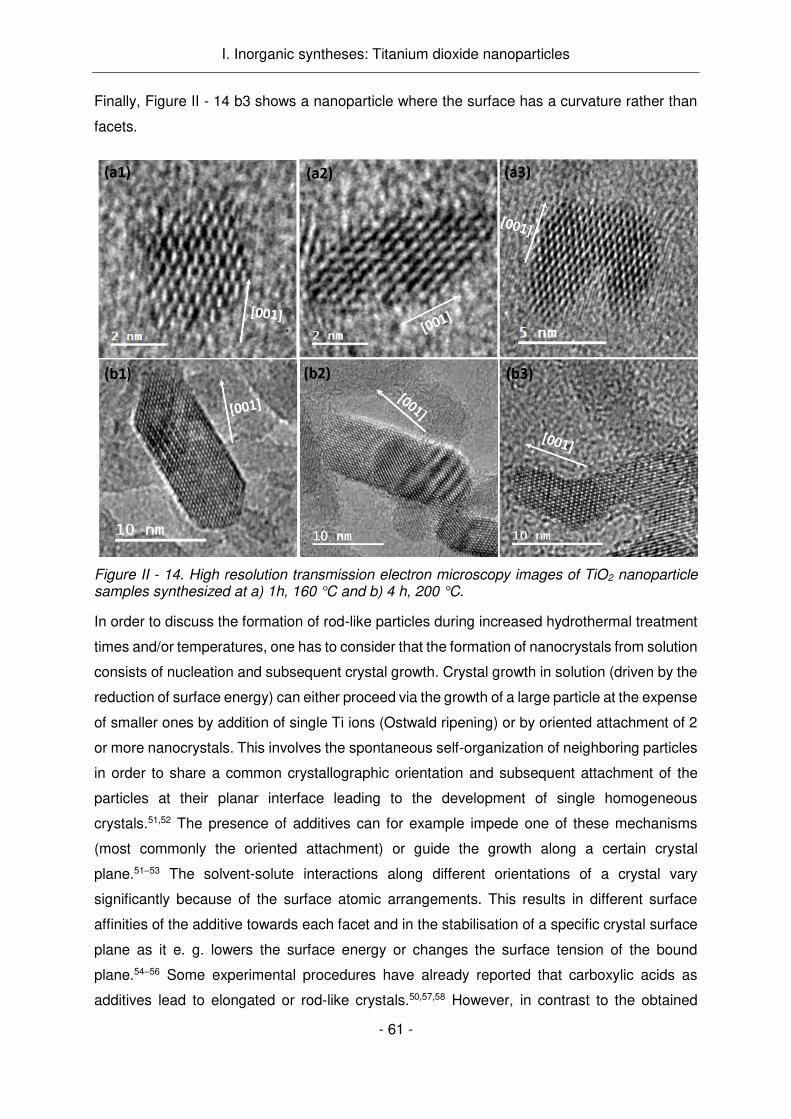
I. Inorganic syntheses: Titanium dioxide nanoparticles
- 61 -
Finally, Figure II - 14 b3 shows a nanoparticle where the surface has a curvature rather than
facets.
Figure II - 14. High resolution transmission electron microscopy images of TiO2 nanoparticle samples synthesized at a) 1h, 160 °C and b) 4 h, 200 °C.
In order to discuss the formation of rod-like particles during increased hydrothermal treatment
times and/or temperatures, one has to consider that the formation of nanocrystals from solution
consists of nucleation and subsequent crystal growth. Crystal growth in solution (driven by the
reduction of surface energy) can either proceed via the growth of a large particle at the expense
of smaller ones by addition of single Ti ions (Ostwald ripening) or by oriented attachment of 2
or more nanocrystals. This involves the spontaneous self-organization of neighboring particles
in order to share a common crystallographic orientation and subsequent attachment of the
particles at their planar interface leading to the development of single homogeneous
crystals.51,52 The presence of additives can for example impede one of these mechanisms
(most commonly the oriented attachment) or guide the growth along a certain crystal
plane.51–53 The solvent-solute interactions along different orientations of a crystal vary
significantly because of the surface atomic arrangements. This results in different surface
affinities of the additive towards each facet and in the stabilisation of a specific crystal surface
plane as it e. g. lowers the surface energy or changes the surface tension of the bound
plane.54–56 Some experimental procedures have already reported that carboxylic acids as
additives lead to elongated or rod-like crystals.50,57,58 However, in contrast to the obtained
I. Inorganic syntheses: Titanium dioxide nanoparticles
- 62 -
nanorods elongated along [011] direction, the crystals were shown to grow preferentially along
[001]. Nanorods grown along [001] direction are most probably formed due to either the
preferential stabilisation of {010} facets by an additive or the oriented attachment of {001}
facets of several single crystals.46,51,59 Deduced from these findings, the obtained nanorods
grown along [011] direction could be formed due to absorption of MEEAA onto {001} facets
leading to a commonly not favored51 attachment of {011} facets (Figure II - 14 a3, b2). Also the
acidic pH and the presences of an excess of water is said to favor the crystal growth via
oriented attachment compared to Oswald ripening (even though the cause has not been
clarified yet).51
II.2.2. Surface moieties†
To continue the study of the influence of the processing parameters on the NP properties, the
following section deals with the behaviour of the surface moieties of the MEEAA-TiO2 NP
systems. For this, zeta potential titrations, TGA studies and IR measurements have been
carried out. The IEPs obtained by zeta potential titrations are shown in Table II - 3. All IEP
values are between pH 6.4 and 6.7. It is expected that the measuring error for the
determination of the IEP is around ± 0.2 and therefore it can be stated that all samples provide
the same surface potential. This could be a first indicator that the amount of organic MEEAA
groups on the particle surface do not change when the autoclaving parameters are varied. In
order to examine this assumption more closely, IR measurements were carried out.
Table II - 3. pHs at IEP of MEEAA-TiO2 samples with varied processing parameters determined by zeta potential titrations.
treatment time / temperature
1 h / 160 °C 4 h / 160 °C
(standard sample)
1 h / 160 °C 4 h / 180 °C 4 h / 200 °C
pH at IEP [-] 6.5 6.7 6.6 6.4 6.6
In Figure II - 15, the obtained DRIFT transmission spectra are shown. It is evident, that the
structure or composition of the surface groups is not influenced by the autoclaving parameters.
All spectra show the IR bands typical for this NP type which has been discussed in II.1.2. If
there is a small change in the amount of organic surface groups on the particle, it cannot be
determined by this method. To determine the amount of organic surface groups in the different
samples, TGA and DTA measurements were carried out.
† Parts of this chapter have been submitted to Nanoscale for publication. The submitted title is “Discovering the determining parameters for the photocatalytic activity of TiO2 colloids based on an anomalous dependence on the specific surface area”.

I. Inorganic syntheses: Titanium dioxide nanoparticles
- 63 -
Figure II - 15. IR (DRIFT) spectra of MEEAA-TiO2 samples synthesized with varied hydrothermal treatment parameters. (* marks a background signal).
In Figure II - 16, both diagrams are displayed. The mass loss takes for all of the samples a
similar course due to a characteristic decomposition process of the MEEAA-TiO2 samples
which has been described in II.1.2.
Figure II - 16. a) Simultaneous thermogravimetric (TGA) and b) differential thermal analysis (DTA) performed on dried MEEAA-TiO2 particle samples synthesized with varied hydrothermal processing parameters.
The amount of organic groups that is removed when heating up to 900 °C, was determined to
be between 9 % and 13 %. To examine the amount of surface groups on the particles, the
obtained mass of total evolved organic moieties was divided by the experimentally determined
specific surface area of each sample (Figure II - 17). The thereby obtained mass of organics,

I. Inorganic syntheses: Titanium dioxide nanoparticles
- 64 -
which can be related to surface groups per square meter, is plotted in dependence of the
specific surface area. The results indicate that the amount of organic surface moieties per
square meter is the same for all samples. A slight variance such as for sample 4 h, 160 °C
may be caused by experimental errors in mass or temperature determination or small sample
heterogeneities.60,61
Figure II - 17. Mass of organic surface groups per square meter calculated based on TG analysis and plotted versus the specific surface area of the samples.
The exothermic DTA curve does not show any differences for the MEEAA-TiO2 samples
treated for different time spans; the signal maximum can always be found around 350 °C. In
contrast, if the autoclaving temperature is increased, the signal maximum shifts slightly to
higher temperatures from ~ 350 °C to ~ 400 °C for an autoclaving temperature of 180 °C and
~ 450 °C for an autoclaving temperature of 200 °C. This may indicate that because of the
higher autoclave treatment the organic acid (which is complexed onto the particles) is slightly
more heat resistant. This impression can be confirmed by the evolved gas analysis using mass
spectrometry during TGA and DTA experiments (Figure II - 18). While most of the evolved
mass curves do not show any changes for all samples, in the case of CO2+/C2H4O+, C2H5O+
and C+ the ion current stays higher up to a temperature of around 750 °C for the samples
treated with a higher autoclaving temperature.
To conclude, one can state that the MEEAA coordinated onto the particle surfaces is not
significantly modified. In the case of zeta potential titrations and IR measurements, no
differences between the samples were measured. Only the evolved mass analysis during TGA
studies indicated a small change in the properties of the organic surface groups when the
hydrothermal treatment temperature is increased.

I. Inorganic syntheses: Titanium dioxide nanoparticles
- 65 -
Figure II - 18. Evolved gas analysis by mass spectrometry during TGA/DTA experiments on dried MEEAA-TiO2 particle samples synthesized with varied hydrothermal processing parameters.
II.2.3. Photocatalytic activity‡
To complete the study of MEEAA-TiO2 samples treated with varying processing parameters,
the PC activity of the particles was examined. For this, the PC DCA degradation was carried
out for all samples and compared to commercial P25 TiO2 NPs. The results are shown in Figure
II - 19. As one can see in Figure II - 19 a) the same PC activity as of the bench mark material
P25 can be achieved or even surpassed by the particle sample treated for 4 h at 200 °C.
Furthermore, the photocatalysis curve of P25 is rather linear while of the synthesized particles
it seems to be less efficient initially but increases with longer UV-light application time. To
explain this, one has to keep in mind that P25 is synthesized via a high temperature pyrogenic
process62 and therefore does not bear organic surface groups. That is why it decomposes
‡ Parts of this chapter have been submitted to Nanoscale for publication. The submitted title is “Discovering the determining parameters for the photocatalytic activity of TiO2 colloids based on an anomalous dependence on the specific surface area”. All XAFS measurements, analyses, modelling and discussion were carried out by the researchers of the “Bundesanstalt für Materialprüfung BAM”, mainly Wojciech Szczerba. It is used here with Wojciech Szczerba’s permission.
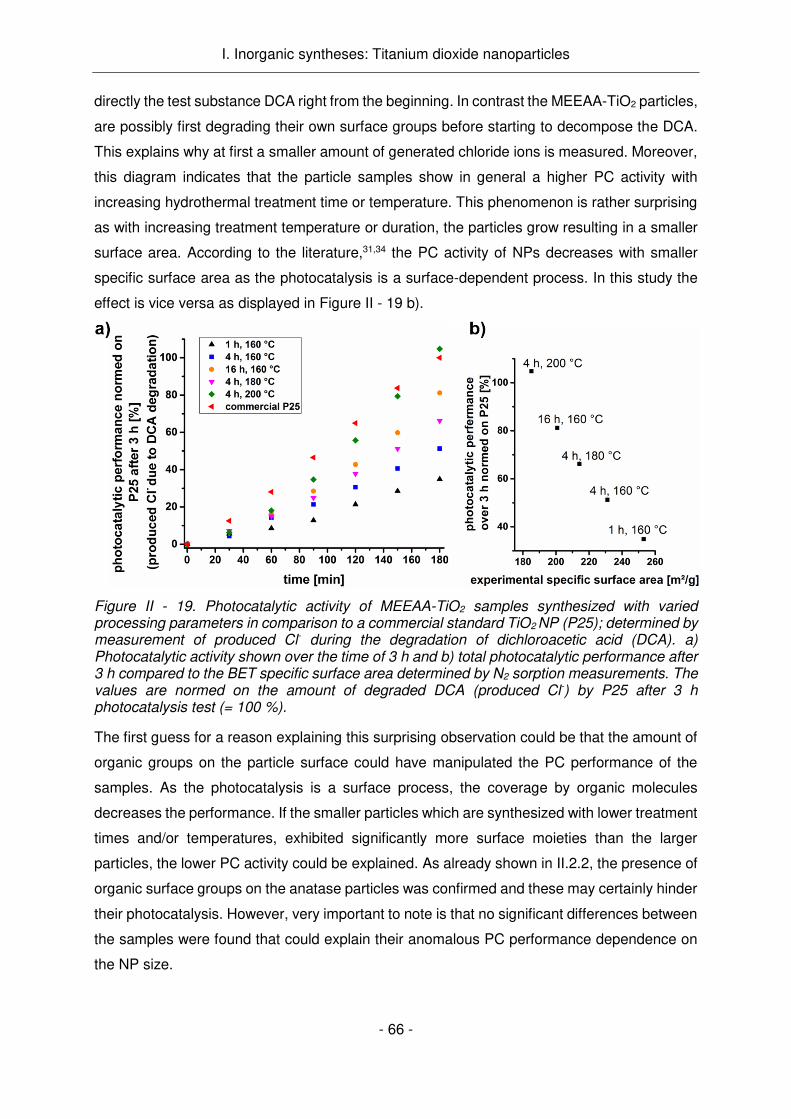
I. Inorganic syntheses: Titanium dioxide nanoparticles
- 66 -
directly the test substance DCA right from the beginning. In contrast the MEEAA-TiO2 particles,
are possibly first degrading their own surface groups before starting to decompose the DCA.
This explains why at first a smaller amount of generated chloride ions is measured. Moreover,
this diagram indicates that the particle samples show in general a higher PC activity with
increasing hydrothermal treatment time or temperature. This phenomenon is rather surprising
as with increasing treatment temperature or duration, the particles grow resulting in a smaller
surface area. According to the literature,31,34 the PC activity of NPs decreases with smaller
specific surface area as the photocatalysis is a surface-dependent process. In this study the
effect is vice versa as displayed in Figure II - 19 b).
Figure II - 19. Photocatalytic activity of MEEAA-TiO2 samples synthesized with varied processing parameters in comparison to a commercial standard TiO2 NP (P25); determined by measurement of produced Cl- during the degradation of dichloroacetic acid (DCA). a) Photocatalytic activity shown over the time of 3 h and b) total photocatalytic performance after 3 h compared to the BET specific surface area determined by N2 sorption measurements. The values are normed on the amount of degraded DCA (produced Cl-) by P25 after 3 h photocatalysis test (= 100 %).
The first guess for a reason explaining this surprising observation could be that the amount of
organic groups on the particle surface could have manipulated the PC performance of the
samples. As the photocatalysis is a surface process, the coverage by organic molecules
decreases the performance. If the smaller particles which are synthesized with lower treatment
times and/or temperatures, exhibited significantly more surface moieties than the larger
particles, the lower PC activity could be explained. As already shown in II.2.2, the presence of
organic surface groups on the anatase particles was confirmed and these may certainly hinder
their photocatalysis. However, very important to note is that no significant differences between
the samples were found that could explain their anomalous PC performance dependence on
the NP size.

I. Inorganic syntheses: Titanium dioxide nanoparticles
- 67 -
Besides organic molecules covering the crystal surface, the presence of oxygen defects in the
crystal lattice can influence the PC performance as already mentioned in Chapter I.1.2.63–65 To
examine the possible presence of oxygen defects, the composition and the valence state of
the synthesized samples were investigated by X-ray photoelectron spectroscopy (XPS). The
XPS analyses (Figure II - 20 a) reveal that, as expected, Ti, O and C (as well as N from the
atmosphere and In from the substrate) were detected within all samples. The Ti 2p3/2 and Ti
2p1/2 XPS peaks at 459.5 eV and 465.5 eV (Figure II - 20 b) are characteristic for Ti4+-O bonds
in TiO2.63–66 If a considerable amount of oxygen vacancies was present within the TiO2 crystal,
a peak at the high energy side of the Ti 2p3/2 XPS peak around 457.0 eV typical for Ti3+ species
would be expected.65,66 This peak was not found in any of the samples indicating the absence
of bulk defects (with bulk meaning the particle interior, not surface atoms).63
Figure II - 20. a) Spectra obtained by XPS survey of synthesized TiO2 samples and enlarged studies of the b) Ti 2p, c) O 1s and d) C region.
In the O 1s region (Figure II - 20 c), the XPS peak at 530.8 eV is assigned to crystal lattice
oxygen (O-Ti4+).63 The shoulder around 533 eV is caused by hydroxide species which belong
to surface-bound water or MEEAA. In the C region (Figure II - 20 d), the main XPS peak (~286
eV) is caused by contamination from air, while the second peak at the higher binding energy
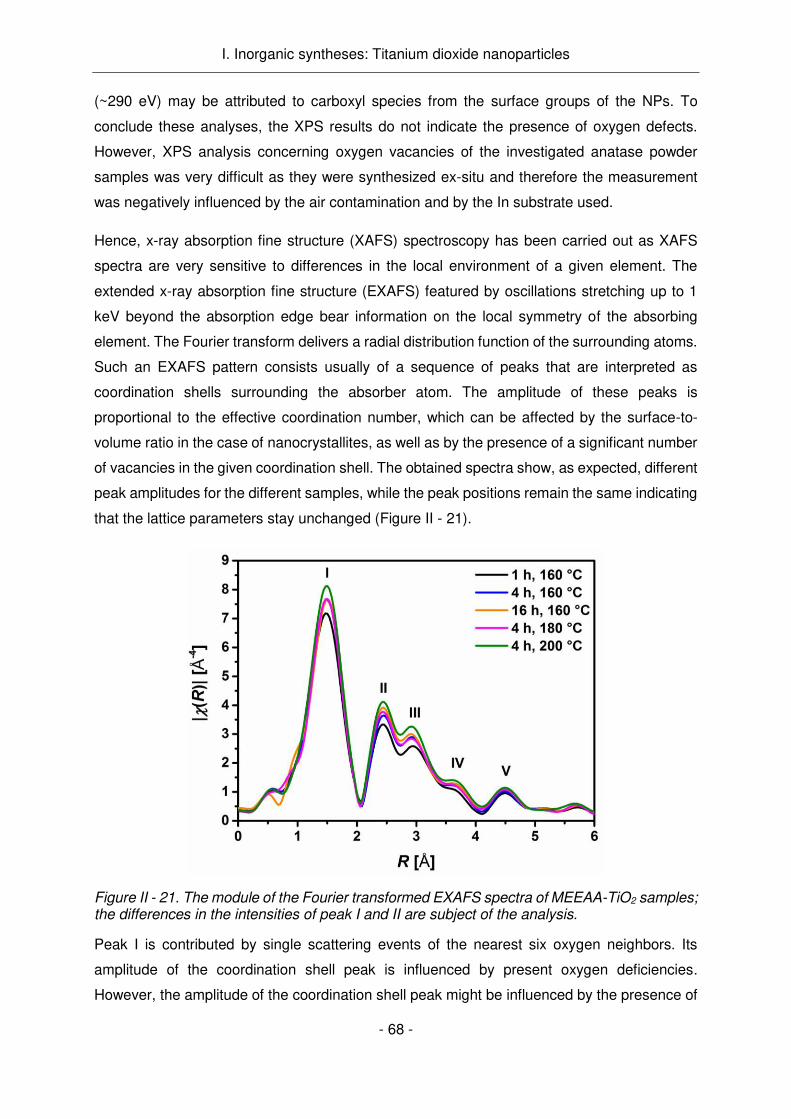
I. Inorganic syntheses: Titanium dioxide nanoparticles
- 68 -
(~290 eV) may be attributed to carboxyl species from the surface groups of the NPs. To
conclude these analyses, the XPS results do not indicate the presence of oxygen defects.
However, XPS analysis concerning oxygen vacancies of the investigated anatase powder
samples was very difficult as they were synthesized ex-situ and therefore the measurement
was negatively influenced by the air contamination and by the In substrate used.
Hence, x-ray absorption fine structure (XAFS) spectroscopy has been carried out as XAFS
spectra are very sensitive to differences in the local environment of a given element. The
extended x-ray absorption fine structure (EXAFS) featured by oscillations stretching up to 1
keV beyond the absorption edge bear information on the local symmetry of the absorbing
element. The Fourier transform delivers a radial distribution function of the surrounding atoms.
Such an EXAFS pattern consists usually of a sequence of peaks that are interpreted as
coordination shells surrounding the absorber atom. The amplitude of these peaks is
proportional to the effective coordination number, which can be affected by the surface-to-
volume ratio in the case of nanocrystallites, as well as by the presence of a significant number
of vacancies in the given coordination shell. The obtained spectra show, as expected, different
peak amplitudes for the different samples, while the peak positions remain the same indicating
that the lattice parameters stay unchanged (Figure II - 21).
Figure II - 21. The module of the Fourier transformed EXAFS spectra of MEEAA-TiO2 samples; the differences in the intensities of peak I and II are subject of the analysis.
Peak I is contributed by single scattering events of the nearest six oxygen neighbors. Its
amplitude of the coordination shell peak is influenced by present oxygen deficiencies.
However, the amplitude of the coordination shell peak might be influenced by the presence of
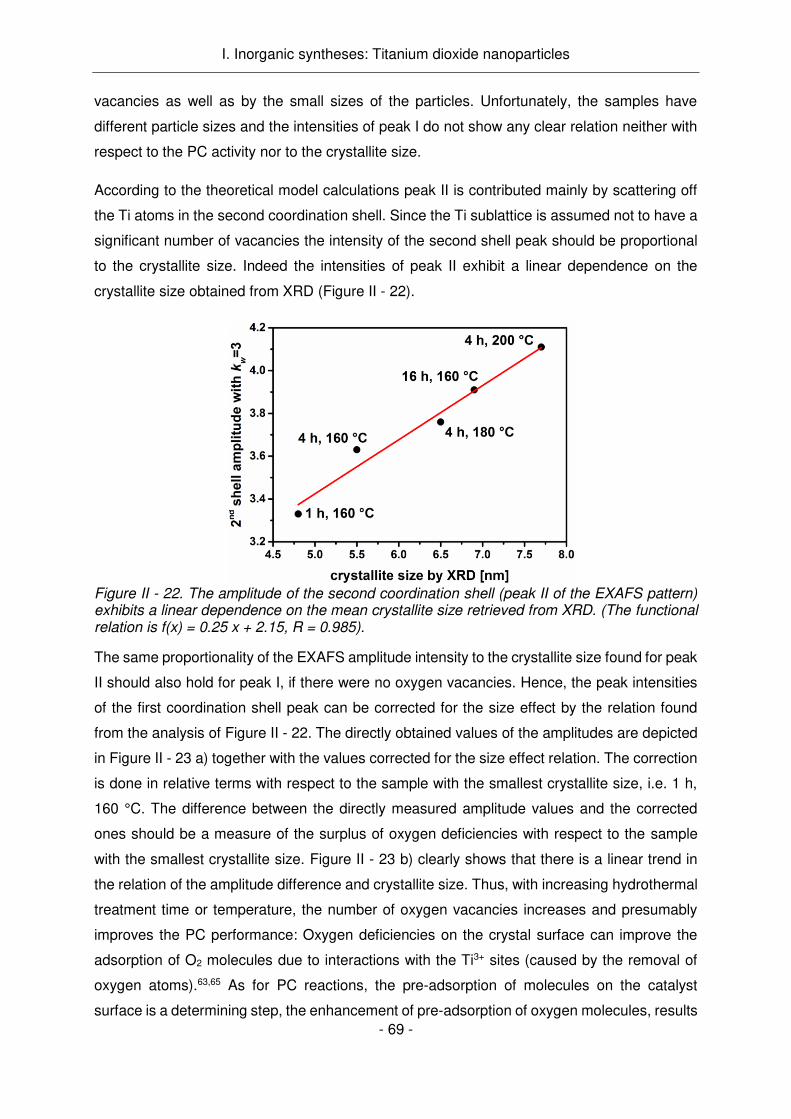
I. Inorganic syntheses: Titanium dioxide nanoparticles
- 69 -
vacancies as well as by the small sizes of the particles. Unfortunately, the samples have
different particle sizes and the intensities of peak I do not show any clear relation neither with
respect to the PC activity nor to the crystallite size.
According to the theoretical model calculations peak II is contributed mainly by scattering off
the Ti atoms in the second coordination shell. Since the Ti sublattice is assumed not to have a
significant number of vacancies the intensity of the second shell peak should be proportional
to the crystallite size. Indeed the intensities of peak II exhibit a linear dependence on the
crystallite size obtained from XRD (Figure II - 22).
Figure II - 22. The amplitude of the second coordination shell (peak II of the EXAFS pattern) exhibits a linear dependence on the mean crystallite size retrieved from XRD. (The functional relation is f(x) = 0.25 x + 2.15, R = 0.985).
The same proportionality of the EXAFS amplitude intensity to the crystallite size found for peak
II should also hold for peak I, if there were no oxygen vacancies. Hence, the peak intensities
of the first coordination shell peak can be corrected for the size effect by the relation found
from the analysis of Figure II - 22. The directly obtained values of the amplitudes are depicted
in Figure II - 23 a) together with the values corrected for the size effect relation. The correction
is done in relative terms with respect to the sample with the smallest crystallite size, i.e. 1 h,
160 °C. The difference between the directly measured amplitude values and the corrected
ones should be a measure of the surplus of oxygen deficiencies with respect to the sample
with the smallest crystallite size. Figure II - 23 b) clearly shows that there is a linear trend in
the relation of the amplitude difference and crystallite size. Thus, with increasing hydrothermal
treatment time or temperature, the number of oxygen vacancies increases and presumably
improves the PC performance: Oxygen deficiencies on the crystal surface can improve the
adsorption of O2 molecules due to interactions with the Ti3+ sites (caused by the removal of
oxygen atoms).63,65 As for PC reactions, the pre-adsorption of molecules on the catalyst
surface is a determining step, the enhancement of pre-adsorption of oxygen molecules, results

I. Inorganic syntheses: Titanium dioxide nanoparticles
- 70 -
in a higher PC performance.54,68–70 Additionally, Ti3+ sites can act as hole scavengers and
therefore delay the charge carrier recombination which also improves the PC activity.63–65
Figure II - 23. a) Amplitudes of the first coordination shell as “measured” (after FEFF967 fit) and corrected for the size effect. b) The difference between the measured EXAFS amplitude of the first coordination shell and the size-effect corrected one is a direct measure of the anion deficiency in the oxygen lattice.
Additionally, high resolution TEM studies and XRD analyses (II.2.1) showed an elongation of
the synthesized crystals (along [011] direction) forming rod-like morphologies with increasing
autoclaving temperature (or time). Especially in the case of spherical nanocrystals around
10 nm, an increased electron-hole recombination at surface trapping sites is expected which
reduces their PC performance.50 However, the crystal anisotropy of nanorods is assumed to
lead to a lower charge recombination due to the spontaneous charge carrier separation
towards the different crystal facets and to an increased delocalization of the carrier as they can
freely move throughout the whole crystal lenghts.49,50,68 This could partly compensate the
presence of surface trap states resulting in a higher PC activity of the rod-like crystal samples.
In conclusion, the synergy of both the increase in oxygen deficiencies and the elongation of
the nanocrystals must be responsible for a higher PC activity and overrules the expected
dependence on the specific surface area.

I. Inorganic syntheses: Titanium dioxide nanoparticles
- 71 -
II.3. Luminescent TiO2 based core/shell structured nanoparticles
After the successful synthesis and characterization of PC anatase NPs, the incorporation of
luminescence properties into these systems was a main goal of this work. This is due to the
fact that luminescence on the one hand is very helpful to analyse the particle behaviour within
cell culture studies: The particle uptake can easily be quantified by luminescence
measurements and their position within cells can be detected e. g. via confocal fluorescence
microscopy. On the other hand, luminescence enables the use of PC particles not only as
therapeutic agents but also possibly as diagnostics: If a targeting surface molecule of the
particles specifically binds to tumour cells, these could be visualized due to the luminescence
of the particles. This could facilitate the detection of the tumour location and the surgical
elimination of tumour tissue. Different strategies to synthesize luminescent TiO2 based NP
systems have been presented in Chapter I.1.4. A common and rather straight forward strategy,
is the doping of metal oxide particles with rare earth ions. This usually results in bright
luminescence in a colour depending of the nature of the rare earth ion. Nevertheless, this
strategy is most often only efficient when the material is heated in the presence of oxygen
(calcination).71,72 This heat treatment is an eminent disadvantage as it usually leads to
aggregation of the particles and disintegration of functional surface groups. Furthermore the
doping can also negatively influence the PC activity of the particles as it manipulates the band
gap and can therefore enhance recombination of electrons and holes.64,73 Another drawback
is that first several rare earth ions are classified as carcinogens and second also their supply
is limited.74–77 Therefore, the current trend is to find substitutes for these elements. Due to
these reasons, two different approaches were carried out for the synthesis of luminescent TiO2
based particle systems avoiding the doping of TiO2 with rare earth elements.
II.3.1. Luminescent TiO2/SiO2 core/shell nanoparticles
The synthesis of luminescent NP systems by doping a silica matrix with organic dyes is well-
known and may be transferrable to other NP materials as well.78,79 As the TiO2 NPs were
synthesized by heat treatment in an autoclave which would destroy organic dyes, an
incorporation of a dye during synthesis was no option. This is why the addition of a silica shell,
containing the organic luminescent agent, after the anatase crystal synthesis was chosen as
a strategy to obtain a fluorescent particle system. The formation of a well-defined silica shell
around TiO2 NPs has already been carried out various times in literature 22,23,80–84, but particles
with organic surface groups have not been utilized for this before. This is why the synthesis of
a silica shell (without any dye incorporation) was proved first. For this TiO2 NPs (AA-TiO2 –
160 °C 4 h which was chosen for the proof of concept in all reactions in this chapter) were
coated with a silica shell via a typical Stoeber synthesis: tetraorthosilicate was hydrolysed in a

I. Inorganic syntheses: Titanium dioxide nanoparticles
- 72 -
water/ethanol mixture in the presence of ammonium hydroxide as base. The hydrolysed silica
precursor condensates onto the present TiO2 particles, acting as seeds, resulting in Ti-O-Si
bonding between the particle surface and TEOS. Scheme II - 1 showing the simplified reactions
that take place during the shell formation, can be found below. Further hydrolysis and
condensation reactions result in three-dimensional siloxane networks and finally a
homogeneous silica shell.23,82,83,85 These reactions leading to a particle growth rather occur by
addition of monomers to the surface than by aggregation of the small nuclei particles (which
would be pure silica particles as side products).86 The final particle size and composition can
be manipulated by the initial alkoxysilane, water and ammonia concentration.86,87 The present
base favours condensation over hydrolysis reactions resulting in spherically expanding
particles rather than in linear chain structures that could form a gel.88
Scheme II - 1. Simplified (and idealized) mechanism of the formation of Si-O-Ti bonds leading to a shell formation around the TiO2 nanoparticle.
To prove the successful shell formation, the synthesized particle system was analysed via
TEM, zeta potential and DLS measurements. Zeta potential measurements showed that the
IEP of the coated particle system was at pH = 4.6. If compared to the uncoated TiO2 with an
IEP at the pH of 6.58 and the IEP of pure silica NPs at pH = 2.8-3.5,89,90 the IEP of the
measured sample lay in between these materials. This also indicates the successful silica shell
formation80,81 as the properties of the silica shell superimposes the surface properties of the
TiO2. Furthermore, the IEP lying in between the characteristic values of the uncoated TiO2 and

I. Inorganic syntheses: Titanium dioxide nanoparticles
- 73 -
silica NPs, can also indicate an incomplete shell formation or a shell of high porosity which
would in both cases be advantageous for the accessibility of the TiO2 core allowing
photocatalytic reactions.91 TEM images (Figure II - 24) showed that the coated particles were
still sphere-like and only slightly larger than the TiO2. It is possible to distinguish the silica shell
from the titanium dioxide core due to different material densities. According to the TEM images
the particle samples seem to be agglomerated which is only due to the preparation method for
TEM. DLS measurements on the contrary, show agglomerate sizes of 256.4 ± 5.5 nm with a
PDI of 0.27 ± 0.01 for the TiO2/SiO2 system in acidic water which indicates a good dispersion
state.
Figure II - 24. TEM images of a) TiO2 (AA-TiO2) and b) silica-coated TiO2 nanoparticles.
After having proved the silica shell formation around the TiO2 particles, the synthesis of silica
shells doped with an organic dye and varying shell thicknesses was carried out. First the
commercially available Rhodamine B isothiocyanate (RhBitc) was coupled to
aminopropyltriethoxy silane (AMEO) to enable a covalent incorporation of the dye into the silica
shell. This was to make sure that the dye cannot leak out of the particle systems after synthesis.
The reaction is shown in Scheme II - 2.
Scheme II - 2. Reaction of Rhodamine B isothiocyanate (RhBitc) with aminopropyltriethoxy silane (AMEO).

I. Inorganic syntheses: Titanium dioxide nanoparticles
- 74 -
The silica shell synthesis was carried out as described above but now the silanized dye was
mixed with the TEOS before addition. The amount of TEOS was varied (Table II - 4, theoretical
molar ratio) to obtain 3 samples (TiO2/SiO2_1 to TiO2/SiO2_3) with different silica shell
thicknesses and the amount of dye was always 0.5 weight-% of the added amount of TEOS.
This amount of dye was chosen according to literature92,93 as the occurrence of self-quenching
of the dye with too high concentrations of dye in a silica matrix is a well-known problem. To
evaluate the synthesized luminescent particle systems DRIFT, X-ray fluorescence
spectroscopy (XRF), zeta potential, photoluminescence (PL) and PC measurements were
carried out.
Table II - 4. Theoretical and experimental molar ratios (obtained by XRF) of Ti and Si in TiO2/SiO2 core/shell nanoparticles with increasing shell thicknesses (_1 to _3) doped with Rhodamine dye. Additionally, the reaction yield calculated from the experimental molar ratios is displayed.
sample Theoretical molar ratio Ti : Si
Experimental molar ratio Ti : Si (XRF)
Yield (%)
TiO2/SiO2_1 1 : 0.07 1 : 0.04 60.0
TiO2/SiO2_2 1 : 0.14 1 : 0.11 76.4
TiO2/SiO2_3 1 : 0.29 1 : 0.19 64.8
The DRIFT spectra of the synthesized particles and the uncoated TiO2 particle (AA-TiO2 –
DRIFT discussed in II.1.2) as reference are shown in Figure II - 25. They affirmed the formation
of a silica shell around the titanium dioxide core: a strong signal at 1066 cm-1 and the shoulder
at about 1180 cm-1 were attributed to asymmetric Si-O-Si bending and stretching vibrations. 23
Vibration of covalent Si-O-Ti bonds between the titanium dioxide core and the silica shell
caused a weak signal between 910 cm-1 and 960 cm-1.85 The weakness of it can be explained
by the overlap of the Ti-O-Ti vibration band and the possible existence of only a few Ti-O-Si
bonds due to the other organic surface moieties obstructing this binding. Signals at
2927 cm-1, 2856 cm-1 and 1400 cm-1 corresponded to C-H vibrations of TEOS intermediate
reaction products ((OCH2CH3)xSi(OH)4-x).23 The band at 1628 cm-1 was assigned to O-H
bending vibration of Si-O-H groups on the surface of the shell.23 Depending on the increase of
silica shell thickness the IR bands are more pronounced and the organic surface groups of the
uncoated particle do almost completely disappear due to their coverage by silica. XRF analysis
of the samples showing the experimental molar ratio of Ti to Si, suggested yields of the shell
syntheses between 60 % and 76 % (Table II - 4). The IEPs at the pH of 6.3, 5.4 and 4.9 of
TiO2/SiO2_1 to TiO2/SiO2_3 were received by zeta potential measurements. With higher silica
content and therefore growing shell thickness the pH values shift closer to the IEP of silica

I. Inorganic syntheses: Titanium dioxide nanoparticles
- 75 -
(2.8-3.5). This can be explained by the increasing overlay of the surface potential of TiO2 by
the shell.
Figure II - 25. IR (DRIFT) spectra of TiO2/SiO2 core/shell particles with increasing shell thicknesses (_1 to _3) compared to the uncoated TiO2 sample (AA-TiO2).
The measurements of the fluorescence intensity of TiO2/SiO2_1 to TiO2/SiO2_3 at an excitation
wavelength of 555 nm are shown Figure II - 26. As expected the fluorescence intensity rose
with increasing shell thickness because the RhBitc content is proportional to the Si content if
one assumes a homogeneous placement of RhBitc-AMEO into the shell without preferences.
Figure II - 26. Fluorescence spectra of TiO2/SiO2 core/shell particles with increasing shell thicknesses (_1 to _3) compared to the uncoated TiO2 sample (AA-TiO2) excited at 555 nm.
For investigating the influence of the silica shell thickness on the PC activity of the TiO2 core,
the decomposition of DCA was utilized (as already described in II.1.3). The PC activity tests
(Figure II - 27) reveal that an increasing shell thickness depresses the PC activity.

I. Inorganic syntheses: Titanium dioxide nanoparticles
- 76 -
Figure II - 27. Photocatalytic activity of TiO2/SiO2 core/shell particles with increasing shell thicknesses (_1 to _3) compared to the uncoated TiO2 sample (AA-TiO2); determined by measurement of produced Cl- during the degradation of dichloroacetic acid (DCA). The values are normed on the amount of degraded DCA (produced Cl-) by TiO2 after 3 h photocatalysis test (= 100 %).
This is logically as the shell impedes the interaction of the TiO2 surface with surrounding water
or oxygen. Taking into consideration the PL and PC examinations, it becomes evident that a
good PL activity is always on the cost of the PC activity of the NPs. This is due to fact that the
amount of dye cannot be increased due to occurring self-quenching and therefore, the higher
the wished PC activity, the higher the silica shell has to be and the lower is the PC efficiency.
To sum up, this developed particle system can fulfil the requirement of the application as
luminescent PC particle system but does not ideally combine both of these properties.
II.3.2. ZnO/TiO2 core/shell nanoparticles§
Another approach to introduce luminescence into a particle system is to synthesize a
luminescent core of another appropriate material while the shell still remains to be anatase
with the desired properties. In the past, particle setups with a luminescent core were mainly
used for quantum dots such as CdS, CdSe and CdTe which are highly luminescent, but most
often toxic.94,95 This is why they were coated with a silica shell, preventing the toxic substance
from leaking and offering a non-toxic surface for functionalization. In our case, it was important
to achieve a TiO2 surface that is highly PC active, while the core provides the PL. As quantum
§ A part of this chapter has been published and is reused in this work by courtesy of The Royal Society of Chemistry, Original article: S. Koch et al., J. Mater. Chem. C, 2015, 3, 12430-2435.

I. Inorganic syntheses: Titanium dioxide nanoparticles
- 77 -
dots (synthesized in nonpolar organic solvents) are most often not easily transferrable into
aqueous solutions and toxic,96 in this work the synthesis of ZnO NPs was chosen. These
undoped ZnO quantum dots can exhibit PL in the visible wavelength range.97–100 The visible
emission is supposed to be caused by electron transitions from the conduction band to a deep-
level hole defect.101,102 These deep-level defects were identified as doubly charged oxygen
vacancies originating from the charging of an oxygen vacancy with a photogenerated hole. To
ensure the formation of these defects, adsorbed surface groups such as bridging acetates or
hydroxyls, scavenging the photoexcited electrons, have to be present.100,102 For small particles,
due to quantum confinement, the width of the bandgap and therefore also the difference
between the conduction band and defect states increases.103 Consequently, the emitted
(visible) colours that depend on that width are directly related to the NP size.101,102 Due to their
adjustable colour emission and non-toxicity, these undoped ZnO quantum dots seemed to be
good candidates as luminescent cores. For the synthesis the most common sol–gel
synthesis99,104–108 was chosen using zinc acetate precursors and KOH or LiOH as base in
ethanol as solvent. In this study it was possible to determine the accessibility of air during
synthesis as yield and synthesis speed driving factor. To visualize this, the particle synthesis
was carried out under 3 different conditions: in a closed flask versus an opened flask which
allowed air circulation, and a nitrogen flooded flask. Particle growth was only observed in the
case of air circulation, which can be seen in Figure II - 28. It shows the PL (Figure II - 28 a)
and absorbance (Figure II - 28 b) spectra of the three differently treated samples.
Figure II - 28. a) Luminescence and b) absorbance spectra of ZnO nanoparticles after 4 h of reaction time, synthesized in flasks closed with a lid (dotted line), without a lid allowing air circulation (solid line) or under a nitrogen atmosphere (dashed line). As precursors, low concentrated Zn(CH3CO2)2 and LiOH in ethanol were chosen.
Only the sample reacted under air circulation shows a significant PL and absorbance for the
wavelength ranges that are expected from what has been described in the literature for ZnO
NPs.101,104 While a slight PL of the other samples (closed flask, respectively nitrogen flooded)
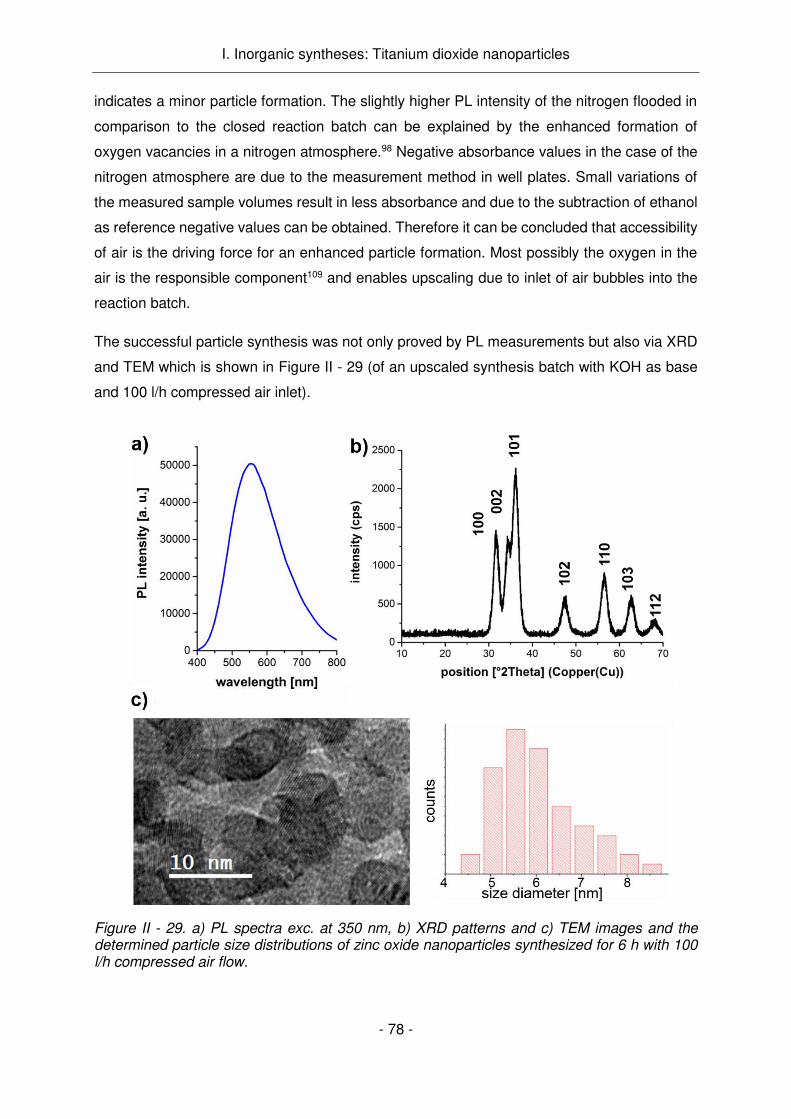
I. Inorganic syntheses: Titanium dioxide nanoparticles
- 78 -
indicates a minor particle formation. The slightly higher PL intensity of the nitrogen flooded in
comparison to the closed reaction batch can be explained by the enhanced formation of
oxygen vacancies in a nitrogen atmosphere.98 Negative absorbance values in the case of the
nitrogen atmosphere are due to the measurement method in well plates. Small variations of
the measured sample volumes result in less absorbance and due to the subtraction of ethanol
as reference negative values can be obtained. Therefore it can be concluded that accessibility
of air is the driving force for an enhanced particle formation. Most possibly the oxygen in the
air is the responsible component109 and enables upscaling due to inlet of air bubbles into the
reaction batch.
The successful particle synthesis was not only proved by PL measurements but also via XRD
and TEM which is shown in Figure II - 29 (of an upscaled synthesis batch with KOH as base
and 100 l/h compressed air inlet).
Figure II - 29. a) PL spectra exc. at 350 nm, b) XRD patterns and c) TEM images and the determined particle size distributions of zinc oxide nanoparticles synthesized for 6 h with 100 l/h compressed air flow.

I. Inorganic syntheses: Titanium dioxide nanoparticles
- 79 -
XRD confirms the ZnO crystal structure with a crystallite size of about 6 nm calculated applying
Scherrer's formula, which is in agreement with the size determination of the TEM image (6.0
nm ± 0.9 nm).
In the next step the synthesis of 4 different visible luminescence colours as described in
literature101,110–112 was also proved (Figure II - 30). Due to variation of the Base LiOH, the
particle size and therefore the luminescence wavelength is manipulated resulting in colours
from red to green.
Figure II - 30. PL intensities of ZnO nanoparticles synthesized with Zn(CH3CO2)2 and LiOH with the ratios 1:7.5, 1:3, 1:2 and 1:1.5; all spectra are normalized as the NP concentration and therefore the PL intensity of each sample differed due to the ratio of starting materials. (All samples were excited at a wavelength of 290 nm.)
During the synthesis and characterization of all synthesized ZnO NPs, it became evident that
these particles easily lose their luminescence behaviour and even dissolve under aqueous
acidic conditions. The TiO2 shell synthesis which is described in the following paragraph, is
carried out under these conditions (similar to the synthesis of TiO2 NPs of II.1 and II.2). Due to
this fact, the synthesis of ZnO/TiO2 core/shell particles is not possible with the synthesized
ZnO NPs and the planned synthesis protocol for TiO2 cores. Even if most of the literature does
not mention the drawback of water sensibility,110,112,113 some references tried to improve the
water stability of ZnO particles. One possibility is the coating of these particles with polymers
made out of triethylene glycol, oleic acid, polyethylene glycol derivatives and/or
diethanolamine.114–118 These syntheses result in an efficient protection of the ZnO core of acidic
water but are not adequate for the coating with TiO2 as the polymer surfaces are very different
from inorganic metal oxide surfaces and therefore a successful TiO2 condensation onto them
it is not guaranteed. Furthermore, one tried to synthesize core/shell particles with silica as
shell.110–112 While silica would provide similar inorganic metal oxide surface properties for
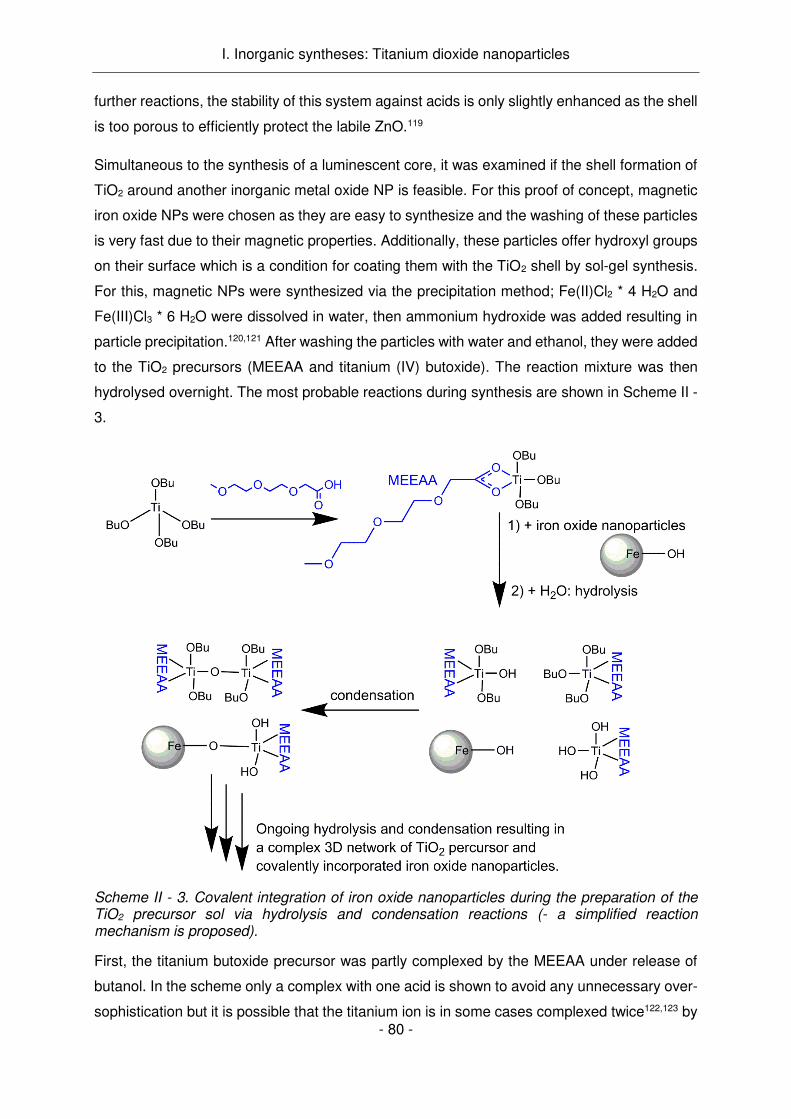
I. Inorganic syntheses: Titanium dioxide nanoparticles
- 80 -
further reactions, the stability of this system against acids is only slightly enhanced as the shell
is too porous to efficiently protect the labile ZnO.119
Simultaneous to the synthesis of a luminescent core, it was examined if the shell formation of
TiO2 around another inorganic metal oxide NP is feasible. For this proof of concept, magnetic
iron oxide NPs were chosen as they are easy to synthesize and the washing of these particles
is very fast due to their magnetic properties. Additionally, these particles offer hydroxyl groups
on their surface which is a condition for coating them with the TiO2 shell by sol-gel synthesis.
For this, magnetic NPs were synthesized via the precipitation method; Fe(II)Cl2 * 4 H2O and
Fe(III)Cl3 * 6 H2O were dissolved in water, then ammonium hydroxide was added resulting in
particle precipitation.120,121 After washing the particles with water and ethanol, they were added
to the TiO2 precursors (MEEAA and titanium (IV) butoxide). The reaction mixture was then
hydrolysed overnight. The most probable reactions during synthesis are shown in Scheme II -
3.
Scheme II - 3. Covalent integration of iron oxide nanoparticles during the preparation of the TiO2 precursor sol via hydrolysis and condensation reactions (- a simplified reaction mechanism is proposed).
First, the titanium butoxide precursor was partly complexed by the MEEAA under release of
butanol. In the scheme only a complex with one acid is shown to avoid any unnecessary over-
sophistication but it is possible that the titanium ion is in some cases complexed twice122,123 by
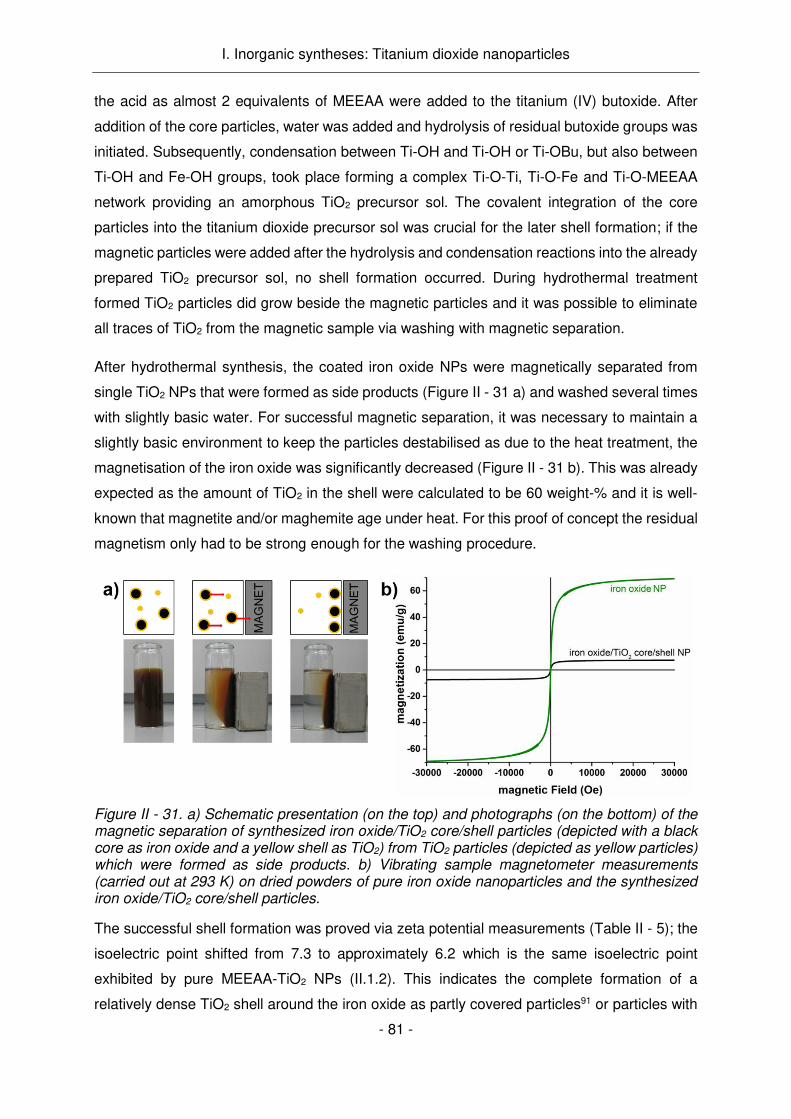
I. Inorganic syntheses: Titanium dioxide nanoparticles
- 81 -
the acid as almost 2 equivalents of MEEAA were added to the titanium (IV) butoxide. After
addition of the core particles, water was added and hydrolysis of residual butoxide groups was
initiated. Subsequently, condensation between Ti-OH and Ti-OH or Ti-OBu, but also between
Ti-OH and Fe-OH groups, took place forming a complex Ti-O-Ti, Ti-O-Fe and Ti-O-MEEAA
network providing an amorphous TiO2 precursor sol. The covalent integration of the core
particles into the titanium dioxide precursor sol was crucial for the later shell formation; if the
magnetic particles were added after the hydrolysis and condensation reactions into the already
prepared TiO2 precursor sol, no shell formation occurred. During hydrothermal treatment
formed TiO2 particles did grow beside the magnetic particles and it was possible to eliminate
all traces of TiO2 from the magnetic sample via washing with magnetic separation.
After hydrothermal synthesis, the coated iron oxide NPs were magnetically separated from
single TiO2 NPs that were formed as side products (Figure II - 31 a) and washed several times
with slightly basic water. For successful magnetic separation, it was necessary to maintain a
slightly basic environment to keep the particles destabilised as due to the heat treatment, the
magnetisation of the iron oxide was significantly decreased (Figure II - 31 b). This was already
expected as the amount of TiO2 in the shell were calculated to be 60 weight-% and it is well-
known that magnetite and/or maghemite age under heat. For this proof of concept the residual
magnetism only had to be strong enough for the washing procedure.
Figure II - 31. a) Schematic presentation (on the top) and photographs (on the bottom) of the magnetic separation of synthesized iron oxide/TiO2 core/shell particles (depicted with a black core as iron oxide and a yellow shell as TiO2) from TiO2 particles (depicted as yellow particles) which were formed as side products. b) Vibrating sample magnetometer measurements (carried out at 293 K) on dried powders of pure iron oxide nanoparticles and the synthesized iron oxide/TiO2 core/shell particles.
The successful shell formation was proved via zeta potential measurements (Table II - 5); the
isoelectric point shifted from 7.3 to approximately 6.2 which is the same isoelectric point
exhibited by pure MEEAA-TiO2 NPs (II.1.2). This indicates the complete formation of a
relatively dense TiO2 shell around the iron oxide as partly covered particles91 or particles with
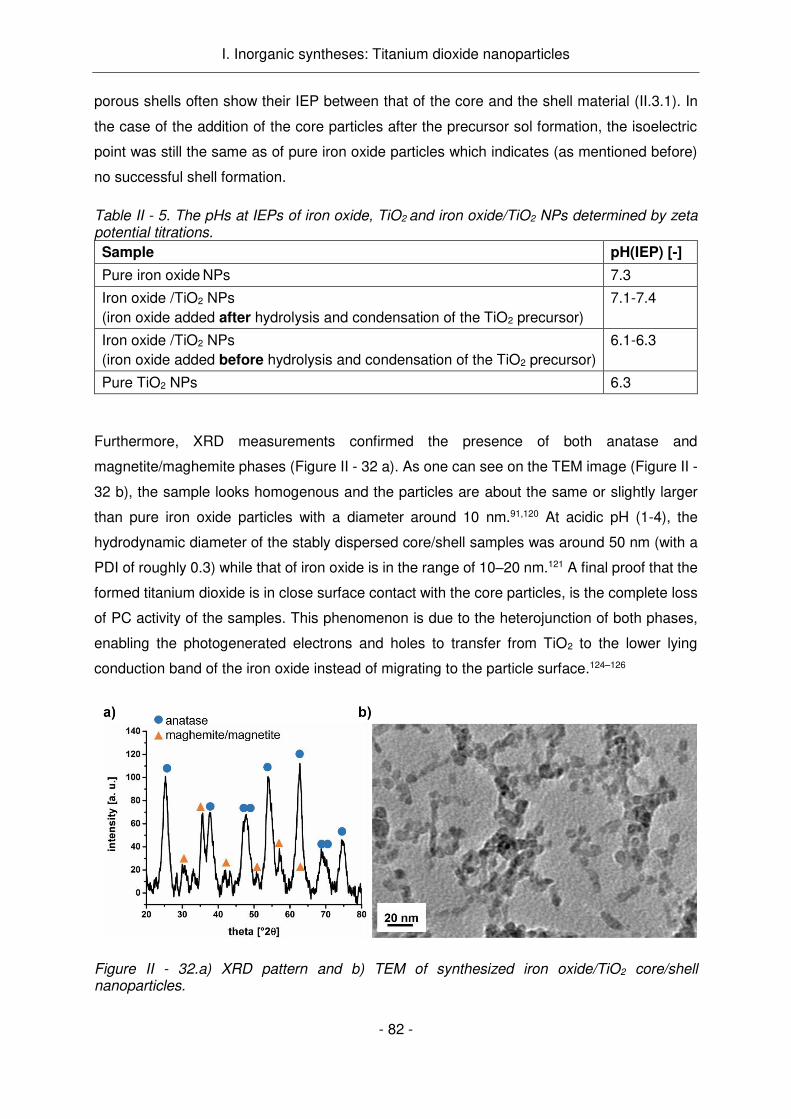
I. Inorganic syntheses: Titanium dioxide nanoparticles
- 82 -
porous shells often show their IEP between that of the core and the shell material (II.3.1). In
the case of the addition of the core particles after the precursor sol formation, the isoelectric
point was still the same as of pure iron oxide particles which indicates (as mentioned before)
no successful shell formation.
Table II - 5. The pHs at IEPs of iron oxide, TiO2 and iron oxide/TiO2 NPs determined by zeta potential titrations.
Sample pH(IEP) [-]
Pure iron oxide NPs 7.3
Iron oxide /TiO2 NPs
(iron oxide added after hydrolysis and condensation of the TiO2 precursor)
7.1-7.4
Iron oxide /TiO2 NPs
(iron oxide added before hydrolysis and condensation of the TiO2 precursor)
6.1-6.3
Pure TiO2 NPs 6.3
Furthermore, XRD measurements confirmed the presence of both anatase and
magnetite/maghemite phases (Figure II - 32 a). As one can see on the TEM image (Figure II -
32 b), the sample looks homogenous and the particles are about the same or slightly larger
than pure iron oxide particles with a diameter around 10 nm.91,120 At acidic pH (1-4), the
hydrodynamic diameter of the stably dispersed core/shell samples was around 50 nm (with a
PDI of roughly 0.3) while that of iron oxide is in the range of 10–20 nm.121 A final proof that the
formed titanium dioxide is in close surface contact with the core particles, is the complete loss
of PC activity of the samples. This phenomenon is due to the heterojunction of both phases,
enabling the photogenerated electrons and holes to transfer from TiO2 to the lower lying
conduction band of the iron oxide instead of migrating to the particle surface.124–126
Figure II - 32.a) XRD pattern and b) TEM of synthesized iron oxide/TiO2 core/shell nanoparticles.
I. Inorganic syntheses: Titanium dioxide nanoparticles
- 83 -
II.4. Conclusion
Given the results obtained during inorganic syntheses of titanium dioxide NPs and related
attempts of core-and-shell particle syntheses to introduce luminescence properties into the
systems, one can sum up that two different TiO2 NPs were successfully synthesized. They
were thoroughly analyzed via XRD, TEM, zeta potential measurements, DLS, TGA, nitrogen
sorption and DRIFT. While the morphology (oval shape) and size (between 5 nm and 6 nm) of
both anatase crystals seem to be very similar, they mainly differ in the surface functions
introduced during the synthesis. While the AA-TiO2 bears acetyl acetonate and PTSA groups,
the MEEAA-TiO2 features MEEAA on its surface. The higher PC activity of the MEEAA-TiO2
compared to the AA-TiO2 is therefore mainly related to the different surface groups or more
precisely the higher amount of functional groups on the AA-TiO2. Due to these results, the
experiments into the influence of the hydrothermal treatment conditions on the NP properties
were conducted with the more promising MEEAA-TiO2 system. If the autoclaving time or
temperature during the synthesis is increased, the crystallite size increases from 4.8 nm to 7.7
nm (1h, 160 °C to 4h, 200 °C). This was verified by XRD, TEM, DLS and nitrogen sorption
measurements. While the properties of the surface groups are only marginally influenced by
changes in the treatment time and/or duration (as shown via DRIFT, TGA and zeta potential
measurements), the PC activity of the sample is significantly improved with increasing particle
size. This was in contrast to the initial expectation that PC activity of the samples decreases
with increasing size as the specific surface area in the sample is diminished. Their increasing
PC performance with decreasing specific surface area were found to be caused by a change
in crystal morphology. While small crystallites show the typical equilibrium state truncated
tetragonal bipyramidal morphology, crystal growth leads to the formation of rod-like crystals
with oxygen vacancies provoked by oriented attachment of single particles (as shown by
XAFS, XRD and HR-TEM analyses). Both the more anisotropic crystal shape and the increase
in oxygen vacancies improve the photocatalytic activity of the samples - most probably due to
a more efficient charge carrier separation. The crystal growth via oriented attachment of {011}
facets is presumably caused by the acidic aqueous hydrothermal treatment conditions and the
preferential adsorption of the utilized carboxylic acid (MEEAA) onto the high energy {001}
facets.
After having successfully synthesized and characterized the stably dispersed,
photocatalytically active TiO2 NPs with sizes smaller than 10 nm, that can even compete with
the benchmark material P25, the incorporation of luminescence properties (see below) and the
transfer into cell culture applications (Chapter IV) were then investigated. To introduce
luminescence properties into the obtained TiO2 particles, the synthesis of luminescent
Rhodamine B doped TiO2/SiO2 core/shell NPs was successfully carried out; the homogeneous

I. Inorganic syntheses: Titanium dioxide nanoparticles
- 84 -
formation of a silica shell around TiO2 was proved via TEM, DLS and zeta potential
measurements. The incorporation of Rhodamine B into the shell was evident due to the
luminescence of the final particle system. Unfortunately, the PC activity of the particle system
is progressively decreased with increasing silica shell thickness. For the doping of the silica
shell with Rhodamine B, the dye concentration is limited due to self-quenching of the dye within
the shell. This means, the higher the wished PL, the thicker the silica shell and the lower the
PC activity of the TiO2/SiO2 particle system. The synthesis of a ZnO/TiO2 system still remained
challenging; while luminescent ZnO NPs were successfully synthesized, their stability in acidic
water was not sufficient for the synthesis of a TiO2 shell. Nevertheless, it was possible to prove
the feasibility of a TiO2 shell formation around inorganic NPs such as iron oxide NPs. This
means, if a sufficiently acid-stable luminescent inorganic particle system is found, the TiO2
shell formation around it can be realized. For this, it has to be taken into consideration that the
excitation of the core material must be above the absorption wavelengths of the TiO2 shell to
ensure the arrival of the excitation wavelength to the core. Additionally, one has to bear in mind
that the PC activity of the shell could be negatively influenced by the core. To conclude the
attempts of luminescent core/shell particle synthesis, it can be stated that both systems were
not deemed sophisticated enough for the use as highly photocatalytically active, luminescent
NPs. This is the reason why another way had to be found to integrate the luminescence
properties into the NP system. The integration of an organic dye into the coupling agents was
identified as most promising pathway (treated in detail in Chapter III). It does not heavily
influence the PC activity and the addition is carried out after the particle synthesis which avoids
heat treatments of the organic components. Moreover, the excitation and emission
wavelengths of the luminescent agent can be selected out of the range of all commercially
available dyes and its concentration can most probably be significantly increased compared to
a dye doped into a silica shell.
I. Inorganic syntheses: Titanium dioxide nanoparticles
- 85 -
References:
1 H. Dong, G. Zeng, L. Tang, C. Fan, C. Zhang, X. He and Y. He, Water Res., 2015, 79, 128–146.
2 Z. Fei Yin, L. Wu, H. Gui Yang and Y. Hua Su, Phys. Chem. Chem. Phys., 2013, 15, 4844.
3 C.-C. Wang and J. Y. Ying, Chem. Mater., 1999, 11, 3113–3120.
4 J. Zhu, F. Chen, J. Zhang, H. Chen and M. Anpo, J. Photochem. Photobiol. Chem., 2006, 180, 196–204.
5 S. Ito, S. Yoshida and T. Watanabe, Chem. Lett., 2000, 29, 70–71.
6 S. Valencia, J. M. Marín and G. Restrepo, Open Mater. Sci. J., 2010, 4, 9–14.
7 M. Bockmeyer, B. Herbig and P. Löbmann, Thin Solid Films, 2009, 517, 1596–1600.
8 D. Biskupski, B. Herbig, G. Schottner and R. Moos, Sens. Actuators B Chem., 2011, 153, 329–334.
9 P. Löbmann, J. Sol-Gel Sci. Technol., 2005, 33, 275–282.
10 M. Bockmeyer and P. Löbmann, J. Sol-Gel Sci. Technol., 2008, 45, 251–259.
11 K. Thamaphat, P. Limsuwan and B. Ngotawornchai, Kasetsart JNat Sci, 2008, 42, 357–361.
12 C.-C. Wang and J. Y. Ying, Chem. Mater., 1999, 11, 3113–3120.
13 S. Brunauer, P. H. Emmett and E. Teller, J. Am. Chem. Soc., 1938, 60, 309–319.
14 P. S. Awati, S. V. Awate, P. P. Shah and V. Ramaswamy, Catal. Commun., 2003, 4, 393–400.
15 J. Rouquerol, F. Rouquerol, P. Llewellyn, G. Maurin and K. S. W. Sing, Adsorption by Powders and Porous
Solids: Principles, Methodology and Applications, Academic Press, 2013.
16 Malvern Instruments Limited, Dynamic Light Scattering - common terms defined,
http://www.biophysics.bioc.cam.ac.uk/wp-content/uploads/2011/02/DLS_Terms_defined_Malvern.pdf,
(accessed August 25, 2016).
17 R. C. Murdock, L. Braydich-Stolle, A. M. Schrand, J. J. Schlager and S. M. Hussain, Toxicol. Sci., 2008, 101,
239–253.
18 R. Coco, L. Plapied, V. Pourcelle, C. Jérôme, D. J. Brayden, Y.-J. Schneider and V. Préat, Int. J. Pharm., 2013,
440, 3–12.
19 K. Nakamoto, in Infrared and Raman Spectra of Inorganic and Coordination Compounds, John Wiley & Sons,
Inc., 2008, pp. 333–402.
20 D. Lin-Vien, N. B. Colthup, W. G. Fateley and J. G. Grasselli, The Handbook of Infrared and Raman
Characteristic Frequencies of Organic Molecules, Elsevier, 1991.
21 M. Chatry, M. Henry, M. In, C. Sanchez and J. Livage, J. Sol-Gel Sci. Technol., 1994, 1, 233–240.
22 A. M. El-Toni, S. Yin and T. Sato, J. Colloid Interface Sci., 2006, 300, 123–130.
23 X. Feng, S. Zhang and X. Lou, Colloids Surf. B Biointerfaces, 2013, 107, 220–226.
24 D. Gumy, C. Morais, P. Bowen, C. Pulgarin, S. Giraldo, R. Hajdu and J. Kiwi, Appl. Catal. B Environ., 2006,
63, 76–84.
25 C. Freitas and R. H. Müller, Int. J. Pharm., 1998, 168, 221–229.
26 D. Li, M. B. Müller, S. Gilje, R. B. Kaner and G. G. Wallace, Nat. Nanotechnol., 2008, 3, 101–105.
27 N. Mandzy, E. Grulke and T. Druffel, Powder Technol., 2005, 160, 121–126.
28 M. Lindner, University Hannover, 1997.
29 Y. Li, W. Xie, X. Hu, G. Shen, X. Zhou, Y. Xiang, X. Zhao and P. Fang, Langmuir, 2010, 26, 591–597.
30 C. M. Teh and A. R. Mohamed, J. Alloys Compd., 2011, 509, 1648–1660.
31 D. S. Bhatkhande, V. G. Pangarkar and A. A. C. M. Beenackers, J. Chem. Technol. Biotechnol., 2002, 77,
102–116.
32 S. Ottofuelling, F. Von Der Kammer and T. Hofmann, Environ. Sci. Technol., 2011, 45, 10045–10052.
33 S. Sakthivel, B. Neppolian, M. V. Shankar, B. Arabindoo, M. Palanichamy and V. Murugesan, Sol. Energy
Mater. Sol. Cells, 2003, 77, 65–82.
I. Inorganic syntheses: Titanium dioxide nanoparticles
- 86 -
34 D. W. Bahnemann, S. N. Kholuiskaya, R. Dillert, A. I. Kulak and A. I. Kokorin, Appl. Catal. B Environ., 2002,
36, 161–169.
35 M. H. Habibi and H. Vosooghian, J. Photochem. Photobiol. Chem., 2005, 174, 45–52.
36 U. I. Gaya and A. H. Abdullah, J. Photochem. Photobiol. C Photochem. Rev., 2008, 9, 1–12.
37 M. S. Vohra and K. Tanaka, Water Res., 2003, 37, 3992–3996.
38 A. R. Khataee and M. B. Kasiri, J. Mol. Catal. Chem., 2010, 328, 8–26.
39 D. P. Macwan, P. N. Dave and S. Chaturvedi, J. Mater. Sci., 2011, 46, 3669–3686.
40 B. Herbig, Julius-Maximilians University Würzburg, 2007.
41 Q. Xiang, J. Yu, W. Wang and M. Jaroniec, Chem. Commun., 2011, 47, 6906.
42 M. D’Arienzo, J. Carbajo, A. Bahamonde, M. Crippa, S. Polizzi, R. Scotti, L. Wahba and F. Morazzoni, J. Am.
Chem. Soc., 2011, 133, 17652–17661.
43 X. Y. Ma, Z. G. Chen, S. B. Hartono, H. B. Jiang, J. Zou, S. Z. Qiao and H. G. Yang, Chem. Commun., 2010,
46, 6608.
44 F. Tian, Y. Zhang, J. Zhang and C. Pan, J. Phys. Chem. C, 2012, 116, 7515–7519.
45 X. Zhao, W. Jin, J. Cai, J. Ye, Z. Li, Y. Ma, J. Xie and L. Qi, Adv. Funct. Mater., 2011, 21, 3554–3563.
46 C.-T. Dinh, T.-D. Nguyen, F. Kleitz and T.-O. Do, ACS Nano, 2009, 3, 3737–3743.
47 J. Pan, University of Queensland, 2014.
48 J. Pan, X. Wu, L. Wang, G. Liu, G. Q. (Max) Lu and H.-M. Cheng, Chem. Commun., 2011, 47, 8361–8363.
49 B. Wu, C. Guo, N. Zheng, Z. Xie and G. D. Stucky, J. Am. Chem. Soc., 2008, 130, 17563–17567.
50 P. D. Cozzoli, A. Kornowski and H. Weller, J. Am. Chem. Soc., 2003, 125, 14539–14548.
51 R. L. Penn and J. F. Banfield, Geochim. Cosmochim. Acta, 1999, 63, 1549–1557.
52 R. L. Penn and J. F. Banfield, Science, 1998, 281, 969–971.
53 H. Zhang, R. L. Penn, R. J. Hamers and J. F. Banfield, J. Phys. Chem. B, 1999, 103, 4656–4662.
54 N. Roy, Y. Sohn and D. Pradhan, ACS Nano, 2013, 7, 2532–2540.
55 J. Li and D. Xu, Chem. Commun., 2010, 46, 2301–2303.
56 A. S. Barnard and L. A. Curtiss, Nano Lett., 2005, 5, 1261–1266.
57 X.-L. Li, Q. Peng, J.-X. Yi, X. Wang and Y. Li, Chem. – Eur. J., 2006, 12, 2383–2391.
58 J. Joo, S. G. Kwon, T. Yu, M. Cho, J. Lee, J. Yoon and T. Hyeon, J. Phys. Chem. B, 2005, 109, 15297–15302.
59 T. Sugimoto, X. Zhou and A. Muramatsu, J. Colloid Interface Sci., 2003, 259, 53–61.
60 J.-L. Dirion, C. Reverte and M. Cabassud, Chem. Eng. Res. Des., 2008, 86, 618–625.
61 A. Tiwari and B. Raj, Reactions and Mechanisms in Thermal Analysis of Advanced Materials, John Wiley &
Sons, 2015.
62 D. Kwon, S. H. Lee, J. Kim and T. H. Yoon, Toxicol. Environ. Health Sci., 2, 78–85.
63 J. Yan, G. Wu, N. Guan, L. Li, Z. Li and X. Cao, Phys. Chem. Chem. Phys., 2013, 15, 10978.
64 Z. Zhao, X. Zhang, G. Zhang, Z. Liu, D. Qu, X. Miao, P. Feng and Z. Sun, Nano Res., 2015, 8, 4061–4071.
65 X. Jiang, Y. Zhang, J. Jiang, Y. Rong, Y. Wang, Y. Wu and C. Pan, J. Phys. Chem. C, 2012, 116, 22619–
22624.
66 X. Chen, L. Liu, Z. Liu, M. A. Marcus, W.-C. Wang, N. A. Oyler, M. E. Grass, B. Mao, P.-A. Glans, P. Y. Yu, J.
Guo and S. S. Mao, Sci. Rep., 2013, 3, 1510.
67 J. J. Rehr, J. J. Kas, F. D. Vila, M. P. Prange and K. Jorissen, Phys. Chem. Chem. Phys., 2010, 12, 5503–
5513.
68 G. Liu, J. C. Yu, G. Q. (Max) Lu and H.-M. Cheng, Chem. Commun., 2011, 47, 6763.
69 A. Vittadini, A. Selloni, F. P. Rotzinger and M. Grätzel, Phys. Rev. Lett., 1998, 81, 2954–2957.
70 A. Selloni, Nat. Mater., 2008, 7, 613–615.
71 I. Cacciotti, A. Bianco, G. Pezzotti and G. Gusmano, Chem. Eng. J., 2011, 166, 751–764.

I. Inorganic syntheses: Titanium dioxide nanoparticles
- 87 -
72 X. Chen and W. Luo, J. Nanosci. Nanotechnol., 2010, 10, 1482–1494.
73 J. Liqiang, Q. Yichun, W. Baiqi, L. Shudan, J. Baojiang, Y. Libin, F. Wei, F. Honggang and S. Jiazhong, Sol.
Energy Mater. Sol. Cells, 2006, 90, 1773–1787.
74 K. T. Rim, K. H. Koo and J. S. Park, Saf. Health Work, 2013, 4, 12–26.
75 E. Nakamura and K. Sato, Nat. Mater., 2011, 10, 158–161.
76 E. Alonso, A. M. Sherman, T. J. Wallington, M. P. Everson, F. R. Field, R. Roth and R. E. Kirchain, Environ.
Sci. Technol., 2012, 46, 3406–3414.
77 M. A. de Boer and K. Lammertsma, ChemSusChem, 2013, 6, 2045–2055.
78 A. Imhof, M. Megens, J. J. Engelberts, D. T. N. de Lang, R. Sprik and W. L. Vos, J. Phys. Chem. B, 1999, 103,
1408–1415.
79 R. Kumar, I. Roy, T. Y. Ohulchanskyy, L. N. Goswami, A. C. Bonoiu, E. J. Bergey, K. M. Tramposch, A. Maitra
and P. N. Prasad, ACS Nano, 2008, 2, 449–456.
80 I. A. Siddiquey, T. Furusawa, M. Sato, K. Honda and N. Suzuki, Dyes Pigments, 2008, 76, 754–759.
81 Y.-L. Lin, T.-J. Wang and Y. Jin, Powder Technol., 2002, 123, 194–198.
82 O. K. Park and Y. S. Kang, Colloids Surf. Physicochem. Eng. Asp., 2005, 257–258, 261–265.
83 A. Jaroenworaluck, W. Sunsaneeyametha, N. Kosachan and R. Stevens, Surf. Interface Anal., 2006, 38, 473–
477.
84 S. Pazokifard, S. M. Mirabedini, M. Esfandeh, M. Mohseni and Z. Ranjbar, Surf. Interface Anal., 2012, 44, 41–
47.
85 Z. Li, B. Hou, Y. Xu, D. Wu and Y. Sun, J. Colloid Interface Sci., 2005, 288, 149–154.
86 C. A. P. Leite, E. F. de Souza and F. Galembeck, J. Braz. Chem. Soc., 2001, 12, 519–525.
87 C. A. R. Costa, C. A. P. Leite and F. Galembeck, J. Phys. Chem. B, 2003, 107, 4747–4755.
88 H. Ye, X. Zhang, Y. Zhang, L. Ye, B. Xiao, H. Lv and B. Jiang, Sol. Energy Mater. Sol. Cells, 2011, 95, 2347–
2351.
89 X. Fu and S. Qutubuddin, Colloids Surf. Physicochem. Eng. Asp., 2001, 179, 65–70.
90 X. Fu and S. Qutubuddin, Colloids Surf. Physicochem. Eng. Asp., 2001, 178, 151–156.
91 K. Mandel, M. Straßer, T. Granath, S. Dembski and G. Sextl, Chem. Commun., 2015, 51, 2863–2866.
92 S. Kim, H. E. Pudavar, A. Bonoiu and P. N. Prasad, Adv. Mater., 2007, 19, 3791–3795.
93 E.-B. Cho, D. O. Volkov and I. Sokolov, Adv. Funct. Mater., 2011, 21, 3129–3135.
94 Y. Kobayashi, T. Nozawa, T. Nakagawa, K. Gonda, M. Takeda, N. Ohuchi and A. Kasuya, J. Sol-Gel Sci.
Technol., 2010, 55, 79–85.
95 D. Gerion, F. Pinaud, S. C. Williams, W. J. Parak, D. Zanchet, S. Weiss and A. P. Alivisatos, J. Phys. Chem.
B, 2001, 105, 8861–8871.
96 X. Michalet, F. F. Pinaud, L. A. Bentolila, J. M. Tsay, S. Doose, J. J. Li, G. Sundaresan, A. M. Wu, S. S.
Gambhir and S. Weiss, Science, 2005, 307, 538–544.
97 A. van Dijken, E. A. Meulenkamp, D. Vanmaekelbergh and A. Meijerink, J. Lumin., 2000, 87–89, 454–456.
98 A. Asok, M. N. Gandhi and A. R. Kulkarni, Nanoscale, 2012, 4, 4943.
99 K. Vanheusden, C. H. Seager, W. L. Warren, D. R. Tallant and J. A. Voigt, Appl. Phys. Lett., 1996, 68, 403–
405.
100 L. Spanhel, J. Sol-Gel Sci. Technol., 2006, 39, 7–24.
101 Y. Lv, W. Xiao, W. Li, J. Xue and J. Ding, Nanotechnology, 2013, 24, 175702.
102 A. van Dijken, E. A. Meulenkamp, D. Vanmaekelbergh and A. Meijerink, J. Lumin., 2000, 90, 123–128.
103 K.-F. Lin, H.-M. Cheng, H.-C. Hsu, L.-J. Lin and W.-F. Hsieh, Chem. Phys. Lett., 2005, 409, 208–211.
104 X. Tang, E. S. G. Choo, L. Li, J. Ding and J. Xue, Chem. Mater., 2010, 22, 3383–3388.
105 L. Spanhel and M. A. Anderson, J. Am. Chem. Soc., 1991, 113, 2826–2833.
I. Inorganic syntheses: Titanium dioxide nanoparticles
- 88 -
106 E. A. Meulenkamp, J. Phys. Chem. B, 1998, 102, 5566–5572.
107 R. D. Yang, S. Tripathy, Y. Li and H.-J. Sue, Chem. Phys. Lett., 2005, 411, 150–154.
108 K. Rekha, M. Nirmala, M. G. Nair and A. Anukaliani, Phys. B Condens. Matter, 2010, 405, 3180–3185.
109 S. Koch, S. Späth, A. Shmeliov, V. Nicolosi and K. Mandel, J Mater Chem C, 2015, 3, 12430–12435.
110 X. Xu, C. Xu, X. Wang, Y. Lin, J. Dai and J. Hu, CrystEngComm, 2013, 15, 977–981.
111 H.-J. Zhang, H.-M. Xiong, Q.-G. Ren, Y.-Y. Xia and J.-L. Kong, J. Mater. Chem., 2012, 22, 13159.
112 H.-Q. Shi, W.-N. Li, L.-W. Sun, Y. Liu, H.-M. Xiao and S.-Y. Fu, Chem. Commun., 2011, 47, 11921.
113 J. Zhang, G. Gao and F. Liu, J. Appl. Polym. Sci., 2013, 128, 2162–2166.
114 L.-H. Zhao and S.-Q. Sun, CrystEngComm, 2011, 13, 1864–1869.
115 X. Tang, E. S. G. Choo, L. Li, J. Ding and J. Xue, Langmuir, 2009, 25, 5271–5275.
116 Y.-S. Fu, X.-W. Du, S. A. Kulinich, J.-S. Qiu, W.-J. Qin, R. Li, J. Sun and J. Liu, J. Am. Chem. Soc., 2007, 129,
16029–16033.
117 S. Saliba, C. Valverde Serrano, J. Keilitz, M. L. Kahn, C. Mingotaud, R. Haag and J.-D. Marty, Chem. Mater.,
2010, 22, 6301–6309.
118 H.-M. Xiong, Y. Xu, Q.-G. Ren and Y.-Y. Xia, J. Am. Chem. Soc., 2008, 130, 7522–7523.
119 B. Rohe, University Duisburg-Essen, 2005.
120 K. Mandel, W. Szczerba, A. F. Thünemann, H. Riesemeier, M. Girod and G. Sextl, J. Nanoparticle Res., 2012,
14, 1066.
121 K. Mandel, F. Hutter, C. Gellermann and G. Sextl, Colloids Surf. Physicochem. Eng. Asp., 2011, 390, 173–
178.
122 X.-Q. Chen, G.-B. Gu and H.-B. Liu, Huaxue Xuebao, 2003, 61, 1592–1596.
123 X.-Q. Chen and W.-H. Shen, Chem. Eng. Technol., 2008, 31, 1277–1281.
124 C. Wang, L. Yin, L. Zhang, L. Kang, X. Wang and R. Gao, J. Phys. Chem. C, 2009, 113, 4008–4011.
125 D. Beydoun, R. Amal, G. Low and S. McEvoy, J. Mol. Catal. Chem., 2002, 180, 193–200.
126 D. Beydoun, R. Amal, G. K.-C. Low and S. McEvoy, J. Phys. Chem. B, 2000, 104, 4387–4396.

- 89 -
III. Synthesis of organic
coupling agents and their
grafting onto TiO2
nanoparticles
III. Synthesis of organic coupling agents and their grafting onto TiO2 nanoparticles
- 90 -
Contents
III. Synthesis of organic coupling agents and their grafting onto TiO2 nanoparticles ... - 91 - III.1. Synthesis of functional coupling agents ............................................................. - 91 -
III.1.1. Synthesis of linear and dendritic fluorescent coupling agents ..................... - 94 - III.1.1.a. Coupling agent I (compound 4) ........................................................... - 94 - III.1.1.b. Coupling agent II ................................................................................. - 97 - III.1.1.c. Coupling agent III (compound 22) ..................................................... - 103 -
III.1.2. Synthesis of dendritic non-fluorescent coupling agents ............................ - 111 - III.1.2.a. Coupling agent IV (compound 25) ..................................................... - 111 -
III.2. Grafting of functional coupling agents onto particles........................................ - 115 - III.2.1. Optimization of grafting protocols with commercial silanes ....................... - 116 - III.2.2. Grafting of synthesized coupling agents onto MEEAA-TiO2 (200 °C, 4 h) . - 123 -
III.2.2.a. Grafting of coupling agent I ............................................................... - 123 - III.2.2.b. Grafting of coupling agent IV ............................................................. - 127 -
III.3. Conclusion ...................................................................................................... - 133 -

- 91 -
III. Synthesis of organic coupling agents and their grafting onto
TiO2 nanoparticles
After the successful design of photocatalytic anatase nanocrystals, their surface
functionalization was an essential objective to adapt the particle systems to the demands of
their later applications in photodynamic cancer therapy. The elaborate design of organic
coupling agents allows the fine tuning of molecular properties such as hydrophilicity, charge,
geometry, luminescence or functional groups and the transfer of these characteristics to the
entire particle system.
III.1. Synthesis of functional coupling agents
For the design of coupling agents, it was important to define the requirements they had to fulfil
as functional surface groups of the nanoparticles. The first objective was to mediate the cellular
uptake of the particles using these functional groups. It is well-known that the surface charge
of particles has a great influence on their cellular uptake and that the surface potential can be
easily modified by functional surface groups.1–14 Wise selection of functional groups can
therefore optimize the cellular NP uptake. Furthermore, they can be used for the coupling of
biological molecules onto the particle for example for targeted tumour treatment.15–19 A second
objective was the introduction of luminescence properties into the particle system. This can be
achieved by the incorporation of an organic dye into the coupling agent.20–24 Luminescence
enables the detection of the particle systems in cell culture studies for better analysis and
examination of the particle interaction with the cells.25 It also gives the opportunity for their
imaging in human tissue when they are for example used as anti-tumour agents. The final task
for the coupling agent was to improve or at least not decrease the solubility and dispersibility
of the particles in physiological solutions. These objectives have driven the design of
fluorescent and non-fluorescent molecules, which are presented in the following in more detail
(Figure III - 1; 1st generation dendritic coupling agents as examples).
Figure III - 1. Structure of the a) fluorescent and b) non-fluorescent 1st generation dendritic coupling agents.

III. Synthesis of organic coupling agents and their grafting onto TiO2 nanoparticles
- 92 -
First, the functional terminal groups of the coupling agents were chosen to be amines as in
general positive surface charge at physiological pH leads to a better cellular uptake of the
particles.3–6,10–12,14 Additionally, by fine tuning of the surface potential it may even be possible
to enhance the particle uptake by cancer cells while healthy cells do not show an increased
uptake.26 This behaviour is especially preferred for nanoparticles that are used for cancer
treatment. To be able to finely tune the positive particle surface potential, we not only relied on
linear coupling agents but dendritic structures were also used. By increasing the number of
branches and therefore of functional terminal groups of the molecules, the positive charge of
the particle surface is step-wise increased while maintaining the number of coupling agents
per nanoparticle. This was of the utmost importance for this study as the functionalized TiO2
nanoparticles were meant to be used as photocatalytic cancer treatment agent. By covering
the surface with more coupling agents, the free TiO2 surface is decreased and as the
photocatalysis is a surface process, its efficiency is strongly diminished. By using dendritic
structures, one can most probably incline the surface charge while not decreasing the
photocatalytic activity. Furthermore, the steric hindrance of dendritic surface agents during
grafting is expected to lead to a less dense surface functionalization and therefore “non-
passivated” TiO2 surface is available for catalytic reactions.27 It also has to be mentioned, that
amino groups are suitable for couplings with biological molecules that bear succinimidyl esters
or carboxylic groups.15,17,18 This could enable the coupling of targeting agents like epithelial
growth factors receptor antibodies,28 aptamers19 or folates29 onto the particles for active
targeting of cancer cells resulting in a more efficient cancer treatment.
The dendritic structures were chosen to be polyamidoamine (PAMAM) based as these
structures are one of the most common structures used in materials science as well as in
biotechnology due to their architecture and functionalities.30 These can be easily modified and
therefore adapted for various fields of application.31–33 PAMAM are said to be in general non-
toxic (if low generation dendrons are used) and show a good solubility in physiological solutions
due to their hydrophilic properties.31,34–36
Another essential part of the coupling agent was the anchoring site that allows the binding of
the organic molecule onto the inorganic particle. For this, silanes like organofunctional
ethoxysilanes (RSi(OEt)3) were the most preferred reagents as silanol groups can covalently
bind on titanium surfaces, which exhibit hydroxyl moieties.37–39 The subsequent grafting can
be carried out under mild conditions e.g. in hydroalcoholic medium by hydrolysis of the ethoxy
groups and subsequent condensation with the TiO2 hydroxyls.40,41 The formed Si-O-Ti bond is
expected to be stable in water under mild acidic and basic conditions, which is suitable for
biomedical applications.
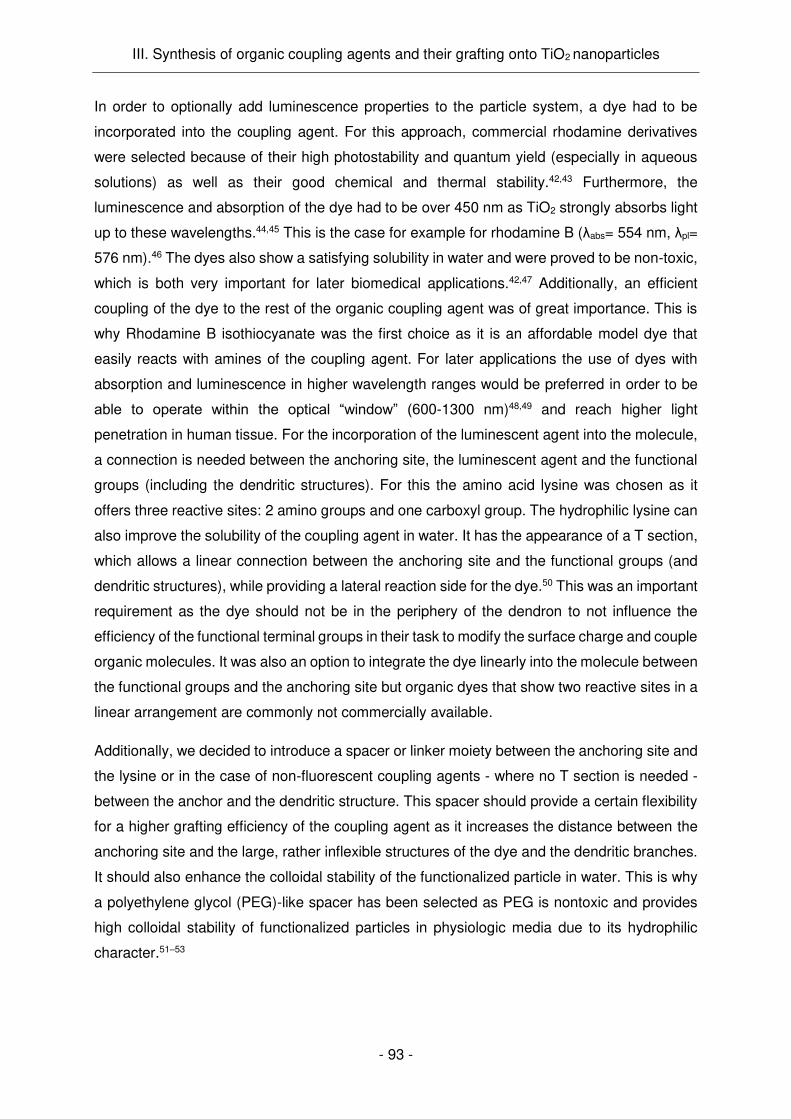
III. Synthesis of organic coupling agents and their grafting onto TiO2 nanoparticles
- 93 -
In order to optionally add luminescence properties to the particle system, a dye had to be
incorporated into the coupling agent. For this approach, commercial rhodamine derivatives
were selected because of their high photostability and quantum yield (especially in aqueous
solutions) as well as their good chemical and thermal stability.42,43 Furthermore, the
luminescence and absorption of the dye had to be over 450 nm as TiO2 strongly absorbs light
up to these wavelengths.44,45 This is the case for example for rhodamine B (λabs= 554 nm, λpl=
576 nm).46 The dyes also show a satisfying solubility in water and were proved to be non-toxic,
which is both very important for later biomedical applications.42,47 Additionally, an efficient
coupling of the dye to the rest of the organic coupling agent was of great importance. This is
why Rhodamine B isothiocyanate was the first choice as it is an affordable model dye that
easily reacts with amines of the coupling agent. For later applications the use of dyes with
absorption and luminescence in higher wavelength ranges would be preferred in order to be
able to operate within the optical “window” (600-1300 nm)48,49 and reach higher light
penetration in human tissue. For the incorporation of the luminescent agent into the molecule,
a connection is needed between the anchoring site, the luminescent agent and the functional
groups (including the dendritic structures). For this the amino acid lysine was chosen as it
offers three reactive sites: 2 amino groups and one carboxyl group. The hydrophilic lysine can
also improve the solubility of the coupling agent in water. It has the appearance of a T section,
which allows a linear connection between the anchoring site and the functional groups (and
dendritic structures), while providing a lateral reaction side for the dye.50 This was an important
requirement as the dye should not be in the periphery of the dendron to not influence the
efficiency of the functional terminal groups in their task to modify the surface charge and couple
organic molecules. It was also an option to integrate the dye linearly into the molecule between
the functional groups and the anchoring site but organic dyes that show two reactive sites in a
linear arrangement are commonly not commercially available.
Additionally, we decided to introduce a spacer or linker moiety between the anchoring site and
the lysine or in the case of non-fluorescent coupling agents - where no T section is needed -
between the anchor and the dendritic structure. This spacer should provide a certain flexibility
for a higher grafting efficiency of the coupling agent as it increases the distance between the
anchoring site and the large, rather inflexible structures of the dye and the dendritic branches.
It should also enhance the colloidal stability of the functionalized particle in water. This is why
a polyethylene glycol (PEG)-like spacer has been selected as PEG is nontoxic and provides
high colloidal stability of functionalized particles in physiologic media due to its hydrophilic
character.51–53

III. Synthesis of organic coupling agents and their grafting onto TiO2 nanoparticles
- 94 -
After having defined the targeted structure of the grafting agents, the planned synthesis routes
are described in the following sections: First, the synthesis of the linear and dendritic
fluorescent coupling agents is discussed (III.1.1) before moving forward to the non-fluorescent
grafting agents (III.1.2).
III.1.1. Synthesis of linear and dendritic fluorescent coupling agents
III.1.1.a. Coupling agent I (compound 4)
The first strategy was to synthesize a linear, rather simple molecule that features the same
modules as the following more complex fluorescent coupling agents with anchoring site,
spacer and dye but was obtained after only 4 reaction steps. It was mainly meant to test the
feasibility of the synthesis route, in particular the incorporation of the commercial dye
rhodamine B isothiocyanate into the molecule. This coupling agent should help to investigate
if the dye survives all reaction conditions for the molecule synthesis and the grafting onto
particles (including acidic and basic conditions as well as heat). The synthetic pathway of this
so called compound 4 or coupling agent I is described in Scheme III - 1.
The starting material 2,2-(ethylenedioxy)bis(ethylamine) provides on each side a terminal
amine. As it was intended to react each side with two different highly reactive molecules, one
first had to be protected. Di-tert-butyl dicarbonate (Boc anhydride) was chosen as reagent
because its related Boc protection is very resistant against basic conditions, heat (up to 185
°C) and nucleophilic attacks.54,55 This was important as the protected starting compound had
to survive all following reaction and washing steps with basic treatments. Furthermore, with
this protecting group high yields in mono-protected product can be obtained if the molecule
that is to be protected is taken in excess and reaction conditions are optimized.56,57 During the
amine protection carbon dioxide and t-butanol are formed as side products, which is shown in
Scheme III - 2. The solvent and the volatile side products were removed under vacuum and
the excess 2,2-(ethylenedioxy)bis(ethylamine) was removed by washing the organic phase
(CH2Cl2) with water. The mono-protected product (compound 1) was obtained in 97 % yield
containing only traces of di-protected compound not visible in NMR. These traces visualized
by thin layer chromatography (TLC) did not take part in the following reaction and were then
easily removed by washing.

III. Synthesis of organic coupling agents and their grafting onto TiO2 nanoparticles
- 95 -
Sch
em
e I
II -
1.
Pla
nn
ed
syn
the
sis
ro
ute
of
the c
ou
pli
ng
ag
en
t I.
The i
ntr
odu
ced R
hB
itc i
s o
nly
sh
ow
n a
s 6
-Rh
Bitc w
hile
fo
r synth
esis
a
mix
ture
of
isom
ers
wa
s u
se
d.

III. Synthesis of organic coupling agents and their grafting onto TiO2 nanoparticles
- 96 -
Scheme III - 2. Mechanism of the protection of a primary amine with di-tert-butyl dicarbonate.
In the next step, Rhodamine B isothiocyanate (RhBitc) was reacted with the free amine of
compound 1. The reaction was carried out under basic conditions with the addition of
triethylamine (TEA). This ensured that the free amine was not protonated and therefore
provided a free electron pair for the nucleophilic attack of the isothiocyanate carbon. The
reaction mechanism is shown in Scheme III - 3. As solvents, a mixture of CH2Cl2 and
dimethylformamide (DMF) was chosen to achieve the solubility of RhBitc salt while minimizing
the amount of high boiling point solvent. The reaction was carried out overnight and after
evaporation of all volatile components, the crude powder was extensively washed with diethyl
ether to remove unreacted compound 1 (as it had been added in slight excess) as well as
traces of di-protected 2,2-(ethylenedioxy)bis(ethylamine) produced during the synthesis of
compound 1. In order to remove the TEA•HCl salt resulting from the reaction of TEA with the
chloride of RhBitc, a wash with basic water was carried out in order to free the TEA. After
evaporation of the free TEA, compound 2 was obtained with a yield of 94 %.
Scheme III - 3. Reaction mechanism of a primary amine with an isothiocyanate.
Now the Boc protecting group of compound 2 was cleaved by bubbling anhydrous HCl in the
CH2Cl2 solution. The cleavage takes place through an SN1 pathway forming the tert-butyl
cation. With Cl- as a weak nucleophile, the cation can be slowly converted into tert-butyl
chloride or rearranges into isobutene both of which can easily be eliminated out of the reaction
batch by evaporation.58,59 The reaction mechanism is shown in Scheme III - 4. After
evaporation of all volatile components, no further purification was necessary and compound
3 was obtained as an ammonium salt, in quantitative yield.
For the grafting of the organic molecule, the silane moiety had to be introduced into the
compound 3. For this the deprotected amine, which was obtained as an ammonium salt was
dissolved in CH2Cl2 with the help of a large excess of TEA (15 eq - otherwise it was not soluble).

III. Synthesis of organic coupling agents and their grafting onto TiO2 nanoparticles
- 97 -
Then it was reacted with a slight excess of triethoxy(3-isocyanatopropyl)silane (1.2 eq).
Afterwards, the solvent and excess TEA were evaporated. The residue was thoroughly washed
with pentane to remove the unreacted silane.
Scheme III - 4. Mechanism of the cleavage of the Boc protecting group from an amine with gaseous HCl.
After evaporation of all traces of pentane, the compound 4 was obtained in about 90 % yield.
It has to be mentioned that traces of TEA•HCl were still present in the compound. Therefore
the yield was calculated with the help of the 1H-NMR integrals. No further purification was
needed as the salt was not supposed to interfere with the grafting reactions. Compound 4,
also called coupling agent I, is later on used for the grafting onto TiO2 nanoparticles. It has to
be mentioned that the commercial RhBitc contained impurities, mainly visible in mass
spectroscopy (MS). Most of them did not take part into the reactions and were removed during
washing procedures. Nevertheless small amounts of rhodamine B amine (identified via MS)
were not removed during all reaction steps and therefore reacted with the triethoxy(3-
isocyanatopropyl)silane forming a side product to the desired compound 4. The amount of
this side product is expected to be considerably low as NMR analysis does not show signals
that can be assigned to it.
III.1.1.b. Coupling agent II
The second linear molecule was synthesized as a reference to the planned dendritic coupling
agent III (treated later on in this chapter); it has the same basic components but does not
contain a dendritic structure. The synthesis procedure of this linear coupling agent, is described
in Scheme III - 5. For the design of this molecule, the most crucial point was to use three
different protecting groups for amines (contained in the coupling agent) and to place them most
ideally to avoid the unwanted deprotection during a reaction or during the cleavage of another
protecting group. As a result, benzyloxycarbonyl (Z), tert-butoxycarbonyl (Boc) and 9-
Fluorenylmethoxycarbonyl (Fmoc) were chosen as protecting groups. They are shortly
introduced now, while more precise descriptions of their coupling and cleavage reactions will
be provided later. The Z protecting group is the most popular protecting group in peptide
synthesis due to its facile introduction and removal conditions.
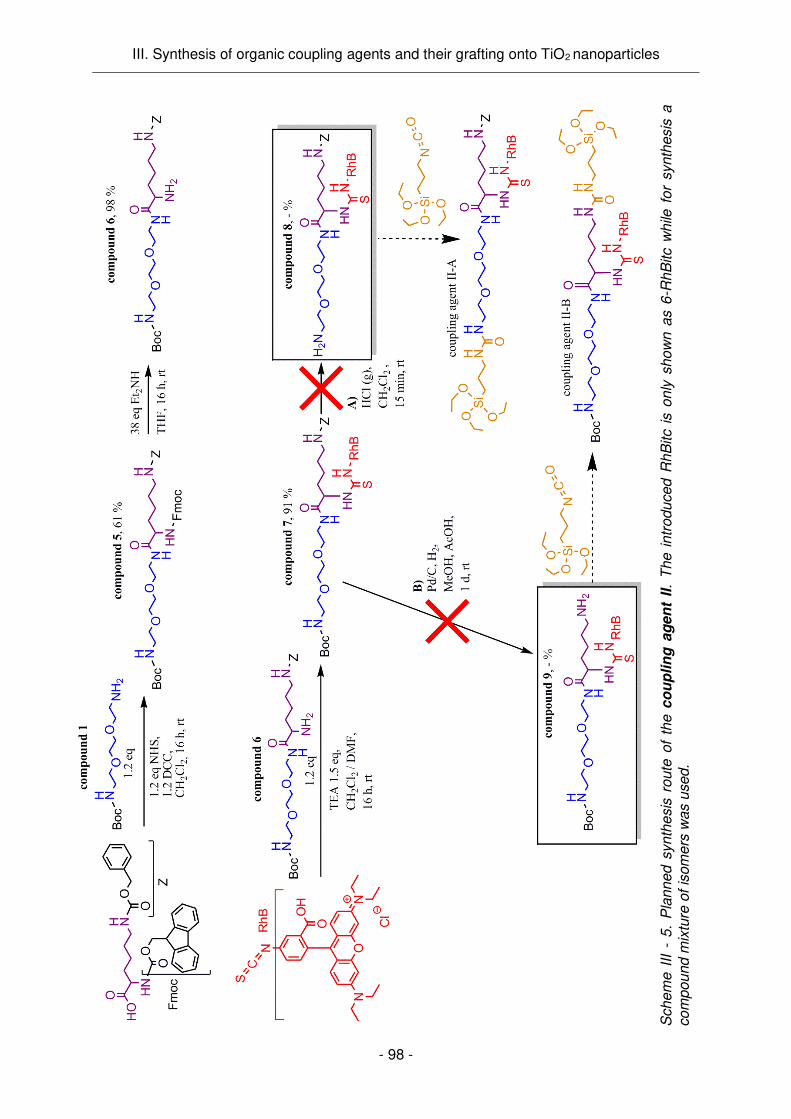
III. Synthesis of organic coupling agents and their grafting onto TiO2 nanoparticles
- 98 -
Sch
em
e I
II -
5.
Pla
nn
ed
syn
the
sis
ro
ute
of
the c
ou
pli
ng
ag
en
t II
. T
he i
ntr
odu
ced
Rh
Bitc i
s o
nly
sh
ow
n a
s 6
-Rh
Bitc w
hile
fo
r synth
esis
a
co
mp
ou
nd
mix
ture
of
isom
ers
wa
s u
se
d.

III. Synthesis of organic coupling agents and their grafting onto TiO2 nanoparticles
- 99 -
It can be easily cleaved by catalytic hydrogenation or by acidolysis and is stable to most of the
coupling reactions.54,55,58 Boc was the first urethane-type protection found that was stable to
catalytic hydrogenation (used for Z cleavage) while labile under mild acidic conditions (as
already mentioned before).54,55,58 The Fmoc group was found to be the perfect completion for
Boc and Z as it is completely stable against acids and to a large extent to catalytic
hydrogenation while it can be removed with bases such as alkyl amines.54,55,58 Comparing the
cleavage conditions of all three protecting groups, the Fmoc protecting group was found to be
the most labile group as it may be cleaved during prolonged catalytic hydrogenation (used for
Z removal).58 Additionally, this protecting group could be involuntarily removed during several
coupling reactions needed for the synthesis of the coupling agents. For example, the reaction
of isocyanates and isothiocyanates with amines had to be carried out under basic conditions
and would most probably result in Fmoc cleavage. This is why Fmoc was always cleaved first.
One of the two other protecting groups was also planned to be cleaved during the synthesis
route, while the last protecting group was meant to be removed after grafting of the final
coupling agent onto the nanoparticles.
The starting materials for the linear coupling agent II were compound 1 and the commercially
available Fmoc-lysine-Z-OH (Scheme III - 6). The amines of this lysine are already Fmoc and
Z protected; the epsilon amine is Z protected and the alpha amine is Fmoc protected.
Scheme III - 6. Fmoc-lysine-Z-OH.
The carboxylic group is the only unprotected reactive group and can form an amide with the
unprotected amine of compound 1. The coupling between compound 1 and Fmoc-lysine-Z-
OH was carried out by activating the carboxylic acid with N-hydroxysuccinimide (NHS) and
N,N'-dicyclohexylcarbodiimide (DCC). First, the carboxylic acid is added to DCC leading to O-
acylurea. Then NHS reacts with the O-acylurea to form a second, more stable activated ester.
This avoids the formation of N-acylurea as a side product60,61 as NHS reacts with the DCC-
activated compound faster than the reaction forming the side product can take place (Scheme
III - 7).61 The activated ester reacts with the amine forming an amide and dicyclohexylurea
(DCU).60,61 For this reaction Fmoc-lysine-Z-OH was dissolved in CH2Cl2 and reacted with DCC
and NHS. The formed DCU, which was insoluble in CH2Cl2, was filtered off and compound 1

III. Synthesis of organic coupling agents and their grafting onto TiO2 nanoparticles
- 100 -
was added. The activated carboxyl group reacted with the free amine resulting in an amide
bond (releasing the NHS) and the formation of compound 5. In order to purify this product,
first the organic reaction phase was washed with acidic water to quench unreacted DCC
converting it in dicyclourea (which was removed by filtration). Then, washing with basic water
removed the main part of NHS and drying and subsequent washing of the powder with
diethylether eliminated unreacted starting materials. To withdraw any remaining traces of NHS
a silica column was run and pure compound 5 was obtained with a yield of 61 %.
Scheme III - 7. Amide formation with the help of DCC and NHS.
In order to go on with further reactions, the Fmoc protected amine had to be deprotected under
basic conditions.58,62,63 For this, a treatment with diethylamine in tetrahydrofuran (THF) was
chosen. The cleavage mechanism is shown in Scheme III - 8. In contrast to other nonhydrolytic
bases used for the cleavage like piperidine or morpholine, it does not form adducts with the
produced dibenzofulvene. This is on one side a risk, as dibenzofulvene can polymerize,
forming an insoluble mass or can irreversibly react with the deblocked amine. On the other
hand, scavenging this compound by the base is a reversible equilibrium dependent reaction
and often incomplete, which results in mixture that is even more difficult to separate.58,63
Scheme III - 8. Mechanism of the Fmoc protecting group cleavage with diethylamine.
The produced CO2 and the diethylamine were easily removed after the reaction. Nevertheless
the obtained side product dibenzofulvene had to be separated from the product by washing.
This was achieved by dissolving the crude material in acetonitrile followed by the addition of

III. Synthesis of organic coupling agents and their grafting onto TiO2 nanoparticles
- 101 -
water (with a ratio of 1:9). Now the dibenzofulvene was eliminated from this very polar phase
by washing with pentane while the product stayed in the water phase and was then extracted
with CH2Cl2 after basification of the water phase to yield compound 6 (98 %). Eventually
polymerized dibenzofulvene was not extracted with pentane but also stayed in the water phase
as a white mass during extraction of the compound with CH2Cl2.
Now, similar to the synthesis of compound 2 the free amine of compound 6 was coupled to
the luminescent agent (RhBitc) to yield compound 7 (91 %).
Then two different routes were investigated; either the cleavage of the Boc (Scheme III - 5;
route A) or of the Z protecting group (Scheme III - 5; route B). Both reactions were supposed
to lead to a free amine that can be reacted with the triethoxy(3-isocyanatopropyl)silane to
obtain a final coupling agent, while the remaining protecting group has to be removed after
grafting onto the nanoparticles. For the Boc deprotection, a treatment with HCl similar to the
one used for compound 3 was conducted. While the Boc protecting group was entirely
removed, compound 8 was not obtained but fragments of it. If the Boc cleavage was carried
out treating compound 7 with trifluoroacetic acid (TFA, with the same reaction mechanism as
the cleavage with HCl), the Boc protecting group was not successfully cleaved and fragments
of compound 7 were obtained. In both cases, MS revealed the amide bond hydrolysis on the
alpha position of the lysine with the neighbouring thiourea group participation.64
The proposed mechanism for this reaction is shown in Scheme III - 9 in the case of weak acids
(i.e. without parallel Boc group cleavage). This reaction has only been documented by Lang et
al.64 who studied the stability of glutamic acid linked to peptides and e. g. a phenyl. The
breakage of the amine bond because of the neighbouring thiourea group was observed at pH
= 4 in aqueous conditions and at elevated temperatures (80 - 100°C). In the case of coupling
agent II, no heat was applied but stronger acids (HCl, TFA) were used either under anhydrous
(HCl treatment) conditions or in the presence of water traces (TFA treatment).
The same fragmentation of compound 7 was obtained while carrying out the Z deprotection
to obtain compound 9. For this deprotection a hydrogenation with the catalyst Pd on carbon
was chosen. The proposed mechanism of this reaction is described in Scheme III - 10. It has
to be mentioned that while in the case of homogenous catalysis the depicted mechanism
seems to be the most probable one, for heterogeneous one (which has been used in this study)
it may be different as dissociative adsorption of the reactant onto the Pd particles would be
necessary for the catalysis.
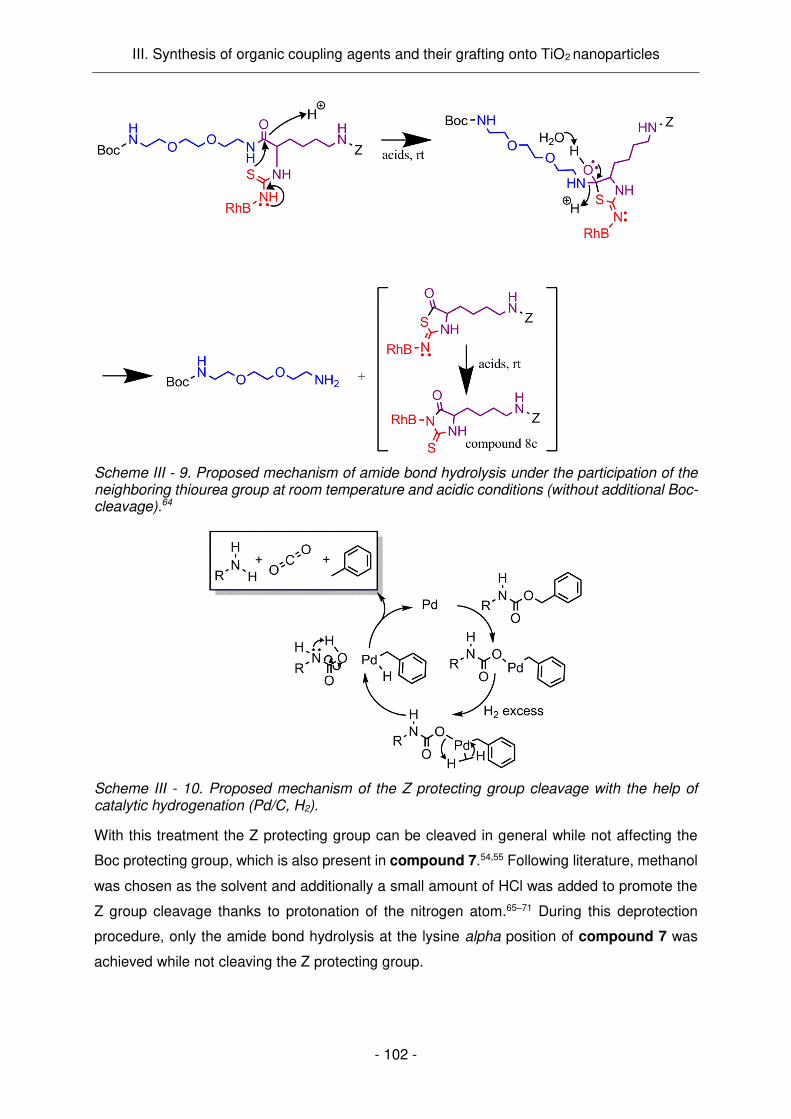
III. Synthesis of organic coupling agents and their grafting onto TiO2 nanoparticles
- 102 -
Scheme III - 9. Proposed mechanism of amide bond hydrolysis under the participation of the neighboring thiourea group at room temperature and acidic conditions (without additional Boc-cleavage).64
Scheme III - 10. Proposed mechanism of the Z protecting group cleavage with the help of catalytic hydrogenation (Pd/C, H2).
With this treatment the Z protecting group can be cleaved in general while not affecting the
Boc protecting group, which is also present in compound 7.54,55 Following literature, methanol
was chosen as the solvent and additionally a small amount of HCl was added to promote the
Z group cleavage thanks to protonation of the nitrogen atom.65–71 During this deprotection
procedure, only the amide bond hydrolysis at the lysine alpha position of compound 7 was
achieved while not cleaving the Z protecting group.

III. Synthesis of organic coupling agents and their grafting onto TiO2 nanoparticles
- 103 -
Thus, this specific amide bond is less stable than both carbamates of the Z and Boc protecting
groups and it is not possible to complete this synthesis route to obtain coupling agent II. It
also has to be mentioned that a separation of the dye from the rest of compound 7 by rupture
of the thiourea was detected in MS analysis of the synthesis attempts of compound 8 and
compound 9. Nevertheless, this bond breakage is assumed to be caused by the electrospray
ionization for MS. In order to avoid the amide bond hydrolysis on the alpha position of the
lysine with the neighbouring thiourea group participation, the most evident solution was to
change the function connecting the dye with the lysine. In the case of an amide bond instead
of a thiourea at this position, this reaction was reported not to take place.64 This approach was
attempted for coupling agent III and will be described later on.
III.1.1.c. Coupling agent III (compound 22)
In parallel to the synthesis of coupling agent II, the preparation of its dendritic version, named
coupling agent III was investigated. The first planned synthetic pathway of this 1st generation
dendritic coupling agent is described in Scheme III - 11. This molecule contains two dendritic
branches with phthalimide-protected amines as end groups. These protecting groups were
meant to be cleaved after successful grafting of the coupling agent onto the particles while
preventing the reaction of the terminal amines during synthesis.
Due to the design of this molecule the location or cleavage order of the protecting groups had
to be slightly changed according to their stability and cleavage mechanisms as mentioned
before. As Z-lysine-Fmoc-OH was not commercially affordable, it was first synthesized by the
protection of the commercial Z-lysine-OH.
The free epsilon amine was protected by the reaction with 9-Fluorenylmethoxycarbonyl
chloride (Fmoc-Cl) as shown in Scheme III - 12. When carrying out Fmoc protection of amino
acids, it always has to be considered that di-peptide formation can occur as a side reaction.
Especially during protection procedures of the alpha amine detectable amounts of dipeptide
acids or even tripeptide acids have been reported when chloroformates like Fmoc-Cl were
utilized.58 The carboxy group of amino acids can be activated by the reaction with a
chloroformate forming an anhydride. These intermediates are sufficiently stable in aqueous-
organic reaction media to then undergo aminolysis and form a peptide with another amino
acid. They are usually difficult to detect and to separate from the product and therefore a major
concern for the Fmoc protection of amino acids. These side products were obtained even
under Schotten–Baumann conditions (mixture of aqueous and organic solvent and reaction at
0 °C).58
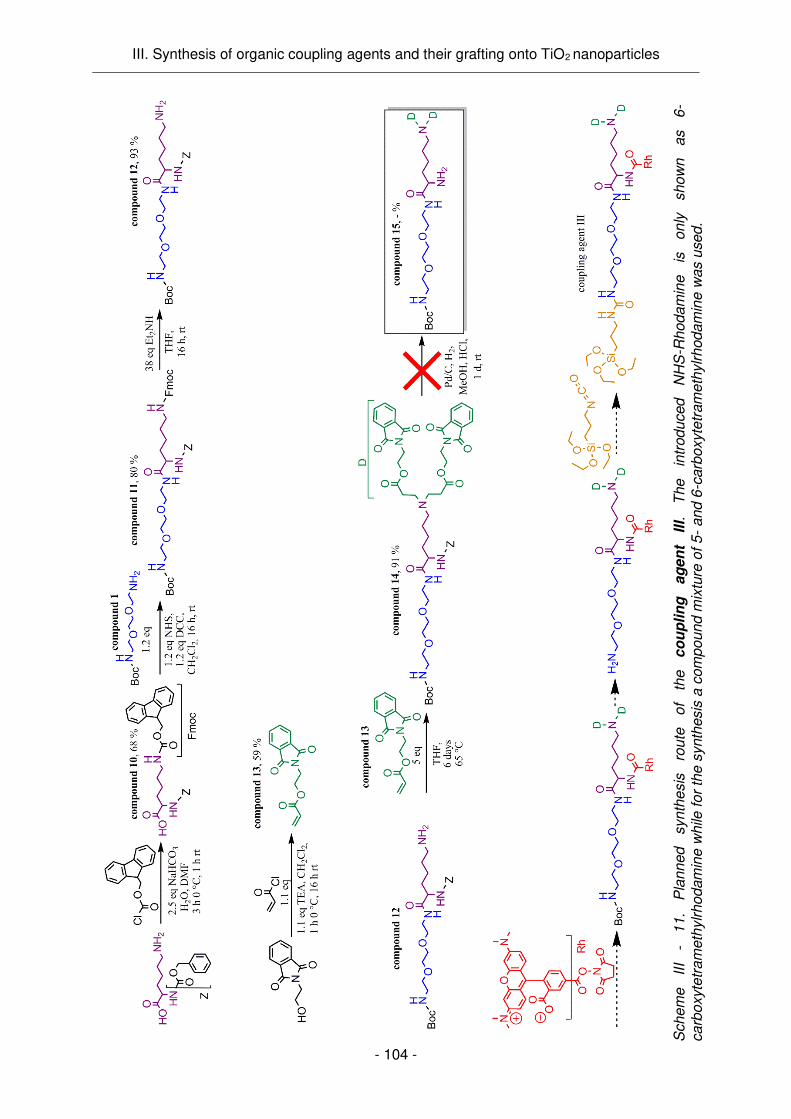
III. Synthesis of organic coupling agents and their grafting onto TiO2 nanoparticles
- 104 -
Sch
em
e
III
- 11.
Pla
nn
ed
syn
the
sis
ro
ute
o
f th
e
co
up
lin
g
ag
en
t III.
T
he
in
trod
uced
N
HS
-Rh
od
am
ine
is
only
sh
ow
n
as
6-
ca
rbo
xyte
tra
meth
ylrh
od
am
ine
wh
ile f
or
the s
ynth
esis
a c
om
pou
nd
mix
ture
of
5-
and 6
-carb
oxyte
tram
eth
ylrh
od
am
ine
wa
s u
se
d.

III. Synthesis of organic coupling agents and their grafting onto TiO2 nanoparticles
- 105 -
Scheme III - 12. Reaction mechanism of Fmoc protection of an amine with FmocCl.
Nevertheless, dipeptide formation during the Fmoc protection of Z-lysine-OH or lysine-Z-OH
has in general not been mentioned before.67,72,73 Following the reaction protocols from
literature,67,72,73 Z-lysine-OH was reacted with Fmoc-Cl in a mixture of Na2CO3-water solution
and an organic solvent. In contrast to former publications, dipeptide formation was detected by
TLC and even visible in NMR. The probable reaction mechanism for the formation of dipeptides
is shown in Scheme III - 13.
Scheme III - 13. Probable mechanisms of dipeptide formation during Fmoc protection of Z-lysine-OH with FmocCl.
With the help of several washing procedures the Z-lysine-Fmoc-OH was purified; after
complete reaction of Fmoc-Cl (controlled by TLC), the crude compound was precipitated by
addition of 1 M potassium hydrogenosulfate solution. Then the precipitate was washed with
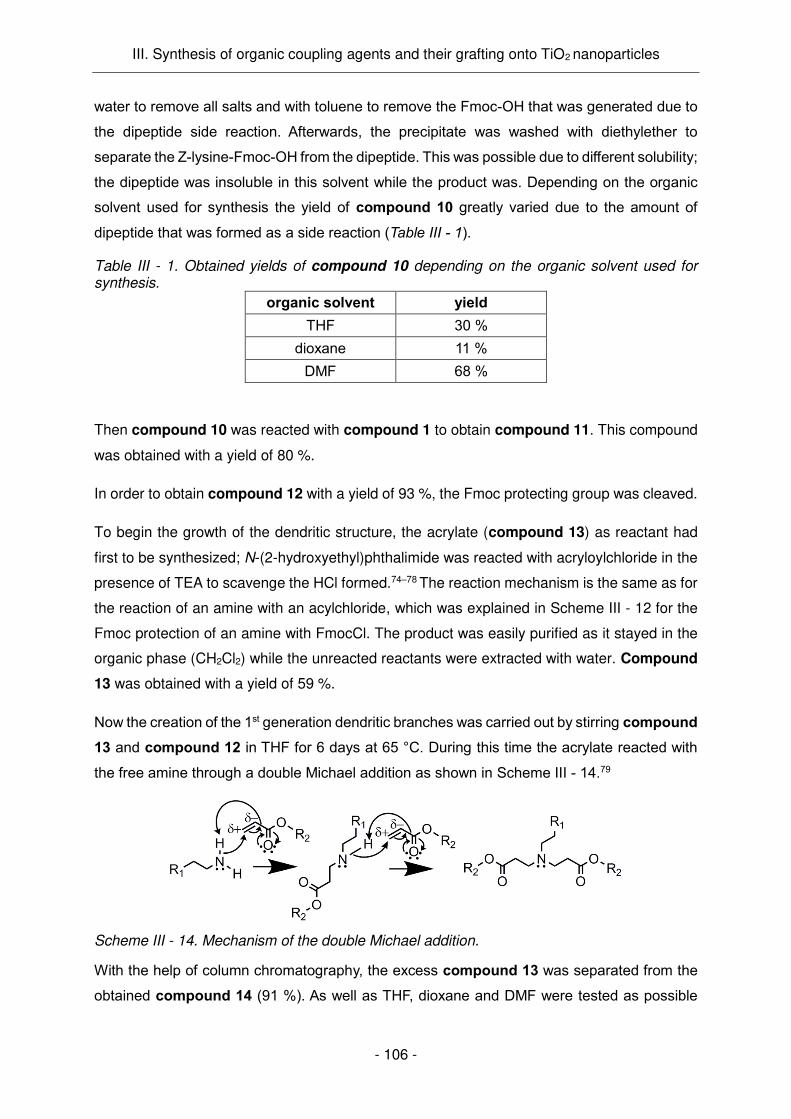
III. Synthesis of organic coupling agents and their grafting onto TiO2 nanoparticles
- 106 -
water to remove all salts and with toluene to remove the Fmoc-OH that was generated due to
the dipeptide side reaction. Afterwards, the precipitate was washed with diethylether to
separate the Z-lysine-Fmoc-OH from the dipeptide. This was possible due to different solubility;
the dipeptide was insoluble in this solvent while the product was. Depending on the organic
solvent used for synthesis the yield of compound 10 greatly varied due to the amount of
dipeptide that was formed as a side reaction (Table III - 1).
Table III - 1. Obtained yields of compound 10 depending on the organic solvent used for synthesis.
organic solvent yield
THF 30 %
dioxane 11 %
DMF 68 %
Then compound 10 was reacted with compound 1 to obtain compound 11. This compound
was obtained with a yield of 80 %.
In order to obtain compound 12 with a yield of 93 %, the Fmoc protecting group was cleaved.
To begin the growth of the dendritic structure, the acrylate (compound 13) as reactant had
first to be synthesized; N-(2-hydroxyethyl)phthalimide was reacted with acryloylchloride in the
presence of TEA to scavenge the HCl formed.74–78 The reaction mechanism is the same as for
the reaction of an amine with an acylchloride, which was explained in Scheme III - 12 for the
Fmoc protection of an amine with FmocCl. The product was easily purified as it stayed in the
organic phase (CH2Cl2) while the unreacted reactants were extracted with water. Compound
13 was obtained with a yield of 59 %.
Now the creation of the 1st generation dendritic branches was carried out by stirring compound 13 and compound 12 in THF for 6 days at 65 °C. During this time the acrylate reacted with
the free amine through a double Michael addition as shown in Scheme III - 14.79
Scheme III - 14. Mechanism of the double Michael addition.
With the help of column chromatography, the excess compound 13 was separated from the
obtained compound 14 (91 %). As well as THF, dioxane and DMF were tested as possible

III. Synthesis of organic coupling agents and their grafting onto TiO2 nanoparticles
- 107 -
reaction solvents that solubilized the reactants sufficiently. Nevertheless, in these solvents only
the formation of one branch was achieved.
For the subsequent deprotection of the Z-protected amine of compound 14 the hydrogenation
with Pd on carbon was carried out as described for the attempt to obtain compound 9. This
treatment does usually not affect the Boc and phthalimide protecting groups present in
compound 14.54,55 During analysis of the expected Z-deprotected compound 15, NMR and
MS analyses indicated a decomposition of the compound; parts of the dendritic branches were
removed by transesterification reactions with the methanol solvent. The base and acid
catalysed transesterification mechanism is shown in Scheme III - 15.
Scheme III - 15. The a) base and b) acid catalysed transesterification mechanism with B representing a base.84
In this specific case R1 would be the methanol solvent, R2 the coupling agent and R3 the benzyl
group of Z. How the Pd/H2 catalyses the transesterification has not been studied in detail yet
as acidic or basic catalysis seems to be handier and very few publications can be found that
mention such transesterifications using similar catalysts.80–83
In order to further determine which reaction conditions are leading to a transesterification
reaction, several stability tests were carried out on compound 14. The results of these
examinations are shown in Table III - 2. As this mechanism is an equilibrium driven reaction
with an alcohol, it is logical that the presence of methanol or ethanol favoured
transesterifications. Additionally, a base or Pd and H2 had to be present to catalyse this
reaction, while acidic conditions did not promote the reaction in this case. If the catalytic

III. Synthesis of organic coupling agents and their grafting onto TiO2 nanoparticles
- 108 -
hydrogenation would be carried out in THF no side reactions are supposed to occur and the
reaction product would be compound 15 as expected (given that the Z cleavage is
successful).
Table III - 2. Stability tests with compound 14 over 24 h (except for the last case: 12 h).
solvent catalyst stability (proved by NMR and/or MS)
methanol HCl in water stable
methanol KOH in water transesterification
methanol Pd/C, H2 transesterification
THF Pd/C, H2 stable
THF KOH in water hydrolysis
ethanol/water NH3 in water transesterification
Nevertheless, in the following planned reaction steps, washings with basic water were
necessary, which also seemed to affect the stability of the compound (like in Table III - 2; THF
and KOH) even without the presence of an alcohol. In this case a small percentage of
compound 14 appeared to be hydrolysed under base catalysis resulting in the carboxylic acid
and the alcohol. The reaction mechanism of this reaction is similar to Scheme III - 15 a) while
R1 would be a proton. This was the first argument against the use of compound 14 for the
synthesis as a coupling agent but even more crucial was the planned grafting of the final
coupling agent onto the particle. This reaction had to be carried out in a hydroalcoholic solvent
and in the presence of a base (like in Table III - 2 ethanol/water and NH3), which both are
indispensable for the hydrolysis and condensation reactions of the coupling agent (as
discussed in III.2.). Under these conditions, the coupling agent would definitely be destroyed.
This is why a modification of the structure of the dendritic branches was necessary; the ester
groups were replaced by amide groups, which are more stable and should withstand the
subsequent reaction steps.
The alternative synthesis route for the 1st generation dendritic coupling agent III is shown in
Scheme III - 16. The acrylate was substituted by an acrylamide for the creation of the branches.
In order to obtain this reactant, two synthetic steps were required.85 First, 2-chloropropylamine
hydrochloride was reacted with acryloylchloride in CH2Cl2 and in the presence of TEA to
scavenge the HCl formed. The reaction mechanism is the same as for the reaction of an amine
with an acylchloride, which was explained in Scheme III - 12. The TEA•HCl salt was filtered off
and the unreacted reactants were washed away with basic water to obtain pure compound
16 (88 %).
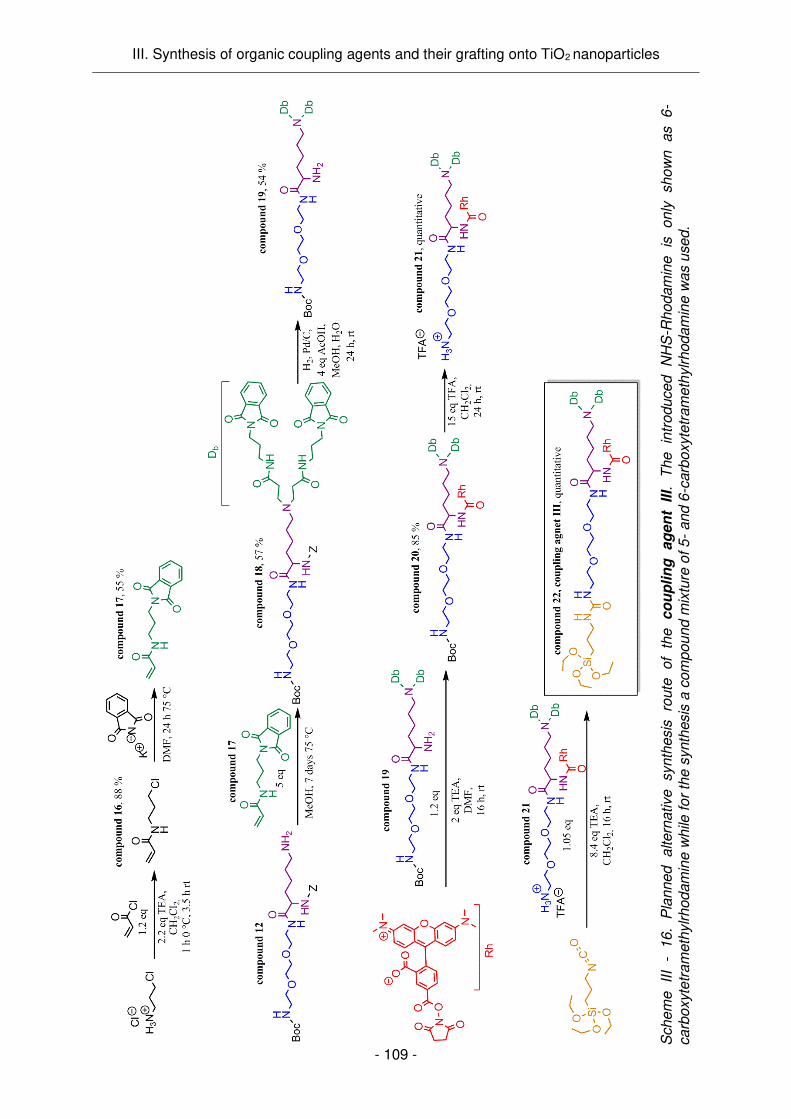
III. Synthesis of organic coupling agents and their grafting onto TiO2 nanoparticles
- 109 - S
ch
em
e
III
- 16.
Pla
nne
d
altern
ative
synth
esis
ro
ute
of
the
co
up
lin
g
ag
en
t III.
The
intr
oduce
d
NH
S-R
hod
am
ine
is
only
sh
ow
n
as
6-
ca
rbo
xyte
tra
meth
ylrh
od
am
ine
wh
ile f
or
the s
ynth
esis
a c
om
pou
nd
mix
ture
of
5-
and 6
-carb
oxyte
tram
eth
ylrh
od
am
ine
wa
s u
se
d.
III. Synthesis of organic coupling agents and their grafting onto TiO2 nanoparticles
- 110 -
Afterwards, potassium phthalimide was reacted with compound 16 in DMF (75 °C, 24 h) via
Gabriel synthesis to yield compound 17, following a SN2 mechanism. The reaction results in
a phthalimide-protected primary amine. The formed KCl as a side product was filtered off and
the compound was purified via column chromatography to yield pure compound 17 (55 %).
During this reaction, polymerization of the reactant compound 16 led to various side products
lowering the yield.
In order to obtain compound 18, compound 12 and compound 17 were reacted in methanol
via double Michael addition as described in Scheme III - 14.86,87 For this reaction to take place,
the reactants had to be heated to 75 °C and stirred for 7 days. In contrast to the acrylate, the
acrylamide showed a lower reactivity towards the free amine while easily polymerizing, which
led to lower yields of compound 18 (57 %). The pure desired product was obtained after
purification by column chromatography.
Subsequent Z deprotection was carried out via hydrogenation with Pd on carbon as described
for the synthesis attempt of compound 9. Our findings confirmed other publications that - in
the case of lysine - the Z cleavage was only possible with the addition of an acid protonating
the heteroatom to facilitate the reaction while strongly acidic conditions led to a parallel Boc
deprotection.65–71 In the presence of 4 eq acetic acid the Boc protecting group was not affected
while an addition of 2 eq HCl already resulted in Boc cleavage. Due to the present acid,
compound 19 was first obtained as a salt and it was possible to extract it with water from the
organic phase that contained the unreacted compound 18. After basification of the aqueous
phase, the pure product as free amine was recovered with dichloromethane (54 % yield).
In order to introduce the dye into the coupling agent, compound 19 was reacted with 5-/6-
carboxytetramethylrhodamine, succinimidyl ester (NHS-Rhodamine) in presence of TEA. DMF
was used as solvent to guarantee the solubility of all reactants. After 15 h of reaction, all volatile
compounds were removed and the obtained crude product was dissolved in CH2Cl2. The
desired product was separated from deactivated NHS-Rhodamine (due to hydrolysis), the side
product NHS and unreacted compound 19 by washing with basic and acidic water. This
procedure resulted in compound 20 (85 %).
For Boc protecting group cleavage, similar to the second synthesis attempt of compound 8,
compound 20 was dissolved in CH2Cl2 and TFA was added to obtain compound 21 after
reaction overnight in quantitative yield. Finally, the silane moiety was added to the compound
21. In order to do so, the deprotected amine, which was obtained as an ammonium salt, was
dissolved in CH2Cl2 with the help of an excess of TEA. Then it was reacted with triethoxy(3-
isocyanatopropyl)silane overnight. Afterwards, the solvent and excess TEA were evaporated

III. Synthesis of organic coupling agents and their grafting onto TiO2 nanoparticles
- 111 -
to obtain compound 22, also called coupling agent III, in quantitative yield. It has to be
mentioned that the side product TEA•TFA was still present in the compound. This small
quantity of salt was not supposed to interfere in subsequent grafting reactions.
The feasibility to introduce rhodamine into the coupling agent via amide bond formation and to
finalize the coupling agent III has been herein proved. Nevertheless, the commercial NHS-
rhodamine was only available in small quantities. Consequently, the coupling agent III was
obtained in quantities too limited to be used for grafting approaches. In general, the NHS-
activated as well as the non-activated 5-/6-carboxytetramethylrhodamine are both
commercially not available with a reasonable price and quantity. This is why for future studies,
the synthesis of carboxytetramethylrhodamine and its subsequent activation for amide
formation would be advisable and has already been proved to be feasible in literature.88
III.1.2. Synthesis of dendritic non-fluorescent coupling agents
The approach to synthesize non-fluorescent coupling agents emerged out of the problems
occurring during the synthesis of the coupling agents II and III. Non-fluorescent dendritic
coupling agents are useful to study the charge-dependent cellular uptake as they can finely
manipulate the particle surface charge. They will also be a suitable tool to study the dendritic
effect of the positively charged terminal groups without having to consider charge effects of an
incorporated dye. Analysis techniques that do not rely on fluorescence, can be used to detect
the functionalized nanoparticles; for example confocal Raman microscopy. This is why the
synthesis of non-fluorescent coupling agents is valuable to gain more insights into the
behaviour of functionalized NP systems.
III.1.2.a. Coupling agent IV (compound 25)
The first non-fluorescent coupling agent is a 1st generation dendron showing a similar structure
to coupling agent III while not containing the lysine and the rhodamine B components. Its
synthesis route is described in Scheme III - 17.
In order to obtain compound 23, compound 1 and compound 17 were reacted under the
same conditions as used for compound 18. In the same way, the yield (46 %) of the purified
compound 23 (after column chromatography) was considerably low due to polymerization
reactions of the acrylamide. Subsequent Boc deprotection was carried out with the help of a
TFA treatment, similar to the second synthesis attempt of compound 8. The resulting
compound 24 was obtained as a TFA salt in quantitative yield and not transformed into a salt-

III. Synthesis of organic coupling agents and their grafting onto TiO2 nanoparticles
- 112 -
Sch
em
e III -
17.
Pla
nn
ed s
yn
thesis
ro
ute
of th
e c
ou
pli
ng
ag
en
t IV
.

III. Synthesis of organic coupling agents and their grafting onto TiO2 nanoparticles
- 113 -
free compound as this free amine acts as a strong base, reacting with the phthalimide
protecting group during storage. The proposed mechanism for this reaction is described in
Scheme III - 18 and may lead mainly to a cyclisation of the molecule (or to a smaller extent in
a polymerization, which was not detectable in MS). The cyclisation of compound 24 was
concluded as MS showed the same mass but NMR indicated the shift of the protons whose
environment changed due to the reaction. Additionally, the subsequent urea formation did not
take place due to no available primary amine.
Scheme III - 18. Proposed mechanism for the phthalimide ring opening by a primary amine.
For the synthesis of compound 25, compound 24 was reacted with triethoxy(3-
isocyanatopropyl)silane in presence of TEA similar to the synthesis of compound 4. TEA
withdrew the TFA from the primary amine of compound 24 making it accessible for a reaction
with the isocyanate. The isourea formation proceeded faster than the before described reaction
of the amine with the phthalimide group resulting in compound 25 in quantitative yield. This
coupling agent IV, is later on used for the grafting onto TiO2 nanoparticles.
The synthesis of 2nd generation dendritic coupling agent V and coupling agent VI (Scheme
III - 19) with a similar structure either to coupling agent III or to coupling agent IV was started
but as the coupling agents were not completed, these synthesis routes are not discussed here.
Nevertheless, the synthesis protocols can be found in the experimental part of this manuscript
(compound 26 to compound 30).

III. Synthesis of organic coupling agents and their grafting onto TiO2 nanoparticles
- 114 -
Scheme III - 19. 2nd generation dendritic coupling agents.

III. Synthesis of organic coupling agents and their grafting onto TiO2 nanoparticles
- 115 -
III.2. Grafting of functional coupling agents onto particles
After the synthesis of the organic coupling agents, their grafting onto TiO2 nanoparticles was
carried out. The surface modification of TiO2 groups was realized via the reaction of the surface
hydroxyl groups of the particles with the silanol group of the grafting agents resulting in
covalent bonds. As grafting agents, organo-silanes were chosen as their reactive silane groups
can typically covalently react onto inorganic substrates (like silica, gold or metal oxides)89 while
they do not react with organic molecules. The chosen trimethoxy- or triethoxy-organo-silanes
were preferred to trichloro-organo-silanes as these are less reactive (R–Si(OC2H5)3 < R–
Si(OCH3)3 < R–SiCl3) and may lead to a more uniform grafting due to less self-condensation
before or during grafting.
As the particles were obtained in aqueous solution during synthesis and mainly showed
hydrophilic properties, the grafting conditions had to be in aqueous solutions. Furthermore, the
presence of water is favourable for the silanization, since it promotes the hydrolysis of the
alkoxy-organo-silanes. Hydrolysis has first to take place before further condensation reactions
can proceed - as already shown in Chapter II.3.1. Additionally, the reaction medium was
chosen to be hydroalcoholic as hydrophilic and protic solvents usually accelerate the
hydrolysis of silanes increasing the reaction kinetics.90,91 In the case of silanization, the amount
of free hydroxyl groups on a surfaces is often too low to form more than one siloxane group on
it, which may be the case for the TiO2 particles used, bearing additional organic groups on their
surface (as discussed in Chapter II.1. and II.2.). This is the reason why cross-linking reactions
between the coupling agents also occur leading to a densification of the siloxane layer and
thus to an even stronger attachment of the layer around the particle surface.92 Nevertheless,
the already present organic surface moieties may also impede the cross-linking reactions
between the coupling agents.
In addition to the silanization, an unwanted polycondensation of the organo-silane can also
take place leading to the formation of silane aggregates. If these aggregates condensate onto
the particle surfaces the homogeneity of the surface layer can be greatly diminished.93 The
preferential reaction of silanes can be mediated by the addition of an acid or a base as
catalysts. Acids tend to promote the formation of net like structures (due to slower hydrolysis)
while bases promote particle like structures (due to faster hydrolysis).94,95 The functionalization
of a material works with both catalysts but under acidic conditions oligomerization is more
probable.96 This is why a base is usually chosen to promote the surface functionalization of
nanoparticles. Most often ammonia is used as the base but also other amines with
exchangeable protons like ethylamine or diethylamine are an option.95,97,98 Even if base
catalysed functionalization is preferred, the acidic catalysis approach also had to be taken into

III. Synthesis of organic coupling agents and their grafting onto TiO2 nanoparticles
- 116 -
consideration as the synthesized TiO2 nanoparticles are nicely dispersed only under acidic
conditions, which is important for the accessibility of hydroxyl surface groups. The stabilisation
of the nanoparticles under basic conditions with the help of an stabilising agent is an option
that has been chosen before.99–101 However, the stabiliser can also impede the surface
accessibility of the particles and the removal of it after grafting cannot be guaranteed. This
influences the final surface properties and can have negative effects on the later cell culture
application. Due to this, the stabilisation of particles with stabilising agents was not chosen for
the graftings carried out in this work.
Furthermore, the reaction of organo-silanes can also be influenced by the experimental
parameters like the reaction time, temperature and solvent or water concentration chosen for
the surface functionalisation. Raising the temperature for example accelerates the reaction
kinetics and therefore decrease the reaction time, which is mainly dependent on the reactivity
of the silane and can vary from several minutes to hours.102 Additionally, the slower the silane
addition is, the more efficient the surface coverage.103 The concentration of particles in the
reaction solution should also be relatively low, to avoid cross-linking between the particles
through siloxane bridges.
III.2.1. Optimization of grafting protocols with commercial silanes
Due to the before mentioned factors influencing the successful grafting of organo-silanes onto
particle surfaces, the commercial silane [3-(2-aminoethylamino)propyl]trimethoxysilane
(Scheme III - 20) was used to first determine an optimized grafting protocol. This molecule was
chosen as a model as it also shows hydrophilic properties and an amine end group similar to
the synthesized coupling agents (III.1). Grafting conditions104 such as ethanol to water
concentration, were chosen according to the results of the silica shell formation around the
synthesized TiO2 particles as discussed in Chapter II.3.1. In order to determine the most
suitable catalyst, graftings were carried out first with the addition of ammonia as a catalyst
(improving the functionalization of the particles by the silane). A second reaction protocol
included the addition of nitric acid for the silane addition as it provides good particle stability
and later ammonia to complete the grafting reaction, in an attempt to combine both advantages
of the catalysts.
Scheme III - 20. [3-(2-Aminoethylamino)propyl]trimethoxysilane.

III. Synthesis of organic coupling agents and their grafting onto TiO2 nanoparticles
- 117 -
In order to determine the minimum of silane needed for the grafting reactions, the theoretical
amount of silanes needed to obtain a monolayer on the particles was calculated. The following
assumptions were made: the surface area of the particle samples that is available for grafting
is the BET surface area determined by N2 sorption and the restricting factor for the monolayer
density on a surface is the distance between uncoupled hydrolysed silanes.89 As the maximal
length of a Si-OH…HO-Si sequence is d = 0.6 nm,89 this is the diameter of the assumed
covered circular area A = d ∗ π of a single hydrolysed organo-silane (N = 1). The surface
coverage c by an organo-silane is therefore:
c = nA = NNA ∗ A = NA ∗ d ∗ π = . ∗ −6 molm² with NA as Avogadro’s constant ( . ∗ o ) and the chemical amount n = NNA. The
calculated amount of silane for each of the particle samples utilized for grafting in this chapter
are shown in Table III - 3.
Table III - 3. Calculation of the theoretic amount of silane needed depending on the specific surface area of the particle sample.
particle samples specific surface area S (N2 sorption) [m²/g]
theoretic amount a of required silane per mg particles: 𝐚 = 𝐜 ∗ 𝐒 [µmol/mg]
AA-TiO2 207.5 1.22
MEEAA-TiO2 (200 °C 4 h) 185.2 1.09
Following this, concentrations from 50 µmol to 0.5 µmol [3-(2-aminoethylamino)propyl]-
trimethoxysilane per mg nanoparticle were used. The AA-TiO2 particles (160 °C, 4 h) were
chosen as model particles for both the basic and acidic (to later basic) grafting protocols. After
grafting the silane onto them, the samples were characterized via zeta potential, DLS, as well
as DRIFT measurements. The results are shown in Table III - 4 (zeta potential and DLS
analyses) and in Figure III - 2 (DRIFT). DLS measurements have been carried out in ethanol,
to visualize a successful functionalization of the nanoparticles as the non-functionalized
particles are not stably dispersed in ethanol resulting in large agglomerate sizes. The organo-
silane mediates a stabilisation in ethanol; this means if the agglomerate size is significantly
decreased, the functionalization has been successful and the particle surface is sufficiently
modified to ensure a tuning of the surface properties of the particles by the organic grafting
agent. The results of DLS measurements all indicate a successful functionalization as the
agglomerate size of the (former not stably dispersed) particles in ethanol is smaller than 50 nm
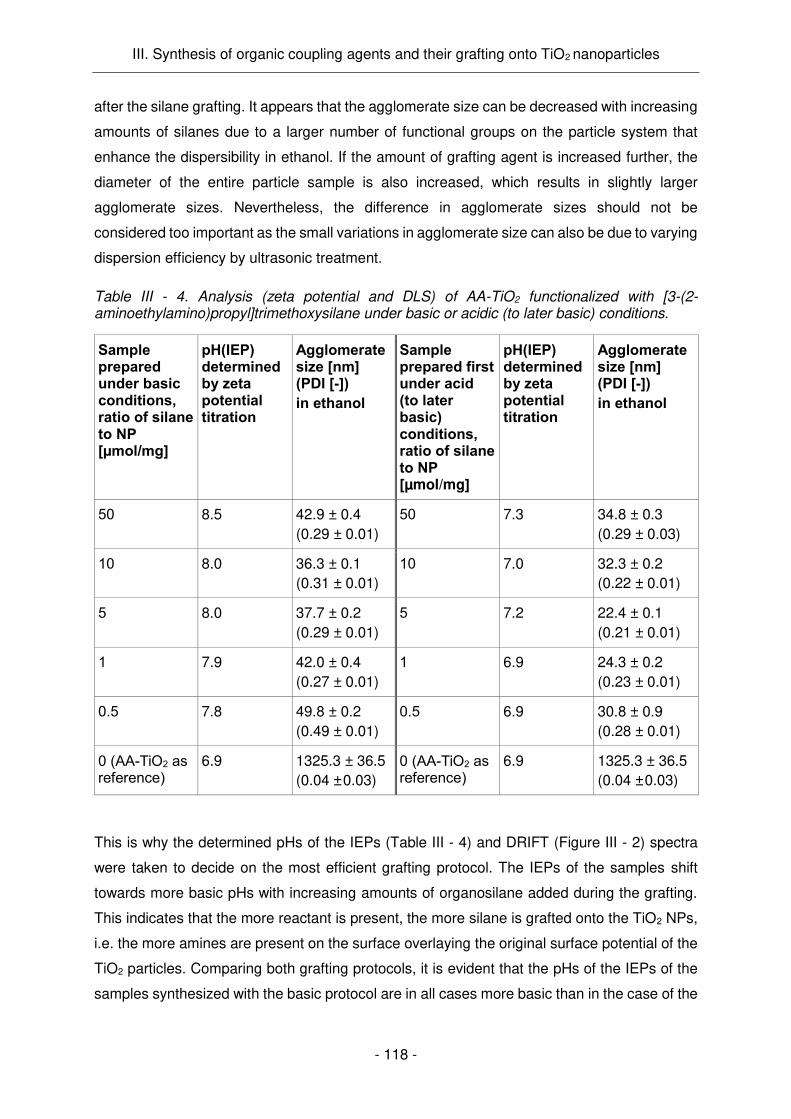
III. Synthesis of organic coupling agents and their grafting onto TiO2 nanoparticles
- 118 -
after the silane grafting. It appears that the agglomerate size can be decreased with increasing
amounts of silanes due to a larger number of functional groups on the particle system that
enhance the dispersibility in ethanol. If the amount of grafting agent is increased further, the
diameter of the entire particle sample is also increased, which results in slightly larger
agglomerate sizes. Nevertheless, the difference in agglomerate sizes should not be
considered too important as the small variations in agglomerate size can also be due to varying
dispersion efficiency by ultrasonic treatment.
Table III - 4. Analysis (zeta potential and DLS) of AA-TiO2 functionalized with [3-(2-aminoethylamino)propyl]trimethoxysilane under basic or acidic (to later basic) conditions.
Sample prepared under basic conditions, ratio of silane to NP [µmol/mg]
pH(IEP) determined by zeta potential titration
Agglomerate size [nm] (PDI [-]) in ethanol
Sample prepared first under acid (to later basic) conditions, ratio of silane to NP [µmol/mg]
pH(IEP) determined by zeta potential titration
Agglomerate size [nm] (PDI [-]) in ethanol
50 8.5 42.9 ± 0.4
(0.29 ± 0.01)
50 7.3 34.8 ± 0.3
(0.29 ± 0.03)
10 8.0 36.3 ± 0.1
(0.31 ± 0.01)
10 7.0 32.3 ± 0.2
(0.22 ± 0.01)
5 8.0 37.7 ± 0.2
(0.29 ± 0.01)
5 7.2 22.4 ± 0.1
(0.21 ± 0.01)
1 7.9 42.0 ± 0.4
(0.27 ± 0.01)
1 6.9 24.3 ± 0.2
(0.23 ± 0.01)
0.5 7.8 49.8 ± 0.2
(0.49 ± 0.01)
0.5 6.9 30.8 ± 0.9
(0.28 ± 0.01)
0 (AA-TiO2 as reference)
6.9 1325.3 ± 36.5
(0.04 ± 0.03)
0 (AA-TiO2 as reference)
6.9 1325.3 ± 36.5
(0.04 ± 0.03)
This is why the determined pHs of the IEPs (Table III - 4) and DRIFT (Figure III - 2) spectra
were taken to decide on the most efficient grafting protocol. The IEPs of the samples shift
towards more basic pHs with increasing amounts of organosilane added during the grafting.
This indicates that the more reactant is present, the more silane is grafted onto the TiO2 NPs,
i.e. the more amines are present on the surface overlaying the original surface potential of the
TiO2 particles. Comparing both grafting protocols, it is evident that the pHs of the IEPs of the
samples synthesized with the basic protocol are in all cases more basic than in the case of the

III. Synthesis of organic coupling agents and their grafting onto TiO2 nanoparticles
- 119 -
protocol starting under acidic conditions. This indicates a more efficient grafting under basic
conditions.
The DRIFT spectra show an increase in the relative intensities of the characteristic absorption
bands of the grafted organo-silane. The intensities of the bending vibrations of CH2 and NH at
1450 cm-1 and 1590 cm-1 incline with higher amounts of added grafting agent for both grafting
conditions. This becomes evident if one compares these maxima for example with the local
absorption minima close to 1500 cm-1. However, it has to be mentioned that these spectra
cannot be quantitatively analysed as firstly the baseline corrections are rather difficult due to
the high absorption of TiO2 (below ~ 1000 cm-1) and secondly no specific vibration band was
found without intensity changes for all measured samples. Already with the smallest organo-
silane addition, the vibration bands of the organic moieties (acetylacetonate and p-toluene
sulfonic acid) resting from TiO2 synthesis seem to be drastically decreased. This can be
explained by the surface sensitivity of DRIFT measurements; the grafted silane present on the
surface may overlay the signals of the other present molecules.
Figure III - 2. IR (DRIFT) spectra of AA-TiO2 functionalized with [3-(2-aminoethylamino)propyl]trimethoxysilane under a) basic or b) acidic (to later basic) conditions.(*adsorbed HNO3 of the grafting procedure)
In this context it is also not clear, if the grafted silane layer substitutes the organic surface
moieties (Scheme III - 21 a), leaves space for them (Scheme III - 21 b), covers for them
(Scheme III - 21 c) or does a combination of all these possibilities. Comparing the samples of
both grafting protocols modified with 0.5 or 0 µmol/mg organo-silane, the basic protocol seems
to be slightly more efficient as the vibration bands of the organic surface groups from NP
synthesis are less intense compared to the vibration bands of the grafted [3-(2-
aminoethylamino)propyl]trimethoxysilane, i.e. the CH2 and NH vibrations.

III. Synthesis of organic coupling agents and their grafting onto TiO2 nanoparticles
- 120 -
Scheme III - 21. Possible interactions between the grafted silanes and surface moieties of TiO2 particles (R, R1 = organic groups): silanes a) substitute the surface group, b) leave space for it or c) enclose it.
Thus, the results obtained by DRIFT measurements seem to confirm the outcomes of zeta
potential analyses and the basic protocol is considered to be the more suitable protocol as the
grafting of silane onto the particles is more efficient. This is important as it means that less side
products caused by oligomerization are formed and the total amount of silane needed for the
grafting is lower. As the basic protocol was therefore chosen for future graftings, the
photocatalytic activity of the samples (functionalized via the basic protocol) with the smallest
amounts of silane (1 and 0.5 µmol/mg), was examined to determine the influences of the
surface functionalization on the photocatalytic activity. The results are shown in Figure III - 3.
The activity of AA-TiO2 functionalized with 1 µmol/mg and 0.5 µmol/mg [3-(2-
aminoethylamino)propyl]trimethoxysilane is reduced to 56 % and 64 % compared to the
unmodified particles.
Figure III - 3. Photocatalytic activity of AA-TiO2 functionalized with 1 µmol/mg or 0.5 µmol/mg [3-(2-aminoethylamino)propyl]trimethoxysilane in comparison to the unmodified AA-TiO2. The values are normed on the amount of degraded dichloroacetic acid (DCA, i.e. produced Cl-) by AA-TiO2 after 3 h photocatalysis test (= 100%).

III. Synthesis of organic coupling agents and their grafting onto TiO2 nanoparticles
- 121 -
In order to study if a further decrease in the amount of grafting agent still results in an efficient
functionalization but a higher preserved photocatalytic activity, (3-trimethoxysilylpropyl)-
diethylenetriamine was utilized as a model organo-silane (Scheme III - 22).
Scheme III - 22. (3-Trimethoxysilylpropyl)-diethylenetriamine.
This molecule bears more CH2 and NH groups and therefore the shift of the IEPs of the
functionalized particles was expected to be more pronounced. Additionally, it has a higher
molecular weight, which is more similar to the synthesized organo-silanes and might impede
the photocatalytic activity more significantly. The results obtained from grafting AA-TiO2 with
N1-(3-trimethoxysilylpropyl)diethylenetriamine in concentrations from 1 to 0.05 µmol/mg
particle are summarized in Table III - 5.
Table III - 5. Analysis (zeta potential, DLS and photocatalytic efficiency) of AA-TiO2 functionalized with N1-(3-trimethoxysilylpropyl)diethylenetriamine under basic conditions.
Sample prepared under basic conditions, ratio of silane to NP [µmol/mg]
pH(IEP) determined by zeta potential titration
Agglomerate size [nm] (PDI [-]) in ethanol
Photocatalytic efficiency compared to the unmodified particle samples after 3 h photocatalysis test
1 8.7 59.0 ± 19.0 (0.48 ± 0.24) 64 %
0.5 8.5 62.1 ± 5.7 (0.64 ± 0.20) 73 %
0.1 7.7 1200 ± 145 (0.38 ± 0.05) 67 %
0.05 7.3 932 ± 178 (0.17 ± 0.05) 82 %
0 (AA-TiO2 as reference)
6.9 1325.3 ± 36.5 (0.04 ± 0.03) 100 %
In comparison to the 1 and 0.5 µmol/mg [3-(2-aminoethylamino)propyl]-trimethoxysilane
grafted under basic conditions (Table III - 4), the pHs of the IEPs of N1-(3-
trimethoxysilylpropyl)diethylenetriamine are as expected more basic (8.7 and 8.5 compared to
7.9 and 7.8 for 1 and 0.5 µmol/mg, respectively). Additionally, the slightly higher hydrodynamic
diameters of the samples (around 60 nm instead of around 45 nm for both 1 and 0.5 µmol/mg)
are supposed to be mainly caused by the longer organic chain of the silane. Surprisingly, the
larger silane reduces the PC performance slightly less (64 % and 73 % compared to 56 % and
64 % for 1 and 0.5 µmol/mg, respectively). Possible explanations can be a better dispersion
state and higher positive surface charge at the acidic pH of the DCA degradation test. This
results in more accessible NP surface area and favours molecular adsorption, which is

III. Synthesis of organic coupling agents and their grafting onto TiO2 nanoparticles
- 122 -
supposed to lead to a more efficient catalytic degradation of DCA. Concerning the smaller
concentration of silane per mg NP (0.1 and 0.05 µmol/mg), one can conclude from DLS (large
agglomerate sizes) and zeta potential analyses (only small shifts of the pHs of the IEPs) that
these quantities are not sufficient to significantly influence the surface properties of the
particles. Therefore, these quantities are considered too low to provide an efficient surface
functionalization of the NPs.
Due to these results a concentration of 0.5 to 1 µmol silane per mg AA-TiO2 seems to be
optimal to obtain a significant change in the surface properties of the particles. These
concentrations are slightly smaller than the calculated one (1.22 µmol/mg), which could
indicate that the formed silane layer is not completely closed around the NP. This should
therefore provide a sufficient surface availability for PC reactions. However, the decrease in
the PC activity of 30 to 40 % cannot be avoided if one intends to manipulate the surface
properties via functionalization with organo-silanes.
After having proved the feasibility of modifying the AA-TiO2 nanoparticles with organo-silanes
and having determined the most efficient grafting conditions, the photocatalytically most active
particle sample MEEAA-TiO2 synthesized at 200 °C for 4 h was also functionalized with N1-(3-
trimethoxysilylpropyl)diethylenetriamine to determine the most appropriate silane
concentration for this system. This system was also chosen to be functionalized later on with
the synthesized coupling agents (III.2.2). The obtained results are summarized in Table III - 6.
Table III - 6. Analysis (zeta potential, DLS and photocatalytic efficiency) of MEEAA-TiO2 functionalized with N1-(3-trimethoxysilylpropyl)diethylenetriamine under basic conditions. The values obtained during the photocatalysis tests are normed on the amount of degraded DCA (produced Cl-) by MEEAA-TiO2 after 3 h photocatalysis test (= 100%).
ratio of silane to NP [µmol/mg]
pH(IEP) determined by zeta potential titration
Agglomerate size [nm] (PDI [-])
in EtOH
Photocatalytic efficiency compared to the unmodified particle samples after 3 h photocatalysis test
4 7.1 41.3 ± 0.6 (0.23 ± 0.01) 78 %
2 7.3 41.6 ± 0.6 (0.24 ± 0.02) 67 %
1 7.1 36.1 ± 0.6 (0.23 ± 0.03) 62 %
0.5 7.3 62.8 ± 0.5 (0.37 ± 0.01) 81 %
0 (MEEAA-TiO2 as reference)
6.6 1672 ± 520.4 (0.18 ± 0.12) 100 %

III. Synthesis of organic coupling agents and their grafting onto TiO2 nanoparticles
- 123 -
While the grafting with 0.5 µmol/mg seems to form a less dense layer, which is expressed by
a larger agglomerate size, all other concentrations show no significant differences in
agglomerate size or PC activity. It is assumed that with the amount of 1 µmol/mg a monolayer
is formed on the NP surfaces and therefore further condensation onto the surfaces is hindered
by the organic chains of the silanes. For increasing the silane layer on the particles,
significantly more grafting agent is needed. This assumption is supported by the theoretic
calculations, which indicated exactly a concentration of 1 µmol/mg for a monolayer on the
chosen MEEAA-TiO2 (200 °C 4 h). In comparison to the functionalized AA-TiO2 the IEP of the
MEEAA-TiO2 samples are slightly less shifted which could indicate either a less efficient
grafting or a higher influence of the organic surface groups that are already present on the
particle samples after synthesis.
Based on the obtained results, the concentration of 2 µmol/mg silane per NP was chosen as
ideal concentration for the future graftings (of synthesized coupling agents, discussed in
III.2.2). This concentration seemed to be a good equilibrium between a sufficient amount of
silane to guarantee a successful grafting even with larger, bulkier silanes and the probable
waste of excess silane.
III.2.2. Grafting of synthesized coupling agents onto MEEAA-TiO2 (200 °C, 4 h)
After having optimized the grafting protocol and determined suitable concentrations for the
functionalization of the most efficient photocatalytic nanoparticles, namely MEEAA-TiO2
synthesized at 200 °C for 4 h, the graftings of the synthesized coupling agents I and IV were
carried out with the chosen concentration of 2 µmol silane per mg NP.
III.2.2.a. Grafting of coupling agent I
The successful grafting of coupling agent I (Scheme III - 23) onto MEEAA-TiO2 was examined
with the help of zeta potential, DLS, IR and PL measurements.
Scheme III - 23. Coupling agent I.
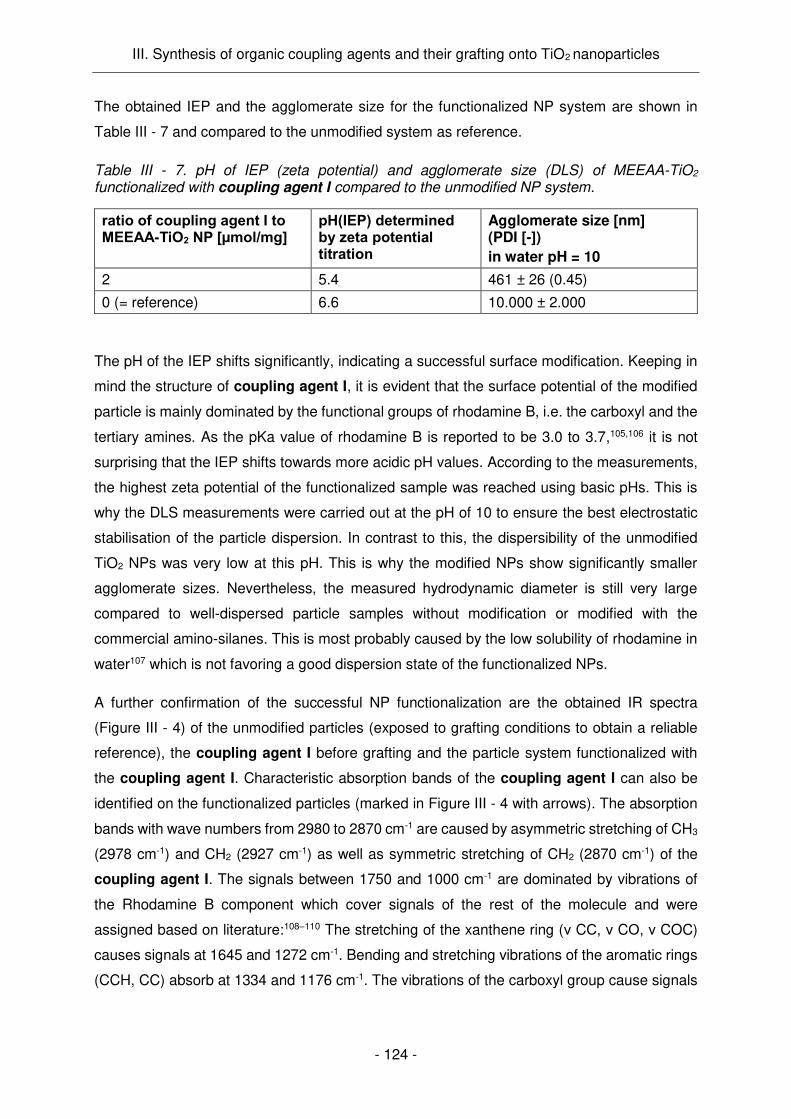
III. Synthesis of organic coupling agents and their grafting onto TiO2 nanoparticles
- 124 -
The obtained IEP and the agglomerate size for the functionalized NP system are shown in
Table III - 7 and compared to the unmodified system as reference.
Table III - 7. pH of IEP (zeta potential) and agglomerate size (DLS) of MEEAA-TiO2 functionalized with coupling agent I compared to the unmodified NP system.
ratio of coupling agent I to MEEAA-TiO2 NP [µmol/mg]
pH(IEP) determined by zeta potential titration
Agglomerate size [nm] (PDI [-])
in water pH = 10
2 5.4 461 ± 26 (0.45)
0 (= reference) 6.6 10.000 ± 2.000
The pH of the IEP shifts significantly, indicating a successful surface modification. Keeping in
mind the structure of coupling agent I, it is evident that the surface potential of the modified
particle is mainly dominated by the functional groups of rhodamine B, i.e. the carboxyl and the
tertiary amines. As the pKa value of rhodamine B is reported to be 3.0 to 3.7,105,106 it is not
surprising that the IEP shifts towards more acidic pH values. According to the measurements,
the highest zeta potential of the functionalized sample was reached using basic pHs. This is
why the DLS measurements were carried out at the pH of 10 to ensure the best electrostatic
stabilisation of the particle dispersion. In contrast to this, the dispersibility of the unmodified
TiO2 NPs was very low at this pH. This is why the modified NPs show significantly smaller
agglomerate sizes. Nevertheless, the measured hydrodynamic diameter is still very large
compared to well-dispersed particle samples without modification or modified with the
commercial amino-silanes. This is most probably caused by the low solubility of rhodamine in
water107 which is not favoring a good dispersion state of the functionalized NPs.
A further confirmation of the successful NP functionalization are the obtained IR spectra
(Figure III - 4) of the unmodified particles (exposed to grafting conditions to obtain a reliable
reference), the coupling agent I before grafting and the particle system functionalized with
the coupling agent I. Characteristic absorption bands of the coupling agent I can also be
identified on the functionalized particles (marked in Figure III - 4 with arrows). The absorption
bands with wave numbers from 2980 to 2870 cm-1 are caused by asymmetric stretching of CH3
(2978 cm-1) and CH2 (2927 cm-1) as well as symmetric stretching of CH2 (2870 cm-1) of the
coupling agent I. The signals between 1750 and 1000 cm-1 are dominated by vibrations of
the Rhodamine B component which cover signals of the rest of the molecule and were
assigned based on literature:108–110 The stretching of the xanthene ring (ν CC, ν CO, ν COC)
causes signals at 1645 and 1272 cm-1. Bending and stretching vibrations of the aromatic rings
(CCH, CC) absorb at 1334 and 1176 cm-1. The vibrations of the carboxyl group cause signals

III. Synthesis of organic coupling agents and their grafting onto TiO2 nanoparticles
- 125 -
at 1583 cm-1 (νas COO-), 1409 cm-1 (νs COO-) and 1243 cm-1 (ν CO), while the absorption band
at 1468 cm-1 may be attributed to vibrations of the ethylamino groups (ν CN).
Figure III - 4. IR (DRIFT or ATR) spectra of the MEEAA-TiO2 functionalized with coupling agent I (black) compared to the coupling agent I (red) and the unmodified MEEAA-TiO2
(blue).
The last evidence of a successful particle modification is the measured PL spectrum and the
strong pink colour of the samples visible by eye (Figure III - 5). The absorption and PL maxima
lie in the expected wavelength ranges, outside the absorption range of the TiO2 nanoparticles.
In order to finalize the examinations of the NP system functionalized with coupling agent I,
its photocatalytic (PC) activity was assessed and compared to the unmodified NPs reference.
The outcomes are shown in Figure III - 6. Based on the results obtained for the particles
modified with commercial silanes (III.2.1), it was expected that the PC performance is going to
be decreased after the grafting of coupling agent I. Nevertheless, the PC activity was
significantly increased which is surprising as the grafting of the silane reduced the TiO2 surface
area available for photocatalysis. There are two possible explanations for this behaviour; either
the rhodamine acts as photosensitizer or the modified surface charge enhances molecular
adsorption.

III. Synthesis of organic coupling agents and their grafting onto TiO2 nanoparticles
- 126 -
Figure III - 5. PL spectrum of unmodified (blue) and functionalized (black) MEEAA-TiO2 (with coupling agent I); excited at 556 nm (i.e. at the absorption maximum of the functionalized particle system). Additionally, photographs of both particle samples as dispersions in water at pH = 10 are shown.
Figure III - 6. PC activity of MEEAA-TiO2 functionalized with coupling agent I (black) compared to the unmodified MEEAA-TiO2 (blue). The values are normed on the amount of degraded DCA (produced Cl-) by MEEAA-TiO2 (4 h, 200 °C) after 3 h photocatalysis test (= 100 %).
It is well-known, that dyes that are in contact with semiconductor surfaces can transfer
absorbed energy.111 As rhodamine B absorbs light of a different wavelength range compared
to TiO2, the energy transfer of the dye onto the NP would increase the PC performance as
more light is absorbed in total, i.e. more electron-hole pairs are created that can take part in
PC reactions. Rhodamine B seems suitable for this approach112 but it is questionable if this is
really happening or/and having a significant influence on the PC performance of the sample

III. Synthesis of organic coupling agents and their grafting onto TiO2 nanoparticles
- 127 -
as the applied UV-light for the PC test should only lie between 300 and 400 nm and the main
absorbance of rhodamine B takes place over 460 nm.113 It is considered as more probable that
the modified surface charge (significant shift of the pH of the IEP) or the properties of the
surface moieties may either favour the adsorption of the dichloroacetic acid used as
degradable substance or of the water or oxygen molecules. This would also lead to a more
efficient photocatalysis as every photocatalytic reaction demands pre-adsorption of the
participating molecules.114
To sum up, while a PL nanoparticle system with a good PC activity was successfully obtained,
its surface charge and agglomerate size is not adequate for the use as positively charged anti-
tumour agent. This is why the introduction of amines as functional terminal groups within the
surface agent has to be achieved.
III.2.2.b. Grafting of coupling agent IV
Concerning this matter, the successfully synthesized coupling agent IV (Scheme III - 24) was
grafted onto MEEAA-TiO2 (4 h, 200 °C). The obtained modified NP system was again analysed
with zeta potential and DLS (Table III - 8).
Scheme III - 24. Coupling agent IV.
Table III - 8. IEP (zeta potential) and agglomerate size (DLS) of MEEAA-TiO2 functionalized with coupling agent IV compared to the unmodified NP system.
ratio of coupling agent IV to MEEAA-TiO2 NP [µmol/mg]
pH(IEP) determined by zeta potential titration
Agglomerate size [nm] (PDI [-])
in water pH = 3
2 6.2 658.1 ± 21.2 (0.8) 0 (= reference) 6.6 32.8 ± 0.8 (0.1)
Considering the structure of coupling agent IV, the only marginal shift of the IEP of the
functionalized NPs in comparison to the NPs before grafting is no surprise as the organic
molecule does not bear any ionic groups and should therefore not influence the surface charge
of the NPs. This is why the zeta potential measurements are not appropriate to prove the
grafting in this particular case. The agglomerate size of the samples was considerably

III. Synthesis of organic coupling agents and their grafting onto TiO2 nanoparticles
- 128 -
augmented after the functionalization which may be explained by a less efficient electrostatic
stabilisation of the samples due to the uncharged coupling agent. However, it could also point
out that the functionalization led to the formation of NP clusters resulting in the aggregation of
particles. IR measurements (Figure III - 7) were able to finally prove the grafting of the
coupling agent IV onto MEEAA-TiO2.
Figure III - 7. IR (DRIFT or ATR) spectra of the MEEAA-TiO2 functionalized with coupling agent IV (black) compared to the coupling agent IV (red – compound 24) and the unmodified MEEAA-TiO2 (blue) in the region a) 3750-2500 cm-1 and b) 1800-1250 cm-1.
For these measurements compound 24 (Scheme III - 17) instead of compound 25 (Scheme
III - 17) was used as it was more stable and therefore easier to handle during the analysis
while already providing the most important molecular functions of the coupling agent. Its IR
spectrum is compared to the spectra of the unmodified NPs and of the coupling agent IV
grafted onto the NPs. Characteristic absorption bands of the compound 24 can also be
identified on the functionalized particles (marked in Figure III - 7 with arrows). Symmetric
stretching of NH in amides absorbs at 2285 cm-1 and symmetric stretching of CH in the
aromatic rings of the phthalimide at 3085 cm-1. The absorption bands with wave numbers from
2955 to 2850 cm-1 are caused by asymmetric and symmetric stretching of CH2. The signals at
1770 and 1706 cm-1 are dominated by asymmetric and symmetric stretching vibrations of the
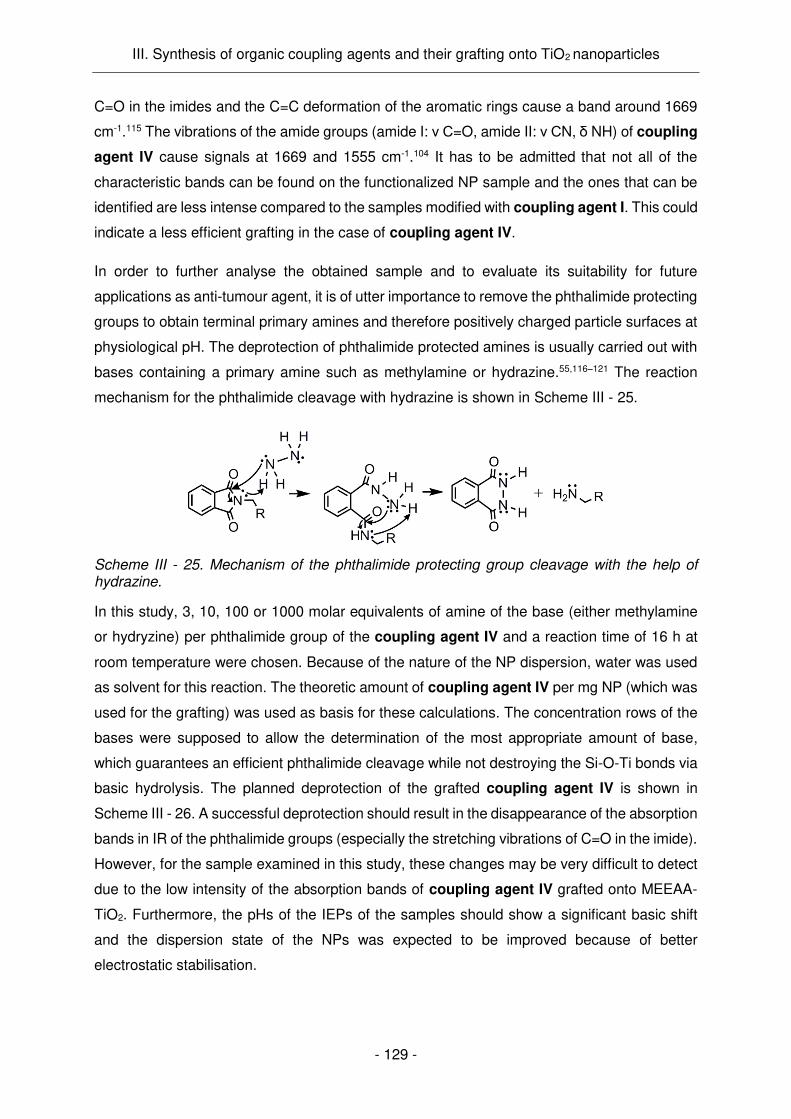
III. Synthesis of organic coupling agents and their grafting onto TiO2 nanoparticles
- 129 -
C=O in the imides and the C=C deformation of the aromatic rings cause a band around 1669
cm-1.115 The vibrations of the amide groups (amide I: ν C=O, amide II: ν CN, δ NH) of coupling
agent IV cause signals at 1669 and 1555 cm-1.104 It has to be admitted that not all of the
characteristic bands can be found on the functionalized NP sample and the ones that can be
identified are less intense compared to the samples modified with coupling agent I. This could
indicate a less efficient grafting in the case of coupling agent IV.
In order to further analyse the obtained sample and to evaluate its suitability for future
applications as anti-tumour agent, it is of utter importance to remove the phthalimide protecting
groups to obtain terminal primary amines and therefore positively charged particle surfaces at
physiological pH. The deprotection of phthalimide protected amines is usually carried out with
bases containing a primary amine such as methylamine or hydrazine.55,116–121 The reaction
mechanism for the phthalimide cleavage with hydrazine is shown in Scheme III - 25.
Scheme III - 25. Mechanism of the phthalimide protecting group cleavage with the help of hydrazine.
In this study, 3, 10, 100 or 1000 molar equivalents of amine of the base (either methylamine
or hydryzine) per phthalimide group of the coupling agent IV and a reaction time of 16 h at
room temperature were chosen. Because of the nature of the NP dispersion, water was used
as solvent for this reaction. The theoretic amount of coupling agent IV per mg NP (which was
used for the grafting) was used as basis for these calculations. The concentration rows of the
bases were supposed to allow the determination of the most appropriate amount of base,
which guarantees an efficient phthalimide cleavage while not destroying the Si-O-Ti bonds via
basic hydrolysis. The planned deprotection of the grafted coupling agent IV is shown in
Scheme III - 26. A successful deprotection should result in the disappearance of the absorption
bands in IR of the phthalimide groups (especially the stretching vibrations of C=O in the imide).
However, for the sample examined in this study, these changes may be very difficult to detect
due to the low intensity of the absorption bands of coupling agent IV grafted onto MEEAA-
TiO2. Furthermore, the pHs of the IEPs of the samples should show a significant basic shift
and the dispersion state of the NPs was expected to be improved because of better
electrostatic stabilisation.

III. Synthesis of organic coupling agents and their grafting onto TiO2 nanoparticles
- 130 -
Scheme III - 26. Phthalimide protecting group cleavage of the grafted coupling agent IV.
All IEPs of the obtained samples lay in the pH range of 5.8 to 6.1 (for more details see Appendix
II) which clearly is no significant shift towards basic pH and rather resembles the IEP of the
unmodified MEEAA-TiO2. Also, the hydrodynamic diameters of the samples were not
significantly decreased (for more details see Appendix II). While the shift in the pH of the IEP
could indicate that the entire coupling agent is removed from the particle surface instead of a
phthalimide group cleavage, the DLS measurements do not confirm this assumption as the
agglomerate sizes were not decreased (which is expected for a “cleaned” MEEAA-TiO2
surface). For more insights, DRIFT measurements were conducted. Independent of the type
(methylamine or hydrazine) or concentration of base used, there was no difference in the
obtained DRIFT spectra between all base-treated samples. This is why the spectrum of the
sample (coupling agent IV-MEEAA-TiO2) treated with 10 eq methylamine is shown as
representative example in Figure III - 8 and compared to the unmodified MEEAA-TiO2, the
unmodified MEEAA-TiO2 treated with methylamine and the coupling agent IV-MEEAA-TiO2.
Comparing the unmodified MEEAA-TiO2 to the unmodified MEEAA-TiO2 treated with
methylamine, it is evident that the base treatment does not change the nature of MEEAA
surface groups. Small variances in the spectra such as between 1700 and 1600 cm-1 are most
probably caused by a varying amount of adsorbed water in the samples. The characteristic
absorption bands of coupling agent IV-MEEAA-TiO2 are partly maintained during the base
treatment (indicated with arrows in Figure III - 8).

III. Synthesis of organic coupling agents and their grafting onto TiO2 nanoparticles
- 131 -
Figure III - 8. IR (DRIFT) spectra of the coupling agent IV-MEEAA-TiO2 treated with 10 eq methylamine (orange) compared to the unmodified MEEAA-TiO2 (blue), the unmodified MEEAA-TiO2 treated with methylamine (green) and the coupling agent IV-MEEAA-TiO2 (black) in the region a) 3800-2500 cm-1 and b) 1800-1250 cm-1.
The most evident signals are the asymmetric and symmetric stretching of CH2 (from 2955 to
2850 cm-1) which prove the presence of organic coupling agent components on the particles.
Other signals (marked with * in Figure III - 8) such as the symmetric stretching of CH in the
aromatic rings of the phthalimide (3085 cm-1) or asymmetric and symmetric stretching
vibrations of the C=O in the imides (1770 and 1706 cm-1) seem to be no longer detectable.
Due to the low intensity of the before mentioned absorption bands, it is not clear if they
disappeared because of phthalimide cleavage or destruction of parts of the coupling agent or
if they are just partly covered for example by vibrations of higher amounts of adsorbed water.
Based on these not very conclusive results, one can deduce that possibly no cleavage of the
phthalimide group occurred, while a destruction of parts of the coupling agent or the partial
removal of the entire coupling agent by Si-O-Ti cleavage seem to be an option. While there
are still a lot of options to improve the deprotection procedure such as the use of temperature
or decrease in present water along with the use of other solvents, the evaluation of the

III. Synthesis of organic coupling agents and their grafting onto TiO2 nanoparticles
- 132 -
deprotection success will always remain challenging with this functionalized NP sample. One
obstacle is the difficulty to first determine the grafting success as the characteristic vibration
bands in DRIFT of the grafted coupling agent IV are weak and IEP does only shift minimally.
This means it is not possible to distinguish between the unsuccessful cleavage with the
coupling agent remaining intact and the removal of parts of the coupling agent during the
phthalimide cleavage procedure. For more meaningful investigations, the use of other NPs
with less absorptive material (such as silica) and no organic groups (such as P25 TiO2 or silica)
would be advisable to obtain more significant changes in the DRIFT spectra. However, this
was not the aim of this work and is therefore not treated herein.

III. Synthesis of organic coupling agents and their grafting onto TiO2 nanoparticles
- 133 -
III.3. Conclusion
In this chapter the synthesis of organic coupling agents and their subsequent grafting onto the
before synthesized TiO2 NPs was investigated. Concerning the organic syntheses, four either
luminescent or non-luminescent dendritic or linear structures were aimed at as shown in
Scheme III - 27. The first three coupling agents all contain a rhodamine dye. The coupling
agent I as linear molecule without terminal amine group was successfully obtained and proved
the stability of the luminescence agent during all synthesis and washing steps. The coupling
agent II was supposed to combine the incorporation of the dye with a terminal functional group.
Several synthesis steps were successfully carried out up to the coupling of the non-
luminescent components of the coupling agent to the dye by establishing a thiourea linkage.
However, this thiourea linkage on the alpha position of the lysine was responsible for the
rearrangement (cycle formation) of the molecule under acidic conditions. The lability of the
amide linkage next to the thiourea has never been reported for lysine under the reaction
conditions used (strong acids, room temperature). In this context, the cleavage of both the Boc
and Z protection group was not possible and the synthetic pathway was not continued.
Nevertheless, the insights gained during the synthesis of coupling agent II helped to
synthesize coupling agent III, a luminescent 1st generation dendritic molecule. This was by
far the most complex synthesis route with several obstacles that had to be overcome; for
example, the dipeptide formation during Fmoc-protection of Z-lysine was effectively reduced
to a minimum by the use of DMF as organic solvent (instead of THF or dioxane). The instability
of the ester bond of the first established dendron under hydrogenation due to transesterification
reactions (in presence of an alcohol) was rather surprising as well and initiated further
examinations of the stability of this bond. It became evident, that these ester bonds will partly
be transformed by transesterification reactions due to the basic hydroalcoholic milieu used.
Using an amide instead of the ester function, provided a stable molecule up to the final reaction
step. Thanks to the experiences made during the synthesis of coupling agent II, instead of
rhodamine isothiocyanate, the NHS-rhodamine was used. This guaranteed the stability of the
compound during the subsequent reaction steps. Coupling agent III was therefore
successfully obtained. Coupling agent IV, a dendritic non-luminescent coupling agent bears
the same dendritic branches as coupling agent III while not containing the lysine moiety or a
dye. This compound was also successfully obtained. The synthesis of 2nd generation dendritic
coupling agent V and coupling agent VI with a similar structure either to coupling agent III
or to coupling agent IV was started but is still in progress. While the quantity of the
successfully synthesized coupling agent III was too low to proceed with the grafting reaction,
both coupling agent I and IV were available for it.

III. Synthesis of organic coupling agents and their grafting onto TiO2 nanoparticles
- 134 -
Scheme III - 27. Organic coupling agents synthesized in this chapter.

III. Synthesis of organic coupling agents and their grafting onto TiO2 nanoparticles
- 135 -
For the grafting, first the most adequate grafting procedure was successfully determined with
commercial silanes ([3-(2-aminoethylamino)propyl]-trimethoxysilane, N1-(3-trimethoxysilyl-
propyl)diethylenetriamine). Basic hydroalcoholic grafting conditions seemed to be superior to
a protocol starting under acidic conditions while both procedures led to a successful particle
modification. The surface charge of the particles was effectively manipulated as shown by zeta
potential measurements, while the PC activity of the TiO2 particles was slightly reduced (a
reduction of 20 – 40 % was generally determined). In the case of MEEAA-TiO2 (4 h, 200 °C),
an amount of 1 to 4 µmol of added silane per mg NPs resulted in similar results concerning
the surface charge and PC activity. This indicates that a monolayer is formed that impedes
further condensation of silane molecules because of the steric hindrance of the organic groups
of the grafting agent. The amount of 1 µmol/mg as minimal amount of silanes needed to obtain
a monolayer on the particles is in good agreement with the calculated amount of 1.09 µmol/mg
(for MEEAA-TiO2). The addition of considerably higher amounts of silane (as tested with AA-
TiO2) presumably leads to the growth of further molecular layers around the NPs.
This is why 2 µmol silane per mg NP was chosen as optimal amount for the grafting of the
synthesized coupling agents I and IV onto MEEAA-TiO2 (4 h, 200 °C). The successful grafting
of coupling agent I was confirmed by all used analysis methods (IR, DLS, zeta potential
measurements). The surface potential of the NPs was significantly modified by the
functionalisation which led to a considerably negative surface charge at physiological pH. In
the context of the planned later applications in cell culture tests, a positive surface charge is
desired and therefore, this result stressed the need of basic groups such as primary amines in
the coupling agents. Also the dispersion state of the modified particles in water was not
satisfying which is not surprising as rhodamine is known to have a low solubility in it. An
integration of terminal amine groups into the coupling agent would therefore also certainly
improve the dispersibility of the sample. Nevertheless, the obtained modified NPs showed a
very high PL and an excellent PC activity even outreaching the results of unmodified samples.
This surprising PC performance was supposed to be caused by the significantly changed
surface charge which may favour the adsorption of molecules taking part into the photocatalytic
reactions. The successful grafting of coupling agent IV was confirmed by IR even though the
detected characteristic absorption bands were of low intensity. The IEP of the sample was not
significantly changed which may be owed to the absence of ionic components in the coupling
agent. The attempts which were carried out in order to cleave the phthalimide protection group
of the grafted coupling agents IV, were not conclusive and have not yet been successful.
Summing up, the feasibility to synthesize luminescent and non-luminescent dendritic coupling
agents as well as their grafting onto the before synthesized TiO2 NPs was successfully shown
III. Synthesis of organic coupling agents and their grafting onto TiO2 nanoparticles
- 136 -
(while the complete synthesis of all planned coupling agents is still under progress). The
potentials as well as obstacles of the organic synthesis routes and grafting procedures of these
coupling agents were clearly shown. For future studies the synthesis of luminescent coupling
agents (in particular) should be further investigated and optimized. Also, the phthalimide
protecting group cleavage of grafted coupling agents still has to be developed. Additionally, it
could be considered to use the phthalimide protected coupling agents as obtained because of
the probable anti-tumour activity of phthalimide groups.122

III. Synthesis of organic coupling agents and their grafting onto TiO2 nanoparticles
- 137 -
References:
1 M. J. D. Clift, B. Rothen-Rutishauser, D. M. Brown, R. Duffin, K. Donaldson, L. Proudfoot, K. Guy and V. Stone,
Toxicol. Appl. Pharmacol., 2008, 232, 418–427.
2 S. Patil, A. Sandberg, E. Heckert, W. Self and S. Seal, Biomaterials, 2007, 28, 4600–4607.
3 R. Kumar, I. Roy, T. Y. Ohulchanskyy, L. N. Goswami, A. C. Bonoiu, E. J. Bergey, K. M. Tramposch, A. Maitra
and P. N. Prasad, ACS Nano, 2008, 2, 449–456.
4 C. He, Y. Hu, L. Yin, C. Tang and C. Yin, Biomaterials, 2010, 31, 3657–3666.
5 W.-K. Oh, S. Kim, M. Choi, C. Kim, Y. S. Jeong, B.-R. Cho, J.-S. Hahn and J. Jang, ACS Nano, 2010, 4, 5301–
5313.
6 A. Villanueva, M. Cañete, A. G. Roca, M. Calero, S. Veintemillas-Verdaguer, C. J. Serna, M. del Puerto Morales
and R. Miranda, Nanotechnology, 2009, 20, 115103.
7 B. J. Teubl, C. Schimpel, G. Leitinger, B. Bauer, E. Fröhlich, A. Zimmer and E. Roblegg, J. Hazard. Mater.,
2015, 286, 298–305.
8 Y. Zhang, N. Kohler and M. Zhang, Biomaterials, 2002, 23, 1553–1561.
9 C. Wilhelm, C. Billotey, J. Roger, J. N. Pons, J.-C. Bacri and F. Gazeau, Biomaterials, 2003, 24, 1001–1011.
10 T.-H. Chung, S.-H. Wu, M. Yao, C.-W. Lu, Y.-S. Lin, Y. Hung, C.-Y. Mou, Y.-C. Chen and D.-M. Huang,
Biomaterials, 2007, 28, 2959–2966.
11 A. Verma and F. Stellacci, Small, 2010, 6, 12–21.
12 D. L. J. Thorek and A. Tsourkas, Biomaterials, 2008, 29, 3583–3590.
13 T. S. Hauck, A. A. Ghazani and W. C. W. Chan, Small, 2008, 4, 153–159.
14 L. Chen, J. M. Mccrate, J. C.-M. Lee and H. Li, Nanotechnology, 2011, 22, 105708.
15 S. Setua, D. Menon, A. Asok, S. Nair and M. Koyakutty, Biomaterials, 2010, 31, 714–729.
16 A. M. Derfus, W. C. Chan and S. N. Bhatia, Adv. Mater., 2004, 16, 961–966.
17 A. Quintana, E. Raczka, L. Piehler, I. Lee, A. Myc, I. Majoros, A. K. Patri, T. Thomas, J. Mulé and J. R. Baker
Jr, Pharm. Res., 2002, 19, 1310–1316.
18 V. Bagalkot, L. Zhang, E. Levy-Nissenbaum, S. Jon, P. W. Kantoff, R. Langer and O. C. Farokhzad, Nano
Lett., 2007, 7, 3065–3070.
19 O. C. Farokhzad, S. Jon, A. Khademhosseini, T.-N. T. Tran, D. A. LaVan and R. Langer, Cancer Res., 2004,
64, 7668–7672.
20 T. Palacin, H. L. Khanh, B. Jousselme, P. Jegou, A. Filoramo, C. Ehli, D. M. Guldi and S. Campidelli, J. Am.
Chem. Soc., 2009, 131, 15394–15402.
21 M. A. Fox, J. K. Whitesell, D. Magde and L.-Y. Zhu, Molecules, 2009, 14, 3851–3867.
22 Y.-C. Chen, T.-Y. Juang, T.-M. Wu, S. A. Dai, W.-J. Kuo, Y.-L. Liu, F. M. C. Chen and R.-J. Jeng, ACS Appl.
Mater. Interfaces, 2009, 1, 2371–2381.
23 P. G. Hoertz, R. A. Carlisle, G. J. Meyer, D. Wang, P. Piotrowiak and E. Galoppini, Nano Lett., 2003, 3, 325–
330.
24 K. G. Thomas and P. V. Kamat, Acc. Chem. Res., 2003, 36, 888–898.
25 K. T. Thurn, T. Paunesku, A. Wu, E. M. B. Brown, B. Lai, S. Vogt, J. Maser, M. Aslam, V. Dravid, R. Bergan
and G. E. Woloschak, Small, 2009, 5, 1318–1325.
26 T. Osaka, T. Nakanishi, S. Shanmugam, S. Takahama and H. Zhang, Colloids Surf. B Biointerfaces, 2009, 71,
325–330.
27 L. M. Bronstein and Z. B. Shifrina, Chem. Rev., 2011, 111, 5301–5344.
28 E. B. Dickerson, E. C. Dreaden, X. Huang, I. H. El-Sayed, H. Chu, S. Pushpanketh, J. F. McDonald and M. A.
El-Sayed, Cancer Lett., 2008, 269, 57–66.
III. Synthesis of organic coupling agents and their grafting onto TiO2 nanoparticles
- 138 -
29 C. Leamon, Adv. Drug Deliv. Rev., 2004, 56, 1127–1141.
30 R. Esfand and D. A. Tomalia, Drug Discov. Today, 2001, 6, 427–436.
31 I. J. Majoros, A. Myc, T. Thomas, C. B. Mehta and J. R. Baker, Biomacromolecules, 2006, 7, 572–579.
32 A. R. Menjoge, R. M. Kannan and D. A. Tomalia, Drug Discov. Today, 2010, 15, 171–185.
33 A. W. Bosman, H. M. Janssen and E. W. Meijer, Chem. Rev., 1999, 99, 1665–1688.
34 O. M. Milhem, C. Myles, N. B. McKeown, D. Attwood and A. D’Emanuele, Int. J. Pharm., 2000, 197, 239–241.
35 R. Jevprasesphant, J. Penny, R. Jalal, D. Attwood, N. B. McKeown and A. D’Emanuele, Int. J. Pharm., 2003,
252, 263–266.
36 N. Malik, R. Wiwattanapatapee, R. Klopsch, K. Lorenz, H. Frey, J. W. Weener, E. W. Meijer, W. Paulus and
R. Duncan, J. Controlled Release, 2000, 65, 133–148.
37 Y. Nakanishi and T. Imae, J. Colloid Interface Sci., 2006, 297, 122–129.
38 S. Marcinko and A. Y. Fadeev, Langmuir, 2004, 20, 2270–2273.
39 R. Helmy and A. Y. Fadeev, Langmuir, 2002, 18, 8924–8928.
40 J. Zhao, M. Milanova, M. M. C. G. Warmoeskerken and V. Dutschk, Colloids Surf. Physicochem. Eng. Asp.,
2012, 413, 273–279.
41 M. Iijima, M. Kobayakawa and H. Kamiya, J. Colloid Interface Sci., 2009, 337, 61–65.
42 X.-F. Yang, X.-Q. Guo and Y.-B. Zhao, Talanta, 2002, 57, 883–890.
43 T. Fujii, A. Ishii and M. Anpo, J. Photochem. Photobiol. Chem., 1990, 54, 231–237.
44 S. V. Ingale, P. B. Wagh, A. K. Tripathi, R. S. Srivastav, I. K. Singh, R. C. Bindal and S. C. Gupta, Soft Nanosci.
Lett., 2012, 02, 67–70.
45 Y. R. Dai and L. F. Yin, Catal Sci Technol, 2014, 4, 456–463.
46 A. S. Kristoffersen, S. R. Erga, B. Hamre and Ø. Frette, J. Fluoresc., 2014, 24, 1015–1024.
47 I. eho , V. Vilímová, P. Jendelová, V. Kubíček, D. Jirák, V. Herynek, M. Kapcalová, J. Kotek, J. Černý, P.
Hermann and I. Lukeš, J. Med. Chem., 2011, 54, 5185–5194.
48 R. R. Anderson and J. A. Parrish, J. Invest. Dermatol., 1981, 77, 13–19.
49 F. Scholkmann, S. Kleiser, A. J. Metz, R. Zimmermann, J. Mata Pavia, U. Wolf and M. Wolf, NeuroImage,
2014, 85, Part 1, 6–27.
50 C.-H. Lai, T.-C. Chang, Y.-J. Chuang, D.-L. Tzou and C.-C. Lin, Bioconjug. Chem., 2013, 24, 1698–1709.
51 J. Manson, D. Kumar, B. J. Meenan and D. Dixon, Gold Bull., 2011, 44, 99–105.
52 N. Kohler, G. E. Fryxell and M. Zhang, J. Am. Chem. Soc., 2004, 126, 7206–7211.
53 A. C. Balazs, T. Emrick and T. P. Russell, Science, 2006, 314, 1107–1110.
54 A. Isidro-Llobet, M. Alvarez and F. Albericio, Chem. Rev., 2009, 109, 2455–2504.
55 Theodora W. Greene and W. Peter G. M., Protective Groups in Organic Synthesis, John Wiley & Sons, Inc.,
New York, 3rd edition., 1999.
56 R. N. Zuckermann, E. J. Martin, D. C. Spellmeyer, G. B. Stauber, K. R. Shoemaker, J. M. Kerr, G. M. Figliozzi,
D. A. Goff and M. A. Siani, J. Med. Chem., 1994, 37, 2678–2685.
57 D. W. Lee, H. Ha and W. K. Lee, Synth. Commun., 2007, 37, 737–742.
58 A. B. Hughes, Ed., Amino acids, peptides and proteins in organic chemistry, Wiley-VCH, Weinheim, 2009.
59 I. W. Ashworth, B. G. Cox and B. Meyrick, J. Org. Chem., 2010, 75, 8117–8125.
60 E. Valeur and M. Bradley, Chem Soc Rev, 2009, 38, 606–631.
61 C. A. G. N. Montalbetti and V. Falque, Tetrahedron, 2005, 61, 10827–10852.
62 G. Fields, in Peptide Synthesis Protocols, eds. M. Pennington and B. Dunn, Humana Press, 1995, pp. 17–27.
63 S. Höck, R. Marti, R. Riedl and M. Simeunovic, Chim. Int. J. Chem., 2010, 64, 200–202.
64 L. Lang, Y. Ma, D. O. Kiesewetter and X. Chen, Mol. Pharm., 2014, 11, 3867–3874.
65 G.-H. Chen, P. Pan, Y. Chen, X.-B. Meng and Z.-J. Li, Tetrahedron, 2009, 65, 5922–5927.

III. Synthesis of organic coupling agents and their grafting onto TiO2 nanoparticles
- 139 -
66 P. R. Sultane, T. B. Mete and R. G. Bhat, Tetrahedron Lett., 2015, 56, 2067–2070.
67 M. Rodriguez, M. Amblard, M.-C. Galas, M.-F. Lignon, A. Aumelas and J. Martinez, Int. J. Pept. Protein Res.,
1990, 35, 441–451.
68 M. R. Burns, C. L. Carlson, S. M. Vanderwerf, J. R. Ziemer, R. S. Weeks, F. Cai, H. K. Webb and G. F.
Graminski, J. Med. Chem., 2001, 44, 3632–3644.
69 R. Srinivas, A. Garu, G. Moku, S. B. Agawane and A. Chaudhuri, Biomaterials, 2012, 33, 6220–6229.
70 M. Bergmann and L. Zervas, Berichte Dtsch. Chem. Ges. B Ser., 1932, 65, 1192–1201.
71 J. Montenegro and S. Matile, Chem. – Asian J., 2011, 6, 681–689.
72 C. Marrano, P. de Macédo, P. Gagnon, D. Lapierre, C. Gravel and J. W. Keillor, Bioorg. Med. Chem., 2001, 9,
3231–3241.
73 J. C. Slootweg, J. Kemmink, R. M. J. Liskamp and D. T. S. Rijkers, Org. Biomol. Chem., 2013, 11, 7486.
74 J. De Abajo, E. L. Madruga, J. San Roman, J. G. De La Campa and J. Guzman, Polymer, 1992, 33, 1090–
1095.
75 D. M. Patel, M. I. Shekh, K. P. Patel and R. M. Patel, J. Chem. Pharm. Res., 2015, 7, 470–480.
76 A. A. Khalil, J. Appl. Polym. Sci., 2006, 99, 2258–2262.
77 T. M. Pyriadi and N. J. Alasli, J. Polym. Sci. Part Polym. Chem., 1989, 27, 2491–2496.
78 T. M. Pyriadi and F. M. Ali Alsalami, J. Polym. Sci. Part Polym. Chem., 1997, 35, 3125–3130.
79 B. D. Mather, K. Viswanathan, K. M. Miller and T. E. Long, Prog. Polym. Sci., 2006, 31, 487–531.
80 M. M. Dell’Anna, V. F. Capodiferro, M. Mali and P. Mastrorilli, J. Organomet. Chem., 2016, 818, 106–114.
81 D. R. Edwards, A. A. Neverov and R. S. Brown, Inorg. Chem., 2011, 50, 1786–1797.
82 T. Iwasaki, Y. Maegawa, Y. Hayashi, T. Ohshima and K. Mashima, J. Org. Chem., 2008, 73, 5147–5150.
83 Y. Maegawa, K. Agura, Y. Hayashi, T. Ohshima and K. Mashima, Synlett, 2012, 2012, 137–141.
84 E. F. Aransiola, T. V. Ojumu, O. O. Oyekola, T. F. Madzimbamuto and D. I. O. Ikhu-Omoregbe, Biomass
Bioenergy, 2014, 61, 276–297.
85 J.-C. Alfred, J. Daunis and R. Jacquier, Macromol. Chem. Phys., 1996, 197, 389–401.
86 A. Akinc, A. Zumbuel, M. Goldberg, E. S. Leshchiner, V. Busini, N. Hossain and S. A. Bacallado, Nat.
Biotechnol., 26, 561–569.
87 K. McAdam, H. Kimpton, C. Vas, D. Rushforth, A. Porter and B. Rodu, Chem. Cent. J., , DOI:10.1186/s13065-
015-0132-1.
88 A. Desvergne, Y. Cheng, S. Grosay-Gaudrel, X. Maréchal, M. Reboud-Ravaux, E. Genin and J. Vidal, J. Med.
Chem., 2014, 57, 9211–9217.
89 P. Somasundaran, Encyclopedia of Surface and Colloid Science, CRC Press, 2006.
90 I. J. Bruce and T. Sen, Langmuir, 2005, 21, 7029–7035.
91 M. W. Daniels, J. Sefcik, L. F. Francis and A. V. McCormick, J. Colloid Interface Sci., 1999, 219, 351–356.
92 F. Luderer and U. Walschus, in Immobilisation of DNA on Chips I, ed. C. Wittmann, Springer Berlin Heidelberg,
2005, pp. 37–56.
93 M. P. J. Peeters, J. Sol-Gel Sci. Technol., 19, 131–135.
94 C. J. Brinker and G. W. Scherer, Sol-Gel Science: The Physics and Chemistry of Sol-Gel Processing,
Academic Press, 2013.
95 A. M. Buckley and M. Greenblatt, J. Chem. Educ., 1994, 71, 599.
96 C. R. Silva and C. Airoldi, J. Colloid Interface Sci., 1997, 195, 381–387.
97 F. D. Osterholtz and E. R. Pohl, J. Adhes. Sci. Technol., 1992, 6, 127–149.
98 E. J. A. Pope and J. D. Mackenzie, J. Non-Cryst. Solids, 1986, 87, 185–198.
99 I. Pastoriza-Santos, J. Pérez-Juste and L. M. Liz-Marzán, Chem. Mater., 2006, 18, 2465–2467.
100 C. Graf, D. L. J. Vossen, A. Imhof and A. van Blaaderen, Langmuir, 2003, 19, 6693–6700.

III. Synthesis of organic coupling agents and their grafting onto TiO2 nanoparticles
- 140 -
101 S.-Y. Lin, Y.-T. Tsai, C.-C. Chen, C.-M. Lin and C. Chen, J. Phys. Chem. B, 2004, 108, 2134–2139.
102 M.-C. Brochier Salon and M. N. Belgacem, Colloids Surf. Physicochem. Eng. Asp., 2010, 366, 147–154.
103 R. Denoyel, J. C. Glez and P. Trens, Colloids Surf. Physicochem. Eng. Asp., 2002, 197, 213–223.
104 L. A. Mitcova, Université de Bordeaux, 2014.
105 T. Kasnavia, D. Vu and D. A. Sabatini, Ground Water, 1999, 37, 376–381.
106 M. Mohammadi, A. J. Hassani, A. R. Mohamed and G. D. Najafpour, J. Chem. Eng. Data, 2010, 55, 5777–
5785.
107 H. M. H. Gad and A. A. El-Sayed, J. Hazard. Mater., 2009, 168, 1070–1081.
108 L. Wang, A. Roitberg, C. Meuse and A. K. Gaigalas, Spectrochim. Acta. A. Mol. Biomol. Spectrosc., 2001, 57,
1781–1791.
109 M. Majoube and M. Henry, Spectrochim. Acta Part Mol. Spectrosc., 1991, 47, 1459–1466.
110 N. O. Mchedlov-Petrosyan, L. A. Fedorov, S. A. Sokolovskii, Y. N. Surov and R. S. Maiorga, Bull. Russ. Acad.
Sci. Div. Chem. Sci., 1992, 41, 403–409.
111 S. Biswas, V. Sundstrom and S. De, Mater. Chem. Phys., 2014, 147, 761–771.
112 J. Zhao, T. Wu, K. Wu, K. Oikawa, H. Hidaka and N. Serpone, Environ. Sci. Technol., 1998, 32, 2394–2400.
113 P. Bartasun, H. Cieliski, A. Bujacz, A. Wierzbicka-Wo? and J. Kur, PLoS ONE, 2013, 8, e55697.
114 R. Comparelli, E. Fanizza, M. Curri, P. Cozzoli, G. Mascolo, R. Passino and A. Agostiano, Appl. Catal. B
Environ., 2005, 55, 81–91.
115 A. M. Al-Azzawi and M. S. A. Al-Razzak, Int J Res Pharm Chem, 2013, 3, 682–90.
116 O. S. Curley, J. E. McCormick, R. S. McElhinney and T. B. H. McMurry, Arkivoc, 2003, 7, 180–189.
117 S. Wolfe and S. K. Hasan, Can. J. Chem., 1970, 48, 3572–3579.
118 M. A. González and D. Pérez-Guaita, Tetrahedron, 2012, 68, 9612–9615.
119 S.-H. Chung, T.-J. Lin, Q.-Y. Hu, C.-H. Tsai and P.-S. Pan, Molecules, 2013, 18, 12346–12367.
120 M. V. Ramakrishnam Raju, E. Chandra Prakash, H.-C. Chang and H.-C. Lin, Dyes Pigments, 2014, 103, 9–
20.
121 N. Engelhardt, A. Ernst, A.-L. Kampmann and R. Weberskirch, Macromol. Chem. Phys., 2013, 214, 2783–
2791.
122 N. Kasoju, D. K. Bora, R. R. Bhonde and U. Bora, J. Nanoparticle Res., 2010, 12, 801–810.

- 141 -
IV. Cell culture examinations
of synthesized TiO2 particle
systems

- 142 -
Contents
IV. Cell culture examinations of synthesized TiO2 particle systems .......................... - 143 - IV.1. Stabilisation of TiO2 nanoparticles in cell culture media ............................... - 144 - IV.2. Cytotoxicity of TiO2 nanoparticles ................................................................ - 151 - IV.3. Tumour treatment effect of MEEAA-TiO2 particles ....................................... - 154 - IV.4. Conclusion ................................................................................................... - 164 -

- 143 -
IV. Cell culture examinations of synthesized TiO2 particle systems
The first step for future applications of TiO2 nanoparticles in the biomedical field is the
examination of their in vitro cytotoxicity. A compound is considered to be cytotoxic in vitro if it
interferes with the cells, which includes cellular attachment, significant morphology alterations,
an adverse cell growth rate or cell death.1 Nevertheless, the most common and reliable method
for the evaluation of cytotoxicity is the evaluation of the relative number of dead cells compared
to viable cells. The cytotoxicity of the synthesized nanoparticles (NPs) towards malignant and
non-malignant cell types has to be examined as this is very important for later applications as
tumour treatment agent; the particles should be non-toxic (in their inactivated form) towards all
cell types to provide a specific photocatalytic (PC) tumour treatment when ultraviolet (UV) light
is applied.
FaDu cells and primary human mesenchymal stem cells have been selected as representative
cell systems for all in vitro tests in this chapter. FaDu is a well-established cell line of head and
neck squamous cell carcinoma (HNSCC). Previously, cancer cell elimination of HNSCC by
photoactivated NPs has been described.2 In the current investigation, FaDu cells were used
for the cytotoxicity tests with respect to possible applications of TiO2 NPs as a photosensitising
agent in experimental cancer therapy in future. Furthermore, human bone marrow-derived
mesenchymal stem cells (BMSC) were applied in order to examine toxicity in non-malignant
cells. Due to their phenotypic and cellular plasticity, stem cells are considered a promising test
system for cytotoxicity evaluations.3 For further cytotoxicity assessments also HLaC78 cells as
another tumour cell line and primary human fibroblasts as a non-malignant cell type, which are
present in the tissue of interest, were selected.
The duration of NP incubation with the cells before cytotoxicity assessment was chosen to be
24 h as the particle uptake is said to start as early as one hour after NP addition and proceeds
at least for 24 hours.4 The chosen 3-(4,5-dimethylthiazol-2-yl)-2,5-diphenyl tetrazolium
bromide (MTT) assay detects the viability of cells; only viable cells bearing intact mitochondria
are able to metabolise the applied yellow tetrazolium MTT salt into a purple formazan crystal
(Scheme IV - 1).5–7 This colour change can be easily detected using an automated
spectrophotometric microplate reader. It is a well-established method used for various
categories of malignant and non-malignant cells and cell lines in vitro in immunological
investigations, cancer research and material biocompatibility evaluations.1,8–10 The advantage
of this assay is that it only needs a small amount of cells and is quite sensitive towards cytotoxic
events, which allows the miniaturization of the test into 96-well plate formats.1,9,11 The assay
protocol is considerably simple and rapid, reproducible and economic.9,10 As the water-
insoluble formazan requires the addition of DMSO, the assay is a lytic end point assay, giving

IV. Cell culture examinations of synthesized TiO2 particle systems
- 144 -
for example no opportunity for additional spectrophotometric readings.1 Also the pH
dependence of the absorption spectrum of reduced MTT has to be considered for obtaining
reliable results.7
Scheme IV - 1. Reduction of tetrazolium salt into formazan.12 The use of MTT assays to determine the cytotoxicity of particles such as TiO2 NPs is already
well established.7 Using this method it has to be kept in mind that the metal ions derived from
the particle samples (like Zn2+ in the case of ZnO NPs) can inhibit the MTT reduction reaction.
Furthermore, NPs can also deplete free MTT by interactions and therefore cause false
negative results. Concerning the readout, present NPs can increase the light absorption and
therefore also falsify the outcomes.7 This is why for every NP sample blind tests with only the
NPs and MTT have to be carried out to ensure reliable measurements.
Prior to the toxicity determinations, the particles had to be transferred into cell culture medium
(and stabilised). This procedure is discussed in the following chapter (IV.1). Subsequently the
cytotoxicity of both stabilised and not-stabilised particles was examined (IV.2). Finally, an
observed tumour treatment effect of the examined particle samples is described in IV.3.
IV.1. Stabilisation of TiO2 nanoparticles in cell culture media*
For the use of nanoparticles in in vitro or in vivo tests the particles have to be transferred into
physiological solutions. Doing this, a problem arises: without appropriate surface modification,
NPs tend to agglomerate and sediment in these solutions due to their pH and salt
content.13–15 This was also the case for the synthesized AA-TiO2 and MEEAA-TiO2 standard
particles that were used for these examinations. The particles already lost their dispersion state
* Parts of this chapter have been published and are reused in this work by courtesy of Elsevier, original article: S. Koch et al., Colloids Surf., B, 2016, 143, 7–14.

IV. Cell culture examinations of synthesized TiO2 particle systems
- 145 -
if they were brought to neutral pH, which was necessary for the transfer into cell culture media.
Agglomerate sizes of several µm were observed (Figure IV - 1).
Figure IV - 1. Average hydrodynamic diameter (Z-average) of AA-TiO2 and MEEAA-TiO2 after synthesis and ultrasonic treatment (US), after neutralisation and after transfer into DMEM, BEGM or RPMI. *Standard deviations of these values may not be reliable as DLS measurements were impeded by sedimentation of the NPs.
In aqueous solutions the colloids are mainly stabilised by electrostatic repulsion between
equally charged particles16. This electrostatic stabilisation is always limited to a certain pH
range as at a particular concentration of OH−or H3O+, these ions may neutralize the surface
charge of the particles up to their isoelectric point resulting in flocculation.17,18 In the same way,
an increase of ionic strength of the solution, for example due to dissolved salts, results in
destabilisation of colloidal dispersions, which is well described by the DLVO (Derjaguin-
Landau-Verwey-Overbeek) theory.19 This is why, after transfer into cell culture media (DMEM,
BEGM or RPMI), the agglomerate sizes of the samples had not been significantly reduced and
sedimentation of the particles occurred immediately. In order to ensure a consistent
assessment of the therapeutic and diagnostic potential of NPs in cell culture experiments or
animal testing, this issue needs to be addressed: studies concerning particle concentrations
are only reliable when carried out with stable dispersions that guarantee an accurate dosing.
The effect of different sized particles on cells can only be studied if the particles do not form
large agglomerates.13,20,21 In the case of PC NPs, agglomeration also leads to an unwanted
reduction of surface area and therefore lower PC efficiency.13,22
Thus, a suitable stabilising agent had to be found to achieve stable, non-agglomerated NP
dispersions in cell culture media. In order to do so, several stabilising agent have been

IV. Cell culture examinations of synthesized TiO2 particle systems
- 146 -
screened: fetal bovine serum (FBS) and bovine serum albumin (BSA) were used as biological
stabilising agents since they have been previously applied for this purpose,13–15,20 and thus
serve as reference systems. BSA can be found abundantly in bovine blood plasma14,15,20 and
FBS is commonly added as a growth supplement to cell culture media.13,14 They both form a
protein corona around particles through ionic interactions and therefore act as stabilisers23,24
due to mainly electrostatic but also to a certain extent weak steric effects.14 Furthermore,
polycarboxylate ethers (like Melflux®4930 F, Melpers®V4343 and Sika®ViscoCrete®-
10110178) as combined ionic and steric surfactants have been chosen as stabilising agent.
Their great potential for various NPs in solutions has been demonstrated recently.18,25,26
Polycarboxylate ethers have been commonly used in the cement industry as superplasticisers
that adsorb onto silicate particles, improving the particle mobility and flow behaviour of cement.
The polycarboxylate ether comb-polymers consist of a polycarboxylate backbone and
polyethylene oxide side chains bound to the backbone as esters. They adsorb onto the
nanoparticle surface via coulombic attractions between the negatively charged backbone and
the positively charged particle surface.27 Due to the charge of the backbone and steric effects
of the comb-polymer side chains, the particles are electrosterically stabilised.18 Although this
property means they are promising candidates for particle stabilisation in environments with
high ionic strength, to the best of our knowledge, these stabilising agents have never been
applied in cell culture experiments so far.
The particles were stabilised following the protocol described in literature.15,20 The surface-
active agents (FBS, BSA, Melflux, Melpers or Sika ViscoCrete) were added to the US treated
samples at pH 2–3 where the particles are ideally dispersed, as this ensures that the complete
surface of each individual NP is accessible by the stabiliser molecules for adsorption. When
the dispersions were then neutralised, the stabilisers prevented particle agglomeration. In
order to quantitatively evaluate the stabilisation efficiency, DLS and sedimentation studies
were carried out. The agglomerate size of the stabilised particles was only measured
immediately after the transfer to cell culture media as the hydrodynamic diameter stayed the
same over 24 h, which has been proved by Ji et al.14 The sedimentation of the stabilised NPs
in cell culture media was examined by measuring the absorbance (at 490 nm) of the
supernatant (= upper 10 %) of the samples immediately and at 24 h after NP transfer. Due to
light scattering by the particles, the absorbance decreased with lower particle concentration in
the supernatant when the particles sedimented. The absorbance directly after particle transfer
was taken as 100 % stably dispersed particles and the measured reference (medium with
stabiliser but without particles) was considered as 0 % stably dispersed particles. Taking these
numbers into account the percentage of particles that were still stably dispersed after 24 h was
calculated. The results for AA-TiO2 are shown in Figure IV - 2. The results for MEEAA-TiO2

IV. Cell culture examinations of synthesized TiO2 particle systems
- 147 -
can be found in the Appendix III. Slight differences between these results are due to different
surface groups and varied surface charges, however, the results are overall very similar.
Figure IV - 2. AA-TiO2 (0.5 mg/ml) in different cell culture media (DMEM, BEGM, RPMI) stabilised with 1 mg, 10 mg, 50 mg or 100 mg BSA, FBS, Melflux, Melpers or Sika ViscoCrete per 1 mg NP. a) Percentage of particles still stably dispersed after 24 h with decreasing dispersion stability from A: 100% (dark green) to E: <25 % (dark red). b) Agglomerate size (Z-average) with increasing hydrodynamic diameter from a: <100 nm (dark green) to f: >700 nm (dark red).
The commonly used stabilisers BSA and FBS (in the chosen concentration range) only show
stabilising effects in the FBS-containing DMEM (and RPMI). This indicates that for these
biological stabilisers a high amount of cell culture supplement, FBS, is additionally needed to
build up a larger protein corona that is sufficient to stabilise the particles. BSA does not seem
to be an adequate stabilising agent for the examined NPs as BSA only adsorbs at strong
negatively charged oxide surfaces14,15,28 and the examined particles only exhibit a low negative
charge at physiological pH (∼7.4). A cell culture medium can be seen as an electrolytic solution
with high ionic strength14 comparable to a 0.12 M NaCl solution.13 As the zeta potential of BSA
itself decreases in salt solutions29 due to interactions with the salts, the electrostatic
stabilisation of particles by BSA is less efficient in cell culture media. In contrast to BSA, FBS
stabilises the NPs independent of their surface charge due to a synergistic effect of its
components such as globulin, BSA and transferrin.14 Therefore, it seems to be more suitable
as a stabilising agent for the examined only slightly charged TiO2 NPs. Additionally, several
studies have already indicated that even if FBS contains a large amount of BSA, the albumin
that is initially adsorbed onto the NP surfaces is usually replaced within several minutes up to
a few hours by other less abundant but more specific proteins like apolipoproteins.30–32 This
may also be an explanation for the higher stabilisation efficiency of FBS compared to BSA.
The stabilisation of AA-TiO2 and MEEAA-TiO2 by polycarboxylate ethers (Melflux, Melpers and
Sika ViscoCrete) seems to be independent of the addition of FBS as a supplement. This may

IV. Cell culture examinations of synthesized TiO2 particle systems
- 148 -
be due to the mainly steric stabilisation of polycarboxylate ethers (see below) not favouring
ionic interactions with FBS.
As suggested by Mandel et al.,18 polycarboxylate ethers develop hydrogen bridging bonds
between their carboxylic groups and the hydroxyl groups on the particle surface, when added
at acidic pH to the particle dispersion (Figure IV - 3 a). This means that with this procedure,
surfactants are not only weakly adsorbed but to a certain extent sufficiently anchored onto the
particles. Thus they chemically functionalize the particles so that they show the surface
characteristics of the polymer. Therefore, the measured isoelectric points of the functionalized
particles were found at acidic pH values depending on the composition of the polycarboxylate
ether (Melflux and Sika-ViscoCrete around pH 2 and Melpers around pH 3; these values are
also confirmed in other works).18,33 The surfactant sterically stabilises the particles via the bulky
polyethylene oxide side chains. With increased pH (>2) the unbound carboxylic acid groups of
the polymer backbone start to deprotonate, resulting in an electrostatic stabilisation that adds
to the steric stabilisation. At neutral pH, these systems exhibit both the electrostatic and steric
repulsion mechanisms, known as electrosteric stabilisation (Figure IV - 3 b). For this reason
this class of polycarboxylate ethers are ideally suited for NP stabilisation in cell culture media
as the charged groups render the polymers (respective to functionalized particles) dispersible
in water. However, even if the electrostatic stabilisation efficiency is very low in cell culture
media, due to the prevailing high ionic strength, the steric repulsion keeps the particles
separated. In summary, the stabilisation of the particles with polycarboxylate ethers is not
influenced by the pH, ionic strength or chemical composition of the media. This has also been
shown for other well-anchored polyethylene oxide moieties in literature.34
As a result, the efficiency of polycarboxylate ethers as stabilisers mainly depends on their
anchoring strength onto the particles, the particle surface coverage and the polymer
composition (e.g. chain lengths). From the experiments shown in Figure IV - 2 it can be
concluded that the most efficient stabilising agent is Melflux. It provides a stable dispersion for
both particle systems in all media with 1 mg stabiliser per mg nanoparticle. Agglomerate sizes
smaller than 100 nm are obtained in all three cell culture media. In comparison to the other
polycarboxylate ethers (Sika ViscoCrete with 2000 g/mol side chain and Melpers with 500
g/mol side chain) this polymer has the longest polyethylene side chains (3000 g/mol), providing
the best steric stabilisation. Due to its side chain lengths, Sika ViscoCrete is the second best
of the tested polycarboxylate ethers.

IV. Cell culture examinations of synthesized TiO2 particle systems
- 149 -
Figure IV - 3. Schemes of particles stabilised with a polycarboxylate ether at physiological pH showing a) the binding of the polymer onto the particle surface and b) one polymer chain adsorbed onto the particle surface, stabilising the particle electrosterically.
For further examinations (in RPMI medium) Melflux, the most efficient stabiliser, and FBS, as
a control from the literature, have been selected. The best stabilising agent concentrations
were chosen with the help of DLS measurements (Figure IV - 4).The agglomerate sizes of the
particles first decreased with increasing stabilising agent concentrations and then finally
started to increase again. This can be explained as with a low concentration there are not
enough stabiliser molecules to completely cover the surface of every single particle and, due
to their partly uncovered surface, particles still form agglomerates. With increasing stabiliser
concentration, there are enough surface-active molecules to stabilise smaller agglomerates.
When an ideal concentration is reached, each NP is surrounded with a monolayer of stabilising
agent; this results in a perfectly stabilised dispersion. With increasing stabiliser concentration,
further stabilising agent layers are formed around each particle.15
Figure IV - 4. Average hydrodynamic diameter of AA-TiO2 and MEEAA-TiO2 (0.5 mg/ml) in RPMI stabilised with a) FBS or b) Melflux.
Due to this and possible bridging effects of the stabiliser between particles, resulting in a
connection of particles, the agglomerate size starts to increase again. The smallest stabiliser
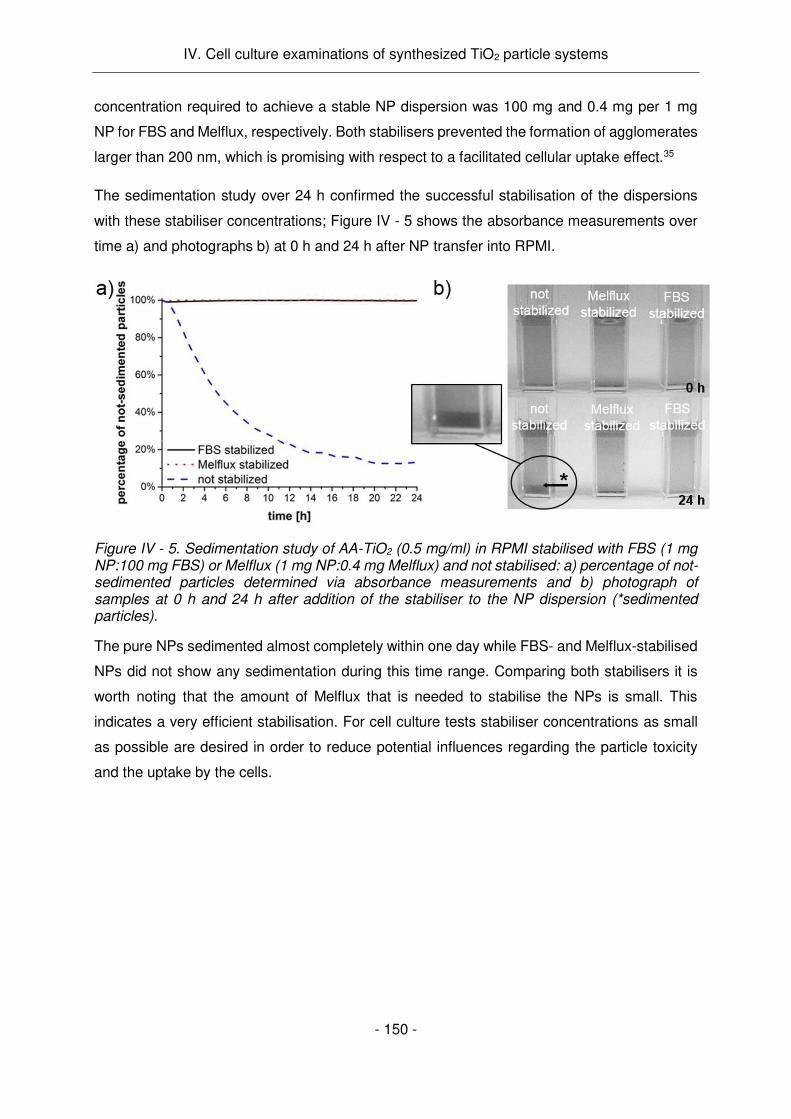
IV. Cell culture examinations of synthesized TiO2 particle systems
- 150 -
concentration required to achieve a stable NP dispersion was 100 mg and 0.4 mg per 1 mg
NP for FBS and Melflux, respectively. Both stabilisers prevented the formation of agglomerates
larger than 200 nm, which is promising with respect to a facilitated cellular uptake effect.35
The sedimentation study over 24 h confirmed the successful stabilisation of the dispersions
with these stabiliser concentrations; Figure IV - 5 shows the absorbance measurements over
time a) and photographs b) at 0 h and 24 h after NP transfer into RPMI.
Figure IV - 5. Sedimentation study of AA-TiO2 (0.5 mg/ml) in RPMI stabilised with FBS (1 mg NP:100 mg FBS) or Melflux (1 mg NP:0.4 mg Melflux) and not stabilised: a) percentage of not-sedimented particles determined via absorbance measurements and b) photograph of samples at 0 h and 24 h after addition of the stabiliser to the NP dispersion (*sedimented particles).
The pure NPs sedimented almost completely within one day while FBS- and Melflux-stabilised
NPs did not show any sedimentation during this time range. Comparing both stabilisers it is
worth noting that the amount of Melflux that is needed to stabilise the NPs is small. This
indicates a very efficient stabilisation. For cell culture tests stabiliser concentrations as small
as possible are desired in order to reduce potential influences regarding the particle toxicity
and the uptake by the cells.

IV. Cell culture examinations of synthesized TiO2 particle systems
- 151 -
IV.2. Cytotoxicity of TiO2 nanoparticles†
Prior to the cytotoxicity evaluation of stabilised and not-stabilised particles, the novel stabiliser
Melflux had to prove its biocompatibility. This characteristic was assessed in cell culture
studies; FaDu cells were treated with different Melflux concentrations for 24 h and examined
via MTT assay. RPMI was chosen as cell culture medium for all viability tests as this medium
was proved to be very suitable for PC tumour treatment experiments.36 The viability of FaDu
after incubation with Melflux is shown in Figure IV - 6. The stabiliser can be considered as non-
toxic up to 500 µg/ml as the statistical analysis (Wilcoxon Test) showed no significant decrease
in viability for all tested concentrations. For the cytotoxicity assay with TiO2, nanoparticle
concentrations up to 300 µg/ml were chosen and so the highest necessary Melflux
concentration was 120 µg/ml. Therefore, with respect to the results of the MTT assay with
Melflux alone, the stabiliser should not influence the toxicity of the particles.
Figure IV - 6. Viability of FaDu cells treated with Melflux for 24 h compared to the viability of non-treated cells. No significance (n.s.) with p < 0.05 was found in all tested NP concentrations in comparison to the negative control.
After approval of Melflux as biocompatible stabilising agent, the cytotoxicity of AA-TiO2 and
MEEAA-TiO2 with and without FBS or Melflux towards FaDu and stem cells was examined.
The obtained viability results are shown in Figure IV - 7 and Figure IV - 8. Both particle systems
were non-toxic up to 300 µg/ml for both stem cells and cancer cells: the not-stabilised particle
agglomerates as well as the two differently stabilised agglomerates with diameters under 200
† Parts of this chapter have been published and are reused in this work by courtesy of Elsevier, original article: S. Koch et al., Colloids Surf., B, 2016, 143, 7–14.

IV. Cell culture examinations of synthesized TiO2 particle systems
- 152 -
nm. This indicates that both agglomerates as well as single particles are non-toxic towards
malignant and non-malignant cells. Although cell viability of both cell types was decreased
after exposure to high concentrations (such as 300 µg/ml) of AA-TiO2, the results were not
significant. Nevertheless, MEEAA-TiO2 seems to be slightly more biocompatible in comparison
to AA-TiO2, which may be due to differences in the surface moieties of both particle systems:
the MEEAA derivative has a polyethylene glycol-like structure and this polymer is known to be
non-toxic and is therefore used for medical applications. As a result, MEEAA bearing MEEAA-
TiO2 may be slightly less toxic towards cells than AA-TiO2. The addition of Melflux and FBS
did not significantly influence the toxicity of the NPs. However, cell viability tended to increase
in samples treated with MEEAA-TiO2 and FBS (Figure IV - 7 b). A possible explanation for this
is that with increasing NP concentration, the FBS concentration also increases, which may
lead to enhanced cell viability. This is due to growth factors contained in FBS, which stimulate
cell growth. The addition of FBS as a stabiliser can therefore significantly influence studies on
particle toxicity. Furthermore in cell culture experiments addition of FBS varies the medium
composition leading to less well-defined chemical conditions, notwithstanding any ethical
implications.37 For these reasons the use of Melflux as non-toxic stabiliser is a very promising
alternative to commonly used stabilisers.
Figure IV - 7. Viability of tumour cells (FaDu) treated with a) AA-TiO2 and b) MEEAA-TiO2 without stabiliser and stabilised with FBS (1 mg NP:100 mg FBS) or Melflux (1 mg NP:0.4 mg Melflux). The values are normalised with respect to the vitality of no particle treated cells. No significance (n.s.) with p < 0.05 was found in all tested NP concentrations in comparison to the negative control.
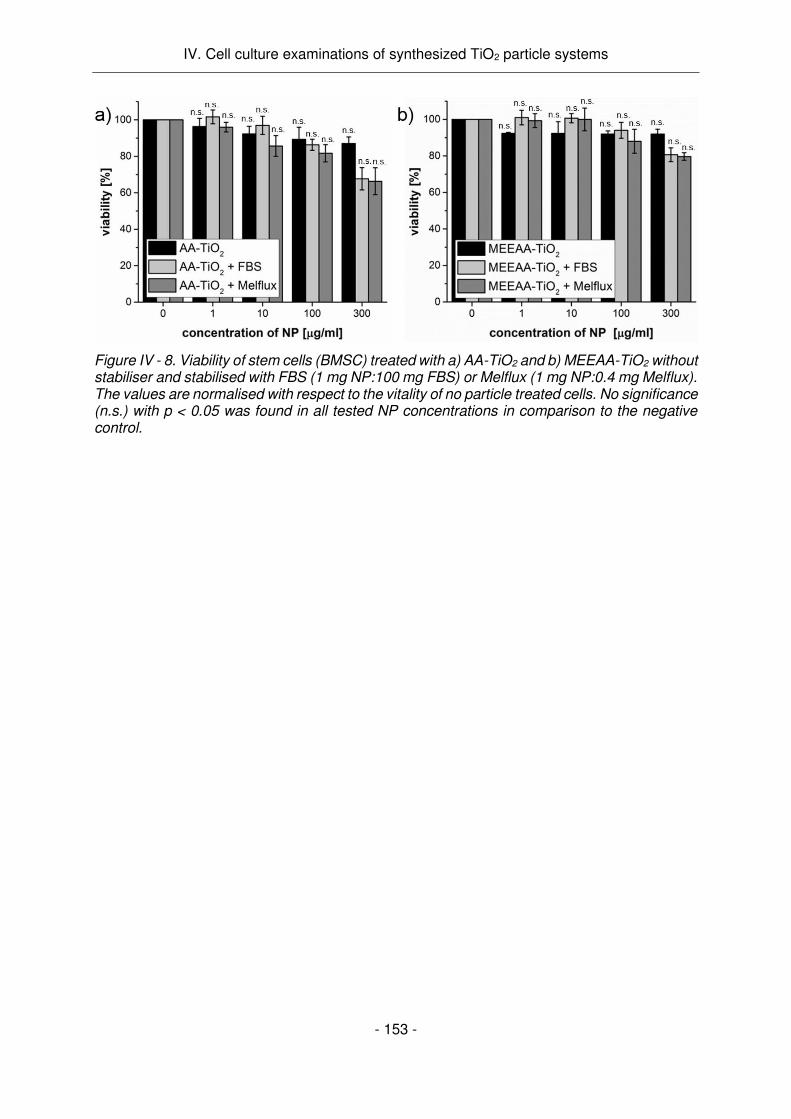
IV. Cell culture examinations of synthesized TiO2 particle systems
- 153 -
Figure IV - 8. Viability of stem cells (BMSC) treated with a) AA-TiO2 and b) MEEAA-TiO2 without stabiliser and stabilised with FBS (1 mg NP:100 mg FBS) or Melflux (1 mg NP:0.4 mg Melflux). The values are normalised with respect to the vitality of no particle treated cells. No significance (n.s.) with p < 0.05 was found in all tested NP concentrations in comparison to the negative control.

IV. Cell culture examinations of synthesized TiO2 particle systems
- 154 -
IV.3. Tumour treatment effect of MEEAA-TiO2 particles
After successful stabilisation of the synthesized TiO2 NPs in cell culture media and proof of
their non-toxicity, the next logical step towards an application as PC anti-tumour agent is the
assessment of their cytotoxicity after/during UVA-1 light application in vitro. The state of the art
approach to determine the anti-tumour activity of PC NPs is shown in Figure IV - 9 a).38–43
Figure IV - 9. a) State of the art photocatalytic tumour treatment including the direct UVA-1 light application onto cells after NP uptake compared to b) a new approach avoiding it.
For this examination, the NPs are exposed to the cells (Figure IV - 9 a), step 1) and incubated
for 24 h to allow cellular uptake of the NPs before applying the UVA-1 (340-400 nm wavelength
range) light (Figure IV - 9 a), step 2). During UVA-1 light application, the NPs are activated to
do photocatalysis, which leads to cellular damages and apoptosis ((Figure IV - 9 a), step 3) as
e. g. shown by a MTT assay. However, even if the NPs are exclusively taken up by malignant
cells or their toxicity is specific towards malignant cells, the damage of non-malignant cells
caused by UVA-1 light can never be avoided. Regarding our experimental approach, we tried
to exclude direct UVA light application to cells and we found that MEEAA-TiO2 (4 h, 160 °C)
samples were anti-tumour active after a UVA (315-400 nm wavelength range) light pre-
activation for 24 h (Figure IV - 9 b). Within this setting, the NPs were first pre-activated with
UVA light (Figure IV - 9 b), step 1) for 24 h, then added to the cells and incubated for another
24 h (Figure IV - 9 b), step 2) before evaluating the cell viability (Figure IV - 9 b), step 3). This
procedure was carried out with two malignant (FaDu, HLaC78) and two non-malignant (BMSC,
fibroblasts) cell types and compared to the exposure of non-irradiated and therefore inactive
MEEAA-TiO2 samples to the cells. For all cell culture tests described in this chapter, NP
samples without any stabilising agent were utilized to not further complicate the toxicity
evaluations. The subsequent MTT test after incubation revealed that while the inactive NPs
were as expected non-toxic to all cell types (Figure IV - 10 a), the pre-activated NPs showed

IV. Cell culture examinations of synthesized TiO2 particle systems
- 155 -
specific toxicity towards the cancer cells while affecting the non-malignant ones only at higher
concentrations (Figure IV - 10 b).
Figure IV - 10. Viability of non-malignant cells (BMSC, fibroblasts) and malignant cells (HLaC78, FaDu) treated with a) MEEAA-TiO2 (160 °C, 4 h) without UVA light pre-activation and b) MEEAA-TiO2 (160 °C, 4 h) pre-activated with UVA light for 24 h. The values are normalised with respect to the vitality of no particle treated cells. Significance compared to the control with a P-value < 0.05 is indicated by asterisks.
To further examine this result and to determine, which component of the samples may be
responsible for the anti-tumour effect, four different samples were prepared and toxicologically
evaluated (Figure IV - 11). The sample 1) was MEEAA as commercially obtained, which was
UVA light pre-activated for 24 h and the sample 2) was pure TiO2 as the present MEEAA was
removed by washing steps with diluted HNO3 and then UVA light pre-activated for 24 h. The
sample 3) was MEEAA-TiO2 as synthesized, which was first UVA light pre-activated for 24 h
and then the NPs were removed via centrifugation and only the supernatant containing pre-
activated MEEAA was utilized. The sample 4) consisted of MEEAA-TiO2 as synthesized and
was just treated with UVA light for 24 h exactly like the standard sample used before (Figure
IV - 10). While sample 1) and 2) showed no anti-tumour activity, sample 3) was as toxic to
cancer cells as the reference sample 4). These results lead to the conclusion that both
components MEEAA and TiO2 NPs are needed for the activation of the samples. The MEEAA
is “activated” by the PC activity of the TiO2 NPs and subsequently acts anti-tumour active even
if no particles are present in the cell culture.

IV. Cell culture examinations of synthesized TiO2 particle systems
- 156 -
Figure IV - 11. Viability of tumour cells (FaDu) treated with UVA light (24 h) pre-activated samples: 1) pure MEEAA, 2) TiO2 NPs (160 °C, 4 h) without MEEAA (realized with the help of washing steps), 3) MEEAA, which was separated from the TiO2 NPs after pre-activation via centrifugation and 4) MEEAA-TiO2 NPs (standard sample). The values are normalised with respect to the vitality of no particle treated cells. Significance compared to the control with a P-value < 0.05 is indicated by asterisks.
While reactive oxygen species (•O2−, •OH) generated by photocatalysis are short-lived entities
(less than 70–200 ns),44,45 it is well-known that the photocatalysed degradation of an organic
molecule usually does not result in instantaneous formation of carbon dioxide but long-lived
intermediate species such as long-lived radicals are formed.46,47 Therefore, the long term
activity of the samples were tested to investigate the possible creation of long-lived species,
which could act toxic towards malignant cells either because of their properties or due to
continuing degradation into carbon dioxide during cell culture incubation. If the photocatalysis
by TiO2 led to long-lasting but unstable intermediate species in the MEEAA sample, the probe
would lose its anti-tumour activity during storage. As shown in Figure IV - 12 a), the samples
do not change their toxic behaviour even after 5 days storage time and therefore, the acid must
be irreversibly and long-term modified by the TiO2 photocatalysis during UVA light treatment.
In order to study a possible degradation of the MEEAA during UVA light activation, HPLC and
NMR analysis were planned to be carried out before and after UVA treatment. However, as
the commercial MEEAA used for synthesis showed a low purity (70 %), the first analyses of
the samples were not conclusive because of too high contamination by other unidentified
organic compounds. Based on these findings, a purer commercial MEEAA sample (> 95 %)
was purchased and compared to the standard compound. For this examination, the acids were
intermixed with commercial P25 TiO2 NPs as this procedure is less time consuming than the

IV. Cell culture examinations of synthesized TiO2 particle systems
- 157 -
hydrothermal synthesis approach for MEEAA-TiO2 and gives the same results concerning PC
UVA light activation of the MEEAA samples. The MTT tests depicted in Figure IV - 12 b) clearly
show that the anti-tumour effect is caused by the impurities of the sample and not by the
MEEAA as the purer commercial MEEAA does not induce any significant toxicity.
Figure IV - 12. Viability of tumour cells (FaDu) treated with UVA light (24 h) pre-activated samples: a) MEEAA-TiO2 NPs (standard sample) after storage for 0, 1 or 5 days and b) P25 TiO2 NP dispersions prepared with standard MEEAA (purity = 70 %) or MEEAA with a higher purity (> 95 %). The values are normalised with respect to the vitality of no particle treated cells. Significance compared to the control with a P-value < 0.05 is indicated by asterisks.
In order to further investigate, which is the compound responsible for the anti-tumour effect in
the commercial MEEAA sample (70 %), it was divided into several fractions via distillation
(heating up to 250 °C under dynamic vacuum – further information in the experimental part).
The aim was to divide possible non-toxic from toxic components. After distillation, all samples
were intermixed with P25 colloids, UVA light pre-activated and subsequently tested for their
cytotoxicity towards cancer cells. The results are summarized in Figure IV - 13 and compared
to the undistilled MEEAA. It is evident that fraction II did not show any significant anti-tumour
effect up to 150 µg/ml NP concentration (included) while fraction IV exhibited the highest anti-
tumour activity with significant toxicity already at a concentration of 100 µg/ml. This is why
these two fractions were analysed in more detail; fraction II appeared to be the purified MEEAA
(verified by NMR and MS), which explains the low cytotoxicity of this fraction. It is therefore
also logical that the viability values of FaDu cells treated with this fraction II resemble the ones
treated with commercial MEEAA with a higher purity (> 95 %, Figure IV - 12). Fraction IV could
first not be identified as it was a mixture out of at least 2 compounds, which was mainly
indicated by the detection of several molecular masses by MS and impossible integral ratios
of the signals in the 1H-NMR. This is why fraction IV was separated via column
chromatography, obtaining two fractions, denoted as IV-a and IV-b. Fraction IV-a consists of

IV. Cell culture examinations of synthesized TiO2 particle systems
- 158 -
one single pure compound IV-a. This compound IV-a is the main component of fraction IV by
weight (76 %) and its structure (Scheme IV - 2) was identified with the help of 2D NMR analysis
and MS.
Figure IV - 13. Viability of tumour cells (FaDu) treated with UVA light (24 h) pre-activated P25 TiO2 dispersions prepared with commercial MEEAA sample before distillation and fractions I to IV obtained during its distillation. Significance compared to the control with a P-value < 0.05 is indicated by asterisks.
Scheme IV - 2. Identified compound IV-a of fraction IV-a.
This compound IV-a did not show any anti-tumour activity after UVA light activation in presence
of P25 TiO2 NPs (Figure IV - 14) and also NMR analysis did not show any changes in molecular
structure (such as signal shifts or changes in integral value). Thus, this compound seems to
be not affected by the UVA light treatment and can be taken as internal standard for
subsequent NMR analyses of the fraction IV.
In contrast to the fraction IV-a, the fraction IV-b is highly anti-tumour active after the pre-
activation. The NMR measurements of this fraction showed pure spectra of MEEAA and also
MS analysis indicated the presence of pure MEEAA. These results were rather surprising as
it was shown before that the pure MEEAA does not possess any anti-tumour activity. This is
why the presence of further undetectable impurities was expected. Organic impurities in the
sample must be existent in concentrations lower than the detection limit of NMR while inorganic
impurities such as salts can be present in higher concentrations as they are usually not
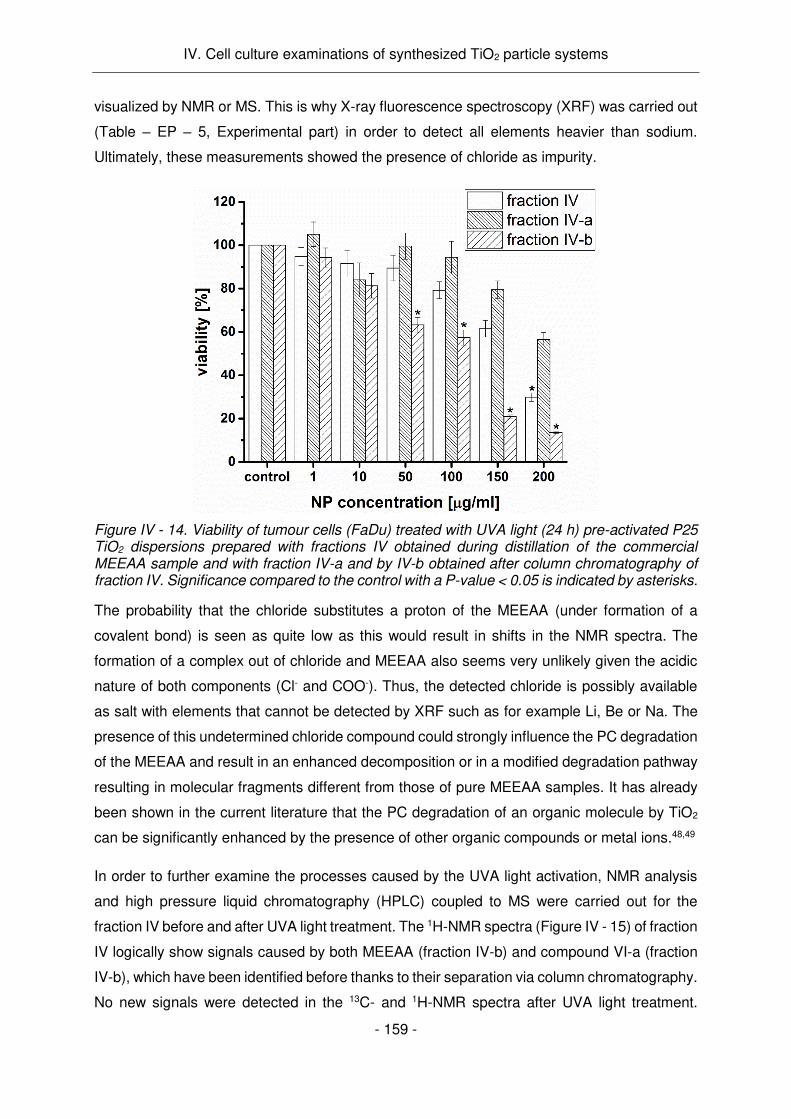
IV. Cell culture examinations of synthesized TiO2 particle systems
- 159 -
visualized by NMR or MS. This is why X-ray fluorescence spectroscopy (XRF) was carried out
(Table – EP – 5, Experimental part) in order to detect all elements heavier than sodium.
Ultimately, these measurements showed the presence of chloride as impurity.
Figure IV - 14. Viability of tumour cells (FaDu) treated with UVA light (24 h) pre-activated P25 TiO2 dispersions prepared with fractions IV obtained during distillation of the commercial MEEAA sample and with fraction IV-a and by IV-b obtained after column chromatography of fraction IV. Significance compared to the control with a P-value < 0.05 is indicated by asterisks.
The probability that the chloride substitutes a proton of the MEEAA (under formation of a
covalent bond) is seen as quite low as this would result in shifts in the NMR spectra. The
formation of a complex out of chloride and MEEAA also seems very unlikely given the acidic
nature of both components (Cl- and COO-). Thus, the detected chloride is possibly available
as salt with elements that cannot be detected by XRF such as for example Li, Be or Na. The
presence of this undetermined chloride compound could strongly influence the PC degradation
of the MEEAA and result in an enhanced decomposition or in a modified degradation pathway
resulting in molecular fragments different from those of pure MEEAA samples. It has already
been shown in the current literature that the PC degradation of an organic molecule by TiO2
can be significantly enhanced by the presence of other organic compounds or metal ions.48,49
In order to further examine the processes caused by the UVA light activation, NMR analysis
and high pressure liquid chromatography (HPLC) coupled to MS were carried out for the
fraction IV before and after UVA light treatment. The 1H-NMR spectra (Figure IV - 15) of fraction
IV logically show signals caused by both MEEAA (fraction IV-b) and compound VI-a (fraction
IV-b), which have been identified before thanks to their separation via column chromatography.
No new signals were detected in the 13C- and 1H-NMR spectra after UVA light treatment.
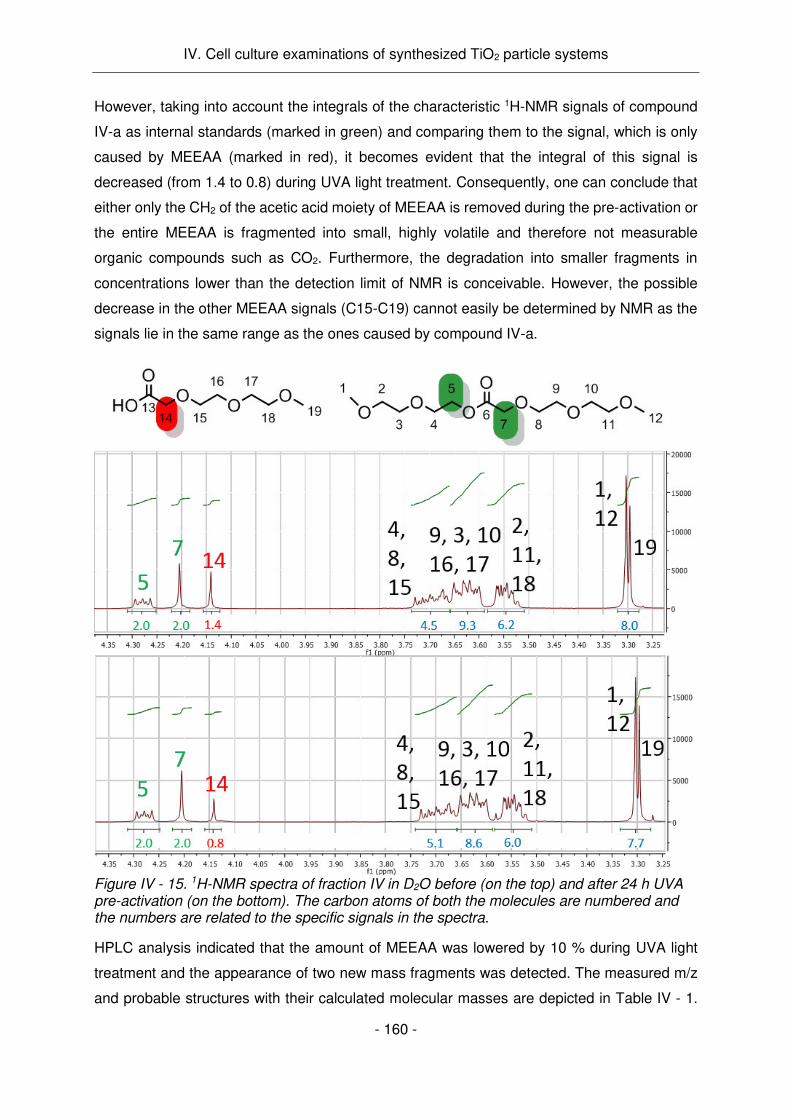
IV. Cell culture examinations of synthesized TiO2 particle systems
- 160 -
However, taking into account the integrals of the characteristic 1H-NMR signals of compound
IV-a as internal standards (marked in green) and comparing them to the signal, which is only
caused by MEEAA (marked in red), it becomes evident that the integral of this signal is
decreased (from 1.4 to 0.8) during UVA light treatment. Consequently, one can conclude that
either only the CH2 of the acetic acid moiety of MEEAA is removed during the pre-activation or
the entire MEEAA is fragmented into small, highly volatile and therefore not measurable
organic compounds such as CO2. Furthermore, the degradation into smaller fragments in
concentrations lower than the detection limit of NMR is conceivable. However, the possible
decrease in the other MEEAA signals (C15-C19) cannot easily be determined by NMR as the
signals lie in the same range as the ones caused by compound IV-a.
Figure IV - 15. 1H-NMR spectra of fraction IV in D2O before (on the top) and after 24 h UVA pre-activation (on the bottom). The carbon atoms of both the molecules are numbered and the numbers are related to the specific signals in the spectra.
HPLC analysis indicated that the amount of MEEAA was lowered by 10 % during UVA light
treatment and the appearance of two new mass fragments was detected. The measured m/z
and probable structures with their calculated molecular masses are depicted in Table IV - 1.

IV. Cell culture examinations of synthesized TiO2 particle systems
- 161 -
The proposed structures were selected based on the reactant MEEAA and possible
degradation pathways of the methyl ethers and carboxylic acids found in literature.48–53
However, it must be admitted that PC decomposition reactions are very complex and therefore,
other possible structures may not have been identified. Also the proton abstractions of ethoxy
groups could take place and lead to other degradation pathways not considered in this work.
The degradation could occur similarly to the degradation of butanoic acid via the H abstraction
from a methylene group.54
Table IV - 1. New fragments (m/z) after UVA light treatment detected by HPLC-MS and belonging possible molecular structures and their calculated m/z.
measured m/z, negative mode
probable structure, name calculated m/z of [M-H]-
117.07 compound MS117
117.06
163.15 compound MS163
163.06
The detected compound MS163 is most probably obtained during the PC degradation of the
methyl ether group (Scheme IV - 3, highlighted in green colour). The proposed possible
degradation pathway of the methyl ether group of MEEAA was deduced from the PC
decomposition of methyl-tert-butyl ether or methyl perfluoroalkyl ethers.52,53 The detected
compound MS117 must most probably be produced by both the removal of the methoxy group
(Scheme IV - 3, highlighted in green colour) and the degradation of the carboxylic acid via the
proton abstraction from the α-carbon by hydroxyl radicals and further reaction with the
surrounding oxygen resulting in a formate ester. Possible degradation pathways of the
carboxylic acid are depicted in Scheme IV - 4 deduced from the PC decompositions of
carboxylic acids such as propanoic and octanoic acids.48–51 In both schemes the red arrows
indicate reaction steps that are considered very probable but could not be confirmed by the
literature.
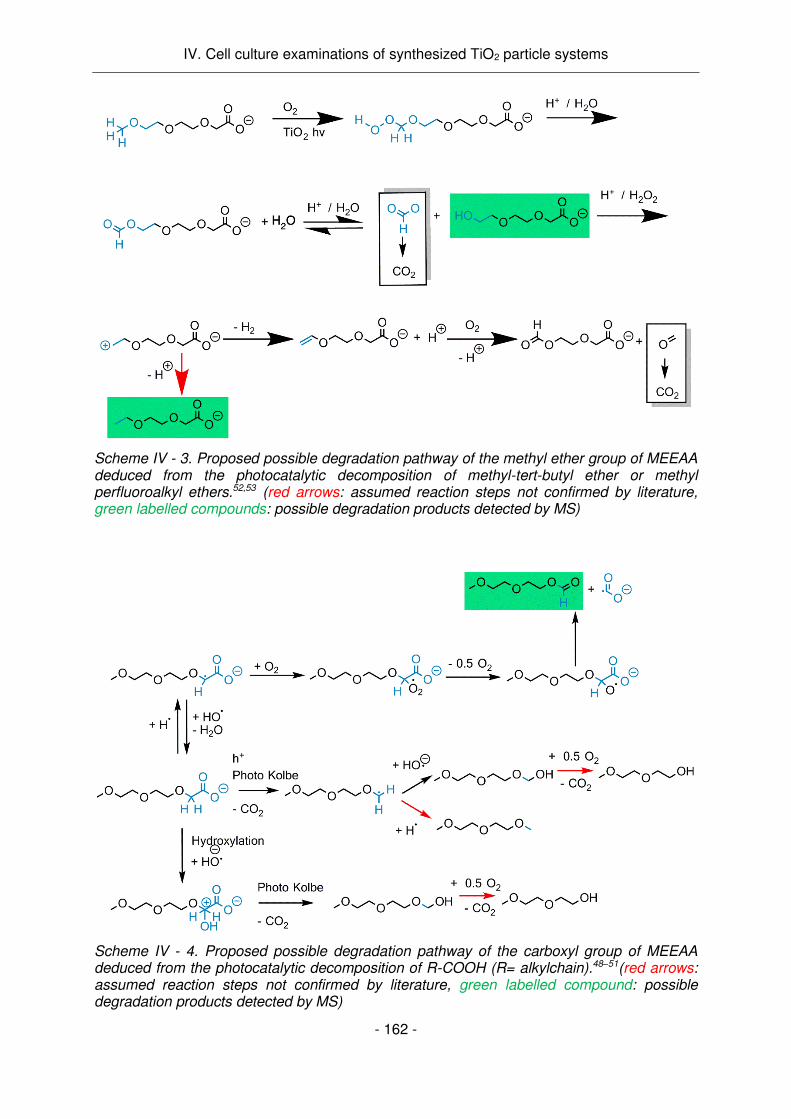
IV. Cell culture examinations of synthesized TiO2 particle systems
- 162 -
Scheme IV - 3. Proposed possible degradation pathway of the methyl ether group of MEEAA deduced from the photocatalytic decomposition of methyl-tert-butyl ether or methyl perfluoroalkyl ethers.52,53 (red arrows: assumed reaction steps not confirmed by literature, green labelled compounds: possible degradation products detected by MS)
Scheme IV - 4. Proposed possible degradation pathway of the carboxyl group of MEEAA deduced from the photocatalytic decomposition of R-COOH (R= alkylchain).48–51(red arrows: assumed reaction steps not confirmed by literature, green labelled compound: possible degradation products detected by MS)

IV. Cell culture examinations of synthesized TiO2 particle systems
- 163 -
The potential cytotoxicity of the identified compounds has not been evaluated yet. While pure
MEEAA (shown in this study) and (2-methoxyethoxy)acetic acid55 are considered as non-toxic,
the toxicity by alkoxyacetic acids has been proved to increase with decreasing chain length (e.
g. in the case of testicular toxicity in rats).56 Shorter alkoxyacetic acids such as methoxyacetic
acid, ethoxyacetic acid or butoxyacetic acid have for example been confirmed to be
embryotoxic.57 They lead to an intracellular acidification of cells inhibiting their cell
differentiation.57 Studying the hematotoxicity of alkoxyacetic and -propionic acids, it was shown
that the presence and location of the ether bond plays a determining role in the toxicity of the
compound.58 A cytotoxic behaviour of formates such as commercially available ethyl formate
has not been reported.59 Taking into account all the before mentioned insights, the cytotoxicity
(e.g. towards malignant cells) of the two identified compounds seems probable and should
therefore be studied in future.

IV. Cell culture examinations of synthesized TiO2 particle systems
- 164 -
IV.4. Conclusion
For the transfer of the samples into cell culture media, the synthesized unmodified AA- and
MEEAA-TiO2 NPs were stabilised to avoid agglomeration and sedimentation. Stabilising the
NPs with BSA, FBS, Melpers® V4343 or Sika® ViscoCrete®-10110178 improved the NP
dispersion in various cell culture media. Melflux® 4930 F appeared to be the most suitable
stabilising agent in this study, stabilising the particles against agglomeration and subsequent
sedimentation over 24 h in all three tested cell culture media. The stabilisation assures an
accurate dosing of particles for cell culture tests and reliable concentration-dependent particle
uptake studies as the particles do not sediment. In contrast to FBS, which is commonly used
as a stabiliser in the literature, Melflux does not influence the cytotoxicity of the particles.
Therefore, it is suitable as a stabilising agent of TiO2 NPs and may be of special interest for
studies on the toxicity or therapeutic potential of these NPs.
In addition and essential for this research work, the tested synthesized NP systems AA-TiO2
and MEEAA-TiO2 were both proved to be non-toxic towards both malignant and non-malignant
cells in their inactive state, at least within the applied concentrations - both as well-stabilised
single particles or not-stabilised agglomerates. This paves the way towards their application
as tumour treatment agent as their non-toxicity may enable UVA light activated specific tumour
treatment. Furthermore, these tests provide the basis for subsequent cytotoxicity tests of
functionalized TiO2 particles, enabling studies on the influence of modified surface properties
on their toxicity.
The detected anti-tumour activity of 24 h UVA light pre-activated MEEAA-TiO2 samples is most
probably caused by the PC degradation of MEEAA into cytotoxic compounds enhanced by the
presence of chloride impurities in the commercially obtained acid. This work on the one hand
provided impressive results concerning a specific tumour treatment, on the other hand it
stressed that the transfer of commercial and chemical compounds into biomedical applications
can provoke unexpected obstacles concerning the toxicity of unidentified impurities. However,
for the organically modified NPs synthesized in this work (Chapter III), this toxicity is of no
relevance as the particles are purified during the functionalization procedure.
Future works should include the cytotoxicity assessment of the functionalized MEEAA-TiO2
samples as well as the development of the state of the art PC tumour treatment via the UVA
light application onto cells exposed to PC NPs (as shown in Figure IV - 9).
IV. Cell culture examinations of synthesized TiO2 particle systems
- 165 -
References:
1 A. L. Niles, R. A. Moravec and T. L. Riss, Expert Opin. Drug Discov., 2008, 3, 655–669.
2 S. Hackenberg, A. Scherzed, W. Harnisch, K. Froelich, C. Ginzkey, C. Koehler, R. Hagen and N. Kleinsasser,
J. Photochem. Photobiol. B, 2012, 114, 87–93.
3 M. Scanu, L. Mancuso and G. Cao, Toxicol. In Vitro, 2011, 25, 1989–1995.
4 R. C. Stearns, J. D. Paulauskis and J. J. Godleski, Am. J. Respir. Cell Mol. Biol., 2001, 24, 108–115.
5 T. Mosmann, J. Immunol. Methods, 1983, 65, 55–63.
6 P. R. Twentyman and M. Luscombe, Br. J. Cancer, 1987, 56, 279–285.
7 A. Kroll, M. H. Pillukat, D. Hahn and J. Schnekenburger, Eur. J. Pharm. Biopharm., 2009, 72, 370–377.
8 M. C. Alley, D. A. Scudiero, A. Monks, M. L. Hursey, M. J. Czerwinski, D. L. Fine, B. J. Abbott, J. G. Mayo, R.
H. Shoemaker and M. R. Boyd, Cancer Res., 1988, 48, 589–601.
9 J. M. Edmondson, L. S. Armstrong and A. O. Martinez, J. Tissue Cult. Methods, 1988, 11, 15–17.
10 G. Ciapetti, E. Cenni, L. Pratelli and A. Pizzoferrato, Biomaterials, 1993, 14, 359–364.
11 G. Fotakis and J. A. Timbrell, Toxicol. Lett., 2006, 160, 171–177.
12 D. A. Scudiero, R. H. Shoemaker, K. D. Paull, A. Monks, S. Tierney, T. H. Nofziger, M. J. Currens, D. Seniff and
M. R. Boyd, Cancer Res., 1988, 48, 4827–4833.
13 Z. E. Allouni, M. R. Cimpan, P. J. Høl, T. Skodvin and N. R. Gjerdet, Colloids Surf. B Biointerfaces, 2009, 68,
83–87.
14 Z. Ji, X. Jin, S. George, T. Xia, H. Meng, X. Wang, E. Suarez, H. Zhang, E. M. V. Hoek, H. Godwin, A. E. Nel
and J. I. Zink, Environ. Sci. Technol., 2010, 44, 7309–7314.
15 P. Bihari, M. Vippola, S. Schultes, M. Praetner, A. G. Khandoga, C. A. Reichel, C. Coester, T. Tuomi, M. Rehberg
and F. Krombach, Part. Fibre Toxicol., 2008, 5, 14.
16 N. Mandzy, E. Grulke and T. Druffel, Powder Technol., 2005, 160, 121–126.
17 A.-H. Lu, E. L. Salabas and F. Schüth, Angew. Chem. Int. Ed., 2007, 46, 1222–1244.
18 K. Mandel, F. Hutter, C. Gellermann and G. Sextl, Colloids Surf. Physicochem. Eng. Asp., 2011, 390, 173–178.
19 M. Robins and A. Fillery-Travis, J. Chem. Technol. Biotechnol., 1992, 54, 201–202.
20 C. Guiot and O. Spalla, Environ. Sci. Technol., 2013, 47, 1057–1064.
21 E. C. Cho, Q. Zhang and Y. Xia, Nat. Nanotechnol., 2011, 6, 385–391.
22 N. Lakshminarasimhan, W. Kim and W. Choi, J. Phys. Chem. C, 2008, 112, 20451–20457.
23 A. Salvati, A. S. Pitek, M. P. Monopoli, K. Prapainop, F. B. Bombelli, D. R. Hristov, P. M. Kelly, C. Åberg, E.
Mahon and K. A. Dawson, Nat. Nanotechnol., 2013, 8, 137–143.
24 L. Wang, J. Li, J. Pan, X. Jiang, Y. Ji, Y. Li, Y. Qu, Y. Zhao, X. Wu and C. Chen, J. Am. Chem. Soc., 2013, 135,
17359–17368.
25 S. Kawashima, J.-W. T. Seo, D. Corr, M. C. Hersam and S. P. Shah, Mater. Struct., 2014, 47, 1011–1023.
26 S. V. Samchenko, O. V. Zemskova and I. V. Kozlova, Russ. J. Appl. Chem., 2014, 87, 1872–1876.
27 L. Vaisman, H. D. Wagner and G. Marom, Adv. Colloid Interface Sci., 2006, 128–130, 37–46.
28 K. Rezwan, A. R. Studart, J. Vörös and L. J. Gauckler, J. Phys. Chem. B, 2005, 109, 14469–14474.
29 S. Salgın, U. Salgın and S. Bahadır, Int J Electrochem Sci, 2012, 7, 12404–12414.
30 T. Cedervall, I. Lynch, S. Lindman, T. Berggård, E. Thulin, H. Nilsson, K. A. Dawson and S. Linse, Proc. Natl.
Acad. Sci., 2007, 104, 2050–2055.
31 J. Vidic, F. Haque, J. M. Guigner, A. Vidy, C. Chevalier and S. Stankic, Langmuir, 2014, 30, 11366–11374.
32 A. L. Barrán-Berdón, D. Pozzi, G. Caracciolo, A. L. Capriotti, G. Caruso, C. Cavaliere, A. Riccioli, S. Palchetti
and A. Laganà, Langmuir, 2013, 29, 6485–6494.
33 O. Akhlaghi, O. Akbulut and Y. Z. Menceloglu, Colloid Polym. Sci., 2015, 293, 2867–2876.
IV. Cell culture examinations of synthesized TiO2 particle systems
- 166 -
34 D. H. Napper and A. Netschey, J. Colloid Interface Sci., 1971, 37, 528–535.
35 M. Horie, K. Nishio, K. Fujita, H. Kato, S. Endoh, M. Suzuki, A. Nakamura, A. Miyauchi, S. Kinugasa, K.
Yamamoto, H. Iwahashi, H. Murayama, E. Niki and Y. Yoshida, Toxicol. In Vitro, 2010, 24, 1629–1638.
36 C.-K. Yu, K.-H. Hu, S.-H. Wang, T. Hsu, H.-T. Tsai, C.-C. Chen, S.-M. Liu, T.-Y. Lin and C.-H. Chen, Appl. Phys.
A, 2011, 102, 271–274.
37 D. Brunner, ALTEX, 2010, 53–62.
38 I. eho , V. Vilímová, P. Jendelová, V. Kubíček, D. Jirák, V. Herynek, M. Kapcalová, J. Kotek, J. Černý, P.
Hermann and I. Lukeš, J. Med. Chem., 2011, 54, 5185–5194.
39 K. T. Thurn, E. M. B. Brown, A. Wu, S. Vogt, B. Lai, J. Maser, T. Paunesku and G. E. Woloschak, Nanoscale
Res. Lett., 2007, 2, 430–441.
40 J. Seo, H. Chung, M. Kim, J. Lee, I. Choi and J. Cheon, Small, 2007, 3, 850–853.
41 S. Yamaguchi, H. Kobayashi, T. Narita, K. Kanehira, S. Sonezaki and Y. Kubota, Photochem. Photobiol., 2010,
86, 964–971.
42 X. Feng, S. Zhang and X. Lou, Colloids Surf. B Biointerfaces, 2013, 107, 220–226.
43 J. Xu, Y. Sun, J. Huang, C. Chen, G. Liu, Y. Jiang, Y. Zhao and Z. Jiang, Bioelectrochemistry, 2007, 71, 217–
222.
44 H.-U. Simon, A. Haj-Yehia and F. Levi-Schaffer, Apoptosis, 2000, 5, 415–418.
45 S. Koyama, S. Kodama, K. Suzuki, T. Matsumoto, T. Miyazaki and M. Watanabe, Mutat. Res. Mol. Mech.
Mutagen., 1998, 421, 45–54.
46 I. K. Konstantinou and T. A. Albanis, Appl. Catal. B Environ., 2004, 49, 1–14.
47 A. Vidal, Z. Dinya, F. Mogyorodi Jr. and F. Mogyorodi, Appl. Catal. B Environ., 1999, 21, 259–267.
48 J. Araña, V. M. R. López, J. M. D. Rodríguez, J. A. H. Melián and J. P. Peña, Catal. Today, 2007, 129, 185–
193.
49 T. Sakata, T. Kawai and K. Hashimoto, J. Phys. Chem., 1984, 88, 2344–2350.
50 V. Gandhi, M. Mishra and P. A. Joshi, Mater. Sci. Forum, 2012, 712, 175–189.
51 J. Schwitzgebel, J. G. Ekerdt, H. Gerischer and A. Heller, J. Phys. Chem., 1995, 99, 5633–5638.
52 R. D. Barreto, K. A. Gray and K. Anders, Water Res., 1995, 29, 1243–1248.
53 M. Toma, K. Takeuchi and T. Ibusuki, Environ. Sci. Technol., 1999, 33, 1071–1076.
54 C. Guillard, J. Photochem. Photobiol. Chem., 2000, 135, 65–75.
55 K. L. Cheever, D. E. Richards, W. W. Weigel, J. B. Lal, A. M. Dinsmore and F. B. Daniel, Toxicol. Appl.
Pharmacol., 1988, 94, 150–159.
56 P. M. D. Foster, S. C. Lloyd and D. M. Blackburn, Toxicology, 1987, 43, 17–30.
57 J. Louisse, Y. Bai, M. Verwei, J. J. M. van de Sandt, B. J. Blaauboer and I. M. C. M. Rietjens, Toxicol. Appl.
Pharmacol., 2010, 245, 236–243.
58 B. I. Ghanayem, L. T. Burka and H. B. Matthews, Chem. Biol. Interact., 1989, 70, 339–352.
59 V. S. Haritos and G. Dojchinov, Comp. Biochem. Physiol. Part C Toxicol. Pharmacol., 2003, 136, 135–143.

- 167 -
General conclusion

General conclusion
- 168 -
Head and neck cancer is one of the ten most common cancers globally and typically shows
difficult-to-treat field cancerization, which means that the tumour is not situated in a well-
defined location but widely spread over the tissue. Usually these formations are a mixture of
pre-malignant and malignant superficial manifestations with some regions having deeply
invasive tumour fractions. This unclear extent of the tumour makes a surgical removal very
difficult and also radiation or chemotherapy are often meeting their limits raising the desire for
novel therapy strategies.
Photocatalytic nanoparticles (PC NPs), such as titanium dioxide, with their unique physical and
chemical properties due to their dimensions below 100 nm have a great potential as
photodynamic tumour treatment agent and could therefore enhance the current standard
treatments. Additionally, these NPs combine their function as a therapeutic agent with surfaces
that can be functionalized to mediate cellular uptake or carry molecules for diagnostic. Thus,
the key points this research has sought to address were the synthesis of anatase NPs, their
functionalization with dendritic and non-dendritic surface agents and the transfer of the
developed NPs into cell culture studies.
The first part of this work was therefore dedicated to the synthesis and thorough
characterization (XRD, TEM, zeta potential, DLS, TGA, nitrogen sorption, DRIFT and PC
degradation) of two anatase NP systems AA-TiO2 and MEEAA-TiO2 mainly differing in their
surface groups (acetonate – AA plus para-toluene sulfonic acid and 2-[2-(2-
methoxyethoxy)ethoxy]acetic acid - MEEAA) from the hydrothermal synthesis. The higher PC
activity of the MEEAA-TiO2 compared to the AA-TiO2 was therefore mainly related to the
different surface groups or more precisely the higher amount of organic groups on the AA-
TiO2. With increasing autoclaving time or temperature during the synthesis, the crystallite size
of the synthesized systems was increased (from ~5 to ~8 nm) while the properties of the
surface groups were not significantly influenced. Surprisingly, the photocatalytic performance
of the samples augmented with increasing particle size, which is reverse to basic knowledge
and was found to be caused by a change in crystal morphology at longer hydrothermal
treatment times or higher temperatures. While small crystallites show the typical equilibrium
state truncated tetragonal bipyramidal morphology, crystal growth leads to the formation of
rod-like crystals with oxygen vacancies provoked by oriented attachment of single particles
(XAFS, XRD and HR-TEM analyses). Both the more anisotropic crystal shape and the increase
in oxygen vacancies improve the charge carrier separation and thus the photocatalytic activity
of the samples.
For the next approach, the synthesized anatase NPs were prepared for cell culture
examinations, which included their stabilisation in cell culture media. The polycarboxylate ether
General conclusion
- 169 -
Melflux® 4930 F, which has never been used for cell culture studies before, was shown to be
the most suitable stabilising agent, stabilising the particles against agglomeration and
subsequent sedimentation over 24 h in cell culture media. The non-toxicity of this stabiliser
was demonstrated as well as its superiority (in stabiliser concentration and influence on the
cytotoxicity) over foetal bovine serum, which is commonly used as a stabiliser in the literature.
In addition both stabilised and not-stabilised NP systems AA-TiO2 and MEEAA-TiO2 were
proved to be non-toxic towards both malignant and non-malignant cells in their inactive state,
which paves the way towards their therapeutic application enabling ultraviolet (UV) light
triggered specific tumour treatment.
With the help of commercial silanes ([3-(2-aminoethylamino)propyl]-trimethoxysilane, N1-(3-
trimethoxysilyl-propyl)diethylenetriamine) the feasibility of grafting onto the developed TiO2
NPs was proved. The grafting procedure and the concentration of coupling agents for an
efficient grafting of the NPs was optimized guaranteeing a strongly modified particle surface
while maintaining the photocatalytic activity of the samples. These results were the basis for
the functionalization of NPs with self-synthesized well-tailored and well-characterized surface
agents. The synthesis routes for four either luminescent or non-luminescent dendritic or linear
structures for the particle functionalization via silanization were planned, carried out and
critically examined. Three of the synthesized coupling agents contained a rhodamine dye;
while the first coupling agent was as linear molecule without terminal amine group, the second
linear coupling agent combined the dye with a terminal functional group. The luminescent 1st
generation dendritic molecule united the two terminal amine groups thanks to the dendritic
branches with an off-centred dye. The last coupling agent also bore a dendritic structure with
two terminal amine groups but no dye. Two of the mentioned coupling agents were grafted
onto MEEAA-TiO2 and the successful surface modification was shown via IR, DLS and zeta
potential measurements. First studies on the PC activity of one of the modified samples were
also carried out and indicated the surprising increase in its performance probably caused by
the properties of the rhodamine dye-containing coupling agent that also resulted in a strong
luminescence of the NPs.
This is why, one can state that the synthesis of luminescent NPs by grafting a dye-containing
coupling agent was successfully carried out. Another approach to introduce luminescence
properties into the TiO2 particle systems via the synthesis of luminescent Rhodamine B doped
TiO2/SiO2 core/shell NPs was shown to be feasible. However, this modification always resulted
in a drastically reduced PC activity due to the silica shell that covers the photocatalytically
active surface. Thus, the development of NPs consisting of a luminescent core and a
photocatalytically active shell would be advantageous as it would ideally not influence the
General conclusion
- 170 -
photocatalytic performance of the sample while possessing luminescence properties. As a side
effect, the synthesis of the coupling agents would be facilitated as there would be no more
need for the integration of a dye into the molecule structure. While the feasibility to form a TiO2
shell around inorganic NPs such as iron oxide NPs has been already shown in this work, future
studies should search for a luminescent inorganic particle, which is sufficiently stable under
the hydrothermal synthesis conditions of TiO2.
Concerning the synthesis of luminescent, dendritic coupling agents, first synthesis routes have
successfully been established. However, further research might well be conducted on these
coupling agents in order to optimize the design and reaction pathway for example of the dye-
and terminal amine-containing linear organosilane. Furthermore, the use of phthalimide as
protecting group of the terminal amines and its cleavage after grafting should be rethought;
either a more efficient cleavage procedure not affecting the Ti-O-Si bonds should be found or
the phthalimide could be substituted by another protecting group, which can be cleaved under
milder conditions.
Subsequently, future works should focus on the cytotoxicity assessment of the functionalized
TiO2 samples as well as the development of the state of the art PC tumour treatment via the
UV light application onto cells exposed to PC NPs. Regarding the detected anti-tumour activity
of 24 h UV light pre-activated MEEAA-TiO2 samples, this work pointed out that the transfer of
commercial and chemical compounds into biomedical applications can provoke unexpected
obstacles concerning the toxicity of unidentified impurities. Nevertheless, the discovered
specific anti-tumour activity is quite impressive and surely it would be interesting to evaluate it
in more detail for the use of this compound as possible future tumour drug.
One unique characteristic of this research work has been the development of functionalized
NP systems for biomedical applications, starting from the particle synthesis, proceeding the
synthesis of organic coupling agents, as well as the grafting onto the particles and ending with
the preparation of the samples for cell culture examinations and additional cytotoxicity studies.
While most researches only focus on one step of the descriped pathway, the challenging option
to carry out all steps in the same project allows the better understanding of the influences of
each step on the others and the possibilty to track back problems to their routes that occure in
the later steps of the research.
The novel insights gained in the augmentation of PC performance of the synthesized anatase
NPs due to a morphology change during crystal growth could benefit the perfection of the
hydrothermal sol-gel synthesis of highly photocatalytically active TiO2 NPs.
The stabilisation of these NPs in cell culture media with Melflux® 4930 F can surely be
transferred to particles consisting of other materials and may therefore be of special interest
for studies on the toxicity or therapeutic potential of NPs in general.

General conclusion
- 171 -
The proof of the feasibility to graft organo-silanes onto the synthesized TiO2 particles paves
the way for their utilization in a broad range of applications as well-determined, manipulable
surface properties are the basis for this. They could possibly be used as additives for example
in plastics or functional coatings, as drug carriers or in solar cells.
The development of novel luminescent dendritic coupling agents is not only of great importance
for the functionalization of photocatalytic NPs used for tumour treatment, but also for the
modification of for example drug-carrier particles consisting of other materials as they allow
the combination of diagnostic with therapeutic applications and a monitoring of the applied
substances. Also fundamental research concerning the particle uptake by cells could be
facilitated by the functionalization of NPs with these luminescent coupling agents as they may
allow their facile luminescence detection.
The photocatalytic TiO2 NP systems in their functionalized or unmodified state, which were
developed in this work, are of great interest for photodynamic tumour therapy. This therapy
approach would consist of the particle application onto the tissue of interest and the cellular
uptake of the NPs by cells. Subsequently, the UV light is supposed to be applied on the treated
area to activate the NPs in order to photocatalytically destroy cellular components leading to
cell apoptosis and tumour destruction. Due to the proved non-toxicity in their inactive state,
areas that are not treated with UV light may not be damaged and TiO2 photocatalysis is
expected to specifically destroy tumour cells.
As well as photodynamic tumour treatment, the developed NP systems could also benefit
photocatalytic water purification or the development of photonic and optoelectronic devices. In
the case of water purification, the stably dispersed NP samples showing an excellent
photocatalytic activity could be used to decompose organic contaminants in waste water such
as pesticides or drugs. For the development of photonic and optoelectronic devices, the
semiconductor properties of the anatase NPs providing a wide band-gap are ideal for the light
energy conversion. The possibility to functionalize the surface gives the opportunity to couple
sensitizers such as dyes on it in order to construct for example dye-sensitized solar cells.

General conclusion
- 172 -

- 173 -
Experimental part

- 174 -
Contents
Experimental part .......................................................................................................... - 175 - 1. Materials, equipment and experimental set-ups ..................................................... - 175 -
1.1. Solvents, reagents and materials for cell culture experiments ......................... - 175 - 1.2. Equipment and experimental set-ups .............................................................. - 175 -
2. Inorganic nanoparticle synthesis protocols ............................................................. - 179 - 2.1. Synthesis of TiO2 nanoparticles ....................................................................... - 179 - 2.2. Synthesis of luminescent TiO2 based core/shell nanoparticles ........................ - 180 -
3. Organic coupling agent synthesis protocols ........................................................... - 182 - 4. Grafting protocols................................................................................................... - 206 -
4.1. Optimization of grafting protocols with commercial silanes .............................. - 206 - 4.2. Grafting of synthesized coupling agents onto MEEAA-TiO2 (200 °C, 4 h) ........ - 206 -
5. Cell culture tests .................................................................................................... - 208 -
- 175 -
Experimental part*
1. Materials, equipment and experimental set-ups
1.1. Solvents, reagents and materials for cell culture experiments
Solvents and reagents for inorganic and organic syntheses Solvents and starting materials were purchased from Acros, Alfa Aesar, Aldrich, Fisher Scientific, Lehmann & Voss & Co or Bachem. All chemical compounds were reagent-grade (but 2-[2-(2-methoxyethoxy)ethoxy]acetic acid which was technical grade) and used without further purification (but triethylamine and isocyanatopropyltriethoxysilane which were purified by distillation over CaH2 or under dynamic vacuum). Water was deionised before use. All solvents for organic synthesis were anhydrous. DMF and dioxane were purchased, others were dried over dehydrating agents and distilled under inert atmosphere: - CH2Cl2: CaH2; - MeOH: CaH2; - EtOH: CaH2; - THF: Benzophenone, Na; - pentane: Benzophenone, Na;
Solvents, media and cells for cell culture experiments Stabilising agents for particles in cell culture media were purchased from Sigma–Aldrich, BASF and Sika. The cell culture media utilised for this research were bronchial epithelial cell growth medium (BEGM with 1 vol-% penicillin and streptomycin (10000 µg/ml, PenStrep) and supplement mix C-39165), Roswell Park Memorial Institute medium (RPMI with 1 vol-% FBS, 1 vol-% PenStrep, 1 vol-% non-essential amino acids and 1 vol-% sodium pyruvate) and Dulbecco’s modified eagle medium (DMEM with 10 vol-% FBS and 1 vol% PenStrep). These substances were ordered from PromoCell GmbH, Sigma-Aldrich, Linaris, gibcoR life technologiesTM and Biochrom AG. 3-(4,5-dimethylthiazol-2-yl)-2,5-diphenyl tetrazolium bromide (MTT) was also ordered from Sigma-Aldrich.
The head and neck squamous cell carcinoma cell line FaDu was established from the lymph node metastasis of a hypopharyngeal squamous cell carcinoma. Primary human bone marrow-derived mesenchymal stem cells (BMSC) from human bone marrow were obtained from voluntary patients undergoing surgery in the Department of Orthopedics of the University Clinic Wuerzburg. The study was approved by the Ethics Committee of the Medical Faculty, University of Wuerzburg (12/06) and informed consent was obtained from all of the individuals included. Primary fibroblasts were obtained from voluntary patients undergoing surgery in the Department of Oto-Rhino-Laryngology, Plastic, Aesthetic and Reconstructive Head and Neck Surgery of the University Clinic Wuerzburg. The study was approved by the Ethics Committee of the Medical Faculty, University of Wuerzburg (16/06) and informed consent was obtained from all of the individuals included. The laryngeal squamous cell carcinoma cell line HLaC78 was generated at the Department of Oto-Rhino-Laryngology, Plastic, Aesthetic and Reconstructive Head and Neck Surgery of the University Clinic Wuerzburg.1
1.2. Equipment and experimental set-ups BET – Nitrogen sorption: Nitrogen sorption experiments were carried out on an automated volumetric analyser (Model Autosorb 3B). Prior to the measurement, the nanoparticle (NP) samples were dried at 110 °C for 16 h at reduced pressure. The specific surface area of the
* Parts of this chapter have been published and are reused in this work by courtesy of: The Royal Society of Chemistry, original article: S. Koch et al., J. Mater. Chem. C, 2015, 3, 12430-2435, Elsevier, original article: S. Koch et al., Colloids Surf., B, 2016, 143, 7–14.

Experimental part
- 176 -
powder samples was determined according to Brunauer, Emmet and Teller by using the adsorption data in the relative pressure range from 0.05 to 0.3 p/p0.
Elemental analysis (EA): The elemental compositions of the synthesized compounds were determined by elemental analysis, carried out on a THERMO FISHER FLASH 2000.
Fourier transform infrared analysis: Diffuse reflectance infrared Fourier transform (DRIFT) measurements were conducted on a Thermo Fisher Scientific Nicolet 6700 spectrometer equipped with a diffuse reflection unit. The spectra were recorded via 200 scans from 4000 to 400 cm-1 at a resolution of 4 cm-1. All powder samples (at a concentration of 1 - 4 weight-%) were intermixed with dried KBr and finely ground. Attenuated total reflection (ATR) spectra were recorded on a Nicolet iS50 spectrometer with an integrated ATR unit using 200 scans from 4000 to 400 cm-1 at a resolution of 4 cm-1.
High pressure liquid chromatography (HPLC): HPLC measurements were performed on a Shimadzu Nexera LC-30AD liquid chromatograph with a SIL-30AC autosampler and a column-thermostat with integrated column-switching valve. The system was coupled to a Shimadzu 8040 triple-quadrupole mass spectrometer with an electrospray ion source. Full scan mass spectra were taken from 50 to 400 m/z with a scan speed of 5000 u/sec in Q1 and 15000 u/sec in Q3 for 1.5 minutes. The mass spectrometer was used in the negative ion mode. The ESI source was operated with a capillary voltage of -3.5 kV. The temperature of the heat block and of the desolvation line in the ion source was set to 450°C and 200 °C, respectively. The nebulizing and drying gas flow was 3 and 10 l/min, respectively. An isocratic elution was performed with water and methanol in the ratio of 30 to 70, the flow rate was 0.2000 ml/min, and the column oven was set to 25°C.
Mass spectrometry (MS): Mass spectra were performed on a QStar Elite Mass Spectrometer equipped with an electrospray ionization (ESI) source (operated in a positive or negative ion mode) or on a Jeol Masse AccuToF Spectrometer with an electric ionization (EI) or field desorption (FD) source. All samples were dissolved in methanol for these measurements.
Nuclear magnetic resonance (NMR): NMR spectra were performed on the Bruker Avance 300 FT NMR spectrometer (1H: 300 MHz, 13C: 75 MHz), the Bruker DPX 400 FT NMR spectrometer (1H: 400 MHz, 13C: 101 MHz) and the Bruker DPX 600 FT NMR spectrometer (1H: 600 MHz, 13C: 151 MHz). Chemical shifts of 1H NMR signals were calibrated according to the signals of deuterated solvents quoted to internal standard TMS (δ = 0.00). All samples were dissolved in an appropriate deuterated solvent prior to the measurements. Following abbreviations are used for the analysis of NMR spectra: s = singlet, d = doublet, dd = doublet-doublet, t = triplet, q = quartet, p = pentet, m = multiplet, br = broad, J = J coupling constant.
Photocatalytic activity tests: The photocatalytic activity of the synthesized samples is measured by a dichloroacetic acid degradation with the set-up shown in Figure - EP - 1. The test is carried out in a double-jacket reactor that is cooled by water to 20 °C. In the center of the reactor a halogen lamp (Philips CLEO Compact 15W) with wavelengths of 300-400 nm is placed in a silica tube. Furthermore, a glass tube for bubbling compressed air into the testing solution, a temperature sensor, a chloride measuring electrode and its reference Ag/AgCl electrode were also placed into the vessel. For the photocatalytic activity test, 0.5 to 0.8 litre of solution (depending on the set-up) were filled into the reactor, consisting of water with 100 mg/l NPs and 1 g/l dichloroacetic acid. Magnetic stirring was used during the whole test to guarantee a homogeneous dispersion of the particles. Before starting the UV activated dichloroacetic acid decomposition, the aqueous solution was stirred for 20 min in darkness to ensure constant reaction conditions. Then the light was switched on and after 5 min the first chloride concentration was recorded as zero-point.

Experimental part
- 177 -
Figure - EP - 1. Photocatalytic activity test set-up.
Sedimentation studies: The sedimentation of AA-TiO2 and MEEAA-TiO2 NPs with or without chosen stabilising agents in cell culture media was examined by absorbance measurements; 6 ml of NPs in cell culture media (0.5 mg/ml) was transferred into a 15 ml vial and 0.2 ml of the upper 10 % of the dispersion was then taken immediately and at 24 h after NP transfer. The absorbance at 490 nm of the withdrawn aliquots was measured and as references the absorbance of the pure media with stabiliser was also measured at the two time points. The 24 h continuous sedimentation studies were carried out by monitoring the absorbance at 490 nm as a function of time. As a reference RPMI containing the appropriate amount of water and stabiliser without particles was simultaneously acquired. The percentage of non-sedimented particles was then calculated taking the first measurement as 100 % and the reference as 0 %.
Thermogravimetric (TG) measurements coupled with mass spectrometry: TG coupled with MS analyses were performed on Netzsch STA 409 Pyrolysor coupled to a Balzers Instruments Thermostar quadrupolar mass spectrometer. The mass loss of the dried samples (10–20 mg) was monitored under argon at temperatures from 30°C to 1000°C with a heating rate of 5 K/min.
Transmitted electron microscopy (TEM): TEM images were obtained on a HITACHI H7650, (100 kV, equipped with a GATAN 11 mPx camera) or on a JEOL JSM 2010 at an acceleration voltage of 200 kV. High resolution TEM micrographs were obtained on a FEI Titan operating at 300 keV. The samples were prepared onto carbon-coated copper grids and slowly dried on the grid under ambient conditions.
UV-Vis and photoluminescence analysis: UV-Vis measurements on sample solutions were carried out on a TECAN Multimode-Microplate-Reader Infinite® M1000 PRO, a Shimadzu UV-3100, a Titertek Multiskan PLUS MK II from Labsystems or a Shimadzu UV-1560 PC. X-ray absorption fine structure (XAFS) analyses: The XAFS spectra were recorded at the K-edge of titanium (4966 eV) in transmission mode at the μ-Spot beamline, at the Bessy II light source, Berlin, Germany. The x-ray absorption near edge spectra (XANES) were measured
Experimental part
- 178 -
with a step of 0.5 eV at the absorption edge and with a 2 eV step above the edge. The extended x-ray absorption fine structre (EXAFS) range was scanned up to k = 12 Å-1 with a constant step in k-space of 0.04 Å-1. The spectra underwent the standard data treatment procedure using the IFFEFIT software package.2,3 Cellulose pellets filled with dry powder sample with an absorption optimized thickness were produced for XAFS measurements.
X-ray diffraction (XRD): The phase composition of the prepared TiO2 powder samples was analysed on a PANalytical Empyrean Series 2 or on a Bruker D2 PHASER employing Cu Kα radiation.
X-ray fluorescence spectroscopy (XRF): The liquid samples were analysed on a PANalytical sequential spectrometer system AXIOS DY 1495 with an Rh-target x-ray spectrografic tube (60 kV, 4 kW).
X-ray photoelectron spectra (XPS): Electronic properties were investigated by the Darmstadt Integrated System for MATerial research (DAISY-MAT), which combines a Physical Electronics PHI 5700 multitechnique surface analysis system with several deposition chambers via an ultrahigh vacuum sample transfer. X-ray photoelectron spectra were recorded using monochromatic Al Kα (1486.6 eV) radiation with an energy resolution of ≈0.4 eV as determined from the broadening of the Fermi edge of a sputter-cleaned Ag sample. Binding energies of core levels and valence band maximum can be determined with an accuracy of 50 meV and 100 meV, respectively. Binding energies obtained by XPS were calibrated by the Fermi level energy of the sputter-cleaned Ag sample. Hence, all the biding energies are given respect to the calibrated Fermi level. TiO2 powder samples were pressed onto the Indium foil as a conductive substrate to avoid a charging problem and transferred into the XPS chamber without any pre-treatments.
Zeta potential and dynamic light scattering (DLS): DLS and zeta potential analyses were carried out on the Malvern Instruments Zetasizer Nano ZS ZEN 3600 in combination with the Multi-Purpose Titrator MPT-2 or on Horiba Scientific NP analyzer SZ-100. The measurements were performed at 25°C for diluted aqueous particle dispersions. The isoelectric points were determined by zeta potential measurements during titration with the help of HCl and NaOH.

Experimental part
- 179 -
2. Inorganic nanoparticle synthesis protocols
2.1. Synthesis of TiO2 nanoparticles
Synthesis of acetyl acetonate (AA) coordinated TiO2-NPs (AA-TiO2) 100.12 g acetyl acetone (1 mol, 1 eq) was dropped into 342.17 g titanium (IV) ethoxide (1.5 mol, 1.5 eq) over 1.5 h under stirring. 90.08 g water (5 mol, 5 eq) was mixed with 9.51 g p-toluene sulfonic acid (0.05 mol, 0.05 eq). The water solution was added dropwise over 1 h to the titanium precursors and stirred overnight at room temperature. The solution was then concentrated by rotary evaporation resulting in an orange powder (TiO2 content: 56.8 weight-%, determined by heating up to 800 °C). The powder was subsequently dissolved in water to obtain a 12 weight-% (dark red, clear) amorphous titanium sol. This dispersion was hydrothermally treated in an autoclave (with 250 ml teflon insert filled to 75 % volume) with one of the following settings:
- 1 h at 160 °C - 4 h at 160 °C - 16 h at 160 °C - 4 h at 180 °C - 4 h at 200 °C
The obtained orange to beige gel was dissolved in water (3 weight-% TiO2 content) and subsequently pressure filtrated (0.8 µm membrane).
For analysis the samples were either washed with ethanol (for TEM and DRIFT) via centrifugation and redispersion (3 times at 30 000 rpm for 0.5 h), dried under vacuum if necessary (DRIFT) or washed via dialysis (10-20 kDa molecular cut-off) against water with up to 6 water changes (for photocatalytic activity test, TGA, XRD, zeta potential, DLS) and dried via freeze drying (TGA, XRD, XPS) or re-stabilised with the addition of 1 M HNO3 (to obtain pH = 3, for DLS).
Synthesis of 2-[2-(2-methoxyethoxy)ethoxy]acetic acid (MEEAA) coordinated TiO2-NPs (MEEAA-TiO2) 204.19 g 2-[2-(2-methoxyethoxy)ethoxy]acetic acid (1.13 mol, 1.89 eq) was dropped into 342.17 g titanium(IV) butoxide (0.6 mol, 1 eq) over 1 h under stirring. 36.03 g water (2 mol, 3.33 eq) was added dropwise over 30 min to the titanium precursors and stirred overnight at room temperature. The solution was then concentrated by rotary evaporation resulting in an orange viscous liquid (TiO2 content: 18.3 weight-%. determined by heating up to 800 °C). It was subsequently diluted with water to obtain a 12 weight-% orange, clear amorphous titanium sol. This dispersion was hydrothermally treated in an autoclave (with 250 ml Teflon insert filled to 75 % volume) with one of the following settings:
- 1 h at 160 °C - 4 h at 160 °C - 16 h at 160 °C - 4 h at 180 °C - 4 h at 200 °C
The obtained orange to beige gel was dissolved in water (3 weight-% TiO2 content) and subsequently pressure filtrated (0.8 µm membrane).
For analysis the samples were either washed with ethanol (for TEM and DRIFT) via centrifugation and redispersion (3 times at 30 000 rpm for 0.5 h), dried under vacuum if necessary (DRIFT) or washed via dialysis (10-20 kDa molecular cut-off) against water with up to 6 water changes (for photocatalytic activity test, TGA, XRD, zeta potential, DLS) and dried via freeze drying (TGA, XRD, XPS, XAFS) or re-stabilised with the addition of 1 M HNO3 (to obtain pH = 3, for DLS).

Experimental part
- 180 -
2.2. Synthesis of luminescent TiO2 based core/shell nanoparticles
Synthesis of TiO2/SiO2 core/shell nanoparticles For the coating of TiO2 NPs with a SiO2 shell 16.67 g TiO2 NP dispersion (0.5 g titanium dioxide) was mixed with 2.7 ml ammonia aqueous solution (25 %) to obtain a pH of 10 and redispersed using ultrasonic treatment (Branson Sonifier 450, 4 min, duty cycle = 30 %, strength = 7). 60 ml of ethanol were immediately added and 0.38 g TEOS in 20 ml ethanol were dropwise added within 30 min under permanent stirring. After 2 h of stirring, the reaction mixtures were concentrated via rotary evaporation and subsequently washed three times with ethanol via centrifugation.
Synthesis of luminescent TiO2/rhodamine-doped SiO2 core/shell nanoparticles with varying shell thicknesses Before the synthesis of the silica shell doped with RhBitc, the luminescent agent was conjugated to AMEO. Therefore, RhBitc (5.6 µg) was dissolved in DMF (2 ml) and a fivefold excess of AMEO was added to the dye solution under argon atmosphere. The reaction mixture was stirred overnight at room temperature in darkness. The modified luminescent agent is denoted as RhBitc-AMEO.
For the coating of TiO2 NPs with a dye doped SiO2 shell, 16.67 g TiO2 NP dispersion (0.5 g TiO2) was mixed with 2.7 ml ammonia aqueous solution (25 %) to obtain a pH of 10 and redispersed using ultrasonic treatment. 60 ml of ethanol were immediately added and 0.09 g, 0.18 g or 0.38 g TEOS with 49 µl, 106 µl or 212 µl RhBitc-AMEO in 20 ml ethanol were dropwise added within 30 min under permanent stirring. Due to this, 0.3 mol-% of Si-atoms added to the reaction belonged to AMEO or RhBitc-AMEO and the theoretic molar ratio Ti/Si/RhBitc was 1/0.07/4.11E-5, 1/0.14/8.8E-5 or 1/0.29/17.77E-5. After 2 h of stirring, the reaction mixtures were concentrated via rotary evaporation and subsequently washed with ethanol via centrifugation until a clear supernatant was obtained. The NPs were stored in ethanol or dried under vacuum for further characterization. The TiO2/SiO2 core/shell NPs are named as TiO2/SiO2_1 to TiO2/SiO2_3 (0.09 g to 0.38 g TEOS).
Synthesis of ZnO nanoparticles with LiOH as base Zn(CH3CO2)2 (37 mg, 0.2 mmol) was dissolved in ethanol (20 ml) in an ultrasonic bath. LiOH (36 mg, 1.5 mmol) was also ultrasonically dissolved in ethanol (20 ml). Then, both solutions were mixed together and stirred for 4 h at room temperature. The synthesis was carried out under three different conditions: firstly in a lid-covered flask, secondly in an open flask (which allowed for air exchange) and thirdly in a flask flooded with nitrogen.
Synthesis of ZnO nanoparticles with KOH as base Zn(CH3CO2)2 * H2O (8.13 g, 37 mmol) was dissolved in ethanol (700 ml) with the help of continuous sonication using a Branson Sonifier II Model 450 for 15 min in an ice water bath. Also KOH (8.31 g, 148 mmol) was dissolved in ethanol (280 ml) in an ultrasonic bath. After combining both solutions, compressed air was continuously bubbled into the stirred reaction batch at a flow rate of 100 l/h. The compressed air was introduced into the reaction vessel via a glass frit with holes of a diameter of 200 mm. The reaction was performed for 6 h at room temperature.
Synthesis of ZnO nanoparticles with varying LiOH ratios Zn(CH3CO2)2 (37 mg, 0.2 mmol) was dissolved in ethanol (3.08 ml) in an ultrasonic bath. LiOH (in appropriate concentration – see Table - EP - 1) was also ultrasonically dissolved in ethanol. Then, both solutions were mixed together and stirred for 24 h in an open flask at room temperature.
Experimental part
- 181 -
Table - EP - 1. Variation of reactant ratios for ZnO synthesis.
concentration ZnOAc:LiOH [mol]:[mol]
mass [g] (quantity [mmol]) amount of ethanol as solvent [ml]
1:1.15 0.0055 (0.23) 0.55
1:2 0.0096 (0.4) 0.96
1:3 0.0144 (0.6) 1.44
1:7.5 0.0360 (1.5) 3.6
Synthesis of Fe2O3/TiO2 core/shell nanoparticles First the synthesis of 3.9 g Fe2O3 NPs was carried out by a precipitation method. For this, Fe(II)Cl2 * 4 H2O (1 eq., 8 mmol, 1.59 g) and Fe(III)Cl3 * 6 H2O (2 eq., 16 mmol, 4.325 g) were dissolved in 200 ml water under strong stirring. 12 ml of 25 % ammonium hydroxide in water was quickly added. The obtained particles were washed twice with water and twice with ethanol by magnetic separation and redispersion. The ethanol was removed before the transfer of the particle pellet into the titanium precursor batch.
For the shell synthesis, 33.56 g 2-[2-(2-methoxyethoxy)ethoxy]acetic acid (0.1883 mol, 1.883 eq) was dropped into 34.03 g titanium(IV) butoxide (0.1 mol, 1 eq) over 1 h under stirring. This batch was added to the Fe2O3 particle pellet (3.9 g) under stirring. Then 6.01 g water (0.33 mol, 3.33 eq) was added dropwise over 30 min to the titanium precursors and stirred overnight at room temperature. The solution was then concentrated by rotary evaporation resulting in a black viscous liquid (Fe2O3/TiO2 content: 25.2 weight-%, determined by heating up to 800 °C). It was subsequently diluted with water to obtain sol with 12 weight-% inorganic core/shell precursor. This dispersion was hydrothermally treated in an autoclave (with 100 ml Teflon insert filled to 75 % volume) at 160 °C for 4 h. The finally obtained brown to black gel was diluted with water, destabilised with NaOH (pH = 10), 5 times washed with water via magnetic separation and redispersion and finally stabilised with HNO3 (pH = 3-4).

Experimental part
- 182 -
3. Organic coupling agent synthesis protocols All reactions described below were carried out under argon atmosphere. Exceptions were the reactions for compound 9, compound 10, compound 15, compound 19, compound 21 and compound 24.
Compound 1:
Chemical formula: C11H24N2O4
Molecular weight: 248.32 g/mol
Di-tert-butyl dicarbonate (1 eq., 0.05 mmol, 10.91 g) was dissolved in 100 ml CH2Cl2 and dropwise added to 2,2-(ethylenedioxy)bis(ethylamine) (10 eq., 0.5 mmol, 74.10 g) under strong stirring at 0 °C over 8 h. The reaction batch was then stirred for 16 h at room temperature. 300 ml water was added and the product was extracted with 3 x 50 ml CH2Cl2. The combined organic phases were washed with 3 x 150 ml water. The organic phase was dried over MgSO4, filtrated and concentrated under vacuum to yield compound 1 (97 %) as clear and pale yellow oil.
1H NMR (300 MHz, DMSO, δ [ppm]): 5.77 (s, 1H, 3-NH-4), 3.51-3.49 (m, 4H, 7, 6), 3.41-3.37 (m, 4H, 8, 5), 3.07 (dd, J = 5.97 Hz, 2H, 4), 2.80 (s, 2H, 9-NH2), 2.68 (t, J = 5.73 Hz, 2H, 9), 1.38 (s, 9H, 1).
13C NMR (75 MHz, DMSO, δ [ppm]): 156.03 (1C, 3), 78.02 (1C, 2), 72.85 (2C, 8, 5), 70.01/69.94 (2C, 7, 6), 41.51 (1C, 9), ~ 40.12 (1C, 4 in solvent signal), 29.57 (3C, 1).
MS (ESI, m/z) [M+H]+ calculated: 249.18, found: 249.20
EA† calculated: C, 53.21; H, 9.74; N, 11.28; O, 25.77 found: C, 50.72; H, 9.03; N, 10.26
Compound 2:
Chemical formula: C40H53N5O7S
Molecular weight: 747.95 g/mol
Compound 1 (1.2 eq., 0.48 mmol, 0.119 g) was dissolved in 3 ml CH2Cl2, triethylamine (TEA – 1.5 eq., 0.6 mmol, 83.74 µl) was then added and stirred for 10 min. Rhodamine B isothiocyanate (RhBitc – 1 eq., 0.4 mmol, 0.214 g) was dissolved in 3 ml DMF and added to the reaction batch. The reaction was carried out for 16 h under stirring at room temperature in darkness. The crude compound as powder was obtained by complete removal of all volatile compounds under vacuum. It was extensively washed with diethyl ether with the aid of
† The difference between calculated and found percentage of the elements is caused by traces of di-Boc protected compound.
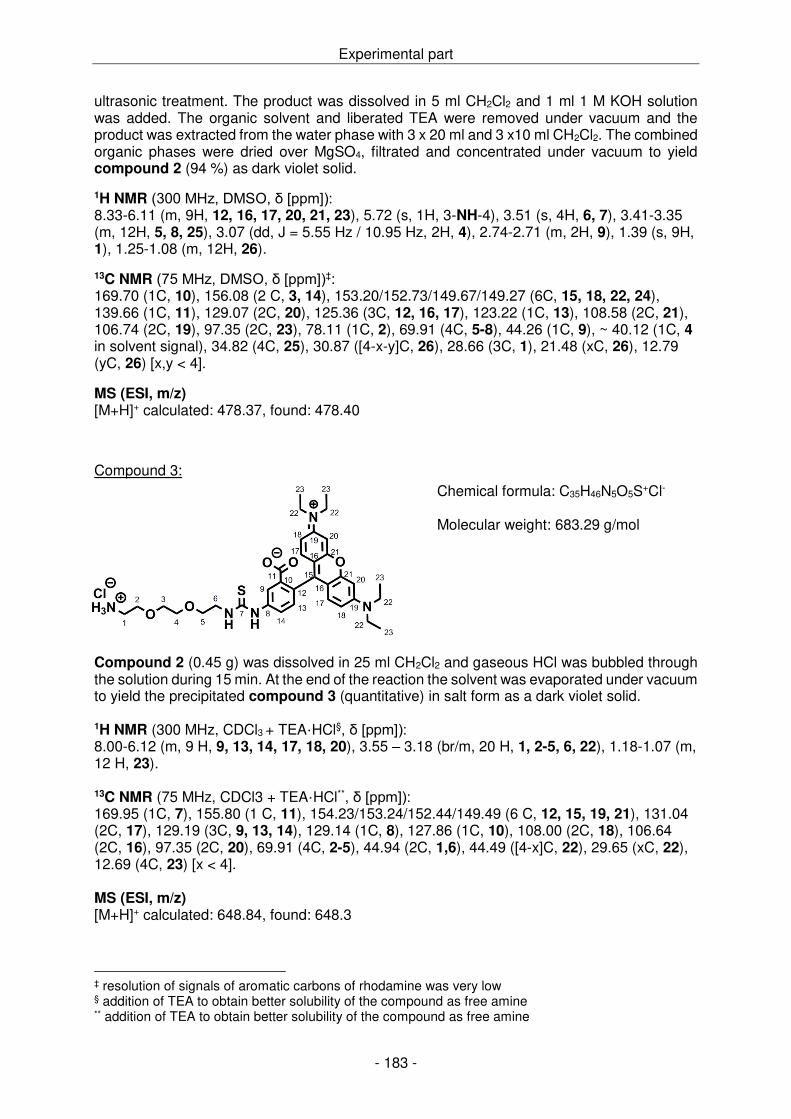
Experimental part
- 183 -
ultrasonic treatment. The product was dissolved in 5 ml CH2Cl2 and 1 ml 1 M KOH solution was added. The organic solvent and liberated TEA were removed under vacuum and the product was extracted from the water phase with 3 x 20 ml and 3 x10 ml CH2Cl2. The combined organic phases were dried over MgSO4, filtrated and concentrated under vacuum to yield compound 2 (94 %) as dark violet solid.
1H NMR (300 MHz, DMSO, δ [ppm]): 8.33-6.11 (m, 9H, 12, 16, 17, 20, 21, 23), 5.72 (s, 1H, 3-NH-4), 3.51 (s, 4H, 6, 7), 3.41-3.35 (m, 12H, 5, 8, 25), 3.07 (dd, J = 5.55 Hz / 10.95 Hz, 2H, 4), 2.74-2.71 (m, 2H, 9), 1.39 (s, 9H, 1), 1.25-1.08 (m, 12H, 26).
13C NMR (75 MHz, DMSO, δ [ppm])‡: 169.70 (1C, 10), 156.08 (2 C, 3, 14), 153.20/152.73/149.67/149.27 (6C, 15, 18, 22, 24), 139.66 (1C, 11), 129.07 (2C, 20), 125.36 (3C, 12, 16, 17), 123.22 (1C, 13), 108.58 (2C, 21), 106.74 (2C, 19), 97.35 (2C, 23), 78.11 (1C, 2), 69.91 (4C, 5-8), 44.26 (1C, 9), ~ 40.12 (1C, 4 in solvent signal), 34.82 (4C, 25), 30.87 ([4-x-y]C, 26), 28.66 (3C, 1), 21.48 (xC, 26), 12.79 (yC, 26) [x,y < 4].
MS (ESI, m/z) [M+H]+ calculated: 478.37, found: 478.40
Compound 3:
Chemical formula: C35H46N5O5S+Cl-
Molecular weight: 683.29 g/mol
Compound 2 (0.45 g) was dissolved in 25 ml CH2Cl2 and gaseous HCl was bubbled through the solution during 15 min. At the end of the reaction the solvent was evaporated under vacuum to yield the precipitated compound 3 (quantitative) in salt form as a dark violet solid. 1H NMR (300 MHz, CDCl3 + TEA·HCl§, δ [ppm]): 8.00-6.12 (m, 9 H, 9, 13, 14, 17, 18, 20), 3.55 – 3.18 (br/m, 20 H, 1, 2-5, 6, 22), 1.18-1.07 (m, 12 H, 23). 13C NMR (75 MHz, CDCl3 + TEA·HCl**, δ [ppm]): 169.95 (1C, 7), 155.80 (1 C, 11), 154.23/153.24/152.44/149.49 (6 C, 12, 15, 19, 21), 131.04 (2C, 17), 129.19 (3C, 9, 13, 14), 129.14 (1C, 8), 127.86 (1C, 10), 108.00 (2C, 18), 106.64 (2C, 16), 97.35 (2C, 20), 69.91 (4C, 2-5), 44.94 (2C, 1,6), 44.49 ([4-x]C, 22), 29.65 (xC, 22), 12.69 (4C, 23) [x < 4]. MS (ESI, m/z) [M+H]+ calculated: 648.84, found: 648.3
‡ resolution of signals of aromatic carbons of rhodamine was very low § addition of TEA to obtain better solubility of the compound as free amine ** addition of TEA to obtain better solubility of the compound as free amine

Experimental part
- 184 -
Compound 4:
Chemical formula: C45H66N6O9SSi Molecular weight: 895.20 g/mol
Compound 3 (1 eq., 0.208 mmol, 0.15 g) was dispersed in 6 ml CH2Cl2, TEA (15 eq., 3.12 mmol, 435 µl) was added and stirred until compound 3 was solubilized. Isocyanatopropyltriethoxysilane (1.2 eq., 0.250 mmol, 61.8 µl) was added and the reaction proceeded at room temperature for 16 h. Afterwards the solvent and excess TEA were evaporated. The obtained product was washed with pentane (3 x 30 ml). Then, all traces of the solvent were evaporated to yield compound 4 as purple solid (~ 90 %). 1H NMR (300 MHz, CDCl3 + TEA·HCl††, δ [ppm]): 8.03-6.32 (m, 9H, 15, 19, 20, 23, 24, 26), 5.73/5.36/5.12 (br s/s/s, 2H/1H/1H, 4xNH), 3.79-3.72 (m, 6H, 2), 3.64 (dd, J = 7.05 Hz / 13.95 Hz, 8H, 28), 3.54 (s, 4H, 9, 10), 3.44 (t, J = 5.10 Hz, 4H, 8, 11), 3.42-3.37 (m, 2H, 12), 3.29 (t, J = 5.36 Hz, 2H, 7), 3.05 (covered by TEA·HCl, 2H, 5), 1.59-1.54 (m, 2H, 4), 1.19-1.14 (m, 21H, 1, 29), 0.60-0.55 (m, 2H, 3). 13C NMR (75 MHz, CDCl3 + TEA·HCl‡‡, δ [ppm])§§: 169.95 (1C, 13), 157.68 (1C, 6), 155.28 (1C, 17), 154.23/153.24/152.44/149.49 (6C, 18, 21, 25, 27), 131.04 (2C, 23), 129.19 (3C, 15, 19, 20), 129.14 (1C, 14), 127.86 (1C, 16), 108.00 (2C, 24), 106.64 (2C, 22), 97.35 (2C, 26), 70.71/ 70.28 (4C, 8-11), 58.33 (4C, 28), 57.99 (3C, 2), 44.92 (1C, 12), 42.85 (1C, 5), 40.08 (1C, 7), 23.63 (1C, 4), 18.33 (3C, 1), 12.52 (4C, 29), 7.56 (1C, 3). MS (ESI, m/z) [M+H]+ calculated: 895.44, found: 895.4
Compound 5:
Chemical formula: C40H52N4O9 Molecular weight: 732.88 g/mol
Fmoc-lysine-Z-OH (1 eq., 8.725 mmol, 4.385 g) was dissolved in 175 ml CH2Cl2 and cooled down to 0 °C. N-hydroxysuccinimide (1.2 eq., 10.47 mmol, 1.205 g) and N,N'-dicyclohexylcarbodiimide (1.2 eq., 10.47 mmol, 2.160 g) were added and stirred for 6 h (30
†† side product due to reaction of Cl- and TEA ‡‡ side product due to reaction of Cl- and TEA §§ resolution of signals of aromatic carbons of rhodamine was very low

Experimental part
- 185 -
min at 0 °C and then at room temperature). The reaction mixture was filtered and rinsed with CH2Cl2 . The filtrate was mixed with compound 1 (1.2 eq., 10.47 mmol, 2.60 g) and stirred for 16 h at room temperature. The reaction batch was washed with 3 x 100 ml 10 vol-% acetic acid, 3 x 100 ml saturated NaHCO3 and 3 x 100 ml water. The organic phase was evaporated to obtain a highly concentrated solution and filtrated. The organic solvent of the filtrate was evaporated and the obtained powder was washed with 1 x 80 ml and 3 x 40 ml diethyl ether. The crude powder was then again dissolved in 10 ml CH2Cl2 per g powder and was purified by column chromatography on 25 g silica gel per g powder with 100% EtOAc as eluent to yield the pure compound 5 (61 %) as white powder.
1H NMR (300 MHz, DMSO, δ [ppm]): 7.91-7.89 (m, 3H, 19, 9-NH-10), 7.73 (d, J = 7.03 Hz, 2H, 16), 7.42-7.16 (m, 11H, 28-30, 17, 18, 11-NH-12, 24-NH-25), 6.76 (t, J = 4.88 Hz, 1 H, 3-NH-4), 5.01 (s, 2H, 26), 4.31-4.22 (m, 3H, 14, 13), 3.97-3.89 (m, 1H, 11), 3.49 (s, 4H, 6, 7), 3.39-3.33 (m, 4H, 5, 8), 3.24-3.16 (m, 2H, 9), 3.08 (dd, J = 6.15 Hz / 11.85 Hz, 2H, 4), 2.98 (dd, J = 6.52 Hz / 12.75 Hz, 2H, 24), 1.61-1.49 (br/m, 2H, 21), 1.37 (s, 9H, 1), 1.37-1.24 (br/m, 4H, 23, 22).
13C NMR (75 MHz, DMSO, δ [ppm]): 172.50 (1C, 10), 156.53 (1C, 25), 156.38 (1C, 12), 156.04 (1C, 3), 144.35 (2C, 15), 141.17 (2C, 20), 137.72 (1C, 27), 128.80-127.52 (9C, 17, 18, 28-30), 125.81 (2C, 16), 120.57 (2C, 19), 78.05 (1C, 2), 69.99/69.91/69.45 (4C, 5-8), 66.25/65.57 (2C, 13, 26), 55.06 (1C, 11), 47.13 (1C, 14), ~ 40 (3C, 4, 9, 24 in solvent signal), 32.18 (1C, 21), 29.57 (1C, 23), 28.68 (3C, 1), 23.27 (1C, 22).
MS (ESI, m/z) [M+Na]+ calculated: 755.87, found 755.4 EA calculated: C, 65.56; H, 7.15; N, 7.64; O, 19.65 found: C, 64.72; H, 6.89 ; N, 7.13
Compound 6:
Chemical formula: C25H42N4O7
Molecular weight: 510.63 g/mol
Compound 5 (1 eq., 4.09 mmol, 3.00 g) was dissolved in 30 ml THF and Et2NH (38 eq., 155.42 mmol, 16.24 ml) was added. The reaction batch was stirred for 16 h at room temperature. The product was concentrated under vacuum, then dissolved in 10 ml acetonitrile and 90 ml of water was added. The water phase was washed with 3 x 100 ml pentane. To the water phase 10 ml of 0.5 M NaOH were added and the product was finally extracted with 3 x 100 ml CH2Cl2. The combined organic phases were dried over MgSO4, filtrated and concentrated under vacuum to yield compound 6 (98 %) as slightly yellow, highly viscous, clear oil.
1H NMR (300 MHz, DMSO, δ [ppm]): 7.87 (t, J = 5.79 Hz, 1H, 9-NH-10), 7.41-7.32 (m, 5H, 19-21), 7,20 (t, J = 5.76 Hz, 1H, 15-NH-16), 6.75 (t, J = 5.63 Hz, 1H, 3-NH-4), 5.01 (s, 2H, 17), 3.50 (s, 4H, 6, 7), 3.44-3.32 (m, 4H, 5, 8), 3.24-3.15 (m, 2H, 9), 3.13-2.90 (m, 3H, 4,11), 2.96 (dd, J = 6.52 Hz / 12.75 Hz, 2H, 15), 1.72 (s, 2H, 11-NH2), 1.57-1.48 (br/m, 2H, 12), 1.37 (s, 9H, 1), 1.33-1.25 (br/m, 4H, 14, 13).
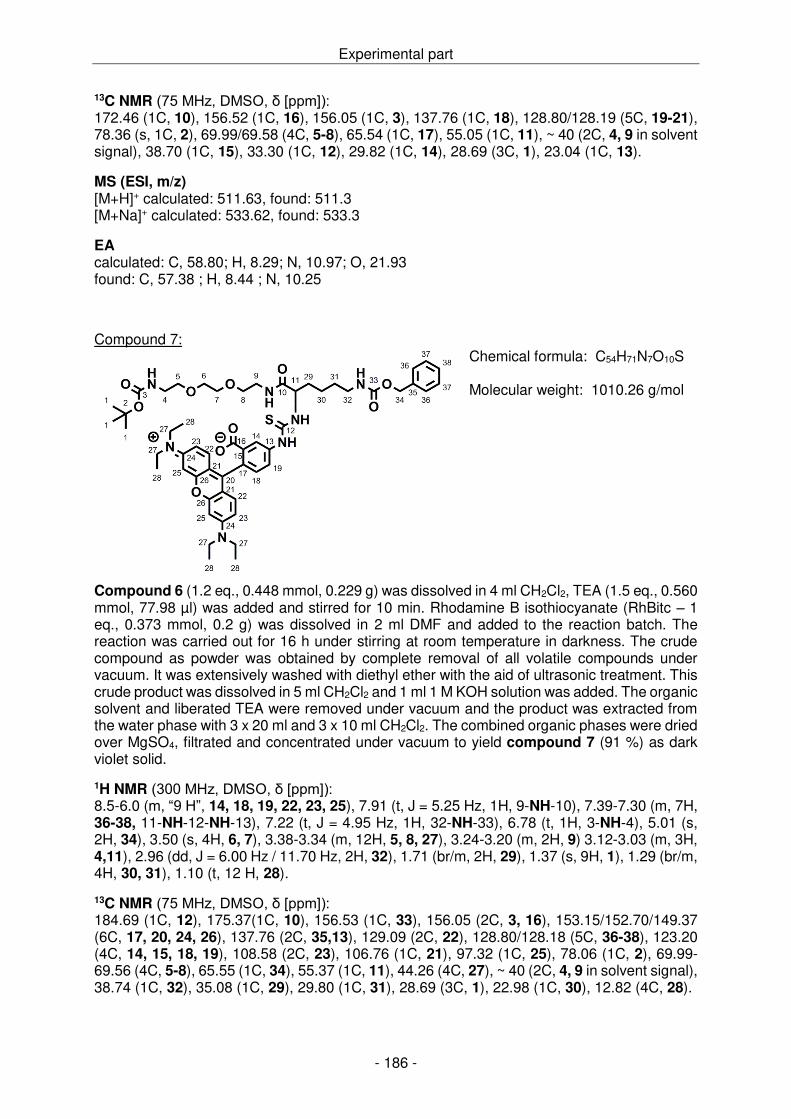
Experimental part
- 186 -
13C NMR (75 MHz, DMSO, δ [ppm]): 172.46 (1C, 10), 156.52 (1C, 16), 156.05 (1C, 3), 137.76 (1C, 18), 128.80/128.19 (5C, 19-21), 78.36 (s, 1C, 2), 69.99/69.58 (4C, 5-8), 65.54 (1C, 17), 55.05 (1C, 11), ~ 40 (2C, 4, 9 in solvent signal), 38.70 (1C, 15), 33.30 (1C, 12), 29.82 (1C, 14), 28.69 (3C, 1), 23.04 (1C, 13).
MS (ESI, m/z) [M+H]+ calculated: 511.63, found: 511.3 [M+Na]+ calculated: 533.62, found: 533.3
EA calculated: C, 58.80; H, 8.29; N, 10.97; O, 21.93 found: C, 57.38 ; H, 8.44 ; N, 10.25
Compound 7:
Chemical formula: C54H71N7O10S Molecular weight: 1010.26 g/mol
Compound 6 (1.2 eq., 0.448 mmol, 0.229 g) was dissolved in 4 ml CH2Cl2, TEA (1.5 eq., 0.560 mmol, 77.98 µl) was added and stirred for 10 min. Rhodamine B isothiocyanate (RhBitc – 1 eq., 0.373 mmol, 0.2 g) was dissolved in 2 ml DMF and added to the reaction batch. The reaction was carried out for 16 h under stirring at room temperature in darkness. The crude compound as powder was obtained by complete removal of all volatile compounds under vacuum. It was extensively washed with diethyl ether with the aid of ultrasonic treatment. This crude product was dissolved in 5 ml CH2Cl2 and 1 ml 1 M KOH solution was added. The organic solvent and liberated TEA were removed under vacuum and the product was extracted from the water phase with 3 x 20 ml and 3 x 10 ml CH2Cl2. The combined organic phases were dried over MgSO4, filtrated and concentrated under vacuum to yield compound 7 (91 %) as dark violet solid.
1H NMR (300 MHz, DMSO, δ [ppm]): 8.5-6.0 (m, “9 H”, 14, 18, 19, 22, 23, 25), 7.91 (t, J = 5.25 Hz, 1H, 9-NH-10), 7.39-7.30 (m, 7H, 36-38, 11-NH-12-NH-13), 7.22 (t, J = 4.95 Hz, 1H, 32-NH-33), 6.78 (t, 1H, 3-NH-4), 5.01 (s, 2H, 34), 3.50 (s, 4H, 6, 7), 3.38-3.34 (m, 12H, 5, 8, 27), 3.24-3.20 (m, 2H, 9) 3.12-3.03 (m, 3H, 4,11), 2.96 (dd, J = 6.00 Hz / 11.70 Hz, 2H, 32), 1.71 (br/m, 2H, 29), 1.37 (s, 9H, 1), 1.29 (br/m, 4H, 30, 31), 1.10 (t, 12 H, 28).
13C NMR (75 MHz, DMSO, δ [ppm]): 184.69 (1C, 12), 175.37(1C, 10), 156.53 (1C, 33), 156.05 (2C, 3, 16), 153.15/152.70/149.37 (6C, 17, 20, 24, 26), 137.76 (2C, 35,13), 129.09 (2C, 22), 128.80/128.18 (5C, 36-38), 123.20 (4C, 14, 15, 18, 19), 108.58 (2C, 23), 106.76 (1C, 21), 97.32 (1C, 25), 78.06 (1C, 2), 69.99-69.56 (4C, 5-8), 65.55 (1C, 34), 55.37 (1C, 11), 44.26 (4C, 27), ~ 40 (2C, 4, 9 in solvent signal), 38.74 (1C, 32), 35.08 (1C, 29), 29.80 (1C, 31), 28.69 (3C, 1), 22.98 (1C, 30), 12.82 (4C, 28).

Experimental part
- 187 -
MS (ESI, m/z) [M+Na]+ calculated: 1032.5, found: 1032.5
Compound 8:
Chemical formula: C49H64ClN7O8S Molecular weight: 946.6 g/mol
First attempt: Compound 7 (0.3 g) was dissolved in 17 ml CH2Cl2 and gaseous HCl was bubbled through the solution during 4 min. At the end of the reaction the solvent and all volatile side products were evaporated under vacuum. Compound 8 was not obtained due to fragmentation of the compound 7 and/or 8 during the reaction. MS (ESI, m/z) – detected fragments: Compound 8a: [M + H]+: calculated: 411.25, found: 411.3
Compound 8b: [M + H]+: calculated: 458.24, found: 458.2
Compound 8c: [M + H]+: calculated: 762.32, found: 762.3

Experimental part
- 188 -
Second attempt: Compound 7 (1 eq., 0.265 mmol, 0.268 g) was dissolved in 15 ml CH2Cl2 and trifluoroacetic acid (15 eq., 3.975 mmol, 0.304 µl) was dropwise added under stirring. The reaction was stirred for 16 h. To eliminate all free TFA, a coevaporation with 3 x 20 ml toluene was subsequently carried out. Compound 8 was not obtained due to fragmentation of the compound 7 and/or 8 during the reaction. MS (ESI, m/z) – detected fragments: Compound 8c: [M + H]+: calculated: 762.32, found: 762.3 Compound 8d: [M + H]+: calculated: 248.17, found: 249.2
Compound 9:
Chemical formula: C46H65N7O8S Molecular weight: 876.13 g/mol
Compound 7 (1 eq., 0.148 mmol, 0.150 g) was dissolved in 4 ml methanol and 100 µl acetic acid in 0.9 ml water was added under stirring. The catalyst Pd on C with 10 weight-% loading (0.015 g) was added and the flask was set under H2 atmosphere by setting the sample 3 times under vacuum and subsequently flooding it with H2. The reaction was stirred for 24 h, the Pd/C was filtered off over celite and the solvent was evaporated. Compound 9 was not obtained due to fragmentation of the compound 7 during the reaction. MS (ESI, m/z) – detected fragments: Compound 8b: [M + H]+: calculated: 458.24, found: 458.2 Compound 8c: [M + H]+: calculated: 762.32, found: 762.3 Compound 8d: [M + H]+: calculated: 248.17, found: 249.2 Compound 8e: [M + H]+: calculated: 511.31, found: 511.3

Experimental part
- 189 -
Compound 10:
Chemical formula: C29H30N2O6
Molecular weight: 502.57 g/mol
First attempt: Sodiumbicarbonate (2.5 eq., 25 mmol, 2.10 g) was dissolved in 25 ml water, added to Nα-Z-lysine (1 eq., 10 mmol, 2.80 g) and stirred for 15 min at 0 °C to yield a turbid solution. 15 ml of THF was added. To this batch, 9-Fluorenylmethoxycarbonyl chloride (1 eq., 10 mmol, 2.59 g) was stepwise added with a spatula. The reaction was complete after stirring for 3 h at 0 °C and 1 h at room temperature. 200 ml 0.5 M and 40 ml 1 M potassium hydrogenosulfate solution were added under stirring. The precipitate was filtered and washed with 3 x 50 ml water, followed by excessive washing with toluene (9 x 20 ml). Finally the precipitate was washed with diethyl ether (3 x 100 ml). The ether phases were combined and concentrated to yield compound 10 (30 %) as white powder.
Second attempt: The same protocol was followed as in the first attempt but dioxane instead of THF was used as solvent. After purification, compound 10 with a yield of 11 % was obtained. Third attempt: The same protocol was followed as in the first attempt but DMF instead of THF was used as solvent. After purification, compound 10 with a yield of 68 % was obtained.
1H NMR (300 MHz, DMSO, δ [ppm]): 12.59 (s, 1H, HO-1), 7.90 (d, J = 7.36 Hz, 2H, 20), 7.69 (d, J = 7.38 Hz, 2H, 17), 7.58 (d, J = 7.89 Hz, 1H, 12-NH-13), 7.45-7.30 (m, 10H, 18, 19, 6-8, 2-NH-3), 5.04 (s, 2H, 14), 4.30 (d, J = 6.76 Hz, 2H, 4), 4.21 (t, J = 6.68 Hz, 1H, 15), 3.96-3.89 (m, 1H, 2), 2.96 (dd, J = 6.00 Hz / 12.00 Hz, 2H, 12), 1.68-57 (br/m, 2H, 9), 1.39-1.31 (br/m, 4H, 11, 10).
13C NMR (75 MHz, DMSO, δ [ppm]): 174.4 (1C, 1), 156.65 (2C, 3, 13), 144.40 (1C, 16), 141.20 (1C, 21), 137.46 (1C, 5),128.80-128.05 (10C, 18, 19, 6-8), 125.60 (2C, 17), 120.58 (2C, 20), 65.86 (1C, 4), 65.62 (1C, 14), 54.32 (1C, 2), 47.24 (1C, 15), ~ 40 (2C, 12 in solvent signal), 30.91 (1C, 9), 29.39 (1C, 11), 23.35 (1C, 10).
MS (ESI, m/z) [M+Na]+ calculated: 525.56, found: 525.2 [M+K]+ calculated: 541.67, found: 541.2
EA calculated: C, 69.31; H, 6.02; N, 5.57; O, 19.10 found: C, 68.79; H, 4.67; N, 5.42

Experimental part
- 190 -
Compound 11:
Chemical formula: C40H52N4O9
Molecular weight: 732.88 g/mol
Compound 10 (1 eq., 5.717 mmol, 2.873 g) was dissolved in 115 ml CH2Cl2 and cooled down to 0 °C. N-hydroxysuccinimide (1.2 eq., 6.860 mmol, 0.790 g) and then N,N'-dicyclohexylcarbodiimide (1.2 eq., 6.860 mmol, 1.415 g) were added and stirred for 6 h (30 min at 0 °C and then at room temperature). The reaction mixture was filtered and rinsed with CH2Cl2 . The filtrate was mixed with compound 1 (1.2 eq., 6.680 mmol, 1.703 g) and stirred for 16 h at room temperature. The reaction batch was washed with 3 x 100 ml 10 vol-% acetic acid, 3 x 100 ml saturated NaHCO3 and 3 x 100 ml water. The organic phase was evaporated to obtain a highly concentrated solution and filtrated. The organic solvent of the filtrate was evaporated and the obtained powder was washed with 1 x 80 ml and 3 x 40 ml diethyl ether. The crude powder was then again dissolved in 10 ml CH2Cl2 per g powder and was purified by column chromatography on 25 g silica gel per g powder with 100% EtOAc as eluent to yield the pure compound 11 (80 %) as white powder.
1H NMR (300 MHz, DMSO, δ [ppm]): 7.91-7.89 (m, 5H, 29, 26, 9-NH-10), 7.78-7.68 (m, 2H, 27), 7.42-7.27 (m, 9H, 15-17, 28, 11-NH-12, 21-NH-22), 6.78 (t, J = 6.20 Hz, 1H, 3-NH-4), 5.02 (s, 2H, 13), 4.31-4.21 (m, 3H, 24, 23), 3.95-3.90 (m, 1H, 11), 3.49 (s, 4H, 6, 7), 3.40-3.35 (m, 4H, 5, 8), 3.25-3.17 (m, 2H, 9), 3.06 (dd, J = 5.70 Hz / 11.70 Hz, 2H, 4), 2.97 (dd, J = 6.90 Hz / 12.90 Hz, 2H, 21), 1.61-1.53 (br/m, 2H, 18), 1.38 (s, 9H, 1), 1.27-1.19 (br/m, 4H, 20, 19).
13C NMR (75 MHz, DMSO, δ [ppm]): 172.51 (1C, 10), 156.65 (2C, 22, 12), 156.05 (1C, 3), 144.40 (2C, 25), 144.20 (2C, 30), 137.54 (1C, 14), 128.80-128.14 (9C, 27, 28, 15-17), 125.60 (2C, 26), 120.50 (2C, 29), 78.05 (1C, 2), 70.00-69.43 (4C, 5-8), 65.81/65.62 (2C, 23, 13), 55.14 (1C, 11), 47.24 (1C, 24), ~ 40 (3C, 4, 9, 21 in solvent signal), 33.20 (1C, 18), 29.79 (1C, 20), 28.69 (3C, 1), 23.29 (1C, 19).
MS (ESI, m/z) [M+Na]+ calculated: 755.87, found 755.4 EA calculated: C, 65.56; H, 7.15; N, 7.64; O, 19.65 found: C, 64.91; H, 6.77; N, 6.78

Experimental part
- 191 -
Compound 12:
Chemical formula: C25H42N4O7
Molecular weight: 510.63 g/mol Compound 11 (1 eq., 3.14 mmol, 2.30 g) was dissolved in 23 ml THF and diethylamine (38 eq., 119.26 mmol, 12.5 ml) was added. The reaction batch was stirred for 16 h at room temperature. The product was concentrated under vacuum, then dissolved in 10 ml acetonitrile and 90 ml of water was added. The water phase was washed with 4 x 100 ml pentane. To the water phase 10 ml of 0.5 M NaOH were added and the product was finally extracted with 3 x 100 ml CH2Cl2. The combined organic phases were dried over MgSO4, filtrated and concentrated under vacuum to yield compound 12 (93 %) as slightly yellow, highly viscous, clear oil.
1H NMR (300 MHz, DMSO, δ [ppm]): 7.92 (t, J = 5.55 Hz, 1H, 9-NH-10), 7.40-7.30 (m, 6H, 15-17, 11-NH-12), 6.79 (t, J = 5.74 Hz, 1H, 3-NH-4), 5.02 (s, 2H, 13), 3.98-3.89 (m, 1H, 11) 3.49 (s, 4H, 6, 7), 3.42-3.35 (m, 6H, 5, 8, 21), 3.25-3.12 (m, 2H, 9), 3.06 (dd, J = 6.00 Hz / 12.00 Hz, 2H, 4), 1.61-1.51 (br/m, 4H, 18, 20), 1.37 (s, 9H, 1), 1.28-1.19 (br/m, 2H, 19).
13C NMR (75 MHz, DMSO, δ [ppm]): 172.51 (1C, 10), 156.35 (1C, 12), 156.05 (1C, 3), 137.54 (1C, 14), 128.78/128.14 (5C, 15-17), 78.36 (1C, 2), 69.99/69.64/69.44 (5C, 5-8, 21), 65.58 (1C, 13), 55.17 (1C, 11), 41.88/~40 (2C, 4, 9 in solvent signal), 33.35 (1C, 18), 32.40 (1C, 20), 28.69 (3C, 1), 23.29 (1C, 19).
MS (ESI, m/z) [M+H]+ calculated: 511.31, found: 511.3 [M+Na]+ calculated: 533.32, found: 533.3
EA calculated: C, 58.80; H, 8.29; N, 10.97; O, 21.93 found: C, 56.65; H, 7.97; N, 10.37 Compound 13:
Chemical formula: C13H11NO4
Molecular weight: 245.33 g/mol
N-(2-Hydroxyethyl)phthalimide (1 eq., 35 mmol, 6.69 g) was dissolved in 100 ml CH2Cl2 and TEA (1.1 eq., 38.5 mmol, 5.34 ml) was added. The reaction batch was cooled down to 0°C, acryloylchloride (1.1 eq, 38.5 mmol, 3.17 ml) was added dropwise over an hour under agitation and then the reaction was stirred for 16 h at room temperature. The batch was filtered and the residue (TEAxHCl) was rinsed with CH2Cl2. The filtrate was washed with 1 x 100 ml water and 3 x 100 ml 0.5 M NaOH. The organic phase was dried over MgSO4, filtrated and concentrated under vacuum to yield compound 13 (59 %) as white to slightly yellow powder.

Experimental part
- 192 -
1H NMR (300 MHz, DMSO, δ [ppm]): 7.92-7.82 (m, 4H, 8, 9), 6.25 (dd, J = 1.81 Hz / 17.16 Hz, 1H, 1), 6.07 (dd, J = 10.26 Hz / 17.16 Hz, 1H, 2), 5.86 (dd, J = 1.81 Hz / 10.26 Hz, 1H, 1), 4.33 (t, J = 5.34 Hz, 2H, 4), 4.03 (t, J = 5.34 Hz, 2H, 5).
13C NMR (75 MHz, DMSO, δ [ppm]): 168.03 (2C, 6), 165.80 (1C, 3), 134.08 (2C, 9), 131.98 (2C, 7), 131.43 (1C, 1), 127.91 (1C, 2), 123.39 (2C, 8), 61.70 (1C, 4), 36.96 (1C, 5).
MS (ESI, m/z) [M+Na]+ calculated: 268.32, found: 268.1 EA calculated: C, 63.67; H, 4.52; N, 5.71; O, 26.1; found: C, 63.62; H, 4.4 ; N, 5.5
Compound 14:
Chemical formula: C51H64N6O15 Molecular weight: 1001.10 g/mol
Compound 12 (1 eq., 0.930 mmol, 0.500 g) was dissolved in 20 ml THF and compound 13 (5 eq., 4.896 mmol, 1.201 g) was added. The reaction batch was stirred for 6 days at 65 °C. The solvent was evaporated and the crude product was dissolved in CH2Cl2. Over a short column (10 g silica per g crude product), the excess acrylate was removed with 100 % CH2Cl2. To obtain the product, 10 % methanol in CH2Cl2 was used. The solvent was evaporated to obtain the pure compound 14 (91 %) as orange, clear, highly viscous liquid.
1H NMR (300 MHz, DMSO, δ [ppm]): 7.93-7.80 (m, 9H, 9-NH-10, 29, 30), 7.34-7.29 (m, 6H, 15-17, 11-NH-12), 6.76 (t, J = 5.49 Hz, 1H, 3-NH-4), 5.01 (s, 2H, 13), 4.21 (t, J = 5.29 Hz, 4H, 25), 3.91 (dd, J = 8.21 Hz / 13.66 Hz, 1H, 11), 3.81 (t, J = 5.29 Hz, 4H, 26), 3.44 (s, 4H, 6, 7), 3.39-3.36 (m, 4H, 5, 8), 3.25-3.16 (m, 2H, 9), 3.05 (dd, J = 5.85 Hz / 11.85 Hz, 2H, 4), ~2.5 (4H, 23 in solvent signal), 2.26 (t, J = 6.98 Hz, 4H, 22), 2.16 (t, J = 5.55 Hz, 2H, 21), 1.61-43 (br/m, 2H, 18), 1.37 (s, 9H, 1), 1.28-1.16 (br/m, 4H, 20, 19).
13C NMR (75 MHz, DMSO, δ [ppm]): 172.33 (3C, 10, 24), 169.03 (4C, 27), 156.32 (1C, 12), 156.02 (1C, 3), 137.51 (1C, 14),134.91 (4C, 30), 131.94 (4C, 28), 128.76/128.14 (5C, 15-17), 123.53 (4C, 29), 78.04 (1C, 2), 69.99/69.91/69.63/69.44 (4C, 5-8), 65.79 (1C, 13), 61.39 (2C, 25), 55.17 (1C, 11), 53.13 (1C, 21), 48.66 (2C, 22), ~40 (2C, 4, 9 in solvent signal), 37.14 (2C, 23), 32.54 (1C, 18), 32.08 (2C, 26), 28.67 (3C, 1), 26.48 (1C, 20), 23.67 (1C, 19).
MS (ESI, m/z) [M+Na]+ calculated: 1023.44, found: 1023.4
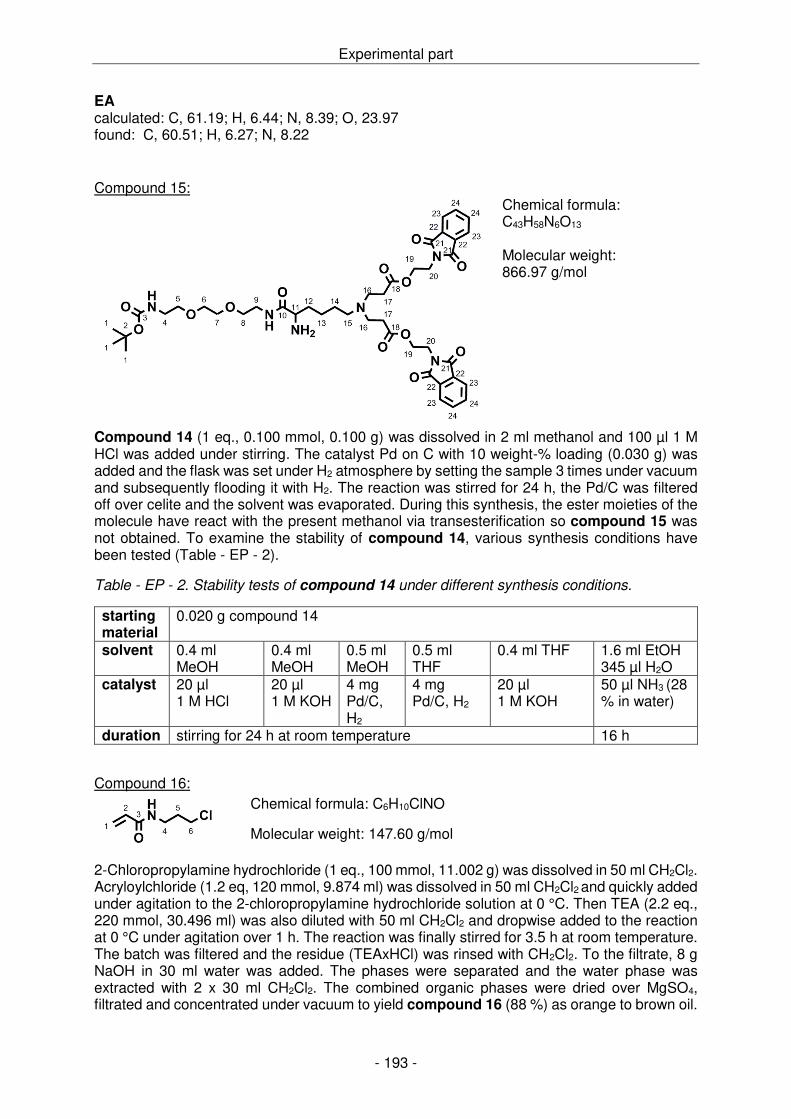
Experimental part
- 193 -
EA calculated: C, 61.19; H, 6.44; N, 8.39; O, 23.97 found: C, 60.51; H, 6.27; N, 8.22 Compound 15:
Chemical formula: C43H58N6O13
Molecular weight: 866.97 g/mol
Compound 14 (1 eq., 0.100 mmol, 0.100 g) was dissolved in 2 ml methanol and 100 µl 1 M HCl was added under stirring. The catalyst Pd on C with 10 weight-% loading (0.030 g) was added and the flask was set under H2 atmosphere by setting the sample 3 times under vacuum and subsequently flooding it with H2. The reaction was stirred for 24 h, the Pd/C was filtered off over celite and the solvent was evaporated. During this synthesis, the ester moieties of the molecule have react with the present methanol via transesterification so compound 15 was not obtained. To examine the stability of compound 14, various synthesis conditions have been tested (Table - EP - 2).
Table - EP - 2. Stability tests of compound 14 under different synthesis conditions.
starting material
0.020 g compound 14
solvent 0.4 ml MeOH
0.4 ml MeOH
0.5 ml MeOH
0.5 ml THF
0.4 ml THF 1.6 ml EtOH 345 µl H2O
catalyst 20 µl 1 M HCl
20 µl 1 M KOH
4 mg Pd/C, H2
4 mg Pd/C, H2
20 µl 1 M KOH
50 µl NH3 (28 % in water)
duration stirring for 24 h at room temperature 16 h
Compound 16: Chemical formula: C6H10ClNO
Molecular weight: 147.60 g/mol
2-Chloropropylamine hydrochloride (1 eq., 100 mmol, 11.002 g) was dissolved in 50 ml CH2Cl2. Acryloylchloride (1.2 eq, 120 mmol, 9.874 ml) was dissolved in 50 ml CH2Cl2 and quickly added under agitation to the 2-chloropropylamine hydrochloride solution at 0 °C. Then TEA (2.2 eq., 220 mmol, 30.496 ml) was also diluted with 50 ml CH2Cl2 and dropwise added to the reaction at 0 °C under agitation over 1 h. The reaction was finally stirred for 3.5 h at room temperature. The batch was filtered and the residue (TEAxHCl) was rinsed with CH2Cl2. To the filtrate, 8 g NaOH in 30 ml water was added. The phases were separated and the water phase was extracted with 2 x 30 ml CH2Cl2. The combined organic phases were dried over MgSO4, filtrated and concentrated under vacuum to yield compound 16 (88 %) as orange to brown oil.
Experimental part
- 194 -
1H NMR (300 MHz, CDCl3, δ [ppm]): 6.53 (br/s, 1H, 3-NH-4), 6.29 (dd, J = 1.66 Hz / 16.97 Hz, 1H, 1), 6.16 (dd, J = 10.08 Hz / 16.97 Hz, 1H, 2), 5.69 (dd, J = 1.66 Hz / 10.08 Hz, 1H, 1), 3.65 (t, J = 6.33 Hz, 2H, 6), 3.54 (q, J = 6.48 Hz, 2H, 4), 2.09 (p, J = 6.52 Hz, 2H, 5).
13C NMR (75 MHz, CDCl3, δ [ppm]): 166.02 (1C, 3), 130.81 (1C, 2), 126.42 (1C, 1), 42.55 (1C, 6), 37.03 (1C, 4), 32.05 (1C, 5).
EA calculated: C, 48.82; H, 6.83; Cl, 24.02; N, 9.49; O, 10.84 found: C, 47.92; H, 6.74; N, 9.08
Compound 17:
Chemical formula: C14H14N2O3
Molecular weight: 258.28 g/mol
Potassium phthalimide (1 eq., 46 mmol, 8.52 g) was dissolved in 24 ml DMF. N-Acryloyl-3-chloropropylamine (1 eq, 46 mmol, 6.79 g) was dissolved in 25 ml DMF and quickly added under agitation to the potassium phthalimide solution. Then the reaction was stirred for 15 h at 75 °C. The batch was filtered and the residue (KCl) was rinsed with DMF. The solvent of the filtrate was evaporated and the crude solid was dissolved in 50 ml CH2Cl2. The organic phase was washed with 3 x 30 ml brine, dried over MgSO4, filtrated and concentrated under vacuum. The obtained orange to brown crude product was then again dissolved in 10 ml CH2Cl2 per g powder and was purified by column chromatography on 50 g silica gel per g powder with 50 % ethyl acetate in CH2Cl2 to yield the pure compound 17 (55 %) as white powder.
1H NMR (300 MHz, CDCl3, δ [ppm]): 7.93-7.86 (m, 2H, 9), 7.84-7.74 (m, 2H, 10), 6.49 (br/s, 1H, 3-NH-4), 6.30 (dd, J = 1.73 Hz / 17.04 Hz, 1H, 1), 6.17 (dd, J = 10.00 Hz / 17.04 Hz, 1H, 2), 5.66 (dd, J = 1.73 Hz / 10.00 Hz, 1H, 1), 3.80 (t, J = 6.30 Hz, 2H, 6), 3.37 (q, J = 6.28 Hz, 2H, 4), 1.94 (p, J = 6.23 Hz, 2H, 5). 13C NMR (75 MHz, CDCl3, δ [ppm]): 168.79 (2C, 7), 165.73 (1C, 3), 134.77 (2C, 10), 131.92 (2C, 8), 131.01 (1C, 1), 126.33 (1C, 2), 123.39 (2C, 9), 36.06 (1C, 4), 34.92 (1C, 6), 28.21 (1C, 5).
MS (EI, m/z) [M] calculated: 258.10, found: 258.10
EA calculated: C, 65.11; H, 5.46; N, 10.85; O, 18.58 found: C, 64.45; H, 5.39; N, 10.45

Experimental part
- 195 -
Compound 18:
Chemical formula: C53H70N8O13 Molecular weight: 1027.19 g/mol
Compound 12 (1 eq., 2.651 mmol, 1.354 g) was dissolved in 35 ml methanol and compound 17 (5 eq., 13.258 mmol, 3.424 g) was added. The reaction batch was stirred for 7 days at 75 °C. The solvent was evaporated and the crude product was dissolved in CH2Cl2. Excess acrylamide (compound 17) was removed over a column (25 g silica per g crude product) with 5 % methanol in CH2Cl2. To obtain the product (compound 18), the polarity of the eluent was increased (10 % methanol in CH2Cl2). The solvent was evaporated to obtain the pure compound 18 (57 %) as orange, clear, highly viscous liquid.
1H NMR (300 MHz, DMSO, δ [ppm]): 7.92 (t, J = 5.40 Hz, 2H, 24-NH-25), 7.88-7.81 (m, 9H, 9-NH-10, 30, 31), 7.36-7.31 (m, 6H, 15-17, 11-NH-12), 6.78 (t, J = 5.73 Hz, 1H, 3-NH-4), 5.01 (s, 2H, 13), 3.95-3.88 (m, 1H, 11), 3.57 (t, J = 7.14 Hz, 4H, 27), 3.49 (s, 4H, 6, 7), 3.39-3.33 (m, 4H, 5, 8), 3.20-3.16 (m, 2H, 9), 3.07-3.01 (m, 6H, 4, 25), 2.59 (t, J = 6.74 Hz, 4H, 22), 2.31 (t, J = 6.00 Hz, 2 H, 21), 2.18 (t, J = 6.75 Hz, 4 H, 23), 1.74 (p, J = 7.06 Hz, 4 H, 26),1.59-48 (br/m, 2H, 18), 1.37 (s, 9H, 1), 1.28-1.15 (br/m, 4H, 20, 19).
13C NMR (75 MHz, DMSO, δ [ppm]): 172.45 (1C, 10), 171.73 (2C, 24), 168.32 (4C, 28), 156.34 (1C, 12), 156.03 (1C, 3), 137.49 (1C, 14),134.77 (4C, 31), 132.09 (4C, 29), 128.75/128.12 (5C, 15-17), 123.42 (4C, 30), 78.03 (1C, 2), 69.99/69.91/69.63/69.43 (4C, 5-8), 65.80 (1C, 13), 55.14 (1C, 11), 53.00 (1C, 21), 49.83 (2C, 22), ~40 +38.98 (2C, 4, 9 in solvent signal), 36.57 (2C, 25), 35.95 (2C, 27), 33.50 (2C, 23), 32.47 (1C, 18), 28.68 (5C, 1, 26), 26.58 (1C, 20), 23.83 (1C, 19).
MS (FD) [M+H]+ calculated: 1027.51, found: 1027.52
EA calculated: C, 61.97; H, 6.87; N, 10.91; O, 20.25 found: C, 62.27; H, 7.04; N, 11.37

Experimental part
- 196 -
Compound 19:
Chemical formula: C45H64N8O11 Molecular weight: 893.05 g/mol
Compound 18 (1 eq., 0.574 mmol, 0.590 g) was dissolved in 4 ml methanol and 1 ml water. Acetic acid (4 eq, 2.298 mmol, 131.5 µl) is added under stirring. The catalyst Pd on C with 10 weight-% loading (0.059 g) was added and the flask was set under H2 atmosphere by setting the sample 3 times under vacuum and subsequently flooding it with H2. The reaction was stirred for 24 h under H2 atmosphere, the Pd/C was filtered off over celite and the solvent was evaporated. The crude product was dissolved in 10 ml water and washed with 3 times 10 ml CH2Cl2 to remove unreacted compound 18. The water phase was then neutralized with saturated NaHCO3 and extracted with 3 times 10 ml CH2Cl2. The combined organic phases were dried over MgSO4, filtrated and concentrated under vacuum to yield compound 19 (54 %) as transparent solid.
1H NMR (300 MHz, DMSO, δ [ppm]): 7.92 (m, 2H, 18-NH-19), 7.88-7.80 (m, 9H, 9-NH-10, 24, 25), 6.75 (t, J = 5.47 Hz, 1H, 3-NH-4), 3.56 (t, J = 7.16 Hz, 4H, 21), 3.49 (s, 4H, 6, 7), 3.43-3.29 (m, 4H, 5, 8), 3.27-3.13 (m, 2H, 9), 3.10-2.99 (m, 7H, 4, 19, 11), 2.59 (t, J = 7.10 Hz, 4H, 16), 2.32 (t, J = 6.95 Hz, 2 H, 15), 2.15 (t, J = 7.06 Hz, 4 H, 17), 1.71 (p, J = 7.03 Hz, 4 H, 20),1.59-48 (br/m, 2H, 12), 1.36 (s, 9H, 1), 1.28-1.15 (br/m, 4H, 14, 13).
13C NMR (75 MHz, DMSO, δ [ppm]): 175.41 (1C, 10), 171.76 (2C, 18), 168.33 (4C, 22), 156.02 (1C, 3), 134.78 (4C, 25), 132.09 (4C, 23), 123.42 (4C, 24), 78.04 (1C, 2), 69.91-69.56 (4C, 5-8), 54.98 (1C, 11), 53.12 (1C, 15), 49.90 (2C, 16), ~40 +38.98 (2C, 4, 9 in solvent signal), 36.68 (2C, 19), 35.96 (2C, 21), 35.34 (1C, 12), 33.56 (2C, 17), 28.65 (5C, 1, 20), 26.86 (1C, 14), 23.61 (1C, 13).
MS (EI, m/z) [M+H]+ calculated: 893.47; found: 893.5 [M+Na]+ calculated: 915.47; found: 915.5
EA calculated: C, 60.52; H, 7.22; N, 12.55; O, 19.71 found: C, 58.66; H, 7.17; N, 11.42

Experimental part
- 197 -
Compound 20:
Chemical Formula: C70H84N10O15 Molecular Weight: 1305.50 g/mol
Compound 19 (1.2 eq., 0.056 mmol, 0.050 g) was dissolved in 0.25 ml DMF, TEA (2 eq., 0.093 mmol, 13.00 µl) was added and stirred for 10 min. NHS-Rhodamine (5-/6-carboxytetramethylrhodamine, succinimidyl ester, 1 eq., 0.047 mmol, 0.025 g) was dissolved in 0.3 ml DMF and added to the reaction batch. The reaction was carried out for 16 h under stirring at room temperature in darkness. All volatile compounds were evaporated and the crude product was dissolved in 5 ml CH2Cl2. The organic phase was washed with 3 x 5 ml saturated NaHCO3 and 3 x 1 ml 10 vol-% acetic acid in water. The organic phase was subsequently dried over MgSO4, filtrated and concentrated under vacuum to yield compound 20 (85 %) as pink highly viscous liquid.
1H NMR (300 MHz, CDCl3, δ [ppm]): 8.66 (s, 1H, 33), 8.25 / 8.14 (d / d, J = 8.02 / 9.43 Hz, 1H, 27/28 5/6-isomere), 7.78-7.76 (m, 5H, 24, 9-NH-10), 7.68-7.64 (m, 6H, 25, 18-NH-19), 7.20 (d, J = 7.97 Hz, 1H, 29), 6.90-6.87 (m, 2H, 36), 6.62-6.59 (m, 6H, 37, 39, 3-NH-4, 11-NH-26), 4.73 (m, 1H, 11), 3.68 (t, J = 6.90 Hz, 4H, 21), 3.57-3.46 (m, 10H, 5-8, 9), 3.26-3.20 (m, 10H, 4, 16, 19), 3.11 (s, 12H, 41), 2.89 (br/s, 2H, 15), 2.69 (t, J = 6.67 Hz, 4H, 17), 1.86-1.75 (m, 8H, 20, 12, 14), 1.42-39 (m, 11H, 1, 13).
13C NMR (151 MHz, CDCl3, δ [ppm]): 172.18 (1C, 10), 170.98 (2C, 18), 168.98 (1C, 26), 168.33 (4C, 22), 166.29 (1C, 32), 162.75 (1C, 34), 156.07 (1C, 3), 154.41 (2C, 40), 153.79 (2C, 38), 135.35 (1C, 27/28 5/6-isomere), 133.93/133.89 (5C, 25, 30), 132.30 (1C, 27/28 5/6-isomere), 131.88 (4C, 23), 129.68 (2C, 36), 126.04 (1C, 33), 125.68 (1C, 31), 123.14 (5C, 24, 29), 110.47 (2C, 37), 108.76 (2C, 35), 97.61 (2C, 39), 79.11 (1C, 2), 70.07/69.47 (4C, 5-8), 53.45 (1C, 11), 52.52 (1C, 15), 49.34 (2C, 16), 40.27/39.31 (6C, 4, 9, 41), 36.64 (2C, 19), 35.33 (2C, 21), 31.72 (2C, 17), 29.58 (1C, 12), 28.31/28.17 (5C, 1, 20), 23.57 (1C, 14), 22.95 (1C, 13).
MS (ESI, m/z) [M+H]+ calculated: 1305.61, found: 1305.6 [M+Na]+ calculated: 1327.60, found: 1327.6

Experimental part
- 198 -
Compound 21:
Chemical Formula: C65H77N10O13
+ C2F3O2-
Molecular Weight: 1206.39 g/mol + 113.02 g/mol
Compound 20 (1 eq., 0.038 mmol, 0.050 g) was dissolved in 3 ml CH2Cl2 and trifluoroacetic acid (15 eq., 0.575 mmol, 44 µl) was dropwise added under stirring. The reaction was stirred for 16 h at room temperature. At the end of the reaction the solvent and all volatile side products were evaporated under vacuum. To eliminate all free TFA, a coevaporation with 3 x 5 ml toluene was carried out to yield the pure compound 21 (quantitative) as pink solid in TFA-salt form.
1H NMR (600 MHz, MeOD, δ [ppm]): 8.79 (d, J = 1.86 Hz, 1H, 30), 8.42 (dd, J = 1.88 / 7.87 Hz, 1H, 24/25 5/6-isomere), 7.76 (s, 8H, 21, 22), 7.56 (d, J = 7.89 Hz, 1H, 26), 7.08 (dd, J = 6.02 / 9.48 Hz, 2H, 33), 7.01 (dd, J = 2.42 / 9.48 Hz, 2H, 34), 6.85 (dd, J = 2.42 / 10.90 Hz, 2H, 36), 4.63-4.58 (m, 1H, 8), 3.77-3.72 (m, 2H, 2), 3.69 (s, 6H, 3-5), 3.65-3.54 (m, 8H, 18, 13), 3.53-3.41 (m, 4H, 12, 6), 3.26 (s, 12H, 38), 3.42-3.12 (m, 6H, 16, 1), 2.81 (br/s, 4H, 14), 2.06-1.95 (m, 2H, 9), 1.95-1.89 (m, 2H, 11), 1.80 (br/s, 4H, 17), 1.65-1.58 (m, 2H, 10).
13C NMR (151 MHz, MeOD, δ [ppm]): 173.04 (1C, 7), 171.07 (2C, 15), 168.75 (4C, 19), 167.10 (1C, 23), 165.94 (1C, 29), 159.09 (1C, 31), 157.53/157.43 (4C, 35, 37), 136.84 (1C, 24/25 5/6-isomere), 135.85 (1C, 27), 134.02 (4C, 22), 131.79 (4C, 20), 131.53 (1C, 28), 131.17 (3C, 24/25 5/6-isomere, 30), 130.43 (3C, 26, 33), 122.72 (4C, 21), 114.12 (2C, 34), 113.27 (2C, 32), 96.06 (2C, 36), 69.97/69.13/66.52 (4C, 2-5), 54.30 (1C, 8), 52.92 (1C, 12), 50.08 (2C, 13), 39.53 (4C, 38), 39.33/39.00 (3C, 6, 16), 36.64 (1C, 1), 35.03 (2C, 18), 30.94 (1C, 9), 27.75 (4C, 17, 14), 23.19 (1C, 11), 22.60 (1C, 10).
MS (ESI, m/z) [M+H]+ calculated: 1205.57, found: 1305.5 [M+Na]+ calculated: 1227.58, found: 1227.2

Experimental part
- 199 -
Compound 22:
Chemical Formula: C75H97N11O17Si Molecular Weight: 1452.75 g/mol
Compound 21 (1.05 eq., 0.0288 mmol, 0.038 g) was dispersed in 6 ml CH2Cl2, TEA (8.4 eq., 0.2304 mmol, 32.11 µl) was added and stirred until compound 21 was solubilized. Isocyanatopropyltriethoxysilane (1.0 eq., 0.0274 mmol, 6.78 µl) was added and the reaction proceeded at room temperature for 16 h. Afterwards the solvent and excess TEA were evaporated to yield compound 22 as purple solid (quantitative). 1H NMR (600 MHz, CDCl3, δ [ppm]): 8.50 (s, 1H, 36), 8.13 (d, J =8.74 Hz, 1H, 30/31 6/5-isomere), 7.77-7.74 (m, 5H, 27, 12-NH-13), 7.68-7.64 (m, 5H, 28, 14-NH-29), 7.58 (br/s, 2H, 21-NH-22), 7.20 (d, J = 7.93 Hz, 1H, 32), 6.64 (br/s, 2H, 39), 6.50 (s, 2H, 40), 6.45-6.43 (m, 2H, 42), 5.59-5.53 (br/m, 2H, 5-NH-6-NH-7), 4.71-4.64 (m, 1H, 14), 3.80-3.76 (m, 6H, 2), 3.70-3.63 (m, 4H, 24), 3.55-3.14 (m,18H, 7-12, 5, 22), 3.01 (s, 12H, 44), 2.85-2.83(m, 4H, 19), 2.53 (br/s, 2H, 18), 2.42 (br/s, 4H, 20), 2.02-1.95 (m, 2H, 15), 1.86-1.79 (m, 6H, 23, 17), 1.60-1.53 (m, 4H, 4, 16), 1.21-1.15 (m, 9H, 1), 0.60-0.57 (m, 2H, 3).
13C NMR (151 MHz, CDCl3, δ [ppm]): 172.13 (1C, 13), 169.02 (2C, 21), 168.48 (4C, 25), 168.33 (1C, 29), 166.13 (1C, 35), 162.01 (1C, 37), 158.95 (1C, 6), 153.59 (2C, 43), 152.85 (2C, 41), 135.72 (2C, 33, 30/31 6/5-isomere), 133.99 (4C, 28), 131.98 (4C, 26), 131.88 (3C, 30/31 5/6-isomere, 23), 129.09 (2C, 39), 126.81 (1C, 36), 123.21 (4C, 27), 119.75 (1C, 32), 109.50 (2C, 40), 107.18 (2C, 38), 98.12 (2C, 42), 70.62/70.30/69.60 (4C, 8-11), 58.34 (3C, 2), 54.07 (1C, 14), 53.44 (1C, 18), 49.98 (2C, 19), 42.95 (1C, 5), 40.29/40.20 (5C, 44, 7), 39.55 (1C, 12), 36.48 (2C, 22), 35.48 (2C, 24), 28.54/28.41 (4C, 20, 23), 23.74/23.63/23.38 (3C, 4, 17, 16), 18.30 (3C, 1), 7.62 (1C, 3).
MS (ESI, m/z) [M+H]+ calculated: 1452.68, found: 1452.7 [M+Na]+ calculated: 1474.69, found: 1474.7
Experimental part
- 200 -
Compound 23:
Chemical formula: C39H52N6O10
Molecular weight: 764.88 g/mol
Compound 1 (1 eq., 3.020 mmol, 0.750 g) and compound 17 (5 eq., 15.101 mmol, 3.901 g) were dissolved in a total volume of 30 ml methanol and the reaction mixture was stirred at 75 °C for 7 days. The solvent was evaporated and the crude product was dissolved in CH2Cl2. Over a column (25 g silica per g crude product), the excess acrylamide (compound 17) was removed with 2 % methanol in CH2Cl2. To obtain the product, the polarity of the eluent was increased (6 % methanol and in CH2Cl2). The solvent was evaporated to obtain the pure compound 23 (46 %) as slightly yellow, clear, highly viscous liquid.
1H NMR (300 MHz, CDCl3, δ [ppm]): 7.81-7.79 (m, 4H, 18), 7.71-7.68 (m, 4H, 19), 7.31 (br/s, 2H, 12-NH-13), 5.13 (br/s, 1H, 3-NH-4), 3.73 (t, J = 6.90 Hz, 4H, 15), 3.61-3.57 (m, 6H, 5-7), 3.54-3.47 (m, 2H, 8), 3.29-3.25 (m, 6H, 4,13), 2.85 (t, J = 6.53 Hz, 4H, 10), 2.74 (t, J = 5.58 Hz, 2 H, 9), 2.43 (t, J = 6.47 Hz, 4 H, 11), 1.87 (p, J = 6.77 Hz, 4 H, 14), 1.42 (s, 9H, 1)
13C NMR (75 MHz, DMSO, δ [ppm]): 171.73 (2C, 12), 171.73 (4C, 16), 156.01 (1C, 3), 134.78 (4C, 19), 132.07 (4C, 17), 123.41 (4C, 18), 78.02 (1C, 2), 70.00/69.91/69.63 (4C, 5-8), 52.70 (1C, 9), 50.39 (2C, 10), ~40.00 (1C, 4), 36.69 (2C, 13), 35.94 (2C, 15), 33.72 (2C, 11), 28.67 (5C, 1, 14)
MS (ESI, m/z) [M+H]+ calculated: 765.37, found: 765.4 [M+Na]+ calculated: 787.36, found: 787.4
EA calculated: C, 61.24; H, 6.85; N, 10.99; O, 20.92 found: C, 59.82; H, 6.69; N, 10.84
Compound 24:
Chemical formula: C34H45N6O8
+ C2F3O2-
Molecular weight: 664.76 g/mol + 113.02 g/mol
Compound 23 (1 eq., 0.870 mmol, 0.650 g) was dissolved in 40 ml CH2Cl2 and trifluoroacetic acid (15 eq., 13.054 mmol, 999 µl) was dropwise added under stirring. The reaction was stirred for 16 h at room temperature. At the end of the reaction the solvent and all volatile side products

Experimental part
- 201 -
were evaporated under vacuum. To eliminate all free TFA, a coevaporation with 3 x 20 ml toluene was carried out to yield the pure compound 24 (quantitative) as yellowish, clear, highly viscous liquid in TFA-salt form. 1H NMR (300 MHz, CDCl3, δ [ppm]): 8.11 (s, 3H, H3N+-1), 7.78-7.76 (m, 4H, 15), 7.73-7.68 (m, 6H, 16, 9-NH-10), 3.85-3.83 (m, 2H, 5), 3.75-3.67 (m, 6H, 2, 12), 3.64 (s, 4H, 3, 4), 3.57-3.56 (m, 4H, 7), 3.45-3.43 (m, 2H, 6), 3.28-3.19 (m, 6H, 1, 10), 2.84 (t, J = 5.97, 4H, 8), 1.86 (p, J = 6.58 Hz, 4H, 11)
13C NMR (75 MHz, CDCl3, δ [ppm]): (signals of TFA are not attributed) 170.12 (2C, 9), 168.24 (4C, 13), 133.83 (4C, 16), 131.59 (4C, 14), 122.95 (4C, 15), 69.82 (2C, 3, 4), 66.06 (1C, 2), 64.00 (1C, 5), 53.16 (1C, 6), 50.53 (2C, 7), 39.52 (1C, 1), 36.65 (2C, 10), 34.86 (2C, 12), 28.95 (2C, 8), 27.58 (2C, 11)
MS (ESI, m/z) [M-TFA+H]+ calculated: 665.32 found: 665.3 [M-TFA+Na]+ calculated: 687.31 found: 687.3
EA calculated: C, 61.43; H, 6.67; N, 12.64; O, 19.25 found: C, 59.4; H, 6.57; N, 10.71
Compound 25:
Chemical formula: C44H65N7O12Si Molecular weight: 912.13 g/mol
Compound 24 (1.05 eq., 0.210 mmol, 0.163 g) was dissolved in 6 ml CH2Cl2 and TEA (8.4 eq., 1.68 mmol, 234.2 µl) was added. Subsequently isocyanatopropyltriethoxysilane (1 eq., 0.200 mmol, 49.5 µl) was added under stirring and the reaction proceeded at room temperature for 16 h. Then the solvent and excess TEA were evaporated to yield compound 25 as yellow highly viscous liquid (quantitative). 1H NMR (300 MHz, CDCl3, δ [ppm]): (signals of TFA-TEA are not attributed) 7.83-7.72 (m, 4H, 22), 7.72-7.64 (m, 4H, 21), 7.48 (br/s, 2H, 15-NH-16), 5.58/5.47 (2*br/s, 2H, 5-NH-6, 6-NH-7), 3.82-3.68 (m, 10H, 2, 18), 3.62-3.46 (m, 10H, 8-12), 3.34-3.22 (m, 8H, 7, 16, 5), ~3.12 (m, 4H, 13), 1.85 (p, J = 6.70 Hz, 4 H, 17), 1.55 (p, J =7.71, 2H, 4), 1.25-1.16 (m, 13H, 14, 1), 0.61-0.58 (m, 2H, 3).
13C NMR (75 MHz, CDCl3, δ [ppm]): (signals of TFA-TEA are not attributed) 168.80 (4C, 19), 162.61 (2C, 15), 159.17 (1C, 6), 134.39 (4C, 22), 132.27 (4C, 20), 123.55 (4C, 21), 71.39/70.76/70.68 (4C, 8-11), 58.78 (3C, 2), 53.42 (1C, 12), 51.06 (2C, 13), 43.19 (1C, 5), 40.45 (1C, 7), 36.76 (2C, 16), 35.70 (2C, 18), 30.00 (2C, 14), 28.76 (2C, 17), 24.13 (1C, 4), 18.61 (3C, 1), 8.00 (1C, 3).

Experimental part
- 202 -
MS (ESI, m/z) [M+H]+ calculated: 912.45, found: 912.4 [M+Na]+ calculated: 934.44, found: 934.4
Compound 26:***
Chemical formula: C19H36N2O8
Molecular weight: 420.50 g/mol
Compound 1 (1 eq., 24.16 mmol, 6.00 g) was dissolved in 100 ml methanol and methylacrylate (10 eq., 241.6 mmol, 20.8 g) was added. The reaction mixture was stirred at 50 °C for 3 days. The solvent and the excess methyl acrylate were evaporated to obtain the pure compound 26 (quantitative) as slightly yellow oil.
1H NMR (300 MHz, CDCl3, δ [ppm]): 5.09 (s, 1H, 3-NH-4), 3.66 (s, 6H, 13), 3.58 (s, 4H, 7, 6), 3.52 (t, J = 5.4 Hz, 4H, 8, 5), 3.31 (dd, J = 10.4 Hz, 2H, 4), 2.83 (t, J = 7.1 Hz, 4H, 10), 2.67 (t, J = 6.1 Hz, 2H, 9), 2.46 (t, J = 7.1 Hz, 4H, 11), 1.38 (s, 9H, 1).
13C NMR (75 MHz, CDCl3, δ [ppm]): 172.92 (2C, 12), 156.01 (1C, 3), 79.16 (1C, 2), 70.39/70.28 (4C, 5-8), 53.23 (1C, 9), 51.58 (2C, 13), 49.91 (2C, 10), 40.38 (1C, 4), 32.52 (2C, 11), 29.57 (3C, 1).
MS (ESI, m/z) [M+H]+ calculated: 421.25, found: 421.2 [M+Na]+ calculated: 443.24, found: 443.2
Compound 27:†††
Chemical formula: C21H44N6O6
Molecular weight: 467.62 g/mol
Compound 26 (1 eq., 22.8 mmol, 9.57 g) was dissolved in 100 ml methanol and ethylenediamine (80 eq., 1824 mmol, 109.4 g) was added. The reaction mixture was stirred at 25 °C for 5 days. The solvent and the excess diamine were evaporated. The compound was then washed with 3 x 20 ml diethyl ether to remove di-boc protected 2,2-(ethylenedioxy)bis(ethylamine) which was a side product of compound 1. This compound was soluble in diethylether while the desired product was not and thus sedimented. The pure compound 27 (92 %) was obtained as yellow oil.
1H NMR (300 MHz, CDCl3, δ [ppm]): 7.40 (s, 2H, 12-NH-13), 5.69 (s, 1H, 3-NH-4), 3.57 (s, 4H, 7, 6), 3.52 (m, 4H, 8, 5), 3.27 (dd,
*** This synthesis route was not completed; the reaction is therefore not discussed in Chapter III ††† This synthesis route was not completed; the reaction is therefore not discussed in Chapter III

Experimental part
- 203 -
J = 11.7, 6H, 4, 13), 2.81-2.73 (m, 8H, 10, 14), 2.65 (t, J = 5.3 Hz, 2H, 9), 2.35 (t, J = 6.2 Hz, 4H, 11), 1.57 (s, 4H, 14-NH2), 1.42 (s, 9H, 1).
13C NMR (75 MHz, CDCl3, δ [ppm]): 172.88 (2C, 12), 156.26 (1C, 3), 79.23 (1C, 2), 70.39 (2C, 6, 7), 69.39 (2C, 5, 8), 53.81 (1C, 9), 51.07 (2C, 10), 42.24 (2C, 13), 41.56 (2C, 14), 40.38 (1C, 4), 34.42 (2C, 11), 28.55 (3C, 1).
MS (ESI, m/z) – exact mass [M+Na]+ calculated: 499.3214, found: 499.3199
Compound 28:‡‡‡
Chemical formula: C77H100N14O18
Molecular weight: 1509.73 g/mol
Compound 27 (1 eq., 1.621 mmol, 0.758 g) and compound 17 (8 eq., 12.970 mmol, 3.350 g) were dissolved in a total volume of 30 ml methanol and the reaction mixture was stirred at 75 °C for 14 days. The solvent was evaporated and the crude product was dissolved in CH2Cl2. Over a column (25 g silica per g crude product), the excess of reactant (compound 17) and side products were removed with 1 % methanol and 2 % TEA in CH2Cl2. To obtain the product (compound 28), the polarity of the eluent was slightly increased (2 % methanol and 2 % TEA in CH2Cl2). The solvent was evaporated to obtain the pure compound 28 (21 %) as yellow, highly viscous liquid.
1H NMR (300 MHz, CDCl3, δ [ppm]): 7.79-7.76 (m, 8H, 23), 7.69-7.66 (m, 8H, 24), 7.48 (t, J = 5.42, 2H, 12-NH-13), 7.23 (br/s, 4H, 17-NH-18), 5.25 (br/s, 1H, 3-NH-4), 3.81-3.67 (m, 8H, 20), 3.55-3.44 (m, 8H, 5-8), 3.29-3.18 (m, 14H, 4, 13, 18), 2.78-2.74 (m, 12H, 10, 15), 2.68-2.65 (m, 4H, 14), 2.54 (t, J = 5.89 Hz, 2H, 9), 2.36 (t, J = 6.15 Hz, 8H, 16), 2.27 (t, J = 6.06 Hz, 4 H, 11), 1.87 (p, J = 6.63 Hz, 8 H, 19), 1.39 (s, 9H, 1).
13C NMR (75 MHz, CDCl3, δ [ppm]): 172.71 (2C, 12), 172.28-171.97 (4C, 17), 168.13 (8C, 21), 155.75 (1C, 3), 133.72 (8C, 24), 131.68 (8C, 22), 122.92 (8C, 23), 79.23 (1C, 2), 69.91/69.79.39 (2C, 6, 7), 68.51 (2C, 5, 8),
‡‡‡ This synthesis route was not completed; the reaction is therefore not discussed in Chapter III

Experimental part
- 204 -
52.69/52.39 (3C, 9, 14), 49.95/49.68 (6C, 10, 15), 37.63/37.56 (5C, 4, 18), 36.12 (2C, 13), 36.12 (4C, 20), 35.09 (2C, 11), 33.96 (4C, 16), 28.23/28.10 (7C, 1, 19).
MS (ESI, m/z) [M+H]+ calculated: 1509.73, found: 1509.7 [M+Na]+ calculated: 1531.72, found: 1531.7
Compound 29:§§§
Chemical formula: C33H54N4O11
Molecular weight: 682.81 g/mol
Compound 12 (1 eq., 0.257 mmol, 0.131 g) was dissolved in 2.1 ml methanol and methyl acrylate (10 eq., 2.565 mmol, 0.231 ml) was added. The reaction batch was stirred for 3 days at 30 °C. The excess methyl acrylate and solvent were evaporated to obtain the pure compound 29 (quantitative) as yellow, clear liquid.
1H NMR (300 MHz, DMSO, δ [ppm]): 7.92 (t, J = 5.55 Hz, 1H, 9-NH-10), 7.38-7.30 (m, 6H, 15-17, 11-NH-12), 6.77 (br/s, 1H, 3-NH-4), 5.02 (s, 2H, 13), 3.99-3.91 (m, 1H, 11), 3.59 (s, 6H, 25), 3.50 (s, 4H, 6, 7), 3.41-3.34 (m, 4H, 5, 8), 3.24-3.18 (m, 2H, 9), 3.08 (appears q, J = 5.97, 2H, 4), 2.72-2.60 (m, 4H, 22), 2.44-2.27 (m, 6H, 23, 21), 1.61-46 (br/m, 2H, 18), 1.38 (s, 9H, 1), 1.28-1.16 (br/m, 4H, 20, 19)
13C NMR (75 MHz, DMSO, δ [ppm]): 172.86 (2C, 24), 172.46 (1C, 10), 156.34 (1C, 12), 156.04 (1C, 3), 137.53 (1C, 14), 128.76/128.14 (5C, 15-17), 78.04 (1C, 2), 70.00/69.64/69.44 (4C, 5-8), 65.80 (1C, 13), 55.10 (1C, 11), 53.23 (1C, 21), 51.63 (2C, 25), 49.08 (2C, 22), ~40 (2C, 4, 9 in solvent signal), 32.42 (2C, 23), 32.40 (1C, 18), 29.65 (1C, 20), 28.68 (3C, 1), 23.60 (1C, 19)
MS (ESI, m/z) [M+Na]+ calculated: 705.38, found: 705.4 [M+H]+ calculated: 683.38, found: 683.4
EA calc: C, 58.05; H, 7.97; N, 8.21; O, 25.77 found: C, 58.91; H, 7.82; N, 7.16
§§§ This synthesis route was not completed; the reaction is therefore not discussed in Chapter III

Experimental part
- 205 -
Compound 30:****
Chemical formula: C35H62N8O9
Molecular weight: 738.93 g/mol
Compound 29 (1 eq., 0.158 mmol, 0.108 g) was dissolved in 2.1 ml methanol and ethylene diamine (80 eq., 12.64 mmol, 0.846 ml) was added. The reaction batch was stirred for 5 days at 25 °C. The excess ethylene diamine and solvent were evaporated to obtain the pure compound 30 (quantitative) as yellow, clear and viscous liquid.
1H NMR (300 MHz, DMSO, δ [ppm]): 8.03-7.91 (m, 1H, 9-NH-10), 7.37-7.30 (m, 8H, 24-NH-25, 15-17, 11-NH-12), 6.78 (br/s, 1H, 3-NH-4), 5.02 (s, 2H, 13), 4.06 (br/s, 4H, 26-NH2), 4.11-3.90 (m, 1H, 11), 3.50 (s, 4H, 6, 7), 3.39-3.45 (m, 4H, 5, 8), 3.22-3.16 (m, 2H, 9), 3.10-3.06 (m, 6H, 4, 25), 2.70-2.60 (m, 8H, 22, 26), 2.37-2.25 (m, 2 H, 21), 2.20 (t, J = 6.79, 4H, 23), 1.59-49 (br/m, 2H, 18), 1.38 (s, 9H, 1), 1.28-1.16 (br/m, 4H, 20, 19)
13C NMR (75 MHz, DMSO, δ [ppm]): 172.50 (2C, 10), 171.96 (1C, 24), 156.37 (1C, 12), 156.05 (1C, 3), 137.51 (1C, 14), 128.78/128.22 (5C, 15-17), 78.06 (1C, 2), 69.99/69.63/69.44 (4C, 5-8), 65.82 (1C, 13), 55.18 (1C, 11), 53.14 (1C, 21), 49.93 (2C, 22), ~40 (2C, 4, 9, 25, 26 in solvent signal), 33.64 (2C, 23), 32.48 (1C, 18), 29.65 (1C, 20), 28.68 (3C, 1), 23.83 (1C, 19)
MS (FD) [M+H]+ calculated: 739.46, found: 739.47
**** This synthesis route was not completed; the reaction is therefore not discussed in Chapter III

Experimental part
- 206 -
4. Grafting protocols
4.1. Optimization of grafting protocols with commercial silanes
Grafting of 3-(2-aminoethyl-amino)propyl-trimethoxy-silane onto AA-TiO2 under acidic conditions, adding the base after silane addition 200 mg AA-TiO2 NPs as synthesized in water (30 mg/ml) were mixed with 24 ml ethanol and 100 µl of 1 M nitric acid. 3-(2-aminoethyl-amino)propyl-trimethoxy-silane (50, 10, 5, 1 and 0.5 µmol/mg particles) was mixed with 8 ml anhydrous ethanol and added to the particle solution in 50 addition steps under agitation over 2.5 h (every 3 min) at 50 °C. The reaction was then stirred for 1 h at 50 °C and subsequently the pH was changed to 9.5 to 10 via addition of 28-30 % ammonium hydroxide in water solution. Afterwards the reaction batch was heated up to 70 °C for one hour.
Grafting of 3-(2-aminoethyl-amino)propyl-trimethoxy-silane onto AA-TiO2 under basic conditions 200 mg AA-TiO2 NPs as synthesized in water (30 mg/ml) were mixed with 24 ml ethanol and 1 ml of 28-30 % ammonium hydroxide in water solution. 3-(2-aminoethyl-amino)propyl-trimethoxy-silane (50, 10, 5, 1 and 0.5 µmol/mg particles) was mixed with 8 ml anhydrous ethanol and added in 50 addition steps to the particle solution under agitation over 2.5 h (every 3 min at room temperature). Then the reaction batch was heated up to 40 °C for one hour.
Grafting of (3-Trimethoxysilylpropyl)-diethylenetriamine onto AA-TiO2 under basic conditions The grafting protocol as described above (Grafting of 3-(2-aminoethyl-amino)propyl-trimethoxy-silane onto AA-TiO2 under basic conditions) was carried out with the following change: as organo-silane (3-Trimethoxysilylpropyl)-diethylenetriamine in concentrations from 1, 0.5, 0.1 and 0.05 µmol/mg particles was used.
Grafting of (3-Trimethoxysilylpropyl)-diethylenetriamine onto MEEAA-TiO2 (200 °C, 4 h) under basic conditions The grafting protocol as described above (Grafting of 3-(2-aminoethyl-amino)propyl-trimethoxy-silane onto AA-TiO2 under basic conditions) was carried out with the following changes: as organo-silane (3-Trimethoxysilylpropyl)-diethylenetriamine in concentrations from 4, 2, 1 and 0.5 µmol/mg particles was utilized and as particle samples MEEAA-TiO2 (200 °C, 4 h) was chosen.
Purification of the obtained functionalized particle samples After reaction, the samples were centrifuged at 10.000 rpm for 1 h and redispersed in 10 ml water. For zeta potential titrations and photocatalysis tests, 75 % of each sample was dialysed against water (including 3 water changes). For DLS and DRIFT examinations, the rest of each sample was washed with ethanol via centrifugation (3 times at 30000 rpm for 1 h and subsequent redispersion) and dried under vacuum if necessary (DRIFT).
4.2. Grafting of synthesized coupling agents onto MEEAA-TiO2 (200 °C, 4 h)
Grafting of coupling agent I onto MEEAA-TiO2 (200 °C, 4 h) under basic conditions 100 mg MEEAA-TiO2 NPs as synthesized in water (30 mg/ml) were mixed with 12 ml ethanol and 0.5 ml of 28 % ammonium hydroxide in water solution. Coupling agent I (2 µmol/mg particles) was mixed with 4 ml freshly distilled ethanol and added in 50 addition steps to the particle solution under agitation over 2.5 h (every 3 min at room temperature). Then the reaction batch was heated up to 40 °C for one hour.
Grafting of coupling agent IV onto MEEAA-TiO2 (200 °C, 4 h) under basic conditions 100 mg MEEAA-TiO2 NPs as synthesized in water (30 mg/ml) were mixed with 12 ml ethanol and 0.5 ml of 28 % ammonium hydroxide in water solution. Coupling agent IV (2 µmol/mg particles) was mixed with 4 ml freshly distilled ethanol and added in 50 addition steps to the

Experimental part
- 207 -
particle solution under agitation over 2.5 h (every 3 min at room temperature). Then the reaction batch was heated up to 40 °C for one hour.
Washing of the obtained functionalized particle samples After reaction, the samples were centrifuged at 8.000 rpm for 1 h and redispersed in 10 ml water. The samples were subsequently dialysed against water (including 5 water changes) and dried under vacuum if necessary (DRIFT).
Phthalimide cleavage attempt of coupling agent IV grafted onto MEEAA-TiO2 (200 °C, 4 h) The dispersion of coupling agent IV-MEEAA-TiO2 (5 mg NPs, 10 µmol coupling agent IV) in water in a concentration of 3 mg/ml was transferred into an Eppendorf cap and the desired amount of base was added (Table - EP - 3). The reaction mixture was stirred for 16 h at room temperature. Then, each batch was transferred into a dialysis bag and dialysed against 1 l of water including 3 water changes (after 3 h, 8 h and 24 h) and dried under vacuum if necessary (DRIFT).
Table - EP - 3. Amount of base used for the phthalimide deprotection procedure.
ratio of primary amine (from base) to phthalimide group of the grafted coupling agent IV (on MEEAA-TiO2 NP)
methylamine 40 w%
hydrazine monohydrate 65 %
3:1 60 µmol 5.194 µl 30 µmol 1.433 µl 10:1 200 µmol 17.31 µl 100 µmol 4.778 µl 100:1 2 000 µmol 173.13 µl 1 000 µmol 47.778 µl 1000:1 20 000 µmol 1731.33 µl 10 000 µmol 477.787 µl unmodified MEEAA-TiO2 as reference
20 000 µmol 1731.33 µl 10 000 µmol 477.787 µl
Experimental part
- 208 -
5. Cell culture tests
Stabilisation of particles in cell culture media The as synthesized samples AA-TiO2 (160 °C, 4 h) and MEEAA-TiO2 (160 °C, 4 h) in a concentration of 3 mg/ml in water were ultrasonically treated (Branson Sonifier 450, 4 min, duty cycle 30 %, strength 7); if a stabilisation of the particles was chosen, the selected stabiliser was added at this time point under magnetic stirring. Finally the pH was adjusted to 7 adding 1 M sodium hydroxide solution and the stabilised dispersion was transferred into the selected cell culture media (DMEM, RPMI and BEGM) resulting in NP concentrations of 0.5 mg/ml. From this standard dilution, the required particle concentrations for cytotoxicity tests were generated by dilution with cell culture medium.
Cytotoxicity tests From the standard dilution (0.5 mg/ml NPs in cell culture medium), the required particle concentrations for cell culture tests were generated by dilution with cell culture medium, respectively. For cytotoxicity assessment cells were seeded into 96 well round bottom culture plates (1x10⁴ cells per well). Cells were allowed to attach and proliferate for 24 h. The particle dispersions were added at working concentrations on the second day and incubated with the cells for 24 h. After that, the exposure medium was removed by suction and the cells were then washed three times with PBS in order to remove residual NPs. Then, the MTT colorimetric staining method was applied to study cell viability. All plates were incubated with cell culture medium containing 1 mg/ml of MTT-solution for 4 h. The MTT solution from each well was replaced by isopropanol after 4 h of inoculation at 37 °C with 5 % CO2. Isopropanol was used to solubilise the resulting formazan crystals overnight at 37 °C with 5 % CO2. The colour conversion of the blue formazan dye was measured by a spectrophotometer at a wavelength of 570 nm. All cytotoxicity studies were carried out on 8 technical and 3 biological replicates. Positive control samples (non-cellular controls) were carried out and confirmed that there are no interferences between the tested nanomaterials and the biochemical assay reagents. Statistical analysis of the results was performed using Graph Pad Prism software 4. The Wilcoxon test was used to evaluate statistical significance of the mean viability values compared to the untreated control, which was defined to be 100%. Differences were considered statistically significant when the P-value was less than 0.05.
24 h UV light pre-activation of particles The as synthesized MEEAA-TiO2 (160 °C, 4 h) samples in a concentration of 3 mg/ml in water were neutralized with 1 M NaOH (when necessary). Then they were transferred into a glass petri dish and covered with a fused silica lid. UV-light (0.3-0.5 mW/cm2, 366 nm) was applied on its top for 24 h. The samples were then diluted with the selected cell culture medium (in general RPMI) to obtain a stock solution with a NP concentration of 0.5 mg/ml. From this standard dilution, the required particle concentrations for cytotoxicity tests were generated by dilution with cell culture medium.
For further studies on the 24 h UV light pre-activation of particles and the resulting anti-tumour effect (described in Chapter IV.3.), following protocols were carried out:
- “pure MEEAA”: MEEAA as commercially obtained was diluted in water to a concentration of 12.6 mg/ml which is the same concentration present in a 3 mg/ml MEEAA-TiO2 (160°C, 4) NP sample. The sample was neutralized, pre-activated, diluted with cell culture medium and tested for cytotoxicity as described before.
- “TiO2 NPs”: MEEAA-TiO2 (160°C, 4) were washed with HNO3 water (pH = 3) via repeated centrifugation and redispersion. The sample was neutralized, pre-activated, diluted with cell culture medium and tested for cytotoxicity as described before.
- “MEEAA separated from the TiO2 NPs after pre-activation”: The sample was neutralized and pre-activated as described before. Then, the particles were sedimented via centrifugation and

Experimental part
- 209 -
only the supernatant containing the MEEAA was diluted with cell culture medium and tested for cytotoxicity as described before.
- “pre-activated samples stored for 1 or 5 days”: The samples were neutralized and pre-activated as described before. Then, the samples were stored at room temperature in a closed flask for 1 or 5 days. They were diluted with cell culture medium and tested for cytotoxicity as described before.
- comparison of MEEAAs with different purity grades: For cell culture tests, the commercially obtained MEEAA compounds (12.6 mg/ml) with either 70 % purity which is the standard sample used or 95 % purity were intermixed with commercial P25 TiO2 NPs (3 mg/ml) in water and ultrasonically treated (ultrasound bath, 1 h). The samples were then neutralized, pre-activated, diluted with cell culture medium and tested for cytotoxicity as described before.
- NMR analysis of UV light activated compounds: 3 mg/ml P25 NPs, 12.6 mg/ml MEEAA compound (or other compounds to be examined) were intermixed in D2O. One part of this solution was transferred into a UV light transparent cuvette, air-sealed and 24 h UV light treated while the other part was stored as reference. Both sample parts were then centrifuged at 13 000 rpm for 1 h in order to remove the P25 NPs and the supernatants were transferred into NMR tubes for analysis.
- distillation of MEEAA: MEEAA was distilled under dynamic vacuum (~9 mbar), increasing the heating temperature up to 250 °C, the heating temperature, appearance, name of the fraction and the amount of each distilled fraction is shown in the following Table - EP - 4. The most interesting fractions were chosen based on the cytotoxicity results, analytically analysed and are presented in the following section. For cell culture tests, all obtained fractions (12.6 mg/ml) were intermixed with commercial P25 TiO2 NPs (3 mg/ml) in water and ultrasonically treated (ultrasound bath, 1 h). The samples were then neutralized, pre-activated, diluted with cell culture medium and tested for cytotoxicity as described before.
Table - EP - 4. MEEAA fractions obtained at different distillation temperatures; their appearance, name and obtained amount.
T appearance name of fraction amount
starting material, slightly yellow
MEEAA before distillation 151 g
< 194 °C yellow fraction I 57 g
194 °C slightly yellow fraction II 54 g
194 °C – 204 °C slightly yellow fraction III 20 g
204 °C – 250 °C slightly yellow fraction IV 15 g
residue in the flask dark brown residue (discarded) 4 g
Analysis of fraction II:
Chemical formula: C7H14O5
Molecular weight: 178.18 g/mol

Experimental part
- 210 -
Compound name: 2-[2-(2-methoxyethoxy)ethoxy]acetic acid
1H NMR (300 MHz, CDCl3, δ [ppm]): 7.96 (br/s, 1H, HO-1), 4.19 (s, 2H, 2), 3.79-3.77 (m, 2H, 3), 3.73-3.69 (m, 4H, 4, 5), 3.60-3.57 (m, 2H, 6), 3.40 (s, 3H, 7). 13C NMR (75 MHz, CDCl3, δ [ppm]): 173.31 (1C, 1), 71.69 (1C, 6), 71.12 (1C, 5), 70.46 (1C, 4), 70.27 (1C, 3), 68.51 (1C, 2), 58.95 (1C, 7). MS (ESI, m/z) [M+Na]+ calculated: 201.09, found: 201.1
Analysis of fraction IV:
A column chromatography of fraction IV was carried out over 50 g silica per g product, starting with 2 % MeOH in CH2Cl2 as eluent and then increasing to 5 % MeOH in CH2Cl2. Fraction IV-a and IV-b were obtained and analysed.
Fraction IV-a:
Chemical formula: C12H24O7
Molecular weight: 280.32 g/mol
Yield: 76 %
1H NMR (300 MHz, D2O, δ [ppm]): 4.39-4.36 (m, 2H, 5), 4.30 (s, 2H, 7), 3.82-3.77 (m, 4H, 4, 8), 3.75-3.69 (m, 6H, 9, 3, 10), 3.66-3.59 (m, 4H, 2, 11), 3.40 (s, 3H, 1), 3.39 (s, 3H, 12).
13C NMR (75 MHz, D2O, δ [ppm]): 172.22 (1C, 6), 70.96/70.91 (2C, 2, 11), 70.21 (1C, 8), 69.49/69.43/69.40 (3C, 9, 3, 10), 68.28 (1C, 4), 67.75 (1C, 7), 64.13 (1C, 5), 58.03 (2C, 1, 12).
MS (ESI, m/z) – exact mass [M+Na]+ calculated: 303.1414, found: 303.1419
Fraction IV-b:
Chemical formula: C7H14O5
Molecular weight: 178.18 g/mol
Yield: 8 %
Compound name: 2-[2-(2-methoxyethoxy)ethoxy]acetic acid
1H NMR (300 MHz, D2O, δ [ppm]): 4.23 (s, 2H, 2), 3.76-3.74 (m, 2H, 3), 3.73-3.67 (m, 4H, 4, 5), 3.64-3.62 (m, 2H, 6), 3.38 (s, 3H, 7).

Experimental part
- 211 -
13C NMR (75 MHz, D2O, δ [ppm]): 174.29 (1C, 1), 70.94 (1C, 6), 70.07 (1C, 5), 69.51 (1C, 4), 69.38 (1C, 3), 67.58 (1C, 2), 58.01 (1C, 7). MS (ESI, m/z) – exact mass [M+Na+Na]+ calculated: 223.0552, found: 223.0560
X-ray fluorescence spectroscopy Table - EP - 5. X-ray fluorescence spectroscopy of fraction IV, compared to the MEEAA before distillation and pure MEEAA. Due to the small concentration of the detected elements, the obtained results cannot be taken as quantitative values.
element MEEAA purity = 70% [weight-%]
distilled fraction IV [weight-%]
MEEAA purity > 95% [weight-%]
Al - 0.001 0.002 Br 0.006 - - Cl 0.117 0.014 -
Fe 0.003 - - Si 0.004 0.002 0.002

Experimental part
- 212 -
Bibliography:
1 H. P. Zenner, W. Lehner and I. F. Herrmann, Arch. Otorhinolaryngol., 1979, 225, 269–277. 2 M. Newville, J. Synchrotron Radiat., 2001, 8, 322–324. 3 B. Ravel and M. Newville, J. Synchrotron Radiat., 2005, 12, 537–541.

- 213 -
Appendices
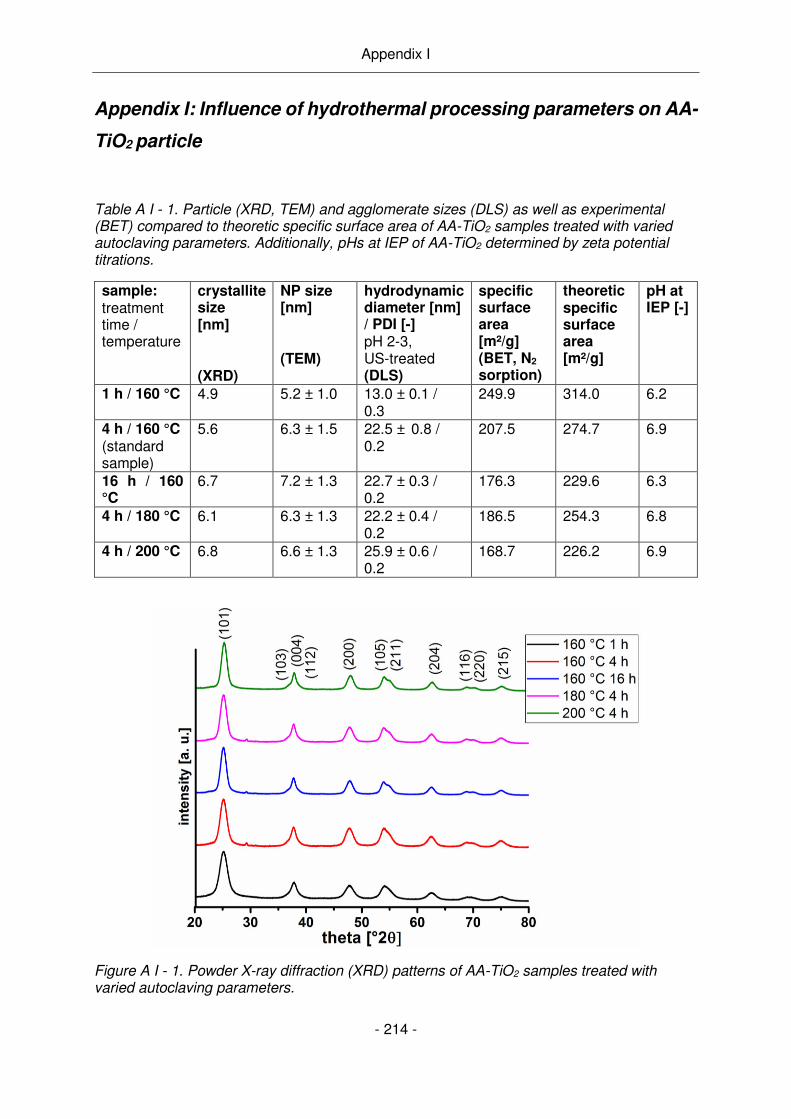
Appendix I
- 214 -
Appendix I: Influence of hydrothermal processing parameters on AA-
TiO2 particle
Table A I - 1. Particle (XRD, TEM) and agglomerate sizes (DLS) as well as experimental (BET) compared to theoretic specific surface area of AA-TiO2 samples treated with varied autoclaving parameters. Additionally, pHs at IEP of AA-TiO2 determined by zeta potential titrations.
sample: treatment time / temperature
crystallite size [nm] (XRD)
NP size [nm] (TEM)
hydrodynamic diameter [nm] / PDI [-] pH 2-3, US-treated (DLS)
specific surface area [m²/g] (BET, N2 sorption)
theoretic specific surface area [m²/g]
pH at IEP [-]
1 h / 160 °C 4.9 5.2 ± 1.0 13.0 ± 0.1 / 0.3
249.9 314.0 6.2
4 h / 160 °C (standard sample)
5.6 6.3 ± 1.5 22.5 ± 0.8 / 0.2
207.5 274.7 6.9
16 h / 160 °C
6.7 7.2 ± 1.3 22.7 ± 0.3 / 0.2
176.3 229.6 6.3
4 h / 180 °C 6.1 6.3 ± 1.3 22.2 ± 0.4 / 0.2
186.5 254.3 6.8
4 h / 200 °C 6.8 6.6 ± 1.3 25.9 ± 0.6 / 0.2
168.7 226.2 6.9
Figure A I - 1. Powder X-ray diffraction (XRD) patterns of AA-TiO2 samples treated with varied autoclaving parameters.

Appendix I
- 215 -
Figure A I - 2. Transmission electron microscopy (TEM) of AA-TiO2 samples treated with varied hydrothermal processing parameters and their size distributions, obtained from counting at least 100 particles per sample: a) 1 h, 160 °C; b) 4 h, 160 °C; c) 16 h, 160 °C; d) 4 h, 180 °C; e) 4 h, 200 °C.

Appendix I
- 216 -
Figure A I - 3. IR (DRIFT) spectra of AA-TiO2 samples synthesized with varied hydrothermal treatment parameters. [the attribution of vibration band can be found in II.1.2. Figure II – 4.]
Figure A I - 4. a) Simultaneous thermogravimetric (TGA) and b) differential thermal analysis (DTA) performed on dried AA-TiO2 particle samples synthesized with varied hydrothermal processing parameters.
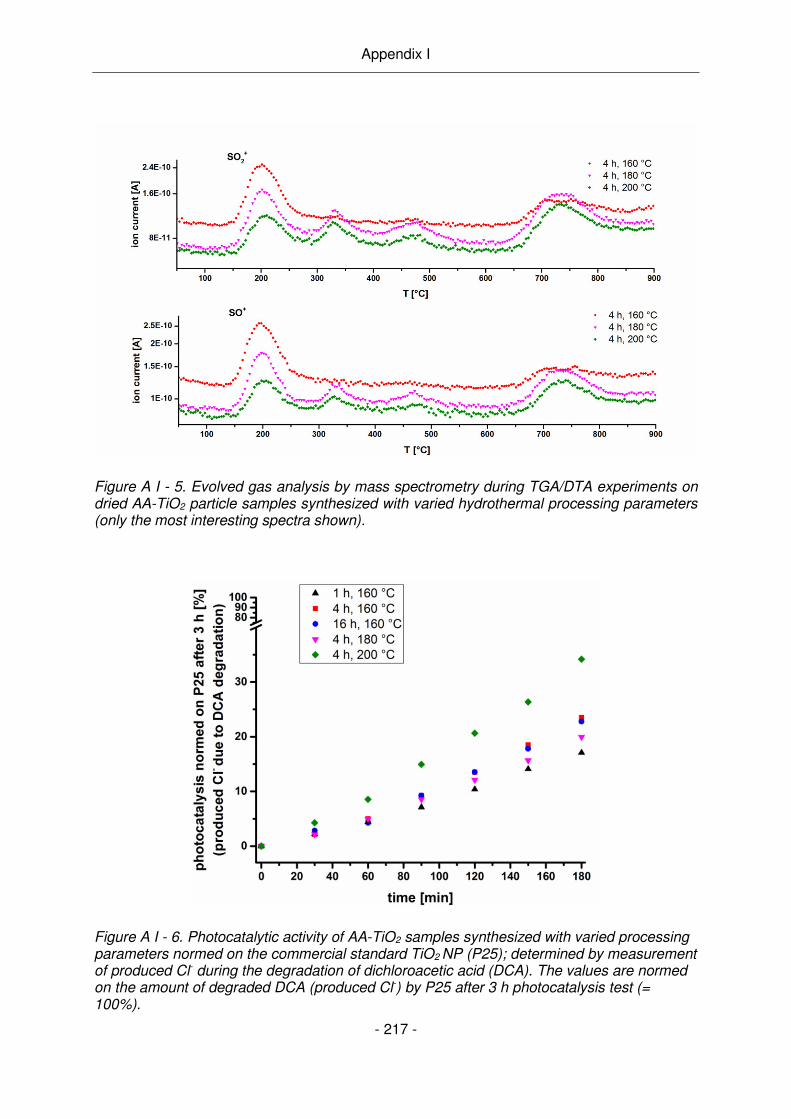
Appendix I
- 217 -
Figure A I - 5. Evolved gas analysis by mass spectrometry during TGA/DTA experiments on dried AA-TiO2 particle samples synthesized with varied hydrothermal processing parameters (only the most interesting spectra shown).
Figure A I - 6. Photocatalytic activity of AA-TiO2 samples synthesized with varied processing parameters normed on the commercial standard TiO2 NP (P25); determined by measurement of produced Cl- during the degradation of dichloroacetic acid (DCA). The values are normed on the amount of degraded DCA (produced Cl-) by P25 after 3 h photocatalysis test (= 100%).

Appendix II
- 218 -
Appendix II: Cleavage of the phthalimide protecting group of the
coupling agent IV grafted onto MEEAA-TiO2 (200 °C, 4 h)
Table A II - 2. IEP (zeta potential) and agglomerate size (DLS) of MEEAA-TiO2 functionalized with coupling agent IV and treated with either methylamine or hydrazine.
amount of amine (from base) per phthalimide group of the grafted coupling agent IV (on MEEAA-TiO2 NP)
pH(IEP) determined by zeta potential titration
Agglomerate size [nm] (PDI [-]) in water pH = 3
methylamine 3 5.8 319.1 ± 30.2 (0.6) 10 5.9 283.0 ± 6.0 (0.4) 100 6.0 288.9 ± 17.2 (0.4) 1000 6.1 544.3 ± 113.5 (0.9)
hydrazine 3 5.8 285.1 ± 7.0 (0.4) 10 5.8 406.5 ± 47.4 (0.7) 100 6.0 198.5 ± 2.0 (0.3) 1000 6.1 1059.2 ± 105.1 (0.7)

Appendix III
- 219 -
Appendix III: Stabilization of MEEAA-TiO2 in cell culture media with
FBS, BSA, Melflux, Melpers or Sika ViscoCrete
Table A III - 3. MEEAA-TiO2 (0.5 mg/ml) in different cell culture media (DMEM, BEGM, RPMI) stabilized with 1 mg, 10 mg, 50 mg or 100 mg BSA, FBS, Melflux, Melpers or Sika ViscoCrete per 1 mg NP. a) Percentage of particles still stably dispersed after 24 h with decreasing dispersion stability from A: 100% (dark green) to E: <25 % (dark red). b) Agglomerate size (Z-average) with increasing hydrodynamic diameter from a: <100 nm (dark green) to f: >700 nm (dark red).

- 220 -

- 221 -
List of appreviations
List of appreviations
- 222 -
AA acetyl acetone AMEO aminopropyltriethoxy silane ATR attenuated total reflection BEGM bronchial epithelial cell growth medium BET Brunauer-Emmett-Teller BMSC bone marrow-derived mesenchymal stem cells Boc tert-butyloxycarbonyl BSA bovine serum albumin DAISY-MAT Darmstadt Integrated System for MATerial research DCA dichloroacetic acid DCC N,N'-dicyclohexylcarbodiimide DCU dicyclohexylurea DLS dynamic light scattering DLVO Derjaguin-Landau-Verwey-Overbeek DMEM Dulbecco’s modified eagle medium DMF dimethylformamide DRIFT diffuse reflectance infrared Fourier transformed (spectroscopy) DTA differential thermal analysis EA elemental analysis EXAFS extended X-ray absorption fine structure FBS fetal bovine serum FFT fast Fourier transformation Fmoc Fluorenylmethoxycarbonyl FTIR Fourier transformed infrared (spectroscopy) IARC International Agency for Research on Cancer HNSCC head and neck squamous cell carcinoma HPLC high pressure liquid chromatography IR infrared JECFA Joint FAO/WHO Expert Committee on Food Additives MEEAA 2-[2-(2-methoxyethoxy)ethoxy]acetic acid MS mass spectrometry MTT 3-(4,5-dimethylthiazol-2-yl)-2,5-diphenyl tetrazolium bromide NHS N-hydroxysuccinimide NHS-R hodamine 5-/6-carboxytetramethylrhodamine, succinimidyl ester NMR nuclear magnetic resonance (spectroscopy) NP nanoparticle PAMAM polyamidoamine PEG polyethylene glycol PC photocatalytic PDI polydispersity index PL photoluminescence PTSA para-toluene sulfonic acid P25 commercial Degussa P25 TiO2 nanoparticles RhBitc Rhodamine B isothiocyanate ROS reactive oxidizing species RPMI Roswell Park Memorial Institute medium rt room temperature TEA triethylamine TEM transmission electron microscopy TFA trifluoroacetic acid TGA thermogravimetric analysis TG thermogravimetric THF tetrahydrofuran TiO2 titanium dioxide

List of appreviations
- 223 -
TLC thin layer chromatography US ultrasonic UV ultraviolet XAFS X-ray absorption fine structure XANES X-ray absorption near edge structure XPS X-ray photoelectron spectroscopy XRD X-ray diffraction XRF X-ray fluorescence spectroscopy Z benzyloxycarbonyl

Functional coupling agents
S. Koch: Dendritic surface modification of photocatalytic nanoparticles for tumour therapy