Thermo acoustic tiles performance in small-scale sheds for ...
11
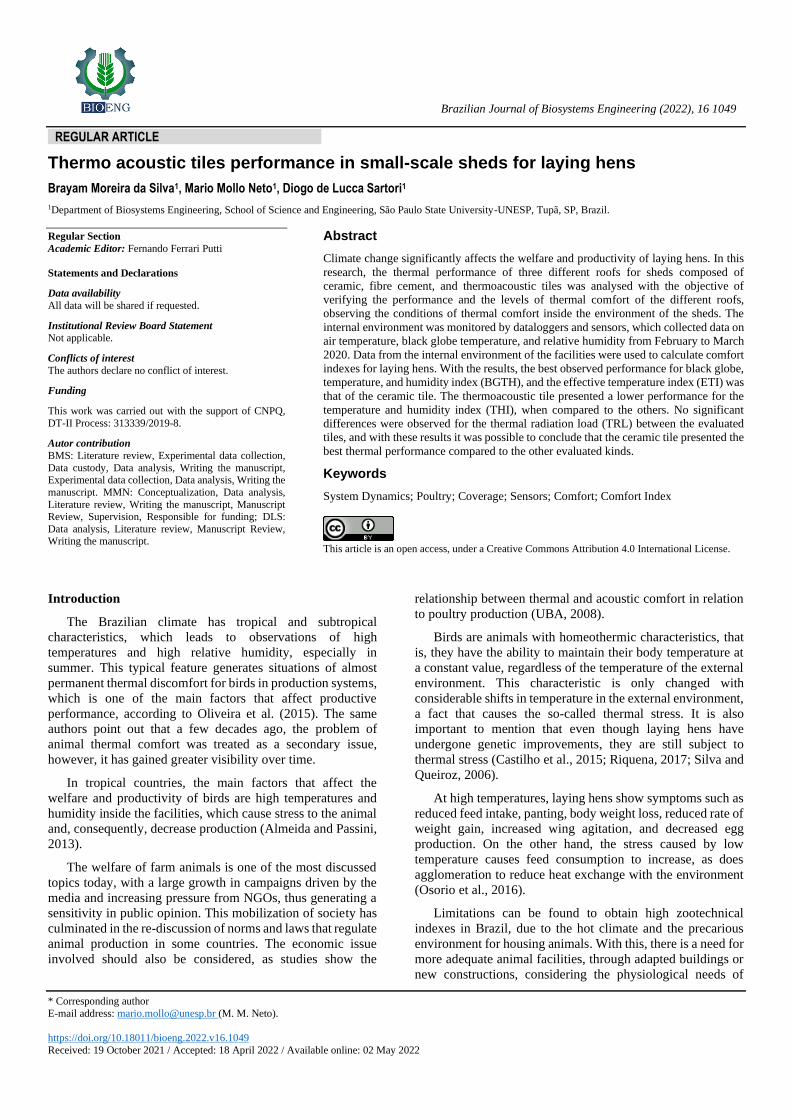
Brazilian Journal of Biosystems Engineering (2022), 16 1049 * Corresponding author E-mail address: [email protected] (M. M. Neto). https://doi.org/10.18011/bioeng.2022.v16.1049 Received: 19 October 2021 / Accepted: 18 April 2022 / Available online: 02 May 2022 REGULAR ARTICLE Thermo acoustic tiles performance in small-scale sheds for laying hens Brayam Moreira da Silva 1 , Mario Mollo Neto 1 , Diogo de Lucca Sartori 1 1 Department of Biosystems Engineering, School of Science and Engineering, São Paulo State University-UNESP, Tupã, SP, Brazil. Regular Section Academic Editor: Fernando Ferrari Putti Statements and Declarations Data availability All data will be shared if requested. Institutional Review Board Statement Not applicable. Conflicts of interest The authors declare no conflict of interest. Funding This work was carried out with the support of CNPQ, DT-II Process: 313339/2019-8. Autor contribution BMS: Literature review, Experimental data collection, Data custody, Data analysis, Writing the manuscript, Experimental data collection, Data analysis, Writing the manuscript. MMN: Conceptualization, Data analysis, Literature review, Writing the manuscript, Manuscript Review, Supervision, Responsible for funding; DLS: Data analysis, Literature review, Manuscript Review, Writing the manuscript. Abstract Climate change significantly affects the welfare and productivity of laying hens. In this research, the thermal performance of three different roofs for sheds composed of ceramic, fibre cement, and thermoacoustic tiles was analysed with the objective of verifying the performance and the levels of thermal comfort of the different roofs, observing the conditions of thermal comfort inside the environment of the sheds. The internal environment was monitored by dataloggers and sensors, which collected data on air temperature, black globe temperature, and relative humidity from February to March 2020. Data from the internal environment of the facilities were used to calculate comfort indexes for laying hens. With the results, the best observed performance for black globe, temperature, and humidity index (BGTH), and the effective temperature index (ETI) was that of the ceramic tile. The thermoacoustic tile presented a lower performance for the temperature and humidity index (THI), when compared to the others. No significant differences were observed for the thermal radiation load (TRL) between the evaluated tiles, and with these results it was possible to conclude that the ceramic tile presented the best thermal performance compared to the other evaluated kinds. Keywords System Dynamics; Poultry; Coverage; Sensors; Comfort; Comfort Index This article is an open access, under a Creative Commons Attribution 4.0 International License. Introduction The Brazilian climate has tropical and subtropical characteristics, which leads to observations of high temperatures and high relative humidity, especially in summer. This typical feature generates situations of almost permanent thermal discomfort for birds in production systems, which is one of the main factors that affect productive performance, according to Oliveira et al. (2015). The same authors point out that a few decades ago, the problem of animal thermal comfort was treated as a secondary issue, however, it has gained greater visibility over time. In tropical countries, the main factors that affect the welfare and productivity of birds are high temperatures and humidity inside the facilities, which cause stress to the animal and, consequently, decrease production (Almeida and Passini, 2013). The welfare of farm animals is one of the most discussed topics today, with a large growth in campaigns driven by the media and increasing pressure from NGOs, thus generating a sensitivity in public opinion. This mobilization of society has culminated in the re-discussion of norms and laws that regulate animal production in some countries. The economic issue involved should also be considered, as studies show the relationship between thermal and acoustic comfort in relation to poultry production (UBA, 2008). Birds are animals with homeothermic characteristics, that is, they have the ability to maintain their body temperature at a constant value, regardless of the temperature of the external environment. This characteristic is only changed with considerable shifts in temperature in the external environment, a fact that causes the so-called thermal stress. It is also important to mention that even though laying hens have undergone genetic improvements, they are still subject to thermal stress (Castilho et al., 2015; Riquena, 2017; Silva and Queiroz, 2006). At high temperatures, laying hens show symptoms such as reduced feed intake, panting, body weight loss, reduced rate of weight gain, increased wing agitation, and decreased egg production. On the other hand, the stress caused by low temperature causes feed consumption to increase, as does agglomeration to reduce heat exchange with the environment (Osorio et al., 2016). Limitations can be found to obtain high zootechnical indexes in Brazil, due to the hot climate and the precarious environment for housing animals. With this, there is a need for more adequate animal facilities, through adapted buildings or new constructions, considering the physiological needs of
-
Upload
khangminh22 -
Category
Documents
-
view
2 -
download
0
Transcript of Thermo acoustic tiles performance in small-scale sheds for ...
Brazilian Journal of Biosystems Engineering (2022), 16 1049
* Corresponding author
E-mail address: [email protected] (M. M. Neto).
https://doi.org/10.18011/bioeng.2022.v16.1049
Received: 19 October 2021 / Accepted: 18 April 2022 / Available online: 02 May 2022
REGULAR ARTICLE
Thermo acoustic tiles performance in small-scale sheds for laying hens
Brayam Moreira da Silva1, Mario Mollo Neto1, Diogo de Lucca Sartori1
1Department of Biosystems Engineering, School of Science and Engineering, São Paulo State University-UNESP, Tupã, SP, Brazil.
Regular Section
Academic Editor: Fernando Ferrari Putti
Statements and Declarations
Data availability
All data will be shared if requested.
Institutional Review Board Statement
Not applicable.
Conflicts of interest
The authors declare no conflict of interest.
Funding
This work was carried out with the support of CNPQ,
DT-II Process: 313339/2019-8.
Autor contribution
BMS: Literature review, Experimental data collection,
Data custody, Data analysis, Writing the manuscript, Experimental data collection, Data analysis, Writing the
manuscript. MMN: Conceptualization, Data analysis,
Literature review, Writing the manuscript, Manuscript Review, Supervision, Responsible for funding; DLS:
Data analysis, Literature review, Manuscript Review, Writing the manuscript.
Abstract
Climate change significantly affects the welfare and productivity of laying hens. In this
research, the thermal performance of three different roofs for sheds composed of
ceramic, fibre cement, and thermoacoustic tiles was analysed with the objective of
verifying the performance and the levels of thermal comfort of the different roofs,
observing the conditions of thermal comfort inside the environment of the sheds. The
internal environment was monitored by dataloggers and sensors, which collected data on
air temperature, black globe temperature, and relative humidity from February to March
2020. Data from the internal environment of the facilities were used to calculate comfort
indexes for laying hens. With the results, the best observed performance for black globe,
temperature, and humidity index (BGTH), and the effective temperature index (ETI) was
that of the ceramic tile. The thermoacoustic tile presented a lower performance for the
temperature and humidity index (THI), when compared to the others. No significant
differences were observed for the thermal radiation load (TRL) between the evaluated
tiles, and with these results it was possible to conclude that the ceramic tile presented the
best thermal performance compared to the other evaluated kinds.
Keywords
System Dynamics; Poultry; Coverage; Sensors; Comfort; Comfort Index
This article is an open access, under a Creative Commons Attribution 4.0 International License.
Introduction
The Brazilian climate has tropical and subtropical
characteristics, which leads to observations of high
temperatures and high relative humidity, especially in
summer. This typical feature generates situations of almost
permanent thermal discomfort for birds in production systems,
which is one of the main factors that affect productive
performance, according to Oliveira et al. (2015). The same
authors point out that a few decades ago, the problem of
animal thermal comfort was treated as a secondary issue,
however, it has gained greater visibility over time.
In tropical countries, the main factors that affect the
welfare and productivity of birds are high temperatures and
humidity inside the facilities, which cause stress to the animal
and, consequently, decrease production (Almeida and Passini,
2013).
The welfare of farm animals is one of the most discussed
topics today, with a large growth in campaigns driven by the
media and increasing pressure from NGOs, thus generating a
sensitivity in public opinion. This mobilization of society has
culminated in the re-discussion of norms and laws that regulate
animal production in some countries. The economic issue
involved should also be considered, as studies show the
relationship between thermal and acoustic comfort in relation
to poultry production (UBA, 2008).
Birds are animals with homeothermic characteristics, that
is, they have the ability to maintain their body temperature at
a constant value, regardless of the temperature of the external
environment. This characteristic is only changed with
considerable shifts in temperature in the external environment,
a fact that causes the so-called thermal stress. It is also
important to mention that even though laying hens have
undergone genetic improvements, they are still subject to
thermal stress (Castilho et al., 2015; Riquena, 2017; Silva and
Queiroz, 2006).
At high temperatures, laying hens show symptoms such as
reduced feed intake, panting, body weight loss, reduced rate of
weight gain, increased wing agitation, and decreased egg
production. On the other hand, the stress caused by low
temperature causes feed consumption to increase, as does
agglomeration to reduce heat exchange with the environment
(Osorio et al., 2016).
Limitations can be found to obtain high zootechnical
indexes in Brazil, due to the hot climate and the precarious
environment for housing animals. With this, there is a need for
more adequate animal facilities, through adapted buildings or
new constructions, considering the physiological needs of

Mollo et al. Brazilian Journal of Biosystems Engineering (2022), 16 1049
2
birds to ensure better thermal comfort, to obtain better
development and greater production (Abreu et al., 2011).
In order to identify the level of thermal comfort in the
animal production environment, indicators are used, such as
the black globe, temperature, and humidity index (BGTH); the
thermal radiation load (TRL); the average radiant temperature
(ART); the temperature and humidity index (THI), and the
effective temperature index (ETI), among others. The
indicators are dependent on factors such as temperature,
relative air humidity, wind speed, and ambient radiation
(Marta Filho, 1993; Fehr et al., 1993; Gomes, 2009; Kawabata
et al., 2005; Fernandes and Krüger, 2019; Jácome, 2009;
Coutinho et al., 2014; Fante et al., 2017).
In animal production facilities, the roof plays a
fundamental role in determining its thermal exchange,
especially in hot climate regions (Turnpenny et al., 2000). For
birds, the roof is the constructive element that has the greatest
significance in a shed in relation to the control of incident solar
radiation for thermal comfort (Nääs et al, 2001).
The internal temperature of the environment is greatly
influenced by the roof, as it absorbs and repels a large part of
the energy from solar radiation and transmits it to the interior
of the buildings, increasing the internal temperature through
the thermal gain. This occurs due to the large area of
interception of radiation that the roof occupies (Almeida et al,
2016). Thus, the use of suitable roofing materials in animal
production sheds promotes the reduction of the internal
thermal load of the environment when compared to situations
of exposure to direct solar radiation, improving the thermal
comfort of the occupants (Baêta and Souza, 2010).
The sheds used for poultry production must promote a
comfortable, clean, and protected environment, without
requiring expenses for energy conversion or bird heat
dissipation. This allows the animal to perform its genetic
potential to the fullest in a comfortable area, resulting in
greater production (Almeida and Passini, 2013; Lopes, 2011).
For egg production to be effective, the thermal comfort
zone for laying hens must be between 20 and 30 °C. Below 20
°C and above 30 °C, thermal stress occurs, affecting bird
performance, causing a decrease or increased food intake and
provoking changes in physical behaviours. In addition to loss
of production, such as a decrease in the number of produced
eggs, there is also the increase in eggs with poor formation and
bird death (Baêta and Souza, 2010; Vitorasso and Pereira,
2009; Costa et al., 2012; Silva et al., 2012).
Therefore, seeking to mitigate the sudden changes that the
external environment causes on the internal environment of
poultry facilities, it is necessary to develop research for the
collection of zootechnical data through electronic equipment.
Researchers such as Nardone et al. (2010), Powers et al.
(2013), Chasea et al. (2014), Soutullo et al. (2014), Megersa et
al. (2014), Silva et al. (2014), and Mollo et al. (2020) work in
this direction. Camerini et al. (2011) also point out that the use
of alternative and conventional (2015) dataloggers is
expensive and requires software.
The hypothesis of the present work is that thermoacoustic
tile present better thermal performance when compared to
ceramic tiles and fibre cement sheets.
Therefore, the objective of this work was to evaluate the
thermal performance of thermoacoustic tiles in roofs of
poultry production sheds in relation to traditional tiles
(ceramic and fibre cement), analysing the performance and the
thermal comfort indexes of the facilities with the different
coverings, verifying which type of tile provides the best
thermodynamic response for the installations.
Materials and methods
The research was conducted on the campus of the São
Paulo State University (UNESP), latitude 21° 55' 40.9" S and
longitude 50° 29' 30.8" W and 530 m altitude. The city has a
tropical climate (Cwa in the Köppen classification), with
average maximum temperature of 29.3 ºC, minimum of 19.6
ºC, and average annual rainfall of 1365 mm.
The experiment consisted of using three types of tiles that
can be applied to cover sheds for laying hens, namely:
Portuguese Ceramic Tiles (PCT), Corrugated Fibre Cement
Sheets (CFC), and Trapezoidal Thermoacoustic Tiles (TT).
Ceramic tiles initially appeared in China, then spread
around the world, and are considered as one of the oldest
materials used as roofing. These tiles need a minimum slope
of 30 to 45 degrees for rainwater runoff (Lessa 2009; Lengen,
2009). The Portuguese Ceramic Tile used in this research has
dimensions of 40 x 25 cm. Per square meter (m²), these tiles
weigh around 40 kg, so to support their weight, a strong
wooden or metallic structure is needed, also requiring a
minimum slope of 30 % (Reis, 2007).
Fibre cement sheets, which appeared after ceramic tiles,
were initially manufactured using a mixture of water, cement,
limestone, chrysotile asbestos fibre, cellulose, and lime mud.
However, with the discovery that asbestos is harmful to the
health of those who manipulate the mineral and of those who
use the material derived from it, the manufacture of these
sheets with asbestos fibre was prohibited. Since then, factories
started to manufacture them using synthetic fibres (Lessa,
2009; Petrucci, 1979). Fibre cement sheets are lighter, do not
need a structure as robust as that of ceramic tiles, and their
minimum slope is also lower than the one required by the
latter. They can be found in different thicknesses and models,
requiring different slopes for the drainage of rainwater
(Lengen, 2009; Logsdon, 2002). In this research, the
Corrugated Fibre Cement Sheet used measures 244 cm x 110
cm, with a thickness of 0.60 cm.
Thermoacoustic tiles are normally formed by two zinc tiles
or a zinc tile and an aluminium sheet, with a polystyrene
(Styrofoam) or polyurethane filling that can measure from 3 to
5 cm, which serves as a thermal and acoustic insulator
(METAL FORTE, 2020). For the use of these tiles, a structure
as robust as those needed for ceramic tiles is not necessary and,
for rainwater to run off, a slope of 5% is enough, although a
slope of 20% is recommended. The Trapezoidal
Thermoacoustic Tile used in this research is composed of two
zinc tiles measuring 0.050 cm, with a 3 cm Styrofoam filling
between them, and dimensions of 300 cm x 100 cm.
The tiles were installed in small-scale sheds in the
experimental area of the university campus. The existing roof
structure consisted of wooden purlins, and, for the installation

Mollo et al. Brazilian Journal of Biosystems Engineering (2022), 16 1049
3
of the ceramic tiles, the structure was adapted to support them
through the additional installation of rafters and slats.
The experimental units constructed were three small-scale
sheds, with concrete floor and a 10% slope for the roof, with
an East-West orientation. The east and west walls were closed
with bricks, while the north and south walls were covered with
screens that were kept closed during the experiment.
From February 21, 2020 to March 23, 2020, the thermal
variables of the internal environment were collected through
dataloggers (so that observers could control the variables) and
through hardware built with a plate of Arduino Mega as well
as DHT22 and LM35 micro sensors, which were installed
inside the sheds on a reduced scale to collect temperature and
humidity data (Figures 1 and 2).
Figure 1. Top view of the distribution of sensors and batteries for powering the hardware.
Figure 2. Front view of the distribution of sensors and batteries for powering the hardware.
BATTER
Y
BLAC
K
GLOB

Mollo et al. Brazilian Journal of Biosystems Engineering (2022), 16 1049
4
The values of the average, maximum, and minimum
temperatures, as well as the average, maximum, and minimum
humidity and black globe temperature were recorded for each
shed. Then, the calculation of comfort indexes took place
aimed at evaluating the environment in which the birds would
be housed (Table 1).
AUTHOR INDEX EQUATION
Buffington et al. (1981) Black globe temperature and
humidity index ITGU = Tgn+0.36*Tpo+41.5
Esmay (1969) Radiation heat load CTR = σ*(TMR)⁴
Bond and Kelly (1955) Average radiant temperature TRM = 100*[2.51*v1/2 ∗Tgn- Tbs)+(Tgn/100)⁴] 1/4
Thom (1959) Temperature and humidity index ITU = 0.8*Tbs+(UR/100)*(Tbs-14.4)+46.4
Missenard (1937) Effective temperature TE = T – 0.4*[( 1 UR
100 )]*(T – 10)
The thermal comfort indexes were calculated, as indicated
by the authors in Table 1, for each of the reduced models with
different coverages on 17 consecutive days, at 08:00, 12:00,
and 16:00. For the calculations, the data collected by the micro
sensors and stored in the Arduino Mega 2560 R3 modules
were used.
A total of 17 days of data collection were considered for
the calculation of comfort indexes in the period from March 6
to 22, 2020, at three times (8:00, 12:00, and 16:00).
In order to have a better understanding and to be able to
identify the conditions inside the sheds, different colours were
used to define whether the environment was under thermal
stress or thermoneutrality. Thus, it was defined that:
A. Severe stress caused by cold is represented by the colour
blue;
B. Mild stress caused by cold is represented by the colour
turquoise;
C. Thermoneutrality is represented by the colour green;
D. Mild heat stress is represented by the colour yellow;
A. Severe heat stress is represented by the colour red.
Results and discussion
Based on the definitions of thermoneutrality and stress
presented by Teixeira (1983), Armstrong (1994), Barbosa
Filho (2004), Vale (2010), UBA (2008), Alves (2006), Bento
(2010), Souza and Nery (2012), and Andrade (2017), the
classification ranges of the results of THI, BGTH, and ETI
were prepared for the study (Table 3), following the colour
scheme described previously on the methodology section.
Table 3. Comfort and thermal stress ranges according to the temperature and humidity index (THI), black globe, temperature, and
humidity index (BGTH), and effective temperature index (ETI).
Comfort and thermal discomfort ranges THI BGTH ETI
Severe stress caused by the cold – Danger < 59 <67 < 21 °C
Mild stress caused by the cold – Alert 59 - 67 68 - 70 21 – 23 °C
thermoneutrality – Comfort 67.01 - 77 70 - 77 24 – 28 °C
Mild stress caused by heat – Alert 77.01 - 89 78 - 88 29 – 31 °C
Severe stress caused by heat – Danger > 89 > 88 > 31 °C
Source: Adapted from Teixeira (1983), Armstrong (1994), Barbosa Filho (2004), Vale (2010), Uba (2008), Alves (2006), Bento
(2010), Souza and Nery (2012), and Andrade (2017).
With the results obtained for the BGTH (Table 4), it is
possible to observe that only in the period of early morning
(8:00), there is comfort for laying hens in all Sheds (Green).
However, one can notice that this does not occur in Shed 01
on the days 15/03 – 22/03, and in Shed 02 on 18/03. In Shed
03, the entire period from 8:00 is comfortable, and the other
periods in all Sheds are on alert due to mild heat stress
(Yellow).

Mollo et al. Brazilian Journal of Biosystems Engineering (2022), 16 1049
5
. Table 4. Calculation of the black globe, temperature, and humidity index (BGTH) thermal comfort index
DATE SHED 01 -
FIBRE CEMENT SHEET
SHED 02 -
THERMOACUSTIC
TILE
SHED 03 -
CERAMIC TILE
8:00 12:00 16:00 8:00 12:00 16:00 8:00 12:00 16:00
06/03 69.58 80.89 80.65 70.13 79.32 79.96 70.01 78.24 79.06
07/03 68.71 80.64 80.66 69.25 79.35 79.67 69.09 77.96 78.08
08/03 68.05 80.88 81.89 69.06 78.82 80.63 68.45 77.91 79.05
09/03 69.77 81.85 81.00 70.25 80.43 80.35 70.13 79.23 78.36
10/03 71.85 83.48 85.44 72.33 83.20 84.69 71.73 81.14 81.77
11/03 73.07 82.75 83.88 73.59 83.02 84.13 73.42 80.63 81.65
12/03 74.13 84.54 85.48 74.09 84.45 85.71 73.93 81.71 82.11
13/03 72.93 84.60 85.48 73.34 84.24 85.15 72.68 81.71 82.09
15/03 82.92 85.47 85.72 74.79 83.72 86.73 74.23 82.09 83.67
16/03 85.18 84.67 84.13 76.37 84.01 84.48 75.18 81.38 81.55
17/03 84.20 85.66 85.51 74.58 84.60 86.05 74.45 81.77 83.18
18/03 85.58 85.93 86.21 80.36 81.20 84.70 76.63 80.32 82.93
19/03 84.80 86.00 83.91 75.49 83.24 76.51 75.34 81.68 74.94
20/03 86.11 85.92 85.49 74.31 78.04 80.74 73.78 77.61 79.64
21/03 86.71 86.44 85.73 76.31 82.99 84.61 74.55 79.41 80.14
22/03 80.49 83.81 81.57 75.26 86.51 86.46 71.65 79.11 78.62
Table 5 shows TRL values. Accordingly, Sheds 02 and 03
had higher TRL than Shed 01 in almost the entire period
(Table 5). Shed 01 displayed a higher TRL value than Sheds
02 and 03 only on days 06/03, 07/03, 10/03, 12/03, 13/03,
15/03, 16/03, 17/03, 20/03 and 21/03 at 8:00 am, and on 06/03
and 19/03 at 4:00 pm. Nevertheless, the difference is minimal,
reaching a maximum of around 10%.
On 21/03 at 12:00 and at 16:00, as well as on 22/03 at 8:00,
12:00, and 16:00, Shed 02 had a TRL value much higher than
Sheds 01 and 03 (in pink in Table 5), with a difference of 20
to 30% between the TRL values of the other Sheds.
According to research that addresses the recommended
thermoneutrality zone, THI should be up to 78 (Armstrong,
1994), BGTH up to 77 (Teixeira, 1983), and TRL up to 498.3
wm² (ROSA, 1984). Following that, it was observed that, for
the three sheds, the values obtained for TRL are, most of the
time, within the range recommended as thermoneutral by Rosa
(1984) and the difference of approximately 10%, for birds, is
imperceptible and thus does not cause physiological damage.

Mollo et al. Brazilian Journal of Biosystems Engineering (2022), 16 1049
6
Table 5. Calculation of the thermal radiation load (TRL) thermal comfort index (Wm ²).
DATE SHED 01 -
FIBRE CEMENT SHEET
SHED 02 -
THERMOACUSTIC
TILE
SHED 03 -
CERAMIC TILE
8:00 12:00 16:00 8:00 12:00 16:00 8:00 12:00 16:00
06/03 425.50 439.31 468.44 418.61 447.34 466.13 421.39 488.46 485.69
07/03 416.88 439.12 466.27 412.24 463.13 477.80 412.16 499.65 495.32
08/03 401.91 431.34 470.62 410.54 441.37 473.97 403.12 483.12 492.88
09/03 415.31 437.94 469.27 416.92 462.28 470.21 420.07 498.54 488.79
10/03 423.60 449.28 495.64 425.28 480.35 495.97 412.35 500.18 512.70
11/03 429.18 446.38 467.23 428.18 467.95 478.14 432.87 482.05 502.34
12/03 446.26 460.50 474.65 428.44 488.74 489.65 433.96 490.62 493.91
13/03 439.43 470.26 497.88 436.23 495.79 512.47 426.28 521.21 520.76
15/03 440.98 470.36 472.20 437.24 481.18 498.44 431.99 496.50 516.09
16/03 443.07 453.37 477.07 447.71 491.63 491.32 435.12 486.68 490.50
17/03 443.22 443.54 493.25 439.31 493.99 509.71 443.04 496.45 512.59
18/03 456.13 455.37 474.88 527.13 456.78 491.70 456.34 470.99 501.41
19/03 437.26 473.88 410.85 439.77 482.14 405.30 442.19 494.94 397.17
20/03 435.76 442.46 460.42 429.60 450.54 469.12 433.96 458.06 483.08
21/03 438.86 451.77 463.06 462.09 520.95 566.98 435.95 465.99 482.68
22/03 413.28 433.96 454.22 533.64 658.70 684.77 439.52 491.70 485.79
The values obtained from ART are shown in Table 6. The
results obtained from the ART analysis were used to calculate
the TRL. In both cases, Sheds 02 and 03 have the highest
values of these indexes, since one uses the other.
A greater emphasis can be given to Shed 02 where, on
21/03 at 12:00 and at 16:00, as well as on 22/03 at 8:00, 12:00,
and 16:00 had an ART value greater than that of the other
Sheds (highlighted in pink in Table 6). The same case occurs
for the TRL in Table 6, however the value of the difference
between the ART of Shed 02 on the days and hours highlighted
in pink is not equal to or equals the difference shown in Table
6 of the TRL which is highlighted in pink as well.
.

Mollo et al. Brazilian Journal of Biosystems Engineering (2022), 16 1049
7
Table 6. Calculation of the average radiant temperature (ART) thermal comfort index (Wm ²)
DATE SHED 01 -
FIBRE CEMENT
SHEET
SHED 02 -
THERMOACUSTIC
TILE
SHED 03 -
CERAMIC TILE
8:00 12:00 16:00 8:00 12:00 16:00 8:00 12:00 16:00
06/03 294.33 296.69 301.49 293.13 298.03 301.11 293.61 304.66 304.22
07/03 292.82 296.65 301.14 292.01 300.63 302.98 291.99 306.39 305.72
08/03 290.16 295.33 301.84 291.71 297.03 302.37 290.38 303.82 305.34
09/03 292.55 296.45 301.62 292.83 300.49 301.77 293.38 306.22 304.71
10/03 294.00 298.35 305.77 294.29 303.38 305.82 292.03 306.47 308.37
11/03 294.96 297.87 301.29 294.79 301.41 303.03 295.59 303.65 306.80
12/03 297.85 300.20 302.48 294.83 304.70 304.84 295.78 304.99 305.50
13/03 296.71 301.78 306.12 296.16 305.79 308.33 294.46 309.64 309.57
15/03 296.97 301.79 302.09 296.34 303.52 306.20 295.44 305.90 308.88
16/03 297.32 299.03 302.86 298.09 305.15 305.10 295.98 304.38 304.97
17/03 297.34 297.40 305.40 296.69 305.52 307.92 297.31 305.89 308.35
18/03 299.49 299.36 302.52 310.52 299.59 305.16 299.52 301.90 306.66
19/03 296.34 302.36 291.76 296.76 303.67 290.77 297.17 305.66 289.30
20/03 296.08 297.22 300.19 295.03 298.56 301.60 295.78 299.80 303.82
21/03 296.61 298.77 300.62 300.46 309.60 316.22 296.12 301.09 303.75
22/03 292.19 295.78 299.17 311.47 328.30 331.51 296.72 305.16 304.24
With the results of the THI (Table 7), a situation very
different from that of the BGTH (Table 4) is observed.
Only one day at 8:00 in Shed 01 there is mild stress caused
due to heat, otherwise the general state is that of alert.
In Shed 03, only on 18/03 and 19/03 it was obtained values
relative to mild stress caused by heat, while all other days
should be on alert.
In Shed 02, on 10/03 – 13/03, and on 15/03 – 21/03, there
was mild stress caused by heat, and a state of alert for a much
longer period than Sheds 01 and 03. In addition to the fact that
only on 03/20 at 12:00 pm, and 03/19 and 03/20 at 4:00 pm,
the internal environment can be described as mild stress
caused by heat, while on the other days, the environment is
that of severe stress caused by heat, thus existing danger.
Table 7 shows results that contribute to the objectives of
the present research, as it is clear that the thermoacoustic tile
is not efficient.
The red highlight shows that the THI values indicate severe
stress for Shed 2, extrapolating the THI of up to 78, indicated
in the research by Armstrong (1994).

Mollo et al. Brazilian Journal of Biosystems Engineering (2022), 16 1049
8
Table 7. Calculation of the temperature and humidity index (THI).
DATE SHED 01 -
FIBRE CEMENT SHEET
SHED 02 -
THERMOACUSTIC TILE
SHED 03 -
CERAMIC TILE
8:00 12:00 16:00 8:00 12:00 16:00 8:00 12:00 16:00
06/03 69.74 82.09 81.00 74.13 90.11 91.50 70.40 77.87 78.74
07/03 69.03 81.59 80.81 73.38 90.25 92.66 69.64 77.10 77.26
08/03 68.73 82.15 82.05 72.71 89.22 93.08 69.12 77.74 78.38
09/03 70.63 83.16 81.28 74.67 91.54 93.60 70.78 78.55 77.78
10/03 72.80 84.99 84.88 77.03 94.97 97.96 73.10 80.74 80.65
11/03 74.18 83.83 84.06 79.00 95.31 97.77 74.49 80.78 81.00
12/03 74.81 85.51 85.75 79.88 96.06 99.42 75.05 81.93 81.88
13/03 73.59 84.81 84.76 79.44 98.11 100.39 73.84 80.13 80.35
15/03 75.69 84.66 86.20 81.31 95.86 101.02 76.09 82.07 82.78
16/03 76.80 84.67 84.10 82.08 95.36 97.62 76.92 81.88 81.48
17/03 75.18 85.59 85.44 80.11 95.90 99.58 75.68 81.88 82.34
18/03 78.25 82.78 85.39 84.21 90.77 96.61 77.79 81.50 82.95
19/03 76.14 83.70 76.40 81.39 93.78 84.39 77.17 82.07 77.82
20/03 74.78 78.89 82.30 78.81 84.46 89.36 75.29 79.21 80.25
21/03 75.61 82.83 82.41 79.51 89.92 91.12 76.40 80.78 80.85
22/03 71.06 82.42 80.97 75.80 91.24 92.40 71.75 78.98 78.31
The results for the ETI values obtained are presented in
Table 8, where the effective temperatures were coloured
according to the values of the thermal comfort index ranges
represented in Table 3, using the indications by Missenard
(1937) and Fante et al., (2017).

Mollo et al. Brazilian Journal of Biosystems Engineering (2022), 16 1049
9
Table 8. Calculation of the effective temperature index (ETI).
DATE SHED 01 - SHED 01 -
FIBRE CEMENT SHEET
SHED 02 -
THERMOACUSTIC TILE
SHED 03 -
CERAMIC TILE
8:00 12:00 16:00 8:00 12:00 16:00 8:00 12:00 16:00
06/03 18.76 30.03 30.42 19.43 27.85 28.92 18.86 26.53 27.97
07/03 18.71 31.27 32.35 19.29 28.27 30.44 18.86 27.21 29.01
08/03 18.06 30.14 32.46 18.74 27.33 30.07 17.99 26.02 28.59
09/03 19.20 31.64 32.27 19.63 28.59 30.56 18.97 27.34 29.17
10/03 20.01 32.46 33.78 20.46 29.98 32.17 19.85 27.85 29.91
11/03 20.80 31.46 32.77 21.32 30.35 32.12 20.64 27.97 29.45
12/03 21.23 31.36 33.51 21.80 30.42 32.64 21.11 27.82 29.44
13/03 21.44 34.66 36.08 22.14 32.60 34.35 21.48 30.45 32.04
15/03 21.52 31.06 34.29 22.44 30.50 33.59 21.48 28.34 30.43
16/03 21.37 30.92 32.18 22.35 29.94 31.75 21.19 27.28 29.07
17/03 20.55 31.61 33.38 21.52 30.18 32.86 20.60 27.57 29.79
18/03 22.59 27.24 31.00 23.48 27.04 30.53 22.10 25.56 28.49
19/03 20.80 28.81 21.28 21.86 28.78 23.55 21.05 26.60 21.47
20/03 19.35 22.55 26.89 20.11 23.03 26.17 19.57 22.26 24.58
21/03 19.68 26.63 27.13 20.48 26.22 27.27 19.90 24.45 25.29
22/03 18.77 28.43 29.72 19.79 27.83 29.35 18.86 25.81 27.32
As it can be seen in Table 8, according to the ETI
classification, as presented in the research by Missenard
(1937) and Fante et al., (2017), in all the Sheds, there were
times when a state of danger and alert due to cold were
observed, mainly in the period of early morning (8:00).
Considering the periods of 12:00 and 16:00, indications of
comfort and alert due to heat, and also of danger due to heat
were observed, making it clear that Shed 01 was the one that
presented the highest number of days in which there was
danger due to both cold and heat, with the fewest days of
comfort, requiring greater acclimatization effort for the birds.
On the other hand, Shed 02 was in a balance between all
classifications, not depending on any, as the difference was
minimal within the classifications pointed out by Missenard
(1937) and Fante et al., (2017). Furthermore, in Shed 03, it was
possible to observe the highest number of days with comfort,
with only 1 day of danger due to heat, which shows the best
performance for the ceramic tile.
In general, analysing all the obtained results, we can
consider that, according to the BGTH data, the ceramic tile had
an average performance of 2.35% lower than the temperatures
of the thermoacoustic tile, but both tiles had a better
performance than the fibre cement sheet. The ceramic and
thermoacoustic tiles provided comfort at 8:00 and mild heat
stress at 12:00 and 16:00, whereas the fibre cement sheet
provided comfort and mild stress caused by heat at 8:00, with
no noticeable difference in the other times.
Nonetheless, according to the data obtained by the THI, the
thermoacoustic tile presented the worst performance,
displaying periods with severe stress caused by heat
representing danger. The fibre cement and ceramic tile were
the ones that obtained the best results according to with the
THI, and even so, the ceramic tile had a better performance
than the fibre cement, having an average result of 2.20% less
in the index, which is positive for the evaluation.
The results obtained by the TRL of all the tiles are similar,
reaching a maximum of 10% of positive and negative
difference, that is, a small difference between them, which
would not affect the birds physiologically. Yet, in two days of
data collection, it can be seen that there was a significant
difference value for the thermoacoustic tiles, which displayed
a TRL much higher than the fibre cement and ceramic tiles,
reaching this difference up to 40% of the index.
The ETI results show that, among the three roofs, ceramic
tile has the best result for the ETI, with an average lower by
6.55%, followed by the thermoacoustic tile with an average
lower by 5.70%, and finally, the fibre cement sheet with an
average ETI at 7.36% more for the index.
Conclusions
According to the results obtained from all the indexes
studied in the field survey, the analysis carried out allowed us
to conclude that: the ceramic tile obtained the most adequate
performance of the black globe, temperature, and humidity
index (BGTH) and the effective temperature index (ETI). The

Mollo et al. Brazilian Journal of Biosystems Engineering (2022), 16 1049
10
thermoacoustic tile presented lower performance for the
temperature and humidity index (THI), when compared to the
others. In addition, no significant differences were observed
for the thermal radiation load (TRL) between the evaluated
tiles. Thus, we can consider that, under the conditions of the
proposed study, the ceramic tile is the one that best performs
its role to reduce thermal gain and heat exchange. The
thermoacoustic tile represents a second option, while the fibre
cement sheet presented the least favorable results to attenuate
thermal gain and heat exchange in the sheds.
Acknowledgments
The authors would like to thank the São Paulo State
University (UNESP), Tupã city Campus, for their research
support, authorizing the use of the facilities belonging to the
vivarium, comprising the models of small-scale sheds. The
authors are also grateful to the National Council for Scientific
and Technological Development (CNPq) for promoting the
DT-II productivity grant Process: 313339/2019-8.
References
Abreu , P. G., Abreu, V. M. N., Coldebella, A., Lopes, L. S., Conceição, V., Tomazelli, I. L. (2011). Análise termográfica da temperatura superficial
de telhas. Revista Brasileira de Engenharia Agrícola e Ambiental, 15(11),
1193–1198. https://doi.org/10.1590/S1415-43662011001100013
Almeida, E. A., Passini, R. Thermal comfort in reduced models of broilers’
houses, under different types of roofing materials. (2013). Rev. Engenharia Agrícola, 33(1), 19-27. https://doi.org/10.1590/S0100-
69162013000100003
Almeida, E. A., Godoi, W. M., Passini, R. Avaliação da temperatura interna
e externa de coberturas alternativas utilizadas em instalações avícolas.
Available in: http://ppstma.unievangelica.edu.br/sncma/anais/anais/2011/2011_cl05_00
3.pdf. Acces in: 15 de out. 2018.
Alves, S. P. Uso da zootecnia de precisão na avaliação do bem-estar
bioclimático de aves poedeiras em diferentes sistemas de criação. (2006).
(Tese de doutorado em agronomia). Escola Superior de Agricultura Luiz De Queiroz, Piracicaba – SP.
Andrade, R. R. Determinação da faixa de conforto térmico para galinhas poedeiras na fase inicial de criação. (2017). (Dissertação de mestrado).
Universidade Federal de Viçosa, Viçosa – MG.
Armstrong, D. (1994). Heat Stress Interaction With Shade And Cooling.
Journal of Dairy Science, 77(7), 2044-2050.
Baêta, F. C., Souza, C. F. (2010) Ambiência em Edificações Rurais: Conforto
Animal (2nd ed. Viçosa: UFV.
Barbosa Filho, J. A. D. (2004). Avaliação do bem-estar de aves poedeiras em
diferentes sistemas de produção e condições ambientais, utilizando
análise de imagens. (Dissertação de Mestrado). Escola Superior De
Agricultura Luiz De Queiroz, Piracicaba – SP.
Bento, F. M. H. (2010). Efeito do ambiente biomicroclimático sobre o desempenho de aves de postura, um estudo realizado “indoor”, Na Região
De União dos Palmares, Alagoas. (Dissertação de Mestrado em
Meteorologia) Universidade Federal De Alagoas, Maceió – AL.
Bond, T. E., Kelly, C. F. (1955). The globe thermometer in agricultural
research. Agricultural Engineering, 36(5), 251-255.
Buffington, C. S., Collazo-Arocho, A., Canton, G. H., Pitt, D., Thatcher, W.
W., Collier, R. J. (1981). Black Globe Humidity Comfort Index for Dairy Cows. St. Joseph: Transactions of the Asae, Paper, 77(4517).
Camerini, N. L., Mendes L. B., Mota, J. K. M., Nascimento, J. W. B., Furtado,
D. A. (2011). Avaliação de instrumentos agrometeorológicos alternativos para o monitoramento da ambiência em galpões avícolas. Reveng, 19(2),
125-131. https://doi.org/10.13083/reveng.v19i2.190
Castilho, V. A. R., Garcia, R. G., Lima, N. D., Nunes, K. C., Caldara, F. R.,
Nääs, I. A., Barreto, B., Jacob, F. G. (2015). Bem-estar de galinhas
poedeiras em diferentes densidades de alojamento. Revista Brasileira de Engenharia de Biossistemas, 9, 122-131.
https://doi.org/10.18011/bioeng2015v9n2p122-131
Chasea, O. A., Almeida, J. F. S., Souza, J. R. B., Costa Junior, C. T. (2014).
Sensory platform architecture for in situ monitoring the thermal comfort
in rural environments – the case study at Federal Rural University of Amazonian, Brazil. Measurement, 58, 294–300.
https://doi.org/10.1016/j.measurement.2014.08.031
Costa, E. M. S., Dourado, L. R. B., Merval, R. R. (2012). Medidas para avaliar
o conforto térmico em aves. Publicações em Medicina Veterinária e
Zootecnia, 6(31).
Coutinho, M. D. L., Santos, T. S. dos, Gomes, A. C. dos S., Silva, A. R., Costa,
M. da S., & Morais, M. D. C. de. (2014). O MICROCLIMA E O (DES)CONFORTO TÉRMICO EM AMBIENTES ABERTOS NA
CIDADE DE NATAL. Hygeia - Revista Brasileira De Geografia Médica
e Da Saúde, 10(19), 65–73. Recuperado de https://seer.ufu.br/index.php/hygeia/article/view/28195
Esmay, M. L. (1969). Principles of Animal Environment (2nd ed.). West Port: Avi.
Fante, K. P., Dubreuil, V., Sant’anna Neto, J. L. (2017). Avaliação comparativa entre metodologias de identificação de situações de conforto
térmico humano aplicado ao contexto tropical, Presidente
Prudente/Brasil. Revista Brasileira de Climatologia, 21, 588-612, 2017. http://dx.doi.org/10.5380/abclima.v21i0.53839.
Fehr, R.L., Priddy, K.T., Mcneill, S.G., Overhults, D.G. (1993). Limiting swine stress with evaporative cooling in the southeast. Transactions of
The Asae. St. Joseph, 26(4), 542-555.
Fernandes, L. C., Krüger, E. L. (2019). Temperatura radiante média obtida via
termômetro de globo: análise crítica de dados de um estudo de campo.
Revista de arquitetura IMED, 8(1), 147-163. https://doi.org/10.18256/2318-1109.2019.v8i1.3456.
Gomes, R. C. C. (2009). Predição do índice de temperatura do globo negro e umidade (ITGU) em galpões climatizados para aves de corte.
(Dissertação de Mestrado), Universidade Federal de Lavras, Lavras – MG.
Jácome, I. M. T. D. (2009). Diferentes sistemas de iluminação artificial usados no alojamento de poedeiras leves. (Tese de Doutorado).
Faculdade de Engenharia Agrícola, Universidade Estadual de Campinas,
Campinas - SP.
Kawabata, C. Y., Castro, R. C., Junior, H. V. (2005). Índices de conforto
térmico e respostas fisiológicas de bezerros da raça holandesa em bezerreiros individuais com diferentes coberturas. Revsita de Engenharia
Agrícola Jaboticabal, 25(3), 598-607. https://doi.org/10.1590/S0100-
69162005000300004
Lessa, M. L. S. (2009). Critérios de sustentabilidade para elementos
construtivos – um estudo sobre telhas “ecológicas” empregadas na construção civil. (Dissertação de Mestrado em Engenharia Ambiental
Urbana), Escola Politécnica da Universidade Federal da Bahia, Salvador
– BA.
Lengen, J. V. (2009). Manual do arquiteto descalço (5nd ed.). São Paulo:
Empório Do Livro, Reimpressão.
Logsdon, N. B. (2002). Estruturas de madeira para coberturas, sob a ótica
da NBR 7190/1997. Faculdade de Engenharia Florestal, Universidade Federal de Mato Grosso. Cuiabá – MT.
Lopes, J. C. O. (2011). Avicultura. Floriano - PI, Edufpi, UFRN.

Mollo et al. Brazilian Journal of Biosystems Engineering (2022), 16 1049
11
Marta Filho, J. (1993). Método quantitativo de avaliação de edificações para
animais, através da análise do mapeamento dos índices de conforto térmico. (Tese de Doutorado), Faculdade De Ciências Agronômicas,
Universidade Estadual Paulista, Botucatu.
Megersa, B., Markemann, A., Angassa, A., Ogutu, J.O., Piepho, H., Zaráte,
A. V. (2014). Impacts of climate change and variability on cattle
production in southern Ethiopia: perceptions and empirical evidence. Agricultural Systems, 130, 23–34.
Metal Forte. Telhas Termoacústicas. Avaiable in: Http://www.metalforte.com.br/wp-content/uploads/2018/06/telhas-
termoacustica.pdf. Acces in: 09 Nov. 2020.
Missenard. (1937). L'homme Et Le Climat. Paris.
Mollo, M. N., Matulovic, M. Santos, P. S. B. (2020). Supervisory system for monitoring, control and estimating thermal comfort for broiler and laying
hens production sheds. International Journal for Innovation Education
and Research. 8(03), 316-331. https://doi.org/10.31686/ijier.vol8.iss3.2232
Mollo Neto, M., Gabriel, C., Santos, V., & Zanetti, W. A. (2015). Avaliação de sensores eletrônicos para uso em instrumentos agrometeorológicos
alternativos em galpões avícolas. Enciclopédia Biosfera, 11(21).
Recovered from https://conhecer.org.br/ojs/index.php/biosfera/article/view/1987
Nääs, I. A., Sevegnani, K. B., Marcheto, F. G., Espelho, J. C. C., Menegassi, V., Silva, I. J. O. (2001). Avaliação térmica de telhas de composição de
celulose e betumem, pintadas de branco, em modelos de aviários com
escala reduzida. Engenharia Agrícola, 21(2), 121-126.
Nardone, A., Ronchi, B., Lacetera, N., Ranieri, M.S., Bernabucci, U. (2010).
Effects of climate changes on animal production and sustainability of livestock systems. Livestock Science, 130, 57–69.
https://doi.org/10.1016/j.livsci.2010.02.011
Oliveira, F. G., Godoi, W. M., Passini, R. (2015). Environment in poultry
production covered with thermal and aluminum roofing tiles. Revista
Engenharia Agrícola, Jaboticabal, 35(2), 206-214.
https://doi.org/10.1590/1809-4430-Eng.Agric.v35n2p206-214/2015
Osorio, R. H., Tinoco, I. F. F., Osorio, J. A. S., Mendes, L. B., Rocha, K. S. O., Guerra, L. M. G. (2016). Thermal environment in two broiler barns
during the first three weeks of age. Revista Brasileira de Engenharia
Agrícola e Ambiental, 20(3), 256–262. https://doi.org/10.1590/1807-1929/agriambi.v20n3p256-262
Petrucci, E. G. R. (1979). Materiais de Construção (4nd ed.). Porto Alegre:
Globo. 435p.
Powers, W., Liu, Z., Vaddella, V. (2013). Climate vulnerabilities of the
poultry industry. Earth Systems and Environmental Sciences, 2, 73–76.
https://doi.org/10.1016/B978-0-12-384703-4.00216-1
Reis, F. S. B. (2007). Coberturas com telhado: definições, características
gerais e visão analítica. São Paulo: Epusp, 14p. (Boletim Técnico da Escola Politécnica da USP, Departamento de Engenharia de Construção
Civil, Bt/Pcc/456).
Riquena, R. S. (2017). Modelo computacional para previsão de mortalidade
de galinhas poedeiras em função de ondas de calor e tipologia dos
aviários. (Dissertação de Mestrado em Agronegócio e Desenvolvimento). Faculdade de Ciências e Engenharia - Universidade Estadual Paulista
"Júlio De Mesquita Filho", Tupã-SP.
Rosa, Y. B.C. J. (1984). Influência de três materiais de cobertura no índice
de conforto térmico, em condições de verão para Viçosa, MG.
(Dissertação de Mestrado), Universidade Federal De Viçosa, Viçosa-MG.
Silva, R. C., Nascimento, J. W. B. do, Oliveira, D. L., Camerini, N. L.,
Furtado, D. A. (2012). Força de ruptura da casca do ovo em função das temperaturas da água e do ambiente. Revista Educação Agrícola
Superior, 27, 13-18. http://dx.doi.org/10.12722/0101-756X.v27n01a02
Silva, V. P., Werf, H. M. G. V. D., Soares, S. R., Corson, M. S. (2014).
Environmental impacts of French and Brazilian broiler chicken production scenarios: an LCA approach. Journal of Environmental
Management, 133, 222-231.
https://doi.org/10.1016/j.jenvman.2013.12.011
Silva, D. J., Queiroz, A. C. (2006). Análises de alimentos: métodos químicos
e biológicos (3nd ed.). Editora UFV, Viçosa, MG.
Soutullo, S., Enríquez, R., Jiménez, M. J., Heras M. R. (2014). Thermal
comfort evaluation in a mechanically ventilated office building located in a continental climate. Energy and Buildings, 81, 424-429.
Souza, D. M., Nery, J. T. (2012). O conforto térmico na perspectiva da climatologia geográfica. Geografia (Londrina), 21(2), 65-83.
http://dx.doi.org/10.5433/2447-1747.2012v21n2p65
Teixeira, V. H. (1983). Estudo dos índices de conforto em duas instalações de
frango de corte para as regiões de Viçosa e Visconde do Rio Branco -
MG. (Dissertação de Mestrado em Engenharia Agrícola), Universidade Federal de Viçosa, Viçosa-MG.
Thom, E. C. (1959). The Discomfort Index. Weatherwise, 12, 57-59.
Turnpenny, J. R., Wathes, C. M., Clark, J. A., Mcarthur, A. J. (2000). Thermal
balance of livestock. 2. applications of a parsimonious model. Agricultural and Forest Meteorology, 101, 29-52.
https://doi.org/10.1016/S0168-1923(99)00157-4
UBA - União Brasileira de Avicultura. (2008). Protocolo de bem-estar para
aves poedeiras. São Paulo: Ubá.
Vale, M. M., Moura, D. J., Nääs, I. A., Pereira, D. F. (2010). Characterization
of heat waves affecting mortality rates of broilers between 29 days and
market age. Brazillian Journal of Poultry Science, 12(4), 279-285. https://doi.org/10.1590/S1516-635X2010000400010
Vitorasso, G.; Pereira, D. F. (2009). Análise comparativa do ambiente de aviários de postura com diferentes sistemas de acondicionamento. Revista
Brasileira Engenharia Agrícola e Ambiental, 13, 788-794.
https://doi.org/10.1590/S1415-43662009000600018