Thermal Performance Analysis of ETFE-foil Panels ... - CORE
333
Thermal Performance Analysis of ETFE-foil Panels and Spaces Enclosed with ETFE-foil Cushion Envelope Submitted by Sabrina Afrin Doctoral Thesis Submitted for the award of Doctor of Philosophy of the University of Nottingham Department of Architecture and Built Environment University of Nottingham Copyright © by Sabrina Afrin 2016 All rights reserved
-
Upload
khangminh22 -
Category
Documents
-
view
1 -
download
0
Transcript of Thermal Performance Analysis of ETFE-foil Panels ... - CORE

Thermal Performance Analysis of ETFE-foil
Panels and Spaces Enclosed with ETFE-foil
Cushion Envelope
Submitted by
Sabrina Afrin
Doctoral Thesis
Submitted for the award of Doctor of Philosophy
of the University of Nottingham
Department of Architecture and Built Environment
University of Nottingham
Copyright © by Sabrina Afrin 2016
All rights reserved

Dedicated to my beloved Parents, my loving Husband and my
beautiful Daughter …

i
Acknowledgement
Firstly, I would like to express my sincere gratitude to my supervisor Prof. John Chilton
for his continuous and patient support throughout this research project, who also gave
me the opportunity to work in this research project.
I would like to express my sincere gratitude to my supervisor Benson Lau. I am very
much grateful for their support to complete this thesis. Without the encouragement of
my supervisors, I would have not been able to finish my thesis.
I would like to thank Nottingham High School for allowing access to monitor the atrium.
Particularly I am also grateful to Mr. Chris Scott, Estate Manager, Nottingham High
School, who assisted in the installation of monitoring equipment, and facilitated access
to the site as required; and the school technicians who were very supportive during the
equipment installation and data collection. I also thank Architen Landrell Associates,
for providing ETFE-foil samples, and Maber Architects who provided CAD drawings
for the project. I am also grateful to Mr. Richard Mitchell, Energy Management Officer,
Estate Office, University of Nottingham, for his support during data collection.
Particularly without the help of Mr. Chris Scott and Mr. Richard Mitchell, I would not be
able to collect valuable data for this research. I also like to thank all the technical staff
of the Faculty of Engineering who assisted me throughout my research work.
At the end, my heartfelt appreciation to my beloved husband Shariful Shikder. The
support he rendered during this process cannot be expressed in words. He was my
guide throughout the study and I gained a lot of valuable knowledge from him on
research. Without his enormous and continuous help and support it would be
impossible for me to finish this PhD. Also I would like to mention my wonderful
daughter Suzana. She occasionally seated by my side, draw pictures and waited for
me when I would give her time to play or watch TV. She was born the year when I
started my PhD in 2012; she and my research knowledge grew together, also within
this time I did not realise when she grew bigger; she will be five-year-old soon. My
special thanks to my beloved parents, my lovely sisters, nieces and all family members
back home, for their encouragement to become ambitious and complete this thesis.
Lastly, I would like to thank all of my friends in Loughborough and Nottingham for their
presence around me and making my life beautiful.

ii
Abstract
Ethylene-tetra-fluoro-ethylene (ETFE) is a synthetic fluoropolymer. In the form of
ETFE-foil it is applied in building envelopes in a single layer or more commonly, as
inflatable cushions composed of multiple layers. ETFE-foils are widely used as a
lightweight building envelope where high translucency, low structural weight, and
complex shape is essential. However, limited research in the field of thermal
performance of ETFE-foil panels and spaces enclosed with it instigated this study.
Therefore, this study investigated (I) the thermal behaviour of ETFE-foil materials and
the thermal performance of spaces enclosed with ETFE cushion roofs, (II) used
commercially available thermal simulation software to predict the thermal performance
of spaces enclosed with ETFE cushion and glass roofs and compared this with actual
monitored behaviour (III) identified strategies to improve the thermal performance of
spaces enclosed with ETFE cushion roofs in current and projected climate scenarios;
and finally (IV) proposed design recommendations of ETFE-foil panels/cushions as a
building fabric components.
Material properties were investigated in laboratory based experiments. Further data
were collected from two custom built outdoor test-rigs equipped with single-, two- and
three-layer ETFE-foil panels. Environmental data were collected from two case study
buildings to evaluate the thermal performance of the spaces enclosed with ETFE-foil
cushion roofs. In addition, building simulation was conducted using EDSL TAS version
9.3.3.b to further analyse the indoor thermal environment and compare with monitored
behaviour.
The study identified variable thermal-optical properties of ETFE foils caused by various
percentages of fritted area and its pigment density. The results also identified that the
thermal environment of the test-rigs was affected by the variations in the surface
temperatures of ETFE-foils and the temperature of air volume between multiple ETFE-
foils (in case of two and three layer panels) by convective and radiative heat transfer
mechanisms. The results from the case study buildings identified that during hot
summer days, indoor air temperature and temperature stratification was higher in the
atrium space enclosed with three-layer ETFE-foil cushions compared to the space
enclosed with two-layer ETFE-foil cushion covered with rain mesh. However, both of
the spaces were overheated during the summer of 2015. To develop an accurate
simulation model for ETFE cushion roofs, a novel approach of modelling was
developed. The simulation model was validated and calibrated by comparing with
measured data from test-rigs and case study buildings. A comparison of predicted

iii
results of the spaces enclosed with a multi-layer ETFE-foil cushion roof and a glass
roof showed that the extent of overheating was high when spaces were enclosed with
glass roofs. Among two-and three-layer ETFE-foil cushion and glass roofs, two-layer
ETFE-foil cushions with 75% fritting and rain mesh effectively reduced air temperature
and cooling load during the peak summer period. The findings of this study will enable
designers to select and develop design strategies for applying ETFE-foils in building
envelopes on the basis of thermal and optical requirements. The study also suggested
to change the view of current design practice that only focused on current conditions;
such as the use of ETFE-foils may require more adaptive approach to mitigate
overheating problems in projected climate.

iv
Table of Contents
Abstract .................................................................................................................... ii
List of Figures ........................................................................................................ xii
List of Tables ........................................................................................................ xix
Chapter 1 ............................................................................................................... 1-1
1 Introduction and Background ...................................................................... 1-1
1.1 Context of the research ............................................................................ 1-1
1.2 Knowledge gap and Identification of research questions .......................... 1-3
1.3 Research aim, objectives, methods .......................................................... 1-5
1.4 Thesis Outline .......................................................................................... 1-5
Chapter 2 ............................................................................................................... 1-8
2 Thermal behaviour of membrane envelopes and the spaces they enclose 2-
8
2.1 Introduction .............................................................................................. 2-8
2.1.1 ETFE-foil ........................................................................................... 2-8
2.1.2 Colouring printing and coating in ETFE-foil........................................ 2-9
2.1.3 ETFE-foil cushion configurations ....................................................... 2-9
2.2 The thermal behaviour of fabric membranes .......................................... 2-14
2.3 Heat transfer in membrane envelopes .................................................... 2-15
2.3.1 Conduction ...................................................................................... 2-16
2.3.2 Convection ...................................................................................... 2-16
2.3.3 Radiation ......................................................................................... 2-17
2.4 The observed Thermal behaviour of space enclosed with membrane
envelope ........................................................................................................... 2-17
2.5 Impact of thermal behaviour of membrane envelope on thermal comfort 2-21
2.6 Indoor environment quality indicators ..................................................... 2-22
2.6.1 Thermal environment ...................................................................... 2-22
v
2.6.2 Ventilation and air quality ................................................................ 2-23
2.6.3 Lighting ........................................................................................... 2-23
2.7 Thermal comfort environmental parameters ........................................... 2-24
2.7.1 Temperature .................................................................................... 2-24
2.7.2 Air movement .................................................................................. 2-25
2.7.3 Relative humidity ............................................................................. 2-25
2.8 Thermal environment assessment methods ........................................... 2-26
2.8.1 Fanger’s thermal comfort model ...................................................... 2-26
2.8.2 PMV-PPD model by ASHRAE ......................................................... 2-27
2.8.3 The concept of adaptive thermal comfort models ............................ 2-28
2.9 Comfort models ...................................................................................... 2-28
2.9.1 de Dear and Brager (1998) .............................................................. 2-28
2.9.2 ASHRAE Standard 55 ..................................................................... 2-29
2.9.3 BS 15251 ........................................................................................ 2-29
2.10 Summary ................................................................................................ 2-30
Chapter 3 ............................................................................................................. 2-32
3 Methodology ................................................................................................ 3-32
3.1 Introduction ............................................................................................ 3-32
3.2 Background ............................................................................................ 3-32
3.3 The Pilot Studies .................................................................................... 3-33
3.3.1 The purpose of the pilot studies ....................................................... 3-33
3.3.2 Method adopted for the pilot study .................................................. 3-33
3.3.3 Equipment used for the pilot study .................................................. 3-34
3.4 The results ............................................................................................. 3-36
3.5 Analysis of information acquired by the pilot study ................................. 3-37
3.6 Proposed methodology........................................................................... 3-38
3.6.1 Thermal performance evaluation of ETFE-foils ................................ 3-38
3.6.2 Thermal performance evaluation of ETFE-foil cushions and the spaces
enclosed with an ETFE foil cushion envelope ................................................ 3-39
vi
3.7 Method to analyse thermal performance of spaces enclosed with ETFE-foil
cushion roof ...................................................................................................... 3-43
3.7.1 Criteria for selection of monitored buildings ..................................... 3-43
3.8 Case Study A: Nottingham Boys High School, Nottingham, UK .............. 3-44
3.8.1 Building information ......................................................................... 3-44
3.8.2 Building usage pattern ..................................................................... 3-45
3.8.3 Services .......................................................................................... 3-45
3.8.4 Installed monitoring equipment ........................................................ 3-45
3.8.5 Weather data ................................................................................... 3-53
3.8.6 Data collection and synthesis .......................................................... 3-54
3.9 Case Study B: Engineering and Science Learning Centre (ESLC),
Nottingham, UK ................................................................................................ 3-55
3.9.1 Building information ......................................................................... 3-55
3.9.2 Building usage pattern ..................................................................... 3-56
3.9.3 Services .......................................................................................... 3-56
3.9.4 Building regulation compliance ........................................................ 3-56
3.9.5 Post occupancy evaluation .............................................................. 3-57
3.9.6 Installed monitoring equipment ........................................................ 3-57
3.10 Thermal comfort assessment method ..................................................... 3-61
3.10.1 CIBSE Temperature benchmark ...................................................... 3-62
3.10.2 Building Bulletin 101 ........................................................................ 3-62
3.10.3 Adaptive comfort criteria to assess overheating .............................. 3-63
3.11 Building Simulation ................................................................................. 3-66
3.11.1 Dynamic thermal simulation ............................................................ 3-66
3.11.2 Simulation ....................................................................................... 3-66
3.12 Summary ............................................................................................... 3-67
Chapter 4 ............................................................................................................. 3-69
4 Measuring thermal-optical properties of ETFE foil ................................... 4-69
4.1 Introduction ............................................................................................ 4-69
vii
4.2 The Classification of Thermal Optical Properties .................................... 4-69
4.3 Methods used in previous studies .......................................................... 4-70
4.4 Justification ............................................................................................ 4-72
4.5 The thermal optical properties of ETFE foil ............................................. 4-74
4.5.1 The selection of foil samples ........................................................... 4-74
4.5.2 Apparatus used to measure the Solar Optical Properties of the ETFE foil
samples 4-78
4.5.3 Methods .......................................................................................... 4-80
4.5.4 The Results ..................................................................................... 4-81
4.6 Thermal transmittance ............................................................................ 4-88
4.7 The thermal transmittance of ETFE foil/ cushion .................................... 4-89
4.7.1 Method ............................................................................................ 4-90
4.7.2 The Results ..................................................................................... 4-92
4.8 Summary ................................................................................................ 4-94
4.9 Limitation ................................................................................................ 4-96
Chapter 5 ............................................................................................................. 4-98
5 Thermal performance analysis of ETFE-foil panels .................................. 5-98
5.1 Introduction and Background .................................................................. 5-98
5.2 Objectives ............................................................................................ 5-101
5.3 Methodology ......................................................................................... 5-101
5.3.1 Description of the test rig ............................................................... 5-105
5.3.2 ETFE foil selection ........................................................................ 5-111
5.3.3 Weather data ................................................................................. 5-112
5.3.4 Timescale of the monitoring .......................................................... 5-114
5.4 Measurement of solar transmittance of ETFE-foil panels ...................... 5-116
5.5 Thermal performance analysis of ETFE-foil panels .............................. 5-122
5.5.1 Relationship between the surface temperature of ETFE-foil layers and
test-rig internal condition ............................................................................. 5-141
viii
5.5.2 Impact of rain mesh on internal thermal condition of the experimental
boxes 5-145
5.6 Summary .............................................................................................. 5-149
Chapter 6 ........................................................................................................... 5-151
6 Thermal performance of existing space enclosed with an ETFE- foil cushion
envelope ............................................................................................................ 6-151
6.1 Introduction .......................................................................................... 6-151
6.1.1 Outdoor weather ........................................................................... 6-152
6.2 Case Study A: Nottingham High School ............................................... 6-155
6.2.1 Analysis of monitored data and discussion .................................... 6-156
6.2.2 Indoor air temperature distribution ................................................. 6-160
6.2.3 Overview of typical thermal behaviour of the ETFE-foil cushion roof ... 6-
168
6.2.4 Effect of ETFE-foil surface temperature on thermal comfort .......... 6-177
6.2.5 Impact of environmental variable on indoor thermal environment .. 6-178
6.2.6 Impact of atrium thermal environment to the adjacent spaces ....... 6-179
6.3 Case Study B: Engineering and Science Learning Centre (ESLC) ....... 6-182
6.3.1 Analysis of monitored data and discussion .................................... 6-182
6.3.2 Indoor air temperature distribution ................................................. 6-185
6.3.3 Comparison of the thermal environment of the Nottingham High School
and the Engineering and Science Learning Centre (ESLC) atrium .............. 6-192
6.4 Thermal performance of atria enclosed with ETFE-foil cushion roof ..... 6-193
6.4.1 CIBSE Temperature benchmark .................................................... 6-195
6.4.2 Adaptive comfort ........................................................................... 6-196
6.4.3 Building Bulletin 101 ...................................................................... 6-203
6.5 Comparison of the thermal behaviour of space enclosed with ETFE-foil
cushion roof and fabric membrane roof ........................................................... 6-203
6.6 Summary .............................................................................................. 6-207
6.6.1 Summary of thermal behaviour of space enclosed with ETFE-foil cushion
roof 6-207

ix
6.6.2 Summary of thermal performance of space enclosed with ETFE-foil
cushion roof ................................................................................................. 6-208
6.6.3 Challenges .................................................................................... 6-209
6.6.4 Limitations ..................................................................................... 6-210
Chapter 7 ........................................................................................................... 6-211
7 Modelling thermal performance of ETFE foils and spaces enclosed with
ETFE foil cushion roofs ................................................................................... 7-211
7.1 Introduction .......................................................................................... 7-211
7.2 Calibration of the simulation model ....................................................... 7-212
7.3 Weather file .......................................................................................... 7-213
7.4 Properties of ETFE foil panels and glazing panels used in simulation .. 7-214
7.5 Simulation of test rig ............................................................................. 7-214
7.5.1 Calibration ..................................................................................... 7-215
7.5.2 Simulation results .......................................................................... 7-219
7.6 Simulation model of ETFE-foil cushion roofs in TAS ............................. 7-222
7.6.1 Approach adopted to model the ETFE cushion roof ...................... 7-224
7.6.2 Simulation model of Nottingham High School building and atrium ETFE-
foil cushion roof ........................................................................................... 7-226
7.6.3 Simulation model of Engineering and Science Learning Centre and
atrium ETFE-foil cushion roof ...................................................................... 7-227
7.7 Zoning .................................................................................................. 7-228
7.7.1 Zone specification of Nottingham High School .............................. 7-228
7.7.2 Zone specification of Engineering and Science Learning Centre ... 7-231
7.8 Specifications of building fabrics in simulation models .......................... 7-232
7.8.1 Nottingham High School ................................................................ 7-232
7.8.2 Engineering and Science Learning Centre (ESLC) ........................ 7-233
7.9 Simulation parameters.......................................................................... 7-234
7.9.1 Nottingham High School ................................................................ 7-234
7.9.2 Engineering and Science Learning Centre (ESLC) ........................ 7-238
7.10 Model Calibration ................................................................................. 7-241
x
7.10.1 Calibration results for simulation mode of Nottingham High School7-242
7.10.2 Calibration results for ESLC simulation model ............................... 7-244
7.11 Strategies to improve thermal performance of space ............................ 7-247
7.11.1 Strategies applied for the Nottingham High School and ESLC simulation
model 7-247
7.11.2 Results of implication of simulation criteria .................................... 7-251
7.12 Comparison with glass roof .................................................................. 7-257
7.12.1 Comparison of thermal performance of ETFE foil cushion and glass ... 7-
257
7.12.2 Comparison of energy consumption of ETFE foil cushions,
polycarbonate and glass .............................................................................. 7-258
7.13 Future weather data ............................................................................. 7-260
7.13.1 The result ...................................................................................... 7-260
7.14 Summary .............................................................................................. 7-261
Chapter 8 ........................................................................................................... 7-264
8 Discussion and Conclusions .................................................................... 8-264
8.1 Introduction .......................................................................................... 8-264
8.2 Summary of findings ............................................................................. 8-264
8.2.1 Investigation of thermal-optical properties ..................................... 8-264
8.2.2 Summary of findings from test-rig experiment ............................... 8-269
8.2.3 Summary of findings from on-site monitoring of actual buildings ... 8-270
8.2.4 Summary of findings from modelling and simulation ...................... 8-274
8.3 Evaluation of methodology .................................................................. 8-276
8.4 Recommendations ............................................................................... 8-278
8.5 Conclusions and fulfillment of aim and objectives ................................. 8-281
8.5.1 Objective one ................................................................................ 8-281
8.5.2 Objective two ................................................................................. 8-282
8.5.3 Objective three .............................................................................. 8-282
8.5.4 Objective four ................................................................................ 8-283

xi
8.5.5 Objective five ................................................................................. 8-283
8.5.6 Objective six .................................................................................. 8-284
8.5.7 Objective seven ............................................................................. 8-285
8.6 Novelty and contribution to the knowledge ........................................... 8-285
8.7 Limitations of the study ......................................................................... 8-287
8.8 Future research .................................................................................... 8-287
References ........................................................................................................... 289
APPENDIX A: List of Publications ...................................................................... 297
APPENDIX B: Figures and Tables ...................................................................... 299
xii
List of Figures
Figure 2-1: Construction types of ETFE-foil cushions (Schiemann and Moritz, 2010)2-11
Figure 2-2: Movable middle layer in ETFE-foil cushion ......................................... 2-11
Figure 2-3: Moveable central layer with intelligent printing, (a) open, (b) closed (Knippers et al., 2011) .......................................................................................... 2-11
Figure 2-4: (a) Pattern open, (b) Pattern superimposed (LeCuyer, 2008) ............. 2-12
Figure 2-5: Festo Technology centre atrium (LeCuyer, 2008) ............................... 2-12
Figure 2-6: Kingsdale School atrium (a) exterior view (top), interior view (bottom); (b) printed top layers (top), view of cushions (bottom) (LeCuyer, 2008) ..................... 2-13
Figure 2-7: Kingsdale School atrium solar gain controlled by (a) opening ETFE-foil cushion at clerestory level, (c) closing top two layers of cushion (LeCuyer, 2008) 2-13
Figure 2-8: Building physics aspects for polymer foil enclosure [reproduced from Knippers et al. (2011)] .......................................................................................... 2-22
Figure 3-1: Location of the data logger and the solar radiation sensor (top), location of the cushion where internal surface temperature was measured using thermal camera (bottom)- Pilot study [Plans (nts): Maber Architects] ............................................. 3-35
Figure 3-2: Location of sensors in the School atrium [Section (nts): Maber Architects] ............................................................................................................................. 3-36
Figure 3-3: Data obtained from Pilot study during 22nd August 2013 (location- Nottingham High School atrium) ........................................................................... 3-37
Figure 3-4: ETFE foil surface temperature measured in the middle (left) and at the edge (right) of the cushion at 14:11pm, 22nd August 2013 using thermal imaging (for location of cushion- see Figure 3-1) ................................................................................... 3-37
Figure 3-5: Flow diagram of methodologies and associated objectives................. 3-41
Figure 3-6: Experimental and environmental data analysis, and modelling/ simulation process ................................................................................................................. 3-42
Figure 3-7:(a) Location of High school [Source: Google map], (b) roof of atrium [photo: Sabrina Afrin], (c) atrium [photo: Sabrina Afrin] ..................................................... 3-45
Figure 3-8: Location of the data logger (a,b,c) and temperature sensors in (a) Ground floor, (b) First floor, (c) Second floor, (d) Level 4, Plan (nts)- drawing courtesy of Maber Architects, Photo -Sabrina Afrin ............................................................................ 3-49
Figure 3-9: (a) Air temperature and mean radiant temperature sensors, (b) Thermometer (PCE-WB 20SD)............................................................................. 3-50
Figure 3-10: Plan (nts) showing ETFE-foil cushion roof and location of the monitored cushion, outlined in orange, surface temperature (both external and internal sensors

xiii
location pointed in red (Drawing courtesy of Maber Architects, Nottingham), Photo -Sabrina Afrin......................................................................................................... 3-51
Figure 3-11: Location of -(a) internal surface temperature sensors attached to cushion 1 & 2, solar radiation sensors placed on the internal roof, (b) external surface temperature sensors (cushion 1), solar radiation sensors adjacent to ETFE-foil cushion roof. Plan (nts)- drawing courtesy of Maber Architects, Photo -Sabrina Afrin ........ 3-52
Figure 3-12: Weather station location on Nottingham High School roof ................ 3-53
Figure 3-13: Data collection and synthesis ........................................................... 3-54
Figure 3-14: (a) Engineering and Science Learning Centre, University of Nottingham, (b) The atrium, (c) ETFE-foil cushion roof of ELSC [Photo- Sabrina Afrin] ............ 3-55
Figure 3-15: (a) Installation of data logger and sensors on the lift roof, (b) location of data logger ........................................................................................................... 3-58
Figure 3-16: Air temperature and mean radiant temperature sensors at different occupied levels of the atrium (Location a) ............................................................. 3-59
Figure 3-17: Air temperature sensors at different levels of the atrium (Location b) 3-60
Figure 3-18: Location of the external and internal solar radiation sensors with respect to ETFE-foil cushion roof ...................................................................................... 3-61
Figure 4-1: Electromagnetic wave spectrum [for radiation travelling through vacuum, refractive index ‘n=1’] (Incropera et al., 2013) ....................................................... 4-70
Figure 4-2: Angular transmittance of 100 µm ETFE sheet at various detector and sample angles (Robinson-Gayle, 2003) ................................................................ 4-71
Figure 4-3: Measurement of thermal optical properties using spectrometers- (a) IFS 66v/s, (b) Biochrom Libra S22 .............................................................................. 4-79
Figure 4-4: Spectral transmittance of ETFE foil and Glass measured using spectrometers ....................................................................................................... 4-82
Figure 4-5: Solar Transmittance and Light Transmittance of transparent single layer ETFE foils of different thickness (ETFE-foil types are listed in Table 4-1) ............. 4-83
Figure 4-6: Solar Transmittance of single layer fritted ETFE foil panel .................. 4-84
Figure 4-7: Light Transmittance of single layer fritted ETFE foil panel .................. 4-85
Figure 4-8: Solar Transmittance of two-layer ETFE foil panel ............................... 4-86
Figure 4-9: Light Transmittance of two-layer ETFE foil panel ................................ 4-86
Figure 4-10: Solar Transmittance of three-layer ETFE foil panel .......................... 4-87
Figure 4-11: Light Transmittance of three-layer ETFE foil panel ........................... 4-87
Figure 4-12: Comparison of measured thermal optical properties and the same values obtained from DETR (2003) for the Type 1 (100μm), Type 2 (150μm) and Type 3 (200μm) ETFE foil ................................................................................................ 4-88

xiv
Figure 4-13: Variation in U-value in a single cushion ............................................ 4-92
Figure 4-14: Variation of thermal transmittance (U-value) in a single cushion with variation of air gap ................................................................................................ 4-93
Figure 4-15: Variation of U-value of Two layer ETFE foil cushion with variation in air gap and emissivity of internal surface ................................................................... 4-93
Figure 5-1: Temperature gradient recorded on ETFE-foil cushion roof and rain mesh using thermal image device. ................................................................................. 5-99
Figure 5-2: Diagrammatic sectional drawings and position of pyranometer in test-rigs during phase 1 .................................................................................................... 5-106
Figure 5-3: Diagrammatic sectional drawings and position of pyranometer in test-rigs during phase 2 .................................................................................................... 5-107
Figure 5-4: (a) Pyranometer measuring incident total solar radiation, (b) DT85 Datalogger attached with temperature and radiation sensors and located inside equipment box .................................................................................................... 5-109
Figure 5-5: (a) Temperature sensors measuring mean radiant temperature and, air temperature, and solar radiation sensor measuring transmitted solar radiation, located just below ETFE-foil panel (b) Temperature sensors measuring internal surface temperature ........................................................................................................ 5-109
Figure 5-6: Temperature sensors measuring external surface temperature and mesh surface temperature ........................................................................................... 5-109
Figure 5-7: Diagrammatic section of test-rigs (a) with single layer ETFE-foil panel, (b) with two-layer ETFE-foil panel and, (c) with three- layer ETFE panel during the Second phase experiment ............................................................................................... 5-111
Figure 5-8: (a) 200 µm transparent with 75% fritting, (b) 200 µm transparent with 25%
fritting ................................................................................................................. 5-112
Figure 5-9: (a) Temperature sensor measuring external ambient temperature and humidity, (b) steel frame around the sensor, (c) pyranometer measuring total horizontal solar radiation ..................................................................................................... 5-113
Figure 5-10: Phase 1 test-rig experiment ............................................................ 5-117
Figure 5-11: Incident and Transmitted Solar Radiation comparison (Single layer panel with 75% fritted ETFE-foil) .................................................................................. 5-119
Figure 5-12: Incident and Transmitted Solar Radiation comparison (Two-layer panel with 75% fritted top ETFE-foil) ............................................................................ 5-119
Figure 5-13: Incident and Transmitted Solar Radiation comparison (Thee-layer panel with 75% fritted top ETFE-foil) ............................................................................ 5-120
Figure 5-14: Incident and Transmitted Solar Radiation comparison (Single layer panel with 25% fritted top ETFE-foil) ............................................................................ 5-120

xv
Figure 5-15: Incident and Transmitted Solar Radiation comparison (Two-layer panel with 25% fritted top ETFE-foil) ............................................................................ 5-121
Figure 5-16: Incident and Transmitted Solar Radiation comparison (Three-layer panel with 25% fritted top ETFE-foil) ............................................................................ 5-121
Figure 5-17: Second phase test-rig investigation (without mesh) ........................ 5-122
Figure 5-18: Second phase test-rig investigation (with and without mesh) .......... 5-123
Figure 5-19: Comparison of Test-rig 1 and Test-rig 2 air temperature, air volume air temperature and surface temperature recorded during 9th Sep 15 ...................... 5-124
Figure 5-20: Comparison of Test-rig 1 and Test-rig 2 air temperature, air volume air temperature and surface temperature recorded during 19th Sep 15 .................... 5-124
Figure 5-21: Comparison of Test-rig 1 and Test-rig 2 air temperature, air volume air temperature and surface temperature recorded during 26th Sep 15 .................... 5-125
Figure 5-22: Relative condition of experimental Test-rig 1 and Test-rig 2 ........... 5-126
Figure 5-23: Relative internal condition of Test-rig 1 and Test-rig 2 .................... 5-127
Figure 5-24: Relative condition of Test-rig 1 and Test-rig 2 ................................. 5-128
Figure 5-25: Test-rig 1 (two-layer 75% fritted top layer) and Test-rig 2 (three-layer 25% fritted top layer) internal air temperatures, air-volume air temperatures, relative to outdoor ambient temperatures ............................................................................ 5-134
Figure 5-26: Test-rig 1 (two-layer 75% fritted top layer) and Test-rig 2 (three-layer 25% fritted top layer) ETFE-foil panel surface temperatures relative to outdoor ambient temperature ........................................................................................................ 5-135
Figure 5-27: Test-rig 1 (three-layer 75% fritted top layer) and Test-rig 2 (three-layer 25% fritted top layer) internal air temperatures, air-volume air temperatures, relative to outdoor ambient temperatures ............................................................................ 5-136
Figure 5-28: Test-rig 1 (three-layer 75% fritted top layer) and Test-rig 2 (three-layer 25% fritted top layer) ETFE-foil surface temperatures relative to outdoor ambient temperatures ...................................................................................................... 5-137
Figure 5-29: Test-rig 1 (single layer 75% fritted) and Test-rig 2 (single layer 25% fritted) internal air temperatures, air-volume air temperatures, and ETFE-foil surface temperatures relative to outdoor ambient temperatures ...................................... 5-138
Figure 5-30: Convective heat transfer between ETFE surface and air temperature adjacent to it in Test-rig 1 and Test-rig 2 ............................................................. 5-144
Figure 5-31: Radiative heat transfer through ETFE-foil surface in Test-rig 1 and Test-rig 2 .................................................................................................................... 5-144
Figure 5-32: Relative condition of surface temperature, air volume air temperature and air temperature of Test-rig 1 and Test-rig 2 ........................................................ 5-147
Figure 5-33: Comparison of Test-rig 1 and Test-rig 2 condition 13th Sep 15 ...... 5-148

xvi
Figure 6-1: OAT, daily mean temperature and ExIR recorded during summer 2014 . 6-153
Figure 6-2: OAT, daily mean temperature, and ExIR recorded during summer 2015 6-154
Figure 6-3: Outdoor air temperature recorded adjacent to Nottingham High School and ESLC .................................................................................................................. 6-155
Figure 6-4: Indoor air temperatures and solar radiation recorded in Nottingham High School atrium between 29th June and 3rd July 2015 – clear sky conditions ......... 6-158
Figure 6-5: Indoor air temperatures and solar radiation recorded in Nottingham High School atrium during 14th September 2015 – overcast sky conditions ................ 6-159
Figure 6-6: Temperature differences between air temperatures of different atrium levels of Nottingham High School and outdoor air temperatures between 29th June and 3rd July 2015 ....................................................................................................... 6-162
Figure 6-7: Temperature differences between air temperatures of different atrium levels of Nottingham High School and outdoor air temperatures during 14th September 2015 ................................................................................................................... 6-163
Figure 6-8: Temperature difference between Nottingham High School atrium level 1, 2, 3 and 4, between 29th June and 3rd July 2015 ................................................. 6-166
Figure 6-9: Temperature difference between Nottingham High School atrium level 1, 2, 3 and 4 during 14th September 15................................................................... 6-167
Figure 6-10: Internal and external cushion surface temperatures, occupied level 3 air temperatures, level 4 air and mean-radiant temperatures, incident and transmitted solar radiation, and outdoor air temperature recorded between 29th June and 3rd July 2015 ................................................................................................................... 6-169
Figure 6-11: Temperature difference between external surface temperature (ST Loc1)– internal surface temperature (ST Loc 4) [middle of the cushion]; internal surface temperature [ST Loc 4 (middle of the cushion)]- internal surface temperature [ST Loc 5 (edge of the cushion)]; external surface temperature (ST Loc 2) – internal surface temperature [ST Loc 5 (edge of the cushion)] ..................................................... 6-171
Figure 6-12: Temperature difference between external surface temperature (ST Loc 1) -outdoor air temperature; internal surface (ST Loc 4)- outdoor air temperature, internal surface temperature (ST Loc 4)- level 4 (adjacent to ETFE-foil cushion air temperature); internal surface temperature (ST Loc 4)- level 3 (second floor) between 29th June and 3rd July ....................................................................................... 6-174
Figure 6-13: Temperature difference between external surface temperature (ST Loc 1)-outdoor air temperature; internal surface (ST Loc 4)- outdoor air temperature, internal surface temperature (ST Loc 4)- level 4 (adjacent to ETFE-foil cushion air temperature); internal surface temperature (ST Loc 4)- level 3 (second floor) during 14th September 2015 .......................................................................................... 6-175
Figure 6-14: Relationship between internal surface temperature (STLoc4_NH), air temperature [Tsi 4(a)_NH] and mean radiant temperature [MRTsi 4(a)_NH] ...... 6-177

xvii
Figure 6-15: Location of temperature sensors in level 3 (second floor) [Plan (nts): drawing courtesy Maber architect] ...................................................................... 6-180
Figure 6-16: Air temperatures of different vertical and horizontal positions in the atrium and space adjacent to atrium during 29th August and 30th August....................... 6-181
Figure 6-17: Impact of atrium level 3 (Tsi (a)_NH) air temperature on internal space adjacent to it ....................................................................................................... 6-181
Figure 6-18: Indoor air temperatures and solar radiation recorded in the ESLC atrium between 29th June and 3rd July 2015 – clear sky conditions ................................ 6-183
Figure 6-19: Indoor air temperatures and solar radiation recorded in the ESLC atrium between 14th September 15 – overcast sky ........................................................ 6-184
Figure 6-20: Temperature difference between ESLC atrium level 1, 2, 3 and 4, between 29th June and 3rd July 2015 ................................................................................. 6-186
Figure 6-21: Temperature difference between ESLC atrium level 1, 2, 3 and 4, during 14th September 2015 .......................................................................................... 6-187
Figure 6-22: Temperature differences between air temperatures of atrium levels of ESLC and outdoor air temperatures between 29th June and 3rd July 2015 ....... 6-188
Figure 6-23: Temperature differences between air temperatures of atrium levels of ESLC and outdoor air temperatures during 14th September 2015 ...................... 6-189
Figure 6-24: Internal surface temperatures variations of ETFE-foil cushion roof of Nottingham High School (fixed sensor) and ESLC (thermal imaging) atria (7th August 2014) .................................................................................................................. 6-191
Figure 6-25: Temperature difference between occupied level 1, 2 and 3 of ESLC and Nottingham High School atrium between 29th June and 3rd July 2015................. 6-192
Figure 6-26: Percentage of occupied hours when Nottingham High School and ESLC atrium level 1, 2 and 3 were above 25°C, 26°C, 28°C, 30°C and 32°C ................ 6-193
Figure 6-27: Air temperature of level 3 (second floor) of Nottingham High School atrium, CIBSE temperature benchmark, maximum and minimum acceptable temperature range for category II building, BB101 Criteria 1 & 3 temperature benchmark ......................................................................................................... 6-198
Figure 6-28: Air temperature of level 3 (second floor) of ESLC atrium, CIBSE temperature benchmark, maximum and minimum acceptable temperature range for category II building ............................................................................................. 6-199
Figure 6-29: Air temperature of level 2 (first floor) of Nottingham High School atrium, CIBSE temperature benchmark, maximum and minimum acceptable temperature range for category II building .............................................................................. 6-200
Figure 6-30: Air temperature of occupied level 2 (first floor) of ESLC atrium, CIBSE temperature benchmark, maximum and minimum acceptable temperature range for category II building ............................................................................................. 6-201

xviii
Figure 6-31: Atrium level 3 without (before) and wih (after) air conditioning system .. 6-209
Figure 7-1: Results obtained from model calibration of single layer ETFE panel roof with 75% fritted ETFE foil panel .......................................................................... 7-216
Figure 7-2: Linear relationship between predicted (model 5) and measured data 7-217
Figure 7-3: Temperature differences between simulation model enclosed with glass roof and two-layer ETFE foil panel with 75% fritted top layer .............................. 7-220
Figure 7-4: Temperature differences between simulation model enclosed with glass roof and three-layer ETFE foil panel with 75% fritted top layer ........................... 7-221
Figure 7-5: ETFE cushion roof structure (two-way curve) of Nottingham High School (top), Engineering and Science Learning Centre (Bottom) .................................. 7-223
Figure 7-6: Representation of ETFE cushion roof in studied models (i) Roof model 1, (ii) Roof model 2, (iii) Roof model 3, (iv) Roof model 4 ........................................ 7-225
Figure 7-7: Simulation model of ETFE-foil cushion roof of Nottingham High School atrium ................................................................................................................. 7-227
Figure 7-8: Simulation model of ETFE foil cushion roof of Engineering and Science Learning Centre atrium ....................................................................................... 7-228
Figure 7-9: Zoning of (a) Ground floor, (b) First floor, (c) Second floor of simulation model (Nottingham High School) ........................................................................ 7-230
Figure 7-10: Zoning of (a) Ground floor, (b) First floor, (c) second floor of Engineering and Science Learning Centre ............................................................................. 7-232
Figure 7-11: Base Case 1 air temperature relative to Base-Case 0 .................... 7-242
Figure 7-12: Simulated air temperatures of the second floor of the atrium with various window opening percentage and comparison with measured data ..................... 7-243
Figure 7-13: Base model 1 and Base model 2 air temperature relative to measured data .................................................................................................................... 7-244
Figure 7-14: Base model 1 air temperature relative to Base model 0 .................. 7-245
Figure 7-15: Simulated air temperatures of the second floor of the atrium with various window opening percentage and comparison with measured data ..................... 7-245
Figure 7-16: Base model 1 and Base model 2 air temperature relative to measured data .................................................................................................................... 7-246
Figure 7-17: Temperature differences between case 24, 25, 26 and Predicted model air temperatures during occupied hours (Nottingham High School) .................... 7-252
Figure 7-18: Air temperatures of Predicted, Case 24, Case 25, Case 26 model; maximum, minimum and comfort temperature (Nottingham High School) .......... 7-252
Figure 7-19: Temperature differences between case 24, 25, and 26 and predicted air temperatures during occupied hours (ESLC) ...................................................... 7-254

xix
Figure 7-20: Air temperatures of Predicted, Case 24, Case 25, Case 26 model maximum, minimum and comfort temperature (ESLC) ....................................... 7-254
Figure 7-21: Cooling load in Predicted model of Nottingham High School, roofed with two layer ETFE cushion and Glass type 1, 2, 3 .................................................. 7-259
Figure 7-22: Cooling load in Predicted model of ESLC, roofed with three layer ETFE cushion and Glass type 1, 2, 3 ........................................................................... 7-260
Figure 8-2: Design and evaluation stages for building performance analysis ...... 8-280
List of Tables
Table 2-1: Summary of results obtained from previous studies on thermal behaviour of space enclosed with membrane envelope ............................................................ 2-19
Table 2.2: Surface temperatures necessary to avoid condensation assuming internal air temperature of 20 °C and different RH (CIBSE, 2006) ..................................... 2-26
Table 2-3: ASHRAE thermal sensation scale (ASHRAE 2013) ............................. 2-27
Table 3-1: Sensors identification and location -Pilot Study .................................... 3-34
Table 3-2: Research objectives and associated methodologies ............................ 3-40
Table 3-3: Summary of salient features of monitored ETFE-foil cushion enclosures . 3-44
Table 3-4: Location of air temperature sensors ..................................................... 3-46
Table 3-5: Location of surface temperature sensors ............................................. 3-47
Table 3-6: U-value of the building fabric (Estate, University of Nottingham) .......... 3-57
Table 3-7: Location of temperature sensors ......................................................... 3-58
Table 3-8: Suggested applicability of the categories and their associated acceptable temperature range for free running buildings (Standards, 2008) ........................... 3-65
Table 4-1: List of ETFE foil samples used to measure solar transmittance and Light transmittance ........................................................................................................ 4-75
Table 4-2: List of combination of Two layer ETFE foils ......................................... 4-76
Table 4-3: List of combination of Three layer ETFE foils ....................................... 4-77
Table 4-4: Direct solar and light transmittance of ETFE foil and glass .................. 4-82
Table 4-5: Total solar energy transmittance (g-value) of single layer ETFE foil ..... 4-83
Table 4-6: U-value of ETFE foil cushion ............................................................... 4-89
Table 4-7: Gas conductance in variable air gap .................................................... 4-92
Table 5-1: Description of measurement sensors ................................................. 5-108
xx
Table 5-2: List of parameters measured on the test-rigs (First phase ) ............... 5-108
Table 5-3: List of parameters measured on the test-rigs (Second phase) ........... 5-108
Table 5-4: Description of measurement sensors ................................................. 5-113
Table 5-5: Measured environmental parameters and identifications ................... 5-113
Table 5-6: Different combinations of ETFE-foil in Test-rig 1 (First phase) ........... 5-115
Table 5-7: Different combination of ETFE-foil in Test-rig 1 and Test-rig 2 (Phase 2) . 5-116
Table 5-8: Comparison of measured and calculated transmittance of ETFE-foil panel with that of test-rig experiment ............................................................................ 5-118
Table 5-9:Average transmitted solar radiation recorded during daylight hours .... 5-130
Table 5-10:Temperature differences between Test-rig 1 and Test-rig 2 air temperatures and air-volume air temperatures ................................................... 5-131
Table 6-1: Identification of environmental parameters ........................................ 6-156
Table 6-2: correlation between air temperature at different occupied level and incident, transmitted solar radiation and outdoor ambient temperature 1st July 15 ............ 6-179
Table 6-3: Summary of occupied periods in summer 2014, 2015 ....................... 6-194
Table 6-4: Criteria for assessing internal temperature in naturally ventilated atrium space ................................................................................................................. 6-194
Table 6-5: Total occupied hours above 28°C for summer 2014 and 2015 ........... 6-196
Table 6-6: TM52 Overheating assessment of the Nottingham High School and the ESLC atria .......................................................................................................... 6-202
Table 6-7: BB101 Overheating assessment of the Nottingham High School atrium .. 6-203
Table 6-8: Summary of results obtained for research on thermal behaviour of space enclosed with membrane envelope .................................................................... 6-205
Table 7-1: Weather file parameters used in simulation ....................................... 7-213
Table 7-2: Glazing types used in the Predicted model (EDLS TAS Version 9.3.3.b) . 7-214
Table 7-3: Construction of simulation model ....................................................... 7-215
Table 7-4: Thermal Properties of ETFE foil used in simulation model ................. 7-215
Table 7-5: Input parameters in simulation ........................................................... 7-215
Table 7-6: Pearson Correlation of measured and predicted result with variable infiltration rate ..................................................................................................... 7-216

xxi
Table 7-7: Input parameters in simulation ........................................................... 7-218
Table 7-8: Properties of ETFE-foil panels (single layer) and glazed panels ........ 7-218
Table 7-9: Properties of ETFE-foil (two-layer) panels and glazed panels ............ 7-219
Table 7-10: Properties of ETFE foil panels (three-layer) ..................................... 7-219
Table 7-11: Selection of model ........................................................................... 7-226
Table 7-12: Properties of ETFE foil cushion ....................................................... 7-233
Table 7-13: U-value of building fabrics................................................................ 7-233
Table 7-14: Properties of ETFE foil ..................................................................... 7-233
Table 7-15: U-value of building fabrics................................................................ 7-234
Table 7-16: NCM Activities_v5.2.4 (Part L 2010) followed (EDLS TAS Version 9.3.3.b) ........................................................................................................................... 7-236
Table 7-17: Window opening details, function used in analysis model and TAS building simulator ............................................................................................................. 7-236
Table 7-18: Occupancy, lighting and equipment schedule .................................. 7-237
Table 7-19: NCM Activities_v5.2.4 (Part L 2010) followed (EDLS TAS Version 9.3.3.b) ........................................................................................................................... 7-239
Table 7-20: Window opening details, function used in analysis model and TAS building simulator ............................................................................................................. 7-239
Table 7-21: Occupancy, lighting and equipment schedule .................................. 7-240
Table 7-22: Model description and parameter ..................................................... 7-241
Table 7-23: Thermal optical properties of the external layer of ETFE foil cushion7-248
Table 7-24: Thermal optical properties of external and internal layer of ETFE foil cushion ............................................................................................................... 7-249
Table 7-25: Emissivity of ETFE foil ..................................................................... 7-250
Table 7-26: Window opening and associated air temperature of atrium second floor, Nottingham High School ..................................................................................... 7-250
Table 7-27: Window opening and associated air temperature of atrium second floor, Engineering and Science Learning Centre ......................................................... 7-251
Table 7-28: Period selected for simulation in summer 2015 ................................ 7-251
Table 7-29: Results and remarks on simulation criteria ...................................... 7-255
Table 7-30: Percentage of Hours air temperature of Predicted simulation models enclosed with ETFE cushion roof and different type of glazing above Tmax during Peak period ................................................................................................................. 7-257

xxii
Table 7-31: Percentage of Hours air temperature of Predicted simulation models enclosed with ETFE cushion roof and different type of glazing above Tmax during Peak period ................................................................................................................. 7-258
Table 7-32: Projected Scenario of the predicted model of the Nottingham High School and ESLC ........................................................................................................... 7-261
Table 8-1: List of properties, and combination of single, two and three-layer ETFE-foils ........................................................................................................................... 8-266
Table 8-2: Thermal optical properties of single, two- and three-layer ETFE-foils 8-268
Table 8-3: Summary of air temperature (°C) at different levels of the atria on 1st July
2015 ................................................................................................................... 8-271
Table 8-4: Comparison of extreme temperature differences (thermal stratification) between different levels in the monitored atria (1st July 2015) ............................. 8-272
Table 8-5: Comparison of temperature difference (°C) between individual atrium levels
and outdoor air temperature ............................................................................... 8-272
1-1
Chapter 1
1 Introduction and Background
1.1 Context of the research
In recent decades, scientific evidence of climate change and environmental impact of
greenhouse gas emissions have made it essential to reduce energy use in buildings,
as buildings account for a significant amount of energy consumption globally (Pérez-
Lombard et al., 2008, Harvie, 2015, Knippers et al., 2011). As a consequence, growing
concern and interest in building performance is evident in the building design domain.
Emphasis is given to improving environmental performance to compensate the overall
energy consumption and it is also expected that new buildings will have minimum
impact on the environment.
Building envelope plays an important role to moderate the impact of the external
environment. This comprises the outer elements of a building and consists of walls,
roof, windows, doors, etc. The major function of a building envelope is to create a
comfortable environment for the occupants by ensuring thermal and solar control,
indoor air quality, sufficient daylight, fire resistance, acoustic control, and creating the
visible links between indoor and outdoor environment.
Materials like brick, wood, concrete, glass, stone etc. are conventional materials used
to construct building envelopes. Other than these conventional materials, flexible
fabrics or foil materials known as membranes are also used to construct building
envelopes. In contrast to conventional materials, membranes are extremely light
weight. Different types of fibrous materials and polymers are used as membranes.
They can be transparent or opaque. Membrane materials for building application
include – PVC (polyvinyl chloride) coated polyester woven fabric, PTFE
(polytetrafluoroethylene) coated glass fibre woven fabric, fluorine polymer coated glass
fibre woven fabric, polyester blend woven fabric, PVC foil, ETFE (Ethylene
tetrafluoroethylene) foil, THV (a polymer of tetrafluoroethylene, hexafluoropropylene
and vinylidene fluoride) foil etc. (Milwich, 2010).
Among different polymers suitable for building integration, ETFE (ethylene-tetra-flouro-
ethylene) is a synthetic fluoropolymer, that has been used commercially since the
1970s. The first large-scale use of extruded ETFE-foil in inflated cushions was for the
roof of the Mangrove Hall at Burgers’ Zoo, in Arnhem, The Netherlands, constructed

1-2
in 1982 (LeCuyer, 2008). Since then there have been developments of its material
properties, technology, and installation systems. These have increased ETFE-foil’s
use in architectural applications (Chilton, 2013), such that the material is now widely
used as a lightweight building envelope where high translucency, low structural weight,
and complex shape is essential. ETFE-foil (typically 100μm to 300μm in thickness) is
typically applied in building envelopes in the form of inflatable cushions and can consist
of single and multiple layers of ETFE-foils.
Evidence showed that the application of ETFE-foil in building envelopes is increasing
in frequency. Moritz (2007), conducted an extensive survey on the application of ETFE-
foil and documented 200 projects constructed with ETFE-foil cushions in different
countries. From the outcomes, it can be stated that building integration of ETFE-foils
is increasing throughout the world and widely applied in Germany (59%) and Great
Britain (18.9%). This is also evident in the study of Gómez-González et al. (2011).
Moreover, application of ETFE-foil cushions in building envelopes of impressive large-
scale projects, for example the Eden Project in Cornwall (built in 2000), the Allianz
Arena in Munich (built in 2005), Olympic stadium and swimming pool in Beijing (built
for Beijing Olympics 2008), moved this material and its construction method into the
focus of architectural and engineering interest.
ETFE-foil differs fundamentally from coated fabric membranes in terms of thermal as
well as building physics behaviour. The thermal optical characteristics of ETFE-foils
are significantly advantageous over other fabric membranes because of its
transparency (Knippers et al., 2011, Schiemann and Moritz, 2010). ETFE-foils are
virtually transparent to short-wave (solar radiation) and long wave radiation (Poirazis
et al., 2009). This transmittance depends on the membrane construction properties
such as number of foil layers, thickness, colour or fritting of the foils. It transmits about
90% of daylight in the visible light spectrum. For that reason, ETFE-foils are in direct
competition with other materials such as glass, fibre reinforced plastics or textile
membranes. The major difference between ETFE-foil and glass is that in ETFE-foil
envelopes spectral distribution of the visible light spectrum is almost constant with
hardly any refraction so the intensity and quality of colours retained inside the building
but for glass this intensity and quality of colour altered by refraction (Moritz, 2007,
Schiemann and Moritz, 2010). Another significant difference between ETFE-foil and
glass or polycarbonates is the high transmission of the ultraviolet spectrum (Moritz,
2007, Schiemann and Moritz, 2010). Different thermoplastics used for building
envelopes other than ETFE-foil e.g. polyethylmethacrylate, polystyrene,
polytetrafluoroethylene (PTFE), polyethylene (PE) were examined by Callister (2011)
1-3
and Minamisawa et al. (2007), as an alternative to glass. But the results found to be
unsuitable as a replacement material. The reason stated is that their visual
performance, material and energy performance are not similar to glass (Baille et al.,
2006, Callister, 2011)
The purpose of the advancement of ETFE-foil in the building industry was to reduce
material costs at the same time confirming benefits in terms of comfort, aesthetics, and
safety. Integration of this reduces embodied energy by reducing supporting structures
in comparison to glass (Monticelli et al., 2009, EPD, 2014, Chilton et al., 2013a).
Moreover, as a transparent foil material ETFE-foil allows flexibility in building geometry,
reduce fragility and weight of the building components while providing sufficient access
to light and heat (Robinson-Gayle et al., 2001, DETR, 2003). Thus, ETFE-foil cushions
are now widely used as an alternative to glass when building complex structures.
1.2 Knowledge gap and Identification of research questions
Review of the existing body of knowledge on ETFE-foil used in cushions showed that
aspects of their application, fabrication, and structural modification have been
investigated substantially (LeCuyer, 2008, Knippers et al., 2011, Chilton, 2013, Harvie,
2015, Robinson-Gayle et al., 2001, Wu et al., 2011, Cremers, 2010) . Robinson-Gayle
(2003), DETR (2003), Knippers et al. (2011), Mainini et al. (2014) stated thermal-
optical properties of ETFE-foil (e.g. transparent and white foil of different thickness).
However, they did not specify optical properties of fritted ETFE-foils of different
coverage. These types of fritted foils are now applied widely to control solar gain into
the enclosed space. Antretter et al. (2008), carried out a test-cell investigation and
CFD simulation (transient and steady state) to examine heat transfer through airflow
inside the ETFE-foil cushion. In a different test-cell investigation Dimitriadou (2015),
determined and compared the energy consumption of glass and ETFE-foil panels.
Using a hot-box, Max et al. (2012), investigated a novel greenhouse glazing system
composed of glazed unit and ETFE-foil. While Mainini et al. (2014) measured thermal
transmittance of vertical ETFE-foil panel using a test-rig experiment in an
environmental chamber. But no study measured and compared the thermal condition
of an enclosure covered with single, two and three layers ETFE-foil panel. Toyoda and
Takahashi (2013), Schöne (2007) investigated a solution for rain noise control of
ETFE-foil cushion using silicone-gel layers and non-woven fabric (mesh). Although
Desmarais et al. (1999) indicated that mesh with smaller holes decreases solar
radiation, its actual impact on internal air temperature was not investigated. Poirazis et
al. (2009), carried out a study on energy transmission properties of ETFE-foil to

1-4
determine thermal and optical performance on the basis of a mathematical model. He
pointed towards the limitations of dynamic simulation software in that available
software in current use does not provide material templates for ETFE-foil unlike for
other glazing materials. Turrin et al. (2010), developed a parametric model to identify
the structural behaviour of a large roof and its effect on thermal comfort and daylighting
of the space underneath. In a different study Turrin et al. (2012), investigated
performance oriented design of a large roof structure for semi-outdoor space.
Dimitriadou (2015), performed simulations to predict thermal conditions and energy
consumption of an ETFE-foil cushion enclosure.
It is evident that the above studies neither focused on the actual thermal performance
of the space enclosed with an ETFE-foil cushion envelope nor compared this thermal
performance with predicted behaviour. Moreover, the impact of ETFE-foil cushion
envelope on the internal thermal environment of a building remained unexplored yet.
The increasing frequency of building integration of ETFE-foil cushions in more complex
and permanent enclosures has made it necessary to identify the relevant thermal
properties of the material.
A transparent/ translucent ETFE-foil cushion envelope can be considered as a passive
environmental filter that moderates the outdoor environment e.g. outdoor air
temperature, solar radiation, glare etc. But on a hot day, continuous transmittance of
solar radiation through ransparent/ translucent ETFE-foil can result in overheating.
Furthermore, the double curved geometry of this envelope, its thermal-optical
properties etc., make it different from conventional envelope systems. Additionally,
existing standards available for conventional materials and construction systems
cannot be applied directly for ETFE-foil cushions (Antretter et al., 2008). So thermal
performance analysis of ETFE-foil cushion building envelopes is essential to prove its
construction complies with the user requirements.
Considering these gaps in existing knowledge, the following key research questions
emerged and were established as the focus of this research.
• What are the current barriers to the accurate prediction of the thermal
performance of ETFE-foil panels and spaces enclosed with ETFE-foil cushion
envelopes?
• What approach is necessary to predict the thermal performance of ETFE-foil
panels and spaces enclosed with ETFE-foil cushion envelopes?
1-5
• How thermal performance of ETFE cushions affect the thermal performance of
spaces enclosed by ETFE-foil cushion envelope?
• What is the overall implication of this research for the future development of
the area?
1.3 Research aim, objectives, methods
The overall aim of the research is to evaluate the thermal performance of ETFE-foil
panels and spaces enclosed with ETFE-foil cushion envelopes.
Objectives of the research:
Objective 1: Develop knowledge base on properties of ETFE-foils and ETFE-
foil cushion construction; identify the thermal behaviour of fabric membranes
and spaces enclosed with fabric membrane envelope (method: literature
review).
Objective 2: Determine thermal-optical properties of ETFE-foils (methods: Lab
experiment, British Standard).
Objective 3: Evaluate the thermal performance of single, two and three layers
ETFE-foil panels (methods: Test cell monitoring).
Objective 4: Evaluate the thermal performance of occupied spaces enclosed
with ETFE-foil cushion envelope (method: Monitoring existing building).
Objective 5: Evaluate and compare the thermal performance of spaces
enclosed with ETFE-foil cushion and glass roofs (method: computer
simulation).
Objective 6: Identify strategies to improve the thermal performance
(overheating) of spaces enclosed with ETFE-foil cushion in current and
projected climate scenarios (method: Data analysis and computer simulation)
Objective 7: Identify implications of the research for designers and develop
design recommendations of ETFE-foil panels and spaces enclosed with ETFE-
foil cushion envelope (Result analysis).
1.4 Thesis Outline
This thesis consisted of eight chapters. The structure of the thesis and contents of
each chapter are discussed in this section.

1-6
Chapter 1: This chapter presents a synopsis of the thesis. At the beginning, it
discusses the context of the research, identifies knowledge gaps and states research
aim and objectives. Lastly, the chapter provides an outline to the rest of the thesis.
Chapter 2: This chapter presents a review of the properties of ETFE-foil and
configurations of ETFE-foil in cushion construction used to enhance the thermal
performance of the space it encloses; and thermal behaviour of fabric membrane and
spaces enclosed with fabric membrane envelope. It also describes the impact of this
thermal behaviour on the thermal comfort of occupants and identifies thermal comfort
assessment methods to evaluate indoor thermal performance.
Chapter 3: This chapter provides an overview of the research methodologies used to
achieve the research aim and objectives. The criteria to identify the research methods
were initially gathered by reviewing relevant research articles, books, guides,
standards, etc. Subsequently, the chapter prescribed detailed methods adopted to
conduct the empirical research. The chapter includes detailed descriptions of the case
study buildings, data collection and analysis techniques, environmental performance
analysis methods, and selection of building simulation tools.
Chapter 4: This chapter presents thermal-optical properties of single, two- and three-
layer ETFE-foils. To achieve the objective, this chapter reviews methods adopted by
previous studies to determine thermal-optical properties of ETFE-foils. It also
discusses justification of selection of the methods adopted to measure the thermal-
optical properties of ETFE-foils. The methods applied to obtain these properties are
also discussed.
Chapter 5: This chapter presents the results and analysis of the thermal performance
of single-layer, two-layer and three-layer ETFE-foil panels. This is completed in two
phases: the first phase determined solar transmittance of single-layer, two-layer and
three-layer ETFE-foil panels, and the second phase evaluated the thermal
performance of single-layer, two-layer and three-layer ETFE-foil panels. This chapter
discusses the methods adopted in previous studies and justification of selection of
methods applied in the study to analyse the thermal performance of ETFE-foil panels.
Chapter 6: This chapter presents the results and analysis of the thermal performance
of occupied spaces enclosed with ETFE-foil cushion envelope. The chapter discusses
details of data collection procedures for the case study buildings. The indoor thermal
environment of both of the buildings is critically analysed with adopted methodology.

1-7
Chapter 7: This chapter presents simulation based analysis to evaluate and compare
the thermal performance of spaces enclosed with ETFE-foil cushion roofs and glass
roofs. It also identifies strategies to improve the thermal performance (overheating) of
spaces in current and projected climate scenarios. At the beginning, simulation models
are calibrated by comparing with the measured data. Further simulations are
conducted to estimate and compare buildings energy consumption when enclosed with
ETFE-foil roofs and glass roofs.
Chapter 8: This chapter presents the summary of findings from the research study
and then critically evaluates the methodologies adopted to conduct the research. On
the basis of theoretical knowledge and findings obtained from the empirical studies,
design recommendations are proposed. Finally, the chapter discusses the fulfillment
of research aim and objectives. The novelty of the study and contribution to the
knowledge are discussed with limitations and proposals for future research.

2-8
Chapter 2
2 Thermal behaviour of membrane envelopes and the spaces
they enclose
2.1 Introduction
This chapter introduces ETFE-foil, its properties and various configurations of ETFE-
foil in cushion construction that can be used to enhance the thermal performance of
enclosed spaces. From the previous chapter, it was apparent that research in the area
of the thermal performance of ETFE-foil cushion and space enclosed with it is limited.
Therefore, a review of the typical thermal behaviour of the membrane and thermal
behaviour of space enclosed with a membrane envelope was attempted and discussed
in this chapter. This review particularly focused on the results obtained in previous
research on the thermal behaviour of spaces enclosed with membrane envelopes.
Even though ETFE-foil’s characteristics are different from that of other fabric
membranes, its application and functional purposes are similar. Thus, it was assumed
that similar thermal conditions might exist in the spaces enclosed with an ETFE-foil
cushion envelope. This chapter also describes the impact of this thermal condition
(which is likely to be encountered in the space enclosed with ETFE-foil cushions) on
thermal comfort of occupants and thermal comfort assessment methods that can be
used to assess indoor thermal performance.
2.1.1 ETFE-foil
Ethylene-tetra-fluoro-ethylene (ETFE) is a synthetic fluoropolymer. Although patented
by DuPont in 1940, it was not used commercially until the 1970s. In the form of ETFE-
foil (typically 100μm to 300μm in thickness) it is applied in building envelopes in a
single layer or, more commonly, as inflatable cushions composed of multiple layers.
Because of their high light transmission and transparency, ETFE-foil cushions are now
widely used as an alternative to glass as a cladding for complex structures (Moritz,
2007, Schiemann and Moritz, 2010). ETFE foil is very resistant to environmental
influence where the material is exposed to a diverse range of aggressive actions e.g.
ultraviolet (UV) radiation, acids, alkalis etc., and it exhibits excellent long-term
resistance to soiling. Thus, this material neither changes its colour nor becomes brittle.
With all these advantages, in the recent times ETFE-foil has become one of the most
popular materials that is ideal for membrane envelopes and tensile structures
(LeCuyer, 2008, Knippers et al., 2011).

2-9
2.1.2 Colouring printing and coating in ETFE-foil
Transparent ETFE-foils are commonly used in building envelopes e.g. façades, roofs
etc. Nevertheless, ETFE-foil can also be found in silver, white and different other
colours e.g. blue, green, pink etc. Among these different colour, white ETFE-foil
reduces radiation transmission in the UV range considerably (Knippers et al., 2011).
ETFE foils can be printed also, however, because of its anti-adhesive behaviour, pre-
treatment is necessary before printing. For printing, silver or white ink is used to reflect
light and heat in particular. Moreover, the degree of transmittance of these inks can be
controlled during printing. Thus, it is possible to print a variety of motifs, patterns (e.g.
dot, honeycomb, chequer board etc.) by varying the transmittance of ink accordingly.
While printing, using repetitive pattern, it is possible to vary the degree of coverage of
the printed part e.g. dots of various size and degree of coverage. By using sputtering
techniques foils can be coated with metallic, ceramic or organic coating. Furthermore,
printed or coated foils can be laminated using transparent foil layers. This lamination
of multiple foils is considered as a single ply that improves the strength of the foil layer
and also protects printed motifs and coatings (Knippers et al., 2011). Nowofol
developed a selective coating using Ultra-Violet and Infra-red filter. This helps to
improve thermal properties of ETFE-foil by selectively transmitting or reflecting
different wavelengths in the solar spectrum (Vector-foiltec, 2013).
2.1.3 ETFE-foil cushion configurations
In ETFE-foil cushion systems, foil layers’ form part of the load bearing structure, which
is integrated into the form as pneumatically prestressed layers with their edge clamped
to extruded aluminium framing. Moreover, construction of ETFE-foil cushion varies
with regards to load bearing and building physics characteristics (Schiemann and
Moritz, 2010). In a cushion, the middle layer can be much thinner because it is
subjected to low pressure. However, by creating a dual chamber system, the middle
layer improves heat insulation properties. Therefore, it is possible to enhance
insulation properties of ETFE-foil cushions by increasing the number of air chambers
(LeCuyer, 2008). Furthermore, fritting and printing of foil layers increases opportunities
to improve the thermal performance of ETFE-foil cushion by controlling solar gain into
the enclosure. Depending on the functional requirements, fritting can be reflective or
absorbtive. Highly reflective frit is more efficient to moderate indoor thermal conditions
than highly absorbing frit. In a cushion system with highly absorbing frit the temperature
of the middle layer is increased (Poirazis et al., 2009). As a result, transmission of long
wave radiation towards the interior and exterior is increased. Moreover, reflective frit
2-10
acts as a screen for longwave radiation exchange. Thus incorporation of frit reduces
the possibilities of overheating and excessive cooling (Poirazis et al., 2009). Besides,
low-emissivity coating of the ETFE-foil layer can reduce solar gain as well as longwave
radiation exchange. Therefore, it is possible to alter the thermal performance of the
envelope system. Heat and light transmission of ETFE-foil cushions can also be
manipulated by the following procedures (Knippers et al., 2011, LeCuyer, 2008, Moritz
and Hafner, 2010).
• Separating individual foil layers at anchoring profiles e.g. Figure 2-1(e).
• Separate pressure control for two air chambers and moving the middle layer
by repositioning and elastic elongation while changing pressure (see Figure
2-2). In this type of system the outer and middle layer can be printed or fritted
in an inverse pattern motif known as intelligent printing (see Figure 2-3, Figure
2-4).
• Use of different colours in the middle layer.
• Incorporating aluminium and ETFE lamellae, mobile textile membranes.

2-11
(a) (b)
(c) (d)
(e) (f)
Figure 2-1: Construction types of ETFE-foil cushions (Schiemann and Moritz, 2010)
(a) open (c)open
(b) closed (d) closed
(a, b) moved by repositioning (c, d ) moved by elastic elongation
Figure 2-2: Movable middle layer in ETFE-foil cushion
(a) (b)
Figure 2-3: Moveable central layer with intelligent printing, (a) open, (b) closed (Knippers et al., 2011)

2-12
(a)
(b)
Figure 2-4: (a) Pattern open, (b) Pattern superimposed (LeCuyer, 2008)
Figure 2-5, Figure 2-6 and Figure 2-7 present the different configurations of ETFE-foil
cushion and control strategies that were applied in the Festo Technology and
Kingsdale School building envelopes to improve the indoor thermal environment.
Figure 2-5: Festo Technology centre atrium (LeCuyer, 2008)

2-13
(a) (b)
Figure 2-6: Kingsdale School atrium (a) exterior view (top), interior view (bottom); (b) printed top layers (top), view of cushions (bottom) (LeCuyer, 2008)
(a) (b)
Figure 2-7: Kingsdale School atrium solar gain controlled by (a) opening ETFE-foil cushion at clerestory level, (c) closing top two layers of cushion (LeCuyer, 2008)
2-14
2.2 The thermal behaviour of fabric membranes
Typical fabric membranes used in building envelopes are around 1 mm thick and have
a weight of around or less than 1kg/m2. According to Harvie (2015), this type of
membrane envelope can change temperature by 5°C within a minute just because of
cloud moving in front of the sun. On a sunny day in summer it may become 20°C hotter
than the ambient external air temperature during the day yet become 3.5°C cooler than
external ambient temperature under a clear night sky (Harvie, 1996). It is also apparent
that the surface temperature of this type of envelope can be raised to 40°C to 50°C on
hot days (Croome and Moseley, 1984a, Harvie, 1996). Moreover, membrane
envelopes are usually used to cover large facade or roof areas, which respond quickly
to the exterior conditions. Because, unlike for thicker and heavier materials, there is no
significant time lag between a temperature change on their outside surface and the
resulting change in their inside surface, a rapid change of surface condition means it
has an impact on indoor thermal conditions.
However, in ETFE-foil cushions, particularly with multiple air chambers, a temperature
gradient exists between the external and internal surface. This was evident in a test
rig experiment carried by Antretter et al. (2008), where the study found in a two layer
cushion that the internal layer was a maximum 13.3°C hotter than the external layer
when transmitted solar radiation inside the test rig recorded was 219 W/m2. Whereas
in the three-layer cushion, the middle layer was found to be hotter than both the internal
and external layer while the internal layer was also 8°C hotter than the external layer
(Poirazis et al., 2009, Hu et al., 2016). However, these results were obtained using
test-rig experiment and mathematical modelling. Therefore, from this finding, it can
only be assumed that surface temperature will vary in two and three-layer cushion, but
the extent of this in an actual building envelope is not known yet. Besides similar to
coated fabric membranes, ETFE-foil cushions might interact with the external
conditions. Nevertheless, how quickly an ETFE-foil cushion responds to the change in
outdoor conditions in the presence of an air layer between foils, which provides
insulation is still relatively unexplored. Variation in surface temperatures of ETFE-foil
in a cushion system might have an impact on the internal air temperature, but this is
yet to be examined under actual condition.
Although membrane envelopes behave unconventionally but the underlying heat
transfer mechanisms such as conductive, convective and radiative heat transfer is the
same as for any other conventional building materials. Again, this heat transfer
depends on material properties e.g. thermal optical properties, thermal transmittance
2-15
etc. Thus, it is important to examine actual properties that might have an impact on
their performance as well as the thermal performance of spaces they enclose.
Therefore, in order to better understand the thermal performance of materials like
ETFE-foils, it is necessary to measure the following.
• Solar transmittance - indicates the amount of solar radiation transmitted through
ETFE-foils.
• Solar absorbtance and reflectance - indicates the amount of solar radiation
absorbed and reflected.
• Longwave infrared heat transfer - it is a function of the surface temperature of the
ETFE-foil, the emissivity of foil as well as the emissivity of the surrounding building
fabric and their surface temperatures.
• Emissivity - is a measure of longwave infrared radiation that a surface emits to its
surroundings.
• Thermal transmittance - heat flux through ETFE-foil cushion which depends on
temperature difference between indoor and outdoor.
2.3 Heat transfer in membrane envelopes
It was already mentioned in section 2.2 that the heat transfer mechanism will be
identical for unconventional membrane envelopes those constructed of materials like
ETFE-foil, PVC coated polyester fabric etc., as well as conventional construction e.g.
brick wall, concrete floor etc., (Knippers et al., 2011, Harvie, 2015, Devulder 2004).
Poirazis et al. (2009) applied the principles of heat transfer mechanism in the
mathematical model to determine heat flux on ETFE-foil cushion surface. Antretter et
al. (2008), also suggested considering basic principles of heat transfer while analysing
the performance of ETFE-foil.
According to Incropera et al. (2013), “Heat transfer is thermal energy in transit due to
a spatial temperature difference”.
“Any layer in a component, the quantity of energy transmitted per unit of time depends
on the temperature differences between two sides of layer, the distance covered by
the energy flow (the thickness of the material) and thermal conductivity of the material
forming that layer’’.
However, the process of heat exchange in a translucent envelope system is a complex
phenomenon and is discussed in the following sections.

2-16
2.3.1 Conduction
In conductive heat transfer, a temperature gradient exists in a static medium that may
be either solid or fluid. It takes place in solid bodies and fluids at rest. It is transfer of
energy from more energetic to less energetic particles of a substance due to the
interaction between particles with the presence of temperature gradient and in the
direction of decrease of temperature. An appropriate rate equation can be used to
quantify the amount of energy transferred per unit time through conduction. For
conduction, the rate equation is known as Fourier’s law (Incropera et al., 2013).
2.3.1.1 Conduction heat transfer of a membrane surface
For membrane materials, it is important to quantify intra-surface conduction, in order
to assess the rate at which variations in conditions occurs between the surfaces of
multi-layer membranes (Harvie, 1996). However, transient conductivity depends on
material density, specific heat capacity and conductivity. These properties are related
with thermal diffusivity. In materials with little thermal mass, heat conducts very rapidly
and is said to have thermal diffusivity. From material diffusivity, it is possible to
calculate time lag. However, the limited range of conductivities, specific heat capacities
and densities of membranes resulted in very low time delay that is less than a minute.
So it is adequate to represent thermal conductivity of membranes by using steady state
methods (Clarke, 1985) however for accuracy it is not necessary to measure specific
heat capacities and densities for membranes (Harvie, 1996).
2.3.2 Convection
In convective heat transfer, two mechanisms are associated. Energy is transferred by
random molecular motion as well as bulk or macroscopic motion of a fluid. This type
of motion contributes to heat transfer in the presence of a temperature gradient
(Incropera et al., 2013).
2.3.2.1 Convection heat transfer of a surface
One material property that significantly affects the rate of convective heat transfer is
the surface roughness. Building materials with smooth surface finishes are considered
to have a roughness of zero (McAdams, 1954). Therefore a membrane with a surface
thickness less than a millimetre and smooth surface coating would be considered to
have surface roughness zero and no convective heat transfer will occur on it’s surface
(Harvie, 1996). However, this phenomenon is not real in the case of ETFE- foil. This is
one of the heat transfer mechanism that impact surface temperature of ETFE-foil in a
cushion, even though the foils are smooth. This was evident in the investigation results

2-17
obtained by Antretter et al. (2008). Thus surface roughness might accelerate heat
transfer rate but convective heat transfer also occurs on the smooth membrane
surface.
2.3.3 Radiation
Thermal radiation is the energy emitted by a substance that is at nonzero temperature.
Heat radiation emits in a range of frequencies specific to this temperature region
(Knippers et al., 2011). Emission occurs from solid surface as well as liquids and
gases. Here energy transported by electromagnetic waves. Although conduction and
convection process requires the presence of a material medium for energy transfer but
radiation do not. Thus radiative heat transfer occurs most efficiently in vacuum
(Incropera et al., 2013).
2.3.3.1 Radiative heat transfer of a surface
Radiation can also be incident on a surface from its surroundings, from a sources e.g.
sun or from another surface to which the surface is exposed. The rate at which all such
radiation is incident on a unit area of the surface is known as irradiation and expressed
as ‘G’. A part or all of the irradiation can be absorbed or emit by the surface, thus
modify the thermal energy of the material (Incropera et al., 2013). The rate at which
radiant energy is absorbed or emit per unit area of a surface termed as absorptivity or
emissivity. These are the radiative property of the surface and depend on surface
finishes. The thermal energy of a matter increased and decreased by absorbed and
emitted radiation whereas reflected and transmitted radiation has no effect on this
energy.
Radiative heat transfer affects the thermal condition of ETFE-foil cushion. However
this heat transfer depends on emissivity, thus can be reduced by the application of low-
E coating on ETFE-foil surface (Antretter et al., 2008, Poirazis et al., 2009).
2.4 The observed Thermal behaviour of space enclosed with
membrane envelope
It was discussed in section 2.2 that membrane envelopes are repond rapidly to outdoor
weather conditions e.g. solar radiation. However, buildings constructed with this type
of membrane roof often also consist of thermally massive walls, floors etc which barely
change their condition during the day and tend to preserve indoor thermal conditions
as preferred by the occupants. Therefore, thermal conditions vary depending on
2-18
proximity to the membrane roof or close to the ground. This is the result of variation in
air temperature and radiant temperature.
It was already discussed in chapter 1 that no study had investigated thermal behaviour
of space enclosed with an ETFE-foil cushion envelope. Therefore, an attempt was
made to acquire information from previous research that investigated thermal
behaviour of spaces enclosed with coated fabric membrane envelopes. The results
obtained in previous research are presented briefly in Table 2-1. The purpose was to
see the extent of variation in thermal condition.

2-19
Table 2-1: Summary of results obtained from previous studies on thermal behaviour of space enclosed with membrane envelope
Study Space type, location, weather
HVAC system Envelope type Surface temperature
Temperature difference between air close to membrane and outdoor air
Temperature difference between air close to membrane and near to the floor
Wu et al. (1984)
Stadium
moderately cold climate
Air conditioned (seating area of a stadium only)
air-supported roof, composed of single and double layer membrane
3°C above outdoor temperature
On warm summer day-
9°C (without AC)
11°C (with AC operating in the seating area)
Croome and Moseley (1984a)
Air house, The University of Bath
Inflation fans
air-supported structure with PVC-coated polyamide skin
40°C 8°C above outdoor temperature during day,
1°C below outdoor air temperature at night
4°C
Harvie (1996) Factory,
Chepstow, UK
Air conditioning system, destratification
fans, natural
ventilation
through the apex
of the roof
Double membrane composed of PVC coated polyester membrane and permeable proban treated cotton calico
31°C 8°C (free running period)

2-20
(Table 2-1 continued)
Harvie (1996) Arena,
Llangollen,
Clwyd.
Apex extract fans, low level natural ventilation is provided by small openings
Single layer, PVC coated polyester
33°C (maximum 40°C)
12.5°C above outdoor temperature during day
10°C (positive stratification during the day)
1.1°C (negative stratification during the night)
Lawn Tennis and
Croquet Club
Wimbledon,
London.
Louvres provide
natural
ventilation,
ventilators to
extract air from
occupied space,
infra-red heaters
PVC coated polyester membrane
45°C (maximum 50°C)
5.6°C (positive stratification during the day)
Devulder (2004)
New Inland
Revenue Amenity
Building (IRAB),
Nottingham, UK
Electric radiant
heaters Single skin PTFE/glass
15°C above outdoor temperature during day
6°C to 12°C (positive stratification during the day)
3°C (negative stratification during the night)
2-21
On the basis of findings of previous research (presented in Table 2-1) the thermal
environment enclosed within a membrane envelope can be characterised by non-
uniformity and high responsiveness. Both indoor and outdoor air temperature, and
membrane surface temperature are key to the creation of this non-uniform behaviour.
It can be anticipated that similar conditions might exist in spaces enclosed with ETFE-
foil cushions, although this was unexplored. In order to investigate thermal
performance of ETFE-foil covered enclosures it is necessary to focus on the following:
• impact of external environmental stimuli e.g. solar radiation, external ambient
temperature on thermal state of ETFE-foil cushion surface
• impact of surface temperature of ETFE-foil on the adjacent air temperature
• solar radiation transmission through ETFE-foil cushion and its impact on the
enclosed space
• impact of external ambient temperature on the enclosed space
• identify whether temperature stratification exists and the extent of this
stratification
• impact of this stratification on thermal comfort of the users of the space
• selection of a space which can be used to represent above phenomenon e.g.
enclosed space with large internal height
2.5 Impact of thermal behaviour of membrane envelope on thermal
comfort
Results obtained from previous studies presented in Table 2-1 indicates that the
temperature difference between the space enclosed, the membrane envelope and
close to the ground is significant. This variation in thermal condition might have
considerable impact on the thermal comfort of the occupants of the spaces adjacent
to membrane roof in particular due to overheating. Thus, the primary significance of
the thermal behaviour of space enclosed by membranes, e.g. ETFE-foil cushions, is
the way it affects the comfort of the occupants of that space. Although thermal comfort
depends on various parameters e.g. physical activity, clothing type, air temperature,
mean radiant temperature etc, but it may primarily be affected by the permeable heat
transfer of the membrane envelope (Harvie, 1996). Permeable heat transfer in an
ETFE-foil cushion envelope is specified by Knippers et al. (2011) and illustrated in
Figure 2-8.
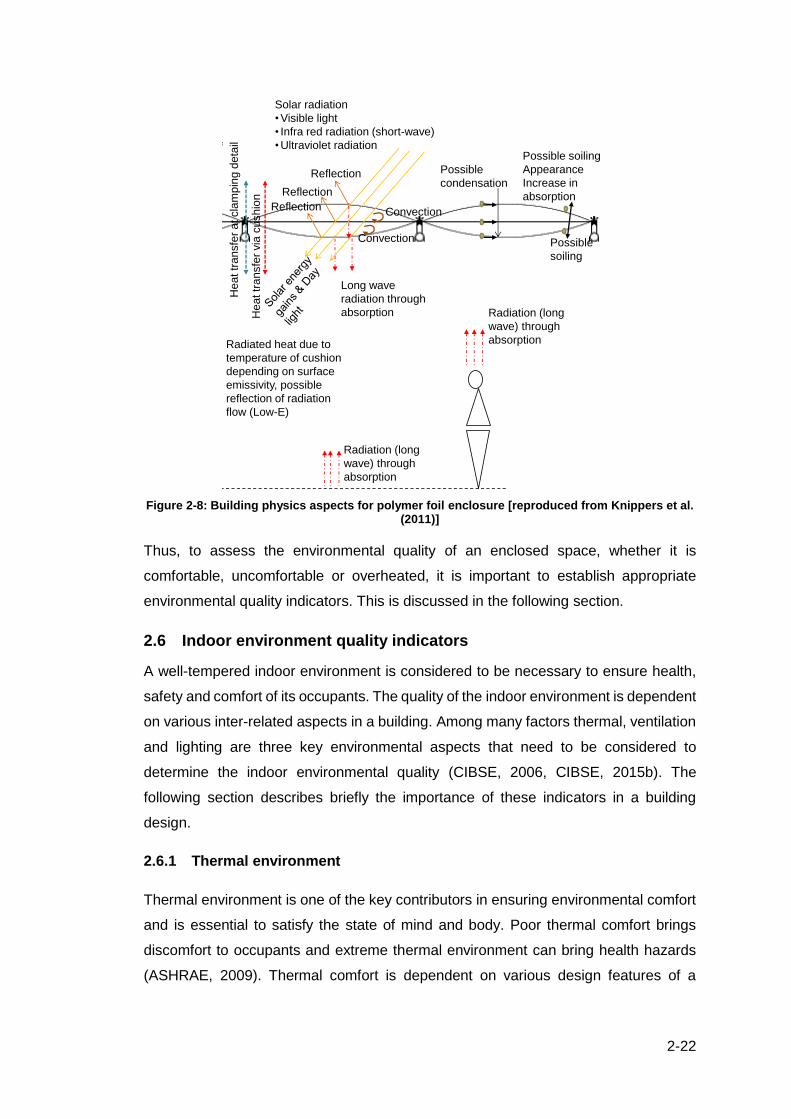
2-22
Figure 2-8: Building physics aspects for polymer foil enclosure [reproduced from Knippers et al. (2011)]
Thus, to assess the environmental quality of an enclosed space, whether it is
comfortable, uncomfortable or overheated, it is important to establish appropriate
environmental quality indicators. This is discussed in the following section.
2.6 Indoor environment quality indicators
A well-tempered indoor environment is considered to be necessary to ensure health,
safety and comfort of its occupants. The quality of the indoor environment is dependent
on various inter-related aspects in a building. Among many factors thermal, ventilation
and lighting are three key environmental aspects that need to be considered to
determine the indoor environmental quality (CIBSE, 2006, CIBSE, 2015b). The
following section describes briefly the importance of these indicators in a building
design.
2.6.1 Thermal environment
Thermal environment is one of the key contributors in ensuring environmental comfort
and is essential to satisfy the state of mind and body. Poor thermal comfort brings
discomfort to occupants and extreme thermal environment can bring health hazards
(ASHRAE, 2009). Thermal comfort is dependent on various design features of a
Reflection
Reflection
Reflection Convection
Convection
Heat tr
ansfe
r via
cushio
n
Long wave
radiation through
absorption
Radiated heat due to
temperature of cushion
depending on surface
emissivity, possible
reflection of radiation
flow (Low-E)
Heat tr
ansfe
r at cla
mpin
g d
eta
il
Solar radiation
•Visible light
• Infra red radiation (short-wave)
•Ultraviolet radiation
Possible
condensation
Possible
soiling
Radiation (long
wave) through
absorption
Radiation (long
wave) through
absorption
Possible soiling
Appearance
Increase in
absorption
Integration of
active solar
technologies
e.g. PV

2-23
building such as envelope type e.g. brick wall, membrane roof, etc, window
configuration, ventilation strategies, etc.
The transparent building envelope e.g. ETFE-foil cushions, incorporated into a large
high interior space (e.g. atrium) allows deeper penetration of high levels of natural light
and strong solar radiation. This can create either a pleasant thermal environment or if
designed incorrectly, adverse factors such as glare and poor thermal comfort.
The issue of thermal environment is a growing concern due to extreme climatic
conditions (too cold or too hot) in recent years around the world as well as in the UK
and other European countries.
2.6.2 Ventilation and air quality
Ventilation is a widely used technique, that is used for cooling, for reducing the amount
of undesired components in the air (e.g. carbon dioxide concentration) and to control
moisture and/or humidity in the air. It is essential to provide fresh air to keep occupants
active and healthy. Buildings can be ventilated either naturally using windows, vents
etc. or mechanically by means of a heating ventilation and air-conditioning (HVAC)
system.
In a building with transparent/ translucent roof e.g. ETFE-foil cushions and large
interior space, ventilation plays an important role in providing optimum quality of indoor
air circulation within the space and maintaining acceptable level of thermal comfort.
People spend most of their time indoors, however, poor ventilation can cause
discomfort and health hazard.
2.6.3 Lighting
Lighting (natural or artificial) defines the visual environment including definition of
colour and texture. Availability of daylight is essential to define the visual relationship
between the outdoor and indoor environment. A sufficient amount of daylight helps to
eliminate the need for artificial lighting; thus, saves energy.
Lighting quality and availability is a complex task to measure as light levels can vary
widely within a space. Moreover, perceived lighting quality in a space is dependent on
illumination level, distribution of illumination, and glare.
Other than visual parameters, there are non-visual parameters that can influence the
overall environmental comfort such as heat emission from the light sources and their
energy consumption.

2-24
In large spaces such as in atria, transparent/ translucent roofs are incorporated to
admit high levels of daylight and create a visual link between indoor and outdoor.
However, without proper control, significant access of daylight can cause discomfort.
2.7 Thermal comfort environmental parameters
According to CIBSE guide A (CIBSE, 2006, CIBSE, 2015b) the environmental
parameters that affect thermal comfort are as discussed in the following sections.
2.7.1 Temperature
The temperature is the most important environmental parameter affecting thermal
comfort. Indoor air temperature is the dry-bulb temperature of the air.
Mean radiant temperature (MRT) is an important variable of the environment that
defines people’s thermal comfort. This can be measured by a uniform black enclosure
in which an occupant exchanges the same amount of thermal radiation as in the actual
the non-uniform enclosure. There are various approaches of gathering or calculating
MRT. Mean radiant temperature is dependent on the surface temperatures of the
space and position of the person in relation to the surfaces.
MRT can be calculated or estimated by measuring globe temperature, air temperature
and air velocity (ASHRAE, 2009). The accuracy of estimating MRT is dependent on
the type of environment and the accuracy of the measurement device used. Another
way of measuring mean radiant temperature can be by measuring area weighted mean
temperature of all the objects surrounding the body and the respective position of the
person. Detail of this method is stated in ASHRAE (2013).
Operative temperature combines the air and radiant temperature in a single index. This
includes combined effect of convective and radiative heat exchange. This is a weighted
mean temperature between the air and radiant temperature (CIBSE, 2006, CIBSE,
2015b). In well-designed buildings during winter air temperature can often be equal to
the operative temperature. A realistic assessment of operative temperatures within a
space under normal occupant behaviour is important. The operative temperature in
summer can be calculated using Equation 2.1.
𝑇𝑜𝑝 = 𝐻𝑇𝑎 + (1 − 𝐻)𝑇𝑟 …………(2.1)
Where, 𝑇𝑎 (°C) = indoor air temperature
𝑇𝑟(°C) = mean radiant temperature

2-25
𝐻 = ℎ𝑐/(ℎ𝑐 + ℎ𝑟) and 1 − 𝐻 = ℎ𝑟/(ℎ𝑐 + ℎ𝑟)
ℎ𝑐 (Wm-2 K-1) = surface heat transfer co-efficient by convection,
ℎ𝑟 (Wm-2 K-1) = surface heat transfer co-efficient by radiation
CIBSE guide A (CIBSE, 2006), ℎ𝑐
ℎ𝑟 = √(10v), where v is the air velocity (ms-1)
𝑇𝑜𝑝 = 𝑇𝑎 √(10𝑣)+ 𝑇𝑟
1+ √(10𝑉) …………(2.2)
At very low indoor air velocity (below 0.1 ms-1) natural convection (v) is assumed to be
0.1, and Equation 2.1 becomes,
𝑇𝑜𝑝 =1
2 𝑇𝑎 +
1
2 𝑇𝑟 …………(2.3)
2.7.2 Air movement
Air movement provides a cooling effect. However, if cooling is not desired then it may
cause discomfort by creating a draught. The air temperature of this moving air should
be in between room temperature and air temperature of ventilation.
2.7.3 Relative humidity
According to CIBSE (2006), relative humidity (RH) has an influence on thermal comfort
and overall environmental perception. Low relative humidity can cause dryness and
irritation feeling in the eyes and adversely affect respiration. In a building with
mechanical ventilation, this can happen during winter when external air is preheated
to vent (Kuchen & Fisch 2009). Medium humidity has lower impact; however, high
humidity restricts evaporation from the skin and respiration, and can cause thermal
discomfort (Szokolay 2008). In naturally ventilated buildings RH can be influenced by
interior equipment, ventilation, configuration of the space, etc.
In a moderate thermal environment, 40-70% RH is acceptable but perception of
humidity increases at higher temperatures (above 26-28°C). At design temperature,
particularly for sedentary occupancy, humidity should be above 40%, although for
short periods humidity below 30% is acceptable. It was also suggested that in heated
only buildings in the UK during cold weather humidity can remain below 40% (CIBSE,
2006). But in this condition moisture control is important to reduce condensation risk.
Surface temperatures of building envelope necessary to avoid condensation are listed
in Table 2.2.

2-26
Table 2.2: Surface temperatures necessary to avoid condensation assuming internal air temperature of 20 °C and different RH (CIBSE, 2006)
Internal relative humidity (%) Surface temperature to avoid condensation (°C)
40 6
50 9.3
60 12
70 14.4
2.8 Thermal environment assessment methods
The thermal sensation of people is the basis for the development of the thermal
environment assessment methods. With the continuous improvement of the
knowledge in the thermal sensation of people, various methods evolved over time. At
the early stage, this knowledge in thermal sensation principles were developed through
extensive lab-based studies. However, in the later stage, data were collected from
actual buildings. This procedure provided more realistic evidence about the thermal
comfort preference of the occupants. Based on these findings, a range of thermal
comfort models have been proposed to date. The following sections present a review
of existing thermal comfort models and assessment methods.
2.8.1 Fanger’s thermal comfort model
Fanger (1967), determined a thermal comfort model. The model was developed from
extensive data collection and analysis with the participation of approximately 1300
college-age students and 128 older adults in a climate chamber based experimental
setting (Fanger, 1967).
Equation 2.4 describes Fanger’s thermal comfort model:
𝐹(𝑀, 𝐼𝑐𝑙, 𝑣, 𝑡𝑟, 𝑡𝑎, 𝑃𝑤) = 0 ………….(2.4)
Where, M = metabolic rate, met
Icl = cloth index, clo
v = air velocity, m/s
tr = mean radiant temperature, C°
ta = ambient air temperature, C°
Pw = vapour pressure of water in ambient air, Pa
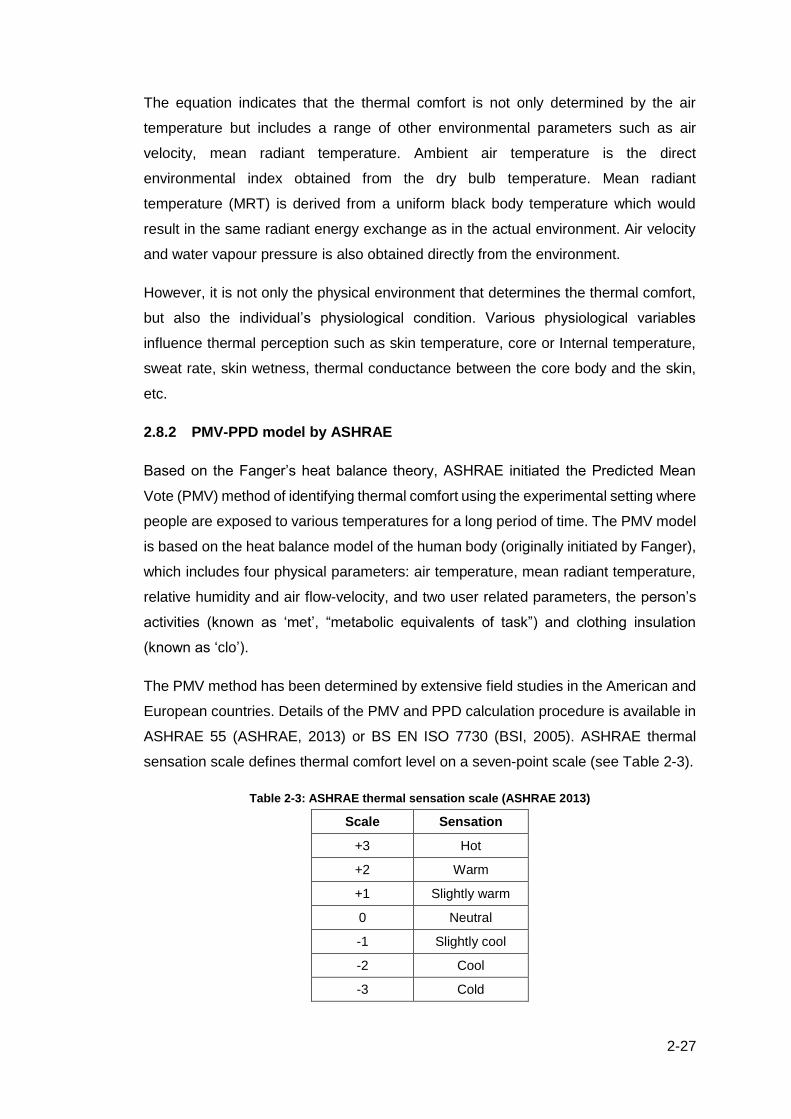
2-27
The equation indicates that the thermal comfort is not only determined by the air
temperature but includes a range of other environmental parameters such as air
velocity, mean radiant temperature. Ambient air temperature is the direct
environmental index obtained from the dry bulb temperature. Mean radiant
temperature (MRT) is derived from a uniform black body temperature which would
result in the same radiant energy exchange as in the actual environment. Air velocity
and water vapour pressure is also obtained directly from the environment.
However, it is not only the physical environment that determines the thermal comfort,
but also the individual’s physiological condition. Various physiological variables
influence thermal perception such as skin temperature, core or Internal temperature,
sweat rate, skin wetness, thermal conductance between the core body and the skin,
etc.
2.8.2 PMV-PPD model by ASHRAE
Based on the Fanger’s heat balance theory, ASHRAE initiated the Predicted Mean
Vote (PMV) method of identifying thermal comfort using the experimental setting where
people are exposed to various temperatures for a long period of time. The PMV model
is based on the heat balance model of the human body (originally initiated by Fanger),
which includes four physical parameters: air temperature, mean radiant temperature,
relative humidity and air flow-velocity, and two user related parameters, the person’s
activities (known as ‘met’, “metabolic equivalents of task”) and clothing insulation
(known as ‘clo’).
The PMV method has been determined by extensive field studies in the American and
European countries. Details of the PMV and PPD calculation procedure is available in
ASHRAE 55 (ASHRAE, 2013) or BS EN ISO 7730 (BSI, 2005). ASHRAE thermal
sensation scale defines thermal comfort level on a seven-point scale (see Table 2-3).
Table 2-3: ASHRAE thermal sensation scale (ASHRAE 2013)
Scale Sensation
+3 Hot
+2 Warm
+1 Slightly warm
0 Neutral
-1 Slightly cool
-2 Cool
-3 Cold

2-28
2.8.3 The concept of adaptive thermal comfort models
The bases for adaptive comfort models were established from early studies in the
1970s which specified the relationship between outdoor temperature and human
thermal comfort. The attempt to include adaptive comfort models in the standards are
found from ASHRAE. de Dear et al. (1998) conducted a study within the project known
as ASHRAE RP-884 to identify adaptive thermal comfort indices. The authors
conducted an extensive analysis of previously collected data from all over the world.
Their analysis was based on 21,000 individual data collected from 160 countries
around the world. According to the authors, three clearly distinguished broad
categories of thermal adaption are - behavioural adjustments, and occupants’
physiological and psychological condition. Among these three, behavioural adjustment
of the body’s heat balance probably plays the most dynamic role in maintaining
people’s comfort. Clothing control is one of the most active adaptive approaches used
to control the heat balance associated with behavioural adjustments.
2.9 Comfort models
2.9.1 de Dear and Brager (1998)
The following equation is presented in the publication by de Dear and Brager (1998)
for the adaptive comfort calculation for a centralized HVAC building. The authors also
proposed 80% and 90% comfort criteria based on percentage dissatisfied.
𝑇𝑐𝑜 = 22.6 + 0.04. 𝐸𝑇𝑜𝑢𝑡∗ …………(2.5)
Equation 2.5 was derived after accounting the effects of semantic artefacts in comfort
criteria as described in de Dear et al. (1998), analysing the field data (described in
section 2.8.3). Here 𝑇𝑐𝑜 is the comfort temperature.
The upper (+) and lower (-) limit for 80% acceptability criteria can be defined by:
𝑇𝑐𝑜 = 22.6 + 0.04. 𝐸𝑇∗ ± 1.91 …………(2.6)
And the upper (+) and lower (-) limit for 90% acceptability criteria can be defined by:
𝑇𝑐𝑜 = 0.04 𝑥 𝐸𝑇* + 22.6 ± 1.12 …………(2.7)
For naturally ventilated buildings, the comfort criteria are described by the following
equation:
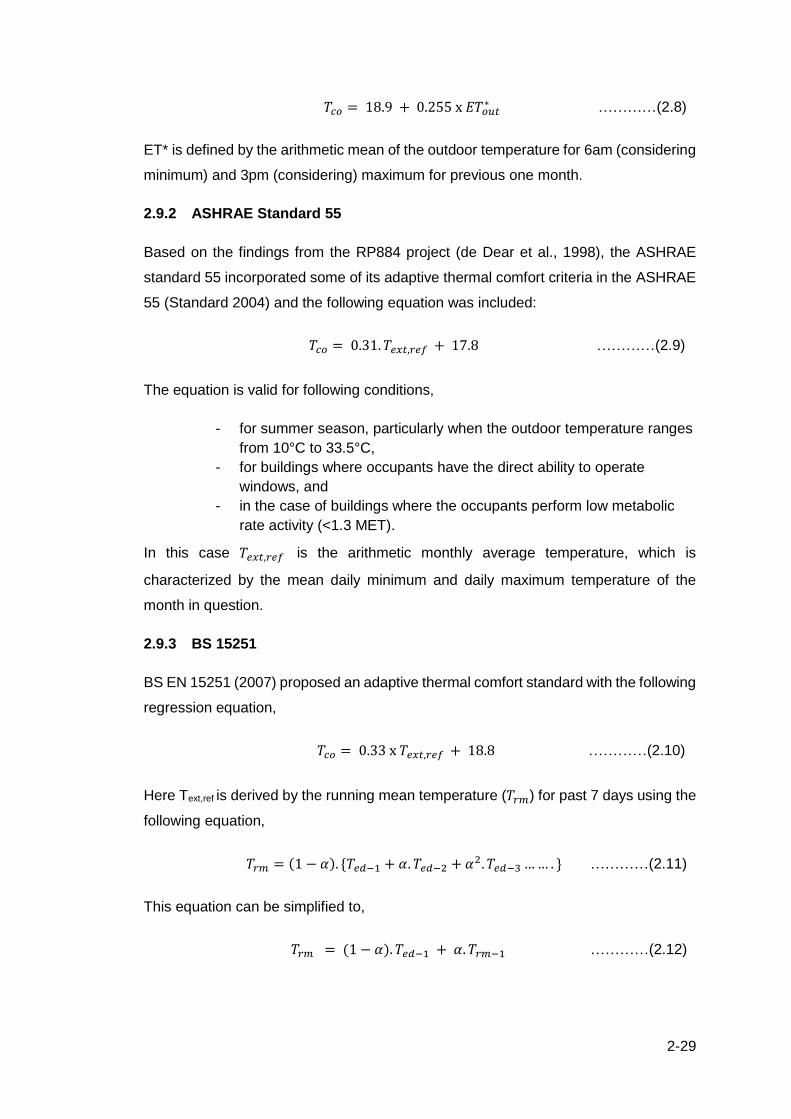
2-29
𝑇𝑐𝑜 = 18.9 + 0.255 x 𝐸𝑇𝑜𝑢𝑡∗ …………(2.8)
ET* is defined by the arithmetic mean of the outdoor temperature for 6am (considering
minimum) and 3pm (considering) maximum for previous one month.
2.9.2 ASHRAE Standard 55
Based on the findings from the RP884 project (de Dear et al., 1998), the ASHRAE
standard 55 incorporated some of its adaptive thermal comfort criteria in the ASHRAE
55 (Standard 2004) and the following equation was included:
𝑇𝑐𝑜 = 0.31. 𝑇𝑒𝑥𝑡,𝑟𝑒𝑓 + 17.8 …………(2.9)
The equation is valid for following conditions,
- for summer season, particularly when the outdoor temperature ranges
from 10°C to 33.5°C,
- for buildings where occupants have the direct ability to operate
windows, and
- in the case of buildings where the occupants perform low metabolic
rate activity (<1.3 MET).
In this case 𝑇𝑒𝑥𝑡,𝑟𝑒𝑓 is the arithmetic monthly average temperature, which is
characterized by the mean daily minimum and daily maximum temperature of the
month in question.
2.9.3 BS 15251
BS EN 15251 (2007) proposed an adaptive thermal comfort standard with the following
regression equation,
𝑇𝑐𝑜 = 0.33 x 𝑇𝑒𝑥𝑡,𝑟𝑒𝑓 + 18.8 …………(2.10)
Here Text,ref is derived by the running mean temperature (𝑇𝑟𝑚) for past 7 days using the
following equation,
𝑇𝑟𝑚 = (1 − 𝛼). {𝑇𝑒𝑑−1 + 𝛼. 𝑇𝑒𝑑−2 + 𝛼2. 𝑇𝑒𝑑−3 … … . } …………(2.11)
This equation can be simplified to,
𝑇𝑟𝑚 = (1 − 𝛼). 𝑇𝑒𝑑−1 + 𝛼. 𝑇𝑟𝑚−1 …………(2.12)
2-30
Where,
Trm = Running mean temperature for today
Trm-1 = Running mean temperature for previous day
Ted-1 = Daily mean external temperature for the previous day
Ted-2 = Daily mean external temperature for the day before and so on
α is a constant between 0 to 1, and recommended to use 0.8.
The guide also proposes that running mean temperature can be derived using
following approximate equation,
𝑇𝑟𝑚 = (𝑇𝑒𝑑−1 + 0.8 𝑇𝑒𝑑−2 + 0.6𝑇𝑒𝑑−3 + 0.5𝑇𝑒𝑑−4 + 0.4𝑇𝑒𝑑−5 + 0.3𝑇𝑒𝑑−6 +
0.2𝑇𝑒𝑑−7) / 3.8 …………(2.13)
According to BS EN 15251 (BSI, 2007), the risk of overheating relates to comfort
temperature, along with the categories of building and its users. Acceptable
temperature ranges for different categories of the buildings are listed in Table 3-8.
2.10 Summary
This chapter presents properties of ETFE-foil and various alternatives to modify
properties of ETFE foils those can be used to enhance thermal performance ETFE-foil
cushion. It also discusses the results obtained on previous studies which shows that
air in-between foil layers in a cushion creates a temperature gradient across the air
chamber that in turn affects surface temperature of the ETFE-foil, particularly in two
and three-layer cushion systems. Both convective and radiative heat transfer results
in this temperature gradient. Therefore, in order to better understand the thermal
performance of membranes like ETFE-foil, it is necessary to focus on following
properties.
▪ Solar transmittance
▪ Solar absorptance
▪ Reflectance
▪ Emissivity
▪ Thermal transmittance

2-31
On the basis of findings of previous research, the thermal behaviour of space enclosed
with a membrane envelope can be characterised by non-uniformity and responsive.
Both air temperature, and surface temperature results in this non-uniform behaviour.
It can be assumed that similar conditions might exist in spaces enclosed with ETFE
cushions which is unexplored. Thus in order to investigate the thermal condition of a
spaces enclosed with ETFE cushion, it is necessary to focus on following aspects.
• Influence of external environmental stimuli e.g. solar radiation, outdoor
temperature on thermal state of ETFE-foil cushion surface
• Influence of surface temperature of ETFE-foil on the air temperature
• Identify whether temperature stratification exists and the extent of this
stratification
• Impact of this stratification on occupant’s thermal comfort
• Selection of a space which can be used to represent above phenomenon e.g.
enclosed space with large internal height
This chapter also reviewed thermal comfort models presented in different standards
such as CIBSE, ASHRAE and British Standard. The basic principles of these comfort
models are identical and applicable for naturally ventilated buildings. In order to identify
comfort band, outdoor temperature is the key along with occupant’s activity,
physiological condition etc. On the basis of the category of the building (e.g. category
II of BS 15251) and outdoor temperature, it is possible to identify the temperature
benchmark that can be used to assess the thermal performance of existing space
enclosed with ETFE-foil cushion.

3-32
Chapter 3
3 Methodology
3.1 Introduction
This chapter outlines the research methodologies used to achieve the research aim
and objectives. The bases to identify the research methods were initially gathered by
reviewing relevant research articles and books. Also guides and standards were
reviewed to identify thermal performance standards and specific methods for material
performance analysis. A pilot study was conducted to verify the data collection
approach for occupied buildings, which provided the basis to finalise the approach for
collecting long term environmental data.
At the beginning, this chapter discusses the context of the research and establishes
the wider research approach. Then the chapter presents the procedure followed to
conduct the pilot study and results obtained from this study. Subsequently the chapter
describes detailed methods adopted to evaluate the thermal performance of ETFE foil
cushions and spaces enclosed with them. A detailed description of the case study
buildings, data collection and analysis techniques and environmental performance
analysis methods is provided, and the selection of building simulation tools is
discussed.
3.2 Background
In Chapter 2 the existing body of knowledge on the thermal perfromance of ETFE foil
and space enclosed by it was critically reviewed. It was apparent that, limited research
had investigated thermal performance of ETFE foil cushions whereas no research was
focused on actual thermal performance of a space enclosed with an ETFE cushion
enclosure. Although ETFE foil’s thermal-optical properties, structural properties,
thermal characteristics etc., were different from other fabric membranes e.g. PVC
coated polyester, PTFE coated glass etc., their application and functional purposes
were similar. Therefore, the methodology adopted by different researchers to analyse
environmental performance of lightweight envelope were reviewed here, e.g. Harvie
(1996), Devulder et al. (2007), He and Hoyano (2010), He and Hoyano (2010), Croome
and Moseley (1984b), Wu et al. (1984) etc. It was evident from their studies that fabric
membranes are extremely responsive to the external weather conditions. Besides,
Harvie (1996) and Devulder (2004) found that thermal behaviour of spaces enclosed
3-33
by light-weight envelopes was unconventional. However, heat transfer mechanisms
that caused this type of behaviour were similar to those found within any other type of
enclosures constructed of conventional building materials. Nevertheless, the thermal
performance of ETFE foil cushions and the space they enclose would need to be
quantified. This could only be explained on the basis of knowledge of individual heat
transfer mechanisms that occur on the ETFE foil cushion envelope.
Moreover, appropriate analytical techniques developed through empirical knowledge
would require to evaluate the thermal performance of ETFE foil and the spaces
enclosed by it. Therefore, this subject would require long-term research that would
include investigation on thermal-optical properties of ETFE foil, evaluation, and
prediction of thermal performance of ETFE foil and spaces enclosed by ETFE cushion
envelope.
Because of the complexity of the subject, it was thought to be necessary to undertake
simple pilot studies at the beginning. The fundamental aim was to provide basic
information about the thermal performance of space enclosed by ETFE foil cushions
and to recognize difficulties that were likely to be encountered while investigating that
performance more precisely.
3.3 The Pilot Studies
3.3.1 The purpose of the pilot studies
Because no existing research has analysed the thermal performance of actual spaces
enclosed with an ETFE cushion roof, a pilot study was carried out. The pilot study
conducted limited monitoring of an existing space enclosed with an ETFE cushion
envelope. The objectives of this study was:
• to gain an overall impression of the thermal performance of space enclosed by
ETFE foil cushions,
• to reveal how thermal performance could best be studied for a more
comprehensive monitoring programme,
• to identify what information would be required if an attempt was made to predict
that performance.
3.3.2 Method adopted for the pilot study
An in-situ method was adopted for the pilot study. This was conducted between 21st
August 2013 and 26th August 2013. For this study only one building was available, the
Nottingham High School. The Nottingham High School has a three-storey atrium which

3-34
was enclosed with a two-layer, 25 cushion ETFE foil cushion roof, in 2009. The
rationale of selection of the building and detailed description of this can be found in
Section 3.7.1.
The screened thermocouples continuously recorded diurnal variations of air
temperature at various levels in the atrium, at 1 minute intervals to give a clear
impression of how quickly the thermal condition of the space responded to the climatic
variation. Site weather data was collected from a weather station located on an
adjacent roof of the school which was close to the ETFE cushion roof (see Figure
3-12). This weather station recorded data at 5 minute intervals. Thus, to see the impact
of outdoor weather (e.g. outdoor temperature) on indoor thermal conditions data
recorded at 5 minute intervals was extracted, plotted and analysed.
3.3.3 Equipment used for the pilot study
During the pilot study, internal air temperature of various levels of the atrium and
transmitted solar radiation through the ETFE cushions was monitored with available
equipment. Table 3-1, Figure 3-1 and Figure 3-2 present sensor identifications and
locations in the atrium. Figure 3-1 also presents location of the cushion in which
surface temperature was measured using thermal imaging.
The equipment used in the pilot study were:
• 𝜙0.1 mm K-type thermocouple (screened) to measure internal air temperature
• Data Taker DT80 data logger to record data
• Kipp & Zonen CMP1 Pyranometer (spectral range: 0.3-2.8μm) to measure
internal transmitted solar radiation
• Internal surface temperature of cushion measured using thermal imaging
camera (FLIR T900)
Table 3-1: Sensors identification and location -Pilot Study
Sensor identification Location
H1 First floor air temperature
H2, H3 Second floor air temperature
InIR Internal transmitted solar radiation
OAT Outdoor air temperature

3-35
Figure 3-1: Location of the data logger and the solar radiation sensor (top), location of the cushion where internal surface temperature was measured using thermal camera (bottom)- Pilot
study [Plans (nts): Maber Architects]

3-36
Figure 3-2: Location of sensors in the School atrium [Section (nts): Maber Architects]
The selected time for the pilot study was a school holiday period. Therefore, the atrium
was not occupied by students and the HVAC system was not operating during that
period. Besides during the study period, it was possible to access to the school atrium
on 22nd August 13 to acquire thermal images of the ETFE cushion roof.
3.4 The results
Second floor (H2) and first floor (H1) air temperature was on average 3.8°C and 3°C
hotter than that of outdoor air temperature respectively. Besides, temperature
differences recorded at two different positions apart by 1.5m on the second floor (H2
and H3) varied between 0.37°C to 1.98°C during the day but coincided at night and
morning. Figure 3-3 presents internal air temperatures of the atrium, outdoor air
temperature and transmitted solar radiation on 22nd August 2013. From Figure 3-3 it
can be seen that during the day air temperature of second floor (H2, H3) stayed 1°C
to 4.5°C hotter than that of the first floor (H1). However, at night the first floor air
temperature was 0.5°C above the air temperature recorded on the second floor (H2,
H3). Therefore, this variation in air temperature indicates existence of positive and
negative stratification during the day and night respectively. Moreover, during the day
air temperature of the second floor (H2, H3), followed a similar trend to outdoor air
temperature and transmitted solar radiation. This indicated the impact of outdoor
weather parameter (OAT, InIR) on the second floor thermal condtions during both day
and night.
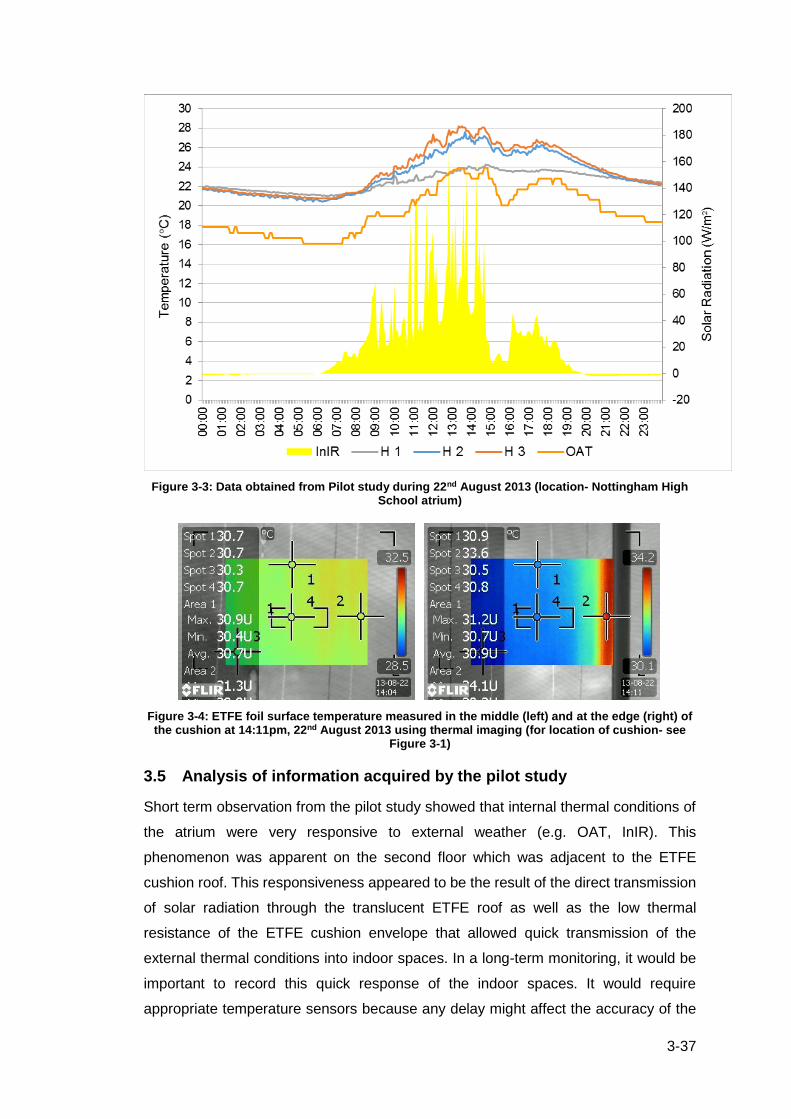
3-37
Figure 3-3: Data obtained from Pilot study during 22nd August 2013 (location- Nottingham High School atrium)
Figure 3-4: ETFE foil surface temperature measured in the middle (left) and at the edge (right) of the cushion at 14:11pm, 22nd August 2013 using thermal imaging (for location of cushion- see
Figure 3-1)
3.5 Analysis of information acquired by the pilot study
Short term observation from the pilot study showed that internal thermal conditions of
the atrium were very responsive to external weather (e.g. OAT, InIR). This
phenomenon was apparent on the second floor which was adjacent to the ETFE
cushion roof. This responsiveness appeared to be the result of the direct transmission
of solar radiation through the translucent ETFE roof as well as the low thermal
resistance of the ETFE cushion envelope that allowed quick transmission of the
external thermal conditions into indoor spaces. In a long-term monitoring, it would be
important to record this quick response of the indoor spaces. It would require
appropriate temperature sensors because any delay might affect the accuracy of the

3-38
data recorded. Besides, solar transmittance of the translucent ETFE cushion envelope
seemed to be responsible for the frequent change in internal conditions of the atrium.
Thus, it was essential to determine these two properties of ETFE foil cushion.
Conditions recorded at different vertical positions within the atrium were found to be
different as a result of their proximity to the ETFE cushion roof. Observation of the pilot
study also suggested that during periods of bright sunshine significant thermal
stratification exist in the atrium. Therefore, it is important to establish an appropriate
strategy while positioning internal temperature sensors for long-term monitoring.
On the other hand, along with monitoring of indoor spaces, it would be important to
monitor the thermal condition of the ETFE cushion envelope e.g. surface temperature
of the ETFE foil. This would demonstrate the impact of the thermal condition of ETFE
foil envelope on the thermal performance of the actual enclosures.
However, the environmental conditions of the actual enclosures were uncontrolled.
Moreover, these conditions were also influenced by the HVAC system, occupancy,
internal gains etc. During the monitoring, it would be difficult to clearly identify the effect
of the ETFE foil cushion roof on the overall performance of the environment it enclosed.
Therefore, to see the actual impact of ETFE foil on the enclosed spaces, it would be
necessary to investigate this separately under controlled and known environment.
3.6 Proposed methodology
On the basis of analysis of the results obtained from the pilot study it was decided to
investigate two elements separately. These were:
• thermal performance evaluation of ETFE foil, and
• thermal performance evaluation of spaces enclosed with a ETFE foil
cushion envelope
The following section presents the objectives and methods to investigate this two
element separately.
3.6.1 Thermal performance evaluation of ETFE-foils
The thermal performance of single, two and three layer ETFE-foil panels were
evaluated and compared in a test rig investigation. This was completed to achieve
objective 3 and the method is discussed thoroughly in Chapter 5. This test rig
experiment was also applied to measure the solar transmittance of single, two- and
three-layer ETFE-foil panels. Results were validated by comparing these with values

3-39
obtained using lab-based experiment and BS EN 410: 2011 (BSI, 2011). In order to
achieve objective 5 thermal modelling and simulation was done. Here predicted
models represented a similar configuration to that of the test rig. Using the same model
thermal conditions of ETFE foil panels and glass panels were simulated and compared.
The results were validated by comparison with values measured in the test rig
experiment. Detailed description of this method is presented in Chapter 7. The
environmental data and simulation data were analysed adopting the similar procedure.
3.6.2 Thermal performance evaluation of ETFE-foil cushions and the spaces
enclosed with an ETFE foil cushion envelope
In order to evaluate the thermal performance of ETFE foil cushions and the spaces
enclosed, two different buildings were selected. These were the Nottingham High
school, and the Engineering and Science Learning Centre (ESLC) at the University of
Nottingham. Both are institutional buildings. Selected case study buildings can be
considered to represent the desired sample and data obtained from these buildings
were expected to fulfil the research objectives. The rationale for selection of the case
study buildings are presented in section 3.7; building information, usage pattern,
services etc. of the Nottingham High School and the ESLC are stated in section 3.8
and section 3.9 respectively. Detailed methods are discussed in Chapter 6. Modelling
and simulation were applied to predict the performance of case study buildings in
current time and according to the UKCP09 climate change scenarios (the 2050s,
2100s). Thermal conditions and energy consumption of predictive models enclosed
with an ETFE foil cushion roof and glass roof were analysed and compared. Detailed
methods are stated in Chapter 7. The method adopted for environmental assessment
of actual buildings and predictive models were identical. Similar guides and standards
were used to assess overheating and indoor thermal performance.
Table 3-2 presents objectives and associated methodologies adopted in this research.
Figure 3-5 presents the flow diagram showing methodologies and associated
objectives. Figure 3-6 shows the methods adopted to obtain and analyse data obtained
from the experimental investigation, environmental monitoring and simulation and
modelling process.

3-40
Table 3-2: Research objectives and associated methodologies
No. Objectives Method
1 Develop knowledge base on properties of ETFE-foils and ETFE-foil cushion construction; identify the thermal behaviour of fabric membranes and spaces enclosed with fabric membrane envelope
Literature review
2 Determine thermal-optical properties of ETFE-foils Lab experiment, British Standard
3 Evaluate the thermal performance of single, two and three layers ETFE-foil panels
Test rig experiment
4 Evaluate the thermal performance of occupied spaces enclosed with ETFE-foil cushion envelope
Monitoring existing buildings
5 Evaluate and compare the thermal performance of spaces enclosed with ETFE-foil cushion and glass roof
Computer simulation
6 Identify strategies to improve the thermal performance (overheating) of spaces enclosed with ETFE-foil cushion in current and projected climate scenarios
Data analysis and computer simulation
7 Identify implication of the research and develop design recommendations of ETFE-foil panels and spaces enclosed with ETFE-foil cushion envelope
Result analysis

3-41
Figure 3-5: Flow diagram of methodologies and associated objectives
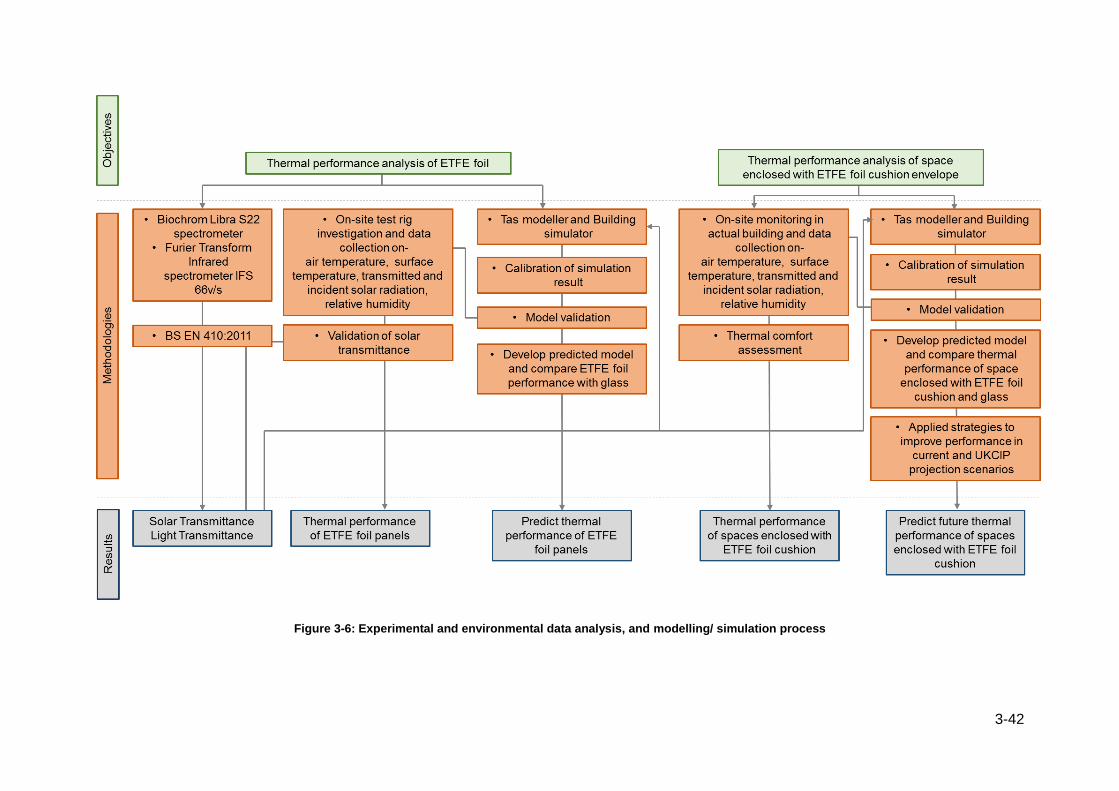
3-42
Figure 3-6: Experimental and environmental data analysis, and modelling/ simulation process

3-43
3.7 Method to analyse thermal performance of spaces enclosed with
ETFE-foil cushion roof
Following sections describes the rationale for selection of the type of buildings for long-
term monitoring.
3.7.1 Criteria for selection of monitored buildings
Two buildings were selected to measure the performance of ETFE-foil cushions.
Summary of salient features of case study buildings are presented in Table 3-3. The
rationale for selection of these buildings is described in the following sections.
3.7.1.1 Scale
For the purpose of this study spaces covered with ETFE-foil cushion were necessary,
however, to observe the full range of thermal stratification it was necessary that space
is large enough, such as an atrium. Thermal stratification that also impacts thermal
comfort is also a common phenomenon to evaluate thermal performance. It was also
considered to select a building with an atrium mostly used for functional purposes. The
selection was also based on buildings that were compliant with recent building
regulations on energy efficiency. Therefore, results obtain could serve as a basis for
establishing the typical thermal behaviour of ETFE-foil enclosures to assist designers
and architects in the decision making process while applying ETFE-foil cushion
envelopes in building design.
3.7.1.2 Location
Available resources for the data collection and on-site monitoring were limited.
Therefore, existing buildings situated within reasonable traveling distance were given
priority.
3.7.1.3 Occupancy
Occupancy profile and internal gains affect a building’s indoor thermal performance.
However, monitoring user behaviour requires complex equipment, which was not
available during the monitoring. Therefore, preference was given to select moderate
occupancy building with fixed user behaviour patterns.
3.7.1.4 ETFE-foil cushion construction
Building envelopes that were constructed with two- or three-layer ETFE-foil cushion
systems were given priority.

3-44
Table 3-3: Summary of salient features of monitored ETFE-foil cushion enclosures
Description Case Study 1: Nottingham Boys High School
Case Study 2: Engineering and Science Learning centre (ESLC)
Built year 1860-1960 (renovated in 2009)
2011
Atrium Total Floor area 1297m2 (approx.) 615m2 (approx.)
Number of floor 3 3
Type of space (ETFE-foil cushion roofing system was used)
Atrium Atrium
Occupancy Continuous
High
Intermittent
Moderate
ETFE-foil cushion type Double layer
Top layer: 200 microns (75% fritted)
Bottom layer: 200 microns (transparent)
Covered with rain noise suppression mesh externally
Triple layer
Top layer: 200 microns with 4.2mm standard dot matrix pattern (65% coverage)
Middle layer: 150 microns clear
Bottom layer: 150 microns clear
Monitored period November 2013- September 2015
August 2014 to September 2015
Roof area 625m2 396m2
Location Nottingham, UK Nottingham, UK
3.8 Case Study A: Nottingham Boys High School, Nottingham, UK
3.8.1 Building information
The three-storey school building, located in Nottingham, was originally built in 1860. It
has a central courtyard, which was renovated during 2009 to form an enclosed atrium.
The three-storey high atrium contains a dining hall and cafeteria at ground floor and
first floor respectively, and a study space for students on the second floor. The atrium
roof consists of two–layer ETFE-foil cushions with fritted top layer and clear bottom
layer both of 200μm covered with a rain noise suppression mesh. This roof, see Figure
3-7 (b), is complete with aluminum framing, inflation and air management equipment
with associated air handling pipework and connections. In turn, these are supported
by steel trusses and columns so that the atrium roof structure does not bear on the
existing school buildings.

3-45
(a) (b) (c)
Figure 3-7:(a) Location of High school [Source: Google map], (b) roof of atrium [photo: Sabrina Afrin], (c) atrium [photo: Sabrina Afrin]
3.8.2 Building usage pattern
The school building and its system operate between 8am and 6pm with most activities
take place in the atrium between 8am and 3pm, which are the usual school hours.
During school holidays, the ground floor of the atrium is generally used by the holiday
club for particular times and rest of the floors remain unoccupied.
3.8.3 Services
The atrium space heating system consists of fan coil units, fan convectors, under floor
heating systems and mechanical ventilation, controlled by a Building Management
System (BMS). It operates on a global time zone set from 08.00 to 18.00, Monday-
Friday, and is turned off at weekends. Natural ventilation operates automatically
through windows at high level (located on the west side only) in conjunction with
dampers located above north and south entrance doors at the ground floor. Under floor
heating systems operates throughout the year when average air temperature of the
atrium dropped below 18°C.
Later in August 2015, four wall mounted air conditioning units were installed in the
second floor of the atrium. But according to the school management, this air
conditioning system was not operating until the end of September 2015.
3.8.4 Installed monitoring equipment
The on-site monitoring started from November 2013 and was completed in September
2015. The detailed monitoring protocol is described in the following sections.

3-46
3.8.4.1 Data logger
Two different roof spaces were selected to place the data loggers and sensors on the
basis of agreement with the estate manager. These roofs were internal flat roofs near
to the ETFE-foil cushion roof of the atrium. For clarity, roof locations were considered
as location a and location b. A DT85 data logger (location a) and a DT 80 data logger
(location b) were placed on these roofs. In total 18 and 12 number of thermocouples
were connected to the DT 85 (location a) and the DT 80 (location b) data loggers
respectively. Sensors connected with the data loggers were attached to the ETFE-foil
cushion surface (both internal and external) and suspended through the voids to reach
to each floor below. Location of these sensors is illustrated in Figure 3-8. These
temperature sensors were wired in a shared output configuration and their
electromagnetic shields were connected to the appropriate input of the data loggers.
These data loggers measured and recorded data at 1 minute intervals. Air temperature
and surface temperature sensor identification and location is presented in Table 3-4
and Table 3-5.
Table 3-4: Location of air temperature sensors
Sensor Identification Location Measured thermal conditions represent
Tsi 1(a)_NH Ground floor (Level 1) Part of the atrium adjacent to classroom, circulation
space Tsi 2(a)_NH First floor (Level 2)
Tsi 3(a)_NH Second floor (Level 3)
Tsi 4(a)_NH Adjacent to ETFE-foil cushion 1 surface (Level 4)
Tsi 2(b)_NH First floor (Level 2)
Tsi 3(b)_NH Second floor (Level 3)
Tsi 4(b)_NH Adjacent to ETFE-foil cushion 2 surface (Level 4)
Tsi 1(c)_NH Ground floor (Level 1) Middle of the atrium
Tsi 2(c)_NH First floor (Level 2)
Tsi 3(c)_NH Second floor (Level 3)

3-47
Table 3-5: Location of surface temperature sensors
Sensor Identification Location Measured temperatures represent
ST_Loc 1_NH Cushion 1 External Middle of the cushion
ST_Loc 2_NH Edge of the cushion
ST_Loc 3_NH Internal Middle of the cushion
ST_Loc 4_NH Middle of the cushion
ST_Loc 5_NH Edge of the cushion
ST_Loc 7_NH Cushion 2 Internal Middle of the cushion
(a) Ground floor (Occupied level 1) [Figure 3-8 continued to the next page]

3-48
(b) First floor (Occupied level 2)
(c) Second floor (Occupied level 3) [Figure 3-8 continued to the next page]

3-49
(d) Below ETFE-foil cushion roof (Level 4)
Figure 3-8: Location of the data logger (a,b,c) and temperature sensors in (a) Ground floor, (b) First floor, (c) Second floor, (d) Level 4, Plan (nts)- drawing courtesy of Maber Architects, Photo -
Sabrina Afrin
3.8.4.2 Air temperature sensors
Thermocouples (𝜙0.1 mm, K-type) were distributed vertically and horizontally in
various plan position inside the atrium. Figure 3-8 shows location of these temperature
sensors located at the ground floor, first floor and second floor of the atrium. While
placing these sensors, it was considered that sensors would not interfere with school
activities which was also advised by school management. Thermocouple tips were
shielded in lightweight thin aluminium tubes to minimise influence of incident radiation
and moisture on measured air temperatures. During the school holiday period between
21st August and 1st September 2015, the air temperatures in the middle of the atrium
were measured using Tiny tag data loggers. This location was described as Location
c in Figure 3-8.
3.8.4.3 Mean radiant temperature sensors
Harvie (1996), suggested that CIBSE (CIBSE, 2006, CIBSE, 2015b) method for
measuring mean radiant temperature using blackened globe might not be appropriate
for monitoring the thermal performance of fast response spaces enclosed by
membranes. Because this sort of globe could take up to 20 minutes to reach
equilibrium temperature (Parsons, 2003). Therefore the thick black globe
recommended by CIBSE (CIBSE, 2006, CIBSE, 2015b) was also considered
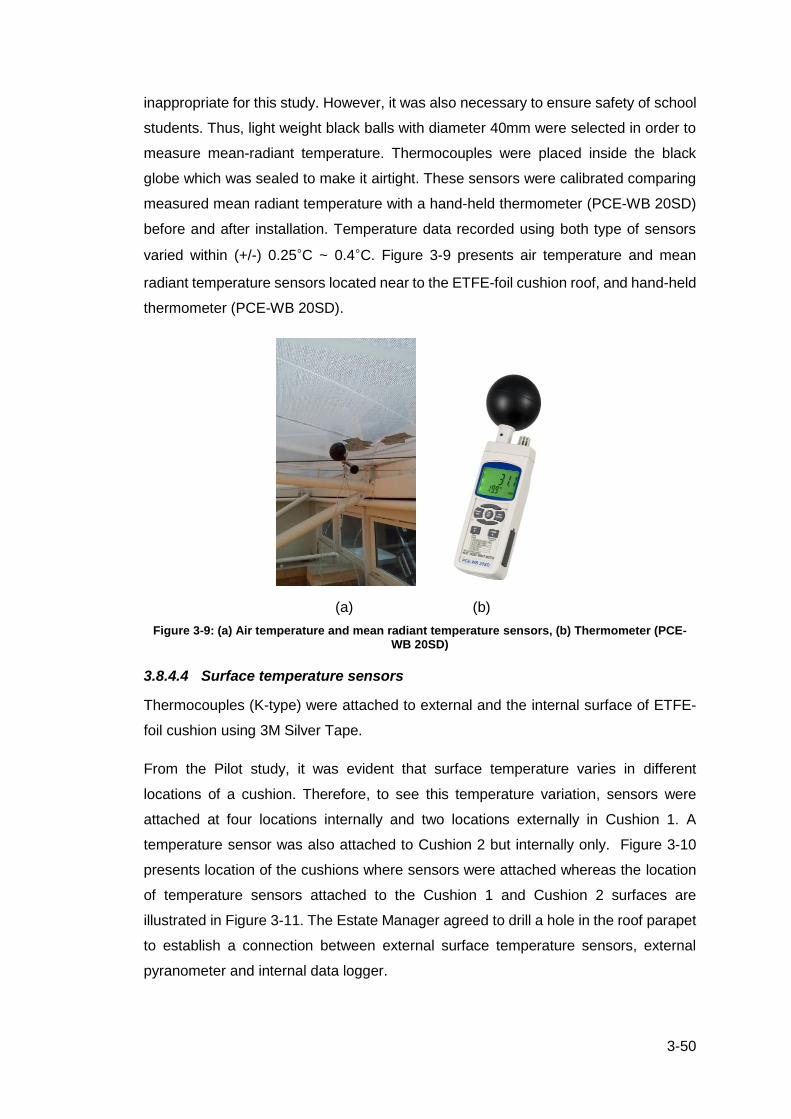
3-50
inappropriate for this study. However, it was also necessary to ensure safety of school
students. Thus, light weight black balls with diameter 40mm were selected in order to
measure mean-radiant temperature. Thermocouples were placed inside the black
globe which was sealed to make it airtight. These sensors were calibrated comparing
measured mean radiant temperature with a hand-held thermometer (PCE-WB 20SD)
before and after installation. Temperature data recorded using both type of sensors
varied within (+/-) 0.25°C ~ 0.4°C. Figure 3-9 presents air temperature and mean
radiant temperature sensors located near to the ETFE-foil cushion roof, and hand-held
thermometer (PCE-WB 20SD).
(a) (b)
Figure 3-9: (a) Air temperature and mean radiant temperature sensors, (b) Thermometer (PCE-WB 20SD)
3.8.4.4 Surface temperature sensors
Thermocouples (K-type) were attached to external and the internal surface of ETFE-
foil cushion using 3M Silver Tape.
From the Pilot study, it was evident that surface temperature varies in different
locations of a cushion. Therefore, to see this temperature variation, sensors were
attached at four locations internally and two locations externally in Cushion 1. A
temperature sensor was also attached to Cushion 2 but internally only. Figure 3-10
presents location of the cushions where sensors were attached whereas the location
of temperature sensors attached to the Cushion 1 and Cushion 2 surfaces are
illustrated in Figure 3-11. The Estate Manager agreed to drill a hole in the roof parapet
to establish a connection between external surface temperature sensors, external
pyranometer and internal data logger.

3-51
Figure 3-10: Plan (nts) showing ETFE-foil cushion roof and location of the monitored cushion, outlined in orange, surface temperature (both external and internal sensors location pointed in
red (Drawing courtesy of Maber Architects, Nottingham), Photo -Sabrina Afrin
(a) Internal roof plan (nts) [Figure 3-11 continued to the next pages]
Cushion 1
Cushion 2
ST Loc 2_NH
ST Loc 1_NH
External surface
temperature location
Internal surface
temperature location
ST Loc 4_NH
ST Loc 5_NH
ST Loc 7_NH

3-52
(b) External surface temperature sensors
Figure 3-11: Location of -(a) internal surface temperature sensors attached to cushion 1 & 2, solar radiation sensors placed on the internal roof, (b) external surface temperature sensors (cushion 1), solar radiation sensors adjacent to ETFE-foil cushion roof. Plan (nts)- drawing
courtesy of Maber Architects, Photo -Sabrina Afrin
3.8.4.5 Indoor and outdoor irradiance
Two Kipp&Zonen CMP3 Pyranometer (sensitive wavelength band: 0.3-2.8µm) were
positioned adjacent to the ETFE-foil Cushion 1. One was positioned internally to
measure transmitted total solar radiation and the other one was positioned externally
to measure incident total solar radiation. The internal pyranometer was positioned just
below the Cushion 1, and the external pyranometer was placed on the external roof,
adjacent to the Cushion 1. The distance between the internal and external
pyranometers were two metres (approx.). These solar radiation sensors were not used
to provide accurate tracking of the sun inside the space because the position of the
sensors and obvious shading created by the supporting structures would render
difficulties in the accuracy. The fundamental aim of measuring incident and transmitted
radiation via the ETFE-foil cushion roof was to identify its impact on the internal thermal
environment. It was observed that internal pyranometer was shaded by supporting and
surrounding structures, therefore a frame was mounted around the external
pyranometer to provide approximately similar shading characteristics. It was also
considered that this measurement could highlight short-term phenomenon
experienced on the site, e.g. passage of an isolated cloud in front of the sun, clear sky
radiation blocked by moving cloud, diffuse radiation in the absence of direct radiation
during the overcast day etc. Because of limited resources, it was only possible to
measure transmitted radiation through Cushion 1. Furthermore, external radiation

3-53
sensors were placed adjacent to Cushion 1 because the area adjacent to Cushion 2
was shaded by adjacent structures.
3.8.4.6 Relative humidity
During the monitoring period, internal relative humidity was recorded both in winter and
summer period. In winter this was done by placing Tiny Tag Plus 2- TGP-4017 data
logger near to the ETFE-foil cushion to examine the risk of condensation. In summer,
it was measured to observe the extent of variation in humidity in different occupied
levels.
3.8.5 Weather data
Weather data was collected at a regular interval from the weather station placed at a
distance of 30 metres (approx.) from the southeast part of the ETFE-foil cushion roof
(marked in red in Figure 3-12). This weather station records external ambient
temperature, relative humidity, wind speed, wind direction, and rainfall at five minute
intervals. However, for a limited period (May 2014 to July 2014) a sensor was placed
near to the ETFE-foil cushion roof (location marked in yellow in Figure 3-12) to record
outdoor ambient temperature and humidity at five minute intervals.
Figure 3-12: Weather station location on Nottingham High School roof
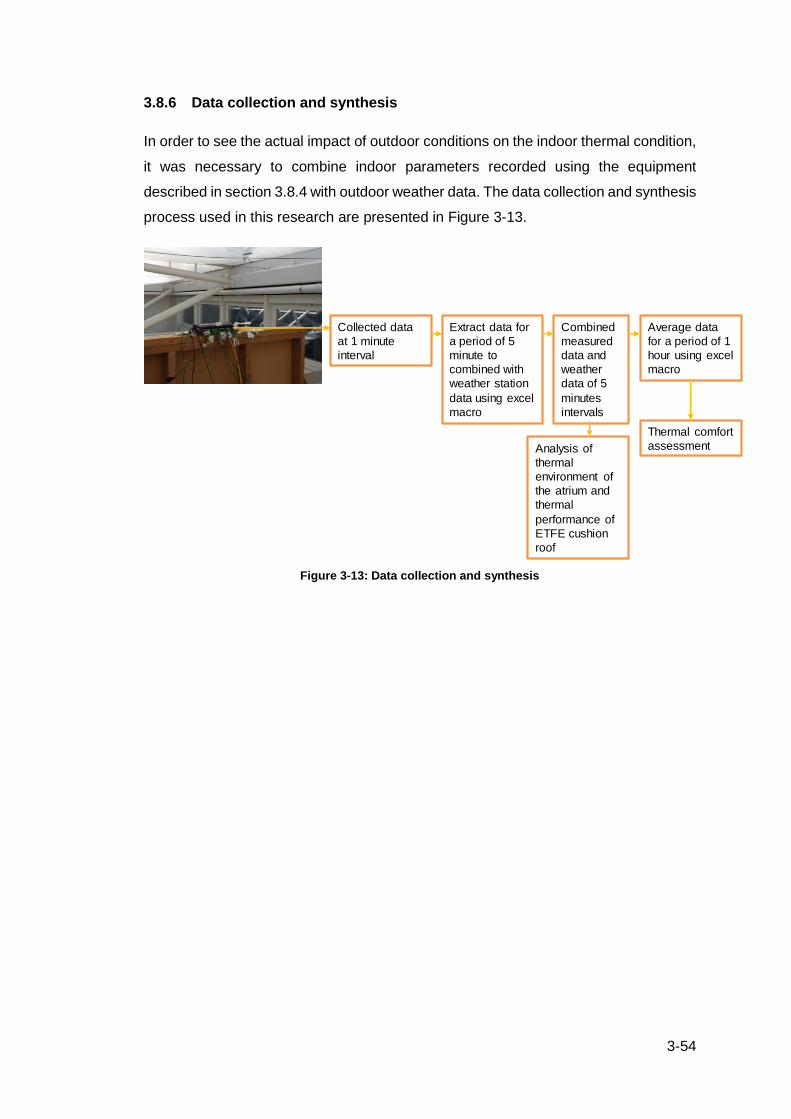
3-54
3.8.6 Data collection and synthesis
In order to see the actual impact of outdoor conditions on the indoor thermal condition,
it was necessary to combine indoor parameters recorded using the equipment
described in section 3.8.4 with outdoor weather data. The data collection and synthesis
process used in this research are presented in Figure 3-13.
Figure 3-13: Data collection and synthesis
Collected data
at 1 minute
interval
Extract data for
a period of 5
minute to
combined with
weather station
data using excel
macro
Average data
for a period of 1
hour using excel
macro
Analysis of
thermal
environment of
the atrium and
thermal
performance of
ETFE cushion
roof
Thermal comfort
assessment
Combined
measured
data and
weather
data of 5
minutes
intervals

3-55
3.9 Case Study B: Engineering and Science Learning Centre (ESLC),
Nottingham, UK
3.9.1 Building information
The Engineering & Science Learning Centre at the University of Nottingham is located
at the University Park Campus. This three-storey building was built during 2011. This
building contains support centre, graduate centre, learning and teaching space,
seminar rooms, computer rooms, seating spaces and a central atrium [see Figure 3-14
(b)] used for multipurpose activities. According to the designer, this large atrium is the
heart of the building and varying capacity rooms are arranged off the atrium on all three
floors. The main purpose of using ETFE-foil cushion roof was to gain natural light
through a lightweight roof.
(a) (b)
(c)
Figure 3-14: (a) Engineering and Science Learning Centre, University of Nottingham, (b) The atrium, (c) ETFE-foil cushion roof of ELSC [Photo- Sabrina Afrin]
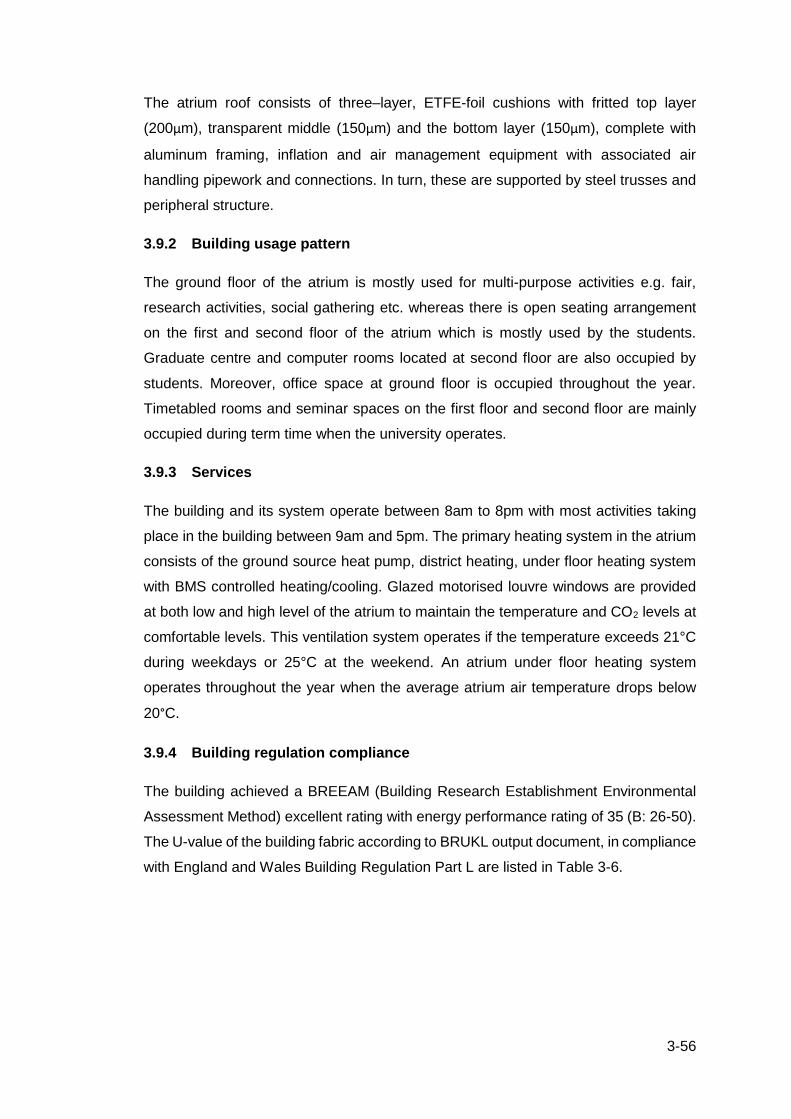
3-56
The atrium roof consists of three–layer, ETFE-foil cushions with fritted top layer
(200μm), transparent middle (150μm) and the bottom layer (150μm), complete with
aluminum framing, inflation and air management equipment with associated air
handling pipework and connections. In turn, these are supported by steel trusses and
peripheral structure.
3.9.2 Building usage pattern
The ground floor of the atrium is mostly used for multi-purpose activities e.g. fair,
research activities, social gathering etc. whereas there is open seating arrangement
on the first and second floor of the atrium which is mostly used by the students.
Graduate centre and computer rooms located at second floor are also occupied by
students. Moreover, office space at ground floor is occupied throughout the year.
Timetabled rooms and seminar spaces on the first floor and second floor are mainly
occupied during term time when the university operates.
3.9.3 Services
The building and its system operate between 8am to 8pm with most activities taking
place in the building between 9am and 5pm. The primary heating system in the atrium
consists of the ground source heat pump, district heating, under floor heating system
with BMS controlled heating/cooling. Glazed motorised louvre windows are provided
at both low and high level of the atrium to maintain the temperature and CO2 levels at
comfortable levels. This ventilation system operates if the temperature exceeds 21°C
during weekdays or 25°C at the weekend. An atrium under floor heating system
operates throughout the year when the average atrium air temperature drops below
20°C.
3.9.4 Building regulation compliance
The building achieved a BREEAM (Building Research Establishment Environmental
Assessment Method) excellent rating with energy performance rating of 35 (B: 26-50).
The U-value of the building fabric according to BRUKL output document, in compliance
with England and Wales Building Regulation Part L are listed in Table 3-6.
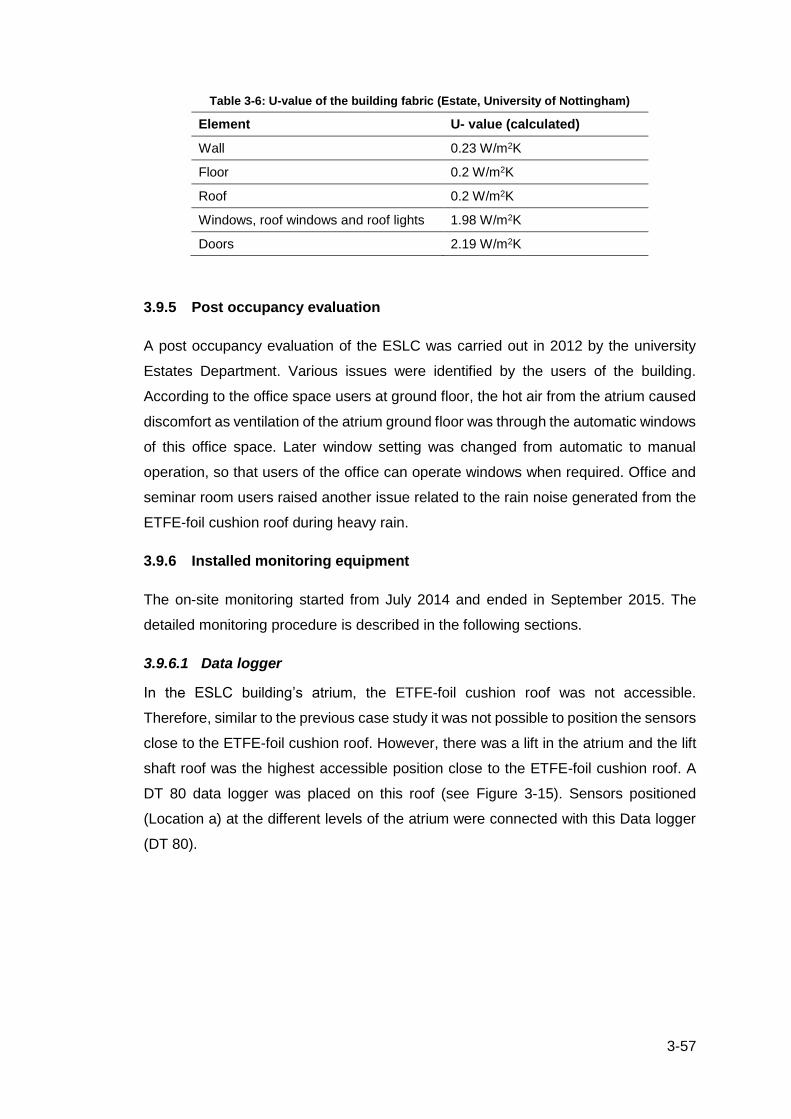
3-57
Table 3-6: U-value of the building fabric (Estate, University of Nottingham)
Element U- value (calculated)
Wall 0.23 W/m2K
Floor 0.2 W/m2K
Roof 0.2 W/m2K
Windows, roof windows and roof lights 1.98 W/m2K
Doors 2.19 W/m2K
3.9.5 Post occupancy evaluation
A post occupancy evaluation of the ESLC was carried out in 2012 by the university
Estates Department. Various issues were identified by the users of the building.
According to the office space users at ground floor, the hot air from the atrium caused
discomfort as ventilation of the atrium ground floor was through the automatic windows
of this office space. Later window setting was changed from automatic to manual
operation, so that users of the office can operate windows when required. Office and
seminar room users raised another issue related to the rain noise generated from the
ETFE-foil cushion roof during heavy rain.
3.9.6 Installed monitoring equipment
The on-site monitoring started from July 2014 and ended in September 2015. The
detailed monitoring procedure is described in the following sections.
3.9.6.1 Data logger
In the ESLC building’s atrium, the ETFE-foil cushion roof was not accessible.
Therefore, similar to the previous case study it was not possible to position the sensors
close to the ETFE-foil cushion roof. However, there was a lift in the atrium and the lift
shaft roof was the highest accessible position close to the ETFE-foil cushion roof. A
DT 80 data logger was placed on this roof (see Figure 3-15). Sensors positioned
(Location a) at the different levels of the atrium were connected with this Data logger
(DT 80).

3-58
(a) (b)
Figure 3-15: (a) Installation of data logger and sensors on the lift roof, (b) location of data logger
Table 3-7: Location of temperature sensors
Sensor Identification Location Measured thermal conditions represent
Tsi 1(a)_ESLC Ground floor (Level 1) Part of the atrium adjacent to class rooms, circulation
space Tsi 2(a)_ ESLC First floor (Level 2)
Tsi 3(a)_ ESLC Second floor (Level 3)
Tsi 4(a)_ ESLC Adjacent to ETFE-foil cushion 1 surface (Level 4)
Tsi 1 (b)_ ESLC Ground floor (Level 1)
Tsi 2 (b)_ ESLC First floor (Level 2)
Tsi 3 (b)_ ESLC Second floor (Level 3)
3.9.6.2 Air temperature sensors
Thermocouples (𝜙0.1 mm, K-type) were distributed vertically from the top of the lift
shaft roof towards the ground floor of the atrium. In total 10no. thermocouples were
used to measure air temperature of the atrium. Thermocouple tips were shielded in
lightweight thin aluminium tubes to minimise the influence of incident radiation and
moisture on measured air temperature. Location of these sensors are specified as
Location a and illustrated in Figure 3-16. Through personal communication with
University of Nottingham Estate, it was possible to collect air temperature data from
the building management system. The temperature sensors associated with the BMS
system were placed 8 metres away from Location a. These temperature sensors are
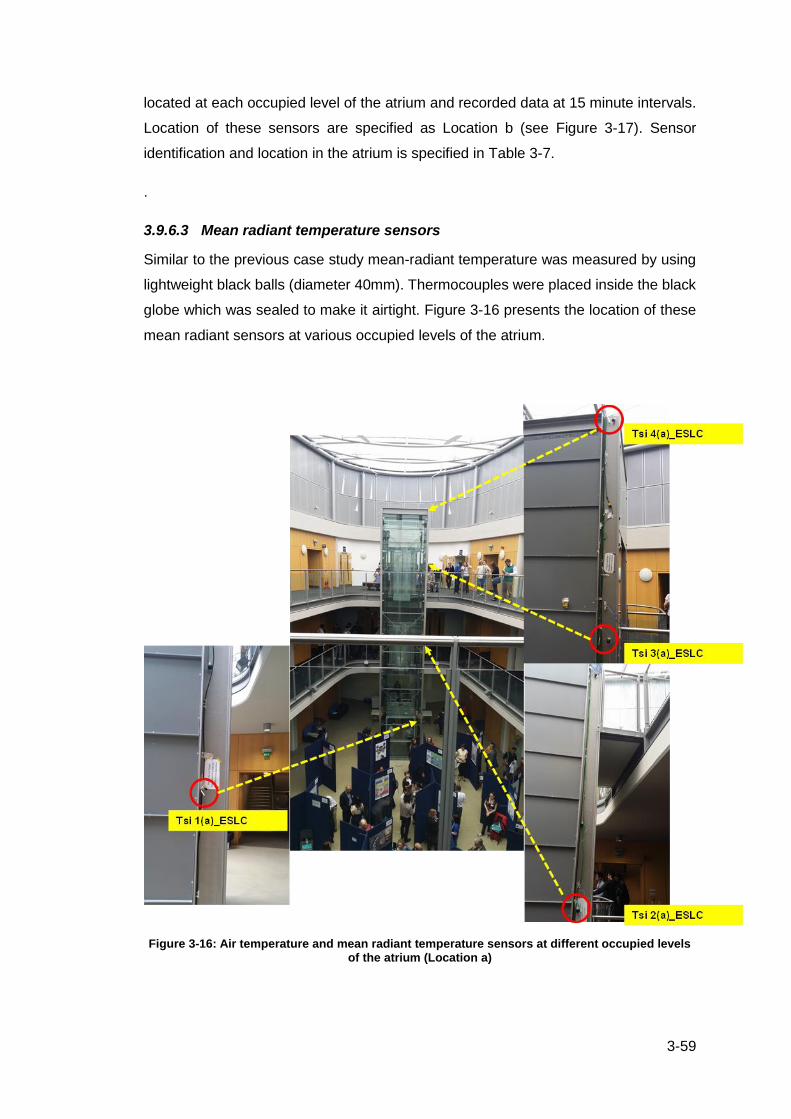
3-59
located at each occupied level of the atrium and recorded data at 15 minute intervals.
Location of these sensors are specified as Location b (see Figure 3-17). Sensor
identification and location in the atrium is specified in Table 3-7.
.
3.9.6.3 Mean radiant temperature sensors
Similar to the previous case study mean-radiant temperature was measured by using
lightweight black balls (diameter 40mm). Thermocouples were placed inside the black
globe which was sealed to make it airtight. Figure 3-16 presents the location of these
mean radiant sensors at various occupied levels of the atrium.
Figure 3-16: Air temperature and mean radiant temperature sensors at different occupied levels of the atrium (Location a)

3-60
Figure 3-17: Air temperature sensors at different levels of the atrium (Location b)
3.9.6.4 Surface temperature sensors
It was mentioned earlier that the ETFE-foil cushion roof was not accessible in the ESLC
building. Therefore, it was not possible to attached sensors to the ETFE-foil cushion
surface.
3.9.6.5 Indoor irradiance
Transmitted solar radiation was measured by Kipp & Zonen CMP3 Pyranometer
(sensitive wavelength band: 0.3-2.8µm). This pyranometer was positioned internally
on top of the lift roof. Figure 3-18 shows location of the internal pyranometer.

3-61
Figure 3-18: Location of the external and internal solar radiation sensors with respect to ETFE-foil cushion roof
3.9.6.6 Relative humidity
Indoor relative humidity of the occupied level 3 in summer was recorded using Tiny
Tag Plus 2- TGP-4017 data logger. The purpose was to examine its variability
particularly in the level that was exposed to the ETFE-foil cushion roof.
3.9.6.7 Weather data
Outdoor air temperature and relative humidity was recorded using Tiny Tag Plus 2-
TGP-4017 data logger. External total solar radiation was measured by Kipp & Zonen
CMP3 Pyranometer, (sensitive wavelength band: 0.3-2.8µm) which was placed
externally on a different roof 10 metres (approx.) apart from the ETFE-foil cushion roof
of ESLC (Figure 3-18). Weather data was also collected from weather station
positioned on top of the EoN house, which is located near the School of Architecture
and Built-Environment, University of Nottingham. This weather station is located
approximately 0.7 miles away from the Engineering and Science Learning Centre
building.
3.10 Thermal comfort assessment method
This section discusses the thermal comfort assessment methods that were applied to
evaluate the thermal performance of Nottingham High School and Engineering and
Science Leaning Centre atria.

3-62
3.10.1 CIBSE Temperature benchmark
The Chartered Institution of Building Services Engineers (CIBSE) has published
several guides on environmental design of buildings. CIBSE Environmental Guide A
(CIBSE, 2006, CIBSE, 2015b) provides temperature benchmarks or thresholds to
identify buildings’ overheating performance. This temperature threshold remains the
same, irrespective of the time of year and geographical location. CIBSE guide A states
the following criteria to assess overheating.
I. Criterion: The building will be overheated when peak temperature exceeds
more than 1% of annual occupied hours above 28°C.
3.10.2 Building Bulletin 101
Approved document Part L2A (HMGovernment, 2010b) and Part F1 (HMGovernment,
2010a) referred Building Bulletin 101 (UKGOV, 2014) as a source of guidance for
assessing overheating risk in educational buildings. According to The Building Bulletin
101 the performance standards for summertime overheating in compliance with the
Approved Document Part L2 are following:
1) Criterion 1: There should be no more than 120 hours when the air temperature
in the teaching and learning space rises above 28°C
2) Criterion 2: The average internal air temperature should no more than 5°C
above the outdoor air temperature
3) Criterion 3: The internal air temperature should not exceed 32°C during the
occupied hours
The Approved Document also stated that proposed school buildings should meet at
least two of the above criteria in order to comply with the performance standard and
demonstrate that teaching and learning spaces will not suffer from overheating.
Although BB101 considers external conditions by limiting temperature difference
between outdoor and indoor air temperature it does not consider occupant’s
vulnerabilities. Because during the summer period, it allows air temperature of 28°C
for the duration up to 120 hours (22% of the occupied hours). Acceptable temperature
and percentage of occupied hours both are quite high, the relationship between
outdoor and the indoor temperature is not realistic also. As a result, many schools
designed according to BB101 suffered from a number of difficulties e.g. overheating,
excessive energy use for heating, draught etc.(CIBSE, 2015c).

3-63
3.10.3 Adaptive comfort criteria to assess overheating
Thermal comfort range is influenced by the outside temperature and people can adapt
to a wider range of temperatures depending on their thermal experience of outdoor
temperatures of previous days (de Dear et al. 1998; de Dear & Brager 2002; Nicol &
Humphreys 2002). Thus, this provides a wider range of acceptable temperatures
specifically for naturally ventilated buildings. This concept is adopted in later standards
known as adaptive thermal comfort models and included in ASHRAE, BS EN and
CIBSE guides (BSEN15251, 2007, ASHRAE, 2013, CIBSE, 2013a).
The CIBSE overheating task force has considered adaptive thermal comfort models
and decided that it is no longer suitable to have a fixed indoor temperature regardless
of the outdoor conditions. This task force also suggested the application of an adaptive
approach for overheating assessment of free-running buildings, where the target
indoor temperature should reflect the outdoor temperature at that time (Nicol et al.,
2012). Lomas and Giridharan (2012) recommended using an adaptive approach while
analysing comfort conditions of the occupant in current and future UK climate.
However, in free running buildings occupant discomfort is related to the temperature
difference between the operative temperature and the comfort temperature whereas
comfort temperature changes with outdoor temperature.
CIBSE TM57 (CIBSE, 2015d) is the latest guide for integrated school design, which
specifies a temperature benchmark similar to that stated in BS EN 15251 (2007) and
CIBSE TM52 (CIBSE, 2013b). CIBSE TM52 (CIBSE, 2013b) gives specific guidance
on thermal comfort and overheating analysis for the UK. This guide provides various
thermal comfort and overheating criteria and summarises their use based on
building/usage types. The adaptive comfort criteria for free running - naturally
ventilated buildings are primarily based on BS EN 15251 (2007) adaptive comfort
models. The CIBSE TM52 specified three criteria to evaluate overheating in free-
running buildings. These criteria are presented in the following:
a) Criterion 1: Hours of exceedance (𝐻𝑒)
The number of hours (𝐻𝑒) during which ΔT (difference between maximum acceptable
temperature and operative temperature) is greater than or equal to one degree (K)
during the period between May and September inclusive shall not be more than three
per cent of occupied hours.

3-64
b) Criterion 2: Daily weighted exceedance (𝑊𝑒)
To allow for the severity of overheating on any individual day weighted exceedance
(𝑊𝑒) shall be less than or equal to 6 in any one day. The following equation can be
used to calculate this weighted exceedance:
𝑊𝑒 = ∑[(ℎ_𝑒 )×𝑊𝐹] ………..(3.1)
= (ℎ_𝑒0×0) + (ℎ_𝑒1×1) + (ℎ_𝑒2×2) + (ℎ_𝑒3×3) ………..(3.2)
Where the weighting factor 𝑊𝐹 = 0, if ΔT ≤ 0, otherwise 𝑊𝐹 = 𝛥𝑇, and ℎ𝑒𝑦 is the
time (h) when 𝑊𝐹 = 𝑦. Further details are available on CIBSE TM52 guide (CIBSE
2013).
c) Criterion 3: Upper limit temperature (𝑇𝑢𝑝𝑝)
The difference between operative temperature and maximum acceptable temperature
(ΔT) should not be more than 4K.
A free-running building that fails to meet any two of the above criteria would be
classified as overheated.
• Running mean temperature ( 𝑇𝑟𝑚)
The calculation of acceptable temperature limits is based on running mean
temperature, which is the weighted average of outdoor mean temperatures for the
previous seven days. According to BS EN 15251 (2007), running mean temperature
can be calculated using the following formula:
𝑇𝑟𝑚 = (1 − 𝛼). (𝑇𝑒𝑑−1 + 𝛼. 𝑇𝑒𝑑−2 + 𝛼2. 𝑇𝑒𝑑−3 … . . ) ………..(3.3)
Where,
𝑇𝑟𝑚 = running mean temperature;
𝑇𝑒𝑑−1 = Daily mean outdoor temperature for the previous day;
𝑇𝑒𝑑−2 = Daily mean outdoor temperature for the day before and so on;
α is a constant between 0 and 1 (recommended to use 0.8).
Adaptive comfort upper and lower limit temperatures determine the thermal comfort
band, means people will be satisfied when the indoor operative temperature is within

3-65
this limit. Upper and lower limit temperatures can be calculated by following Equation
3.5 and Equation 3.6 respectively, when running mean temperatures are known:
𝑇𝑐𝑜𝑚𝑓 = 0.33 𝑇𝑟𝑚 + 18.8 ………..(3.4)
𝑇𝑚𝑎𝑥 = 0.33 𝑇𝑟𝑚 + 21.8 ………..(3.5)
𝑇𝑚𝑖𝑛 = 0.33 𝑇𝑟𝑚 + 15.8 ………..(3.6)
Where, Tcomf (°C) is the comfort temperature, Tmax (°C) is the maximum acceptable
temperature and Tmin (°C) is the minimum acceptable temperature.
Equation 3.3 was used in most of the previous studies to calculate running mean
temperatures (Lomas & R Giridharan 2012; Ferrari & Zanotto 2012; Sameni et al.
2015).
According to BS EN 15251 (BSEN15251, 2007) the risk of overheating relates to
comfort temperature, along with the categories of building and its users. Acceptable
temperature ranges for different categories of the building are listed in Table 3-8. Here
CIBSE (2013a), (CIBSE, 2015d) suggested that designers should aim to remain within
Category II limits.
Table 3-8: Suggested applicability of the categories and their associated acceptable temperature range for free running buildings (Standards, 2008)
Category Description Acceptable range (K)
I Spaces occupied by very sensitive and fragile persons
+/-2
II Normal expectation (for new and renovated building) +/-3
III A moderate expectation (used for existing building) +/-4
IV Values outside the criteria for the above categories (only acceptable for limited periods)
>4
This study applied overheating assessment methods - CIBSE temperature benchmark
and adaptive comfort criteria to assess overheating in the Nottingham High School and
Engineering and Science Learning Centre atrium. Overheating criterion specified in
Building Bulletin 101 were also applied to assess the thermal condition of Nottingham
High School atrium. This was considered because the school atrium was built in 2009
when BB101 was the benchmark to assess comfort conditions of renovated and new
school buildings. A number of case studies of schools presented in CIBSE (2015d),
3-66
also used BB101 to assess overheating in recent times. On the basis of overheating
analysis methods thermal performance of both atria enclosed with ETFE-foil cushion
roof were evaluated. This is presented in Chapter 6.
3.11 Building Simulation
3.11.1 Dynamic thermal simulation
Models are abstract representations of buildings. In the case of environmental
performance simulation, the model presents a three dimensional geometric
representation of the building with essential elements (such as doors, windows,
ventilation, occupancy, internal gains, climate, etc.). The dynamic thermal simulation
(DTS) is the process of simulating a building’s thermal performance on an hourly basis
using specific climate data with the range of input variables. The flexibility of loading
various climate data in the same model made the process suitable to evaluate thermal
performance using projected climate scenarios.
3.11.2 Simulation
The use of simulation software has escalated in the building performance domain
because of the increased computing power by desktop computers and improvement
of calculation algorithms. The process and standards of building performance
modelling is provided by CIBSE AM11 (CIBSE, 2015a) in the UK. The guides provide
methods of calculation and guidance on modelling procedure for thermal, ventilation,
lighting and energy performance of buildings. Among various software Design Builder,
TRNSYS, Tas, IES-VE and Hevacomp are widely used packages which provide
CIBSE AM11 recommended calculation ability. The simulation engine EnergyPlus
(NREL, 2015) is a software developed by US Department of Energy (DOE) and used
as a background calculation engine in Design Builder and Hevacomp packages.
EnergyPlus also allows to import geometry from Google SketchUp using the
OpenStudio Plug-in (NREL, 2016). Design Builder can be used in association with
TRNSYS to simulate the behaviour of transient systems to assess performance of
thermal and electrical energy systems (TRNSYS, 2016). IES-VE is integrated with an
integrated DTS engine called ApacheSim, which is capable to perform detailed
simulation with the ability to handle complex inputs and geometric shapes.
According to Byrn and Schiefloe (1996), selection of software packages for simulation
depends on the type of work (e.g. simplified design tools are used in the early design
stage while detailed simulation tools are used when design evolves and details are
available etc.), accuracy of software and individual preferences. Gilbert (2006),

3-67
reviewed different software that were used for simulation, assessments and design
purposes. He investigated the capability, usability, level of integration of different
software packages. On the basis of the investigation, his study recommended to use
Tas for thermal simulation. This was because, according to the investigation, Tas has
the best workflow methodology and also provides flexibility to model complex systems
and simulation results will be as accurate as any other competitive software. An
investigation carried by Rodrigues (2009) also used Tas for thermal performance
analysis. This study also used Environmental Design Solutions Limited (EDSL) Tas
Version 9.3.3.b. Tas simulates the thermal performance using dynamic calculations
based on the response factor method (EDSL, 2016). The dynamic simulation tool
EDSL Tas consists of two parts, the Tas 3D modeller and Tas building simulator. The
building geometry is modelled in the Tas modeller which is then exported to the
Building simulator. The functions of the software are:
• The assessment of the environmental performance of the building
• Prediction of energy consumption
• Natural ventilation analysis (basic level)
• Day light factor (basic level)
3.12 Summary
This chapter presented the detailed methodologies required to obtain the objectives of
the research. The chapter also presented the findings of a pilot study, which defined
the detailed methodologies adopted to investigate the thermal performance of the
ETFE-foil cushions. The pilot study was conducted by collecting physical
environmental data (air temperature and solar radiation) from Nottingham High School
atrium between 21st August 2013 and 25th August 2013. A summary of findings from
the pilot study is:
• The space enclosed with ETFE-foil cushion envelope is very responsive to
external weather conditions e.g. solar radiation, outdoor ambient temperature.
• Significant variation of indoor air temperature was apparent between different
vertical levels of the atrium.
• During the day the surface of the ETFE-foil cushion was hotter than indoor air
temperatures of the floor adjacent to the roof.
• There might be an effect of heat transfer between the ETFE-foil cushion surface
and the space adjacent to it.

3-68
• The surface temperature of the ETFE-foil varies in a single cushion (identified
by thermal imaging).
On the basis of the above observation it was decided to investigate the thermal
performance of ETFE-foil, and the space enclosed with the ETFE-foil cushion
envelope separately.
It was proposed that the thermal performance of the ETFE-foil should be investigated
by adopting the following methods:
• measurement of thermal-optical properties of ETFE-foil,
• test rig investigation, and
• modelling and simulation.
Thermal-optical properties of the ETFE-foil are to be measured using spectrometers
and analysed using BSEN 410 (BSI, 2011). A test rig investigation is to be conducted
by collecting data from simplified test rigs equipped with ETFE-foil panels of different
configuration (single-layer, two-layer, and three-layer); the test rigs are to be placed on
a roof terrace and directly exposed to outdoor conditions to obtain unobstructed solar
radiation. Modelling and simulation are to be conducted to validate the measured data
and compare the test rig results against glass panels. Detailed descriptions are
discussed in Chapter 5 and 7.
Thermal performance of the space enclosed with ETFE-foil cushions was investigated
in a pilot study. Further studies are proposed adopting the following methods:
• On-site monitoring of the actual spaces: Air temperature, mean radiant
temperature, incident and transmitted solar radiation, and relative humidity
were measured using sensors and data loggers within the space. Temperature
sensors were placed in each levels at varying heights to identify stratification
(Figure 3-8, Figure 3-16 and Figure 3-17). Further details of the data collection
and analysis are presented in Chapter 6.
• Modelling and simulation: To estimate predicted thermal performance of
spaces enclosed with ETFE-foil cushions using dynamic simulation Tas version
9.3.3.b.
• Assessment of htermal comfort of actual buildings and predicted model using
criteria described in section 3.10.

4-69
Chapter 4
4 Measuring thermal-optical properties of ETFE foil
4.1 Introduction
This chapter investigates thermal optical properties of ETFE foils. It initially reviews the
methods adopted in previous studies to determine the thermal-optical properties of
ETFE-foils. Subsequently it discusses the justification of selection of the methods and
finally presents thermal-optical properties of single, two- and three-layer ETFE-foil
panels. Findings of this chapter address Objective 2, which is to independently
determine thermal-optical properties of ETFE-foil.
4.2 The Classification of Thermal Optical Properties
The thermal optical properties of a material define its typical radiant behaviour within
the thermal spectrum (Bauer, 1965). These properties are considered as a function of
three fundamental parameters, they are: transmittance, reflectance and absorptance.
These parameters describe the ratio of the transmitted, reflected and, absorbed radiant
flux, to the incident radiant flux (ASTM, 1986b) and sum to 1.0.
The Earth receives electromagnetic as well as corpuscular radiation from the sun. The
electromagnetic radiation emits from the sun is known as the solar radiation. The solar
radiation, incident on the upper boundary of the terrestrial atmosphere is known as
extra-terrestrial solar radiation. The extra-terrestrial solar radiation varies with time of
the year because the distance from the sun to the earth varies due to the elliptical orbit,
on which earth moves round the sun (Badescu., 2008).
Solar radiation is attenuated by scattering and absorption by the molecules of the air,
aerosol particles suspended in the air, water droplets and, ice crystals etc., on its path
through the atmosphere. Direct solar radiation is the part of the extra-terrestrial solar
radiation that reaches the Earth’s surface. The solar radiation incident on a surface
being normal to the solar beam is called direct normal solar radiation. The part of solar
radiation scattered in the atmosphere and reaches to the earth surface is known as
diffuse solar radiation. The sum of direct and diffuse solar radiation on a horizontal
plane at the Earth’s surface is called global solar radiation (Kasten et al., 1989).
Around 97% of solar radiation reaching the Earth’s surface is within the range between
0.3 µm and 2.3 µm, however, 97% of the radiation emerging from a hot surface will be
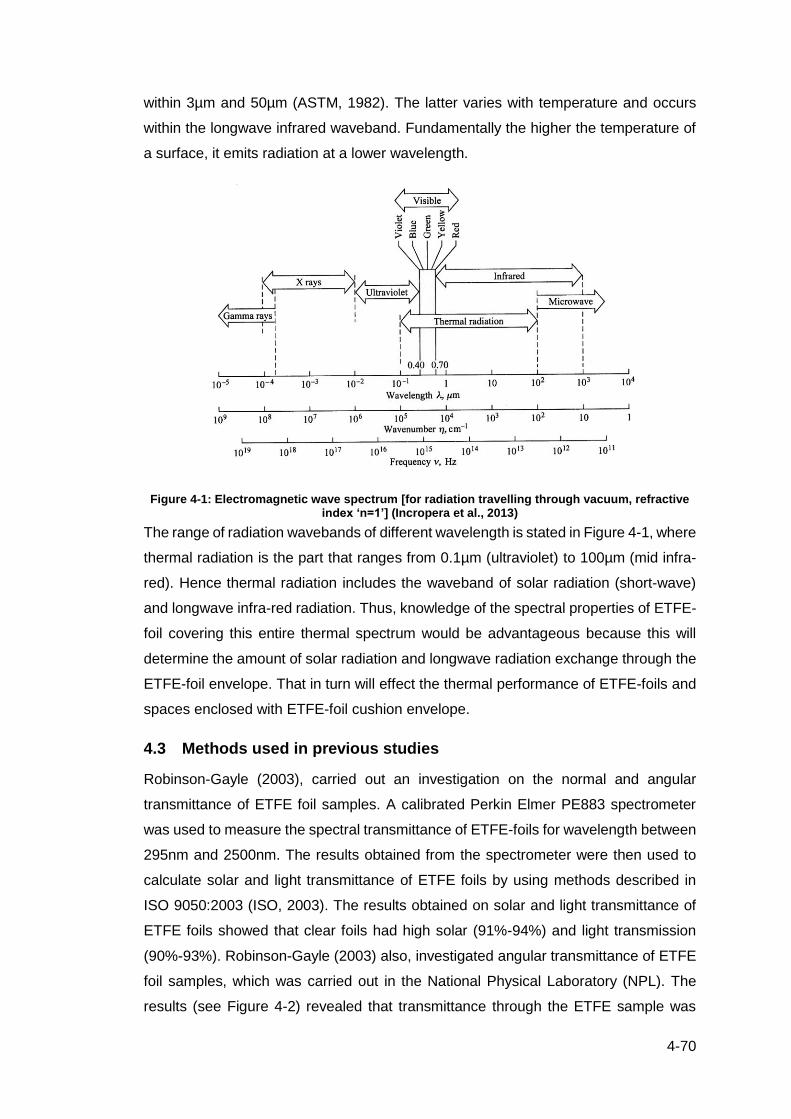
4-70
within 3µm and 50µm (ASTM, 1982). The latter varies with temperature and occurs
within the longwave infrared waveband. Fundamentally the higher the temperature of
a surface, it emits radiation at a lower wavelength.
Figure 4-1: Electromagnetic wave spectrum [for radiation travelling through vacuum, refractive index ‘n=1’] (Incropera et al., 2013)
The range of radiation wavebands of different wavelength is stated in Figure 4-1, where
thermal radiation is the part that ranges from 0.1µm (ultraviolet) to 100µm (mid infra-
red). Hence thermal radiation includes the waveband of solar radiation (short-wave)
and longwave infra-red radiation. Thus, knowledge of the spectral properties of ETFE-
foil covering this entire thermal spectrum would be advantageous because this will
determine the amount of solar radiation and longwave radiation exchange through the
ETFE-foil envelope. That in turn will effect the thermal performance of ETFE-foils and
spaces enclosed with ETFE-foil cushion envelope.
4.3 Methods used in previous studies
Robinson-Gayle (2003), carried out an investigation on the normal and angular
transmittance of ETFE foil samples. A calibrated Perkin Elmer PE883 spectrometer
was used to measure the spectral transmittance of ETFE-foils for wavelength between
295nm and 2500nm. The results obtained from the spectrometer were then used to
calculate solar and light transmittance of ETFE foils by using methods described in
ISO 9050:2003 (ISO, 2003). The results obtained on solar and light transmittance of
ETFE foils showed that clear foils had high solar (91%-94%) and light transmission
(90%-93%). Robinson-Gayle (2003) also, investigated angular transmittance of ETFE
foil samples, which was carried out in the National Physical Laboratory (NPL). The
results (see Figure 4-2) revealed that transmittance through the ETFE sample was
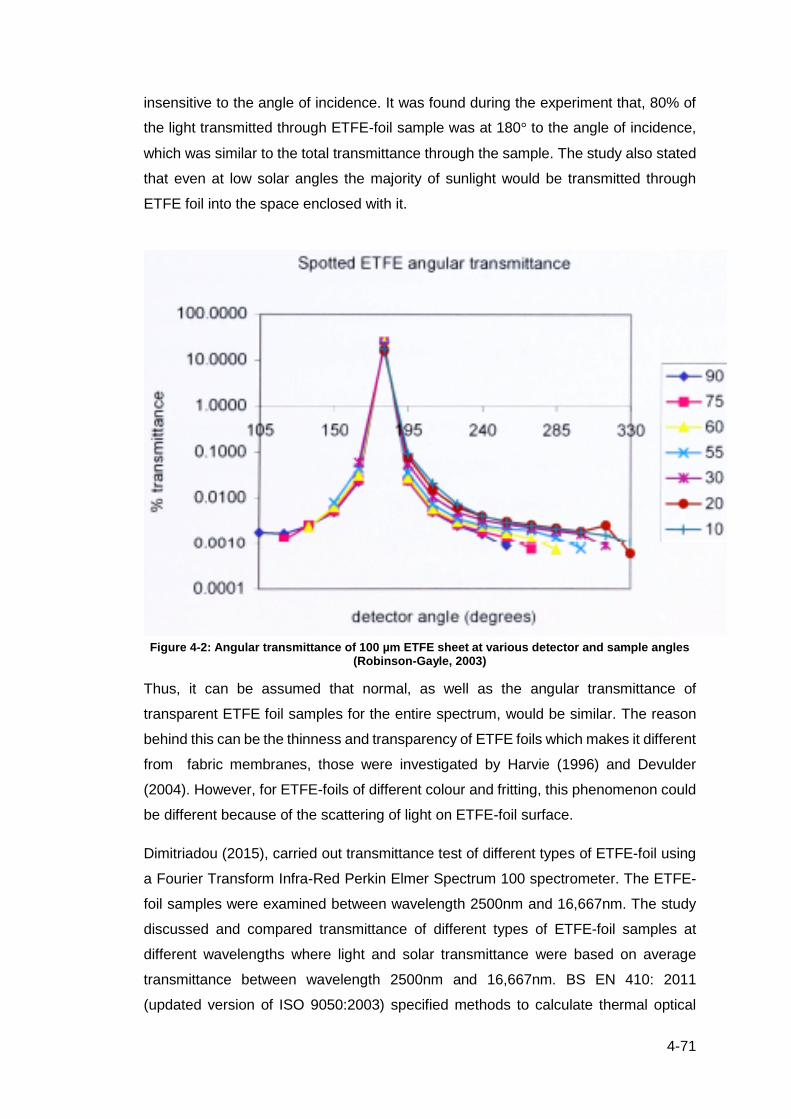
4-71
insensitive to the angle of incidence. It was found during the experiment that, 80% of
the light transmitted through ETFE-foil sample was at 180° to the angle of incidence,
which was similar to the total transmittance through the sample. The study also stated
that even at low solar angles the majority of sunlight would be transmitted through
ETFE foil into the space enclosed with it.
Figure 4-2: Angular transmittance of 100 µm ETFE sheet at various detector and sample angles
(Robinson-Gayle, 2003)
Thus, it can be assumed that normal, as well as the angular transmittance of
transparent ETFE foil samples for the entire spectrum, would be similar. The reason
behind this can be the thinness and transparency of ETFE foils which makes it different
from fabric membranes, those were investigated by Harvie (1996) and Devulder
(2004). However, for ETFE-foils of different colour and fritting, this phenomenon could
be different because of the scattering of light on ETFE-foil surface.
Dimitriadou (2015), carried out transmittance test of different types of ETFE-foil using
a Fourier Transform Infra-Red Perkin Elmer Spectrum 100 spectrometer. The ETFE-
foil samples were examined between wavelength 2500nm and 16,667nm. The study
discussed and compared transmittance of different types of ETFE-foil samples at
different wavelengths where light and solar transmittance were based on average
transmittance between wavelength 2500nm and 16,667nm. BS EN 410: 2011
(updated version of ISO 9050:2003) specified methods to calculate thermal optical

4-72
properties of single, two- and three-layer glazing systems. However, Dimitriadou
(2015), did not consider any particular method to determine transmittance of ETFE-
foils. Information provided on the transmittance of ETFE-foil samples seemed
unreliable. Therefore results determined by Dimitriadou (2015) was not considered in
this study while comparing measured results with previous research.
Mainini et al. (2014), measured spectral transmittance and reflectance of ETFE-foil
samples with a UV-Vis-NIR Spectrophotometer Perkin Elmer Lambda 950. On the
basis of result acquired from the spectrophotometer, actual transmittance and
reflectance of single layer foil were calculated according to ISO 9050:2003.
Methods adopted by Robinson-Gayle (2003) and Mainini et al. (2014), to determine
spectral properties of ETFE-foils were similar. Both used a spectrometer to measure
spectral transmittance and reflectance, while overall transmittance of ETFE foils were
calculated based on the method stated in ISO 9050:2003. These methods applied in
previous studies are found suitable to determine solar and light transmittance of ETFE-
foil samples for this study.
4.4 Justification
The thermal optical properties of transparent/ translucent building envelopes impact
the thermal environment of enclosed spaces by allowing access of external
environmental stimuli such as solar radiation, outdoor temperature, etc. This
phenomenon was evident in the previous chapter, where the results of the pilot study
demonstrated that an ETFE foil cushion transmits a significant amount of solar
radiation affecting the thermal performance of the space it encloses. Therefore, it was
thought to be necessary to obtain the overall solar transmittance and light
transmittance of a selection of ETFE-foils. Collectively these properties are known as
thermal optical properties (Bauer, 1965).
On the other hand, the knowledge of the thermal transmittance (U-value) of building
envelope is necessary for the quantification of heat losses and (or) gain through it.
Thus, it was necessary to determine thermal transmittance of the ETFE-foil cushion
envelope also.
According to Harvie (2015), it can be difficult to obtain thermal optical properties of
architectural fabrics and foils (e.g. PVC coated polyester, PTFE coated glass, ETFE
foil, etc.), because manufacturers are more used to supplying information about
structural performance. Moreover, the specification sheet of manufacturers reflects the
priorities of the designers which tend to be as follows:

4-73
• Structural properties
• Behaviour in fire
• Colour and degradation
• Transmittance of visual light
However, an attempt was made to compile data available from the manufacturers on
the thermal optical properties of ETFE-foils. From the acquired information, it was also
evident that the available information tended to concentrate on structural rather than
environmental properties. The standard information on the thermal properties included
solar transmittance and reflectance, and U-value of single layer foil etc. The limited
available information on the thermal properties of ETFE-foils might be due to that, in
most countries, there are regulatory requirements for the maximum thermal
transmittance or a minimum thermal resistance, while no regulations impose any strict
value for optical properties of glazing material to limit solar gain. Thus, the information
on material properties tended to fulfil regulatory requirements and priorities of the
designers. As a result, the environmental properties obtained from the manufacturer’s
information were incomplete, unsubstantiated and also entirely inadequate.
It also proved difficult while collecting information on these properties from previous
research work carried by Robinson-Gayle (2003), Mainini et al. (2014), DETR (2003),
Dimitriadou (2015). Poirazis et al. (2009), also found difficulties while obtaining
information on the thermal optical properties of ETFE foils, particularly in the longwave
spectrum. His research suggested that detailed knowledge on this area is essential to
predict the impact of longwave radiation on the thermal performance of space enclosed
by an ETFE-foil cushion envelope. He also stated that as ETFE-foil is not entirely
opaque to longwave radiation, considering ETFE-foil as glass while simulating
building’s performance might result in significant error. Besides Harvie (2015),
suggested that accurate modelling of architectural fabrics requires specification on
optical thermal properties which can be developed based on either a specific request
to the manufacturers, measurements or assumption made on the known properties of
similar materials. Therefore, measurement and documentation of thermal optical
properties of different types of ETFE-foils are important to determine their impact on
the thermal performance of spaces.
It was apparent from the above discussion that the most appropriate way to acquire
the appropriate information necessary for this research would be to measure the
thermal optical properties of ETFE foils. The following sections describe the
experimental techniques that were carried out to measure the thermal optical
4-74
properties of different types of ETFE foils. Information obtained by these procedures
was used to develop the simulation model used to predict the thermal performance of
ETFE foils and spaces enclosed with it, which is presented in Chapter 7.
4.5 The thermal optical properties of ETFE foil
Thermal optical properties of materials are measured by shining a beam of radiation
of known wavelength on to the surface of a material sample and comparing the
intensity of the incident beam to that of transmitted, reflected and absorbed radiation.
Because of the smoothness of the surface of thin (100μm- 500 μm), transparent ETFE
foils it is more likely that it will transmit the major part of incident radiation. However,
for fritted ETFE-foils the radiation they transmit and reflect, is likely to be partially
diffuse. Diffusely transmitted radiation can be measured by placing material samples
in front of a standard integrating sphere which will collect all the transmitted radiation
(Harvie, 1996).
The equipment required to measure solar optical properties are sensitive and not
commonly available. Therefore, with available equipment in the Engineering lab of the
University of Nottingham, it was possible to measure near normal spectral properties
of foil samples between wavelengths of 0.2μm and 2.7μm. This range covered ultra-
violet, visible, infrared and mid-infrared range. The term near normal refers to the beam
of radiation which strikes a sample at an angle of incidence close to its surface normal.
4.5.1 The selection of foil samples
ETFE-foil samples were obtained from Architen Landrell and Vector foiltec, both of
them being ETFE-foil enclosure fabricator. These samples included different
thicknesses of transparent ETFE-foils, silver foils with different density of pigment and
foils with different coverage of fritting. These fritted samples were printed on one side.
Fritting or printing on the ETFE-foil surface is generally done by using different colour
pigments of different density, using different patterns and motifs with different
coverage. Among different patterns, dots of varying degree of coverage and honey
comb pattern, etc. are commonly applied in ETFE-foil cushions. Foils with different
coverage of fritting refer to the foils printed with different percentage of fritting
coverage, such as foil with 75% fritting comprised of 75% fritted area (can be printed
with different density of pigments) and 25% transparent area.
Fritted foils examined in this study were categorised by the percentage of fritting and
density of pigment used in printing. The pigment colour consisted of silver. Due to the
variation in density of pigment in fritting, foils were classified with 25% translucent silver
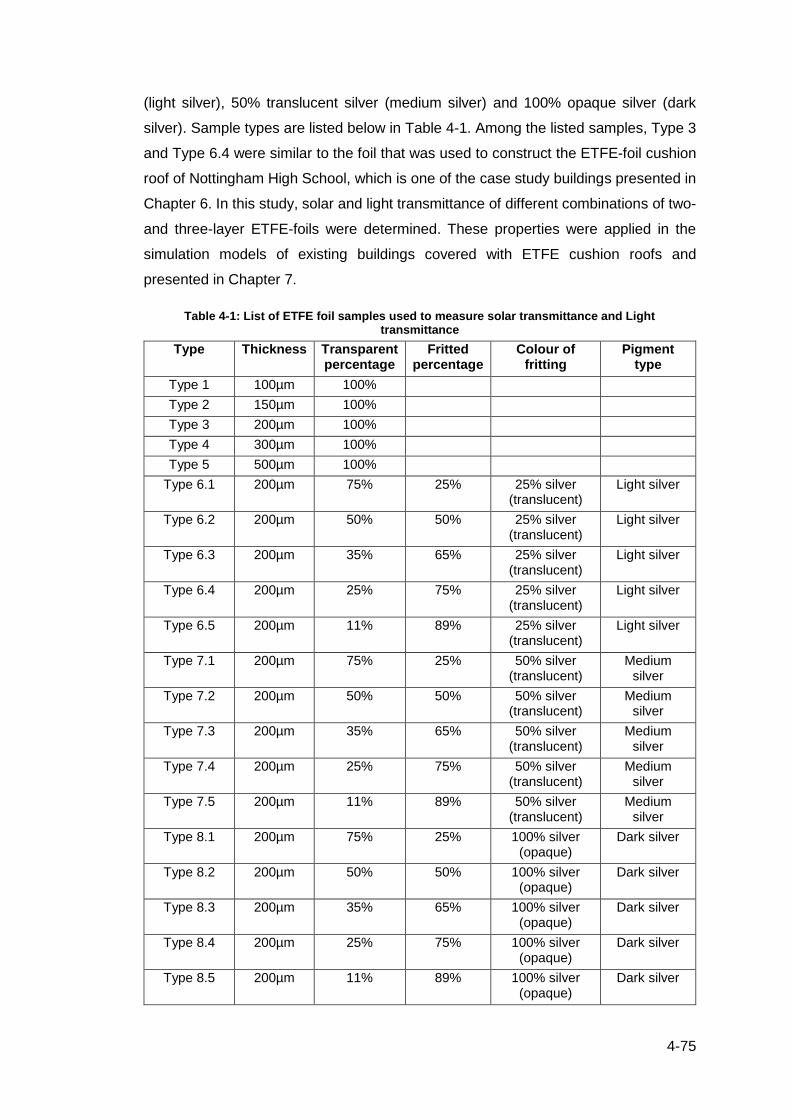
4-75
(light silver), 50% translucent silver (medium silver) and 100% opaque silver (dark
silver). Sample types are listed below in Table 4-1. Among the listed samples, Type 3
and Type 6.4 were similar to the foil that was used to construct the ETFE-foil cushion
roof of Nottingham High School, which is one of the case study buildings presented in
Chapter 6. In this study, solar and light transmittance of different combinations of two-
and three-layer ETFE-foils were determined. These properties were applied in the
simulation models of existing buildings covered with ETFE cushion roofs and
presented in Chapter 7.
Table 4-1: List of ETFE foil samples used to measure solar transmittance and Light transmittance
Type Thickness Transparent percentage
Fritted percentage
Colour of fritting
Pigment type
Type 1 100µm 100%
Type 2 150µm 100%
Type 3 200µm 100%
Type 4 300µm 100%
Type 5 500µm 100%
Type 6.1 200µm 75% 25% 25% silver (translucent)
Light silver
Type 6.2 200µm 50% 50% 25% silver (translucent)
Light silver
Type 6.3 200µm 35% 65% 25% silver (translucent)
Light silver
Type 6.4 200µm 25% 75% 25% silver (translucent)
Light silver
Type 6.5 200µm 11% 89% 25% silver (translucent)
Light silver
Type 7.1 200µm 75% 25% 50% silver (translucent)
Medium silver
Type 7.2 200µm 50% 50% 50% silver (translucent)
Medium silver
Type 7.3 200µm 35% 65% 50% silver (translucent)
Medium silver
Type 7.4 200µm 25% 75% 50% silver (translucent)
Medium silver
Type 7.5 200µm 11% 89% 50% silver (translucent)
Medium silver
Type 8.1 200µm 75% 25% 100% silver (opaque)
Dark silver
Type 8.2 200µm 50% 50% 100% silver (opaque)
Dark silver
Type 8.3 200µm 35% 65% 100% silver (opaque)
Dark silver
Type 8.4 200µm 25% 75% 100% silver (opaque)
Dark silver
Type 8.5 200µm 11% 89% 100% silver (opaque)
Dark silver

4-76
This study also determined solar and light transmittance of two and three layer ETFE-foil panels. Foil combinations used in this process are listed in Table 4-2 and
Table 4-3.
Table 4-2: List of combination of Two layer ETFE foils
Two layer ETFE foil combinations
Combination Type Layer description
Combination 1
Type 3 Layer 1: 200 μm Transparent
Type 6.1 Layer 2: 200 μm 25% Light silver
Combination 2
Type 3 Layer 1: 200 μm Transparent
Type 6.2 Layer 2: 200 μm 50% Light silver
Combination 3
Type 3 Layer 1: 200 μm Transparent
Type 6.3 Layer 2: 200 μm 65% Light silver
Combination 4
Type 3 Layer 1: 200 μm Transparent
Type 6.4 Layer 2: 200 μm 75% Light silver
Combination 5
Type 3 Layer 1: 200 μm Transparent
Type 6.5 Layer 2: 200 μm 89% Light silver
Combination 6
Type 3 Layer 1: 200 μm Transparent
Type 7.1 Layer 2: 200 μm 25% Mid silver
Combination 7
Type 3 Layer 1: 200 μm Transparent
Type 7.2 Layer 2: 200 μm 50% Mid silver
Combination 8
Type 3 Layer 1: 200 μm Transparent
Type 7.3 Layer 2: 200 μm 65% Mid silver
Combination 9
Type 3 Layer 1: 200 μm Transparent
Type 7.4 Layer 2: 200 μm 75% Mid silver
Combination 10
Type 3 Layer 1: 200 μm Transparent
Type 7.5 Layer 2: 200 μm 89% Mid silver
Combination 11
Type 3 Layer 1: 200 μm Transparent
Type 8.1 Layer 2: 200 μm 25% Dark silver
Combination 12
Type 3 Layer 1: 200 μm Transparent
Type 8.2 Layer 2: 200 μm 50% Dark silver
Combination 13
Type 3 Layer 1: 200 μm Transparent
Type 8.3 Layer 2: 200 μm 65% Dark silver
Combination 14
Type 3 Layer 1: 200 μm Transparent
Type 8.4 Layer 2: 200 μm 75% Dark silver
Combination 15
Type 3 Layer 1: 200 μm Transparent
Type 8.5 Layer 2: 200 μm 89% Dark silver

4-77
Table 4-3: List of combination of Three layer ETFE foils
Three layer ETFE foil combinations
Combination Type Layer description
Combination 16
Type 3 Layer 1: 200 μm Transparent
Type 1 Layer 2: 100 μm Transparent
Type 6.1 Layer 3: 200 μm 25% Light silver
Combination 17
Type 3 Layer 1: 200 μm Transparent
Type 1 Layer 2: 100 μm Transparent
Type 6.2 Layer 3: 200 μm 50% Light silver
Combination 18
Type 3 Layer 1: 200 μm Transparent
Type 1 Layer 2: 100 μm Transparent
Type 6.3 Layer 3: 200 μm 65% Light silver
Combination 19
Type 3 Layer 1: 200 μm Transparent
Type 1 Layer 2: 100 μm Transparent
Type 6.4 Layer 3: 200 μm 75% Light silver
Combination 20
Type 3 Layer 1: 200 μm Transparent
Type 1 Layer 2: 100 μm Transparent
Type 6.5 Layer 3: 200 μm 89% Light silver
Combination 21
Type 3 Layer 1: 200 μm Transparent
Type 1 Layer 2: 100 μm Transparent
Type 7.1 Layer 3: 200 μm 25% Mid silver
Combination 22
Type 3 Layer 1: 200 μm Transparent
Type 1 Layer 2: 100 μm Transparent
Type 7.2 Layer 3: 200 μm 50% Mid silver
Combination 23
Type 3 Layer 1: 200 μm Transparent
Type 1 Layer 2: 100 μm Transparent
Type 7.3 Layer 3: 200 μm 65% Mid silver
Combination 24
Type 3 Layer 1: 200 μm Transparent
Type 1 Layer 2: 100 μm Transparent
Type 7.4 Layer 3: 200 μm 75% Mid silver
Combination 25
Type 3 Layer 1: 200 μm Transparent
Type 1 Layer 2: 100 μm Transparent
Type 7.5 Layer 3: 200 μm 89% Mid silver
Combination 26
Type 3 Layer 1: 200 μm Transparent
Type 1 Layer 2: 100 μm Transparent
Type 8.1 Layer 3: 200 μm 25% Dark silver

4-78
(
Table 4-3 continued)
Combination Type Layer description
Combination 27
Type 3 Layer 1: 200 μm Transparent
Type 1 Layer 2: 100 μm Transparent
Type 8.2 Layer 3: 200 μm 50% Dark silver
Combination 28
Type 3 Layer 1: 200 μm Transparent
Type 1 Layer 2: 100 μm Transparent
Type 8.3 Layer 3: 200 μm 65% Dark silver
Combination 29
Type 3 Layer 1: 200 μm Transparent
Type 1 Layer 2: 100 μm Transparent
Type 8.4 Layer 3: 200 μm 75% Dark silver
Combination 30
Type 3 Layer 1: 200 μm Transparent
Type 1 Layer 2: 100 μm Transparent
Type 8.5 Layer 3: 200 μm 89% Dark silver
To compare the thermal optical properties of ETFE-foil with that of glass, the
transmittance of different glass samples was determined using the same procedure.
Glass samples were obtained from Pilkington glass and included 4mm thick K glass
and Opti-float clear glass.
4.5.2 Apparatus used to measure the Solar Optical Properties of the ETFE foil
samples
A Biochrom Libra S22 spectrometer [Figure 4-3 (b)] was used to measure the
transmittance of foil samples for the wavelengths ranging from 0.2µm to 0.9 µm, which
cover ultra violet, visible and near infra-red waveband. During the measurement, the
scan step was 1nm and scan speed was 750nm/min.
A Fourier Transform Infrared spectrometer IFS 66v/s [Figure 4-3 (a)] was used to
measure spectral transmission for the wavelengths ranging from 0.9 µm to 27 µm,
covering near to mid-infrared waveband. Two different setups of the spectrometer
were employed to measure the transmittance of ETFE-foil samples. For the first setup,
the light source covered wavelengths from 0.869 µm to 1.6 µm (near and, mid-infrared
waveband) and the second setup covered wavelength from 1.33 µm to 27 µm (near-
infrared and mid-infrared waveband).

4-79
The spectrometer had two options to measure transmittance, they are step-scan and
rapid-scan mood. During the experiment step-scan option was used because this
technique allows the resolution of very weak signals which cannot be detected in the
rapid-scan mode. Using step-scan mood, in total 32 scans were acquired at each step.
The Fourier transformation was performed for the sum of all these steps.
(a)
(b)
Figure 4-3: Measurement of thermal optical properties using spectrometers- (a) IFS 66v/s, (b) Biochrom Libra S22
Before the experiment, samples were cleaned with lens cleaning fluid to remove dust
and particles as much as possible, because the presence of dust might impact the
accuracy of measurements. At the beginning of the experiment, an initial spectrometer
scan was done without any sample, to calibrate the equipment. If the results showed
100% transmittance, then the sample was positioned in a sample holder, which was
placed in between the light source and detector in an air tight box.
In the experiment, a nearly parallel direct beam of light (6mm diameter light source) of
known wavelength strikes a sample at an angle of incidence close to its surface
normal, passes through the sample and then onto the detector, which measures the
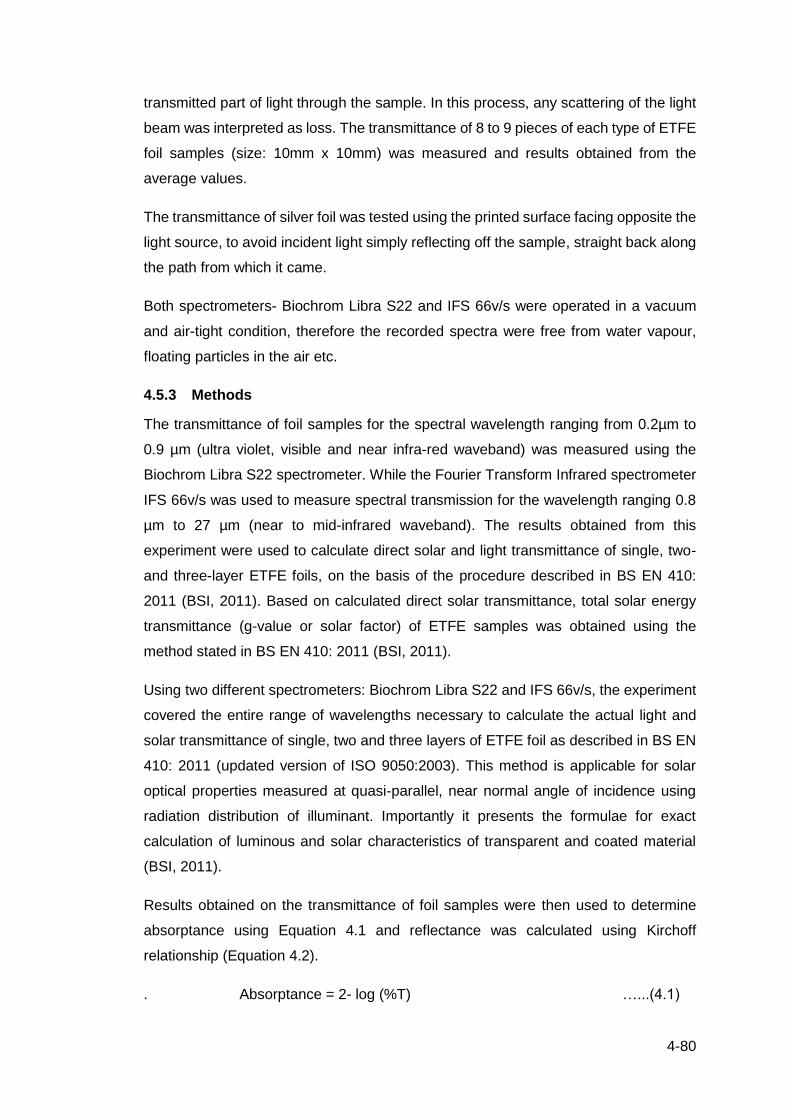
4-80
transmitted part of light through the sample. In this process, any scattering of the light
beam was interpreted as loss. The transmittance of 8 to 9 pieces of each type of ETFE
foil samples (size: 10mm x 10mm) was measured and results obtained from the
average values.
The transmittance of silver foil was tested using the printed surface facing opposite the
light source, to avoid incident light simply reflecting off the sample, straight back along
the path from which it came.
Both spectrometers- Biochrom Libra S22 and IFS 66v/s were operated in a vacuum
and air-tight condition, therefore the recorded spectra were free from water vapour,
floating particles in the air etc.
4.5.3 Methods
The transmittance of foil samples for the spectral wavelength ranging from 0.2µm to
0.9 µm (ultra violet, visible and near infra-red waveband) was measured using the
Biochrom Libra S22 spectrometer. While the Fourier Transform Infrared spectrometer
IFS 66v/s was used to measure spectral transmission for the wavelength ranging 0.8
µm to 27 µm (near to mid-infrared waveband). The results obtained from this
experiment were used to calculate direct solar and light transmittance of single, two-
and three-layer ETFE foils, on the basis of the procedure described in BS EN 410:
2011 (BSI, 2011). Based on calculated direct solar transmittance, total solar energy
transmittance (g-value or solar factor) of ETFE samples was obtained using the
method stated in BS EN 410: 2011 (BSI, 2011).
Using two different spectrometers: Biochrom Libra S22 and IFS 66v/s, the experiment
covered the entire range of wavelengths necessary to calculate the actual light and
solar transmittance of single, two and three layers of ETFE foil as described in BS EN
410: 2011 (updated version of ISO 9050:2003). This method is applicable for solar
optical properties measured at quasi-parallel, near normal angle of incidence using
radiation distribution of illuminant. Importantly it presents the formulae for exact
calculation of luminous and solar characteristics of transparent and coated material
(BSI, 2011).
Results obtained on the transmittance of foil samples were then used to determine
absorptance using Equation 4.1 and reflectance was calculated using Kirchoff
relationship (Equation 4.2).
. Absorptance = 2- log (%T) …...(4.1)

4-81
Transmittance+ Reflectance+ Absorptance = 1 …...(4.2)
Fritted foils usually consist of the transparent and translucent (printed) part. Therefore,
difficulties arose particularly to identify which part the light passed through during the
experiment. Because the experiment operated in an air tight box.
Thus, the transmittance of fritted foils was estimated using the transmittance of the
transparent part and translucent (printed) part. For example, to determine solar and
light transmittance of transparent foil fritted with silver fritting and 25% fritting coverage,
the transmittance of transparent foil and silver foil was determined separately. Then
the average transmittance for the fritted sample was estimated using the ratio of the
fritted part (e.g. 25%) and transparent part (e.g. 75%).
4.5.4 The Results
The results obtained from the experiment are presented and discussed in the following
sections.
4.5.4.1 Solar and light transmittance of single layer ETFE foil panel
The solar optical properties of ETFE-foil and glass samples can be characterised as
high transmittance up to wavelength 3.0μm. However, transmittance began to
decrease at higher wavelengths particularly for glass, while spectral transmittance of
ETFE-foils was still high even above a wavelength of 5.0μm. The spectral
transmittance of 100 μm, 200 μm and 300μm transparent ETFE-foils and, opti-float and
K-glass measured using the spectrometers is presented in Figure 4-4. Solar and, light
transmittance, calculated according to BS EN 410: 2011 (BSI, 2011) is presented in
Table 4-4. ETFE-foil types are listed in Table 4-1. The results presented in Figure 4-4,
showed that in the visible spectrum and infra-red spectrum, the transmittance of ETFE
foil was generally higher than that of opti-float glass and k-glass. The spectral
transmittance of ETFE-foil reduces as its thickness increases. This is evident from
Table 4-4, where the light and solar transmittance of 100μm transparent ETFE foil,
according to the method of BS EN 410, was 0.905 and 0.91 respectively, while these
values reduce correspondingly to 0.76 and 0.72 for 500μm transparent foil (Figure 4-5).
At a wavelength of 5μm and beyond, the spectral transmittance of both glass samples
decreased to nearly 0% while ETFE-foil samples still transmitted significant levels of
spectral light. This waveband partially includes the longwave range. Therefore, it can
be stated that in the longwave range transparent ETFE foils will transmit radiation,
while glasses will be effectively opaque for this waveband.

4-82
Figure 4-4: Spectral transmittance of ETFE foil and Glass measured using spectrometers
Table 4-4: Direct solar and light transmittance of ETFE foil and glass
Materials Light transmittance
Light reflectance
Solar transmittance
Solar reflectance
100μm ETFE foil
0.905 0.094 0.91 0.0893
200μm ETFE foil
0.84 0.16 0.857 0.142
300μm ETFE foil
0.76 0.236 0.794 0.2047
Opti-float glass
0.895 0.105 0.66 0.33
K-glass 0.838 0.16 0.494 0.498
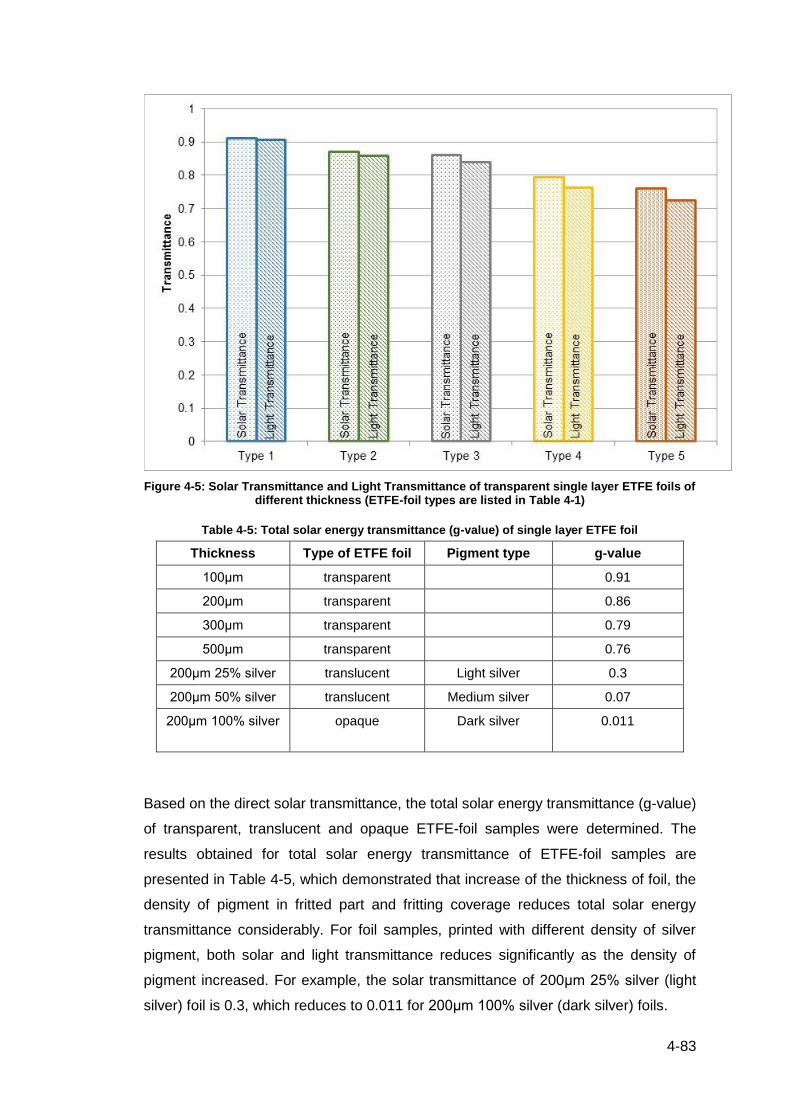
4-83
Figure 4-5: Solar Transmittance and Light Transmittance of transparent single layer ETFE foils of different thickness (ETFE-foil types are listed in Table 4-1)
Table 4-5: Total solar energy transmittance (g-value) of single layer ETFE foil
Thickness Type of ETFE foil Pigment type g-value
100μm transparent 0.91
200μm transparent 0.86
300μm transparent 0.79
500μm transparent 0.76
200μm 25% silver translucent Light silver 0.3
200μm 50% silver translucent Medium silver 0.07
200μm 100% silver
opaque Dark silver 0.011
Based on the direct solar transmittance, the total solar energy transmittance (g-value)
of transparent, translucent and opaque ETFE-foil samples were determined. The
results obtained for total solar energy transmittance of ETFE-foil samples are
presented in Table 4-5, which demonstrated that increase of the thickness of foil, the
density of pigment in fritted part and fritting coverage reduces total solar energy
transmittance considerably. For foil samples, printed with different density of silver
pigment, both solar and light transmittance reduces significantly as the density of
pigment increased. For example, the solar transmittance of 200μm 25% silver (light
silver) foil is 0.3, which reduces to 0.011 for 200μm 100% silver (dark silver) foils.
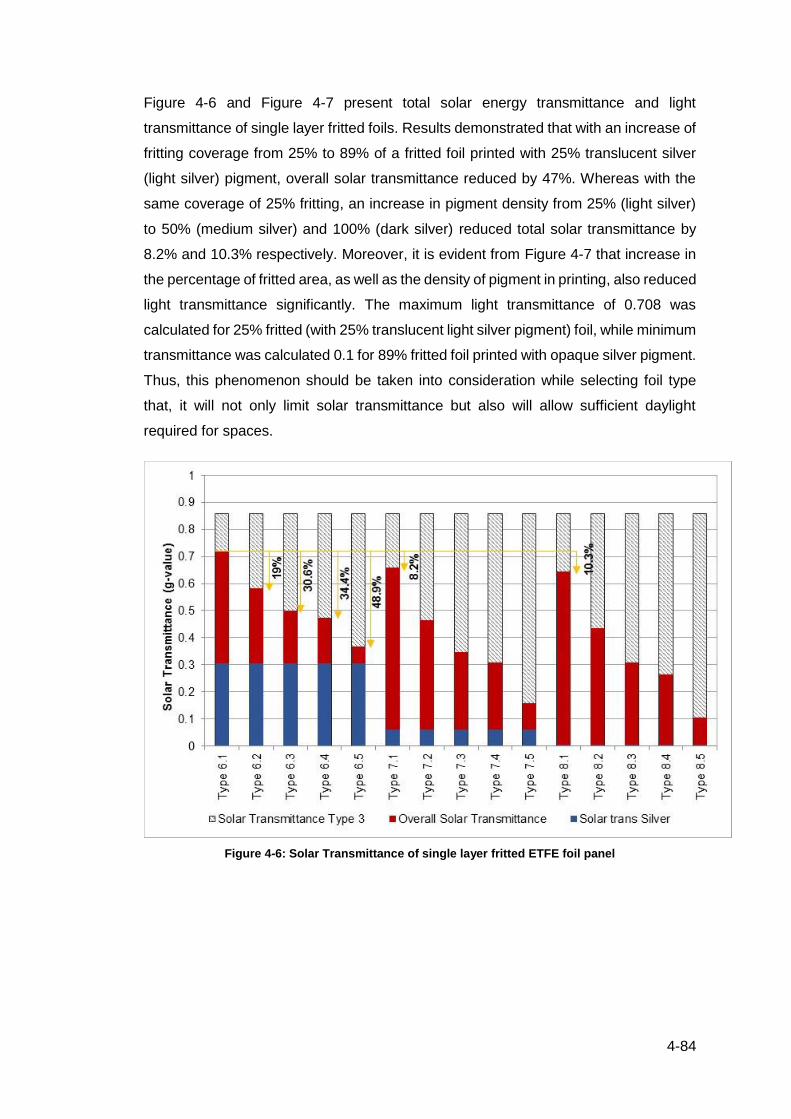
4-84
Figure 4-6 and Figure 4-7 present total solar energy transmittance and light
transmittance of single layer fritted foils. Results demonstrated that with an increase of
fritting coverage from 25% to 89% of a fritted foil printed with 25% translucent silver
(light silver) pigment, overall solar transmittance reduced by 47%. Whereas with the
same coverage of 25% fritting, an increase in pigment density from 25% (light silver)
to 50% (medium silver) and 100% (dark silver) reduced total solar transmittance by
8.2% and 10.3% respectively. Moreover, it is evident from Figure 4-7 that increase in
the percentage of fritted area, as well as the density of pigment in printing, also reduced
light transmittance significantly. The maximum light transmittance of 0.708 was
calculated for 25% fritted (with 25% translucent light silver pigment) foil, while minimum
transmittance was calculated 0.1 for 89% fritted foil printed with opaque silver pigment.
Thus, this phenomenon should be taken into consideration while selecting foil type
that, it will not only limit solar transmittance but also will allow sufficient daylight
required for spaces.
Figure 4-6: Solar Transmittance of single layer fritted ETFE foil panel
4-85
Figure 4-7: Light Transmittance of single layer fritted ETFE foil panel
4.5.4.2 Solar and light transmittance of two-layer and three-layer ETFE foil
panel
In the experiment the spectrometers only allowed the spectral transmittance of single
layer foil to be measured; hence, the total solar and light transmittance for two-and
three-layer ETFE-foil panels was calculated using the method stated in BS EN 410:
2011(BSI, 2011) considering an average air gap of 125mm between foil layers. A list
of combinations of two- and three-layer ETFE-foil are presented in Table 4-2 and Table
4-3 respectively.
The results obtained for solar and light transmittance of different combinations of two-
layer ETFE-foil panels is illustrated Figure 4-8 and Figure 4-9, while Figure 4-10 and
Figure 4-11 present the same properties but for three-layer ETFE-foil panels.
The results demonstrated that in ETFE panels, increase (or decrease) in fritted
coverage, increase (or decrease) of the density of pigment, and increase (or decrease)
in air gap and ETFE-foil layers, reduce (or increase) overall solar and light
transmittance of ETFE-foil panels.

4-86
Figure 4-8: Solar Transmittance of two-layer ETFE foil panel
Figure 4-9: Light Transmittance of two-layer ETFE foil panel
16
.12
%
26
.45
%
30
%
43
.71
%
7.4
2%
9.3
5%

4-87
Figure 4-10: Solar Transmittance of three-layer ETFE foil panel
Figure 4-11: Light Transmittance of three-layer ETFE foil panel
The results obtained for direct solar and light transmittance of single-layer ETFE-foil
samples were compared with those stated in Robinson-Gayle (2003), DETR (2003)
and illustrated in Figure 4-12. The results were in close agreement, with a maximum
deviation of 2% being found for both measured light and solar transmittance. The
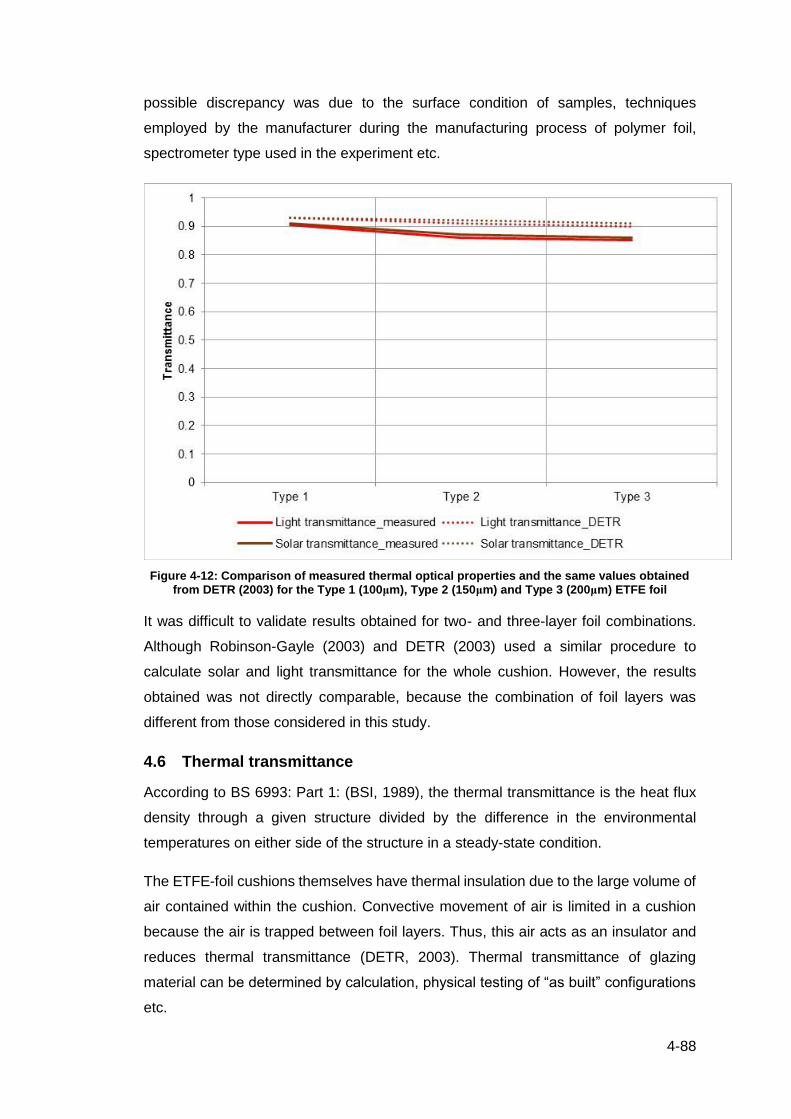
4-88
possible discrepancy was due to the surface condition of samples, techniques
employed by the manufacturer during the manufacturing process of polymer foil,
spectrometer type used in the experiment etc.
Figure 4-12: Comparison of measured thermal optical properties and the same values obtained from DETR (2003) for the Type 1 (100μm), Type 2 (150μm) and Type 3 (200μm) ETFE foil
It was difficult to validate results obtained for two- and three-layer foil combinations.
Although Robinson-Gayle (2003) and DETR (2003) used a similar procedure to
calculate solar and light transmittance for the whole cushion. However, the results
obtained was not directly comparable, because the combination of foil layers was
different from those considered in this study.
4.6 Thermal transmittance
According to BS 6993: Part 1: (BSI, 1989), the thermal transmittance is the heat flux
density through a given structure divided by the difference in the environmental
temperatures on either side of the structure in a steady-state condition.
The ETFE-foil cushions themselves have thermal insulation due to the large volume of
air contained within the cushion. Convective movement of air is limited in a cushion
because the air is trapped between foil layers. Thus, this air acts as an insulator and
reduces thermal transmittance (DETR, 2003). Thermal transmittance of glazing
material can be determined by calculation, physical testing of “as built” configurations
etc.

4-89
DETR (2003), modelled a three-layer cushion using the finite element analysis
program ANSYS and validated the results by comparing with the thermal transmittance
(U-value) obtained using the guarded hot box method. The guidelines specified by
BS6993 were followed in the Finite Element Analysis program ANSYS, to generate U-
value of ETFE-foil cushion. The results produced by ANSYS showed that the heat flux
is high around the corner of the cushion compared with those at the central area.
Mainini et al. (2014), measured thermal transmittance of a two-layer ETFE-foil panel
in a vertical position using the in-situ procedure. U-value of the vertical panel was
calculated based on the thermal flux through the panel, the surface temperatures,
indoor temperature and temperature of the climatic chamber.
The results obtained on the thermal transmittance of multi-layer ETFE-foil cushion
obtained by previous studies are presented in Table 4-6.
Table 4-6: U-value of ETFE foil cushion
Stated in Number of layer in ETFE
Method Horizontal (W/m2K)
Vertical (W/m2K)
DETR (2003), Robinson-Gayle
(2003)
Three-layer The guarded hot box and
ANSYS
2.73 2.59
Mainini et al. (2014)
Two-layer In-situ 2.748
Poirazis et al. (2009)
Two-layer - 2.9 -
Three-layer - 1.9 -
Four-layer - 1.4 -
4.7 The thermal transmittance of ETFE foil/ cushion
BS 6993: Part 1 (BSI, 1989), specified a method for calculation of U-value (thermal
transmittance) of single, double and multiple glazing panels with uncoated and (or)
coated low-emissivity surfaces. BS 6993: Part 1 (BSI, 1989), also stated standard
values for all parameters required for the calculation.
This study calculated U-value of two layer ETFE-foil cushion on the basis of the steady-
state method described in BS 6993: Part 1. The purpose was to investigate if there is
any variation in thermal transmittance in the ETFE-foil cushion imposed by double
curved surface and air enclosed with it.

4-90
4.7.1 Method
Thermal transmittance of ETFE-foil cushion was calculated using Equation 4.3,
𝑈 =
1
1ℎ𝑒
+1ℎ𝑡
+1ℎ𝑖
……………4.3
Where, ℎ𝑒 = exterior heat transfer co-efficient,
ℎ𝑖 = interior heat transfer co-efficient,
ℎ𝑡 = conductance of ETFE-foil cushion,
ℎ𝑡 = [
1
ℎ𝑔+ 𝑑𝑟]−1
……………4.4
Where, 𝑑𝑟 = thickness of ETFE-foil layer in cushion,
ℎ𝑔 = Total conductance of gas space,
ℎ𝑔 = ℎ𝑓 + ℎ𝑟 ……………4.5
Where, ℎ𝑓 = gas conductance,
ℎ𝑓 =
𝑁𝑢
𝑆 𝜆
……………4.6
𝑁𝑢= 𝐶(𝐺𝑟𝑃𝑟)ᶯ ……………4.7
Where, 𝑁𝑢 is the Nusselt number,
C (constant) = 0.16 [horizontal position and direction of heat flow upward]
n (constant) = 0.28 [horizontal position and direction of heat flow upward]
𝐺𝑟 =
𝑔𝑠3∆𝑇𝜌2𝛽
𝜇2
……………4.8
Where, Gr is the Grashof number,
∆T=15K, s = thickness of air gap,

4-91
𝑃𝑟 =
𝜇𝐶𝑝
𝜆
……………4.9
Where, 𝑃𝑟 is the Prandtl number,
μ = Viscosity [kg/ (m s)],
𝐶𝑝 = specific heat [J/(kg K)]
λ = conductivity [(w/m K)]
ℎ𝑟 = 4𝜎 [
1
𝜖1+
1
𝜖2− 1]−1 𝑇𝑚
3 ……………4.10
Where, ℎ𝑟 is the Radiation conductance,
σ is the Stefan’s constant = 5.67 x 10⁻⁸ [ W/m2K4]
Tm mean temperature of glazing 283K
𝜖1 is the effective emissivity of surface 1
𝜖2 effective emissivity of surface 2.
𝜑 = 𝜎 [1
𝜖1+
1
𝜖2− 1]−1 ……………4.11
Where, 𝜑 is the inter-surface emittance for infinite plane,
ℎ𝑡 = [1
ℎ𝑔+ 𝑑𝑟]−1 ……………4.12
Where ℎ𝑡 is the conductance of ETFE-foil layers,
𝑑𝑟 is the total thickness of ETFE-foil
In the calculation, it was considered that cushion consisted of 200μm thick ETFE-foil
layers, and emissivity of the external layer and, the internal layer was 0.82 and 0.6
respectively. Exterior and interior heat transfer co-efficient was considered 25 w/(m2K)
and 10 w/(m2K) respectively as standardised by BS6993: Part 1(BSI, 1989). It was
considered that cushion air gap varied between 100mm and 500mm.
Another calculation was made by keeping all the values as above, however, emissivity
of internal surface varied between 0.89 and 0.1, considering an air gap of 125mm
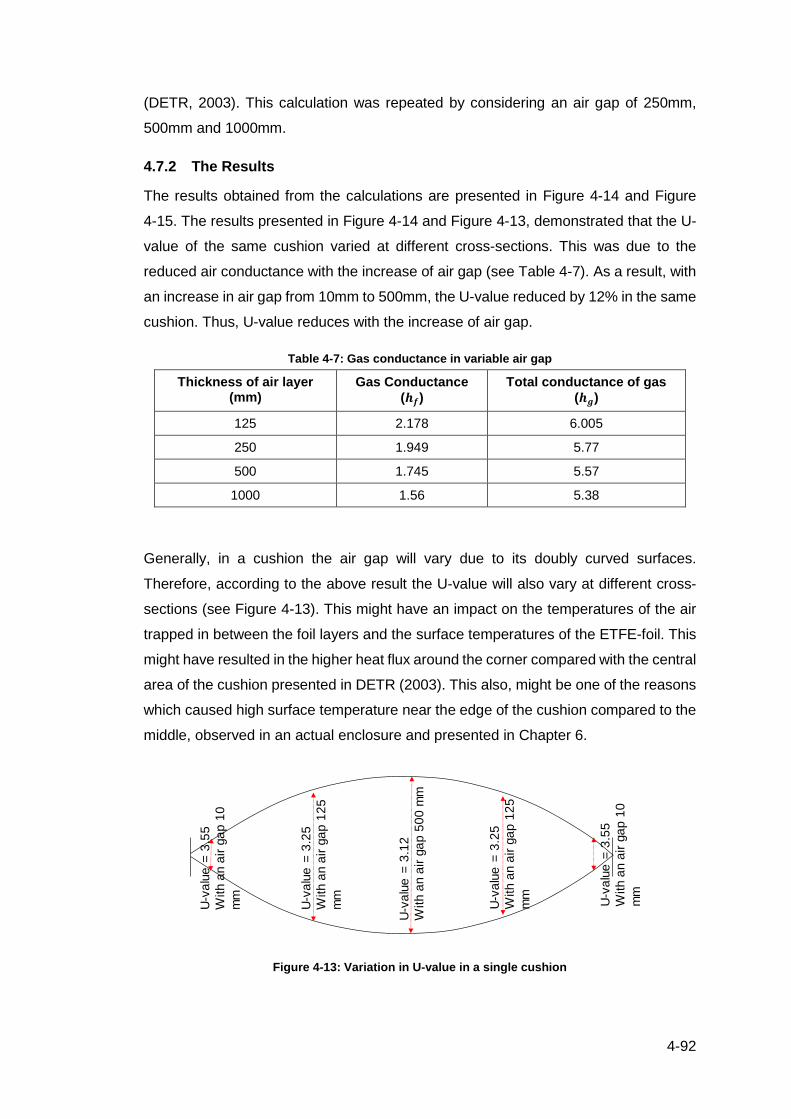
4-92
(DETR, 2003). This calculation was repeated by considering an air gap of 250mm,
500mm and 1000mm.
4.7.2 The Results
The results obtained from the calculations are presented in Figure 4-14 and Figure
4-15. The results presented in Figure 4-14 and Figure 4-13, demonstrated that the U-
value of the same cushion varied at different cross-sections. This was due to the
reduced air conductance with the increase of air gap (see Table 4-7). As a result, with
an increase in air gap from 10mm to 500mm, the U-value reduced by 12% in the same
cushion. Thus, U-value reduces with the increase of air gap.
Table 4-7: Gas conductance in variable air gap
Thickness of air layer (mm)
Gas Conductance
(𝒉𝒇)
Total conductance of gas
(𝒉𝒈)
125 2.178 6.005
250 1.949 5.77
500 1.745 5.57
1000 1.56 5.38
Generally, in a cushion the air gap will vary due to its doubly curved surfaces.
Therefore, according to the above result the U-value will also vary at different cross-
sections (see Figure 4-13). This might have an impact on the temperatures of the air
trapped in between the foil layers and the surface temperatures of the ETFE-foil. This
might have resulted in the higher heat flux around the corner compared with the central
area of the cushion presented in DETR (2003). This also, might be one of the reasons
which caused high surface temperature near the edge of the cushion compared to the
middle, observed in an actual enclosure and presented in Chapter 6.
Figure 4-13: Variation in U-value in a single cushion
U-v
alu
e =
3.1
2
With a
n a
ir g
ap 5
00
mm
U-v
alu
e =
3.2
5
With a
n a
ir g
ap 1
25
mm
U-v
alu
e =
3.5
5
With a
n a
ir g
ap 1
0
mm
U-v
alu
e =
3.2
5
With a
n a
ir g
ap 1
25
mm
U-v
alu
e =
3.5
5
With a
n a
ir g
ap 1
0
mm

4-93
Figure 4-14: Variation of thermal transmittance (U-value) in a single cushion with variation of air gap
Figure 4-15: Variation of U-value of Two layer ETFE foil cushion with variation in air gap and emissivity of internal surface
The results presented in Figure 4-15 showed that change of emissivity from 0.89 to
0.1, reduced the thermal transmittance of ETFE-foil cushion. Thus, a decrease in
emissivity of foil layer reduced the thermal transmittance of ETFE-foil cushion.
4-94
Moreover, short-wave and long-wave radiation exchange depend on the surface
emissivity (Incropera et al., 2013, Poirazis et al., 2009). Thus, a decrease in emissivity
of ETFE-foil surfaces improves thermal performance, by limiting heat gain and loss
through the cushion surface, by reducing the impact of short-wave and long-wave heat
transfer.
The steady-state method was employed here to calculate the thermal transmittance of
a two-layer ETFE-foil cushion. The derived value was 93% (3.12 W/m2K, at the middle
of the cushion) to 82% (3.55 W/m2K, at the edge of the cushion) when compared to
the value (see Table 4-6) presented in Poirazis et al. (2009). Therefore, using the
method stated in BSI (1989), it is possible to generate a U-value. However, these
values need to be verified using other established methods such as Hot-Box testing.
On the basis of the results obtained for thermal transmittance, a number of
assumptions can be made, which might impact the thermal performance of ETFE-foil
cushions and spaces enclosed with ETFE-foil cushion envelopes by allowing or limiting
exchange of heat with the external thermal environment.
Moreover, the variation in U-value in the different cross-sections of a single cushion
may raise difficulties, if a single value is assumed for a two-layer, or three-layer
cushion. Particularly in the thermal performance assessment using dynamic simulation
tools, a single value of thermal transmittance of cushion envelope might impact the
accuracy of predicted results.
4.8 Summary
In the previous chapter, the results of the pilot study revealed that thermal optical
properties of ETFE foil cushion affect the thermal performance of the enclosed space
. However, the study found limited information on the thermal optical properties of
ETFE-foils. Therefore, measurements were carried out in the laboratory using
spectrometers (Biochrom Libra S22 and IFS 66v/s) to quantify the thermal optical
properties of ETFE-foils. This chapter outlined the methods to obtain thermal optical
properties of ETFE-foil samples. This study also measured thermal optical properties
of glass samples following the similar method in order to compare properties of ETFE-
foils and glass.
Solar optical properties of ETFE-foil and glass samples can be characterised as high
transmittance in the visible and near infra-red spectrum. However, the transmittance
of both materials decreases at higher wavelengths. The spectral transmittance of glass
dropped to nearly 0% at the mid-infrared range, while ETFE-foil samples still

4-95
transmitted spectral light to a higher percentage. Therefore, at higher wavelengths,
transparent ETFE-foils will exchange a higher percentage of radiation than glass which
is effectively opaque.
On the basis of measured light and solar transmittance of single-layer ETFE-foil
samples and glass, the procedure described in BS EN 410: 2011(BSI, 2011) was
followed to calculate overall light and solar transmittance. Results were in close
agreement with previous research. It was revealed that overall light and solar
transmittance of ETFE-foils were higher than Opti-float and K-glass. Besides total light
and solar transmittance of ETFE-foils reduced from 0.905 to 0.72 and from 0.91 to 0.76
as the thickness of ETFE-foil respectively increased from 100μm to 500μm.
The results obtained on the thermal optical properties of fritted ETFE foils showed that
• With the similar fritting percentage, solar and light transmittance reduced
significantly as the density of pigment increased in the fritted part.
• Increase in the percentage of fritted part, as well as the density of pigment,
reduced light transmittance significantly.
• This impact of fritting coverage and pigment density on the solar and light
transmittance of two-layer and three-layer ETFE panel system was also
apparent.
• Above phenomenon should be taken into consideration while selecting fritted
foil for the cushion system, therefore it should not only reduce solar gain but
also would allow sufficient daylight required for spaces.
U-value of 2-layer ETFE-foil cushion was calculated on the basis of the steady-state
method stated in BS 6993: Part 1(BSI, 1989). The purpose was to see if there was any
variation in thermal transmittance in the ETFE-foil cushion imposed by double curved
surface and air enclosed with it. The results showed that increase of air gap from 10mm
to 500mm reduces U-value by 12%. This was because the air conductance reduced
with the increase of air gap. Generally, in a same cushion air gap varied due to doubly
curved surfaces. Therefore, due to the variation in air conductance in a single cushion,
U-value varied at the different cross section. The calculated U-value of the cushion
near the edge was 3.55 W/m2K, while in the middle of the cushion U-value reduced to
3.12 W/m2K.
This variation in thermal transmittance might have an impact on the temperatures of
the air trapped in between the foil layers, and the surface temperatures of ETFE-foils.
This might have resulted in high heat flux around the corner than that at the central

4-96
area of the cushion presented in DETR (2003). Also, might be one of the reasons
which caused high surface temperatures near the edge of the cushion than middle,
observed in the actual enclosure and presented in Chapter 6.
The results also demonstrated that decrease in emissivity of foil layers reduced the
thermal transmittance of ETFE-foil cushion. Moreover, the short-wave and the long-
wave radiation exchange depends on the surface emissivity (Incropera et al., 2013,
Poirazis et al., 2009). Thus, the reduction in emissivity of ETFE-foil surfaces improves
thermal performance, by limiting heat gain and loss through cushion surface, by
reducing the impact of short-wave and long-wave heat transfer.
The steady-state method was employed in this study to calculate the thermal
transmittance of a two-layer ETFE-foil cushion. On the basis of the results obtained on
the thermal transmittance, a number of assumptions can be made which might impact
the thermal performance of ETFE-foil cushion and space enclosed with ETFE-foil
cushion envelope.
Moreover, the variation in U-value in the different cross section of a single cushion will
raise difficulties, if a single value is assumed for two-layer, three-layer cushion.
Particularly in the thermal performance assessment using dynamic simulation tools, a
single value of thermal transmittance of ETFE-foil cushion envelope might impact the
accuracy of predicted results.
The results obtained on the solar and light transmittance of single, two- and three-layer
ETFE-foil was compared with that obtained from the in-situ procedure presented in
Chapter 5. Chapter 7 demonstrates the development of a simulation model using
EDLS TAS 9.3.3.b, to predict the thermal performance of spaces enclosed with ETFE-
foil cushion roof under current and future climatic scenarios, also compared this
performance with spaces when enclosed with a glass roof. The properties information
presented in this chapter were used to generate simulation models and results
obtained from simulation was validated with the actual performance data discussed in
Chapter 6.
4.9 Limitation
• The study only measured normal optical properties of ETFE-foil samples
because a spectrometer with integrating sphere was not available in the
Engineering lab. Thus it was not possible to measure angular solar optical
properties of ETFE-foil samples

4-97
• ETFE samples used in this experiment was obtained from off-cut samples.
Thus, samples were not necessarily very clean and potentially scratched.
However, these samples perhaps better represent the material in use.
• The method stated in BS EN 410: 2011 (BSI, 2011) is specifically for glazing
with parallel panels. Thus, the results obtained represent thermal and optical
properties of ETFE-foil panels rather than a cushion.
• The steady-state method was used to determine the thermal-transmittance of
a single cushion.

5-98
Chapter 5
5 Thermal performance analysis of ETFE-foil panels
5.1 Introduction and Background
From Chapter 2, it was evident that the thermal performance of actual ETFE-foil
enclosures was not investigated in previous studies. Therefore, to understand the
thermal performance of ETFE-foil and the space enclosed with it, a pilot study was
carried out in the Nottingham High School, where ETFE-foil cushions were
incorporated in the roof of the atrium. This pilot study was planned to cover a short
period of time, particularly when the school was closed during summer 2013. The
results of this pilot study were presented in Chapter 3, which suggested that because
of the complexity, the thermal performance of ETFE-foil and the space enclosed with
it need to be examined separately. To verify the thermal environment assumed from
the pilot study it was decided to start long-term monitoring when the buildings were
occupied. Therefore, thermal monitoring of the Nottingham High School and, the
Engineering and Science Learning Centre started during summer 2014 and finished
during summer 2015. The results of this monitoring is presented in Chapter 6 which
showed that ETFE-foil remained very sensitive to the variation of external weather
conditions. The significant impact of solar radiation on the surface temperatures of the
ETFE-foil cushion was identified. This was also identified by Harvie (1996) in his study,
which investigated membrane enclosure, and the author suggested that architectural
fabric affects thermal performance of the spaces they enclose through the amount of
solar radiation they absorb, reflect and transmits.
The ETFE-foil cushion usually consists of multiple layers of ETFE-foils with air-filled
chambers between them. The air between foil layers in an ETFE-foil cushion system
has an impact on the thermal environment it encloses which was also identified by
Antretter et al. (2008). This air between ETFE-foil layers possibly caused large
temperature differences between internal and external layers of the ETFE-foil cushion,
where internal layers were always hotter than external layers.
The results obtained from the pilot study (presented in Chapter 3), demonstrated that
in hot summer days’ strong temperature stratification exist in the spaces enclosed by
ETFE-foil cushion envelope. However, the environmental conditions of actual
enclosures were uncontrolled during the monitoring. The impact of internal gains,
occupancy and HVAC system on the indoor thermal environment are obvious in an

5-99
enclosed space. Thus, it was not possible to clearly identify the effect of ETFE-foil
cushion separately, on the overall performance of the spaces it enclosed. Therefore,
during summer 2014 it was decided to carry out a test rig experiment under a controlled
and known environment. From this experiment, it was expected to identify the actual
response of ETFE-foil under different weather conditions, and the relationship between
monitored thermal environmental of test rigs and the thermal response of ETFE-foils.
The ETFE-foil cushion roof of Nottingham High School is also covered with a rain
suppression mesh to reduce rain noise. A thermal imaging of the rain mesh (Figure
5-1) shows that the temperature of the mesh was hotter than the adjacent ETFE-foil
cushion surface. However, during the monitoring of Nottingham High School, it was
not possible to identify the impact of rain suppression mesh separately, on the internal
thermal environment of the atrium.
Figure 5-1: Temperature gradient recorded on ETFE-foil cushion roof and rain mesh using thermal image device.
Besides, to predicted the thermal performance of actual enclosures using digital
simulation, it was necessary to measure the solar and light transmittance of ETFE-foils
as data from the manufacturers were insufficient. Even though this data was generated
by lab experiment and presented in Chapter 4, but for fritted foils difficulties arose.
Because this type of foils consisted of the transparent part and semi-transparent or
printed part. During the lab experiment, it was not possible to identify through which
part light was passing. Thus, transmittance of the transparent part and translucent part
was measured separately and use to calculate the average transmittance (see 4.5.3).

5-100
Hence it was required to validate the approximated solar transmittance of fritted foils.
Moreover, the top layers of the ETFE-foil cushion roof of both of the monitored
buildings (presented in Chapter 6) were fritted. Therefore, it was necessary to acquire
appropriate information on the properties of fritted ETFE-foils, otherwise, it could cause
error in the simulation results. Additionally, the laboratory test only measured spectral
transmittance through single-layer ETFE-foil samples for particular wavelength ranges,
while the actual solar and light transmittance of single, two- and three-layer ETFE-foil
panels were calculated according to BS EN410:2011 (BSI, 2011). The method stated
in BS EN410:2011 (BSI, 2011) is specified to measure optical properties of glazing
material thus it also needs verification.
On the other hand, by comparing the results obtained on solar transmittance of ETFE-
foils using different methods, it would be possible to validate the test-rig experiment
that was used to measure the solar transmittance of fritted and multiple layer ETFE-
foil panels, as presented in this chapter. Additionally, this would provide a basis to
generate information for material properties, particularly for fritted foils, which were
required for digital simulation (presented in Chapter 7).
The thermal performance of single, two- and three-layer ETFE-foil panels were
investigated in two phases:
• The first phase determined solar transmittance of single, two- and three-layer
ETFE-foil panels.
• The second phase analysed the thermal performance of single, two- and three
-layer ETFE-foil panels, and evaluated the impact of fritting and, rain noise
suppression mesh on this performance.
Therefore, the first part of this chapter includes an experimental method, that was used
to measure the solar transmittance of single layer and multilayer foil panel under actual
outdoor environment. The results obtained from this investigation was compared with
the measured solar transmittance obtained in the laboratory, the appropriate British
Standard, and information from the supplier (single layer only).
The second part of this chapter describes the analysis of thermal environment of single
and multiple layer ETFE-foil panels recorded during summer 2015. This analysis was
done by comparing thermal environment of two identical test rigs, roofed with the
different configurations of ETFE-foil panels.

5-101
5.2 Objectives
The aim of the study was to evaluate the thermal performance of single, two- and three-
layer ETFE-foil panels using a test-rig experiment under actual outdoor environmental
conditions. The objectives of the study were:
1. to measure the amount of solar radiation transmitted through the different
configurations of ETFE-foil panels under actual weather conditions;
2. to evaluate and compare thermal performance of different configurations of
ETFE panels based on internal air temperature, air-volume air temperature,
surface temperature etc.;
3. to compare and analyse the relationship between surface temperatures of
ETFE-foil and air temperatures it encloses;
4. to ascertain the impact of rain suppression mesh on this performance;
5. to compare the impact of different fritting on the thermal environment; and
6. to provide reliable experimental data for the verification of simulation model
presented in Chapter 7.
5.3 Methodology
Mainini et al. (2014), conducted an in-situ experiment to obtain thermal transmittance
of a vertical ETFE-foil panel. Ward and Doran (2005), also conducted in-situ
measurements to examine multi-foil insulation in wall, roof and, floor, as defined by
ISO 9896 and, calculated U-value according to BS EN 6946 (BSI, 2007). Results
obtained in this in-situ experiment were compared with that obtained by guarded hot
box and concluded that the in-situ experiment agreed well with actual data. Max et al.
(2012), measured thermal transmittance of a novel glazing system composed of anti-
reflection coated glass and, ETFE film used for greenhouses and similar buildings.
Asdrubali and Baldinelli (2011), conducted a hot box experiment taking into account
three standards for calibrating hot boxes: The European EN ISO 8990, the American
ASTM C1363-05 and the Russian GOST 26602.1-99. The analysis of the result
showed that Russian method (Russian GOST 26602.1-99) was the ideal method to
define the thermal behaviour of glazing components.
In most of the hot box experiments, the specimen position was vertical while Elmahdy
and Haddad (2000), modified this typical position of the specimen and evaluated
thermal transmittance of skylights and sloped glazing in various inclination.
5-102
Dimitriadou (2015), conducted an in-situ experiment to compare the thermal
performance of a two-layer inflated ETFE-foil cushion and double glazed unit. The
results of the study were based on night time recorded data. The study concluded that,
under cold weather, the ETFE-foil cushion was able to create a comfortable interior
environment at a comparatively low energy cost, thus ETFE-foil cushions can be
successfully applied to replace glass in buildings. This study was based on night-time
and, cold weather conditions only, when the building’s thermal environment is mostly
controlled by a HVAC system. However, the results provided basic knowledge on
energy consumption through the HVAC system, which might have resulted from the
use of the ETFE-foil cushion and glass roof.
Poirazis et al. (2009), studied heat transfer through ETFE-foil using mathematical
models. The results of the study estimated that, due to night time long-wave radiation
exchange, heat loss increased by 12% in ETFE-foil cushions in comparison to glazing.
At the Fraunhofer Institut fϋr Bauphysik, Germany, Antretter et al. (2011) examined a
full-scale model of a structure covered by an ETFE-foil cushion. The purpose was to
validate results obtained using CFD, to predict heat distribution in an ETFE-foil cushion
under different inclinations. Findings of the study showed that heat flux on the ETFE-
foil cushion surface resulted from convective and radiative heat flux components. In
horizontal positions when the temperature difference between ETFE-foil cushion
surface and the outdoor air was 30°K, approximately 30% of the total heat flux was
caused by convection and 70% was caused by radiation. As the temperature difference
increased, the proportion of convective heat flux increased too. Moreover, at the time
when the temperature of top foil of the cushion increased over bottom foil, caused a
stable temperature layering, convective heat flux reduced, and almost all energy was
transferred by surface to surface radiation.
Hu et al. (2016) developed an experimental setup that was composed of an open
structure, covered with three-layer ETFE-foil cushion roof integrated with amorphous
silicon photovoltaic cells, consisting of a solar energy control system and a pressure
control system. The study aimed to investigate the thermal performance of three-layer
a ETFE-foil cushion roof integrated with amorphous silicon photovoltaics on the basis
of surface temperature distribution and heat transfer coefficient. The experiment was
done in sunny summer conditions and the results were compared with those obtained
using computer simulation (using FLUENT). The maximum difference between the air
temperature of the experimental setup and the numerical model was 3.4°K. The
experimental results showed that in the three-layer cushion, the temperature of the
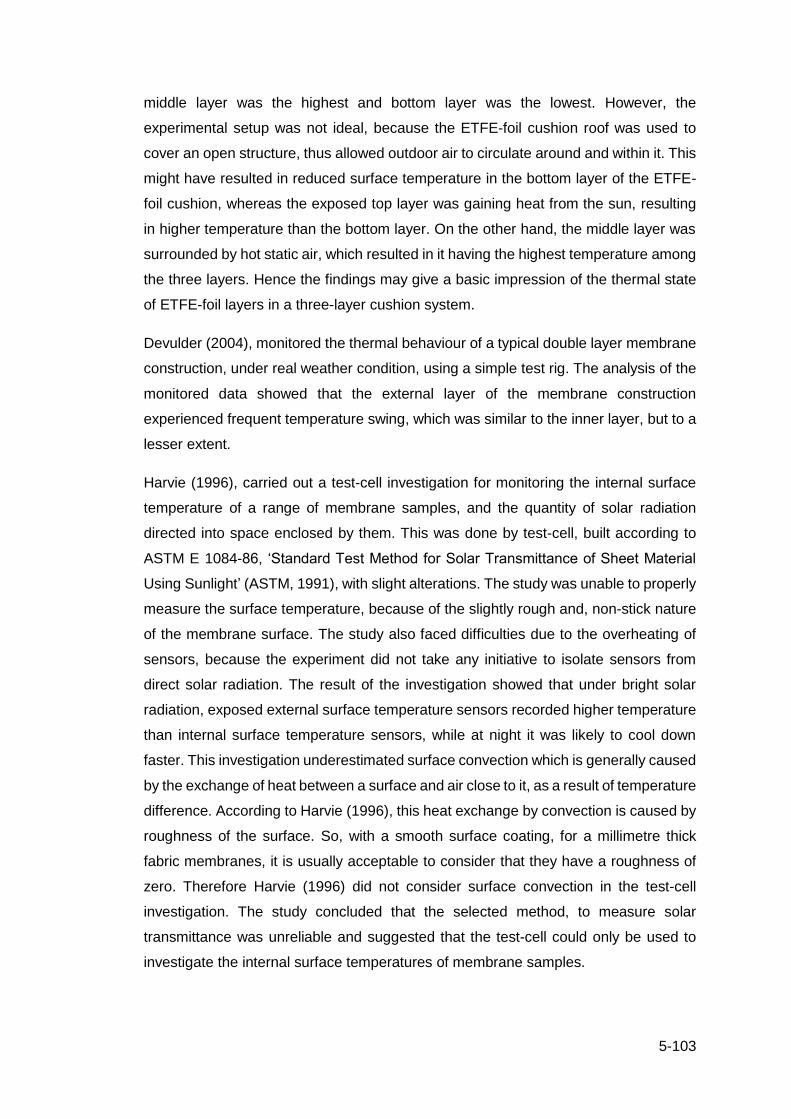
5-103
middle layer was the highest and bottom layer was the lowest. However, the
experimental setup was not ideal, because the ETFE-foil cushion roof was used to
cover an open structure, thus allowed outdoor air to circulate around and within it. This
might have resulted in reduced surface temperature in the bottom layer of the ETFE-
foil cushion, whereas the exposed top layer was gaining heat from the sun, resulting
in higher temperature than the bottom layer. On the other hand, the middle layer was
surrounded by hot static air, which resulted in it having the highest temperature among
the three layers. Hence the findings may give a basic impression of the thermal state
of ETFE-foil layers in a three-layer cushion system.
Devulder (2004), monitored the thermal behaviour of a typical double layer membrane
construction, under real weather condition, using a simple test rig. The analysis of the
monitored data showed that the external layer of the membrane construction
experienced frequent temperature swing, which was similar to the inner layer, but to a
lesser extent.
Harvie (1996), carried out a test-cell investigation for monitoring the internal surface
temperature of a range of membrane samples, and the quantity of solar radiation
directed into space enclosed by them. This was done by test-cell, built according to
ASTM E 1084-86, ‘Standard Test Method for Solar Transmittance of Sheet Material
Using Sunlight’ (ASTM, 1991), with slight alterations. The study was unable to properly
measure the surface temperature, because of the slightly rough and, non-stick nature
of the membrane surface. The study also faced difficulties due to the overheating of
sensors, because the experiment did not take any initiative to isolate sensors from
direct solar radiation. The result of the investigation showed that under bright solar
radiation, exposed external surface temperature sensors recorded higher temperature
than internal surface temperature sensors, while at night it was likely to cool down
faster. This investigation underestimated surface convection which is generally caused
by the exchange of heat between a surface and air close to it, as a result of temperature
difference. According to Harvie (1996), this heat exchange by convection is caused by
roughness of the surface. So, with a smooth surface coating, for a millimetre thick
fabric membranes, it is usually acceptable to consider that they have a roughness of
zero. Therefore Harvie (1996) did not consider surface convection in the test-cell
investigation. The study concluded that the selected method, to measure solar
transmittance was unreliable and suggested that the test-cell could only be used to
investigate the internal surface temperatures of membrane samples.
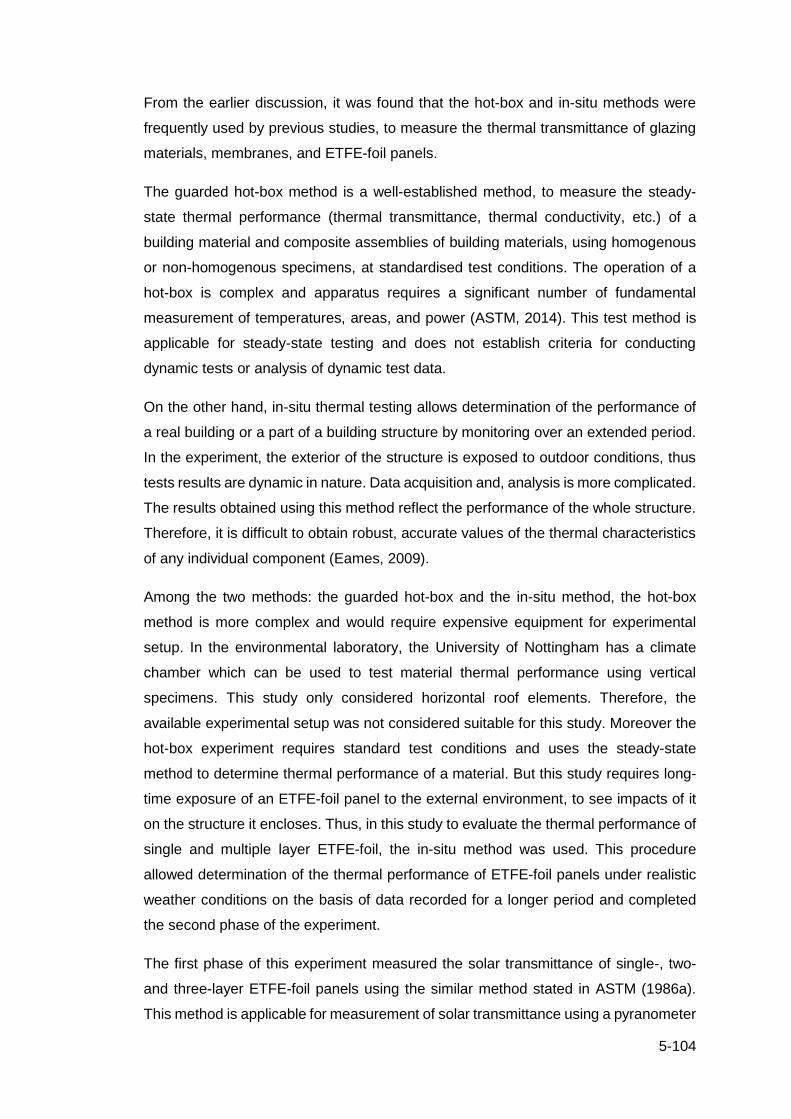
5-104
From the earlier discussion, it was found that the hot-box and in-situ methods were
frequently used by previous studies, to measure the thermal transmittance of glazing
materials, membranes, and ETFE-foil panels.
The guarded hot-box method is a well-established method, to measure the steady-
state thermal performance (thermal transmittance, thermal conductivity, etc.) of a
building material and composite assemblies of building materials, using homogenous
or non-homogenous specimens, at standardised test conditions. The operation of a
hot-box is complex and apparatus requires a significant number of fundamental
measurement of temperatures, areas, and power (ASTM, 2014). This test method is
applicable for steady-state testing and does not establish criteria for conducting
dynamic tests or analysis of dynamic test data.
On the other hand, in-situ thermal testing allows determination of the performance of
a real building or a part of a building structure by monitoring over an extended period.
In the experiment, the exterior of the structure is exposed to outdoor conditions, thus
tests results are dynamic in nature. Data acquisition and, analysis is more complicated.
The results obtained using this method reflect the performance of the whole structure.
Therefore, it is difficult to obtain robust, accurate values of the thermal characteristics
of any individual component (Eames, 2009).
Among the two methods: the guarded hot-box and the in-situ method, the hot-box
method is more complex and would require expensive equipment for experimental
setup. In the environmental laboratory, the University of Nottingham has a climate
chamber which can be used to test material thermal performance using vertical
specimens. This study only considered horizontal roof elements. Therefore, the
available experimental setup was not considered suitable for this study. Moreover the
hot-box experiment requires standard test conditions and uses the steady-state
method to determine thermal performance of a material. But this study requires long-
time exposure of an ETFE-foil panel to the external environment, to see impacts of it
on the structure it encloses. Thus, in this study to evaluate the thermal performance of
single and multiple layer ETFE-foil, the in-situ method was used. This procedure
allowed determination of the thermal performance of ETFE-foil panels under realistic
weather conditions on the basis of data recorded for a longer period and completed
the second phase of the experiment.
The first phase of this experiment measured the solar transmittance of single-, two-
and three-layer ETFE-foil panels using the similar method stated in ASTM (1986a).
This method is applicable for measurement of solar transmittance using a pyranometer

5-105
in an enclosure, and considering the sun as the energy source. The spectral sensitivity
of the pyranometer extends from the ultraviolet to near infrared wavelengths (0.3μm to
2.8μm), thus encompassing all the solar spectrum. Using this method, the solar
transmittance of the test specimens is measured from the ratio of the solar radiation
measured when the test specimen is placed between the sun and, the pyranometer,
and the solar radiation measured by the pyranometer with no test specimen.
5.3.1 Description of the test rig
For the purpose of this study, two identical test rigs of 1000mm (length) x 800mm
(width) x 1000mm (height) were constructed with exterior ply and, lined internally with
rigid insulation. To reduce air losses through the corners of the test rigs, silicon sealant
was used along the perimeter and, in between the edges of the rigid insulation; which
made the test rigs fully sealed. The test rigs were coated with weatherproof paint. The
test rigs were located on the roof of the Coates Building at the University of
Nottingham. Exposed area of foil was 1000 x 800mm and test rigs were tilted towards
the south at an angle of 14° from horizontal. While selecting this configuration, it was
considered that foil exposed to the direct beam solar radiation would also have a large
view of the sky dome. This would emphasize the effect of short-wave and long-wave
radiation exchanges on the thermal balance of foils.
Each test rigs consisted of a frame of 1000mm (length) x 800mm (width) x 250mm
(height) to attach the ETFE-foils. This frame was used as a cap to fit above the test
rigs. This approach allowed to attach various types of ETFE-foils (e.g. single-layer,
double layered, etc.). In a single-layer system, one foil was tensioned on top of the
frame; to develop a double layer foil panel, two foils were tensioned on top and bottom
of this frame parallel to one another, with an air gap of approximately 250mm. This
panel was then used to cap these insulated and instrumented test rigs. For the three-
layer panel systems, a single layer foil was tensioned in a different frame and clamped
on top of the two-layer system to provide an air gap of 250mm. These panels were
also constructed with exterior ply and, rigid insulation and, to reduce air loss, the edge
of the panel was filled with silicon sealant.
In the first phase of this test-rig experiment, the solar transmittance of single, two and
three-layer ETFE-foil panels were measured. ASTM (1986b), describes the method to
measure solar transmittance, by the ratio of average radiation with and without a test
specimen, using a box and a pyranometer located inside it. However, in this study, two
test-rigs (Test-rig 1, Test-rig 2) were used, and both of the test-rigs were equipped with
a pyranometer, located in the same relative position. One test-rig (Test-rig 1) was

5-106
covered with ETFE-foil panels while the immediately adjacent test-rig (Test-rig 2) was
uncovered. The pyranometer located in Test-rig 1 and covered with the ETFE-foil panel
measured transmitted solar radiation. Whereas, the pyranometer located in Test-rig 2
measured incident solar radiation. Thus, solar transmittance was measured from the
ratio of transmitted and incident solar radiation.
In the second phase of the experiment, both of the test-rigs were covered with ETFE-
foil panels of different combinations. A part of this test rig experiment also included rain
suppression mesh, which was placed on top of the ETFE-foil panel of one of the test-
rigs while the adjacent test rig was capped with a similar ETFE-foil panel without mesh.
The thermal performance was evaluated by comparing the air temperature within the
test-rigs and, surface temperatures of the ETFE-foil panels, used to cover test-rigs.
5.3.1.1 Irradiance
Kipp & Zonen CMP3 Pyranometers (sensitive wave band: 0.3-2.8µm) were employed
to measure the incident and transmitted solar radiation.
At the first phase of the experiment, a pyranometer was placed in Test-rig 1. At the
same relative position as the first pyranometer of the Test-rig 1, a second pyranometer
was placed in Test-rig 2. This was because the pyranometer measuring solar radiation
was slightly recessed inside the test-rigs, so hemispherical solid angle viewed by this
sensor was slightly obstructed. Therefore, the view factor of both pyranometers was
same. Figure 5-2 presents schematic drawing and position of the pyranometer in test-
rigs during phase 1 experiment.
Figure 5-2: Diagrammatic sectional drawings and position of pyranometer in test-rigs during phase 1
At the second phase of the experiment, pyranometers placed inside the Test-rig 1 and
Test-rig 2 were aligned to be parallel to the ETFE-foil panels and located immediately
below the internal layer of foil to record transmitted solar radiation. A third pyranometer

5-107
was placed externally at 4 metres above the floor level of the roof adjacent to test-rigs,
to record incident total solar radiation. Figure 5-3 presents diagrammatic sectional
drawings and position of pyranometers in test-rigs during phase 2 experiment.
Figure 5-3: Diagrammatic sectional drawings and position of pyranometer in test-rigs during phase 2
5.3.1.2 Temperature sensors
In the second phase of the experiment, internal air temperatures of the test-rigs, air
temperatures between foil layers (in the two-layer and three-layer ETFE-foil panels),
and the surface temperatures of each ETFE-foil layers were recorded using screened
thermocouple (𝜙0.1 mm, K-type) temperature sensors, similar to those installed in the
actual enclosure monitoring (presented in Chapter 6). Location of this sensors are
shown in diagrammatic section of test rig in Figure 5-7.
The tip of thermocouple sensors measuring air temperatures was shielded in a
lightweight aluminum tube to minimise solar radiation effects from the measurements.
To measure surface temperatures, thermocouple tips were directly attached to the
ETFE- foil surface as well as test-rig surface by using silver tape. Besides small pieces
of ETFE-foils were placed in between silver tape and thermocouple tip so that
temperature sensors would not heat by reflective aluminum foil tape surface.
5.3.1.3 Data logger
The thermocouples and pyranometers were connected to a Data Taker 85 data logger.
The thermocouples were wired in a shared input configuration and their
electromagnetic shields connected to the appropriate input of the data logger. The
sampling rate was set to one minute. This sampling period of one minute was selected
to record the frequent change of thermal state of ETFE-foils as an impact of the change
in external environment. Description of the sensors attached with this logger can be
found from Table 5-2 (First phase) and Table 5-3 (Second phase).
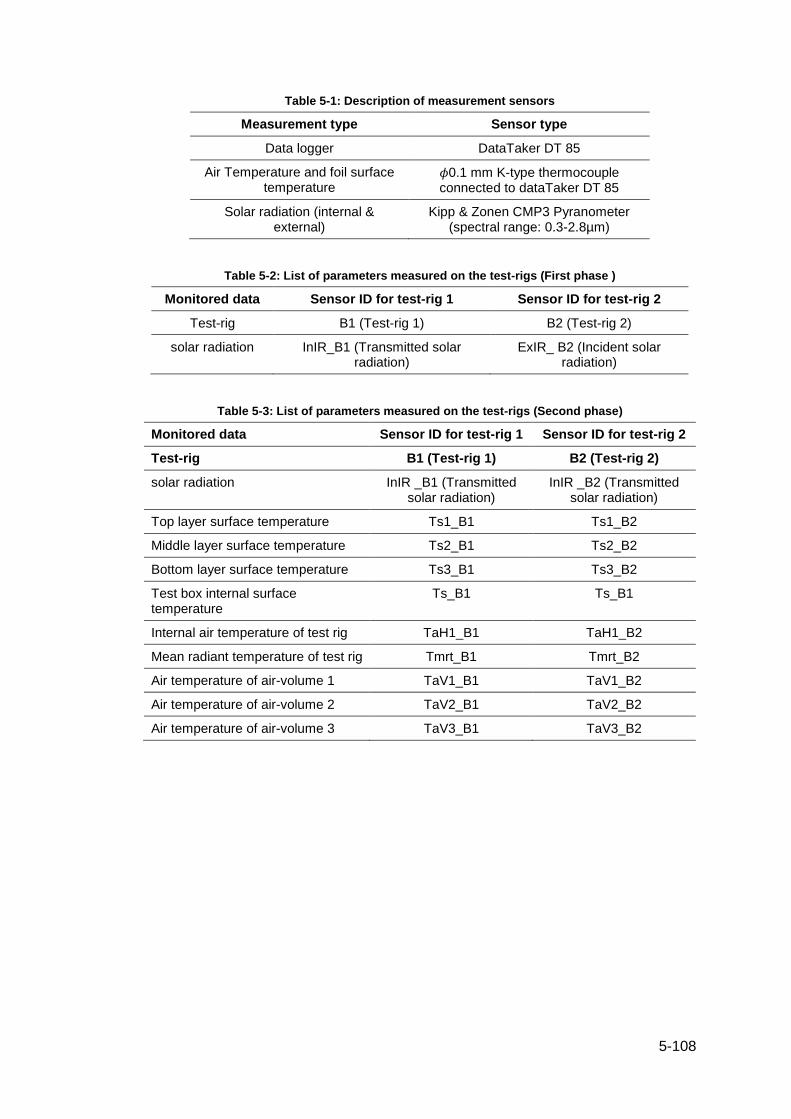
5-108
Table 5-1: Description of measurement sensors
Measurement type Sensor type
Data logger DataTaker DT 85
Air Temperature and foil surface temperature
𝜙0.1 mm K-type thermocouple connected to dataTaker DT 85
Solar radiation (internal & external)
Kipp & Zonen CMP3 Pyranometer (spectral range: 0.3-2.8µm)
Table 5-2: List of parameters measured on the test-rigs (First phase )
Monitored data Sensor ID for test-rig 1 Sensor ID for test-rig 2
Test-rig B1 (Test-rig 1) B2 (Test-rig 2)
solar radiation InIR_B1 (Transmitted solar radiation)
ExIR_ B2 (Incident solar radiation)
Table 5-3: List of parameters measured on the test-rigs (Second phase)
Monitored data Sensor ID for test-rig 1 Sensor ID for test-rig 2
Test-rig B1 (Test-rig 1) B2 (Test-rig 2)
solar radiation InIR _B1 (Transmitted solar radiation)
InIR _B2 (Transmitted solar radiation)
Top layer surface temperature Ts1_B1 Ts1_B2
Middle layer surface temperature Ts2_B1 Ts2_B2
Bottom layer surface temperature Ts3_B1 Ts3_B2
Test box internal surface temperature
Ts_B1 Ts_B1
Internal air temperature of test rig TaH1_B1 TaH1_B2
Mean radiant temperature of test rig Tmrt_B1 Tmrt_B2
Air temperature of air-volume 1 TaV1_B1 TaV1_B2
Air temperature of air-volume 2 TaV2_B1 TaV2_B2
Air temperature of air-volume 3 TaV3_B1 TaV3_B2
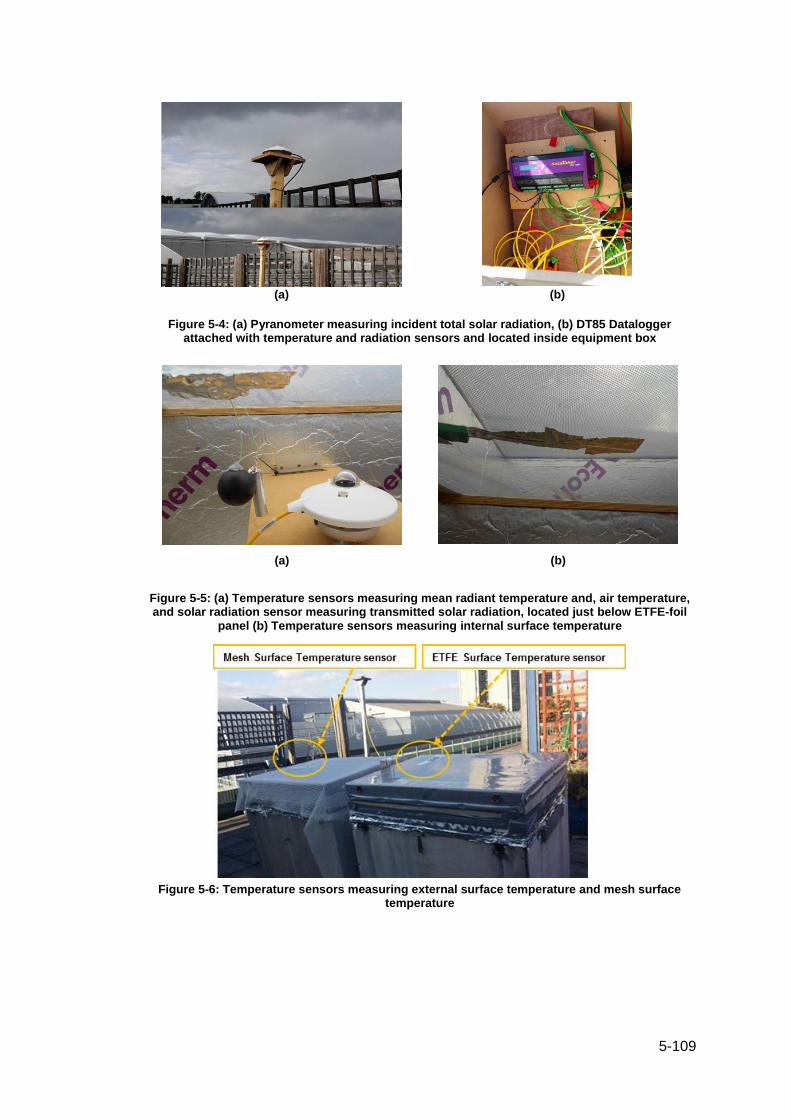
5-109
(a) (b)
Figure 5-4: (a) Pyranometer measuring incident total solar radiation, (b) DT85 Datalogger attached with temperature and radiation sensors and located inside equipment box
(a) (b)
Figure 5-5: (a) Temperature sensors measuring mean radiant temperature and, air temperature, and solar radiation sensor measuring transmitted solar radiation, located just below ETFE-foil
panel (b) Temperature sensors measuring internal surface temperature
Figure 5-6: Temperature sensors measuring external surface temperature and mesh surface
temperature
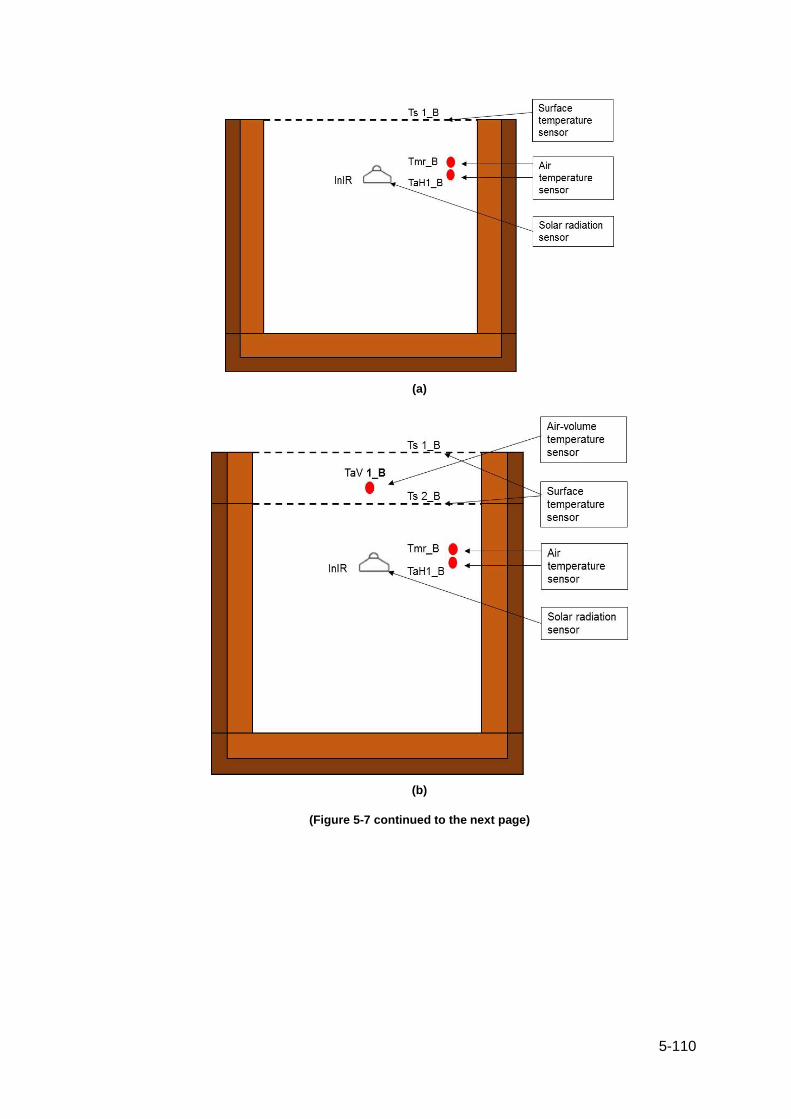
5-110
(a)
(b)
(Figure 5-7 continued to the next page)
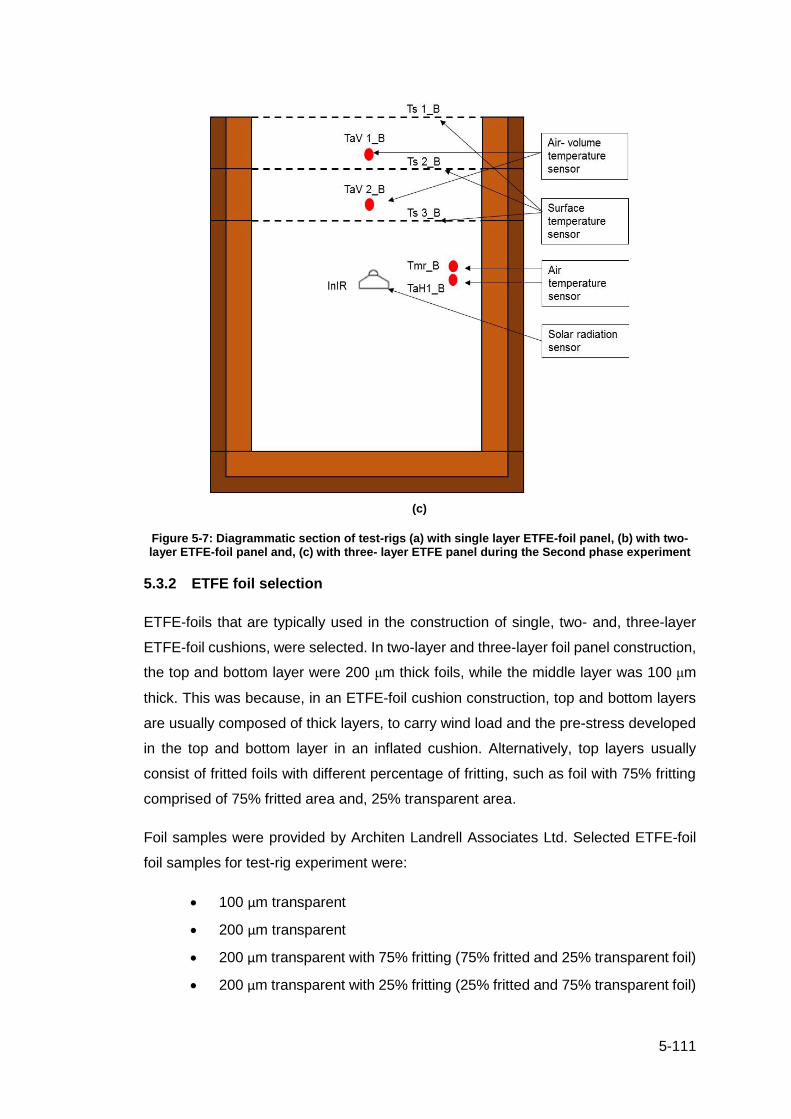
5-111
(c)
Figure 5-7: Diagrammatic section of test-rigs (a) with single layer ETFE-foil panel, (b) with two-layer ETFE-foil panel and, (c) with three- layer ETFE panel during the Second phase experiment
5.3.2 ETFE foil selection
ETFE-foils that are typically used in the construction of single, two- and, three-layer
ETFE-foil cushions, were selected. In two-layer and three-layer foil panel construction,
the top and bottom layer were 200 μm thick foils, while the middle layer was 100 μm
thick. This was because, in an ETFE-foil cushion construction, top and bottom layers
are usually composed of thick layers, to carry wind load and the pre-stress developed
in the top and bottom layer in an inflated cushion. Alternatively, top layers usually
consist of fritted foils with different percentage of fritting, such as foil with 75% fritting
comprised of 75% fritted area and, 25% transparent area.
Foil samples were provided by Architen Landrell Associates Ltd. Selected ETFE-foil
foil samples for test-rig experiment were:
• 100 µm transparent
• 200 µm transparent
• 200 µm transparent with 75% fritting (75% fritted and 25% transparent foil)
• 200 µm transparent with 25% fritting (25% fritted and 75% transparent foil)

5-112
(a) (b)
Figure 5-8: (a) 200 µm transparent with 75% fritting, (b) 200 µm transparent with 25% fritting
Figure 5-8 presents 200 µm transparent foil with 75% fritting and 200 µm transparent
foil with 25% fritting. Among the selected types, foils similar to the 200 µm transparent
with 75% fritting [see Figure 5-8 (a)] and, 200 µm transparent foils were used to
construct the cushion roof of one of the case study buildings (Nottingham High School),
presented in Chapter 6.
5.3.3 Weather data
Weather data e.g. outdoor air temperature and humidity was monitored by a Tiny tag
Plus 2 - TGP-4017 data logger. This data logger was attached to the exterior of Test-
rig 1. Although this sensor was water proof, extra care was taken to avoid contact with
rain water and direct solar radiation by placing a steel frame around the datalogger. A
sampling period of one minute was applied. External incident solar radiation was
measured by a Kipp & Zonen CMP 3 pyranometer, located adjacent to the test-rigs
which was already mentioned in section 5.3.1.1. Figure 5-9 presents sensors used to
measure environmental parameters and Table 5-4 presents sensor types used to
measure environmental parameters. Table 5-5 presents identifications of
environmental data used in the analysis.
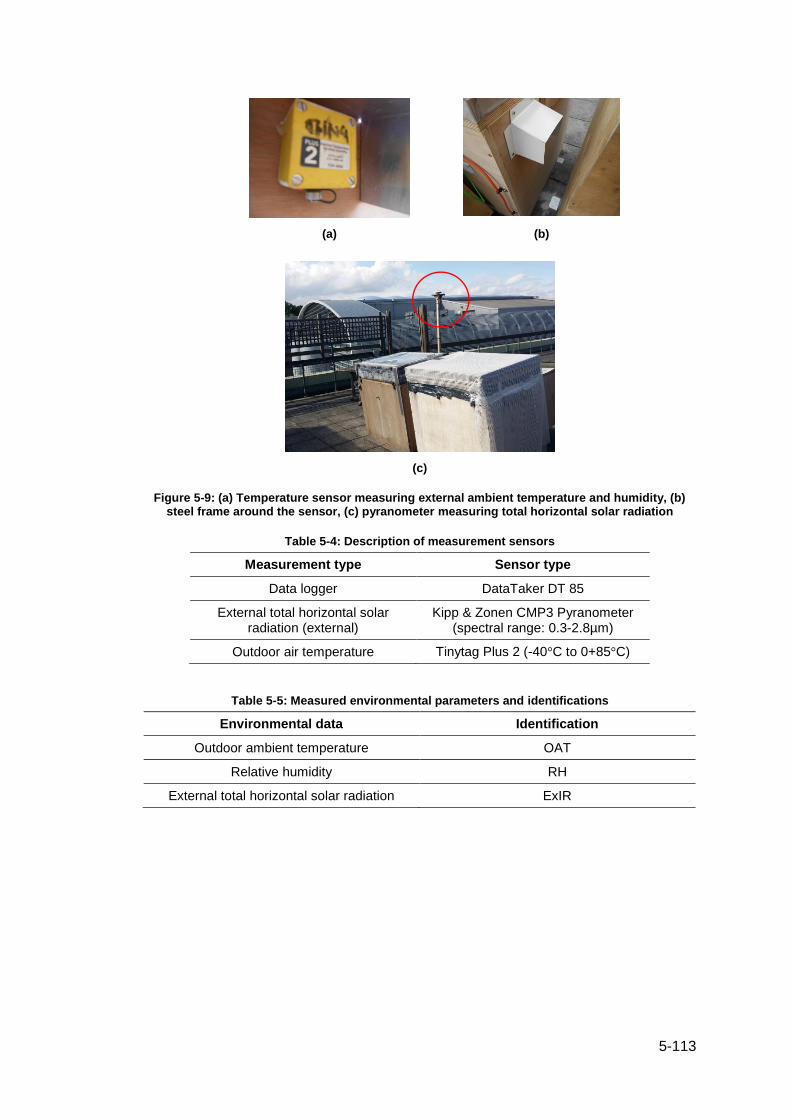
5-113
(a) (b)
(c)
Figure 5-9: (a) Temperature sensor measuring external ambient temperature and humidity, (b) steel frame around the sensor, (c) pyranometer measuring total horizontal solar radiation
Table 5-4: Description of measurement sensors
Measurement type Sensor type
Data logger DataTaker DT 85
External total horizontal solar radiation (external)
Kipp & Zonen CMP3 Pyranometer (spectral range: 0.3-2.8µm)
Outdoor air temperature Tinytag Plus 2 (-40°C to 0+85°C)
Table 5-5: Measured environmental parameters and identifications
Environmental data Identification
Outdoor ambient temperature OAT
Relative humidity RH
External total horizontal solar radiation ExIR

5-114
5.3.4 Timescale of the monitoring
Continuous monitoring commenced on 15 April 2014. A number of observations were
made and the test-rig position was changed depending on the sun’s position so that
the ETFE-foil panels had the largest view of the sky dome. The position of the
pyranometer measuring incident solar radiation was changed so that the view factor of
the pyranometer would not be obstructed by adjacent structures. After completion of
all necessary steps, it was possible to start the experiment from 1st July 2014. The
priority of this study is to observe and analyse the optical and thermal performance of
single and multi-layer ETFE-foil under different weather conditions. The orientation of
both test-rigs was the same throughout the monitoring period to obtain sufficient data
to represent the thermal performance of ETFE-foil panels.
This test-rig experiment was conducted in two different phases. The first phase was
conducted between July 2014 and October 2014. In this phase solar transmittance of
different types of single, two- and three-layer flat ETFE-foil panels was measured.
During this experiment Test-rig 1 was capped with ETFE-foil panels of different single
and multiple layer configuration while Test-rig 2 was kept open. Each box contained
one Kipp & Zonen CMP3 pyranometer which was placed internally and at the same
height. So pyranometer in one of the test-rig with ETFE-foil panel measured
transmitted radiation while another pyranometer in another test-rig without any cap
measured incident solar radiation. The results were obtained from the ratio of
transmitted and incident solar radiation. Using this procedure the solar transmittance
of single, two- and three-layer ETFE-foil panels were determined. Table 5-6 presents
the schedule of monitoring for the first phase experiment.

5-115
Table 5-6: Different combinations of ETFE-foil in Test-rig 1 (First phase)
Test rig 1 Test rig 2
ETFE-foil layer number in panels
Combination Foil type Thickness ETFE-foil layer number in panels
Study Period
Two-layer Layer 1
(Top layer)
Fritted (75% fritted and 25% transparent)
200μm None 1st July to 20th July 14
Layer 2
(Bottom layer)
Transparent 200μm
Single-layer Layer 1
(Top layer)
Fritted (75% fritted and 25% transparent)
200μm As above 25th July to 31st July 14
Three-layer Layer 1
(Top layer)
Fritted (75% fritted and 25% transparent)
200μm As above 5th August to 25th August 14
Layer 2
(Middle layer)
Transparent 150μm
Layer 3
(Bottom layer)
Transparent 200μm
Three-layer Layer 1
(Top layer)
Fritted (25% fritted and 75% transparent)
200μm As above 1 September to 25th September 14
Layer 2
(Middle layer)
Transparent 150μm
Layer 3
(Bottom layer
Transparent 200μm
Single-layer Layer 1 Fritted (25% fritted and 75% transparent)
200μm As above 25th October 14 to 10th November 14
Two-layer Layer 1
(Top layer)
Fritted (25% fritted and 75% transparent)
As above 30th April to 10th May 15
Layer 2
(Bottom layer)
Transparent 200μm
The second phase test-rig experiment was conducted between May 2015 and October
2015 to examine the thermal performance of a variety of single, two-layer and three-

5-116
layer flat ethylene-tetra-fluoro-ethylene (ETFE) foil panels under different weather
conditions. A number of multi-layer combinations incorporating different thicknesses of
transparent and/or fritted ETFE-foils were examined. A part of this test-rig experiment
also included rain suppression mesh which was placed on top of the ETFE-foil panel
of one of the test-rigs while the adjacent test-rig was capped with an ETFE-foil panel
without mesh. The purpose was to determine the effect of rain noise suppression mesh
on the thermal performance of ETFE-foil panels. Table 5-7 presents the schedule of
monitoring of second phase experiment.
Table 5-7: Different combination of ETFE-foil in Test-rig 1 and Test-rig 2 (Phase 2)
Test-rig 1 Test-rig 2
Position of ETFE
layers in panel
Foil type Thick
-ness
Position of ETFE-foil layers in
panel
Foil Type Thick
-ness
Study Period
Layer 1
(Top layer)
Fritted (75% fritted and
25% transparent)
200μm Layer 1 (Top layer)
Fritted (25% fritted and
75% transparent)
200 μm 1st September 15 to 10th September
15 Layer 2
(Bottom layer)
Transparent
200μm Layer 2 (Middle layer)
Transparent 150 μm
Layer 3 (Bottom layer)
Transparent 200 μm
Layer 1 (Top layer)
Fritted (75% fritted and
25% transparent)
200 μm Layer 1 (Top layer)
Fritted (25% fritted and
75% transparent)
200 μm 18th September
to 24th September
Layer 2 (Middle layer)
Transparent 150 μm Layer 2 (Middle layer)
Transparent 150 μm
Layer 3 (Bottom layer)
Transparent 200 μm Layer 3 (Bottom layer)
Transparent 200 μm
Layer 1 (Top layer)
Fritted (75% fritted and
25% transparent)
200 μm Layer 1 (Top layer)
Fritted (25% fritted and
75% transparent)
200 μm 25th September
to 2nd October
5.4 Measurement of solar transmittance of ETFE-foil panels
In the first phase, field measurements of actual solar transmittance are compared with
the solar transmittance measured in the laboratory and calculated according to BS

5-117
EN410:2011(BSI, 2011) and presented in Table 5-8. Here, the spectral transmittance
of different types of transparent and silver single layer ETFE-foil was measured in the
laboratory which is described in Chapter 5. For fritted ETFE-foil overall transmittance
was approximated based on the percentage of fritted area and transparent part. The
overall solar transmittance of single, two- and three-layer ETFE-foil panel was
calculated based on the measured transmittance of single layer ETFE-foil and
according to BS EN410:2011.
Solar transmittance measured in the test-rig experiment was estimated from the
incident solar radiation (unobstructed) recorded in Test-rig 2 and, the transmitted
(through ETFE) solar radiation recorded in Test-rig 1. This procedure to estimate solar
transmittance is stated in ASTM (1986b). Figure 5-10 shows Test-rig 1 and Test-rig 2,
with and without ETFE-foil. The results recorded on a clear day were considered. Data
recorded between 9.00 am and 3.00 pm was averaged as stated in ASTM (1986b).
According to ASTM (1986b), during this period the solar radiation is at least 80% of
the value obtained at solar noon for that day. This procedure was followed to measure
solar transmittance of single, two- and three-layer ETFE-foil panels of different
combination stated Table 5-6. Measured solar transmittance of ETFE-foil panels was
within 88.2% to 97% of the results obtained from lab and calculated using BS
EN410:2011(BSI, 2011) and also information obtained from Architen Landrell (single
layer only). The results of the experiment are presented in Table 5-8. Figure 5-11,
Figure 5-12, Figure 5-13, Figure 5-14, Figure 5-15, Figure 5-16 illustrated solar
radiation transmission through single, two- and three-layers 25% and 75% fritted
ETFE-foil panels.
Figure 5-10: Phase 1 test-rig experiment
Test rig 2 without ETFE foil panel Test rig 1 with ETFE foil panel
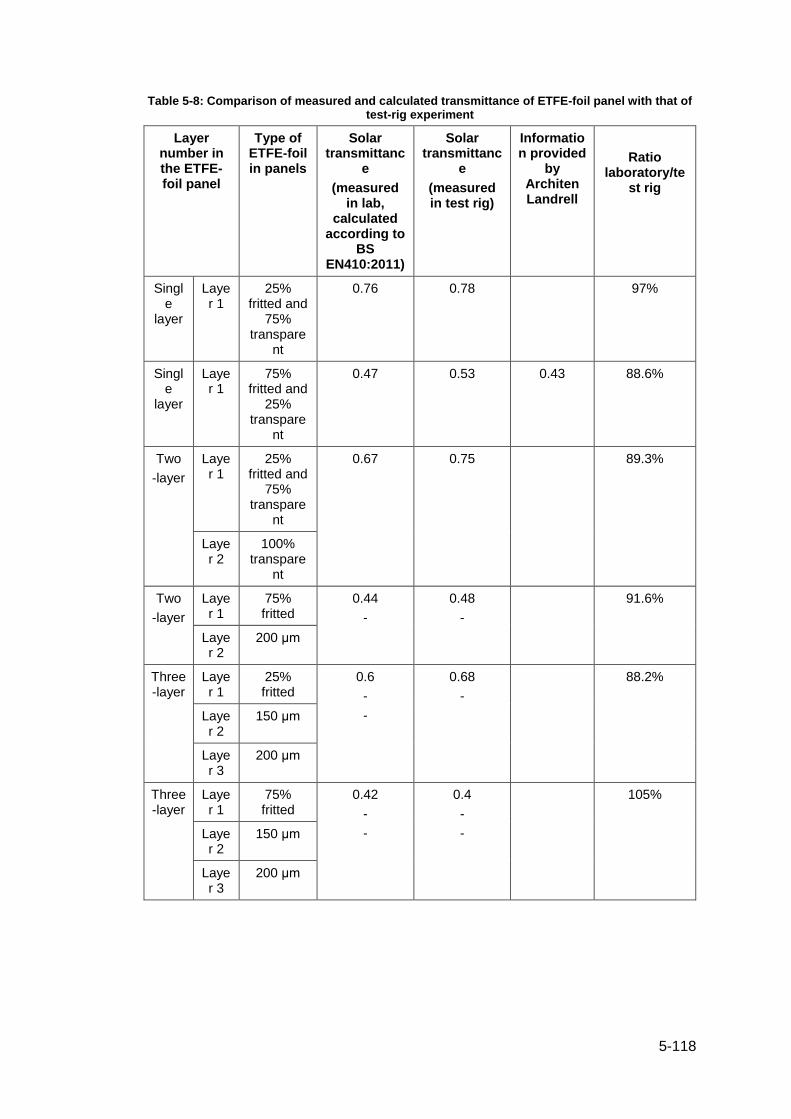
5-118
Table 5-8: Comparison of measured and calculated transmittance of ETFE-foil panel with that of test-rig experiment
Layer number in the ETFE-foil panel
Type of ETFE-foil in panels
Solar transmittanc
e
(measured in lab,
calculated according to
BS EN410:2011)
Solar transmittanc
e
(measured in test rig)
Information provided
by Architen Landrell
Ratio laboratory/te
st rig
Single
layer
Layer 1
25% fritted and
75% transpare
nt
0.76 0.78 97%
Single
layer
Layer 1
75% fritted and
25% transpare
nt
0.47 0.53 0.43 88.6%
Two
-layer
Layer 1
25% fritted and
75% transpare
nt
0.67 0.75 89.3%
Layer 2
100% transpare
nt
Two
-layer
Layer 1
75% fritted
0.44
-
0.48
-
91.6%
Layer 2
200 μm
Three -layer
Layer 1
25% fritted
0.6
-
-
0.68
-
88.2%
Layer 2
150 μm
Layer 3
200 μm
Three -layer
Layer 1
75% fritted
0.42
-
-
0.4
-
-
105%
Layer 2
150 μm
Layer 3
200 μm

5-119
Figure 5-11: Incident and Transmitted Solar Radiation comparison (Single layer panel with 75%
fritted ETFE-foil)
Figure 5-12: Incident and Transmitted Solar Radiation comparison (Two-layer panel with 75%
fritted top ETFE-foil)

5-120
Figure 5-13: Incident and Transmitted Solar Radiation comparison (Thee-layer panel with 75%
fritted top ETFE-foil)
Figure 5-14: Incident and Transmitted Solar Radiation comparison (Single layer panel with 25%
fritted top ETFE-foil)

5-121
Figure 5-15: Incident and Transmitted Solar Radiation comparison (Two-layer panel with 25%
fritted top ETFE-foil)
Figure 5-16: Incident and Transmitted Solar Radiation comparison (Three-layer panel with 25%
fritted top ETFE-foil)

5-122
5.5 Thermal performance analysis of ETFE-foil panels
Combination, specification and study periods of ETFE-foil panels used in two different
test-rigs are presented in Table 5-7. To measure the thermal behaviour of the ETFE-
foils the following parameters were measured from Test-rig 1 and Test-rig 2:
• internal air temperature,
• air-volume air temperature,
• mean radiant temperature,
• surface temperature (both external and internal),
• incident and transmitted solar radiation.
In between 6th and 11th September 2015, Test-rig 1 and Test-rig 2 were equipped with
two-layer ETFE-foil panels with 75% fritted top layer and a three-layer ETFE panel with
a 25% fritted top layer, respectively. Between 19th and 24th September 2015, Test-rig
1 and Test-rig 2 were roofed with a three layer ETFE-foil panel with 75% fritted top
layer and a three layer ETFE-foil panel with 25% fritted top layer, correspondingly. For
the study period between 26th September and 2nd October 2015, Test-rig 1 and Test-
rig 2, respectively, were capped with 75% and 25% fritted single layer ETFE-foil
panels.
Figure 5-17: Second phase test-rig investigation (without mesh)
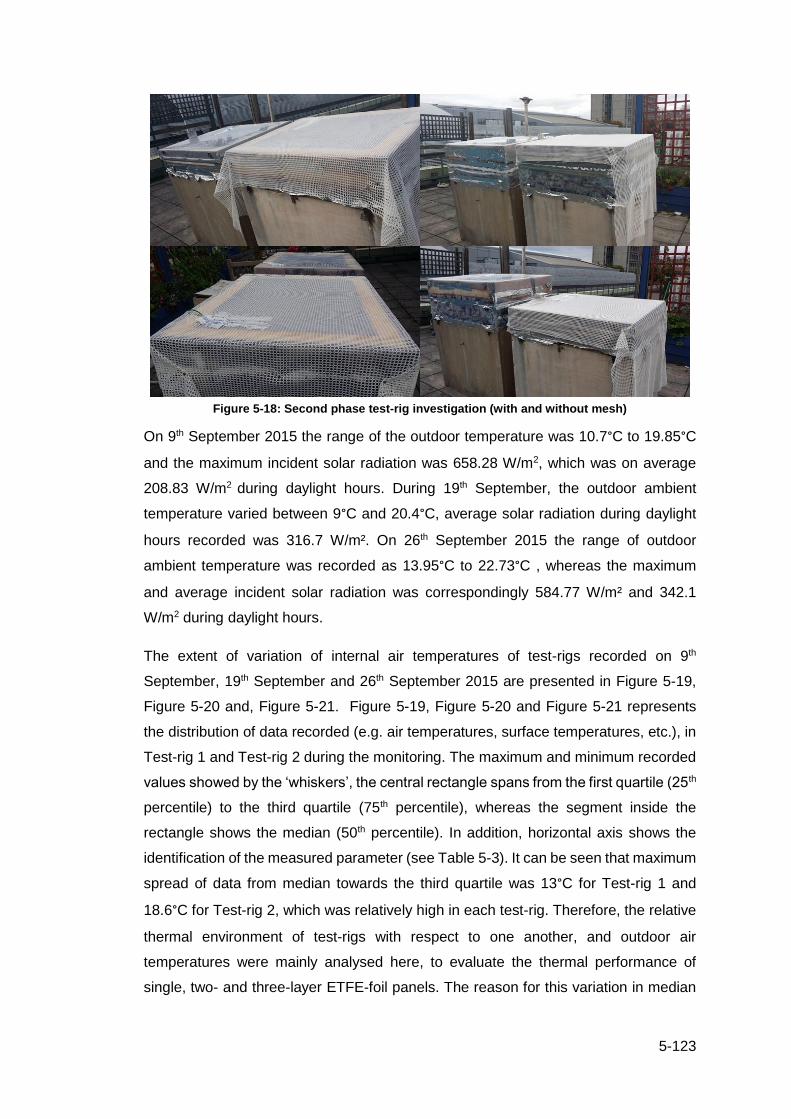
5-123
Figure 5-18: Second phase test-rig investigation (with and without mesh)
On 9th September 2015 the range of the outdoor temperature was 10.7°C to 19.85°C
and the maximum incident solar radiation was 658.28 W/m2, which was on average
208.83 W/m2 during daylight hours. During 19th September, the outdoor ambient
temperature varied between 9°C and 20.4°C, average solar radiation during daylight
hours recorded was 316.7 W/m². On 26th September 2015 the range of outdoor
ambient temperature was recorded as 13.95°C to 22.73°C , whereas the maximum
and average incident solar radiation was correspondingly 584.77 W/m² and 342.1
W/m2 during daylight hours.
The extent of variation of internal air temperatures of test-rigs recorded on 9th
September, 19th September and 26th September 2015 are presented in Figure 5-19,
Figure 5-20 and, Figure 5-21. Figure 5-19, Figure 5-20 and Figure 5-21 represents
the distribution of data recorded (e.g. air temperatures, surface temperatures, etc.), in
Test-rig 1 and Test-rig 2 during the monitoring. The maximum and minimum recorded
values showed by the ‘whiskers’, the central rectangle spans from the first quartile (25th
percentile) to the third quartile (75th percentile), whereas the segment inside the
rectangle shows the median (50th percentile). In addition, horizontal axis shows the
identification of the measured parameter (see Table 5-3). It can be seen that maximum
spread of data from median towards the third quartile was 13°C for Test-rig 1 and
18.6°C for Test-rig 2, which was relatively high in each test-rig. Therefore, the relative
thermal environment of test-rigs with respect to one another, and outdoor air
temperatures were mainly analysed here, to evaluate the thermal performance of
single, two- and three-layer ETFE-foil panels. The reason for this variation in median

5-124
air temperature might be that both test-rigs were air tight and no air circulation was
allowed while the physical conditions of the both test-rigs were identical.
Figure 5-19: Comparison of Test-rig 1 and Test-rig 2 air temperature, air volume air temperature and surface temperature recorded during 9th Sep 15
Figure 5-20: Comparison of Test-rig 1 and Test-rig 2 air temperature, air volume air temperature
and surface temperature recorded during 19th Sep 15
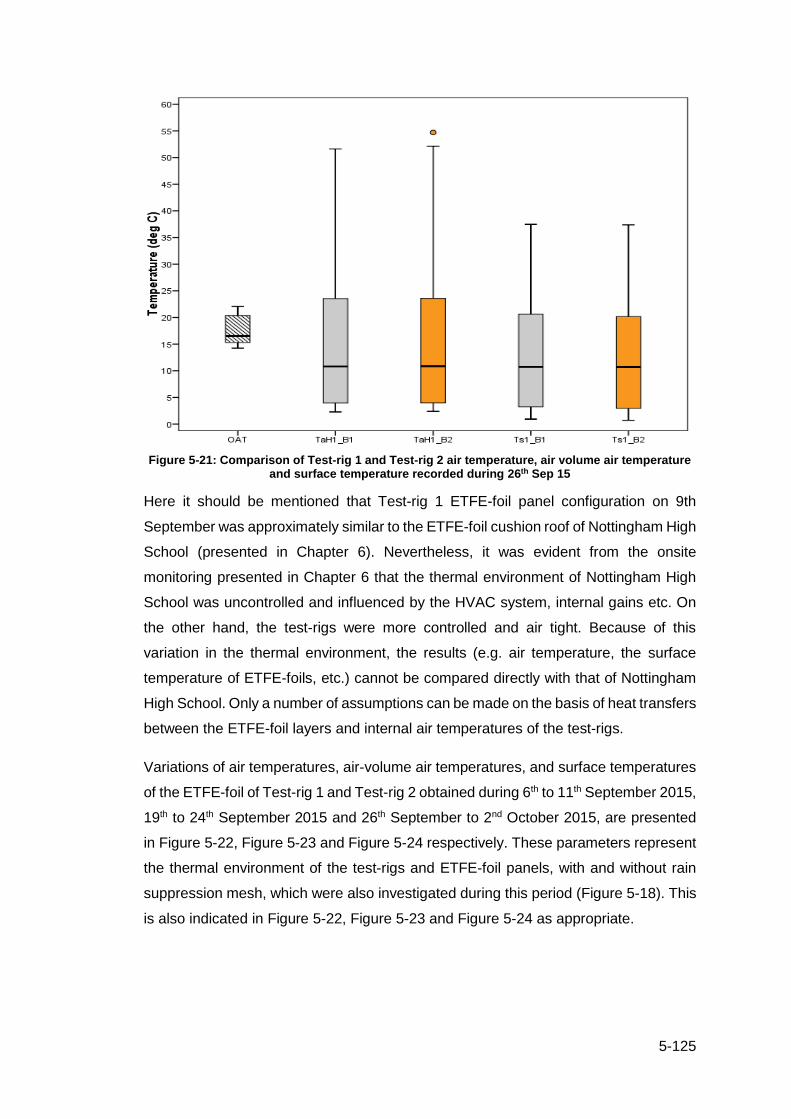
5-125
Figure 5-21: Comparison of Test-rig 1 and Test-rig 2 air temperature, air volume air temperature
and surface temperature recorded during 26th Sep 15
Here it should be mentioned that Test-rig 1 ETFE-foil panel configuration on 9th
September was approximately similar to the ETFE-foil cushion roof of Nottingham High
School (presented in Chapter 6). Nevertheless, it was evident from the onsite
monitoring presented in Chapter 6 that the thermal environment of Nottingham High
School was uncontrolled and influenced by the HVAC system, internal gains etc. On
the other hand, the test-rigs were more controlled and air tight. Because of this
variation in the thermal environment, the results (e.g. air temperature, the surface
temperature of ETFE-foils, etc.) cannot be compared directly with that of Nottingham
High School. Only a number of assumptions can be made on the basis of heat transfers
between the ETFE-foil layers and internal air temperatures of the test-rigs.
Variations of air temperatures, air-volume air temperatures, and surface temperatures
of the ETFE-foil of Test-rig 1 and Test-rig 2 obtained during 6th to 11th September 2015,
19th to 24th September 2015 and 26th September to 2nd October 2015, are presented
in Figure 5-22, Figure 5-23 and Figure 5-24 respectively. These parameters represent
the thermal environment of the test-rigs and ETFE-foil panels, with and without rain
suppression mesh, which were also investigated during this period (Figure 5-18). This
is also indicated in Figure 5-22, Figure 5-23 and Figure 5-24 as appropriate.

5-126
Figure 5-22: Relative condition of experimental Test-rig 1 and Test-rig 2

5-127
Figure 5-23: Relative internal condition of Test-rig 1 and Test-rig 2

5-128
Figure 5-24: Relative condition of Test-rig 1 and Test-rig 2

5-129
The results of the study obtained during 9th September showed that the solar
radiation recorded in Test-rig 1 (enclosed with two-layer ETFE panel with 75%
fritted top layer) was on average 41.9% less than the solar radiation recorded
in Test-rig 2 (enclosed with three -layer ETFE panel with 25% fritted top layer).
This had an impact on the air temperatures of the test-rigs and resulted in an
average 5°C less air temperature in Test-rig 1 than the Test-rig 2. The
maximum air temperature of Test-rig 2 was 9°C hotter than the same of Test-
rig 1 and occurred at noon. This maximum difference of internal air temperature
of the test-rigs was 4°C on 19th September when both of the test-rigs were
enclosed with three layer panels. On that day, Test-rig 2 internal air
temperature was also hotter than Test-rig 1.
Table 5-9 presents average solar radiation transmitted through the ETFE-foil
panels recorded during daylight hours of 9th September, 19th September and
26th September 2015. The results presented in Table 5-9 showed that Test-rig
1 three-layer ETFE-foil panel (75% fritted top layer) transmitted 30.7% less
solar radiation than Test-rig 2 three-layer ETFE-foil panel (25% fritted top
layer). This is the result of the density of fritting of top ETFE-foil layer in three-
layer ETFE-foil panel of Test-rig 1 while compared to Test-rig 2. While
comparing the thermal environment of the test-rigs on 9th September, Test-rig
2 internal air temperature was also influenced by an extra layer of ETFE-foil
and air volume enclosed by it. This increased the insulation properties of Test-
rig 2 and caused rise in air temperature over Test-rig 1. On the other hand, Test
rig 1 internal thermal environment was shaded by fritting, which reduced solar
gain, this in turn resulted in lower air temperature in Test-rig 1 than Test-rig 2.

5-130
Table 5-9:Average transmitted solar radiation recorded during daylight hours
ETFE-foil panel description
Average transmitted
solar radiation during the day
time in 9th September
2015
Average transmitted
solar radiation during the day
time in 19th September
2015
Average transmitted
solar radiation
during the day time in
26th September
2015
W/m2 W/m2 W/m2
Single-layer ETFE-foil with 25% fritted top layer
- - 113.65
Single-layer ETFE-foil with 75% fritted top layer
- - 97.6
Two-layer ETFE-foil with 75% fritted top layer and transparent bottom layer
51.6 - -
Three-layer ETFE-foil with 25% fritted top layer,
transparent middle and bottom layer
88.8 95.81 -
Three-layer ETFE-foil with 75% fritted top layer,
transparent middle and bottom layer
- 66.37 -
The results of temperature variation between Test-rig 1 and Test-rig 2 air
temperatures and air-volume air temperatures of ETFE-foil panels are
presented in Table 5-10. From Table 5-10, it can be demonstrated that average
test-rig air temperatures and air-volume air temperatures were high in test-rigs
when enclosed with 25% fritted ETFE-foil panels of different combination, while
this average air temperatures were relatively lower when they were enclosed
with 75% fritted ETFE-foil panels of different combination presented in Table
5-7 (single, two- and three-layer panels). However, this temperature
differences varies depending on weather conditions.
The results presented in Figure 5-19,Figure 5-20,Figure 5-21 demonstrated
that, the first quartile, third quartile, median air temperature of Test rig 2 was
respectively 1.5°C, 8.7°C and 3.2°C higher than the same of Test-rig 1. This
also indicated that the test-rig’s thermal environment enclosed with 25% fritted
ETFE-foil panels was hotter than when enclosed 75% fritted ETFE-foil panels.

5-131
Table 5-10:Temperature differences between Test-rig 1 and Test-rig 2 air temperatures and air-volume air temperatures
Description Identification Night and early morning
Day time
Temperature difference between air temperature of test rigs enclosed with single-layer panel with 75% ETEF layer and 25% fritted ETFE-foil layer
TD_TaH1_B1-B2 similar 0.6°C (TaH1_B1<
TaH1_B2)
Temperature difference between air temperature of test rigs enclosed with two-layer panel with 75% top layer and three- layer 25% fritted ETFE-foil
TD_TaH1_B1-B2 1.4°C (TaH1_B1< TaH1_B2)
5°C (TaH1_B1< TaH1_B2)
Temperature difference between air temperature of air-volume enclosed with two-layer panel with 75% top layer and three-layer 25% fritted ETFE-foil
TD_TaV1_B1-B2 0.65°C (TaV1_B1< TaV1_B2)
3°C (TaV1_B1< TaV1_B2)
Temperature difference between air temperature of test rigs enclosed with three-layer panel with 75% top layer and 25% fritted ETFE-foil
TD_TaH1_B1-B2 0.4°C (TaH1_B1< TaH1_B2)
1.4°C (TaH1_B1< TaH1_B2)
Temperature difference between air temperature of air- volumes enclosed with three-layer panel with 75% top layer and 25% fritted ETFE-foil
TD_TaV1_B1-B2 No difference in air temperature
1.5°C (TaV1_B1<
TaV1_B2)
TD_TaV2_B1-B2 As above 4.4°C (TaV2_B1< TaV2_B2)
5-132
On a sunny day hourly temperature swing recorded in Test-rig 1 (with double
layer ETFE panel) was (+/-) 1.5°C to 13°C, while in Test-rig 2 (with three-layer
ETFE panel) air temperature fluctuated by (+/-) 1°C to 14°C. However, within
five minutes, air temperature increased by 5°C (with double-layer ETFE panel)
and 3°C (with three-layer ETFE panel). Again, this can be explained as an
impact of the additional air layer in Test-rig 2, which better controlled frequent
fluctuation of air temperature. In addition, within five minutes, in the presence
of moving cloud in front of the sun, air temperature swung by 2°C to 4°C in the
morning and in the afternoon in both test-rigs enclosed with single, two- and
three-layer ETFE-foil panels. In both test-rigs, this fluctuation of internal air
temperatures observed particularly during the day time and in the presence of
solar radiation. Additionally, a maximum hourly increase of air temperature by
14°C was observed in Test-rig 2 during 19th September 15. This was the results
of 40% increase of solar radiation within an hour.
Figure 5-25, Figure 5-27 and Figure 5-29 presents Test-rig 1 and Test-rig 2
internal air temperatures and, air-volume air temperatures relative to outdoor
air temperatures obtained between 6th and 11th September, 19th and 24th
September, and 26th September and 2nd October 2015.
The results demonstrated that during the day time, on average the air
temperature of test-rigs enclosed with single-layer, two-layer and three-layer
ETFE-foil panel went above outdoor temperature. Test-rigs air temperature
covered with a two-layer 75% fritted ETFE-foil panel and three-layer 25% fritted
ETFE-foil panel went maximum 45.7°C and 47.8°C above outdoor air
temperature during the afternoon of 6th September 2015. Whereas between
night and early morning, internal air temperatures of test-rigs enclosed with
double layer and three-layer ETFE-foil panels stayed close to outdoor air
temperatures under cloudy sky but went below outdoor temperature under
clear sky. The test-rig’s internal air temperature, when enclosed with a single
layer ETFE-foil panel went on average 11.6°C below outdoor air temperature
between night and morning of 26th September when average outdoor
temperature was 14.5°C. Here because of the additional layers of ETFE-foil
and volume of air layers in multilayer ETFE-foil panels, the test-rig’s internal
thermal condition was warmer than the same when enclosed with single layer
ETFE-foil panels. Thus, single layer panels release more heat to the external
environment and causes significant decrease in internal air temperatures of the

5-133
test-rigs below outdoor air temperatures particularly at night. While during the
day time, in a single layer fritted system interaction with the external
environment was more rapid than that of multilayer panel systems, where heat
is transmitted, absorbed and reflected through more layers.
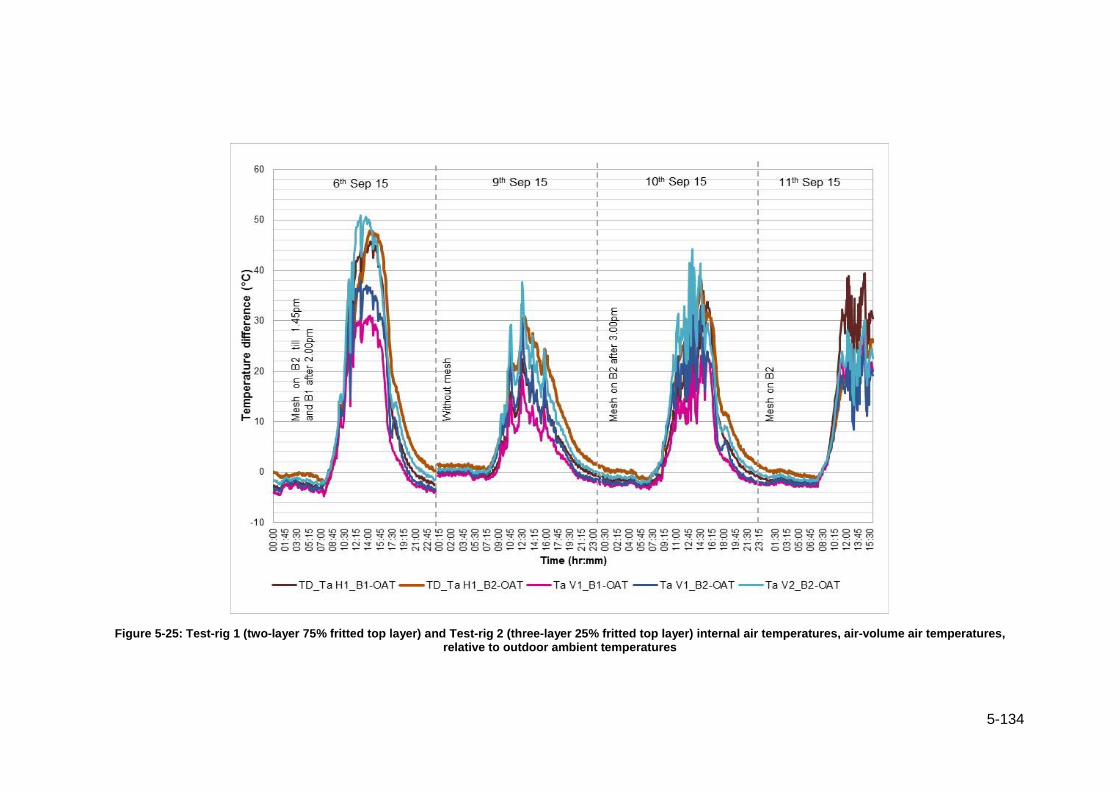
5-134
Figure 5-25: Test-rig 1 (two-layer 75% fritted top layer) and Test-rig 2 (three-layer 25% fritted top layer) internal air temperatures, air-volume air temperatures, relative to outdoor ambient temperatures

5-135
Figure 5-26: Test-rig 1 (two-layer 75% fritted top layer) and Test-rig 2 (three-layer 25% fritted top layer) ETFE-foil panel surface temperatures relative to outdoor ambient temperature
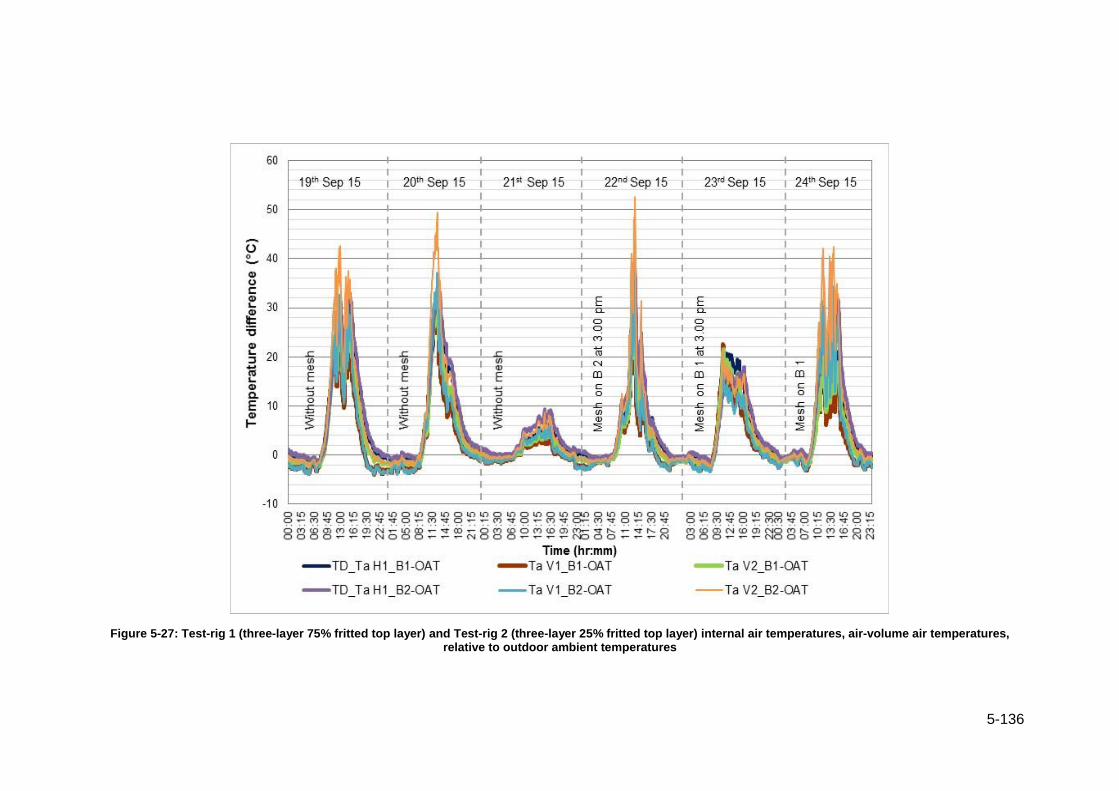
5-136
Figure 5-27: Test-rig 1 (three-layer 75% fritted top layer) and Test-rig 2 (three-layer 25% fritted top layer) internal air temperatures, air-volume air temperatures, relative to outdoor ambient temperatures
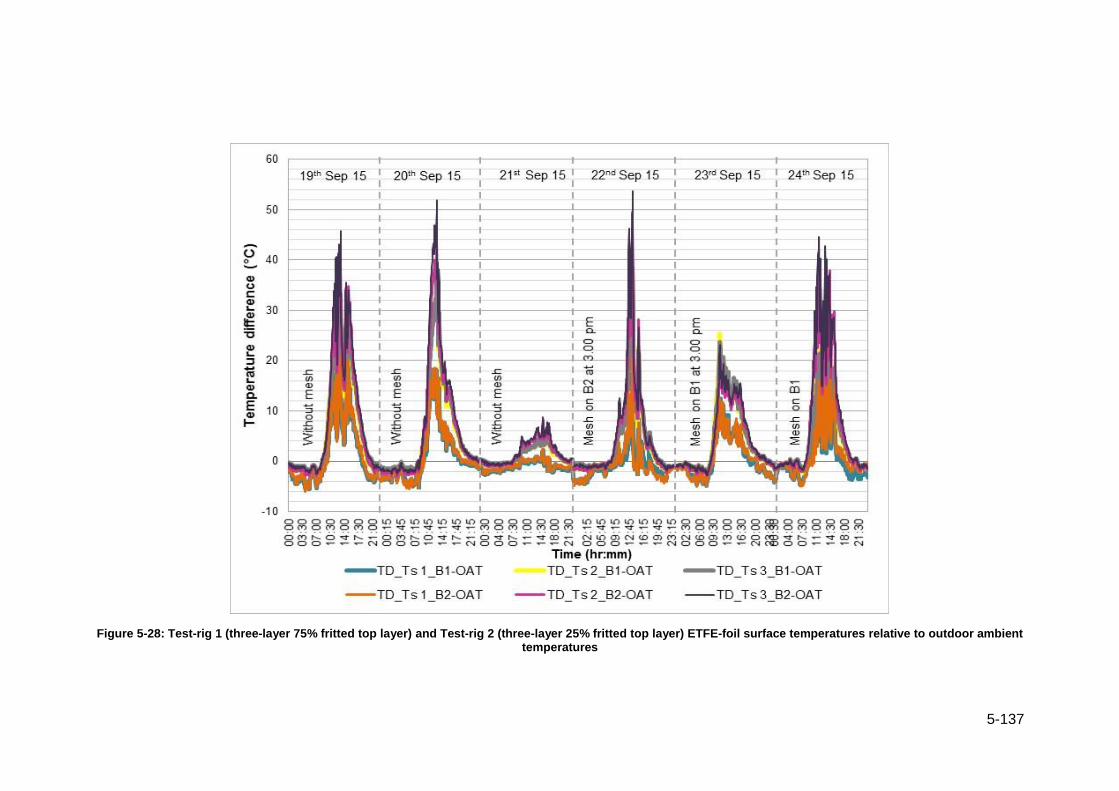
5-137
Figure 5-28: Test-rig 1 (three-layer 75% fritted top layer) and Test-rig 2 (three-layer 25% fritted top layer) ETFE-foil surface temperatures relative to outdoor ambient temperatures

5-138
Figure 5-29: Test-rig 1 (single layer 75% fritted) and Test-rig 2 (single layer 25% fritted) internal air temperatures, air-volume air temperatures, and ETFE-foil surface temperatures relative to outdoor ambient temperatures
5-139
Relative conditions of ETFE-foil surfaces to outdoor air temperatures obtained
between 6th and 11th September 2015, 19th and 24th September 2015, 26th September
and 2nd October 2015 are presented in Figure 5-26, Figure 5-28 and Figure 5-29
respectively. From the results, it is apparent that external surface temperatures of
ETFE foil in both test-rigs (enclosed with single, two- and three-layer ETFE-foil panels)
dropped to below outdoor air temperature during the night and early morning. This is
due to the longwave radiation losses from the ETFE-foil surfaces to the cold sky.
It was observed that the fluctuations of solar radiation directly impact surface
temperatures of ETFE-foil. This scenario was apparent during 10th September in the
afternoon, when in five minutes solar radiation increased from 292.4 W/m2 to 722.9
W/m2 and outdoor air temperature increased by 1.5°C. This change of external
conditions, in turn, caused an increase of external surface temperatures of the ETFE-
foil by 5°C in Test-rig 1 and 6°C in Test-rig 2. Whereas the internal surface
temperatures of the ETFE panel of Test-rig 1 and Test-rig 2 also increased by 10°C
and 15°C respectively. Again, just after this time in the next five minutes’ solar radiation
dropped to 362.89 W/m2. This caused decrement of external and internal surface
temperatures of Test-rig 1 ETFE-foil panel by 6°C and 8°C respectively. Whereas the
Test-rig 2 ETFE-foil panel external surface temperature also dropped by 6°C and
internal surface dropped by 12°C. Fluctuation of air-volume air temperatures and test-
rig air temperatures were also evident within this 10 minutes. During this time air-
volume and Test-rig 1 internal air temperature fluctuated by (+/-) 4°C ~ 6°C whereas
in Test-rig 2, air-volume and rig air temperature fluctuated by (+/-) 8°C ~10°C.
The extent of increase in surface temperatures was more in internal surfaces than
external surfaces. This can also be the result of the extremely hot thermal condition of
the test-rigs which impacts surface temperatures as a result of convective heat
transfer. Here it was also noticed that the fluctuations of the test-rig’s surface
temperature were less than that of ETFE-foil surfaces. Therefore, even if the ETFE-
foil surface temperature fluctuated by 5°C~15°C within 5 minutes, the test-rig’s internal
insulation surface temperature increased by 1°C~ 2°C during this time.
Additionally, it was also noticed that during the day time the air-volume 2 (lower
chamber) air temperature in a three-layer ETFE-foil panel system was on average 4°C
and 8°C higher than air-volume 1 (upper chamber) air temperatures and the test-rig’s
internal air temperature, respectively. The reason behind this was that air-volume 2 air
is mainly influenced by insulation of upper air chamber and hot ETFE-foil surface
5-140
temperatures adjacent to it (Ts3, Ts2) whereas test-rig’s internal air temperatures was
particularly influenced by ETFE-foil surface (Ts3) next to it and the internal surfaces of
the test-rig. Whereas air-volume 1 air temperatures were influenced by surrounding
ETFE-foil surfaces (Ts1, Ts2) which had relatively low temperatures compared to the
bottom surface of ETFE-foil (Ts3). But at night and in absence of adequate solar
radiation, surface temperatures, air-volume air temperatures, and the test-rig’s internal
air temperatures stayed close to outdoor air temperatures in the test-rigs enclosed with
two-layer and three-layer ETFE-foil panels.
A gradual increase of air temperature and surface temperature was observed from the
external surface towards the internal volume of Test-rig 1 and 2 which was more
significant in Test-rig 2 because it was enclosed with three layer ETFE-foil panel.
Test-cell investigation carried out by Harvie (1996), on fabric membranes found it
difficult to measure the surface temperature of the membrane, research also
mentioned that sensors attached to the external surface recorded higher temperature
than those attached to the internal surface of the membrane. But this on-site
experiment on ETFE- foil panels of the different type found a different scenario where
internal surface temperatures of the ETFE-foil were hotter than the external surface,
which should be the actual scenario. This is because the internal surface of the ETFE-
foil panel during the day time was in contact with extremely hot air temperatures within
the test-rigs, whereas the external surface was exposed to outdoor air, which was
relatively cooler. This variation of surface and air temperatures was influenced by heat
transfer mechanisms - convective and radiative heat transfer in particular. Harvie
(1996), specified in his study that because of smoothness of membrane surface, there
would be no convective heat transfer. This phenomenon proved incorrect while
analysing the thermal performance of ETFE-foil in this study as the impact of
convective heat transfer between the ETFE-foil surface and it’s adjacent air was
apparent.
In this analysis the effect of the radiative process is presented by the measured
incident irradiance. This parameter during the day time presents the effect of short-
wave solar irradiance while at night pyranometer measurement with negative readings
represent the magnitude of net long-wave radiation losses (Kipp & Zonen, 2016).
Long wave radiation losses to the clear sky affect more strongly the surface
temperature of the outer ETFE-foil of both test-rigs than the air temperature within the
test-rig and air-volume between ETFE-foil layers in panels. As a result, the external

5-141
surface dropped below outdoor air temperature during clear night by 1°C~4°C whereas
internal surfaces dropped by 1°C ~2°C below outdoor air temperature, while panel air-
volume air and test-rigs internal air temperature stayed within +/-0.5°C ~1.5°C of
outdoor air temperature until incident solar radiation was significant over longwave
radiation during the day. These phenomena were evident in each test-rigs mostly
during the night and early morning, was significant in test-rig when enclosed with single
layer foil panel where on a clear sky morning surface temperature and test-rig internal
air temperature dropped 15.5°C and 13°C below outdoor air temperature respectively.
Therefore, it can be explained that the combined effect of convective and radiative heat
transfer was pronounced on surface temperatures of the ETFE-foil panel both external
and internal. Heat captured and stored in the air tight test-rigs also influenced internal
surface temperatures as a process of convective heat transfer. As a result, although
the external surface shielded internal layers in the panel, the internal surface
temperature exceeded the external surface temperature during day time. Besides, at
night long-wave radiation loss to the external environment resulted in drop of external
surface temperature below outdoor ambient temperature.
In order to see the extent of convective and radiative heat transfer on the surface of
the ETFE-foil an attempt was made to calculate the heat transfer based on the
equation of heat transfer which is presented in section 5.5.1.
5.5.1 Relationship between the surface temperature of ETFE-foil layers and
test-rig internal condition
It was observed that ETFE-foil surfaces and the test rig’s air temperatures were
strongly influenced by outdoor environment e.g. incident solar radiation, outdoor
ambient temperature, longwave radiation. Harvie (1996), stated that with no thermal
mass architectural fabrics affect the spaces by the amount of solar radiation they
transmit and heat they introduce into space as a result of the temperature of their
surface. In this study transmittance of solar radiation through different type of ETFE-
foils was measured which is presented in section 5.4. Besides it was already discussed
earlier that convective and radiative heat transfer particularly affects the thermal
environment of test-rigs enclosed with ETFE-foil panels. Therefore, it was important to
evaluate the impact of these two heat transfer mechanisms on the thermal environment
of the test-rigs. This was done by calculating convective and radiative heat transfer
through the surface of the ETFE-foil, on the basis of measured surface temperatures
of ETFE-foil, adjacent air temperatures of foil panel and emissivity of the ETFE-foil
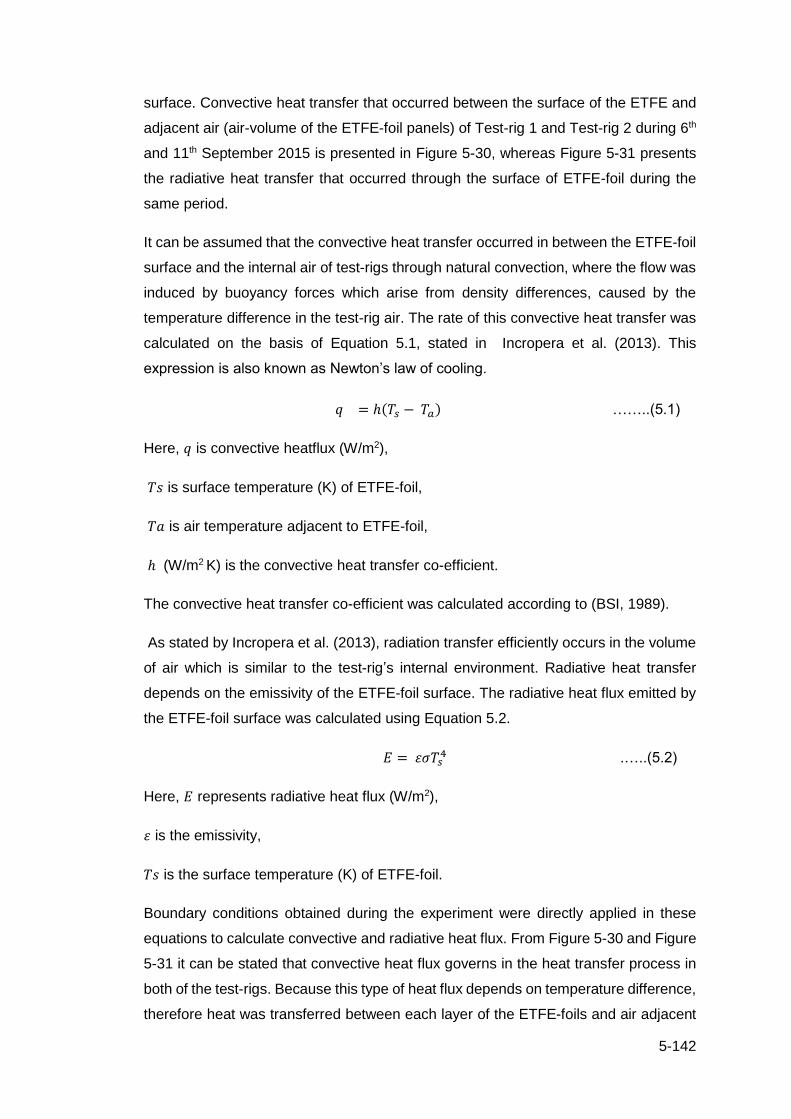
5-142
surface. Convective heat transfer that occurred between the surface of the ETFE and
adjacent air (air-volume of the ETFE-foil panels) of Test-rig 1 and Test-rig 2 during 6th
and 11th September 2015 is presented in Figure 5-30, whereas Figure 5-31 presents
the radiative heat transfer that occurred through the surface of ETFE-foil during the
same period.
It can be assumed that the convective heat transfer occurred in between the ETFE-foil
surface and the internal air of test-rigs through natural convection, where the flow was
induced by buoyancy forces which arise from density differences, caused by the
temperature difference in the test-rig air. The rate of this convective heat transfer was
calculated on the basis of Equation 5.1, stated in Incropera et al. (2013). This
expression is also known as Newton’s law of cooling.
𝑞 = ℎ(𝑇𝑠 − 𝑇𝑎) ……..(5.1)
Here, 𝑞 is convective heatflux (W/m2),
𝑇𝑠 is surface temperature (K) of ETFE-foil,
𝑇𝑎 is air temperature adjacent to ETFE-foil,
ℎ (W/m2 K) is the convective heat transfer co-efficient.
The convective heat transfer co-efficient was calculated according to (BSI, 1989).
As stated by Incropera et al. (2013), radiation transfer efficiently occurs in the volume
of air which is similar to the test-rig’s internal environment. Radiative heat transfer
depends on the emissivity of the ETFE-foil surface. The radiative heat flux emitted by
the ETFE-foil surface was calculated using Equation 5.2.
𝐸 = 𝜀𝜎𝑇𝑠4 .…..(5.2)
Here, 𝐸 represents radiative heat flux (W/m2),
𝜀 is the emissivity,
𝑇𝑠 is the surface temperature (K) of ETFE-foil.
Boundary conditions obtained during the experiment were directly applied in these
equations to calculate convective and radiative heat flux. From Figure 5-30 and Figure
5-31 it can be stated that convective heat flux governs in the heat transfer process in
both of the test-rigs. Because this type of heat flux depends on temperature difference,
therefore heat was transferred between each layer of the ETFE-foils and air adjacent

5-143
to it. This heat transfer was particularly significant between the external ETFE-foil
surface of the multilayer panel and adjacent air-volume, which was the result of higher
temperature difference.
It is known that ETFE-foil is relatively transparent to longwave radiation. Radiative heat
transfer occurring in the ETFE-foil surfaces was calculated using Equation 5.2 and
presented in Figure 5-31. The radiative heat transfer here represents the combined
effect of shortwave and long-wave radiation. Because it was not possible to isolate the
effect of long-wave radiation. It can be assumed that during the day, heat transfer
occurred on the surfaces was dominated by short-wave radiation. Whereas at night
due to longwave radiation losses surface temperature dropped, this, in turn, reduced
heat transfers in air and ETFE-foil layers. For optically thin surfaces, the radiative heat
transfer decreases with the decrease of surface emissivity (Libby et al., 1967).
Therefore, among the different layers of ETFE foils in multi-layer panels, radiative heat
transfer was more pronounced on internal transparent ETFE-foil surfaces. Whereas
little less in external fritted surfaces which were the result of low emissivity and the
relatively lower temperature of external surfaces (Ts1) while compared with internal
surfaces (Ts2 and Ts3) in each test-rig. Besides particularly at night and early morning,
stable conditions occurred, however as soon as the external surface temperatures
increased above the internal surface, radiative and convective heat transfer was
constant for all the surfaces and increased as the temperature difference increased
between the surface of ETFE-foil and adjacent air layers during the day.

5-144
Figure 5-30: Convective heat transfer between ETFE surface and air temperature adjacent to it in Test-rig 1 and Test-rig 2
Figure 5-31: Radiative heat transfer through ETFE-foil surface in Test-rig 1 and Test-rig 2
Impact of mesh on convective heat transfer was also evident particularly on 6th
September, when a sudden increase in heat transfer was apparent at 3.00pm, one
hour after the rain mesh was removed from Test-rig 2. Heat transfer accelerated
6th Sep 15 9th Sep 15 10th Sep 15 11th Sep 15

5-145
between internal surface (Ts3_B2) of the ETFE-foil and internal air temperatures
(Ta_H1 B2) of Test-rig 2.
5.5.2 Impact of rain mesh on internal thermal condition of the experimental
boxes
In order to see the impact of rain mesh on the internal air temperature of test-rigs, rain
mesh was placed on top of two-layer and three-layers ETFE-foil panels. Figure 5-22,
Figure 5-23 and Figure 5-24 illustrated relative internal air temperature, air-volume air
temperature, mean radiant temperature of Test-rig 1 and Test-rig 2, surface
temperature (both external and internal), incident and transmitted solar radiation
recorded during 6th to 11th September, 19th to 24th September, 26th September to
2nd October 2015 respectively. Figure 5-22, Figure 5-23 and Figure 5-24 also showed
the impact of mesh on test-rigs internal thermal environment as indicated. The
configuration of ETFE-foil panel of Test-rig 1 and Test-rig 2 can be found from Table
5-7.
On 6th September rain mesh was placed on top of Test-rig 2 till 1.45pm, after that time
it was removed and placed on top of Test-rig 1 at 2.00pm. It can be noticed from Figure
5-22 that from morning till noon (1.00pm) transmitted solar radiation through Test-rig
1 two-layer ETFE-foil panel (with 75% fritted top layer) and Test-rig 2 three-layer ETFE-
foil panel (with 25% fritted top layer) was 36.9% and 32.5% of that of the incident solar
radiation respectively. Even though ETFE-foil panel of Test-rig 2 comprised with 25%
fritted three-layer system but due to the rain mesh, it transmitted 4.5% less solar
radiation than Test-rig 1. It was also noticeable that during that period, on average
Test-rig 2 air temperature was 1.5°C lower than Test-rig 1.
It can be noticed that during 6th September 2015, at night and in the morning (till
8.00am), the air temperature of Test-rig 2 was up to 2.7°C above Test-rig 1 air
temperature. However, after 8.00am in the morning, solar radiation increased in each
hour, causing an increase in internal air temperature of both test-rigs. Test-rig 1 air
temperatures were above Test-rig 2 air temperatures until mesh was placed on it, at
1.45pm. During this period (between 8.00am and 1.45pm) the air temperature of Test-
rig 1 went a maximum of 7°C above Test-rig 2 air temperature. After the mesh was
removed and placed on Test-rig 1, the average transmission of solar radiation
(between 2.00pm and 7.00pm) of Test-rig 2 ETFE-foil panel increased by 6% than that
of Test-rig 1 ETFE-foil panel. This also had an impact on the recorded internal air
5-146
temperatures and Test-rig 2 air temperature on average rose 5°C above Test-rig 1 air
temperature in between 2.00 pm and 7.00pm.
Therefore, 75% fritted two-layer panel system with mesh performed better with 5°C
less temperature than three-layer 25% fritted ETFE-foil panel system. It can be
assumed that mesh reduced air temperature of the test-rigs by creating shading.
Mesh surface temperature was on average 4°C lower than outdoor air temperature
during the day time. Whereas at night, its temperatures stayed relatively close to
outdoor air temperatures similar to the ETFE-foil and test-rig’s internal air
temperatures. Mesh surface temperature increased up to 5°C above the external
surface temperature of ETFE-foil during the night and early morning. Moreover,
between noon and late afternoon, this external surface temperature of ETFE-foil went
to a maximum of 18°C above mesh surface temperature. The temperature difference
between mesh surface and external ETFE foil surface was also identified in the
Nottingham High School (see Figure 5-1) roof. This elevated temperature of ETFE-foil
surface may be due to the influence of the outdoor temperature, heated air-volume air
temperature of ETFE-foil panel adjacent to it. However, it was necessary to identify the
impact of rain mesh individually on thermal environment of test rigs.
An investigation was carried out between 12th September and 14th September 2015 to
determine the impact of rain mesh on the test-rig’s internal thermal environment.
During the experiment, Test-rig 1 was roofed over by two-layer transparent ETFE-foil
panel (200μm top layer and bottom layer of 100 μm), also covered with mesh. While
Test-rig 2 was roofed over by the similar configuration of ETFE-foil panel as Test-rig
1, but no mesh was placed on it. Relative air temperatures, surface temperatures and
air-volume air temperatures of Test-rig 1 and Test-rig 2 are presented in Figure 5-32.
Comparison of thermal environment of two test-rigs showed no variation between
measured surface temperatures, air temperatures of Test-rig 1 and Test-rig 2 at night
and early morning. But particularly between 5.00am to 8.00pm, ETFE-foil panel of
Test-rig 1 with mesh transmitted on average 12% less solar radiation than that of
ETFE-foil panel of Test-rig 2. During this time, internal air temperature of Test-rig 2
went 2°C above Test-rig 1 air temperature, while the internal surface temperature of
ETFE-foil panel of Test- rig 1 was 4°C less than same of Test-rig 2.

5-147
Figure 5-32: Relative condition of surface temperature, air volume air temperature and air temperature of Test-rig 1 and Test-rig 2

5-148
Data recorded during 13th September 15 is presented in Figure 5-33, here grey and
orange coloured boxes indicated the range of air temperature of test-rigs, air-volume
air temperatures and surface temperatures recorded in Test-rig 1 and Test-rig 2
respectively. From Figure 5-33 it is also evident that presence of mesh reduced the
range of air temperature and surface temperature in Test-rig 1 while comparing with
Test-rig 2.
Figure 5-33: Comparison of Test-rig 1 and Test-rig 2 condition 13th Sep 15
From the study, it was apparent that incident solar radiation and surface temperatures
of ETFE-foil panels (both external and internal) influenced the thermal environment of
the test-rigs. This phenomenon is typical in a membrane enclosure which was also
identified by Harvie (2015). Although air temperature ranges in each test-rig was
significantly higher because of the air tightness, when comparison was made between
air temperatures, air volume temperatures and surface temperatures of the ETFE-foil
panels, it was evident that application of rain mesh reduced air-volume air
temperatures, internal air temperatures of the test-rig and internal surface
temperatures of the ETFE-foil panel. Therefore, it can be stated that rain mesh impacts
the thermal environment of the test-rig by reducing solar gain and by creating shading,
which also reduces surface temperatures of the ETFE-foil panel and air temperatures
of the test-rig.

5-149
5.6 Summary
The fundamental purposes of this chapter were to analyse the thermal performance of
single, two- and three-layer ETFE-foil panels. This was done in two phases-
• First phase: Measured the solar transmittance of single, two- and three-layer
ETFE-foil panels through an in-situ method and compared results with values
calculated according to BS EN410:2011.
• Second phase: Analysed thermal performance of single, two- and three-layer
ETFE-foil panels and also evaluated the impact of fritting and rain-mesh on this
performance.
In the first phase of the test-rig experiment solar transmittance of single, two- and three
-layer ETFE-foil panels were determined following the similar method stated in ASTM
(1986b) with slight alterations. Measured solar transmittance was validated with the
results obtained in the laboratory experiment (Chapter 4) and calculated according to
BS EN410:2011 (BSI, 2011). The results were in close agreement with 88% to 100%
accuracy.
The second phase of the experiment analysed the thermal environment of the test-
rigs, and the thermal state of the ETFE-foil panels that were used to enclose the test-
rigs. The results showed that the thermal environment of the test-rigs and thermal state
of ETFE-foils changed rapidly as a result of the variations in the outdoor environment.
Comparison of the thermal environment enclosed with two-layer (75% fritted top layer)
and three -layer (25% fritted top layer) ETFE-foil panels showed that air temperature
of the test-rig enclosed with three-layer ETFE-foil panel was on average 5°C hotter
than the test-rig when enclosed with two-layer ETFE-foil panel. This was because the
extra layer of air and ETFE-foil increased the insulation properties of the test-rig
enclosure, thus reducing heat transmission from the test rig’s internal environment
towards the exterior. Hence in three-layer ETFE-foil panel systems heat was better
preserved than in the two-layer ETFE-foil panel system. Therefore, increase in layer
number of ETFE-foils in the panel increased insulation properties of the space it
enclosed. Besides, under the same outdoor condition the air temperature of enclosed
test-rig with three-layer ETFE-foil panel with 25% fritted top layer, was on average
1.4°C warmer than the test-rig, when enclosed with a three-layer panel with 75% fritted
top layer. Thus, the density of fritting also influenced thermal environment enclosed
with ETFE foil panel by reducing solar gain.

5-150
In ETFE-foil panels, air temperatures of the air-volume enclosed with ETFE-foil also
varied depending on fritting and number of foil layers in the panel. Moreover, air-
volume air temperatures were influenced by adjacent ETFE-foil surface temperatures.
In turn, both ETFE foil surface temperatures and air-volume air temperatures of the
ETFE-foil panels affected air temperatures of the test-rigs they enclosed.
This variation of temperature in ETFE-foil surfaces and air temperatures of air-volume
and test-rigs occurred by convective and radiative heat transfer mechanisms.
Convective heat flux depends on temperature difference, therefore heat was
transferred between each layer of ETFE-foil panel and air adjacent to it by natural
convection. Besides radiative heat transfer occurred on the ETFE-foil surfaces, and
was dominated by short-wave radiation during the day and longwave radiation during
the night. However, radiative heat transfer depends on the emissivity of materials.
Therefore, in two and three-layer ETFE-foil panels with fritted top layer and transparent
middle and bottom layers, radiative heat transfer was more pronounced on transparent
layers than fritted foil surfaces. Besides particularly at night and early morning, stable
conditions occurred as external surface temperature increased over the internal
surface, radiative and convective heat transfer was constant for all the surfaces, and
increased as the temperature difference increased between the surface of ETFE-foil
and adjacent air layers during the day.
In this experiment impact of rain-mesh on test-rigs thermal environment was evident.
The shading created by rain suppression mesh reduced surface temperatures as well
as air temperatures inside the test-rigs. The experimental investigation also found that
presence of mesh reduced solar radiation transmission by 12%. Air temperature of the
test-rig and internal surface temperature of ETFE-foil also reduced by 2°C and 4°C
respectively.
In this study the test-rigs’ thermal environment were evaluated based on its air
temperatures and surface temperatures of ETFE-foils. This focused on the actual
thermal performance of ETFE-foil but it is necessary to compare this thermal
performance with that of glass, which is typically used in construction for similar
purposes. In Chapter 7, a simulation model replicating Test-rig 1 and Test-rig 2 was
developed using EDSL TAS version 9.3.3. The results obtained from this in-situ
experiment was then used to verify the simulation model. After verification, this
simulation model was used to simulate different types of glass panels, particularly used
as overhead glazing. Thermal performance of single, two- and three-layer ETFE-foil
panels was then compared with that of similar glass panels.

6-151
Chapter 6
6 Thermal performance of existing space enclosed with an
ETFE- foil cushion envelope
6.1 Introduction
Building integration of ETFE-foil cushions has increased significantly in recent years,
which has been addressed in Chapter 1. However, available information about the
thermal performance analysis of ETFE-foil cushion enclosures is limited and no study
had investigated the actual thermal performance of ETFE-foil cushion systems as well
as spaces enclosed by it. The unknown performance specifications of ETFE-foil
cushions may be a barrier to identifying actual building performance.
A number of studies which carried out environmental performance analysis of tensile
membrane enclosures were reviewed and presented in Chapter 2, considering that
similar challenges exist in the case of ETFE-foil enclosures.
Chapter 3 presented a simple pilot study of the thermal performance of an ETFE-foil
cushion enclosure. Depending on the complexity observed in the study it was
considered to carry out an investigation of the thermal performance of ETFE-foil
cushions and the space enclosed by them, separately.
This study also carried out an experimental investigation on the thermal and optical
properties of different types of ETFE-foil which is presented in Chapter 4. Chapter 5
discussed results obtained on the thermal performance of different types of ETFE-foil
panel construction using a test-rig investigation.
To investigate the actual thermal performance of ETFE-foil cushions and the spaces
enclosed by them, two different atria incorporating ETFE-foil cushions in the roof were
selected. The rationale behind the selection of the buildings along with detailed
methods of data collection and assessment procedure are discussed in Chapter 3. The
first case study atrium is a part of the building complex of the Nottingham High School,
located in the central part of Nottingham, United Kingdom; whereas the second case
study is the Engineering and Science Learning Centre (ESLC) building, University Of
Nottingham.

6-152
This chapter addresses Objective 4 of the research which was to:
• Evaluate thermal performance of occupied spaces enclosed with ETFE-foil
cushion envelope
To achieve this objective long-term thermal monitoring was conducted at Nottingham
High School and Engineering and Science Learning Centre (ESLC) to observe
following features:
• thermal responsiveness of the ETFE-foil cushions,
• vertical and horizontal temperature stratification,
• the impact of outdoor weather changes on the internal thermal
environment,
• effect of the thermal condition of the atrium on adjacent occupied spaces,
and
• impact of the thermal performance of ETFE-foil cushion enclosures on
thermal comfort
6.1.1 Outdoor weather
According to CIBSE guide A (CIBSE, 2006, CIBSE, 2015b),1st May to 30th September
is considered as the UK summer period. This period was also considered as summer
in environmental monitoring.
During summer 2014, the average outdoor air temperature was 2°C hotter than that of
summer 2015. However, the maximum outdoor air temperature (1st July 2015) was
3.5°C hotter than the maximum outdoor air temperature (10th July 2014) recorded in
summer 2014. Figure 6-1 and Figure 6-2 present outdoor air temperature, solar
radiation and daily mean temperature recorded during summer 2014 and 2015
respectively.
The data presented in Figure 6-2 shows that during summer 2015, the maximum
outdoor temperature was 33.5°C on 1st July 2015 which was 24°C hotter than the
minimum outdoor temperature recorded during 14th September 2015. On this date (1st
July 2015) during occupied hours (8.00am to 15.00pm) the difference between
maximum and minimum outdoor temperature was 11.1°C (maximum 33.5°C, minimum
22.4°C).

6-153
Therefore, the period between 29th June and 3rd July 2015 can be considered as peak
period of summer 2015. Variation of air temperature during that period can be seen in
Figure 6-2. Thus, to investigate the thermal condition of spaces enclosed with an
ETFE-foil cushion envelope under extreme outdoor conditions, such as a day with a
maximum temperature of the year (1st July 2015), the period between 29th June and
3rd July 2015 was considered for further analysis. Also, the thermal conditions that
occurred in the atrium during 14th September 2015 was considered to examine the
impact of lowest outdoor temperature and limited solar radiation on the spaces
enclosed with an ETFE-foil cushion envelope.
Figure 6-1: OAT, daily mean temperature and ExIR recorded during summer 2014
-50
150
350
550
750
950
1150
0
5
10
15
20
25
30
35
01/0
5/2
014
01:0
005/0
5/2
014
00:0
008/0
5/2
014
23:0
012/0
5/2
014
22:0
016/0
5/2
014
21:0
020/0
5/2
014
20:0
024/0
5/2
014
19:0
028/0
5/2
014
18:0
001/0
6/2
014
17:0
005/0
6/2
014
16:0
009/0
6/2
014
15:0
013/0
6/2
014
14:0
017/0
6/2
014
13:0
021/0
6/2
014
12:0
025/0
6/2
014
11:0
029/0
6/2
014
10:0
003/0
7/2
014
09:0
007/0
7/2
014
08:0
011/0
7/2
014
07:0
015/0
7/2
014
06:0
019/0
7/2
014
05:0
023/0
7/2
014
04:0
027/0
7/2
014
03:0
031/0
7/2
014
02:0
004/0
8/2
014
01:0
008/0
8/2
014
00:0
011/0
8/2
014
23:0
015/0
8/2
014
22:0
019/0
8/2
014
21:0
023/0
8/2
014
20:0
027/0
8/2
014
19:0
031/0
8/2
014
18:0
004/0
9/2
014
17:0
008/0
9/2
014
16:0
012/0
9/2
014
15:0
016/0
9/2
014
14:0
020/0
9/2
014
13:0
024/0
9/2
014
12:0
028/0
9/2
014
11:0
0
So
lar R
ad
iatio
n (W
m²)
Te
mp
era
ture
( C
)
Date/ TimeExIR OAT Daily mean

6-154
Figure 6-2: OAT, daily mean temperature, and ExIR recorded during summer 2015
Both of the case study buildings – Nottingham High School and the Engineering
Science Learning Centre (ESLC) are located in Nottingham. It was already addressed
in Chapter 3 that outdoor temperature of Nottingham High School was recorded from
a weather station that was located on a different roof, adjacent to the ETFE-foil cushion
roof. However, outdoor temperature adjacent to the ESLC building atrium was
measured using a Tiny Tag Plus 2- TGP-4017 data logger. External incident solar
radiation on these two locations were measured using Kipp & Zonen CMP3
pyranometers. Variation was observed in recorded incident solar radiation and outdoor
air temperature. Figure 6-3 shows the outdoor air temperature recorded at Nottingham
High School and ESLC.
Average outdoor air temperature measured adjacent to ESLC building (during 2015)
was 1.4°C hotter than that at the Nottingham High School. A possible reason for this
difference was the location of the temperature sensors, shading from adjacent
structures etc.
However, according to CIBSE guide A (CIBSE, 2015b, CIBSE, 2006), for a realistic
assessment of the thermal environment, the outdoor condition such as outdoor air
temperature, solar radiation etc. should be measured in the vicinity of the building to
be assessed. Thus, to analyse the impact of the outdoor condition on the thermal
environment of the Nottingham High School atrium and ESLC atrium, environmental
data recorded from the vicinity of both of the buildings were considered.
-50
150
350
550
750
950
1150
0
5
10
15
20
25
30
35
01/0
5/2
015
01:0
004/0
5/2
015
20:0
008/0
5/2
015
15:0
012/0
5/2
015
10:0
016/0
5/2
015
05:0
020/0
5/2
015
00:0
023/0
5/2
015
19:0
027/0
5/2
015
14:0
031/0
5/2
015
09:0
004/0
6/2
015
04:0
007/0
6/2
015
23:0
011/0
6/2
015
18:0
015/0
6/2
015
13:0
019/0
6/2
015
08:0
023/0
6/2
015
03:0
026/0
6/2
015
22:0
030/0
6/2
015
17:0
004/0
7/2
015
12:0
008/0
7/2
015
07:0
012/0
7/2
015
02:0
015/0
7/2
015
21:0
019/0
7/2
015
16:0
023/0
7/2
015
11:0
027/0
7/2
015
06:0
031/0
7/2
015
01:0
003/0
8/2
015
20:0
007/0
8/2
015
15:0
011/0
8/2
015
10:0
015/0
8/2
015
05:0
019/0
8/2
015
00:0
022/0
8/2
015
19:0
026/0
8/2
015
14:0
030/0
8/2
015
09:0
003/0
9/2
015
04:0
006/0
9/2
015
23:0
010/0
9/2
015
18:0
014/0
9/2
015
13:0
018/0
9/2
015
08:0
0
So
lar R
ad
iatio
n (W
/m²)
Te
mp
era
ture
( C
)
Date/ TimeExIR OAT Daily mean

6-155
Figure 6-3: Outdoor air temperature recorded adjacent to Nottingham High School and ESLC
6.2 Case Study A: Nottingham High School
This section discusses the thermal behaviour of the Nottingham High School atrium.
The atrium roof consists of two–layer ETFE-foil cushions with fritted top layer and clear
bottom layer both of 200μm, covered with a rain noise suppression mesh. Detailed
description of the building and monitoring setup is presented in Chapter 3 (section 3.8).
The thermal behaviour was analysed on the basis of data recorded during summer
2014 and 2015.
A summary of the salient features of the monitored atrium of Nottingham High School,
its roof and time period of environmental monitoring is presented in Table 3-3.
While selecting days for the analysis, it was considered that the school was operating
on its normal schedule within the summer period in the UK.
Sensors identifications used to describe outdoor environment are presented in Table
6-1, while Table 3-4, and Table 3-5 (Chapter 3) present sensors identification used to
discuss the thermal conditions of the atrium and ETFE-foil cushion roof respectively.
Detailed description of the method and installed equipment for monitoring is presented
in Chapter 3.
0
5
10
15
20
25
30
35
40
01/0
5/2
015
01
:00
04/0
5/2
015
18
:00
08/0
5/2
015
11
:00
12/0
5/2
015
04
:00
15/0
5/2
015
21
:00
19/0
5/2
015
14
:00
23/0
5/2
015
07
:00
27/0
5/2
015
00
:00
30/0
5/2
015
17
:00
03/0
6/2
015
10
:00
07/0
6/2
015
03
:00
10/0
6/2
015
20
:00
14/0
6/2
015
13
:00
18/0
6/2
015
06
:00
21/0
6/2
015
23
:00
25/0
6/2
015
16
:00
29/0
6/2
015
09
:00
03/0
7/2
015
02
:00
06/0
7/2
015
19
:00
10/0
7/2
015
12
:00
14/0
7/2
015
05
:00
17/0
7/2
015
22
:00
21/0
7/2
015
15
:00
25/0
7/2
015
08
:00
29/0
7/2
015
01
:00
01/0
8/2
015
18
:00
05/0
8/2
015
11
:00
09/0
8/2
015
04
:00
12/0
8/2
015
21
:00
16/0
8/2
015
14
:00
20/0
8/2
015
07
:00
24/0
8/2
015
00
:00
27/0
8/2
015
17
:00
31/0
8/2
015
10
:00
04/0
9/2
015
03
:00
07/0
9/2
015
20
:00
11/0
9/2
015
13
:00
15/0
9/2
015
06
:00
18/0
9/2
015
23
:00
Tem
pera
ture
(
C)
Date/ Time
OAT_ESLC OAT_NH

6-156
Table 6-1: Identification of environmental parameters
Identification environmental parameter
OAT Outdoor air temperature
Tcomf Comfort temperature (category II building)
Tmax Maximum acceptable temperature (category II building)
Tmin Minimum acceptable temperature (category II building)
ExIR Incident solar radiation
InIR Transmitted solar radiation
RH Relative humidity
6.2.1 Analysis of monitored data and discussion
The graphs in this section represent monitored data recorded at five-minute intervals.
This allowed to graphically represent dynamic thermal responsiveness of the ETFE-
foil cushion envelope. All numerical values specified in a text format are based on
instant readings.
6.2.1.1 Overview of typical thermal environment
Two specific patterns in the thermal environment of the spaces enclosed by ETFE-foil
cushion envelopes were identified. Based on the sky conditions these can be defined
as thermal environment under clear sky conditions and overcast sky conditions. The
typical thermal environment observed under clear sky conditions and overcast
conditions are illustrated in Figure 6-4 and Figure 6-5 respectively. The results
indicated that the thermal environment under clear sky condition (30th June, 1st July
and 3rd July 2015) was largely influenced by large swings in cushion surface
temperatures (ST Loc 4_NH) relative to its surrounding air temperatures [Tsi 4(a)_NH),
Tsi3(a)_NH]. This significant variation in cushion surface temperatures was observed
to coincide with the extent of the vertical air temperature stratification. Thus, it resulted
in strong positive stratification during the daytime and negative at night (Figure 6-4).
Thermal environment on typical sunny days (30th June, 1st July and 3rd July 2015) was
particularly influenced by the surface temperature of the ETFE-foil cushions, radiant
temperature, solar gain into the enclosure and outdoor air temperature. Here the effect
of the HVAC system on indoor thermal environment [Tsi3(a)_NH] seemed to be very
poor in relation to the effect of heat gain from solar radiation and hot outdoor
temperature.
In the case of limited cloud cover, moving clouds and fluctuations in intensity of solar
radiation, surface temperature as well as indoor air temperature reacted rapidly
6-157
affecting the thermal environment of the atrium particularly on hot summer days
observed during 29th June, 1st July and 2nd July 2015.

6-158
Figure 6-4: Indoor air temperatures and solar radiation recorded in Nottingham High School atrium between 29th June and 3rd July 2015 – clear sky conditions
-50
50
150
250
350
450
550
650
750
850
950
1050
1150
0
10
20
30
40
50
60
29/0
6/2
015
00:0
0
29/0
6/2
015
04:0
0
29/0
6/2
015
08:0
0
29/0
6/2
015
12:0
0
29/0
6/2
015
16:0
0
29/0
6/2
015
20:0
0
30/0
6/2
015
00:0
0
30/0
6/2
015
04:0
0
30/0
6/2
015
08:0
0
30/0
6/2
015
12:0
0
30/0
6/2
015
16:0
0
30/0
6/2
015
20:0
0
01/0
7/2
015
00:0
0
01/0
7/2
015
04:0
0
01/0
7/2
015
08:0
0
01/0
7/2
015
12:0
0
01/0
7/2
015
16:0
0
01/0
7/2
015
20:0
0
02/0
7/2
015
00:0
0
02/0
7/2
015
04:0
0
02/0
7/2
015
08:0
0
02/0
7/2
015
12:0
0
02/0
7/2
015
16:0
0
02/0
7/2
015
20:0
0
03/0
7/2
015
00:0
0
03/0
7/2
015
04:0
0
03/0
7/2
015
08:0
0
03/0
7/2
015
12:0
0
03/0
7/2
015
16:0
0
03/0
7/2
015
20:0
0
So
lar
Ra
dia
tio
n (
W/m
²)
Te
mp
era
ture
( C
)
Date/ TimeExIR InIR OAT Tsi 1(a)_NH
Tsi 2(a)_NH Tsi 3(a)_NH Tsi 4(a)_NH MRTsi 4(a)_NH
ST Loc 1_NH ST Loc 4_NH

6-159
Figure 6-5: Indoor air temperatures and solar radiation recorded in Nottingham High School atrium during 14th September 2015 – overcast sky conditions
-50
50
150
250
350
450
550
650
750
850
950
1050
0
10
20
30
40
50
60
00:0
0
01:0
0
02:0
0
03:0
0
04:0
0
05:0
0
06:0
0
07:0
0
08:0
0
09:0
0
10:0
0
11:0
0
12:0
0
13:0
0
14:0
0
15:0
0
16:0
0
17:0
0
18:0
0
19:0
0
20:0
0
21:0
0
22:0
0
23:0
0
So
lar R
ad
iatio
n (W
/m²)
Te
mp
era
ture
( C
)
Time (00:00)
ExIR InIR Tsi 1(a)_NH Tsi 2(a)_NH
Tsi 3(a)_NH Tsi 4(a)_NH MRTsi 4(a)_NH ST Loc 1_NH
ST Loc 4_NH OAT

6-160
However, the thermal environment (Figure 6-5) under overcast sky condition was
different. Typically, during an overcast day, the thermal condition of spaces enclosed
with ETFE-foil cushions was more stable with relatively uniform temperature
distribution. This seemed to be the result of relatively low outdoor air temperature and
radiant temperature, limited solar gains, little variation in cushion surface temperature
and surrounding air temperature, the impact of HVAC system etc. Therefore, this
resulted in limited vertical stratification throughout the day and night.
6.2.2 Indoor air temperature distribution
During the summer period, the variations of outdoor air temperatures and incident solar
radiation significantly impact surface temperatures of the ETFE-foil cushions. Thus,
the variation of the indoor air temperatures of adjacent occupied levels appeared to be
determined by the variations in surface temperatures of the ETFE-foil cushions and
the amount of solar radiation transmitted though the ETFE-foil cushion roof. The
average temperature difference between the occupied levels and the exterior were
oscillating between 4.2°C to 6.3°C where the occupied level temperatures were hotter
than the outdoor temperatures. However, as the outdoor temperature increased a
sharp decrease in this temperature difference was evident particularly on 1st July 2015
(between 12.00pm and 8.00pm). Figure 6-6 presents temperature differences between
occupied levels in the atrium and outdoor air temperature. The results presented in
Figure 6-6 shows that during 1st July 2015, the outdoor air temperature was a
maximum of 4°C hotter than the air temperature of occupied levels (ground floor and
first floor) at noon. This was the result of extreme high outdoor temperature (33.8°C)
and stability of occupied level air temperatures due to the HVAC system, shading from
the floors above and the thermal inertia of the adjacent atrium floors and masonry
walls. However, during the same period the occupied level 3 (second floor) air
temperature stayed close to outdoor air temperature while the air temperature of level
4 (adjacent to the ETFE-foil cushion roof) was hotter than the outdoor air temperature.
This was due to level 4 air being heated by radiant heat from warmer inner ETFE-foil
surface as well as direct solar radiation accessing through translucent ETFE cushion.
This accumulated hot air of level 4 in turn affected air temperature of the level (level 3)
adjacent to it.
On the other hand, in the absence of solar radiation, during the day with low solar gain
(e.g. overcast day) and low outdoor temperature the occupied level air temperatures
were stable between 21°C and 22°C and stayed on average 9°C above outdoor
temperature (Figure 6-7). This stable condition can be explained as an impact of

6-161
thermal inertia, insulation provided by ETFE-foil cushion roof on indoor air
temperature. Thus, the thermal conditions of the occupied levels agreed well with
indoor design temperature.

6-162
Figure 6-6: Temperature differences between air temperatures of different atrium levels of Nottingham High School and outdoor air temperatures between 29th June and 3rd July 2015

6-163
Figure 6-7: Temperature differences between air temperatures of different atrium levels of Nottingham High School and outdoor air temperatures during 14th September 2015

6-164
The recorded vertical temperature gradient was on average positive during the day
and negative during the night. Diurnal temperature swing was high during peak
insolation periods while less on overcast days of summer. Figure 6-8 and Figure 6-9
present air temperature difference between occupied level 1, 2, 3 and level 4 during
the peak period (between 29th June and 3rd July 2015) and overcast day (14th
September) respectively. During the peak period, maximum vertical temperature
stratification observed was 11.5°C (between occupied level 1 and level 4). This was
relatively weak (2.62°C) on the overcast day. Moreover, the maximum variation of
internal air temperature range of occupied level 3 observed on a peak day (1st July
2015) was 8.9°C, this was also significant while compared to the same on an overcast
day (2.5°C).
At night (30th June, 1st July 2015) the air temperature of level 4 dropped while at
occupied levels 2 and 3 the air temperature was 1°C warmer than that of level 4 i.e.
negative stratification.
During hot summer days (1st July, 30th June 2015), this positive stratification resulted
from solar gain, hot outdoor temperature, radiant temperature and surface temperature
of ETFE-foil cushion. During occupied periods this was also influenced by occupancy
and internal gains etc. The average temperature difference between occupied levels
and the level adjacent to the ETFE-foil cushions ranged from 4.5°C (occupied level 3)
to 6.8°C (occupied level 1). At night, the decrease in air temperature at the level
adjacent to the ETFE-foil cushions (level 4) can be explained by the longwave infrared
radiation losses experienced by the ETFE-foil cushion surface.
Under warm sunny conditions direct solar radiation and warmer ETFE cushion
surfaces form a reservoir of warm air accumulating near to the ETFE-foil cushion roof.
This hot air is also heated by radiant heat thus the air temperature at the level adjacent
to the ETFE-foil cushions rose to a maximum of 41°C, which was 11.4°C and 7.7°C
hotter than level 1 and level 3 air temperature, respectively.
The effect of high outdoor air temperature was significant even after the solar radiation
intensity reduced after 8.00 pm but the air temperature of the occupied levels remained
high (Figure 6-4) and varied between 26.5°C and 32.2°C (30th June and 1st July 15).
There are automatic windows on the west façade of the atrium, which operate when
the air temperature of the second floor (level 3) rises to 25°C. However, on hot summer
days (30th June, 1st July 2015) no significant variation in air temperature or any drop of

6-165
air temperature was evident particularly on the upper levels of the atrium (level 4) close
to those automatic windows.
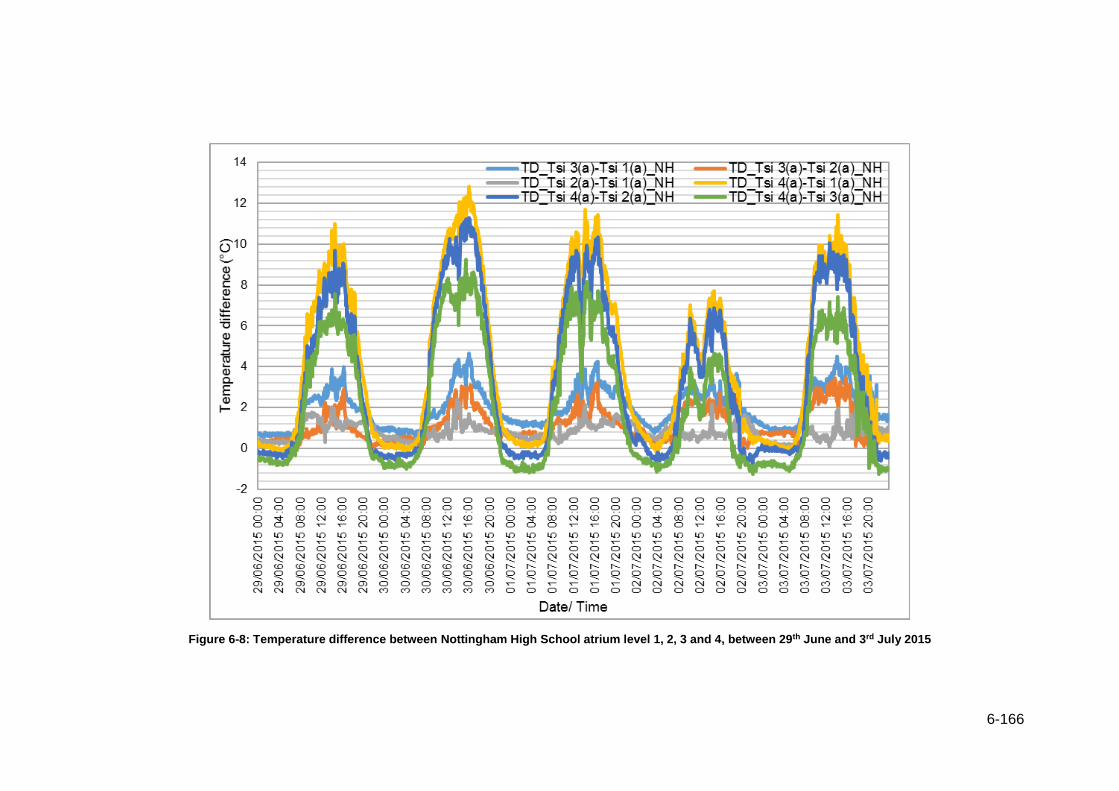
6-166
Figure 6-8: Temperature difference between Nottingham High School atrium level 1, 2, 3 and 4, between 29th June and 3rd July 2015
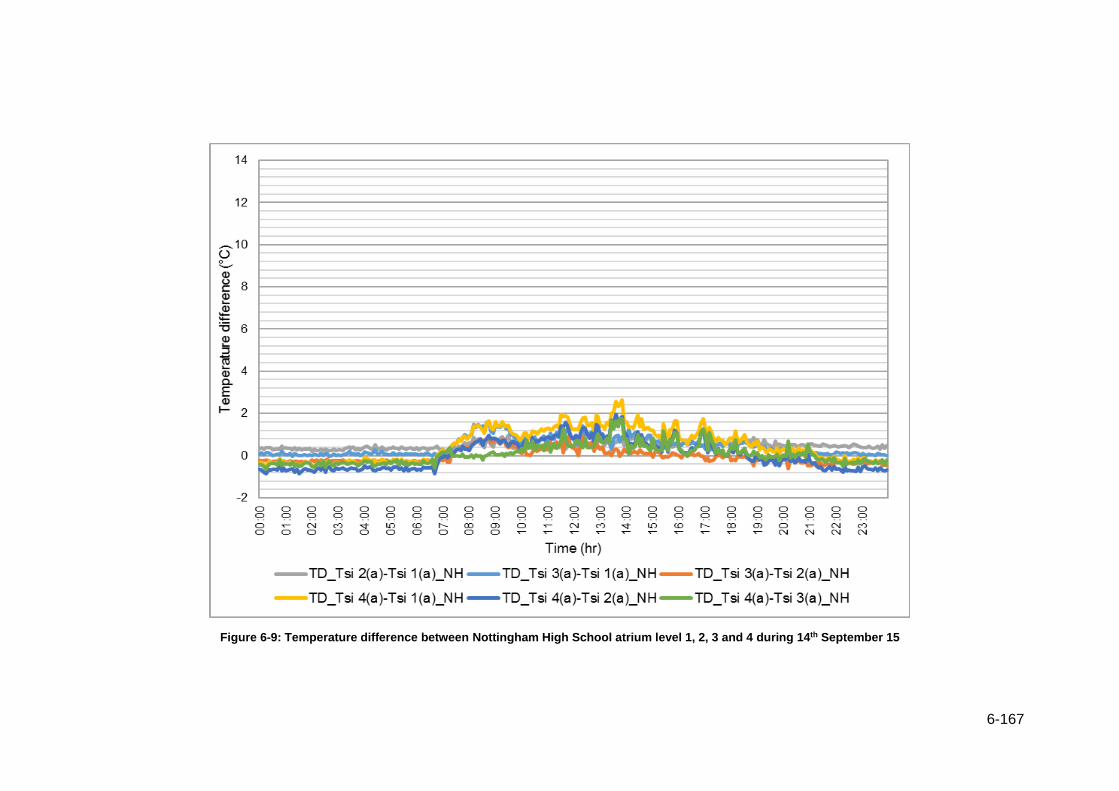
6-167
Figure 6-9: Temperature difference between Nottingham High School atrium level 1, 2, 3 and 4 during 14th September 15

6-168
6.2.3 Overview of typical thermal behaviour of the ETFE-foil cushion roof
The ETFE-foil cushion roof was very responsive to external weather conditions e.g.
solar radiation. The roof demonstrated more extreme thermal behaviour under clear
sky conditions where both direct solar and long-wave infrared radiation appeared to
govern the fluctuation of the ETFE-foil surface temperatures. However, under overcast
sky conditions this variation in ETFE-foil cushion surface temperatures were influenced
by the limited amount of diffuse radiation filtering through the cloud and mean radiant
temperature of the sky. This variation in the temperature of the ETFE-foil cushion
surface affects the thermal environment of the atrium and may result in temperature
stratification. Internal and external cushion surface temperatures, occupied level 3 air
temperatures, level 4 air and mean-radiant temperatures, incident and transmitted
solar radiation, and outdoor air temperature recorded under clear sky conditions and
overcast conditions is illustrated in Figure 6-10 and Figure 6-5 respectively.

6-169
Figure 6-10: Internal and external cushion surface temperatures, occupied level 3 air temperatures, level 4 air and mean-radiant temperatures, incident and transmitted solar radiation, and outdoor air temperature recorded between 29th June and 3rd July 2015
-50
50
150
250
350
450
550
650
750
850
950
1050
1150
0
10
20
30
40
50
60
29/0
6/2
015
00:0
0
29/0
6/2
015
04:0
0
29/0
6/2
015
08:0
0
29/0
6/2
015
12:0
0
29/0
6/2
015
16:0
0
29/0
6/2
015
20:0
0
30/0
6/2
015
00:0
0
30/0
6/2
015
04:0
0
30/0
6/2
015
08:0
0
30/0
6/2
015
12:0
0
30/0
6/2
015
16:0
0
30/0
6/2
015
20:0
0
01/0
7/2
015
00:0
0
01/0
7/2
015
04:0
0
01/0
7/2
015
08:0
0
01/0
7/2
015
12:0
0
01/0
7/2
015
16:0
0
01/0
7/2
015
20:0
0
02/0
7/2
015
00:0
0
02/0
7/2
015
04:0
0
02/0
7/2
015
08:0
0
02/0
7/2
015
12:0
0
02/0
7/2
015
16:0
0
02/0
7/2
015
20:0
0
03/0
7/2
015
00:0
0
03/0
7/2
015
04:0
0
03/0
7/2
015
08:0
0
03/0
7/2
015
12:0
0
03/0
7/2
015
16:0
0
03/0
7/2
015
20:0
0
So
lar
Ra
dia
tio
n (
W/m
²)
Te
mp
era
ture
( C
)
Date/ TimeExIR InIR OAT Tsi 3(a)_NH
Tsi 4(a)_NH MRTsi 4(a)_NH ST Loc 1_NH ST Loc 2_NH
ST Loc 4_NH ST Loc 5_NH
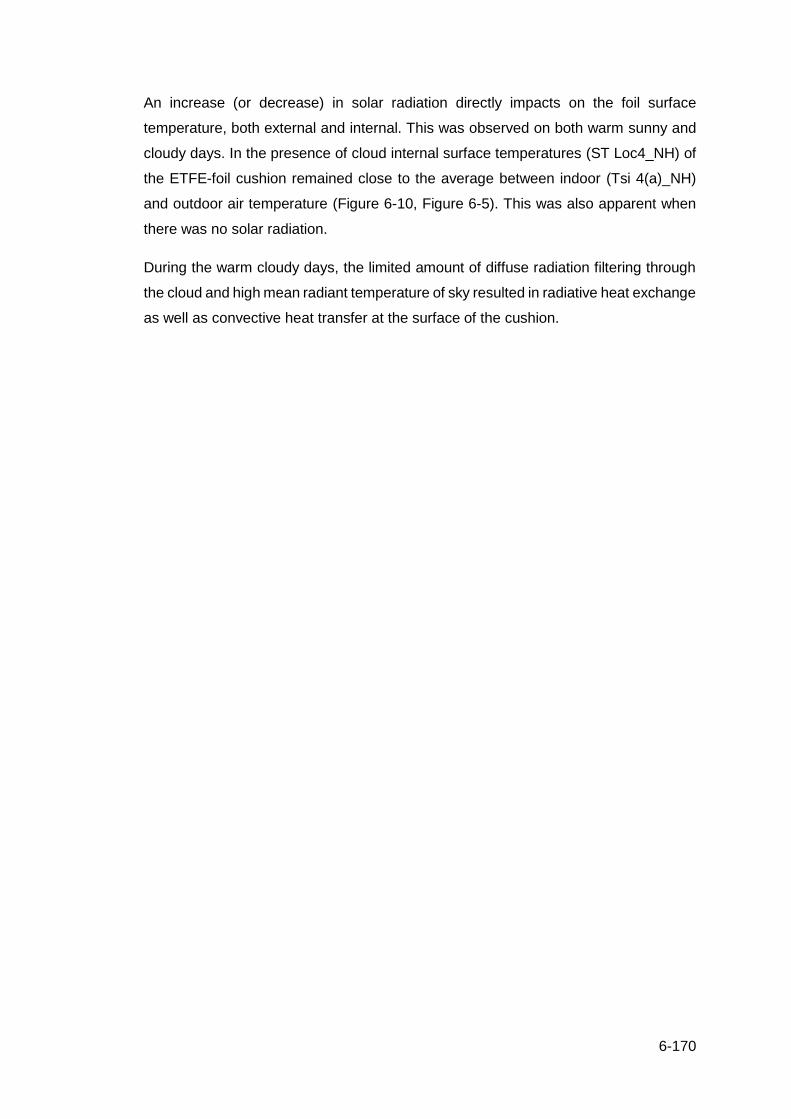
6-170
An increase (or decrease) in solar radiation directly impacts on the foil surface
temperature, both external and internal. This was observed on both warm sunny and
cloudy days. In the presence of cloud internal surface temperatures (ST Loc4_NH) of
the ETFE-foil cushion remained close to the average between indoor (Tsi 4(a)_NH)
and outdoor air temperature (Figure 6-10, Figure 6-5). This was also apparent when
there was no solar radiation.
During the warm cloudy days, the limited amount of diffuse radiation filtering through
the cloud and high mean radiant temperature of sky resulted in radiative heat exchange
as well as convective heat transfer at the surface of the cushion.
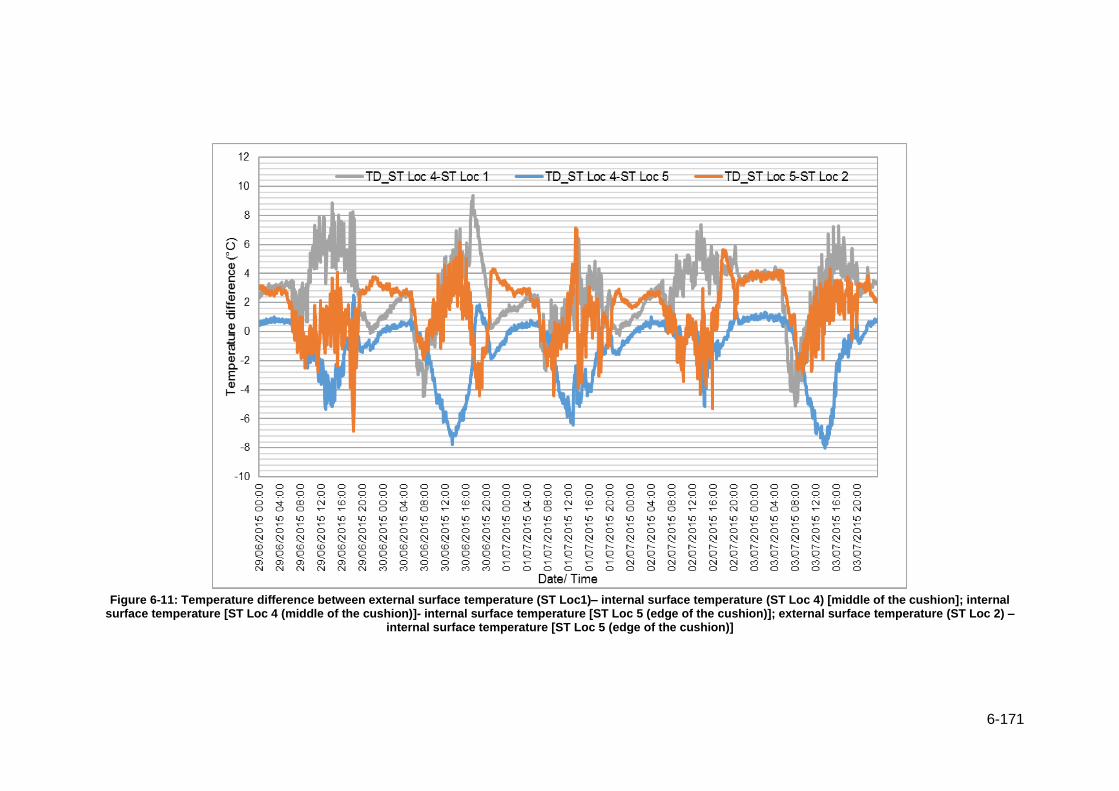
6-171
Figure 6-11: Temperature difference between external surface temperature (ST Loc1)– internal surface temperature (ST Loc 4) [middle of the cushion]; internal
surface temperature [ST Loc 4 (middle of the cushion)]- internal surface temperature [ST Loc 5 (edge of the cushion)]; external surface temperature (ST Loc 2) – internal surface temperature [ST Loc 5 (edge of the cushion)]

6-172
During the warm sunny day, radiative heat exchange effects dominated those of
convective heat transfer. As a result, a higher difference (15.6°C on the warm sunny
day, 4.2°C on the warm overcast day) was observed between foil surface temperatures
(ST Loc 4) and the average of indoor and outdoor temperature. Moreover, the air in
between the cushion layers creates a thermal barrier between the two 200μm ETFE-
foil layers and the external and internal air. For that reason, although the external
surface temperature stays close to the outdoor air temperature in the absence of solar
radiation, the internal surface temperature is always higher than that of the external
surface temperature. Moreover, it was apparent from Figure 6-11 that during the day
the edge of the cushion (STLoc4_NH) was a maximum of 8°C hotter than the middle
of the cushion (STLoc1_NH). This might be the result of the variation in the thermal
transmittance of the middle and edge of the same cushion (discussed in Chapter 4)
resulting from the variation in air conductance between these two location of a single
cushion and proximity to the aluminium clamping profile.
At night external surface temperatures stayed close to the external air temperature
during both warm sunny and overcast sky conditions. But variation was observed
during the day time. A sharp increase (from 17.15°C to 23°C) in exteranl surface
temperature was observed in the morning on the warm sunny day (1st July 2015).
During that period (around 6.30 am) the external surface temperature reached close
to the internal surface temperature and stayed 1°C to 2°C above the internal surface
temperature until 8.30am. After this time (8.30am), as the intesity of solar radation
increased (from 129 W/m2 to 559.56 W/m2), the internal surface temperature increased
above that of the external surface. Furthermore between 8.30am and 12.00 pm the
temperature differences between internal and external surface varied by 1°C to 2°C.
However after this hour (12.00pm) internal surface temperature remained above the
external surface temperature until the night. On the warm sunny afternoon, the
maximum internal foil surface temperature was 50.3°C (4.1°C hotter than external
surface), while the adjacent (internal) air temperature Tsi 4(a)_NH was 40.5°C (1st July
2015). Maximum and minimum temperature difference observed between the internal
and external surfaces of the ETFE-foil cushion were 9.36°C and 0.5°C on the clear
warm sunny day, whereas during the warm cloudy day this difference was 4.4°C and
0.2°C.
On the warm sunny day at mid-day, the internal surface temperature was influenced
by radiative heat transfer at the surfaces of the cushion, also radiation from the sky
and internal surfaces. In turn this warm internal ETFE-foil surfaces and direct solar

6-173
radiation accessing through transclusent ETFE cushion impacting air temperature of
atrium levels ( level 3, level 4). As there was no opening for the warm air to escape
through the high level it also influences the surface temperature of the cushion as a
process of convective heat transfer. Therefore the temperature of internal foil surfaces
rose above the air temperature of level 4 (level adjacent to ETFE-foil cushion roof).
Warm air rising from the lower levels is also heated by internal incident radiation
entering through the translucent ETFE-foil cushion roof impacting the temperature of
occupied level 3 and atrium level 4.

6-174
Figure 6-12: Temperature difference between external surface temperature (ST Loc 1) -outdoor air temperature; internal surface (ST Loc 4)- outdoor air
temperature, internal surface temperature (ST Loc 4)- level 4 (adjacent to ETFE-foil cushion air temperature); internal surface temperature (ST Loc 4)- level 3 (second floor) between 29th June and 3rd July

6-175
Figure 6-13: Temperature difference between external surface temperature (ST Loc 1)-outdoor air temperature; internal surface (ST Loc 4)- outdoor air temperature,
internal surface temperature (ST Loc 4)- level 4 (adjacent to ETFE-foil cushion air temperature); internal surface temperature (ST Loc 4)- level 3 (second floor) during 14th September 2015

6-176
Figure 6-12 and Figure 6-13 present the difference between external surface
temperature and outdoor air temperature; internal surface and outdoor air temperature;
internal surface temperature and atrium level 4 (adjacent to ETFE-foil cushion) air
temperature; internal surface temperature and occupied level 3 (second floor) air
temperature recorded between 29th June and 3rd July, and 14th September 2015
respectively.
The roof demonstrated more extreme thermal behavior under clear sky conditions
where both direct solar and long-wave infrared radiation appeared to govern the
fluctuation of the ETFE-foil surface temperatures. It was noticed that before sunset
(during 30th June between 7.00pm and 8.00pm) external and internal surface
temperature respectively drop by 8°C and 6°C within 1 hour due to the long wave
radiation losses to the exposed sky dome. Here solar radiation reaching the surface
was insufficient to counterbalance this long wave radiation loss. During this hour, the
minimum difference between internal surface and outdoor air temperature observed at
this time was 1.2°C. After this hour a gradual decrease of internal and external surface
temperature was observed until just before sunrise (see Figure 6-12). This also had an
impact on the air temperature and mean radiant temperature of level 4 (level adjacent
to ETFE-foil cushion roof).
Because of ETFE-foil’s higher transparency to long wave radiation, when compared to
glass, radiation losses from the foil surfaces caused a decrease in surface
temperature. This, in turn, had an impact on the air temperature and mean radiant
temperature at level 4 (level adjacent to ETFE-foil cushion roof). It also resulted in
negative stratification at night. The internal surface temperature was lower than the
occupied level 1 (ground floor) temperature, the opposite scenario to that observed at
mid-day with bright sunshine. After sunset, the external foil surface temperature stays
close to the external air temperature but the internal foil surface temperature is
approximately equal to the average of indoor and outdoor air temperature, due to long-
wave radiation exchange to the clear night sky and convective heat transfer effects. A
gradual decrease in foil surface temperature was observed until about 1 hour before
sunrise. During bright sunny days both foil surface temperatures are greater than the
air temperature immediately below the cushion (level 4), from morning till late
afternoon.

6-177
Figure 6-14: Relationship between internal surface temperature (STLoc4_NH), air temperature [Tsi 4(a)_NH] and mean radiant temperature [MRTsi 4(a)_NH]
The internal surface temperature of the ETFE-foil cushion is plotted against the air
temperature [Tsi 4(a)_NH] and mean radiant temperature [MRTsi 4(a)_NH] of level 4
(adjacent to ETFE cushion) in a scatter plot and presented in Figure 6-14. The purpose
was to identify the impact of surface temperature on adjacent air and mean radiant
temperature. The result presented in Figure 6-14 shows that both air temperature and
mean radiant temperature increased linearly with internal surface temperature of
ETFE-foil cushion. A higher value of regression coefficient R2 (0.984,0.933) also
indicated that internal surface temperature was correlated with adjacent air and mean
radiant temperature and contributed in increase and decrease of air temperature and
mean radiant temperature of the level 4 of the atrium.
6.2.4 Effect of ETFE-foil surface temperature on thermal comfort
It was apparent from the above discussion that during the day thermal behaviour of
the ETFE-foil cushion was dominated by short-wave solar radiation however at night
this was particularly influenced by longwave radiation exchanges with the surrounding
surfaces e.g. clear sky vault.
6-178
This shortwave and longwave thermal radiation does not rely on an intermediate fluid
for its transmission. However, the effect of temperature difference will be experienced
by the occupant as a deviation of mean radiant temperature from air temperature.
It was already identified in section 6.2.2 (Figure 6-4) that mean radiant temperatures
were higher than air temperatures of the level 4 (adjacent to ETFE-foil cushion)
particularly during the day and went below air temperatures during the night. This had
impact on mean radiant temperatures of the levels below affecting the thermal comfort
of the occupants on those levels.
The thermal environment under clear sky condition was largely influenced by large
swings in cushion surface temperatures, relative to its surrounding air temperatures.
This significant variation in cushion surface temperatures observed to coincide with
the extent of the vertical air temperature stratification which was positive during the
day and negative at night. This temperature stratification effects thermal comfort by
creating difference in temperature in different locations at the same time and, is
influenced by heat transfer to the air from the heated surfaces in the upper levels of a
large space such as an atrium (IEATask12, 1996).
Research on the effect of asymmetric radiant fields stated that occupants would be
more sensate to warm ceiling than to a cool ceiling.
Thus, surface temperatures of ETFE-foil roof (effectively ceiling) particularly influence
occupants’ thermal comfort by increasing mean radiant temperature during the day
and reducing it at night, as well as inducing temperature stratification during day and
night.
Air temperatures of level 3 and level 4 of the atrium fluctuated relatively quickly as an
impact of frequent change in surface temperature, also because of the curved surface
the view factor of the ETFE-foil cushion roof was generally large. Therefore, even small
variations in the internal surface temperatures of ETFE-foil resulted in noticeable
variation in air temperatures as well as mean radiant temperatures of level 3 and level
4.
6.2.5 Impact of environmental variable on indoor thermal environment
The results of the onsite monitoring presented and discussed in the section 6.2.3
showed that the thermal condition of the atrium on a typical sunny day was particularly
influenced by the surface temperature of the ETFE-foil cushion, radiant temperature,
solar radiation and outdoor air temperature. However, the relationship between

6-179
individual environmental parameters and the resulting thermal condition of the atrium
are unknown because the recorded condition was the combined effect of all the
monitored parameters. Therefore, the correlation coefficient R2 formula was used to
determine this interrelationship between air temperature of atrium occupied levels and
environmental parameters such as incident and transmitted solar radiation, outdoor air
temperature and presented in Table 6-2. This found a strong correlation between
outdoor air temperatures and occupied levels air temperatures (R2 value ranged from
0.884 to 0.966). However, outdoor temperature, as well as transmitted solar radiation,
had a strong positive relationship with indoor air temperatures of occupied levels and
level adjacent to ETFE-foil cushion roof (R2 value ranged from 0.952 to 0.984). This
relationship between outdoor and indoor environment (level 3 and level 4 of the atrium)
was found to be established by the ETFE-foil cushion roof, through its responsiveness
to outdoor conditions as well as continuous interaction with indoor environment.
Table 6-2: correlation between air temperature at different occupied level and incident, transmitted solar radiation and outdoor ambient temperature 1st July 15
Environmental parameters
level 1
Tsi 1(a)_NH
level 2
Tsi 2(a)_NH
level 3
Tsi 3(a)_NH
level 4
Tsi 4(a)_NH
R2 (Incident Solar radiation)
0.101 0.082 0.156 0.44
R2 (Transmitted Solar radiation)
0.096 0.081 0.153 0.436
R2 (OAT) 0.884 0.865 0.923 0.966
R2 (Incident Solar radiation and OAT)
0.949 0.947 0.954 0.984
R2 (Transmitted Solar radiation and OAT)
0.951 0.946 0.954 0.984
R2 (Transmitted and Incident Solar radiation)
0.1 (only impact of transmitted radiation to 0.093)
0.082 0.156 0.442
R2 (OAT, Transmitted and Incident Solar radiation)
0.952
(Transmitted Solar radiation and OAT)
0.946 (only impact of transmitted radiation and ODT)
0.954 (only impact of transmitted radiation and ODT)
0.984
6.2.6 Impact of atrium thermal environment to the adjacent spaces
To examine the impact of the atrium’s thermal condition on other internal spaces,
temperature sensors were installed in the spaces (e.g. classroom, corridor etc.)

6-180
adjacent to the atrium. These recorded data between 21st August and 1st September
2015. Figure 6-15 presents location of the sensors.
Figure 6-15: Location of temperature sensors in level 3 (second floor) [Plan (nts): drawing courtesy Maber architect]
Thermal conditions in the atrium influence air temperatures of the adjacent spaces
(classroom, corridor). Figure 6-16 presents air temperatures of occupied level 3 (Tsi
3(a)_NH), corridor, interview room and outdoor measured during 29th and 30th August
15. The results presented in Figure 6-16 showed that air temperatures of the interview
room and corridor varied within 1.5°C of the air temperature of Tsi 3(a)_NH during the
day while little variation was observed at night.
To see the extent of this impact of the atrium’s thermal condition on indoor spaces, air
temperatures of the interview room and corridor were plotted against air temperatures
of Tsi 3(a)_NH and presented in Figure 6-17. These indicated that the interview room
and corridor air temperatures had a linear relationship with Tsi 3(a)_NH air
temperatures. Whereas higher correlation coefficient R2 value (0.89, 0.86) confirmed
the impact of atrium’s thermal condition on indoor air temperatures of the school
building such as spaces adjacent to the atrium. This was the result of air circulation
between the spaces (interview room, corridor etc) and the atrium through window
openings.

6-181
Figure 6-16: Air temperatures of different vertical and horizontal positions in the atrium and space adjacent to atrium during 29th August and 30th August
Figure 6-17: Impact of atrium level 3 (Tsi (a)_NH) air temperature on internal space adjacent to it
6-182
6.3 Case Study B: Engineering and Science Learning Centre (ESLC)
This section discusses the thermal behaviour of the ESLC atrium. The atrium roof
consists of three-layer ETFE-foil cushions with fritted top layer (200μm) transparent
middle (150μm) and bottom layer (150μ m). Detailed description of the building and
monitoring setup is presented in Chapter 3 (section 3.9).
Summary of the salient features of the monitored atrium of ESLC, its roof and time
period of environmental monitoring is presented in Table 3-3 (Chapter 3).
When selecting days for analysis, it was considered that the building was operating on
its normal schedule within the summer period in the UK.
Sensor identification used to describe the outdoor environment are presented in Table
6-1, while Table 3-7 (Chapter 3) presents sensors identification used to discuss the
thermal conditions of the atrium. Detailed description of the method and installed
equipment for monitoring is presented in Chapter 3 (section 3.9).
6.3.1 Analysis of monitored data and discussion
The graphs in this section represent monitored data recorded at fifteen minute
intervals. This allowed to graphically represent dynamic thermal responsiveness of the
ETFE-foil cushion envelope. All numerical value specified in a text format are based
on instant readings. Indoor air temperature here represents air temperature at a
particular time of the day at shielded measuring points along the same vertical line and
horizontal plan position on each floor.
6.3.1.1 Overview of typical thermal environment
The typical thermal behaviour of the Engineering and Science Learning centre and the
Nottingham High School were found to be similar. Two specific patterns in the thermal
environment were also identified in the ESLC building. Figure 6-18 and Figure 6-19
presents the typical thermal conditions observed under clear sky conditions and
overcast conditions respectively.
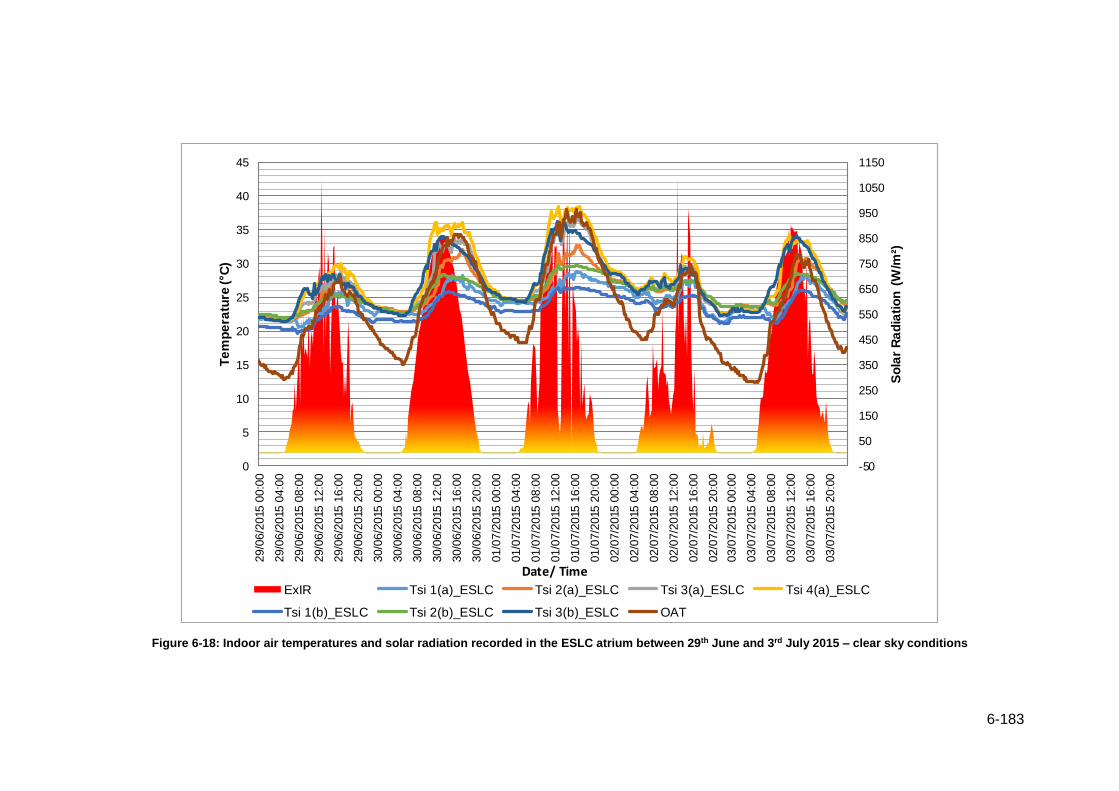
6-183
Figure 6-18: Indoor air temperatures and solar radiation recorded in the ESLC atrium between 29th June and 3rd July 2015 – clear sky conditions
-50
50
150
250
350
450
550
650
750
850
950
1050
1150
0
5
10
15
20
25
30
35
40
45
29/0
6/2
015
00:0
0
29/0
6/2
015
04:0
0
29/0
6/2
015
08:0
0
29/0
6/2
015
12:0
0
29/0
6/2
015
16:0
0
29/0
6/2
015
20:0
0
30/0
6/2
015
00:0
0
30/0
6/2
015
04:0
0
30/0
6/2
015
08:0
0
30/0
6/2
015
12:0
0
30/0
6/2
015
16:0
0
30/0
6/2
015
20:0
0
01/0
7/2
015
00:0
0
01/0
7/2
015
04:0
0
01/0
7/2
015
08:0
0
01/0
7/2
015
12:0
0
01/0
7/2
015
16:0
0
01/0
7/2
015
20:0
0
02/0
7/2
015
00:0
0
02/0
7/2
015
04:0
0
02/0
7/2
015
08:0
0
02/0
7/2
015
12:0
0
02/0
7/2
015
16:0
0
02/0
7/2
015
20:0
0
03/0
7/2
015
00:0
0
03/0
7/2
015
04:0
0
03/0
7/2
015
08:0
0
03/0
7/2
015
12:0
0
03/0
7/2
015
16:0
0
03/0
7/2
015
20:0
0
So
lar
Ra
dia
tio
n (
W/m
²)
Te
mp
era
ture
( C
)
Date/ Time
ExIR Tsi 1(a)_ESLC Tsi 2(a)_ESLC Tsi 3(a)_ESLC Tsi 4(a)_ESLC
Tsi 1(b)_ESLC Tsi 2(b)_ESLC Tsi 3(b)_ESLC OAT
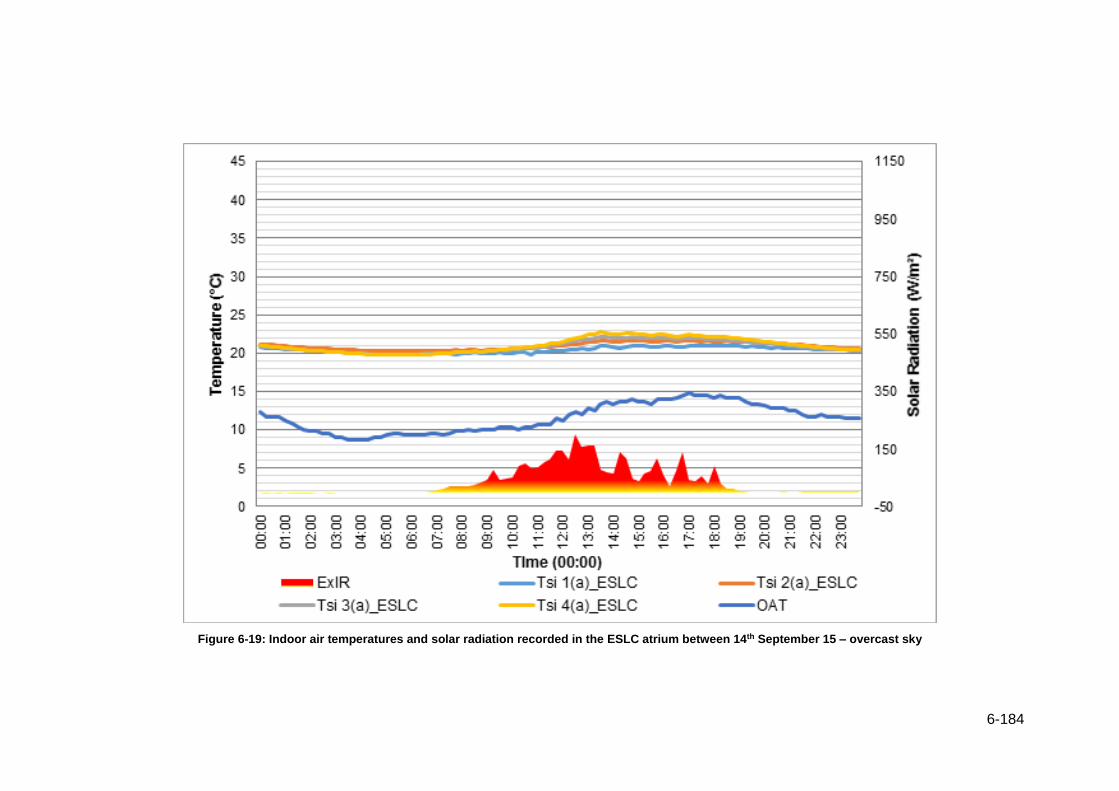
6-184
Figure 6-19: Indoor air temperatures and solar radiation recorded in the ESLC atrium between 14th September 15 – overcast sky
6-185
6.3.2 Indoor air temperature distribution
The ground floor (level 1) air temperature was generally the lowest among the three
levels of the atrium. Figure 6-22 presents temperature differences between the
occupied levels (1, 2, 3 and 4) of the atrium and outdoor air temperature. The result
presented in Figure 6-22 shows that on an extremely hot day (1st July 15) air
temperature of the ground floor was a maximum of 11°C lower than outdoor air
temperature. During warm sunny conditions the range of temperature of the ground
floor (6.5°C) was found to be similar in both ESLC and Nottingham High School atria.
Correspondingly, air temperature at the first floor [shown by Tsi 2(a)_ESLC] was
slightly higher than that on the ground floor and slightly more affected by outdoor
weather conditions. Figure 6-20 presents temperature differences between atrium
level 1, 2, 3 and 4 during warm sunny days. From Figure 6-20 it can be noticed that
during the warm sunny days the maximum temperature difference between ground
floor and first floor was 4.5°C. However, this temperature difference between ground
floor and first floor air temperature was comparatively less (2°C) in Nottingham High
School atrium. In both of the buildings, this difference occurred during the afternoon.
The highest temperature recorded at first floor over the two days (30th June and 1st
July 15) was 32°C (32°C in Nottingham High School). During the warm sunny days,
the direct and diffuse radiation could penetrate more deeply to lower atrium levels
resulting in raised air and mean radiant temperatures. Extremely hot outdoor air
temperature also had an influence on this significant rise in air temperature.

6-186
Figure 6-20: Temperature difference between ESLC atrium level 1, 2, 3 and 4, between 29th June and 3rd July 2015
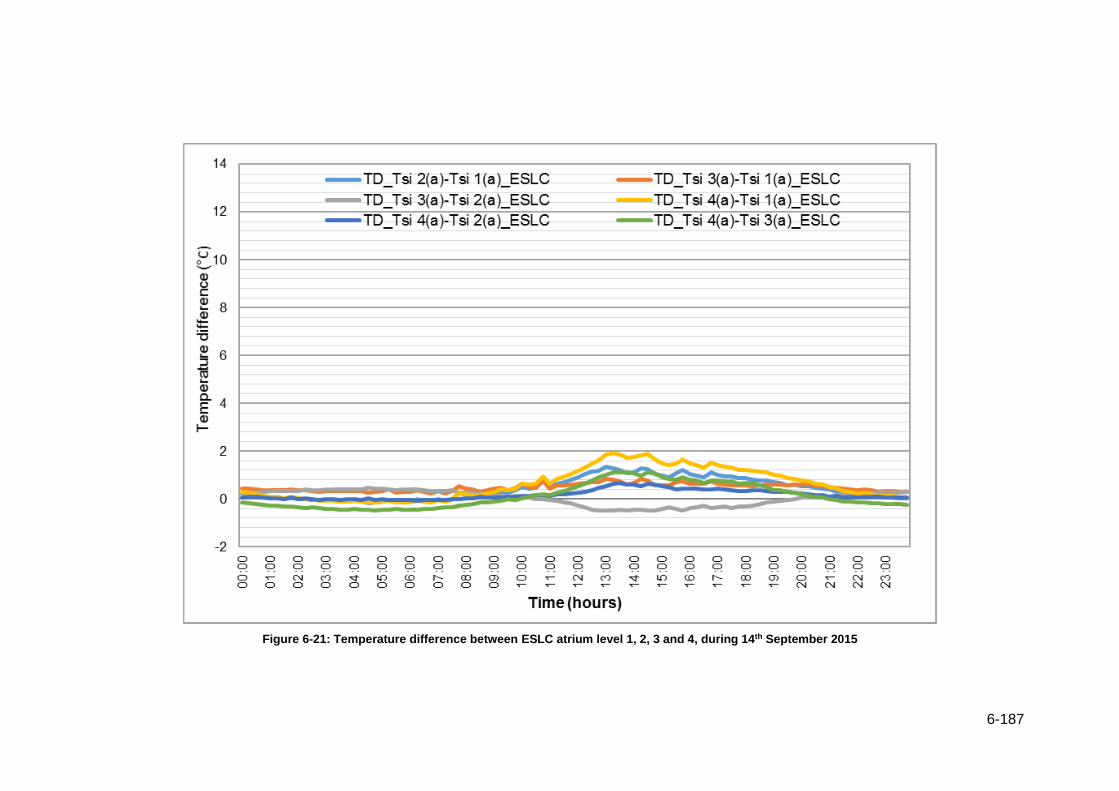
6-187
Figure 6-21: Temperature difference between ESLC atrium level 1, 2, 3 and 4, during 14th September 2015

6-188
Figure 6-22: Temperature differences between air temperatures of atrium levels of ESLC and outdoor air temperatures between 29th June and 3rd July 2015
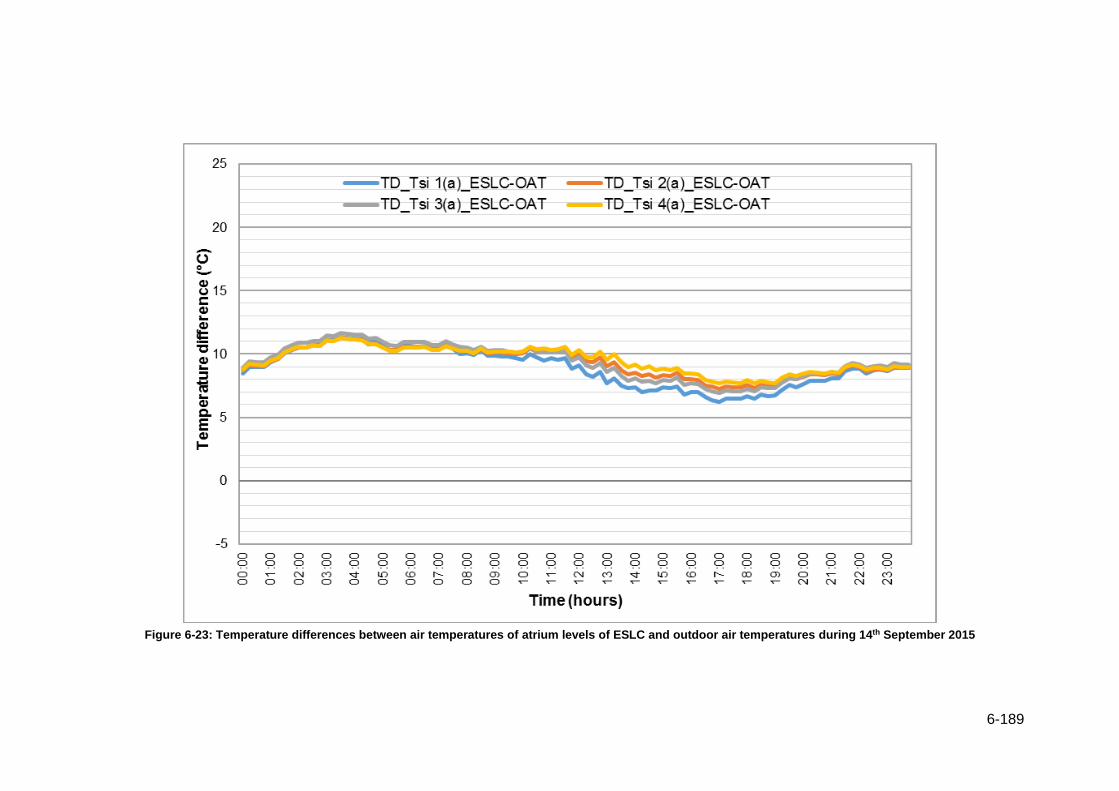
6-189
Figure 6-23: Temperature differences between air temperatures of atrium levels of ESLC and outdoor air temperatures during 14th September 2015

6-190
On the second floor, air temperatures [shown by Tsi 3(a)_ESLC] were higher than
ground and first floor. Around noon on the sunny day (1st July 2015), second floor air
temperatures rose to 33°C (30°C in Nottingham High School) then increased to a
maximum of 36.8°C in the afternoon (33.5°C in Nottingham High School). It is
considered that the main reason for this is the proximity of the translucent ETFE-foil
cushion roof to this atrium level which increases the sky view factor, radiant heat
effects from the ETFE-foil cushion roof surfaces as well as radiant heat from the direct
sunlight.
Besides, at noon a significant temperature rise was observed in air temperature of
level 4 (approx. 4m above the second floor), which was 6.5°C higher than the second
floor air temperature. The amount of incident solar radiation affects the thermal
environment of the second and third floors significantly, creating strong vertical positive
stratification during the daytime. Whereas in the absence of solar radiation, longwave
radiation exchange to the clear cold sky may cause negative stratification at night. This
positive and negative stratification was also observed during the overcast day but to a
lesser degree. During the warm sunny and overcast days, the maximum temperature
difference between level 4 [Tsi 4(a)_ESLC] and ground floor [Tsi 1(a)_ESLC] was
11.6°C (during 30th June and 1st July 15) and 1.9°C respectively, whereas between the
second floor [Tsi 3(a)_ESLC] and ground floor [Tsi 1(a)_ESLC], it was 9.6°C and 0.8°C
correspondingly. However, in Nottingham High School maximum temperature
difference between level 4 [Tsi 4(a)_NH] and ground floor [Tsi 1(a)_NH] was 11.6°C,
whereas between second floor [Tsi 3(a)_NH] and ground floor [Tsi 1(a)_NH], it was
4.3°C.
It was mentioned in Chapter 3 (section 3.9), that the ETFE-foil cushion roof was not
reachable from inside of the ESLC atrium. Therefore, it was not possible to install
sensors closer to ETFE-foil cushion roof. Hence level 4 (approx. 4m below the ETFE-
foil cushion roof) air temperatures were not directly comparable with those of
Nottingham High School level 4 (directly adjacent to the ETFE-foil cushion roof) air
temperatures.
However, temperature stratification (the difference between second floor and ground
floor air temperature) was high (5.3°C) in the ESLC atrium than that of Nottingham
High School atrium.
In both of the buildings during hot days (30th June and 1st July 2015) air temperatures
of the second floor of the atria were similar to outdoor temperatures, particularly during
the day ( Figure 6-6 and Figure 6-22).
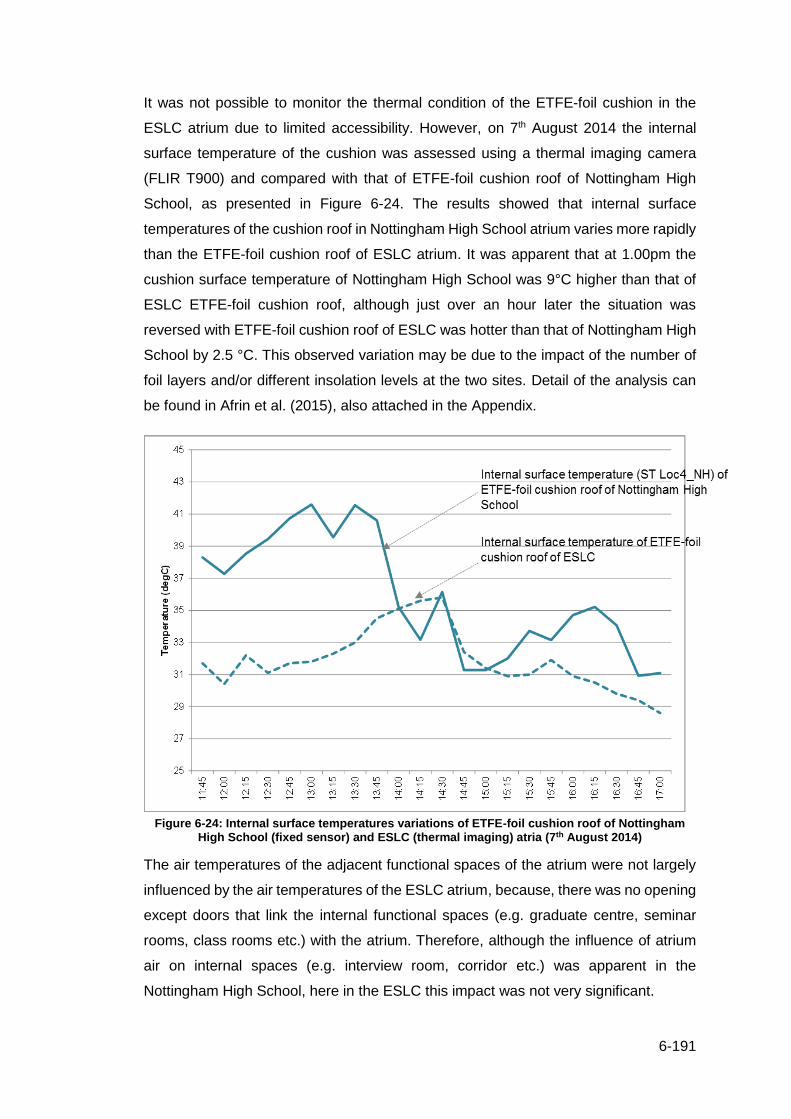
6-191
It was not possible to monitor the thermal condition of the ETFE-foil cushion in the
ESLC atrium due to limited accessibility. However, on 7th August 2014 the internal
surface temperature of the cushion was assessed using a thermal imaging camera
(FLIR T900) and compared with that of ETFE-foil cushion roof of Nottingham High
School, as presented in Figure 6-24. The results showed that internal surface
temperatures of the cushion roof in Nottingham High School atrium varies more rapidly
than the ETFE-foil cushion roof of ESLC atrium. It was apparent that at 1.00pm the
cushion surface temperature of Nottingham High School was 9°C higher than that of
ESLC ETFE-foil cushion roof, although just over an hour later the situation was
reversed with ETFE-foil cushion roof of ESLC was hotter than that of Nottingham High
School by 2.5 °C. This observed variation may be due to the impact of the number of
foil layers and/or different insolation levels at the two sites. Detail of the analysis can
be found in Afrin et al. (2015), also attached in the Appendix.
Figure 6-24: Internal surface temperatures variations of ETFE-foil cushion roof of Nottingham
High School (fixed sensor) and ESLC (thermal imaging) atria (7th August 2014)
The air temperatures of the adjacent functional spaces of the atrium were not largely
influenced by the air temperatures of the ESLC atrium, because, there was no opening
except doors that link the internal functional spaces (e.g. graduate centre, seminar
rooms, class rooms etc.) with the atrium. Therefore, although the influence of atrium
air on internal spaces (e.g. interview room, corridor etc.) was apparent in the
Nottingham High School, here in the ESLC this impact was not very significant.

6-192
6.3.3 Comparison of the thermal environment of the Nottingham High School
and the Engineering and Science Learning Centre (ESLC) atrium
It was evident from the earlier discussion that in the ESLC atrium, air temperatures of
occupied levels (first floor and second floor) were higher than that of same occupied
levels in the Nottingham High School atrium. Figure 6-25 presents temperature
differences between air temperatures of occupied levels (1,2 and 3) of the ESLC and
the Nottingham High School atrium. The result presented in Figure 6-25, indicated that
during warm summer days (between 8.00am and 8.00pm during 30th June, 1st and 3rd
July 2015) the air temperature of occupied level 3 [Tsi 3(a)_ESLC (second floor)] of
ESLC atrium was continuously hotter than that of Nottingham High School atrium [Tsi
3(a)_NH (second floor)]. During this period, average air temperature difference
between these two atria was 2.6°C (occupied level 3) while during the afternoon (30th
June 2015) occupied level 3 of ESLC atrium was maximum 5.4°C hotter than occupied
level 3 of Nottingham High School atrium. But reverse conditions occurred on summer
nights and early in the mornings when air temperature of each occupied level of the
Nottingham high school was on average 1°C to 2°C hotter than that of the same
occupied levels of the ESLC atrium because of thermal inertia of surrounding masonry
wall and floor.
Figure 6-25: Temperature difference between occupied level 1, 2 and 3 of ESLC and Nottingham High School atrium between 29th June and 3rd July 2015
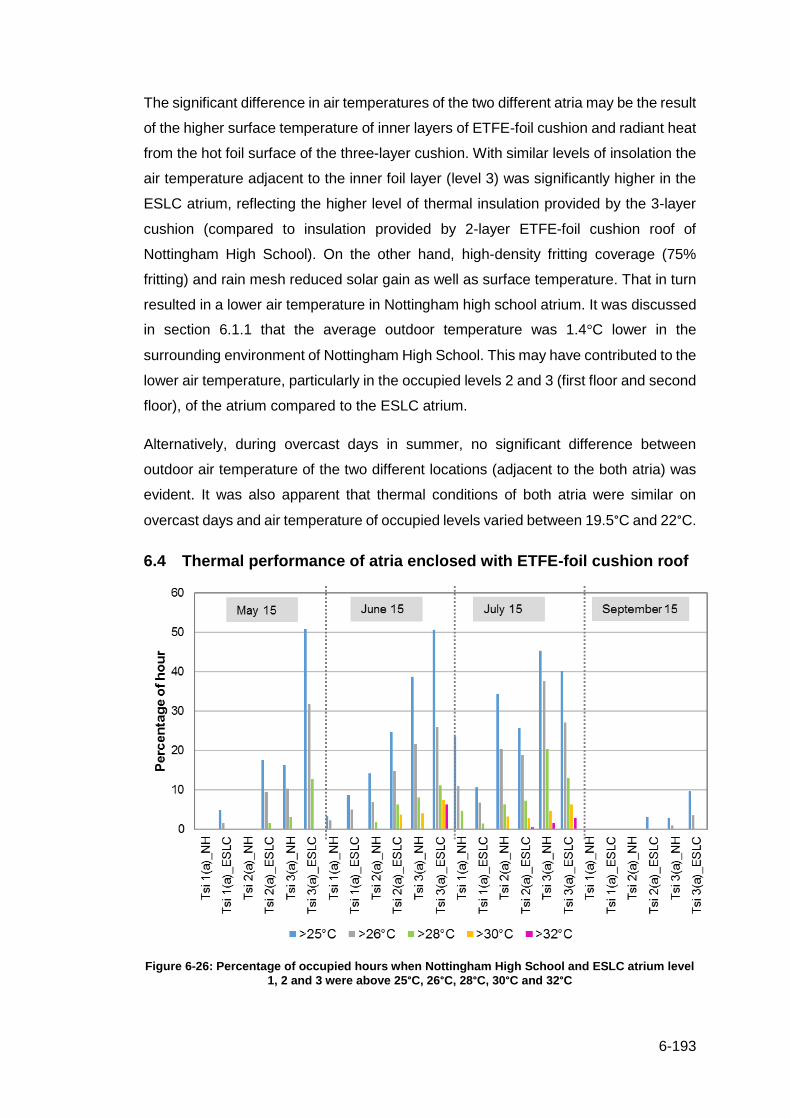
6-193
The significant difference in air temperatures of the two different atria may be the result
of the higher surface temperature of inner layers of ETFE-foil cushion and radiant heat
from the hot foil surface of the three-layer cushion. With similar levels of insolation the
air temperature adjacent to the inner foil layer (level 3) was significantly higher in the
ESLC atrium, reflecting the higher level of thermal insulation provided by the 3-layer
cushion (compared to insulation provided by 2-layer ETFE-foil cushion roof of
Nottingham High School). On the other hand, high-density fritting coverage (75%
fritting) and rain mesh reduced solar gain as well as surface temperature. That in turn
resulted in a lower air temperature in Nottingham high school atrium. It was discussed
in section 6.1.1 that the average outdoor temperature was 1.4°C lower in the
surrounding environment of Nottingham High School. This may have contributed to the
lower air temperature, particularly in the occupied levels 2 and 3 (first floor and second
floor), of the atrium compared to the ESLC atrium.
Alternatively, during overcast days in summer, no significant difference between
outdoor air temperature of the two different locations (adjacent to the both atria) was
evident. It was also apparent that thermal conditions of both atria were similar on
overcast days and air temperature of occupied levels varied between 19.5°C and 22°C.
6.4 Thermal performance of atria enclosed with ETFE-foil cushion roof
Figure 6-26: Percentage of occupied hours when Nottingham High School and ESLC atrium level
1, 2 and 3 were above 25°C, 26°C, 28°C, 30°C and 32°C

6-194
During hot summer days, the excessive solar gain, hot outdoor temperature and high
surface temperature over the large roof area may adversely affect user thermal
comfort. In order to investigate the extent of variation of air temperature that might
impact thermal comfort of the users, the percentage of occupied hours that exceeded
25°C, 26°C, 28°C, 30°C and 32°C in each occupied level of both Nottingham High
School and ESLC atria was calculated and plotted in Figure 6-26.
Results presented in Figure 6-26 demonstrated that in both atria during July 2015,
1.5% to 4.5%, 6% to 7% and 13% to 30% of occupied hours, respectively ground floor,
first floor and second floor air temperature was above 28°C. However, in both atria, a
significant rise of air temperature of occupied level 3 was also evident, as for 1.6% to
2.9% of occupied hours the air temperature exceeded 32°C. This significant rise in air
temperature of occupied levels, as well as the duration, affects the thermal comfort of
the occupants.
Thermal comfort of the Nottingham High School and ESLC atria enclosed with an
ETFE-foil cushion roof was evaluated based on overheating analysis methods. TM52
adaptive comfort criteria, CIBSE temperature benchmark and Building Bulletin 101
(performance standard for the avoidance of overheating) were used in the analysis
procedure, as detailed in Table 6-4. Discussion on these methods adopted in this study
was provided in Chapter 3.
Table 6-3: Summary of occupied periods in summer 2014, 2015
Monitoring period
Year Occupied hours
Number of days
monitored during
summer
Number of
occupied hours
Annual occupied
hours/ year
Space type
Nottingham High
School
1st May- 30th September
2014 8.00-15.00
77 536 1236 Atrium
1st May- 21st September
2015 8.00-15.00
60 480 1236 Atrium
ESLC 1st August -30th
Septembe
2014 9.00- 17.00
43 387 1578 Atrium
1st May- 30th September
2015 9.00- 17.00
82 738 1578 Atrium
Table 6-4: Criteria for assessing internal temperature in naturally ventilated atrium space
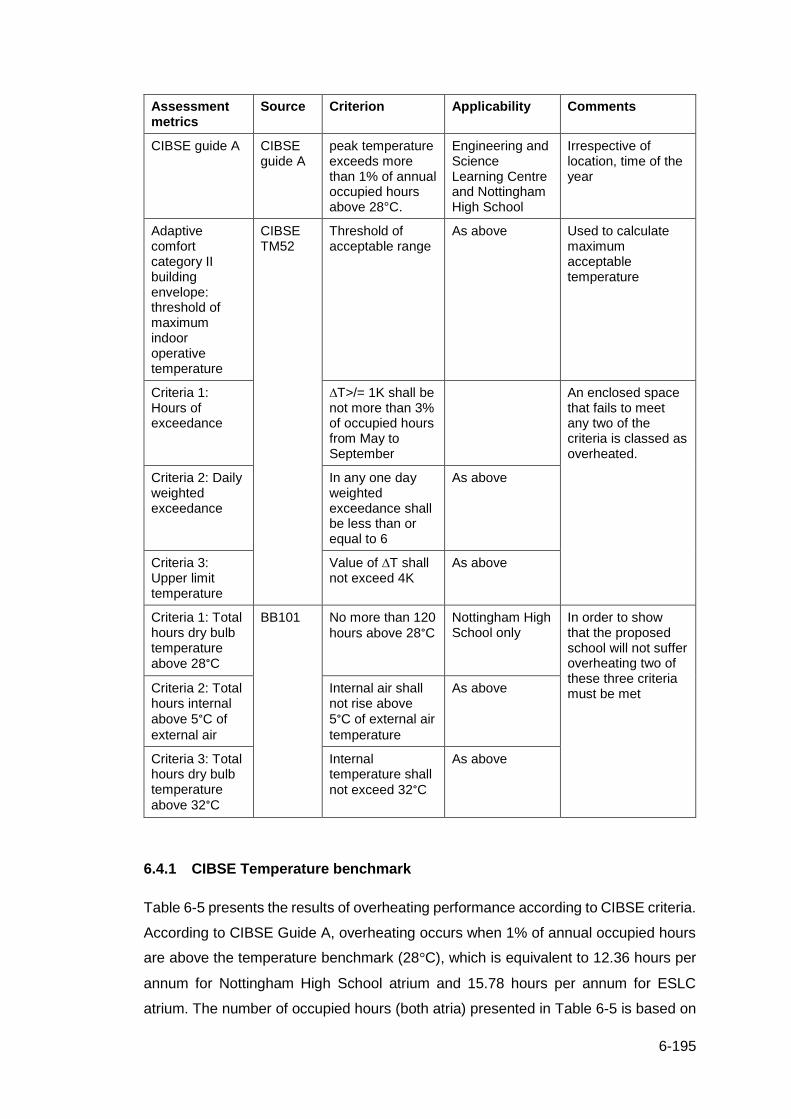
6-195
Assessment metrics
Source Criterion Applicability Comments
CIBSE guide A CIBSE guide A
peak temperature exceeds more than 1% of annual occupied hours above 28°C.
Engineering and Science Learning Centre and Nottingham High School
Irrespective of location, time of the year
Adaptive comfort category II building envelope: threshold of maximum indoor operative temperature
CIBSE TM52
Threshold of acceptable range
As above Used to calculate maximum acceptable temperature
Criteria 1: Hours of exceedance
∆T>/= 1K shall be not more than 3% of occupied hours from May to September
An enclosed space that fails to meet any two of the criteria is classed as overheated.
Criteria 2: Daily weighted exceedance
In any one day weighted exceedance shall be less than or equal to 6
As above
Criteria 3: Upper limit temperature
Value of ∆T shall not exceed 4K
As above
Criteria 1: Total hours dry bulb temperature above 28°C
BB101
No more than 120
hours above 28°C
Nottingham High School only
In order to show that the proposed school will not suffer overheating two of these three criteria must be met Criteria 2: Total
hours internal
above 5°C of
external air
Internal air shall not rise above
5°C of external air
temperature
As above
Criteria 3: Total hours dry bulb temperature
above 32°C
Internal temperature shall
not exceed 32°C
As above
6.4.1 CIBSE Temperature benchmark
Table 6-5 presents the results of overheating performance according to CIBSE criteria.
According to CIBSE Guide A, overheating occurs when 1% of annual occupied hours
are above the temperature benchmark (28°C), which is equivalent to 12.36 hours per
annum for Nottingham High School atrium and 15.78 hours per annum for ESLC
atrium. The number of occupied hours (both atria) presented in Table 6-5 is based on
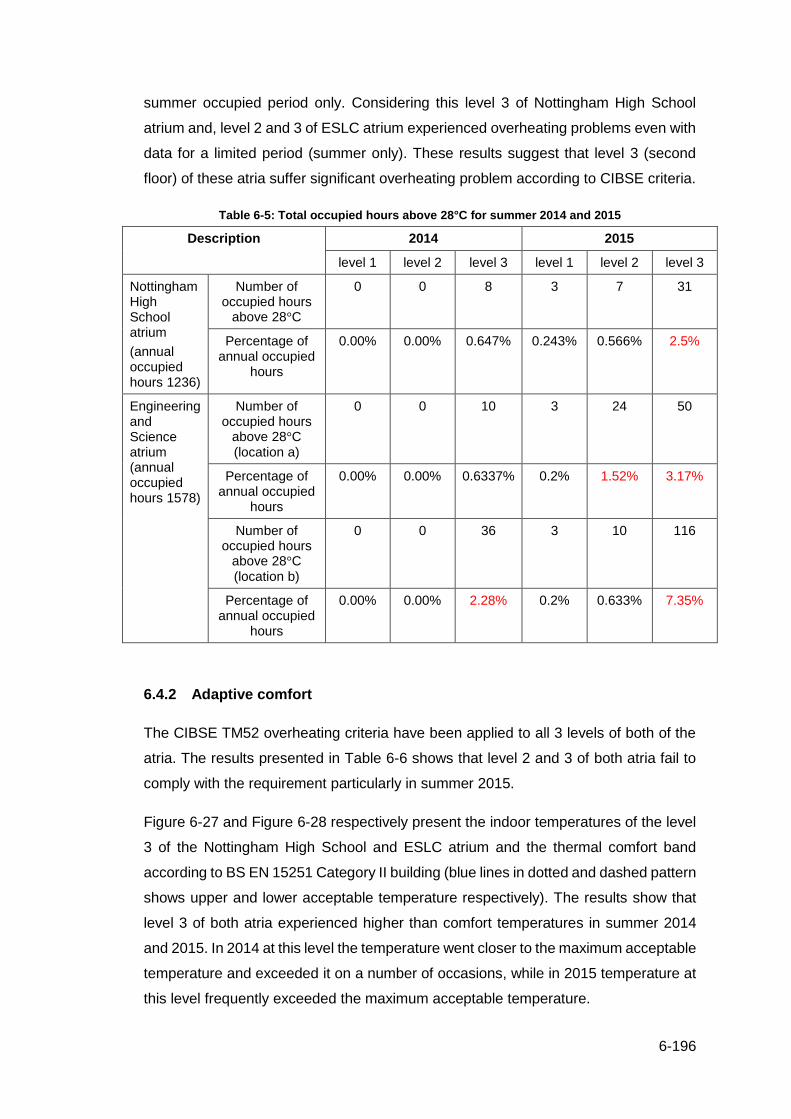
6-196
summer occupied period only. Considering this level 3 of Nottingham High School
atrium and, level 2 and 3 of ESLC atrium experienced overheating problems even with
data for a limited period (summer only). These results suggest that level 3 (second
floor) of these atria suffer significant overheating problem according to CIBSE criteria.
Table 6-5: Total occupied hours above 28°C for summer 2014 and 2015
Description 2014 2015
level 1 level 2 level 3 level 1 level 2 level 3
Nottingham High School atrium
(annual occupied hours 1236)
Number of occupied hours
above 28°C
0 0 8 3 7 31
Percentage of annual occupied
hours
0.00% 0.00% 0.647% 0.243% 0.566% 2.5%
Engineering and Science atrium (annual occupied hours 1578)
Number of occupied hours
above 28°C (location a)
0 0 10 3 24 50
Percentage of annual occupied
hours
0.00% 0.00% 0.6337% 0.2% 1.52% 3.17%
Number of occupied hours
above 28°C (location b)
0 0 36 3 10 116
Percentage of annual occupied
hours
0.00% 0.00% 2.28% 0.2% 0.633% 7.35%
6.4.2 Adaptive comfort
The CIBSE TM52 overheating criteria have been applied to all 3 levels of both of the
atria. The results presented in Table 6-6 shows that level 2 and 3 of both atria fail to
comply with the requirement particularly in summer 2015.
Figure 6-27 and Figure 6-28 respectively present the indoor temperatures of the level
3 of the Nottingham High School and ESLC atrium and the thermal comfort band
according to BS EN 15251 Category II building (blue lines in dotted and dashed pattern
shows upper and lower acceptable temperature respectively). The results show that
level 3 of both atria experienced higher than comfort temperatures in summer 2014
and 2015. In 2014 at this level the temperature went closer to the maximum acceptable
temperature and exceeded it on a number of occasions, while in 2015 temperature at
this level frequently exceeded the maximum acceptable temperature.

6-197
Figure 6-29 and Figure 6-30 correspondingly presents the indoor temperatures of the
level 2 of the Nottingham High School and ESLC atrium and the thermal comfort band
according to BS EN 15251 Category II band (blue lines in dot and dashed pattern
shows upper and lower acceptable temperature respectively). The results show that at
this level air temperature was mostly in between comfort bands in summer 2014 but
exceeded the maximum acceptable temperature band in summer 2015, particularly
during June and July.
Thus, among different levels of the atrium, level 3 experienced substantially higher
temperatures compared to other levels. The severity of overheating was observed to
be extreme in Location b of ESLC atrium which is widely exposed to ETFE-foil cushion
roof.

6-198
Figure 6-27: Air temperature of level 3 (second floor) of Nottingham High School atrium, CIBSE temperature benchmark, maximum and minimum acceptable temperature range for category II building, BB101 Criteria 1 & 3 temperature benchmark
0
2
4
6
8
10
12
14
16
18
20
22
24
26
28
30
32
34
36
38
40
08:0
010:0
012:0
014:0
008:0
010:0
012:0
009:0
011:0
013:0
015:0
009:0
011:0
013:0
010.0
012.0
014.0
011.0
013.0
015.0
09.0
011.0
013.0
015.0
012.0
014.0
08.0
010.0
012.0
09.0
011.0
013.0
015.0
09.0
011.0
013.0
010.0
012.0
014.0
011.0
013.0
015.0
09.0
0
Te
mpera
ture
( C
)
Time (00:00)OAT TSi 3(a)_NHTcomf (Adaptive comfort category II) Tmax (Adaptive comfort category II)Tmin (Adaptive comfort category II) CIBSE Temp. Benchmark/ BB101-Criteria 1BB101-Criteria 3
Monitoring Period 2014 Monitoring Period 2015
May 1
4
June 1
4
July
14
Sep 1
4
May 1
5
June 1
5
July
15
Sep 1
5
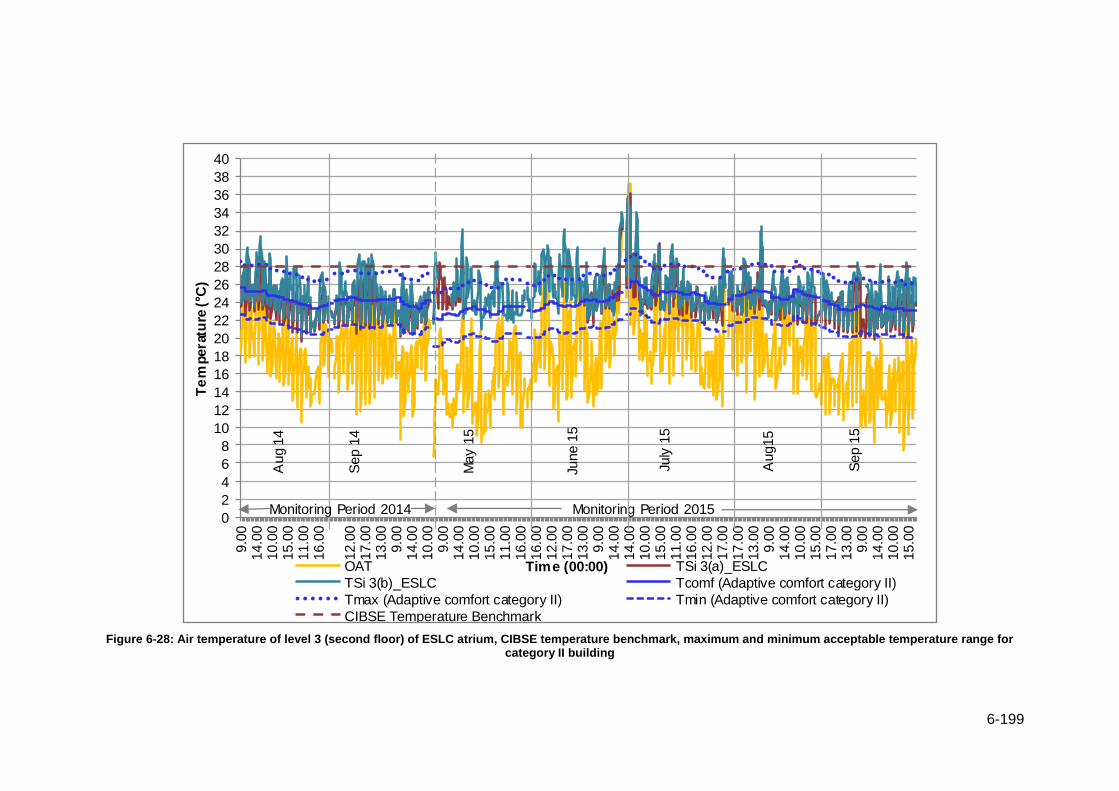
6-199
Figure 6-28: Air temperature of level 3 (second floor) of ESLC atrium, CIBSE temperature benchmark, maximum and minimum acceptable temperature range for category II building
0
2
4
6
8
10
12
14
16
18
20
22
24
26
28
30
32
34
36
38
40
9.0
014.0
010.0
015.0
011.0
016.0
0
12.0
017.0
013.0
09.0
014.0
010.0
09.0
014.0
010.0
015.0
011.0
016.0
016.0
012.0
017.0
013.0
09.0
014.0
014.0
010.0
015.0
011.0
016.0
012.0
017.0
017.0
013.0
09.0
014.0
010.0
015.0
017.0
013.0
09.0
014.0
010.0
015.0
0
Te
mpera
ture
( C
)
Time (00:00)OAT TSi 3(a)_ESLC
TSi 3(b)_ESLC Tcomf (Adaptive comfort category II)
Tmax (Adaptive comfort category II) Tmin (Adaptive comfort category II)
CIBSE Temperature Benchmark
Monitoring Period 2014 Monitoring Period 2015
Aug 1
4
Sep 1
4
May 1
5
June 1
5
July
15
Aug15
Sep 1
5

6-200
Figure 6-29: Air temperature of level 2 (first floor) of Nottingham High School atrium, CIBSE temperature benchmark, maximum and minimum acceptable temperature range for category II building
Monitoring Period 2014 Monitoring Period 2015
May 1
4
June 1
4
July
14
Sep 1
4
May 1
5
June 1
5
July
15
Sep 1
5
0
2
4
6
8
10
12
14
16
18
20
22
24
26
28
30
32
34
36
38
40
08:0
009:0
010:0
011:0
012:0
013:0
014:0
015:0
011:0
012:0
013:0
014:0
015:0
008:0
0
13.0
014.0
010.0
011.0
012.0
013.0
014.0
015.0
08.0
0
13.0
014.0
015.0
08.0
09.0
013.0
014.0
015.0
08.0
09.0
010.0
011.0
0
8.0
09.0
013.0
014.0
015.0
08.0
0
Te
mpera
ture
( C
)
Time (00:00)OAT TSi 2(a)_NHTcomf (Adaptive comfort category II) Tmax (Adaptive comfort category II)Tmin (Adaptive comfort category II) CIBSE Temp. Benchmark/ BB101-Criteria 1BB101-Criteria 3

6-201
Figure 6-30: Air temperature of occupied level 2 (first floor) of ESLC atrium, CIBSE temperature benchmark, maximum and minimum acceptable temperature range for category II building
0
2
4
6
8
10
12
14
16
18
20
22
24
26
28
30
32
34
36
38
40
9.0
014.0
010.0
015.0
011.0
016.0
0
12.0
017.0
013.0
09.0
014.0
010.0
09.0
014.0
010.0
015.0
011.0
016.0
016.0
012.0
017.0
013.0
09.0
014.0
014.0
010.0
015.0
011.0
016.0
012.0
017.0
017.0
013.0
09.0
014.0
010.0
015.0
017.0
013.0
09.0
014.0
010.0
015.0
0
Te
mpera
ture
( C
)
Time (00:00)OAT TSi 2(a)_ESLCTSi 2(b)_ESLC Tcomf (Adaptive comfort category II)Tmax (Adaptive comfort category II) Tmin (Adaptive comfort category II)CIBSE Temperature Benchmark
Monitoring Period 2014 Monitoring Period 2015
Aug 1
4
Sep 1
4
May 1
5
June 1
5
July
15
Aug15
Sep 1
5
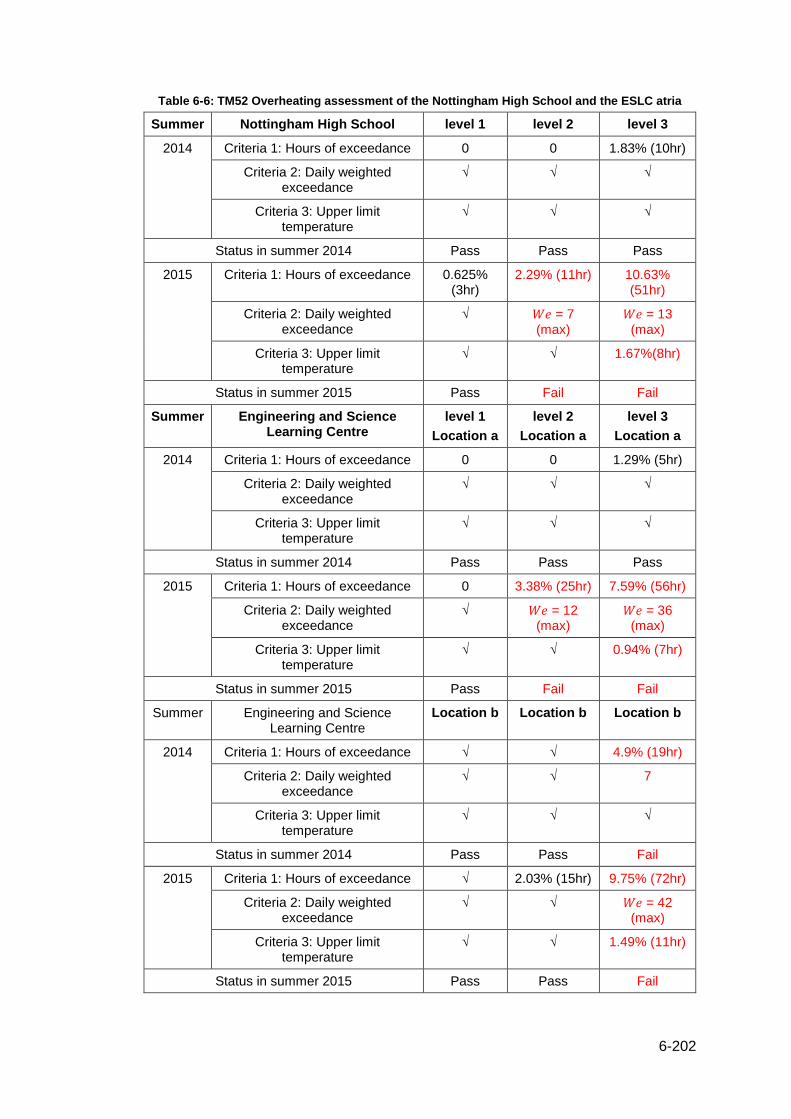
6-202
Table 6-6: TM52 Overheating assessment of the Nottingham High School and the ESLC atria
Summer Nottingham High School level 1 level 2 level 3
2014 Criteria 1: Hours of exceedance 0 0 1.83% (10hr)
Criteria 2: Daily weighted exceedance
√ √ √
Criteria 3: Upper limit temperature
√ √ √
Status in summer 2014 Pass Pass Pass
2015 Criteria 1: Hours of exceedance 0.625% (3hr)
2.29% (11hr) 10.63% (51hr)
Criteria 2: Daily weighted exceedance
√ 𝑊𝑒 = 7 (max)
𝑊𝑒 = 13 (max)
Criteria 3: Upper limit temperature
√ √ 1.67%(8hr)
Status in summer 2015 Pass Fail Fail
Summer Engineering and Science Learning Centre
level 1
Location a
level 2
Location a
level 3
Location a
2014 Criteria 1: Hours of exceedance 0 0 1.29% (5hr)
Criteria 2: Daily weighted exceedance
√ √ √
Criteria 3: Upper limit temperature
√ √ √
Status in summer 2014 Pass Pass Pass
2015 Criteria 1: Hours of exceedance 0 3.38% (25hr) 7.59% (56hr)
Criteria 2: Daily weighted exceedance
√ 𝑊𝑒 = 12 (max)
𝑊𝑒 = 36 (max)
Criteria 3: Upper limit temperature
√ √ 0.94% (7hr)
Status in summer 2015 Pass Fail Fail
Summer Engineering and Science Learning Centre
Location b Location b Location b
2014 Criteria 1: Hours of exceedance √ √ 4.9% (19hr)
Criteria 2: Daily weighted exceedance
√ √ 7
Criteria 3: Upper limit temperature
√ √ √
Status in summer 2014 Pass Pass Fail
2015 Criteria 1: Hours of exceedance √ 2.03% (15hr) 9.75% (72hr)
Criteria 2: Daily weighted exceedance
√ √ 𝑊𝑒 = 42 (max)
Criteria 3: Upper limit temperature
√ √ 1.49% (11hr)
Status in summer 2015 Pass Pass Fail

6-203
6.4.3 Building Bulletin 101
Thermal performance of Nottingham High School atrium was also assessed using the
overheating assessment criteria of Building Bulletin 101. The results presented in
Table 6-7 indicated that level 3 of the atrium also failed to comply with the requirement
in summer 2015.
Table 6-7: BB101 Overheating assessment of the Nottingham High School atrium
Criteria 2014 2015
level 1 level 2 level 3 level 1 level 2 level 3
Number of hours > 28°C
0 0 8 3 hr 7 hr 31 hr
TD_OAT greater than 5°C
281hr 354hr 427hr 338 hr 391 hr 445 hr
Number of hours > 32°C
0 0 0 0 0 1
Status Pass Pass Pass Pass Pass fail
The results presented in Figure 6-27 (also Figure 6-28, Figure 6-29 and Figure 6-30)
also included CIBSE temperature benchmark (28°C) and maximum temperature limit
(32°C) according to BB101 and CIBSE TM52. It can be observed from Figure 6-27 that
in summer 2014 maximum acceptable temperature was closer to the CIBSE
temperature benchmark. However particularly in July 2015, this maximum limit of
acceptable temperature even exceeded temperature benchmark (28°C). This was the
result of extreme hot outdoor temperature, that even exceeded the maximum
temperature limit (32°C) pushing the acceptable temperature higher than the CIBSE
temperature benchmark. Thus, it is important to identify the occurrence of this type of
extreme outdoor condition in future that will impact thermal performance by creating
overheating problem in the spaces such as atria enclosed with ETFE-foil cushion roofs.
In this study, this was done by applying the United Climate Impacts Program (UKCIP)
projected scenario on the predictive models of both of the case study buildings. This
is discussed in Chapter 7.
6.5 Comparison of the thermal behaviour of space enclosed with ETFE-
foil cushion roof and fabric membrane roof
Table 6-8 presents a comparison of the the results of research on the thermal
behaviour of spaces enclosed with different single and double layer membrane roofs
and observed thermal behaviour of spaces enclosed with ETFE-foil cushion roofs.
From the results presented in Table 6-8, it can be identified that thermal behaviour of
spaces enclosed with two and three layer ETFE-foil cushion roofs doesn’t vary

6-204
significantly from that of spaces enclosed with different types of double layer fabric
membrane roof. However, temperature stratification was found to be higher in the
spaces enclosed with a single layer membrane roof compared to the spaces enclosed
with double- and three-layer ETFE-foil cushion and, fabric membrane roofs.

6-205
Table 6-8: Summary of results obtained for research on thermal behaviour of space enclosed with membrane envelope
Study Space type,
Location,
Weather
HVAC system Method Envelope type Surface temperature
Temperature difference between air closed to membrane and outdoor air
Temperature difference between air closed to membrane and near to the floor
Wu et al. (1984)
Stadium
moderately cold climate
Air conditioned (seating area of a stadium only)
On-site monitoring
air-supported roof, composed of single and double layer membrane
3°C above outdoor temperature
warm summer day
9°C (without AC)
11°C (with AC operating in the seating area)
Croome and Moseley (1984a)
Air house, The University of Bath
Inflation fans
Same as above
air-supported structure with PVC-coated polyamide skin
40°C 8°C above outdoor temperature during day,
1°C below outdoor air temperature at night
4°C
Harvie (1996)
Factory,
Chepstow, UK
Air conditioning system, destratification fans, natural ventilation through the apex of the roof
Same as above
Double membrane composed of PVC coated polyester membrane and permeable proban treated cotton calico
31°C 8°C (free running period)
Harvie (1996)
Arena,
Llangollen,
Clwyd.
Apex extract fans, low level natural ventilation is provided by small openings
Same as above
Single layer, PVC coated polyester
33°C (maximum 40°C)
12.5°C (maximum) above outdoor temperature during day
10°C (positive stratification during the day)
1.1°C (negative stratification during the night)

6-206
(Table 6-8 continued)
Harvie (1996)
Lawn Tennis and Croquet Club
Wimbledon,
London.
Louvres provide natural ventilation, ventilators to extract air from occupied space, infra-red heaters
Same as above
PVC coated polyester membrane
45°C (maximum 50°C)
5.6°C (positive stratification during the day)
Devulder (2004)
New Inland Revenue Amenity Building (IRAB),
Nottingham, UK
Electric radiant heaters Same as above
Single skin PTFE/glass
15°C (maximum) above outdoor temperature during day
6°C to 12°C (positive stratification during the day)
3°C (negative stratification during the day)
This research -Case study
Nottingham High School atrium,
Nottingham
Heating system consisted of ran coil units, fan convectors, under floor heating system, mechanical ventilation, natural ventilation operates automatically through windows at high level.
Same as above
Two–layer ETFE-foil cushions with fritted top layer and clear bottom layer both of 200μm and covered with a rain noise suppression mesh
External layer – 30.5 (average), 46.4°C (maximum)
Internal layer –32.8°C (average),
50.3°C (maximum)
5.88°C (average)
and 8.1°C (maximum) above outdoor temperature during day
[Measured adjacent to ETFE-foil cushion roof]
4.89°C (average) and
11.7°C (maximum),
[positive stratification during the day]
[Measured adjacent to ETFE-foil cushion roof]
This research -Case study
Engineering and Science Learning Centre Atrium,
Nottingham
Primary heating system in the atrium consists of ground source heat pump, district heating, under floor heating system, glazed motorised louvres and windows at high level
Same as above
Fritted top layer
(200μm), transparent middle (150μm) and bottom layer (150μ m)
3°C (average),
6.27°C (maximum)
[Measured at 4.75 meter (approx.) below ETFE-foil cushion roof]
5.19 (average)
11.63 (maximum)
[Measured at 4.75 meter (approx.) below ETFE-foil cushion roof]
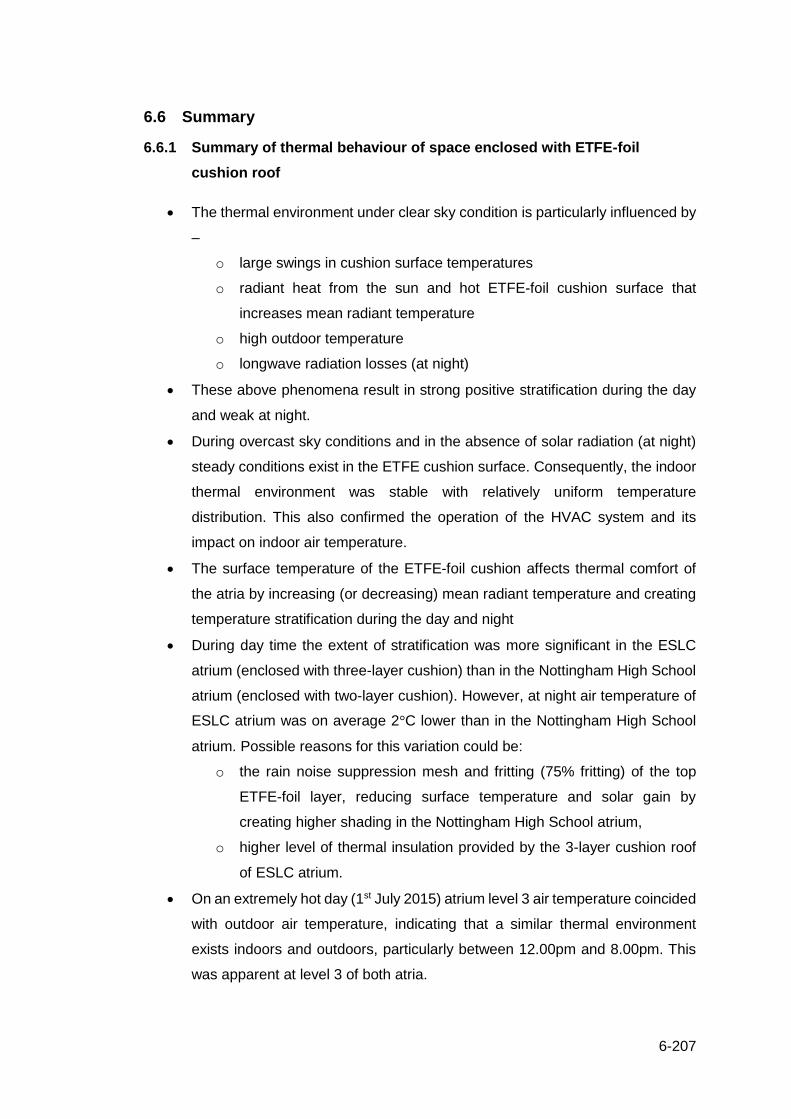
6-207
6.6 Summary
6.6.1 Summary of thermal behaviour of space enclosed with ETFE-foil
cushion roof
• The thermal environment under clear sky condition is particularly influenced by
–
o large swings in cushion surface temperatures
o radiant heat from the sun and hot ETFE-foil cushion surface that
increases mean radiant temperature
o high outdoor temperature
o longwave radiation losses (at night)
• These above phenomena result in strong positive stratification during the day
and weak at night.
• During overcast sky conditions and in the absence of solar radiation (at night)
steady conditions exist in the ETFE cushion surface. Consequently, the indoor
thermal environment was stable with relatively uniform temperature
distribution. This also confirmed the operation of the HVAC system and its
impact on indoor air temperature.
• The surface temperature of the ETFE-foil cushion affects thermal comfort of
the atria by increasing (or decreasing) mean radiant temperature and creating
temperature stratification during the day and night
• During day time the extent of stratification was more significant in the ESLC
atrium (enclosed with three-layer cushion) than in the Nottingham High School
atrium (enclosed with two-layer cushion). However, at night air temperature of
ESLC atrium was on average 2°C lower than in the Nottingham High School
atrium. Possible reasons for this variation could be:
o the rain noise suppression mesh and fritting (75% fritting) of the top
ETFE-foil layer, reducing surface temperature and solar gain by
creating higher shading in the Nottingham High School atrium,
o higher level of thermal insulation provided by the 3-layer cushion roof
of ESLC atrium.
• On an extremely hot day (1st July 2015) atrium level 3 air temperature coincided
with outdoor air temperature, indicating that a similar thermal environment
exists indoors and outdoors, particularly between 12.00pm and 8.00pm. This
was apparent at level 3 of both atria.

6-208
• On hot days in summer the effect of the HVAC system, window operation etc.
on indoor air temperature was found to be poor in relation to the effect of heat
gain from solar radiation and high outdoor temperature.
• Outdoor temperature, as well as transmitted solar radiation, had a strong
positive relationship with indoor air temperature of occupied levels and level
adjacent to ETFE-foil cushion roof while the surface temperature of the ETFE-
foil cushion was strongly related with adjacent mean radiant temperature
(Correlation coefficient R2 value ranged from 0.952 to 0.984).
• Air temperature of the atrium had an impact on the air temperature of adjacent
spaces (main school building). This was the result of air circulation between
those spaces (e.g. interview room, corridor etc.) and the atrium through window
openings.
• Operable window area (2.3% of floor area) in the atrium was found to be
inconsistent with the area recommended in Building Bulletin 101 (UKGOV,
2014) (recommended operable window area is 5% of floor area).
• In both of the atria poor ventilation system, insufficient window area might have
result in longer delay to eliminate heat from indoor spaces.
6.6.2 Summary of thermal performance of space enclosed with ETFE-foil
cushion roof
Thermal performance of the Nottingham High School and ESLC atria during summer
2014 and 2015 was assessed based on overheating performance. The result of this
assessment showed that in summer 2015, level 3 of both of the atria failed to fully
comply with the requirements stated in CIBSE temperature benchmark, CIBSE TM52,
and BB101.
Thus, both of the atria (level 3 and 2) overheated during summer 2015. Particularly
this was reflected when additional air conditioning systems were installed to avoid heat
stress in level 3 of the Nottingham High School atrium (Figure 6-31). However
according to school management, these air-conditioning systems were not operating
until the end of September 2015, thus its impact on the thermal condition of the atrium
was not reflected in the results presented in this study.

6-209
(a) In summer 2014 (b) In summer 2015 (August)
Figure 6-31: Atrium level 3 without (before) and wih (after) air conditioning system
Findings from this chapter imply the necessity of further investigation of the atrium
spaces covered with ETFE-foil cushion roofs to evaluate overheating mitigation
scenarios. Considering this agenda, the purpose of the next chapter is to conduct
detailed thermal modelling and simulation. The purpose is to predict the thermal
performance of both of the atria enclosed with ETFE-foil cushion roof. Based on the
validity of the result, these models will be used to improve the existing thermal
environment that was recorded and analysed in this section. Also predicted models of
both of the buildings were used to analyse overheating performance using UKCIP
projected scenarios to investigate the impact of frequency of overheating in the existing
buildings in future climate.
6.6.3 Challenges
• Direct access to the case study buildings to collect data for long period.
• School environment is relatively sensitive, thus safety procedures were
followed to install monitoring equipment and also during data collection.
• Within budget constraints, equipment to monitor these buildings were carefully
selected.
• To find location to install sensors/ data loggers so that recorded parameters
would represent the thermal environment of the atrium.
• Work at height to install equipment close to the ETFE-foil cushion roof.
• Careful measures were followed while sensors were attached to the ETFE-foil
cushion surface to avoid damage.
6-210
6.6.4 Limitations
• Study considered spaces enclosed with multi-layer ETFE-foil cushion systems.
• Selection of space to install equipment was restricted due to safety issues.
• Access to building occupancy schedule was not available, in this study this was
based on personal observation and communication with Estate (both
Nottingham High School and ESLC).
• Data logger unauthorised removal from site was a common issue.

7-211
Chapter 7
7 Modelling thermal performance of ETFE foils and spaces
enclosed with ETFE foil cushion roofs
7.1 Introduction
This chapter presents a simulation-based analysis to evaluate and compare the
thermal performance of spaces enclosed with ETFE-foil cushion and glass roofs with
a view to identifying the specific influence of these materials may induce. TAS version
3.2.2 was used to simulate the building which includes the atrium roofed with ETFE-
foil cushion. A simulation approach was used to improve existing thermal conditions of
the spaces by altering thermal optical properties of the ETFE-foil cushion roof. The
thermal performance was assessed using the criteria mentioned in CIBSE guides
(Guide A and TM52). The thermal performance of the spaces enclosed with ETFE-foil
cushion roof was also assessed in current and future climatic scenarios.
This chapter depicts the simulation procedure and necessary modifications and
considerations to validate simulated results with measured data. Because most of the
dynamic simulation tools (e.g. TAS, IES) do not have any template that includes
properties of ETFE foil, material templates of different types of ETFE foils were created
based on measured properties. The methods used to measure and calculate the
properties of ETFE-foil were already discussed in Chapter 4. At this stage, the
simulation results were validated against measured data collected from a test-rig
experiment. Environmental data were collected from the test-rig for a selected period.
Details of data collection process and results were discussed in Chapter 5. A
simulation model was created to replicate the test-rig, and results were compared with
the measured data to calibrate and validate the simulation models.
The simulation study further considered different types of roof configuration to
represent an original curvilinear form of ETFE-foil roof. While modelling the curvilinear
roof consisted of ETFE-foil cushions, a traditional approach using flat surface was
found not appropriate, hence a customised approach was identified and applied in this
study.
Finally, simulation models of two different buildings were created, they were:
Nottingham High School, and Engineering and Science Learning Centre. Results from
the simulation were compared with monitored data from these two buildings as well to

7-212
calibrate and validate the models. Details of on-site data collection and results were
discussed in Chapter 6. The simulation process considered climatic scenarios using
current and future weather data and performed overheating analysis.
Findings of this chapter address the Objective 5, which is to evaluate and compare the
thermal performance of space enclosed with ETFE foil cushion and glass roof and
build up the knowledge to achieve Objective 6 of the original aim.
7.2 Calibration of the simulation model
Simulation is useful for designers to determine the performance of buildings on the
basis of various information (e.g. building operation, material properties etc). The
results obtained from simulation create the basis for evaluation of building design.
However, simulation result accuracy depends on knowledge of real scenarios. A
performance gap was evident between measured and simulation output (Kim and
Park, 2016, Reddy, 2007, Clarke et al., 1993). Nevertheless, to have accurate results
and match this closely with real data, calibration has become an essential procedure
to be carried out for building simulation. The calibration procedure is influenced by the
details of initial models (Kim and Park, 2016). Therefore, without accurate data from a
real building, there may be high levels of uncertainty (Tamburrini et al., 2003, Clarke
et al., 1993). Therefore, it is necessary to carry out sensitivity analysis of input
parameters. Lomas and Eppel. (1992), described the importance of sensitivity analysis
and compared different approaches. They emphasised that sensitivity analysis may
require a set of parametric simulations to identify the influence of various parameter
changes as well as error analysis to estimate the biased result of various parameters.
But these methods require high technical knowledge and extensive computing power.
In a different study, a sensitivity analysis was done by Westphal and Lamberts (2005),
where they calibrated simulated output by modifying different parameters of a base
model. In the simulation, they modified one parameter at a time. Although this method
of sensitivity analysis did not consider the influence of multiple parameters, it requires
less computing knowledge and does not require a large number of parametric
simulations. However, clear knowledge of input parameters can eliminate this error. A
similar approach was adopted by Paliouras. P. et al. (2015), in their study. This method
was used for calibration of simulation in this study also.
Pellegrino et al. (2016), Macdonald and Strachan (2001), Hopfe and Hensen (2011),
compared measured and simulated air temperatures to validate their study. They
calibrated the simulation models by adjusting materials’ thermal transmittance (U-
value), occupancy profile and ventilation. An earlier study by Lomas et al. (1997)
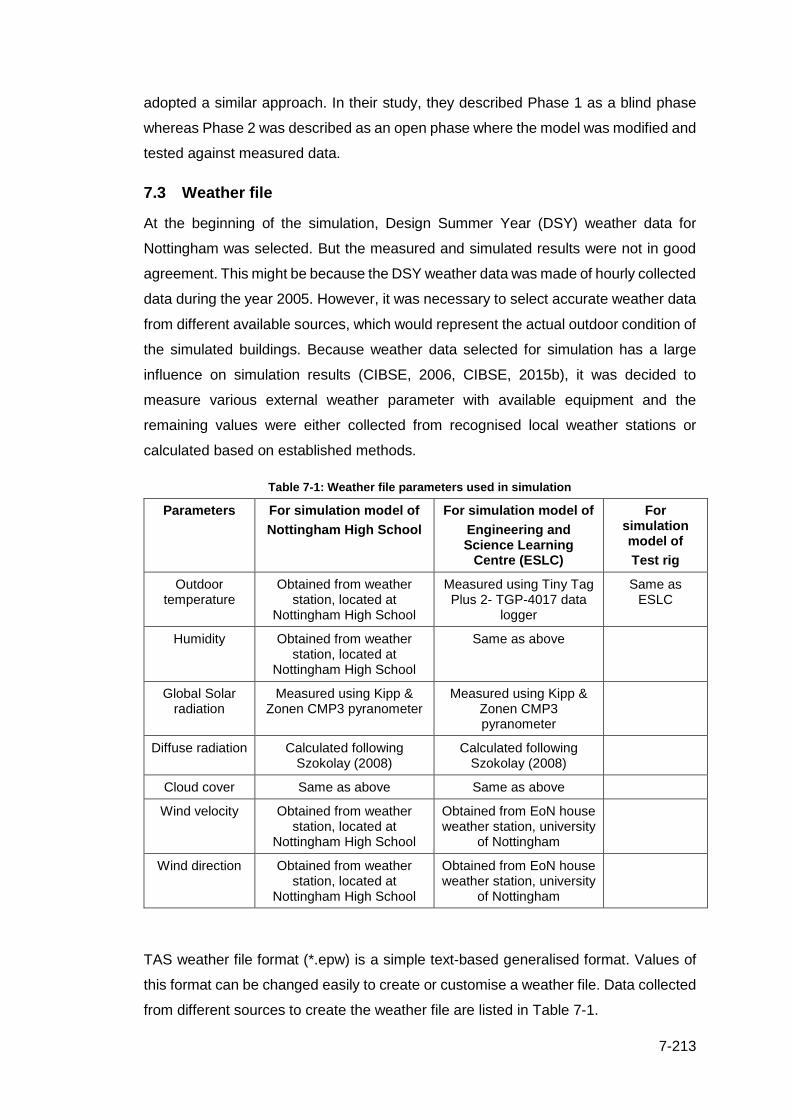
7-213
adopted a similar approach. In their study, they described Phase 1 as a blind phase
whereas Phase 2 was described as an open phase where the model was modified and
tested against measured data.
7.3 Weather file
At the beginning of the simulation, Design Summer Year (DSY) weather data for
Nottingham was selected. But the measured and simulated results were not in good
agreement. This might be because the DSY weather data was made of hourly collected
data during the year 2005. However, it was necessary to select accurate weather data
from different available sources, which would represent the actual outdoor condition of
the simulated buildings. Because weather data selected for simulation has a large
influence on simulation results (CIBSE, 2006, CIBSE, 2015b), it was decided to
measure various external weather parameter with available equipment and the
remaining values were either collected from recognised local weather stations or
calculated based on established methods.
Table 7-1: Weather file parameters used in simulation
Parameters For simulation model of
Nottingham High School
For simulation model of
Engineering and Science Learning
Centre (ESLC)
For simulation model of
Test rig
Outdoor temperature
Obtained from weather station, located at
Nottingham High School
Measured using Tiny Tag Plus 2- TGP-4017 data
logger
Same as ESLC
Humidity Obtained from weather station, located at
Nottingham High School
Same as above
Global Solar radiation
Measured using Kipp & Zonen CMP3 pyranometer
Measured using Kipp & Zonen CMP3 pyranometer
Diffuse radiation Calculated following Szokolay (2008)
Calculated following Szokolay (2008)
Cloud cover Same as above Same as above
Wind velocity Obtained from weather station, located at
Nottingham High School
Obtained from EoN house weather station, university
of Nottingham
Wind direction Obtained from weather station, located at
Nottingham High School
Obtained from EoN house weather station, university
of Nottingham
TAS weather file format (*.epw) is a simple text-based generalised format. Values of
this format can be changed easily to create or customise a weather file. Data collected
from different sources to create the weather file are listed in Table 7-1.
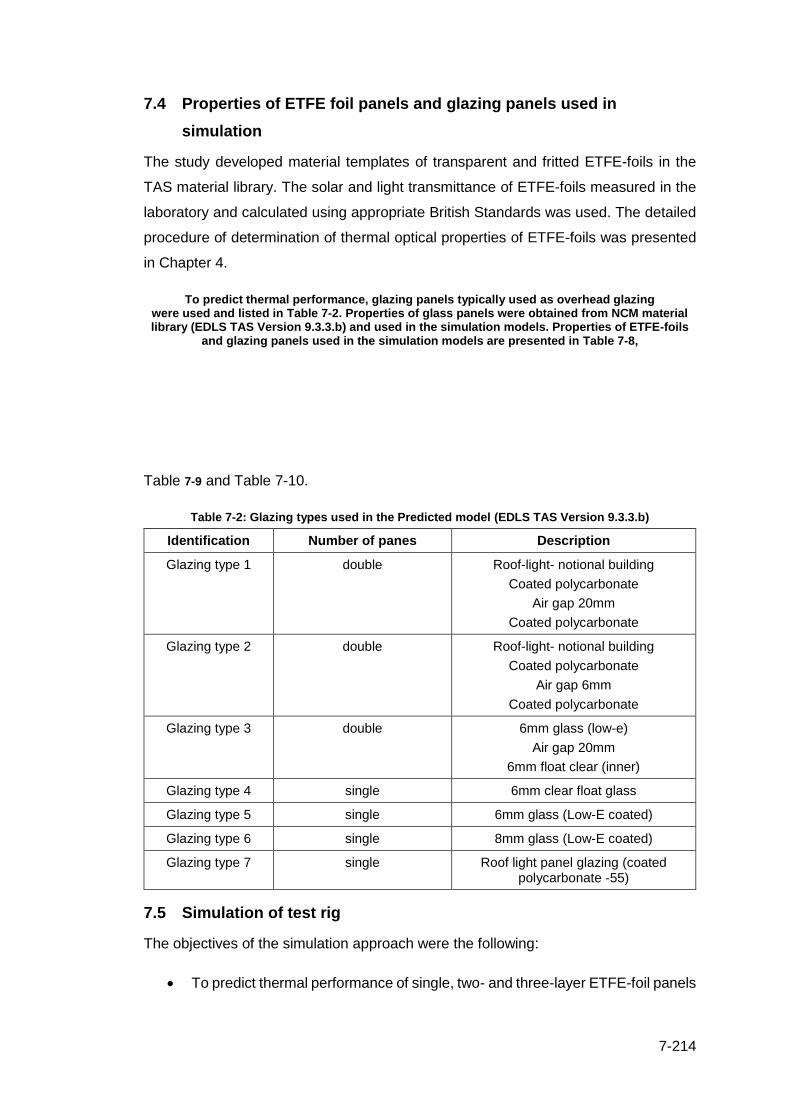
7-214
7.4 Properties of ETFE foil panels and glazing panels used in
simulation
The study developed material templates of transparent and fritted ETFE-foils in the
TAS material library. The solar and light transmittance of ETFE-foils measured in the
laboratory and calculated using appropriate British Standards was used. The detailed
procedure of determination of thermal optical properties of ETFE-foils was presented
in Chapter 4.
To predict thermal performance, glazing panels typically used as overhead glazing were used and listed in Table 7-2. Properties of glass panels were obtained from NCM material library (EDLS TAS Version 9.3.3.b) and used in the simulation models. Properties of ETFE-foils
and glazing panels used in the simulation models are presented in Table 7-8,
Table 7-9 and Table 7-10.
Table 7-2: Glazing types used in the Predicted model (EDLS TAS Version 9.3.3.b)
Identification Number of panes Description
Glazing type 1 double Roof-light- notional building
Coated polycarbonate
Air gap 20mm
Coated polycarbonate
Glazing type 2 double Roof-light- notional building
Coated polycarbonate
Air gap 6mm
Coated polycarbonate
Glazing type 3 double 6mm glass (low-e)
Air gap 20mm
6mm float clear (inner)
Glazing type 4 single 6mm clear float glass
Glazing type 5 single 6mm glass (Low-E coated)
Glazing type 6 single 8mm glass (Low-E coated)
Glazing type 7 single Roof light panel glazing (coated polycarbonate -55)
7.5 Simulation of test rig
The objectives of the simulation approach were the following:
• To predict thermal performance of single, two- and three-layer ETFE-foil panels

7-215
• To assess and compare this thermal performance with that of polycarbonate
and glass panels
7.5.1 Calibration
The dynamic simulation requires a range of input parameters to assign to model actual
scenarios. These parameters include detailed construction properties of materials,
environmental control features (e.g. doors, windows), occupancy profile, building
services, etc. Gathering all this information in detail from actual buildings may be
difficult or in some cases not possible. Therefore, it is important to make
approximations and assumptions.
At first, simulation models were created in EDLS TAS (Version 9.3.3.b) to replicate
test-rigs used in the ETFE-foil panel testing. This gave the opportunity to compare
simulation results with the data collected. As these test-rigs were less complex
compared to actual buildings, assumptions also included a lower number of
parameters as described below. Construction materials for the simulation model of
test-rig are listed in Table 7-3. Table 7-4 and Table 7-5 respectively present thermal
properties of the ETFE panels and input parameters used in the simulation models.
Table 7-3: Construction of simulation model
Construction Simulation model U-value
Wall/ floor 75mm thick Polyurethane (foil faced) insulation
18mm thick plywood
0.4 (W/m2°C)
ETFE foil panel Single layer 75% fritted ETFE-foil panel
5.85 (W/m2°C)
Table 7-4: Thermal Properties of ETFE foil used in simulation model
Properties Simulation model ETFE properties
(75% fritting layer)
Emissivity (ex) 0.82
Emissivity (int) 0.6
Solar Transmittance (G-value) 0.474
Shading Coefficient 0.557
Table 7-5: Input parameters in simulation
Weather data According to Table 7-1
Calendar 1st May to 30th September was considered as summer 1st October till 30th April considered as winter
Internal gain
Infiltration (ach) Variable (0.05 to 8)
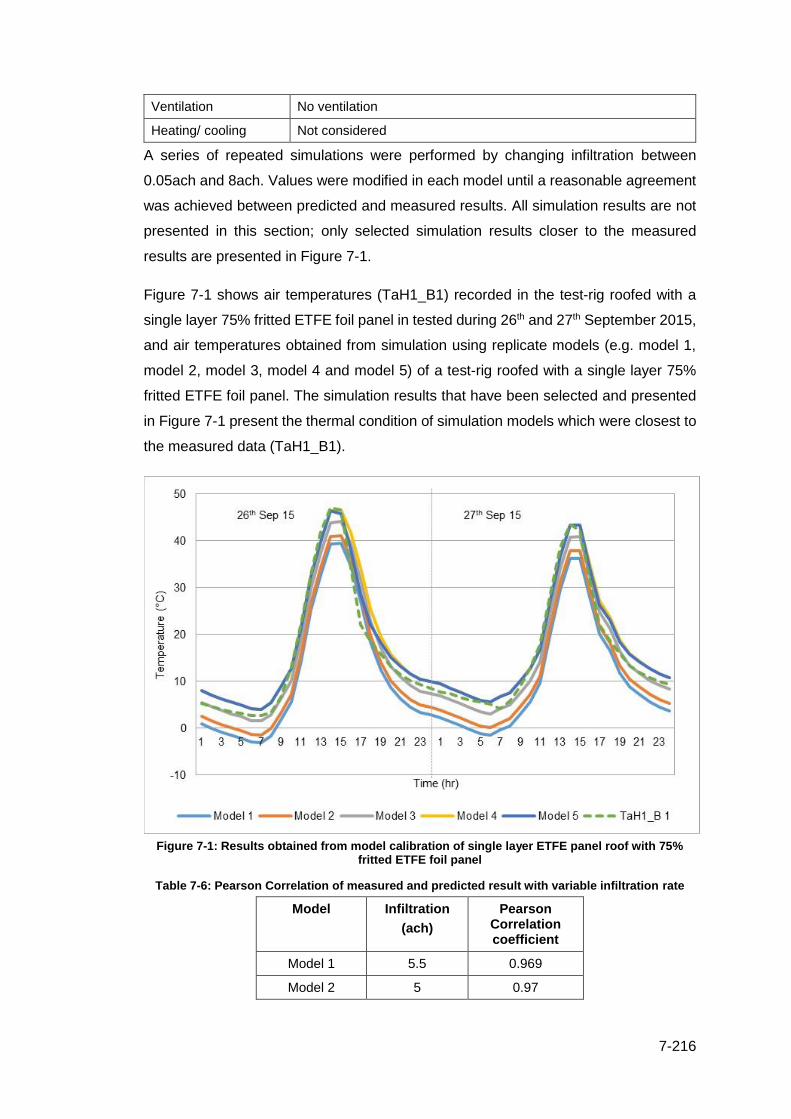
7-216
Ventilation No ventilation
Heating/ cooling Not considered
A series of repeated simulations were performed by changing infiltration between
0.05ach and 8ach. Values were modified in each model until a reasonable agreement
was achieved between predicted and measured results. All simulation results are not
presented in this section; only selected simulation results closer to the measured
results are presented in Figure 7-1.
Figure 7-1 shows air temperatures (TaH1_B1) recorded in the test-rig roofed with a
single layer 75% fritted ETFE foil panel in tested during 26th and 27th September 2015,
and air temperatures obtained from simulation using replicate models (e.g. model 1,
model 2, model 3, model 4 and model 5) of a test-rig roofed with a single layer 75%
fritted ETFE foil panel. The simulation results that have been selected and presented
in Figure 7-1 present the thermal condition of simulation models which were closest to
the measured data (TaH1_B1).
Figure 7-1: Results obtained from model calibration of single layer ETFE panel roof with 75%
fritted ETFE foil panel
Table 7-6: Pearson Correlation of measured and predicted result with variable infiltration rate
Model Infiltration
(ach)
Pearson Correlation coefficient
Model 1 5.5 0.969
Model 2 5 0.97

7-217
Model 3 3.5 0.976
Model 4 3 0.979
Model 5 2.5 0.984
Figure 7-2: Linear relationship between predicted (model 5) and measured data
Infiltration rates used in simulation models are presented in Table 7-6. It is evident from
Figure 7-1 that air temperatures of the test rig vary with variable infiltration rate. Among
different simulated models, model 5 agreed well with measured results particularly
around mid-day. Maximum deviation between measured and simulated air
temperature recorded was 2.5°C, where the measured air temperature was less than
that of the simulated temperature. However, the R2 coefficient of determination
presented in Figure 7-2 as well as Pearson correlation coefficient listed in Table 7-6
indicated that the air temperature of model 5 was closely correlated (0.984) with
measured air temperature. Thus, this model 5 was used as a base case model to
simulate and compare ETFE foil panels, polycarbonate and glass panels where
infiltration rate was set to 2.5ach.
The following sections describe the method, assumptions and results obtained from
the simulated test-rig roofed with single-, two- and three-layer ETFE foil panels,
polycarbonate and glass panels.
I. Scope and Method
A series of simulations were performed to predict the thermal performance of models
enclosed with ETFE-foil panels, polycarbonate and glass panels. The results obtained
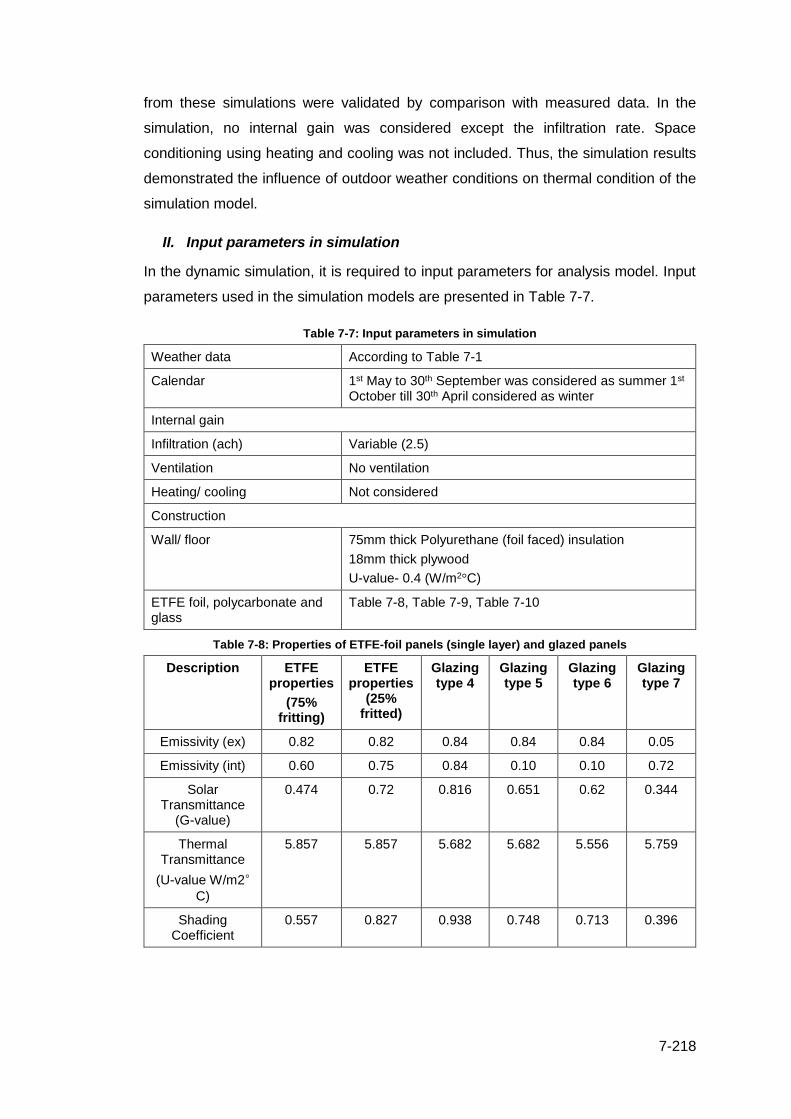
7-218
from these simulations were validated by comparison with measured data. In the
simulation, no internal gain was considered except the infiltration rate. Space
conditioning using heating and cooling was not included. Thus, the simulation results
demonstrated the influence of outdoor weather conditions on thermal condition of the
simulation model.
II. Input parameters in simulation
In the dynamic simulation, it is required to input parameters for analysis model. Input
parameters used in the simulation models are presented in Table 7-7.
Table 7-7: Input parameters in simulation
Weather data According to Table 7-1
Calendar 1st May to 30th September was considered as summer 1st October till 30th April considered as winter
Internal gain
Infiltration (ach) Variable (2.5)
Ventilation No ventilation
Heating/ cooling Not considered
Construction
Wall/ floor 75mm thick Polyurethane (foil faced) insulation
18mm thick plywood
U-value- 0.4 (W/m2°C)
ETFE foil, polycarbonate and glass
Table 7-8, Table 7-9, Table 7-10
Table 7-8: Properties of ETFE-foil panels (single layer) and glazed panels
Description ETFE properties
(75% fritting)
ETFE properties
(25% fritted)
Glazing type 4
Glazing type 5
Glazing type 6
Glazing type 7
Emissivity (ex) 0.82 0.82 0.84 0.84 0.84 0.05
Emissivity (int) 0.60 0.75 0.84 0.10 0.10 0.72
Solar Transmittance
(G-value)
0.474 0.72 0.816 0.651 0.62 0.344
Thermal Transmittance
(U-value W/m2°C)
5.857 5.857 5.682 5.682 5.556 5.759
Shading Coefficient
0.557 0.827 0.938 0.748 0.713 0.396

7-219
Table 7-9: Properties of ETFE-foil (two-layer) panels and glazed panels
Description ETFE Glazing type 1
Glazing type 2
Glazing type 3
Glazing type 5
Glazing type 6
Glazing type 7
Layer 1
Layer 2
Solar Transmittance
(G-value)
0.474 0.863 0.203 0.202 0.566 0.651 0.62 0.344
0.436
Thermal Transmittance
(U-value
W/m2°C)
5.857 5.857 1.42 2.469 1.555 5.682 5.556 5.759
Shading Co-efficient
0.827 0.991 0.233 0.232 0.651 0.748 0.713 0.396
Table 7-10: Properties of ETFE foil panels (three-layer)
Description ETFE (75% fritted top layer) ETFE (25% fritted top layer)
Layer 1 Layer 2 Layer 3 Layer 1 Layer 2 Layer 3
Solar Transmittance
(G-value)
0.474 0.91 0.863 0.72 0.91 0.863
0.42 0.6
Thermal Transmittance
(U-value W/m2°C)
5.857 5.87 5.857 5.857 5.87 5.857
Shading co-efficient 0.827 1.037 0.991 0.827 1.037 0.991
Description Glass type 1
Glass type 2
Glass type 3
Glass type 5
Glass type 6
Glass type 7
Solar Transmittance
(G-value)
0.203 0.202 0.566 0.651 0.62 0.344
Thermal Transmittance
(U-value W/m2°C)
1.42 2.469 1.555 5.682 5.556 5.759
Shading co-efficient 0.233 0.232 0.651 0.748 0.713 0.396
7.5.2 Simulation results
Internal air temperature of the simulation model covered with 25% fritted and 75%
fritted single layer ETFE-foil panels, respectively, was less than the average air
temperature of the same model when enclosed with single glazing (Glazing type 4,
Glazing type 5, Glazing type 6, Glazing type 7). However, relative internal air
temperatures of the model with double glazing panels and two-layer and three-layer
ETFE-foil panels varied depending on glazing type. Figure 7-3 and Figure 7-4 present
7-220
relative air temperatures of the model enclosed with various glazed roofs and two-layer
(75% fritted top layer) and three-layer (75% fritted and 25% fritted top layer) ETFE-foil
panels.
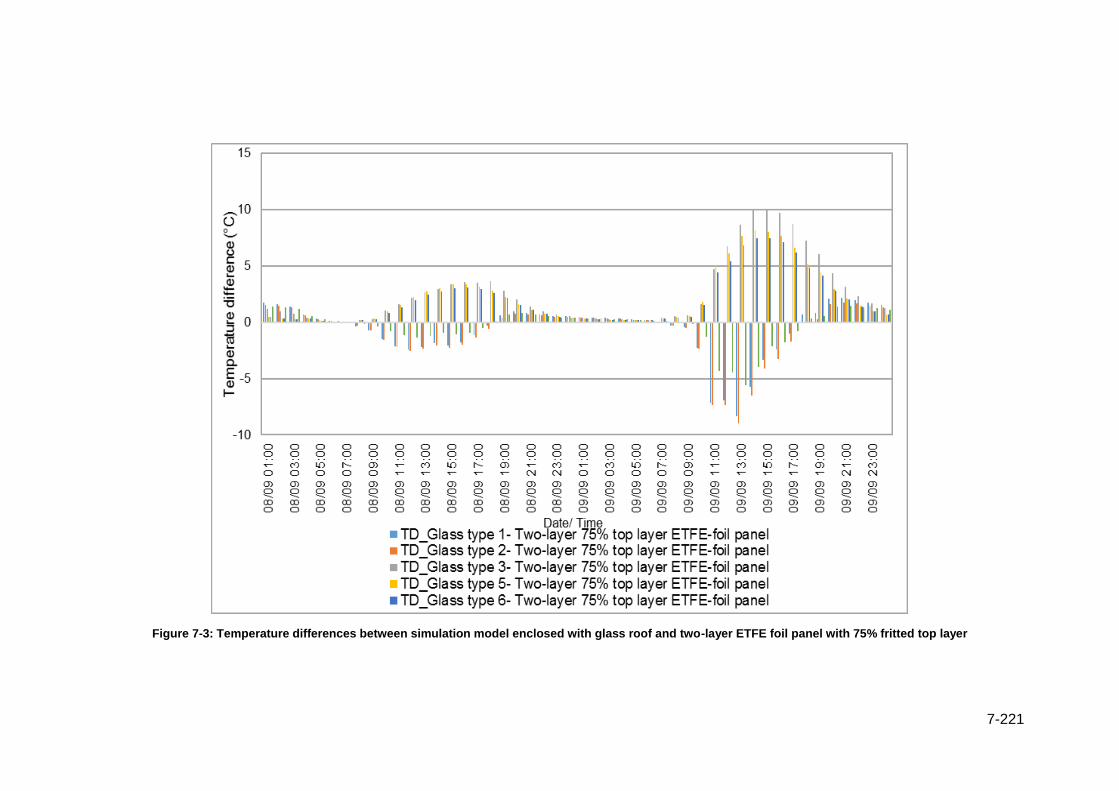
7-221
Figure 7-3: Temperature differences between simulation model enclosed with glass roof and two-layer ETFE foil panel with 75% fritted top layer

7-222
Figure 7-4: Temperature differences between simulation model enclosed with glass roof and three-layer ETFE foil panel with 75% fritted top layer

7-223
The results demonstrated that at particular times of the day (between 11.00 am and
3.00pm), internal air temperatures of the model enclosed with two-layer and three-
layer ETFE-foil panels were hotter than the models when enclosed with polycarbonate
glazing roofs, this variation was significant between models enclosed with ETFE-foil
panels and Glazing type 1, 2 and 7. The maximum difference found between average
internal air temperature of Glazing type 2 and three-layer ETFE-foil panel (with 25%
fritted top layer) was 3.78°C. It was also apparent that average air temperatures of
models enclosed with Glazing type 3, 5 and 6 were hotter than models when enclosed
with two-layer, also three-layer ETFE-foil panels. The maximum difference found
between average internal air temperature of two layer ETFE-foil and Glazing type 3
was 3.71°C. The reason behind these variations in air temperature was the high solar
transmittance of double glazing unit (0.566) compared to ETFE-foil panels (75% fritted
two-layer panel solar transmittance was 0.42), while low thermal transmittance (1.55
W/m2K) of glazing panels and low-E coating reduced heat exchange between the
interior and exterior, thus the increased air temperature of the simulation model.
Between the ETFE-foil panels and glazing panel constructed with polycarbonate, solar
transmittance of polycarbonate (0.203) was lower than the two-layer (75% fritted top
layer) and three-layer (75% and 25% fritted top layer) ETFE-foil panels. However,
presence of air-volume in the ETFE-foil panels might also have an impact on this
temperature difference when compared with different glazing types (Glazing type 1, 2
and 7).
7.6 Simulation model of ETFE-foil cushion roofs in TAS
A number of simplifications and assumptions were made to create the models of ETFE-
foil cushion roofs using the simulation tool.
One of the limitations of dynamic simulation tools is that there is no option to draw
curved shapes in the simulation model. Curved shapes are usually divided into many
smaller surfaces and drawn as series of flat plane surfaces. For this reason, the
curvature of the ETFE-foil cushions could not be accurately represented here in TAS
model.
It can be seen from Figure 7-5 that height of the steel truss as well as the ETFE-foil
cushion increase towards the middle of the roof in both of the case study buildings -
Nottingham High School and Engineering Science Learning Centre. This variation was
taken into account while modelling ETFE-foil cushion roof using TAS modeller.
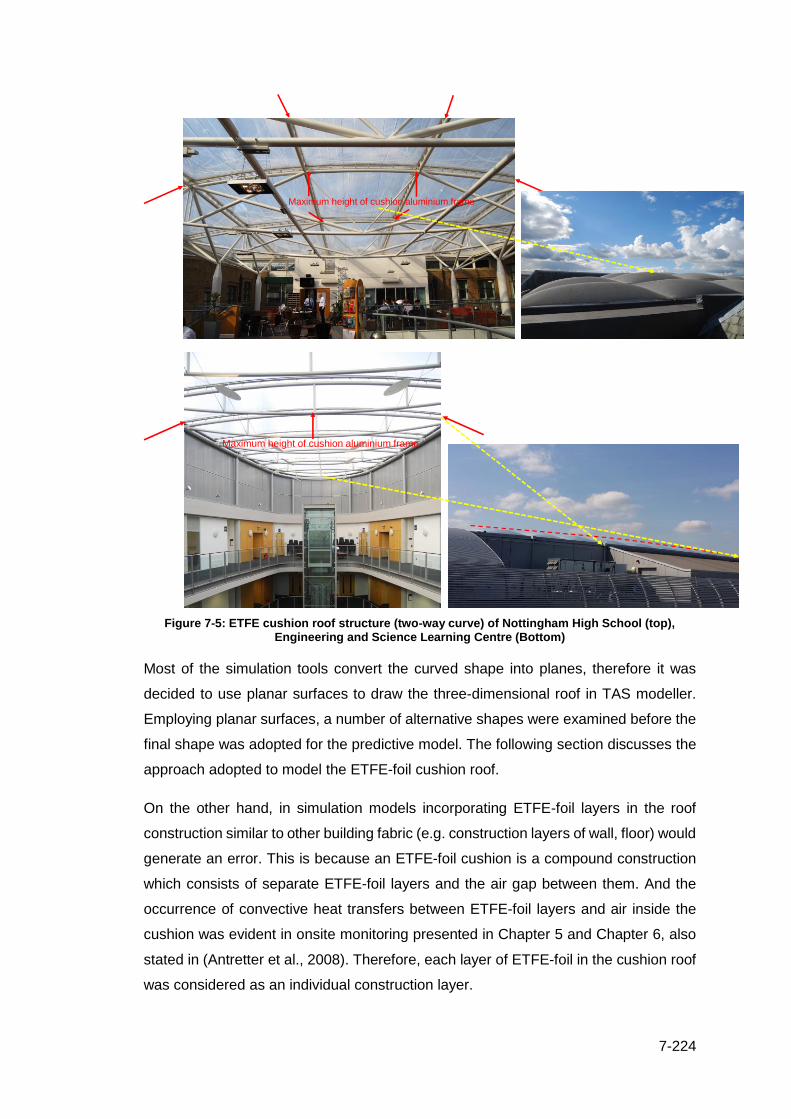
7-224
Figure 7-5: ETFE cushion roof structure (two-way curve) of Nottingham High School (top), Engineering and Science Learning Centre (Bottom)
Most of the simulation tools convert the curved shape into planes, therefore it was
decided to use planar surfaces to draw the three-dimensional roof in TAS modeller.
Employing planar surfaces, a number of alternative shapes were examined before the
final shape was adopted for the predictive model. The following section discusses the
approach adopted to model the ETFE-foil cushion roof.
On the other hand, in simulation models incorporating ETFE-foil layers in the roof
construction similar to other building fabric (e.g. construction layers of wall, floor) would
generate an error. This is because an ETFE-foil cushion is a compound construction
which consists of separate ETFE-foil layers and the air gap between them. And the
occurrence of convective heat transfers between ETFE-foil layers and air inside the
cushion was evident in onsite monitoring presented in Chapter 5 and Chapter 6, also
stated in (Antretter et al., 2008). Therefore, each layer of ETFE-foil in the cushion roof
was considered as an individual construction layer.
Maximum height of cushion aluminium frame
Maximum height of cushion aluminium frame

7-225
7.6.1 Approach adopted to model the ETFE cushion roof
Construction of the ETFE-foil cushion roof in TAS modeller was a difficult task. This
difficulty arose particularly from the double curved surface of the ETFE-foil cushion.
Therefore, it was decided to model a single cushion at the initial stage. Using planar
surfaces four different shapes were examined. Figure 7-6 presents alternative models
of ETFE-foil cushion roof. The difficulties that arose from each of the approaches
adopted to model the ETFE-foil cushion roof, are listed in Table 7-11.
(i) Roof model 1
(ii) Roof model 2
Figure 7-6: (i), (ii) studied models [Figure 7-6 continued to the next page]
Massage generated
in TAS while
selected four corner
of the plane
Shape of the
cushion expected

7-226
(iii) Roof model 3
(iv) Roof model 4
Figure 7-6: Representation of ETFE cushion roof in studied models (i) Roof model 1, (ii) Roof model 2, (iii) Roof model 3, (iv) Roof model 4
Shape of the
cushion expected
Error massage
generated in TAS

7-227
Table 7-11: Selection of model
Alternative roof model
Approach to draw planar surface
Difficulties Further consideration
Roof model 1 Model plane required four points to create a
planar surface
Three points were required to generate
plane in TAS
Therefore, it was decided to divide each of the planes into two
triangles
Roof model 2 Each of the planes divided into two triangular plane
This model required 20 triangular planes to
generate doubly curved surface, to
represent one single cushion
This procedure of modelling of ETFE roof would increase
complexity in simulation as the
number of planes will be significant
Roof model 3 In this model small boxes representing double curved roof created at different
floor height
Box spaces intersect one another at different height
caused error while generating analysis
model
Too complex to model large ETFE-foil cushion roof,
Simplification was necessary to build
complex atrium model
Roof model 4 A rectangular surface divided into four triangular plane
No difficulties raised while generating analysis model
Using this procedure eight triangular planes were required to build
two sided curved cushion
Using the configuration of Roof model 4 it was possible to approximate a double curved
surface of the ETFE-foil cushion. It required 8 planar surfaces, each plane can be
created using three points as required by TAS modeller.
It can be identified from Figure 7-5 that the height of the ETFE-foil cushion supporting
frame varied in both of the case study buildings. Camber of the cushion near the edge
and middle of the roof was also different. Using Roof model 4 it was possible to include
both of these by changing the height of the planar surfaces.
7.6.2 Simulation model of Nottingham High School building and atrium ETFE-
foil cushion roof
The ETFE-foil cushion roof of Nottingham High School consisted of 25 cushions. In
TAS modeller each of the cushions was modelled using 8 triangular planes, therefore
200 triangular planes were used to build the double curved ETFE-foil cushion roof of
Nottingham High School atrium. Figure 7-7 presents plan and section (not to scale) of
the roof model of ETFE-foil cushion roof.

7-228
Figure 7-7: Simulation model of ETFE-foil cushion roof of Nottingham High School atrium
7.6.3 Simulation model of Engineering and Science Learning Centre and
atrium ETFE-foil cushion roof
The configuration of the ETFE-foil cushion roof of the Engineering and Science
Learning Centre (ESLC) is different from the ETFE-foil cushion roof of Nottingham High
School. The ETFE-foil cushion roof of ESLC was built using 150 planar surfaces in
total. Figure 7-8 presents plan and section (not to scale) of the ETFE-foil cushion roof
of the ESLC.

7-229
Figure 7-8: Simulation model of ETFE foil cushion roof of Engineering and Science Learning Centre atrium
7.7 Zoning
In the simulation model of Nottingham High School and the ESLC each space was
zoned according to its functional use. Complexity rose while zoning the atria. According
to IEATask12 (1996) horizontal and vertical zoning of the atrium model is the most
important parameter for the correct temperature calculation in the simulation. Without
appropriate portioning, the whole atrium will give a single average temperature. In an
atrium temperature stratification is very important. Thus the simulation result should
consider this while evaluating thermal performance. IEATask12 (1996), also presented
different studies that conducted the simulation of the atrium by dividing its big volume
into small vertical and horizontal zones. Therefore, in the simulation model, a similar
approach was adopted in this study. This process also allowed the specification of the
internal gains and occupancy pattern of each part of the atrium separately.
7.7.1 Zone specification of Nottingham High School
Figure 7-9 illustrates the simulation model plan showing functional zones located on
the ground floor, first floor and second floor of the Nottingham High School.

7-230
(a) Ground floor
(b) First floor
( Figure 7-9continued to the next page)
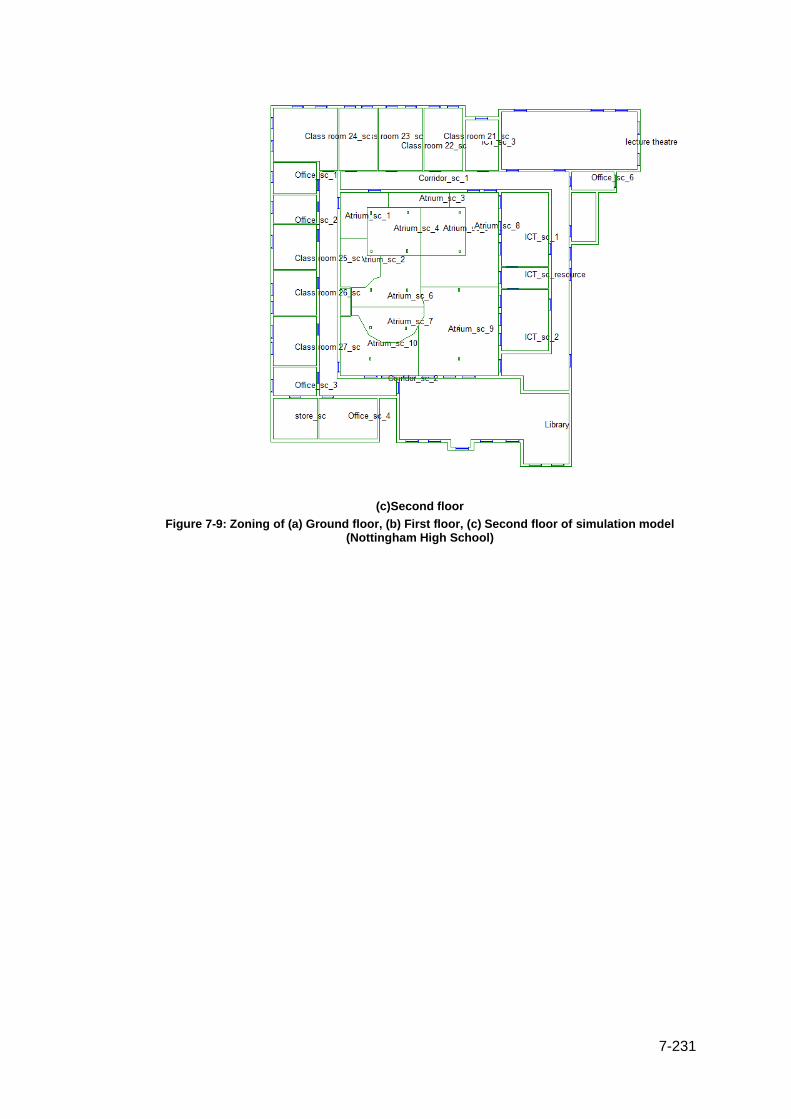
7-231
(c)Second floor
Figure 7-9: Zoning of (a) Ground floor, (b) First floor, (c) Second floor of simulation model (Nottingham High School)
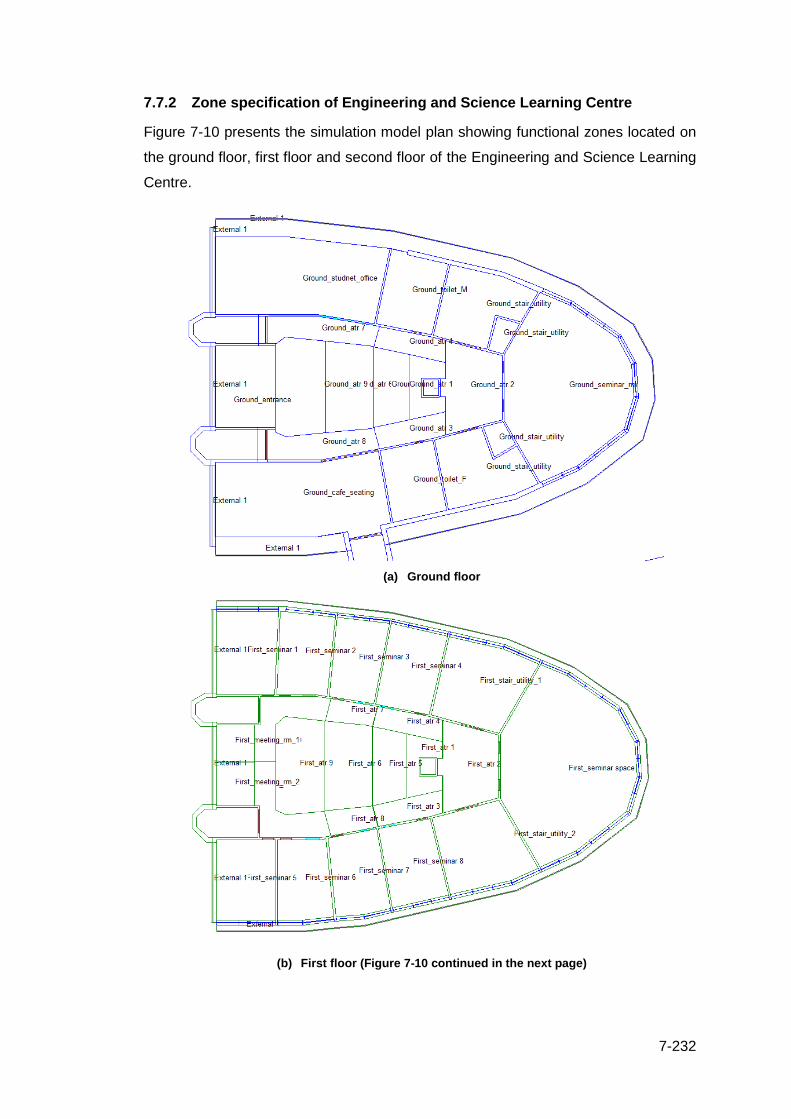
7-232
7.7.2 Zone specification of Engineering and Science Learning Centre
Figure 7-10 presents the simulation model plan showing functional zones located on
the ground floor, first floor and second floor of the Engineering and Science Learning
Centre.
(a) Ground floor
(b) First floor (Figure 7-10 continued in the next page)

7-233
(c) Second floor
Figure 7-10: Zoning of (a) Ground floor, (b) First floor, (c) second floor of Engineering and Science Learning Centre
7.8 Specifications of building fabrics in simulation models
7.8.1 Nottingham High School
Façade properties other than ETFE-foil was obtained from the building management
system of Nottingham High School. Thermal optical properties of the ETFE-foils used
in the analysis model of Nottingham High School are listed in Table 7-12. In the
Nottingham High School, rain suppression mesh was placed on top of the ETFE-foil
cushion roof of the atrium. Moreover, from the investigation results presented in
Chapter 5, it was evident that presence of rain mesh on top of ETFE-foil panel reduced
solar transmittance by 12%. This reduction in solar transmittance was taken into
account while calculating thermal optical properties of ETFE-foil cushion. Table 7-13
presents U-value of building fabrics.
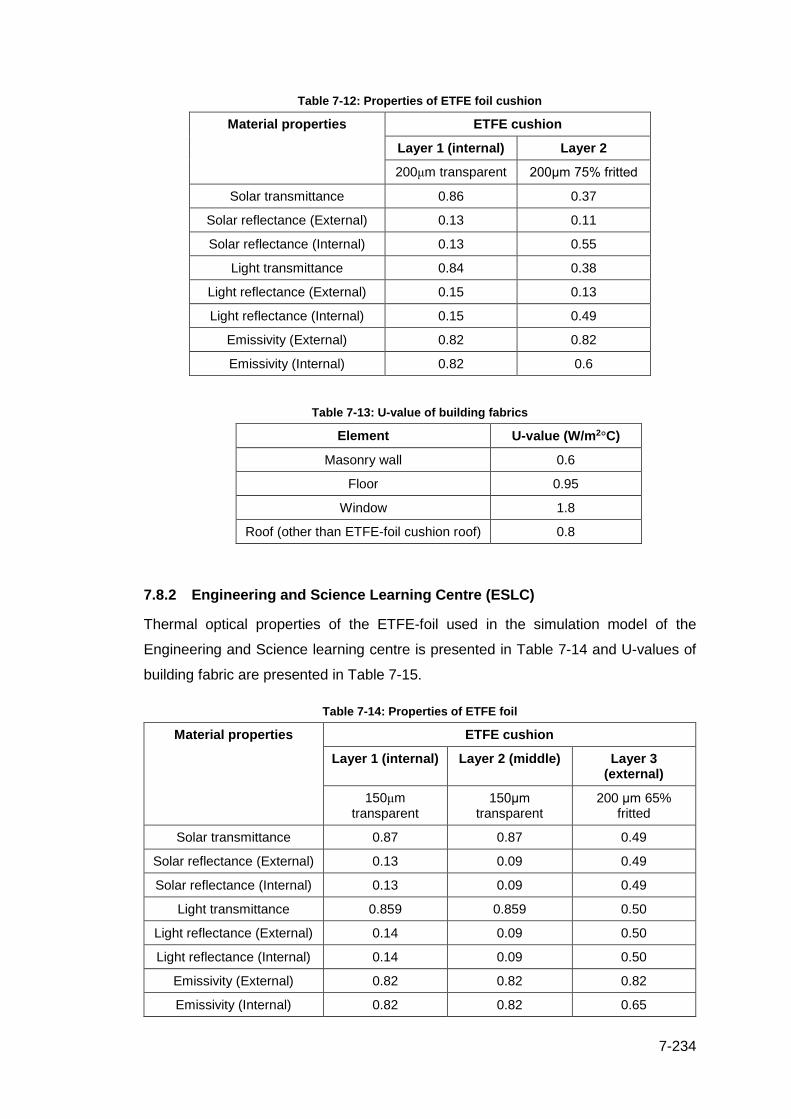
7-234
Table 7-12: Properties of ETFE foil cushion
Material properties ETFE cushion
Layer 1 (internal) Layer 2
200μm transparent 200μm 75% fritted
Solar transmittance 0.86 0.37
Solar reflectance (External) 0.13 0.11
Solar reflectance (Internal) 0.13 0.55
Light transmittance 0.84 0.38
Light reflectance (External) 0.15 0.13
Light reflectance (Internal) 0.15 0.49
Emissivity (External) 0.82 0.82
Emissivity (Internal) 0.82 0.6
Table 7-13: U-value of building fabrics
Element U-value (W/m2°C)
Masonry wall 0.6
Floor 0.95
Window 1.8
Roof (other than ETFE-foil cushion roof) 0.8
7.8.2 Engineering and Science Learning Centre (ESLC)
Thermal optical properties of the ETFE-foil used in the simulation model of the
Engineering and Science learning centre is presented in Table 7-14 and U-values of
building fabric are presented in Table 7-15.
Table 7-14: Properties of ETFE foil
Material properties ETFE cushion
Layer 1 (internal) Layer 2 (middle) Layer 3 (external)
150μm transparent
150μm transparent
200 μm 65% fritted
Solar transmittance 0.87 0.87 0.49
Solar reflectance (External) 0.13 0.09 0.49
Solar reflectance (Internal) 0.13 0.09 0.49
Light transmittance 0.859 0.859 0.50
Light reflectance (External) 0.14 0.09 0.50
Light reflectance (Internal) 0.14 0.09 0.50
Emissivity (External) 0.82 0.82 0.82
Emissivity (Internal) 0.82 0.82 0.65

7-235
Table 7-15: U-value of building fabrics
Element U- value (W/m2°C)
Wall 0.23
Floor 0.2
Roof 0.2
Windows, roof windows and roof lights 1.98
Doors 2.19
7.9 Simulation parameters
Accurate and realistic assumptions on input parameters are required to develop the
simulation model. Based on the usage information, internal gains from different
sources e.g. occupancy, lighting, equipment, ventilation etc. needs to be specified.
CIBSE Guide A (CIBSE, 2006, CIBSE, 2015b) provides reliable information on internal
gains. But CIBSE guides do not present an occupancy profile that specifies the time
schedule of various internal gains.
The Department for Communities and Local Government (DCLG) defined the National
Calculation Method (NCM) for the EPDB (Energy Performance of Buildings Directive).
The NCM is the procedure for validating compliance with Building Regulations for non-
domestic buildings. This validation process is based on calculations that use standard
sets of data for different activity areas, construction and service elements. Thus NCM
includes the calculation methods as well as the standard data set (DCLG, 2015).
However, the NCM profiles may be more suitable for new buildings to check
compliance rather than apply in existing buildings where occupancy profiles can be
identified. Different approved simulation software e.g. EDSL TAS comprises NCM
profile database for occupancy, internal gains and usage patterns of equipment. The
following section discusses the selection of input parameters for the simulation models.
7.9.1 Nottingham High School
Simulation parameters:
This section presents simulation parameters used in the model. These parameters
were based on data collection, observation and personal communication with the
building manager.
• Calendar
Summer period was considered from 1st May to 30th September and winter period
considered from 1st October to 30th April. School holidays and weekends were
specified in the calendar.

7-236
• Weather data
Data collected from different sources to create weather file are listed in Table 7-1.
• Internal gain
Table 7-16 presents internal gains obtained from the NCM database.
• Natural ventilation
Windows located on the west façade were operable only. Detail of window opening
used in TAS analysis model and Building Simulator is presented in Table 7-17.
According to information provided by the building management system, these windows
operate as the air temperature of the second floor reaches 25°C.
• Infiltration for occupied spaces was 0.35ach and unoccupied spaces was
0.3ach.
• Ventilation rate set to 12.5 l/s/p (occupied hours only).
• Profile
The occupancy profile used in the TAS building simulator for different spaces is listed
in Table 7-18. Occupied time was considered to be between 8.00am and 6.00pm.
Occupancy of each space is represented by factor 0 (unoccupied) to 1 (fully occupied).
• Heating and cooling were not considered.

7-237
Table 7-16: NCM Activities_v5.2.4 (Part L 2010) followed (EDLS TAS Version 9.3.3.b)
Space type Source Sensible gain (W/m2)
Latent gain (W/m2)
Teaching space
Occupant 38.663 38.663
Equipment 4.7
Lighting 10.5
IT
Occupant 15.98 10.217
Equipment 30
Lighting 11.25
Lecture room
Occupant 18.644 11.92
Equipment 2
Lighting 11.25
Office
Occupant 7.519 5.15
Equipment 11.9
Lighting 15
Communal area
Occupant 6.964 4.452
Equipment 5.27
Lighting 7.8
Kitchen
Occupant 5.941 11.033
Equipment 27.2 12.8
Lighting 26
Class room
Occupant 14.24 14.24
Equipment 4.74
Lighting 11.25
Atrium ground floor and first floor
Occupant 10.889 6.962
Equipment 20
Lighting 7.8
Atrium second floor
Occupant 21.12 18.15
Equipment 15.25
Lighting 19.05
Table 7-17: Window opening details, function used in analysis model and TAS building simulator
Description Width
(m)
Height
(m)
Area
(m2)
Frame
(m)
Opening percentage
(factor)
value Function
High Window 1.10 1 1.10 0.05 0.25 Hourly
Air temperature =/> 25°C
Internal doors 0.9 2.1 1.89 0.05 1 Hourly (8.00am-16.00pm
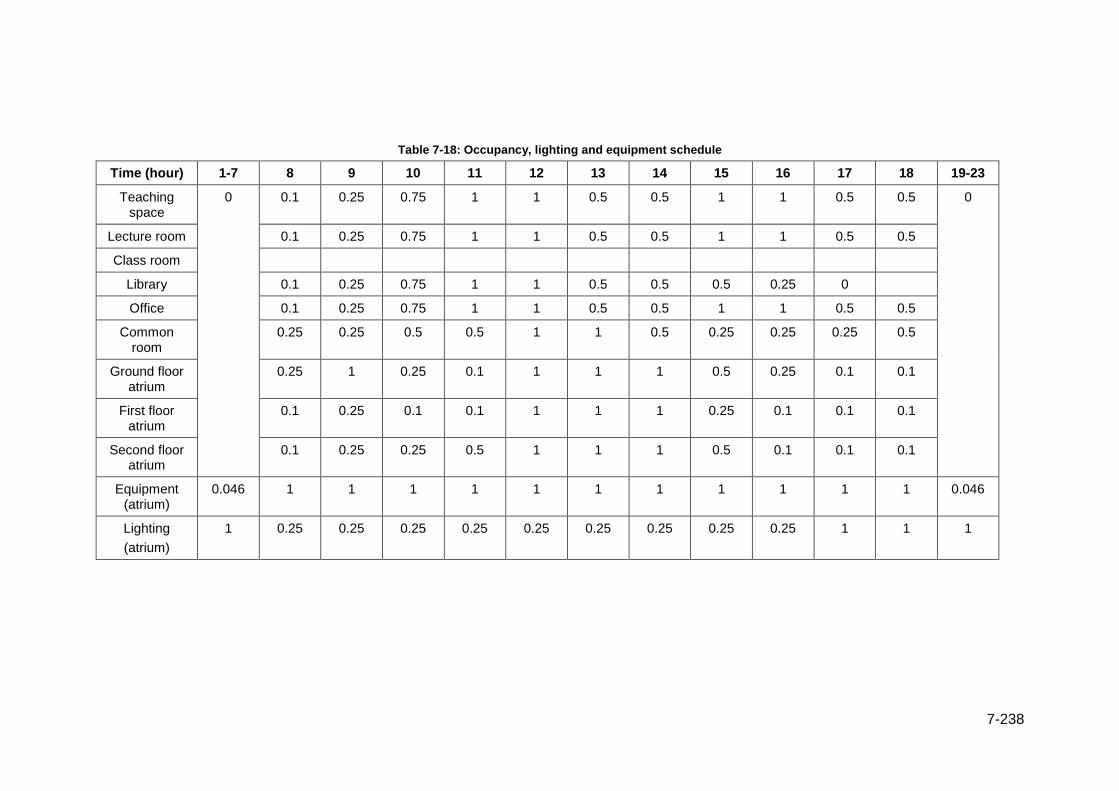
7-238
Table 7-18: Occupancy, lighting and equipment schedule
Time (hour) 1-7 8 9 10 11 12 13 14 15 16 17 18 19-23
Teaching space
0 0.1 0.25 0.75 1 1 0.5 0.5 1 1 0.5 0.5 0
Lecture room 0.1 0.25 0.75 1 1 0.5 0.5 1 1 0.5 0.5
Class room
Library 0.1 0.25 0.75 1 1 0.5 0.5 0.5 0.25 0
Office 0.1 0.25 0.75 1 1 0.5 0.5 1 1 0.5 0.5
Common room
0.25 0.25 0.5 0.5 1 1 0.5 0.25 0.25 0.25 0.5
Ground floor atrium
0.25 1 0.25 0.1 1 1 1 0.5 0.25 0.1 0.1
First floor atrium
0.1 0.25 0.1 0.1 1 1 1 0.25 0.1 0.1 0.1
Second floor atrium
0.1 0.25 0.25 0.5 1 1 1 0.5 0.1 0.1 0.1
Equipment (atrium)
0.046 1 1 1 1 1 1 1 1 1 1 1 0.046
Lighting
(atrium)
1 0.25 0.25 0.25 0.25 0.25 0.25 0.25 0.25 0.25 1 1 1
7-239
7.9.2 Engineering and Science Learning Centre (ESLC)
Simulation parameters:
This section presents simulation parameters used in the model and based on data
collection, observation and personal communication with University of Nottingham,
Estate.
• Calendar
Summer period was considered from 1st May to 30th September and winter period
considered from 1st October to 30th April. University closure days and weekends were
specified in the calendar.
• Weather data
Data collected from different sources to create weather file are listed in Table 7-1
• Internal gain
Table 7-19Table 7-19 presents internal gains obtained from the NCM database (EDLS
TAS Version 9.3.3.b) and used in the simulation model.
• Natural ventilation
Detail of window opening used in TAS analysis model and building simulator is
presented in Table 7-20. According to information provided by Estates, these windows
operate when the average air temperature of the atrium and outdoor air temperature
rises above 25°C and 10°C respectively.
• Infiltration for occupied spaces was 0.35ach and unoccupied spaces were
0.3ach.
• Ventilation rate set to 12.5 l/s/p (occupied hours only).
• Heating and cooling
Heating and cooling were assumed for predicted model
• Profile
The occupancy profile used in the TAS building simulator for different spaces is listed
in Table 7-21. Occupied time was considered to be between 8.00am and 9.00pm.
Occupancy of each space is represented by factor 0 (unoccupied) to 1 (fully occupied).

7-240
Table 7-19: NCM Activities_v5.2.4 (Part L 2010) followed (EDLS TAS Version 9.3.3.b)
Space type Source Sensible gain (W/m2)
Latent gain (W/m2)
IT
Occupant 16.927 10.823
Equipment 27.81
Lighting 11.25
class room
Occupant 14.24 14.24
Equipment 4.74
Lighting 11.25
Office
Occupant 7.519 5.15
Equipment 11.9
Lighting 15
Communal area
Occupant 7.453 7.453
Equipment 1.83
Lighting 5.2
lecture room
Occupant 17.22 11.011
Equipment 1.83
Lighting 11.25
Cafe Occupant 14.648 9.365
Equipment 17.62
Lighting 7.8
Graduate centre Occupant 13.839 8.48
Equipment 17.17
Lighting 19.05
Atrium ground floor
Occupant 11.677 11.677
Equipment 4.3
Lighting 23.6
Atrium first floor
Occupant 7.453 7.453
Equipment 1.83
Lighting 5.2
Atrium second floor
Occupant 6.964 4.452
Equipment 5.27
Lighting 15.25
Table 7-20: Window opening details, function used in analysis model and TAS building simulator
Description Width
(m)
Height
(m)
Area
(m2)
Frame
(m)
Opening percentage
(factor)
value Function
High Window 1.15 1 1.15 0.05 0.25 Hourly
Air temperature
=/> 25°C
Internal doors
0.9 2.1 1.89 0.05 1 Hourly
Entry door 1.5 2.5 3.75 0.05 1 Hourly
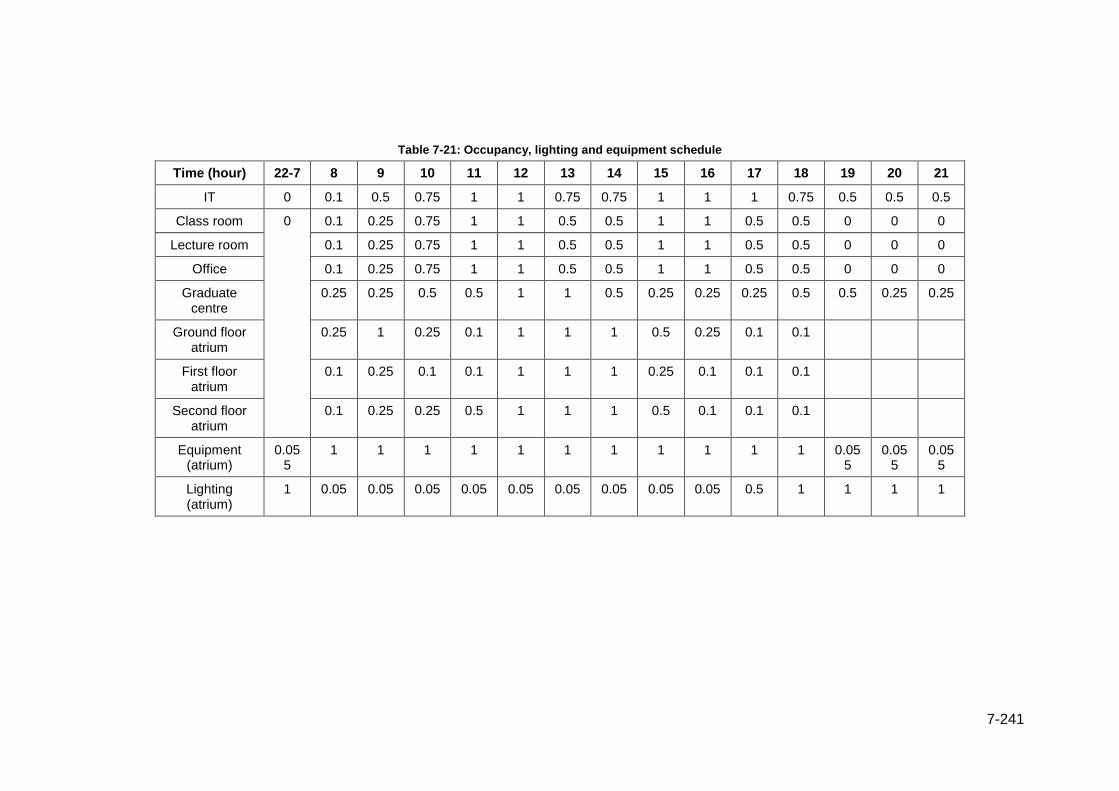
7-241
Table 7-21: Occupancy, lighting and equipment schedule
Time (hour) 22-7 8 9 10 11 12 13 14 15 16 17 18 19 20 21
IT 0 0.1 0.5 0.75 1 1 0.75 0.75 1 1 1 0.75 0.5 0.5 0.5
Class room 0 0.1 0.25 0.75 1 1 0.5 0.5 1 1 0.5 0.5 0 0 0
Lecture room 0.1 0.25 0.75 1 1 0.5 0.5 1 1 0.5 0.5 0 0 0
Office 0.1 0.25 0.75 1 1 0.5 0.5 1 1 0.5 0.5 0 0 0
Graduate centre
0.25 0.25 0.5 0.5 1 1 0.5 0.25 0.25 0.25 0.5 0.5 0.25 0.25
Ground floor atrium
0.25 1 0.25 0.1 1 1 1 0.5 0.25 0.1 0.1
First floor atrium
0.1 0.25 0.1 0.1 1 1 1 0.25 0.1 0.1 0.1
Second floor atrium
0.1 0.25 0.25 0.5 1 1 1 0.5 0.1 0.1 0.1
Equipment (atrium)
0.055
1 1 1 1 1 1 1 1 1 1 1 0.055
0.055
0.055
Lighting (atrium)
1 0.05 0.05 0.05 0.05 0.05 0.05 0.05 0.05 0.05 0.5 1 1 1 1

7-242
7.10 Model Calibration
This section investigates the influence of internal gains, occupancy, window opening,
the shape of the roof etc. on the performance of the atrium of Nottingham High School
and ESLC. Description of the simulation model and criteria are listed in Table 7-22.
Table 7-22: Model description and parameter
Model description
Simulation parameter Roof configuration
Purpose
Level 3_NH_Base Case 0
• Internal gains and window opening was not considered
Two way curved • To examine the impact of external environmental parameters e.g. solar radiation, outdoor ambient temperature etc. on the thermal performance of atrium
Level 3_ESLC_Base Case 0
Level 3_NH_Base Case 1
• Internal gain, infiltration, occupancy profile included according to
• Table 7-16,Table 7-18.
• Window opening was considered according to Table 7-17.
Two way curved • To compare with Base case 0
• To examine impact of input parameter on the thermal performance of atrium
Level 3_ESLC_Base Case 1
• Internal gain, infiltration, occupancy profile included according to
• Table 7-19 and Table 7-21.
• Window opening was considered according to
• Table 7-20
Level 3_NH_Base Case 2
• Similar to Base case 1
Flat ETFE panel • To compare with Base case 1 to see the influence of roof configuration on the thermal environment of the atrium
Level 3_ESLC_Base Case 2
Onsite monitoring results presented in Chapter 6 showed that external environmental
parameters e.g. incident solar radiation, outdoor ambient temperature etc. affected the
thermal performance of different levels of the atria. It was also evident that among

7-243
different floor levels, floor (Level 3) adjacent to ETFE foil cushion roof was affected
significantly. In both of the case study buildings, second floor (Level 3) was adjacent
to ETFE cushion roof. Therefore, calibration results particularly focused on air
temperatures of the second floor of simulation models of the atria.
7.10.1 Calibration results for simulation mode of Nottingham High School
A Base Case 0 was created using the properties of fabric materials listed in Table 7-12
and Table 7-13. In this model occupancy profile, internal gains and window opening
profile was not included.
In the next step Base Case 1, was developed by adding occupancy profile (Table
7-18), internal gains (Table 7-16) and window opening (see Table 7-17) in Base Case
0. The rationale for developing Base Case 0 and Base Case 1 is stated in Table 7-22.
Figure 7-11 presents temperature difference of Level 3_NH_Base Case 1 and Level
3_NH_Base Case 0.
Figure 7-11: Base Case 1 air temperature relative to Base-Case 0
From Figure 7-11 it is evident that internal gains, window opening and occupancy had
a significant impact on air temperatures of Level 3 (second floor) of the atrium. At this
level, air temperature of Base Case 1 showed a maximum deviation of 4.5°C from that
of Base Case 0. Thus, the selection of input parameters on the basis of building
operation is important to avoid discrepancy in predicted results. Among the different
input parameters - window opening, internal gains and occupancy schedule etc., were

7-244
found to have a considerable impact on the simulation results. Furthermore, the
calibration process might be challenging if one of these parameters is unknown. These
findings are also consistent with the previous study carried by Lomas et al. (1997),
Westphal and Lamberts (2005), Pellegrino et al. (2016).
In this study standard values of occupancy profile and internal gains were used in Base
Case 1 whereas a window opening schedule was assumed on the basis of personal
observation and information from building management. Therefore, in the next step, a
different window opening percentage was simulated using Base Case 1 where internal
gains, window opening and occupancy schedule was not changed. The results of this
variable window opening and its impact on air temperature is presented in Figure 7-12.
Figure 7-12: Simulated air temperatures of the second floor of the atrium with various window opening percentage and comparison with measured data
From the results presented in Figure 7-12, it can be seen that air temperatures of the
second floor of the atrium did not vary significantly as opening percentage was
changed from 0.1 to 0.3. Besides, the opening percentage of 0.25 was suggested by
school management. Therefore, this Base Case 1 opening was set to 0.25 and this
model was selected for further analysis.
The ETFE-foil cushion roof of Base Case 1 was modelled in a way that (approximately)
represented the doubly curved roof configuration. To see the impact of roof
configuration on the atrium air temperatures, another model with flat ETFE-foil panels
was created and named as Base Case 2. The difference between simulated air
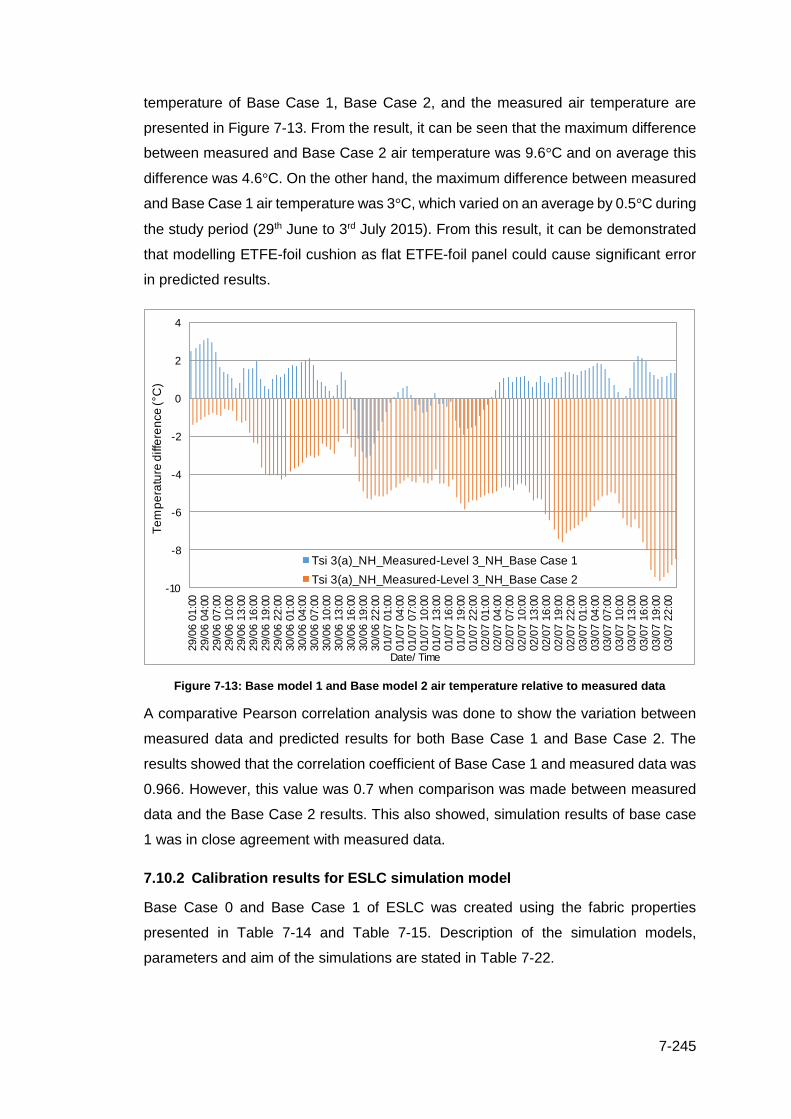
7-245
temperature of Base Case 1, Base Case 2, and the measured air temperature are
presented in Figure 7-13. From the result, it can be seen that the maximum difference
between measured and Base Case 2 air temperature was 9.6°C and on average this
difference was 4.6°C. On the other hand, the maximum difference between measured
and Base Case 1 air temperature was 3°C, which varied on an average by 0.5°C during
the study period (29th June to 3rd July 2015). From this result, it can be demonstrated
that modelling ETFE-foil cushion as flat ETFE-foil panel could cause significant error
in predicted results.
Figure 7-13: Base model 1 and Base model 2 air temperature relative to measured data
A comparative Pearson correlation analysis was done to show the variation between
measured data and predicted results for both Base Case 1 and Base Case 2. The
results showed that the correlation coefficient of Base Case 1 and measured data was
0.966. However, this value was 0.7 when comparison was made between measured
data and the Base Case 2 results. This also showed, simulation results of base case
1 was in close agreement with measured data.
7.10.2 Calibration results for ESLC simulation model
Base Case 0 and Base Case 1 of ESLC was created using the fabric properties
presented in Table 7-14 and Table 7-15. Description of the simulation models,
parameters and aim of the simulations are stated in Table 7-22.
-10
-8
-6
-4
-2
0
2
4
29/0
6 0
1:0
029/0
6 0
4:0
029/0
6 0
7:0
029/0
6 1
0:0
029/0
6 1
3:0
029/0
6 1
6:0
029/0
6 1
9:0
029/0
6 2
2:0
030/0
6 0
1:0
030/0
6 0
4:0
030/0
6 0
7:0
030/0
6 1
0:0
030/0
6 1
3:0
030/0
6 1
6:0
030/0
6 1
9:0
030/0
6 2
2:0
001/0
7 0
1:0
001/0
7 0
4:0
001/0
7 0
7:0
001/0
7 1
0:0
001/0
7 1
3:0
001/0
7 1
6:0
001/0
7 1
9:0
001/0
7 2
2:0
002/0
7 0
1:0
002/0
7 0
4:0
002/0
7 0
7:0
002/0
7 1
0:0
002/0
7 1
3:0
002/0
7 1
6:0
002/0
7 1
9:0
002/0
7 2
2:0
003/0
7 0
1:0
003/0
7 0
4:0
003/0
7 0
7:0
003/0
7 1
0:0
003/0
7 1
3:0
003/0
7 1
6:0
003/0
7 1
9:0
003/0
7 2
2:0
0
Te
mp
era
ture
diffe
ren
ce
( C
)
Date/ Time
Tsi 3(a)_NH_Measured-Level 3_NH_Base Case 1
Tsi 3(a)_NH_Measured-Level 3_NH_Base Case 2

7-246
Figure 7-14 illustrates temperature difference between air temperature of Base Case
1 and Base Case 0. The results showed significant deviation (6.3°C) of air temperature
between Base Case 1 and Base Case 0. This deviation resulted from input parameters,
such as internal gains, occupancy profile, window opening etc.
Figure 7-14: Base model 1 air temperature relative to Base model 0
Figure 7-15: Simulated air temperatures of the second floor of the atrium with various window opening percentage and comparison with measured data

7-247
Figure 7-15 presents variations of air temperatures obtained from simulation, by
varying window opening percentage from 0.1 to 0.3 in Base Case 1. The results
showed that variation in window opening percentage from 0.1 to 0.3 had little impact
on predicted air temperatures. Finally, window opening 0.3 was selected and included
in Base Case 1 model for further analysis.
In Base Case 0 and Base Case 1 the ETFE-foil roof was modelled as a double curved
shape. It was decided to model the ETFE-foil cushion roof as a flat three layer ETFE-
foil panel also. This was done in Base Case 2. All input parameters of Base Case 1
and Base Case 2 were identical. Relative air temperature of Base Case 1 and Base
Case 2 with respect to measured data is presented in Figure 7-16. The results
demonstrated that if the ETFE-foil roof is modelled as a flat ETFE-foil panel then
average temperature difference between predicted and measured air temperature was
4.25°C whereas if this roof is modelled in doubly curved shape this average reduced
to 0.3°C. The maximum difference found between measured and Base Case 2 air
temperature was 6.4°C. Therefore, the modelling configuration of three layer ETFE-
foil cushion roof had a considerable impact on the predicted result. This was also
evident while calculated Pearson coefficient. Pearson coefficient was 0.95 when
compared with Base Case 1 and measured data. But Pearson coefficient was 0.75
while comparison was made between Base Case 2 and measured data. This Base
Case 1 was considered for further analysis which is presented in the subsequent
section where Base Case 1 was named as Predicted model.
Figure 7-16: Base model 1 and Base model 2 air temperature relative to measured data
-10
-8
-6
-4
-2
0
2
4
29/0
6 01
:00
29/0
6 04
:00
29/0
6 07
:00
29/0
6 10
:00
29/0
6 13
:00
29/0
6 16
:00
29/0
6 19
:00
29/0
6 22
:00
30/0
6 01
:00
30/0
6 04
:00
30/0
6 07
:00
30/0
6 10
:00
30/0
6 13
:00
30/0
6 16
:00
30/0
6 19
:00
30/0
6 22
:00
01/0
7 01
:00
01/0
7 04
:00
01/0
7 07
:00
01/0
7 10
:00
01/0
7 13
:00
01/0
7 16
:00
01/0
7 19
:00
01/0
7 22
:00
02/0
7 01
:00
02/0
7 04
:00
02/0
7 07
:00
02/0
7 10
:00
02/0
7 13
:00
02/0
7 16
:00
02/0
7 19
:00
02/0
7 22
:00
03/0
7 01
:00
03/0
7 04
:00
03/0
7 07
:00
03/0
7 10
:00
03/0
7 13
:00
03/0
7 16
:00
03/0
7 19
:00
03/0
7 22
:00
Te
mp
era
ture
diff
ere
nce
( C
)
Date/ Time
Tsi3(a)_ESLC_Measured-Level 3_ESLC_Base Case 1
Tsi3(a)_ESLC_Measured-Level 3_ESLC_Base Case 2

7-248
7.11 Strategies to improve thermal performance of space
The results of monitoring presented in Chapter 5 showed that both of the buildings-
Nottingham High School and ESLC overheated during summer 2015. This was the
result of increase in outdoor temperature, solar radiation transmission through the
ETFE-foil cushion roof, increase of mean radiant temperature of occupied levels due
to increase in surface temperatures of the ETFE-foil cushions, inadequate ventilation
system, opening area with respect to atrium floor area etc. The peak summer period
was observed between 29th June and 3rd July 2015. Therefore, for detailed simulation,
this particular period was selected.
Studies carried by Modirrousta and Boostani (2016), He and Hoyano (2009), Wang.
X. et al. (2011), Moosavi et al. (2015), also demonstrated that solar radiation and
inadequate ventilation systems are the major factors that can cause overheating in
atria with large glazed roofs. Thus, previous investigation results were consistent with
the finding of this study. Therefore, to improve thermal comfort conditions of the atria,
different strategies were applied in the simulation model. These strategies included
solar radiation control by modifying solar and light transmittance of the ETFE-foil and
change of opening percentage. Solar and light transmittance of the ETFE-foil cushions
were based on the results presented in Chapter 4. Moreover, opening percentage of
existing windows located adjacent to the ETFE-foil cushion roof were modified and
investigated. The fundamental aim of this simulation was to examine whether
modification of optical properties of ETFE foil and/or opening percentage could
improve thermal comfort of the monitored spaces by eliminating overheating.
7.11.1 Strategies applied for the Nottingham High School and ESLC simulation
model
The following section discusses the application of strategies in the simulation models
for the Nottingham High School and Engineering and Science Learning Centre
(ESLC). It was mentioned in section 7.10.1 and 7.10.2 that the Base model 1 was
selected to carry out further investigation. This Base model 1 is described as Predicted
model in the following analysis.
i. Criteria 1
Thermal optical properties of the ETFE foil cushions of Nottingham High School and
ESLC were presented in Table 7-12 and Table 7-14 respectively. Thermal optical
properties of the external layer of the ETFE-foil cushion were modified exclusively in

7-249
the simulation Cases as described in Table 7-23. These properties of ETFE-foil are
based on the results presented in Chapter 4.
Table 7-23: Thermal optical properties of the external layer of ETFE foil cushion
Simulation
number
Case 1
Case 2 Case 3 Case 4 Case 5
Case 6 Case 7
Silver (Pigment) type
Light Medium Medium Medium Dark Dark Dark
Fritting percentage 89% 65% 75% 89% 65% 75% 89%
Solar transmittance 0.31 0.255 0.225 0.127 0.225 0.187 0.0833
Solar reflectance (External)
0.11 0.11 0.11 0.11 0.11 0.11 0.11
Solar reflectance (Internal)
0.628 0.68 0.726 0.83 0.72 0.764 0.88
Light transmittance 0.318 0.2516 0.219 0.126 0.217 0.1784 0.082
Light reflectance (External)
0.13 0.13 0.13 0.13 0.13 0.13 0.13
Light reflectance (Internal)
0.62 0.69 0.732 0.839 0.73 0.769 0.883
Emissivity of layer 2 (External)
0.82 0.82 0.82 0.82 0.82 0.82 0.82
Emissivity of layer 2 (Internal)
0.6 0.6 0.6 0.6 0.6 0.6 0.6
ii. Criteria 2
Thermal optical properties of the external and internal layer were modified and
presented in Table 7-24.

7-250
Table 7-24: Thermal optical properties of external and internal layer of ETFE foil cushion
Simulation
Case number
Case 8 Case 9 Case 10 Case 11 Case 12 Case 13 Case 14
Location Int. Ext. Int. Ext. Int. Ext. Int. Ext. Int. Ext. Int. Ext. Int. Ext.
Silver (pigment) type
Light Med-ium
Light Med-ium
Light Dark Light Dark Light Med-ium
Light Dark Med-ium
Dark
Fritting percentage
25% 25% 25% 50% 25% 25% 25% 50% 50% 50% 50% 50% 25% 25%
Solar transmittance
0.72 0.58 0.72 0.405 0.72 0.567 0.72 0.378 0.58 0.405 0.58 0.3784
0.66 0.566
Solar reflectance (External)
0.13 0.11 0.13 0.11 0.13 0.11 0.13 0.11 0.13 0.11 0.13 0.11 0.13 0.11
Solar reflectance (Internal)
0.278
0.33 0.278 0.53 0.278 0.35 0.278 0.55 0.415 0.53 0.415 0.55 0.33 0.35
Light transmittance
0.708
0.563 0.708 0.45 0.708 0.63 0.708 0.42 0.578 0.45 0.578 0.42 0.64 0.63
Light reflectance (External)
0.15 0.13 0.15 0.13 0.15 0.13 0.15 0.13 0.15 0.13 0.15 0.13 0.15 0.13
Light reflectance (Internal)
0.289
0.35 0.289 0.54 0.289 0.36 0.289 0.56 0.42 0.54 0.42 0.35 0.35 0.36
Emissivity of layer 1& 2 (External)
0.82 0.82 0.82 0.82 0.82 0.82 0.82 0.82 0.82 0.82 0.82 0.82 0.82 0.82
Emissivity of layer 1 & 2 (Internal)
0.6 0.55 0.6 0.55 0.6 0.5 0.6 0.5 0.6 0.55 0.6 0.5 0.55 0.5

7-251
iii. Criteria 3
The internal emissivity of the external layer of ETFE-foil cushion was modified.
Different emissivity considered in the simulation are presented in Table 7-25.
Table 7-25: Emissivity of ETFE foil
Emissivity Original Case 15 Case 16 Case 17 Case 18 Case 19
External emissivity of
layer 2
0.82 0.82 0.82 0.82 0.82 0.82
Internal emissivity of
layer 2
0.6 0.5 0.4 0.3 0.2 0.1
iv. Criteria 4
The indoor thermal performance of the spaces is influenced by the window opening
profile. In order to investigate this, opening area and percentage of existing windows
located on the second floor of the atrium were modified in the simulation. In addition,
variable indoor air temperature thresholds were applied to modulate window opening
profiles (e.g. window was open when the indoor air temperature was above 21°C,
22°C, 23°C and 25°C). However, the results identified no significant impact for these
variable threshold scenarios on indoor thermal performance. The findings are similar
for both the Nottingham High School and ESLC. These simulation cases were not
presented here. Options that were examined in the Nottingham High School and ESCL
simulation models are presented in Table 7-26 and Table 7-27.
Table 7-26: Window opening and associated air temperature of atrium second floor, Nottingham High School
Case no.
North
windows
South
windows
East
windows
West
windows
Case 20
- Open (factor= 0.25), 24hr
- Open (factor= 0.25), 24hr
Case 21
Open (factor= 0.25), 24hr
Open (factor= 0.25), 24hr
- Open (factor= 0.25), 24hr
Case 22
- Open (factor= 0.25), 24hr
Open (factor= 0.25), 24hr
Open (factor= 0.25), 24hr
Case 23
Open (factor= 0.25), 24hr
Open (factor= 0.25), 24hr
Open (factor= 0.25), 24hr
Open (factor= 0.25), 24hr
Case 24
Open (factor= 0.5), 24hr
Open (factor= 0.5), 24hr
Open (factor= 0.5), 24hr
Open (factor= 0.5), 24hr
Case 25
Open (factor= 0.75), 24hr
Open (factor= 0.75), 24hr
Open (factor= 0.75), 24hr
Open (factor= 0.75), 24hr
Case 26
Open (factor= 1),
24hr
Open (factor= 1),
24hr
Open (factor= 1),
24hr
Open (factor= 1),
24hr

7-252
Table 7-27: Window opening and associated air temperature of atrium second floor, Engineering and Science Learning Centre
Case no. North East
windows
South East
windows
West
windows
Case 20 Open (factor= 0.25), 24hr
Open (factor= 0.25), 24hr
Case 22 Open (factor= 0.25), 24hr
Open (factor= 0.25),
24hr
Case 23 Open (factor= 0.25), 24hr
Open (factor= 0.25), 24hr
Open (factor= 0.25),
24hr
Case 24 Open (factor= 0.5),
24hr
Open (factor= 0.5),
24hr
Open (factor= 0.5),
24hr
Case 25 Open (factor= 0.75), 24hr
Open (factor= 0.75), 24hr
Open (factor= 0.75),
24hr
Case 26 Open (factor= 1),
24hr
Open (factor= 1),
24hr
Open (factor= 1),
24hr
The time period selected for simulation is presented in Table 7-28, this period also
represents the hottest period of summer 2015.
Table 7-28: Period selected for simulation in summer 2015
Time period Nottingham High School ESLC
29th June to 3rd July 5 days 5 days
Number of occupied hours
simulated
40 hours 45hours
Percentage of time covered 8.33% (480 occupied hours) 6.1% (738 occupied hours)
7.11.2 Results of implication of simulation criteria
Figure 7-17 presents air temperature difference between Case 24, Case 25, Case 26,
and predicted model of Nottingham High School.
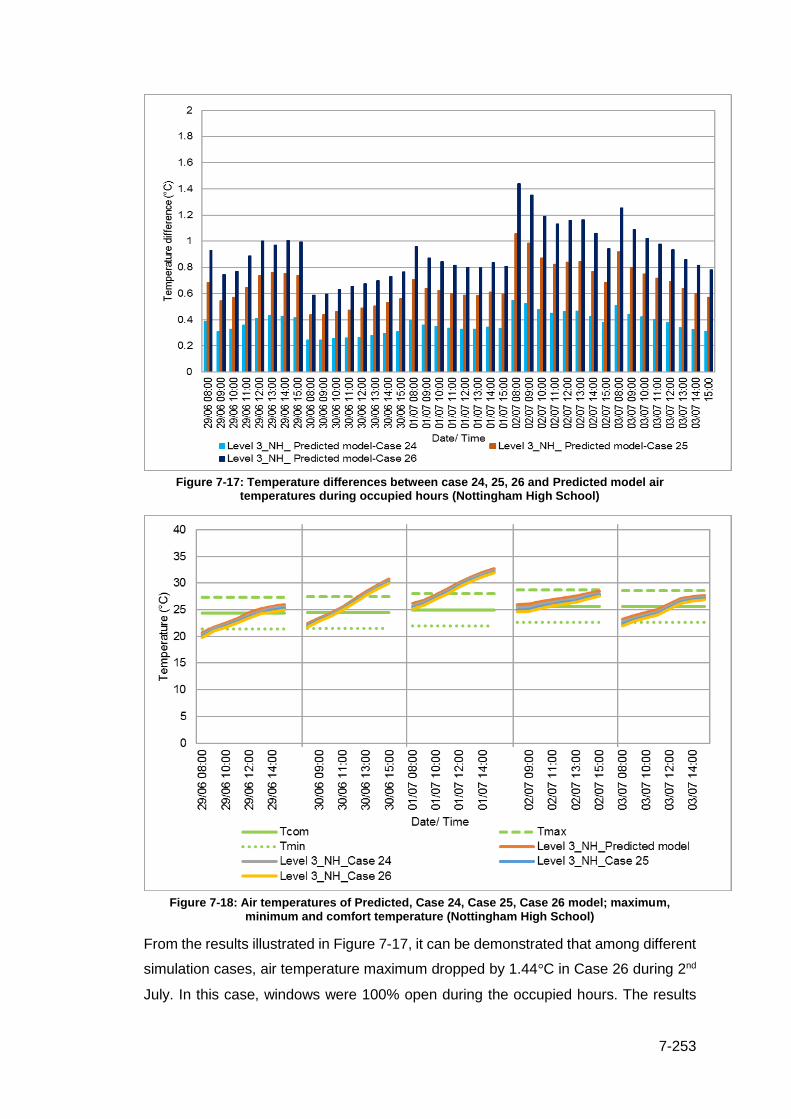
7-253
Figure 7-17: Temperature differences between case 24, 25, 26 and Predicted model air
temperatures during occupied hours (Nottingham High School)
Figure 7-18: Air temperatures of Predicted, Case 24, Case 25, Case 26 model; maximum,
minimum and comfort temperature (Nottingham High School)
From the results illustrated in Figure 7-17, it can be demonstrated that among different
simulation cases, air temperature maximum dropped by 1.44°C in Case 26 during 2nd
July. In this case, windows were 100% open during the occupied hours. The results

7-254
obtained during the hottest days showed that this model was only able to reduce air
temperature on average by 0.67°C (in 30th June) and 0.84°C (in 1st July) even if
windows were 100% open. Nevertheless, this reduction is not sufficient to ease
overheating occurring during the peak summer period. This is reflected in the following
discussion on thermal comfort assessment.
Figure 7-18 presents air temperature obtained from the Predicted model, Cases 24,
26 and 27 as well as comfort temperature, maximum and minimum acceptable
temperature between 29th June and 3rd July 15. Detailed description and calculation
procedure for comfort temperature, maximum and minimum acceptable temperature
range can be found in Chapter 6.
The results presented in Figure 7-18 showed that during 30th June and 1st July the air
temperature of the Predicted model, Case 24, 25 and 26 rose above the maximum
acceptable temperature and for 15% of occupied hours the air temperature of the
second floor of the atrium (Case 26) stayed above Tmax. Although this was less than
that occurred in the base Predicted model (where 20% of occupied hours predicted
model air temperature was above Tmax).
In Case 26 of the simulated model of the ESLC (Figure 7-19), air temperature of the
second floor of the atrium maximum was reduced by 1.77°C during 3rd July. In this
model, windows were also 100% open. During the peak period observed on 30th June
and 1st July, average air temperature of this model reduced by 0.9°C and 0.85°C
respectively. Similarly to Case 26 of Nottingham High School, this model did not
provide any substantial variation in air temperature from that of the predicted model,
particularly during 30th June and 1st July.
Comfort temperature, maximum and minimum acceptable temperature range and air
temperature of Case 24, 25, 26 are stated in Figure 7-20. From Figure 7-20 it is evident
that air temperature of the Predicted model, Case 24, 25 and 26 rose significantly
above the maximum acceptable temperature, particularly in 30th June and 1st July
2015. Therefore the overheated condition observed in on-site monitoring was not
possible to eliminate with the scenarios investigated, even if existing windows were
100% open. It was also apparent that for 40% of the occupied hours air temperature
of predicted model was above Tmax, which was less in Case 26 (31%), Case 25
(33.33%) and Case (35.55%).

7-255
Figure 7-19: Temperature differences between case 24, 25, and 26 and predicted air temperatures
during occupied hours (ESLC)
Figure 7-20: Air temperatures of Predicted, Case 24, Case 25, Case 26 model maximum,
minimum and comfort temperature (ESLC)
The results obtained from simulation cases of Nottingham High School and ESLC is
summarised in Table 7-29.
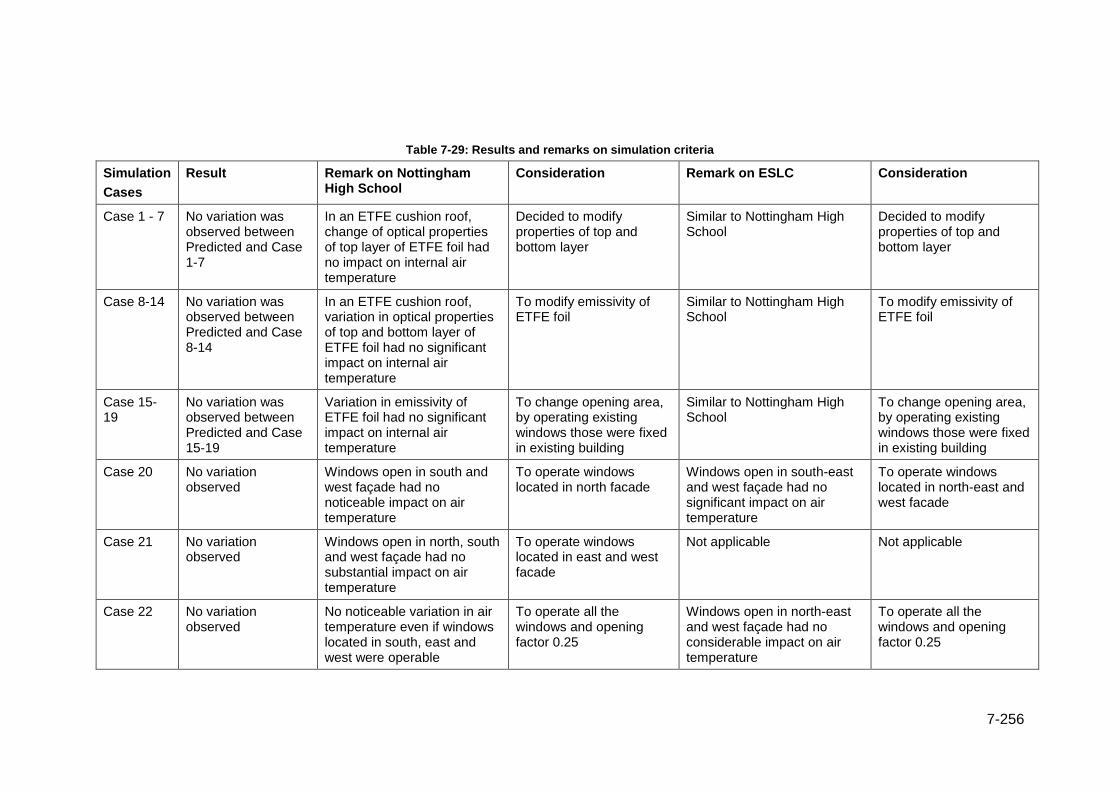
7-256
Table 7-29: Results and remarks on simulation criteria
Simulation
Cases
Result Remark on Nottingham High School
Consideration Remark on ESLC Consideration
Case 1 - 7 No variation was observed between Predicted and Case 1-7
In an ETFE cushion roof, change of optical properties of top layer of ETFE foil had no impact on internal air temperature
Decided to modify properties of top and bottom layer
Similar to Nottingham High School
Decided to modify properties of top and bottom layer
Case 8-14 No variation was observed between Predicted and Case 8-14
In an ETFE cushion roof, variation in optical properties of top and bottom layer of ETFE foil had no significant impact on internal air temperature
To modify emissivity of ETFE foil
Similar to Nottingham High School
To modify emissivity of ETFE foil
Case 15-19
No variation was observed between Predicted and Case 15-19
Variation in emissivity of ETFE foil had no significant impact on internal air temperature
To change opening area, by operating existing windows those were fixed in existing building
Similar to Nottingham High School
To change opening area, by operating existing windows those were fixed in existing building
Case 20 No variation observed
Windows open in south and west façade had no noticeable impact on air temperature
To operate windows located in north facade
Windows open in south-east and west façade had no significant impact on air temperature
To operate windows located in north-east and west facade
Case 21 No variation observed
Windows open in north, south and west façade had no substantial impact on air temperature
To operate windows located in east and west facade
Not applicable Not applicable
Case 22 No variation observed
No noticeable variation in air temperature even if windows located in south, east and west were operable
To operate all the windows and opening factor 0.25
Windows open in north-east and west façade had no considerable impact on air temperature
To operate all the windows and opening factor 0.25

7-257
(Table 7-29 continued)
Case 23 No significant variation observed
Even if the all the windows were 25% open, this had no significant impact on air temperature of the second floor
Increase opening factor to 0.5.
Condition observed was similar to that of Nottingham High School atrium
Increase opening factor to 0.5.
Case 24 Air temperature was on average 0.5°C~0.6°C lower
than predicted air temperature
Maximum reduction 0.7°C
17.5% of occupied hour air temperature was above maximum acceptable temperature (Tmax) [20% of hour occupied hour predicted air temperature was hotter than Tmax]
Did not fulfil comfort criteria stated in CIBSE TM52, CIBSE TM57.
To increase opening factor to 0.75.
35.33% of occupied hour air temperature was above maximum acceptable temperature (Tmax) [42% of hours occupied hour predicted air temperature was hotter than Tmax]
Did not fulfil comfort criteria stated in CIBSE TM52, CIBSE TM57.
To increase opening factor to 0.75.
Case 25 On average air temperature reduced by 0.6°C ~0.9°C from predicted model
Maximum reduction 1 °C
Similar to Case 24 Did not fulfil comfort criteria stated in CIBSE TM52, CIBSE TM57.
To increase opening factor to 1.
33.33% of occupied hour air temperature was above maximum acceptable temperature
Did not fulfil comfort criteria stated in CIBSE TM52, CIBSE TM57.
To increase opening factor to 1.
Case 26 Air temperature reduced by 0.8°C ~1.2°C, maximum 1.44°C reduced from predicted air temperature
15% of occupied hour air temperature above maximum acceptable temperature (Tmax)
Even if all the windows opened 100%, air temperature of the second floor of the atrium did not fulfil comfort criteria stated in CIBSE TM52, CIBSE TM57.
31% of occupied hour air temperature was above maximum acceptable temperature
Even if all the windows opened 100%, air temperature of second floor of the atrium did not fulfil comfort criteria stated in CIBSE TM52, CIBSE TM57.
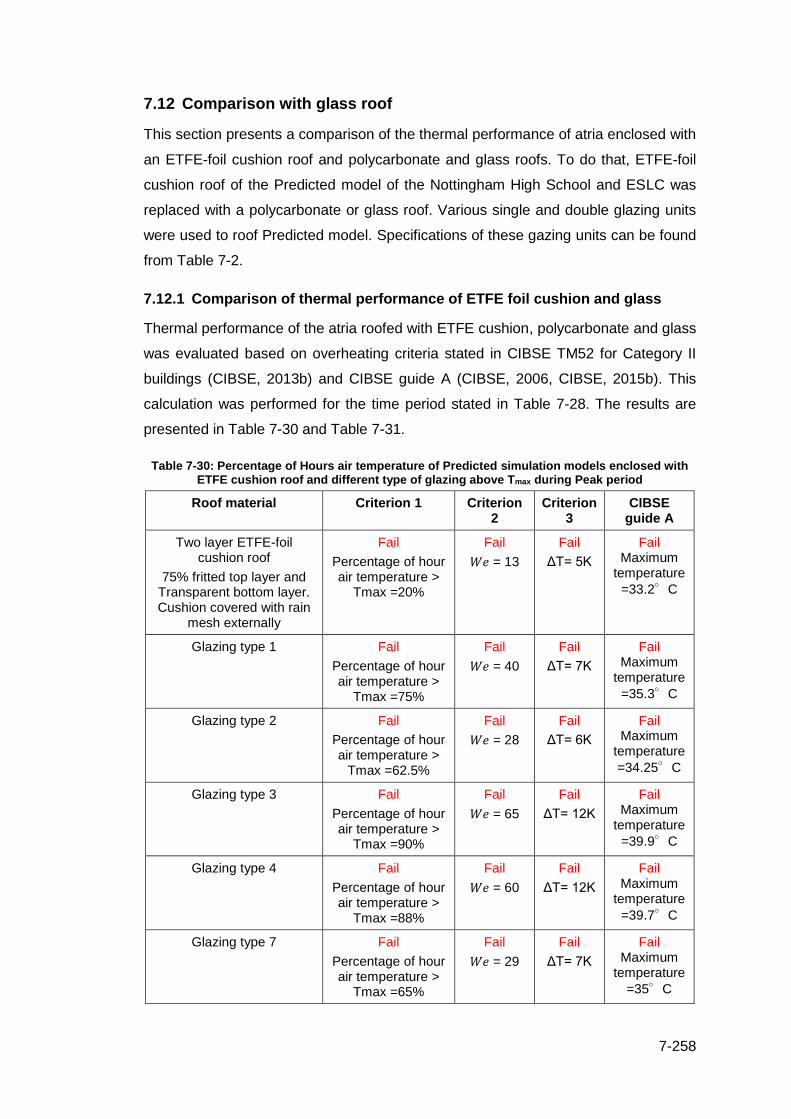
7-258
7.12 Comparison with glass roof
This section presents a comparison of the thermal performance of atria enclosed with
an ETFE-foil cushion roof and polycarbonate and glass roofs. To do that, ETFE-foil
cushion roof of the Predicted model of the Nottingham High School and ESLC was
replaced with a polycarbonate or glass roof. Various single and double glazing units
were used to roof Predicted model. Specifications of these gazing units can be found
from Table 7-2.
7.12.1 Comparison of thermal performance of ETFE foil cushion and glass
Thermal performance of the atria roofed with ETFE cushion, polycarbonate and glass
was evaluated based on overheating criteria stated in CIBSE TM52 for Category II
buildings (CIBSE, 2013b) and CIBSE guide A (CIBSE, 2006, CIBSE, 2015b). This
calculation was performed for the time period stated in Table 7-28. The results are
presented in Table 7-30 and Table 7-31.
Table 7-30: Percentage of Hours air temperature of Predicted simulation models enclosed with ETFE cushion roof and different type of glazing above Tmax during Peak period
Roof material Criterion 1 Criterion 2
Criterion 3
CIBSE guide A
Two layer ETFE-foil cushion roof
75% fritted top layer and Transparent bottom layer. Cushion covered with rain
mesh externally
Fail
Percentage of hour air temperature >
Tmax =20%
Fail
𝑊𝑒 = 13
Fail
ΔT= 5K
Fail Maximum
temperature
=33.2°C
Glazing type 1 Fail
Percentage of hour air temperature >
Tmax =75%
Fail
𝑊𝑒 = 40
Fail
ΔT= 7K
Fail Maximum
temperature
=35.3°C
Glazing type 2 Fail
Percentage of hour air temperature >
Tmax =62.5%
Fail
𝑊𝑒 = 28
Fail
ΔT= 6K
Fail Maximum
temperature
=34.25°C
Glazing type 3 Fail
Percentage of hour air temperature >
Tmax =90%
Fail
𝑊𝑒 = 65
Fail
ΔT= 12K
Fail Maximum
temperature
=39.9°C
Glazing type 4 Fail
Percentage of hour air temperature >
Tmax =88%
Fail
𝑊𝑒 = 60
Fail
ΔT= 12K
Fail Maximum
temperature
=39.7°C
Glazing type 7 Fail
Percentage of hour air temperature >
Tmax =65%
Fail
𝑊𝑒 = 29
Fail
ΔT= 7K
Fail Maximum
temperature
=35°C

7-259
Table 7-31: Percentage of Hours air temperature of Predicted simulation models enclosed with ETFE cushion roof and different type of glazing above Tmax during Peak period
Roof material Criterion 1 Criterion 2 Criterion 3 CIBSE guide A
ETFE cushion roof
Three layer ETFE-foil cushion with 65% fritted top layer,
transparent bottom and middle layers
Fail
Percentage of hour air temperature >
Tmax =42%
Fail
𝑊𝑒 = 45
Fail
ΔT= 8K
Fail Maximum
temperature
=37°C
Glazing type 1 Fail
Percentage of hour air temperature > Tmax =46.67%
Fail
𝑊𝑒 = 43
Fail
ΔT= 8K
Fail Maximum
temperature
=37°C
Glazing type 2 Fail
Percentage of hour air temperature > Tmax =46.67%
Fail
𝑊𝑒 = 42
Fail
ΔT= 8K
Fail Maximum
temperature
=37°C
Glazing type 3 Percentage of hour air temperature >
Tmax =60%
Fail
𝑊𝑒 = 65
Fail
ΔT= 11K
Fail Maximum
temperature
=39.5°C
Glazing type 4 Fail
Percentage of hour air temperature >
Tmax =58%
Fail
𝑊𝑒 = 63
Fail
ΔT= 11K
Fail Maximum
temperature
=39.8°C
Glazing type 7 Fail
Percentage of hour air temperature > Tmax =46.67%
Fail
𝑊𝑒 = 48
Fail
ΔT= 9K
Fail Maximum
temperature
=37.5°C
The results showed that all of the simulation models with two-layer and three-layer
ETFE foil cushion roof, polycarbonate and glass roofs failed to meet the criteria stated
in CIBSE TM52 and CIBSE guide A. Therefore, the model roofed two-layer and three-
layer ETFE foil cushion roof, polycarbonate and glass roofs were overheated.
7.12.2 Comparison of energy consumption of ETFE foil cushions,
polycarbonate and glass
During the selected period stated in Table 7-28 cooling loads were calculated for the
atrium spaces covered with two-layer and three-layer ETFE-foil cushion roofs,
polycarbonate and glass roofs. The results showed that cooling load of the predicted
model of the ESLC (roofed with three-layer ETFE foil cushion) was higher than that of
the Nottingham High School (roofed with two-layer ETFE foil cushion). Figure 7-21
presents cooling loads of the predicted model of the Nottingham High School and
cooling load of this same model when covered with Glazing type 1, 2 and 3. Whereas
Figure 7-22 states cooling load of the predicted model of the ESLC and cooling load

7-260
of this same model when it was roofed with Glazing type 1, 2 and 3. The results,
demonstrated that during peak periods the cooling load of the Nottingham High School
model when enclosed with two-layer ETFE-foil cushion roof, was up to 42.5% less than
that of the same model when enclosed with a glazed roofs. During this period, the
cooling load of the predicted model of the ESLC enclosed with ETFE roof was also
less (up to 14.5%) than that of model enclosed with glazed roofs, Glazing type 3 roof
in particular.
Insulation properties of three-layer the ETFE-foil cushion roof compared to the two-
layer ETFE-foil was better due to the extra layer of air and ETFE-foil. Moreover, fritting
and rain mesh reduced solar gain by creating shading in the model enclosed with the
two-layer ETFE-foil cushion roof. As a result, cooling load of the model enclosed with
three-layer ETFE-foil cushion roof was higher than the two-layer ETFE-foil cushion
roof. However, a glazing panel with low- E coating also caused a significant rise in air
temperature of the spaces and, due to the presence of the low-E coating which limits
heat exchange between warm indoor towards relatively cold outdoor, increased the
cooling load of the spaces.
Figure 7-21: Cooling load in Predicted model of Nottingham High School, roofed with two layer ETFE cushion and Glass type 1, 2, 3

7-261
Figure 7-22: Cooling load in Predicted model of ESLC, roofed with three layer ETFE cushion and Glass type 1, 2, 3
7.13 Future weather data
A simulation approach was used to investigate the thermal performance of the atria of
Nottingham High School and the ESLC in 2050 and 2080 using UKCIP climate change
scenarios.
The objective of this section is to investigate the performance of the Nottingham High
School and the ESLC in 2050 and 2080 to see how these models will perform in future.
This was done by changing the weather file while all other input parameters of the
simulation were similar to the Predicted models of both of the buildings.
7.13.1 The result
Table 7-32 presents percentage of occupied hours when the air temperature of the
second floor (Level 3) of the atrium was hotter than the maximum acceptable
temperature (Tmax) during 2015, 2050 and 2080. This maximum acceptable
temperature (Tmax) was calculated based on outdoor air temperature which was
obtained from the weather file for the year 2050 and 2080.

7-262
Table 7-32: Projected Scenario of the predicted model of the Nottingham High School and ESLC
Period Nottingham High School
ESLC
Time period considered in simulation
Between 18th June and 3rd July
Number of occupied hours 96 108
Atrium level Level 3 (Second floor)
2015 8% of occupied hours > Tmax
17.6% of occupied hours > Tmax
2050 16.67% of occupied hours > Tmax
37.2% of occupied hours > Tmax
2080 21.88% of occupied hours > Tmax
48.5% of occupied hours > Tmax
The result of the simulation showed that both of these atria will also face the
overheating problems in 2050 and 2080. Nevertheless, the extent of overheating will
be higher than that observed in the recent time (2015).
7.14 Summary
This chapter presented simulation-based analysis to evaluate and compare the
thermal performance of the atria enclosed with ETFE-foil cushion, polycarbonate and
glass roofs with a view to identifying the specific influence of these construction
materials may induce.
To represent doubly curved surfaces in the simulation was a difficult task. Therefore,
a procedure was developed to represent the roof configuration of ETFE-foil cushions
in the simulation model. Using this roof configuration, simulation of atria enclosed with
ETFE-foil cushion roofs was completed. Simulation models were calibrated by
validating results with the measured data and the results agreed well. The calibration
process indicated that occupancy profile, window opening, internal gains, and roof
shape etc., impact air temperature of both of the atria.
It was also identified that modelling the doubly curved surface of an ETFE-foil cushion
roof as flat panels could impact the accuracy of the predicted models. This was evident
in both of the atria.
The results from on-site monitoring identified that the atria overheated in summer 2015,
detailed findings were presented in Chapter 6. Therefore, an initiative was made to
apply alternative approaches to mitigate this overheating problem from both of the
atria. The results showed that by varying thermal optical properties of ETFE-foil
cushion, it was not possible to eliminate existing overheating problems. However, in
both of the atria, by opening existing windows 100% for 24 hours, it was possible to

7-263
reduce the number of hours when indoor air temperatures were below the maximum
acceptable temperature Tmax. Thus, window opening influenced indoor thermal
environment. This result was consistent with Moosavi et al. (2014). However, this
criterion was not able to fulfil the criteria stated in CIBSE TM52 to mitigate overheating.
Besides it may not be a realistic solution that windows will be open 100% for 24 hours.
The results of the study also showed that indoor air temperature of the modelled test-
rig enclosed with two-layer and three-layer ETFE-foil panels was hotter than when
covered with a double glazing unit constructed of polycarbonate (e.g. Glazing type 1
and 2). The results further show that indoor air temperature of spaces (replicated
model of the test- rig and both atria) configured with double glazing panels with low-E
coating was hotter when enclosed with two and three-layer ETFE-foil flat panels as
well as cushions.
Comparison of air temperature of atria covered with two-layer and three-layer ETFE-
foil cushion, polycarbonate and glass roofs showed that atria covered with glazed roofs
were also overheated. Moreover, the extent of overheating was higher in the atria when
enclosed with a glass roof than ETFE-foil cushion roof.
The simulation also measured the energy consumption for both of the atria. The results
showed that cooling load of the predicted model of the ESLC (roofed with three-layer
ETFE foil cushion) was higher than that of the Nottingham High School (roofed with
two-layer ETFE foil cushion). The results also showed that atria with double glazing
with low-E coating increased cooling load compared with an ETFE-foil cushion roof
(both two-layer and three-layer).
The thermal environment is largely influenced by solar gain, internal gains, ventilation
opportunities and construction U-values of the space; roof configuration may have an
impact on the internal thermal environment as well. The insulation properties were
improved for three-layer ETFE-foil cushions (used in the ESLC) compared to two-layer
ETFE-foil cushions (used in Nottingham High School) may cause to stabilise the high
temperature for longer period. Also, fritting and rain mesh (used in Nottingham High
School) may reduce direct solar gain by creating shading in the space enclosed with
two-layer the ETFE-foil cushion roof. As a result, cooling load of the model enclosed
with the three-layer ETFE-foil cushion roof was higher than the two-layer ETFE-foil
cushion roof. However, a glazing panel with low-E coating also caused a significant
rise in the indoor air temperature, this may be because the presence of low-E coating
limits heat exchange between warm indoor towards relatively cold outdoor, therefore
increased required cooling load.

7-264
Simulation performed using projected climate scenarios showed that both of the atria
will be overheated in 2050 and 2080, however it is expected that the extent of
overheating will be higher than that observed in this study.

8-265
Chapter 8
8 Discussion and Conclusions
8.1 Introduction
This chapter summarises the findings from previous chapters and draws conclusions.
The results are analysed critically and correlated to obtain the collective outcome of
the empirical research. At the beginning, the chapter presents a summary of results
gathered through experimental investigation of ETFE-foil material properties; data
collection and analysis from onsite monitoring; and simulation. This chapter also
evaluates the research methods adopted to conduct the research. A set of design
recommendations are proposed on the basis of theoretical knowledge and findings
obtained from the empirical studies. Finally, the chapter discusses the fulfilment of
research aim and objectives. Novelty of the study and contribution to the knowledge
are discussed with limitations and future research.
8.2 Summary of findings
8.2.1 Investigation of thermal-optical properties
Experimental investigations were carried out to determine the thermal-optical
properties of ETFE-foils. ETFE-foil samples were selected which are typically used in
the construction of building envelopes. On the basis of measured thermal-optical
properties of foil samples, properties of single, two- and three-layer ETFE-foils were
calculated. Thermal-optical behaviour was identified for a range of combinations of
single, two- and three-layer ETFE-foil panels. A list of various combinations is
presented in Table 8-1 and a summary of identified thermal-optical properties of these
combinations are presented Table 8-2. Detailed descriptions of foil types and
combinations, and methods used in these investigations were presented in Chapter 4.
Thermal-optical properties of single, two- and three-layer foils developed knowledge
on solar and light transmittance of different types of ETFE-foil and combination of
ETFE-foils which was one of the barriers in the development of ETFE-foil and its
building integration, particularly for the fritted foil types. This information about
properties will enable designers to select ETFE-foils to integrate in building envelopes
in the form of cushions or panels, depending on the functional requirement of the
spaces.

8-266
Thermal transmittance of a two layer ETFE-foil cushion was also determined using a
steady-state method. Detail methodological descriptions are discussed in Chapter 4
(section 4.7). The results summarised that thermal transmittance (U-value) of a single
cushion varied at different cross sections (see Figure 4-13). This variation was due to
the influence of air conductance that varies in the same cushion due to curvature. As
a result, the thermal transmittance of the middle of the cushion (highest point in the
camber) was less than near the edge. Thermal transmittance is also influenced by
emissivity, such that the thermal transmittance of ETFE-foil cushion decreases as the
emissivity of foil layers’ increases. This was the result of the reduction in radiation
conductance in the ETFE-foil cushion due to the increase of emissivity of ETFE-foil
layers.

8-267
Table 8-1: List of properties, and combination of single, two and three-layer ETFE-foils
Properties of Single Layer ETFE-foils Combination of Two Layer ETFE- foil panels
Combination of Three Layer ETFE-foil panels
Type (single layer)
Thick-ness
Transparent part
Fritted part
Colour of fritting (density of pigment)
Combi-nation
Layer 1 (single layer type)
Layer 2 (single layer type)
Combi-nation
Layer 1 (singles layer type)
Layer 2 (single layer type)
Layer 3 (single layer type)
Type 1 100µm 100% - - Combination 1
Type 3 Type 6.1 Combination 16
Type 3 Type 1 Type 6.1
Type 2 150µm 100% - - Combination 2
Type 3 Type 6.2 Combination 17
Type 3 Type 1 Type 6.2
Type 3 200µm 100% - - Combination 3
Type 3 Type 6.3 Combination 18
Type 3 Type 1 Type 6.3
Type 4 300µm 100% - - Combination 4
Type 3 Type 6.4 Combination 19
Type 3 Type 1 Type 6.4
Type 5 500µm 100% - - Combination 5
Type 3 Type 6.5 Combination 20
Type 3 Type 1 Type 6.5
Type 6.1 200µm 75% 25% 25% silver (translucent)
Combination 6
Type 3 Type 7.1 Combination 21
Type 3 Type 1 Type 7.1
Type 6.2 200µm 50% 50% 25% silver (translucent)
Combination 7
Type 3 Type 7.2 Combination 22
Type 3 Type 1 Type 7.2
Type 6.3 200µm 35% 65% 25% silver (translucent)
Combination 8
Type 3 Type 7.3 Combination 23
Type 3 Type 1 Type 7.3
Type 6.4 200µm 25% 75% 25% silver (translucent)
Combination 9
Type 3 Type 7.4 Combination 24
Type 3 Type 1 Type 7.4
Type 6.5 200µm 11% 89% 25% silver (translucent)
Combination 10
Type 3 Type 7.5 Combination 25
Type 3 Type 1 Type 7.5
Type 7.1 200µm 75% 25% 50% silver (translucent)
Combination 11
Type 3 Type 8.1 Combination 26
Type 3 Type 1 Type 8.1

8-268
(Table 8-1 continued)
Properties of Single Layer ETFE-foils Combination of Two Layer ETFE- foil panels
Combination of Three Layer ETFE-foil panels
Type (single layer)
Thick-ness
Transparent part
Fritted part
Colour of fritting (density of pigment)
Combi-nation
Layer 1 (single layer type)
Layer 2 (single layer type)
Combi-nation
Layer 1 (singles layer type)
Layer 2 (single layer type)
Layer 3 (single layer type)
Type 7.2 200µm 50% 50% 50% silver (translucent)
Combination 12
Type 3 Type 8.2 Combination 27
Type 3 Type 1 Type 8.2
Type 7.3 200µm 35% 65% 50% silver (translucent)
Combination 13
Type 3 Type 8.3 Combination 28
Type 3 Type 1 Type 8.3
Type 7.4 200µm 25% 75% 50% silver (translucent)
Combination 14
Type 3 Type 8.4 Combination 29
Type 3 Type 1 Type 8.4
Type 7.5 200µm 11% 89% 50% silver (translucent)
Combination 15
Type 3 Type 8.5 Combination 30
Type 3 Type 1 Type 8.5
Type 8.1 200µm 75% 25% 100% silver (opaque)
Type 8.2 200µm 50% 50% 100% silver (opaque)
Type 8.3 200µm 35% 65% 100% silver (opaque)
Type 8.4 200µm 25% 75% 100% silver (opaque)
Type 8.5 200µm 11% 89% 100% silver (opaque)

8-269
Table 8-2: Thermal optical properties of single, two- and three-layer ETFE-foils
Single layer Double layer Three layer
Type (single layer)
Solar transmittance
Light transmittance
Combination Solar transmittance
Light transmittance
Type (three
Layer)
Solar transmittance
Light transmittance
Type 1 0.91 0.905 Combination 1 0.644 0.62 Combination 16 0.6 0.586
Type 2 0.87 0.859 Combination 2 0.53 0.52 Combination 17 0.5 0.494
Type 3 0.86 0.84 Combination 3 0.46 0.456 Combination 18 0.44 0.435
Type 4 0.794 0.763 Combination 4 0.436 0.434 Combination 19 0.42 0.415
Type 5 0.76 0.724 Combination 5 0.345 0.349 Combination 20 0.33 0.336
Type 6.1 0.719 0.708 Combination 6 0.594 0.574 Combination 21 0.56 0.542
Type 6.2 0.582 0.578 Combination 7 0.43 0.415 Combination 22 0.41 0.398
Type 6.3 0.499 0.5 Combination 8 0.325 0.314 Combination 23 0.31 0.304
Type 6.4 0.472 0.4739 Combination 9 0.289 0.28 Combination 24 0.28 0.272
Type 6.5 0.367 0.375 Combination 10 0.15 0.145 Combination 25 0.148 0.143
Type 7.1 0.66 0.645 Combination 11 0.58 0.562 Combination 26 0.55 0.53
Type 7.2 0.464 0.45 Combination 12 0.4 0.389 Combination 27 0.385 0.374
Type 7.3 0.346 0.335 Combination 13 0.286 0.28 Combination 28 0.277 0.2715
Type 7.4 0.307 0.304 Combination 14 0.25 0.24 Combination 29 0.243 0.236
Type 7.5 0.157 0.149 Combination 15 0.1 0.094 Combination 30 0.096 0.093
Type 8.1 0.645 0.63
Type 8.2 0.434 0.422
Type 8.3 0.307 0.296
Type 8.4 0.265 0.255
Type 8.5 0.1044 0.096

8-270
The steady-state method was employed here to calculate thermal transmittance of two
layer ETFE-foil cushion. This derived value was 93% (3.12 W/m2K, middle of the
cushion) to 82% (3.55 W/m2K, edge of the cushion) of the value (see Table 4-6)
presented in Poirazis et al. (2009). Therefore, using the method stated in BS 6993:
Part 1 (BSI 1989), it is possible to generate U-values. However, these values need to
be verified using other established methods such as Hot-Box testing. On the basis of
the results obtained on thermal transmittance, a number of assumptions can be made
which might impact the thermal performance of ETFE-foil cushion and spaces
enclosed with ETFE-foil cushion envelope by allowing or limiting exchange of heat with
the external thermal environment.
8.2.2 Summary of findings from test-rig experiment
This study analysed the thermal performance of single, two- and three- layer ETFE-
foil panels in an experimental environment in two phases.
In the first phase of the experiment, solar transmittance of single, two- and three- layer
ETFE-foil panels were measured through on-site monitoring in test-rigs placed in the
outdoor environment. The results obtained from this experiment demonstrated that
under actual outdoor environment, solar transmittance of ETFE-foil panels varied
during different times of the day depending on the position of the sun.
In the second phase of the experiment the thermal performance of the single, two- and
three- layer ETFE-foil panels were evaluated though on-site monitoring using test-rigs
in the outdoor environment. The results showed that-
• Surface temperature of the ETFE-foil and the thermal environment of the test-
rig changed rapidly as a result of the variations in the outdoor conditions e.g.
solar radiation, outdoor temperature etc.
• Under the same external condition, heat was better preserved in the test-rig
enclosed with three-layer ETFE-foil panel system, than with the two-layer
ETFE-foil panel system.
• Density of fritting also influenced thermal environment enclosed with ETFE-foil
panel by reducing solar gain.
• Thermal environment of the test-rigs were affected by the variations in the
surface temperatures of ETFE-foils and, the air temperature of the air-volume
enclosed with ETFE-foils, by convective and radiative heat transfer
mechanism.

8-271
• During the day this heat transfer was dominated by short-wave radiation and
increased mean radiant temperature of the adjacent air. Whereas at night, due
to the impact of long-wave radiation exchange between the surface of ETFE-
foil and cold night sky, foil surface temperature decreased, this, in turn, reduced
heat transfers in air and ETFE-foil layers, and also reduced mean radiant
temperature of the air adjacent to it.
• In this experiment impact of rain-mesh on the test-rigs’ air temperatures were
evident in (Figure 5-33). The shading created by rain-mesh reduced foil
surfaces temperatures as well as air temperatures inside the test-rig.
8.2.3 Summary of findings from on-site monitoring of actual buildings
Environmental data was collected from two different atria with different configurations
of ETFE-foil cushion roof.
8.2.3.1 Thermal behaviour of spaces enclosed with ETFE-foil cushion roof
Thermal behaviour was studied based on clear sky conditions and overcast sky
conditions.
Thermal environment, on a typical sunny day was particularly influenced by the surface
temperature of ETFE-foil cushion, radiant temperature, solar gain into the enclosure
and, outdoor air temperature. Typically, during an overcast day, this thermal
environment was more stable with relatively uniform temperature distribution.
The roof demonstrated more extreme thermal behavior under clear sky conditions
where both direct solar and long-wave infrared radiation appeared to govern the
fluctuations of the ETFE-foil surface temperatures.
It was apparent that, outdoor temperatures, as well as transmitted solar radiation, had
a strong positive relationship with the indoor air temperatures of occupied levels and,
level adjacent to ETFE-foil cushion roof, while the surface temperatures of ETFE-foil
cushion were strongly related with adjacent mean radiant temperature (Correlation
coefficient R2 value ranged from 0.952 to 0.984).
The thermal environment observed in both of the atria on overcast days in summer
was similar. However, on hot summer days during the day the extent of stratification
was more significant in the ESLC atrium (enclosed with three-layer cushion) than the
Nottingham High School atrium (enclosed with two-layer cushion). Whereas, at night
air temperature of the ESLC atrium was on average 2°C less than the average air
temperature of the Nottingham High School atrium. Table 8-3 and Table 8-4
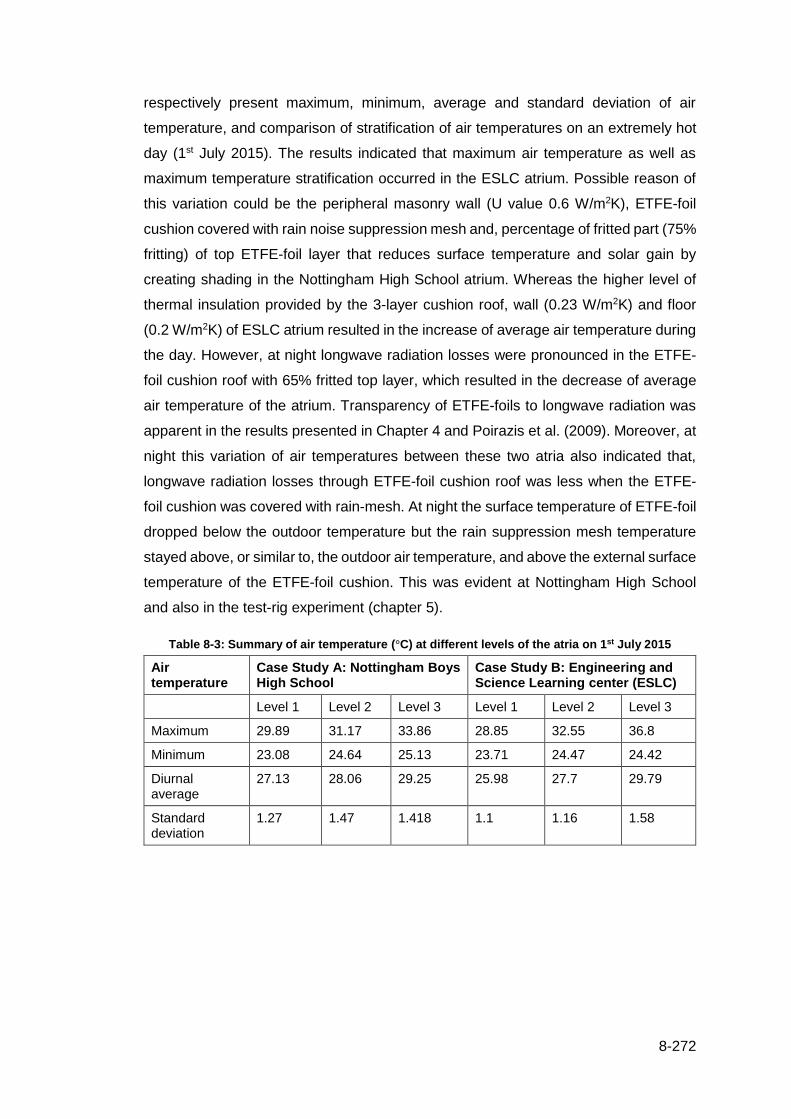
8-272
respectively present maximum, minimum, average and standard deviation of air
temperature, and comparison of stratification of air temperatures on an extremely hot
day (1st July 2015). The results indicated that maximum air temperature as well as
maximum temperature stratification occurred in the ESLC atrium. Possible reason of
this variation could be the peripheral masonry wall (U value 0.6 W/m2K), ETFE-foil
cushion covered with rain noise suppression mesh and, percentage of fritted part (75%
fritting) of top ETFE-foil layer that reduces surface temperature and solar gain by
creating shading in the Nottingham High School atrium. Whereas the higher level of
thermal insulation provided by the 3-layer cushion roof, wall (0.23 W/m2K) and floor
(0.2 W/m2K) of ESLC atrium resulted in the increase of average air temperature during
the day. However, at night longwave radiation losses were pronounced in the ETFE-
foil cushion roof with 65% fritted top layer, which resulted in the decrease of average
air temperature of the atrium. Transparency of ETFE-foils to longwave radiation was
apparent in the results presented in Chapter 4 and Poirazis et al. (2009). Moreover, at
night this variation of air temperatures between these two atria also indicated that,
longwave radiation losses through ETFE-foil cushion roof was less when the ETFE-
foil cushion was covered with rain-mesh. At night the surface temperature of ETFE-foil
dropped below the outdoor temperature but the rain suppression mesh temperature
stayed above, or similar to, the outdoor air temperature, and above the external surface
temperature of the ETFE-foil cushion. This was evident at Nottingham High School
and also in the test-rig experiment (chapter 5).
Table 8-3: Summary of air temperature (°C) at different levels of the atria on 1st July 2015
Air temperature
Case Study A: Nottingham Boys High School
Case Study B: Engineering and Science Learning center (ESLC)
Level 1 Level 2 Level 3 Level 1 Level 2 Level 3
Maximum 29.89 31.17 33.86 28.85 32.55 36.8
Minimum 23.08 24.64 25.13 23.71 24.47 24.42
Diurnal average
27.13 28.06 29.25 25.98 27.7 29.79
Standard deviation
1.27 1.47 1.418 1.1 1.16 1.58
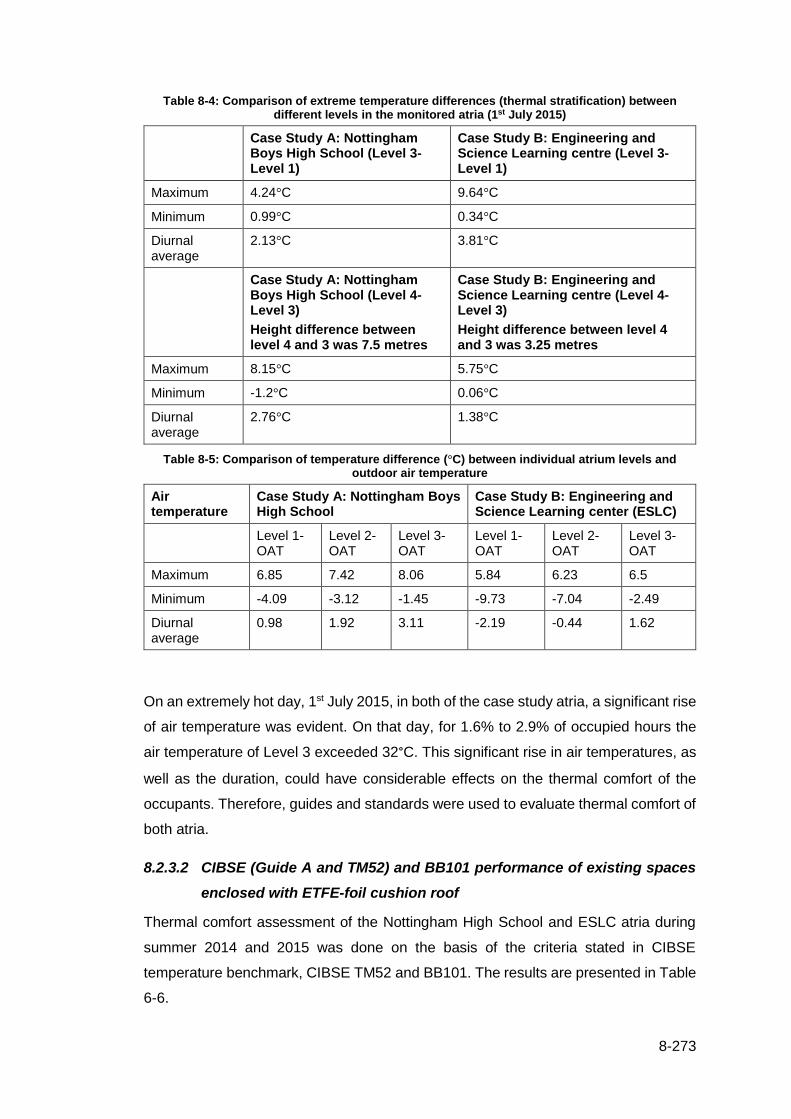
8-273
Table 8-4: Comparison of extreme temperature differences (thermal stratification) between different levels in the monitored atria (1st July 2015)
Case Study A: Nottingham Boys High School (Level 3-Level 1)
Case Study B: Engineering and Science Learning centre (Level 3-Level 1)
Maximum 4.24°C 9.64°C
Minimum 0.99°C 0.34°C
Diurnal average
2.13°C 3.81°C
Case Study A: Nottingham Boys High School (Level 4-Level 3)
Height difference between level 4 and 3 was 7.5 metres
Case Study B: Engineering and Science Learning centre (Level 4-Level 3)
Height difference between level 4 and 3 was 3.25 metres
Maximum 8.15°C 5.75°C
Minimum -1.2°C 0.06°C
Diurnal average
2.76°C 1.38°C
Table 8-5: Comparison of temperature difference (°C) between individual atrium levels and outdoor air temperature
Air temperature
Case Study A: Nottingham Boys High School
Case Study B: Engineering and Science Learning center (ESLC)
Level 1-OAT
Level 2-OAT
Level 3-OAT
Level 1-OAT
Level 2-OAT
Level 3-OAT
Maximum 6.85 7.42 8.06 5.84 6.23 6.5
Minimum -4.09 -3.12 -1.45 -9.73 -7.04 -2.49
Diurnal average
0.98 1.92 3.11 -2.19 -0.44 1.62
On an extremely hot day, 1st July 2015, in both of the case study atria, a significant rise
of air temperature was evident. On that day, for 1.6% to 2.9% of occupied hours the
air temperature of Level 3 exceeded 32°C. This significant rise in air temperatures, as
well as the duration, could have considerable effects on the thermal comfort of the
occupants. Therefore, guides and standards were used to evaluate thermal comfort of
both atria.
8.2.3.2 CIBSE (Guide A and TM52) and BB101 performance of existing spaces
enclosed with ETFE-foil cushion roof
Thermal comfort assessment of the Nottingham High School and ESLC atria during
summer 2014 and 2015 was done on the basis of the criteria stated in CIBSE
temperature benchmark, CIBSE TM52 and BB101. The results are presented in Table
6-6.
8-274
Thermal comfort assessment showed that, Level 3 of the Nottingham High School
atrium 2.5% of occupied hours in summer, the air temperature went above 28°C. Even
during occupied hours, the air temperature at this level stayed above 32°C between
12.30pm and 15.00pm on 1st July 2015. Whereas for Level 3 of the ESLC atrium, for
3.17% (location a) and 7.35% (location b) of occupied hours the air temperature went
above 28°C. Moreover, the air temperature of location b of Level 3 of this atrium also
failed to comply with the CIBSE temperature benchmark during 2014 (Table 6-6), as
for 2.28% of occupied hours the temperature of this location went above 28°C.
In Nottingham High School atrium the Level 2 and 3 air temperature exceeded the
maximum acceptable temperature (Tmax) for 2.29% and 10.63% of occupied hours
respectively, whereas the daily weighted exceedance (We) was at a maximum of 7
(Level 2) and 13 (Level 3). Also for Level 3 the temperature difference (difference
between air temperature and Tmax) went above 4K for 1.67% of occupied hours.
Therefore, Level 2 and 3 of Nottingham High School atrium failed to comply with the
criteria stated in CIBSE TM52 (CIBSE, 2013b).
In the ESLC atrium, the Level 3 air temperature was above Tmax for 7.58% (location a)
and 9.75% (location b) of occupied hours, and the weighted exceedance was a
maximum of 36 (location a) and 42 (location b). Also for 0.94% (location a) and 1.49%
(location b) of occupied hours the temperature difference (difference between air
temperature and Tmax) went above 4K. Furthermore, the Level 2 air temperature
(location a) was above Tmax for 3.38% of occupied hours, and the weighted exceedance
was a maximum of 36. Thus, Level 3 and Level 2 of the ESLC atrium failed to meet
the criteria stated in CIBSE TM52 during 2015. Besides, location b of Level 3 also
failed to comply with the criteria during 2014, as for 4.9% of occupied hours the air
temperature of this location went above Tmax and the daily weighted exceedance (We)
was a maximum of 7. Thus, this level 3 (location b) also failed to meet the criteria
during summer 2014.
Again, in the Nottingham High School atrium the temperature difference between Level
3 and outdoor air temperature was above 5°C for 445 hours and Level 3 air
temperature went above 32°C, thus this level of the atrium also failed to comply with
the criteria stated in BB101.
Thus, the above results showed that in both of the atria (both Levels 2 and 3)
overheated during summer 2015. In the ESCL atrium, Location b of Level 3 also
overheated during summer 2014.

8-275
In the Nottingham High School, it was observed air conditioning systems were installed
on Level 3 of the atrium during August 2015. This might be one of the initiatives of the
school management to ease the excessive air temperatures experienced throughout
the summers of 2014 and 2015.
8.2.4 Summary of findings from modelling and simulation
The simulation based analysis evaluated the thermal performance of ETFE-foil
panels/cushions of two test-rigs and two case study buildings. The test-rigs were
covered with single, two- and three- layer ETFE-foil panels, and detailed descriptions
were presented in Chapter 5. The simulation model of the test-rig was also used to
investigate various glass panels to compare their thermal performance with that of the
ETFE-foil panels.
The results showed that-
• Internal air temperatures of the test-rig with two-layer and three-layer ETFE-foil
panels were hotter than the notional glazing unit constructed of polycarbonate
(e.g. Gtype 1 and 2). Between the ETFE-foil panels and the glazing panel
constructed with polycarbonate, the solar transmittance of polycarbonate
(0.203) was less than that of the two-layer and three-layer ETFE-foil panels.
However, the presence of air-volume in the ETFE-foil panels might also have
an impact on this temperature difference when compared with different glazing
types (Glass type 1, 2 and 7).
• It was also evident that the internal air temperatures of test-rig, roofed with a
double glazing [Glass type 3 (see Table 7.2)] unit with low-E coating were hotter
than both of the above two-layer and three-layer ETFE-foil panels. Also the
high solar transmittance of the double glazing unit (0.566) compared to ETFE-
foil panels (75% fritted two-layer solar transmittance was 0.42), while low
thermal transmittance (1.55 W/m2K) of glazing panels with low-E coating
reduced heat exchange between the interior and exterior, thus increased the
internal air temperature of simulation model.
Simulation based analysis was also conducted to evaluate alternative strategies to
improve thermal performance under current and projected climatic scenarios for the
two case study buildings. The thermal environment of the two existing atria covered
with different compositions of ETFE-foil cushion roof were evaluated. The two case
study buildings were the Nottingham High School (atrium roof configured with two-
layer ETFE-foil cushion), and Engineering and Science Learning Centre (atrium roof
8-276
configured with three-layer ETFE-foil cushion). These atria were investigated with
various strategies (e.g. by changing the thermal optical properties, the emissivity of
ETFE-foil cushion roof etc.) to improve their performance under current and UKCIP
projected climate scenarios. Finally, glass panels were applied instead of ETFE-foil
cushions for the atrium spaces of these two buildings and a comparative simulation
analysis is presented using current climate scenarios.
The simulation results agreed well with the monitored data for both of the atria and
indicated that:-
• With various alternative thermal optical properties of the ETFE-foil cushion
studied, it was not possible to overcome the existing overheating problem
under current scenarios in both of the simulated atria.
• Adequate ventilation through atria would be effective to mitigate overheating.
However, with the existing opening area in the two atria studied, it was not
possible to eliminate overheating from the large scale atria under current
scenarios.
• Both of the atria have a high risk of overheating under current and, projected
climate scenarios (2050, 2080). However, the extent of overheating will be
higher in future than that observed under current scenarios.
Comparison of air temperature of atria covered with ETFE-foil cushion and glass roof
under current scenarios showed that:-
• The extent of overheating was a maximum of 70% higher in the atria when
enclosed with a glass roof than an ETFE-foil cushion roof (model roofed with
double layer ETFE-foil cushion with 75% fritted top layer and rain mesh, similar
to the Nottingham High School atrium roof).
• Both of the atria modelled with two-layer and three-layer ETFE-foil cushion and
glass roofs failed to meet the criteria stated in CIBSE temperature benchmark
and CIBSE TM52. The results are presented in Table 7-30. As a consequence,
atria with glass roofs had increased cooling load in summer compared to ETFE-
foil cushion roof.
• During the peak period (a day with extreme outdoor temperature- 1st July 2015)
in summer the average cooling load of the atrium enclosed with three layer
ETFE-foil cushion roof was similar to (or slightly higher than) that with glass
panels. However, two-layer ETFE-foil cushion performed better than glass
panels.

8-277
• Therefore, ETFE-foil can be applied in the building envelope as an effective
alternative to a glass roof (double glazing). This not only improved the thermal
environment but also reduced energy consumption by 36.4% on the peak
summer day observed during 2015, 1st July.
8.3 Evaluation of methodology
To conduct the empirical research a mixed approach was adopted. Research methods
included experimental investigations in the laboratory, onsite monitoring of a test-rig
and actual buildings, and computer simulation.
Thermal-optical properties of ETFE-foils were determined by laboratory experiment
using the appropriate British Standard. During the experiment, a Biochrom Libra S22
spectrometer and a Fourier Transform Infrared spectrometer IFS 66v/s were used to
get the accurate results. The results obtained were validated by comparing with results
from previous similar studies. In a number of studies, a similar approach was applied
and found effective in determining thermal optical properties of ETFE-foils.
The steady-state method was used to calculate thermal transmittance of an ETFE-foil
cushion. This method required various input parameter such as conductance of air,
heat transfer co-efficient between exterior to interior, etc. Careful selection of data was
important to get the accurate results for this purpose.
The thermal performance of single, two and three layer ETFE-foil panels were
analysed by conducting a test-rig experiment. Transparent foils of different thickness
and two different percentages of fritted (75% and 25% fritted) ETFE-foils were used.
This method was challenging because the experimental setup had to be installed in an
exposed outdoor environment with a range of sensors and data-loggers installed in the
correct manner. This was a bespoke designed experimental setting considering the
above mentioned issues. Moreover, it was necessary to ensure that the ETFE- foil
panels could be fitted firmly to withstand extreme weather and could also be replaced
easily when required.
The experimental setup included data loggers, pyranometers, etc. Necessary
measures were taken to ensure security, such as the data logger being secured in a
box with a padlock; and the test-rig containing a pyranometer inside was secured with
ETFE-foil panels using padlocks, etc. The safety issue was considered for the users
of the adjacent space. Test-rigs were fixed to the roof paving, panels were clamped to
the test-rigs to protect them from being blown away by strong winds, etc. This
experimental study was completed in two phases. The first phase measured thermal

8-278
properties of single, two- and three- layer ETFE-foil using a test-rig under actual
outdoor conditions. The approach applied was similar to the method stated in ASTM
(1986b) with slight alteration. ASTM (1986b) specified use of the same experimental
box, with and without the test specimen, such that the solar transmittance will be the
ratio of average solar radiation transmitted through specimen (measured by a
pyranomteer), and the average solar radiation measured by the same pyranometer
without the specimen. However, in this study two separate test-rigs were placed side
by side (Test-rig 1 and Test-rig 2) with dedicated pyronameters for each. Test-rig 1
was capped with ETFE-foil panels whereas Test-rig 2 was without a cap to obtain
unobstructed solar radiation. Thus, the solar transmittance was obtained from the ratio
of the average solar radiation transmitted through ETFE-foil in Test rig 1, and the
average solar radiation incident in Test rig 2. This method was found more accurate
than method stated in ASTM (1986b) to measure the solar transmittance for single,
two- and three-layer ETFE-foil panels because in both of the test-rigs, the pyranometer
location was identical. Using this method, it was possible to determine solar
transmittance of the ETFE-foil panels under actual outdoor conditions. The results
obtained were validated with solar transmittance obtained from the laboratory
experiment, and accuracy was 88.2%-97%. Therefore, if the pyranometers are
properly calibrated as readings with and without the specimen are taken
simultaneously, under exactly the same weather conditions this method can be applied
to measure solar transmittance of ETFE-foil panels of different configurations.
The second phase of the experiment evaluated and compared thermal behaviour of
single, two- and three- layer ETFE-foil panels by measuring environmental data (e.g.
temperature, humidity, etc.) in a time series inside the test-rigs. Selection of foil layers
to construct ETFE-foil panels was completed carefully to ensure they were adequate
to meet the objective.
The thermal performance of spaces enclosed with a ETFE-foil cushion envelope was
investigated by conducting on-site monitoring of indoor environmental parameters from
two case study buildings. This was another challenging method in this study, that
required direct access to a school building and another institutional building, and
collection of data for a long period (two years approximately). Equipment to monitor
these buildings was carefully selected to meet research objectives while meeting the
budget constraints. It was also challenging to find appropriate locations to install
sensors and data logger. While identifying suitable locations for sensors and data
loggers the following issues were considered: safety for school users (particularly
pupils) and the researcher, ease of accessibility for regular maintenance purposes
8-279
(e.g. data download, etc.) and locations closer to the ETFE-foil cushion roof where
required. The method was verified by reviewing similar previous studies (Harvie, 1996,
Devulder, 2004, Croome and Moseley, 1984a, Wu et al., 1984) and it was identified
that a similar approach was effective to assess the thermal behaviour of spaces
enclosed with other light-weight envelopes.
To evaluate and compare the thermal performance of the spaces enclosed with ETFE-
foil cushions and glass roofs, simulation-based analysis was undertaken. The selection
of dynamic simulation software was validated by reviewing acceptability and validity of
the software by recognised institutions (e.g. CIBSE). To select the appropriate
approach for calibration of simulation models, various methods were reviewed. The
simulation models were calibrated using a systematic procedure described in Chapter
7. The calibration ensured the validity of the simulation model and developed
confidence with the final results.
8.4 Recommendations
It was identified from the onsite monitoring of actual spaces that the thermal
performance of the spaces is influenced by the surface temperatures of ETFE-foil and
temperature stratification during summer. Solar radiation and outdoor air temperature
affected the thermal environment significantly. Therefore, it is necessary to develop
approaches to reduce the impact of surface temperatures and extent of temperature
stratification. Furthermore, simulation results indicated that by varying thermal optical
properties of the ETFE-foil cushion roof it was not possible to eliminate overheating
from large scale atria with currently available material under current climatic scenarios.
The simulation also demonstrated that adequate ventilation through atria would be
effective to mitigate overheating. However, within the available opening area in both of
the atria studied, it was not possible to eliminate overheating in current and future
climatic scenarios. Improvement of the ventilation system was not included in the
scope of this research and should be considered in future research. This could be done
by applying alternative ventilation techniques such as cross ventilation, stack
ventilation, modification of inlet and outlet size located at lower and upper level of the
atrium etc. Controllable ventilation flaps can be incorporated in ETFE-foil cushion roofs
to potentially eliminate hot air zones at roof level. However, in-depth analysis is
necessary to determine the ventilation strategies that could be used in the existing
spaces to improve the indoor thermal environment.
It was evident from the study that rain suppression mesh reduced solar gain thus
reduced ETFE-foil surface temperature and internal air temperature by creating

8-280
shading. Similar to rain suppression mesh, a sun shading effect can be created with
partially opaque top and/or middle layers in a multilayer ETFE-foil cushion system. This
type of envelope has been used in building façades already and presented in Knippers
et al. (2011). However, further investigations are required to evaluate the performance
of spaces with this type of envelope systems. Solar shading can also be provided by
operable high-level solar blinds. Nevertheless, it is necessary to identify that these
shading systems should not absorb heat and contribute to increasing radiant
temperature of adjacent spaces.
It is also necessary to consider alternative design and construction strategies to lower
the internal surface temperatures of the ETFE-foil cushion, which, in turn, will reduce
mean radiant temperature in the enclosed spaces. Use of a water spray on a vertical
ETFE-foil panel was investigated by Mainini et al. (2016), and found effective in
reducing surface and air temperatures. However, it can be challenging to drain water
from cushions in the horizontal position, used in the roofs and also imposes high load
on the foil, possibly causing failure. Besides, water may be an expensive resource in
urban context.
It is necessary to assess different strategies to improve the performance of an ETFE-
foil cushion roof before implementation. This assessment can be done by using
building simulation or following data collection from an experimental setup or from
existing buildings where similar design strategies are already implemented. Simulation
based analysis has now become a widely recognised method to identify design
strategies for buildings. However, discrepancies between predicted and actual
performance may be wide, because output from simulation models is limited by the
assumptions made in the model, which do not always represent the actual use. This
may be exacerbated because dynamic simulation software e.g. EDSL Tas, IES VE etc.
do not currently include material templates for ETFE-foils. Without appropriate material
properties, it is not possible to accurately represent the actual building envelope in
simulation and could generate results with a high level of uncertainty. Thus, without
accurate information on thermal/optical properties of ETFE-foils, the simulation-based
approach cannot be used to achieve an effective solution. This area needs further
development. Alternatively, data collected from actual buildings measure the true
performance and may identify specific problems or risks. Nowadays, building
management systems (BMS) have become an integral part of new buildings and,
therefore, environmental data (e.g. air temperature, humidity, etc.) from existing
buildings are technically available. In this study, a part of data was collected from
sensors associated with the BMS system of ESLC, which represented location b (see
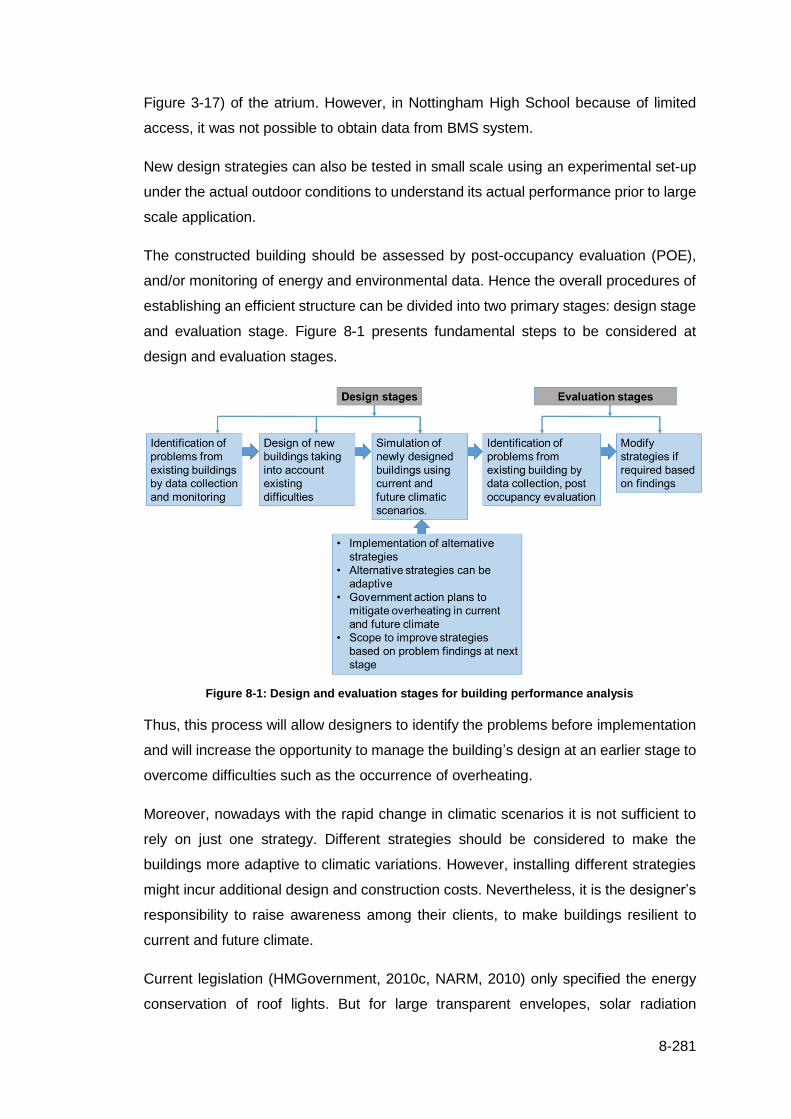
8-281
Figure 3-17) of the atrium. However, in Nottingham High School because of limited
access, it was not possible to obtain data from BMS system.
New design strategies can also be tested in small scale using an experimental set-up
under the actual outdoor conditions to understand its actual performance prior to large
scale application.
The constructed building should be assessed by post-occupancy evaluation (POE),
and/or monitoring of energy and environmental data. Hence the overall procedures of
establishing an efficient structure can be divided into two primary stages: design stage
and evaluation stage. Figure 8-1 presents fundamental steps to be considered at
design and evaluation stages.
Figure 8-1: Design and evaluation stages for building performance analysis
Thus, this process will allow designers to identify the problems before implementation
and will increase the opportunity to manage the building’s design at an earlier stage to
overcome difficulties such as the occurrence of overheating.
Moreover, nowadays with the rapid change in climatic scenarios it is not sufficient to
rely on just one strategy. Different strategies should be considered to make the
buildings more adaptive to climatic variations. However, installing different strategies
might incur additional design and construction costs. Nevertheless, it is the designer’s
responsibility to raise awareness among their clients, to make buildings resilient to
current and future climate.
Current legislation (HMGovernment, 2010c, NARM, 2010) only specified the energy
conservation of roof lights. But for large transparent envelopes, solar radiation

8-282
significantly affects thermal performance of the spaces they enclose. Therefore, it
would be desirable to improve legislation to provide specific guidelines to limiting solar
gain.
BS EN 410:2011 (BSI, 2011), was developed for luminous and solar characteristics of
glazing, therefore, only considered flat panels. Whereas, nowadays, ETFE-foil
cushions with double-curved surfaces are widely applied in building envelopes. Thus
it requires a standard method that can be used to determine overall thermal optical
properties of ETFE-foil cushions considering multiple reflections (Knippers et al., 2011)
occurring at the ETFE-foil cushion surfaces due to their curvature.
Simulation based analysis indicated that the thermal performance of ETFE-foil cushion
roofs was similar to or in some cases better than glass roofs. Although the space
enclosed with both ETFE-foil cushion and glass roofs was found to overheat during
summer, the extent of overheating was higher in the space enclosed with a glass roof
with a higher energy consumption (cooling load). This was apparent when comparing
the air temperature and cooling load of the atrium model, roofed with two-layer ETFE-
foil cushion with 75% fritted top layer and rain mesh, and glass roofs. Although the
solar transmittance of ETFE-foils (200μm transparent foil - 0.86) are higher than for
glasses considered (e.g. Glass type 3 - 0.566), but use of fritting and an additional
layer of ETFE-foil in the two-layer cushion system reduced solar transmittance to
(0.436). Moreover, rain mesh also reduced the internal air temperature by creating
shading (as was evident in the test rig experiment). Thus, use of a fritted layer and rain
mesh reduced the internal air temperature of the model with ETFE-foil cushion roof
when compared to the glass roof. Therefore, ETFE-foil with fritting and rain mesh can
be used as an effective alternative to glass. However, the field of application of ETFE-
foil requires further research to develop innovative systems that can be used to reduce
foil surface temperature as well as solar gain in ETFE-foil cushion enclosures. It is
required to take initiatives to improve the performance of ETFE-foil covered enclosures
to gain confidence in its field of application.
8.5 Conclusions and fulfillment of aim and objectives
8.5.1 Objective one
Objective one was to develop a knowledge base on properties of ETFE-foils and
ETFE-foil cushion construction; identify the thermal behaviour of fabric membranes
and spaces enclosed with fabric membrane envelope. To achieve this objective an
extensive literature review was conducted on related areas. The literature review

8-283
provided understanding about the topic and helped to narrow down the required
information to progress with the empirical study.
8.5.2 Objective two
Objective two was to determine thermal-optical properties of ETFE-foil, which was
achieved by conducting laboratory experiments and using the appropriate
methodology recommended by BS EN 410 (BSI 2011).
The novelty of this study was to be able to independently determine thermal optical
properties of single, two- and three- layer ETFE-foil panels including combinations of
transparent and fritted foils of different fritting percentage.
Results obtained compared well with previous studies, to develop confidence about
the thermal optical properties of ETFE-foil and multilayer cushions. However, further
studies are required.
8.5.3 Objective three
The objective three was to evaluate the thermal performance of single, two- and three-
layer ETFE-foil panels achieved by measuring thermal properties of test-rigs installed
in exposed outdoor environment. The results provided useful insight into the thermal
performance of different combinations of single, two- and three-layer foil panels under
actual outdoor conditions.
Conclusions:
The results obtained in the first phase of the test-rig experiment agreed reasonably
well (88.2% to 97%) with measured and calculated thermal properties (solar
transmittance) obtained from the laboratory experiment and BS EN 410. Thus, to
determine thermal properties (solar transmittance) of ETFE-foil panels the method was
useful.
In the lab it was only possible to measure thermal optical properties of single layer
ETFE-foil samples and difficulties arose while measuring these properties for fritted
foils. Therefore, the method incorporating test-rigs provided an opportunity to measure
directly the thermal properties (solar transmittance) of single, two- and three- layer
ETFE-foil panel of different combinations of fritted and transparent foils. Using this
method, the solar transmittance was measured over the range of sensitivity of the
pyranometer that covered ultra-violet to infra-red wavelength, which also covered the
total wavelength required to measure solar transmittance using BSI (2011). Thus,

8-284
depending on the sensitivity of the pyranometer, this method can be used to determine
the properties of multilayer systems and for future research.
The results obtained in the second phase showed how the number of foil layers and
air layers influenced the thermal performance of ETFE-foil panels by increasing (or
decreasing) the internal air temperature of the test-rig it enclosed. The effect of fritting
of various proportions and covering of the ETFE-foil panels with rain suppression mesh
on the rate of radiative and convective heat transfers between the foils and
intermediate air layers, and the influence this variation has on the enclosed air
temperature of the test-rig, was demonstrated for a number of commonly applied
multilayer systems. However, further studies in this area are required to gain
confidence about the developed methods.
8.5.4 Objective four
The objective four was to evaluate the thermal performance of occupied spaces
enclosed with an ETFE-foil cushion envelope, which was achieved by conducting on-
site monitoring of indoor environment parameters from two case study buildings. This
study was being able to evaluate thermal performance on the basis of overheating
assessment criteria and also presented a comparative analysis of thermal environment
of two different atria covered with different compositions of ETFE-foil cushion roof. The
novelty of this objective was it evaluated thermal performance of two separate atria
covered with two types of ETFE-foil cushion roof (two layer and three layer) and
presented a comparative study.
Conclusions:
The indoor thermal environment was found to vary depending on the type of envelope
system. Both buildings which have large transparent/ translucent ETFE-foil cushion
roofs were found to be at high risk of overheating in summer according to commonly
used assessment criteria - CIBSE temperature benchmark, CIBSE TM52, Building
Bulletin 101. Further studies are required in the field to develop more confidence about
the results.
8.5.5 Objective five
Objective five was to evaluate and compare thermal performance between the spaces
enclosed with ETFE-foil cushions and glass roofs using building simulation.
8-285
Conclusions:
A novel approach of modelling and simulating ETFE-foil cushion roofs was developed.
The approach was validated by comparing with actual measurements.
Comparative analysis of indoor air temperature distribution between similar enclosures
covered with either ETFE-foil cushions or glass panels demonstrated very similar
results. Both the simulated atrium spaces were found to overheat in current climate
scenarios.
The extent of overheating was higher in the atria when enclosed with a glass roof
compared to two-layer ETFE foil cushions. Results also demonstrated that atria with a
glass roof increased cooling load in summer. However, during a day with extreme
outdoor temperature in summer the average cooling load of the atrium enclosed with
three layer ETFE-foil cushion roof was similar to the glass roof.
Simulation of the test-rigs showed that the model with two- layer (with 75% fritted top
layer, 200 μm bottom layer) and three-layer ETFE-foil panel (with 25% fritted top layer,
100 μm middle and 200 μm bottom layer), and notional glazing unit constructed of poly
carbonate (e.g. Gtype 1 and 2) performed better than a typical double glazing unit with
low-E coating under summer conditions.
The low-E coated double glazing roof system was found to be more efficient in winter.
However, in summer, the thermal performance and energy consumption was better in
the simulation model enclosed with ETFE-foil cushion roofs.
8.5.6 Objective six
Objective six was to identify strategies to improve the thermal performance
(overheating) of spaces in current and projected climate scenarios. The objective was
achieved by applying alternative strategies in simulation to improve the thermal
performance of existing spaces enclosed with ETFE-foil cushion roofs under current
and projected climatic scenarios. Strategies were selected carefully to ensure they
were suitable to meet the anticipated objective.
Conclusions:
It was concluded that by varying thermal optical properties of the ETFE-foil cushion
roofs studied it was not possible to eliminate overheating in the studied enclosures
under current or projected climate scenarios, using currently available materials.

8-286
It was demonstrated that appropriately designed ventilation through the studied atria
would be effective to mitigate overheating under current and projected scenarios.
8.5.7 Objective seven
Objective seven was to identify implications of the research for designers and develop
design recommendations of ETFE-foil panels and spaces enclosed with ETFE-foil
cushion envelope. This objective was achieved by synthesizing theoretical knowledge
and findings from the empirical studies.
Conclusions:
Design recommendations for ETFE-foil covered enclosures were presented in section
8.5, based on:-
• reducing solar gain by shading, such as use of fritted layers and rain mesh to
actively reduce internal air temperature and foil surface temperature of the
ETFE-foil cushion
• updating of material libraries of current dynamic simulation software by adding
material templates for ETFE-foils based on this research to provide more
accurate simulations.
• application of improved and adequate ventilation strategies determined by
simulation
• consideration of projected as well as current climate scenarios in simulations
• collection of energy and environmental data, and post occupancy evaluation in
completed buildings covered with ETFE-foil to determine any health and safety
risks resulting from unexpected indoor environmental factors (e.g. overheating,
excessive glare, etc.).
• revision of legislation to take into account energy conservation characteristics
of the light-weight envelope like ETFE-foil cushions.
8.6 Novelty and contribution to the knowledge
The novelty of this study was to be able to accurately determine thermal optical
properties of single, two-, and three- layer ETFE-foil panels, including combinations of
transparent and fritted foils. In this study this information was incorporated into the
material template of EDSL TAS version 9.3.3 b and applied in the simulations. These
thermal optical properties of ETFE-foil can be used in future research to do similar
investigations.

8-287
This study also developed new evidence base of environmental performance of actual
buildings configured with ETFE-foil cushion. The study evaluated the thermal
performance of actual spaces enclosed with ETFE-foil cushion roofs and also
presented a comparative analysis of the thermal environment of two different atria
covered with different compositions of ETFE-foil cushion roof. Thus, an evidence base
was developed and this knowledge can be used in future research on ETFE-foil and
glass covered enclosures.
Using the custom designed test-rigs located in an outdoor environment, the study
assessed the thermal performance of single, two- and three- layer ETFE-foil panels.
This particular study was unique in its character as previous studies using test-rigs
were in controlled chambers rather than exposed to an actual outdoor setting. This
was a novel approach in this study and knowledge generated through this research
can also be used as an evidence base for future research. This study also measured
thermal properties of ETFE-foil (e.g. solar transmittance) in an actual outdoor
condition. Data was validated with the same properties measured in the laboratory.
Thus, the study was able to generate new knowledge on solar transmittance of single,
two- and three-layer foil. This method can be used in future research to investigate
thermal properties of ETFE-foil under actual outdoor conditions.
This study also investigated the thermal performance of spaces enclosed with ETFE-
foil cushion roofs under current and future climatic scenarios. It also applied alternative
strategies to improve the thermal performance under current and future climatic
conditions. The novelty was to be able to evaluate thermal performance under current
and future scenarios and compare the performance of spaces with alternative
approaches.
This study assessed and compared the thermal performance of ETFE-foil panels and
glass panels in simulation using replicate model of the test-rig; it also evaluated the
thermal performance of spaces enclosed with ETFE-foil cushions and glass roofs in
simulation using replicate models of Nottingham High School and the Engineering and
Science Learning Centre, under current and projected climate scenarios. A
comparative analysis between these two materials is limited in existing literature. Also
the validity of simulations models was based on data measured from the on-site
monitoring of the test-rig, Nottingham High School and ESLC, thus findings from this
study are original and strengthen the current knowledge base.
This study also developed a novel method of modelling doubly curved surfaces of the
ETFE-foil cushion roof. This approach was validated by comparing with measured data

8-288
and found effective in evaluating spaces configured with ETFE-foil cushions. A similar
approach can be applied to model ETFE-foil cushion roofs in further research.
8.7 Limitations of the study
• ETFE-foil samples were obtained from off cut samples provided by the supplier,
some of them were scratched and dusty, measures were taken to remove dust
as possible however it was not possible to remove scratches from ETFE-foil
surface. Nevertheless, these type of foil samples gave more realistic properties
for foil in normal use.
• BS EN 410: 2011 was used to determine thermal optical properties of ETFE
foils. This standard is particularly used for glazing panels. Therefore, these
derived optical properties represent thermal optical properties of ETFE-foil
panels of different combinations of parallel foil layers, rather than ETFE
cushions which usually consist of doubly-curved surfaces.
• This is the limitation of British Standard that only considered flat panels, while
nowadays ETFE-foil cushions are widely applied in the building envelopes.
Thus, it requires a standard method that can be used to determine overall
thermal optical properties of ETFE-foil cushion considering multiple reflections
occurring at ETFE-foil cushion surface.
• Equipment to measure the thermal transmittance of horizontal façade element
was limited, thus it was not possible to measure the thermal transmittance of
an ETFE-foil cushion in an actual test condition.
• The method used to determine solar transmittance of ETFE-foil panels using a
test rig in an outdoor environment, sometimes required days with clear sky and
with no cloud. However, in a country such as the UK, it is very rare to find sky
without any cloud cover.
8.8 Future research
• Direct measurement of thermal transmittance of ETFE-foil cushions (e.g.
double layer, three layers, etc.) taking into account variation in U-value at
different cross sections of a cushion.
• Investigation of angular thermal-optical properties of different colour ETFE-
foils.
• Lack of evidence base for building with ETFE-foil cushion envelopes is
apparent. Therefore, it is necessary to get further evidence from different other
buildings where ETFE-foil cushion envelopes are incorporated.

8-289
• Focus can be given to the ventilation system of the buildings constructed with
ETFE-foil cushion envelope. This can include both natural and mechanical
ventilation. Both summer and winter weather should be considered while
investigating the ventilation system.
• The cost of improving ventilation system can be considered and analysed.
• Cost analysis of the implementation of alternative strategies to improve the
thermal performance of spaces enclosed with ETFE-foil cushion envelopes in
summer and winter.
• Based on knowledge developed in this research, different strategies can be
applied to improve performance of existing and new spaces enclosed with
ETFE-foil cushion roofs
• Intelligent envelope systems using ETFE-foils were already applied in different
buildings, however, it is important to assess the performance of innovative
envelope systems.

290
References
Afrin, S., Chilton, J. & Lau, B. 2015. Evaluation and Comparison of Thermal
Environment of Atria Enclosed with ETFE Foil Cushion Envelope. Energy Procedia,
78, 477 – 482.
Antretter, F., Haupt, W. & Holm, A. 2008. Thermal Transfer through Membrane
Cushions Analyzed by Computational Fluid Dynamics. In: Rode, C., ed. Proceedings
of the 8th Symposium on Building Physics in the Nordic Countries, June 16-18 2008
Dept. of Civil Engineering, Technical University of Denmark. Copenhagen: Kgs.
Lyngby, 347- 354.
Asdrubali, F. & Baldinelli, G. 2011. Thermal transmittance measurements with the hot
box method: Calibration, experimental procedures, and uncertainty analyses of three
different approaches. Energy and Buildings, 43, 1618-1626.
ASHRAE 2009. ASHRAE Handbook: Fundamentals SI. Atlanta, GA: ASHRAE.
ASHRAE 2013. ASHRAE Handbook Fundamentals. Atlanta: ASHRAE.
ASTM 1986a. Annual Book of ASTM Standards. ASTM E 424-71: Standard Test
Methods for Solar Energy Transmittance and Reflectance (Terrestrial) of Sheet
Materials. U. S. A: ASTM.
ASTM 1986b. Annual Book of ASTM Standards. Standard Test Method for Solar
Absorptance, Reflectance, and Transmittance of Materials Using Integrating Spheres.
U. S. A: Easton, MD.
ASTM 1991. ASTM E 1084-86: Standard Test Method for Solar Transmittance
(Terrestrial) of Sheet Materials Using Sunlight. U. S. A: ASTM.
ASTM 2014. C1363-11: Standard Test Method for Thermal Performance of Building
Materials and Envelope Assemblies by Means of a Hot Box Apparatus. United States:
ASTM International.
Badescu., V. 2008. Modelling Solar Radiation at the Earth's Surface, Berlin, Springer.
Baille, A., Lo´pez, J., C & Bonachela, S. 2006. Night energy balance in a heated low-
cost plastic greenhouse. Agriculture and Forest Meteorology, 137, 107-118.
Bauer, G. 1965. Measurement of Optical Radiations: The detection of electromagnetic
radiation from ultra-violet to infra-red, London, The Focal Press.

291
BSEN15251 2007. Indoor environmental input parameters for design and assessment
of energy performance of buildings addressing indoor air quality, thermal environment,
lighting and acoustics. UK: BSI.
BSI 1989. BS 6993: Part 1: Thermal and radiometric properties of glazing. United
Kingdom: BSI.
BSI 2005. BS EN ISO 7730: Ergonomics of the thermal environment. Analytical
determination and interpretation of thermal comfort using calculation of the PMV and
PPD indices and local thermal comfort criteria UK: BSI.
BSI 2007. BS EN ISO 6946: Building components and building elements. Thermal
resistance and thermal transmittance. Calculation method United Kingdom: BSI.
BSI 2011. Glass in building Determination of luminous and solar characteristics of
glazing. UK: BSI.
Callister, W., D. 2011. Materials Science and Engineering, Chichester, GB, John Wiley
and Sons Ltd.
Chilton, J., C. 2013. Lightweight envelopes: ethylene tetra-fluoro-ethylene foil in
architecture Proceedings of the ICE - Construction Materials, 166, 343-357.
Chilton, J., Pezeshkzadeh, S., A. & Afrin, S. 2013a. Embodied energy in ETFE foil
construction. Tensinet Ssymposium 2013- [RE]THINKING lightweight structures.
Mimar Sinan Fina-Art University, Istanbul.
Chilton, J., Pezeshkzadeh, S. & Afrin, S. EFFECT OF CUSHION GEOMETRY AND
CONFIGURATION ON THE EMBODIED ENERGY OF ETFE FOIL CONSTRUCTION.
VI International Conference on Textile Composites and Inflatable Structures,
STRUCTURAL MEMBRANES 2013, 9-11 October 2013 2013b Munich.
CIBSE 2006. CIBSE Guide A - Environmental Design Great Britain: CIBSE.
CIBSE 2013a. The limits of thermal comfort : avoiding overheating in European
buildings. London, UK.
CIBSE 2013b. TM52: The limits of thermal comfort: avoiding overheating in European
buildings. Predicting discomfort. London: Page Bros. (Norwich) Ltd.
CIBSE 2015a. Applications Manual AM11: Building performance modelling. London,
UK.
CIBSE 2015b. CIBSE GUIDE A: ENVIRONMENTAL DESIGN 2015. Great Britain:
CIBSE.
292
CIBSE 2015c. CIBSE Journal. April 2015 ed.: CIBSE.
CIBSE 2015d. TM57: Integrated school design. Norwich: Page Bros. (Norwich) Ltd.
Clarke, J. A., Strachan, P., A., & C., P. 1993. An approach to the calibration of building
energy simulation models. ASHRAE Transactions, 99, 917-927.
Cremers, J. 2010. Research in Architectural Engineering : Future Envelope 3 :
Facades : The Making Of. In: Klein, T. & Knaack, U. (eds.). Amsterdam, NLD IOS
Press.
Croome, D. & Moseley, P. Energy and thermal performance of airhouses. Proceedings
of conference The design of air-supported structures, 1984a Bristol. the Institution of
Structural Engineers, London, 223-237.
Croome, D. & Moseley, P. Temperature Prediction Methods for Lightweight Structures.
The design of air- supported structures, 1984b London. The Institute of Structural
Engineers, 247-260.
DCLG 2015. UK's National Calculation Method for Non Domestic Buildings BRE.
de Dear, R., Brager, G. & Berkeley, U., C. 1998. Developing an adaptive model of
thermal comfort and preference. ASHRAE RP- 884, 104, 1-18.
Desmarais, G., C.,, Ratti, C. & Raghavan, G., S. 1999. Heat transfer modelling of
screenhouse. Solar Energy, 65, 271-284.
DETR 2003. DETR sponsord research project: ETFE Foil Cushions as an alternative
to glass for roofs and atria. Department of the Environment, Transport and the
Regions.
Devulder, T. 2004. The Thermal Response of Textile membrane Constructions. PhD
Thesis, University of Nottingham.
Devulder, T., Wilson, R. & Chilton, J. 2007. The thermal behaviour of buildings
incorporating single skin tensile membrane structures. International Journal of Low
Carbon Technologies, 2, 195-213.
Dimitriadou, E. 2015. Experimental Assessment and Thermal Characterisation of
Lightweight Co-Polymer Building Envelope Materials. Doctor of Philosophy, University
of Bath.
Eames 2009. Multi-foil Insulation BD2768. United Kingdom.
293
Elmahdy, A. H. & Haddad, K. 2000. Experimental procedure and uncertainty analysis
of a guarded hot box method to determine the thermal transmission coefficient of
skylights and sloped glazing. ASHRAE Transactions, 106, 601-613.
EPD 2014. ENVIRONMENTAL PRODUCT DECLARATION. 06/05/2014 ed.: Institut
Bauen und Umwelt e.V. (IBU).
Fanger, M., O. 1967. Calculation of Thermal Comfort: Introduction of a Basic Comfort
Equation. ASHRAE Transactions, 73.
Gómez-González, A., Neila, J. & Monjo, J. 2011. Pneumatic Skins in Architecture.
Sustainable Trends in Low Positive Pressure Inflatable Systems. Procedia
Engineering, 21, 125-132.
Harvie, G. 1996. An investigation into the thermal behaviour of spaces enclosed by
fabric membranes. PhD Thesis, Cardiff University.
Harvie, G. 2015. Thermal behaviour in architectural fabric structures. In: Llorens, J.
(ed.) Fabric Structures in Architecture. Cambridge: Woodhead Publishing.
He, J. & Hoyano, A. 2009. Measurement and simulation of the thermal environment in
the built space under a membrane structure. Building and Environment, 44, 1119-
1127.
He, J. & Hoyano, A. 2010. Measurement and evaluation of the summer microclimate
in the semi-enclosed space under a membrane structure. Building and Environment,
46, 230-242.
HMGovernment 2010a. Approved Document F1: Means of ventilation. England: Online
Version.
HMGovernment 2010b. Approved Document L2A: Conservation of fuel and power in
new buildings other than dwellings. England: Online Version.
HMGovernment 2010c. Approved document L2B: Conservation of fuel and power in
exsiting buildings other than dwellings. England: Online version.
Hopfe, C., J. & Hensen, J., L., M. 2011. Uncertainty analysis in building performance
simulation for design support. . Energy and Buildings, 43, 2798-2805.
Hu, J., Chen, W., Yang, D., Zhao, B., Song, H. & Ge, B. 2016. Energy performance of
ETFE cushion roof integrated photovoltaic/thermal system on hot and cold days.
Applied Energy, 173, 40-51.
IEATask12 1996. Atrium Models for the Analysis of Thermal Comfort and Energy Use.
In: Bryn, I. & Schiefloe, P. (eds.) A Report of Task 12: Building Energy Analysis and
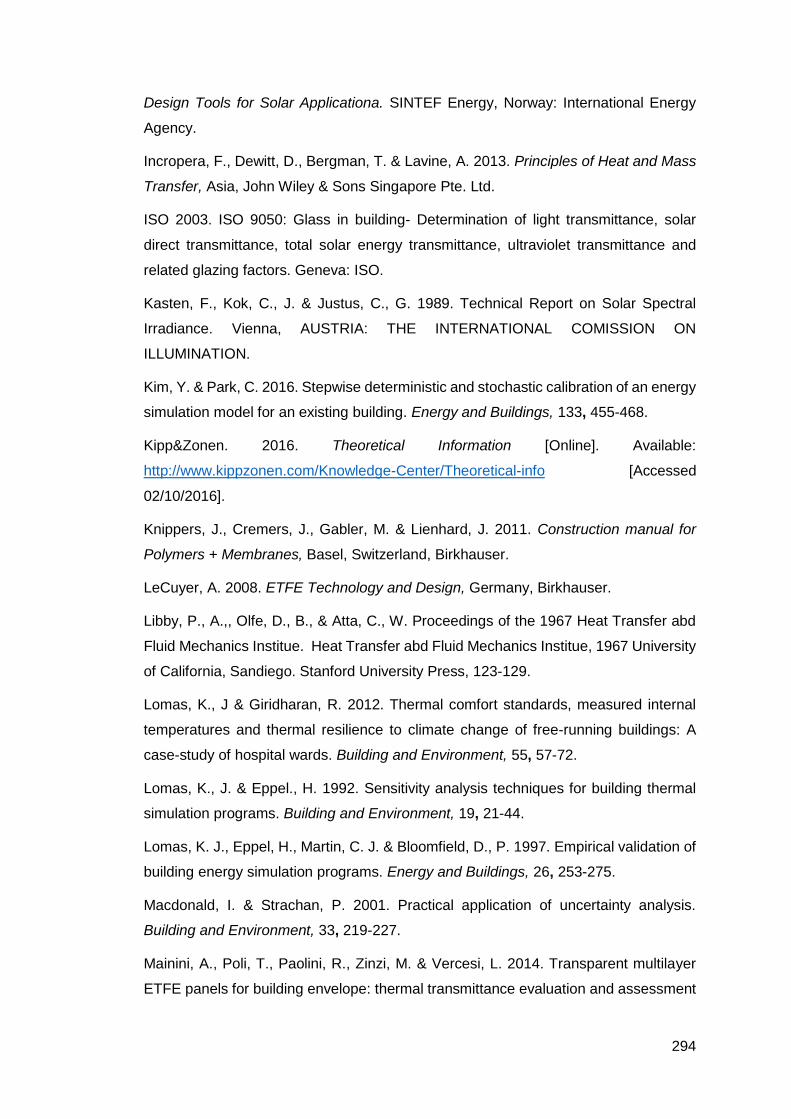
294
Design Tools for Solar Applicationa. SINTEF Energy, Norway: International Energy
Agency.
Incropera, F., Dewitt, D., Bergman, T. & Lavine, A. 2013. Principles of Heat and Mass
Transfer, Asia, John Wiley & Sons Singapore Pte. Ltd.
ISO 2003. ISO 9050: Glass in building- Determination of light transmittance, solar
direct transmittance, total solar energy transmittance, ultraviolet transmittance and
related glazing factors. Geneva: ISO.
Kasten, F., Kok, C., J. & Justus, C., G. 1989. Technical Report on Solar Spectral
Irradiance. Vienna, AUSTRIA: THE INTERNATIONAL COMISSION ON
ILLUMINATION.
Kim, Y. & Park, C. 2016. Stepwise deterministic and stochastic calibration of an energy
simulation model for an existing building. Energy and Buildings, 133, 455-468.
Kipp&Zonen. 2016. Theoretical Information [Online]. Available:
http://www.kippzonen.com/Knowledge-Center/Theoretical-info [Accessed
02/10/2016].
Knippers, J., Cremers, J., Gabler, M. & Lienhard, J. 2011. Construction manual for
Polymers + Membranes, Basel, Switzerland, Birkhauser.
LeCuyer, A. 2008. ETFE Technology and Design, Germany, Birkhauser.
Libby, P., A.,, Olfe, D., B., & Atta, C., W. Proceedings of the 1967 Heat Transfer abd
Fluid Mechanics Institue. Heat Transfer abd Fluid Mechanics Institue, 1967 University
of California, Sandiego. Stanford University Press, 123-129.
Lomas, K., J & Giridharan, R. 2012. Thermal comfort standards, measured internal
temperatures and thermal resilience to climate change of free-running buildings: A
case-study of hospital wards. Building and Environment, 55, 57-72.
Lomas, K., J. & Eppel., H. 1992. Sensitivity analysis techniques for building thermal
simulation programs. Building and Environment, 19, 21-44.
Lomas, K. J., Eppel, H., Martin, C. J. & Bloomfield, D., P. 1997. Empirical validation of
building energy simulation programs. Energy and Buildings, 26, 253-275.
Macdonald, I. & Strachan, P. 2001. Practical application of uncertainty analysis.
Building and Environment, 33, 219-227.
Mainini, A., Poli, T., Paolini, R., Zinzi, M. & Vercesi, L. 2014. Transparent multilayer
ETFE panels for building envelope: thermal transmittance evaluation and assessment

295
of optical and solar performance decay due to soiling. Energy Procedia 48, 1302 –
1310.
Mainini, A., Speroni, A., Zani, A. & Poli, T. 2016. The effect of water spray systems on
thermal and solar performance of an ETFE panel for building envelope Procedia
Engineering, 155, 352-360.
Max, J. F. J., Reisinger, G., Hofmann, T., Hinken, J., Tantau, H., Ulbrich, A.,
Lambrecht, S., Elsner, B. & Schurr, U. 2012. Glass–film-combination: Opto-physical
properties and energy saving potential of a novel greenhouse glazing system. Energy
and Buildings, 50, 298-307.
McAdams, W. H. 1954. Heat Transmission, New York, McGraw Hill.
Minamisawa, R. A., Abidzina, V., de Almeida, A., Budak, S., Tereshko, I., Elkin, I. &
Ila, D. 2007. Radiation effects on ETFE polymer exposed to glow discharge. Nuclear
Instruments and Methods in Physics Research Section B: Beam Interactions with
Materials and Atoms, 261, 715-718.
Modirrousta, S. & Boostani, H. Analysis of Atrium Pattern, Trombe Wall and Solar
Greenhouse on Energy Efficiency. International Conference on Sustainable Design,
Engineering and Construction, 2016. Procedia Engineering 145, 1549-1556.
Monticelli, C., Campioli, A. & Zanelli, A. Evolution and Trends in Design, Analysis and
Construction of Shell and Spatial Structures. Symposium of the IASS, 28 September
09 – 2 October 09 2009 Valencia. 200-202.
Moosavi, L., Mahyuddin, N. & Ghafar, N. 2014. Thermal performanceofatria: An
overview of natural ventilation effective designs. Renewable and Sustainable Energy
Reviews, 34, 654-670.
Moosavi, L., Mahyuddin, N. & Ghafar, N. 2015. Atrium cooling performance in a low
energy office building in the Tropics, a field study. Building and Environment, 94, 384-
394.
Moritz, K. 2007. ETFE -Foile als Tragelement. PhD, Technical University of Munich.
Moritz, K. & Hafner, A. Transparency carried by air-pneumatic ETFE-foil cushion
technology. Proceedings of the structures congress, 2010. 2518-2529.
NARM 2010. Assessment of thermal performance of out-of-plane rooflights. United
Kingdom: NARM.
Nicol, F., Humphreys, M. & Roaf, S. 2012. Adaptive Thermal Comfort: Principles and
practice, Great Britain, Routledge.

296
NREL 2015. Building Technologies Office: EnergyPlus Energy Simulation Software.
Energy Efficiency and Renewable Energy.
NREL 2016. OpenStudio SketchUp Plug-in Interface Guide. User Documentation.
Paliouras. P., Matzaflaras. N., Peuhkuri, R. H. & Kolarik, J. 2015. Using measured
indoor environment parameters for calibration of building simulation model- a passive
house case study. 6th International Building Physics Conference. Elsevier Ltd.
Parsons, K. C. 2003. Human Thermal Environments: The effects of hot, moderate and
cold environments on human health comfort and performance. The principles and the
practice, London, Taylor & Francis Ltd.
Pellegrino, M., Simonetti, M. & Chiesa, G. 2016. Reducing thermal discomfort and
energy consumption of Indian residential buildings: Model validation by in-field
measurements and simulation of low-cost interventions. Energy and Buildings, 113,
145-158.
Pérez-Lombard, L., Ortiz, J. & Pout, C. 2008. A review on buildings energy
consumption information. Energy and Buildings, 40, 394-398.
Poirazis, H., Kragh, M. & Hogg, C. Energy modelling of ETFE membranes in building
application. Eleventh International IBPSA Conference, 27-30 July 2009 Glasgow,
Scotland.
Reddy, T. 2007. Calibrating detailed building energy simulation programs with
measured data—part I: general methodology (RP-1051). ASHRAE Transactions, 13,
221-241.
Robinson-Gayle, S. 2003. Environmental Impact And Perfromance Of Transparent
Building Envelope Materials And Systems. Doctor of Engineering, Brunel University.
Robinson-Gayle, S., Kolokotroni, M., Cripps, A. & Tanno, S. 2001. ETFE foil cushions
in roofs and atria. Construction and Building Materials, 15, 323-327.
Schiemann, L. & Moritz, K. 2010. Polymer foils used in construction. In: Pohl, G. (ed.)
Textiles, polymers and composites for buildings. Cambridge: Woodhead Publishing.
Schöne, L. 2007. Bauen mit ETFE-Folien – Ein Praxisbericht. Stahlbau, 76, 305-313.
British Standards 2008. BS EN 15251:2007 Indoor environmental input parameters for
design and assessment of energy performance of buildings addressing indoor air
quality, thermal environment, lighting and acoustics.
Szokolay, S. V. 2008. Introduction to architectural science: the basis of sustainable
design, Oxford Elsevier Architectural Press.
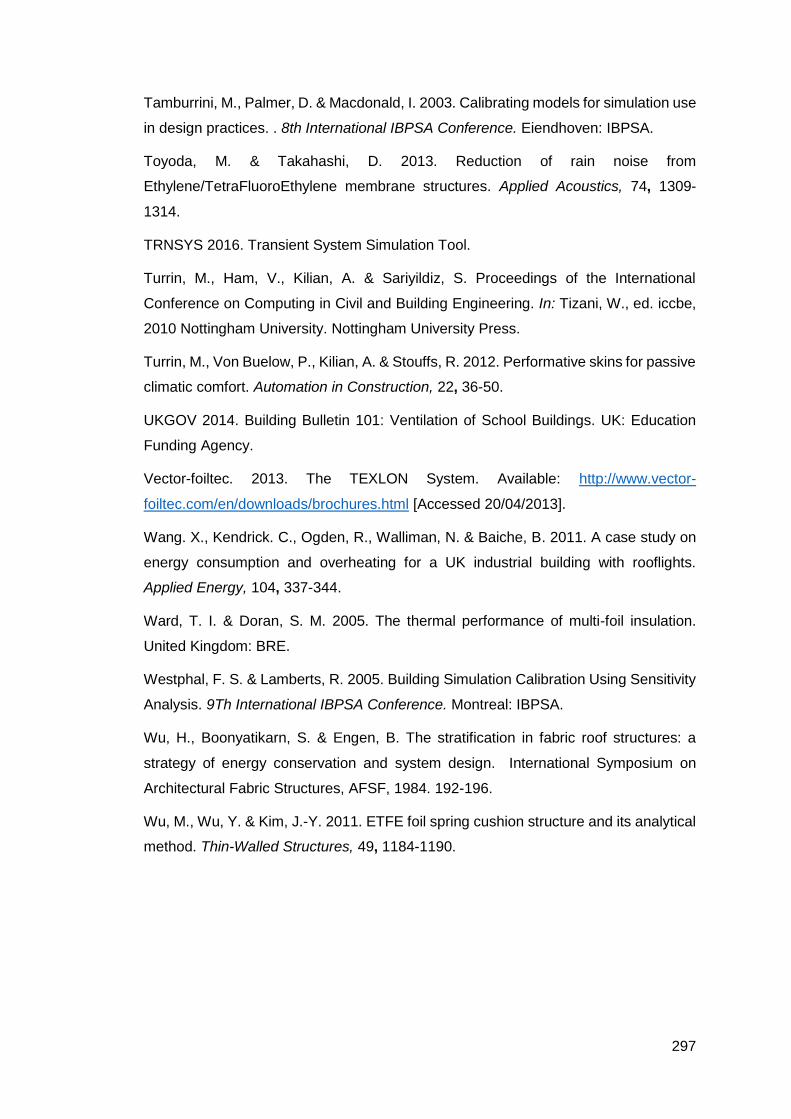
297
Tamburrini, M., Palmer, D. & Macdonald, I. 2003. Calibrating models for simulation use
in design practices. . 8th International IBPSA Conference. Eiendhoven: IBPSA.
Toyoda, M. & Takahashi, D. 2013. Reduction of rain noise from
Ethylene/TetraFluoroEthylene membrane structures. Applied Acoustics, 74, 1309-
1314.
TRNSYS 2016. Transient System Simulation Tool.
Turrin, M., Ham, V., Kilian, A. & Sariyildiz, S. Proceedings of the International
Conference on Computing in Civil and Building Engineering. In: Tizani, W., ed. iccbe,
2010 Nottingham University. Nottingham University Press.
Turrin, M., Von Buelow, P., Kilian, A. & Stouffs, R. 2012. Performative skins for passive
climatic comfort. Automation in Construction, 22, 36-50.
UKGOV 2014. Building Bulletin 101: Ventilation of School Buildings. UK: Education
Funding Agency.
Vector-foiltec. 2013. The TEXLON System. Available: http://www.vector-
foiltec.com/en/downloads/brochures.html [Accessed 20/04/2013].
Wang. X., Kendrick. C., Ogden, R., Walliman, N. & Baiche, B. 2011. A case study on
energy consumption and overheating for a UK industrial building with rooflights.
Applied Energy, 104, 337-344.
Ward, T. I. & Doran, S. M. 2005. The thermal performance of multi-foil insulation.
United Kingdom: BRE.
Westphal, F. S. & Lamberts, R. 2005. Building Simulation Calibration Using Sensitivity
Analysis. 9Th International IBPSA Conference. Montreal: IBPSA.
Wu, H., Boonyatikarn, S. & Engen, B. The stratification in fabric roof structures: a
strategy of energy conservation and system design. International Symposium on
Architectural Fabric Structures, AFSF, 1984. 192-196.
Wu, M., Wu, Y. & Kim, J.-Y. 2011. ETFE foil spring cushion structure and its analytical
method. Thin-Walled Structures, 49, 1184-1190.

298
APPENDIX A: List of Publications
Afrin S., Chilton J. and Lau B. Evaluation and Comparison of Thermal Environment of
Atria Enclosed with ETFE Foil Cushion Envelope, In 6th International Building Physics
Conference, IBPC 2015, Energy Procedia.
Afrin S., Chilton J. and Lau B. (2014). Thermal Environment of an atrium enclosed by
an ethylene-tetrafluoro-ethylene (ETFE) foil roof, In Shells, Membranes and Spatial
Structures Footprints, Proceedings of the International Association for Shell and
Spatial Structures (IASS)-SLTE Symposium 2014 (Reyolando M.L.R.F. and Ruy M.O.
(eds.)). Brasilia, Brazil.
Afrin S., Chilton J. and Lau B. Thermal Environment of an Atrium enclosed with ETFE
Foil Cushion Envelope, In 14th International Conference on Sustainable Energy
Technologies – SET 2015, August 2015, Nottingham, UK.
Afrin S., Chilton J. and Lau B. MEASUREMENT AND SIMULATION OF SUMMER
THERMAL ENVIRONMENT OF AN ATRIUM ENCLOSED WITH ETFE FOIL, In VI

299
International Conference on Textile Composites and Inflatable Structures,
STRUCTURAL MEMBRANES 2015. E. Oñate, K. U. Bletzinger, and B. Kröplin (Eds)
Spain, Barcelona.
Chilton J., Pezeshkzadeh S., and Afrin S.,Effect of cushion geometry and
configuration on the embodied energy of ETFE foil construction, VI International
Conference on Textile Composites and Inflatable Structures, STRUCTURAL
MEMBRANES, K.-U.Bletzinger, B. Kröplin and E. Oñate (Eds) 2013.
Chilton J., Pezeshkzadeh S.A. and Afrin S. Embodied energy in ETFE foil
construction, [RE]THINKING lightweight structures Proc. TensiNet Symposium 2013,
(Bögner-Balz H and Mollaert M (eds)). Istanbul, Turkey, (2013) 457-466.
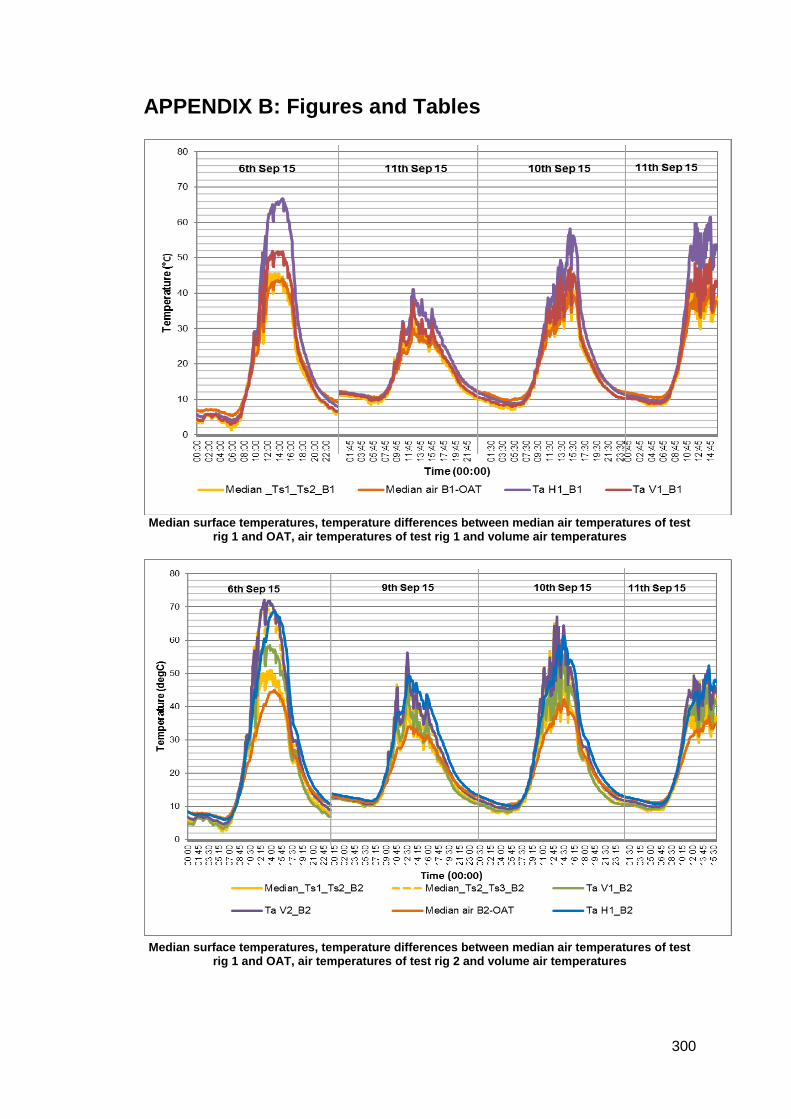
300
APPENDIX B: Figures and Tables
Median surface temperatures, temperature differences between median air temperatures of test
rig 1 and OAT, air temperatures of test rig 1 and volume air temperatures
Median surface temperatures, temperature differences between median air temperatures of test
rig 1 and OAT, air temperatures of test rig 2 and volume air temperatures

301
Air volume air temperature relative to surface median temperature, test rig 1 air temperature
relative to median air temperature, air volume air temperature relative to median air temperature
Air volume air temperature relative to surface median temperature, test rig 2 air temperature
relative to median air temperature, air volume air temperature relative to median air temperature
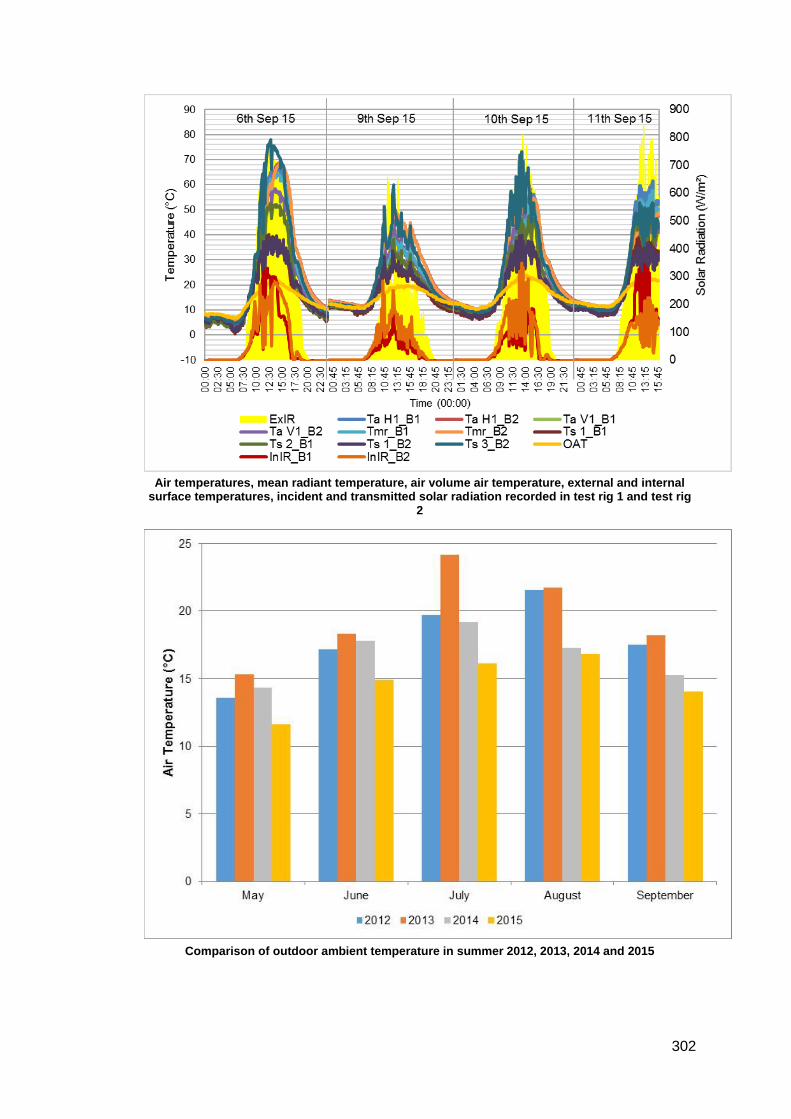
302
Air temperatures, mean radiant temperature, air volume air temperature, external and internal
surface temperatures, incident and transmitted solar radiation recorded in test rig 1 and test rig 2
Comparison of outdoor ambient temperature in summer 2012, 2013, 2014 and 2015

303
Comparison of ExIR during summer 2014 and 2015 (Incident solar radiation, outdoor ambient
temperature)
Comparison of OAT during summer 2014 and 2015 (Incident solar radiation, outdoor ambient
temperature)

304
Recorded temperature ranges during occupied hours in all occupied level of the atrium
Air temperature range, median of air temperature of different occupied levels denoted by TSi
1(a)_NH, TSi 2(a)_NH, TSi 3(a)_NH and outdoor ambient temperature recorded during 19th May 14, 4th of June 14; 1st July 15 and 14th September 15

305
Air temperature range, median of air temperature of TSi 3(a)_NH, TSi 4(a)_NH; internal and
external surface temperatures, and outdoor ambient temperatures recorded during 19th May 14, 4th of June 14; 1st July 15 and 14th September 15
Recorded temperatures and solar radiation for Nottingham High School atrium during 19th May
2014
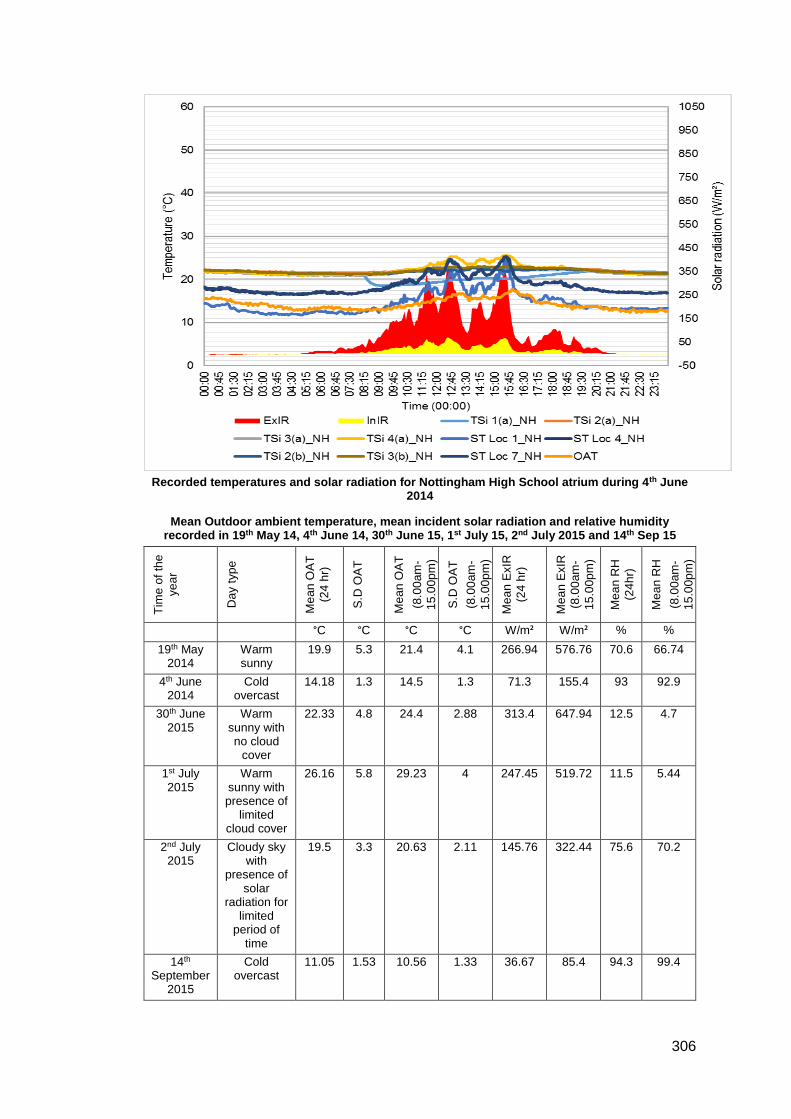
306
Recorded temperatures and solar radiation for Nottingham High School atrium during 4th June
2014
Mean Outdoor ambient temperature, mean incident solar radiation and relative humidity recorded in 19th May 14, 4th June 14, 30th June 15, 1st July 15, 2nd July 2015 and 14th Sep 15
Tim
e o
f th
e
ye
ar
Day t
yp
e
Me
an O
AT
(24
hr)
S.D
OA
T
Me
an O
AT
(8.0
0am
-
15
.00p
m)
S.D
OA
T
(8.0
0am
-
15
.00p
m)
Me
an E
xIR
(24
hr)
Me
an E
xIR
(8.0
0am
-
15
.00p
m)
Me
an R
H
(24
hr)
Me
an R
H
(8.0
0am
-
15
.00p
m)
°C °C °C °C W/m² W/m² % %
19th May 2014
Warm sunny
19.9 5.3 21.4 4.1 266.94 576.76 70.6 66.74
4th June 2014
Cold overcast
14.18 1.3 14.5 1.3 71.3 155.4 93 92.9
30th June 2015
Warm sunny with no cloud
cover
22.33 4.8 24.4 2.88 313.4 647.94 12.5 4.7
1st July 2015
Warm sunny with presence of
limited cloud cover
26.16 5.8 29.23 4 247.45 519.72 11.5 5.44
2nd July 2015
Cloudy sky with
presence of solar
radiation for limited
period of time
19.5 3.3 20.63 2.11 145.76 322.44 75.6 70.2
14th September
2015
Cold overcast
11.05 1.53 10.56 1.33 36.67 85.4 94.3 99.4

307
Recorded incident solar radiation in ESLC during summer 2014 and 2015
Recorded incident OAT in ESLC during summer 2014 and 2015
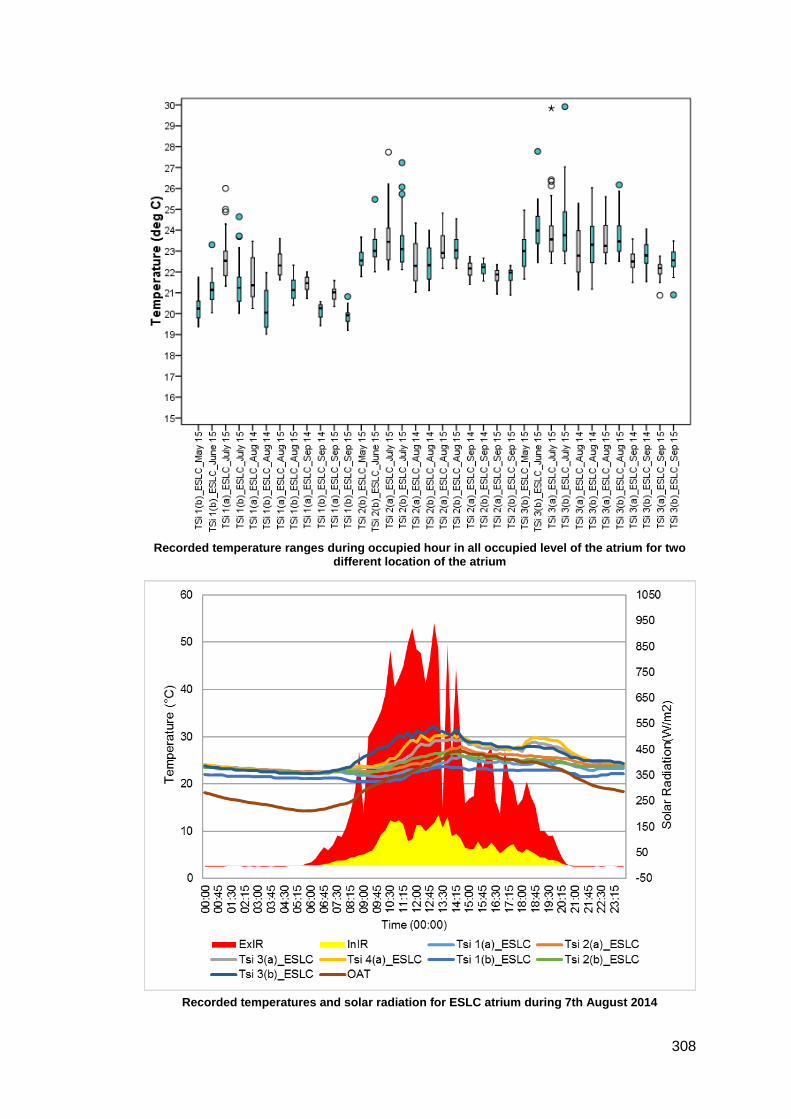
308
Recorded temperature ranges during occupied hour in all occupied level of the atrium for two
different location of the atrium
Recorded temperatures and solar radiation for ESLC atrium during 7th August 2014

309
Air temperature difference between two different horizontal locations at each occupied level of
the atrium 7th August 2014
Recorded temperatures and solar radiation for ESLC atrium during 19th September 2014