TheOxfordEncyclopediaofMaritimeHistory
12
Publisher: Oxford University Press Print Publication Date: 2007 Print ISBN13: 9780195130751 Published online: 2007 Current Online Version: 2007 eISBN: 9780195307405 The Oxford Encyclopedia of Maritime History Edited by John J. Hattendorf Oxford Reference Meteorology Meteorology, or the observation and study of the weather, is as old as human civilization. It is rooted in practical affairs such as agriculture, commerce, health, and navigation, as well as—in an Aristotelian sense—in the natural philosophy of the traditional “mixed” elements of earth, water, air, and fire. From antiquity through the early modern era, weather phenomena carried sacred connotations and have been widely perceived as the manifestations of divine (or perhaps demonic) activity. The scientific revolution of the sixteenth and seventeenth centuries has been portrayed as a period in which Aristotelian natural philosophy and other traditionbound views were decisively overthrown and replaced by the new “mechanical philosophy.” This older historiography cites new theories and practices in astronomy, physics, and medicine (but not in meteorology) to illustrate the elimination of formal and final causes from the realm of scientific explanation and the victory of science over superstition. This is an incomplete view, however, since meteorology long retained an Aristotelian character that was not in conflict with the emerging mechanical philosophy. Francis Bacon (1561–1626) advocated a new methodology for investigating nature, based on observation, inductive reasoning, and the compilation of reliable natural histories, for example, of the winds. René Descartes (1596–1650) applied deductive reasoning in his Meteorology to explain atmospheric phenomena using geometric principles and as the result of the motions and mechanical interactions of particles of matter. Although both scholars successfully distanced themselves from the authority of the scholastics, they tacitly accepted many of the nonteleological aspects of Aristotelian meteorology. Instruments In the seventeenth century new instruments—thermometer, barometer, hygrometer, calibrated rain gauge, and anemometer—were developed for measuring, weighing, and describing the atmosphere. The air thermometer (or thermoscope) is attributed to Galileo Galilei (1564–1642), Santorio Santorre (1561–1636), and others. Between 1641 and
Transcript of TheOxfordEncyclopediaofMaritimeHistory
Publisher: Oxford University Press Print Publication Date: 2007Print ISBN13: 9780195130751 Published online: 2007Current Online Version: 2007 eISBN: 9780195307405
The Oxford Encyclopedia of Maritime HistoryEdited by John J. Hattendorf
Oxford Reference
Meteorology
Meteorology, or the observation and study of the weather, is as old as human civilization. It is rooted in practical affairssuch as agriculture, commerce, health, and navigation, as well as—in an Aristotelian sense—in the natural philosophyof the traditional “mixed” elements of earth, water, air, and fire. From antiquity through the early modern era, weatherphenomena carried sacred connotations and have been widely perceived as the manifestations of divine (or perhapsdemonic) activity.
The scientific revolution of the sixteenth and seventeenth centuries has been portrayed as a period in which Aristoteliannatural philosophy and other traditionbound views were decisively overthrown and replaced by the new “mechanicalphilosophy.” This older historiography cites new theories and practices in astronomy, physics, and medicine (but not inmeteorology) to illustrate the elimination of formal and final causes from the realm of scientific explanation and thevictory of science over superstition. This is an incomplete view, however, since meteorology long retained anAristotelian character that was not in conflict with the emerging mechanical philosophy.
Francis Bacon (1561–1626) advocated a new methodology for investigating nature, based on observation, inductivereasoning, and the compilation of reliable natural histories, for example, of the winds. René Descartes (1596–1650)applied deductive reasoning in his Meteorology to explain atmospheric phenomena using geometric principles and asthe result of the motions and mechanical interactions of particles of matter. Although both scholars successfullydistanced themselves from the authority of the scholastics, they tacitly accepted many of the nonteleological aspectsof Aristotelian meteorology.
Instruments
In the seventeenth century new instruments—thermometer, barometer, hygrometer, calibrated rain gauge, andanemometer—were developed for measuring, weighing, and describing the atmosphere. The air thermometer (orthermoscope) is attributed to Galileo Galilei (1564–1642), Santorio Santorre (1561–1636), and others. Between 1641 and
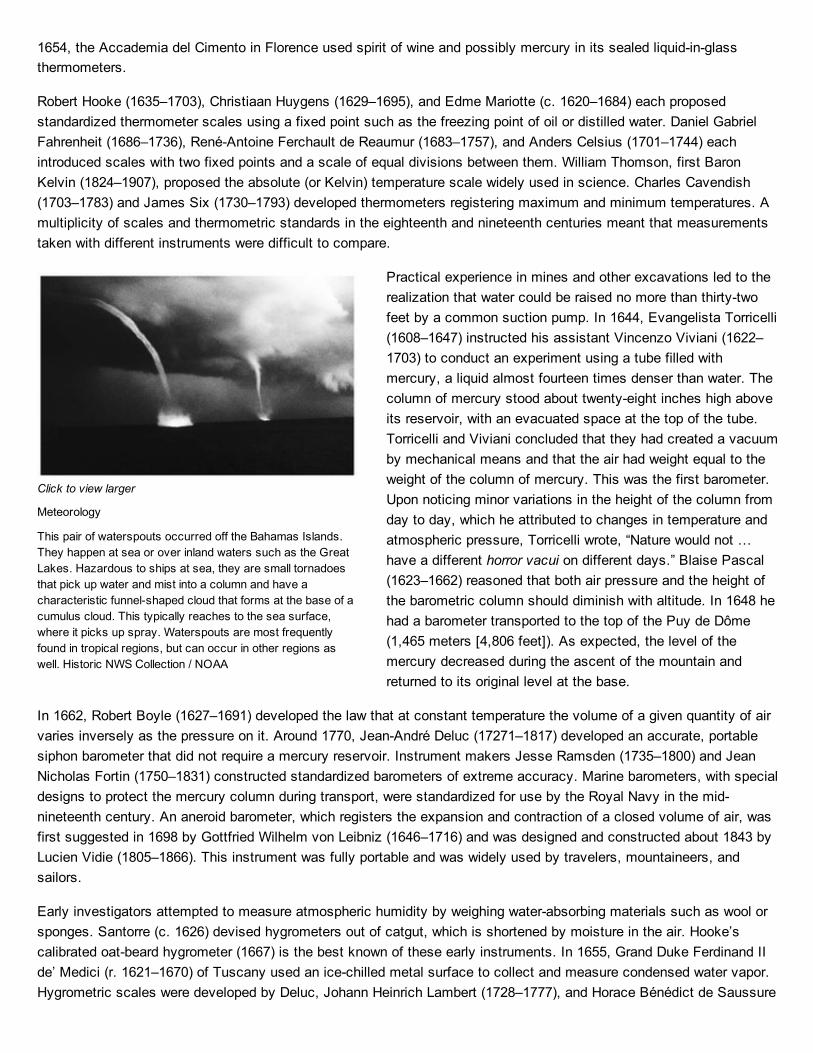
Click to view larger
Meteorology
This pair of waterspouts occurred off the Bahamas Islands.They happen at sea or over inland waters such as the GreatLakes. Hazardous to ships at sea, they are small tornadoesthat pick up water and mist into a column and have acharacteristic funnelshaped cloud that forms at the base of acumulus cloud. This typically reaches to the sea surface,where it picks up spray. Waterspouts are most frequentlyfound in tropical regions, but can occur in other regions aswell. Historic NWS Collection / NOAA
1654, the Accademia del Cimento in Florence used spirit of wine and possibly mercury in its sealed liquidinglassthermometers.
Robert Hooke (1635–1703), Christiaan Huygens (1629–1695), and Edme Mariotte (c. 1620–1684) each proposedstandardized thermometer scales using a fixed point such as the freezing point of oil or distilled water. Daniel GabrielFahrenheit (1686–1736), RenéAntoine Ferchault de Reaumur (1683–1757), and Anders Celsius (1701–1744) eachintroduced scales with two fixed points and a scale of equal divisions between them. William Thomson, first BaronKelvin (1824–1907), proposed the absolute (or Kelvin) temperature scale widely used in science. Charles Cavendish(1703–1783) and James Six (1730–1793) developed thermometers registering maximum and minimum temperatures. Amultiplicity of scales and thermometric standards in the eighteenth and nineteenth centuries meant that measurementstaken with different instruments were difficult to compare.
Practical experience in mines and other excavations led to therealization that water could be raised no more than thirtytwofeet by a common suction pump. In 1644, Evangelista Torricelli(1608–1647) instructed his assistant Vincenzo Viviani (1622–1703) to conduct an experiment using a tube filled withmercury, a liquid almost fourteen times denser than water. Thecolumn of mercury stood about twentyeight inches high aboveits reservoir, with an evacuated space at the top of the tube.Torricelli and Viviani concluded that they had created a vacuumby mechanical means and that the air had weight equal to theweight of the column of mercury. This was the first barometer.Upon noticing minor variations in the height of the column fromday to day, which he attributed to changes in temperature andatmospheric pressure, Torricelli wrote, “Nature would not …have a different horror vacui on different days.” Blaise Pascal(1623–1662) reasoned that both air pressure and the height ofthe barometric column should diminish with altitude. In 1648 hehad a barometer transported to the top of the Puy de Dôme(1,465 meters [4,806 feet]). As expected, the level of themercury decreased during the ascent of the mountain andreturned to its original level at the base.
In 1662, Robert Boyle (1627–1691) developed the law that at constant temperature the volume of a given quantity of airvaries inversely as the pressure on it. Around 1770, JeanAndré Deluc (17271–1817) developed an accurate, portablesiphon barometer that did not require a mercury reservoir. Instrument makers Jesse Ramsden (1735–1800) and JeanNicholas Fortin (1750–1831) constructed standardized barometers of extreme accuracy. Marine barometers, with specialdesigns to protect the mercury column during transport, were standardized for use by the Royal Navy in the midnineteenth century. An aneroid barometer, which registers the expansion and contraction of a closed volume of air, wasfirst suggested in 1698 by Gottfried Wilhelm von Leibniz (1646–1716) and was designed and constructed about 1843 byLucien Vidie (1805–1866). This instrument was fully portable and was widely used by travelers, mountaineers, andsailors.
Early investigators attempted to measure atmospheric humidity by weighing waterabsorbing materials such as wool orsponges. Santorre (c. 1626) devised hygrometers out of catgut, which is shortened by moisture in the air. Hooke’scalibrated oatbeard hygrometer (1667) is the best known of these early instruments. In 1655, Grand Duke Ferdinand IIde’ Medici (r. 1621–1670) of Tuscany used an icechilled metal surface to collect and measure condensed water vapor.Hygrometric scales were developed by Deluc, Johann Heinrich Lambert (1728–1777), and Horace Bénédict de Saussure
(1740–1799) in the closing decades of the eighteenth century. In 1775, John Leslie (1766–1832) estimated the humidityof the air by measuring the temperature difference between thoroughly ventilated wet and dry thermometer bulbs. Theinstrument based on this principle is called the psychrometer.
Rainfall was recorded throughout antiquity, mainly in connection with agriculture. In the West, a rain gauge was used byBenedetto Castelli (1577–1643), a student of Galileo, to estimate a downpour that occurred in 1639. Christopher Wren(1632–1723) and Hooke developed tipping bucket mechanisms for their rain gauges. In 1722 the Reverend SamuelHorsley (1733–1806) added a wide funnel to the end of a graduated glass cylinder, which allowed measurements ofsmall amounts of rain. To address the problems caused by splashing, wind gusts, and local exposure, Francis E. Nipher(1847–1926) devised an effective raingauge shield.
Traditionally, wind vanes were used to indicate wind direction, while blowing objects such as leaves or clouds indicatedwind speed. Leon Battista Alberti (1404–1472) reportedly designed a pressureplate anemometer in about 1450 tomeasure the force of the wind. In 1672, Hooke designed a rotating windmill anemometer in which the speed of rotationwas measured by gears. In 1775, James Lind (1716–1794) designed an anemometer in which the dynamic pressure ofthe wind displaced the water level in a Ushaped tube. An early version of the rotatingcup anemometer, whicheliminates highfrequency wind variations, was developed by Thomas Romney Robinson (1793–1882) in 1846. Cup andpressuretube anemometers, especially as improved by William Henry Dines (1855–1927) in the 1890s, are still in usetoday.
Winds and Currents of the Globe
In 1686 the British astronomer Edmond Halley (1656–1742) developed his theory of the trade winds by compilingobservations by mariners from three oceans. He attributed the seasonal reversal of winds in the Indian monsoons todifferential heating between land and ocean. He further identified solar heating as the driving force of the trade winds,speculating that the air would rise in low latitudes and sink in high latitudes. Two years later he published the first chartof the world’s winds, intended for the benefit of shipping companies and mariners.
George Hadley (1685–1768) returned to this topic in 1735, explaining tropical wind systems as the combined result ofsolar heating and the earth’s rotational motion. In his system, unequal heating from equator to pole produces a giantconvection cell in each hemisphere, with heated air at the Equator rising and flowing poleward before sinking andreturning to the Equator at lower levels. Because of the rotation of the earth, conservation of angular momentum in airmoving northward produces the westerly winds, while winds in the tropics have an easterly component. Frictional forcesexplained the dissipation of wind energy. Hadley’s ideas on the general circulation of the atmosphere were rediscoveredin 1756 by Immanuel Kant (1724–1804) and were popularized by John Dalton (1766–1844).
In 1805, Admiral Francis Beaufort (17741–1857) of the Royal Navy proposed a system for estimating and reporting windspeeds at sea. A number from zero to twelve representing wind speed was assigned based on the amount of canvasthat a fullrigged frigate of the period would carry. Beaufort also developed an early shorthand system of notation todistinguish among weather types. In the 1850s wind scales were adapted to nonnaval use and were calibrated using therotations of a cup anemometer. Of course Beaufort’s was not the first numerical scale. Robert Hooke referred to one in1662, as did Daniel Defoe (1660–1731) in 1704 and the instrument maker John Smeaton (1724–1792) in 1738; otherestimates of wind speed were traditionally used by mariners.
Beginning in the 1840s, wind and current charts of the oceans, as well as sailing directions, were constructed fromobservations collected systematically by Matthew Fontaine Maury (1806–1873) of the U.S. Navy. He played a leadingrole in organizing the Brussels Maritime Conference of 1853 and in popularizing marine meteorological observations, buthis theories about the general circulation of the atmosphere and oceans were physically unrealistic and were notaccepted by his contemporaries. His work was superseded by observations published by the Deutsche Seewarte and
other similar institutions that focused on marine meteorology.
A theory of the general circulation of the atmosphere and oceans was developed by William Ferrel (1817–1891), whoapplied his considerable mathematical skills and physical intuition to data compiled by others. In 1858, Ferrelannounced a “new force” that had not been taken into account in previous studies of atmospheric circulation: “If a bodyis moving in any direction, there is a force, arising from the earth’s rotation, which always deflects it to the right in thenorthern hemisphere, and to the left in the southern.” In fact he had rediscovered the Coriolis force and was applying itto the earth’s atmosphere. But Ferrel went far beyond Coriolis, who had only hinted that his discovery might beimportant to meteorologists. Ferrel’s theory explained both average meridional and zonal winds on the rotating earth (seePersson).
Atmospheric Electricity
In 1750, Benjamin Franklin (1706–1790) hypothesized that if tall conductors were carefully insulated from ground, theycould be used to determine if thunderclouds were electrified. He also postulated that grounded metal rods would protectbuildings from lightning damage. Franklin’s investigations demonstrated that lightning is an electrical discharge and thatmost flashes originate in clouds that are “most commonly in a negative state of electricity, but sometimes in a positivestate.” Franklin coined much of the vocabulary of modern electricity, including such terms as positive and negativecharge. He was able to simulate many types of lightning damage, and he showed that grounded metallic lightning rodswould protect most structures from such effects.
Maps and Charts
In 1817, Alexander von Humboldt (1769–1859) published a chart depicting isothermal lines circling the earth in irregularcourse, joining together places with the same mean annual temperature. In 1820, Heinrich William Brandes (1777–1834)in Germany began plotting on maps the weather observations collected earlier by the Mannheim meteorological society.He pointed out that air flows toward a low pressure area. Heinrich Wilhelm Dove (1803–1879) produced detailed monthlymaps of isotherms and winds that represented the general circulation of the atmosphere—including, notably, monsoonalcirculations. He classified the winds as permanent, periodical, or variable and attributed the development of midlatitudestorms to the constant strife between tropical air currents flowing northward and polar air currents flowing southward. In1827, Dove formulated his famous “Drehungsgesetz,” which states that all winds are deflected from their course by theearth’s rotation and take on a gyratory motion—that, in short, all local winds are minor eddies in the great polarequatorial whirl, and they tend to reproduce in miniature the character of that vast maelstrom. In the 1840s, JamesPollard Espy (1785–1860) and Elias Loomis (1811–1889) improved synoptic weatherplotting methods and developedsynoptic charts depicting winds, precipitation, isotherms, and lines of minimum pressure.
Storm Theories
Between 1834 and 1859, Espy and William Redfield (1789–1857) argued over the nature and causes of storms and theproper way to investigate them. Espy emphasized thermally induced vertical convection and the “steam power” of thecooling and condensing of moist air. As heated columns of air rise, winds from all directions rush inward, producingcentripetal wind patterns associated with cumulus clouds, hailstorms, and tornadoes. In his system, the wind field wasderived from the pressure distribution and ultimately from the temperature, density, and moisture distributions of theatmosphere.
Redfield focused on the rotary gales of the North Atlantic. He believed that hurricanes, like winter storms and tornadoes,
are “aerial vortices” or whirls in the global wind pattern, produced by gravitational forces on the rotating earth and carriedalong by the currents of the upper air. Once generated, hurricanes follow a parabolic course: northwesterly until reachingthe Atlantic coast of the United States, then curving northeast along the eastern seaboard or out to sea.
Redfield was supported in his views by the work of William Reid (1791–1858), author of the Law of Storms, and byHenry Piddington (1797–1858), who studied tropical storms in the Indian Ocean and coined the term “cyclone,” meaningthe coil of a snake. Many of these results were codified in the oftreiterated law of pressurewind relations ofChristophorus H. D. Buys Ballot (1817–1890): in the Northern Hemisphere, because the wind circulatescounterclockwise around lowpressure areas, if you stand with your back to the wind, the center of low pressure will beto your left.
Dynamics and Thermodynamics
Karl Theodor Reye (1838–1919) produced formulas and tables for dry and moist adiabatic expansions and definedstability criteria for the atmosphere. Applied to clouds and storms, unstable conditions exist when the temperature of arising air mass remains higher than that of its surroundings. In 1874, Julius Hann (1839–1921) pointed out thatthermodynamics alone could not account for the pressure changes and precipitation patterns of storms; the mechanicsof the earth’s atmosphere was also needed.
Hermann von Helmholtz (1821–1894) likened the behavior of the atmosphere to a number of flywheels, or rings of air,spinning around the earth’s axis at different latitudes. The energy for this circulation comes from seasonal and latitudinaldifferences in solar radiation that generate a slow meridional circulation. Surface friction and eddy viscosity serve tomoderate the speed of the circulation. Von Helmholtz defined isentropic surfaces and described sloping surfaces ofdiscontinuity (later called fronts). Max Margules (1856–1920) considered the atmosphere as both a mechanical and athermodynamic system in which thermal and potential energy are released in the kinetic energy of storms. Hedeveloped the equilibrium conditions for surfaces of discontinuity and a formula for their slope.
Vertical Soundings
By the 1890s balloonborne selfrecording meteorographs were reaching altitudes as high as twenty kilometers (twelvemiles), and a coherent picture of the structure of the atmosphere was beginning to emerge. At the turn of the twentiethcentury, Léon Teisserenc de Bort (1855–1913) and Richard Assmann (1845–1918) identified an isothermal zone in theatmosphere at an altitude of about ten kilometers (six miles). In 1908, Teisserenc de Bort coined the terms“troposphere” and “stratosphere” to denote the lower and upper layers of the atmosphere, with the isothermal zonebetween coming to be called the “tropopause.”
During World War I, meteorographs were attached to airplanes that flew over and around a military theater of operations.Networks of aircraft sounding stations emerged in the 1920s and 1930s in support of the growing needs of commercialaviation. The data collected by airplanes were less than ideal: the soundings were horizontally oriented, limited inaltitude, and collected only when the weather was good enough for safe flying. Moreover, the data could not be analyzeduntil the airplane landed. Still, airplanes were extremely useful for specialized missions and research. In 1943 the U.S.Navy began research flights into hurricanes. Meteorologist Harry Wexler (1911–1962) made some of the first flights intothe eye of a hurricane.
By the mid1920s experimental radio transmitters had been fitted to free balloons; by 1936 these socalled radiosondeswere in widespread use by meteorologists interested in vertical profiles of temperature, pressure, and humidity; a“rawindsonde” provides further information about upperlevel winds. Today, balloons fitted with miniaturized instruments,computers, and telemetry are tracked using the Global Positioning System (GPS).
The Bergen School
In 1904, Vilhelm Bjerknes (1862–1951) stated the problem of weather forecasting as an initialvalue problem inmathematics: using the ideal gas law, the first law of thermodynamics, the conservation of mass, and the dynamicalequations of an ideal compressible gas, and given the current values of the temperature, pressure, density, and threedimensional wind field, calculate the future values of these variables. After working in Leipzig, Bjerknes settled inBergen, Norway, in 1917 with two research assistants, his son Jacob (Jack) Bjerknes (1897–1975) and Halvor Solberg(1895–1974); they were later joined by the Swedish meteorologist Tor Bergeron (1891–1977). This group had at itsdisposal a network of stations, in part provided by Norwegian fishers, sufficiently dense to delineate the properties ofdifferent air masses and describe the life history of cyclones generated along the polar front. New information on thevertical structure of the atmosphere enabled Jack Bjerknes to extend the model to include the dynamics of an inclinedsurface of discontinuity separating two distinct air masses, the front. These developments provided meteorologists witha threedimensional model that could be used to impose a semblance of order on the amorphous (and huge) collectionsof data. Although the Bergen school, as the group is called, promoted the use of graphical methods of analysis, it wasbecoming clear that the prediction of future atmospheric configurations could theoretically be achieved by integrating thetimedependent equations of atmospheric motion, given suitable boundary conditions.
The Bergen school of meteorology was evangelistic, hosting numerous visitors and sending acolytes to postsinternationally. The most energetic and influential, CarlGustav Arvid Rossby (1898–1957), came to America in 1926,while Jack Bjerknes joined the faculty of the University of California, Los Angeles (UCLA), in 1939, the same year thatSverre Petterssen (1898–1974) arrived at the Massachusetts Institute of Technology (MIT). Rossby and his assistantHorace Byers (19061998), supported by the Daniel Guggenheim Fund for the Promotion of Aviation, established thefirst airway weather service, for Western Air Express in California. As head of the meteorology program at MIT, Rossbyidentified planetary long waves in the westerlies (called Rossby waves) that support and steer the movements of airmasses at the surface. Rossby served briefly as head of research for the U.S. Weather Bureau and, in 1941, instituteda training program in meteorology to support the U.S. war effort. Later he founded the Journal of Meteorology andencouraged the development of numerical weather prediction using electronic computers. He also established theInstitute of Meteorology at the University of Stockholm and founded the journal Tellus. MIT meteorologist Hurd C. Willett(1903–1992) and two chiefs of the U.S. Weather Bureau, Willis R. Gregg (1880–1938) and Francis W. Reichelderfer(1895–1983)—Reichelderfer was a former commander in the U.S. Navy—were influential in bringing the methods of theBergen school to the United States.
Weather Data and Reports
There is a long tradition of disseminating weather information to the public and other endusers using the latestcommunications technologies. The first daily weather reports were compiled by James Glaisher, secretary of the BritishMeteorological Society, who in 1849 arranged for observations to be taken each morning at railway stations, the resultsto be transported to London for publication the following day in the London Daily News.
Two years later the Electric Telegraph Company provided experimental weather reports that were displayed on dailymaps at the Crystal Palace Exhibition. In 1856, Joseph Henry began to display weather messages received viatelegraph on a large map of the United States that hung in the great hall of the Smithsonian Institution. The U.S.national weather service supported dedicated shiptoshore communications links along the Atlantic coast usingtelegraphy and flag signals in the 1870s.
With the advent of wireless and broadcast radio communication, weather data and reports could be shared across theoceans. The World Weather Watch (WWW), established in 1963, fostered international sharing of data collected on land,
by satellite remote sensing, and at sea from ships, oil rigs, and buoys. Today, marine weather predictions aredisseminated routinely to merchant ships and coastal communities, while most modern navies have their own dedicatedweather information systems. Of special relevance to the mariner are wind direction and speed, wave periodicity andheights, tides, and precipitation events.
Weather and War
General “Winter” and Admiral “Storm” have always had a big influence on military affairs. In 1588 the Spanish Armada,on its way to attack Britain, was destroyed by a storm in the English Channel. Napoleon’s attack on Russia wasthwarted by winter weather, as was Adolf Hitler’s siege of Leningrad. In World War I, it was quiet on the western frontduring mud season. The miracle at Dunkerque took place under the cover of heavy fog, the Japanese attack on PearlHarbor was launched under the cover of Pacific storms, and the Dday invasion of Normandy was launched based onthe most critical weather and surf forecasts in history.
World War I meteorologists studied battlefield climatology, the effects of wind on shell trajectories, and conditions forlaunching and defending against poison gas attacks. They also provided routine and specialized forecasts for aviation.Military patronage and the wartime experience both shaped and distorted the civilian scientific agenda, presaging moreelaborate connections between geophysicists and the military that developed later in the century. In World War II,emergency education programs were instituted that trained approximately eight thousand weather officers in the U.S.alone. Forecasters were needed for bombing raids, naval task forces, and other special operations. After the war, manycontinued their careers in weatherrelated areas. Wardamaged national weather services required rebuilding, and thegrowth of transatlantic air traffic required data from an array of dedicated weather ships, a program begun in 1946 andsubsequently abandoned because of its expense.
Atom Bombs and the Weather
The dawn of the nuclear era raised the issue of how atomic bombs might affect the weather. Although a nuclearexplosion releases an immense amount of energy, it is small compared to environmental processes. Yet atmospherictests produced radioactive tracers that spread in a plume downwind and circled the globe at high altitudes in the jetstream, giving meteorologists a new view of the earth’s atmosphere. Tests at Bikini Atoll, for example, also served asan outdoor laboratory for ocean currents and coral reef studies.
In 1963, based on concerns about environmental pollution and following a long crusade supported by meteorologists andspearheaded by nongovernmental groups, the three nuclear nations—the United States, Great Britain, and the SovietUnion—signed and ratified the Limited Test Ban Treaty, which banned atmospheric nuclear testing. One year later,China conducted an atmospheric test, becoming the world’s fourth nuclear nation.
Weather Modification
In the nineteenth century, James Espy advocated rainmaking by setting large fires to create convective updrafts.Another prominent hypothesis held that rain followed military engagements. Many rainmakers of the late nineteenth andearly twentieth centuries made pseudoscientific claims that appealed to droughtstricken farmers. A new era of weathermodification began in 1946 at the General Electric Research Laboratory when Irving Langmuir (1881–1957), VincentSchaefer (1906–1993), and Bernard Vonnegut (1914–1997) demonstrated new techniques of cloud modification usingdry ice and silver iodide. Langmuir enthusiastically promoted a vision of largescale weather control, including redirectinghurricanes by cloud seeding.
The U.S. military actually tried weather modification and other techniques of environmental warfare between 1967 and1972 in Vietnam in an attempt to increase the rainfall over portions of the Ho Chi Minh Trail. Both the U.S. Congressand the United Nations investigated these activities, and in 1978 the U.N. established the Convention on the Prohibitionof Military or Any Other Hostile Use of Environmental Modification Techniques. Current assessments of weathermodification include the ability to clear cold fogs, suppress frost, and augment orographic precipitation by up to 10percent. None of the more extravagant claims, however, including drought relief, storm modification, climatemodification, or geophysical warfare, have materialized.
Computational Methods
Before the advent of digital computers, the British mathematician Lewis Fry Richardson (1881–1953) proposed avisionary scheme for solving the equations of atmospheric motion that would have required some sixtyfour thousandhuman calculators working in concert to keep ahead of the current weather. He worked alone for many weeks to producea single time step, sixhour retrospective forecast, with results in error by two orders of magnitude. This was partly theresult of the paucity and poor quality of the available observations, and partly because of the computational stepschosen. During World War II, punchcard readers were used to sort massive amounts of data from surface and upperairstations and to prepare analog forecasts in which weather maps from the past were compared with current weatherconditions. Tabulating machines were also used to calculate tables of atmospheric radiation, investigate windsea waveinteractions, and search for periodic weather cycles.
In 1946 the noted mathematician John von Neumann established the Meteorology Project at the Institute for AdvancedStudy in Princeton, New Jersey, to explore the possibility of using a digital computer to predict the weather. Within fouryears, with support from the U.S. Weather Bureau and the military weather services, and a stellar team ofmeteorologists that included Rossby, Jule Gregory Charney (1917–1981), Joseph Smagorinsky (1924–2005), and PhillipThompson (1922–1994), the project prepared a promising retrospective twentyfourhour forecast in less than twentyfourhours using the ENIAC (Electronic Numerical Integrator and Calculator) at Aberdeen Proving Grounds in Maryland. Thefirst numerical predictions in real time were prepared by Rossby’s team in 1954 in Sweden, the same year thatoperational numerical forecasting began in the United States.
Radar and Satellites
In 1941 a rain shower was tracked by a tencentimeter radar to a range of seven kilometers (4.3 miles) off the Englishcoast; similar precipitation echoes were detected at the Radiation Laboratory at MIT at about the same time. In the1950s the U.S. Weather Bureau established a network of conventional WSR57 radars, each with a detection range of250 miles. This network served into the 1990s, when it was replaced by a system of operational Doppler radars that canidentify severe storms, wind shear, and downdrafts.
In 1947, cloud formations were photographed from high altitude using a V2 rocket. The American satellite Explorer 6took the first photograph of earth from space in 1959, while in the same year Explorer 7 measured the radiation budgetof earth with a pair of infrared radiometers with spinscan stabilization designed and built by Verner Suomi (1915–1995).Tiros 1 (Television InfraRed Observation Satellite), the world’s first allweather satellite, was launched into polar orbit byNASA in 1960 carrying video cameras and radiometers that produced over twenty thousand images of the earth in bothvisible and infrared wavelengths. Tiros also produced the first image from space with an identifiable human feature: theshadow of a contrail from a jet aircraft extending hundreds of miles across the Arctic ice. Tiros 3 tracked HurricaneCarla in September 1963, resulting in a planned evacuation of some 350,000 people from its path and possibly areduction in casualties. Since Tiros had been developed in coordination with the U.S. Department of Defense, itspawned a series of classified satellites, including the Defense Meteorological Satellite Program (DMSP) used in
support of military operations.
In 1964, NASA launched the first Nimbus satellite into nearpolar orbit, carrying an improved video camera and aspectrometer that allowed the satellite to measure the temperature of the surface and the cloud tops and retrievevertical profiles of temperature and moisture from the infrared radiation welling up from earth. This kind of data, givingextended coverage over the oceans and uninhabited areas, was just what the modelers needed to initialize theircomputer models. Many other experimental and operational satellites followed, including those with the ability to trackocean currents and measure sea surface temperatures.
The Soviet Union launched weather satellites as early as 1963 in its Cosmos series. Cosmos 122 (1966) carried a TVcamera, while the Meteor series (1967) carried TV cameras and infrared sensors. Despite Cold War tensions, U.S. andSoviet meteorologists exchanged images daily from their weather satellites. Since 1966, with the launch of ATS 1(Applications Technology Satellite) into geostationary orbit, the entire earth has been photographed at least once a day,and severe weather is routinely monitored from space. This has opened up a new era of weather services called“nowcasting,” new possibilities to investigate climate change using satellite archival data, and expanded opportunities tomonitor the atmosphere, hydrosphere, lithosphere, and biosphere of the entire planet.
Interdisciplinary Atmospheric Sciences
New interdisciplinary problems, approaches, and techniques now characterize the modern subdisciplines of theatmospheric sciences. Specialties in cloud physics, atmospheric chemistry, satellite meteorology, and climatedynamics have developed along with more traditional programs in weather analysis and prediction. The U.S. NationalCenter for Atmospheric Research and many new departments of atmospheric science date from the 1960s.
In the 1970s, the Global Atmospheric Research Programme (GARP) sponsored experiments to measure the globalcirculation of the atmosphere, model its behavior, and improve predictions of its future state. The GARP AtlanticTropical Experiment (GATE) was carried out off the coast of Africa in 1974. The Global Weather Experiment ran from1978 to 1979 with the goal of extending accurate forecasting from several days to several weeks. These experimentsinvolved the coordination of hundreds of ground stations, ships, aircraft, and satellites from the United States, theSoviet Union, the Europe Space Agency, and Japan. Since then, many international programs have been launched inglobal meteorology and climatology.
Fundamental contributions have been made by Edward Lorenz (b. 1917) on the chaotic behavior of the atmosphere. By“chaos,” Lorenz meant something very precise: the behavior and final state of a dynamical system described by a set ofnonlinear equations is very sensitive to initial conditions. Small differences or perturbations can cause large changes.His work challenges the received notion of longrange predictability. Also of note, Paul Crutzen (b. 1933), Mario Molina(b. 1943), and F. Sherwood Rowland (b. 1927) won the Nobel Prize for Chemistry in 1995 for work on reactions involvingthe depletion of stratospheric ozone. Their work supported the enactment of the 1987 Montreal Protocol on Substancesthat Deplete the Ozone Layer and subsequent agreements that control the production and consumption of ozonedepleting chemicals.
Climate Change Science and Policy
In the middle of the nineteenth century, the discovery that the earth had experienced ice ages produced a plethora ofcomplex but highly speculative theories of climatic change involving astronomical, physical, geological, andpaleontological factors. Joseph Adhèmar (1797–1862) attributed ice ages to the catastrophic collapse of Antarctic iceand the subsequent worldwide deluge. Later, James Croll (1821–1890), Svante Arrhenius (1859–1927), T. C. Chamberlin(1843–1928), and many others attempted explanations based on earth’s orbital elements, the global carbon budget, and
the behavior of the oceans.
Gilbert Walker (1868–1958) and Jack Bjerknes are usually given credit for discovering the El Niño–Southern Oscillationphenomenon. During the early 1920s, Walker empirically identified a periodic variation in atmospheric pressure over theIndoPacific, which he christened the “Southern Oscillation.” During the 1960s, Bjerknes posited a physical mechanismto explain the atmospheric features of this phenomenon over the equatorial Pacific, which he christened the “WalkerCirculation.” They and many others deserve recognition for their contributions toward understanding this global climatephenomenon.
Beginning in 1938, during a period of climate warming, the British engineer and scientist Guy Stewart Callendar (1898–1964) established the carbon dioxide theory of climate change in its recognizably modern form, reviving it from itsearlier, physically unrealistic and moribund status. Today, the theory that global climate change can be attributed to anenhanced greenhouse effect because of elevated levels of carbon dioxide in the atmosphere from anthropogenicsources, primarily from the combustion of fossil fuels, is called the “Callendar Effect.” Since 1958, measurements ofatmospheric carbon dioxide have been accurately and faithfully taken at the summit of Mauna Loa volcano in Hawai‘i byCharles David Keeling (1928–2005) and his associates. Subsequently, many more international baseline stations havebeen established. The Keeling curve, the famous sawtoothed curve of rising carbon dioxide concentrations, becamethe environmental icon of the twentieth century.
In the 1950s, Gilbert Plass (1920–2004) developed an early computer model of infrared radiative transfer in support ofhis research on carbon dioxide and climate. Several years later, in the interest of national security, a climate modelknown as Nile Blue was developed by the Advanced Research Projects Administration (ARPA) in the Department ofDefense. It was hoped that this model could be used to test the sensitivity of the climate to major perturbations,including Soviet tinkering and those that could result from a major environmental war. In 1967, Syukuro Manabe (b.1931) and Richard T. Weatherald (b. 1938) published the results of a onedimensional model that included the effects ofboth radiation and convection to calculate temperature as a function of latitude. It predicted a mean warming of 2.3ºCelsius (36.14º Fahrenheit) for a doubling of carbon dioxide. Two years later, Manabe and Kirk Bryan (b. 1929) addedbasic oceanic features to the model.
In 1971, when some meteorologists were looking into the possibility of a widespread global cooling, a report from theStudy of Man’s Impact on Climate conference returned the scientific focus to carbon dioxide emissions, calling themthe largest single anthropogenic change that may influence the climate in the foreseeable future. In 1988 the scientistJames Hansen (b. 1941) announced to Congress and the world that “Global warming has begun.” He went on to reportthat, at least to his satisfaction, he had seen the “signal” in the climate noise, and significant and perhaps catastrophicclimate warming, perhaps in the form of a runaway greenhouse effect, would occur. Hansen later revised his remarks,but his statement remains the starting point of recent widespread social and political concerns over global warming.That same year, the Intergovernmental Panel on Climate Change (IPCC) was formed as a joint program of the UnitedNations Environmental Programme, the World Meteorological Organization, and the International Congress of ScientificUnions. It has a mandate to prepare regular assessments of what is known and what should be done aboutanthropogenic climate change.
The 1992 Framework Convention on Climate Change (FCCC) calls for a stabilization of atmospheric carbon dioxideconcentrations at a level that would prevent harm to the global climate. The 1997 Kyoto Protocol, calling for legallybinding greenhouse gas emission targets for all developed countries, was ratified in 2004, but it remains a contentiousissue, with the United States and Australia as holdouts. More recently, the Asia Pacific Partnership on CleanDevelopment and Climate (AP6), involving the United States, Australia, China, India, Japan, and South Korea, seeks toreduce emissions and develop clean energy sources, but with no international enforcement mechanisms. Theseconventions and protocols represent geopolitical interventions in the climate system. Many more policy initiatives areunder way. Economics has also begun to play a role as taxes and incentives are put in place to reduce unwantedemissions. Meanwhile, green social engineers are attempting to convince the general public to live sustainably,
engineers are involved in carbon sequestration and climate adaptation projects, and “geoengineers” hold in reservemassive technical fixes for the climate system.
Progress in meteorology and weather forecasting over the past three centuries has been threefold: technologicalinnovation, observational knowledge, and theoretical understanding. All three need cultivation. Over the years, the socialaspects of meteorology have grown to include practical forecasting, severe weather warnings, growing publicexpectations, and governmental and diplomatic initiatives regarding the health and future of the planet. Through theWorld Wide Web and the media, the products of the modern atmospheric sciences reach more people on a daily basisthan those of any other science. Images of the weather from radar and satellites are familiar to everyone. Moreover,recent social concerns such as air pollution, ozone depletion, severe storms, and climate change have placed theatmospheric sciences at the focus of international attention.
[See also MARINE STATIONS; METEOROLOGICAL DEPARTMENTS AND INSTITUTES; OBSERVATORIES; and WEATHER ROUTING.]
Bibliography
Fleming, James Rodger, ed. Historical Essays on Meteorology, 1919–1995: The Diamond Anniversary History Volumeof the American Meteorological Society. Boston: American Meteorological Society, 1996.Find This Resource
Fleming, James Rodger, Vladimir Jankovic, and Deborah R. Coen, eds. Intimate Universality: Local and Global Themesin the History of Weather and Climate. Sagamore Beach, Mass.: Science Publications/USA, 2006.Find This Resource
Frisinger, Howard H. The History of Meteorology to 1800. Boston: American Meteorological Society, 1983.Find This Resource
Khrgian, Aleksandr Khristoforovich. Meteorology: A Historical Survey. 2d ed., rev. Edited by Kh.P. Pogosyan.Translated by Ron Hardin. Jerusalem: Israel Program for Scientific Translations, 1970.Find This Resource
Kutzbach, Gisela. The Thermal Theory of Cyclones: A History of Meteorological Thought in the Nineteenth Century.Boston: American Meteorological Society, 1979.Find This Resource
Lorenz, Edward N. The Nature and Theory of the General Circulation of the Atmosphere. Geneva, Switzerland: WorldMeteorological Organization, 1967.Find This Resource
Persson, Anders. The Coriolis Effect: Four Centuries of Conflict between Common Sense and Mathematics, Part I: AHistory to 1885. History of Meteorology 2 (2005): 1–24.Find This Resource
SchneiderCarius, Karl. Weather Science, Weather Research: History of Their Problems and Findings from Documentsduring Three Thousand Years. New Delhi: Indian National Scientific Documentation Centre, 1975.Find This Resource
WAS THIS USEFUL?
JAMES RODGER FLEMING
Yes No
PRINTED FROM OXFORD REFERENCE (www.oxfordreference.com). (c) Copyright Oxford University Press, 2013. All Rights Reserved. Under the terms of the licence agreement, an individual user may print out a PDF of asingle entry from a reference work in OR for personal use. Subscriber: Columbia University; date: 11 December 2013
Log out