Immigrants in Richmond, Virginia : Lebanese, Armenians and ...
Upload
independentCategory
view
13download
0
DI
SC
US
SI
ON
P
AP
ER
S
ER
IE
S
Forschungsinstitut zur Zukunft der ArbeitInstitute for the Study of Labor
Work, Risk and Health: Differences betweenImmigrants and Natives in Spain
IZA DP No. 5338
November 2010
Meritxell SoléLuis Diaz-SerranoMarisol Rodríguez
Work, Risk and Health: Differences
between Immigrants and Natives in Spain
Meritxell Solé Universitat de Barcelona
and CREB
Luis Diaz-Serrano Universitat Rovira i Virgili
and IZA
Marisol Rodríguez Universitat de Bercelona
and CREB
Discussion Paper No. 5338 November 2010
IZA
P.O. Box 7240 53072 Bonn
Germany
Phone: +49-228-3894-0 Fax: +49-228-3894-180
E-mail: [email protected]
Any opinions expressed here are those of the author(s) and not those of IZA. Research published in this series may include views on policy, but the institute itself takes no institutional policy positions. The Institute for the Study of Labor (IZA) in Bonn is a local and virtual international research center and a place of communication between science, politics and business. IZA is an independent nonprofit organization supported by Deutsche Post Foundation. The center is associated with the University of Bonn and offers a stimulating research environment through its international network, workshops and conferences, data service, project support, research visits and doctoral program. IZA engages in (i) original and internationally competitive research in all fields of labor economics, (ii) development of policy concepts, and (iii) dissemination of research results and concepts to the interested public. IZA Discussion Papers often represent preliminary work and are circulated to encourage discussion. Citation of such a paper should account for its provisional character. A revised version may be available directly from the author.
IZA Discussion Paper No. 5338 November 2010
ABSTRACT
Work, Risk and Health: Differences between Immigrants and Natives in Spain*
We analyze the impact of working and contractual conditions, particularly exposure to job risks, on the probability of acquiring a disability. We postulate a model in which this impact is mediated by the choice of occupation, with a level of risk associated to it. We assume this choice is endogenous, and that it depends on preferences and opportunities in the labour market, both of which may differ between immigrants and natives. To test this hypothesis we use data from the Continuous Sample of Working Lives of the Spanish SS system. It contains individual, job and firm information of over a million workers, including a representative sample of immigrants. We find that risk exposure increases the probability of permanent disability by 5.3%; temporary employment also influences health. Migrant status – with differences among regions of origin – significantly affects both disability and the probability of being employed in a risky occupation. Most groups of immigrants work in riskier jobs, but have lower probability of becoming disabled. Nevertheless, our theoretical hypothesis that disability and risk are jointly determined is not valid for immigrants: i.e. for them working conditions is not a matter of choice in terms of health. JEL Classification: J28, J61, J81 Keywords: disability, working conditions, immigration, Spain, MCVL Corresponding author: Luis Diaz-Serrano Department of Economics Universitat Rovira i Virgili Av. de la Universitat, 1 43204 Reus Spain E-mail: [email protected]
* The author would like to acknowledge the financial support of the Spanish Ministry of Education (grant number SEJ2007-66318).
2
1. Introduction Numerous investigations have demonstrated that working conditions have an impact on health
(Llena-Nozal et al, 2004; Robone et al, 2010; Bartley et al 2004; Benach et al 2004; Moden,
2005). In particular, the exposure to work related risk of injury and illness has an expected
reflect on ill health (Berger and Leigh, 1989). Many of those investigations apply an equity
lens to demonstrate a link between the unequal distribution of working conditions and
inequalities in health (Artazcoz et al 2005; Warren et al, 2004, Borg and Kristensen, 2000;
Power et al 1998; Lundberg, 1991). But not only material working conditions are likely to
have an impact on health and permanent disability, psychological factors related to lack of
autonomy at work, job dissatisfaction and contractual conditions that affect job stability have
also appeared in several studies as strong determinants of general health or specific diseases
(Gash et al 2007; Datta Gupta and Kristensen 2007; Marmot, 2005; Virtanen et al, 2005;
Pikhart et al 2004; Smith et al 1995).
Conceiving health as a dynamic concept, it is plausible that working conditions and work
environment affect both the gradual changes in health and the occurrence of events that have a
sudden impact on individual’s health, like work-related accidents. This approach is stressed in
Kerkhofs and Lindeboom, 1997 and it stands at the basis of the present investigation. In their
model, these authors assume that health status and labour market outcomes may be jointly
determined. Individuals with low time discount rates may be more likely to invest in future
labour market positions and health than those with higher discount rates.
Following this line, our starting notion is that the relationship between working conditions
and health is mediated by the occupational choice in terms of risk. It is plausible to assume
3
that on choosing a job –with a level of risk associated to it- workers do not ignore the effects
of working in a risky job on their health status1. The idea that individuals invest in their own
health has an outstanding place in the literature since the publication of Grossman seminal
work (1972), and the treatment of occupational choice as an investment in health can be
found, for example, in Cropper (1977). On the other hand, the choice of work related risk
level is partially determined by taste and economic circumstances. Among them, migrant
status is supposed to strongly affect the occupational choice and, at the same time, contribute
to determine health outcomes. Several researchers have documented differences in workplace
risk exposures by country of origin or race within a broader discussion on the role of tastes
and market opportunities in assuming a certain level of risk at work (Viscusi, 2003, Leeth and
Ruser, 2006). Under a health investment framework, differences in health investments by
migrant status are thus assumed.
This research uses a dataset containing ample information about working lives and disability
status to explore two sets of issues. First, what is the contribution of working and contractual
conditions, and particularly the exposure to health risks, to the probability of acquiring a
disability, taking into account the endogeneity of risk level choices? Second, are immigrants
and natives significantly different in terms of risk choices and in the effect of these choices on
their health status? Moreover, are all immigrants the same? The existence of socioeconomic
health inequalities due to differences in working conditions constitutes itself a focus of
interest of public policies. Possible differences in market opportunities by country of origin
conducing immigrants to higher risk exposure or more precarious employment constitute an 1 The importance of taking into account endogeneity has been illustrated in Haveman et al (1994) who use Grossman’s framework to address the question of the interdependency of health status, work-time and wages where work-time beyond some norm is supposed to entail stress and other deleterious side effects. They demonstrate that the simultaneous GMM estimations differ substantially from those derived from simpler models with more restrictive assumptions commonly used in the literature.
4
additional source of inequality and are in the basis of the debate on the conditions in which a
society integrates the new arrivals.
Due to the recent dramatic growth in the immigrant population in Spain 2 , the above-
mentioned issues stand out as a very important topic of public debate. Despite the magnitude
of the immigration phenomenon and the political interest on it, the evidence about health
status and workplace conditions of immigrant populations in Spain and other developed
countries is still scarce. Furthermore, the existing evidence is based on subjective perceptions
of both working conditions and health status, or restricted to differences by country of origin
in workplace illness and injury rates. This paper seeks to contribute to the quality of the
discussion by applying a behavioural model using objective measures of working conditions
and disability status obtained from the Social Security census of working lives.
One would expect there to be differences in health investments related to occupational choice
between immigrants and non-immigrants for different reasons. First, from the hedonic
equilibrium framework perspective, differences in risk preferences fully explain discrepancies
in workplace risk across demographic groups. Differences in wage-risk tradeoffs by country
of origin may arise from unequal economic circumstances or from differences in tastes. For
instance, inequalities in lifetime levels of wealth -supposed to be lower for immigrants- may
explain differences in willingness to bear risk, i.e. immigrants or ethnic minorities would be
more likely to be employed in risky jobs (Viscusi, 2003; Lucas, 1974; Robinson, 1984).
Second, immigrant and non-immigrants might differ in terms of market opportunities. It is
known that differences in market offer curve of wages as function of fatality risk by country
2 In 2009, 13.8% of the population had been born abroad, while the percentage was only 3.13% in 1999.
5
of origin may arise from discrimination or from unmeasured productivity differences
(Akhavan, 2006; Leeth and Ruser, 2006). In this respect, literature on market discrimination
documents that immigrants are paid less for the same job (Viscusi, 2003). Other factors
different from preferences may explain divergencies in risk levels between immigrants and
non-immigrants if some hypotheses behind the hedonic equilibrium theory are unrealistic.
Informational disadvantages or occupational crowding probably force immigrants to choose
higher levels of risk than those arising from their preferences.
For Spain, Ahonen and Benavides (2006) not only find that immigrants are employed in
riskier jobs than native-born Spaniards, they also show that they experiment more work
related injuries and diseases than do natives. A similar finding appears in Parra et al (2006)
for the region of Navarra. Finally, immigrants’ rate of accidents has been reported to be about
twice that of natives in Germany, France and the Netherlands (Bollini and Siem, 1995).
After this introduction, in the next section we discuss the conceptual and empirical
frameworks. In section three we describe the institutional context and the data, and we present
the variables and their descriptive statistics. Section four contains the econometric results, and
section five concludes with a discussion of the main results and some limitations.
2. Methodological framework
2.1. Conceptual framework
We aim to model two simple facts that are in the basis of our analysis: health depends on
6
working and contractual conditions, mainly through the exposure to work related health risks;
and the occupational choice that determines the level of risk depends on preferences and
opportunities in the labour market that may differ between immigrants and natives.
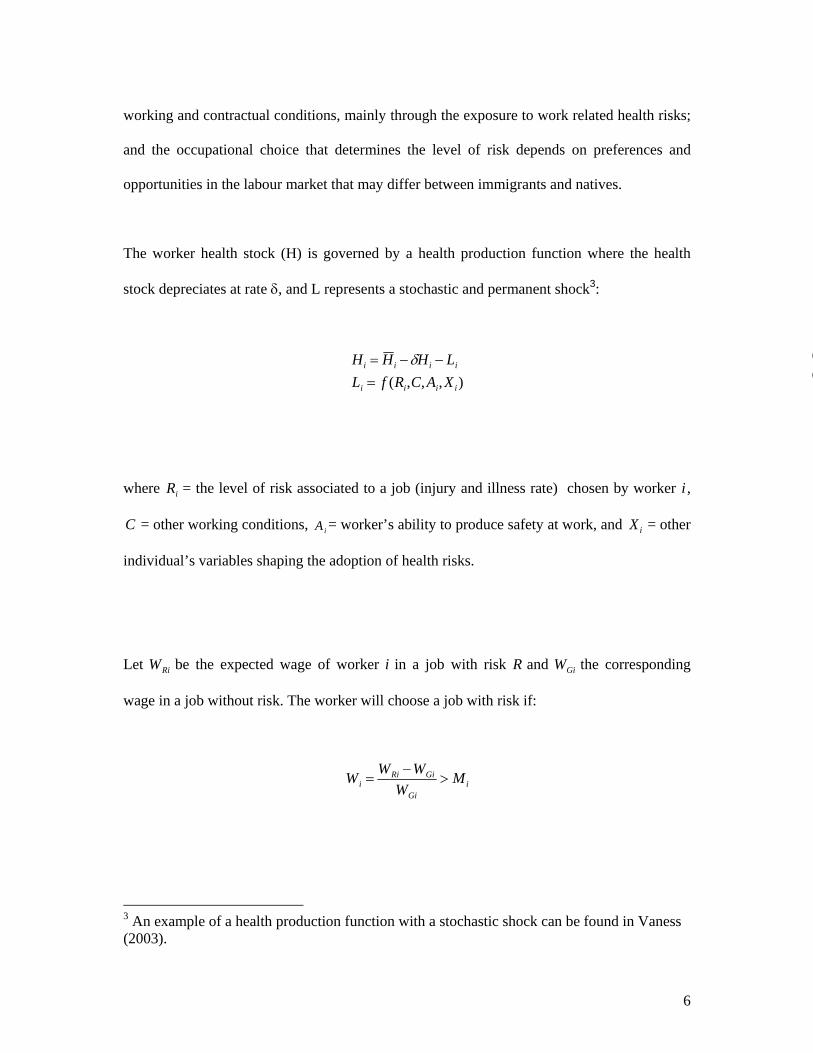
The worker health stock (H) is governed by a health production function where the health
stock depreciates at rate δ, and L represents a stochastic and permanent shock3:
Hi = H i −δHi − Li
Li = f (Ri,C,Ai,Xi)
where Ri = the level of risk associated to a job (injury and illness rate) chosen by worker i ,
C = other working conditions, Ai = worker’s ability to produce safety at work, and Xi = other
individual’s variables shaping the adoption of health risks.
Let WRi be the expected wage of worker i in a job with risk R and WGi the corresponding
wage in a job without risk. The worker will choose a job with risk if:
Wi =WRi −WGi
WGi
> Mi
3 An example of a health production function with a stochastic shock can be found in Vaness (2003).
(
(
7
Following previous studies (Daniel and Sofer, 1998) Mi can be interpreted as i´s reservation
relative wage or as the relative shadow prize for risky working conditions, and therefore
related to individual’s risk preferences. In other words, in a utility function that depends on
health and wages, Mi is the MRS between safety and salary. Wi represents the expected wage
premium for risk (if existing), or simply the difference, in terms of wage, between working in
a risky job and i´s alternative in the labour market. Particularly, our model allows for WGi to
be 0 in the presence of unemployment. Being an immigrant may affect both Mi and Wi .
Migrant decision might reflect itself certain risk tolerance, so that Mi can be smaller for
immigrants than for natives. Leigh (1989) argues that blacks and others who have been reared
in relative poverty have less aversion to risk than whites that come from predominantly
middle to upper-income families. With respect to Wi , our hypothesis is that the probability of
choosing a better job without risk (WGi not being 0) and the compensating wage premium for
risk is lower for immigrants4. They face different hedonic wages than natives and, therefore,
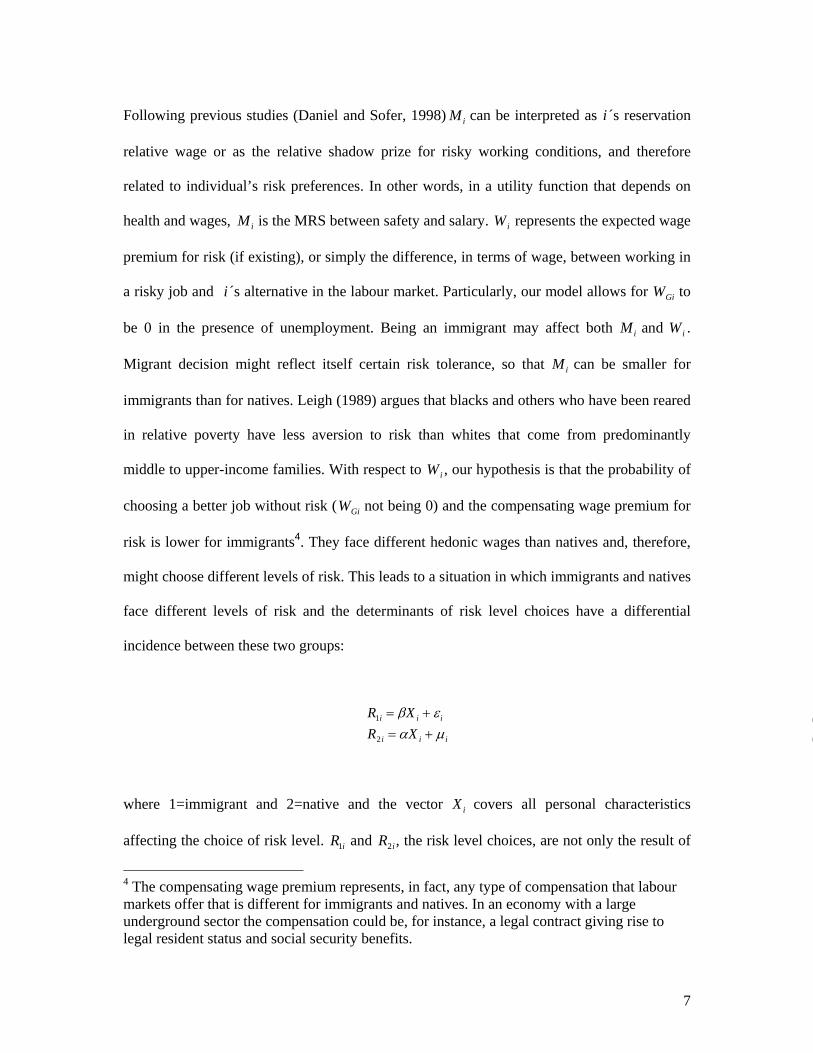
might choose different levels of risk. This leads to a situation in which immigrants and natives
face different levels of risk and the determinants of risk level choices have a differential
incidence between these two groups:
R1i = βX i + ε i
R2 i = αX i + µi
where 1=immigrant and 2=native and the vector Xi covers all personal characteristics
affecting the choice of risk level. R1i and R2i, the risk level choices, are not only the result of
4 The compensating wage premium represents, in fact, any type of compensation that labour markets offer that is different for immigrants and natives. In an economy with a large underground sector the compensation could be, for instance, a legal contract giving rise to legal resident status and social security benefits.
(
(
8
individuals’ acceptance of risk ( Mi) but are also related to iW , the wage premium for risk. In
this respect, the components of vectors R1i and R2i express each level of risk associated to a
marginal price that results from the intersections of demand and supply functions of workers
and firms choosing those particular job risks5. The formulation presented in equation (3.1)
and (3.2) is appropriate to empirically account for the sorting of workers into levels of risk
underlying personal characteristics.
2.2. Empirical framework
Our model consists of a recursive system of equations for disability and risk exposure, where
the random component of the disability equation is allowed to be freely correlated with the
random component of the risk equation. This specification is able to take into account
endogeneity, which may arise from both simultaneity and unobservable heterogeneity
influencing both disability and risk exposure. Simultaneity issues may emerge from the fact
that individuals do not ignore the consequences in terms of health of their risk level choices.
This consideration is fully consistent with our conceptual framework, where risk choice is
inserted in a health production function.
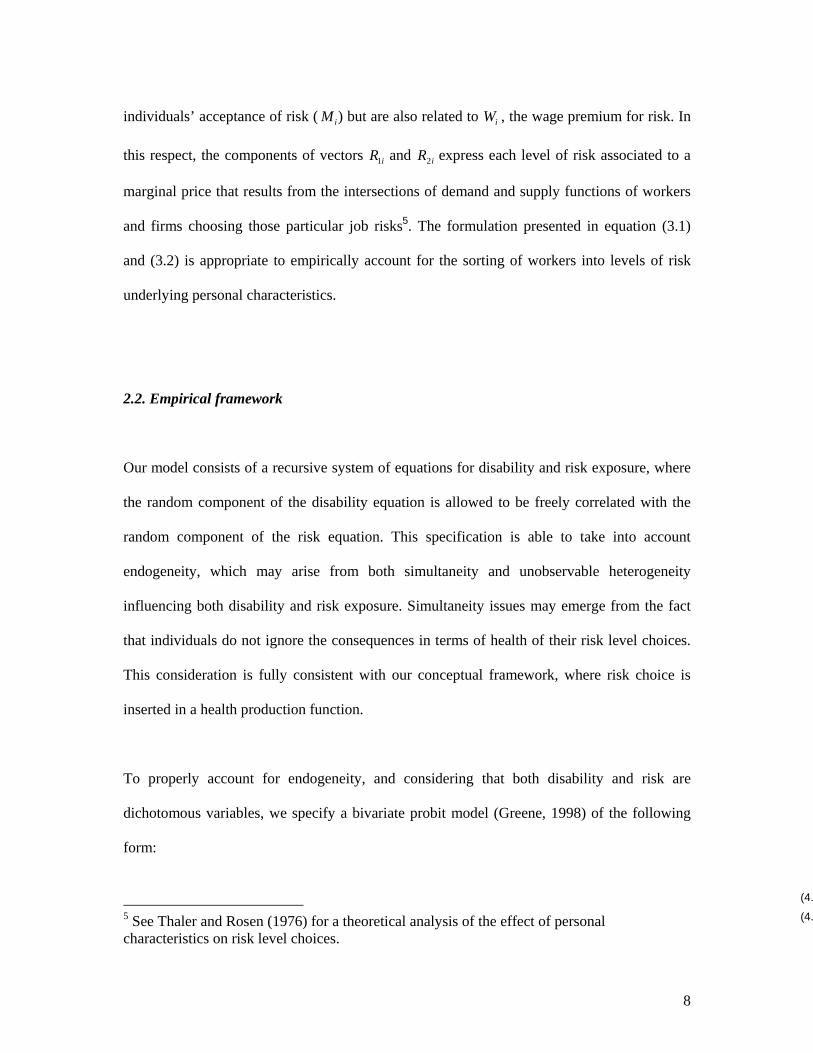
To properly account for endogeneity, and considering that both disability and risk are
dichotomous variables, we specify a bivariate probit model (Greene, 1998) of the following
form:
5 See Thaler and Rosen (1976) for a theoretical analysis of the effect of personal characteristics on risk level choices.
(4.
(4.2
9
Di* = β1Xi + δRi + εi
Di =1 if Di* > 0
Ri* = β2Xi + γZi + µi
Ri =1 if Ri* > 0
for individual i , the *iD and *
iR are unobserved latent variables indicating individual’s
probability of acquiring a disability and individual’s propensity to choose a risky job,
respectively. The vector Xi , contains the explanatory variables of disability. Zi is a vector of
variables that influence current risk level choice but are uncorrelated with εi; the remaining
terms in equations (4.1) and (4.2) are the unknown parameters of interest that we wish to
estimate, 1β , 2β δ and γ , the random error terms, εi and µi.The correlation between εi and µi
,ρ , will be also estimated, assuming that it follows a bivarate normal distribution.
The unobserved propensities *iD and *
iR specified in the system of equations will be
estimated first for the whole sample, with migrant status as a dummy variable; we then
introduce some interactions taking into account the region of origin and, finally, we estimate
the bivariate probit separately for native-born Spaniards and immigrants distinguishing among
different regions of origin of those immigrants.
3. Institutional Framework and Data
3.1 Institutional context
The labour market based social security is mandatory for workers in Spain. Contributions
(around 37% of calculated monthly earnings) are scaled according to occupational category.
(5.
(5.2
10
Employers contribute approximately 85% of the total amount and employees the remaining
15%. The Social Security system provides the most important welfare program in Spain:
public pensions. As far as permanent disability pensions are concerned, the law distinguishes
four levels characterized by increasing severity (the first two are compatible with holding a
job): 1) partial-permanent disability for the usual profession, refers to disability cases where
worker's ability to perform his/her usual tasks is decreased by 33% or more 2) total
permanent disability for the usual profession, 3) absolute permanent disability, applies to
cases were the individual is unable to do any kind of job and 4) severe disability, the person
requires continued attendance by other persons in order to carry out the basic daily activities
(Jiménez-Martín et al, 2006). In terms of requirements, when the disability is caused by an
ordinary illness, eligibility to a pension requires a minimum of five years of contributions.
There is no requirement when the disability is caused by an accident,-whether work-related or
not- or a professional illness.
3.2. Data and Variables
We use the Muestra Continua de Vidas Laborales (MCVL), 2006, (Continuous Sample of
Working Lives), an administrative data set provided by the Social Security Administration
with information on individuals who had an active record with the Social Security system at
any time during 2006. The sample is a 4% non-stratified random draw from a reference
population that includes employed workers (wage earners and self-employed), unemployment
benefits recipients and pensioners. It consists of nearly 1.1 million individuals. The MCVL
contains information on the employment and contribution history (dating back to 1967) of the
selected individuals.
11
Individual variables include sex, date and place of birth, family status, monthly earnings,
pension benefits, disability degree and the year of its commencement. Firm characteristics
comprise number of employees, foundation date and geographical location. Job characteristics
cover type of contract, tenure, social security scheme, firm’s sector of activity and dates of
beginning and end of each contract. Job and firm characteristics are registered for each
contractual relation the worker has been involved in.
The MCVL has two characteristics especially relevant for our analysis: it contains a large and
representative subsample of immigrants and information about disability and its degree. An
immigrant is defined as someone who was born abroad. We work with cross section data: any
relation with the Social Security prevailing in 2006 in the case of the active non-disable
population and the relationship applicable when the disability appeared in the case of disabled
people receiving a pension. Since every labour relation generates a new record that means we
can observe the actual working conditions prevailing when the disability occurred. From the
original data set, we have restricted our sample to working age (16 to 64) individuals who
have contributed at least five years to the social security system, the minimum required to be
eligible for a non-accident caused disability pension. A detailed description of the variables
follows.
Disability
The first endogeneous variable is “Disability”, a binary variable that takes the value 1 if the
person moves to a permanent disability status (any of the four categories mentioned above) at
any time of his/her active working life and 0 otherwise. The information comes from the
12
administrative records contained in the MCVL. Our data allows identifying transitions to
disability in two ways: if the individual starts receiving a disability benefit from the Social
Security System or if the employer starts declaring workers disability (there are incentives –
reduced contributions to the Social Security- to declare the disability). Both can occur
simultaneously. For disabled individuals, the working conditions considered are those
applicable in the moment of the transition to disability, and further working relations are
eliminated.
Risk
We have constructed the risk measure using injury and illness rates by industry-occupation:
i.e. number of individuals receiving a pension for non-fatal 6 work-related injuries or
professional illness in a certain industry-occupation divided by the total number of individuals
working in that industry-occupation. There are 44 industries and 10 occupations, which
provides a total of 440 job-industry cells. The risk variable takes the value 1 if the job-
industry cell the individual belongs to is in the top quartile in the illness/injury rate ranking,
and 0 otherwise.
Our risk measure satisfies two important conditions. First, it is narrowly defined in order to
capture the variation in risk by both occupation and industry at a high level of detail. Second,
it is elaborated following the same classification of industries and occupations used to define
the rest of working conditions -both based on the MCVL-, what guaranties coherence. Other
sources of information that directly provide work-related injury and illness rates not requiring
6 Our investigation excludes fatal injury rates as measure of risk. Since we investigate disability status -our sample only contains individuals who are alive- nonfatal rates are more suitable to capture the effects of risk on disability status.
13
further elaborations (for example, the statistics published by the Ministry of Labour and
Migrations) do not use the same occupational categories as those considered in the MCVL.
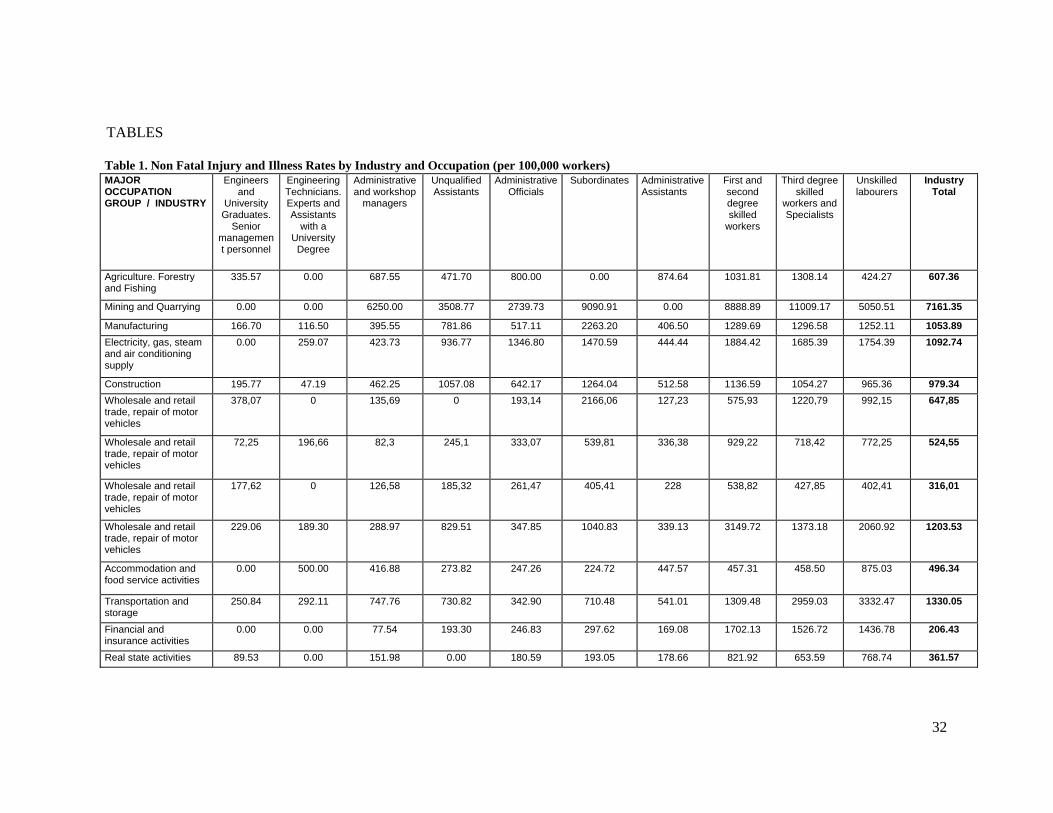
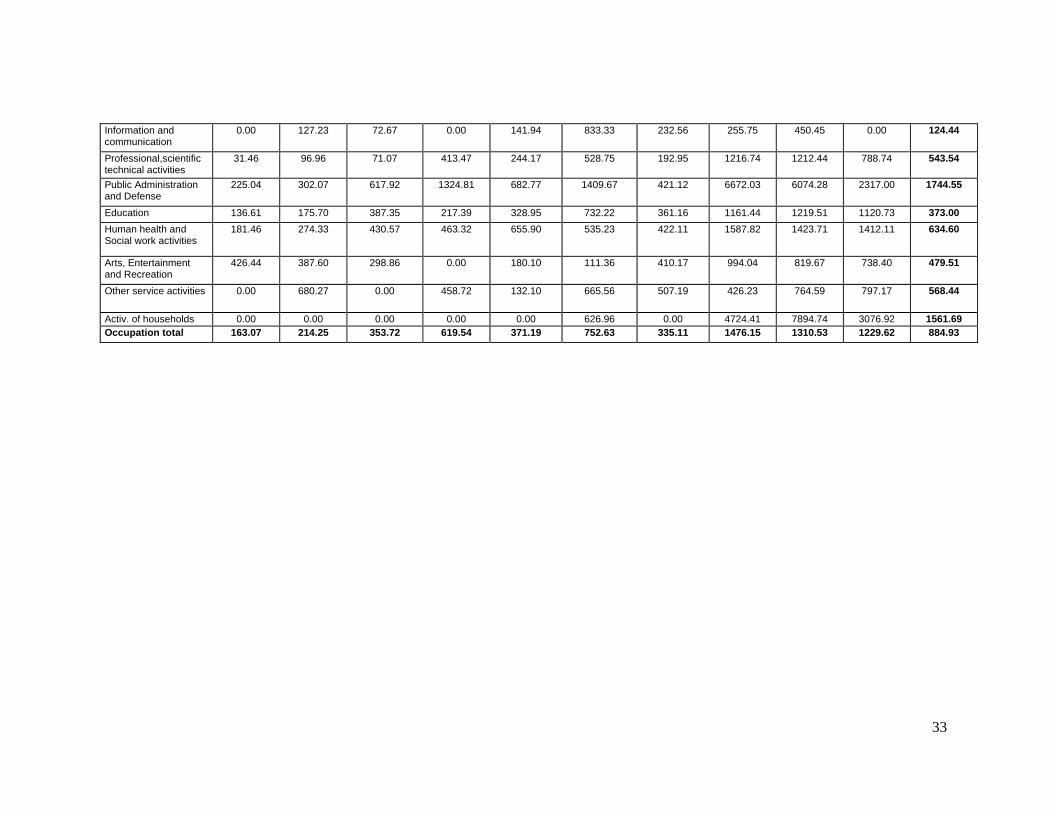
Table 1 presents the non-fatal injury and illness rates by major industry-occupation cells.
Studies that employ simultaneously occupation and industry to estimate risks are rare in the
Spanish context. Riera and Font (2007) used 8 industries and 9 occupations to estimate a
hedonic wage function. Lopez-Jacob et al (2008) in comparing immigrants and autochthones
injury and illness rates used 10 industries (occupations were not considered). Nevertheless,
our results are consistent with theirs, despite the fact that the terms of comparison are not
exact. Higher skilled occupations –engineers and university degree graduates, senior
managers and engineering technicians and assistants with a university degree- have the lowest
injury and illness rates7. The highest incidence of work related injuries and illness is found
among workers in low-skilled job categories of mining and quarrying (25,675 disabled per
100,000 workers). It is worth mentioning that we consider risk level as a characteristic
intrinsic to the job and as such it is observed by the worker.
INSERT TABLE 1
Explanatory variables
In the disability equation we include both individual characteristics -age, sex, education,
number of family members, and marital status- and working conditions: days since the first
affiliation, type of contract, a dummy variable for low skilled jobs, and risk exposure. The 7 Although a university degree is necessary to belong to these two occupational groups, there can be people with a university degree in other categories. Occupation is not a worker’s attribute but reflect the contractual relation with the employer, contributing to define the tasks involved.
14
variable “type of contract” takes the value 1 for temporary and fixed-term contracts, and 0 for
civil servants and other kinds of permanent workers. Following the classification published by
the Spanish Ministry of Labour we consider “low skilled” workers employed as subordinated
and low skilled labourers. This variable is used as a proxy for lack of autonomy on the job.
We believe that individual’s characteristics also influence the choice of risk level; in
particular, “number of family members” and “marital status” have been used in some studies
as proxies for risk preferences (Leeth and Ruser, 2006). The risk equation also contains a
dummy variable that takes the value 1 for workers whose previous working status was
“unemployed”, and therefore moved from unemployment to the current job 8 . Being
unemployed when the occupational decision takes place may influence the choice of job
characteristics, and particularly the level of risk. Crowded occupations or lack of worker’s
bargaining power are natural correlates of unemployment status and delimit worker’s set of
opportunities in the job market. Therefore, it is reasonable to expect shifts from
unemployment to risky jobs to be more likely than transitions from other jobs to risky
occupations, everything else equal. On the other hand, if risk preferences fully account for
differences in risk level choices -as predicted by the hedonic equilibrium theory-, workers in a
disadvantaged situation (as unemployment) would not be more likely than others to be
employed in risky occupations. Control variables for firm characteristics are also considered
in the risk equation: size (number of employees), and years since foundation. Findings from
industrial safety literature indicate that firm size and accident rates are strongly correlated. Oi
(1974) found an inverted U shape with its peak accident rate for firms with 160 workers. The
number of employees appears positively related to safety practices in Thomason (2002).
8 The job performed in 2006 or, in the case of disable people, the job held in the moment of the transition to disability.
15
Descriptive statistics
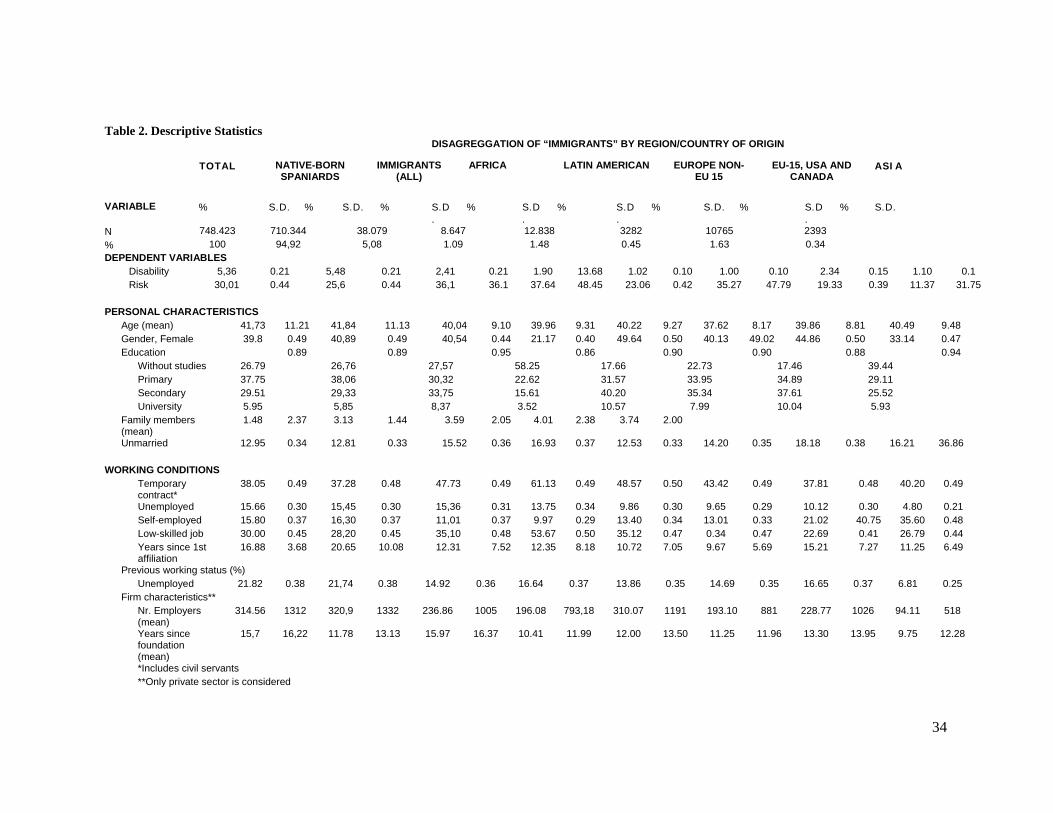
Table 2 shows that the proportion of immigrants that have made the transition to a permanent
disability (2.4%) is lower than that of natives (5.5%). On average, immigrants exhibit a higher
educational attainment than natives. The percentages of immigrants with secondary (33.8%)
or university (8.9%) studies are larger than those for natives (29.3% and 5.9%), what seems to
be contradictory with the higher representation of immigrants in the worst working
conditions.9 Immigrants have higher rates of unemployment and temporary employment, and
are found more often than natives in low-skilled jobs. More telling for our analysis is the fact
that immigrants are more likely to be employed in risky jobs: 36 % of immigrants are exposed
to work related risks, while this proportion is 26% for natives. When the three potentially
“unhealthy” working conditions – temporary employment, risk, and lack of autonomy at work
(low-skilled jobs)- are jointly considered, the proportion of immigrants employed in
temporary, low skilled and risky jobs is nearly three times that of native-born Spaniards. This
finding reinforces the violation of the expected positive relation between high education
attainment and good working conditions and is consistent with previous studies that show a
higher incidence of overeducation among immigrant population in Spain (Fernández and
Ortega 2008; Díaz-Serrano 2010).
Persons born in the US, Canada, China and EU-15 are the least likely to be found in risky
occupations. At the other extreme, Latin America, Portugal, Eastern Europe and Africa are the
countries/regions of origin associated to higher percentages of risky jobs. This preliminary
9 However, this finding is also observed in Diaz-Serrano (2010), who used a health survey from Catalonia.
16
analysis suggests an opposite relation between country’s level of wealth and risk exposure.
However, two observations break this link: Portugal is associated to high levels of risk
contrasting to other EU-15 members, and citizens born in China and other Asian countries
hardly participate in risky occupations.
Summarizing, and as far as the comparison between immigrants and native-born Spaniards is
concerned, three intuitions can be obtained from this preliminary analysis: immigrants have
better education and are less likely to be disabled; however, they are more likely to be
employed in risky jobs, and risky jobs seem to be associated to higher disability rates10. In the
econometric analysis we will try to disentangle this puzzle by exploring the effect of working
conditions on disability for both immigrants and native-born Spaniards.
INSERT TABLE 2
4. Econometric results
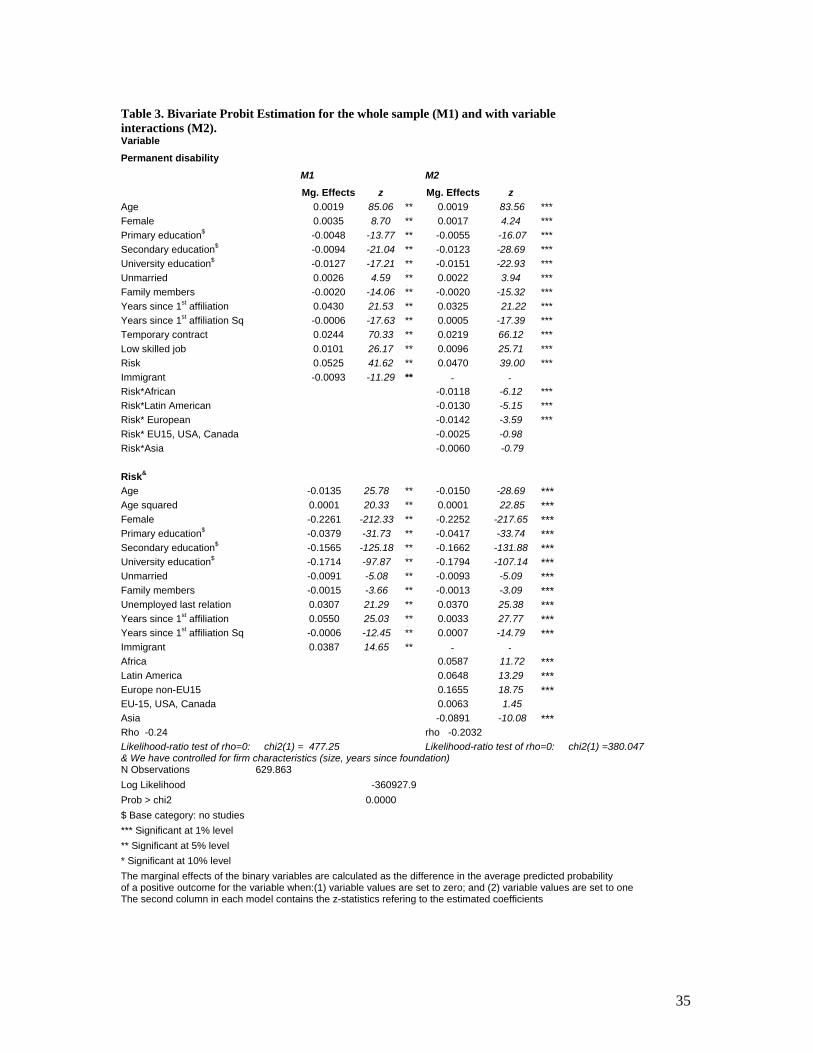
Table 3 contains two models with the estimation results of the recursive bivariate probit for
the whole sample. In the first model, immigrant status is captured by single dummy variable;
in the second model we include several regional dummies and their interactions with the risk
variable. Separate estimations by region of origin are shown in table 4. In order to allow for
comparisons we report the marginal effects instead of the estimated coefficients.
10 In our data, workers employed in risky jobs represent 29% of all workers and accumulate 40% of all cases of disability, which suggests that exposure to work related health risks strongly influences the probability of becoming disabled.
17
To formally test the null hypothesis of exogenous risk choice, we employed the Hausman-Wu
test (Hausman, 1978). This test entails a χ 2 test of the explanatory power of the residuals
from the first-stage risk choice equation when added to the second-stage disability equation.
The exogeneity of risk choice was rejected ( p < 0.05) in all models.
Migrant status significantly affects both disability status and the probability of being
employed in a risky occupation. Immigrants have better health –measured by permanent
disability -but are employed more likely than natives in risky jobs. The impact of our key
variable, risk exposure, is strong and significant when the whole sample is considered.
Workers employed in risky jobs increase their probability of becoming disabled by 5.3%.
Moreover, all the marginal effects associated to working conditions are significant and large,
in fact, larger than those of other relevant variables such as education. University studies
reduce the probability of becoming disabled by 1.3% with respect to a person without studies,
while being employed in a temporary job compared to an indefinite contract increases that
probability by 2.4%.
The second model highlights the differential effect of risk on disability depending on the
region of origin. The interactions of risk exposure with the regional dummies are all negative;
this implies that with respect to natives, immigrants exposed to risky working conditions are,
on average, less likely to become permanently disabled. Nevertheless, the coefficients are not
significant for those born in EU-15, the US, Canada and Asia, implying no differences with
natives.
18
The estimations regarding the determinants of risk also provide interesting results. We can
distinguish three groups of countries. The first and most numerous is composed of African,
Latin American and European non-EU countries, with positive and large marginal effects.
European non-EU countries show the highest marginal effect (0.16, in absolute value). The
second group is made up of people from China and other Asian countries, actually less likely
to be exposed to work-related risks than natives. Finally, those born in the EU-15, the US and
Canada are not significantly different from natives with regard to work related risk choices.
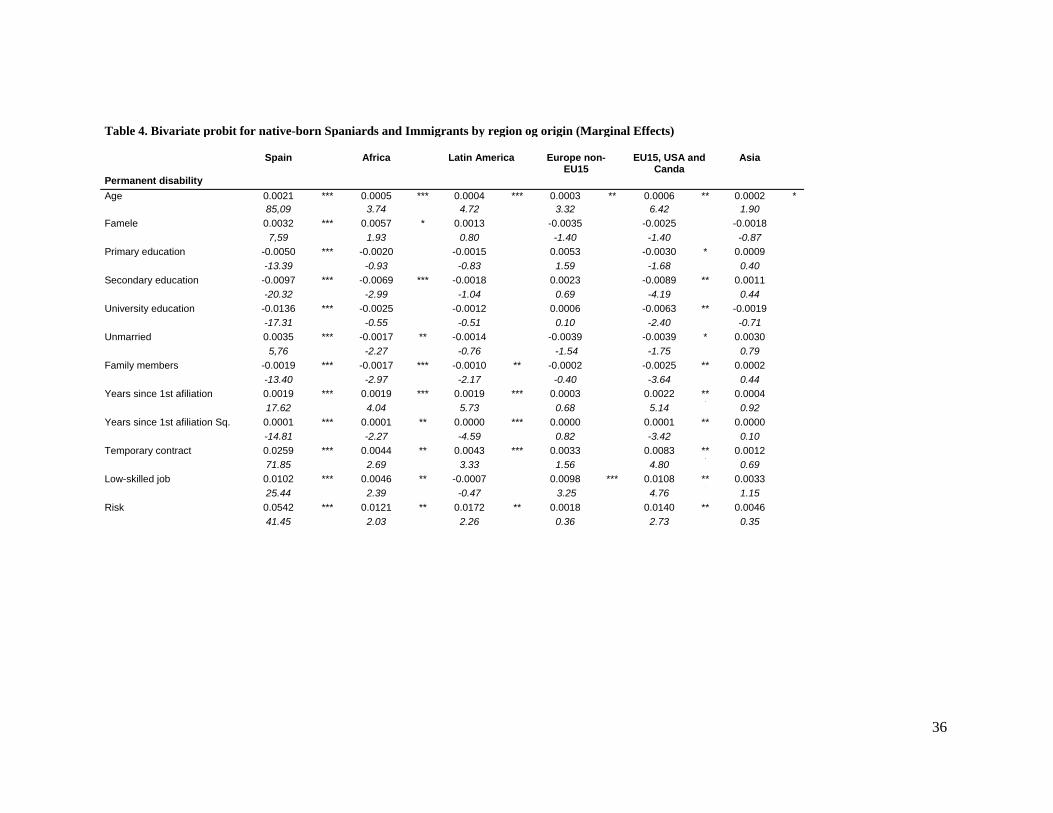
Table 4, which contains the results of the model estimated separately for each region of
origin, shows that ρ is significantly different from 0 only for Spain. This result may arise
from two possible sources of endogeneity: unobserved factor(s) that influences both the
probability of becoming disabled and the probability of work risk exposure, or the joint
determination of disability and risk. As a consequence, a univariate probit will produce biased
estimates of the impact of risk exposure. For the rest of countries, the non- significance of ρ ,
indicates that both univaritate probit and bivariate probit estimations will yield the same
empirical results.
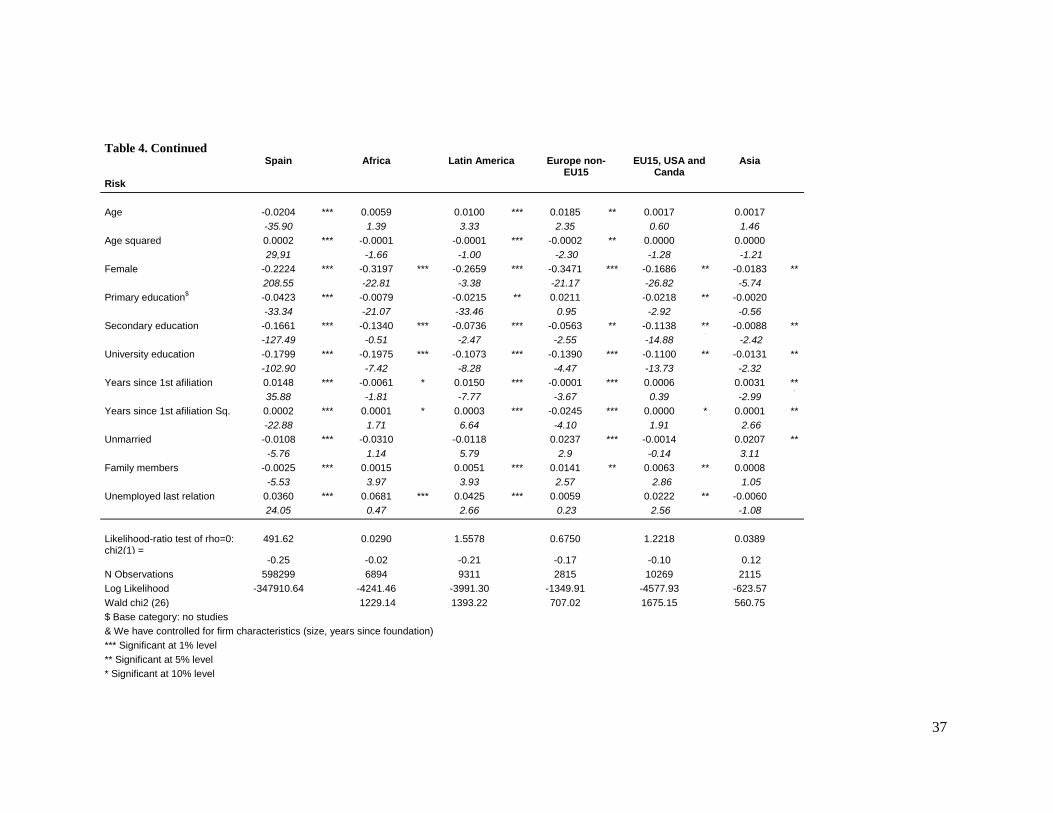
Examination of the determinants of risk suggests a number of comments. For all the regions
of origin, almost all the variables exert a significant effect. Age presents mixed results. It
appears to be significant only for natives, Latin American and European non-EU15, with
opposite effects for natives and immigrants. Older natives are less likely to be employed in
risky jobs while the reverse is true for immigrants. It may reflect that immigrants are less
likely to shift to better working conditions than natives, and consequently remain in risky jobs
for a longer time. On the other hand, women are less likely to assume work related risks than
19
men in all of the regions, but this difference is higher in the case of the African and the non-
EU15 immigrants.
INSERT TABLE 3
The probability of working in a risky job decreases in general as educational attainment
increases. The negative effect of secondary education is bigger for natives than for
immigrants. To have university studies implies a big decline in the probability of working in a
risky job (between 10% and 20%) with the highest effect being that of African immigrants.
Time since the first affiliation exerts a negative and significant effect on the probability of
being employed in a risky job for all the groups of immigrants, except for Africans and for the
group of EU-15, American and Canadian immigrants. By contrast, risky jobs are more likely
found among natives with longer work trajectories. The reasons that explain the lack of effect
of this variable may not be the same for Africans as for those born in the richer countries. For
African immigrants it may indicate that they do not tend to assimilate to natives, which could
be linked to reasons of skill transferability, language proficiency and/or labour market
discrimination. The existence of an occupational attainment gap and the lack of an
assimilation pattern for Africans are documented in previous studies (Amuedo and de la Rica,
2007). Immigrants born in rich countries do not differ from natives in terms of risk level
choices (see table 3) and the non-significance of the time since first affiliation may simply
indicate that the likeness to natives remains.
20
Marital status reduces native’s probability of being employed in a risky job and has no effect
on immigrants, except for a slight increase in the case of Asians. The results regarding the
number of family members differ more: it shows a negative impact for natives and a positive
one for the rest of regions, except for Africans and Asians. Since these variables are plausible
indicators of risk preferences (as in Leeth and Ruser, 2006), this result may reflect that tastes
play a less important role on determining risk level choices in the case of immigrants. Finally,
the transit from unemployment to a risky job is more likely than the transit from a safer job to
a risky job for all the groups except for Asian and European non-EU15. The impact is
especially large for people coming from Africa and Latin America.
Regarding the disability equation, we observe that risk exposure notably increases the
probability of becoming disabled in the case of natives, Africa, Latin America and the group
of rich countries (EU-15, US and Canada): a 5% increase for natives and increases of around
1% for the rest are found. The rest of variables defining working conditions exhibit similar
results: are irrelevant for Asian and European non-EU15 and have a strong effect on disability
in the rest of countries. Interestingly, the effects of working conditions are, in general, higher
for native-born Spaniards than for immigrants.
Educational attainment has the expected negative effect on the probability of becoming
disabled for native-born Spaniards and those born in EU-15, the US and Canada. However, it
has turned out to be statistically non-significant for immigrants (except secondary education
for Africans). This finding is consistent with investigations indicating that, compared to
natives, immigrants face a higher incidence of overeducation (Fernández and Ortega, 2007).
Another interesting finding is the smaller magnitude of the effect compared to working
21
conditions. Holding a temporary contract has twice the effect of having a university degree.
This ratio is 5 to 1 when risk exposure and university education are compared.
Age exerts the expected effect for all the groups: it significantly increases the probability of
acquiring a permanent disability, especially among natives. Women have higher probabilities
of disability only in the case natives and African, these with a 10% level of significance.
Being married increases the probability of disability only for Africans, but decreases this
probability in the case of natives.
Some of the most telling results are those related to years since the first affiliation. Being this
a proxy for time since arrival in Spain, its behaviour helps to understand the assimilation
patterns of immigrants. For all the regions of origin except for Asian and European non-
EU15, this variable appears to be relevant to explain (increase) the probability of becoming
disabled. This result is coherent with the “healthy migrant effect”: those more likely to
migrate are the healthier, but immigrants’ health tends to assimilate to that of natives if they
are exposed to similar or worst conditions, everything else equal.
INSERT TABLE 4
5. Discussion
Our study is an effort to assess the different role of working and contractual conditions,
particularly risk exposure, on determining the probability of acquiring a permanent disability
for immigrants and natives. Our paper differs from previous literature in various ways. First,
it is based on an objective measure of health rather than the commonly used indicators of self-
perceived health. Second, we analyse differences by region of origin, what is uncommon for
22
Spanish studies. Third, our investigation tries to capture the determinants of the occupational
choice to better understand the factors behind differences in health outcomes. In our
estimations, we account for possible endogeneity of risk exposure on the disability equation.
We unambiguously determine that working conditions have an impact on health for natives
and the most numerous communities of immigrants. Risk exposure is, as expected, an
important factor to account for differences in disability. The big magnitude of its effect
compared to other traditional determinants of health such as education is one of our most
interesting findings. Moreover, the results regarding the strong impact of temporary
employment on disability deserve further comments. As we mentioned in the introduction, the
experience of job insecurity has been associated with ill health. Nevertheless, the previous
evidence of this association for Spain is scarce and ambiguous. The present investigation
shows that the conclusions regarding the negative effect of temporary employment on health
are unambiguous when its impact is measured on an indicator of overall health status, as
permanent disability, and not restricted to differences in workplace safety.
Regarding differences between immigrants and natives, we find, first of all, that our
theoretical hypothesis that disability and risk are jointly determined is not valid for
immigrants. Such is the econometric explanation of the non-significance of the ρ parameter
for the immigrant population. The conceptual implication is that health considerations play no
role on determining occupational choice for immigrants. Neither is unmeasured heterogeneity
–e.g. in time discount rates- simultaneously affecting the risk level choice and the probability
of disability. A theoretical model in which working conditions have an important role on
determining health status is obviously valid for immigrants. Nevertheless, the occupational
23
choice cannot be interpreted as an investment in health simply because working conditions
are not a matter of choice in terms of health.
Moreover, occupational choice seems to mediate the effect of education on disability
propensities in the case of immigrants11. While education exerts a significant effect on risk
level choices for all the groups, its impact on disability is restricted to natives and EU-15,
American and Canadian immigrants. Education is one of the classical determinants
socioeconomic inequalities in health. The absence of effect of this variable in the case of
immigrants when working conditions are included in the model suggests that the relative role
of education and working conditions in explaining health inequalities may have not being
properly measured yet, or it is changing, and that it requires further investigations.
We have also shown that the impact of working conditions on disability is dissimilar between
immigrants and natives. This may arise from unmeasured differences in their ability to
produce safety at work or from unmeasured differences in initial heath status. The lower
probability of disability in the case of immigrants is coherent with previous findings
indicating that the healthier are the most likely to migrate. But our results also confirm the
assimilation hypothesis since for all the groups of immigrants time since the first affiliation
increases the probability of disability.
Both Table 3 and Table 4 reveal that immigrants are far from homogeneous. Region of origin
and not only migrant status is fundamental to explain risk choice. We have seen that marital
status and family members, commonly used in the literature as indicators of risk preferences,
11 This result is supported by the fact that estimations of the model without including risk as determinant of disability show a significant effect of education on disability.
24
have less effect on the probability of choosing risky jobs for immigrants. Moreover, transit
from unemployment increases the probability to bear risks more in the case of Africans and
Latin Americans than for native-born Spaniards. These findings can be interpreted as
confirming that, regarding occupational choices, immigrants are more affected than natives by
lack of opportunities in the labour market. In addition, the differential effect of the region of
origin suggests a heterogeneous pattern of occupational choice among the different
communities of immigrants. We postulate an integration model of immigrants in the local
labour markets with specialization by country; that is to say, with networks of people from the
same country playing a central role. It is also reasonable to suppose differences in
reservations wages among groups. Immigrants that originate from richer countries and enjoy a
greater degree of skill transferability –EU-15, American and Canadian immigrants- may have
higher reservation wages. Therefore, everything else equal, they may be less prone to accept
workplace risks.
Policies aiming at reducing health inequalities among sociodemographic groups are in the
agenda of most of developed countries. Our results indicate that effective and equitable health
policies must comprise a full understanding of the role of working conditions on determining
health differences. Also, a better knowledge of the conditions in which vulnerable groups -
like immigrants- access to safe working conditions may contribute to avoid future health
inequalities. The strong effect on disability of risk exposure and other forms of precarious
employment –like temporary jobs- suggest that the actions involved in these policies probably
must exceed the frame of the traditional occupational health policies.
25
Finally, it is necessary to mention the limitations of our investigation. First, our data include
only insured workers, which exclude irregular labour relations, more likely to happen among
foreign workers. Second, institutional and bureaucratic requirements to obtain a disability
pension may affect differently natives and immigrants. The latter may be more likely
dissuaded to apply for a pension, due to lack of information or specific capabilities.
Nevertheless, the individuals –also immigrants- included in our sample have been working
and living in Spain at least for five years, so that the above mentioned limitation is supposed
to be mitigated.
26
References
Ahonen EQ, Benavides FG. 2006. Risk of fatal and non-fatal occupational injury in foreign
workers in Spain. Journal of Epidemiology & Community Health 60: 424-426
Akhavan S. 2006. The health and working conditions of female immigrants in Sweden.
Stockholm: Karolinska Institutet.
Amuedo-Dorantes C, De la Rica S. 2007. Labour Market Assimilation of Recent Immigrants
in Spain. British Journal of Industrial Relations 45 (2): 257-284.
Artazcoz L, Benach J, Borrell C, Cortes I. Social inequalities in the impact of flexible
employment on different domains of psychological health. Journal of Epidemiology and
Community Health 59: 761–767.
Bartley M, Sacker A, Clarke P. 2004. Journal of Epidemiology and Community Health 58:
501–506. DOI: 10.1136/jech.2003.009878.
Benach et al. 2004. Types of employment and health in the European Union. Changes from
1995 to 2000. European Journal of Public Health 14: 314–321.
Berger M, Leigh J. 1989. Schooling, self-selection, and health. The Journal of Human
Resources 24(3): 433-455.
Bollini P, Siem H. 1995. No real progress towards equity: Health of migrants and ethnic
minorities on the eve of the year 2000. Social Science & Medicine 41 (6): 819-828
27
Borg V, Kristensen TS. 2000. Social class and self-rated health: can the gradient be explained
by differences in life style or work environment? Social Science and Medicine 51: 1010-1030.
Cropper M. Health, Investment in Health, and Occupational Choice. 1977. The Journal of
Political Economy 85(6):1273.
Daniel C, Sofer C. 1998. Bargaining, Compensating Wage Differentials, and Dualism of the
Labor Market: Theory and Evidence for France. Journal of Labor Economics 16 (3): 546-575.
Datta Gupta N, Kristensen N. 2008. Work environment satisfaction and employee health:
panel evidence from Denmark, France and Spain, 1994–2001. European Journal of Health
Economics 9: 51–61.
Diaz-Serrano L. Do Legal Immigrants and Natives Compete in the Labour Market? Evidence
from Catalonia. IZA Discussion Paper No. 4693. Available at SSRN:
http://ssrn.com/abstract=1545120.
Fernández C, Ortega C. 2008. Labor market assimilation of immigrants in Spain: employment
at the expense of bad job-matches? Spanish Economic Review 10 (2): 83-107.
Gash V, Mertens A, Romeu Gordo L. 2007. Are fixed-term jobs bad for your health? A
comparison of West-Germany and Spain. European Societies 9(3): 429–458.
28
Greene W. 1998. Gender Economics Courses in Liberal Arts Colleges: Further Results.
Journal of Economic Education 29(4):291-300.
Grossman M. On the Concept of Health Capital and the Demand for Health. Journal of
Political Economy 1972;80(2):223.
Hausman JA. 1978. Specification tests in econometrics. Econometrica 46: 1251-1271.
Jiménez-Martín S, Labeaga J, Prieto C. 2006. Award errors and permanent disability benefits
in Spain. Economics Working Papers: 966.
Kerkhofs M, Lindeboom M. 1997. Age related health dynamics and changes in labour market
status. Health Economics 6: 407–423.
Leeth J, Ruser J. 2006. Safety segregation: The importance of gender, race, and ethnicity on
workplace risk. Journal of Econic Inequality 4(2):123-152.
Leigh J. 1989. Compensating wages for job-related death: the opposing arguments. Journal of
Economic Issues 23(3): 823-842.
Llena-Nozal A, Lindeboom M, Portrait F. 2004. The efect of work on mental health: does
occupation matter? Health Economics 13: 1045–1062.
29
López-Jacob M, Ahonen E, García A, Gil A, Benavides F. 2008. Comparación de las lesiones
por accidente de trabajo en trabajadores extranjeros y españoles por actividad económica y
comunidad autónoma (España, 2005). Revista Española de Salud Pública 82(2):179-187.
Lucas R. The Distribution of Job Characteristics. 1974. The Review of Economics and
Statistics 56 (4): 530-540.
Lundberg O. 1991. Causal Explanations for Class Inequality in Health: an Empirical
Analysis. Social Science & Medicine 32(4):385-393.
Marmot, M. The Status Syndrome. 2005. How social standing affects our health and
longevity. New York: Owl Books.
Monden C. Current and lifetime exposure to working conditions. Do they explain educational
differences in subjective health? Social Science & Medicine 60(11): 2465-2476.
Oi WY. 1974. On the economics of industrial safety. Law and Contemporary Problems.
Occupational Safety and Health 38 (4): 669-699.
Parra A, Fernández Baraibar J, García López V, Ayestarán JR, Extramiana E. 2006. Mercado
de trabajo, salud laboral e inmigración. Labour market, occupational health and immigration.
An. Sist. Sanit. Navar. Vol. 29, Suplemento 1
Pikhart et al. 2001. Psychosocial work characteristics and self rated health in four post-
communist countries. Journal of Epidemiology and Community Health 55:624–630.
30
Power C, Matthews S, Manor O. 1998. Inequalities in self-rated health: explanations from
different stages of life. Lancet 351 (9108): 1009-1014.
Riera Font A, Ripoll Penalva A, Mateu Sbert J. 2007. Estimación del valor estadístico de la
vida en España: una aplicación del Método de Salarios hedónicos. Hacienda Pública
Española 181: 29-48.
Robinson JC. Racial Inequality and the Probability of Occupation-Related Injury or Illness.
1984. The Milbank Memorial Fund Quarterly. Health and Society 62 (4): 567-590.
Robone S, Jones AM, Rice N. 2010. Contractual conditions, working conditions and their
impact on health and well-being. European Journal of Health Economics. DOI -
10.1007/s10198-010-0256-0. Available at
http://www.springerlink.com/content/0663263V846452G6.
Smith KK, Kaminstein DS, Makadok RJ. 1995. The Health of the Corporate Body: Illness
and Organizational Dynamics. The Journal of Applied Behavioral Science 31: 328
Thomason T, Pozzebon S. 2002. Determinants of Firm Workplace Health and Safety and
Claims Management Practices. Industrial and Labor Relations Review 55 (2): 286-307 (21)
Virtanen M, Kivimaki M, Elovainio M, Vahtera J, Ferrie JE. 2003. From insecure to secure
employment: changes in work, health, health related behaviours, and sickness absence.
Occupation and Environmental Medicine 60: 948–953
31
Viscusi WK. 2003. Racial Differences in Labor Market Values of a Statistical Life. Journal of
Risk and Uncertainty 27(3): 239–256
Warren JR, Hoonakker P, Carayon P, Brand J. 2004. Job characteristics as mediators in SES-
health relationships. Social science & medicine 59(7):1367-78.
32
TABLES Table 1. Non Fatal Injury and Illness Rates by Industry and Occupation (per 100,000 workers) MAJOR OCCUPATION GROUP / INDUSTRY
Engineers and
University Graduates.
Senior management personnel
Engineering Technicians. Experts and Assistants
with a University
Degree
Administrative and workshop
managers
Unqualified Assistants
Administrative Officials
Subordinates Administrative Assistants
First and second degree skilled
workers
Third degree skilled
workers and Specialists
Unskilled labourers
Industry Total
Agriculture. Forestry and Fishing
335.57 0.00 687.55 471.70 800.00 0.00 874.64 1031.81 1308.14 424.27 607.36
Mining and Quarrying 0.00 0.00 6250.00 3508.77 2739.73 9090.91 0.00 8888.89 11009.17 5050.51 7161.35
Manufacturing 166.70 116.50 395.55 781.86 517.11 2263.20 406.50 1289.69 1296.58 1252.11 1053.89 Electricity, gas, steam and air conditioning supply
0.00 259.07 423.73 936.77 1346.80 1470.59 444.44 1884.42 1685.39 1754.39 1092.74
Construction 195.77 47.19 462.25 1057.08 642.17 1264.04 512.58 1136.59 1054.27 965.36 979.34 Wholesale and retail trade, repair of motor vehicles
378,07 0 135,69 0 193,14 2166,06 127,23 575,93 1220,79 992,15 647,85
Wholesale and retail trade, repair of motor vehicles
72,25 196,66 82,3 245,1 333,07 539,81 336,38 929,22 718,42 772,25 524,55
Wholesale and retail trade, repair of motor vehicles
177,62 0 126,58 185,32 261,47 405,41 228 538,82 427,85 402,41 316,01
Wholesale and retail trade, repair of motor vehicles
229.06 189.30 288.97 829.51 347.85 1040.83 339.13 3149.72 1373.18 2060.92 1203.53
Accommodation and food service activities
0.00 500.00 416.88 273.82 247.26 224.72 447.57 457.31 458.50 875.03 496.34
Transportation and storage
250.84 292.11 747.76 730.82 342.90 710.48 541.01 1309.48 2959.03 3332.47 1330.05
Financial and insurance activities
0.00 0.00 77.54 193.30 246.83 297.62 169.08 1702.13 1526.72 1436.78 206.43
Real state activities 89.53 0.00 151.98 0.00 180.59 193.05 178.66 821.92 653.59 768.74 361.57
33
Information and communication
0.00 127.23 72.67 0.00 141.94 833.33 232.56 255.75 450.45 0.00 124.44
Professional,scientific technical activities
31.46 96.96 71.07 413.47 244.17 528.75 192.95 1216.74 1212.44 788.74 543.54
Public Administration and Defense
225.04 302.07 617.92 1324.81 682.77 1409.67 421.12 6672.03 6074.28 2317.00 1744.55
Education 136.61 175.70 387.35 217.39 328.95 732.22 361.16 1161.44 1219.51 1120.73 373.00 Human health and Social work activities
181.46 274.33 430.57 463.32 655.90 535.23 422.11 1587.82 1423.71 1412.11 634.60
Arts, Entertainment and Recreation
426.44 387.60 298.86 0.00 180.10 111.36 410.17 994.04 819.67 738.40 479.51
Other service activities 0.00 680.27 0.00 458.72 132.10 665.56 507.19 426.23 764.59 797.17 568.44
Activ. of households 0.00 0.00 0.00 0.00 0.00 626.96 0.00 4724.41 7894.74 3076.92 1561.69 Occupation total 163.07 214.25 353.72 619.54 371.19 752.63 335.11 1476.15 1310.53 1229.62 884.93
34
Table 2. Descriptive Statistics DISAGREGGATION OF “IMMIGRANTS” BY REGION/COUNTRY OF ORIGIN
TOTAL NATIVE-BORN SPANIARDS
IMMIGRANTS (ALL)
AFRICA LATIN AMERICAN EUROPE NON-EU 15
EU-15, USA AND CANADA
ASIA
VARIABLE % S.D. % S.D. % S.D.
% S.D.
% S.D.
% S.D. % S.D.
% S.D.
N 748.423 710.344 38.079 8.647 12.838 3282 10765 2393 % 100 94,92 5,08 1.09 1.48 0.45 1.63 0.34 DEPENDENT VARIABLES
Disability 5,36 0.21 5,48 0.21 2,41 0.21 1.90 13.68 1.02 0.10 1.00 0.10 2.34 0.15 1.10 0.1 Risk 30,01 0.44 25,6 0.44 36,1 36.1 37.64 48.45 23.06 0.42 35.27 47.79 19.33 0.39 11.37 31.75
PERSONAL CHARACTERISTICS Age (mean) 41,73 11.21 41,84 11.13 40,04 9.10 39.96 9.31 40.22 9.27 37.62 8.17 39.86 8.81 40.49 9.48 Gender, Female 39.8 0.49 40,89 0.49 40,54 0.44 21.17 0.40 49.64 0.50 40.13 49.02 44.86 0.50 33.14 0.47 Education 0.89 0.89 0.95 0.86 0.90 0.90 0.88 0.94 Without studies 26.79 26,76 27,57 58.25 17.66 22.73 17.46 39.44 Primary 37.75 38,06 30,32 22.62 31.57 33.95 34.89 29.11 Secondary 29.51 29,33 33,75 15.61 40.20 35.34 37.61 25.52 University 5.95 5,85 8,37 3.52 10.57 7.99 10.04 5.93 Family members
(mean) 1.48 2.37 3.13 1.44 3.59 2.05 4.01 2.38 3.74 2.00
Unmarried 12.95 0.34 12.81 0.33 15.52 0.36 16.93 0.37 12.53 0.33 14.20 0.35 18.18 0.38 16.21 36.86
WORKING CONDITIONS Temporary
contract* 38.05 0.49 37.28 0.48 47.73 0.49 61.13 0.49 48.57 0.50 43.42 0.49 37.81 0.48 40.20 0.49
Unemployed 15.66 0.30 15,45 0.30 15,36 0.31 13.75 0.34 9.86 0.30 9.65 0.29 10.12 0.30 4.80 0.21 Self-employed 15.80 0.37 16,30 0.37 11,01 0.37 9.97 0.29 13.40 0.34 13.01 0.33 21.02 40.75 35.60 0.48 Low-skilled job 30.00 0.45 28,20 0.45 35,10 0.48 53.67 0.50 35.12 0.47 0.34 0.47 22.69 0.41 26.79 0.44 Years since 1st
affiliation 16.88 3.68 20.65 10.08 12.31 7.52 12.35 8.18 10.72 7.05 9.67 5.69 15.21 7.27 11.25 6.49
Previous working status (%) Unemployed 21.82 0.38 21,74 0.38 14.92 0.36 16.64 0.37 13.86 0.35 14.69 0.35 16.65 0.37 6.81 0.25 Firm characteristics** Nr. Employers
(mean) 314.56 1312 320,9 1332 236.86 1005 196.08 793,18 310.07 1191 193.10 881 228.77 1026 94.11 518
Years since foundation (mean)
15,7 16,22 11.78 13.13 15.97 16.37 10.41 11.99 12.00 13.50 11.25 11.96 13.30 13.95 9.75 12.28
*Includes civil servants **Only private sector is considered
35
Table 3. Bivariate Probit Estimation for the whole sample (M1) and with variable interactions (M2). Variable Permanent disability
M1 M2 Mg. Effects z Mg. Effects z
Age 0.0019 85.06 ***
0.0019 83.56 *** Female 0.0035 8.70 **
*0.0017 4.24 ***
Primary education$ -0.0048 -13.77 ***
-0.0055 -16.07 *** Secondary education$ -0.0094 -21.04 **
*-0.0123 -28.69 ***
University education$ -0.0127 -17.21 ***
-0.0151 -22.93 *** Unmarried 0.0026 4.59 **
*0.0022 3.94 ***
Family members -0.0020 -14.06 ***
-0.0020 -15.32 *** Years since 1st affiliation 0.0430 21.53 **
*0.0325 21.22 ***
Years since 1st affiliation Sq -0.0006 -17.63 ***
0.0005 -17.39 *** Temporary contract 0.0244 70.33 **
*0.0219 66.12 ***
Low skilled job 0.0101 26.17 ***
0.0096 25.71 *** Risk 0.0525 41.62 **
*0.0470 39.00 ***
Immigrant -0.0093 -11.29 ***
- - Risk*African -0.0118 -6.12 *** Risk*Latin American -0.0130 -5.15 *** Risk* European -0.0142 -3.59 *** Risk* EU15, USA, Canada -0.0025 -0.98 Risk*Asia -0.0060 -0.79
Risk& Age -0.0135 25.78 **
*-0.0150 -28.69 ***
Age squared 0.0001 20.33 ***
0.0001 22.85 *** Female -0.2261 -212.33 **
*-0.2252 -217.65 ***
Primary education$ -0.0379 -31.73 ***
-0.0417 -33.74 *** Secondary education$ -0.1565 -125.18 **
*-0.1662 -131.88 ***
University education$ -0.1714 -97.87 ***
-0.1794 -107.14 *** Unmarried -0.0091 -5.08 **
*-0.0093 -5.09 ***
Family members -0.0015 -3.66 ***
-0.0013 -3.09 *** Unemployed last relation 0.0307 21.29 **
*0.0370 25.38 ***
Years since 1st affiliation 0.0550 25.03 ***
0.0033 27.77 *** Years since 1st affiliation Sq -0.0006 -12.45 **
*0.0007 -14.79 ***
Immigrant 0.0387 14.65 ***
- - Africa 0.0587 11.72 *** Latin America 0.0648 13.29 *** Europe non-EU15 0.1655 18.75 *** EU-15, USA, Canada 0.0063 1.45 Asia -0.0891 -10.08 *** Rho -0.24 rho -0.2032 Likelihood-ratio test of rho=0: chi2(1) = 477.25 Likelihood-ratio test of rho=0: chi2(1) =380.047 & We have controlled for firm characteristics (size, years since foundation) N Observations 629.863 Log Likelihood -360927.9 Prob > chi2 0.0000 $ Base category: no studies *** Significant at 1% level ** Significant at 5% level * Significant at 10% level The marginal effects of the binary variables are calculated as the difference in the average predicted probability of a positive outcome for the variable when:(1) variable values are set to zero; and (2) variable values are set to one The second column in each model contains the z-statistics refering to the estimated coefficients
36
Table 4. Bivariate probit for native-born Spaniards and Immigrants by region og origin (Marginal Effects) Spain Africa Latin America Europe non-
EU15 EU15, USA and
Canda Asia
Permanent disability Age 0.0021 *** 0.0005 *** 0.0004 *** 0.0003 ** 0.0006 ** 0.0002 *
85,09 3.74 4.72 3.32 6.42 1.90 Famele 0.0032 *** 0.0057 * 0.0013 -0.0035 -0.0025 -0.0018
7,59 1.93 0.80 -1.40 -1.40 -0.87 Primary education -0.0050 *** -0.0020 -0.0015 0.0053 -0.0030 * 0.0009
-13.39 -0.93 -0.83 1.59 -1.68 0.40 Secondary education -0.0097 *** -0.0069 *** -0.0018 0.0023 -0.0089 **
*0.0011
-20.32 -2.99 -1.04 0.69 -4.19 0.44 University education -0.0136 *** -0.0025 -0.0012 0.0006 -0.0063 ** -0.0019
-17.31 -0.55 -0.51 0.10 -2.40 -0.71 Unmarried 0.0035 *** -0.0017 ** -0.0014 -0.0039 -0.0039 * 0.0030
5,76 -2.27 -0.76 -1.54 -1.75 0.79 Family members -0.0019 *** -0.0017 *** -0.0010 ** -0.0002 -0.0025 **
*0.0002
-13.40 -2.97 -2.17 -0.40 -3.64 0.44 Years since 1st afiliation 0.0019 *** 0.0019 *** 0.0019 *** 0.0003 0.0022 **
*0.0004
17.62 4.04 5.73 0.68 5.14 0.92 Years since 1st afiliation Sq. 0.0001 *** 0.0001 ** 0.0000 *** 0.0000 0.0001 **
*0.0000
-14.81 -2.27 -4.59 0.82 -3.42 0.10 Temporary contract 0.0259 *** 0.0044 ** 0.0043 *** 0.0033 0.0083 **
*0.0012
71.85 2.69 3.33 1.56 4.80 0.69 Low-skilled job 0.0102 *** 0.0046 ** -0.0007 0.0098 *** 0.0108 **
*0.0033
25.44 2.39 -0.47 3.25 4.76 1.15 Risk 0.0542 *** 0.0121 ** 0.0172 ** 0.0018 0.0140 **
*0.0046
41.45 2.03 2.26 0.36 2.73 0.35
37
Table 4. Continued
Spain Africa Latin America Europe non- EU15
EU15, USA and Canda
Asia
Risk
Age -0.0204 *** 0.0059 0.0100 *** 0.0185 ** 0.0017 0.0017 -35.90 1.39 3.33 2.35 0.60 1.46
Age squared 0.0002 *** -0.0001 -0.0001 *** -0.0002 ** 0.0000 0.0000 29,91 -1.66 -1.00 -2.30 -1.28 -1.21
Female -0.2224 *** -0.3197 *** -0.2659 *** -0.3471 *** -0.1686 ***
-0.0183 *** 208.55 -22.81 -3.38 -21.17 -26.82 -5.74
Primary education$ -0.0423 *** -0.0079 -0.0215 ** 0.0211 -0.0218 ***
-0.0020 -33.34 -21.07 -33.46 0.95 -2.92 -0.56
Secondary education -0.1661 *** -0.1340 *** -0.0736 *** -0.0563 ** -0.1138 ***
-0.0088 ** -127.49 -0.51 -2.47 -2.55 -14.88 -2.42
University education -0.1799 *** -0.1975 *** -0.1073 *** -0.1390 *** -0.1100 ***
-0.0131 ** -102.90 -7.42 -8.28 -4.47 -13.73 -2.32
Years since 1st afiliation 0.0148 *** -0.0061 * 0.0150 *** -0.0001 *** 0.0006 0.0031 *** 35.88 -1.81 -7.77 -3.67 0.39 -2.99
Years since 1st afiliation Sq. 0.0002 *** 0.0001 * 0.0003 *** -0.0245 *** 0.0000 * 0.0001 ** -22.88 1.71 6.64 -4.10 1.91 2.66
Unmarried -0.0108 *** -0.0310 -0.0118 0.0237 *** -0.0014 0.0207 *** -5.76 1.14 5.79 2.9 -0.14 3.11
Family members -0.0025 *** 0.0015 0.0051 *** 0.0141 ** 0.0063 ** 0.0008 -5.53 3.97 3.93 2.57 2.86 1.05
Unemployed last relation 0.0360 *** 0.0681 *** 0.0425 *** 0.0059 0.0222 ***
-0.0060 24.05 0.47 2.66 0.23 2.56 -1.08
Likelihood-ratio test of rho=0: chi2(1) =
491.62 0.0290 1.5578 0.6750 1.2218 0.0389
-0.25 -0.02 -0.21 -0.17 -0.10 0.12 N Observations 598299 6894 9311 2815 10269 2115 Log Likelihood -347910.64 -4241.46 -3991.30 -1349.91 -4577.93 -623.57 Wald chi2 (26) 1229.14 1393.22 707.02 1675.15 560.75 $ Base category: no studies & We have controlled for firm characteristics (size, years since foundation) *** Significant at 1% level ** Significant at 5% level * Significant at 10% level
Copyright © 2022 FDOKUMEN