The bright side of migration: Hedonic, psychological, and social well-being in immigrants in Spain
16
The bright side of migration: Hedonic, psychological, and social well-being in immigrants in Spain Magdalena Bobowik ⇑ , Nekane Basabe, Darío Páez Department of Social Psychology and Methodology of Behavior Sciences, University of the Basque Country, Avenida Tolosa 70, 20018 San Sebastián, Spain article info Article history: Received 13 February 2012 Revised 26 September 2014 Accepted 29 September 2014 Available online 18 October 2014 Keywords: Immigrant Hedonic well-being Psychological well-being Social well-being Social support Income abstract The aim of this study was to examine the multi-dimensional structure of well-being in immigrant population, as well as to explore the complexity of well-being disparities between immigrants and host nationals. We analyzed hedonic, psychological, and social well-being in a sample of 1250 immigrants from Bolivia, Colombia, Morocco, Romania and Sub-Saharan Africa, together with that of 500 matched host nationals from Spain. Par- ticipants were selected by means of probability sampling with stratification by age and sex. Confirmatory factor analyses revealed that the re-specified tripartite model of well-being, including hedonic, psychological, and social components of the individual’s functioning, was the best fitting model, as compared to alternative models. Importantly, after adjust- ment for perceived friendship and support, marital status, income, sex and age, immigrants presented higher levels of well-being than host nationals. Compared to host nationals, immigrants reported especially higher eudaimonic well-being: social contribution and actualization, personal growth, self-acceptance, and purpose in life, and lower levels of well-being only in terms of positive relations with others and negative affect. These results are discussed in the context of positive psychology. Ó 2014 Elsevier Inc. All rights reserved. ‘‘Emigration is pain, loneliness, nostalgia, and a lot of work; however, it is also joy, reinvention, desire for the future, and flexibility’’ [Edmundo Paz Soldan (El País 28, 11, 2009, p. 18)] 1. Introduction Research on mental health has shifted its focus from the absence of illness toward the presence of well-being in its diverse forms (Keyes, 2006). A rich debate on hedonia and eudaimonia as two components of happiness (Delle Fave et al., 2011; Huta and Ryan, 2010; Kashdan et al., 2008; Ryan and Deci, 2001; Ryff and Singer, 2008; Waterman, 2008) suggests that people not only constantly seek to rectify deficiencies of pleasure and comfort (hedonic approach) for self-regulation, but also try to spread their wings so as to live a fuller life than one which merely maintains the status quo (eudaimonic approach). However, little research in positive psychology has contextualized well-being. In turn, studies of minorities have usually taken into account social context but neglected the contributions of positive psychology, stress and coping being common starting points for perspectives on minorities’ health (Delle Fave and Bassi, 2009a, 2009b). In particular, no research has been http://dx.doi.org/10.1016/j.ssresearch.2014.09.011 0049-089X/Ó 2014 Elsevier Inc. All rights reserved. ⇑ Corresponding author. Fax: +34 943015670. E-mail addresses: [email protected] (M. Bobowik), [email protected] (N. Basabe), [email protected] (D. Páez). Social Science Research 51 (2015) 189–204 Contents lists available at ScienceDirect Social Science Research journal homepage: www.elsevier.com/locate/ssresearch
-
Upload
independent -
Category
Documents
-
view
0 -
download
0
Transcript of The bright side of migration: Hedonic, psychological, and social well-being in immigrants in Spain

Social Science Research 51 (2015) 189–204
Contents lists available at ScienceDirect
Social Science Research
journal homepage: www.elsevier .com/locate /ssresearch
The bright side of migration: Hedonic, psychological, and socialwell-being in immigrants in Spain
http://dx.doi.org/10.1016/j.ssresearch.2014.09.0110049-089X/� 2014 Elsevier Inc. All rights reserved.
⇑ Corresponding author. Fax: +34 943015670.E-mail addresses: [email protected] (M. Bobowik), [email protected] (N. Basabe), [email protected] (D. Páez).
Magdalena Bobowik ⇑, Nekane Basabe, Darío PáezDepartment of Social Psychology and Methodology of Behavior Sciences, University of the Basque Country, Avenida Tolosa 70, 20018 San Sebastián, Spain
a r t i c l e i n f o a b s t r a c t
Article history:Received 13 February 2012Revised 26 September 2014Accepted 29 September 2014Available online 18 October 2014
Keywords:ImmigrantHedonic well-beingPsychological well-beingSocial well-beingSocial supportIncome
The aim of this study was to examine the multi-dimensional structure of well-being inimmigrant population, as well as to explore the complexity of well-being disparitiesbetween immigrants and host nationals. We analyzed hedonic, psychological, and socialwell-being in a sample of 1250 immigrants from Bolivia, Colombia, Morocco, Romaniaand Sub-Saharan Africa, together with that of 500 matched host nationals from Spain. Par-ticipants were selected by means of probability sampling with stratification by age and sex.Confirmatory factor analyses revealed that the re-specified tripartite model of well-being,including hedonic, psychological, and social components of the individual’s functioning,was the best fitting model, as compared to alternative models. Importantly, after adjust-ment for perceived friendship and support, marital status, income, sex and age, immigrantspresented higher levels of well-being than host nationals. Compared to host nationals,immigrants reported especially higher eudaimonic well-being: social contribution andactualization, personal growth, self-acceptance, and purpose in life, and lower levels ofwell-being only in terms of positive relations with others and negative affect. These resultsare discussed in the context of positive psychology.
� 2014 Elsevier Inc. All rights reserved.
‘‘Emigration is pain, loneliness, nostalgia, and a lot of work; however, it is also joy, reinvention, desire for the future, andflexibility’’
[Edmundo Paz Soldan (El País 28, 11, 2009, p. 18)]
1. Introduction
Research on mental health has shifted its focus from the absence of illness toward the presence of well-being in its diverseforms (Keyes, 2006). A rich debate on hedonia and eudaimonia as two components of happiness (Delle Fave et al., 2011; Hutaand Ryan, 2010; Kashdan et al., 2008; Ryan and Deci, 2001; Ryff and Singer, 2008; Waterman, 2008) suggests that people notonly constantly seek to rectify deficiencies of pleasure and comfort (hedonic approach) for self-regulation, but also try tospread their wings so as to live a fuller life than one which merely maintains the status quo (eudaimonic approach).
However, little research in positive psychology has contextualized well-being. In turn, studies of minorities have usuallytaken into account social context but neglected the contributions of positive psychology, stress and coping being commonstarting points for perspectives on minorities’ health (Delle Fave and Bassi, 2009a, 2009b). In particular, no research has been
190 M. Bobowik et al. / Social Science Research 51 (2015) 189–204
reported that examines both hedonic (affect balance and satisfaction with life) and eudaimonic (concerning human potentialand the art of living) aspects of well-being in foreign-born immigrants.
Although the health of such risk populations as immigrants or ethnic minorities has frequently been measured in terms ofnegative symptoms, such as depressive mood (Finch et al., 2000; Fenta et al., 2004; Kiang et al., 2010; Mesch et al., 2008;Walsemann et al., 2009), poorer mental and physical health (Williams et al., 2008), emotional problems (Beiser et al.,2009), distress (Huynh and Fuligni, 2010; Moradi and Risco, 2006), alienation and loneliness (Tartakovsky and Schwartz,2001) or substance use (Kulis et al., 2009; Myers et al., 2009), increasingly more studies address positive aspects of adapta-tion. As regards hedonia, more and more research explores immigrants’ and minorities’ well-being in terms of its ‘‘tradi-tional’’ components, such as life satisfaction (e.g., Roccas et al., 2000; Sam, 2000) or affectivity (e.g., Bobowik et al., 2011).Research on physical and mental health in risk populations has also been expanding rapidly (Baron-Epel and Kaplan,2009; Gee et al., 2006; Wiking et al., 2004). Eudaimonia, in turn, would be predominantly reflected in research with minor-ities on such classic psychological phenomena as self-esteem (Bourguignon et al., 2006; Moradi and Risco, 2006; Sam, 2000;Williams et al., 2008), self-efficacy (Mesch et al., 2008) and perceived control (Moradi and Risco, 2006). Also, coping litera-ture emphasized that ethnic minorities, including immigrants, develop cultural resiliency because they are equipped withdiverse coping and emotional regulation resources (Miller and Kaiser, 2001). Yet only a few scholars have explored ethnicminorities’ well-being in terms of psychological or social well-being (Abu-Rayya and Abu-Rayya, 2009; Iwamoto and Liu,2010; Ryff et al., 2003; Keyes, 2009a). By breaking the mold of the traditional focus on negative symptoms and hedonicwell-being (HWB), the present study makes room for the consideration of eudaimonia in the context of immigration.
1.1. Immigration and a shift toward positivity: do immigrants always show disadvantaged well-being compared to host nationals?
Recent qualitative research has shown that lay beliefs about happiness across cultures coincide with our emphasis on theneed for combining hedonia with eudaimonia (Delle Fave et al., 2011). People tend to define happiness as a psychologicalbalance and harmony – they describe happiness primarily from the eudaimonic approach, according to which happinessis attained when one lives in harmony with one’s ‘‘true self’’ or daimon (for a review, see Waterman, 2011). Therefore,although the experience of discrimination can impair emotional well-being, it does not necessarily perturb a person’s psy-chological well-being (PWB) in terms of his or her feelings of autonomy, control, growth, or resilience. Consequently,whereas immigrants might be at a disadvantage compared to the native-born population in terms of HWB, there is not nec-essarily a disparity between the two populations in terms of other aspects of psychological functioning.
At the first glance, empirical evidence suggests that immigrant status is associated with lower levels of mental or emotionalhealth (Baron-Epel and Kaplan, 2009; García-Gómez and Oliva, 2009) and life satisfaction (Bartram, 2011; Safi, 2009) in diversecultural contexts. However, other studies show that, for instance, immigrants present lower risk of psychiatric disorders(Alegría et al., 2008). Another study based on representative European Social Survey samples demonstrated that immigrantshave lower subjective well-being (overall happiness) but higher satisfaction with societal conditions than host nationals(Baltatescu, 2005). In turn, a cross-cultural study by Beirens and Fontaine (2010) revealed that although Turkish immigrantsreport fewer positive emotions than the Belgian majority, they express more positive affect than Turks living in Turkey.
Such nuances in the levels of functioning of immigrants may be especially evident in relation to their PWB (Ryff, 1989; Ryffand Keyes, 1995), which would include such concepts as self-esteem and self-acceptance, a perception of life with meaningand purpose, a sense of control over the environment (mastery), autonomy and personal fulfilment, sustaining positive rela-tionships with others, and a satisfactory level of integration and social support. Such aspects of well-being as perceived control,positive relationships with others (especially members of the host society), or feelings of personal progress are substantial ele-ments in a successful migratory process. For instance, Ryff et al. (2003) showed that, controlling for age, employment, and mar-ital status, minority status was linked to higher levels of humanistic and existential well-being, in terms of self-acceptance,positive relations with others, personal growth, and environmental mastery. In the same vein, Keyes (2009) found thatalthough minority status led to poorer mental health, it was related to higher flourishing. On controlling for perceived discrim-ination, Blacks exhibited even greater PWB, especially in terms of self-acceptance, autonomy, and environmental mastery.
Similarly, few studies have focused on social well-being (SWB) among migrants (Keyes, 2006). SWB, a public facet of eudai-monic well-being, is the appraisal of one’s circumstances and functioning in the society (Keyes, 1998, 2006), and embraces fivedomains. Social integration refers to feeling of belongingness and being accepted; social acceptance includes an acceptingview of human nature, trust in others, and the belief in their kindness; social contribution concerns one’s social value andbelief in having something to contribute to society; social actualization means being hopeful about the future of the societyor believing in its potential and growth; finally, social coherence implies concern for knowledge about and an understanding ofsocial life (Keyes, 1998, 2006). These aspects of the individual’s functioning are crucial ones in the examination of immigrantpopulations because they refer to those social tasks that could be particularly challenging for an immigrant person in a newcommunity. As in the case of PWB, empirical evidence suggests that Blacks show a great advantage over Whites in socialcoherence, actualization and integration, after adjustment for perceived discrimination (Keyes, 2009). Blacks also showed amore subtle advantage over the majority group in terms of social contribution, though not in terms of social acceptance.
One explanation of the resilience found among minority groups in previously-reported research might be that in most ofthese studies, variables related to material and personal resources, necessary for a successful migratory process (Massey andSánchez, 2009), were controlled for. For example, Ryff et al. (2003) found that well-being was especially higher among well-

M. Bobowik et al. / Social Science Research 51 (2015) 189–204 191
educated minority group members. The authors argue that status inconsistency (being a minority group member but well-educated) might affect the individual’s well-being.
Indeed, contextual factors, which might characterize an immigrant person, such as occupational status, job security,income or religious affiliation, account for a limited but important portion of the variance in the person’s happiness(Lyubomirsky et al., 2005). Following this rationale, we propose that it is not actually the minority status that leads to higherlevels of psychological well-being, but rather some factors ‘‘under the cover’’ of minority status. Empirical evidence confirmsthat income is an important factor that positively contributes to immigrants’ PWB (Jibeen and Khalid, 2010). Another studyshowed that, compared to native-born participants, immigrants benefit somewhat more from higher incomes (Bartram,2011). In this vein, the disparities in mental health between immigrants and non-immigrants can be explained by subjectiveor objective socio-economic status (Baron-Epel and Kaplan, 2009). Marital status is also a relevant antecedent. For example,Ryff et al. (2003) found that minority group members showed higher levels of eudaimonic well-being when marital statuswas controlled. Also, being married predicted fewer depressive symptoms in Turkish immigrants in Canada (Uskul andGreenglass, 2005).
Social resources can also be of great relevance. Research has demonstrated the crucial role of perceived social support forminority groups’ well-being. The perception of social support from the members of the ethnic (e.g., Finch and Vega, 2003;Noh and Kaspar, 2003) and host community play a significant role in immigrants’ positive functioning (e.g., HernándezPlaza et al., 2005; Martínez García et al., 2002; Jasinskaja-Lahti et al., 2006), as well as social support provided by ethnic net-works abroad (González-Castro and Ubillos, 2011; Jasinskaja-Lahti et al., 2006). A study carried out in the Spanish contextshowed that not only was subjective satisfaction with obtained social support an important predictor of well-being, but theactual number of Spaniards in the support network was a relevant antecedent of psychological well-being among immigrantwomen in Spain (Martínez García et al., 2002). Finally, Jibeen (2011) found that perceived social support moderated the rela-tion between acculturative stress and PWB, the variable of special interest in the present study.
1.2. The complexity and multi-dimensionality of well-being: how do we measure nuances?
In order to capture the nuances in well-being, the current study will need to deal with the complexity and multi-dimen-sionality of the well-being construct. Since the emergence of the positive psychology approach, its scholars have set out todisentangle the components of well-being. Within the hedonic tradition, the main concern was whether life satisfaction,positive affect and negative affect are discriminable, and how they are related to each other. Ambiguities concerning thestructure of subjective or hedonic well-being have persisted because each of its conceptualizations has a mixture ofstrengths and weaknesses (for a review, see Busseri and Sadava, 2011). More importantly, empirical evidence suggests a sub-stantial overlap between hedonic and psychological well-being (Burns and Machin, 2009; Keyes et al., 2002).
As regards eudaimonic well-being, there has recently been a heated debate on the validity of the six-dimensional model ofpsychological well-being (Abbott et al., 2006; Burns and Machin, 2009; Ryff and Singer, 2006; Springer and Hauser, 2006;Springer et al., 2006) due to high covariation between some of the six components. Moreover, although Spanish data favorsa six-factor model with a single second-order factor, purpose of life and self-acceptance correlated strongly with environmentalmastery (Van Dierendonck et al., 2008). As far as the construct validity of SWB is concerned, scarce research has been devoted toit, apart from the original study by Keyes (1998). Gallagher et al. (2009) found evidence for a five-factor model of SWB in twolarge samples, while in the Spanish context (Blanco and Díaz, 2005) the five-factor model of SWB was also corroborated.
Finally, although there are a number of studies analyzing the structure of hedonic, psychological, and social well-being,scarce research has been devoted to examining the hierarchical structure of well-being. To our knowledge, only two studies(Díaz et al., 2011; Gallagher et al., 2009) have explored the structure of well-being including not only HWB and PWB but alsoSWB, providing mixed evidence. Gallagher et al. (2009) confirmed via confirmatory factor analyses that the tripartite modelof well-being presents a better fit than the alternative well-being models. In turn, in the Spanish context, Díaz et al. (2011)found a strong relation between subjective and psychological well-being, with a two-factor oblique model of personal well-being and social well-being showed the best fit in comparison with alternative models.
To conclude, the purpose of this research was to test a tripartite structure of well-being in immigrant populations in Spainas well as to examine the differences in well-being between immigrants and host nationals. First, we examine the constructvalidity of the tripartite model of well-being (including hedonic, psychological, and social well-being) compared to alternativemodels via confirmatory factor analysis, and demonstrate its convergent validity. Second, we examine socio-demographic andpsycho-social predictors of well-being, also in terms of the differences between immigrants and host nationals. We expectthat social support and number of friends, as well as income and marital status, will be relevant predictors of well-being.
2. Method
2.1. Participants
The current cross-sectional study is based on questionnaire data collected between December 2009 and February 2010 inthe Basque Country autonomous region of Spain. The sample was obtained through a probability sampling procedure by eth-nicity with stratification by age and sex.
192 M. Bobowik et al. / Social Science Research 51 (2015) 189–204
2.1.1. ImmigrantsThe immigrant sample consisted of 1250 immigrants (CI = 95%, r = 1.96 and rx = ±2.77) who had lived for at least six
months in the Basque Country, northern Spain, having been born in Bolivia, Colombia, Morocco, Romania or Sub-SaharanAfrican countries (mostly Senegal, Nigeria, Equatorial Guinea and Cameroon). Selection of countries of origin was basedon the data for the largest migrant groups in Spain (Pajares, 2010), with special focus on those samples from countries withsocio-economic indices lower than Spain’s. The sample was drawn from public records.1 Among the immigrant participants,55.7% were female, while their mean age was 33.22 years (SD = 9.44) and ranged from 18 to 64. Participants’ mean time of res-idence was 6.2 years (SD = 4.83). Thirteen percent of the respondents had no formal education, 30.3% had completed primaryeducation, 41.4% had completed secondary education, and 14.1% had a university degree. Most participants (43%) declaredthemselves as Catholic, followed by Muslim (29.2%) and other religious confession (19.9%). More than half lived with their part-ner (63.0%) and 47.6% were professionally active, 42.1% being unemployed or looking for a job. The majority of participants hadtheir legal status regularized: 49.9% had a residence permit, 20.6% had European Union citizenship, and 4.3% had become nat-uralized. Even so, 23.1% of the total sample were living in Spain without a residence permit. Net household income in the case of45.5% of the respondents ranged from 600 to 1800 euro, while in the case of 30.2% it was below 600 euro. In only 5.5% of casesdid the household income exceed 1800 euro, though it should be added that 18.8% of the respondents gave no information ontheir household income. With regard to the previously-described socio-demographic characteristics of the sample, there was nomissing data, or the amount never exceeded 2%.
2.1.2. Host nationalsA sample of 500 host nationals (CI = 95%, r = 1.96 and rx = ±4.38), born in Spain and living in the Basque Country auton-
omous region, was matched with the immigrant sample by sex and age. Mean age of the host national participants was 34.77(SD = 10.38), ranging from 18 to 64, and 44.4% were female. Twenty-three percent had only primary education, 40.6% – sec-ondary education, and 36.8% a university degree; just 0.6% did not have any formal education. The majority (67%) were Cath-olic (though only 12.4% practicing) and agnostic (39.8%). A large part of the sample were professionally active (64%) orstudying (9.2%), while 18.2% were unemployed or looking for a job; 56.3% lived with their partner. Net household incomeof 42.4% of the respondents ranged from 600 to 1800 euro, for 22.4% from 1801 to 3000 euro, for 7.8% it was over 3000 euro,and for only 3.6% was it below 600 euro (23.8% did not respond on this item). There was no missing data, or it never exceeded1.5%, in the socio-demographic characteristics of the host nationals’ sample.
2.2. Measures
Prior to the data collection proper, we carried out a pilot study with a sample of 30 immigrant persons whose native lan-guage was not Spanish in order to verify whether all the items included in the survey were comprehensible, as well as toassess the length of the interview. The survey questionnaire consisted of a series of measures, out of which we describe onlythose that we included in the analyses. All the participants’ comments and difficulties for filling out the questionnaire orresponding to particular items were recorded. Based on this information, we simplified/modified some items (e.g., substi-tuted some words by their simpler synonyms or eliminated negatively-worded expressions), as well as drawing up fieldworkinstructions for the interviewers.
All the items are presented in Table 1. Except for the item CHR1 (which was difficult to phrase without negation), all theitems were positively worded.
We collected data on two components of HWB: satisfaction with life and affectivity. The items measuring these two HWBcomponents were standardized to compute a single score of HWB.
2.2.1. Life Satisfaction (LS)This well-being indicator was measured with an item extracted from the World Value Survey (Inglehart et al., 2004) for
general evaluation of one’s life. Participants were asked to indicate their response on a 10-point Likert scale (1 = dissatisfiedand 10 = satisfied).
2.2.2. Positive and negative affectTo measure positive affect (PA; immigrants: a = .84; host nationals: a = .83) and negative affect (NA immigrants: a = .81;
host nationals: a = .71), we used the Bradburn Affect Balance Scale (Bradburn, 1969, translated by Echevarría and Páez,1989). Participants rated the extent to which each of 18 affect items described how they were feeling during the last monthon a scale that ranged from 1 (seldom or never) to 4 (almost always).
We also selected two well-known and previously-validated eudaimonic components: psychological and social well-being.
1 According to official statistics, in the Basque Country autonomous region, 91% of the foreign-born population is registered, with between-country variation:from 97% for Colombians to 86% for Sub-Saharan Africans. Twenty-three per cent are undocumented (the Basque Observatory of Immigration, 2009¡).
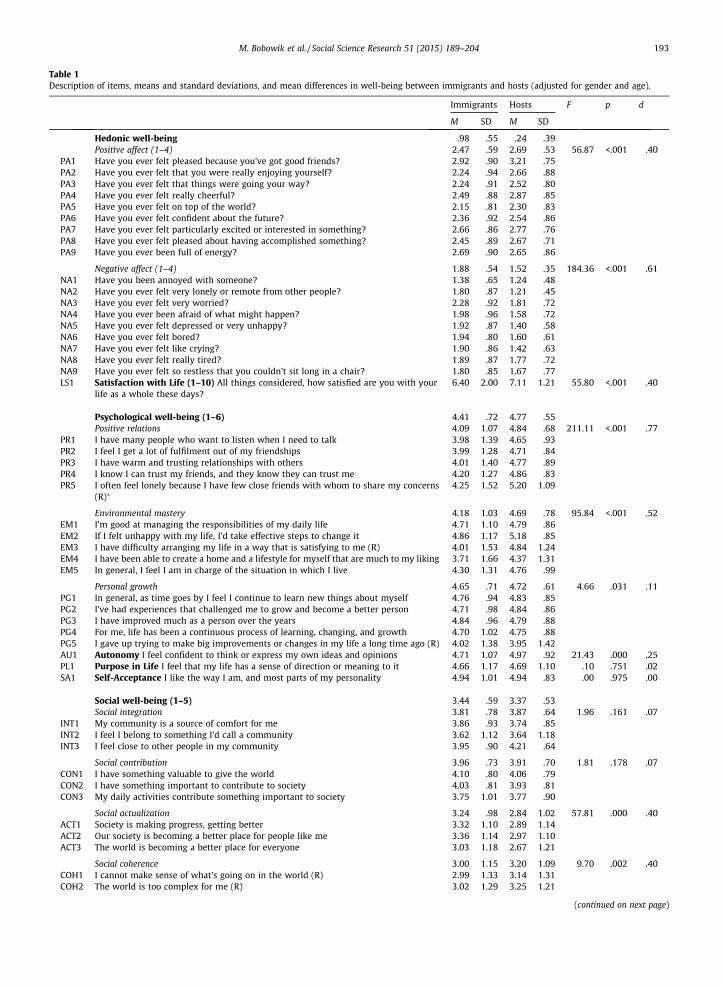
Table 1Description of items, means and standard deviations, and mean differences in well-being between immigrants and hosts (adjusted for gender and age).
Immigrants Hosts F p d
M SD M SD
Hedonic well-being �.98 .55 .24 .39Positive affect (1–4) 2.47 .59 2.69 .53 56.87 <.001 �.40
PA1 Have you ever felt pleased because you’ve got good friends? 2.92 .90 3.21 .75PA2 Have you ever felt that you were really enjoying yourself? 2.24 .94 2.66 .88PA3 Have you ever felt that things were going your way? 2.24 .91 2.52 .80PA4 Have you ever felt really cheerful? 2.49 .88 2.87 .85PA5 Have you ever felt on top of the world? 2.15 .81 2.30 .83PA6 Have you ever felt confident about the future? 2.36 .92 2.54 .86PA7 Have you ever felt particularly excited or interested in something? 2.66 .86 2.77 .76PA8 Have you ever felt pleased about having accomplished something? 2.45 .89 2.67 .71PA9 Have you ever been full of energy? 2.69 .90 2.65 .86
Negative affect (1–4) 1.88 .54 1.52 .35 184.36 <.001 .61NA1 Have you been annoyed with someone? 1.38 .65 1.24 .48NA2 Have you ever felt very lonely or remote from other people? 1.80 .87 1.21 .45NA3 Have you ever felt very worried? 2.28 .92 1.81 .72NA4 Have you ever been afraid of what might happen? 1.98 .96 1.58 .72NA5 Have you ever felt depressed or very unhappy? 1.92 .87 1.40 .58NA6 Have you ever felt bored? 1.94 .80 1.60 .61NA7 Have you ever felt like crying? 1.90 .86 1.42 .63NA8 Have you ever felt really tired? 1.89 .87 1.77 .72NA9 Have you ever felt so restless that you couldn’t sit long in a chair? 1.80 .85 1.67 .77LS1 Satisfaction with Life (1–10) All things considered, how satisfied are you with your
life as a whole these days?6.40 2.00 7.11 1.21 55.80 <.001 �.40
Psychological well-being (1–6) 4.41 .72 4.77 .55Positive relations 4.09 1.07 4.84 .68 211.11 <.001 �.77
PR1 I have many people who want to listen when I need to talk 3.98 1.39 4.65 .93PR2 I feel I get a lot of fulfilment out of my friendships 3.99 1.28 4.71 .84PR3 I have warm and trusting relationships with others 4.01 1.40 4.77 .89PR4 I know I can trust my friends, and they know they can trust me 4.20 1.27 4.86 .83PR5 I often feel lonely because I have few close friends with whom to share my concerns
(R)a4.25 1.52 5.20 1.09
Environmental mastery 4.18 1.03 4.69 .78 95.84 <.001 �.52EM1 I’m good at managing the responsibilities of my daily life 4.71 1.10 4.79 .86EM2 If I felt unhappy with my life, I’d take effective steps to change it 4.86 1.17 5.18 .85EM3 I have difficulty arranging my life in a way that is satisfying to me (R) 4.01 1.53 4.84 1.24EM4 I have been able to create a home and a lifestyle for myself that are much to my liking 3.71 1.66 4.37 1.31EM5 In general, I feel I am in charge of the situation in which I live 4.30 1.31 4.76 .99
Personal growth 4.65 .71 4.72 .61 4.66 .031 �.11PG1 In general, as time goes by I feel I continue to learn new things about myself 4.76 .94 4.83 .85PG2 I’ve had experiences that challenged me to grow and become a better person 4.71 .98 4.84 .86PG3 I have improved much as a person over the years 4.84 .96 4.79 .88PG4 For me, life has been a continuous process of learning, changing, and growth 4.70 1.02 4.75 .88PG5 I gave up trying to make big improvements or changes in my life a long time ago (R) 4.02 1.38 3.95 1.42AU1 Autonomy I feel confident to think or express my own ideas and opinions 4.71 1.07 4.97 .92 21.43 .000 �.25PL1 Purpose in Life I feel that my life has a sense of direction or meaning to it 4.66 1.17 4.69 1.10 .10 .751 �.02SA1 Self-Acceptance I like the way I am, and most parts of my personality 4.94 1.01 4.94 .83 .00 .975 .00
Social well-being (1–5) 3.44 .59 3.37 .53Social integration 3.81 .78 3.87 .64 1.96 .161 �.07
INT1 My community is a source of comfort for me 3.86 .93 3.74 .85INT2 I feel I belong to something I’d call a community 3.62 1.12 3.64 1.18INT3 I feel close to other people in my community 3.95 .90 4.21 .64
Social contribution 3.96 .73 3.91 .70 1.81 .178 .07CON1 I have something valuable to give the world 4.10 .80 4.06 .79CON2 I have something important to contribute to society 4.03 .81 3.93 .81CON3 My daily activities contribute something important to society 3.75 1.01 3.77 .90
Social actualization 3.24 .98 2.84 1.02 57.81 .000 .40ACT1 Society is making progress, getting better 3.32 1.10 2.89 1.14ACT2 Our society is becoming a better place for people like me 3.36 1.14 2.97 1.10ACT3 The world is becoming a better place for everyone 3.03 1.18 2.67 1.21
Social coherence 3.00 1.15 3.20 1.09 9.70 .002 �.40COH1 I cannot make sense of what’s going on in the world (R) 2.99 1.33 3.14 1.31COH2 The world is too complex for me (R) 3.02 1.29 3.25 1.21
(continued on next page)
M. Bobowik et al. / Social Science Research 51 (2015) 189–204 193
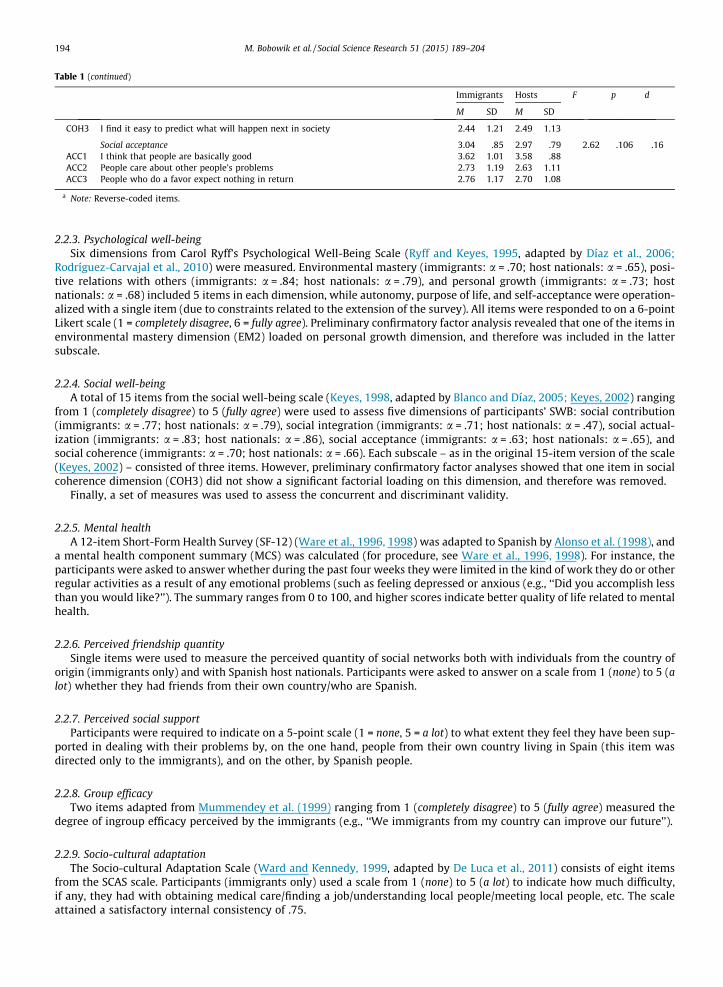
Table 1 (continued)
Immigrants Hosts F p d
M SD M SD
COH3 I find it easy to predict what will happen next in society 2.44 1.21 2.49 1.13
Social acceptance 3.04 .85 2.97 .79 2.62 .106 �.16ACC1 I think that people are basically good 3.62 1.01 3.58 .88ACC2 People care about other people’s problems 2.73 1.19 2.63 1.11ACC3 People who do a favor expect nothing in return 2.76 1.17 2.70 1.08
a Note: Reverse-coded items.
194 M. Bobowik et al. / Social Science Research 51 (2015) 189–204
2.2.3. Psychological well-beingSix dimensions from Carol Ryff’s Psychological Well-Being Scale (Ryff and Keyes, 1995, adapted by Díaz et al., 2006;
Rodríguez-Carvajal et al., 2010) were measured. Environmental mastery (immigrants: a = .70; host nationals: a = .65), posi-tive relations with others (immigrants: a = .84; host nationals: a = .79), and personal growth (immigrants: a = .73; hostnationals: a = .68) included 5 items in each dimension, while autonomy, purpose of life, and self-acceptance were operation-alized with a single item (due to constraints related to the extension of the survey). All items were responded to on a 6-pointLikert scale (1 = completely disagree, 6 = fully agree). Preliminary confirmatory factor analysis revealed that one of the items inenvironmental mastery dimension (EM2) loaded on personal growth dimension, and therefore was included in the lattersubscale.
2.2.4. Social well-beingA total of 15 items from the social well-being scale (Keyes, 1998, adapted by Blanco and Díaz, 2005; Keyes, 2002) ranging
from 1 (completely disagree) to 5 (fully agree) were used to assess five dimensions of participants’ SWB: social contribution(immigrants: a = .77; host nationals: a = .79), social integration (immigrants: a = .71; host nationals: a = .47), social actual-ization (immigrants: a = .83; host nationals: a = .86), social acceptance (immigrants: a = .63; host nationals: a = .65), andsocial coherence (immigrants: a = .70; host nationals: a = .66). Each subscale – as in the original 15-item version of the scale(Keyes, 2002) – consisted of three items. However, preliminary confirmatory factor analyses showed that one item in socialcoherence dimension (COH3) did not show a significant factorial loading on this dimension, and therefore was removed.
Finally, a set of measures was used to assess the concurrent and discriminant validity.
2.2.5. Mental healthA 12-item Short-Form Health Survey (SF-12) (Ware et al., 1996, 1998) was adapted to Spanish by Alonso et al. (1998), and
a mental health component summary (MCS) was calculated (for procedure, see Ware et al., 1996, 1998). For instance, theparticipants were asked to answer whether during the past four weeks they were limited in the kind of work they do or otherregular activities as a result of any emotional problems (such as feeling depressed or anxious (e.g., ‘‘Did you accomplish lessthan you would like?’’). The summary ranges from 0 to 100, and higher scores indicate better quality of life related to mentalhealth.
2.2.6. Perceived friendship quantitySingle items were used to measure the perceived quantity of social networks both with individuals from the country of
origin (immigrants only) and with Spanish host nationals. Participants were asked to answer on a scale from 1 (none) to 5 (alot) whether they had friends from their own country/who are Spanish.
2.2.7. Perceived social supportParticipants were required to indicate on a 5-point scale (1 = none, 5 = a lot) to what extent they feel they have been sup-
ported in dealing with their problems by, on the one hand, people from their own country living in Spain (this item wasdirected only to the immigrants), and on the other, by Spanish people.
2.2.8. Group efficacyTwo items adapted from Mummendey et al. (1999) ranging from 1 (completely disagree) to 5 (fully agree) measured the
degree of ingroup efficacy perceived by the immigrants (e.g., ‘‘We immigrants from my country can improve our future’’).
2.2.9. Socio-cultural adaptationThe Socio-cultural Adaptation Scale (Ward and Kennedy, 1999, adapted by De Luca et al., 2011) consists of eight items
from the SCAS scale. Participants (immigrants only) used a scale from 1 (none) to 5 (a lot) to indicate how much difficulty,if any, they had with obtaining medical care/finding a job/understanding local people/meeting local people, etc. The scaleattained a satisfactory internal consistency of .75.
M. Bobowik et al. / Social Science Research 51 (2015) 189–204 195
2.3. Procedure
The data were collected by trained interviewers. Respondents participated in a structured face-to-face interview ofapproximately 1 h duration and were informed that their participation was voluntary and that their responses would be con-fidential. The interviewers were provided with fieldwork instructions and equipped with a set of show cards displaying thecorresponding response scales to be used when asking each question. Interviews with both immigrants and host nationalswere conducted in Spanish (for the Latino immigrant groups this is their native language and the vast majority of the otherimmigrant groups in Spain are able to speak and understand it). Nevertheless, many of the interviewers were bilingual(Spanish plus English or French), and they all had English and French versions of the questionnaire as back-up, even thoughpractically all the participants were able to understand the survey items in Spanish without the need for help.
2.4. Analyses
First, we tested the convergent and concurrent validity of well-being components in immigrants and host nationalsthrough a series of bivariate correlations. Second, we performed a random split of the immigrant sample so as to obtain com-parable sizes for the immigrant and host samples. We analyzed the construct validity of the well-being structure via a seriesof Confirmatory Factor Analyses (CFA) in one of the two random splits of the immigrant sample. Next, we cross-validated thewell-being model through a multi-group CFA across two groups: the remaining part of the immigrant sample and the hostnational sample. Finally, we tested a path model to examine different predictors of well-being components, and also to com-pare the immigrant and host national samples in their well-being levels.
All the CFA and path analyses were performed with EQS 6.1 for Windows (Bentler, 1995). The estimation procedureapplied was maximum likelihood, which tests the hypothesis of equality of covariance matrices of the theoretical and empir-ical models. Because of the lack of multivariate normality, various robust indices that adjust for non-normality were used toassess model fit, both chi-square statistics and goodness of fit criteria. Given the v2 test’s sensitivity to sample size and ourrelatively large sample, it may not be appropriate to interpret the v2 statistic, and thus more attention was paid to incremen-tal fit measures such as CFI (Schermelleh-Engel et al., 2003), as well as AIC, which serves to compare alternative models, bothnested and non-nested.
An array of indices was used to assess model fit: (a) the chi-square value of statistical fitting of the empirical model, whichis expected to take low values (be non-significant); (b) the comparative fit index (CFI) and non-normed fit index (NNFI) asindicators of goodness of fit, with values of over .90 considered acceptable, and values greater than .95 representing good fit.;and (c) the root mean-square error of approximation (RMSEA), a value of under .05 being recommended as indicating goodfit, and reasonable fit at values between .05 and .08 (Bentler and Bonett, 1980; Hu and Bentler, 1999). Whereas the NFI is stillaffected by sample size, the CFI is less sensitive in that regard (Schermelleh-Engel et al., 2003). Finally, to compare nestedmodels, we focused on a change in CFI value. A value of DCFI smaller than or equal to 0.01 indicates that the null hypothesisof invariance should not be rejected (Cheung and Rensvold, 2002). Correlational analyses were applied to test the discrim-inant and concurrent validity.
Missing data were estimated using the maximum-likelihood expectation maximization approach (Dempster et al., 1977;Little and Rubin, 2002).
3. Results
Table 1 shows the univariate descriptive statistics of the well-being components and the items making up the indicatorsof well-being in the immigrant and host national samples, as well as ANCOVA mean comparisons of well-being componentsbetween the two samples, controlled for sex and age. As regards HWB components, host nationals reported significantlyhigher positive affect and satisfaction with life, whereas immigrants showed higher negative affect (medium effect size).Host nationals also scored higher on some PWB dimensions: especially positive relations and environmental mastery (med-ium effect size), as well as autonomy and personal growth (although the effect size was small). Finally, immigrants and hostnationals presented similar levels of SWB. The only significant differences in SWB (of medium effect size) were found insocial coherence, with immigrants scoring significantly lower than host nationals, and social actualization, with immigrantsscoring higher than host nationals. The relatively strongest differences were found in NA and positive relations with others.
3.1. Convergent and concurrent validity of well-being components
We ran bivariate correlations to test the convergent validity of well-being components in the immigrant and host nationalsamples. As seen in Table 2, none of the correlation coefficients exceeded .60 in either sample, indicating that they indeed areindependent dimensions, even though there is still common variance (second-order dimensions) between them because themajority of correlations were significant and/or moderate. The strongest correlation in both samples was found for PA withLS, positive relations, and environmental mastery, whilst the weakest were found for NA with other well-being dimensions,although the correlations were clearly stronger in the immigrant sample compared to the host national sample (correlationsmostly below .20). SWB also correlated weakly with other well-being components. The correlations between PWB
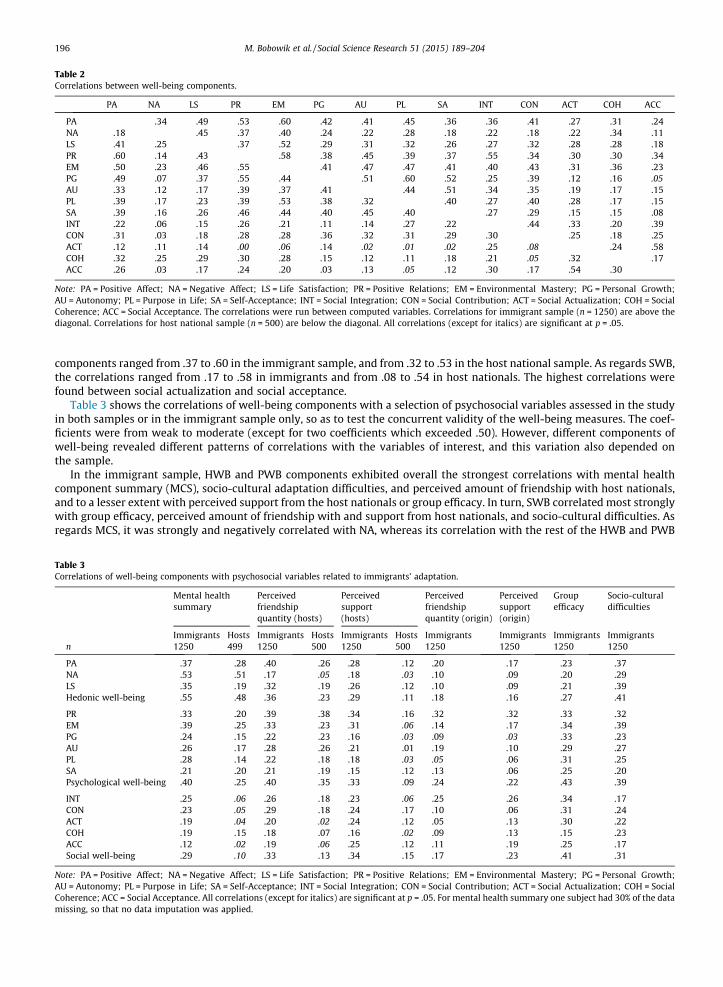
Table 2Correlations between well-being components.
PA NA LS PR EM PG AU PL SA INT CON ACT COH ACC
PA �.34 .49 .53 .60 .42 .41 .45 .36 .36 .41 .27 .31 .24NA �.18 �.45 �.37 �.40 �.24 �.22 �.28 �.18 �.22 �.18 �.22 �.34 �.11LS .41 �.25 .37 .52 .29 .31 .32 .26 .27 .32 .28 .28 .18PR .60 �.14 .43 .58 .38 .45 .39 .37 .55 .34 .30 .30 .34EM .50 �.23 .46 .55 .41 .47 .47 .41 .40 .43 .31 .36 .23PG .49 �.07 .37 .55 .44 .51 .60 .52 .25 .39 .12 .16 .05AU .33 �.12 .17 .39 .37 .41 .44 .51 .34 .35 .19 .17 .15PL .39 �.17 .23 .39 .53 .38 .32 .40 .27 .40 .28 .17 .15SA .39 �.16 .26 .46 .44 .40 .45 .40 .27 .29 .15 .15 .08INT .22 �.06 .15 .26 .21 .11 .14 .27 .22 .44 .33 .20 .39CON .31 .03 .18 .28 .28 .36 .32 .31 .29 .30 .25 .18 .25ACT .12 �.11 .14 .00 .06 �.14 �.02 �.01 �.02 .25 .08 .24 .58COH .32 �.25 .29 .30 .28 .15 .12 .11 .18 .21 .05 .32 .17ACC .26 �.03 .17 .24 .20 .03 .13 .05 .12 .30 .17 .54 .30
Note: PA = Positive Affect; NA = Negative Affect; LS = Life Satisfaction; PR = Positive Relations; EM = Environmental Mastery; PG = Personal Growth;AU = Autonomy; PL = Purpose in Life; SA = Self-Acceptance; INT = Social Integration; CON = Social Contribution; ACT = Social Actualization; COH = SocialCoherence; ACC = Social Acceptance. The correlations were run between computed variables. Correlations for immigrant sample (n = 1250) are above thediagonal. Correlations for host national sample (n = 500) are below the diagonal. All correlations (except for italics) are significant at p = .05.
196 M. Bobowik et al. / Social Science Research 51 (2015) 189–204
components ranged from .37 to .60 in the immigrant sample, and from .32 to .53 in the host national sample. As regards SWB,the correlations ranged from .17 to .58 in immigrants and from .08 to .54 in host nationals. The highest correlations werefound between social actualization and social acceptance.
Table 3 shows the correlations of well-being components with a selection of psychosocial variables assessed in the studyin both samples or in the immigrant sample only, so as to test the concurrent validity of the well-being measures. The coef-ficients were from weak to moderate (except for two coefficients which exceeded .50). However, different components ofwell-being revealed different patterns of correlations with the variables of interest, and this variation also depended onthe sample.
In the immigrant sample, HWB and PWB components exhibited overall the strongest correlations with mental healthcomponent summary (MCS), socio-cultural adaptation difficulties, and perceived amount of friendship with host nationals,and to a lesser extent with perceived support from the host nationals or group efficacy. In turn, SWB correlated most stronglywith group efficacy, perceived amount of friendship with and support from host nationals, and socio-cultural difficulties. Asregards MCS, it was strongly and negatively correlated with NA, whereas its correlation with the rest of the HWB and PWB
Table 3Correlations of well-being components with psychosocial variables related to immigrants’ adaptation.
Mental healthsummary
Perceivedfriendshipquantity (hosts)
Perceivedsupport(hosts)
Perceivedfriendshipquantity (origin)
Perceivedsupport(origin)
Groupefficacy
Socio-culturaldifficulties
Immigrants Hosts Immigrants Hosts Immigrants Hosts Immigrants Immigrants Immigrants Immigrantsn 1250 499 1250 500 1250 500 1250 1250 1250 1250
PA .37 .28 .40 .26 .28 .12 .20 .17 .23 �.37NA �.53 �.51 �.17 �.05 �.18 �.03 �.10 �.09 �.20 .29LS .35 .19 .32 .19 .26 .12 .10 .09 .21 �.39Hedonic well-being .55 .48 .36 .23 .29 .11 .18 .16 .27 �.41
PR .33 .20 .39 .38 .34 .16 .32 .32 .33 �.32EM .39 .25 .33 .23 .31 .06 .14 .17 .34 �.39PG .24 .15 .22 .23 .16 .03 .09 .03 .33 �.23AU .26 .17 .28 .26 .21 �.01 .19 .10 .29 �.27PL .28 .14 .22 .18 .18 �.03 .05 .06 .31 �.25SA .21 .20 .21 .19 .15 .12 .13 .06 .25 �.20Psychological well-being .40 .25 .40 .35 .33 .09 .24 .22 .43 �.39
INT .25 .06 .26 .18 .23 .06 .25 .26 .34 �.17CON .23 .05 .29 .18 .24 .17 .10 .06 .31 �.24ACT .19 .04 .20 �.02 .24 .12 .05 .13 .30 �.22COH .19 .15 .18 .07 .16 �.02 .09 .13 .15 �.23ACC .12 .02 .19 .06 .25 .12 .11 .19 .25 �.17Social well-being .29 .10 .33 .13 .34 .15 .17 .23 .41 �.31
Note: PA = Positive Affect; NA = Negative Affect; LS = Life Satisfaction; PR = Positive Relations; EM = Environmental Mastery; PG = Personal Growth;AU = Autonomy; PL = Purpose in Life; SA = Self-Acceptance; INT = Social Integration; CON = Social Contribution; ACT = Social Actualization; COH = SocialCoherence; ACC = Social Acceptance. All correlations (except for italics) are significant at p = .05. For mental health summary one subject had 30% of the datamissing, so that no data imputation was applied.
M. Bobowik et al. / Social Science Research 51 (2015) 189–204 197
components was positive and moderate. MCS was rather weakly correlated with SWB. Socio-cultural adaptation and per-ceived amount of friendship with host nationals correlated positively and moderately with most HWB and PWB components(except for NA and friendships). Perceived support from host nationals was positively and moderately correlated with posi-tive relations and environmental mastery, and slightly more weakly with the rest of the well-being components. Group effi-cacy was moderately and positively related to the three PWB and most SWB components (especially social contribution,integration, and actualization). Perceived friendships with and support from people from the country of origin were weaklyassociated with well-being, except for positive relations. In the host national sample, MCS was the most strongly (and neg-atively) correlated with negative affect, whereas friendship quantity was correlated with positive relations. The remainingcorrelations were weak, and demonstrated that mental health and social networks are less determinant of host nationals’than of immigrants’ well-being. The finding that HWB and PWB are more strongly related to mental health, but SWB to groupefficacy, provides evidence for the concurrent validity of the well-being measures used in this study. At the same time, dif-ferent well-being components showed differential functioning depending on the sample type.
3.2. Confirmatory factor analyses: the structure of well-being
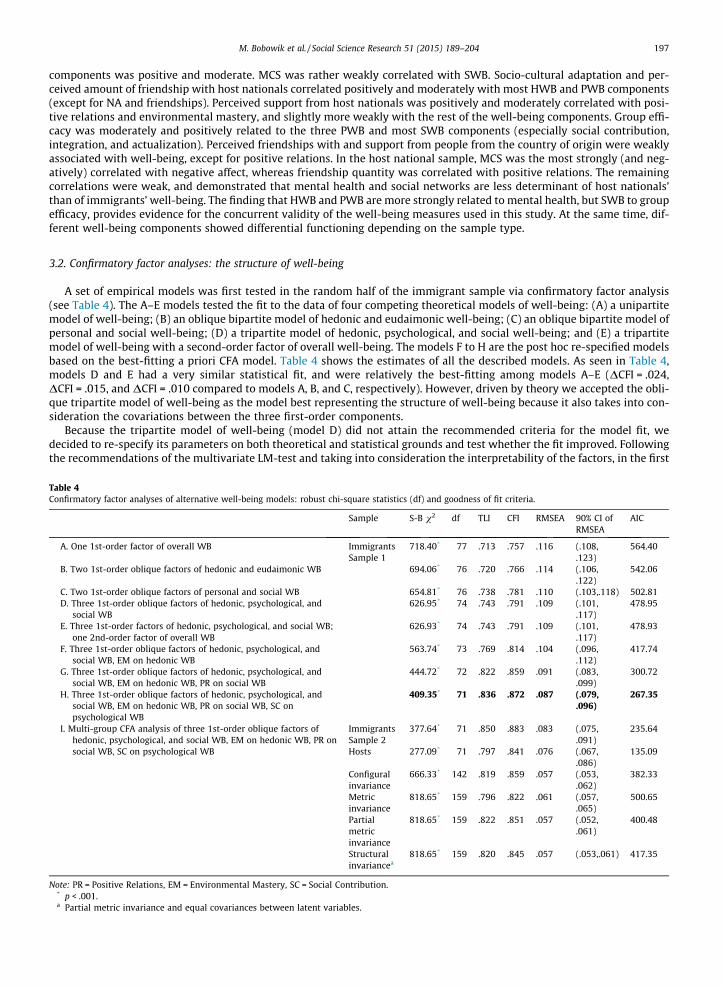
A set of empirical models was first tested in the random half of the immigrant sample via confirmatory factor analysis(see Table 4). The A–E models tested the fit to the data of four competing theoretical models of well-being: (A) a unipartitemodel of well-being; (B) an oblique bipartite model of hedonic and eudaimonic well-being; (C) an oblique bipartite model ofpersonal and social well-being; (D) a tripartite model of hedonic, psychological, and social well-being; and (E) a tripartitemodel of well-being with a second-order factor of overall well-being. The models F to H are the post hoc re-specified modelsbased on the best-fitting a priori CFA model. Table 4 shows the estimates of all the described models. As seen in Table 4,models D and E had a very similar statistical fit, and were relatively the best-fitting among models A–E (DCFI = .024,DCFI = .015, and DCFI = .010 compared to models A, B, and C, respectively). However, driven by theory we accepted the obli-que tripartite model of well-being as the model best representing the structure of well-being because it also takes into con-sideration the covariations between the three first-order components.
Because the tripartite model of well-being (model D) did not attain the recommended criteria for the model fit, wedecided to re-specify its parameters on both theoretical and statistical grounds and test whether the fit improved. Followingthe recommendations of the multivariate LM-test and taking into consideration the interpretability of the factors, in the first
Table 4Confirmatory factor analyses of alternative well-being models: robust chi-square statistics (df) and goodness of fit criteria.
Sample S-B v2 df TLI CFI RMSEA 90% CI ofRMSEA
AIC
A. One 1st-order factor of overall WB ImmigrantsSample 1
718.40* 77 .713 .757 .116 (.108,.123)
564.40
B. Two 1st-order oblique factors of hedonic and eudaimonic WB 694.06* 76 .720 .766 .114 (.106,.122)
542.06
C. Two 1st-order oblique factors of personal and social WB 654.81* 76 .738 .781 .110 (.103,.118) 502.81D. Three 1st-order oblique factors of hedonic, psychological, and
social WB626.95* 74 .743 .791 .109 (.101,
.117)478.95
E. Three 1st-order factors of hedonic, psychological, and social WB;one 2nd-order factor of overall WB
626.93* 74 .743 .791 .109 (.101,.117)
478.93
F. Three 1st-order oblique factors of hedonic, psychological, andsocial WB, EM on hedonic WB
563.74* 73 .769 .814 .104 (.096,.112)
417.74
G. Three 1st-order oblique factors of hedonic, psychological, andsocial WB, EM on hedonic WB, PR on social WB
444.72* 72 .822 .859 .091 (.083,.099)
300.72
H. Three 1st-order oblique factors of hedonic, psychological, andsocial WB, EM on hedonic WB, PR on social WB, SC onpsychological WB
409.35* 71 .836 .872 .087 (.079,.096)
267.35
I. Multi-group CFA analysis of three 1st-order oblique factors ofhedonic, psychological, and social WB, EM on hedonic WB, PR onsocial WB, SC on psychological WB
ImmigrantsSample 2
377.64* 71 .850 .883 .083 (.075,.091)
235.64
Hosts 277.09* 71 .797 .841 .076 (.067,.086)
135.09
Configuralinvariance
666.33* 142 .819 .859 .057 (.053,.062)
382.33
Metricinvariance
818.65* 159 .796 .822 .061 (.057,.065)
500.65
Partialmetricinvariance
818.65* 159 .822 .851 .057 (.052,.061)
400.48
Structuralinvariancea
818.65* 159 .820 .845 .057 (.053,.061) 417.35
Note: PR = Positive Relations, EM = Environmental Mastery, SC = Social Contribution.* p < .001.a Partial metric invariance and equal covariances between latent variables.

198 M. Bobowik et al. / Social Science Research 51 (2015) 189–204
step the environmental mastery dimension, which initially loaded on PWB, was also allowed to load on the HWB factor. CFIchange parameter indicated a significant improvement of the model, DCFI = .023. In the next step, we freed another param-eter belonging to PWB, the positive relations dimensions, but in this case on SWB again obtaining an improved model fit(DCFI = .045). Furthermore, social contribution dimension was allowed to cross-load between the SWB and PWB factors(DCFI = .013). These steps were not devoid of theoretical grounds. The model improvements suggest that the environmentalmastery and positive relations dimensions share some variance with hedonic and social aspects of well-being, respectively.Indeed, the previous research on the Psychological Well-being Scale’s psychometric properties has revealed that the positiverelations dimension was in fact loaded on SWB. Also, environmental mastery (together with other PWB components) wasfound to share variance with HWB or with positive affect specifically (see Section 1). Finally, social contribution is the most‘‘private’’ aspect of SWB because it refers to individual’s feeling of usefulness.
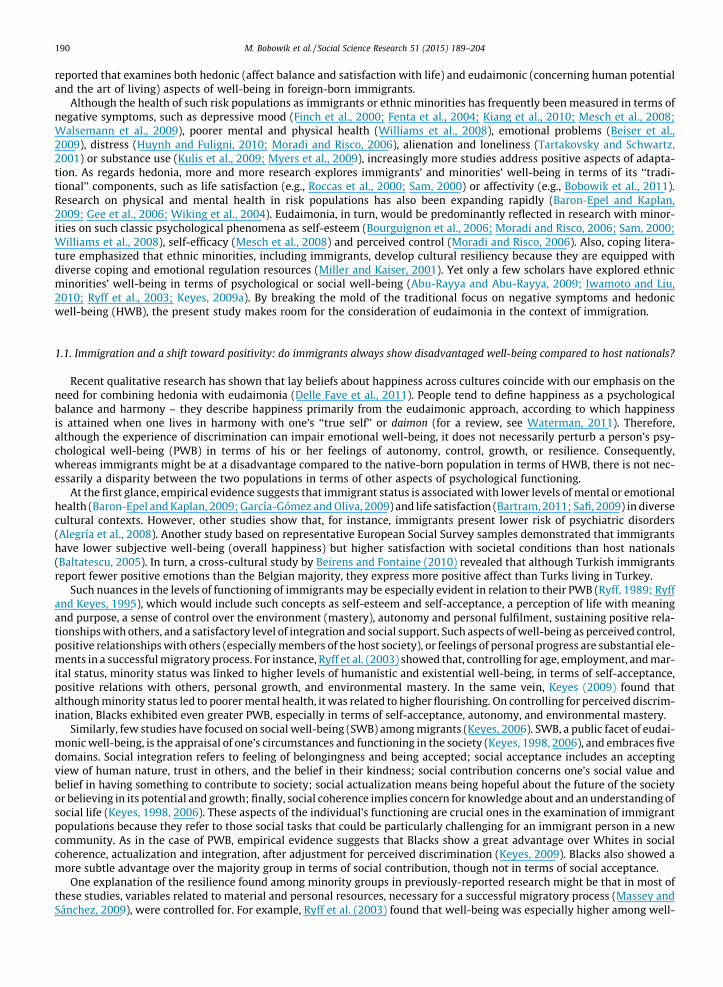
As further recommendations of the LM-test could not be substantiated theoretically, we ceased the model re-specificationat this step. The modified final measurement model showed reasonable fit to the data, as all three fit indices were close to thecriteria (CFI close to .90, and RMSEA close to .08). The AIC value also showed improvement of the model in comparison to thea priori models.
3.3. Confirmatory factor analyses: cross-validation
Once the baseline model was specified in the first half of the immigrant sample based on the random split, we performeda multi-group CFA with the remaining half of the immigrant participants and the host national sample. The first step con-sisted of fitting the previously established re-specified tripartite well-being model in each of the two samples separately. Themodel achieved a somewhat better fit in immigrant sample 2 and a somewhat poorer fit in the host national sample (seeTable 4), but still comparable fit to the one obtained for immigrant sample 1. Subsequently, a two-group freely-estimatedCFA model was tested. This model exhibited relatively acceptable fit characteristics (as compared to the baseline modelfor the immigrant sample 1), and therefore supported the basic requirement of configural invariance (i.e., the a priori spec-ified structure of factor loadings was equivalent across groups). Factor loadings of the same items were then constrained tobe equal across groups in order to test metric invariance. The difference in model fit for the more and less constrained modelswas found to be significant (DCFI = .037), and thus the regression slopes relating the latent factors to the observed variablescould not be considered equal for each group. However, although the model failed to exhibit metric invariance, some indi-cators may still be invariant. We therefore examined each indicator separately for group invariance through the LM-test forreleasing constraints. The constraints released are presented in Fig. 1 with an asterisk, and included negative affect, life sat-isfaction, environmental mastery (cross-loading on HWB), positive relations (cross-loading on SWB), social integration, andautonomy. The model with the seven constraints released revealed an improved fit in comparison to the full metric invari-ance model (DCFI = .029) and a similar fit to that of the configural invariance model (DCFI = .008). Therefore, the measure-ment model could be accepted as showing partial metric invariance. Finally, we tested for structural invariance and re-ranthe same model, but constrained so that the correlation paths between latent variables had to be equal. The model fit did notchange significantly (DCFI = .006), and the correlations between the groups can be considered equal.
The final re-specified tripartite well-being model is represented graphically in Fig. 1 for each of the samples in theanalysis.
3.4. Differences between immigrants and host nationals
We next tested fourteen path models to examine the role of immigrant status and other antecedents for each of the well-being components. Although we confirmed the existence of a tripartite model of well-being, we ran the analyses for each ofthe well-being components separately, based on the mean comparisons in the preliminary analyses section (see Table 1).Five main correlated predictors were included in each model: immigrant status, perceived friendships with host nationals,perceived support from host nationals, marital status, and income. Sex and age were included in the model as controls. Thefit of all the path models was excellent (Table 5).
The analyses showed (Table 5) that immigrant status was a significant predictor of all well-being components, except forenvironmental mastery and social coherence. Interestingly, direct effects of immigrant status on ten out of fourteen well-being components were positive. When adjusted for perceived friendship and support, marital status, and income (as wellas sex and age), immigrants report especially higher eudaimonic well-being: social contribution and actualization, followedby personal growth, self-acceptance, and purpose in life. However, they still scored lower on positive relations and higher onnegative affect compared to host nationals.
As far as the effect of other antecedents on well-being is concerned, perceived friendship quantity with host nationals wasalso a significant predictor of most well-being components (except for social actualization and social acceptance). Perceivedfriendships were a particularly strong predictor of positive affect and positive relations, but a rather weak though still sig-nificant predictor of negative affect or social coherence. In turn, perceived support from host nationals was a less relevant(weaker) predictor of well-being components, being a relatively stronger predictor of positive relations, environmental mas-tery, social actualization and acceptance.
As regards demographic and socio-economic variables, income was among them the most important predictor of well-being in most models. Net family income significantly predicted all HWB and PWB components, whereas it predicted only
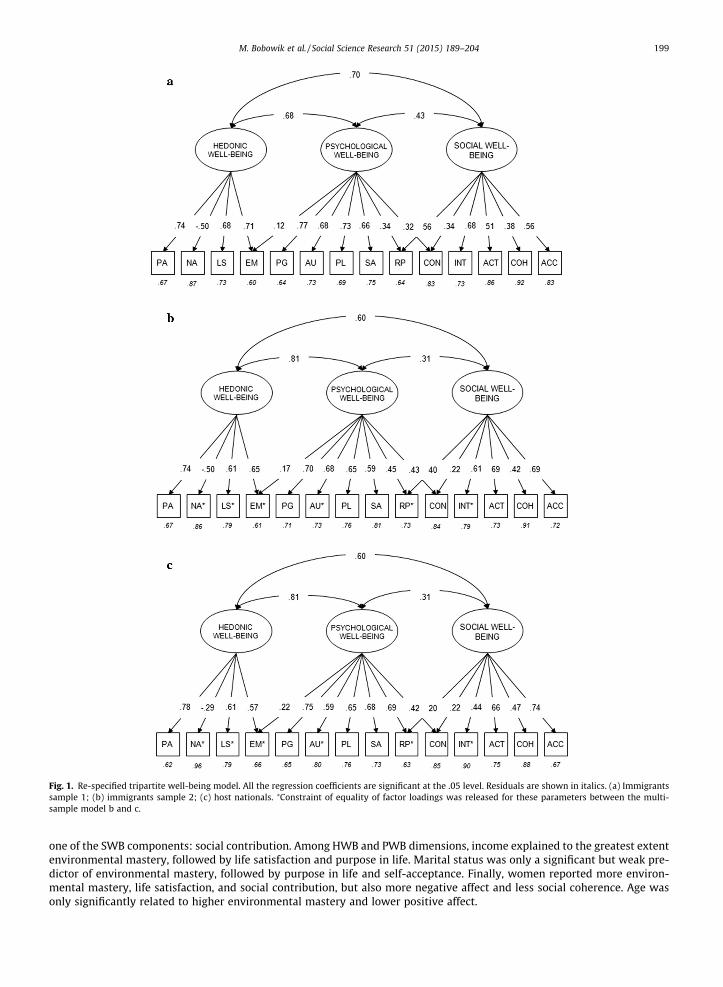
Fig. 1. Re-specified tripartite well-being model. All the regression coefficients are significant at the .05 level. Residuals are shown in italics. (a) Immigrantssample 1; (b) immigrants sample 2; (c) host nationals. ⁄Constraint of equality of factor loadings was released for these parameters between the multi-sample model b and c.
M. Bobowik et al. / Social Science Research 51 (2015) 189–204 199
one of the SWB components: social contribution. Among HWB and PWB dimensions, income explained to the greatest extentenvironmental mastery, followed by life satisfaction and purpose in life. Marital status was only a significant but weak pre-dictor of environmental mastery, followed by purpose in life and self-acceptance. Finally, women reported more environ-mental mastery, life satisfaction, and social contribution, but also more negative affect and less social coherence. Age wasonly significantly related to higher environmental mastery and lower positive affect.
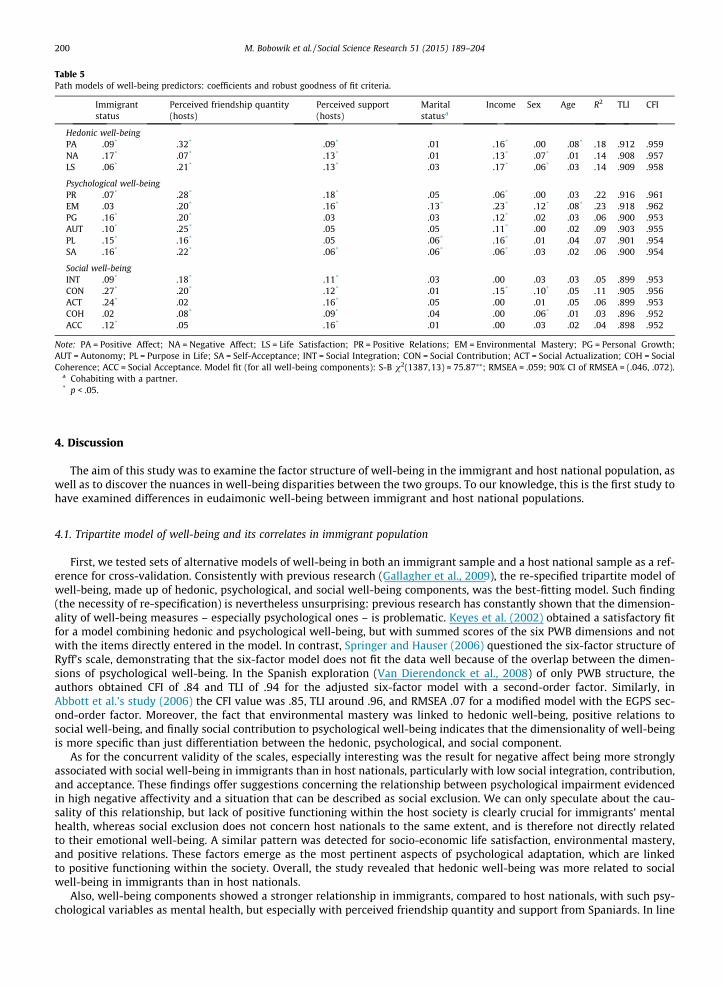
Table 5Path models of well-being predictors: coefficients and robust goodness of fit criteria.
Immigrantstatus
Perceived friendship quantity(hosts)
Perceived support(hosts)
Maritalstatusa
Income Sex Age R2 TLI CFI
Hedonic well-beingPA .09* .32* .09* .01 .16* .00 �.08* .18 .912 .959NA .17* �.07* �.13* �.01 �.13* .07* .01 .14 .908 .957LS .06* .21* .13* .03 .17* .06* �.03 .14 .909 .958
Psychological well-beingPR �.07* .28* .18* .05 .06* .00 �.03 .22 .916 .961EM .03 .20* .16* .13* .23* .12* .08* .23 .918 .962PG .16* .20* .03 .03 .12* .02 �.03 .06 .900 .953AUT .10* .25* .05 .05 .11* .00 .02 .09 .903 .955PL .15* .16* .05 .06* .16* �.01 .04 .07 .901 .954SA .16* .22* .06* .06* .06* .03 .02 .06 .900 .954
Social well-beingINT .09* .18* .11* .03 .00 .03 �.03 .05 .899 .953CON .27* .20* .12* .01 .15* .10* .05 .11 .905 .956ACT .24* .02 .16* .05 .00 .01 .05 .06 .899 .953COH �.02 .08* .09* .04 .00 �.06* �.01 .03 .896 .952ACC .12* .05 .16* .01 .00 .03 .02 .04 .898 .952
Note: PA = Positive Affect; NA = Negative Affect; LS = Life Satisfaction; PR = Positive Relations; EM = Environmental Mastery; PG = Personal Growth;AUT = Autonomy; PL = Purpose in Life; SA = Self-Acceptance; INT = Social Integration; CON = Social Contribution; ACT = Social Actualization; COH = SocialCoherence; ACC = Social Acceptance. Model fit (for all well-being components): S-B v2(1387,13) = 75.87⁄⁄; RMSEA = .059; 90% CI of RMSEA = (.046, .072).
a Cohabiting with a partner.* p < .05.
200 M. Bobowik et al. / Social Science Research 51 (2015) 189–204
4. Discussion
The aim of this study was to examine the factor structure of well-being in the immigrant and host national population, aswell as to discover the nuances in well-being disparities between the two groups. To our knowledge, this is the first study tohave examined differences in eudaimonic well-being between immigrant and host national populations.
4.1. Tripartite model of well-being and its correlates in immigrant population
First, we tested sets of alternative models of well-being in both an immigrant sample and a host national sample as a ref-erence for cross-validation. Consistently with previous research (Gallagher et al., 2009), the re-specified tripartite model ofwell-being, made up of hedonic, psychological, and social well-being components, was the best-fitting model. Such finding(the necessity of re-specification) is nevertheless unsurprising: previous research has constantly shown that the dimension-ality of well-being measures – especially psychological ones – is problematic. Keyes et al. (2002) obtained a satisfactory fitfor a model combining hedonic and psychological well-being, but with summed scores of the six PWB dimensions and notwith the items directly entered in the model. In contrast, Springer and Hauser (2006) questioned the six-factor structure ofRyff’s scale, demonstrating that the six-factor model does not fit the data well because of the overlap between the dimen-sions of psychological well-being. In the Spanish exploration (Van Dierendonck et al., 2008) of only PWB structure, theauthors obtained CFI of .84 and TLI of .94 for the adjusted six-factor model with a second-order factor. Similarly, inAbbott et al.’s study (2006) the CFI value was .85, TLI around .96, and RMSEA .07 for a modified model with the EGPS sec-ond-order factor. Moreover, the fact that environmental mastery was linked to hedonic well-being, positive relations tosocial well-being, and finally social contribution to psychological well-being indicates that the dimensionality of well-beingis more specific than just differentiation between the hedonic, psychological, and social component.
As for the concurrent validity of the scales, especially interesting was the result for negative affect being more stronglyassociated with social well-being in immigrants than in host nationals, particularly with low social integration, contribution,and acceptance. These findings offer suggestions concerning the relationship between psychological impairment evidencedin high negative affectivity and a situation that can be described as social exclusion. We can only speculate about the cau-sality of this relationship, but lack of positive functioning within the host society is clearly crucial for immigrants’ mentalhealth, whereas social exclusion does not concern host nationals to the same extent, and is therefore not directly relatedto their emotional well-being. A similar pattern was detected for socio-economic life satisfaction, environmental mastery,and positive relations. These factors emerge as the most pertinent aspects of psychological adaptation, which are linkedto positive functioning within the society. Overall, the study revealed that hedonic well-being was more related to socialwell-being in immigrants than in host nationals.
Also, well-being components showed a stronger relationship in immigrants, compared to host nationals, with such psy-chological variables as mental health, but especially with perceived friendship quantity and support from Spaniards. In line
M. Bobowik et al. / Social Science Research 51 (2015) 189–204 201
with the existing literature (Finch and Vega, 2003; González-Castro and Ubillos, 2011; Hernández Plaza et al., 2005; MartínezGarcía et al., 2002; Noh and Kaspar, 2003; Jasinskaja-Lahti et al., 2006), our data affirm that both quantity and quality ofsocial networks are among the principal resources for an immigrant individual to maintain or rebuild well-being. As forthe mental health component being more strongly related to well-being in immigrants, this relationship does not differacross the two populations for negative affect – rather, life satisfaction, psychological well-being, and above all socialwell-being are more strongly linked to mental health in immigrants. Again, the stronger association of the ‘‘public’’ aspectsof well-being with mental health reflects the process of socio-cultural adaptation. In fact, it was particularly positive affect,life satisfaction, and environmental mastery that showed a stronger association with the variables analyzed in immigrantscompared to host nationals. As regards the two latter components, unemployment and illegal status are common and impor-tant stressors for immigrants that affect the socio-economic domain of life satisfaction, as well as their feelings of controlover their situation. In the case of SWB, social integration and actualization revealed a similar pattern. Communal belong-ingness and social trust appeared to depend on social networking, and good mental health seemed to depend on this factormore among immigrants than among host nationals.
Furthermore, immigrants’ well-being was linked to group efficacy and low socio-cultural difficulties, giving additionalsupport to the concurrent validity of the scale. Indeed, measures of psychological adjustment and societal functioning areexpected to be sensitive to such factors as difficulties during the migratory process. Group efficacy, in turn, is anotherresource (together with social networks) that immigrants use to achieve adaptation in terms of both the private and publicaspects of well-being. Finally, in congruence with previous research (Finch and Vega, 2003; Noh and Kaspar, 2003), perceivedsupport from the ethnic community and friendships with its members contributed to immigrants’ well-being, though thecorrelations were rather weak, and stronger for eudaimonic compared to hedonic well-being.
4.2. Immigrants do not have lower well-being compared to host nationals
However, one of the most important findings of this study is that immigrant status was related to higher well-being inmost aspects, after adjustment for perceived friendship and support, marital status, income, sex and age. Immigrants pre-sented especially higher levels of social contribution and actualization, followed by personal growth, self-acceptance, andpurpose in life, whereas they reported only lower levels of positive relations with others and higher negative affect comparedto host nationals. As the results of the adjusted path analyses reveal, most of the differences between the two groups wouldbe attenuated if the social and materials resources were equally accessible to immigrants and host nationals. Another inter-pretation of these findings is that immigrants perceive their migratory experience as a process of personal growth. Theybelieve that the host society improves their personal and their families’ life conditions (e.g. allows the access to educationand health services) compared to the situation in their countries of origin where inequality is often extreme. These relativelymore positive expectations compared to host nationals are the source for their higher levels of psychological well-being,reflecting the level of self-fulfillment and personal advancement. That is, even in the situation of economic disadvantagein the host country, immigrants demonstrate higher perception of eudaimonic well-being compared to host nationals(who might have higher expectations although objectively better economic situation).
Our results expand previous research demonstrating that minority status is positively related to eudaimonic well-being(when some contextual factors are adjusted for). As concerns psychological well-being, confirming previous findings (Keyes,2009; Ryff et al., 2003), immigrants as a minority group presented an advantage over the majority in terms of personalgrowth, self-acceptance, and autonomy. However, we did not corroborate previous results on minority groups’ advantagein positive relations or environmental mastery. Such differences between the results of the two studies can, however, easilybe understood if we analyze the differences between the two populations. Compared to ethnic minorities (but born in themajority community), foreign-born minorities have to deal with the acculturation process, which involves both adaptationto a new culture and its members and addressing societal and economic difficulties, involving housing, employment, oraccess to health services. The experience related to acculturation may affect such aspects of the individual’s functioningas one’s perceived control of the new environment (e.g., difficulties in obtaining housing) or one’s perception of the qualityof relations with others (e.g., difficulties in relating to host society members).
With regard to social well-being, the immigrants in Spain presented an advantage over the host nationals in all aspectsexcept for social coherence. Keyes (2009) found, similarly, that Blacks enjoyed higher levels of social actualization, contribu-tion, and integration. However, whereas Keyes’s (2009) study provides evidence that minority status is related to highersocial coherence but lower social acceptance (when perceived discrimination is controlled), our findings suggest the oppo-site. Again, our different findings may be related to the challenge of acculturation. Immigrants are newcomers to the hostsociety and its macro-social dynamics. Due to cultural distance, immigrants may face difficulties in understanding the inter-nal societal structure.
Perceived amount of friendship with and, to a lesser extent, perceived support from host nationals would seem, then, tobe important for achieving higher levels of well-being (except for the cases of social actualization and social acceptance).Social networks within the host society are particularly important for maintaining high levels of positive affect and, impor-tantly, for enjoying positive relations with others (Martínez García et al., 2002).
As far as economic antecedents are concerned, net family income augments above all immigrants’ hedonic and psycho-logical well-being, whilst, as previously highlighted, social resources contribute more to social well-being. These findingsexpand on previous research which demonstrates that income is an important antecedent of immigrants’ life satisfaction
202 M. Bobowik et al. / Social Science Research 51 (2015) 189–204
(Safi, 2009). Income explained to the greatest extent environmental mastery, followed by life satisfaction and purpose in life.These findings are in line with the results revealing the disparity between immigrants and host nationals in environmentalmastery. Probably, income is a relevant factor for immigrants to achieve a feeling of control over their lives in the new cul-tural context.
To recapitulate, satisfactory levels of both objective and subjective aspects of immigrants’ integration in the receptor soci-ety mitigate the effects of acculturative stress. These results are congruent with those of previous studies on the stress buf-fering effect of social support (Cohen, 2003), and suggest that socio-economic mobility – together with social integrationwith the host – are core mechanisms for improving migrants’ well-being.
Importantly, future research should address the shortcomings of this study. The first limitation concerns its cross-sectionalcharacter, which meant that we could not draw any conclusions about predictive validity, and longitudinal studies are there-fore necessary. Qualitative research is also needed to enrich the quantitative data on immigrants’ well-being. Finally, the issueof the cross-cultural generalizability of such research needs to be addressed in future studies.
5. Conclusion
In this study we argued that migratory processes also involve development of personal strengths as a result of the suc-cessful negotiation of challenges in life, including the confrontation of discrimination and prejudice. With a focus on positiveaspects of immigrants’ adaptation, we examined and confirmed the tripartite structure of well-being in immigrant and hostpopulation as well as demonstrated that immigrant status does not necessarily involves lower well-being. We conclude thatimmigrants’ well-being should be considered a society’s ‘‘diamond’’ because it reflects the degree of contextualized mentalhealth of the society.
Acknowledgments
This research was supported by the Spanish Ministry of Science and Innovation Grant (PSI2008-02689/PSIC), the Univer-sity of the Basque Country (GIC07/113-IT-255-07 and UFI 11/04) grants, and the Spanish Ministry of Science and Innovation(AP2008-01980 Predoctoral Fellowship Program grant awarded to Magdalena Bobowik).
The authors would like to thank Xabier Aierdi, Basque Observatory of Immigration, and University of the Basque Countryfor their support and all participants for their collaboration in this research.
References
Abbott, R.A., Ploubidis, G.B., Huppert, F.A., Kuh, D., Wadsworth, M.E.J., Croudace, T.J., 2006. Psychometric evaluation and predictive validity of Ryff’spsychological well-being items in a UK birth cohort sample of women. Health Qual. Life Outcomes 4, 76. http://dx.doi.org/10.1186/1477-7525-4-76.
Abu-Rayya, H.M., Abu-Rayya, M.H., 2009. Acculturation, religious identity, and psychological well-being among Palestinians in Israel. Int. J. Intercult. Relat.33, 325–331. http://dx.doi.org/10.1016/j.ijintrel.2009.05.006.
Alegría, M., Canino, G., Shrout, P.E., Woo, M., Duan, N., Vila, D., Torres, M., Chen, C., Meng, X., 2008. Prevalence of mental illness in immigrant and non-immigrant U.S. Latino groups. Am. J. Psychiat. 165 (3), 359–369.
Alonso, J., Regidor, E., Barrio, G., Prieto, L., Rodríguez, C., De La Fuente, L., 1998. Valores poblacionales de referencia de la versión española del Cuestionario deSalud SF-36 [Population values of reference in the Spanish version of the SF-36 Questionnaire]. Med. Clín. 111, 410–416.
Balt�atescu, S., 2005. Subjective well-being of immigrants in Europe and their evaluation of societal conditions. An exploratory study. In: Pop, L., Matiut�a, C.(Eds.), European Identity and Free Movement of Persons in Europe. University of Oradea Publishing House, Oradea.
Baron-Epel, O., Kaplan, K., 2009. Can subjective and objective socioeconomic status explain minority health disparities in Israel? Soc. Sci. Med. 69, 1460–1467. http://dx.doi.org/10.1016/j.socscimed.2009.08.028.
Bartram, D., 2011. Economic migration and happiness: comparing immigrants’ and natives’ happiness gains from income. Soc. Indic. Res. 103 (1), 57–76.http://dx.doi.org/10.1007/s11205-010-9696-2.
Basque Observatory of Immigration, 2009. Panorámica de la inmigración (informe 29) [Immigration Outlook (Report 29]. <http://www.ikuspegi.org/documentos/documentos_internos/panoramica29cas.pdf>.
Beirens, K., Fontaine, J.R.J., 2010. Somatic and emotional well-being among Turkish immigrants in Belgium: acculturation or culture? J. Cross Cult. Psychol.42 (1), 56–74. http://dx.doi.org/10.1177/0022022110361773.
Beiser, M., Hamilton, H., Rummens, J.A., Oxman-Martinez, J., Ogilvie, L., Humphrey, C., Armstrong, R., 2009. Predictors or emotional problems and physicalaggression among children of Hong Kong Chinese, Mainland Chinese and Filipino immigrants to Canada. Soc. Psychiat. Epidemiol. 45 (10), 1011–1021.http://dx.doi.org/10.1007/s00127-009-0140-3.
Bentler, P.M., 1995. EQS Structural Equations Program Manual. Multivariate Software, Encino, CA.Bentler, P.M., Bonett, D.G., 1980. Significance tests and goodness of fit in the analysis of covariance structures. Psychol. Bull. 88 (3), 588–606. http://
dx.doi.org/10.1037//0033-2909.88.3.588.Blanco, A., Díaz, D., 2005. El bienestar social: Su concepto y mediación [Social well-being: the concept and measurement]. Psicothema 14 (4), 582–589.Bobowik, M., Basabe, N., Paez, D., Jimenez-Aristizabal, A., Bilbao, M.A., 2011. Personal values and well-being among Europeans, Spanish natives and
immigrants to Spain: does the culture matter? J. Happiness Stud. 12 (3), 401–419. http://dx.doi.org/10.1007/s10902-010-9202-1.Bourguignon, D., Seron, E., Yzerbyt, V., Herman, G., 2006. Perceived group and personal discrimination: differential effects on personal self-esteem. Eur. J.
Soc. Psychol. 36 (5), 773–789. http://dx.doi.org/10.1002/ejsp.326.Bradburn, N.M., 1969. The Structure of Psychological Well-being. England, Oxford.Burns, R.A., Machin, M.A., 2009. Investigating the structural validity of Ryff’s psychological well-being scales across two samples. Soc. Indic. Res. 93, 359–
375. http://dx.doi.org/10.1007/s11205-008-9329-1.Busseri, M.A., Sadava, S.W., 2011. A review of the tripartite structure of subjective well-being, implications for conceptualization, operationalization, and
synthesis. Person. Soc. Psychol. Rev. 15 (3), 290–314. http://dx.doi.org/10.1177/1088868310391271.Cheung, G.W., Rensvold, R.B., 2002. Evaluating goodness-of-fit indexes for testing measurement invariance. Struct. Equ. Model.: Multidiscip. J. 9 (2), 233–
255. http://dx.doi.org/10.1207/S15328007SEM0902_5.
M. Bobowik et al. / Social Science Research 51 (2015) 189–204 203
Cohen, S., 2003. Psychosocial models of the role of social support in the etiology of physical disease. In: Salovey, P., Rothman, A.J. (Eds.), Social Psychology ofHealth. Psychology Press, New York and Hove, pp. 227–244.
De Luca, S., Bobowik, M., Basabe, N., 2011. Adaptación socio-cultural de los inmigrantes brasileños en el País Vasco [Socio-cultural adaptation of Brazilianimmigrants in the Basque Country]. Rev. Psicol. Soc. 26 (2), 275–294. http://dx.doi.org/10.1174/021347411795448983.
Delle Fave, A., Bassi, M., 2009a. The contribution of diversity to happiness research. J. Positive Psychol. 4 (3), 205–207. http://dx.doi.org/10.1080/17439760902844319.
Delle Fave, A., Bassi, M., 2009b. Sharing optimal experiences and promoting good community life in a multicultural society. J. Positive Psychol. 4 (4), 280–289. http://dx.doi.org/10.1080/17439760902933716.
Delle Fave, A., Brdar, I., Freire, T., Vella-Brodrick, D., Wissing, M.P., 2011. The eudaimonic and hedonic components of happiness: qualitative and quantitativefindings. Soc. Indic. Res. 100, 185–207. http://dx.doi.org/10.1007/s11205-010-9632-5.
Dempster, A.P., Laird, N.M., Rubin, D.B., 1977. Maximum likelihood from incomplete data via the EM algorithm. J. Roy. Stat. Soc.: Ser. B (Methodol.) 39 (1), 1–38.
Díaz, D., Rodríguez-Carvajal, R., Blanco, A., Moreno-Jiménez, B., Gallardo, I., Valle, C., van Dierendonck, D., 2006. Adaptación española de las escalas debienestar psicológico de Ryff [Spanish adaptation of Ryff’s Psychological Well-Being Scale]. Psicothema 18 (3), 572–577.
Díaz, D., Blanco, A., Durán, M.M., 2011. La estructura del bienestar: el encuentro empírico de tres tradiciones [The structure of well-being: the empiricalencounter of three traditions]. Rev. Psicol. Soc. 26 (3), 357–372. http://dx.doi.org/10.1174/021347411797361266.
Echevarría, A., Páez, D., 1989. Emociones: Perspectivas psicosociales. Fundamentos, Madrid, pp. 486–487.Fenta, H., Hyman, I., Noh, S., 2004. Determinants of depression among Ethiopian immigrants and refugees in Toronto. J. Nerv. Ment. Dis. 192 (5), 363–372.
http://dx.doi.org/10.1097/01.nmd.0000126729.08179.07.Finch, B.K., Vega, W.A., 2003. Acculturation stress, social support, and self-rated health among Latinos in California. J. Immigr. Health 5 (3), 109–117. http://
dx.doi.org/10.1023/A:1023987717921.Finch, B.K., Kolody, B., Vega, W.A., 2000. Perceived discrimination and depression among Mexican-origin adults in California. J. Health Soc. Behav. 41 (3),
295–313. http://dx.doi.org/10.2307/2676322.Gallagher, M.W., Lopez, S.J., Preacher, K.J., 2009. The hierarchical structure of well-being. J. Pers. 77 (4), 1025–1049. http://dx.doi.org/10.1111/j.1467-
6494.2009.00573.x.García-Gómez, P., Oliva, J., 2009. Health-related quality of life of working-age immigrant population. Gac. Sanit. 23 (1), 38–46. http://dx.doi.org/10.1016/
j.gaceta.2009.09.008.Gee, G.C., Ryan, A., Laflamme, D.J., Holt, J., 2006. Self-reported discrimination and mental health status among African descendants, Mexican Americans, and
other Latinos in the New Hampshire REACH 2010 initiative: the added dimension of immigration. Am. J. Public Health 96 (10), 1821–1828. http://dx.doi.org/10.2105/AJPH.2005.080085.
González-Castro, J.L., Ubillos, S., 2011. Determinants of psychological distress among migrants from Ecuador and Romania in a Spanish city. Int. J. Soc.Psychiat. 57 (1), 30–44.
Hernández Plaza, S., Pozo Muñoz, C., Alonso Morillejo, E., Martos Méndez, M.J., 2005. Estructura y funciones del apoyo social en un colectivo de inmigrantesmarroquíes. [Structure and functions of social support in Moroccan immigrants]. An. Psicol. 21 (2), 304–315.
Hu, L., Bentler, P.M., 1999. Cutoff criteria for fit indexes in covariance structure analysis: conventional criteria versus new alternatives. Struct. Equ. Model. 6(1), 1–55. http://dx.doi.org/10.1080/10705519909540118.
Huta, V., Ryan, R.M., 2010. Pursuing pleasure or virtue: the differential and overlapping well-being benefits of hedonic and eudaimonic motives. J. HappinessStud. 11, 735–762. http://dx.doi.org/10.1007/s10902-009-9171-4.
Huynh, V.W., Fuligni, A.J., 2010. Discrimination hurts: the academic, psychological, and physical well-being of adolescents. J. Res. Adolescence 20 (4), 916–941. http://dx.doi.org/10.1111/j.1532-7795.2010.00670.x.
Inglehart, R., Basáñez, M., Díez-Medrano, J., Halman, L., Luijkx, R. (World Values Survey), 2004. Human Beliefs and Values. S.XXI, México.Iwamoto, D.K., Liu, W.M., 2010. The impact of racial identity, ethnic identity, Asian values and race-related stress on Asian Americans’ well being. J. Couns.
Psychol. 57, 79–91. http://dx.doi.org/10.1037/a0017393.Jasinskaja-Lahti, I., Liebkind, K., Jaakkola, M., Reuter, A., 2006. Perceived discrimination, social support networks, and psychological well-being among three
immigrant groups. J. Cross Cult. Psychol. 37, 293–331. http://dx.doi.org/10.1177/0022022106286925.Jibeen, T., 2011. Moderators of acculturative stress in Pakistani immigrants in Toronto, Canada. Int. J. Intercult. Relat. 35 (5), 523–533. http://dx.doi.org/
10.1016/j.ijintrel.2011.04.002.Jibeen, T., Khalid, R., 2010. Predictors of psychological well-being of Pakistani immigrants in Toronto, Canada. Int. J. Intercult. Relat. 34, 452–464. http://
dx.doi.org/10.1016/j.ijintrel.2010.04.010.Kashdan, T.B., Biswas-Diener, R., King, L.A., 2008. Reconsidering happiness: the costs of distinguishing between hedonics and eudaimonia. J. Positive
Psychol. 8, 219–233. http://dx.doi.org/10.1080/17439760802303044.Keyes, C., 1998. Social well-being. Soc. Psychol. Quart. 61, 121–140. http://dx.doi.org/10.2307/2787065.Keyes, C., 2002. The mental health continuum – from languishing to flourishing in life. J. Health Soc. Behav. 43 (2), 207–222. http://dx.doi.org/10.2307/
3090197.Keyes, C., 2006. Subjective well-being in mental health and human development research worldwide: an introduction. Soc. Indic. Res. 77, 1–10. http://
dx.doi.org/10.1007/s11205-005-5550-3.Keyes, C., 2009. The black–white paradox in health: flourishing in the face of social inequality and discrimination. J. Pers. 77 (6), 1677–1706. http://
dx.doi.org/10.1111/j.1467-6494.2009.00597.x.Keyes, C., Ryff, C., Shmotkin, D., 2002. Optimizing well-being: the empirical encounter of two traditions. J. Pers. Soc. Psychol. 82, 1007–1022. http://
dx.doi.org/10.1037//0022-3514.82.6.1007.Kiang, L., Grzywacz, J.G., Marin, A.J., Arcury, T.A., Quandt, S.A., 2010. Mental health in immigrants from nontraditional receiving sites. Cult. Divers. Ethnic
Minority Psychol. 16 (3), 386–394. http://dx.doi.org/10.1037/a0019907.Kulis, S., Marsiglia, F.F., Nieri, T., 2009. Perceived ethnic discrimination versus acculturation stress: influences on substance use among Latino youth in the
Southwest. J. Health Soc. Behav. 50 (4), 443–459. http://dx.doi.org/10.1177/002214650905000405.Little, R., Rubin, D., 2002. Statistical Analysis with Missing Data, second ed. Wiley-Interscience, New York.Lyubomirsky, S., Sheldon, K.M., Schkade, D., 2005. Pursuing happiness: the architecture of sustainable change. Rev. Gen. Psychol. 9 (2), 111–131. http://
dx.doi.org/10.1037/1089-2680.9.2.111.Martínez García, M.F., García Ramírez, M., Maya Jariego, I., 2002. Social support and locus of control as predictors of psychological well-being in Moroccan
and Peruvian immigrant women in Spain. Int. J. Intercult. Relat. 26 (2002), 287–310. http://dx.doi.org/10.1016/S0147-1767(02)00005-6.Massey, D., Sánchez, M., 2009. Human Development Research Paper 2009/43: Restrictive Immigration Policies and Latino Immigrant Identity in the United
States. <http://hdr.undp.org/en/reports/global/hdr2009/papers/HDRP_2009_43.pdf>.Mesch, G.S., Turjeman, H., Fishman, G., 2008. Perceived discrimination and the well-being of immigrant adolescents. J. Youth Adolesc. 37 (5), 592–604.
http://dx.doi.org/10.1007/s10964-007-9210-6.Miller, C.T., Kaiser, C.R., 2001. A theoretical perspective on coping with stigma. J. Soc. Issues 57 (1), 73–92. http://dx.doi.org/10.1111/0022-4537.00202.Moradi, B., Risco, C., 2006. Perceived discrimination experiences and mental health of Latino/a American persons. J. Couns. Psychol. 53 (4), 411–421. http://
dx.doi.org/10.1037/0022-0167.53.4.411.Mummendey, A., Kessler, T., Klink, A., Mielke, R., 1999. Strategies to cope with negative social identity: predictions by social identity theory and relative
deprivation theory. J. Pers. Soc. Psychol. 76 (2), 229–245. http://dx.doi.org/10.1037//0022-3514.76.2.229.
204 M. Bobowik et al. / Social Science Research 51 (2015) 189–204
Myers, R., Chou, C., Sussman, S., Baezconde-Garbanati, L., Pachon, H., Valente, T.W., 2009. Acculturation and substance use: social influence as a mediatoramong Hispanic alternative high school youth. J. Health Soc. Behav. 50, 164–179. http://dx.doi.org/10.1177/002214650905000204.
Noh, S., Kaspar, V., 2003. Perceived discrimination and depression: moderating effects of coping, acculturation, and ethnic support. Am. J. Public Health 93(2), 232–238. http://dx.doi.org/10.2105/AJPH.93.2.232.
Pajares, M., 2010. Inmigración y Mercado de Trabajo. Informe 2010 [Immigration and Jobmarket. 2010 Report]. Permanent Observatory of Immigration,Immigration and Emigration State Office (MTI). Madrid.
Paz Soldan, E., 2009. De inmigrantes a emigrantes [From immigrants to emigrants]. Babelia, El País 28, 11, p. 18.Roccas, S., Horenczyk, G., Schwartz, S., 2000. Acculturation discrepancies and well being: the moderating role of conformity. Eur. J. Soc. Psychol. 30, 323–
334. http://dx.doi.org/10.1002/(SICI)1099-0992(200005/06)30:3<323::AID-EJSP992>3.0.CO;2-5.Rodríguez-Carvajal, R., Díaz, D., Moreno-Jiménez, B., Blanco, A., Van Dierendonck, D., 2010. Vitality and inner resources as relevant components of
psychological well-being. Psicothema 22, 63–70.Ryan, R.M., Deci, E.L., 2001. On happiness and human potentials: a review of research on hedonic and eudaimonic well-being. Annu. Rev. Psychol. 52, 141–
166.Ryff, C., 1989. Happiness is everything, or is it? Explorations on the meaning of psychological well-being. J. Pers. Soc. Psychol. 57, 1069–1081. http://
dx.doi.org/10.1037//0022-3514.57.6.1069.Ryff, C.D., Keyes, C., 1995. The structure of psychological well-being revisited. J. Pers. Soc. Psychol. 69 (4), 719–727. http://dx.doi.org/10.1037//0022-
3514.69.4.719.Ryff, C.D., Singer, B.H., 2006. Best news yet on the six-factor model of well-being? Soc. Sci. Res. 35, 1103–1119. http://dx.doi.org/10.1016/
j.ssresearch.2006.01.002.Ryff, C.D., Singer, B., 2008. Know thyself and become what you are: a eudaimonic approach to psychological well-being. J. Happiness Stud. 9 (1), 13–39.
http://dx.doi.org/10.1007/s10902-006-9019-0.Ryff, C.D., Keyes, C.L.M., Hughes, D.L., 2003. Status inequalities, perceived discrimination, and eudaimonic well-being: do the challenges of minority life hone
purpose and growth? J. Health Soc. Behav. 44 (3), 275–291. http://dx.doi.org/10.2307/1519779.Safi, M., 2009. Immigrants’ life satisfaction in Europe: between assimilation and discrimination. Eur. Sociol. Rev. 26 (2), 159–176. http://dx.doi.org/10.1093/
esr/jcp013.Sam, D., 2000. Psychological adaptation of adolescents with immigrant backgrounds. J. Soc. Psychol. 140 (1), 5–25. http://dx.doi.org/10.1080/
00224540009600442.Schermelleh-Engel, K., Moosbrugger, H., Müller, H., 2003. Evaluating the fit of structural equation models: test of significance and descriptive goodness-of-
fit measures. Methods Psychol. Res.-Online 8 (2), 23–74.Springer, K.W., Hauser, R.M., 2006. An assessment of the construct validity of Ryff’s scales of psychological well-being: method, mode and measurement
effects. Soc. Sci. Res. 35 (4), 1080–1102. http://dx.doi.org/10.1016/j.ssresearch.2005.07.004.Springer, K.W., Hauser, R.M., Freese, J., 2006. Bad news indeed for Ryff’s six-factor model of well-being. Soc. Sci. Res. 35, 1120–1131. http://dx.doi.org/
10.1016/j.ssresearch.2006.01.003.Tartakovsky, E., Schwartz, S.H., 2001. Motivation for emigration, values, well-being, and identification among young Russian Jews. Int. J. Psychol. 36 (2), 88–
99.Uskul, A.K., Greenglass, E., 2005. Psychological well-being in a Turkish–Canadian sample. Anxiety, Stress Coping 18, 169–178. http://dx.doi.org/10.1080/
10615800500205983.Van Dierendonck, D., Díaz, D., Rodríguez-Carvajal, R., Blanco, A., Moreno-Jiménez, B., 2008. Ryff’s six factor model of psychological well-being, a Spanish
exploration. Soc. Indic. Res. 87, 473–479. http://dx.doi.org/10.1007/s11205-007-9174-7.Walsemann, K.M., Gilbert, C.G., Arline, T.G., 2009. Ethnic differences in trajectories of depressive symptoms: disadvantage in family background, high school
experiences, and adult characteristics. J. Health Soc. Behav. 50 (1), 82–98. http://dx.doi.org/10.1177/002214650905000106.Ward, C., Kennedy, A., 1999. The measurement of sociocultural adaptation. Int. J. Intercult. Relat. 23, 659–678. http://dx.doi.org/10.1016/S0147-
1767(99)00014-0.Ware, J.E., Kosinski, M., Keller, S.D., 1996. A 12-item short-form health survey: construction of scales and preliminary tests of reliability and validity. Med.
Care 34 (3), 220–233.Ware, J.E., Kosinski, M., Keller, S.D., 1998. SF-12: How to Score the SF-12 Physical and Mental Health Summary Scales, third ed. Quality Metric Incorporated,
Lincoln (RI).Waterman, A.S., 2008. Reconsidering happiness. A eudaimonist’s perspective. J. Positive Psychol. 3, 234–252. http://dx.doi.org/10.1080/
17439760802303002.Waterman, A.S., 2011. Eudaimonic identity theory: identity as self-discovery. In: Schwartz, S.J., Luyckx, K., Vignoles, V.L. (Eds.), Handbook of Identity Theory
and Research, vol. 2. Springer, New York, pp. 357–379.Wiking, E., Johansson, S.E., Sundquist, J., 2004. Ethnicity, acculturation, and self-reported health. A population based study among immigrants from Poland,
Turkey, and Iran in Sweden. J. Epidemiol. Community Health 58 (7), 574–582. http://dx.doi.org/10.1136/jech.2003.011387.Williams, D.R., Neighbors, H.W., Jackson, J.S., 2008. Racial/ethnic discrimination and health: findings from community studies. Am. J. Public Health 93 (2),
200–208. http://dx.doi.org/10.2105/AJPH.93.2.200.