Immigrants in Spain: skills acquisition and development. A regional study
26
Transcript of Immigrants in Spain: skills acquisition and development. A regional study


IMMIGRANTS IN SPAIN: SKILLSACQUISITION AND DEVELOPMENT.
A REGIONAL STUDY∗
Ignacio Dıaz-Emparanza † Alexandra M. Espinosa ‡
September 21, 2002
Abstract
The consequences of international migration for development in coun-tries of origin and destination remain hotly debated. The immigration flowscould be considered an appropriate mechanism to contribute to the devel-opment of origin countries if host countries recognize the qualifications ofimmigrants or contribute to the acquisition of skills. Correspondence anal-ysis is used to determine the relation between education level, job positionand legal situation of immigrants in Spain. The results indicate that im-migrants are occupying non skilled tasks, even in the case of well educatedimmigrants. Furthermore, these immigrants have no options to increasetheir skills nor by experience (in the job) neither by theirself (attendinga school), if the immigration policy only authorizes very short migration.Hence, Spain is not contributing appropriately to the development of origincountries.
key words: Migration, skills, correspondence analysis
∗This research was supported by Grant No PI9970 from the Basque Government and byGrant No 9/UPV-00038.321-13503/2001 from the University of the Basque Country
†Department of Applied Economics III (Econometrics y Statistics) and Institut of PublicEconomics. University of the Basque Country, Avenida Lehendakari Aguirre, 83, E48015,Bilbao, Spain. (e-mail: [email protected])
‡Department of Applied Economics IV (Mathematics for Economics and Business). Univer-sity of the Basque Country, Avenida Lehendakari Aguirre, 83, E48015, Bilbao, Spain. (e-mail:[email protected])
1

1 Introduction
The most part of the international organizations agree in consider the skills of
the immigrants and development as a part of the same problem. In this context,
economic development is argued by international organizations and NGOs to
force the developed world to tolerate immigration. The argument is based upon
two lines: remittances and skills acquisition. By one part, remittances contribute
to alleviate the poverty and the foreign debits of domestic economies; by other,
the possibility to acquire new abilities and skills could contribute positively in
the catch-up of developing countries. Nevertheless, the role of immigration are
not clear neither for host countries, nor for origin countries. In other words, “the
consequences of international migration for development in countries of origin
and destination remain hotly debated” (Stanton-Rusell 2001), since immigration
flows could reduce the stock of skilled workers of developing countries. Concerning
to this problem, developing countries claim for compensations from destination
countries due the loss of skilled personnel (UN 1999). Avoiding the polemic,
UNFPA (1998) considers reasonable recommending to developed world maximize
the benefits of skilled immigrants through the recognition of their qualifications
and employment in appropriate positions. However, in spite of their solidarity
with poor countries, the native population fear the impact of immigration over the
domestic culture and standard of life. Otherwise, the natives of the host countries
that are already annoyed because of the unemployment, feel their displeasure
augmented, if immigrants are occupying skilled and well paid jobs. Consequently,
some countries could decide to implement restrictive policies with respect the
immigration of skilled workers, be avoiding their entrance, be limiting the access
2

of immigrants to skilled and well paid jobs. Then, migration may or may not
contribute to the acquisition of skills abroad (Stanton-Rusell 2001).
1.1 The role of the European Union (EU)
The analysis of immigration must take into account that Spain is an EU Member
State. Consequently, the EU policy on immigration matters. The Treaty of Maas-
tricht in December 1991 and its coming into force in November 1993, supposed a
first step in the recognition of the immigration as a common problem, which could
not be solved only by securing outer borders. Hence, the Treaty of Maastricht
considered the immigration problem at various levels: asylum, external borders,
immigration (entrance, residence, family and illegal residence), traffic of drugs,
international fraud, judicial cooperation, police and custom cooperation. Also, in
1993, the Commission recommend its Member States to prevent asylum seekers
with economic purposes from receive the refugee status recognition; and control
the illegal immigration (Rasmussen 1996). However, the Treaty of Amsterdam
(1999) supposed a substantial advance in the design of an unique normative for
all Member States. Firstly, introducing a common policy on immigration and
asylum. Second, transferring from the third pillar to the first pillar the follow-
ing subjects: asylum, external borders, immigration policy, cooperation in civil
matters and customs cooperation. Broadly speaking, the targets are to eliminate
the illegal immigration and to impose restrictions to the long run immigration.
Hence, the EU “emphasized that these policies should of necessity be restrictive
(...) and admission for temporary employment may therefore be considered only
in terms of what is purely exceptional (EU 1996e)”.
Then, recommendations of the international organizations and the immigra-
3

tion policy of the EU Member States are clearly in contradiction, since the EU
never declares the development of origin countries a target. Then, all efforts of
EU Member States are focused to control and avoid the entrance of non autho-
rized or desired immigrants. Furthermore, the EU immigration policy declare
compulsive for all members to assume that immigration is only a temporal solu-
tion for origin and host countries. Consequently, designing a long run policy to
provide skills to immigrants, in order to help developing countries to achieve the
technological catch-up is clearly difficult. Despite the recognition of this problem
(EU 1996a), only short run policies specially designed, could increase or adequate
the skills of the immigrants to the actual technological requirements.
2 Data and Methodology
2.1 Data
The information about the education level of the 99.059 immigrants (INE 1999)
accounted by the Instituto Nacional de Estadıstica (INE) is based on new reg-
istrations and registry removals in the municipal registers of inhabitants due to
changes in residence. In fact, these are migrations and not immigrants, since a
citizen may change his residence from one municipality to another one more than
once a year. The “education level” data shows the categories Illiterate, First
Basic Education, Second Basic Education and Secondary and More education.
The data grouped by “Job Position” —Managerial, Scientists, Technicians, Ad-
ministrative, Services, Clerical, Skilled Agriculture, Skilled Construction, Skilled
Industry, Skilled Textile, Stationary Engine Operators, Maids, Sellers, Unskilled
Agriculture, Unskilled Construction, Unskilled Industry and Unskilled Textile—,
4

and “Work Permits” —Seasonal less 1 year, Employee 1 year, Employee 2 year,
Employee 3 year, Employee Permanent, Self-employed 1 year, Self employed 2
year, Self employed 3 year, Self employed Permanent—, show the structure of
the 199.759 immigrants with work permits in Spain. These data are accounted
by Ministerio de Trabajo y Asuntos Sociales (MTAS 1999b, MTAS 1999a), given
the information provided by the application form —work and residence— filled
by immigrants and processed at the Direccion General de Policıa. It is clear that
the data “Education Level” is a flow and that the sets “Job Position” and “Work
Permits” are stocks of immigrants. Consequently, the structure of data is not
completely comparable, since the first data set accounts for the 99.059 interna-
tional immigrants that changed its residence in 1999 and, the others two data
sets accounts for the 199.759 immigrants legally residing and with work permits.
This is a problem if we need to treat all the tables simultaneously, since both
data sets are not related. Then, we will keep in mind these characteristics, in
order to select the technique and correctly interpret the data.
Finally, all the data are analyzed by regions, given the administrative division
of Spain in Comunidades Autonomas (CC.AA.) —Andalucıa, Aragon, Asturias,
Baleares, Canarias, Cantabria, Castilla Leon, Castilla La Mancha, Catalunya,
Valencia, Extremadura, Galicia, Madrid, Murcia, Navarra, Paıs Vasco and La
Rioja—, in order to take into account the particular regional specialization and
economic level of each CC.AA.
2.2 Methodology
The methodology applied to analyze the data is the Correspondence Analysis.
This exploratory technique permits to reveal features in the data, without impos-
5

ing any hypothesis a priori. Also, is a technique very flexible allowing to analyze
almost any kind of cross-tabulation. The aim of this technique is visualize in a
low dimensional space (i.e. in Rn with n ≤ 3) a set of data that belongs to a high
dimensional space. Benzecri (1973) popularized in France this visualization tech-
nique using the algebraic formulation proposed by Hirschfeld (1935). However,
this approach was almost unknown for English-speaking researchers until 1980,
when the publication of several books, in special Greenacre (1984), Greenacre
(1993) and Greenacre & Blasius (1994) with application to marketing research,
rised the interest of researchers of others disciplines and countries in the use of
these techniques. This study uses the approach proposed by Greenacre. .
The Correspondence Analysis (CA), uses a single cross-tabulation as input
data and explore the importance of the association between rows and columns
analyzing the χ2 statistic for independence test. The “χ2 distance” between
individual entries and the center of the cloud is analyzed in order to establish
which of the entries explains better the association between data and in which
direction this association is. Thus, the CA approach can be used to investigate
the substantive nature of the association between row and column categories of
the contingence table. By other hand, the CA is a useful technique to visualize
the data in a low dimensional space and consequently, we can easily interpret the
relationship between rows and columns.
The CA is a fairly popular technique. Thus, only the main definitions will be
given in order to make the results clear for readers. The proofs and extensions
are in (Greenacre 1984) and (Greenacre & Blasius 1994).
Let a table be an I × J matrix of absolute frequencies nij, i = 1, . . . , I and
j = 1, . . . , J . Let define the marginal frequencies as total row ni. and total column
6

n.j, and n.. as the grand total.
Definition 2.1 Profile. A row profile is the vector of absolute frequencies of
a row i divided by their total row, prij = nij/ni.; a column profile is the vector
of absolute frequencies of a column j divided by their total column, pcij = nij/n.j
Definition 2.2 Mass is the marginal frequency ni. or n.j relative to n.. The row
mass is ri = ni./n.. and the column mass, cj = n.j/n...
Definition 2.3 Inertia is the χ2 statistic defined in a proper manner divided
by the grand total, i.e.
Inercia =χ2
n..=
∑
i
∑
j
(nij − n..cjri)2
n2..cjri
Thus, the objective of the CA is find the best projection of the cloud in a
few axes, where the criterion to decide the best representation is the minimum
distance between profiles and one axis. Given that the profile matrix (row or
column) is in the dimension K = min {I − 1, J − 1} then, there are K possible
axis then, each axis must be extracted taking into account that the former axis
(axes) found is (are) the best. Let define A = [aij] = D−1/2r (Y − rcT )D−1/2
c given
Dr and Dc, diagonal matrices of row masses and column masses; Y, the frequency
matrix; rT = [r1, . . . , rI ] and cT = [c1 . . . , cJ ], the vectors of masses. The next
theorem guarantees the existence of a solution.
Theorem 2.1 Singular Value Decomposition A = UΛV solves the prob-
lem of minimize the distance between a point and their projection over a low
dimensional plane. Furthermore, the properties of the solution are
7

1. The matrix Λ is diagonal and the elements λ1 ≥, . . . ,≥ λK. These numbers
are called the singular values. The sum of these λ2i for all i = 1, . . . , K is
the total inertia.
2. The matrix U and V are orthonormal, i.e. UT U = I and V T V = I.
The theorem 2.1 guarantees that exists a function which maps each original
point from its original coordinate system to a new coordinate system. There are
two symmetrical possible solutions (each point belongs to RI or to RJ). Thus,
rows can be seen as individuals explained by the column categories or columns can
be seen as individuals explained by the row categories. Then, the best representa-
tion of each point (individuals) are called principal axes and the inertia accounted
by a principal axis is called principal inertia. Furthermore, each original category
can be plotted in the new coordinate system. The coordinate position of vertices
with respect to the principal axes are called standard coordinates.
Theorem 2.2 Given the solution 2.1, denoting V = [vij] and U = [uij], for
k = 1, . . . , K then, the Standard Coordinates are given by φik = uik/√
ri and
γjk = vjk/√cj. and the Principal Coordinates are given by fik = λkφik/
√ri
and gjk = λkγjk/√cj.
Given A = [aij] the total inertia of the contingence table is∑
i
∑
j a2ij =
∑
k λ2k. Then, each λ2
k quantify the inertia explained by each axis. Also, the total
inertia can be decomposed in the inertia of rows and columns, i.e. in the partial
sums∑
j a2ij (for the ith row) and
∑
i a2ij (for the jth column). The relation
between both magnitude measures the quality of displays and decompose the
information contained in the solution.
8

Definition 2.4 The Square Correlations, r2 of the rows with the principal
axes are the inertia components expressed relative to the row inertia. Then, the
Contribution of the kth principal axis to the ith row is rif 2ik/
∑
j a2ij and to the
jth column is cig2jk/
∑
i a2ij. These quantities are interpreted as the square cosine
of the angles between each profile and each principal axis.
Also, square correlations are a measure of the Quality of the display of a
row (column) since quantify the contribution of the k first axes to the inertia of
the row (column).
Definition 2.5 The Contribution to the inertia is given by the contribution
of the ith row to the principal inertia of the kth axis rif2ik/λ
2k or by the contribution
of the jth column to the principal inertial of the kth axis cjg2jk/λ
2k. These contri-
bution measure in what extent the geometric orientation of an axis is determined
by a single variable categories.
Theorem (2.1) guarantee the symmetry of the analysis between rows and
columns. Then, the interpretation of results can be made by means of contribu-
tions to the total inertia and inertia of each axis and by means of correlation of
each point with axes. Thus, given the biggest contributions of columns (rows) to
inertia of one axis, this can be labeled. Then, each row (column) point can be
represented in the plane —assuming an R2 representation—, such that its qual-
ity measures if it is well represented, given the best represented rows (columns).
Finally, square correlations of the best represented row (column) points are used
to determine which coordinates are significant and characterize these points.
9

3 Results
3.1 χ2 test
Before analyzing the χ2 statistic we must explain the number of total individuals
included in each analysis. From all tables we excluded the categories with more
than 25% of entries with zero individuals, in order to avoid non desired effects.
Then the categories Border Permits (F) and Extraordinary Permits are excluded
from the data set. Furthermore, the categories Ceuta and Melilla, are excluded,
since both Comunidades are in Africa and the pressure of immigration is quite
difficult to evaluate. Also, the education level E have been excluded, since CA
solution is completely conditioned by this category, despite their relative non
importance.
Table 1: Inertia and χ2 statisticVariable n.. K χ2 Inertia V CramerEducation 99,059 3 5,999 0.06 0.15Legal Status 197,265 8 20,985 0.11 0.12Job 195,141 15 102,797 0.53 0.19
Table 1 show the number of individuals analyzed and the χ2 statistic, which
clearly rejects the null hypothesis of homogeneity between rows and columns.
Nevertheless, in the last column the Cramer’s V defined as V =√
χ2/nK ∈ [0, 1]
provide crude measure for the variation in the data. The values between 0.1 and
0.3 for the three tables shows a not very high variability. Consequently, the most
part of points will be represented in the middle of both axis. Nevertheless, these
values are sufficiently high as to consider that there is more than purely random
effect.
10

Tab
le2:
Res
ults
for
Edu
cati
onLev
elC
ateg
ory
Id.
Qua
lM
ass
Iner
tA
xis
1(5
9%)
Axi
s2
(33%
)C
oord
√r2
Con
trC
oord
√r2
Con
trC
C.A
A.
And
aluc
iaA
nd0.
336
0.12
30.
046
-0.0
870.
580
0.02
6-0
.002
0.00
00.
000
Ara
gon
Ara
0.87
40.
006
0.00
4-0
.165
0.85
70.
005
-0.0
720.
374
0.00
2A
stur
ias
Ast
0.83
40.
009
0.02
40.
293
0.74
80.
023
-0.2
060.
524
0.02
0B
alea
rsB
al0.
997
0.03
50.
077
0.32
00.
883
0.10
20.
169
0.46
60.
050
Can
aria
sC
an0.
961
0.10
70.
062
0.15
90.
844
0.07
50.
094
0.49
90.
047
Can
tabr
iaC
tb0.
849
0.00
30.
001
0.15
90.
908
0.00
20.
027
0.15
50.
000
Cas
tilla
-Leo
nC
asL
0.89
10.
019
0.00
1-0
.057
0.89
70.
002
-0.0
190.
295
0.00
0C
asti
lla-M
anch
aC
asM
0.94
40.
013
0.01
3-0
.160
0.64
90.
010
-0.1
780.
723
0.02
1C
atal
unya
Cat
0.93
50.
134
0.10
0-0
.008
0.03
20.
000
-0.2
060.
966
0.28
3V
alen
cia
Val
1.00
00.
182
0.19
6-0
.149
0.58
40.
114
0.20
80.
812
0.39
0E
xtre
mad
ura
Ext
0.99
90.
014
0.12
0-0
.672
0.95
00.
184
-0.2
190.
310
0.03
5G
alic
iaG
al0.
319
0.02
40.
010
0.03
40.
212
0.00
1-0
.084
0.52
30.
009
Mad
rid
Mad
0.94
80.
253
0.06
00.
105
0.88
00.
079
-0.0
500.
418
0.03
2M
urci
aM
ur0.
906
0.03
20.
173
-0.5
430.
948
0.26
3-0
.050
0.08
90.
004
Nav
arra
Nav
0.98
40.
005
0.00
2-0
.106
0.66
40.
002
0.11
70.
737
0.00
4Pai
sV
asco
Eus
0.92
40.
030
0.04
50.
229
0.75
60.
044
-0.1
800.
594
0.04
8La
Rio
jaR
ij0.
947
0.01
00.
064
0.50
10.
808
0.07
00.
337
0.54
20.
057
Edu
cati
onLev
elIllit
erat
eA
0.53
60.
116
0.11
8-0
.044
0.17
60.
006
-0.1
760.
711
0.18
0Fir
stB
asic
Stag
eB
0.97
0.36
80.
311
-0.2
220.
983
0.50
9-0
.014
0.06
30.
004
Seco
ndB
asic
Stag
eC
0.98
50.
254
0.25
20.
095
0.39
00.
065
0.22
30.
913
0.63
2Se
cond
ary
and
Mor
eD
0.96
70.
261
0.32
00.
240
0.88
00.
420
-0.1
190.
438
0.18
5Sourc
e:Vari
aci
ones
Pobla
cionale
s.In
stit
uto
Naci
onalde
Est
adıs
tica
(IN
E1999)
11

Tab
le3:
Res
ults
for
Jobs
Pos
itio
nC
ateg
ory
Id.
Qua
lM
ass
Iner
tA
xis
1(6
4%)
Axi
s2
(14%
)C
oord
√r2
Con
trC
oord
√r2
Con
trC
C.A
A.
And
aluc
iaA
nd0.
935
0.12
30.
132
0.71
20.
947
0.18
60.
146
0.03
80.
036
Ara
gon
Ara
0.37
00.
034
0.02
40.
260
0.42
90.
007
-0.2
610.
186
0.03
2A
stur
ias
Ast
0.02
30.
011
0.21
4-0
.354
0.11
00.
004
0.33
70.
011
0.01
7B
alea
rsB
al0.
126
0.02
60.
018
-0.1
990.
327
0.00
30.
083
0.01
90.
002
Can
aria
sC
an0.
857
0.04
40.
116
-0.4
110.
351
0.02
21.
004
0.73
40.
617
Can
tabr
iaC
tb0.
365
0.00
50.
007
-0.3
550.
400
0.00
20.
401
0.20
40.
011
Cas
tilla
-Leo
nC
asL
0.53
00.
026
0.00
90.
270
0.65
30.
006
-0.1
330.
104
0.00
6C
asti
lla-M
anch
aC
asM
0.08
80.
020
0.00
7-0
.088
0.20
70.
000
0.09
10.
045
0.00
2C
atal
unya
Cat
0.58
20.
276
0.06
9-0
.207
0.57
00.
035
-0.1
840.
257
0.12
9V
alen
cia
Val
0.33
80.
061
0.01
60.
091
0.24
90.
002
0.19
20.
275
0.03
1E
xtre
mad
ura
Ext
0.96
70.
020
0.06
61.
288
0.98
20.
100
0.05
00.
001
0.00
1G
alic
iaG
al0.
243
0.01
50.
047
-0.2
150.
164
0.00
20.
605
0.21
50.
074
Mad
rid
Mad
0.74
10.
248
0.20
1-0
.558
0.85
40.
231
-0.0
690.
011
0.01
7M
urci
aM
ur0.
969
0.06
40.
260
1.43
90.
982
0.39
4-0
.091
0.00
40.
007
Nav
arra
Nav
0.44
60.
017
0.00
50.
067
0.16
70.
000
-0.2
580.
417
0.01
6Pai
sV
asco
Eus
0.36
30.
014
0.01
4-0
.386
0.53
80.
006
0.19
50.
074
0.00
7La
Rio
jaR
ij0.
374
0.00
70.
010
0.42
50.
486
0.00
4-0
.326
0.13
90.
010
Job
Pos
itio
nM
anag
eria
lM
an0.
855
0.04
70.
034
-0.1
720.
281
0.00
40.
540
0.77
60.
189
Scie
ntis
tsSc
i0.
487
0.02
50.
013
-0.2
930.
550
0.00
60.
229
0.18
40.
018
Tec
hnic
ians
Tec
0.62
20.
023
0.01
5-0
.177
0.30
00.
002
0.43
00.
532
0.05
9A
dmin
istr
ativ
eA
dm.
0.87
20.
017
0.00
8-0
.294
0.59
70.
004
0.35
50.
517
0.02
9Se
rvic
esSe
rv0.
900
0.10
60.
036
-0.3
360.
796
0.03
60.
218
0.26
70.
070
Cle
rica
lC
le0.
777
0.02
50.
052
-0.2
940.
279
0.00
60.
878
0.69
80.
263
Skill
edA
gric
ultu
reSk
.Ag
0.18
50.
006
0.00
80.
238
0.29
50.
001
0.25
40.
098
0.00
5Sk
illed
Con
stru
ctio
nSk
.Con
0.63
30.
028
0.01
3-0
.385
0.79
00.
012
-0.0
460.
009
0.00
1Sk
illed
Indu
stry
Sk.Ind
0.07
40.
012
0.00
9-0
.166
0.27
00.
001
-0.0
070.
000
0.00
0Sk
illed
Tex
tile
Sk.T
x0.
221
0.02
20.
020
-0.1
350.
195
0.00
1-0
.294
0.18
30.
026
Stat
iona
ryen
gine
oper
ator
sO
p.M
a0.
516
0.01
20.
004
-0.2
800.
704
0.00
30.
055
0.01
90.
001
Mai
dsH
ouse
0.72
40.
277
0.14
5-0
.421
0.80
10.
146
-0.1
500.
082
0.08
6Se
llers
Sell
0.12
60.
043
0.05
40.
168
0.20
50.
004
0.23
70.
084
0.03
3U
nski
lled
Agr
icul
ture
Uk.
Agr
0.99
20.
212
0.47
81.
085
0.99
50.
744
-0.0
360.
001
0.00
4U
nski
lled
Con
stru
ctio
nU
k.C
on0.
541
0.06
10.
039
-0.3
270.
563
0.01
9-0
.275
0.22
40.
063
Uns
kille
dIn
dust
ryU
k.In
d0.
359
0.04
40.
034
-0.1
570.
247
0.00
3-0
.348
0.29
90.
074
Uns
kille
dTex
tile
NoC
la.
0.36
20.
040
0.04
0-0
.224
0.31
00.
006
-0.3
730.
266
0.07
8Sourc
e:Per
mis
os
de
Tra
bajo
por
Ocu
paci
on,(M
TA
S1999a
)
12
Tab
le4:
Res
ults
for
Wor
kPer
mit
sC
ateg
ory
Id.
Qua
lM
ass
Iner
tA
xis
1(4
2%)
Axi
s2
(35%
)C
oord
√r2
Con
trC
oord
√r2
Con
trC
C.A
A.
And
aluc
iaA
nd0.
577
0.12
20.
031
-0.0
440.
265
0.00
5-0
.117
0.71
20.
044
Ara
gon
Ara
0.03
0.03
40.
003
-0.0
140.
138
0.00
00.
011
0.11
00.
000
Ast
uria
sA
st0.
450.
011
0.00
80.
099
0.34
80.
002
-0.1
630.
574
0.00
8B
alea
rsB
al0.
098
0.02
60.
131
0.04
80.
063
0.00
1-0
.225
0.30
50.
035
Can
aria
sC
an0.
703
0.04
40.
069
-0.1
660.
407
0.02
7-0
.300
0.73
30.
105
Can
tabr
iaC
tb0.
783
0.00
50.
018
-0.0
030.
000
0.00
0-0
.560
0.88
50.
041
Cas
tilla
-Man
cha
Cas
L0.
262
0.02
60.
004
0.06
00.
472
0.00
2-0
.025
0.19
70.
000
Cas
tilla
-Leo
nC
asM
0.66
20.
020
0.02
10.
052
0.15
50.
001
-0.2
720.
799
0.03
8C
atal
unya
Cat
0.99
30.
273
0.23
5-0
.260
0.86
00.
411
0.15
20.
504
0.16
8V
alen
cia
Val
0.90
60.
061
0.07
4-0
.007
0.00
00.
000
-0.3
430.
952
0.18
9E
xtre
mad
ura
Ext
0.01
60.
020
0.00
60.
012
0.07
10.
000
0.01
80.
105
0.00
0G
alic
iaG
al0.
851
0.01
50.
094
-0.0
780.
095
0.00
2-0
.760
0.91
80.
223
Mad
rid
Mad
0.98
80.
245
0.24
40.
309
0.95
00.
521
0.09
50.
293
0.05
9M
urci
aM
ur0.
790.
063
0.03
50.
084
0.34
80.
010
0.19
70.
818
0.06
5N
avar
raN
av0.
444
0.01
70.
013
0.13
00.
445
0.00
6-0
.144
0.49
50.
009
Pai
sV
asco
Eus
0.52
70.
014
0.00
6-0
.093
0.43
40.
003
-0.1
250.
582
0.00
6La
Rio
jaR
ij0.
738
0.00
60.
009
-0.2
300.
610
0.00
80.
228
0.60
50.
009
Wor
kPer
mit
Seas
onal
less
1ye
arA
0.05
50.
004
0.12
9-0
.270
0.13
80.
006
-0.3
710.
190
0.01
3E
mpl
oyee
1ye
arb
0.97
40.
236
0.24
80.
328
0.98
00.
565
-0.0
390.
118
0.01
0E
mpl
oyee
2ye
arB
0.50
70.
204
0.06
2-0
.124
0.68
80.
070
-0.0
330.
187
0.00
6E
mpl
oyee
3ye
arC
0.75
90.
316
0.06
90.
024
0.16
10.
004
0.13
00.
856
0.14
2E
mpl
oyee
Per
man
ent
Per_C
A0.
919
0.15
00.
171
-0.2
870.
825
0.27
50.
170
0.48
80.
115
Self
empl
oyed
1ye
ard
0.76
60.
006
0.01
9-0
.187
0.31
50.
004
-0.4
860.
817
0.03
5Se
lfem
ploy
ed2
year
D0.
873
0.01
10.
050
-0.1
090.
155
0.00
3-0
.643
0.92
10.
121
Self
empl
oyed
3ye
arE
0.91
60.
043
0.14
2-0
.090
0.15
20.
008
-0.5
620.
945
0.35
9Se
lfem
ploy
edPer
man
ent
Per_C
P0.
887
0.03
10.
111
-0.3
050.
499
0.06
5-0
.489
0.79
90.
200
Sourc
e:C
lase
sde
Per
mis
os
de
Tra
bajo
Conce
did
os.
(MTA
S1999b
)
13

3.2 Education Level
Table (2) shows that the contribution to the first axis formation of the categories
B and D are 51% and 42%, respectively; then the first axis opposes immigrants
with basic education (negative score) to immigrants with high education (pos-
itive score). The 63% of the second axis formation is due to the category C,
opposing the secondary education (positive scores) to the rest of the categories
(negative scores). The Figure (1) illustrates the results. The 92% of total inertia
is accounted by the first two axis, 59% by the first and 33% by the second. Then,
both axis should be considered in the analysis. The quality of the representation
of the most part of CC.AA. is greater than 85%, excepting by Andalusia (33%)
and Galicia (32%), which will nor be analyzed.
Table (2) shows that Cantabria, Murcia, Extremadura, Castilla la Mancha
and Aragon correlate highly with the first axis; Catalunya with the second axis;
and Baleares, Canarias, La Rioja, Valencia, Navarra , Asturias, Madrid, Paıs
Vasco, Valencia and Navarra correlate highly with both axes.
Given this information, the figure (1) can be systematically interpreted. Mur-
cia, Extremadura, Castilla Leon and Aragon correlates only with first axis, and
these are on the left of figure (1), then these communities are characterized by
immigrants with basic education level; Cantabria, on the right of figure (1) corre-
lates only with first axis also, therefore Cantabria is characterized by immigrants
with high education. Catalunya correlates only with second axis, and their neg-
ative score shows that the education level of immigrants of this community is
indeterminate; similarly, Castilla Leon on the bottom left is indeterminate. The
remaining communities correlates with both axis: Baleares, Canarias and La Ri-
oja shows positive scores in both coordinates; then these communities seem have
14

immigrants with medium-high education level; Valencia and Navarra are on the
top left side of figure (1), immigrants possess basic or medium studies; Asturias,
Madrid and the Basque Country, on the left bottom seems to be characterized
by immigrants highly educated.
�����
�����
���
���
��� �����
����� ���
�����
�����
������ ���
!"��#
�$���
%'& (
)+*-,/.
)+*-,10
)+*-,32
*-,/*
*-,32
*-,10
*-,/.
*-, 4
)+*-,/5 )+*-,16 )+*-, 4 )+*-,10 *-,/* *-,10 *-, 4 *-,16
Basic
Medium
High
Figure 1: Education Level
3.3 Job Position
Table 3 shows the results for the job position declared by immigrants. The
contribution to the first axis formation of the categories Maids and Unskilled
Agriculture are 15% and 74%, respectively; then the first axis opposes maids and
related housekeeping services immigrants workers (negative score) to Unskilled
Agriculture immigrants workers (positive score). The second axis formation is
due to a two surprising categories: 19% of the second axis formation is due to
the category Managerial immigrant workers (positive scores) opposing Clerical
15

�����
�����
���
� ���
� ���
� ��
� �����
� �����
� ��
�����
����
� ���
� ��� �"!��
#$��%
�&!��
')( *
+-,�.0/
+-,�.01
,�.01
,�.0/
2 .3,
+-,�.34 ,5.3, ,�.34 2 .0/
,�.0/6,�,����7�%�8
Maids Uk.Agr.
Managers
Clerical
Figure 2: Job Position
and related immigrant workers, contributing 26% to axis formation (negative
scores). The 78% of total inertia is accounted by the first two axis, 64% by
the first and 14% by the second. The quality of the representation of the most
part of CC.AA. is smaller than 60%. Only Andalusia (94%), Canarias (86%),
Extremadura (97%), Madrid (74%) and Murcia (97%) overcome this lower bound.
However, the mass of these communities sums up to 50% indicating that only
Catalunya (58%) and Valencia with high masses are not to much well represented.
Figure (2) represents the quality of representation of each CC.AA. by colors. In
light gray, appear the points whose quality is smaller than 60% and in dark gray,
points whose quality is greater than 60%.
Andalusia (0.95), Extremadura (0.98), Castilla la Mancha (0.65) and Murcia
(0.98) on the right of Figure (2) correlates highly with first axis, —correlations are
displayed in parenthesis—, indicating that these communities are characterized
16

by unskilled agriculture workers; Madrid (0.85), on the left, is characterized by
maids and related housekeeping services immigrants workers. Canarias (0.86),
on the top of second axis, is the unique community with high correlation with
this axis, indicating that is characterized by managerial and related workers.
Catalunya, on the left bottom, correlates weakly with both axis (0.57 and 0.51)
and is characterized by maids and clerical immigrant workers.
3.4 Work Permits
Table 4 shows the results for the work permits or legal status of workers im-
migrants. The contribution of the categories Employee less than one year and
Employee Permanent to the first axis formation are 57% and 28%, respectively;
then the first axis opposes immigrants employees with very short term work
permits (positive score) to immigrants employees with long term work permits
(negative score). The second axis formation is due employee with long term work
permits (26%) on the top (positive scores), and long term self employed immi-
grant workers (68%) on the bottom (negative scores). The 77% of total inertia
is accounted by the first two axis, 42% by the first and 35% by the second.
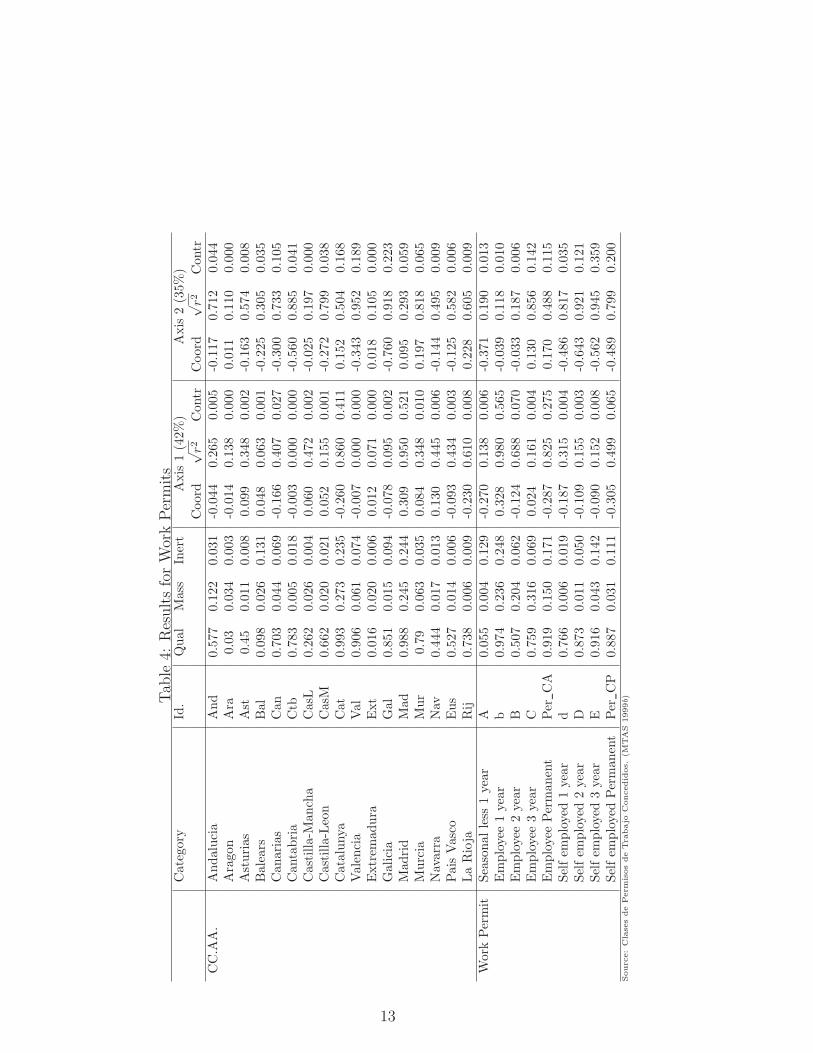
Figure (3) represents the quality of representation of each CC.AA. by colors.
In light gray, appear the points whose quality is low and in dark gray, the points
whose quality high (dark gray). In the left bottom, the legend shows the border
limits of each color measured in quality of displays: the best represented commu-
nities —in dark gray— are Canarias, Cantabria, Catalunya, Valencia, Galicia,
Madrid, Murcia and La Rioja, with more than 70% of total point inertia ex-
plained by the first 2 axes, or plane; between 70-35% of the inertia of Andalusia,
Asturias, Castilla Leon, Navarra and Paıs Vasco is accounted by the plane —
17
�����
�����
���
� � �
� ��
� �����
� �����
� ��
�����
����
� ���
�����
� ���
!"��#�$���
%'& (
)+*�,.-
)+*�,./
)+*�,.0
)+*�,.1
)+*�,32
*�,32
*�,.1
)+*�,.1 )+*�,54 )+*�,32 *�,.* *�,32 *�,54 *�,.1 *�, 6
0.350 0.700 above
Employee Permanent
Self Permanent
Employee 1 year
Employee Permanent
Figure 3: Legal Status
in gray—; Aragon, Castilla la Mancha and Extremadura —in light gray—, are
the communities worst explained, since the plane explain less than 35% of point
inertia.
Table (4) shows that Catalunya (0.86) and Madrid (0.95) correlate highly with
the first axis only; Andalusia (0.72), Canarias (0.74), Cantabria (0.88), Castilla
la Mancha (0.80), Valencia (0.95), Galicia (0.92) and Murcia (0.82) with the
second axis only; La Rioja (0.61 and 0.61) correlates with both axes. Given
this information, the figure (3) is systematically interpreted: Madrid, on the
right of figure (3) is opposes to Catalunya on the left, indicating that Madrid
is characterized by immigrants employees with very short term work permits
and Catalunya, by employees with long run work permits. From top to bottom,
Murcia in the top is characterized by immigrants employees with long term work
permits opposed to Andalusia, Canarias, Cantabria, Castilla la Mancha, Valencia
18

and Galicia on the bottom, indicating that these communities are characterized
by self employed immigrants with very long term immigrants.
3.5 General Overview
Table 5 shows one global appreciation of the results. The first column shows
the number of immigrants with work permission for each 1000 inhabitants. No
Community attain to 20 immigrant workers for each 1000 inhabitants. Therefore,
one can affirm that Spain in 1999 was not an immigration country, at least for the
legal migration. The other columns present a result enough disappointing, only
four rows, corresponding to Catalunya, Madrid, Canarias and Murcia, are full.
The other rows or communities do not present any characteristic that identifies
them. For these three communities we reach the conclusion that: Catalunya, is
characterized by maids and clerical immigrants with a very stable legal status;
Madrid, traditionally consecrated to the sector services, it represents 25% of
the total of immigrant residents in Spain, it is characterized by very educated
immigrants that work in non skilled jobs (maids and housekeeping) and with short
term permits; Canarias, is characterized by educated immigrants self-employed
occupying managerial jobs, a surprising result; and Murcia, is characterized by
immigrants with basic studies devoted to non skilled agrarian activities with work
permits of long duration.
Table Summary
Observing the last column, we verify that, except for some cases, most of
the communities are correlated with the category self-employed, although this
category only represents 9% of the total immigrants–see mass column in table
3—. Are exceptions Madrid and Catalunya. In the case of Catalunya, devoted
19

Table 5: SummaryCommunity (1) Education Level Job Position Legal StatusAndalusia 3.36% — Unskilled Agriculture Self-employed LongAragon 5.70% Basic — —Asturias 2.00% High — —Baleares 6.90% Medium-High — —Canarias 5.48% Medium-High Managers Self-employed LongCantabria 1.82% High — Self-employed LongCastilla M 2.05% Basic Unskilled Agriculture —Castilla L 2.27% Basic — Self-employed LongCatalunya 8.87% Indeterminate Maids and Clerical Employee LongValencia 3.04% Basic-Medium — Self-employed LongExtremadura 3.65% Basic Unskilled Agriculture —Galicia 1.05% — — Self-employed LongMadrid 9.64% High Maids Employee ShortMurcia 11.42% Basic Unskilled Agriculture Employees LongNavarra 6.32% Basic-Medium — Empl. Short, Self. LongPaıs Vasco 1.33% High — Empl. and Self. LongLa Rioja 4.75% High-Medium — Employee Long
(1) Immigrant workers per 1000 inhabitants
traditionally to the trade and textile industry, represents 28% of the total ap-
plications of work permits, and is not characterized by any specific educational
level or position of the work, but is characterized by immigrants employees with
permanent work permits.
4 conclusion
Consequently, the international immigration in Spain, have a non clearly identi-
fiable pattern. On one hand, in general, despite 12% of immigrants are illiterate,
this category is not clearly significant in any community. For other, categories
that are not traditional immigrant occupations turn out to characterize the com-
munities, like in the case of managers in Canarias or self-employees in other cases.
This result is very difficult of valuing without entering in polemic or in difficultly
contrastable statements.
20

Generally speaking, Murcia — with low qualified immigrants that work in
unskilled jobs but with permits of long duration—, could facilitates that the im-
migrant qualify by themselves attending a school. However, Madrid seems to
implement an inadequate politics from the point of view of the development,
since it is characterized by educated immigrants working in unskilled jobs with
short duration permits, which could impede immigrants qualify themselves by
attending a school or realizing a skilled job in host country. Finally, Catalunya
could improve development policies to get better educational level of its immi-
grants, but this study indicates that an educational level that prevails does not
exist.
References
Benzecri, J. (1973), L’analyse des donnees. L’analyse de Correspondence, Dunce,
Paris.
Escofier, B. & Pages, J. (1988), Analyses factorielles simples et multiples, Dunce,
Paris.
EU (1996a), ‘Council Recommendation of 27 september 1996 on combating
the illegal employment of third-country nationals’, Official Journal C in
14/10/1996(304), 0001–0002.
EU (1996b), ‘Council Recommendetion of 30 November 1994 concerning a spec-
imen bilateral readmission agreement between a Member State and a third
country’, Official Journal C in 19/09/1996(274), 0020–0024.
21

EU (1996c), ‘Council Recommendetion of 30 November 1994 concerning of thr
adoption of a standard travel document for the expulsion of third country
nationals’, Official Journal C in 19/09/1996(274), 0018–0019.
EU (1996d), ‘Council Recommendetion of 30 November 1994 relating to the lim-
itations on the admition of third-country national to the territory of the
Member States for purpose of pursuing activities as self-employed persons’,
Official Journal C in 19/09/1996(274), 0007–0009.
EU (1996e), ‘Council Resolution of 20 June 1994 on limitation on admission of
third-country nationals to the territory of Member States for employment’,
Diario Oficial C in 19/09/1996(274), 0003–0006.
EU (1996f), ‘Council Resolution of 30 November 1994 on the admission of third-
country nationals to the territory of Member States for study purposes’,
Official Journal C in 19/09/1996(274), 0010–0012.
EU (1997), ‘Council resolution of 4 december 1997 on measures to be adopted
on the combating of marriages of convenience’, Official Journal C in
16/12/1997(382), 0001–0002.
EU (2000), ‘Acervo de schengen – decision del comite ejecutivo de 25 de abril de
1997 sobre la adjudicacion del estudio preliminar del sids ii [sch/com-ex(97)
2, 2a rev.]’, Diario Oficial de 22/09/2000 L(239), 029–029.
Greenacre, M. (1984), Theory and Applications of Correspondence Analysis, Aca-
demic Press Limited, London, chapter Chapter 2 and Appendix A.
Greenacre, M. (1993), Correspondence Analysis in Practice, Academic Press Lim-
ited, San Diego, CA.
22

Greenacre, M. & Blasius, J. (1994), Correspondence Analysis in Practice, Aca-
demic Press Limited, San Diego, CA.
Hirschfeld, H. (1935), ‘A connection between correlation and contingency’, Pro-
ceedings of the Cambridge Philosophical Society 31, 520–524.
INE (1999), ‘Inmigraciones de Extranjeros procedentes del extranjero clasificadas
por Provincia de destino (agrupadas por CC.AA) y titulacion academica.
Estadıstica de Variaciones Residenciales’, Instituto Nacional de Estadısitica
in www.ine.es.
L. Lebart, A. M. & Tabard, N. (1977), Techniques de las description statistique,
Dunce, Paris.
MTAS (1999a), ‘Estadıstica de Permisos de Trabajo a Extranjeros. Permisos de
Trabajo por Clase de Permiso y CC.AA.’, Ministerio de Trabajo y Asuntos
Sociales in www.mtas.es.
MTAS (1999b), ‘Estadıstica de Permisos de Trabajo a Extranjeros. Permisos de
Trabajo por Ocupacion y CC.AA.’, Ministerio de Trabajo y Asuntos Sociales
in www.mtas.es.
Rasmussen, H. K. (1996), No Entry: Immigration Policy in Europe, D, Han-
delshøjskolens Forlag, Copenhagen Business School Press, Copenhagen.
Stanton-Rusell, S. (2001), International Migration: Implication for the World
Bank, Working Paper 54, World Bank, HCO.
UN (1999), Fifty-second session item 99 (d) of the provisional agenda * sus-
tainable development and international economic cooperation international
23

migration and development, including the convening of a united nations con-
ference on international migration and development report of the secretary-
general, Report, United Nation.
UNFPA (1998), Technical simposium on international migration and develop-
ment, Technical meetings, United Nation Population Found.
24