
Optically induced transport through semiconductor-based molecular electronics
Theory of plasmon-enhanced Förster energy transfer in optically-excited semiconductor and metal nanoparticles
1 Alexander O. Govorov *, Jaebeom Lee , and Nicholas A. Kotov 1 2,3 2
1
Department of Physics and Astronomy, Ohio University, Athens, OH, 45701 2Department of Chemical Engineering, Biomedical Engineering, and Material Sciences and Engineering University of Michigan, Ann Arbor, MI, 4810 3Pusan National University, Busan 609-735, Korea
ABSTRACT
We describe the process of Förster transfer between semiconductor nanoparticles in the
presence of a metal subsystem (metal nanocrystals). In the presence of metal
nanocrystals, the Förster process can become faster and more long-range. The
enhancement of Förster transfer occurs due to the effect of plasmon-assisted
amplification of electric fields inside the nanoscale assembly. Simultaneously, metal
nanocrystals lead to an increase of energy losses during the Förster transfer process. We
derive convenient equations for the energy transfer rates, photoluminescence intensities,
and energy dissipation rates in the please of plasmon resonances. Because of strong
dissipation due to the metal, an experimental observation of plasmon-enhanced Förster
transfer requires special conditions. As possible experimental methods, we consider cw-
and time-resolved photoluminescence studies and describe the conditions to observe
plasmon-enhanced transfer. In particular, we show that the photoluminescence spectra
should be carefully analyzed since the plasmon-enhanced Förster effect can appear
together with strong exciton energy dissipation. Our results can be applied to a variety of
experimental nanoscale systems.
1 *Corresponding Author: [email protected]
1

Keywords: nanoparticles, energy transfer, excitons, plasmons, optical properties PACS: 78.67.Hc, 78.67.Bf
Introduction
In many experiments, colloidal nanoparticles (NPs) strongly confine carriers and do not
permit efficient tunnel coupling. However, instead of direct tunnel coupling, the colloidal
NPs permit Förster transfer (FT) of optically-generated excitons.1 The FT mechanism
comes from the inter-NP Coulomb interaction and does not require the tunnel coupling
between semiconductor nanoparticles (SNPs). The FT process can also be viewed as
exciton energy flow a donor to accepter nanocrystal/molecule. Fig. 1a illustrates a
process of exciton transfer from a donor SNP1 to acceptor SNP2. Both SNPs can emit
photons and FT can be observed experimentally as enhanced emission from SNP2.2,3,4
Another type of structures studied in recent experiments consists of SNPs and metal
nanocrystals. In these structures, individual NPs can also interact via the Coulomb forces.
However, the character of interaction can be different due to large electric dipole
moments and plasmon resonances in metal nanoparticles (MNPs). The interaction
between excitons in SNPs and surface plasmons in MNPs can result in enhanced exciton
emission due to the so-called plasmon-induced field enhancement effect.5,6,7,8 Such
plasmon-enhanced exciton emission can appear due to amplification of both absorption
and emission processes.8 Simultaneously, in the metal-semiconductor structures, the
exciton energy can be transferred from SNPs to MNPs and then converted into heat.
SNP-MNP energy transfer becomes especially strong in the exciton-plasmon resonance
and can be observed as shortening of the exciton lifetime.5,8,9 The FT process can also be
2
combined with the plasmon resonances in the structures incorporating a emitter (dye or
SNP) and MNPs. For the case of dye molecules and silver MNPs, such plasmon-assisted
FT process was studied experimentally in ref.10 and theoretically in ref.11.
Here we study theoretically the FT process between SNPs in the presence of
metal nanocrystals. Our calculations show an effect of long-range FT assisted by
plasmons. Simultaneously, the exciton lifetime can become shorter due to energy transfer
to the metal component. This leads to energy losses and can strongly reduce the
efficiency of FT process. Our formalism is based on the rate equations and fluctuation-
dissipation theorem. Previously, plasmon-assisted FT was studies for dye molecules and
silver NPs.10,11 Here we describe the plasmon-assisted FT process for the case of SNPs.
From the point of view of physics, SNPs and dye molecules have important differences:
1) A SNP has three optically active excitons which take part in the FT process; it also has
several dark excitons. At the same time, a dye molecule can be well approximated as a
single optically-active dipole. 2) Because of fast spin-flips at room temperature, dark and
bright excitons in a SNP become almost equally populated. The resultant FTR rate should
incorporate the exciton populations in a SNP. For the case of a dye molecule, such
exciton dynamics is not involved. 3) SNPs have a large background dielectric constant
(about 5-10). This background dielectric constant strongly affects the process. From the
mathematical side, dye molecules and SNPs should also be treated differently. In ref.11,
dye molecule was treated as a point-like dipole in the vicinity of metal particle. For this
case, the FT rate can be written analytically as an infinite sum. A SNP is not a point-like
dipole since it size can be comparable with the inter-nanocrystal distances in the
complex. In addition, SNP has a large background dielectric constant and, therefore, the
3

effect of surface charges on the electrostatics and FT process is strong. Therefore, the FT
process rate should be modeled numerically. Here we suggest a convenient numerical
formalism to compute the FT rates for complexes with arbitrary architecture. Our
formalism is based on the multi-pole expansion and fluctuation-dissipation theorem. In
addition, we derive convenient analytical equations for the dipole limit; these analytical
expressions can be used to obtain reliable estimates. For the general case, the FT and
energy dissipation rates should be calculated numerically. This paper considers several
material systems where plasmon-enhanced FT can be observed. Our results suggest that
the conditions to observe long-range FT are quite peculiar due to strong energy
dissipation in MNPs. In the paper, we mostly focus on the optical effects at room
temperature.
1. Rate equations
Here we describe energy transfer between two SNPs in the presence of metal component
(Fig. 1a). In our system, SNPs have different optical band gaps due to the size-
quantization. A small nanoparticle (SNP1) absorbs an incident photon and then acts as a
donor supplying an exciton to a larger nanoparticle (SNP2) which represents an acceptor.
Exciton transfer between the donor and acceptor is induced by the Coulomb interaction.
This transfer process has three steps: fast energy relaxation in SNP1, FT process, and fast
energy relaxation in SNP2 (Fig. 1b). Finally, SNP2 emits a secondary photon at a lower
energy. The FT scheme shown in Fig. 1b is rather conventional1,2; this scheme also
includes direct absorption of incident photons by the SNP2. In the presence of efficient
4

FT, optical emission of SNP2 should be much stronger than that of SNP1 because of
directional exciton flow from SNP1 to SNP2. The MNPs in our scheme can strongly
change the FT probability and energy dissipation rates. Depending on the parameters of
the system, the FT rate can be enhanced or suppressed in the presence of MNPs.
Below, we consider the following conditions: a NP complex size ( ) is
much smaller than the wavelength of incident light (
complexL
laserλ ), i.e. complexlaser L>>λ . Under
the typical experimental conditions, we also have laserSNPSNP λλλ ~~ 21 and
complexSNPSNP L>>21,λλ , where 1SNPλ and 2SNPλ are the exciton emission wavelengths
of SNP1 and SNP2, respectively. In addition, we assume that intra-band relaxation
processes within SNPs are fast (continuous blue arrows in Fig.1b) whereas the exciton
recombination and FT processes are slower. Typically, the intra-band energy relaxation
time enerτ is in the range of while the recombination and FT times (ps10 recτ and
transferτ ) are 2ns2010− ,4 at room temperature. Another fast process involved in our
scheme is plasmon relaxation in MNP; the lifetime of plasmon ( plasτ ) is very short, in
the range of . fs
Excitons in their excited states ( 1exc and 2exc ) can be created optically or due
to FT (Fig. 1b). After fast intra-band relaxation, optically-generated excitons in SNP1 and
SNP2 reside in the low-energy exciton states, 1ψ and 2ψ (see Fig. 1b). These exciton
states with low energies ( 1ψ and 2ψ ) will be denoted as αi , where 8,...2,1=α and
is the SNP number. The energies of the states 2,1=i iψ with 2,1=i will be denoted as
11 ωh=E and 22 ωh=E , respectively; SNPii c λπω /2= . The number of excitons with
5

low energies in SNP is eight since there are four single-electron states in the valence band
(heavy and light holes with 2/3,2/1 ±±=zj ) and two electrons states in the conduction
band (with spins 2/1±=zs ).12,13 The total recombination rate of exciton αi is given by
αααα γγγγ imetaliradnoniradiexc ,0
,,, ++= − ,
where and are radiative and non-radiative recombination rates,
respectively. Here we assume, for simplicity, that all “intrinsic” non-radiative rates are
the same: ;
αγ irad ,0
, αγ iradnon−
00, radnoniradnon −− = γγ α αγ imetal , are the rates of exciton-energy transfer from
SNPs to MNPs. For fast intra-band energy relaxation of excitons, the rate equations at
room temperature take the form:
,)()(
)(
'''''2'2
,,''''1'2''1,'2'2,2,
0'2
'2
''''221
,,''''21,1,1,
01
1
∑∑
∑∑
≠=→−
≠=→−
−−⋅+⋅++−=
−−⋅⎟⎟
⎠
⎞
⎜⎜
⎝
⎛+++−=
αααα
αααααααα
α
ααααα
αααααα
α
γγγγγ
γγγγγ
nnnnIdt
dn
nnnIdt
dn
spinzyxForstermetalradradnon
spinzyxForstermetalradradnon
(1)
where and are averaged numbers of excitons in the low-energy excitons states α1n '2αn
α1 and '2α , respectively. The exciton-state index α and 'α vary independently
( 8,...2,1=α and 8,...2,1'=α ). The rates describe optical generation of excitons in
SNPs in the presence of laser light. The rate
αiI
'21, ααγ →Forster represents the unidirectional
FT process '21 αα → . The FT process is unidirectional because of fast energy relaxation
and trapping of excitons in SNP2. The rate spinγ is responsible for spin relaxation
between different exciton ground states. We should stress that the equations (1) are given
6

for the room temperature regime. At room temperature, spin relaxation is typically fast
(in the ps range) and we obtain 'αα ii nn ≈ . At low temperatures, the spin relaxation can
be slow and therefore for 'αα ii nn ≠ 'αα ≠ .14 Below we will comment more on the low-
temperature regime.
Using the approximation of fast spin relaxation ( 'αα ii nn ≈ , ∞→spinγ ) and the
steady-state condition, we can easily solve eqs. 1 for the total exciton populations in
SNPs:
1
,1
'''''21,1,1,
0
1
11
8
γγγγγα αα
αααα
αα
αα
tot
Forstermetalradradnon
II
nn =+++
==∑ ∑
∑∑
→−
,
2
1,2
1,2,0
'','''2'1,
12
228
8γ
γ
γγγ
γ
ααα
αααα
βα
αα
Forstertot
metalradradnon
ForsternI
nI
nn⋅+
=++
+
==∑
∑∑∑
−
→
, (2)
where are the total absorption rates in SNPs. The rates ∑=α
αitoti II , iγ and Forsterγ are
the averaged recombination rates of excitons and the averaged FT rate, respectively.
These rates are given by:
8/''
''21,1,1,0
1 ∑ ∑ ⎟⎟⎠
⎞⎜⎜⎝
⎛+++= →−
α ααααα γγγγγ Forstermetalradradnon ,
8/1,2,0
2 ⎟⎟⎠
⎞⎜⎜⎝
⎛++= ∑ −
ααα γγγγ metalradradnon ,
8/'''
''21,∑ →=αα
ααγγ ForsterForster .
7

The exciton rates depend on the exciton wave functions. For the sake of simplicity, we
employ here simplified wave functions without the mixing between heavy- and light-hole
states. In other words, we use the approximation: )()()()( hjhheseeexc zzuu rrrr ΨΨ=Ψ ,
where and are the Bloch wave functions in the conduction and valence
bands, respectively. In the absence of valence-band mixing, the corresponding envelope
functions for a spherical SNP are
)( eszu r )( hjz
u r
)2/()/sin( rRRr SNPSNPhe ⋅=Ψ=Ψ=Ψ ππ , where
is a radius of SNP. Among the functions SNPR )()()()( hjhheSee zzuu rrrr ΨΨ=α , there
are several optically-dark states. We can make linear combinations of these functions and
obtain a more convenient set of states ),()()( ehnewhhee unew rrrr ΨΨ= . Among the new
functions, there are three optically-active states ( zyx ,,=β ) and five dark states
( 5,...2,1=ν ). The β -exciton has optical dipole moment in the β -direction. We can
make this convenient choice of wavefunctions due to the spherical symmetry of SNPs.15
Therefore, we can write the transfer rates in terms of the bright states:
8/,, ''
''21,1,1,0
1 ∑ ∑=
→− ⎟⎟
⎠
⎞
⎜⎜
⎝
⎛+++=
xyxForstermetalradradnon
β βββββ γγγγγ ,
8/1,2,0
2 ⎟⎟
⎠
⎞
⎜⎜
⎝
⎛++= ∑−
βββ γγγγ metalradradnon , 8/
'''''21,∑ →=
ββββγγ ForsterForster . (3)
In our model, the dark states do not take part in optical and energy-transfer processes.
However, they take part in exciton dynamics due to spin flips and this brings the factor
1/8 in eq. 3. We should note that the above approximation makes our description much
more convenient and transparent, but it ignores the valence-band mixing. The valence-
8

band mixing effect can lead to non-zero optical and FT matrix elements for dark excitons
if the size of SNPs is comparable with inter-NP distance. This is due to inhomogeneous
fields inside a nano-complex induced by the long-wavelength photonic fields
( complexL>>λ ). Numerically, the valence-band mixing effects in the optical and FT
matrix elements are relatively small.16 We also should mention that the above
simplification holds for small SNPs ( complexSNP LR << ) even in the presence of the
valance-band mixing effect.
We also should mention the effect of energy splitting between bright and dark
excitons and the influence of temperature (T). The darks states in nanocrystals have
typically a lower energy. The dark-bright exciton splitting excΔ is meV5~ for both CdTe
and CdSe SNPs with .mnRSNP 2~ 3,13 This is essentially smaller than the thermal energy
at room temperature: meVTkB 26≈ . Therefore, our assumption is a good
approximation at room temperature. At low temperatures, the spin-flip rates for the
processes should have an exponential factor . Therefore, at low
temperatures, the dark-exciton population should be larger than the bright-exciton one.
Simultaneously, the averaged energy-transfer rates will also acquire the same Boltzmann
factor and all inter-NP transfer processes should slow down as temperature
decreases. Overall, the exciton dynamics at low T can become more complicated; this
comes also from the fact that the processes become slow and bring
additional exponential functions to photoluminescence kinetics.
'αα ii nn ≈
brightdark→ TkBexce /Δ−
TkBexce /Δ−
brightdark→
17 Some of these issues
were addressed in the recent experimental papers.3,17
9

The parameters and αiI βγ irad , can be strongly modified inside a NP complex
due to the plasmon resonances in MNPs. To account for this effect, we will calculate
these parameters in the following way18:
0,, )( excradi
aiirad P γωγ ββ ⋅= , , (4) 0
, )( ilaserb
itoti IPI ⋅= ω
where h/ii E=ω is the optical emission frequency of i-SNP, laserω is the exciting laser
frequency, is the radiative rate of SNP in the absence of the metal; for simplicity,
we assume is the same for both SNPs. The enhancement factor is
introduced for the process of emission from the lowest exciton states:
0,excradγ
0,excradγ )( i
aiP ωβ
2
2
)(
)()(
∫
∫=
Viaimetalno
Viaiactuala
idVrDE
dVrDEP
rrr
rrr
β
ββ ω , (5)
where actualEr
is the resultant electric field inside the SNP induced by the external field
tieEtE ω−⋅= 00 )(rr
( complexSNPiSNPi LR ,>>λ ); the function )(rDai
rrβ describes the spatial
distribution of inter-band dipole moment in the ground-state exciton βi . For our choice
of wavefunctions, we obtain )()( 2SNPiexc
ai rrderD rrrrr
−Ψ⋅= ββ , where SNPirr is the position
of i-SNP, ixxdexc 0= is the inter-band dipole moment of SNP ( is few
typically), is the unit vector (
excd A&
βer xr , yr , or zr ) parallel to the β -direction, and zyx ,,=β .
The integral , where )2/(3)( 00,0 sexcViaimetalno EddVrDE εεεββ +=∫
rrr0ε and sε are the
dielectric constants of the surrounding media and semiconductor, respectively. The factor
10

)2/(3 00 sR εεε += appears due to screening of external field inside a dielectric sphere.19
The absorption process is described with a similar factor:
2
,
2,
)(
)(
)(
∫∑
∫∑=
Vibexclasermetalno
exc
Vibexclaseractual
excbi
dVrDE
dVrDE
P
i
i
i
i
rrr
rrr
ω , (6)
where is the external laser field, tilasermetalno eEtE ω−⋅= 0, )(
rriexc are the excited states
of exciton in i-SNP. In this case, the function )(rDbexci
rr describes the local dipole moment
of an excited state of exciton. Since excited states have a more uniform spatial probability
distribution, we will assume that the local dipole moment inside a SNP is a constant:
for SNPiexcexcbexc VderD
ii/)( ⋅=
rrr22 SNPSNP Rrr <−
rr , where is the volume of i-SNP.
For bright excited states,
SNPiV
iexci γ= , where zyx ,,=γ ; γeeiexc
rr= are the unit vectors.
Then, the denominator of eq. 6 can be written as
20
222
)( ERddVrDE excVibexcmetalno i
=∫∑ rrr
γ. Note that, in a NP complex, the factor (6)
depends on the direction of the laser field 0Er
. Using similar approximations for the
enhancement factors (eqs. 5 and 6), we could successfully describe several recent
experiments.8,18
2. Transfer times and correlation functions
11

To describe exciton transfer between SNPs and energy dissipation due to MNPs
we should compute the transfer energy rates βγ imetal, and '21, ββγ →Forster . The plasmons
and excitons in our system interact via Coulomb fields and we are going to explore this
interaction. The total transfer rates for an exciton β1 are given by the Fermi’s golden
rule:
)(1ˆ21
21,1,1 χ
χβββ δβχπγγγ EEU CoulForstermetal −=+= ∑
h, (7)
where 11 ωh=E is the exciton energy of the states β1 in SNP1, is the inter-NP
Coulomb interaction, and
CoulU
χ are the collective states of the system. These states χ
include plasmons in MNPs and excitons in SNP2 and have energies . In the states χE
χ , there is no the exciton in SNP1 since the SNP1 exciton is assumed to be transferred
to the other NPs. Eq. 7 describes two types of processes: energy transfer to the metal and
FT. The FT rate is composed of transitions from the low-energy exciton state β1 in
SNP1 to the excited states of exciton in SNP2 1exc : .
For the SNP2, we have a similar equation
∑ →=2
21,1,exc
excForsterForster ββ γγ
)(2ˆ22
22,2 χ
χββ δβχπγγ EEUCoulmetal −== ∑
h, (8)
where 22 ωh=E are the exciton energy of the states β2 in SNP2. Since the
rate
12 EE <
βγ 2,metal does not include the FT process. Again, the states χ include plasmons in
12

MNPs and have no exciton in SNP2. The above approach is based on the perturbation
theory. This approach assumes that the excitons are well defined quasi-particles and the
exciton-plasmon interaction is relatively weak. In other words, ii E<<βγh .
Now we express the rates (7 and 8) through correlation functions. The states
involved in eq. 7 can be written as ββ 1;01 = and 0;f=χ , where the second index
describes the SNP1 states and the first belongs to the rest (MNPs and SNP2). In other
words, β -exciton β1;0 turns into another excitation 0;f . Then, we can write the
Coulomb matrix element as 0ˆ1;0ˆ0;1ˆCoulCoulCoul VfUfU == ββχ , where
∑ ∑ −=
i k ikCoul rr
eV β10ˆ2rr ; here, the index i numbers all electrons in the system
excluding the electrons involved in the SNP1 excitons and the index k belongs to the
electrons contributing to the SNP1 excitons. In typical SNPS, there are four electrons
involved in the low-energy excitons. The integral in the matrix element β10'
2
ik rrerr
−
should be taken over the coordinates krr
(k=1,2,3,4) and β1 is the exciton wave
function. To evaluate this integral, we can use the method used in Ref.20 . The integral
should be replaced by a sum of integrals over unit cells inside a SNP and the function
ik rr rr−/1 should be expanded within a single unit cell. As a result, we obtain:
31
122
)()(
0SNPj
SNPjexc
k ik rrrre
derr
err
rrr
rr−
−⋅=
−∑ ββ for jrr is outside of the SNP1. This potential
corresponds to a local dipole density )()( 12
SNPexc rrderd rrrrr−Ψ⋅= ββ ; the corresponding
charge density is rrredr SNPexcrrrrr∂−Ψ∂⋅−= /)()( 1
2ββρ . The Coulomb operator takes
13

now the form: ∑∑−
−⋅=−=
i SNPj
SNPjexc
iSNPjCoul rr
rrederrVV 3
1
1210 )(
)()(ˆ r
rrrrr β , where the potential
energy 32
0)(
)(r
rederV exc
rrr ⋅= β for rr outside the SNP1. Inside SNP1, )(0 rV r
is given by
the Poisson equation: rrederV excrrr∂Ψ∂⋅=∇ /)(4)( 22
02
βπ . Using the standard methods21,
we can rewrite eq. 7 in terms of the correlation function:
∫∞
∞−
⋅= dteVtV tiECoulCoul
h
h
/*21
10ˆ)(ˆ01βγ , (9)
where . Applying the fluctuation-dissipation theoremhh /ˆ*/ˆ* ˆ)(ˆ tHiCoul
tHiCoul eVetV −= 21, we
obtain
)(Im
)1(
1211
1EF
e TkE
B −
=−h
βγ , (10)
where the response function is given by )( 1EF
[ ] τ//*
01
1),()( ttiECoulCoul eVtVdtiEF −
∞
∫−
= h
h, (11) .
where ∞→τ . According to the general theory, the response function should be found as
a response to the “driving” potential tidriving ertr 1)(),( 0
ω−⋅Φ=Φrr
:
tititi ernrVrderrrdtrrrdeEF 111 )()()()(),()()( *0
3*0
3*0
31
ωωω ρρ −−− ⋅⋅=⋅Φ⋅=⋅Φ⋅=⋅ ∫∫∫ (12)
14

where is the non-equilibrium charge density in the
system of NPs in the presence of the “driving” potential , and
titi erneertr 11 )()(),( ωωρρ −− ⋅==
tier 1)(0ω−⋅Φ
[ ]( )3
1
1100 /)()(
SNP
SNPexcSNP
Rr
RreedeRrVr rr
rrrrrr
−
−⋅=−=Φ β is the dipole potential created by the
exciton in SNP1 and the center of SNP1 correspond to 1SNPRrrr
= . The factor
1)1(1
−≈−−
TkE
Be , since at room temperature 1/1 >>TkE B .
Mathematically, in order to obtain the response function , we have to
compute the function
)( 1EF
)(rρ and then take an integral over rr . The integral (12) and the
transfer rate (10) can be rewritten as:
1
*3
*0
31
)()(
Im)()(Im)(Imω
ρωi
rErjrd
rrrdFtotrr
⋅
=Φ⋅=∫
∫ ,
)()(Im2)(Im2 *3
111,1,1 rErjrdiF totForstermetal
rr
hh⋅=−=+= ∫ω
ωγγγ βββ , (13)
where is the electric current density and tierj 1)( ω−r titot erE 1)( ω−r
is the total field;
totindtot ErE Φ∇−=+Φ∇−=rrrr
0)( , where indEr
is the field of induced charges. To obtain
eq. 13, we used two equalities: 0)()(1 =∇+− rjrirr
ρω and .
The right-hand side of Eq. 13 is very convenient for calculations since it has a form of an
integral of the current density over the space. In fact, the product
0)]()(Im[ *3 ≡Φ⋅∫ rrrd indρ
)()( * rErj totrr
is the local
heat dissipation (local Joule heat). We also can separate the contribution to the current
15

due to bound charges, plasmons, and excitons. The total potential is given by the Poisson
equation:
rRreedrr SNPexctotrrrrrrrr∂−Ψ∂⋅=Φ∇∇ /)(4)(),( 1
21 βπωε , (14)
where ),( 11 ωε rr is the local dielectric constant. Outside NPs 01),( εωε =rr , inside metal
MNPs )(),( 1 ωεωε mr =r
, and inside SNPs sr εωε =),( 1r
. For a single SNP,
3)(
)(rre
edreff
exctotΔ
Δ⋅=Φ
εβ
rrr for 1|| SNPRr >Δ
r, where 1SNPrrr rrr
−=Δ , 3/)2( 0εεε += seff ,
and and 1SNPR 1SNPrr are the SNP1 radius and position, respectively. The above potential
does not include a contribution from the charges induced by the excitons in SNP2. The
reason is that the exciton dipole moment is relatively small and its contribution to the
induced potential can be neglected compared with dipoles induced by MNPs and bound
charges at SNP surfaces. However, we should include the electric currents due to the
exciton in SNP2 in the next step. The electric current can be split into two terms:
)()()( rjrjrj excelectrrr
+= . The currents due to bound charges and plasmons are given by:
)(4
1),()( 11 rErirj totelect
rrrr
πωεω −
−= . The excitons inside SNP2 create an additional
current: )(rjexcr
. Therefore, the total rate can be split into two parts:
1
*
2
3*13*3
11 Im
4)(Im)()(1Im)(Im
ωπωε
ωω
iEjrdEErdrErjrd
iF totexc
SNPtottot
m
metaltot
rrrrrr
⋅+−=⋅= ∫∫∫ ,
(14)
16

where the first and second terms describe energy transfer processes and
, respectively. To derive eq. 14, we assumed that
MNPsSNP →1
21 SNPSNP → 0ImIm 0 == sεε and
0Im ≠mε . The physical meaning of the function )()( * rErj totrr
inside the integrals in eq.
13 and 14 is the local Joule heat. For the rate of transfer to the MNPs, we obtain
*13*0
31, 4
)(Im2)()(Im2tottot
m
metalelect
NPsallmetal EErdrrrd
rr
hh πωεργ β ∫∫ =Φ⋅−= , (15)
where )(relectρ is the surface charges induced by the current )(rjelectr
. We should stress
that these charges appear also on the surface of both SNPs. For the FT rate, we should
evaluate the second integral in eq. 14:
1
*
2
31,1, Im2
2
2 ωγγ ββ i
Ejrd totexc
SNPexcexcForsterForster
rr
h⋅−== ∫∑ → .
To calculate the current due to the excited states of exciton 2exc in SNP2, we employ
the equation of motion of the density matrix (see the Appendix 1). After the standard
calculations22, we obtain:
( )])([
)(2)( 21
2
2
,2
2
32211,
22
2
2
22
excexc
exc
excexctotexc
SNPexcForster EE
eErrddeE−+Γ
Γ⋅Ψ⋅= ∑ ∫ π
πγ ββrr
h.
(16)
Here the state 2exc has an electron envelope function and a interband dipole
moment parallel to the unit vector
)(2
rexcΨ
2excer ( zyxeexcrrrr ,,
2= ); the state 2exc is described by
17

two quantum indexes ( ), where k is the number of energy level and
determines the dipole moment direction. The parameters
keexc ,2
r
2excer2excΓ and are the
off-diagonal broadening and energy of the excited state
2excE
2exc of SNP2. Then
and . Since three vectors )()(2
rr kexc Ψ=Ψ kexc EE =2
zyxeexcrrrr ,,
2=
are orthogonal:
( )∑ ∑ ∫∫ Ψ⋅=⋅Ψ⋅2
22
2
,2
2
32
,2
2
3 )()(exc k
totkSNP
exctotexcSNP
ErrdeErrd ββrrr
.
We now can make one more step further and include the broadening of the initial exciton
state β1 . After simple algebra (see Appendix 2), we arrive to
)()(2~1
2
,2
2
3221, k
ktoti
SNPexcForster EEJErrdde −Ψ⋅= ∑ ∫ ββ
πγr
h,
'])'(][)'([
)( 221
2221
2
2 dEEEEE
EEJjkexc
excjk ∫ −+Γ−+Γ
ΓΓ=−
π, (17)
where is the spectra overlap integral.)( 1 kEEJ − 1 Now eq. 17 for FT incorporates both
off-diagonal broadenings, and . It is not necessary to involve the broadening
for modification of the transfer rate to the metal (eq. 15). The reason is that the
plasmon has typically a very broad resonance (about 100 meV) whereas is typically
about ten meV.
2excΓ 1Γ
1Γ
1Γ
18
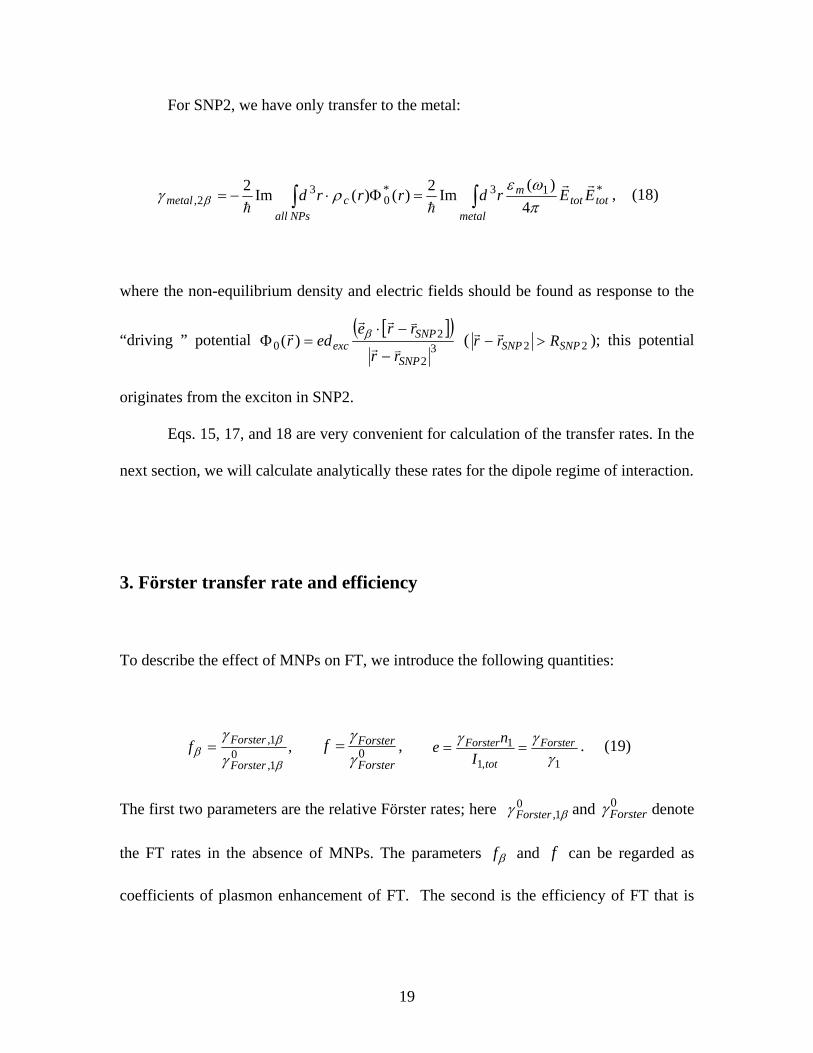
For SNP2, we have only transfer to the metal:
*13*0
32, 4
)(Im2)()(Im2
tottotm
metalc
NPsallmetal EErdrrrd
rr
hh πωε
ργ β ∫∫ =Φ⋅−= , (18)
where the non-equilibrium density and electric fields should be found as response to the
“driving ” potential [ ]( )
32
20 )(
SNP
SNPexc
rr
rreedr vr
vrrr
−
−⋅=Φ β ( 22 SNPSNP Rrr >−
rr ); this potential
originates from the exciton in SNP2.
Eqs. 15, 17, and 18 are very convenient for calculation of the transfer rates. In the
next section, we will calculate analytically these rates for the dipole regime of interaction.
3. Förster transfer rate and efficiency
To describe the effect of MNPs on FT, we introduce the following quantities:
,01,
1,
β
ββ γ
γ
Forster
Forsterf =
0Forster
Forsterfγγ
= , 1,1
1γ
γγ Forster
tot
ForsterI
ne == . (19)
The first two parameters are the relative Förster rates; here and denote
the FT rates in the absence of MNPs. The parameters and can be regarded as
coefficients of plasmon enhancement of FT. The second is the efficiency of FT that is
01, βγ Forster
0Forsterγ
βf f
19

defined as a ratio: tot
ForsterI
n
,1
1 SNP1 inside generated excitons ofnumber
SNP2 toSNP1 from ed transferrexcitons ofnumber γ= . In
the absence of energy transfer, 0=e . In the presence of strong energy dissipation due the
metal, the parameter . 0→e
4. Dipole limit
4.1 Energy transfer to metal nanoparticles
Fig. 2a shows the geometry. We now use eq. 15 and apply the dipole condition:
, where is the inter-NP distance. The electric field generated by the
exciton
MNPSNP RRd ,1>> d
β1 outside SNP1 along the z-axis is: )/( 3deedbE effexcexc εββrr
= , where
and 1−== yx bb 2=zb , 3/)2( 0εεε += seff ; βer are the unit exciton-polarization vectors
as before. The field is partially screened by the background dielectric constant of
SNP. Then, the resultant field inside the MNP becomes “screened” one more time
excEr
19:
0
03 2)(
3εωε
εε
ββ
⋅+⋅
=meff
exctot d
eedbE
rr
.
Assuming that does not vary much over the MNP volume, we obtain from eq. 15
(right-hand side form) for the energy transfer rate:
totEr
)(Im2)(
322
0
320
26
222
1, ωεεωε
εε
γ ββ m
m
MNP
eff
excmetal
Rd
deb
⋅+
⋅⋅⋅−=
h. (20)
20

Using this formula, it was possible to describe experimental data of several groups.18 The
-dependence corresponds to the FT theory. In the other limit and
, (see ref.
6/1 d MNPR<<Δ
1SNPR>>Δ 31, ~ −dmetal βγ 23). Here Δ is the surface-to-surface distance (Fig.
2a).
4.2 The role of bound charges in transfer processes
It is seen from eq. 15 that the rate βγ 1,metal can be written either through the charge
density or through the current density. It is interesting that the correct expression for the
transfer rate, that is written through the charge density, should include two terms:
⎥⎥⎦
⎤
⎢⎢⎣
⎡Φ⋅+Φ⋅−= ∫∫ )()()()(Im2 *
03*
01
31, rrrdrrrd elect
MNPelect
SNPmetal ρργ β
h. (21)
The first term is due to the image charges on the surface of SNP1. Even though the
constants 0ε and sε have not an imaginary part ( 0Im ,0 =sε ), the first term contributes
to the dissipation. Mathematically, the reason is that these charges are partially induced
by the dipole moment of the MNP and this dipole moment includes )(ωεm with a
nonzero imaginary part ( 0)(Im ≠ωεm ). Simultaneously, the current form for the transfer
rate βγ 1,metal includes only an integral over MNP, i.e.
*131, 4
)(Im2tottot
m
MNPmetal EErd
rr
h πωεγ β ∫−= . (22)
21

Since the function inside this integral is the local Joule-heat dissipation rate, this form
indicates that the dissipation process appears inside the MNP, whereas the formula (21) is
another mathematical representation for the integral (22).
The role of the bound surface charges on the SNP1 surface is important
numerically since, for most matrixes, 0ε is essentially large than unit. For example,
8.10 ≈ε and 2.3 for water and polymers at the optical energies . We can see
from eq. 20 that the metal transfer rate strongly depends on
eVE 2~1
0ε . In the case of matrix
with 10 >ε , the bound charges originate both from NPs and matrix. Fig. 2d illustrates this
situation. If we formally introduce a thin vacuum layer between NPs and matrix, we can
see that bound charges can be accumulated on both interfaces. Since our general
formalism treats the surface changes consistently, the general formulas (15, 18)
incorporate the surface bound charges originating from both NPs and matrix. We also
note that the operator in eq. 9 includes summation over electrons of the matrix (e.g.
water).
CoulV
4.3 Förster transfer
Now we calculate the FT rate from eq. 17 in the absence of MNPs (Fig. 2b). The electric
field induced by the exciton β1 inside SNP2 is 0
03 2
3εε
εε
ββ
⋅+⋅
=seff
exctot d
eedbE
rr
. The sum
in eq. 17 should be taken over three bright excitons with zyxeexcrrrr ,,
2= (Fig. 2b). The FT
rate is
22

)(2~14
20
6
244
1, EJd
bde
eff
excForster ε
επγ ββ
h= , (23)
where
∑ −=2 2
)()( 11 exc excEEJEJ
is the overlap integral. Equation (23) corresponds to the Förster theory1 and also includes
the screening effect of bound charges ( ). Again, we see the importance of surface
charges.
420 / effεε
4.4 Plasmon-assisted Förster transfer
Now we focus on the FT rate in the presence of MNP (Fig. 2c). In the dipole limit, the
total electric field inside SNP2 created by the exciton β1 is a sum of two contributions
coming from SNP1 and MNP:
52
22220
512
21212120
,)(3)(3
m
MNPmmmMNP
effeff
exc
efftot r
DrrrDr
errreedErrrrrrrr
r −⋅+
−⋅=
εε
εεε ββ
β ,
where
01)( SNPMNPMNP ED
rr⋅= ωβ
is the dipole moment induced in MNP by the SNP1 exciton, )2(
)( 3
mw
wmMNP R
εεεεωβ+−
= ,
51
21110
1)(3
m
mmm
eff
excSNP r
errreedE ββ
ε
rrrrr −⋅
= , 11 rrr mmrrr
−= , 1212 rrr rrr−= , and mm rrr rrr
−= 22 ; 1rr , 2r
r ,
23
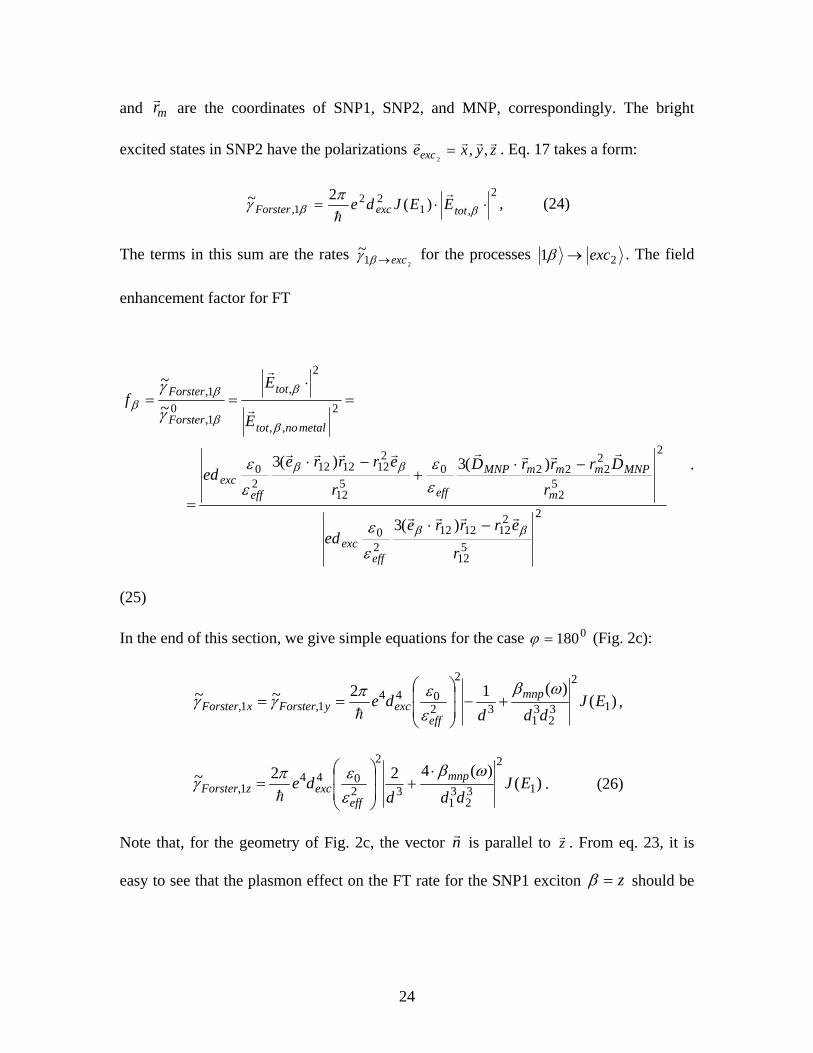
and mrr
are the coordinates of SNP1, SNP2, and MNP, correspondingly. The bright
excited states in SNP2 have the polarizations zyxeexcrrrr ,,
2= . Eq. 17 takes a form:
2,1
221, )(2~ ⋅⋅= ββ
πγ totexcForster EEJder
h, (24)
The terms in this sum are the rates 21
~exc→βγ for the processes 21 exc→β . The field
enhancement factor for FT
2
512
2121212
20
2
52
22220
512
2121212
20
2,,
2,
01,
1,
)(3
)(3)(3
~
~
r
errreed
rDrrrD
r
errreed
E
Ef
effexc
m
MNPmmmMNP
effeffexc
metalnotot
tot
Forster
Forster
ββ
ββ
β
β
β
ββ
εε
εε
εε
γ
γ
rrrr
rrrrrrrr
r
r
−⋅
−⋅+
−⋅
=
=⋅
==
.
(25)
In the end of this section, we give simple equations for the case (Fig. 2c): 0180=ϕ
)()(12~~
1
2
32
31
3
2
2044
1,1, EJddd
de mnp
effexcyForsterxForster
ωβ
εεπγγ +−
⎟⎟
⎠
⎞
⎜⎜
⎝
⎛==h
,
)()(422~
1
2
32
31
3
2
2044
1, EJddd
de mnp
effexczForster
ωβ
εεπγ
⋅+
⎟⎟
⎠
⎞
⎜⎜
⎝
⎛=h
. (26)
Note that, for the geometry of Fig. 2c, the vector nr is parallel to zr . From eq. 23, it is
easy to see that the plasmon effect on the FT rate for the SNP1 exciton z=β should be
24

the largest, because of the factor . The reason is that the optical dipole for the state 24
z=β is perpendicular to the MNP surface.
4.5 Numerical results for plasmon-assisted Förster transfer in the dipole limit
The NP position vectors in a rather complicated eq. 22 can be expressed, for
convenience, through the inter-NP distances , , and , and the angle 1d 2d d ϕ (Fig. 2c).
Figs. 3, 4, and 5 show the results for Ag MNP. For the Ag dielectric constant )(ωεm , we
use empirical bulk values from ref.24. For the other dielectric constants, we took 8.10 =ε
(water) and 2.7=sε (CdTe). The geometrical parameters were somewhat similar to the
experiments4,18: and nmdd 1021 == nmRNMP 4= . The optical dipole moment can be
estimated from the typical radiative lifetime. For CdTe and CdSe SNPs, a radiative
lifetime measured in time-resolved PL studies at room temperature . Since
there are three bright and five dark excitons, , where
is the radiative rate of a bright exciton (
nsrad 10/1 0 ≈γ
0,
0 )8/3( excradrad γγ = 0,
0, βγγ radexcrad =
zyx ,,=β ). From the quantum optics22, we know
that
320
22300
, )/(38
chde
eff
excexcexcrad
⋅=
εεωεπ
γ . (27)
Using the above value for , we obtain an estimate: . Another important
parameter of the problem is the overlap integral, J. From experimental studies,
0radγ Adexc 6.4≈
4 we can
estimate the typical FT rate as )10/(1~8/'''
''21, nsForsterForster ∑ →=αα
ααγγ for . nmd 10~
25

From these numbers, we obtain an estimate: . The FT parameters
( and
1008.0~ −meVJ
βf βγ 1,Forster ) are calculated using eqs. 24 and 25. The angle ϕ was taken as
and for Fig. 3a and b, respectively. We can see significant enhancement of FT
for the wavelengths close the plasmon resonance. Orientation of exciton dipole relative to
the MNP surface plays an important role. Strongest enhancement can be achieved if the
exciton dipole is perpendicular to the surface of MNP; this is because the MNP plasmon
resonance mostly enhances electric fields perpendicular to the MNP surface.
060 0180
18 Fig. 3b
also includes numerical results (see Sec. 5.1). We can see that the analytical results
obtained within the dipole approximation provide us with reasonable estimates for the NP
complex with (error is about 10%). 4.0/)2(1 =MNPRd
Another important geometrical parameter is the angle ϕ . Figs. 4 and 5 show the spatial
maps of the FT coefficient. As a two-directional variable, we use the SNP2 position,
2SNPrr . The position of SNP1 is fixed: )10,0,0(1 nmrSNP =r
. The geometry with
has clear advantage from the point of view of FT rate enhancement. Simultaneously, the
geometry with has obvious disadvantage: the inter-SNP distance for
is relatively long and the absolute value of the FT rate can be relatively small; therefore,
the FT effect would be less visible in optical spectra.
0180=ϕ
0180=ϕ 0180=ϕ
Calculated FT rate is shown in Figs. 6 and 7. One can see that the plasmon
resonance effect on the FT process. Plasmon-enhancement of FT can be seen for the
exciton in the geometry of in the vicinity of the plasmon resonance in Ag
NP (below ) and in the geometry of for
−z 060=ϕ
nm400 0180=ϕ nm400>λ . We also can see
the effects of screening and suppression of FT process. In particular, z-exciton transfer
26
becomes strongly enhanced for the geometry (Fig. 7, middle). Such process can
be called as plasmon-assisted long-distance Förster transfer.
0180=ϕ
4.4 Diagram representation for the plasmon-enhanced FT
We now derive eq. 26 using the diagram method. We start from the expression (7) and
apply the standard perturbation theory method. To the second order of the perturbation
theory, the amplitude of FT is given by25:
∑ +−
+=
−−
−
' '1
212
212
/
0;0;1ˆ';0;0';0;0ˆ0;;0
0;0;1ˆ0;;01ˆ
22121
2
pl pl
plexcMNPSNPexcexcexcexcMNPSNPpl
plexcSNPSNPplCoul
iEE
UplplUexc
UexcU
τ
β
ββχ
h
, (28)
where the wave function plexc 0;0;12
β describes the state with one exciton β1 in
SNP1, and no plasmons and excitons in MNP and SNP2; similarly, the wave function
';0;021
plexcexc denotes the state with one plasmon and no excitons. The total Coulomb
interaction operator should be written as:
, where the terms describe the dipole-
dipole interactions between three NPs. For example,
MNPSNPMNPSNPSNPSNPCoul UUUU −−− ++= 2121ˆˆˆˆ
∑ ⋅⋅−⋅=−
2,13
21212
20
21))((3ˆ
dnrnrrre
Ueff
SNPSNP
rrrrrr δδδδεε , where 1r
rδ and 2rrδ are electron
coordinates related to SNP1 and SNP2, respectively; the sum should be taken over all
27
electrons taking part in inter-band transitions in SNPs. The unit vector nr “connects” the
SNPs (Fig. 2c). For the SNP-MNP interaction, we have
∑ ⋅⋅−⋅=−
m
mm
effSNPSNP d
nrnrrreU,1
31
112
21))((3ˆrrrrrr δδδδ
ε, where mr
rδ is the position of an electron
inside MNP; again, mrrδ is related to the MNP center. Using the fluctuation-dissipation
theorem21 and the response function of a single spherical MNP, one can obtain the useful
equality:
∑⎪⎭
⎪⎬⎫
⎪⎩
⎪⎨⎧
+−−
+−−=
' ''
2
0
2
/1
/10')(
pl plplplMNP iEiE
xpleτωτωε
ωβhhhh
. (29)
In the next step, we use the resonant approximation (i.e. neglecting the second term in the
equation 29) and obtain
⎟⎟⎠
⎞⎜⎜⎝
⎛+= 3
231
322
20 )(11ˆ
ddb
ddeU mnp
exceff
Coulωβ
εεβχ β , (30)
where and 1−== yx bb 2=zb , as before. This equation reproduces our previous result
(eq. 26). The upper two diagrams in Fig. 8a show the processes corresponding to the two
terms in eq. 26. The second diagram in Fig. 8a describes the FT assisted by virtual
creation of a plasmon in MNP. Using perturbation theory, we also can calculate the FT
amplitude in the presence of few MNPs. As an example, we solve now the case of two
MNPs ( and ) arranged in a line (Fig. 8c). This case has a rather simple geometry;
is the inter-MNP distance, and and are the SNP-MNP distances. Including the
interaction between MNPs in all orders of the parameter , we arrive to
a b
abd iad ibd
3/1 abd
28

⎟⎟⎟⎟⎟
⎠
⎞
⎜⎜⎜⎜⎜
⎝
⎛
⋅⋅−⎪⎭
⎪⎬⎫
⎪⎩
⎪⎨⎧ ⋅⋅
++⋅⋅
++=
=
6
2
2
20
332
31
220
32
31
332
31
220
32
31
322
20
1
11
1ˆ
ab
ba
eff
abab
ba
effbb
b
abba
ba
effaa
aexc
eff
Coul
dbddd
bdd
b
dddb
dd
b
dde
U
ββ
εε
ββ
εεβββ
εεβ
εε
βχ
β
ββββ
where the fuctions )()(,)( ωββ baMNPba = are defined for two MNPs (a and b). The above
formula assumes that the interaction between MNPs involves only dipole moments. In
the following, we will give numerical results involving all multi-poles.
In the end of this section, we comment on the renormalization of the exciton
energy of a single SNP due to the presence of other NPs. Mathematically, the exciton
shift due to the presence of other NPs is given by the real part of the response function:
)(Re1~ 11 EFEh
βδ . For the case of SNP-MNP interaction only, this shift is given be the
MNP response function: *131 4
)(Re1~ tottotm
metal
EErdErr
h πωεδ β ∫ . To calculate the shift using
diagrams, one should look at the response function )( ωhF and sum up an infinite series
of diagrams that involve the exciton state; Fig. 8b shows two first relevant diagrams. For
SNP-MNP molecule, the exciton shift is a relatively small number (less than 1 meV) as
calculated in ref.18 This shift of exciton energy can become important at low
temperatures whereas, at room temperature, it can be neglected.
29
5. Numerical results
5.1 Numerical method
For numerical results, it is necessary to compute reliably electric fields inside a NP
complex and the response function and )( ωhF (eq. 11). Here we employ the multipole
expansion method. This method is every efficient and was used by us to calculate optical
properties of complexes with many NPs (up to one hundred).18 To solve the Poisson
equation (eq. 14) for the medium with non-uniform dielectric constant ),(1 ωε rr , we
expand the electrical potential in terms of spherical harmonics:
∑+=n
nexternaltot rt ϕϕϕ ),( r , where tiextexternal errt ωϕϕ −= )(),( rr and nϕ is the potential
induced by the charges on the surface of the nth-NP. The potentials of single NPs are
expanded in terms of spherical harmonics:
∑ +=ml
ln
nnmlnmln r
Yq
,1
,,
),()(
φθϕ r , (31)
where ),(, φθmlY are the spherical harmonics, lml ≤≤− , and the coordinates ),,( nnn rφθ
are related to the coordinate system of the nth-NP. The standard boundary conditions are
introduced at the surface of each NP and involve the dielectric constants 0ε , mε , and sε .
In our computations, we truncate the system of equations assuming that the coefficients
rapidly decrease as a function of . Therefore, we include only . Below we
will use that provides us with a very good precision (the error is a few %).
nmlq , l maxll ≤
5max =l
30

5.2 Silver NPs
Below we will use geometrical parameters similar to those used in Sec.4.5:
and . First of all, we show that the dipole approximation
provides us with reliable estimates. As an example, Fig. 9a shows the rates of exciton
transfer from SNP1 to MNP calculated within the dipole approximation (eq.15) and
numerically. We also observed that the dipole approximation gives reliable estimates for
the FT rates (Fig. 3b).
nmdd 1021 == nmRNMP 4=
First we show the numerical results for the imaginary part of the response
function (eq. 7). As an example, we will compute the response function describing the
transfer process of -exciton: z1
∫ ⋅=−=+= )()(Im2)(Im2 *3
111,1,1 rErjrdiF totzForsterzmetalz
rr
hh ωωγγγ
(see Fig. 10). This function describes energy transfer from SNP1 to SNP2 and MNP.
Mathematically, this function looks like a dissipation rate of a SNP1 exciton due to
absorption in SNP2 and MNP. In Fig. 10, the exciton emission wavelength of SNP1 is a
variable, whereas the exciton wavelength of SNP2 is fixed ( nmSNP 6002 =λ ). The
dielectric constants and the overlap integral (J) were specified above. We see that
zForsterzmetal 1,1, γγ >> . This inequality reflects the fact that MNP has many mobile
electrons participating in the energy transfer process. These electrons create a strong
plasmon resonance and large dipole. Simultaneously, SNP2 absorbs the SNP1-exciton
31

via the exciton resonance; in our simplified model, the exciton absorption under the
resonant condition ( ) involves only 4 valence-band electrons (2 heavy-hole
and 2 light-hole states). However, SNPs give the main contribution to photoluminescence
process and, therefore, the rate
21 excEE ≈
Forsterγ plays the important role in optical experiments
and can be measured.2,3,4 Emission from metal NPs and their quantum yield are typically
small because of fast energy relaxation inside the metal crystal.
Due to fast spin relaxation, the optical spectra of SNPs at room temperature
depend on the averaged FT and metal transfer rates:
8/,,',
'21,∑=
→=xyx
ForsterForsterββ
ββγγ , 8/1,1, ∑=β
βγγ metalmetal .
These rates can be calculated using the following formulas (see eqs. 16 and 17):
)()(Im2 *0
31, rrrd elect
NPsallmetal Φ⋅−= ∫ ργ β
h,
)()(Im2 *0
32, rrrd elect
NPsallmetal Φ⋅−= ∫ ργ β
h
)()(2~1
2
,2
2
3221, k
ktotk
SNPexcForster EEJErrdde −Ψ⋅= ∑ ∫ ββ
πγr
h, (32)
where the functions )(relectrρ and )(, rEtot
rrβ should be numerically calculated from the
Poisson equation (14). These functions are the change density induced on the surfaces of
all NPs and the total electric field. The above charges and electric field originate from the
oscillating dipole with spatial charge density
32

tiSNPexc erRreedtr 1)/)((),( 1
20
ωβρ −⋅∂−Ψ∂⋅=
rrrr . The “driving” potential ,
created by
tier 1)(0ω−Φ
),(0 trρ , also enters eq. 32. For the excited states in eq. 32, we use the
approximation . In addition, we assume for simplicity that the overlap
integral is a constant: . As it was mentioned above, with
this number for the overlap integral, we obtain realistic numbers for inter-SNP FT rates.
Figs. 11 and 12 show the averaged FT rate. The plasmon enhancement effect for the
geometry is very remarkable. Again, we see plasmon-enhanced, long-range FT.
22 /1)( SNPk Vr =Ψ
)( 1EJ 11 008.0)( −== meVJEJ
0180=ϕ
Now we compute the FT efficiency and the ratio of emission peaks. The
corresponding equations involve the bright excitons:
Forstermetalrad
ForsterForstereγγγ
γγ
γ++
==1,1,1
,
where the averaged radiative rate is:
8/)( 110
,1, ∑=β
β ωγγ aexcradrad P .
Calculated efficiency and metal transfer rate are shown in Fig. 13. As expected, the
presence of the metal component reduces the FT efficiency since the exciton energy
flows to MNP. We also can see the regime of enhanced FT efficiency for and
the exciton wavelength
0180=ϕ
nmSNP 5701 >λ . The increase of efficiency in this regime
happens because the metal transfer rate becomes small far from the plasmon resonance.
33

In general, we observe that the FT efficiency is reduced in the vicinity of the plasmon
resonance due to strong dissipation.
Now we calculate the PL spectrum of a SNP. The PL peak intensities are given
by
totrad
PL II ,11
1,1, γ
γ= , ⎟⎟
⎠
⎞⎜⎜⎝
⎛+=
1,1,2
2
2,2, γ
γγ
γ Forstertottot
radPL III .
We calculated PL spectra as a sum of two Lorentzian peaks:
)()()( 22,11, SNPPLSNPPLPL LILII ωωωωω −⋅+−⋅= , where and
. Figure 14 shows the results. As before, we used: and
. Also, we assumed that
)/()( 22 ωω +ΓΓ= PLPLL
meVPL 80=Γ nsrad 10/1 0 ≈γ
1008.0 −= meVJ tottot II ,1,2 = . Calculated PL spectra are mostly
governed by the processes of energy transfer to MNP and it is not easy to see the effect of
FT. For the SNP pair )500,440(),( 21 nmnmSNPSNP =λλ and , we obtain the
following parameters: and . The corresponding FT
enhancement parameter . Simultaneously, the metal transfer rates become large:
and . The asymmetry of peaks in Fig. 14a is mostly
due to the large difference between and . For the case of
090=ϕ
10 1.0 −= nsForsterγ 178.0 −= nsForsterγ
8.7=f
11, 2.5 −= nsmetalγ 1
2, 1.1 −= nsmetalγ
1,metalγ 2,metalγ
)500,400(),( 21 nmnmSNPSNP =λλ and , we obtain the same behavior. The PL
peak asymmetry is mostly due to a large difference between metal transfer rates for SNP1
0180=ϕ
34

and SNP2. In the case of Fig. 14b, the FT enhancement factor is remarkably large:
. 50≈f
To summarize, we see from our calculations that the cw-PL study is not so
informative and should be analyzed very carefully using the rate equations incorporating
the set of parameters, , , , and . In particular, we should
comment on the PL peak asymmetry. In many experiments, the PL peak asymmetry can
be taken as a signature of FT. But, this is not the case for our situation. Here, the PL peak
asymmetry occurs due to exciton energy transfer to MNP. The exciton peak of SNP1
becomes less intensive than that of SNP2 because the energy relaxation rate for SNP1
exciton is larger (see the numbers in Fig. 14). The latter comes from the fact that the
SNP1 exciton energy is closer to the plasmon resonance. A time-resolved study of
single NP complex may be more productive and we will discuss this opportunity below.
Forsterγ )2(1,metaγ )2(1,radγ totI ),2(1
5.3 Gold NPs
Another important material system is Au nanocrystals. We now show the results for SNP-
MNP complexs with parameters: nmdd 821 == , nmRNMP 4= , , and
. For the geometry , the FT process is suppressed due to the
screening effect (Fig. 15a). But, the geometry demonstrates again enhanced,
plasmon-assisted FT (Fig. 15b). In Fig. 15b, we also plot the metal energy transfer rate.
Again, this rate is larger than . This leads to a small FT efficiency, like in the case
of Ag-MNP (Fig. 13).
nmRSMP 5.11 =
nmRSMP 5.22 = 090=ϕ
0180=ϕ
Forsterγ
35
Like in the case of Ag-MNP, the metal relaxation rates determine the intensity of
exciton peaks in cw-PL spectra. AS an example, we show the PL spectrum for
)900,800(),( 21 nmnmSNPSNP =λλ . Because of fast energy relaxation, the PL emission
becomes strongly reduced (inset of Fig. 16). The peak asymmetry comes mostly from the
difference in energy relaxation rates, and . The effect of FT is visible in
Fig. 16. In experiments, it can be derived from the PL spectrum using the rate equations.
1,metalγ 2,metalγ
A more promising method to observe plasmon-enhanced FT can be time-resolved
PL. We now consider temporal dynamics of excitons and denote the populations of SNPs
as be and . At t=0, )(1 tn )(2 tn 101 )0( nn = and 202 )0( nn = for excitons in SNP1 and
SNP2, respectively. The temporal evolution of exciton populations is given by:
tentn 1101 )( γ−= , , tt ebeatn 21)(2
γγ −− ⋅+⋅=
where 1021 )/( na Forster γγγ −−= and 102120 )/( nnb Forster γγγ −+= . For simplicity, we
assume that . Fig. 17 shows temporal dynamics. The indication of FT is the
presence of two exponential functions in the temporal evolution of PL signal of SNP2.
Therefore, we will analyze the ratio . For the case
2012 nn =
ba /
)660,600(),( 21 nmnmSNPSNP =λλ , 03.0/ ≈ba . The ratio between pre-exponential
amplitudes for the case is )660,600( nmnm 33.0/ ≈ba . Therefore, this looks assessable
for experimental studies. Fig. 17 shows also the straight line with a slope equal to
. We can see in Fig. 17 that the functions decrease more rapidly
than the straight lines. In this way, one can see the effect of FT. We note that similar
( ) 02 |/)(ln =tdttnd )(ln 2 tn
36

dynamics was observed, for example, in ref.3 for an ensemble of SNPs. We also note that
the FT enhancement factors for the data in Fig. 17 are large ( ). 17,8~
6. Discussion and conclusions
The FT process is qualitatively different to the process of energy transfer in plasmonic
wave guides.26,27 The main difference is that the FT process can appear without
excitation of plasmons. Moreover, direct plasmon excitation leads to dissipation and
makes it difficult to observe the FT process. In other words, energy transfer through
virtual plasmons is the best. In contrast, energy transfer in plasmonic waveguides comes
from excitation and propagation of real plasmons; experimentally such transfer was
realized in ref.26. The ideal situation for plasmon-assisted FT is energy channeling
without excitation of real plasmons. This trend can be well seen using an idealized Drude
model with very small plasmon damping. We now assume that MNP has the following
dielectric constant: . For the parameters of the model,
we take: ,
)](/(1[)( 2ppm iγωωεωε −Ω−= ∞
eVp 6.2=Ω 12=∞ε , and eVp 005.0=γ . The last parameter is the plasmon
damping. Of course, the realistic damping frequencies in metals are much larger. Figure
18 describes the FT process assisted by a metal NP with very small plasmon damping.
The ratio 1,1, / metalzForter γγ is minimal in the plasmon resonance because of strong energy
losses during the FT process. As the exciton energy moves away the plasmon resonance,
the ratio 1,1, / metalzForter γγ increases and FT becomes more efficient.
37

Plasmons in optical experiments with metals represent oscillators with strong
damping and, therefore, plasmon-assisted FT of excitons should appear together with
strong energy relaxation. This tells us that the conditions for experimental observation of
plasmon-enhanced FT are peculiar: the enhanced FT process should be studied in the
regime of relatively weak dissipation. In this paper, we describe several examples of SNP
pairs: ),( 21 SNPSNP λλ = (400, 500), (440, 500), (600, 660), and (800 nm, 900 nm). CdTe
SNP pair can be used for the case 600/660. InGaN can be used for all above pairs as this
material has the unique compositional tunability; the band gap of InGaN can be tuned
from 0.7 to 3.45 eV.28 PbSe NPs also offer the exciton energies from about 0.2 to 1.6
eV.29 PbSe NPs can be used for the pair (800, 900). A disadvantage of PbSe NPs is a
relatively high background dielectric constant ( 23=sε ); this will reduce the FT rate.
Simultaneously, the dielectric constants of CdTe and InGaN are not very large. For CdTe
2.7=sε and, for InGaN, the dielectric constant is in the range 4.815.5 << sε .
To summarize our results, we developed a theory of plasmon-assisted energy
transfer between SNPs. For NP complexes with relatively large dimensions
( ), we derived convenient analytical formulas based on the dipole
approximation. In the general case, the energy transfer rates are expressed through the
response function
NPcomplex RL >
)(ωF and should be calculated numerically. We performed our
calculations for both Ag- and Au-based nano-complexes. Our theory can be applied to a
variety of semiconductor and metal nanocrystal structures.
Acknowledgements
38

This work was supported by NSF and BNNT Initiative at Ohio University.
Appendix 1
We now apply the equation of motion of the density matrix to the exciton dynamics of
SNP2:
∑Γ−=∂
∂
nmnmnmij
ij jHiit
ρρρ
ˆ]ˆ,ˆ[ˆ
,h
, (A1)
where ρ and H are the density matrix and the Hamiltonian, respectively; the matrix
describes incoherent energy relaxation within the NPs and the index i represents all
states of SNP2 (
nmij ,Γ
2exc ). The Hamiltonian is .
The current induced in the SNP2 is given by:
titot
titot ereereHH 11 )()(ˆˆ *
0ωω ⋅Φ+⋅Φ+= −
( )∑ Ψ∇Ψ−Ψ∇Ψ=nm
mexcnexcnexcmexcmnexc imetj
,
*,,,
*,
02)(
rrhrρ , where the functions
include the wave functions for the states
*,mexcΨ
2exc and for the vacuum state 20 . In the
linear regime, the most important matrix element is given by22
( )212
,2
2
30, )(
)()( 2
2
1
2excexc
exctotexc
SNP
tiexcexc iEE
erErrdeed
Γ−−
⋅Ψ⋅= ∫−
rrβωρ . (A2).
39

Then, the dissipation rate can be calculated as
( )∑ ∫∫ Γ−−
⋅Ψ⋅−=⋅
2 2
2
221
,2
2
322
1
*
2
3)()(
)(exc excexc
exctotexc
SNPexc
totexc
SNP iEEerE
rrddei
Ejrdrrrr
β
ω. (A3)
To obtain the above equation, we used the equality 22 0ˆexcexcEidvexc =
r, where
is the electron velocity operator; we also assumed that and 0/ˆˆ mpv rr=
22 excexc E<<Γ
112EEEexc <<− . In addition we took the exciton wavefunctions in the form
),()()(222
2 ehexchexceexc urrexc rrΨΨ= , where the Bloch function has an
interband dipole moment parallel to
),( ehu rrα
2excer .
Appendix 2
We now modify slightly eq. 16. This equation describes ET transfer process
χβψ →= 11 , where χ denotes all states in the system excluding the excitons
β1 . This approach assumes weak, incoherent coupling of the excitons β1 with the
other states. The Hamiltonian of the system reads Coulnn
UHH ˆˆˆ 0 +=∑ , where are
the Hamiltonians of single NPs and describes Coulomb interaction between the
NPs. The off-diagonal components of density matrix can be obtained from the equation
0ˆnH
CoulU
40

of motion of the density matrix: [ ]11/ˆˆ1ˆ1 Γ+−⋅−= iEEUCoul χχρχχβχρβ ,
where is the off-diagonal broadening of the excitons 1Γ 1ψ in SNP1. The set of matrix
elements χρβ ˆ1 describe energy transfer from SNP1 to MNPs and SNP2. The
diagonal matrix element βρβ 1ˆ1 can be expressed through χρβ ˆ1 . The resultant
equation for the diagonal component is:
βρβγγγβρβ
βαα 1ˆ1)~(1ˆ1
10
,, ++−= − iradnoniraddtd
, where
( )[ ]21
21
121,1,1 1ˆ2~~~
Γ+−
Γ=+= ∑
χχβββ
πβχπγγγ
EEUCoulForstermetal
h. (A4)
It is essential to note that this equation is valid for the incoherent regime of ET:
βγ11~h>>Γ . In other words, the width of exciton states is larger that the parameter βγ1
~h ;
this parameter describes the inter-NP interaction. Now we write Eq. A4 in the form of the
correlation function (9) with substitution 111 /// Γ−→ ttiEtiE ee hh . Then, using the inverse
Fourier transformation of eq. 9, one can show that
( )∫ Γ+−
Γ= '
]'[)'()(~
21
21
1111 dE
EEEE
πγγ ββ .
This equation introduces the broadening due to the donor SNP1 and leads to eq. 17.
41

Fig. 1. a) Schematics of the system. b) Energy diagram of FT process and other related
processes. The processes are specified in the right upper corner.
42

Fig. 2. Schematics of NP complexes. Figures a) , b) and c) depict the processes of energy
transfer between NPs. Figure d) illustrates the role of surface changes.
43

Fig. 3. a) Calculated FT ratios for the geometry with . b) The same for the
geometry ; red and dark blue curves correspond to the dipole approximation and
numerical results. Insets show NP complexes to scale.
βf060=ϕ
0180=ϕ
44
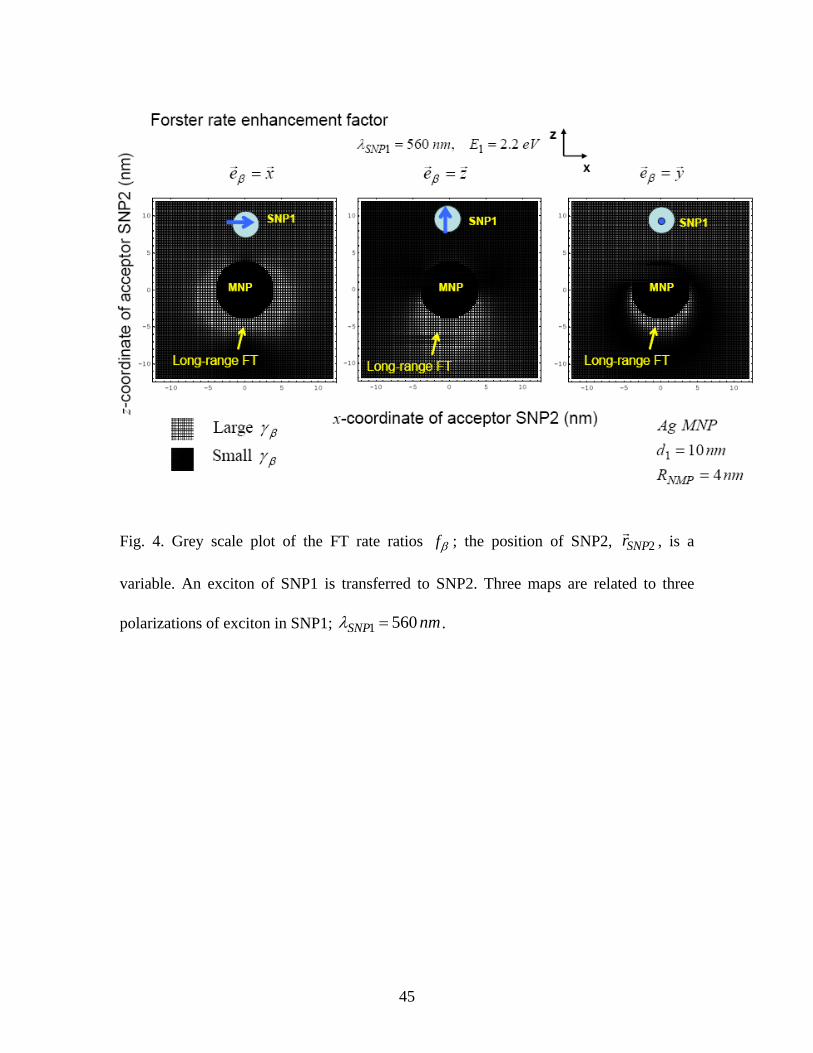
Fig. 4. Grey scale plot of the FT rate ratios ; the position of SNP2, βf 2SNPrr , is a
variable. An exciton of SNP1 is transferred to SNP2. Three maps are related to three
polarizations of exciton in SNP1; nmSNP 5601 =λ .
45

Fig. 5. Grey scale plot of the FT rate ratios ; the position of SNP2, βf 2SNPrr , is a
variable. An exciton of SNP1 is transferred to SNP2. Three maps are related to three
polarizations of exciton in SNP1; nmSNP 3801 =λ .
46

Fig. 6. a) Calculated FT rates βγ ,Forster for two geometries with and .
Dashed curves are the FT rate in the absence of MNP, whereas solid lines represent the
plasmon-assisted FT processes. Insets show NP complexes to scale.
060=ϕ 0180=ϕ
47

Fig. 7. Grey scale plot of the FT rate βγ ,Forster ; the position of SNP2, 2SNPrr , is a
variable. An exciton of SNP1 is transferred to SNP2. Three maps are related to three
polarizations of exciton in SNP1; nmSNP 5601 =λ .
48

Fig. 8. a) Diagrams responsible for FT, plasmon-assisted FT, and transfer of energy to
MNP. b) These diagrams represent the shift of the exciton energy in the presence of
plasmons. c) Diagrams for plasmon-assisted FT in the presence of two interacting
MNPs.
49

Fig. 9. a) Calculated metal transfer rates βγ 1,metal for the geometries with .
Dashed curves are obtained within the dipole approximation, whereas solid lines
represent numerical results. b) The field enhancement factor for SNP1 calculated
numerically.
0180=ϕ
50

Fig. 10. Calculated components of the response functions, zmetal 1,γ and zForster 1,γ for the
geometry with . The lowest exciton wavelength of SNP2 is assumed to be 0180=ϕnmSNP 5002 =λ .
51
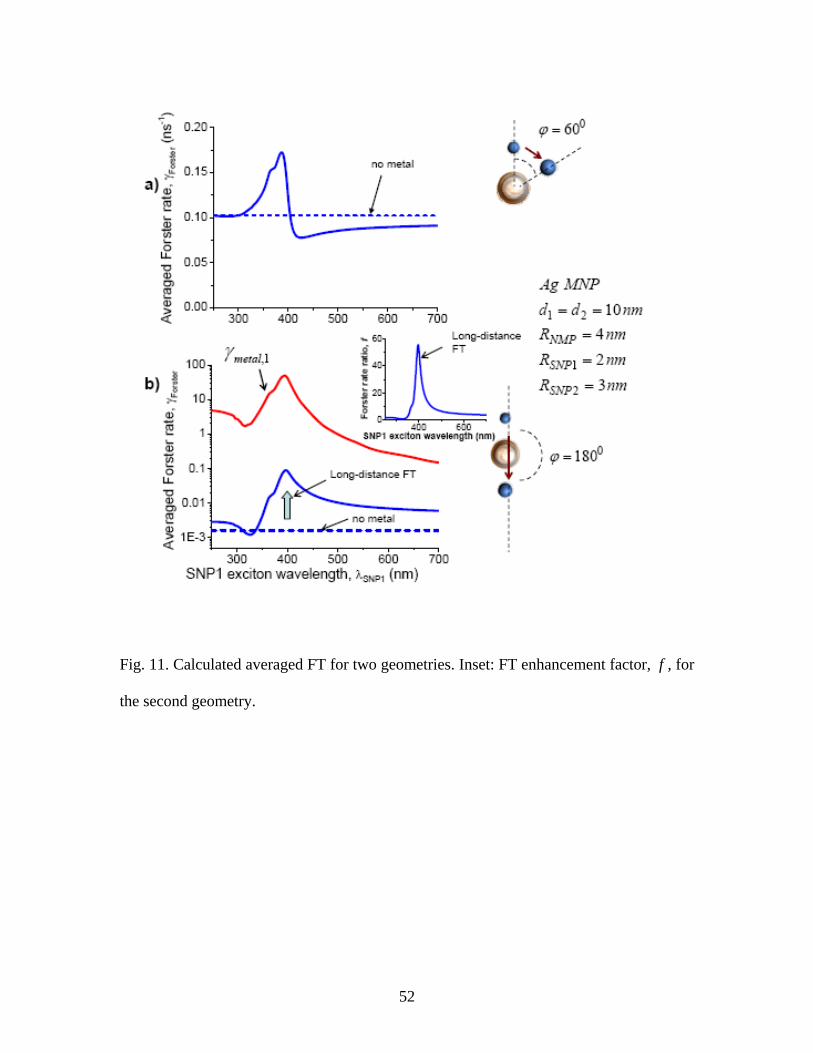
Fig. 11. Calculated averaged FT for two geometries. Inset: FT enhancement factor, f , for
the second geometry.
52

Fig. 12. Calculated averaged FT as a function of the angle ϕ . Inset shows the geometry.
53

Fig. 13. Calculated efficiency and metal transfer rate as a function of 1SNPλ .
54

Fig. 14. Calculated PL spectra for two systems. The dashed curves show the spectra in the absence of MNP. Insets: schematics of nano-complexes.
55

Fig. 15. Calculated averaged FT rates for two complexes incorporating Au-MNP. The
panel b) also depicts the metal transfer rate for SNP1. Solid and dashed lines show the
results with and without MNP, respectively. Insets: NP complexes.
56
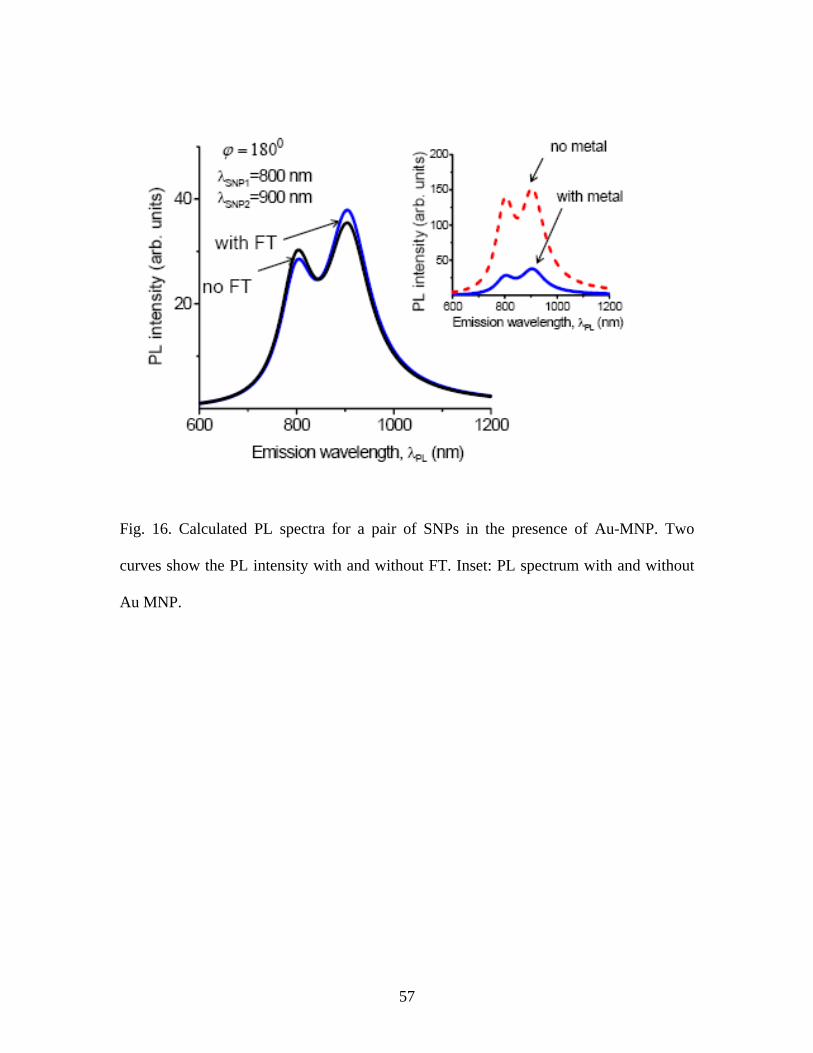
Fig. 16. Calculated PL spectra for a pair of SNPs in the presence of Au-MNP. Two
curves show the PL intensity with and without FT. Inset: PL spectrum with and without
Au MNP.
57

Fig. 17. Temporal dynamics of exciton population of SNP2. Figures a) and b) describe
SNP2 exciton dynamics in the presence of Au-NP. Figure c) shows in the
absence of MNP. One can see that dynamics in the case c) becomes slower compared to
figure b). The straight lines are drawn to show the FT effect. These lines have a slope
.
)(ln 2 tn
( ) 02 |/)(ln =tdttnd
58

Fig. 18. Calculated FT rate for an idealized model (a). We also show the metal transfer rate (a) and the ratio 1,1, / metalzForter γγ (b).
59
References 1 Th. Förster, in Modern Quantum Chemistry, edited by O. Sinanoglu (Academic, New York, 1965). 2 C.R. Kagan, C.B. Murray, and M.G. Bawendi, Phys. Rev. B 54, 8633 (1996). 3 M. Furis, J. A. Hollingsworth, V. I. Klimov, and S. A. Crooker, J. Phys. Chem. B, 109, 15332 (2005). 4 J. Lee, A. O. Govorov, and N. A. Kotov, Nano Lett. 5, 2063 (2005). 5 K. T. Shimizu, W. K. Woo, B. R. Fisher, H. J. Eisler, and M. G. Bawendi, Phys. Rev. Lett. 89, 117401 (2002). 6 G. Lu, H. Shen, B. Cheng, Z. Chen, C. A. Marquette, L. J. Blum, O. Tillement, S. Roux, G. Ledoux, M. Ou, and P. Perriat, Appl. Phys. Lett. 89, 223128 (2006). 7 J. Jiang, K. Bosnick, M. Maillard, and L. Brus, J. Phys. Chem. B 107, 9964 (2003). 8 J. Lee, A. O. Govorov, J. Dulka, and N. A. Kotov, Nano Letters, 4, 2323 (2004); J. Lee, T. Javed, T. Skeini, A. O. Govorov, G.W. Bryant, N. A. Kotov, Angew. Chem. 45, 4819 (2006). 9 K. Ray, R. Badugu, and J. R. Lakowicz, J. Am. Chem. Soc. 128, 8998 (2006). 10 J. R. Lakowicz, Analytical Biochemistry 298, 1 (2001). 11 X. M. Hua, J. I. Gersten, and A. Nitzan, J. Chem. Phys. 83, 3650 (1985). 12 G. L. Bir and G. E. Pikus, Symmetry and Strain-induced Effects in Semiconductors (Wiley, N. Y. 1975). 13 Al. L. Efros, M. Rosen, M. Kuno, M. Nirmal, D.J. Norris, and M. Bawendi, Phys. Rev. B 54, 4843 (1996). 14 In addition, in the low-temperature regime, the fine energy structure of the exciton states αi αααα can be important and, therefore, γ γ iispiniispin →→ ≠ ',',
TkEiispiniispin
Biie /',',
,'/ αααααα γγ Δ
→→ = '', αααα iiii EEE
and more precisely
, where = −Δ is the difference of
energies for the excitons and T is the temperature. and α1 '1α 15 This can also be done for SNPs with cylindrical symmetry.
60
16 A. O. Govorov, Phys. Rev. B 68, 075315 (2003). 17 J. M. Smith, P. A. Dalgarno, R. J. Warburton, A. O. Govorov, K. Karrai, B. D. Gerardot, and P. M. Petroff, Phys. Rev. Lett. 94, 197402 (2005). 18 A. O. Govorov, G. W. Bryant, W. Zhang, T. Skeini, J. Lee, N. A. Kotov, J. M. Slocik, and R. R. Naik, Nano Lett. 6, 984 (2006); J. M. Slocik, A. O. Govorov, and R. R. Naik, Supramolecular Chem., 18 , 415 (2006). 19 L. D. Landau and E. M. Lifshitz, Electrodynamics of Continuous Media (Pergamon, New York, 1960). 20 A. O. Govorov, Phys. Rev. B 71, 155323 (2005). 21 P. M. Platzman and P.A. Wolf, Waves and Interactions in Solid State Plasma (Academic Press, N. Y.,1973). 22 A. Yariv, Quantum Electronics (Wiley, New York, 1975). 23 B. N. J. Persson and N. D. Lang, Phys. Rev. B 26, 5409 (1982). 24 E. D. Palik, Handbook of Optical Constant of Solids (Academic, New York, 1985). 25 L. D. Landau and E. M. Lifshitz: Quantum Mechanics: Non-Relativistic Theory, Volume 3, (Butterworth-Heinemann, Oxford, 2002).
26 Stefan A. Maier, Pieter G. Kik, Harry A. Atwater, Sheffer Meltzer, Elad Harel, Bruce E. Koel, Ari A.G. Requicha, Nature Materials 2, 229 (2003).
27 D. S. Citrin, Nano Lett. 4, 1561 (2004). 28 V. Yu. Davydov, A. A. Klochikhin, V. V. Emtsev, S. V. Ivanov, V. V. Vekshin, F. Bechstedt, J. Furthmüller, H. Harima, A. V. Mudryi, A. Hashimoto, A. Yamamoto, J. Aderhold, J. Graul, and E. E. Haller, phys. stat. solidi (b), 230(2), R4 (2002). 29 G. Allan and C. Delerue, Phys. Rev. B 70, 245321 (2004).
61
Copyright © 2022 FDOKUMEN