Theory and Practice of Enzyme Bioaffinity Electrodes. Direct Electrochemical Product Detection
10
Theory and Practice of Enzyme Bioaffinity Electrodes. Chemical, Enzymatic, and Electrochemical Amplification of in Situ Product Detection Benoît Limoges,* Damien Marchal, François Mavré, and Jean-Michel Savéant* Laboratoire d’Electrochimie Moléculaire, UniVersité Paris Diderot, UMR CNRS 7591, 2 place Jussieu, 75251 Paris Cedex 05, France Received November 22, 2007; E-mail: [email protected]; [email protected] Abstract: The two articles in this series are dedicated to bioaffinity electrodes with in situ detection of the product of the enzyme label after recognition by its conjugate immobilized on the electrode. Part 1 was devoted to direct electrochemical detection, whereas the present contribution deals with homogeneous chemical and enzymatic amplification of the primary electrochemical signal. The theoretical relationships that are established for these modes of amplification are applied to the avidin–biotin recognition in a system that involves alkaline phosphatase as enzyme label and 4-amino-2,6-dichloro-phenyl phosphate as substrate, generating 2,6-dichloro-4-aminophenol as electrochemically active product. Chemical amplification then results from the addition of NADH, which reduces the 2,6-dichloro-quinonimine resulting from the electrochemical oxidation of 2,6-dichloro-4-aminophenol. An increased amplification is obtained when the reduction of 2,6-dichloro-quinonimine involves diaphorase in solution with NADH as substrate. The excellent agreement between theoretical predictions and experimental data required a detailed theoretical analysis and the independent determination of the key kinetic parameters of the system. The theoretical analysis was extended to monolayer and multilayered films of auxiliary enzyme as well as to electrochemical amplification by means of closely spaced dual electrodes so as to offer a rational comparative panorama of the amplification capabilities of the various possible strategies. Confinement of the profile of the product, and/or its oxidized form, in the vicinity the electrode surface appears as a key parameter of amplification. Introduction As discussed in details in the introduction of Part 1 1 of this series, enzyme-amplified binding assays associated with electrochemical detection have progressively emerged over the last fifteen years as a viable and attractive alternative to optical methods. There are two main ways of transducing the activity of the enzyme label immobilized on the electrode into an electrochemical signal. One in which the current is the electrocatalytic response of a redox couple serving as cosubstrate to a redox enzyme label and the other where transduction consists in the electrochemical detection of the enzyme label product. Concerning the latter approach, the theoretical relationships characterizing the direct electrochemical detection of the enzyme label product in conventional high volume-to-surface cells have been established and tested experimentally in Part 1. It has also been shown, on theoretical and experimental grounds, that the sensitivity can be significantly improved by use of electrochemi- cal cells with small volume-to-surface ratios. Another possibility consists in increasing the response of the enzyme label product by redox cycling. 2 This is feasible when the enzyme-generated product is a redox compound that can be reversibly oxidized or reduced. Among the numerous approaches that have been proposed, one-step in situ strategies are particularly attractive in terms of simplicity and efficiency when applied to bioaffinity electrodes. The bioaffinity electrode serves both as an im- mobilization platform of the binding recognition, allowing to specifically attaching the enzyme label onto the electrode surface, and as an electrochemical detector. These one-step in situ strategies consist in a continuous regeneration of the enzyme label product as production goes along in the close vicinity of the bioaffinity electrode. The electrochemical redox cycling between two working electrodes held at different potentials to cause alternative oxidation and reduction of the redox product generated by the enzyme label has been the most widely investigated in this respect. 3–10 The electrochemical cycling is efficient if the two electrodes are very close to each other as in (1) Limoges, B.; Mavré, F.; Marchal, D.; Savéant,J.-M.; Schöllhorn, B. J. Am. Chem. Soc. 2008, 130, 7259–7275. (2) Scheller, F. W.; Bauer, C. G.; Makower, A.; Wollenberger, U.; Warsinke, A.; Bier, F. F. Anal. Lett. 2001, 34, 1233–12. (3) Niwa, O.; Xu, Y.; Halsall, H. B.; Heineman, W. R. Anal. Chem. 1993, 65, 1559–63. (4) Thomas, J. H.; Kim, S. K.; Hesketh, P. J.; Halsall, H. B.; Heineman, W. R. Anal. Biochem. 2004, 328, 113–22. (5) Thomas, J. H.; Kim, S. K.; Hesketh, P. J.; Halsall, H. B.; Heineman, W. R. Anal. Chem. 2004, 76, 2700–7. (6) Kim, S. K.; Hesketh, P. J.; Li, C.; Thomas, J. H.; Halsall, H. B.; Heineman, W. R. Biosens. Bioelectron. 2004, 20, 887–94. (7) Nebling, E.; Grunwald, T.; Albers, J.; Schäfer, P.; Hintsche, R. Anal. Chem. 2004, 76, 689–96. (8) Gabig-Ciminska, M.; Holmgren, A.; Andresen, H.; Bundvig Barken, K.; Wumpelmann, M.; Albers, J.; Hintsche, R.; Breitenstein, A.; Neubauer, P.; Los, M.; Czyz, A.; Wegrzyn, G.; Silfversparre, G.; Jurgen, B.; Schweder, T.; Enfors, S.-O. Biosens. Bioelectron. 2004, 19, 537–46. (9) Liu, D.; Perdue, R. K.; Sun, L.; Crooks, R. M. Langmuir 2004, 20, 5905–10. Published on Web 05/20/2008 10.1021/ja7102873 CCC: $40.75 2008 American Chemical Society 7276 9 J. AM. CHEM. SOC. 2008, 130, 7276–7285
-
Upload
univ-paris-diderot -
Category
Documents
-
view
0 -
download
0
Transcript of Theory and Practice of Enzyme Bioaffinity Electrodes. Direct Electrochemical Product Detection

Theory and Practice of Enzyme Bioaffinity Electrodes.Chemical, Enzymatic, and Electrochemical Amplification of in
Situ Product Detection
Benoît Limoges,* Damien Marchal, François Mavré, and Jean-Michel Savéant*
Laboratoire d’Electrochimie Moléculaire, UniVersité Paris Diderot, UMR CNRS 7591, 2 placeJussieu, 75251 Paris Cedex 05, France
Received November 22, 2007; E-mail: [email protected]; [email protected]
Abstract: The two articles in this series are dedicated to bioaffinity electrodes with in situ detection of theproduct of the enzyme label after recognition by its conjugate immobilized on the electrode. Part 1 wasdevoted to direct electrochemical detection, whereas the present contribution deals with homogeneouschemical and enzymatic amplification of the primary electrochemical signal. The theoretical relationshipsthat are established for these modes of amplification are applied to the avidin–biotin recognition in a systemthat involves alkaline phosphatase as enzyme label and 4-amino-2,6-dichloro-phenyl phosphate as substrate,generating 2,6-dichloro-4-aminophenol as electrochemically active product. Chemical amplification thenresults from the addition of NADH, which reduces the 2,6-dichloro-quinonimine resulting from theelectrochemical oxidation of 2,6-dichloro-4-aminophenol. An increased amplification is obtained when thereduction of 2,6-dichloro-quinonimine involves diaphorase in solution with NADH as substrate. The excellentagreement between theoretical predictions and experimental data required a detailed theoretical analysisand the independent determination of the key kinetic parameters of the system. The theoretical analysiswas extended to monolayer and multilayered films of auxiliary enzyme as well as to electrochemicalamplification by means of closely spaced dual electrodes so as to offer a rational comparative panoramaof the amplification capabilities of the various possible strategies. Confinement of the profile of the product,and/or its oxidized form, in the vicinity the electrode surface appears as a key parameter of amplification.
Introduction
As discussed in details in the introduction of Part 11 of this series,enzyme-amplified binding assays associated with electrochemicaldetection have progressively emerged over the last fifteen yearsas a viable and attractive alternative to optical methods. There aretwo main ways of transducing the activity of the enzyme labelimmobilized on the electrode into an electrochemical signal. Onein which the current is the electrocatalytic response of a redoxcouple serving as cosubstrate to a redox enzyme label and the otherwhere transduction consists in the electrochemical detection of theenzyme label product.
Concerning the latter approach, the theoretical relationshipscharacterizing the direct electrochemical detection of the enzymelabel product in conventional high volume-to-surface cells havebeen established and tested experimentally in Part 1. It has alsobeen shown, on theoretical and experimental grounds, that thesensitivity can be significantly improved by use of electrochemi-cal cells with small volume-to-surface ratios. Another possibilityconsists in increasing the response of the enzyme label productby redox cycling.2 This is feasible when the enzyme-generatedproduct is a redox compound that can be reversibly oxidizedor reduced. Among the numerous approaches that have beenproposed, one-step in situ strategies are particularly attractive
in terms of simplicity and efficiency when applied to bioaffinityelectrodes. The bioaffinity electrode serves both as an im-mobilization platform of the binding recognition, allowing tospecifically attaching the enzyme label onto the electrodesurface, and as an electrochemical detector. These one-step insitu strategies consist in a continuous regeneration of the enzymelabel product as production goes along in the close vicinity ofthe bioaffinity electrode. The electrochemical redox cyclingbetween two working electrodes held at different potentials tocause alternative oxidation and reduction of the redox productgenerated by the enzyme label has been the most widelyinvestigated in this respect.3–10 The electrochemical cycling isefficient if the two electrodes are very close to each other as in
(1) Limoges, B.; Mavré, F.; Marchal, D.; Savéant,J.-M.; Schöllhorn, B.J. Am. Chem. Soc. 2008, 130, 7259–7275.
(2) Scheller, F. W.; Bauer, C. G.; Makower, A.; Wollenberger, U.;Warsinke, A.; Bier, F. F. Anal. Lett. 2001, 34, 1233–12.
(3) Niwa, O.; Xu, Y.; Halsall, H. B.; Heineman, W. R. Anal. Chem. 1993,65, 1559–63.
(4) Thomas, J. H.; Kim, S. K.; Hesketh, P. J.; Halsall, H. B.; Heineman,W. R. Anal. Biochem. 2004, 328, 113–22.
(5) Thomas, J. H.; Kim, S. K.; Hesketh, P. J.; Halsall, H. B.; Heineman,W. R. Anal. Chem. 2004, 76, 2700–7.
(6) Kim, S. K.; Hesketh, P. J.; Li, C.; Thomas, J. H.; Halsall, H. B.;Heineman, W. R. Biosens. Bioelectron. 2004, 20, 887–94.
(7) Nebling, E.; Grunwald, T.; Albers, J.; Schäfer, P.; Hintsche, R. Anal.Chem. 2004, 76, 689–96.
(8) Gabig-Ciminska, M.; Holmgren, A.; Andresen, H.; Bundvig Barken,K.; Wumpelmann, M.; Albers, J.; Hintsche, R.; Breitenstein, A.;Neubauer, P.; Los, M.; Czyz, A.; Wegrzyn, G.; Silfversparre, G.;Jurgen, B.; Schweder, T.; Enfors, S.-O. Biosens. Bioelectron. 2004,19, 537–46.
(9) Liu, D.; Perdue, R. K.; Sun, L.; Crooks, R. M. Langmuir 2004, 20,5905–10.
Published on Web 05/20/2008
10.1021/ja7102873 CCC: $40.75 2008 American Chemical Society7276 9 J. AM. CHEM. SOC. 2008, 130, 7276–7285

interdigitated electrode arrays.3–10 However, these microdevicesare difficult to fabricate and fragile. It should also be noted thatthe lack of theoretical analysis of these systems has so farprevented a rational evaluation of their performances.
Enzymatic amplification of the electrochemical signal of theenzyme label product seems a promising strategy in terms ofsimplicity and sensitivity. Although multienzymatic systemshave attracted active attention,11–17 it is only recently thatenzymatic catalytic amplification has been specifically appliedto one-step in situ amplification of the signal of enzymebioaffinity electrodes.18 Amplification factors higher than 3000could thus be reached by co-immobilization with the firstenzyme of a monolayer of an appropriate enzyme amplifier.
In the same vein, signal amplification by means of chemicalregeneration has been recently proposed.19 The method consistsin the electrochemical oxidation of the reduced form of theenzyme label product and its regeneration by means of achemical reagent added to the solution (Scheme 1).
Although the high amplification rates achieved with theimmobilized bienzymatic system are quite attractive for devel-oping highly sensitive biological assays,18 co-immobilizationof the two enzymes on the electrode surface complicates theprocedure. The approach that consists in adding the enzymaticamplifier in the solution (Scheme 1) is more practicable. It has
however never been investigated to the best of our knowledge.The main objective of the present work was thus to examinethe potentiality of this approach and to compare it with thealternative strategy of chemical regeneration. As in Part 1 ofthe series, attainment of this goal requires the establishment ofthe theoretical relationships that link the electrochemical currentresponse to the amount of primary enzyme label specificallyattached to the electrode surface and therefore determine thekey parameters that govern signal amplification in the enzymaticand in the chemical case. To complete the comparison, we havealso derived the relationships pertaining to electrochemicalamplification in conditions that mimic those where oppositelypolarized close-spaced electrodes are used (Scheme 1).
To illustrate the applicability of the theoretical relationshipsthus derived to an experimental system and evaluate theamplification achievements of the various approaches, we haveselected alkaline phosphatase (AP) as primary enzyme label. Itis able to rapidly hydrolyze the substrate 4-amino-2,6-dichlo-rophenyl phosphate (2,6-DCPAPP) into an electroactive redoxcompound, the 4-amino-2,6-dichlorophenol (2,6-DCPAP), bya reversible two-electrons/two-proton exchange at the electrode.1
The substrate/product couple 2,6-DCPAPP/2,6-DCPAP waspreferred to the classical p-aminophenylphosphate/p-aminophe-nol couple because 2,6-DCPAP has a faster apparent hetero-geneous electron transfer rate at an electrode coated withproteins than p-aminophenol.1 This better-defined reversibilityindeed improves the redox regeneration efficiency. As enzymeamplifier, we have chosen the diaphorase (DI) from Bacillusstearothermophilus, a redox enzyme that we previously char-acterized kinetically.20 Assembling AP-based bioaffinity elec-trode with DI regeneration was as depicted in Scheme 2,showing the specific binding of alkaline phosphatase-conjugatedneutravidin (N-AP) to a monolayer of biotinylated immuno-globulin (b-IgG) irreversibly adsorbed on the surface of a glassycarbon electrode, followed by the amplified electrochemical
(10) Honda, N.; Inaba, M.; Katagiri, T.; Shoji, S.; Sato, H.; Homma, T.;Osaka, T.; Saito, M.; Mizuno, J.; Wada, Y. Biosens. Bioelectron. 2005,20, 2306–9.
(11) Yamaguchi, S.; Ozawa, S.; Ikeda, T.; Senda, M. Anal. Sci. 1992, 8,87–8.
(12) Della Ciana, L.; Bernacca, G.; Bordin, F.; Fenu, S.; Garetto, F. J.Electroanal. Chem. 1995, 381, 129–35.
(13) Ito, S.; Yamazaki, S.; Kano, K.; Ikeda, T. Anal. Chim. Acta 2000,424, 57–63.
(14) Rose, A.; Nistor, C.; Emnéus, J.; Pfeiffer, D.; Wollenberger, U.Biosens. Bioelectron. 2002, 17, 1033–43.
(15) Nistor, C.; Rose, A.; Wollenberger, U.; Pfeiffer, D.; Emneus, J. Analyst2002, 127, 1076–81.
(16) Cardosi, M. F.; Birch, S. W.; Stanley, C. J.; Johannsson, A.; Turner,A. P. F. Am. Biotech. Lab. 1989, 7, 50–8.
(17) Bauer, C. G.; Eremenko, A. V.; Ehrentreich-Förster, E.; Bier, F. F.;Makower, A.; Halsall, H. B.; Heineman, W. R.; Scheller, F. W. Anal.Chem. 1996, 68, 2453–8.
(18) Limoges, B.; Marchal, D.; Mavré, F.; Savéant, J.-M. J. Am. Chem.Soc. 2006, 128, 6014–5.
(19) Das, J.; Jo, K.; Lee, J. L.; Yang, H, Anal. Chem. 2007, 79, 2790–6.(20) Limoges, B.; Marchal, D.; Mavré, F.; Savéant, J.-M. J. Am. Chem.
Soc. 2006, 128, 2084–92.
Scheme 1. Various Modes of Redox Cycling Amplification Scheme 2
J. AM. CHEM. SOC. 9 VOL. 130, NO. 23, 2008 7277
Enzyme Bioaffinity Electrodes. Amplification A R T I C L E S

detection of the activity of the AP label in the presence of DI.Once the 2,6-DCPAP is generated by AP it is immediatelyoxidized at the electrode into 2,6-dichloro-quinonimine (2,6-DCQI) according to a -2e--2H+ reaction. In the presence ofthe auxiliary enzyme DI, the 2,6-DCQI is reduced back to 2,6-DCPAP and the oxidized form of DI is finally regenerated inits reduced native state by its natural substrate, NADH.
Selection of this bienzymatic system was guided by the factthat DI has a very high reactivity toward quinonimine deriva-tives, with a bimolecular rate constant close to diffusion control(i.e., higher than 108 M-1 s-1), and also because both enzymeshave their optimal activity within the same pH range (∼8.5 forDI and ∼9.5 for AP).
As a chemical amplification example, we chose the same systemwith no DI present. 2,6-DCPAP is then chemically regeneratedby direct reduction of 2,6-DCQI by NADH in the solution.
Results and Discussion
1. Theoretical Relationships for Steady-State Chronoam-perometry and Cyclic Voltammetry. 1.1. General. The primaryenzyme E1 is assumed to follow a simple Michaelis–Mentenkinetics (involving two forms, E1 and E1S), while the secondaryenzyme, serving as amplifier, is considered to operate accordingto a classical ping-pong mechanism (involving the three formsE2, E2,R and E3). For the chemical regeneration a simpleirreversible bimolecular reaction is considered. Scheme 3 showsthe various layers that are met successively when going towardthe solution perpendicularly to the electrode surface (assumedto be planar). The familiar enzyme label film and the diffusion-natural convection layer,1 are enfolding the “reaction layer” inwhich the chemical or enzymatic regenerating reaction takes
place. Since the chemical or enzymatic reactions of interest arefast, the reaction layer is thin, much thinner than the diffusion-convection layer (unlike what is represented in Scheme 3). Assoon as the enzyme bioaffinity electrode is immersed in asolution containing the substrate S, P is produced at the electrodesurface, diffuses in the solution, and is oxidized into Q if theelectrode potential is set at an appropriate value (we consideroxidations, but what follows is easily transposed to reductions).Taking into account that the primary enzyme film is muchthinner than the diffusion and diffusion-reaction layers in thesolution, the resulting flux balance writes
I2F
)D(d[P]dx )x)0
+ k1,2ΓE1S )-D(d[Q]dx )x)0
(1)
where I is the current density. Here and below, D is the diffusioncoefficient of P and Q and is assumed to be approximately thesame, the square brackets represent the corresponding concen-trations, and Γ is the surface concentrations of the subscriptforms of enzyme. The subscript x ) 0, indicates that the fluxesand concentrations are taken at the electrode or at the enzymelayer surfaces in the framework of linear diffusion. The twocorresponding average planes may be confounded since thethickness of the enzyme film is small as compared to the dif-fusion layer (the thicknesses in Scheme 3 are arbitrary). Thefactor 2 in the first member of the above equation is astoichiometric factor expressing the fact that the electrochemicaloxidation of the product consumes two electrons per moleculeas in the illustrating example below and as in a number of othercases. In the framework of Michaelis–Menten kinetics, thesteady-state enzymatic production of P, to be introduced in eq1, may be expressed as
k1,2ΓE1S ) k1,2ΓE1
0 [S]x)0
KM,1 + [S]x)0
where ΓE1
0 is the surface concentration of the enzyme labeledrecognized analyte. In the general case, when both the enzymekinetics and substrate diffusion jointly govern the productionof P (see Part 1):
k1,2ΓE1S )DSCS
0
δ×
1+K1,M
CS0+
k1,2ΓE1
0 δ
DSCS0
-�(1+K1,M
CS0+
k1,2ΓE1
0 δ
DSCS0 )2
- 4k1,2ΓE1
0 δ
DSCS0
2(2)
(DS is the diffusion coefficient of S and CS0, its bulk concentra-
tion, δ is the diffusion-natural convection layer thickness). Thisexpression simplifies to
k1,2ΓE1S ) k1,2ΓE1
0 (3)
when the bulk substrate concentration is increased so as to reacha situation where the production of P is solely governed by asaturated Michaelis–Menten kinetics with no interference ofsubstrate diffusion.
1.2. Chemical Amplification. P linearly diffuses in the portionof space adjacent to the electrode and to the enzyme labelsurface, while being regenerated by solution reduction of Q that
Scheme 3
7278 J. AM. CHEM. SOC. 9 VOL. 130, NO. 23, 2008
A R T I C L E S Limoges et al.
has been produced by the oxidation of P at the electrode. Thesecombined events are governed by the following equations.
Dd2[P]
dx2+ kCCR
0 [Q]) 0 (4)
Dd2[Q]
dx2- kCCR
0 [Q]) 0 (5)
The neglect of the variations of [P] and [Q] with time followsfrom the fact that regenerating reactions of interest are fast, sofast that a steady state is reached resulting from the mutualcompensation of diffusion and chemical reaction. These “purekinetic conditions”21 also entail the confinement of the Q profilewithin a thin layer, the “reaction layer”, adjacent to the electrodesurface. Moreover, in writing eqs 4 and 5, we have consideredthe case where the concentration of the substrate R is largeenough for being constant throughout the reaction layer andequal to its bulk concentration, CR
0. Under these conditions, thecurrent response in cyclic voltammetry and chronoamperometrycan be obtained as follows. Addition of eqs 4 and 5, followedby integration leads to (see Figure 1):
[P]+ [Q])k1,2ΓE1S
D(δ- x) (6)
after having taken into account eq 1 and [P]x)δ + [Q]x)δ ) 0as boundary conditions at x)0 and x ) δ, respectively.
Integration of eq 5 alone taking into account the “pure kineticconditions” leads to
I2F
)-D(d[Q]dx )x)0
) √DkCCR0 [Q]x)0
From eq 6:
[P]x)0 + [Q]x)0 )k1,2ΓE1Sδ
D
If the electrode potential is positive enough for the conditionto be fulfilled [P]x)0 ) 0, then
[Q]x)0 )k1,2ΓE1Sδ
D(7)
and therefore
I2F
)�kCCR0
Dδk1,2ΓE1S (8)
This steady state current is the one observed in chronoamper-ometry when the electrode potential is poised at a sufficientlypositive potential. It would be reached along an S-shaped curvein cyclic voltammetry at the end of the scan. The final expressionof the current is obtained from eq 8 after replacement of ΓE1Sby its expression in eq 2:
I2F
)�kCCR0
Dδ
DSCS0
δ×
1+K1,M
CS0+
k1,2ΓE1
0 δ
DSCS0
-�(1+K1,M
CS0+
k1,2ΓE1
0 δ
DSCS0 )2
- 4k1,2ΓE1
0 δ
DSCS0
2(9)
or, more simply by its expression in eq 3, when the substrateconcentration is large enough for reaching saturated Michaelis–Menten kinetics. In the latter case,
I2F
)�kCCR0
Dδk1,2ΓE1
0 (10)
The P and Q concentration profiles in the reaction anddiffusion layers, shown in Figure 1 are given by the followingequation and by eq 7.
[Q])k1,2ΓE1Sδ
Dexp(-x�kCCR
0
D )1.3. Enzymatic Amplification. The analysis is similar to the
preceding case. The only change is the replacement of eqs 5and 6 by the equations that describe the kinetics of theamplifying enzyme in the reaction layer:
D∂
2[P]
∂x2+
CE2
0
1k3[Q]
+ 1k2,2
+ 1
k2CR0
) 0
D∂
2[Q]
∂x2-
CE2
0
1k3[Q]
+ 1k2,2
+ 1
k2CR0
) 0 (11)
with k2 ) k2,2/K2,M and K2,M ) (k2,-1 + k2,2)/k2,1.Integration of eq 11 under “pure kinetic conditions” leads to
-(∂[Q]∂x )x)0
) [Q]x)0�k3CE2
0
DP � 2
k3[Q]x)0( 1k2,2
+ 1
k2CR0 )
×
�[1-
ln(1+ k3[Q]x)0( 1k2,2
+ 1
k2CR0 ))
k3[Q]x)0( 1k2,2
+ 1
k2CR0 ) ]
by analogy with the derivations in ref 22. Maximizing theenzymatic amplification by using large concentrations of thesubstrate R pushes the enzymatic kinetics in the saturatedMichaelis–Menten limit:
(21) Savéant, J.-M. Elements of Molecular and Biomolecular Electrochem-istry; Wiley-Interscience: New York, 2006; Chapter 2.
(22) Limoges, B.; Moiroux, J.; Savéant, J.-M. J. Electroanal. Chem. 2002,521, 1–7.
Figure 1. Chemical amplification. Concentration profiles.
J. AM. CHEM. SOC. 9 VOL. 130, NO. 23, 2008 7279
Enzyme Bioaffinity Electrodes. Amplification A R T I C L E S
-(∂[Q]∂x )x)0
)
[Q]x)0�k3CE2
0
D � 2k3[Q]x)0
k2,2 �[1-ln(1+
k3[Q]x)0
k2,2)
k3[Q]x)0
k2,2]
Taking the still valid eqs 1 and 7 into account, the cyclicvoltammetric plateau current or chronoamperometric steady-state current may be expressed as
I2F
)
k1,2ΓE1Sδ�k3CE2
0
D � 2k3k1,2ΓE1Sδ
k2,2D �[1-ln(1+
k3k1,2ΓE1Sδ
k2,2D )k3k1,2ΓE1Sδ
k2,2D]
(12)
The final expression of the limiting current density is obtainedfrom eq 12 after replacement of ΓE1S by its expression in eq 2or, more simply, by its expression in eq 3, when the substrateconcentration is large enough for reaching saturated Michaelis–Menten kinetics. In the latter case, ΓE1S is simply replaced byΓE1
0 in eq 12.The main objective of amplification is the detection of small
amount of the enzyme label on the electrode surface, that is,small values of ΓE1
0 . Under these conditions eq 13 becomessimply
I2F
) k1,2ΓE1Sδ�k3CE2
0
D(13)
reflecting the fact that the production of P by the first enzymebeing slow, the rate-determining constant in the kinetics of thesecond enzyme becomes k3. Here again, ΓE1S may be replacedby ΓE1
0 when the substrate concentration is large enough forreaching saturated Michaelis–Menten kinetics. Then
I2F
) k1,2ΓE1
0 δ�k3CE2
0
D(14)
1.4. Electrochemical Amplification. In the electrode config-uration sketched in the bottom figure of Scheme 1 that mimicsan electrochemical redox cycling at parallel electrodes, ampli-fication results from opposite polarization of the two electrodes.Amplification will be maximized if, for example, the leftelectrode is polarized at a potential sufficiently positive toenforce the condition [P] ) 0 at its surface and the rightelectrode polarized at a potential sufficiently negative to enforcethe condition [Q] ) 0 at its surface. Then the Q generated atthe left electrode diffuses in the interelectrode gap to the rightelectrode where it is reduced into P that diffuses back to theleft electrode where it is oxidized and so on. A symmetricalsuccession of events takes place at the right electrode. In additionto these back-and-forth diffusions from one electrode to theother, P and Q tend to diffuse out of the interelectrode gaptoward the bulk of the electrochemical cell. Since we do notneed a very precise estimate of the mutual collection efficiencyof the dual electrodes, we can transform the actual system intothe equivalent simplified arrangement sketched in Scheme 4,
where formal holes are pierced through each electrode and itsimmobilized enzyme layer, so as to allow the diffusion of Pand Q not only to the other electrode but also within an externalsteady-state diffusion layer of thickness δ. Under these condi-tions the balance of fluxes of P writes
Ic
2F+ k1,2ΓE1S )D
[P]x)d⁄2
δ+D
[P]x)d⁄2
d
at the right electrode (cathode) and
-Ia
2F- k1,2ΓE1S )D
[P]x)d⁄2
d
at the left electrode (anode). At steady-state, Ic ) - Ia ) I, andtherefore
I2F
) k1,2ΓE1S(1+ 2δd )= 2k1,2ΓE1S
δd
(in practical applications d , δ), in which ΓE1S should bereplaced by its expression in eq 2 or, more simply, by ΓE1
0
when the substrate concentration is large enough for reachingsaturated Michaelis–Menten kinetics.
1.5. Comparison of Amplification Rates. Confinement. Wemay define the amplification rate by reference to the steady-state chronoamperometric current, I/2F ) k1,2ΓE1S. In all threecases ampl ) δ/ µ, where µ is a distance characterizing eachmode of amplification:
chemical: ampl) δ√kCCR0 /D, µ) √D ⁄ kCCR
0 (15)
enzymatic: ampl) δ√k3CE2
0 /D, µ) √D/k3CE2
0 (16)
electrochemical: ampl) 2δ/d, µ) d/2 (17)
In the electrochemical case, the smallest value of d/2 is ofthe order of micrometers. Equivalent or smaller values of µ canbe reached in the case of chemical and enzymatic amplificationthanks to an appropriate choice of the amplifier and of itsconcentration as exemplified in the next section.
We thus see that amplification increases as a function of theincreased confinement of the concentration profile of the oxidizedsubstrate. The same notion also applies to the cyclic voltammetricsampling procedures detailed in Part 1. The confinement length isthen the cyclic voltammetric diffusion layer (RT/DFV)1/2/A, adecreasing function of the scan rate (A is the stoichiometric factorof the order of 0.7 defined in Part 1).
Scheme 4
7280 J. AM. CHEM. SOC. 9 VOL. 130, NO. 23, 2008
A R T I C L E S Limoges et al.

It is also interesting to recall the equation giving the rate ofenzymatic amplification when a monolayer of auxiliary enzymeis co-immobilized with the enzyme label on the electrode surfaceas described in a recent preliminary note,18
ampl) k3ΓE2
0 δ/D (18)
in conditions where k3 is the rate-determining constant in thekinetics of the auxiliary enzyme. The corresponding “confine-ment length”, µ ) D/k3ΓE1
0 , has no obvious physical meaningin this case. This notion gets back its relevance when examiningthe use of thicker, multilayered, auxiliary enzyme films. Theirpotential interest lies in an increase of the amplification rate asΓE2
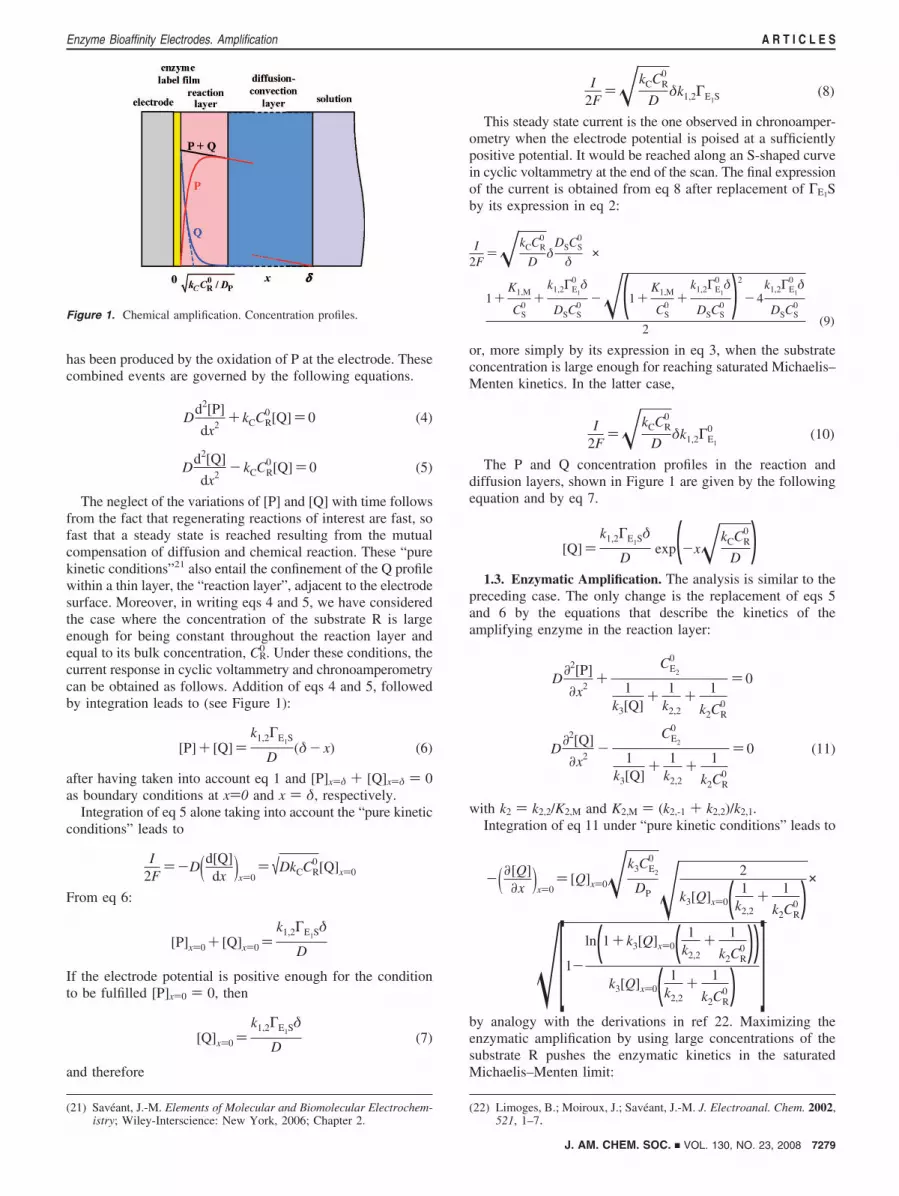
0 (intended as the total amount of enzyme per unit surfacearea) increases according to eq 18. However, the question arisesof the validity of eq 18 as the film gets thicker and thicker.Indeed, as the thickness increases, a competition between theenzymatic reaction and diffusion of P and Q takes place insidethe film. Figure 2 shows the various successive layers thatare met upon going from the electrode to the solution. Theenzymatic catalytic cycle that is running inside the light redzone designated as “auxiliary enzyme film” is the same as theone in the light red zone designated as “reaction layer” inScheme 3.
Inside the film, that is, for 0 e x e L:
DFd2[P]
dx2+ k3CE2
0 [Q]) 0 (19)
DFd2[Q]
dx2- k3CE2
0 [Q]) 0 (20)
in conditions where k3 is the rate-determining constant in thekinetics of the auxiliary enzyme, valid for low coverages ofthe enzyme label. DF is the common value of the P and Qdiffusion coefficients inside the film as opposed to D, their valuein the solution. CE2
0 ) ΓE2
0 /L is the volume concentration of theauxiliary enzyme in the film and ΓE2
0 is the total amount ofauxiliary enzyme per unit surface area. The boundary conditionsat the electrode surface are embodied in the following expres-sions of the current density that derive from the flux balancesfor P and Q.
I2F
) k1,2ΓE1S +DF(d[P]dx )x)0
)-DF(d[Q]dx )x)0
[P]x)0 ) 0
At the film/diffusion-convection layer interface:
-DF(d[P]dx )x)L-
)-D(d[P]dx )x)L+
)D[P]x)L
δ
-DF(d[Q]dx )x)L-
)-D(d[Q]dx )x)L+
)D[Q]x)L
δ
Introducing the reaction layer thickness,
µF )� DF
k3CE2
0)� LDF
k3ΓE2
0(21)
integration of eqs 19 and 20, taking the above boundaryconditions into account, leads to
[Q]) k1,2ΓE1SδD
exp(x- LµF
)+ exp(-x- LµF
)exp( L
µF)+ exp(- L
µF)
Typical concentration profiles are shown in Figure 2 (for L )µF). The current is given by
I2F
) k1,2ΓE1S
DF
DδµF
tanh( LµF
)and thus:
ampl)DF
DδµF
tanh( LµF
)) DF
Dδ�k3ΓE2
0
LDFtanh(�k3ΓE2
0 L
DF)(22)
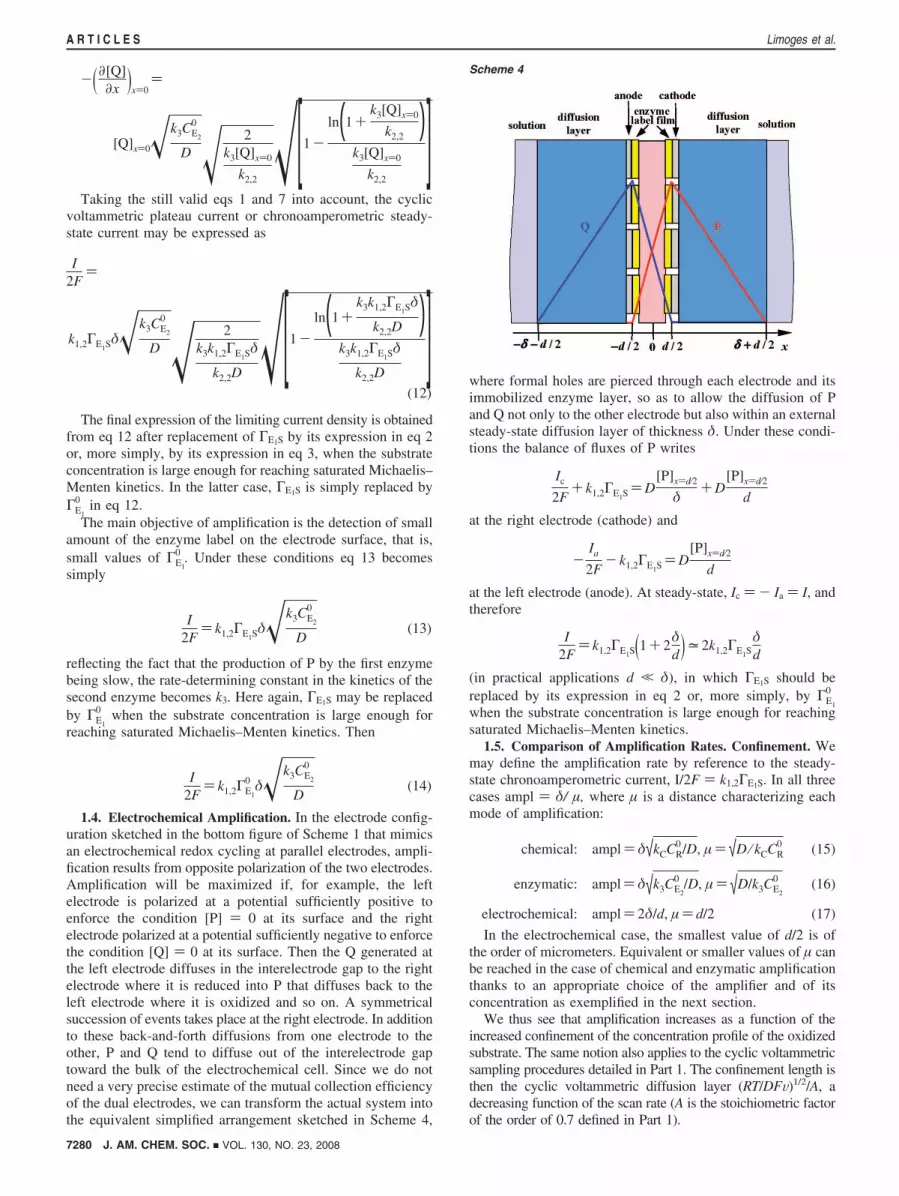
The variation of the amplification rate with the film thicknessof auxiliary enzyme is represented in Figure 3. After an initiallinear variation:
ampl98µ ⁄ Lf ∞ δ
Dk3ΓE2
0 ) δD
k3CE2
0 × L
where amplification increases proportionally to the thickness,or equivalently, to the total amount of enzyme per unit surfacearea; it tends asymptotically toward a limit:
ampl98µ ⁄ Lf 0 DF
Dδ�k3ΓE2
0
LDF)
DF
Dδ�k3CE2
0
DF
After L ) µF ) (DF⁄k3CE2
0 )1/2 , it is of no longer practical useto increase the film thickness. A typical example will bediscussed in section 2.4.
Figure 2. Enzymatic amplification with a multilayered immobilized enzymefilm. Concentration profiles.
Figure 3. Enzymatic amplification with a multilayered immobilized enzymefilm. Variation of the amplification rate with the film thickness.
J. AM. CHEM. SOC. 9 VOL. 130, NO. 23, 2008 7281
Enzyme Bioaffinity Electrodes. Amplification A R T I C L E S
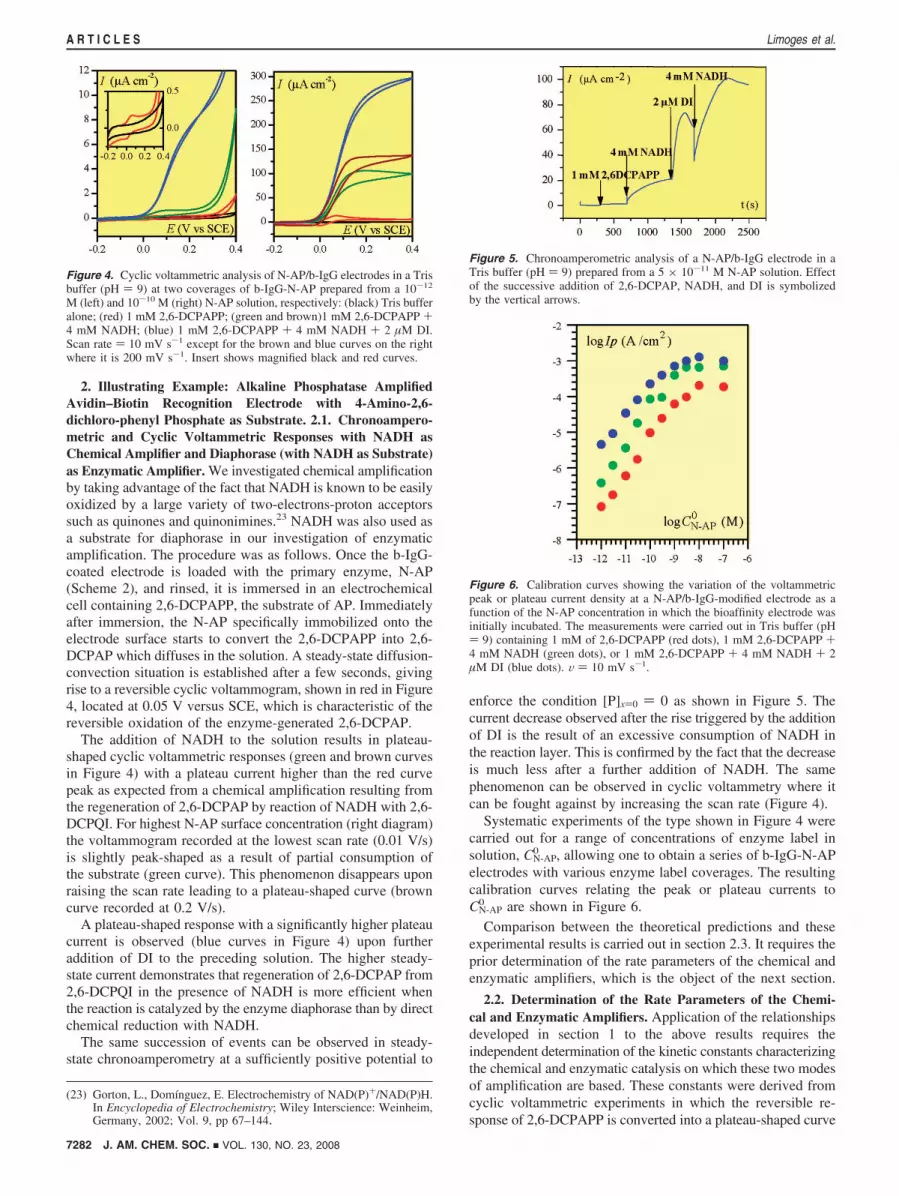
2. Illustrating Example: Alkaline Phosphatase AmplifiedAvidin–Biotin Recognition Electrode with 4-Amino-2,6-dichloro-phenyl Phosphate as Substrate. 2.1. Chronoampero-metric and Cyclic Voltammetric Responses with NADH asChemical Amplifier and Diaphorase (with NADH as Substrate)as Enzymatic Amplifier. We investigated chemical amplificationby taking advantage of the fact that NADH is known to be easilyoxidized by a large variety of two-electrons-proton acceptorssuch as quinones and quinonimines.23 NADH was also used asa substrate for diaphorase in our investigation of enzymaticamplification. The procedure was as follows. Once the b-IgG-coated electrode is loaded with the primary enzyme, N-AP(Scheme 2), and rinsed, it is immersed in an electrochemicalcell containing 2,6-DCPAPP, the substrate of AP. Immediatelyafter immersion, the N-AP specifically immobilized onto theelectrode surface starts to convert the 2,6-DCPAPP into 2,6-DCPAP which diffuses in the solution. A steady-state diffusion-convection situation is established after a few seconds, givingrise to a reversible cyclic voltammogram, shown in red in Figure4, located at 0.05 V versus SCE, which is characteristic of thereversible oxidation of the enzyme-generated 2,6-DCPAP.
The addition of NADH to the solution results in plateau-shaped cyclic voltammetric responses (green and brown curvesin Figure 4) with a plateau current higher than the red curvepeak as expected from a chemical amplification resulting fromthe regeneration of 2,6-DCPAP by reaction of NADH with 2,6-DCPQI. For highest N-AP surface concentration (right diagram)the voltammogram recorded at the lowest scan rate (0.01 V/s)is slightly peak-shaped as a result of partial consumption ofthe substrate (green curve). This phenomenon disappears uponraising the scan rate leading to a plateau-shaped curve (browncurve recorded at 0.2 V/s).
A plateau-shaped response with a significantly higher plateaucurrent is observed (blue curves in Figure 4) upon furtheraddition of DI to the preceding solution. The higher steady-state current demonstrates that regeneration of 2,6-DCPAP from2,6-DCPQI in the presence of NADH is more efficient whenthe reaction is catalyzed by the enzyme diaphorase than by directchemical reduction with NADH.
The same succession of events can be observed in steady-state chronoamperometry at a sufficiently positive potential to
enforce the condition [P]x)0 ) 0 as shown in Figure 5. Thecurrent decrease observed after the rise triggered by the additionof DI is the result of an excessive consumption of NADH inthe reaction layer. This is confirmed by the fact that the decreaseis much less after a further addition of NADH. The samephenomenon can be observed in cyclic voltammetry where itcan be fought against by increasing the scan rate (Figure 4).
Systematic experiments of the type shown in Figure 4 werecarried out for a range of concentrations of enzyme label insolution, CN-AP
0 , allowing one to obtain a series of b-IgG-N-APelectrodes with various enzyme label coverages. The resultingcalibration curves relating the peak or plateau currents toCN-AP
0 are shown in Figure 6.Comparison between the theoretical predictions and these
experimental results is carried out in section 2.3. It requires theprior determination of the rate parameters of the chemical andenzymatic amplifiers, which is the object of the next section.
2.2. Determination of the Rate Parameters of the Chemi-cal and Enzymatic Amplifiers. Application of the relationshipsdeveloped in section 1 to the above results requires theindependent determination of the kinetic constants characterizingthe chemical and enzymatic catalysis on which these two modesof amplification are based. These constants were derived fromcyclic voltammetric experiments in which the reversible re-sponse of 2,6-DCPAPP is converted into a plateau-shaped curve
(23) Gorton, L., Domínguez, E. Electrochemistry of NAD(P)+/NAD(P)H.In Encyclopedia of Electrochemistry; Wiley Interscience: Weinheim,Germany, 2002; Vol. 9, pp 67–144.
Figure 4. Cyclic voltammetric analysis of N-AP/b-IgG electrodes in a Trisbuffer (pH ) 9) at two coverages of b-IgG-N-AP prepared from a 10-12
M (left) and 10-10 M (right) N-AP solution, respectively: (black) Tris bufferalone; (red) 1 mM 2,6-DCPAPP; (green and brown)1 mM 2,6-DCPAPP +4 mM NADH; (blue) 1 mM 2,6-DCPAPP + 4 mM NADH + 2 µM DI.Scan rate ) 10 mV s-1 except for the brown and blue curves on the rightwhere it is 200 mV s-1. Insert shows magnified black and red curves.
Figure 5. Chronoamperometric analysis of a N-AP/b-IgG electrode in aTris buffer (pH ) 9) prepared from a 5 × 10-11 M N-AP solution. Effectof the successive addition of 2,6-DCPAP, NADH, and DI is symbolizedby the vertical arrows.
Figure 6. Calibration curves showing the variation of the voltammetricpeak or plateau current density at a N-AP/b-IgG-modified electrode as afunction of the N-AP concentration in which the bioaffinity electrode wasinitially incubated. The measurements were carried out in Tris buffer (pH) 9) containing 1 mM of 2,6-DCPAPP (red dots), 1 mM 2,6-DCPAPP +4 mM NADH (green dots), or 1 mM 2,6-DCPAPP + 4 mM NADH + 2µM DI (blue dots). V ) 10 mV s-1.
7282 J. AM. CHEM. SOC. 9 VOL. 130, NO. 23, 2008
A R T I C L E S Limoges et al.

upon addition of NADH (Figure 7) and NADH + DI (Figure8), respectively.
As expected, the plateau current is proportional to theconcentration of 2,6-DCPAP, C2
0,6-DCPAP (Figure 7), and the
square root of NADH concentration, CNADH0 (not shown)
according to21,24
Ip ) 2FC2,6-DCPAP0 √D2,6-DCPAP√kCCNADH
0 (23)
thus leading from fitting of the experimental data with eq 23 tokC ) 900 M-1 s-1. Significantly higher plateau currents areobtained upon addition of a modest amount of DI (Figure 8).From the analysis of the variation of the plateau currents withthe cosubstrate concentration, under saturated Michaelis–Mentenconditions, one obtains k3 ) 3 × 10⁸ M-1 s-1 and k2,2 ) 1000s-1 according to the procedure described in ref 20.
2.3. Application of the Theoretical Relationships. Two ad-ditional pieces of information were required to analyze, accord-ing to the theoretical relationships developed in section 1, theresults displayed in Figure 6 which summarizes all the data wehave gathered using direct detection as well as chemical andenzymatic amplification. The first piece of information was therate constants of N-AP attached to the b-IgG-coated electrode.
It was found to be approximately the same as in homogeneoussolution (i.e., k1,2 ) 1500 s-1, K1,M ) 50 µM).1 The secondpiece of information relates to the recognition isotherm assumedto be of the Langmuir type (see the first companion paper):
ΓE1
0 )ΓE1,max0 KbCN-AP
0
1+KbCN-AP0
(24)
with Kb ) 7 × 10⁷ M-1 and ΓE1,max
0 ) 1.5 × 10⁻¹² mol cm-2.1
For convenience, the various constants required for theanalysis of the experimental data are all gathered in Table 1.
The cyclic voltammetric data in Figure 6 (red dots) shows alinear variation at low values of CN-AP
0 , which corresponds tothe linear (Henry) part of the Langmuir isotherm, while theleveling off observed upon increasing does not correspond tothe saturated part of the Langmuir isotherm but rather to thefact that diffusion of the substrate, here 2,6-DCPAPP, becomesrate-limiting. Such behaviors have been analyzed in details inPart 1. We focus here on the variations exhibited under chemicaland enzymatic amplification (Figure 9).
Considering first chemical amplification, we observe that atlow values of CN-AP
0 , the plateau current adheres to the linear(Henry) part of the Langmuir isotherm. The leveling off at highvalues of CN-AP
0 does not embody reaching saturation of theLangmuir isotherm (represented by the theoretical green dottedline in Figure 9). It rather indicates that the kinetic control ofthe enzyme label is passing from the enzymatic reaction to the
(24) Savéant, J-M.; Vianello, E. in AdVances in Polarography; Longmuir,I., Ed.; Pergamon Press: New York, 1960; p 367.
Figure 7. (Left) Cyclic voltammograms recorded at a glassy carbonelectrode in a 0.1 M Tris buffer (pH ) 9.0) containing 1 mM MgCl2, 4mM NADH and, from bottom to top, 0, 1, 2, 3, 6, 10, 30, 60, 100 µM2,6-DCPAP. Scan rate ) 0.03 V s-1. (Right) Variation of the catalyticplateau current with the concentration of 2,6-DCPAP: (red solid line) fittingof data with eq 23 with kC ) 900 M-1 s-1, D2,6-DCPAP ) 4 × 10⁻⁶ cm2
s-1.
Figure 8. (Left) Cyclic voltammograms recorded at a GC electrode in aTris buffer solution in presence of 4 mM NADH, 100 nM DI, and, frombottom to top, [2,6-DCPAP] ) 0.8, 2.8, 9.8, 29.8, 100, 300 µM. (Right)Variation with 2,6-DCPAP concentration of the catalytic plateau current:(red line) best fit considering a bimolecular rate constant toward cosubstratek3 ) 3 × 10⁸ M-1 s-1 and a turnover kcat ) 1000 s-1. Scan rate ) 0.1 Vs-1.
Table 1. Parameters for the Analysis of the Experimental Data
δ (cm) 0.019DP ≈ DS (cm2 s-1) 4 × 10⁻⁶
k1,2 (s-1) 1500K1,M (M) 5 × 10⁻⁵
ΓE1
0,max (mol cm-2) 1.5 × 10⁻¹²
Kb (M-1) 7 × 10⁷
kC (M-1 s-1) 900k3 (M-1 s-1) 3 × 10⁸
k2,2 (s-1) 1000CS
0 (M) 10-3
CR0 (M) 4 × 10⁻³
CE2
0 (M) 2 × 10⁻⁶
Figure 9. Calibration curves showing the variation of the voltammetricplateau current density at a N-AP/b-IgG-modified electrode with the N-APconcentration in the solution where the bioaffinity electrode was initiallyincubated for chemical (green dots) and enzymatic (blue dots) amplificationunder the same conditions as in Figure 6. Full and dotted green lines showthe simulation according to 9 and 10, respectively. Full and dotted bluelines show the simulation according to eqs 12 and 2 and eq 14, respectively,taking additionally into account the chemical catalysis by NADH.
J. AM. CHEM. SOC. 9 VOL. 130, NO. 23, 2008 7283
Enzyme Bioaffinity Electrodes. Amplification A R T I C L E S
diffusion of the 2,6-DCPAPP substrate. Indeed, the fitting ofthe experimental data with eq 9, in which a mixed kinetic controlis taken into account, is excellent.
As for enzymatic amplification, (blue dots and curves inFigure 9), the adherence to the Langmuir isotherm is evenmore restricted that in the preceding case. Limitation by 2,6-DCPAPP diffusion again occurs in the leveling off of thecurrent but this is not the only factor that interferes in thisconcentration range. One has to take also into account thatthe Michaelis–Menten kinetics tends to reach saturation. Allthese factors had to be taken into account through the mostcomplete eqs (12 and 2) to generate the excellent agreementobserved in Figure 9. An additional factor had in fact to beconsidered, namely, the fact that, in the large concentrationrange, enzymatic amplification and direct chemical amplifica-tion by NADH are of the same order of magnitude becauseof Michaelis–Menten saturation of the auxiliary enzyme. Thesolid blue curve in Figure 9 was thus obtained by the additionof the two catalytic current densities.
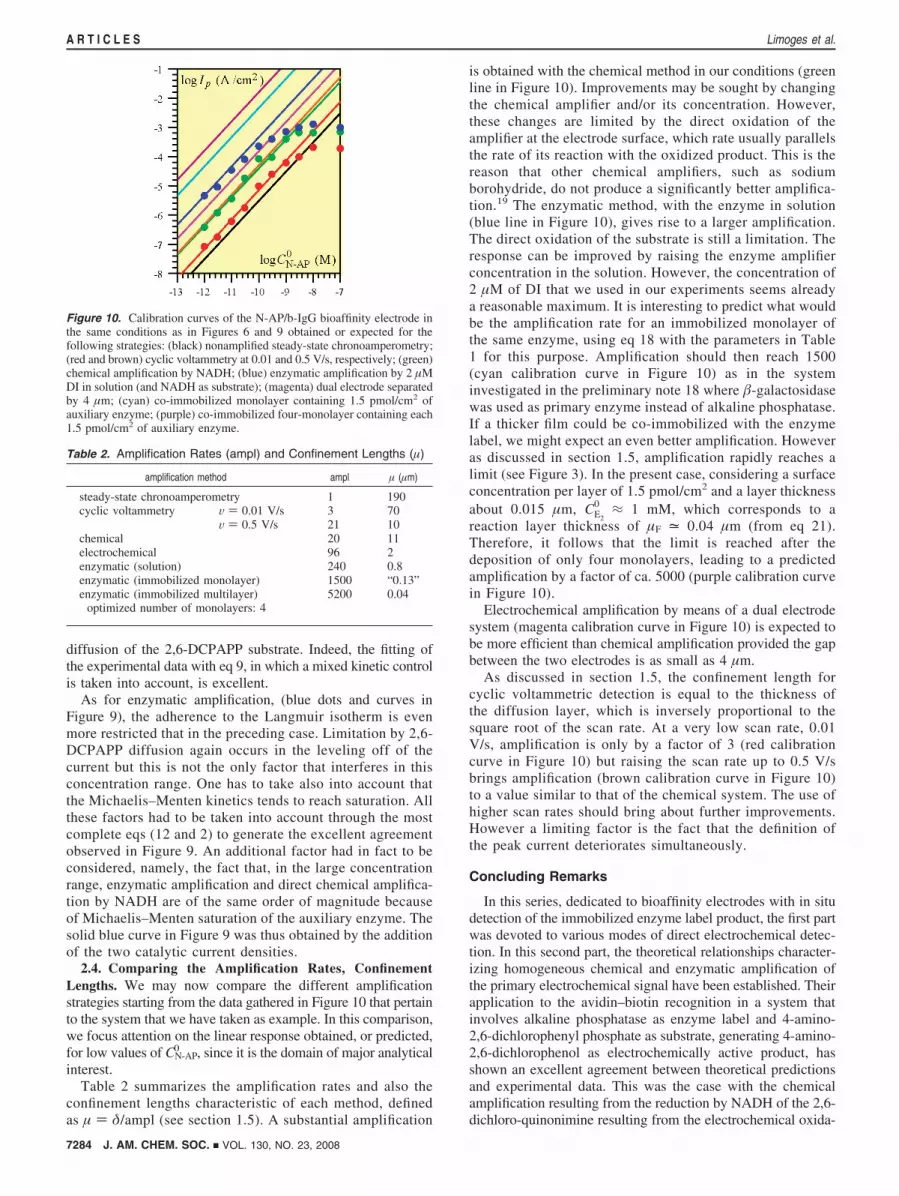
2.4. Comparing the Amplification Rates, ConfinementLengths. We may now compare the different amplificationstrategies starting from the data gathered in Figure 10 that pertainto the system that we have taken as example. In this comparison,we focus attention on the linear response obtained, or predicted,for low values of CN-AP
0 , since it is the domain of major analyticalinterest.
Table 2 summarizes the amplification rates and also theconfinement lengths characteristic of each method, definedas µ ) δ/ampl (see section 1.5). A substantial amplification
is obtained with the chemical method in our conditions (greenline in Figure 10). Improvements may be sought by changingthe chemical amplifier and/or its concentration. However,these changes are limited by the direct oxidation of theamplifier at the electrode surface, which rate usually parallelsthe rate of its reaction with the oxidized product. This is thereason that other chemical amplifiers, such as sodiumborohydride, do not produce a significantly better amplifica-tion.19 The enzymatic method, with the enzyme in solution(blue line in Figure 10), gives rise to a larger amplification.The direct oxidation of the substrate is still a limitation. Theresponse can be improved by raising the enzyme amplifierconcentration in the solution. However, the concentration of2 µM of DI that we used in our experiments seems alreadya reasonable maximum. It is interesting to predict what wouldbe the amplification rate for an immobilized monolayer ofthe same enzyme, using eq 18 with the parameters in Table1 for this purpose. Amplification should then reach 1500(cyan calibration curve in Figure 10) as in the systeminvestigated in the preliminary note 18 where �-galactosidasewas used as primary enzyme instead of alkaline phosphatase.If a thicker film could be co-immobilized with the enzymelabel, we might expect an even better amplification. Howeveras discussed in section 1.5, amplification rapidly reaches alimit (see Figure 3). In the present case, considering a surfaceconcentration per layer of 1.5 pmol/cm2 and a layer thicknessabout 0.015 µm, CE2
0 ≈ 1 mM, which corresponds to areaction layer thickness of µF = 0.04 µm (from eq 21).Therefore, it follows that the limit is reached after thedeposition of only four monolayers, leading to a predictedamplification by a factor of ca. 5000 (purple calibration curvein Figure 10).
Electrochemical amplification by means of a dual electrodesystem (magenta calibration curve in Figure 10) is expected tobe more efficient than chemical amplification provided the gapbetween the two electrodes is as small as 4 µm.
As discussed in section 1.5, the confinement length forcyclic voltammetric detection is equal to the thickness ofthe diffusion layer, which is inversely proportional to thesquare root of the scan rate. At a very low scan rate, 0.01V/s, amplification is only by a factor of 3 (red calibrationcurve in Figure 10) but raising the scan rate up to 0.5 V/sbrings amplification (brown calibration curve in Figure 10)to a value similar to that of the chemical system. The use ofhigher scan rates should bring about further improvements.However a limiting factor is the fact that the definition ofthe peak current deteriorates simultaneously.
Concluding Remarks
In this series, dedicated to bioaffinity electrodes with in situdetection of the immobilized enzyme label product, the first partwas devoted to various modes of direct electrochemical detec-tion. In this second part, the theoretical relationships character-izing homogeneous chemical and enzymatic amplification ofthe primary electrochemical signal have been established. Theirapplication to the avidin–biotin recognition in a system thatinvolves alkaline phosphatase as enzyme label and 4-amino-2,6-dichlorophenyl phosphate as substrate, generating 4-amino-2,6-dichlorophenol as electrochemically active product, hasshown an excellent agreement between theoretical predictionsand experimental data. This was the case with the chemicalamplification resulting from the reduction by NADH of the 2,6-dichloro-quinonimine resulting from the electrochemical oxida-
Figure 10. Calibration curves of the N-AP/b-IgG bioaffinity electrode inthe same conditions as in Figures 6 and 9 obtained or expected for thefollowing strategies: (black) nonamplified steady-state chronoamperometry;(red and brown) cyclic voltammetry at 0.01 and 0.5 V/s, respectively; (green)chemical amplification by NADH; (blue) enzymatic amplification by 2 µMDI in solution (and NADH as substrate); (magenta) dual electrode separatedby 4 µm; (cyan) co-immobilized monolayer containing 1.5 pmol/cm2 ofauxiliary enzyme; (purple) co-immobilized four-monolayer containing each1.5 pmol/cm2 of auxiliary enzyme.
Table 2. Amplification Rates (ampl) and Confinement Lengths (µ)
amplification method ampl µ (µm)
steady-state chronoamperometry 1 190cyclic voltammetry V ) 0.01 V/s 3 70
V ) 0.5 V/s 21 10chemical 20 11electrochemical 96 2enzymatic (solution) 240 0.8enzymatic (immobilized monolayer) 1500 “0.13”enzymatic (immobilized multilayer)
optimized number of monolayers: 45200 0.04
7284 J. AM. CHEM. SOC. 9 VOL. 130, NO. 23, 2008
A R T I C L E S Limoges et al.

tion of 4-amino-2,6-dichlorophenol. The same is true with themore efficient amplification obtained when the reduction of 2,6-dichloro-quinonimine involves diaphorase in solution withNADH as substrate. In both cases, a detailed theoretical analysisand an independent determination of the key kinetic parametersof the system were required. This approach also allowedevidencing and optimizing the parameters that govern theamplification performances. Extension of the theoretical analysisto monolayer and multilayered films of auxiliary enzyme andto electrochemical amplification by means of closely spaced dualelectrodes offered a rationale for comparing the amplificationcapabilities of the various possible strategies. In this connection,confinement of the profile of the product, and/or its oxidizedform in the close vicinity the electrode surface appears as akey parameter of amplification.
Experimental Section
Reagents and procedures were the same as described in Part 1.1
Lyophilised diaphorase from Bacillus stearothermophilus (E.C. 1.6.99.-)was purchased from Unitika (Japan) and NADH from Sigma.
An AUTOLAB potentiostat (Ecochemie) interfaced to a PCcomputer (GPES software) was used for cyclic voltammetry andchronoamperometry. A glassy carbon electrode (3-mm diameter)was used as working electrode. A classical water-jacketed electro-chemical cell (maintained at 20 ( 0.5 °C) equipped with a saturatedcalomel reference electrode (SCE) and a platinum counter electrodewas used. The voltammetric curves presented in this work weresystematically referred to SCE.
JA7102873
J. AM. CHEM. SOC. 9 VOL. 130, NO. 23, 2008 7285
Enzyme Bioaffinity Electrodes. Amplification A R T I C L E S