The usefulness of the resting electrocardiogram for characterizing acute Chagas' heart disease in...
11
International Journal of Cardiology, 18 (1988) 305-315 Elsevier 305 IJC 00655 The usefulness of the resting electrocardiogram for characterizing acute Chagas’ heart disease in the rat Reiualdo B. Bestetti ‘, Giorgio Baroldi 2, Vicente N. Sales-Net0 3, Edson G. Soares ’ and J. Samuel M. Oliveira ’ I Department of Pathology, Faculty of Medicine, Ribeiriio Preto, Brazil; ’ Department of Cardiovascular Pathology, Medical School, Universiv of Milan, Italy; 3 Department of Pathology, Faculty of Medicine, Federal Universiq of Cear6, Brazil (Received 20 May 1987; revision accepted 5 October 1987) Bestetti RB, Baroldi G, Sales-Net0 VN, Soares EG, Oliveira JSM. The usefulness of the resting electrocardiogram for characterizing acute Chagas’ heart disease in the rat. Int J Cardiol 1988:18:305-315. The present experiment was undertaken to characterize the resting electrocardio- gram of rats in the acute stage of experimental T. cruzi infection. One-hundred-and- eighty-seven newly-weaned male albino rats were infected intraperitoneally with 1000 parasites/g body weight. Thirty-two similar but non-infected rats served as controls. Groups of eight randomly chosen rats were killed on day 8, and on days 15, 18,22,25 and 29 after infection. Groups of 8 control rats were killed on days 8, 15 and 22. Electrocardiographic changes were observed in 25 of 48 (52%) infected rats. P wave abnormalities indicating atrial chamber dilatation, QRS axis deviation, QRS complex changes compatible with left ventricular hypertrophy or myocardial damage, increased PR interval and ventricular repolarization alteration were detected in 24, 27, 18, 10, and 6% of infected rats, respectively. A mononuclear cell infiltrate and pseudocysts of amastigote forms of T. cruzi were found in 91, and 56% of infected animals, respectively. The sensitivity and the positive predictive value of the electrocardio- graphic changes were 66, 91, and %%, respectively. Thus, the resting electrocardio- gram is a reliable method for detecting myocardial lesions in the rat with acute Chagas’ heart disease. Key words: Trypanosomiasis - South American; Chagas’ cardiomyopathy; Electro- cardiography Correspondence to: Dr. J. Samuel M. Oliveira, Department of Pathology, Faculty of Medicine. 14049-RibeirIo Preto (SP), Brazil. 0167-5273/88/$03.50 0 1988 Elsevier Science Publishers B.V. (Biomedical Division)
-
Upload
independent -
Category
Documents
-
view
2 -
download
0
Transcript of The usefulness of the resting electrocardiogram for characterizing acute Chagas' heart disease in...

International Journal of Cardiology, 18 (1988) 305-315
Elsevier 305
IJC 00655
The usefulness of the resting electrocardiogram for characterizing acute Chagas’ heart disease in the rat
Reiualdo B. Bestetti ‘, Giorgio Baroldi 2, Vicente N. Sales-Net0 3, Edson G. Soares ’ and J. Samuel M. Oliveira ’
I Department of Pathology, Faculty of Medicine, Ribeiriio Preto, Brazil; ’ Department of Cardiovascular
Pathology, Medical School, Universiv of Milan, Italy; 3 Department of Pathology, Faculty of Medicine,
Federal Universiq of Cear6, Brazil
(Received 20 May 1987; revision accepted 5 October 1987)
Bestetti RB, Baroldi G, Sales-Net0 VN, Soares EG, Oliveira JSM. The usefulness of
the resting electrocardiogram for characterizing acute Chagas’ heart disease in the rat. Int J Cardiol 1988:18:305-315.
The present experiment was undertaken to characterize the resting electrocardio- gram of rats in the acute stage of experimental T. cruzi infection. One-hundred-and- eighty-seven newly-weaned male albino rats were infected intraperitoneally with 1000 parasites/g body weight. Thirty-two similar but non-infected rats served as controls. Groups of eight randomly chosen rats were killed on day 8, and on days 15, 18,22,25 and 29 after infection. Groups of 8 control rats were killed on days 8, 15 and 22. Electrocardiographic changes were observed in 25 of 48 (52%) infected rats. P wave abnormalities indicating atrial chamber dilatation, QRS axis deviation, QRS complex changes compatible with left ventricular hypertrophy or myocardial damage, increased PR interval and ventricular repolarization alteration were detected in 24, 27, 18, 10, and 6% of infected rats, respectively. A mononuclear cell infiltrate and pseudocysts of amastigote forms of T. cruzi were found in 91, and 56% of infected animals, respectively. The sensitivity and the positive predictive value of the electrocardio- graphic changes were 66, 91, and %%, respectively. Thus, the resting electrocardio- gram is a reliable method for detecting myocardial lesions in the rat with acute Chagas’ heart disease.
Key words: Trypanosomiasis - South American; Chagas’ cardiomyopathy; Electro- cardiography
Correspondence to: Dr. J. Samuel M. Oliveira, Department of Pathology, Faculty of Medicine.
14049-RibeirIo Preto (SP), Brazil.
0167-5273/88/$03.50 0 1988 Elsevier Science Publishers B.V. (Biomedical Division)
306
Introduction
The acute stage of Chagas’ heart disease has been studied in monkeys [1,2], dogs [3,4], mice and rats [5]. The pathological features of the disease have been shown to be similar in all these species, i.e., myocarditis of varying extent associated with diffuse intracellular amastigote forms of 7’. cruzi. Electrocardiographic studies have been conducted on monkeys [2] and dogs [3,4], but not on mice or rats in the acute stage of the disease.
Most studies on experimental Chagas’ disease are conducted on small mammals such as mice and rats not only because of the technical facility and low cost, but also because of the susceptibility of these animals to T. cruzi infection. However, the supposed models for Chagas’ heart disease [6] in these animals are seldom backed up by electrocardiographic studies or any other attempt to characterize the actual presence of heart disease. Considering that the pathogenesis of Chagas’ heart disease is a very controversial subject [7,8], it is of the utmost importance to employ other techniques for a thorough characterization of experimental Chagas’ heart disease both in the acute and in the chronic stage.
The objective of this investigation was to characterize the resting electrocardio- gram of the rat with acute Chagas’ heart disease, and to demonstrate that the rat may be a valuable experimental model for studying acute Chagas’ heart disease by comparing the electrocardiographic tracings with the pathological features.
Material and Methods
Animals
One-hundred-and-forty-seven male albino rats (50 g) from the breeding colony of our Institution were infected intraperitoneally with the Colombia strain of T. cruzi
(1000 parasites/g body weight) shortly after weaning. When blood was collected from the tail of each animal two weeks later, parasites were,detected in all of them. Thirty-two similar but non-infected rats served as controls. Groups of eight ran- domly chosen infected rats were killed on day 8, and on days 15, 18, 22, 25 and 29 after infection. Groups of 8 control rats were killed on days 8, 15 and 22 after the beginning of the experiment. All animals were kept in the same environment, 16 to a cage. The rats had free access to Purina rat food and drinking water.
Electrocardiography
A FUNBEC, ECG-3 model electrocardiograph was used to record the electro- cardiogram (paper speed 100 msec, 2 N amplitude) on the day of killing. All rats were lightly anesthetized with ether and then classical and three precordial leads were obtained as follows: VA, electrode positioned at the fourth intercostal space in the medium subclavian line; VB, electrode placed at the fifth intercostal space in the medium subclavian line; and VC, electrode introduced subcutaneously at the fifth intercostal space in the anterior axillary line. The following electrocardiographic parameters were analysed for each tracing obtained from the animals: heart rate, amplitude and duration of P wave, duration of PR interval, lengthening of the QRS

307
complex as well as amplitude of each wave of this complex, QaT interval and QRS axis. The P wave was measured in leads II, III, AVF and VB; the PR and QaT interval were measured in lead VB, while lengthening of the QRS complex and the amplitude of each wave of this complex were obtained from all leads.
The 5th and 95th percentiles for each of the above electrocardiographic parame-
ters were established using the control rats. On this basis, the following abnormali- ties were considered to be present in the infected animals. (1) Left atria1 enlarge-
ment when the P wave duration exceeded the 95th percentile, and right atria1 hypertrophy when the P wave amplitude exceeded the 95th percentile in leads II and/or III and/or AVF for control rats. (2) First-degree atrioventricular block
when the PR interval was higher than the 95th percentile for control rats. (3) Left ventricular hypertrophy when the QRS lengthening in leads I, AVL, VC was greater than the 95th percentile for control rats and the R wave of the same leads exceeded
the 95th percentile for control rats. (4) Low voltage of the QRS complex when all QRS complexes of classical leads were of lower amplitude than the 5th percentile of uninfected animals. (5) Loss of the R wave progression in precordial leads when the amplitude of the R wave in lead VB was less than the 5th percentile of control rats
in the absence of right axis deviation. (6) Necrosis of the anterior left ventricular wall when a Q wave duration was > 10 msec in both leads I and AVL. (7) Left axis
deviation when the QRS axis was between - 45 o and - 90 O, right axis deviation when the QRS axis was between + 120 o and + 150 O, and indeterminate axis when
the QRS axis was between - 150 o and - 90 O. (8) J point elevation > 1 mm in leads I, AVL or VC and J point depression > 3 mm in the same leads were also considered to be abnormal because neither pattern has been detected in the normal
rat electrocardiogram.
Pathology
After obtaining the resting electrocardiogram, the animal was killed with excess ether anesthesia. The heart was rapidly excised, blotted, and weighed. A 2-mm transversal section was cut immediately below the atrioventricular groove for
histological examination. Seven histological sections (7 pm) were obtained and routinely stained with HE. The myocardial lesions, i.e. inflammatory cell infiltrate,
necrosis and fibrosis were scored as follows: light = + , moderate = + + or severe = + + + intensity. The pseudocysts of amastigote forms of T. cruzi were scored as follows: 1 to 10 nests = + ; 10 to 50 nests = + + ; 50 to 100 nests = + + + ; 100
nests = + + + +. The total score for each animal was obtained by summing the
partial scores. T. cruzi-infected rats having a score of 5 were considered normal from a
morphological point of view, since this score may be found in normal rats. Also, T. cruzi-infected rats exhibiting isolated pseudocysts of parasites < 10 were considered not to have myocardial disease.
By comparing the electrocardiographic changes with the pathological findings, the sensitivity, specificity and positive predictive value of the electrocardiographic method were determined, as described previously [9].

308
Results
Control Rats
Electrocardiographic Findings. J point elevation > 1 mm in lead III with recipro- cal changes in lead AVL was observed in 3 of 32 (9%) rats; a similar J point elevation was also detected in 3 of 32 (9%) rats in lead VA. J point depression in lead AVL of less than 3 mm was visualized in 11 of 32 (34%) animals. A deep Q wave in lead AVL was observed in 1 of 32 (3%) animals, while a QRS complex pattern was observed in the same lead in 2 of 32 (6%) rats. Isolated premature ventricular contraction was detected in 1 of 32 (3%) rats. Fig. 1A illustrates these findings.
Pathological Features. An isolated mononuclear cell infiltrate localized in the left ventricle and scored as 1, was found in 1 of 32 (3%) uninfected rats. No other morphological changes were detected in this group of animals.
T. Cmzi-Infected Rats
Electrocardiographic Findings. Electrocardiographic changes were detected in 25 of 48 (52%) rats. P wave abnormalities were found in 12 of 48 (24%) rats; increased P wave duration compatible with left atria1 enlargement was observed in 5 of 48 (10%) rats, while increased P wave amplitude suggesting right atria1 hypertrophy
Fig. 1. A. Normal rat electrocardiogram. B. Electrocardiographic tracing exhibiting left atria1 enlarge-
ment and right axis deviation.

309
TABLE 1
Electrocardiographic changes in T. crazi-infected rats in the acute stage (n = 48).
Electrocardiographic findings
P wave abnormalities Increased P wave duration (left atria1 enlargement)
Increased P wave amplitude (right atrial hypertrophy)
PR interval change Increased PR interval (first-degree atrioventricular block)
QRS complex alterations Lengthened QRS complex plus tall R waves
in leads I, AVL and VC (left ventricular hypertrophy)
Low voltage of QRS complex
Loss of R wave progression in anterior precordial leads
Necrosis of left ventricular lateral wall
Bizarre QRS complex
QRS axis abnormalities Left axis deviation
Indeterminate axis
Right axis deviation
Ventricular repolaritation alteration Abnormal J point elevation
Abnormal J point depression
n (%)
12 (24) 5 (10) I (14)
5 (10) 9 (18) 5 (10)
1 (2) 1 (2) 1 (2) 1 (2)
13 (27) 11 (22)
1 (2) 1 (2) 3 (6) 2 (4) 1 (2)
was detected in 7 of 48 rats (14%). Increased PR interval compatible with first-de- gree atrioventricular block was visualized in 5 of 48 (10%) infected animals. QRS axis abnormalities were seen in 13 of 48 (27%) rats; left axis deviation in 11 of 48
(22%) right axis deviation in 1 of 48 rats (2%) and indeterminate axis in 1 of 48 (2%) animals. QRS complex abnormalities were detected in 9 of 48 (18%) rats; low QRS voltage, loss of R wave progression and necrosis of left ventricular lateral wall were
each observed in 1 of 48 (2%) rats. A left ventricular hypertrophy pattern was seen
in 5 of 48 (10%) infected animals. Ventricular repolarization alterations were observed in 3 of 48 (6%) rats. These electrocardiographic changes are summarized in Table 1 and illustrated in Figs. lB, 2A and 3.
Pathological Features. A mononuclear cell infiltrate was detected in 44 of 48 (91%) of these animals, while a polymorphonuclear cell infiltrate was observed in 14 of 48 (29%) animals. Pseudocysts of parasites were found in 27 of 48 (56%) infected animals. Edema and vascular congestion dissociating the myofibers were detected in 16 of 48 (33%) rats. Necrosis was seen in 5 of 48 (10%) rats and focal fibrosis in 1 of 48 (2%) infected rats. Inflammatory cell infiltrates of varying intensity were ob- served throughout the analysed myocardium.
These lesions were scored from 1 to 30 with the median score being 15. Twelve rats with normal electrocardiographic tracings were shown to have important myocardial lesions (score > 15), whereas 11 rats with normal electrocardiographic tracings did not show any pathological change. For the 25 abnormal electrocardio-

310
Fig. 2. A. Electrocardiographic tracing reveals right atria1 hypertrophy and left axis deviation. B. A
histological section of the myocardium shows mononuclear cell infiltrate dissociating the myofibers, and
many amastigote forms of T. cruzi.
Fig. 3. Electrocardiographic tracing showing massive left atrial enlargement and right axis deviation.
311
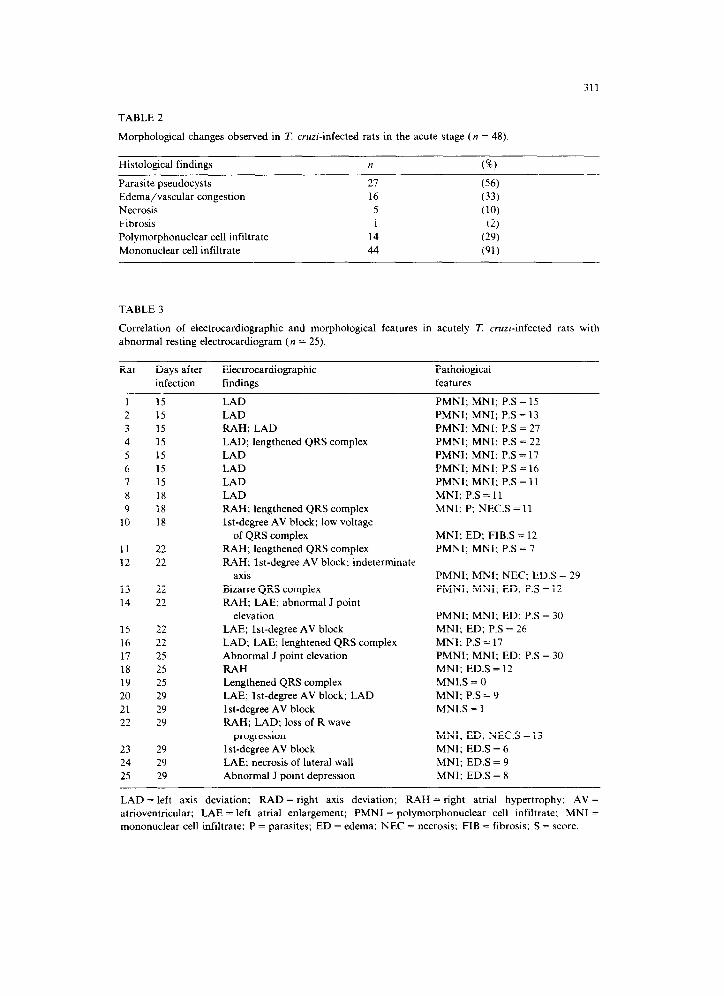
TABLE 2
Morphological changes observed in T. crnri-infected rats in the acute stage (n = 48).
Histological findings n (%)
Parasite pseudocysts 21 (56) Edema/vascular congestion 16 (33) Necrosis 5 (IO) Fibrosis 1 (2) Polymorphonuclear cell infiltrate 14 (29) Mononuclear cell infiltrate 44 (91)
TABLE 3
Correlation of electrocardiographic and morphological features in acutely T. cruzi-infected rats with
abnormal resting electrocardiogram (n = 25).
Rat Days after Electrocardiographic Pathological
infection findings features
PMNI; MNI; P.S = 15
PMNI: MNI; P.S = 13
PMNI; MNI; P.S = 27
PMNI; MNI; P.S = 22
PMNI: MNI: P.S = 17
PMNI; MNI; P.S = 16
PMNI; MNI; P.S = 11
MNI; P.S = 11
MNI: P; NECS = 11
1 15
2 15
3 15
4 15
5 15
6 15
7 15
8 18
9 18
10 18
LAD
LAD
RAH; LAD
LAD; lengthened QRS complex
LAD
LAD
LAD
LAD
RAH; lengthened QRS complex
lst-degree AV block; low voltage
11
12
22
22
of QRS complex
RAH; lengthened QRS complex
RAH; lst-degree AV block; indeterminate
axis
13 22 Bizarre QRS complex
14 22 RAH; LAE; abnormal J point
elevation
15 22
16 22
17 25
18 25
19 25
20 29
21 29
22 29
LAE; lst-degree AV block
LAD; LAE; lenghtened QRS complex
Abnormal J point elevation
RAH
Lengthened QRS complex
LAE; lst-degree AV block; LAD
lst-degree AV block
RAH; LAD; loss of R wave
23 29
24 29
25 29
progression
lst-degree AV block
LAE; necrosis of lateral wall
Abnormal J point depression
MNI; ED; F1B.S = 12
PMNI; MNI; P.S = 7
PMNI: MNI; NEC: ED.S = 29
PMNI; MNI; ED: PS = 12
PMNI; MNI; ED; PS = 30
MNI; ED; P.S = 26
MNI; P.S = 17
PMNI; MNI: ED; P.S = 30
MNI; ED.S = 12
MN1.S = 0
MNI; P.S = 9
MN1.S = 1
MNI; ED; NEC.S = 13
MNI; ED.S = 6
MNI; EDS = 9
MNI; ED.S = 8
LAD = left axis deviation: RAD = right axis deviation; RAH = right atria1 hypertrophy; AV=
atrioventricular; LAE = left atria1 enlargement; PMNI = polymorphonuclear cell infiltrate; MN1 =
mononuclear cell infiltrate: P = parasites: ED = edema; NEC = necrosis; FIB = fibrosis; S = score.

312
TABLE 4
Spontaneous mortality of the infected rat population (187) and its relationship to the electrocardio-
graphic and pathological changes detected in the sacrificed groups of rats.
Days after
infection
8*
15 *
18
22 *
25
29 *
Spontaneous mortality
Within the Cumulative (51;)
period (8)
1.06 1.06
3.35 4.41
3.50 7.91
6.13 14.04
1.29 15.33
1.36 16.69
Abnormal
electrocar-
diogram
(I&)
_
87.5
50.0
62.5
37.5
75.0
Heart histopathology
T. cruti Myocardial
pseudocysts lesions scored
(%) above 5 (‘%)
50.0 25.0
87.5 100
75.0 100
75.0 100
37.5 62.5
12.5 62.5
* Days when control groups were simultaneously killed.
graphic tracings, only 1 animal with first degree atrioventricular block failed to reveal concomitant myocardial disease. Table 2 summarizes these features, which are illustrated in Fig. 2B.
By comparing the electrocardiographic changes with the concomitant pathologi- cal features (Table 3) the sensitivity, specificity and the positive predictive value of the electrocardiographic tracings were found to be 66, 91, and 96%. respectively.
The spontaneous mortality of the initial group of 187 infected rats along the experimental period, together with the percentage of electrocardiographic and
morphological alterations detected at each period of killing are given in Table 4. Animals that died spontaneously were not examined because of the high frequency
of autolytic changes occurring in their bodies and mostly because their study was not the aim of this experiment.
Discussion
Control Rats
The electrocardiographic tracings obtained from these animals are similar to those previously described [lo-121. The J point elevation in lead III observed in some rats is believed to be the consequence of ether anesthesia [13]. The J point elevation in lead VA is thought to represent the characteristic pattern of rat ventricular repolarization, which consists of a very fast initial half and a very slow second half simulating myocardial injury [ll]. A deep Q wave or a QRS pattern in
lead AVL was detected in 9% of the uninfected animals. However, a concomitant deep Q wave lengthening of more than 10 msec in leads I and AVL was not visualized. A deep Q wave is believed to be related to the activation of the free left ventricular wall commonly seen in normal rats [12]. QRS axis deviation, lengthening of the QRS complex in relation to the pattern previously described [14], J point elevation in leads in which J point depression is commonly observed (I, AVL, VC)

313
were not visualized in control rats. Since none of the uninfected rats showed histological lesions indicating myocardial damage, the electrocardiographic alter- ations observed in these animals can be attributed to the peculiarities of the normal
rat electrocardiogram.
T. Cnrzi-Infected Rats
The striking feature of this investigation was the presence of P wave abnormali- ties indicating atria1 involvement. These electrocardiographic changes have been
detected at a similar frequency in dogs with experimental acute Chagas’ heart disease [3], whereas they are seldom observed in dogs [3], primates [15], rabbits [16], mice [17] and rats [14] with experimental chronic Chagas’ heart disease. Morpho-
logical studies carried out on mice [17] and dogs [3,4] in the acute stage of the disease have documented a more severe inflammatory reaction in the atria than in the ventricles. Therefore, it appears that P wave abnormalities reflect atria1 impair-
ment occurring in acute Chagas’ cardiopathy. QRS axis deviation was detected in 27% of infected animals. This phenomenon
has been observed in senescent rats [18], thiamine-deficient rats [19]. spontaneously hypertensive rats [20] and chronically T. cruzi-infected rats [14]. Similar changes
have also been detected in dogs [3,4] and primates [2] in the acute stage of the disease. In all of these reports, QRS axis deviation was believed to indicate myocardial disease extending to the bundle branches or ventricular enlargement. In fact, all animals showing QRS axis deviation were found to have important myocardial infiltrates. Thus, QRS axis deviation in acute Chagas’ cardiopathy of the
rat [15] is consistent with severe myocardial involvement.
QRS complex changes compatible with intraventricular conduction delay were also found in the present investigation. These changes have been observed in several forms of rat myocardial disease [14,17,19,20]. A lengthened QRS complex has been considered to be the consequence of myocardial lesions [21]. Our findings, therefore,
are indicative of the latter condition, inasmuch as all animals presented myocardial damage concomitant with these electrocardiographic changes.
Increased PR interval was detected in 14% of infected animals. This change has
also been detected in both human [22] and experimental acute Chagas’ heart disease [2,3]. Anselmi et al. [23] have demonstrated a stimulus conduction delay as a result of atrioventricular inflammatory reaction. Therefore, it seems that an increased PR interval may indicate atrioventricular node dysfunction in rat acute Chagas’ heart disease.
Abnormal J point elevation was also detected in this investigation. The same phenomenon has been observed in both acute and chronic Chagas’ heart disease of
the dog as a result of severe myocardial destruction resulting in ventricular aneurysm [3,24]. We have also found this electrocardiographic change in chronic Chagas’ heart disease in the rat [14]. Since the animals with J point elevation had concomitant myocardial lesions, it became apparent that these electrocardiographic alterations may be another marker of myocardial damage in the setting of acute Chagas’ heart disease.
314
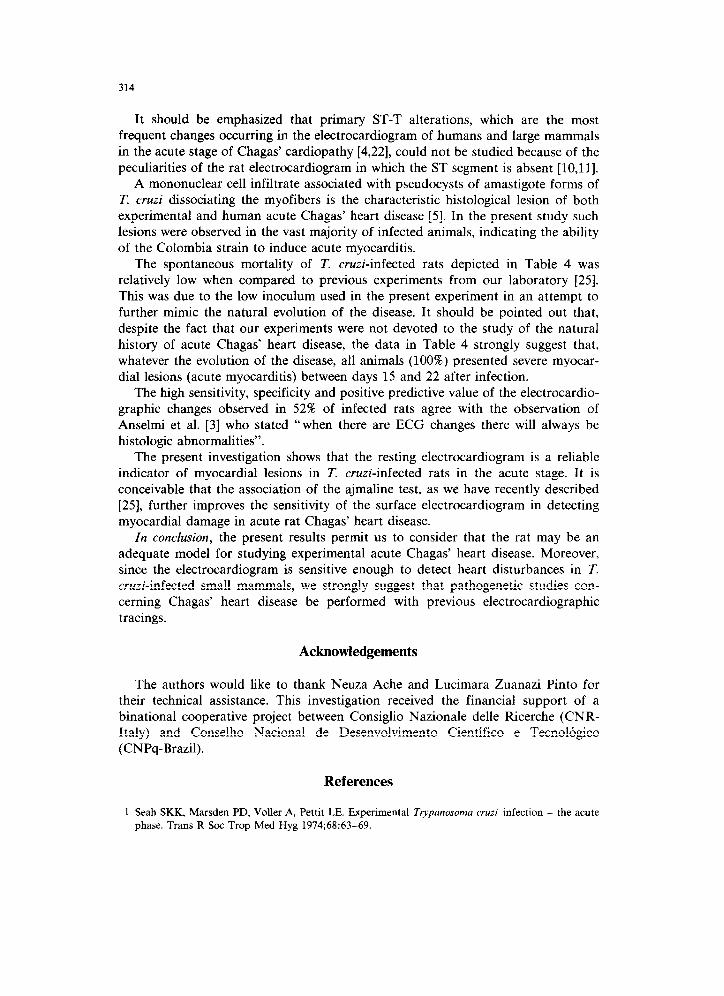
It should be emphasized that primary ST-T alterations, which are the most frequent changes occurring in the electrocardiogram of humans and large mammals in the acute stage of Chagas’ cardiopathy [4,22], could not be studied because of the
peculiarities of the rat electrocardiogram in which the ST segment is absent [lO,ll]. A mononuclear cell infiltrate associated with pseudocysts of amastigote forms of
T. cruzi dissociating the myofibers is the characteristic histological lesion of both experimental and human acute Chagas’ heart disease [5]. In the present study such
lesions were observed in the vast majority of infected animals, indicating the ability of the Colombia strain to induce acute myocarditis.
The spontaneous mortality of T. cruzi-infected rats depicted in Table 4 was relatively low when compared to previous experiments from our laboratory [25].
This was due to the low inoculum used in the present experiment in an attempt to
further mimic the natural evolution of the disease. It should be pointed out that, despite the fact that our experiments were not devoted to the study of the natural
history of acute Chagas’ heart disease, the data in Table 4 strongly suggest that, whatever the evolution of the disease, all animals (100%) presented severe myocar- dial lesions (acute myocarditis) between days 15 and 22 after infection.
The high sensitivity, specificity and positive predictive value of the electrocardio-
graphic changes observed in 52% of infected rats agree with the observation of Anselmi et al. [3] who stated “when there are ECG changes there will always be histologic abnormalities”.
The present investigation shows that the resting electrocardiogram is a reliable indicator of myocardial lesions in T. cruzi-infected rats in the acute stage. It is
conceivable that the association of the ajmaline test, as we have recently described [25], further improves the sensitivity of the surface electrocardiogram in detecting myocardial damage in acute rat Chagas’ heart disease.
In conclusion, the present results permit us to consider that the rat may be an adequate model for studying experimental acute Chagas’ heart disease. Moreover, since the electrocardiogram is sensitive enough to detect heart disturbances in T. cruzi-infected small mammals, we strongly suggest that pathogenetic studies con-
cerning Chagas’ heart disease be performed with previous electrocardiographic tracings.
Acknowledgements
The authors would like to thank Neuza Ache and Lucimara Zuanazi Pinto for their technical assistance. This investigation received the financial support of a binational cooperative project between Consiglio Nazionale delle Ricerche (CNR- Italy) and Conselho National de Desenvolvimento Cientifico e Tecnologico (CNPq-Brazil).
References
1 Seah SKK, Marsden PD, Voller A, Pettit LE. Experimental Trypan~soma cruzi infection - the acute
phase. Tram R Sot Trop Med Hyg 1974;68:63-69.
315
2 Lima JAC, Szarfman A. Lima SD, et al. Absence of left ventricular dysfunction during acute chagasic
myocarditis in the rhesus monkey. Circulation 1986;73:172-179.
3 Anselmi A. Pifano F, Suarez A, Dominguez A. Vazquez AD, Anselmi G. Experimental Schizorqpanum
cruzi myocarditis. Am Heart J 1965;70:638-656.
4 Andrade ZA. Andrade SG. Sadigursky M, Lima JAC. Doenca de Chagas experimental no cfo.
Rela$o morfologica e eletrocardiografica na fase aguda da infec$o. Arq Bras Cardiol
1980;35:485-490.
5 Andrade ZA, Andrade SG. Patologia. In: Brener Z. Andrade ZA, eds. Tvpanosoma crux e doenca de
Chagas. Rio de Janeiro: Editora Guanabara-Koogan SA. 1979:199-248.
6 World Health Organization. Report of the scientific working group on the development and
evaluation of animal models for Chagas’ disease. TDR 1984;84:1-10.
7 Kierszenbaum F. Autoimmunity in Chagas’ disease. J Parasitol 1986;72:201-211.
8 Oliveira JSM. A natural human model for intrinsic heart nervous system denervation: Chagas‘
cardiopathy. Am Heart J 1985;110:1092-1098.
9 Horan LG, Flowers NC. In: Braunwald E, ed. A textbook of cardiovascular medicine. Philadelphia,
London. Toronto: Saunders Company. 1980;198-252.
10 Lombard EA. Electrocardiogram of small mammals. Am J Physiol 1952:171:189-193.
11 Sambhi MP, White FN. The electrocardiogram of the normal and hypertensive rat. Circ Res
1960;8:129-134.
12 Beinfield WH. Lehr D. QRS-T variations in the rat electrocardiogram. Am J Physiol
1968;214:197-204.
13 Bijovsky T. Elizari MV. Muller LA, Katzin VJ. Cappa SMG. Chronic infection in mice with
Trypanosoma cruzi. Rev Inst Med Trop S&o Paulo 1983;25:207-214.
14 Bestetti RB; Soares EG. Sales-Net0 VN, Corria de Araujo R. Oliveira JSM. The resting electrocardio- gram of T. cruzi-infected rats. Rev Inst Med Trop 1987;29:224-229.
15 Miles MA, Marsden PD. Pettit LE, Draper CC, Watson S. Seah SKK. Experimental Ttypanosoma
cruzi infection in rhesus monkeys. III. Electrocardiographic and histopathological findings. Trans Sot
Trop Med Hyg 1979:73:528-532.
16 Teixeira ARL. Figueiredo F, Rezende-Filho JM, Macedo V. Chagas’ disease: a clinical, parasitologi-
cal. immunological and pathological study in rabbits. Am J Trop Med Hyg 1983;32:258-272.
17 Laguens RP, Meckert PC, Basombrio MA, et al. Infeccibn cronica de ratbn corn Ttypanosoma cruzi:
modelo experimental de enfermedad de Chagas. Medicina (Buenos Aires) 1980;40:33-39.
18 Berg B. The electrocardiogram in aging rats. J Gerontol 1955;10:420-423.
19 Hundley JM. Ashbum LL, Sebrell WH. The electrocardiogram in chronic thiamine deficiency in rats.
Am J Physiol 1945;144:404-414.
20 Dunn FG. Pfeffer MA, Frohlich ED. ECG alterations with progressive left ventricular hypertrophy in
spontaneous hypertension. Clin Exp Hyp 1978;1:67-86.
21 Mazzoleni A, Curtin ME, Wolff R, Reiner L. On the relationship between heart weight. fibrosis and
QRS duration. J Electrocardiol 1975;8:233-236.
22 Rassi A. Cllnica: Fase aguda. In: Brener Z, Andrade ZA, eds. Trypanosomn cruzi e Doenqa de
Chagas. Rio de Janeiro: Editora Guanabara-Koogan SA. 1979;249-264.
23 Anselmi A, Gurdiel 0, Suarez JA, Anselmi G. Disturbances in the A-V conduction system in Chagas’
myocarditis in the dog. Circ Res 1967;20:56-64.
24 Anselmi A, Moleiro F, Suarez R, Suarez JA, Ruesta V. Ventricular aneurysm in acute experimental
Chagas’ myocardiopathy. Chest 1971;59:654-658.
25 Bestetti RB, Soares EG, Sales-Net0 VN, Co&a de Araujo R, Oliveira JSM. Electrocardiographic
changes in T. cruri-infected rats after the ajmaline test. Res Exp Med 1987:187:185-194.