Electrocardiogram Quality Assessment with a Generalized ...
14
life Article Electrocardiogram Quality Assessment with a Generalized Deep Learning Model Assisted by Conditional Generative Adversarial Networks Xue Zhou 1 , Xin Zhu 1, * , Keijiro Nakamura 2, * and Mahito Noro 3 Citation: Zhou, X.; Zhu, X.; Nakamura, K.; Noro, M. Electrocardiogram Quality Assessment with a Generalized Deep Learning Model Assisted by Conditional Generative Adversarial Networks. Life 2021, 11, 1013. https://doi.org/10.3390/life11101013 Academic Editors: Md. Altaf-Ul-Amin, Shigehiko Kanaya, Naoaki Ono and Ming Huang Received: 31 August 2021 Accepted: 21 September 2021 Published: 26 September 2021 Publisher’s Note: MDPI stays neutral with regard to jurisdictional claims in published maps and institutional affil- iations. Copyright: © 2021 by the authors. Licensee MDPI, Basel, Switzerland. This article is an open access article distributed under the terms and conditions of the Creative Commons Attribution (CC BY) license (https:// creativecommons.org/licenses/by/ 4.0/). 1 Biomedical Information Engineering Lab, The University of Aizu, Aizu-Wakamatsu, Fukushima 965-8580, Japan; [email protected] 2 Division of Cardiovascular Medicine, Toho University Ohashi Medical Center, Tokyo 153-8515, Japan 3 Division of Cardiovascular Medicine, Odawara Cardiovascular Hospital, Tokyo 250-0873, Japan; [email protected] * Correspondence: [email protected] (X.Z.); [email protected] (K.N.); Tel.: +81-242-37-2771 (X.Z.); +81-3-468-1251 (K.N.) Abstract: The electrocardiogram (ECG) is widely used for cardiovascular disease diagnosis and daily health monitoring. Before ECG analysis, ECG quality screening is an essential but time-consuming and experience-dependent work for technicians. An automatic ECG quality assessment method can reduce unnecessary time loss to help cardiologists perform diagnosis. This study aims to develop an automatic quality assessment system to search qualified ECGs for interpretation. The proposed system consists of data augmentation and quality assessment parts. For data augmentation, we train a conditional generative adversarial networks model to get an ECG segment generator, and thus to increase the number of training data. Then, we pre-train a deep quality assessment model based on a training dataset composed of real and generated ECG. Finally, we fine-tune the proposed model using real ECG and validate it on two different datasets composed of real ECG. The proposed system has a generalized performance on the two validation datasets. The model’s accuracy is 97.1% and 96.4%, respectively for the two datasets. The proposed method outperforms a shallow neural network model, and also a deep neural network models without being pre-trained by generated ECG. The proposed system demonstrates improved performance in the ECG quality assessment, and it has the potential to be an initial ECG quality screening tool in clinical practice. Keywords: data augmentation; deep learning; ECG quality assessment 1. Introduction Electrocardiogram (ECG) is widely used for cardiovascular disease diagnosis, treat- ment, and daily personal health monitoring via wearable devices [1,2]. ECG signals are expected to have sufficient signal quality to extract temporal and morphological infor- mation for further analysis, such as heart rate variability (HRV) analysis and arrhythmia classification [3,4]. Low-quality ECG signals owing to baseline wander, muscle artifacts, and power-line interferences may cause false ECG arrhythmia alarms [5]. Additionally, ECG collected by wearable devices may include severe electrode motion artifacts, plain lines, and huge impulses due to lead-off. In particular, electrode motion artifacts may be treated as ectopic beats and cannot be removed by simple filters. This is one of the major fac- tors that cause alarm fatigue [6–8]. In clinical practice, before disease diagnosis, low-quality ECG signals are expected to be removed through manual screening by technicians. How- ever, manual quality screening is time-consuming, laborious, and experience-dependent. Therefore, a reliable automatic ECG signal quality assessment system is significant for ECG technicians and cardiologists. To date, many studies have been conducted on ECG quality assessment. PhysioNet organized a challenge in cardiology in 2011 to classify 12-lead ECG signals as acceptable Life 2021, 11, 1013. https://doi.org/10.3390/life11101013 https://www.mdpi.com/journal/life
-
Upload
khangminh22 -
Category
Documents
-
view
2 -
download
0
Transcript of Electrocardiogram Quality Assessment with a Generalized ...

life
Article
Electrocardiogram Quality Assessment with a GeneralizedDeep Learning Model Assisted by Conditional GenerativeAdversarial Networks
Xue Zhou 1 , Xin Zhu 1,* , Keijiro Nakamura 2,* and Mahito Noro 3
�����������������
Citation: Zhou, X.; Zhu, X.;
Nakamura, K.; Noro, M.
Electrocardiogram Quality
Assessment with a Generalized Deep
Learning Model Assisted by
Conditional Generative Adversarial
Networks. Life 2021, 11, 1013.
https://doi.org/10.3390/life11101013
Academic Editors: Md.
Altaf-Ul-Amin, Shigehiko Kanaya,
Naoaki Ono and Ming Huang
Received: 31 August 2021
Accepted: 21 September 2021
Published: 26 September 2021
Publisher’s Note: MDPI stays neutral
with regard to jurisdictional claims in
published maps and institutional affil-
iations.
Copyright: © 2021 by the authors.
Licensee MDPI, Basel, Switzerland.
This article is an open access article
distributed under the terms and
conditions of the Creative Commons
Attribution (CC BY) license (https://
creativecommons.org/licenses/by/
4.0/).
1 Biomedical Information Engineering Lab, The University of Aizu, Aizu-Wakamatsu,Fukushima 965-8580, Japan; [email protected]
2 Division of Cardiovascular Medicine, Toho University Ohashi Medical Center, Tokyo 153-8515, Japan3 Division of Cardiovascular Medicine, Odawara Cardiovascular Hospital, Tokyo 250-0873, Japan;
[email protected]* Correspondence: [email protected] (X.Z.); [email protected] (K.N.);
Tel.: +81-242-37-2771 (X.Z.); +81-3-468-1251 (K.N.)
Abstract: The electrocardiogram (ECG) is widely used for cardiovascular disease diagnosis and dailyhealth monitoring. Before ECG analysis, ECG quality screening is an essential but time-consumingand experience-dependent work for technicians. An automatic ECG quality assessment method canreduce unnecessary time loss to help cardiologists perform diagnosis. This study aims to developan automatic quality assessment system to search qualified ECGs for interpretation. The proposedsystem consists of data augmentation and quality assessment parts. For data augmentation, wetrain a conditional generative adversarial networks model to get an ECG segment generator, andthus to increase the number of training data. Then, we pre-train a deep quality assessment modelbased on a training dataset composed of real and generated ECG. Finally, we fine-tune the proposedmodel using real ECG and validate it on two different datasets composed of real ECG. The proposedsystem has a generalized performance on the two validation datasets. The model’s accuracy is 97.1%and 96.4%, respectively for the two datasets. The proposed method outperforms a shallow neuralnetwork model, and also a deep neural network models without being pre-trained by generatedECG. The proposed system demonstrates improved performance in the ECG quality assessment, andit has the potential to be an initial ECG quality screening tool in clinical practice.
Keywords: data augmentation; deep learning; ECG quality assessment
1. Introduction
Electrocardiogram (ECG) is widely used for cardiovascular disease diagnosis, treat-ment, and daily personal health monitoring via wearable devices [1,2]. ECG signals areexpected to have sufficient signal quality to extract temporal and morphological infor-mation for further analysis, such as heart rate variability (HRV) analysis and arrhythmiaclassification [3,4]. Low-quality ECG signals owing to baseline wander, muscle artifacts,and power-line interferences may cause false ECG arrhythmia alarms [5]. Additionally,ECG collected by wearable devices may include severe electrode motion artifacts, plainlines, and huge impulses due to lead-off. In particular, electrode motion artifacts may betreated as ectopic beats and cannot be removed by simple filters. This is one of the major fac-tors that cause alarm fatigue [6–8]. In clinical practice, before disease diagnosis, low-qualityECG signals are expected to be removed through manual screening by technicians. How-ever, manual quality screening is time-consuming, laborious, and experience-dependent.Therefore, a reliable automatic ECG signal quality assessment system is significant for ECGtechnicians and cardiologists.
To date, many studies have been conducted on ECG quality assessment. PhysioNetorganized a challenge in cardiology in 2011 to classify 12-lead ECG signals as acceptable
Life 2021, 11, 1013. https://doi.org/10.3390/life11101013 https://www.mdpi.com/journal/life
Life 2021, 11, 1013 2 of 14
or unacceptable [6,9]. Quesnel et al. evaluated the quality of ECG signals contaminatedwith various levels of motion artifacts. They segmented PQRST complexes, which werealigned and averaged to form an estimate of true PQRST complexes. Then, a signal-to-noise ratio (SNR) was estimated by comparing each PQRST complex to the average PQRSTcomplex. In this way, they got a 0.89 Pearson correlation coefficient between estimatedand real SNRs [10]. The machine learning technique was also implemented in the ECGquality assessment. Redmond et al. used a Parzen window classifier to classify noisy andclean ECG, and got 82% and 78.7% accuracies using human and automatic annotationfeatures, respectively [11]. Shahriari et al. obtained ECG signals from an ECG alarmstudy at the University of California, San Francisco (UCSF) and PhysioNet Computingin Cardiology Challenge 2011. They developed an image-based ECG quality assessmentmethod. They computed a structural similarity measure (SSIM) at first, and then selectedrepresentative ECG images from the training dataset as templates. The SSIM between eachECG image and all the templates were used to build the features and input them into alinear discriminant analysis classifier. The classifier achieved 93.1% and 82.5% accuracies inthe UCSF and Cardiology Challenge 2011 database, respectively [12]. Zhao et al. manuallyextracted six features, such as R peaks, the power spectrum distribution of QRS complexes,and so forth to build fuzzy vectors. They used the fuzzy comprehensive evaluationmethod as a feature analysis module. Their model demonstrated a 94.67% accuracy,90.33% recall, and 93.00% specificity, training and testing on data from the PhysioNetcomputing in Cardiology Challenge 2011 and 2017 [13]. In 2019, Moeyersons et al. useddata from a sleep study collected by the University Hospital Leuven, PhysioNet Computingin Cardiology Challenge 2017 and MIT-BIH Noise Stress Test Database with manuallabels. They segmented the ECG signal into 5 s episodes after filtering. Each episode wascharacterized by an autocorrelation function, and then three features were extracted andfed to a RUSBoot classifier. For Challenge 2017 and Sleep Study Datasets, they obtaineda recall of 79.4% and 96.6%, specificity of 78.7% and 84.8%, and area under the curve of0.928 and 0.970, respectively [14]. More recently, Fu et al. assessed the quality of wearableECG signals collected via Lenovo H3 Devices. They compared three machine learningalgorithms: the support vector machine (SVM), least-squares SVM (LS-SVM), and longshort-term memory (LSTM) with manually extracted features. The LSTM models achievedthe best performance with 95.5% accuracy [15].
The above studies usually follow three procedures. The first procedure is signalprepossessing, such as filtering. Then, feature extraction is the most important step, and di-rectly affects the model’s performance. However, no gold standard exists to identifynecessary, effective, or redundant features. As a result, feature extraction usually dependson the experiences of researchers. The final step is model development using machinelearning techniques or designing decision rules via setting thresholds or computing relatedstatistical values based on extracted features. However, feature extraction, decision rules,or threshold-making are experience-dependent, and it is hard to cover or find out all signif-icant features, such as QRS-related information [11,13], R-peak-related information [13],or autocorrelation function-related features [14]. In addition, significant features may varywith decision strategies and models. Furthermore, features manually extracted from acertain dataset may not be generalized on other datasets. For example, Shahriari et al.manually extracted the same features on two datasets: the UCSF and Cardiology Chal-lenge 2011 database, but their model had a considerable difference of performance onanother two datasets (UCSF vs. Cardiology Challenge 2011: accuracy: 93.1% vs. 82.5%,sensitivity: 96.3% vs. 83.9%, specificity: 90.0% vs. 77.7%) [12]. Manually extracted featuresgeneralized for different datasets are usually impractical in view of the costly and limitedmedical databases.
In this study, the proposed ECG quality assessment system consists of two stages:dataaugmentation using adversarial networks, and quality assessment using deep neuralnetworks. The goal of data augmentation is to generate versatile ECG to improve thetraining efficiency. The proposed system can automatically extract features from raw
Life 2021, 11, 1013 3 of 14
ECG signals and make final decisions. In this case, the system can avoid relying onexperience- and database-specific manual features for model development, and thresholdsor rules for decision-making; therefore, they may have better generalization ability. Thesystem demonstrates improved performance on two different datasets, and outperformsthe shallow neuronal networks model and deep neural networks model without dataaugmentation. All the experiments were conducted using MATLAB R2019b [16] andTensorFlow 2.3.0. [17].
2. Materials and Methods2.1. Datasets Introduction and Construction
This study uses data from PhysioNet Computing in the Cardiology Challenge 2017(PCCC2017) database [18], TELE ECG database [19], MIT-BIH arrhythmia database (MIT-BIHA) [20], and MIT-BIH normal sinus rhythm database (MIT-BIHNSR) [21].
PCCC2017 aims to classify single-lead ECG recordings to the sinus rhythm, atrialfibrillation (AF), alternative rhythm, or as too noisy. All the recordings last for 9 to 60 s,sampled at 300 Hz. Then, each recording was resampled to 500 Hz and segmented intosegments of 10 s duration with 2 s and 4 s overlap, respectively, to increase the numberof unacceptable segments (in the noisy category). In total, there are 555 unacceptable andselect 2618 acceptable ECG segments from this dataset, each with 10 s duration.
The TELE ECG database was initially recorded by Redmond et al. [11] from 288 home-dwelling patients. Each ECG recording was collected with single-lead and sampled at500 Hz. Khamis et al. regarded this database as poor-quality telehealth ECG [22]. In thisstudy, all the recordings are marked as noisy ECG signals as well. After signal segmentation,there are 734 unacceptable 10 s ECG segments.
The PCCC2017 and TELE ECG database officially provided specific quality labelsfor ECG segments, and then the two databases are combined to a new dataset named asCOMD. COMD consists of 1289 unacceptable and 2618 acceptable ECG segments in total.
MIT-BIHA contains 48 two-channel ECG recordings, each with a duration of 30 min,sampled at 360 Hz. MIT-BIHNSR includes 18 long-term ECG recordings, and all the record-ings are sampled at 128 Hz. The MIT-BIH noise stress test database (MIT-BIHNST) wascreated by using two clean ECG recordings (118 and 119) from the MIT-BIHA and addingnoise recordings on them [7]. The noise recordings are available in MIT-BIHNST, includingbaseline wander (bm), muscle artifact (ma), and electrode motion artifact (em). Inspiredby the construction method of MIT-BIHNST, the original ECG recordings in MIT-BIHAand MIT-BIHNSR as regarded clean signals (acceptable recordings) as well in this study,and then the same noise-added rules as MIT-BIHNST are followed to recreate a new noise-included dataset (RECD for short) using a WFDB software package [23]. The recreated ECGrecordings will include severe “ma”, “bm”, or “em” noises provided by MIT-BIHNST or aGaussian noise and power interference simulated by MATLAB. The detailed noise-addedrule is listed in Table 1, where “g” means Gaussian noise generated by a MATLAB function“awgn” in the WFDB software package, and “p” means a power interference simulatedby a sine function, with 60 Hz frequency. To increase data diversity, RECD is created bycomplying with different noise combinations. Then, all the ECG recordings in RECD areresampled at 500 Hz. After that, there were 7557 unacceptable and 20114 acceptable ECGsegments available.
ECG segments in COMD were used to train a conditional generative adversarial net-works (CGANs) model for ECG segment generation at first. Then, generated unacceptableand real acceptable ECG data were used to pre-train a quality assessment model. Finally,training sets in COMD and RECD were both used for fine-tuning the assessment model,and testing sets were used to test the model. The detailed usage of data is illustrated inTable 2.

Life 2021, 11, 1013 4 of 14
Table 1. The noise-add rules of dataset recreation.
Noise Type MIT-BIHA MIT-BIHNSR
bw - “19093”, “19140”, “19830”em - All 17 recordings
ma“101_V1”, “106_V1”, “112_V1”, “113_V1”, “114_V5”,“115_V1”, “122_V1”, “200_V1”, “205_V1”, “209_V1”,“215_V1”, “220_V1”, “221_V1”, “222_MLII”
All 17 recordings
bw, g - Recordings expect “19093”, “19140”, “19830”(Total 14 recordings)
bw, p - Recordings expect “19093”, “19140”, “19830”(Total 14 recordings)
em, g“101_V1”, “106_V1”, “112_V1”, “113_V1”, “114_V5”,“115_V1”, “122_V1”, “200_V1”, “205_V1”, “209_V1”,“215_V1”, “220_V1”, “221_V1”, “222_MLII”
-
ma, bw “112”, “113”, “114”, “115”, “116”, “117”, “118”, “119”,“121”, “122”, “123”
-
ma, em “124”, “200”, “201”, “202”, “203”, “205”, “207”, “208”,“209”, “210”, “213”, “214”, “215”
All 17 recordings
bw, g, p“101_V1”, “106_V1”, “112_V1”, “113_V1”, “114_V5”,“115_V1”, “122_V1”, “200_V1”, “205_V1”, “209_V1”,“215_V1”, “220_V1”, “221_V1”, “222_MLII”
-
em, bw, g “212”, “217”, “219”, “220”, “221”, “228”, “230”, “231”,“232”, “233”, “234”
-
ma, em, bw “100”, “101”, “102”, “103”, “104”, “105”, “106”, “107”,“108”, “109”, “111”
-
g first 5 min of each recording first 5 min of each recordingp first 5 min of each recording first 5 min of each recording
Table 2. Usage of datasets.
UsageCOMD Generated
UnacceptableECG
RECDTraining Set Testing Set Parts of
Acceptable ECGTraining Set Testing Set
Train CGANs√
- -Pretrain AssessmentModel -
√ √-
Finetune AssessmentModel
√- - -
√-
Test Assessment Model -√
- - -√
2.2. Methods2.2.1. Data Augmentation
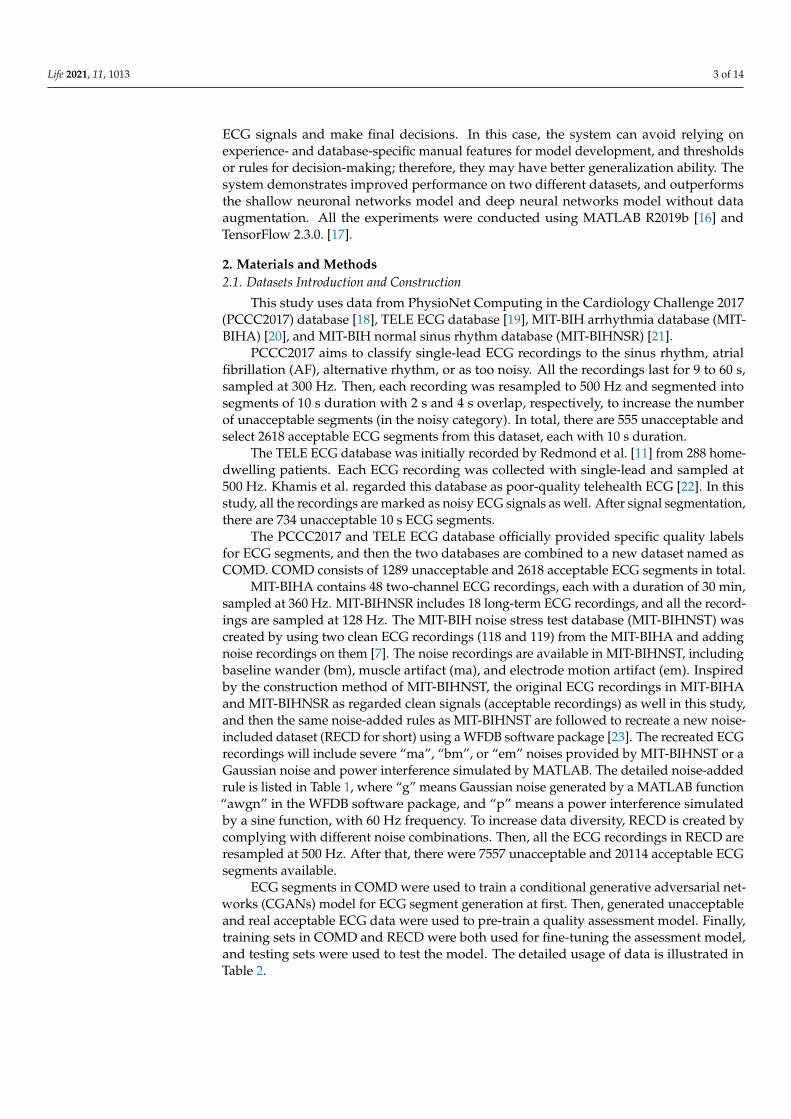
Insufficient and imbalanced data may reduce the performance of deep learning mod-els [24,25]. Thus, the first procedure of the work was to automatically generate unac-ceptable ECG segments to solve data imbalance issues and perform data augmentation.Although traditional mathematical modeling methods can generate realistic heartbeats,the synthetic heartbeat’s morphology lacks diversity or is even almost the same as thoseof training data [26]. Recently, several studies have confirmed that the generative adver-sarial networks (GANs) model has the ability to generate real-like ECG segments andarrhythmia [26–31]. The proposed system is shown in Figure 1, a GANs model [32] isdeveloped and trained based on COMD to obtain an ECG generator (G’), and G’ is usedto generate unacceptable ECG segments with 10 s duration (G’(z|y = 1)). The generatorand discriminator are abbreviated as G and D, respectively. Figure 2(a) shows the structureof the proposed CGANs model. The label information is used as the condition, and eachlabel (“0” for acceptable and “1” for unacceptable) is assembled to an M1-element vectorrepresentation, one input of G. The other input of G is a random M2-element noise signal,

Life 2021, 11, 1013 5 of 14
and following the uniform distribution, their amplitude is limited in –1 to 1. Here, M1 andM2 are determined to be 20 and 700, respectively, by trials and errors. G mainly consistsof two LSTM layers with 200 and 600 units, respectively. The main layers of D are twoconvolutional neural network (CNN) layers, with 128 and 64 units, respectively. Theirkernel sizes are set to 10 and 5, respectively, and the alpha of the “LeakyReLU” activationlayer is set to 0.2. The dropout rate is 0.3. The Dense layer has 32 units and uses “ReLu” asthe activation function. For the output layer, we use “sigmoid” as its activation function.The Adam optimizer with a 0.0002 learning rate and binary crossentropy loss function areapplied to train the CGANs model. By trials and errors, D is updated three times, and G isthen updated once to train the model. After that, an ECG generator (G’) is obtained fromthe CGANs model for unacceptable ECG segment generation.
Figure 1. The proposed ECG quality assessment system. It consists of two parts: data augmentation by CGANs and aquality assessment model.
2.2.2. Quality Assessment
The generated unacceptable ECG segments and parts of real acceptable segmentsin RECD (5000 unacceptable and 5000 acceptable ECG segments in total) were used topre-train the quality assessment model. The structure of the model is shown in Figure 2b,and consists of three branches: two CNN branches (branch1: left; branch2: middle) and anLSTM branch (branch3: right). For branch1, the number of filters in the two CNN layersis 128 and 32 with a kernel size of 50 and 10, respectively. A dropout rate was set to 0.3,and the pooling size to 10. Branch2 has the same structure as branch1, where its two CNNlayers use 64 and 16 filters and the kernel size of each is 25 and 2, respectively. The dropoutrate and pooling size are the same as branch1. The number of units in the two LSTMlayers of branch3 are 200 and 100, respectively. The Dense layer has 32 units with a “ReLu”activation function. A batch size of 64, an Adam optimizer with a 0.0002 learning rate, andbinary crossentropy loss function were applied for training. For model fine-tuning, the
Life 2021, 11, 1013 6 of 14
three branches were frozen and only parameters in the final two layers (Dense and Outputlayers) were updated with real data.
(a) (b)
Figure 2. Structures of the proposed models. (a) The structure of CGANs; (b) the structure of the assessment model.
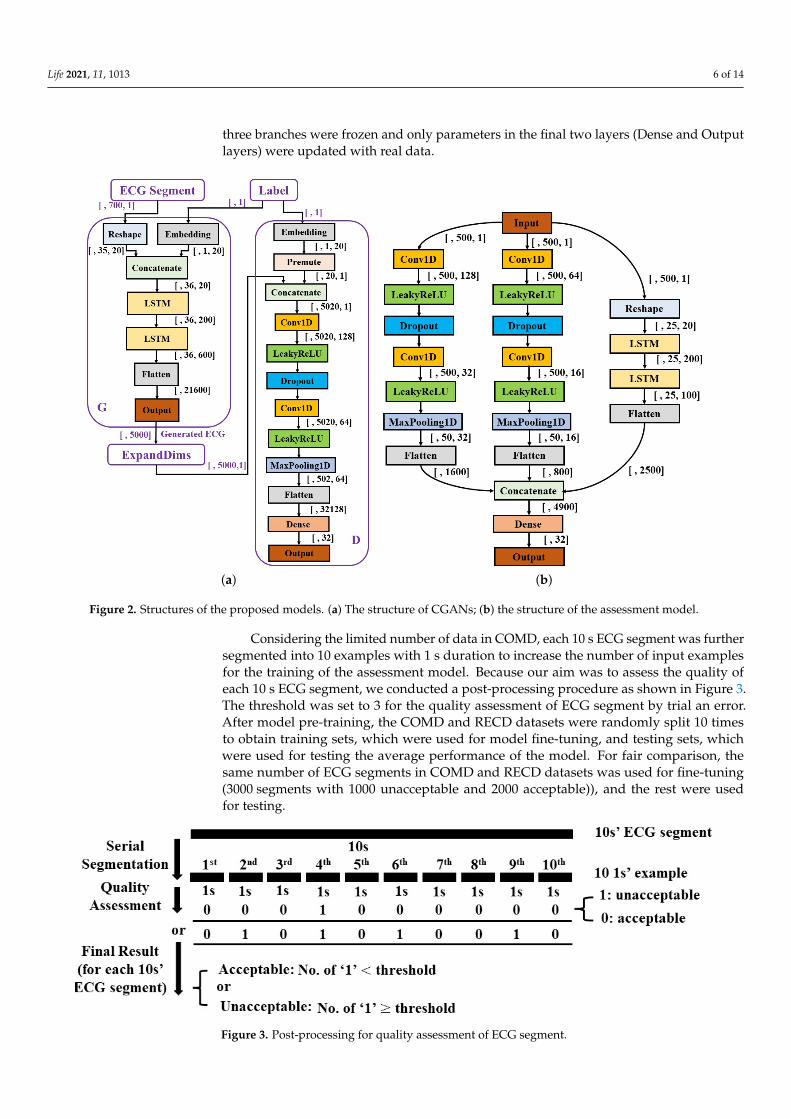
Considering the limited number of data in COMD, each 10 s ECG segment was furthersegmented into 10 examples with 1 s duration to increase the number of input examplesfor the training of the assessment model. Because our aim was to assess the quality ofeach 10 s ECG segment, we conducted a post-processing procedure as shown in Figure 3.The threshold was set to 3 for the quality assessment of ECG segment by trial an error.After model pre-training, the COMD and RECD datasets were randomly split 10 timesto obtain training sets, which were used for model fine-tuning, and testing sets, whichwere used for testing the average performance of the model. For fair comparison, thesame number of ECG segments in COMD and RECD datasets was used for fine-tuning(3000 segments with 1000 unacceptable and 2000 acceptable)), and the rest were usedfor testing.
Figure 3. Post-processing for quality assessment of ECG segment.
Life 2021, 11, 1013 7 of 14
3. Results3.1. Data Augmentation
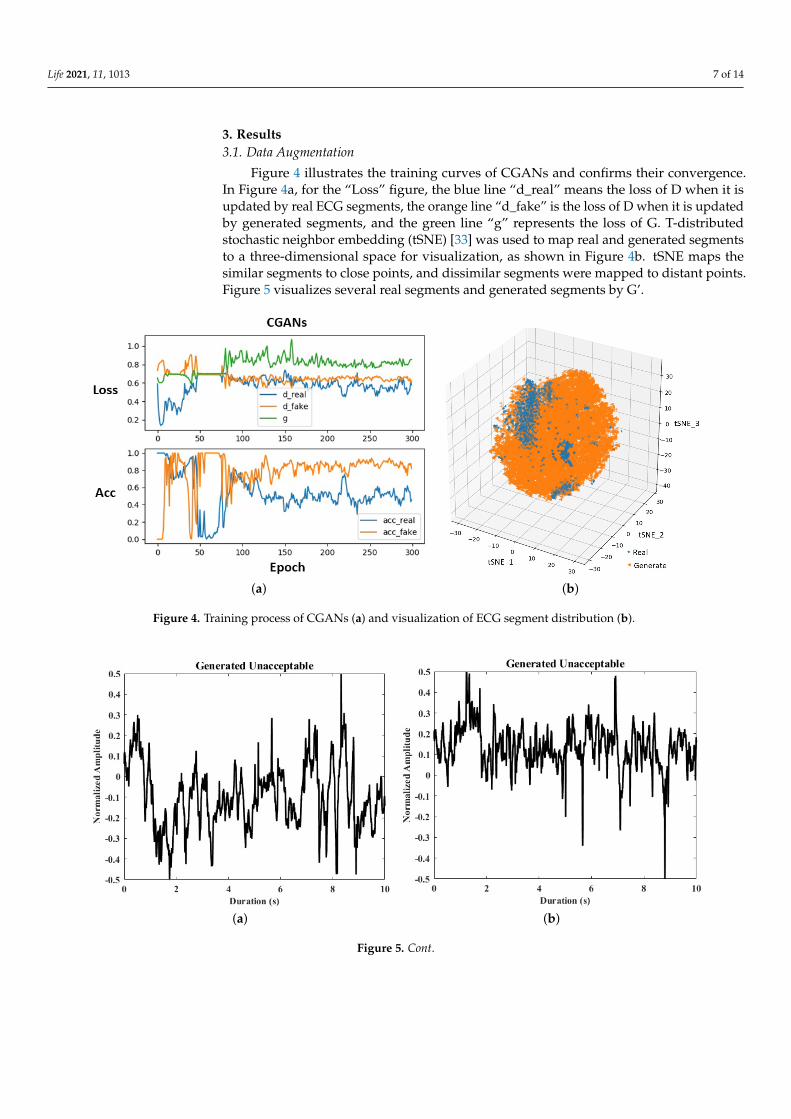
Figure 4 illustrates the training curves of CGANs and confirms their convergence.In Figure 4a, for the “Loss” figure, the blue line “d_real” means the loss of D when it isupdated by real ECG segments, the orange line “d_fake” is the loss of D when it is updatedby generated segments, and the green line “g” represents the loss of G. T-distributedstochastic neighbor embedding (tSNE) [33] was used to map real and generated segmentsto a three-dimensional space for visualization, as shown in Figure 4b. tSNE maps thesimilar segments to close points, and dissimilar segments were mapped to distant points.Figure 5 visualizes several real segments and generated segments by G’.
(a) (b)
Figure 4. Training process of CGANs (a) and visualization of ECG segment distribution (b).
(a) (b)
Figure 5. Cont.
Life 2021, 11, 1013 8 of 14
(c) (d)
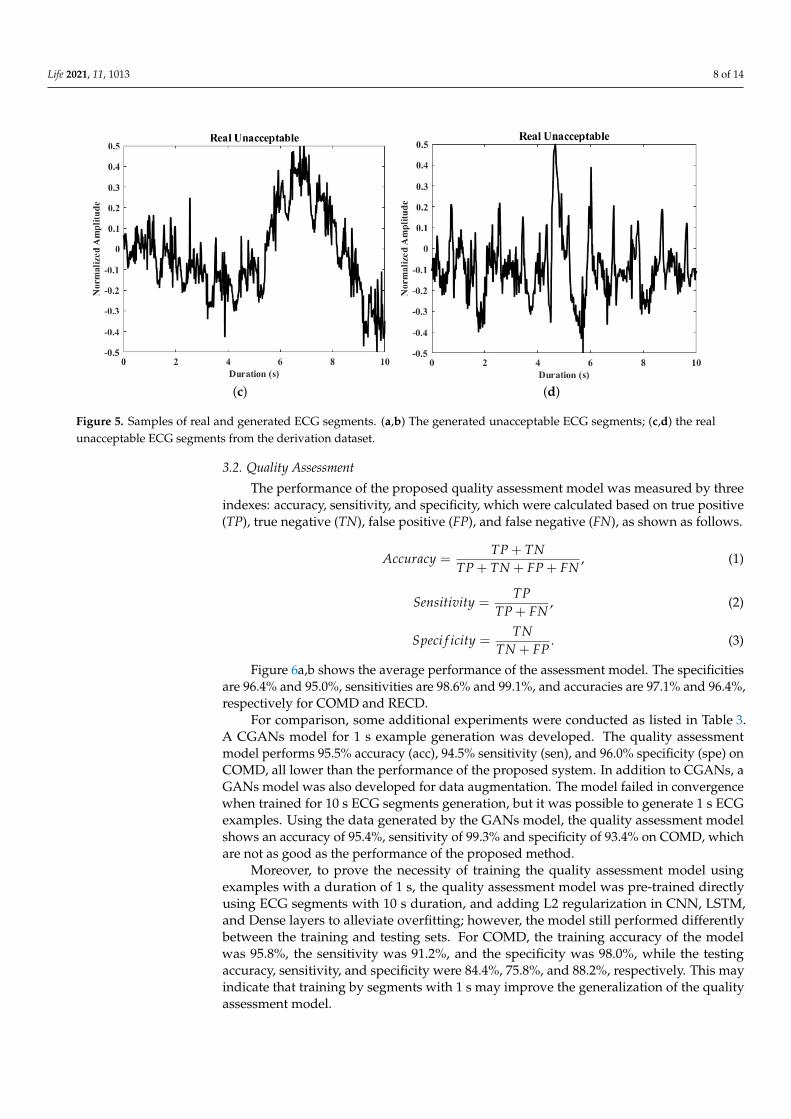
Figure 5. Samples of real and generated ECG segments. (a,b) The generated unacceptable ECG segments; (c,d) the realunacceptable ECG segments from the derivation dataset.
3.2. Quality Assessment
The performance of the proposed quality assessment model was measured by threeindexes: accuracy, sensitivity, and specificity, which were calculated based on true positive(TP), true negative (TN), false positive (FP), and false negative (FN), as shown as follows.
Accuracy =TP + TN
TP + TN + FP + FN, (1)
Sensitivity =TP
TP + FN, (2)
Speci f icity =TN
TN + FP. (3)
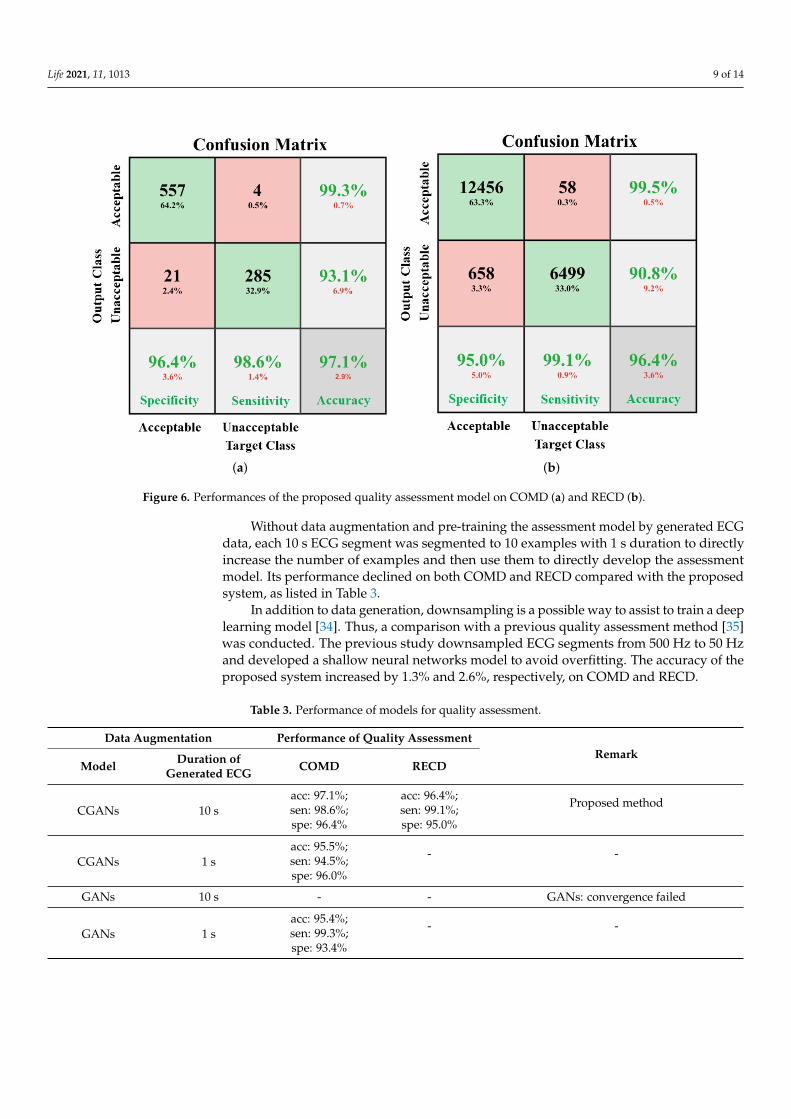
Figure 6a,b shows the average performance of the assessment model. The specificitiesare 96.4% and 95.0%, sensitivities are 98.6% and 99.1%, and accuracies are 97.1% and 96.4%,respectively for COMD and RECD.
For comparison, some additional experiments were conducted as listed in Table 3.A CGANs model for 1 s example generation was developed. The quality assessmentmodel performs 95.5% accuracy (acc), 94.5% sensitivity (sen), and 96.0% specificity (spe) onCOMD, all lower than the performance of the proposed system. In addition to CGANs, aGANs model was also developed for data augmentation. The model failed in convergencewhen trained for 10 s ECG segments generation, but it was possible to generate 1 s ECGexamples. Using the data generated by the GANs model, the quality assessment modelshows an accuracy of 95.4%, sensitivity of 99.3% and specificity of 93.4% on COMD, whichare not as good as the performance of the proposed method.
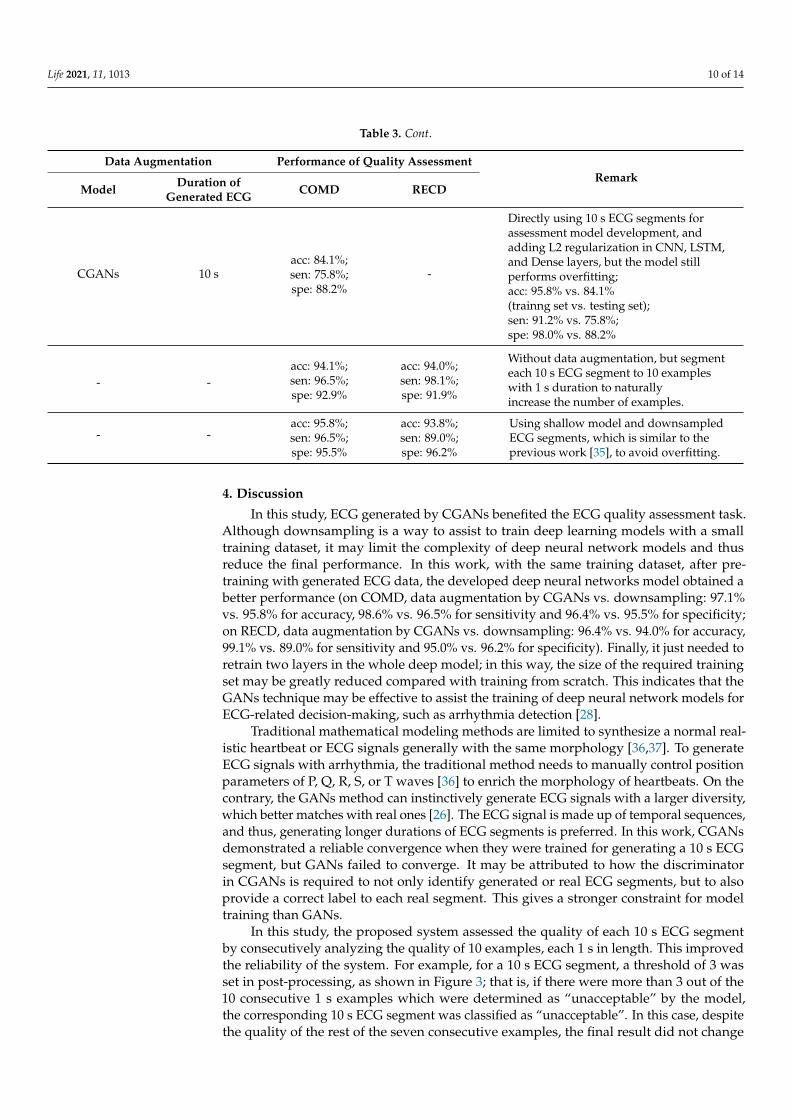
Moreover, to prove the necessity of training the quality assessment model usingexamples with a duration of 1 s, the quality assessment model was pre-trained directlyusing ECG segments with 10 s duration, and adding L2 regularization in CNN, LSTM,and Dense layers to alleviate overfitting; however, the model still performed differentlybetween the training and testing sets. For COMD, the training accuracy of the modelwas 95.8%, the sensitivity was 91.2%, and the specificity was 98.0%, while the testingaccuracy, sensitivity, and specificity were 84.4%, 75.8%, and 88.2%, respectively. This mayindicate that training by segments with 1 s may improve the generalization of the qualityassessment model.
Life 2021, 11, 1013 9 of 14
(a) (b)
Figure 6. Performances of the proposed quality assessment model on COMD (a) and RECD (b).
Without data augmentation and pre-training the assessment model by generated ECGdata, each 10 s ECG segment was segmented to 10 examples with 1 s duration to directlyincrease the number of examples and then use them to directly develop the assessmentmodel. Its performance declined on both COMD and RECD compared with the proposedsystem, as listed in Table 3.
In addition to data generation, downsampling is a possible way to assist to train a deeplearning model [34]. Thus, a comparison with a previous quality assessment method [35]was conducted. The previous study downsampled ECG segments from 500 Hz to 50 Hzand developed a shallow neural networks model to avoid overfitting. The accuracy of theproposed system increased by 1.3% and 2.6%, respectively, on COMD and RECD.
Table 3. Performance of models for quality assessment.
Data Augmentation Performance of Quality AssessmentRemark
Model Duration ofGenerated ECG COMD RECD
CGANs 10 sacc: 97.1%;sen: 98.6%;spe: 96.4%
acc: 96.4%;sen: 99.1%;spe: 95.0%
Proposed method
CGANs 1 sacc: 95.5%;sen: 94.5%;spe: 96.0%
- -
GANs 10 s - - GANs: convergence failed
GANs 1 sacc: 95.4%;sen: 99.3%;spe: 93.4%
- -
Life 2021, 11, 1013 10 of 14
Table 3. Cont.
Data Augmentation Performance of Quality AssessmentRemark
Model Duration ofGenerated ECG COMD RECD
CGANs 10 sacc: 84.1%;sen: 75.8%;spe: 88.2%
-
Directly using 10 s ECG segments forassessment model development, andadding L2 regularization in CNN, LSTM,and Dense layers, but the model stillperforms overfitting;acc: 95.8% vs. 84.1%(trainng set vs. testing set);sen: 91.2% vs. 75.8%;spe: 98.0% vs. 88.2%
- -acc: 94.1%;sen: 96.5%;spe: 92.9%
acc: 94.0%;sen: 98.1%;spe: 91.9%
Without data augmentation, but segmenteach 10 s ECG segment to 10 exampleswith 1 s duration to naturallyincrease the number of examples.
- -acc: 95.8%;sen: 96.5%;spe: 95.5%
acc: 93.8%;sen: 89.0%;spe: 96.2%
Using shallow model and downsampledECG segments, which is similar to theprevious work [35], to avoid overfitting.
4. Discussion
In this study, ECG generated by CGANs benefited the ECG quality assessment task.Although downsampling is a way to assist to train deep learning models with a smalltraining dataset, it may limit the complexity of deep neural network models and thusreduce the final performance. In this work, with the same training dataset, after pre-training with generated ECG data, the developed deep neural networks model obtained abetter performance (on COMD, data augmentation by CGANs vs. downsampling: 97.1%vs. 95.8% for accuracy, 98.6% vs. 96.5% for sensitivity and 96.4% vs. 95.5% for specificity;on RECD, data augmentation by CGANs vs. downsampling: 96.4% vs. 94.0% for accuracy,99.1% vs. 89.0% for sensitivity and 95.0% vs. 96.2% for specificity). Finally, it just needed toretrain two layers in the whole deep model; in this way, the size of the required trainingset may be greatly reduced compared with training from scratch. This indicates that theGANs technique may be effective to assist the training of deep neural network models forECG-related decision-making, such as arrhythmia detection [28].
Traditional mathematical modeling methods are limited to synthesize a normal real-istic heartbeat or ECG signals generally with the same morphology [36,37]. To generateECG signals with arrhythmia, the traditional method needs to manually control positionparameters of P, Q, R, S, or T waves [36] to enrich the morphology of heartbeats. On thecontrary, the GANs method can instinctively generate ECG signals with a larger diversity,which better matches with real ones [26]. The ECG signal is made up of temporal sequences,and thus, generating longer durations of ECG segments is preferred. In this work, CGANsdemonstrated a reliable convergence when they were trained for generating a 10 s ECGsegment, but GANs failed to converge. It may be attributed to how the discriminatorin CGANs is required to not only identify generated or real ECG segments, but to alsoprovide a correct label to each real segment. This gives a stronger constraint for modeltraining than GANs.
In this study, the proposed system assessed the quality of each 10 s ECG segmentby consecutively analyzing the quality of 10 examples, each 1 s in length. This improvedthe reliability of the system. For example, for a 10 s ECG segment, a threshold of 3 wasset in post-processing, as shown in Figure 3; that is, if there were more than 3 out of the10 consecutive 1 s examples which were determined as “unacceptable” by the model,the corresponding 10 s ECG segment was classified as “unacceptable”. In this case, despitethe quality of the rest of the seven consecutive examples, the final result did not change
Life 2021, 11, 1013 11 of 14
and the sensitivity was assured. This characteristic is confirmed in the results, as shown inFigure 6; that is, the sensitivity of the model validated by COMD and RECD is higher thanboth the specificity and accuracy.
This work has some limitations, as follows.(1) The proposed system is suitable for an initial ECG quality assessment, without con-
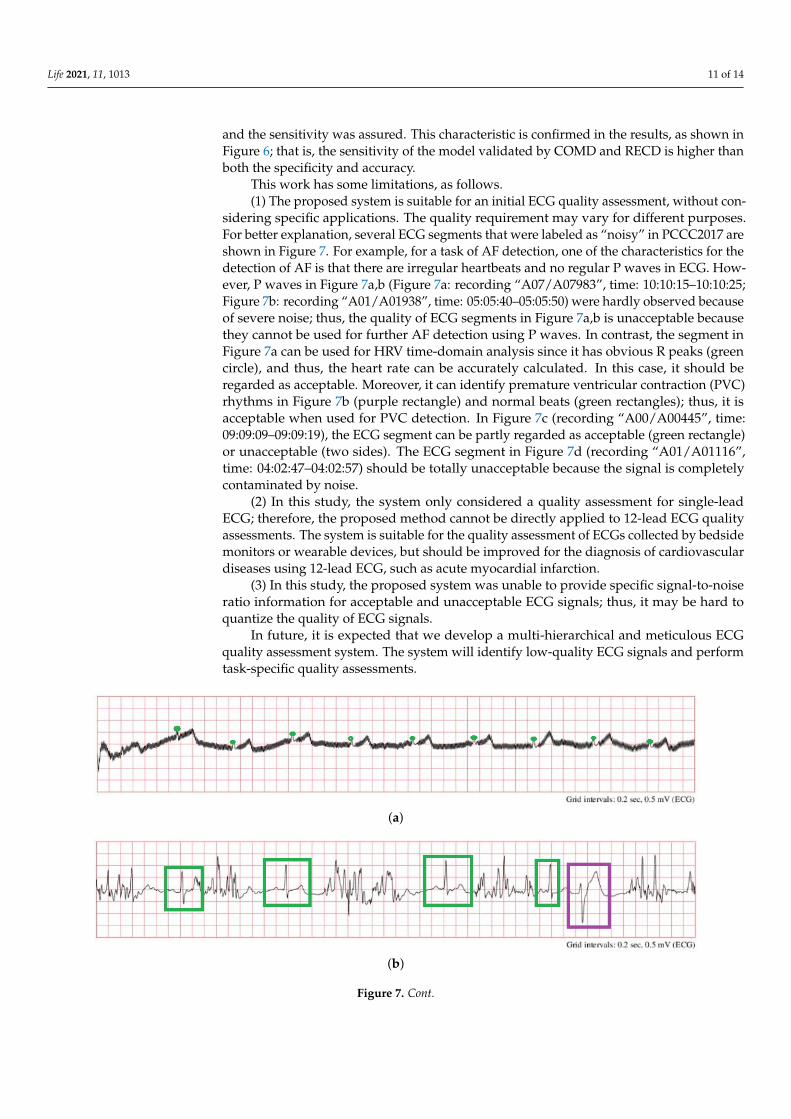
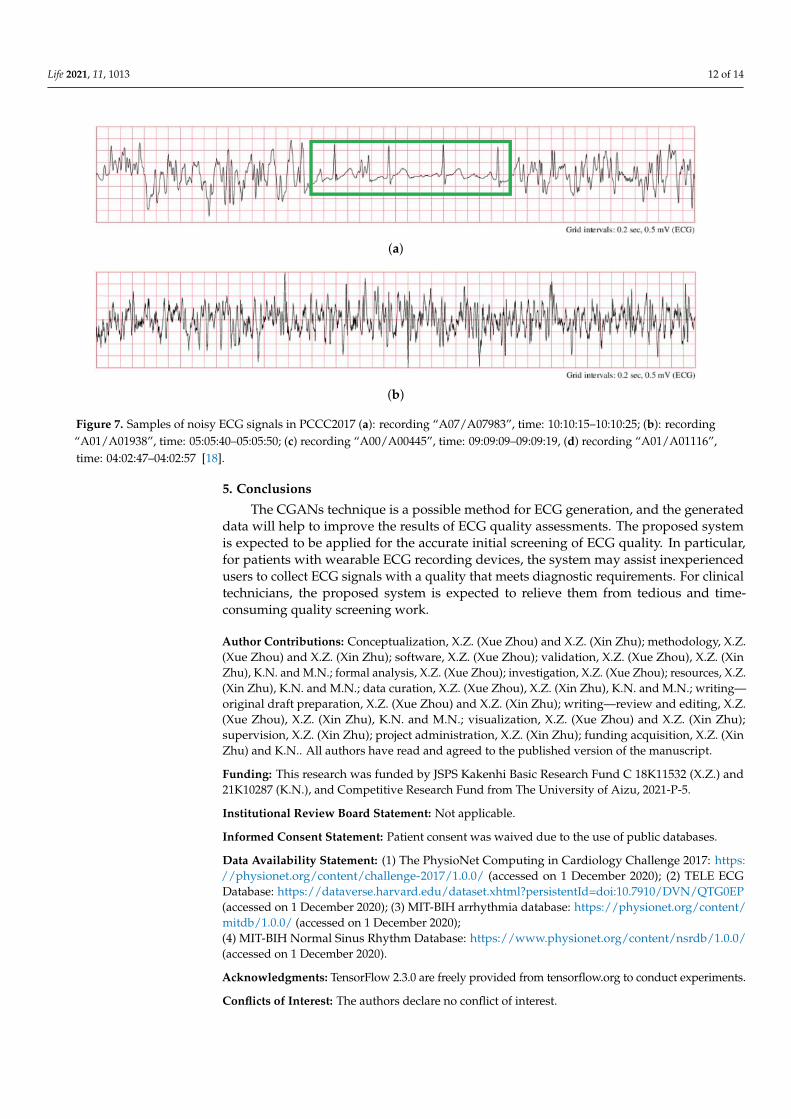
sidering specific applications. The quality requirement may vary for different purposes.For better explanation, several ECG segments that were labeled as “noisy” in PCCC2017 areshown in Figure 7. For example, for a task of AF detection, one of the characteristics for thedetection of AF is that there are irregular heartbeats and no regular P waves in ECG. How-ever, P waves in Figure 7a,b (Figure 7a: recording “A07/A07983”, time: 10:10:15–10:10:25;Figure 7b: recording “A01/A01938”, time: 05:05:40–05:05:50) were hardly observed becauseof severe noise; thus, the quality of ECG segments in Figure 7a,b is unacceptable becausethey cannot be used for further AF detection using P waves. In contrast, the segment inFigure 7a can be used for HRV time-domain analysis since it has obvious R peaks (greencircle), and thus, the heart rate can be accurately calculated. In this case, it should beregarded as acceptable. Moreover, it can identify premature ventricular contraction (PVC)rhythms in Figure 7b (purple rectangle) and normal beats (green rectangles); thus, it isacceptable when used for PVC detection. In Figure 7c (recording “A00/A00445”, time:09:09:09–09:09:19), the ECG segment can be partly regarded as acceptable (green rectangle)or unacceptable (two sides). The ECG segment in Figure 7d (recording “A01/A01116”,time: 04:02:47–04:02:57) should be totally unacceptable because the signal is completelycontaminated by noise.
(2) In this study, the system only considered a quality assessment for single-leadECG; therefore, the proposed method cannot be directly applied to 12-lead ECG qualityassessments. The system is suitable for the quality assessment of ECGs collected by bedsidemonitors or wearable devices, but should be improved for the diagnosis of cardiovasculardiseases using 12-lead ECG, such as acute myocardial infarction.
(3) In this study, the proposed system was unable to provide specific signal-to-noiseratio information for acceptable and unacceptable ECG signals; thus, it may be hard toquantize the quality of ECG signals.
In future, it is expected that we develop a multi-hierarchical and meticulous ECGquality assessment system. The system will identify low-quality ECG signals and performtask-specific quality assessments.
(a)
(b)
Figure 7. Cont.
Life 2021, 11, 1013 12 of 14
(a)
(b)
Figure 7. Samples of noisy ECG signals in PCCC2017 (a): recording “A07/A07983”, time: 10:10:15–10:10:25; (b): recording“A01/A01938”, time: 05:05:40–05:05:50; (c) recording “A00/A00445”, time: 09:09:09–09:09:19, (d) recording “A01/A01116”,time: 04:02:47–04:02:57 [18].
5. Conclusions
The CGANs technique is a possible method for ECG generation, and the generateddata will help to improve the results of ECG quality assessments. The proposed systemis expected to be applied for the accurate initial screening of ECG quality. In particular,for patients with wearable ECG recording devices, the system may assist inexperiencedusers to collect ECG signals with a quality that meets diagnostic requirements. For clinicaltechnicians, the proposed system is expected to relieve them from tedious and time-consuming quality screening work.
Author Contributions: Conceptualization, X.Z. (Xue Zhou) and X.Z. (Xin Zhu); methodology, X.Z.(Xue Zhou) and X.Z. (Xin Zhu); software, X.Z. (Xue Zhou); validation, X.Z. (Xue Zhou), X.Z. (XinZhu), K.N. and M.N.; formal analysis, X.Z. (Xue Zhou); investigation, X.Z. (Xue Zhou); resources, X.Z.(Xin Zhu), K.N. and M.N.; data curation, X.Z. (Xue Zhou), X.Z. (Xin Zhu), K.N. and M.N.; writing—original draft preparation, X.Z. (Xue Zhou) and X.Z. (Xin Zhu); writing—review and editing, X.Z.(Xue Zhou), X.Z. (Xin Zhu), K.N. and M.N.; visualization, X.Z. (Xue Zhou) and X.Z. (Xin Zhu);supervision, X.Z. (Xin Zhu); project administration, X.Z. (Xin Zhu); funding acquisition, X.Z. (XinZhu) and K.N.. All authors have read and agreed to the published version of the manuscript.
Funding: This research was funded by JSPS Kakenhi Basic Research Fund C 18K11532 (X.Z.) and21K10287 (K.N.), and Competitive Research Fund from The University of Aizu, 2021-P-5.
Institutional Review Board Statement: Not applicable.
Informed Consent Statement: Patient consent was waived due to the use of public databases.
Data Availability Statement: (1) The PhysioNet Computing in Cardiology Challenge 2017: https://physionet.org/content/challenge-2017/1.0.0/ (accessed on 1 December 2020); (2) TELE ECGDatabase: https://dataverse.harvard.edu/dataset.xhtml?persistentId=doi:10.7910/DVN/QTG0EP(accessed on 1 December 2020); (3) MIT-BIH arrhythmia database: https://physionet.org/content/mitdb/1.0.0/ (accessed on 1 December 2020);(4) MIT-BIH Normal Sinus Rhythm Database: https://www.physionet.org/content/nsrdb/1.0.0/(accessed on 1 December 2020).
Acknowledgments: TensorFlow 2.3.0 are freely provided from tensorflow.org to conduct experiments.
Conflicts of Interest: The authors declare no conflict of interest.
Life 2021, 11, 1013 13 of 14
References1. Baig, M.M.; Gholamhosseini, H.; Connolly, M.J. A comprehensive survey of wearable and wireless ECG monitoring systems for
older adults. Med. Biol. Eng. Comput. 2013, 51, 485–495. [CrossRef] [PubMed]2. Rosiek, A.; Leksowski, K. The risk factors and prevention of cardiovascular disease: The importance of electrocardiogram in the
diagnosis and treatment of acute coronary syndrome. Ther. Clin. Risk Manag. 2016, 12, 1223–1229. [CrossRef] [PubMed]3. Shaffer, F.; Ginsberg, J.P. An overview of heart rate variability metrics and norms. Front. Public Health 2017, 5, 285. [CrossRef] [PubMed]4. Maršánová, L.; Ronzhina, M.; Smíšek, R.; Vítek, M.; Nemcová, A.; Smital, L.; Nováková, M. ECG features and methods for
automatic classification of ventricular premature and ischemic heartbeats: A comprehensive experimental study. Sci. Rep. 2017,7, 1–11.
5. Satija, U.; Ramkumar, B.; Manikandan, M.S. A review of signal processing techniques for electrocardiogram signal qualityassessment. IEEE Rev. Biomed. Eng. 2018, 11, 36–52. [CrossRef] [PubMed]
6. Improving the Quality of ECGs Collected Using Mobile Phones—The PhysioNet Computing in Cardiology Challenge 2011.Available online: https://www.physionet.org/content/challenge-2011/1.0.0/ (accessed on 3 August 2021).
7. Moody, G.B.; Muldrow, W.; Mark, R.G. A noise stress test for arrhythmia detectors. Comput. Cardiol. 1984, 11, 381–384.8. Tsien, C.L.; Fackler, J.C. Poor prognosis for existing monitors in the intensive care unit. Crit. Care Med. 1997, 25, 614–619. [CrossRef]9. Goldberger, A.L.; Amaral, L.A.; Glass, L.; Hausdorff, J.M.; Ivanov, P.C.; Mark, R.G.; Mietus, J.E.; Moody, G.B.; Peng, C.K.;
Stanley, H.E. PhysioBank, PhysioToolkit, and PhysioNet: Components of a new research resource for complex physiologic signals.Circulation. 2000, 101, e215–e220. [CrossRef]
10. Quesnel, P.X.; Chan, A.D.; Yang, H. Real-time biosignal quality analysis of ambulatory ECG for detection of myocardial ischemia.In Proceedings of the 2013 IEEE International Symposium on Medical Measurements and Applications (MeMeA), Gatineau, QC,Canada, 4–5 May 2013.
11. Redmond, S.J.; Xie, Y.; Chang, D.; Basilakis, J.; Lovell, N.H. Electrocardiogram signal quality measures for unsupervised telehealthenvironments. Physiol. Meas. 2012, 33, 1517–1533. [CrossRef]
12. Shahriari, Y.; Fidler, R.; Pelter, M.M.; Bai, Y.; Villaroman, A.; Hu, X. Electrocardiogram signal quality assessment based onstructural image similarity metric. IEEE. Trans. Biomed. Eng. 2017, 65, 745–753. [CrossRef]
13. Zhao, Z.; Zhang, Y. SQI quality evaluation mechanism of single-lead ECG signal based on simple heuristic fusion and fuzzycomprehensive evaluation. Front. Physiol. 2018, 9, 727. [CrossRef] [PubMed]
14. Moeyersons, J.; Smets, E.; Morales, J.; Villa, A.; De Raedt, W.; Testelmans, D.; Buyse, B.; Van Hoof, C.; Willems, R.; Van Huffel,S.; Varon, C. Artefact detection and quality assessment of ambulatory ECG signals. Comput. Methods Programs Biomed. 2019,182, 105050. [CrossRef]
15. Fu, F.; Xiang, W.; An, Y.; Liu, B.; Chen, X.; Zhu, S.; Li, J. Comparison of Machine Learning Algorithms for the Quality Assessmentof Wearable ECG Signals Via Lenovo H3 Devices. J. Med. Biol. Eng. 2021, 41, 231–240. [CrossRef]
16. MATLAB R2019b. Available online: https://www.tensorflow.org/learn (accessed on 11 December 2020).17. TensorFlow. Available online: https://jp.mathworks.com/products/new_products/release2019b.html (accessed on
7 January 2021).18. AF Classification from a Short Single Lead ECG Recording—The PhysioNet Computing in Cardiology Challenge 2017. Available
online: https://physionet.org/content/challenge-2017/1.0.0/ (accessed on 1 December 2020).19. Khamis, H.; Weiss, R.; Xie, Y.; Chang, C.W.; Lovell, N.H.; Redmond, S.J. TELE ECG Database: 250 Telehealth ECG Records
(Collected Using Dry Metal Electrodes) with Annotated QRS and Artifact Masks, and MATLAB Code for the UNSW ArtifactDetection and UNSW QRS Detection Algorithms. Harvard Dataverse, V3. Available online: https://dataverse.harvard.edu/dataset.xhtml?persistentId=doi:10.7910/DVN/QTG0EP (accessed on 1 December 2020).
20. Moody, G.B.; Mark, R.G. The impact of the MIT-BIH arrhythmia database. IEEE Eng. Med. Biol. Mag. 2001, 20, 45–50.[CrossRef] [PubMed]
21. MIT-BIH Normal Sinus Rhythm Database. Available online: https://physionet.org/content/nsrdb/1.0.0/ (accessed on 1December 2020).
22. Khamis, H.; Weiss, R.; Xie, Y.; Chang, C.W.; Lovell, N.H.; Redmond, S.J. QRS detection algorithm for telehealth electrocardiogramrecordings. IEEE. Trans. Biomed. Eng. 2016, 63, 1377–1388. [CrossRef] [PubMed]
23. The WFDB Software Package. Available online: https://archive.physionet.org/physiotools/wfdb.shtml (accessed on1 December 2020).
24. Dong, Q.; Gong, S.; Zhu, X. Imbalanced deep learning by minority class incremental rectification. IEEE Trans. Pattern Anal. Mach.Intelligence. 2018, 41, 1367–1381. [CrossRef]
25. Japkowicz, N.; Stephen, S. The class imbalance problem: A systematic study. Intell. Data Anal. 2002, 6, 429–449. [CrossRef]26. Wulan, N.; Wang, W.; Sun, K.; Xia, Y.; Zhang, H. Generating electrocardiogram signals by deep learning. Neurocomputing 2020,
404, 122–136. [CrossRef]27. Goodfellow, I.J.; Pouget-Abadie, J.; Mirza, M.; Xu, B.; Warde-Farley, D.; Ozair, S.; Courville, A.; Bengio, Y. Generative adversarial
nets. Adv. Neural Inf. Process. Syst. 2014, 2014, 2672–2680.28. Zhu, F.; Ye, F.; Fu, Y.; Liu, Q.; Shen, B. Electrocardiogram generation with a bidirectional LSTM-CNN generative adversarial
network. Sci. Rep. 2019, 9, 6734. [CrossRef]

Life 2021, 11, 1013 14 of 14
29. Wang, P.; Hou, B.; Shao, S.; Yan, R. ECG arrhythmias detection using auxiliary classifier generative adversarial network andresidual network. IEEE Access 2019, 7, 100910–100922. [CrossRef]
30. Ye, F.; Zhu, F.; Fu, Y.; Shen, B. ECG generation with sequence generative adversarial nets optimized by policy gradient. IEEEAccess 2019, 7, 159369–159378. [CrossRef]
31. Hazra, D.; Byun, Y. SynSigGAN: Generative Adversarial Networks for Synthetic Biomedical Signal Generation. Biology 2020,9, 441. [CrossRef] [PubMed]
32. Mirza, M.; Osindero, S. Conditional generative adversarial nets. arXiv 2014, arXiv:1411.1784.33. Maaten, L.V.D.; Hinton, G. Visualizing data using t-SNE. J Mach Learn Res. 2008, 9, 2579–2605.34. Jeon, E.; Oh, K.; Kwon, S.; Son, H.; Yun, Y.; Jung, E. S.; Kim, M. S. A Lightweight Deep Learning Model for Fast Electrocardio-
graphic Beats Classification With a Wearable Cardiac Monitor: Development and Validation Study. JMIR Med. Inform. 2020,8, e17037. [CrossRef] [PubMed]
35. Zhou, X.; Zhu, X.; Nakamura, K.; Noro, M. ECG quality assessment using 1D-convolutional neural network. In Proceedings ofthe 2018 14th IEEE International Conference on Signal Processing (ICSP), Beijing, China, 12–16 August 2018; pp. 780–784.
36. McSharry, P. E.; Clifford, G. D.; Tarassenko, L.; Smith, L. A. A dynamical model for generating synthetic electrocardiogram signals.IEEE Trans. Biomed. Eng. 2003, 50, 289–294. [CrossRef] [PubMed]
37. Roonizi, E. K.; Sameni, R. Morphological modeling of cardiac signals based on signal decomposition. Comput. Biol. Med. 2013, 43,1453–1461. [CrossRef]