THE TOD EVALUATION METHOD - Metro Transit
104
THE TOD EVALUATION METHOD Evaluating TOD on Station Area and Corridor Scales Frank Alarcón Y.J. Joanne Cho Andrew Degerstrom Ashley Hartle Reed Sherlock University of Minnesota Humphrey School of Public Affairs
-
Upload
khangminh22 -
Category
Documents
-
view
2 -
download
0
Transcript of THE TOD EVALUATION METHOD - Metro Transit
THE TOD EVALUATION METHODEvaluating TOD on Station Area and Corridor Scales
Frank AlarcónY.J. Joanne Cho
Andrew DegerstromAshley Hartle
Reed Sherlock
University of MinnesotaHumphrey School of Public Affairs

This page intentionally left blank
3
The
TOD
Eva
luat
ion
Met
hod
Tabl
e of
Con
tent
s
Table of ContentsExecutive Summary 4
Definitions and AcronymsThrive MSP 2040Transportation Policy PlanTOD Policy
1. Vision 10
2. Existing Conditions 12IntroductionWhy is TOD ImportantEffects of TODWhat is the Metropolitan Council Doing? Benefits of Measuring TOD TOD Station Area Evaluation Tools and MethodsA Framework for TOD in the Twin Cities
3. TOD Scoring Tool 26IntroductionHow the scoring is doneTOD Scores
4. Action Steps 42IntroductionAction StrategiesUsing the Actions and Strategies for Success
Conclusion 52
5. Appendix 54Literature ReviewStakeholder Relationship to TODSWOT AnalysisMethodologyInterview Questions and ListReferences
4
The
TOD
Eva
luat
ion
Met
hod
Exec
utiv
e Su
mm
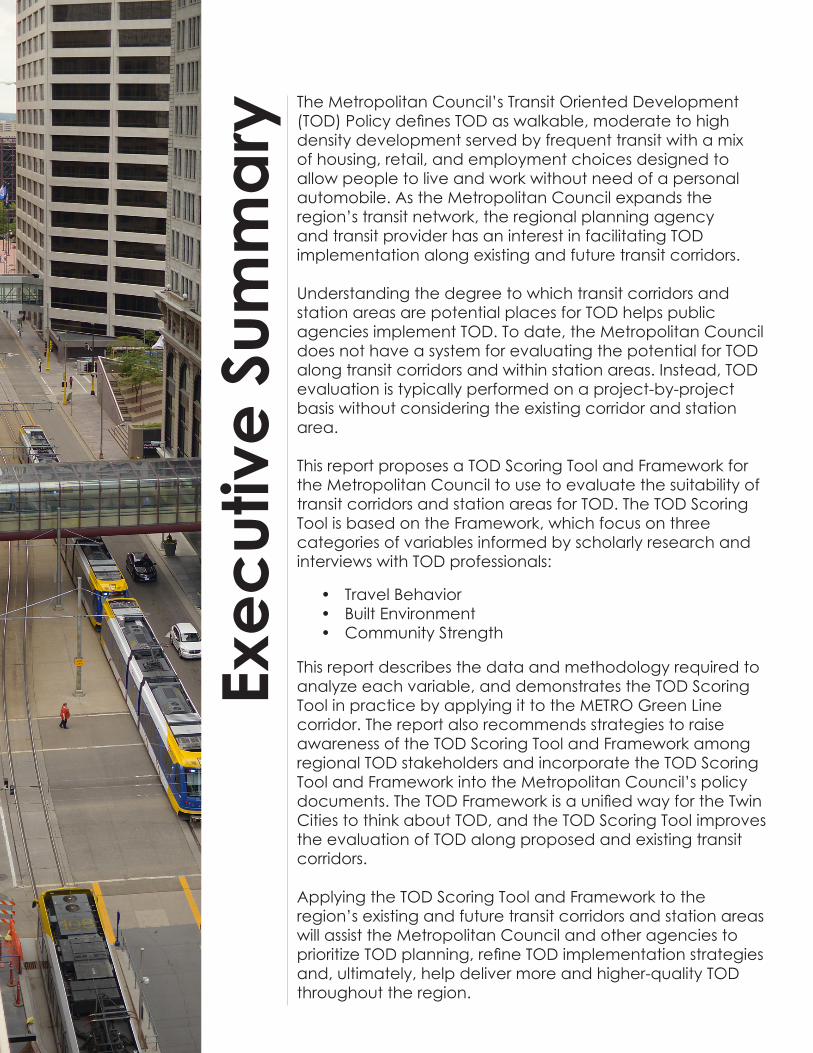
ary The Metropolitan Council’s Transit Oriented Development
(TOD) Policy defines TOD as walkable, moderate to high density development served by frequent transit with a mix of housing, retail, and employment choices designed to allow people to live and work without need of a personal automobile. As the Metropolitan Council expands the region’s transit network, the regional planning agency and transit provider has an interest in facilitating TOD implementation along existing and future transit corridors.
Understanding the degree to which transit corridors and station areas are potential places for TOD helps public agencies implement TOD. To date, the Metropolitan Council does not have a system for evaluating the potential for TOD along transit corridors and within station areas. Instead, TOD evaluation is typically performed on a project-by-project basis without considering the existing corridor and station area.
This report proposes a TOD Scoring Tool and Framework for the Metropolitan Council to use to evaluate the suitability of transit corridors and station areas for TOD. The TOD Scoring Tool is based on the Framework, which focus on three categories of variables informed by scholarly research and interviews with TOD professionals:
• Travel Behavior• Built Environment• Community Strength
This report describes the data and methodology required to analyze each variable, and demonstrates the TOD Scoring Tool in practice by applying it to the METRO Green Line corridor. The report also recommends strategies to raise awareness of the TOD Scoring Tool and Framework among regional TOD stakeholders and incorporate the TOD Scoring Tool and Framework into the Metropolitan Council’s policy documents. The TOD Framework is a unified way for the Twin Cities to think about TOD, and the TOD Scoring Tool improves the evaluation of TOD along proposed and existing transit corridors.
Applying the TOD Scoring Tool and Framework to the region’s existing and future transit corridors and station areas will assist the Metropolitan Council and other agencies to prioritize TOD planning, refine TOD implementation strategies and, ultimately, help deliver more and higher-quality TOD throughout the region.
5
The
TOD
Eva
luat
ion
Met
hod
Defin
ition
s an
d A
cron
yms
Definitions ListTransit Oriented Development: walkable, moderate to high density development served by frequent transit with a mix of housing, retail, and employment choices designed to allow people to live and work without need of a personal automobile.
Station Areas: area within a half mile of a transit line station. When the area within a half mile of a station overlaps, the overlapping area will only be included in the station area that it is closest to.
Corridor: collection of all the station areas along a single transit line.
Vehicle Miles Traveled (VMT): the number of mile driven by vehicles within a defined geographic area.
SWOT Analysis: a tool used to identify the strengths and weaknesses, as well as identifying the opportunities open to us and threats faced, within the context of our problem statement.
Acronyms ListTOD: Transit Oriented Development
RFP: Request for Proposals
LCA: Livable Communities Act
VMT: Vehicle Miles Traveled
TPP: Transportation Policy Plan
AOD: Accessibility Oriented Development
CBA: Community Benefit Agreement
LIHTC: Low Income Housing Tax Credit

6
The
TOD
Eva
luat
ion
Met
hod
Thriv
e M
SP 2
040
Thriv
e M
SP 2
040 Thrive MSP 2040 is the long-range vision for the Twin Cities.
Adopted in 2014, this document outlines the framework for planning in the Twin Cities over the next thirty years. Thrive MSP 2040 identifies five outcomes for the region to achieve by the year 2040: stewardship, prosperity, equity, livability and sustainability. Following is a summary of the importance of each outcome identified in Thrive MSP 2040:
Stewardship: Stewardship establishes financial accountability within the region. Financial accountability means making the most out of large investments, such as transit projects. This is a reason why transit ridership is so important. Transit ridership is related to the station area’s access to housing and jobs. Transit projects cost a lot of public money, therefore, it is important to be financially accountable of these transit investments by encouraging people to take advantage of transit.
Prosperity: Prosperity is achieved through investments in infrastructure and amenities that make the region economically competitive. An economically competitive region attracts and retains businesses, workers, and consequently, wealth. A high-quality transit system is a key element of a competitive region.
Equity: Equity ensures that everyone has the opportunity to succeed in the Twin Cities. The transportation system should provide everyone the ability to travel around the region, regardless of socioeconomic status or race. When an area is equitable, it means that everyone has a choice and the ability to benefit from the transit corridors that connect people to housing and job opportunities.
Livability: By focusing on the quality of life of the region’s residents, the Metropolitan Council can create places people want to live. This means that people should be able to walk around their neighborhoods safely and bike through the Twin Cities’ trails. Livability guarantees that people have places worth traveling to, and enhances the journey to these destinations.
Sustainability: Sustainability means that people are able to travel in ways that are not detrimental to future generations. When people choose to ride transit, they are not driving in a private automobile, which release harmful pollutants and greenhouse gases. Practicing sustainability is investing in the Twin Cities’ future.
7
The
TOD
Eva
luat
ion
Met
hod
Tran
spor
tatio
n Po
licy
Plan
Tran
spor
tatio
n Po
licy
Plan
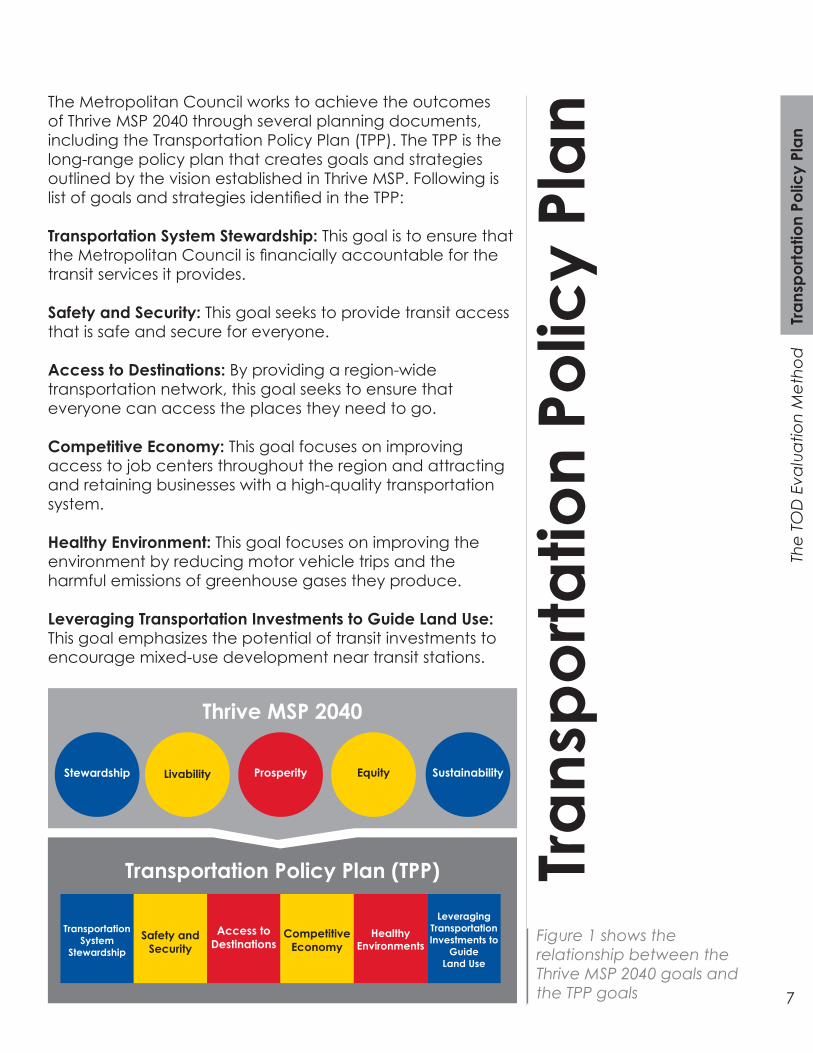
The Metropolitan Council works to achieve the outcomes of Thrive MSP 2040 through several planning documents, including the Transportation Policy Plan (TPP). The TPP is the long-range policy plan that creates goals and strategies outlined by the vision established in Thrive MSP. Following is list of goals and strategies identified in the TPP:
Transportation System Stewardship: This goal is to ensure that the Metropolitan Council is financially accountable for the transit services it provides.
Safety and Security: This goal seeks to provide transit access that is safe and secure for everyone.
Access to Destinations: By providing a region-wide transportation network, this goal seeks to ensure that everyone can access the places they need to go.
Competitive Economy: This goal focuses on improving access to job centers throughout the region and attracting and retaining businesses with a high-quality transportation system.
Healthy Environment: This goal focuses on improving the environment by reducing motor vehicle trips and the harmful emissions of greenhouse gases they produce.
Leveraging Transportation Investments to Guide Land Use: This goal emphasizes the potential of transit investments to encourage mixed-use development near transit stations.
Figure 1 shows the relationship between the Thrive MSP 2040 goals and the TPP goals
Stewardship Prosperity EquityLivability Sustainability
Transportation System
Stewardship
Leveraging TransportationInvestments to
GuideLand Use
Healthy Environments
Transportation Policy Plan (TPP)
Thrive MSP 2040
Safety andSecurity
Access toDestinations
CompetitiveEconomy
8
The
TOD
Eva
luat
ion
Met
hod
TOD
Polic
y
TOD
Polic
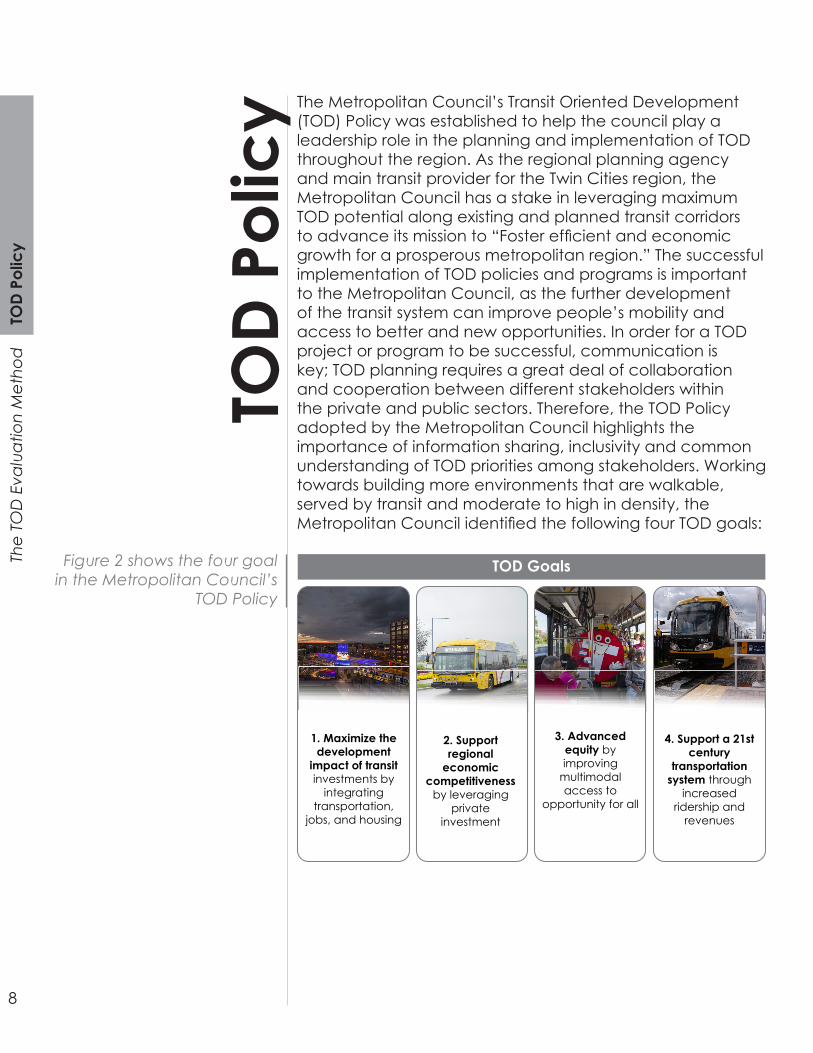
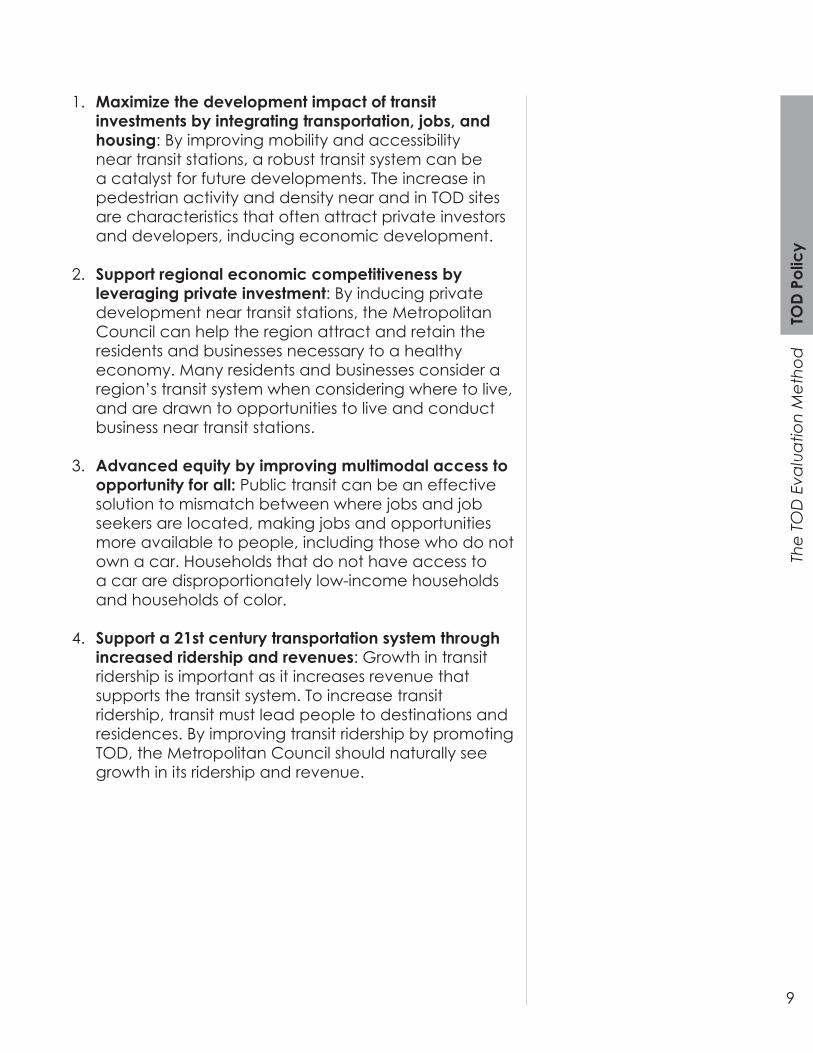
y The Metropolitan Council’s Transit Oriented Development (TOD) Policy was established to help the council play a leadership role in the planning and implementation of TOD throughout the region. As the regional planning agency and main transit provider for the Twin Cities region, the Metropolitan Council has a stake in leveraging maximum TOD potential along existing and planned transit corridors to advance its mission to “Foster efficient and economic growth for a prosperous metropolitan region.” The successful implementation of TOD policies and programs is important to the Metropolitan Council, as the further development of the transit system can improve people’s mobility and access to better and new opportunities. In order for a TOD project or program to be successful, communication is key; TOD planning requires a great deal of collaboration and cooperation between different stakeholders within the private and public sectors. Therefore, the TOD Policy adopted by the Metropolitan Council highlights the importance of information sharing, inclusivity and common understanding of TOD priorities among stakeholders. Working towards building more environments that are walkable, served by transit and moderate to high in density, the Metropolitan Council identified the following four TOD goals:
Figure 2 shows the four goal in the Metropolitan Council’s
TOD Policy
TOD Goals
4. Support a 21st century
transportation system through
increased ridership and
revenues
1. Maximize the development
impact of transit investments by
integrating transportation,
jobs, and housing
2. Support regional
economic competitiveness
by leveraging private
investment
3. Advanced equity by improving
multimodal access to
opportunity for all
9
The
TOD
Eva
luat
ion
Met
hod
TOD
Polic
y
1. Maximize the development impact of transit investments by integrating transportation, jobs, and housing: By improving mobility and accessibility near transit stations, a robust transit system can be a catalyst for future developments. The increase in pedestrian activity and density near and in TOD sites are characteristics that often attract private investors and developers, inducing economic development.
2. Support regional economic competitiveness by leveraging private investment: By inducing private development near transit stations, the Metropolitan Council can help the region attract and retain the residents and businesses necessary to a healthy economy. Many residents and businesses consider a region’s transit system when considering where to live, and are drawn to opportunities to live and conduct business near transit stations.
3. Advanced equity by improving multimodal access to opportunity for all: Public transit can be an effective solution to mismatch between where jobs and job seekers are located, making jobs and opportunities more available to people, including those who do not own a car. Households that do not have access to a car are disproportionately low-income households and households of color.
4. Support a 21st century transportation system through increased ridership and revenues: Growth in transit ridership is important as it increases revenue that supports the transit system. To increase transit ridership, transit must lead people to destinations and residences. By improving transit ridership by promoting TOD, the Metropolitan Council should naturally see growth in its ridership and revenue.
10
Sect
ion
1: V
ision
The
TOD
Eva
luat
ion
Met
hod
Visio
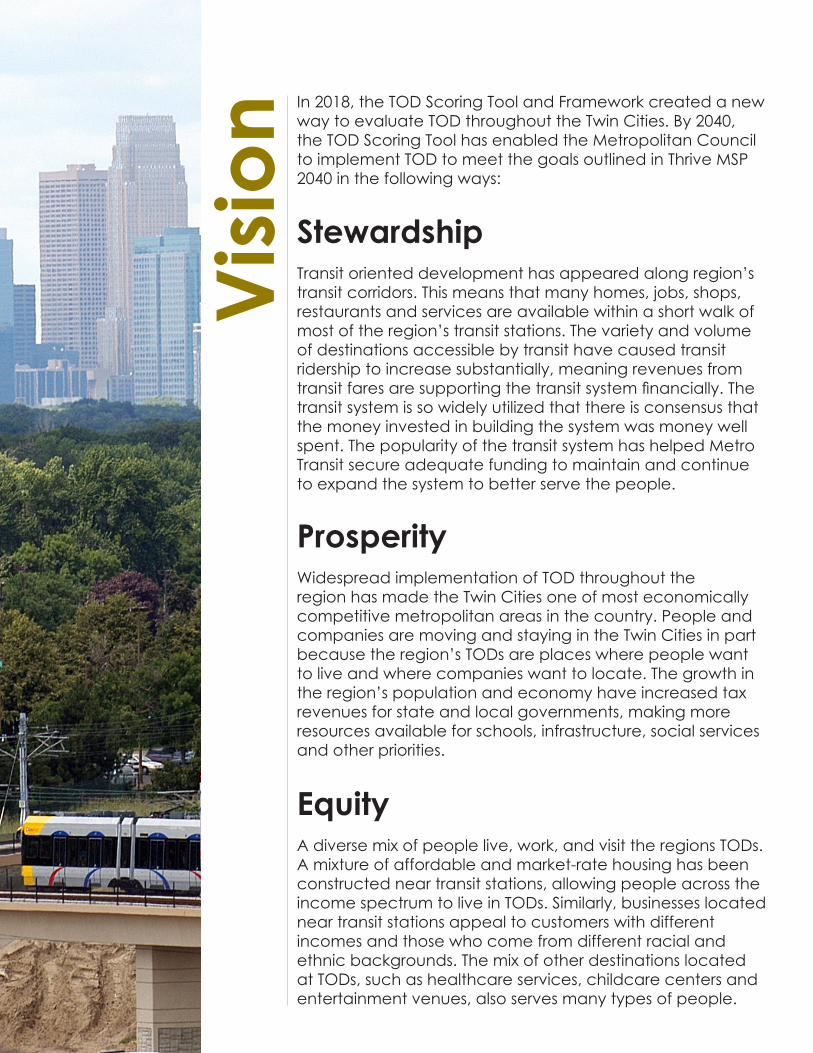
n In 2018, the TOD Scoring Tool and Framework created a new way to evaluate TOD throughout the Twin Cities. By 2040, the TOD Scoring Tool has enabled the Metropolitan Council to implement TOD to meet the goals outlined in Thrive MSP 2040 in the following ways:
StewardshipTransit oriented development has appeared along region’s transit corridors. This means that many homes, jobs, shops, restaurants and services are available within a short walk of most of the region’s transit stations. The variety and volume of destinations accessible by transit have caused transit ridership to increase substantially, meaning revenues from transit fares are supporting the transit system financially. The transit system is so widely utilized that there is consensus that the money invested in building the system was money well spent. The popularity of the transit system has helped Metro Transit secure adequate funding to maintain and continue to expand the system to better serve the people.
ProsperityWidespread implementation of TOD throughout the region has made the Twin Cities one of most economically competitive metropolitan areas in the country. People and companies are moving and staying in the Twin Cities in part because the region’s TODs are places where people want to live and where companies want to locate. The growth in the region’s population and economy have increased tax revenues for state and local governments, making more resources available for schools, infrastructure, social services and other priorities.
EquityA diverse mix of people live, work, and visit the regions TODs. A mixture of affordable and market-rate housing has been constructed near transit stations, allowing people across the income spectrum to live in TODs. Similarly, businesses located near transit stations appeal to customers with different incomes and those who come from different racial and ethnic backgrounds. The mix of other destinations located at TODs, such as healthcare services, childcare centers and entertainment venues, also serves many types of people.
Sect
ion
1: V
ision
The
TOD
Eva
luat
ion
Met
hod
11
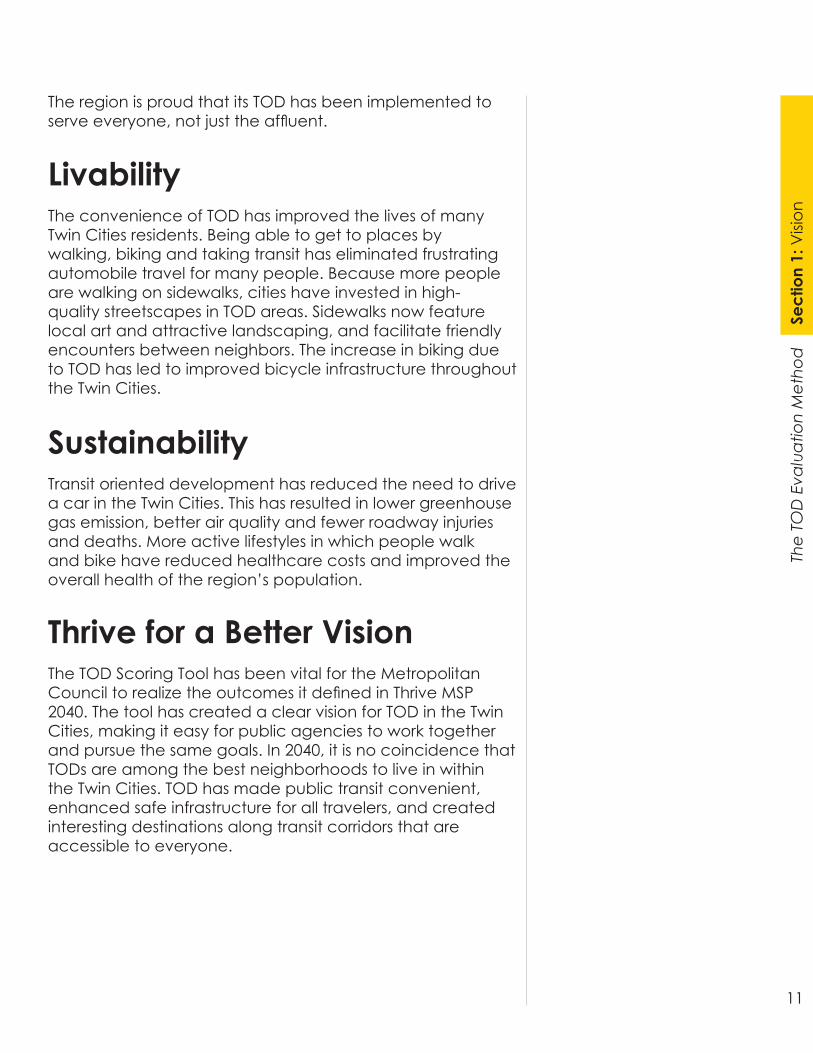
The region is proud that its TOD has been implemented to serve everyone, not just the affluent.
LivabilityThe convenience of TOD has improved the lives of many Twin Cities residents. Being able to get to places by walking, biking and taking transit has eliminated frustrating automobile travel for many people. Because more people are walking on sidewalks, cities have invested in high-quality streetscapes in TOD areas. Sidewalks now feature local art and attractive landscaping, and facilitate friendly encounters between neighbors. The increase in biking due to TOD has led to improved bicycle infrastructure throughout the Twin Cities.
SustainabilityTransit oriented development has reduced the need to drive a car in the Twin Cities. This has resulted in lower greenhouse gas emission, better air quality and fewer roadway injuries and deaths. More active lifestyles in which people walk and bike have reduced healthcare costs and improved the overall health of the region’s population.
The TOD Scoring Tool has been vital for the Metropolitan Council to realize the outcomes it defined in Thrive MSP 2040. The tool has created a clear vision for TOD in the Twin Cities, making it easy for public agencies to work together and pursue the same goals. In 2040, it is no coincidence that TODs are among the best neighborhoods to live in within the Twin Cities. TOD has made public transit convenient, enhanced safe infrastructure for all travelers, and created interesting destinations along transit corridors that are accessible to everyone.
Thrive for a Better Vision
SECTION 2
Existing Conditions
In this sectionIntroductionWhy is TOD ImportantEffects of TODWhat is the Metropolitan Council Doing? Benefits of Measuring TOD TOD Station Area Evaluation Tools and MethodsA Framework for TOD in the Twin Cities
Sect
ion
2: E
xistin
g C
ond
ition
s
13
The
TOD
Eva
luat
ion
Met
hod
IntroductionAbout this ReportThis report was prepared in the spring of 2018 for Metro Transit’s Transit Oriented Development (TOD) Office by a group of Master of Urban and Regional Planning students at the Humphrey School of Public Affairs. The Metro Transit TOD Office has partnered with the Humphrey School of Public Affairs to determine the best way to evaluate TOD at a station area and corridor level.
This report explores how the Twin Cities and peer regions plan, implement and evaluate TOD along transit corridors. It considers what Metro Transit and the Metropolitan Council are missing by not evaluating TOD at the station area and corridor levels. In order to do this, it outlines the benefits of TOD based on scholarly research and interviews with stakeholders who are or have been involved with TOD in the region. The TOD evaluation tool at the station area and corridor scale will help the TOD Office identify policies that need improvements and introduce new TOD policies that adhere to long-term planning. This report further analyzes how peer regions evaluate TOD projects.
By understanding the benefits and impacts of TOD, this report will establish a framework for analyzing TOD at the station area and corridor levels. The framework will guide the Metro Transit TOD Office in future TOD policy planning and TOD implementation practices. Establishing and understanding the TOD Framework will provide a better comprehension of the variables used to create a tool that evaluates TOD at the station area and corridor levels.
More information about the stakeholder interviews can be found in the appendix, along with a list of questions and interviewees
Why Does the TOD Office Need an Evaluation Tool?The TOD Office needs a tool to score and evaluate TOD station areas and corridors to establish a standard for implementing TOD throughout the region. Currently, TOD is evaluated on a site-by-site basis that only includes a general overview of the TOD project’s outcome; it does not consider
14
Sect
ion
2: E
xistin
g C
ond
ition
sTh
e TO
D E
valu
atio
n M
etho
d
the suitability of the station area or corridor at large or overlooks the impact of TOD projects over a period of time. Many public agencies, including counties, cities and the Metropolitan Council, offer funding programs and grants opportunities to support TOD projects; most TOD projects are eligible for any development-related grants. As a result, current criteria to evaluate TOD varies across each public agency.
A common tool for evaluating TOD at the station area and corridor levels would help cities and counties implement TOD more strategically. By implementing this tool, the TOD Office can maximize the benefit of transit corridors throughout the region.
Why is TOD ImportantTransit oriented development is important because it is a catalyst to economic growth and prosperity while connecting places, people and communities through a successful transit network. There is agreement among public agencies in the Twin Cities that TOD should be implemented as the transit system expands within the region. There is less agreement about why TOD is important and what TOD should accomplish. Even within the same agency, staff can disagree about the primary purpose of TOD. One interview expressed that the primary purpose of TOD is to increase transit ridership, while a different staff member at the same agency stated that the most important aspect of TOD is its tendency to create walkable environments. These differences illustrate the challenge the TOD Office faces working with public agencies to implement TOD in the region.
Despite the different perspectives on the importance of TOD, there appears to be consensus among public agencies in the Twin Cities that TOD has beneficial effects on travel behavior and the built environment, and is influenced by its surrounding neighborhood.
See Appendix for more about why TOD is important
Sect
ion
2: E
xistin
g C
ond
ition
s
15
The
TOD
Eva
luat
ion
Met
hod
TOD Impacts on Travel BehaviorTOD is vital to transit use. Because increases in density and desirability typically increases transit riders. Because of this, counties and the Metropolitan Council are interested in TOD to leverage large transit investments. As new attractions rise with developments around transit station areas and corridors, people will be more inclined to travel to these areas. By providing an easy and reliable transit network that allows people to get to places, TOD will encourage people to drive less and take advantage of the transit system. This is why station area planning is so important. It is designed to enhance the longevity of the transit corridors’ performance by shifting travel behavior from a personal vehicle to multimodal commuting. As a result, without developmental potential, there would be less support for transit projects.
Creating a Built Environment for Pedestrians: Living without a carWhile TOD focuses on increasing ridership and leveraging transit investors to develop transit station areas, there is another important component to TOD: creating an environment for pedestrians and bicyclists. When people have access to transit, they are more inclined to walk or bike to places. By integrating pedestrian and bicyclist friendly infrastructures as part of development, the built environment encourages positive, smart and healthier travel options that does not involve driving.
Cities such as Minneapolis and Saint Paul are also interested in increasing their population densities. To do this they have focused on transit corridors. Station areas are locations that can increase in density and increase the whole city’s population without new development in areas that would require additional transportation infrastructure investments. Encouraging TOD is an ideal way to increase population density while also supporting transit. Moreover, because of TOD’s impact on travel behavior, it can remove travelers from the road and onto public transit or walking and biking.
16
Sect
ion
2: E
xistin
g C
ond
ition
sTh
e TO
D E
valu
atio
n M
etho
d
Community Matters: One size does not fit allWhile there may be similar TOD projects, there are no same projects. Each neighborhood’s surrounding station areas are unique, therefore, it is not possible to evaluate TOD without acknowledging the context. What is good TOD in the suburbs may be inappropriate downtown. This means that there is no “one size fits all” TOD station area. Transit oriented development should be appropriate to the location and the people, seamlessly integrating transit into the community as part of the development. When new transit stations are built in neighborhoods, this can prompt an influx of new businesses and communities to the neighborhood. However, it is important that these businesses serve as amenities for the neighborhood and surrounding corridor. Furthermore, one TOD project will not solve all the problems. While a TOD project cannot create development or increase density alone, it has the potential to attract new developments to the area that will prompt growth in the future.
Effects of TODIt is important to note that the effects of TOD are similar to the importance of TOD: effects of TOD are measured by academic research, whereas the importance of TOD focuses on the public good TOD serves. The effects of TOD established by research further correspond with the Metropolitan Council’s TOD Policy as well as their Thrive MSP 2040 document. There is a significant body of research on the effects of TOD on outcomes of interest to policymakers, transit agencies and the general public. This section will briefly summarize the effects of TOD on the following areas:
• Travel Behavior• Built Environment• Community Strength
Sect
ion
2: E
xistin
g C
ond
ition
s
17
The
TOD
Eva
luat
ion
Met
hod
Travel Behavior TransiT ridershipBy increasing transit ridership, TOD contributes to the TOD Policy’s goal to “support a 21st century transportation system through increased ridership,” and Thrive MSP 2040’s “stewardship” priority; TOD encourages transit use, validating the investments made on transit. Strong TODs should encourage people with cars to drive less and take advantage of the transit system.
Vehicle Miles TraVeledBecause TOD encourages people to use public transit, people who live within TODs are less likely to rely on personal automobiles for everyday use. Naturally, when one uses their personal vehicle infrequently, this will decrease their vehicle miles traveled (VMT). Studies show that a household’s VMT can be substantially reduced by residing in a “location efficient neighborhood,” or an area with dense land use within a half mile of transit (Haas et al., 2010; Nasri and Zhang, 2014).
enVironMenTIn addition to reducing their VMT, people improve the environment by taking transit over driving. Seventeen percent of greenhouse gas emission is from the use of personal vehicles in the U.S. Therefore, by creating an environment that encourages people to use less cars, TOD advocates for a cleaner environment that helps mitigate climate change (Renne, 2009a).
Built EnvironmenteconoMic deVelopMenT, land Values and eMployMenTThe impacts of TOD on economic development, land values and employment are consistent with the TOD Policy goals:
1. Maximize the development impact of transit investments
2. Support regional economic competitiveness
18
Sect
ion
2: E
xistin
g C
ond
ition
sTh
e TO
D E
valu
atio
n M
etho
d
Transit oriented development can influence where people live, but it can also influence where people work. Employment around TODs has received less attention but is an important element of a transit corridor. When transit stations are within job centers, the transit not only serves the people who live near transit stations, but also those who work near transit stations. Researchers have studied the effects of transit access on land values, referring to it as transit’s “value uplift,” (Cao and Luo, 2017). Because transit can have a great impact on land values, there is more incentive to develop high density development in TODs; this can increase the population density in the area.
housing affordabiliTyEquity is important to both the TOD Policy and Thrive MSP 2040. The TOD Policy outlines a goal to “advance equity by improving multimodal access to opportunity for all.” As inequality has grown in major U.S. metropolitan areas, proponents of TOD have become increasingly interested in TOD as a means to promote social equity. Because TOD is important for the built environment, TOD needs to incorporate diverse housing costs near transit stations. There is growing evidence that living in an area that is well-served by transit is associated with lower overall housing and transportation costs, as transit access reduces the need to own and operate a personal automobile (Singh, 2015).
Community Strengthsocial equiTy: socio-econoMic diVersiTyJust as TOD impacts the cost of housing, TOD can impact the type of people who can afford to live there. This is why the TOD Policy and Thrive MSP highlights equity as a priority. Historically, TOD implementation has occurred largely in affluent neighborhoods. When TOD is slated for implementation in poorer areas, it risks catalyzing gentrification by raising area property values and attracting new, wealthier residents who displace longtime, poorer residents. A high level of public engagement in the TOD planning process can help ensure that future TOD addresses the needs of existing area residents (Jeihani et al., 2013).
TODs can increase socio-economic diversity if certain strategies are employed. Strategies to avoid gentrification include public subsidies for affordable housing, the low-

Sect
ion
2: E
xistin
g C
ond
ition
s
19
The
TOD
Eva
luat
ion
Met
hod
income housing tax credit (LIHTC), community benefits agreements (CBAs), tax abatements to encourage developers to preserve existing housing and affordable housing trust funds.
healThWhen people choose to walk and bike within their neighborhoods, they can improve their cardiovascular and mental health. Meanwhile, choosing to rely on an automobile results in less physical activity, which can increase the risk of high blood pressure, diabetes and obesity. If implemented in a way that emphasizes improving the health of disadvantaged communities, TOD can serve the equity goals of the Metropolitan Council’s TOD Policy and Thrive MSP 2040. By placing people within walking and biking distance of amenities and transit stations, TOD encourages healthy travel behavior. Having safe and comfortable sidewalks and bike lanes encourages people to walk and bike, not just to the transit station, but to other amenities within the neighborhood.
What is the Metropolitan Council Currently Doing to Promote TOD?The Metropolitan Council proactively develops strategies for TOD throughout the Twin Cities metropolitan area. The Metropolitan Council relies on two documents for long term policy planning: Thrive MSP 2040 and the Transportation Policy Plan (TPP). Other public agencies within the Twin Cities are also responsible for implementing TOD and evaluating TOD projects. The previous sections established why TOD is important and the effects of TOD. This section outlines what is currently lacking in the TOD policy which guides TOD implementation.
20
Sect
ion
2: E
xistin
g C
ond
ition
sTh
e TO
D E
valu
atio
n M
etho
d
Existing PoliciesUpdated every ten years, the Thrive MSP 2040 framework establishes the long-range vision for growth and development in the Twin Cities region. The Metropolitan Council implements TOD policies to support livability and collaborative outcomes with stakeholders. These TOD goals are reflected as courses of action in the regional Transportation Policy Plan (TPP). Within the TPP, TOD implementation strategies coincide with regional land use goals to integrate transportation planning with land use.
In 2014, the Metropolitan Council adopted the TOD Policy Plan. Transit Oriented Development Policy utilizes the priorities outlined in Thrive MSP 2040. Outlining the strategies to collaborate with developers and public agencies, TOD Policy acts as a guideline to proactively communicate with various stakeholders.
However, the Metropolitan Council does not typically develop TOD projects. This makes it vital to work with other public agencies and developers to implement TOD throughout the region. Because there is not currently a framework that addresses TOD in the region, each public agency prioritizes TOD differently. When the TOD Office implements the tool and framework proposed later in this report, the Metropolitan Council can establish a region-wide understanding of TOD, and public agencies can work together to meet the same goals.
Benefits of Measuring TOD at the Station Area and Corridor LevelsThis report has outlined the effects of TOD and established why TOD is important. It has also described the Metropolitan Council’s and the TOD Office’s roles in TOD, and identified gaps in how public agencies in the Twin Cities promote TOD.
See Appendix for more about evaluating TOD on
the station area and corridor level
Sect
ion
2: E
xistin
g C
ond
ition
s
21
The
TOD
Eva
luat
ion
Met
hod
The TOD Office is seeking a standard method to evaluate TOD at the station area and corridor levels. This section describes how to evaluate TOD at these levels.
Evaluating TOD at the Station Area LevelThere are number of methodologies for evaluating TOD at the station area level based on station typologies (Bertolini, 2009; Balz & Schrinjen, 2009; Reusser et al., 2008; Zemp et al., 2011; CTOD, 2013; Chorus & Bertolini, 2011) . Using existing land use and density information within a given station area, one would be able to determine the TOD potential of the selected area. However, because station typologies, TOD goals and vision vary, it is hard for the TOD Office to simply adopt a TOD evaluation methodology based on an approach done in the past (Zemp et al., 2011; Kamruzzaman et al., 2014). In comparison to evaluating TOD based on station typology, a study in the Netherlands developed a TOD index that quantifies the transit orientation of TOD station areas using variables (Singh et al., 2014; Singh et al., 2015). For the index to be accurate and effective, all variables must be measurable; the variables should be diverse and include both development and transit characteristics in a TOD index.
Evaluating TOD at the Corridor LevelBecause of TODs impact on housing and employment, not all station areas along a transit corridor will develop the same. Development opportunities will not be the same because each community is unique, and will be impacted by the transit corridor differently. The same TOD Index used to evaluate TOD at the station area level can be used to rank each station. Examining the transit corridor by comparing all of the station areas to one another, this can be used to determine which station areas to prioritize for remedial actions to improve their transit orientation.

22
Sect
ion
2: E
xistin
g C
ond
ition
sTh
e TO
D E
valu
atio
n M
etho
d
Overview of TOD Station Area Evaluation Tools and MethodsIn the previous section, it was established that TOD can be evaluated at a station area and corridor level. This section explores TOD station area evaluation tools and policies that are currently utilized within and the Twin Cities.
In 2014, the Metropolitan Council created a classification guide: the TOD Classification Tool. This tool categorizes TOD based on land use and quantifies TODs based on what it called “transit orientation” and “market potential”. The TOD Classification Tool is used before a project is proposed to help determine if a given site has the potential to succeed as a TOD. Transit orientation is measured by looking at:
• Intersection density • Car-free population• Transit service frequency• Intensity (population and job density)• Amenities
Market potential is measured by looking at:
• Job access• Land values• Sales activity• Development potential
These measurements are then scaled from low to high scores to create five categories that determine how TOD-ready the station area is: Raise the Bar, Catalyze, Connect, Transition, and Plan & Partner. Each category corresponds to a set of actions. The TOD Classification Tool considers different types of implications, including equity and economic development, and outlines priorities for each category.
The User Guide can be utilized to categorize and evaluate potential TOD sites at a station area level. Even though the current tool is a reliable source for determining the potential of developing TOD at a station area, it needs to be able to analyze all station areas compared to one another along
See Appendix for more about evaluation methods
and tools
Sect
ion
2: E
xistin
g C
ond
ition
s
23
The
TOD
Eva
luat
ion
Met
hod
the corridor. Moreover, while the tool indicates that it can be used to compare TOD station areas to one another, it is unclear how that can be done.
Although the Metropolitan Council has the TOD Classification Tool, this tool has not been used. The Metropolitan Council needs a tool that has a clear vision and framework, as well as a clear action plan to ensure the use and validity of the tool.
A Framework for TOD in the Twin CitiesSo far, this report has established that the Metropolitan Council and the TOD Office lacks a clear framework that addresses TOD in the Twin Cities and a tool to evaluate station areas and corridors.
This report further outlined why TOD is important based on professional feedback and academic research. Because of the importance and the effects of TOD, it is clear that the TOD Office and the Metropolitan Council need to rethink how they prioritize TOD projects in the Twin Cities. The importance and effects of TOD have highlighted the impacts on the following factors:
• Travel Behavior• Built Environment• Community Strength
Because of their influence on TOD based on professional interviews and academic research, these three factors will shape one of the key findings of this report: the TOD Framework. Using the TOD Framework to create the evaluation tool will help create an effective, region-wide approach to planning and implementing TOD.
The current TOD policies the Metropolitan Council and the TOD Office use require vision and direction for TOD planning in the Twin Cities. This report has created a TOD Framework which will shape the TOD Scoring Tool. Because of this, this report will serve as a key link for the TOD Office to evaluate
24
Sect
ion
2: E
xistin
g C
ond
ition
sTh
e TO
D E
valu
atio
n M
etho
d
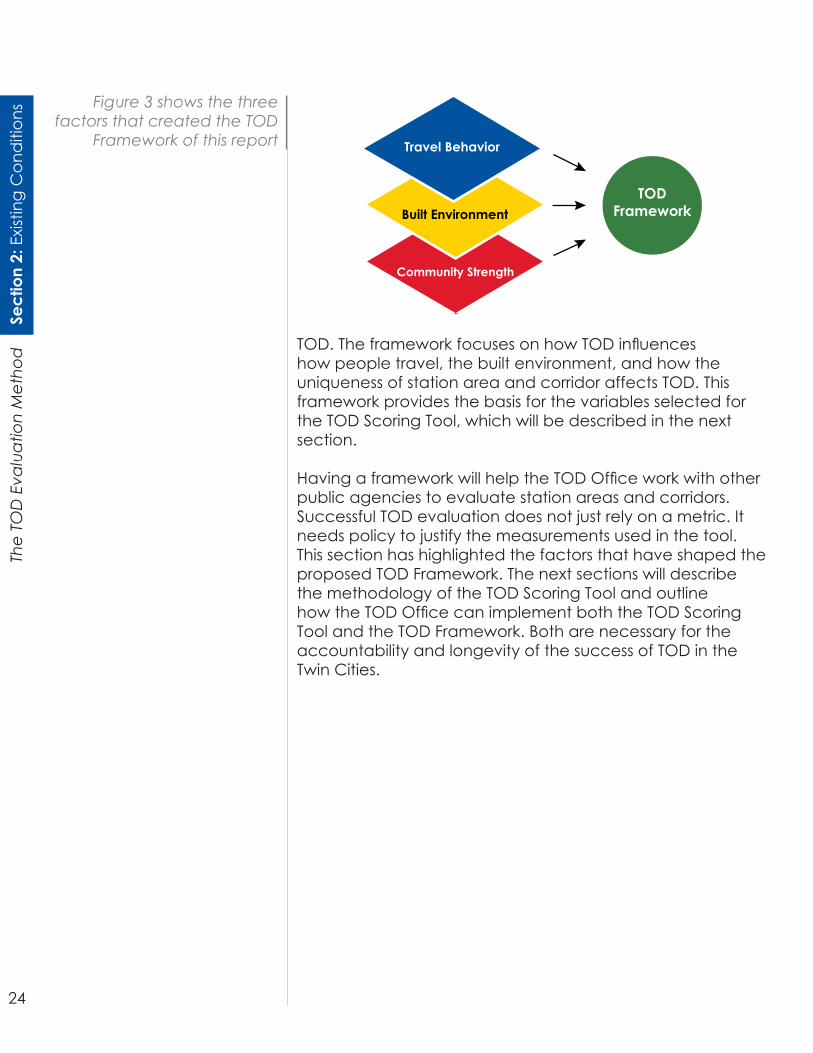
Figure 3 shows the three factors that created the TOD
Framework of this report
TODFrameworkBuilt Environment
Community Strength
Travel Behavior
TOD. The framework focuses on how TOD influences how people travel, the built environment, and how the uniqueness of station area and corridor affects TOD. This framework provides the basis for the variables selected for the TOD Scoring Tool, which will be described in the next section.
Having a framework will help the TOD Office work with other public agencies to evaluate station areas and corridors. Successful TOD evaluation does not just rely on a metric. It needs policy to justify the measurements used in the tool. This section has highlighted the factors that have shaped the proposed TOD Framework. The next sections will describe the methodology of the TOD Scoring Tool and outline how the TOD Office can implement both the TOD Scoring Tool and the TOD Framework. Both are necessary for the accountability and longevity of the success of TOD in the Twin Cities.
Sect
ion
2: E
xistin
g C
ond
ition
s
25
The
TOD
Eva
luat
ion
Met
hod
This page intentionally left blank
SECTION 3
TOD Scoring Tool
In this sectionIntroductionHow the scoring is doneTOD Scores
27
Sect
ion
3: T
OD
Sco
ring
Tool
The
TOD
Eva
luat
ion
Met
hod
IntroductionMetro Transit’s TOD Office has a unique role in TOD projects. The TOD Office uses the Metropolitan Council’s TOD Policy as the foundation to plan and help implement TOD throughout the region. The Existing Conditions section established that the Metropolitan Council defines TOD policy goals and provides funding for TOD implementation, but does not have the resources in its toolkit to evaluate potential and re-evaluate existing TOD at station areas. A successful toolkit should consist of policy, potential funding opportunities, a framework and an evaluation tool. This TOD Scoring Tool relies on the significance of travel behavior, the built environment, and community strength as the framework for determining viable TOD sites.
A working TOD tool should predict the success of TOD at potential stations areas and help assess the success of TOD at existing station areas. Neighborhoods change, businesses grow, building vacancy rates fluctuate; station areas will need to be evaluated regularly to maintain the accountability of the TOD Office and the TOD Scoring Tool.
The Metropolitan Council seeks to evaluate TOD within a station area and along a corridor. As discussed in the Existing Conditions section, peer regions and academic research indicate that TOD can be evaluated by considering travel behavior, the built environment and various community characteristics, which the TOD Scoring Tool refers to as community strength. These three criteria form the framework behind the evaluation tool. By collecting data on variables within the three evaluation criteria, a metric can score stations areas and entire transit corridors for TOD suitability. The following section will describe the evaluation tool and the variables that encompass the framework.
OverviewThe TOD Scoring Tool uses the criteria of travel behavior, the built environment and community strength to evaluate TOD in station areas and corridors. The scoring tool assigns a score between 0 and 100 to each station area and corridor
28
Sect
ion
3: T
OD
Sco
ring
Tool
The
TOD
Eva
luat
ion
Met
hod
for the three criteria that comprise the framework. The tool then aggregates these scores to produce an overall TOD score for each station area or corridor. Each part of the framework represents an important aspect of an area’s ability to support TOD.
How the scoring is doneAn overall score is given to a station area or corridor based on the three criteria of the framework: travel behavior, built environment and community strength. The subscores generated for each criterion can be assigned different weights to represent their ability to predict the success of TOD in the area. Each station area is evaluated within a half mile buffer of the station. In the event that stations are less than a half mile apart, the buffer is adjusted to avoid double counting areas.
Each subscore is determined by analyzing a group of variables that affect a station area’s suitability for TOD. These variables were carefully selected based on academic literature and interviews with TOD professionals. Each variable is calculated to provide information about a station area or corridor. An individual variable is standardized based on its value for all station areas or corridors being evaluated. This standardization process is based on the goal for each variable. Some variables measure percentages while other variables measure straight numbers. Standardization allows variables with widely different types of values to feed into the same composite score. Because this standardization is based on the pool of numbers being evaluated, the TOD Scoring Tool will be most effective when evaluating large numbers of station areas at once. This report applies the TOD Scoring Tool to all 23 station areas along the Green Line, but the tool will be more effective when applied to a larger sample of station areas.
Once the variables have been standardized, they are combined into subscores. This is done through weighting each variable based on its importance. The relative importance of each variable is determined through a survey of TOD professionals throughout the region. This allows some variables that are less important to be included without allowing them to have an outsized influence on
See page 86 in the Appendix for a detailed explanation
of each variable and the calculation process for standardization and
assigning weights
29
Sect
ion
3: T
OD
Sco
ring
Tool
The
TOD
Eva
luat
ion
Met
hod
the outcome of the evaluation. The variables that were analyzed are explained below.
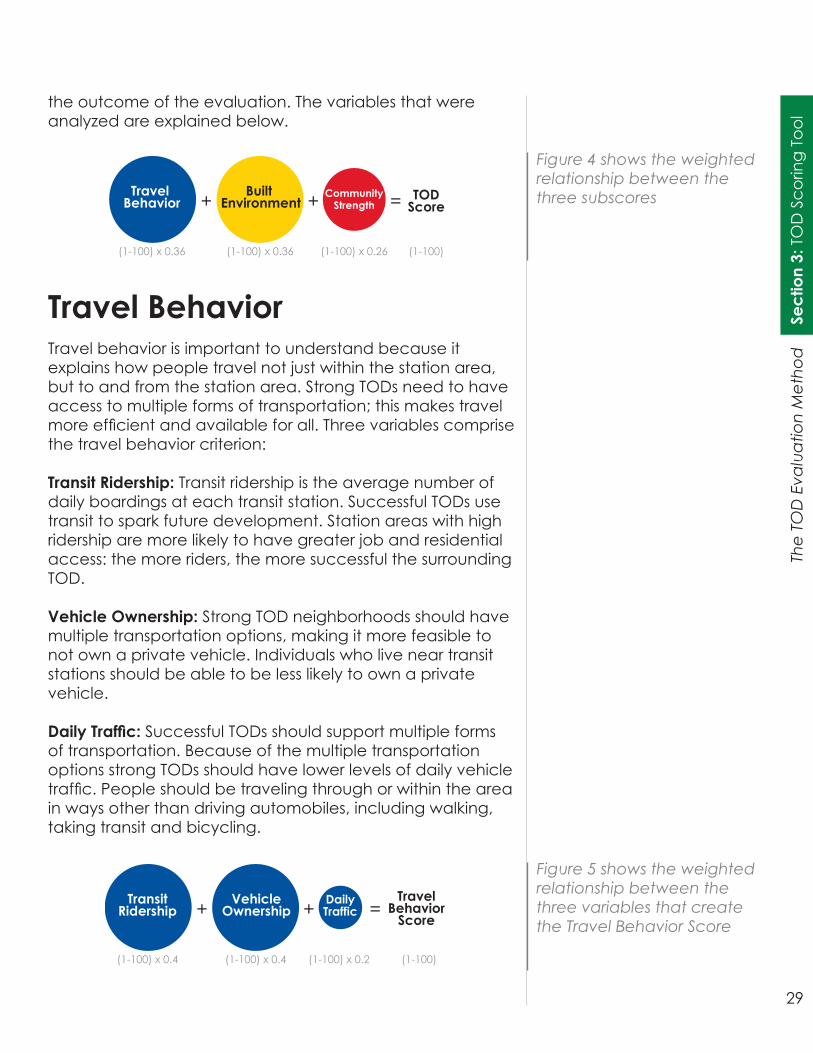
Figure 4 shows the weighted relationship between the three subscoresTravel
BehaviorBuilt
EnvironmentCommunity
Strength+ + = TODScore
(1-100) x 0.36 (1-100) x 0.36 (1-100) x 0.26 (1-100)
Travel BehaviorTravel behavior is important to understand because it explains how people travel not just within the station area, but to and from the station area. Strong TODs need to have access to multiple forms of transportation; this makes travel more efficient and available for all. Three variables comprise the travel behavior criterion:
Transit Ridership: Transit ridership is the average number of daily boardings at each transit station. Successful TODs use transit to spark future development. Station areas with high ridership are more likely to have greater job and residential access: the more riders, the more successful the surrounding TOD.
Vehicle Ownership: Strong TOD neighborhoods should have multiple transportation options, making it more feasible to not own a private vehicle. Individuals who live near transit stations should be able to be less likely to own a private vehicle.
Daily Traffic: Successful TODs should support multiple forms of transportation. Because of the multiple transportation options strong TODs should have lower levels of daily vehicle traffic. People should be traveling through or within the area in ways other than driving automobiles, including walking, taking transit and bicycling.
Figure 5 shows the weighted relationship between the three variables that create the Travel Behavior Score
TransitRidership
VehicleOwnership
DailyTraffic+ + =
TravelBehavior
Score
(1-100) x 0.4 (1-100) x 0.4 (1-100) x 0.2 (1-100)
30
Sect
ion
3: T
OD
Sco
ring
Tool
The
TOD
Eva
luat
ion
Met
hod
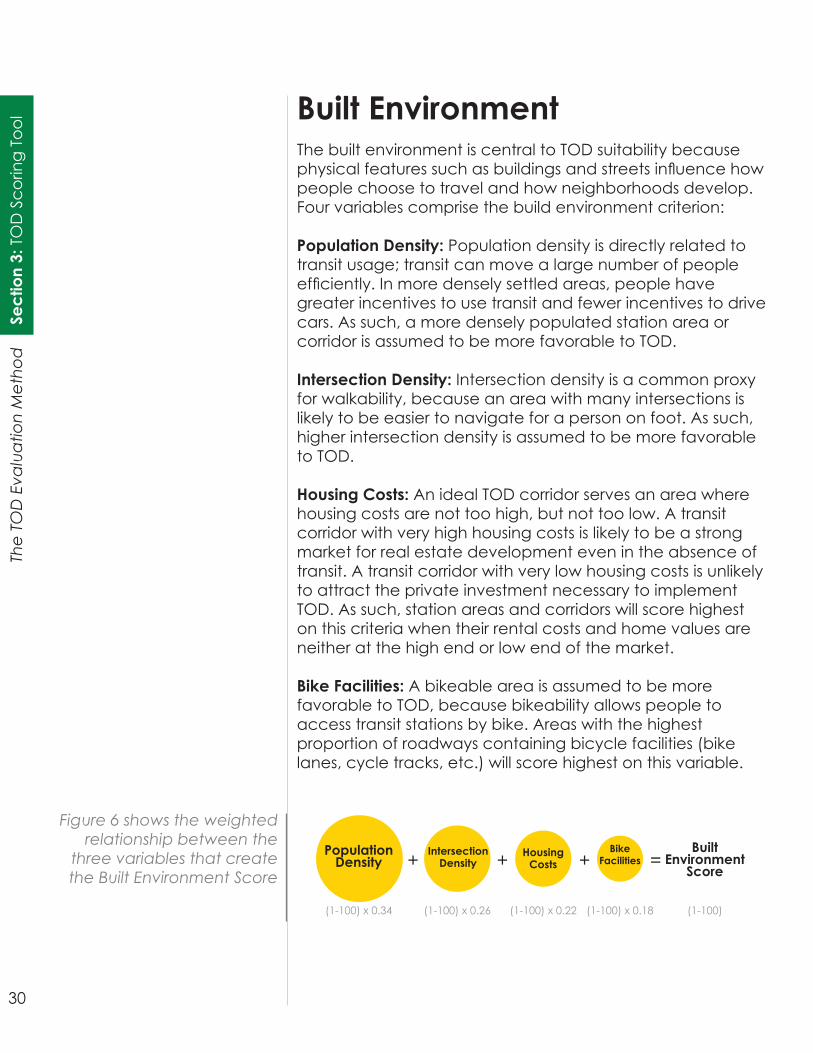
Built EnvironmentThe built environment is central to TOD suitability because physical features such as buildings and streets influence how people choose to travel and how neighborhoods develop. Four variables comprise the build environment criterion:
Population Density: Population density is directly related to transit usage; transit can move a large number of people efficiently. In more densely settled areas, people have greater incentives to use transit and fewer incentives to drive cars. As such, a more densely populated station area or corridor is assumed to be more favorable to TOD.
Intersection Density: Intersection density is a common proxy for walkability, because an area with many intersections is likely to be easier to navigate for a person on foot. As such, higher intersection density is assumed to be more favorable to TOD.
Housing Costs: An ideal TOD corridor serves an area where housing costs are not too high, but not too low. A transit corridor with very high housing costs is likely to be a strong market for real estate development even in the absence of transit. A transit corridor with very low housing costs is unlikely to attract the private investment necessary to implement TOD. As such, station areas and corridors will score highest on this criteria when their rental costs and home values are neither at the high end or low end of the market.
Bike Facilities: A bikeable area is assumed to be more favorable to TOD, because bikeability allows people to access transit stations by bike. Areas with the highest proportion of roadways containing bicycle facilities (bike lanes, cycle tracks, etc.) will score highest on this variable.
Figure 6 shows the weighted relationship between the
three variables that create the Built Environment Score
PopulationDensity
IntersectionDensity
HousingCosts+ + =
BuiltEnvironment
Score
(1-100) x 0.34 (1-100) x 0.26 (1-100) x 0.22 (1-100)
BikeFacilities+
(1-100) x 0.18
31
Sect
ion
3: T
OD
Sco
ring
Tool
The
TOD
Eva
luat
ion
Met
hod
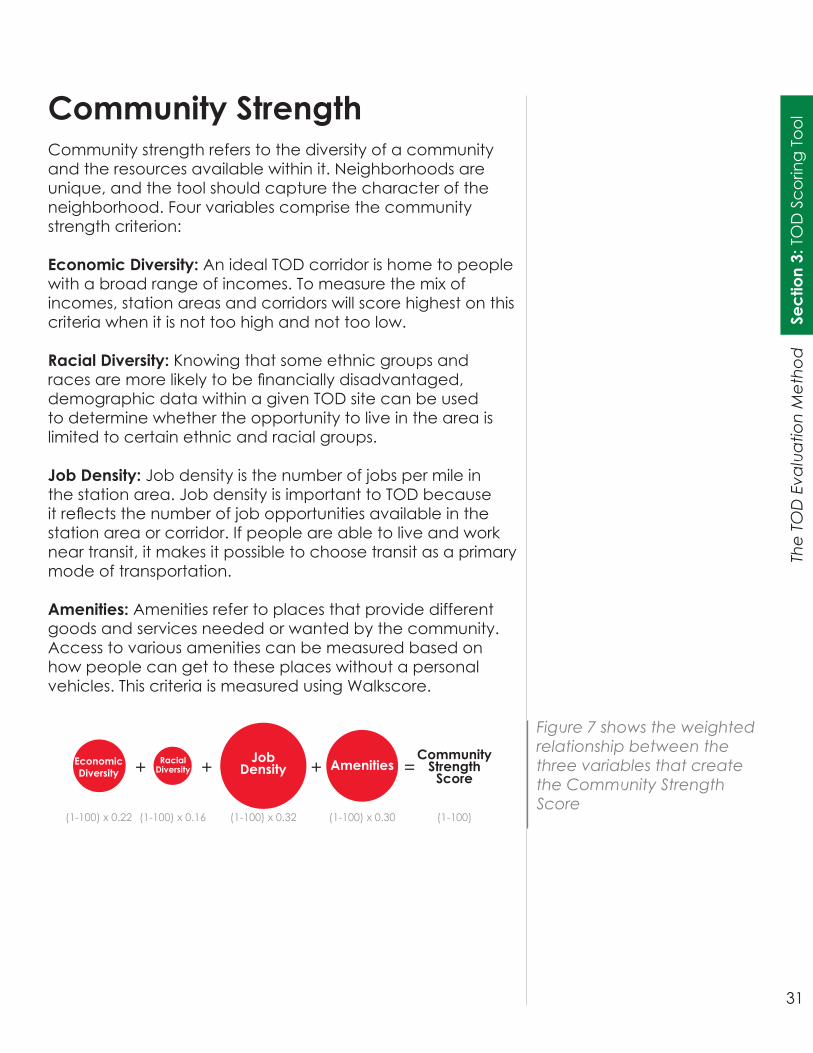
Figure 7 shows the weighted relationship between the three variables that create the Community Strength Score
Community StrengthCommunity strength refers to the diversity of a community and the resources available within it. Neighborhoods are unique, and the tool should capture the character of the neighborhood. Four variables comprise the community strength criterion:
Economic Diversity: An ideal TOD corridor is home to people with a broad range of incomes. To measure the mix of incomes, station areas and corridors will score highest on this criteria when it is not too high and not too low.
Racial Diversity: Knowing that some ethnic groups and races are more likely to be financially disadvantaged, demographic data within a given TOD site can be used to determine whether the opportunity to live in the area is limited to certain ethnic and racial groups.
Job Density: Job density is the number of jobs per mile in the station area. Job density is important to TOD because it reflects the number of job opportunities available in the station area or corridor. If people are able to live and work near transit, it makes it possible to choose transit as a primary mode of transportation.
Amenities: Amenities refer to places that provide different goods and services needed or wanted by the community. Access to various amenities can be measured based on how people can get to these places without a personal vehicles. This criteria is measured using Walkscore.
EconomicDiversity
RacialDiversity
JobDensity+ + =
CommunityStrength
Score
(1-100) x 0.22 (1-100) x 0.16 (1-100) x 0.32 (1-100)
Amenities+
(1-100) x 0.30

32
Sect
ion
3: T
OD
Sco
ring
Tool
The
TOD
Eva
luat
ion
Met
hod
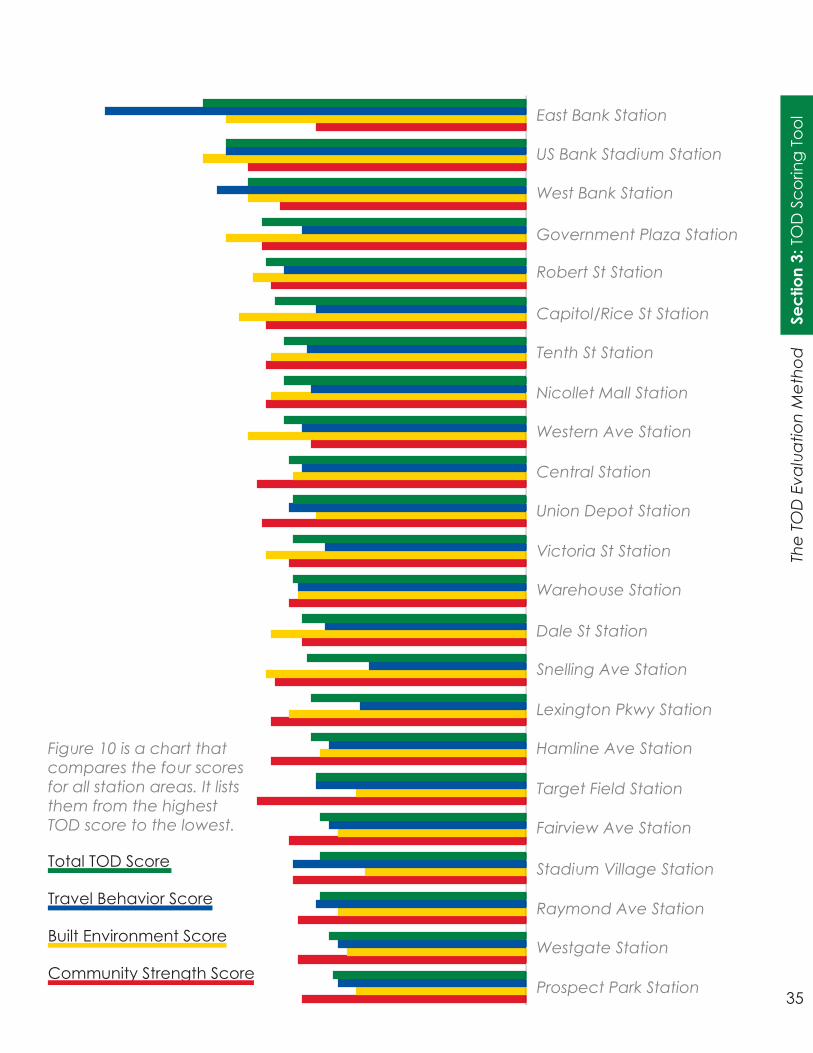
TOD ScoresEach station area has four scores: a score for travel behavior, built environment, community strength and the total score. Using the TOD Scoring Tool, each Green Line station was given a total score between 0 and 100. With 52 being the median TOD Score, the average for the 23 Green Line Station is 53. East Bank Station has the highest TOD Score of 72 and Prospect Park Station has the lowest TOD Score of 43. These scores are an illustration of how station areas compare to each other.
Furthermore, East Bank Station has the highest travel behavior score of 94 while the Snelling Avenue station has the lowest score of 35. In terms of the built environment score, U.S. Bank Station has the highest score of 72 while the Stadium Village station has the lowest built environment score of 36. While the difference between the minimum and maximum scores for the travel behavior and built environment categories are well over 20 points, the gap is much smaller for the community strength category. The U.S. Bank station has the highest community strength score
of 62 while the East Bank station has the lowest score of 47, only a 15 point difference between the minimum and the maximum scores.
While the overall TOD score provides general insights about the station area, it does not help identify specific station’s strengths and weaknesses. While all station areas can continue to be improved, the TOD score does not provide
Figure 8 shows TOD scores of each station area along the
Green Line
47
46
4443
46726267
5954
52
33
Sect
ion
3: T
OD
Sco
ring
Tool
The
TOD
Eva
luat
ion
Met
hod
information on how to improve TOD in the given area. In order to get a more detailed TOD analysis, users must not overlook the three categories that help quantify the TOD score. The three category scores are essential as they reflect on the station area’s strengths and weaknesses, providing more constructive feedback for improvements in the future.
For example, the East Bank station had the highest TOD score among the 23 Green Line stations. However, a TOD score of 72 on a scale of 1 to 100 does not communicate all of the information. The East Bank station’s TOD score of 72 is only meaningful when users of the TOD Scoring Tool regard the score in relation to the other 22 Green Line station areas’ TOD scores. In addition, the East Bank station is one of the two main Green Line stations located on the University of Minnesota campus. Located in an environment that is often considered to be a diverse community with great access to amenities to cater the university community. The East Bank station had the highest score for travel behavior and built environment. Yet, the East Bank station had the lowest community strength score out of all 23 Green Line stations. Therefore, by taking a closer look at the three categories’ scores, the TOD Office will have a better idea of which areas it would need to address to improve the East Bank station’s TOD score.
This report highlights six station areas’ scores. The six Green Line stations were selected because they are generally representative of the broader corridor. Once the score for the station area is finalized, TOD can be improved in these station areas by employing recommended strategies. These strategies are examples of how the Metropolitan Council can use the TOD Scoring Tool to improve TOD at existing station areas.
A Station Area is the area within a half mile of a transit line station. When the area within a half mile of a station overlaps, the overlapping area will only be included in the station area that it is closest to.
484946
52
53
54
585654505248
34
Sect
ion
3: T
OD
Sco
ring
Tool
The
TOD
Eva
luat
ion
Met
hod
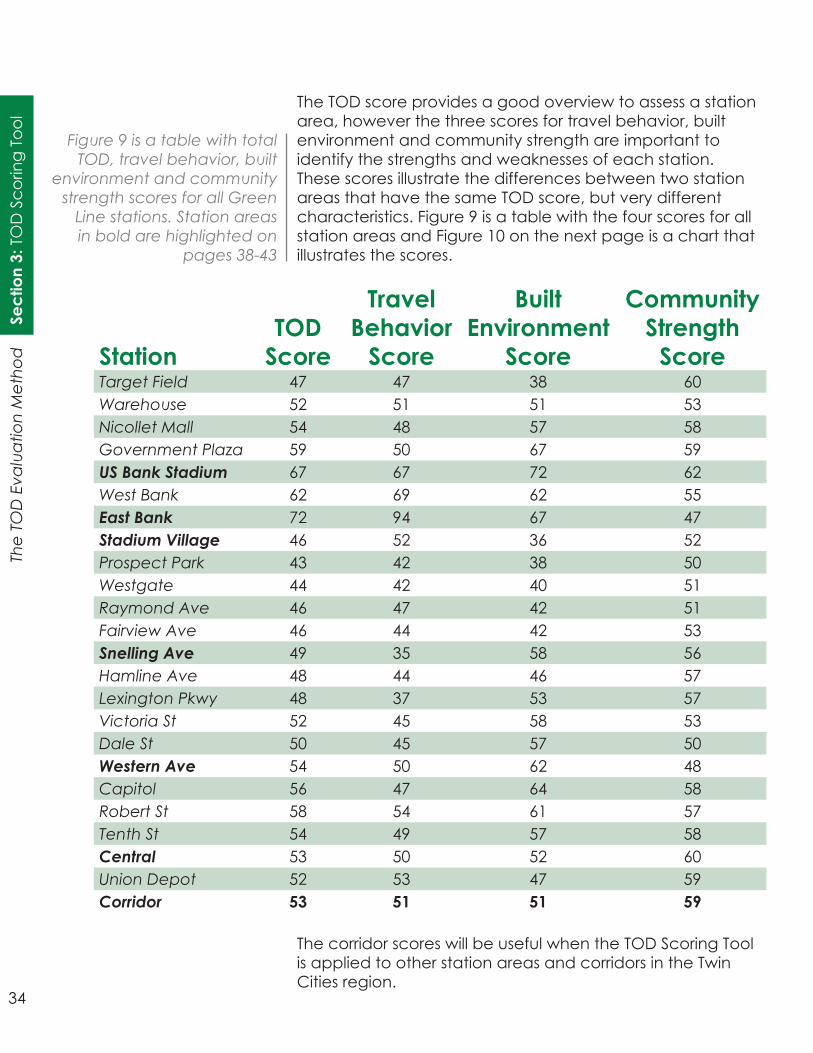
The TOD score provides a good overview to assess a station area, however the three scores for travel behavior, built environment and community strength are important to identify the strengths and weaknesses of each station. These scores illustrate the differences between two station areas that have the same TOD score, but very different characteristics. Figure 9 is a table with the four scores for all station areas and Figure 10 on the next page is a chart that illustrates the scores.
Figure 9 is a table with total TOD, travel behavior, built
environment and community strength scores for all Green
Line stations. Station areas in bold are highlighted on
pages 38-43
StationTOD
Score
Travel Behavior
Score
Built Environment
Score
Community Strength
ScoreTarget Field 47 47 38 60Warehouse 52 51 51 53Nicollet Mall 54 48 57 58Government Plaza 59 50 67 59US Bank Stadium 67 67 72 62West Bank 62 69 62 55East Bank 72 94 67 47Stadium Village 46 52 36 52Prospect Park 43 42 38 50Westgate 44 42 40 51Raymond Ave 46 47 42 51Fairview Ave 46 44 42 53Snelling Ave 49 35 58 56Hamline Ave 48 44 46 57Lexington Pkwy 48 37 53 57Victoria St 52 45 58 53Dale St 50 45 57 50Western Ave 54 50 62 48Capitol 56 47 64 58Robert St 58 54 61 57Tenth St 54 49 57 58Central 53 50 52 60Union Depot 52 53 47 59Corridor 53 51 51 59
The corridor scores will be useful when the TOD Scoring Tool is applied to other station areas and corridors in the Twin Cities region.
35
Sect
ion
3: T
OD
Sco
ring
Tool
The
TOD
Eva
luat
ion
Met
hod
East Bank Station
US Bank Stadium Station
West Bank Station
Government Plaza Station
Robert St Station
Capitol/Rice St Station
Tenth St Station
Nicollet Mall Station
Western Ave Station
Central Station
Union Depot Station
Victoria St Station
Warehouse Station
Dale St Station
Snelling Ave Station
Lexington Pkwy Station
Hamline Ave Station
Target Field Station
Fairview Ave Station
Stadium Village Station
Raymond Ave Station
Westgate Station
Prospect Park Station
Total TOD Score
Travel Behavior Score
Built Environment Score
Community Strength Score
050100Community Strength Score
Prospect Park
Westgate
Raymond AVE
Stadium Village
Fairview AVE
Target Field
Hamline AVE
Snelling AVE
Dale ST
Victoria ST
Union Depot
Central
Western AVE
Nicollet Mall
10th ST
Capitol/Rice ST
Robert ST
Government Plaza
West Bank
U.S. Bank Stadium
East Bank
Built Environment Score
Travel Behavior ScoreTOD Score
Warehouse District/Hennepin AVE
GREEN LINE STATIONS
LexingtonParkway
Figure 10 is a chart that compares the four scores for all station areas. It lists them from the highest TOD score to the lowest.

36
Sect
ion
3: T
OD
Sco
ring
Tool
The
TOD
Eva
luat
ion
Met
hod
Green and Blue Line: US Bank Stadium StationTOD Score
67Travel Behavior Score
67
Built Environment Score72
Community Strength Score62
Develop additional housing to boost transit ridership. While this station area already scored well on population density, there is plenty of land that can continue to be developed in the area. This will continue to build on the strength of the station while also increasing other variables like transit ridership.
Add more jobs to increase transit ridership. This station area already has a high job density, however this strength can be built on. Increasing jobs in the station area will increase transit ridership, as well as increase overall activity within the station area.
Use affordable housing dollars to increase housing options. The station has high population density but does not score well on housing cost. Many of the housing options in this station area are above median costs. Increasing the supply of affordable housing will create a better mix of housing options.
Implement parking maximums to decrease car ownership. While some people in this station area live without a vehicle, it scores poorly on this variable. Using land for more active uses than parking will encourage the use of transit.
37
Sect
ion
3: T
OD
Sco
ring
Tool
The
TOD
Eva
luat
ion
Met
hod
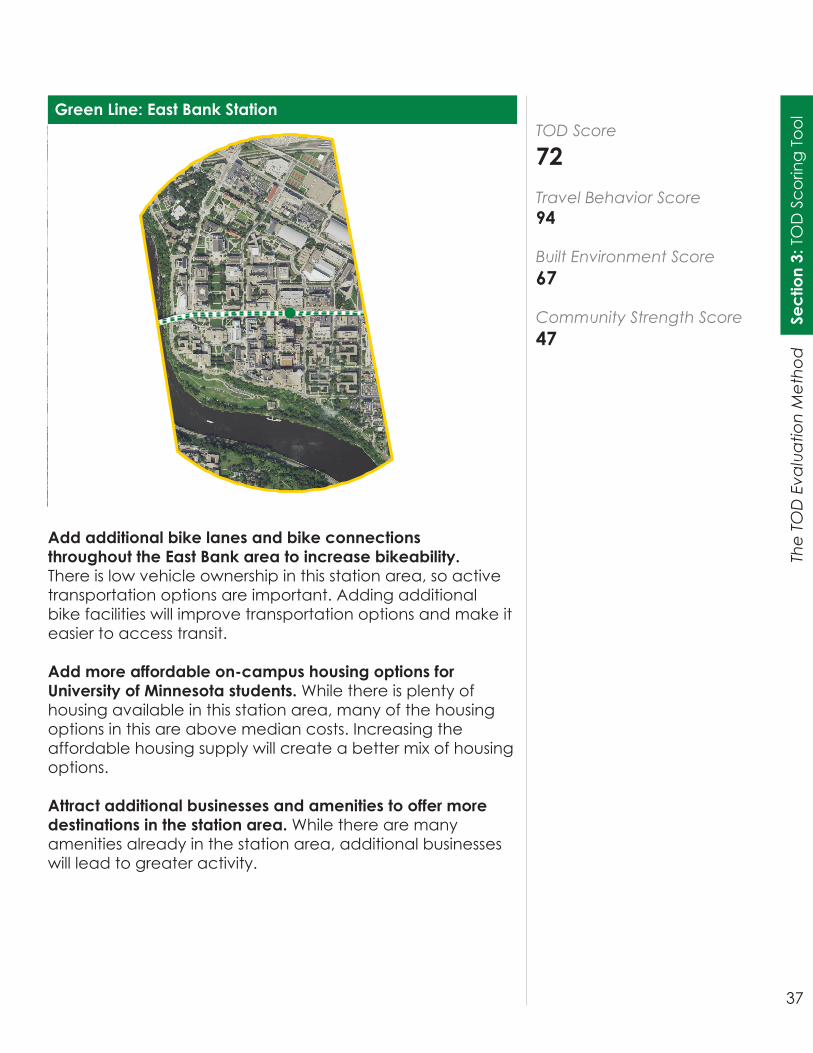
Green Line: East Bank StationTOD Score
72Travel Behavior Score94
Built Environment Score67
Community Strength Score47
Add additional bike lanes and bike connections throughout the East Bank area to increase bikeability. There is low vehicle ownership in this station area, so active transportation options are important. Adding additional bike facilities will improve transportation options and make it easier to access transit.
Add more affordable on-campus housing options for University of Minnesota students. While there is plenty of housing available in this station area, many of the housing options in this are above median costs. Increasing the affordable housing supply will create a better mix of housing options.
Attract additional businesses and amenities to offer more destinations in the station area. While there are many amenities already in the station area, additional businesses will lead to greater activity.

38
Sect
ion
3: T
OD
Sco
ring
Tool
The
TOD
Eva
luat
ion
Met
hod
Green Line: Stadium Village StationTOD Score
46Travel Behavior Score
52
Built Environment Score36
Community Strength Score52
Develop additional housing to increase population density and increase transit ridership. This station area currently scores low on population density. Additional housing will better support transit. The industrial land to the north of the station presents an opportunity to add housing through redevelopment.
Add more jobs to increase job density and increase transit ridership. Increasing the number of jobs available in the station area will improve job density, increase transit ridership and help attract new businesses to the station area.
Use affordable housing dollars to increase housing options for students. While this station area needs more housing to increase population density, it also needs additional affordable housing to diversify the type of housing available.
Add additional bike lanes to increase bikeability. This station area has fewer bike facilities than others. Adding bike lanes will make biking a more viable transportation option in the station area.

39
Sect
ion
3: T
OD
Sco
ring
Tool
The
TOD
Eva
luat
ion
Met
hod
Green Line: Snelling Ave StationTOD Score
49Travel Behavior Score35
Built Environment Score58
Community Strength Score56
Add more jobs to increase job density and increase transit ridership. While there are already many jobs in this station area, vacant and underutilized land presents an opportunity to increase job density and increase transit ridership.
Develop additional housing to increase population density and increase transit ridership. Population density of this station area can be improved. There is a perfect opportunity to develop additional housing to the southeast of the station. Incorporating additional housing will also improve transit ridership and support new amenities.
Implement transit improvements to give it a competitive advantage over traveling by car, reducing overall daily traffic counts. The high daily traffic counts in this station area is a sign of the area’s success and ability to support additional development. However, it also make the station area less attractive to pedestrians and transit riders. Implementing transit improvements and creating incentives for travel without a vehicle will improve the station area.
Add additional bike lanes to increase bikeability. With high daily traffic counts in the station area, dedicated facilities for bikes are important to promote bike safety. Additional bike facilities will make biking a viable transportation option.
40
Sect
ion
3: T
OD
Sco
ring
Tool
The
TOD
Eva
luat
ion
Met
hod
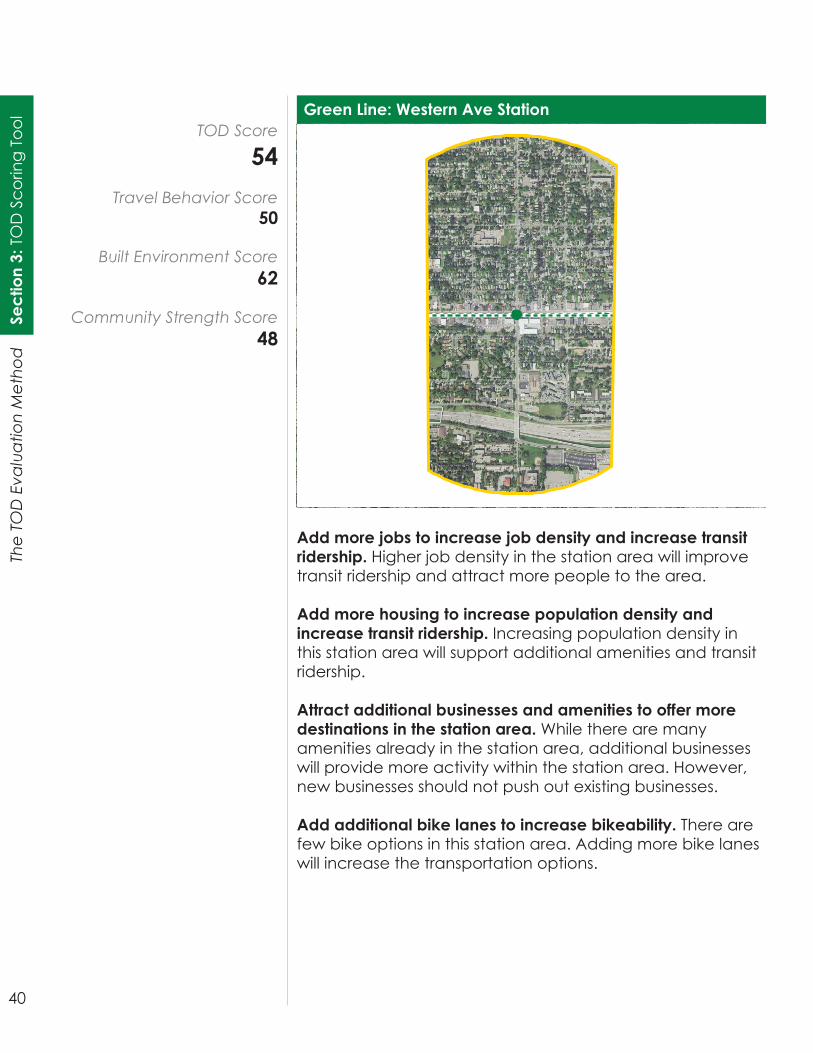
Green Line: Western Ave StationTOD Score
54Travel Behavior Score
50
Built Environment Score62
Community Strength Score48
Add more jobs to increase job density and increase transit ridership. Higher job density in the station area will improve transit ridership and attract more people to the area.
Add more housing to increase population density and increase transit ridership. Increasing population density in this station area will support additional amenities and transit ridership.
Attract additional businesses and amenities to offer more destinations in the station area. While there are many amenities already in the station area, additional businesses will provide more activity within the station area. However, new businesses should not push out existing businesses.
Add additional bike lanes to increase bikeability. There are few bike options in this station area. Adding more bike lanes will increase the transportation options.
41
Sect
ion
3: T
OD
Sco
ring
Tool
The
TOD
Eva
luat
ion
Met
hod
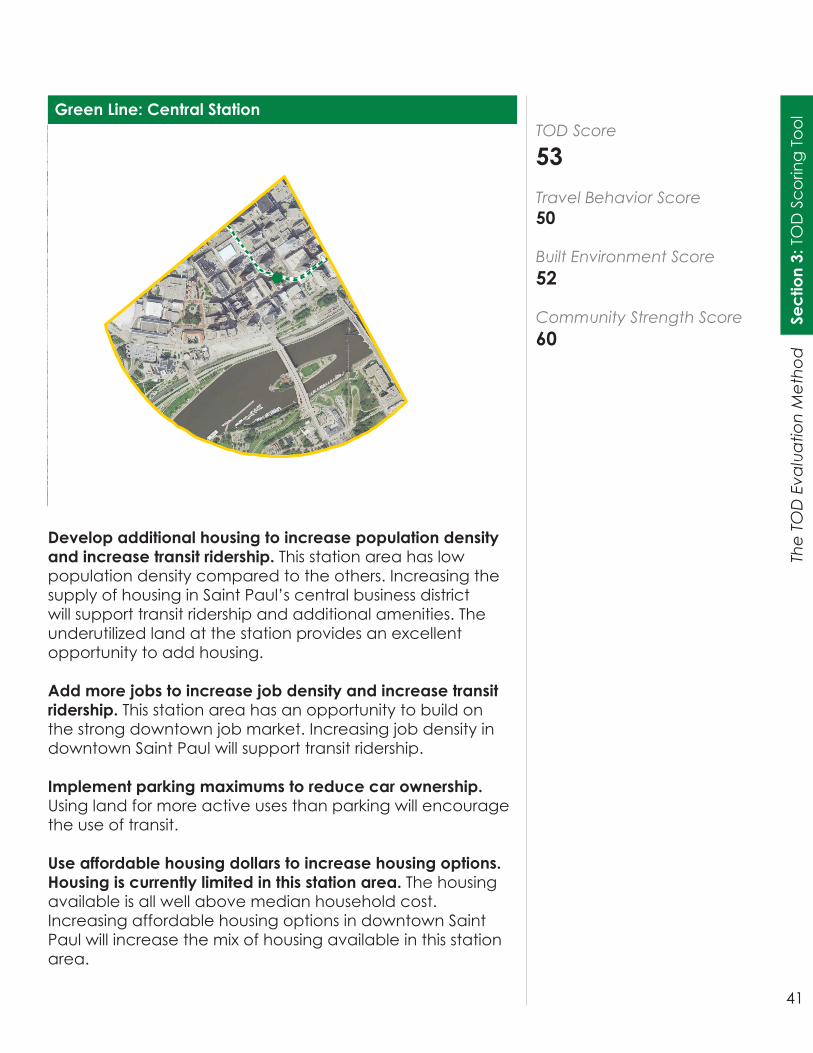
Green Line: Central StationTOD Score
53Travel Behavior Score50
Built Environment Score52
Community Strength Score60
Develop additional housing to increase population density and increase transit ridership. This station area has low population density compared to the others. Increasing the supply of housing in Saint Paul’s central business district will support transit ridership and additional amenities. The underutilized land at the station provides an excellent opportunity to add housing.
Add more jobs to increase job density and increase transit ridership. This station area has an opportunity to build on the strong downtown job market. Increasing job density in downtown Saint Paul will support transit ridership.
Implement parking maximums to reduce car ownership. Using land for more active uses than parking will encourage the use of transit.
Use affordable housing dollars to increase housing options. Housing is currently limited in this station area. The housing available is all well above median household cost. Increasing affordable housing options in downtown Saint Paul will increase the mix of housing available in this station area.
SECTION 4
Action Steps
In this sectionIntroductionAction StrategiesUsing the Actions and Strategies for Success
Sect
ion
4: A
ctio
n St
eps
43
The
TOD
Eva
luat
ion
Met
hod
IntroductionThe TOD Scoring Tool is a starting point to evaluate potential TOD station areas and transit corridors and re-evaluate existing station areas and transit corridors. To make best use of the tool, the TOD Framework should be integrated into transportation planning in the Twin Cities. To maximize the potential of the TOD Scoring Tool and integrate the TOD Framework, the following actions should be employed:
1. Implement the TOD Scoring Tool 2. Raise awareness of TOD goals among stakeholders3. Incorporate the TOD Scoring Tool and Framework into
policy documents 4. Use the results of the TOD Scoring Tool to improve how
individual TOD projects are evaluated in the region
Each recommended action is accompanied by a set of strategies that the TOD Office can use to perform each action. Actions and strategies are ordered based on prioritization; high priority strategies are listed first, followed by lower priorities.
A list of recommended variables that may be helpful in fortifying the TOD Evaluation Tool in the future can be found in the appendix
44
Sect
ion
4: A
ctio
n St
eps
The
TOD
Eva
luat
ion
Met
hod
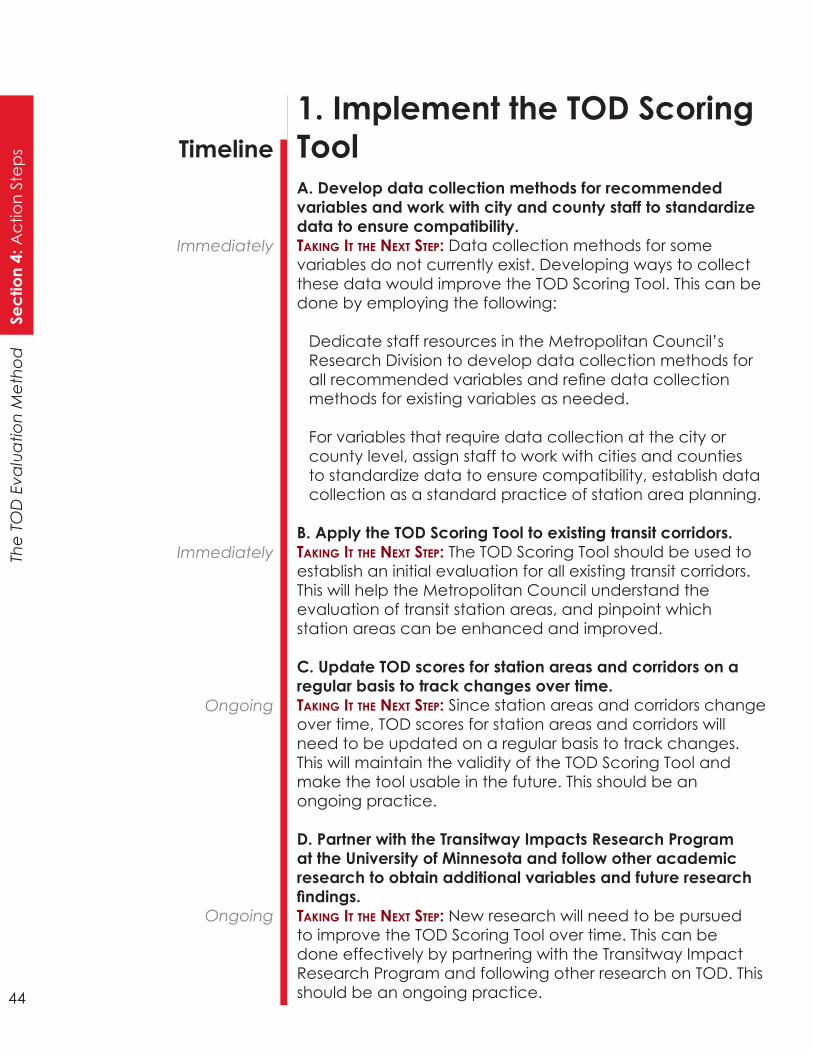
Immediately
Immediately
Ongoing
Ongoing
Timeline1. Implement the TOD Scoring ToolA. Develop data collection methods for recommended variables and work with city and county staff to standardize data to ensure compatibility. Taking iT The nexT STep: Data collection methods for some variables do not currently exist. Developing ways to collect these data would improve the TOD Scoring Tool. This can be done by employing the following:
Dedicate staff resources in the Metropolitan Council’s Research Division to develop data collection methods for all recommended variables and refine data collection methods for existing variables as needed.
For variables that require data collection at the city or county level, assign staff to work with cities and counties to standardize data to ensure compatibility, establish data collection as a standard practice of station area planning.
B. Apply the TOD Scoring Tool to existing transit corridors.Taking iT The nexT STep: The TOD Scoring Tool should be used to establish an initial evaluation for all existing transit corridors. This will help the Metropolitan Council understand the evaluation of transit station areas, and pinpoint which station areas can be enhanced and improved.
C. Update TOD scores for station areas and corridors on a regular basis to track changes over time.Taking iT The nexT STep: Since station areas and corridors change over time, TOD scores for station areas and corridors will need to be updated on a regular basis to track changes. This will maintain the validity of the TOD Scoring Tool and make the tool usable in the future. This should be an ongoing practice.
D. Partner with the Transitway Impacts Research Program at the University of Minnesota and follow other academic research to obtain additional variables and future research findings.Taking iT The nexT STep: New research will need to be pursued to improve the TOD Scoring Tool over time. This can be done effectively by partnering with the Transitway Impact Research Program and following other research on TOD. This should be an ongoing practice.
Sect
ion
4: A
ctio
n St
eps
45
The
TOD
Eva
luat
ion
Met
hod
Ongoing
Before next transit line begins station areas planning
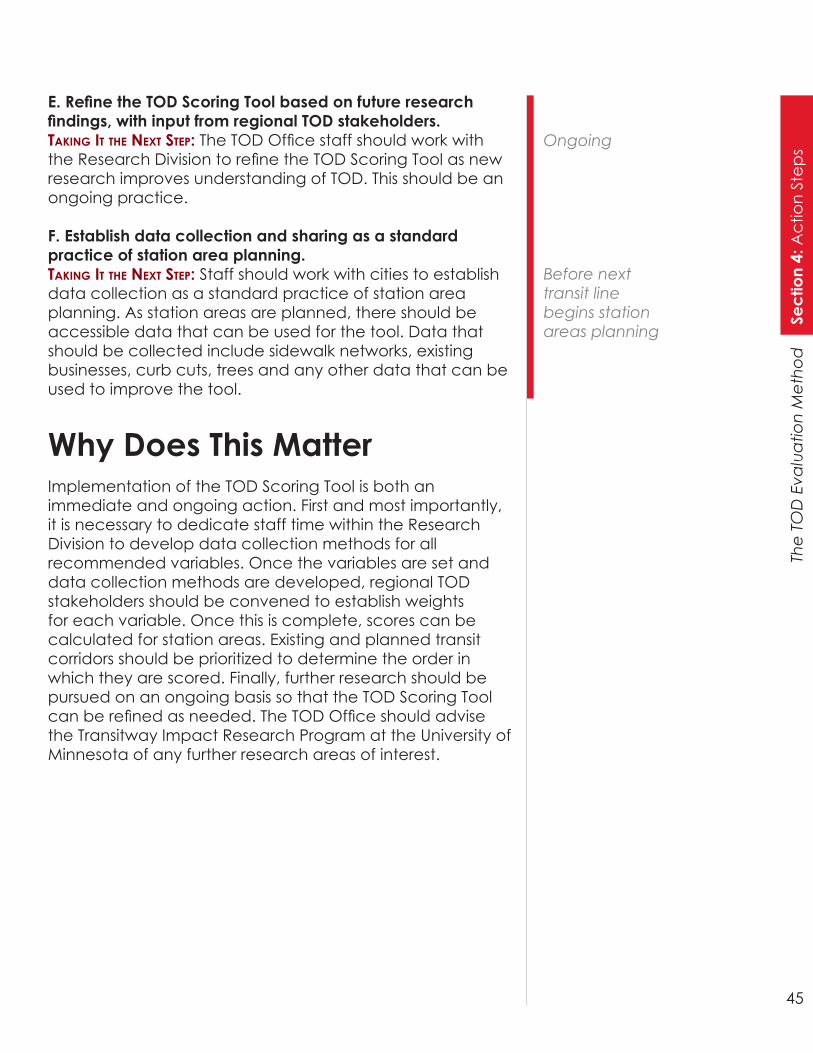
E. Refine the TOD Scoring Tool based on future research findings, with input from regional TOD stakeholders.Taking iT The nexT STep: The TOD Office staff should work with the Research Division to refine the TOD Scoring Tool as new research improves understanding of TOD. This should be an ongoing practice.
F. Establish data collection and sharing as a standard practice of station area planning. Taking iT The nexT STep: Staff should work with cities to establish data collection as a standard practice of station area planning. As station areas are planned, there should be accessible data that can be used for the tool. Data that should be collected include sidewalk networks, existing businesses, curb cuts, trees and any other data that can be used to improve the tool.
Why Does This MatterImplementation of the TOD Scoring Tool is both an immediate and ongoing action. First and most importantly, it is necessary to dedicate staff time within the Research Division to develop data collection methods for all recommended variables. Once the variables are set and data collection methods are developed, regional TOD stakeholders should be convened to establish weights for each variable. Once this is complete, scores can be calculated for station areas. Existing and planned transit corridors should be prioritized to determine the order in which they are scored. Finally, further research should be pursued on an ongoing basis so that the TOD Scoring Tool can be refined as needed. The TOD Office should advise the Transitway Impact Research Program at the University of Minnesota of any further research areas of interest.
46
Sect
ion
4: A
ctio
n St
eps
The
TOD
Eva
luat
ion
Met
hod
Immediately
Immediately
After TAC approves and after the TOD Policy Plan is
updated
After TAC approves and after the TOD Policy Plan is
updated
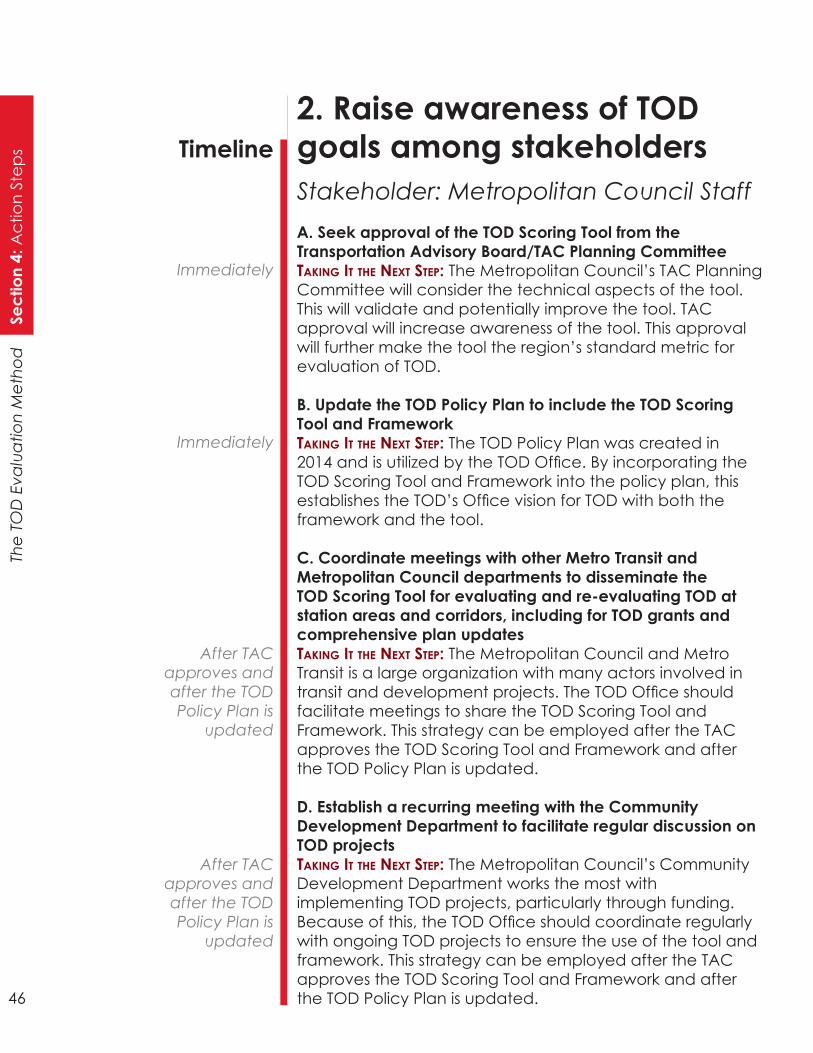
Timeline2. Raise awareness of TOD goals among stakeholdersStakeholder: Metropolitan Council StaffA. Seek approval of the TOD Scoring Tool from the Transportation Advisory Board/TAC Planning CommitteeTaking iT The nexT STep: The Metropolitan Council’s TAC Planning Committee will consider the technical aspects of the tool. This will validate and potentially improve the tool. TAC approval will increase awareness of the tool. This approval will further make the tool the region’s standard metric for evaluation of TOD.
B. Update the TOD Policy Plan to include the TOD Scoring Tool and FrameworkTaking iT The nexT STep: The TOD Policy Plan was created in 2014 and is utilized by the TOD Office. By incorporating the TOD Scoring Tool and Framework into the policy plan, this establishes the TOD’s Office vision for TOD with both the framework and the tool.
C. Coordinate meetings with other Metro Transit and Metropolitan Council departments to disseminate the TOD Scoring Tool for evaluating and re-evaluating TOD at station areas and corridors, including for TOD grants and comprehensive plan updatesTaking iT The nexT STep: The Metropolitan Council and Metro Transit is a large organization with many actors involved in transit and development projects. The TOD Office should facilitate meetings to share the TOD Scoring Tool and Framework. This strategy can be employed after the TAC approves the TOD Scoring Tool and Framework and after the TOD Policy Plan is updated.
D. Establish a recurring meeting with the Community Development Department to facilitate regular discussion on TOD projectsTaking iT The nexT STep: The Metropolitan Council’s Community Development Department works the most with implementing TOD projects, particularly through funding. Because of this, the TOD Office should coordinate regularly with ongoing TOD projects to ensure the use of the tool and framework. This strategy can be employed after the TAC approves the TOD Scoring Tool and Framework and after the TOD Policy Plan is updated.
Sect
ion
4: A
ctio
n St
eps
47
The
TOD
Eva
luat
ion
Met
hod
Immediately
Immediately
When the next round of comprehensive planning begins
After a TOD Office primary contact is selected
After the TOD Policy Plan is updated
Stakeholder: City and County StaffE. Select a TOD Office employee as the primary contact for the TOD Scoring ToolTaking iT The nexT STep: As the TOD Office begins sharing the tool and framework in meetings, more stakeholders will have questions about the tool. Because of this, a TOD Office employee should be designated as the primary contact to field questions regarding the tool and framework.
F. Create a presentation to present at transit corridor planning committee meetings, such as the Corridor Management Committee and Business Management Committee, to establish the tool as the standard for evaluating TODTaking iT The nexT STep: To predict the success of planned TODs, the TOD Office should become involved in the transit corridor planning process. This can begin by presenting the tool and framework to the Green and Blue Line Extension regularly scheduled committee meetings.
G. Incorporate the TOD Policy as a minimum requirement for comprehensive plan updatesTaking iT The nexT STep: Cities and county staff with transit station areas need the TOD tools to ensure the success of the station areas within their boundaries. Incorporating the TOD policy into comprehensive plans will provide municipalities with clear expectations of TOD policy. This strategy can be employed once the next round of comprehensive planning begins around 2028
Stakeholder: PublicH. Share the contact information of the primary contact for the TOD Scoring Tool on the Metropolitan Council’s websiteTaking iT The nexT STep: The TOD Office’s primary contact for the tool and framework should be public information to make the tool accessible. This strategy can be employed after a TOD Office primary contact is selected.
I. Share the TOD Policy Plan with the TOD Scoring Tool update on the Metropolitan Council’s websiteTaking iT The nexT STep: The TOD Policy plan with updates reflecting the tool and framework should be public information and easily accessible. This strategy can be employed after the TOD Policy Plan is updated.
48
Sect
ion
4: A
ctio
n St
eps
The
TOD
Eva
luat
ion
Met
hod
Immediately
Immediately
Timeline
Why Does This MatterWith this action, strategies should address various stakeholders. Each stakeholder should be addressed differently based on their role in TOD. First, the Metropolitan Council should make sure that all departments understand the TOD Scoring Tool and Framework. This can be done by first seeking approval of the TOD Scoring Tool and Framework by the Transportation Advisory Board committee and meeting with other departments to share the tool. Because of the Community Development Department’s influence on funding for TOD projects in the region, the TOD Office should coordinate with the Community Development Department regularly to ensure that the tool is being used and is effective.
3. Incorporate the TOD Scoring Tool and Framework into policy documentsA. Include the TOD Scoring Tool in the TOD Office’s annual report.Taking iT The nexT STep: Including the TOD Scoring Tool and Framework into Metropolitan Council’s long term planning documents will help ensure they are consistently utilized. The TOD Office should update its annual report to begin to implement the tool and framework into the Metropolitan Council’s policy planning activities.
B. Determine a plan and schedule to update the TOD Policy Plan regularly.Taking iT The nexT STep: The TOD Office should establish a regular schedule to update the TOD Policy Plan, and integrate the tool and framework into this plan. By explaining the importance of the tool and framework in the policy, the Metropolitan Council can maintain a clear vision throughout the organization.
Sect
ion
4: A
ctio
n St
eps
49
The
TOD
Eva
luat
ion
Met
hod
When the 2022 TPP Update begins
When the 2050 long range planning update begins
C. Incorporate the framework (Travel Behavior, Built Environment, and Community Strength) language into next draft of the TPP updateTaking iT The nexT STep: The importance of TOD is not prominent in the TPP and Thrive MSP 2040; the tool and framework will fill this gap by highlighting the benefits of TOD. The 2018 TPP update is underway, therefore the tool and framework cannot be incorporated in the TPP until the 2022 TPP update. This strategy can be employed once the 2022 TPP update begins.
D. Incorporate framework language into the next draft of Thrive MSPTaking iT The nexT STep: The importance of TOD can further be emphasized in other long term planning documents such as Thrive MSP. Thrive MSP 2040 was published in 2014. The next opportunity to incorporate the tool and framework into this policy document is for the 2050 update.
Why Does This MatterIncluding the TOD Scoring Tool and Framework into the Metropolitan Council’s long term planning documents is vital to the successful implementation of the tool and framework. The importance of TOD is currently not prominent in the TPP and Thrive MSP 2040. The tool and framework will fill this gap by highlighting the benefits of TOD. Thrive MSP 2040 was published in 2014, and the 2018 TPP update is well underway, making it a couple of years before the tool and framework can be incorporated into long term planning documents.
In the meantime, the TOD Office can integrate the tool and framework into its annual report. The TOD Office should further establish a regular schedule to update the TOD Policy Plan, and integrate the tool and framework into this plan. By explaining the importance of the tool and framework in the policy, the Metropolitan Council can maintain a clear vision throughout the organization.
50
Sect
ion
4: A
ctio
n St
eps
The
TOD
Eva
luat
ion
Met
hod After TOD
Scoring Tool has been
implemented and used
to produce evaluations of all transit
corridors
After strategy A has been
employed
Timeline
4. Use the results of the TOD Scoring Tool to improve how individual TOD projects are evaluated in the regionA. Collect feedback from personnel throughout region involved in evaluation of TOD projects about how to utilize results of TOD scoring tool to improve individual TOD evaluation.Taking iT The nexT STep: The TOD Office should work with all personnel throughout the region involved in evaluating proposals for specific TOD projects. By showing them the TOD station area and corridor evaluations produced using the tool and engaging them in a discussion about the evaluations, the TOD Office can determine how the evaluations can be utilized to improve evaluation of specific TOD project proposals. This strategy can be employed after the TOD Scoring Tool has been implemented and used to produce evaluations of all transit corridors.
B. Incorporate the results of the TOD Scoring Tool into evaluation of individual projects based on feedback from personnel involved in evaluation of TOD projects.Taking iT The nexT STep: Based on feedback from personnel involved in TOD project evaluation, the TOD Office can determine how to use station area and corridor evaluations to improve evaluation of individual TOD proposals. This might lead to the creation of written materials that pose key questions about a project’s suitability for its corridor or station. This strategy can be employed after the previous strategy has been employed.
Why Does This MatterThe analyses of regional transit corridors and station areas produced using the TOD Scoring Tool can be utilized to improve the evaluation of TOD project proposals that the Metropolitan Council and other public entities perform as part of grant programs and other initiatives. Examples of these programs include Livable Communities TOD grants and Hennepin County TOD grants. By engaging personnel throughout the region, the TOD Office can solicit feedback
Sect
ion
4: A
ctio
n St
eps
51
The
TOD
Eva
luat
ion
Met
hod
from the personnel regarding how the corridor and station area evaluations can be utilized to improve evaluation of specific TOD project proposals.
Using the Actions and Strategies for SuccessThe TOD Office can use the TOD Scoring Tool and Framework to be more proactive about TOD Policy and implementation. Using the tool and framework can help make TOD goals more standard throughout the region. Each action has various strategies that should be employed to further advance the potential of the tool and the framework. Most of these actions and strategies can be carried out at no additional cost to the TOD Office, besides staff time.
These actions and strategies are necessary for the TOD Office to employ to ensure the success of TOD evaluation. If these actions and strategies are not practiced, TOD will likely not change throughout the region, and development and transit ridership may plateau. Currently, the Metropolitan Council is not guided by a clear framework for TOD. As the Twin Cities continues to grow its transit system, investing time and resources in TOD is becoming more crucial to the success of transit stations and corridors. By implementing this tool and framework, the TOD Office can help ensure successful development opportunities and ridership along transit corridors.
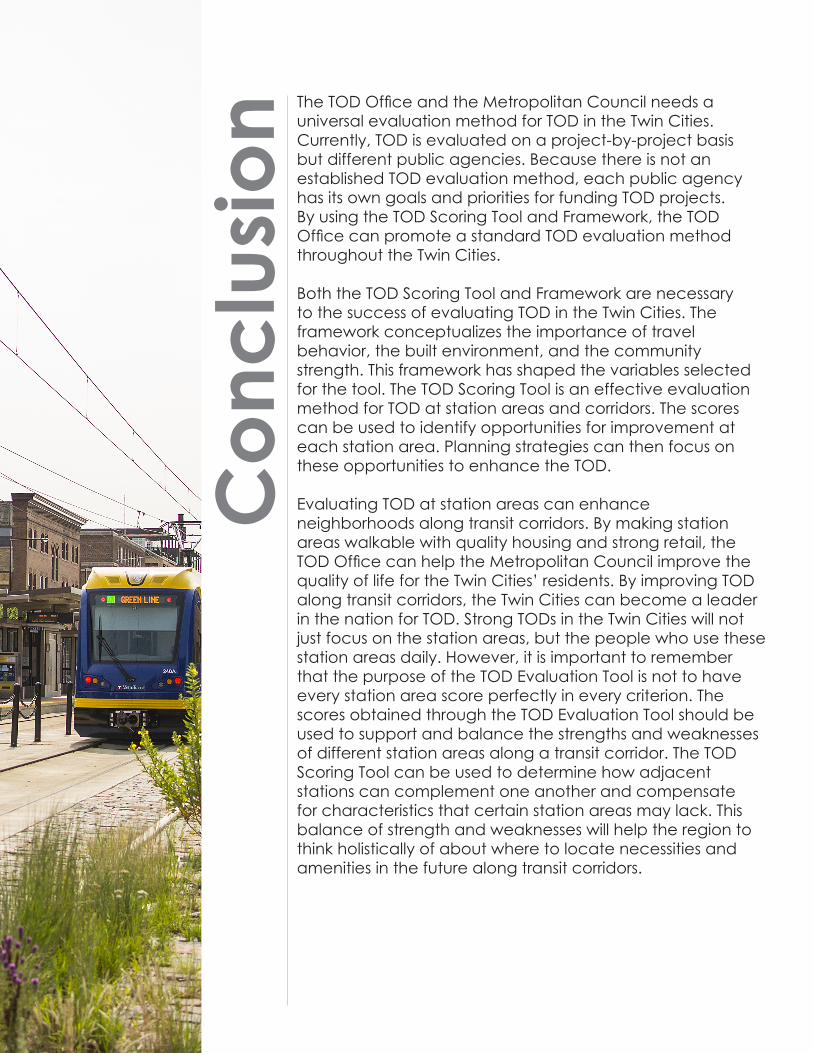
52
The
TOD
Eva
luat
ion
Met
hod
Con
clus
ion The TOD Office and the Metropolitan Council needs a
universal evaluation method for TOD in the Twin Cities. Currently, TOD is evaluated on a project-by-project basis but different public agencies. Because there is not an established TOD evaluation method, each public agency has its own goals and priorities for funding TOD projects. By using the TOD Scoring Tool and Framework, the TOD Office can promote a standard TOD evaluation method throughout the Twin Cities.
Both the TOD Scoring Tool and Framework are necessary to the success of evaluating TOD in the Twin Cities. The framework conceptualizes the importance of travel behavior, the built environment, and the community strength. This framework has shaped the variables selected for the tool. The TOD Scoring Tool is an effective evaluation method for TOD at station areas and corridors. The scores can be used to identify opportunities for improvement at each station area. Planning strategies can then focus on these opportunities to enhance the TOD.
Evaluating TOD at station areas can enhance neighborhoods along transit corridors. By making station areas walkable with quality housing and strong retail, the TOD Office can help the Metropolitan Council improve the quality of life for the Twin Cities’ residents. By improving TOD along transit corridors, the Twin Cities can become a leader in the nation for TOD. Strong TODs in the Twin Cities will not just focus on the station areas, but the people who use these station areas daily. However, it is important to remember that the purpose of the TOD Evaluation Tool is not to have every station area score perfectly in every criterion. The scores obtained through the TOD Evaluation Tool should be used to support and balance the strengths and weaknesses of different station areas along a transit corridor. The TOD Scoring Tool can be used to determine how adjacent stations can complement one another and compensate for characteristics that certain station areas may lack. This balance of strength and weaknesses will help the region to think holistically of about where to locate necessities and amenities in the future along transit corridors.

53
The
TOD
Eva
luat
ion
Met
hod
Con
clus
ion
This page intentionally left blank
SECTION 5
Appendix
In this sectionLiterature ReviewStakeholder Relationship to TODSWOT AnalysisMethodologyCompleted Interview ListReferences
55
The
TOD
Eva
luat
ion
Met
hod
Sect
ion
5: A
ppen
dix
1. Section summarized from Carlton (2009)
Literature ReviewIntroductionThe purpose of this literature review is to provide an overview of the history of TOD to put this project in context, briefly summarize the effects of TOD that are of particular interest to Metro Transit based on the goals outlined in the Thrive MSP 2040 and the Metropolitan Council’s TOD Policy, review the literature on TOD evaluation and examine TOD policies and evaluation methods in the Twin Cities and peer regions. Accordingly, the literature review is organized into four sections:
• History and Background of TOD• Effects of TOD• Benefits of Measuring TOD at the Station Area and
Corridor Levels• Overview of Existing TOD and Station Area Evaluation
Tools and Methods
History and Background of TOD1
Before the concept of TOD emerged—and even before the advent of modern urban planning—the coordination of real estate development and transit was widespread in the United States. In the early twentieth century, the United States witnessed a great deal of what has come to be known as “development-oriented transit.” During this time, real estate entrepreneurs took advantage of a new technology—the electric streetcar—to unlock land outside the (in some cases overcrowded) urban core for development. The development that resulted was what we now refer to as “streetcar suburbs”: compact, walkable communities outside the urban core with an urban form that reflected residents’ dependence on the streetcar to access jobs and other necessities in the inner city.
After World War II, the rail-oriented form for urban America gave way to the more dispersed development patterns associated with Americans’ increasingly automobile-oriented lifestyles. During this era, federal investment in transportation infrastructure—even mass transit
56
The
TOD
Eva
luat
ion
Met
hod
Sect
ion
5: A
ppen
dix
infrastructure—favored automobile users. The 1964 Urban Mass Transportation Act spurred the development of heavy-rail systems in the San Francisco, Washington and Atlanta metropolitan areas in the 1970s that extended far into the suburbs and were designed to serve suburban riders through a new practice called “park-n-ride.” These “auto-oriented transit” systems failed to reach their ridership targets, prompting transit agencies to explore new ways to increase ridership and reduce reliance on operating subsidies. The agencies quickly learned that by leasing land near stations to real estate developers, they could achieve three complementary goals: increase transit ridership, earn rental income and defray the cost of maintaining stations and other transit infrastructure. As this practice, which came to be known as “joint development”, grew in popularity, research began to emerge pointing to a connection between the degree of transit ridership benefit from joint development was related to the intensity of that development. Research pioneered by Robert Cervero of the University of California, Berkeley found that high-density office and residential uses clustered around stations generated substantial new transit ridership.
In the 1980s, transit agencies across the country embraced the role of promoting transit-supportive land uses, both on agency-owned land and privately-owned land near stations. At the same time, greater awareness of the environmental pitfalls of urban sprawl led to an anti-sprawl movement critical of the effect of sprawl on traffic congestion and air quality. This aligned the interests of transit agencies and a growing number of environmentalists in promoting development that favored walking and transit use.
British-American architect and urban designer Peter Calthorpe coined the term TOD in the late 1980s, and after publication of Calthorpe’s 1993 book, “The New American Metropolis,” TOD became a prominent theme in urban planning. Calthorpe conceived of TOD not solely as a set of urban design guidelines, but as a remedy to numerous social and environmental problems such as segregation along racial, age and class lines. TOD was hatched as a neo-traditional idea, meaning that it called for a return to development principles that were widespread in past eras: human scale, walkability, and density to support high-frequency transit. Calthorpe did not envision TOD (or the “Pedestrian Pocket,” a similar concept that he developed
57
The
TOD
Eva
luat
ion
Met
hod
Sect
ion
5: A
ppen
dix
2. C. Hiniker (personal communication, February 6, 2018); J. Olson, (personal communication, February 7, 2018); K. Hansen (personal communication, February 7, 2018)
earlier) as a wholesale replacement for suburban sprawl. He realistically accepted that sprawl would continue, and offered TOD as a market-driven alternative paradigm to offer people more residential and lifestyle choices.
Since the advent of TOD in the early 1990s, TOD has been implemented throughout the United States on a limited basis. Several factors has impeded more widespread implementation of TOD, including a lack of investment in mass transit, zoning laws that prohibit dense development around transit stations and abundant free parking. Regardless of the challenges TOD faces, almost every metropolitan region in the United States with significant transit infrastructure maintains some form of TOD policy or vision and many planners and developers continue to pursue TOD (Carlton, 2009).
Why is TOD ImportantThere is agreement among government authorities in the Twin Cities that TOD is good practice. There is less agreement about why TOD is important and what TOD should accomplish. This section uses professional interviews to understand why TOD is important. Even within the same agency there can be disagreement about the primary purpose of TOD. In separate interviews, two different descriptions of TOD were provided by Metropolitan Council employees. The first expressed that TOD was important primarily because it supported large investments in transit lines by increasing transit ridership. The second view was that transit was barely relevant to TOD, and instead the most important aspect of TOD was the creation of walkable environments. These differences illustrate the difficulty in defining TOD and describing why it is important.
TransiT ridership2
TOD is focused in areas around transit investments specifically because increasing density and desirability typically increases transit riders. Counties and the Metropolitan Council are interested in TOD in part because it can leverage large transit investments to attract new development, which in turn supports the transit system
58
The
TOD
Eva
luat
ion
Met
hod
Sect
ion
5: A
ppen
dix
3. A. Jerve (personal communication, February 2, 2018); J. Bernard (personal communication, February 6, 2018); K. Hansen (personal communication, February 7, 2018)4. A. Owen (Personal Communication, February 8, 2018); J. Bernard J. Bernard (personal communication, February 6, 2018); J. Wittenberg (personal communication, February 7, 2018); M. Larson & R. Kelley (personal communication, February 6, 2018)
through increased ridership. Station area planning is designed to enhance the longevity of the transit corridor’s performance. These planning efforts place a high priority on TOD because it is seen as the most important way to increase transit ridership. Oreton Metro, the regional government in the Portland area, uses transit ridership as its primary, and in many cases, only metric to measure the impact and success of TOD. Transit investment is tied to TOD, and without development potential there would be less support for large transit projects.
densiTy: increasing populaTion3
The increase in transit ridership is often attributed to increasing the density around transit stations. Density is always a component of TOD. There should be higher density around transit because this increases transportation options and ridership. Density also increases the number of people in the area, which increases safety and activity.
Minneapolis and Saint Paul are also interested in increasing their population densities. To do this they have focused on transit corridors. These are locations that can increase in density and increase the whole city’s population without new development in areas that would require additional transportation infrastructure investments. Encouraging TOD is an ideal way to increase population density while also supporting transit.
pedesTrians: liVing wiThouT a car4
Automobiles are expensive and not everyone can afford to own one. Even if it is financially possible, not everyone wants to own a car. TOD creates the possibility for people to live without a car. The City of Minneapolis is one of many agencies that cares about providing its residents with different transportation options. TOD is necessary to provide transit as a reasonable option for many. Transit use inherently requires walkable locations. Traveling to and from transit will inevitably be done by walking. Creating walkable areas through TOD supports transit use, but also creates an
59
The
TOD
Eva
luat
ion
Met
hod
Sect
ion
5: A
ppen
dix
5. C. Hiniker (personal communication, February 6, 2018); J. Bernard (personal communication, February 6, 2018); K. Hansen (personal communication, February 7, 2018); M. Larson & R. Kelley (personal communication, February 6, 2018)
enjoyable environment. TOD must relate to the public realm in a pleasant way, otherwise no one will walk to walk within it and TOD will not be able to support transit.
conTexT: one size does noT fiT all5
There is no single description of TOD. While there are many elements of TOD that are important, the context and location of TOD must be considered. What is good TOD in the suburbs may be inappropriate downtown. It is not possible to evaluate TOD without acknowledging the context. TOD should be appropriate to the location and people should want to walk in TOD areas. There should be seamless integration between transit, the community and TOD.
There are two purposes that TOD can serve; it will reinforce the existing development in the area or it can be a catalyst for more development. Many hope that TOD can cause a ripple effect that results in more development. One project cannot do everything, but it has the potential to bring other projects to the area.
Effects of TODDespite the limited implementation of TOD nationwide, a significant body of literature has emerged to evaluate the effects of TOD on outcomes of widespread interest to policymakers, transit agencies and the general public. There is also substantial research on the impacts of TOD outside the United States. This section will briefly summarize the effects of TOD on the following areas, and relate these effects to the goals outlined in Thrive MSP 2040 and the Metropolitan Council’s TOD Policy:
• Economic development, land values and employment
• Travel behavior and transit ridership• Vehicle miles traveled (VMT)• The environment• Social equity• Health
60
The
TOD
Eva
luat
ion
Met
hod
Sect
ion
5: A
ppen
dix
econoMic deVelopMenT, land Values and eMployMenTThe impacts of TOD on economic development, land values and employment are consistent with goals 1 (“maximize the development impact of transit investments”) and 2 (“support regional economic competitiveness”) of the Metropolitan Council’s TOD policy. They also relate most closely to the stewardship and prosperity priorities from Thrive MSP 20404. Many researchers have studied the effects of transit access on land values, sometimes referred to as transit’s “value uplift.” By increasing the accessibility of land near stations, transit generally increases the value of that land. An exception to this tendency is that land immediately adjacent to transit infrastructure can decrease in value due to nuisances associated with the transit service, such as noise. According to Cao and Luo (2017), most studies have found transit to have a positive impact on property values. The degree of value uplift from transit varies based on factors such as land uses near stations, the mode of transit, the age of the transit system and the distance from the nearest station. The value uplift generated by transit often provides the economic basis for siting high-density development near a transit station.
Much of TOD promotion has focused on housing, or the trip-generation side of the travel equation. Employment at TODs has received less attention but is an important element of a transit corridor. A 2011 report by the Center for Transit Oriented Development, hereinafter referred to as “CTOD,” recommends that transit planning identify areas with high employment densities for future transit investments, as many significant job centers have emerged in suburban areas in recent decades and these areas have potential to support significant ridership (CTOD, 2011).
TraVel behaVior and TransiT ridershipTOD’s effect on travel behavior and transit ridership contributes to the fourth goal of the Metropolitan Council’s TOD Policy, “support a 21st century transportation system through increased ridership,” and to Thrive MSP 2040’s “stewardship” priority, by maximizing the benefit of regional transit investments. The degree to which TOD affects travel behavior and transit ridership is a prominent question within the literature on TOD, as a major goal of TOD is to effectuate a shift from driving to sustainable modes of travel. Colman
61
The
TOD
Eva
luat
ion
Met
hod
Sect
ion
5: A
ppen
dix
et al. (1992) modeled trip generation rates around TODs in the Sacramento area and concluded that TODs reduced motor vehicle trips by 6 to 7 percent compared to suburban-style development. A similar study by Arrington and Cervero (2008) that modeled trip generation around TOD zones in the Philadelphia, Portland, Washington and Oakland regions found that the TOD zones generated 44% less motor vehicle travel than auto-oriented control areas.
Robert Cervero’s research of TOD throughout California has shown that TOD delivers a substantial “ridership bonus” to transit systems. Part of the ridership bonus can be attributed to what the literature calls “residential self-selection,” or the expression of a lifestyle preference for multi-modal transportation behavior; the availability of TOD in a region allows people who prefer a transit-oriented lifestyle to live as they choose. As such, Cervero (2007) concludes that “the greatest ridership pay-off comes from intensifying station-area housing.” Other research, however, has emphasized that a majority (59%) of transit ridership is employment-related trips (Tilahun and Fan, 2014).
The concentration of activity at TODs is another characteristic that boosts transit ridership. The mixed-use nature of some TODs further contributes to the ridership bonus. While residential and office uses largely generate trips during peak commuting hours, entertainment, dining and retail generate trips mostly outside of peak hours. This can provide for more balanced, bidirectional ridership patterns than the typical pattern in the United States, which is characterized by unidirectional flows (inbound in the morning, outbound in the evening) (Cervero, 2007).
Vehicle Miles TraVeledHaas et al. (2010) found that a household’s vehicle miles traveled (VMT) can be substantially reduced by residing in a “location efficient neighborhood,” or an area with dense land use within a half mile of transit. An analysis by Nasri and Zhang (2014) found that the VMT of people living in TOD areas in Baltimore and Washington was reduced by 38% and 21%, respectively.
enVironMenTThe use of personal vehicles represents 17% of total U.S. energy consumption and emissions from vehicles creates air pollution and contributes to global warming. There are
62
The
TOD
Eva
luat
ion
Met
hod
Sect
ion
5: A
ppen
dix
no comprehensive studies documenting the environmental benefits of TOD globally, across the U.S. or in other countries. There is a general consensus, however, that TOD generates environmental benefits compared to other development paradigms by reducing automobile use and traffic congestion (Renne 2009a). The environmental benefits of TOD relate to the “sustainability” priority outlined in Thrive MSP 2040.
social equiTyTOD can be implemented in such a way that it contributes to the third goal of the Metropolitan Council’s TOD Policy, “advance equity by improving multimodal access to opportunity for all.” Equity is also a priority outlined in Thrive MSP 2040. As inequality has grown in major U.S. metropolitan areas, proponents of TOD have become increasingly interested in TOD as a means to promote social equity. Housing and transportation are the two largest household costs for the average household in the U.S. Increasingly, housing affordability is being considered in tandem with the transportation costs associated with living in a particular area. There is growing evidence that living in an area that is well-served by transit is associated with lower overall housing and transportation costs, as transit access reduces the need to own and operate a personal automobile (Singh, 2015).
Historically, TOD implementation has occurred largely in affluent neighborhoods, as developers expect higher returns in areas with high spending power. When TOD is slated for implementation in poorer areas, it risks catalyzing gentrification by raising area property values and attracting new, wealthier residents who displace longtime, poorer residents. Strategies to avoid this outcome include public subsidies for affordable housing, the low-income housing tax credit (LIHTC), community benefits agreements (CBAs), tax abatements to encourage developers to preserve existing housing and affordable housing trust funds. A high level of public engagement in the TOD planning process can help ensure that future TOD addresses the needs of existing area residents (Jeihani et al., 2013).
healThThe literature on TOD increasingly finds that TOD “aligns closely with principles of health,” (Minnesota Department of Health, 2017). By placing people within walking and biking distance of amenities and transit stations, and
63
The
TOD
Eva
luat
ion
Met
hod
Sect
ion
5: A
ppen
dix
emphasizing safe and comfortable walking and biking infrastructure, TOD can cause people to increase their use of active transportation modes. This can result in improved cardiovascular and mental health and lower incidences of conditions associated with inactivity, such as diabetes and obesity. If implemented in a way that disproportionately improves the health of disadvantaged communities, the health impacts of TOD can serve the equity goals of the Metropolitan Council’s TOD Policy and Thrive MSP 2040, as well as the latter document’s “livability” priority.
Benefits of Measuring TOD at the Station Area and Corridor Levels
connecTion beTween Tod planning and Tod eValuaTionThe scale at which TOD is planned is important for developing TOD evaluation methods. Zimbabwe & Anderson (2011) argue that planning for TOD must be done at both the regional and local scales so that TOD goals for each scale can be properly incorporated. However, TOD planning at the local level is the most important since TOD, in essence, is about “conducive development around… stops/stations,” (Singh, 2015, p. 11).
However, in order for TOD to be successfully implemented on the regional level, individual stations need to fit within the context of an entire network. Therefore, planning for TOD at the regional level is also important to coordinate TOD and corresponding infrastructure across an entire region (Singh, 2015).
Other research supporting the case for planning TOD at the regional level include Newman (2009), which argues that while local scale planning for TOD must adhere to regional goals, local governments are more closely tied to local politics which often conflict with regional goals. Thus, planning for TOD at the local scale alone cannot be counted on to achieve regional goals, and thus there is a need for regional TOD planning.
how Tod projecTs are generally eValuaTedSingh (2015) and Renne (2009b) argue that since stakeholders in TOD have different goals, the evaluation
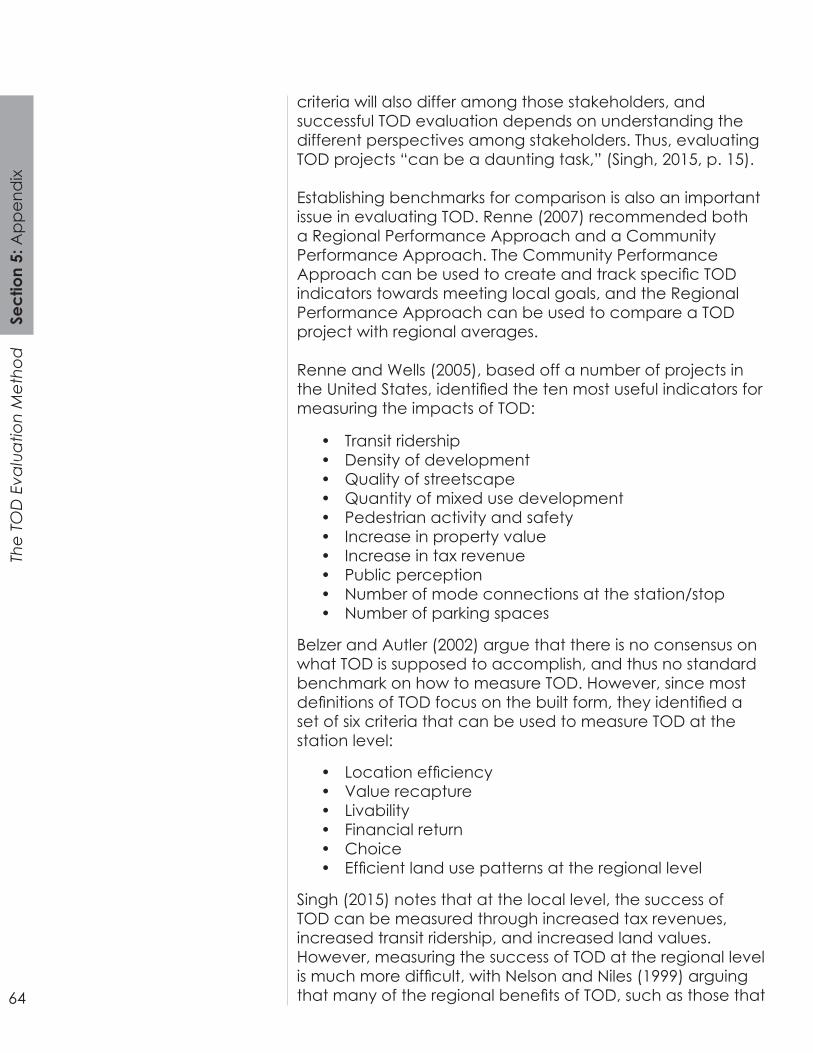
64
The
TOD
Eva
luat
ion
Met
hod
Sect
ion
5: A
ppen
dix
criteria will also differ among those stakeholders, and successful TOD evaluation depends on understanding the different perspectives among stakeholders. Thus, evaluating TOD projects “can be a daunting task,” (Singh, 2015, p. 15).
Establishing benchmarks for comparison is also an important issue in evaluating TOD. Renne (2007) recommended both a Regional Performance Approach and a Community Performance Approach. The Community Performance Approach can be used to create and track specific TOD indicators towards meeting local goals, and the Regional Performance Approach can be used to compare a TOD project with regional averages.
Renne and Wells (2005), based off a number of projects in the United States, identified the ten most useful indicators for measuring the impacts of TOD:
• Transit ridership• Density of development• Quality of streetscape• Quantity of mixed use development • Pedestrian activity and safety• Increase in property value• Increase in tax revenue• Public perception• Number of mode connections at the station/stop• Number of parking spaces
Belzer and Autler (2002) argue that there is no consensus on what TOD is supposed to accomplish, and thus no standard benchmark on how to measure TOD. However, since most definitions of TOD focus on the built form, they identified a set of six criteria that can be used to measure TOD at the station level:
• Location efficiency• Value recapture• Livability• Financial return• Choice• Efficient land use patterns at the regional level
Singh (2015) notes that at the local level, the success of TOD can be measured through increased tax revenues, increased transit ridership, and increased land values. However, measuring the success of TOD at the regional level is much more difficult, with Nelson and Niles (1999) arguing that many of the regional benefits of TOD, such as those that
65
The
TOD
Eva
luat
ion
Met
hod
Sect
ion
5: A
ppen
dix
lead to a better quality of life, are difficult to quantify.
Most of the previous indicators recommended for measuring TOD that have been discussed often got bogged down in the difficulty of obtaining data for those criteria, thus there are very few examples of the impacts of TOD projects being quantified to measure its success (Singh, 2015). Evans and Pratt (2007) proposed a TOD index to measure the transit orientation of TOD projects. Several indicators that were part of the proposed index included centrally located transit, pedestrian priority, high quality transit, mix of uses, supportive density, and parking management. The proposed TOD index, however, was never fully realized or applied to any case study (Singh, 2015).
Measuring accessibiliTy in relaTion To TodMany definitions of TOD emphasize the goal of reducing automobile dependence and increasing the ability to get around without the need of a personal automobile. In other words, many definitions of TOD actually deemphasize transit. Calthorpe (1993) argued that TOD should actually develop without transit and that delivery of transit service could merely be a potential end result of TOD. Thus, the main goals of TOD puts a focus on non-auto oriented accessibility, or the ability to access places that people want or need to go to without using a personal automobile—but not necessarily on transit.
Deboosere et al. (2017) argue that the ability to access transit is different from the ability to access destinations that people care about, and thus argue that TOD should be reframed as Accessibility Oriented Development (AOD). Reframing the TOD to AOD can “aid the process of creating functional connections between neighborhoods and the rest of the region,” (Deboosere et al., 2017, p. 2). However, the accessibility aspect of AOD only takes into consideration job accessibility, and leaves accessibility for non-work related trips out of consideration. There is not any existing literature about measuring non-auto oriented accessibility for work and non-work trips across transit corridors or networks.
66
The
TOD
Eva
luat
ion
Met
hod
Sect
ion
5: A
ppen
dix
Overview of Existing TOD and Station Area Evaluation Tools and MethodsThis section explores TOD and station area evaluation tools and policies that are utilized both within and outside the Twin Cities.
MeTropoliTan council Tod policyThe Metropolitan Council proactively develops strategies for TOD throughout the Twin Cities metropolitan area. The Metropolitan Council relies on two documents for long term policy planning: Thrive MSP 2040 and the Transportation Policy Plan (TPP). In order to conceptualize potential evaluation and measurement methods, it first needs to be established what tools currently exist. Tools utilized are based on strategies and goals, which are defined in policy.
Regional planning policy is established in the Metropolitan Council’s Thrive MSP document. Updated every ten years, the Thrive MSP framework establishes the long-range vision for the region. The Metropolitan Council maintains a TOD Policy to support livability and other Thrive MSP outcomes. The TOD Policy’s goals are reflected as courses of action in the regional Transportation Policy Plan (TPP). Within the TPP, TOD implementation strategies coincide with regional land use goals: to make transit efficient by integrating it with the built environment.
In 2014, the Metropolitan Council published the TOD Policy Plan. This policy guide outlines goals for both TOD policy and implementation. The TOD Policy utilizes the framework outlined in Thrive MSP 2040. While the Metropolitan Council does not typically develop TOD projects, this plan outlines strategies to collaborate with developers and municipalities to proactively acquire land and pursue TOD opportunities.
Tod eValuaTion for MeTropoliTan council liVable coMMuniTies granTsAn ongoing collaborative effort is the Metropolitan Council’s Livable Communities Grant program. These development grants are awarded each year to help fund TOD projects along the region’s transit corridors. Selected projects are based on access to transit, walkability, intersection density, urban design and alignment with Metro Transit’s station design.
67
The
TOD
Eva
luat
ion
Met
hod
Sect
ion
5: A
ppen
dix
This grant program includes a handbook that includes design standards for applicants to follow. The handbook has a checklist for applicants to ensure that their projects fit the criteria in terms of design, land use and mobility. Successful applicants adhere to standards for building setbacks, building texture, public art and ADA accessibility, among other design elements. The handbook also outlines streetscape design, with recommended minimum widths for the entire street, including 6’ throughway for pedestrians and 4’ for bicycle lanes. Land use evaluation criteria are defined by floor-to-area ratios, dwelling units per acre, job density and access to transit. The handbook encourages mobility by recommending short blocks lined with sidewalks, and a streetscape that utilizes safety measures such as bump outs and signalized crosswalks. Mobility is further evaluated by parking strategies. Successful TOD sites avoid surface parking lots and promote car sharing. These sites not only provide parking for private automobiles, but also provide bike storage facilities for private and shared use and parking for car sharing vehicles.
The Livable Communities Grants evaluation is based on the applications, which include site plans. The program does not reevaluate TODs after the funds have been awarded and the project has been completed. A follow up of these grants, or other TOD projects, could create more accountability for the projects implemented.
caTegorizing Tod siTesThe Center for Transit-Oriented Development (CTOD) is a nonprofit organization dedicated to helping communities collaborate with developers to create TOD. In 2010, CTOD created the “Performance-Based Transit Oriented Development Typology Guidebook.”
This guidebook considers the uniqueness of each development site, and created 15 categories to describe the varying levels of TOD potential of a development site. Figure 11 shows the categories that are defined by five levels of VMT, ranging from high to low, and three use mix types: residential, balanced, and employment (CTOD, 2010). These categories create 15 different station area types and are a way to compare TOD sites from multiple regions. This categorization is a useful, broad methodology that focuses on encouraging decreasing VMT. This typology analyzes existing development just in terms of VMT and land use. Within the case studies examined, each station
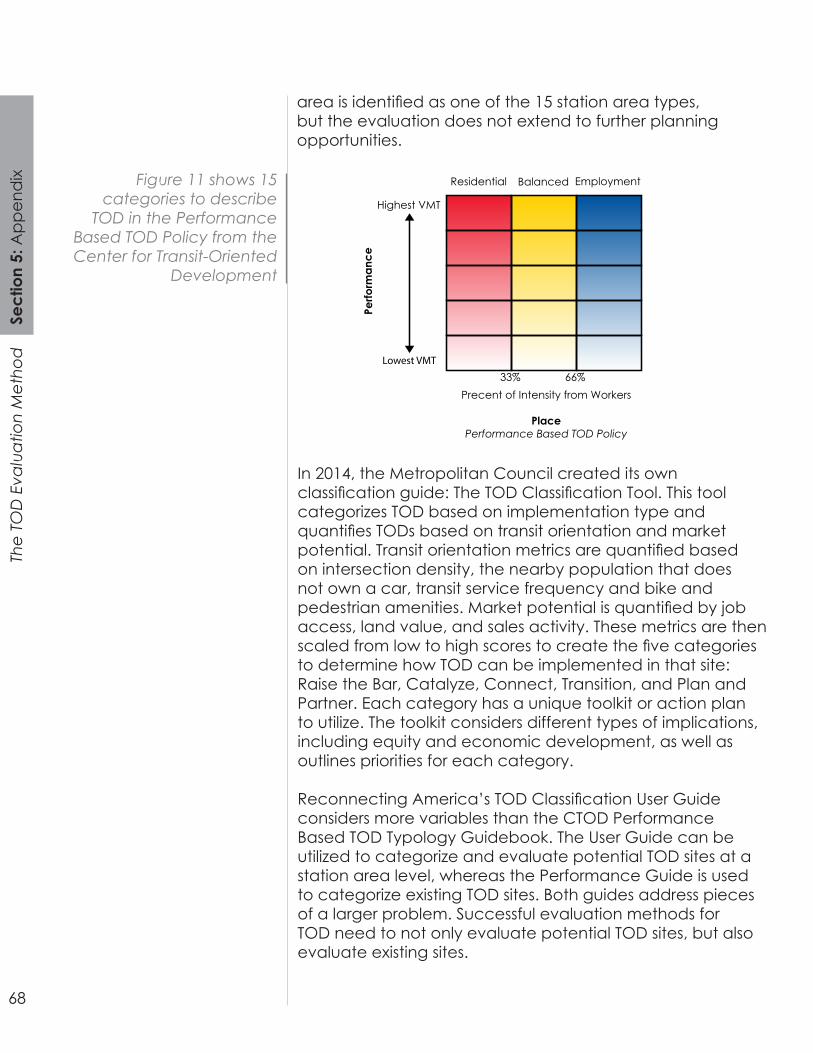
68
The
TOD
Eva
luat
ion
Met
hod
Sect
ion
5: A
ppen
dix
area is identified as one of the 15 station area types, but the evaluation does not extend to further planning opportunities.
Figure 11 shows 15 categories to describe
TOD in the Performance Based TOD Policy from the Center for Transit-Oriented
Development
Highest VMT
Perfo
rman
ce33% 66%
Residential Balanced
Precent of Intensity from Workers
PlacePerformance Based TOD Policy
Employment
Lowest VMT
In 2014, the Metropolitan Council created its own classification guide: The TOD Classification Tool. This tool categorizes TOD based on implementation type and quantifies TODs based on transit orientation and market potential. Transit orientation metrics are quantified based on intersection density, the nearby population that does not own a car, transit service frequency and bike and pedestrian amenities. Market potential is quantified by job access, land value, and sales activity. These metrics are then scaled from low to high scores to create the five categories to determine how TOD can be implemented in that site: Raise the Bar, Catalyze, Connect, Transition, and Plan and Partner. Each category has a unique toolkit or action plan to utilize. The toolkit considers different types of implications, including equity and economic development, as well as outlines priorities for each category.
Reconnecting America’s TOD Classification User Guide considers more variables than the CTOD Performance Based TOD Typology Guidebook. The User Guide can be utilized to categorize and evaluate potential TOD sites at a station area level, whereas the Performance Guide is used to categorize existing TOD sites. Both guides address pieces of a larger problem. Successful evaluation methods for TOD need to not only evaluate potential TOD sites, but also evaluate existing sites.
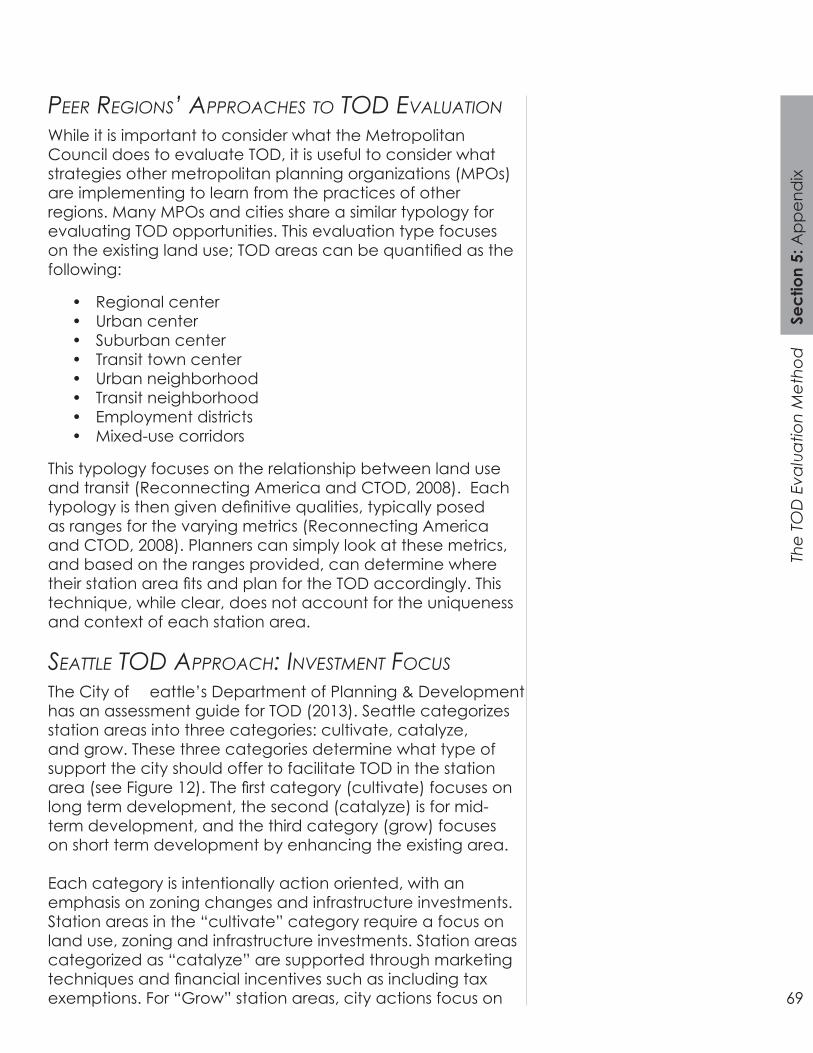
69
The
TOD
Eva
luat
ion
Met
hod
Sect
ion
5: A
ppen
dix
peer regions’ approaches To Tod eValuaTionWhile it is important to consider what the Metropolitan Council does to evaluate TOD, it is useful to consider what strategies other metropolitan planning organizations (MPOs) are implementing to learn from the practices of other regions. Many MPOs and cities share a similar typology for evaluating TOD opportunities. This evaluation type focuses on the existing land use; TOD areas can be quantified as the following:
• Regional center• Urban center• Suburban center• Transit town center• Urban neighborhood• Transit neighborhood• Employment districts • Mixed-use corridors
This typology focuses on the relationship between land use and transit (Reconnecting America and CTOD, 2008). Each typology is then given definitive qualities, typically posed as ranges for the varying metrics (Reconnecting America and CTOD, 2008). Planners can simply look at these metrics, and based on the ranges provided, can determine where their station area fits and plan for the TOD accordingly. This technique, while clear, does not account for the uniqueness and context of each station area.
seaTTle Tod approach: inVesTMenT focusThe City of Seattle’s Department of Planning & Development has an assessment guide for TOD (2013). Seattle categorizes station areas into three categories: cultivate, catalyze, and grow. These three categories determine what type of support the city should offer to facilitate TOD in the station area (see Figure 12). The first category (cultivate) focuses on long term development, the second (catalyze) is for mid-term development, and the third category (grow) focuses on short term development by enhancing the existing area.
Each category is intentionally action oriented, with an emphasis on zoning changes and infrastructure investments. Station areas in the “cultivate” category require a focus on land use, zoning and infrastructure investments. Station areas categorized as “catalyze” are supported through marketing techniques and financial incentives such as including tax exemptions. For “Grow” station areas, city actions focus on
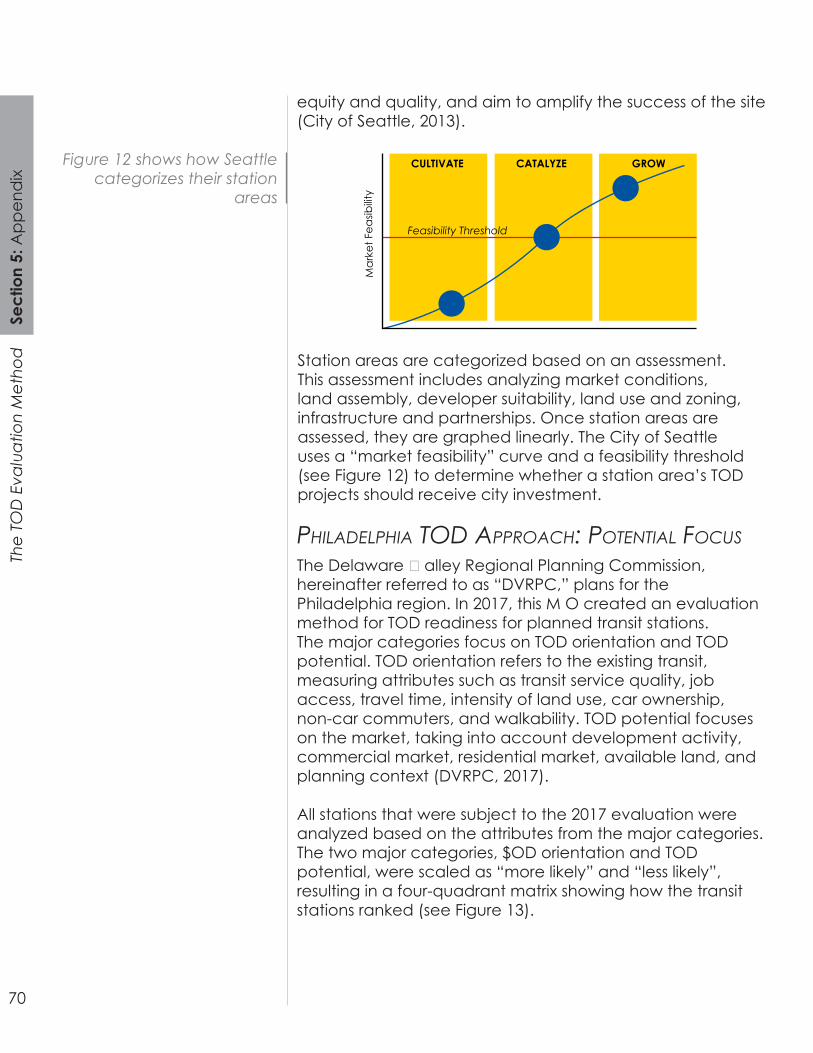
70
The
TOD
Eva
luat
ion
Met
hod
Sect
ion
5: A
ppen
dix
equity and quality, and aim to amplify the success of the site (City of Seattle, 2013).
Figure 12 shows how Seattle categorizes their station
areas
CULTIVATE CATALYZE GROW
Mar
ket F
easib
ility
Feasibility Threshold
Station areas are categorized based on an assessment. This assessment includes analyzing market conditions, land assembly, developer suitability, land use and zoning, infrastructure and partnerships. Once station areas are assessed, they are graphed linearly. The City of Seattle uses a “market feasibility” curve and a feasibility threshold (see Figure 12) to determine whether a station area’s TOD projects should receive city investment.
philadelphia Tod approach: poTenTial focusThe Delaware Valley Regional Planning Commission, hereinafter referred to as “DVRPC,” plans for the Philadelphia region. In 2017, this MPO created an evaluation method for TOD readiness for planned transit stations. The major categories focus on TOD orientation and TOD potential. TOD orientation refers to the existing transit, measuring attributes such as transit service quality, job access, travel time, intensity of land use, car ownership, non-car commuters, and walkability. TOD potential focuses on the market, taking into account development activity, commercial market, residential market, available land, and planning context (DVRPC, 2017).
All stations that were subject to the 2017 evaluation were analyzed based on the attributes from the major categories. The two major categories, TOD orientation and TOD potential, were scaled as “more likely” and “less likely”, resulting in a four-quadrant matrix showing how the transit stations ranked (see Figure 13).
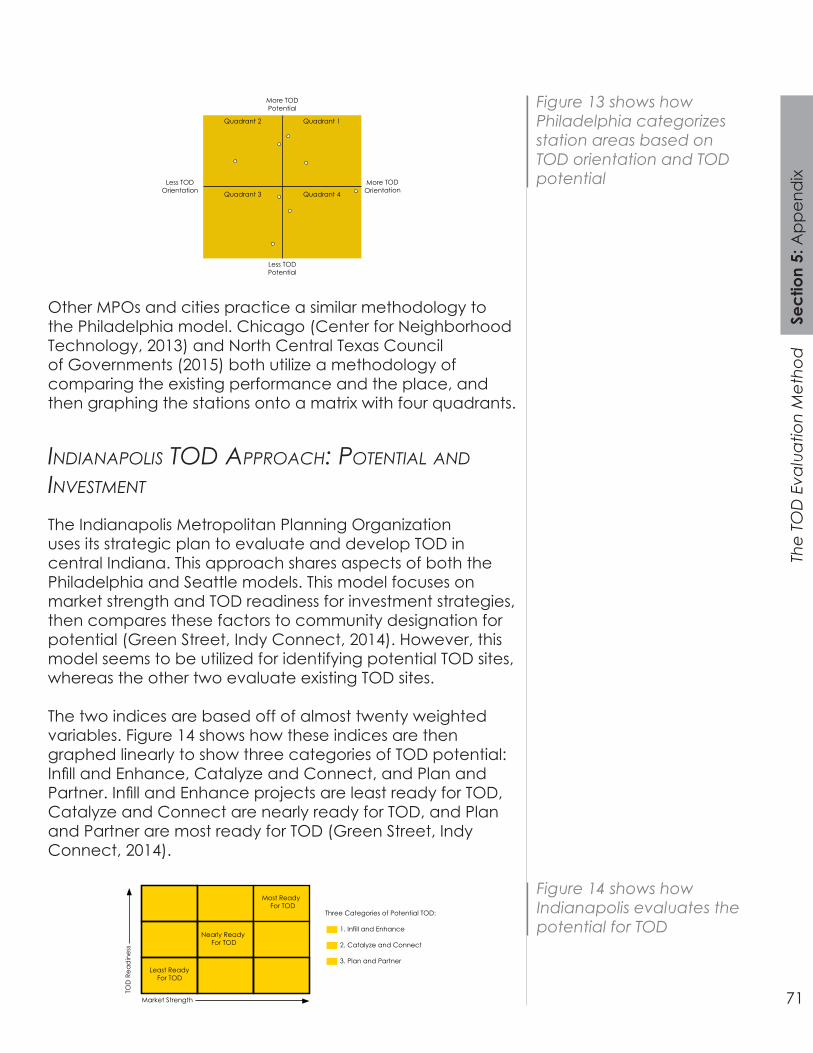
71
The
TOD
Eva
luat
ion
Met
hod
Sect
ion
5: A
ppen
dix
Figure 13 shows how Philadelphia categorizes station areas based on TOD orientation and TOD potential
Less TODPotential
Less TODOrientation
More TODPotential
Quadrant 1Quadrant 2
Quadrant 3 Quadrant 4
More TODOrientation
Other MPOs and cities practice a similar methodology to the Philadelphia model. Chicago (Center for Neighborhood Technology, 2013) and North Central Texas Council of Governments (2015) both utilize a methodology of comparing the existing performance and the place, and then graphing the stations onto a matrix with four quadrants.
indianapolis Tod approach: poTenTial and inVesTMenT The Indianapolis Metropolitan Planning Organization uses its strategic plan to evaluate and develop TOD in central Indiana. This approach shares aspects of both the Philadelphia and Seattle models. This model focuses on market strength and TOD readiness for investment strategies, then compares these factors to community designation for potential (Green Street, Indy Connect, 2014). However, this model seems to be utilized for identifying potential TOD sites, whereas the other two evaluate existing TOD sites.
The two indices are based off of almost twenty weighted variables. Figure 14 shows how these indices are then graphed linearly to show three categories of TOD potential: Infill and Enhance, Catalyze and Connect, and Plan and Partner. Infill and Enhance projects are least ready for TOD, Catalyze and Connect are nearly ready for TOD, and Plan and Partner are most ready for TOD (Green Street, Indy Connect, 2014).
Three Categories of Potential TOD:
1. Infill and Enhance
2. Catalyze and Connect
3. Plan and Partner
TOD
Rea
din
ess
Market Strength
Most ReadyFor TOD
Nearly ReadyFor TOD
Least ReadyFor TOD
Figure 14 shows how Indianapolis evaluates the potential for TOD
72
The
TOD
Eva
luat
ion
Met
hod
Sect
ion
5: A
ppen
dix
This method then separately maps the community designation of station areas: central business district, district center, walkable neighborhood, regional office park and access. The two station categories by community designation and TOD potential are then both utilized to plan for TOD.
whaT can The Twin ciTies learn froM Tod eValuaTion in oTher regions?All TOD evaluation methodologies capture important factors for measuring TOD. Community designation defines the existing land use in the area. The Philadelphia and Indianapolis approaches both consider TOD as a long-term planning objectives, but their approaches do not outline how to evaluate existing TOD sites. Seattle’s approach uses investment strategies to enhance and focus on existing TOD sites. The Metropolitan Council’s current evaluation method utilizes many principles and concepts utilized in peer regions. Going forward, the Metropolitan Council needs to consider how to measure both TOD potential and evaluate the success of existing TOD to most effectively measure TOD in the Twin Cities.
Stakeholder Relationship to TODThis analysis determines the current view of TOD by professionals in the Twin Cities and potential impacts of the development of TOD. The majority of the content in this section comes from interviews with TOD professionals and stakeholders. There are many stakeholders involved in TOD, each with differing interests and impact on how it is evaluated. This project is primarily focused internally at how public agencies evaluate TOD. The stakeholder analysis is intended to identify the groups that are most invested in this process and document the nuances of the perspectives of these different stakeholder groups. This section also investigates the roles different stakeholders play and the challenges present with evaluating TOD.
73
The
TOD
Eva
luat
ion
Met
hod
Sect
ion
5: A
ppen
dix
Stakeholder AnalysisThis analysis identifies the stakeholder groups that have interest in our project and who has power over TOD. Figure 12 shows how the clusters of these stakeholders are identified and their impacts are discussed.
Figure 15 shows the stakeholders who are interested in TOD and the amount of power they have
Power
Inte
rest
Environmental AdvocatesHousing Advocates
Public who live near potential TOD
Affordable Housing Developers
Metro Transit
Neighborhood Groups
Met CouncilCities
Counties
Mixed Use Developers
Local Government
Public and Advocates
Developers
Federal Gov
Public who do not live near potential TOD
Suburban Developers
Local Businesses
Banks and Financial Institutions
State Legislature
local goVernMenTThe cluster of local governments, counties, cities, and the Metropolitan Council all have great interest in TOD. They all care about the type of development that is happening within their jurisdictions and they have all worked on transit projects and want to see the success of these projects. These stakeholders also have a large amount of power. Through land use regulation, grant funding, and planning authority, each of these stakeholders is able to impact what type of development happens. Evaluation of TOD is important to these stakeholders because they are able to make changes happen and they have the motivation to do it.
public and adVocaTesThese stakeholders are very interested in TOD, both in support or against, but they have limited power. The
74
The
TOD
Eva
luat
ion
Met
hod
Sect
ion
5: A
ppen
dix
neighborhoods around transit and the public that live near potential TOD have some power, but it is limited. They are able to exert pressure of elected officials, but ultimately they cannot prevent or create TOD by themselves. Advocates are just as interested in TOD, but have slightly less power in the situation. Elected officials are less obligated to advocates than voters. These stakeholders have strong interest in TOD, but they have limited power to directly impact TOD.
deVelopersThere is interest from developers in TOD, but it is not universal. The financial bottom line is more important to a developer than TOD principles, however, TOD can provide a financial benefit to developers. Many aspects of TOD can add to the profitability of a development, but without this financial incentive there is less interest in TOD from developers. Developers must originate any development project. This means that they have power to effect TOD, but their power can be limited by some situations. They must work within existing regulations and frequently financial institutions are able to dictate requirements necessary to receive funding. Developers are important stakeholders for TOD.
Government Control over TODIn the Twin Cities there are many levels of government that are interested in TOD. Large investments in light rail or bus rapid transit involve coordination between cities, counties and the Metropolitan Council. There is strong support from all of these governmental agencies for TOD, but there is not always consensus on the qualities that define good TOD. Each level of government also has different abilities to influence the implementation and success of TOD. Sometimes these levels of government can work seamlessly together to create TOD, but without agreement or a shared vision, it can become difficult to work towards good TOD.
75
The
TOD
Eva
luat
ion
Met
hod
Sect
ion
5: A
ppen
dix
6. A. Jerve (personal communication, February 2, 2018); J. Bernard (personal communication, February 6, 2018); J. Olson (personal communication, February 7, 2018)
ciTies6
Basic land use decisions and zoning authority reside with cities. Cities have the immediate control over zoning decisions and specific building projects. Cities’ evaluations of projects can be very technical and specific. Developments must go through a regulatory review process with the city to verify that the proposal conforms with land use regulations. While TOD has become a common label, some cities including Minneapolis and Saint Paul do not formally distinguish between TOD and other development projects. Cities will normally change their land use regulations around new transit investment but this does not mean there will be any special consideration when development projects are being proposed.
The control cities have over land use regulations means that without city support for TOD it will not happen. Cities must decide to change their zoning to allow for TOD projects. Without this support, counties and the Metropolitan Council are unable to override local land use decisions. Counties and the Metropolitan Council are responsible for the funding to build and operate new transit lines. They are also responsible for making station area and corridor plans. Cities work closely with these agencies to build consensus on these plans. Without city involvement the plans cannot be implemented. The investments made in transit are a great opportunity to encourage TOD. Because of this the Metropolitan Council offers grant programs for TOD. Cities will work closely with the Metropolitan Council to make sure developers are able to receive these grants and that these grants are going to locations where they will provide the largest returns.
Zoning and Land Use Regulations
These regulations control what is allowed to be built on each parcel. They can affect density, building use, and many other elements. TOD projects are normally higher density than surrounding areas and can involve mixed uses and different parking requirements. New transit lines will typically require changes to surrounding zoning in order to allow for TOD projects. If cities want TOD, they must change the zoning to allow it.
76
The
TOD
Eva
luat
ion
Met
hod
Sect
ion
5: A
ppen
dix
7. J. Olson, (personal communication, February 7, 2018)8. C. Hiniker (personal communication, February 6, 2018); M. Larson & R. Kelley (personal communication, February 6, 2018)
counTies7
The planning process for new transit lines typically starts with the counties. They begin the process by studying a corridor and selecting a locally preferred alternative, which includes the route and mode of the transit line. Counties are responsible for a significant portion of funds that pay for new transit lines. To protect their investments, counties work to promote TOD in new or future transit station areas. TOD increases transit ridership and the county tax base. Counties take the lead role in station area and corridor planning and have been successful in setting the overall vision for TOD and development along transit corridors. They do not, however, work on individual projects along the corridors.
While planning for new transit lines counties must work with cities and other local governments. Counties typically select the locally preferred alternative, but do so in close coordination with local governments. At some point following the selection of the locally preferred alternative, the Metropolitan Council takes over the project to design and build the line. These large projects provide great locations for TOD and some communities are more eager to take advantage of this opportunity than others. To support their transit investment and encourage TOD, counties sometimes make grants available for TOD projects. Counties take a holistic approach to new transit lines and TOD. The Metropolitan Council has partnered with counties to do station area planning around planned transit lines.
Station Area and Corridor Planning
Planning around new transit lines is extremely important. Station area plans create a framework for development and changes within the area around new stations and corridors. Creation of these plans are typically lead by counties and are coordinated with cities and the Metropolitan Council.
MeTropoliTan council8
The Metropolitan Council has the responsibility to design and build new transit lines that have been selected by counties. These are large efforts that the Metropolitan Council undertakes, and like most Metropolitan Council
77
The
TOD
Eva
luat
ion
Met
hod
Sect
ion
5: A
ppen
dix
responsibilities it involves significant coordination with other levels of government.
Thrive MSP 2040 is a document created by the Metropolitan Council that creates a vision for the region over 30 years and outlines implementation measures the Metropolitan Council will pursue to fulfill this vision. One of the five outcomes listed in this document is “Stewardship.” Leveraging transit investments to achieve better land use and TOD is one of the ways identified to reach the goal of stewardship. Cities must respond to this regional vision through the creation of comprehensive plans. The Metropolitan Council reviews and approves these comprehensive plans. Through this process the Metropolitan Council can push cities to incorporate TOD concepts. The Metropolitan Council works with cities to identify areas where TOD investments are most likely to be successful. There is a continual dialog between government agencies in the Twin Cities about many topics, including TOD. When there is resistance to TOD from cities, the Metropolitan Council frames TOD as an economic development strategy.
Part of the design and build process of new transit lines is the creation of station area plans for all new stations. This process is typically lead by the county, but the Metropolitan Council is heavily involved in the process. The Metropolitan Council partners with counties to create corridor plans that place a focus on TOD. To support transit investments the Metropolitan Council also provides grants for TOD and development near transit. These grants are used to encourage TOD and the Metropolitan Council works closely with cities to get funding to the best projects.
Livable Communities Grant Program
This Metropolitan Council program was started in 1995 to revitalize communities, create affordable housing, and connect land uses with transportation options. One type of these grants is for TOD, specifically to increase density and mixed uses within walking distance of light rail or bus rapid transit projects. This grant program is completely voluntary, but provides an additional potential funding stream for TOD. It makes these projects more financially feasible for developers to undertake.
Environmental Remediation Grant Programs
This is another grant program offered by the Metropolitan Council. Grant funding is available from the Metropolitan
78
The
TOD
Eva
luat
ion
Met
hod
Sect
ion
5: A
ppen
dix
9. K. Hansen (personal communication, February 7, 2018)10. A. Jerve (personal communication, February 2, 2018); J. Wittenberg (personal communication, February 7, 2018); K. Hansen (personal communication, February 7, 2018); M. Larson & R. Kelley (personal communication, February 6, 2018)
Council for environmental remediation on sites that would otherwise be too polluted to develop on. While this program is not specific to TOD projects, it has been used for these projects and provides another source of funding for projects that otherwise might be too expensive complete.
MeTro TransiT9
The primary responsibility of Metro Transit is to implement transit service in the Twin Cities. Metro Transit believes that TOD plays an important role, but its primary responsibility is transit safety and operations. TOD is important to transit agencies because it increases the ridership base for the transit system. In 2013 Metro Transit established its TOD Office as a one-stop-shop for TOD resources. It supports cities and counties pursuing TOD, and implements the Metropolitan Council’s TOD Policy.
The Metro Transit TOD Office is also responsible for the land owned by Metro Transit near transit lines. This land is leased to developers to be used for TOD. This utilizes land already owned by Metro Transit to build the ridership base near large transit investments and provides a funding stream for Metro Transit’s operations.
Publicly Owned Land
Metro Transit is one agency that owns land near transit stations, but many cities also own land in these areas. When a public agency owns land, it has considerable control over what will be built on the land. The agency is able to wait until the market supports the type of development it wants to see on the land. It is also able to place requirements on new development as a condition of lease or sale of the land. Through leasing or selling the land they are able to create their preferred development, build transit ridership and provide additional funding for operations.
Public and Private Relationship10
Developers typically initiate the development process. TOD is normally treated by a city in the same way as any other
79
The
TOD
Eva
luat
ion
Met
hod
Sect
ion
5: A
ppen
dix
11. A. Jerve (personal communication, February 2, 2018); J. Bernard (personal communication, February 6, 2018); J. Olson, (personal communication, February 7, 2018); K. Hansen (personal communication, February 7, 2018); M. Larson & R. Kelley (personal communication, February 6, 2018)
development project. The developer will work with the city to make sure that the development conforms to all land use regulations or goes through the process to change the zoning regulations. The site plan review process is a tool that cities can use to ensure new development meets desired design specifications and will have successful pedestrian and transit orientation.
Metro Transit’s TOD Office provides resources for both the developers and cities for projects near transit. It can provide advice to cities or locations of potential grant funding for developers. The Metropolitan Council and many counties provide funding for TOD projects. These grants are typically given for specific elements of a project.
Some projects are initiated by government agencies. This typically happens when a city, county, or Metro Transit owns land that they are interested in leasing or selling to a developer for TOD. In these cases the agency will issue a request for proposals. The agency has a larger impact on the final project when they own the land initially. It will work closely with a developer to make sure its TOD goals are met. Depending on the agency these goals could be different.
TOD Evaluation Scale11
Current TOD evaluation methods in the Twin Cities focus on individual projects without considering the station area or corridor. The context is important for TOD. Because of this, evaluating TOD on a station area or corridor level would provide important information about the effectiveness of TOD. There is great interest in evaluation on these scales, as this would facilitate much better understanding and outcomes. However, this is not a common practice.
Cities currently evaluate new development based only on the individual project. The corridors influence city plans and these plans impact land use and zoning. In this way the corridors affect what is built, but there is no evaluation of the corridor at the stage when development is happening. Varying property ownership is one problem that makes it
80
The
TOD
Eva
luat
ion
Met
hod
Sect
ion
5: A
ppen
dix
12. A. Owen (personal communication, February 8, 2018); C. Hiniker (personal communication, February 6, 2018); J. Bernard (personal communication, February 6, 2018); J. Wittenberg (personal communication, February 7, 2018); K. Hansen (personal communication, February 7, 2018); M. Larson & R. Kelley (personal communication, February 6, 2018); Y. Fan (personal communication, February 1, 2018)
difficult to do larger evaluations.
There has been some success in coordinating the plans between multiple cities. County-led efforts for transit planning, especially for the Green and Blue Line extensions, have resulted in coordinated plans between all cities along the lines. Some current metrics used to evaluate individual projects are scalable. These metrics apply to individual projects, but could also apply to a station area or corridor. These could include transit dependence, which can be evaluated for a single project or an entire corridor.
One project cannot be everything to everyone, which is why station area and corridor evaluation is important. One project will never fulfill everyone’s interests. However, when all projects along a corridor are considered together it becomes more likely that everyone will be satisfied by something.
When is TOD Evaluated12
Typically TOD projects are only evaluated when they are proposed. After the project has been completed, there is limited follow-up review. Evaluations will be done by the city to make sure TOD projects meet land use regulations. They can also be done by the county or Metropolitan Council if the project is seeking TOD grants. These evaluations are done on the potential of the TOD, but there is no guarantee that accurate projections are made during this process.
After completion of projects there are rarely formal evaluations that are completed. This could be because of limited resources at government agencies, but also because there is very little impact these agencies can have on the project after it has been built. Sometimes lessons can be learned from a project and applied to a new project, but there is no formal process that embraces this practice. This results in limited accountability. Without reviews it is not always clear if the goals an agency has for a project are met.
81
The
TOD
Eva
luat
ion
Met
hod
Sect
ion
5: A
ppen
dix
In contrast to professionals, academics typically evaluate TOD after it has opened. However, these evaluations are usually focused on other questions and have limited applicability to improving evaluations performed by practitioners. This is because academics are primarily interested in long term impacts, while professionals are interested in implementation and what it will encourage.
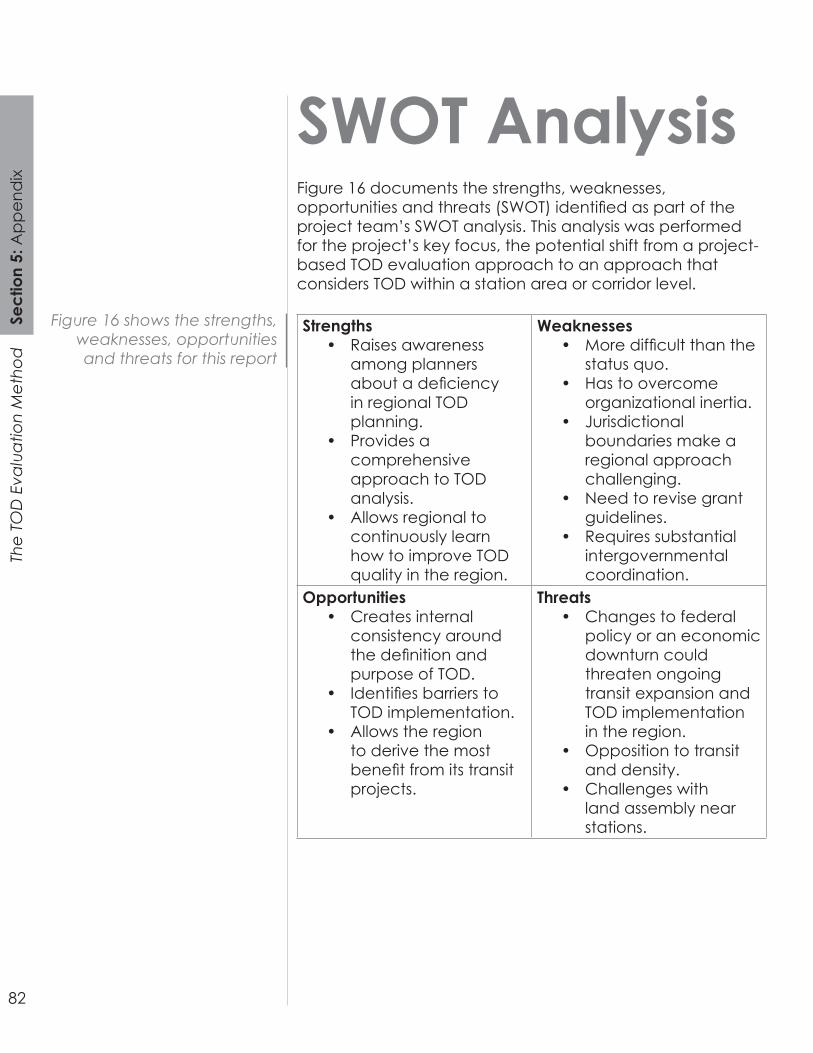
82
The
TOD
Eva
luat
ion
Met
hod
Sect
ion
5: A
ppen
dix
SWOT AnalysisFigure 16 documents the strengths, weaknesses, opportunities and threats (SWOT) identified as part of the project team’s SWOT analysis. This analysis was performed for the project’s key focus, the potential shift from a project-based TOD evaluation approach to an approach that considers TOD within a station area or corridor level.
Figure 16 shows the strengths, weaknesses, opportunities and threats for this report
Strengths• Raises awareness
among planners about a deficiency in regional TOD planning.
• Provides a comprehensive approach to TOD analysis.
• Allows regional to continuously learn how to improve TOD quality in the region.
Weaknesses• More difficult than the
status quo.• Has to overcome
organizational inertia.• Jurisdictional
boundaries make a regional approach challenging.
• Need to revise grant guidelines.
• Requires substantial intergovernmental coordination.
Opportunities• Creates internal
consistency around the definition and purpose of TOD.
• Identifies barriers to TOD implementation.
• Allows the region to derive the most benefit from its transit projects.
Threats• Changes to federal
policy or an economic downturn could threaten ongoing transit expansion and TOD implementation in the region.
• Opposition to transit and density.
• Challenges with land assembly near stations.
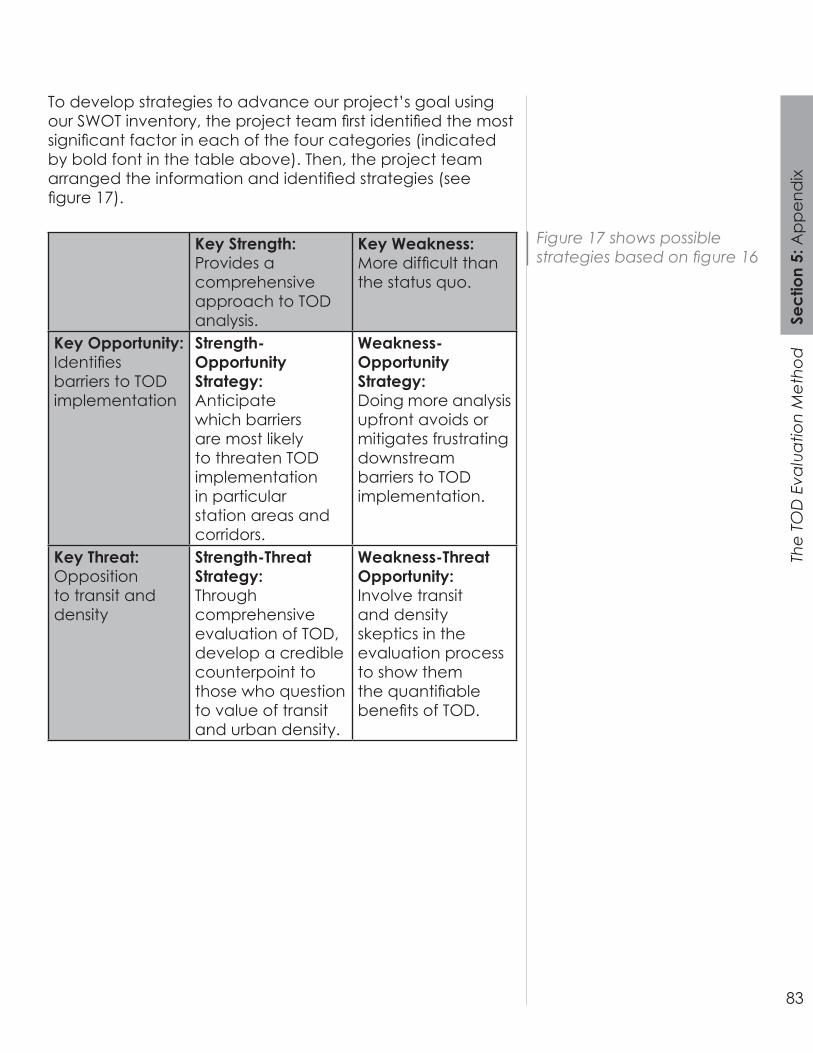
83
The
TOD
Eva
luat
ion
Met
hod
Sect
ion
5: A
ppen
dix
To develop strategies to advance our project’s goal using our SWOT inventory, the project team first identified the most significant factor in each of the four categories (indicated by bold font in the table above). Then, the project team arranged the information and identified strategies (see figure 17).
Figure 17 shows possible strategies based on figure 16
Key Strength: Provides a comprehensive approach to TOD analysis.
Key Weakness: More difficult than the status quo.
Key Opportunity: Identifies barriers to TOD implementation
Strength-Opportunity Strategy:Anticipate which barriers are most likely to threaten TOD implementation in particular station areas and corridors.
Weakness-Opportunity Strategy:Doing more analysis upfront avoids or mitigates frustrating downstream barriers to TOD implementation.
Key Threat: Opposition to transit and density
Strength-Threat Strategy:Through comprehensive evaluation of TOD, develop a credible counterpoint to those who question to value of transit and urban density.
Weakness-Threat Opportunity:Involve transit and density skeptics in the evaluation process to show them the quantifiable benefits of TOD.
84
The
TOD
Eva
luat
ion
Met
hod
Sect
ion
5: A
ppen
dix
MethodologyThe TOD Scoring Tool uses the criteria of travel behavior, the built environment, and community strength to evaluate TOD in station areas and along corridors. The tool assigns a score between 0 and 100 to each station area and corridor for the three criteria that comprise the framework. Each criteria represents an important aspect of an area’s ability to support TOD. The tool also aggregates these scores to produce an overall TOD score for each station area and corridor.
The tool is a method for station area and corridor evaluation that can be refined and adjusted. As more data become available and new research improves our understanding of TOD, the tool can be easily updated to reflect the best research and resources available. New variables can be introduced or the importance of existing variables can be changed as deemed appropriate.
How the scoring is doneAn overall score is given to a station area or corridor based on the three criteria of the framework: travel behavior, built environment and community strength. The subscores generated for each criterion can be assigned different weights to represent their importance to predict the success of TOD in the area. Each station area is evaluated within a half-mile buffer. In the event that the half mile buffer around stations overlap, the overlapping area is split and only included in the station area of the station that is closest to the area to avoid double counting areas.
Each subscore is determined by analyzing a group of variables. Each variable is calculated to provide information about a station area or corridor. Variables are standardized based on their values for all station areas or corridors being evaluated. Once the variables have been standardized, variables are combined into subscores. This is done through weighting each variable based on its importance. This allows some variables that are less important to be included without allowing them to have an outsized influence on the outcome of the evaluation. The subscores are then weighted to create the overall TOD score.
85
The
TOD
Eva
luat
ion
Met
hod
Sect
ion
5: A
ppen
dix
The first step is identifying variables and collecting data. The variables in this report are based on research, however, many important variables were not included because of limited data. Each variable used in this evaluation and how the variable was calculated are detailed below.
The data for each variable must be standardized to allow comparisons between different variables. Some variables measure percentages while other variables measure straight numbers. Standardization allows variables with widely different types of values to feed into the same composite score. Because this standardization is based on the pool of numbers being evaluated, this tool will be most effective when evaluating large numbers of station areas at once. This project applied the TOD Scoring Tool to all 23 station areas along the Green Line, but will become more effective with a larger sample of station areas. The TOD Scoring Tool will provide the best results when evaluations of all station areas and corridors for existing and planned transit corridors are completed.
Standardization of each variable changes the variable value to a number between 0 and 100. This standardization process is based on the goal for each variable and the variation from that goal for each station area. Some variable goals are simple to identify; when evaluating transit ridership the goal is the higher the better. Other variables are more complex; when evaluating housing costs the goal will be in the middle of the range. Once a goal has been identified the range of scores must also be identified, specifically the distance between the goal and the minimum or maximum variable value. The calculation uses a standard normal table or z table. When the goal is used as the mean, and the range is used as the standard deviation, the z value can be used to standardize the scores. The absolute value of the z value will be a number between 0 and 1 that represents the distance from the variable’s goal.
The equation used for this calculation is:(1-|z|)*100=standardization
This can also be accomplished in Microsoft Excel using the formula:
=(1-ABS(STANDARDIZE(variable value, goal, range)))*100
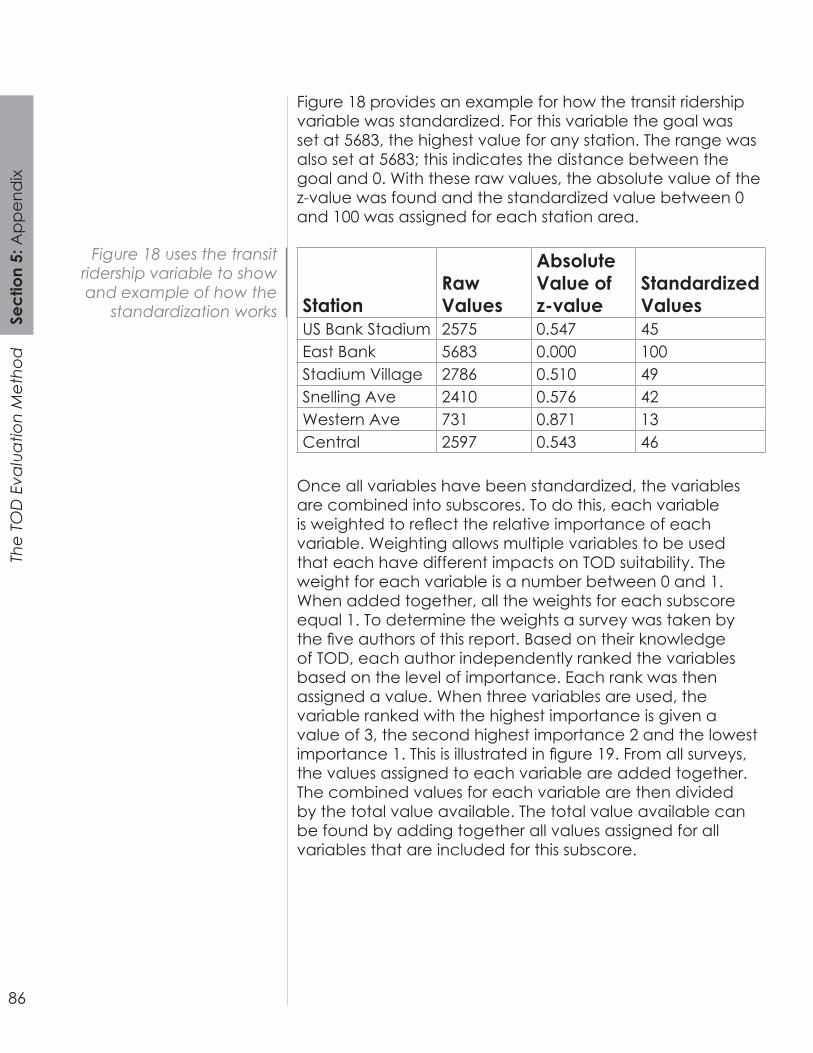
86
The
TOD
Eva
luat
ion
Met
hod
Sect
ion
5: A
ppen
dix
Figure 18 provides an example for how the transit ridership variable was standardized. For this variable the goal was set at 5683, the highest value for any station. The range was also set at 5683; this indicates the distance between the goal and 0. With these raw values, the absolute value of the z-value was found and the standardized value between 0 and 100 was assigned for each station area.
Figure 18 uses the transit ridership variable to show and example of how the
standardization works StationRaw Values
Absolute Value of z-value
Standardized Values
US Bank Stadium 2575 0.547 45East Bank 5683 0.000 100Stadium Village 2786 0.510 49Snelling Ave 2410 0.576 42Western Ave 731 0.871 13Central 2597 0.543 46
Once all variables have been standardized, the variables are combined into subscores. To do this, each variable is weighted to reflect the relative importance of each variable. Weighting allows multiple variables to be used that each have different impacts on TOD suitability. The weight for each variable is a number between 0 and 1. When added together, all the weights for each subscore equal 1. To determine the weights a survey was taken by the five authors of this report. Based on their knowledge of TOD, each author independently ranked the variables based on the level of importance. Each rank was then assigned a value. When three variables are used, the variable ranked with the highest importance is given a value of 3, the second highest importance 2 and the lowest importance 1. This is illustrated in figure 19. From all surveys, the values assigned to each variable are added together. The combined values for each variable are then divided by the total value available. The total value available can be found by adding together all values assigned for all variables that are included for this subscore.
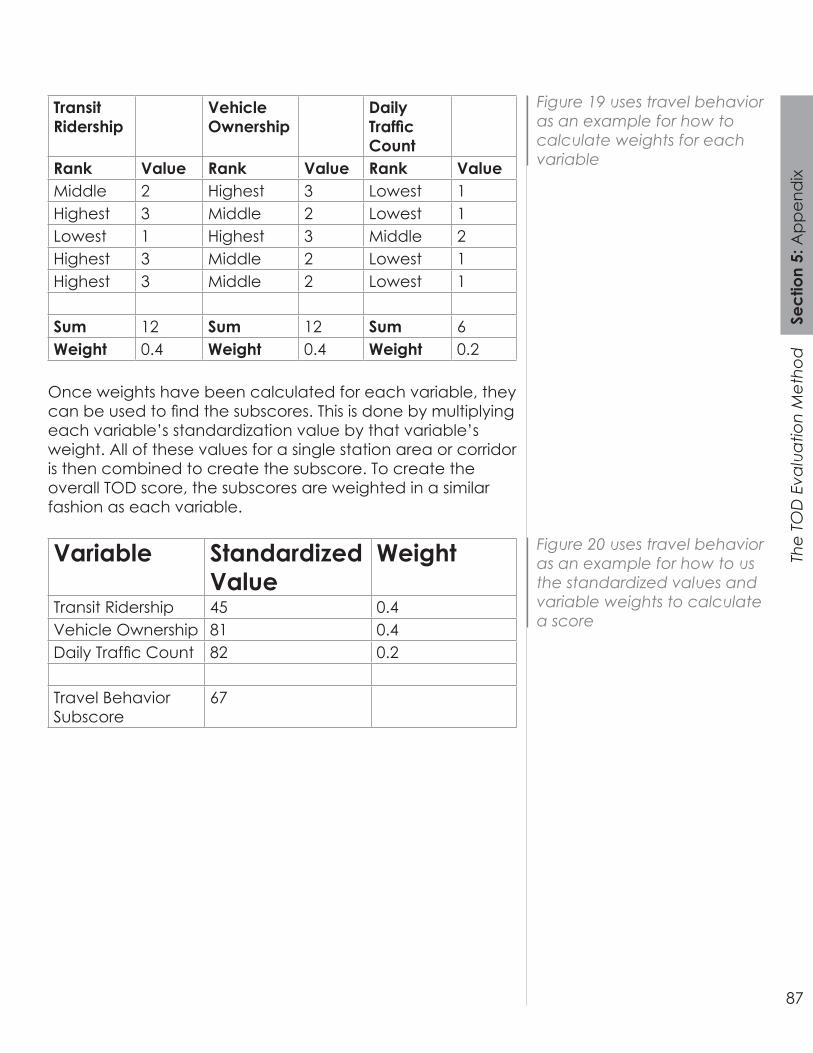
87
The
TOD
Eva
luat
ion
Met
hod
Sect
ion
5: A
ppen
dix
Figure 19 uses travel behavior as an example for how to calculate weights for each variable
Transit Ridership
Vehicle Ownership
Daily Traffic Count
Rank Value Rank Value Rank ValueMiddle 2 Highest 3 Lowest 1Highest 3 Middle 2 Lowest 1Lowest 1 Highest 3 Middle 2Highest 3 Middle 2 Lowest 1Highest 3 Middle 2 Lowest 1
Sum 12 Sum 12 Sum 6Weight 0.4 Weight 0.4 Weight 0.2
Once weights have been calculated for each variable, they can be used to find the subscores. This is done by multiplying each variable’s standardization value by that variable’s weight. All of these values for a single station area or corridor is then combined to create the subscore. To create the overall TOD score, the subscores are weighted in a similar fashion as each variable.
Figure 20 uses travel behavior as an example for how to us the standardized values and variable weights to calculate a score
Variable Standardized Value
Weight
Transit Ridership 45 0.4Vehicle Ownership 81 0.4Daily Traffic Count 82 0.2
Travel Behavior Subscore
67
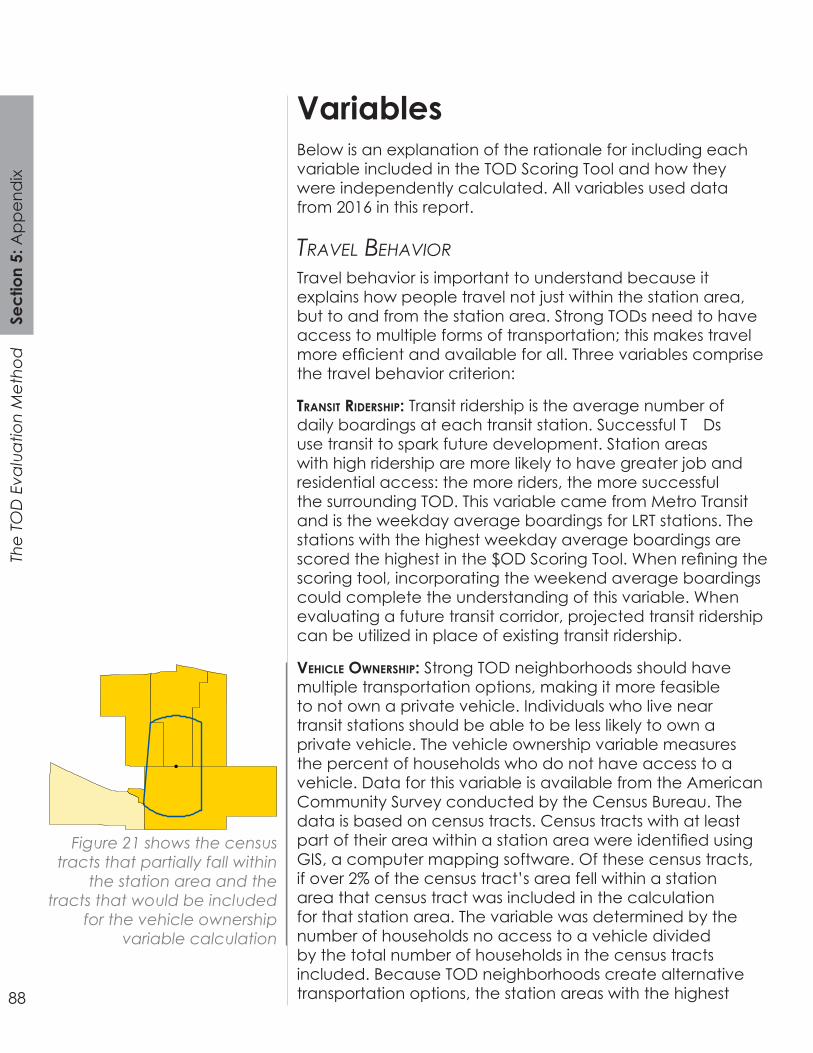
88
The
TOD
Eva
luat
ion
Met
hod
Sect
ion
5: A
ppen
dix
Below is an explanation of the rationale for including each variable included in the TOD Scoring Tool and how they were independently calculated. All variables used data from 2016 in this report.
Variables
TraVel behaViorTravel behavior is important to understand because it explains how people travel not just within the station area, but to and from the station area. Strong TODs need to have access to multiple forms of transportation; this makes travel more efficient and available for all. Three variables comprise the travel behavior criterion:
TranSiT riderShip: Transit ridership is the average number of daily boardings at each transit station. Successful TODs use transit to spark future development. Station areas with high ridership are more likely to have greater job and residential access: the more riders, the more successful the surrounding TOD. This variable came from Metro Transit and is the weekday average boardings for LRT stations. The stations with the highest weekday average boardings are scored the highest in the TOD Scoring Tool. When refining the scoring tool, incorporating the weekend average boardings could complete the understanding of this variable. When evaluating a future transit corridor, projected transit ridership can be utilized in place of existing transit ridership.
Vehicle OwnerShip: Strong TOD neighborhoods should have multiple transportation options, making it more feasible to not own a private vehicle. Individuals who live near transit stations should be able to be less likely to own a private vehicle. The vehicle ownership variable measures the percent of households who do not have access to a vehicle. Data for this variable is available from the American Community Survey conducted by the Census Bureau. The data is based on census tracts. Census tracts with at least part of their area within a station area were identified using GIS, a computer mapping software. Of these census tracts, if over 2% of the census tract’s area fell within a station area that census tract was included in the calculation for that station area. The variable was determined by the number of households no access to a vehicle divided by the total number of households in the census tracts included. Because TOD neighborhoods create alternative transportation options, the station areas with the highest
Figure 21 shows the census tracts that partially fall within
the station area and the tracts that would be included
for the vehicle ownership variable calculation
!
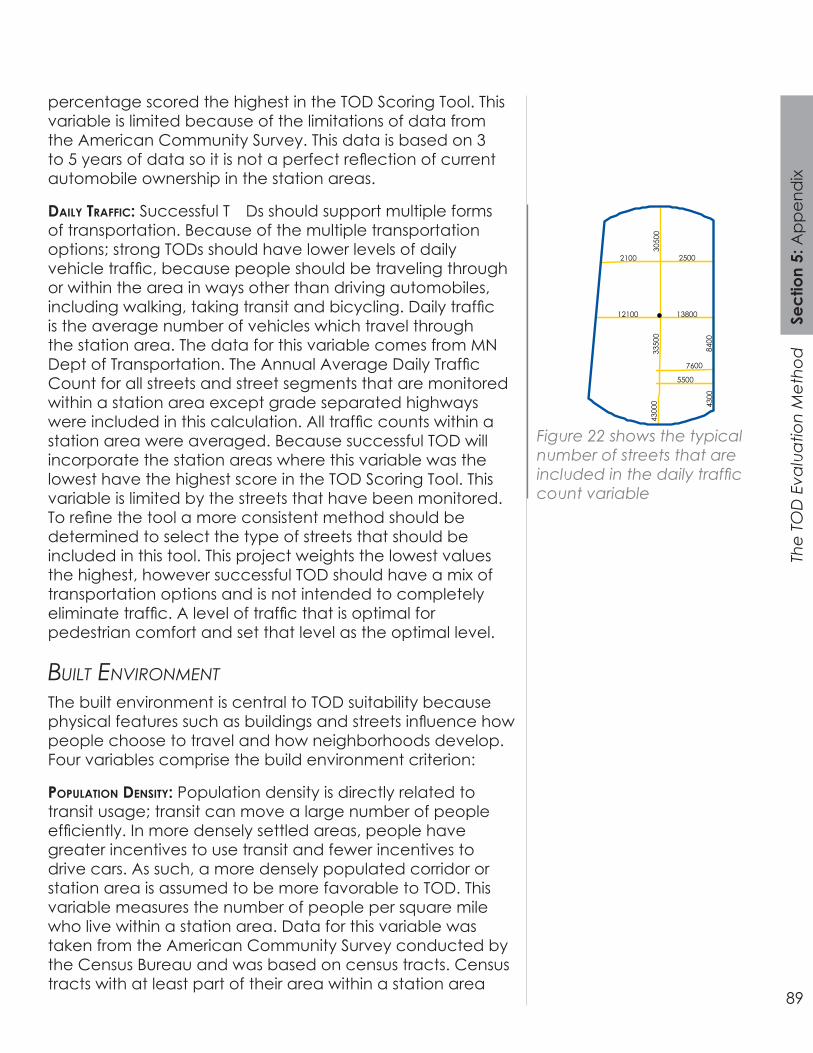
89
The
TOD
Eva
luat
ion
Met
hod
Sect
ion
5: A
ppen
dix
percentage scored the highest in the TOD Scoring Tool. This variable is limited because of the limitations of data from the American Community Survey. This data is based on 3 to 5 years of data so it is not a perfect reflection of current automobile ownership in the station areas.
daily Traffic: Successful TODs should support multiple forms of transportation. Because of the multiple transportation options; strong TODs should have lower levels of daily vehicle traffic, because people should be traveling through or within the area in ways other than driving automobiles, including walking, taking transit and bicycling. Daily traffic is the average number of vehicles which travel through the station area. The data for this variable comes from MN Dept of Transportation. The Annual Average Daily Traffic Count for all streets and street segments that are monitored within a station area except grade separated highways were included in this calculation. All traffic counts within a station area were averaged. Because successful TOD will incorporate the station areas where this variable was the lowest have the highest score in the TOD Scoring Tool. This variable is limited by the streets that have been monitored. To refine the tool a more consistent method should be determined to select the type of streets that should be included in this tool. This project weights the lowest values the highest, however successful TOD should have a mix of transportation options and is not intended to completely eliminate traffic. A level of traffic that is optimal for pedestrian comfort and set that level as the optimal level.
Figure 22 shows the typical number of streets that are included in the daily traffic count variable
!
2100
7600
5500
2500
12100
8400
4300
0
13800
3350
0
4300
3050
0
builT enVironMenTThe built environment is central to TOD suitability because physical features such as buildings and streets influence how people choose to travel and how neighborhoods develop. Four variables comprise the build environment criterion:
pOpulaTiOn denSiTy: Population density is directly related to transit usage; transit can move a large number of people efficiently. In more densely settled areas, people have greater incentives to use transit and fewer incentives to drive cars. As such, a more densely populated corridor or station area is assumed to be more favorable to TOD. This variable measures the number of people per square mile who live within a station area. Data for this variable was taken from the American Community Survey conducted by the Census Bureau and was based on census tracts. Census tracts with at least part of their area within a station area
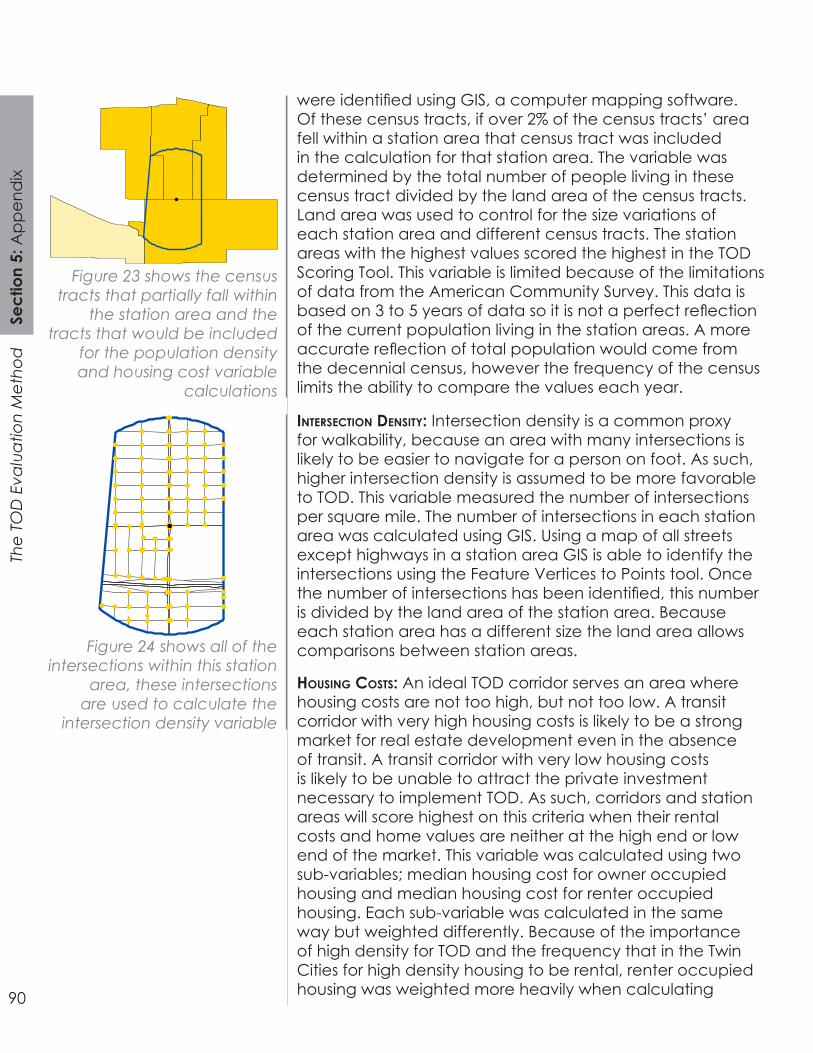
90
The
TOD
Eva
luat
ion
Met
hod
Sect
ion
5: A
ppen
dix
were identified using GIS, a computer mapping software. Of these census tracts, if over 2% of the census tracts’ area fell within a station area that census tract was included in the calculation for that station area. The variable was determined by the total number of people living in these census tract divided by the land area of the census tracts. Land area was used to control for the size variations of each station area and different census tracts. The station areas with the highest values scored the highest in the TOD Scoring Tool. This variable is limited because of the limitations of data from the American Community Survey. This data is based on 3 to 5 years of data so it is not a perfect reflection of the current population living in the station areas. A more accurate reflection of total population would come from the decennial census, however the frequency of the census limits the ability to compare the values each year.
Figure 23 shows the census tracts that partially fall within
the station area and the tracts that would be included
for the population density and housing cost variable
calculations
!
inTerSecTiOn denSiTy: Intersection density is a common proxy for walkability, because an area with many intersections is likely to be easier to navigate for a person on foot. As such, higher intersection density is assumed to be more favorable to TOD. This variable measured the number of intersections per square mile. The number of intersections in each station area was calculated using GIS. Using a map of all streets except highways in a station area GIS is able to identify the intersections using the Feature Vertices to Points tool. Once the number of intersections has been identified, this number is divided by the land area of the station area. Because each station area has a different size the land area allows comparisons between station areas. Figure 24 shows all of the
intersections within this station area, these intersections
are used to calculate the intersection density variable
!!! !! !!!! !! !!
!
!
!
!
! !
!
!! !
!
!
!
!
!
!
!
!
!!!
!!!!!! !!!! !!!!!!
!
!
!
!
!
!
! !!
!!
!
! !!!!
!
!
!
!
!
!
!
!
!
!! !! !!!! !! !! !! !!
! !!
!
! !!
!
! !!
!
! !!
!
!!
!!
!
!
!
! !!
!
! !! !!
!
! !!
!
! !! !!
! !!
!
!
!
!!!
!
! !!
!
! !!
!
!!!
!!
!
! !!!!
!
! !!
!
!!! !!
!
! !!
!
!!
!
!
! !!
!
! !!
!
! !!
!
! !!
!
! !!
!
!!
!
!
! !!
!
! !! !!
!
! !!
!
! !!
!
! !!
!
!!!
! !!
!
!
!
! !!
!
! !!
!
!!
!
!
!
!
!
!
!!!
!
!
!
!!!!!!! !!!!!!!!!
!!!!!! !! ! !!!
!!
!!
!
!
!!
!!
!!!!
!!
!!
!!
!!
!!
!!
!!
!!
!!!!!!!!!! !! !
!
!
!!
!!
!
!!!
!
!!
!
!!!!!!!!!
!
!!
!
!!
!
hOuSing cOSTS: An ideal TOD corridor serves an area where housing costs are not too high, but not too low. A transit corridor with very high housing costs is likely to be a strong market for real estate development even in the absence of transit. A transit corridor with very low housing costs is likely to be unable to attract the private investment necessary to implement TOD. As such, corridors and station areas will score highest on this criteria when their rental costs and home values are neither at the high end or low end of the market. This variable was calculated using two sub-variables; median housing cost for owner occupied housing and median housing cost for renter occupied housing. Each sub-variable was calculated in the same way but weighted differently. Because of the importance of high density for TOD and the frequency that in the Twin Cities for high density housing to be rental, renter occupied housing was weighted more heavily when calculating
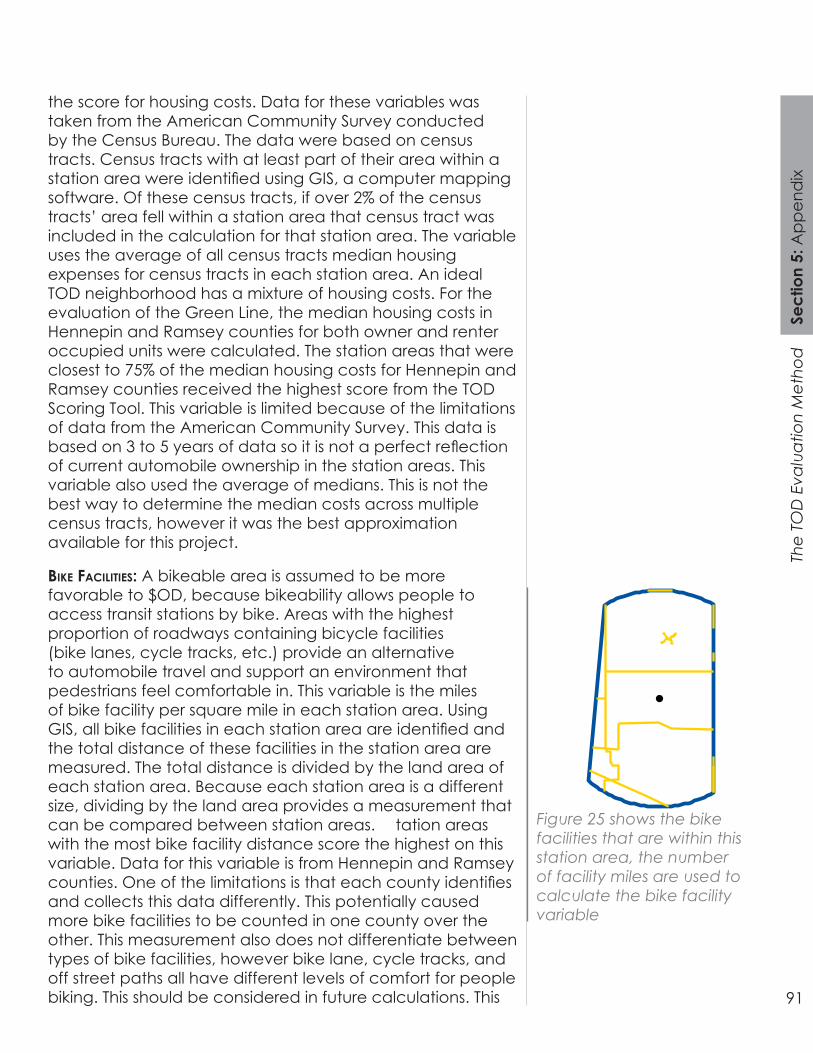
91
The
TOD
Eva
luat
ion
Met
hod
Sect
ion
5: A
ppen
dix
the score for housing costs. Data for these variables was taken from the American Community Survey conducted by the Census Bureau. The data were based on census tracts. Census tracts with at least part of their area within a station area were identified using GIS, a computer mapping software. Of these census tracts, if over 2% of the census tracts’ area fell within a station area that census tract was included in the calculation for that station area. The variable uses the average of all census tracts median housing expenses for census tracts in each station area. An ideal TOD neighborhood has a mixture of housing costs. For the evaluation of the Green Line, the median housing costs in Hennepin and Ramsey counties for both owner and renter occupied units were calculated. The station areas that were closest to 75% of the median housing costs for Hennepin and Ramsey counties received the highest score from the TOD Scoring Tool. This variable is limited because of the limitations of data from the American Community Survey. This data is based on 3 to 5 years of data so it is not a perfect reflection of current automobile ownership in the station areas. This variable also used the average of medians. This is not the best way to determine the median costs across multiple census tracts, however it was the best approximation available for this project.
Bike faciliTieS: A bikeable area is assumed to be more favorable to TOD, because bikeability allows people to access transit stations by bike. Areas with the highest proportion of roadways containing bicycle facilities (bike lanes, cycle tracks, etc.) provide an alternative to automobile travel and support an environment that pedestrians feel comfortable in. This variable is the miles of bike facility per square mile in each station area. Using GIS, all bike facilities in each station area are identified and the total distance of these facilities in the station area are measured. The total distance is divided by the land area of each station area. Because each station area is a different size, dividing by the land area provides a measurement that can be compared between station areas. Station areas with the most bike facility distance score the highest on this variable. Data for this variable is from Hennepin and Ramsey counties. One of the limitations is that each county identifies and collects this data differently. This potentially caused more bike facilities to be counted in one county over the other. This measurement also does not differentiate between types of bike facilities, however bike lane, cycle tracks, and off street paths all have different levels of comfort for people biking. This should be considered in future calculations. This
Figure 25 shows the bike facilities that are within this station area, the number of facility miles are used to calculate the bike facility variable
!
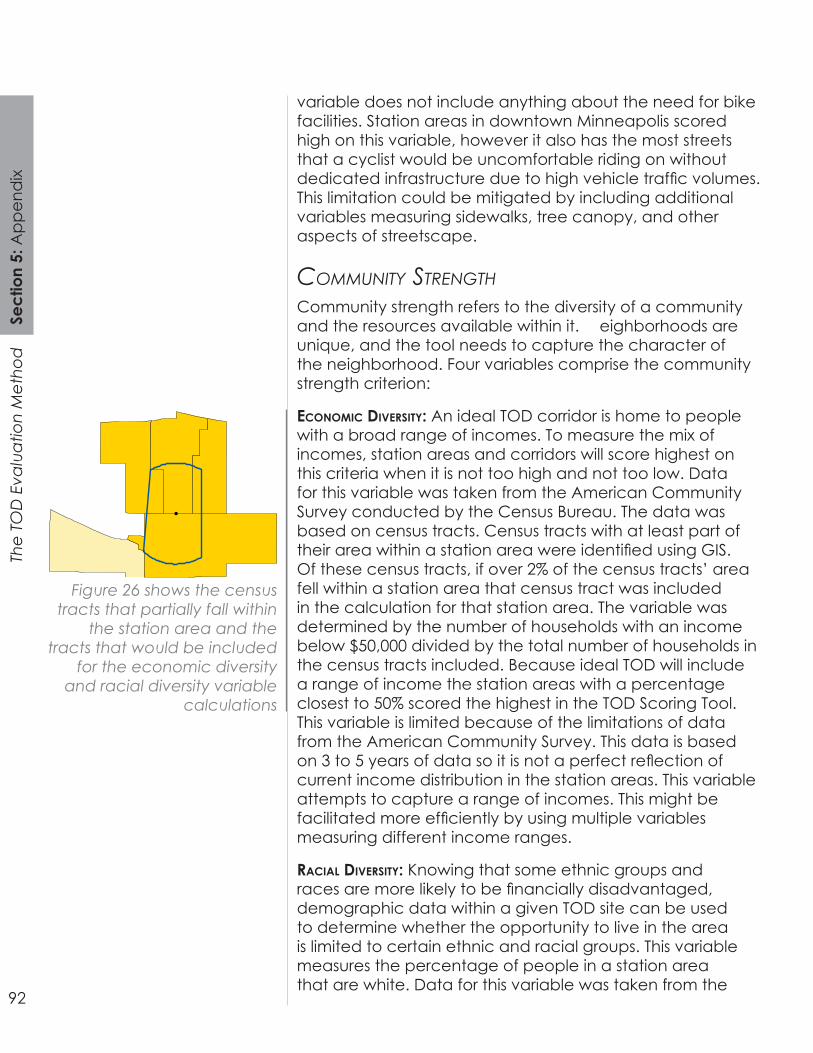
92
The
TOD
Eva
luat
ion
Met
hod
Sect
ion
5: A
ppen
dix
variable does not include anything about the need for bike facilities. Station areas in downtown Minneapolis scored high on this variable, however it also has the most streets that a cyclist would be uncomfortable riding on without dedicated infrastructure due to high vehicle traffic volumes. This limitation could be mitigated by including additional variables measuring sidewalks, tree canopy, and other aspects of streetscape.
coMMuniTy sTrengThCommunity strength refers to the diversity of a community and the resources available within it. Neighborhoods are unique, and the tool needs to capture the character of the neighborhood. Four variables comprise the community strength criterion:
ecOnOmic diVerSiTy: An ideal TOD corridor is home to people with a broad range of incomes. To measure the mix of incomes, station areas and corridors will score highest on this criteria when it is not too high and not too low. Data for this variable was taken from the American Community Survey conducted by the Census Bureau. The data was based on census tracts. Census tracts with at least part of their area within a station area were identified using GIS. Of these census tracts, if over 2% of the census tracts’ area fell within a station area that census tract was included in the calculation for that station area. The variable was determined by the number of households with an income below $50,000 divided by the total number of households in the census tracts included. Because ideal TOD will include a range of income the station areas with a percentage closest to 50% scored the highest in the TOD Scoring Tool. This variable is limited because of the limitations of data from the American Community Survey. This data is based on 3 to 5 years of data so it is not a perfect reflection of current income distribution in the station areas. This variable attempts to capture a range of incomes. This might be facilitated more efficiently by using multiple variables measuring different income ranges.
Figure 26 shows the census tracts that partially fall within
the station area and the tracts that would be included
for the economic diversity and racial diversity variable
calculations
!
racial diVerSiTy: Knowing that some ethnic groups and races are more likely to be financially disadvantaged, demographic data within a given TOD site can be used to determine whether the opportunity to live in the area is limited to certain ethnic and racial groups. This variable measures the percentage of people in a station area that are white. Data for this variable was taken from the
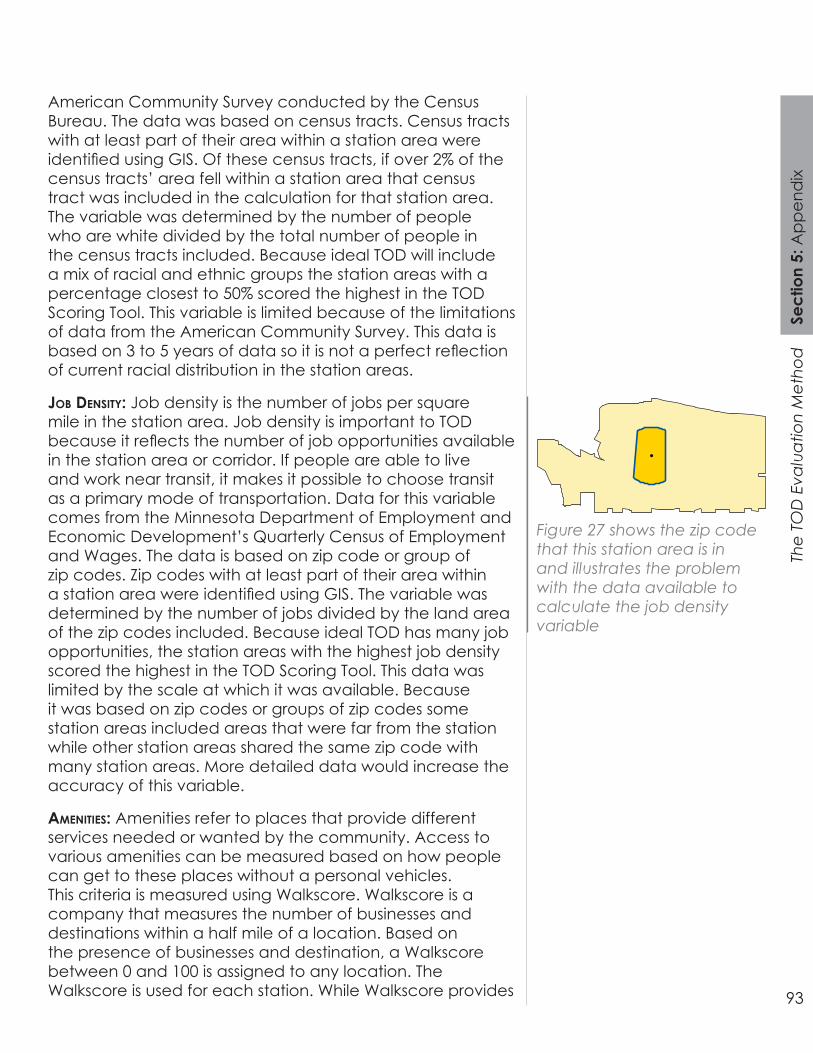
93
The
TOD
Eva
luat
ion
Met
hod
Sect
ion
5: A
ppen
dix
American Community Survey conducted by the Census Bureau. The data was based on census tracts. Census tracts with at least part of their area within a station area were identified using GIS. Of these census tracts, if over 2% of the census tracts’ area fell within a station area that census tract was included in the calculation for that station area. The variable was determined by the number of people who are white divided by the total number of people in the census tracts included. Because ideal TOD will include a mix of racial and ethnic groups the station areas with a percentage closest to 50% scored the highest in the TOD Scoring Tool. This variable is limited because of the limitations of data from the American Community Survey. This data is based on 3 to 5 years of data so it is not a perfect reflection of current racial distribution in the station areas.
JOB denSiTy: Job density is the number of jobs per square mile in the station area. Job density is important to TOD because it reflects the number of job opportunities available in the station area or corridor. If people are able to live and work near transit, it makes it possible to choose transit as a primary mode of transportation. Data for this variable comes from the Minnesota Department of Employment and Economic Development’s Quarterly Census of Employment and Wages. The data is based on zip code or group of zip codes. Zip codes with at least part of their area within a station area were identified using GIS. The variable was determined by the number of jobs divided by the land area of the zip codes included. Because ideal TOD has many job opportunities, the station areas with the highest job density scored the highest in the TOD Scoring Tool. This data was limited by the scale at which it was available. Because it was based on zip codes or groups of zip codes some station areas included areas that were far from the station while other station areas shared the same zip code with many station areas. More detailed data would increase the accuracy of this variable.
Figure 27 shows the zip code that this station area is in and illustrates the problem with the data available to calculate the job density variable
!
ameniTieS: Amenities refer to places that provide different services needed or wanted by the community. Access to various amenities can be measured based on how people can get to these places without a personal vehicles. This criteria is measured using Walkscore. Walkscore is a company that measures the number of businesses and destinations within a half mile of a location. Based on the presence of businesses and destination, a Walkscore between 0 and 100 is assigned to any location. The Walkscore is used for each station. While Walkscore provides
94
The
TOD
Eva
luat
ion
Met
hod
Sect
ion
5: A
ppen
dix
a basic understanding of an area, it is limited in its ability to differentiate between types of businesses. Ideally amenities would be measured by the distribution of specific types of businesses and destination including grocery stores, coffee shops, restaurants, and others.
Recommended VariablesThere are some variables that were not able to be collected for this report. These are additional variables that, if collected and added to the analysis, would improve the results of the TOD Scoring Tool. These are variables that the TOD Office can consider for future updates to the tool.
Bike and pedeSTrian acTiViTy: As one of the goals of TOD is to allow for more travel options by having dense, mixed land uses near transit, one of the ways to evaluate that goal is to measure bike and pedestrian activity within the station area. In order to use transit, pedestrians or bikers must feel comfortable around transit stations. The data for this variable does not currently exist and would need to come from either automatic or manual bike and pedestrian counts within each station area. Proxy variables could also be explored to evaluate the bike and pedestrian activity.
TranSiT frequency: High transit frequency is important for making transit a more viable transportation option for residents. Increased transit routes and options increase the destinations accessible by transit. Transit frequency can be further broken down to distinguish between frequency for the LRT or BRT corridor being scored and frequency of connecting bus routes, and between rush hour, midday, and weekend frequency. This data is available from Metro Transit and is updated quarterly.
parking raTiOS: Since one of the goals of TOD is to increase the number of non-auto trips, and since parking also increases development costs, total parking supply should be lower within a station area compared to areas outside of station areas. This variable would require data for the total number of parking spaces within the station area. Although existing parking requirements distinguish between residential and non-residential uses, this variable would most likely require determining the desired combined parking ratio for all uses within a station area, especially as district parking becomes more common, and then measuring existing parking ratios against that goal.
95
The
TOD
Eva
luat
ion
Met
hod
Sect
ion
5: A
ppen
dix
land uSe diVerSiTy: Greater land use diversity is desirable as it helps to utilize non-peak hour and non-peak direction transit capacity, and contributes to a more lively atmosphere within a station area. This variable would require standardized land use data across jurisdictions and any land use classified as mixed use would need to be broken down into its component land uses. Land use diversity could be calculated using an entropy index as follows:
land uSe mixedneSS: Land use mixedness is a term first utilized by Singh et al. (2014 and 2015). Although it sounds similar to land use diversity, it actually measures how well residential land uses are mixed with other land uses and can be used to measure the bikeability and walkability of a station area as a higher mixedness means that residents can walk or bike for their trips within the station area. This variable would also require the same data for land use diversity,
BlOck lengTh: Similar to intersection density, block length is another method to measure the walkability within a station area, as shorter blocks are considered more walkable. This variable would require GIS street datasets with an ability to calculate block length from that data. The goal would be shorter average block lengths within station areas.

96
The
TOD
Eva
luat
ion
Met
hod
Sect
ion
5: A
ppen
dix
Sidewalk widTh: Sidewalk width is another important variable to measure the walkability within a station area, as wider sidewalks are considered more walkable. This variable would require GIS sidewalk datasets that contain sidewalk widths. The goal would be for greater average sidewalk widths within a station area.
curB cuTS: Curb cuts are another useful indicator for measuring the walkability within a station area. The shorter the distance between curb cuts, the increase in non-controlled points of conflict between pedestrians and cars, which results in lower walkability. This variable would require GIS sidewalk datasets that includes location of all curb cuts. The goal would be longer average distance between curb cuts within a station area.
TreeS: The tree canopy is another important indicator for measuring the walkability within a station area as it provides shade for pedestrians and adds to the overall liveliness of the station area. This variable would require GIS tree canopy datasets and would measure the average spacing between trees within a station area to what would need to be determined as the ideal average spacing so as to provide optimal shade.
ameniTieS: Amenities (grocery stores, daycare, pharmacies, doctors offices, etc.) are an important feature of station areas as it allows for residents to complete more of their non-work related trips within a station area, as well as creating additional destinations for people traveling in from outside the station area. The Metropolitan Council has some of these amenities mapped in a GIS shapefile; however, this data has not been updated since the Green Line opened. The TOD Office can either work to update this data or obtain business license data from cities, as most amenities would most likely require different business license types. The data would need to be reasonably standardized between jurisdictions.
grOund flOOr windOwS: Ground floor windows can add to the perception of safety within a station area. It would require data from cities that measure the total ground floor window coverage as a ratio of total ground floor building frontage, where the goal would be for a larger ratio.
STreeT lighT fixTureS: Street lights can add to the perception of safety within a station area. It would require GIS street light datasets that can measure street light spacing and the total
97
The
TOD
Eva
luat
ion
Met
hod
Sect
ion
5: A
ppen
dix
coverage of each street light, with a goal to maximize street light coverage.
acceSSiBiliTy: Since one of the goals of TOD is to allow people to live and work without the need of a car, maximizing accessibility, or the ability to reach the destinations that a person wants to reach, is essential. It is fairly easy to calculate job accessibility distinguished between travel modes now, with the data available from the Accessibility Observatory at the University of Minnesota. However, it is still extremely difficult to calculate accessibility for non-work related trips, and would require further advances in research to be able to measure.
98
The
TOD
Eva
luat
ion
Met
hod
Sect
ion
5: A
ppen
dix
Interview QuestionsAgencies and Organizations
• Could you tell us a little bit about your role in TOD projects? • How is your agency involved in TOD projects?
• Why does your agency care about transit oriented development?
• Does your agency have any explicit goals related to TOD?
• Does your agency have an implementation plan/strategy plan?
• How are your agency’s interests different from other agencies and organizations’ interests?
• What are some good examples of TOD (within your jurisdiction)?
• What are peer regions you consider for TOD? • How does your agency bring TOD projects to your
jurisdiction?• Specific follow up for cities: how do you approach
zoning and TOD projects?• How does your agency evaluate TOD projects?
• Do you evaluate TOD project on a station area or corridor level?
• How has that practice evolved?• Would anything be lost by evaluating TOD on a
station area level vs. at a site-by-site basis?• Do you have a scorecard/evaluation sheet you
would be willing to share? • How do you determine if a TOD project is successful or
needs improvement?• How do you maintain the success of a TOD project? • If it needs improvement, what do you do?
• Are there sites that are not suitable for TOD opportunities along a transit corridor?
• How do you coordinate with developers on TOD projects?• Who initiates the process?
• What challenges have your agency faced in terms of TOD projects?
• What should be used to measure effective TOD projects?• Do you have any resources or additional contacts you
think would be helpful going forward?
99
The
TOD
Eva
luat
ion
Met
hod
Sect
ion
5: A
ppen
dix
Researchers• How did you get interested in TOD? Why is it important to
research TOD?• How do you define transit oriented development?• What are some good examples of TOD?• Are there any particular TOD evaluation methodologies or
typologies that your research uses to evaluate TOD? • Could you share any other methodologies or
typologies that is practiced in academia?• Is there a difference in the way TOD projects are evaluated
between academics and the profession field of planning? • What are some differences, if there is any?
• In your opinion, is there a particular environment or condition in which TOD projects are not suitable?
• Any resources that you would like to recommend us in regards to the evaluation of TOD projects?
Developers• Could you tell us about your experience with development
projects?• Could you tell us a little bit about your experience
with TOD projects?• How do you define transit oriented development?• How often does TOD influence your development projects? • How do you determine if a development would benefit
from TOD?• How does transit influence the decisions you make
regarding development?• What are some good examples of TOD?• How do you pitch TOD to potential clients, investors,
policymakers and the public?• How do you work with adjacent property owners when
developing a site? • How do you coordinate with the public sector when
facilitating TOD projects?• What challenges have your agency faced in terms of
development projects?• Do TOD projects have any unique challenges?
• How does public agencies (ie: the Met Council) TOD policy influence your company’s TOD?
• How can public agencies be more proactive about encouraging TOD implementation?
• Have you ever pursued TOD-related funding to support a project?
• If so, how was that process? Did you understand the criteria your project was being judged on?
100
The
TOD
Eva
luat
ion
Met
hod
Sect
ion
5: A
ppen
dix
Interview ListAndrew Owen, Director of Accessibility Observatory, University of Minnesota
Anton Jerve, Planner, City of Saint Paul
Cole Hiniker, Manager of Multimodal Planning, Metropolitan Council
Elise Durban, TOD Program Manager, Hennepin County
Jason Wittenberg, Manager of Land Use, Preservation, & Design, City of Minneapolis
Jonathan Ehrlich, Manager MTS Technical Services, Metropolitan Council
Joseph Bernard, Senior Planner, City of Minneapolis
Josh Olson, Redevelopment Manager, Ramsey County
Kathryn Hansen, TOD Senior Project Manager, Metro Transit
Lucy Galbraith, Director of Transit Oriented Development, Metro Transit
Michael Larson, Senior Planner, Metropolitan Council
Mike Lamb, Urban Design and Planning Leader, LHB
Michael Lander, President, Lander Group
Patrick McLaughlin, Senior Development Project Manager, Oregon Metro
Ryan Kelley, TOD Grant Program Officer, Metropolitan Council
Thatcher Imboden, Senior TOD Project Manager, Sound Transit
Tony Kuechle, Senior Vice President of Development, Doran Companies
Yingling Fan, Associate Professor, University of Minnesota
101
The
TOD
Eva
luat
ion
Met
hod
Sect
ion
5: A
ppen
dix
References1. Arrington, G. B., & Cervero, R. (2008). TCRP Report
128: Effects of TOD on Housing, Parking, and Travel. Transportation Research Board of the National Academies, Washington, DC, 3.
2. Balz, V., & Schrijnen, J. (2009). From Concept to Projects: Stedenbaan, The Netherlands. In C. Curtis, J. L. Renne & L. Bertolini (Eds.), Transit Oriented Development: Making it Happen (pp. 75-90): Ashgate e- Book.
3. Balz, V., Gerretsen, P., Edens, C., & Atelier, Z. (2006). Ruimte en lijn : ruimtelijke verkenning stedenbaan 2010-2020 : zuidvleugel van de Randstad. Den Haag: Provincie Zuid-Holland.
4. Belzer, D., & Autler, G. (2002). Transit oriented development: moving from rhetoric to reality (pp. 06-15). Washington, DC: Brookings Institution Center on Urban and Metropolitan Policy.
5. Bertolini, L. (1999). Spatial development patterns and public transport: the application of an analytical model in the Netherlands. Planning Practice and Research, 14(2), 199-210.
6. Calthorpe, P. (1993). The Next American Metropolis - Ecology, Community and the American Dream. Canada: Princeton Architectural Press.
7. Cao, X., & Lou, S. (2017). When and How Much Did the Green Line LRT Increase Single-Family Housing Values in St. Paul, Minnesota?. Journal of Planning Education and Research, 0739456X17707811.
8. Carlton, I. (2009). Histories of Transit-oriented Development: Perspectives on the Development of the TOD Concept: Real Estate and Transit, Urban and Social Movements, Concept Protagonist. University of California, Institute of Urban and Regional Development.
9. Center for Neighborhood Technology. (2013). Transit Oriented Development in the Chicago Region: Efficient and Resilient Communities for the 21st Century. Chicago, IL.
10. Center for Transit Oriented Development. (2010).
102
The
TOD
Eva
luat
ion
Met
hod
Sect
ion
5: A
ppen
dix
Performance-Based Transit Oriented Development Typology Guidebook. Washington, DC.
11. Center for Transit Oriented Development. (2011). Transit-Oriented Development (TOD) and Employment.
12. Cervero, R. (2007). Transit-oriented development’s ridership bonus: a product of self-selection and public policies. Environment and planning A, 39(9), 2068-2085.
13. City of Seattle. (2013). Implementing Transit Oriented Development in Seattle: Assessment and Recommendations for Action. Seattle, WA.
14. Colman, S. B., Long, J. P., Lewis, J. C., & TRACY, S. (1992, March). Back to the future: trip generation characteristics of transit oriented developments. Transportation engineering in a new era. Issue papers for the ITE 1992 international conference, Monterey, California. In Transportation Engineering in a New Era Institute of Transportation Engineers.
15. Deboosere, R., Levinson, D. M., & El-Geneidy, A. (2017). Accessibility-oriented development.
16. Delaware Valley Regional Planning Commission. (2017). Building on our Strengths: Evaluating Transit Oriented Development (TOD) Opportunities in Greater Philadelphia. Philadelphia, PA.
17. Evans, J. E., & Pratt, R. H. (2007). Transit Oriented Development Transit Cooperative Research Program (TCRP) Report 95: Traveler Response to Transportation System Changes Handbook (3 ed., pp. 17(11) - 17(138)). U.S.A: Transport Research Board of the National Academies.
18. Green Street, Indy Connect. (2014). Transit Oriented Development Strategic Plan. Indianapolis, IN.
19. Haas, P., Miknaitis, G., Cooper, H., Young, L., & Benedict, A. (2010). Transit oriented development and the potential for VMT-related greenhouse gas emissions growth reduction. Report of the Center for Neighborhood Technology for the Center for Transit Oriented Development, 1-64.
20. Jeihani, M., Zhang, L., Ardeshiri, A., Amiri, A., Nasri, A., Zamir, K. R., & Baghaei, B. (2013). Development of a framework for transit-oriented development (TOD) (No. MD-13-SP209B4N).
21. Kamruzzaman, M., Baker, D., Washington, S., & Turrell,
103
The
TOD
Eva
luat
ion
Met
hod
Sect
ion
5: A
ppen
dix
G. (2014). Advance transit-oriented development typology: case study in Brisbane, Australia. JouRnal of Transport Geography, 34, 54-70.
22. Metropolitan Council. (2014). Handbook for Transit-Oriented Development Grants. Retrieved From https://metrocouncil.org/Communities/Services/Livable-Communities-Grants/Maps,-forms-misc/LCA-TOD-Handbook.aspx
23. Metropolitan Council. (2016). Lake Street Station Transit Oriented Development Guide. Retrieved from https://metrocouncil.org/Communities/Planning/TOD/Files/LCA-Case-Study-Lake- Street-Station.aspx
24. Minnesota Department of Health. (2017) Livable Communities Demonstration Account Transit-Oriented Development HIA. Saint Paul, MN.
25. Nasri, A., & Zhang, L. (2014). The analysis of transit-oriented development (TOD) in Washington, DC and Baltimore metropolitan areas. Transport policy, 32, 172-179.
26. Nelson, D., & Niles, J. (1999). Essential for Transit Oriented Development Planning : Analysis of Non-Work Activity Patterns and a Method for Predicting Success. Paper presented at the Seventh TRB Conference on the Application of Transportation Planning Methods, Boston, Massachusetts
27. Newman, P. (2009). Planning for Transit Oriented Development: Strategic Principles. In C. Curtis, J. L. Renne & L. Bertolini (Eds.), Transit Oriented Development: Making it Happen (pp. 13-22): Ashgate e- Book.
28. North Central Texas Council of Governments. (2015). Transit Oriented Development Task Force Working Group. Arlington, TX.
29. Reconnecting America, Center for Transit-Oriented Development. (2008). TOD 202: Station Area Planning. Washington, D.C.
30. Renne, J. L. (2007). Measuring the performance of transit-oriented developments in Western Australia. Victoria Transport Policy Institute.
31. Renne, J. L. (2009a). Evaluating transit-oriented development using a sustainability framework: Lessons from Perth’s network city. Planning Sustainable
104
The
TOD
Eva
luat
ion
Met
hod
Sect
ion
5: A
ppen
dix
Communities: Diversity of Approaches and Implementation Challenges. Ed. Sasha Tsenkova. Calgary: University of Calgary, 115-148.
32. Renne, J. L. (2009b). Measuring the Success of Transit Oriented Development. In C. Curtis, J. L. Renne & L. Bertolini (Eds.), Transit Oriented Development: Making it Happen (pp. 241-257): Ashgate e- Book.
33. Renne, J. L. (2009b). Measuring the Success of Transit Oriented Development. In C. Curtis, J. L. Renne & L. Bertolini (Eds.), Transit Oriented Development: Making it Happen (pp. 241-257): Ashgate e- Book.
34. Renne, J. L., & Wells, J. S. (2005). Research Results Digest 294 - Transit Oriented Development: Developing a Strategy to Measure Success: Transport Research Board of the National Academies.
35. Reusser, D. E., Loukopoulos, P., Stauffacher, M., & Scholz, R. W. (2008). Classifying railway stations for sustainable transitions–balancing node and place functions. Journal of transport geography, 16(3), 191-202.
36. Singh, Y. J. (2015). Measuring transit-oriented development (TOD) at regional and local scales: a planning support tool.
37. Singh, Y. J., Fard, P., Zuidgeest, M. H. P., Brussel, M., & van Maarseveen, M. F. A. M. (2014). Measuring Transit Oriented Development: a Spatial Multi-Criteria Assessment Approach for the City Region Arnhem and Nijmegen. Journal of Transport Geography, 35(0), 130-143. Doi: http://dx.doi.org/10.1016/j.jtrangeo.2014.01.014
38. Singh, Y. J., Lukman, A., He, P., Flacke, J., & Zuidgeest, M. (2015). Planning for Transit Oriented Development (TOD) using a TOD index. Planning, 15, 2132.
39. Tilahun, N., & Fan, Y. (2014). Transit and job accessibility: an empirical study of access to competitive clusters and regional growth strategies for enhancing transit accessibility. Transport Policy, 33, 17-25.
40. Zemp, S., Stauffacher, M., Lang, D. J., & Scholz, R. W. (2011). Classifying railway stations for strategic transport and land use planning: Context matters!. Journal of transport geography, 19(4), 670-679.
41. Zimbabwe, S., & Anderson, A. (2011). TOD 204 Planning for TOD at Regional Scale: The Big Picture (pp. 1-28): The Center for Transit-Oriented Development.