the metro hartford region
206
A Comprehensive Economic Development Strategy: Part II - Trend Analyses prepared by Connecticut Economic Resource Center, Inc. - October, 2012 THE METRO HARTFORD REGION MOVING THE REGION FORWARD
-
Upload
khangminh22 -
Category
Documents
-
view
0 -
download
0
Transcript of the metro hartford region

A Comprehensive Economic Development Strategy: Part II - Trend Analyses prepared by Connecticut Economic Resource Center, Inc. - October, 2012
THE
METRO
HARTFORD
REGION
MOVING THE REGION FORWARD

MOVING THE REGION FORWARD
1
Table of Contents The Metro Hartford Region .................................................................................................................................................. 2
Demographic Analysis ............................................................................................................................................................ 9
Economic Trends - Recession and Recovery Update ............................................................................................ 23
Workforce Trends .................................................................................................................................................................. 24
Business and Real Estate .................................................................................................................................................... 28
Occupational Projections 2008-2018 ........................................................................................................................... 34
Industry Analysis ................................................................................................................................................................... 37
Municipal Fiscal Analysis Summary .............................................................................................................................. 38
Themes from Stakeholder Interviews.......................................................................................................................... 42
APPENDIX A: Town Groupings by Population Size ............................................................................................... 44
APPENDIX B: Municipal Fiscal Analysis ...................................................................................................................... 45
APPENDIX C: Strategic Projects ...................................................................................................................................... 64
APPENDIX D: MetroHartford Regional Goals and Action Steps Matrix ....................................................... 74
APPENDIX E: Stakeholder Interview List ................................................................................................................... 75
APPENDIX F: Meetings ........................................................................................................................................................ 76
APPENDIX G: Capital Projects ........................................................................................................................................103
APPENDIX H: Steering Committee Participants ....................................................................................................204
APPENDIX I: Integration of EDA Objectives and HUD Livability Principles ............................................205

2 METROHARTFORD REGIONAL OVERVIEW
The Metro Hartford Region The region used for this analysis is the metro Hartford region – a set of thirty-one municipalities located in north central Connecticut. Below are the individual municipalities that make up the region:
1. Andover 2. Avon 3. Bloomfield 4. Bolton 5. Canton 6. Cromwell 7. East Granby 8. East Hartford 9. East Windsor 10. Ellington
11. Enfield 12. Farmington 13. Glastonbury 14. Granby 15. Hartford 16. Hebron 17. Manchester 18. Marlborough 19. Newington 20. Rocky Hill
21. Simsbury 22. Somers 23. South Windsor 24. Stafford 25. Suffield 26. Tolland 27. Vernon 28. West Hartford 29. Wethersfield 30. Windsor 31. Windsor Locks
The metro Hartford region not only includes Hartford, the capital of Connecticut, but also the state’s largest airport, Bradley International Airport, rail lines and highways. Figure 1 shows the major transportation attributes for the region.
Figure 1: Metro Hartford Region Transportation Attributes

3 METROHARTFORD REGIONAL OVERVIEW
Figure 2: Quick Facts About the Region
Hartford County Rank in U.S. Tolland County Rank in U.S.
Population (2011) 894,705 57 152,507 414
Households (2010) 350,854 49 54,477 437
Labor Force (2010) 465,733 49 86,567 359
Per Capita Personal Income (2009)
$51,234 87 $45,424 187
Median HH Income $60,028 217 $74,868 61
Poverty Rate (2010) 11.3 2,558 6.4 3,087
H.S Diploma or More* 87.1 1,108 92.2 194
Bachelor’s or More* 33.3 228 36.8 158 *2010 ACS 5 year
Source: STATS America
The metro Hartford region is uniquely positioned between two major metropolitan areas – Boston and New York. Within a 60 mile radius of Hartford County you can reach almost all of Connecticut and most of Western Massachusetts. Within 150 miles of Hartford County, you can reach Boston, New York, Northern New Jersey, and Southern Vermont and New Hampshire, encompassing 11% of the U.S. population. Figure 3:Within 60 mile radius of Hartford County
Source: STATS America
Within 60 miles of Hartford County you find:
• 7,153,801 people • 611.6 people/sq mile • 3,748,931 in the labor
force
Figure 4:Within 150 miles of Hartford County
Source: STATS America
Within 150 miles of Hartford County you find:
• 33,769,52 people reside • 17,356,799 in the labor
force and • you have 11% of the U.S.
population

DEMOGRAPHIC ANALYSIS
4
Figure 5: Population density of the metro Hartford region
This figure shows that the highest population density in the region centers around the capital city.
Hartford has the highest in the region followed by the adjacent cities of West Hartford, Newington,
Wethersfield, and East Hartford. Manchester and Vernon also have relatively high population
densities in the region.

DEMOGRAPHIC ANALYSIS
5
Utility services, not surprisingly, are loosely correlated with population density patterns. Most of
the larger municipalities and urban areas in the metro Hartford region enjoy water and sewer
services. Nearly all of the municipalities, except for Stafford, have at least portions covered with gas
service. And electric service is available universally.
Figure 6: Utility service in the metro Hartford region

DEMOGRAPHIC ANALYSIS
6
Figure 7: Land cover metro Hartford region, 2002
Figure 8: Land cover metro Hartford region, 2006
Land cover has remained fairly constant through the 2000s – the urban areas are very developed
with forests and greenspace remaining along the corridors to the east and west of the I-91 corridor.

DEMOGRAPHIC ANALYSIS
7
The topography map below shows the elevation variance in the metro Hartford region. The center
of the region, of course, is dominated by the Connecticut River, and there are low-lying areas
around this large body of water. Higher elevation runs north-south on both the eastern and western
sides of the region.
Figure 9: Topography of metro Hartford region

DEMOGRAPHIC ANALYSIS
8
The figure below provides an overvie w of the key statistics from the demographic, economic, and
industry analyses that follow.
Figure 10: Key Regional Statistics
•36% of population have Bachelor’s degree or more •41% of 25-34 year olds have bachelor’s degree or more
EDUCATIONAL ATTAINMENT
•2005-2010 population growth slower than the nation •Gained 38,105 people between 2000 and 2010
POPULATION
•Almost 40% of in-migration from another county in state MIGRATION
•More than 10%of population in 4 towns is foreign born •Hartford, East Hartford, West Hartford, and Manchester have
largest number of foreign born FOREIGN BORN
•The largest population groups by age in the region are: less than 19 years and between 45 and 59 years of age.
•45 and 69 increased in share while the 30-44 age cohort decreased in share of the total population
AGE DISTRIBUTION OF POPULATION
•In 2010, 14,625 TFA recipients – 47% live in Hartford •53% of probationers live in Hartford and East Hartford
SPECIAL POPULATIONS
•All towns have a poverty rate less than 10% except Hartford (32%) and East Hartford (15%) POVERTY
•Per capita income is 1.2 times higher than U.S. HOUSEHOLD INCOME
•Hartford MSA has recovered a greater percentage of jobs that were lost due to the recession than CT and the U.S. EMPLOYMENT
•12% of workers in the region are self-employed SELF EMPLOYED
•All towns have lower unemployment rates (March ’11 to ’12) •Almost one-quarter in region are from Hartford
UNEMPLOYED
•Highest annual growth 2008-2018: Education, Healthcare, and Math/Computer
•Math/Computer occupations projected to grow at faster rate than state
OCCUPATIONAL PROJECTIONS
•Almost one-quarter of patents in state originate in Hartford or Tolland counties. PATENT ACTIVITY

DEMOGRAPHIC ANALYSIS
9
Demographic Analysis This section of the report looks at the demographic trends occurring in the region. In particular, the analysis includes information on the following topics: general population growth, population by age, educational attainment of the population, poverty, foreign born, special populations, housing statistics, household income, and migration into and out of the region. The analysis uses the most recent data available. In terms of looking specifically at data for the region, when town level data was not available, either county level information or the North Central Workforce Investment Area (NC WIA) data was used for comparison.
Population
As shown in Figure 11,
the population growth
of the metro Hartford
region over the past six
years has been slower
than the nation but
equal to Connecticut.
Figure 11: Population growth for the U.S., Connecticut, and metro Hartford region – 2005-2010
Source: U.S. Census
Between 2000 and
2010, the region’s net
population gain was
38,105 people. Only
three towns in the
metro Hartford region
lost population while
the remaining 28
municipalities gained
population. Figure 12
shows the three towns
that lost population and
also the towns with the
highest absolute gains.
Figure 12: Population change by town – 2000 to 2010
Town 2000 Pop 2010 Pop # Diff % Diff
Enfield 45,212 44,654 (558) (1%)
West Hartford 63,589 63,268 (321) (1%)
Bolton 5,017 4,980 (37) (1%)
Manchester 54,740 58,241 3,501 6%
Hartford 121,578 124,775 3,197 3%
Ellington 12,921 15,602 2,681 21%
Glastonbury 31,876 34,427 2,551 8%
Avon 15,832 18,098 2,266 14%
Suffield 13,552 15,735 2,183 16%
metro Hartford
745,498 783,603 38,105 5%
Source: U.S. Census
0.97
0.98
0.99
1.00
1.01
1.02
1.03
1.04
1.05
2005 2006 2007 2008 2009 2010
Ind
ex P
op
ula
tio
n (
2005
=1.0
)
MetroHartford Connecticut U.S.

DEMOGRAPHIC ANALYSIS
10
Age Distribution of Population
As shown in the figure to the
right, in 2010, the two largest
population groups by age in
the region are those less than
19 years and those between 45
and 59 years of age.
Figure 13: The Metro Hartford Region’s Population by Age – 2010 Census
Source: U.S. Census
When looking at the distribution of the population by age between the 2000 Census and the 2010 Census, those between the ages of 45 and 69 increased in share while the 30-44 age cohort decreased in share of the total population.
The net gain in population
between 2000 and 2010 was
38,105 people. However, the
age group of 30-44 years
decreased by almost 30,000
people; a 16.5% loss.
However, it could also be that
rather than losing those
people, they aged into the next
cohort (45-59) and there
wasn’t a similar replacement
from the 20-29 cohort into the
30-44 cohort.
Figure 14: Population changes by age 2000 to 2010
2000 % of pop 2010 % of pop Diff ’00-‘10
< 19 years 202,084 27% 198,963 25% (3,121)
20-29 years 81,923 11% 95,309 12% 13,386
30-44 years 180,494 24% 150,736 19% (29,758)
45-59 146,215 20% 180,412 23% 34,197
60-69 55,780 7% 77,758 10% 21,978
70-79 47,835 6% 43,788 6% (4,047)
80+ 31,167 4% 36,637 5% 5,470
Total 745,498 783,603 38,105 Source: U.S. Census
0
50,000
100,000
150,000
200,000
250,000
<19 yrs 20-29 yrs 30-44 yrs 45-59 yrs 60-69 yrs 70+ yrs
2010 Metro Hartford Population by Age

DEMOGRAPHIC ANALYSIS
11
Racial Composition
The majority of the
population in the metro
Hartford region is Caucasian.
However, 28 percent are of a
racial minority.
Figure 15: Racial Composition of the metro Hartford region
Source: U.S. Census
White, 72.2%
Black or African Am.,
14.0%
Am. Indian and Alaska
Native, 0.3%
Asian, 4.6%
Native Hawaiian/ Other P.I.,
0.0%
Some Other Race, 6.3%
Two or More Races, 2.6%

DEMOGRAPHIC ANALYSIS
12
Educational Attainment For the class of 2010, 15
towns in the metro Hartford
region had a 4-year high
school graduation rate of
greater than 90 percent. (The
new graduation rate
calculation tracks a group of
students from their initial
entrance into ninth grade
through to graduation with
student-level data from a
longitudinal data set.)
Figure 16: 4-year high school graduation rates of more than 90% by town – class of 2010
Source: Connecticut State Department of Education
However, for the class of
2010, 14 towns in the region
had 4-year high school
graduation rates of less than
90 percent. Hartford had the
lowest 4-year graduation rate
of 59.8 percent.
Figure 17: 4-year high school graduation rates of less than 90% by town – class of 2010
Source: Connecticut State Department of Education
Young, well-educated workers are among the most mobile people in our nation. Their mobility makes them an important indicator of trends in workforce education and availability. Places with lots of well educated young workers today are likely to have lots of well-educated workers in the years ahead. (City Vitals, CEOs for Cities)
87.0% 88.0% 89.0% 90.0% 91.0% 92.0% 93.0% 94.0% 95.0% 96.0%
East Granby Somers Canton
Avon Farmington
Ellington Suffield
South Windsor West Hartford
Granby Glastonbury
Simsbury Tolland
Cromwell Bolton
4-yr graduation rate
40.0% 50.0% 60.0% 70.0% 80.0% 90.0%
Hartford
East Hartford
Stafford
Manchester
Bloomfield
Vernon
Windsor Newington
Wethersfield
Enfield
Regional SD #8
East Windsor
Windsor Locks
Rocky Hill
4-yr graduation rate

DEMOGRAPHIC ANALYSIS
13
The educational attainment of
the metro Hartford region
mirrors that of the state. More
than a third of the population
in the region that is 25 years
and older (36%) has a
bachelor’s degree or more.
Figure 18: Educational attainment metro Hartford region compared to CT, 2006-2010
Source: U.S. Census American Community Survey 5-year estimates, 2006-2010
Unfortunately, in general the percentage of people who recently moved to the metro Hartford region are less educated when compared to the percentage moving to other parts of the state. However, the metro Hartford region had a higher percentage of those moving in with a bachelor’s degree when compared to the state as a whole.
Figure 19: Educational Attainment of people moving into the metro Hartford region compared to Connecticut
Educational attainment for population over 25 years
% Moved from different state one year ago
% Moved from abroad one year ago
Metro Hartford CT Metro Hartford CT
Less than high school 10% 8% 29% 21%
High school 16% 18% 18% 17%
Some college or associate’s
18% 21% 12% 18%
Bachelor’s degree 34% 29% 27% 25%
Graduate or professional degree
21% 24% 15% 20%
Source: U.S. Census American Community Survey 5-year estimates, 2006-2010
12%
27% 25%
20%
16%
12%
29%
25%
20%
15%
0%
5%
10%
15%
20%
25%
30%
Less than High School
High School Some college or associate's
degree
Bachelor's degree
Graduate degree
% o
f P
op
ula
tio
n 2
5 y
ears
an
d o
lder
MetroHartford CT

DEMOGRAPHIC ANALYSIS
14
The metro Hartford region has 37,412 people ages 25 to 34 years old with at least a bachelor’s degree – 41% of that age cohort. Within the city of Hartford itself, 18% of residents ages 25 to 34 have a bachelor’s degree or more.
The figure to the right shows the educational attainment of the population over the age of 25 in the metro Hartford region by town size. The figure shows that the mid-size towns have populations with more bachelor’s and advanced degrees where the larger towns have a higher percentage of the population with a high school degree or less.(For a list of the towns in each population grouping see Appendix A)
Figure 20: Educational attainment by town population grouping
Source: U.S. Census American Community Survey 5-year estimates, 2006-2010
This figure shows educational attainment by age. It shows that those ages 25 to 24 years have a higher percentage with a bachelor’s degree or more than those in the older age groups. This positions the region well for the future supply of the workforce for the knowledge economy. However, the young and well-educated are the most mobile so retaining this workforce will be important for the region.
Figure 21: % of population with bachelor’s degree or more by age and town population grouping
Source: U.S. Census American Community Survey 5-year estimates, 2006-2010
0%
5%
10%
15%
20%
25%
30%
35%
Less than HS
High School Some college
Associate's Bachelor's Graduate or Prof.
% o
f P
op
ula
tio
n 2
5 y
ear
and
old
er
Towns < 15,000 15-50,000 > 50,000
0%
10%
20%
30%
40%
50%
60%
25 to 34 years 35 to 44 45 to 64 65+
% o
f P
op
ula
tio
n w
ith
Bac
hel
or'
s d
egre
e o
r m
ore
Towns <15,000 15-50,000 >50,000

DEMOGRAPHIC ANALYSIS
15
Poverty
All towns in the metro Hartford region had poverty rates of less than 10 percent except Hartford (32%) and East Hartford (15%). In Hartford, 13% of those living in poverty are children.
Figure 22: % of population below 100% of poverty by age
Source: : U.S. Census, American Community Survey 5-year estimates, 2006-2010
However, when looking at poverty by race in the region, African Americans and minorities of other races or two or more races are disproportionately represented. Approximately 46% of those living in poverty in the metro Hartford region are Caucasian yet they represent 73% of the population. On the other hand, only 13% of the metro Hartford population is African American, yet they make up 25% of those living in poverty.
Figure 23: Poverty by Race in metro Hartford region
Race # in poverty
% of poverty population
% of metro Hartford population of this race
Caucasian 34,011 45.7% 73.3%
African American 18,748 25.2% 13.1%
Asian 2,323 3.1% 4.5%
American Indian 369 0.5% 0.2%
Some other race 16,230 21.8% 6.6%
Two or more races 2,795 3.8% 2.4%
Total 74,476 100% 100%
Source: U.S. Census, American Community Survey 5-year estimates, 2006-2010
0% 5% 10% 15% 20% 25% 30% 35%
Population <15,000
Population 15-50,000
Population > 50,000*
East Hartford
Hartford
% of Total Population below 100% of poverty level, 2006-2009 (*West Hartford and Manchester only)
<18 yrs
18-64 yrs
65+ yrs

DEMOGRAPHIC ANALYSIS
16
Foreign Born
Fourteen percent of the metro Hartford region’s population is foreign-born (105,321 people). The figure to the right shows the towns with more than 10% of their residents are foreign-born.
Figure 24: More than 10% of the population in 14 towns are foreign-born
Source: Source: U.S. Census, American Community Survey 5-year estimates, 2006-2010
The pie chart shows the regions of the world where the foreign-born originate and the table lists the cities with the largest absolute number of foreign-born. The table shows the countries of the largest number of residents for each town. The following towns have the highest foreign-born populations: Hartford (26,774); West Hartford (11,372); East Hartford (9,764); and Manchester (7,706).
Figure 25: Origin for Foreign Born
Source: U.S. Census, American Community Survey 5-year estimates, 2006-2010
Figure 26: Country of Origin for towns with highest number of foreign born
Country of origin
Hartford West Hartford
East Hartford Manchester
Jamaica 7,774 1,331 477
Peru 1,972
Dominican Republic
1,605
Guyana 1,070
Columbia 1,024 492
India 1,021 731 944 1,627
China 668
Portugal 601
Ghana 708
Vietnam 734
Total 14,907 2,000
Total FB 26,774 11,372 9,764 7,706
0.0% 5.0% 10.0% 15.0% 20.0% 25.0%
Windsor Locks South Windsor
Avon East Windsor Wethersfield
Manchester Farmington
Windsor Newington
West Hartford East Hartford
Rocky Hill Bloomfield
Hartford
% of Population that is foreign-born
Europe 27%
Asia 26%
Africa 5%
Carribean
22%
Central Americ
a 5%
South Americ
a 11%
North Americ
a 4%
Oceania 0%

DEMOGRAPHIC ANALYSIS
17
Special Populations
The following information on special populations is published by the CT Department of Labor in a publication called “2011 Information for Workforce Planning.” The data are provided by workforce investment area. For this report, the North Central Workforce Investment Area (NC WIA) data is presented since it contains all the towns in the metro Hartford region except Cromwell. The NCWIA also includes seven towns that are not part of the metro Hartford region.
Temporary Family Assistance (TFA) Recipients Thirty-five percent of Connecticut’s total TFA population lived in the North Central WIA (14,625 recipients) in 2010, among which 47 percent lived in Hartford. The majority of the increase in TFA recipients between 2009 and 2010 occurred in New Britain, Bristol, and Vernon. The towns with the largest decreases were Hartford, Enfield, and Plainville.
Figure 27: TFA recipients in North Central WIA
Source: CT DOL “2011 Information for Workforce Planning”
Food Stamp Recipients As shown in the figure, the NCWIA has the largest percentage of food stamp recipients in the state (100,786 recipients or 34%). In addition, from 2009 to 2010, NCWIA had the largest nominal year-over-year increase (+21,463). Two-thirds of food stamp recipients in the NCWIA live in Hartford, New Britain, and East Hartford.
Figure 28: Connecticut’s Food stamp recipients by WIA, 2010
Source: CT DOL “2011 Information for Workforce Planning”
15,993
14,702
14,256 14,263
14,625
13,000
13,500
14,000
14,500
15,000
15,500
16,000
16,500
2006 2007 2008 2009 2010
NC WIA, 34%
SC WIA, 21%
SW WIA, 17%
EA WIA, 12%
NW WIA, 16%

DEMOGRAPHIC ANALYSIS
18
Department of Developmental Services (DDS) clients In June 2011, the NCWIA had 4,365 consumers of services – 29% of the state population – the largest in the state. Hartford (463) and Manchester (411) had the largest number of consumers.
Figure 29: Connecticut’s DDS clients by WIA, June 2011
Source: CT DOL “2011 Information for Workforce Planning”
Adult Probationers The North Central WIA had 13,926 adult probationers in 2011, down 1,147 from 2010. However, the towns that make up the metro Hartford region had 10,428 probations in 2011. In the metro Hartford region, Hartford (4,579) and East Hartford (962) accounted for 53% of the region’s probationers.
Figure 30: Adult probationers, 2011
Top Ten Towns in Metro Hartford Region
# of Probationers 2011
Hartford 4,579
East Hartford 962
Manchester 788
Enfield 550
Vernon 454
West Hartford 332
Bloomfield 314
Windsor 306
Newington 205
Wethersfield 173
Total for top ten towns 8,663
Total for Metro Hartford Region
10,428
Source: CT DOL “2011 Information for Workforce Planning”
NC WIA 29%
EA WIA 14%
SW WIA 17%
NW WIA 19%
SC WIA 21%

DEMOGRAPHIC ANALYSIS
19
Housing
According to the Greater Hartford Association of Realtors, the housing market did not rebound in 2011 in the greater Hartford area – a 57-town area. Some experts say the sale of foreclosed properties and short sales — where lenders agree to accept a sales price below what is owed on a mortgage — is a factor pushing down the median.1 Many local real estate experts agree, however, that property values have slid an average of 20 percent since the housing downturn began in 2007.
Figure 31: Housing market in Greater Hartford region – 2010 versus 2011
Greater Hartford 2010 2011 % Change
New Listings 16,983 15,998 (6%)
Pending Sales 8,910 8,189 (8%)
Closed Sales 7,861 7,255 (8%)
Dollar volume closed sales $2.1 billion $1.9 billion (9%)
Average Sale Price $265K $262k (1%)
Median Sale Price $230K $221K (4%)
Average days on market 73 83 14%
Source: Greater Hartford Association of Realtors
Although new home construction is struggling in the region due to the housing/mortgage crisis, the region has seen a recent increase in plans for new apartment buildings. There are plans for more than 2,500 apartment units to rent at full market value and will be ready in the next three to five years.2 The data provided below is from the City of Hartford’s Economic Development Department. Planned Apartment Development:
Hartford conversion of the Clarion Hotel on Constitution Plaza into 199 apartments Simsbury – 88 apartments as part of mixed-use development South Windsor – 200 units as part of Evergreen Walk Glastonbury – 250 units as part of redevelopment of old mill Glastonbury – add residential component to existing office, hotel and retail space in Somerset Square
with 155 units Other – Manchester (224); Windsor (300-400); Bloomfield (78)
There are additional plans for apartments to be built in Hartford at various stages of development:
1. 286 units at 777 Main Street – seeking developer 2. Estimated 225 units 95-101 & 111 Pearl Street – seeking developer 3. 115 units at Front Street – have developer but seeking funding 4. 300 units at 160 Jewel Street (former YMCA building) – Northland is the developer and has put
development on hold until economic conditions improve
1 Lee, Mara, “Single-Family House Sales Rise in March” Hartford Courant, April 20, 2012. 2 Gosselin, Kenneth, “Apartment Boom Emerges as House Sales Lag,” Hartford Courant, March 31, 2012.

DEMOGRAPHIC ANALYSIS
20
Household Income
Relative to the United States, Hartford and Tolland counties have high per capita incomes. As show in Figure 32, Hartford county has a per capita income approximately 1.2 times higher than the nation. Below are some additional facts about household income for the region that are not shown in the figure. • In 2010, median household
income was higher than the CT median of $66,347 for 22 towns
• 6 towns had median household income greater than $100,000 in 2010 - Avon, Simsbury, Glastonbury, Granby, Tolland, and Hebron
• Hartford had the lowest median household income of $26,117
Figure 32: Per capita income indexed to the United States
Source: U.S. Bureau of Economic Analysis
From 2008 to 2010, the per capita personal income in the Hartford Metropolitan Statistical Area has consistently been higher than the New England area but lower than Connecticut.
Similar to other regions, the Hartford MSA saw a decrease in per capita income between 2008 and 2009 and then increasing from 2009 to 2010 – this reflects the impact of the economic recession. Although the per capita income for the Hartford MSA in 2010 equaled that of 2008, for the rest of the state, 2010 per capita income did not rebound to the level it was at in 2008.
Figure 33: Per capita income for Hartford MSA, Connecticut, and New England
Source: U.S. Bureau of Economic Analysis
0
20
40
60
80
100
120
140
160
Ind
ex
Pe
r C
ap
ita
In
com
e (
U.S
. = 1
00
)
2005 2009
$42,000
$44,000
$46,000
$48,000
$50,000
$52,000
$54,000
$56,000
$58,000
Hartford MSA Connecticut New England
Pe
r C
ap
ita
Pe
rso
na
l In
com
e
2008 2009 2010

DEMOGRAPHIC ANALYSIS
21
Migration
The following county-level information regarding migration patterns is gathered from the Internal Revenue Services. This data tracks the migration of people by the number of exemptions on the federal tax return. In the 1990s, Hartford & Tolland county lost an average of 7,500 filers per year. Between 1999 and 2001, an average of 650 filers left each year, and since 2003 an average of 2,500 filers are lost every year. 2002 was the only year that had a net gain of filers–509 filers.
Figure 34: Migration of Tax Filers
Source: Internal Revenue Service (IRS) based on movements of IRS filers
Foreigners have helped to offset the loss of native filers. For most years, Hartford and Tolland counties have experienced a net migration gain of foreign filers. Only in 1992, 1993, 2000 (11 people) and 2005-2008 did Hartford County have a net gain of foreigners. However, in Tolland county every year but two there was a net gain in foreigners.
Figure 35: Migration of Foreign Tax Filers
Source: Internal Revenue Service (IRS) based on movements of IRS filers
0
5,000
10,000
15,000
20,000
25,000
30,000
35,000
19
90
19
91
19
92
19
93
19
94
19
95
19
96
19
97
19
98
19
99
20
00
20
01
20
02
20
03
20
04
20
05
20
06
20
07
20
08
20
09
Nu
mb
er
of
Ex
em
pti
on
s
Into Hartford & Tolland Counties Net Migration Loss
0
100
200
300
400
500
600
700
800
900
1,000
19
90
19
91
19
92
19
93
19
94
19
95
19
96
19
97
19
98
19
99
20
00
20
01
20
02
20
03
20
04
20
05
20
06
20
07
20
08
20
09
Nu
mb
er
of
Ex
em
pti
on
s
Into Hartford & Tolland Counties Out of Hartford & Tolland Counties

DEMOGRAPHIC ANALYSIS
22
The top counties for in- migration are also the top counties for out-migration. 44% of those moving into Hartford County and 36% of those moving out in 2009 moved from eight U.S. counties; six were in Connecticut. The population moving into Hartford County from these eight counties in 2009 was 9,815. A total of 22,261 people moved into Hartford county in 2009. The population moving out of Hartford County from these eight counties in 2009 was 9,159 out of 25,411 people moving out.
Figure 36: Counties with the highest number of in and out migrants to Hartford County
Source: Internal Revenue Service (IRS) based on IRS filers
Approximately 38% of the population moving into Tolland and Hartford County comes from another part of Connecticut. The average income was higher for the in-migrants than the out-migrants for five of the eight counties that have the highest in/out migration.
Figure 37: Adjusted Gross Income of in and out migrants
Source: Internal Revenue Source (IRS) based on IRS filers
356
553
708
795
1,044
1,051
2,236
3,072
359
524
630
872
992
1,100
2,062
2,620
0 500 1,000 1,500 2,000 2,500 3,000 3,500
Middlesex, MA
Windham, CT
Fairfield, CT
New London, CT
Hampden, MA
Litchfield, CT
Middlesex, CT
New Haven, CT
Number of Exemptions
Out Migration In Migration
$30,000
$40,000
$50,000
$60,000
$70,000
Av
era
ge
Ad
just
ed
Gro
ss I
nco
me
(A
GI)
p
er
retu
rn, 2
00
9
Inbound Outbound

ECONOMIC TRENDS
23
Economic Trends - Recession and Recovery Update The development of this plan and the analysis is occurring on the heels of the great recession and during a slow economic recovery period. Since most economic data are published with a 3 to 6-month or greater lag time, much of the recent data in this report presents a bleak picture. However, the Connecticut Department of Labor has produced some recent statistics analyzing the recession and recovery period which is presented below and provides a perspective on how the Hartford metropolitan statistical area has fared relative to other areas in the state, and the state and nation as a whole. The figure to the right shows the recession peak, duration, and recovery length for the U.S., Connecticut, and the metropolitan statistical areas (MSA) in Connecticut. The Hartford MSA experienced a 23-month recession and a recovery that has lasted 25 months (through March 2012). This was about the average for the state and mirrors the U.S. duration.
Figure 38: Cycle-Phase Durations
Region or metropolitan statistical area
Recession peak
Phase trough
Recession length (months)
Recovery length (months)
U.S. Jan - 08 Feb - 10 25 25
CT Mar - 08 Feb – 10 23 25
Bridgeport-Stamford
Mar - 08 Feb – 10 23 25
Danbury Dec – 07 Jan – 10 25 26
Hartford Mar – 08 Feb – 10 23 25
New Haven Mar – 08 Feb – 10 23 25
New London May – 08 Dec – 11 43 3
Waterbury Dec – 06 Feb – 10 38 25 *Cycles looking at nonfarm employment Source: CT DOL, CT Recession/Recovery Update Spring 2012 – Benchmark 2012
Figure 39 shows the number of jobs lost during the recession and the number that have been gained during the recovery. The Hartford MSA had the lowest percentage loss in jobs during the recession and now has a higher percentage of jobs recovered than the U.S. and Connecticut. In fact it ranks behind Danbury in terms of the percentage of jobs recovered. Figure 39: Job-Growth Performance-Current Cycle
Region or metropolitan statistical area
Recession Peak (jobs)
Phase trough (jobs)
Jobs Lost
% of Jobs
Jobs Gained
% of Jobs Gained
% of Jobs Recovered
U.S. 138,023 129,244 (8,779) 6.4% 3,577 2.8% 40.7%
CT 1,712 1,595 (118) 6.9% 38 2.4% 31.9%
Bridgeport-Stamford
422 392 (30) 7.1% 8 2.0% 26.7%
Danbury 71 64 (7) 9.4% 4 6.7% 65.2%
Hartford 561 528 (33) 5.9% 16 3.0% 48.2%
New Haven 280 263 (17) 6.2% 4 1.4% 21.3%
New London 138 126 (12) 8.9% 0.5 0.4% 4.1%
Waterbury 69 61 (8) 11.0% 0.5 0.8% 6.6% Source: CT DOL, CT Recession/Recovery Update Spring 2012 – Benchmark 2012

ECONOMIC TRENDS
24
Workforce Trends
Labor force measures are based on the civilian non-institutional population 16 years old and over. People with jobs are counted as employed. People who are jobless, looking for jobs, and available for work are regarded as unemployed, and people who are neither employed nor unemployed are considered not in the labor force. The unemployment rate represents the percentage of the labor force that is unemployed. (Source: CT Department of Labor)
• Percent of population age 15-69 that is in the workforce: – Town population <15,000: 81% – Town population 15-50,000: 79% – Town population >50,000: 70%
• Hartford’s workforce participation rate for ages 15-69 years is 63%; the lowest in the region (excludes those living in group quarters)
Figure 40: Labor force for Connecticut and metro Hartford region
Source: CT DOL
The growth and decline of the metro Hartford region workforce mirrors that of the state, as seen in the figure.
Unemployment Similar to the rest of the nation, the metro Hartford region experienced high rates of unemployment during the recession and has seen those rates decrease since. For example, the highest rate of unemployment in the metro Hartford region in March 2011 was 16.3% (Hartford) and in March 2012 it was 14.7% (Hartford). Unfortunately, Hartford continues to experience unemployment rates higher than the national average of 8.2% and the state average of 7.7%. All towns in the metro Hartford region have seen a decrease in unemployment from March 2011 to March 2012. Canton saw the largest drop of 1.8 percentage points, going from an
385
390
394
401
406 408 407
1,807
1,827
1,846
1,869
1,887
1,897 1,888
1,760
1,780
1,800
1,820
1,840
1,860
1,880
1,900
1,920
370
375
380
385
390
395
400
405
410
2005 2006 2007 2008 2009 2010 2011
Co
nn
ect
icu
t W
ork
forc
e (
tho
usa
nd
s)
Me
tro
Ha
rtfo
rd W
ork
forc
e (
tho
usa
nd
s)
MetroHartford CT

ECONOMIC TRENDS
25
unemployment rate of 7.3% in March 2011 to 5.5% in March 2012. On the other hand, Windsor Locks saw the smallest decrease, dropping only 0.2 percentage points from 7.9% in March 2011 to 7.7% in March 2012. Figure 41: Towns with highest unemployment rates in metro Hartford
Town Unemployment Rate
Annual Avg 2011 March 2012
Hartford 16.2% 14.7%
East Hartford 11.2% 9.9%
Bloomfield 10.1% 9.2%
East Windsor 9.2% 7.8%
Stafford 8.7% 9.6%
Manchester 8.4% 8.2%
Source: CT DOL
Figure 41 shows the towns with the highest average annual unemployment rates in 2011 in the metro Hartford region. These same towns also had the highest unemployment rates in March 2012.
The city of Hartford represents an area of deep poverty and also high unemployment coupled with low workforce participation rates. These are serious challenges for the region and need to be understood so that they can be remedied. Almost 50% of the labor force that lives below poverty resides in Hartford. Figure 42: Number of people unemployed by town population grouping
Source: CERC analysis of CT DOL data
Almost one-quarter of the unemployed in the region are from Hartford. However, only 12% of the region’s workforce is in Hartford.
0
5,000
10,000
15,000
20,000
25,000
30,000
35,000
40,000
2005 2006 2007 2008 2009 2010 2011
# U
ne
mp
loy
ed
in
Me
tro
Ha
rtfo
rd r
eg
ion
Towns <15K 15-50K >50K (excludes Hartford) Hartford

ECONOMIC TRENDS
26
Self-Employed
The self-employed are often not included in workforce figures as they are difficult to count. The U.S. Census County Business Patterns does separate out the self-employed but there is a time-lag in release of that data set. The self-employment data includes data for businesses that have no paid employees but are subject to federal income tax; most non-employers are self-employed operating unincorporated businesses (sole proprietorships). The table below shows the breakout of self-employed individuals versus those employed in private employment for Hartford and Tolland Counties in 2009 (the most recent year of data available). A total of 61,563 people in the two counties are self-employed. Approximately 12% of those working in the two counties in 2009 were self-employed; 85% of the self-employed worked in Hartford County. Figure 43: Self-Employment in Hartford and Tolland counties compared to Connecticut, 2009
2009 Employed (Private)
Self-Employed Total % of total Self-Employed
Hartford & Tolland Counties 442,121 61,563 502,684 12.2%
Connecticut 1,368,940 246,784 1,615,724 15.3%
Source: Private employment from CT DOL QCEW data for 2009; Self-Employment data from U.S. Census County Business Patterns 2009
The figure to the right shows that the self-employed in Hartford and Tolland counties are dispersed throughout multiple industry sectors – no one sector has a majority of the self-employed.
The industry sector with the largest number of self-employed is the professional, scientific and technical industry sector representing 17% of the self-employed.
Figure 44: Percent of self-employed in Hartford & Tolland counties by industry sector
Source: U.S. Census Nonemployer Statistics, 2009 for Hartford & Tolland counties
Prof./Scientific/Technical
17%
Real estate 12%
Construction 12%
Retail trade 8%
Admin support/waste
mngmt 7%
Health care/social assistance
9%
Other serivces (except public
admin) 12%
Arts/Entertain/recreation
6%
All other industries
17%

BUSINESS AND REAL ESTATE
27
Seven out of 10 self-employed individuals work in seven industry sectors. The largest categories of employment for Professional and Scientific include: legal; accountants; architectural/engineering; computer systems design; management, scientific & technical consulting services. The largest categories for healthcare include: offices of physicians; offices of mental health practitioners; home health care services; child day care services; individual and family services. Figure 45: Self-employment by industry sector for Hartford & Tolland Counties and Connecticut
2009 Hartford Cty Tolland Cty Connecticut % of state total
Professional & Scientific 8,659 1,573 44,352 23%
Real Estate 6,363 845 29,625 24%
Construction 5,910 1,420 31,916 23%
Health Care & Social Assistance 5,126 719 21,354 27%
Retail Trade 4,308 896 18,510 28%
Finance & Insurance 2,245 296 10,491 24%
Admin support/waste mngmt 3,633 604 18,451 23%
Total for listed industries 36,244 6,353 174,699
Total Self Employed in region 52,402 9,161 246,784 25%
Source: U.S. Census Nonemployer Statistics, 2009 for Hartford & Tolland counties

BUSINESS AND REAL ESTATE
28
Business and Real Estate
Business Expansion and Reduction Announcements Economic and employment data captured by the Department of Labor provides information on what has happened in the past upon which future trends can be gleaned. However, the news media provides announcements on business expansions and startups which give insight into future business deals and potential growth opportunities for the region. Figure 46 provides the most recent data on business startups and expansions that were announced in the news media. The figure provides the date of the announced startup or expansion, company name, location, number of workers, and reason. As shown in the figure, over the past couple years in the metro Hartford region most of the recent announcements are for the service sector – either retail or restaurants. However, there were several expansions or startups outside of service. GKN Aerospace Services, a manufacturing company; LEGO, a children’s toy company; and Comcast, a cable company, all announced expansions. CIGNA, an insurance company, announced a relocation of its headquarters from Philadelphia to Bloomfield as part of the Governor’s First Five program. Figure 46: Start-ups and Expansions in the Metro Hartford Region
Startup/Expansion date
Company Location # workers
Reason
August 2013 Walmart East Windsor 100 Super center opening
2012-2014 GKN Aerospace Services Cromwell 60 Expanding facility
April 2012 Nordstrom Rack Farmington 70 New store
January 2012 Tilted Kilt Wethersfield 100 New restaurant
November 2011 Urban Outfitters Farmington 75 New store
September 2011 Maine Oxy South Windsor INA Opened first CT store
August 2011 Lululemon Athletica West Hartford 16-20 New store
Summer 2011 Inner Circle Fresh Foods Rocky Hill 160 New company
May 2011 LEGO Enfield 25 Expanding headquarters
March 2011 Ted’s restaurant Cromwell INA New restaurant
Winter 2011 The Fresh Market Avon 90 New store
Feb-March 2011 Home Depot Hartford area 600 Part-time seasonal workers
2011 Comcast Enfield 100 Adding customer service representatives
2011-2013 CIGNA Bloomfield 200 Moving headquarters from Philadelphia
2011-2013 TicketNetwork South Windsor 200
*INA – information not available or not known Source: CT Department of Labor as of March 2012

BUSINESS AND REAL ESTATE
29
In addition to startups and expansions, there have also been announcements in the media of layoffs and reductions. The figure below lists the announcements that have been made over the past couple of years. Figure 47: Layoffs and reductions announced in the news media for the metro Hartford region
Layoffs/Reductions Company Location # Workers
Reason
March 2012 Pratt & Whitney East Hartford -50 Pentagon’s decision to slow deliveries of F-35 Joint Striker
March 2012 Wethersfield Health Care Center
Wethersfield -145 Reduction due to decline in residents
March 2012 RR Donnelley Windsor -117 Facility closure
February 2012 Capewell Horsenails
Bloomfield -26 Consolidate nail production at a facility in Sweden
Oct 2011-May 2012 Aetna Hartford -400 Cutting jobs through early retirement incentive
September 2011 J.C. Penney Manchester -442 Closing “.com” unit at distribution center
August-Dec 2011 Bank of America East Hartford -50 Lock box unit moved to MA
Sept 2011 Bank of America Hartford -57 Cash vault unit jobs moved to MA and NY
April 2011 UTC Power South Windsor
-40 Positions eliminated
2011 Hamilton Sundstrand
Windsor Locks
-200 Jobs moving to Poland & Singapore
2011 J.C. Penney Manchester -150 Reconfiguring facility
2011 SS&C Technologies Windsor -<50 Moving headquarters out of state
2010-2011 Precision Camera & Video Repair
Enfield -200 to -400
Shifting work to TX and Mexico
Source: CT Department of Labor as of March 2012

BUSINESS AND REAL ESTATE
30
Real Estate This next section highlights the real estate market in the Hartford region (the area that most closely matches the metro Hartford region) in the fourth quarter of 2011. The figures below show the available commercial real estate in the region.
Figure 48: Market view of Hartford Area Office Space
Source: CBRE Market View Hartford Office Snapshot, 4th quarter 2011
In the fourth quarter of 2011, thirty percent of the office space in the Hartford Central Business District (CBD) was vacant or approximately 2.4 million square feet of space (CBRE Market View Office Snapshot). The region directly outside Hartford’s central business district has seen the largest decrease in vacancy rates when comparing fourth quarter results from the previous seven years. In general, vacancy rates did not change between the fourth quarter of 2010 and 2011.
Figure 49: 4th quarter vacancy rates in Greater Hartford region
Source: CBRE Market View Hartford Office Snapshot, various years
31%
9%
13% 13%
13%
21%
Hartford CBD (43 buildings - 7.9 M sq ft)
Hartford Periphery (42 buildings - 2.3 M sq ft)
Northern Hartford (58 buildings - 3.2 M sq ft)
Southern Hartford (90 buildings - 3.4 M sq ft)
Eastern Hartford (69 buildings - 3.2 M sq ft)
Western Hartford (114 buildings - 5.4 M sq ft)
0.0%
5.0%
10.0%
15.0%
20.0%
25.0%
30.0%
35.0%
4Q 2005 4Q 2006 4Q 2007 4Q 2008 4Q 2009 4Q 2010 4Q 2011
Hartford CBD Outside CBD Northern Hartford Southern Hartford Eastern Hartford Western Hartford

BUSINESS AND REAL ESTATE
31
CERC, Inc. maintains a database called CERC SiteFinder® that displays available commercial and industrial facilities and property in the state. The table below provides a point-in-time assessment of available buildings (including total square feet) and sites (including available acres) for each of the municipalities in the metro Hartford region. On a square feet per building basis, Windsor Locks has the largest ratios, followed by Enfield and East Hartford. On an acre per site basis, Enfield and Suffield have the largest ratios. Figure 50: Available Commercial and Industrial Facilities and Property in Metro Hartford Region as of May 1, 2012
SQFT Acres # of
Buildings # of Sites
Andover 72,867 2 5 1
Avon 233,198 10 26 1
Bloomfield 591,210 135 26 6
Bolton - 19 0 1
Canton 39,275 0 12 0
Cromwell 165,318 14 15 1
East Granby 95,675 3 5 1
East Hartford
1,335,256 40 31 5
East Windsor 145,336 34 8 3
Ellington 8,106 0 3 0
Enfield
1,367,323 405 19 8
Farmington 514,926 42 28 3
Glastonbury 289,764 14 21 3
Granby 15,000 3 6 1
Hartford
2,829,310 298 143 14
Hebron 2,538 4 1 1
Manchester 698,563 1 27 1
Marlborough - 0 0 0
Newington
1,174,608 8 32 2
Rocky Hill 418,865 89 38 6
Simsbury 307,797 20 26 3
Somers - 0 0 0
South Windsor
1,038,846 109 27 12
Stafford 24,253 7 2 1
Suffield 50,160 402 2 9
Tolland 2,100 22 1 1
Vernon 52,786 58 3 4
West Hartford 202,618 0 22 0
Wethersfield 257,808 2 15 1
Windsor
1,383,309 170 81 19
Windsor Locks 813,101 7 6 1
Total
14,129,916
1,918 631 109
Between January 1 and April 24, 2012, almost 17,000 searches were made for properties in the
metro Hartford region. More than 7,300 were for industrial properties, almost 5,400 were for retail
properties, and almost 4,200 were for office properties.

BUSINESS AND REAL ESTATE
32
Patent Activity
As shown in Figure 51, almost one quarter of all patents in the state originate in either Hartford or Tolland counties, with the majority of that activity in Hartford county. However, patent activity is generally recorded at the company’s headquarters location and not necessarily where the research occurred. Although not shown in the table, the Hartford-West Hartford-East Hartford Metropolitan Statistical Area ranked #34 in total number of patents produced between 2006 and 2010 (there were 374 Metropolitan Statistical Areas that produced patents).
Figure 51: Patent activity by Connecticut county
County 2006-2010 Patents
% of State Total
Fairfield County 2,781 36%
New Haven County 1,629 21%
Hartford County 1,462 19%
New London County 509 7%
Middlesex County 476 6%
Litchfield County 405 5%
Tolland County 348 5%
Windham County 77 1%
Total 7,686 100%
Source: U.S. Patent and Trademark Office
Figure 52 shows the companies with the most patents between 2006 and 2010. United Technologies is a major creator of patents for the region, however, a large number of individually owned patents were issued over this time period.
Figure 52: Patent activity by company
Source: U.S. Patent and Trademark Office (MSA includes Hartford, Tolland, and Middlesex Counties)
Hartford/West Hartford/ East Hartford MSA
2006-2010 Total # of Patents
United Technologies 494
Individually Owned Patent 213
Hamilton Sundstrand 77
University of Connecticut 76
Bristol-Meyers Squibb 74
Otis Elevator 73
Zygo Corp 66
Carrier Corp 57
Cidra Corp 54
Henkel 39
UTC Fuel Cells 34

BUSINESS AND REAL ESTATE
33
Figure 53 below lists the technology class with the most patents in the region. Power plants top the list but several technology classes related to the medical device industry and bioscience industry also top the list.
Figure 53: Patent activity by technology class
2006-2010 Patents by Technology Class for Hartford/West Hartford/East Hartford MSA
Technology # Patents Technology # Patents
Power Plants 120 Elevator, Industrial Lift Truck, or Stationary Lift for Vehicle
49
Drug, Bio-Affecting and Body Treating Compositions (includes Class 514)
118 Optical Waveguides 48
Fluid Reaction Surfaces (i.e., Impellers) 94 DP: Measuring, Calibrating, or Testing (Data Processing)
47
Measuring and Testing 90 Refrigeration 42
Optics: Measuring and Testing 82 Organic Compounds (includes Classes 532-570)
35
Chemistry: Electrical Current Producing Apparatus, Product, and Process
79 Stock Material or Miscellaneous Articles
34
Rotary Kinetic Fluid Motors or Pumps 72 Communications: Electrical 31
DP: Financial, Business Practice, Management, or Cost/Price Determination (Data Processing)
57 Metal Founding 30
Synthetic Resins or Natural Rubbers (includes Classes 520-528)
50 Metal Working 29
Source: U.S. Patent and Trademark Office

OCCUPATIONAL PROJECTIONS 2008-2018
34
Occupational Projections 2008-2018 The Connecticut Department of Labor every two years publishes ten-year occupational projections. The most recent projections for the North Central Workforce Investment Area (NC WIA) region are from 2008-2018. However, developing accurate projections ten years out is quite difficult so these figures should be viewed with some precaution. The Connecticut Department of Labor projects that overall employment growth in North Central Connecticut between 2008 and 2018 will be 4.6% (27,334 jobs), bringing the region’s employment to 618,856. The top ten occupational groups by projected growth from 2008 to 2018 are shown in Figure 54. Education related occupations are projected to have the highest annual growth from 2008-2018. Two healthcare related occupations are also in the top ten for projected growth. Ranking third in projected growth are computer and mathematical occupations. These occupations cut across many industries including insurance, manufacturing, and health sciences.
Figure 54: Top Ten Occupations by Projected Growth (2008-2018)
Occupational Group Projected Growth 2008-2018
Education, Training, and Library 478
Healthcare Practitioners and Technical
396
Computer and Mathematical 354
Healthcare Support 333
Office and Admin Support 323
Business and Financial Operations 285
Personal Care and Service 278
Food Preparation and Serving Related
207
Management Occupations 175
Sales and Related 120 Source: CT Department of Labor
Figure 55 shows the three occupational groups with the highest expected employment levels in 2018 for the NC WIA. It also shows within the occupational groups the particular occupations that will have the highest employment levels. The occupations that are expected to have the highest levels of employment by 2018 are Office and Administrative Support Occupations, Sales and Related Occupations, and Management Occupations.
Figure 55: Occupational Groups with Highest Projected Employment Levels in 2018
Occupational Group
Occupation Title Projected Employment 2018
Office and Administrative Support 94,832
Information & Record Clerks 22,701
Office & Admin Support 18,448
Secretaries & Admin Asst. 17,529
Financial Clerks 14,312
Material recording, scheduling, dispatching, & distributing workers
13,849
Sales and Related Occupations 57,163
Retail Salespersons 17,781
Cashiers 12,593
Management Occupations 48,261
Top executives 11,730
Advertising, Marketing, Promotions, Public Relations, and sales managers
5,962
Financial Managers 5,781
Computer and Information Systems Managers
3,978
Source: CT Department of Labor

OCCUPATIONAL PROJECTIONS 2008-2018
35
However, the occupations in Figure 55 are the occupations with the highest number of people, but not the occupations with the highest projected absolute growth. Figure 56 shows the top five out of 22 major occupational categories with the largest projected net employment growth. Interestingly, the Computer and Mathematical occupational category is projected to grow at a faster rate than the state (13.5% for the state versus 16% for the NC WIA) indicating a continued concentration and need for these occupations in the region. Although not shown in the table, three of the 22 major occupational categories are projected to decline: Production, Protective Service, and Farming, Fishing, and Forestry occupations.
Figure 56: Occupational Groups with Highest Projected Net Employment Growth
Occupational Group 2008 2018 Net % Annual Openings
Education, Training, and Library 35,592 40,362 4,770 13% 1,257
Healthcare Practitioners and Technical
31,127 35,078 3,951 13% 1,021
Computer and Mathematical 21,030 24,384 3,354 16% 719
Healthcare Support 19,349 22,625 3,276 17% 546
Business and Financial Operations 36,734 39,580 2,846 8% 1,044
Total All Occupations 591,522 618,856 27,334 5% 17,040 Source: CT Department of Labor Occupational Projections for NC WIA
Figure 57 takes the occupational groups from Figure 56 (with highest projected net employment growth) and looks at the occupations within each occupational group that are projected to have the highest annual openings. Further, the figure shows the education and training requirements for each of the occupations. Half of the occupations require a Bachelor’s degree, one requires an Associate’s, three require postsecondary vocational training, and three require on-the-job-training.
Figure 57: Education and Training Requirements of Occupations with highest Annual Openings in each Occupational Group
Occupation Group
Occupation Title Annual Openings
Education Requirement
Education, Training, and Library
Teacher Assts 260 Short-term OJT*
Elementary teachers 197 Bachelor’s
Secondary teachers 148 Bachelor’s
Preschool teachers 108 Postsecondary vocational
Healthcare Practitioners
Registered nurses 377 Associate’s
Licensed practical and licensed vocational nurses
108 Postsecondary vocational
Computer and Mathematical
Computer software engineers, applications 172 Bachelor’s
Computer systems analysts 143 Bachelor’s
Network systems and data communications analysts
93 Bachelor’s
Healthcare Support
Home health aides 195 Short-term OJT*
Nursing aides, orderlies, attendants 141 Postsecondary vocational
Business and Financial Operations
Accountants/Auditors 180 Bachelor’s
Claims adjusters, examiners, investigators 107 Long-term OJT*
Financial analysts 87 Bachelor’s *OJT: on-the-job-training Source: CT Department of Labor Occupational Projections

OCCUPATIONAL PROJECTIONS 2008-2018
36
Figure 58 shows the sectors with highest projected employment growth between 2008 and 2018. The Healthcare and Education sectors top the list which coincides with the occupational projections. Also in the top two for growth are Professional, Scientific, and Technical, and Finance and Insurance sectors. These two sectors would employ people with computer and mathematical skills which are also why that occupation is projected to grow.
Figure 58: Top Growing Sectors, NC WIA, 2008-2018 Job Growth
Source: CT Department of Labor Occupational Projections for NC WIA
1,063
1,419
1,500
1,822
2,963
4,795
5,342
12,610
0 5000 10000 15000
Information
Accommodation and Food Services
Arts, Entertainment, and Recreation
Admin. & Support & Waste Mngmt & Remediation Services
Finance and Insurance
Professional, Scientific, & Technical
Educational Services
Health Care and Social Assistance

INDUSTRY ANALYSIS
37
Industry Analysis Figure 60 shows the major clusters for the metro Hartford region. As shown in the figure, there
exists overlap between the clusters. For example, Insurance is part of the Financial Services cluster
but is also an important component of the Health Sciences and Services cluster and the two have
important linkages in the region. Furthermore, Chemical Manufacturing is part of the Advanced
Manufacturing cluster but in the region most of the companies are supporting bioscience and
medical device companies. Finally, Headquarters (NAICS 55: Management of Companies) has
linkages with all the clusters in the region and is shown as connecting to each of the other three
clusters in the region.
For more detail and the complete analysis, see the supplemental section, “IN-DEPTH CLUSTER
ANALYSIS FOR THE METRO HARTFORD REGION.”
Figure 60: Metro Hartford Region Industry Clusters, 2012
Headquarters
Health Sciences & Services
Ad
van
ced
M
an
ufa
cturin
g
Fin
an
cia
l S
erv
ice
s
Insurance
Chemical
Manufact.
& Med.
Device

MUNICIPAL FISCAL ANALYSIS
38
Municipal Fiscal Analysis Summary
When looking at the metro Hartford region, it is important to look at the fiscal indicators of the
individual towns in order to understand the fiscal health of the region. This part of the analysis
pulls together the individual town fiscal data and creates a comprehensive view of the region’s
fiscal health. However, there is not one single measure that can create the whole story of a town or
region’s fiscal health, but rather it is a collection of indicators that create the story.
The following are a list of all the indicators used in this analysis and why they are important when
looking at town fiscal health.
Budget surpluses and deficits – Indication of whether the town is able to provide services
based on the revenue collected.
Undesignated fund balance – This indicator represents the town’s money available for
activities that are not directly reserved for other uses. Annual changes in the undesignated
fund balance reflect the requirements associated with maintaining town services, covering
unexpected costs and budget surpluses not spent.
Debt measures – Overall indication of the amount of debt a town carries and the revenue
requirements for the future.
Taxable assets – A municipality’s grand list or the overall measure of the assets in a town
provides a critical dimension in the understanding of the capacity to carry a given level of
debt and shows the town’s base from which it can raise revenue.
Debt to Grand List Ratio –Provides an indication of the amount of debt a town owes relative
to its property wealth. This ratio indicates a town’s capacity to repay its debt without
affecting services. However, the indicator should be used cautiously because a town’s debt
could temporarily increase when it issues bonds for major capital improvements.
Commercial and Industrial Share of Grand list – This indicator shows the percentage of
assets in a town that are non-residential. As towns have increased their reliance on
property taxes, this provides a relative measure of the burden tax increases place on non-
residents versus residents.
Moody’s Bond Rating – Reflects the rating agency’s view of the town’s relative credit risk.
Figure 61 provides a comprehensive summary of all the metrics used in this municipal fiscal
analysis except for the Moody’s bond ratings (see Appendix B, Figure 100). The municipalities in
the metro Hartford region approach their financial challenges in a variety of ways. Although some
of the approaches taken appear to be associated with the population size of the municipality many
of the metrics appear to be independent of their overall population size, especially when including
the other 138 Connecticut municipalities in the analysis.

MUNICIPAL FISCAL ANALYSIS
39
Seventeen of the 31, or 55 percent, of municipalities in the metro Hartford region had higher
budget surpluses over the last three years than the average for the state. Across the rest of the
state, 57 of the 169 municipalities, or 41 percent, had budget surpluses (measured as total revenues
less total expenditures divided by total expenditures) above the 1.93 percent observed for the state.
The highest share of municipalities among the groups based on population size were for the
midsized population towns in the metro Hartford region in which 10 of the 15 towns were above
the state average. The average budget surplus as a share of the total expenditures for the 15 towns
in the metro Hartford region with this set was 3.19 percent, much higher than the 1.00 percent
observed for the 42 municipalities in the rest of the state.
The municipalities in the metro Hartford region also averaged a higher change in the undesignated
fund balance in the three time periods of change between 2007-2008 and 2009-2010. The
midsized municipalities in the metro Hartford region again seem to have performed significantly
better (4.7 percent increase) than the midsized municipalities across the rest of the state (3.2
percent decrease).
These midsized municipalities in the metro Hartford region also tended to have lower debt service
on a per capita basis, $210 compared to $274 for the rest of the state and lower total debt per capita
Measure Region Filter
MetroHartford
Region
Rest of
State
MetroHartford
Region
Rest of
State
All Municipalities 2.3% 1.8% 55% 41%
Population < 15,000 1.5% 2.2% 50% 53%
Population 15-50K 3.2% 1.0% 67% 24%
Population greater than 50,000 1.8% 2.2% 25% 27%
All Municipalities 2.9% 1.0% 58% 46%
Population < 15,000 3.8% 3.1% 58% 47%
Population 15-50K 4.7% -3.2% 67% 45%
Population greater than 50,000 -6.8% 1.0% 25% 40%
All Municipalities $222 $267 32% 35%
Population < 15,000 $215 $260 25% 23%
Population 15-50K $210 $274 33% 50%
Population greater than 50,000 $287 $289 50% 53%
All Municipalities $1,701 $1,842 45% 43%
Population < 15,000 $1,777 $1,605 50% 36%
Population 15-50K $1,598 $2,112 40% 50%
Population greater than 50,000 $1,858 $2,363 50% 60%
All Municipalities $85,252 $121,878 6% 36%
Population < 15,000 $86,700 $123,398 0% 36%
Population 15-50K $91,655 $121,507 13% 40%
Population greater than 50,000 $56,898 $114,713 0% 27%
All Municipalities 31.8% 73.5% 45% 70%*
Population < 15,000 60.3% 81.7% 67% 73%
Population 15-50K 20.5% 60.4% 40% 69%*
Population greater than 50,000 -47.3% 81.0% 0% 60%
All Municipalities 2.1% 1.7% 52% 38%
Population < 15,000 2.0% 1.3% 58% 31%
Population 15-50K 1.7% 1.8% 33% 43%
Population greater than 50,000 3.9% 3.9% 100% 67%
All Municipalities 14.5% 9.6% 65% 42%
Population < 15,000 10.3% 6.5% 42% 20%
Population 15-50K 15.3% 12.8% 73% 67%
Population greater than 50,000 23.8% 17.8% 100% 93%
Source: Data are from Connecticut Office of Policy and Management. Calculations by CERC.
* Rest of state averages does not include Waterford (a significant outlier that distorts the metrics of this methodology).
Share of Towns Above
State Average
Average Metrics
Grand List per Capita,
2008-2010
Change in Grand List per
capita less Change in Total
Debt per capita, 2001 - 2010
Total Debt per Grand List,
2010
Commercial and industrial
Share of Total Grand List,
2010
Budget Surplus,
2008-2010
Change in Undesignated
Fund Balance,
2007-2008 to 2009-2010
Debt Service Per Capita,
2008-2010
Total Debt per Capita,
2008-2010
Figure 61: Municipal Fiscal Indicators – MetroHartford and the Rest of the State

MUNICIPAL FISCAL ANALYSIS
40
at $1,598 when compared with $2,112 for the municipalities of that size range in the rest of the
state. However, those towns also had lower grand lists per capita by nearly $30,000. Overall the
debt and grand list measures compared favorably for the midsized municipalities in the metro
Hartford region with the ratio of 1.7 percent being very close to the 1.8 percent observed for the
rest of the state. The midsized municipalities in the metro Hartford region also averaged a slightly
higher share of their grand lists in commercial and industrial properties – 15.3 percent compared to
the rest of the state at 12.8. For this measure, 11 of the 15 midsized municipalities were above the
state average while for the rest of the state a slightly smaller percent (67 percent) indicated that 28
of the 42 midsized Connecticut municipalities not in the metro Hartford region were above the
state average.
All four of the largest municipalities in the metro Hartford region were above the state’s average for
the share of the grand list accounted for in commercial and industrial properties. In the rest of the
state, 14 of the 15 largest municipalities had more than 10.4 percent of their total grand list
accounted for in their commercial and industrial properties. Similar shares of the large
municipalities in the metro Hartford region ran budget surpluses, had debt service per capita above
the state average and had ratios of debt levels to grand lists as did the large municipalities in the
rest of the state. The differences for the large municipalities in the metro Hartford region from
similar municipalities in the rest of the state showed up in the much lower change in undesignated
fund balances, lower grand lists per capita, and more negative differences in the change between
2001 and 2010 between the grand lists per capita and debt per capita.
The metrics shown in Figure 83 for the small towns appear in general to be fairly similar between
those in the metro Hartford region and those in the rest of the state. As observed for the other
population sizes the smallest municipalities in the metro Hartford region had an average grand list
that is only 70 percent of those of similar size in the rest of the state and had a higher debt per
capita by 11 percent. Overall, these two metrics result in a slightly higher debt to grand list ratio
(2.0 percent compared to 1.3 percent). The small towns in the metro Hartford region however, also
had a slightly higher share of their grand list accounted for in commercial and industrial property
which may suggest that they may have a broader and more robust tax base to work from than the
small towns across the rest of the state.
One additional summary perspective is presented in Figure 62 which shows the rankings among all
the 169 municipalities in Connecticut for the 31 municipalities in the metro Hartford Alliance.

MUNICIPAL FISCAL ANALYSIS
41
Debt and Grand
list
Budget
Surplus
Change in
Undesignated
Fund Balance
Debt
Service
per Capita
Debt per
Capita
Commercial
Industrial
Share
Debt to
Grand List
Ratio
Grand List per
Capita
Connecticut Total 85 85 85 85 85 85 85
MetroHartford Alliance 73 79 92 86 62 99 103
Small Population Towns 85 79 92 89 90 102 99
Andover 23 3 22 100 156 117 111
Bolton 88 81 87 25 118 37 108
Canton 36 41 104 83 64 86 77
Cromwell 98 69 111 121 34 134 89
East Granby 50 12 49 7 42 9 70
East Windsor 163 155 80 39 6 47 98
Granby 74 133 146 147 136 151 99
Hebron 93 36 74 136 149 146 95
Marlborough 129 88 128 153 123 157 73
Somers 59 47 122 92 140 136 142
Stafford 159 163 106 108 99 149 146
Windsor Locks 46 116 69 57 10 57 83
Midsized Population Towns 60 67 88 80 50 88 95
Avon 64 31 120 59 75 38 41
Bloomfield 33 8 46 97 14 111 109
Ellington 114 30 71 50 102 67 117
Enfield 38 124 39 28 19 46 132
Farmington 91 93 145 142 15 109 38
Glastonbury 83 58 137 133 57 122 59
Newington 17 48 31 19 27 29 100
Rocky Hill 128 125 58 46 12 52 82
Simsbury 71 54 136 123 72 119 67
South Windsor 69 114 85 63 28 62 74
Suffield 13 50 86 58 100 81 124
Tolland 84 44 135 148 109 158 114
Vernon 47 80 77 101 36 152 157
Wethersfield 37 87 60 64 81 90 118
Windsor 7 60 92 74 5 83 87
Large Population Towns 91 122 107 97 22 134 149
East Hartford 135 127 82 55 18 103 154
Hartford 14 156 129 127 1 167 169
Manchester 101 131 56 78 9 114 144
West Hartford 113 75 160 128 60 150 127
A rank of 1 is the highest or
could be considered the
strongest measure observed for
the specific variable.
More of a
surplus
reduces the
rank
number
A larger positive
change in the
undesignated
fund balance
reduces the
rank number
A smaller
debt
service
per capita
reduces
the rank
number
A smaller
debt per
capita
reduces
the rank
number
A larger
commercial
and
industrial
share
reduces the
rank number
A smaller
ratio of
debt to
grand list
reduces
the rank
number
A higher
commercial and
industrial share
of total grand list
per capita
reduces the rank
number
Budget Items Debt Items Grand List Items
Figure 62: Ranking based on all 169 municipalities in Connecticut

SUMMARY OF INTERVIEWS
42
Themes from Stakeholder Interviews During the course of the metro Hartford CEDS process, in addition to analyzing quantitative
demographic, economic and fiscal data, CERC conducted 21 interviews and one focus group to
ascertain additional qualitative findings. General themes emerged from the interviews and focus
groups, which are outlined below. A list of the stakeholders interviewed is presented in Appendix E.
Do small and medium size things. Weave the urban fabric that makes for a dynamic city.
Ken Greenberg’s work in 1998 and Doug Suisman’s work on the iQuilt are connected in
tactics and strategies to create a vibrant urban center for the region. The iQuilt deals with
connectivity and creates the fabric while the Greenberg plan adds the other elements –
housing, commercial and office development that needs to be placed within the new urban
concept. Tie the neighborhoods to downtown by implementing the Hartford 2010 plan.
Coordinate civic investments with larger capital projects. Something must be done with
the XL Center, but recognize that it is only one piece of creating a vibrant city, and don’t let a
huge investment crowd out the other smaller and medium size investments that are
actually more critical to creating the vibrant urban center we desire.
Build capacity for Hartford to manage its own development. The City needs support
from the state in order to accomplish the goal of creating a vibrant region center. However,
the state has, in effect, removed many of the development decisions from the city. There
needs to be more of a partnership in order to prioritize investments.
Address public safety concerns. Almost all of the corporate leaders interviewed
mentioned public safety as a key issue. These responses were somewhat driven by the
timing of the interviews – close to the date of a severe beating of a Trinity college student
right near the campus. Nonetheless this is a critical issue.
Take advantage of Hartford’s role as our Capital city. Since Hartford is the Capital, it
draws in visitors from across the state, country, and world. It is also a center of activity
during the legislative session. The City should seek ways to capitalize on the influx of
tourists, visitors, and workers by having amenities – such as restaurants, cafes, and retail -
near the Capital that will draw the visitors from the property to the areas nearby and
beyond. This requires making the area surrounding the state buildings more walkable and
adding more retail establishments in the area that will draw visitors out of the building.
Develop the education presence. Take greater advantage of the presence of institutions
of higher education – strategically look at the opportunities for growth at these institutions
and support them with necessary infrastructure. Connect the campuses to downtown with
transportation options. Develop assets downtown of interest to the college and university
students. Encourage a greater presence by UCONN downtown – Resolve the expensive
parking issue that limits class scheduling to evenings.
Look at the p-20 approaches to education that have developed at the University of
Hartford and Goodwin College as models for others. These approaches address many of
the issues of remediation faced by students entering our community college and state
university systems.
Address workforce training. Workforce training is important to smaller companies, and to
those with less formal education. The companies with national and international presence

SUMMARY OF INTERVIEWS
43
recruit in those markets, so the quality of local and regional workforce is not as critical.
Consider that many of our workforce issues are not solved through education and training
locally, but by creating vibrant places where people with skills want to be. Further, there is
a real manufacturing strength in the region and the region needs to seek ways to retrain
workers to fill the positions that are available.
Seize the Jackson Lab opportunity. We need a robust strategy of collaboration to take
best advantage of this great opportunity. The collaboration is between Jackson Laboratory,
UCONN, Hartford-based hospitals and even our insurance companies. We can create a
laboratory for modeling the best practices of delivering health care services, and paying for
them, for the future.
Increase Downtown Hartford housing opportunities. Particularly affordable rental
housing and the stock of entry level housing for recent college graduates – is key to
Hartford’s success
Coordinate resources. The future for Hartford and the other towns in the region is
intertwined. The suburbs have an asset in the city of Hartford that drives their own
economic success. Suburban residents need to recognize the importance of Hartford as a
regional asset. Working regionally is very difficult – people want to be local – but to
compete globally it is time to act regionally. The region needs a system of shared revenue,
for example, implement the regional asset tax, where museums are treated as community
assets but managed as one. Another idea is to do assessments regionally.
Increase transportation options. High speed rail in the region would be a game changer
for the region. If you could be to Boston for dinner and back or make it to New York City in
an hour, the region would be transformed. There is also an immediate need to link the
communities in the region.
Summary:
Many of the interviewees focused on the need to make Hartford a vibrant urban center noting
that the future of Hartford and the other towns in the region is intertwined. The City needs
support from the state in order to accomplish the goal of creating a vibrant region center.
Almost all of the corporate leaders interviewed mentioned public safety and housing as key
issues for Hartford that must be addressed in order to make Hartford liveable. In addition,
interviewees mentioned taking greater advantage of the presence of institutions of higher
education – strategically look at the opportunities for growth at these institutions and support
them with necessary infrastructure.

APPENDIX A: TOWN GROUPINGS BY POPULATION SIZE
44
APPENDIX A: Town Groupings by Population Size Part of the analysis that was provided in the report grouped towns according to their population
from the 2010 Census. The following chart shows which towns were in each group.
Population < 15,000 Population 15-50,000 Population > 50,000 Town 2010 Pop Town 2010 Pop Town 2010 Pop
Andover 3,303 Avon 18,098 Hartford* 124,775
Bolton 4,980 Bloomfield 20,486 West Hartford 63,268
Canton 10,292 Ellington 15,602 Manchester 58,241
Cromwell 14,005 Enfield* 44,654 East Hartford 51,252
East Granby 5,148 Farmington 25,340
East Windsor 11,162 Glastonbury 34,427
Granby 11,282 Newington 30,562
Hebron 9,686 Rocky Hill 19,709
Marlborough 6,404 Simsbury 23,511
Somers* 11,444 South Windsor 25,709
Stafford 12,087 Suffield* 15,735
Windsor Locks 12,498 Tolland 15,052
Vernon 29,179
Wethersfield 26,668
Windsor 29,044 *includes those living in group quarters

APPENDIX B: MUNICIPAL FISCAL ANALYSIS
45
APPENDIX B: Municipal Fiscal Analysis
Municipalities address specific challenges and restrictions associated with the fiscal aspects of
managing budgets by using different strategies. These different strategies result from the unique
geographies, traditions and demographic characteristics of each municipality’s political, fiscal and
economic histories. As a result there is no single measure that is capable of capturing the
comprehensive fiscal health of a municipal government. Therefore this analysis includes a number
of different measures derived from different aspects of a local government’s budget and revenue
sources. The following measures are from the Municipal Fiscal Indicators database developed by
the Connecticut Office of Policy and Management:
Budget and accounting measures o Budget surplus or deficit o Undesignated fund balance
Debt measures o Debt per capita or debt per total revenues o Annual debt service
Taxable assets o Grand list per capita or per total revenues o Commercial and industrial share of total grand list
Municipal vulnerability o Intergovernmental revenues o Tax collection rates
Summary measures o Moody’s bond rating
In addition to including the above measures this analysis will often benchmark the municipalities in
the metro Hartford region with all 169 Connecticut municipalities.
Budget and Accounting Measures - Revenues Less Expenditures
From 2008 through 20103 the 31 towns in the metro Hartford region had a budget surplus on
average of 2.3 percent of total revenues. At 2.3 percent the metro Hartford region municipalities
were slightly higher (0.4 percentage points) than the 169 towns in the state. As Figure 85 shows
there was some variation in the towns based on their population size.
3 A three year average is used because year to year changes can have a relatively significant impact and for some towns the 2010 data appears to be more of an anomaly when compared to earlier years.

APPENDIX B: MUNICIPAL FISCAL ANALYSIS
46
Figure 59: Three year average of budget surplus in Connecticut towns, 2008-2010
The 12 towns with the smallest populations in the metro Hartford region tended to have the
smallest surpluses relative to their total revenues. The 15 midsized towns had a three year average
surplus of 3.2 percent, more than twice that of the small population towns. The four towns with the
largest population had on average a surplus of 1.8 percent above their revenues for the most recent
three years of fiscal data.4 Hartford however, which averaged a surplus between 2008 and 2010 of
six percent, had a significant impact on the average. In fact, without Hartford the average was 0.3
percent for the other three towns. The six percent average surplus for Hartford over the last three
years reflects the City’s longer term trend of maintaining a budget surplus. Over the last five years
Hartford averaged 5.9 percent and over the last 10 it has averaged 4.4 percent. Ranked among the
169 towns in the state, Hartford’s surplus was the 14th highest over the last three years; over the
last ten years the city ranked 31st.
Among the larger towns, East Hartford ran a slight deficit, averaging 0.4 percent over the last three
years. Looking back over the previous five years however, the City of East Hartford’s budget
balanced slightly to the positive with an average surplus of 0.3 percent of its total revenues.
Although the negative over the last three years likely indicates the city faced some challenges, there
were still 34 municipalities in the state with a larger relative deficit. Two of those municipalities
with relative deficits higher than East Hartford over the last three years, also in the metro Hartford
region, included East Windsor (2.9%) and Stafford (2.4%). Among the 169 towns in Connecticut,
East Windsor ranked 163rd and Stafford ranked 159th in the measure of their relative surplus or
deficit. Stafford also was the only town to run a deficit six or more times during the last 10 years
among the municipalities of the metro Hartford region. For a perspective on this impact on the
region, Stafford with slightly more than 12,000 people accounts for 1.6 percent of the total
population and 1.3 percent of the total municipal revenues in the metro Hartford region.
4 See Appendix A for list of municipalities by population size.

APPENDIX B: MUNICIPAL FISCAL ANALYSIS
47
Other towns in the metro Hartford region that had relative surpluses, on average greater than four
percent over the last three years, included Bloomfield (4.03%), Andover (4.8%), Newington (5.3%),
Suffield (7.1%) and Windsor (9.2%). When examined over the last five years, these towns again
had an average surplus greater than four percent. This extension of the time frame back to include
the two years prior to the start of the recent economic crisis, so that the entire time frame runs
from 2006 through 2010, results in including the towns of Canton, Enfield, Wethersfield, and
Windsor Locks to the group of towns with average surpluses greater than 4 percent of their
revenues. Going back to the average over the last ten years adds East Granby, which had an average
surplus of 9.3 percent from 2001 through 2005, and drops Bloomfield out of the set that averaged a
surplus greater than 4.0 percent from 2001 through 2010. Bloomfield’s average relative surplus for
the first half of the decade (from 2001 through 2005) was only 2.2 percent.
Budget and Accounting Measures – Change in the Undesignated Fund Balance
An important line item within a municipality’s general fund is the undesignated fund balance. This
value reports a government’s money available for activities that are not directly reserved for other
uses. Annual changes in the undesignated fund balance reflect the requirements associated with
maintaining town services, covering unexpected costs and budget surpluses not spent.
Over the last three years of change (2007-2008 to 2009-2010), the 31 towns in the metro Hartford
region averaged an increase in their undesignated fund balance of 2.9 percent while all 169 of
Connecticut’s municipalities averaged an increase of 1.3 percent. Figure 86 shows these averages
for the five aggregate geographic groups primarily used for this study.
This average over time, however, hides important annual changes. Within the region, and
population size groups, the annual changes (averaged in Figure 86) are shown in Figure 87. To
provide additional context the changes between 2005-06 and 2006-07 are also included in Figure
87.
Figure 60: Average of Year to Year Change in the Undesignated Fund Balance, 2007-08 to 2009-2010

APPENDIX B: MUNICIPAL FISCAL ANALYSIS
48
Figure 61: Average of the year-to-year change in the Undesignated Fund Balance
While on average all the towns in the various regional groups presented in Figure 87 had declines
in undesignated fund balances from the 2008 to 2009 time frame, the larger population towns also
averaged a decrease from 2007 to 2008 but then averaged a slight increase between 2009 and
2010. Even within the four large population towns, Hartford and East Hartford showed increases in
undesignated fund balances between 2009 and 2010 while East Hartford and Manchester drew
down their undesignated fund balances again during those years.
Although all four of the largest towns reduced their undesignated fund balances between 2008 and
2009 in response to the financial and economic crises during that time, only nine of the 12 towns
with the smallest populations drew down their undesignated fund balance and only six of the
fifteen midsized population towns decreased. Overall, between 2008 and 2009, 19 towns in the
metro Hartford region drew down their fund balance accounting for 61 percent of all the
municipalities in the region while across the state 55 percent (93 municipalities) decreased their
undesignated fund balance.
-20%
-15%
-10%
-5%
0%
5%
10%
15%
20%
25%
Connecticut
Total
MetroHartford
Alliance
Small Population
Towns
Midsized
Population
Towns
Large Population
Towns
2005-06 2006-07 2007-08 2008-09 2009-10
Source: CT Office of Policy and Management

APPENDIX B: MUNICIPAL FISCAL ANALYSIS
49
Debt Measures - Debt Service per Capita
On average, over the 2008 through 2010 fiscal years, the 31 towns in the metro Hartford region
spent $37 less in servicing their debt on a per capita5 level than the $259 observed for the 169
municipalities in the entire state. Figure 88 shows that, on average, small and midsized towns had
lower debt service per capita than the state ($215 and $210 respectively) while the average of the
four larger population municipalities had a three year average debt service per capita of $287, $28
dollars per person above the state average.
Among all 31 metro Hartford region municipalities nine of the 12 small population towns had debt
servicing measures below the state’s average. The three small towns with three year averages
higher than the average for all the towns in the state include Granby at $367, Marlborough at $287,
and Somers at $276. Andover had the lowest debt servicing measure with an average debt per
person expenditure of only $68 over the last three years—this was the lowest measure of all the 31
towns in the metro Hartford region and 22nd lowest of all the 169 municipalities in the state.
Figure 62: Debt Service as a Share of Total Expenditures in Connecticut towns, 2007-2010
Among the midsized towns, five exceeded the state average including Avon ($275), Farmington
($365), Glastonbury ($317), Simsbury ($314), and Tolland ($311). Newington, with an annual
average of debt service per capita of $91 was the midsized population town with the lowest metric
in debt service.
Two of the four large population towns exceeded the state average for debt service per capita.
Hartford’s three year average of $290 was a modest $31 higher than the state’s average while West
Hartford’s $531 was $272 higher than the state. The higher debt service, observed in Figure 83 in
the Municipal Fiscal Analysis section of the report, for the municipalities in the metro Hartford
5 Because of the impact on the debt service per capita measure from unexplainable estimates in population changes between 2009 and 2010 CERC used population estimates (the denominator in the metric) based on liner interpolation of the population estimates from the 2000 and 2010 Census.

APPENDIX B: MUNICIPAL FISCAL ANALYSIS
50
region with the largest populations results from only the 2010 fiscal year data. A three year
average from 2007 through 2009 results in the average for the four towns in the region with the
highest population being $248 while the average for all 169 towns in the state was $252. For these
years Hartford was only 4 percent higher than the all town average. Even the measure of West
Hartford during 2007 through 2009 was only 69 percent above the state average, much lower than
the 105 percent above the state average observed for 2008 through 2010.
Debt Measures - Debt per Capita
Annual payments of debt service are closely associated with the overall level of debt carried by a
municipality. In 2010 this correlation averaged out to an increase of $0.11 in debt service for each
additional dollar of debt per capita among all Connecticut municipalities. Figure 89 shows that
Connecticut’s municipalities averaged slightly over $1,800 in debt per person over the three years
2008, 2009 and 2010. The average debt for each resident for the 31 municipalities in the metro
Hartford region during the same time was about $1,700 or approximately $100 less than the
average for the state.
Figure 63: Debt per capita 2008-2010
As was seen in Figure 88 the municipalities with the smaller populations had slightly higher
measures of debt service relative to the midsized municipalities. As would be expected, Figure 89
shows that the smaller towns also carried a higher level of debt relative to their population than the
midsized towns. These observations may suggest that there are efficiencies that can be gained by
relatively larger populations. However, as figures 88 and 89 indicate there is an upper boundary on
those efficiencies on issues related to debt as the municipalities with the largest populations appear
to be more burdened. The municipalities with the largest populations had higher debt measures
than the state’s average--$1,858 compared to the state average of $1,816.

APPENDIX B: MUNICIPAL FISCAL ANALYSIS
51
Among the individual towns in the metro Hartford region, the town with the highest three year
average is Marlborough with a debt per capita of $3,388. Even at this level there were 16
municipalities in the state with higher measures. Within the metro Hartford region Tolland had the
second highest debt per capita average over the three years from 2008 through 2010 at $2,848.
Granby was third highest at $2,845. The towns with the lowest debt per capita rates included East
Granby ($272), Newington ($570), Bolton ($710) and Enfield ($774).
The increase in debt service that was observed for the four municipalities with the largest
populations in 2010 is explained in part in the change in debt per capita observed over the last 10
years (Figure 90). The four municipalities with the largest populations started out in 2001 with the
lowest debt per capita rate of slightly over $1,000 while the midsized population towns started
with around $1,100 and the small population towns started significantly higher at more than
$1,550.
Figure 64: Debt per capita for Towns in the Metro Hartford Region, 2001-2010
Over the ten years from 2001 to 2010, the small towns increased some and then in recent years
decreased in the debt per capita so that over the full decade their overall increase was $149 or
about 9.5 percent. The midsized population towns grew more rapidly between 2001 and 2008
increasing their debt per capita by 2008 to $1,637. After 2008 they decreased slightly so that over
the 10 years between 2001 and 2010 they had an increase of $490 (44 percent). The municipalities
with the largest populations increased their debt per capita by $838 or 82 percent over the ten
years from 2001 to 2010. Among these towns, West Hartford had the largest increase in value at
$1,100 with Hartford slightly behind at $964. In percentage terms, Manchester’s debt per capita
increased by 131 percent, the highest of the four largest municipalities in the metro Hartford
region.

APPENDIX B: MUNICIPAL FISCAL ANALYSIS
52
Overall among the 31 towns in the metro Hartford region, Bloomfield increased its debt per capita
the most from $186 in 2001 to $2,372 by 2010. Cromwell had the second highest increase going
from $472 to $2,421.
Taxable Assets - Grand List per Capita
Although annual payments in debt service and overall measures of debt are important measures, a
municipality’s grand list or the overall measure of the assets in a town provides a critical dimension
in the understanding of the capacity to carry a given level of debt. Figure 91 shows that, on average,
the towns in the metro Hartford region had lower grand list per capita (average 2008-2010)
measures than the towns in Connecticut. Because this is a measure of assets and many of the towns
in Fairfield County have relatively high value assets, Figure 91 also includes a bar for the average
for the 146 towns in the state that are not in Fairfield County. However, even with a decline in the
average grand list per capita from more than $115,000 to nearly $101,850 for the municipalities
not in Fairfield County, the grand list per capita for the municipalities in the remaining seven
counties in the state is still nearly $16,600 higher than the average of the 31 towns in the metro
Hartford region. Among all 169 municipalities in the state, 65 had lower measures of average grand
list per capita than the metro Hartford region average.
Figure 65: Grand List per capita, average 2008 through 2010
As observed in the other graphics that have compared the towns based on population sizes, the 15
midsized towns on average had slightly stronger measures than towns with small populations and
the large population towns on average had weaker measures. In this case, the four municipalities
with the largest populations had the lowest grand list per capita average of the three groups of
towns.
Only the two towns of Avon ($132,000) and Farmington ($132,900) in the metro Hartford region
had higher grand list per capita measures than the average for the state as a whole. Although not
an outlier in the statistical sense, Hartford’s grand list per capita average of $27,500 was only 24
percent of the state as a whole. In fact, Hartford’s three year, five year and ten year averages in its

APPENDIX B: MUNICIPAL FISCAL ANALYSIS
53
grand list per capita measure were the lowest for each time period of all 169 municipalities in the
state. Among the metro Hartford region, Vernon with a three year average grand list per capita of
$57,100, was more than twice as large as the average for Hartford.
Over the ten years from 2001 through 2010, metro Hartford municipalities averaged an increase in
their grand lists per capita of nearly $35,200 from $55,300 to $90,500 (64 percent). However,
when compared to all towns in Connecticut their growth was 26 percentage points less. Since the
metro Hartford municipalities started in 2001 with an average grand list per capita of nearly $8,800
less and had slower growth, the overall trend is that the metro Hartford region is diverging from
the state in this important measure of wealth.
The small and medium population towns within the metro Hartford region increased their grand
list per capita by $37,500 and $38,600 respectively while the four towns with the largest
populations increased their average grand list per capita by about $15,300. Figure 92 shows these
increases and also reveals that the growth in grand lists per capita for the largest population towns
had only been in the last three years.
Figure 66: Growth in Grand List per capita, 2001-2010
Within the set of four municipalities of the metro Hartford region with the largest populations,
Hartford’s grand list per capita actually declined from $29,130 in 2001 to $27,829 in 2010, a decline
of slightly over $1,300. Of the remaining three, East Hartford grew the least in absolute terms, from
$41,630 to $60,550. However, this increase was the largest in percentage growth of the four (45
percent). The grand list per capita in Manchester grew by nearly $21,350 to $73,140 by 2010 (41
percent) while the grand list in West Harford grew by nearly $22,200 (40 percent) to $78,190 by
2010.
The ability of a municipality to carry debt can be shown to be statistically related to a municipality’s
grand list. The average grand list for all 169 municipalities in the state of Connecticut was $2,291.6

APPENDIX B: MUNICIPAL FISCAL ANALYSIS
54
million while the average debt was $46.3 million in 2010. For the 31 municipalities in the metro
Hartford region the average grand list was $2,007 million ($284m less than the state) and the
average debt was $44.6 million ($1.8 million less than the state). Thus, the average municipality in
the metro Hartford region had approximately 12 percent less in grand lists and nearly 4 percent
less debt in 2010. Hartford, with a grand list valued at $3,471.5 million and debt of $303.1 million
strongly impacts the grand list and debt averages for the metro Hartford region. Thus, when the
region is considered without Hartford, the remaining 30 municipalities still had an average debt of
$35.9 million (77 percent of the state average) and a grand list average of $1,959.0 million (85
percent of the state average).
Change in Debt and Grand List per Capita
As has been noted the ability of a municipality to carry debt is dependent in part on the grand list.
Figure 93 presents the 2000 and 2010 average of these measures on a per capita basis for all the
municipalities in Connecticut and the 31 municipalities in the metro Hartford region. Connecticut
shows an increased debt per capita measure from $1,456 in 2001 to $1,797 in 2010, an increase of
$341 or 23 percent. During the same years, the grand list per capita for the municipalities in
Connecticut grew from $64,125 to $121,999 an increase of $57,874 or 90 percent. The difference
between the increase in debt per capita and grand list per capita on average was 67 percentage
points as shown in data column 9 in Figure 93.
The average of the 31 municipalities in the metro Hartford region had a smaller debt per capita
measure in both 2001 and in 2010 than the average of all the towns in Connecticut. However, they
had higher increases in both total ($403) and in percent (32%) than the average of the 169 towns.
Consistent with the lower levels of debt per capita the municipalities in the metro Hartford region
had lower grand list per capita measures in both 2000 and 2010 and an increase in the measure
that was $22,703 per person less ($35,170 less $57,874) resulting an increase of 64 percent—26
percent less than the average for the 90 percent increase observed for all municipalities in the state
over that time.
Within the metro Hartford region the 12 towns with the smallest populations had the smallest
increase in debt per capita over the 10 years at only $149 or 10 percent while the municipalities
with the largest populations increased the average of their debt per person by $838 or 82 percent.
This increase in debt per capita for these towns was offset with an increase in grand lists of
Region
2000 2010 Change Percent
Change
2000 2010 Change Percent
ChangeColumn # 1 2 3 4 5 6 7 8 9
(8 - 4)
Connecticut Total $1,456 $1,797 $341 23% $64,125 $121,999 $57,874 90% 67%
MetroHartford Alliance $1,270 $1,674 $403 32% $55,329 $90,500 $35,170 64% 32%
Small Population Towns $1,558 $1,707 $149 10% $53,664 $91,167 $37,503 70% 60%
Midsized Population Towns $1,105 $1,596 $491 44% $59,513 $98,119 $38,606 65% 20%
Large Population Towns $1,028 $1,865 $838 82% $44,637 $59,925 $15,288 34% -47%
Source: CT Office of Policy and Management, U.S. Census Bureau. CERC calculations
Debt per Capita Grand List Per Capita Difference
in Percent
Changes
Figure 67: Change in debt and grand list averages for municipalities in regions of Connecticut, 2001 and 2010

APPENDIX B: MUNICIPAL FISCAL ANALYSIS
55
$15,288. When considered on a mill rate basis these increases suggest the mill rate (tax per
thousand) for the ratio of the new debt to the new grand would be a relatively high 54.42 and that
would be just for the debt expenditures rather than total government expenditures.
Debt to Grand List Ratio
The ratio of total debt to total grand list provides an additional perspective on the fiscal health of a
municipality. The average debt to grand list ratio for all the municipalities in Connecticut in 2010
was 1.81 percent—shown in Figure 94. This means that for every $1,000,000 in grand list the
average municipality in the state will have $18,100 in debt. The 31 towns in the metro Hartford
region had a debt to grand list ratio in 2010, on average, of 2.07 percent. Thus, for every $1 million
in grand list they had $20,700 in debt. However, removing Hartford which had a debt to grand list
ratio of 8.73 percent reduces the ratio for the remaining 30 municipalities in the metro Hartford
region to 1.85 percent, bringing the average for the remainder of the region to being on par with the
state average.
Figure 68: Average Ratio of Debt to Grand List for Municipalities in Regions, 2010
The 12 municipalities in the metro Hartford region with the smallest populations had a ratio of debt
to grand list of 1.95 percent on average, resulting in an average of nearly $1,500 more debt per $1
million in their grand list than the average for all municipalities in the state. Within this set of
towns, the ratio varies from a low of 0.16 percent for East Granby and 0.59 percent for Bolton to a
high of 3.32 percent for Stafford and 3.43 percent for Marlborough. The 15 midsized towns had a
lower average ratio of just 1.67 and slightly less variance. Within this set, the towns of Newington
with a 0.60 percent debt to grand list ratio, Rocky Hill with 0.83 percent, and Enfield with 0.96
percent, were the towns with the lowest debt to grand list ratio; while Tolland and Vernon both had
ratios of 3.26 percent to make them the highest ratios. The average debt per grand list for the large
population towns was 3.94 percent with the average dominated by Hartford. Without Hartford the
three remaining towns in that group would each still have higher debt to grand list ratios than the
state but with ratios of 1.99 percent for East Hartford, 1.97 percent for Manchester and 3.05
percent for West Hartford their average debt to grand list ratio would be 2.34 percent.

APPENDIX B: MUNICIPAL FISCAL ANALYSIS
56
The trend in the debt per grand list ratio over the last ten years is presented in Figure 95 for the
average of all towns in Connecticut and for the towns in the metro Hartford region. For all the
municipalities in Connecticut and the metro Hartford region the overall trend has been a reduction
in the ratio over the 10 years.
Figure 69: Trend in the Ratio of Debt per Grand List, 2001-2010
The average for all municipalities in Connecticut started with a ratio of nearly 2.8 percent, higher
than the 2.4 percent for those in the metro Hartford region. However, over the decade, the average
for the municipalities in Connecticut fell by nearly a percentage point while those of the metro
Hartford region fell by only 0.36 percent during that time.
The decline in the trend for the ratio in the metro Hartford region is shown in Figure 96 to be the
result of the decline observed on average for the municipalities with small populations. Ten of the
12 municipalities with small populations had declining ratios during the 2000 through 2010 time
period. On average, as shown in Figure 96, the decline in the ratio was 1.1 percent.

APPENDIX B: MUNICIPAL FISCAL ANALYSIS
57
Figure 70: Trend in Ratio of Debt per Grand List within Metro Hartford Region, 20001-2010
Among the midsized population municipalities in the metro Hartford region, nine of the 15 had
declines in the ratios of debt to grand list with the average of those 15 being around 0.2 percent.
The four large population municipalities in the metro Hartford region all increased the ratio of debt
to grand list over the 2001 to 2010 time period. Hartford with an increase of 3.7 percent was the
largest. Both Manchester and West Hartford had increases of 0.76 percent while East Hartford had
the smallest increase at 0.22 percent.
Commercial and Industrial Share of Total Grand List
The share of the grand list that is accounted for by commercial and industrial properties provides a
general indication of the rural or urban nature of the municipality identified by the level of business
presence. For all municipalities in Connecticut in 2010, about 40 percent of the variation in the
share of the grand list that was accounted for by commercial and industrial properties was
explained by the population in the municipality. On average, an increase in the population size by
10,000 results in nearly a 2 percent increase in the commercial and industrial share of the grand
list.
Figure 97 reflects these statistics with the small population towns having commercial and
industrial properties accounting for slightly more than 10 percent of the total properties on the
grand list, the midsized population towns accounting for slightly more than 15 percent, and the
large population towns account for nearly 24 percent. The average commercial and industrial
grand list share for the 31 municipalities in the metro Hartford region was slightly less than 15
percent and about 4 percent higher than the average for all municipalities in Connecticut.

APPENDIX B: MUNICIPAL FISCAL ANALYSIS
58
Figure 71: Average Share of Commercial and Industrial Properties in Total Grand List, 2010
Increasing the commercial and industrial share of the grand list for a municipality is commonly
perceived as an important strategy for economic development. Municipalities that increase non-
residential aspects of their grand lists should be able to reduce the relative taxes paid by the
residents of the town. The challenge against expanding commercial and industrial properties in a
municipality however will often come from residents who are concerned with the impact the new
properties could have. Figure 98 reveals that the trend has been toward a reduction in the share of
the value of the averages for the commercial and industrial properties for both the average
municipality in the state and for those in the metro Hartford region.
Figure 72: Trend in Commercial and Industrial Share of Total Grand List, 2001-2010
The slight increase seen since 2008 for the municipalities in the metro Hartford region was a result
of increases in 11 of the 15 midsized population towns with the most significant increases (4.5
percentage points) being observed for both Rocky Hill and Windsor. South Windsor was the next

APPENDIX B: MUNICIPAL FISCAL ANALYSIS
59
largest of the midsized towns with a one percentage point increase. Half of the 12 smaller towns
had increases in their shares of grand lists accounted for by commercial and industrial properties.
Among the largest population towns only East Hartford had an increase in the commercial and
industrial share between 2008 and 2010; however, over the ten year period Hartford was the only
large population town with an increase, moving from 36 percent to 39 percent. In fact, during the
10 year period from 2001 through 2010, Hartford had the highest commercial and industrial share
of the grand list of all 169 municipalities in the state of Connecticut.
Moody’s Bond Ratings
In the metro Hartford region, 29 of the 31 municipalities received Moody’s bond ratings as of July
2010. As shown in Figure 99, five of the metro Hartford region municipalities were rated at Aaa,
the highest rating. Since among all 169 towns in Connecticut only 18 received a Aaa rating in 2010,
the metro Hartford region had a higher share of municipalities than the state with the highest
rating—17 percent for the metro Hartford region and 13 percent for the state.
Region Total Aaa Aa1 Aa2 Aa3 A1 A2 A3 Baa1 Baa2
Connecticut 140 18 16 63 19 22 0 1 1 0
MetroHartford Alliance 29 5 3 17 3 1 0 0 0 0
Small Population Towns 10 0 1 7 1 1 0 0 0 0
Midsized Population Towns 15 4 1 9 1 0 0 0 0 0
Large Population Towns 4 1 1 1 1 0 0 0 0 0
Source: CT Office of Policy and Management
Figure 73: Count of Municipalities by Rating Level from Moody’s Bond Rating Analysis, 2010

APPENDIX B: MUNICIPAL FISCAL ANALYSIS
60
Both Connecticut and the metro Hartford region had the largest number of municipalities rated as
Aa2 – with 59 percent of the 29 municipalities in the metro Hartford region and 45 percent
statewide receiving the third highest rating. Both the small and midsized population municipalities
within the metro Hartford region also had the largest numbers of towns rated Aa2. The four large
municipalities in the region were spread evenly out among the four highest ratings.
The individual Moody’s bond ratings for the municipalities in the metro Hartford region are
presented in Figure 100.
Figure 74: Moody’s Bond Ratings for Towns in the Metro Hartford Region
Region Moody's Bond Rating
Small Population Towns Andover A3 (2009) Bolton Aa3 Canton Aa2 Cromwell A1 (2008) East Granby Aa2 East Windsor Aa2 Granby Aa2 Hebron Aa2 Marlborough Aa2 Somers Aa2 Stafford A1 Windsor Locks Aa1 Midsized Population Towns Avon Aaa Bloomfield Aa2 Ellington Aa3 Enfield Aa2 Farmington Aaa Glastonbury Aaa Newington Aa2 Rocky Hill Aa2 Simsbury Aaa South Windsor Aa2 Suffield Aa2 Tolland Aa2 Vernon Aa2 Wethersfield Aa2 Windsor Aa1 Large Population Towns East Hartford Aa2 Hartford Aa3 Manchester Aa1 West Hartford Aaa
Source: CT Office of Policy and Management Date: July 2010 unless otherwise specified

APPENDIX B: MUNICIPAL FISCAL ANALYSIS
61
The five municipalities with the highest rating Aaa included Avon, Farmington, Glastonbury,
Simsbury and West Hartford. The three municipalities with the second highest rating in the region
included Windsor Locks, Windsor and Manchester. Nearly all the other municipalities that received
rankings in 2010 were classified as Aa2 or Aa3, a classification that specifies them as “high quality
and very low credit risk” for long-term debt and among the “best ability to repay short-term debt.”
Andover and Cromwell were not rated in 2010 and although they received lower ratings, the
ratings are still classified as Prime 1/Prime 2 “best ability to repay short-term debt” and rated as
“upper-medium grade and low credit risk” for long-term debt.
The overall impression from the Moody’s bond ratings suggests a high to extremely high level of
confidence on the part of the rating agency in relation to the ability of the municipalities in the
metro Hartford region to repay the debt.
Municipal Fiscal Analysis Summary
The municipalities in the metro Hartford region approach their financial challenges in a variety of
ways. Although some of the approaches taken appear to be associated with the population size of
the municipality many of the metrics appear to be independent of their overall population size,
especially when including the other 138 Connecticut municipalities in the analysis. Figure 101
provides a comprehensive summary of all the metrics used in this municipal fiscal analysis except
for the Moody’s bond ratings which are summarized in Figure 100.
Figure 75: Municipal Fiscal Indicators Summary – Metro Hartford Region and Rest of State
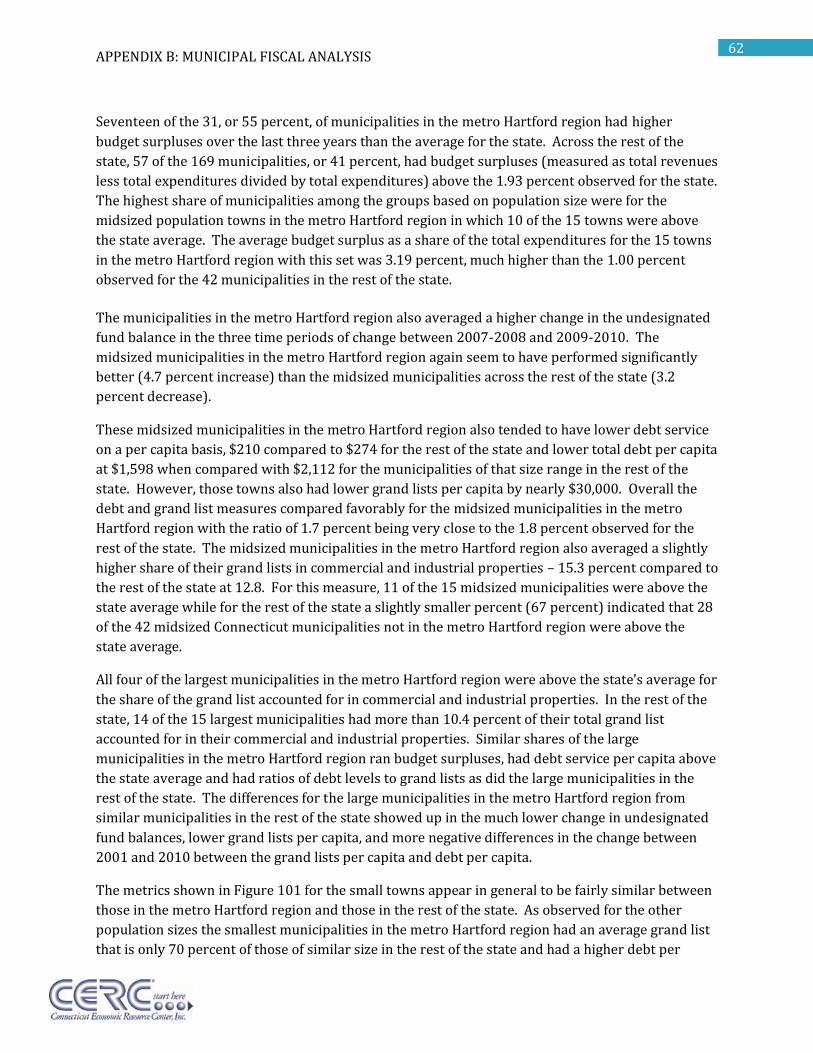
APPENDIX B: MUNICIPAL FISCAL ANALYSIS
62
Seventeen of the 31, or 55 percent, of municipalities in the metro Hartford region had higher
budget surpluses over the last three years than the average for the state. Across the rest of the
state, 57 of the 169 municipalities, or 41 percent, had budget surpluses (measured as total revenues
less total expenditures divided by total expenditures) above the 1.93 percent observed for the state.
The highest share of municipalities among the groups based on population size were for the
midsized population towns in the metro Hartford region in which 10 of the 15 towns were above
the state average. The average budget surplus as a share of the total expenditures for the 15 towns
in the metro Hartford region with this set was 3.19 percent, much higher than the 1.00 percent
observed for the 42 municipalities in the rest of the state.
The municipalities in the metro Hartford region also averaged a higher change in the undesignated
fund balance in the three time periods of change between 2007-2008 and 2009-2010. The
midsized municipalities in the metro Hartford region again seem to have performed significantly
better (4.7 percent increase) than the midsized municipalities across the rest of the state (3.2
percent decrease).
These midsized municipalities in the metro Hartford region also tended to have lower debt service
on a per capita basis, $210 compared to $274 for the rest of the state and lower total debt per capita
at $1,598 when compared with $2,112 for the municipalities of that size range in the rest of the
state. However, those towns also had lower grand lists per capita by nearly $30,000. Overall the
debt and grand list measures compared favorably for the midsized municipalities in the metro
Hartford region with the ratio of 1.7 percent being very close to the 1.8 percent observed for the
rest of the state. The midsized municipalities in the metro Hartford region also averaged a slightly
higher share of their grand lists in commercial and industrial properties – 15.3 percent compared to
the rest of the state at 12.8. For this measure, 11 of the 15 midsized municipalities were above the
state average while for the rest of the state a slightly smaller percent (67 percent) indicated that 28
of the 42 midsized Connecticut municipalities not in the metro Hartford region were above the
state average.
All four of the largest municipalities in the metro Hartford region were above the state’s average for
the share of the grand list accounted for in commercial and industrial properties. In the rest of the
state, 14 of the 15 largest municipalities had more than 10.4 percent of their total grand list
accounted for in their commercial and industrial properties. Similar shares of the large
municipalities in the metro Hartford region ran budget surpluses, had debt service per capita above
the state average and had ratios of debt levels to grand lists as did the large municipalities in the
rest of the state. The differences for the large municipalities in the metro Hartford region from
similar municipalities in the rest of the state showed up in the much lower change in undesignated
fund balances, lower grand lists per capita, and more negative differences in the change between
2001 and 2010 between the grand lists per capita and debt per capita.
The metrics shown in Figure 101 for the small towns appear in general to be fairly similar between
those in the metro Hartford region and those in the rest of the state. As observed for the other
population sizes the smallest municipalities in the metro Hartford region had an average grand list
that is only 70 percent of those of similar size in the rest of the state and had a higher debt per

APPENDIX B: MUNICIPAL FISCAL ANALYSIS
63
capita by 11 percent. Overall, these two metrics result in a slightly higher debt to grand list ratio
(2.0 percent compared to 1.3 percent). The small towns in the metro Hartford region however, also
had a slightly higher share of their grand list accounted for in commercial and industrial property
which may suggest that they may have a broader and more robust tax base to work from than the
small towns across the rest of the state.
One additional summary perspective is presented in Figure 102 which shows the rankings among
all the 169 municipalities in Connecticut for the 31 municipalities in the metro Hartford region.
Figure 76: Ranking based on all 169 Municipalities in Connecticut
Debt and Grand
list
Budget
Surplus
Change in
Undesignated
Fund Balance
Debt
Service
per Capita
Debt per
Capita
Commercial
Industrial
Share
Debt to
Grand List
Ratio
Grand List per
Capita
Connecticut Total 85 85 85 85 85 85 85
MetroHartford Alliance 73 79 92 86 62 99 103
Small Population Towns 85 79 92 89 90 102 99
Andover 23 3 22 100 156 117 111
Bolton 88 81 87 25 118 37 108
Canton 36 41 104 83 64 86 77
Cromwell 98 69 111 121 34 134 89
East Granby 50 12 49 7 42 9 70
East Windsor 163 155 80 39 6 47 98
Granby 74 133 146 147 136 151 99
Hebron 93 36 74 136 149 146 95
Marlborough 129 88 128 153 123 157 73
Somers 59 47 122 92 140 136 142
Stafford 159 163 106 108 99 149 146
Windsor Locks 46 116 69 57 10 57 83
Midsized Population Towns 60 67 88 80 50 88 95
Avon 64 31 120 59 75 38 41
Bloomfield 33 8 46 97 14 111 109
Ellington 114 30 71 50 102 67 117
Enfield 38 124 39 28 19 46 132
Farmington 91 93 145 142 15 109 38
Glastonbury 83 58 137 133 57 122 59
Newington 17 48 31 19 27 29 100
Rocky Hill 128 125 58 46 12 52 82
Simsbury 71 54 136 123 72 119 67
South Windsor 69 114 85 63 28 62 74
Suffield 13 50 86 58 100 81 124
Tolland 84 44 135 148 109 158 114
Vernon 47 80 77 101 36 152 157
Wethersfield 37 87 60 64 81 90 118
Windsor 7 60 92 74 5 83 87
Large Population Towns 91 122 107 97 22 134 149
East Hartford 135 127 82 55 18 103 154
Hartford 14 156 129 127 1 167 169
Manchester 101 131 56 78 9 114 144
West Hartford 113 75 160 128 60 150 127
A rank of 1 is the highest or
could be considered the
strongest measure observed for
the specific variable.
More of a
surplus
reduces the
rank
number
A larger positive
change in the
undesignated
fund balance
reduces the
rank number
A smaller
debt
service
per capita
reduces
the rank
number
A smaller
debt per
capita
reduces
the rank
number
A larger
commercial
and
industrial
share
reduces the
rank number
A smaller
ratio of
debt to
grand list
reduces
the rank
number
A higher
commercial and
industrial share
of total grand list
per capita
reduces the rank
number
Budget Items Debt Items Grand List Items

APPENDIX C: STRATEGIC DOCMENTS
64
APPENDIX C: Strategic Projects
Metro Hartford Millennium Project: An Economic Development Action Agenda, January 1998 The goal of this project is to develop an inclusive and creative economic plan for the region that will inspire municipalities to start to feel ownership in regional outcomes and in the regional economic synergy those outcomes will create. The second goal is to develop a Strategic Action Agenda with specific steps to achieve the goals. Key recommendations: 1. Support and strengthen a renewed civic infrastructure to create and sustain economic development at the neighborhood, city, and regional level. 2. Forge a globally competitive regional economic base that generates quality jobs for all residents. 3. Challenge the region to build a world-class workforce and educational system suited to a global economy. 4. Create a vibrant and culturally rich city with a vital downtown serving as a regional arts and entertainment center with strong neighborhoods providing improved quality of life. 5. Support regional land use and infrastructure policies and efficient use of regional resources by promoting cooperative service delivery and reduced reliance on property tax.
Economic and Urban Design Action Strategy – December 1998 The Action Strategy springs from the Millennium Project which identified that a vibrant downtown is a significant element in a healthy regional economy. The Action Strategy outlines actions to be implemented in downtown Hartford over the short, medium, and long term. The actions are broadly grouped into: Urban Structure, Land Use and Transportation. The plan proposed action strategies to reinforce a more complex pattern of land use – have people come into the city to live, work, shop, and for entertainment The plan developed a series of high priority initiatives for implementation over the next 3-5 years that it called the Circuit Line. The Circuit Line is a band of rejuvenation and also a transit line. The strategy includes: streetscape improvements, restoration of green spaces, building more residential units, expanding retail space, and consolidating parking lots into garages and building residential units on old parking lots. In order to implement the strategies, the plan calls for:
1. Creating a design center made up of professionals representing urban design, architecture, transportation and landscape architecture to review projects and recommend those that will have the greatest benefit.
2. Creating a Downtown Development Corporation to spearhead and serve as a public-private catalyst for downtown investment decisions.
3. Consolidate downtown parking resources under a common management and marketing umbrella. 4. Refine and calibrate land use regulations in support of the plan, in particular, preserving key sites for
resident use and to require development to respond to urban design guidelines. 5. Define a capital budget that includes public improvements and infrastructure investments in
downtown.
Hartford 2010 – June 2007
After looking at the City’s recent and ongoing economic development initiatives, a set of recommendations were developed to attract more private investment to Hartford. This report focuses on revitalizing Hartford and more effectively linking the City’s major streets and avenues to create a more dynamic region. Several key objectives of the report include:
1. Leveraging the investment of over $1billion in public and private funds that occurred over five years to strengthen Downtown and all of the City’s neighborhoods;

APPENDIX C: STRATEGIC DOCMENTS
65
2. Enhance the ability of the Region to market itself as a dynamic, growing economy; and 3. Ensure that economic opportunities reach all Hartford residents.
The iQuilt Plan – 2012) http://theiquiltplan.org/storage/iQ2%20Overview%20Jan.27.pdf The iQuilt is a culture based urban design plan for Downtown Hartford. The goal is to make Connecticut’s capital city more culturally vibrant, environmentally sustainable, and economically prosperous.; the central gathering place for the neighborhoods of the city and the towns in the region. The iQuilt Plan lays out a strategy and design for making Downtown’s public spaces more enjoyable and walkable, by linking Hartford’s arts and cultural assets and by showcasing the Region’s strengths in cultural and industrial innovation. The plan leverages existing investments and assets such as the Riverfront redevelopment and The Bushnell; integrates funded capital improvements; and focuses on projects that are both achievable and transformative. The iQuilt is an integrated suite of projects, both large and small, that can be implemented by different entities in different phases. Examples of some of the projects include: making the city more walkable by widening sidewalks, improving lighting and street signage, and including favorable signal timing; linking the cultural assets by creating walking trails linking major cultural destinations; developing a visual language through coordinated signs; and making it easy to bike, run, and exercise by creating a bike station in Bushnell Gardens and the creation of bike lanes.
One City, One Plan – Adopted in 2010, reissued in 2011 One City, One Plan is Hartford’s Plan of Conservation and Development (POCD). The plan contains five main themes that serve as the organizing structure for the goals and implementation strategies. The five broad planning themes are:
1. Promote liveable and sustainable neighborhoods 2. Protect the City’s natural and built environment 3. Enhance mobility through transit, pedestrian, and bike systems city-wide 4. Advance Downtown’s role as the region’s center for commerce, culture and city living 5. Promote and encourage the integration of sustainable practices
HARTFORD 360: The Capital City’s Near Term Development Agenda, April 5, 2011
http://development.hartford.gov/Documents/Copy%20of%20Hartford%20360%20-%20FINAL_040511.pdf Hartford 360: The Capital City’s Three‐Year Development Agenda (“Hartford 360”), constitutes a framework for moving forward aggressively with strategic implementation of the development strategy set forth within One City, One Plan – Hartford’s Plan of Conservation and Development 2020, (“One City, One Plan”). Prepared in mid‐2010, One City, One Plan is the overall guide to the growth and development of the City as required by Connecticut state statute. The overarching goal of Hartford 360 is to achieve long‐term economic health for the City of Hartford and its residents. Hartford 360 is based on the five goals of One City, One Plan and adds a single new goal, that of achieving citywide economic development and workforce readiness. Thus, the goals of Hartford 360 are as follows: Goal 1. Promote livable and sustainable neighborhoods. Goal 2. Protect the City’s natural and built environment. Goal 3. Enhance mobility through transit, pedestrian, and bike systems citywide .

APPENDIX C: STRATEGIC DOCMENTS
66
Goal 4. Advance the City’s role as the region’s center for commerce, culture, sports, and entertainment. Goal 5. Promote and encourage the integration of sustainable practices. Goal 6. Expand the City’s economic base and align with future workforce readiness efforts.
Key Recommendations: The successful implementation of Hartford 360 will require the following:
The focused allocation of scarce human and financial resources to these initiatives in advance of other competing projects
A sustained focus and a commitment to the long‐term success of this strategy. Systematic monitoring of progress will be essential to the effectiveness of Hartford 360 as a vehicle for focusing municipal energy and resources at a strategic level. The mayor should meet monthly with a “Development Cabinet” to be chaired by the Director of Development Services, to review progress and to determine appropriate mid‐course corrections. Updates would be provided by the municipal officials with lead responsibilities for the various Priority Areas and Action Steps. Hartford 360 is intended as a dynamic management tool and should be adapted to changing circumstances and opportunities as appropriate over time.
Finally, Hartford 360 represents an opportunity to capitalize on the huge investment of the City and others in the multiple plans and studies prepared in the past. This is the acid test. This is an opportunity for the City to clearly articulate its priorities, to embark on a strategic implementation process, and to manage its resources with the goal of achieving a Hartford renaissance.
New Britain-Hartford Busway The New Britain-Hartford Busway is a dedicated Bus Rapid Transit (BRT) facility running 9.4 miles between downtown New Britain and downtown Hartford. The busway corridor follows an abandoned railroad right-of-way from New Britain to Newington Junction for about 4.4 miles. From that point north for approximately 5 miles, the corridor lies within active Amtrak railroad right-of-way and will end at Asylum Street and Spruce Street adjacent to Hartford’s Union Station. Construction of the busway will start in the spring of 2012 and is expected to be operational by 2014. The busway will serve 11 transit stations and operate between 5am and 1am, approximately. There will also be extension lines serving the UConn Health Center and Eastern Connecticut State University. The total project cost was anticipated to be $567 million.
Metro Hartford Strategic Plan 2012-2015 http://www.metrohartford.com/initiatives/strategic-plan The MetroHartford Alliance serves as economic development leader for the Hartford region and as the City’s Chamber of Commerce. The Alliance’s mission is to ensure that the region competes aggressively and successfully for jobs, capital, and talent. To achieve this mission ,the Alliance set for the following priorities:
1. Foster a climate for job creation and infrastructure investment 2. Retain, develop, recruit, and engage a diverse and talented pool of employees and entrepreneurs 3. Market the region and attract people, jobs and capital 4. Promote the stability and expansion of specific industry sectors with a link to support small business
growth 5. Market the region’s assets to retain and attract businesses 6. Ensure that the Capital City is the dynamic urban core of the Region
HUD Livability Principles CRCOG and the Pioneer Valley Planning Corporation (PVPC) heading up HUD project.

APPENDIX C: STRATEGIC DOCMENTS
67
1. Provide more transportation choices 2. Promote equitable, affordable housing. 3. Enhance economic competitiveness 4. Support existing communities 5. Coordinate and leverage federal policies and investment 6. Value communities and neighborhoods
Lessons From Resurgent Cities http://www.bostonfed.org/about/ar/ar2009/lessons-from-resurgent-cities.pdf In 2008, the Federal Reserve Bank began a project to help reinvigorate Springfield, MA – a struggling mid-sized older industrial New England city. Based on their research, they developed a set of lessons that could be applied to other cities facing similar economic conditions –economic performance over the past fifty years has not been as strong as the national economy; deep changes in racial and ethnic composition; and an economy that transitioned away from being manufacturing-oriented economy. A total of 25 cities were identified – ten cities were found to have done substantially better than the others and were identified as ‘resurgent cities’ – Hartford was not one of them but was identified as a ‘peer city’ to Springfield. Key components to a resurgent city:
1. Leadership – The more successful cities typically have a private, nonprofit organization heading economic development. Economic resurgence has only been weakly linked to geography. For example, New Haven was identified as a resurgent city whereas Hartford was not. This suggests that although statewide policies may have been a factor in easing economic adjustment, the cities themselves ultimately played an important role in determining their own fates. The following are a few examples from resurgent cities that involved public sector, nongovernmental, and private development leadership:
a. Providence, RI the “Renaissance City”- relocated railroad tracks that ran through downtown; removed a bridge that obscured the two rivers; established tax incentives to allure artists to live downtown; and created a loan program to help in launching restaurants.
b. The ‘medical mile’ in Grand Rapids, MI – created a healthcare industry c. Jersey City’s redevelopment of the waterfront
2. Universities make a difference – Institutions of higher education have played a role in invigorating cities’ economies as major employers and educators.
a. Greensboro Community College, NC – redesigned job-training curriculum to help area businesses
b. Worcester, MA – the educational institutions formed the UniverCity Partnership to adopt strategies allowing higher education to participate in economic growth by improving local purchasing, employment, real estate development, business incubation, and workforce development.
3. Planning and re-evaluating are critical-Leadership and collaboration facilitated long-term planning that allowed resurgent cities to develop more dynamic economies.
a. Worcester, MA – Working with the Chamber of Commerce, UMass, Worcester established the MA Biotechnology Research Institute to attract biotech companies. However, it had to readapt its approach because biotech companies employ a small number of people and take a long time to achieve profitability so it changed its name to MA Biomedical Initiatives and now focus on attracting biomedical device companies.
4. Infrastructure Improvements and industry modernization matter – The resurgent cities have focused on modernizing their transportation and communication infrastructures by expanding regional airports,

APPENDIX C: STRATEGIC DOCMENTS
68
improving roads, and building high-speed communication networks. Resurgent cities have also recognized the importance of revitalizing downtown as a way to create employment and attract residents. Several cities rely exclusively on nonprofit organizations to create, develop, and implement revitalization strategies.
a. Peoria, IL – a new airport terminal improved manufacturers’ and distributors’ access to transportation
b. Worcester, MA – establishment of frequent commuter rail to Boston and direct access to the Turnpike encouraged new investments in the city
c. Greensboro, NC – Downtown Greensboro, Inc. focuses entirely on downtown; part of the plan includes the Restaurant Row Program to help finance new eateries.
5. Disadvantaged neighborhoods require specific focus – Resurgent cities continue to struggle with extending prosperity to all residents. Direct involvement and collaboration with the community in shaping planning efforts has proved to be important in creating long-term strategies.
a. Jersey City, NJ – residents of one of the poorest neighborhoods participated in writing their neighborhood development plan and also controlled its implementation through a neighborhood development corporation.
CAPITOL REGION TRANSPORTATION PLAN: A Guide for Transportation Investments through the Year 2040, published May 4, 2011 http://www.crcog.org/publications/TransportationDocs/RTP2011/2011-RTPFinal.pdf
The Capitol Region Transportation Plan outlines a comprehensive program for improving the transportation system to meet travel needs through the year 2040 for the towns in the MetroHartford region. For the most part, it is a systems level plan that provides general policy guidance. It defines the Region's greatest needs, identifies which problems are the Region‘s highest priority, and outlines how the Region should spend its limited capital funds. It reaffirms the Council‘s commitment to developing a transportation system that offers more and better travel choices, and continues its emphasis on developing a good regional transit system as an alternative to the automobile. It also reaffirms and strengthens our commitment to developing a bicycle and pedestrian system. This Plan also includes a strong commitment to linking land use and transportation planning, aimed at creating a sustainable transportation system. A continued support for Bradley International Airport, the beginning of a freight planning program, and a commitment to environmental justice are also included.

APPENDIX C: STRATEGIC DOCMENTS
69
The Contribution of Bradley International Airport to Connecticut’s Economy: Economic Impact Analysis, May 27, 2005 http://www.ct.gov/ecd/lib/ecd/bradley_airport_study_5.27.05_final_.pdf
The purpose of this study is to illustrate the importance and interconnectedness of Bradley to Connecticut’s economy and future economic development. To show the effects of the airport on the level of economic activity in the state of Connecticut, the broadly defined economic impact measures of jobs (employment), value added (gross regional product), and personal income (including wages) is used. The RIMS II analysis estimates the economic impacts of Bradley at 22,140 jobs, which produces $2.0 billion in output, which helps create $618 million in income for Connecticut residents. This is directly comparable to the Airport Operations scenario in the REMI analysis, which estimates Bradley’s impacts at 17,700 jobs, $1.8 billion in output, and $578 million in income. The next two sets of results include dynamic projections of Bradley’s impact over a 20-year horizon. The Tourism Effect scenario shows the double-edged sword of traveler impacts, relative to the first REMI scenario, in that employment impacts decrease to 8,251, and output and income decrease to $1.1 billion and $480 million respectively. Finally, the Airport Contribution scenario shows the real value of Bradley as a facilitator of air travel for passenger and cargo purposes. Here the long-term contribution of the airport sustains over 140,000 jobs, more than $34 billion in output, and over $11 billion in income for residents. These analyses show the critical role that Bradley plays in the local and regional economies as both an active employer and driver of economic impacts, but more so, as an invaluable transportation asset that propels Connecticut’s people and businesses forward in an increasingly integrated and competitive international economy.
Opportunities Hartford: A Progress Report on the Citywide Effort to Enhance and Expand Existing Educational, Job and Income Opportunities in Hartford, 2011 http://opportunities.hartford.gov/about.aspx
The long-term goal is to bring existing opportunities to a scale large enough to significantly, measurably and sustainably improve the quality of life in Hartford and increase the ability of low-income Hartford families to improve their economic status. The study developed the following key findings:
1) Downtown Hartford needs to continue its transformation from primarily a business locale to a 24/7 multi-dimensional center connected to people in the neighborhoods—with opportunities for shopping, entertainment, learning, cultural enrichment, and housing. The downtown move of Capital Community College was cited by many as a positive step.
2) Improving educational outcomes in the City was widely recognized as both a critical need and opportunity. The Hartford Public Library is seen as a model for success in terms of its accessibility and emphasis on family education: ELL, financial literacy, and early child care and education.
3) Partnerships and collaborations that create efficiencies among agencies and funders are considered essential to the ongoing success in the effective delivery of support services in Hartford.
Comprehensive Economic Development Strategy for MetroHartford: A Call for a Sustained Regional Team Effort, 2006 The purpose of this Comprehensive Economic Development Strategy is to call to action political, business, and civic leaders in Metro Hartford. Key findings: This plan presents 40 recommendations in five functional areas. However, there are six recommendations or sets of recommendations that should be considered the highest priority, and those

APPENDIX C: STRATEGIC DOCMENTS
70
recommendations should be given the greatest level of attention to help put the Metro Hartford region on the right economic track.
1. Influence public policy to change factors affecting the cost and ease of doing business in Connecticut. 2. Build a stronger support system for entrepreneurs and small businesses. 3. Establish innovative programs to improve the performance of public K-12 education systems to make
the City of Hartford and the Metro Hartford region globally competitive. 4. Develop housing policies and programs that promote affordable housing throughout the region. 5. Continue to enhance and build a positive image for the Metro Hartford region. 6. Establish a collective compact agreement to implement the recommendations in this report.
Central Connecticut Comprehensive Economic Development Strategy: A plan for sustainable economic development, 2011 http://www.ccrpa.org/CEDS/2011-CEDS-final.pdf
The Central Connecticut Region comprises the cities of New Britain and Bristol and the towns of Berlin, Burlington, Plainville, Plymouth, and Southington. In the year 2030 the Central Connecticut Region will be a vibrant industrial, commercial and technological region that supports a thriving educational community, successfully embraces diversity, and recognizes the value of its rich spectrum of popular, cultural and natural environments. It will be the home of an energized technological cluster of industries, and will have a fully employed, multi-skilled, effectively educated work force upon which the region’s strong public institutions and its participatory democracy will be built. The region will be addressing its challenges on a regional basis with strong inter-community cooperation and with institutions capable of dealing satisfactorily with the needs of its disadvantaged citizens. The region’s success will be founded upon an integrated fabric of well-designed, constructed, and maintained community infrastructure facilities. It will host a series of community events and programs that will demonstrate the effectiveness of its cooperative spirit, and will capitalize on the region’s valued historic heritage. It will be a place that is perceived as successful and desirable, as well as one which its residents and business-people will speak of with great pride. Goal 1: Planning and Cooperation Build a stronger regional economic development program that achieves closer coordination among municipalities and between Central Connecticut, the state, and other surrounding regions. Goal 2: Responsible Growth Promote responsible development patterns that improve the region’s quality of life, provide recreational amenities, use resources wisely, promote sustainability, and contribute to economic development. Goal 3: Workforce Development Attract, retain, and develop a skilled and diverse workforce that meets the needs of existing employers and is attractive to new firms providing high quality, high paying jobs. Goal 4: Business Creation, Attraction, & Retention Foster an environment that is conducive to the creation and at-traction of new firms and industry clusters, while helping to strengthen existing firms and clusters. Goal 5: Physical Infrastructure Maintain, improve, and develop the region’s infrastructure so that it meets the needs of existing and growing industries and clusters.

APPENDIX C: STRATEGIC DOCMENTS
71
ANNUAL CEDS REPORT: Signs of Sustainability, The Pioneer Valley Plan for Progress, The Region’s Comprehensive Economic Development Strategy, August 2011 http://www.pvpc.org/resources/ecdev/CEDS-2011-final-web.pdf Geography: 43 cities and towns comprising the Hampshire and Hampden county areas in western Massachusetts Overall goals or mission
Strengthen and expand the region’s economic base Foster means of regional competitiveness Supply the region with an educated, skilled, and adequately sized pool of workers Foster the region’s business climate and prospects for sustainable economic growth
Key recommendations The Plan includes seven cross-cutting themes that strategy teams must consider in their action plans in order to meet the region’s goals: cross-border collaboration (with the greater Hartford region), diversity, education, industry clusters, sustainability, technology, and urban investment.
ACHIEVING THE BALANCE: A Plan of Conservation and Development for the Capitol Region (adopted 2003, updated October 2009) http://www.crcog.org/community_dev/regional_plan.html
Geography: Connecticut’s Capitol Region encompasses the City of Hartford and the 28 surrounding suburban and rural communities. Overall goal or mission: Plan is primarily used to guide the Capital Region Council of Government’s (CCROG) planning and review activities Following is a summary of the goals designed to implement CCROG’s vision for the region’s future: Conservation Goals
Natural Resource Conservation • Protect air, water, and soil quality in the region • Grow and develop in harmony with natural resources • Promote active natural resource stewardship Watersheds and Water Quality • Improve and maintain water quality • Protect water supply and increase water conservation efforts • Reduce nonpoint source pollution • Continue combined sewer overflow and point-source pollution discharge reductions • Use innovative wastewater treatment techniques for new developments Open Space and Farmland Preservation • Support protection of more open space in the region • Encourage preservation of farmland in the region • Encourage preservation of declassified water company land as open space • Coordinate and prioritize open space preservation throughout the region • Expand and protect open space along major rivers Food System • Preserve the Capitol Region’s working lands • Improve regional residents’ access to food resources • Improve the health and nutrition of the region’s population • Reduce environmental impacts of the food system

APPENDIX C: STRATEGIC DOCMENTS
72
Development Goals Land Use and Zoning • Guide growth to regional centers and areas of established infrastructure • Increase redevelopment and infill development efforts • Revise zoning and subdivision regulations to address local and regional land use concerns Public Water and Sewer Service • Ensure an adequate and high quality water supply • Reduce environmental impacts of sewage discharge • Use existing water and sewer infrastructure to guide future growth • Balance water supply and ecosystem considerations Transportation • Provide a range of viable transportation options within the region • Improve interregional and interstate transportation • Coordinate land use, environmental, and transportation efforts • Anticipate and plan for future transportation needs Housing • Increase the range of choice in housing for people of all incomes and all ages, but especially for those who have the least choice in achieving their locational preference • Enforce Federal and State fair housing laws • Encourage and support the maintenance of viable residential neighborhoods • Support preservation of the region’s rental housing stock, and the expansion of housing opportunities for renters throughout the region. • Continue to improve the Capitol Region transportation system in order to better link housing, jobs and services, thus expanding individuals’ housing choices Economic Development • Revitalize Hartford as the economic, residential, entertainment, and cultural center of the Capitol Region • Coordinate and promote regional land use, infrastructure, and fiscal policies for economic development • Increase the recognition of a regional identity • Maintain a focus on workforce development • Support and improve regional business development strategies and efforts
New England’s Knowledge Corridor: The Hartford-Springfield Economic (HSEP) Partnership, September 2000
http://www.hartfordspringfield.com/about_us/overview
It comprises the Hartford and Springfield metropolitan areas and is centered on six counties—three in each state—linked by a shared economy, history and culture and by features including Bradley International Airport, rail lines, Interstate 91 and the Connecticut River.
HSEP markets the region as “New England’s Knowledge Corridor,” emphasizing the area’s rich history of innovation, invention and world-class educational assets.
HSEP promotes the region through a variety of initiatives focused on business development, talent retention, advocacy and research. HSEP has advanced projects with regional implications and furthered the economic progress of the interstate region by capitalizing on historic economic, natural and cultural ties. For marketing purposes, the region has been branded, "New England’s Knowledge Corridor: Gateway to Innovation," underscoring the area’s rich tradition of inventions, research and higher education.

APPENDIX C: STRATEGIC DOCMENTS
73
CAPITAL WORKFORCE PARTNERS BUSINESS PLAN SUMMARY 2011-2012 http://www.capitalworkforce.org/documents/BPES-11-web.pdf
The Capital Workforce Partners provides workforce development programs and services to 37 municipalities in North Central Connecticut. The Business Plan provides a framework from which Capital Workforce Partners will operate. The Plan integrates all elements of Capital Workforce Partners’ budget, programs, and initiatives. Key recommendations Capital Workforce Partners Strategies Sector-driven business strategy - Need for market intelligence to focus training efforts on developing skills for occupations in demand in sectors with the most job growth, i.e., Green Construction/Technology, Advanced Manufacturing, Allied Health, emerging sectors. Business support and employer engagement - CWP activities need to be consistent with and meet the needs of business, while developing partnerships with employers and economic development entities to create more focused training opportunities to support job creation. Career development and advancement strategies, including the work and learn model - It is not enough to place people in jobs. Instead, there should be a focus on skill development and helping people find career pathways that will lead to better wages and self sufficiency. The work and learn model is one approach to developing skills while obtaining work experience. Career competencies - Career competencies are employer identified competencies that workers need. The system for developing these competencies (basic skills, prevocational, and vocational) provides businesses with workers who have work readiness skills. Linkage with 8th-12th grade school system - Developing a career focus in youth at an earlier age helps youth stay motivated. Involvement in youth programming (aligning school/career competency and summer/year round) outside of school helps youth stay in school and gain workplace skills. CWP’s mutually supportive services enable increased numbers of youth to graduate from high school with full a full set of career competencies. Community Outreach/Partnership - Workforce development requires attention at the policy level and adequate resources for effective outcomes. This can only be accomplished through diligent local, state and federal outreach. Recognition of and support for employer needs, partnership for efficiencies and maximized results, workforce development system success and its intrinsic relationship with economic development, require continuous education of key stakeholders. It also requires collaboration and partnership development to maximize limited resources.
2012-2016Connecticut DRAFT State Rail Plan (SRP) http://www.ct.gov/dot/lib/dot/documents/dplansprojectsstudies/plans/state_rail_plan/State_Rail_Plan_Final_Draft_2-8-12.pdf
The purpose of the SRP is to set forth state policy involving passenger and freight rail in the state, to present strategies and priorities to enhance rail service that benefits the public, and to serve as the basis for federal and state rail investments within the state. The vision for rail transportation in Connecticut is a system that provides high-speed, intercity, regional commuter and freight services that will be a catalyst for smart growth, encourage greater mobility, promote the state and regional competitive advantage in the global economy, decrease highway and aviation congestion, reduce energy use, and improve air quality. The SRP presents strategies and programs aimed at carrying out its vision by first ensuring that the existing passenger and freight rail infrastructure is maintained in a state of good repair and then maximizing the potential of current rail services.

APPENDIX D: MetroHartford Regional Goals and Action Steps Matrix
74
APPENDIX D: MetroHartford Regional Goals and Action Steps Matrix
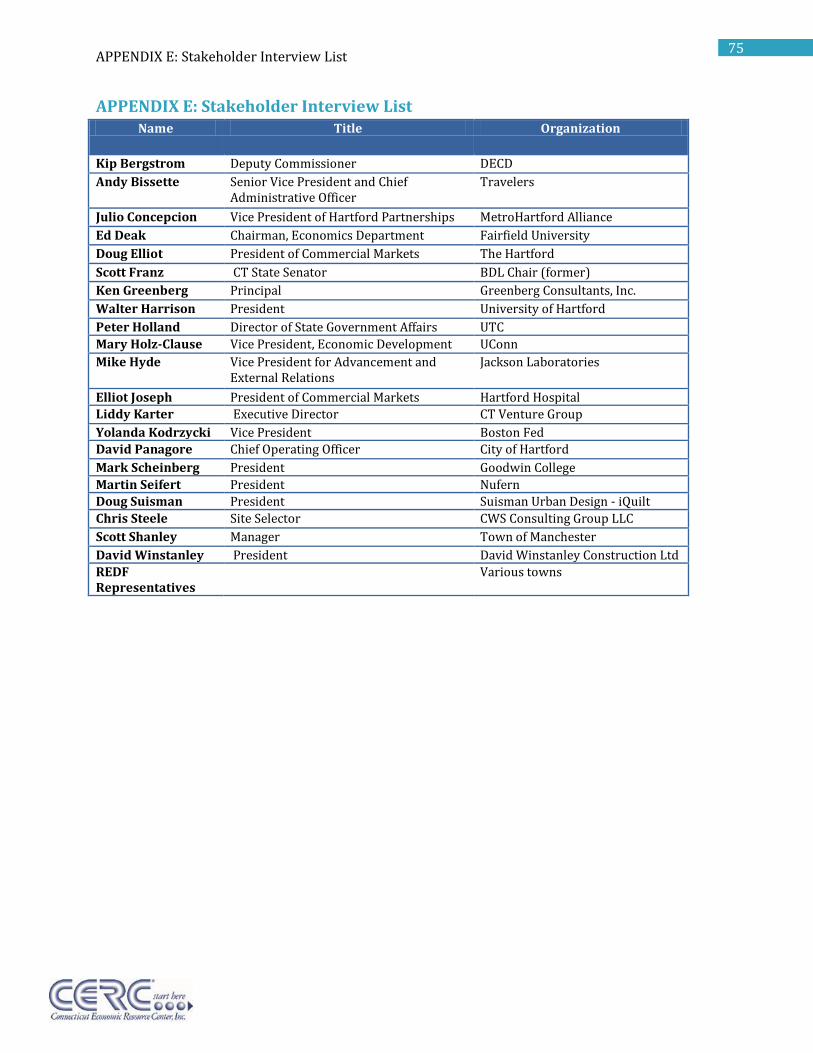
APPENDIX E: Stakeholder Interview List
75
APPENDIX E: Stakeholder Interview List Name Title Organization
Kip Bergstrom Deputy Commissioner DECD
Andy Bissette Senior Vice President and Chief Administrative Officer
Travelers
Julio Concepcion Vice President of Hartford Partnerships MetroHartford Alliance
Ed Deak Chairman, Economics Department Fairfield University
Doug Elliot President of Commercial Markets The Hartford
Scott Franz CT State Senator BDL Chair (former)
Ken Greenberg Principal Greenberg Consultants, Inc.
Walter Harrison President University of Hartford
Peter Holland Director of State Government Affairs UTC
Mary Holz-Clause Vice President, Economic Development UConn
Mike Hyde Vice President for Advancement and External Relations
Jackson Laboratories
Elliot Joseph President of Commercial Markets Hartford Hospital
Liddy Karter Executive Director CT Venture Group
Yolanda Kodrzycki Vice President Boston Fed
David Panagore Chief Operating Officer City of Hartford
Mark Scheinberg President Goodwin College
Martin Seifert President Nufern
Doug Suisman President Suisman Urban Design - iQuilt
Chris Steele Site Selector CWS Consulting Group LLC
Scott Shanley Manager Town of Manchester
David Winstanley President David Winstanley Construction Ltd
REDF Representatives
Various towns

APPENDIX F: Meetings
76
APPENDIX F: Meetings
MetroHartford CEDS Planning Meeting
September 28, 2011
2:00 p.m.
Conference Call
AGENDA
Timeline Strategy Committee
o membership o division of labor
Public Outreach Communications with EDA
o scope o submission and approval
Previous CEDS o what worked well o challenges
Consideration of non-EDA funded CEDS – 303.7(c) Other Plans to be Considered – 303.7(b)(2)(i)
o workforce o TIP o regional plan of C&D
Idea of past, present and future projects Level of specificity in action plan – 303.7(b)(8) Incorporating the state’s economic development priorities Does graphic in proposal meet needs for EDA/HUD integration? Other discussion items
PARTICIPANTS
Alissa DeJonge, Connecticut Economic Resource Center
Bob Santy, Connecticut Economic Resource Center
John Shemo, MetroHartford Alliance

APPENDIX F: Meetings
77
MetroHartford CEDS Planning Meeting
November 3, 2011
9:30 a.m.
at Capital Region Council of Governments Office
Hartford, CT
AGENDA
1. EDA CEDS Requirements
2. Integration with HUD Livability Principles
3. Review of CEDS Timeline
PARTICIPANTS
Alissa DeJonge, Connecticut Economic Resource Center
MaryEllen Kowalewski, Capital Region Council of Governments
Bob Santy, Connecticut Economic Resource Center
John Shemo, MetroHartford Alliance
Lyle Wray, Capital Region Council of Government
MEETING NOTES
Need to integrate with Springfield and Knowledge Corridor. do the analysis of the MetroHartford region, but tie in critical recommendations based on cooperative activities
Nothing is too big to address. We need to push on the issues which are really game changers, like Property tax reform. Look at the language on property tax reform in the Millennium report.
APPENDIX F: Meetings
78
Look at the CCRPA Ceds and the Pioneer Valley Plan for Progress
Big idea: What is the right relationship between the state and the region? How do we avoid the disconnects like the $39 million state investment in the CT-21 project as opposed to recommendations in the Greenberg Report?
Approaches to development are changing, and are more integrated. This is reflected by the federal Sustainable Communities approach across agencies. Communities and regions naturally take a more integrated approach. However, the state structures do not reflect this new approach. Initial efforts ( like the TSB) to work across disciplines have not worked. The current administration is already operating in an integrated fashion on some issues. How do we institutionalize this to make it worked, with the goal being the development of successful communities?
We need to do something on energy reliability and redundancy and cost.
Are their major infrastructure issues that are holding us back as a region? Are we addressing the broadband issues?
Do we want to update the Regional index? Is there and opportunity to apply the index to the HSEP region? Is there the possibility of funding from NU for this?
We need to monitor state DECD's approach to EDDs. Will that still be a organizational priority for them? This will lead to a decision on whether MetroHartford pursues EDD status
Need to have Steve meet with Maryellen and maybe "Gang of Five" to review the project criteria, moving them in a more "sustainable" direction.
Maybe we need a rural development component, particularly if we are asking certain communities
that are not part of the Hub and spoke to forego certain development.

APPENDIX F: Meetings
79
MetroHartford CEDS Subcommittee Meeting
November 21, 2011
1:00 p.m.
at MetroHartford Alliance Office
Hartford, CT
AGENDA
1. Vision of MetroHartford CEDS
2. Potential Stakeholder Interviews
3. Interview Questions
4. Timeline
5. MetroHartford Towns in Analysis
6. Next Steps
PARTICIPANTS
Alissa DeJonge, Connecticut Economic Resource Center
Elliot Ginsberg, Connecticut Center for Advanced Technology
Patrick McMahon, Town of Suffield
Mark Pellegrini, Town of Manchester
Bob Santy, Connecticut Economic Resource Center
John Shemo, MetroHartford Alliance
Lyle Wray, Capital Region Council of Governments

APPENDIX F: Meetings
80
MEETING NOTES
What has changed since last CEDS? o $1.5B transportation infrastructure investment o Innovation around transit o Sustainable Knowledge Corridor (focus on green/sustainability) o $900M Farmington
What is working for and against the region? We have a list of assets, but is it robust enough for businesses? What investments do we
need? Where is growth potential for region? Emerging industries? What economic opportunities do we want? How do we get there?
o Where do we find the opportunities? How do we repurpose Hartford’s role?
o There is currently a 40% vacancy rate for office space in the city o Consider Howard Baldwin’s project for downtown Hartford o Day Hill Road, Windsor has a large development being completed – how does that
affect the region and Hartford? What are strategic investment areas/projects to support the opportunities we want? Who is looking at this area (SiteFinder searches)?
o What are the perception barriers? How do other areas (like Portland, ME and Charlotte, NC) leverage opportunities? Average age of workers + High school completion rate by race + Population trends by race =
workforce crisis

APPENDIX F: Meetings
81
Regional Economic Development Forum
MetroHartford CEDS Focus Group
December 15, 2011
2:00 p.m.
at MetroHartford Alliance Office
Hartford, CT
AGENDA
Background and Overview:
1. Principles for this CEDS Process: fewer, well-defined goals, recommendations and capital
projects
2. Timeline – Highlight Dates for Towns
Initial Questions:
1. What is the role of your town in the MetroHartford region (not necessarily what is currently
happening)
2. A challenge in economic development is choosing among many competing priorities and
activities. What do you see as the priorities for this region?
3. What infrastructure projects are most important in the region?
4. Can you think of past economic development projects that were a success? Why were they
successful? Can you think of ones that didn’t work and why didn’t they work?
5. If the region had geographically targeted investments, how could nearby towns benefit from
them?
6. How do you think your chief elected officials may react to property tax reform?
Additional Questions:
1. What are the skills of your workforce, and are they sufficient to meet the needs of business?
2. Is the local and regional housing stock diverse enough to provide for a wide range of
housing needs?
3. When you talk about the Hartford region, which industry clusters come to mind as
strengths or ones that have potential to evolve, or perhaps a cluster of the past?
4. What industries in your community and region are growing or struggling?
5. What barriers and support services exist for local entrepreneurs and small businesses?
6. What are three strengths of the region? What are three weaknesses?
7. How can we capitalize on the resources we have?

APPENDIX F: Meetings
82
PARTICIPANTS
Representative Town/Org
Steve Kushner (Planner) Avon
Jim Mahoney (ED) Berlin
Alissa DeJonge (Research) CERC
Kristi Sullivan (Mkting) CERC
Wayne Benjamin (ED) City of Hartford
Mary Ellen Kowalewski (Planner) CRCOG
LindyLee Gold (Str & Policy) DECD
Lisa Houlihan Ellington
Robert Phillips (Planner) Ellington
Ray Warren (ED) Enfield
Courtney Hendricson (ED) Farmington
Ken Leslie (ED) Glastonbury
Mark Pelligrini (ED) Manchester
Sandra Johnson MetroHartford
Becky Nolan MetroHartford
John Shemo MetroHartford
Tom Marano (ED) Northeast Utilities
John O'Toole (ED) Northeast Utilities
Matt Galligan (Twn Mgr) South Windsor
Patrick McMahon (ED) Suffield
Shaun Gately Vernon
Jim Burke (ED) Windsor
Steve Wawruck (1 Select) Windsor Locks
Jim Fuda (Alliance Investor) Purcell Associates
Dan Kennedy Vernon - EDC

APPENDIX F: Meetings
83
MEETING NOTES
1 New Center of the region/universe
Manchester/South Windsor – G. Buckland Area
A bus way, interstate, N-S Rail System
Housing, retail opportunity
Subregional Center
Healthy, residential neighborhoods
Rail the emphasis, Enfield has stop
If not this decade, some day
Redevelopment opportunities
Small region for both states
25 K jobs, 3 mil, SF retail, Biz Center
Smaller region
CEDS priority 1-2 + Rail is high w/__________
Demographic analysis showed Hartford was major
What could influence that
Aware of keeping a strong Hartford
Improve transp. connections, travel between suburbs & city
Mega Region - How does Hartford fit with New England & North East – trans.
Connections with bus systems & roadways
Easier to get to other Ed Opps
Windsor – Long term – NE to Boston – place Hartford in b/t
Place you get off welcome mat for region interconnect of train stop guide
Comfortable place to work/live
Employment center – 23K ees , 16 in town

APPENDIX F: Meetings
84
Trans patterns – spread out, rationalize
Hartford roads, others raw bad
Supply opp for distribution – big trucks to Suburb instead of city
Airport – Tras Opp – To the world (not rail)
International flights, Convient Conn to rest of area
Maintaining healthy neighborhoods, good access, affordable
Focus on neighborhoods not past jobs
Recognition of strategies for regions – who plays what role
Reinforce principles of sustainability – i.e. foot at zoning, types of housing, no
__________ (not allowed to build apts in area)
Affordability of housing
Start discussion tran CEDS
Interconnectedness – Support ideas for sustain.
Cultural assets, XL, Bushnell, H. Stage
Center for it all
Restaurants, social life
Q of Life factors
Hartford has certain type, not in other centers
Impt to building characters
Depends on which town get invest
Count/ agree that $ + Strength = challenge made
What are the location, labor, assets at each town – match to cetain bizs – What do you need to
attract certain investment may not belong
which comm. match. What they need growth instead of moving around
more likely for support.

APPENDIX F: Meetings
85
Walgreen – don’t have land in city, employment for region however
Glastonbury, East of River – Rentsler Field, not sure what vision is these days (_____)
CT as whole - Culture to real estate
Opposed to close airport b/c future permit impossible
Still incredible __ piece
More interest from region how to grow
P&W – pp is smaller – Space on campus
Larger distressed retail – adapted reuse at showcase cinemas E. Windsor &
other retail prospects
Manchester paleademodel – many other call center, Enfield mall, dedicated area
Studio update – Create new tiff property of pay bonds, solar deal leasing/power
Play shell game
12/23 – extend Tiff districts, new process, w/ change in plans
South Windsor – Biz get thru process guidelines
Certain towns are limited
Within 18 days get building permit
Issue in other areas – educational
Transport is by
NY has fast system, no Cars
UConn is strong to create same environment
Not selling it for some reason
Build body of people living in downtown
Could be 55 + older, came downtown, __ cool
SW + March doing grant
We’re capitalized off some of it
ICMA Caf – Buses 5-10 always to conv. Center

APPENDIX F: Meetings
86
Better job
Don’t want to build more in SW
City is here – advertise Hartford
Do better & educate @ transp/housing
Not sure state is on top of things @ intercity
________ Wall
New leadership, break down & get things done
That used to be in s capital of world
Legislator voting against – stakeholders, voted
Rep people not just party
Focus on people to work
ED. to legislator to more city along
Virtual workforce, other empty space
How it impacts communities
Use libraries differently
Action _ down space – Wake at home
Transp – star to shuttle to circulate people
Shuttle from airport to conv. Center for $1
How can trains work together?
Referals to others, Tell CERC
Use Alliance as coord. (Sandra)
Regulations: Through, state building code, fire code
Variations in code official
Being Transactional, cultural thing
More standardized would be great – sustainability plan
No two are alike – definitions

APPENDIX F: Meetings
87
Training – What control – more discretion, more $
Risk adverse, Wasn’t waste of time
Educational
Succum w/ redevelopment @ _____
Stand zoning imp w/ cross town border
1 imp w/ Bradley (Sandra)
Opportunity is there (Mark) & shore revenue
Bradley Master planning
mandatory standization
Acquire P&Z combined to agency
Shorter time
That is poised to be great
Providence has charisma
Affluent suburbs spent $ in city
Asset to Hartford, Take advantated of city
Sports & Culture
As the cusp – advance in litter more
Public perception
Workforce that com in – stay to spend$
Suburbians good coming in, not going to sustain city
Downtown OK – neighborhoods curbside dragging image down
More people to live in, build rep as great place to live
Hartford in hand that those who play will live?
City in transition – offers amenities, brings more rev to city, More people
Conv Centers follow hotels vs build center & then people go there
People first – spend $ & local biz – keystore projects vs cornerstores

APPENDIX F: Meetings
88
Stuck market goes up – value of co goes up
Same w/ health & perception of city – feed off each othere
Newberg – distressed – changed in 2 years
We change image by leadership – more caps
Cleaned up city
Dupoint plan also, build riverfront
Hartford – Bad Rap
Mayor – Leadership – clean up, educate, motivate, & coordinate
Change background
Support Mayor’s tough decisions
DECD does not have unlimited resources
State wants to spend money to increase jobs, not just clean up an area (brownfields)
What is role of Hartford?
TIF financing is a cumbersome process (lots of legal fees)
Create TIF district, public hearings, legal fees – need to streamline bond process
Studies, assessments
CT’s enabling legislation is not clear
Vacant mill buildings – state won’t finance residential conversion list of projects – central city
strategic plan
Financial market is difficult right now.
EB5 program – federal program; if company puts in $1m & create jobs through regional center; can
get green card for themselves & immediate family
Manchester/South Windsor Greater Buckland Area
Enfield – Real line – impact
With actual stops
Smaller regional area for two states.
Concentration among rail area

APPENDIX F: Meetings
89
Is Hartford still the major employer?
Improve trans connections
How fit in with New England & Northeast Region?
Long term for Hartford – get off NY-Boston
Welcome mat for region
How design interconnectedness
If not enough parking come Windsor – distribution spread out commuters
Airport (world) – Bus – Rail (east coast)
Maintain healthy neighborhoods – challenge
Can’t focus on jobs
We can’t all be the same thing
Strategy for region
Sustainability – zoning, what types of housing is allowed
Feeder trans network
Hartford culture assets
Every community cannot be everything
What are location & labor assets for each town?
What do you need to attract something?
Rentschler Field – What is vision? potential; how tied in Pratt & Whitney space available
Showcase Cinemas reuse (along I-84); larger retail reuse
12/23 South Windsor – Solar deal, TIF financing
get through process quickly to get biz usually within 45days have their permits
transportation is the key & housing
Hartford has tourism amenities
Need to build up body of people
City is Core

APPENDIX F: Meetings
90
Don’t use car
Educate legislators
Shifting of industries – virtual workforce – adaptive reuse
Star Shuttle
Shuttle Fly - convention center to airport for $1
Code Officials
Municipalities have transactional
More standardized zoning would be great but long way off
Most P&Z want control – educational
Important when crosses town borders i.e. Bradley
Would want revenue sharing too.
State could mandate:
P&Z Combine to one agency (municipalities)
Hartford is poised to be great
Affluent suburbs – poised to take advantage of Hartford, but just on the cusp
Maybe just public perception
Outlining neighborhoods drag it down.
Need reputation – Hartford is a great place to live.
People first
Keystone projects rather than cornerstone projects
Changed image by leadership
More cops
More detectives
Leadership needs to clean up image & educate

APPENDIX F: Meetings
91
MetroHartford CEDS Planning Meeting
January 17, 2012
3:00 p.m.
Conference Call
AGENDA
1. EDA CEDS Requirements
2. Integration with HUD Livability Principles
3. Review of CEDS Timeline
PARTICIPANTS
Alissa DeJonge, Connecticut Economic Resource Center
Bob Santy, Connecticut Economic Resource Center
John Shemo, MetroHartford Alliance

APPENDIX F: Meetings
92
MetroHartford CEDS Planning Meeting
February 14, 2012
2:30 p.m.
Conference Call
AGENDA
1. EDA CEDS Requirements
2. Review of CEDS Timeline
3. Interview Process
4. Preparation for Strategy Committee Meeting
PARTICIPANTS
Alissa DeJonge, Connecticut Economic Resource Center
Steve MacKenzie, Connecticut Economic Resource Center
Michelle Riordan-Nold, Connecticut Economic Resource Center
Bob Santy, Connecticut Economic Resource Center
John Shemo, MetroHartford Alliance

APPENDIX F: Meetings
93
MetroHartford CEDS Strategy Committee Meeting
March 6, 2012
2:00 p.m.
at MetroHartford Alliance Office
Hartford, CT
AGENDA
1. Introductions
2. EDA CEDS Requirements
3. Review of CEDS Workplan
4. Review of Demographic Key Findings
5. Review of Outreach Activities
- CEDS Subcommittee Meeting
- Stakeholder Interviews
6. Capital Projects Process
7. Discussion of Key Concepts
- Vision of MetroHartford Region
- Hartford’s Role in the Region
- Issues Within the Region’s Control
- Potential for Property Tax Modifications
PARTICIPANTS
Todd Andrews, Goodwin College
Wayne Benjamin, City of Hartford
David Bonney, Lux, Bond & Green
John Choquette, Town of East Hartford

APPENDIX F: Meetings
94
Alissa DeJonge, Connecticut Economic Resource Center
Julie Geyer, Capital Workforce Partners
Steve MacKenzie, Connecticut Economic Resource Center
Patrick McMahon, Town of Suffield
Mark Pellegrini, Town of Manchester
John Shemo, MetroHartford Alliance

APPENDIX F: Meetings
95
MetroHartford CEDS Subcommittee Meeting
March 27, 2012
10:00 a.m.
at MetroHartford Alliance Office
Hartford, CT
AGENDA
1. Review of CEDS Workplan
2. Review of Stakeholder Interviews
3. Review of Industry Analysis
4. Capital Projects Process
5. Discussion of Key Concepts
6. Additional Research
PARTICIPANTS
Alissa DeJonge, Connecticut Economic Resource Center
MaryEllen Kowalewski, Capital Region Council of Governments
Steve MacKenzie, Connecticut Economic Resource Center
Patrick McMahon, Town of Suffield
Mark Pellegrini, Town of Manchester
John Shemo, MetroHartford Alliance

APPENDIX F: Meetings
96
MetroHartford CEDS Planning Meeting
April 19, 2012
1:00 p.m.
Conference Call
AGENDA
1. review CEDS timeline (currently editing report, developing goals & action steps, capital projects status, etc.)
2. direction regarding goals and action steps
3. EDA communications
4. occupational analysis
5. other
PARTICIPANTS
Alissa DeJonge, Connecticut Economic Resource Center
Steve MacKenzie, Connecticut Economic Resource Center
Michelle Riordan-Nold, Connecticut Economic Resource Center
Bob Santy, Connecticut Economic Resource Center
John Shemo, MetroHartford Alliance

APPENDIX F: Meetings
97
MetroHartford CEDS Planning Meeting
May 16, 2012
10:00 a.m.
Conference Call
AGENDA
1. Review Draft Report
2. Prepare for Subcommittee Meeting
3. Other
PARTICIPANTS
Alissa DeJonge, Connecticut Economic Resource Center
Steve MacKenzie, Connecticut Economic Resource Center
Michelle Riordan-Nold, Connecticut Economic Resource Center
Bob Santy, Connecticut Economic Resource Center
John Shemo, MetroHartford Alliance

APPENDIX F: Meetings
98
MetroHartford CEDS Subcommittee Meeting
May 24, 2012
12:00 p.m.
at MetroHartford Alliance Office
Hartford, CT
AGENDA
1. Review of CEDS Workplan
2. Review of Draft Report
3. Discuss Key Themes
4. Discuss Matrix of Goals and Action Steps
5. Capital Projects Process
6. Additional Research

APPENDIX F: Meetings
99

APPENDIX F: Meetings
100
MetroHartford CEDS Planning Meeting
August 6, 2012
3:00 p.m.
Conference Call
AGENDA
1. Review Draft Report
PARTICIPANTS
Alissa DeJonge, Connecticut Economic Resource Center
Michelle Riordan-Nold, Connecticut Economic Resource Center
Bob Santy, Connecticut Economic Resource Center
John Shemo, MetroHartford Alliance

APPENDIX F: Meetings
101
MetroHartford CEDS Planning Meeting
September 18, 2012
3:00 p.m.
Conference Call
AGENDA
1. Review Draft Report
2. Review Capital Projects Process
PARTICIPANTS
Alissa DeJonge, Connecticut Economic Resource Center
Steve MacKenzie, Senior Vice President
Michelle Riordan-Nold, Connecticut Economic Resource Center
Bob Santy, Connecticut Economic Resource Center
John Shemo, MetroHartford Alliance

APPENDIX F: Meetings
102
MetroHartford CEDS Strategy Committee Meeting
October 24, 2012
8:30 a.m.
at South Congregational Church
Hartford, CT
AGENDA
1. Introductions
2. Review of Key Findings, Initiatives and Action Steps
3. Discussion of Capital Projects
4. VOTE: Whether to accept the CEDS document
5. Next Steps: EDA Approval
Regarding the vote, Lyle Wray made the motion to accept the CEDS document and finalize for EDA
approval, with Wayne Benjamin seconding the motion. The vote was unanimous to accept the CEDS
document and finalize for EDA approval.
PARTICIPANTS
Wayne Benjamin, City of Hartford John Choquette, Town of East Hartford
Alissa DeJonge, Connecticut Economic Resource Center Martin D’Eramo, United Technologies Corporation
Julie Geyer, Capital Workforce Partners Peter Grok, Connecticut Business & Industry Association
MaryEllen Kowalewski, Capital Region Council of Governments Steve MacKenzie, Senior Vice President
Patrick McMahon, Town of Suffield Sean Meehan, United Way
Rebecca Nolan, MetroHartford Alliance Mark Pellegrini, Town of Manchester
Bob Santy, Connecticut Economic Resource Center Nancy Scirocco, Webster Bank
John Shemo, MetroHartford Alliance Lyle Wray, Capital Region Council of Governments

APPENDIX G: Capital Projects
103
APPENDIX G: Capital Projects This Capital Projects section has been divided into two parts. Part A is the list of Capital Projects
that have been reviewed by the Steering Committee, and approved for inclusion in the CEDS. Part B
is a summary of additional major projects that are being planned or implemented in the region that
will have significant impact on issues identified in the CEDS, and on the economic health of the
region as a whole. These have also been reviewed by the steering committee.
Part A
I. Hartford, CT
Swift Factory Project
370 Asylum Street Project
Downtown North Redevelopment Plan
Parkville Municipal Development Plan
II. Bolton, CT
Bolton Crossroads Industrial/Office Park
III. Rocky Hill, CT
Rocky Hill Business park Phase II Infrastructure Project
IV. University of Connecticut
UCONN Technology Park
UCONN Health Center – Bioscience Connecticut Initiative
Detailed overviews for each project listed above are as follows:

APPENDIX G: Capital Projects
104
2012 Metro Hartford Alliance CEDS
Regional Project Questionnaire/Submission
1. Project Name: Swift Factory Project
2. Lead Contact: Sweta Patel, Project Manager Organization: Northeast Neighborhood
Partners, Inc.
Address: 410 Asylum Street, Hartford Connecticut 06103
Phone #: 212-461-0872 Fax: Email [email protected]
3. Municipalities and/or Organizations involved: City of Hartford
4. Type of Initiative: Multi-use, “Green” Economic Engine and Village Center
Business/Economic Development X Education/Workforce _____ Energy _____
Planning _____ Real Estate/Infrastructure X Transportation _____ Technical
Assistance X Other _____
If other, please provide details.
5. Please provide a description of the project.
To create jobs and anchor the revitalization of the Northeast neighborhood, Community Solutions
(CS) and its development partner, Northeast Neighborhood Partners, Inc. (NNPI), are rebuilding the
historic Swift Factory complex, which consists of a 65,000 square feet former gold leaf

APPENDIX G: Capital Projects
105
manufacturing factory and vacant land. The site is located at 10 to 50 Love Lane and 60 Love Lane
in Northeast. The Swift Factory complex consists of three vacant buildings on two tax lots totaling
approximately 2.6 acres on the eastern side of Love Lane and the western side of Garden Street.
The re-development of the Swift Factory, formerly the neighborhood’s largest employer, will
provide an entrepreneurial engine for Northeast, which is one of Connecticut’s poorest
neighborhoods. The main Swift Factory building will offer environmentally sustainable and
affordable workspaces for occupancy by arts-related and small manufacturing enterprises focused
on artisan crafts or “green” products and services, and will create at least 50 permanent jobs. The
facility will be modeled on similar projects in New York City and Toronto. The private and
cooperative business enterprises will employ Northeast residents to produce goods and services to
meet local demand.
The Swift Factory initiative includes Five Corners Farm, a two-acre farm employing and teaching
local adults and youth farming skills while producing healthy, fresh food for Northeast residents.
The Swift Factory property also serves as the hub for a neighborhood urban farm network to
reclaim and repurpose empty lots in the neighborhood, which will both create jobs and improve
residents’ access to affordable, healthy food. The third component of the Swift Factory initiative is
to develop new units of affordable housing. The two historic homes on the property, once the
homes of the Swift family, will be renovated to become energy efficient affordable housing.
6. Why is this project important to the region?
The Northeast neighborhood of Hartford is one of the poorest in the state of Connecticut and meets
EDA’s economic distress criteria, defined by the neighborhood’s unemployment rate and per capita
income compared with national averages. According to the U.S. Census, the Northeast
neighborhood’s unemployment rate was 20.7%6 in 2005-2009 compared with 4.7%7, the national
unemployment rate during the same period.
During the past year, the Northeast’s potential has been fully explored and a Community Asset Map
that catalogues all neighborhood resources except housing has been developed. Critical challenges
have also been identified, including problem locations, such as vacant lots, and underutilized
neighborhood assets, including parks and stable institutions. Through this detailed local
assessment, we have documented 22 churches, a library, two community centers, a senior center,
20 corner stores, five food pantries, three soup kitchens, three mental health service providers, a
job training program, four elementary/middle schools, four Head Start programs, a Salvation Army
multi-service center, a branch of The Catholic Worker focused on outreach to children and youth, a
small grocery store, and nine neighborhood restaurants. Strikingly, also found were few
connections between these institutions and services, little coordination, and no shared vision for
the neighborhood’s future.
Despite its assets, the Northeast neighborhood faces significant infrastructure, environmental, and
physical development challenges. The neighborhood contains crumbling sidewalks, broken
6 U.S. Census, American Community Survey 2005-2009 7 U.S. Census, 2005-2009

APPENDIX G: Capital Projects
106
streetlights, and numerous vacant lots. Two- and three-family homes line the streets, many in a
state of disrepair, with only 24%8 occupied by their owners, one of the lowest rates of
homeownership of any Hartford neighborhood. Keney Park is an extraordinary neighborhood asset,
but because it is poorly maintained and offers little programming, security concerns keep residents
from regularly using it. Residents tend to cluster along ethnicities, and so the Northeast
neighborhood is comprised of West Indian niches, Latino areas, and Black American
neighborhoods.
Analysis of Northeast and ongoing meetings with neighborhood residents, public, non-profit,
institutional, and other stakeholders have informed the three components of the Swift Factory
initiative: 1) the redevelopment of Swift Factory; 2) the creation of a Green Neighborhood Plan;
and 3) a community-based care coordination program to better manage residents’ health care
needs and reduce hospital emergency department services.
The Swift Factory initiative capitalizes on the Northeast neighborhood’s competitive assets and
strengths, such as Keney Park and the Factory’s central location, and will bring substantial benefits
to the distressed neighborhood in which Swift Factory is located.
7. Does this project involve more than one town and/or promote greater regional
cooperation?
Yes
8. Please explain how the proposed project fits one or more of the EDA Investment Guideline
criteria outlined below.
EDA will select applications competitively based on the investment policy guidelines funding
priority considerations identified below. EDA will evaluate the extent to which a project embodies
the maximum number of investment policy guidelines and funding priorities possible and strongly
exemplifies at least one of each. All applications will be competitively evaluated on their ability to
satisfy the following investment policy guidelines, each of equivalent weight.
A. Be market-based and results driven.
An EDA investment will capitalize on a region’s competitive strengths and will positively
move a regional economic indicator, such as: an increased number of higher-skill, higher-
wage jobs; increased tax revenue; or increased private sector investment resulting from the
EDA investment.
This market-based, results-driven project will generate quantifiable outcomes in neighborhood
health, safety, and economic indicators such as increased numbers of higher-skill, higher-wage jobs;
increased tax revenue; and increased private sector investment. When completed, the Swift Factory
project will serve as a central, unifying force in the neighborhood. Additionally, the project will spur
economic growth in the Northeast neighborhood through the redevelopment of vacant lots as part
8 U.S. Census, 2000

APPENDIX G: Capital Projects
107
of an urban farm network and the expansion of health-related services. These initiatives will also
create jobs for residents of Northeast.
After Swift Factory’s redevelopment, this work will leverage the working Factory’s presence to
stabilize Northeast’s housing conditions and increase the home ownership rate, support
neighborhood schools, and develop other neighborhood assets, which will help make Northeast
even more economically resilient.
B. Have strong organizational leadership.
An EDA investment will have strong leadership, relevant project management experience, and
a significant commitment of human resources talent to ensure a project’s successful
execution.
Community Solutions’ founder and Board president, Rosanne Haggerty, is an internationally
recognized social entrepreneur and Ashoka Fellow who has developed innovative strategies to end
homelessness and strengthen neighborhoods. Her strong leadership and relevant project
management experience is supported by city and state elected officials and business community
leaders, and will ensure the successful implementation of the Swift Factory initiative.
C. Advance productivity, innovation and entrepreneurship.
An EDA investment will enable entrepreneurship; enhance regional industry clusters, and
leverage and link technology innovators and local universities to the private sector to create
the conditions for greater productivity, innovation, and job creation.
Restoring the Swift Factory creates significant benefits for both Hartford and the Northeast
neighborhood. In addition to fulfilling the specific Hartford CEDS goals discussed below,
redeveloping the Swift Factory preserves an important neighborhood landmark, improves access to
healthy food, creates a positive ripple effect of neighborhood pride, and anchors a safety/health/job
creation partnership. The Swift Factory initiative will establish a foundation for sustainable job
growth and the building of a durable economy in an economically challenged neighborhood.
In addition to the economic benefits of the Swift Factory redevelopment, the project will provide
quality of life benefits to the Northeast neighborhood by improving residents’ health and economic
outcomes, creating a replicable neighborhood economic development and health improvement
model for other Hartford neighborhoods, and strengthening connections between Northeast’s
physical and health assets through the creation of a Green Neighborhood Plan.
D. Look beyond the immediate economic horizon, anticipate economic changes, and diversify
the local and regional economy.
An EDA investment will be part of an overarching, long-term comprehensive economic
development strategy that enhances a region’s success in achieving a rising standard of living
by supporting existing industry clusters, developing emerging new clusters or attracting new
regional economic drivers. (Please refer to the attached CEDS recommendations)

APPENDIX G: Capital Projects
108
The Swift Factory initiative will contribute to the City of Hartford’s overall economic development
goals by serving as a catalyst for other needed investments in Northeast, increasing the value of
neighboring properties, and stimulating other neighborhood investments. These improvements will
result in the creation of additional indirect jobs to benefit Northeast residents.
By building upon two key economic drivers -- innovation and collaboration -- the redevelopment of
the Swift Factory will establish a foundation for sustainable job growth and a durable economy in
Northeast.
E. Demonstrate a high degree of local commitment by exhibiting:
High levels of local government or non-profit matching share funds and private sector
leverage;
Clear and unified leadership and support by local elected officials; and
Strong cooperation among the business sector, relevant regional partners and local, State
and federal governments.
CS and NNPI are adept at attracting and leveraging private sector investments. To date, they have
raised $3,160,000 in project funding, including environmental assessment and remediation grants
and loans administered by the State of Connecticut DECD, Office of Brownfield Remediation, grants
from the Connecticut State Historic Trust supporting the design and planning of the Swift Factory,
Newman’s Own Foundation for the urban farm at the site, and the Langeloth Foundation for the
community health care initiative.
They are aggressively seeking additional private and public sector funding to complete this project,
and have submitted proposals to several local foundations. They are currently exploring the use of
New Markets and Historic Rehabilitation Tax credits to attract private equity to the Swift Factory
redevelopment.
9. Please explain how the proposed project fits one or more of the Funding Priorities
outlined below.
Within the parameters of a competitive grant process, all projects are evaluated to determine if
they advance global competitiveness, create jobs, leverage public and private resources, can
demonstrate readiness and ability to use funds quickly and effectively, and link to specific and
measurable outcomes. To facilitate evaluation, EDA has established the following investment
priorities:
A. Collaborative Regional Information:
Initiatives that support the development and growth of innovation clusters based on
existing regional competitive strengths. Initiatives must engage stakeholders; facilitate
collaboration among urban, suburban, and rural (including tribal) areas; provide stability
for economic development through long term intergovernmental and public/private
collaboration; and support the growth of existing and emerging industries.

APPENDIX G: Capital Projects
109
CS and NNPI understand that the key to project success is collaboration with private citizens,
business leaders, government officials, similarly-focused civic organizations, and other
stakeholders. For more than a year, CS and NNPI have worked to foster partnerships with several
nonprofits, the business sector, universities, a hospital, local government agencies, and state and
federal agencies. We have convened large stakeholder meetings to share the Community Asset Map
we developed, review local data trends, and gather suggested neighborhood priorities.
As CS and NNPI move through the development process, each phase of the Swift Factory initiative
will continue to be informed by the needs of local institutions and community residents. They are
partnering with residents, city agencies, and local service providers in order to create more and
better jobs and a durable Northeast economy. Working with their network of health care, social
service, business sector, and municipal agency partners, they will respond to residents’ articulated
needs and target physical infrastructure improvements and service delivery to build economic
prosperity for all.
Intervention areas include: roads, sidewalks, lamps, parks, housing quality, employment
opportunities, community safety, quality of life amenities, and access to healthy food to encourage a
resilient neighborhood economy. It is only through long-term governmental and public and private
collaboration that these improvements can be made, all of which will provide the necessary
stability to fuel economic development.
B. Public/Private Partnerships:
Investments that use both public and private sector resources and leverage complementary
investments by other government/public entities and/or nonprofits.
The re-development of Swift Factory is a true public/private partnership. Creating a safer,
healthier, more prosperous Northeast requires connecting residents, not-for-profits, businesses,
and government organizations around a common vision: fostering job creation and supporting the
growth of existing and emerging industries. Collaboration and cooperation among the business
sector, regional partners, and federal, state and local governments also allows CS, NNPI, and our
partners to use our collective strengths to overcome weaknesses.
Current project partners are:
Governance: City of Hartford, City of Hartford COO Office, State of Connecticut, University of Hartford, St. Francis Hospital/Burgdorf Health Center, University of Connecticut, Department of Health and Human Services, Capital Workforce Partners
Infrastructure improvements: Hartford Food System, City of Hartford, Swift Factory Community Organizing: Department of Health and Human Services, NAACP, University of
Connecticut, St. Francis Hospital Community-based Care Coordination: Department of Health and Human Services, St.
Francis Hospital/Burgdorf Health Center, University of Hartford
These partners and stakeholders allow us to leverage complementary government and public
investments to advance the project and encourage increased investment by the private sector.

APPENDIX G: Capital Projects
110
These partnerships will be leveraged to create new jobs and train workers in order to create the
conditions for greater productivity, innovation, and job creation in the Northeast neighborhood.
C. National Strategic Priorities:
Initiatives that encourage job growth and business expansion in clean energy; green
technologies; sustainable manufacturing; information technology (e.g. broadband, smart
grid) infrastructure; communities severely impacted by automotive industry restricting;
urban waters; natural disaster mitigation and resiliency; access to capital for small, medium
sized, and ethnically diverse enterprises; and innovations in science, health care, and
alternative fuel technologies.
The Swift Factory redevelopment project embraces the principles of, and encourages, innovation
and entrepreneurship, and is consistent with economic goals and strategies outlined in the Hartford
CEDS. The Swift Factory redevelopment will encourage job growth and business expansion by
providing support to small, ethnically diverse enterprises, including guidance on how to access
capital.
D. Global Competitiveness:
Investments that support high-growth businesses and innovation-based entrepreneurs to
expand and compete in global markets.
The Swift Factory development will support high-growth businesses and entrepreneurs to
strengthen Northeast residents’ ability to be innovative and advance regional and potentially global
competitiveness. The project will also strengthen critical infrastructure by providing specialized
training to prepare residents to compete in the current economy and support strategies that link
Hartford’s economy with the global marketplace. Through the Swift Factory initiative, local adults
and youth will gain the concrete skills they need to prepare them for success in work, school, and
life.
E. Environmentally-Sustainable Development:
Investments that encompass best practices in “environmentally sustainable development”,
broadly defined to include projects that enhance environmental quality and develop and
implement green products, processes, places, and buildings as part of the green economy.
The Swift Factory initiative will promote job creation and economic prosperity through businesses
that develop and produce green products and support energy-efficient green technologies.
F. Economically Distressed and Underserved Communities:
Investments that strengthen diverse communities that have suffered disproportionate
economic job losses and/or are rebuilding to become more competitive in the global
economy.

APPENDIX G: Capital Projects
111
Redeveloping the Swift Factory will strengthen the Northeast neighborhood, which has suffered
disproportionate job losses, by becoming a catalyst to improving the Northeast neighborhood’s
economic health.
10. Please explain how this project supports the overall CEDS’ regional strategic initiatives
outlined below?
A. Cluster Initiative: Foster and grow the industry clusters with a strong presence in the region
but also seek cross-regional synergies of growth and opportunity.
The critical regional clusters identified are:
Advanced Manufacturing Financial Services Health Sciences and Services Management of Companies
One of the CEDS’s goals is to create a business climate that supports entrepreneurs and small
businesses, fosters diverse job opportunities, and attracts companies in the target industries
identified by the CEDS (one of which is healthcare) that provide quality jobs.
The Swift Factory initiative addresses the goal of supporting innovation and entrepreneurs by:
Establishing a network of employee-owned and other small businesses that are based locally and hire locally
Providing entrepreneurial individuals and groups with enhanced access to space, labor, and capital
Cultivating a favorable climate and support system for entrepreneurs, particularly minority entrepreneurs
Providing tax revenues to the City of Hartford Encouraging neighborhood revitalization Leveraging local partnerships and partnerships with other State and Federal programs, e.g.
Centers of Innovation (DECD) and Healthy Food Financing Initiative (HHS) Geographically concentrate firms, suppliers, support services, producers of related products Pursue innovation through small companies and entrepreneurs Linking development planning to support supply chain requirements of local businesses
and institutions
B. Workforce & Education Initiative: Focus on improving the workforce today, while educating,
training and recruiting the pipeline for tomorrow.
Goal: Education and Workforce Development
One of the strategies of Workforce Development is to support education programs that train
workers in skills most demanded by target industries, such as healthcare. This initiative focuses on
improving the workforce today while educating, training, and recruiting the pipeline for tomorrow.

APPENDIX G: Capital Projects
112
The Hartford CEDS states that, in order to meet future demand, a productive and innovative
workforce is the most important factor in industry and cluster success.
The CEDS discusses a crisis occurring in Connecticut where low-income students are approximately
three grade levels behind higher-income students and that the underperformance of urban schools
is a critical issue. The CEDS cites existing demographic trends that show younger, less educated,
low-income workers replacing older, more educated, high-income workers in Connecticut, a
problem reflected in the Northeast neighborhood’s poorly educated workforce.
The Swift Factory initiative addresses this goal by:
Providing jobs that will train the region’s high school students at risk for dropping out and instead present clear career opportunities that include filling the vacancies in the middle skill workforce
Addressing immediate skill challenges among low-income students by providing internships and training opportunities to raise Northeast residents’ skill levels
Creating jobs in construction and at least 50 permanent jobs for local residents Hiring and training Community-based Healthcare Coordinators Hiring and training community organizers (Community Planning Partners)
C. Infrastructure Initiative: Support infrastructure investments tied to business and job
growth.
Since creating private sector jobs is the first CEDS priority, any infrastructure investment
should be measured by its contribution to and support of that job creation. Transportation
is critical to supporting a competitive economy. The MetroHartford region will benefit from
critical investments that can be transformative for its targeted industry clusters, as well as
many other industries.
When redeveloped, the 2.6 acre historic Swift Factory complex will become a multi-use, “green”
economic engine and community center, and will include:
New space for private and cooperative business enterprises that will employ residents to produce goods and services to meet local demand
New units of affordable housing in two historic homes A new, two acre community run farm and greenhouse employing and teaching local adults
and youth while producing healthy, fresh food for residents year round A network of care providers to connect residents who frequently use Emergency
Department services to primary care
Additionally, working with our network of health care, social service, business sector, and
municipal agency partners, we will respond to residents’ articulated needs and target physical
infrastructure improvements and service delivery to build economic prosperity for all. Intervention
areas include: roads, sidewalks, lamps, parks, housing quality, employment opportunities,
community safety, quality of life amenities, and access to healthy food to encourage a resilient
neighborhood economy. It is only through long-term governmental and public and private

APPENDIX G: Capital Projects
113
collaboration that these improvements can be made, all of which will provide the necessary
stability to fuel economic development.
D. Downtown Hartford Initiative: Transform Downtown Hartford into a dynamic urban
environment that is the epicenter of culture, entertainment, and innovation.
EDA funding stipulates that economic development programs should be designed to have
positive economic development impacts within economically distressed regions.
MetroHartford qualifies because the City of Hartford meets the EDA’s distress criteria.
Not applicable because Swift Factory is not located in downtown Hartford.
11. Project Budget
Local Investment _________________ Amount Secured ____________
State Investment see below Amount Secured
Federal Investment _________________ Amount Secured ____________
Private Investment see below Amount Secured
Total Budget $11,066,409 Amount Secured $3,160,000
Swift Factory site (building related)
Connecticut Remediation Award $600,000
Connecticut DECD- SCPRIF $45,000
Connecticut Trust - Vibrant Communities Award $50,000
Connecticut Construction Envt. BRDA Loan $1,000,000
NNPI Contribution $650,000
Total $2,345,000

APPENDIX G: Capital Projects
114
Programming
Bank of America $15,000
Newman's Own Foundation $250,000
Langeloth Foundation $350,000
Annie E. Casey Foundation $50,000
MetLife Foundation $150,000
Total $815,000
If this will be an ongoing project, identify sources of operating revenue:
The Swift Factory project will be sustained through a combination of rental revenues from business
tenants, rental payments from residential tenants, available housing subsidies, and programmatic
grants.
12. Economic Benefits
Number of new permanent jobs anticipated 50+* By when? Spring 2015
Number of construction jobs anticipated ________
Number of jobs retained ________
New local taxes anticipated (if applicable) __________________
*A tangible aspect of the Swift Factory initiative’s direct impact on the revitalization of the
Northeast neighborhood will be the number of jobs created and retained. In addition to creating
dozens of construction jobs by restoring the Swift Factory, the Swift Factory initiative will create
more than 100 permanent jobs, some of which will be part-time, as follows:

APPENDIX G: Capital Projects
115
Swift Factory will create at least 50 permanent jobs (many of which will be green) by providing affordable space and business support services to green business and small manufacturers, at the digital learning center on site, and through the development of a year-round hydroponic farm on the roof of the Factory.
The neighborhood urban farm network will create at least five additional permanent jobs. CS will hire and train 40 part-time Community-based Care Coordinators from the Northeast
neighborhood and will also hire one Public Health Nurse; one Managing Director; one Health Policy and Practice Associate; one Director, Health Integration; and one Director of Operations. The last five positions will be fulltime.
CS will create 18 part-time jobs in community organizing (Community Planning Partners), all to be filled by residents of the Northeast neighborhood.
13. Land Use Issues (if applicable)
Has the property been acquired yet? The Swift Factory property was donated to NNPI in
2010.
If not, please explain circumstances.
Is the land appropriately zoned for project? YES
Are any zoning variances or other public approvals needed? (Please explain.)
Local Political Support?
14. Please provide a brief timeframe for this project including start, finish, duration, and
major milestones, as appropriate for the project.
The project began Oct. 5, 2010 when NNPI took possession of the vacant Swift Factory property.
During summer 2011, Community Solutions, NNPI, and our local partners Hartford Food System
and Knox Park Foundation began the work of transforming open space with clean soil on the Swift
Factory site into an urban farm called 5 Corners Farm. 5 Corners Farm not only created jobs, but
established a presence for CS and NNPI on the site.
NNPI, CS’s development partner, selected the architects and planners Winter 2012
Planning for the creation of a neighborhood greenbelt to transform Fall 2012
vacant and brownfield sites into a network of neighborhood farms begins Winter 2012
NNPI will invite general contractors to competitively bid Winter 2013
Restoration of the Swift Factory building begins Spring 2013
Swift Factory restoration is complete Spring 2015
Develop a rooftop hydroponic farm on the Factory building itself Spring 2015

APPENDIX G: Capital Projects
116
Community kitchen for nutrition education and training classes opens Summer 2015
Lease space to entrepreneurs Fall 2015

APPENDIX G: Capital Projects
117
2012 Metro Hartford Alliance CEDS
Regional Project Questionnaire/Submission
1. Project Name: 370 Asylum Street Project
2. Lead Contact: Sweta Patel, Project Manager Organization: Northeast Neighborhood
Partners, Inc.
Address: 410 Asylum Street, Hartford Connecticut 06103
Phone #: 212-461-0872 Fax: Email [email protected]
3. Municipalities and/or Organizations involved: City of Hartford
4. Type of Initiative: Multi-use, “Green” Economic Engine and Village Center
Business/Economic Development X Education/Workforce _____ Energy _____
Planning _____ Real Estate/Infrastructure X Transportation_______ Technical
Assistance X Other _____
If other, please provide details.
5. Please provide a description of the project.
370 Asylum Street is a vacant office building in downtown Hartford that will be converted into a
mixed use property to include affordable housing for two underserved groups: those working in the
arts and adults with disabilities. The 53-unit project will include 16 supportive units for adults with
disabilities with 14 studio, 25 one-bedroom, and 8 three-bedroom apartments to be constructed,
providing a mix of housing for artists and adults with disabilities.
The building will also include an arts and innovation center on the second floor with a shared work
setting modeled on other centers (e.g. General Assembly in New York City, a campus for technology,
design, and entrepreneurship) that have recently been developed to facilitate start-up businesses in

APPENDIX G: Capital Projects
118
arts and technology as well as social enterprise. The first floor will include a cafe, gallery, and small
conference center.
The arts and innovation center will be managed by Social Enterprise Trust (reSET), an organization
that helps entrepreneurs leverage the free market to create public good. The arts and innovation
incubator will facilitate start-up businesses by providing common meeting space, equipment,
display space, business support services, marketing, and other shared services that offer innovative
businesses a creative, affordable environment in which to develop products and services.
6. Why is this project important to the region?
Restoring 370 Asylum to active use will create significant benefits for Hartford including: increasing
the number of downtown residents to support economic development investments downtown;
supporting Hartford’s arts community by providing affordable, well-located housing; creating
attractive options for individuals with special needs wishing to live in a vibrant mixed income
environment; adding street level commercial and arts uses to increase pedestrian traffic on the
north side of Hartford’s Bushnell Park as well as adding jobs in construction, building operations,
retail and the arts.
Additionally, reSET’s presence will help in promoting the development of social enterprise ventures
that are designed to address key social challenges facing Connecticut, including:
health and access to healthcare women and children homelessness returning veterans environmental conservation income disparity educational achievement gap
7. Does this project involve more than one town and/or promote greater regional
cooperation?
Yes
8. Please explain how the proposed project fits one or more of the EDA Investment Guideline
crteria outlined below.
EDA will select applications competitively based on the investment policy guidelines funding
priority considerations identified below. EDA will evaluate the extent to which a project embodies
the maximum number of investment policy guidelines and funding priorities possible and strongly
exemplifies at least one of each. All applications will be competitively evaluated on their ability to
satisfy the following investment policy guidelines, each of equivalent weight.
A. Be market-based and results driven.
An EDA investment will capitalize on a region’s competitive strengths and will positively
move a regional economic indicator, such as: an increased number of higher-skill, higher-

APPENDIX G: Capital Projects
119
wage jobs; increased tax revenue; or increased private sector investment resulting from the
EDA investment.
The 370 Asylum Street project will have a direct impact on the revitalization of downtown Hartford
by increasing the number of social enterprises that will be incentivized and supported over the
immediate and long-term life of the project.
By building upon two key economic drivers -- innovation and collaboration -- the redevelopment of
370 Asylum Street will establish a foundation for sustainable job growth and a durable economy
based on the principals of social enterprise. Providing social enterprise trailblazers in Connecticut
with support in business model development and planning, investment strategies, social impact
measurement, and developing public/private partnerships will all be critical to the formation of a
successful social enterprise community.
B. Have strong organizational leadership.
An EDA investment will have strong leadership, relevant project management experience, and
a significant commitment of human resources talent to ensure a project’s successful
execution.
Northeast Neighborhood Partners, Inc., the project sponsor, will also be the owner and operator of
the property. Community Solutions helped to establish Northeast Neighborhood Partners, Inc.
(NNPI) in 2010. NNPI’s work helps to create employment, health, and housing options for residents
while simultaneously transforming the blighted physical environment of the neighborhood to
promote economic revitalization, housing stability, and all dimensions of neighborhood health.
Community Solutions (CS) partners with community leaders, public agencies, not-for-profits,
property developers, and health and human service organizations to create practical, scalable, cost
effective solutions to homelessness. CS focuses on the people and places facing the most complex
challenges, where effective solutions can have the widest impact on health and housing outcomes
and financial stability and on practices and policies within the field. Their three areas of work
include creating new housing options for those not served by the mainstream housing market,
building models of homelessness prevention in high-poverty neighborhoods where large numbers
of households are vulnerable to homelessness, and spreading solutions that work to end
homelessness through our national 100,000 Homes Campaign network of more than 130
communities.
CS’s integrated, solution-oriented approach to homelessness evolved over 20 years of creating
mixed income housing serving formerly homeless individuals, artists, low wage workers, and
others. CS combined affordable housing with clinical services for those with health and mental
health needs and created and operated businesses to provide jobs at their predecessor
organization, Common Ground. In building and operating nearly 3,000 units of affordable housing,
principally in New York City, they learned that without working to prevent homelessness, they
could never fully gain ground on this issue. That led them to identify locations in cities such as
Hartford to develop comprehensive homelessness prevention strategies that connect the most
vulnerable families and individuals in these stressed communities to effective assistance. By

APPENDIX G: Capital Projects
120
investing in community assets such as 370 Asylum Street, they address the housing and economic
conditions that produce homelessness.
Jonathan Rose Companies, the project co-developer, is a leading green real estate policy, planning,
development, civic development and investment firm currently managing more than $1.5 billion of
work. The goal of Jonathan Rose Companies is to help metropolitan regions become more resilient,
competitive and equitable. Founded in 1989 by Jonathan F.P. Rose as a mission-based practice, the
firm is recognized for its ability to achieve visionary goals through practical strategies and
affordable green urban solutions.
CS’s founder and Board president, Rosanne Haggerty, is an internationally recognized social
entrepreneur and Ashoka Fellow who has developed innovative strategies to end homelessness and
strengthen neighborhoods. Her strong leadership and relevant project management experience is
supported by city and state elected officials and business community leaders, and will ensure the
successful implementation of the 370 Asylum Street project.
C. Advance productivity, innovation and entrepreneurship.
An EDA investment will enable entrepreneurship; enhance regional industry clusters, and
leverage and link technology innovators and local universities to the private sector to create
the conditions for greater productivity, innovation, and job creation.
reSET is committed to promoting, preserving, and protecting the concept of social enterprise, and
helping entrepreneurs leverage the power of the free market to create public good. reSet’s goal is to
make Harford a hub of social enterprise by creating a community of individuals and organizations
who are committed to the ongoing economic and social development of Connecticut.
Social enterprise is a new hybrid business model that will help Hartford and Connecticut as a whole
develop a business community committed to addressing social challenges, and help entrepreneurs
and business owners participate as allies with government agencies and robust nonprofit sector in
the process of making our communities, safer, healthier, and more prosperous places to live for all
of our citizens.
reSET will develop an ongoing Social Enterprise Incubator at 370 Asylum Street that will help
house emerging social enterprises, and also serve as a hub of activity and programming for
Connecticut’s growing social enterprise community. reSET seeks to develop a vibrant, collaborative
space where social entrepreneurs can come together, and share ideas, inspiration, and resources.
In addition, the Asylum Street incubator will host reSET’s accelerator program, which will follow
the model of several other successful accelerator programs nationwide by opening up a highly-
selective application process, and selecting only the applicants with the right team and the right
idea for success. Possible candidates would be encouraged to participate in the Social Enterprise
Design Lab process, and open up their ideas for vetting, critique, and feedback, and then document
the lessons and insights that they have gained through that process.

APPENDIX G: Capital Projects
121
D. Look beyond the immediate economic horizon, anticipate economic changes, and diversify
the local and regional economy.
An EDA investment will be part of an overarching, long-term comprehensive economic
development strategy that enhances a region’s success in achieving a rising standard of living
by supporting existing industry clusters, developing emerging new clusters or attracting new
regional economic drivers. (Please refer to the attached CEDS recommendations)
The 370 Asylum Street redevelopment project embraces the principles of, and encourages,
innovation and entrepreneurship, and is consistent with economic goals and strategies outlined in
the Hartford CEDS. The project will encourage job growth and business expansion by providing
support to small, diverse social enterprises, including guidance on how to access capital. reSET will
assist in drafting and introducing new legislation that will help businesses legally incorporate as
social enterprises and work with elected officials and public policy makers to create a business
environment that is welcoming and friendly to social entrepreneurs.
E. Demonstrate a high degree of local commitment by exhibiting:
High levels of local government or non-profit matching share funds and private sector
leverage;
Clear and unified leadership and support by local elected officials; and
Strong cooperation among the business sector, relevant regional partners and local, State
and federal governments.
CS is aggressively seeking additional private and public sector funding for the project, and have
submitted proposals to state agencies and foundations interested in revitalizing Hartford.
Anticipated sources of funding are $1 million from the U.S. Economic Development Administration,
Connecticut Department of Economic and Community Development, tax-exempt bonds, private
investors, and philanthropic sources.
Federal and state resources are also being sought for arts initiatives and social enterprise business
development and grants from philanthropic organizations, corporations, and private individuals for
program-related investments. The use of 4% Low Income Housing Tax Credits are also currently
being explored.
9. Please explain how the proposed project fits one or more of the Funding Priorities
outlined below.
Within the parameters of a competitive grant process, all projects are evaluated to determine if
they advance global competitiveness, create jobs, leverage public and private resources, can
demonstrate readiness and ability to use funds quickly and effectively, and link to specific and
measurable outcomes. To facilitate evaluation, EDA has established the following investment
priorities:

APPENDIX G: Capital Projects
122
A. Collaborative Regional Information:
Initiatives that support the development and growth of innovation clusters based on
existing regional competitive strengths. Initiatives must engage stakeholders; facilitate
collaboration among urban, suburban, and rural (including tribal) areas; provide stability
for economic development through long term intergovernmental and public/private
collaboration; and support the growth of existing and emerging industries.
The key to success is collaboration with private citizens, business leaders, government officials,
similarly-focused civic organizations, and other stakeholders. Each phase of the 370 Asylum Street
project will continue to be informed by the needs of local institutions and community residents.
Partnerships with residents, city agencies, and local service providers will be established in order
to create sustainable, quality jobs and an improved downtown economy.
B. Public/Private Partnerships:
Investments that use both public and private sector resources and leverage complementary
investments by other government/public entities and/or nonprofits.
reSET is Connecticut’s largest support organization for social entrepreneurs. Its goal is not only to
support and grow the social enterprise movement within the state of Connecticut, but also to
connect social entrepreneurs with other sectors who will support ongoing economic development
and growth. Mainstream entrepreneurs, investors, educators, and policy makers are key members
of a healthy innovation ecosystem that will help social entrepreneurs thrive. As a result, in addition
to developing key business development support services and resources designed specifically for
social entrepreneurs, reSET will form working relationships with other business development
support organizations and agencies, as well as key organizations and agencies in the nonprofit
sector.
This strategy includes finding ways that the social enterprise support materials developed by reSET
could be used by local Chambers of Commerce, organizations such as the Small Business
Development Council and other public and private agencies, as well as opportunities for social
entrepreneurs to make use of basic business skills development and networking opportunities
through these same types of groups. In addition, reSET intends to build in opportunities for social
entrepreneurs to interact, learn from, and collaborate with other types of organizations including
mainstream for-profit companies and non-profit organizations. reSET believes best practices, and
inspiration for innovation are best fostered when people with many different viewpoints and
approaches to problem solving have the opportunity to learn from one another. As a result, reSET
hopes that mainstream businesses that can provide synergistic energy will take up residence
alongside members of the Social Enterprise Incubator at 370 Asylum Avenue. These entities will be
able to work with the leaders of Connecticut’s Innovation Ecosystem Hartford Hub to find ways to
support each other’s efforts to create a new wave of entrepreneurship within Hartford, and
throughout the state.
APPENDIX G: Capital Projects
123
C. National Strategic Priorities:
Initiatives that encourage job growth and business expansion in clean energy; green
technologies; sustainable manufacturing; information technology (e.g. broadband, smart
grid) infrastructure; communities severely impacted by automotive industry restricting;
urban waters; natural disaster mitigation and resiliency; access to capital for small, medium
sized, and ethnically diverse enterprises; and innovations in science, health care, and
alternative fuel technologies.
The 370 Asylum Street incubator will also serve as reSET’s operational headquarters within the
state, and house many of the other programs such as the Social Enterprise Investment Fund, which
encourages and enables the development of viable, scalable social enterprise in Connecticut. Unlike
traditional venture capital, this pool of money (which can be used for grants or low interest loans)
is earmarked for social entrepreneurs. reSET has interest from the investment community in these
special types of funds, and would like to set it up to enable impact investors to earmark funds for
specific issues or populations, while leaving the selection of specific investments to reSET, and its
dedicated group of financial and investment advisors.
D. Global Competitiveness:
Investments that support high-growth businesses and innovation-based entrepreneurs to
expand and compete in global markets.
The 370 Asylum Street development will support high-growth businesses and entrepreneurs to
strengthen downtown Hartford’s residents’ ability to be innovative and advance regional and
potentially global competitiveness. Becoming an innovative leader in social entrepreneurship will
put Hartford and Connecticut in the position to spread the knowledge that the pursuit of profits and
purpose can be united for the public good. Additionally, this leadership will help social
entrepreneurs gain public recognition for the benefits that they create for neighborhoods,
municipalities, and regions.
E. Environmentally-Sustainable Development:
Investments that encompass best practices in “environmentally sustainable development”,
broadly defined to include projects that enhance environmental quality and develop and
implement green products, processes, places, and buildings as part of the green economy.
370 Asylum Street was originally constructed in 1982 as a commercial office building. The
redeveloped arts and business innovation center will be constructed using environmentally
sustainable materials and technologies, including highly efficient building systems. The building is
in excellent condition and some temporary programming on the lower floors might be initiated
during the planning and development of the full program.
F. Economically Distressed and Underserved Communities:

APPENDIX G: Capital Projects
124
Investments that strengthen diverse communities that have suffered disproportionate
economic job losses and/or are rebuilding to become more competitive in the global
economy.
Redeveloping the 370 Asylum Street will strengthen downtown Hartford, which has suffered
disproportionate job losses and increased residential expenses, by becoming a catalyst to
improving the neighborhood’s economic vitality and capitalize on its various cultural and
commercial assets.
10. Please explain how this project supports the overall CEDS’ regional strategic initiatives
outlined below?
A. Cluster Initiative: Foster and grow the industry clusters with a strong presence in the region
but also seek cross-regional synergies of growth and opportunity.
The critical regional clusters identified are:
Advanced Manufacturing Financial Services Health Sciences and Services Management of Companies
The 370 Asylum Street project will create jobs in construction and at least 15 permanent jobs.
B. Workforce & Education Initiative: Focus on improving the workforce today, while educating,
training and recruiting the pipeline for tomorrow.
Industry growth will require new workers prepared to fill the jobs that will be created. In
order to meet future demand, the region will need to retain and train the talented
individuals currently here and attract new talented individuals to become the future leaders
and entrepreneurs of the region.
One of the CEDS’s goals is to create a business climate that supports entrepreneurs and small
businesses, fosters diverse job opportunities, and attracts companies in the target industries
identified by the CEDS that provide quality jobs.
The 370 Asylum Street project addresses the goal of supporting innovation and entrepreneurs by:
Establishing a network of employee-owned and other small businesses that are based locally and hire locally
Providing entrepreneurial individuals and groups with enhanced access to space, labor, and capital
Cultivating a favorable climate and support system for entrepreneurs minority entrepreneurs
Encouraging neighborhood revitalization

APPENDIX G: Capital Projects
125
Pursue innovation through small companies and entrepreneurs
C. Infrastructure Initiative: Support infrastructure investments tied to business and job
growth.
Since creating private sector jobs is the first CEDS priority, any infrastructure investment
should be measured by its contribution to and support of that job creation. Transportation
is critical to supporting a competitive economy. The MetroHartford region will benefit from
critical investments that can be transformative for its targeted industry clusters, as well as
many other industries.
Located across the street from Bushnell Park in downtown Hartford’s entertainment district, just
steps from Union Station, 370 Asylum Street is a collaboration with arts organizations and social
entrepreneurs that will provide a mix of housing for artists, performers, and disabled adults; spaces
for display, education and performance arts; and a collective work space offering affordable space,
shared services, and a creative community for innovative small businesses and artists. The 370
Asylum Street project will integrate the energies of many partners and be a catalyst for involving
Hartford’s creative community in the transformation of downtown Hartford.
D. Downtown Hartford Initiative: Transform Downtown Hartford into a dynamic urban
environment that is the epicenter of culture, entertainment, and innovation.
EDA funding stipulates that economic development programs should be designed to have
positive economic development impacts within economically distressed regions.
MetroHartford qualifies because the City of Hartford meets the EDA’s distress criteria.
370 Asylum Street plays a crucial role in the portfolio of powerful strategies to transform
downtown Hartford. One of the four goals identified in the 2012 Metro Hartford Region’s
Comprehensive Economic Strategy (CEDS) is “Transform Downtown Hartford into a dynamic urban
environment that is the epicenter of culture, entertainment, and innovation”. The CEDS noted
Downtown Hartford’s assets (compact, walkable downtown; abundant public green space; and
many cultural amenities) and its primary weakness -- lack of population.
The CEDS’s first recommendation to build downtown Hartford’s vibrancy is to increase housing
stock and it recommends converting vacant office buildings into residential buildings. It also
recommends capitalizing on Bushnell Park, Downtown’s natural center, by knitting assets together
around the Park. 370 Asylum’s proximity to Bushnell Park and fit with the iQuilt plan, which links
Hartford’s more than 45 cultural assets with a pedestrian walkway, fulfills this recommendation.
11. Project Budget
APPENDIX G: Capital Projects
126
Local Investment _________________ Amount Secured ____________
State Investment _________________ Amount Secured ____________
Federal Investment _________________ Amount Secured ____________
Private Investment _________________ Amount Secured ____________
Total Budget $10,913,915 Amount Secured $215,000
If this will be an ongoing project, identify sources of operating revenue:
The 370 Asylum Street project will be sustained through a combination of rental revenues from
business tenants, rental payments from residential tenants, available housing subsidies, and
programmatic grants.
12. Economic Benefits
Number of new permanent jobs anticipated 15+ By when? 2014
The 370 Asylum Street project will create an estimated 15 permanent jobs at the arts and
innovation center, conference center, gallery, and café that will be developed and in property
maintenance.
Number of construction jobs anticipated ________
Number of jobs retained ________
New local taxes anticipated (if applicable) __________________

APPENDIX G: Capital Projects
127
13. Land Use Issues (if applicable)
Has the property been acquired yet? The property was donated to NNPI.
If not, please explain circumstances.
Is the land appropriately zoned for project?
Are any zoning variances or other public approvals needed? (Please explain.)
Local Political Support?
14. Please provide a brief timeframe for this project including start, finish, duration, and
major milestones, as appropriate for the project.
The renovation of 370 Asylum Street will require several construction components to alter the
previous commercial office use to a mixed use facility based on current acceptable interior design
standards and efficient and sustainable utilities. Approximately 8,000 square feet on the first floor
could be occupied immediately, with little to no construction. We have invited reSET to find a way
to use this space as soon as possible while the renovations on the rest of the building are being
executed.
Restoration of 370 Asylum Street is projected to begin winter 2013 with the commercial
component of the project to be completed within three to four months. NNPI, CS’s development
partner, has selected the architects and planners and will competitively bid the construction work
this winter.
APPENDIX G: Capital Projects
128
2012 Metro Hartford Alliance CEDS
Regional Project Questionnaire/Submission
1. Project Name: Downtown North Redevelopment Plan
2. Lead Contact: Wayne Benjamin, Director of Economic Development
Organization: City of Hartford
Address: 250 Constitution Plaza, 4th Floor, Hartford, CT 06103
Phone #: 860-757-9077 Fax: 860-722-6074 Email: [email protected]
3. Municipalities and/or Organizations involved: City of Hartford acting by and through the
Hartford Redevelopment Agency
4. Type of Initiative
Business/Economic Development X Education/Workforce _____ Energy _____
Planning _____ Real Estate/Infrastructure X Transportation X Technical
Assistance _____ Other _____
If other, please provide details.
5. Please provide a description of the project.
The Downtown North Project consists of 81 properties in an area generally located to the north of
Downtown Hartford along the northern side of I-84. The Project is approximately 123.1 acres
consisting of vacant land mixed with an educational facility, two financial sector data centers, a
hotel and a small national historic district. Approximately 15.5% of the area is currently classified
as vacant land, and many of the occupied properties contain surface parking that are under-utilized.
The Redevelopment Plan provides for development of a mixed-use district with strong connections
to the Downtown core. The Project Area itself is subdivided into five sub-areas, each with varying
redevelopment visions and objectives.
The Primary goal of the Downtown North Project is to remove obsolete and blighted buildings from
a critical perimeter area of the Downtown; conduct site assemblage, and create a development
opportunity for mixed use development; rehabilitation of historic structures, and educational and
commercial development that will strengthen the development patterns of the Project Area. An
additional goal of the Downtown North Project is to create a pattern of development that provides a
strong and effective linkage between the core Downtown area south of Interstate 84 and the
residential neighborhoods north of the Project Area.

APPENDIX G: Capital Projects
129
6. Why is this project important to the region?
The initiatives in the plan will improve public safety and the image of Downtown as a secure
environment for visitors and tourists. It will also create linkages between Downtown and other
Hartford neighborhoods and surrounding communities through the implementation of efficient and
convenient mass transportation, vehicular circulation and pedestrian movement systems.
The excellent location of the Project Area north of the central Downtown area which is adjacent to
both Interstate 91 and Interstate 84, as well as the substantial presence of vacant and underutilized
land, has the potential to achieve large-scale redevelopment goals which will have a substantial
impact on the surrounding areas north of Downtown Hartford.
In addition, the plan area is part of a larger regional and intergovernmental approach to planning
and creating sustainable and livable communities in the Knowledge Corridor that has evolved over
the last 10 years. The Knowledge Corridor includes three MPO planning regions: the Pioneer Valley
Planning Commission of Springfield, MA, the Capitol Region Council of Governments of Hartford,
CT, and the Central Connecticut Regional Planning Agency of Bristol, CT. The growth, vitality and
long term sustainability of the Knowledge Corridor is tied to how well the region, their constituent
municipalities, and a wide range of public and private sector stakeholders are able to implement
development, conservation, and economic growth strategies that are sustainable in the long-term.
7. Does this project involve more than one town and/or promote greater regional
cooperation?
Yes. The Downtown North Redevelopment effort is funded, in part, by a HUD Sustainable
Communities Regional Planning Grant, whose purpose is to support metropolitan and multi-
jurisdictional planning that integrates housing, land use, economic and workforce development,
transportation, and infrastructure investments.
8. Please explain how the proposed project fits one or more of the EDA Investment Guideline
criteria outlined below.
EDA will select applications competitively based on the investment policy guidelines funding priority
considerations identified below. EDA will evaluate the extent to which a project embodies the maximum
number of investment policy guidelines and funding priorities possible and strongly exemplifies at least one
of each. All applications will be competitively evaluated on their ability to satisfy the following investment
policy guidelines, each of equivalent weight.
A. Be market-based and results driven.
An EDA investment will capitalize on a region’s competitive strengths and will positively move a
regional economic indicator, such as: an increased number of higher-skill, higher-wage jobs; increased
tax revenue; or increased private sector investment resulting from the EDA investment.
B. Have Strong organizational leadership.

APPENDIX G: Capital Projects
130
An EDA investment will have strong leadership, relevant project management experience, and a
significant commitment of human resources talent to ensure a project’s successful execution.
C. Advance productivity, innovation and entrepreneurship.
An EDA investment will enable entrepreneurship; enhance regional industry clusters, and leverage and
link technology innovators and local universities to the private sector to create the conditions for
greater productivity, innovation, and job creation.
D. Look beyond the immediate economic horizon, anticipate economic changes, and diversify the local
and regional economy.
An EDA investment will be part of an overarching, long-term comprehensive economic development
strategy that enhances a region’s success in achieving a rising standard of living by supporting existing
industry clusters, developing emerging new clusters or attracting new regional economic drivers.
(Please refer to the attached CEDS recommendations)
E. Demonstrate a high degree of local commitment by exhibiting:
High levels of local government or non-profit matching share funds and private sector leverage;
Clear and unified leadership and support by local elected officials; and strong cooperation among the
business sector, relevant regional partners and local, State and federal governments.
Response:
The Downtown North Plan includes development projects that seek to support and strengthen the
medical, financial, and insurance industries, which play a prominent role in the region’s economy.
The Rensselaer at Hartford Graduate Center and the Travelers Insurance Company data center are
two of the most prominent properties in the Downtown North Plan. A portion of the plan area is
envisioned as a research and development/hi-tech industry office park. It is anticipated that the
combined education/technology campus could include both office and laboratory space, as well as
limited hi-tech manufacturing uses ancillary to the office and laboratory space, with the technology-
related and educational uses building capitalizing on one another. The development of medical
offices (both administrative offices and patient-care offices) located along one of the central
arteries in the Downtown North Plan could easily serve the region’s population due to easy access
to the highway system.
The afore-mentioned development projects would act to strengthen the existing industry clusters
enabling them to experience even higher growth and in turn promote job creation.
9. Please explain how the proposed project fits one or more of the Funding Priorities
outlined below.
Within the parameters of a competitive grant process, all projects are evaluated to determine if they advance
global competitiveness, create jobs, leverage public and private resources, can demonstrate readiness and
ability to use funds quickly and effectively, and link to specific and measurable outcomes. To facilitate
evaluation, EDA has established the following investment priorities:

APPENDIX G: Capital Projects
131
A. Collaborative Regional Information:
Initiatives that support the development and growth of innovation clusters based on existing
regional competitive strengths. Initiatives must engage stakeholders; facilitate collaboration among
urban, suburban, and rural (including tribal) areas; provide stability for economic development
through long term intergovernmental and public/private collaboration; and support the growth of
existing and emerging industries.
B. Public/Private Partnerships:
Investments that use both public and private sector resources and leverage complementary
investments by other government/public entities and/or nonprofits.
C. National Strategic Priorities:
Initiatives that encourage job growth and business expansion in clean energy; green technologies;
sustainable manufacturing; information technology (e.g. broadband, smart grid) infrastructure;
communities severely impacted by automotive industry restricting; urban waters; natural disaster
mitigation and resiliency; access to capital for small, medium sized, and ethnically diverse
enterprises; and innovations in science, health care, and alternative fuel technologies.
D. Global Competitiveness:
Investments that support high-growth businesses and innovation-based entrepreneurs to expand
and compete in global markets.
E. Environmentally-Sustainable Development:
Investments that encompass best practices in “environmentally sustainable development”, broadly
defined to include projects that enhance environmental quality and develop and implement green
products, processes, places, and buildings as part of the green economy.
F. Economically Distressed and Underserved Communities:
Investments that strengthen diverse communities that have suffered disproportionate economic job
losses and/or are rebuilding to become more competitive in the global economy.
RESPONSE:
The Redevelopment Plan is based on Smart Growth principles with a focus on Transit-Oriented
Development. Downtown Hartford will soon have enhanced commuter capability as the New
Haven-Springfield commuter rail initiative and the New Britain-Hartford Busway become
operational. These transportation initiatives will support investment in the Downtown as a mixed-
use urban environment.
As previously discussed, the Downtown North Technology Campus includes the Rensselaer at
Hartford Graduate Center and the Travelers Insurance Company data center. In further developing
this combined education/technology campus, a strong emphasis will be placed on the landscaping
and green design at the campus as well as limiting impervious surface areas, to present an

APPENDIX G: Capital Projects
132
attractive image to the surrounding residential and mixed use neighborhood
In addition, a small triangular area formed by Main Street, Trumbull Street and North Chapel Street
may be utilized as a public art and sculpture park to help connect the neighborhood with the
platform across Interstate 84 into the core Downtown area. This linkage would tie into other
pedestrian and “greenway” elements throughout the Project Area to form a continuous greenway
connection between Downtown, a new magnet school at the former Barnard-Brown site, and
existing park space along the Connecticut River.
10. Please explain how this project supports the overall CEDS’ regional strategic initiatives
outlined below?
A. Cluster Initiative: Foster and grow the industry clusters with a strong presence in the region but also
seek cross-regional synergies of growth and opportunity.
The critical regional clusters identified are:
Advanced Manufacturing Financial Services Health Sciences and Services Management of Companies
B. Workforce & Education Initiative: Focus on improving the workforce today, while educating, training
and recruiting the pipeline for tomorrow.
Industry growth will require new workers prepared to fill the jobs that will be created. In order to
meet future demand, the region will need to retain and train the talented individuals currently here
and attract new talented individuals to become the future leaders and entrepreneurs of the region.
C. Infrastructure Initiative: Support infrastructure investments tied to business and job growth.
Since creating private sector jobs is the first CEDS priority, any infrastructure investment should be
measured by its contribution to and support of that job creation. Transportation is critical to
supporting a competitive economy. The MetroHartford region will benefit from critical investments
that can be transformative for its targeted industry clusters, as well as many other industries.
D. Downtown Hartford Initiative: Transform Downtown Hartford into a dynamic urban environment
that is the epicenter of culture, entertainment, and innovation.
EDA funding stipulates that economic development programs should be designed to have positive
economic development impacts within economically distressed regions. MetroHartford qualifies
because the City of Hartford meets the EDA’s distress criteria.
RESPONSE:
The Downtown North Project Area is divided into five sub-areas: The Ann Street Historic Corridor,
Trumbull Street Village, Downtown North Technology Campus, Market Street Service Corridor, and
the New Magnet School at Barnard-Brown.

APPENDIX G: Capital Projects
133
The Ann Street Historic Corridor Sub-Area is bounded by Main Street, Pleasant Street, Chapel Street
North and High Street; Ann Uccello Street itself cuts through this two-block area from north to
south. Proposed used include rehabilitating the existing historic structures in this area and
supplementing them with in-fill development on vacant lots or surface parking lot in the area. The
reconfiguration of the six-way intersection on Main Street at the north end of this area, possibly as a
roundabout with a water feature, may occur as part of the redevelopment effort. Ann Uccello Street
could possibly be closed to vehicular traffic and converted into a pedestrian street. Both existing
buildings that currently face onto Ann Uccello Street and newly constructed buildings along Ann
Uccello Street would have access along the street. Three story walk-up townhomes and small
professional offices and stores are envisioned for a pedestrianized Ann Ucello Street. Portions of
this sub-area that front on Main Street and Pleasant Street are envisioned for ground floor
commercial space with apartments located on the upper floors.
The Trumbull-Main Village Sub-Area is bounded by Pleasant Street to the north and west, Chapel
Street North and Morgan Street North to the South, and Market Street to the east. This sub-area
also includes the platform that extends over interstate 84 between Trumbull Street and Main Street.
Trumbull Street and Main Street are the key traffic routes through this neighborhood, forming a
prominent focal point for the neighborhood at their intersection point at the former location of
1161-1179 Main Street. The Crowne Plaza Hotel is envisioned to remain. The two blocks along
Pleasant Street and Trumbull Street between Windsor Street and North Chapel Street are
envisioned to be developed as higher density residential, which would provide a substantial
customer base for existing retail and commercial space along Trumbull Street on the southern side
of I-84, only three to four blocks away. The undeveloped area between the Crowne Plaza Hotel and
Main Street is planned for a mix of retail stores, restaurants, entertainment venues and upper floor
residential units.
The Downtown North Technology Campus includes the Rensselaer at Hartford Graduate Center and
the Travelers Insurance Company data centers as its most prominent properties. A portion of the
plan area is envisioned as a research and development/hi-tech industry office park. It is
anticipated that the combined education/technology campus could include both office and
laboratory space, as well as limited hi-tech manufacturing uses ancillary to the office and laboratory
space, with the technology-related and educational uses building capitalizing on one another. A
strong emphasis will be placed on the landscaping and green design at the campus as well as
limiting impervious surface areas, to present an attractive image to the surrounding residential and
mixed-use neighborhood.
The Market Street Service Corridor is envisioned as a mix of service establishments, hospitality
businesses and health care sector offices. An 11-story Best Western Hotel has been proposed in
this area and would form a suitable anchor for the remainder of the sub-area. Other hotels, should
they be proposed, would be suitable additions to this area. Service establishments servicing the
newly created residential developments elsewhere in the Downtown North Redevelopment Area
would help strengthen activity levels. Medical offices (both administrative offices and patient-care
offices) planned for this area could easily serve the region’s population due to easy access to the

APPENDIX G: Capital Projects
134
highway system. Pedestrian-oriented urban design improvements beginning at the easterly
terminus of Pleasant Street and connecting with the existing pedestrian overpass over I-91 would
provide better connectivity to Riverside Park for the entire Project Area.
The former Magnet School at Barnard-Brown is now the site of the new Capitol Prep Magnet School,
which is now the top performing school in the nation. The opening of this new magnet school will
provide a strong public investment presence in the Project Area and another critical connection
point between the Project Area and the surrounding residential neighborhoods. The current space
surrounding Keeney Tower will also be enhanced.
This plan serves as a mechanism to achieve the above goals and incorporates several policy
recommendations of the City of Hartford’s Comprehensive Plan of Development. These goals and
recommendations include:
Expansion of Hartford’s property tax base Improvement of public safety and the image of Downtown as a secure environment The creation of linkages between Downtown and other Hartford neighborhoods The implementation of efficient and convenient mass transportation, vehicular circulation
and pedestrian movement systems Improve conditions by removing blight
11. Project Budget
The Downtown North Project execution activities will be financed, in part, by City appropriations.
Additional sources of financing will be pursued to implement the anticipated activities. $4.25
million in CIP funds have been allocated to this project to date.
Local Investment $4.25 million Amount Secured $4.25 million
State Investment ____________ Amount Secured ____________
Federal Investment $387,600 Amount Secured $387,600
Private Investment TBD Amount Secured $0
Total Budget $4,637,600 Amount Secured $4,637,600

APPENDIX G: Capital Projects
135
If this will be an ongoing project, identify sources of operating revenue: City and CIP funds
_______________________________________________________________________
12. Economic Benefits
Number of new permanent jobs anticipated: 750 By when? 2015
Number of construction jobs anticipated: 300
Number of jobs retained: 750
New local taxes anticipated (if applicable) $2,000,000
13. Land Use Issues (if applicable)
Has the property been acquired yet? If not, please explain circumstances.
The plan provides for the eventual acquisition of a total of three (3) parcels that are privately
owned. Two of the three properties are owned by Rensselaer at Hartford, with the stipulation that
if Rensselaer does not develop the two properties within a defined period of time, ownership of the
properties will revert to the City of Hartford. The third privately-owned property has been
demolished.
Is the land appropriately zoned for project?
The Project Area is presently zoned B-1, B-2, C-1, I-2 and P (Park). The plan proposes to maintain
the existing zoning designations in the Project Area, with the possible exception of the C-1 zone.
Are any zoning variances or other public approvals needed? (Please explain.)
The C-1 zone is under study and review for a possible change to a design district. Public approval
will be needed.
Local Political Support?

APPENDIX G: Capital Projects
136
Yes. There is tremendous local support for the project given its visibility and potential for job
retention, creation and transit-oriented development.
14. Please provide a brief timeframe for this project including start, finish, duration, and
major milestones, as appropriate for the project.
In the winter of 2009, the City of Hartford Court of Common Council approved the Downtown North
Redevelopment Plan. By the summer of 2010, The City had acquired two properties in the plan
area-1161 Main Street and 40 Chapel Street, and demolished 1161 Main Street later in the fall. In
the winter of 2010 the City was awarded the Sustainable Grant to further the initiatives in the
Downtown North Redevelopment Plan. By the fall of 2011, implementation of the Plan began. This
past spring, the Court of Common Council approved the acquisition of 58 Chapel Street with the
closing on the property being imminent.

APPENDIX G: Capital Projects
137
2012 Metro Hartford Alliance CEDS
Regional Project Questionnaire/Submission
1. Project Name: Parkville Municipal Development Plan
2. Lead Contact: Wayne Benjamin, Director of Economic Development
Organization: City of Hartford
Address: 250 Constitution Plaza, 4th Floor, Hartford, CT 06103
Phone #: 860-757-9077 Fax: 860-722-6074 Email: [email protected]
3. Municipalities and/or Organizations involved: City of Hartford
4. Type of Initiative
Business/Economic Development X Education/Workforce _____ Energy _____
Planning _____ Real Estate/Infrastructure___X_ Transportation ___X__ Technical
Assistance _____ Other _____
If other, please provide details.
5. Please provide a description of the project.
The approximately 300-acre Parkville Municipal Development Plan (MDP) Project Area is located in
a neighborhood to the western part of the City that is a mix of small businesses, industry, offices
and residences. The Parkville MDP is aimed at accomplishing three major goals: 1) supporting
existing businesses; 2) attracting additional private investment; and 3) providing the necessary
infrastructure. Specific action items are identified in the plan to meet these three goals.
The projects presented in the plan will expand private and public parking facilities and will visually
unify a major corridor where the critical mass of businesses exists. The anticipated improvements
will also help to convey a safe, secure and inviting environment to those who visit and work in the
area. The Plan will encourage private revitalization of buildings or redevelopment of properties for
mixed use through the acquisition of specific parcels and/or by partnering with private property
owners. An additional focus of the Plan will be to build the appropriate infrastructure that will
support the new businesses that are expected to locate in the Project area. These improvements,
while enhancing the function of operations and services, will achieve a higher level of aesthetic
appearance and will improve environmental sustainability.
6. Why is this project important to the region?

APPENDIX G: Capital Projects
138
The implementation of the proposed activities is expected to generate new jobs. Approximately
500 jobs are expected to be filled primarily by Hartford residents and residents from the region. It
is estimated that a total of 494 permanent jobs may be created as a result of this Project. The
projected cost included land acquisitions. Using the 493,665 SF anticipated for acquisition, and
assuming a 50% coverage ratio and three (3) story buildings, a total of 740,496 SF of flex space
could potentially result from the implementation of this Plan. Assuming 1 job per 1,500 SF, a total
of 494 permanent jobs could be created. For construction-related jobs, it is anticipated that
between the 493,000 SF of new construction, and the anticipated streetscape, roadway and utility
work necessary for Plan implementation, there may be a range of 500 to 650 construction-related
jobs created.
In addition, the anticipated infrastructure improvements, remediation and blight removal will
enhance the viability of existing businesses and create new economic development opportunities,
increasing the market value of the land within the MDP area. Also, given these anticipated
improvements, the standard of living of all the City residents, particularly in the Parkville
neighborhood, will be enhanced.
Lastly, development within the Project Area is anticipated to expand the city’s tax base. Based on
the approximately 493,665 SF of new construction, the City anticipates that $1,118,854.60 in new
taxes will be generated.
7. Does this project involve more than one town and/or promote greater regional
cooperation?
Yes. The New Britain-Hartford Busway project is intended to enhance the vitality in the city and
Region.
8. Please explain how the proposed project fits one or more of the EDA Investment Guideline
criteria outlined below.
EDA will select applications competitively based on the investment policy guidelines funding priority
considerations identified below. EDA will evaluate the extent to which a project embodies the maximum
number of investment policy guidelines and funding priorities possible and strongly exemplifies at least one
of each. All applications will be competitively evaluated on their ability to satisfy the following investment
policy guidelines, each of equivalent weight.
A. Be market-based and results driven.
An EDA investment will capitalize on a region’s competitive strengths and will positively move a
regional economic indicator, such as: an increased number of higher-skill, higher-wage jobs; increased
tax revenue; or increased private sector investment resulting from the EDA investment.
B. Have Strong organizational leadership.
An EDA investment will have strong leadership, relevant project management experience, and a
significant commitment of human resources talent to ensure a project’s successful execution.

APPENDIX G: Capital Projects
139
C. Advance productivity, innovation and entrepreneurship.
An EDA investment will enable entrepreneurship; enhance regional industry clusters, and leverage and
link technology innovators and local universities to the private sector to create the conditions for
greater productivity, innovation, and job creation.
D. Look beyond the immediate economic horizon, anticipate economic changes, and diversify the local
and regional economy.
An EDA investment will be part of an overarching, long-term comprehensive economic development
strategy that enhances a region’s success in achieving a rising standard of living by supporting existing
industry clusters, developing emerging new clusters or attracting new regional economic drivers.
(Please refer to the attached CEDS recommendations)
E. Demonstrate a high degree of local commitment by exhibiting:
High levels of local government or non-profit matching share funds and private sector leverage;
Clear and unified leadership and support by local elected officials; and
Strong cooperation among the business sector, relevant regional partners and local, State and federal
governments.
Response:
The initiatives presented in the Parkville Municipal Development Plan were the result of the
collaborative effort of a number of public and private entities, and incorporates the extensive
research and market studies performed by the City, key stakeholders, and industry professionals
commissioned specifically for the project.
Since the completion of a Neighborhood Revitalization Plan in 1998, the City and the Parkville
Neighborhood Revitalization Association (PNRA) have worked proactively to improve the area
economically as well as aesthetically. The neighborhood provided the primary impetus for a study
of the industrial sector “Shifting Gears: Parkville Industrial Corridor” which studied the industrial
sector and “Picture it Better Together” directed toward physical improvements and enhancing
pedestrian and bicycling connections.
In 2002, the Parkville Economic Opportunities Report was commissioned by the Parkville
Neighborhood Revitalization Association to focus more intently on revitalization and economic
development. This report analyzed market and real estate conditions and assessed the
redevelopment potential of the Project area. A series of recommended actions set the course for
implementation.
In addition, City of Hartford Planning staff researched various approaches to allow housing in older
industrial buildings. As a result, the City adopted Industrial Reuse Overlay District regulations
which allowed for the redevelopment of two parcels in the Project area.

APPENDIX G: Capital Projects
140
Finally, the City of Hartford issued a Request for Proposal to retain the assistance of a consultant to
prepare the Municipal Development Plan. The consultant identified potential MDP actions together
with an Advisory Committee consisting of members of the Parkville Revitalization Association,
residents, local businesses and property owners. Through a series of meetings and a site walk,
needs and issues were identified. The Advisory Committee independently met and prioritized the
actions and provided feedback to the City.
The result was a municipal development plan prepared to accomplish three major goals: 1) support
existing businesses; 2) attract additional private investment; and 3) provide the necessary
infrastructure. Specific action items are identified in the plan to meet these three goals.
9. Please explain how the proposed project fits one or more of the Funding Priorities
outlined below.
Within the parameters of a competitive grant process, all projects are evaluated to determine if they advance
global competitiveness, create jobs, leverage public and private resources, can demonstrate readiness and
ability to use funds quickly and effectively, and link to specific and measurable outcomes. To facilitate
evaluation, EDA has established the following investment priorities:
A. Collaborative Regional Information:
Initiatives that support the development and growth of innovation clusters based on existing
regional competitive strengths. Initiatives must engage stakeholders; facilitate collaboration among
urban, suburban, and rural (including tribal) areas; provide stability for economic development
through long term intergovernmental and public/private collaboration; and support the growth of
existing and emerging industries.
B. Public/Private Partnerships:
Investments that use both public and private sector resources and leverage complementary
investments by other government/public entities and/or nonprofits.
C. National Strategic Priorities:
Initiatives that encourage job growth and business expansion in clean energy; green technologies;
sustainable manufacturing; information technology (e.g. broadband, smart grid) infrastructure;
communities severely impacted by automotive industry restricting; urban waters; natural disaster
mitigation and resiliency; access to capital for small, medium sized, and ethnically diverse
enterprises; and innovations in science, health care, and alternative fuel technologies.
D. Global Competitiveness:
Investments that support high-growth businesses and innovation-based entrepreneurs to expand
and compete in global markets.
E. Environmentally-Sustainable Development:

APPENDIX G: Capital Projects
141
Investments that encompass best practices in “environmentally sustainable development”, broadly
defined to include projects that enhance environmental quality and develop and implement green
products, processes, places, and buildings as part of the green economy.
F. Economically Distressed and Underserved Communities:
Investments that strengthen diverse communities that have suffered disproportionate economic job
losses and/or are rebuilding to become more competitive in the global economy.
RESPONSE:
Parkville’s population has remained relatively stable compared to other neighborhoods in Hartford.
A continued, albeit moderated rate of growth is projected for Parkville through 2011. Household
incomes in Parkville are generally low to moderate (43% earn under $25,000 compared to l7% for
the State); its median income is slightly higher than that of the City as a whole but only one-half of
the State median, with per capita income remaining stubbornly low. Parkville’s housing is primarily
rental (72%) and multi-family (84.6%). Most Parkville residents are relatively new to the area, with
growing numbers coming from outside the country, adding to the broad ethnic base of the
neighborhood.
Although Parkville’s residential occupational profile very closely resembles the city there are a
number of differences of note. Higher job concentrations are found in retail trade and services,
typically lower paying jobs, while less representation is found in insurance and finance and public
administration. Meanwhile, a greater percentage of residents report construction jobs compared to
the city, indicative of the well established business base in trades located in the Parkville area. One
of every three employed Parkville residents are employed in services compared to one of every five
in the state. White collar jobs account for 44% of all Parkville resident employment.
A total of 847 businesses are located within a 2 minute drive of Park Street and Bartholomew
Avenue in Parkville. This business base supports 9,208 employees, almost 10% of the total
employment in the city. Insurance carriers and agents constitute the most sizable employment base
in the Parkville area with 25% of total jobs, followed by government with 19%, and retail trade
with 15.6% a likely source of jobs for local residents as noted in the previous section on resident
occupational profile Construction, manufacturing and wholesale trade are also well represented in
the 2 minute trade area with 89 businesses and 646 jobs.
Expanding the drive time to 3 minutes triples the business base to 2,582 companies and 45,479
employees. Major shifts occur in employment share with the increased trade area with service
employment jumping to 42% of total jobs as compared to 29% in the 2 minute trade area. The
share in retail trade jobs, on the other hand, drops to 6% as compared to 16% in the smaller
business base.
Data gathered by the US Department of Labor in its Consumer Expenditure Survey and reported by
ESRI to identify sources of retail spending in the area, city and region were reviewed. Data is
presented in both terms of average annual dollars spent per household and also compared to the
national profile (US Index) as a measure of strength or weakness for a range of consumer goods and

APPENDIX G: Capital Projects
142
services.
Consumer spending patterns were identified for areas within 1 mile, 3 miles and 5 miles of the
intersection of Park Street and Bartholomew Avenue. Based on the data presented, retail capacity
within a one mile radius incorporating roughly half of Hartford and eastern border of West
Hartford is relatively modest as compared to the national index with most spending categories
ranking close to half the US index. Some improvement occurs with expansion to the 3 mile radius
that takes in Hartford and parts of West Hartford, East Hartford, Bloomfield and Wethersfield. At
the 5 mile radius, often used as trade area for larger retailers, the retail consumption reaches near
parity with US index.
The presence of a viable retail district in Parkville area located both on Park Street and along New
Park Avenue and more recently on Flatbush Avenue, with Charter Oak Marketplace, attests to the
capacity of the area to draw from a large trade area. Within the five mile trade area, major retail and
service strengths were identified for apparel products and services, entertainment and recreation,
financial services, moving and storage services, and food (both at home and away).
Parkville has been the focus of much commercial investment activity even as the market softened
with the onset of the 2001-2 recessions. Over a three year period, a total of $16.4 million was
recorded in 54 commercial and industrial sales, although not surprisingly, most activity occurred in
the first two years. A greater percentage of mixed-use property sales are noted compared to three
years ago reflecting the rising interest in housing as an investment. Numerous industrial or mixed-
industrial sales are also observed, including many within the Project Area, indicative of the
importance of this land use in the neighborhood. Meanwhile, New Park Avenue continues to be the
focal point for much of the sale of retail and commercial properties, with the largest transaction
occurring at 330 New Park Avenue for $14 million (originally developed as Crown Theatres). More
recently, retail growth and pressures have emerged along Flatbush Avenue with the recent opening
of Charter Oak Marketplace, a 328,000 SF retail development anchored by Wal-Mart that has spun
off other retail, services and dining. The market assessment completed by AMS is designed to serve
as a base for review of proposed concepts and any market findings and conclusions prepared by
any project developers by determining market capacity and thresholds for proposed concepts.
Three market categories were selected for evaluation: industrial, retail-commercial and office.
Industrial Market
• Although some positive trends are emerging, the industrial market within the nation and region has generally experienced moderate growth over the last three years. This has resulted in low turnover. Based on projections, a generally favorable market environment will continue short term although wholesaling and distribution will be the primary beneficiary.
• Much of the inventory in the immediate region is found in larger buildings that are difficult
to convert to smaller sub-tenant and multi-lease format. Mid-range 30,000 to 50,000 square
feet also exhibiting leasing — sales softness. Core demand in the area is for smaller facilities
of under than 10,000 square feet which are in less supply.

APPENDIX G: Capital Projects
143
• Hartford does not appear to have a great inventory of already zoned, ready to build
industrial sites. A recent listing identified only a small number of available sites within the
city.
• Although the Project Area has excellent visibility from Interstate 84, its lack of direct or easy
access from the highway is a marketing disadvantage made worse by the fact that trucks are
not able to pass under the railroad overpass on Park Street. Circulation in and out of the
Project area is also hampered to some degree by the rail line which closes access to
Hamilton Street when trains pass through and by on-street parking that further narrows
already narrow roadways.
• To the extent access and circulation issues are resolved, the Subject Area could expect to
capture demand for industrial space primarily from small to mid-size users ranging from
1,000 to 5,000 square feet in size, with expansion options (in existing multi-tenanted
facilities). Stand alone facilities are expected to fall within the 10,000 to 15,000 SF range
with expansion potential (warehousing and distribution facilities of course much larger).
Moreover, it is anticipated that demand will come from an eclectic business mix that is more
often than not service- based users looking for low cost but functional space as opposed to
traditional industrial users.
Retail Market
• Competitive retail pressures are expected to be intense in the trade area where over 11
million square feet in retail centers currently exist and another 900,000 square feet is in
planned or concept stage.
• Areas with the greatest ability to attract retail development at present are suburbs east and
west of Hartford. In the case of eastern Hartford retail market, its strength is primarily in
South Windsor and Manchester in areas where clustering and or co-location of retail,
particularly national chains, can be accomplished.
• Longer term, retail stability and growth is expected to favor expansion east of the river
indicative of the shift in population base that is occurring in the Hartford region to this area
where population is growing at an annual rate of 0.72% a year versus 0.5% or less a year
west of the river.
• An analysis of retail leakage versus supply points to a potentially saturated environment in
all three market areas when all retail is considered. Oversupply appears to be acute in the 1
and 3 mile radius which both include all or portions of the major regional centers in the
area.
• While the data indicated the presence of a possible over-stored environment in the region,
unmet demand for food and drink and food stores retail dollars was evident in all 3 and 5
mile markets. Grocery and food stores ranked highest in potential demand along with food

APPENDIX G: Capital Projects
144
and beverage establishments and at the southern end of the Project Area likely to benefit
from the strategic location to New Park and Flatbush Avenue and 1-84 and the high traffic
counts produced in the area.
• Although there are indications of oversupply, an argument can be made for retail in terms of
support for convenience based retail and food and drink establishments as well as the
potential spin-off success from nearby Charter Oak Marketplace. With respect to the latter,
an important maxim in the trade is that retail likes to follow retail and the presence of
anchors Wal-Mart and Marshalls at Charter Oak Marketplace immediately opposite of the
Project Area to the south along with more than 20 other establishments greatly enhance the
retail opportunity for sites nearby. For the southern area of the Project Area off Flatbush,
retail opportunities will be defined to large extent by site capacity and access but could
potentially support up to 50,000 to 75,000 feet that could include food-related stores, drug
store, restaurant or business to business type establishments. Branch banks, which in the
1990s experienced wholesale closings, now rank highest in service-based new construction
and are continually seeking locations on heavy traffic corridors. Other possible uses for this
area could include facilities for recreation, health and fitness which have seen significant
growth, most notably seen in the rapid rise of LA Fitness Center.
• The Bartholomew Project area has already established a strong nexus of household
trades/retail outlets and design showroom centers that represents an opportunity for
expansion. This base is most recently highlighted by the development of the Design Center
at the former Barradon building (1409 Park Street) which houses several different
showrooms for various home-related goods and services the largest of which is
DesignSource CT featuring luxury home decor. Nearby as well are older establishments that
include Lyman Kitchens (moved to area in 1995) and R.L. Fisher Home (linens, bedding,
fabrics, and home accessories). With consumers, vendors and distributors often
appreciating the convenience of finding resources for home improvements and upgrades in
close proximity of each other, a strong potential exists for building on this base and
attracting additional businesses that cater to home improvements ranging from tile and
flooring centers to plumbing outlets.
Office Market
• It is expected that the region and state will move into a more favorable office market
environment with vacancies stabilizing and rents nudging up. Moreover, new construction,
thus new inventory, continues to be restrained, particularly in the Hartford area by slow job
growth of under 0.7% a year.
• Contributing to the health of the local office market is the conversion of hundreds of
thousands of square feet of office to residential or other uses, which has especially
decreased the amount of B and C space.
• Despite significant inventory of available office space in the city, the Parkville-Bartholomew
location offers a potentially favorable alternative to the downtown and other areas of the

APPENDIX G: Capital Projects
145
city for B and C space based on location and accessibility to major thoroughfares that
include Park Street, New Park Street and I- 84. While office properties in the area report
some success in capturing a share of the city’s office market, this market would be greatly
enhanced by improvements to circulation, parking, and streetscape appearance.
• Prospects for new office development would appear to be limited in the Project Area
outside of R&D and flex-office potential. Special niche markets that include educational and
medical office are unlikely for the Bartholomew area due to marginal access to its
constituent market base. The Parkville-Bartholomew area support the level of rents
necessary to consider new construction of conventional office space with baseline rents
ranging between $10.00 to $15.00 a square foot while new office construction would need
$25.00 SF or more.
10. Please explain how this project supports the overall CEDS’ regional strategic initiatives
outlined below?
A. Cluster Initiative: Foster and grow the industry clusters with a strong presence in the region but also seek
cross-regional synergies of growth and opportunity.
The critical regional clusters identified are:
Advanced Manufacturing Financial Services Health Sciences and Services Management of Companies
B. Workforce & Education Initiative: Focus on improving the workforce today, while educating, training and
recruiting the pipeline for tomorrow.
Industry growth will require new workers prepared to fill the jobs that will be created. In order to
meet future demand, the region will need to retain and train the talented individuals currently here
and attract new talented individuals to become the future leaders and entrepreneurs of the region.
C. Infrastructure Initiative: Support infrastructure investments tied to business and job growth.
Since creating private sector jobs is the first CEDS priority, any infrastructure investment should be
measured by its contribution to and support of that job creation. Transportation is critical to
supporting a competitive economy. The MetroHartford region will benefit from critical investments
that can be transformative for its targeted industry clusters, as well as many other industries.
D. Downtown Hartford Initiative: Transform Downtown Hartford into a dynamic urban environment that is the
epicenter of culture, entertainment, and innovation.
EDA funding stipulates that economic development programs should be designed to have positive
economic development impacts within economically distressed regions. MetroHartford qualifies
because the City of Hartford meets the EDA’s distress criteria.

APPENDIX G: Capital Projects
146
RESPONSE:
Roads, utilities, and site preparation activities play a critical role in the MDP Plan. New or improved
infrastructure is intended to support the new businesses expected to locate in the Project Area.
One of the primary development goals of the plan is to connect two major arteries leading into the
MDP area. The existing city roadway network is fractured in the MDP area. Direct and easy public
access between parcels located to the north and south of I-84 is currently unavailable. In addition
to the lack of roadway connectivity in the overall MDP area, access to potential redevelopment
parcels is also restricted due to the lack of a suitable roadway network. The new city street created
as a result of the proposed connection would enhance the viability of the Parkville area for
redevelopment.
The MDP also recognizes that the entire heart of the Parkville neighborhood is ripe for transit
oriented development. Improvements to surface parking lots, establishment of additional public
one-street parking spaces and streetscape improvements are all infrastructure initiatives that form
an overall strategic transit oriented plan.
11. Project Budget
Local Investment $1 million Amount Secured: $1 million (CIP funds)
State Investment $ 5 million Amount Secured: applied for
Federal Investment $5 million Amount Secured: $3 million-secured from
federal DOT
$2 million-current
application to EDA
Private Investment $14 million Amount Secured: $0
Total Budget $25 million Amount Secured: $4 million
If this will be an ongoing project, identify sources of operating revenue: City government and
private sources
12. Economic Benefits
Number of new permanent jobs anticipated: 494 By when? 2014
Number of construction jobs anticipated: 500-650
Number of jobs retained: 600

APPENDIX G: Capital Projects
147
New local taxes anticipated (if applicable) approx $1.1 million
13. Land Use Issues (if applicable)
Has the property been acquired yet? If not, please explain circumstances. No. Some
properties are targeted by the City for taking
Is the land appropriately zoned for project? Yes
Are any zoning variances or other public approvals needed? (Please explain.) Yes. A
significant amount of properties are zoned industrial and may need to be converted to retail /
mixed use. Public approval will be needed.
Local Political Support?
There is tremendous local support for the project given its visibility and potential for job
retention, job creation and transit-oriented development.
14. Please provide a brief timeframe for this project including start, finish, duration, and
major milestones, as appropriate for the project.
The project was conceived and adopted in 2009. To date there are thirteen distinct projects. The
streetscape improvements have been completed. The City has set aside CIP funding and $3 million
in federal funding. The next phase is to acquire properties for infrastructure improvements that
are critical in order to advance the key initiatives of the municipal development plan.

APPENDIX G: Capital Projects
148
2012 Metro Hartford Alliance CEDS
Regional Project Questionnaire/Submission
1. Project Name: Bolton Crossroads Industrial / Office Park
2. Lead Contact: Joyce Stille, Administrative Officer Organization: Town of Bolton
Address: 222 Bolton Center Road, Bolton, CT 06043
Phone #: 860-649-8066 Fax: 860-643-0021 Email: [email protected]
3. Municipalities and/or Organizations involved: Route 6 Regional Economic
Development Council (REDC); Town of Coventry; Town of Andover; Town of
Columbia; Capital Region Council of Governments; Windham Region Council of
Governments
4. Type of Initiative
Business/Economic Development X Education/Workforce _____ Energy _____
Planning X Real Estate/Infrastructure X Transportation X Technical
Assistance _____ Other _____
If other, please provide details.
5. Please provide a description of the project.
The project was conceptualized in the Route 6 Hop River Corridor Economic
Development Strategy and Master Plan (“Master Plan”) produced and approved by
the REDC in 2010 and further detailed and fine-tuned in the Route 6 Hop River
Corridor Transportation Study (“Transportation Study”) produced by CRCOG in
2012. The REDC‟s master Plan envisions 4 development nodes conceptualized based on
sustainable principles with development controlled by zoning regulations and design
guidelines consistently applied in the four towns. A Committee consisting of PZC members
from the four towns is currently reviewing a draft regulation and
guidelines. It is also envisioned that the four towns would eventually share the tax
benefits of any development produced along the Route 6 corridor.

APPENDIX G: Capital Projects
149
Bolton Crossroads is located on Route 6 in Bolton immediately east of the Bolton
Notch intersection of Routes 384/6/44. It has two components: A mixed use village
style development on the south side of the road generally across from the Munson‟s
candy factory / retail outlet, and the Bolton Crossroads Industrial and Office Park (unofficial
name created in the interim for the purpose of this submission). The latter is proposed in
connection with this application. It consists of a new industrial road approximately one mile
in length together with and associated utilities and multi-purpose path extending from
Route 6 at a point just east of the Munson‟s facility to a point opposite the intersection of
Route 44 and Vernon Road. It is anticipated that this road would be developed in phases. The
added benefit of this road is that it will provide a much needed connection to Route 44 east
close to the Notch, which connection presently does not exist. A plan for the reconstruction
of the Route 384/6/66 intersection contained in the Route 6 Transportation Study has been
endorsed by the CRCOG Transportation Committee, which plan includes a more
comprehensive approach to connectivity, but is designated a long-term project under the
Study.
The project is targeting expansion and relocation of existing industry and
businesses, new businesses, and perhaps a business incubator. All of this is
supported by an Economic Development Study which is a component of the Master
Plan which was prepared by Mark Waterhouse.
Please see Appendices A & B, attached, which are excerpts from the respect Master
Plan and transportation Study. The complete studies can be found at
http://www.route6hoprivercorridor.com/p_description.html and
http://www.crcog.org/transportation/current_stud/Route6.html#Top
6. Why is this project important to the region?
This project is important to the two regions because rural small towns such as the
four towns along the corridor are highly dependent on residential tax base to
provide services, which are generally inadequate to support the community.
Municipalities in Connecticut require strong commercial / industrial, high density,
or mixed use development to enhance and diversify its tax base. These rural

APPENDIX G: Capital Projects
150
communities are also at a general disadvantage because needed infrastructure is
generally lacking. These communities alone cannot and have no chance of
competing with Hartford suburban Office and industrial parks and large-scale
commercial development, such as big box retailers – the market is for parks and
uses smaller in scale. Working together, the towns would be at a greater competitive
advantage.
The Economic Development Action Report (Chapter 16 of the above referenced
Economic Development Study and master Plan), prepared by Mark Waterhouse
acknowledges the “there is a shared interest in the creation of at least one modestly
sized, high quality, mixed use office park in which all the corridor communities can be
investors (Chapter 16, p. 7). “Such a joint venture may allow the area to take advantage
(and be a leader in the State) of new legislation (Public Act 9-231 which authorizes the chief
elected officials of two or more municipalities to enter into an agreement to promote
regional economic development and share the real and personal property tax revenue from
new economic development”. Given the conclusion that 80% of prospects look for an
existing buildings, “the 4 towns could develop a flex space building that would be available
to meet the space needs of small occupants. Such a building could be part of a business
park” discussed above (Chapter 16, p. 8). Based on this analysis, which assumes a rebound
form the economic conditions existing at the time of the report (and still existing at this
time), Mr. Waterhouse, in Recommendation 7, stated the following (Chapter 16, p. 15):
7. A site should be sought for development of at least one modestly sized,
high quality, mixed use business park in which all the corridor communities
could be investors under the provisions of Connecticut Public Act 09-231. In
order to take advantage of this new legislation, the Route 6 Regional
Economic Development Council, in association with the two Councils of
Government serving the region should work with their state legislative
delegation to begin the process of establishing a federally recognized
Economic Development District (EDD) for the region (or a single EDD for
the state).

APPENDIX G: Capital Projects
151
8. The 4 Route 6 Hop River Corridor towns should consider joint
development of a speculative flex-space building (or the design of a virtual
speculative building) that would be available to meet the space needs of
multiple small occupants. Such a building could be part of the business park
discussed in item 6 above.
7. Does this project involve more than one town and/or promote greater regional
cooperation?
As already stated about, this Office / business park is a joint venture of the REDC, a
regional council, and the Towns of Bolton, Coventry, Andover, and Columbia. The
regional council‟s territory encapsulates portions of two planning regions: CRCOG and
WINCOG. To date, the Route 6 plan is consistent with CRCOG‟s regional POCD.
WINCOG‟s inclusion is pending.
8. Please explain how the proposed project fits one or more of the EDA Investment
Guideline criteria outlined below.
EDA will select applications competitively based on the investment policy guidelines
funding priority considerations identified below. EDA will evaluate the extent to which a
project embodies the maximum number of investment policy guidelines and funding
priorities possible and strongly exemplifies at least one of each. All applications will be
competitively evaluated on their ability to satisfy the following investment policy
guidelines, each of equivalent weight.
A. Be market-based and results driven.
An EDA investment will capitalize on a region’s competitive strengths and will
positively move a regional economic indicator, such as: an increased number of
higher-skill, higher-wage jobs; increased tax revenue; or increased private sector

APPENDIX G: Capital Projects
152
investment resulting from the EDA investment.
Please see the answers to #6, which contains excepts from the Market report
prepared by Mark Waterhouse. This report can be found in its entirety at
http://www.route6hoprivercorridor.com/p_description.html .
B. Have Strong organizational leadership.
An EDA investment will have strong leadership, relevant project management
experience, and a significant commitment of human resources talent to ensure a
project’s successful execution.
C. Advance productivity, innovation and entrepreneurship.
An EDA investment will enable entrepreneurship; enhance regional industry
clusters, and leverage and link technology innovators and local universities to the
private sector to create the conditions for greater productivity, innovation, and job
creation.
D. Look beyond the immediate economic horizon, anticipate economic changes, and
diversify the local and regional economy.
An EDA investment will be part of an overarching, long-term comprehensive
economic development strategy that enhances a region’s success in achieving a
rising standard of living by supporting existing industry clusters, developing
emerging new clusters or attracting new regional economic drivers. (Please refer to
the attached CEDS recommendations)
From the viewpoint of this economic downturn, we foresee, as Mr. Waterhouse
did, a market for the office / business park, which may also contain a flexbusiness

APPENDIX G: Capital Projects
153
facility. The Market Study also predicts that the 4 town‟s joint
venture is feasible, signaling a change from the type of “marginal”
development which has occurred along the corridor for years. The
abandonment of the “Route 6 Expressway by CTDOT also signals a change –
the end to a 40 year period of uncertainty about the market along Route 6. The
REDC has capitalized on this event and has carefully planned for a sea change
along the Corridor which this newfound stability has brought. . Recent
improvements have transformed Route 6 from its image as “Suicide 6”, and a recent
Transportation Study of this section of Route 6 by the CRCOG has
help establish a blueprint for development and multi-modal accommodation
was is integral to this vision.
The addition of the first office park along this corridor is a diversification of
uses along the corridor, and the incubator facility will be the first that is
committed to grow and sustain jobs along the corridor.
E. Demonstrate a high degree of local commitment by exhibiting:
High levels of local government or non-profit matching share funds and private
sector leverage;
Clear and unified leadership and support by local elected officials; and
Strong cooperation among the business sector, relevant regional partners and
local, State and federal governments.
The implementation of the Master Plan and Transportation Study objectives
is in its infancy, and thus no funding has been allocated for government
matching share funds. The REDC had applied for and received a STEEP
grant for the Master Plan, and significant transportation funds were
allocated for the Transportation Study. To date, representatives of the 4

APPENDIX G: Capital Projects
154
Planning and Zoning Commissions along the corridor have been meeting to
develop zoning and design guidelines templates that are intended to be
implemented by the 4 towns to establish a consistent regulatory and design
framework.
There is strong support on the part of the leadership of the 4 towns for this
project, demonstrated by unanimous votes of support for both the Economic
and Master Plan, and the Transportation Study. As stated previously,
CRCOG recently approved its regional plan in a manner that is consistent
with the Route 6 Master Plan. WINCOG‟s inclusion is pending. And, just
last week, the REDC submitted changes to the draft State Policies Plan due
to be endorsed by the legislature in 2013, consistent with the Route 6 Master
Plan. The State legislators representing the 4 towns have been in attendance
at Route 6 presentations, and are supportive of the strategy.
9. Please explain how the proposed project fits one or more of the Funding Priorities
outlined below.
Within the parameters of a competitive grant process, all projects are evaluated to
determine if they advance global competitiveness, create jobs, leverage public and private
resources, can demonstrate readiness and ability to use funds quickly and effectively, and
link to specific and measurable outcomes. To facilitate evaluation, EDA has established
the following investment priorities:
A. Collaborative Regional Information:
Initiatives that support the development and growth of innovation clusters based
on existing regional competitive strengths. Initiatives must engage stakeholders;
facilitate collaboration among urban, suburban, and rural (including tribal) areas;
provide stability for economic development through long term intergovernmental

APPENDIX G: Capital Projects
155
and public/private collaboration; and support the growth of existing and emerging
industries.
The planning process to date in connection with the Master Plan and
Transportation Study has been a model for regional and intermunicipal
cooperation and stakeholder involvement. Both processes involved extensive
participation by stakeholders, starting with the composition of the REDC
(EDC, PZC, CEOs). The Economic Development Strategy component of the
Master Plan analyzed regional strengths in the context of Hartford and
adjoining suburban areas.
The business and office park will also target expansion of existing industries.
Only this year, Munson Candy Co. approached us in terms of their need to
expand. This led to meetings considering the relative location of Munson‟s at
the intersection with the new road, and DOT conveying a portion of the
former Expressway ROW to facilitate their future expansion. That parcel
was planned to complement the construction of the new road. Access to their
expanded site is largely dependent on at least the construction of the first
phase of the road. CRCOG and its consultant were engaged with Munson‟s,
the Town, and DOT in negotiations for acquisition of the parcel.
B. Public/Private Partnerships:
Investments that use both public and private sector resources and leverage
complementary investments by other government/public entities and/or
nonprofits.
C. National Strategic Priorities:
Initiatives that encourage job growth and business expansion in clean energy;
green technologies; sustainable manufacturing; information technology (e.g.
broadband, smart grid) infrastructure; communities severely impacted by

APPENDIX G: Capital Projects
156
automotive industry restricting; urban waters; natural disaster mitigation and
resiliency; access to capital for small, medium sized, and ethnically diverse
enterprises; and innovations in science, health care, and alternative fuel
technologies.
D. Global Competitiveness:
Investments that support high-growth businesses and innovation-based
entrepreneurs to expand and compete in global markets.
E. Environmentally-Sustainable Development:
Investments that encompass best practices in “environmentally sustainable
development”, broadly defined to include projects that enhance environmental
quality and develop and implement green products, processes, places, and
buildings as part of the green economy.
The design of the Master Plan is based on adherence to the State‟s
sustainable principles. The project, located in a corridor with random mixes
of Residential, rural, industrial, and commercial development, proposed 4
discrete development nodes – including Bolton Crossroads, designed as
village style developments which share parking, access, and utilities, and
contain mixed uses. The development which occurs in these nodes will
require state health department approval for package treatment plants or
community septic systems. The development occurring in the nodes will be
required to utilize Low Impact Development techniques, many characterized
as green technology based, to treat, manage, and dispose of storm water. The
village-type developments will be compact-style developments, pedestrian
and bike friendly, with multi-modal interconnections to the adjacent East
Coast Greenway.
APPENDIX G: Capital Projects
157
F. Economically Distressed and Underserved Communities:
Investments that strengthen diverse communities that have suffered
disproportionate economic job losses and/or are rebuilding to become more
competitive in the global economy.
The 4 communities which are part of this regional effort are not economically
distressed or underserved communities. The adjoining Town of Windham is
a town meeting Federal Economic Distress Criteria on the basis of income.
10. Please explain how this project supports the overall CEDS’ regional strategic
initiatives outlined below?
A. Cluster Initiative: Foster and grow the industry clusters with a strong presence in
the region but also seek cross-regional synergies of growth and opportunity.
The critical regional clusters identified are:
Advanced Manufacturing
Financial Services
Health Sciences and Services
Management of Companies
The Office and Business Park may capitalize on its location within the 19-town
service area for the Eastern Connecticut Health Network.
B. Workforce & Education Initiative: Focus on improving the workforce today, while
educating, training and recruiting the pipeline for tomorrow.
Industry growth will require new workers prepared to fill the jobs that will be
created. In order to meet future demand, the region will need to retain and train
the talented individuals currently here and attract new talented individuals to
become the future leaders and entrepreneurs of the region.
Bolton is within the geographic area served by the Capital Workforce
Partners and will therefore benefit from the services, training, and job
APPENDIX G: Capital Projects
158
placement services it provides.
C. Infrastructure Initiative: Support infrastructure investments tied to business and job
growth.
Since creating private sector jobs is the first CEDS priority, any infrastructure
investment should be measured by its contribution to and support of that job
creation. Transportation is critical to supporting a competitive economy. The
MetroHartford region will benefit from critical investments that can be
transformative for its targeted industry clusters, as well as many other industries.
The Infrastructure of the proposed Business and Office park will serve two
functions: an important transportation connection from Route 6 west to
Route 44 east. Built to industrial road standards, this road will provide a
needed connection for business traffic from Route 6 to the north and east.
The only connection at this time is a system of rural roads which cannot
support this type of traffic. The road will also serve as the core of the office
and business park. Funding for the road and associated infrastructure and
its benefit in terms of jobs generated is thus not calculated solely on the basis
of jobs generated by the development proposed as part of the Business and
Office Park.
The plans for the road supporting the industrial park are concept only, and
therefore costs have not been estimated. The numbers of jobs have been
estimated from two sources: The estimate of warehouse, light industry,
general office, commercial, and corporate office space allocations for the
Business and Office Park in the amount of 860,000 s. f. for the life of the
project. These estimates are derived from the Transportation Study, pp. 3-2
and 3-3, based on assumed ratios of 15% Warehouse / Light Industry (70,000
s. f.), 35% General Office / Commercial (560,000 s. f.), and 50% Corporate

APPENDIX G: Capital Projects
159
Office (230,000 s. f.). We then applied the Employment Assumptions for New
Development contained in the Fiscal Impact analysis model (FIAM) by
Fishkind and Associates, which yielded a general estimate of 3,027 jobs.
Based on the assumption that 55 of the development potential would be built
out by 2030, then the park can be expected to generate 151 jobs by 2030.
D. Downtown Hartford Initiative: Transform Downtown Hartford into a dynamic
urban environment that is the epicenter of culture, entertainment, and innovation.
EDA funding stipulates that economic development programs should be designed
to have positive economic development impacts within economically distressed
regions. MetroHartford qualifies because the City of Hartford meets the EDA’s
distress criteria.
The project is in the Hartford metro Area, and not Hartford.
11. Project Budget
At this very early concept stage, no project budget has yet been established.
Local Investment _________________ Amount Secured ____________
State Investment _________________ Amount Secured ____________
Federal Investment _________________ Amount Secured ____________
Private Investment _________________ Amount Secured ____________
Total Budget _________________ Amount Secured ____________
If this will be an ongoing project, identify sources of operating revenue: _____________
_______________________________________________________________________
12. Economic Benefits
Number of new permanent jobs anticipated 3,027 +/- (life of project); 151 +/-
(by 2030)
By when? See above

APPENDIX G: Capital Projects
160
Number of construction jobs anticipated Unknown at this time
Number of jobs retained Unknown at this time
New local taxes anticipated (if applicable)
To estimate taxes expected to be generated through a future unnegotiated
regional tax sharing agreement would be highly speculative at this time
13. Land Use Issues (if applicable)
Has the property been acquired yet? If not, please explain circumstances.
The property has not been acquired. However there are two property owners
– one private, and one the State of Connecticut (consisting of the ROW which
had been acquired for the now defunct Route 6 Expressway. CTDOT will not
release further pieces of this ROW pending a review of the former corridor,
utilizing a prioritization process for its future use and disposition. That
process is underway.
Is the land appropriately zoned for project?
The land is currently Zoned Industrial and General Business, and this could
be developed for this use. However, the REDC has envisioned consistent
Zoning regulations and design guidelines which is under review by a
Committee comprised of PZC members from the 4 Corridor Towns. A
Corridor Commercial Zone is Planned, but this Office and Industrial Park is
unique from the village-style development plans for the rest of the Corridor
in that uses will be limited as described herein. A possible Office and
Business Park Overlay Zone is possible.
Are any zoning variances or other public approvals needed? (Please explain.)
It is highly unlikely that zoning variances will be needed at this time, since
flexible regulations create opportunities for consolidated development
(access, utilities, parking, etc.) which can be preplanned as part of the Office

APPENDIX G: Capital Projects
161
/ Business park Design. It is in the concept stage at this point, and this level of
detail has not yet been developed.
Local Political Support?
Both Plans cited herein have been approved by the REDC, and the governing
bodies of both communities. The CRCOG Transportation Committee has
approved the Transportation Study, and it is pending approval by the
CRCOG Policy Board.
The town’s respective legislative representatives have been kept abreast of,
and have been supportive of, both Plans / Studies.
14. Please provide a brief timeframe for this project including start, finish, duration, and
major milestones, as appropriate for the project.
No specific timeframe has been established. The REDC and the Towns first need to
have approved SEDS, and received Federal EDA approval before investment can be
made towards acquisition and design. The inclusion in the SEDS is an important
first step.

APPENDIX G: Capital Projects
162
2012 Metro Hartford Alliance CEDS
Regional Project Questionnaire/Submission
1. Project Name: Rocky Hill Business Park Phase II Infrastructure Project________
2. Lead Contact: Ray Carpentino, Eco. Dev. Dir. Organization: Town of Rocky Hill
Address: 761 Old Main Street, Rocky Hill, CT____________________________
Phone #: 860-258-7717 Fax:860-258-7638 Email: [email protected]
3. Municipalities and/or Organizations involved: Rocky Hill --------------------------------
4. Type of Initiative
Business/Economic Development X__ Education/Workforce _____ Energy _____
Planning _____ Real Estate/Infrastructure X___ Transportation _____ Technical
Assistance _____ Other _____
If other, please provide details.
5. Please provide a description of the project. The town of Rocky Hill is requesting funding for
the construction of approximately 1,000 linear feet of roadway, a pump station, utilities and
span bridge over Dividend Brook to access the site Phase II of the Rocky Hill Business Park.
The Town originally purchased this site in 1977 for expansion of the Rocky Hill Industrial
Park initiated in the early 1970’s. This site, referred to as “BP Phase II”, consists of
approximately 62 acres. It is a vacant former sand pit located along the Providence-
Worchester rail line in the south east corner of Town near the Cromwell town line. Access is
provided from Old Forge Road in Rocky Hill. The existing Rocky Hill Industrial Park abuts to
the north of Old Forge Road and is generally associated with Hammer Mill and Dividend
Roads. This is part of a larger industrial area in the southeastern corner of the Town with a
long history of industrial and other business use.
The proposed expansion would allow the initial development of a 6 to 8 lot industrial park
to create approximately 105,000 square feet of manufacturing/R&D/office space OR allow
the and development for a single user. The existing Rocky Hill Industrial Park abuts to the
north of Old Forge Road. The intent is to have this Phase I be a catalyst for additional road
and infrastructure of an additional 2,000 feet of road for the development of an additional
15 or 16 lots potentially providing and additional 300,000 square feet of
manufacturing/R&D/office space.
6. Why is this project important to the region? For over 10 years, the Town has been
attempting to function as the “developer” and/or agent of the BP Phase II parcel as they did

APPENDIX G: Capital Projects
163
with the original Industrial Park, hoping to sell the land to prospective users, or wholesaling
the land “as is” to a land developer who would be responsible for all development activities
through the RFP process and by dealing directly with realtors and CERC. However, due to
costs associated with a culvert crossing over Dividend Brook and road and utility expansion,
these efforts have not been successful. The most recent development losses for this site due
to infrastructure costs include:
A 600,000 sq.ft. distribution facility A 21 lot green energy park A 60,000 sq.ft. whole sale lumber company An 80,000 sq.ft. indoor recreation facility
In addition to the above specific business losses, the Town is unable to respond to the
increasing requests for properties (and buildings) suitable for the construction of 5000-
15,000 sq.ft. Commercial/industrial buildings. Including the subject site, there are only 2
vacant properties in Town available for purchase for manufacturing in Rocky Hill.
Construction of the road and related will the potential construction of approximately
105,000 to 420,000 square feet of manufacturing/R&D/office space. Development of the BP
Phase II site has the potential to generate and sustain millions of dollars of non-residential
tax revenue and provide hundreds of jobs for Town, Regional and State residents.
7. Does this project involve more than one town and/or promote greater regional cooperation?
While the project does not require involvement by other municipalities, the successful
completion of the project will have positive regional impact on both temporary and
permanent job creation.
8. Please explain how the proposed project fits one or more of the EDA Investment Guideline
criteria outlined below.
EDA will select applications competitively based on the investment policy guidelines funding
priority considerations identified below. EDA will evaluate the extent to which a project embodies
the maximum number of investment policy guidelines and funding priorities possible and strongly
exemplifies at least one of each. All applications will be competitively evaluated on their ability to
satisfy the following investment policy guidelines, each of equivalent weight.
A. Be market-based and results driven.

APPENDIX G: Capital Projects
164
An EDA investment will capitalize on a region’s competitive strengths and will positively
move a regional economic indicator, such as: an increased number of higher-skill, higher-
wage jobs; increased tax revenue; or increased private sector investment resulting from the
EDA investment. Installation of the road, bridge crossing and infrastructure will allow
the Town to sell the parcel to a private entity for private sector business development,
thereby increasing tax revenues locally and on a State level and ultimately providing
job growth locally, Regionally and State-wide.
B. Have Strong organizational leadership.
An EDA investment will have strong leadership, relevant project management experience, and
a significant commitment of human resources talent to ensure a project’s successful
execution.
C. Advance productivity, innovation and entrepreneurship.
An EDA investment will enable entrepreneurship; enhance regional industry clusters, and
leverage and link technology innovators and local universities to the private sector to create
the conditions for greater productivity, innovation, and job creation.
D. Look beyond the immediate economic horizon, anticipate economic changes, and diversify
the local and regional economy.
An EDA investment will be part of an overarching, long-term comprehensive economic
development strategy that enhances a region’s success in achieving a rising standard of living
by supporting existing industry clusters, developing emerging new clusters or attracting new
regional economic drivers. (Please refer to the attached CEDS recommendations) The
availability of this parcel will provide the opportunity for long term employment
opportunities and provide an opportunity to diversify the business make-up by
providing small lot development opportunities for small businesses.
E. Demonstrate a high degree of local commitment by exhibiting:

APPENDIX G: Capital Projects
165
High levels of local government or non-profit matching share funds and private sector
leverage;
Clear and unified leadership and support by local elected officials; and
Strong cooperation among the business sector, relevant regional partners and local, State
and federal governments.
9. Please explain how the proposed project fits one or more of the Funding Priorities outlined
below.
Within the parameters of a competitive grant process, all projects are evaluated to determine if
they advance global competitiveness, create jobs, leverage public and private resources, can
demonstrate readiness and ability to use funds quickly and effectively, and link to specific and
measurable outcomes. To facilitate evaluation, EDA has established the following investment
priorities:
A. Collaborative Regional Information:
Initiatives that support the development and growth of innovation clusters based on
existing regional competitive strengths. Initiatives must engage stakeholders; facilitate
collaboration among urban, suburban, and rural (including tribal) areas; provide stability
for economic development through long term intergovernmental and public/private
collaboration; and support the growth of existing and emerging industries.
B. Public/Private Partnerships:
Investments that use both public and private sector resources and leverage complementary
investments by other government/public entities and/or nonprofits.
C. National Strategic Priorities:
Initiatives that encourage job growth and business expansion in clean energy; green
technologies; sustainable manufacturing; information technology (e.g. broadband, smart
grid) infrastructure; communities severely impacted by automotive industry restricting;
urban waters; natural disaster mitigation and resiliency; access to capital for small, medium
sized, and ethnically diverse enterprises; and innovations in science, health care, and
alternative fuel technologies.
APPENDIX G: Capital Projects
166
D. Global Competitiveness:
Investments that support high-growth businesses and innovation-based entrepreneurs to
expand and compete in global markets.
E. Environmentally-Sustainable Development:
Investments that encompass best practices in “environmentally sustainable development”,
broadly defined to include projects that enhance environmental quality and develop and
implement green products, processes, places, and buildings as part of the green economy.
The subject parcel was once a candidate for a self contained “green energy park”
presented by a prominent CT energy enterprise in responding to a Town initiated
RFP. Unfortunately, due the excessive costs of infrastructure, the proposal never
came to fruition. This parcel, with the appropriate investment in infrastructure,
could once again draw the same (or similar) development proposal, making CT a
forerunner in environmentally sustainable development.
F. Economically Distressed and Underserved Communities:
Investments that strengthen diverse communities that have suffered disproportionate
economic job losses and/or are rebuilding to become more competitive in the global
economy.
10. Please explain how this project supports the overall CEDS’ regional strategic initiatives outlined
below?
A. Cluster Initiative: Foster and grow the industry clusters with a strong presence in the region
but also seek cross-regional synergies of growth and opportunity.
The critical regional clusters identified are:
Advanced Manufacturing Financial Services Health Sciences and Services Management of Companies
The development of this parcel will provide opportunities for all the above clusters. The
parcel is appropriately zoned.
B. Workforce & Education Initiative: Focus on improving the workforce today, while educating,
training and recruiting the pipeline for tomorrow.
Industry growth will require new workers prepared to fill the jobs that will be created. In
order to meet future demand, the region will need to retain and train the talented
individuals currently here and attract new talented individuals to become the future leaders
and entrepreneurs of the region.

APPENDIX G: Capital Projects
167
C. Infrastructure Initiative: Support infrastructure investments tied to business and job
growth.
Since creating private sector jobs is the first CEDS priority, any infrastructure investment
should be measured by its contribution to and support of that job creation. Transportation
is critical to supporting a competitive economy. The MetroHartford region will benefit from
critical investments that can be transformative for its targeted industry clusters, as well as
many other industries.
While the proposed infrastructure proposed is not regional in nature, the potential
impact to job creation will be on a regional level. The infrastructure proposed is
directly proportional to the creation of jobs: Jobs will not be created without
investment in the proposed infrastructure.
D. Downtown Hartford Initiative: Transform Downtown Hartford into a dynamic urban
environment that is the epicenter of culture, entertainment, and innovation.
EDA funding stipulates that economic development programs should be designed to have
positive economic development impacts within economically distressed regions.
MetroHartford qualifies because the City of Hartford meets the EDA’s distress criteria.
11. Project Budget
Local Investment Land value: $2.2 million Amount Secured ____________
State Investment _________________ Amount Secured ____________
Federal Investment $2.7 million; Amount Secured __
Private Investment _________________ Amount Secured ____________
Total Budget $2.7 million Amount Secured ____________
If this will be an ongoing project, identify sources of operating revenue: _____________
_______________________________________________________________________
APPENDIX G: Capital Projects
168
12. Economic Benefits
Number of new permanent jobs anticipated 22-400_______By when? Within 3 years
Number of construction jobs anticipated ?________
Number of jobs retained NA________
New local taxes anticipated (if applicable) $200,000 - $1.1 million annually (@ build
out).
13. Land Use Issues (if applicable)
Has the property been acquired yet? If not, please explain circumstances.
Property is owned by the Town of Rocky Hill
Is the land appropriately zoned for project? Yes
Are any zoning variances or other public approvals needed? (Please explain.) Typical Inland
Wetlands & Planning & Zoning approvals will be required as will Army Corps of Engineers
approval.
Local Political Support?
14. Please provide a brief timeframe for this project including start, finish, duration, and major
milestones, as appropriate for the project. 13 months from initiation to completion.

APPENDIX G: Capital Projects
169
2012 Metro Hartford Alliance CEDS
Regional Project Questionnaire/Submission
1. Project Name: University of Connecticut, UConn Technology Park
2. Lead Contact: Rita Zangari
Organization: University of Connecticut, Office of Economic Development
Address: 1392 Storrs Road, Unit 4213, Storrs, CT 06269-4213
Phone #: 860-486-3010 Fax: 860- 486-3536 Email: [email protected]
3. Municipalities and/or Organizations involved; Mansfield, Tolland
4. Type of Initiative
Business/Economic Development X Education/Workforce _X Energy X
Planning _X Real Estate/Infrastructure X Transportation _____ Technical X
Assistance _____ Other _____
If other, please provide details.
5. Please provide a description of the project.
The UConn Technology Park merges physical space with the latest equipment, talent, technology, and laboratories intended to open avenues of exploration and development for entrepreneurs, existing key state industries and inventive startups. The first new building in the Park is slated for completion by 2015. It will
offer 125,000 SF of state of the art R&D space with open labs, specialized equipment and incubator facilities for use by existing industry and startups. The idea is to allow faculty scientists to collaborate with peers in industry thus building new opportunities for products, companies and Connecticut.
The Park has capacity for a total of 900,000 SF on 330 acres planned and in the permitting process for this
purpose at the UConn campus in Storrs. Financial commitment from the State of Connecticut is in place for the road and infrastructure, as well as the
first building. Also critical, have been aspirations and support from existing industries and entrepreneurs looking for an open door. The university, already strong in resources to support the entrepreneurial spirit, was the third essential component.
6. Why is this project important to the region?

APPENDIX G: Capital Projects
170
This project will support the needs of the economy and its employers addressing specific technical and workforce requirements of industry in Connecticut.
Results for the state will be enhanced industrial expansion, business growth, and increased success for startup companies, workforce development, job growth and retention, and hastened movement of new materials and
products into the marketplace.
New technologies such as additive manufacturing, computational modeling, bio-nanofabrication, lithography, and thin-film deposition will be combined with UConn’s intellectual assets, physical assets and cyber assets to change lives and livelihoods of the region’s population and assure the rebuilding of our economy.
7. Does this project involve more than one town and/or promote greater regional cooperation?
It will provide statewide benefits as part of a Connecticut research triangle with points in Storrs,
Farmington and New Haven that will create new companies and jobs as a result of investments in
innovation, technology and R&D. Results for the state will be enhanced industrial expansion, business
growth, and increased success for startup companies, workforce development, job growth and retention. It capitalizes on our location that is between economic/investment centers NYC and Boston.
8. Please explain how the proposed project fits one or more of the EDA Investment Guideline
criteria outlined below.
EDA will select applications competitively based on the investment policy guidelines funding
priority considerations identified below. EDA will evaluate the extent to which a project embodies
the maximum number of investment policy guidelines and funding priorities possible and strongly
exemplifies at least one of each. All applications will be competitively evaluated on their ability to
satisfy the following investment policy guidelines, each of equivalent weight.
A. Be market-based and results driven.
An EDA investment will capitalize on a region’s competitive strengths and will positively
move a regional economic indicator, such as: an increased number of higher-skill, higher-
wage jobs; increased tax revenue; or increased private sector investment resulting from the
EDA investment.
The vision for this effort was created by Connecticut employers and is aimed at leveraging
their strengths, while responding to emerging needs of companies and the economy. Key
needs include a technically talented workforce and hastened movement of new materials and
products into the marketplace. A recent $7 million investment from GE in Plainville in an UConn partnership demonstrates the market value of this effort to private sector stakeholders. This is just one of
many conversations in process with key employers.
For the purposes of a feasibility study our tech park consultants estimated the total salary
generated by the employment of the Park, not including construction employment. In the
first 10-year period, employment in the park will generate $136.5M to $170.7M in salaries.
APPENDIX G: Capital Projects
171
The second 10-year period will generate an additional $196.4M to $245.5M for a total of
$333 to $416 million over the first 20-year period.
B. Have Strong organizational leadership.
An EDA investment will have strong leadership, relevant project management experience, and
a significant commitment of human resources talent to ensure a project’s successful
execution.
UConn manages over $230 million in federal funds annually and is entering its 7th
year
acting as an EDA University Center. Our new and growing Office of Economic
Development was formed to raise the stature of ED at the University and is part of the
President’s leadership team.
C. Advance productivity, innovation and entrepreneurship.
An EDA investment will enable entrepreneurship; enhance regional industry clusters, and
leverage and link technology innovators and local universities to the private sector to create
the conditions for greater productivity, innovation, and job creation.
The project will provide specific offerings that support tech based entrepreneurship
including access to business and technical services, as well as space and facilities for
entrepreneurial companies.
Core needs necessary to sustain and grow companies have been identified by the State of Connecticut, the university and business leaders. They include efforts to retain and replace technically skilled talent
lost due to manufacturing and pharmaceutical employment reductions occurring over the past two decades -- each were once a cornerstone of the Connecticut economy. The project offers specific support for advanced product development, biomedical engineering, pharmaceutical processing, and advanced
information systems -- all areas that can provide top quality sustainable jobs. In addition, strategic challenges of business success – continuous improvement, identification of
opportunities, product innovation and development, and sustainability in products and processes – will be addressed at the park.
D. Look beyond the immediate economic horizon, anticipate economic changes, and diversify
the local and regional economy.
An EDA investment will be part of an overarching, long-term comprehensive economic
development strategy that enhances a region’s success in achieving a rising standard of
living by supporting existing industry clusters, developing emerging new clusters or

APPENDIX G: Capital Projects
172
attracting new regional economic drivers. (Please refer to the attached CEDS
recommendations)
The projects was proposed and funded as part of the State’s economic development
strategy supported by legislative leaders and the executive branch which leverages
research, expertise and technology for economic value and is the basis of the research
triangle concept put forward by Governor Malloy.
Selected Long Term Benefits of a Technology Park at the University
Ability of the park to attract research anchor tenants, such as major national laboratories that can rebuild the economy long term Help to attract leading research faculty and post-docs able to create economic value through tech commercialization and industry relationships Increased sponsored research as a result of the interactions and collaborations of faculty and companies to ensure we are able to compete globally Employment for students (internship co-ops, after graduation jobs, graduate assistantship…) resulting in talent retention and addressing trends for population loss Opportunities to commercialize university intellectual property offering high potential to translate discovery into application Recognition globally as a “go to” place for technology and where for faculty and students to work seamlessly with industry
A focus on entrepreneurship, technology and leveraging university resources is embedded
in many CEDS in the state including Metro Hartford, Southeast Connecticut and Northeast
Connecticut documents.
E. Demonstrate a high degree of local commitment by exhibiting:
High levels of local government or non-profit matching share funds and private sector
leverage; clear and unified leadership and support by local elected officials; and strong
cooperation among the business sector, relevant regional partners and local, state and
federal governments.
Financial commitment from the State of Connecticut is in place for the road and infrastructure, as well
as the first building. The total state investment is nearly $200 Million. There will be a variety
of private sector partners at the UConn Technology Park leveraging the state investment,
such as a $7 million partnership with GE. State Senate President Donald Williams,
Governor Malloy and many state legislators advocated for the park and continue to support
the projects going forward.

APPENDIX G: Capital Projects
173
9. Please explain how the proposed project fits one or more of the Funding Priorities outlined
below.
Within the parameters of a competitive grant process, all projects are evaluated to determine if
they advance global competitiveness, create jobs, leverage public and private resources, can
demonstrate readiness and ability to use funds quickly and effectively, and link to specific and
measurable outcomes. To facilitate evaluation, EDA has established the following investment
priorities:
A. Collaborative Regional Information:
Initiatives that support the development and growth of innovation clusters based on
existing regional competitive strengths. Initiatives must engage stakeholders; facilitate
collaboration among urban, suburban, and rural (including tribal) areas; provide stability
for economic development through long term intergovernmental and public/private
collaboration; and support the growth of existing and emerging industries.
The project has engaged and supported clusters associated with advanced materials and
manufacturing such as Energy, Aerospace, Defense and Medical Device sectors statewide;
industry has participated in planning for this focus and the aim of the tech park is
innovation associated with building companies and industries historically prominent in the
region. Our planning also includes consultation with the towns of Mansfield, Tolland,
Windham, Hartford and statewide regional and technology organizations.
B. Public/Private Partnerships:
Investments that use both public and private sector resources and leverage complementary
investments by other government/public entities and/or nonprofits.
There is significant state investment ($182 million) as well as federal DOT dollars ($6
million) in the project. Building construction, beyond the anchor, will be funded with
private investment.
C. National Strategic Priorities:
Initiatives that encourage job growth and business expansion in clean energy; green
technologies; sustainable manufacturing; information technology (e.g. broadband, smart
grid) infrastructure; communities severely impacted by automotive industry restricting;
urban waters; natural disaster mitigation and resiliency; access to capital for small, medium

APPENDIX G: Capital Projects
174
sized, and ethnically diverse enterprises; and innovations in science, health care, and
alternative fuel technologies.
The UConn tech park will have a focus on materials and in particular matters that support
sustainability. Among our partners is DEEP and we will host the DEEP technology Hub for
clean energy. Additionally, the advanced materials focus of the first building was selected
based on a desire to support the Federal Materials Genome Project.
D. Global Competitiveness:
Investments that support high-growth businesses and innovation-based entrepreneurs to
expand and compete in global markets.
Core needs for companies to be globally competitive have been identified by the State of Connecticut, the university and business leaders. They include efforts to retain and replace technically skilled talent lost due to manufacturing and pharmaceutical employment reductions occurring over the past two
decades -- each were once a cornerstone of the Connecticut economy. In addition, strategic challenges of business success – continuous improvement, identification of opportunities, product innovation and development, and sustainability in products and processes – will be addressed at the park in order to
meet challenges presented by global competition.
E. Environmentally-Sustainable Development:
Investments that encompass best practices in “environmentally sustainable development”,
broadly defined to include projects that enhance environmental quality and develop and
implement green products, processes, places, and buildings as part of the green economy.
UConn ranked number 5 in the Sierra Cool Schools rankings for environmental awareness
and sustainability. The planned park and building build off this success and will be a
minimum of LEED silver certified which is standard for all UConn development. The master
plan for the park includes multiple aspect of environmental sensitivity, preserving views,
wetlands and recapturing waste water for selected reuse. Additionally, the DEEP clean
energy innovation hub will be within the first building adding to our resources that support
the sustainability interests of companies.
F. Economically Distressed and Underserved Communities:
Investments that strengthen diverse communities that have suffered disproportionate
economic job losses and/or are rebuilding to become more competitive in the global
economy.
The park will not only service Greater Hartford where there has been repeated downsizing
by leading aerospace firms, but will also reach in to Southeastern Connecticut which is
experiencing huge downsizings in the pharmaceutical industry.

APPENDIX G: Capital Projects
175
10. Please explain how this project supports the overall CEDS’ regional strategic initiatives outlined
below?
A. Cluster Initiative: Foster and grow the industry clusters with a strong presence in the region
but also seek cross-regional synergies of growth and opportunity.
The critical regional clusters identified and supported by this project are:
Advanced Manufacturing Financial Services Health Sciences and Services Management of Companies
The anchor facility and park will be a resource for advanced manufacturing for multiple
sectors and was created with the intent to capitalize on our expertise and resources that
support the materials and computational needs across many clusters, such as aerospace and
health sciences.
B. Workforce & Education Initiative: Focus on improving the workforce today, while educating,
training and recruiting the pipeline for tomorrow.
Industry growth will require new workers prepared to fill the jobs that will be created. In
order to meet future demand, the region will need to retain and train the talented
individuals currently here and attract new talented individuals to become the future leaders
and entrepreneurs of the region.
A key value of this project is retention of UConn graduates for the region, creating
employment relationships before graduation and allowing them to develop as
entrepreneurs as well as employees.
C. Infrastructure Initiative: Support infrastructure investments tied to business and job
growth.
Since creating private sector jobs is the first CEDS priority, any infrastructure investment
should be measured by its contribution to and support of that job creation. Transportation
is critical to supporting a competitive economy. The MetroHartford region will benefit from
critical investments that can be transformative for its targeted industry clusters, as well as
many other industries.

APPENDIX G: Capital Projects
176
More than 300,000 people work in a university research park in North America Every job in a research park generates an average of 2.57 jobs in the economy, which is an additional 414,738 jobs Battelle estimates the total employment impact of all research parks in the US and Canada to be more than 750,000 jobs
The UConn Technology Park, based on a feasibility analysis conducted by leading tech park
consultants George Henry George Partners and Diks Consulting, estimated employment at
1500 in year ten and 2800 in year 20, not including indirect employment. The multiplier for
industries we anticipate supporting at the park range from 3.68 to 5.64 -- well above the
2.57 average noted by Battelle.
D. Downtown Hartford Initiative: Transform Downtown Hartford into a dynamic urban
environment that is the epicenter of culture, entertainment, and innovation.
EDA funding stipulates that economic development programs should be designed to have
positive economic development impacts within economically distressed regions.
MetroHartford qualifies because the City of Hartford meets the EDA’s distress criteria.
This project shares unique university resources only attainable at a research institution
with local businesses and entrepreneurs to support region-wide employment growth. As in
New Haven, where Yale sparked an economic revival through with a network of innovation,
entrepreneurial companies and new development to house them, we expect the same result
throughout this region. UConn’s Business Learning Center in Downtown Hartford will
support efforts to assure Hartford is at the center of this region’s revival as it is
geographically located at the center of the new research triangle with the UConn Health
Center and Storrs an easy distance on each side of the city.
11. Project Budget
Local Investment _________________ Amount Secured ____________
State Investment $182 M Amount Secured $182 M
Federal Investment $6.2 Million Amount Secured $6.2 M
Private Investment Future Construction -- $1 billion Amount Secured -0-

APPENDIX G: Capital Projects
177
Total Budget $1.2 billion Amount Secured $182 M
If this will be an ongoing project, identify sources of operating revenue: University departments,
federal grants and private fundraising specifically for this effort.
_______________________________________________________________________
12. Economic Benefits
Number of new permanent jobs anticipated 2800 direct, and at least 414,738
indirect By when? 2035
Number of construction jobs anticipated ________
Number of jobs retained ________
New local taxes anticipated (if applicable) __________________
A study of the economic impact of the Iowa State University Research Park found that the
park links directly to almost $88 million in industrial output and businesses that provide
services to park customers and generates an additional $46.3 million for a total impact of
$1.34 billion.
13. Land Use Issues (if applicable)
Has the property been acquired yet? Yes
If not, please explain circumstances.
Is the land appropriately zoned for project? Yes
Are any zoning variances or other public approvals needed? (Please explain.) DEP permits which
are in process
Local Political Support? Yes – support from the legislature, governor, regional and
municipal authorities are in place.
14. Please provide a brief timeframe for this project including start, finish, duration, and major
milestones, as appropriate for the project.
Construction start - spring 2013 for completion and occupancy in 2015,

APPENDIX G: Capital Projects
178
2012 Metro Hartford Alliance CEDS
Regional Project Questionnaire/Submission
1. Project Name: University of Connecticut Health Center, Bioscience Connecticut Initiative
2. Lead Contact: Rita Zangari Organization: University of Connecticut, Office of Economic Development
Address: 1392 Storrs Rd Unit 4213, Storrs, CT 06269
Phone #: 860-486-3010 Fax: 860-486-3536 Email: [email protected]
3. Municipalities and/or Organizations involved; State Government, Yale, UConn, the City of
Hartford and the Town of Farmington
4. Type of Initiative
Business/Economic Development X Education/Workforce X Energy
Planning _ Real Estate/Infrastructure X Transportation _____ Technical X
Assistance _____ Other health care __________
If other, please provide details.
5. Please provide a description of the project.
This is a forward thinking plan to create thousands of construction and related jobs in the short
term and generate long term, sustainable economic growth based on bioscience research,
innovation, entrepreneurship and commercialization. It is a multifaceted plan that rebuilds and
improves the UConn Health Center and helps to reinvent the state’s economy, drawing upon
research resources from the University of Connecticut, UConn Health Center, Yale University and
points in between The University will play a pivotal role in this economic development and public
health initiative. The overarching goals of Bioscience Connecticut are to put Connecticut at the
forefront of the bioscience industry; to improve access to state-of-the-art care today; and to help
meet the health care needs of Connecticut’s future.
6. Why is this project important to the region?

APPENDIX G: Capital Projects
179
This project will support the needs of the economy and its employers addressing specific technical and
workforce requirements of industry in Connecticut as well as health care needs of our citizens. Results for the state will be a robust expansion of health care opportunities and life science jobs, business
growth, successful startup companies, and workforce development to support healthcare needs, job growth and retention. New therapies associated with personalized medicine will result from collaborations with industry, Yale and UConn’s changing the lives and livelihoods of the region’s population and assure the rebuilding of
our economy.
7. Does this project involve more than one town and/or promote greater regional cooperation?
It will provide statewide benefit as part of a Connecticut research triangle with points in Storrs,
Farmington and New Haven that will create new companies and jobs as a result of investments in
innovation, technology and R&D. Results for the state will be enhanced business growth, increased
success for startup companies, workforce development, job growth and retention. It capitalizes on our location
that is between economic/investment center NYC and Boston,
8. Please explain how the proposed project fits one or more of the EDA Investment Guideline
criteria outlined below.
EDA will select applications competitively based on the investment policy guidelines funding
priority considerations identified below. EDA will evaluate the extent to which a project embodies
the maximum number of investment policy guidelines and funding priorities possible and strongly
exemplifies at least one of each. All applications will be competitively evaluated on their ability to
satisfy the following investment policy guidelines, each of equivalent weight.
A. Be market-based and results driven.
An EDA investment will capitalize on a region’s competitive strengths and will positively
move a regional economic indicator, such as: an increased number of higher-skill, higher-
wage jobs; increased tax revenue; or increased private sector investment resulting from the
EDA investment.
The vision for this effort was created by Connecticut health care providers and policy
advisors and is aimed at leveraging regional strengths, the emergence of a new personalized
medicine sector and responding to the economic challenges of the region. Additionally, it will engage
the base of insurance providers for which Hartford is well known as we seek opportunities for new
health care opportunities with requirements for unique approaches to insurance coverage.
B. Have Strong organizational leadership.
An EDA investment will have strong leadership, relevant project management experience, and
a significant commitment of human resources talent to ensure a project’s successful
execution.

APPENDIX G: Capital Projects
180
UConn manages over $230 million in federal funds annually and is entering its 7th year acting
as an EDA University Center. Our new and growing Office of Economic Development was
formed to raise the stature of ED at the University and is part of the President’s leadership
team.
C. Advance productivity, innovation and entrepreneurship.
An EDA investment will enable entrepreneurship; enhance regional industry clusters, and
leverage and link technology innovators and local universities to the private sector to create
the conditions for greater productivity, innovation, and job creation.
The project will provide specific offerings that support tech based entrepreneurship including
access to business and technical services, space and facilities for entrepreneurial companies.
It will double the size of UConn’s current technology business incubator. The Bioscience Zone
surrounding the site will bolster the current cluster of healthcare related businesses and
allow the region to be a healthcare destination supporting additional job creation in travel
and retail sectors.
Core needs necessary to sustain and grow life science companies have been identified by the State
of Connecticut, the universities and business leaders through the state’s Life Science working
Group. This will build on the state’s stem cell initiative and includes efforts to retain and replace
technically skilled talent lost to multiple recessions from which the region never recovered. It will
address strategic challenges of business success and identification of new opportunities for
product innovation and translational medicine.
D. Look beyond the immediate economic horizon, anticipate economic changes, and diversify
the local and regional economy.
An EDA investment will be part of an overarching, long-term comprehensive economic
development strategy that enhances a region’s success in achieving a rising standard of living
by supporting existing industry clusters, developing emerging new clusters or attracting new
regional economic drivers. (Please refer to the attached CEDS recommendations)
Bioscience Connecticut was proposed and funded as part of the State’s economic development
strategy supported by legislative leaders and the executive branch which leverages research,
expertise and technology for economic value and is the basis of the research triangle concept
put forward by Governor Malloy.
Selected Long Term Benefits
Ability to attract new genomic and stem cell research funding and national programs that can support this work at a time when NIH funding is being reduced. Ability to recruit leading research faculty, and medical students able to support health
care needs and create economic opportunities through translational medicine.

APPENDIX G: Capital Projects
181
Opportunities to commercialize university intellectual property offering high potential to translate discovery into application and increased industry sponsored research as a result of the interactions and collaborations among multiple institutions. Employment for students (internship coops, after graduation jobs, graduate assistantship…) resulting in talent retention and addressing trends for population loss and healthcare needs. Recognition globally as a “go to” place for leading edge health care needs utilizing personalized medicine and genomics research.
A focus on entrepreneurship, technology and leveraging University resources is embedded in
many CEDS in the state including Metro Hartford, Southeast Connecticut and Northeast
Connecticut documents.
E. Demonstrate a high degree of local commitment by exhibiting:
High levels of local government or non-profit matching share funds and private sector
leverage; clear and unified leadership and support by local elected officials; and strong
cooperation among the business sector, relevant regional partners and local, State and federal
governments.
Financial commitment from the State of Connecticut is in place and has legislative approval. The
total state investment is over $1 Billion. There will be a variety of private sector partners
leveraging the state investment such as JAX which will provide $809 million through federal
research grants.
9. Please explain how the proposed project fits one or more of the Funding Priorities outlined
below.
Within the parameters of a competitive grant process, all projects are evaluated to determine if
they advance global competitiveness, create jobs, leverage public and private resources, can
demonstrate readiness and ability to use funds quickly and effectively, and link to specific and
measurable outcomes. To facilitate evaluation, EDA has established the following investment
priorities:
A. Collaborative Regional Information:
Initiatives that support the development and growth of innovation clusters based on
existing regional competitive strengths. Initiatives must engage stakeholders; facilitate
collaboration among urban, suburban, and rural (including tribal) areas; provide stability
for economic development through long term intergovernmental and public/private
collaboration; and support the growth of existing and emerging industries.

APPENDIX G: Capital Projects
182
The project already has engaged and supported the regions life science cluster through a
state-led Life Science Working Group. Our planning also includes consultation with the
towns of Farmington, CURE and other regional technology organizations.
B. Public/Private Partnerships:
Investments that use both public and private sector resources and leverage complementary
investments by other government/public entities and/or nonprofits.
The attraction of The Jackson Laboratory (JAX) to Connecticut is a direct result of the state’s
investment in Bioscience Connecticut.
The Jackson Lab project will enable Connecticut to assume a position of global leadership in
developing new medical treatments tailored to each patient’s unique genetic makeup. It will
create 661 research-related jobs, as well as 842 construction jobs and an estimated 6,200
spinoff and indirect jobs.
The new institute associated with JAX and BIOCT is projected to be $1.1 billion, with
Jackson Laboratory providing $809 million through federal research grants, philanthropy
and service income, and the State of Connecticut contributing $291 million ($192 million in
a construction loan and $99 million in research partnership participation).
C. National Strategic Priorities:
Initiatives that encourage job growth and business expansion in clean energy; green
technologies; sustainable manufacturing; information technology (e.g. broadband, smart
grid) infrastructure; communities severely impacted by automotive industry restricting;
urban waters; natural disaster mitigation and resiliency; access to capital for small, medium
sized, and ethnically diverse enterprises; and innovations in science, health care, and
alternative fuel technologies.
HealthCare and Genomic medicine as well as linkages to historical base of insurance.
D. Global Competitiveness:
Investments that support high-growth businesses and innovation-based entrepreneurs to
expand and compete in global markets.
Core needs for the region’s companies to be globally competitive have been identified by the
State of Connecticut, the universities and business leaders involved with this effort. They include
retention and replacement of talent lost due to pharmaceutical employment reductions
occurring over the past five years with multiple closures at industry research campuses. The
limited capacity of our medical school has also been an impediment and is addressed in the
initiative by doubling its capacity and funding and recruiting new faculty to fill gaps in expertise
identified by the Life Science Working Group and needed in the region.

APPENDIX G: Capital Projects
183
E. Environmentally-Sustainable Development:
Investments that encompass best practices in “environmentally sustainable development”,
broadly defined to include projects that enhance environmental quality and develop and
implement green products, processes, places, and buildings as part of the green economy.
UConn ranked number 5 in the Sierra Cool Schools rankings for environmental awareness
and sustainability. LEED silver certification is standard for all UConn development and will
be the minimum standard for this development as well.
F. Economically Distressed and Underserved Communities:
Investments that strengthen diverse communities that have suffered disproportionate
economic job losses and/or are rebuilding to become more competitive in the global
economy.
BIOCT will not only service Hartford’s heath care needs, but has the capacity to create jobs
directly for a diverse population with not only healthcare jobs, but with an expected
resurgence within the insurance companies located within the city. It will expand inpatient
and outpatient clinical services; improve performance and provide 9 new community health
initiatives.
10. Please explain how this project supports the overall CEDS’ regional strategic initiatives
outlined below?
A. Cluster Initiative: Foster and grow the industry clusters with a strong presence in the region
but also seek cross-regional synergies of growth and opportunity.
The critical regional clusters identified and supported by this project are:
Advanced Manufacturing Financial Services Health Sciences and Services Management of Companies
The development will be an anchor for Health Science Service as well as insurance and
financial services and was created with the intent to capitalize on our expertise and
resources that support local clusters.
B. Workforce & Education Initiative: Focus on improving the workforce today, while educating,
training and recruiting the pipeline for tomorrow.

APPENDIX G: Capital Projects
184
Industry growth will require new workers prepared to fill the jobs that will be created. In
order to meet future demand, the region will need to retain and train the talented
individuals currently here and attract new talented individuals to become the future leaders
and entrepreneurs of the region.
A key value of this project is retention of UConn graduates for the region, creating
employment relationships before graduation and allowing them to develop as
entrepreneurs as well as employees.
C. Infrastructure Initiative: Support infrastructure investments tied to business and job
growth.
Since creating private sector jobs is the first CEDS priority, any infrastructure investment
should be measured by its contribution to and support of that job creation. Transportation
is critical to supporting a competitive economy. The MetroHartford region will benefit from
critical investments that can be transformative for its targeted industry clusters, as well as
many other industries.
This initiative will construct/renovate research, clinical and academic facilities. According
to estimates from a 2011 study by the Connecticut Center for Economic Analysis, Bioscience
Connecticut will help to create:
• 3,000 construction-related jobs annually through 2018.
• 16,400 jobs through 2037
• $4.6 billion increase in personal income by 2037 and the project is
expected to double federal and industry research grants to the Region
The Jackson Laboratory for Genomic Medicine is expected to create:
• 842 construction-related jobs
• 661 research-related jobs
• 6,200 spin-off and related jobs
D. Downtown Hartford Initiative: Transform Downtown Hartford into a dynamic urban
environment that is the epicenter of culture, entertainment, and innovation.
EDA funding stipulates that economic development programs should be designed to have
positive economic development impacts within economically distressed regions.
MetroHartford qualifies because the City of Hartford meets the EDA’s distress criteria.
This project builds on unique university resources only attainable at a research institution
with local businesses and entrepreneurs to support region-wide employment growth. As in
New Haven, where Yale sparked an economic revival through a network of innovation,
entrepreneurial companies and new development to house them, we expect the same result
APPENDIX G: Capital Projects
185
throughout this region. UConn’s link to local hospital such as CCMC and Hartford Hospital,
for which we act as the tech transfer office and share faculty appointments, will support
efforts to assure Hartford is at the center of this region’s revival as it is geographically
located at the center of the new research triangle with the UConn Health Center and Storrs
an easy distance on each side of the city.
11. Project Budget
Local Investment ____________ Amount Secured ____________
State Investment $864M and 291 M Amount Secured $864 M and
$291 M for each of the two developments
Federal Investment Amount Secured
Private Investment -- $809 M Amount Secured $809 M
Total Budget $1.964 billion Amount Secured $ 1.2 billion
If this will be an ongoing project, identify sources of operating revenue: University departments,
federal grants and private fundraising specifically for this effort.
_______________________________________________________________________
12. Economic Benefits
Number of new permanent jobs anticipated 2800 direct, and at least 414,738
indirect By when? 2035
Number of construction jobs anticipated ________
Number of jobs retained ________
New local taxes anticipated (if applicable) __________________
A study of the economic impact of the Iowa State University Research Park found that the
park links directly to almost $88 million in industrial output and businesses that provide
services to park customers and generates an additional $46.3 million for a total impact of
$1.34 billion.
13. Land Use Issues (if applicable)
Has the property been acquired yet? Yes
If not, please explain circumstances.

APPENDIX G: Capital Projects
186
Is the land appropriately zoned for project? Yes
Are any zoning variances or other public approvals needed? (Please explain.) DEP permits
which are in process
Local Political Support?
Yes – support from the legislature, governor, regional and municipal authorities are in
place.
14. Please provide a brief timeframe for this project including start, finish, duration, and major
milestones, as appropriate for the project.
Construction start - spring 2013 for completion and occupancy in 2015

APPENDIX G: Capital Projects
187
Part B
iQuilt Project
http://theiquiltplan.org/
http://planning.hartford.gov/Oneplan/Transit%20Center/TIGER%20IV/Project%20Narrative.pdf
Who owns/controls the project: collaboration of the City of Hartford, the Greater Hartford
Transit District, CT Transit and CTDOT
Timeframe: The planning process for the iQuilt project began in mid-March 2009
Cost: $21,121,000 These costs include survey, design, construction, capital investments and
equipment and contingencies. (page 17)
Status: Ongoing/Rolling
Relationship to CEDS: Downtown Hartford Initiative: Transform Hartford into a dynamic urban
environment that is the epicenter of culture, entertainment, and innovation.
The iQuilt Plan (which is a major component of the Intermodal Triangle Project) is organized
around three themes: Walking, Culture, and Innovation. It capitalizes on two of Hartford’s greatest
strengths: its extraordinary concentration of arts, cultural and landscape assets and its compact
downtown.
The iQuilt projects are a strategic mix of small and large, immediate and long-term, public and
private investments. Each initiative is a patch that contributes to downtown’s overall pattern or
quilt. The “i” in iQuilt stands for innovation, and each project incorporates innovative approaches to
walkability and placemaking. The goal is for downtown Hartford to become the central gathering
place for the neighborhoods of the city and the towns of the region: a place of streets and sidewalks
alive with people; a magnet for residents, visitors, creative workers and cultural innovators; a
driver of economic activity and growth; and a model of livable, sustainable urban design.
Funds from the federal TIGER IV (Transportation Investment Generating Economic Recovery)
Grant continue to make it possible for projects such as the iQuilt Plan to move forward in an effort
to promote job creation and economic revitalization in the City of Hartford.
Recently completed projects include the Winterfest Outdoor Skating Rink in Bushnell Park, and the
pedestrian oriented improvements which include Wayfinding Signs that give distance and
direction of nearest civic and cultural landmark/attraction.

APPENDIX G: Capital Projects
188
The XL Center
http://www.xlcenter.com
Who owns/controls the project: Owner-City of Hartford, Operator - Anschutz Entertainment
Group (AEG)
Timeframe: Ongoing
Cost:
Status: Complete
Relationship to CEDS: Downtown Hartford Initiative: Transform Hartford into a dynamic urban
environment that is the epicenter of culture, entertainment, and innovation.
The XL Center is Connecticut’s premier destination for sports & entertainment.
The 16,000+ seat downtown arena is home to the three-time National Champion UConn Men's
Basketball team and the seven-time National Champion UConn Women's Basketball team. Led by
Hall of Fame basketball Head Coaches (recently retired) Jim Calhoun and (currently active) Geno
Auriemma; and proud host of the BIG EAST Women's Basketball Championship - the most highly
attended women's conference tournament in the country. The 2013 tournament will mark the
Championship's 10 year anniversary in Hartford.
The XL Center is also home to the AHL’s Connecticut Whale, the primary developmental affiliate of
the New York Rangers. Formerly known as the Hartford Wolf Pack.
The XL Center entertains millions of visitors annually with a variety of concerts, family shows, ice-
skating spectaculars, consumer events and trade shows throughout the season. The venue has
played host to an extraordinary roster of world-renowned artists, including Taylor Swift, Justin
Beiber, Bruce Springsteen, Billy Joel, Miley Cyrus, Black Eyed Peas, Britney Spears, Drake, and many
others.
The XL Center will continue to be the center of sports and entertainment for Hartford and the state
of Connecticut for years to come.

APPENDIX G: Capital Projects
189
New Britain Busway
http://www.ctfastrak.com
Who owns/controls the project: DOT
Timeframe: Project construction began in 2012 and will open for service in April 2015.
Cost: $567,053,000
Status: Construction has begun
Relationship to CEDS: Infrastructure Initiative: Support infrastructure investments tied to
business and job growth.
CTfastrak is the beginning of a new era of transportation in Connecticut, combining the fast, traffic-
free advantages of a train with the frequent, direct-to-your-destination flexibility of a bus. With
express and feeder routes that use a new dedicated roadway for bus commuters to avoid traffic
congestion on local streets and on I-84, CTfastrak will benefit a large geographic area and provide a
one-seat, no transfer ride to regional employment, shopping, cultural, educational and healthcare
destinations.
Eleven landscaped transit stations along the way will enhance local communities with increased
access and development opportunities. A five mile multi-use trail for pedestrians and cyclists will
offer additional transportation choices.
Colt Gateway Project
http://www.coltgateway.com/
Who owns/controls the project: City of Hartford, Homes For America Holdings, Inc.
Timeframe:
Cost: $110M (http://www.aerco.com/Products/Case-Studies/Colt-Gateway) published 7/2005
Status:
Relationship to CEDS: Downtown Hartford Initiative: Transform Hartford into a dynamic urban
environment that is the epicenter of culture, entertainment, and innovation. Infrastructure
Initiative: Support infrastructure investments tied to business and job growth.

APPENDIX G: Capital Projects
190
The Colt Gateway Project offers a mix of charming and contemporary office/commercial space in
conjunction with brand new apartment homes. For more than 150 years the blue onion dome of
the Colt historic landmark had adorned Hartford's southern skyline. Now, that deep historic
essence is giving downtown living a dramatic New England flare.
This development has already created significant benefits for the state’s economy. The impact on
the state of Connecticut due to investments from 2003 to the end of 2011 was estimated to be
slightly more than $177 million as measured in sales and slightly more than 1,250 annual jobs. This
value included $37.4 million in economic activity due to the new capital investments of nearly $140
million. In addition, if the planned investments between 2012 and 2016 occur, the development can
be expected to further stimulate the state’s economy with an additional $151 million in sales and
slightly more than 1,000 jobs.
Front Street Project
http://www.frontstreetdistrict.com/fsd_brochure.pdf
Who owns/controls the project: The HB Nitken Group
Timeframe: Ongoing
Cost:
Status: 60% commercial space leased/ 1st Phase completed in 2010/ 2nd phase will be
construction of residential (http://articles.courant.com/2012-10-07/business/hc-helen-nitkin-qa-
20121007_1_bradley-nitkin-hb-nitkin-group-hartford-s-front-street)
Relationship to CEDS: Downtown Hartford Initiative: Transform Hartford into a dynamic urban
environment that is the epicenter of culture, entertainment, and innovation. Also impacts
workforce and cluster initiatives.
Located at the intersection of Columbus Boulevard and Arch Street in Downtown Hartford, this
project consists of more than 60,000 square feet of brand new buildings fully built to shell specifi-
cations with ample ceiling heights, new utilities, storefronts, roofs and common areas. Completed in
2010, The HB Nitkin Group constructed the project that forms the cornerstone of the Adriaen’s
Landing development, providing retail, restaurant and entertainment in downtown Hartford.
The Front Street District completes the final phase of Adriaen’s Landing, a state and privately
funded master planned development intended to attract activity by way of residents, retail, and
other commercial activity. The plan includes the existing Connecticut Convention Center,
Connecticut Science Center and the 409 room Marriott Hartford Hotel.
Directly across Columbus Boulevard from the Connecticut Convention Center and the Marriott
Hotel, when completed, the project will include 150,000 square feet of building area that will be
occupied by restaurant, entertainment and retail spaces as well as over 200 residential units. The

APPENDIX G: Capital Projects
191
Front Street District will be the centerpiece of the Adriaen’s Landing master plan as the capital
city’s source of energy, entertainment, and excitement.
Unparalleled access to I-91 & I-84 makes the location super-regional. Less than 500 yards from I-91 and 1-mile from I-84 1,000,000+ visitors per year within walking distance to the Front Street District More than 750,000 people reside within 20 minutes of the site Daytime population of more than 64,000 within 1 mile of the site destination
The New Haven-Hartford-Springfield (NHHS) Rail Project
http://www.nhhsrail.com/
Who owns/controls the project: CT, MA, VT, Amtrak, and the Federal Railroad Administration
Timeframe: 2016 to 2030
Cost: $647M+
Status: Proceeding with detailed engineering and service planning and the preparation of project
specific environmental reviews.
Relationship to CEDS: Infrastructure Initiative: Support infrastructure investments tied to
business and job growth. Also impacts workforce and cluster initiatives.
Overview
The New Haven-Hartford-Springfield Rail project represents a broad partnership between the State
of Connecticut, Amtrak and the Federal Railroad Administration, as well as the states of
Massachusetts and Vermont. The goal is to provide those living, working or traveling between New
Haven, Hartford and Springfield with high speed rail service equal to the nation’s best rail
passenger service. The new service will connect with existing Metro-North commuter rail and
Amtrak Acela high-speed rail service on the New Haven Line to New York and on the Northeast
Corridor to New London and Boston. With this level of direct and connecting service linking the
region, towns along the NHHS rail line will become magnets for growth – ideal places to live and to
relocate businesses that depend on regional markets and travel.
Benefits
Increased passenger rail service on the NHHS corridor will provide important transportation,
economic development and environmental benefits for local communities and the entire region.
Most importantly, it will provide travelers with a fast, safe and reliable public transportation
alternative to the congestion that plagues our roads during rush hour each day and to the steadily
increasing price of gasoline.

APPENDIX G: Capital Projects
192
The NHHS project will provide the following benefits:
Providing Local and Regional Connections
Ridership: 1.26 million new annual trips by 2030 Car trips diverted to rail: 1.15 million by 2030 Service to both Grand Central Terminal and to Penn Station in New York Direct bus connection from the NHHS to Bradley International Airport Major connection to the NHHS from the New Britain to Hartford busway corridor Connections to regional train service at New Haven to the New Haven Line, Shore Line East
and AMTRAK to Boston New Jobs During Construction
4,710 construction-related jobs 8,090 total jobs (direct and indirect)
Energy Savings
Over 100 million fewer vehicle miles driven each year by 2030 Over 3.5 million gallons/year of fuel saved; Over 25,000 metric tons less carbon released per year
Catalyst for Transit-Oriented Development (TOD) Around NHHS Stations
Encourage compact, mixed use development within ¼ mile of stations that provide places to live, work and play within a convenient walk to transit
Enhance quality of life while reducing dependence on automobiles Develop new opportunities for businesses to access expanded markets
Regional Vision
The New Haven-Hartford-Springfield (NHHS) Rail Project will provide significant new regional
passenger rail service options as a key component of a robust and vibrant multi-modal regional
transportation system. New train service will connect communities, generate sustainable economic
growth, help build energy independence, and provide links to travel corridors and markets within
and beyond the region.
In the future, NHHS rail service will operate at speeds up to 110 mph, cutting travel time between
Springfield and New Haven to just 73 minutes. Travelers at New Haven, Wallingford, Meriden,
Berlin, Hartford, Windsor, Windsor Locks and Springfield will be able to board trains every 30
minutes during the peak morning and evening rush hour and hourly during the rest of day, with
direct or connecting service to New York City and multiple frequencies to Boston or Vermont (via
Springfield).
The NHHS is a key and necessary component of a broader New England passenger rail vision
developed by the Governors in the Northeast.

APPENDIX G: Capital Projects
193
The vision calls for a significant expansion of intercity passenger rail service across New England
and the Northeast linking into the high-speed Northeast Corridor spine. New trains would serve
key Northeast markets:
Washington-New Haven-Springfield-White River Junction-Essex Junction, with future service to Montreal
Boston-Springfield-Vermont-Montreal Boston-Springfield-New Haven along the Inland Route New Haven-Hartford-Springfield service expansion Boston-Portland-Brunswick, on the Down east corridor New service connecting Boston and Concord, NH
Many of these new services operate over the NHHS corridor. As a result, upgrade of the NHHS
corridor to accommodate the planned increases in service is a pre-condition to this regional service
expansion. Connecticut is working closely with Massachusetts and Vermont to coordinate the
planning and funding for the NHHS Rail Project and implementation of the vision for New England.
Rentschler Field
http://www.rentschler-field.com/home.html
Who owns/controls the project: United Technologies Corp./The Matos Group, LLC
Timeframe: 15 year development
Cost: $2B
Status: Phase I completed – Development is ongoing
Relationship to CEDS: Infrastructure Initiative: Support infrastructure investments tied to
business and job growth. Also impacts workforce and cluster initiatives
A $2 billion, 1,000-acre mixed-use community with a 24/7 combination of business, entertainment and residential opportunities.
Located in East Hartford, Connecticut - midway between New York and Boston - surrounded by Fortune 500 companies.
Convenient, high-visibility site: approximately 140,000 vehicles pass each day on Interstate 84, and 150,000 on Interstate 91.
Existing home of Pratt & Whitney, United Technologies Research Center and the 40,000-seat University of Connecticut Football Stadium.
Expanding to become a major innovation center for technology-based research and development companies.
Master-planned community with high-tech, 21st-century architecture and lush natural landscaping.
Sites available for offices, laboratories, manufacturing and retail buildings, totaling up to 7.8 million sq. ft..

APPENDIX G: Capital Projects
194
Enlivened by engineering-oriented academic and medical facilities, as well as sports, recreational, restaurant and retail attractions.
Well-educated and experienced workforce in the immediate area. Enterprise Zone advantages Phase I completed by 2008; entire Rentschler Field development spanning 15 years
Connecticut Studios
http://ctstudiosllc.com/
Who owns/controls the project: Connecticut Studios, LLC, a partnership between Los Angeles,
CA-based Pacifica Ventures, LLC and Providence, RI-based Halden Acquisition Group, LLC
Timeframe: TBD
Cost: $50 million
Status: Delayed
Relationship to CEDS: Cluster Initiative: Foster and grow the industry clusters with a strong
presence in the region but also seek cross-regional synergies of growth and opportunity.
Connecticut Studios, LLC is the developer and operator of the proposed full service, state of the
art motion picture and television studio, production and post production facility to be located in
the town of South Windsor, CT. The proposed site for Connecticut Studios is located at the
intersection of I-291 and Route 5 in South Windsor, CT.
This development in South Windsor will include a total of 495,000+/- square feet of newly
constructed facilities including:
Nine sound stages totaling approximately 175,000 square feet of space. Approximately 104,000 square feet of executive offices. Approximately 75,000 square feet of mill and storage facilities. Sufficient space for location shooting. Room for expansion as business grows. A 125-room, 75,000 square-foot hotel. Four restaurants occupying 30,000 square feet of space. Retail building with 16,000 square feet of space
Economic Benefits
Motion picture production is a highly desired and welcomed industry in Connecticut.
Connecticut Studios is a project that will provide immediate and sustained economic benefits to
South Windsor and the state.

APPENDIX G: Capital Projects
195
Immediate Construction Jobs & Economic Impact:
$50 million project investment will anchor the film industry in Connecticut Immediate creation of 400-500 union construction jobs Area businesses will be strengthened and supported during the construction period, and
beyond
Sustained Annual Movie Production Jobs & Long-Term Economic Impact:
1,650 production related union jobs per year paying an average yearly salary of $68,200 and generating approximately $112.5 million in additional Connecticut payroll
40 full time facility studio jobs paying an average yearly salary of $45,000 and generating approximately $1.8 million in additional Connecticut payroll
Industry statistics show the economic multiplier effect is approximately four times direct production expenditures
Connecticut Studios will provide a valuable connection to the entertainment industry for Connecticut’s regional technical schools, colleges and universities with related academic programs and will provide a strong incentive for graduates of those programs and young professionals to remain in the state
Economic Benefit Studies:
A February 2009 Ernst & Young study prepared for the New York State Governors Office of Motion Picture and Television Development and the Motion Picture Association of America evaluated the state’s 30% production tax credit program and reported: - At $940 million of film spending in 2007 the credit created and retained 19,512 jobs - The credit also generated New York State and City return-on-investment of $1.90 for every $1.00 invested in tax credits
A January 2009 Ernst & Young study prepared for the New Mexico State Film Office and State
Investment Council reported:
- The state’s film production tax credits resulted in combined state and local tax collections of $1.50
for each $1.00 of state credits
Great Pond in Windsor
http://greatpondinwindsor.com
Who owns/controls the project: Winstanley Enterprises / ABB
Timeframe: 14 to 20 year span
Cost: $750M to $1B
Status: clean-up of site complete, residential development begun

APPENDIX G: Capital Projects
196
Relationship to CEDS: Workforce & Education Initiative: Focus on improving the workforce today,
while educating, training and recruiting the pipeline for tomorrow. Housing for young, dynamic
regional workforce.
http://windsor.patch.com/articles/great-pond-village-to-add-thousands-of-windsor-residents
http://www.winent.com/
Great Pond in Windsor is a new, sustainable community along the Farmington River. Its
neighborhoods are designed to provide residents with direct connections to the great outdoor
amenities in Connecticut and Western Massachusetts. This is a place dedicated to meet the needs of
a young, creative, and technologically-oriented workforce. Windsor attracts a broad regional base
of professional employees with over 60,000 plus technology and financial sector jobs, all within 15
miles of Great Pond.
The design for the new community builds on the regional demand for a broad offering of housing
choices and services that will appeal to a young, highly mobile workforce as well as empty-nester
households.
The community is designed as a mix of residential apartments, townhouses, condominiums, and
houses integrated with neighborhood retail shops, community fitness centers, offices, and
education facilities.
The proposed 653-acre development would include:
4,010 residential units, including multifamily homes, condos and rental units, and single-family attached and stand alone homes for sale.
a projected population of 7,847 residents upon completion (including 720 children who could attend Windsor Public Schools).
640,000 square feet of small business and corporate office space. 85,000 square feet of retail space. Connection to the Farmington River and Northwest Park trails State of the art technology (broadband wireless access, community intranet and energy
efficiency) 355 acres of open space, recreational space or natural preserve (including small,
neighborhood parks throughout the development). A pedestrian-oriented market district with small retailers, restaurants and an active market
house (year-round farmer's market).
________________________________________________________________________
Jackson Laboratory for Genomic Medicine
Who owns/controls the project: Jackson Labs

APPENDIX G: Capital Projects
197
Timeframe: Estimated to be fully developed over 20 years
Cost: $1.1B ($291M from CT)
Status: In-process
Relationship to CEDS: Cluster Initiative: Foster and grow the industry clusters with a strong
presence in the region but also seek cross-regional synergies of growth and opportunity.
Gov. Press Release http://www.governor.ct.gov/malloy/cwp/view.asp?A=4010&Q=493818
www.jax.org
Jackson Laboratory is an independent, nonprofit organization that focuses on mammalian genetics
research to advance human health. Their mission is to discover the genetic basis for preventing,
treating and curing human disease, and to enable research and education for the global biomedical
community.
Once Jackson Labs Genomic Medicine is fully developed over, the institute will employ 600
scientists and technicians in 250,000 square feet of state-of-the-art lab space. The total 20-year
capital and research budget for the institute is projected to be $1.1 billion, of which the State of
Connecticut has approved $291 million: $192 million in a secured, forgivable construction loan and
$99 million in grants for research and related activities. The Jackson Laboratory will raise the
balance of $860 million through federal research grants, philanthropy and service income. The
facility is expected to support 6,800 permanent jobs.
Jackson Labs will give preference to Connecticut residents when hiring if they meet all job
qualifications. Connecticut vendors will be given preference when cost-effective and scientifically
sound. And will enter into a Community Workforce Agreement for construction of the facility.
The Laboratory is currently on track to meet its hiring goal of 27 new employees by the end of
2012.
A great addition to the bioscience industry sector.
New Terminal – Bradley International Airport
Who owns/controls the project: State of Connecticut
Timeframe: Undetermined
Cost: Phase I - $650 million
Status: Planning Stage

APPENDIX G: Capital Projects
198
Relationship to CEDS: Infrastructure Initiative: Support infrastructure investments tied to
business and job growth.
http://articles.courant.com/2012-07-10/business/hc-bradley-airport-expansion-
20120710_1_murphy-terminal-new-terminal-parking-garage
An expansion of Bradley International Airport, with an additional terminal and parking garage,
would benefit the region's economy while making travel smoother for Connecticut residents and
visitors.
The plan — parts of which may not come about until demand materializes, which could take many
years — includes a 19-gate terminal at the location of the old Murphy Terminal, which closed in
2010 as the oldest terminal at any major U.S. airport.
A parking garage with consolidated car rental facilities would rise where the surface lot is now
located in front of the Murphy Terminal, and the airport would have its own power plant on site.
The project, as laid out in a report for the state Department of Transportation and the Federal
Aviation Administration, would nearly double the number of gates now available. The first phase —
demolition of Murphy, also known as Terminal B; site preparation; and part of the new terminal,
would cost as much as $650 million, using a combination of federal and state funds.
The current plan relies on growth projections of about 5 percent a year from 2009 to 2013. The
garage and demolition project are viewed as the more solid parts of the plan for the near term.
The most likely immediate benefit for travelers would be a move of the rental car lots to a new
garage at the airport. For the last two years, rental car customers have been paying a $3.50
surcharge, and $10 million has been put into escrow for that project.
Once the garage opens, that fee will be raised so it covers the full cost of the debt service on the
bonds that will pay for the construction. An estimate on how much the garage would cost has not
been provided. The plan makes it clear that the garage will happen even if the terminal expansion
never does.
Implement Recommendations of the Bradley Area Transportation Study
Who owns/controls the project: Capitol Region Council of Governments, the Town of Windsor,
and the Connecticut Department of Transportation. The consulting firm, URS Corporation AES,
provided technical assistance.
Timeframe: Ongoing
Cost:
Status:
Relationship to CEDS: Infrastructure Initiative: Support infrastructure investments tied to
business and job growth.

APPENDIX G: Capital Projects
199
The Bradley Area Transportation Study includes a comprehensive analysis of current and future
traffic conditions and land use in the airport area. The study identifies transportation
improvements that are needed to accommodate growth and to develop a strategic plan for
maintaining safe and efficient access to the airport area. The project team includes staff from
CRCOG, Connecticut Department of Transportation, the four towns surrounding the airport, and the
technical consulting firm, URS Corporation. The project team operates under the direction of a
project Steering Committee as well as four Local Advisory Committees.
Improvements identified in the study are categorized as regional or local based on the nature of
their impacts and/or benefits. Most are classified as local improvements, indicating they are
primarily of local neighborhood or town concern. However, the following four (4) improvements
are identified as being of regional significance:
1. Northern Bradley Connector Roadway 2. Bradley Park Road, East Granby 3. Route 75 - Bradley
Airport Gateway, Windsor Locks and Windsor 4 Improved Transit Service to the Bradley Area.
I-91 Interchange with Route 75 and Day Hill Road, Windsor, Connecticut
Who owns/controls the project: Capitol Region Council of Governments, the Town of Windsor,
and the Connecticut Department of Transportation. The consulting firm, URS Corporation AES,
provided technical assistance.
Timeframe: TBD
Cost: $20 million
Status: Planning stages
Relationship to CEDS: Infrastructure Initiative: Support infrastructure investments tied to
business and job growth.
Goals:
Provide a clearance phase for Route 75 northbound traffic between its intersections with I-91
southbound and Day Hill Road eastbound.
Provide advance-warning measures for eastbound Day Hill Road motorists approaching the Route
75 and Day Hill Road intersection.
Provide a right-turn lane from Route 75 northbound to the I-91 northbound on-ramp and a second
left-turn lane from the I-91 northbound off-ramp to Route 75 southbound, along with associated
traffic signal timing modifications.

APPENDIX G: Capital Projects
200
Recommend additional study of a long-term traffic congestion solution involving direct (or more
direct) connection for movements from Day Hill Road to I-91 northbound.
Bradley Park Road, East Granby, Connecticut
Who owns/controls the project: East Granby
Timeframe:
Cost: $4.6 million
Status:
Relationship to CEDS: Infrastructure Initiative: Support infrastructure investments tied to
business and job growth.
Improvements to Bradley Park Road in East Granby include the addition of center left turn lanes, a
landscaped median, and a sidewalk, along with intersection improvements. These improvements
are recommended to improve access, safety, and aesthetics, and provide Bradley Park Road with a
similar industrial park look of adjacent International Drive. Bradley Park road intersection
improvements at Route 20 and Nicholson Road
include provisions for safety and operational improvements and design measures to better
accommodate truck traffic.
Sigourney/Homestead Project Redevelopment Plan
Who owns/controls the project: City of Hartford, Redevelopment Agency
Timeframe: TBD
Cost: TBD
Status: Remediation in process; when completed, city will put out RFP for development
Relationship to CEDS: Workforce & Education Initiative: Focus on improving the workforce today,
while educating, training and recruiting the pipeline for tomorrow. Downtown Hartford Initiative:
Transform Hartford into a dynamic urban environment that is the epicenter of culture,
entertainment, and innovation.
Project Description

APPENDIX G: Capital Projects
201
The Sigourney/Homestead Redevelopment Plan calls for the remediation and redevelopment of a
deteriorated, mixed use area in the Upper Albany neighborhood. It is part of a major development
initiative by the City of Hartford which includes three city neighborhoods - Upper Albany, Clay
Arsenal and Asylum Hill. The Asylum Hill neighborhood boundary is just south of the
redevelopment plan area and Clay Arsenal is to the east. The total project area covers 3.6 acres. The
project area was recently rezoned from C-1 (commercial) to B-3 (Linear Business District). This is
reflective of declining industrial and commercial uses along the homestead corridor.
Recent infrastructure improvements include the MDC Clean Water Project, the realignment of
Walnut/Garden and Homestead Streets, a major arterial realignment as well as street widening and
bridge repairs on Sigourney Street. The Sigourney/Homestead plan will integrate and showcase
these major investments and create new parcels specifically geared to economic development.
Commercial enterprises are interspersed with residential units on this major arterial corridor
which reaches from the edge of West Hartford on the west and up to the major insurance
companies on Asylum Hill to the east. The redevelopment of this area includes the preservation of
historic housing units and demolition of units which are unsafe or obsolete. This redevelopment
plan will include the creation of 3 parcels for new commercial development.
Benefits of the Project
The primary goal of the Sigourney/Homestead Project is to eliminate blighted conditions which are
considered a major disinvestment in the neighborhood. Creation of enhanced commercial uses will
bring new dollars spent in the neighborhood, particularly on Homestead Avenue, a major
commuter route into downtown. This project will also provide for complementary retail and
commercial uses to support the Veeder Place revitalization effort. The Veeder Place development is
a major employer for Hartford residents.
Steps taken to further the Project
The Hartford Redevelopment Agency was recently awarded a Brownfield Pilot Site Assessment
grant in the amount of $500,000. This Pilot was used to assess vacant or underutilized sites for soil
contamination and to prepare sites for redevelopment. The Sigourney/Homestead Corridor is
within the target area. The Pilot will be used in the predevelopment phase of project execution.
Streetscape improvements to date include improved lighting, additional tree plantings and a
realignment of a critical intersection in the form of an island gateway that is highly visible in the
neighborhood. The City included additional amenities into this space, including more elaborate
paver finishes to the sidewalk areas, irrigation for the landscaping, ornamental bollards for
protection of pedestrians, and a 'Welcome to the Upper Albany Neighborhood" sign.
City Investment
The City's Housing Preservation Loan Program provides low interest loans for the moderate
rehabilitation of both 1-4 unit houses and multi-unit buildings occupied by low-moderate income
owners and/or tenants. The purpose of the program is to encourage owners to renovate and

APPENDIX G: Capital Projects
202
improve their properties. Six buildings comprising a total of 15 units in the tri-neighborhood were
targeted for this program.
Capewell Factory
70 Popieluszko Court, Hartford, Connecticut
Who owns/controls the project: Property is privately held by Charter Oak Land ,LLC; City is
attempting to find a developer to acquire the property
Timeframe: TBD
Cost: TBD
Status: Environmental assessments in process; additional funding required to complete this phase
Relationship to CEDS: Workforce & Education Initiative: Focus on improving the workforce today,
while educating, training and recruiting the pipeline for tomorrow. Housing. Downtown Hartford
Initiative: Transform Hartford into a dynamic urban environment that is the epicenter of culture,
entertainment, and innovation.
Property Description: The former factory property located in the Sheldon Charter Oak
neighborhood at 70 Popieluszko Court is a 3.028-acre parcel with improvements constructed in
1892 and operated by the Capewell Horseshoe Nail Company. The parcel includes a single
structure – the main factory building, which contains approximately 106,000 square feet. The
three-story mill factory building’s construction type is a steel frame/masonry combination. The
factory building, which is listed on the National Register of Historic Places - is in very poor
condition and continues to deteriorate.
Environmental Assessment: In years past, the factory site has been evaluated and found to be
contaminated with asbestos, PCBs, and lead-based paint. (In 2011, the property was appraised at
zero fair market value due to the property’s condition and the extent of environmental hazards.)
The site needs a current environmental site assessment, fully characterizing the site – ultimately
delineating the degree and the extent of contamination – as well as a cost estimate for property
remediation. The assessment will include a cost benefit analysis and a structural assessment to
determine the building’s usefulness. Next steps include the engagement of an environmental
engineering firm (licensed environmental professional (LEP)) to work as an environmental
consultant to perform a study of the property, and the City of Hartford will apply for Brownfield
grant funding to assess, test and/or remediate the factory site.
Future Development Plan: Rehabilitation/conversion of a historic mill factory building to a mixed-
use property, with off-street parking. Redevelopment funding may be dependent on Capital Region
Development Authority (CRDA) funding. The factory parcel is located within the boundaries of
CRDA’s recently devised target development area. The City of Hartford’s goal is to preserve this
historic building, which has a place in the city’s industrial history. Development plans to convert

APPENDIX G: Capital Projects
203
the existing structure into a useful, productive property will produce tax revenue for the City,
improve the livability of the neighborhood by eliminating blight and enhance the quality of life for
the residents of the Sheldon Charter Oak neighborhood.
Major Housing Initiatives – Hartford
Who owns/controls the project: Various
Timeframe: Ongoing
Cost:
Status: Ongoing
Relationship to CEDS: Workforce & Education Initiative: Focus on improving the workforce today,
while educating, training and recruiting the pipeline for tomorrow.
There are several large housing projects under consideration in downtown Hartford. The overall
effort is to create 2000 additional units downtown over the next 6 years, focused 80% market/20%
affordable with $60 million in state money to jump start it all already authorized via Capital Region
Development Authority.
Constitution Plaza: Project includes housing, both new construction and conversion of the former
hotel to housing.
Front Street Phase 2
Conversion of former Bank of America building at 777 Main Street.
Conversion of former commercial offices around Bushnell Park to housing
Renovation of old downtown small retail/commercial buildings with housing on upper levels.

APPENDIX H: Steering Committee Participants
204
APPENDIX H: Steering Committee Participants
MetroHartford Comprehensive Economic Development Strategy
Steering Committee CEDS - 2011-2012
Todd Andrews Goodwin College
Wayne Benjamin City of Hartford, Department of Development Services
David Bonney Lux Bond & Green
Larry Brown Horton International, LLC
John Choquette Town of East Hartford
John Coleman Rideshare
Ken Cook Peer to Peer Advisors
Martin D'Eramo United Technologies Corporation
Ken Flanagan Flanagan Brothers
Bob Flynn Travelers
Paula Gilberto United Way
Elliot Ginsberg Connecticut Center for Advanced Technology
Peter Gioia Connecticut Business & Industry Association
Peter Holland Bartram & Cochran
Rochelle Kingsley United Way
Mary Ellen Kowalewski Capitol Region Council of Governments (CRCOG)
Sean Meehan Willis
Ned Moore Department of Economic & Community Develoment
John O'Toole Northeast Utilities Service Company
David Panagore City of Hartford
John Patrick Farmington Bank
Mark Pellegrini Town of Manchester
Kinson Perry AT&T
Thomas Phillips Capital Workforce Partners
Nancy Scirocco Webster Bank
Charlie Smith J. H. Cohn, LLP
Dan Tapper Sullivan & LeShane Public Relations, Inc.
Lyle Wray Capitol Region Council of Governments (CRCOG)

APPENDIX I: Integration of EDA Objectives and HUD Livability Principles
205
APPENDIX I: Integration of EDA Objectives and HUD Livability Principles
The below figure integrates the EDA Objectives and the HUD Livability Principles showing the
overlap in both of their missions. These principles and objectives were used as basis for developing
the goals and action steps for the MetroHartford region.
EDA
Objective
HUD
Livability
Principle