The Structure and Kinematics of the Circum-Galactic Medium from Far-UV Spectra of z~2-3 Galaxies
34
arXiv:1003.0679v2 [astro-ph.CO] 19 May 2010 RECEIVED 2010 FEBRUARY 23; ACCEPTED 2010 MAY 11 Preprint typeset using L A T E X style emulateapj v. 08/22/09 THE STRUCTURE AND KINEMATICS OF THE CIRCUM-GALACTIC MEDIUM FROM FAR-UV SPECTRA OF Z ≃ 2 - 3 GALAXIES 1 CHARLES C. STEIDEL 2 ,DAWN K. ERB 3,4 ,ALICE E. SHAPLEY 5,6,7 ,MAX PETTINI 8,9 ,NAVEEN REDDY 10,11 ,MILAN BOGOSAVLJEVI ´ C 2 , GWEN C. RUDIE 2 ,&OLIVERA RAKIC 12 Received 2010 February 23; Accepted 2010 May 11 ABSTRACT We present new results on the kinematics and spatial distribution of metal-enriched gas within ∼ 125 kpc of star-forming (“Lyman Break”) galaxies at redshifts 2 < ∼ z < ∼ 3. In particular, we focus on constraints provided by the rest-frame far-UV spectra of faint galaxies– and demonstrate how galaxy spectra can be used to obtain key spatial and spectral information more efficiently than possible with QSO sightlines. Using a sample of 89 galaxies with 〈z〉 =2.3 ± 0.3 and with both rest-frame far-UV and Hα spectra, we re-calibrate the measurement of accurate galaxy systemic redshifts using only survey-quality rest-UV spectra. We use the velocity-calibrated sample to investigate the kinematics of the galaxy-scale outflows via the strong interstellar (IS) absorption lines and Lyman α emission (when present), as well as their dependence on other physical properties of the galaxies. We construct a sample of 512 close (1 - 15 ′′ ) angular pairs of z ∼ 2 - 3 galaxies with redshift differences indicating a lack of physical association. Sightlines to the background galaxies provide new information on the spatial distribution of circumgalactic gas surrounding the foreground galaxies. The close pairs sample galactocentric impact parameters 3-125 kpc (physical) at 〈z〉 =2.2, providing for the first time a robust map of cool gas as a function of galactocentric distance for a well-characterized population of galaxies. We propose a simple model of circumgalactic gas that simultaneously matches the kinematics, depth, and profile shape of IS absorption and Lyα emission lines, as well as the observed variation of absorption line strength (H I and several metallic species) versus galactocentric impact parameter. Within the model, cool gas is distributed symmetrically around every galaxy, accelerating radially outward with v out (r) increasing with r (i.e., the highest velocities are located at the largest galactocentric distances r). The inferred radial dependence of the covering fraction of cool gas (which modulates the absorption line strength) is f c (r) ∝ r -γ with 0.2 < ∼ γ < ∼ 0.6 depending on transition. We discuss the results of the observations in the context of “cold accretion”, in which cool gas is accreting via filamentary streams directly onto the central regions of galaxies. At present, we find little observational evidence for cool infalling material, while evidence supporting the large-scale effects of super- wind outflows is strong. This “pilot” study using faint galaxy spectra demonstrates the potential of using galaxies to trace baryons within galaxies, in the circumgalactic medium, and ultimately throughout the IGM. Subject headings: cosmology: observations — galaxies: evolution — galaxies: high-redshift 1. INTRODUCTION Observational studies of the galaxy formation process are reaching a critical juncture, where the accumulation rate of new data may be overtaking our ability to reach new under- standing. There are now many large surveys designed to study galaxy formation and evolution over ever-increasing volumes and redshift ranges, backed by the unquestionable power of 1 Based on data obtained at the W.M. Keck Observatory, which is operated as a scientific partnership among the California Institute of Technology, the University of California, and NASA, and was made possible by the generous financial support of the W.M. Keck Foundation. 2 California Institute of Technology, MS 249-17, Pasadena, CA 91125 3 Department of Physics, University of California, Santa Barbara, Santa Barbara, CA 93106 4 Spitzer Fellow 5 Department of Physics and Astronomy, University of California, Los An- geles, 430 Portola Plaza, Box 951547, Los Angeles, CA 90095 6 Alfred P. Sloan Fellow 7 Packard Fellow 8 Institute of Astronomy, Madingley Road, Cambridge CB3 OHA UK 9 International Centre for Radio Astronomy Research, University of West- ern Australia, 35 Stirling Highway, Crawley, WA 6009, Australia 10 National Optical Astronomy Observatories, 950 N. Cherry Ave., Tuc- son, AZ 85258 11 Hubble Fellow 12 Leiden Observatory, Leiden University, P.O. Box 9513, 2300 RA Lei- den, The Netherlands multi-wavelength observations from X-rays to the far-IR/sub- mm and radio. Interpretation of the survey data is aided by a multitude of theoretical results based on simulations and/or semi-analytic calculations. However, many of the most funda- mental remaining questions in galaxy formation involve com- plex baryonic processes that are difficult to model, are not well-constrained by current observations, or involve physics that are not yet well understood. While there is general agreement about the development of structure in the dark matter component on scales larger than that of galaxies, the astrophysics of the baryonic response to the dark matter structure, the subsequent feedback of en- ergy from star formation, supernova explosions, and accre- tion energy from the growth of supermassive black holes, and the flow of gas into and out of galaxies, remain largely unconstrained– and thus subject to substantial debate. “Feed- back” has become a buzzword, universally acknowledged as something important to understand, but there is little agree- ment about what it really means and how it affects the “big picture”. Nevertheless, some kind of feedback is invoked to explain many otherwise-inexplicable observations: the cessa- tion of star formation in massive galaxies at high redshift; the small number of low-mass galaxies relative to the dark mat- ter halo mass function predicted by the otherwise successful ΛCDM cosmology; the correlation between galaxy spheroid
-
Upload
independent -
Category
Documents
-
view
5 -
download
0
Transcript of The Structure and Kinematics of the Circum-Galactic Medium from Far-UV Spectra of z~2-3 Galaxies
arX
iv:1
003.
0679
v2 [
astr
o-ph
.CO
] 19
May
201
0RECEIVED 2010 FEBRUARY 23; ACCEPTED2010 MAY 11Preprint typeset using LATEX style emulateapj v. 08/22/09
THE STRUCTURE AND KINEMATICS OF THE CIRCUM-GALACTIC MEDIUMFROM FAR-UV SPECTRA OFZ ≃ 2− 3GALAXIES1
CHARLES C. STEIDEL2, DAWN K. ERB3,4, ALICE E. SHAPLEY5,6,7, MAX PETTINI8,9, NAVEEN REDDY10,11, M ILAN BOGOSAVLJEVIC2,GWEN C. RUDIE2, & OLIVERA RAKIC 12
Received 2010 February 23; Accepted 2010 May 11
ABSTRACTWe present new results on the kinematics and spatial distribution of metal-enriched gas within∼ 125 kpc of
star-forming (“Lyman Break”) galaxies at redshifts 2<∼ z <
∼ 3. In particular, we focus on constraints providedby the rest-frame far-UV spectra of faint galaxies– and demonstrate how galaxy spectra can be used to obtainkey spatial and spectral information more efficiently than possible with QSO sightlines. Using a sample of 89galaxies with〈z〉 = 2.3±0.3 and with both rest-frame far-UV and Hα spectra, we re-calibrate the measurementof accurate galaxy systemic redshifts using only survey-quality rest-UV spectra. We use the velocity-calibratedsample to investigate the kinematics of the galaxy-scale outflows via the strong interstellar (IS) absorption linesand Lymanα emission (when present), as well as their dependence on other physical properties of the galaxies.We construct a sample of 512 close (1− 15′′ ) angular pairs ofz∼ 2− 3 galaxies with redshift differencesindicating a lack of physical association. Sightlines to the background galaxies provide new information onthe spatial distribution of circumgalactic gas surrounding the foreground galaxies. The close pairs samplegalactocentric impact parameters 3-125 kpc (physical) at〈z〉 = 2.2, providing for the first time a robust map ofcool gas as a function of galactocentric distance for a well-characterized population of galaxies. We proposea simple model of circumgalactic gas that simultaneously matches the kinematics, depth, and profile shapeof IS absorption and Lyα emission lines, as well as the observed variation of absorption line strength (HIand several metallic species) versus galactocentric impact parameter. Within the model, cool gas is distributedsymmetrically around every galaxy, accelerating radiallyoutward withvout(r) increasing withr (i.e., the highestvelocities are located at the largest galactocentric distancesr). The inferred radial dependence of the coveringfraction of cool gas (which modulates the absorption line strength) isfc(r) ∝ r−γ with 0.2 <
∼ γ <∼ 0.6 depending
on transition. We discuss the results of the observations inthe context of “cold accretion”, in which cool gasis accreting via filamentary streams directly onto the central regions of galaxies. At present, we find littleobservational evidence for cool infalling material, whileevidence supporting the large-scale effects of super-wind outflowsis strong. This “pilot” study using faint galaxy spectra demonstrates the potential of usinggalaxies to trace baryons within galaxies, in the circumgalactic medium, and ultimately throughout the IGM.Subject headings:cosmology: observations — galaxies: evolution — galaxies:high-redshift
1. INTRODUCTION
Observational studies of the galaxy formation process arereaching a critical juncture, where the accumulation rate ofnew data may be overtaking our ability to reach new under-standing. There are now many large surveys designed to studygalaxy formation and evolution over ever-increasing volumesand redshift ranges, backed by the unquestionable power of
1 Based on data obtained at the W.M. Keck Observatory, which isoperatedas a scientific partnership among the California Institute of Technology, theUniversity of California, and NASA, and was made possible bythe generousfinancial support of the W.M. Keck Foundation.
2 California Institute of Technology, MS 249-17, Pasadena, CA 911253 Department of Physics, University of California, Santa Barbara, Santa
Barbara, CA 931064 Spitzer Fellow5 Department of Physics and Astronomy, University of California, Los An-
geles, 430 Portola Plaza, Box 951547, Los Angeles, CA 900956 Alfred P. Sloan Fellow7 Packard Fellow8 Institute of Astronomy, Madingley Road, Cambridge CB3 OHA UK9 International Centre for Radio Astronomy Research, University of West-
ern Australia, 35 Stirling Highway, Crawley, WA 6009, Australia10 National Optical Astronomy Observatories, 950 N. Cherry Ave., Tuc-
son, AZ 8525811 Hubble Fellow12 Leiden Observatory, Leiden University, P.O. Box 9513, 2300RA Lei-
den, The Netherlands
multi-wavelength observations from X-rays to the far-IR/sub-mm and radio. Interpretation of the survey data is aided bya multitude of theoretical results based on simulations and/orsemi-analytic calculations. However, many of the most funda-mental remaining questions in galaxy formation involve com-plex baryonic processes that are difficult to model, are notwell-constrained by current observations, or involve physicsthat are not yet well understood.
While there is general agreement about the development ofstructure in the dark matter component on scales larger thanthat of galaxies, the astrophysics of the baryonic responseto the dark matter structure, the subsequent feedback of en-ergy from star formation, supernova explosions, and accre-tion energy from the growth of supermassive black holes,and the flow of gas into and out of galaxies, remain largelyunconstrained– and thus subject to substantial debate. “Feed-back” has become a buzzword, universally acknowledged assomething important to understand, but there is little agree-ment about what it really means and how it affects the “bigpicture”. Nevertheless, some kind of feedback is invoked toexplain many otherwise-inexplicable observations: the cessa-tion of star formation in massive galaxies at high redshift;thesmall number of low-mass galaxies relative to the dark mat-ter halo mass function predicted by the otherwise successfulΛCDM cosmology; the correlation between galaxy spheroid
2 Steidel et al.
mass and the mass of central super-massive black holes; thegeneral absence of cooling flows in clusters of galaxies; themetal enrichment of intracluster gas, just to name a few. Themost obvious sources of the energy and/or momentum re-quired to explain these phenomena are massive stars, super-novae, and AGN activity, all of which must have exerted mostof their influence in the distant past, when these processeswere at their peak intensity.
One route to understanding the relevant baryonic processesis via simultaneous study of galaxies and the IGM, in thesame cosmic volumes during the epoch when they were ar-guably exerting the greatest influence on one another– nearthe peak of both universal star formation and supermassiveblack hole growth in the redshift range 3>∼ z >
∼ 1.5. Com-bining two powerful lines of investigation provides comple-mentary information on the state of baryons, both those col-lapsed into galaxies and those residing outside of galaxies.The IGM and “circumgalactic medium” (CGM; by which wemean the gas-phase structures found within<
∼ 300 kpc [phys-ical] of galaxies), together present a laboratory in which theeffects of galaxy formation and AGN accretion (e.g., radiativeand hydrodynamical “feedback” and its recent history) can bemeasured on scales that are not accessible using direct obser-vations of galaxies. Similarly, the galaxy distribution relativeto the lines of sight to background objects tells us more abouthow the physical information garnered from the absorptionline studies should be interpreted. These ambitious sciencegoals – to observe both diffuse gasandgalaxies/AGN in thesame survey volume at high fidelity and down to small scales– require a different approach as compared to most spectro-scopic surveys of the distant universe. Whereas the move-ment of most galaxy surveys has been toward larger and largerscales, the most vexing remaining uncertainties are related tophenomena occurring on∼ 1− 10 Mpc scales, where the fig-ure of merit isinformation densityand not total survey vol-ume.
It has been known for some time that galactic-scale out-flows with velocities of several hundred km s−1 are ubiq-uitous in star-forming galaxies at all redshifts for whichinterstellar (IS) absorption features are accessible (e.g.,Steidel et al. 1996; Franx et al. 1997; Pettini et al. 2000,2001; Shapley et al. 2003; Martin 2005; Rupke et al. 2005;Tremonti et al. 2007; Weiner et al. 2009.) Evidence is foundin the offsets between the redshifts of the nebular emis-sion lines, interstellar absorption lines, and Lyα emis-sion (Pettini et al. 2001), in the relative velocities of stel-lar, interstellar and nebular lines in composite UV spectra(Shapley et al. 2003), and in the correlation of CIV systemsseen in absorption in QSO spectra with the positions of thegalaxies themselves (Adelberger et al. 2003; Adelberger etal.2005a). The outflowing gas has been observed in de-tail for only a handful of lensed galaxies (Pettini et al.2002; Quider et al. 2009a,b); in the best-observed of these,MS1512-cB58, the interstellar absorption is distributed overa very wide range of velocities,−800 <
∼ v <∼ + 200, with a
centroid velocity of−255 km s−1 (Pettini et al. 2002). Suchoutflows are also a general feature of starburst galaxies inthe local universe, where rest-UV spectroscopic studies re-veal similarly complex velocity structure and gas in multiplephases (e.g. Heckman et al. 1990; Lehnert & Heckman 1996;Martin 1999; Strickland et al. 2004; Schwartz et al. 2006;Grimes et al. 2009; Chen et al. 2010). However, the outflowphenomenon is so much more widespread at high redshifts
that it is influencing essentiallyeverygalaxy, and potentiallyevery galaxy’s local environment. It must have an influenceon both the chemical evolution of the galaxies and of the IGM,it may well regulate the maximum star formation rate attain-able by a galaxy, and without doubt it is an essential ingre-dient to basic understanding of the circulation of baryons asgalaxies are forming.
In spite of the substantial observational evidence forgalaxy-scale outflows, most of the recent theoretical work hasfocused instead on theinfall of cool gas (“Cold Accretion”or “Cold Flows”) via filaments, directly onto the central re-gions of forming galaxies. According to much of the recentwork, this mode of gas accretion is what feeds (and regu-lates) high star formation rates in high redshift galaxies un-til they attain a particular mass threshold (Mtot
>∼ 1012 M⊙) at
which point virial shocks develop and accretion of cold mate-rial is suppressed (Kereš et al. 2005, 2009; Dekel et al. 2009;Brooks et al. 2009; Ceverino et al. 2009). This transition isbelieved to be at least partially responsible for producingmas-sive “red and dead” galaxies as early asz∼ 2.5. Similarly,the phenomenon of spatially extended Lyα emission, includ-ing giant Lyα “blobs” (Steidel et al. 2000) has been ascribedto cooling radiation from the denser portions of the coldstreams as they are accreting directly onto the galaxy’s cen-tral regions (e.g., Haiman et al. 2000; Furlanetto et al. 2005;Dijkstra & Loeb 2009; Goerdt et al. 2009). Although the coldaccretion picture may be attractive, the predictions of theobservational consequences for CGM gas are rather model-dependent for both absorption lines and Lyα emission. Thesimulations which predict the cold accretion generally do notaccount for IS gas that may have been carried to large galac-tocentric radii by outflows, nor for Lyα photons produced byphotoionization in a galaxy’s HII regions which then scattertheir way in space through CGM gas before escaping. It maywell be that the observational signatures of infall by cold ac-cretion and outflows via supernova-drivenwinds are very sub-tle, and perhaps indistinguishable. Possibly the most tellingdifferences would be kinematic– absorption line signaturesof infalling material in galaxy spectra would be expected tobe primarilyredshifted, while outflowing material would beblue-shiftedand could reach much higher velocities with re-spect to the galaxy systemic redshift. Thus, accurate determi-nation of the galaxy systemic redshift is an essential part ofunderstanding the nature of the CGM.
The spatial distribution of the blue-shifted high-velocitymaterial seen in absorption against the galaxy continuum isnot yet established. We know that virtually everyz> 2 galaxybright enough to be observed spectroscopically is driving outmaterial at velocities of at least several hundred km s−1 , butwe do not know how far this material travels, or even whereit is with respect to the galaxy as we observe it. The massflux associated with such flows has been measured in onlyone case at high redshift, MS1512-cB58 (Pettini et al. 2000),and even in this case the result depends very sensitively on theassumed physical location of the absorbing material responsi-ble for the bulk of the observed absorption. The best hope forconstraining the location of outflowing gas is by observing ob-jects lying in the background, but at small angular separation,relative to the galaxy of interest. In this case the challengeis to find background objects bright enough in the rest-framefar-UV but close enough to the foreground galaxy to provideinteresting constraints. A great deal of effort, over a largerange of redshifts, has been invested using QSOs as back-

The Circum-Galactic Medium atz= 2− 3 3
ground sources, where absorption by metallic ions or HI in thespectrum of the QSO is compared with galaxies with knownredshifts and projected separations (e.g., Bergeron & Boissé1991; Steidel et al. 1994; Chen et al. 2001; Steidel et al. 2002;Lanzetta et al. 1995; Danforth & Shull 2008; Bowen et al.1995; Bouché et al. 2007; Kacprzak et al. 2009); most of thiswork has focused on redshiftsz< 1 because of the increas-ing difficulty obtaining spectra of the foreground galaxiesathigher redshifts. Even if galaxies are identified and have red-shifts that correspond closely with observed absorption, theassociation of particular absorption systems with identifiedgalaxies is almost always ambiguous, since the dynamic rangefor identifying faint galaxies is limited, and often the brightbackground QSOs make it challenging to observe galaxieswithin a few arcsec of the QSO sightline. Finally, there is thecontroversial issue of whether metals seen near to, but outsideof, galaxies are a direct result of recent star formation or AGNactivity, or are simply tracing out regions of the universe inwhich somegalaxies, perhaps in the distant past, polluted thegas with metals (e.g., Madau et al. 2001; Scannapieco et al.2002; Mori et al. 2002; Ferrara 2003 ; cf. Adelberger et al.2003; Adelberger et al. 2005a).
In this paper, our goal is to try to understand the spatialdistribution of cool gas seen in absorption against the stel-lar continuum of every galaxy observed at high redshift. Theobjective is to empirically track the kinematics and structurein the CGM from the central parts of galaxies all the way tolarge galactocentric radii. In this work, we use only galaxyspectra, primarily in the rest-frame far-UV, but we calibratethe velocity zero-point using a set of nearly 100 Hα mea-surements in the observed-frame near-IR for galaxies in theredshift range 1.9 <
∼ z <∼ 2.6. The near-IR measurements are
drawn primarily from the sample of Erb et al. (2006c), afterwhich we use a much more extensive set of rest-UV spectrafrom a nearly completed UV-selected galaxy survey targetingthe same range of redshifts.
The paper is organized as follows: in §2 we examinethe statistics of the kinematics of the outflows using a sub-sample of galaxies for which both near-IR nebular Hα spec-troscopy and reasonably high-quality optical (rest-UV) spec-tra are available. We also present new empirical formulae forestimating galaxy systemic redshifts for the typical case inwhich only low S/N rest-UV spectra are available. In §3, weseek correlations between the interstellar absorption line kine-matics, in particular the bulk velocities measured from stronglow-ionization transitions, and other measured galaxy proper-ties. §4 describes further inferences on the structure and kine-matics of outflowing material from high S/N composite far-UV spectra, while §5 examines the observed behavior of Lyαemission and its relationship to the IS absorption features, andattempts to understand the observations with simple models.We introduce in §6 the use of close angular pairs of galaxies atdifferent redshifts for mapping the spatial distribution of thecircumgalactic gas around the foreground galaxies, while §7develops a simple geometrical and kinematic model for out-flows consistent with both the line profiles in galaxy spectraand the larger-scale distribution of gas in the CGM. §8 dis-cusses the observational results and their interpretationin thecontext of the models, and §9 summarizes the conclusions anddiscusses the prospects for improvement in the future.
We assume aΛ-CDM cosmology withΩm = 0.3,ΩΛ = 0.7,andh = 0.7 throughout, unless specified otherwise.
2. BULK OUTFLOW VELOCITIES ASSOCIATED WITHZ ∼ 2− 3GALAXIES
2.1. Spectra in theHα Galaxy Sample
The rest-frame far-UV spectra of star forming galaxies in-clude numerous absorption features which (in principle) pro-vide detailed information on the young OB stars responsi-ble for the bright continuum, as well as the IS and circum-galactic atomic and ionized gas associated with the galaxy(see, e.g., Pettini et al. 2000, 2002). The strongest stellar fea-tures are due to stellar winds from massive stars, producingbroad P-Cygni profiles in higher ionization lines such as NVλλ1238,1242, CIV λλ1548,1550, and SiIV λλ1393,1402.The absorption is broad (∆v >
∼ 2000 km s−1 ) and shallow,with depth dependent on the metallicity of the O-stars. Pho-tospheric lines from the same OB stars are also present, butthe lines are generally much weaker than the wind features,and so can be difficult to discern in the spectra of individ-ual high redshift galaxies. The IS lines are superposed onthe integrated stellar spectrum, where absorption features ofabundant species (e.g., HI, O I, C II , C IV , Si II , Si III , Si IV ,Fe II , Al II ) can be extremely strong — strong enough to beuseful for redshift identification in low S/N spectra. Unfor-tunately, the most accessible absorption features– the IS andwind features – are not useful for accurate measurements ofgalaxy redshifts because of the non-gravitational origin oftheir kinematics. Similarly, Lyα emission, which is observedin ≃ 50% of a continuum-selected sample atz∼ 2− 3 (e.g.Shapley et al. 2003; Steidel et al. 2004; Kornei et al. 2009) isresonantly scattered, altering the emergent kinematics inamanner that depends on both the optical depth and velocitydistribution of the gas doing the scattering.
Fortunately, nebular emission lines lines originating in agalaxy’s HII regions are also relatively accessible observa-tionally, with the strongest lines (e.g., Hα , Hβ , [OIII])found in the observed-frame near-IR at the redshifts of in-terest. The Hα line, which is not resonantly scattered andwhose strength is strongly dependent on both the ionizing UVradiation field and the density, is likely to provide a reason-able estimate of the systemic redshift of the stars, as well as ameasure of gravitationally-induced motion within the galaxy(Pettini et al. 2001; Erb et al. 2006c). The only disadvantageof the nebular spectra is that their numbers are currently smallin comparison with the available rest-UV spectra.
The quality of rest-UV survey spectra for typical high red-shift galaxies is generally not sufficient for detailed spectralanalysis, and so much of what we know about general trendsbetween spectral properties and other physical parametersof galaxies is based on composites (e.g., Steidel et al. 2001;Shapley et al. 2003; Erb et al. 2006a). In order to form thesecomposites for the far-UV spectra, one must assume a rela-tionship between the velocities of measured spectral featuresand the object’s systemic redshiftzsys; as discussed above, thistask is made difficult by the fact that the strong lines of reso-nance transitions in the far-UV are seldom closer than a fewhundred km s−1 to the objects’ true redshifts.
With the current, enlarged sample ofz∼ 2 galaxies, includ-ing generally higher-quality UV spectra than available in thepast, we revisit the measurement of galaxy systemic redshiftsusing far-UV spectral features, building on previous results(Pettini et al. 2001; Adelberger et al. 2003; Adelberger et al.2005a). In this section, we examine in detail the relation-ship between observed far-UV IS lines, Lyα emission, andthe redshifts defined by the Hα line in the rest-frame optical,
4 Steidel et al.
including careful attention to possible systematic errors.The redshifts (both Hα and UV-based) for all but 8 of the
galaxies have been presented in Erb et al. (2006c), where theobservations are described in detail. The new Hα spectra wereobtained in the same manner using NIRSPEC (McLean et al.1998) in 2005 June. Using a 0′′.76 entrance slit, the typicalspectral resolution achieved with NIRSPEC isR≃ 1400, orFWHM≃ 215 km s−1 , so that the typical Hα line widths ofσv ∼ 100 km s−1 (FWHM≃ 240 km s−1 ) are marginally re-solved. The rest-UV spectra were obtained with the LRIS-Bspectrograph on the Keck 1 telescope, primarily using a 400line/mm grism blazed at 3400 Å with a dichroic beam splittersending all wavelengthsλ < 6800 Å into the blue channel, asdescribed in Steidel et al. (2004). As discussed in detail be-low, the typical effective spectral resolution achieved inthismode is≃ 370 km s−1 (FWHM), orσres≃ 160 km s−1 .
For objects whose UV spectra show detectable interstellarabsorption lines, we have included only those measurementsdeemed of sufficient quality to yield reasonably precise mea-surements. We have also excluded the handful of objects fromthe Erb et al. 2006c sample withz< 1.9, in order to avoidsystematic biases caused by differential atmospheric refrac-tion (discussed below), and to focus on the redshift range forwhich we have the highest quality ancillary data.
The resulting Hα sample consists of a total of 89 galax-ies with〈z〉 = 2.27±0.16, of which 48 (54%) have UV spec-tra in which only an interstellar absorption line redshift wasmeasured, 38 (43%) have measurements of both Lyα emis-sion and interstellar absorption, and 3 (3.5%) have only Lyαemission redshifts measured. These fractions are compara-ble to those obtained from the full spectroscopic sample of≃ 1600 galaxies in the same range of redshifts, 1.9≤ z≤ 2.6(see Steidel et al. 2004). Most (87% ) of the galaxies in theparent sample satisfy the “BX” photometric selection criteria(Adelberger et al. 2004; Steidel et al. 2004), with the remain-der satisfying the “MD” color criteria defined in Steidel et al.(2003). These galaxies selected on the basis of their UV colorhave been shown to include all but the dustiest star-forminggalaxies in the redshift range of interest (Adelberger & Steidel2000; Reddy et al. 2008).
2.2. Redshift Uncertainties
As discussed in detail by Shapley et al. (2003), a large num-ber of interstellar absorption lines is commonly observed infar–UV spectra of star-forming galaxies. In general, all ofthe detected lines are used to verify that the assigned redshiftis correct, but the positions of only 3 lines: CII λ1334.53,Si IV λ1393.76, and SiII λ1526.72, have been used to mea-surezIS. Of the strong resonance lines in the rest wavelengthrange 1000–1600 Å (the range in common for almost all ofthe spectra discussed in this paper), these lines are the leastlikely to be blended with other strong lines and most likelyto yield a consistent measure ofzIS. Clearly, the accuracy ofeach measurement ofzIS depends on the strength and widthof the lines, and on the quality of the spectra. The S/N of thespectra used for the current study varies considerably. Empir-ically, from internal agreement of different absorption linesin the same spectrum, and from repeated measurements ofthe same galaxy on different slitmasks, we estimate that thetypical measurement uncertainties are∼ 100 km s−1 for zIS
redshifts and∼ 50 km s−1 for zLyα.Unfortunately, systematic uncertainties can be more diffi-
cult to quantify. For example, the measured wavelengths of
features depend on the illumination of the spectrograph slitby the object, whereas the wavelength solutions are deter-mined from calibration lamps and night sky spectra whichilluminate the 1′′.2 slits uniformly. This source of error canalso be wavelength-dependent due to the effects of differ-ential atmospheric refraction. The features used for redshiftmeasurement generally fall in the observed wavelength range∼ 3750− 5200 Å for the Hα sample considered here, with〈zHα〉 = 2.27± 0.16. Over this wavelength range, the differ-ential refraction13 would be∼ 0.7 arcsec at an airmass ofsecz= 1.3. Slitmasks were almost always observed within∼ 10− 15 degrees of the parallactic angle when the airmasswas significantly different from 1.0, but even so, the ampli-tude of differential refraction perpendicular to the slit couldbe as large as∼ 0.2 arcsec, which could map into a velocityshift of up to∼ ±75 km s−1 depending on the seeing and thespatial profile of the galaxy.
The measurements ofzHα are subject to a different setof systematic uncertainties. Differential refraction in thenear-IR is negligible for our purposes, but the observationswere obtained using a 0′′.76 slit after applying a blind off-set from a nearby star to the position of the galaxy mea-sured from either an optical or near-IR continuum image(see Erb et al. 2003, 2006c). While the observations weretaken in a way that should minimize any systematic offsetsin the resultingzHα due to pointing or astrometric inaccura-cies, they of course measure the velocity of only the flux thatentered the slit. Empirically, we found that repeated obser-vations of the same galaxy (using different slit position an-gles) suggest an accuracy of±60 km s−1 for zHα (rms), withthe largest excursions from consistency applying to objectsknown to be spatially extended. Another direct comparisonof the redshifts for 14 objects from the NIRPSEC sample ofErb et al. (2006c) is provided by observations of the same ob-jects with the integral-field spectrometer SINFONI at the VLT(Förster Schreiber et al. 2006). The SINFONI redshifts arebased on the velocity centroid of all detected Hα flux from theobject, and are not affected significantly by pointing errors orby slit losses. This comparison shows a level of agreementsimilar to our estimate from multiple observations with NIR-SPEC:〈zN −zS〉 = −34±59 km s−1 (rms), wherezN is the NIR-SPEC redshift andzS is the SINFONI redshift. The averageoffset is marginally significant (≃ 2σ), but the scatter is con-sistent with our NIRSPEC experience. Eleven of the galaxiesin the present Hα sample were also observed using OSIRIS (with Laser Guide Star Adaptive Optics (LGSAO) on the Keck2 telescope (Law et al. 2009); the average redshift differencezN − zO = 8±41 km s−1 , indicating no evidence for a system-atic difference.
In summary, adopting an uncertainty inzHα of 60 km s−1 ,the typical uncertainties in the measured values of∆vIS =c(zIS −zHα)/(1+zHα) and∆vLyα = c(zLyα −zHα)/(1+zHα) fora given galaxy are∼ 130 km s−1 and∼ 90 km s−1 , respec-tively.
2.3. Sample Statistics
Fig. 1 shows a histogram of the IS and Lyα emission veloc-ities with respect to the systemic redshift defined byzHα. The
13 All of the spectroscopic observations of the Hα sample were obtainedbefore the commissioning of the Cassegrain ADC on Keck 1. We are ex-cluding for the moment galaxies at redshifts where key features fall at wave-lengths shorter than 3750 Å due to the rapidly increasing amplitude of differ-ential refraction.

The Circum-Galactic Medium atz= 2− 3 5
FIG. 1.— Histogram of the measured (centroid) velocities of interstellarabsorption lines (blue) and Lymanα emission (red) with respect to the galaxynebular redshift as defined by the centroid of the Hα emission line, for asample of 89 galaxies with〈z〉 = 2.27±0.16. The sample includes only thosegalaxies having both nebular line redshifts and rest-UV spectra of adequatequality to measure absorption line centroids. In this sample, 86 of the 89galaxies have measured values ofzIS, 3 have onlyzLyα, and 39 have both.The mean values of the velocity offsets are indicated.
distributions have〈∆vIS〉 = −164±16 km s−1 , and〈∆vLyα〉 =445± 27 km s−1 , where the quoted uncertainties are errorsin the mean. Fig. 2 illustrates the same sample as in Fig. 1,where different symbols are used depending on the UV spec-tral morphology of the galaxies.
In light of the current Hα sample ofz∼ 2.3 galaxies, itis worth re–examining the “rules” that one would use to es-timate the true systemic redshift of the galaxies given onlyinformation contained in their rest-UV spectra, and assumingthatzHα defines the rest frame. Using a linear regression formsimilar to that used by Adelberger et al. (2005a), for galaxieswith bothzLyα andzIS measurements,
zHα = zIS + 0.00289− 0.0026(2.7− zIS) σz = 0.00127 (1)
zHα = zLyα − 0.0054+ 0.0001(2.7− zLyα) σz = 0.00193, (2)
corresponding to velocity offsets of∆vIS = −170± 115km s−1and∆vLyα = +485± 175 km s−1 , respectively, at themean redshift ofzHα = 2.27. For objects with a measurementof zIS only,
zHα = zIS + 0.00303− 0.0031(2.7− zIS); σz = 0.00145, (3)
or∆vIS = −165±140 km s−1 (error is the standard deviation)at the mean redshift of the sample.
Using all 86 Hα galaxies with measuredzIS, the best fitsingle relation of the form in eqs. 1-3 is
zHα = zIS + 0.00299− 0.00291(2.7− zIS) σz = 0.00138 (4)
or ∆vIS = −166± 125 km s−1 at 〈zHα〉 = 2.27. We find thatincludingzLyα in the above regression formulae increases therms redshift uncertainty over that obtained using onlyzIS, incontrast to similar estimates at somewhat higher redshift byAdelberger et al. (2005a). One possible explanation for thedifference could be the generally weaker Lyα lines in the
z≃ 2.3 sample compared to that atz≃ 3 (Reddy et al. 2008).We return in §5 to a discussion of the kinematics of the Lyαemission line. In any case, usingonly the absorption redshift,with a constant offset of≃ +165 km s−1 , would provide anestimate ofzHα accurate to∼ 125 km s−1 (rms).
There are too few objects (3 of 89) in the Hα sample hav-ing only zLyα to define a significant relationship for such ob-jects (which are also quite rare in the fullz >
∼ 2 spectroscopicsample), although these 3 objects have〈∆vLyα〉 = 400±183,consistent with equation 2 above. For this reason, we useequation 2 for subsequent estimates ofzHα when only Lyαemission is available.
FIG. 2.— Plot showing the interstellar absorption line centroid velocities(blue) and centroid Lymanα emission velocities relative to the redshift de-fined by Hα for the same sample as in Fig. 1. Galaxies for which both in-terstellar absorption redshifts and Lymanα emission redshifts are availableare indicated with blue (absorption) and red (emission) solid dots; open trian-gles show systems for which one or the other measurements is not available.The circled objects are ones which exhibited measurable velocity shear in thesample of Erb et al. 2006c (see text for discussion).
Figs. 1 and 2 show that a significant fraction of the galax-ies have IS absorption line centroid velocity shift∆vIS con-sistent with zero. Given the uncertainties in∆vIS, this isnot particularly significant for individual objects, but wedis-cuss the issue further because of the intriguing behavior of∆vIS and∆vLyα with respect to one another and because ofthe greater significance of the result in higher S/N compositespectra discussed below. Three of the 11 galaxies with mea-sured∆vIS ≥ 0 also have Lyα emission, and have〈∆vLyα〉 =+708± 50 km s−1 , ∼ 250 km s−1 higher than the averageof the full sample; however, the average〈∆vLyα −∆vIS〉 =622±40 km s−1 for this set of objects is nearly identical tothat of the full sample. The relative consistency of the dif-ference∆vLyα −∆vIS in the Hα sample, as well as in muchlarger samples without the benefit of Hα spectroscopy (e.g.,Shapley et al. 2003; Steidel et al. 2004), suggests a situationin which ∆vLyα moves in concert with∆vIS irrespective ofwhether the centroid of the absorption line velocities are blue-shifted with respect to systemic.
Interestingly, 3 other galaxies of the 11 (see Fig. 2) with∆vIS ≥ 0 are among those with spatially resolved velocityshear in the Hα emission line, meaning that the Hα spectrum

6 Steidel et al.
exhibits a significant velocity offset as a function of spatialposition; see Erb et al. (2006c) for details. Given the overalldetection rate of shear in the sample of Erb et al. (2006c), wewould expect to find∼ 1 such object in a sample of 11. Fur-thermore, of the 14 objects with tilted Hα emission lines inthe Erb et al. 2006c sample, eight have high quality absorp-tion redshifts with〈∆vIS〉 = −47± 35 km s−1 ; 6 of 8 have∆vIS > −60 km s−1 .
The apparent connection between decreased|∆vIS| and ob-servation of measurable velocity shear in Hα can be inter-preted in at least two ways. If the velocity shear indicatesan unresolved merger, infalling gas (or an unusual amountof gas near zero velocity) could significantly reduce the av-erage blue-shift of the interstellar lines. The interstellar andnebular redshifts could also arise from different pieces ofamerger, or even different galaxies altogether (see Quider et al.2009b for a possible example). Alternatively, if the tiltedemission lines are caused by rotation that is most easily de-tected in nearly edge-on configurations, the outflows in theseobjects may be loosely collimated perpendicular to the diskas for many local starburst galaxies. If this were the case,one might expect to observe lower outflow velocities and per-haps stronger IS absorption near the galaxy systemic redshiftfor objects with smaller inclination angles to the line of sight.Both of these effects appear to play a role in the Na D IS linekinematics observed in a large sample of nearby star-forminggalaxies (Chen et al. 2010). While possible inclination effectswould not naturally account for highly redshifted Lyα emis-sion, none of the objects with velocity shear identified fromtheir Hα spectra happen to have Lyα in emission. Inclinationeffects could be present in our sample, although the signifi-cant bulk outflows observed in the vast majority of the sampleargue against collimation and projection effects being a majorfactor in most cases.
As we will show in §4 below, we favor an explanation formany of the observed trends discussed in this section thathinges on the quantity of gas at or near zero velocity (andnoton the overall outflow speed).
3. THE RELATION BETWEEN BULK OUTFLOWS AND OTHERGALAXY PROPERTIES
One of the advantages of the sample ofz∼ 2 galaxies dis-cussed in this paper is that a large number of other galaxyproperties are available to look for trends with respect to thebulk outflow properties. Most of the measurements and in-ferred quantities used here are tabulated in Erb et al. 2006c,b.Among the parameters available are the Hα line widthsσv,the star formation rates inferred from the Hα line fluxes (cor-rected for extinction according to the method outlined inErb et al. 2006b), the surface density of star formationΣSFR,the dynamical massMdyn measured from a combination ofσvand the observed physical size of the Hα emitting region, andthe stellar massM∗ inferred from SED fitting from the rest-UV to the rest optical/IR. The cold gas massMgas is estimatedby using the measured Hα surface brightness and galaxy sizeand assuming that the local Schmidt-Kennicutt (Kennicutt1998) relation between gas surface density and star formationrate applies. Finally, the total baryonic massMbar = M∗ +Mgasand the fraction of the inferred baryonic mass in the form ofcold gas,µ = Mgas/Mbar, have been utilized.
Table 1 summarizes the results of Spearman correlationtests between∆vIS, ∆vLyα, ∆vLyα − ∆vIS, and these otherphysical quantities. The number of galaxies available in thesample for each test, which is also given in table 1, varies
TABLE 1CORRELATIONS OF∆vIS AND ∆vLyα WITH GALAXY
PROPERTIESa
Quantity −∆vIS ∆vLyα ∆vLyα −∆vIS
σvb −2.08 (65) +1.81 (29) +0.74 (29)
SFRc −1.52 (87) −0.04 (42) −0.08 (39)ΣSFR
d +0.95 (81) +0.82 (37) +0.49 (35)Mdyn
e −2.24 (57) +1.02 (24) +0.14 (24)Mgas
f −1.68 (73) +0.71 (36) +0.85 (34)M∗
g −1.93 (73) −0.37 (36) −0.48 (34)Mbar
h −2.66 (73) −0.10 (36) −0.10 (34)µi +1.72 (73) +0.64 (36) +0.93 (34)
.
a All values are the number of standard deviations from the nullhypothesis that the quantities are uncorrelated, based on aSpear-man rank correlation test. Negative values indicate anti-correlationsbetween the quantities. The number in parentheses following eachvalue is the number of galaxies in the sample used to evaluatethecorrelation.b Velocity dispersion measured from the Hα emission line.c Star formation rate, in M⊙ yr−1, measured from the intensity of theHα emission line, and corrected for extinction as in Erb et al. 2006b.d Average star formation surface density, as in Erb et al. 2006b.e Dynamical mass, as tabulated in Erb et al. 2006a.f Cold gas mass, estimated from the star formation surface densityand the observed Hα size, as in Erb et al. 2006a,b.g Stellar mass, estimated from SED fitting, from Erb et al. 2006ch Total baryonic mass, M∗ + Mgas.i Gas fraction, Mgas/Mbar, as in Erb et al. 2006a,c.
depending on the quantity being evaluated. The tests havebeen conducted against the absolute value of the quantities∆vIS and∆vLyα so that the sense of any correlations is posi-tive when the bulk velocity differences increase with the otherphysical characteristic. None of the quantities considered issignificantly correlated with∆vLyα or ∆vLyα −∆vIS at morethan the 95% (2σ) confidence level, although the measuredHα velocity dispersionσv may be marginally correlated, inthe sense that∆vLyα is larger for objects with largerσv.
The measured values of∆vIS, on the other hand, showgreater than 2σ deviations from the null hypothesis (no cor-relation) for the quantitiesσv, Mdyn, andMbar. While σv andMdyn are correlated with one another by virtue of the fact thatthe former is used to calculate the latter (see Erb et al. 2006c),the two mass estimatesMdyn and Mbar are measured usingcompletely independent methods. Erb et al. (2006c) showthat these mass estimates track each other very well, inspir-ing some confidence that both are providing reasonable esti-mates of the true masses within the Hα emitting regions of thegalaxies. Within the Hα sample considered here, the inferredvalue ofMbar ranges from≃ 1×10¹⁰ to ≃ 3×10¹¹ M⊙, andwas shown to trackMdyn much more tightly thanM∗, the stel-lar mass. Fig. 3 shows plots ofMdyn andMbar versus∆vLyαand∆vIS. The sense of the possible correlations of∆vIS withgalaxy mass is that∆vIS (the centroid velocity of the inter-stellar absorption lines) tends to be closer tov = 0 for objectswith higher mass. The more significant of the mass corre-lations, withMbar (significant at the 99% confidence level),appears to arise because none of the galaxies with baryonicmasses smaller than≃ 3×10¹⁰ M⊙ have measures of∆vIS
near zero, while at massesMbar > 3×10¹⁰ M⊙, a significantfraction do.
There are no significant correlations between|∆vIS| and pa-rameters related to star formation. The lack of correlationis interesting in light of recent studies relating outflow ve-locity to galaxy properties in local starbursts; for example,

The Circum-Galactic Medium atz= 2− 3 7
FIG. 3.— Plots showing the dependence of bulk outflow velocitieson dy-namical mass estimated from Hα line widths and observed sizes (top panels)and total baryonic mass (i.e., the sum of inferred stellar and cold gas masses)(bottom panels).
both Martin (2005) and Rupke et al. (2005) find evidence forcorrelations of outflow speed with SFR and dynamical mass(represented by the circular velocity), in the sense that theoutflow velocities increase with both quantities (i.e., appar-ently the opposite to what is observed in thez≃ 2 sample).These relatively local galaxy samples have a dynamic rangespanning∼ 4 orders of magnitude in SFR, and include dwarfstarbursts withvc ∼ 30 km s−1 and SFR< 1 M⊙ yr−1, i.e. amuch larger range than present in ourz∼ 2.3 sample. Theobserved correlations in the local sample flatten for galaxieswith SFR& 10–100 M⊙ yr−1 (Rupke et al. 2005), the approx-imate range of SFRs in our current sample. In other words,no trends are present in the low-redshift samples when onlygalaxies with parameters characteristic of ourz∼ 2 galaxiesare considered. Also, as we discuss below, other effects onthe kinematics measured from centroid velocities would likelymask the presence of a weak correlation if it were present.
At higher redshift, Weiner et al. (2009) also found that theinferred outflow velocity in composite spectra ofz ≃ 1.4star-forming galaxies is a slowly increasing function of SFR,vout ∝ SFR0.3. However, because their composite spectraare of relatively high spectral resolution, Weiner et al. (2009)measure∆vIS as the velocity at which the IS absorptionreaches 90% of the continuum value, i.e. close to themax-imumblue shifted velocity rather than the centroid. They de-compose the MgII IS line into a “symmetric” and “outflow-ing” component, and find that the strength of the symmetriccomponent is very steeply dependent on stellar mass– in fact,it is muchsteeperthan the variation of the outflowing compo-nent. As in our sample, the lowest-mass galaxies are consis-tent with havingzerosymmetric component (see their Fig 13and Table 1).
Clearly, the centroid velocity of strongly saturated IS ab-sorption lines is in many ways a blunt tool for characterizingthe velocity of outflowing gas. First, the lines may includea significant amount of interstellar gas at or near zero veloc-ity with respect to the galaxy systemic redshift, which wouldhave the effect of decreasing the measured value of|∆vIS|
even if outflow velocities were substantial. While Martin2005; Rupke et al. 2005 and Weiner et al. 2009 removed acomponent of interstellar absorption centered at zero veloc-ity before evaluating the velocity of outflowing material, it isgenerally not possible to do this for individual spectra in ourz≃ 2 sample because of more limited spectral resolution. Itis also not clear that subtracting a symmetricv = 0 componentof IS absorption is the best approach for evaluating the kine-matics of circumgalactic gas. It is possible, or perhaps evenlikely, that the IS line profiles would be sensitive to infallingmaterial, which when seen in absorption against the galaxy’sUV continuum would tend to be redshifted by up to a few hun-dred km s−1 with respect to a galaxy’s systemic redshift; if so,the observed redshifted wing of IS absorption could be sub-stantially stronger than the blue-shifted portion of thev ≃ 0profile. As we have mentioned (see also §8.4 below), gas withpositive (red-shifted) velocities with respect tozsys would beexpected in at least a fraction of galaxies if infalling coolgasis present with a non-negligible covering fraction.
FIG. 4.— Dependence of the Hα velocity dispersionσv on centroid veloci-ties∆vLyα and∆vIS measured from the far–UV spectra.
Finally, we address whether outflows influence the Hα linewidths used to calculate dynamical masses (Erb et al. 2006c).In Fig. 4 we show a comparison of∆vLyα and∆vIS withthe Hα velocity dispersionσv. As mentioned above, thereis a marginally significant (≃ 2σ) tendency for|∆vIS| to besmaller in galaxies with larger values ofσv. The correlationis likely to be related to the trends with galaxy mass we havealready noted. If strong outflows were significantly influenc-ing the observed Hα lines, one might expect objects with thelargest|∆vIS| also to have largerσv, a trend opposite to whatis observed. As further evidence of the disassociation of theobservable Hα emission and the winds, composite UV spectra(discussed in §4) constructed by combining individual spectrashifted to the nebular redshift show that Hα is at the same red-shift as the stars. Additionally, observations of local galaxiessuggest that Hα emission from outflowing material would fallfar below our detection threshold; for example, Lehnert et al.(1999) studied the extended Hα emission from the superwindin the starburst galaxy M82, finding that it has a total lumi-nosity of 2.4×1038 ergs s−1 and comprises only∼ 0.3% ofthe total Hα flux. Since the typical S/N of ourz∼ 2.3 Hαobservations is<∼ 10, it would be extremely difficult to rec-ognize a component of emission coming from wind material.Finally, Colina et al. (2005) have also found, through integralfield spectroscopy of Hα emission in local ULIRGs, that thecentral velocity dispersions are unaffected by outflows.
4. INFERENCES FROM COMPOSITE FAR-UV SPECTRA
4.1. The use of zHα to measure galaxy systemic redshifts
8 Steidel et al.
The existence of a large sample of galaxies for which bothrest-frame optical (Hα) and rest-frame far-UV spectra areavailable provides an opportunity to evaluate high S/N com-posite UV spectra formed from unusually precise knowledgeof the systemic redshifts of the galaxies. A stacked compos-ite UV spectrum was formed by shifting each spectrum intothe rest-frame usingzHα, scaling based on the flux density inthe range 1300− 1500 Å, re-sampling onto a common wave-length scale of 0.33 Å per pixel, and averaging at each disper-sion point, with outlier rejection. Thus, the composite is anunweighted average of all 89 galaxies having both Hα spectrafrom NIRSPEC and high quality UV spectra from LRIS-B;the result is shown in Fig. 5. A measurement of the cen-troids of weak stellar photospheric absorption features (SVλ1501.76, O IV λ1343.354, and CIII λ1171.76 were usedfor this purpose; see Shapley et al. 2003; Pettini et al. 2000)in the rest-frame composite spectrum verifies that the Hα red-shifts are very close to the systemic redshifts of the stars in thegalaxies, with a mean velocity ofv∗ = 13±24 km s−1 . Com-posites formed from various subsets of the data yield a simi-lar level of agreement: for example, a composite formed fromthe subset of 28 galaxies with significantly deeper LRIS-Bspectra (with total integration times ranging from 5-20 hourscompared to the typical 1.5 hours) hasv∗ = 2±36 km s−1 .
4.2. Velocity widths of IS lines and the maximum outflowvelocity
One of the quantities that can be evaluated with increasedconfidence using the new sample is the velocityextentof theinterstellar absorption lines and Lyα emission, in addition tothe centroid velocities discussed in the previous section.Ofparticular interest areηIS, the FWHM of the interstellar ab-sorption lines, andηLyα, the FWHM of the Lyα emissionline, corrected for the instrumental resolution. Unfortunately,as discussed above, the instrumental resolution is not alwaysknown precisely, because it depends on the seeing-convolvedsize of the galaxy compared to the 1′′.2 slits used for all of theLRIS-B spectroscopy. For objects illuminating the slit uni-formly, the spectral resolution is measured to be 450 km s−1
(FWHM) for the 400 line/mm grism used for almost all ofthe optical spectra of galaxies in the Hα sample; however, fortypical seeing of≃ 0.6− 0.8′′ , galaxies in our sample haveFWHM≃ 1.0′′ . Given this, we would expect that the actualspectral resolution is FWHM≃ 370 km s−1 (R= 800). We haveverified this for both the composite spectrum of all Hα galax-ies, and for a smaller subset of galaxies with very deep spec-troscopic integrations, by measuring the spatial size of eachobject in the slit direction. Assuming that the Hα redshiftuncertainties areσz ≃ 60 km s−1 and that individual spectrahaveσres≃ 160 km s−1 (i.e., FWHM/2.355), the estimatedin-trinsic FWHM of IS absorption features and Lyα emissionin the composite spectrum areηIS ≃ 540− 570 km s−1andηLyα ≃ 620− 650 km s−1 , respectively.
We have recently obtained LRIS-B spectra of galaxies se-lected in the same way as the Hα sample, but observed usingthe 600 line/mm grism instead of the 400 line/mm grism usedfor the vast majority of the Hα sample. These observationsprovide spectral resolution 1.68 times higher for the same slitwidth and object size. As a test of our ability to measure lineprofiles with marginally resolved data, we assembled a sam-ple of 102 spectra all obtained on the same observing run andwith consistent observing conditions (seeing of≃ 0.6− 0.7′′
FWHM evaluated at 4800 Å) in a field which remained veryclose to the zenith at the Keck Observatory, thus minimizingissues of differential atmospheric refraction. We appliedtherules given in equation 4 above to shift the spectra into therest frame, and produced a composite spectrum, shown in thebottom panel of Fig. 5, with an effective spectral resolutionof FWHM≃ 225 km s−1 (R≃ 1330). The stellar photosphericabsorption features in the stacked spectrum havev∗ = −2±10km s−1 , illustrating that the rules for estimating the systemicvelocity from the UV spectra work very well on average, andthat the higher resolution spectra are advantageous for pro-ducing more accurate wavelengths for weak (stellar and IS)features.
The line profiles of theR = 800 andR = 1330 compositespectra are remarkably similar, for both Lyα emission and thestrong interstellar absorption features, as shown in Fig. 6. Thespectra yield the same value ofηLyα andηIS after accountingfor the difference in spectral resolution. One is particularlyinterested in the asymmetry of the line profiles and the valueof the maximum blue-shifted velocityvmax, which we defineas the velocity at which the blue wing of the IS absorptionlines meets the continuum. We find thatvmax, although diffi-cult to measure for typical spectra of individual galaxies dueto limited S/N, is not strongly dependent on spectral resolu-tion; Figure 6 shows that|vmax| ≃ 700− 800 km s−1 for bothcomposite spectra. As discussed above, the CIV and (to alesser extent) SiIV doublets in galaxy spectra have contribu-tions from both the IS lines and from the P-Cygni stellar windlines from massive stars, and thus the IS component must beseparated from the stellar feature in the process of fitting thelocal continuum. An example of a continuum fit near the SiIVand CIV features is shown in Fig. 4.2. Fortunately, the PCygni feature is generally both broader and shallower thanthe IS components of these lines, so that while the continuumuncertainties are larger than for unblended features, theydonot prevent an accurate measurement in relatively high S/Ncomposite spectra.
The velocity profiles of some of the strongest spectral fea-tures in the stacked spectrum of the galaxies observed withR = 1330 are over-plotted in Fig. 8. Evidently,|vmax| ≃
700− 800 km s−1 is a generic feature of the spectra of theserapidly star-forming galaxies, in spite of the fact that theav-eragecentroid of the IS line profiles is more modest, with∆vIS ∼ −165 km s−1 from the previous section. The apparentvalues of|vmax| are relatively insensitive to spectral resolution.
The line profiles in the spectra of individual galaxies can, ofcourse, vary considerably. Fig. 9 shows the spectra of two in-dividual galaxies to illustrate the point: one is MS1512-cB58,thez= 2.729 lensed LBG whose spectrum has been analyzedin detail by Pettini et al. (2000, 2002); the other is Q0000-D6(Shapley et al. 2003), a bright LBG atz = 2.966 observed ata comparable spectral resolution of≃ 1500. These spectrashow clear differences in the details of the profiles and withthe apparent covering fraction of the continuum, particularlyfor the low-ionization species which differ in apparent opticaldepth by a factor of≃ 2. Clearly, Lyα emission is promi-nent in D6, but very weak in the spectrum of cB58 (see alsoQuider et al. 2009a). The spectrum of Q0000-D6 also has anunusual high ionization component that produces clear Lymanα absorption in the apparent blue wing of the Lyα emissionline, as well as in the high ions (but is less prominent in thelower ions) nearv= 0. Still, the velocity envelope for the blue-shifted material is remarkably consistent with that seen inthe
The Circum-Galactic Medium atz= 2− 3 9
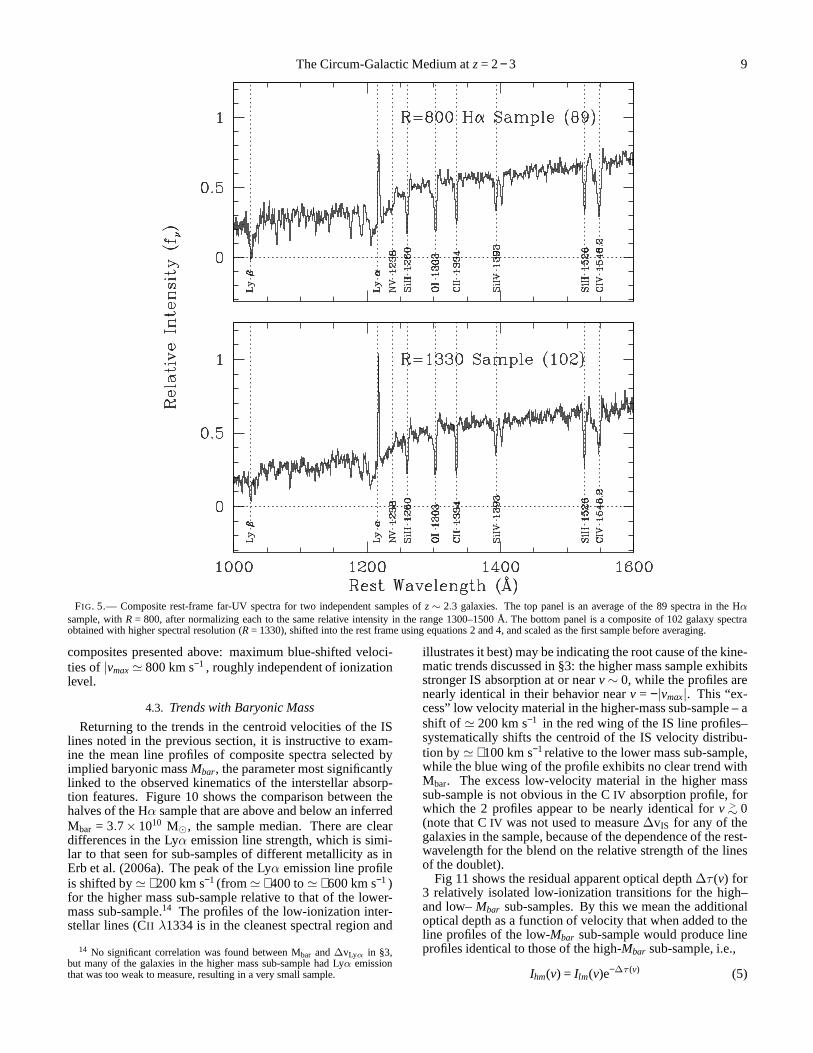
FIG. 5.— Composite rest-frame far-UV spectra for two independent samples ofz∼ 2.3 galaxies. The top panel is an average of the 89 spectra in theHα
sample, withR = 800, after normalizing each to the same relative intensityin the range 1300–1500 Å. The bottom panel is a composite of 102 galaxy spectraobtained with higher spectral resolution (R= 1330), shifted into the rest frame using equations 2 and 4, and scaled as the first sample before averaging.
composites presented above: maximum blue-shifted veloci-ties of|vmax≃ 800 km s−1 , roughly independent of ionizationlevel.
4.3. Trends with Baryonic Mass
Returning to the trends in the centroid velocities of the ISlines noted in the previous section, it is instructive to exam-ine the mean line profiles of composite spectra selected byimplied baryonic massMbar, the parameter most significantlylinked to the observed kinematics of the interstellar absorp-tion features. Figure 10 shows the comparison between thehalves of the Hα sample that are above and below an inferredMbar = 3.7× 10¹⁰ M⊙, the sample median. There are cleardifferences in the Lyα emission line strength, which is simi-lar to that seen for sub-samples of different metallicity asinErb et al. (2006a). The peak of the Lyα emission line profileis shifted by≃ +200 km s−1 (from≃ +400 to≃ +600 km s−1 )for the higher mass sub-sample relative to that of the lower-mass sub-sample.14 The profiles of the low-ionization inter-stellar lines (CII λ1334 is in the cleanest spectral region and
14 No significant correlation was found between Mbar and∆vLyα in §3,but many of the galaxies in the higher mass sub-sample had Lyα emissionthat was too weak to measure, resulting in a very small sample.
illustrates it best) may be indicating the root cause of the kine-matic trends discussed in §3: the higher mass sample exhibitsstronger IS absorption at or nearv∼ 0, while the profiles arenearly identical in their behavior nearv = −|vmax|. This “ex-cess” low velocity material in the higher-mass sub-sample –ashift of ≃ 200 km s−1 in the red wing of the IS line profiles–systematically shifts the centroid of the IS velocity distribu-tion by≃ +100 km s−1 relative to the lower mass sub-sample,while the blue wing of the profile exhibits no clear trend withMbar. The excess low-velocity material in the higher masssub-sample is not obvious in the CIV absorption profile, forwhich the 2 profiles appear to be nearly identical forv >
∼ 0(note that CIV was not used to measure∆vIS for any of thegalaxies in the sample, because of the dependence of the rest-wavelength for the blend on the relative strength of the linesof the doublet).
Fig 11 shows the residual apparent optical depth∆τ (v) for3 relatively isolated low-ionization transitions for the high–and low–Mbar sub-samples. By this we mean the additionaloptical depth as a function of velocity that when added to theline profiles of the low-Mbar sub-sample would produce lineprofiles identical to those of the high-Mbar sub-sample, i.e.,
Ihm(v) = Ilm(v)e−∆τ (v) (5)

10 Steidel et al.
FIG. 6.— A comparison of the Lyα and IS line profiles for the full Hαsample (red) and the composite of 102 identically-selectedobjects observedwith higher spectral resolution (blue), where the latter have been shifted intothe rest frame using the rules defined in §2. For blended features such asO I λ1302/SiII λ1304 and CIV λλ1548, 1550, a separate panel is given foreach; in both cases, one should look at the longer of the two components forthe profile nearv ∼ 0 and the shorter one to gauge the extent of the mostblue-shifted velocities. Note the very similar velocity profiles for the twoindependent samples, for both the minimum and maximum velocities.
FIG. 7.— A portion of the composite spectrum shown in the lower panel ofFig. 5 in the vicinity of the SiIV and CIV doublets. The dashed red curve isan example continuum fit used to normalize the spectrum for measuring thestrength of the IS component of these lines. Note that the continuum has beenadjusted to remove the broad absorption due to the stellar wind componentof C IV ; a similar adjustment was made to remove the stellar component ofSi IV , though it is much weaker than the CIV feature. The weak emission linewithin the broad CIV wind absorption feature is nebular SiII* λ1533, one ofseveral weak excited fine structure emission lines observedin the spectra ofz≃ 2− 3 galaxies (Shapley et al. 2003). The weak absorption line near 1501Å is photospheric SV.
whereIhm and Ilm are the spectral intensity of the high-Mbarand low-Mbar sub-samples, respectively. The spectrum∆τ (v)
FIG. 8.— The velocity profiles of strong IS lines and Lyα emission featuresrelative to systemic for the composite UV spectrum of theR = 1330 sam-ple. The CIV profile is a solid blue histogram for theλ1548 component anddashed forλ1550.
FIG. 9.— As for Fig. 6, comparing the spectra of two individual objectshaving particularly high quality UV spectra as well as accurate systemic red-shifts from stellar absorption features. The spectrum of MS1512-cB58 (theR≃ 1600 spectrum from Pettini et al. 2000) is in red, while the spectrumof Q0000-D6, obtained withR≃ 1300, is in blue. Despite significant dif-ferences in spectral “morphology” (e.g., D6 has strong Lyα line emission,while cB58 has strong absorption, and the ratio of the strengths of high ion-ization lines to low-ionization lines is quite different),therangeof velocitiesspanned by the outflows are quite similar in both cases, with the maximumvelocities ofv≃ 800 km s−1 . Note that the SiIIλ1526 line of D6 is affectedby absorption from another system in the blue wing of the profile. Both ofthese galaxies would be in the Mbar< 3.7×10¹⁰ M⊙ (i.e, lower baryonicmass) sub-sample.
has a peak atv≃ 0, a centroid atv= +154 km s−1 , and a veloc-ity width of σv ≃ 120 km s−1 after correcting for the effectiveinstrumental resolution. The excess apparent optical depth∆τ in these transitions accounts for≃ 25% of the equivalent
The Circum-Galactic Medium atz= 2− 3 11
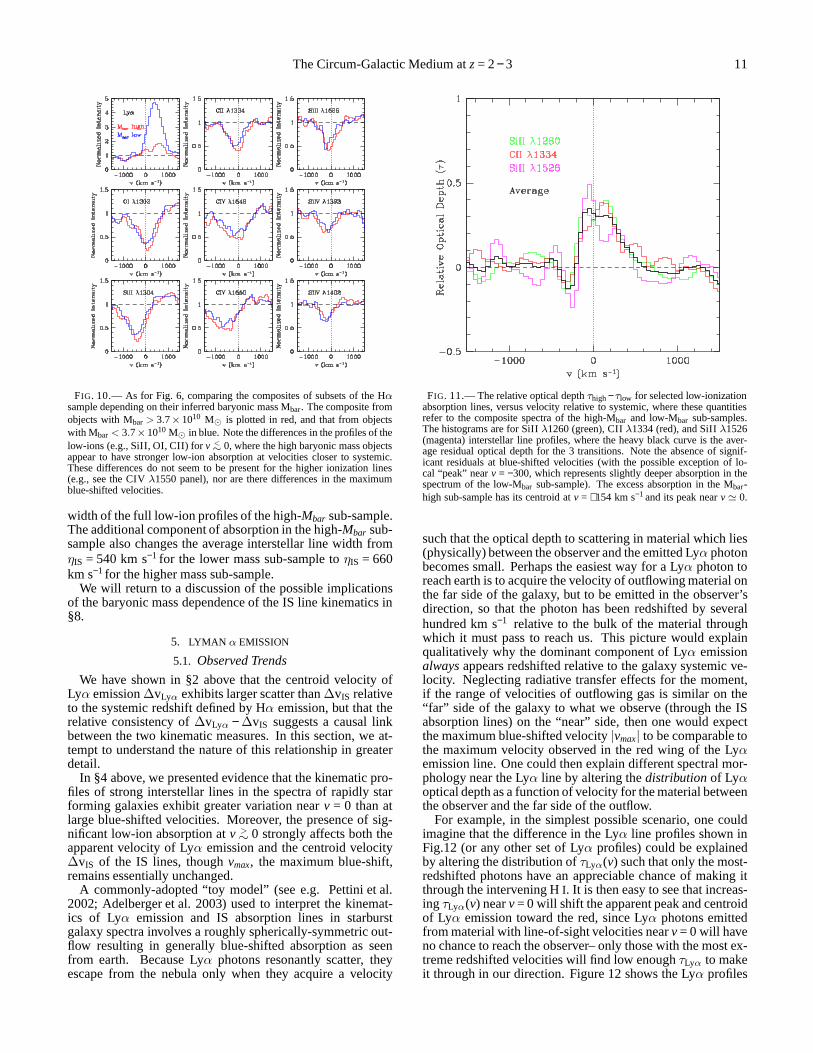
FIG. 10.— As for Fig. 6, comparing the composites of subsets of the Hαsample depending on their inferred baryonic mass Mbar. The composite fromobjects with Mbar> 3.7×10¹⁰ M⊙ is plotted in red, and that from objectswith Mbar< 3.7×10¹⁰ M⊙ in blue. Note the differences in the profiles of thelow-ions (e.g., SiII, OI, CII) forv <
∼ 0, where the high baryonic mass objectsappear to have stronger low-ion absorption at velocities closer to systemic.These differences do not seem to be present for the higher ionization lines(e.g., see the CIVλ1550 panel), nor are there differences in the maximumblue-shifted velocities.
width of the full low-ion profiles of the high-Mbar sub-sample.The additional component of absorption in the high-Mbar sub-sample also changes the average interstellar line width fromηIS = 540 km s−1 for the lower mass sub-sample toηIS = 660km s−1 for the higher mass sub-sample.
We will return to a discussion of the possible implicationsof the baryonic mass dependence of the IS line kinematics in§8.
5. LYMAN α EMISSION
5.1. Observed Trends
We have shown in §2 above that the centroid velocity ofLyα emission∆vLyα exhibits larger scatter than∆vIS relativeto the systemic redshift defined by Hα emission, but that therelative consistency of∆vLyα −∆vIS suggests a causal linkbetween the two kinematic measures. In this section, we at-tempt to understand the nature of this relationship in greaterdetail.
In §4 above, we presented evidence that the kinematic pro-files of strong interstellar lines in the spectra of rapidly starforming galaxies exhibit greater variation nearv = 0 than atlarge blue-shifted velocities. Moreover, the presence of sig-nificant low-ion absorption atv >
∼ 0 strongly affects both theapparent velocity of Lyα emission and the centroid velocity∆vIS of the IS lines, thoughvmax, the maximum blue-shift,remains essentially unchanged.
A commonly-adopted “toy model” (see e.g. Pettini et al.2002; Adelberger et al. 2003) used to interpret the kinemat-ics of Lyα emission and IS absorption lines in starburstgalaxy spectra involves a roughly spherically-symmetric out-flow resulting in generally blue-shifted absorption as seenfrom earth. Because Lyα photons resonantly scatter, theyescape from the nebula only when they acquire a velocity
FIG. 11.— The relative optical depthτhigh−τlow for selected low-ionizationabsorption lines, versus velocity relative to systemic, where these quantitiesrefer to the composite spectra of the high-Mbar and low-Mbar sub-samples.The histograms are for SiIIλ1260 (green), CIIλ1334 (red), and SiIIλ1526(magenta) interstellar line profiles, where the heavy blackcurve is the aver-age residual optical depth for the 3 transitions. Note the absence of signif-icant residuals at blue-shifted velocities (with the possible exception of lo-cal “peak” nearv = −300, which represents slightly deeper absorption in thespectrum of the low-Mbar sub-sample). The excess absorption in the Mbar-high sub-sample has its centroid atv = +154 km s−1 and its peak nearv≃ 0.
such that the optical depth to scattering in material which lies(physically) between the observer and the emitted Lyα photonbecomes small. Perhaps the easiest way for a Lyα photon toreach earth is to acquire the velocity of outflowing materialonthe far side of the galaxy, but to be emitted in the observer’sdirection, so that the photon has been redshifted by severalhundred km s−1 relative to the bulk of the material throughwhich it must pass to reach us. This picture would explainqualitatively why the dominant component of Lyα emissionalwaysappears redshifted relative to the galaxy systemic ve-locity. Neglecting radiative transfer effects for the moment,if the range of velocities of outflowing gas is similar on the“far” side of the galaxy to what we observe (through the ISabsorption lines) on the “near” side, then one would expectthe maximum blue-shifted velocity|vmax| to be comparable tothe maximum velocity observed in the red wing of the Lyαemission line. One could then explain different spectral mor-phology near the Lyα line by altering thedistributionof Lyαoptical depth as a function of velocity for the material betweenthe observer and the far side of the outflow.
For example, in the simplest possible scenario, one couldimagine that the difference in the Lyα line profiles shown inFig.12 (or any other set of Lyα profiles) could be explainedby altering the distribution ofτLyα(v) such that only the most-redshifted photons have an appreciable chance of making itthrough the intervening HI. It is then easy to see that increas-ing τLyα(v) nearv= 0 will shift the apparent peak and centroidof Lyα emission toward the red, since Lyα photons emittedfrom material with line-of-sight velocities nearv= 0 will haveno chance to reach the observer– only those with the most ex-treme redshifted velocities will find low enoughτLyα to makeit through in our direction. Figure 12 shows the Lyα profiles
12 Steidel et al.
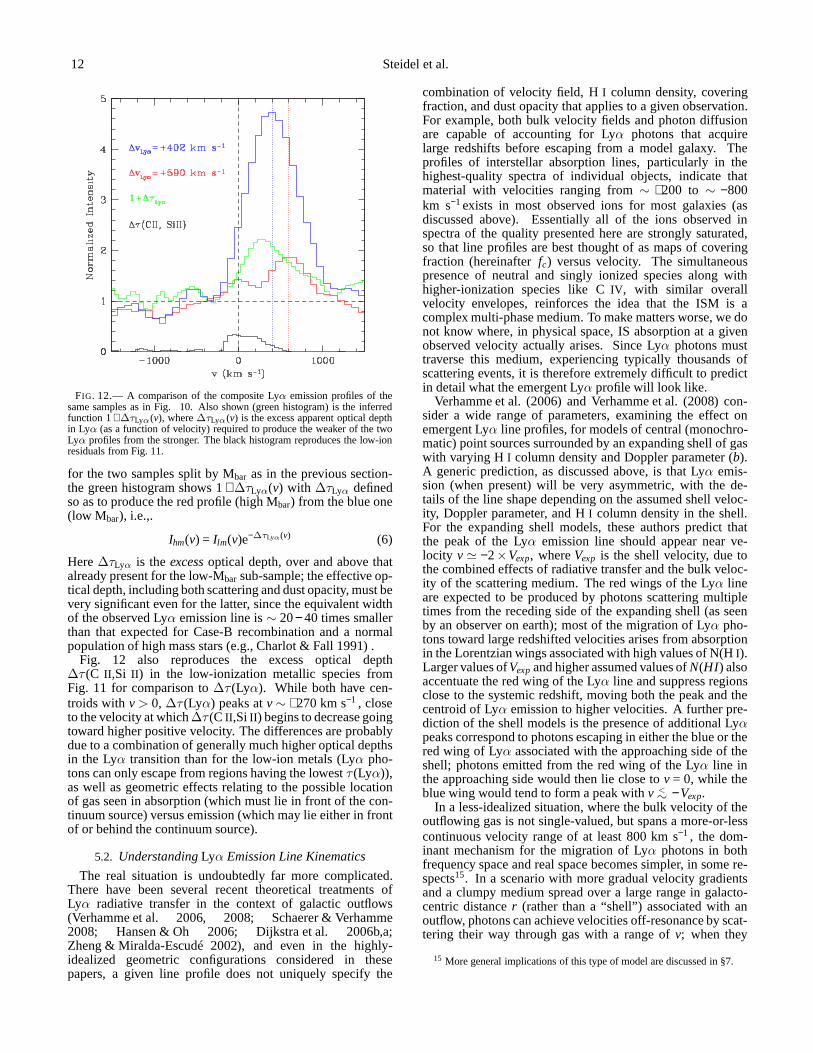
FIG. 12.— A comparison of the composite Lyα emission profiles of thesame samples as in Fig. 10. Also shown (green histogram) is the inferredfunction 1+∆τLyα(v), where∆τLyα(v) is the excess apparent optical depthin Lyα (as a function of velocity) required to produce the weaker ofthe twoLyα profiles from the stronger. The black histogram reproduces the low-ionresiduals from Fig. 11.
for the two samples split by Mbar as in the previous section-the green histogram shows 1+∆τLyα(v) with ∆τLyα definedso as to produce the red profile (high Mbar) from the blue one(low Mbar), i.e.,.
Ihm(v) = Ilm(v)e−∆τLyα(v) (6)
Here∆τLyα is theexcessoptical depth, over and above thatalready present for the low-Mbar sub-sample; the effective op-tical depth, including both scattering and dust opacity, must bevery significant even for the latter, since the equivalent widthof the observed Lyα emission line is∼ 20− 40 times smallerthan that expected for Case-B recombination and a normalpopulation of high mass stars (e.g., Charlot & Fall 1991) .
Fig. 12 also reproduces the excess optical depth∆τ (C II ,Si II ) in the low-ionization metallic species fromFig. 11 for comparison to∆τ (Lyα). While both have cen-troids withv> 0, ∆τ (Lyα) peaks atv∼ +270 km s−1 , closeto the velocity at which∆τ (C II ,Si II ) begins to decrease goingtoward higher positive velocity. The differences are probablydue to a combination of generally much higher optical depthsin the Lyα transition than for the low-ion metals (Lyα pho-tons can only escape from regions having the lowestτ (Lyα)),as well as geometric effects relating to the possible locationof gas seen in absorption (which must lie in front of the con-tinuum source) versus emission (which may lie either in frontof or behind the continuum source).
5.2. UnderstandingLyα Emission Line Kinematics
The real situation is undoubtedly far more complicated.There have been several recent theoretical treatments ofLyα radiative transfer in the context of galactic outflows(Verhamme et al. 2006, 2008; Schaerer & Verhamme2008; Hansen & Oh 2006; Dijkstra et al. 2006b,a;Zheng & Miralda-Escudé 2002), and even in the highly-idealized geometric configurations considered in thesepapers, a given line profile does not uniquely specify the
combination of velocity field, HI column density, coveringfraction, and dust opacity that applies to a given observation.For example, both bulk velocity fields and photon diffusionare capable of accounting for Lyα photons that acquirelarge redshifts before escaping from a model galaxy. Theprofiles of interstellar absorption lines, particularly inthehighest-quality spectra of individual objects, indicate thatmaterial with velocities ranging from∼ +200 to ∼ −800km s−1 exists in most observed ions for most galaxies (asdiscussed above). Essentially all of the ions observed inspectra of the quality presented here are strongly saturated,so that line profiles are best thought of as maps of coveringfraction (hereinafterfc) versus velocity. The simultaneouspresence of neutral and singly ionized species along withhigher-ionization species like CIV , with similar overallvelocity envelopes, reinforces the idea that the ISM is acomplex multi-phase medium. To make matters worse, we donot know where, in physical space, IS absorption at a givenobserved velocity actually arises. Since Lyα photons musttraverse this medium, experiencing typically thousands ofscattering events, it is therefore extremely difficult to predictin detail what the emergent Lyα profile will look like.
Verhamme et al. (2006) and Verhamme et al. (2008) con-sider a wide range of parameters, examining the effect onemergent Lyα line profiles, for models of central (monochro-matic) point sources surrounded by an expanding shell of gaswith varying H I column density and Doppler parameter (b).A generic prediction, as discussed above, is that Lyα emis-sion (when present) will be very asymmetric, with the de-tails of the line shape depending on the assumed shell veloc-ity, Doppler parameter, and HI column density in the shell.For the expanding shell models, these authors predict thatthe peak of the Lyα emission line should appear near ve-locity v ≃ −2×Vexp, whereVexp is the shell velocity, due tothe combined effects of radiative transfer and the bulk veloc-ity of the scattering medium. The red wings of the Lyα lineare expected to be produced by photons scattering multipletimes from the receding side of the expanding shell (as seenby an observer on earth); most of the migration of Lyα pho-tons toward large redshifted velocities arises from absorptionin the Lorentzian wings associated with high values of N(HI).Larger values ofVexpand higher assumed values ofN(HI ) alsoaccentuate the red wing of the Lyα line and suppress regionsclose to the systemic redshift, moving both the peak and thecentroid of Lyα emission to higher velocities. A further pre-diction of the shell models is the presence of additional Lyαpeaks correspond to photons escaping in either the blue or thered wing of Lyα associated with the approaching side of theshell; photons emitted from the red wing of the Lyα line inthe approaching side would then lie close tov = 0, while theblue wing would tend to form a peak withv <
∼ −Vexp.In a less-idealized situation, where the bulk velocity of the
outflowing gas is not single-valued, but spans a more-or-lesscontinuous velocity range of at least 800 km s−1 , the dom-inant mechanism for the migration of Lyα photons in bothfrequency space and real space becomes simpler, in some re-spects15. In a scenario with more gradual velocity gradientsand a clumpy medium spread over a large range in galacto-centric distancer (rather than a “shell”) associated with anoutflow, photons can achieve velocities off-resonance by scat-tering their way through gas with a range ofv; when they
15 More general implications of this type of model are discussed in §7.
The Circum-Galactic Medium atz= 2− 3 13
escape the nebula and are observed as red-shifted Lyα pho-tons by the observer, they would generally exhibit Dopplershifts that directly reflect the velocity with respect to systemicof the gas from which they were last scattered. Since themedium is clumpy, the column density N(HI) for individual“clumps” becomes less relevant than their velocity distribu-tion and covering fraction , since most Lyα photons will scat-ter off the “surfaces” of clumps, rarely encountering regionswhere absorption or emission in the broad wings of a line isimportant (see Neufeld (1991) for a discussion of this typesituation). Note that the clumpy geometry is qualitativelydif-ferent from, e.g., the “Hubble expansion” model consideredby Verhamme et al. (2006), which hasv increasing smoothlywith r. In this case, the radiative transfer is still importantbecause the scattering medium is continuous and has associ-ated with it a particular N(HI) through which all Lyα photonsmust pass on their way to largerr. The picture we are advo-cating has photons scattering from theτ (Lyα) ∼ 1 surfacesof discrete clumps; this causes most Lyα photons to emergefrom scattering events near line center, and thus to acquirea Doppler shift characteristic of the velocity (with respect tosystemic) of the most recent clump. In other words, bulk-motion induced velocity shifts, rather than radiative transfereffects, may be most responsible for the kinematics of the ob-served Lyα emission line.
In this context, the IS absorption lines provide a reasonableproxy for the velocity distribution of gas that will comprisethe medium through which the Lyα photons must scatter inorder to escape in the observer’s direction.16. If the flows areroughly spherically symmetric, it should be possible to seekconsistency between the kinematics of Lyα emission (whichwould probe the kinematics of gas on the receding side of theflow) and that of the IS absorption, which samples the blue-shifted, or approaching, side. The Lyα photons will be mostsuccessful in escaping the galaxy when they acquire velocityshifts well off resonance of whatever material lies betweenthelast scattering surface and the observer. This effect wouldtendto produce emission from both the redshifted and blue-shiftedgas.
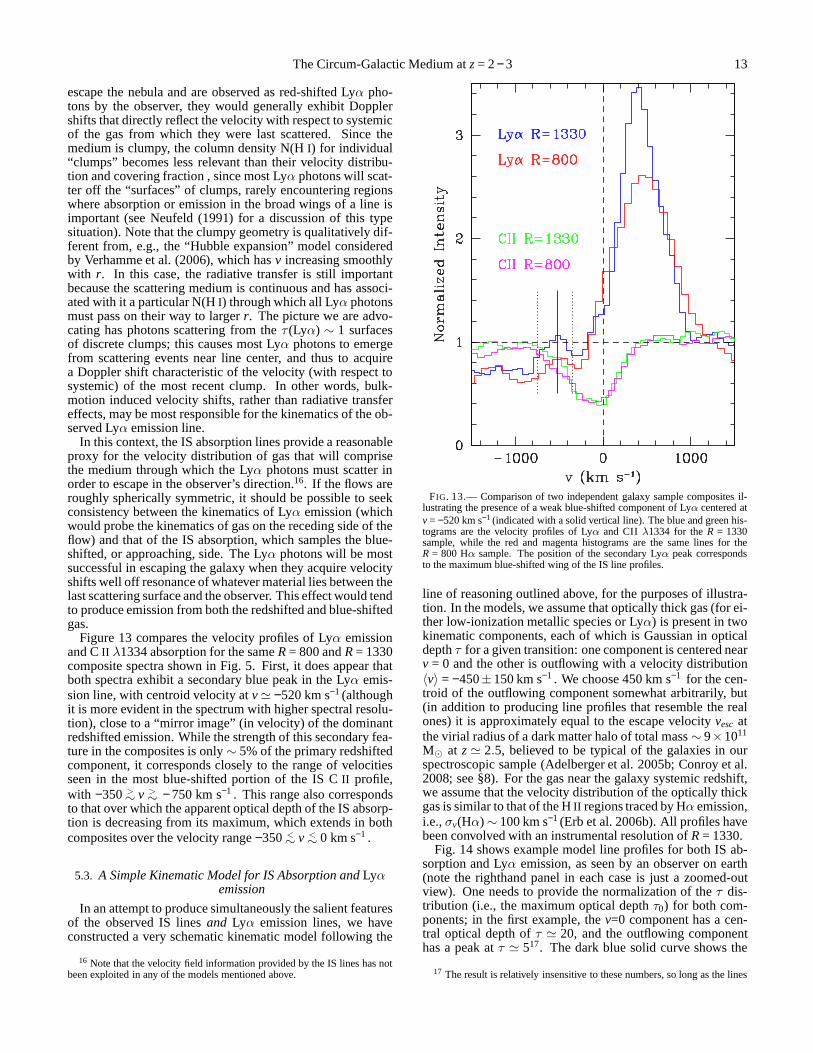
Figure 13 compares the velocity profiles of Lyα emissionand CII λ1334 absorption for the sameR= 800 andR= 1330composite spectra shown in Fig. 5. First, it does appear thatboth spectra exhibit a secondary blue peak in the Lyα emis-sion line, with centroid velocity atv≃ −520 km s−1 (althoughit is more evident in the spectrum with higher spectral resolu-tion), close to a “mirror image” (in velocity) of the dominantredshifted emission. While the strength of this secondary fea-ture in the composites is only∼ 5% of the primary redshiftedcomponent, it corresponds closely to the range of velocitiesseen in the most blue-shifted portion of the IS CII profile,with −350>
∼ v >∼ − 750 km s−1 . This range also corresponds
to that over which the apparent optical depth of the IS absorp-tion is decreasing from its maximum, which extends in bothcomposites over the velocity range−350 <
∼ v <∼ 0 km s−1 .
5.3. A Simple Kinematic Model for IS Absorption andLyαemission
In an attempt to produce simultaneously the salient featuresof the observed IS linesand Lyα emission lines, we haveconstructed a very schematic kinematic model following the
16 Note that the velocity field information provided by the IS lines has notbeen exploited in any of the models mentioned above.
FIG. 13.— Comparison of two independent galaxy sample composites il-lustrating the presence of a weak blue-shifted component ofLyα centered atv = −520 km s−1 (indicated with a solid vertical line). The blue and green his-tograms are the velocity profiles of Lyα and CII λ1334 for theR = 1330sample, while the red and magenta histograms are the same lines for theR = 800 Hα sample. The position of the secondary Lyα peak correspondsto the maximum blue-shifted wing of the IS line profiles.
line of reasoning outlined above, for the purposes of illustra-tion. In the models, we assume that optically thick gas (for ei-ther low-ionization metallic species or Lyα) is present in twokinematic components, each of which is Gaussian in opticaldepthτ for a given transition: one component is centered nearv = 0 and the other is outflowing with a velocity distribution〈v〉 = −450±150 km s−1 . We choose 450 km s−1 for the cen-troid of the outflowing component somewhat arbitrarily, but(in addition to producing line profiles that resemble the realones) it is approximately equal to the escape velocityvesc atthe virial radius of a dark matter halo of total mass∼ 9×10¹¹
M⊙ at z≃ 2.5, believed to be typical of the galaxies in ourspectroscopic sample (Adelberger et al. 2005b; Conroy et al.2008; see §8). For the gas near the galaxy systemic redshift,we assume that the velocity distribution of the optically thickgas is similar to that of the HII regions traced by Hα emission,i.e.,σv(Hα) ∼ 100 km s−1 (Erb et al. 2006b). All profiles havebeen convolved with an instrumental resolution ofR= 1330.
Fig. 14 shows example model line profiles for both IS ab-sorption and Lyα emission, as seen by an observer on earth(note the righthand panel in each case is just a zoomed-outview). One needs to provide the normalization of theτ dis-tribution (i.e., the maximum optical depthτ0) for both com-ponents; in the first example, thev=0 component has a cen-tral optical depth ofτ ≃ 20, and the outflowing componenthas a peak atτ ≃ 517. The dark blue solid curve shows the
17 The result is relatively insensitive to these numbers, so long as the lines
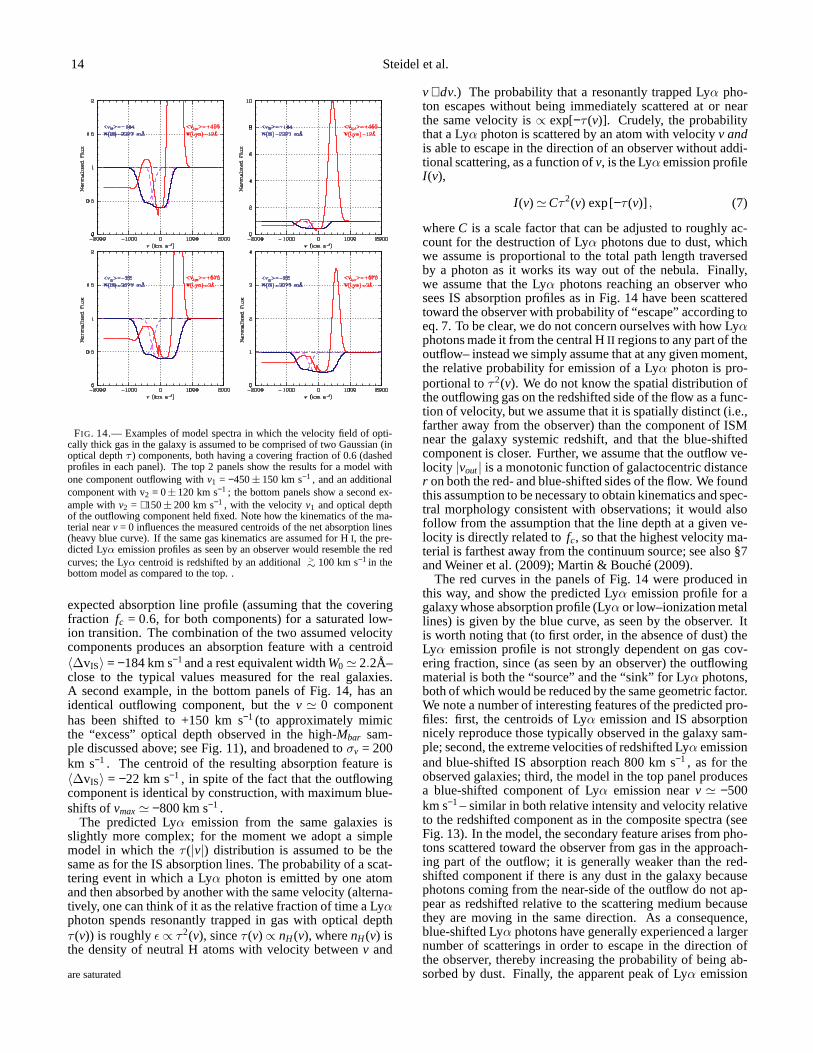
14 Steidel et al.
FIG. 14.— Examples of model spectra in which the velocity field ofopti-cally thick gas in the galaxy is assumed to be comprised of twoGaussian (inoptical depthτ ) components, both having a covering fraction of 0.6 (dashedprofiles in each panel). The top 2 panels show the results for amodel withone component outflowing withv1 = −450± 150 km s−1 , and an additionalcomponent with v2 = 0±120 km s−1 ; the bottom panels show a second ex-ample withv2 = +150± 200 km s−1 , with the velocityv1 and optical depthof the outflowing component held fixed. Note how the kinematics of the ma-terial nearv = 0 influences the measured centroids of the net absorption lines(heavy blue curve). If the same gas kinematics are assumed for H I, the pre-dicted Lyα emission profiles as seen by an observer would resemble the redcurves; the Lyα centroid is redshifted by an additional>∼ 100 km s−1 in thebottom model as compared to the top. .
expected absorption line profile (assuming that the coveringfraction fc = 0.6, for both components) for a saturated low-ion transition. The combination of the two assumed velocitycomponents produces an absorption feature with a centroid〈∆vIS〉 = −184 km s−1 and a rest equivalent widthW0 ≃ 2.2Å–close to the typical values measured for the real galaxies.A second example, in the bottom panels of Fig. 14, has anidentical outflowing component, but thev ≃ 0 componenthas been shifted to +150 km s−1 (to approximately mimicthe “excess” optical depth observed in the high-Mbar sam-ple discussed above; see Fig. 11), and broadened toσv = 200km s−1 . The centroid of the resulting absorption feature is〈∆vIS〉 = −22 km s−1 , in spite of the fact that the outflowingcomponent is identical by construction, with maximum blue-shifts ofvmax≃ −800 km s−1 .
The predicted Lyα emission from the same galaxies isslightly more complex; for the moment we adopt a simplemodel in which theτ (|v|) distribution is assumed to be thesame as for the IS absorption lines. The probability of a scat-tering event in which a Lyα photon is emitted by one atomand then absorbed by another with the same velocity (alterna-tively, one can think of it as the relative fraction of time a Lyαphoton spends resonantly trapped in gas with optical depthτ (v)) is roughlyǫ ∝ τ2(v), sinceτ (v) ∝ nH(v), wherenH(v) isthe density of neutral H atoms with velocity betweenv and
are saturated
v+ dv.) The probability that a resonantly trapped Lyα pho-ton escapes without being immediately scattered at or nearthe same velocity is∝ exp[−τ (v)]. Crudely, the probabilitythat a Lyα photon is scattered by an atom with velocityv andis able to escape in the direction of an observer without addi-tional scattering, as a function ofv, is the Lyα emission profileI (v),
I (v) ≃Cτ2(v) exp[−τ (v)] , (7)
whereC is a scale factor that can be adjusted to roughly ac-count for the destruction of Lyα photons due to dust, whichwe assume is proportional to the total path length traversedby a photon as it works its way out of the nebula. Finally,we assume that the Lyα photons reaching an observer whosees IS absorption profiles as in Fig. 14 have been scatteredtoward the observer with probability of “escape” accordingtoeq. 7. To be clear, we do not concern ourselves with how Lyαphotons made it from the central HII regions to any part of theoutflow– instead we simply assume that at any given moment,the relative probability for emission of a Lyα photon is pro-portional toτ2(v). We do not know the spatial distribution ofthe outflowing gas on the redshifted side of the flow as a func-tion of velocity, but we assume that it is spatially distinct(i.e.,farther away from the observer) than the component of ISMnear the galaxy systemic redshift, and that the blue-shiftedcomponent is closer. Further, we assume that the outflow ve-locity |vout| is a monotonic function of galactocentric distancer on both the red- and blue-shifted sides of the flow. We foundthis assumption to be necessary to obtain kinematics and spec-tral morphology consistent with observations; it would alsofollow from the assumption that the line depth at a given ve-locity is directly related tofc, so that the highest velocity ma-terial is farthest away from the continuum source; see also §7and Weiner et al. (2009); Martin & Bouché (2009).
The red curves in the panels of Fig. 14 were produced inthis way, and show the predicted Lyα emission profile for agalaxy whose absorption profile (Lyα or low–ionization metallines) is given by the blue curve, as seen by the observer. Itis worth noting that (to first order, in the absence of dust) theLyα emission profile is not strongly dependent on gas cov-ering fraction, since (as seen by an observer) the outflowingmaterial is both the “source” and the “sink” for Lyα photons,both of which would be reduced by the same geometric factor.We note a number of interesting features of the predicted pro-files: first, the centroids of Lyα emission and IS absorptionnicely reproduce those typically observed in the galaxy sam-ple; second, the extreme velocities of redshifted Lyα emissionand blue-shifted IS absorption reach 800 km s−1 , as for theobserved galaxies; third, the model in the top panel producesa blue-shifted component of Lyα emission nearv ≃ −500km s−1 – similar in both relative intensity and velocity relativeto the redshifted component as in the composite spectra (seeFig. 13). In the model, the secondary feature arises from pho-tons scattered toward the observer from gas in the approach-ing part of the outflow; it is generally weaker than the red-shifted component if there is any dust in the galaxy becausephotons coming from the near-side of the outflow do not ap-pear as redshifted relative to the scattering medium becausethey are moving in the same direction. As a consequence,blue-shifted Lyα photons have generally experienced a largernumber of scatterings in order to escape in the direction ofthe observer, thereby increasing the probability of being ab-sorbed by dust. Finally, the apparent peak of Lyα emission
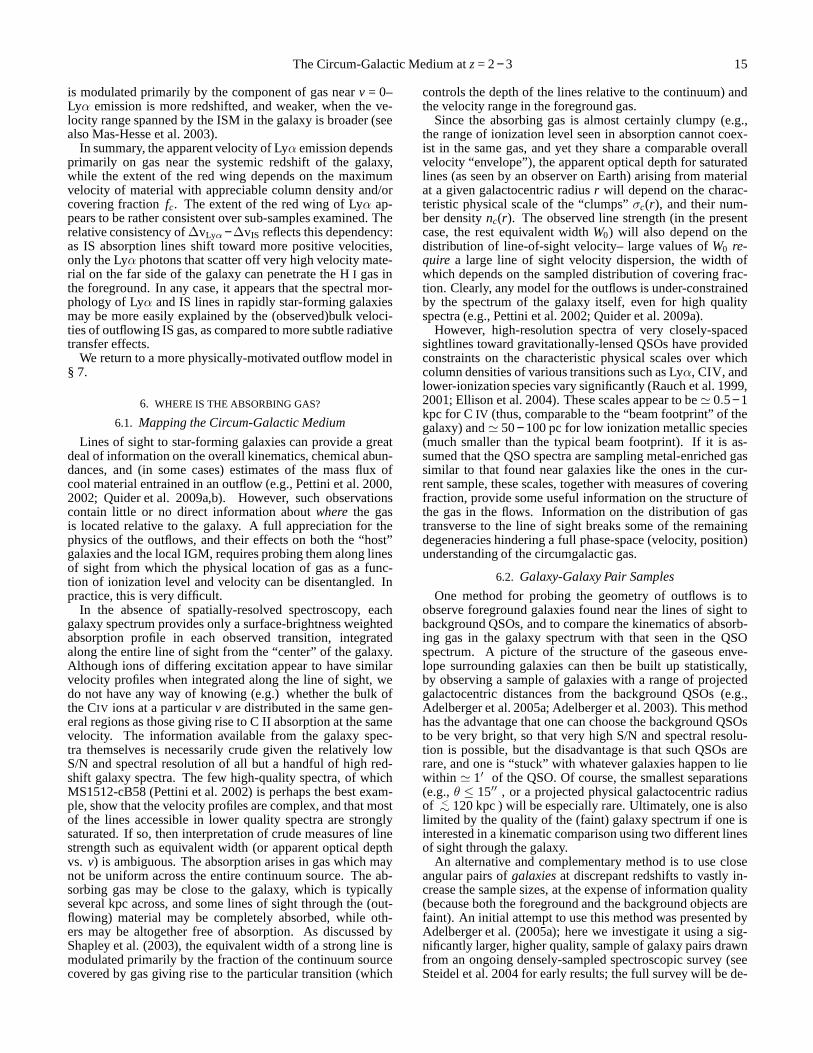
The Circum-Galactic Medium atz= 2− 3 15
is modulated primarily by the component of gas nearv = 0–Lyα emission is more redshifted, and weaker, when the ve-locity range spanned by the ISM in the galaxy is broader (seealso Mas-Hesse et al. 2003).
In summary, the apparent velocity of Lyα emission dependsprimarily on gas near the systemic redshift of the galaxy,while the extent of the red wing depends on the maximumvelocity of material with appreciable column density and/orcovering fractionfc. The extent of the red wing of Lyα ap-pears to be rather consistent over sub-samples examined. Therelative consistency of∆vLyα−∆vIS reflects this dependency:as IS absorption lines shift toward more positive velocities,only the Lyα photons that scatter off very high velocity mate-rial on the far side of the galaxy can penetrate the HI gas inthe foreground. In any case, it appears that the spectral mor-phology of Lyα and IS lines in rapidly star-forming galaxiesmay be more easily explained by the (observed)bulk veloci-ties of outflowing IS gas, as compared to more subtle radiativetransfer effects.
We return to a more physically-motivated outflow model in§ 7.
6. WHERE IS THE ABSORBING GAS?
6.1. Mapping the Circum-Galactic Medium
Lines of sight to star-forming galaxies can provide a greatdeal of information on the overall kinematics, chemical abun-dances, and (in some cases) estimates of the mass flux ofcool material entrained in an outflow (e.g., Pettini et al. 2000,2002; Quider et al. 2009a,b). However, such observationscontain little or no direct information aboutwhere the gasis located relative to the galaxy. A full appreciation for thephysics of the outflows, and their effects on both the “host”galaxies and the local IGM, requires probing them along linesof sight from which the physical location of gas as a func-tion of ionization level and velocity can be disentangled. Inpractice, this is very difficult.
In the absence of spatially-resolved spectroscopy, eachgalaxy spectrum provides only a surface-brightness weightedabsorption profile in each observed transition, integratedalong the entire line of sight from the “center” of the galaxy.Although ions of differing excitation appear to have similarvelocity profiles when integrated along the line of sight, wedo not have any way of knowing (e.g.) whether the bulk ofthe CIV ions at a particularv are distributed in the same gen-eral regions as those giving rise to C II absorption at the samevelocity. The information available from the galaxy spec-tra themselves is necessarily crude given the relatively lowS/N and spectral resolution of all but a handful of high red-shift galaxy spectra. The few high-quality spectra, of whichMS1512-cB58 (Pettini et al. 2002) is perhaps the best exam-ple, show that the velocity profiles are complex, and that mostof the lines accessible in lower quality spectra are stronglysaturated. If so, then interpretation of crude measures of linestrength such as equivalent width (or apparent optical depthvs. v) is ambiguous. The absorption arises in gas which maynot be uniform across the entire continuum source. The ab-sorbing gas may be close to the galaxy, which is typicallyseveral kpc across, and some lines of sight through the (out-flowing) material may be completely absorbed, while oth-ers may be altogether free of absorption. As discussed byShapley et al. (2003), the equivalent width of a strong line ismodulated primarily by the fraction of the continuum sourcecovered by gas giving rise to the particular transition (which
controls the depth of the lines relative to the continuum) andthe velocity range in the foreground gas.
Since the absorbing gas is almost certainly clumpy (e.g.,the range of ionization level seen in absorption cannot coex-ist in the same gas, and yet they share a comparable overallvelocity “envelope”), the apparent optical depth for saturatedlines (as seen by an observer on Earth) arising from materialat a given galactocentric radiusr will depend on the charac-teristic physical scale of the “clumps”σc(r), and their num-ber densitync(r). The observed line strength (in the presentcase, the rest equivalent widthW0) will also depend on thedistribution of line-of-sight velocity– large values ofW0 re-quire a large line of sight velocity dispersion, the width ofwhich depends on the sampled distribution of covering frac-tion. Clearly, any model for the outflows is under-constrainedby the spectrum of the galaxy itself, even for high qualityspectra (e.g., Pettini et al. 2002; Quider et al. 2009a).
However, high-resolution spectra of very closely-spacedsightlines toward gravitationally-lensed QSOs have providedconstraints on the characteristic physical scales over whichcolumn densities of various transitions such as Lyα, CIV, andlower-ionization species vary significantly (Rauch et al. 1999,2001; Ellison et al. 2004). These scales appear to be≃ 0.5−1kpc for CIV (thus, comparable to the “beam footprint” of thegalaxy) and≃ 50− 100 pc for low ionization metallic species(much smaller than the typical beam footprint). If it is as-sumed that the QSO spectra are sampling metal-enriched gassimilar to that found near galaxies like the ones in the cur-rent sample, these scales, together with measures of coveringfraction, provide some useful information on the structureofthe gas in the flows. Information on the distribution of gastransverse to the line of sight breaks some of the remainingdegeneracies hindering a full phase-space (velocity, position)understanding of the circumgalactic gas.
6.2. Galaxy-Galaxy Pair Samples
One method for probing the geometry of outflows is toobserve foreground galaxies found near the lines of sight tobackground QSOs, and to compare the kinematics of absorb-ing gas in the galaxy spectrum with that seen in the QSOspectrum. A picture of the structure of the gaseous enve-lope surrounding galaxies can then be built up statistically,by observing a sample of galaxies with a range of projectedgalactocentric distances from the background QSOs (e.g.,Adelberger et al. 2005a; Adelberger et al. 2003). This methodhas the advantage that one can choose the background QSOsto be very bright, so that very high S/N and spectral resolu-tion is possible, but the disadvantage is that such QSOs arerare, and one is “stuck” with whatever galaxies happen to liewithin ≃ 1′ of the QSO. Of course, the smallest separations(e.g.,θ ≤ 15′′ , or a projected physical galactocentric radiusof <
∼ 120 kpc ) will be especially rare. Ultimately, one is alsolimited by the quality of the (faint) galaxy spectrum if one isinterested in a kinematic comparison using two different linesof sight through the galaxy.
An alternative and complementary method is to use closeangular pairs ofgalaxiesat discrepant redshifts to vastly in-crease the sample sizes, at the expense of information quality(because both the foreground and the background objects arefaint). An initial attempt to use this method was presented byAdelberger et al. (2005a); here we investigate it using a sig-nificantly larger, higher quality, sample of galaxy pairs drawnfrom an ongoing densely-sampled spectroscopic survey (seeSteidel et al. 2004 for early results; the full survey will bede-

16 Steidel et al.
scribed in detail elsewhere).The survey has been conducted over a total of 18 inde-
pendent fields, 15 of which are centered on bright QSOswith zQ ≃ 2.6 − 2.8 (high resolution spectra of the brightQSOs are used in §6.5). The spectroscopic sample includes>∼ 2500 galaxy spectra in the redshift range 1.5 ≤ z≤ 3.6,with 〈z〉 = 2.28±0.42. We used this galaxy survey catalog toidentify pairs of spectroscopically-confirmed galaxies ineachof 3 bins in angular separation:θ < 5′′ , 5′′ < θ ≤10′′ , and10′′ < θ ≤ 15′′ , which will be identified as samples P1, P2,and P3, respectively (see Table 2). At the mean redshift of theforeground galaxies of〈z〉 = 2.2, the angular bins correspondto projected physical distances ofb ≤ 41 kpc, 41< b ≤ 83kpc, and 83< b ≤ 124 kpc for samples P1, P2, and P3, re-spectively (see Table 2). The conversion from angular sep-aration to physical impact parameter changes by only±2%over the full redshift range of the foreground galaxy samples,so that we will use angular separation and impact parameterinterchangeably.
Within each pair sample, a number of additional criteriawere imposed: 1) both galaxy spectra within the pair musthave accurately-determined redshifts; the redshift-space sep-aration of the two galaxies in each pair must be> 3000km s−1 to ensure that their geometry is unambiguous (i.e., sothat we know which galaxy is “behind” the other); 2) theredshift separationzbg − zf g ≤ 1.0 to ensure that the spectracontain a significant rest wavelength interval in common af-ter both are shifted to the rest frame of the foreground object.Redshifts were assigned to each galaxy using their Hα red-shift if available, and otherwise using equations 2 or 4, de-pending on spectral morphology. As discussed in §2.3, theuncertainty in the redshifts for the bulk of the galaxies in thesamples are expected to be≃ 125 km s−1 . After culling, thefinal pair samples include 42, 164, and 306 pairs for samplesP1, P2, and P3, respectively. The properties of these threeangular pair samples are summarized in Table 2.
6.3. A Case Study: GWS-BX201 and GWS-BM115
Among these pair samples, there is a handful for which thespectra were of sufficient quality to be analyzed individually.One example, illustrated in Figs. 15 and Fig. 16 (see alsoFig. 4 of Adelberger et al. 2005a), allows us to compare theinterstellar absorption lines in the spectrum of thez= 1.6065galaxy GWS-BM115 with the same features observed in thespectrum of a background galaxy projected only 1′′.9 awayon the plane of the sky, GWS-BX201 (z = 2.173). In thiscase, the systemic redshift of GWS-BM115 is known fromHα spectroscopy (Erb et al. 2006b), and the optical spectra ofboth objects were obtained with spectral resolutionR≃ 1500(i.e., ≃ 2 times higher than most of the other spectra in thesample). These galaxies have apparent magnitudesg′ = 23.5(BX201) andg′ = 23.7 (BM115),≃ 1 magnitude brighter thantypical galaxies in our sample. Using the systemic redshiftofthe foreground galaxy (GWS-BM115) measured from its Hαline, both spectra were shifted into the foreground galaxy’srest-frame, and continuum normalized, to produce the com-parison in Fig. 16 which shows the AlII λ1670 and CIVλλ1548,1550 transitions18. A summary of relevant measure-ments is given in Table 3.
18 Because of the low redshift of BM115, there are fewer lines incommonfor these two galaxies than for most of the pairs in the 3 samples; the tran-sitions shown are representative of low-ionization and high-ionization lines,respectively.
FIG. 15.— HST/ACS image of the GWS-BM115/BX201 galaxy pair, in theF814W filter. BM115 haszsys = 1.6065, based on the Hα line observed withKeck/NIRSPEC. BX201 lies 1′′.9 away on the plane of the sky, correspondingto an impact parameter atz = 1.6065 of≃ 16.1 kpc (physical). Fig. 16 andTable 3 compare the interstellar lines observed in the spectrum of the fore-ground galaxy BM115 and those observed in the spectrum of BX201 at theredshift of BM115.
There are several points worth making for this particularcase: first, the lines seen in the spectrum of the foregroundgalaxy have blue-shifted centroids, with∆vIS ≃ −192 km s−1 ,which we have shown is typical of the objects in the Hα sam-ple. Although the CIV lines are very broad (FWHM≃ 400km s−1 after correcting for the instrumental resolution), onecan still discern a separation of the two components of thedoublet. The line of sight to the background galaxy (GWS-BX201) passes the foreground galaxy at a projected physi-cal distance (hereinafter “impact parameter”,b) of b = 16.1kpc. Along this line of sight, the centroids of AlII and CIVare consistent with∆vIS = 0 relative to the foreground galaxyGWS-BM115– fitting the two lines of the CIV doublet and theAl II feature yields a velocity offset∆vIS = 0±15 km s−1 andvelocity width FWHM≃ 300 km s−1 after accounting for theinstrumental resolution. For both transitions, the “offset” lineof sight produces lines which are significantlystronger (interms of equivalent width) than those seen directly towardBM115 itself (see Table 3)! Of course, the path lengththrough the galaxy is different in the two cases; one line ofsight passes through only the “front half” of whatever gas isassociated with the foreground galaxy, while the sightlinetothe background object, although spatially offset, samplesma-terial both “behind” and “in front of” BM115 as seen by anobserver on earth. The fact that the centroid of the absorptionhas∆vIS ≃ 0 is consistent with any picture in which materialis distributed reasonably symmetrically around BM115; e.g.,this would be expected for axisymmetric radial outflow from(or infall onto) BM115, reaching a galactocentric distanceofat leastrg ≥ 16.1 kpc.
As mentioned above, strong lines such as AlII λ1670 andC IV are very likely to be saturated; they clearly exhibit sat-uration along theb = 16 kpc line of sight, but the lines in theforeground galaxy spectrum itself do not reach zero intensity.Al II λ1670 and both components of the CIV doublet haveapproximately the same residual intensity of≃ 0.5 (Fig. 16).The inference offc < 1 for cool outflowing material is notunusual, and in fact a covering fraction of∼ 50% is quitetypical of z∼ 2 − 3 galaxies (see, e.g., Shapley et al. 2003;Quider et al. 2009a).
Based on the HST/ACS image (I band) shown in Figure 15,
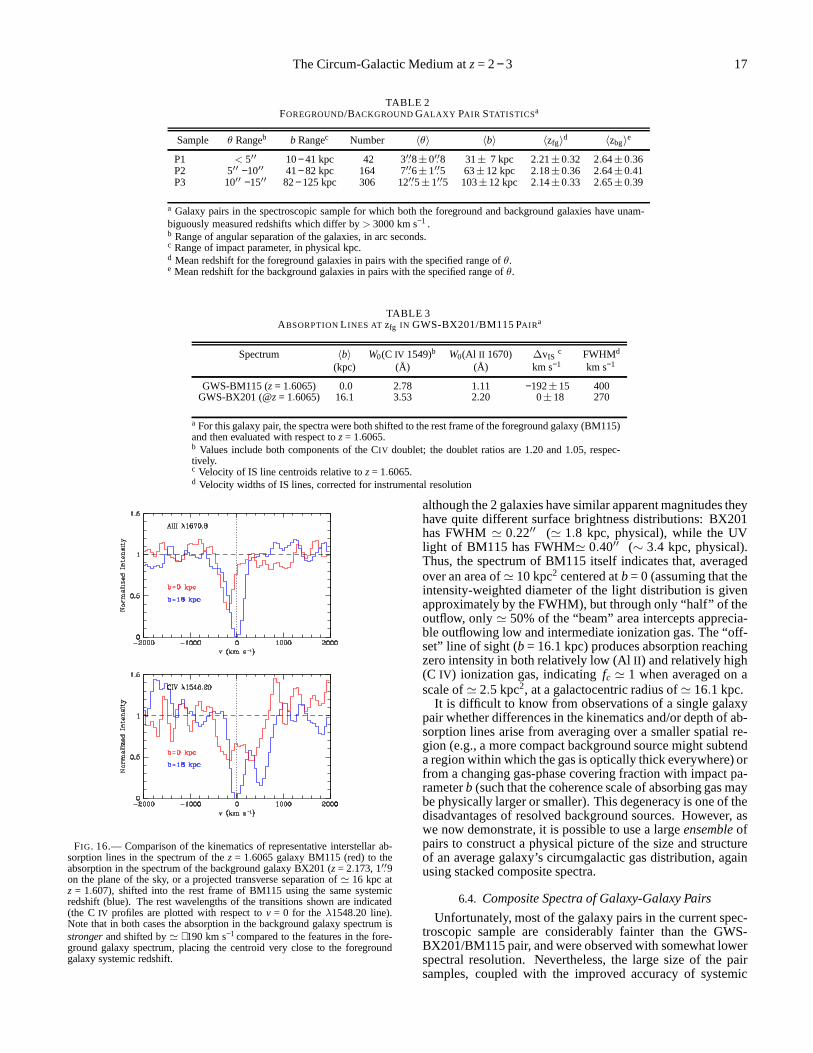
The Circum-Galactic Medium atz= 2− 3 17
TABLE 2FOREGROUND/BACKGROUNDGALAXY PAIR STATISTICSa
Sample θ Rangeb b Rangec Number 〈θ〉 〈b〉 〈zfg〉d 〈zbg〉
e
P1 < 5′′ 10− 41 kpc 42 3′′.8±0′′.8 31± 7 kpc 2.21±0.32 2.64±0.36P2 5′′ −10′′ 41− 82 kpc 164 7′′.6±1′′.5 63±12 kpc 2.18±0.36 2.64±0.41P3 10′′ −15′′ 82− 125 kpc 306 12′′.5±1′′.5 103±12 kpc 2.14±0.33 2.65±0.39
a Galaxy pairs in the spectroscopic sample for which both the foreground and background galaxies have unam-biguously measured redshifts which differ by> 3000 km s−1 .b Range of angular separation of the galaxies, in arc seconds.c Range of impact parameter, in physical kpc.d Mean redshift for the foreground galaxies in pairs with the specified range ofθ.e Mean redshift for the background galaxies in pairs with the specified range ofθ.
TABLE 3ABSORPTIONL INES AT zfg IN GWS-BX201/BM115 PAIRa
Spectrum 〈b〉 W0(C IV 1549)b W0(Al II 1670) ∆vISc FWHMd
(kpc) (Å) (Å) km s−1 km s−1
GWS-BM115 (z= 1.6065) 0.0 2.78 1.11 −192±15 400GWS-BX201 (@z= 1.6065) 16.1 3.53 2.20 0±18 270
a For this galaxy pair, the spectra were both shifted to the rest frame of the foreground galaxy (BM115)and then evaluated with respect toz= 1.6065.b Values include both components of the CIV doublet; the doublet ratios are 1.20 and 1.05, respec-tively.c Velocity of IS line centroids relative toz= 1.6065.d Velocity widths of IS lines, corrected for instrumental resolution
FIG. 16.— Comparison of the kinematics of representative interstellar ab-sorption lines in the spectrum of thez = 1.6065 galaxy BM115 (red) to theabsorption in the spectrum of the background galaxy BX201 (z= 2.173, 1′′.9on the plane of the sky, or a projected transverse separationof ≃ 16 kpc atz = 1.607), shifted into the rest frame of BM115 using the same systemicredshift (blue). The rest wavelengths of the transitions shown are indicated(the C IV profiles are plotted with respect tov = 0 for theλ1548.20 line).Note that in both cases the absorption in the background galaxy spectrum isstrongerand shifted by≃ +190 km s−1 compared to the features in the fore-ground galaxy spectrum, placing the centroid very close to the foregroundgalaxy systemic redshift.
although the 2 galaxies have similar apparent magnitudes theyhave quite different surface brightness distributions: BX201has FWHM≃ 0.22′′ (≃ 1.8 kpc, physical), while the UVlight of BM115 has FWHM≃ 0.40′′ (∼ 3.4 kpc, physical).Thus, the spectrum of BM115 itself indicates that, averagedover an area of≃ 10 kpc2 centered atb = 0 (assuming that theintensity-weighted diameter of the light distribution is givenapproximately by the FWHM), but through only “half” of theoutflow, only≃ 50% of the “beam” area intercepts apprecia-ble outflowing low and intermediate ionization gas. The “off-set” line of sight (b = 16.1 kpc) produces absorption reachingzero intensity in both relatively low (AlII ) and relatively high(C IV) ionization gas, indicatingfc ≃ 1 when averaged on ascale of≃ 2.5 kpc2, at a galactocentric radius of≃ 16.1 kpc.
It is difficult to know from observations of a single galaxypair whether differences in the kinematics and/or depth of ab-sorption lines arise from averaging over a smaller spatial re-gion (e.g., a more compact background source might subtenda region within which the gas is optically thick everywhere)orfrom a changing gas-phase covering fraction with impact pa-rameterb (such that the coherence scale of absorbing gas maybe physically larger or smaller). This degeneracy is one of thedisadvantages of resolved background sources. However, aswe now demonstrate, it is possible to use a largeensembleofpairs to construct a physical picture of the size and structureof an average galaxy’s circumgalactic gas distribution, againusing stacked composite spectra.
6.4. Composite Spectra of Galaxy-Galaxy Pairs
Unfortunately, most of the galaxy pairs in the current spec-troscopic sample are considerably fainter than the GWS-BX201/BM115 pair, and were observed with somewhat lowerspectral resolution. Nevertheless, the large size of the pairsamples, coupled with the improved accuracy of systemic

18 Steidel et al.
FIG. 17.— Comparison of the absorption lines in composite spectra formed from galaxy-galaxy pairs. The top spectrum is the composite of all foregroundgalaxies in pairs from sample P3 with redshift differences> 3000 km s−1 . The second spectrum is the composite of allbackgroundgalaxies in pairs withangular separation∆θ ≤ 5′′ [sample P1(bg)], formed by shifting each to the redshift of the foreground galaxy and averaging, as described in the text. The thirdand fourth spectra were formed the same way, for the background galaxies in pairs with 5-10′′ and 10-15′′ angular separations [samples P2(bg) and P3(bg)],respectively.
redshifts estimated from far-UV spectral features (most ofthe galaxies in pairs do not have Hα measurements), allowfor interesting measurements from composite spectra. Foreach angular pair of galaxies, the spectrum of the foregroundgalaxy in each pair was shifted to its own rest frame usingthe measured values of∆vIS and the rules given in eqs. 2or 4, and continuum-normalized. The resulting foregroundspectra were then averaged within each pair sample, produc-ing stacked spectra which we refer to as P1(fg), P2(fg), andP3(fg), respectively. A similar approach was used to producestacked spectra of the background galaxies: each individualbackground galaxy spectrum was shifted into theforegroundgalaxy’s rest frame using the same systemic redshift appliedto the foreground galaxy spectrum, and continuum normal-ized. The strong IS absorption features at the redshift of eachbackground galaxy constitute a source of noise that can af-fect the composite spectrum of the background galaxies (aftershifting the spectra tozf g, the lines will appear at differentwavelengths for each spectrum). To minimize this effect, thestrongest interstellar lines in each background galaxy spec-trum (at the galaxy redshift,zbg) were masked when produc-ing the average spectrum atzf g. The resulting compositesP1(bg), P2(bg), and P3(bg) are shown in Figure 17, together
with (for display purposes only; in the analysis below we useadistinct stack of the foreground spectra within each pair sam-ple) the spectrum of the average of all foreground galaxy spec-tra in sample P3.
Figures 18, 19, and 20 show line profile comparisons ofP1(bg) and P1(fg), P2(bg) and P2(fg), and P3(bg) and P3(fg),respectively, for selected transitions. Table 4 summarizesthe measured rest-frame line equivalent widths for the samestacked spectra. The quoted errors on the equivalent widthsin Table 4 account for sample variance, continuum uncertain-ties, and measurement errors based on repeated measurementswith spectra formed from subsets of the data.
As might be expected, the composites P1(fg), P2(fg), andP3(fg) are very similar, since they are averages of galaxyspectra for 3 sets of galaxies selected using identical criteria,with very similar redshift ranges (see Table 2). Nevertheless,they are completely independent, having been formed fromthe spectra of distinct samples of galaxies. The differences inmeasured line strength for the foreground galaxy compositesindicate the approximate level of sample variance (< 10% forthe strongest absorption lines). It is of interest to predict whatthe absorption line profiles of the spectra of the foregroundgalaxies would look like if the line of sight were to probe
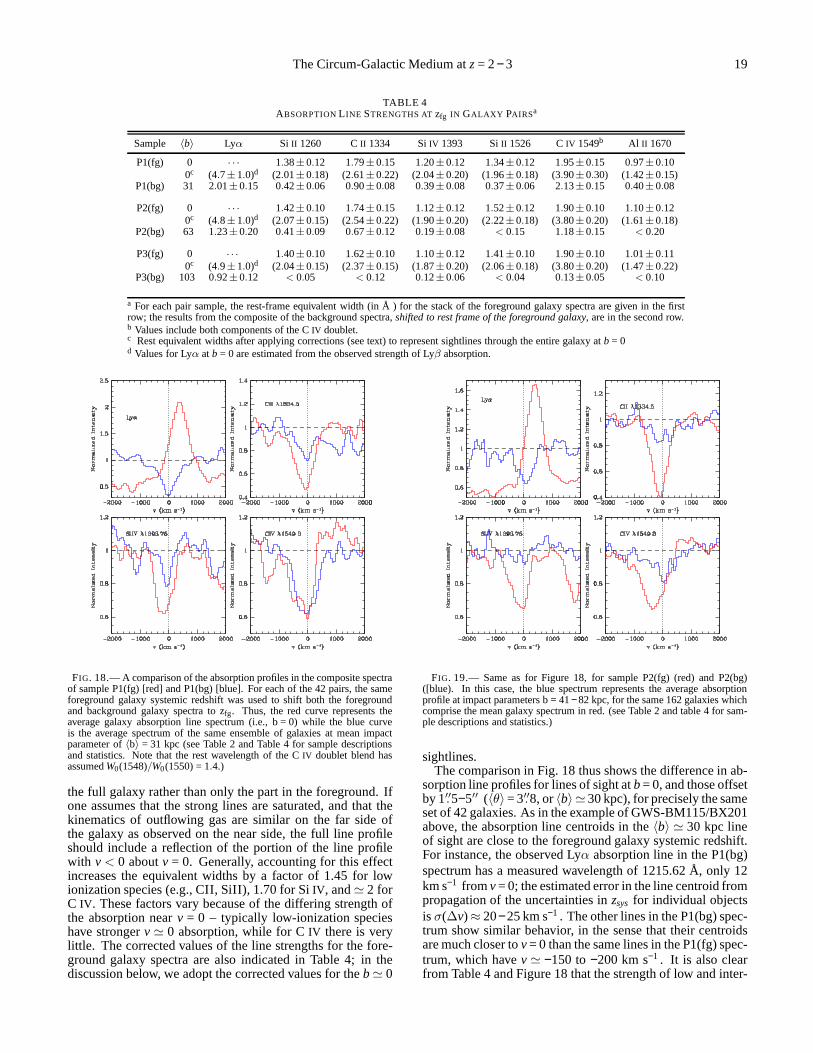
The Circum-Galactic Medium atz= 2− 3 19
TABLE 4ABSORPTIONL INE STRENGTHS ATzfg IN GALAXY PAIRSa
Sample 〈b〉 Lyα Si II 1260 CII 1334 SiIV 1393 SiII 1526 CIV 1549b Al II 1670
P1(fg) 0 · · · 1.38±0.12 1.79±0.15 1.20±0.12 1.34±0.12 1.95±0.15 0.97±0.100c (4.7±1.0)d (2.01±0.18) (2.61±0.22) (2.04±0.20) (1.96±0.18) (3.90±0.30) (1.42±0.15)
P1(bg) 31 2.01±0.15 0.42±0.06 0.90±0.08 0.39±0.08 0.37±0.06 2.13±0.15 0.40±0.08
P2(fg) 0 · · · 1.42±0.10 1.74±0.15 1.12±0.12 1.52±0.12 1.90±0.10 1.10±0.120c (4.8±1.0)d (2.07±0.15) (2.54±0.22) (1.90±0.20) (2.22±0.18) (3.80±0.20) (1.61±0.18)
P2(bg) 63 1.23±0.20 0.41±0.09 0.67±0.12 0.19±0.08 < 0.15 1.18±0.15 < 0.20
P3(fg) 0 · · · 1.40±0.10 1.62±0.10 1.10±0.12 1.41±0.10 1.90±0.10 1.01±0.110c (4.9±1.0)d (2.04±0.15) (2.37±0.15) (1.87±0.20) (2.06±0.18) (3.80±0.20) (1.47±0.22)
P3(bg) 103 0.92±0.12 < 0.05 < 0.12 0.12±0.06 < 0.04 0.13±0.05 < 0.10
a For each pair sample, the rest-frame equivalent width (in Å )for the stack of the foreground galaxy spectra are given in the firstrow; the results from the composite of the background spectra,shifted to rest frame of the foreground galaxy, are in the second row.b Values include both components of the CIV doublet.c Rest equivalent widths after applying corrections (see text) to represent sightlines through the entire galaxy atb = 0d Values for Lyα atb = 0 are estimated from the observed strength of Lyβ absorption.
FIG. 18.— A comparison of the absorption profiles in the composite spectraof sample P1(fg) [red] and P1(bg) [blue]. For each of the 42 pairs, the sameforeground galaxy systemic redshift was used to shift both the foregroundand background galaxy spectra to zfg. Thus, the red curve represents theaverage galaxy absorption line spectrum (i.e., b = 0) while the blue curveis the average spectrum of the same ensemble of galaxies at mean impactparameter of〈b〉 = 31 kpc (see Table 2 and Table 4 for sample descriptionsand statistics. Note that the rest wavelength of the CIV doublet blend hasassumedW0(1548)/W0(1550) = 1.4.)
the full galaxy rather than only the part in the foreground. Ifone assumes that the strong lines are saturated, and that thekinematics of outflowing gas are similar on the far side ofthe galaxy as observed on the near side, the full line profileshould include a reflection of the portion of the line profilewith v < 0 aboutv = 0. Generally, accounting for this effectincreases the equivalent widths by a factor of 1.45 for lowionization species (e.g., CII, SiII), 1.70 for SiIV , and≃ 2 forC IV . These factors vary because of the differing strength ofthe absorption nearv = 0 – typically low-ionization specieshave strongerv ≃ 0 absorption, while for CIV there is verylittle. The corrected values of the line strengths for the fore-ground galaxy spectra are also indicated in Table 4; in thediscussion below, we adopt the corrected values for theb≃ 0
FIG. 19.— Same as for Figure 18, for sample P2(fg) (red) and P2(bg)([blue). In this case, the blue spectrum represents the average absorptionprofile at impact parameters b = 41− 82 kpc, for the same 162 galaxies whichcomprise the mean galaxy spectrum in red. (see Table 2 and table 4 for sam-ple descriptions and statistics.)
sightlines.The comparison in Fig. 18 thus shows the difference in ab-
sorption line profiles for lines of sight atb= 0, and those offsetby 1′′.5−5′′ (〈θ〉= 3′′.8, or〈b〉 ≃30 kpc), for precisely the sameset of 42 galaxies. As in the example of GWS-BM115/BX201above, the absorption line centroids in the〈b〉 ≃ 30 kpc lineof sight are close to the foreground galaxy systemic redshift.For instance, the observed Lyα absorption line in the P1(bg)spectrum has a measured wavelength of 1215.62 Å, only 12km s−1 fromv= 0; the estimated error in the line centroid frompropagation of the uncertainties inzsys for individual objectsisσ(∆v)≈ 20−25 km s−1 . The other lines in the P1(bg) spec-trum show similar behavior, in the sense that their centroidsare much closer tov= 0 than the same lines in the P1(fg) spec-trum, which havev ≃ −150 to−200 km s−1 . It is also clearfrom Table 4 and Figure 18 that the strength of low and inter-
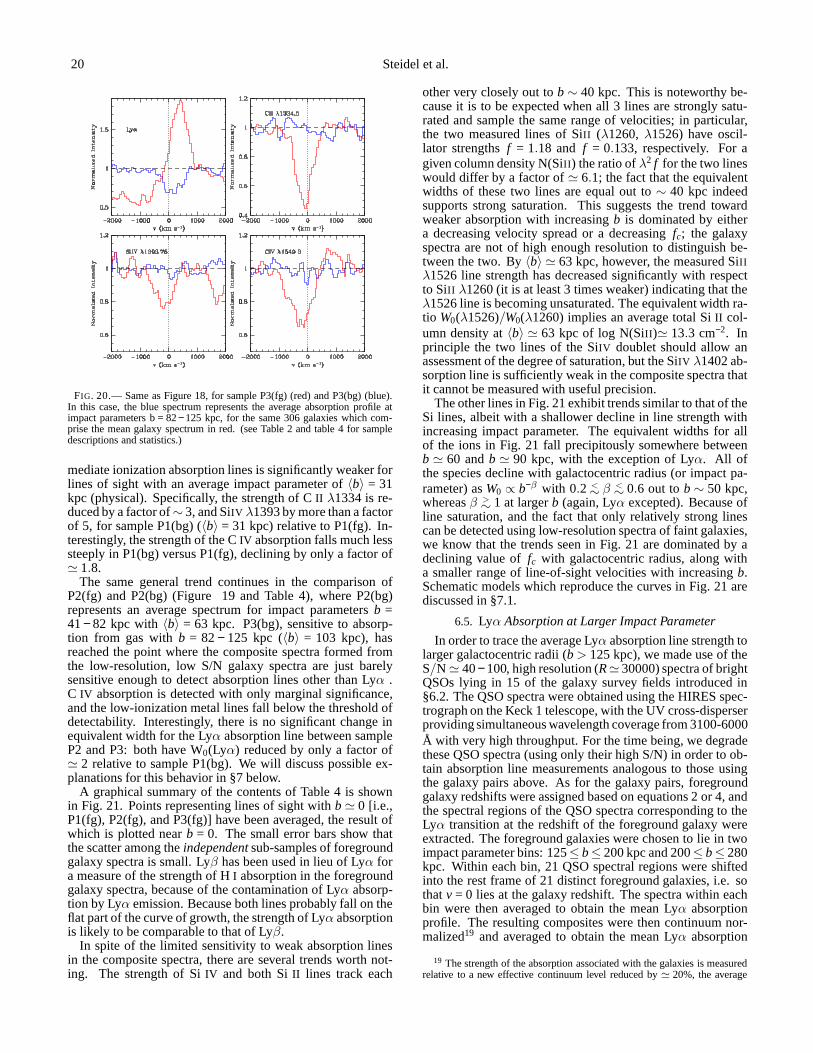
20 Steidel et al.
FIG. 20.— Same as Figure 18, for sample P3(fg) (red) and P3(bg) (blue).In this case, the blue spectrum represents the average absorption profile atimpact parameters b = 82− 125 kpc, for the same 306 galaxies which com-prise the mean galaxy spectrum in red. (see Table 2 and table 4for sampledescriptions and statistics.)
mediate ionization absorption lines is significantly weaker forlines of sight with an average impact parameter of〈b〉 = 31kpc (physical). Specifically, the strength of CII λ1334 is re-duced by a factor of∼ 3, and SiIV λ1393 by more than a factorof 5, for sample P1(bg) (〈b〉 = 31 kpc) relative to P1(fg). In-terestingly, the strength of the CIV absorption falls much lesssteeply in P1(bg) versus P1(fg), declining by only a factor of≃ 1.8.
The same general trend continues in the comparison ofP2(fg) and P2(bg) (Figure 19 and Table 4), where P2(bg)represents an average spectrum for impact parametersb =41− 82 kpc with 〈b〉 = 63 kpc. P3(bg), sensitive to absorp-tion from gas withb = 82− 125 kpc (〈b〉 = 103 kpc), hasreached the point where the composite spectra formed fromthe low-resolution, low S/N galaxy spectra are just barelysensitive enough to detect absorption lines other than Lyα .C IV absorption is detected with only marginal significance,and the low-ionization metal lines fall below the thresholdofdetectability. Interestingly, there is no significant change inequivalent width for the Lyα absorption line between sampleP2 and P3: both have W0(Lyα) reduced by only a factor of≃ 2 relative to sample P1(bg). We will discuss possible ex-planations for this behavior in §7 below.
A graphical summary of the contents of Table 4 is shownin Fig. 21. Points representing lines of sight withb≃ 0 [i.e.,P1(fg), P2(fg), and P3(fg)] have been averaged, the result ofwhich is plotted nearb = 0. The small error bars show thatthe scatter among theindependentsub-samples of foregroundgalaxy spectra is small. Lyβ has been used in lieu of Lyα fora measure of the strength of HI absorption in the foregroundgalaxy spectra, because of the contamination of Lyα absorp-tion by Lyα emission. Because both lines probably fall on theflat part of the curve of growth, the strength of Lyα absorptionis likely to be comparable to that of Lyβ.
In spite of the limited sensitivity to weak absorption linesin the composite spectra, there are several trends worth not-ing. The strength of SiIV and both SiII lines track each
other very closely out tob∼ 40 kpc. This is noteworthy be-cause it is to be expected when all 3 lines are strongly satu-rated and sample the same range of velocities; in particular,the two measured lines of SiII (λ1260,λ1526) have oscil-lator strengthsf = 1.18 and f = 0.133, respectively. For agiven column density N(SiII ) the ratio ofλ2 f for the two lineswould differ by a factor of≃ 6.1; the fact that the equivalentwidths of these two lines are equal out to∼ 40 kpc indeedsupports strong saturation. This suggests the trend towardweaker absorption with increasingb is dominated by eithera decreasing velocity spread or a decreasingfc; the galaxyspectra are not of high enough resolution to distinguish be-tween the two. By〈b〉 ≃ 63 kpc, however, the measured SiIIλ1526 line strength has decreased significantly with respectto SiII λ1260 (it is at least 3 times weaker) indicating that theλ1526 line is becoming unsaturated. The equivalent width ra-tio W0(λ1526)/W0(λ1260) implies an average total SiII col-umn density at〈b〉 ≃ 63 kpc of log N(SiII )≃ 13.3 cm−2. Inprinciple the two lines of the SiIV doublet should allow anassessment of the degree of saturation, but the SiIV λ1402 ab-sorption line is sufficiently weak in the composite spectra thatit cannot be measured with useful precision.
The other lines in Fig. 21 exhibit trends similar to that of theSi lines, albeit with a shallower decline in line strength withincreasing impact parameter. The equivalent widths for allof the ions in Fig. 21 fall precipitously somewhere betweenb ≃ 60 andb ≃ 90 kpc, with the exception of Lyα. All ofthe species decline with galactocentric radius (or impact pa-rameter) asW0 ∝ b−β with 0.2 <
∼ β <∼ 0.6 out tob ∼ 50 kpc,
whereasβ >∼ 1 at largerb (again, Lyα excepted). Because of
line saturation, and the fact that only relatively strong linescan be detected using low-resolution spectra of faint galaxies,we know that the trends seen in Fig. 21 are dominated by adeclining value offc with galactocentric radius, along witha smaller range of line-of-sight velocities with increasing b.Schematic models which reproduce the curves in Fig. 21 arediscussed in §7.1.
6.5. Lyα Absorption at Larger Impact Parameter
In order to trace the average Lyα absorption line strength tolarger galactocentric radii (b> 125 kpc), we made use of theS/N ≃ 40− 100, high resolution (R≃ 30000) spectra of brightQSOs lying in 15 of the galaxy survey fields introduced in§6.2. The QSO spectra were obtained using the HIRES spec-trograph on the Keck 1 telescope, with the UV cross-disperserproviding simultaneous wavelength coverage from 3100-6000Å with very high throughput. For the time being, we degradethese QSO spectra (using only their high S/N) in order to ob-tain absorption line measurements analogous to those usingthe galaxy pairs above. As for the galaxy pairs, foregroundgalaxy redshifts were assigned based on equations 2 or 4, andthe spectral regions of the QSO spectra corresponding to theLyα transition at the redshift of the foreground galaxy wereextracted. The foreground galaxies were chosen to lie in twoimpact parameter bins: 125≤ b≤ 200 kpc and 200≤ b≤ 280kpc. Within each bin, 21 QSO spectral regions were shiftedinto the rest frame of 21 distinct foreground galaxies, i.e.sothatv = 0 lies at the galaxy redshift. The spectra within eachbin were then averaged to obtain the mean Lyα absorptionprofile. The resulting composites were then continuum nor-malized19 and averaged to obtain the mean Lyα absorption
19 The strength of the absorption associated with the galaxiesis measuredrelative to a new effective continuum level reduced by≃ 20%, the average
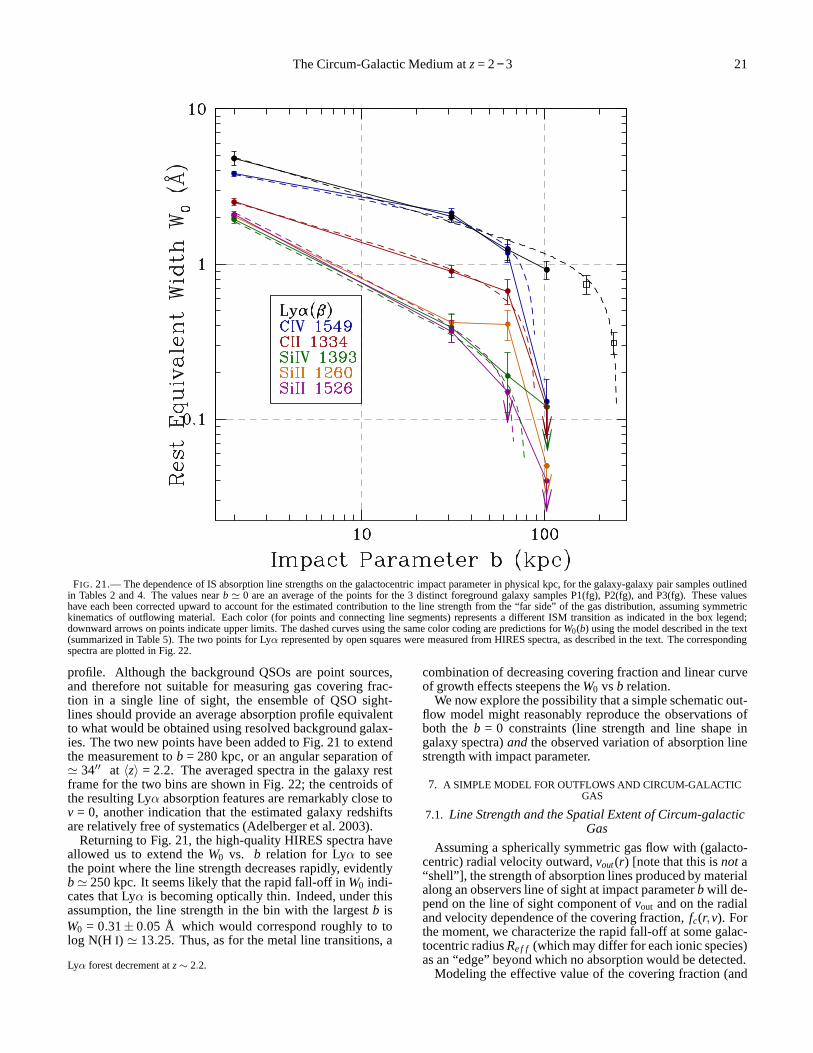
The Circum-Galactic Medium atz= 2− 3 21
FIG. 21.— The dependence of IS absorption line strengths on the galactocentric impact parameter in physical kpc, for the galaxy-galaxy pair samples outlinedin Tables 2 and 4. The values nearb ≃ 0 are an average of the points for the 3 distinct foreground galaxy samples P1(fg), P2(fg), and P3(fg). These valueshave each been corrected upward to account for the estimatedcontribution to the line strength from the “far side” of the gas distribution, assuming symmetrickinematics of outflowing material. Each color (for points and connecting line segments) represents a different ISM transition as indicated in the box legend;downward arrows on points indicate upper limits. The dashedcurves using the same color coding are predictions forW0(b) using the model described in the text(summarized in Table 5). The two points for Lyα represented by open squares were measured from HIRES spectra, as described in the text. The correspondingspectra are plotted in Fig. 22.
profile. Although the background QSOs are point sources,and therefore not suitable for measuring gas covering frac-tion in a single line of sight, the ensemble of QSO sight-lines should provide an average absorption profile equivalentto what would be obtained using resolved background galax-ies. The two new points have been added to Fig. 21 to extendthe measurement tob = 280 kpc, or an angular separation of≃ 34′′ at 〈z〉 = 2.2. The averaged spectra in the galaxy restframe for the two bins are shown in Fig. 22; the centroids ofthe resulting Lyα absorption features are remarkably close tov = 0, another indication that the estimated galaxy redshiftsare relatively free of systematics (Adelberger et al. 2003).
Returning to Fig. 21, the high-quality HIRES spectra haveallowed us to extend theW0 vs. b relation for Lyα to seethe point where the line strength decreases rapidly, evidentlyb≃ 250 kpc. It seems likely that the rapid fall-off inW0 indi-cates that Lyα is becoming optically thin. Indeed, under thisassumption, the line strength in the bin with the largestb isW0 = 0.31± 0.05 Å which would correspond roughly to tolog N(H I) ≃ 13.25. Thus, as for the metal line transitions, a
Lyα forest decrement atz∼ 2.2.
combination of decreasing covering fraction and linear curveof growth effects steepens theW0 vsb relation.
We now explore the possibility that a simple schematic out-flow model might reasonably reproduce the observations ofboth theb = 0 constraints (line strength and line shape ingalaxy spectra)and the observed variation of absorption linestrength with impact parameter.
7. A SIMPLE MODEL FOR OUTFLOWS AND CIRCUM-GALACTICGAS
7.1. Line Strength and the Spatial Extent of Circum-galacticGas
Assuming a spherically symmetric gas flow with (galacto-centric) radial velocity outward,vout(r) [note that this isnot a“shell”], the strength of absorption lines produced by materialalong an observers line of sight at impact parameterb will de-pend on the line of sight component ofvout and on the radialand velocity dependence of the covering fraction,fc(r,v). Forthe moment, we characterize the rapid fall-off at some galac-tocentric radiusRe f f (which may differ for each ionic species)as an “edge” beyond which no absorption would be detected.
Modeling the effective value of the covering fraction (and
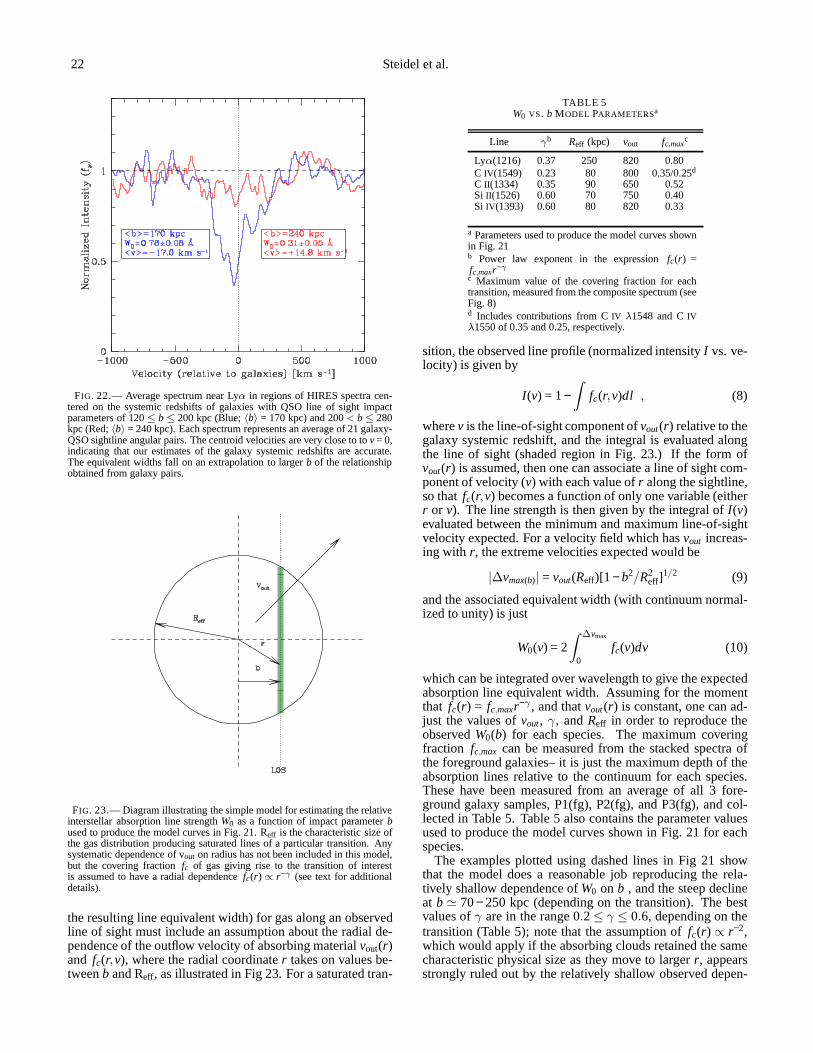
22 Steidel et al.
FIG. 22.— Average spectrum near Lyα in regions of HIRES spectra cen-tered on the systemic redshifts of galaxies with QSO line of sight impactparameters of 120≤ b ≤ 200 kpc (Blue;〈b〉 = 170 kpc) and 200< b ≤ 280kpc (Red;〈b〉 = 240 kpc). Each spectrum represents an average of 21 galaxy-QSO sightline angular pairs. The centroid velocities are very close to tov= 0,indicating that our estimates of the galaxy systemic redshifts are accurate.The equivalent widths fall on an extrapolation to largerb of the relationshipobtained from galaxy pairs.
FIG. 23.— Diagram illustrating the simple model for estimatingthe relativeinterstellar absorption line strengthW0 as a function of impact parameterbused to produce the model curves in Fig. 21. Reff is the characteristic size ofthe gas distribution producing saturated lines of a particular transition. Anysystematic dependence of vout on radius has not been included in this model,but the covering fractionfc of gas giving rise to the transition of interestis assumed to have a radial dependencefc(r) ∝ r−γ (see text for additionaldetails).
the resulting line equivalent width) for gas along an observedline of sight must include an assumption about the radial de-pendence of the outflow velocity of absorbing materialvout(r)and fc(r,v), where the radial coordinater takes on values be-tweenb and Reff, as illustrated in Fig 23. For a saturated tran-
TABLE 5W0 VS. b MODEL PARAMETERSa
Line γb Reff (kpc) vout fc,maxc
Lyα(1216) 0.37 250 820 0.80C IV(1549) 0.23 80 800 0.35/0.25d
C II(1334) 0.35 90 650 0.52Si II(1526) 0.60 70 750 0.40Si IV(1393) 0.60 80 820 0.33
a Parameters used to produce the model curves shownin Fig. 21b Power law exponent in the expressionfc(r) =fc,maxr−γc Maximum value of the covering fraction for eachtransition, measured from the composite spectrum (seeFig. 8)d Includes contributions from CIV λ1548 and CIVλ1550 of 0.35 and 0.25, respectively.
sition, the observed line profile (normalized intensityI vs. ve-locity) is given by
I (v) = 1−∫
fc(r,v)dl , (8)
wherev is the line-of-sight component ofvout(r) relative to thegalaxy systemic redshift, and the integral is evaluated alongthe line of sight (shaded region in Fig. 23.) If the form ofvout(r) is assumed, then one can associate a line of sight com-ponent of velocity (v) with each value ofr along the sightline,so thatfc(r,v) becomes a function of only one variable (eitherr or v). The line strength is then given by the integral ofI (v)evaluated between the minimum and maximum line-of-sightvelocity expected. For a velocity field which hasvout increas-ing with r, the extreme velocities expected would be
|∆vmax(b)| = vout(Reff)[1 − b2/R2eff]
1/2 (9)
and the associated equivalent width (with continuum normal-ized to unity) is just
W0(v) = 2∫
∆vmax
0fc(v)dv (10)
which can be integrated over wavelength to give the expectedabsorption line equivalent width. Assuming for the momentthat fc(r) = fc,maxr−γ , and thatvout(r) is constant, one can ad-just the values ofvout, γ, andReff in order to reproduce theobservedW0(b) for each species. The maximum coveringfraction fc,max can be measured from the stacked spectra ofthe foreground galaxies– it is just the maximum depth of theabsorption lines relative to the continuum for each species.These have been measured from an average of all 3 fore-ground galaxy samples, P1(fg), P2(fg), and P3(fg), and col-lected in Table 5. Table 5 also contains the parameter valuesused to produce the model curves shown in Fig. 21 for eachspecies.
The examples plotted using dashed lines in Fig 21 showthat the model does a reasonable job reproducing the rela-tively shallow dependence ofW0 on b , and the steep declineat b ≃ 70− 250 kpc (depending on the transition). The bestvalues ofγ are in the range 0.2≤ γ ≤ 0.6, depending on thetransition (Table 5); note that the assumption offc(r) ∝ r−2,which would apply if the absorbing clouds retained the samecharacteristic physical size as they move to largerr, appearsstrongly ruled out by the relatively shallow observed depen-
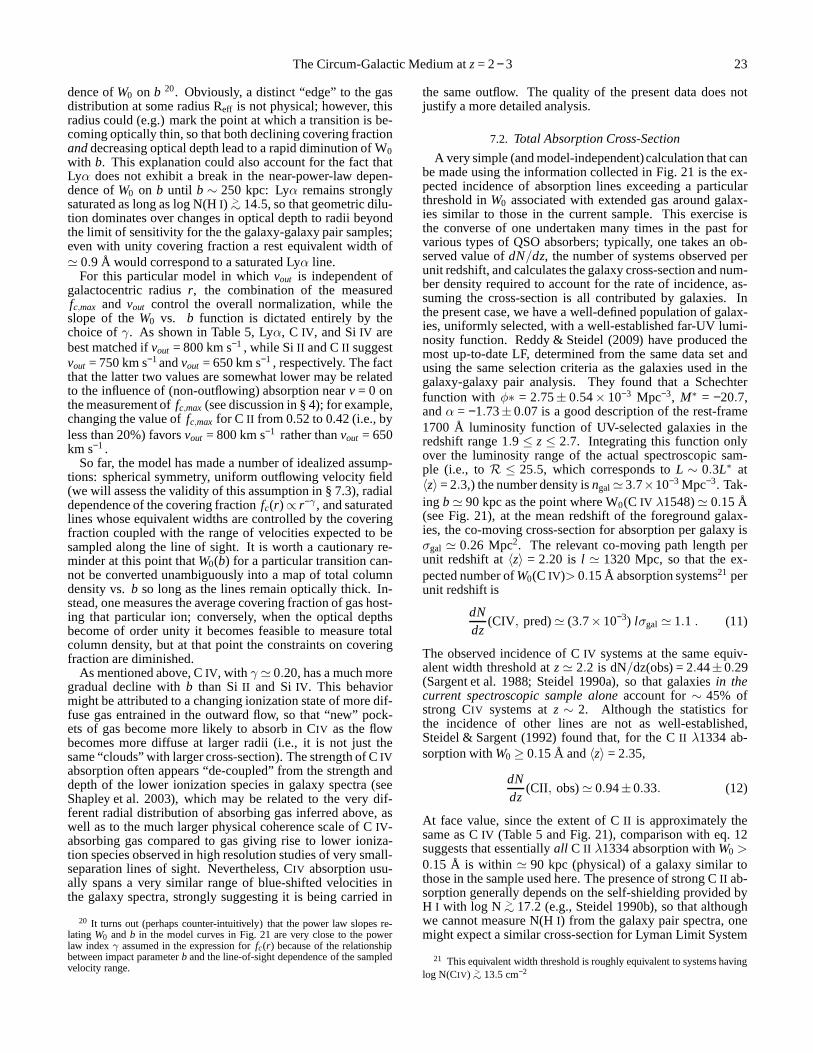
The Circum-Galactic Medium atz= 2− 3 23
dence ofW0 on b 20. Obviously, a distinct “edge” to the gasdistribution at some radius Reff is not physical; however, thisradius could (e.g.) mark the point at which a transition is be-coming optically thin, so that both declining covering fractionanddecreasing optical depth lead to a rapid diminution of W0with b. This explanation could also account for the fact thatLyα does not exhibit a break in the near-power-law depen-dence ofW0 on b until b ∼ 250 kpc: Lyα remains stronglysaturated as long as log N(HI) >
∼ 14.5, so that geometric dilu-tion dominates over changes in optical depth to radii beyondthe limit of sensitivity for the the galaxy-galaxy pair samples;even with unity covering fraction a rest equivalent width of≃ 0.9 Å would correspond to a saturated Lyα line.
For this particular model in whichvout is independent ofgalactocentric radiusr, the combination of the measuredfc,max and vout control the overall normalization, while theslope of theW0 vs. b function is dictated entirely by thechoice ofγ. As shown in Table 5, Lyα, C IV , and SiIV arebest matched ifvout = 800 km s−1 , while Si II and CII suggestvout = 750 km s−1andvout = 650 km s−1 , respectively. The factthat the latter two values are somewhat lower may be relatedto the influence of (non-outflowing) absorption nearv = 0 onthe measurement offc,max(see discussion in § 4); for example,changing the value offc,max for C II from 0.52 to 0.42 (i.e., byless than 20%) favorsvout = 800 km s−1 rather thanvout = 650km s−1 .
So far, the model has made a number of idealized assump-tions: spherical symmetry, uniform outflowing velocity field(we will assess the validity of this assumption in § 7.3), radialdependence of the covering fractionfc(r)∝ r−γ , and saturatedlines whose equivalent widths are controlled by the coveringfraction coupled with the range of velocities expected to besampled along the line of sight. It is worth a cautionary re-minder at this point thatW0(b) for a particular transition can-not be converted unambiguously into a map of total columndensity vs.b so long as the lines remain optically thick. In-stead, one measures the average covering fraction of gas host-ing that particular ion; conversely, when the optical depthsbecome of order unity it becomes feasible to measure totalcolumn density, but at that point the constraints on coveringfraction are diminished.
As mentioned above, CIV , with γ ≃ 0.20, has a much moregradual decline withb than SiII and SiIV . This behaviormight be attributed to a changing ionization state of more dif-fuse gas entrained in the outward flow, so that “new” pock-ets of gas become more likely to absorb in CIV as the flowbecomes more diffuse at larger radii (i.e., it is not just thesame “clouds” with larger cross-section). The strength of CIVabsorption often appears “de-coupled” from the strength anddepth of the lower ionization species in galaxy spectra (seeShapley et al. 2003), which may be related to the very dif-ferent radial distribution of absorbing gas inferred above, aswell as to the much larger physical coherence scale of CIV-absorbing gas compared to gas giving rise to lower ioniza-tion species observed in high resolution studies of very small-separation lines of sight. Nevertheless, CIV absorption usu-ally spans a very similar range of blue-shifted velocities inthe galaxy spectra, strongly suggesting it is being carriedin
20 It turns out (perhaps counter-intuitively) that the power law slopes re-lating W0 andb in the model curves in Fig. 21 are very close to the powerlaw indexγ assumed in the expression forfc(r) because of the relationshipbetween impact parameterb and the line-of-sight dependence of the sampledvelocity range.
the same outflow. The quality of the present data does notjustify a more detailed analysis.
7.2. Total Absorption Cross-Section
A very simple (and model-independent)calculation that canbe made using the information collected in Fig. 21 is the ex-pected incidence of absorption lines exceeding a particularthreshold inW0 associated with extended gas around galax-ies similar to those in the current sample. This exercise isthe converse of one undertaken many times in the past forvarious types of QSO absorbers; typically, one takes an ob-served value ofdN/dz, the number of systems observed perunit redshift, and calculates the galaxy cross-section andnum-ber density required to account for the rate of incidence, as-suming the cross-section is all contributed by galaxies. Inthe present case, we have a well-defined population of galax-ies, uniformly selected, with a well-established far-UV lumi-nosity function. Reddy & Steidel (2009) have produced themost up-to-date LF, determined from the same data set andusing the same selection criteria as the galaxies used in thegalaxy-galaxy pair analysis. They found that a Schechterfunction with φ∗ = 2.75± 0.54× 10⁻³ Mpc−3, M∗ = −20.7,andα = −1.73±0.07 is a good description of the rest-frame1700 Å luminosity function of UV-selected galaxies in theredshift range 1.9 ≤ z≤ 2.7. Integrating this function onlyover the luminosity range of the actual spectroscopic sam-ple (i.e., toR ≤ 25.5, which corresponds toL ∼ 0.3L∗ at〈z〉 = 2.3,) the number density isngal≃ 3.7×10⁻³ Mpc−3. Tak-ing b≃ 90 kpc as the point where W0(C IV λ1548)≃ 0.15 Å(see Fig. 21), at the mean redshift of the foreground galax-ies, the co-moving cross-section for absorption per galaxyisσgal ≃ 0.26 Mpc2. The relevant co-moving path length perunit redshift at〈z〉 = 2.20 is l ≃ 1320 Mpc, so that the ex-pected number ofW0(C IV)> 0.15 Å absorption systems21 perunit redshift is
dNdz
(CIV, pred)≃ (3.7×10⁻³) lσgal ≃ 1.1 . (11)
The observed incidence of CIV systems at the same equiv-alent width threshold atz≃ 2.2 is dN/dz(obs) = 2.44±0.29(Sargent et al. 1988; Steidel 1990a), so that galaxiesin thecurrent spectroscopic sample aloneaccount for∼ 45% ofstrong CIV systems atz ∼ 2. Although the statistics forthe incidence of other lines are not as well-established,Steidel & Sargent (1992) found that, for the CII λ1334 ab-sorption withW0 ≥ 0.15 Å and〈z〉 = 2.35,
dNdz
(CII, obs)≃ 0.94±0.33. (12)
At face value, since the extent of CII is approximately thesame as CIV (Table 5 and Fig. 21), comparison with eq. 12suggests that essentiallyall C II λ1334 absorption withW0 >0.15 Å is within ≃ 90 kpc (physical) of a galaxy similar tothose in the sample used here. The presence of strong CII ab-sorption generally depends on the self-shielding providedbyH I with log N >
∼ 17.2 (e.g., Steidel 1990b), so that althoughwe cannot measure N(HI) from the galaxy pair spectra, onemight expect a similar cross-section for Lyman Limit System
21 This equivalent width threshold is roughly equivalent to systems havinglog N(CIV ) >
∼ 13.5 cm−2
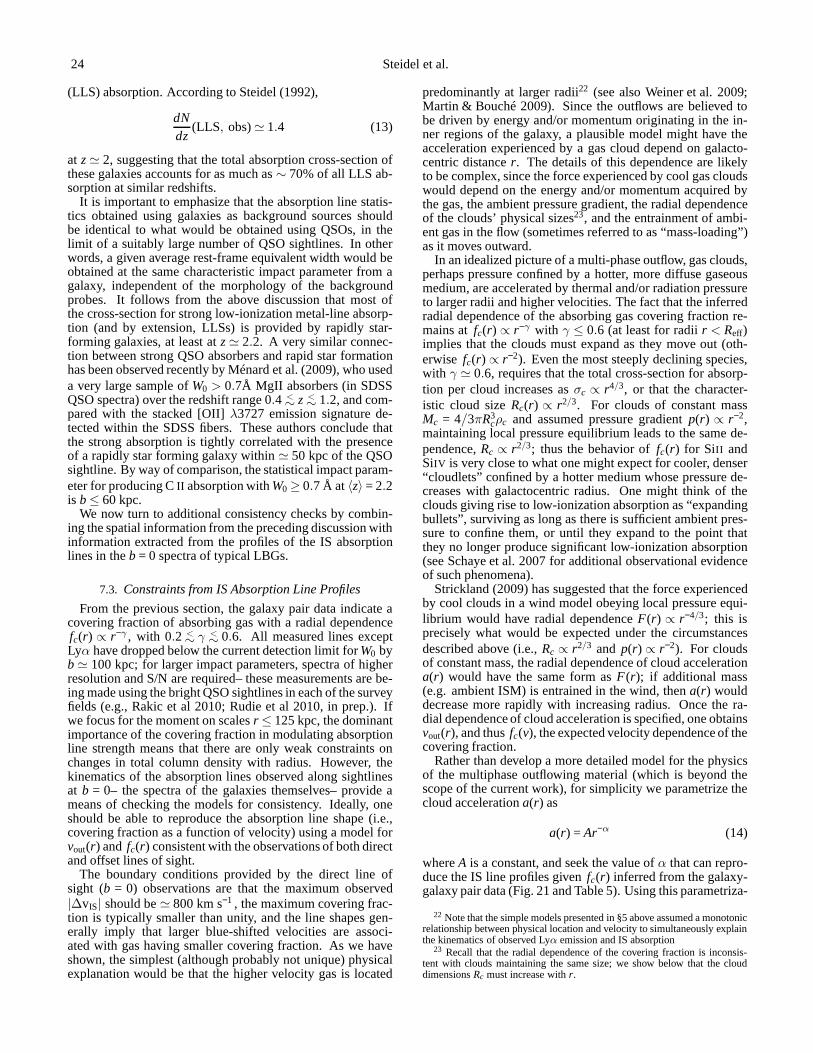
24 Steidel et al.
(LLS) absorption. According to Steidel (1992),
dNdz
(LLS, obs)≃ 1.4 (13)
at z≃ 2, suggesting that the total absorption cross-section ofthese galaxies accounts for as much as∼ 70% of all LLS ab-sorption at similar redshifts.
It is important to emphasize that the absorption line statis-tics obtained using galaxies as background sources shouldbe identical to what would be obtained using QSOs, in thelimit of a suitably large number of QSO sightlines. In otherwords, a given average rest-frame equivalent width would beobtained at the same characteristic impact parameter from agalaxy, independent of the morphology of the backgroundprobes. It follows from the above discussion that most ofthe cross-section for strong low-ionization metal-line absorp-tion (and by extension, LLSs) is provided by rapidly star-forming galaxies, at least atz≃ 2.2. A very similar connec-tion between strong QSO absorbers and rapid star formationhas been observed recently by Ménard et al. (2009), who useda very large sample ofW0 > 0.7Å MgII absorbers (in SDSSQSO spectra) over the redshift range 0.4 <
∼ z <∼ 1.2, and com-
pared with the stacked [OII]λ3727 emission signature de-tected within the SDSS fibers. These authors conclude thatthe strong absorption is tightly correlated with the presenceof a rapidly star forming galaxy within≃ 50 kpc of the QSOsightline. By way of comparison, the statistical impact param-eter for producing CII absorption withW0 ≥ 0.7 Å at〈z〉 = 2.2is b≤ 60 kpc.
We now turn to additional consistency checks by combin-ing the spatial information from the preceding discussion withinformation extracted from the profiles of the IS absorptionlines in theb = 0 spectra of typical LBGs.
7.3. Constraints from IS Absorption Line Profiles
From the previous section, the galaxy pair data indicate acovering fraction of absorbing gas with a radial dependencefc(r) ∝ r−γ , with 0.2 <
∼ γ <∼ 0.6. All measured lines except
Lyα have dropped below the current detection limit forW0 byb≃ 100 kpc; for larger impact parameters, spectra of higherresolution and S/N are required– these measurements are be-ing made using the bright QSO sightlines in each of the surveyfields (e.g., Rakic et al 2010; Rudie et al 2010, in prep.). Ifwe focus for the moment on scalesr ≤ 125 kpc, the dominantimportance of the covering fraction in modulating absorptionline strength means that there are only weak constraints onchanges in total column density with radius. However, thekinematics of the absorption lines observed along sightlinesat b = 0– the spectra of the galaxies themselves– provide ameans of checking the models for consistency. Ideally, oneshould be able to reproduce the absorption line shape (i.e.,covering fraction as a function of velocity) using a model forvout(r) and fc(r) consistent with the observations of both directand offset lines of sight.
The boundary conditions provided by the direct line ofsight (b = 0) observations are that the maximum observed|∆vIS| should be≃ 800 km s−1 , the maximum covering frac-tion is typically smaller than unity, and the line shapes gen-erally imply that larger blue-shifted velocities are associ-ated with gas having smaller covering fraction. As we haveshown, the simplest (although probably not unique) physicalexplanation would be that the higher velocity gas is located
predominantly at larger radii22 (see also Weiner et al. 2009;Martin & Bouché 2009). Since the outflows are believed tobe driven by energy and/or momentum originating in the in-ner regions of the galaxy, a plausible model might have theacceleration experienced by a gas cloud depend on galacto-centric distancer. The details of this dependence are likelyto be complex, since the force experienced by cool gas cloudswould depend on the energy and/or momentum acquired bythe gas, the ambient pressure gradient, the radial dependenceof the clouds’ physical sizes23, and the entrainment of ambi-ent gas in the flow (sometimes referred to as “mass-loading”)as it moves outward.
In an idealized picture of a multi-phase outflow, gas clouds,perhaps pressure confined by a hotter, more diffuse gaseousmedium, are accelerated by thermal and/or radiation pressureto larger radii and higher velocities. The fact that the inferredradial dependence of the absorbing gas covering fraction re-mains atfc(r) ∝ r−γ with γ ≤ 0.6 (at least for radiir < Reff)implies that the clouds must expand as they move out (oth-erwise fc(r) ∝ r−2). Even the most steeply declining species,with γ ≃ 0.6, requires that the total cross-section for absorp-tion per cloud increases asσc ∝ r4/3, or that the character-istic cloud sizeRc(r) ∝ r2/3. For clouds of constant massMc = 4/3πR3
cρc and assumed pressure gradientp(r) ∝ r−2,maintaining local pressure equilibrium leads to the same de-pendence,Rc ∝ r2/3; thus the behavior offc(r) for SiII andSiIV is very close to what one might expect for cooler, denser“cloudlets” confined by a hotter medium whose pressure de-creases with galactocentric radius. One might think of theclouds giving rise to low-ionization absorption as “expandingbullets”, surviving as long as there is sufficient ambient pres-sure to confine them, or until they expand to the point thatthey no longer produce significant low-ionization absorption(see Schaye et al. 2007 for additional observational evidenceof such phenomena).
Strickland (2009) has suggested that the force experiencedby cool clouds in a wind model obeying local pressure equi-librium would have radial dependenceF(r) ∝ r−4/3; this isprecisely what would be expected under the circumstancesdescribed above (i.e.,Rc ∝ r2/3 and p(r) ∝ r−2). For cloudsof constant mass, the radial dependence of cloud accelerationa(r) would have the same form asF(r); if additional mass(e.g. ambient ISM) is entrained in the wind, thena(r) woulddecrease more rapidly with increasing radius. Once the ra-dial dependence of cloud acceleration is specified, one obtainsvout(r), and thusfc(v), the expected velocity dependence of thecovering fraction.
Rather than develop a more detailed model for the physicsof the multiphase outflowing material (which is beyond thescope of the current work), for simplicity we parametrize thecloud accelerationa(r) as
a(r) = Ar−α (14)
whereA is a constant, and seek the value ofα that can repro-duce the IS line profiles givenfc(r) inferred from the galaxy-galaxy pair data (Fig. 21 and Table 5). Using this parametriza-
22 Note that the simple models presented in §5 above assumed a monotonicrelationship between physical location and velocity to simultaneously explainthe kinematics of observed Lyα emission and IS absorption
23 Recall that the radial dependence of the covering fraction is inconsis-tent with clouds maintaining the same size; we show below that the clouddimensionsRc must increase withr .
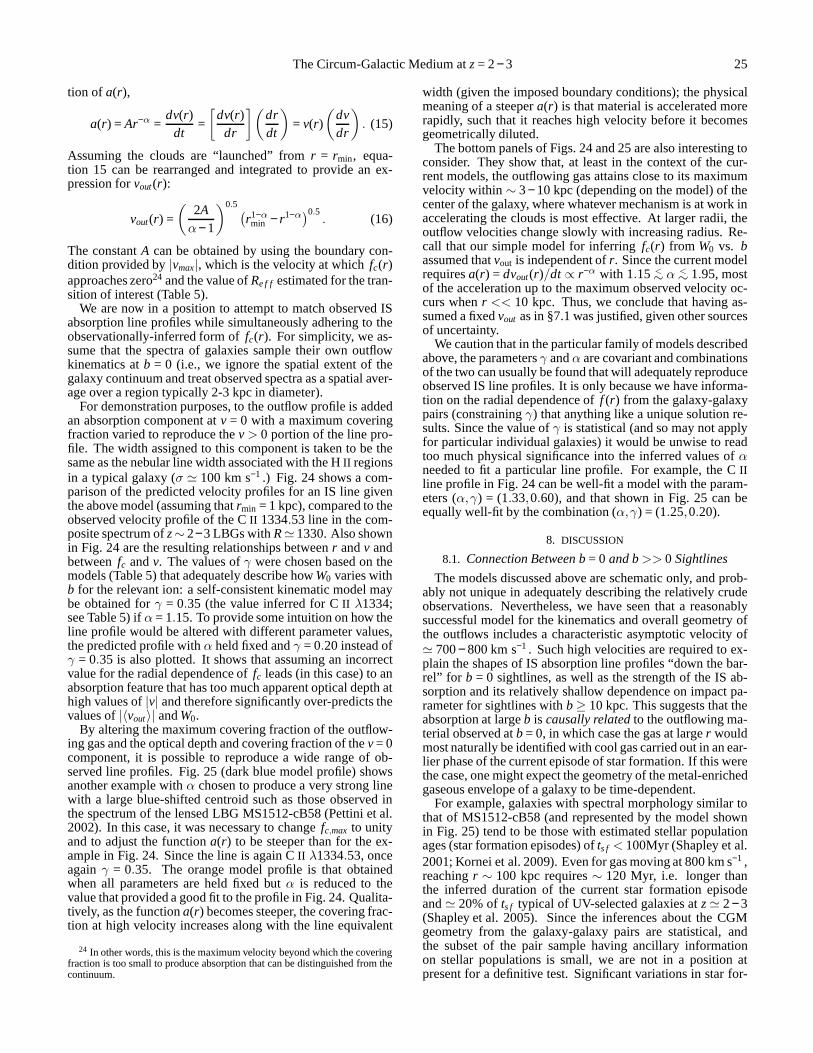
The Circum-Galactic Medium atz= 2− 3 25
tion of a(r),
a(r) = Ar−α =dv(r)
dt=
[
dv(r)dr
](
drdt
)
= v(r)
(
dvdr
)
. (15)
Assuming the clouds are “launched” fromr = rmin, equa-tion 15 can be rearranged and integrated to provide an ex-pression forvout(r):
vout(r) =
(
2Aα− 1
)0.5(
r1−αmin − r1−α)0.5
. (16)
The constantA can be obtained by using the boundary con-dition provided by|vmax|, which is the velocity at whichfc(r)approaches zero24 and the value ofRe f f estimated for the tran-sition of interest (Table 5).
We are now in a position to attempt to match observed ISabsorption line profiles while simultaneously adhering to theobservationally-inferred form offc(r). For simplicity, we as-sume that the spectra of galaxies sample their own outflowkinematics atb = 0 (i.e., we ignore the spatial extent of thegalaxy continuum and treat observed spectra as a spatial aver-age over a region typically 2-3 kpc in diameter).
For demonstration purposes, to the outflow profile is addedan absorption component atv = 0 with a maximum coveringfraction varied to reproduce thev> 0 portion of the line pro-file. The width assigned to this component is taken to be thesame as the nebular line width associated with the HII regionsin a typical galaxy (σ ≃ 100 km s−1 .) Fig. 24 shows a com-parison of the predicted velocity profiles for an IS line giventhe above model (assuming thatrmin = 1 kpc), compared to theobserved velocity profile of the CII 1334.53 line in the com-posite spectrum ofz∼ 2−3 LBGs withR≃ 1330. Also shownin Fig. 24 are the resulting relationships betweenr andv andbetweenfc andv. The values ofγ were chosen based on themodels (Table 5) that adequately describe howW0 varies withb for the relevant ion: a self-consistent kinematic model maybe obtained forγ = 0.35 (the value inferred for CII λ1334;see Table 5) ifα = 1.15. To provide some intuition on how theline profile would be altered with different parameter values,the predicted profile withα held fixed andγ = 0.20 instead ofγ = 0.35 is also plotted. It shows that assuming an incorrectvalue for the radial dependence offc leads (in this case) to anabsorption feature that has too much apparent optical depthathigh values of|v| and therefore significantly over-predicts thevalues of|〈vout〉| andW0.
By altering the maximum covering fraction of the outflow-ing gas and the optical depth and covering fraction of thev= 0component, it is possible to reproduce a wide range of ob-served line profiles. Fig. 25 (dark blue model profile) showsanother example withα chosen to produce a very strong linewith a large blue-shifted centroid such as those observed inthe spectrum of the lensed LBG MS1512-cB58 (Pettini et al.2002). In this case, it was necessary to changefc,max to unityand to adjust the functiona(r) to be steeper than for the ex-ample in Fig. 24. Since the line is again CII λ1334.53, onceagainγ = 0.35. The orange model profile is that obtainedwhen all parameters are held fixed butα is reduced to thevalue that provided a good fit to the profile in Fig. 24. Qualita-tively, as the functiona(r) becomes steeper, the covering frac-tion at high velocity increases along with the line equivalent
24 In other words, this is the maximum velocity beyond which thecoveringfraction is too small to produce absorption that can be distinguished from thecontinuum.
width (given the imposed boundary conditions); the physicalmeaning of a steepera(r) is that material is accelerated morerapidly, such that it reaches high velocity before it becomesgeometrically diluted.
The bottom panels of Figs. 24 and 25 are also interesting toconsider. They show that, at least in the context of the cur-rent models, the outflowing gas attains close to its maximumvelocity within∼ 3− 10 kpc (depending on the model) of thecenter of the galaxy, where whatever mechanism is at work inaccelerating the clouds is most effective. At larger radii,theoutflow velocities change slowly with increasing radius. Re-call that our simple model for inferringfc(r) from W0 vs. bassumed thatvout is independent ofr. Since the current modelrequiresa(r) = dvout(r)/dt ∝ r−α with 1.15 <
∼ α <∼ 1.95, most
of the acceleration up to the maximum observed velocity oc-curs whenr << 10 kpc. Thus, we conclude that having as-sumed a fixedvout as in §7.1 was justified, given other sourcesof uncertainty.
We caution that in the particular family of models describedabove, the parametersγ andα are covariant and combinationsof the two can usually be found that will adequately reproduceobserved IS line profiles. It is only because we have informa-tion on the radial dependence off (r) from the galaxy-galaxypairs (constrainingγ) that anything like a unique solution re-sults. Since the value ofγ is statistical (and so may not applyfor particular individual galaxies) it would be unwise to readtoo much physical significance into the inferred values ofαneeded to fit a particular line profile. For example, the CIIline profile in Fig. 24 can be well-fit a model with the param-eters (α,γ) = (1.33,0.60), and that shown in Fig. 25 can beequally well-fit by the combination (α,γ) = (1.25,0.20).
8. DISCUSSION
8.1. Connection Between b= 0 and b>> 0 Sightlines
The models discussed above are schematic only, and prob-ably not unique in adequately describing the relatively crudeobservations. Nevertheless, we have seen that a reasonablysuccessful model for the kinematics and overall geometry ofthe outflows includes a characteristic asymptotic velocityof≃ 700− 800 km s−1 . Such high velocities are required to ex-plain the shapes of IS absorption line profiles “down the bar-rel” for b = 0 sightlines, as well as the strength of the IS ab-sorption and its relatively shallow dependence on impact pa-rameter for sightlines withb≥ 10 kpc. This suggests that theabsorption at largeb is causally relatedto the outflowing ma-terial observed atb = 0, in which case the gas at larger wouldmost naturally be identified with cool gas carried out in an ear-lier phase of the current episode of star formation. If this werethe case, one might expect the geometry of the metal-enrichedgaseous envelope of a galaxy to be time-dependent.
For example, galaxies with spectral morphology similar tothat of MS1512-cB58 (and represented by the model shownin Fig. 25) tend to be those with estimated stellar populationages (star formation episodes) ofts f < 100Myr (Shapley et al.2001; Kornei et al. 2009). Even for gas moving at 800 km s−1 ,reachingr ∼ 100 kpc requires∼ 120 Myr, i.e. longer thanthe inferred duration of the current star formation episodeand≃ 20% ofts f typical of UV-selected galaxies atz≃ 2− 3(Shapley et al. 2005). Since the inferences about the CGMgeometry from the galaxy-galaxy pairs are statistical, andthe subset of the pair sample having ancillary informationon stellar populations is small, we are not in a position atpresent for a definitive test. Significant variations in starfor-
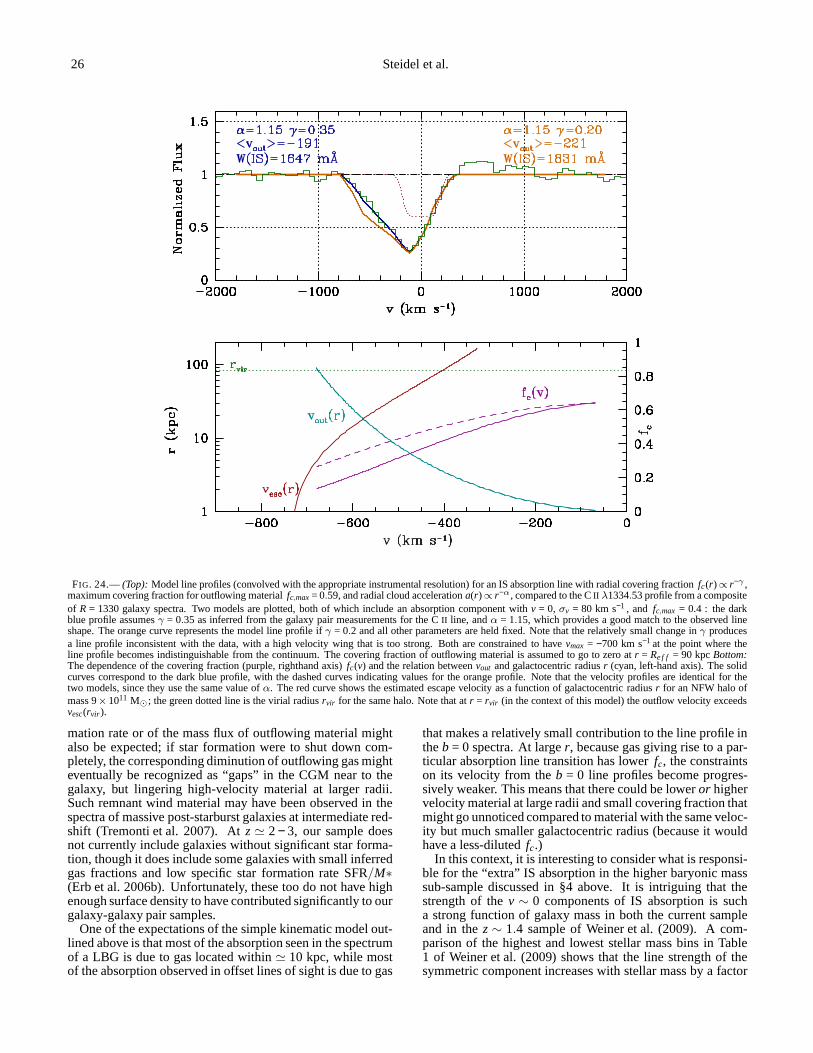
26 Steidel et al.
FIG. 24.—(Top): Model line profiles (convolved with the appropriate instrumental resolution) for an IS absorption line with radial covering fraction fc(r)∝ r−γ ,maximum covering fraction for outflowing materialfc,max= 0.59, and radial cloud accelerationa(r)∝ r−α, compared to the CII λ1334.53 profile from a compositeof R = 1330 galaxy spectra. Two models are plotted, both of which include an absorption component withv = 0, σv = 80 km s−1 , and fc,max = 0.4 : the darkblue profile assumesγ = 0.35 as inferred from the galaxy pair measurements for the CII line, andα = 1.15, which provides a good match to the observed lineshape. The orange curve represents the model line profile ifγ = 0.2 and all other parameters are held fixed. Note that the relatively small change inγ producesa line profile inconsistent with the data, with a high velocity wing that is too strong. Both are constrained to havevmax = −700 km s−1 at the point where theline profile becomes indistinguishable from the continuum.The covering fraction of outflowing material is assumed to goto zero atr = Re f f = 90 kpcBottom:The dependence of the covering fraction (purple, righthandaxis) fc(v) and the relation betweenvout and galactocentric radiusr (cyan, left-hand axis). The solidcurves correspond to the dark blue profile, with the dashed curves indicating values for the orange profile. Note that the velocity profiles are identical for thetwo models, since they use the same value ofα. The red curve shows the estimated escape velocity as a function of galactocentric radiusr for an NFW halo ofmass 9×10¹¹ M⊙; the green dotted line is the virial radiusrvir for the same halo. Note that atr = rvir (in the context of this model) the outflow velocity exceedsvesc(rvir ).
mation rate or of the mass flux of outflowing material mightalso be expected; if star formation were to shut down com-pletely, the corresponding diminution of outflowing gas mighteventually be recognized as “gaps” in the CGM near to thegalaxy, but lingering high-velocity material at larger radii.Such remnant wind material may have been observed in thespectra of massive post-starburst galaxies at intermediate red-shift (Tremonti et al. 2007). Atz≃ 2− 3, our sample doesnot currently include galaxies without significant star forma-tion, though it does include some galaxies with small inferredgas fractions and low specific star formation rate SFR/M∗(Erb et al. 2006b). Unfortunately, these too do not have highenough surface density to have contributed significantly toourgalaxy-galaxy pair samples.
One of the expectations of the simple kinematic model out-lined above is that most of the absorption seen in the spectrumof a LBG is due to gas located within≃ 10 kpc, while mostof the absorption observed in offset lines of sight is due to gas
that makes a relatively small contribution to the line profile intheb = 0 spectra. At larger, because gas giving rise to a par-ticular absorption line transition has lowerfc, the constraintson its velocity from theb = 0 line profiles become progres-sively weaker. This means that there could be loweror highervelocity material at large radii and small covering fraction thatmight go unnoticed compared to material with the same veloc-ity but much smaller galactocentric radius (because it wouldhave a less-dilutedfc.)
In this context, it is interesting to consider what is responsi-ble for the “extra” IS absorption in the higher baryonic masssub-sample discussed in §4 above. It is intriguing that thestrength of thev ∼ 0 components of IS absorption is sucha strong function of galaxy mass in both the current sampleand in thez∼ 1.4 sample of Weiner et al. (2009). A com-parison of the highest and lowest stellar mass bins in Table1 of Weiner et al. (2009) shows that the line strength of thesymmetric component increases with stellar mass by a factor

The Circum-Galactic Medium atz= 2− 3 27
FIG. 25.— Same as Fig. 24, but with increased maximum covering fraction of the outflowing gasfc,max = 1, and a slightly larger covering fractionfc,max = 0.5for the component atv = 0. The dark blue model profile shows that forγ = 0.35, a good match to the observed CII line in the spectrum of the lensed LBGMS1512-cB58 (R≃ 1500, to match Fig. 24; see Pettini et al. 2000) is obtained ifα = 1.95. The orange curve illustrates the change in the model lineprofile ifα = 1.15 is assumed instead, with all other parameters held fixed. Clearly the latter model fails to produce the depth of the absorption at high values of|v|. Asfor the example in Fig. 24, the outflow velocity is significantly higher thanvescat the virial radius of the assumed halo.
of at least 16.6. Weiner et al. (2009) argue that the absorp-tion nearv = 0 is due primarily to stellar photospheric MgIIabsorption. However, the set of far-UV transitions used forour z∼ 2.3 sample are not contaminated by significant stel-lar photospheric absorption, and yet the line profiles exhibit avery similar trend with galaxy mass. We therefore concludethat the “excess” absorption nearv = 0 arises from IS gas, atleast in ourz∼ 2− 3 sample..
There is generally little evidence for infalling (redshifted)gas in the far-UV spectra of the galaxies, and even less ev-idence thatv(r) could be decreasing with increasingr (theline shapeswould be very different if this were the case). Itwould also be difficult to explain the spectral morphology ofLyα emission (see § 5) if the relationship betweenvout andrwere inverted, as might be expected if stalling winds and/orinfall dominated the gas flows. The expected signature of in-fall as seen in the galaxy spectra is IS absorption velocitiesredshiftedwith respect to the galaxy systemic velocity. Suchabsorption would be expected if gas were prevented from es-caping the galaxy potential and eventually began to fall backonto the central regions; a similar signature could also resultfrom “fresh” (rather than recycled) infalling cool gas thatisexpected to have physical conditions (T ≃ 104 − 105K; e.g.,Goerdt et al. 2009) very similar to the cool outflowing gas.
The absorption line strength for the metallic species we havebeen able to measure would be relatively insensitive to themetal abundance of infalling material, once again due to thehigh degree of saturation in the strong IS lines. In otherwords, the presence of infalling gas should be easily detectedin the galaxy spectra (both atb = 0 and at large galactocen-tric radii). Redshifted absorption should be observed in thevelocity range 0<∼ v <
∼ + 300 km s−1 as long as the coveringfraction is within a factor of a few of that inferred for outflow-ing gas. Under the current model, infalling gas should haveincreasingly redshifted velocities as its covering fraction in-creases(i.e., asr becomes smaller); the expected line profileswould then be inverted with respect to the observations, in thesense that line profiles would be deepest at the high velocityend of the distribution.
We have discussed evidence from the composite spectra in§4 that galaxies with higher baryonic mass are more likely tohave stronger absorption atv >
∼ 0, which could possibly be asignature of stalled outflowing material and/or infalling gas.This possibility is discussed further in §8.4 below.
8.2. The CGM and Dark Matter Halos
Fig. 21 shows that among the strong lines we can measurefrom the composite galaxy spectra, all except Lyα appear to
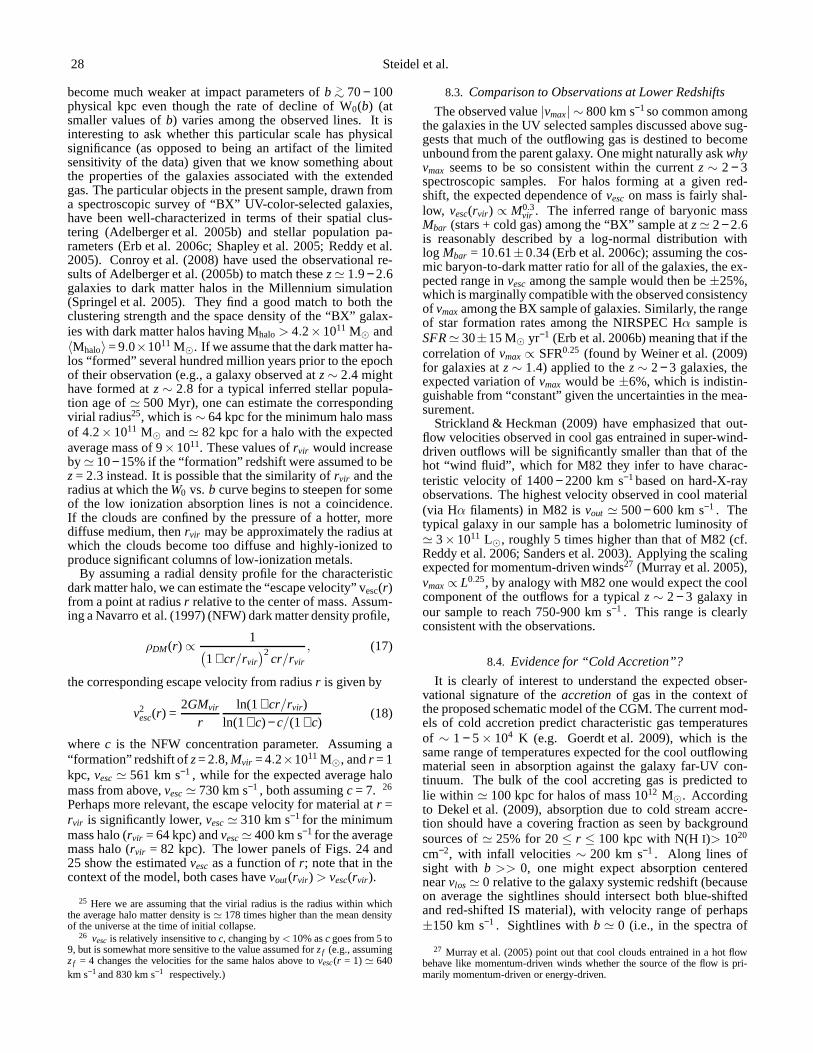
28 Steidel et al.
become much weaker at impact parameters ofb >∼ 70− 100
physical kpc even though the rate of decline of W0(b) (atsmaller values ofb) varies among the observed lines. It isinteresting to ask whether this particular scale has physicalsignificance (as opposed to being an artifact of the limitedsensitivity of the data) given that we know something aboutthe properties of the galaxies associated with the extendedgas. The particular objects in the present sample, drawn froma spectroscopic survey of “BX” UV-color-selected galaxies,have been well-characterized in terms of their spatial clus-tering (Adelberger et al. 2005b) and stellar population pa-rameters (Erb et al. 2006c; Shapley et al. 2005; Reddy et al.2005). Conroy et al. (2008) have used the observational re-sults of Adelberger et al. (2005b) to match thesez≃ 1.9− 2.6galaxies to dark matter halos in the Millennium simulation(Springel et al. 2005). They find a good match to both theclustering strength and the space density of the “BX” galax-ies with dark matter halos having Mhalo> 4.2×10¹¹ M⊙ and〈Mhalo〉= 9.0×10¹¹ M⊙. If we assume that the dark matter ha-los “formed” several hundred million years prior to the epochof their observation (e.g., a galaxy observed atz∼ 2.4 mighthave formed atz∼ 2.8 for a typical inferred stellar popula-tion age of≃ 500 Myr), one can estimate the correspondingvirial radius25, which is∼ 64 kpc for the minimum halo massof 4.2×10¹¹ M⊙ and≃ 82 kpc for a halo with the expectedaverage mass of 9×10¹¹. These values ofrvir would increaseby≃ 10−15% if the “formation” redshift were assumed to bez= 2.3 instead. It is possible that the similarity ofrvir and theradius at which theW0 vs. b curve begins to steepen for someof the low ionization absorption lines is not a coincidence.If the clouds are confined by the pressure of a hotter, morediffuse medium, thenrvir may be approximately the radius atwhich the clouds become too diffuse and highly-ionized toproduce significant columns of low-ionization metals.
By assuming a radial density profile for the characteristicdark matter halo, we can estimate the “escape velocity” vesc(r)from a point at radiusr relative to the center of mass. Assum-ing a Navarro et al. (1997) (NFW) dark matter density profile,
ρDM(r) ∝1
(
1+ cr/rvir)2
cr/rvir
, (17)
the corresponding escape velocity from radiusr is given by
v2esc(r) =
2GMvir
rln(1+ cr/rvir)
ln(1+ c) − c/(1+ c)(18)
wherec is the NFW concentration parameter. Assuming a“formation” redshift ofz= 2.8,Mvir = 4.2×10¹¹ M⊙, andr = 1kpc, vesc≃ 561 km s−1 , while for the expected average halomass from above,vesc≃ 730 km s−1 , both assumingc = 7. 26
Perhaps more relevant, the escape velocity for material atr =rvir is significantly lower,vesc≃ 310 km s−1 for the minimummass halo (rvir = 64 kpc) andvesc≃ 400 km s−1 for the averagemass halo (rvir = 82 kpc). The lower panels of Figs. 24 and25 show the estimatedvesc as a function ofr; note that in thecontext of the model, both cases havevout(rvir ) > vesc(rvir ).
25 Here we are assuming that the virial radius is the radius within whichthe average halo matter density is≃ 178 times higher than the mean densityof the universe at the time of initial collapse.
26 vesc is relatively insensitive toc, changing by< 10% asc goes from 5 to9, but is somewhat more sensitive to the value assumed forzf (e.g., assumingzf = 4 changes the velocities for the same halos above tovesc(r = 1)≃ 640km s−1 and 830 km s−1 respectively.)
8.3. Comparison to Observations at Lower Redshifts
The observed value|vmax| ∼ 800 km s−1 so common amongthe galaxies in the UV selected samples discussed above sug-gests that much of the outflowing gas is destined to becomeunbound from the parent galaxy. One might naturally askwhyvmax seems to be so consistent within the currentz∼ 2− 3spectroscopic samples. For halos forming at a given red-shift, the expected dependence ofvesc on mass is fairly shal-low, vesc(rvir ) ∝ M0.3
vir . The inferred range of baryonic massMbar (stars + cold gas) among the “BX” sample atz≃ 2− 2.6is reasonably described by a log-normal distribution withlog Mbar = 10.61±0.34 (Erb et al. 2006c); assuming the cos-mic baryon-to-dark matter ratio for all of the galaxies, theex-pected range invesc among the sample would then be±25%,which is marginally compatible with the observed consistencyof vmaxamong the BX sample of galaxies. Similarly, the rangeof star formation rates among the NIRSPEC Hα sample isSFR≃ 30±15 M⊙ yr−1 (Erb et al. 2006b) meaning that if thecorrelation ofvmax∝ SFR0.25 (found by Weiner et al. (2009)for galaxies atz∼ 1.4) applied to thez∼ 2− 3 galaxies, theexpected variation ofvmax would be±6%, which is indistin-guishable from “constant” given the uncertainties in the mea-surement.
Strickland & Heckman (2009) have emphasized that out-flow velocities observed in cool gas entrained in super-wind-driven outflows will be significantly smaller than that of thehot “wind fluid”, which for M82 they infer to have charac-teristic velocity of 1400− 2200 km s−1 based on hard-X-rayobservations. The highest velocity observed in cool material(via Hα filaments) in M82 isvout ≃ 500− 600 km s−1 . Thetypical galaxy in our sample has a bolometric luminosity of≃ 3×10¹¹ L⊙, roughly 5 times higher than that of M82 (cf.Reddy et al. 2006; Sanders et al. 2003). Applying the scalingexpected for momentum-driven winds27 (Murray et al. 2005),vmax∝ L0.25, by analogy with M82 one would expect the coolcomponent of the outflows for a typicalz∼ 2− 3 galaxy inour sample to reach 750-900 km s−1 . This range is clearlyconsistent with the observations.
8.4. Evidence for “Cold Accretion”?
It is clearly of interest to understand the expected obser-vational signature of theaccretionof gas in the context ofthe proposed schematic model of the CGM. The current mod-els of cold accretion predict characteristic gas temperaturesof ∼ 1 − 5× 10⁴ K (e.g. Goerdt et al. 2009), which is thesame range of temperatures expected for the cool outflowingmaterial seen in absorption against the galaxy far-UV con-tinuum. The bulk of the cool accreting gas is predicted tolie within ≃ 100 kpc for halos of mass 1012 M⊙. Accordingto Dekel et al. (2009), absorption due to cold stream accre-tion should have a covering fraction as seen by backgroundsources of≃ 25% for 20≤ r ≤ 100 kpc with N(HI)> 1020
cm−2, with infall velocities∼ 200 km s−1 . Along lines ofsight with b >> 0, one might expect absorption centerednearvlos ≃ 0 relative to the galaxy systemic redshift (becauseon average the sightlines should intersect both blue-shiftedand red-shifted IS material), with velocity range of perhaps±150 km s−1 . Sightlines withb ≃ 0 (i.e., in the spectra of
27 Murray et al. (2005) point out that cool clouds entrained in ahot flowbehave like momentum-driven winds whether the source of theflow is pri-marily momentum-driven or energy-driven.

The Circum-Galactic Medium atz= 2− 3 29
the galaxies themselves) should intersect inflowing gas with0 <∼ vlos
<∼ + 200 km s−1 .
As mentioned in §4.3 above (and illustrated in Fig. 11),the “excess” absorption in the composite spectrum of galax-ies withMbar
>∼ 4×10¹⁰ M⊙ may be consistent with both the
expected kinematics and optical depth (or covering fraction)for infalling gas. It is notable that thevlos ≥ 0 component ofabsorption is seen in low-ionization species, but not in morehighly ionized species such as CIV that are otherwise presentover all velocitiesvlos < 0 km s−1 . This may imply that thegas in thevlos > 0 kinematic component is more self-shieldedthan the IS material that contributes most of the observed lineequivalent width, suggesting it lies primarily at smallr. In anycase, even when it is present, a putative infalling IS compo-nent cannot account for the observation of strong absorptionin both Lyα and metal lines whose strength requires high ve-locity dispersion and covering fraction. Nor can accretionex-plain the observed kinematics of Lyα emission discussed ex-tensively in §5. Nevertheless, weknowthat galaxies with halomasses of≃ 1012 M⊙ must accrete material in some form overthe typical star formation timescale of∼ 500 Myr in any rea-sonable hierarchical model; infall of low-metallicity gasmayalso be necessary for producing the observed mass-metallicityrelation atz≃ 2 (e.g. Erb 2008) .
Possibly more intriguing than the dominance of outflowingIS material is the observation (both in the present〈z〉 = 2.3sample and in thez∼ 1.4 sample of Weiner et al. (2009)) thatgalaxies below a threshold in baryonic mass appear to lackthevlos > 0 IS absorption component. In thez∼ 2.3 samplethe mass threshold appears to be nearMbar ≃ 4× 10¹⁰ M⊙,below which essentially all IS absorption is blue-shifted.Wehave seen that the probable range in dark matter halo mass(assuming correspondence between baryonic mass and halomass) for the lower-Mbar half of the Hα sample is 4× 10¹¹
M⊙<∼ Mhalo
<∼ 9×10¹¹ M⊙– a range in mass over which cold
accretion is believed to be near its peak atz≃ 2. Paradox-ically, the sub-sample showing possible evidence for an ac-creting component of cool gas is the half withMhalo
>∼ 1012
M⊙, i.e. close to the critical mass at which virial shocks be-gin to prevent cold gas from streaming to the central regionsof the galaxy (e.g., Dekel & Birnboim 2006; Ceverino et al.2009, but cf. Kereš et al. 2009). Lower baryonic mass galax-ies with similar star formation rates show no evidence for aninfalling component with significant covering fraction, atleastas compared to that of out-flowing material. The extendednature of the galaxies in whose spectra the IS lines are mea-sured provides a spatially-averaged IS absorption profile todetect both the coolest regions of inflowing material as wellas more highly ionized gas (i.e., having N(HI) as low as 1014
cm−2) that would present a larger covering fraction. It wouldbe very hard to miss infalling cool gas, which would appearas redshifted absorption forb = 0 sightlines. Moreover, sight-lines atb>> 0 would produce lines too weak to be consistentwith theW0 vs. b results from §6 due to the quieter velocityfields expected for infalling material; see Dekel et al. (2009).
With the possible exception of thev > 0 absorption in themore massive half of the current sample (which could havealternative explanations; see discussion in §2), the observa-tions reveal an absence of evidence supporting cold flow ac-cretion as currently envisioned. It is possible that the streamscover a much smaller fraction of 4π steradians than the∼ 20− 25% estimated from simulations (Goerdt et al. 2009;Dekel & Birnboim 2008) in order to remain undetected by the
absorption probes; however, since the absorption line probesare sensitive to HI column densities as low as N(HI) <
∼ 1015
cm−2, they would be sensitive to much more than the coolest,most highly collimated regions of the accretion flow. In anycase, there seems to be no way to reconcile the observed CGMabsorption line strength and kinematics with the results ofsimulations which seem consistently to predict that accretionof cool gas should be dominant over outflow for galaxies withMtot ∼ 1012 M⊙. Taken at face value, it seems that the impor-tance of cold accretion has been significantly over-estimated– or at least that its observational signature must be more sub-tle than suggested by the early predictions. Of equal concernis that the influence of outflows, affecting large regions of theCGM of relatively massive galaxies, seems to have been se-riously under-estimated; in many cases, outflowing materialhas been completely ignored or deemed negligible for galax-ies in the same mass range as in our sample. There is strongempirical evidence for high velocity outflows whose influenceextends to galactocentric radii of at least 125 kpc around anaverage galaxy in our sample– roughly the same range ofrover which cold accretion is supposed to be most observable.It would clearly be interesting to understand how high veloc-ity outflows would interact with cool accreting gas in the casethat both are occurring simultaneously in the same galaxiesand where the relevant physics of both processes have been re-alistically modeled. At present, the bulk of the observationalresults do not support the direction in which the theory hasbeen moving– a situation which clearly needs to be resolved.
8.5. Lyα Emission Re-Visited
In §5 we presented a simple 1-D model in an effort tounderstand the kinematics of Lyα emission in the galaxyspectra. The model assumed that the observed blue-shiftedIS absorption is providing information on the relevant gas-phase kinematics on the “far side” of the galaxy. Weshowed that the scattering of Lyα photons in circumgalac-tic gas having large bulk velocities and steep velocity gra-dients would produce redshifted Lyα emission similar tothat observed. A somewhat more physically-motivated CGMmodel was presented in §7. The outflowing material ismulti-phase, where the covering fraction of gas giving riseto a particular transition (rather than the optical depth) ver-sus velocity and galactocentric radius modulates the lineprofile shapes and the line strength as a function of im-pact parameter. A more sophisticated model for Lyα emis-sion, including photon diffusion in 3-D physical space aswell as velocity space (e.g., Laursen & Sommer-Larsen 2007;Verhamme et al. 2008), would be needed for a detailed under-standing of the Lyα morphology. Such modeling is beyondthe scope of the present work; however, the multi-phase gasinvolved in galaxy-scale outflows is likely to lead, qualita-tively, to Lyα kinematics similar to the observations.
As discussed in §5, the high velocity and (more impor-tantly) the large velocityrangeevident from the observed ISabsorption lines allow Lyα photons initially produced by re-combination in the galaxy HII regions to work their way out-ward in both real space and velocity space via multiple scat-tering events. Rather than a shell or a continuous medium ofhigh H I optical depth, the velocity gradient due to the accel-eration of the clumpy outflowing gas allows Lyα photons tomigrate to larger radii and higher velocities until they aresuf-ficiently redshifted that photons emitted toward an observercan escape the galaxy and its circumgalactic gas. Since we

30 Steidel et al.
know that the clouds giving rise to low-ionization absorptionlines typically extend to at leastr ≃ 70 kpc, the model we haveproposed implies that there should be a diffuse Lyα halo onthe same physical scales. The total luminosity in the diffusehalo may, in some cases, represent a significant fraction ofthe galaxy’s production of Lyα, albeit distributed over a pro-jected surface area as much as>
∼ 1000 times larger than thegalaxy continuum light. Of course, most of this Lyα emis-sion would not be included in the narrow slit typically usedfor galaxy spectroscopy. It is possible that the diffuse emis-sion has already been observed in very deep Lyα images inthe form of Lyα “Blobs” (Steidel et al. 2000; Matsuda et al.2004)– the most extreme examples– or as diffuse emissionevident only after stacking spatial regions surrounding normalLBGs (Hayashino et al. 2004, Steidel et al, in preparation).
The main point is that the structure and kinematics of theCGM ultimately control the morphology of escaping Lyαemission, and the Lyα “photosphere” of a galaxy is expectedto be roughly coincident with the distribution of gas responsi-ble for the observed IS absorption features. This “prediction”of very extended Lyα halos on scales of∼ 50− 100 kpc isremarkably similar to recent predictions of cooling Lyα emis-sion associated with cold accretion onto galaxies of very sim-ilar mass scale to those in the current sample (Goerdt et al.2009; Dijkstra & Loeb 2009). Lyα emission is expected to beboth redshifted and relatively axisymmetric for Lyα originat-ing in the galaxy and scattering through the CGM, whereasLyα emission from accreting gas should favor blue-shifts andwill be concentrated in a few dense filaments. However, it re-mains unclear howobservationallydistinct the extended Lyαemission arising from these two very different processes willbe.
We intend to address these issues in greater detail in a sep-arate paper.
8.6. Outflow Mass Flux and the Gas Content of the CGM
In principle, the type of outflow model described above canbe used to estimate the outward mass fluxMout as well asthe total (cool) gas content of the CGM,MCGM. Mass out-flow rates of cool gas have been estimated for nearby star-bursts (e.g., Martin 2005), for rare individual examples ofhigh redshift galaxies (e.g., Pettini et al. 2000), and for com-posite spectra of star-forming galaxies at intermediate red-shifts (Weiner et al. 2009). In all cases, the mass flux is esti-mated to beMout
>∼ M∗ whereM∗ is the galaxy star formation
rate. The calculations generally assume that the outflowingmaterial is in a thin shell located at a galactocentric radius rjust beyond the observed stars, traveling with outward veloc-ity given by the centroid of the outflowing component of theIS absorption lines, where the total gas column densities havebeen estimated from the strength of low-ionization metal ab-sorption lines (forz< 1.6) or from the observed N(HI) mea-sured from the Lyα absorption, in the case of MS1512-cB58.The uncertainties in these calculations are very large eveninthe context of the simple shell model, since they depend onthe assumed shell radius asr2 and the total gas columns arepoorly constrained even when N(HI) has been directly mea-sured, due to unknown ionization corrections.
Unfortunately, the less-idealized model introduced abovedoes not necessarily improve the situation; the IS absorptionis produced by gas with a large range of both radius and ve-locity, rather than a shell at a single radius. This means that agalaxy spectrum contains information on the integral absorp-
tion along its line of sight, and therefore includes materialdeposited by both current and past winds. Since the depth ofabsorption lines is significant out toRe f f ∼ 100 kpc in ouroutflow model, gas that was launched up to>∼ 100 Myr agomay still contribute to the line profiles, albeit diluted by ade-creasing covering fraction with increasingr.
In the context of our model, cool gas deposited by outflowsto r ∼ 100 kpc represents an appreciable fraction of the ex-pectedMbar,tot ≃ 1.5×10¹¹ M⊙ associated with a typical darkmatter halo mass of≃ 9× 10¹¹ M⊙. If we assume for def-initeness thatRe f f ≃ 80 kpc and that the asymptotic outflowvelocity is vout ≃ 750 km s−1 , a packet of cool gas launchedfrom rmin∼1−2 kpc will reachr ≃ 80 kpc aftert80∼ 1.3×10⁸
years. If there is a steady-state flow with mass fluxMout, thetotal cool gas content withinRe f f = 80 kpc deposited by theoutflow would be given approximately by
〈MCGM〉 = 〈Mout〉t80 . (19)
The model that best reproduces the radial behavior offc forlow-ionization species in the CGM of typical galaxies impliescloud densities that increase with galactocentric radius asρc ∝r−2 (§7.3). If we assume that the initial number density ofatoms in a typical cloud isn0 cm−3 at the base of the flowrmin,then the total cool gas mass betweenrmin ∼ 1 kpc andr = 80kpc is
MCGM(r < 80) ≃ 3×10¹⁰ n0 M⊙ , (20)
〈Mout〉 ≃〈MCGM〉
t80≃ 230n0M⊙yr−1 . (21)
Note that this estimate does not attempt to account for hotor highly ionized gas that is also likely to be associatedwith supernova-driven outflows (e.g., Strickland & Heckman2009).
An estimate ofn0 follows from our earlier assertion thatRe f f for low-ion species likely corresponds to a thresholdN(H I) >
∼ 1017 cm−2 (i.e., a Lyman Limit system). The neutralfraction for such HI column density gas ionized by the meta-galactic radiation field is estimated to be∼ 10−3 (e.g., Steidel1990b), so that the total H column will be∼ 1020 cm−2. Fora line of sight withb ∼ 80 kpc, the corresponding averagedensitynH(80)∼ 4×10⁻⁴ cm−3. In the case of the aforemen-tionedr−2 density dependence,
n0 ∼
[
Re f f
rmin
]2
nH(80) ∼ 1 cm−3 . (22)
Adoptingn0 = 1 cm−3, cool gas in the CGM would accountfor at least 20% of the total baryons associated with a typicalgalaxy, with mass comparable to the totalMbar (cold gas plusstars) in the central few kpc, which has〈Mbar〉 ≃ 4×10¹⁰ M⊙
at z = 2.3 (Erb et al. 2006c). If one assumes that the typicalstellar massM∗ ≃ 2× 10¹⁰ M⊙ was formed over the sametimescale (i.e.,t80≃ 1.3×10⁸ yr), then〈SFR〉 ≃ 150 M⊙ yr−1.Thus, a crude (but largely independent) calculation yieldsthesame qualitative result obtained with shell models in previouswork: i.e.,Mout
>∼ M∗.
In any case, it is difficult to escape the conclusion that theCGM contains a substantial fraction of galactic baryons atz ∼ 2 − 3, and that the gas-phase kinematics and geometrypoints to a causal connection between rapid star formation
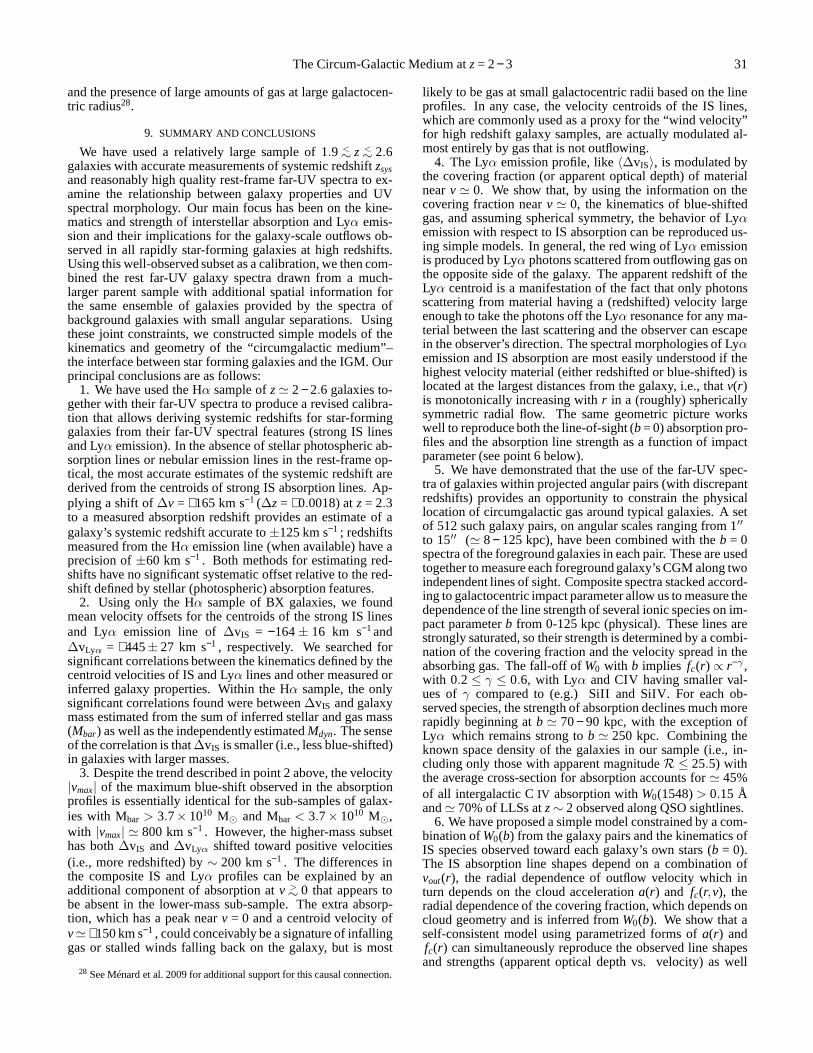
The Circum-Galactic Medium atz= 2− 3 31
and the presence of large amounts of gas at large galactocen-tric radius28.
9. SUMMARY AND CONCLUSIONS
We have used a relatively large sample of 1.9 <∼ z <
∼ 2.6galaxies with accurate measurements of systemic redshiftzsysand reasonably high quality rest-frame far-UV spectra to ex-amine the relationship between galaxy properties and UVspectral morphology. Our main focus has been on the kine-matics and strength of interstellar absorption and Lyα emis-sion and their implications for the galaxy-scale outflows ob-served in all rapidly star-forming galaxies at high redshifts.Using this well-observed subset as a calibration, we then com-bined the rest far-UV galaxy spectra drawn from a much-larger parent sample with additional spatial information forthe same ensemble of galaxies provided by the spectra ofbackground galaxies with small angular separations. Usingthese joint constraints, we constructed simple models of thekinematics and geometry of the “circumgalactic medium”–the interface between star forming galaxies and the IGM. Ourprincipal conclusions are as follows:
1. We have used the Hα sample ofz≃ 2− 2.6 galaxies to-gether with their far-UV spectra to produce a revised calibra-tion that allows deriving systemic redshifts for star-forminggalaxies from their far-UV spectral features (strong IS linesand Lyα emission). In the absence of stellar photospheric ab-sorption lines or nebular emission lines in the rest-frame op-tical, the most accurate estimates of the systemic redshiftarederived from the centroids of strong IS absorption lines. Ap-plying a shift of∆v = +165 km s−1 (∆z= +0.0018) atz= 2.3to a measured absorption redshift provides an estimate of agalaxy’s systemic redshift accurate to±125 km s−1 ; redshiftsmeasured from the Hα emission line (when available) have aprecision of±60 km s−1 . Both methods for estimating red-shifts have no significant systematic offset relative to thered-shift defined by stellar (photospheric) absorption features.
2. Using only the Hα sample of BX galaxies, we foundmean velocity offsets for the centroids of the strong IS linesand Lyα emission line of∆vIS = −164± 16 km s−1and∆vLyα = +445± 27 km s−1 , respectively. We searched forsignificant correlations between the kinematics defined by thecentroid velocities of IS and Lyα lines and other measured orinferred galaxy properties. Within the Hα sample, the onlysignificant correlations found were between∆vIS and galaxymass estimated from the sum of inferred stellar and gas mass(Mbar) as well as the independently estimatedMdyn. The senseof the correlation is that∆vIS is smaller (i.e., less blue-shifted)in galaxies with larger masses.
3. Despite the trend described in point 2 above, the velocity|vmax| of the maximum blue-shift observed in the absorptionprofiles is essentially identical for the sub-samples of galax-ies with Mbar > 3.7× 10¹⁰ M⊙ and Mbar < 3.7× 10¹⁰ M⊙,with |vmax| ≃ 800 km s−1 . However, the higher-mass subsethas both∆vIS and∆vLyα shifted toward positive velocities(i.e., more redshifted) by∼ 200 km s−1 . The differences inthe composite IS and Lyα profiles can be explained by anadditional component of absorption atv >
∼ 0 that appears tobe absent in the lower-mass sub-sample. The extra absorp-tion, which has a peak nearv = 0 and a centroid velocity ofv≃ +150 km s−1 , could conceivably be a signature of infallinggas or stalled winds falling back on the galaxy, but is most
28 See Ménard et al. 2009 for additional support for this causalconnection.
likely to be gas at small galactocentric radii based on the lineprofiles. In any case, the velocity centroids of the IS lines,which are commonly used as a proxy for the “wind velocity”for high redshift galaxy samples, are actually modulated al-most entirely by gas that is not outflowing.
4. The Lyα emission profile, like〈∆vIS〉, is modulated bythe covering fraction (or apparent optical depth) of materialnearv ≃ 0. We show that, by using the information on thecovering fraction nearv ≃ 0, the kinematics of blue-shiftedgas, and assuming spherical symmetry, the behavior of Lyαemission with respect to IS absorption can be reproduced us-ing simple models. In general, the red wing of Lyα emissionis produced by Lyα photons scattered from outflowing gas onthe opposite side of the galaxy. The apparent redshift of theLyα centroid is a manifestation of the fact that only photonsscattering from material having a (redshifted) velocity largeenough to take the photons off the Lyα resonance for any ma-terial between the last scattering and the observer can escapein the observer’s direction. The spectral morphologies of Lyαemission and IS absorption are most easily understood if thehighest velocity material (either redshifted or blue-shifted) islocated at the largest distances from the galaxy, i.e., thatv(r)is monotonically increasing withr in a (roughly) sphericallysymmetric radial flow. The same geometric picture workswell to reproduce both the line-of-sight (b= 0) absorption pro-files and the absorption line strength as a function of impactparameter (see point 6 below).
5. We have demonstrated that the use of the far-UV spec-tra of galaxies within projected angular pairs (with discrepantredshifts) provides an opportunity to constrain the physicallocation of circumgalactic gas around typical galaxies. A setof 512 such galaxy pairs, on angular scales ranging from 1′′
to 15′′ (≃ 8− 125 kpc), have been combined with theb = 0spectra of the foreground galaxies in each pair. These are usedtogether to measure each foreground galaxy’s CGM along twoindependent lines of sight. Composite spectra stacked accord-ing to galactocentric impact parameter allow us to measure thedependence of the line strength of several ionic species on im-pact parameterb from 0-125 kpc (physical). These lines arestrongly saturated, so their strength is determined by a combi-nation of the covering fraction and the velocity spread in theabsorbing gas. The fall-off ofW0 with b implies fc(r) ∝ r−γ ,with 0.2 ≤ γ ≤ 0.6, with Lyα and CIV having smaller val-ues ofγ compared to (e.g.) SiII and SiIV. For each ob-served species, the strength of absorption declines much morerapidly beginning atb ≃ 70− 90 kpc, with the exception ofLyα which remains strong tob ≃ 250 kpc. Combining theknown space density of the galaxies in our sample (i.e., in-cluding only those with apparent magnitudeR ≤ 25.5) withthe average cross-section for absorption accounts for≃ 45%of all intergalactic CIV absorption withW0(1548)> 0.15 Åand≃ 70% of LLSs atz∼ 2 observed along QSO sightlines.
6. We have proposed a simple model constrained by a com-bination ofW0(b) from the galaxy pairs and the kinematics ofIS species observed toward each galaxy’s own stars (b = 0).The IS absorption line shapes depend on a combination ofvout(r), the radial dependence of outflow velocity which inturn depends on the cloud accelerationa(r) and fc(r,v), theradial dependence of the covering fraction, which depends oncloud geometry and is inferred fromW0(b). We show that aself-consistent model using parametrized forms ofa(r) andfc(r) can simultaneously reproduce the observed line shapesand strengths (apparent optical depth vs. velocity) as well
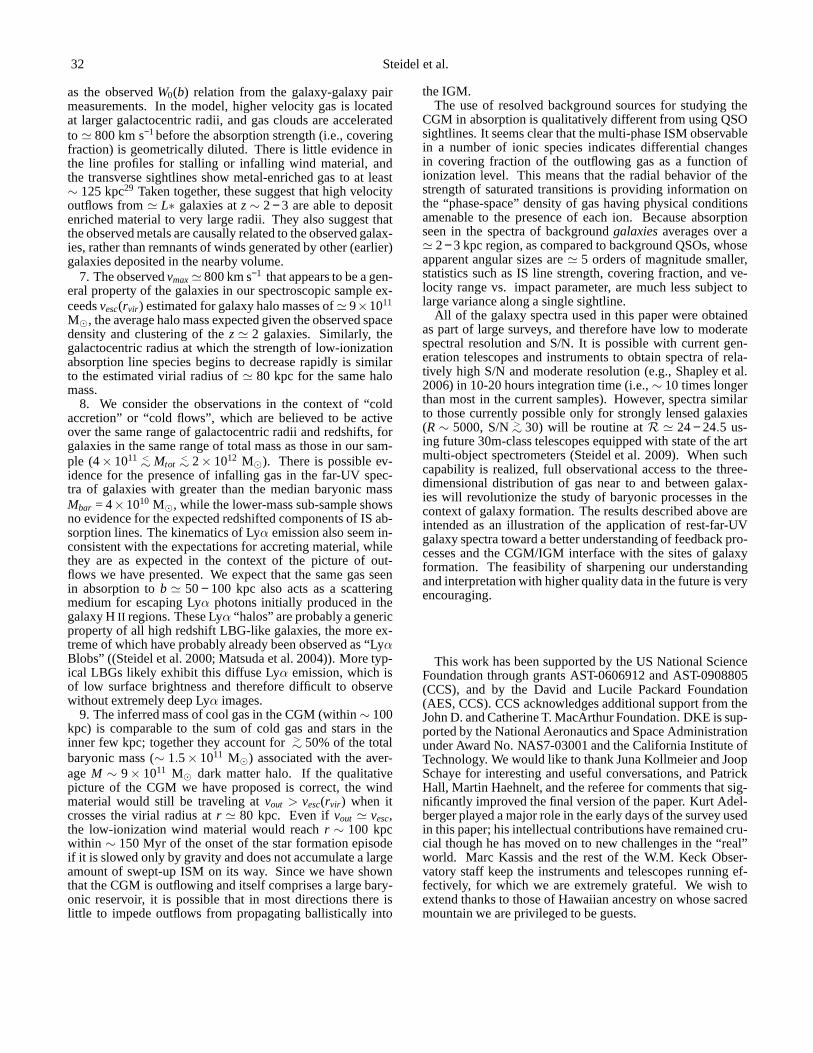
32 Steidel et al.
as the observedW0(b) relation from the galaxy-galaxy pairmeasurements. In the model, higher velocity gas is locatedat larger galactocentric radii, and gas clouds are acceleratedto ≃ 800 km s−1before the absorption strength (i.e., coveringfraction) is geometrically diluted. There is little evidence inthe line profiles for stalling or infalling wind material, andthe transverse sightlines show metal-enriched gas to at least∼ 125 kpc29 Taken together, these suggest that high velocityoutflows from≃ L∗ galaxies atz∼ 2− 3 are able to depositenriched material to very large radii. They also suggest thatthe observed metals are causally related to the observed galax-ies, rather than remnants of winds generated by other (earlier)galaxies deposited in the nearby volume.
7. The observedvmax≃ 800 km s−1 that appears to be a gen-eral property of the galaxies in our spectroscopic sample ex-ceedsvesc(rvir ) estimated for galaxy halo masses of≃ 9×10¹¹
M⊙, the average halo mass expected given the observed spacedensity and clustering of thez≃ 2 galaxies. Similarly, thegalactocentric radius at which the strength of low-ionizationabsorption line species begins to decrease rapidly is similarto the estimated virial radius of≃ 80 kpc for the same halomass.
8. We consider the observations in the context of “coldaccretion” or “cold flows”, which are believed to be activeover the same range of galactocentric radii and redshifts, forgalaxies in the same range of total mass as those in our sam-ple (4× 10¹¹ <
∼ Mtot<∼ 2× 10¹² M⊙). There is possible ev-
idence for the presence of infalling gas in the far-UV spec-tra of galaxies with greater than the median baryonic massMbar = 4×10¹⁰ M⊙, while the lower-mass sub-sample showsno evidence for the expected redshifted components of IS ab-sorption lines. The kinematics of Lyα emission also seem in-consistent with the expectations for accreting material, whilethey are as expected in the context of the picture of out-flows we have presented. We expect that the same gas seenin absorption tob ≃ 50− 100 kpc also acts as a scatteringmedium for escaping Lyα photons initially produced in thegalaxy HII regions. These Lyα “halos” are probably a genericproperty of all high redshift LBG-like galaxies, the more ex-treme of which have probably already been observed as “LyαBlobs” ((Steidel et al. 2000; Matsuda et al. 2004)). More typ-ical LBGs likely exhibit this diffuse Lyα emission, which isof low surface brightness and therefore difficult to observewithout extremely deep Lyα images.
9. The inferred mass of cool gas in the CGM (within∼ 100kpc) is comparable to the sum of cold gas and stars in theinner few kpc; together they account for>∼ 50% of the totalbaryonic mass (∼ 1.5× 10¹¹ M⊙) associated with the aver-ageM ∼ 9× 10¹¹ M⊙ dark matter halo. If the qualitativepicture of the CGM we have proposed is correct, the windmaterial would still be traveling atvout > vesc(rvir ) when itcrosses the virial radius atr ≃ 80 kpc. Even ifvout ≃ vesc,the low-ionization wind material would reachr ∼ 100 kpcwithin ∼ 150 Myr of the onset of the star formation episodeif it is slowed only by gravity and does not accumulate a largeamount of swept-up ISM on its way. Since we have shownthat the CGM is outflowing and itself comprises a large bary-onic reservoir, it is possible that in most directions thereislittle to impede outflows from propagating ballistically into
the IGM.The use of resolved background sources for studying the
CGM in absorption is qualitatively different from using QSOsightlines. It seems clear that the multi-phase ISM observablein a number of ionic species indicates differential changesin covering fraction of the outflowing gas as a function ofionization level. This means that the radial behavior of thestrength of saturated transitions is providing information onthe “phase-space” density of gas having physical conditionsamenable to the presence of each ion. Because absorptionseen in the spectra of backgroundgalaxiesaverages over a≃ 2− 3 kpc region, as compared to background QSOs, whoseapparent angular sizes are≃ 5 orders of magnitude smaller,statistics such as IS line strength, covering fraction, andve-locity range vs. impact parameter, are much less subject tolarge variance along a single sightline.
All of the galaxy spectra used in this paper were obtainedas part of large surveys, and therefore have low to moderatespectral resolution and S/N. It is possible with current gen-eration telescopes and instruments to obtain spectra of rela-tively high S/N and moderate resolution (e.g., Shapley et al.2006) in 10-20 hours integration time (i.e.,∼ 10 times longerthan most in the current samples). However, spectra similarto those currently possible only for strongly lensed galaxies(R∼ 5000, S/N>
∼ 30) will be routine atR ≃ 24− 24.5 us-ing future 30m-class telescopes equipped with state of the artmulti-object spectrometers (Steidel et al. 2009). When suchcapability is realized, full observational access to the three-dimensional distribution of gas near to and between galax-ies will revolutionize the study of baryonic processes in thecontext of galaxy formation. The results described above areintended as an illustration of the application of rest-far-UVgalaxy spectra toward a better understanding of feedback pro-cesses and the CGM/IGM interface with the sites of galaxyformation. The feasibility of sharpening our understandingand interpretation with higher quality data in the future isveryencouraging.
This work has been supported by the US National ScienceFoundation through grants AST-0606912 and AST-0908805(CCS), and by the David and Lucile Packard Foundation(AES, CCS). CCS acknowledges additional support from theJohn D. and Catherine T. MacArthur Foundation. DKE is sup-ported by the National Aeronautics and Space Administrationunder Award No. NAS7-03001 and the California Institute ofTechnology. We would like to thank Juna Kollmeier and JoopSchaye for interesting and useful conversations, and PatrickHall, Martin Haehnelt, and the referee for comments that sig-nificantly improved the final version of the paper. Kurt Adel-berger played a major role in the early days of the survey usedin this paper; his intellectual contributions have remained cru-cial though he has moved on to new challenges in the “real”world. Marc Kassis and the rest of the W.M. Keck Obser-vatory staff keep the instruments and telescopes running ef-fectively, for which we are extremely grateful. We wish toextend thanks to those of Hawaiian ancestry on whose sacredmountain we are privileged to be guests.

The Circum-Galactic Medium atz= 2− 3 33
29 Adelberger et al. (2003), and Adelberger et al. (2005b) haveargued thatthere is evidence that the metals affect regions of≃ 300 kpc (proper) based onC IV–galaxy cross-correlation, and that outflows would be expected to stall
at approximately this distance due to a number of separate considerations.
REFERENCES
Adelberger, K. L., Shapley, A. E., Steidel, C. C., Pettini, M., Erb, D. K., &Reddy, N. A. 2005a, ApJ, 629, 636
Adelberger, K. L. & Steidel, C. C. 2000, ApJ, 544, 218Adelberger, K. L., Steidel, C. C., Pettini, M., Shapley, A. E., Reddy, N. A.,
& Erb, D. K. 2005b, ApJ, 619, 697Adelberger, K. L., Steidel, C. C., Shapley, A. E., Hunt, M. P., Erb, D. K.,
Reddy, N. A., & Pettini, M. 2004, ApJ, 607, 226Adelberger, K. L., Steidel, C. C., Shapley, A. E., & Pettini,M. 2003, ApJ,
584, 45Bergeron, J. & Boissé, P. 1991, A&A, 243, 344Bouché, N., Murphy, M. T., Péroux, C., Davies, R., Eisenhauer, F., Förster
Schreiber, N. M., & Tacconi, L. 2007, ApJ, 669, L5Bowen, D. V., Blades, J. C., & Pettini, M. 1995, ApJ, 448, 634Brooks, A. M., Governato, F., Quinn, T., Brook, C. B., & Wadsley, J. 2009,
ApJ, 694, 396Ceverino, D., Dekel, A., & Bournaud, F. 2009, ArXiv e-printsCharlot, S. & Fall, S. M. 1991, ApJ, 378, 471Chen, H., Lanzetta, K. M., Webb, J. K., & Barcons, X. 2001, ApJ, 559, 654Chen, Y., Tremonti, C. A., Heckman, T. M., Kauffmann, G., Weiner, B. J.,
Brinchmann, J., & Wang, J. 2010, ArXiv e-printsColina, L., Arribas, S., & Monreal-Ibero, A. 2005, ApJ, 621,725Conroy, C., Shapley, A. E., Tinker, J. L., Santos, M. R., & Lemson, G. 2008,
ApJ, 679, 1192Danforth, C. W. & Shull, J. M. 2008, ApJ, 679, 194Dekel, A. & Birnboim, Y. 2006, MNRAS, 368, 2—. 2008, MNRAS, 383, 119Dekel, A., Birnboim, Y., Engel, G., Freundlich, J., Goerdt,T., Mumcuoglu,
M., Neistein, E., Pichon, C., Teyssier, R., & Zinger, E. 2009, Nature, 457,451
Dijkstra, M., Haiman, Z., & Spaans, M. 2006a, ApJ, 649, 14—. 2006b, ApJ, 649, 37Dijkstra, M. & Loeb, A. 2009, MNRAS, 400, 1109Ellison, S. L., Ibata, R., Pettini, M., Lewis, G. F., Aracil,B., Petitjean, P., &
Srianand, R. 2004, A&A, 414, 79Erb, D. K. 2008, ApJ, 674, 151Erb, D. K., Shapley, A. E., Pettini, M., Steidel, C. C., Reddy, N. A., &
Adelberger, K. L. 2006a, ApJ, 644, 813Erb, D. K., Shapley, A. E., Steidel, C. C., Pettini, M., Adelberger, K. L.,
Hunt, M. P., Moorwood, A. F. M., & Cuby, J. 2003, ApJ, 591, 101Erb, D. K., Steidel, C. C., Shapley, A. E., Pettini, M., Reddy, N. A., &
Adelberger, K. L. 2006b, ApJ, 647, 128—. 2006c, ApJ, 646, 107Ferrara, A. 2003, Ap&SS, 284, 415Förster Schreiber, N. M., Genzel, R., Lehnert, M. D., Bouché, N., Verma,
A., Erb, D. K., Shapley, A. E., Steidel, C. C., Davies, R., Lutz, D.,Nesvadba, N., Tacconi, L. J., Eisenhauer, F., Abuter, R., Gilbert, A.,Gillessen, S., & Sternberg, A. 2006, ApJ, 645, 1062
Franx, M., Illingworth, G. D., Kelson, D. D., van Dokkum, P. G., & Tran,K.-V. 1997, ApJ, 486, L75+
Furlanetto, S. R., Schaye, J., Springel, V., & Hernquist, L.2005, ApJ, 622, 7Goerdt, T., Dekel, A., Sternberg, A., Ceverino, D., Teyssier, R., & Primack,
J. R. 2009, ArXiv e-printsGrimes, J. P., Heckman, T., Aloisi, A., Calzetti, D., Leitherer, C., Martin,
C. L., Meurer, G., Sembach, K., & Strickland, D. 2009, ApJS, 181, 272Haiman, Z., Spaans, M., & Quataert, E. 2000, ApJ, 537, L5Hansen, M. & Oh, S. P. 2006, MNRAS, 367, 979Hayashino, T., Matsuda, Y., Tamura, H., Yamauchi, R., Yamada, T., Ajiki,
M., Fujita, S. S., Murayama, T., Nagao, T., Ohta, K., Okamura, S., Ouchi,M., Shimasaku, K., Shioya, Y., & Taniguchi, Y. 2004, AJ, 128,2073
Heckman, T. M., Armus, L., & Miley, G. K. 1990, ApJS, 74, 833Kacprzak, G. G., Churchill, C. W., Ceverino, D., Steidel, C.C., Klypin, A.,
& Murphy, M. T. 2009, ArXiv e-printsKennicutt, R. C. 1998, ApJ, 498, 541Kereš, D., Katz, N., Fardal, M., Davé, R., & Weinberg, D. H. 2009,
MNRAS, 395, 160Kereš, D., Katz, N., Weinberg, D. H., & Davé, R. 2005, MNRAS, 363, 2Kornei, K. A., Shapley, A. E., Erb, D. K., Steidel, C. C., Reddy, N. A.,
Pettini, M., & Bogosavljevic, M. 2009, ArXiv e-printsLanzetta, K. M., Bowen, D. V., Tytler, D., & Webb, J. K. 1995, ApJ, 442,
538Laursen, P. & Sommer-Larsen, J. 2007, ApJ, 657, L69
Law, D. R., Steidel, C. C., Erb, D. K., Larkin, J. E., Pettini,M., Shapley,A. E., & Wright, S. A. 2009, ApJ, 697, 2057
Lehnert, M. D. & Heckman, T. M. 1996, ApJ, 472, 546Lehnert, M. D., Heckman, T. M., & Weaver, K. A. 1999, ApJ, 523,575Madau, P., Ferrara, A., & Rees, M. J. 2001, ApJ, 555, 92Martin, C. L. 1999, ApJ, 513, 156—. 2005, ApJ, 621, 227Martin, C. L. & Bouché, N. 2009, ApJ, 703, 1394Mas-Hesse, J. M., Kunth, D., Tenorio-Tagle, G., Leitherer,C., Terlevich,
R. J., & Terlevich, E. 2003, ApJ, 598, 858Matsuda, Y., Yamada, T., Hayashino, T., Tamura, H., Yamauchi, R., Ajiki,
M., Fujita, S. S., Murayama, T., Nagao, T., Ohta, K., Okamura, S., Ouchi,M., Shimasaku, K., Shioya, Y., & Taniguchi, Y. 2004, AJ, 128,569
McLean, I. S., Becklin, E. E., Bendiksen, O., Brims, G., Canfield, J., Figer,D. F., Graham, J. R., Hare, J., Lacayanga, F., Larkin, J. E., Larson, S. B.,Levenson, N., Magnone, N., Teplitz, H., & Wong, W. 1998, in Proc. SPIEVol. 3354, p. 566-578, Infrared Astronomical Instrumentation, Albert M.Fowler; Ed., Vol. 3354, 566–578
Ménard, B., Wild, V., Nestor, D., Quider, A., & Zibetti, S. 2009, ArXive-prints
Mori, M., Ferrara, A., & Madau, P. 2002, ApJ, 571, 40Murray, N., Quataert, E., & Thompson, T. A. 2005, ApJ, 618, 569Navarro, J. F., Frenk, C. S., & White, S. D. M. 1997, ApJ, 490, 493Neufeld, D. A. 1991, ApJ, 370, L85Pettini, M., Rix, S. A., Steidel, C. C., Adelberger, K. L., Hunt, M. P., &
Shapley, A. E. 2002, ApJ, 569, 742Pettini, M., Shapley, A. E., Steidel, C. C., Cuby, J., Dickinson, M.,
Moorwood, A. F. M., Adelberger, K. L., & Giavalisco, M. 2001,ApJ,554, 981
Pettini, M., Steidel, C. C., Adelberger, K. L., Dickinson, M., & Giavalisco,M. 2000, ApJ, 528, 96
Quider, A. M., Pettini, M., Shapley, A. E., & Steidel, C. C. 2009a, MNRAS,398, 1263
Quider, A. M., Shapley, A. E., Pettini, M., Steidel, C. C., & Stark, D. P.2009b, ArXiv e-prints
Rauch, M., Sargent, W. L. W., & Barlow, T. A. 1999, ApJ, 515, 500—. 2001, ApJ, 554, 823Reddy, N. A., Erb, D. K., Steidel, C. C., Shapley, A. E., Adelberger, K. L.,
& Pettini, M. 2005, ApJ, in pressReddy, N. A. & Steidel, C. C. 2009, ApJ, 692, 778Reddy, N. A., Steidel, C. C., Fadda, D., Yan, L., Pettini, M.,Shapley, A. E.,
Erb, D. K., & Adelberger, K. L. 2006, ApJ, 644, 792Reddy, N. A., Steidel, C. C., Pettini, M., Adelberger, K. L.,Shapley, A. E.,
Erb, D. K., & Dickinson, M. 2008, ApJS, 175, 48Rupke, D. S., Veilleux, S., & Sanders, D. B. 2005, ApJS, 160, 115Sanders, D. B., Mazzarella, J. M., Kim, D., Surace, J. A., & Soifer, B. T.
2003, AJ, 126, 1607Sargent, W. L. W., Boksenberg, A., & Steidel, C. C. 1988, ApJS, 68, 539Scannapieco, E., Ferrara, A., & Madau, P. 2002, ApJ, 574, 590Schaerer, D. & Verhamme, A. 2008, A&A, 480, 369Schaye, J., Carswell, R. F., & Kim, T. 2007, MNRAS, 379, 1169Schwartz, C. M., Martin, C. L., Chandar, R., Leitherer, C., Heckman, T. M.,
& Oey, M. S. 2006, ApJ, 646, 858Shapley, A. E., Steidel, C. C., Adelberger, K. L., Dickinson, M., Giavalisco,
M., & Pettini, M. 2001, ApJ, 562, 95Shapley, A. E., Steidel, C. C., Erb, D. K., Reddy, N. A., Adelberger, K. L.,
Pettini, M., Barmby, P., & Huang, J. 2005, ApJ, 626, 698Shapley, A. E., Steidel, C. C., Pettini, M., & Adelberger, K.L. 2003, ApJ,
588, 65Shapley, A. E., Steidel, C. C., Pettini, M., Adelberger, K. L., & Erb, D. K.
2006, ApJ, 651, 688Springel, V., White, S. D. M., Jenkins, A., Frenk, C. S., Yoshida, N., Gao,
L., Navarro, J., Thacker, R., Croton, D., Helly, J., Peacock, J. A., Cole, S.,Thomas, P., Couchman, H., Evrard, A., Colberg, J., & Pearce,F. 2005,Nature, 435, 629
Steidel, C., Martin, C., Prochaska, J. X., Pettini, M., Schaye, J., & Rakic, O.2009, Astronomy, 2010, 286
Steidel, C. C. 1990a, ApJS, 72, 1—. 1990b, ApJS, 74, 37—. 1992, PASP, 104, 843

34 Steidel et al.
Steidel, C. C., Adelberger, K. L., Shapley, A. E., Pettini, M., Dickinson, M.,& Giavalisco, M. 2000, ApJ, 532, 170
—. 2003, ApJ, 592, 728Steidel, C. C., Dickinson, M., & Persson, S. E. 1994, ApJ, 437, L75Steidel, C. C., Giavalisco, M., Pettini, M., Dickinson, M.,& Adelberger,
K. L. 1996, ApJ, 462, L17Steidel, C. C., Kollmeier, J. A., Shapley, A. E., Churchill,C. W., Dickinson,
M., & Pettini, M. 2002, ApJ, 570, 526Steidel, C. C., Pettini, M., & Adelberger, K. L. 2001, ApJ, 546, 665Steidel, C. C. & Sargent, W. L. W. 1992, ApJS, 80, 1Steidel, C. C., Shapley, A. E., Pettini, M., Adelberger, K. L., Erb, D. K.,
Reddy, N. A., & Hunt, M. P. 2004, ApJ, 604, 534Strickland, D. K. & Heckman, T. M. 2009, ApJ, 697, 2030
Strickland, D. K., Heckman, T. M., Colbert, E. J. M., Hoopes,C. G., &Weaver, K. A. 2004, ApJ, 606, 829
Tremonti, C. A., Moustakas, J., & Diamond-Stanic, A. M. 2007, ApJ, 663,L77
Verhamme, A., Schaerer, D., Atek, H., & Tapken, C. 2008, A&A,491, 89Verhamme, A., Schaerer, D., & Maselli, A. 2006, A&A, 460, 397Weiner, B. J., Coil, A. L., Prochaska, J. X., Newman, J. A., Cooper, M. C.,
Bundy, K., Conselice, C. J., Dutton, A. A., Faber, S. M., Koo,D. C., Lotz,J. M., Rieke, G. H., & Rubin, K. H. R. 2009, ApJ, 692, 187
Zheng, Z. & Miralda-Escudé, J. 2002, ApJ, 578, 33