The Formin Daam1 and Fascin Directly Collaborate to Promote Filopodia Formation
Upload
khangminh22Category
view
0download
0
University of Massachusetts Amherst University of Massachusetts Amherst
ScholarWorks@UMass Amherst ScholarWorks@UMass Amherst
Doctoral Dissertations Dissertations and Theses
July 2016
The Role of the Formin Protein Family in Membrane Dynamics The Role of the Formin Protein Family in Membrane Dynamics
Petrus Adrianus Cornelis van Gisbergen University of Massachusetts Amherst
Follow this and additional works at: https://scholarworks.umass.edu/dissertations_2
Part of the Cell Biology Commons
Recommended Citation Recommended Citation van Gisbergen, Petrus Adrianus Cornelis, "The Role of the Formin Protein Family in Membrane Dynamics" (2016). Doctoral Dissertations. 690. https://doi.org/10.7275/8378302.0 https://scholarworks.umass.edu/dissertations_2/690
This Open Access Dissertation is brought to you for free and open access by the Dissertations and Theses at ScholarWorks@UMass Amherst. It has been accepted for inclusion in Doctoral Dissertations by an authorized administrator of ScholarWorks@UMass Amherst. For more information, please contact [email protected].
THE ROLE OF THE FORMIN PROTEIN FAMILY IN MEMBRANE DYNAMICS
A Dissertation Presented
by
PETRUS ADRIANUS CORNELIS VAN GISBERGEN
Submitted to the Graduate School of the University of Massachusetts Amherst in partial fulfillment
of the requirements for the degree of
DOCTOR OF PHILOSOPHY
May 2016
Plant Biology

© Copyright by Petrus Adrianus Cornelis van Gisbergen 2016
All Rights Reserved

THE ROLE OF THE FORMIN PROTEIN FAMILY IN MEMBRANE DYNAMICS
A Dissertation Presented
by
PETRUS ADRIANUS CORNELIS VAN GISBERGEN
Approved as to style and content by: ____________________________________________________ Magdalena Bezanilla, Chair ____________________________________________________ Tobias I. Baskin, Member ____________________________________________________ Wei-Lih Lee, Member ____________________________________________________ Caleb M. Rounds, Member ____________________________________________________ Elizabeth Vierling, Member
________________________________________________ Elizabeth R. Dumont Director, Interdepartmental Graduate Programs, CNS

iv
ACKNOWLEDGMENTS
It is interesting how a small gesture can induce a life-changing snowball
effect. After high school I was ready to go for a career in engineering when I felt that,
just as a control, I should for once visit an open house for something else. Since
engineering was my goal, this control could be anything and I picked based on the
topic of a book I was reading at that time that my mother gave me. The study was
biomedical laboratory research. I walked in, signed up within 30 minutes and never
regretted it. This seemingly insignificant event put me on the path I am today, but of
course I could not have gotten to where I am now without the help of many people
along the way.
This would not have been possible without the continuous support of my
family. Mam, bedankt voor je nooit aflatende interesse in mijn werk. Pa en Im,
bedankt voor jullie steun en wijze raad tijdens onze lange gesprekken in het
weekend en voor het me behoeden van het kluizenaarschap. Bart, dank voor je vaak
simpele maar doeltreffende oplossingen en je humor. We hebben elkaar lang
moeten missen, maar ik ben blij dat we gezamenlijk de rekbaarheid van het begrip
“anderhalf jaar” hebben kunnen onderzoeken.
To my advisor, Magdalena Bezanilla, thank you for the opportunity to carry
out my graduate work in your lab. It all started in 2007 when I came here for an
internship as part of my MSc degree from Wageningen University. The compass you
gave me when I left did indeed make me find my way back. Thank you for your
patience and for the opportunity to make my own mistakes. They are the best way

v
of learning. I am also very grateful for the collegial, stimulating work environment
you have created in the lab. I could not have wished for a better place to do my PhD!
I also like to thank my committee members Tobias Baskin, Wei-Lih Lee, Caleb
Rounds and Elizabeth Vierling for stimulating discussions. I am still amazed that,
without fail, you always manage to zone in on the topics I know not enough about.
This really helped me develop my knowledge.
Many thanks go to the past and present labmembers. First of all Robert,
thank you for being a great friend, even though you left the lab years ago, I really
appreciate our long skype talks and discussions. Thank you also for introducing me
to salsa, teaching me slang, brewing our own beer and hiking. You made life here
fun. Graham, your wit and humor are dearly missed, as are our hockey-evenings.
Let’s hope that that Rangers-Canadiens Stanley Cup final finally comes around! Shu-
Zon, thank you for our coffee walks and productive discussions, and for always
keeping me questioning my crazy hypotheses. CJ, the resident plant biologist, thank
you for making every morning filled with absurdist humor. Mingqin, thank you for
sharing the passion for formins with me. Find that interactor! I would also like to
thank members of the BBH (now B3H) labmeeting, and in particular Peter Hepler
and Larry Winship for all the useful comments and suggestions through the years.
I would also like to thank the students who helped me do some of the work;
Raz Davidyan, Matt Boyle and Ryan Shepard. Thanks for taking some of the tasks out
of my hands!
Of course, the people out of the lab are also very important. David and
Sandra, thank you for hanging out with me and discussing many non-science topics.

vi
Susan, thank you for all that you have done for me, your dedication to the students is
much valued and appreciated. Our regular chats were always a highlight in the day.
Very, very many thanks to Dan and Andrea. UMass Amherst has no idea how
valuable you two are to the graduate student community here. I truly believe that
your ability to be so hospitable, generous, caring and supportive has made many
doctoral studies here a success. I know it did for me. Please, stay in touch.
I am also grateful for the people who did stay in touch while I am here in the
US. Ruud, my almost brother, Twan and Tom, we have missed much, but it is time to
get the gang together again. Eelco, Bart, Justin and Bas, see you soon! James, it was
great having you over (twice) and hopefully we can play chess in real life now!
Lastly, of course, Berna. It has been a stressful last year for the both of us, but
your support and understanding made it all possible. I am very happy that I can call
you my wife and I am looking forward to our future adventures. Seni çok seviyorum!

vii
ABSTRACT
THE ROLE OF THE FORMIN PROTEIN FAMILY IN MEMBRANE DYNAMICS
MAY 2016
PETRUS ADRIANUS CORNELIS VAN GISBERGEN, BAS., AVANS HOGESCHOOL ETTEN-LEUR
M.SC., WAGENINGEN UNIVERSITY
PH.D., UNIVERSITY OF MASSACHUSETTS AMHERST
Directed by: Professor Magdalena Bezanilla
Using molecular genetics, and high end imaging techniques, I assessed the function
of the formin protein family in the moss Physcomitrella patens. Formins are proteins that
can nucleate and elongate actin filaments. P. patens has 9 formins, divided over three
classes. I found that a class II formin (For2A) is essential for polarized growth and
specifically binds to the phosphoinositide PI(3,5)P2. Additionally, I show that this formin
polymerizes actin filaments in vivo. I demonstrated that binding PI(3,5)P2 is essential for
formin function.
My work also shows that one of the class I formins (For1F) is involved in exocytosis
and likely is a part of the exocyst tethering complex, directly linking exocytosis to the actin
cytoskeleton in plants. For1F is an essential gene, but its deletion can be rescued by
overexpression of For1D, another class I formin, suggesting that class I formins are involved
in exocytosis. Class I formins associate with actin filaments, but their interaction with actin
differs from class II formin interaction with actin. Drug treatments show that their
dynamics are dependent on both microtubules and actin filaments. This is in contrast to
class II formins that do localize to endocytic sites and whose dynamics are only dependent
on actin filaments. An endocytic marker can be seen traveling with the processive formin
For2A when For2A is polymerizing an actin filament. Quantification of the activity of For2A

viii
along the length of tip growing cells reveals that For2A preferentially generates actin
filaments towards the tip of the cell. This provides an actin array that is predominantly tip-
oriented and could serve as a scaffold for myosins to transport cargo along towards the cell
tip.

ix
TABLE OF CONTENTS
Page
ACKOWLEDGEMENTS……………………………………………………………………………………………………iv
ABSTRACT.……………………………………………………………………………………………………………………vii
LIST OF TABLES………………………………………………………………………………………………………………x
LIST OF FIGURES………………………………………………………………………………………………..…………..xi
CHAPTER
1: INTRODUCTION………..…………………………………….…………………………………...………………………1
2: CLASS II FORMIN TARGETING TO THE CELL CORTEX BY BINDING (PI3,5)P2 IS
ESSENTIAL FOR POLARIZED GROWTH………………….……………………………………………22
3: A CLASS I FORMIN DIRECTLY LINKS THE ACTIN CYTOSKELETON TO EXOCYTOSIS….….53
4: CLASS I AND CLASS II FORMINS FUNCTION IN DIFFERENT MEMBRANE DYNAMIC
PROCESSES…………………………………………………………………………………………………….….79
5: DISCUSSION…………..…………………...……………………………………………………………………………...99
6: MATERIALS AND METHODS……………..………………………………………………………………………109
BIBLIOGRAPHY……………..…………………………………………………………….………………………………130

x
LIST OF TABLES
Table Page
2.1 Sequence comparison between formin PTEN domains and PTEN homologues……..34
6.1 Primers used in this study………………………………………………………………………………...124

xi
LIST OF FIGURES
Figure Page
1.1 Tip growing cells in the moss P. patens…………………………………………………………………3
1.2 Model for tip growth in P. patens.………………………………………………………………………….4
1.3 General domain structure of formins………….................................................................................7
1.4 Evolution of plant formins………………………………………………....................................................9
1.5 Plant formins display a wide range of interactions………………………………………………18
1.6 The exocyst complex………………………………………………………………………………………….21
2.1 For2A localizes to sites of dynamic membrane trafficking……………………………………25
2.2 For2A and FM4-64 uptake kinetics……………………………………………………………………..26
2.3 Dynamics of For2A and actin in a growing tip cell………………………………………………..28
2.4 In place of the For2A PTEN domain, PTEN homologues fused to the FH1-FH2
domains of For2A differentially complement formin-mediated polarized growth…30
2.5 Expression of the complementation proteins………………………………………………………32
2.6 Dose dependent complementation of the formin RNAi phenotype using constructs
that replace the For2A PTEN domain with PTEN homologues……………………………...33
2.7 For2A PTEN domain and PTENA specifically bind PI(3,5)P2…………………………………35
2.8 PI(3,5)P2 binding is essential for For2A function in vivo……………………………………….37
2.9 Dose dependent complementation of the Formin RNAi phenotype using constructs
that replace the For2A PTEN domain with unrelated PI(3,5)P2 binding proteins…..38
2.10 PTENA, PTEND and the functional PI(3,5)P2 binders fused to GFP are not enriched
near the cell tip…………………………………………………………………………………………………..40
2.11 Full length MTM1*-FH1FH2-3xmEGFP is functional and not tip enriched…………….41

xii
2.12 Silencing the FAB1 kinases impairs polarized growth and decreases the density of
cortical formin dots……………………………………………………………………………………………44
2.13 Cortical For2A linear movement is actin dependent…………………………………………….46
2.14 For2A-GFP spots generate actin filaments at the cell cortex…………………………………48
3.1 Sec10 and Formin 1F are fused…………………………………………………………………………...56
3.2 Evolution of moss formins………………………………………………………………………………….58
3.3 Phylogenetic analysis of the For1F Sec10 domain……………………………….……………….60
3.4 Silencing of exocyst components……………………………………………………….………………..62
3.5 For1F RNAi affects exocytosis………………………………………………………….…………………64
3.6 Growth assays of the tagged lines……………………………………………………….………………66
3.7 For1F transiently colocalizes with Sec6, and not with endocytic sites…………………..68
3.8 For1F and Sec6 dynamics are actin dependent…………………………………………………….71
3.9 Schematic representation of the knock-out/knock-in strategy…………………………….72
3.10 Genotyping of knock-out-knock-in lines……………………………………………………………..73
3.11 Fusion of the For1F N-terminal and C-terminal domains is not necessary
for survival………………………………………………………………………………………………………...75
3.12 Model of For1F function……………………………………………………………………………………..76
4.1 Growth assays for the lines used in this study……………………………………………………...82
4.2 Localization of class I and class II formins…………………………………………………………...83
4.3 Class II formins, not class I formins are on endocytic sites……………………………………85
4.4 Class I and Class II formins interact with actin differently……………………………………87
4.5 Formin cortical dot dynamics after drug treatments……………………………………………88
4.6 Method of For2A-GFP cortical dot and trajectory quantification…………………………..90
4.7 Cortical For2A-GFP dots are apically enriched…………………………………………………….91
4.8 For2A-GFP linear trajectories are predominantly tip-oriented…………………………….93

xiii
4.9 Model for Class I and Class II formin function………………………………………………………96

1
CHAPTER 1
INTRODUCTION
Parts of this chapter have been published in the following paper:
van Gisbergen PAC, Bezanilla M. (2013) Plant formins: membrane anchors for actin
polymerization. Trends in Cell Biology 23 (5) 227-233.
Tip growth in plants
Tip growth is a form of anisotropic growth where the polarized secretion of cell wall
material results in cell expansion specifically at the apex. Tip growth is important for a
variety of cells and throughout the tree of life. Examples of tip growing cells in plants are
pollen tubes, that after landing on the stigma, grow towards the ovule for fertilization, root
hairs, for nutrient and water uptake, rhizoids, for anchoring the plant to a substrate and
protonemata in mosses and ferns, that establish the plant body after emergence from the
spore to facilitate the development of the gametophores (Hepler et al., 2001; Rounds and
Bezanilla, 2013; Vidali and Bezanilla, 2012).
In this study I focus on the mechanisms of tip growth of protonemata and rhizoids in
the moss Physcomitrella patens. This model organism is easy to grow and transform, is
haploid for most of its life cycle and does efficient homologous recombination. Additionally,
RNAi-mediated gene silencing is efficient (Bezanilla et al., 2003; Bezanilla et al., 2005). The
genome of P. patens has been sequenced (Rensing et al., 2008) and largely annotated,
providing a genetically tractable tool. Moreover, in the protonemal stage, moss grows as a

2
network of tip growing cells that is one cell layer thick (Menand et al., 2007), making it
ideally suited for microscopy.
P. patens has a relatively simple life cycle. Under normal conditions, protonemal
tissue consists of two basic cell types; slow-growing chloronemal cells with many
choroplasts, and fast growing caulonemal cells with fewer chloroplasts (figure 1.1a-d).
Chloronemal cells are the first to arise out of the spore and form the core of the new moss
colony. Chloronemal cells at the tips of filaments can differentiate into caulonemal cells that
rapidly grow out to colonize the substrate in search of nutrients. Off of a protonema, a bud
will form (figure 1.1a and 1.1b), which will grow out into a gametophore. At the base of the
bud rhizoids grow out, which are very fast, straight growing filaments with few chloroplasts
and branches (figure 1.1b and 1.1e). The rhizoids serve to anchor the plant to the substrate.
This is necessary because the moss switches from a relatively two dimensional type of
growth to growth in the third dimension; the gametophore. On top of the gametophores
antheridia will form, which produce free swimming flagellate sperm, as well as archegonia,
which contain the egg cell. Following fertilization a sporophyte will form and after dispersal
the new protonemal tissue will grow out of the spore, completing the life cycle.

3
The actin cytoskeleton and tip growth
Tip growth has been studied extensively for decades, yet the molecular mechanisms
underlying this form of growth are poorly understood. To confine growth specifically to the
apex, the secretion of cell wall building blocks and plasma membrane material needs to be
Figure 1.1. Tip growing cells in the moss P. patens. A. Illustration of P. patens life cycle. B. Young bud growing from a protonema. Arrows indicate rhizoids emerging from the developing gametophore. Scale bar is 50μm. C. Chloronemal filament. D. Caulonemal filament. E. Rhizoid filament. For C-E, scale bar is shown in E and is 10μm. Image modified from Vidali and Bezanilla, 2012.

4
directed to the apex. It is hypothesized that this transport of materials is directed by the
actin cytoskeleton, which is necessary for polarized growth. Disruption of the actin
cytoskeleton using the actin inhibitor latrunculin B results in a loss of (polarized) tip growth
in pollen tubes (Vidali et al., 2001) and moss protonemata (Harries et al., 2005). RNAi
silencing of the actin motor protein myosin XI yields plants that consist of large rounded
cells without polarized outgrowths, indicative of a loss of polarized growth (Vidali et al.,
2010). Since myosin XI is a motor protein that is involved in vesicle transport along actin
filaments, it is likely that myosin XI is involved in the directed transport of cell wall material
loaded vesicles to the cell apex (figure 1.2).
With an expanding cell also comes the need to break down and rebuild the actin
network to keep up with the growing tip. Indeed proteins involved in the disassembly of the
actin array have a dramatic effect on tip growth. Actin depolymerizing factor (ADF) is a
small actin filament severing protein implicated in tip growth. RNAi silencing of ADF results
in small plants composed of small spherical cells, indicative of a loss of polarized growth
(Augustine et al., 2008). Interestingly, loss of ADF also results in a decreased dynamicity of
Figure 1.2. Model for tip growth in P. patens. Exocytic vesicles are transported on actin tracks to the cell tip. The actin tracks are made by membrane-bound class II formins and profilin and broken down by ADF. For fast growing caulonemal and rhizoid cells, the actin nucleator Arp2/3 complex and the ADF activity enhancing protein AIP are also required. Image modified from Vidali and Bezanilla, 2012.

5
the actin cytoskeleton, suggesting a dynamic actin cytoskeleton is required for tip growth.
Actin interacting protein (AIP) directly interacts with ADF and enhances its function, which
is necessary for the formation of the faster growing caulonemata and rhizoids (Augustine et
al., 2011; Vidali and Bezanilla, 2012).
With the breakdown of the actin cytoskeleton also comes the assembly of the
network at a new position tracking the growing tip. New actin filaments need to be
polymerized to facilitate the tracks for myosin XI to transport vesicular cargo along.
Profilins are small proteins capable of binding actin monomers and are implicated in actin
polymerization. RNAi silencing of profilin results in a loss of polarized growth like the loss
of myosin XI (Vidali et al., 2007). Profilin-actin complexes can interact with the actin
filament nucleator and elongator formin. How formins contribute to plant cell growth is the
main topic of this thesis.
Formins
Formins were first identified in the early eighties as proteins encoded by the genes
required for the normal formation of limbs in mice (Kleinebrecht et al., 1982). Mice with
mutations in these loci have fused bones in their extremities and kidney malformations.
Formin homology (FH) proteins, or formins, are defined as proteins with sequence and
structural homology to the original mammalian formins, yeast Bni1p and Drosophila
CAPPUCCINO and DIAPHANOUS (Zeller et al., 1999). Formin homology proteins share two
conserved domains; FH1 and FH2 (figure 1.3). FH1 domains contain one or more poly-L-
proline regions, where profilin-actin complexes can bind to locally increase the actin
monomer concentration to favor polymerization (Chang et al., 1997; Pruyne et al., 2002).
The FH2 domain caps the barbed end of the filament and is also involved in elongation
(Otomo et al., 2005; Xu et al., 2004). Generally, the FH2 domain is sufficient for nucleation,

6
but in specific cases both the FH1 and FH2 domains are required (Ingouff et al., 2005; Ye et
al., 2009; Zheng et al., 2012).
Yeast formins have well characterized regulatory mechanisms and domain
structures. N-terminal to the FH1-FH2 domains they contain a GTPase binding domain
(GBD) that partially overlaps with a conserved, though less defined FH3 domain. C-terminal
to the FH1-FH2 domains is a Diaphanous autoregulatory domain (DAD), which, in an
inactivated state, binds the GBD-FH3 domains (figure 1.3) (Evangelista et al., 2003). Formin
activation occurs when activated Rho binds the GBD domain, thereby relieving the
inhibition by the DAD domain.
Figure 1.3. General domain structure of formins. In the yeast Saccharomyces cerevisiae (Sc), Bni1p is inactivated by binding of the Diaphanous autoregulatory domain (DAD) to the Diaphanous inhibitory domain (DID). The DID and dimerization domains (DDs) form the formin homology 3 (FH3) domain, which is absent in plants. The lower three are schematic representations of the different classes of plant formins. There are variations in domain structure within each class. Models are not drawn to scale. Abbreviations: GBD: GTPase-binding domain; SP, signal peptide; PR, proline-rich extracellular domain; TM, transmembrane domain. Modified from van Gisbergen and Bezanilla, 2013.

7
In budding yeast, distinct cellular actin arrays are nucleated by different protein
complexes. Actin patches, which are essential for endocytosis, are generated by the Arp2/3
complex (Kaksonen et al., 2003). Actin cables, which are required for cell polarity (Pruyne
et al., 2004b), vesicle transport from the mother cell to the bud (Jin et al., 2011), nuclear
migration (Yin et al., 2000) and organelle inheritance (Eves et al., 2012) are made by
formins (Chesarone et al., 2010). There are two distinct populations of actin cables; the
actin cables in the bud are generated at the bud apex by Bni1p, while the actin cables in the
mother are generated at the mother bud neck by Bnr1p (Pruyne et al., 2004a).
Actin filaments are very dynamic in plant cells and comprise different subcellular
arrays. For example, tip-growing plant cells have a concentration of actin near the apex of
the cell, long actin bundles along the length of the cell, and a dense cortical array of actin
filaments (Hepler et al., 2001; Vidali et al., 2009a). In diffusely growing plant cells, actin is
found in a dense network at the cell cortex, within the cytoplasm in close association with
transvacuolar strands (Sheahan et al., 2007), in the preprophase band and in the
phragmoplast (Müller et al., 2009). Among the nucleators of actin filaments, plants contain
the Arp2/3 complex and a diverse family of formins. As is the case in yeast, different
formins might be responsible for generating distinct populations of filamentous actin.
Plant formin evolution
Plant formins are divided into three different classes based on sequence similarities
in their FH2 domains (figure 1.3). In contrast to yeast and some mammalian formins, plant
formins do not contain a GBD or FH3 domain and have no known autoregulatory domains
(Cvrckova et al., 2004; Grunt et al., 2008). In the plant lineage, the GBD/FH3 domain has
been replaced by a variety of different domain configurations.

8
Class I formins have either originated or been lost multiple times during evolution,
because they are present in red algae and land plants, but not in prasinophytes or green
algae (Figure 1.4) (Grunt et al., 2008). The class I and II formins are widely variable in their
N-terminal domains. Generally, class I formins acquired a transmembrane domain, often
accompanied by an extracellular domain that contains extra poly-proline stretches thought
to interact with proteins or polysaccharides in the cell wall matrix (Figure 1.3).
After the split of plants from the red algae, class II formins originated and as plants
colonized land, a family expansion took place, generating a diversity in the class I and class
II formins. Class II formins, in some instances, have only an FH2 domain, no N-terminal
Figure 1.4. Evolution of plant formins. Early in its evolution, the plant lineage lost the GTPase-binding domain (GBD)-FH3 family of formins and gained class III formins. On colonization of land, family expansion took place, giving rise to the multiple formins per class we find today. Class III formins were lost in seed plants. Class I formins appear to have originated or been lost multiple times during evolution. Modified from van Gisbergen and Bezanilla, 2013.

9
domain before the FH1, a coiled coil region in between the FH1 and FH2 or a phosphatase
and tensin homolog (PTEN)-like domain in their N-terminus (Cvrckova et al., 2004). The
PTEN-like domain is similar to human PTEN, a lipid phosphatase that converts
phosphatidyl inositol 3,4,5 tri-phosphate (PI(3,4,5)P3) to phosphatidyl inositol 4,5-
biphosphate (PI(4,5)P2) and subsequently can stay bound to PI(4,5)P2 (Li et al., 1997;
Maehama and Dixon, 1998). The transmembrane and the PTEN domains in classes I and II,
respectively, have likely enabled formins to interact with membranes independent of an
interaction with a small GTPase.
For class III formins, the N-terminus contains a Rho-GAP domain (Figure 1.3) that is
hypothesized to still bind to, but not activate GTPases (Grunt et al., 2008). To date, only six
class III formin genes have been identified: two in land plants and four in prasinophytes
(Grunt et al., 2008). Among land plants, class III formins have thus far only been identified
in plants containing flagellate sperm (Figure 1.4).
Plant formin function
It has been challenging to analyze the cellular functions of plant formins due to
dramatic gene family expansion. In particular, most seed plants have relatively large formin
families. For example, the model plant Arabidopsis thaliana has 21 formins that group into
two classes. In contrast, more basal land plant lineages have fewer formin genes. The moss
Physcomitrella patens only has 9 formins that group into three classes. A systematic loss-of-
function study revealed functional differences between class I and II formins in vivo (Vidali
et al., 2009b). Specifically, silencing of all class I formins results in plants with reduced
overall size, while silencing all class II formins results in plants with dramatic defects in cell
polarity (Vidali et al., 2009b). Although the moss class III formin was a target in this RNAi

10
study (Vidali et al., 2009b), it is not expressed during the developmental stage analyzed, and
so the function of the class III formin in moss remains to be investigated.
Class I formins
While class I formins have a variety of different activities in vitro (figure 1.5)
(Blanchoin and Staiger, 2010; Wang et al., 2012), it is not entirely clear how these
biochemical properties are related to the roles of class I formins in vivo. To date, loss-of-
function studies have been performed for 4 class I formins in seed plants (Favery et al.,
2004; Ingouff et al., 2005; Xue et al., 2011; Ye et al., 2009) and for all class I formins in moss
(Vidali et al., 2009b).
Moss has six class I formins that can be divided in three subgroups. For1A, B and C
(subgroup 1) are predicted to have a transmembrane domain and a signal peptide, whereas
For1D and E (subgroup 2) are predicted to only have a transmembrane domain. In contrast
to other class I formins, For1F (subgroup 3) is not predicted to be a transmembrane
protein. Instead its N-terminal sequence is extremely large and is predicted to contain a
domain that has significant sequence similarity to SEC10, a protein associated with the
exocyst complex (Cvrckova et al., 2012; Grunt et al., 2008). All class I formins are expressed
in young moss plants (Vidali et al., 2009b). However there are significant differences in their
expression levels. For1F is the most highly expressed, representing 80% of all class I
transcripts, while For1D and For1A represent 15% and 3%, respectively (Vidali et al.,
2009b).
Silencing of all moss class I formins results in smaller plants of essentially wild-type
morphology (Vidali et al., 2009b). To determine how each class I formin subgroup
contributes to plant size, RNAi constructs were generated that silence each subgroup
separately and in combination. Reduction in plant size correlates with relative expression

11
levels of the class I formins. Silencing of For1F (subgroup 3), the most highly expressed
class I formin, has the strongest phenotype, resulting in a 30% reduction in plant size.
Silencing For1D and E (subgroup 2) reduces plant size by 25% and silencing of For1A, B and
C (subgroup 1) results in a 10% reduction (Vidali et al., 2009b). While it is unclear whether
class I formin subgroups have distinct functions, this study demonstrates that together they
contribute to optimal plant size. Time-lapse imaging of plants silenced for all class I formins,
revealed that For1-RNAi cells perform tip growth at similar rates as control RNAi cells
(Vidali et al., 2009b). This suggests that defects in plant size are linked to a delay in
development.
Arabidopsis has ten class I formins that are grouped into six subgroups based on
sequence similarity in their FH2 domains (Cvrckova et al., 2004). These subgroups do not
vary extensively in domain structure. Except for AtFH7, all arabidopsis class I formins are
predicted to have a signal peptide and a transmembrane domain followed by the FH1 and
FH2 domains (figure 1.3) (Cvrckova et al., 2004). AtFH7 is a member of the Ie subgroup, but
is not predicted to have a signal peptide or a transmembrane domain.
Apparently, the first plant formin mutant studied was a T-DNA insertion in the
AtFH5 gene (Ingouff et al., 2005). While there was no observable phenotype in vegetative
tissues, the authors reported defects in morphogenesis and cell division in the embryo
posterior pole (Ingouff et al., 2005), suggesting that AtFH5 is likely involved in cell division.
Consistent with this, overexpressed AtFH5-GFP localizes to the growing cell plate (Ingouff
et al., 2005). After completion of cell plate formation, AtFH5-GFP dissociates from the cell
plate (Ingouff et al., 2005). This initial study did not report phenotypes in pollen or pollen
tube growth. However a subsequent study in tobacco demonstrated that RNAi of NtFH5
affects pollen tube growth; pollen tubes are wavy and short, suggestive of a defect in the

12
maintenance of polarized growth (Cheung et al., 2010). Also, the amount of filamentous
actin is diminished in these cells (Cheung et al., 2010).
Silencing of the pollen-specific AtFH3 gene also impairs pollen tube growth; pollen
tubes lacking AtFH3 are swollen and shorter than control tubes (Ye et al., 2009).
Occasionally the pollen tubes swell at the tip, suggestive of defects in directing traffic to and
from the tip (Ye et al., 2009). Consistent with this, AtFH3-RNAi pollen tubes lack
cytoplasmic streaming or have disorganized patterns of streaming (Ye et al., 2009), instead
of the characteristic reverse fountain streaming pattern in control tubes. These cells also
have decreased amounts of F-actin, indicating that AtFH3 is involved in generating F-actin
arrays in pollen tubes (Ye et al., 2009).
Additional evidence that class I formins are involved in cell division and establishing
actin arrays comes from analysis of a T-DNA knockout in the AtFH8 gene. AtFH8 is a
member of the class Ie subgroup. This subgroup has a group Ie domain that in the case of
AtFH4 has been shown to bind microtubules (Deeks et al., 2005). The knockout of AtFH8
does not show any visible phenotypes under normal conditions (Xue et al., 2011). However
if plants are treated with latrunculin B, a drug that depolymerizes the actin cytoskeleton,
atfh8 plants have shorter primary roots and fewer lateral roots (Xue et al., 2011). These
defects are consistent with the AtFH8 expression pattern, which is found at the root
meristem and at sites of emergence of lateral roots (Xue et al., 2011). The decrease in root
length does not result from a defect in cell expansion, but rather results from production of
fewer cells in the root meristem (Xue et al., 2011). A functional copy of AtFH8-GFP localizes
to the nuclear envelope and to new cell plates (Xue et al., 2011). Localization to the new cell
plate, together with the observation that fewer cells are produced in the root tip in the
presence of latrunculin B, suggests that AtFH8 functions in cell division. Further, latrunculin
B treated atfh8 plants have less bundled actin and their arrays are more sensitive to

13
latrunculin B as compared to control plants (Xue et al., 2011). These results are consistent
with the studies in pollen tubes demonstrating that class I formins participate in generating
actin arrays.
Three arabidopsis class I formins (AtFH1, AtFH6 and AtFH10) were found to be
upregulated in the root galls that form at the sites of nematode infection (Favery et al.,
2004). In root knot nematode infection the formation of giant cells is accompanied by a
dramatic reorganization of the cytoskeleton (De Almeida Engler et al., 2004). Using
immunolocalization, AtFH6 was found on the plasma membrane of wild type differentiating
cells within the vascular cylinder (Favery et al., 2004). In infected cells, AtFH6 was found to
localize to the cell cortex in giant cells and neighboring cells during gall formation (Favery
et al., 2004). This localization is consistent with plasma membrane targeting observed in
protoplasts (Favery et al., 2004). Giant cells have a dense cytoplasm and actin is only found
near the cell membrane, suggesting that upregulation of the plasma membrane bound class
I formins leads to an increase in actin near the cell cortex. The authors speculate that
increased cortical actin results in excessive isotropic growth of root gall cells. A line
containing a T-DNA insertion resulting in truncation of AtFH6 still forms giant cells upon
nematode infection (Favery et al., 2004). This might be due to the presence of AtFH1 and
AtFH10 functioning redundantly with AtFH6. Analysis of a triple mutant would help to
address the role of these class I formins during the cytoskeletal changes that occur in these
giant cells.
To address whether AtFH6 has actin nucleation and elongation activity, Favery et al.
(2004) expressed AtFH6 in yeast lacking the two yeast formins, Bni1p and Bnr1p. AtFH6
was able to rescue the temperature sensitive defect of the bni1∆bnr1∆ double mutant
(Favery et al., 2004).Rescued cells had a range of phenotypes with respect to actin
organization. Some resembled wild type, while others still had a large number of actin

14
patches in the mother cell (Favery et al., 2004), suggesting that the rescued cells have slight
defects in cell polarity. Even though the rescue appears partial, it is surprising that a
membrane-bound formin from plants lacking all the regulatory domains found on the yeast
formins replaces the function of both yeast formins. Since overexpression of the FH1-FH2
domain of either Bni1p or Bnr1p alone also partially rescues the bni1∆bnr1∆ double mutant
(Gao and Bretscher, 2009), it suggests that the actin polymerization activity of the FH1-FH2
domains of AtFH6 are likely unregulated in yeast, behaving similar to an isolated FH1-FH2
domain. These results support the idea that AtFH6 generates actin filament arrays in yeast
cells.
In comparison to yeast and mammalian formins, little is known about how plant
formins are regulated. To date the only study identifying potential regulatory proteins was
the study that cloned the first plant formin, AtFH1 (Banno and Chua, 2000). AtFH1 contains
a signal peptide, a transmembrane region and has an extracellular proline-rich region
(Banno and Chua, 2000; Cvrckova et al., 2004; Grunt et al., 2008). AtFH1 overexpression
induces more and longer actin cables and alters pollen tube growth (Cheung and Wu, 2004).
The C-terminus of arabidopsis AtFH1 was used in a two hybrid screen to identify interacting
proteins (Banno and Chua, 2000). One of the interacting proteins contains a PH-like GRAM
domain reminiscent of myotubularin proteins in mammals, which interact with
phosphoinositides (Robinson and Dixon, 2006). This suggests that class I formins reside in
certain plasma membrane micro-domains. Indeed it was found that AtFH1 is localized to the
plasma membrane and interacts with cell wall material directly with its poly-proline
containing extracellular domain (Martinière et al., 2011). This likely serves to anchor the
protein at the cortex while it is nucleating actin filaments. However, to decipher whether
membrane domains and additional proteins are involved in regulating formin activity will

15
require investigating the activity of full-length formins in the presence and absence of
interacting membranes or proteins.
Class II Formins
In P. patens class II formins have been characterized to some degree both in vitro
and in vivo. Moss has 2 class II formins, For2A and For2B. Both have an N-terminal PTEN
domain and are 90% similar to each other (Vidali et al., 2009b). Silencing of both class II
formins results in plants that are severely stunted and composed of small spherical cells,
demonstrating that class II formins are essential for polarized growth. Furthermore, For2A
and For2B are functionally redundant, since expression of a single formin is sufficient for
polarized growth (Vidali et al., 2009b). Complementation analysis with truncation and
deletion mutants demonstrated that both the N-terminal PTEN as well as the FH1-FH2
domains are required for For2 function (Vidali et al., 2009b). The FH1-FH2 domains of
For2A rapidly elongate actin filaments in vitro. In comparison, the For1D FH1-FH2 domains
also promote actin elongation, but the rates of actin elongation are six times lower (Vidali et
al., 2009b). Since the For2A FH1 domain contains 18 stretches of poly-L-prolines, as
compared to only two in the For1D FH1 domain, it was expected that the For2A FH1 domain
might be responsible for the rapid rates of actin elongation observed with the For2A FH1-
FH2 domains. However, when the For2A FH1 domain is attached to the For1D FH2 domain,
the chimeric FH1-FH2 domain does not enhance the rate of actin elongation. Instead, it only
nucleates actin filaments (Vidali et al., 2009b), suggesting that the For2A FH1 and FH2
domains work synergistically to rapidly elongate actin filaments. Notably, chimeric proteins
composed of the PTEN domain fused to different combinations of FH1-FH2 domains from
either For1D or For2A did not rescue the Formin2-RNAi phenotype (Vidali et al., 2009b).

16
Only For2A supported polarized growth (Vidali et al., 2009b), suggesting that rapid rates of
actin elongation are essential for function in vivo.
Arabidopsis has at least ten class II formins, which differ substantially in their
domain organization (Cvrckova et al., 2004). AtFH12, AtFH15b and AtFH17 are predicted to
have only an FH2 domain. AtFH15a and AtFH19 contain only FH1 and FH2 domains.
AtFH16 has a repetitive domain between the FH1 and FH2 domains, and AtFH21 appears to
have a coiled-coil region between the FH1 and FH2 domains (Cvrckova et al., 2004). Four of
the class II formins (AtFH13, AtFH14, AtFH18 and AtFH20) acquired an N-terminal PTEN-
like domain. Interestingly in rice, there are five class II formins, all of which contain an N-
terminal PTEN domain (Cvrckova et al., 2004).
Of the arabidopsis class II formins, two, AtFH14 and AtFH19, have been
characterized in vitro. These two formins have a range of biochemical activities, and AtFH14
was shown to interact with microtubules (figure 1.5). Interestingly, AtFH14 interacts more
strongly with microtubules than with actin (Li et al., 2010). Notably it was recently found
that, after disassembly, actin is specifically recovered along cortical microtubules and that
the recovery of the actin array is dependent on an intact microtubule array (Sampathkumar
et al., 2011). This supports the idea of microtubule-bound formins that build actin networks
at the cortex. When overexpressed in cells as a fusion protein to GFP, AtFH14 labels the
mitotic microtubule arrays, not the cortical microtubule array and not actin (Li et al., 2010).
Recently AtFH19, a class II formin with no domains N-terminal of the FH1-FH2 domains,
was found to nucleate actin filaments using profilin-actin complexes and cap the barbed end
of actin filaments (Zheng et al., 2012). For both of these activities, the FH1 and FH2 domains
are required. Compared to other studied formins, the capping and nucleating efficiencies of
AtFH19 are low (Zheng et al., 2012).

17
In rice, two labs independently described γ-ray-induced mutants in OsFH5: Bent
Uppermost Internode-1 (BUI1) (Yang et al., 2011) and Rice Morphology Determinant-1
(RMD1) (Zhang et al., 2011). OsFH5 contains an N-terminal PTEN domain and is most
closely related to OsFH12, and its closest homolog in arabidopsis is AtFH14 (Cvrckova et al.,
2004). The OsFH5 mutants have various morphological defects, such as dwarfed or stunted
adult plants, shorter flower filaments, and malformed roots and seeds (Yang et al., 2011;
Zhang et al., 2011). On a cellular level, mutants have shorter cells and defects in their
microtubule cytoskeleton organization, as well as a reduction in the amount of filamentous
actin and actin bundles (Yang et al., 2011; Zhang et al., 2011). OsFH5 localizes to the
cytoplasm and acts as a barbed end capper in vitro (Yang et al., 2011; Zhang et al., 2011).
The FH1-FH2 domains are capable of nucleating actin filaments and can interact with
profilin-actin complexes for elongation (Zhang et al., 2011). Also, OsFH5 binds and bundles
microtubules, suggesting a similar mode of action as AtFH14 (Yang et al., 2011; Zhang et al.,
2011).

18
Membrane dynamics and the actin cytoskeleton
Membrane dynamics, particularly exocytosis and endocytosis, is fundamental for
cell growth. Exocytosis delivers new membrane and external material while endocytosis
recycles excess membrane and catabolized secretory products. Endocytosis in budding
yeast requires specialized actin structures (actin patches) that are generated by the Arp2/3
complex (Kukulski et al., 2012). Polarized exocytosis requires the formation of actin
Figure 1.5. Plant formins display a wide range of interactions. (a), Cell wall anchoring is shown for the non-processive formin AtFH1. (b), Microtubule binding is shown for a number of class I and class II formins from different species. Due to sequence similarity to AtFH4, AtFH8 is suggested to bind microtubules. AtFH14 is cytosolic and might not bind cortical microtubules. (c), Specific phosphoinositide binding is essential for moss For2A function. (d), Most investigated formins are able to nucleate and elongate actin filaments and interact with profilin. (e), Many formins have been found to cap the barbed end of the actin filament, preventing or slowing polymerization. (f), Two class I formins have so far been identified that bind to the side of actin filaments and thereby bundle them. (g), AtFH8 binds to the side and severs actin filaments. Asterisks indicate that the interaction was studied both in vitro and in vivo. Abbreviation: PI(3,5)P2, phosphatidylinositol 3,5-biphosphate.

19
filaments to target the vesicles to the delivery site. Delivery of exocytic vesicles to the
plasma membrane does not happen spontaneously. Due to the charged nature of both the
vesicle and the plasma membrane the two repel each other rather than fuse. To overcome
this barrier soluble (N-ethylmaleimide-sensitive factor) attachment protein receptor
(SNARE) proteins on both the vesicle (v-SNARE) as well as the target membrane (t-SNARE)
interact to force the membranes to fuse. Despite SNAREs being sufficient to establish
membrane fusion in vitro, this process is too slow to be efficient in vivo. In order to prevent
vesicles from diffusing away before SNARE-mediated fusion can take place, vesicles are
tethered to the membrane by a tethering complex. A wide variety of tethering complexes
exists, each specific to a target membrane. For exocytosis this complex is named the exocyst
complex (figure 1.6) (He and Guo, 2009; Heider and Munson, 2012; Liu and Guo, 2012).
The exocyst complex, which is essential for plant growth and development, tethers
secretory vesicles that bud off from the trans-Golgi network to the plasma membrane (He
and Guo, 2009; Liu and Guo, 2012). The exocyst complex is an octameric complex conserved
throughout eukaryotes consisting of the subunits Sec3, Sec5, Sec6, Sec8, Sec10, Sec15,
EXO70 and EXO84 (Croteau et al., 2009; Guo et al., 1999; Hala et al., 2008; Heider and
Munson, 2012; TerBush et al., 1996). In yeast and animals, the exocyst complex is intimately
linked with the cytoskeleton. In mammalian cells EXO70 directly interacts with the ARPC1
subunit of the Arp2/3 complex, a complex that nucleates branched actin arrays, and
enhances its activity. In the budding yeast S. cerevisiae, EXO70 interacts with Bem1p, which
in turn interacts with Cdc42, an activator of formin (Liu and Novick, 2014). Fission yeast
Sec3 weakly interacts with the actin cable making formin For3 (Jourdain et al., 2012). As
mentioned above, an early version of the Physcomitrella patens genome predicted a Class I
formin (Formin 1F) to have an N-terminal Sec10 domain. Sec10 in mammalian cells has
been found to interact with the GTPase ARF6, and been implicated in membrane recycling

20
in recycling endosomes (Prigent et al., 2003). In plants, Sec10 is thought to be a core part of
the exocyst complex, but specific functions have not yet been defined (Chong et al., 2010;
Hala et al., 2008). While animals and fungi tend to have one copy of each subunit, plants
have evolved multi-isomer protein families for each subunit (figure 1.6). The EXO70 subunit
in particular has greatly expanded in certain lineages. For example, EXO70 in rice has 47
isoforms (Cvrckova et al., 2012). It has been hypothesized that plants likely have multiple
exocyst complexes, potentially executing distinct patterning functions. Thus it is not
surprising that the exocyst complex has been implicated in a variety of processes, including
autophagy (Kulich et al., 2013), cell polarity (Cole et al., 2005; Synek et al., 2006; Wen et al.,
2005), cell plate formation (Fendrych et al., 2010; Wu et al., 2013) and pathogen resistance
(Stegmann et al., 2013).

21
In plants, little is known about the involvement of the cytoskeleton in endocytosis
and exocytosis. In this thesis, I analyze this by examining formin function in the moss P.
patens. Formins are excellent candidates for connecting the cytoskeleton to membrane
trafficking. Five of the six class I formins have a transmembrane domain, and are therefore
membrane bound, localizing them to areas of membrane traffic. One P. patens class I formin
(For1F) is of particular interest as it contains a N-terminal Sec10-like domain, putatively
linking it directly to the exocyst complex and thus exocytosis. Class II formins contain a N-
terminal PTEN-like domain that is hypothesized to bind phosphoinositides, perhaps
conferring specificity to lipid binding, allowing it to bind to certain lipid domains potentially
implicated in membrane turnover.
Figure 1.6. The exocyst complex. Indicated are the different exocyst complex components. The numbers next to the ovals represent the number of putative isoforms of each subunit in P. patens. Organization of the complex is based off of the organization of the complex in yeast, but is otherwise speculative for plants.

22
CHAPTER 2
CLASS II FORMIN TARGETING TO THE CELL CORTEX BY BINDING
PI(3,5)P2 IS ESSENTIAL FOR POLARIZED GROWTH
This a slightly modified version of this chapter has been published under this title as: van Gisbergen PAC, Li M, Wu SZ and Bezanilla M. (2012) Class II formin targeting to the cell cortex by binding PI(3,5)P2 is essential for polarized growth. The Journal of Cell Biology, 198:235-250). Introduction
Formins are critical for numerous key actin-based processes ranging from cell
polarity and cytokinesis to cell adhesion and migration (Goode and Eck, 2007). In general
formins nucleate and elongate actin filaments to specify where actin arrays are built. Long
actin arrays, such as actin cables in budding and fission yeasts, are generated by formins
(Evangelista et al., 2002; Feierbach and Chang, 2001; Nakano et al., 2002; Sagot et al., 2002).
In plants, as in other eukaryotes, recent studies have linked formins to a variety of actin-
based processes (Banno and Chua, 2000; Cheung et al., 2010; Cheung and Wu, 2004; Deeks
et al., 2005; Deeks et al., 2010; Favery et al., 2004; Ingouff et al., 2005; Michelot et al., 2005;
Vidali et al., 2009b; Yang et al., 2011; Ye et al., 2009; Yi et al., 2005; Zhang et al., 2011).
In flowering plants, analysis of formin function has been challenging because of the
large size of the gene families. Recently, this challenge was addressed by characterizing
formin function in the moss Physcomitrella patens (Vidali et al., 2009b). Like flowering
plants, this species has both class I and class II formin families, but with only six genes in the
former and two genes in the latter.

23
To dissect the function of formin in moss, RNA interference (RNAi) was used taking
advantage of silencing constructs that allow targeting of an entire gene family as well as
concurrent complementation. This approach revealed that class I formins, rather than
contributing to polarized growth, are needed for efficient cytokinesis, and that class II
formins are essential for tip growth (Vidali et al., 2009b). Further the FH1-FH2 domains of
class II formins were shown, in vitro, to promote rapid rates of actin elongation, an activity
that was argued to underlie their role in tip growth. Class II formins localize near the tip of
growing cells and the N-terminal PTEN domain is necessary and sufficient for this
localization (Vidali et al., 2009b).
In humans, PTEN is a lipid phosphatase, which converts PI(3,4,5)P3 to PI(4,5)P2.
PTEN acts as a tumor suppressor by limiting PI(3,4,5)P3 levels, which negatively regulates
oncogenic phosphoinositol-3-kinase and AKT signaling pathways, thereby preventing cells
from growing and dividing too rapidly (Li et al., 1997; Maehama and Dixon, 1998; Salmena
et al., 2008; Steck et al., 1997). In moss the loss of class II formin function is not
complemented by expression of the FH1-FH2 domains alone (Vidali et al., 2009b),
suggesting that the formin PTEN domain is required for formin activity in tip growth. This
suggestion is consistent with an emerging picture in the formin field that N-terminal formin
domains contain key regions, including the small GTPase-binding domains required to
regulate actin polymerization (Goode and Eck, 2007). In this chapter, I, in collaboration with
members of the Bezanilla lab, use a combination of genetics, biochemistry, and live-cell
imaging to investigate the mechanism of the PTEN domain localization and function with
respect to formin-mediated actin polymerization during polarized growth.
24
Results
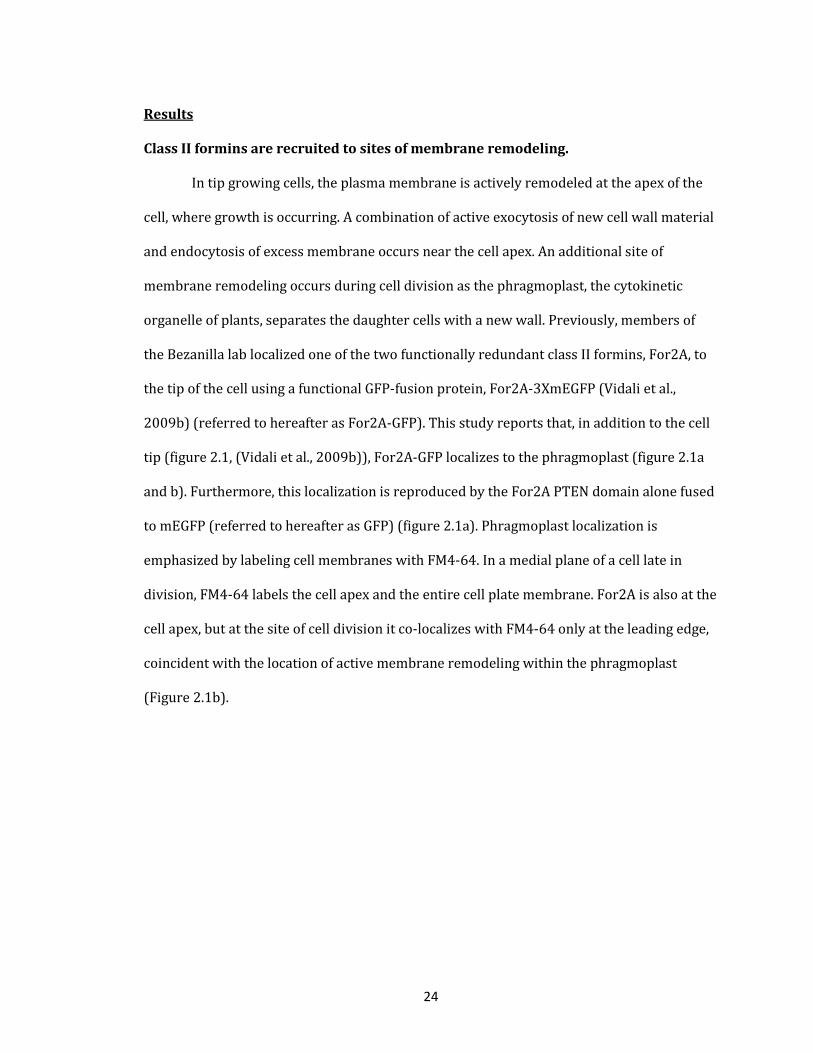
Class II formins are recruited to sites of membrane remodeling.
In tip growing cells, the plasma membrane is actively remodeled at the apex of the
cell, where growth is occurring. A combination of active exocytosis of new cell wall material
and endocytosis of excess membrane occurs near the cell apex. An additional site of
membrane remodeling occurs during cell division as the phragmoplast, the cytokinetic
organelle of plants, separates the daughter cells with a new wall. Previously, members of
the Bezanilla lab localized one of the two functionally redundant class II formins, For2A, to
the tip of the cell using a functional GFP-fusion protein, For2A-3XmEGFP (Vidali et al.,
2009b) (referred to hereafter as For2A-GFP). This study reports that, in addition to the cell
tip (figure 2.1, (Vidali et al., 2009b)), For2A-GFP localizes to the phragmoplast (figure 2.1a
and b). Furthermore, this localization is reproduced by the For2A PTEN domain alone fused
to mEGFP (referred to hereafter as GFP) (figure 2.1a). Phragmoplast localization is
emphasized by labeling cell membranes with FM4-64. In a medial plane of a cell late in
division, FM4-64 labels the cell apex and the entire cell plate membrane. For2A is also at the
cell apex, but at the site of cell division it co-localizes with FM4-64 only at the leading edge,
coincident with the location of active membrane remodeling within the phragmoplast
(Figure 2.1b).

25
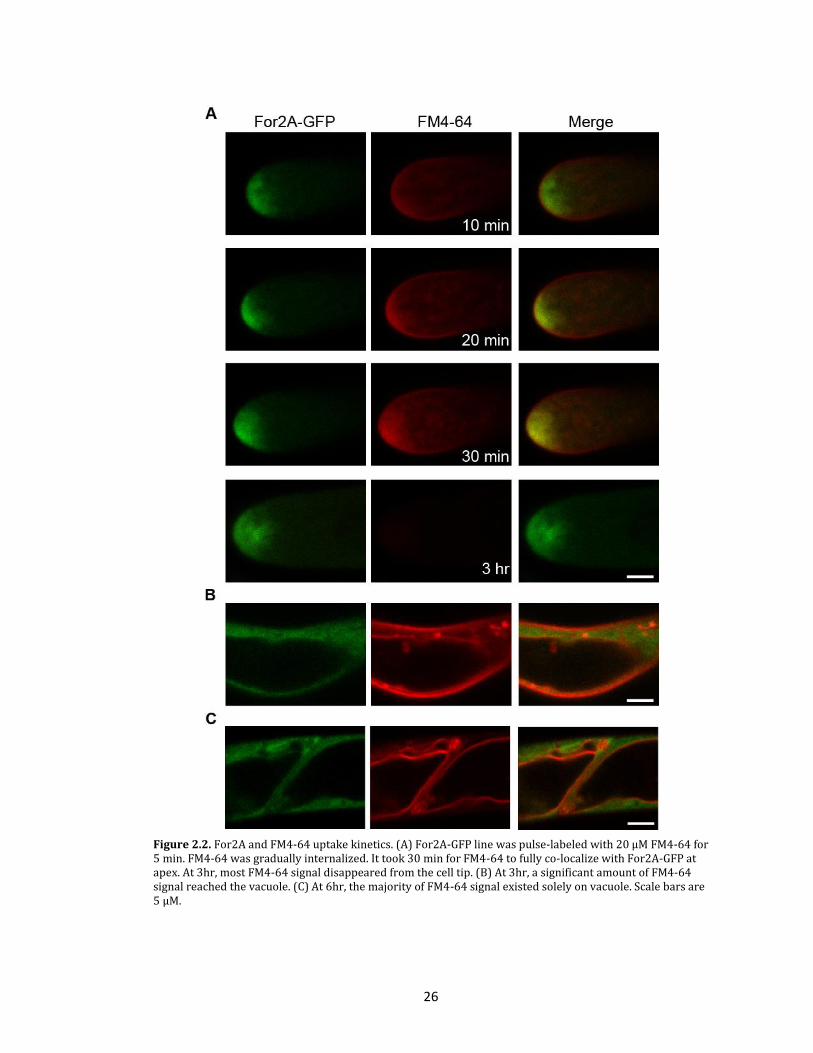
To investigate the co-localization of For2A-GFP and FM4-64 at the cell apex, the
dynamics of FM4-64 internalization in cells expressing For2A-GFP were observed using
pulse-chase labeling of cells with FM4-64. Interestingly, early internalization of FM4-64,
which is likely specific for endocytosis (Van Gisbergen et al., 2008), does not co-localize
with For2A-GFP (figure 2.2). However, after 30 minutes, For2A-GFP dynamics and
localization coincide with the FM4-64 signal (figure 2.1c), suggesting that the For2A
labeling may represent a combination of late endocytic and post-Golgi exocytic membranes.
These data together with the phragmoplast localization suggest that For2A-GFP is enriched
at sites of active membrane remodeling.
Figure 2.1. For2A localizes to sites of dynamic membrane trafficking. (A) For2A-GFP localizes to the tip of the cell and to the phragmoplast. The PTEN domain of For2A alone, fused to GFP also localizes to the tip and the phragmoplast. (B) FM4-64 labeled membranes and For2A co-localize in the phragmoplast, but not the cell plate. Shown is the medial plane of a cell with an almost completed cell division. (C) For2A co-localizes with FM4-64 labeled membranes near the tip. Scale bars are 5µm.
26
Figure 2.2. For2A and FM4-64 uptake kinetics. (A) For2A-GFP line was pulse-labeled with 20 µM FM4-64 for 5 min. FM4-64 was gradually internalized. It took 30 min for FM4-64 to fully co-localize with For2A-GFP at apex. At 3hr, most FM4-64 signal disappeared from the cell tip. (B) At 3hr, a significant amount of FM4-64 signal reached the vacuole. (C) At 6hr, the majority of FM4-64 signal existed solely on vacuole. Scale bars are 5 µM.

27
Actin polymerization is not directly correlated with all populations of cytoplasmic
For2A
To determine the spatial and temporal relationship between For2A and actin, the
colocalization of actin and formin in tip growing cells was studied. A line expressing For2A-
GFP and Lifeact-mCherry, a validated marker for imaging actin in living protonemal cells
was generated (Vidali et al., 2009a). Interestingly, the prominent apical accumulation of
For2A-GFP and the Lifeact signal associated only occasionally (figure 2.3a). The image
series in figure 2.3a represents 45 minutes during which time the cell is actively growing.
Both For2A-GFP and Lifeact-mCherry signals are dynamic with changes in position and
intensity near the apex of the cell. However, there is a low temporal and spatial correlation
between apical accumulation of For2A-GFP and Lifeact-mCherry intensity in this and
similar image sequences.
Occasionally though, accumulation of tip-localized For2A-GFP was closely
associated with an increase in the Lifeact-mCherry intensity (figure 2.3a, 25-35 min). On
average this was observed 2 times in a 50 minute time-lapse acquisition (9 cells). In
addition to these infrequent events at the tip, For2A-GFP transiently accumulated in other
regions of the cell during growth. Time-lapse imaging with higher temporal resolution
revealed that these sub-apical enrichments were always associated with a burst of Lifeact-
mCherry signal indicative of actin polymerization (Figure 2.3b, n=31 accumulations in 9
cells). The formin sub-apical enrichments were stochastic, from none to as many as 18
occurring in a 60 minute time-lapse acquisition. Interestingly, the position of the filaments
with respect to For2A-GFP suggested that actin filaments emerged from the formin
structure consistent with formin-mediated actin polymerization (Figure 2.3b). These data
demonstrate that not all cytoplasmic accumulations of For2A actively generate actin
filaments.

28
Figure 2.3. Dynamics of For2A and actin in a growing tip cell. (A) For2A-GFP is present in the apex and Lifeact-mCherry is present subapically mostly along the cell cortex. The majority of the time, For2A-GFP and Lifeact-mCherry do not overlap. Occasionally a short overlap followed by quick actin polymerization can be seen (25-35 min). (B) Away from the tip, bursts of For2A-GFP are observed, followed by actin polymerization near the For2A-GFP enrichment. Here, the For2A-GFP cloud travels through the cell with actin filaments behind it. Scale bars are 5 µm.

29
PTEN homologues fused to the FH1-FH2 domains differentially restore formin-
mediated polarized growth.
Previous studies demonstrated that neither the FH1-FH2 domains nor the For2A
PTEN domain, when expressed alone, complement loss of formin (Vidali et al., 2009b). To
further investigate the role of the For2A PTEN domain, I tested whether the PTEN domain
could be functionally replaced by PTEN homologues by performing a complementation
analysis of the formin RNAi phenotype. As reported previously (Vidali et al., 2009b), RNAi-
mediated silencing of both class II formins results in severely stunted plants, composed of
small round cells (figure 2.4). Silencing is carried out using an RNAi construct that contains
sequences from the untranslated regions of both For2A and 2B (For2AB-5’UTR). Co-
transforming with a construct that expresses the coding sequence of a single formin gene,
For2A, ameliorates the growth defect (figure 2.4), also see (Vidali et al., 2009b). These
plants are polarized and look like wild type; however, quantification of area and polarity
(via the morphometric parameter, circularity) shows that the plants are modestly smaller
and less polarized (Figure 2.4b). Circularity is the ratio of plant area to the square of the
perimeter. Wild-type plants have low circularity, resulting from the large perimeter of a
highly branched structure. In contrast, the circularity of For2 RNAi plants approaches one
because the shape of these plants is far more circular. The incomplete complementation by
For2A is probably due to the method used to generate the For2A construct (as well as all
others used here), which introduces eight-amino-acid insertions between domains,
insertions that slightly compromise the protein’s activity, see discussion in (Vidali et al.,
2009b).
To investigate if PTEN homologues could function in place of the For2A PTEN
domain, we generated chimeric proteins where the For2A PTEN domain was replaced with
human PTEN or moss PTEN. Moss has four PTEN homologues, which form two groups

30
based on sequence similarity, with PTENA and B forming one group and PTENC and D the
other. For complementation studies we chose one from each group. Human PTEN fused to
the For2A FH1-FH2 domains (HsPTEN-FH1FH2-3XFLAG) and co-transformed with the
formin RNAi construct, was unable to rescue either plant area or circularity (figure 2.4),
suggesting that some aspect of human PTEN renders this chimera inactive.
Interestingly the two moss PTEN homologues investigated showed different degrees
of complementation. PTENA-FH1FH2 rescues, giving rise to plants whose area and
Figure 2.4. In place of the For2A PTEN domain, PTEN homologues fused to the FH1-FH2 domains of For2A differentially complement formin-mediated polarized growth. (A) Representative chlorophyll autofluorescence images of control RNAi (GUS-RNAi), For2 RNAi (For2AB-5’UTR) and For2 RNAi plants cotransformed with indicated constructs. Scale bar is 100 μm. (B) Quantification of area and circularity by chlorophyll autofluorescence shows that replacing the For2A PTEN domain with moss PTEN homologues provides full complementation with PTENA, but not with PTEND. Replacement using HsPTEN does not complement the For2 RNAi phenotype. Tagging the formin with an epitope tag (3XFLAG) tag does not affect its ability to complement the phenotype. Number of plants analyzed is: 101, GUS-RNAi; 101, For2AB-5’UTR; 50, +For2A; 51, +For2A-3XFLAG; 76, +PTENA-FH1FH2; 50, +PTEND-FH1FH2-3XFLAG; 50, +HsPTEN-FH1FH2-3XFLAG. Error bars represent SEM and letters above the bars indicate statistical groups with α = 0.05 from an ANOVA analysis. (C) Alignment of the phosphoinositide binding regions of human PTEN (HsPTEN) with the For2A and For2B PTEN domains and four P. patens PTEN homologues (PpPTENA-D). The arrow indicates an arginine residue critical for catalytic activity. Note this arginine is absent in the formin PTEN domains.

31
circularity are essentially the same as those given by complementation with For2A itself
(figure 2.4). In contrast, PTEND-FH1FH2-3XFLAG does not rescue. Some plants polarize to a
limited extent, as seen in the image (figure 2.4a). But in comparison to formin RNAi, slight
improvements in plant area and morphology (figure 2.4b) are not statistically significant.
Differential rescue might arise from low levels of expression from the
complementing plasmid, which was controlled for in two ways. First, all the expression
plasmids were generated similarly, with the same backbone vector and containing the same
strong constitutive promoter. Additionally non-complementing constructs were generated
with an epitope tag (3XFLAG) and expression of the protein in moss cells was confirmed
(figure 2.5a). As a control, For2A was tested with and without the epitope tag and was found
to rescue similarly (figure 2.4a and b). Second, I performed the complementation assay with
a range of different plasmid concentrations. Complementation of the formin RNAi
phenotype by For2A is optimal using between 5 and 15 µg of the For2A expression plasmid.
Below this concentration, I observe a dose-dependent decrease in complementation (figure
2.6). At higher concentrations of For2A, rescue is also diminished (figure 2.6) and it is
difficult to recover sufficient numbers of transformants. This is likely a result of toxicity
from overexpression of For2A. Similar to For2A, PTENA-FH1FH2 exhibits dose-dependent
complementation under the same concentration range (figure 2.6). In contrast, PTEND-
FH1FH2 rescues weakly and HsPTEN-FH1FH2 does not restore function at any
concentrations tested (figure 2.6). Since the non-complementing constructs were unable to
rescue at the high plasmid concentrations, it should account for lower expression of these
fusion proteins (figure 2.5a). Furthermore, I was unable to recover transformants with high
concentrations of HsPTEN-FH1FH2 suggesting that this construct is also toxic at high levels.
Taken together, these data indicate that PTENA can functionally replace the For2A PTEN
domain, while HsPTEN and PTEND cannot.

32
If PTENA were more similar to the For2A PTEN domain than is human PTEN, then
that might explain the difference in complementation. However, sequence comparison of
human and moss PTENs with the PTEN domains from For2A and For2B does not support
this. PTENA is 27% similar to human PTEN, while only 21.6% and 20.4% similar to For2A
and For2B PTEN domains, respectively. Inspection of the amino acid sequence alignment
near the phosphoinositide binding pocket reveals that the phoshoinositide binding region in
human PTEN (Lee et al., 1999) is highly similar to the class II formin PTEN domains and the
moss PTEN homologues (Grunt et al., 2008) (figure 2.4c). Interestingly, neither of the For2A
nor the For2B PTEN domains have a critical arginine required for catalytic activity (figure
2.4c, arrow) (Barford et al., 1994; Lee et al., 1999). Therefore, as has been suggested (Grunt
et al., 2008), the formin PTEN domains probably bind phosphoinositides but do not
Figure 2.5. Expression of the complementation proteins. (A) PTEND-FH1FH2-3XFLAG and HsPTEN-FH1FH2-3XFLAG do not complement the For2-RNAi phenotype, but are expressed. (B) 2XFYVE-FH1FH2-3XFLAG, HsTAPP1-FH1FH2-3XFLAG and HsPH-FH1FH2-3XFLAG do not complement the For2-RNAi phenotype, but are expressed. Numbers are molecular weight standards in kDa.

33
dephosphorylate them. Thus, perhaps the observed differential rescue results from
different phosphoinositide binding activities of the tested PTEN homologues.
Figure 2.6. Dose dependent complementation of the formin RNAi phenotype using constructs that replace the For2A PTEN domain with PTEN homologues. Complementation using increasing amounts of the For2A (blue) expression plasmid, indicated below each bar in µg, shows a range of phenotypes. At low DNA concentrations, complementation is reduced both in area (top) and circularity (bottom). Between 5 and 15 µg of DNA optimum complementation is achieved. At higher concentrations, fewer plants are obtained from each transformation, indicative of toxicity possibly due to overexpression. Similar titrations with HsPTEN-FH1FH2 (green) and PpPTEND-FH1FH2 (yellow) show no response to increasing concentrations, indicating that these constructs are incapable of rescuing the phenotype. Conversely, PpPTENA-FH1FH2 (purple) shows a similar trend as complementation with For2A. Plasmid concentrations in µg are indicated below each bar. Numbers above the bars indicate the number of plants measured for each condition. Error bars represent standard error.

34
Table 2.1. Sequence comparison between formin PTEN domains and PTEN homologues. For2A For2B PTENA PTENB PTENC PTEND HsPTEN 24.5 / 15.4 26.1 / 16.0 27.0 / 18.9 26.3 / 17.6 20.0 / 13.4 16.0/ 10.8
For2A 93.0 / 89.5 21.6 / 11.5 21.6 / 12.5 17.7 / 10.3 14.8 / 8.8
For2B 20.4 / 11.4 20.7 / 12.1 16.2 / 9.3 14.9 / 9.4
PTENA 86.0/ 81.4 41.8 / 31.8 39.7 / 29.4
PTENB 43.3 / 32.5 41.0 / 30.4
PTENC 51.5 / 43.6
Red = % Similarity Green = % Identity
For2A PTEN domain and moss PTENA homologue bind PI(3,5)P2.
Human PTEN not only converts PI(3,4,5)P3 to PI(4,5)P2 (Maehama and Dixon,
1998), it also binds PI(4,5)P2 (Redfern et al., 2008). The fact that moss PTENA, but not
human PTEN, could functionally replace the For2A PTEN domain, lead to the hypothesis
that the For2A PTEN domain and moss PTENA might interact with a different
phosphoinositide as compared to human PTEN. To test this, lipid overlay assays were used
(Dowler et al., 2002) to determine the phosphoinositide binding preferences of the For2A
PTEN domain, PTENA and PTEND. The For2A PTEN domain fused to glutathione S
transferase (GST) (PTEN-GST) binds phosphoinositides broadly, with the highest specificity
to PI(3,5)P2 (figure 2.7a). GST-PTENA and GST-PTEND appeared more selective, with the
former preferring PI(3,5)P2 and the latter both PI(3)P and PI(3,5)P2, although both moss
PTEN homologues bound the other phosphoinositides to some extent (figure 2.7a).
Since lipid overlay assays do not always reliably report a protein's native
phosphoinositide binding specificity, I used an additional approach to test phosphoinositide
selectivity. I used beads covalently linked to PI(3,5)P2 to perform a pull-down experiment. I
found that both the For2A PTEN domain and PTENA binding to PI(3,5)P2 beads is enhanced
as compared to control beads (figure 2.7b). In contrast, PTEND binds similarly to both
control and PI(3,5)P2, suggesting that PTEND does not effectively bind PI(3,5)P2 in solution.

35
To test for PI(3,5)P2 specificity, I incubated the For2A PTEN-GST or GST-PTENA
with PI(3,5)P2 beads in the presence of micellar dispersions of other phosphoinositides. I
found that binding to the beads is completely eliminated for For2A PTEN-GST or greatly
reduced for GST-PTENA in the presence of PI(3,5)P2, but not other phosphoinositides
(figure 2.7c). Together with the lipid overlay assays, these data strongly suggest that the
Figure 2.7. For2A PTEN domain and PTENA specifically bind PI(3,5)P2. (A) Representative lipid-overlay assay shows that the For2A PTEN-GST binds broadly to phosphoinositides, with highest specificity to PI(3,5)P2. PTENA binds PI(3,5)P2 strongly. PTEND also binds PI(3,5)P2, but weaker than PTENA. Additionally PTEND also binds PI(3)P. GST alone does not interact with phosphoinositides. The numbers indicate amount in picomole of spotted phosphoinositide. At least three independent experiments were carried out for each overlay assay. (B) Immunoblot of For2A PTEN-GST, GST-PTENA, and GST-PTEND using an anti-GST antibody shows that For2A PTEN-GST and GST-PTENA preferentially bind to beads covalently linked PI(3,5)P2 as compared to control beads. In contrast, GST-PTEND binds similarly to control and PI(3,5)P2 beads. Numbers are molecular weight standards in kDa. (C) Immunoblot of For2A PTEN-GST and GST-PTENA using an anti-GST antibody demonstrates that binding to PI(3,5)P2 beads is specifically displaced in the presence of exogenous PI(3,5)P2, but not other phosphoinositides. Numbers are molecular weight standards in kDa.

36
For2A PTEN domain and moss PTENA interact specifically with PI(3,5)P2. Since the For2A
PTEN domain and PTENA rescue formin-mediated polarized growth and specifically
interact with PI(3,5)P2, while PTEND does not rescue and poorly interacts with PI(3,5)P2,
these data argue that PI(3,5)P2 is the critical phosphoinositide.
PI(3,5)P2 binding is sufficient for formin-mediated polarized growth.
To confirm that PI(3,5)P2 is critical for formin function in vivo, the PTEN domain in
For2A was replaced with a variety of other polypeptides of known phosphoinositide
binding specificity. When fused to the For2A FH1FH2 domains, several phosphoinositide
binding polypeptides failed to complement the loss of function phenotype, including
domains that bind PI(3)P (2XFYVE) (Vermeer et al., 2006), PI(3,4)P2 (TAPP1) (Dowler et al.,
2000; Marshall et al., 2002; Thomas et al., 2001), and PI(4,5)P2 (PH) (Van Leeuwen et al.,
2007) (figure 2.8). These constructs were epitope tagged and expression in moss cells was
verified by isolating proteins from cells transformed with the various constructs.
Immunoblots were probed with an antibody to the epitope tag (figure 2.5b). Additionally,
increasing the amount of transformed expression construct did not restore polarized
growth, instead it resulted in very few transformants, suggesting that overexpression of
these proteins is toxic. In contrast, complementation is strong from proteins that bind
PI(3,5)P2, including the yeast protein ATG18 (Dove et al., 2004; Michell et al., 2006) and the
human lipid phosphatase MTM1 (Michell et al., 2006; Schaletzky et al., 2003) (Figure 2.8).
The complementation results are similar to that obtained with For2A, even over a wide
range of plasmid concentrations (figure 2.9). A mutant version of the MTM1 protein where
the catalytic Cys was changed to Ser, thereby inactivating the phosphatase activity while
maintaining phosphoinositide binding (Taylor et al., 2000) was also tested. The mutant
form of MTM1 (MTM1*) fused to FH1-FH2 also restored tip growth (figure 2.8). Taken

37
together, our data imply that PI(3,5)P2 binding is the key activity conferred on moss class II
formins by the PTEN domain.
Figure 2.8. PI(3,5)P2 binding is essential for For2A function in vivo. (A) Representative chlorophyll autofluorescence images of control RNAi (GUS-RNAi), For2 RNAi (For2AB-5’UTR) and For2 RNAi plants cotransformed with indicated constructs. Scale bar is 100 μm. (B) Quantification of area and circularity by chlorophyll autofluorescence shows that replacing the For2A PTEN domain with non-homologous domains from various organisms exclusively rescues For2 RNAi when the domain binds PI(3,5)P2, indicating that PI(3,5)P2 binding is essential for class II formin function in polarized growth. Number of plants analyzed: 175, GUS-RNAi; 176, For2AB-5’UTR; 100, +For2A; 75, +2XFYVE-FH1FH2-3XFLAG; 50, +TAPP1-FH1FH2-3XFLAG; 25, +PH-FH1FH2-3XFLAG; 78, +ATG18-FH1FH2; 75, +MTM1-FH1FH2; 78, +MTM1*-FH1FH2. Error bars represent SEM and letters above the bars indicate statistical groups with α = 0.05 using an ANOVA analysis.

38
Figure 2.9. Dose dependent complementation of the formin RNAi phenotype using constructs that replace the For2A PTEN domain with unrelated PI(3,5)P2 binding proteins. ScATG18-FH1FH2 (light blue), HsMTM1-FH1FH2 (purple) and HsMTM1*-FH1FH2 (pink) all rescue the formin RNAi phenotype similarly to For2A (dark blue). Plasmid concentrations in µg are indicated below each bar. Numbers above the bars indicate the number of plants measured for each condition. Error bars represent standard error.

39
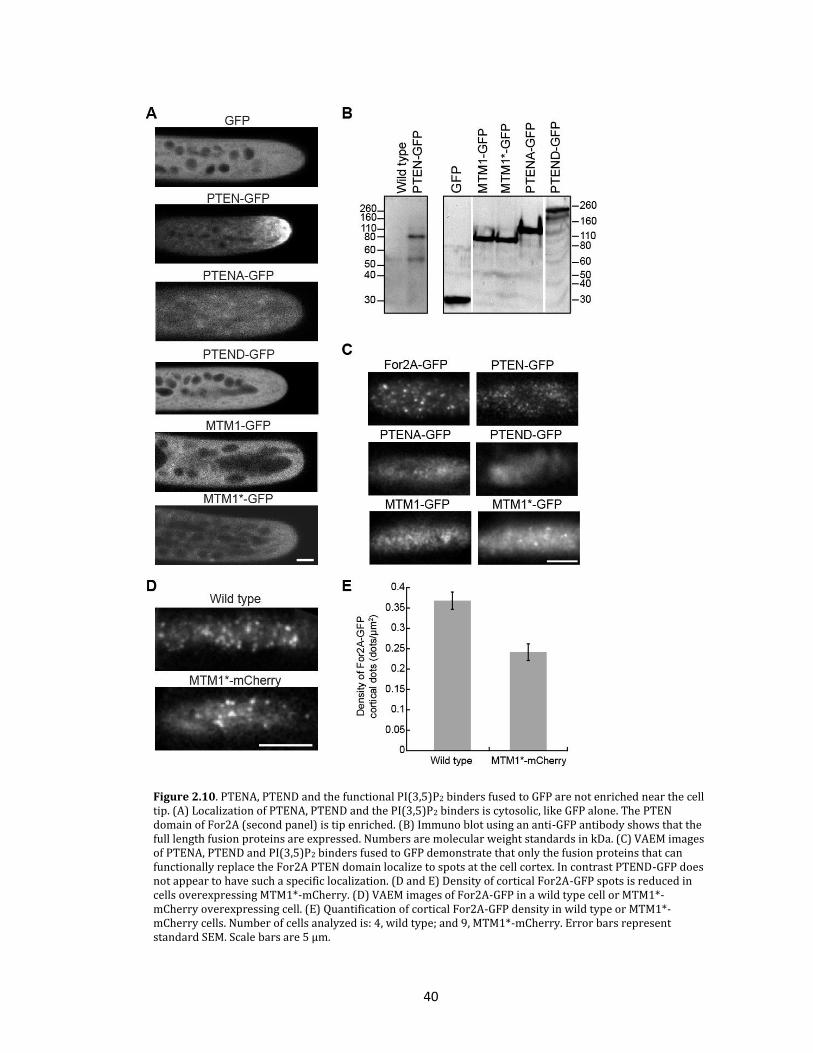
PI(3,5)P2 binders localize to the cortex as dynamic spots
Since PTENA and PI(3,5)P2 binding proteins functionally replaced the For2A PTEN
domain, it was expected that these domains should localize to the tip of the cell, similar to
the For2A PTEN domain. In contrast PTEND, which does not rescue formin-mediated
polarized growth, would be predicted to not localize. To test this, PTENA, PTEND, MTM1
and MTM1* were fused to GFP and isolated stable lines expressing these fusion proteins. As
expected, PTEND was not enriched at the apex of the cell (figure 2.10a) or the
phragmoplast. However, neither were PTENA nor the functional PI(3,5)P2 binding proteins
(figure 2.10a). Instead these fusion proteins were diffusely cytosolic, similar to GFP alone.
To ensure that the expressed fusion proteins were intact, I isolated proteins from plants
carrying the various constructs and probed immunoblots with a GFP antibody (figure
2.10b). Free GFP is undetectable in these protein extracts. Apical accumulation of PTEN-GFP
is likely specific to the For2A PTEN domain and not a result of differing expression levels,
since the average GFP intensity in lines expressing For2A PTEN-GFP, MTM1-GFP, and
MTM1*-GFP are similar (figure 2.11a). Furthermore, a full-length functional MTM1*-
FH1FH2-3XGFP (figure 2.11b) is also not apically enriched when transiently expressed in
moss cells (figure 2.11c). This is in contrast to apical enrichment of transiently expressed
For2A PTEN-3XFLAG-GFP (figure 2.11c), suggesting that the FH1FH2 domains are not
sufficient for apical accumulation.
40
Figure 2.10. PTENA, PTEND and the functional PI(3,5)P2 binders fused to GFP are not enriched near the cell tip. (A) Localization of PTENA, PTEND and the PI(3,5)P2 binders is cytosolic, like GFP alone. The PTEN domain of For2A (second panel) is tip enriched. (B) Immuno blot using an anti-GFP antibody shows that the full length fusion proteins are expressed. Numbers are molecular weight standards in kDa. (C) VAEM images of PTENA, PTEND and PI(3,5)P2 binders fused to GFP demonstrate that only the fusion proteins that can functionally replace the For2A PTEN domain localize to spots at the cell cortex. In contrast PTEND-GFP does not appear to have such a specific localization. (D and E) Density of cortical For2A-GFP spots is reduced in cells overexpressing MTM1*-mCherry. (D) VAEM images of For2A-GFP in a wild type cell or MTM1*-mCherry overexpressing cell. (E) Quantification of cortical For2A-GFP density in wild type or MTM1*-mCherry cells. Number of cells analyzed is: 4, wild type; and 9, MTM1*-mCherry. Error bars represent standard SEM. Scale bars are 5 µm.

41
Although class II formin function in tip growth requires PI(3,5)P2 binding activity,
apical enrichment of formin appears dispensable. In protonemal cells, actin filaments are
abundant near the plasma membrane and are highly dynamic (Vidali et al., 2010; Vidali et
al., 2009a). This suggests that formin activity might be required at the cell cortex. Variable
angle epifluorescence microscopy (VAEM) (Konopka and Bednarek, 2008; Staiger et al.,
2009) was used to determine whether formin localizes to the cell cortex. In the For2A-GFP
line, formin localizes to discrete spots near the cell membrane (figure 2.10c), which are
Figure 2.11. Full length MTM1*-FH1FH2-3xmEGFP is functional and not tip enriched (A) GFP intensity in stable lines expressing GFP fusion constructs. Quantification of GFP levels in the medial section of cells expressing the GFP fusion constructs shown in figure 2.10. The levels of For2A PTEN-GFP (n=5 cells), MTM1-GFP (n=5 cells), and MTM1*-GFP (n=5 cells) are similar. PTENA-GFP (n=4 cells) and PTEND-GFP (n=4 cells) have higher levels of expression. Error bars represent standard deviation of the mean. (B) Quantification of chlorophyll autofluorescence shows that MTM1*-FH1FH2-3XGFP complements For2-RNAi. Number of plants analyzed is: 75, GUS-RNAi; 76, For2AB-5’UTR; 75, +For2A-3XFLAG; and 75, +MTM1*-FH1FH2-3XGFP. Error bars are SEM and letters above the bars indicate statistical groups with α = 0.05 using an ANOVA analysis. (C) Representative images of plants expressing MTM1*-FH1FH2-3XGFP or PTEN-3XFLAG-GFP. PTEN-3XFLAG-GFP is tip enriched, whereas MTM1*-FH1FH2-3XGFP is cytosolic. Scale bar is 10µm.

42
highly dynamic. Similar to For2A-GFP, the For2A PTEN-GFP also localizes to discrete
dynamic spots near the plasma membrane (figure 2.10c), suggesting that the For2A PTEN
domain is sufficient to mediate this localization.
The fact that the For2A PTEN domain is required for the localization of For2A-GFP
near the plasma membrane in discrete dynamic spots led to the hypothesis that this
localization is required for formin function in tip growth. If this is the case, then any of the
PI(3,5)P2 binders capable of replacing the For2A PTEN domain should likewise form
dynamic spots at the cortex. Supporting this hypothesis, PTENA-GFP, MTM1-GFP and
MTM1*-GFP all formed dynamic spots at the cell cortex (figure 2.10c). PTEND, which cannot
functionally replace the For2A PTEN domain localizes diffusely at the cell cortex (figure
2.10c). Interestingly, the spots formed by MTM1-GFP were shorter lived and less discrete
then those formed by MTM1*-GFP. Given that the former is an active lipid phosphatase
whereas the latter is inactive, this suggests that phosphatase activity promotes turnover
within the cortex.
To test whether the For2A and MTM1*cortical spots are similar structures,
members of the Bezanilla lab generated a line that overexpresses MTM1*-mCherry in the
background of For2A-GFP. Interestingly the density of cortical For2A-GFP spots was
reduced in the MTM1*-mCherry line (figure 2.10d and e), suggesting that For2A-GFP and
MTM1*-mCherry are competing for the same sites on the membrane.
Silencing FAB1 kinases impairs polarized growth and results in fewer cortical formin
dots
If cortical PI(3,5)P2 sites are critical for formin-mediated polarized growth, then
reduction of cellular PI(3,5)P2 should impair polarized growth. I reasoned that silencing the
kinases that produce PI(3,5)P2 should lead to a reduction in PI(3,5)P2 levels. Toward this

43
end, I identified three kinases (FAB1-A, FAB1-B, and FAB1-C) that have high sequence
similarity with S. cerevisiae FAB1. In yeast, FAB1 is a 1-phosphatidylinositol-3-phosphate 5-
kinase, which is responsible for generating PI(3,5)P2 (Gary et al., 1998). To silence the moss
FAB1 homologues, I generated an RNAi constructs that target all three FAB1 genes (FAB1-
RNAi).
Using RNAi, it is possible to effectively reduce protein levels in moss within 72-96
hours after transformation of the RNAi construct (Bezanilla et al., 2003; Bezanilla et al.,
2005). However once the FAB1 kinases are depleted, subsequent dephosphorylation of
PI(3,5)P2 must occur to reduce PI(3,5)P2 levels. To allow enough time for these events to
occur, I inhibited 4-day old transformed plants from performing polarized growth by
exposing plants to latrunculin B for 3 days. Transformed plants were then transferred to
normal growth medium and allowed to grow for an additional three days. Using this
procedure, I found that plants transformed with the control construct (GUS-RNAi) were
able to recover from the latrunculin B treatment and grow normally forming polarized
extensions, leading to low levels of circularity (figure 2.12a and b). As expected plants
transformed with the formin-RNAi construct were unable to recover from the drug
treatment, remaining small and composed of spherical cells. Interestingly, plants expressing
the FAB1-RNAi constructs were also unable to fully recover from the latrunculin B
treatment. They remained small in comparison to controls, but had a higher degree of
polarity than the formin-RNAi plants. This is due to the fact that some of the cells in the
FAB1-RNAi plants were able to partially polarize and form a limited number of extensions
(figure 2.12a). Additionally, transformation with the FAB1-RNAi construct consistently
yielded significantly fewer transformed plants as compared to the GUS- and formin-RNAi
constructs.

44
To test if reduction of FAB1 kinases led to a concomitant reduction in the cortical
targeting of formin, cells transformed with the FAB1-RNAi constructs were imaged. In the
RNAi assay, it is possible to identify transformed plants that are actively silencing since
these plants have a reduction in a nuclear GFP:GUS reporter (Bezanilla et al., 2005). In any
given transformation, a fraction of the transformed plants still express the GFP:GUS
reporter and are therefore not silencing the target genes. Taking advantage of this, VAEM
was used to image plants that were transformed with the FAB1-RNAi constructs. On the
same coverslip and with the same imaging conditions, both silenced and non-silenced
Figure 2.12. Silencing the FAB1 kinases impairs polarized growth and decreases the density of cortical formin dots. (A) Representative chlorophyll autofluorescence images of 10 day old plants transformed with control (GUS-RNAi), For2-RNAi (For2AB-5’UTR) and FAB1-RNAi constructs. Scale bar is 100µm. Plants were grown in the presence of latrunculin B from day 4 to day 7. (B) Quantification of chlorophyll autofluorescence area and circularity shows that FAB1-RNAi has an intermediate phenotype. Number of plants analyzed is: 34, GUS-RNAi; 38, For2AB-5’UTR; and 17, FAB1-RNAi. Error bars are SEM and letters above the bars indicate statistical groups with α = 0.05 using an ANOVA analysis. (C) Representative VAEM images of silenced and not silenced FAB1-RNAi plants, stably expressing For2A-GFP. Silenced plants show fewer cortical dots than not silenced plants. (D) Quantification of the number of cortical dots in silenced and not silenced FAB1-RNAi plants. There is a statistically significant decrease in the number of cortical dots upon FAB1 silencing. Number of cells analyzed is: 5, not silenced; and 4, silenced. Error bars are SEM.

45
control plants were identified. For2A-GFP was still targeted to the cell cortex in silenced
plants (figure 2.12c). However, in comparison to non-silenced control plants, targeting of
For2A-GFP was reduced 2.5-fold (figure 2.12d). The presence of reduced levels of cortical
For2A-GFP might explain the limited extent of polarized out growths in the FAB1-RNAi
plants. Taken together these data show that silencing of FAB1 kinases impairs polarized
growth and correct targeting of formin to the cell cortex, likely through production of
PI(3,5)P2.
Linear motility of For2A cortical spots is dependent on actin
To determine whether cortical formin generates actin filaments, the behavior of the
cortical formin spots were investigated. Using VAEM in For2A-GFP cells expressing Lifeact-
mCherry For2A-GFP trajectories were analyzed. About 29% of cortical formin spots move
rapidly in and out of the imaging field, remaining for less than one second on the cortex. The
remaining trajectories of cortical For2A-GFP grouped into three main categories: linear,
random, and stationary (movement no greater than 0.4 µm from the origin). Linear
trajectories can be visualized by displaying the maximum projection of the 30 consecutive
frames, which represents three seconds of real time (figure 2.13a). Of the spots that resided
on the cortex for more than one second, 13.8% displayed linear trajectories (figure 2.13b,
832 spots from 5 cells). Furthermore, the cortical formin spots that moved in linear
trajectories moved at 1.8 ± 0.56 µm/sec (51 spots from 4 cells). To determine if these rates
were similar to rates of actin polymerization in moss, time-lapse series of cells containing
Lifeact-mCherry were analyzed and rates of actin polymerization were measured. New actin
filaments grew at 1.93 ± 0.55 µm/sec (30 filaments from 7 cells), which is statistically
indistinguishable from the rates of formin cortical spots that move in linear trajectories and
similar to the rates measured previously for Lifeact-GFP (Augustine et al., 2011). This rate is

46
also consistent with the rate of actin polymerization in arabidopsis hypocotyls cells
(Smertenko et al., 2010; Staiger et al., 2009).
To test whether cortical formin movement was dependent on actin, cells were
treated with latrunculin B and then imaged cortical formin and actin with VAEM. After 25
minutes in 16 µM latrunculin B, the actin at the cell cortex was completely depolymerized
(figure 2.13c). In the absence of actin, For2A-GFP still formed distinct spots at the cell
cortex, indicating that the localization of formin to the cell cortex is independent of actin.
This is consistent with the fact that PTEN-GFP and all the proteins that replace the function
of PTEN in formin also localize to spots on the membrane. However, cortical formin
dynamics was altered in the absence of actin. Linear trajectories were not observed (figure
2.13c) and the population of random trajectories was greatly diminished, with a
Figure 2.13. Cortical For2A linear movement is actin dependent. (A) Two representative cells imaged with VAEM show that For2A-GFP localizes to cortical dots (left images) and Lifeact-mCherry labels the cortical filamentous actin array (center images). For2A linear trajectories are apparent in a maximum projection of 30 frames, which corresponds to three seconds real time (right panels). (B) Quantification of the percent of cortical dots found in the three categories of trajectories identified for formin cortical dots that resided on the cortex for more than one second. Stationary indicates that no movement greater than 0.4 µm from the origin was observed. (C) Two representative cells imaged with VAEM in the presence of 16 µM latrunculin B show that For2A-GFP localizes to cortical dots (left images) but filamentous actin has been disrupted depicted by diffuse Lifeact-mCherry fluorescence (center images). Furthermore, For2A linear trajectories were no longer observed in maximum projections of 30 frames (right panels). Scale bars are 5 µm.

47
concomitant increase in the stable population of formin spots (figure 2.13b, 245 spots from
5 cells).
Formin generates actin filaments at the cell cortex
Formin spots moving in linear trajectories depend on actin filaments and their
speed is consistent with the rate of actin polymerization in moss. Taken together these data
strongly suggest that the formin spots moving in linear trajectories are generating actin
filaments. To test this, VAEM equipped with a dual view camera, which enabled
simultaneously acquisition of For2A-GFP and Lifeact-mCherry was used. As expected, a
large percentage of formin dots did not correlate with actin filaments (figure 2.14a and b).
However, some cortical formin spots coincided with the formation of new filaments (figure
2.14a, arrow heads). Also a number of events were observed where formin cortical dots
moved along pre-existing actin filaments (figure 2.14b, arrow heads). To ensure that these
events were more than coincidental, 61 linear formin trajectories from 6 cells were
analyzed. This analysis showed that 80% of the formin dots that moved in linear
trajectories either resided on the end of a new actin filament or coincided with a pre-
existing filament (figure 2.14c).
If these formin spots are generating actin filaments, then it would be expected that
they should move at the rates of actin polymerization. Indeed formin associated with the
end of a new actin filament moved at 1.80 ± 0.45 µm/sec (27 spots from 5 cells), while
formin spots associated with pre-existing actin filaments moved at 1.98 ± 0.56 µm/sec (18
spots from 5 cells) (figure 2.14d). A Student t-test confirms that these data are not
statistically different. Furthermore, if the formin spot generates a new actin filament, then it
should be possible to observe an increase in Lifeact-mCherry fluorescence, corresponding
to the new actin filament. Regardless of whether the formin spot was on the end of a
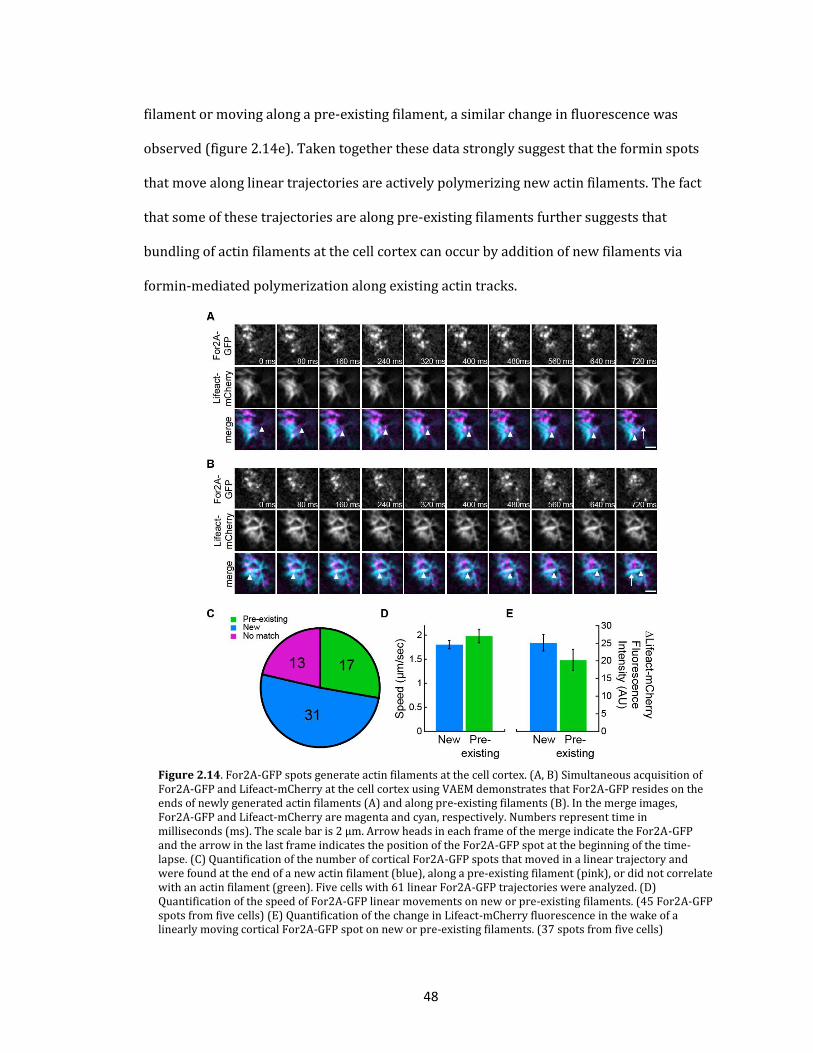
48
filament or moving along a pre-existing filament, a similar change in fluorescence was
observed (figure 2.14e). Taken together these data strongly suggest that the formin spots
that move along linear trajectories are actively polymerizing new actin filaments. The fact
that some of these trajectories are along pre-existing filaments further suggests that
bundling of actin filaments at the cell cortex can occur by addition of new filaments via
formin-mediated polymerization along existing actin tracks.
Figure 2.14. For2A-GFP spots generate actin filaments at the cell cortex. (A, B) Simultaneous acquisition of For2A-GFP and Lifeact-mCherry at the cell cortex using VAEM demonstrates that For2A-GFP resides on the ends of newly generated actin filaments (A) and along pre-existing filaments (B). In the merge images, For2A-GFP and Lifeact-mCherry are magenta and cyan, respectively. Numbers represent time in milliseconds (ms). The scale bar is 2 µm. Arrow heads in each frame of the merge indicate the For2A-GFP and the arrow in the last frame indicates the position of the For2A-GFP spot at the beginning of the time-lapse. (C) Quantification of the number of cortical For2A-GFP spots that moved in a linear trajectory and were found at the end of a new actin filament (blue), along a pre-existing filament (pink), or did not correlate with an actin filament (green). Five cells with 61 linear For2A-GFP trajectories were analyzed. (D) Quantification of the speed of For2A-GFP linear movements on new or pre-existing filaments. (45 For2A-GFP spots from five cells) (E) Quantification of the change in Lifeact-mCherry fluorescence in the wake of a linearly moving cortical For2A-GFP spot on new or pre-existing filaments. (37 spots from five cells)

49
Discussion
This study shows that class II formins interact with PI(3,5)P2 and that this
interaction is required for function in vivo. Heretofore understanding of the regulation of
plant formins has been elusive, since they lack the well-recognized regulatory domains,
such as rho GTPase binding domains found on the N-termini of fungal and many animal
formins (Blanchoin and Staiger, 2010; Goode and Eck, 2007; Grunt et al., 2008).
Interestingly, plant class II formins appear to have acquired a PTEN-like domain (Cvrckova
et al., 2004; Grunt et al., 2008) at their N-terminus, which interacts with phosphoinositides
to promote polarized growth. It was found that the PTEN domain of class II formins
interacts with PI(3,5)P2 and that this interaction is essential for formin’s role in polarized
growth. Furthermore, the For2A PTEN domain is also necessary for class II formin
localization to the cell apex, the phragmoplast, and the cell cortex. Analyzing the localization
of PI(3,5)P2 binding proteins that functionally replace the formin class II PTEN domain,
showed that apical localization is not linked to formin’s function in tip growth. Instead,
cortical localization appears critical. Our study provides a functional link between
membranes containing PI(3,5)P2 and the actin cytoskeleton.
Among PIP2s, PI(3,5)P2 has commanded less attention in comparison to PI(4,5)P2.
The latter is enriched on the plasma membrane and is implicated in a large array of
signaling pathways in animals, fungi, and plants (Munnik and Vermeer, 2010; Perera et al.,
2006; Saavedra et al., 2011; Sun et al., 2007; Yin and Janmey, 2003). In particular, PI(4,5)P2
is known to interact with the actin cytoskeleton through profilin, ADF/cofilin and activation
of the Arp2/3 complex through WAVE and WASP in mammalian systems (Saarikangas et al.,
2010; Shewan et al., 2011). Also, PI(4,5)P2 and the PTEN phosphatase are involved in
establishing cell polarity (Saarikangas et al., 2010; Shewan et al., 2011). In contrast, much
less is known about PI(3,5)P2. In yeast and animals, this phosphoinositide is implicated in

50
endomembrane trafficking (Michell et al., 2006). Although, perhaps due to its low
abundance, PI(3,5)P2 has not been directly localized within the endomembrane system.
However, in yeast and plants PI(3,5)P2 is generated by the FAB1 kinase, a kinase that is
localized to the endomembrane system (Cooke et al., 1998; Gary et al., 1998; Hirano et al.,
2011), and when knocked out (or down) results in enlarged vacuoles (Gary et al., 1998;
Hirano et al., 2011; Whitley et al., 2009). These results suggest that in plants, as in animals
and yeast, PI(3,5)P2 plays a role in membrane trafficking.
To our knowledge, PI(3,5)P2 has not been directly and functionally linked to the
actin cytoskeleton in any system. Evidence for a link to actin is indirect. Yeast deficient in
the epsin N-terminal homology domain containing protein Ent3p localize actin aberrantly
(Eugster et al., 2004). Ent3p is known to bind PI(3,5)P2 and is involved in protein sorting to
multivesicular bodies (Friant et al., 2003). Here it is shown that the For2A PTEN domain
binds to PI(3,5)P2 recruiting formin to the cell cortex where it generates actin filaments
essential for polarized growth, thereby directly linking PI(3,5)P2 to actin nucleation and
filament elongation.
Additionally, moss PTENA, in contrast to human PTEN, binds to PI(3,5)P2, not
PI(4,5)P2. The binding specificities of vascular plant PTENs are unknown. One of the PTEN
homologues in Arabidopsis thaliana catalyzes the conversion of PI(3,4,5)P3 to PI(4,5)P2 in
vitro (Gupta et al., 2002), but its ability to bind PI(3,5)P2 was not assessed. Based on these
findings, I speculate that PTENs in plants have a different phosphoinositide binding
preference, drawing attention to the importance of PI(3,5)P2 in plant signaling. In support of
this, a recent study demonstrated that the plekstrin homology (PH) domain from a rice
dynamin-like protein binds PI(3,5)P2, not PI(4,5)P2 (Xiong et al., 2010).
Surprisingly, proteins unrelated in structure to PTEN are functional as chimeras
with class II formins, provided that they interact with PI(3,5)P2. This suggests that formin

51
function in tip growth does not rely on the specific structure of the PTEN domain. Rather,
the For2A PTEN domain functions to localize formin to sites on the membrane rich in
PI(3,5)P2. The PI(3,5)P2 binding proteins that replace the formin PTEN domain do function
with respect to polarized growth but are localized diffusely throughout the cytosol. Thus,
the apical and phragmoplast enrichment observed for For2A and mediated by the PTEN
domain are evidently not required for formin-mediated polarized growth. Thus, I
hypothesize that the apical accumulation of For2A represents a pool of inactive formin with
respect to polarized growth. These data provide strong evidence unlinking formin apical
enrichment from function in polarized growth.
Further evidence for this was acquired by imaging live cells containing a functional
fluorescent fusion to For2A and a marker for actin, Lifeact-mCherry. During imaging,
variation in the amount of For2A, as well as the position of the enrichment can be seen.
However, at the cell apex bursts of actin polymerization are rarely observed after
accumulation of formin, supporting the hypothesis that the apical enrichment of For2A is a
pool of largely inactive formin with respect to actin polymerization.
I propose that active formin is required at the cell cortex. This is supported by the
localization of the PI(3,5)P2 binding proteins that functionally replace the formin PTEN
domain. Although not accumulating prominently in the cell apex, the functional PI(3,5)P2
binding proteins localize to dynamic spots at the cortex, a localization that is shared by
For2A. Also, overexpression of a PI(3,5)P2 binding protein reduces the density of cortical
For2A spots, suggesting that For2A and the PI(3,5)P2 binding protein are competing for the
same sites on the membrane. Furthermore, silencing of the moss FAB1 homologues impairs
polarized growth and reduces cortical targeting of formin.
To an appreciable extent, formin cortical localization is mediated by the PTEN
domain and is actin-independent. However, detailed analyses of the formin cortical spots

52
demonstrated that a small population of cortical formin moves in linear trajectories and this
movement is actin-dependent. Simultaneous imaging of formin and actin revealed that the
majority of cortical formin spots that move in linear trajectories are either associated with
the ends of new actin filaments or along pre-existing filaments. Importantly these cortical
formin spots move at the rate of actin polymerization. Since formin's actin polymerization
activity is required for polarized growth (chapter 1) (Vidali et al., 2009b), these data suggest
that formin's essential activity at the cell cortex is to rapidly generate new actin filaments.
Furthermore, these data establishes a mechanism for bundling actin in the plant cell cortex.
Cortical imaging revealed formin-mediated actin polymerization occurring along existing
filaments, producing parallel filaments that might be bundled by other factors.
PI(3,5)P2 is essential for formin-mediated polarized growth. The formin PTEN
domain, which specifically binds PI(3,5)P2 serves to localize formin to one of four regions in
the cell: the cell cortex, an apical cytoplasmic enrichment, stochastic subapical
accumulations, and the phragmoplast. However, of these four populations, localization to
discrete dynamic cortical spots correlates with formin-mediated polarized growth.
Interestingly, only a fraction of formin generates new actin filaments at the cell cortex,
suggesting that formin activity is tightly regulated. Thus, I propose that PI(3,5)P2 functions
to localize formin to specific cortical sites. Approximately 14% of the time the PI(3,5)P2
containing site is "primed", perhaps containing a formin activator, and this site stimulates
formin's actin polymerization activity. Interestingly, 30% of the linearly moving For2A-GFP
dots were observed to move along existing actin filaments, while polymerizing a new actin
filament. These events suggest that formin facilitates bundling of actin filaments by
generating new filaments in parallel and in close proximity to existing ones and provide
evidence for formin-mediated bundling of actin filaments in vivo. Taken together these data
link PI(3,5)P2-membrane domains to generation and remodeling of the cortical actin array.

53
CHAPTER 3
A CLASS I FORMIN DIRECTLY LINKS THE ACTIN
CYTOSKELETON TO EXOCYTOSIS
Introduction
Vesicle trafficking, particularly exocytosis and endocytosis, is fundamental for cell
growth. Exocytosis delivers new membrane and external material while endocytosis
recycles excess membrane and catabolized secretory products. In eukaryotes that generate
an extracellular matrix encasing the cell, exocytosis is a critical determinant of cell shape
and polarity (Rounds and Bezanilla, 2013). Plant cells are an excellent example as they are
surrounded by a cell wall that physically constrains the cell. Construction and modifications
of this wall by delivery of building material and remodeling enzymes from within the cell
eventually shapes the cell.
During exocytosis the exocyst complex, which is conserved across eukaryotes and is
essential for plant growth and development, tethers secretory vesicles to the plasma
membrane before vesicle fusion occurs (He and Guo, 2009; Liu and Guo, 2012). The exocyst
complex is an octamer consisting of the subunits Sec3, Sec5, Sec6, Sec8, Sec10, Sec15,
EXO70 and EXO84 (chapter 1) (Guo et al., 1999; Hala et al., 2008; Heider and Munson, 2012;
TerBush et al., 1996).

54
Due to its relative simplicity, the moss Physcomitrella patens provides an
opportunity to study the function of the exocyst complex in cell morphogenesis. Mosses
have few cell types that comprise simple tissues, usually only a single cell layer thick.
Consistent with this, P. patens only has 13 copies of EXO70, which is relatively fewer in
comparison to most seed plants (Cvrckova et al., 2012).
In analyzing the genomic structure of the subunits of the complex, one copy of Sec10
was particularly intriguing because it was predicted to be part of a very large gene encoding
for a protein with an N-terminal Sec10 domain and a C-terminal formin domain. Formins
are nucleators of actin filaments, and are essential for multiple actin-based processes
(chapter 1). The fusion of a component of the exocyst subunit to an actin filament-
nucleating factor within a single protein provides evidence for a direct involvement of actin
polymerization in exocytosis and an opportunity to study the relation between actin and
exocytosis in plants directly.

55
Results
Formin 1F comprises two domains: an N-terminal Sec10 and a C-terminal class I
formin.
For1F is predicted to encode a protein with a novel domain configuration,
comprising an N-terminal exocyst subunit and a C-terminal actin filament-nucleating factor
(Zimmer et al., 2013). The genomic structure is remarkable because the 5’ end of the gene
has similar numbers of coding exons as the other two moss Sec10 genes, and the 3’ end of
the gene has a similar genomic structure to the other five moss class I formins (figure 3.1a).
Additionally, similar to all other formins in the P. patens genome, For1F has a large exon
that in part encodes the formin homology (FH) 1 domain. The predicted amino acid
sequence of the Sec10 domain of For1F is 64% similar to A. thaliana Sec10 and 70% and
53% similar to P. patens Sec10b and Sec10a, respectively. This sequence similarity suggests
that the Sec10 domain of For1F is a functional Sec10, not a divergent relative no longer
capable of interacting with the exocyst.
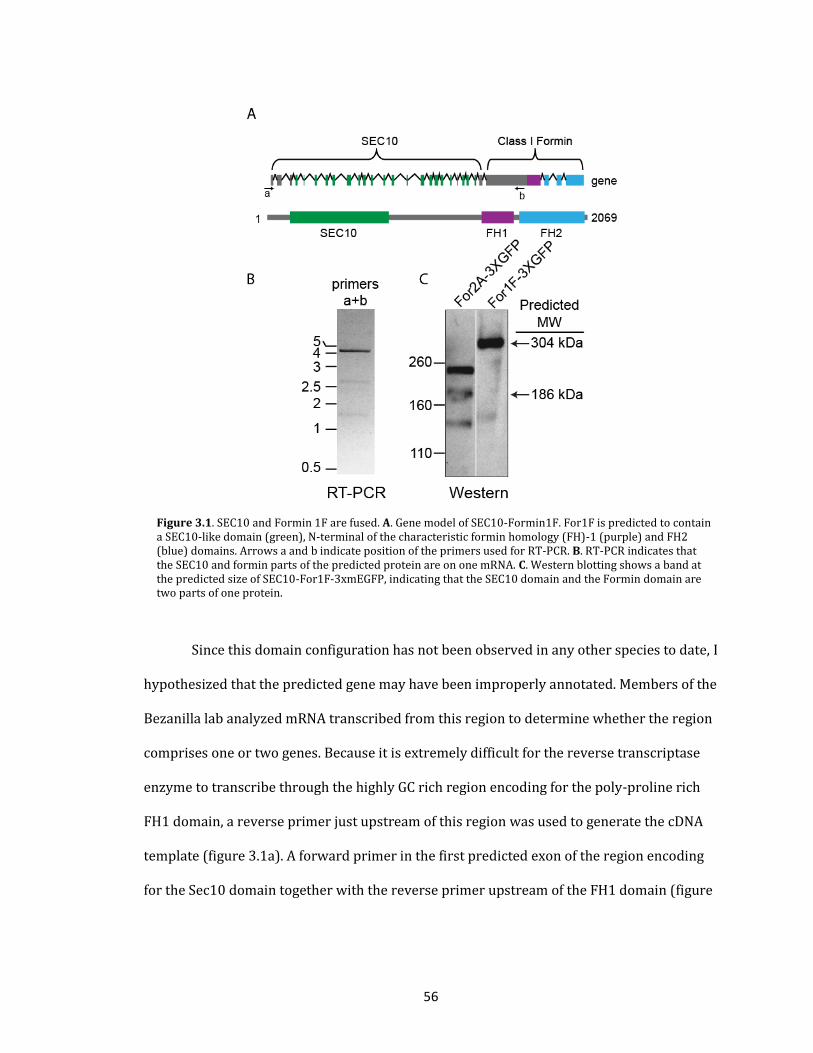
56
Since this domain configuration has not been observed in any other species to date, I
hypothesized that the predicted gene may have been improperly annotated. Members of the
Bezanilla lab analyzed mRNA transcribed from this region to determine whether the region
comprises one or two genes. Because it is extremely difficult for the reverse transcriptase
enzyme to transcribe through the highly GC rich region encoding for the poly-proline rich
FH1 domain, a reverse primer just upstream of this region was used to generate the cDNA
template (figure 3.1a). A forward primer in the first predicted exon of the region encoding
for the Sec10 domain together with the reverse primer upstream of the FH1 domain (figure
Figure 3.1. SEC10 and Formin 1F are fused. A. Gene model of SEC10-Formin1F. For1F is predicted to contain a SEC10-like domain (green), N-terminal of the characteristic formin homology (FH)-1 (purple) and FH2 (blue) domains. Arrows a and b indicate position of the primers used for RT-PCR. B. RT-PCR indicates that the SEC10 and formin parts of the predicted protein are on one mRNA. C. Western blotting shows a band at the predicted size of SEC10-For1F-3xmEGFP, indicating that the SEC10 domain and the Formin domain are two parts of one protein.

57
3.1a) amplified a product large enough to span the Sec10 domain and the formin domain,
consistent with the presence of a single gene (figure 3.1b).
While a continuous mRNA is consistent with a single gene, it is possible that
alternative splice variants are generated and only separate proteins are translated. To
determine the size of the protein that is generated from this locus, the 3’ end of the genomic
locus was tagged in frame with sequences encoding for three tandem copies of mEGFP
(hereafter referred to as GFP). In lines that were properly integrated, protein was isolated,
separated on a polyyacrylamide gel, and probed with a GFP antibody. For1F-3XmEGFP
(hereafter referred to as For1F-GFP) migrates around 300 kDa, closely corresponding to the
predicted size of a protein containing the Sec10 domain, the formin domain, and three
tandem copies of GFP (figure 3.1c), demonstrating that this locus encodes for a single
protein. The presence of Sec10, a subunit of the exocyst complex, and formin, an actin-
interacting module, in one protein is intriguing and suggests that in P. patens there is a
direct link between exocytosis and the actin cytoskeleton.
For1F is not unique to P. patens
To gain insight into the evolution of For1F’s domain configuration, class I formin
FH2 domain sequences were used to retrieve bryophyte sequences from the oneKP
transcriptome database (https://sites.google.com/a/ualberta.ca/onekp). These sequences
were used to perform phylogenetic analyses. These analyses demonstrate that moss
formins group entirely separately from the other bryophytes (liverworts and hornworts)
(figure 3.2). In the mosses, For1D and For1E group with the earliest-diverging moss formin
lineage. For1D and For1E are the products of a recent gene duplication, possibly particular
to P. patens.

58
Figure 3.2. Evolution of moss formins. Phylogenetic analysis of the For1F FH2 domain shows that For1D/E are the ancestral formins in moss. For1F homologs, including a Sec10-like domain are found throughout the moss lineage after the split with the Sphagnum and Takakia mosses. Insets on the right show the relative expression levels of the different formins, where red indicates a higher and blue a lower relative expression level.
59
Although recently diverged, For1D and For1E have adopted different expression patterns
with For1D expression highest in the fast growing caulonemal cells, whereas For1E
expression is highest in slower growing chloronemal cells and in the gametophores
(http://bar.utoronto.ca/efp_physcomitrella/cgi-bin/efpWeb.cgi) (Ortiz-Ramírez et al.,
2016; Winter et al., 2007). A gene duplication earlier than the For1D/1E duplication gave
rise to two more lineages: For1F and the formins For1A, For1B and For1C. The expression
patterns of For1A, For1B and For1C have also diversified, with For1A expression highest in
the caulonemal cells. For1F is highly expressed in all tissues, but the highest For1F
expression is in rhizoids.
So far, 28 moss species spanning all major moss lineages except Takakiopsida and
Sphagnopsida, have a copy of For1F. No gene sequence with homology to For1F was
retrieved from the transcriptomes of the early-diverging mosses Sphagnum palustre,
Sphagnum lescurii or Takakia lepidozoides. The only formin sequence retrieved from the
Takakia transcriptome falls into the early-diverging For1D/For1E gene clade, although with
low statistical support. No gene sequence with homology to any P. patens FH2 domain was
retrieved from the Sphagnum transcriptomes. Sphagnum, liverworts and hornworts all have
rhizoids, but their rhizoids, unlike in the rest of the mosses, are unicellular. Takakia does
not produce rhizoids. This association suggests that For1F was involved in the development
and evolution of multicellular rhizoids. Within the mosses, four species have a Sec10
domain on the same transcript as the For1F homolog, suggesting that Physcomitrella patens
is not the only species with a physical fusion of the two protein domains. These four species
are distantly related, and a Sec10/formin domain fusion is found only in For1F homologs,
suggesting that this fusion happened early on, after the divergence of Takakia and
Sphagnum from the rest of the mosses.

60
Figure 3.3. Phylogenetic analysis of the For1F Sec10 domain. P. patens has 3 Sec10 homologs, Sec10a is only found in P. patens and the closely related Physcomitrium species. The Sec10 of For1F, together with Sec10b, originated after a gene duplication following the split of the mosses from the Sphagnum and Takakia mosses. Insets on the right show the relative expression levels of the different Sec10 homologs, where red indicates a higher and blue a lower relative expression level.
61
To see if the fusion evolved independently from the other Sec10 proteins, a similar analysis
looking at the phylogeny of the Sec10 domains was performed (figure 3.3). P. patens has
two Sec10 isoforms besides For1F; Sec10a and Sec10b. Sec10a is an evolutionarily diverged
isoform retrieved only from P. patens, and from the closely related genus Physcomitrium.
Single Sec10 homologs were retrieved from the Takakia and Sphagnum transcriptomes.
Following the divergence of Takakia and Sphagnum, there was a gene duplication that led to
Sec10b and a monophyletic clade of Sec10s that are fused to For1F. Sec10b was retrieved
from taxa spanning the moss phylogeny. Taken together, these analyses demonstrate that
the Sec10-For1F fusion is not unique to Physcomitrella patens but is found throughout the
moss lineage and that its emergence coincides with the emergence of multicellular rhizoids.
Formin 1F is essential for plant viability
Vidali et al. previously silenced Formin 1F using an RNAi construct targeting a small
region of the FH2 domain, which resulted in plants 30% smaller than control RNAi plants
(Vidali et al., 2009b). However, targeting this region of the For1F gene only results in a 75%
reduction of the transcript, not complete elimination. To increase the silencing efficiency, I
generated a number of constructs containing different regions of the gene. I found that RNAi
constructs containing small regions (~200-400 bp) of the coding sequence of either the
Sec10 or the formin region of the gene recapitulated the data in Vidali et al (Vidali et al.,
2009b). In contrast, transformation of RNAi constructs containing a larger region of the
coding sequence (~3800 bp) or the 5’ and 3’ untranslated regions yielded a survival rate
that is 20-250 times lower than the control construct. These data suggest that silencing
For1F is incompatible with life. Additionally, I repeatedly attempted to use homologous
recombination to generate a knock-out line by replacing the endogenous For1F locus with a

62
G418 antibiotic resistance cassette. Consistent with the RNAi results, this never resulted in
any surviving plants, suggesting that For1F is essential for viability.
To determine if silencing the exocyst complex results in a similar loss of function
phenotype as silencing For1F, I generated an RNAi construct targeting Sec6, which is the
only subunit encoded by a single-copy gene in moss. Because Sec6 is a single copy gene and
a core subunit of the complex, it should be part of every exocyst complex. A Sec6 silencing
construct comprised of the 5’ and 3’ untranslated regions of the gene resulted in plants 40%
smaller than control RNAi plants (figure 3.4). However, silencing Sec6 by targeting the
entire coding sequence did not yield any surviving plants, suggesting that the exocyst is
essential for viability. I also silenced the other two Sec10 proteins in P. patens. Silencing
Sec10a did not affect plant size in young plants composed of primarily chloronemata, which
is consistent with the Sec10a expression data showing that it is predominately expressed in
caulonemata. Silencing Sec10b resulted in 50% smaller plants, while silencing both Sec10a
and Sec10b simultaneously did not have an additional effect on plant size (figure 3.4). These
data suggest that Sec10a and Sec10b are likely redundant with the Sec10 domain on For1F.
Figure 3.4. Silencing of exocyst components. A. Silencing of Sec10 homologs. Shown are the plant area measurements of the indicated silencing experiments. B. Silencing of Sec6. Shown are the plant area measurements of the indicated silencing experiments. Error bars show the standard error of the mean. Letters above the bars indicate the statistical groups (p<0.05). Numbers in the bars are the number of plants analyzed.

63
For1F is involved in exocytosis
To determine whether For1F function is required for efficient exocytosis, I
developed a quantitative exocytosis assay in which I measured secretion of a fluorescently
labeled transmembrane protein. Members of the Bezanilla lab generated a chimeric
transmembrane protein comprising of the signal peptide from For1B fused to a SNAP-tag
followed by the transmembrane domain of For1B fused to mCherry (SNAP-TM-mCherry,
figure 3.5a). The SNAP-TM-mCherry construct was stably transformed into a line that also
expresses GFP-β-glucorinidase (GUS) fused to a nuclear localization signal. The nuclear
GFP-GUS protein serves as a visual marker allowing identification of actively silencing
plants in the transient RNAi assay (Bezanilla et al., 2005). Briefly, all RNAi constructs
contain inverted repeats of GUS sequences fused to inverted repeats of sequences targeting
the gene of interest. Constructs are transformed into protoplasts expressing GFP-GUS,
allowed to regenerate for one week and then actively silencing plants are identified by the
absence of nuclear GFP-GUS fluorescence. The SNAP-TM-mCherry/GFP-GUS line (hereafter
referred to as SNAP-TM-mCherry) is slightly smaller than wildtype in growth assays (figure
3.6).

64
In the SNAP-TM-mCherry line, the mCherry resides on the cytosolic side of the
membrane, clearly labeling the plasma membrane of protonemal cells (figure 3.5b and e).
Since membrane protein delivery depends on the exocytic pathway, interrupting exocytosis
should result in lower fluorescence at the plasma membrane and higher internal
fluorescence. To identify defects in exocytosis, I took a ratio of the fluorescence intensity at
the plasma membrane and the fluorescence intensity inside the cell. As a proof of concept, I
transformed plants with a control RNAi construct that only targets the nuclear GFP-GUS and
regenerated silenced plants for 4 days. At day 4 I treated plants for 24 hours with the
exocytosis-inhibiting drug Brefeldin A (figure 3.5b). To eliminate variations in the intensity
measurements between experiments, ratios were normalized to the control of that day
Figure 3.5. For1F RNAi affects exocytosis. A. Schematic representation of the exocytosis marker. B. Images and corresponding profile plots of SNAP-TM-mCherry fluorescence intensity after drug treatments. C. Quantification of normalized ratios of the plasma membrane fluorescence intensity over the cytoplasm fluorescence intensity, letters above the bars indicate statistical groups. (p<0.05) D. Plant area and circularity measurements after silencing with the indicated constructs. Letters above the bars indicate statistical groups (p<0.05), N=30 plants for each. E. Images and corresponding profile plots of SNAP-TM-mCherry fluorescence intensity after silencing indicated transcripts. F. Quantification of normalized ratios of the plasma membrane fluorescence intensity over the cytoplasm fluorescence intensity. Letters above the bars indicate statistical groups.

65
(figure 3.5c). Brefeldin A treatment dramatically increases the internal signal, presumably
due to accumulation of the transmembrane protein in the ER, demonstrating that this assay
can quantitatively measure exocytosis.
Latrunculin B treatment also results in lower plasma membrane intensity values,
and about a 50% decrease in plasma membrane to internal fluorescence ratio,
demonstrating that actin is required for efficient exocytosis in P. patens.
To address whether For1F silencing also decreases the intensity ratio, I used the
weak For1F silencing construct that results in plants 37% smaller than control RNAi plants
(figure 3.5d). In addition, I silenced Sec10a and Sec10b, which should reduce exocyst
function and also results in smaller plants (figure 3.5d). I found that the plasma membrane
SNAP-TM-mCherry intensity is dramatically reduced upon Sec10a and Sec10b silencing,
indicating that less SNAP-TM-mCherry reaches the plasma membrane (figure 3.5e). In cells
silencing For1F, peak values are also significantly reduced (figure 3.5f). Taken together,
these results demonstrate that efficient exocytosis requires For1F function and that
exocytosis mediated by For1F contributes to plant size.

66
For1F dynamically associates with the exocyst complex
To analyze the intracellular localization of For1F, I took advantage of the For1F-GFP
line that was used to demonstrate that For1F comprises a fusion of Sec10 and formin
domains. Using quantitative growth assays, I found that For1F-GFP grows indistinguishably
from wild type (figure 3.6), suggesting that For1F-GFP is functional. To test if For1F
colocalizes with the exocyst complex, Sec6 was tagged in the For1F-GFP line. Sequences
encoding for three tandem mRuby2 molecules were inserted in frame with the 3’ end of
Sec6. Tagging Sec6 did not affect plant size or polarity (figure 3.6), suggesting that Sec6-
3XmRuby2 (hereafter referred to as Sec6-mRuby) is functional. Since Sec6 is the only
component of the exocyst complex that is encoded by a single gene copy, every exocyst
Figure 3.6. Growth assays of the tagged lines. Shown are the plant area measurements and circularity (calculated by 4π*Area/perimeter2) measurements of the indicated lines. Error bars show the standard error of the mean. Letters above the bars indicate the statistical groups (p<0.05). Numbers in the bars are the number of plants analyzed.

67
complex should be tagged with mRuby2. However, since For1F is not the only Sec10 subunit
in the cell, I do not expect to observe that every exocyst complex will contain For1F.
In protonemal filaments, I find that For1F-GFP and Sec6-mRuby localize to three
distinct membranous areas in the cell all of which are considered to be active areas of
exocytosis: they are weakly enriched at the cell apex, decorate the extending cell plate and
localize to punctae at the cell cortex (figure 3.7). In addition, Sec6 also localizes to larger
intracellular structures, especially during cell plate formation. Consistent with the For1F
expression profile (figure 3.2), I found that For1F is more enriched at the rhizoid apex than
in the apex of protonemal cells (figure 3.7a). These data suggest that For1F and Sec6
associate at exocytosis hot-spots. Cortical For1F that does not co-localize with Sec6 together
with the fact that For1F is absent from the larger intracellular structures that label with
Sec6 suggest that For1F might act as a landmark protein for exocyst complex docking at the
plasma membrane.
To investigate the nature of the For1F cortical particles, I imaged For1F-GFP in the
presence of FM4-64, a lipophilic membrane marker that marks endocytic activity in cells (Li
et al., 2008; Van Gisbergen et al., 2008). Similar to a previous study that utilized TIRF
microscopy to analyze FM4-46 at the cell membrane (Li et al., 2008), I also found that FM4-
64 localizes to the cortex as dots, suggesting that there are specific membrane domains
involved in endocytosis (figure 3.7b). However, For1F localizes where FM4-64 does not, and
is not seen moving together with the FM4-64 dots (figure 3.7c). Additionally the Pearson’s
correlation coefficient for colocalization is low; 0.30±0.05, suggesting that For1F does not
localize to areas of the cell cortex involved in endocytosis and that endocytosis and
exocytosis happen in distinct places on the plant cell membrane.

68
Figure 3.7. For1F transiently colocalizes with Sec6, and not with endocytic sites. A. For1F (top row) and Sec6 (middle row) both localize to the cell apex (left column), to the cell plate (second column) and to discrete dots at the cortex (third column). Localization of For1F to the rhizoid apex is brighter than to the apex of a protonemal cell (right column). Note that Sec6-3xmRuby also localizes to larger structures within the cell, whereas For1F does not (merge, bottom row). B. For1F does not colocalize with FM4-64 labeled endocytic dots. Pearson’s correlation coefficient: 0.30 ± 0.05. C. Kymographs of For1F and FM4-64 dot dynamics. For1F moves independent of FM4-64 (blue arrows), FM4-64 and For1F appear or disappear independently of each other (yellow arrows), or displace each other (white arrows).

69
For1F and Sec6 dynamics are dependent on actin
To investigate whether actin filaments affect For1F and Sec6 localization I imaged
For1F and Sec6 in the presence and absence of actin filaments. Upon depolymerization of
actin filaments with Latrunculin B, I found that For1F and Sec6 accumulate at the cell apex
(figure 3.8a). At the cell cortex where For1F and Sec6 transiently colocalize to dynamic
cortical dots, I observed an increase in co-localization in the absence of actin filaments
(figure 3.8b and c).
These results suggest that actin filaments may play a role in removing For1F from
the membrane. To test this, I analyzed the localization of For1F and actin simultaneously. To
image actin filaments, I expressed LifeAct-mCherry, which binds to filamentous actin (Riedl
et al., 2008) in the For1F-GFP line. Interestingly, I did not find For1F moving in linear
trajectories to make actin filaments, as previously observed for For2A (chapter 2) (van
Gisbergen et al., 2012). Instead, I found that cortical For1F dots aggregate on an existing
actin filament and remain there until the aggregation disintegrates (figure 3.8d). Movement
towards the aggregation is often incremental and of a constant speed.
To investigate whether cortical For1F dynamics depend on the presence of actin, I
quantified global changes in cortical For1F organization by calculating the correlation
coefficient of the intensity of the For1F-GFP signal at all pixel locations between time points
(Vidali et al., 2010). This analysis examines the degree of change in the images of For1F-GFP
– a greater change between images results in a steeper decay of the correlation coefficient
and indicates increased dynamics. Consequently, a line with a rapid decay indicates high
dynamicity. Upon latrunculin B treatment, For1F cortical dots display lower dynamicity
than untreated For1F dots (figure 3.8e). These results indicate that formin 1F dynamics are
dependent on the actin cytoskeleton. Additionally, Sec6 dynamics also appear to be affected

70
by latrunculin B treatment, albeit to a lesser extent, which might be attributed to the low
signal to noise ratio in the images. Taken together, these results indicate that Sec6 localizes
to For1F spots and that their dynamics at the cortex is dependent on actin.

71
Figure 3.8. For1F and Sec6 dynamics are actin dependent. A. Latrunculin B treatment shows that For1F and Sec6 aggregate in the same place near the cell apex. B. Kymographs show increased lifetime of Sec6 dots in places with For1F dots. C. Pearson’s correlation coefficient indicates a higher degree of colocalization of For1F and Sec6 upon Latrunculin B treatment. Letters above the bars indicate statistical groups (p<0.05). D. Timelapse imaging shows For1F cortical dots aggregating on an existing actin filament. White arrows point to For1F dots aggregating, blue arrows to For1F dots dissipating. The kymograph shows For1F dots aggregating on an actin filament and dissipating. E. Correlation coefficient analysis shows decreased dynamics of For1F and Sec6 cortical dots upon Latrunculin B treatment.

72
The For1F Sec10 and Formin domains do not need to be fused to rescue viability.
To investigate whether both the Sec10 and formin domains are required for For1F
function, I performed a complementation experiment. I reasoned that since For1F is
essential, it would only be possible to delete the For1F locus in the presence of a
complementing construct. Therefore, I simultaneously transformed a For1F knockout
construct with a construct driving expression of full-length, the N-terminus (Sec10 domain)
or the C-terminus (formin domain) of For1F from a constitutive promoter. The expression
construct was targeted to integrate into a non-coding locus that is known to be aphenotypic
when disrupted (figure 3.9) (Schaefer and Zrÿd, 1997). Resulting lines were genotyped for
correct disruption of the endogenous For1F locus and the presence of the For1F expression
construct (figure 3.10).
Figure 3.9. Schematic representation of the knock-out/knock-in strategy. We start with both the For1F and the non-coding Pp108 loci intact. Then, a simultaneous transformation is done that replaces the For1F locus with a G418 resistance cassette using homologous recombination and replaces the Pp108 locus with either one of the indicated constructs. The bottom part shows the resulting loci. The For1F genomic locus is replaced with a G418 resistance cassette and the non-coding Pp108 locus with either one of the indicated complementation constructs. Only the full length 3xFLAG tagged For1F construct is shown as an example.

73
As expected, the untagged full length protein rescued the disruption of the For1F
locus. Paradoxically, expression of either the N-terminus (Sec10 domain) or the C-terminus
(formin domain) also resulted in live plants, demonstrating that a single For1F domain is
sufficient to rescue viability and the fusion is not essential (figure 3.11a and c). I speculate
that a single domain is sufficient because P. patens in addition to For1F has two more Sec10
proteins, and five more class I formins. These additional proteins might transiently interact
with the constitutively expressed parts of For1F in the rescue experiments, reconstituting a
protein that functions similar to For1F.
Figure 3.10. Genotyping of knock-out-knock-in lines. A. PCR for presence of the knock-out construct in lines complemented with the indicated parts of For1F. B. PCR for presence of the knock-out construct in the line complemented with Sec10b. C. PCR for presence of the knock-out construct in the line complemented with For1D. D. PCR for the presence of cDNA of the Sec10 part of For1F. Wildtype shows the size of the genomic band, which is absent in the complementation line. E. PCR for the presence of cDNA of the formin part of For1F. Wildtype shows the size of the genomic band, which is absent in the complementation lines. F. PCR for the presence of cDNA of the connecting region between the Sec10 and formin parts of For1F. Wildtype shows the size of the genomic band, which is absent in the complementation line. G. PCR for the presence of cDNA of a part of Sec10b (left lane) or For1D (right lane). Both show both the cDNA band at the expected height, as well as the amplification of the corresponding genomic region (indicated by red arrows).

74
If this is the case, then it suggests that constitutive expression of another class I
formin or another Sec10 could also rescue disruption of the For1F locus. To test this I
disrupted the For1F locus and simultaneously expressed either For1D, Sec10b, or For2A.
Resulting lines were genotyped for correct disruption of the For1F locus and the presence
of the expression construct (figure 3.11). Consistent with my speculation, I found that plants
expressing For1D or Sec10b in the absence of For1F stay alive (figure 3.11b). Similar to the
expression of either domain of For1F, the plants do not show any major phenotypic defects
as compared to wildtype (figure 3.11c). Additionally, I did not obtain any surviving plants
that express For2A, demonstrating that class I, not class II, formin function is required to
rescue For1F. These data suggest that the For1F fusion might have originated as a more
efficient way of simultaneously controlling levels of Sec10 and formin.

75
Figure 3.11. Fusion of the For1F N-terminal and C-terminal domains is not necessary for survival. A. Representative images of For1F knock-out lines overexpressing either the N-terminal Sec10 domain, the C-terminal Formin domain or the full length protein. B. Representative images of For1F knock-out lines overexpressing either For1D or Sec10b C. Plant area and circularity measurements of the generated rescue lines. Letters indicate statistical groups (p<0.05). Numbers indicate the number of plants analyzed.

76
Discussion
My results suggest that For1F directly links the actin cytoskeleton to exocytosis. I
hypothesize that it functions as a landmark protein for the exocyst complex, providing a
mark for exocytic vesicle docking on the plasma membrane (figure 3.12). How actin plays
into this model is not fully understood, but possibly it is required for dissociation or
recycling of the exocyst complex back into the cytoplasm.
Here it is shown that formin 1F and Sec10 are two domains in one protein and that
this protein is unique to mosses. Both the formin and Sec10 domains originated from gene
duplications that occurred after the divergence of Takakia and Sphagnum from the rest of
the mosses. Since the transcriptome data used likely has a 3’ bias, it is highly likely that the
Sec10 domains that are fused to For1F’s of the different species are not represented. The
Sec10-For1F fusion is a very large gene and it is likely that reverse transcriptase has great
difficulty transcribing the entire mRNA. Moreover, the FH1 domain on the formin part is
very GC-rich, making it even less likely that the reverse transcriptase is able to generate a
full cDNA from mRNA. The Sec10 phylogeny showed that all Sec10-For1F fusions found in
the formin phylogeny cluster together. This, in combination with the fact that many of the
Figure 3.12. Model of For1F function. 1. For1F sits as a landmark protein on the plasma membrane. 2. Exocytic vesicles form on the trans-Golgi network and are coated with subunits of the exocyst complex, one of which being Sec6. 3. The exocyst complex comes together to tether the vesicle to the membrane. 4. After vesicle fusion, the exocyst complex dissipates in an actin dependent manner, of which the mechanisms are not yet understood.

77
fusions are likely underrepresented in this analysis, suggests that all For1F proteins found
are likely Sec10-For1F fusions. Evolutionarily, the emergence of the For1F fusion gene
coincides with the emergence of multicellular rhizoids. Transcriptomics data reveal that
while For1F is highly expressed in all tissue types of the moss, it is relatively most highly
expressed in rhizoids. This suggests that For1F is involved in rhizoid multicellularity.
Formin 1F knock-out is lethal, yet overexpression of formin 1D can rescue the loss
of formin 1F. This suggests that formin 1F is not necessary, as long as sufficient levels of
other Class I formin and Sec10 are around. Transcript level analyses
(http://bar.utoronto.ca/efp_physcomitrella/cgi-bin/efpWeb.cgi) show that For1D is
expressed more in caulonemal cells compared to chloronemal cells. This indicates that the
level of endogenous For1D in chloronemal cells might not be high enough to overcome the
effect of For1F knock-out. Constitutive ectopic expression of formin 1D overcomes this,
resulting in enough For1D present in subapical cells to sustain life. Conversely, For2A does
not rescue the knock-out of For1F, suggesting that class I and class II formins have different
functions in the cell. Indeed, silencing class I formins results in smaller but normal growing
plants, whereas silencing class II formins results in a loss of polarized growth.
For1F localizes to areas with high membrane dynamics. In these areas the difference
between areas that are involved in endocytosis or exocytosis are not easily distinguished.
Quantitative exocytosis assays show that For1F is involved in exocytosis, and fluorescent
labeling shows that For1F largely overlaps with the exocyst complex, suggesting it is an
integral member of at least a subset of the exocyst complexes in the plant cell. Moreover, I
show that For1F does not localize with endocytic spots on the cortex, further indicating that
it is involved in exocytosis. Given that there are 2 more Sec10 subunits, I do not expect
formin 1F to be a part of all the exocyst complexes in the plant. Formin 1F localizes to actin
filaments, but does not appreciably polymerize actin filaments along the cortex, unlike

78
formin 2A. It is possible however that Formin 1F generates actin filaments into the cytosol,
away from the imaging plane in TIRF microscopy, especially since formin 1F dynamics are
dependent on actin filaments.
I observed that formin 1F localizes to the cell cortex, and not to intracellular Golgi-
like structures, and hypothesize that formin 1F forms a landmark protein that serves as a
site for the rest of the exocyst complex to dock (figure 3.12). Conversely, Sec6 can be seen in
Golgi-like structures in the cell, suggesting that it is put on vesicles that are destined for
exocytosis at the trans-Golgi network. The lower mobility of the formin 1F cortical dots, as
well as the lower mobility of Sec6 cortical dots and the increased colocalization of the two in
the absence of actin filaments suggests that actin is necessary for dissociation of the
complex from the membrane (figure 3.12).
This study provides evidence of a link between exocytosis and the actin
cytoskeleton in plants. It identifies Formin 1F as a landmark protein for the exocyst
complex. Moreover, I show that a physical fusion between Sec10 and formin is not
necessary for survival and that instead constitutive expression of either part, or a related
part, is sufficient for survival. These data suggest that the actin cytoskeleton is linked to
exocyst complex function in plants, even in the absence of a physical fusion between an
exocyst component and an actin nucleator, which is found throughout the green lineage.

79
CHAPTER 4
CLASS I AND CLASS II FORMINS FUNCTION IN DIFFERENT
MEMBRANE DYNAMIC PROCESSES
Introduction
Formins are a diverse family of proteins found throughout eukaryotes that regulate
the status of specific actin-based structures within cells (Evangelista et al., 2003; Goode and
Eck, 2007). Many formins have been characterized as actin-nucleating proteins, but others
bundle and sever actin filaments as well (van Gisbergen and Bezanilla, 2013). Some formins
also interact with the microtubule cytoskeleton linking actin and microtubule-based
functions. Together these activities underlie critical cellular processes, such as cell polarity,
division, adhesion and migration (Evangelista et al., 1997; Feierbach and Chang, 2001).
Formins have diverged and expanded throughout the eukaryotic kingdom. For
example, human cells have 15 formins that group into 8 families (Schönichen and Geyer,
2010). Budding yeast has two formins (Bni1 and Bnr1) in one family (Pruyne et al., 2004a).
There is growing evidence that formins have distinct functions serving to maintain specific
actin-based subcellular structures. For example, in budding yeast Bni1 generates actin
cables in the bud and Bnr1 generates actin cables in the mother cell (Pruyne et al., 2004a).
In fission yeast there are three formins that have specified further. Cdc12 is involved in
making actin filaments for the contractile ring in cell division (Chang et al., 1997), For3 is

80
involved in polarized growth and the cell apex (Feierbach and Chang, 2001) and Fus1 is
involved in yeast cell mating (Dudin et al., 2015).
The moss Physcomitrella patens has 6 class I formins (For1A-F), 2 class II formins
(For2A and For2B) and 1 class III formin (For3) (chapter 1). Class I formins are further
subdivided in three subclasses; For1A-C constitute subclass 1 and contain both a signal
peptide and a transmembrane domain. Subclass 2 contains For1D and For1E, which both
have a transmembrane domain but no signal peptide. Subclass 3 has For1F as its sole
member (Cvrckova et al., 2012; Grunt et al., 2008). Subclasses 1 and 2 represent the
canonical class I formins in plants. In this study, I examined the localization of three
different formins, the highest expressed formin from each subclass 1 and 2 (For1A and
For1D) (Vidali et al., 2009b), and a class II formin (For2A). I chose For2A over For2B,
because previous studies have shown that For2A and For2B are functionally redundant
(Vidali et al., 2009b).
I found that the two classes of formin exhibit differential activity with respect to
actin filaments. I find evidence for functional diversification, where class I formins are
involved in exocytosis and class II formins in endocytosis. Moreover, I quantified For2A
activity along the length of the cell and found that For2A contributes to polarized growth by
localizing membrane recycling towards the growing tip. This study compares the dynamics
of multiple formins in plant cells and provides a clue as to which processes in which they
are involved.
81
Results
Formins localize to areas of active membrane traffic
To investigate whether class I and class II formins have differential functions, I
began by analyzing their subcellular localization. Members of the Bezanilla lab used
homologous recombination to tag For1A and For1D with 3 tandem copies of mEGFP
(henceforth called GFP) at the genomic locus, similar to previous tagging of For2A (Vidali et
al., 2009b). Correct integration was verified by genotyping and full length expression of the
tagged protein was confirmed by immuno blotting. To assess whether tagging the locus
altered protein function, I measured overall plant area seven days after regeneration from
protoplasts. RNAi silencing of For1A and For1D affects plant growth (Vidali et al., 2009b). I
found that tagging For1A and For1D did not affect plant growth (figure 4.1), suggesting that
the fluorescent fusions are functional.

82
For1A-GFP, For1D-GFP and For2A-GFP are all enriched at the tip of the apical cell,
the site of cell division and localize to dynamic dots at the cell cortex (figure 4.2).
Interestingly, these sites are all areas of that have extensive membrane turnover. However,
the localization patterns of the three formins do have slight differences, particularly with
respect to the apical localization. First, For1A-GFP and For1D-GFP clearly localize to the
apical plasma membrane. In contrast, For2A-GFP localizes to a cytosolic cloud just below
the tip of the cell, as was reported previously (Vidali et al., 2009b) (chapter 2). The plasma
membrane localizations of For1A and For1D also differ. For1A-GFP is enriched at the apical
plasma membrane in a broad band. Conversely, For1D-GFP is confined to a much narrower
Figure 4.1. Growth assays for the stable lines used in this study. Red bars indicate area, blue bars circularity (4π*area/perimeter2). Letters above the bars indicate statistical groups; numbers in the bars indicate the number of plants analyzed. LAmC stands for LifeAct-mCherry.

83
strip along the dome of the tip. In addition to the apical localization, For1A-GFP localizes to
intracellular globular structures. Since For1A has a signal peptide, it is likely that these
globular structures are Golgi bodies. I hypothesize that the very similar but slightly different
localizations of these formins underlie their different functions.
Class II formin, not class I formin, localizes to endocytic hotspots
Both class I and class II formins localize to areas of active membrane turnover. In
these areas both exocytosis and endocytosis occur. To determine whether formins are
involved in endocytosis I stained live cells with FM4-64, a fluorescent lipophilic membrane
dye that marks endocytic membranes (Van Gisbergen et al., 2008). FM4-64 is enriched at
Figure 4.2. Localization of class I and class II formins. For1A-GFP (top row), For1D-GFP (middle row) and For2A-GFP (bottom row) are all enriched at the cell apex, localize to the cell plate in cell division and localize to cortical dots. Additionally, For1A-GFP localizes to structures within the cell (yellow arrows) and the For2A-GFP enrichment seems less cortical than the class I formin apical enrichments (blue arrows). Globular structures of which some are indicated by the green arrows are autofluorescing chloroplasts.

84
the cell apex, and this enrichment is dynamic. For1A-GFP partially colocalizes with the FM4-
64 enrichment, and as the FM4-64 enrichment moves, the center of the For1A-GFP
enrichment seems to be moving with the FM4-64 enrichment (figure 4.3a). For1D-GFP
enrichment intensity does not change in time and thus cannot be seen moving with the
FM4-64 enrichment For1D-GFP and FM4-64 do not colocalize at the cell apex (figure 4.3b).
For2A-GFP localizes to a broader enrichment than FM4-64, but they fully colocalize in the
apical enrichment, as reported previously (chapter 2), and seem to be moving together at
the apex (figure 4.3c).
Using TIRF microscopy, FM4-64 was reported to localize to endocytic membrane
domains (figure 4.3). Because TIRF microscopy has a higher signal-to-noise image
acquisition it affords higher resolution imaging at the cell cortex than confocal microscopy.
Therefore, I investigated if the cortical populations of For1A, 1D and 2A interact with FM4-
64. Both For1A and For1D do not colocalize with cortical FM4-64 (figure 4.3d and 4.3e),
suggesting that they are not involved with initial stages of endocytosis. Interestingly, For2A-
GFP colocalizes with FM4-64 and analysis of their dynamics reveals that they travel
together along the same trajectories (figure 4.3f). Moreover, I used Pearson’s correlation
coefficient analysis to quantify the degree of colocalization. This analysis finds that For1A-
GFP and For1D-GFP are poorly correlated with FM4-64. In contrast, For2A-GFP is
significantly correlated with FM4-64 (figure 4.3g). Together these data suggest that For2A,
not For1A and 1D, associates with endocytic membranes at the cell cortex.

85
Class I and class II formins interact with actin differently
Based on our analysis of the cortical formin populations, I propose that class I and
class II formins reside on different membrane domains. To investigate the interactions
between these formins and actin in vivo the actin marker LifeAct-mCherry was transformed
into the tagged formin lines. Growth assays confirmed that this had little, if any, effect on
plant growth (figure 4.1). In cells grown in microfluidics chambers actin forms an apical
spot that, like that formed by FM4-64, is dynamic (figure 4.4). Movement of the spot
Figure 4.3. Class II formins, not class I formins are on endocytic sites. A. For1A-GFP and FM4-64 enrichments coincide at the cell apex. Blue arrow indicates a barrier the cell is growing along. B. For1D-GFP is more equally distributed and does not seem to be enriched at the FM4-64 spot. C. For2A-GFP dynamically coincides with FM4-64 at the cell apex. D. Kymograph of For1A-GFP and FM4-64 at the cortex. For1A-GFP does not colocalize with FM4-64 spots on the cortex, and do not travel together. E. Kymograph of For1D-GFP and FM4-64 at the cortex. For1D-GFP also does not colocalize with FM4-64 dots at the cortex. F. Kymograph of For2A-GFP and FM4-64 at the cortex. For2A-GFP colocalizes with FM4-64 at the cortex and they also displace together. G. Pearson’s correlation coefficient analysis of the colocalization with FM4-64. Letters above the bars indicate statistical groups.

86
through the apex is reminiscent of the movement of the FM4-64 spot, and consistently,
For1A-GFP only colocalizes partially with this spot (figure 4.4a). Again, For1D-GFP does not
colocalize with the actin spot, as it did not colocalize with FM4-64 (figure 4.4b). Similarly to
FM4-64, For2A-GFP fully colocalizes with the apical actin spot (figure 4.4c).
For2A-GFP was shown to polymerize actin filaments at the cell cortex (chapter 2).
To investigate the interactions between class I formins and actin I imaged the cortex using
dual-color TIRF. For1A-GFP and For1D-GFP both colocalize with actin filaments (figure 4.4d
and 4.4e, respectively), but surprisingly do not seem to polymerize actin when they move.
This is unlike For2A-GFP (figure 4.4f), which can be seen moving along the cortex at much
higher speeds than For1A-GFP and For1D-GFP while polymerizing actin in its wake, as
shown before (chapter 2). For1A-GFP and For1D-GFP instead move at much slower rates.
The movement along the cortex is not linear, and much slower than For2A. These
trajectories are hard to spot, but from my limited measurements they appear to move at
speeds of about 166 nm/s, which closely resembles the 168 nm/s measured for For1D in in
vitro experiments (Vidali et al., 2009b). For1A does appear to make an actin cloud (figure
4.4d), indicating it is possible that For1A makes actin filaments. But the majority of actin
filaments produced by these formins might project into the cytoplasm, rather than along the
plasma membrane, as is suggested for the Arabidopsis thaliana class I formin AtFH1
(Martinière et al., 2011). These data indicate that class I and class II formins have different
interactions with actin, and that only For2A-GFP can be seen polymerizing actin in vivo.

87
Class I formin, not class II formin dynamics are affected by microtubules
Since formins are actin nucleating proteins, but a significant portion of them are also
shown to interact with microtubules (Deeks et al., 2010; Yang et al., 2011; Yi et al., 2005;
Zhang et al., 2011), I questioned whether actin, microtubules or both affect formin
dynamics. Dynamicity of the formin cortical dots can be measured by the correlation
coefficient. Using TIRF microscopy and image processing as described before (Vidali et al.,
2010), I measured the pixel by pixel change in fluorescence intensity over a set time
interval, similar to the correlation coefficient analysis described in chapter 3. To answer
whether actin or microtubules affect formin dynamics, I measured the correlation
Figure 4.4. Class I and Class II formins interact with actin differently. A. For1A-GFP and the apical actin structure localize adjacently in a dynamic fashion. B. For1D-GFP does not colocalize with the apical actin structure and does not enrich in the membrane position closest to the actin structure. C. The For2A-GFP apical enrichment fully colocalizes with the apical actin structure but has a much broader distribution besides. D. Kymograph of For1A-GFP interactions with actin at the cell cortex. For1A-GFP moves along the cortex, but does not appear to polymerize actin. E. Kymograph of For1D-GFP interactions with actin at the cell cortex. For1D-GFP moves along the cortex similarly to For1A-GFP and also does not visibly polymerize actin. F. Kymograph of For2A-GFP interactions with actin at the cell cortex. For2A-GFP rapidly moves along the cortex and polymerizes actin in its wake.

88
coefficients of For1A-GFP, For1D-GFP and For2A-GFP in the presence and absence of the
actin depolymerizing drug latrunculin B or the microtubule depolymerizing drug oryzalin
(figure 4.5). The dynamics of both class I formins are affected significantly by treatment
with oryzalin, indicating that their dynamics are dependent on microtubules. Treatment
with latrunculin B also affects the dynamics of the class I formins, suggesting that the class I
formins interact with both the actin and microtubule cytoskeleton and that they might
provide a link between the two (figure 4.5a and 4.5b), albeit that For1D are faster in the
absence of actin, not slower, suggests a different mode of operation for this formin.
Figure 4.5. Formin cortical dot dynamics after drug treatments. A. For1A-GFP dynamics are slowed down by Oryzalin and Latrunculin B treatment. B. For1D-GFP dynamics are slower in the presence of Oryzalin, and slightly faster in the presence of Latrunculin B C. For2A-GFP dynamics are only affected by Latrunculin B treatment.

89
In contrast, For2A-GFP dynamics are only affected by treatment with latrunculin B,
indicating that its dynamics are only affected by actin, but not by microtubules (figure 4.5c).
This indicates that class I and class II formins interact differently with the cell cytoskeleton.
Since they also display a different phenotype upon RNAi silencing, and localize to different
membrane domains, I conclude that class I and class II formins are involved in different
processes. Since both classes of formins localize to areas of high membrane trafficking and
only class II formins localize to FM4-64 labeled spots, I hypothesize that class II formins are
involved in endocytosis and class I formins are involved in exocytosis.
For2A-GFP cortical dots accumulate near the tip, but are not more active
Since For2A is essential for polarized growth, it polymerizes actin along the cortex
and I found it to colocalize with endocytic spots on the cortex, I next asked where along the
cell cortex For2A is active. Since For2A-GFP movement and activity is dependent on actin
polymerization, and For2A-GFP moves in linear trajectories when polymerizing actin, I can
use this to quantify the activity of For2A-GFP along the length of the cell.
First, I determined For2A-GFP cortical dot densities at various distances from the tip
of the cell. I imaged the formin using TIRF microscopy and took a corresponding whole field
brightfield image and a full field fluorescence image (figure 4.6a). Using the spot detection
software in the NIS elements analysis software I determined the amount of cortical dots per
frame and calculated the average per movie. Then, I measured the ROI area using ImageJ
and calculated the average For2A cortical dot density per movie (figure 4.6c). Subsequently,
I overlayed the brightfield movie with the fluorescence image and measured the distance of
the front and back of the ROI from the tip of the cell (figure 4.6b). The average of these
distances determined in which bin the data would fall (figure 4.7a). Interestingly, I see a

90
gradient of For2A cortical dot densities that is highest at the tip and plateaus to an apparent
basal level 10μm from the tip.
Irrespective of position in the cell, only 14 % of cortical For2A is active (chapter 2),
so an enrichment of cortical dots does not necessarily mean an increase in active formin. To
determine where in the cell For2A-GFP is active I used the dot tracking software in NIS
elements. First, I established a latrunculin B baseline, that shows the trajectories of For2A-
Figure 4.6. Method of For2A-GFP cortical dot and trajectory quantification. A. TIRF images were superimposed on brightfield images so that parameters could be measured. B. Measurement of ROI distance from the tip and ROI distance from the base and ROI length. C. Measuring the ROI area, dots were identified using NIS elements software and automatically counted each frame. Dot density is the average number per frame per movie per area. Movies were binned using the position of the middle of the ROI with respect to the tip. Trajectory quantification was also done using NIS elements. D. Measuring the cell angle to the horizon allows for determining tip orientation. E. Trajectory vectors were plotted on a polar graph and counted for the amount of trajectories per distance from the tip. F. Dividing the polar graph in 4 quadrants with the cell angle being the middle of the “tip” quandrant allows for quantification of the trajectory orientation in relation to the tip-base axis.

91
GFP cortical dots present in the absence of actin. After latrunculin B treatment the cortical
dots move randomly over very short distances, enabling me to set a threshold that excludes
trajectories shorter than 1 μm. The remaining trajectories were counted and binned as
described for the cortical dots (figure 4.7b). Interestingly, there seems to be no apical
enrichment of cortical trajectories. However, since the trajectories have to be longer than 1
μm and given the geometry of the cell apex, it is likely that within 1μm of movement, the
For2A-GFP dot moves out of the TIRF imaging plane, even though it is along the cortex.
Therefore, I am likely underestimating the amount of linear trajectories at the very apex of
the cell.
For2A-GFP trajectories are preferentially tip-ward directed
The apical enrichment of cortical dots, but the absence of an enrichment in apical
trajectories, raises the question of whether the software picks up all the trajectories. To
Figure 4.7. Cortical For2A-GFP dots are apically enriched. A. Measurements of For2A-GFP cortical dot densities at various distances from the tip reveal a tip-ward gradient of For2A. B. Quantification of For2A-GFP linear trajectories at the tip versus the rest of the cell show there is no tip-ward enrichment of active For2A.

92
address this I manually identified trajectories and plotted them as kymographs to verify the
parameters (figure 4.8a). The trajectories found manually are of a remarkably consistent
length and speed (figure 4.8b). In some instances I see For2A trajectories overlap within a
short amount of time (figure 4.8a) as reported before, suggesting a mechanism for actin
filament bundling (chapter 2). Analysis of the kymographs suggests that the parameters I
set for our automatic analysis are, if anything, lenient and are more likely to pick up more
than fewer trajectories. Thus, minimizing the possibility that trajectories are missed due to
too stringent parameter settings.
Another explanation is that For2A apical dots are more numerous, yet less dynamic
than for2A dots further back in the cell. To test this, I compared For2A cortical dot dynamics
at the apex (0-10 µm from the tip) to For2A cortical dot dynamics further back in the cell
(10 μm-cell end) using the correlation coefficient analysis (figure 4.8c). Interestingly, there
is no difference in dynamics between the two populations of cortical dots. I also compared
the average trajectory length and speed of the apical trajectories with the rest of the
trajectories and found that the apical For2A trajectories are both shorter (figure 4.8d) and
slower (figure 4.8e) than trajectories further back in the cell. Despite this difference being
significant, the shorter and slower trajectories still fall well within our set parameters, so
the likelihood of missing apical trajectories as a result of this is small.

93
For2A-GFP linear trajectories are evenly distributed along the cell cortex, but
concentration of the For2A cortical dots can in part be explained by the presence of a
tipward trajectory bias, that directs cortical For2A dots toward the cell apex. To determine
trajectory orientation, I plotted the speed vectors of the trajectories onto a polar graph
using NIS elements (figure 4.6e). With the cell apex angle to the horizontal I can then
determine the amount of trajectories per quadrant (tip directed, base directed, left directed,
Figure 4.8. For2A-GFP linear trajectories are predominantly tip-oriented. A. Example kymographs of For2A-GFP movement along the cortex. Occasionally, two formin dots can be seen moving along the same trajectory (top panels). B. Quantification of the For2A-GFP speed (red bar) and average trajectory length (blue bar) from kymograph measurements. C. Quantification of cortical dot dynamics shows that apical dots are not more dynamic than dots elsewhere in the cell. D. Quantification of trajectory length at the apex compared to the rest of the cell. Letters above the bars indicate statistical groups. E. Quantification of trajectory speed at the apex compared to the rest of the cell. Letters above the bars indicate statistical groups. F. Quantification of the tip-ward/base-ward bias. For2A-GFP trajectories are significantly more tip-ward directed than base-ward. Letters above the bars indicate statistical groups.

94
right directed) (figure 4.6d and 4.6f). I found that significantly more trajectories are tip
directed than base directed (figure 4.8f). This indicates that For2A preferentially
polymerizes actin filaments towards the cell tip. There are far fewer trajectories going to
either the left or the right side of the cell, which again is probably due to the cell roughly
being cylindrically shaped and the trajectories going out of the field of imaging. Similarly,
linear trajectories will be going out of the field of imaging at the very tip of the cell, resulting
in an underestimation of the amount of trajectories at the tip and, since it will be
predominantly tip directed trajectories that will be underrepresented, an underestimation
of the tip-ward bias at the very tip of the cell. Together, our results indicate that For2A-GFP
preferentially polymerizes actin filaments towards the tip of the cell, possibly to focus
endocytosis to the growing apex (figure 4.9).

95
Discussion
My data help define functional differences between class I and class II formins. I find
that class I formins localize to areas of high membrane dynamics, but not to endocytic spots.
In contrast, For2A also localizes to areas of high membrane dynamics, and does colocalize
with endocytic spots. The slight differences in localization between these formins likely are
the result of the different N-terminal domains. For1D has a transmembrane domain but not
a signal peptide, as For1A does. For2A has an N-terminal PTEN domain with which it
specifically binds to the phosphoinositide PI(3,5)P2. Binding PI(3,5)P2 is necessary for
localization and for its function. I hypothesize that binding PI(3,5)P2 targets For2A to
endocytic spots on the cortex.
The observation that For1A and For1D do localize to areas with high membrane
dynamics, but not to endocytic spots, suggests that class I formins might be involved in
exocytosis. Another class I formin, For1F, has an N-terminal Sec10 domain (chapter 3). For
For1F I have shown that this protein is involved in exocytosis and is likely a part of the
exocyst complex. Moreover, deletion of For1F is lethal, but can be rescued by
overexpression of For1D, indicating that For1D and For1F have similar functions. This
suggests that class I formins are involved in exocytosis. Since the class II formin For2A
colocalizes and travels with endocytic spots, and the class I formins are involved in
exocytosis, this indicates that the two classes of formins are involved in two opposite
membrane remodeling processes. Indeed, For2A is unable to rescue the deletion of the
essential exocytosis formin For1F (chapter 3), indicating that the two classes are involved in
different processes.

96
The two classes of formins also interact differently with the cytoskeleton. For2A
moves in linear trajectories while polymerizing an actin filament and this movement is
dependent on actin. For2A is seen moving through the cell while polymerizing an actin
filament, indicating this is a processive formin (chapter 2, figure 4.9). For1D is previously
shown to nucleate and slowly elongate actin filaments in vitro, but it is unclear whether this
formin is processive (van Gisbergen and Bezanilla, 2013; Vidali et al., 2009b). The rate of
actin polymerization of For1D is approximately six times slower than that of For2A (Vidali
et al., 2009b). For2A cortical dynamics do not change upon oryzalin treatment, indicating
Figure 4.9. Model for Class I and Class II formin function. For1A is enriched at the tip, close to where the actin spot is. In addition it also localizes elsewhere on the plasma membrane and likely to the Golgi. Since For1A is on the membrane, but associated with the actin spot, it is possible that For1A generated actin contributes to the actin in the actin spot. For1D localizes evenly along the membrane and, based on the dynamics data, might interact with microtubules. Since I do not see it produce actin along the cortex I hypothesize that For1A and For1D are making actin into the cytoplasm, rather than along the cortex. For1A and For1D are associated with exocytosis. Conversely, For2A is associated with endocytic spots, and For2A-mediated actin polymerization localizes endocytic vesicles or endocytic membrane domains to the cell tip. In the tip, For2A localizes to the actin cloud, but might not be active.

97
that for its dynamics, For2A does not need to interact with microtubules. Strikingly, the
dynamics of the class I formins depends on both the actin cytoskeleton and microtubules.
This suggests that these formins connect the two cytoskeletal systems (figure 4.9). Indeed,
in Arabidopsis thaliana and Oryza sativa formins have been found that bind microtubules,
albeit that in both systems the interaction with microtubules is not limited to class I
formins. The slower movement along the cortex and the absence of polymerized actin in its
wake could suggest movement with a growing microtubule, but the precise interaction
between class I formins and microtubules remains to be studied.
It is not clear whether there is a higher density of For2A trajectories in the region
near the cell apex, due to the shape of the tip. Trajectories following the cell cortex will
rapidly travel out of the field of focus of the TIRF microscope. As a result, I am likely
underestimating the amount of trajectories present at the very apex of the cell.
Nevertheless, a small majority of trajectories are found directed towards the cell tip,
suggesting that For2A is involved in recycling endocytic vesicles towards the cell tip, or in
creating an actin array that is predominantly oriented with the barbed ends towards the tip.
This is significant because myosin XI, that is shown to be important for tip growth, is a
barbed end directed motor. However, the observed bias is small. This bias might be more
significant closer to the very apex of the cell, but since the cell apex is dome-shaped and the
tip is thus away from the cover slip, I am unable to image this using TIRF microscopy.
Taken together, class I formins and class II formins are involved in different parts of
membrane trafficking. Class I formins are likely involved in exocytosis, where For1D
decorates the entire plasma membrane and For1A is delivered to exocytic areas via exocytic
vesicles (figure 4.9). This will enrich class I formins to the sites of exocytosis, although there
function there remains to be elucidated. Class II formins are involved in endocytosis and
their cortical concentrations are enriched towards the cell tip. Moreover, active For2A is

98
traveling more towards the cell tip than away from it, which might be to recycle polarity
factors back to cell tip to maintain polarity. These results reveal new insights in the
interplay between membrane and cytoskeletal dynamics.

99
CHAPTER 5
DISCUSSION
My dissertation work has significantly furthered our knowledge on the function of
the formin protein family in plants. Using Physcomitrella patens as a model system, with its
relatively small formin family of proteins, I was able to define the function of the PTEN
domain in class II formins and their necessity to bind a specific phospholipid to function and
that For2A polymerizes actin filaments in vivo (chapter 2). Also, I found a link between the
cytoskeleton and secretion through an essential class I formin, For1F. For1F is part of a
tethering complex involved in exocytosis and forms a direct link between the actin
cytoskeleton and exocytosis in plants (chapter 3). This, combined with localization studies
of representatives of both the class I and class II formins revealed that class I and class II
formins have functionally diversified, where class I formins are involved in exocytosis and
class II formins in endocytosis. Since class II formins, not class I formins are necessary for
polarized growth, my work suggests that polarizing endocytosis, and perhaps not
exocytosis, is what drives polarized growth in plant cells.
Class I formins and exocytosis
Plant cell growth requires the exocytosis of new cell wall material, and the delivery
of vesicles carrying this material to the cell surface. The class I formin For1F is involved in
exocytosis and interacts both with actin and the exocyst complex. This provides a direct

100
way of connecting actin mediated vesicle delivery to exocytosis. For1F is an essential gene,
making it difficult to study. By simultaneously transforming a For1F knock-out construct
and an expression construct, I showed that the Sec10 and formin parts of For1F do not need
to be fused to ensure survival and also that expression of either part is sufficient for
viability. Using a similar approach I showed that expression of For1D or Sec10b can also
rescue the absence of For1F. This suggests that Sec10 and formin proteins, that are not part
of For1F, weakly interact and that the presence of enough of either can overcome the
absence of having both on the same protein. This normally is not the case, since, besides the
cortical population, fluorescently tagged For1A and For1D are predominantly visible in the
caulonemal tip cell, not the subapical cells. This is supported by expression data from the
eFP browser (figure 3.2). Rescue of a For1F knock-out by For1D is the result of ectopic
expression in apical and subapical cells. However, the possibility of a transient interaction
suggests that class I formins and the exocyst complex likely interact in plants without a
physical fusion. These data also indicate that, since For1D can rescue For1F function, other
class I formins besides For1F can be involved in exocytosis. Supporting this, I also found
that For1A, For1D and For1F do not colocalize with FM4-64 labeled endocytic sites (chapter
3).
Class I formins and class II formins have functionally diversified
Interestingly, it was not possible to rescue the knock-out of For1F with For2A
(chapter 3), providing another line of evidence that class I and class II formins have distinct
functions, besides the distinct RNAi phenotypes (Vidali et al., 2009b). Contrary to the class I
formins, For2A does localize to endocytic sites (chapter 4). Given that For1F is involved in
exocytosis, that For1D can complement loss of For1F function and that For2A localizes to

101
endocytic sites, I propose that class I formins are involved in exocytosis, and class II formins
are involved in endocytosis.
Further evidence for distinct mechanistic functions of class I and class II formins
comes from cortical dynamics studies. I found that the dynamics of class I formins are
mostly affected by the microtubule depolymerizing drug oryzalin (chapter 4), and only
For1F and For1A dynamics are inhibited by the actin depolymerizing drug latrunculin B
(chapter 3 and 4). For1D dynamics are increased by latrunculin B. This is surprising, since
For1D is shown to be able to produce filamentous actin in vitro (Vidali et al., 2009b). The
increased dynamics of For1D without actin suggest that For1D movement is not dependent
on polymerization of actin (in fact, its dynamics are negatively influenced by it). This holds
two possibilities; one is that For1D does not track the actin barbed end, suggesting that this
formin is a non-processive formin; the other possibility is that For1D does track the barbed
end and thus is a processive formin, but stays in the membrane. Contrary to the class I
formins, the dynamics of For2A are dramatically affected by latrunculin B, and not by
oryzalin (chapter 3 and 4). These data indicate that class I formins and class II formins are
involved in distinct membrane processes, and interact differently with the cytoskeleton.
So far, four other plant formins are thought to interact with microtubules (van
Gisbergen and Bezanilla, 2013). My work also indicates that class I formins can interact with
microtubules, as their dynamics are severely affected by the absence of microtubules. The
significance of this is yet unknown, but microtubule interaction of formins provides an
intriguing possibility of cross-talk between the actin and microtubule cytoskeletons. A
possibility would be a direct cross-linking of actin and microtubules, or polymerization of
actin filaments off of microtubules, as is suggested for AtFH4 (Deeks et al., 2010). It would
be interesting to see whether class I formins can bind microtubules directly.

102
Interaction of class I formins with the actin cytoskeleton
By imaging formins and actin simultaneously on the plasma membrane with TIRF
microscopy, I revealed further distinctions between class I and II formins. In contrast to
For2A, class I formins were not observed to rapidly polymerize actin along the cortex
(chapter 3 and 4). However, class I formins do move through the cortex. It is possible that
these formins are not processive, or that they polymerize actin into the cytoplasm, rather
than along the cortex, which means it would be out of our imaging field in TIRF microscopy.
Alternatively, For1A and For1F could be nucleators, not elongators of actin filaments.
However, For1D was previously shown to elongate actin filaments in vitro. Given that plant
formins are known to have diverse effects on actin filaments, it would be interesting to
characterize class I formin interactions with actin in vitro. Biochemical characterization of
class I formins will provide a clue of what their interactions with actin in vivo might be.
Interaction of class II formins with the actin cytoskeleton
When bound to cortical lipid domains a subset of For2A was seen generating actin
filaments. Moreover, For2A is seen moving along the cortex while polymerizing an actin
filament, indicating that it tracks the barbed end of the filament it is polymerizing,
indicating it is a processive formin. This is supported by the absence of For2A movement
after treatment with Latrunculin B. Movement of For2A along the cortex while polymerizing
an actin filament happens in relatively linear trajectories.
Actin filaments generated by For1A were polymerized de novo, or along existing
actin filaments. Polymerization of actin filaments along existing actin filaments provides an
intriguing possibility of forming actin bundles. So far, it is unclear whether the orientation
of the first actin filament is able to dictate what the orientation of the second filament will
be, and it would be interesting to know whether For2A actually interacts with the actin

103
filament that it is moving along. Some indications of formins interacting with the side of
existing actin filaments comes from research on arabidopsis formins. The formins AtFH1
and AtFH8 have been shown to bind to the sides of actin filaments in vitro and induce
filament bundling (Michelot et al., 2005; Xue et al., 2011; Yi et al., 2005). Additionally, AtFH8
is also capable of severing actin filaments after side-binding. Whether For2A is capable of
binding to the side of an actin filament is as of yet unknown. It would be interesting to do an
in vitro actin bundling assay using purified For2A and prepolymerized actin to see whether
For2A itself bundles actin filaments directly.
Cortical For2A is enriched at the cell tip
Quantification of cortical For2A density over the length of the cell revealed that
there is an enrichment of cortical For2A within the first 10 μm from the apex in caulonemal
cells. Since cortical For2A dots travel in linear trajectories when polymerizing actin
filaments, and thus when they are active, I was able to quantify the activity of For2A at
various positions in the cell. Quantification of trajectory density did not show an increase of
For2A activity at the tip of the cell, but since the cell tip is dome-shaped and thus is further
away from the coverslip, we cannot see trajectories going into the very tip. Using spot
detection software to track For2A trajectories, trajectory orientation was quantified. I found
that cortical For2A preferentially polymerizes actin filaments towards the tip. However, the
difference between tip-ward trajectories and base-ward trajectories seen in the shank of the
cell is small. It is very well possible that the bias is greater in the very tip of the cell, but due
to the geometry of cell, these trajectories are out of the range of our TIRF imaging field.
Therefore, we are likely underestimating the bias at the tip of the cell.
Because For2A is a processive formin, and continuously tracks the barbed end of the
filament, this means that the actin filaments are predominantly positioned with their

104
barbed ends towards the cell apex. Myosin XI is a barbed-end directed motor and, like
For2A, is essential for tip growth (Vidali et al., 2010; Vidali et al., 2009b). For2A mediated
tip-ward actin polymerization is therefore a likely candidate to provide the actin tracks on
which myosin XI transports the cargo to the cell apex. Unfortunately, due to the geometry of
the cell, we cannot visualize cortical myosin XI movement at the very apex, so this, though
an intriguing hypothesis, remains an open question.
Polarizing endocytosis is essential for polarized growth
For2A is enriched at the cell tip and localizes to FM4-64 labeled endocytic domains.
In addition to localizing to FM4-64 domains, For2A also travels with them. This movement
also happens in linear trajectories (chapter 4), and since the rate of movement is the same
as the rate of actin polymerization, thus likely also in the event of actin polymerization. This
suggests that endocytic domains are concentrated towards the cell apex. A high rate of
endocytosis is necessary at the tip because the deposition of exocytic vesicles for the
delivery of cell wall building blocks also introduces large amounts of excess membrane at
the apex. The excess membrane needs to be recycled back into the cell through endocytosis.
Interestingly, silencing class II formins, not class I formins, results in a loss of
polarized growth (chapter 1). Since For2A localizes to and tracks with endocytic sites, my
results suggest that endocytosis, rather than exocytosis, is important for the polarization of
growth. Class I formin mediated exocytosis provides the building blocks for growth at the
apex. For1D and For1F do not seem to be enriched at the cell tip, and it is possible that these
formins are involved in a more constitutive form of exocytosis, such as insertion of cellulose
synthases. For1A is enriched at the very apex and is putatively involved in the secretion of
vesicles that carry flexible cell wall material for polarized growth. Delivery of such vesicles
could be mediated by Myosin XI and could also carry polarity factors to positively enforce

105
secretion at the apex. Polarity factors that mark the tip will, with the insertion of more
membrane at the apex, diffuse out over the dome of the tip and into the shank of the tip
growing cell. For2A tipward movement on endocytic sites provides a possible mechanism to
recycle polarity factors back into the cell and then out to the very tip, so they stay
concentrated at the tip. A loss of class II formins would mean a loss of the concentration of
polarity factors and a subsequent loss of focused exocytosis.
For2A speeds of actin polymerization are different in vivo from in vitro
Irrespective of directionality, For2A generates actin filaments at very high speeds
(Vidali et al., 2009b). The reason for polymerizing rapidly is not yet clear, although it was
found that a chimeric formin that polymerizes actin more slowly cannot fully rescue the loss
of polarized growth that results from class II formin RNAi. This indicates that rapid actin
polymerization is essential to the function of For2A. Measurements of the in vitro actin
polymerization speeds of For2A indicate a polymerization speed of 115 actin subunits per
second, which corresponds to about 800 nm per second, while my in vivo quantifications of
For2A speed show that at the cell cortex, For2A moves at around 1800 nm per second
(chapters 2 and 4). This more than two fold difference is intriguing and suggests that in the
cell other proteins are able to amplify formin speed. One can imagine this can be done by
more efficiently supplying actin monomers or by stimulating the processivity of the formin.
This provides an interesting possibility for a formin interacting protein as an amplifier of
actin polymerization.
The For2A PTEN domain is not expected to regulate activity directly
An initial candidate for modifying For2A activity was the N-terminal PTEN domain.
The PTEN domain is homologous to the human PTEN protein, that was shown to bind

106
PI(4,5)P2. Lipid competition assays were used to show that the class II formin PTEN domain
preferentially binds the phosphoinositide PI(3,5)P2, not PI(4,5)P2 (chapter 2). Binding
PI(3,5)P2 is essential for the function of For2A. Previously we have shown that the For2A
FH1FH2 domains are an active formin in vitro, but that this cannot complement the loss of
polarized growth after knock-down of class II formins (Vidali et al., 2009b). This indicates
that FH1FH2 is intrinsically active, and that something in the PTEN domain is necessary for
its regulation. One possibility is that, analogous to the autoinhibition of yeast formins, the
PTEN domain folds back on the FH1FH2 domain, rendering it inactive until it binds
PI(3,5)P2. This however, seems unlikely, since there is still a large population of formin on
the cortex, presumably bound to PI(3,5)P2, that is inactive. Moreover, substitution of the
PTEN domain by a structurally unrelated PI(3,5)P2 binding domain forms a functional
formin. If autoinhibition would be present, such a domain is unlikely to convey
autoinhibition and would leave the formin constitutively active. Since overexpression of
For2A is lethal (Vidali et al., 2009b), this too is an unlikely way of regulating this formin. The
specificity of phosphoinositide binding, and not otherwise targeting to the membrane,
suggests that binding to PI(3,5)P2 lipid domains is important. I hypothesize that an
interactor of For2A, be it an activator or deactivator, or both, also resides on PI(3,5)P2
domains.
Finding a formin regulator
Of all the cortical formin, only 14% generates actin filaments (chapter 2). This
means that most cortical For2A is inactive and thus needs to be activated. To date, no
regulatory mechanism of plant formins is known. In yeast and mammalian systems the
regulation of formins is relatively well understood, but unfortunately, there are no
identifiable homologs of any of the known formin-interacting proteins present in plants.

107
Since plant formins also lack the regulatory domains yeast and mammalian formins have
(see introduction), it is likely that they exhibit different modes of regulation. To date, the
only identified protein to interact with plant formin, besides actin and profilin, is formin
interacting protein 2 (FIP2) (Banno and Chua, 2000), which was identified in a yeast-2-
hybrid screen. The originally identified FIP2 protein is currently named FIP1, as the name
FIP2 is given to an unrelated protein. FIP1 interacts with AtFH1 directly and is a protein of
unknown function. FIP1 contains a PH-like GRAM domain, which is a domain reminiscent of
myotubularin (MTM) and involved in phosphoinositide binding (Robinson and Dixon,
2006). I think the next big question for plant formins is to find the proteins that regulate
their function.
The FH1FH2 domains provide a direct target for For2A regulation. In search for an
interactor I hypothesize that inhibition of the access of profilin-actin complex to the poly-
proline rich FH1 domain can interfere with For2A function and regulate For2A function.
Poly-proline regions form a reasonable target, since many protein domains are known to
interact with poly-prolines, such as SH3 domains and WH2 domains. I searched the P.
patens genome for proteins with SH3 or WH2 domains and found nine SH3 domain
containing proteins and one WH2 domain containing protein. Interestingly, five of the nine
SH3 domain containing proteins also include an F-BAR domain. This is a domain that binds
phosphoinositides, preferably on curved membranes. Additionally, I found ten GRAM
domain containing proteins. In an attempt to identify an interactor, I took a dual approach; I
constructed a cDNA library for moss to do a yeast-2-hybrid screen with For2A, and I cloned
a subset of the mentioned genes to subject them to a directed yeast-2-hybrid assay with
For2A. The full scale yeast-2-hybrid failed twice, probably due to the substandard quality of
the library I generated. For the directed yeast-2-hybrid, I cloned the SH3 domain containing
proteins, the WH2 domain containing protein, the 6 GRAM domain containing proteins with

108
closest homology to FIP2 and the three FAB1 kinases (chapter 2). I subjected them to
directed yeast-2-hybrid with For2A, but failed to find any interactors. I repeated this with
For1D and For1F and found weak interactions between the class I formins and an SH3
domain containing protein and an SH3/F-BAR domain containing protein. These results are
as of yet unconfirmed. To continue the search for interactors I recommend to do pull-down
assays followed by tandem mass spectrometry.

109
CHAPTER 6
MATERIALS AND METHODS
Imaging cell division by confocal laser-scanning microscope (CLSM)
Moss plants were inoculated on top of a thin layer of PpNO3 growth medium (1.03
mM MgSO4, 1.86 mM KH2PO4, 3.3 mM Ca(NO3)2, 45 µM FeSO4, 9.93 µM H3BO3, 220 nM
CuSO4, 1.966 µM MnCl2, 231 nM CoCl2, 191 nM ZnSO4, 169 nM KI, 103 nM Na2MoO4) in a
growth chamber with a cover slide glued to the bottom and grown for 7-10 days (Hiwatashi
et al., 2008). After 7-10 days, many protonemal cells reach the cover slide and therefore can
be imaged with a confocal laser scanning microscope (CLSM). The chamber was mounted on
a Nikon C1 confocal microscope with a Nikon 1.45 NA 60x oil immersion objective equipped
with photomultiplier tube (PMT) detectors. A 488 nm argon laser with 1% power was used.
To image cell division, long protonemal cells were chosen and imaged for several hours at
room temperature until cell division was completed. Image acquisition and 3D
reconstruction of acquired images were conducted using Nikon EZ-C1 3.80 software.
Subsequent imaging processing, which included smoothing and contrast enhancing, was
performed with ImageJ.
For longer imaging experiments, imaging chambers were used. Imaging chambers
are microfabricated polydimethylsiloxane (PDMS) devices that are bonded to a coverslip
that is glued over a hole in the bottom of a 3cm Petri dish. Chambers are soaked overnight
in Hoaglands medium, after which ground tissue is inserted into the PDMS chamber. Plants
110
were allowed to recover for 3-7 days, after which the chambers were mounted on the
microscope. Images for each channel were acquired simultaneously on a Nikon A1R
confocal microscope system with a 1.4 NA 100× oil immersion objective (Nikon) at room
temperature. 488 and 561 nm laser illumination was used for GFP/FM4-64 and mCherry
excitation, respectively. Emission filters were 525/50 nm for GFP and 595/50 for
mCherry/FM4-64. Image acquisition was controlled by NIS-Elements software (Nikon).
Spinning-disc confocal microscopy
One-week old protonemal cells in imaging chambers were mounted on a Nikon Ti-E
inverted microscope equipped with a Yokogawa CSU-X1 spinning disk head and a 512x512
Andor iXON electron multiplying CCD camera. Images were collected with a Nikon 1.4 NA
60x oil immersion objective at room temperature. 30% laser power was used for both 488
and 561 lasers. The electron gain was 300 and exposure time was 200 msec. Image
acquisition process was controlled by Metamorph software (Molecular Devices) and images
were further processed with ImageJ as described above.
To image cell division, long protonemal cells were chosen and imaged for
several hours at room temperature until cell division was completed. Image acquisition and
3D reconstruction of acquired images were conducted using EZ-C1 3.80 software (Nikon).
Subsequent imaging processing, which included smoothing and contrast enhancing, was
performed with ImageJ (National Institutes of Health).
FM4-64 treatment and imaging
Moss cells growing in the imaging chamber were incubated with 20 µM FM4-64
(Calbiochem) diluted in Hoagland’s medium (4 mM KNO3, 2 mM KH2PO4, 1 mM Ca(NO3)2, 89
µM Fe citrate, 300 µM MgSO4, 9.93 µM H3BO3, 220 nM CuSO4, 1.966 µM MnCl2, 231 nM CoCl2,

111
191 nM ZnSO4, 169 nM KI, 103 nM Na2MoO4, 1% sucrose) for 5 min and then washed three
times with Hoagland’s medium to remove excess FM4-64. The plant was then imaged and
processed as described above. The emission was collected with both 515/30 nm and
605/75 nm filter sets for GFP and FM4-64 signals, respectively.
Plasmid construction
Lifeact-mCherry was constructed by assembling Lifeact –L1L5r (Vidali et al., 2009a)
and mCherry-L5L2 into pTHUbi-gate (Vidali et al., 2007). To generate mCherry-L5L2, the
mCherry coding sequence was amplified using mEGFP primers with attB5 and attB2 sites
and cloned into pDONR221-P5-P2 (Invitrogen) using a BP reaction.
To clone PTENA and PTEND, total RNA was first isolated from one-week-old moss
protonemal tissue, using the RNeasy plant mini kit (Qiagen), according to the
manufacturer’s recommendations. Total cDNA was generated using oligo(dT) and
SuperScript II Reverse Transcriptase (Invitrogen) following the manufacturer’s protocol.
Full-length cDNAs of PTENA and PTEND were amplified from total cDNA with primers
designed to amplify the open reading frame.
For PTEN-GST, GST was amplified from pGEX2tk with primers incorporating EcoRI
and XhoI sites and subsequently cloned into pET21, generating pET21-GST. PTEN was
amplified from PTEN-pENT with primers incorporating NdeI and EcoRI sites and cloned
into pET21-GST. For GST-PTENA and GST-PTEND fusion proteins, cDNAs were first cloned
into pENTR-D-Topo (Invitrogen). These entry clones were then transferred to pDEST15
(Invitrogen) using an LR reaction. To generate PTENA-GFP and PTEND-GFP, the coding
sequences were amplified from PTENA-pENT and PTEND-pENT, respectively with primers
incorporating specific attB sites and transferred into pDONR221-P1-P5r using a BP clonase

112
reaction. PTENA-L1L5r was assembled with mEGFP-L5L2 (Vidali et al., 2009b) into pTHUbi-
gate (Vidali et al., 2007) using LR clonase to generate PTENA-GFP and PTEND-GFP.
All complementation constructs were constructed using Multisite Gateway 3-
fragment recombination (Invitrogen). All entry clones were verified by sequencing.
Essentially, HsPTEN, MTM1, MTM1*, PTENA, PTEND, PH, TAPP1, 2XFYVE, and ScAtg18
were amplified using primers containing attB1 and attB4 sites. MTM1 and MTM1* were
amplified from pCDNA3.1(+)-NF-hMTM1 and pCDNA3.1(+)-NF-hMTM1 (C375S) plasmids
(Robinson and Dixon, 2006; Taylor et al., 2000). PTENA, and PTEND were amplified from
PTENA-pENT and PTEND-pENT, respectively. Human TAPP1 was amplified from pCMV-
Taq-nMyc-hTAPP1 (Marshall et al., 2002). Atg18 was amplified from Saccharomyces
cerevisiae genomic DNA. The 2XFYVE and PH sequences were amplified from genomic DNA
isolated from A. thaliana lines stably expressing YFP-2XFYVE and YFP-PH (PLCδ1) (Van
Leeuwen et al., 2007; Vermeer et al., 2006). Human PTEN (HsPTEN) was amplified by RT-
PCR from Hela cells. Total RNA and cDNA of HeLa cells were generated similarly as
mentioned above. All PCR products were transferred into pDONR221-P1-P4 using a BP
clonase reaction. Resulting entry clones were assembled with 2AFH1-L4L3 and 2AFH2-
L3L2 (Vidali et al., 2009b) or 2AFH2-3XFLAG-L3L2 in a 3-fragment recombination reaction
into pTHUbi-gate using LR clonase. To generate 2AFH2-3XFLAG-L3L2, 3 tandem copies of
the FLAG epitope were incorporated into 2AFH2-L3L2 using megaprimer PCR (Barik,
1997).
To generate MTM1*-FH1FH2-3XGFP, a BssSI site from the 5’ region of MTM1*-L1R5
was removed first using site-directed mutagenesis with primers listed in Table S1. Then, a
BssSI site was incorporated at the 3’ end of MTM1* using PCR with primers listed in Table
S1. Taking advantage of a BssSI site in the vector sequence, the new MTM1* clone was
digested with BssSI to remove MTM1* from the L1R5 backbone vector. The full length

113
coding sequence of For2A in pENTR-D-TOPO (For2A-pENT) (Vidali et al., 2009b) was
digested with BssSI removing sequences of the vector and the entire PTEN domain. The
BssSI MTM1* fragment was then cloned into For2A-pENT digested with BssSI, generating
MTM1*-FH1FH2-pENT. To move this clone into the two-fragment Multi-Site Gateway entry
clones, the L2 site from pENT had to be replaced with an R5 site. This was done by first
generating an FH2-L1R5 clone by PCR amplification and BP clonase reaction. A SmaI and
EcoRV fragment from MTM1*-FH1FH2-pENT was replaced with the equivalent fragment
from the FH2-L1R5 construct, resulting in replacement of the L2 site with an R5 site and
generation of MTM1*-FH1FH2-L1R5. All clones were verified by sequencing. MTM1*-
FH1FH2-L1R5 was then recombined with 3XmEGFP-L5L2 using LR clonase to generate
MTM1*-FH1FH2-3XGFP.
To generate the FAB1-RNAi constructs, using primers listed in Table S2 I amplified a
400 bp fragment from the first exon of FAB1-A (Pp1S65_215V6) from moss genomic DNA.
This fragment has high sequence identity with FAB1-B (Pp1S36_196V6). FAB1-C
(Pp1S26_208V6) differs significantly in sequence. FAB1-C is encoded by a gene with no
introns, so using primers listed in Table S1 I amplified 400 bp from the 5’ end of the coding
sequence from genomic DNA. Amplified fragments were cloned into pENT-D-TOPO and
sequenced. Subsequently, the fragments were cloned into pUGGi (Bezanilla et al., 2005)
with an LR reaction to generate the RNAi constructs, FAB1-AB-RNAi and FAB1-C-RNAi.
To clone full length For1D and Sec10b, total RNA was first isolated from 1-wk old
moss protonemal tissue, using the RNeasy plant mini kit (QIAGEN), according to the
manufacturer’s recommendations. Total cDNA was generated using oligo(dT) and
SuperScript III Reverse transcription (Invitrogen) following the manufacturer’s protocol.
Full-length cDNAs of For1D and Sec10b were amplified from total cDNA with primers
designed to amplify the open reading frame (Table S1) and transferred into pENTR-D-

114
TOPO. An LR recombination reaction with pTH-UBI-gate was done to generate
overexpression constructs with For1D or Sec10b.
To generate the Sec10 and formin parts of the For1F complementation constructs,
cDNA was made as described above, with primers specific to the Sec10 part or the Formin
part of For1F. For full length For1F, amplifying from cDNA did not work. Instead, I amplified
the large exon containing the FH1 domain from genomic DNA and cloned it into pENTR-D-
TOPO to generate pENT-FH1. Next, I cloned the region C-terminal of the FH1 poly-proline
region into pENTR-D-TOPO to generate pENT-FH2. The Sec10 part was created by PCR from
cDNA from the start codon until just upstream of the poly-proline regions of the FH1
domain, to generate pENT-Sec10. Both pENT-FH1 and pENT-FH2 were then cut with
BanI/AscI, and the drop-out of the pENT-FH2 digest was ligated into the backbone of the
pENT-FH1 digest. BanI cuts pENT-FH2 twice, resulting in a small BanI/BanI fragment that
was ligated in and screened for orientation after the ligation of the FH2 part into pENT-FH1.
This resulted in pENT-FH1FH2. pENT-FH1FH2 and pENT-Sec10 were then cut with
NdeI/AscI and the drop-out of pENT-FH1FH2 was ligated into the backbone of pENT-Sec10
to generate pENT-For1F, which represents a full length coding sequence gene of For1F.
All complementation constructs were constructed using Multisite Gateway 2-
fragment recombination (Invitrogen). All entry clones were verified by sequencing.
Essentially, the Sec10 part, the formin part and the full length For1F were amplified from
the above described constructs using primers containing attB1 and attB5r sites and (Table
S1). All PCR products were transferred into pDONR221-P1-P5r using a BP clonase reaction.
Resulting entry clones were assembled with 3XFLAG-L5L2 in a 2-fragment recombination
reaction into pTHUbi-gate using LR clonase II plus. To generate the For1F knock-out
construct, using primers listed in Table S2, I amplified a 1000 bp fragment immediately
upstream of the start codon and 1000 bp downstream of the stop codon of For1F (targeting
115
arms). These fragments were cloned into pDONR221-P1-P4 and pDONR221-P3-P2
respectively and were verified by sequencing. The resulting pENT-5’arm and pENT-3’arm
were recombined with pENT-G418 and pTH-UBI-gate to make pTH-UBI-For1F-KO. Plasmids
were digested over night with SwaI to obtain linear fragments needed for homologues
recombination. Upon transformation into moss, the targeting arms will recombine and
replace the For1F locus with a G418 resistance cassette.
Constructs used to fluorescently tag For1A, For1D, For1F and Sec6 were made
similarly. For all, a region 1000 bps directly upstream and downstream of the stop codon
was amplified and cloned into pDONR221-P1-P5r and pDONR221-P3-P2 respectively. For
tagging For1A, For1D and For1F, these were recombined with pGEM-gate, pENT-P5-P4-
3xmEGFP and pENT-P4r-P3r-HYG (hygromycin resistance cassette), for tagging Sec6, these
were recombined with pGEM-gate, pENT-P5-P4-3xmRUBY2 and pENT-P4r-P3r-G418 (G418
resistance cassette). The resulting plasmids were digested with SwaI to make linear
targeted pieces for homologues transformation and transformed into moss.
Tissue culture, protoplast transformation, and complementation analysis
All tissue culture and transformations were performed as previously described
(Bezanilla et al., 2003; Bezanilla et al., 2005; Vidali et al., 2007; Vidali et al., 2009b) with
minor modifications described as follows. Protoplasts were transformed at a concentration
of 2 x 10⁶ protoplasts/mL. For isolation of stable transformants, protoplasts were
regenerated with top agar (1.03 mM MgSO4, 1.86 mM KH2PO4, 3.3 mM Ca(NO3)2, 2.7 mM
(NH4)2-tartrate, 45 µM FeSO4, 9.93 µM H3BO3, 220 nM CuSO4, 1.966 µM MnCl2, 231 nM CoCl2,
191 nM ZnSO4, 169 nM KI, 103 nM Na2MoO4, 6% mannitol, 10 CaCl2). For transient analysis,
protoplasts were plated in 0.5 mL of PpNH4 culture medium (1.03 mM MgSO4, 1.86 mM
KH2PO4, 3.3 mM Ca(NO3)2, 2.7 mM (NH4)2-tartrate, 45 µM FeSO4, 9.93 µM H3BO3, 220 nM
116
CuSO4, 1.966 µM MnCl2, 231 nM CoCl2, 191 nM ZnSO4, 169 nM KI, 103 nM Na2MoO4)
supplemented with 8.5% mannitol and 10 mM CaCl2. Transformed plants were selected 4
days after transformation on PpNH4 medium with 0.7% agar containing hygromycin (15
µg/mL) and imaged 7 days after transformation.
For FAB1-RNAi, transformations were performed similarly. To silence all the three
FAB1 genes, 30µg of FAB1-AB-RNAi plus 30 µg of FAB1-C-RNAi were used simultaneously. 4
days after transformation the plants were transferred to PRMB medium containing
hygromycin (15 µg/mL) and 13µM latrunculin B. 7 days after transformation plants were
moved to PpNH4 medium containing hygromycin (15 µg/mL) and plants were imaged 10
days after transformation.
Plants were imaged at room temperature with a 1X lens at 63X zoom on a
fluorescence stereomicroscope (Leica MZ16FA) equipped with a color camera (Leica
DF300FX) using the GFP2 filter set (Leica). Plant area and morphometric parameters were
measured as described previously (Vidali et al., 2007). Briefly, a 24-bit RGB image of a 1-
week-old plant was manually cropped, and the red channel corresponding to the
chlorophyll autofluorescence was separated. Fluorescence was thresholded using maximum
entropy (ImageJ). Total plant area and circularity were determined from the thresholded
images. Circularity is the plant area divided by the square of the perimeter. Statistical
analyses were performed as previously described (Vidali et al., 2007) except that analysis of
variance for multiple comparisons was done on Kaleidagraph (Synergy). Area was log
transformed to achieve normal distribution. The possibility of differences between
experiments was assessed and none were found. Pairwise comparisons are corrected for
multiple tests using Kramer's procedure so that the overall α level is 0.05 (Kramer, 1956).
Protein Extraction and Immunoblotting
117
To verify expression from constructs that do not rescue the formin-RNAi phenotype,
epitope tagged constructs were transformed into moss protoplasts. After transformation,
protoplasts were incubated in 6 mL of plating medium (PpNH4 + 8.5% Mannitol) for 3 days.
Protoplasts were then harvested and resuspended in 400 µL grinding buffer (100mM
Na3PO4, 10mM DTT, 20µg/ml Leupeptin, 20% Glycerol, 250mM PMSF), supplemented with
Complete mini EDTA-free protease inhibitor cocktail tablets (Roche) (1 tablet per 5 mL).
Lysis was done by 3 freeze-thaw cycles in liquid nitrogen. Cell debris was spun down and
the supernatant was precipitated with methanol/chloroform. For immunoblotting, both the
pellet and precipitated supernatant were solubilized in sample buffer (175 mM Tris base,
2.5% SDS, 80 mM DTT, and 7.5% glycerol). 80% of the sample was loaded, separated on a
6% SDS-PAGE gel and transferred to a nitro-cellulose membrane.
For 3XFLAG immunoblots, membranes were probed with a monoclonal anti-FLAG
antibody (Sigma). For GFP immunoblots, the membranes were probed with polyclonal
rabbit anti-GFP antibody. The anti-GFP polyclonal rabbit antibody was raised against His-
tagged GFP and affinity purified. For immunoblots, the membrane was blocked with 5%
nonfat dry milk dissolved in TBS-T (25mM Tris-HCl pH 7.5, 150mM NaCl and 0.1% Tween-
20) at 25°C for 1 hr. After five washes with TBS-T for 5 min, the membrane was incubated
with primary antibody (1:5000 dilution with 1% BSA in TBS-T) at 25°C for 2 hrs. After five
washes with TBS-T for 5 minutes, the membrane was incubated with horseradish
peroxidase conjugated secondary antibody (1:100,000 dilution for 3XFLAG immunoblots;
1:5,000 dilution for GFP immunoblots) at 25°C for 1 hr. The unbound secondary antibody
was washed five times for 5 minutes with TBS-T. For 3XFLAG immunoblots, SuperSignal
West Femto (Thermo Scientific) was used according to manufacturer’s recommendations.
Chemiluminescence emission was detected with a gel dock system equipped for
chemiluminescence detection (Biorad).
118
For protein extraction from stable moss lines, moss protonemal tissue was dried on
a paper towel and weighed. Lysis was done by grinding in liquid nitrogen. Ground tissue
was then resuspended in 400 µl grinding buffer (50 mM HEPES, 150mM NaCl, 10mM EDTA,
2 mM DTT, 20 µg/ml leupeptin, 2.5% SDS, and 2 mM PMSF), supplemented with Complete
mini EDTA-free protease inhibitor cocktail tablets (1 tablet per 5 ml; Roche) and 0.1%
casein. Cell debris was spun down and the supernatant was precipitated with
methanol/chloroform. For immunoblotting, the pellet fraction was first resuspended in 6M
urea with 1% Triton X-100. The precipitated supernatant was solubilized in sample buffer
(175 mM Tris base, 2.5% SDS, 80 mM DTT, and 7.5% glycerol). 80% of the sample was
loaded, separated on a 6% SDS-PAGE gel, and transferred to a nitrocellulose membrane. For
immunoblotting, protein extract was separated by SDS-PAGE and transferred to a
nitrocellulose membrane and probed with polyclonal rabbit anti-GFP antibody. The anti-
GFP polyclonal rabbit antibody was raised against His-tagged GFP and affinity purified. For
immunoblots, the membrane was blocked with 5% nonfat dry milk dissolved in TBS-T (25
mM Tris-HCl, pH 7.5, 150 mM NaCl, and 0.1% Tween 20) at 25°C for 1h. After five washes
with TBS-T for 5 min, the membrane was incubated with primary antibody (1:5,000
dilution with 5% nonfat dry milk in TBS-T) at 4°C for 16h. After five washes with TBS-T for
5 min, the membrane was incubated with horseradish peroxidase–conjugated secondary
antibody (1:5,000 dilution) at 25°C for 1 h. The unbound secondary antibody was washed
five times for 5 min with TBS-T. SuperSignal West Femto (Thermo Fisher Scientific) was
used according to the manufacturer’s recommendations to detect chemiluminescence
emission with a gel dock system equipped for chemiluminescence detection (GE healthcare
life sciences ImageQuant LAS 500).
119
Protein expression and purification
All proteins were expressed in Rosetta (DE3) pLysS strain (Novagen) and induced
with the Inducer (KD Medical), an IPTG alternative. Bacteria were grown at 37°C until the
optical density of the culture at 600 nm was between 0.6-0.8. The culture was then chilled
on ice before adding the Inducer to 2.5 mg/mL. Protein induction was conducted at 20°C
overnight.
For GST fusion protein purification, cells were resuspended with column buffer (20
mM Tris-HCl, pH 7.5, 150 mM NaCl, 1 mM EDTA, and 1 mM DTT) plus 1mM final
concentration PMSF and 100µg/mL lysozyme and lysed by sonication. After clearing the cell
debris by spinning at 13,000rpm in a SS34 rotor (Thermo Scientific) for 15 min and filtering
through a 0.2µm filter, the supernatant was loaded onto a pre-equilibrated GST column
(Novagen) with column buffer. The column was washed with 15 column volumes of column
buffer, followed by 15 column volumes of 0.1% Triton-X100 in column buffer. Excess
Triton-X100 was removed by washing with 15 column volumes of column buffer. Protein
was eluted with column buffer supplemented with 100 mM reduced glutathione, pH7.5,
(Sigma).
Protein lipid overlay assay
All dipalmitoyl phosphoinositides were purchased from Echelon Biosciences (Salt
Lake City, UT). The assays were conducted following the protocol developed by Dowler et al
(Dowler et al., 2002). Essentially, lyophilized lipids were reconstituted as 0.5 mM stock with
1:1 methanol and chloroform and stored at -80°C. For the assay, phosphoinositide stocks
were diluted with a solution of 2:1:0.8 methanol:chloroform:water. 1 µl of diluted lipids was
spotted on Hybond-C extra membrane (Amersham Biosciences). After the membrane was
air-dried at room temperature for 1 hr, it was blocked with 2 mg/mL BSA (Fisher Scientific)

120
dissolved in TBS-T (50 mM Tris-HCl, pH 7.5, 150 mM NaCl, 0.1% Tween-20) for 1 hr at room
temperature with gentle rocking. The membrane was washed 3 times with TBS-T, followed
by incubation with 10 nM purified protein diluted in the blocking solution (2 mg/mL BSA in
TBS-T) at 4°C for 2 hrs. Then, the membrane was washed with TBS-T 10 times for 5 min,
followed by standard immunoblotting procedures using either anti-GST (Sigma) or anti-
MBP antibodies (NEB).
PI(3,5)P2 bead pull-down and competition assays
PTEN-GST, GST-PTENA or GST-PTEND (0.06 µM) was incubated with 25 µl of
PI(3,5)P2 coupled or control beads (Echelon Biosciences) in pull-down buffer (10 mM
Hepes-NaOH, pH 7.5, 1 mM DTT, 150 mM NaCl, and 0.1% Triton X-100) at room
temperature for 1 hour. Beads were spun down at 1000Xg for 30 seconds and washed 4
times with pull-down buffer. Protein was eluted by boiling the beads with SDS-PAGE sample
buffer. 1.25% of the input material and 48.8% of the elution was loaded and separated on a
10% SDS-PAGE gel. Immunoblotting was performed with an anti-GST antibody. For the
competition assays, incubation of the protein with PI(3,5)P2-coupled beads was performed
in the presence of 5 µM micelle dispersions of different phosphoinositides and analyzed
similarly.
Variable-angle epifluorescence microscopy (VAEM)
Moss protonemal tissue was grown in PpNH4 medium for 5-6 days. For imaging,
protonemal tissue was placed on a 1% agar pad in Hoagland's medium, covered with a glass
coverslip, sealed with VALAP (1:1:1 parts of vaseline, lanoline and paraffin) and
immediately observed at room temperature. The slide was mounted on a Nikon Ti-E
inverted microscope equipped with a mirror-based Nikon T-FL-TIRF illuminator and

121
imaged with a Nikon 1.49 NA 100x oil immersion TIRF objective. The 1.5x optivar was used
for all images to increase magnification. The laser illumination angle was adjusted
individually for each sample to achieve the maximum signal to noise ratio. GFP was excited
with a 488 argon ion laser and GFP emission from the specimen was captured with an
Andor iXON3 1024 × 1024 electron-multiplying CCD camera. Dual-view VAEM was acquired
on a similar system equipped with a Nikon 1.45 NA 60x oil immersion TIRF objective and
equipped with a dual-view (TuCAM, Andor technology) 512 × 512 EM CCD camera (Andor
Technology), and on a similar system using two Zyla sCMOS cameras (Andor technology).
GFP and mCherry were simultaneously excited with a 488 and a 561 argon ion laser,
respectively. The electronic gain was 300 and exposure time was at least 50 msec for both
imaging systems. Image acquisition process was controlled by NIS-Elements AR 3.2
software (Nikon) and images were further processed with ImageJ, including background
subtraction and enhanced contrast.
Tracking of cortical For2A-GFP dots for chapter 2 was performed with Metamorph
Offline 7.0. The original VAEM images were first processed with the software's "2D
deconvolution" function and then analyzed with the "track objects" application. The speed
of linear dots was measured manually using Image J. Quantification of the density of cortical
For2A-GFP was performed in ImageJ, using the “Analyze Particles” function. Images were
first corrected for uneven illumination using the background correction plug-in, filtered
with a FFT bandpass filter, and then binarized using maximum entropy thresholding. 50-60
slices from a time-lapse acquisition were binarized with this method and particles between
8-80 square pixels were counted. The automated counting method was validated by
manually counting the dots in at least five frames from a time-lapse acquisition. The average
number of dots was divided by the total area of the VAEM imaging field. Rate of actin
polymerization was measured manually using ImageJ. The length of a growing filament was

122
measured. The rate was calculated by dividing the total length the filament grew by the time
it took to grow.
For cortical dot density and trajectories presented in chapter 4 and for cortical dot
dynamics presented in chapters 3 and 4, samples were imaged using the Nikon Perfect
Focus system and with a constant TIRF angle. For density and trajectory measurements,
only apical cells were imaged. To qualify for imaging a region of interest (ROI) in the TIRF
imaging field must be located in an apical cell and the tip of the cell must be observable in
the same field. First, a full field brightfield image (not in TIRF) and fluorescence image (in
TIRF) were taken. These were merged to allow measurement of the distance of the
fluorescence area with respect to the cell tip, as well as the angle of the cell tip to the
horizontal. Then, the ROI was captured using a 256x256 pixel box, regardless of ROI size, to
allow a constant imaging time. Movies were taken for 30s or 60s, at no delay with 100ms
exposure time.
Dot identification and trajectory quantification was done in NIS elements (Nikon).
Movies were contrast enhanced by detecting regional maxima and autocontrasting
(count=10) and background subtracted with a 7 pixel rolling ball radius. Cortical dots were
identified using automated spot detection, identifying bright spots and a typical dot
diameter of 0.54μm of bright and clustered dots and an 82.9 contrast setting, giving an
average dot count per movie. ROI size of the movies was measured using ImageJ.
Linear trajectories were also automatically quantified using the track binaries
module in NIS elements. The minimum trajectory length was determined to be 0.75μm,
based on the automated trajectories measured in a 25μm Latrunculin B control sample
(immobile dots). Also, trajectories slower than 1μm/s were omitted. A gap maximum of 3
frames was allowed. For trajectory orientation, speed vectors of the trajectories were

123
plotted on a polar graph using NIS elements and binning of the vectors per quadrant
relative to the cell tip angle was quantified manually.

124
Table 6.1 Primers used in this study Primer Name Primer Sequence Use attB5BamHI-
mEGFP GGGGACAACTTTGTATACAAAAGTTGTGGGATC
CATGGTGAGCAAGGGCGAG, mCherry-L5L2
attB2mEGFPBglI GGGGACCACTTTGTACAAGAAAGCTGGGTAAGATCTTTACTTGTACAGCTCGTCCATGCC
mCherry-L5L2
GST-FOR-EcoRI TTA AGA ATT CAT GTC CCC TAT ACT AGG TTA TTG
pET21-GST
GST-REV-XhoI TTA ACT CGA GAT CCG ATT TTG GAG GAT GGT CG
pET21-GST
PTEN -For-NdeI GGA ATT CCA TAT GTC TCT GTT TCG CCG ATT C
PTEN-GST
PTEN -Rev-EcoRI
TTA AGA ATT CGC GAT CAC GAG ATG AAC TCA G
PTEN-GST
caccPpPTENA For
CACCATGGCAGACATAGCAGAAGCTG PTENA-pENT
PpPTENA Rev TCACTGTAGTTCCTCCTCACTGTC PTENA-pENT caccPpPTEND
For CACCATGGGTGTTGATTGCGACTC PTEND-pENT
PpPTEND Rev TTACATTTCGTCGCTTTCGTAATCC PTEND-pENT attB1 PTENA
For GGGGACAAGTTTGTACAAAAAAGCAGGCT
CTATGGCAGACATAGCAGAAGCTG PTENA-L1R5
attB5r PTENA Rev
GGGGACAACTTTTGTATACAAAGTTGTCTGTAGTTC CTCCTCACTGTC
PTENA-L1R5
attB1 PTEND For
GGGGACAAGTTTGTACAAAAAAGCAGGCT ctATGGGTGTTGATTGCGACTC
PTEND-L1R5
attB5r PTEND Rev
GGGGACAACTTTTGTATACAAAGTTGTCATTTCGTC GCTTTCGTAATCC
PTEND-L1R5
attB4 PTENA Rev
GGGGACAACTTTGTATAGAAAAGTTGGGTGCTGTAG TTCCTCCTCACTGTC
PTENA-L1L4
attB4 PTEND Rev
GGGGACAACTTTGTATAGAAAAGTTGGGTGCATTTC GTCGCTTTCGTAATCC
PTEND-L1L4
attB4For2APTEN
GGGGACAACTTTGTATAGAAAAGTTGGGTGGCGATCACGAGATGAACT
PTENA5-L1L4
attB1For2APTEN
GGGGACAAGTTTGTACAAAAAAGCAGGCTTAATGTCTCTGTTTCGCCGA
PTENA5-L1L4
attB1MTM1 For GGGGACAAGTTTGTACAAAAAAGCAGGCT CTATGGCTTCTGCATCAACTTCTA
MTM1-L1L4 MTM1*-L1L4 MTM1-L1R5 MTM1*-L1R5
attB4MTM1 Rev GGGGACAACTTTGTATAGAAAAGTTGGGTGGAA GTGAGTTTGCACATGGG
MTM1-L1L4 MTM1*-L1L4
attB5rMTM1 Rev
GGGGACAACTTTTGTATACAAAGTTGTGAAGTGAGT TTGCACATGGG
MTM1-L1R5 MTM1*-L1R5
attB1 ATG18 For GGGGACAAGTTTGTACAAAAAAGCAGGCTCTATGTCTGATTCATCACCTACTATCAAC
ATG18-L1L4, ATG18-L1R5
attB4 ATG18 Rev
GGGGACAACTTTGTATAGAAAAGTTGGGTGATCCAT CAAGATGGAATACTGTGAC
ATG18-L1L4

125
attB5r ATG18 Rev
GGGGACAACTTTTGTATACAAAGTTGTATCCATCAA GATGGAATACTGTGAC
ATG18-L1R5
attB1 HsPTEN For
GGGGACAAGTTTGTACAAAAAAGCAGGCTCT ATGACAGCCATCATCAAAGAGATC
HsPTEN-L1L4
attB4 HsPTEN Rev
GGGG ACAACTTTGTATAGAAAAGTTGGGTG GACTTTTGTAATTTGTGTATGCTGATC
HsPTEN-L1L4
attB1-2XFYVE-F3
GGGGACAAGTTTGTACAAAAAAGCAGGCTATGCGAGTGAATTTATCAATTGAATTCG
2xFYVE-L1L4
attb4-2XFYVE-R GGGGACAACTTTGTATAGAAAAGTTGGGTGCTGCAGGTCGACTTTTGC
2xFYVE-L1L4
attB1 TAPP1 For GGGGACAAGTTTGTACAAAAAAGCAGGCTCT ATGCCTTATGTGGATCGTCAG
TAPP1-L1L4
attB4 TAPP1 Rev
GGGGACAACTTTGTATAGAAAAGTTGGGTGCACGTC ACTGACCGGAA
TAPP1-L1L4
attB1 PHplds For
GGGGACAAGTTTGTACAAAAAAGCAGGCTCTATGCGAGGCCTACAGGATGATG
PH-L1L4
attB4 PHplds Rev
GGGGACAACTTTGTATAGAAAAGTTGGGTGGATGTT GAGCTCCTTCAGGAA
PH-L1L4
Mtm1*noBssSI TGAGATCCTTACGAGATACGC Remove BssSI site from MTM1*-L1R5
Mtm1*noBssSIcomp
GCGTATCTCGTAAGGATCTCA Remove BssSI site from MTM1*-L1R5
attB5rBssS1hMTM1R
GGGGACAACTTTTGTATACAAAGTTGTATCACGAGAGAAGTGAGTTTGCACATGGG
Incorporate new BssSI site into MTM1*-L1R5
FH2-EcoTEV3Xflag-F
CCATTGAGATCTAGGATTGGAGAATTCGAGAACCTGTACTTCCAG
2AFH2-3XFLAG-L3L2
L2Stop-3Xflag-R GTACAAGAAAGCTGGGTACTACTTGTCATCGTCATCCTTGTAGTC
2AFH2-3XFLAG-L3L2
FAB1A-FW CACCATGGAAGAAGCGGCTAATGC FAB1-AB-RNAi FAB1A-RV GACTGGAAGGAGAGTCCACAG FAB1-AB-RNAi FAB1C-FW CACCGGCAGATTCTGGAATTCTCGATG FAB1-C-RNAi FAB1c-RV GAAGTAATCTCTCCACAGCTAAGAG FAB1-C-RNAi attB1-SmaFH2-F GGGGACAAGTTTGTACAAAAAAGCAGGCTGCAG
AGGTCCGGGTGGTCC 2AFH2-L1R5
attB5r-SmaFH2-R
GGGGACAACTTTTGTATACAAAGTTGTTCCAATCCTAGATCTCAATGGAGAAAATCTTGCG
2AFH2-L1R5
Formin3-F GAAGGTGATGGATTAAGCATGGAT For1F RNAi Formin3-R CCGCCAGAAGCTTATTGAATGTC For1F RNAi For3RNAiF CACCCTCGAGGCATGCAAAGAGCTGAGA For1F RNAi For3RNAiR TACCGGATCCCAAAGTGCAACAAAGTGG For1F RNAi For1F-F1 GATCAGTGGATGGCTAGACAAGCC Find the 5' end of
For1F For1F-F2 ATGGTGGACATGGTGAAGTGTATCC Find the 5' end of
For1F For1F-F3 CCTTGGTGACAGAGTTGGATCGC Find the 5' end of
For1F For1F-R1 AGGAGCTGATCTTCCTGGTGG Find the 5' end of
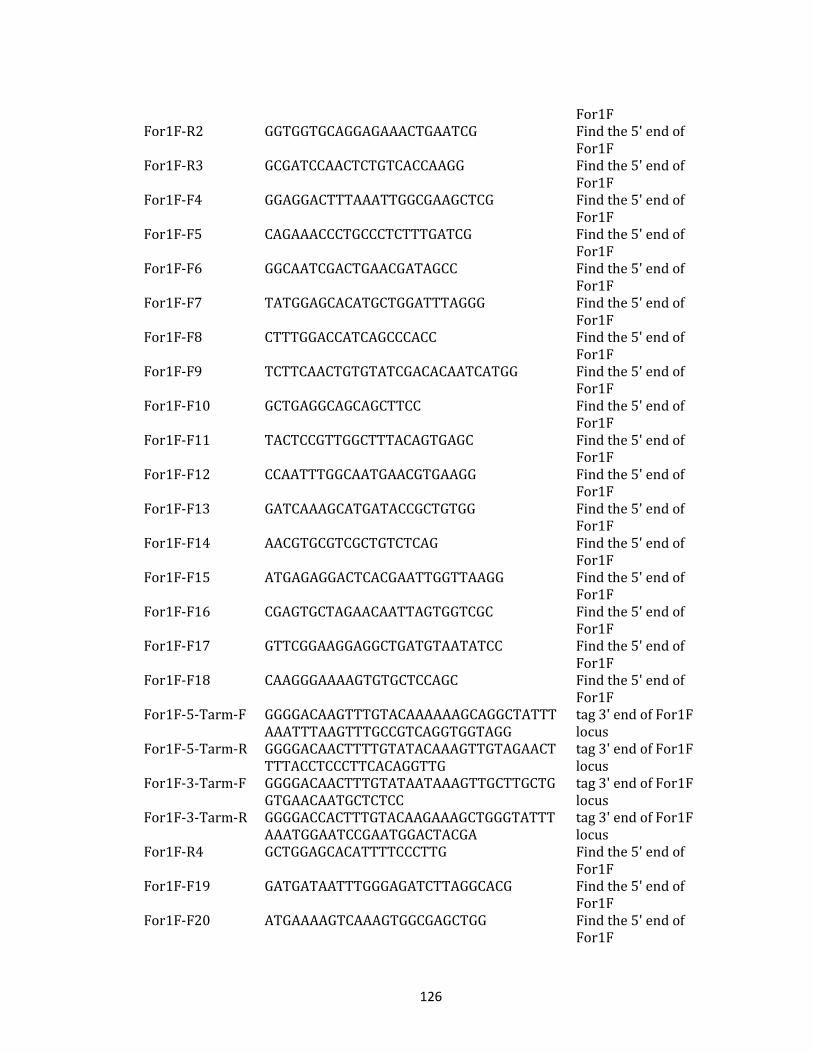
126
For1F For1F-R2 GGTGGTGCAGGAGAAACTGAATCG Find the 5' end of
For1F For1F-R3 GCGATCCAACTCTGTCACCAAGG Find the 5' end of
For1F For1F-F4 GGAGGACTTTAAATTGGCGAAGCTCG Find the 5' end of
For1F For1F-F5 CAGAAACCCTGCCCTCTTTGATCG Find the 5' end of
For1F For1F-F6 GGCAATCGACTGAACGATAGCC Find the 5' end of
For1F For1F-F7 TATGGAGCACATGCTGGATTTAGGG Find the 5' end of
For1F For1F-F8 CTTTGGACCATCAGCCCACC Find the 5' end of
For1F For1F-F9 TCTTCAACTGTGTATCGACACAATCATGG Find the 5' end of
For1F For1F-F10 GCTGAGGCAGCAGCTTCC Find the 5' end of
For1F For1F-F11 TACTCCGTTGGCTTTACAGTGAGC Find the 5' end of
For1F For1F-F12 CCAATTTGGCAATGAACGTGAAGG Find the 5' end of
For1F For1F-F13 GATCAAAGCATGATACCGCTGTGG Find the 5' end of
For1F For1F-F14 AACGTGCGTCGCTGTCTCAG Find the 5' end of
For1F For1F-F15 ATGAGAGGACTCACGAATTGGTTAAGG Find the 5' end of
For1F For1F-F16 CGAGTGCTAGAACAATTAGTGGTCGC Find the 5' end of
For1F For1F-F17 GTTCGGAAGGAGGCTGATGTAATATCC Find the 5' end of
For1F For1F-F18 CAAGGGAAAAGTGTGCTCCAGC Find the 5' end of
For1F For1F-5-Tarm-F GGGGACAAGTTTGTACAAAAAAGCAGGCTATTT
AAATTTAAGTTTGCCGTCAGGTGGTAGG tag 3' end of For1F locus
For1F-5-Tarm-R GGGGACAACTTTTGTATACAAAGTTGTAGAACTTTTACCTCCCTTCACAGGTTG
tag 3' end of For1F locus
For1F-3-Tarm-F GGGGACAACTTTGTATAATAAAGTTGCTTGCTGGTGAACAATGCTCTCC
tag 3' end of For1F locus
For1F-3-Tarm-R GGGGACCACTTTGTACAAGAAAGCTGGGTATTTAAATGGAATCCGAATGGACTACGA
tag 3' end of For1F locus
For1F-R4 GCTGGAGCACATTTTCCCTTG Find the 5' end of For1F
For1F-F19 GATGATAATTTGGGAGATCTTAGGCACG Find the 5' end of For1F
For1F-F20 ATGAAAAGTCAAAGTGGCGAGCTGG Find the 5' end of For1F

127
For1F-F21 TTTGGCTTTGCAGGCGTGC Find the 5' end of For1F
For1F-F22 ATAAAGGGAGTGGACCAATGACTTGG Find the 5' end of For1F
For1F-F23 GTTTTCGAGCATCTGGTGATAACGC Find the 5' end of For1F
For1F-3xGFP-gentyp-F
TAGGCTCTACCTGCTGGTCTTC Genotyping For1F GFP knock-in
For1F-3xGFP-gentyp-R
ATGCAGTGTTCACCACCCTCTT Genotyping For1F GFP knock-in
For1F-3xGFP-GT-F
AATTTTTCTATCCAGCTTCGGG Genotyping For1F GFP knock-in
For1F-3xGFP-GT-R
GCAATCATTTTGTACATTGTGACA Genotyping For1F GFP knock-in
For1F-GT-int-F GAAGGACGCTTCGCTGCATC Genotyping For1F GFP knock-in
For1F-GFP-internal-F
GCATTTGCAGCCGTGAAGAAGGTTAGTATT Genotyping For1F GFP knock-in
F1FFH1-FW CACCATGGTGGACATGGTGAAGTGTATCC Cloning FH1 part of For1F
F1FFH1-RV TCCATTGATTTATCCAGATTATCCCACACC Cloning FH1 part of For1F
SEC-F24 CACCATGCTGATAAAGGGAGTGGACC Cloning Sec10 part of For1F
SEC-RV ATAAAGGTTGACTTCAAAGGAGC Cloning Sec10 part of For1F
F1FFH2-FW CACCGGTAAAAAACCACCTCCGCCG Cloning FH2 part of For1F
F1FFH2-RV CTAAGAACTTTTACCTCCCTTCACAGG Cloning FH2 part of For1F
SEC 5UTR-1 FW CACCGTGGATCGCCGGTGGTGTTGACG Cloning the 5’ untranslated region of For1F
SEC 5UTR-2 FW CACCCGGCAATTGCTTGCGTTGCGTTGC Cloning the 5’ untranslated region of For1F
SECUTR-RV CTTCACTCGTTAATTCAAGAGCAG Cloning the 5’ untranslated region of For1F
S10F1F-out5arm-F
GGCACAAAAAGGAAGTTGAACC Genotyping For1F KO
S10F1F-out3arm-R
CGAAAATAAATACCATCTGTTTTAAGACAAC Genotyping For1F KO
SEC10F1F-3UTR-F
CACCGTATCGTATTGGGCATGTAAAC Cloning the 3’ untranslated region of For1F
SEC10F1f-3UTR-Not1-R
ATTGCGGCCGCCTCGCTCCTTTCGTGTCCTA Cloning the 3’ untranslated region of For1F

128
SEC10-attB1-F GGGGACAAGTTTGTACAAAAAAGCAGGCTTAATGCTGGATAAAGGGAGTGGACC
Cloning the Sec10 part of For1F
SEC10-attB5r-R2
GGGGACAACTTTTGTATACAAAGTTGTTGTATCCTTTACTACTGTATTTG
Cloning the Sec10 part of For1F
SEC10-1-F CACCGGTGGAAGGCATCTCACCACC RNAi fragment of Sec10a
SEC10-EcoR1-1-R
AGGAATTCCCATTTCCATTCAAAGCAGTG RNAi fragment of Sec10a
SEC10-2-EcoR1-F
CACCGAATTCCGGAAAGGGACGGTGGATAC RNAi fragment of Sec10b
SEC10-2-R CGGCTGAAGCTCTCAAACAGG RNAi fragment of Sec10b
SEC6 5UTR-F CACCCTGCTTCGTCATTTTCTCTCTC Cloning the 5’ untranslated region of Sec6
SEC6 5UTR-R GAATTCGATGCTCCGAACTGCTCACAC Cloning the 5’ untranslated region of Sec6
SEC6 3UTR-F CACCGAATTCCGAGAGAAGGAAATAGTGTTATG Cloning the 3’ untranslated region of Sec6
SEC6 3UTR-R CCTGAATATACTTACATCGAG Cloning the 3’ untranslated region of Sec6
SEC6-F CACCATGATGATGCATGATGCTGGC Cloning Sec6 SEC6-R TCACTTCCTTCCTGGCCTGTA Cloning Sec6 SEC10a-nRV GCTGGTACTCCATGTACACCAC Cloning Sec10a 5-arm SEC6-F GGGGACAAGTTTGTACAAAAAAGCAGGCTATTT
AAATCTATACAAACTT Sec6 5’ targeting arm
5-arm SEC6-R GGGGACAACTTTTGTATACAAAGTTGTCTTCCTTCCTGGCCTGTATTTTG
Sec6 5’ targeting arm
3-arm SEC6-F GGGGACAACTTTGTATAATAAAGTTGCTCGAGAGAAGGAAATAGTGTTATGA
Sec6 3’ targeting arm
3-arm SEC6-R GGGGACCACTTTGTACAAGAAAGCTGGGTAATTTGCATGTGTTTAGAAACT
Sec6 3’ targeting arm
3-arm SEC6-RSwaI
GGGGACCACTTTGTACAAGAAAGCTGGGTAATTTAAATGCATGTGTTTAGAAACTG
Sec6 3’ targeting arm
SEC6 CDS int seq-F1
GCAATACCCGAGCTAAGTTTG Sec6 genotyping primer
SEC6 CDS in seq-F2
GGATTGGCAGCTCAGTGTGCTG Sec6 genotyping primer
For1Fgeno-F CACTGTATTAACACTAGGAGAGTGG For1F genotyping primer
For1Fgeno-R GTTACGGTGGAATCCGAATGG For1F genotyping primer
for1Fgeno-R2 GAGTTTGAATGTGGCTTGTGC For1F genotyping primer
SEC6-geno-F GACTGGTACGAAGGTTTAGTG Sec6 genotyping primer

129
SEC6-geno-R TTTTTGAACAACTTGACATG Sec6 genotyping primer
PpSEC10-F CACCATGAGGGTTGCGGAAAGGGAC Sec10b sequencing primer
PpSEC10-R TCAGTGGACTAAAGCCGTAAGCC Sec10b sequencing primer
SEC10b-F2 GATCATCTTCAGAACGCAGATG Sec10b sequencing primer
SEC10b-F3 GTTCCTGGATGCAGAGATTATG Sec10b sequencing primer
SEC10b-F4 GTATCGGTCTTGATGCTGCC Sec10b sequencing primer
For1A-5-Tarm-F GGGGACAAGTTTGTACAAAAAAGCAGGCTATTTAAATTCAATGGGAAACTTTCAGATCTCGG
Tag 5' end of For1A locus
For1A-5-Tarm-R GGGGACAACTTTTGTATACAAAGTTGACGTTGTGGTGGTTGTCCTC
Tag 5' end of For1A locus
For1A3-Tarm-F GGGGACAACTTTGTATAATAAAGTTGCTGGGGCGATGTTTGAAAATTA
Tag 3' end of For1A locus
For1A-3-Tarm-R GGGGACCACTTTGTACAAGAAAGCTGGGTATTTAAATGAAAGCGAAGAGCAAGTGGT
Tag 3' end of For1A locus
For1A-3xGFP-gentyp-F
TTCGACTCTCAATAGCAAGCTG Genotyping For1A GFP knock-in
For1A-3xGFP-gentyp-R
CATCTGTTCAGTCTGTGAGTGA Genotyping For1A GFP knock-in
For1A-3xGFP-gt-f
GAAGTCTTGGAGACGCTGGTCA Genotyping For1A GFP knock-in
For1A-3xGFP-GT-R
TGCTCTCAGTCATTTCCCTTGC Genotyping For1A GFP knock-in
For1D-5-Tarm-R GGGGACAACTTTTGTATACAAAGTTGTATTCGTTTTATTCGGCAGGGAG
Tag 5' end of For1D locus
For1D-3-Tarm-F GGGGACAACTTTGTATAATAAAGTTGCTTGCAGCATGATTTTGAAAGG
Tag 3' end of For1D locus
For1D-3-Tarm-R GGGGACCACTTTGTACAAGAAAGCTGGGTATTTAAATAGAGCTCAAGGTTGCCAAAA
Tag 3' end of For1D locus
For1D-5Tarm-F-new
GGGGACAAGTTTGTACAAAAAAGCAGGCTATTTAAATGCGTTTGAGCGTCTTCAAGC
Tag 5' end of For1D locus
For1D-3xGFP-gentyp-F
TGGCCGGATCAGTATCTACTAA Genotyping For1D GFP knock-in
For1D-3xGFP-gentyp-R
TCCAACCAACCATAATCGATGT Genotyping For1D GFP knock-in
For1D-3xGFP-GT-F
CTCACAACATTGCCATCCAGCT Genotyping For1D GFP knock-in
For1D-3xGFP-GT-R
ATTCGGGGACGCAATCGAGATT Genotyping For1D GFP knock-in

130
BIBLIOGRAPHY
Augustine, R.C., K.A. Pattavina, E. Tüzel, L. Vidali, and M. Bezanilla. 2011. Actin Interacting
Protein1 and Actin Depolymerizing Factor Drive Rapid Actin Dynamics in Physcomitrella patens. The Plant Cell Online. 23:3696-3710.
Augustine, R.C., L. Vidali, K.P. Kleinman, and M. Bezanilla. 2008. Actin depolymerizing factor is essential for viability in plants, and its phosphoregulation is important for tip growth. The Plant Journal. 54:863-875.
Banno, H., and N. Chua. 2000. Characterization of the arabidopsis formin-like protein AFH1 and its interacting protein. Plant Cell Physiol. 41:617 - 626.
Barford, D., A. Flint, and N. Tonks. 1994. Crystal structure of human protein tyrosine phosphatase 1B. Science. 263:1397 - 1404.
Barik, S. 1997. Mutagenesis and gene fusion by megaprimer PCR. Methods Mol Biol. 67:173-182.
Bezanilla, M., A. Pan, and R.S. Quatrano. 2003. RNA Interference in the Moss Physcomitrella patens. Plant Physiol. 133:470-474.
Bezanilla, M., P.F. Perroud, A. Pan, P. Klueh, and R.S. Quatrano. 2005. An RNAi System in Physcomitrella patens with an Internal Marker for Silencing Allows for Rapid Identification of Loss of Function Phenotypes. Plant biol (Stuttg). 7:251-257.
Blanchoin, L., and C.J. Staiger. 2010. Plant formins: Diverse isoforms and unique molecular mechanism. Biochimica et Biophysica Acta (BBA) - Molecular Cell Research. 1803:201-206.
Chang, F., D. Drubin, and P. Nurse. 1997. cdc12p, a Protein Required for Cytokinesis in Fission Yeast, Is a Component of the Cell Division Ring and Interacts with Profilin. The Journal of Cell Biology. 137:169-182.

131
Chesarone, M.A., A.G. DuPage, and B.L. Goode. 2010. Unleashing formins to remodel the actin and microtubule cytoskeletons. Nat Rev Mol Cell Biol. 11:62-74.
Cheung, A.Y., S. Niroomand, Y. Zou, and H.-M. Wu. 2010. A transmembrane formin nucleates subapical actin assembly and controls tip-focused growth in pollen tubes. Proceedings of the National Academy of Sciences. 107:16390-16395.
Cheung, A.Y., and H.-m. Wu. 2004. Overexpression of an Arabidopsis Formin Stimulates Supernumerary Actin Cable Formation from Pollen Tube Cell Membrane. Plant Cell. 16:257-269.
Chong, Y.T., S.K. Gidda, C. Sanford, J. Parkinson, R.T. Mullen, and D.R. Goring. 2010. Characterization of the Arabidopsis thaliana exocyst complex gene families by phylogenetic, expression profiling, and subcellular localization studies. New Phytologist. 185:401-419.
Cole, R.A., L. Synek, V. Zarsky, and J.E. Fowler. 2005. SEC8, a subunit of the putative Arabidopsis exocyst complex, facilitates pollen germination and competitive pollen tube growth. Plant Physiol. 138:2005-2018.
Cooke, F.T., S.K. Dove, R.K. McEwen, G. Painter, A.B. Holmes, M.N. Hall, R.H. Michell, and P.J. Parker. 1998. The stress-activated phosphatidylinositol 3-phosphate 5-kinase Fab1p is essential for vacuole function in S. cerevisiae. Current Biology. 8:1219-S1212.
Croteau, N.J., M.L.M. Furgason, D. Devos, and M. Munson. 2009. Conservation of Helical Bundle Structure between the Exocyst Subunits. PLOS One. 4:e4443.
Cvrckova, F., B. Bavlnka, and F. Rivero. 2004. Evolutionarily conserved modules in actin nucleation: lessons from Dictyostelium discoideum and plants. Protoplasma. 224:15 - 31.
Cvrckova, F., M. Grunt, R. Bezvoda, M. Hala, I. Kulich, A. Rawat, and V. Zarsky. 2012. Evolution of the land plant Exocyst complexes. Frontiers in Plant Science. 3 159.
De Almeida Engler, J., K. Van Poucke, M. Karimi, R. De Groodt, G. Gheysen, G. Engler, and G. Gheysen. 2004. Dynamic cytoskeleton rearrangements in giant cells and syncytia of nematode-infected roots. The Plant Journal. 38:12-26.

132
Deeks, M., F. Cvrckova, L. Machesky, V. Mikitova, T. Ketelaar, V. Zarsky, B. Davies, and P. Hussey. 2005. Arabidopsis group Ie formins localize to specific cell membrane domains, interact with actin-binding proteins and cause defects in cell expansion upon aberrant expression. New Phytologist. 168:529 - 540.
Deeks, M.J., M. Fendrych, A. Smertenko, K.S. Bell, K. Oparka, F. Cvrčková, V. Žárský, and P.J. Hussey. 2010. The plant formin AtFH4 interacts with both actin and microtubules, and contains a newly identified microtubule-binding domain. Journal of Cell Science. 123:1209-1215.
Dove, S.K., R.C. Piper, R.K. McEwen, J.W. Yu, M.C. King, D.C. Hughes, J. Thuring, A.B. Holmes, F.T. Cooke, R.H. Michell, P.J. Parker, and M.A. Lemmon. 2004. Svp1p defines a family of phosphatidylinositol 3,5‐bisphosphate effectors. The EMBO Journal. 23:1922-1933.
Dowler, S., R.A. Currie, D.G. Campbell, M. Deak, G. Kular, C.P. Downes, and D.R. Alessi. 2000. Identification of pleckstrin-homology-domain-containing proteins with novel phosphoinositide-binding specificities. Biochemical Journal. 351:19-31.
Dowler, S., G. Kular, and D.R. Alessi. 2002. Protein Lipid Overlay Assay. Science Signaling. 2002:pl6-pl6.
Dudin, O., F.O. Bendezú, R. Groux, T. Laroche, A. Seitz, and S.G. Martin. 2015. A formin-nucleated actin aster concentrates cell wall hydrolases for cell fusion in fission yeast. The Journal of Cell Biology. 208:897-911.
Eugster, A., E.-I. Pécheur, F. Michel, B. Winsor, F. Letourneur, and S. Friant. 2004. Ent5p Is Required with Ent3p and Vps27p for Ubiquitin-dependent Protein Sorting into the Multivesicular Body. Molecular Biology of the Cell. 15:3031-3041.
Evangelista, M., K. Blundell, M.S. Longtine, C.J. Chow, N. Adames, J.R. Pringle, M. Peter, and C. Boone. 1997. Bni1p, a Yeast Formin Linking Cdc42p and the Actin Cytoskeleton During Polarized Morphogenesis. Science. 276:118-122.
Evangelista, M., D. Pruyne, D.C. Amberg, C. Boone, and A. Bretscher. 2002. Formins direct Arp2/3-independent actin filament assembly to polarize cell growth in yeast. Nat Cell Biol. 4:32-41.

133
Evangelista, M., S. Zigmond, and C. Boone. 2003. Formins: signaling effectors for assembly and polarization of actin filaments. Journal of Cell Science. 116:2603-2611.
Eves, P.T., Y. Jin, M. Brunner, and L.S. Weisman. 2012. Overlap of cargo binding sites on myosin V coordinates the inheritance of diverse cargoes. The Journal of Cell Biology. 198:69-85.
Favery, B., L. Chelysheva, M. Lebris, F. Jammes, A. Marmagne, J. De Almeida-Engler, P. Lecomte, C. Vaury, R. Arkowitz, and P. Abad. 2004. Arabidopsis formin AtFH6 is a plasma membrane-associated protein upregulated in giant cells induced by parasitic nematodes. Plant Cell. 16:2529 - 2540.
Feierbach, B., and F. Chang. 2001. Roles of the fission yeast formin for3p in cell polarity, actin cable formation and symmetric cell division. Current Biology. 11:1656-1665.
Fendrych, M., L. Synek, T. Pecenkova, H. Toupalova, R. Cole, E. Drdova, J. Nebesarova, M. Sedinova, M. Hala, J.E. Fowler, and V. Zarsky. 2010. The Arabidopsis exocyst complex is involved in cytokinesis and cell plate maturation. Plant Cell. 22:3053-3065.
Friant, S., E.-I. Pécheur, A. Eugster, F. Michel, Y. Lefkir, D. Nourrisson, and F. Letourneur. 2003. Ent3p Is a PtdIns(3,5)P2 Effector Required for Protein Sorting to the Multivesicular Body. Developmental Cell. 5:499-511.
Gao, L., and A. Bretscher. 2009. Polarized Growth in Budding Yeast in the Absence of a Localized Formin. Molecular Biology of the Cell. 20:2540-2548.
Gary, J.D., A.E. Wurmser, C.J. Bonangelino, L.S. Weisman, and S.D. Emr. 1998. Fab1p Is Essential for PtdIns(3)P 5-Kinase Activity and the Maintenance of Vacuolar Size and Membrane Homeostasis. The Journal of Cell Biology. 143:65-79.
Goode, B.L., and M.J. Eck. 2007. Mechanism and function of formins in the control of actin assembly. Annual Review of Biochemistry. 76:593-627.
Grunt, M., V. Zarsky, and F. Cvrckova. 2008. Roots of angiosperm formins: The evolutionary history of plant FH2 domain-containing proteins. BMC Evolutionary Biology. 8:115.
Guo, W., A. Grant, and P. Novick. 1999. Exo84p Is an Exocyst Protein Essential for Secretion. Journal of Biological Chemistry. 274:23558-23564.

134
Gupta, R., J. Ting, L. Sokolov, S. Johnson, and S. Luan. 2002. A tumor suppressor homolog, AtPTEN1, is essential for pollen development in Arabidopsis. Plant Cell. 14:2495 - 2507.
Hala, M., R. Cole, L. Synek, E. Drdova, T. Pecenkova, A. Nordheim, T. Lamkemeyer, J. Madlung, F. Hochholdinger, J.E. Fowler, and V. Zarsky. 2008. An exocyst complex functions in plant cell growth in Arabidopsis and tobacco. Plant Cell. 20:1330-1345.
Harries, P.A., A. Pan, and R.S. Quatrano. 2005. Actin-Related Protein2/3 Complex Component ARPC1 Is Required for Proper Cell Morphogenesis and Polarized Cell Growth in Physcomitrella patens. The Plant Cell. 17:2327-2339.
He, B., and W. Guo. 2009. The exocyst complex in polarized exocytosis. Current Opinion in Cell Biology. 21:537-542.
Heider, M.R., and M. Munson. 2012. Exorcising the Exocyst Complex. Traffic. 13:898-907.
Hepler, P.K., L. Vidali, and A.Y. Cheung. 2001. Polarized Cell Growth in Higher Plants. Annual Review of Cell and Developmental Biology. 17:159-187.
Hirano, T., T. Matsuzawa, K. Takegawa, and M.H. Sato. 2011. Loss-of-Function and Gain-of-Function Mutations in FAB1A/B Impair Endomembrane Homeostasis, Conferring Pleiotropic Developmental Abnormalities in Arabidopsis. Plant Physiology. 155:797-807.
Hiwatashi, Y., M. Obara, Y. Sato, T. Fujita, T. Murata, and M. Hasebe. 2008. Kinesins are indispensable for interdigitation of phragmoplast microtubules in the moss Physcomitrella patens. Plant Cell. 20:3094-3106.
Ingouff, M., J.N.F. Gerald, C. Guerin, H. Robert, M.B. Sorensen, D.V. Damme, D. Geelen, L. Blanchoin, and F. Berger. 2005. Plant formin AtFH5 is an evolutionarily conserved actin nucleator involved in cytokinesis. Nat Cell Biol. 7:374-380.
Jin, Y., A. Sultana, P. Gandhi, E. Franklin, S. Hamamoto, Amir R. Khan, M. Munson, R. Schekman, and Lois S. Weisman. 2011. Myosin V Transports Secretory Vesicles via a Rab GTPase Cascade and Interaction with the Exocyst Complex. Developmental Cell. 21:1156-1170.

135
Jourdain, I., H.C. Dooley, and T. Toda. 2012. Fission Yeast Sec3 Bridges the Exocyst Complex to the Actin Cytoskeleton. Traffic. 13:1481-1495.
Kaksonen, M., Y. Sun, and D.G. Drubin. 2003. A pathway for association of receptors, adaptors, and actin during endocytic internalization. Cell. 115:475-487.
Kleinebrecht, J., J. Selow, and W. Winkler. 1982. The mouse mutant limb-deformity (ld). Anatomischer Anzeiger. 152:313-324.
Konopka, C.A., and S.Y. Bednarek. 2008. Variable-angle epifluorescence microscopy: a new way to look at protein dynamics in the plant cell cortex. The Plant Journal. 53:186-196.
Kukulski, W., M. Schorb, M. Kaksonen, and John A.G. Briggs. 2012. Plasma Membrane Reshaping during Endocytosis Is Revealed by Time-Resolved Electron Tomography. Cell. 150:508-520.
Kulich, I., T. Pečenková, J. Sekereš, O. Smetana, M. Fendrych, I. Foissner, M. Höftberger, and V. Žárský. 2013. Arabidopsis Exocyst Subcomplex Containing Subunit EXO70B1 Is Involved in Autophagy-Related Transport to the Vacuole. Traffic. 14:1155-1165.
Lee, J.-O., H. Yang, M.-M. Georgescu, A. Di Cristofano, T. Maehama, Y. Shi, J.E. Dixon, P. Pandolfi, and N.P. Pavletich. 1999. Crystal Structure of the PTEN Tumor Suppressor: Implications for Its Phosphoinositide Phosphatase Activity and Membrane Association. Cell. 99:323-334.
Li, D., N. Ropert, A. Koulakoff, C. Giaume, and M. Oheim. 2008. Lysosomes Are the Major Vesicular Compartment Undergoing Ca2+-Regulated Exocytosis from Cortical Astrocytes. The Journal of Neuroscience. 28:7648-7658.
Li, J., C. Yen, D. Liaw, K. Podsypanina, S. Bose, S. Wang, J. Puc, C. Miliaresis, L. Rodgers, R. McCombie, S. Bigner, B. Giovanella, M. Ittmann, B. Tycko, H. Hibshoosh, M. Wigler, and R. Parsons. 1997. PTEN, a putative protein tyrosine phosphatase gene mutated in human brain, breast, and prostate cancer. Science. 275:1943 - 1946.
Li, Y., Y. Shen, C. Cai, C. Zhong, L. Zhu, M. Yuan, and H. Ren. 2010. The Type II Arabidopsis Formin14 Interacts with Microtubules and Microfilaments to Regulate Cell Division. Plant Cell. 22:2710-2726.

136
Liu, D., and P. Novick. 2014. Bem1p contributes to secretory pathway polarization through a direct interaction with Exo70p. The Journal of Cell Biology. 207:59-72.
Liu, J., and W. Guo. 2012. The exocyst complex in exocytosis and cell migration. Protoplasma. 249:587-597.
Maehama, T., and J.E. Dixon. 1998. The Tumor Suppressor, PTEN/MMAC1, Dephosphorylates the Lipid Second Messenger, Phosphatidylinositol 3,4,5-Trisphosphate. Journal of Biological Chemistry. 273:13375-13378.
Marshall, A.J., A.K. Krahn, K. Ma, V. Duronio, and S. Hou. 2002. TAPP1 and TAPP2 Are Targets of Phosphatidylinositol 3-Kinase Signaling in B Cells: Sustained Plasma Membrane Recruitment Triggered by the B-Cell Antigen Receptor. Molecular and Cellular Biology. 22:5479-5491.
Martinière, A., P. Gayral, C. Hawes, and J. Runions. 2011. Building bridges: FORMIN1 of Arabidopsis forms a connection between the cell wall and the actin cytoskeleton. The Plant Journal:354-365.
Menand, B., G. Calder, and L. Dolan. 2007. Both chloronemal and caulonemal cells expand by tip growth in the moss Physcomitrella patens. Journal of Experimental Botany. 58:1843-1849.
Michell, R.H., V.L. Heath, M.A. Lemmon, and S.K. Dove. 2006. Phosphatidylinositol 3,5-bisphosphate: metabolism and cellular functions. Trends in Biochemical Sciences. 31:52-63.
Michelot, A., C. Guerin, S. Huang, M. Ingouff, S. Richard, N. Rodiuc, C. Staiger, and L. Blanchoin. 2005. The Formin Homology 1 domain modulates the actin nucleation and bundling activity of Arabidopsis FORMIN1. Plant Cell. 17:2296 - 2313.
Müller, S., A.J. Wright, and L.G. Smith. 2009. Division plane control in plants: new players in the band. Trends in Cell Biology. 19:180-188.
Munnik, T., and J.E.M. Vermeer. 2010. Osmotic stress-induced phosphoinositide and inositol phosphate signalling in plants. Plant, Cell & Environment. 33:655-669.

137
Nakano, K., J. Imai, R. Arai, A. Toh-e, Y. Matsui, and I. Mabuchi. 2002. The small GTPase Rho3 and the diaphanous/formin For3 function in polarized cell growth in fission yeast. Journal of Cell Science. 115:4629-4639.
Ortiz-Ramírez, C., M. Hernandez-Coronado, A. Thamm, B. Catarino, M. Wang, L. Dolan, José A. Feijó, and Jörg D. Becker. 2016. A Transcriptome Atlas of Physcomitrella patens Provides Insights into the Evolution and Development of Land Plants. Molecular Plant. 9:205-220.
Otomo, T., D.R. Tomchick, C. Otomo, S.C. Panchal, M. Machius, and M.K. Rosen. 2005. Structural basis of actin filament nucleation and processive capping by a formin homology 2 domain. Nature. 433:488-494.
Perera, R.M., R. Zoncu, L. Lucast, P. De Camilli, and D. Toomre. 2006. Two synaptojanin 1 isoforms are recruited to clathrin-coated pits at different stages. Proceedings of the National Academy of Sciences. 103:19332-19337.
Prigent, M., T. Dubois, G. Raposo, V. Derrien, D. Tenza, C. Rosse, J. Camonis, and P. Chavrier. 2003. ARF6 controls post-endocytic recycling through its downstream exocyst complex effector. J Cell Biol. 163:1111-1121.
Pruyne, D., M. Evangelista, C. Yang, E. Bi, S. Zigmond, A. Bretscher, and C. Boone. 2002. Role of Formins in Actin Assembly: Nucleation and Barbed-End Association. Science. 297:612-615.
Pruyne, D., L. Gao, E. Bi, and A. Bretscher. 2004a. Stable and Dynamic Axes of Polarity Use Distinct Formin Isoforms in Budding Yeast. Molecular Biology of the Cell. 15:4971-4989.
Pruyne, D., A. Legesse-Miller, L. Gao, Y. Dong, and A. Bretscher. 2004b. Mechanisms of Polarized Growth and Organelle Segregation in Yeast. Annual Review of Cell and Developmental Biology. 20:559-591.
Redfern, R.E., D. Redfern, M.L.M. Furgason, M. Munson, A.H. Ross, and A. Gericke. 2008. PTEN Phosphatase Selectively Binds Phosphoinositides and Undergoes Structural Changes. Biochemistry. 47:2162-2171.
Rensing, S.A., D. Lang, A.D. Zimmer, A. Terry, A. Salamov, H. Shapiro, T. Nishiyama, P.-F. Perroud, E.A. Lindquist, Y. Kamisugi, T. Tanahashi, K. Sakakibara, T. Fujita, K. Oishi, T. Shin-I, Y. Kuroki, A. Toyoda, Y. Suzuki, S.-i. Hashimoto, K. Yamaguchi, S. Sugano, Y. Kohara, A.

138
Fujiyama, A. Anterola, S. Aoki, N. Ashton, W.B. Barbazuk, E. Barker, J.L. Bennetzen, R. Blankenship, S.H. Cho, S.K. Dutcher, M. Estelle, J.A. Fawcett, H. Gundlach, K. Hanada, A. Heyl, K.A. Hicks, J. Hughes, M. Lohr, K. Mayer, A. Melkozernov, T. Murata, D.R. Nelson, B. Pils, M. Prigge, B. Reiss, T. Renner, S. Rombauts, P.J. Rushton, A. Sanderfoot, G. Schween, S.-H. Shiu, K. Stueber, F.L. Theodoulou, H. Tu, Y. Van de Peer, P.J. Verrier, E. Waters, A. Wood, L. Yang, D. Cove, A.C. Cuming, M. Hasebe, S. Lucas, B.D. Mishler, R. Reski, I.V. Grigoriev, R.S. Quatrano, and J.L. Boore. 2008. The Physcomitrella Genome Reveals Evolutionary Insights into the Conquest of Land by Plants. Science. 319:64-69.
Riedl, J., A.H. Crevenna, K. Kessenbrock, J.H. Yu, D. Neukirchen, M. Bista, F. Bradke, D. Jenne, T.A. Holak, Z. Werb, M. Sixt, and R. Wedlich-Soldner. 2008. Lifeact: a versatile marker to visualize F-actin. Nat Meth. 5:605-607.
Robinson, F.L., and J.E. Dixon. 2006. Myotubularin phosphatases: policing 3-phosphoinositides. Trends in Cell Biology. 16:403-412.
Rounds, C.M., and M. Bezanilla. 2013. Growth Mechanisms in Tip-Growing Plant Cells. Annual Review of Plant Biology. 64:null.
Saarikangas, J., H. Zhao, and P. Lappalainen. 2010. Regulation of the Actin Cytoskeleton-Plasma Membrane Interplay by Phosphoinositides. Physiological Reviews. 90:259-289.
Saavedra, L., V. Balbi, J. Lerche, K. Mikami, I. Heilmann, and M. Sommarin. 2011. PIPKs are essential for rhizoid elongation and caulonemal cell development in the moss Physcomitrella patens. The Plant Journal. 67:635-647.
Sagot, I., A.A. Rodal, J. Moseley, B.L. Goode, and D. Pellman. 2002. An actin nucleation mechanism mediated by Bni1 and Profilin. Nat Cell Biol. 4:626-631.
Salmena, L., A. Carracedo, and P.P. Pandolfi. 2008. Tenets of PTEN Tumor Suppression. Cell. 133:403-414.
Sampathkumar, A., J.J. Lindeboom, S. Debolt, R. Gutierrez, D.W. Ehrhardt, T. Ketelaar, and S. Persson. 2011. Live Cell Imaging Reveals Structural Associations between the Actin and Microtubule Cytoskeleton in Arabidopsis. The Plant Cell Online. 23:2302-2313.
Schaefer, D.G., and J.-P. Zrÿd. 1997. Efficient gene targeting in the moss Physcomitrella patens. The Plant Journal. 11:1195-1206.

139
Schaletzky, J., S.K. Dove, B. Short, O. Lorenzo, M.J. Clague, and F.A. Barr. 2003. Phosphatidylinositol-5-Phosphate Activation and Conserved Substrate Specificity of the Myotubularin Phosphatidylinositol 3-Phosphatases. Current Biology. 13:504-509.
Schönichen, A., and M. Geyer. 2010. Fifteen formins for an actin filament: A molecular view on the regulation of human formins. Biochimica et Biophysica Acta (BBA) - Molecular Cell Research. 1803:152-163.
Sheahan, M.B., R.J. Rose, and D.W. McCurdy. 2007. Actin-filament-dependent remodeling of the vacuole in cultured mesophyll protoplasts. Protoplasma. 230:141-152.
Shewan, A., D.J. Eastburn, and K. Mostov. 2011. Phosphoinositides in Cell Architecture. Cold Spring Harbor Perspectives in Biology. 3.
Smertenko, A.P., M.J. Deeks, and P.J. Hussey. 2010. Strategies of actin reorganisation in plant cells. Journal of Cell Science. 123:3019-3028.
Staiger, C.J., M.B. Sheahan, P. Khurana, X. Wang, D.W. McCurdy, and L. Blanchoin. 2009. Actin filament dynamics are dominated by rapid growth and severing activity in the Arabidopsis cortical array. The Journal of Cell Biology. 184:269-280.
Steck, P.A., M.A. Pershouse, S.A. Jasser, W.K.A. Yung, H. Lin, A.H. Ligon, L.A. Langford, M.L. Baumgard, T. Hattier, T. Davis, C. Frye, R. Hu, B. Swedlund, D.H.R. Teng, and S.V. Tavtigian. 1997. Identification of a candidate tumour suppressor gene, MMAC1, at chromosome 10q23.3 that is mutated in multiple advanced cancers. Nat Genet. 15:356-362.
Stegmann, M., R.G. Anderson, L. Westphal, S. Rosahl, J.M. McDowell, and M. Trujillo. 2013. The exocyst subunit Exo70B1 is involved in the immune response of Arabidopsis thaliana to different pathogens and cell death. Plant Signaling & Behavior. 8:e27421.
Sun, Y., S. Carroll, M. Kaksonen, J.Y. Toshima, and D.G. Drubin. 2007. PtdIns(4,5)P2 turnover is required for multiple stages during clathrin- and actin-dependent endocytic internalization. The Journal of Cell Biology. 177:355-367.

140
Synek, L., N. Schlager, M. Elias, M. Quentin, M.T. Hauser, and V. Zarsky. 2006. AtEXO70A1, a member of a family of putative exocyst subunits specifically expanded in land plants, is important for polar growth and plant development. Plant J. 48:54-72.
Taylor, G.S., T. Maehama, and J.E. Dixon. 2000. Myotubularin, a protein tyrosine phosphatase mutated in myotubular myopathy, dephosphorylates the lipid second messenger, phosphatidylinositol 3-phosphate. Proceedings of the National Academy of Sciences. 97:8910-8915.
TerBush, D.R., T. Maurice, D. Roth, and P. Novick. 1996. The Exocyst is a multiprotein complex required for exocytosis in Saccharomyces cerevisiae. The EMBO Journal. 15:6483-6494.
Thomas, C.C., S. Dowler, M. Deak, D.R. Alessi, and D.M.F. van Aalten. 2001. Crystal structure of the phosphatidylinositol 3,4-bisphosphate-binding pleckstrin homology (PH) domain of tandem PH-domain-containing protein 1 (TAPP1): molecular basis of lipid specificity. Biochemical Journal. 358:287-294.
van Gisbergen, P.A., M. Li, S.Z. Wu, and M. Bezanilla. 2012. Class II formin targeting to the cell cortex by binding PI(3,5)P(2) is essential for polarized growth. J Cell Biol. 198:235-250.
van Gisbergen, P.A.C., and M. Bezanilla. 2013. Plant formins: membrane anchors for actin polymerization. Trends in Cell Biology. 23:227-233.
Van Gisbergen, P.A.C., A. Esseling-Ozdoba, and J.W. Vos. 2008. Microinjecting FM4–64 validates it as a marker of the endocytic pathway in plants. Journal of Microscopy. 231:284-290.
Van Leeuwen, W., J.E.M. Vermeer, T.W.J. Gadella, and T. Munnik. 2007. Visualization of phosphatidylinositol 4,5-bisphosphate in the plasma membrane of suspension-cultured tobacco BY-2 cells and whole Arabidopsis seedlings. The Plant Journal. 52:1014-1026.
Vermeer, J.E.M., W. van Leeuwen, R. Tobeña-Santamaria, A.M. Laxalt, D.R. Jones, N. Divecha, T.W.J. Gadella, and T. Munnik. 2006. Visualization of PtdIns3P dynamics in living plant cells. The Plant Journal. 47:687-700.
Vidali, L., R.C. Augustine, K.P. Kleinman, and M. Bezanilla. 2007. Profilin Is Essential for Tip Growth in the Moss Physcomitrella patens. Plant Cell. 19:3705-3722.

141
Vidali, L., and M. Bezanilla. 2012. Physcomitrella patens: a model for tip cell growth and differentiation. Current Opinion in Plant Biology. 15:625-631.
Vidali, L., G.M. Burkart, R.C. Augustine, E. Kerdavid, E. Tuzel, and M. Bezanilla. 2010. Myosin XI Is Essential for Tip Growth in Physcomitrella patens. Plant Cell. 22:1868-1882.
Vidali, L., S.T. McKenna, and P.K. Hepler. 2001. Actin Polymerization Is Essential for Pollen Tube Growth. Mol. Biol. Cell. 12:2534-2545.
Vidali, L., C.M. Rounds, P.K. Hepler, and M. Bezanilla. 2009a. Lifeact-mEGFP Reveals a Dynamic Apical F-Actin Network in Tip Growing Plant Cells. PLOS One. 4:e5744.
Vidali, L., P.A.C. van Gisbergen, C. Guérin, P. Franco, M. Li, G.M. Burkart, R.C. Augustine, L. Blanchoin, and M. Bezanilla. 2009b. Rapid formin-mediated actin-filament elongation is essential for polarized plant cell growth. Proceedings of the National Academy of Sciences. 106:13341-13346.
Wang, J., X. Xue, and H. Ren. 2012. New insights into the role of plant formins: regulating the organization of the actin and microtubule cytoskeleton. Protoplasma. 249:101-107.
Wen, T.J., F. Hochholdinger, M. Sauer, W. Bruce, and P.S. Schnable. 2005. The roothairless1 gene of maize encodes a homolog of sec3, which is involved in polar exocytosis. Plant Physiol. 138:1637-1643.
Whitley, P., S. Hinz, and J. Doughty. 2009. Arabidopsis FAB1/PIKfyve Proteins Are Essential for Development of Viable Pollen. Plant Physiology. 151:1812-1822.
Winter, D., B. Vinegar, H. Nahal, R. Ammar, G.V. Wilson, and N.J. Provart. 2007. An Electronic Fluorescent Pictograph Browser for Exploring and Analyzing Large-Scale Biological Data Sets. PLoS ONE. 2:e718.
Wu, J., X. Tan, C. Wu, K. Cao, Y. Li, and Y. Bao. 2013. Regulation of Cytokinesis by Exocyst Subunit SEC6 and KEULE in Arabidopsis thaliana. Molecular Plant. 6:1863-1876.
Xiong, G., R. Li, Q. Qian, X. Song, X. Liu, Y. Yu, D. Zeng, J. Wan, J. Li, and Y. Zhou. 2010. The rice dynamin-related protein DRP2B mediates membrane trafficking, and thereby plays a critical role in secondary cell wall cellulose biosynthesis. The Plant Journal. 64:56-70.

142
Xu, Y., J.B. Moseley, I. Sagot, F. Poy, D. Pellman, B.L. Goode, and M.J. Eck. 2004. Crystal Structures of a Formin Homology-2 Domain Reveal a Tethered Dimer Architecture. Cell. 116:711-723.
Xue, X.-H., C.-Q. Guo, F. Du, Q.-L. Lu, C.-M. Zhang, and H.-Y. Ren. 2011. AtFH8 Is Involved in Root Development under Effect of Low-Dose Latrunculin B in Dividing Cells. Molecular Plant. 4:264-278.
Yang, W., S. Ren, X. Zhang, M. Gao, S. Ye, Y. Qi, Y. Zheng, J. Wang, L. Zeng, Q. Li, S. Huang, and Z. He. 2011. BENT UPPERMOST INTERNODE1 encodes the class II formin FH5 crucial for actin organization and rice development. Plant Cell. 23:661-680.
Ye, J., Y. Zheng, A. Yan, N. Chen, Z. Wang, S. Huang, and Z. Yang. 2009. Arabidopsis Formin3 Directs the Formation of Actin Cables and Polarized Growth in Pollen Tubes. Plant Cell. 21:3868-3884.
Yi, K., C. Guo, D. Chen, B. Zhao, B. Yang, and H. Ren. 2005. Cloning and functional characterization of a formin-like protein (AtFH8) from Arabidopsis. Plant Physiol. 138:1071 - 1082.
Yin, H., D. Pruyne, T.C. Huffaker, and A. Bretscher. 2000. Myosin V orientates the mitotic spindle in yeast. Nature. 406:1013-1015.
Yin, H.L., and P.A. Janmey. 2003. Phosphoinositide Regulation of the Actin Cytoskeleton. Annual Review of Physiology. 65:761-789.
Zeller, R., A.G. Haramis, A. Zuniga, C. McGuigan, R. Dono, G. Davidson, S. Chabanis, and T. Gibson. 1999. Formin defines a large family of morphoregulatory genes and functions in establishment of the polarising region. Cell and Tissue Research. 296:85-93.
Zhang, Z., Y. Zhang, H. Tan, Y. Wang, G. Li, W. Liang, Z. Yuan, J. Hu, H. Ren, and D. Zhang. 2011. RICE MORPHOLOGY DETERMINANT encodes the type II formin FH5 and regulates rice morphogenesis. Plant Cell. 23:681-700.

143
Zheng, Y., H. Xin, J. Lin, C.-M. Liu, and S. Huang. 2012. An Arabidopsis Class II Formin, AtFH19, Nucleates Actin Assembly, Binds to the Barbed End of Actin Filaments, and Antagonizes the Effect of AtFH1 on Actin DynamicsF. Journal of Integrative Plant Biology. 54:800-813.
Zimmer, A., D. Lang, K. Buchta, S. Rombauts, T. Nishiyama, M. Hasebe, Y. Van de Peer, S. Rensing, and R. Reski. 2013. Reannotation and extended community resources for the genome of the non-seed plant Physcomitrella patens provide insights into the evolution of plant gene structures and functions. BMC Genomics. 14:498.
Copyright © 2022 FDOKUMEN