Electromagnetic crack detection inverse problems using terahertz interrogating signals
The role of nonlinear optical absorption in narrow-band
difference-frequency terahertz-wave generation
Matteo Cherchi,1,2,a) Saverio Bivona,1,2 Alfonso C. Cino,3 Alessandro C. Busacca,1,3 and
Roberto L. Oliveri1,2
1CNISM – Consorzio Nazionale Interuniversitario per le Scienze Fisiche della Materia, Unità di ricerca di
Palermo, Università di Palermo, Piazza Marina 57, I-90133 Palermo
2DIFTER – Dipartimento di Fisica e Tecnologie Relative, Università di Palermo, viale delle Scienze edificio 18,
I-90128 Palermo, Italy
3DIEET- Dipartimento di Ingegneria Elettrica, Elettronica e delle Telecomunicazioni, Università di Palermo,
viale delle Scienze edificio 9, I-90128 Palermo, Italy
We present a general analysis of the influence of nonlinear optical absorption on terahertz generation
via optical difference frequency generation, when reaching for the quantum conversion efficiency
limit. By casting the equations governing the process in a suitably normalized form, including either
two-photon- or three-photon-absorption terms, we have been able to plot universal charts for phase
matched optical-to-terahertz conversion for different values of the nonlinear absorption coefficients.
We apply our analysis to some experiments reported to date, in order to understand to what extent
multiphoton absorption could have played a role and also to predict the maximum achievable
conversion efficiency at higher peak pump intensities.
Introduction
Off-laboratory applications of terahertz radiation demand efficient table-top sources, which can
rely either on ultra high frequency microwave circuits or optical-to-terahertz converters [1]. In
particular Difference Frequency Generation (DFG) is one of the most promising physical
mechanism to generate terahertz radiation from optical sources [2]. It exploits the quadratic
nonlinear susceptibility of quadratic nonlinear materials [3] to convert optical pump photons with
frequency u into optical signal photons with frequency v < u and terahertz photons of frequency
w u - v. High conversion efficiencies typically require optical intensities at least of the order
of tens of GW/m2. This implies that, in general, also other nonlinear effects can be involved in these
experiments. In particular in this work we propose a universal approach to analyze the detrimental
effects of two- and three-photon absorption on terahertz photon conversion efficiency, in order to
provide a reference for past and future experiments with high intensity peak lasers.
Among the different optical-to-terahertz conversion mechanisms [4] (including optical
rectification, photoconduction, Cherenkov radiation), the only one that is scalable both with pump
power and sample length, is phase matched DFG based on narrow band optical pulses and pump
photon energies below the bandgap of the chosen nonlinear material. This means that DFG is
probably the only method available to approach the quantum efficiency limit. As a matter of fact,
the only experimental results approaching the quantum limit reported to date [5] are based on this
approach.
Previous analyses and experiments highlighting the nonlinear absorption (NLA) effects in
optical-to-terahertz generation [6-8] have been focused on optical rectification of ultrafast laser
pulses converted into broadband terahertz pulses, that is DFG within each pulse. In this kind of non-
scalable experiments, the pulse length limits the sample length. This is why, even using very high
pump intensities, the quantum limit has never been approached, also because of the detrimental
effects of NLA on very high peak intensity broadband optical pulses. Instead, we present, for the
first time in the literature, a detailed analysis of the role of NLA on DFG, in the standard narrow
band pump-signal configuration. In particular we aim to estimate its detrimental effects when very
high peak optical intensities are launched in the attempt to attain the quantum conversion limit.
Physical model
In two recent papers [9], [10] we have addressed the problem of the analysis of the quantum
efficiency limit, a regime that requires the exact numerical solution of the coupled equations [11]
governing the conversion process in the frame of couple mode theory. In particular in Ref. [10] we
proposed the use of the universal charts defined as follows. All DFG experiments can be effectively
described by a scalar model, by defining a suitable effective nonlinear coefficient deff [3] and an
effective area 2
DFG≡ uvwuuvvww eeeeeeeeeA , that is the inverse of the overlap integral of
the spatial distributions eq(x,y) of the three waves [12], which are assumed to not vary along
propagation. In this way it is possible to define a Figure of Merit [9] (FOM) ℱ 2/
(having the
dimensions of the inverse of a photon flux) featuring the terahertz absorption coefficient and the
coupling coefficient 2 1/2
0 DFG[2 / ( )]eff w u v w u vd Z c n n n A , where c is the vacuum speed of light,
ħ is the Planck constant, Z0 is the vacuum impedance, nq (q = u, v, w) are the refractive indexes for
the three waves This enables to write the coupled equations in terms of the normalized distance
z, of the normalized momentum mismatch 2k/ and of the normalized photon fluxes
amplitudes ˆ( ; ) ( ; )q z t q z t , as follows
*
*
ˆ 1-iˆ ˆ ˆ- -
2
ˆˆ ˆ-
ˆˆ ˆ-
dwiuv w
d
dviuw
d
duivw
d
(1)
Here we are assuming terahertz absorption lengths much longer than terahertz wavelengths [13],
negligible optical losses, and pulse durations not too smaller than the time of flight in the system, in
order to avoid the effects of group velocity dispersion. The space-time dependent q(z;t) functions
are assumed to be slowly varying functions of z and are normalized such that their square moduli
are the photon fluxes Nq (number of photons per unit time) of each wave. In the case of free space
experiments, equations (1) can reliably model nonlinear conversion only if the terahertz beam
profile can be assumed to be almost constant along the whole crystal length L, that is if the waists of
the optical beams are not too much smaller than R / ( )w wr cL n . Otherwise, these equations
overestimate terahertz conversion, so that their predictions can provide just an upper limit to
maximum conversion efficiency [14,15]. Even though this could seem a strong limitation of our
formalism, we notice that tight focusing can be a convenient way only to slightly improve very
small conversion efficiencies, but cannot be an effective way to approach the quantum conversion
limit. This is because terahertz beam diffraction would strongly affect the typical L2 scaling up of
photon conversion. A terahertz Rayleygh length lR << L would act as a cut-off length leading to the
scaling law L×lR [15], and the quantum limit could be hardly approached. As a matter of fact, the
only experimental results approaching the quantum limit reported to date [5] has been obtained with
loosely focused optical beams.
We point out that all assumptions leading to equations (1) are meaningful, since they all
correspond to the optimal conditions for narrow-band DFG, and their fulfilment is mandatory when
reaching for the quantum efficiency limit. As a validation of the proposed model, we also point out
that, based on equations (1), we have been able to provide a physically reliable interpretation [10] of
the high conversion efficiency results of Ref. [5], which were obtained close to complete pump
depletion. This led us also to a reliable estimation of the nonlinear coefficient of high quality GaSe
crystals.
Thanks to the dimensionless form of equations (1), the number of independent variables for
terahertz generation (i.e. with initial terahertz photon flux Nw0 = 0) is reduced to four. They are: the
initial normalized pump photon flux =2
00 ≡ˆ uNu ℱNu0, the ratio R Nv0/Nu0 between the initial
signal and pump photon fluxes, the normalized phase mismatch , and the normalized propagation
distance . By fixing a constraint to any two of these variables, it is possible to plot universal charts
for the terahertz photon conversion efficiency Nu0,R,, Nw/Nu0 as a family of curves that are
all functions of one of the two unconstrained variable, each curve corresponding to a different value
of the other unconstrained variable, acting as a free parameter. For the sake of practice, it is also
convenient to introduce the reference powers /q qP ℱ, and the reference intensities
DFG/q qI P A in order to define the normalized powers and intensities
0 0 0 0 0ˆ ˆ ˆ/ /q q q q q q qP P P I I I N (notice that, by definition, qP are proportional to DFGA , whereas
qI are independent of DFGA ). Physically, qP and qI estimate the optical fluence regime needed to
approach the quantum conversion limit.
Multiphoton absorption terms
The universal charts presented in our previous work [10] showed how the proposed normalization
allows to keep the number of degrees of freedom to a minimum and to analyze the contributions of
every meaningful physical parameter in a very general way. In this paper we will show how these
charts can be extended to include other nonlinear effects that can compete with DFG, especially
when launching high optical intensities. In particular we will analyze the detrimental effects of two-
photon absorption (2PA) and three-photon absorption (3PA) [16], that are due to the imaginary
parts of the third- and fifth-order susceptibility respectively. In fact, even though optical linear
absorption can be avoided working in the near-infrared transparency region of most common
nonlinear materials, in general 2PA and 3PA can be avoided only working with optical pump and
signal in the low energy tail of the mid-infrared region, which is not covered by the most common
laser sources. Since 2PA scales linearly with the light intensity and 3PA scales with the square of
the light intensity, in general, they cannot be neglected when using high peak optical intensities.
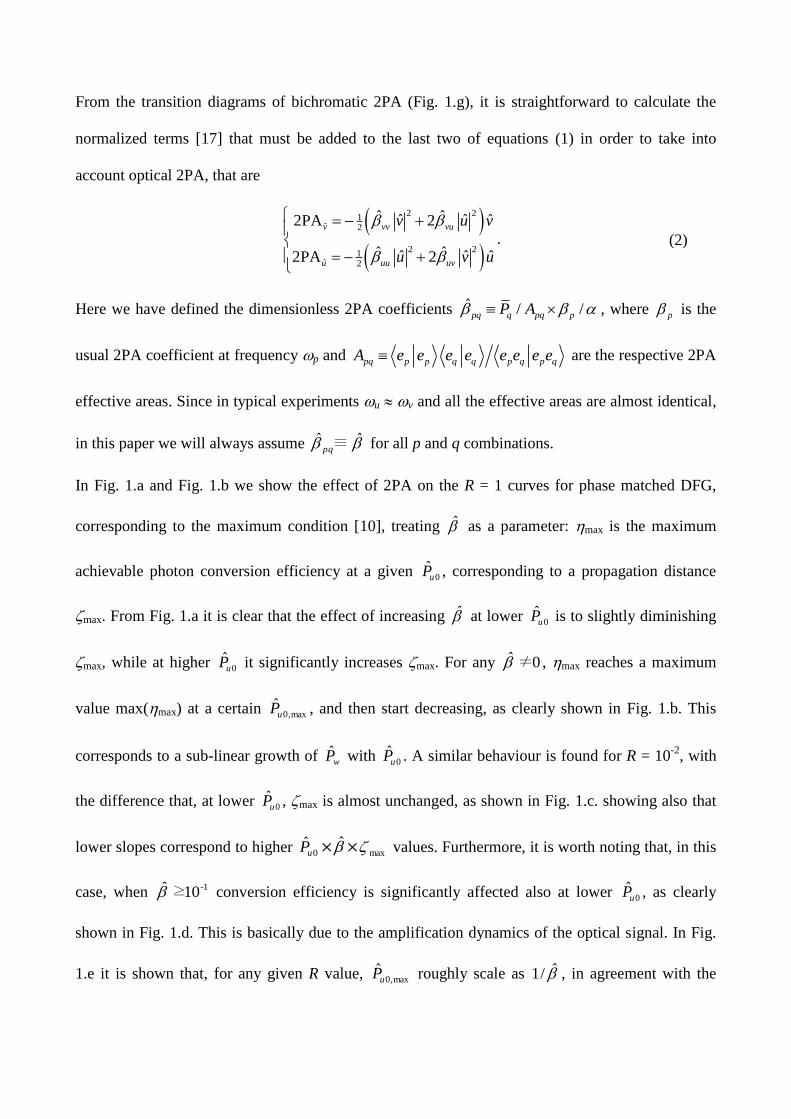
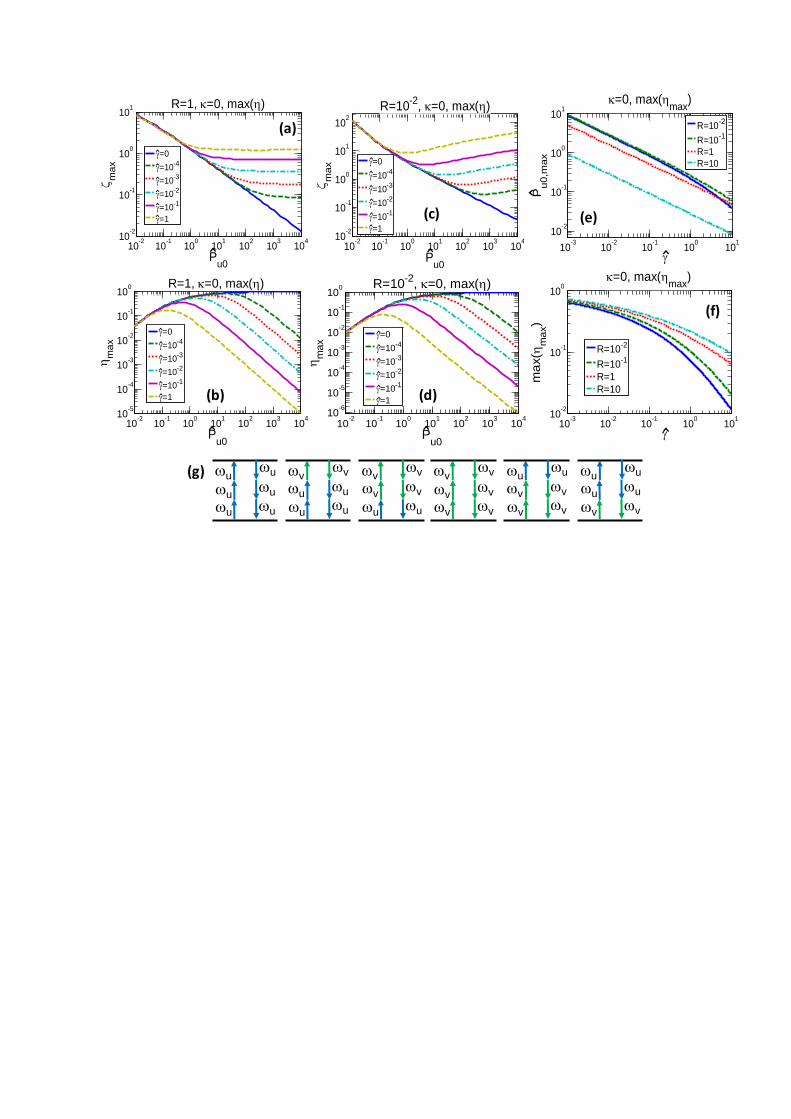
From the transition diagrams of bichromatic 2PA (Fig. 1.g), it is straightforward to calculate the
normalized terms [17] that must be added to the last two of equations (1) in order to take into
account optical 2PA, that are
2 21ˆ 2
2 21ˆ 2
ˆ ˆˆ ˆ ˆ2PA 2
ˆ ˆˆ ˆ ˆ2PA 2
v vv vu
u uu uv
v u v
u v u
. (2)
Here we have defined the dimensionless 2PA coefficients ˆ / /pq q pq pP A , where p is the
usual 2PA coefficient at frequency p and pq p p q q p q p qA e e e e e e e e are the respective 2PA
effective areas. Since in typical experiments u v and all the effective areas are almost identical,
in this paper we will always assume ˆˆ ≡pq for all p and q combinations.
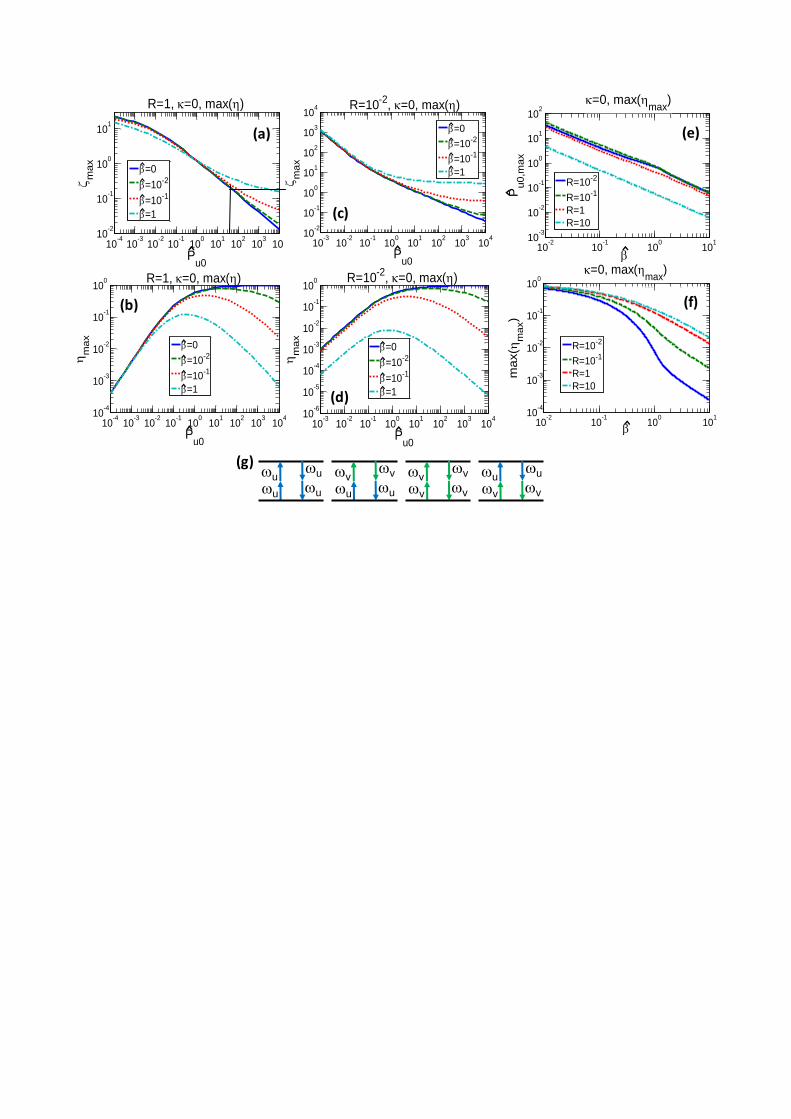
In Fig. 1.a and Fig. 1.b we show the effect of 2PA on the R = 1 curves for phase matched DFG,
corresponding to the maximum condition [10], treating as a parameter: max is the maximum
achievable photon conversion efficiency at a given 0ˆuP , corresponding to a propagation distance
max. From Fig. 1.a it is clear that the effect of increasing at lower 0ˆuP is to slightly diminishing
max, while at higher 0ˆuP it significantly increases max. For any 0ˆ ≠ , max reaches a maximum
value max(max) at a certain max,0ˆuP , and then start decreasing, as clearly shown in Fig. 1.b. This
corresponds to a sub-linear growth of wP with 0ˆuP . A similar behaviour is found for R = 10
-2, with
the difference that, at lower 0ˆuP , max is almost unchanged, as shown in Fig. 1.c. showing also that
lower slopes correspond to higher max0ˆˆ ××uP values. Furthermore, it is worth noting that, in this
case, when 1-10≥ conversion efficiency is significantly affected also at lower 0ˆuP , as clearly
shown in Fig. 1.d. This is basically due to the amplification dynamics of the optical signal. In Fig.
1.e it is shown that, for any given R value, max,0ˆuP roughly scale as /1 , in agreement with the
linear dependence on uP and vP of the 2PA terms (2). From Fig. 1.f it is clear that the
corresponding max(max) is significantly affected only when 2-10≥ .
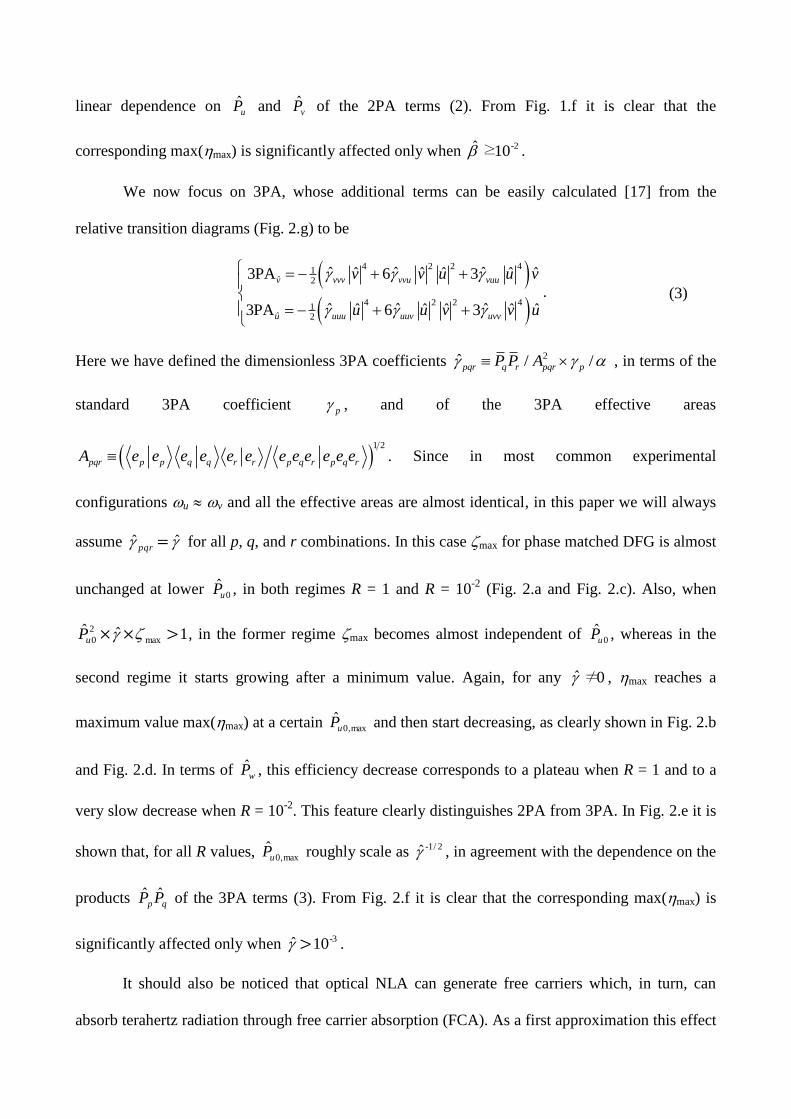
We now focus on 3PA, whose additional terms can be easily calculated [17] from the
relative transition diagrams (Fig. 2.g) to be
4 2 2 41ˆ 2
4 2 2 41ˆ 2
ˆ ˆ ˆˆ ˆ ˆ ˆ ˆ3PA 6 3
ˆ ˆ ˆˆ ˆ ˆ ˆ ˆ3PA 6 3
v vvv vvu vuu
u uuu uuv uvv
v v u u v
u u v v u
. (3)
Here we have defined the dimensionless 3PA coefficients 2ˆ / /pqr q r pqr pP P A , in terms of the
standard 3PA coefficient p , and of the 3PA effective areas
1 2
pqr p p q q r r p q r p q rA e e e e e e e e e e e e . Since in most common experimental
configurations u v and all the effective areas are almost identical, in this paper we will always
assume ˆˆ =pqr for all p, q, and r combinations. In this case max for phase matched DFG is almost
unchanged at lower 0ˆuP , in both regimes R = 1 and R = 10
-2 (Fig. 2.a and Fig. 2.c). Also, when
1ˆˆmax
2
0 >×× uP , in the former regime max becomes almost independent of 0ˆuP , whereas in the
second regime it starts growing after a minimum value. Again, for any 0≠ , max reaches a
maximum value max(max) at a certain max,0ˆuP and then start decreasing, as clearly shown in Fig. 2.b
and Fig. 2.d. In terms of wP , this efficiency decrease corresponds to a plateau when R = 1 and to a
very slow decrease when R = 10-2
. This feature clearly distinguishes 2PA from 3PA. In Fig. 2.e it is
shown that, for all R values, max,0ˆuP roughly scale as 2/1- , in agreement with the dependence on the
products qp PP ˆˆ of the 3PA terms (3). From Fig. 2.f it is clear that the corresponding max(max) is
significantly affected only when -310ˆ > .
It should also be noticed that optical NLA can generate free carriers which, in turn, can
absorb terahertz radiation through free carrier absorption (FCA). As a first approximation this effect
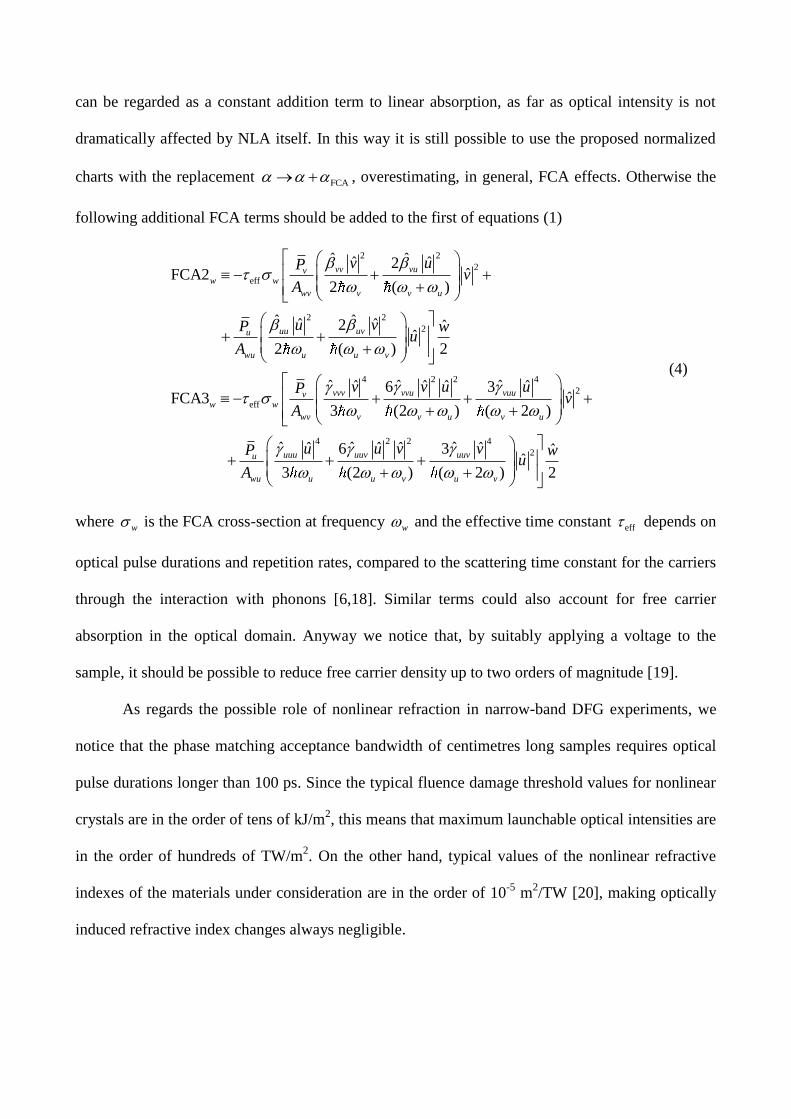
can be regarded as a constant addition term to linear absorption, as far as optical intensity is not
dramatically affected by NLA itself. In this way it is still possible to use the proposed normalized
charts with the replacement FCA , overestimating, in general, FCA effects. Otherwise the
following additional FCA terms should be added to the first of equations (1)
2 2
2
eff
2 2
2
4 2 2 4
2
eff
ˆ ˆˆ ˆ2ˆFCA2
2 ( )
ˆ ˆˆ ˆ2 ˆˆ
2 ( ) 2
ˆ ˆ ˆˆ ˆ ˆ ˆ6 3ˆFCA3
3 (2 ) ( 2 )
vv vuvw w
wv v v u
uu uvu
wu u u v
vvv vvu vuuvw w
wv v v u v u
v uPv
A
u vP wu
A
v v u uPv
A
4 2 2 4
2ˆ ˆ ˆˆ ˆ ˆ ˆ6 3 ˆˆ
3 (2 ) ( 2 ) 2
uuu uuv uuvu
wu u u v u v
u u v vP wu
A
(4)
where w is the FCA cross-section at frequency w and the effective time constant eff depends on
optical pulse durations and repetition rates, compared to the scattering time constant for the carriers
through the interaction with phonons [6,18]. Similar terms could also account for free carrier
absorption in the optical domain. Anyway we notice that, by suitably applying a voltage to the
sample, it should be possible to reduce free carrier density up to two orders of magnitude [19].
As regards the possible role of nonlinear refraction in narrow-band DFG experiments, we
notice that the phase matching acceptance bandwidth of centimetres long samples requires optical
pulse durations longer than 100 ps. Since the typical fluence damage threshold values for nonlinear
crystals are in the order of tens of kJ/m2, this means that maximum launchable optical intensities are
in the order of hundreds of TW/m2. On the other hand, typical values of the nonlinear refractive
indexes of the materials under consideration are in the order of 10-5
m2/TW [20], making optically
induced refractive index changes always negligible.
Discussion and applications
The quantum conversion limit in optical-to-terahertz generation has been approached for the first
time [5] only recently. On the other hand, light intensities in all the other DFG experiments reported
to date are far below the reference power uP for pump depletion, so that the quantum conversion
limit has not been approached. The aim of the proposed charts is to predict whether it will be
possible, using higher optical peak intensities, to approach the quantum limit, even in presence of
NLA.
As a practical example, we now apply our charts to the analysis of terahertz generation in
GaAs and GaSe, two promising materials for terahertz generation, whose multiphoton absorption
has been fully characterized in some recent papers [20], [21], [22]. In the following it should be
taken into account that, unlike the experiments under consideration, the proposed charts correspond
to the optimum length condition max 0ˆ( )uP , and so they can just provide upper efficiency limits.
Recently it has been reported relatively efficient generation (×that is well below the
quantum limit) of 2.2 THz radiation (corresponding to -13.66 cm ) in 5 mm long
(max) quasi phase matched GaAs samples [23], [24] with kWs peak power
picoseconds pulses at wavelengths around 2.2m . The 80 m waist optical beams were tightly
focused with respect to the terahertz diffraction condition R 181 μmr , corresponding to a focusing
parameter 2 2 5.1R wr r , so that, following the analysis of Ref. [15], our charts are expected to
overestimate conversion efficiency by a factor of about 2.5. At the wavelengths under
consideration, 2PA is well below threshold, and hence only 3PA should be kept into account. For
this system R 1, 1.2 MWu vP P and 262 TW/mu vI I , that means -3
0ˆ 10uP , and, since
3 20.3 m /TWu v and -13.7 cm , we find ˆ 4 . From our charts, this clearly means that
nonlinear absorption effects were completely negligible in those experiments. However, it could be
wondered if, in similar experiments, it would be possible to approach the quantum limit by simply
enhancing the launched peak intensity. From Fig. 2.e and Fig. 2.f, it is clear that, due to 3PA,
increasing 0ˆuP , the maximum attainable efficiency in this system is around 10%, corresponding to
about 100 kW optical peak power, that is still well below the optical damage threshold fluence of
GaAs, which exceeds tens of kJ/m2 [25,26] for nanosecond pulses. Actually, because of the tight
focusing of the optical beam with respect to terahertz diffraction, the found result should be
regarded as an upper limit to conversion efficiency. Using the same light intensity with much looser
focusing can just help to reach this upper limit but cannot change the value, which, by definition,
is invariant under scaling of the beam sizes (the same is true for ). The only way to improve the
quantum efficiency limit is to lower the terahertz absorption coefficient, that could be done, for
example, by generating lower terahertz frequencies. In fact we point out that 3 2ˆ / w , and so,
moving for example to 1 THz (corresponding to -10.48 cm ), we find 2ˆ 4 10 . In this case,
since 2 /u wP , maximum achievable conversion efficiency in a max 3 cm long sample
would be more than 40%, corresponding to 0ˆ 0.8 36 kWu uP P input peak power. Alternatively,
the sample should be cooled to cryogenic temperatures, in order to reduce phonon absorption.
As regards GaSe, in a recent paper [5] = 39.2% has been reported at 1.48 THz
(corresponding to -10.2 cm ), relying on birefringent phase matching in a 4.7 cm long
(max 1.5) crystal with hundreds of kW peak power optical nanoseconds pulses at
wavelengths around 1 m, where 2PA dominates ( 10 m/TW ). It should be noticed that, since
in this experiment the waists of the optical pump and of the optical signal were quite different
( 0.75 mmur and 1.93 mmvr respectively), a rigorous analysis should rely on the exact
calculation of the pq terms of Eq. (2). Anyway, in order to estimate the 2PA, we can approximate
the Gaussian beam profiles with uniform distributions, to find 50 kWu vP P ,
228 GW/mu vI I , 0ˆ 4.6uP , R 1/5 and 10
-2. The generated terahertz beam waist
2 21/ 1/ 1/ 0.70 mmw u vr r r is comparable with the reference waist R 0.78 mmr (focusing
parameter 2 2 1.2R wr r ), and our charts are expected to overestimate the conversion efficiency
by 20% only [15], that is within the experimental uncertainties. In the intensity regime of these
experiments, 2PA is expected to reduce by 3% only, i.e. well within the experimental
uncertainties. Hence in this case the effects of nonlinear absorption are less important than in GaAs
and our charts predict that, in an optimal long sample (max), it should be possible to attain
more than 70% photon conversion efficiency when launching 10 times higher optical intensities.
This value is well below the typical value of damage threshold of high quality semiconductors, and
can be certainly achieved with shorter (hundreds of picoseconds) pulses. We also notice that, since
scales as / w , the effects of 2PA should become appreciable, in the attempt to reach the
quantum limit, when generating higher frequencies about 6 THz, corresponding to -110 cm .
Conclusions
We presented a universal method to evaluate the role of NLA, when launching high peak optical
intensities, in the attempt to achieve high terahertz conversion efficiencies in a phase matched DFG
process. Our analysis show that the impact of NLA strongly depends on the amount of terahertz
linear absorption and the higher the order of the multiphoton absorption process the stronger this
dependence. In particular we have shown that, in general, nonlinear absorption in the optical
domain cannot be neglected when the linear terahertz losses are too high. Remarkably, using some
materials in some configurations, this can also make the quantum efficiency limit unachievable. On
the other hand, unlike other optical-to-terahertz conversion mechanisms, in the best configurations
DFG allows to approach the quantum efficiency limit even in presence of NLA.
M. Cherchi was supported by the Consorzio Nazionale Interuniversitario per le Scienze Fisiche della Materia (CNISM).
1. M. Tonouchi, “Cutting-edge terahertz technology,” Nature Photonics 1, 97 (2007).
2. Y.J. Ding, Q. Hu, M. Kock, C. E. Stutz (Eds.), “Special Issue on THz Materials, Devices, and Applications,” IEEE
J. Sel. Topics Quantum Electron. 14, 257 (2008).
3. R. W. Boyd, Nonlinear Optics (Academic Press, New York 2008).
4. X. Mu, Y. J. Ding, and I. B. Zotova, “Exploring fundamental limits to terahertz generation in electrooptic
materials: from bulk to nanolayers,” Laser Phys. 18, 530 (2008).
5. Y. Ding, “High-power tunable terahertz sources based on parametric processes and applications,” IEEE Sel. Topics
Quantum Electron. 13, 705 (2007).
6. Y. J. Ding, “Quasi-single-cycle terahertz pulses based on broadband-phase-matched difference-frequency
generation in second-order nonlinear medium: high output powers and conversion efficiencies,” IEEE J. Sel.
Topics Quantum Electron. 10, 1171 (2004).
7. V. Ya. Gaivoronskii, M. M. Nazarov, D. A. Sapozhnikov, E. V. Shepelyavyi, S. A. Shkel’nyuk, A. P. Shkurinov,
and A. V. Shuvaev, “Competition between linear and nonlinear processes during genertion of pulsed terahertz
radiation in a ZnTe crystal”, Quantum Electron. 35, 407 (2005).
8. Q. Xing, L. Lang, Z. Tian, N. Zhang, S. Li, K. Wang, L. Chai, and Q. Wang, “The effect of two-photon absorption
and optical excitation area on the generation of THz radiation,” Opt. Commun. 267, 422 (2006).
9. M. Cherchi, A. Taormina, A. C. Busacca, R. L. Oliveri, S. Bivona, A. C: Cino, S. Stival, A. Riva Sanseverino, and
C. Leone, “Exploiting the optical quadratic nonlinearity of zinc-blende semiconductors for guided-wave terahertz
generation: a material comparison,” accepted for publication on the IEEE J. Quantum Electron. -
http://arxiv.org/abs/0906.3683
10. M. Cherchi, S. Bivona, A. C. Cino, A. C. Busacca, and R. L. Oliveri, “Universal charts for optical difference
frequency generation in the terahertz domain,” submitted to the IEEE J. Quantum Electron. -
http://arxiv.org/abs/0906.3697
11. J. A. Armstrong, N. Bloembergen, J. Ducuing, and P. S. Pershan, “Interactions between light waves in a nonlinear
dielectric,” Phys. Rev. 127, 1918 (1962).
12. A. Yariv, “Coupled-Mode Theory for Guided-Wave Optics,” IEEE J. Quantum Electron. 9, 919 (1973).
13. C. H. Henry and C. G. B.Garrett, “Theory of parametric gain near a lattice resonance,” Phys. Rev. 171, 1058
(1968).
14. J. R. Morris and Y. R. Shen, “Theory of far-infrared generation by optical mixing,” Phys. Rev. A 15, 1143 (1977).
15. 12. K. L. Vodopyanov, “Optical generation of narrow-band terahertz packets in periodically-inverted electro-optic
crystals: conversion efficiency and optimal laser pulse format,” Opt. Express 14, 2263-2276 (2006).
16. V. Nathan, A. H. Guenther, and S. S. Mitra, “Review of multiphoton absorption in crystalline solids,” J. Opt. Soc.
Am. B 2, 294-316 (1985).
17. M. Cherchi, S. Stivala, A. Pasquazi, A. C. Busacca, S. Riva Sanseverino, A. C. Cino, L. Colace, and G. Assanto,
“Second-harmonic generation in surface periodically poled lithium niobate waveguides: on the role of multiphoton
absorption,” Appl. Phys. B 93, 559-565 (2008) - http://arxiv.org/abs/0906.3705
18. A. Villeneuve, C. C. Yang, G. I. Stegeman, C. N. Ironside, G. Scelsi, and R. M. Osgood, “Nonlinear Absorption in
a GaAs Waveguide Just Above Half the Band Gap,” IEEE J. Quantum Electron. 30, 1172 (1994).
19. R. Jones, A. Liu, H. Rong, and M. Paniccia, “Lossless optical modulation in a silicon waveguide using stimulated
Raman scattering,” Opt. Exp. 13, 1716 (2005).
20. W. C. Hurlbut, Y.-S. Lee, K. L. Vodopyanov, P. S. Kuo, and M. M. Fejer, “Multiphoton absorption and nonlinear
refraction of GaAs in the mid-infrared,” Opt. Lett. 32, 668 (2007).
21. K. R. Allakhverdiev, T. Baykara, S. Joosten, E. Günay, A. A. Kaya, A. Kulibekov, A. Seilmeier, and E.Yu. Salaev,
“Anisotropy of two-photon absorption in gallium selenide at 1064 nm,” Opt. Commun. 261, 60 (2006).
22. I. B. Zotova and Y. J. Ding, “Spectral measurements of two-photon absorption coefficients for CdSe and GaSe
crystals,” Appl. Opt. 40, 6654, (2001).
23. J. E. Schaar, K. L. Vodopyanov, P. S. Kuo, M. M. Fejer, X. Yu, A. Lin, J. S. Harris, D. Bliss, C. Lynch, V. G.
Kozlov, and W. Hulburt, “Terahertz sources based on intracavity parametric down-conversion in quasi-phase-
matched Gallium Arsenide,” IEEE J. Sel. Topics Quantum Electron. 14, 354 (2008).
24. K. L. Vodopyanov, “Optical THz-wave generation with periodically-inverted GaAs,” Laser & Photon. Rev. 2, 11
(2008).
25. T. T. Kajava and A. L. Gaeta, “Q switching of a diode-pumped Nd:YAG laser with GaAs,” Opt. Lett. 21, 1244
(1996).
26. N. R. Shetty, M. F. Becker, and R. M. Walser, “An anomalous absorption model to account for accumulation in N-
on-1 damage in Si and GaAs”, in Laser Induced Damage in Optical Materials: 1986 H. E. Bennett, A. H. Guenther
, D. Milam , B. E. Newnam Eds., p. 634 (ASTM International, West Conshohocken 1988).
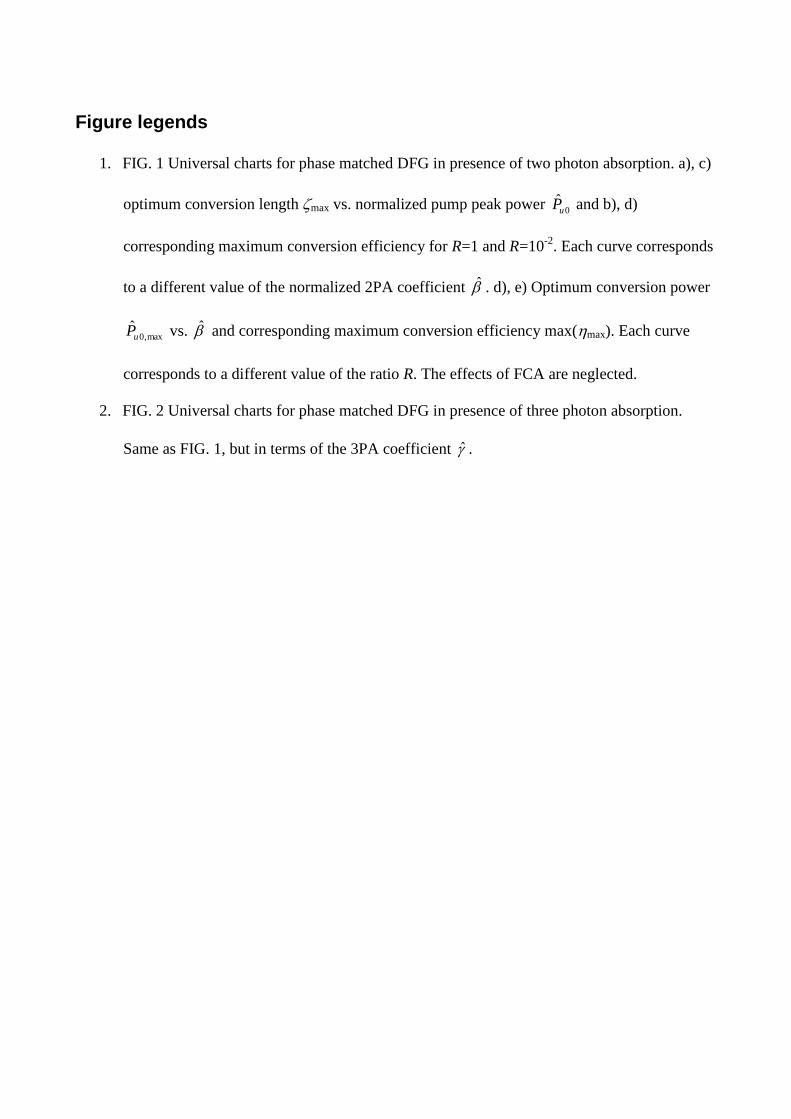
Figure legends
1. FIG. 1 Universal charts for phase matched DFG in presence of two photon absorption. a), c)
optimum conversion length max vs. normalized pump peak power 0ˆuP and b), d)
corresponding maximum conversion efficiency for R=1 and R=10-2
. Each curve corresponds
to a different value of the normalized 2PA coefficient . d), e) Optimum conversion power
max,0ˆuP vs. and corresponding maximum conversion efficiency max(max). Each curve
corresponds to a different value of the ratio R. The effects of FCA are neglected.
2. FIG. 2 Universal charts for phase matched DFG in presence of three photon absorption.
Same as FIG. 1, but in terms of the 3PA coefficient .
10-4
10-3
10-2
10-1
100
101
102
103
104
10-2
10-1
100
101
Pu0
m
ax
R=1, =0, max()
=0
=10-2
=10-1
=1
10-4
10-3
10-2
10-1
100
101
102
103
104
10-4
10-3
10-2
10-1
100
Pu0
m
ax
R=1, =0, max()
=0
=10-2
=10-1
=1
10-3
10-2
10-1
100
101
102
103
104
10-6
10-5
10-4
10-3
10-2
10-1
100
Pu0
m
ax
R=10-2
, =0, max()
=0
=10-2
=10-1
=1
10-3
10-2
10-1
100
101
102
103
104
10-2
10-1
100
101
102
103
104
Pu0
m
ax
R=10-2
, =0, max()
=0
=10-2
=10-1
=1
10-2
10-1
100
101
10-3
10-2
10-1
100
101
102
Pu
0,m
ax
=0, max(max
)
R=10-2
R=10-1
R=1
R=10
10-2
10-1
100
101
10-4
10-3
10-2
10-1
100
ma
x(
max)
=0, max(max
)
R=10-2
R=10-1
R=1
R=10
u
uu
u u
vv
u v
vv
v v
uu
v
(b)
^
^
^
^
^
(d)
^
^
^
^
^
(c)
^
^
^
^
^
(a)
^
^
^
^
^
(f)
^
(e)
^
^
(g)
10-2
10-1
100
101
102
103
104
10-2
10-1
100
101
Pu0
m
ax
R=1, =0, max()
=0
=10-4
=10-3
=10-2
=10-1
=1
10-2
10-1
100
101
102
103
104
10-5
10-4
10-3
10-2
10-1
100
Pu0
m
ax
R=1, =0, max()
=0
=10-4
=10-3
=10-2
=10-1
=1
10-2
10-1
100
101
102
103
104
10-2
10-1
100
101
102
Pu0
m
ax
R=10-2
, =0, max()
=0
=10-4
=10-3
=10-2
=10-1
=1
10-2
10-1
100
101
102
103
104
10-6
10-5
10-4
10-3
10-2
10-1
100
Pu0
m
ax
R=10-2
, =0, max()
=0
=10-4
=10-3
=10-2
=10-1
=1
10-3
10-2
10-1
100
101
10-2
10-1
100
101
Pu0
,max
=0, max(max
)
R=10
-2
R=10-1
R=1
R=10
10-3
10-2
10-1
100
101
10-2
10-1
100
ma
x(
ma
x)
=0, max(max
)
R=10-2
R=10-1
R=1
R=10
u
uu
u
uu
u
vv
u
uu
v
vv
v
uu
v
vv
v
vv
v
uu
v
vv
u
uu
u
vv
(g)
(a)
^
^
^
^
^
^
^ (c)
^
^
^
^
^
^
^
^
(b)
^
^
^
^
^
^ (d)
^
^
^
^
^
^
^
(e)
^
^
(f)
^
Copyright © 2022 FDOKUMEN