Scattering Mechanisms and Modeling for Terahertz Wireless ...
Upload
khangminh22Category
view
1download
0
Characterisation of the In-vivo TerahertzCommunication Channel within the
Human Body Tissues for FutureNano-Communication Networks
Ke YANG
A thesis submitted to the faculty of the University of London in partialfulfillment of the requirements for the degree of
Doctor of Philosophy
School of Electronic Engineering and Computer ScienceQueen Mary, University of London
London E1 4NSUnited Kingdom
September 2015

2015 c© Queen Mary, University of London. All rights reserved.
To my family, for their endless love, encouragement
and support
Abstract
Body centric communication has been extensively studied in the past for a range of fre-
quencies, however the need to reduce the size of the devices makes nano-scale tech-
nologies attractive for future applications. This opens up opportunities of applying
nano-devices made of the novel materials, like carbon nano tubes (CNT), graphene
and etc., which operate at THz frequencies and probably inside human bodies.
With a brief introduction of nano-communications and review of the state of the
art, three main contributions have been demonstrated in this thesis to characterise
nano-scale body-centric communication at THz band:
• A novel channel model has been studied. The path loss values obtained from
the simulation have been compared with an analytical model in order to verify
the feasibility of the numerical analysis. On the basis of the path loss model and
noise model, the channel capacity is also investigated.
• A 3-D stratified skin model is built to investigate the wave propagation from the
under-skin to skin surface and the influence of the rough interface between dif-
ferent skin layers is investigated by introducing two detailed skin models with
different interfaces (i.e.,3-D sine function and 3-D sinc function). In addition, the
effects of the inclusion of the sweat duct is also analysed and the results show
great potential of the THz waves on sensing and communicating.
• Since the data of dielectric properties for biological materials at THz band are
quite scarce, in collaboration with the Blizard Institute, London, UK, different
human tissues such as skin, blood, muscle and etc. are planned to be measured
with the THz Time Domain Spectroscopy (THz-TDS) system at Queen Mary
University of London to enrich the database of electromagnetic parameters at
the band of interest. In this chapter, collagen, the main constitution of skin was
i
mainly studied. Meanwhile, the measured results are compared with the simu-
lated ones with a good agreement.
Finally, a plan for further research activities is presented, aiming at widening and
deepening the present understanding of the THz body-centric nano-communication
channel, thus providing a complete characterisation useful for the design of reliable
and efficient body centric nano-networks.
ii

Acknowledgement
My most sincere and deepest gratitude would like to go to my supervisors and ment-
ors: Prof. Yang Hao & Dr. Akram Alomainy, for their endless support, guidance and
encouragement throughout my entire Ph.D.. They both set excellent models for me to
overcome the difficulties for their unbounded energy and passion to pursue the truth
of science, which has given me the strength and confidence necessary for the develop-
ment of the work. Besides their valuable academic advice and guidance, they are also
kind, friendly and helpful as a human being. I would also like to thank my independ-
ent examiner, Dr. Khalid Rajab for his positive and fruitful comments, and Prof. Clive
Parini for his assistance during my study in Queen Mary University of London.
A special mention would also like to go to Dr. Qammer Hussain Abbassi, his
knowledge and willingness to meet and help all the time during my writing-up period
did me a great favour. Without his help, I could not finish this thesis. Also, I would like
to thank Prof. Josep Miquel Jornet, University at Buffalo, The State University of New
York. Although we just spend two weeks together, I learned much from our detailed
discussion and so did the communication with his students, which consolidated my
research path towards this thesis.
Additionally, I would like to show my appreciation to my colleagues in antenna
group, Dr. Rui Yang, Dr. Oscar Quevedo Teruel , Dr. Rhiannon Mitchell-Thomas, Dr.
Melusine Pigeon, Dr. Max Munoz, Dr. Jiefu Zhang, Ms. Nishtha Chopra, Mr. Jiandong
Lang and etc., from whom I learned how to be both a qualified researcher and a person
knowing how to enjoy life. Without them, I would not have an enjoyable Ph.D.. At
the same time, I would like to thank my friends: Dr. Fang Mai, Dr. Chen Chen, Dr.
Yongfei Cui and Mr. Dong Dong and etc., with whom I broadened my horizon a lot.
Our trips to Europe would always be the pearls in my memory and wish you guys a
bright future from my deep heart.
Many thanks to China Scholarship Council for the financial support. I would also
iii

extend my thanks to all staff in Queen Mary University of London for their provision
of a good working atmosphere.
Above all, I would like to thank all my family. Regardless of physical distance,
their support and affection have always been with me. My last thought goes to: my
grandparents and my parents who are always standing by me through thick and thin
and also my brother. I dedicate this thesis to my family, to honour their unconditional
love, endless encouragement and support, and most importantly, firm confidence in
me throughout my life.
Ke Yang
London, Semptember 2015
iv

List of Publications
Journal Publications
1. K. Yang, A. Pellegrini, M. Munoz, A. Brizzi, A. Alomainy and Y. Hao, Numerical
Analysis and Characterisation of THz Propagation Channel for Body-Centric
Nano-Communication, IEEE Transaction on THz Science and Technology, vol.
5, May 2015.
2. K. Yang, Q.H. Abbasi, N. Chopra, M. Munoz, Y. Hao, and A. Alomainy, Effects of
Non-Flat Interfaces in Human Skin Tissues on the In-Vivo THz Communication
Channel, Nano Communication Network, Nov., 2015.
3. G. Piro, K. Yang, G. Boggia, N. Chopra, L.A. Grieco and A. Alomainy, Terahertz
Communications in Human Tissues at the Nano-Scale for Healthcare Applica-
tions, IEEE Transactions on Nanotechnology, vol. 14, May 2015.
4. Y.F. Chen, S. Bush, A. Eckford, K. Yang, N. Chopra, A. Alomainy, Y. Hao, G. Piro,
A. Aijaz, M. Nakhai, Y. Zhou and P. Kosmas, A Comprehensive Standardized
Framework for Nanoscale and Molecular Communication, Proceedings of the
IEEE (submitted).
Standard Contribution
1. S.F. Bush, A. Echford, J. Paluh, T. Thai, T. Sato, G. Piro, Y. Chen, K. Yang, V.
Rao, V. Prasad, A. Mukherjee, T. Wysocki, E.F. Armay, A. Rafiei, and S. Goel,
P1906.1/D1.1 Draft Recommended Practice for Nanoscale and Molecular Com-
munication Framework, IEEE, 2015.
v

Conference Publications
1. K. Yang, N. Chopra, J. Upton, A. Alomainy, and Y. Hao, Characterizing Skin-
Based Nano-Networks for Healthcare Monitoring Application at THz,IEEE APS/USNC-
URSI 2015, Vancouver, BC, Canada, 19-24 July 2015.
2. N. Chopra, K. Yang, J. Upton, A. Alomainy, M. Philpott, Y. Hao, Understand-
ing and Characterising Nanonetworks for Healthcare Monitoring Applications,
IEEE IMWS-Bio 2014, London, 8-10 December 2014.
3. K. Yang, Q.H. Abbasi, K. Qaraqe, A. Alomainy and Y. Hao, Body-Centric Nano-
Networks: EM Channel Characterisation in Water at the Terahertz Band, The
2014 Asia Pacific Microwave Conference (APMC 2014), 4 to 7 November 2014,
Sendai, Japan. (Invited).
4. M. Munoz, K. Yang, A. Alomainy and H. Yang, Modelling of skin tissue for
body-centric communications at terahertz frequencies, General Assembly and
Scientific Symposium (URSI GASS), 2014 XXXIth URSI, Beijing, China, 16-23
Aug. 2014.
5. Ke Yang, Alice Pellegrini, Alessio Brizzi, Akram Alomainy, Yang Hao, Numer-
ical Analysis of the Communication Channel Path Loss at the THz Band inside
the Fat Tissue, IEEE IMWS-Bio 2013, Singapore, 9-11 December 2013.
6. Ke Yang, Akram Alomainy and Yang Hao, In-vivo Characterisation and Numer-
ical Analysis of the THz Radio Channel for Nanoscale Body-Centric Wireless
Networks, IEEE APS/USNC-URSI 2013, Orlando, Florida, USA, 7-13 July 2013.
7. Richa Bharadwaj, Ke Yang, Akram Alomainy, Clive Parini, Effect of Base Sta-
tion Configurations and Complexity on the Accuracy of Ultra Wideband Local-
isation, 2013 IEEE AP-S/USNC-URSI Symposium, July 7- 13, 2013 in Orlando,
Florida.
vi

Contents
Abstract i
Acknowledgement iii
List of Publications v
Contents vii
List of Abbreviations xi
List of Figures xiii
List of Tables xvii
1 Introduction 1
1.1 Introduction to Nanotechnology . . . . . . . . . . . . . . . . . . . . . . . 1
1.2 Recent Development in Nano-Communication . . . . . . . . . . . . . . . 3
1.3 Applications of Nano-Networks . . . . . . . . . . . . . . . . . . . . . . . 5
1.4 Research Challenges . . . . . . . . . . . . . . . . . . . . . . . . . . . . . . 5
1.5 Research Objectives . . . . . . . . . . . . . . . . . . . . . . . . . . . . . . . 8
1.6 Our Contributions . . . . . . . . . . . . . . . . . . . . . . . . . . . . . . . 9
1.7 Thesis Organisation . . . . . . . . . . . . . . . . . . . . . . . . . . . . . . . 10
References 11
2 Preliminaries of Nano-Communication 14
2.1 Definition of Nano-Communication . . . . . . . . . . . . . . . . . . . . . 14
2.2 Framework of Nano-Communication . . . . . . . . . . . . . . . . . . . . 16
2.3 State-of-Art Achievement of Devices due to Nano-Technologies . . . . . 18
2.4 Various Paradigms of Nano-Communication . . . . . . . . . . . . . . . . 21
vii

2.4.1 Molecular Paradigms . . . . . . . . . . . . . . . . . . . . . . . . . 21
2.4.2 Electromagnetic Paradigm . . . . . . . . . . . . . . . . . . . . . . . 27
2.4.3 Acoustic Paradigm . . . . . . . . . . . . . . . . . . . . . . . . . . . 30
2.5 Structure of Nano-Network to Specific Applications . . . . . . . . . . . . 30
2.6 Available Simulators of Nano-Communication . . . . . . . . . . . . . . . 38
2.7 Summary . . . . . . . . . . . . . . . . . . . . . . . . . . . . . . . . . . . . . 38
References 40
3 Fundamentals of Electromagnetic Waves for Nano-Network Communication 45
3.1 Recent Developments in In-Body Communication . . . . . . . . . . . . . 46
3.1.1 Antennas for In-Body Communication . . . . . . . . . . . . . . . 46
3.1.2 Human Body Models . . . . . . . . . . . . . . . . . . . . . . . . . 47
3.1.3 Channel Characterisation . . . . . . . . . . . . . . . . . . . . . . . 50
3.2 Recent Developments in THz Communication . . . . . . . . . . . . . . . 51
3.2.1 Graphene/CNT as the Elements of THz System . . . . . . . . . . 51
3.2.2 Channel Modelling of the THz Communication for Nano-Network 52
3.2.3 Other Aspects of the THz Communication for Nano-Network . . 56
3.3 Summary . . . . . . . . . . . . . . . . . . . . . . . . . . . . . . . . . . . . . 58
References 59
4 Numerical Modelling of THz Wave Propagation in Human Tissues 64
4.1 Motivation and Related Work . . . . . . . . . . . . . . . . . . . . . . . . . 64
4.2 Channel Modelling of Human Tissues at THz Band . . . . . . . . . . . . 66
4.2.1 Relationship of Optical Parameters to Electromagnetic Parameters 66
4.2.2 Path Loss . . . . . . . . . . . . . . . . . . . . . . . . . . . . . . . . 66
4.2.3 Delay . . . . . . . . . . . . . . . . . . . . . . . . . . . . . . . . . . . 70
4.2.4 Noise . . . . . . . . . . . . . . . . . . . . . . . . . . . . . . . . . . . 70
4.3 Channel Capacity of Human Tissues at THz Band . . . . . . . . . . . . . 73
4.4 Numerical Models and the Corresponding Results . . . . . . . . . . . . . 77
4.4.1 Homogeneous Model . . . . . . . . . . . . . . . . . . . . . . . . . 77
4.4.2 Layered Model . . . . . . . . . . . . . . . . . . . . . . . . . . . . . 78
4.5 Summary . . . . . . . . . . . . . . . . . . . . . . . . . . . . . . . . . . . . . 80
viii
References 81
5 Effects of Non-Flat Interfaces in Human Skin Tissues on the In-Vivo THz
Communication Channel 83
5.1 Motivation and Related Work . . . . . . . . . . . . . . . . . . . . . . . . . 83
5.2 Applied Numerical Skin Models . . . . . . . . . . . . . . . . . . . . . . . 84
5.2.1 Human Skin Structure . . . . . . . . . . . . . . . . . . . . . . . . . 84
5.2.2 Numerical Skin Models . . . . . . . . . . . . . . . . . . . . . . . . 85
5.3 Analysis of Skin-Internal Non-flat Interfaces on the THz EM Channel . 90
5.3.1 Effects of Different Shapes . . . . . . . . . . . . . . . . . . . . . . . 90
5.3.2 Effects of the Antenna Location . . . . . . . . . . . . . . . . . . . . 91
5.3.3 Effects of the Sweat Duct . . . . . . . . . . . . . . . . . . . . . . . 94
5.4 Summary . . . . . . . . . . . . . . . . . . . . . . . . . . . . . . . . . . . . . 95
References 99
6 Characteristics and Modelling of Electromagnetic Parameters of Human Skin
at THz band 100
6.1 Motivation and Related Work . . . . . . . . . . . . . . . . . . . . . . . . . 100
6.2 Principles of the Measurement . . . . . . . . . . . . . . . . . . . . . . . . 101
6.2.1 THz-TDS System Set-up . . . . . . . . . . . . . . . . . . . . . . . . 101
6.2.2 Data-Processing . . . . . . . . . . . . . . . . . . . . . . . . . . . . . 103
6.3 Measured Results and Discussions . . . . . . . . . . . . . . . . . . . . . . 106
6.4 Modelling of the Measured Results . . . . . . . . . . . . . . . . . . . . . . 110
6.4.1 Dielectric Model of Collagen at THz Band . . . . . . . . . . . . . . 110
6.4.2 Fitting Algorithm . . . . . . . . . . . . . . . . . . . . . . . . . . . . 112
6.5 Comparison with the Proposed Model . . . . . . . . . . . . . . . . . . . . 114
6.6 Summary . . . . . . . . . . . . . . . . . . . . . . . . . . . . . . . . . . . . . 114
References 116
7 Conclusion and Future Work 118
7.1 Conclusion . . . . . . . . . . . . . . . . . . . . . . . . . . . . . . . . . . . . 118
7.2 Key Contributions . . . . . . . . . . . . . . . . . . . . . . . . . . . . . . . . 119
ix

7.3 Future Work . . . . . . . . . . . . . . . . . . . . . . . . . . . . . . . . . . . 120
A Applications of Nano-Communication 122
A.1 Biomedical Applications . . . . . . . . . . . . . . . . . . . . . . . . . . . . 122
A.2 Environmental Applications . . . . . . . . . . . . . . . . . . . . . . . . . . 124
A.3 Industrial Applications . . . . . . . . . . . . . . . . . . . . . . . . . . . . . 125
A.4 Military Applications . . . . . . . . . . . . . . . . . . . . . . . . . . . . . . 125
References 127
B Matlab Code of Optical/EM Parameters Extraction 128
B.1 Principle of nlinfit( ) function . . . . . . . . . . . . . . . . . . . . . . . . . 128
B.2 Matlab Code . . . . . . . . . . . . . . . . . . . . . . . . . . . . . . . . . . . 128
x

List of Abbreviations
3D Three Dimension
AIGN Additional Inverse Gaussian Noise
ACW Average Code Weight
BAN Body Area Network
BER Bit Error Rate
CIR Channel Impulse Response
CNT Carbon Nano-Tube
CPW Co-Planar Waveguide
DMC Diffusion-based Molecular Communication
dB Decibels
EM wave Electromagnetic wave
FCC Federal Communications Commission
FDA Food and Drug Administration
FDTD Finite-Difference Time-Domain
FFT Fast Fourier Transform
FIT Finite Integral Technique
FMC Flow-based Molecular Communication
Gbps Gigabits per second
GNR Graphene Nano-Ribbons
IC Integrated Circuit
IEEE Institute of Electrical & Electronics Engineers
IoNT Internet of Nano-Things
IR-UWB Impulse Radio Ultra Wide-Band
ISM Industrial, Scientific and Medical
LoS Line of Sight
MAC Medium Access Control
xi
MB-OFDM Multi-Band Orthogonal Frequency Division Multi-
plexing
MICS Medical Implant Communication System
NLoS Non-Line of Sight
OCT Optical Coherent Tomography
p.s.d power spectrum distribution
PEC Perfect Electronic Conductor
PIFA Planar Inverted-F Antenna
PL Path Loss
PML Perfect Match Layer
PSO Particle Swarm Optimisation
RF Radio Frequency
RMS Root Mean Square
RT Ray Tracing
SAR Specific Absorption Rate
SC Stratum Corneoum
SEM Scanning Electron Micrscope
SNR Signal Noise Ratio
Tbps Tera-bits per second
TDMA Time Division Multiple Access
THz band Tera-Hertz band
TS-OOK Time-Spread On-Off Keying
Tx Transmitter
UWB Ultra Wide-Band
WSN Wireless Sensor Network
VHF Very High-Frequency
xii

List of Figures
1.1 Development map of the micro/nano-devices (reproduced from [10]) . . 3
1.2 Schematics of intelligent office (reproduced from [14]) . . . . . . . . . . . 6
2.1 Various communication models [7]. (The size of the circle indicates the
importance of the elements.) . . . . . . . . . . . . . . . . . . . . . . . . . . 16
2.2 The Realized IC chips . . . . . . . . . . . . . . . . . . . . . . . . . . . . . . 19
2.3 Photos of the nano-bots which can be used in human body . . . . . . . . 20
2.4 Nano devices for other applications . . . . . . . . . . . . . . . . . . . . . 22
2.5 SEM image and schematics of the nano-laser with rcore = 750nm,
rclad = 690nm (∆r = 60nm), and dshield = 150nm with silver coating
where rcore is the radius of InGaAs gain layer, rclad is the radius of
InP cladding. ∆r is the difference between rcore and rclad. dshield is the
thickness of SiO2 shield layer.(reproduced from [25]) . . . . . . . . . . . 23
2.6 A simple diffusion-based molecular nano-network . . . . . . . . . . . . . 24
2.7 A simple nano-network with network coding operation . . . . . . . . . . 25
2.8 Building blocks of the microfluidic channels [43] . . . . . . . . . . . . . . 26
2.9 Envisioned TouchCom system [34] . . . . . . . . . . . . . . . . . . . . . . 27
2.10 Structure of the envisioned nano-robots [34] . . . . . . . . . . . . . . . . . 27
2.11 Path loss and molecular absorption noise temperature for 10% water
concentration [54] . . . . . . . . . . . . . . . . . . . . . . . . . . . . . . . . 29
2.12 Schematic and simulation results of the pulse sphere [64] . . . . . . . . . 31
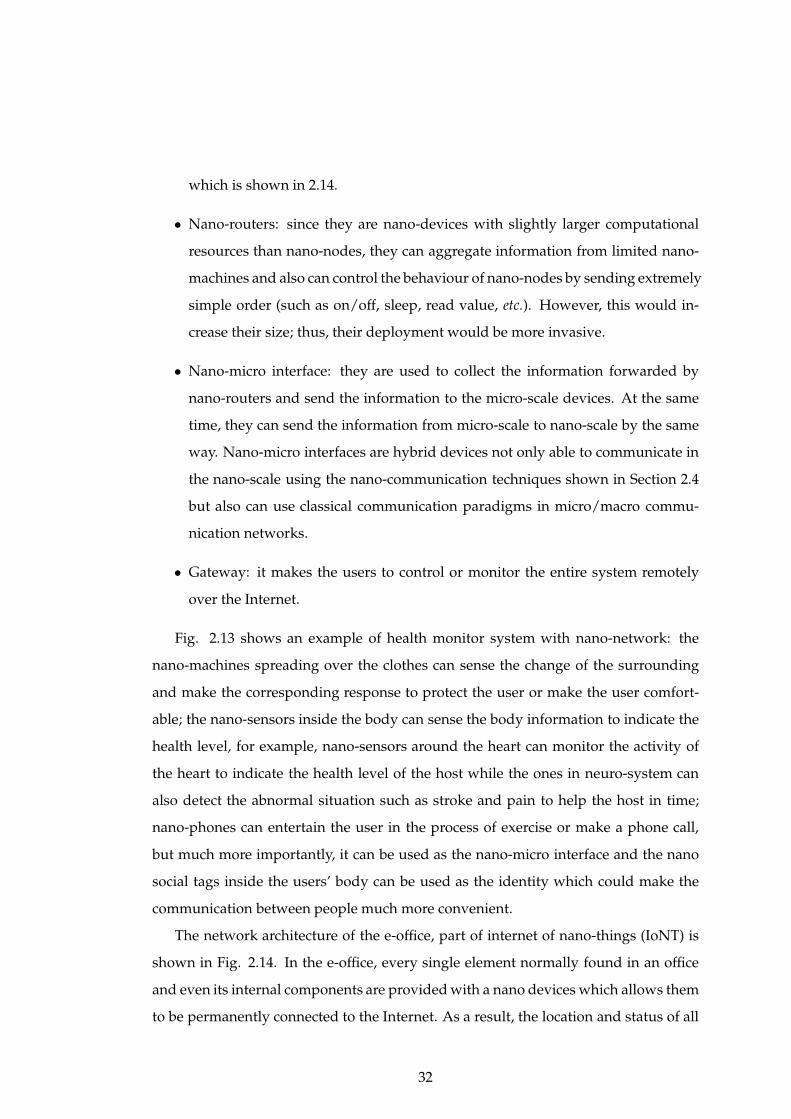
2.13 Architecture of a health monitor nano-network . . . . . . . . . . . . . . . 33
2.14 Network architecture of the e-office [67] . . . . . . . . . . . . . . . . . . . 33
2.15 Details of the network architecture of the proposed IoNT [6] . . . . . . . 36
2.16 Nano-network for plant monitoring [70] . . . . . . . . . . . . . . . . . . . 37
3.1 Miniaturized cavity slot antennas (reproduced from [19]) . . . . . . . . . 46
3.2 Conformal chandelier meandered dipole antenna (reproduce from [23]) 47
xiii

3.3 Bio-compatible capsule with embedded antenna (reproduced from [26]) 48
3.4 Approximations of a complete human model combining canonical
geometries . . . . . . . . . . . . . . . . . . . . . . . . . . . . . . . . . . . . 49
3.5 Examples of different body postures for the Virtual Family Models
(reproduced from [52]) . . . . . . . . . . . . . . . . . . . . . . . . . . . . . 49
3.6 Scatter plot of the path loss vs. distance for deep tissue implant to
another implant (reproduced from [54]) . . . . . . . . . . . . . . . . . . . 50
3.7 Scatter plot of the path loss in the 1-6 GHz band for implant to body
surface (reproduced from [55]) . . . . . . . . . . . . . . . . . . . . . . . . 51
3.8 Graphene-sheet resonant plasmon antenna and its radiation pattern [65] 53
3.9 Total path loss in dB for two different water vapour concentrations [6] . 55
3.10 Molecular absorption noise temperature in K for two different water
vapor concentrations [6] . . . . . . . . . . . . . . . . . . . . . . . . . . . . 55
3.11 Capacity as a function of the distance for four different power spectral
densities [6] . . . . . . . . . . . . . . . . . . . . . . . . . . . . . . . . . . . 56
4.1 Optical and electromagnetic parameters of human tissues (blood, skin
and fat) . . . . . . . . . . . . . . . . . . . . . . . . . . . . . . . . . . . . . . 67
4.2 Total path loss as a function of the distance and frequency for different
human tissues . . . . . . . . . . . . . . . . . . . . . . . . . . . . . . . . . . 69
4.3 Channel capacity comparison between EM and molecular communica-
tion [20] . . . . . . . . . . . . . . . . . . . . . . . . . . . . . . . . . . . . . . 70
4.4 Noise temperature as a function of the distance and frequency for
different human tissues . . . . . . . . . . . . . . . . . . . . . . . . . . . . . 72
4.5 Capacity for different tissues with different power allocations . . . . . . 76
4.6 Schematics of the simplified model of the propagation of the plane
wave in human tissues . . . . . . . . . . . . . . . . . . . . . . . . . . . . . 77
4.7 Absorption path loss vs. distance at 1 THz for different human tissues . 78
4.8 Planar layered models of human body with dipoles aligned in . . . . . . 79
4.9 Comparison of the calculated power loss with the simulated one of
different dipole allocation for the layered structure (hor. sim. is the
short form of horizontal simulation; ver. sim. is the short for vertical
simulation; cal. means the results calculated from theory) . . . . . . . . . 80
xiv
5.1 General 3-layer skin model [14] . . . . . . . . . . . . . . . . . . . . . . . . 85
5.2 Numerical models with different function interfaces, developed in CST
Microwave Studio . . . . . . . . . . . . . . . . . . . . . . . . . . . . . . . . 87
5.3 Cross section of the applied models in Fig. 5.2 (L is the cube length,
H is the cube height, hepi and hderm is the thickness of epidermis and
dermis, A is the amplitude of the surface while S is the span of the
surface) . . . . . . . . . . . . . . . . . . . . . . . . . . . . . . . . . . . . . . 88
5.4 Permittivity of different skin layers and sweat at THz frequencies [16]. . 89
5.5 Numerical model of skin while including sweat ducts. . . . . . . . . . . 90
5.6 Effects of parameter changes on power loss for sine-wave model listed
in Table 5.3 . . . . . . . . . . . . . . . . . . . . . . . . . . . . . . . . . . . . 92
5.7 Dependance of the power loss on the distance for different models . . . 93
5.8 Electric field distribution of the dipoles at 1 THz for the peak scenario
of the sine wave model . . . . . . . . . . . . . . . . . . . . . . . . . . . . . 94
5.9 Electric field distribution of the dipoles at 1 THz for the valley scenario
of the sine wave model . . . . . . . . . . . . . . . . . . . . . . . . . . . . . 95
5.10 Comparison between the two Scenarios: two dipoles located above/beneath
the peak and valley of the interface for the model with 3-D sine function
as the interface. . . . . . . . . . . . . . . . . . . . . . . . . . . . . . . . . . 96
5.11 Comparison between the two Senarios: two dipoles located above/beneath
the peak and valley of the interface for the model with 3-D sinc function
as the interface. . . . . . . . . . . . . . . . . . . . . . . . . . . . . . . . . . 97
5.12 Power loss at 1 THz for three scenario: a) without the sweat duct in
epidermis; b) water is considered as the sweat in sweat duct; c) the
sweat duct is considered as PEC . . . . . . . . . . . . . . . . . . . . . . . 97
6.1 Schmatic diagram of a THz-TDS system operating in transmission mode 102
6.2 THz-TDS system in Queen Mary University of London [16] . . . . . . . . 103
6.3 Sample holder with the stand . . . . . . . . . . . . . . . . . . . . . . . . . 104
6.4 Received THz pulse of air from TDS system . . . . . . . . . . . . . . . . . 104
6.5 Time response of air, empty holder and the holder with the sample
measured by THz-TDS system . . . . . . . . . . . . . . . . . . . . . . . . 107
6.6 Measured optical parameters of collagen from THz-TDS system . . . . . 108
xv

6.7 Calculated complex dielectric constant of collagen from Eq. 6.8 . . . . . 109
6.8 Comparison between the measured results with other avaiblable data
from [23–25] . . . . . . . . . . . . . . . . . . . . . . . . . . . . . . . . . . . 110
6.9 Measured complex permittivity of collagen and its fitting model . . . . . 113
6.10 Comparison of the measured power losses to the theoretical ones of the
sample with thickness of 1 mm with their fitting models . . . . . . . . . 114
xvi

List of Tables
1.1 Overview of the envisioned applications [10][12] . . . . . . . . . . . . . . 7
4.1 The Dielectric parameters of blood, skin and fat at 1 THz . . . . . . . . . 78
5.1 Different parameters of simulated models using sine and sinc functions
as the interface (unit: µm) . . . . . . . . . . . . . . . . . . . . . . . . . . . 86
5.2 Parameters of the dipole antennas used as transmit and receive ele-
ments for the EM propagation power loss study across and within the
human skin tissue models . . . . . . . . . . . . . . . . . . . . . . . . . . . 89
5.3 Amplitude and span change for the different interface models (unit: µm) 91
6.1 Parameters of double Debye model optimised by PSO algorithm . . . . . 112
xvii

Chapter 1
Introduction
”I want to build a billion tiny factories, models of each other, which are manufacturing simul-
taneously. . . The principles of physics, as far as I can see, do not speak against the possibility
of maneuvering things atom by atom. It is not an attempt to violate any laws; it is something,
in principle, that can be done; but in practice, it has not been done because we are too big.”
Richard Feynman
1.1 Introduction to Nanotechnology
Nanotechnology has garnered great attention since its first proposal in 1959 by Richard
Feynman in his talk There’s Plenty of Room at the Bottom, where the possibility of syn-
thesis via direct manipulation of atoms was described; but the term ”nano-technology”
was not used until 1974 by Norio Taniguchi to describe the technology manipulating
materials at the nano-meter level [1]. Later in 1986, K. Eric Drexler proposed the idea
of a nanoscale ”assembler” inspired by Feyman’s talk in the book of Engines of Creation:
The Coming Era of Nanotechnology [2]. Then, through Drexler’s popularisation, the na-
notechnology has been widely accepted by public and well developed in academic
fields.
1

According to ISO/TS 27686:2008, the nano-scale is defined as the size from 1 nm
to 100 nm [3]. Thus, the nanotechnology can be defined as: ”Nanotechnology is sci-
ence, engineering, and technology conducted at the nanoscale, which is about 1 to 100
nanometers. Nanoscience and nanotechnology are the study and application of ex-
tremely small things and can be used across all the other science fields, such as chem-
istry, biology, physics, materials science, and engineering.”[4] according to National
Nanotechnology Initiative (NNI). Therefore, two other statements should be emphas-
ized to further understand the definition [5]: first, nanotechnology should contain the
formation and application of materials, structures, devices, and systems with unique
properties due to their nano-scale size; second, nanotechnology should also include
the technologies which can control the materials at nano scale.
Three main research areas have been conducted since its proposal: nano-science
where the interaction and behaviour of the nano-materials would be studied; nano-
materials fabrication which studies the experimental development of nano-materials
and computer modelling to study the interactions and properties of nano-materials
by simulation. Recently, nanoparticles such as dendrimers, carbon fullerenes (bucky-
balls) and nano-shells are used to target specific tissues and organs [6] and molecular
and genomic tools are used to uncover the complexity of the induced defence sig-
nalling networks of plants [7]. And also, molecular-scale filters and pores with well-
defined sizes, shapes, and surface properties allow engineering better functionality in
molecular sieving [8].
Four generations were proposed for the roadmap of nanotechnology by Mihail
Roco in [9]:
• Passive nanostructures: a) Dispersed and contact nanostructures; b) Products
incorporating nanostructures;
• Active nanostructures: a)Bio-active, health effects; b) Physico-chemical active;
• Systems of nanosystems
• Molecular nanosystems
2

Figure 1.1: Development map of the micro/nano-devices (reproduced from [10])
1.2 Recent Development in Nano-Communication
Based on the general development time-line of nanotechnology, it can be easily seen
that the ultimate goal of nano technology would go for nano-network, where the cur-
rent entire network systems would be shrunk into nanoscale with the nano-robots and
molecular machines as the elements in the near future [10]. The development of nano-
devices is shown in Fig. 1.1. With the introduction of nanotechnology, the idea of
decreasing the size of present sensor network into nano level was also proposed; but
at the same time, how to connect the nano-devices in such networks to conduct com-
plex tasks was also questioned, leading to the proposal of the nano-network, followed
by the introduction of the concept of nano-communication [11, 12].
The size can make the nano-devices reach the places where current technologies
cannot, like in-body environment or some harsh environment [11]. At the same time,
the non-invasive method can be realised or the goal of minimal wound would be
achieved. Due to the characteristics of iniquitousness and variety of the nano-sensor,
different kinds of information can be sensed and gathered together to complete com-
plicated tasks. By using bio-nano-sensors in medicine, e-health monitoring system
3

[13] can be realised, so is the e-drug delivery system [12] with the aid of nano-robots.
The ultimate goal is to connect the nano-network to the internet, by which e-office and
e-living house can be fulfilled [14].
Due to the increasingly garnered attention, more and more academic groups have
put their focuses on nano-communication since the concept was first mentioned in
2004 by Kaifu Cheng [15]. The NaNoNetworking Center in Catalonia (N3Cat) was
set up in 2009 at Universitat Politecnica de Catalunya (UPC), Spain as an initiative
of Prof. Ian F. Akyildiz and Prof. Josep Sol-Pareta with the main goal of carrying
fundamental research on nanonetworks. Now, three main projects are undergoing:
Graphene-enabled Wireless Networks-on-Chip for Massive Multicore Architectures
(GWNoCS), Graphene-enabled Wireless Communications and Fundamentals and Ap-
plications of Molecular Nanonetworks through Cell Signalling [16]. Later, Nano Com-
munications Centre (NC2) was established at Tampere University of Technology, Fin-
land to mainly study the molecular communication for nano-network where bacterial
nanonetworks, neuronal networks and calcium signalling were investigated [17]. The
PhD work of Dr. Josep Miquel Jornet was mainly on EM nano-communication at THz
band [18], under the guidance of Professor Ian F. Akyildiz whose another project was
on Molecular Nano-Communication Networks (MoNaCo) supported by the National
Science Foundation. Meanwhile, as a part of COMNET (Computer Networks) fam-
ily, a new journal, i.e., Nano Communication Networks, was published in 2010 with
Prof. Ian F. Akyildiz as the editor-in-chief, where all aspects of nano-scale networking
and communications were covered [19]. In 2014, Josep joined in University at Buffalo,
The State University of New York as a professor and built a group whose research
emphasis was put on the THz channel characterisation on the basis of the model and
design of the graphene-based plasmonic nano-antennas and nano-transceivers. To
expand the current ISM and mm-wave work at Queen Mary University of London
(QMUL) to nano-scale, the theoretical and numerical studies on the channel perform-
ance of nano-communication at THz band was initially investigated [20] [21]. To make
nano-network systematic, the IEEE has initiated the standard development project
IEEE P1906.1/Draft 1.0 Recommended Practice for Nanoscale and Molecular Com-
munication Framework to provide a definition, common framework, and common
parameters for nanoscale communication networks [22], led by S.F. Bush.
4

1.3 Applications of Nano-Networks [13]
There are a great number of potential applications of nanonetworks, which can be
mainly divided into four groups: biomedical, environmental, industrial and military
[13][12]. Detailed descriptions of the envisioned applications have been summarised
and classified in [12], shown in table 1.1. From it, we can see that nano-networks are
born for biomedical fields due to its advantages of size, bio-compatibility and bio-
stability. Nano devices spreading over the human body can monitor the human phys-
ical movement. For example, nano pressure-sensors distributed in eyes can detect
the intraocular pressure (IOP) for the early diagnosis and treatment of glaucoma to
prevent vision loss [10]. At the same time, the nano devices deployed in bones can
monitor the bone-growth in young diabetes patients to keep them from osteoporosis
[10]. Furthermore, nano-robots inside the biological tissues can detect and then elim-
inate malicious agents or cells , such as viruses or cancer cells, make the treatment less
invasive and real time [23]. Moreover, networked nano-devices will be used for or-
gan, nervous track, or tissue replacements, i.e., bio-hybrid implants. While in [14], the
concept of intelligent office was proposed, shown in Fig. 1.2. Nano-transceivers are
attached to all the elements in the office and even their internal components, which en-
ables them to connect to the Internet all the time; therefore, the user can keep track of
the location and status of all the belongings in an effortless fashion. At the same time,
all the nano-sensors can detect the user’s movement to make essential activity accord-
ing to the corresponding user’s behaviour/needs. The detailed explanation would be
given in Appx.A while the specific application such as health monitor, plant monitor
and etc. will be further explained in Chapter 2 with the structure of the nano-network.
1.4 Research Challenges
To enable nano-devices communicate with each other, many fundamental challenges
need to be addressed. As the functional devices shrink into nano-scale, design, fabric-
ation and control of the systems would require design principles which would greatly
differ from that of macro-scale [10].
• Nano-addressing is an outstanding physical challenge because of the large amount
5

Figure 1.2: Schematics of intelligent office (reproduced from [14])
6
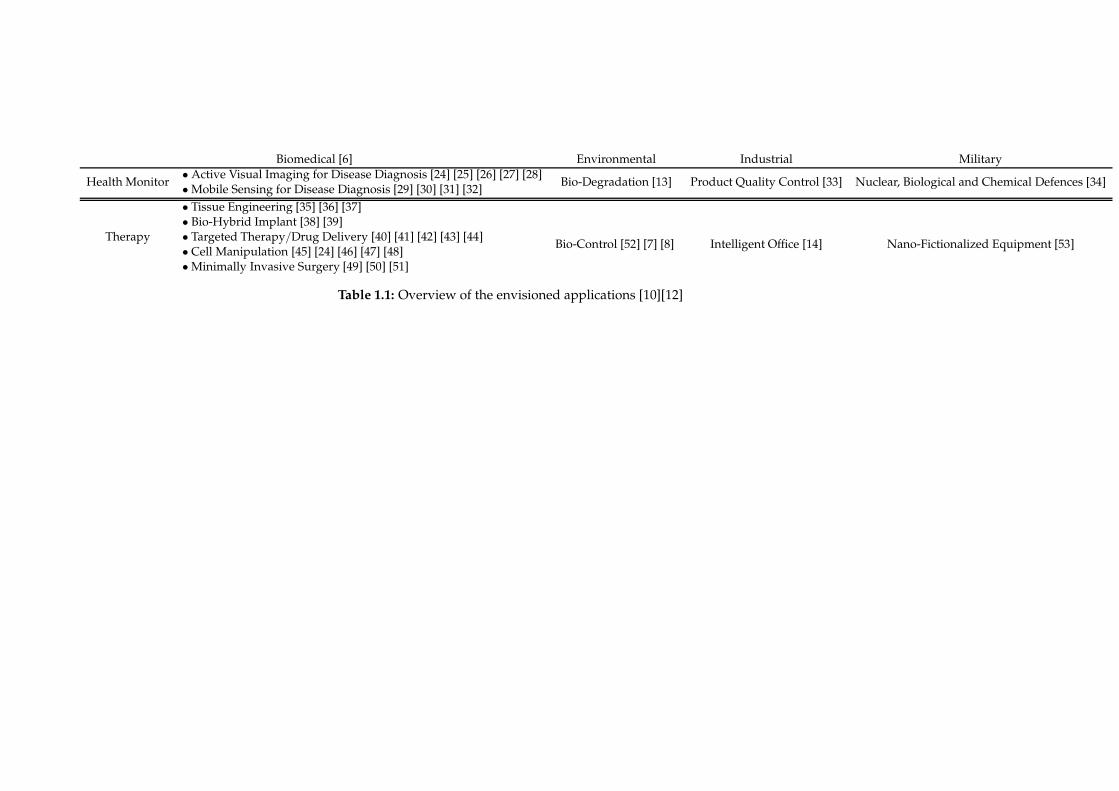
Biomedical [6] Environmental Industrial Military
• Active Visual Imaging for Disease Diagnosis [24] [25] [26] [27] [28]Health Monitor • Mobile Sensing for Disease Diagnosis [29] [30] [31] [32]
Bio-Degradation [13] Product Quality Control [33] Nuclear, Biological and Chemical Defences [34]
• Tissue Engineering [35] [36] [37]• Bio-Hybrid Implant [38] [39]• Targeted Therapy/Drug Delivery [40] [41] [42] [43] [44]• Cell Manipulation [45] [24] [46] [47] [48]
Therapy
• Minimally Invasive Surgery [49] [50] [51]
Bio-Control [52] [7] [8] Intelligent Office [14] Nano-Fictionalized Equipment [53]
Table 1.1: Overview of the envisioned applications [10][12]
of nano-sensors;
• The synchronisation between different devices at nano-scale, another essential
aspect of communication, is also a tough job, especially for large-scale distrib-
uted networks;
• Reliability and communication speed of the nano-network is another additional
challenge because most current communication schemes, e.g. molecular com-
munication, are subject to random processes and diffusion of the molecules;
• Designing the complex nano-scale devices and deploying them is fairly challen-
ging due to the current manufacture technology;
• The interface not among nano-scale components, but also between nano-scale
and macro-scale network is also difficult to deal with according to current tech-
nology;
• Very limited simulation or analysis tools of nano-scale networks have been put
forward. Since the nano-communication is a multidisciplinary topic, the differ-
ent communication paradigms should work together to complete the full task.
However, there is no such simulation platforms to model all the communication
methods.
1.5 Research Objectives
The design of reliable and efficient body-centric systems working at THz band re-
quires a detailed analysis of the communication channel. Being the human body
a lossy and dispersive medium, the effects of its existence on both antennas and
propagation channel have to be properly investigated and modelled.
The initial objectives of this research are summarised as follows:
• Is it possible to use the THz wave for the body-centric nano-communication,
especially the in-body communication?
• If so, is it possible to build the corresponding nano-system?
With these two main questions in mind, the following inquiries should be dis-
cussed and answered:
8

• What is the channel performance? Is it different from the traditional ones?
• How can we study the channel? Or what kind of tools can we use to study the
channel performance?
• If the nano-system can be built, what is the characteristics of such systems?
• What kind of tools can we use to set up such systems?
1.6 Our Contributions
With the objectives in mind, three key contributions have been achieved, which are
summarised below:
• A novel channel model was proposed with the aim to characterise Body-Centric
Nano Communication. The path loss values obtained from the simulation have
been compared with an analytical model in order to verify the feasibility of the
numerical analysis. On the basis of the path loss model and noise model, the
channel capacity is also investigated.
• A 3-D stratified skin model is built to investigate the wave propagation from the
under-skin to skin surface. Then, the influence of the rough interface between
different skin layers is investigated by introducing two detailed skin models
with different interfaces (i.e.,3-D sine and 3-D sinc functions). The effects of the
inclusion of the sweat duct was studied as well. The results show great potential
of the THz waves on sensing and communicating.
• Collagen, main constitute of epidermis of skin, was measured with the THz Time
Domain Spectroscopy (THz-TDS) system at Queen Mary University of London
(QMUL) to obtain its electromagnetic parameters with the cooperation of Blizard
Institute, London UK. At the same time, the double Debye model of the dielectric
function at THz band was studied, followed by the investigation of the power
loss.
9

1.7 Thesis Organisation
The rest of the thesis is organised as follows:
Chapter 2 presents the fundamentals of nano communication with a brief introduc-
tion to its definition, framework, and various paradigms. The development of the
micro/nano-devices is also investigated. Finally, currently available simulation plat-
forms are reviewed.
Chapter 3 gives a brief introduction to EM fundamentals of the communication from
the aspects of antennas for body-centric, especially in-body communication, present
technology of phantom applied for the study, THz technologies and the correspond-
ing channel performance, and etc..
Chapter 4 presents a thorough investigation of the possibility of THz technology ap-
plied to the nano body-centric communication based on the previous studies. A new
model is proposed to study the channel performance, i.e., path loss and noise perform-
ance. Then the capacity of the channel is studied and numerical models are built to
evaluate the proposed model.
Chapter 5 presents a detailed numerical skin model to investigate the effects of the
rough interface between different skin layers on the wave performance. First, two
skin models with different interfaces defined as 3-D sine and 3-D sinc functions are
proposed and compared with a flat model. Then, the sweat duct is included to study
the influence of its different states (with sweat as on and without sweat as off). At the
same time, the impact of the antenna location is also studied.
Chapter 6 contributes to the database of the EM parameters (mainly dielectric con-
stants) of human tissues at THz band. In this chapter, the collagen, the main constitu-
tion of skin, is cultivated and measured by the Time-Domain Spectroscopy system to
investigate the suitability to use collagen to represent the skin at the band of interest.
Then, an analytical model is proposed based on the measured dielectric constant, i.e.,
permittivity. Finally, measured power losses of the sample is compared to the theoret-
ical calculation to validate the accuracy of the model presented in Chapter 4.
Chapter 7 provides a summary of the main contributions and findings of the study
and concludes the accomplished work. Potential future research activities are also
introduced.
10
References
[1] N. Taniguchi et al., “On the basic concept of nanotechnology,” in Proc. Intl. Conf. Prod. Eng.Tokyo, Part II, Japan Society of Precision Engineering, 1974, pp. 18–23.
[2] D. K. Eric, “Engines of creation. the coming era of nanotechnology,” 1986.[3] ISO, “Nanotechnologies terminology and definitions for nano-objects nanoparticle, nan-
ofibre and nanoplate, iso/ts 27687:2008, 2008,” 2008.[4] What is Nanotechnology. [Online]. Available:
http://www.nano.gov/nanotech-101/what/definition[5] F. Allhoff, P. Lin, and D. Moore, Front Matter. Wiley Online Library, 2010.[6] R. A. Freitas, “Nanotechnology, nanomedicine and nanosurgery,” International Journal of
Surgery, vol. 3, no. 4, pp. 243–246, 2005.[7] C. M. Pieterse and M. Dicke, “Plant interactions with microbes and insects: from molecu-
lar mechanisms to ecology,” Trends in plant science, vol. 12, no. 12, pp. 564–569, 2007.[8] J. Han, J. Fu, and R. B. Schoch, “Molecular sieving using nanofilters: past, present and
future,” Lab on a Chip, vol. 8, no. 1, pp. 23–33, 2008.[9] M. C. Roco, “Nanotechnology’s future,” Scientific American, vol. 295, no. 2, pp. 39–39,
2006.[10] M. Sitti, H. Ceylan, W. Hu, J. Giltinan, M. Turan, S. Yim, and E. Diller, “Biomedical ap-
plications of untethered mobile milli/microrobots,” Proceedings of the IEEE, vol. 103, no. 2,pp. 205–224, 2015.
[11] S. F. Bush, Nanoscale Communication Networks. Artech House, 2010.[12] I. F. Akyildiz, F. Brunetti, and C. Blazquez, “Nanonetworks: A new communication
paradigm,” Computer Networks, vol. 52, no. 12, pp. 2260–2279, 2008.[13] I. F. Akyildiz and J. M. Jornet, “Electromagnetic wireless nanosensor networks,” Nano
Communication Networks, vol. 1, no. 1, pp. 3–19, 2010.[14] ——, “The internet of nano-things,” Wireless Communications, IEEE, vol. 17, no. 6, pp.
58–63, 2010.[15] C. Kaifu, “Nano-photoelectronics devices in nano-communication,” Nanoscience & Tech-
nology, vol. 3, p. 008, 2004.[16] Homepage of NanoNetworking Center in Catalonia at Universitat Politecnica de
Catalunya, Spain. [Online]. Available: http://www.n3cat.upc.edu/index[17] Homepage of Nano Communications Centre at Tampere University of Technology,
Finland. [Online]. Available: http://et4nbic.cs.tut.fi/nanocom/index.html[18] J. M. Jornet and I. F. Akyildiz, “Fundamentals of electromagnetic nanonetworks in the
terahertz band,” Foundations and Trends R© in Networking, vol. 7, no. 2-3, pp. 77–233, 2013.[19] Homepage of Nano Communication Networks. [Online]. Available:
http://www.journals.elsevier.com/nano-communication-networks[20] G. Piro, K. Yang, G. Boggia, N. Chopra, L. Grieco, and A. Alomainy, “Terahertz commu-
nications in human tissues at the nano-scale for healthcare applications,” Nanotechnology,IEEE Transactions on, 2015.
[21] K. Yang, A. Pellegrini, M. Munoz, A. Brizzi, A. Alomainy, and Y. Hao, “Numer-ical analysis and characterization of thz propagation channel for body-centric nano-communications,” Terahertz Science and Technology, IEEE Transactions on, vol. 5, no. 3, pp.419–426, May 2015.
[22] S. Bush, J. Eckford, A.and Paluh, T. Thai, T. Sato, G. Piro, Y. Chen, K. Yang, V. Rao,V.and Prasad, A. Mukherjee, T. Wysocki, E. F. Armay, A. Rafiei, and S. Goel, “IEEE draftrecommended practice for nanoscale and molecular communication framework,” IEEEP1906.1/D1.1, October 2014, pp. 1–52, Dec 2014.
[23] G. E. Santagati and T. Melodia, “Opto-ultrasonic communications for wireless intra-bodynanonetworks,” Nano Communication Networks, vol. 5, no. 1, pp. 3–14, 2014.
[24] Z. Liao, R. Gao, C. Xu, and Z.-S. Li, “Indications and detection, completion, and retentionrates of small-bowel capsule endoscopy: a systematic review,” Gastrointestinal endoscopy,vol. 71, no. 2, pp. 280–286, 2010.
11

[25] T. Nakamura and A. Terano, “Capsule endoscopy: past, present, and future,” Journal ofgastroenterology, vol. 43, no. 2, pp. 93–99, 2008.
[26] G. Pan and L. Wang, “Swallowable wireless capsule endoscopy: Progress and technicalchallenges,” Gastroenterology research and practice, vol. 2012, 2011.
[27] M. Fluckiger and B. J. Nelson, “Ultrasound emitter localization in heterogeneous media,”in Engineering in Medicine and Biology Society, 2007. EMBS 2007. 29th Annual InternationalConference of the IEEE. IEEE, 2007, pp. 2867–2870.
[28] K. Kim, L. A. Johnson, C. Jia, J. C. Joyce, S. Rangwalla, P. D. Higgins, and J. M. Rubin,“Noninvasive ultrasound elasticity imaging (uei) of crohn’s disease: animal model,” Ul-trasound in medicine & biology, vol. 34, no. 6, pp. 902–912, 2008.
[29] O. Ergeneman, G. Dogangil, M. P. Kummer, J. J. Abbott, M. K. Nazeeruddin, and B. J.Nelson, “A magnetically controlled wireless optical oxygen sensor for intraocular meas-urements,” Sensors Journal, IEEE, vol. 8, no. 1, pp. 29–37, 2008.
[30] J. M. Dubach, D. I. Harjes, and H. A. Clark, “Fluorescent ion-selective nanosensors forintracellular analysis with improved lifetime and size,” Nano Letters, vol. 7, no. 6, pp.1827–1831, 2007.
[31] J. Li, T. Peng, and Y. Peng, “A cholesterol biosensor based on entrapment of cholesteroloxidase in a silicic sol-gel matrix at a prussian blue modified electrode,” Electroanalysis,vol. 15, no. 12, pp. 1031–1037, 2003.
[32] P. Tallury, A. Malhotra, L. M. Byrne, and S. Santra, “Nanobioimaging and sensing ofinfectious diseases,” Advanced drug delivery reviews, vol. 62, no. 4, pp. 424–437, 2010.
[33] J. W. Aylott, “Optical nanosensorsan enabling technology for intracellular measure-ments,” Analyst, vol. 128, no. 4, pp. 309–312, 2003.
[34] P. Avouris, G. Dresselhaus, and M. Dresselhaus, “Carbon nanotubes: synthesis, structure,properties and applications,” Topics in Applied Physics, 2000.
[35] S. Tasoglu, E. Diller, S. Guven, M. Sitti, and U. Demirci, “Untethered micro-robotic codingof three-dimensional material composition,” Nature communications, vol. 5, 2014.
[36] I. J. Fox, G. Q. Daley, S. A. Goldman, J. Huard, T. J. Kamp, and M. Trucco, “Use of differ-entiated pluripotent stem cells as replacement therapy for treating disease,” Science, vol.345, no. 6199, p. 1247391, 2014.
[37] S. Kim, F. Qiu, S. Kim, A. Ghanbari, C. Moon, L. Zhang, B. J. Nelson, and H. Choi, “Fab-rication and characterization of magnetic microrobots for three-dimensional cell cultureand targeted transportation,” Advanced Materials, vol. 25, no. 41, pp. 5863–5868, 2013.
[38] K. E. Drexler, Nanosystems: molecular machinery, manufacturing, and computation. JohnWiley & Sons, Inc., 1992.
[39] R. A. Freitas, “What is nanomedicine?” Nanomedicine: Nanotechnology, Biology and Medi-cine, vol. 1, no. 1, pp. 2–9, 2005.
[40] R. Fernandez-Pacheco, C. Marquina, J. G. Valdivia, M. Gutierrez, M. S. Romero, R. Cor-nudella, A. Laborda, A. Viloria, T. Higuera, A. Garcıa et al., “Magnetic nanoparticles forlocal drug delivery using magnetic implants,” Journal of Magnetism and Magnetic Materials,vol. 311, no. 1, pp. 318–322, 2007.
[41] R. A. Freitas, “Pharmacytes: An ideal vehicle for targeted drug delivery,” Journal of Nanos-cience and Nanotechnology, vol. 6, no. 9-10, pp. 2769–2775, 2006.
[42] B. P. Timko, T. Dvir, and D. S. Kohane, “Remotely triggerable drug delivery systems,”Advanced materials, vol. 22, no. 44, pp. 4925–4943, 2010.
[43] S. Yim and M. Sitti, “Shape-programmable soft capsule robots for semi-implantable drugdelivery,” Robotics, IEEE Transactions on, vol. 28, no. 5, pp. 1198–1202, 2012.
[44] R. W. Carlsen and M. Sitti, “Bio-hybrid cell-based actuators for microsystems,” Small,vol. 10, no. 19, pp. 3831–3851, 2014.
[45] C.-J. Chen, D. Y. Haik, and J. Chatterjee, “Development of nanotechnology for biomedicalapplications,” in Emerging Information Technology Conference, 2005. IEEE, 2005, pp. 4–pp.
[46] E. B. Steager, M. S. Sakar, C. Magee, M. Kennedy, A. Cowley, and V. Kumar, “Automatedbiomanipulation of single cells using magnetic microrobots,” The International Journal ofRobotics Research, vol. 32, no. 3, pp. 346–359, 2013.
12

[47] T. Kawahara, M. Sugita, M. Hagiwara, F. Arai, H. Kawano, I. Shihira-Ishikawa, andA. Miyawaki, “On-chip microrobot for investigating the response of aquatic microorgan-isms to mechanical stimulation,” Lab on a Chip, vol. 13, no. 6, pp. 1070–1078, 2013.
[48] D.-H. Kim, P. K. Wong, J. Park, A. Levchenko, and Y. Sun, “Microengineered platforms forcell mechanobiology,” Annual review of biomedical engineering, vol. 11, pp. 203–233, 2009.
[49] K.-C. Kong, J. Cha, D. Jeon, and D.-i. D. Cho, “A rotational micro biopsy device for thecapsule endoscope,” in Intelligent Robots and Systems, 2005.(IROS 2005). 2005 IEEE/RSJInternational Conference on. IEEE, 2005, pp. 1839–1843.
[50] P. Miloro, E. Sinibaldi, A. Menciassi, and P. Dario, “Removing vascular obstructions: achallenge, yet an opportunity for interventional microdevices,” Biomedical microdevices,vol. 14, no. 3, pp. 511–532, 2012.
[51] S. Yim, E. Gultepe, D. H. Gracias, and M. Sitti, “Biopsy using a magnetic capsule endo-scope carrying, releasing, and retrieving untethered microgrippers,” Biomedical Engineer-ing, IEEE Transactions on, vol. 61, no. 2, pp. 513–521, 2014.
[52] M. Heil and J. Ton, “Long-distance signalling in plant defence,” Trends in plant science,vol. 13, no. 6, pp. 264–272, 2008.
[53] A. M. Andrew, “Nanomedicine, volume 1: Basic capabilities,” Kybernetes, vol. 29, no.9/10, pp. 1333–1340, 2000.
13

Chapter 2
Preliminaries of
Nano-Communication
In this chapter, the fundamentals such as the definition, framework, structure and
paradigms of nano-communication will be discussed. In addition, a brief review of
the development of small-scale devices will be given. In the end, different simulation
platforms will also be reviewed briefly with an emphasis on the state-of-art.
2.1 Definition of Nano-Communication
Nano-communication has been a hot topic since its proposal, so is its concept. Below
are some explanations on both nano-network and nano-communication from the open
literatures:
• ”... there are many nano-scale networks embedded within each device that
might be otherwise more effectively utilized for communication. ...” (2006) [1]
• ”Nanonetworks. i.e., the interconnection of nano-machines are expected to ex-
pand the capabilities of single nano-machines by allowing them to cooperate
and share information.” (2008) [2]
14
• ”Nanonetworks are communication networks that exist mostly or entirely at the
nanometer scale.” (2010) [3]
• ”Nanocommunication is the exchange of information at the nanoscale and it is
at the basis of any wired/wireless interconnection of nanomachines in a nanon-
etwork.” (2011) [4]
• ”As the name indicates, nano-communication encapsulates the communication
between devices at the nano-scale applying novel and modified communication
and radio propagation principles in comparison to conventional and existing
solutions.” (2015) [5]
• ”Nanonetworking is an emerging field, communicating among nanomachines,
expanding the capacity of single nanomachine.” (2015)[6]
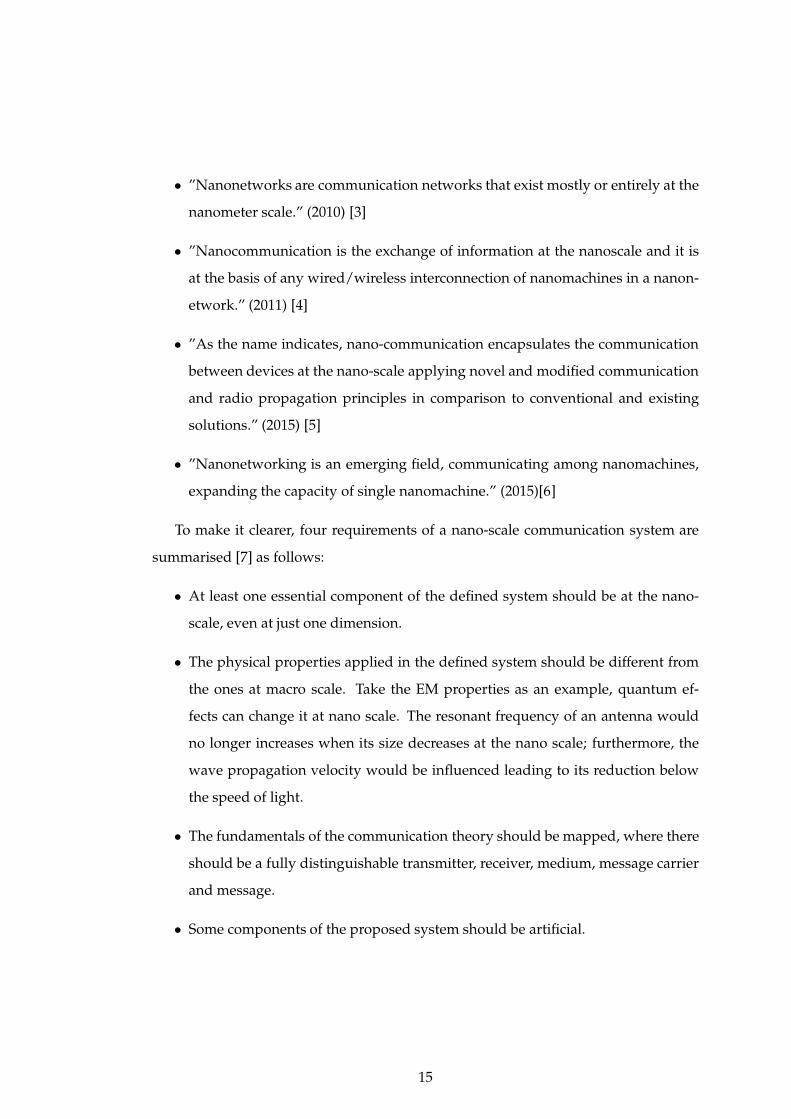
To make it clearer, four requirements of a nano-scale communication system are
summarised [7] as follows:
• At least one essential component of the defined system should be at the nano-
scale, even at just one dimension.
• The physical properties applied in the defined system should be different from
the ones at macro scale. Take the EM properties as an example, quantum ef-
fects can change it at nano scale. The resonant frequency of an antenna would
no longer increases when its size decreases at the nano scale; furthermore, the
wave propagation velocity would be influenced leading to its reduction below
the speed of light.
• The fundamentals of the communication theory should be mapped, where there
should be a fully distinguishable transmitter, receiver, medium, message carrier
and message.
• Some components of the proposed system should be artificial.
15
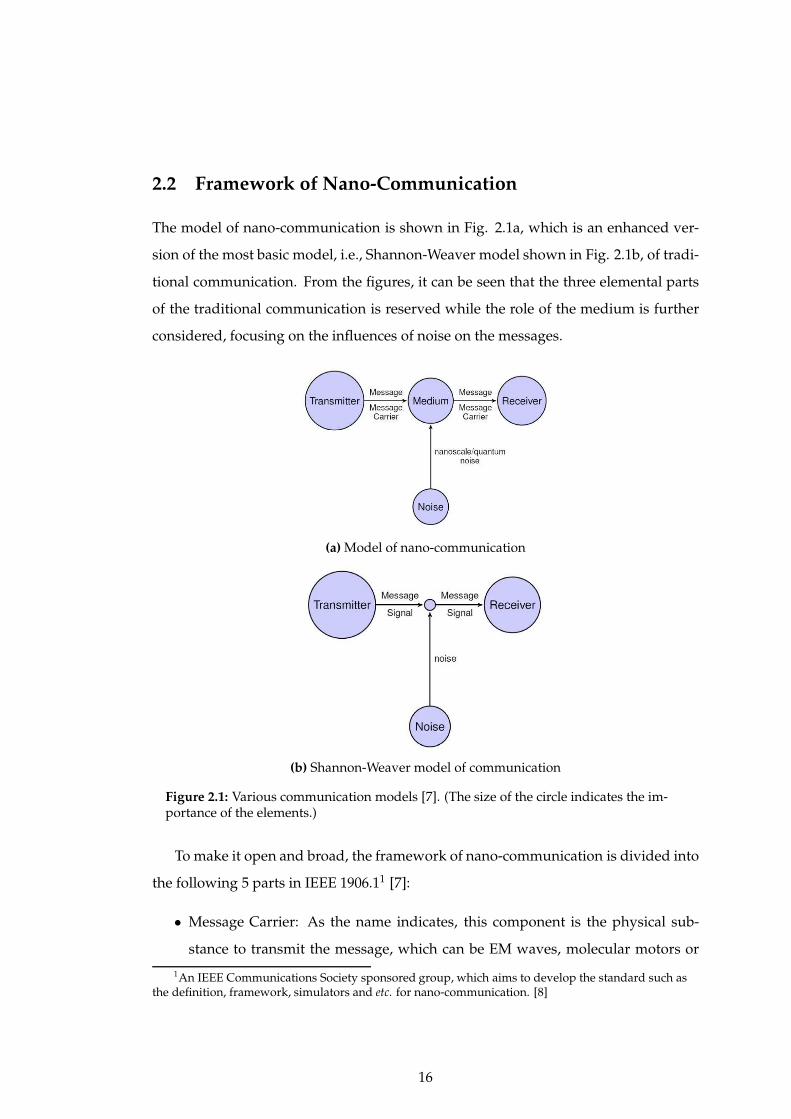
2.2 Framework of Nano-Communication
The model of nano-communication is shown in Fig. 2.1a, which is an enhanced ver-
sion of the most basic model, i.e., Shannon-Weaver model shown in Fig. 2.1b, of tradi-
tional communication. From the figures, it can be seen that the three elemental parts
of the traditional communication is reserved while the role of the medium is further
considered, focusing on the influences of noise on the messages.
(a) Model of nano-communication
(b) Shannon-Weaver model of communication
Figure 2.1: Various communication models [7]. (The size of the circle indicates the im-portance of the elements.)
To make it open and broad, the framework of nano-communication is divided into
the following 5 parts in IEEE 1906.11 [7]:
• Message Carrier: As the name indicates, this component is the physical sub-
stance to transmit the message, which can be EM waves, molecular motors or
1An IEEE Communications Society sponsored group, which aims to develop the standard such asthe definition, framework, simulators and etc. for nano-communication. [8]
16
even nano-bots. Since the message carrier is minute (for molecular commu-
nication) or the equipment to produce the carrier is small (for the EM, acous-
tic communication), the principle at nano scale should be obeyed, for example,
huge surface to mass ratio, Brownian motion (for molecular communication) or
slow wave propagation and Surface Plasmon Polariton wave along graphene to
hugely reduce the antenna size (for EM communication).
• Motion: This part is to make the message carrier move, which can be either
active or passive; but the force to move the carrier is not steerable, leading to the
random or semi-random motion at the nano-scale.
• Field: Unlike motion part, this element is to guide the message carrier [9], which
can be attached to the message carrier or applied externally to the nano-scale
communication system. It can be modelled as a mathematical vector field to
describe the phenomenon such as organised fluid flow, diffusion gradients, EM
fields, microtubule rails, or any other form of well-defined coordinated message
carrier organisation.
• Perturbation: Similar to modulation in traditional communication systems, per-
turbation part could produce controlled variation to introduce the symbols of
the message. On the other hand, it should be more abstract and broader because
it should contain any controllable modifications in the nano-scale system. To cre-
ate a message, some aspects of the massage carrier should be modified, which
is the process of perturbation. The aspects which can be altered include molecu-
lar structure modification, particle concentration variation, voltage level change
through nano-wires and specificity change of the receiver. It should be poin-
ted out that unlike macro scale, much more forms of perturbation could exist,
besides EM ways.
• Specificity and Sensitivity: These two terms were first proposed to measure the
performance of the molecular communication. Specificity measures the propor-
tion of message carrier that are not received by the wrong receiver while sens-
itivity is to quantify the proportion of message carrier which are received by
correctly intended receiver [7]. The reason to put forward such terms is that
17
in nano bio-systems binding is a natural phenomena but from the communica-
tion perspective it should be regarded as message lost when the message carrier
binds with another entity along the path to the intended receiver; thus, the goal
is to avoid such bindings to the wrong receivers between the transmitters and
receivers. To promote these to EM technique, specificity may refer to as the tun-
ing and resonance with the appropriate receiving antenna while the sensitivity
is the capability of the receiver to detect the signal.
2.3 State-of-Art Achievement of Devices due to Nano-Technologies
Due to the developments in micro-fabrication and nano-technologies, the limits of
the sizes and capabilities of devices have been pushed further and further. A cheap
Integrated Chip (IC), whose cost would be less than 1 dollar, was designed by National
Applied Research Laboratories, Taiwan using sensor fusion technologies, shown in
Fig. 2.2a. From the figure, it can be easily seen that the chip is smaller than a grain
of rice. A full-duplex transceiver IC, shown in Fig. 2.2b were presented by Harish
Keishnaswamy from Clumnia High-Speed and mm-wave IC Lab (CoSMIC Lab) at
the International Solid State Circuits Conference [10] in 2015, whose size is extremely
small.
To access the complex and small regions of the human body like gatrointestinal(GI),
spinal cord, blood capillaries, the present tethered medical devices are made smal-
ler and smaller. At the same time, the discomfort due to the tissue loss would be
decreased. The micro-robots voyaging around human body has been developed re-
cently. For example, a tiny permanent magnet, guided inside the human body by a
magnetic stereotaxis system was proposed in [12] while a magnetically driven screw
was made to move through tissues [13]. Micro-mechanical flying insect robots were
first created in 2000 at University of California, Berkeley [14] and then later a solar-
powered crawling robot was realised by Prof. Kristofer S.J. Pister in 2003 [15]. The first
medical-used capsule endoscopes, to replace the traditional ones, were applied clinic-
ally in 2001 with the FDA’s approval. Later the introduction of a crawling mechanism
[16] and on-board drug delivery mechanism [17] were marked as another milestone
for the development of the capsule endoscopy. A nano-scallop - capable of swimming
18
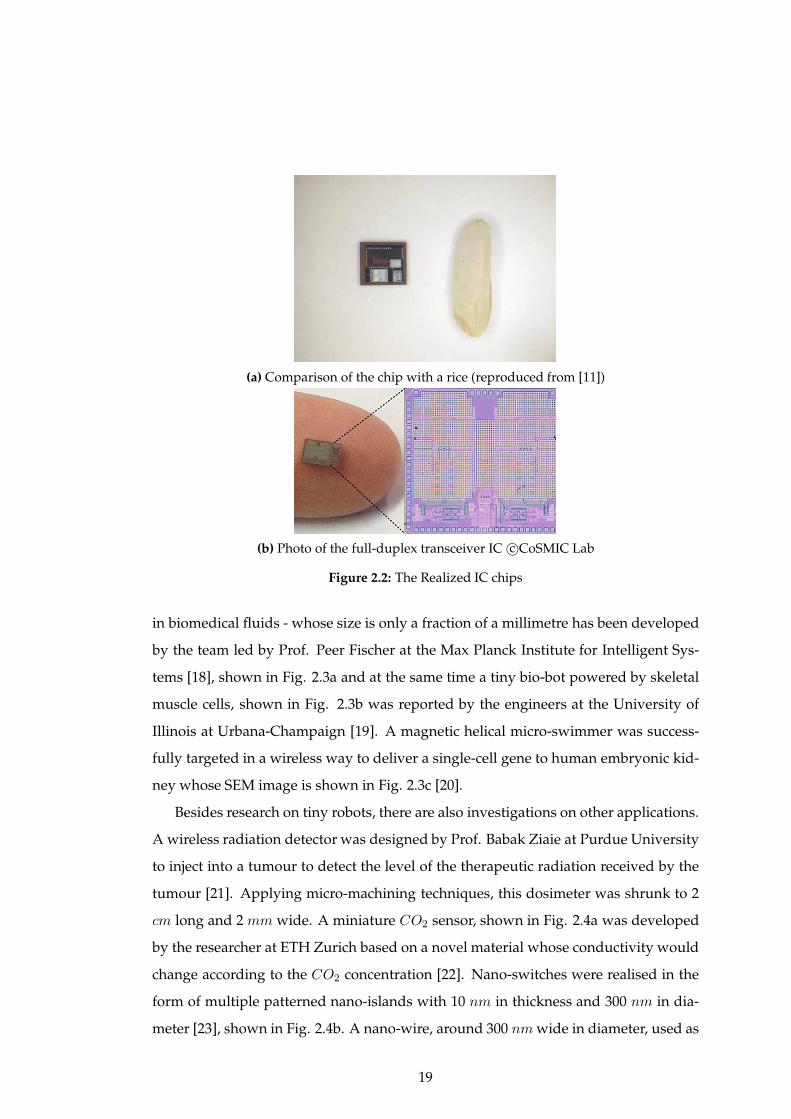
(a) Comparison of the chip with a rice (reproduced from [11])
(b) Photo of the full-duplex transceiver IC c©CoSMIC Lab
Figure 2.2: The Realized IC chips
in biomedical fluids - whose size is only a fraction of a millimetre has been developed
by the team led by Prof. Peer Fischer at the Max Planck Institute for Intelligent Sys-
tems [18], shown in Fig. 2.3a and at the same time a tiny bio-bot powered by skeletal
muscle cells, shown in Fig. 2.3b was reported by the engineers at the University of
Illinois at Urbana-Champaign [19]. A magnetic helical micro-swimmer was success-
fully targeted in a wireless way to deliver a single-cell gene to human embryonic kid-
ney whose SEM image is shown in Fig. 2.3c [20].
Besides research on tiny robots, there are also investigations on other applications.
A wireless radiation detector was designed by Prof. Babak Ziaie at Purdue University
to inject into a tumour to detect the level of the therapeutic radiation received by the
tumour [21]. Applying micro-machining techniques, this dosimeter was shrunk to 2
cm long and 2 mm wide. A miniature CO2 sensor, shown in Fig. 2.4a was developed
by the researcher at ETH Zurich based on a novel material whose conductivity would
change according to the CO2 concentration [22]. Nano-switches were realised in the
form of multiple patterned nano-islands with 10 nm in thickness and 300 nm in dia-
meter [23], shown in Fig. 2.4b. A nano-wire, around 300 nm wide in diameter, used as
19

(a) Nano-scallop which can swim in bio-fluids (reproduced from [18])
(b) Bio-bot powered by skeletal muscle cells c©UIUC
(c) SEM image of the artificial bacterial flagella (reproduced from [20])
Figure 2.3: Photos of the nano-bots which can be used in human body
20

solar cell was studied in 2007 in Harvard University and it shows a great potential for
producing 200 picowatts of electricity, which is believed enough for the nano-devices.
The SEM image of this nano-wire was shown in Fig. 2.4c [24]. Also, due to the recent
advances in nano-optics, the design and fabrication of the nano-lasers is possible [25],
the SEM image and corresponding schematics is shown in Fig. 2.5.
2.4 Various Paradigms of Nano-Communication
To connect the nano-devices, the communication between them need to be completed.
According to [2], nano-communication can be divided into two scenarios: (1) Commu-
nication between a nano-machine and a larger system such as micro/macro-system,
and (2) Communication between two or more nano-devices. Furthermore, the ways
of electromagnetic, acoustic, nanomechanical or molecular can all be applied to nano-
communications [26] which will be discussed in this section.
2.4.1 Molecular Paradigms
As the origin of the idea of the nano-communication, molecular communication are
considered as the most promising paradigm to achieve the nano-communication be-
cause there are numerous examples in nature for us to learn and study. In molecu-
lar communication, an engineered miniature transmitter releases small particles into a
propagation medium while the molecules are applied to encode, transmit, and receive
information. Molecular communication can be classified into several categories such
as walkway-based where molecules propagate along a predefined pathway via mo-
lecular motors, flow-based where molecules propagate in a guided fluidic medium,
diffusion-based where molecules propagate in a fluidic medium via spontaneous dif-
fusion and etc. [27]. As the most general and widespread scheme found in nature, the
diffusion-based molecular communication (DMC) is also the most widely investigated
in literature. Some of the most prominent works include mathematical framework for
a physical end-to-end channel model for DMC [28], development of an energy model
for DMC [29], modeling of diffusion noise [30], channel codes for reliability enhance-
ment [31], and relaying-based solutions for increasing the range of DMC [32, 33]. On
21
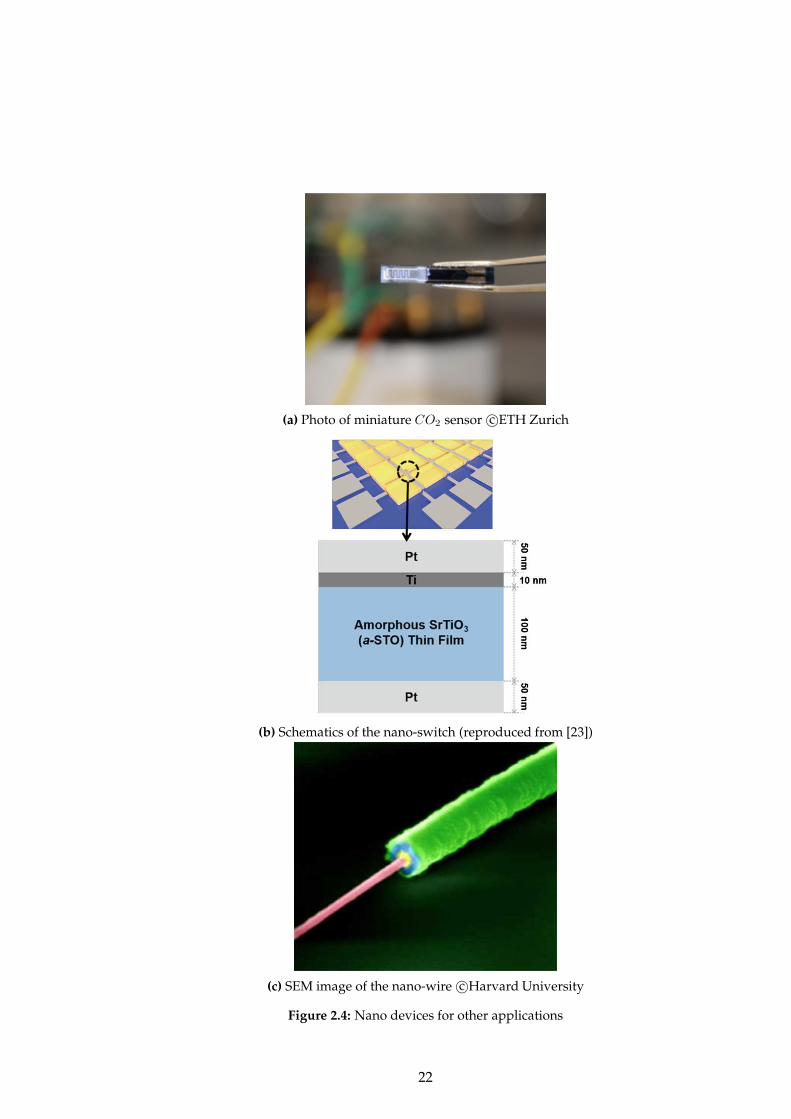
(a) Photo of miniature CO2 sensor c©ETH Zurich
(b) Schematics of the nano-switch (reproduced from [23])
(c) SEM image of the nano-wire c©Harvard University
Figure 2.4: Nano devices for other applications
22
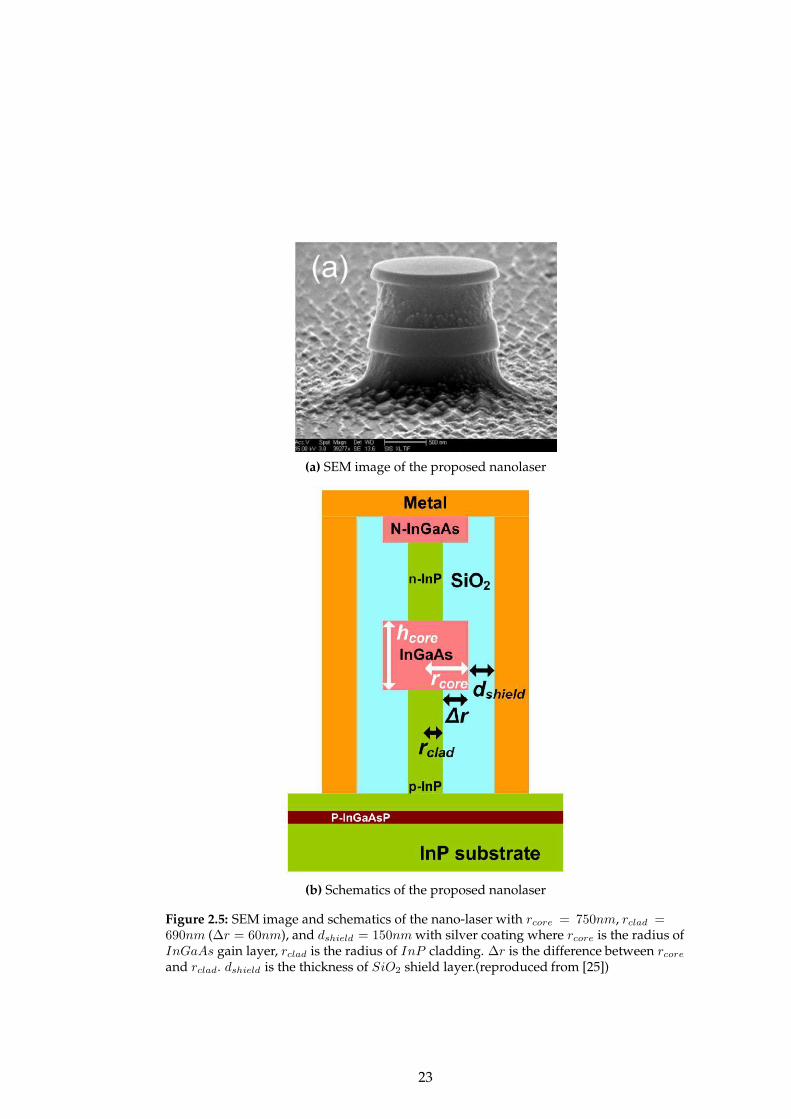
(a) SEM image of the proposed nanolaser
(b) Schematics of the proposed nanolaser
Figure 2.5: SEM image and schematics of the nano-laser with rcore = 750nm, rclad =690nm (∆r = 60nm), and dshield = 150nm with silver coating where rcore is the radius ofInGaAs gain layer, rclad is the radius of InP cladding. ∆r is the difference between rcoreand rclad. dshield is the thickness of SiO2 shield layer.(reproduced from [25])
23
the other hand, the flow-based molecular communication (FMC) is also studied, espe-
cially the one of communication in the circulatory system [34, 35].
Diffusion-Based Molecular Communication
In diffusion-based molecular communication, molecules are used to encode, trans-
mit, and receive information, which propagate through spontaneous diffusion in a
fluidic medium. Massimiliano and Ian developed a mathematical framework to inter-
pret diffusion-based particle communication in details in 2010 [36], where the general
model can be divided into three parts: emission, diffusion and reception. By investig-
ating these three parts individually, the total attenuation and delay was also studied.
And the closed-form mathematical expression for the information capacity of DMC
was provided later in 2013 [37], which depends on the medium diffusion coefficient,
the system temperature, the distance between the transmitter and the receiver, the
bandwidth of the transmitted signal and the average transmitted power. Pulse-based
modulation scheme [38] was studied, where two detection techniques, energy detec-
tion techniques where the nano-receivers measure the energy of the molecular pulse
and amplitude detection where the nano-receiver measures the variation of local con-
centration were compared, showing that energy detection is more robust and suitable
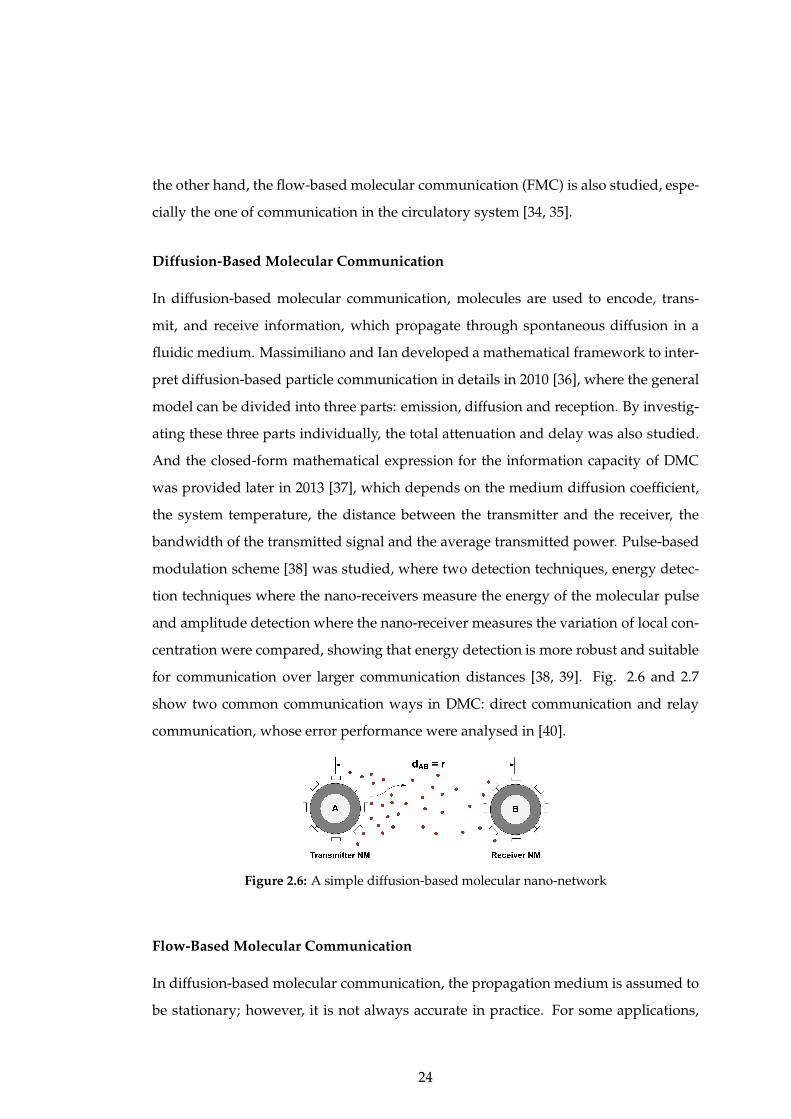
for communication over larger communication distances [38, 39]. Fig. 2.6 and 2.7
show two common communication ways in DMC: direct communication and relay
communication, whose error performance were analysed in [40].
Figure 2.6: A simple diffusion-based molecular nano-network
Flow-Based Molecular Communication
In diffusion-based molecular communication, the propagation medium is assumed to
be stationary; however, it is not always accurate in practice. For some applications,
24

Figure 2.7: A simple nano-network with network coding operation
a drift velocity of the medium may be used to boost the throughput of the molecu-
lar communication systems, such as the scenario that the propagation medium are
human blood, rivers or wind. Thus, flow-based molecular communication started to
catch people’s attention. Usually, in molecular communication, information can be
encoded in various ways, such as in the release time of the molecules (timing mod-
ulation) [41, 42], in the concentration of the molecules or number of molecules per
unit area (concentration modulation) [36, 43], in the number of molecules (amplitude
modulation) [44], or in the identities of the molecules and etc.. [42] first studied the
case of molecules with timing modulation in the fluidic medium which refers as to
the fact that the messenger molecules propagate in the fluid, propelled by a posit-
ive drift velocity and Brownian motion, where the channel was pointed out to be an
Additional Inverse Gaussian Noise channel. Then, flow-based molecular communic-
ation with concentration modulation was initially analysed by Ian in 2013 [43], where
a flow model of microfluidic channel has been proposed and an end-to-end concen-
tration propagation model was developed. To yield the transfer function, the building
blocks, shown in Fig. 2.8, of micro-fluidic channel were introduced. Later, flow-based
molecular communication with amplitude modulation scheme was investigated [44],
where the close form of the probability of error for different schemes (i.e., 2 amplitude
levels, 4 amplitude levels and hybrid scheme), was derived. A more general flow-
based molecular communication model has been proposed recently which can be ap-
plied to both Molecule Shift Keying (MoSK) and Concentration Shift Keying (CSK)
[45], where the effects of the moving medium on the signal propagation and Bit Error
25

Rate (BER) performance was investigated. The noise characterisation was also stud-
ied in [46, 47], which shows that it can be divided into two additive elements for the
medium Brownian noise nb(t) ∼ N (0, s(t)) 2, caused by the random thermal motion
of the molecules which can be described by the Wiener process, and Residual noise
nr(t) ∼ N (α, β) 3, caused by messenger molecules existing in the receiver sensing
area from previous transmissions or messenger molecules that have been released by
the receptors.
(a) straight block (b) turning block
(c) division block (d) combination block
Figure 2.8: Building blocks of the microfluidic channels [43]
Based on the development of the nanotechnology, a new paradigm of touch com-
munication (TouchCom) 4 was also proposed in [34], which use a swarm of nano-
robots as message carrier for information exchange. In TouchCom, transiet microbots
(TMs) [48–50] were applied to carry the drug particles, which can be controlled and
tracked by the external macro-unit (MAU) with a guiding force [35, 51]. These TMs
would survive some time in body and their pathway would be the channel for the
information exchange while the process of loading and unloading is the correspond-
ing transmitting and receiving process. A specific application, illustrated in [34], is
shown in Fig. 2.9 while the structure of the applied nano-robots is shown in Fig. 2.10.
The channel model of TouchCom was derived by defining the propagation delay, path
loss with the angular/delay spectra of the signal strength. Meanwhile, a simulation
2 s(t) is the mean number of messenger molecules in the receiver sensing area.3 α and β depend on the medium and system design factors (such as the propagation area, trans-
mission rate and etc.).4Here, touch means the communication (i.e., drug delivery) process is controllable and trackable.
26

tool was proposed to characterise the movement of the nano-robot swarm in the blood
vessel.
Figure 2.9: Envisioned TouchCom system [34]
Figure 2.10: Structure of the envisioned nano-robots [34]
2.4.2 Electromagnetic Paradigm
As the name indicates, electromagnetic methods use the electromagnetic wave as the
carrier and its properties like amplitude, phase and etc. are used to encode the inform-
ation.
The possibility of EM communication is first discussed in [27], where THz EM
waves travelling in the air were thoroughly investigated. THz band was chosen be-
cause the emerging new materials like Carbon Nano-Tube (CNT) and Graphene [52]
can work at this frequency band as the necessary element to make the nano-transceiver.
Later, [53] demonstrates the theoretical model of the nano-network whose nodes are
made of CNT. Later, the channel model for THz wave propagating in the air with dif-
ferent concentration of the water vapour was presented in [54] and the corresponding
channel capacity was also studied. Based on the characteristics of the channel, a new
physical- layer aware medium access control (MAC) protocol, Time Spread On-Off
27

Keying (TS-OOK), was proposed [55]. Meanwhile, the applications of THz techno-
logy in imaging and medical field [56, 57] have also achieved great development and
the biological effects of THz radiation are reviewed in [58] showing minimum effect
on the human body and no strong evidence of hazardous side effects.
A modified Friis equation has been proposed by Jornet et al. in [54] to calculate the
path loss of the THz channel in water vapour, which can be divided into two parts:
the spread path loss introduced by the expansion of the wave in the medium and the
absorption path loss caused by the absorption of molecules in the air:
PL = PLspr + PLabs [dB] (2.1)
Later, a more detailed model of THz communication was proposed with the con-
sideration of multi-ray scenario; thus, the propagation models for reflection, scatter-
ing and diffraction were considered in [59]. At the same time, the scattering effects of
small particles was discussed with the analysis frequency and the impulse responses
[60]. Also, the Finite-Difference Time-Domain (FDTD) and the Ray-Tracing (RT) tech-
nique were compared to evaluate the reception quality in nanonetwork with the con-
sideration of two cases: line-of-sight (LOS) and multiple objects dispersed near the
LOS [61]; then, the conclusion was drawn that at the THz band RT is as good as FDTD.
Meanwhile, a discussion of the use of VHF band was conducted with the study of the
bit error rate (BER) performance of the nano-receiver made of CNT [62].
The noise power at the receiver can be obtained [54]:
Pn(f, d) =
∫
BN(f, d)df = kB
∫
BTnoise(f, d)df
≃ kB
∫
BTmol(f, d)df
(2.2)
where, Tmol is the equivalent noise temperature due to molecular absorption; kB is the
Boltzmann constant; To is the reference temperature.
The path loss and molecular noise power of the air with 10% water vapour are
shown in Fig. 2.11 and details of EM methods, especially THz wave, will be further
discussed in Chapter 3.
28

(a) Total path loss [dB] vs. frequency and the distance
(b) Molecular absorption noise temperature [K] vs. frequency and thedistance
Figure 2.11: Path loss and molecular absorption noise temperature for 10% water con-centration [54]
29

2.4.3 Acoustic Paradigm
Acoustic propagation introduces slight pressure variations in the fluid or solid me-
dium, which could satisfy Helmholtz equation when the time dependence is con-
sidered [63]:
∇2p(x) + k2p(x) = 0 (2.3)
where ∇2 is the Laplace differential operator and k = ωc + iα is the complex-valued
wave vector with c as the sound speed in the medium and α as the attenuation coeffi-
cient of the sound wave in the medium, which is different from medium to medium.
By solving Eq. 2.3, the sound pressure can be obtained to describe the sound wave
propagation in the medium, where the source of the sound is the motion of the sur-
face in the nano-robot. The behaviour of the nano robots is relevant to their physical
properties, surrounding medium and the working frequency. The feasibility of in vivo
ultrasonic communication is evaluated by Hogg et. al. [64], where communication ef-
fectiveness, power requirements and effects on nearby tissue were examined on the
basis of discussion on the principles. And an isolated robot, shown in Fig. 2.12a and
an aggregated robot were designed to use in blood vessel, whose size are around 10
µm. Later, the nanoscale opto-ultrasonic communications in biological tissues was
discussed in [65, 66], where the generation, propagation model were studied and in
line with [64] the hazards and design challenges were investigated.
2.5 Structure of Nano-Network to Specific Applications
A simple overview of structure of nano-network was briefly mentioned in Section
2.4.1, where the TouchCom is discussed. Similar to the traditional body-centric com-
munication, the nano-one can also be divided into three parts: in-body, on-body and
off-body. An overview of the structure of nano-network can be summarised as below
[67]:
• Nano-nodes: they are the smallest and simplest nano-devices. Due to the lim-
ited energy, limited memory and reduced communication capabilities, they can
only perform simple computation task and can only transmit over very short
distances. The nodes could be composed of sensor and communication units,
30
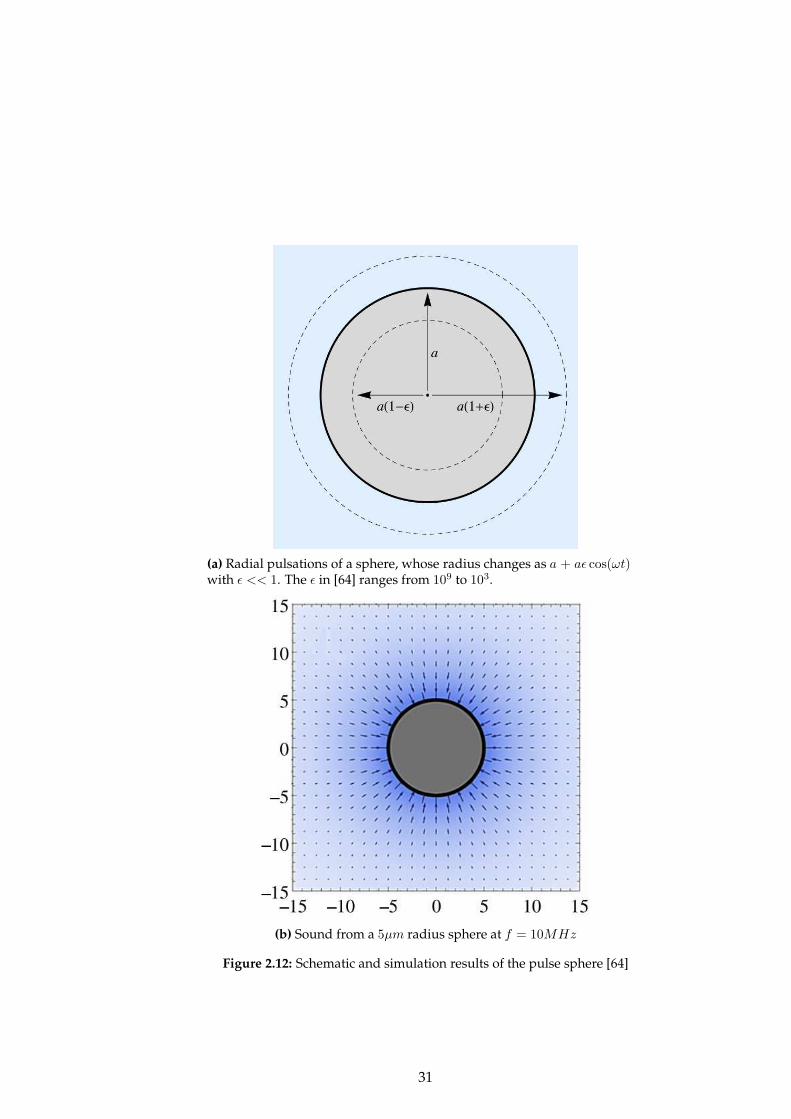
(a) Radial pulsations of a sphere, whose radius changes as a + aǫ cos(ωt)with ǫ << 1. The ǫ in [64] ranges from 109 to 103.
(b) Sound from a 5µm radius sphere at f = 10MHz
Figure 2.12: Schematic and simulation results of the pulse sphere [64]
31
which is shown in 2.14.
• Nano-routers: since they are nano-devices with slightly larger computational
resources than nano-nodes, they can aggregate information from limited nano-
machines and also can control the behaviour of nano-nodes by sending extremely
simple order (such as on/off, sleep, read value, etc.). However, this would in-
crease their size; thus, their deployment would be more invasive.
• Nano-micro interface: they are used to collect the information forwarded by
nano-routers and send the information to the micro-scale devices. At the same
time, they can send the information from micro-scale to nano-scale by the same
way. Nano-micro interfaces are hybrid devices not only able to communicate in
the nano-scale using the nano-communication techniques shown in Section 2.4
but also can use classical communication paradigms in micro/macro commu-
nication networks.
• Gateway: it makes the users to control or monitor the entire system remotely
over the Internet.
Fig. 2.13 shows an example of health monitor system with nano-network: the
nano-machines spreading over the clothes can sense the change of the surrounding
and make the corresponding response to protect the user or make the user comfort-
able; the nano-sensors inside the body can sense the body information to indicate the
health level, for example, nano-sensors around the heart can monitor the activity of
the heart to indicate the health level of the host while the ones in neuro-system can
also detect the abnormal situation such as stroke and pain to help the host in time;
nano-phones can entertain the user in the process of exercise or make a phone call,
but much more importantly, it can be used as the nano-micro interface and the nano
social tags inside the users’ body can be used as the identity which could make the
communication between people much more convenient.
The network architecture of the e-office, part of internet of nano-things (IoNT) is
shown in Fig. 2.14. In the e-office, every single element normally found in an office
and even its internal components are provided with a nano devices which allows them
to be permanently connected to the Internet. As a result, the location and status of all
32
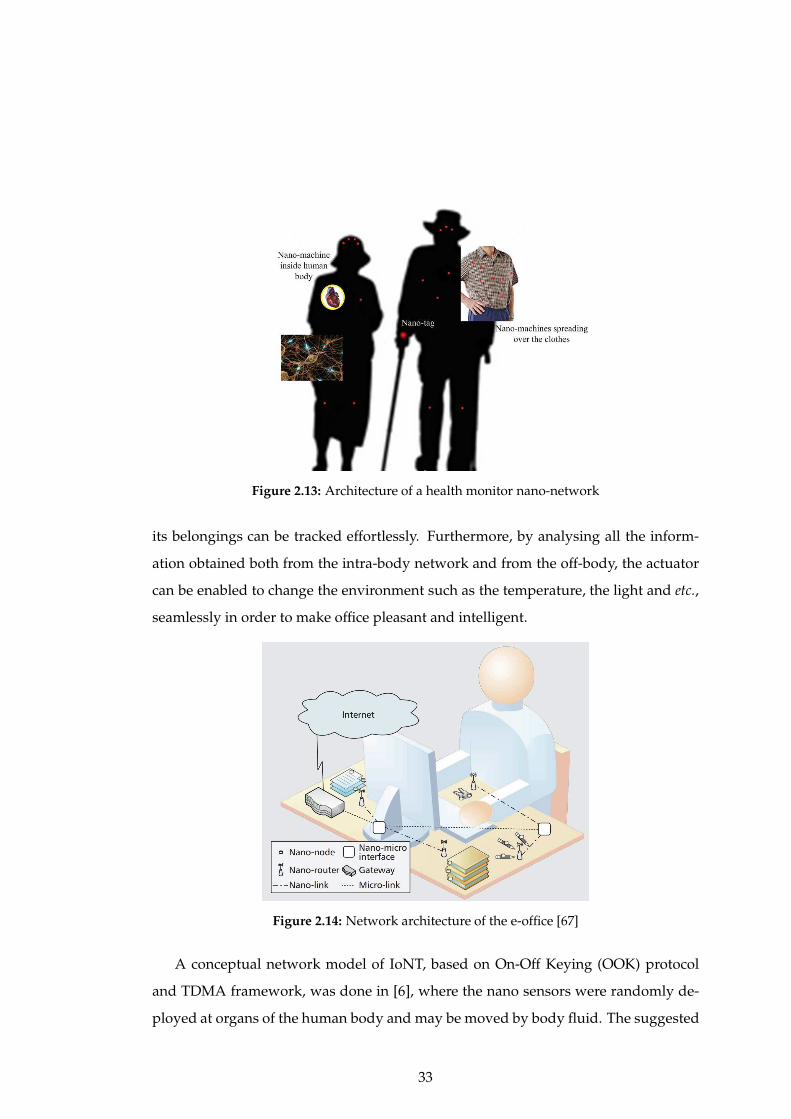
Figure 2.13: Architecture of a health monitor nano-network
its belongings can be tracked effortlessly. Furthermore, by analysing all the inform-
ation obtained both from the intra-body network and from the off-body, the actuator
can be enabled to change the environment such as the temperature, the light and etc.,
seamlessly in order to make office pleasant and intelligent.
Figure 2.14: Network architecture of the e-office [67]
A conceptual network model of IoNT, based on On-Off Keying (OOK) protocol
and TDMA framework, was done in [6], where the nano sensors were randomly de-
ployed at organs of the human body and may be moved by body fluid. The suggested
33

model assumes hexagonal cell-based nano-sensors deployed in cylindrical shape 3-D
hexagonal pole, which is closer to the shape of organs. The network architecture of
the IoNT for intra-body disease detection is shown in Fig. 2.15a. As normal, the net-
work contains nano-sensors, nano-routers, nano-micro interface and gateway. When
nano-sensors detect specific symptoms or virus by means of molecules [52] or bacteria
behaviours [68], simple data (e.g., 1 for detection or 0 for non-detection) will be trans-
mitted over short ranges to nano-routers to inform the existence of symptoms or virus
because of the limited capacity of the nano-sensors. Because of the relatively more
computational resources, nano-routers can aggregate the data and send the related in-
formation to the nano-micro interface. The gateway (i.e., micro-scale device) enable
the remote control of the entire system over the Internet possible. Each cell, the smal-
lest living unit of organs, is considered as a hexagonal shape cell, shown in Fig. 2.15b,
resulting a 3-D structure for the nano-sensor networks. A 3-D space for the individual
target organ, for example, heart, lungs, and kidney, is constructed by the accumulated
unit layers which consist of unit cells. As many nano-sensors as possible are put in the
model where each hexagonal cell has one active nano-sensor.
Nano-sensors within each layer construct a cluster, where the information sensed
by each nano-sensor can be transmitted to the nano-micro interface through the nano-
router of each cluster. Each hexagonal cell may have more than one nano-sensors. To
make the load of the energy consumption evenly distributing in the nano-networks,
only the nano-sensor with the most energy can be selected as the active nano-sensor
while the others will go into the sleep mode which would be used for the next data
transmission. The information detected by the nano-sensors would be transmitted
within the occurrence layer to the nano-router at the center cell (annulus A0) of the
same layer which are also served as an active nano-sensor. Then the data collected by
the nano-router of each layer are sent to layer 0’s nano-router which will forward the
collected data to the nano-micro interface to communicate with micro scale devices,
i.e., gateway. From Fig. 2.15, it can be seen that there are three transmission methods:
• Direct data transmission: the data would be sent directly from the nano-sensor
to the corresponding nano-router [69].
• Multi-hop data transmission: the data would be sent to the adjacent nano-sensors
34

which locate in the neighbour cell and is randomly selected until the correspond-
ing nano-router is reached in the way of annulus by annulus hierarchically.
• Hybrid data transmission: the data can be sent by combining the multi-hop and
direct transmission methods. First, a threshold range is defined. Then, within
the threshold range, every nano-sensor sends the data directly to the nano-router
in the same layer. Otherwise, the multi-hop transmission should be used when
the nano-sensor is outside the range.
Similarly, there are also three data transmission methods between layers, shown in
Fig. 2.15b.
Fig. 2.16 shows an example of using nano-network for agricultural crop-monitor
[70]. The chemical compound released by plants can be caught by the nano-sensors
and such information can be sent to the micro-devices to analyse the knowledge of en-
vironmental conditions and plant interaction patterns; thus, an enhanced chemical de-
fence systems could be developed or the underground soil condition can be retrieved
by using plants as sensors. A large numbers of nano-devices equipped with chem-
ical nano-sensors and THz radio units are deployed on the plant, which can transfer
the data detected to a micro-scale networking device over a short distance, where the
transmission frequency can be dynamically selected in order to optimise throughput
of the network. The hierarchical structure of this monitoring network is illustrated in
Fig. 2.16a where numerous nano-sensors are situated on the plant through suspen-
sion in a spray applied to the plants [70]. The chemical nano-devices deployed in the
nano-network comprise a power block and a communication block along with relev-
ant sensors, processing and storage units. The nano-devices are supposed randomly
scattered on the plant leaves and cluster are formed based on their location and prox-
imity to micro-devices which are located at specified points on the stem to manage
clusters of nano-devices, shown in Fig. 2.16b. The information can only be sent by
single-hopped way which means that there is no NLoS.
35
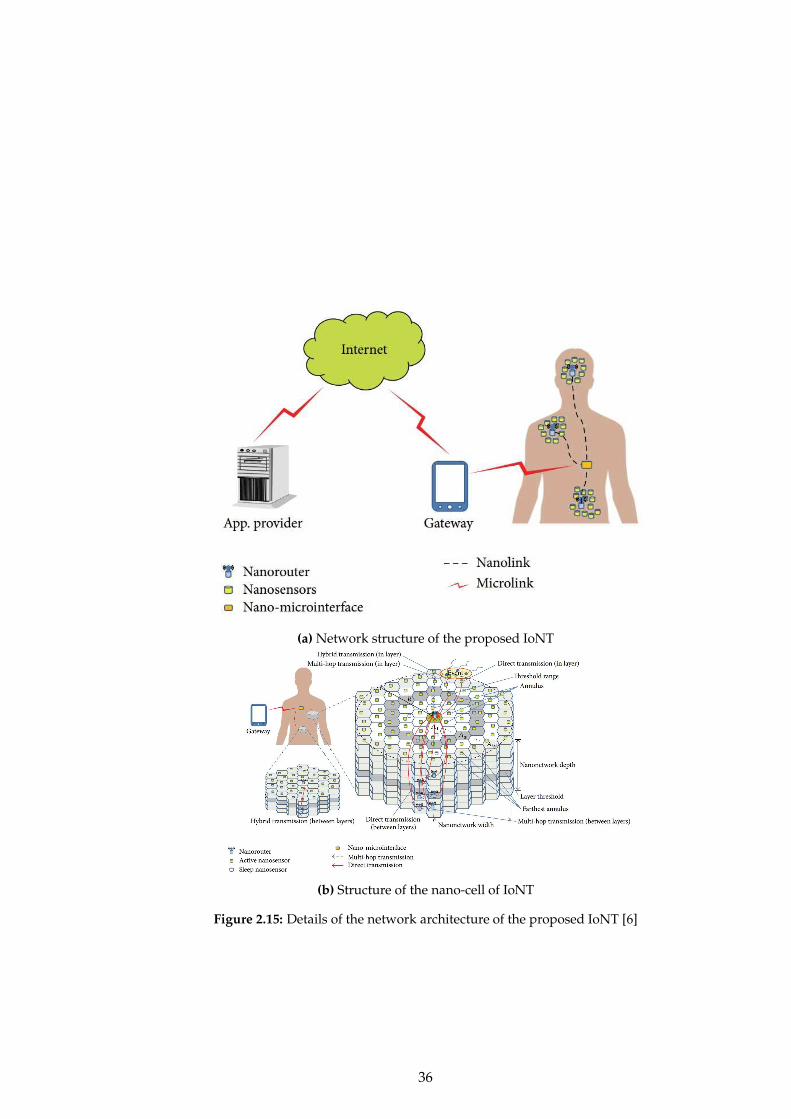
(a) Network structure of the proposed IoNT
(b) Structure of the nano-cell of IoNT
Figure 2.15: Details of the network architecture of the proposed IoNT [6]
36
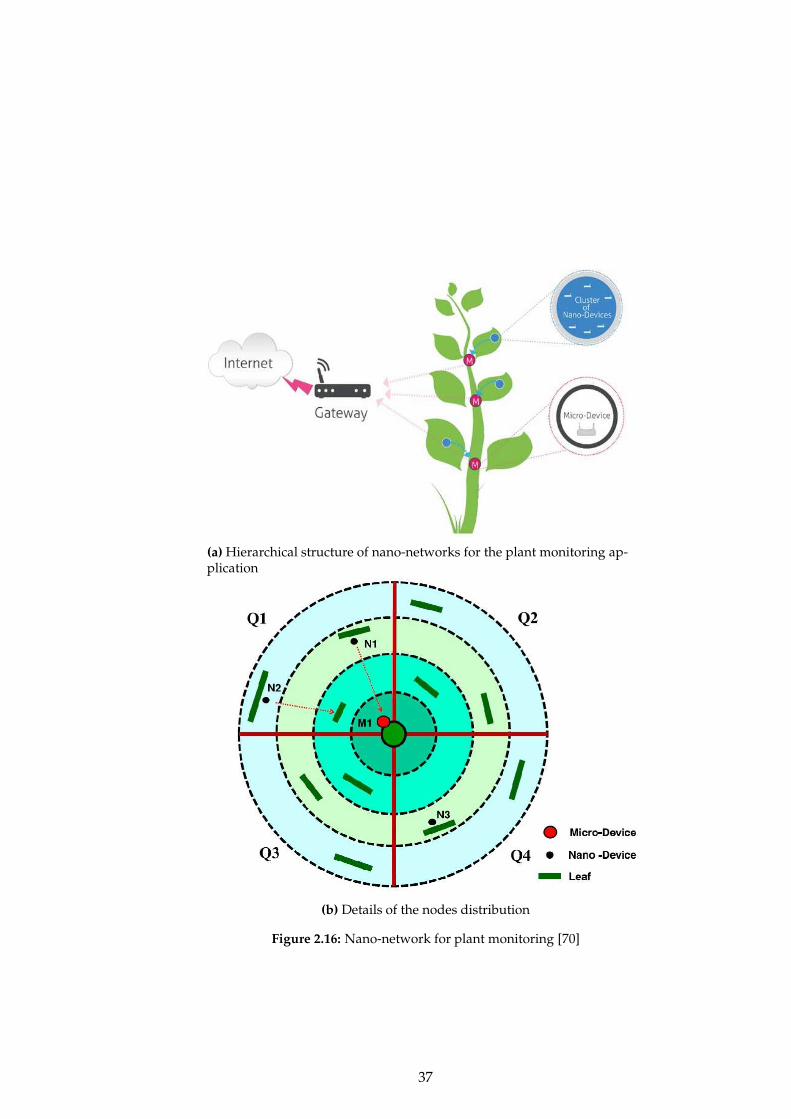
(a) Hierarchical structure of nano-networks for the plant monitoring ap-plication
(b) Details of the nodes distribution
Figure 2.16: Nano-network for plant monitoring [70]
37
2.6 Available Simulators of Nano-Communication
With the wide acceptance of nano-communication, increasingly numerous researches
are on the exploration of novel protocol stacks, network architectures, algorithm com-
munication paradigms and channel access procedures to be adopted at the nanoscale
[3, 67, 71]; therefore, a modular and freely available simulation platform is indispens-
able to enable research activities to achieve the final goal of nano-communication.
NanoNS [72] and N2Sim [73] are simulators for molecular diffusion based on Brownian
motion among immobile nano-devices. A simulator of Brownian motion was invest-
igated in [74] where a dual time-step approach was adopted to manage the runtime
complexity to deal with the large number of the simulated particles: for the particle
far from the destination, its movement is simulated in a coarse-grained time steps;
and when it comes closer to the destination, the fine-grained time steps would be
applied. The simulator development of molecular diffusion using High Level Ar-
chitecture (HLA) is reviewed in 2013 [75] while [76] proposed a generic simulation
platform to fit in with multiple nano-devices, channel models, molecular propagation
models and nano-devices mobility models. However, the platforms mentioned above
are all related to short-range molecular communication. To accommodate the long-
range communication, the neuron-based communication platform was developed and
evaluated in [77]. At the same time, an open source simulator for EM-based nano-
networks, namely Nano-Sim, is proposed in [78, 79], implemented on the top of the
Network Simulator 3 (NS-3) platform [80]. Nano-Sim was designed as an open source
modular tool to allow the community to devise, add, and test new functionalities and
solutions intended for the Terahertz wireless communications. Unfortunately, none of
these simulators could capture all features characterising the nano-communication as
one completed platform; thus, a novel simulation tool is being developed as a refer-
ence simulation model in IEEE P1906.1 [7] which is open-source and extensible.
2.7 Summary
In this chapter, a brief overview of the nano-communication was given starting from
what is nano-network, followed by a brief summary of how to build a nano-network.
Then, current developments of small-scale devices were summarised and various
38
paradigms of nano-communication were illustrated where the emphasis was put on
three main methods: molecular communication (DMC and FMC), EM communica-
tion and acoustic communication. Additionally, the structure of nano-network was
analysed with the consideration of specific applications. Finally, a brief introduction
to the available simulation platform was summarised to make the whole concept of
nano-communication complete.
39

References
[1] S. F. Bush and Y. Li, “Nano-communications: A new field? an exploration into a carbonnanotube communication network,” GE Global Research Technical Report, 2006.
[2] I. F. Akyildiz, F. Brunetti, and C. Blazquez, “Nanonetworks: A new communicationparadigm,” Computer Networks, vol. 52, no. 12, pp. 2260–2279, 2008.
[3] S. F. Bush, Nanoscale Communication Networks. Artech House, 2010.[4] I. F. Akyildiz, J. M. Jornet, and M. Pierobon, “Nanonetworks: A new frontier in commu-
nications,” Communications of the ACM, vol. 54, no. 11, pp. 84–89, 2011.[5] K. Yang, A. Pellegrini, M. Munoz, A. Brizzi, A. Alomainy, and Y. Hao, “Numer-
ical analysis and characterization of thz propagation channel for body-centric nano-communications,” Terahertz Science and Technology, IEEE Transactions on, vol. 5, no. 3, pp.419–426, May 2015.
[6] S. J. Lee, C. A. Jung, K. Choi, and S. Kim, “Design of wireless nanosensor networks forintrabody application,” International Journal of Distributed Sensor Networks, vol. 2015, 2015.
[7] S. Bush, J. Eckford, A.and Paluh, T. Thai, T. Sato, G. Piro, Y. Chen, K. Yang, V. Rao,V.and Prasad, A. Mukherjee, T. Wysocki, E. F. Armay, A. Rafiei, and S. Goel, “IEEE draftrecommended practice for nanoscale and molecular communication framework,” IEEEP1906.1/D1.1, October 2014, pp. 1–52, Dec 2014.
[8] “IEEE P1906.1,” https://standards.ieee.org/develop/project/1906.1.html.[9] S. Bush and S. Goel, “Persistence length as a metric for modeling and simulation of nano-
scale communication networks,” Selected Areas in Communications, IEEE Journal on, vol. 31,no. 12, pp. 815–824, 2013.
[10] J. Zhou, T.-H. Chuang, T. Dinc, and H. Krishnaswamy, “19.1 receiver with¿ 20mhz band-width self-interference cancellation suitable for fdd, co-existence and full-duplex applic-ations,” in Solid-State Circuits Conference-(ISSCC), 2015 IEEE International. IEEE, 2015, pp.1–3.
[11] Multi-sensing ic for internet of things produced in taiwai. [Online]. Available:http://technews.tw/2015/03/24/multi-sensor-soc-made-by-narlabs/
[12] D. C. Meeker, E. H. Maslen, R. C. Ritter, and F. M. Creighton, “Optimal realization ofarbitrary forces in a magnetic stereotaxis system,” Magnetics, IEEE Transactions on, vol. 32,no. 2, pp. 320–328, 1996.
[13] K. Ishiyama, M. Sendoh, A. Yamazaki, and K. Arai, “Swimming micro-machine drivenby magnetic torque,” Sensors and Actuators A: Physical, vol. 91, no. 1, pp. 141–144, 2001.
[14] J. Yan, S. Avadhanula, J. Birch, M. Dickinson, M. Sitti, T. Su, and R. Fearing, “Wing trans-mission for a micromechanical flying insect,” Journal of Micromechatronics, vol. 1, no. 3,pp. 221–237, 2001.
[15] S. Hollar, A. Flynn, C. Bellew, and K. Pister, “Solar powered 10 mg silicon robot,” in MicroElectro Mechanical Systems, 2003. MEMS-03 Kyoto. IEEE The Sixteenth Annual InternationalConference on. IEEE, 2003, pp. 706–711.
[16] M. Quirini, A. Menciassi, S. Scapellato, C. Stefanini, and P. Dario, “Design and fabric-ation of a motor legged capsule for the active exploration of the gastrointestinal tract,”Mechatronics, IEEE/ASME Transactions on, vol. 13, no. 2, pp. 169–179, 2008.
[17] S. Yim and M. Sitti, “Design and rolling locomotion of a magnetically actuated soft cap-sule endoscope,” Robotics, IEEE Transactions on, vol. 28, no. 1, pp. 183–194, 2012.
[18] T. Qiu, T.-C. Lee, A. G. Mark, K. I. Morozov, R. Munster, O. Mierka, S. Turek, A. M.Leshansky, and P. Fischer, “Swimming by reciprocal motion at low reynolds number,”Nature communications, vol. 5, 2014.
[19] C. Cvetkovic, R. Raman, V. Chan, B. J. Williams, M. Tolish, P. Bajaj, M. S. Sakar, H. H.Asada, M. T. A. Saif, and R. Bashir, “Three-dimensionally printed biological machinespowered by skeletal muscle,” Proceedings of the National Academy of Sciences, vol. 111,no. 28, pp. 10 125–10 130, 2014.
[20] F. Qiu, S. Fujita, R. Mhanna, L. Zhang, B. R. Simona, and B. J. Nelson, “Magnetic hel-ical microswimmers functionalized with lipoplexes for targeted gene delivery,” Advanced
40

Functional Materials, vol. 25, no. 11, pp. 1666–1671, 2015.[21] C. Son and B. Ziaie, “A wireless implantable passive microdosimeter for radiation onco-
logy,” Biomedical Engineering, IEEE Transactions on, vol. 55, no. 6, pp. 1772–1775, 2008.[22] C. Willa, J. Yuan, M. Niederberger, and D. Koziej, “When nanoparticles meet poly (ionic
liquid) s: Chemoresistive co2 sensing at room temperature,” Advanced Functional Materi-als, vol. 25, no. 17, pp. 2537–2542, 2015.
[23] H. Nili, S. Walia, A. E. Kandjani, R. Ramanathan, P. Gutruf, T. Ahmed, S. Balendhran,V. Bansal, D. B. Strukov, O. Kavehei et al., “Donor-induced performance tuning ofamorphous srtio3 memristive nanodevices: Multistate resistive switching and mechan-ical tunability,” Advanced Functional Materials, 2015.
[24] B. Tian, X. Zheng, T. J. Kempa, Y. Fang, N. Yu, G. Yu, J. Huang, and C. M. Lieber, “Coaxialsilicon nanowires as solar cells and nanoelectronic power sources,” Nature, vol. 449, no.7164, pp. 885–889, 2007.
[25] J. H. Lee, M. Khajavikhan, A. Simic, Q. Gu, O. Bondarenko, B. Slutsky, M. P. Nezhad,and Y. Fainman, “Electrically pumped sub-wavelength metallo-dielectric pedestal pillarlasers,” Optics express, vol. 19, no. 22, pp. 21 524–21 531, 2011.
[26] A. M. Andrew, “Nanomedicine, volume 1: Basic capabilities,” Kybernetes, vol. 29, no.9/10, pp. 1333–1340, 2000.
[27] I. F. Akyildiz and J. M. Jornet, “Electromagnetic wireless nanosensor networks,” NanoCommunication Networks, vol. 1, no. 1, pp. 3–19, 2010.
[28] M. Pierobon and I. Akyildiz, “A Physical End-to-End Model for Molecular Communica-tion in Nanonetworks,” IEEE J. Sel. Areas Commun., vol. 28, no. 4, pp. 602–611, May 2010.
[29] M. kr Kuran, H. B. Yilmaz, T. Tugcu, and B. zerman, “Energy Model for Communicationvia Diffusion in Nanonetworks,” J. Nano Commun. Networks, vol. 1, no. 2, pp. 86 – 95, 2010.
[30] M. Pierobon and I. Akyildiz, “Diffusion-Based Noise Analysis for Molecular Communic-ation in Nanonetworks,” IEEE Trans. Signal Process., vol. 59, no. 6, pp. 2532–2547, June2011.
[31] P.-J. Shih, C.-H. Lee, P.-C. Yeh, and K.-C. Chen, “Channel Codes for Reliability Enhance-ment in Molecular Communication,” IEEE J. Sel. Areas Commun., vol. 31, no. 12, pp. 857–867, December 2013.
[32] A. Einolghozati, M. Sardari, and F. Fekri, “Relaying in Diffusion-based Molecular Com-munication,” in IEEE International Symposium on Information Theory (ISIT), July 2013, pp.1844–1848.
[33] T. Nakano and J.-Q. Liu, “Design and Analysis of Molecular Relay Channels: An Inform-ation Theoretic Approach,” IEEE Trans. NanoBioscience, vol. 9, no. 3, pp. 213–221, Sept2010.
[34] Y. Chen, P. Kosmas, P. Anwar, and L. Huang, “A touch-communication framework fordrug delivery based on a transient microbot system,” Nanobioscience, IEEE Transactionson, vol. 14, no. 4, pp. 397–408, 2015.
[35] I. Khalil, V. Magdanz, S. Sanchez, O. Schmidt, L. Abelmann, and S. Misra, “Magnetic con-trol of potential microrobotic drug delivery systems: Nanoparticles, magnetotactic bac-teria and self-propelled microjets,” in Engineering in Medicine and Biology Society (EMBC),2013 35th Annual International Conference of the IEEE, July 2013, pp. 5299–5302.
[36] M. Pierobon and I. F. Akyildiz, “A physical end-to-end model for molecular communic-ation in nanonetworks,” Selected Areas in Communications, IEEE Journal on, vol. 28, no. 4,pp. 602–611, 2010.
[37] ——, “Capacity of a diffusion-based molecular communication system with channelmemory and molecular noise,” Information Theory, IEEE Transactions on, vol. 59, no. 2,pp. 942–954, 2013.
[38] I. Llatser, A. Cabellos-Aparicio, M. Pierobon, and E. Alarcon, “Detection Techniques forDiffusion-based Molecular Communication,” IEEE J. Sel. Areas Commun., vol. 31, no. 12,pp. 726–734, December 2013.
[39] A. Aijaz and A.-H. Aghvami, “Error Performance of Diffusion-Based Molecular Com-munication Using Pulse-Based Modulation,” IEEE Trans. NanoBiosci, vol. 14, no. 1, pp.
41

146–151, Jan 2015.[40] A. Aijaz, A. Aghvami, and M. Nakhai, “On Error Performance of Network Coding in
Diffusion-Based Molecular Nanonetworks,” IEEE Trans. Nanotechnol., vol. 13, no. 5, pp.871–874, Sept 2014.
[41] A. W. Eckford, “Molecular communication: Physically realistic models and achievableinformation rates,” arXiv preprint arXiv:0812.1554, 2008.
[42] K. Srinivas, A. W. Eckford, and R. S. Adve, “Molecular communication in fluid media:The additive inverse gaussian noise channel,” Information Theory, IEEE Transactions on,vol. 58, no. 7, pp. 4678–4692, 2012.
[43] A. O. Bicen and I. Akyildiz, “System-theoretic analysis and least-squares design of mi-crofluidic channels for flow-induced molecular communication,” Signal Processing, IEEETransactions on, vol. 61, no. 20, pp. 5000–5013, 2013.
[44] A. Singhal, R. K. Mallik, and B. Lall, “Performance of amplitude modulation schemesfor molecular communication over a fluid medium,” in Personal, Indoor, and Mobile RadioCommunication (PIMRC), 2014 IEEE 25th Annual International Symposium on. IEEE, 2014,pp. 785–789.
[45] H. ShahMohammadian, G. G. Messier, and S. Magierowski, “Nano-machine molecularcommunication over a moving propagation medium,” Nano Communication Networks,vol. 4, no. 3, pp. 142–153, 2013.
[46] M. Pierobon and I. F. Akyildiz, “Diffusion-based noise analysis for molecular communic-ation in nanonetworks,” Signal Processing, IEEE Transactions on, vol. 59, no. 6, pp. 2532–2547, 2011.
[47] H. ShahMohammadian, G. G. Messier, and S. Magierowski, “Optimum receiver for mo-lecule shift keying modulation in diffusion-based molecular communication channels,”Nano Communication Networks, vol. 3, no. 3, pp. 183–195, 2012.
[48] S.-W. Hwang, H. Tao, D.-H. Kim, H. Cheng, J.-K. Song, E. Rill, M. A. Brenckle, B. Pan-ilaitis, S. M. Won, Y.-S. Kim et al., “A physically transient form of silicon electronics,”Science, vol. 337, no. 6102, pp. 1640–1644, 2012.
[49] S. Martel, M. Mohammadi, O. Felfoul, Z. Lu, and P. Pouponneau, “Flagellated mag-netotactic bacteria as controlled mri-trackable propulsion and steering systems for med-ical nanorobots operating in the human microvasculature,” The International journal ofrobotics research, vol. 28, no. 4, pp. 571–582, 2009.
[50] S. Martel, O. Felfoul, J.-B. Mathieu, A. Chanu, S. Tamaz, M. Mohammadi, M. Mankiewicz,and N. Tabatabaei, “Mri-based medical nanorobotic platform for the control of magneticnanoparticles and flagellated bacteria for target interventions in human capillaries,” TheInternational journal of robotics research, vol. 28, no. 9, pp. 1169–1182, 2009.
[51] Y. Chen, P. Kosmas, and R. Wang, “Conceptual design and simulations of a nano-communication model for drug delivery based on a transient microbot system,” in An-tennas and Propagation (EuCAP), 2014 8th European Conference on. IEEE, 2014, pp. 63–67.
[52] M. R. da Costa, O. Kibis, and M. Portnoi, “Carbon nanotubes as a basis for terahertzemitters and detectors,” Microelectronics Journal, vol. 40, no. 4, pp. 776–778, 2009.
[53] C. E. Koksal and E. Ekici, “A nanoradio architecture for interacting nanonetworkingtasks,” Nano Communication Networks, vol. 1, no. 1, pp. 63–75, 2010.
[54] J. M. Jornet and I. F. Akyildiz, “Channel modeling and capacity analysis for electromag-netic wireless nanonetworks in the terahertz band,” Wireless Communications, IEEE Trans-actions on, vol. 10, no. 10, pp. 3211–3221, 2011.
[55] J. M. Jornet, J. C. Pujol, and J. S. Pareta, “Phlame: A physical layer aware mac protocolfor electromagnetic nanonetworks in the terahertz band,” Nano Communication Networks,vol. 3, no. 1, pp. 74–81, 2012.
[56] C. S. Joseph, A. N. Yaroslavsky, V. A. Neel, T. M. Goyette, and R. H. Giles, “Continuouswave terahertz transmission imaging of nonmelanoma skin cancers,” Lasers in Surgeryand Medicine, vol. 43, no. 6, pp. 457–462, 2011.
[57] E. Jung, H. Park, K. Moon, M. Lim, Y. Do, H. Han, H. J. Choi, B.-H. Min, S. Kim, I. Parket al., “Thz time-domain spectroscopic imaging of human articular cartilage,” Journal of
42
Infrared, Millimeter, and Terahertz Waves, vol. 33, no. 6, pp. 593–598, 2012.[58] G. J. Wilmink and J. E. Grundt, “Invited review article: current state of research on bio-
logical effects of terahertz radiation,” Journal of Infrared, Millimeter, and Terahertz Waves,vol. 32, no. 10, pp. 1074–1122, 2011.
[59] C. Han, A. Bicen, and I. Akyildiz, “Multi-ray channel modeling and wideband charac-terization for wireless communications in the terahertz band,” Wireless Communications,IEEE Transactions on, vol. PP, no. 99, pp. 1–1, 2015.
[60] J. Kokkoniemi, J. Lehtomaki, K. Umebayashi, and M. Juntti, “Frequency and time do-main channel models for nanonetworks in terahertz band,” Antennas and Propagation,IEEE Transactions on, vol. 63, no. 2, pp. 678–691, Feb 2015.
[61] K. Kantelis, S. Amanatiadis, C. Liaskos, N. Kantartzis, N. Konofaos, P. Nicopolitidis, andG. Papadimitriou, “On the use of fdtd and ray-tracing schemes in the nanonetwork en-vironment,” Communications Letters, IEEE, vol. 18, no. 10, pp. 1823–1826, Oct 2014.
[62] J. Lehtomaki, A. Bicen, and I. Akyildiz, “On the nanoscale electromechanical wirelesscommunication in the vhf band,” Communications, IEEE Transactions on, vol. 63, no. 1, pp.311–323, Jan 2015.
[63] A. L. Fetter and J. D. Walecka, Theoretical mechanics of particles and continua. CourierCorporation, 2003.
[64] T. Hogg and R. A. Freitas Jr, “Acoustic communication for medical nanorobots,” NanoCommunication Networks, vol. 3, no. 2, pp. 83–102, 2012.
[65] G. E. Santagati and T. Melodia, “Opto-ultrasonic communications in wireless body areananonetworks,” in Signals, Systems and Computers, 2013 Asilomar Conference on. IEEE,2013, pp. 1066–1070.
[66] ——, “Opto-ultrasonic communications for wireless intra-body nanonetworks,” NanoCommunication Networks, vol. 5, no. 1, pp. 3–14, 2014.
[67] I. F. Akyildiz and J. M. Jornet, “The internet of nano-things,” Wireless Communications,IEEE, vol. 17, no. 6, pp. 58–63, 2010.
[68] Y.-M. Lin, C. Dimitrakopoulos, K. A. Jenkins, D. B. Farmer, H.-Y. Chiu, A. Grill, andP. Avouris, “100-ghz transistors from wafer-scale epitaxial graphene,” Science, vol. 327,no. 5966, pp. 662–662, 2010.
[69] M. Pierobon, J. M. Jornet, N. Akkari, S. Almasri, and I. F. Akyildiz, “A routing frameworkfor energy harvesting wireless nanosensor networks in the terahertz band,” Wireless net-works, vol. 20, no. 5, pp. 1169–1183, 2014.
[70] A. Afsharinejad, A. Davy, and B. Jennings, “Dynamic channel allocation in electromag-netic nanonetworks for high resolution monitoring of plants,” Nano Communication Net-works, 2015.
[71] S. Balasubramaniam and J. Kangasharju, “Realizing the internet of nano things: chal-lenges, solutions, and applications,” Computer, no. 2, pp. 62–68, 2013.
[72] E. Gul, B. Atakan, and O. B. Akan, “Nanons: A nanoscale network simulator frameworkfor molecular communications,” Nano Communication Networks, vol. 1, no. 2, pp. 138–156,2010.
[73] I. Llatser, I. Pascual, N. Garralda, A. Cabellos-Aparicio, and E. Alarcon, “N3sim: a simu-lation framework for diffusion-based molecular communication,” 2011.
[74] A. Toth, D. Banky, and V. Grolmusz, “3-d brownian motion simulator for high-sensitivitynanobiotechnological applications,” NanoBioscience, IEEE Transactions on, vol. 10, no. 4,pp. 248–249, 2011.
[75] A. Akkaya and T. Tugcu, “dmcs: distributed molecular communication simulator,” inProceedings of the 8th International Conference on Body Area Networks. ICST (Institute forComputer Sciences, Social-Informatics and Telecommunications Engineering), 2013, pp.468–471.
[76] L. Felicetti, M. Femminella, and G. Reali, “A simulation tool for nanoscale biological net-works,” Nano Communication Networks, vol. 3, no. 1, pp. 2–18, 2012.
[77] J. Suzuki, H. Budiman, T. A. Carr, and J. H. DeBlois, “A simulation framework for neuron-based molecular communication,” Procedia Computer Science, vol. 24, pp. 103–113, 2013.
43
[78] G. Piro, L. A. Grieco, G. Boggia, and P. Camarda, “Nano-sim: simulating electromagnetic-based nanonetworks in the network simulator 3,” in Proceedings of the 6th InternationalICST Conference on Simulation Tools and Techniques. ICST (Institute for Computer Sciences,Social-Informatics and Telecommunications Engineering), 2013, pp. 203–210.
[79] G. Piro, K. Yang, G. Boggia, N. Chopra, L. Grieco, and A. Alomainy, “Terahertz commu-nications in human tissues at the nanoscale for healthcare applications,” Nanotechnology,IEEE Transactions on, vol. 14, no. 3, pp. 404–406, May 2015.
[80] “NS-3 platform,” https://www.nsnam.org/.
44

Chapter 3
Fundamentals of Electromagnetic
Waves for Nano-Network
Communication
Since the concept of nano-network was proposed, increasing number of papers ap-
pear to discuss the communication paradigm at nano-scale [1–3], most of which put
their emphasis on the molecular communication because it is totally bio-compatible
and easy to fabricate [4]. However, like coins have two sides, the molecular commu-
nication also has disadvantages: the actual communication distance is short; the time
delay of the channel is quite large; and the channel is not stable because the molecules
diffused by random motion [4, 5], which would be addressed by the EM communica-
tion. Therefore, some papers start to study the performance of the EM communication
[6–9], which will be discussed in details later in this chapter.
The possibility of the application of EM communication is investigated in [8] and
the THz band is considered as the most promising candidate frequency band for nano-
EM communication. At the same time, another method based on electromechanical
CNT transceiver is presented [10]. After the validation of the application of the THz
45
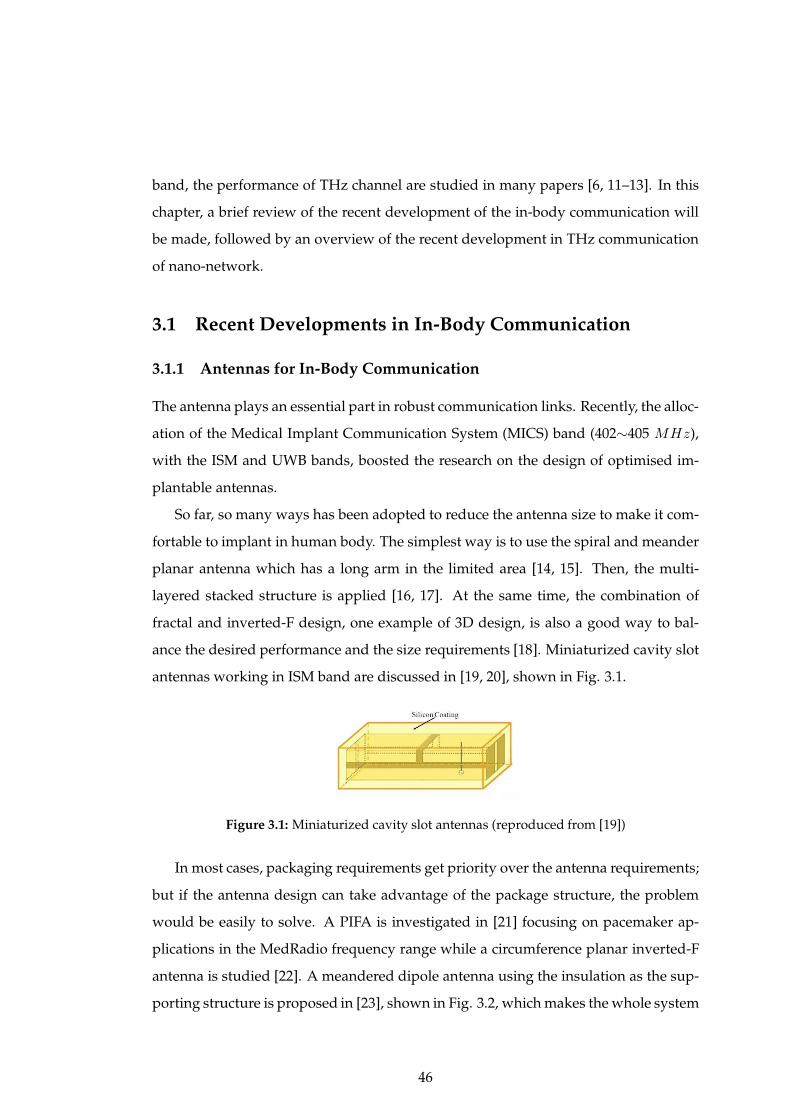
band, the performance of THz channel are studied in many papers [6, 11–13]. In this
chapter, a brief review of the recent development of the in-body communication will
be made, followed by an overview of the recent development in THz communication
of nano-network.
3.1 Recent Developments in In-Body Communication
3.1.1 Antennas for In-Body Communication
The antenna plays an essential part in robust communication links. Recently, the alloc-
ation of the Medical Implant Communication System (MICS) band (402∼405 MHz),
with the ISM and UWB bands, boosted the research on the design of optimised im-
plantable antennas.
So far, so many ways has been adopted to reduce the antenna size to make it com-
fortable to implant in human body. The simplest way is to use the spiral and meander
planar antenna which has a long arm in the limited area [14, 15]. Then, the multi-
layered stacked structure is applied [16, 17]. At the same time, the combination of
fractal and inverted-F design, one example of 3D design, is also a good way to bal-
ance the desired performance and the size requirements [18]. Miniaturized cavity slot
antennas working in ISM band are discussed in [19, 20], shown in Fig. 3.1.
Figure 3.1: Miniaturized cavity slot antennas (reproduced from [19])
In most cases, packaging requirements get priority over the antenna requirements;
but if the antenna design can take advantage of the package structure, the problem
would be easily to solve. A PIFA is investigated in [21] focusing on pacemaker ap-
plications in the MedRadio frequency range while a circumference planar inverted-F
antenna is studied [22]. A meandered dipole antenna using the insulation as the sup-
porting structure is proposed in [23], shown in Fig. 3.2, which makes the whole system
46

as small as 11× 26mm2. Later, the designs with such technology are realised and pro-
posed in [24–26], shown in Fig. 3.3. In [27], a much more special case is discussed
which uses the cardiovascular stents as the antenna for short range communication at
2.45 GHz.
(a) Top view
(b) Side view
Figure 3.2: Conformal chandelier meandered dipole antenna (reproduce from [23])
3.1.2 Human Body Models
In order to predict the effects of the human body on the performance of the im-
planted antennas and the channel characteristics, an extremely broad selection of body
phantoms has been proposed and investigated. Extensive work for the numerical ana-
lysis and the physical realisations have been done by Ito [28]. Particular attention is
paid to the fact that the human body is highly lossy for the propagation of RF waves.
The dielectric properties of the human tissues can be obtained from [29] from 10 Hz to
100 GHz, which are derived from the pioneering work of Gabriel [30].
Among all the phantoms, canonical geometries are the simplest, which not only
allows reducing the simulation time but also provides easy-to-realise conditions for
the radiator formulae. A rectangular cuboid (box) phantoms are considered in [20],
while the cylindrical one, modelled in [31, 32], is recommended as a standard by the
European Telecommunications Standards Institute (ETSI) [33]. Furthermore, a lossy
cylinder was also used in the first experimental validations of theoretical studies on
the EM wave propagation through a lossy medium (sea water) in [34]. Spherical geo-
metries are always used to mimic the head [35–37] but can also be used to model the
whole body [38]. Canonical geometries can be combined for a better representation
of the human body. Human body models made of boxes or cylinders are modelled
in [39] at 2.4GHz for on-body applications, shown in Fig. 3.4. Another example is
47

Figure 3.3: Bio-compatible capsule with embedded antenna (reproduced from [26])
illustrated in [27], where a cylinder is used to mimic the human torso integrated with
a realistic lung. It should be pointed that for the pilot study such simple models are
good enough because it would be time-efficient and memory-efficient. However, if
the more precise results are required, the detailed phantoms should be applied.
The most detailed human body phantoms are obtained from high-resolution scan
data of the human body, for instance, the U.S. Visible Human Project [40]. To com-
plete the database, cryosection MRI and CT image data of the head of a 72 years old
male were built at 0.174mm intervals and photographed at a resolution of 1056×1528
pixels at first. Later, a male cadaver was cut in the axial plane at 1mm intervals while
the female intervals are 0.33mm. These body phantoms are used in [41–44] with ideal
sources, and in [45] with a helical antenna, to evaluate the EM propagation within the
body. Other complete male models are introduced in [46, 47], respectively. In particu-
lar, the latter two are considered to compare the performances of implanted antennas
in [18, 35, 48]. Also based on medical data, complete Japanese male and female models
are developed in [49], including the possibility of modifying their postures [50].
The Virtual Family and Virtual Classroom are shown in [51, 52] consisting of high-
resolution models of a complete family and of four kids based on magnetic resonance
48

(a) Box [39] (b) Cylindrical [27]
Figure 3.4: Approximations of a complete human model combining canonical geomet-ries
images. These phantoms describe accurately the human body geometry with differ-
ent organs for different people with various genders and ages but also allow for the
investigations of different body constitutions (according to age and gender). Some
postures of these models are illustrated in Fig. 3.5.
Figure 3.5: Examples of different body postures for the Virtual Family Models (repro-duced from [52])
From the above, we can see that for the initial study of nano-communication, the
simple phantoms should be used at first and then if needed, more detailed elements
can be added step by step.
49
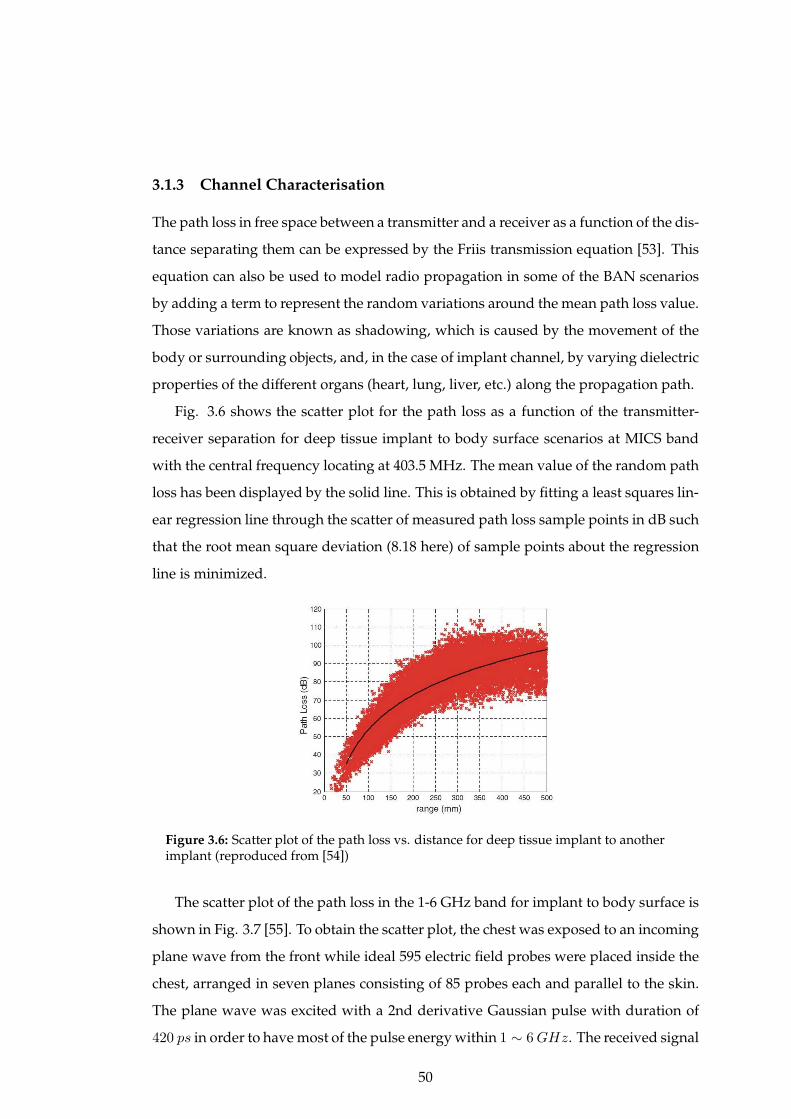
3.1.3 Channel Characterisation
The path loss in free space between a transmitter and a receiver as a function of the dis-
tance separating them can be expressed by the Friis transmission equation [53]. This
equation can also be used to model radio propagation in some of the BAN scenarios
by adding a term to represent the random variations around the mean path loss value.
Those variations are known as shadowing, which is caused by the movement of the
body or surrounding objects, and, in the case of implant channel, by varying dielectric
properties of the different organs (heart, lung, liver, etc.) along the propagation path.
Fig. 3.6 shows the scatter plot for the path loss as a function of the transmitter-
receiver separation for deep tissue implant to body surface scenarios at MICS band
with the central frequency locating at 403.5 MHz. The mean value of the random path
loss has been displayed by the solid line. This is obtained by fitting a least squares lin-
ear regression line through the scatter of measured path loss sample points in dB such
that the root mean square deviation (8.18 here) of sample points about the regression
line is minimized.
Figure 3.6: Scatter plot of the path loss vs. distance for deep tissue implant to anotherimplant (reproduced from [54])
The scatter plot of the path loss in the 1-6 GHz band for implant to body surface is
shown in Fig. 3.7 [55]. To obtain the scatter plot, the chest was exposed to an incoming
plane wave from the front while ideal 595 electric field probes were placed inside the
chest, arranged in seven planes consisting of 85 probes each and parallel to the skin.
The plane wave was excited with a 2nd derivative Gaussian pulse with duration of
420 ps in order to have most of the pulse energy within 1 ∼ 6GHz. The received signal
50

strength at every probe location was obtained and recorded. This model predicts an
RMS delay spread below 1 ns, which is in agreement with the results in [56].
Figure 3.7: Scatter plot of the path loss in the 1-6 GHz band for implant to body surface(reproduced from [55])
From both numerical and statistical studies of path loss model at lower frequency
band, it can be hypothesised that the path loss to THz wave for body-centric nano-
communication can be divided into two parts: i) the part caused by the propagation
of the wave; ii) the part caused by shadowing and scattering.
3.2 Recent Developments in THz Communication
3.2.1 Graphene/CNT as the Elements of THz System
Despite numerous papers on nano-technology are being published every year, en-
abling the EM communication between nano-devices is still a major challenge, which
is mainly related to the development of nano-antennas and the corresponding elec-
tromagnetic transceivers. Reducing the size of the traditional antenna down to a few
hundreds of nanometers would lead to extremely high operating frequencies, which
compromises the feasibility of electromagnetic wireless communication among nano-
devices. However, it has been proved that such limitation can be overcome by adopt-
ing the graphene as the building materials to fabricate the antennas because the wave
propagation velocity in CNTs and GNRs can be up to one hundred times below the
speed of light in vacuum depending on the structure geometry, temperature and Fermi
energy [57], leading to the fact that the resonant frequency of nano-antennas made of
51

graphene can be up to two orders of magnitude below that of nano-antennas fabric-
ated with other materials. Recent studies have already proved that CNT/graphene
antenna can work at the THz band (i.e., 0.1− 10 THz); thus, the band of interest is the
most promising candidate for the EM communication [8, 58, 59]. The CNT antenna
was compared with classical dipoles by numerical analysis [60], while the possibility
of CNT as dipole antenna was discussed, giving a mathematical framework [61]. [62]
first demonstrated the performance of the propagation of EM waves on a graphene
sheet. GNR-based nano patch antenna and CNT-based nano dipole antenna were
compared [63], showing that graphene-based antenna with the length of 1 µm can
radiate EM wave at THz band, which agreed with the prediction in [64].
An example of THz antenna made of plasmonic resonant graphene sheets is shown
in Fig. 3.8 with its radiation pattern [65] from which it can be seen that the radiation
pattern is similar to the traditional Hertzian dipole. In the paper, the comparison
with typical metal implementations in terms of return loss and radiation efficiency
was conducted and the result showed the great potential of the graphene. Later, the
reconfigurable capability was studied in [66].
In addition to the antenna, graphene is also considered as the building material
of novel nano-devices able to operate at Terahertz Band frequencies. Graphene-based
nano-systems for Terahertz wave generation have been analytically and experiment-
ally proved in [67–69]. Modulators for Terahertz Band signals have also been experi-
mentally shown in [70, 71], which take advantage of the intra-band transitions in the
conductivity of graphene at Terahertz Band frequencies. Similarly, filters and polar-
izers [72] and frequency mixers and multipliers [73–76] for Terahertz Band operation
have been analytically and experimentally demonstrated. Moreover, Terahertz Band
signal detection with graphene devices has been demonstrated in [77].
3.2.2 Channel Modelling of the THz Communication for Nano-Network
Because of the limitations such as size, complexity and energy consumption, EM com-
munication between nano-devices have been thought impossible [78]. However, with
the advent of the carbon-based materials like graphene and CNT, attention has been
moved to the EM communication [8, 10] slowly. With the consideration that the com-
munication is at nanoscale, the study of the communication between very short range
52
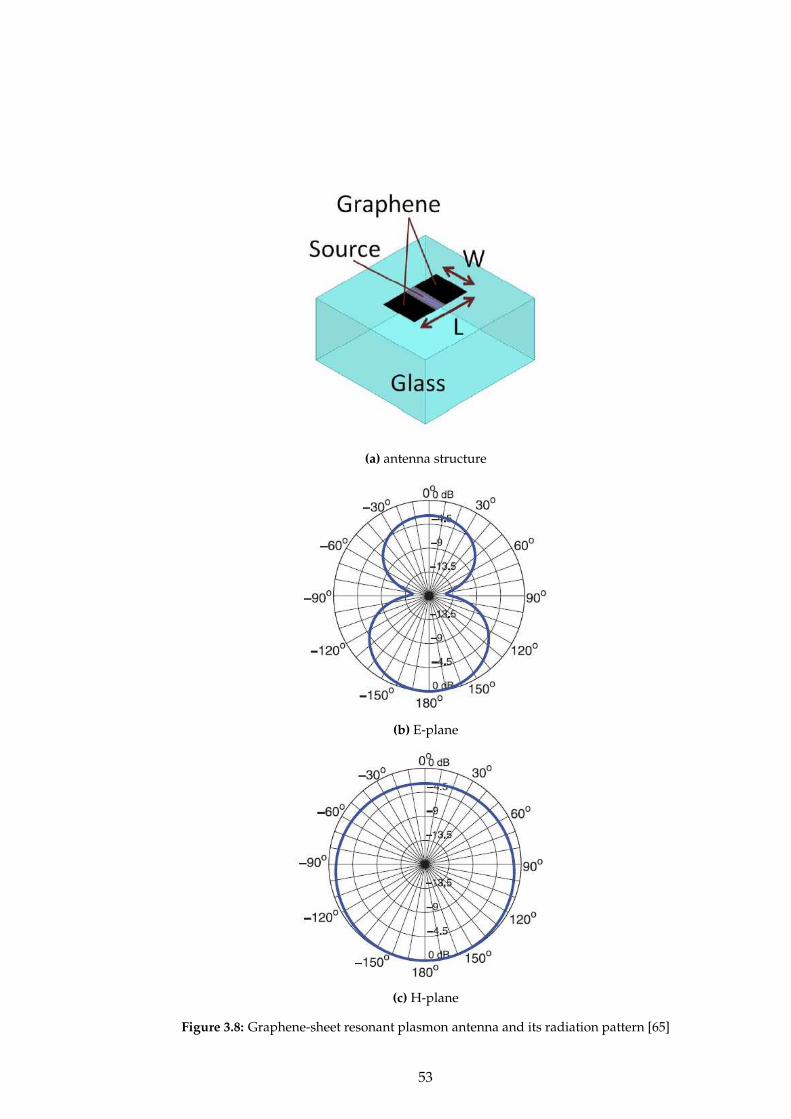
(a) antenna structure
(b) E-plane
(c) H-plane
Figure 3.8: Graphene-sheet resonant plasmon antenna and its radiation pattern [65]
53

is essential [6, 7]. In this section, the details of the channel model will be investigated.
A modified Friis equation has been proposed by Jornet et al. in [6] to calculate the
path loss of the THz channel in water vapor, which can be divided into two parts: the
spread path loss and the absorption path loss. Later, a more detailed model of THz
communication is proposed with the consideration of multi-ray scenario; thus, the
propagation models for reflection, scattering and diffraction is considered [79]. At the
same time, the scattering effects of small particles was discussed with the analysis fre-
quency and the impulse responses [80]. Also, the Finite Difference Time-Domain and
the Ray-Tracing technique were compared to evaluate the reception quality in nano-
network with the consideration of two cases: LOS one and multiple objects dispersed
near the LOS [81]; then, the conclusion is drawn that at the THz band RT performs as
good as FDTD. Meanwhile, a discussion of the use of VHF band is conducted with the
study of the bit error rate (BER) performance of the nano-receiver made of a carbon
nano-tube (CNT) [82]. Similarly, the path loss in human tissues was also studied in
[83].
The noise power of the channel can be obtained:
Pn(f, d) =
∫
BN(f, d)df = kB
∫
BTnoise(f, d)df
≃ kB
∫
BTmol(f, d)df
(3.1)
where, Tmol = To(1− e−4πfdκ/c) is the equivalent noise temperature due to molecular
absorption; kB is the Boltzmann constant; To is the reference temperature; d is the
travelling distance; c stands for the light speed in the free space; f is the frequency; κ
stands for the extinction coefficient of the air.
Fig. 3.9 and 3.10 show the path loss and noise temperature of the air with different
water vapour concentration, individually.
The capacity of the channel was also studied to evaluate the potential of the EM
paradigm. Fig. 3.11 shows the corresponding capacity for four different power spec-
tral densities: optimal p.s.d., flat p.s.d., the Gaussian pulse and the p.s.d. for the case
of the transmission window at 350 GHz, from which it can be easily seen that for the
very short communication range, quite high transmission bit-rates can be supported,
up to Terabits per second indicating the promising future of the application of the EM
54
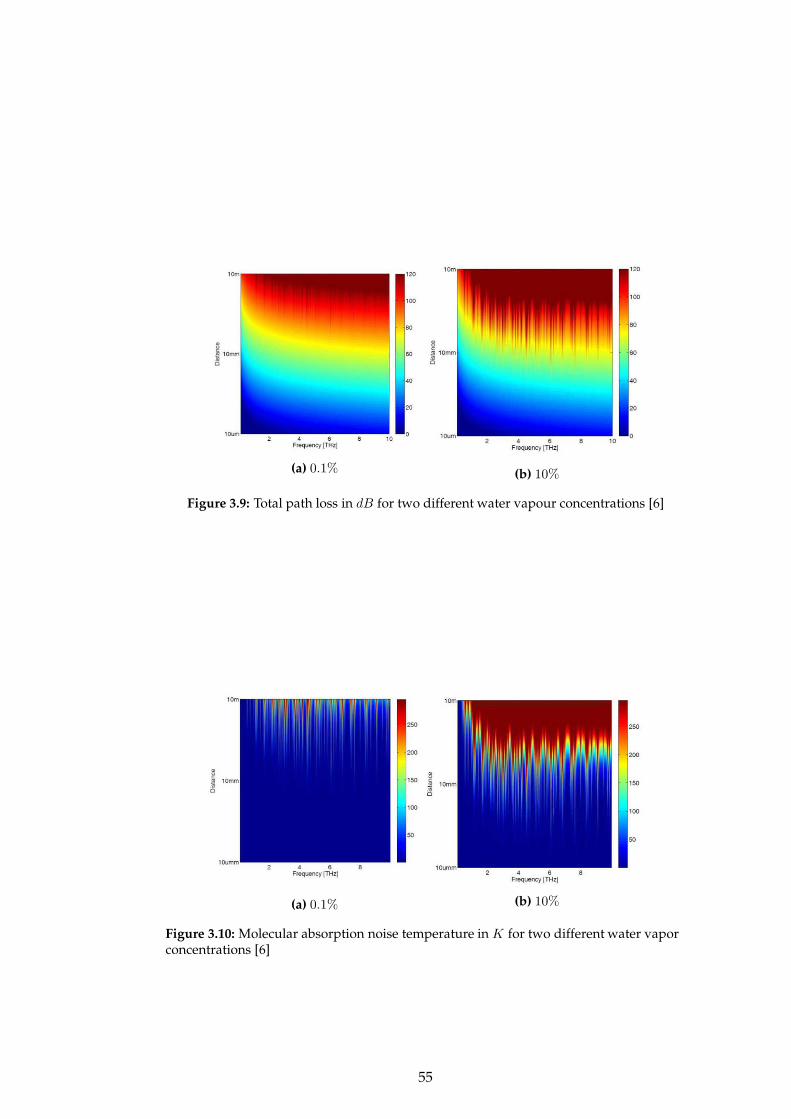
(a) 0.1% (b) 10%
Figure 3.9: Total path loss in dB for two different water vapour concentrations [6]
(a) 0.1% (b) 10%
Figure 3.10: Molecular absorption noise temperature in K for two different water vaporconcentrations [6]
55
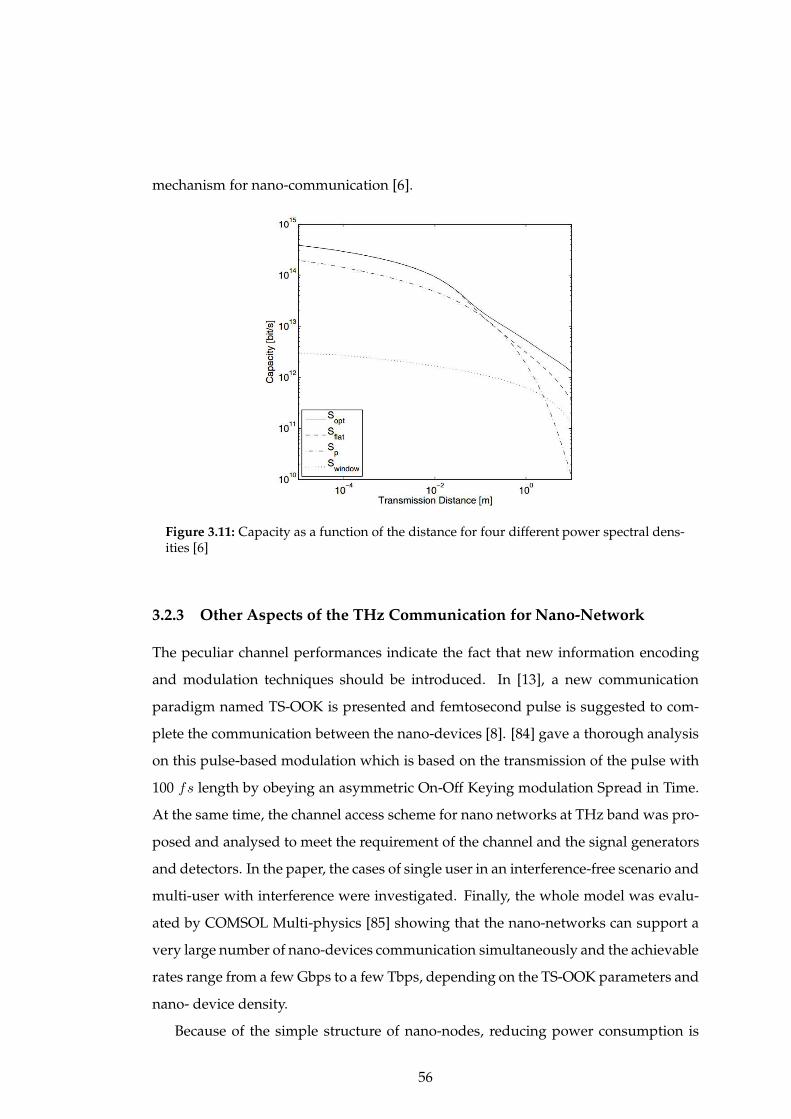
mechanism for nano-communication [6].
Figure 3.11: Capacity as a function of the distance for four different power spectral dens-ities [6]
3.2.3 Other Aspects of the THz Communication for Nano-Network
The peculiar channel performances indicate the fact that new information encoding
and modulation techniques should be introduced. In [13], a new communication
paradigm named TS-OOK is presented and femtosecond pulse is suggested to com-
plete the communication between the nano-devices [8]. [84] gave a thorough analysis
on this pulse-based modulation which is based on the transmission of the pulse with
100 fs length by obeying an asymmetric On-Off Keying modulation Spread in Time.
At the same time, the channel access scheme for nano networks at THz band was pro-
posed and analysed to meet the requirement of the channel and the signal generators
and detectors. In the paper, the cases of single user in an interference-free scenario and
multi-user with interference were investigated. Finally, the whole model was evalu-
ated by COMSOL Multi-physics [85] showing that the nano-networks can support a
very large number of nano-devices communication simultaneously and the achievable
rates range from a few Gbps to a few Tbps, depending on the TS-OOK parameters and
nano- device density.
Because of the simple structure of nano-nodes, reducing power consumption is
56
challenging. To save the trasmitted energy, various coding methods were proposed.
Fixed-length codewords with a constant weight were applied to mitigate interference
in [86], which also reduces the transmitted energy. Kocaoglu et al. [87, 88] studied
the design of fixed-length coding to keep the necessary Hamming distance between
codewords while minimising the Average Code Weight (ACW). Based on the study of
the dependence of the performance of fixed-length codes on the ACW and the code
length [89], the problems of variable-length low weight codes for OOK modulation
was investigated by Chi et al.in [90], aiming to minimise the transmission energy but
guarantee the desired throughput at the same time. Based on the characteristics of
the codes, two algorithms, i.e., Binary Tree-based Weight Decreasing (BT-WD) and
Binary Tree-based Length Decreasing (BT-LD), were proposed to dealt with the integer
nonlinear programming problem, both of which performed well in average code word
weight.
To support the extremely high density of nano-devices in nano-network, Jornet et.
al. proposed a novel PHysical Layer Aware MAC protocol for Electromagnetic nanon-
etworks in the Terahertz Band (PHLAME) in 2012 [91], based on a novel pulse-based
communication scheme, Rate Division Time-Spread OnOff Keying (RD TS-OOK). In
this protocol the nano-transmitter and nano-receiver jointly select the optimal com-
munication parameters and channel coding scheme to minimize the interference and
maximize the probability of successfully decoding the received information. The res-
ults showed that by using such protocol, the network are able to support tens of
Gbps throughput. Later, an energy and spectrum aware MAC protocol to achieve per-
petual network was proposed [92], where a novel important system design parameter,
namely, the critical packet transmission ratio (CTR) was derived. The CTR is the max-
imum allowable ratio of the transmission time to the energy harvesting time, below
which the nano-sensor node can obtain more energy than the consumed one. By us-
ing this term, a symbol-compression solution was introduced and a packet-level time-
line scheduling algorithm, built on a theoretical bandwidth-adaptive capacity-optimal
physical layer, is proposed in order to keep the balance between single-user through-
put and limited network lifetime. The results showed that the proposed simple schedul-
ing algorithms would enable nano-sensors to transmit with high speed perpetually
without draining the limited energy.
57
3.3 Summary
In this chapter, the emphasis was moved to the EM paradigm by briefly browsing the
fundamentals and current development of the body-centric communication. It should
be pointed out that because of the characteristics of CNT and graphene, THz band
was chosen as the most suitable candidate for nano-communication. After the study
of the CNT/graphene antennas, people started focusing on the channel characteristics,
modulation, coding and etc.. Although the research is still at its early phase, its huge
potential remains attractive to numerous academic groups.
58

References
[1] L. P. Gine and I. F. Akyildiz, “Molecular communication options for long range nanonet-works,” Computer Networks, vol. 53, no. 16, pp. 2753–2766, 2009.
[2] M. Kuscu and O. B. Akan, “A physical channel model and analysis for nanoscale molecu-lar communications with forster resonance energy transfer (fret),” Nanotechnology, IEEETransactions on, vol. 11, no. 1, pp. 200–207, 2012.
[3] T. Hogg and R. A. Freitas Jr, “Acoustic communication for medical nanorobots,” NanoCommunication Networks, vol. 3, no. 2, pp. 83–102, 2012.
[4] S. F. Bush, Nanoscale Communication Networks. Artech House, 2010.[5] I. F. Akyildiz, F. Brunetti, and C. Blazquez, “Nanonetworks: A new communication
paradigm,” Computer Networks, vol. 52, no. 12, pp. 2260–2279, 2008.[6] J. M. Jornet and I. F. Akyildiz, “Channel modeling and capacity analysis for electromag-
netic wireless nanonetworks in the terahertz band,” Wireless Communications, IEEE Trans-actions on, vol. 10, no. 10, pp. 3211–3221, 2011.
[7] ——, “Channel capacity of electromagnetic nanonetworks in the terahertz band,” in Com-munications (ICC), 2010 IEEE International Conference on. IEEE, 2010, pp. 1–6.
[8] I. F. Akyildiz and J. M. Jornet, “Electromagnetic wireless nanosensor networks,” NanoCommunication Networks, vol. 1, no. 1, pp. 3–19, 2010.
[9] R. Piesiewicz, T. Kleine-Ostmann, N. Krumbholz, D. Mittleman, M. Koch, J. Schoebel,and T. Kurner, “Short-range ultra-broadband terahertz communications: Concepts andperspectives,” Antennas and Propagation Magazine, IEEE, vol. 49, no. 6, pp. 24–39, 2007.
[10] C. E. Koksal and E. Ekici, “A nanoradio architecture for interacting nanonetworkingtasks,” Nano Communication Networks, vol. 1, no. 1, pp. 63–75, 2010.
[11] Y. Kadoya, M. Onuma, S. Yanagi, T. Ohkubo, N. Sato, and J. Kitagawa, “Thz wavepropagation on strip lines: devices, properties and applications,” Radioengineering,vol. 17, no. 2, pp. 48–55, 2008.
[12] S. Priebe, C. Jastrow, M. Jacob, T. Kleine-Ostmann, T. Schrader, and T. Kurner, “Channeland propagation measurements at 300 ghz,” Antennas and Propagation, IEEE Transactionson, vol. 59, no. 5, pp. 1688–1698, 2011.
[13] J. M. Jornet and I. F. Akyildiz, “Information capacity of pulse-based wireless nanosensornetworks,” in Sensor, Mesh and Ad Hoc Communications and Networks (SECON), 2011 8thAnnual IEEE Communications Society Conference on. IEEE, 2011, pp. 80–88.
[14] P. Soontornpipit, C. M. Furse, and Y. C. Chung, “Design of implantable microstrip an-tenna for communication with medical implants,” Microwave Theory and Techniques, IEEETransactions on, vol. 52, no. 8, pp. 1944–1951, 2004.
[15] ——, “Miniaturized biocompatible microstrip antenna using genetic algorithm,” Anten-nas and Propagation, IEEE Transactions on, vol. 53, no. 6, pp. 1939–1945, 2005.
[16] W.-C. Liu, F.-M. Yeh, and M. Ghavami, “Miniaturized implantable broadband antennafor biotelemetry communication,” Microwave and Optical Technology Letters, vol. 50, no. 9,pp. 2407–2409, 2008.
[17] A. Kiourti, M. Christopoulou, S. Koulouridis, and K. S. Nikita, “Design of a novel mini-aturized implantable pifa for biomedical telemetry,” in Wireless Mobile Communication andHealthcare. Springer, 2011, pp. 127–134.
[18] M. Z. Azad and M. Ali, “A miniature implanted inverted-f antenna for gps application,”Antennas and Propagation, IEEE Transactions on, vol. 57, no. 6, pp. 1854–1858, 2009.
[19] K. Ito, W. Xia, M. Takahashi, and K. Saito, “An implanted cavity slot antenna for medicalcommunication systems,” in Antennas and Propagation, 2009. EuCAP 2009. 3rd EuropeanConference on. IEEE, 2009, pp. 718–721.
[20] W. Xia, K. Saito, M. Takahashi, and K. Ito, “Performances of an implanted cavity slotantenna embedded in the human arm,” Antennas and Propagation, IEEE Transactions on,vol. 57, no. 4, pp. 894–899, 2009.
[21] T. Houzen, M. Takahashi, K. Saito, and K. Ito, “Implanted planar inverted f-antenna for
59
cardiac pacemaker system,” in Antenna Technology: Small Antennas and Novel Metamateri-als, 2008. iWAT 2008. International Workshop on. IEEE, 2008, pp. 346–349.
[22] A. Johansson, “Wireless communication with medical implants: antennas and propaga-tion,” Ph.D. dissertation, Lund University, 2004.
[23] P. M. Izdebski, H. Rajagopalan, and Y. Rahmat-Samii, “Conformal ingestible capsule an-tenna: A novel chandelier meandered design,” Antennas and Propagation, IEEE Transac-tions on, vol. 57, no. 4, pp. 900–909, 2009.
[24] H. Yu, G. Irby, D. Peterson, M.-T. Nguyen, G. Flores, N. Euliano, and R. Bashirullah, “Prin-ted capsule antenna for medication compliance monitoring,” Electronics Letters, vol. 43,no. 22, pp. 1179–1181, 2007.
[25] H. Yu, G. Flores, S. Reza, G. Irby, C. Batich, R. Bashirullah, V. Meka, D. M. Peterson,and N. Euliano, “Feasibility study of printed capsule antennas for medication compli-ance monitoring,” in Biomedical Circuits and Systems Conference, 2007. BIOCAS 2007. IEEE.IEEE, 2007, pp. 41–44.
[26] R. Bashirullah and N. Euliano, “Capsule antennas for medication compliance monitor-ing,” in Radio and Wireless Symposium, 2009. RWS’09. IEEE. IEEE, 2009, pp. 123–126.
[27] E. Y. Chow, Y. Ouyang, B. Beier, W. J. Chappell, and P. P. Irazoqui, “Evaluation of cardi-ovascular stents as antennas for implantable wireless applications,” Microwave Theory andTechniques, IEEE Transactions on, vol. 57, no. 10, pp. 2523–2532, 2009.
[28] K. Ito, “Human body phantoms for evaluation of wearable and implantable antennas,”in The Second European Conference on Antennas and Propagation, EuCAP 2007, 2007.
[29] IFAC-CNR, “Dielectric properties of body tissues in the frequency range 10 hz - 100ghz.” [Online]. Available: http://niremf.ifac.cnr.it/tissprop/
[30] C. Gabriel, “Compilation of the dielectric properties of body tissues at rf and microwavefrequencies.” DTIC Document, Tech. Rep., 1996.
[31] Y. Koyanagi, H. Kawai, K. Ogawa, and K. Ito, “Consideration of the local sar and radi-ation characteristics of a helical antenna using a cylindroid whole body phantom at 150mhz,” Electronics and Communications in Japan (Part I: Communications), vol. 87, no. 1, pp.48–60, 2004.
[32] T. Dissanayake, K. P. Esselle, and M. R. Yuce, “Dielectric loaded impedance matching forwideband implanted antennas,” Microwave Theory and Techniques, IEEE Transactions on,vol. 57, no. 10, pp. 2480–2487, 2009.
[33] ETSI, “Electromagnetic compatibitily and radio specrum matters (erm); short rangedevices (srd); ultra low power active medical implants (ulp-ami) and peripherals (ulp-ami-p) operating in the frequency range 402 mhz to 405 mhz,” 2009.
[34] W. Blair, “Experimental verification of dipole radiation in a conducting half-space,” An-tennas and Propagation, IEEE Transactions on, vol. 11, no. 3, pp. 269–275, 1963.
[35] J. Kim and Y. Rahmat-Samii, “Implanted antennas inside a human body: Simulations,designs, and characterizations,” Microwave Theory and Techniques, IEEE Transactions on,vol. 52, no. 8, pp. 1934–1943, 2004.
[36] C. M. Rappaport and F. R. Morgenthaler, “Optimal source distribution for hyperthermiaat the center of a sphere of muscle tissue,” Microwave Theory and Techniques, IEEE Transac-tions on, vol. 35, no. 12, pp. 1322–1327, 1987.
[37] K. S. Nikita, G. S. Stamatakos, N. K. Uzunoglu, and A. Karafotias, “Analysis of the in-teraction between a layered spherical human head model and a finite-length dipole,”Microwave Theory and Techniques, IEEE Transactions on, vol. 48, no. 11, pp. 2003–2013, 2000.
[38] J. C. Lin, A. W. Guy, and C. C. Johnson, “Power deposition in a spherical model of manexposed to i-20-mhz electromagnetic fields,” Microwave Theory and Techniques, IEEE Trans-actions on, vol. 21, no. 12, pp. 791–797, 1973.
[39] C. Miry, T. Alves, R. Gillard, J.-M. Laheurte, R. Loison, and B. Poussot, “Analysis of thetransmission between on-body devices using the bilateral dual-grid fdtd technique,” An-tennas and Wireless Propagation Letters, IEEE, vol. 9, pp. 1073–1075, 2010.
[40] U. National Library of Medicine, “T.V.H. project.” [Online]. Available:http://www.nlm.nih.gov/research/visible/visible human.html
60

[41] W. G. Scanlon, J. B. Burns, and N. E. Evans, “Radiowave propagation from a tissue-implanted source at 418 mhz and 916.5 mhz,” Biomedical Engineering, IEEE Transactionson, vol. 47, no. 4, pp. 527–534, 2000.
[42] L. C. Chirwa, P. Hammond, S. Roy, D. R. Cumming et al., “Electromagnetic radiationfrom ingested sources in the human intestine between 150 mhz and 1.2 ghz,” BiomedicalEngineering, IEEE Transactions on, vol. 50, no. 4, pp. 484–492, 2003.
[43] A. Alomainy and Y. Hao, “Modeling and characterization of biotelemetric radio chan-nel from ingested implants considering organ contents,” Antennas and Propagation, IEEETransactions on, vol. 57, no. 4, pp. 999–1005, 2009.
[44] J.-H. Jung, S.-W. Kim, Y.-S. Kim, and S.-Y. Kim, “Electromagnetic propagation from theintestine-ingested source in the human body model,” Antennas and Propagation, IEEETransactions on, vol. 58, no. 5, pp. 1683–1688, 2010.
[45] L. Xu, M. Q. Meng, and Y. Chan, “Effects of dielectric parameters of human body onradiation characteristics of ingestible wireless device at operating frequency of 430 mhz,”Biomedical Engineering, IEEE Transactions on, vol. 56, no. 8, pp. 2083–2094, 2009.
[46] P. Dimbylow, “Current densities in a 2 mm resolution anatomically realistic model of thebody induced by low frequency electric fields,” Physics in medicine and biology, vol. 45,no. 4, p. 1013, 2000.
[47] I. G. Zubal, C. R. Harrell, E. O. Smith, Z. Rattner, G. Gindi, and P. B. Hoffer, “Computer-ized three-dimensional segmented human anatomy,” Medical physics, vol. 21, no. 2, pp.299–302, 1994.
[48] Z. N. Chen, G. C. Liu, and T. S. See, “Transmission of rf signals between mics loop an-tennas in free space and implanted in the human head,” Antennas and Propagation, IEEETransactions on, vol. 57, no. 6, pp. 1850–1854, 2009.
[49] T. Nagaoka, S. Watanabe, K. Sakurai, E. Kunieda, S. Watanabe, M. Taki, and Y. Yamanaka,“Development of realistic high-resolution whole-body voxel models of japanese adultmales and females of average height and weight, and application of models to radio-frequency electromagnetic-field dosimetry,” Physics in medicine and biology, vol. 49, no. 1,p. 1, 2004.
[50] T. Nagaoka and S. Watanabe, “Postured voxel-based human models for electromagneticdosimetry,” Physics in medicine and biology, vol. 53, no. 24, p. 7047, 2008.
[51] A. Christ, W. Kainz, E. G. Hahn, K. Honegger, M. Zefferer, E. Neufeld, W. Rascher,R. Janka, W. Bautz, J. Chen et al., “The virtual familydevelopment of surface-based ana-tomical models of two adults and two children for dosimetric simulations,” Physics inmedicine and biology, vol. 55, no. 2, p. N23, 2010.
[52] I. Fundation, “High-resolution whole-body human mod-els of the virtual population.” [Online]. Available:http://www.itis.ethz.ch/services/human-and-animalmodels/human-models/
[53] K. Y. Yazdandoost, K. Sayrafian-Pour et al., “Channel model for body area network (ban),”IEEE P802, vol. 15, 2009.
[54] K. Sayrafian-Pour, W.-B. Yang, J. Hagedorn, J. Terrill, K. Y. Yazdandoost, and K. Hamagu-chi, “Channel models for medical implant communication,” International Journal of Wire-less Information Networks, vol. 17, no. 3-4, pp. 105–112, 2010.
[55] A. Khaleghi, R. Chavez-Santiago, and I. Balasingham, “An improved ultra widebandchannel model including the frequency-dependent attenuation for in-body communic-ations,” in Engineering in Medicine and Biology Society (EMBC), 2012 Annual InternationalConference of the IEEE. IEEE, 2012, pp. 1631–1634.
[56] J. Wang and Q. Wang, “Channel modeling and ber performance of an implant uwb bodyarea link,” in Applied Sciences in Biomedical and Communication Technologies, 2009. ISABEL2009. 2nd International Symposium on. IEEE, 2009, pp. 1–4.
[57] S. Datta, Electronic transport in mesoscopic systems. Cambridge university press, 1997.[58] G. Zhou, M. Yang, X. Xiao, and Y. Li, “Electronic transport in a quantum wire under ex-
ternal terahertz electromagnetic irradiation,” Physical Review B, vol. 68, no. 15, p. 155309,2003.
61
[59] M. R. da Costa, O. Kibis, and M. Portnoi, “Carbon nanotubes as a basis for terahertzemitters and detectors,” Microelectronics Journal, vol. 40, no. 4, pp. 776–778, 2009.
[60] G. W. Hanson, “Fundamental transmitting properties of carbon nanotube antennas,” An-tennas and Propagation, IEEE Transactions on, vol. 53, no. 11, pp. 3426–3435, 2005.
[61] P. J. Burke, S. Li, and Z. Yu, “Quantitative theory of nanowire and nanotube antennaperformance,” Nanotechnology, IEEE Transactions on, vol. 5, no. 4, pp. 314–334, 2006.
[62] G. W. Hanson, “Dyadic greens functions and guided surface waves for a surface conduct-ivity model of graphene,” Journal of Applied Physics, vol. 103, no. 6, p. 064302, 2008.
[63] J. M. Jornet and I. F. Akyildiz, “Graphene-based nano-antennas for electromagnetic nano-communications in the terahertz band,” in Antennas and Propagation (EuCAP), 2010 Pro-ceedings of the Fourth European Conference on. IEEE, 2010, pp. 1–5.
[64] Y.-M. Lin, C. Dimitrakopoulos, K. A. Jenkins, D. B. Farmer, H.-Y. Chiu, A. Grill, andP. Avouris, “100-ghz transistors from wafer-scale epitaxial graphene,” Science, vol. 327,no. 5966, pp. 662–662, 2010.
[65] M. Tamagnone, J. Gomez-Diaz, J. Mosig, and J. Perruisseau-Carrier, “Analysis and designof terahertz antennas based on plasmonic resonant graphene sheets,” Journal of AppliedPhysics, vol. 112, no. 11, p. 114915, 2012.
[66] M. Tamagnone, J. Gomez Diaz, J. Perruisseau-Carrier, and J. R. Mosig, “High-impedancefrequency-agile thz dipole antennas using graphene,” in Antennas and Propagation (Eu-CAP), 2013 7th European Conference on. Ieee, 2013, pp. 533–536.
[67] T. Otsuji, T. Watanabe, A. El Moutaouakil, H. Karasawa, T. Komori, A. Satou, T. Suemitsu,M. Suemitsu, E. Sano, W. Knap et al., “Emission of terahertz radiation from two-dimensional electron systems in semiconductor nano-and hetero-structures,” Journal ofInfrared, Millimeter, and Terahertz Waves, vol. 32, no. 5, pp. 629–645, 2011.
[68] T. Otsuji, S. B. Tombet, A. Satou, H. Fukidome, M. Suemitsu, E. Sano, V. Popov, M. Ryzhii,and V. Ryzhii, “Graphene-based devices in terahertz science and technology,” Journal ofPhysics D: Applied Physics, vol. 45, no. 30, p. 303001, 2012.
[69] T. Otsuji, S. B. Tombet, A. Satou, M. Ryzhii, and V. Ryzhii, “Terahertz-wave generationusing graphene: Toward new types of terahertz lasers,” Selected Topics in Quantum Elec-tronics, IEEE Journal of, vol. 19, no. 1, pp. 8 400 209–8 400 209, 2013.
[70] S. H. Lee, M. Choi, T.-T. Kim, S. Lee, M. Liu, X. Yin, H. K. Choi, S. S. Lee, C.-G. Choi, S.-Y.Choi et al., “Switching terahertz waves with gate-controlled active graphene metamater-ials,” Nature materials, vol. 11, no. 11, pp. 936–941, 2012.
[71] B. Sensale-Rodriguez, R. Yan, M. M. Kelly, T. Fang, K. Tahy, W. S. Hwang, D. Jena, L. Liu,and H. G. Xing, “Broadband graphene terahertz modulators enabled by intraband trans-itions,” Nature communications, vol. 3, p. 780, 2012.
[72] H. Yan, X. Li, B. Chandra, G. Tulevski, Y. Wu, M. Freitag, W. Zhu, P. Avouris, and F. Xia,“Tunable infrared plasmonic devices using graphene/insulator stacks,” Nature Nanotech-nology, vol. 7, no. 5, pp. 330–334, 2012.
[73] H. Wang, D. Nezich, J. Kong, and T. Palacios, “Graphene frequency multipliers,” ElectronDevice Letters, IEEE, vol. 30, no. 5, pp. 547–549, 2009.
[74] H. Wang, A. Hsu, J. Wu, J. Kong, and T. Palacios, “Graphene-based ambipolar rf mixers,”Electron Device Letters, IEEE, vol. 31, no. 9, pp. 906–908, 2010.
[75] H. Wang, A. Hsu, K. K. Kim, J. Kong, and T. Palacios, “Gigahertz ambipolar frequencymultiplier based on cvd graphene,” in Electron Devices Meeting (IEDM), 2010 IEEE Inter-national. IEEE, 2010, pp. 23–6.
[76] Y.-M. Lin, A. Valdes-Garcia, S.-J. Han, D. B. Farmer, I. Meric, Y. Sun, Y. Wu, C. Dimitrako-poulos, A. Grill, P. Avouris et al., “Wafer-scale graphene integrated circuit,” Science, vol.332, no. 6035, pp. 1294–1297, 2011.
[77] G. Deligeorgis, F. Coccetti, G. Konstantinidis, and R. Plana, “Radio frequency signal de-tection by ballistic transport in y-shaped graphene nanoribbons,” Applied Physics Letters,vol. 101, no. 1, p. 013502, 2012.
[78] S. Luryi, J. Xu, and A. Zaslavsky, Future trends in microelectronics: up the nano creek. JohnWiley & Sons, 2007.
62
[79] C. Han, A. Bicen, and I. Akyildiz, “Multi-ray channel modeling and wideband charac-terization for wireless communications in the terahertz band,” Wireless Communications,IEEE Transactions on, vol. PP, no. 99, pp. 1–1, 2015.
[80] J. Kokkoniemi, J. Lehtomaki, K. Umebayashi, and M. Juntti, “Frequency and time do-main channel models for nanonetworks in terahertz band,” Antennas and Propagation,IEEE Transactions on, vol. 63, no. 2, pp. 678–691, Feb 2015.
[81] K. Kantelis, S. Amanatiadis, C. Liaskos, N. Kantartzis, N. Konofaos, P. Nicopolitidis, andG. Papadimitriou, “On the use of fdtd and ray-tracing schemes in the nanonetwork en-vironment,” Communications Letters, IEEE, vol. 18, no. 10, pp. 1823–1826, Oct 2014.
[82] J. Lehtomaki, A. Bicen, and I. Akyildiz, “On the nanoscale electromechanical wirelesscommunication in the vhf band,” Communications, IEEE Transactions on, vol. 63, no. 1, pp.311–323, Jan 2015.
[83] K. Yang, A. Pellegrini, M. Munoz, A. Brizzi, A. Alomainy, and Y. Hao, “Numer-ical analysis and characterization of thz propagation channel for body-centric nano-communications,” Terahertz Science and Technology, IEEE Transactions on, vol. 5, no. 3, pp.419–426, May 2015.
[84] J. M. Jornet and I. F. Akyildiz, “Femtosecond-long pulse-based modulation for terahertzband communication in nanonetworks,” Communications, IEEE Transactions on, vol. 62,no. 5, pp. 1742–1754, 2014.
[85] COMSOL, “COMSOL Multiphysics Simulation Software,”http://www.comsol.com/products/multiphysics/.
[86] J. M. Jornet and I. F. Akyildiz, “Low-weight channel coding for interference mitigationin electromagnetic nanonetworks in the terahertz band,” in Communications (ICC), 2011IEEE International Conference on. IEEE, 2011, pp. 1–6.
[87] M. Kocaoglu and O. B. Akan, “Minimum energy coding for wireless nanosensor net-works,” in INFOCOM, 2012 Proceedings IEEE. IEEE, 2012, pp. 2826–2830.
[88] ——, “Minimum energy channel codes for nanoscale wireless communications,” WirelessCommunications, IEEE Transactions on, vol. 12, no. 4, pp. 1492–1500, 2013.
[89] K. Chi, Y.-h. Zhu, X. Jiang, and X.-z. Tian, “Energy optimal coding for wireless nano-sensor networks,” in Wireless Communications and Networking Conference (WCNC), 2013IEEE. IEEE, 2013, pp. 998–1002.
[90] K. Chi, Y.-h. Zhu, X. Jiang, and V. Leung, “Energy-efficient prefix-free codes for wirelessnano-sensor networks using ook modulation,” Wireless Communications, IEEE Transactionson, vol. 13, no. 5, pp. 2670–2682, 2014.
[91] J. M. Jornet, J. C. Pujol, and J. S. Pareta, “Phlame: A physical layer aware mac protocolfor electromagnetic nanonetworks in the terahertz band,” Nano Communication Networks,vol. 3, no. 1, pp. 74–81, 2012.
[92] P. Wang, J. M. Jornet, M. A. Malik, N. Akkari, and I. F. Akyildiz, “Energy and spectrum-aware mac protocol for perpetual wireless nanosensor networks in the terahertz band,”Ad Hoc Networks, vol. 11, no. 8, pp. 2541–2555, 2013.
63

Chapter 4
Numerical Modelling of THz Wave
Propagation in Human Tissues
To enable electromagnetic paradigm realisable, the characterization of the frequency
band at which nano-devices communicate is essential. In this chapter, a new channel
model for body-centric, especially in-body communication at THz band (0.1 THz to
10 THz) was proposed by investigating the path loss and noise model on the basis
of the previous work where the concept of molecular absorption and noise was re-
visited. Additionally, the channel capacity was calculated to investigate the potential
of the THz band by applying different power allocation. Finally, simple models were
simulated in CST to evaluate the channel model.
4.1 Motivation and Related Work
As shown in Chapter 3, graphene-based plasmonic nano-antennas are expected to
work at THz band [1–3]; thus, THz band is considered as a promising candidate for
nano-communication. At the same time, a substantial amount of work has been per-
formed on the channel characterisation and modelling for body-centric wireless com-
munications at microwave frequencies and mm-wave band [4]. Statistical on-body
64
path loss models for different links and body scenarios have been developed by ana-
lysing the measurement data from on-body propagation with two patch antennas
working at 2.45 GHz in an anechoic and lab environment [5]. The path loss model of
radio propagation in human tissues was presented in [6] and subsequently compared
to experimental results for muscle, validating the reliability of the numerical simula-
tion at 2.45 GHz. A numerical modelling method using parallel FDTD was applied
to study the radio propagation and system performance of the wireless body area
network at UWB band [7], proving that both channel performance and system per-
formance are subject-specific. The path loss model for mm-wave was studied by com-
paring the numerical results from Remcom XGTD and measured data in [8], which
indicated the path loss model for on-body communication at 94 GHz was closely re-
lated to the body shape and garments. At the same time, several papers on THz in-
door communications have been published [9, 10]. In addition, the optical parameters
of human tissues up to 2.5 THz have been empirically characterized in [11], [12] fol-
lowing the discussion of the possibility of applying EM waves in nano-networks [13].
The channel model for THz wave propagating in the air with different concentration
of the water vapor was presented in [14] and the corresponding channel capacity was
also studied. Based on the characteristics of the channel, a new physical- layer aware
medium access control (MAC) protocol, Time Spread On-Off Keying (TS-OOK), was
proposed [15]. Meanwhile, the applications of THz technology in imaging and med-
ical field [16, 17] has also achieved great development and the biological effects of
THz radiation are reviewed in [18] showing minimum effect on the human body and
no strong evidence of hazardous side effects. However, most work presented in the
open literature does not explicitly investigate the EM channel modelling at THz for the
body-centric nano-networks, which would be the main contribution of this chapter.
65

4.2 Channel Modelling of Human Tissues at THz Band
4.2.1 Relationship of Optical Parameters to Electromagnetic Parameters
At optical frequencies, all the information is usually delivered in terms of refractive
index or index of refraction:
n(f) = nr(f)− jni(f) (4.1)
The real part nr can be usually obtained directly from the measurement while the
imaginary part ni (which would also be referred to as κ, named extinction coefficient)
can be calculated from the absorption coefficient α. The relationship between the two
can be given by
ni(f) =α(f)λo
4π(4.2)
where, λo = c/f is the wavelength in free-space.
From n, we can obtain the relative permittivity constant ǫ as
ǫ(f) = n(f)2
= nr(f)2 − κ(f)2 − j2nr(f)κ(f)
(4.3)
Thus, we can obtain:
ǫ′ = nr(f)2 − κ(f)2
ǫ′′ = 2nr(f)κ(f)(4.4)
where, ǫ′ and ǫ′′ are the real and imaginary part of the relative permittivity ǫ.
The absorption coefficient of some human tissues, i.e. blood, skin and fat, is shown
in Fig. 4.1a ([11], [12]) while the EM parameters, i.e., permittivity of the corresponding
tissues, calculated from Eq. 4.4, were shown in Fig. 4.1b and 4.1c. 1
4.2.2 Path Loss
A modified Friis equation has been proposed by Jornet et al. in [14] to calculate the
path loss of the THz channel in water vapor, which can be divided into two parts: the
spread path loss PLspr and the absorption path loss PLabs. Similarly, the path loss in
1 The refractive index nr is 1.97, 1.73 and 1.58 for blood, skin and fat, respectively.
66

(a) Measured absorption coefficient α (Reproducedfrom [11, 12])
(b) Real part of the relative permittivity (calculatedfrom Eq. 4.4)
(c) Imaginary part of the relative permittivity (calcu-lated from Eq. 4.4)
Figure 4.1: Optical and electromagnetic parameters of human tissues (blood, skin andfat)
67
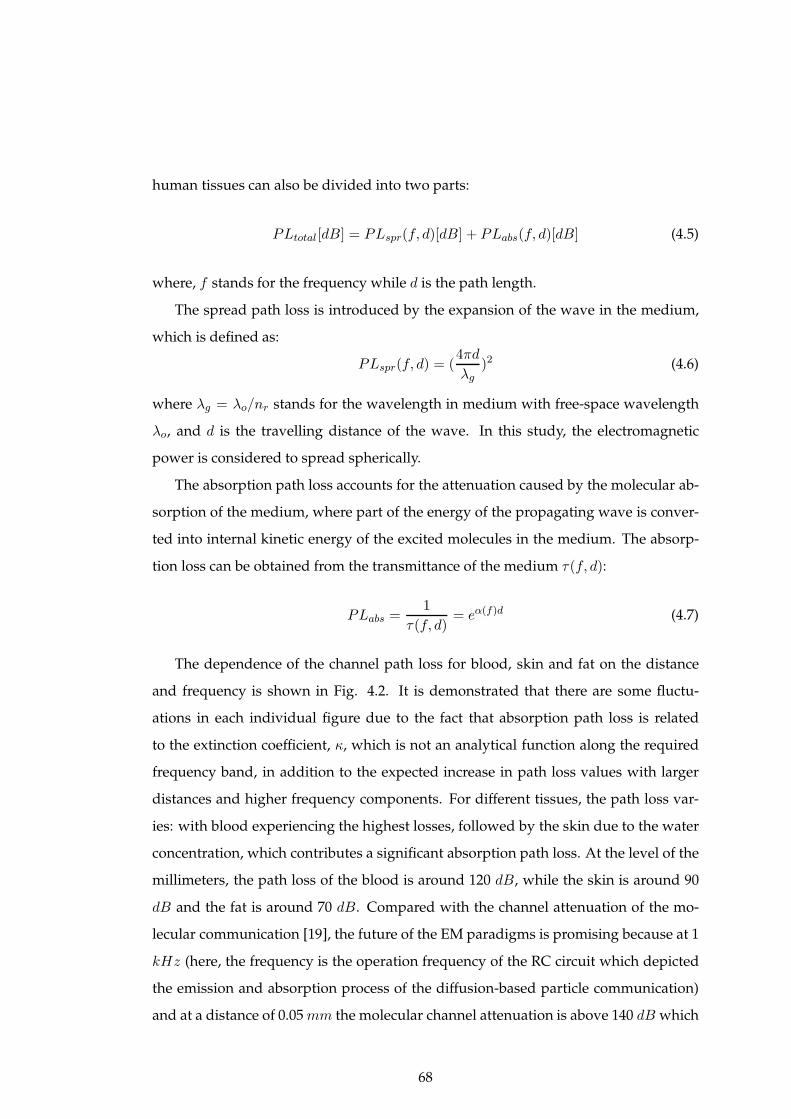
human tissues can also be divided into two parts:
PLtotal[dB] = PLspr(f, d)[dB] + PLabs(f, d)[dB] (4.5)
where, f stands for the frequency while d is the path length.
The spread path loss is introduced by the expansion of the wave in the medium,
which is defined as:
PLspr(f, d) = (4πd
λg)2 (4.6)
where λg = λo/nr stands for the wavelength in medium with free-space wavelength
λo, and d is the travelling distance of the wave. In this study, the electromagnetic
power is considered to spread spherically.
The absorption path loss accounts for the attenuation caused by the molecular ab-
sorption of the medium, where part of the energy of the propagating wave is conver-
ted into internal kinetic energy of the excited molecules in the medium. The absorp-
tion loss can be obtained from the transmittance of the medium τ(f, d):
PLabs =1
τ(f, d)= eα(f)d (4.7)
The dependence of the channel path loss for blood, skin and fat on the distance
and frequency is shown in Fig. 4.2. It is demonstrated that there are some fluctu-
ations in each individual figure due to the fact that absorption path loss is related
to the extinction coefficient, κ, which is not an analytical function along the required
frequency band, in addition to the expected increase in path loss values with larger
distances and higher frequency components. For different tissues, the path loss var-
ies: with blood experiencing the highest losses, followed by the skin due to the water
concentration, which contributes a significant absorption path loss. At the level of the
millimeters, the path loss of the blood is around 120 dB, while the skin is around 90
dB and the fat is around 70 dB. Compared with the channel attenuation of the mo-
lecular communication [19], the future of the EM paradigms is promising because at 1
kHz (here, the frequency is the operation frequency of the RC circuit which depicted
the emission and absorption process of the diffusion-based particle communication)
and at a distance of 0.05 mm the molecular channel attenuation is above 140 dB which
68
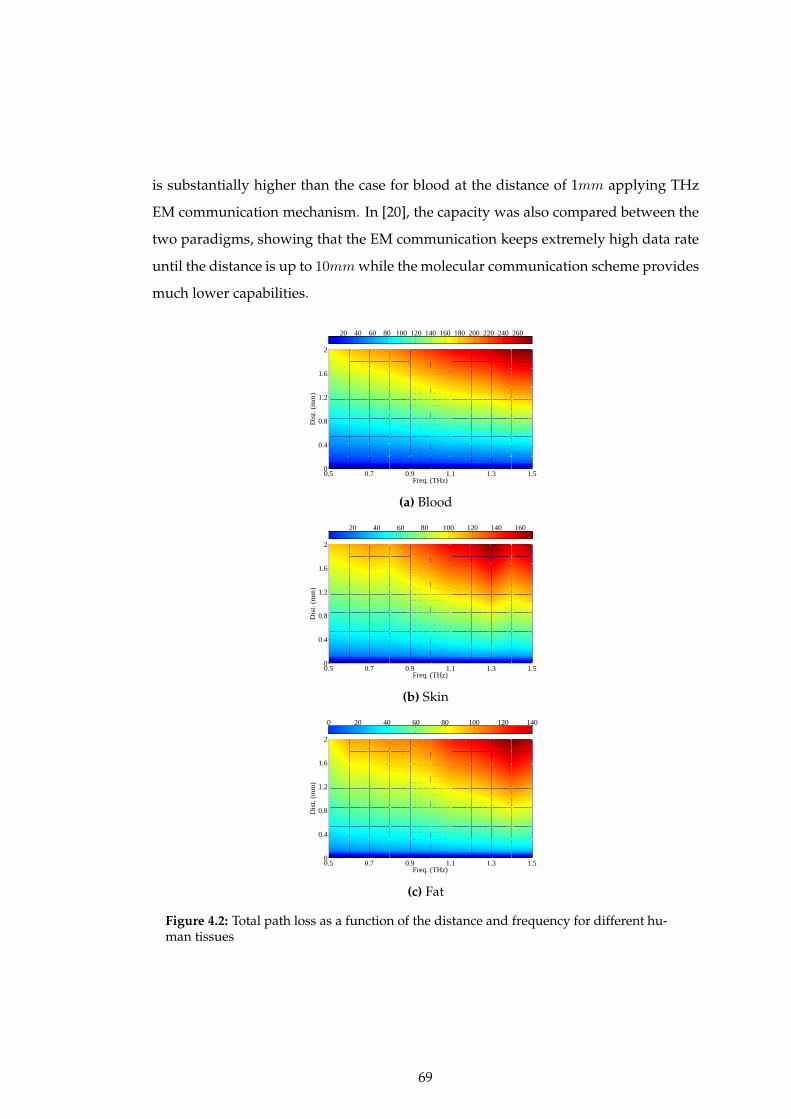
is substantially higher than the case for blood at the distance of 1mm applying THz
EM communication mechanism. In [20], the capacity was also compared between the
two paradigms, showing that the EM communication keeps extremely high data rate
until the distance is up to 10mm while the molecular communication scheme provides
much lower capabilities.
0.5 0.7 0.9 1.1 1.3 1.50
0.4
0.8
1.2
1.6
2
Freq. (THz)
Dis
t. (m
m)
20 40 60 80 100 120 140 160 180 200 220 240 260
(a) Blood
0.5 0.7 0.9 1.1 1.3 1.50
0.4
0.8
1.2
1.6
2
Freq. (THz)
Dis
t. (m
m)
20 40 60 80 100 120 140 160
(b) Skin
0.5 0.7 0.9 1.1 1.3 1.50
0.4
0.8
1.2
1.6
2
Freq. (THz)
Dis
t. (m
m)
0 20 40 60 80 100 120 140
(c) Fat
Figure 4.2: Total path loss as a function of the distance and frequency for different hu-man tissues
69
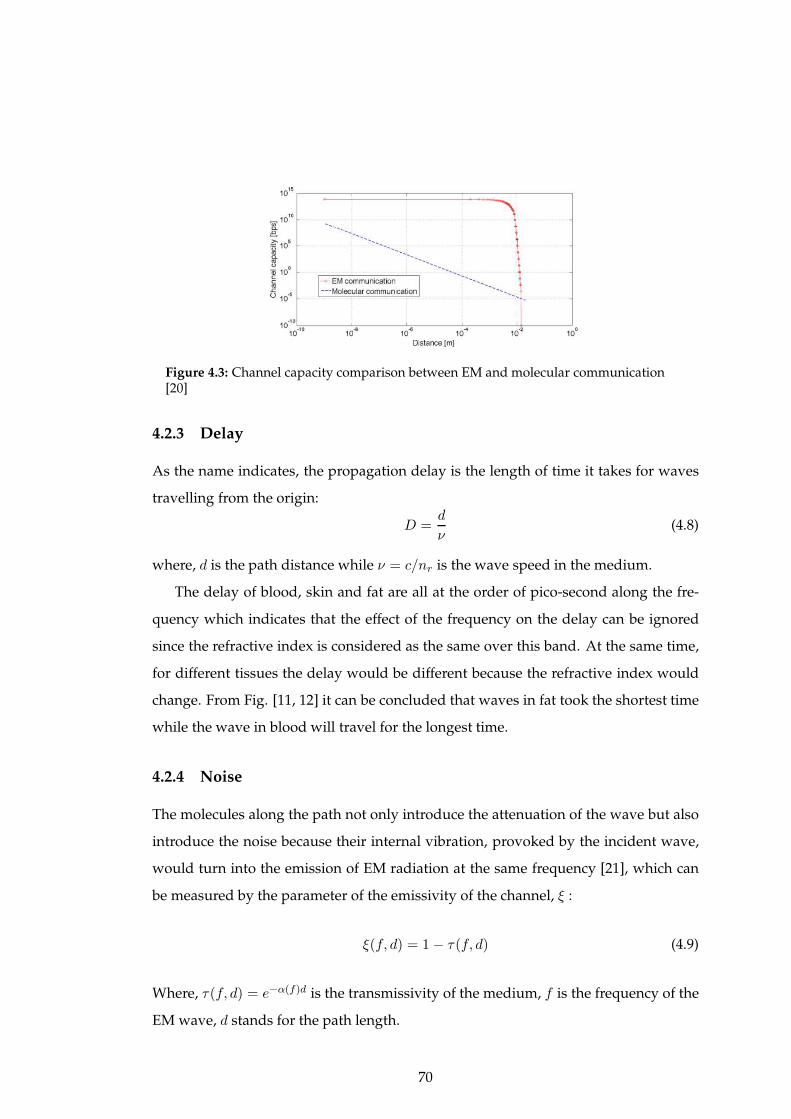
Figure 4.3: Channel capacity comparison between EM and molecular communication[20]
4.2.3 Delay
As the name indicates, the propagation delay is the length of time it takes for waves
travelling from the origin:
D =d
ν(4.8)
where, d is the path distance while ν = c/nr is the wave speed in the medium.
The delay of blood, skin and fat are all at the order of pico-second along the fre-
quency which indicates that the effect of the frequency on the delay can be ignored
since the refractive index is considered as the same over this band. At the same time,
for different tissues the delay would be different because the refractive index would
change. From Fig. [11, 12] it can be concluded that waves in fat took the shortest time
while the wave in blood will travel for the longest time.
4.2.4 Noise
The molecules along the path not only introduce the attenuation of the wave but also
introduce the noise because their internal vibration, provoked by the incident wave,
would turn into the emission of EM radiation at the same frequency [21], which can
be measured by the parameter of the emissivity of the channel, ξ :
ξ(f, d) = 1− τ(f, d) (4.9)
Where, τ(f, d) = e−α(f)d is the transmissivity of the medium, f is the frequency of the
EM wave, d stands for the path length.
70
Thus, the equivalent noise temperature due to molecular absorption can be ob-
tained:
Tmol(f, d) = T0ξ(f, d) (4.10)
where T0 is the reference temperature, f is the frequency of the EM wave, d stands for
the path length, ξ refers to the emissivity of the channel given by Eq. 4.9. It should
be noted that this kind of noise only appears around the frequencies in which the
molecular absorption is quite high.
The total noise temperature of the system Tnoise is composed of the system elec-
tronic noise temperature, Tsys, and the total antenna noise temperature, Tant, which
includes not only the molecular absorption noise temperature, Tmol, but also other
contributions from several sources, Tother , such as the noise created by surrounding
nano-devices or the same device.
Tnoise = Tsys + Tant = Tsys + Tmol + Tother (4.11)
For a given bandwidth, B, the total system noise power at the receiver can be
calculated as follows:
Pn(f, d) =
∫
N(f, d)df = kB
∫
Tnoise(f, d)df (4.12)
Where, N stands for the noise power spectral density; kB is the Boltzmann constant;
Tnoise is the equivalent noise temperature.
Because the electronic noise temperature of the system is assumed to be low due to
the electron transport properties of graphene [22], the main factor affecting the chan-
nel performance will be the molecular absorption noise temperature, which indicates
Tnoise ≈ Tmol.
The molecular absorption noise temperature is shown in Fig. 4.4. It can be seen
that the noise temperature increases with the rise of the frequency and distance, which
will lead to the rise of the noise power. At the level of millimeters, the molecular noise
temperature reaches 310 K , the normal human temperature.
71

(a) Blood
(b) Skin
(c) Fat
Figure 4.4: Noise temperature as a function of the distance and frequency for differenthuman tissues
72

4.3 Channel Capacity of Human Tissues at THz Band
In order to evaluate the potential of the Terahertz Band, the channel capacity would
be used as the performance metric. In the analysis, THz Band is considered as a single
transmission window which is almost 1 THz wide (from 0.5 THz to 1.5 THz) because
of the limit of the current database for human tissues at THz band [11, 12].
According to the Shannons theory, the channel capacity can be obtained as follows
[23]:
C = Blog2(1 +S
N) (4.13)
where B is the whole bandwidth of the system while SN stands for the signal-noise-
ratio.
From the previous investigation, the channel is frequency-selective and the noise
is non-white, thus the whole bandwidth need to be divided into many narrow sub-
bands which can be chosen small enough to make the channel appear non-selective
and the noise power spectrum distribution locally flat [23]. The ith sub-band is centred
at fi with the bandwidth ∆f(i = 1, 2, 3...). Then, the Eq. 4.13 can be rewritten as
C(d) =∑
i
∆flog2[1 +S(fi)
PL(fi, d)SN (fi, d)] (4.14)
where, S(fi) is the power spectral density of the transmitted signal while ∆f is fixed
to 0.1 THz; PL(fi, d) is the path loss over the sub-band; SN (fi, d) is the noise power
spectral density over the sub-band. And here the frequency band covering from 0.5
THz to 1.5 THz with 1 THz bandwidth is considered.
From Eq. 4.13, it can be easily seen that besides the effect of both path loss and
noise temperature communication capabilities are also strictly influenced by the way
how the transmitted power, Ptx, is distributed in the frequency domain. In line with
[14], three communication schemes (i.e., flat, pulse-based, and optimal) are considered in
this work and characterised in what follows.
73

Flat Communication
The total power transmission, Ptx, is uniformly distributed over the entire operating
band. Thus, the corresponding power spectral density is:
Sf (f) =
S0 = Ptx/B if fm ≤ f ≤ fM
0 otherwise
(4.15)
where, obviously,
∫ fM
fm
Sf (f)df = Ptx, that is, S0 = Ptx/B.
Pulse-Based Communication
Taking into account capabilities of graphene-based nanoelectronic, the pulse gener-
ated by a nano-device, i.e., the wave form used to transmit the logical ‘1’, can be mod-
elled with a n-th derivative of a Gaussian-shape, i.e., φ(f) = (2πf)2ne(−2πσf)2 [14].
Hence, the power spectral density can be expressed as:
Sp(f) = a20 · φ(f) , (4.16)
where σ, and a20 are the standard deviation of the Gaussian pulse and a normalising
constant, respectively.
Considering that∫ fMfm
Sp(f)df = Ptx, a20 is given by:
a20 = Ptx
/
∫ fMfm
φ(f) . (4.17)
Optimal Communication
This scheme aims at maximising the overall channel capacity by optimally adapting
the power allocation as a function of frequency-selective properties of the channel. The
optimal transmission scheme can be obtained by solving the following optimisation
74

problem with the consideration of Eq. 4.14:
max{
∑
i ∆f log2
[
1 + So(fi)PL(fi,d)N(fi,d)
]}
subject to∑
i So(fi)∆f = Ptx
(4.18)
As known, the maximum value of a concave function, like the one in Eq. (4.18), can be
done by using Lagrange multiplier, λ. Thus, the optimisation problem can be rewritten
as:
max
{
∑
i
∆f
(
log2
[
1+So(fi)
PL(fi, d)N(fi, d)
]
+λSo(fi)
)
−Ptx
}
(4.19)
The maximum is found by equating to zero the derivative of the argument of Eq.
4.19 with respect to So(fi) and λ. This produces:
1
ln(2)[So(fi) + PL(fi, d)N(fi, d)]= λ ∀i . (4.20)
That is, the overall channel capacity is maximised when:
So(fi) + PL(fi, d)N(fi, d) = β, (4.21)
where β is a constant to be evaluated.
The problem can be solved by using the water-filling principle, which adopts an
iterative procedure for finding the most suitable power distribution on available sub-
bands. In details, at the n-th step, β is computed as:
β(n) =1
L(n)
[
Ptx
∆f+
∑
i
PL(fi, d)N(fi, d)
]
(4.22)
where L(n) is the number of sub-bands at the n-th step.
In particular, considering the i-th sub-band, the power spectral density is set as
So(fi) = β − A(fi, d)N(fi, d). If it results So(fi) ≤ 0, then the corresponding power
spectral density is set to 0 and Eq. (4.22) should be computed again (without consider-
ing the identified sub-band) as long as there are no sub-bands with a negative So(fi).
At the end, the procedure optimally distributes the total power transmission over the
available sub-bands by assigning higher power spectral density values to sub-bands
75

offering better channel conditions (i.e., lower path loss and lower noise power).
Fig. 4.5 shows the capacity for different tissues with different power allocations.
From the figure, it can be seen that with the increase of the distance the capacity will
keep almost the same at first and then drop significantly at some point (for different
tissues and different power allocation, the point changes). And also we can see that
the optimal one always occupies the top while the performance of the pulse-based one
is not as good as the other two but the differences between them is not very huge. By
comparing the three figures listed, we can see that the capacity of fat is better than the
other two.
(a) blood
10−6
10−5
10−4
10−3
10−2
100
105
1010
1015
Dist. (m)
Cha
nnel
cap
acity
(bp
s)
FlatPulse−basedOptimal
(b) skin
10−6
10−5
10−4
10−3
10−2
10−5
100
105
1010
1015
Dist. (m)
Cha
nnel
cap
acity
(bp
s)
FlatPulse−basedOptimal
(c) fat
Figure 4.5: Capacity for different tissues with different power allocations
76

4.4 Numerical Models and the Corresponding Results
In the previous section, the theoretical model of path loss was proposed where a new
term, absorption path loss, was introduced. In this section, a validation through sim-
ulation would be conducted and then the layered model would be built to investigate
the wave propagation at THz band.
4.4.1 Homogeneous Model
A simple model, shown in Fig. 4.6, is set up in CST Microwave Studio [24] to obtain
the path loss due to the absorption of the human tissues [25]. As generally known,
the magnitude of the electric field of the plane wave does not vary when propagating
in free space but attenuates propagating in the lossy material, thus the plane wave
propagating in the tissue is studied to obtain the absorption path loss. As shown in
the Fig. 4.6, a dielectric cube, at the level of mm3, is built first. This assumption is
valid considering the THz range wavelength in comparison to the examined tissue
size (7mm × 7mm × 7mm). By aligning the dielectric constants to the cube, the ho-
mogeneous human tissue can be modelling, which can be obtained from Fig. 4.1b and
4.1c and shown in table 4.1, calculated from the optical parameters in [11], [12] by Eq.
4.4.
(a) 2D Cross-Section of the simplified model of thepropagation of the plane wave in human tissues
(b) 3-D Schematics of the simplified model of thepropagation of the plane wave in human tissues
Figure 4.6: Schematics of the simplified model of the propagation of the plane wave inhuman tissues
As shown in the figure, several probes have been equally spaced in order to mon-
itor the variation of the E-field with the distance from the source. A PML (Perfect
77

Tissues Blood Skin Fat
ǫ′ 3.5781 2.9240 2.2130ǫ′′ 2.0109 0.9085 0.5732
Table 4.1: The Dielectric parameters of blood, skin and fat at 1 THz
Matched Layer) has been considered as the boundary condition in the direction of
propagation and the periodic conditions in other directions. A plane wave has been
defined as the propagating wave travelling in the direction of +z while E-field is point-
ing to +x.
Eq. 4.7 is used to calculate the absorption path loss and the comparison of the
analytical and numerical results with the corresponding difference are demonstrated
in Fig. 4.7. It can be easily observed that the results agree well, indicating the reliability
of the numerical model thus paving the road to the further study of the THz wave for
body-centric nano-communication.
Figure 4.7: Absorption path loss vs. distance at 1 THz for different human tissues
4.4.2 Layered Model
To investigate the effect of the layered structures, the model shown in Fig. 4.8 is nu-
merically simulated in CST Microwave Studio. It can be seen that a traditional 3-
layered human model is built - skin, fat and muscle, whose thickness are 1.5 mm, 5
mm and 1.9 mm, respectively - with the PML as the boundary. Two dipoles working
at the band of 0.8THz ∼ 1.2THz are allocated for two different scenarios: one dipole
in skin with another one in fat (vertical simulation, shown in Fig. 4.8a); both dipoles
in skin allocated along the direction of the interface (horizontal simulation, shown in
78
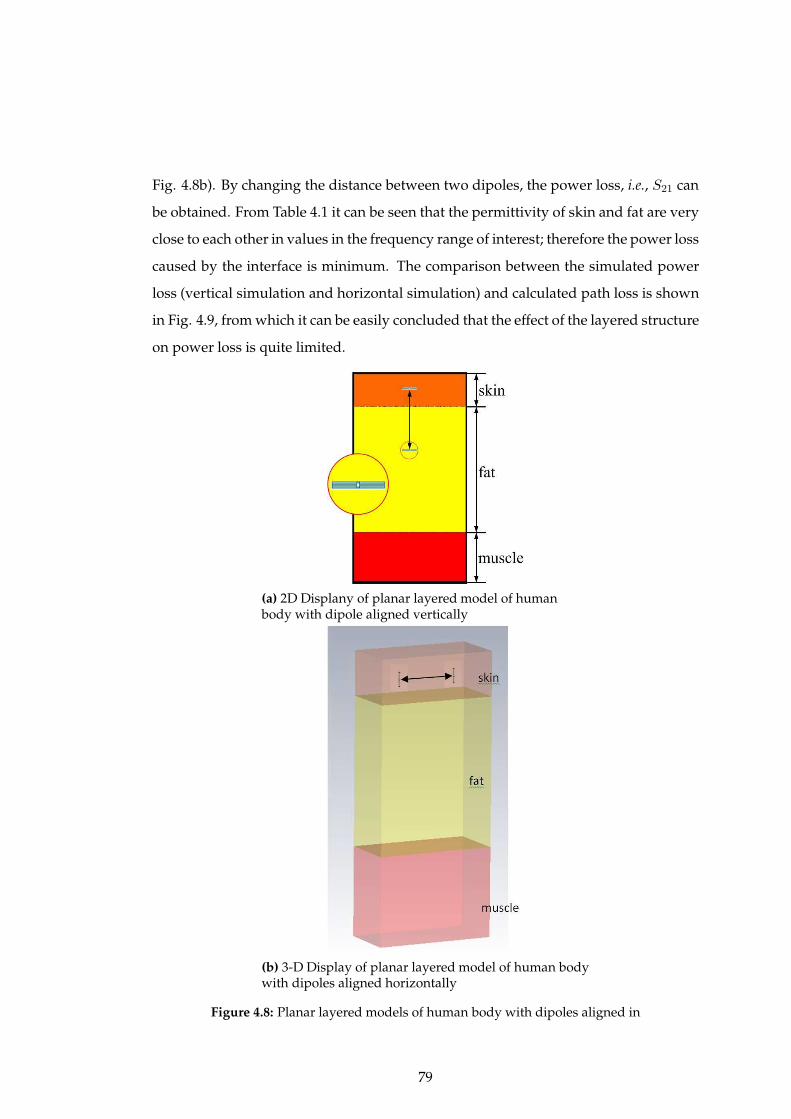
Fig. 4.8b). By changing the distance between two dipoles, the power loss, i.e., S21 can
be obtained. From Table 4.1 it can be seen that the permittivity of skin and fat are very
close to each other in values in the frequency range of interest; therefore the power loss
caused by the interface is minimum. The comparison between the simulated power
loss (vertical simulation and horizontal simulation) and calculated path loss is shown
in Fig. 4.9, from which it can be easily concluded that the effect of the layered structure
on power loss is quite limited.
(a) 2D Displany of planar layered model of humanbody with dipole aligned vertically
(b) 3-D Display of planar layered model of human bodywith dipoles aligned horizontally
Figure 4.8: Planar layered models of human body with dipoles aligned in
79
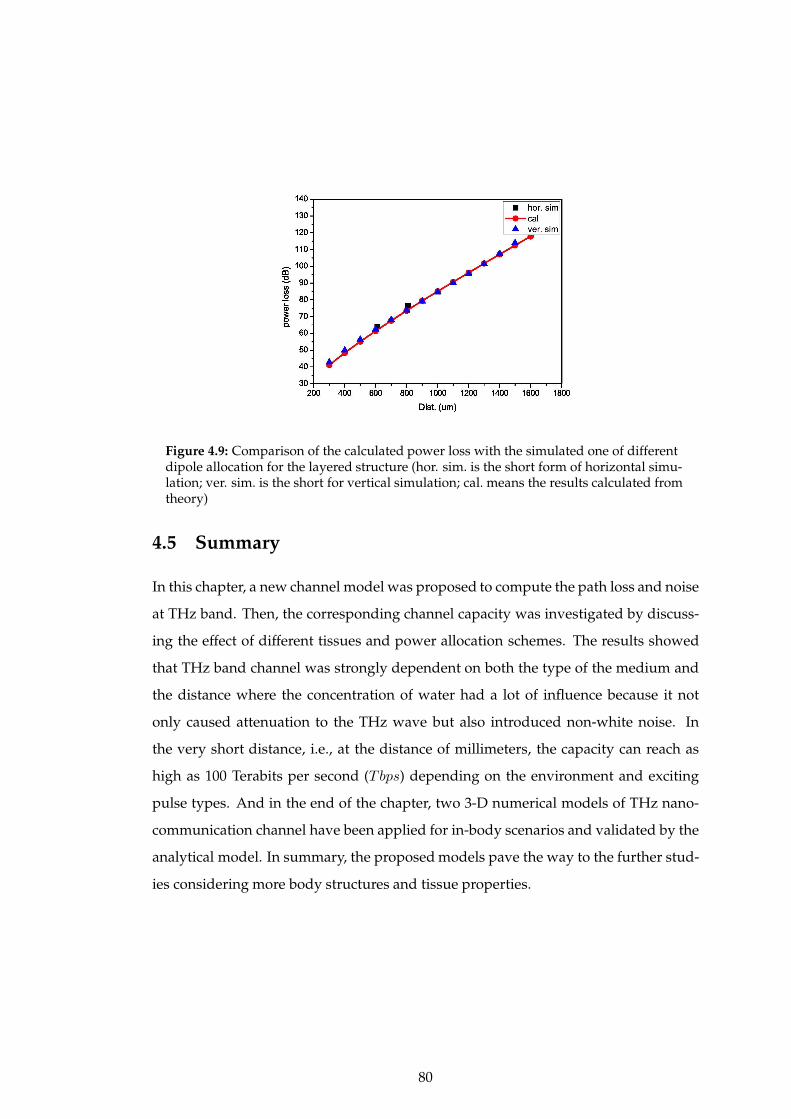
Figure 4.9: Comparison of the calculated power loss with the simulated one of differentdipole allocation for the layered structure (hor. sim. is the short form of horizontal simu-lation; ver. sim. is the short for vertical simulation; cal. means the results calculated fromtheory)
4.5 Summary
In this chapter, a new channel model was proposed to compute the path loss and noise
at THz band. Then, the corresponding channel capacity was investigated by discuss-
ing the effect of different tissues and power allocation schemes. The results showed
that THz band channel was strongly dependent on both the type of the medium and
the distance where the concentration of water had a lot of influence because it not
only caused attenuation to the THz wave but also introduced non-white noise. In
the very short distance, i.e., at the distance of millimeters, the capacity can reach as
high as 100 Terabits per second (Tbps) depending on the environment and exciting
pulse types. And in the end of the chapter, two 3-D numerical models of THz nano-
communication channel have been applied for in-body scenarios and validated by the
analytical model. In summary, the proposed models pave the way to the further stud-
ies considering more body structures and tissue properties.
80

References
[1] S. Luryi, J. Xu, and A. Zaslavsky, Future Trends in Microelectronics: Frontiers and Innova-tions. John Wiley & Sons, 2013.
[2] M. Dragoman, A. Muller, D. Dragoman, F. Coccetti, and R. Plana, “Terahertz antennabased on graphene,” Journal of Applied Physics, vol. 107, no. 10, p. 104313, 2010.
[3] I. Llatser, C. Kremers, A. Cabellos-Aparicio, J. M. Jornet, E. Alarcon, and D. N.Chigrin, “Graphene-based nano-patch antenna for terahertz radiation,” Photonics andNanostructures-Fundamentals and Applications, vol. 10, no. 4, pp. 353–358, 2012.
[4] P. S. Hall and Y. Hao, Antennas and Propagation for Body-Centric Wireless Communication.Artech House, 2012.
[5] A. Alomainy, Y. Hao, A. Owadally, C. G. Parini, Y. Nechayev, C. C. Constantinou, andP. S. Hall, “Statistical analysis and performance evaluation for on-body radio propagationwith microstrip patch antennas,” Antennas and Propagation, IEEE Transactions on, vol. 55,no. 1, pp. 245–248, 2007.
[6] D. Kurup, W. Joseph, G. Vermeeren, and L. Martens, “In-body path loss model for homo-geneous human tissues,” Electromagnetic Compatibility, IEEE Transactions on, vol. 54, no. 3,pp. 556–564, 2012.
[7] Q. H. Abbasi, A. Sani, A. Alomainy, and Y. Hao, “Numerical characterization and model-ing of subject-specific ultrawideband body-centric radio channels and systems for health-care applications,” Information Technology in Biomedicine, IEEE Transactions on, vol. 16,no. 2, pp. 221–227, 2012.
[8] A. Brizzi, A. Pellegrini, L. Zhang, and Y. Hao, “Statistical path-loss model for on-bodycommunications at 94 ghz,” Antennas and Propagation, IEEE Transactions on, vol. 61, no. 11,pp. 5744–5753, 2013.
[9] Y. Choi, J.-W. Choi, and J. M. Cioffi, “A geometric-statistic channel model for thz indoorcommunications,” Journal of Infrared, Millimeter, and Terahertz Waves, vol. 34, no. 7-8, pp.456–467, 2013.
[10] R. Piesiewicz, M. Jacob, M. Koch, J. Schoebel, and T. Kurner, “Performance analysis offuture multigigabit wireless communication systems at thz frequencies with highly dir-ective antennas in realistic indoor environments,” Selected Topics in Quantum Electronics,IEEE Journal of, vol. 14, no. 2, pp. 421–430, 2008.
[11] A. Fitzgerald, E. Berry, N. Zinov’ev, S. Homer-Vanniasinkam, R. Miles, J. Chamberlain,and M. Smith, “Catalogue of human tissue optical properties at terahertz frequencies,”Journal of Biological Physics, vol. 29, no. 2-3, pp. 123–128, 2003.
[12] E. Berry, A. J. Fitzgerald, N. N. Zinov’ev, G. C. Walker, S. Homer-Vanniasinkam, C. D.Sudworth, R. E. Miles, J. M. Chamberlain, and M. A. Smith, “Optical properties of tis-sue measured using terahertz-pulsed imaging,” in Medical Imaging 2003. InternationalSociety for Optics and Photonics, 2003, pp. 459–470.
[13] I. F. Akyildiz and J. M. Jornet, “Electromagnetic wireless nanosensor networks,” NanoCommunication Networks, vol. 1, no. 1, pp. 3–19, 2010.
[14] J. M. Jornet and I. F. Akyildiz, “Channel modeling and capacity analysis for electromag-netic wireless nanonetworks in the terahertz band,” Wireless Communications, IEEE Trans-actions on, vol. 10, no. 10, pp. 3211–3221, 2011.
[15] J. M. Jornet, J. C. Pujol, and J. S. Pareta, “Phlame: A physical layer aware mac protocolfor electromagnetic nanonetworks in the terahertz band,” Nano Communication Networks,vol. 3, no. 1, pp. 74–81, 2012.
[16] C. S. Joseph, A. N. Yaroslavsky, V. A. Neel, T. M. Goyette, and R. H. Giles, “Continuouswave terahertz transmission imaging of nonmelanoma skin cancers,” Lasers in Surgeryand Medicine, vol. 43, no. 6, pp. 457–462, 2011.
[17] E. Jung, H. Park, K. Moon, M. Lim, Y. Do, H. Han, H. J. Choi, B.-H. Min, S. Kim, I. Parket al., “Thz time-domain spectroscopic imaging of human articular cartilage,” Journal ofInfrared, Millimeter, and Terahertz Waves, vol. 33, no. 6, pp. 593–598, 2012.
81

[18] G. J. Wilmink and J. E. Grundt, “Invited review article: current state of research on bio-logical effects of terahertz radiation,” Journal of Infrared, Millimeter, and Terahertz Waves,vol. 32, no. 10, pp. 1074–1122, 2011.
[19] M. Pierobon and I. F. Akyildiz, “A physical end-to-end model for molecular communic-ation in nanonetworks,” Selected Areas in Communications, IEEE Journal on, vol. 28, no. 4,pp. 602–611, 2010.
[20] S. Bush, J. Paluh, G. Piro, V. Rao, V. Prasad, and A. Eckford, “Defining communicationat the bottom,” Molecular, Biological and Multi-Scale Communications, IEEE Transactions on,vol. PP, no. 99, pp. 1–1, 2015.
[21] F. Box, “Utilization of atmospheric transmission losses for interference-resistant commu-nications,” Communications, IEEE Transactions on, vol. 34, no. 10, pp. 1009–1015, 1986.
[22] A. N. Pal and A. Ghosh, “Ultralow noise field-effect transistor from multilayer graphene,”Applied Physics Letters, vol. 95, no. 8, p. 082105, 2009.
[23] A. Goldsmith, Wireless Communication. Cambridge University Press, 2005.[24] C. M. Studio, “Cst microwave studio.” [Online]. Available: https://www.cst.com[25] K. Yang, A. Pellegrini, A. Brizzi, A. Alomainy, and Y. Hao, “Numerical analysis of the
communication channel path loss at the thz band inside the fat tissue,” in MicrowaveWorkshop Series on RF and Wireless Technologies for Biomedical and Healthcare Applications(IMWS-BIO), 2013 IEEE MTT-S International. IEEE, 2013, pp. 1–3.
82

Chapter 5
Effects of Non-Flat Interfaces in
Human Skin Tissues on the In-Vivo
THz Communication Channel
Following the work of Chapter 4, a numerical computational studies would be con-
ducted in this chapter to investigate the quality of the radio communication of nano-
networks depending on the skin structure, where layered models of the human skin of
various geometries in the scale of the THz wavelengths was considered. Additionally,
the effects of the sweat duct would be considered and investigated.
5.1 Motivation and Related Work
The channel model of THz wave in human tissues has been investigated in Chapter
4, but to analyse the wave propagation in the human body, more accurate and finer
model should be considered instead of the homogeneous one. In this chapter, detailed
skin models would be introduced to observe the wave propagation and EM interaction
with the finer skin structures.
83

According to the current researches, there are three main models to describe the
skin structure: 1) 3 layered model; 2) 2 layered model and 3) model with detailed
parts. For the 3-layer models, the skin is divided into 3 layers: stratum corneum layer
(SC), epidermis and dermis layer (E-D) and subcutaneous fat layer (SCF)[1, 2]. In
2 layered models, the skin is modelled as the combination of epidermis and dermis
[3, 4]. On the basis of these models, more sophisticated models with detailed parts are
introduced to further study the skin performance [5, 6]. Furthermore, the helical sweat
duct structure was inserted into the epidermis layer of a 3-layered stratified model to
study its effects on electromagnetic (EM) reflection spectrum of skin in the frequency
range of 100 GHz to 450 GHz [6]. The results have shown that the morphological
features of the skin and the structure of the sweat ducts play an important role in the
reflectance spectrum. It also pointed out that at the higher frequencies the roughness
of the boundary should be incorporated into the model due to the same order of the
magnitude of the wavelength and the roughness but the detailed studies were not
considered. From the 3-D cross-sectional images depicting the different layers of the
skin [7] [8], it can be seen that the interface between the layers was not flat and the
roughness between the different layers of the skin was at the order of millimetre which
was considerable to the wavelength of the applied THz band (300 GHz to 10 THz [9])
of Nano-Communication Network [6]; thus, it is evident that more detailed models of
skin are required in order to understand the effects on EM wave propagation, which
is the main concern of this chapter.
5.2 Applied Numerical Skin Models
5.2.1 Human Skin Structure
The skin is a complex heterogeneous and anisotropic medium, where the small parts,
like blood vessel and pigment content, are spatially distributed in depth [10] [11],
as shown in Fig. 5.1. Human skin can be generally divided into three main visible
layers from the surface: the epidermis (∼ 100 µm, blood-free layer), the dermis (∼1 - 4 mm, vascularized layer) and the subcutaneous fat (from 1 to 6 mm dependent
on the location) as shown in Fig. 5.1 [12]. The epidermis contains two sub-layers:
stratum corneum with only dead quamous cells and the living epidermis layer, where
84

most of the skin pigmentation stay. The stratum corneum is a thin, stratified and
highly specialized layer which is accumulated on the outermost skin surface. The
dermis, supporting the epidermis, is thicker and mainly composed of collagen fibres
and intertwined elastic fibres enmeshed in a gel-like matrix. The subcutaneous fat
layer is composed of the packed cells with considerable fat, where the boundary is
not well demarcated; thus the thickness of this layer varies widely for different part of
human body [13].
Figure 5.1: General 3-layer skin model [14]
5.2.2 Numerical Skin Models
Models with Rough Boundary
From the skin model shown in Fig. 5.1 [15], it can be observed that the interface
between the layers is non-flat [6], and the dermal ridges prolong and penetrate into
the epidermis. In this paper, the influence of rough interface between these two lay-
ers was studied, making the model more physiologically plausible. CST Microwave
85
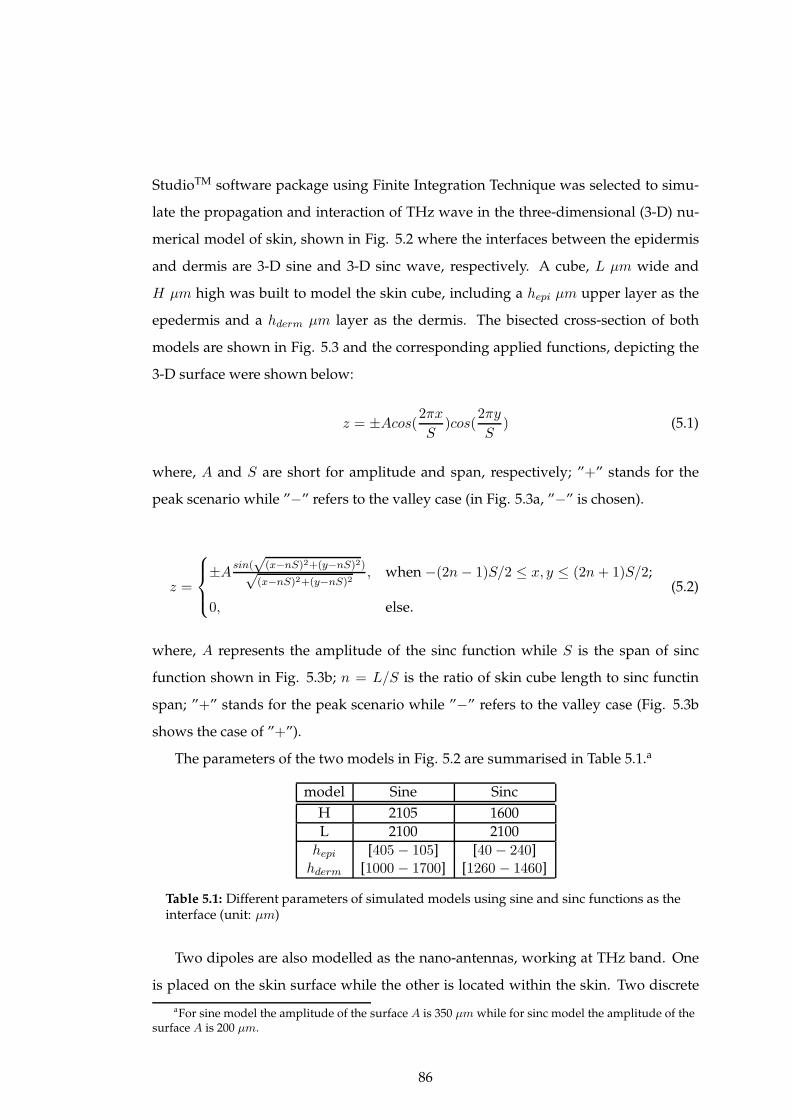
StudioTM software package using Finite Integration Technique was selected to simu-
late the propagation and interaction of THz wave in the three-dimensional (3-D) nu-
merical model of skin, shown in Fig. 5.2 where the interfaces between the epidermis
and dermis are 3-D sine and 3-D sinc wave, respectively. A cube, L µm wide and
H µm high was built to model the skin cube, including a hepi µm upper layer as the
epedermis and a hderm µm layer as the dermis. The bisected cross-section of both
models are shown in Fig. 5.3 and the corresponding applied functions, depicting the
3-D surface were shown below:
z = ±Acos(2πx
S)cos(
2πy
S) (5.1)
where, A and S are short for amplitude and span, respectively; ”+” stands for the
peak scenario while ”−” refers to the valley case (in Fig. 5.3a, ”−” is chosen).
z =
±Asin(
√(x−nS)2+(y−nS)2)√
(x−nS)2+(y−nS)2, when −(2n− 1)S/2 ≤ x, y ≤ (2n+ 1)S/2;
0, else.
(5.2)
where, A represents the amplitude of the sinc function while S is the span of sinc
function shown in Fig. 5.3b; n = L/S is the ratio of skin cube length to sinc functin
span; ”+” stands for the peak scenario while ”−” refers to the valley case (Fig. 5.3b
shows the case of ”+”).
The parameters of the two models in Fig. 5.2 are summarised in Table 5.1.a
model Sine Sinc
H 2105 1600
L 2100 2100
hepi [405 − 105] [40 − 240]hderm [1000 − 1700] [1260 − 1460]
Table 5.1: Different parameters of simulated models using sine and sinc functions as theinterface (unit: µm)
Two dipoles are also modelled as the nano-antennas, working at THz band. One
is placed on the skin surface while the other is located within the skin. Two discrete
aFor sine model the amplitude of the surface A is 350 µm while for sinc model the amplitude of thesurface A is 200 µm.
86
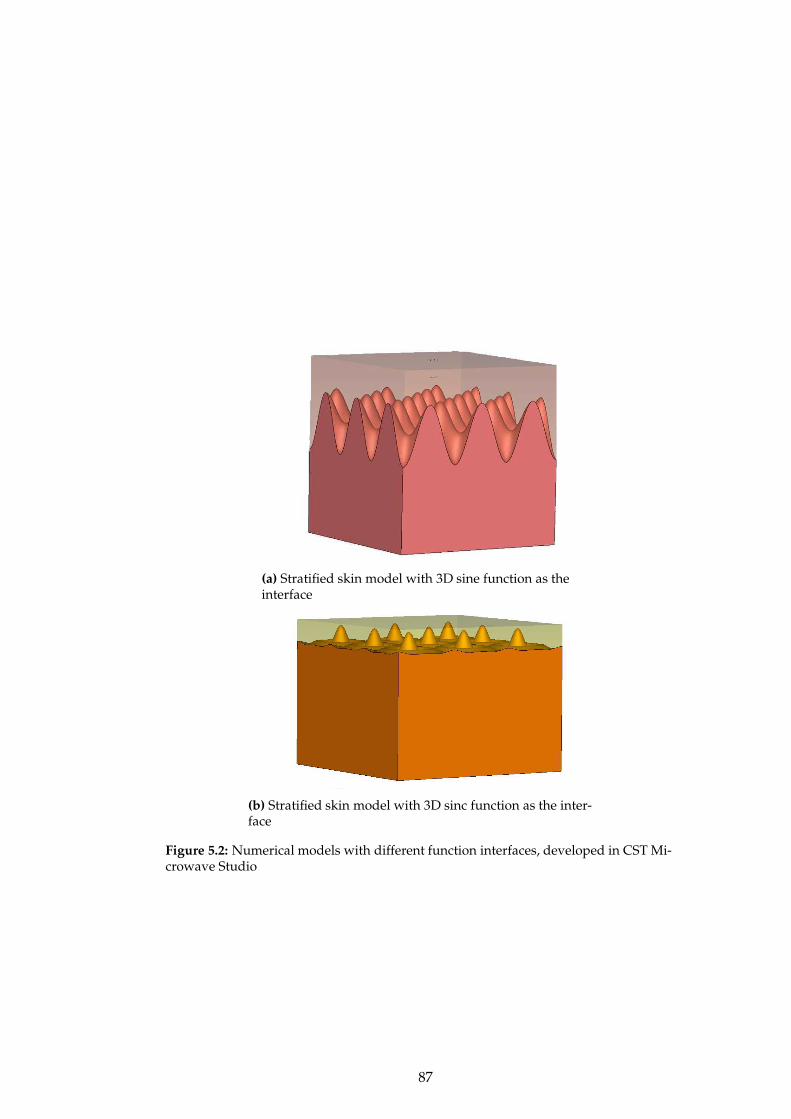
(a) Stratified skin model with 3D sine function as theinterface
(b) Stratified skin model with 3D sinc function as the inter-face
Figure 5.2: Numerical models with different function interfaces, developed in CST Mi-crowave Studio
87

(a) Stratified skin model with 3D sine function as theinterface in CST
(b) Stratified skin model with 3D sinc function as the inter-face in CST
Figure 5.3: Cross section of the applied models in Fig. 5.2 (L is the cube length, H is thecube height, hepi and hderm is the thickness of epidermis and dermis, A is the amplitudeof the surface while S is the span of the surface)
88

ports were applied to the dipoles and the tranmission coefficient, S21, was recorded
to investigate the power loss. The dimensions of the dipoles are shown in Table 5.2,
and they are optimised to ensure that the impedance matching is better than −10 dB.
The open boundary ,i.e., Perfect Match Layer (PML) was applied to ensure that the
reflections of the abruptly-cutting boundaries are neglectable. The nano-second long
Gaussian pulse is applied in the Time-Domain simulation while hexahedral mesh type
was applied. The permittivities applied to the different parts of skin are shown in Fig.
5.4 [16].
dipole on the skin surface dipole in the skin
arm length (µm) 43 36
radius (µm) 5 5
Table 5.2: Parameters of the dipole antennas used as transmit and receive elements forthe EM propagation power loss study across and within the human skin tissue models
0.2 0.4 0.6 0.8 1 1.2 1.4 1.6 1.8 23
3.5
4
4.5
5
5.5
6
6.5
7
Freq. [THz]
Mea
sure
d P
erm
ittiv
ity (
Rea
l Par
t)
dermisepidermiswater as sweat
(a) Real part of the relative permittivity
0.2 0.4 0.6 0.8 1 1.2 1.4 1.6 1.8 20
1
2
3
4
5
6
Freq. [THz]
Mea
sure
d P
erm
ittiv
ity (
Imag
inar
y P
art)
dermisepidermiswater as sweat
(b) Imaginary part of the relative permittivity
Figure 5.4: Permittivity of different skin layers and sweat at THz frequencies [16].
89

Skin Models with Sweat Ducts
For this part of the study, similar detailed skin model as shown in Fig. 5.2a was applied
with the inclusion of sweat ducts, as shown in Fig. 5.5. The sweat duct is 265 µm in
height and 40 µm in diameter. It includes three turns to be considered as a helical
antenna (For helical antenna number of turns should be at least 3.). Only when the
sweat duct contains sweat, containing 99% water and 1% salt and amino acid [17], it
can be regarded as a conductor; and hence the permittivity of water at THz band was
used to model sweat duct, as shown in Fig. 5.4.
Figure 5.5: Numerical model of skin while including sweat ducts.
5.3 Analysis of Skin-Internal Non-flat Interfaces on the THz
EM Channel
5.3.1 Effects of Different Shapes
Since the shape of the interface is determined by amplitude A and span S, to sim-
plified the case one of these two variables is fixed and the other changed with equal
difference. Four scenarios were investigated with model parameters as shown in Table
5.3.
The power loss for individual cases were recorded. Take the sine model as an
example, the line array records are illustrated in Fig. 5.6. Based on the recorded power
90
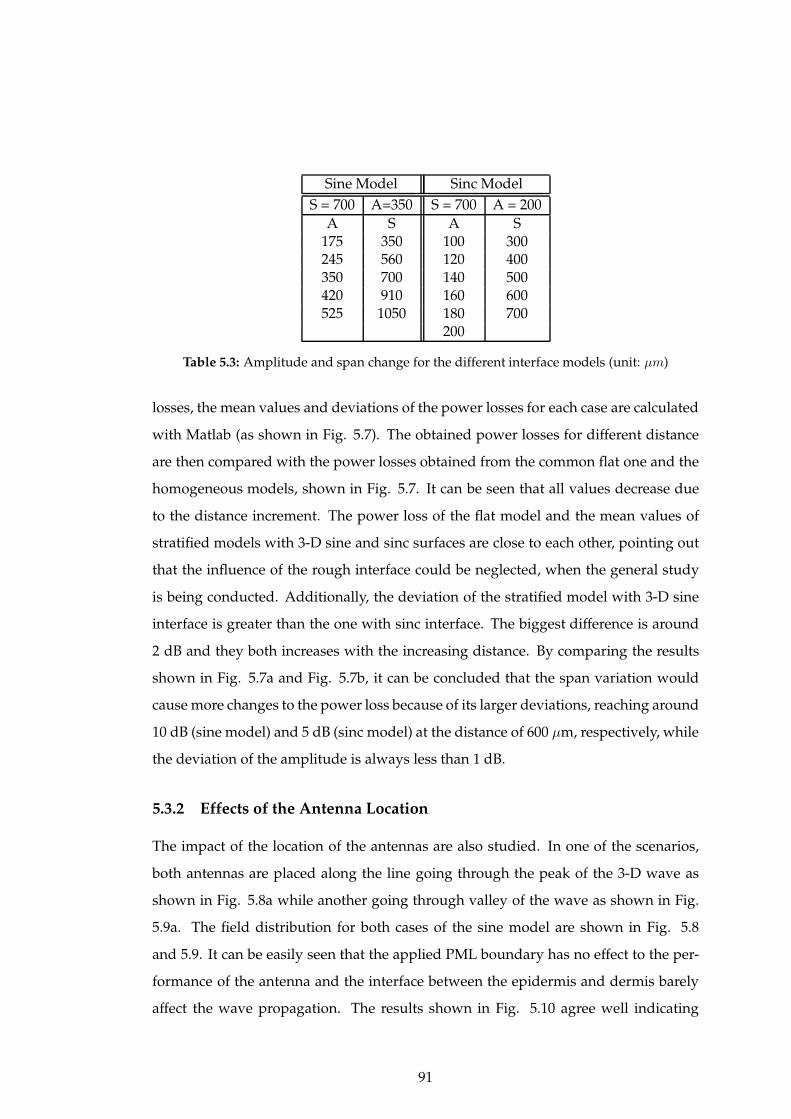
Sine Model Sinc Model
S = 700 A=350 S = 700 A = 200
A S A S175 350 100 300245 560 120 400350 700 140 500420 910 160 600525 1050 180 700
200
Table 5.3: Amplitude and span change for the different interface models (unit: µm)
losses, the mean values and deviations of the power losses for each case are calculated
with Matlab (as shown in Fig. 5.7). The obtained power losses for different distance
are then compared with the power losses obtained from the common flat one and the
homogeneous models, shown in Fig. 5.7. It can be seen that all values decrease due
to the distance increment. The power loss of the flat model and the mean values of
stratified models with 3-D sine and sinc surfaces are close to each other, pointing out
that the influence of the rough interface could be neglected, when the general study
is being conducted. Additionally, the deviation of the stratified model with 3-D sine
interface is greater than the one with sinc interface. The biggest difference is around
2 dB and they both increases with the increasing distance. By comparing the results
shown in Fig. 5.7a and Fig. 5.7b, it can be concluded that the span variation would
cause more changes to the power loss because of its larger deviations, reaching around
10 dB (sine model) and 5 dB (sinc model) at the distance of 600 µm, respectively, while
the deviation of the amplitude is always less than 1 dB.
5.3.2 Effects of the Antenna Location
The impact of the location of the antennas are also studied. In one of the scenarios,
both antennas are placed along the line going through the peak of the 3-D wave as
shown in Fig. 5.8a while another going through valley of the wave as shown in Fig.
5.9a. The field distribution for both cases of the sine model are shown in Fig. 5.8
and 5.9. It can be easily seen that the applied PML boundary has no effect to the per-
formance of the antenna and the interface between the epidermis and dermis barely
affect the wave propagation. The results shown in Fig. 5.10 agree well indicating
91
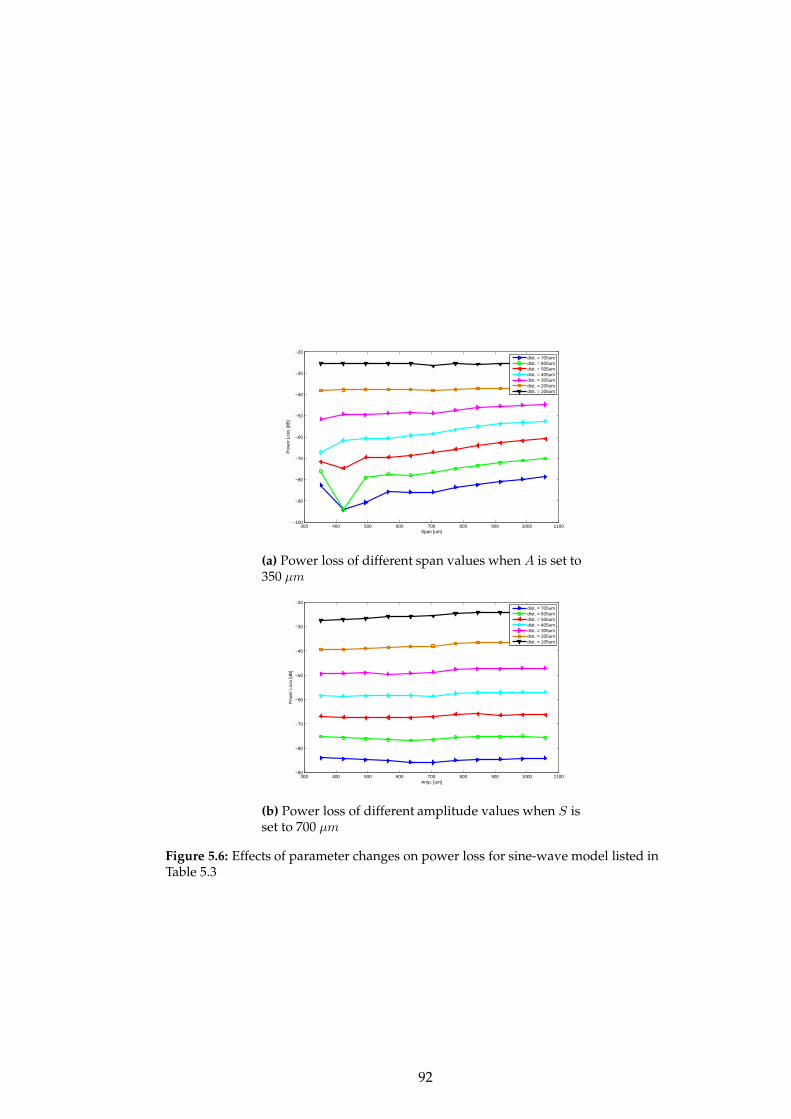
300 400 500 600 700 800 900 1000 1100−100
−90
−80
−70
−60
−50
−40
−30
−20
Span [um]
Pow
er L
oss
[dB
]
dist. = 705umdist. = 605umdist. = 505umdist. = 405umdist. = 305umdist. = 205umdist. = 105um
(a) Power loss of different span values when A is set to350 µm
300 400 500 600 700 800 900 1000 1100−90
−80
−70
−60
−50
−40
−30
−20
Amp. [um]
Pow
er L
oss
[dB
]
dist. = 705umdist. = 605umdist. = 505umdist. = 405umdist. = 305umdist. = 205umdist. = 105um
(b) Power loss of different amplitude values when S isset to 700 µm
Figure 5.6: Effects of parameter changes on power loss for sine-wave model listed inTable 5.3
92
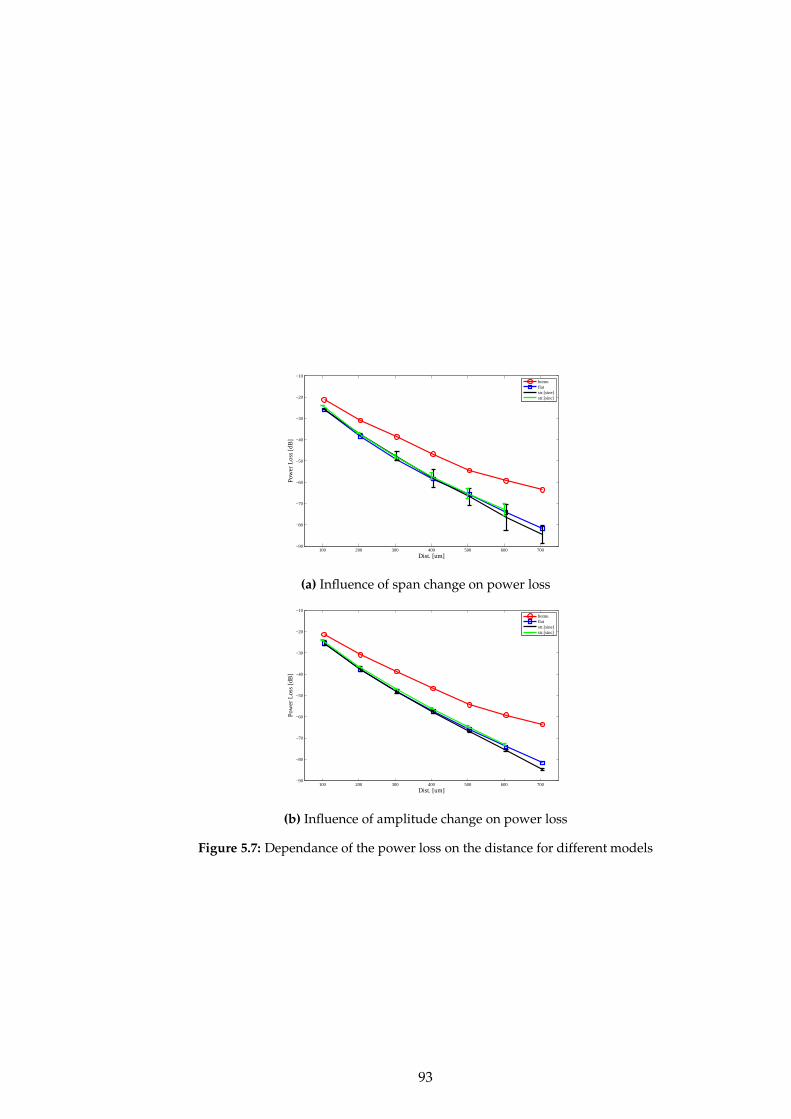
100 200 300 400 500 600 700−90
−80
−70
−60
−50
−40
−30
−20
−10
Dist. [um]
Pow
er L
oss
[dB
]
homo.flatstr.[sine]str.[sinc]
(a) Influence of span change on power loss
100 200 300 400 500 600 700−90
−80
−70
−60
−50
−40
−30
−20
−10
Dist. [um]
Pow
er L
oss
[dB
]
homo.flatstr.[sine]str.[sinc]
(b) Influence of amplitude change on power loss
Figure 5.7: Dependance of the power loss on the distance for different models
93
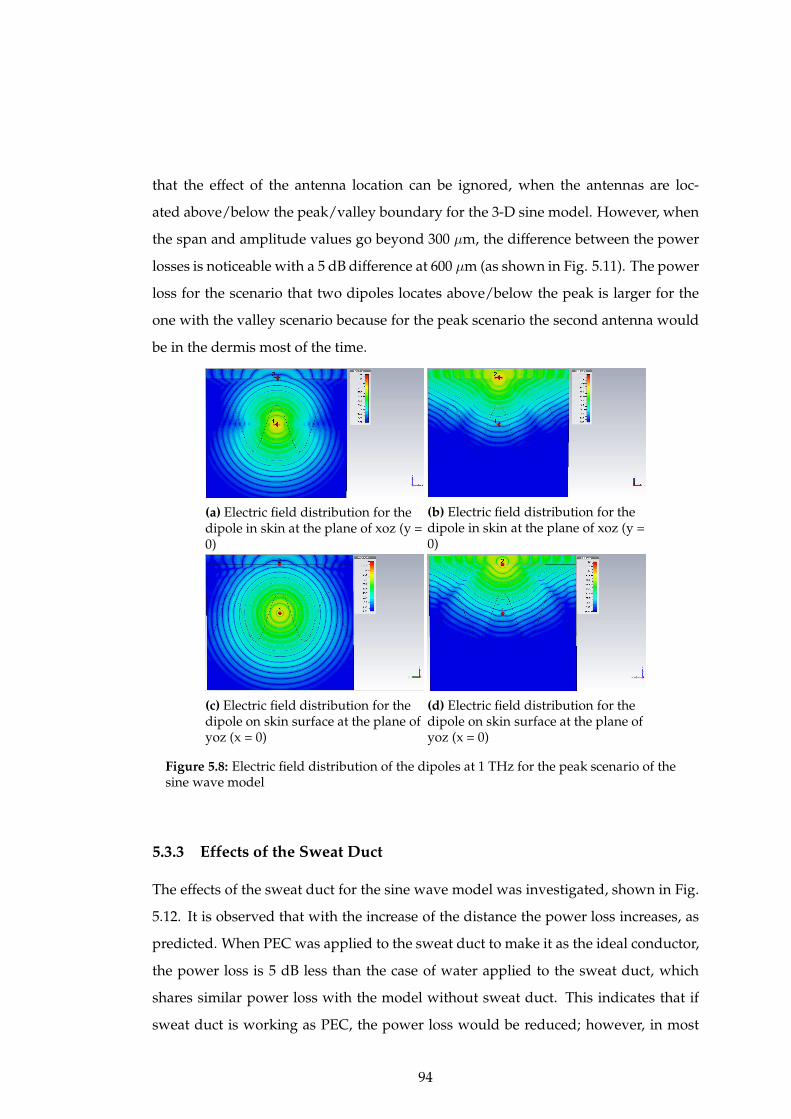
that the effect of the antenna location can be ignored, when the antennas are loc-
ated above/below the peak/valley boundary for the 3-D sine model. However, when
the span and amplitude values go beyond 300 µm, the difference between the power
losses is noticeable with a 5 dB difference at 600 µm (as shown in Fig. 5.11). The power
loss for the scenario that two dipoles locates above/below the peak is larger for the
one with the valley scenario because for the peak scenario the second antenna would
be in the dermis most of the time.
(a) Electric field distribution for thedipole in skin at the plane of xoz (y =0)
(b) Electric field distribution for thedipole in skin at the plane of xoz (y =0)
(c) Electric field distribution for thedipole on skin surface at the plane ofyoz (x = 0)
(d) Electric field distribution for thedipole on skin surface at the plane ofyoz (x = 0)
Figure 5.8: Electric field distribution of the dipoles at 1 THz for the peak scenario of thesine wave model
5.3.3 Effects of the Sweat Duct
The effects of the sweat duct for the sine wave model was investigated, shown in Fig.
5.12. It is observed that with the increase of the distance the power loss increases, as
predicted. When PEC was applied to the sweat duct to make it as the ideal conductor,
the power loss is 5 dB less than the case of water applied to the sweat duct, which
shares similar power loss with the model without sweat duct. This indicates that if
sweat duct is working as PEC, the power loss would be reduced; however, in most
94
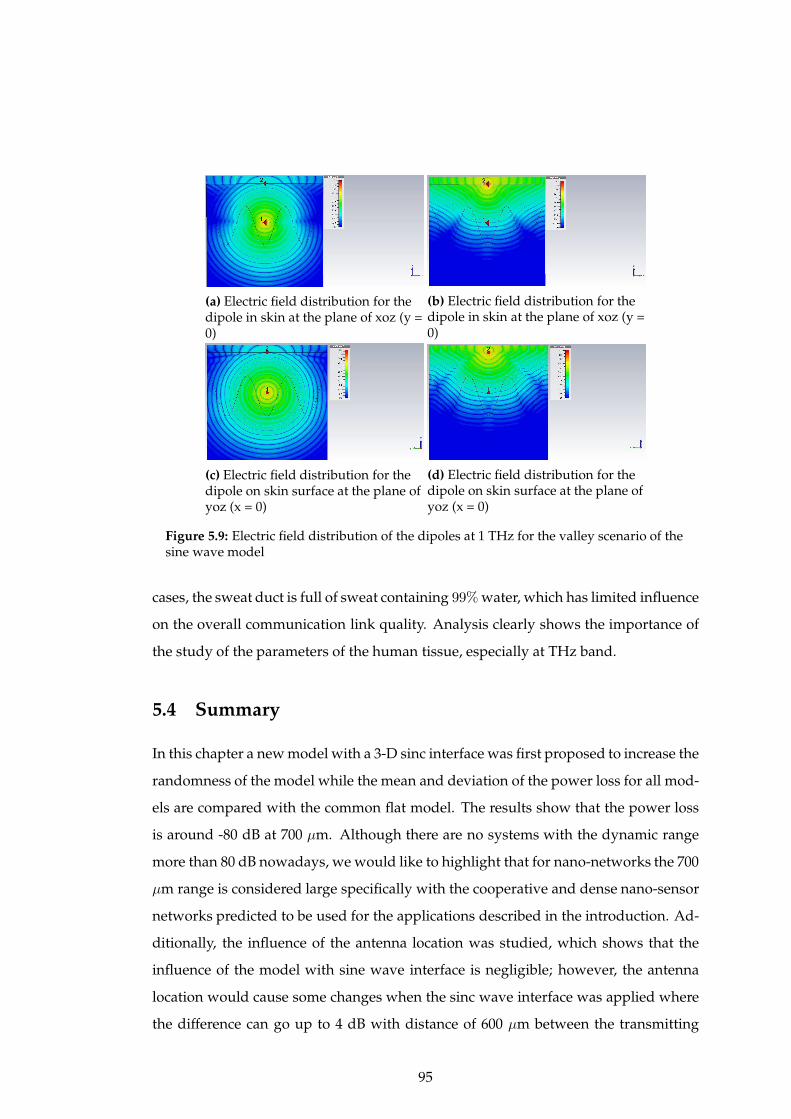
(a) Electric field distribution for thedipole in skin at the plane of xoz (y =0)
(b) Electric field distribution for thedipole in skin at the plane of xoz (y =0)
(c) Electric field distribution for thedipole on skin surface at the plane ofyoz (x = 0)
(d) Electric field distribution for thedipole on skin surface at the plane ofyoz (x = 0)
Figure 5.9: Electric field distribution of the dipoles at 1 THz for the valley scenario of thesine wave model
cases, the sweat duct is full of sweat containing 99% water, which has limited influence
on the overall communication link quality. Analysis clearly shows the importance of
the study of the parameters of the human tissue, especially at THz band.
5.4 Summary
In this chapter a new model with a 3-D sinc interface was first proposed to increase the
randomness of the model while the mean and deviation of the power loss for all mod-
els are compared with the common flat model. The results show that the power loss
is around -80 dB at 700 µm. Although there are no systems with the dynamic range
more than 80 dB nowadays, we would like to highlight that for nano-networks the 700
µm range is considered large specifically with the cooperative and dense nano-sensor
networks predicted to be used for the applications described in the introduction. Ad-
ditionally, the influence of the antenna location was studied, which shows that the
influence of the model with sine wave interface is negligible; however, the antenna
location would cause some changes when the sinc wave interface was applied where
the difference can go up to 4 dB with distance of 600 µm between the transmitting
95
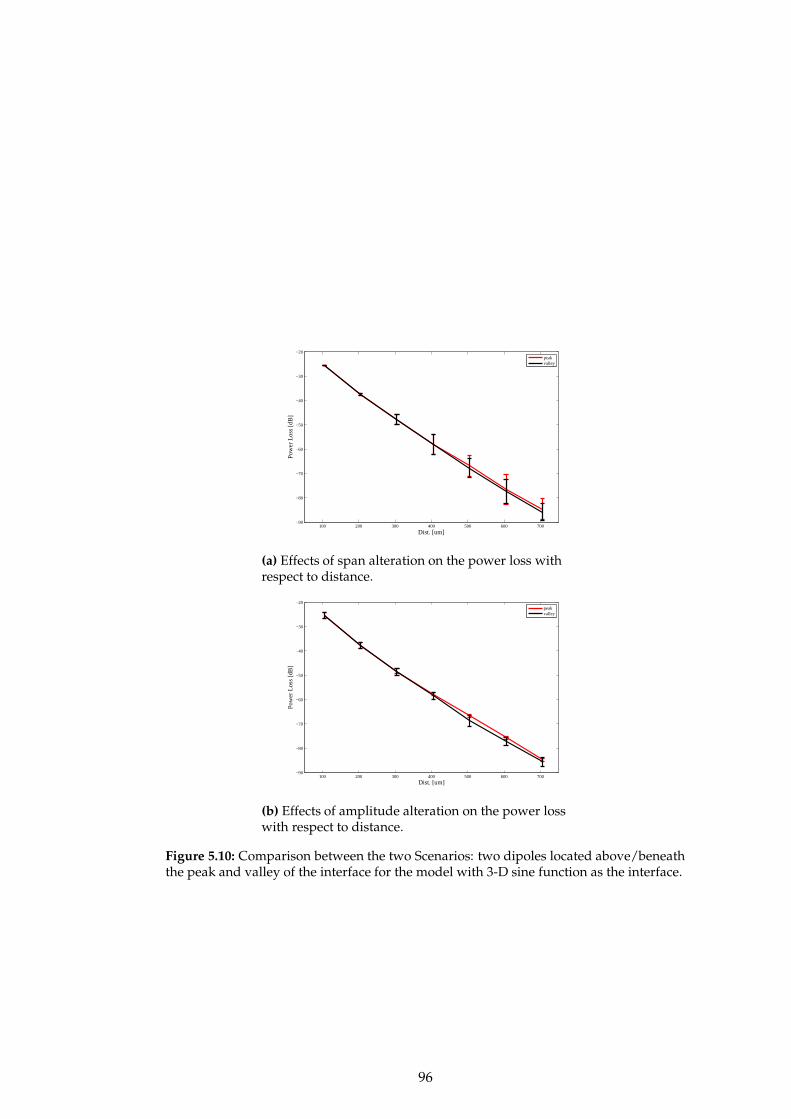
100 200 300 400 500 600 700−90
−80
−70
−60
−50
−40
−30
−20
Dist. [um]
Pow
er L
oss
[dB
]
peakvalley
(a) Effects of span alteration on the power loss withrespect to distance.
100 200 300 400 500 600 700−90
−80
−70
−60
−50
−40
−30
−20
Dist. [um]
Pow
er L
oss
[dB
]
peakvalley
(b) Effects of amplitude alteration on the power losswith respect to distance.
Figure 5.10: Comparison between the two Scenarios: two dipoles located above/beneaththe peak and valley of the interface for the model with 3-D sine function as the interface.
96

100 200 300 400 500 600−80
−70
−60
−50
−40
−30
−20
Dist. [um]
Pow
er L
oss
[dB
]
peakvalley
(a) Effects of span alteration on the power loss withrespect to distance.
100 200 300 400 500 600−80
−70
−60
−50
−40
−30
−20
Dist. [um]
Pow
er L
oss
[dB
]
peakvalley
(b) Effects of amplitude alteration on the power losswith respect to distance.
Figure 5.11: Comparison between the two Senarios: two dipoles located above/beneaththe peak and valley of the interface for the model with 3-D sinc function as the interface.
400 450 500 550 600 650 700 750 800 850−95
−90
−85
−80
−75
−70
−65
−60
−55
Dist. [um]
Pow
er L
oss
[dB
]
w/o sweat ductwater as sweat ductpec as sweat duct
Figure 5.12: Power loss at 1 THz for three scenario: a) without the sweat duct in epi-dermis; b) water is considered as the sweat in sweat duct; c) the sweat duct is consideredas PEC
97
and receiving antennas. Finally, the effects of the sweat duct were investigated by
applying two different materials (PEC and water) and compared to the case without
the sweat duct presence. Result shows that when PEC is considered as a material for
sweat duct, the power loss reduction is around 5 dB, while the power loss is negligible,
when water is considered as a material for sweat duct at THz band.
98
References
[1] R. Aminzadeh, M. Saviz, and A. A. Shishegar, “Dielectric properties estimation of nor-mal and malignant skin tissues at millimeter-wave frequencies using effective mediumtheory,” in Electrical Engineering (ICEE), 2014 22nd Iranian Conference on. IEEE, 2014, pp.1657–1661.
[2] S. Huclova, J. Frohlich, L. Falco, F. Dewarrat, M. S. Talary, and R. Vahldieck, “Validationof human skin models in the mhz region,” in Engineering in Medicine and Biology Society,2009. EMBC 2009. Annual International Conference of the IEEE. IEEE, 2009, pp. 4461–4464.
[3] K. H. Chan, S. W. Leung, Y. L. Diao, Y. M. Siu, and K. T. Ng, “Analysis of millimeter waveradiation to human body using inhomogeneous multilayer skin model,” in Electromag-netic Compatibility (APEMC), 2012 Asia-Pacific Symposium on. IEEE, 2012, pp. 721–724.
[4] C. So-Ling and L. Li, “A multi-layered reflection model of natural human skin,” in Com-puter Graphics International 2001. Proceedings. IEEE, 2001, pp. 249–256.
[5] H. Nugroho, A. F. M. Hani, R. Jolivot, and F. Marzani, “Melanin type and concentra-tion determination using inverse model,” in National Postgraduate Conference (NPC), 2011.IEEE, 2011, pp. 1–7.
[6] I. Hayut, A. Puzenko, P. Ben Ishai, A. Polsman, A. J. Agranat, and Y. Feldman, “The helicalstructure of sweat ducts: Their influence on the electromagnetic reflection spectrum of theskin,” Terahertz Science and Technology, IEEE Transactions on, vol. 3, no. 2, pp. 207–215, 2013.
[7] P.-L. Hsiung, Y. Chen, T. Ko, J. Fujimoto, C. de Matos, S. Popov, J. Taylor, and V. Ga-pontsev, “Optical coherence tomography using a continuous-wave, high-power, ramancontinuum light source,” Optics express, vol. 12, no. 22, pp. 5287–5295, 2004.
[8] P. Cimalla, J. Walther, M. Mehner, M. Cuevas, and E. Koch, “Simultaneous dual-band op-tical coherence tomography in the spectral domain for high resolution in vivo imaging,”Optics express, vol. 17, no. 22, pp. 19 486–19 500, 2009.
[9] I. F. Akyildiz, F. Brunetti, and C. Blazquez, “Nanonetworks: A new communicationparadigm,” Computer Networks, vol. 52, no. 12, pp. 2260–2279, 2008.
[10] W. Montagna, The Structure and Function of Skin 3E. Elsevier, 2012.[11] G. F. Odland, “Structure of the skin,” Physiology, biochemistry, and molecular biology of the
skin, vol. 1, pp. 3–62, 1991.[12] A. Bashkatov, E. Genina, V. Kochubey, and V. Tuchin, “Optical properties of human skin,
subcutaneous and mucous tissues in the wavelength range from 400 to 2000 nm,” Journalof Physics D: Applied Physics, vol. 38, no. 15, p. 2543, 2005.
[13] Q. H. Abbasi, A. Sani, A. Alomainy, and Y. Hao, “Numerical characterization and model-ing of subject-specific ultrawideband body-centric radio channels and systems for health-care applications,” Information Technology in Biomedicine, IEEE Transactions on, vol. 16,no. 2, pp. 221–227, 2012.
[14] R. F. Rushmer, K. J. Buettner, J. M. Short, and G. F. Odland, “The skin,” Science, vol. 154,no. 3747, pp. 343–348, 1966.
[15] A. Knu, S. Bonev, W. Knaak et al., “New method for evaluation of in vivo scattering andrefractive index properties obtained with optical coherence tomography,” Journal of bio-medical optics, vol. 9, no. 2, pp. 265–273, 2004.
[16] K. Yaws, D. Mixon, and W. Roach, “Electromagnetic properties of tissue in the opticalregion,” in Biomedical Optics (BiOS) 2007. International Society for Optics and Photonics,2007, pp. 643 507–643 507.
[17] G. Shafirstein and E. G. Moros, “Modelling millimetre wave propagation and absorptionin a high resolution skin model: the effect of sweat glands,” Physics in medicine and biology,vol. 56, no. 5, p. 1329, 2011.
99
Chapter 6
Characteristics and Modelling of
Electromagnetic Parameters of
Human Skin at THz band
During the study of the channel performance of THz wave for nano communication,
it is found that there is a lack of the data-base of EM parameters of human tissues. In
this chapter, the collagen, main constitute of skin has been cultivated and measured
to obtain the optical/electromagnetic parameters at the THz band of interest. Then, a
double Debye model would be investigated, followed by the validation of the theor-
etical model produced in previous chapters.
6.1 Motivation and Related Work
From the previous discussion, it can be easily seen that the papers on EM/Optical
parameters of human tissues are quite limited in the THz band of interest [1–3]. Pulse
THz spectroscopy was first used to measure the absorbtance of DNA, bovine serum
albumin and collagen at the band of 0.06 to 2.0 THz [4], showing that the absorption
100

would increase with hydration and denaturing. Later, animal tissues, such as pork
skin, pork fat and rat skin, were measured to study the power absorption and far-
infrared signal transmission at THz band [5]. Because the performance of the cancer
is different from the healthy tissue at THz band, more and more studies are conduc-
ted on the characterisation of the human tissues at these bands. The healthy liver
and liver cancer were studied to indicate the possibility of the application of THz
Fiber-scanning Near-Field Imaging technology to diagnose the cancer [6]. Recently,
spectroscopy measurements of normal and cancer breast tissue in the range of 0.1 to
4 THz were conducted by Tyler Bowman and et. al. [7], demonstrating the potential
of THz spectroscopy for the recognisation of the cancer cell while the dielectric model
of human breast tissue in THz band was built by A.J. Fitzgerald [8], where the aver-
age complex permittivity of health tumour, healthy fibrous breast tissue and healthy
fat breast tissue from [9] were compared. However, most of the researches are still re-
stricted to KHz or GHz of range [10–13] because the biological material in this range is
believed to have little scattering and the radiation is readily absorbed and transmitted
through depending on the size and inherent properties of the material [14] and the
study of the tissue parameters at THz band is at its early phase. To enrich the data-
base of the parameters for biological tissues at THz band, the human tissue samples
cultivated in Blizard Institute would be measured with the THz Time Domain Spec-
troscopy (THz-TDS) system at Queen Mary University of London a.In this chapter, the
skin tissue, especially collagen, the main constitute of epidermis, would be the main
focus to investigate if it is enough to use the parameters of collagen as the epidermis
at the band of interest by studying both dielectric constants.
6.2 Principles of the Measurement
6.2.1 THz-TDS System Set-up
To obtain information of complex refractive index of measured samples because of the
nature of THz, Grischkowsky and his co-workers introduced the first THz-TDS [15].
Although current THz-TDS systems are more advanced in the aspect of techniques
such as scanning time, beam generation, detection methods and etc., the fundamental
aEthics Number: East London & The City REC Alpha 09/H0704/69
101

principle of operation remains. A schematic illustration of the set-up of a THz-TDS
in transmission mode is shown in Fig. 6.1. The pulsed titanium-Sapphire laser pro-
duces femto-second pulses, which are then redirected into two separate optical paths
by a beam-splitter. One beam becomes the receiver pulse (a measurement using the
receiver is possible only when a femto-second pulse is incident on the receiver), while
the other is used to excite THz wave at the emitter. Parabolic mirrors are used to focus
and collimate the THz pulses travelling through the sample and onto the detector. The
detector only conducts when it is struck by the femtosecond pulse from the detection
beam line. When the detector is photo-excited, the THz pulses electric field causes an
electric current to flow inside the detector. Using a time delay on the detector beam
line to control the relative time delay between the THz pulse and when the detector
can conduct, the electric field of the THz pulse can be plotted over time.
Figure 6.1: Schmatic diagram of a THz-TDS system operating in transmission mode
The photo of the THz-TDS installed at QMUL is shown in Fig. 6.2. The system
shown here is operating in transmission mode. The main features and characteristics
of this spectrometer are [16]:
• Typical operating frequency domain: 0.1 − 4.0 THz;
• Maximum dynamic range is 25− 30 dB, SNR is normally around 25 dB;
• Motorized delay stage maximum travelling distance is 15 cm;
102

• Typical resolution is 14GHz (scan size 10.24mm, step 10 µm); maximum achiev-
able resolution is 1− 2 GHz;
Figure 6.2: THz-TDS system in Queen Mary University of London [16]
The photo of the sample holder with the stand is shown in Fig. 6.3. It was made
of poly-4-methyl pentene-1 (TPX) because of its non-dispersive characteristics at the
band of interest that its absorption is very low, ≤ 1cm−1 and the refraction index is
1.46 over 0.1 ∼ 4 THz.
6.2.2 Data-Processing [17, 18]
The original measurement data from the THz-TDS system were the received electric
field ~E. The complex spectra of air measured by TDS system is shown in Fig. 6.4.
Conventionally, the rate of the sample spectra to the reference one, which is served
by the absence of the sample, usually the air, is used to calculate the complex refractive
index n = n− iκ. Thus, the measured transfer function is:
Hmeasure(f) =Esam(f)
Eref (f)(6.1)
103
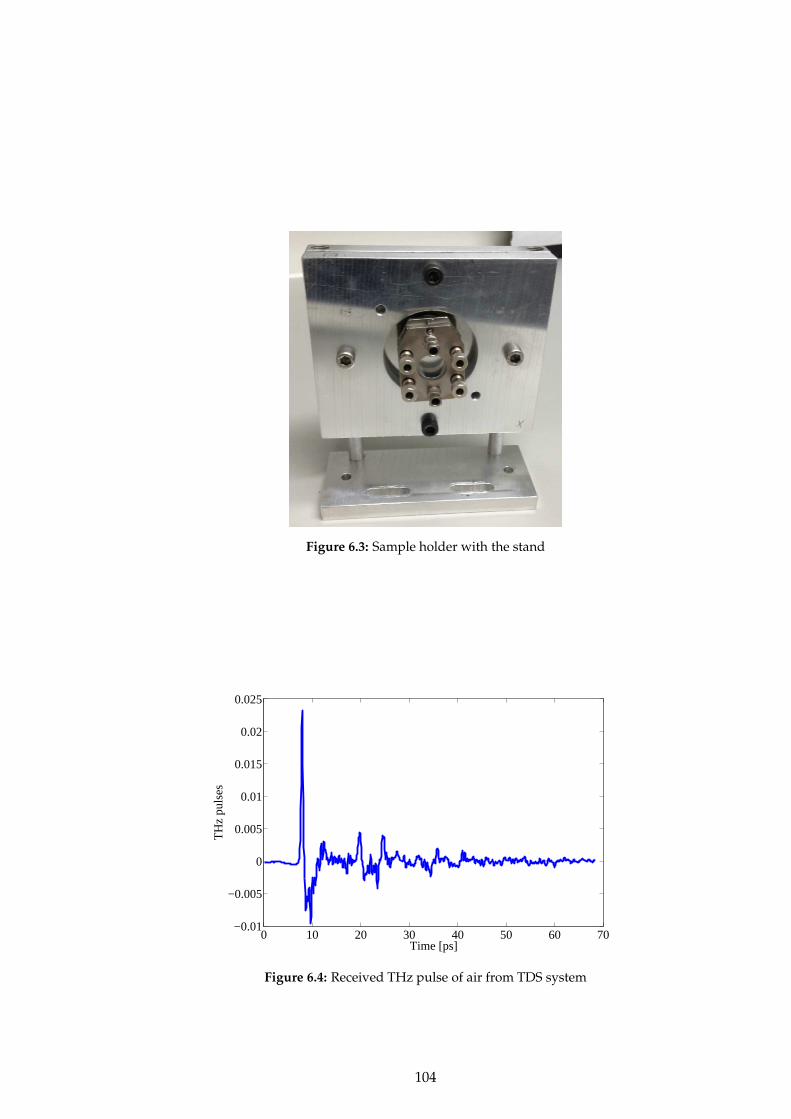
Figure 6.3: Sample holder with the stand
0 10 20 30 40 50 60 70−0.01
−0.005
0
0.005
0.01
0.015
0.02
0.025
Time [ps]
TH
z pu
lses
Figure 6.4: Received THz pulse of air from TDS system
104
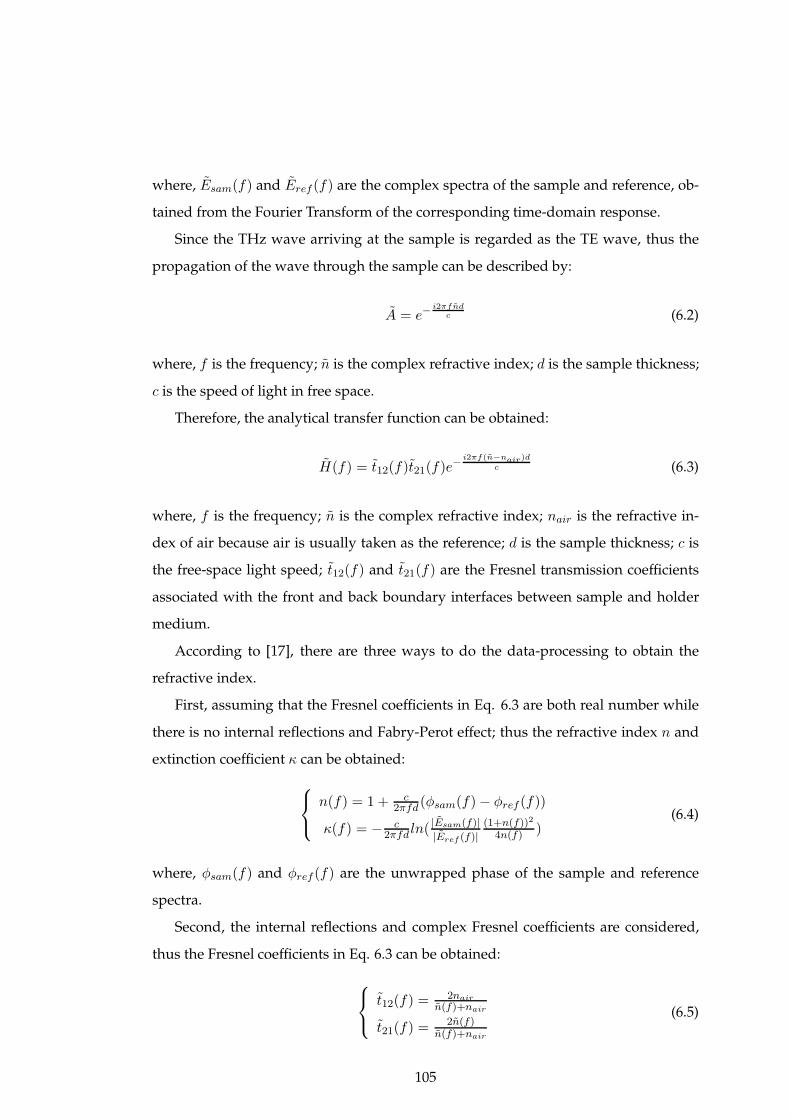
where, Esam(f) and Eref (f) are the complex spectra of the sample and reference, ob-
tained from the Fourier Transform of the corresponding time-domain response.
Since the THz wave arriving at the sample is regarded as the TE wave, thus the
propagation of the wave through the sample can be described by:
A = e−i2πfnd
c (6.2)
where, f is the frequency; n is the complex refractive index; d is the sample thickness;
c is the speed of light in free space.
Therefore, the analytical transfer function can be obtained:
H(f) = t12(f)t21(f)e−
i2πf(n−nair)d
c (6.3)
where, f is the frequency; n is the complex refractive index; nair is the refractive in-
dex of air because air is usually taken as the reference; d is the sample thickness; c is
the free-space light speed; t12(f) and t21(f) are the Fresnel transmission coefficients
associated with the front and back boundary interfaces between sample and holder
medium.
According to [17], there are three ways to do the data-processing to obtain the
refractive index.
First, assuming that the Fresnel coefficients in Eq. 6.3 are both real number while
there is no internal reflections and Fabry-Perot effect; thus the refractive index n and
extinction coefficient κ can be obtained:
n(f) = 1 + c2πfd (φsam(f)− φref (f))
κ(f) = − c2πfd ln(
|Esam(f)|
|Eref (f)|
(1+n(f))2
4n(f) )(6.4)
where, φsam(f) and φref (f) are the unwrapped phase of the sample and reference
spectra.
Second, the internal reflections and complex Fresnel coefficients are considered,
thus the Fresnel coefficients in Eq. 6.3 can be obtained:
t12(f) =2nair
n(f)+nair
t21(f) =2n(f)
n(f)+nair
(6.5)
105
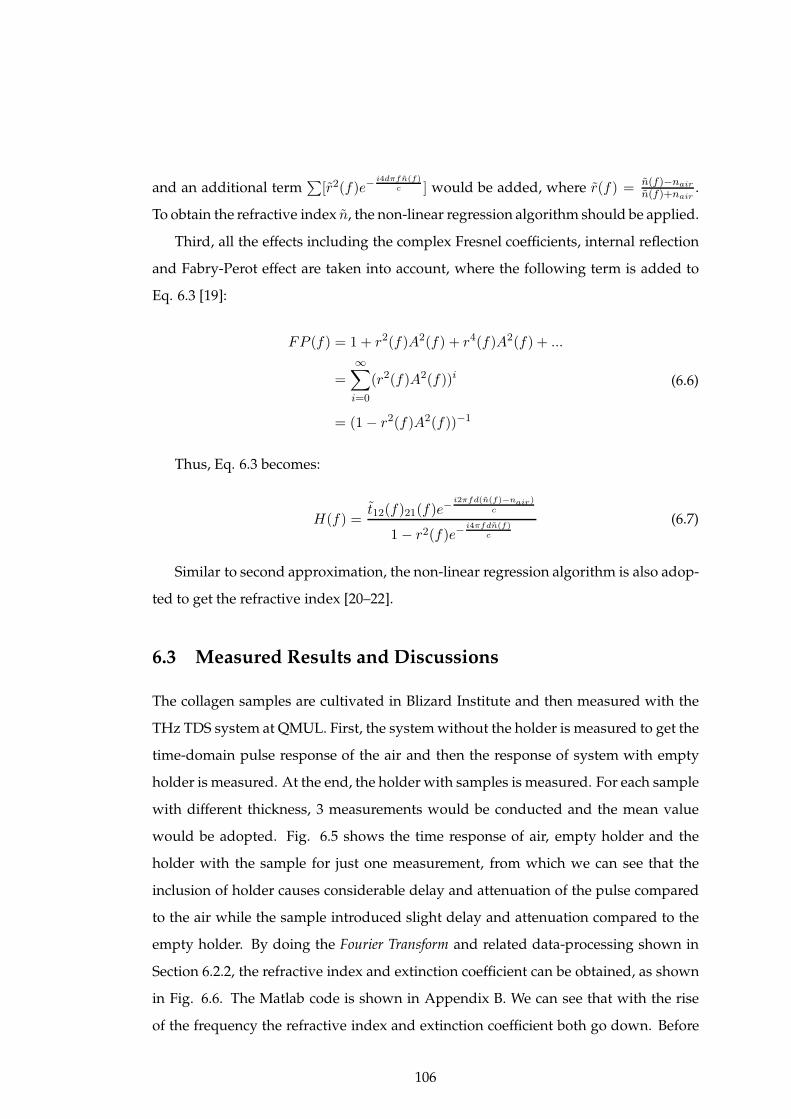
and an additional term∑
[r2(f)e−i4dπfn(f)
c ] would be added, where r(f) = n(f)−nair
n(f)+nair.
To obtain the refractive index n, the non-linear regression algorithm should be applied.
Third, all the effects including the complex Fresnel coefficients, internal reflection
and Fabry-Perot effect are taken into account, where the following term is added to
Eq. 6.3 [19]:
FP (f) = 1 + r2(f)A2(f) + r4(f)A2(f) + ...
=∞∑
i=0
(r2(f)A2(f))i
= (1− r2(f)A2(f))−1
(6.6)
Thus, Eq. 6.3 becomes:
H(f) =t12(f)21(f)e
−i2πfd(n(f)−nair)
c
1− r2(f)e−i4πfdn(f)
c
(6.7)
Similar to second approximation, the non-linear regression algorithm is also adop-
ted to get the refractive index [20–22].
6.3 Measured Results and Discussions
The collagen samples are cultivated in Blizard Institute and then measured with the
THz TDS system at QMUL. First, the system without the holder is measured to get the
time-domain pulse response of the air and then the response of system with empty
holder is measured. At the end, the holder with samples is measured. For each sample
with different thickness, 3 measurements would be conducted and the mean value
would be adopted. Fig. 6.5 shows the time response of air, empty holder and the
holder with the sample for just one measurement, from which we can see that the
inclusion of holder causes considerable delay and attenuation of the pulse compared
to the air while the sample introduced slight delay and attenuation compared to the
empty holder. By doing the Fourier Transform and related data-processing shown in
Section 6.2.2, the refractive index and extinction coefficient can be obtained, as shown
in Fig. 6.6. The Matlab code is shown in Appendix B. We can see that with the rise
of the frequency the refractive index and extinction coefficient both go down. Before
106

0.5 THz, both parameters descend steeply while after 0.5 THz both parameters drop
slightly.
0 10 20 30 40 50 60 70−0.01
−0.005
0
0.005
0.01
0.015
0.02
0.025
Time (ps)
TH
z pu
lses
airsampleempty holder
Figure 6.5: Time response of air, empty holder and the holder with the sample measuredby THz-TDS system
Using the following relationship between the EM parameters to the optical para-
meters, Eq. 6.8, the permittivity of the collagen can be obtained, as shown in Fig. 6.7.
Similar to the optical parameters, the permittivity falls with the increase of the fre-
quency and there is also a frequency point, 0.5 THz approximately, where the trend
of both curves change.
ǫ′ = nr(f)2 − κ(f)2
ǫ′′ = 2nr(f)κ(f)(6.8)
where, ǫ′ and ǫ′′ are the real and imaginary part of the permittivity ǫ.
The comparison between the measured results with the data shown in [23], [24]
and [25] is shown in Fig. 6.8. From the figure, it can be easily seen that although the
trend of the three curves are similar, the permittivity of the measured collagen is less
than the others’ data, demonstrating that the collagen is not enough to represent the
epidermis at the band of interest. Also, it can be easily noticed that the trend of data in
[24] is different from others in the lower frequency band, which is mainly due to the
107

0.2 0.4 0.6 0.8 1 1.2 1.4 1.6 1.8 20
1
2
3
4
5
Freq. (THz)
Ref
ract
ive
inde
x(n)
(a) Relative refractive index measured by THz-TDS system
0.2 0.4 0.6 0.8 1 1.2 1.4 1.6 1.8 20
0.1
0.2
0.3
0.4
0.5
Freq. (THz)
Ext
inct
ion
Coe
ffici
ent (κ
)
(b) Extinction coefficient measured by THz-TDS system
Figure 6.6: Measured optical parameters of collagen from THz-TDS system
108
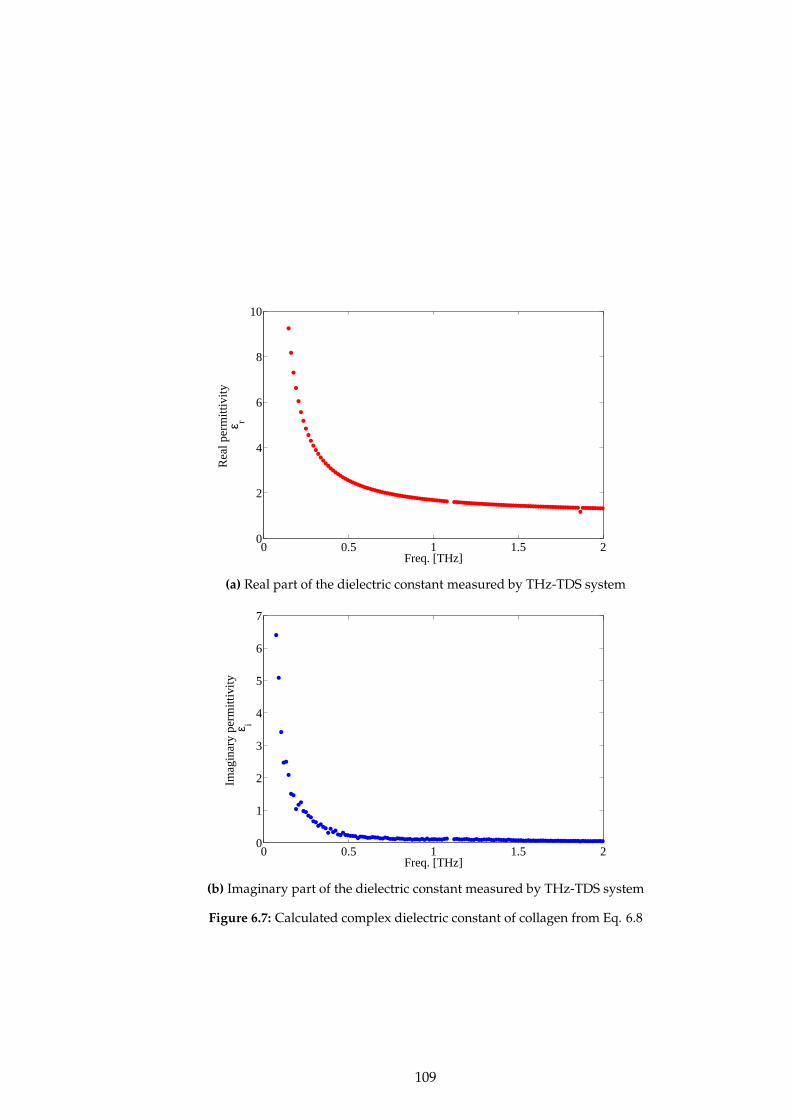
0 0.5 1 1.5 20
2
4
6
8
10
Freq. [THz]
Rea
l per
mitt
ivity
ε r
(a) Real part of the dielectric constant measured by THz-TDS system
0 0.5 1 1.5 20
1
2
3
4
5
6
7
Freq. [THz]
Imag
inar
y pe
rmitt
ivity
ε
i
(b) Imaginary part of the dielectric constant measured by THz-TDS system
Figure 6.7: Calculated complex dielectric constant of collagen from Eq. 6.8
109
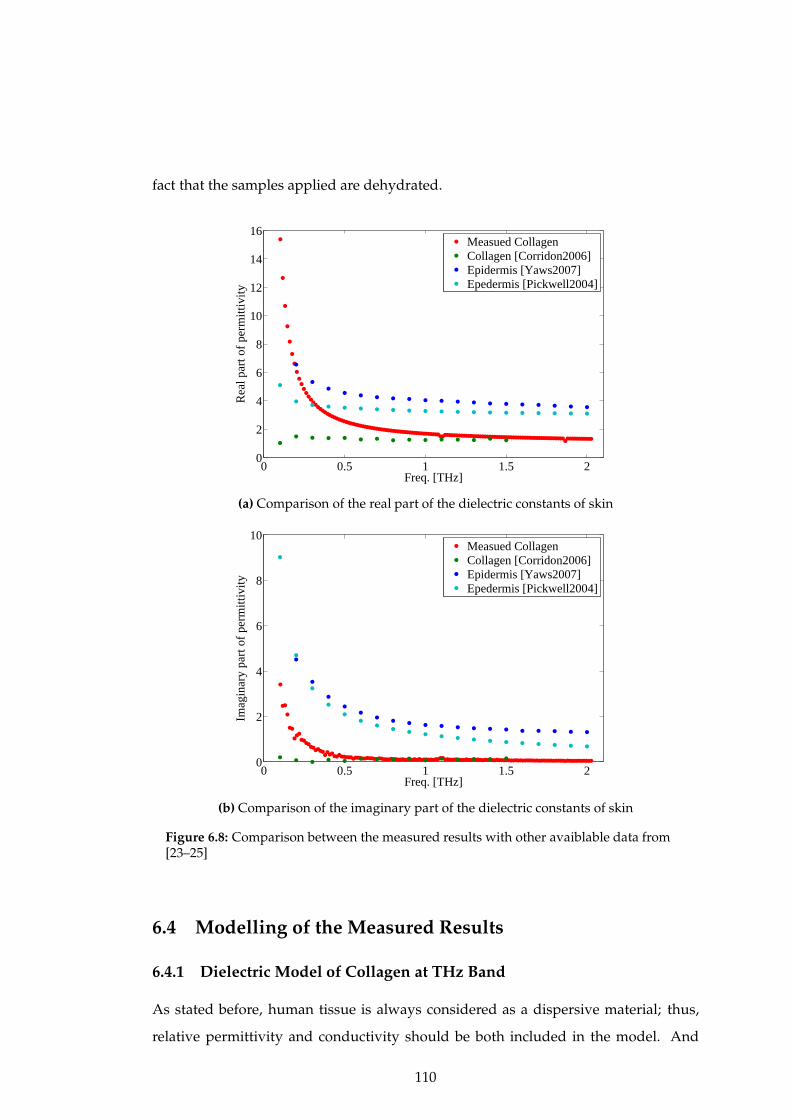
fact that the samples applied are dehydrated.
0 0.5 1 1.5 20
2
4
6
8
10
12
14
16
Freq. [THz]
Rea
l par
t of p
erm
ittiv
ity
Measued CollagenCollagen [Corridon2006]Epidermis [Yaws2007]Epedermis [Pickwell2004]
(a) Comparison of the real part of the dielectric constants of skin
0 0.5 1 1.5 20
2
4
6
8
10
Freq. [THz]
Imag
inar
y pa
rt o
f per
mitt
ivity
Measued CollagenCollagen [Corridon2006]Epidermis [Yaws2007]Epedermis [Pickwell2004]
(b) Comparison of the imaginary part of the dielectric constants of skin
Figure 6.8: Comparison between the measured results with other avaiblable data from[23–25]
6.4 Modelling of the Measured Results
6.4.1 Dielectric Model of Collagen at THz Band
As stated before, human tissue is always considered as a dispersive material; thus,
relative permittivity and conductivity should be both included in the model. And
110
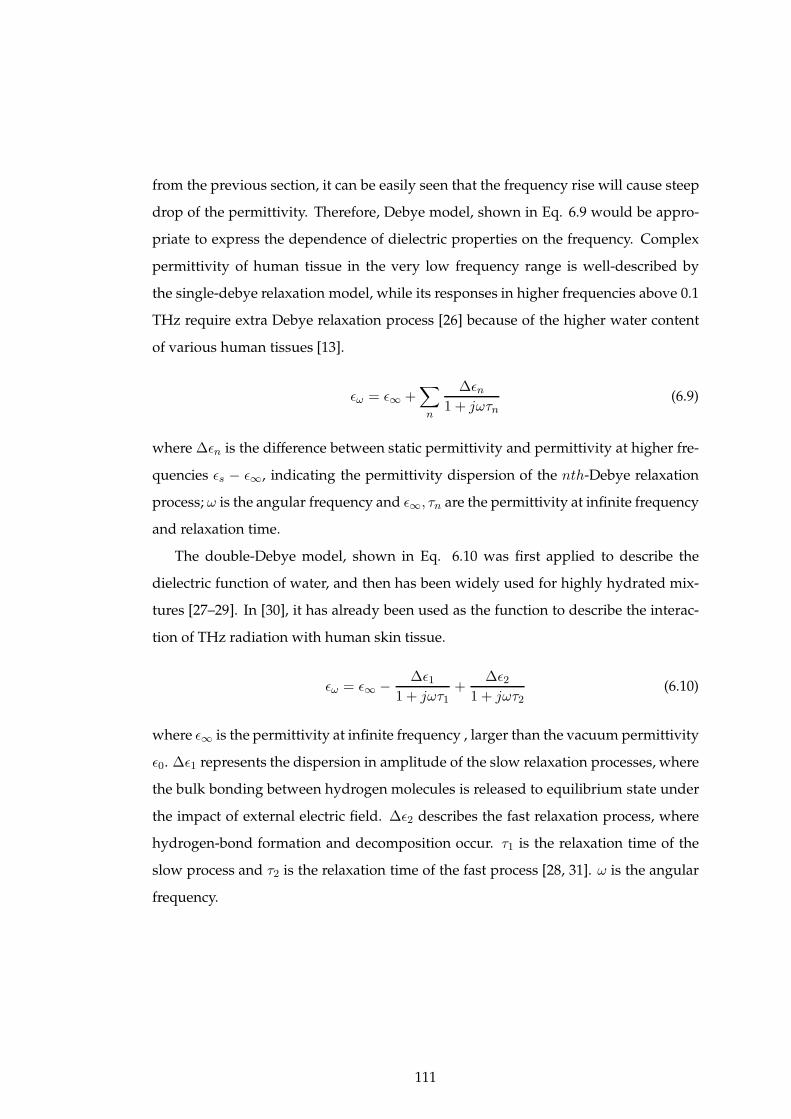
from the previous section, it can be easily seen that the frequency rise will cause steep
drop of the permittivity. Therefore, Debye model, shown in Eq. 6.9 would be appro-
priate to express the dependence of dielectric properties on the frequency. Complex
permittivity of human tissue in the very low frequency range is well-described by
the single-debye relaxation model, while its responses in higher frequencies above 0.1
THz require extra Debye relaxation process [26] because of the higher water content
of various human tissues [13].
ǫω = ǫ∞ +∑
n
∆ǫn1 + jωτn
(6.9)
where ∆ǫn is the difference between static permittivity and permittivity at higher fre-
quencies ǫs − ǫ∞, indicating the permittivity dispersion of the nth-Debye relaxation
process; ω is the angular frequency and ǫ∞, τn are the permittivity at infinite frequency
and relaxation time.
The double-Debye model, shown in Eq. 6.10 was first applied to describe the
dielectric function of water, and then has been widely used for highly hydrated mix-
tures [27–29]. In [30], it has already been used as the function to describe the interac-
tion of THz radiation with human skin tissue.
ǫω = ǫ∞ − ∆ǫ11 + jωτ1
+∆ǫ2
1 + jωτ2(6.10)
where ǫ∞ is the permittivity at infinite frequency , larger than the vacuum permittivity
ǫ0. ∆ǫ1 represents the dispersion in amplitude of the slow relaxation processes, where
the bulk bonding between hydrogen molecules is released to equilibrium state under
the impact of external electric field. ∆ǫ2 describes the fast relaxation process, where
hydrogen-bond formation and decomposition occur. τ1 is the relaxation time of the
slow process and τ2 is the relaxation time of the fast process [28, 31]. ω is the angular
frequency.
111
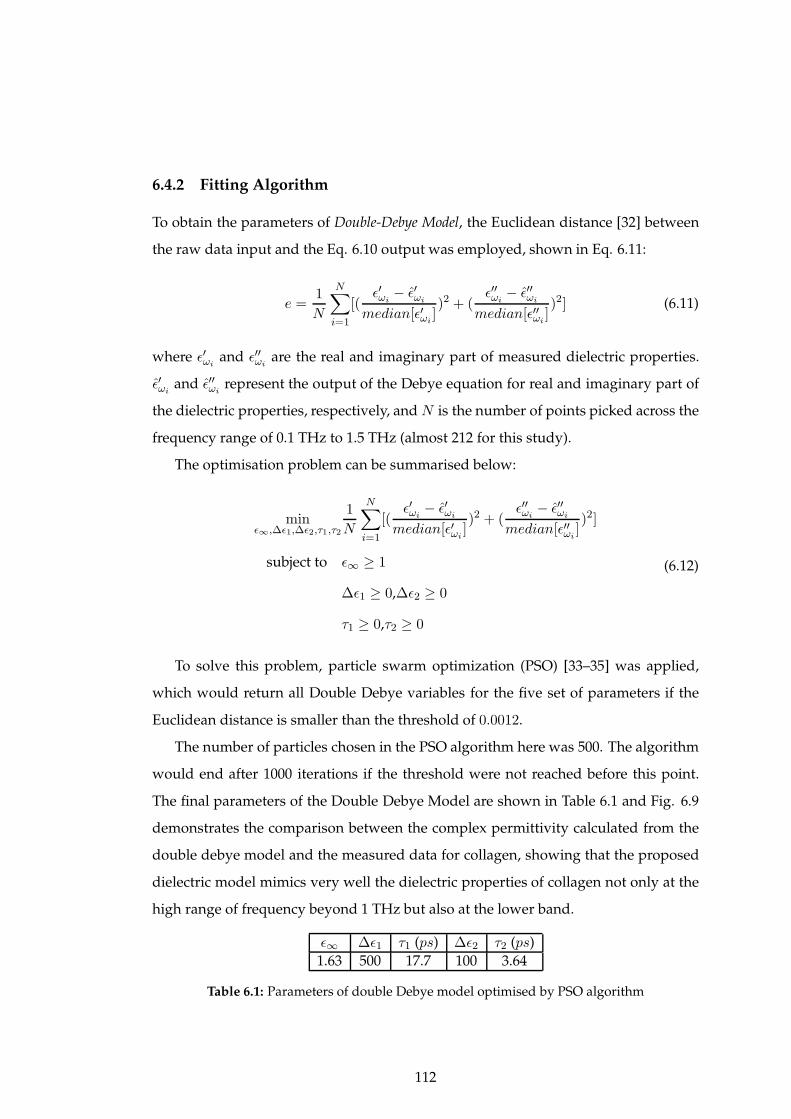
6.4.2 Fitting Algorithm
To obtain the parameters of Double-Debye Model, the Euclidean distance [32] between
the raw data input and the Eq. 6.10 output was employed, shown in Eq. 6.11:
e =1
N
N∑
i=1
[(ǫ′ωi
− ǫ′ωi
median[ǫ′ωi])2 + (
ǫ′′ωi− ǫ′′ωi
median[ǫ′′ωi])2] (6.11)
where ǫ′ωiand ǫ′′ωi
are the real and imaginary part of measured dielectric properties.
ǫ′ωiand ǫ′′ωi
represent the output of the Debye equation for real and imaginary part of
the dielectric properties, respectively, and N is the number of points picked across the
frequency range of 0.1 THz to 1.5 THz (almost 212 for this study).
The optimisation problem can be summarised below:
minǫ∞,∆ǫ1,∆ǫ2,τ1,τ2
1
N
N∑
i=1
[(ǫ′ωi
− ǫ′ωi
median[ǫ′ωi])2 + (
ǫ′′ωi− ǫ′′ωi
median[ǫ′′ωi])2]
subject to ǫ∞ ≥ 1
∆ǫ1 ≥ 0,∆ǫ2 ≥ 0
τ1 ≥ 0,τ2 ≥ 0
(6.12)
To solve this problem, particle swarm optimization (PSO) [33–35] was applied,
which would return all Double Debye variables for the five set of parameters if the
Euclidean distance is smaller than the threshold of 0.0012.
The number of particles chosen in the PSO algorithm here was 500. The algorithm
would end after 1000 iterations if the threshold were not reached before this point.
The final parameters of the Double Debye Model are shown in Table 6.1 and Fig. 6.9
demonstrates the comparison between the complex permittivity calculated from the
double debye model and the measured data for collagen, showing that the proposed
dielectric model mimics very well the dielectric properties of collagen not only at the
high range of frequency beyond 1 THz but also at the lower band.
ǫ∞ ∆ǫ1 τ1 (ps) ∆ǫ2 τ2 (ps)
1.63 500 17.7 100 3.64
Table 6.1: Parameters of double Debye model optimised by PSO algorithm
112
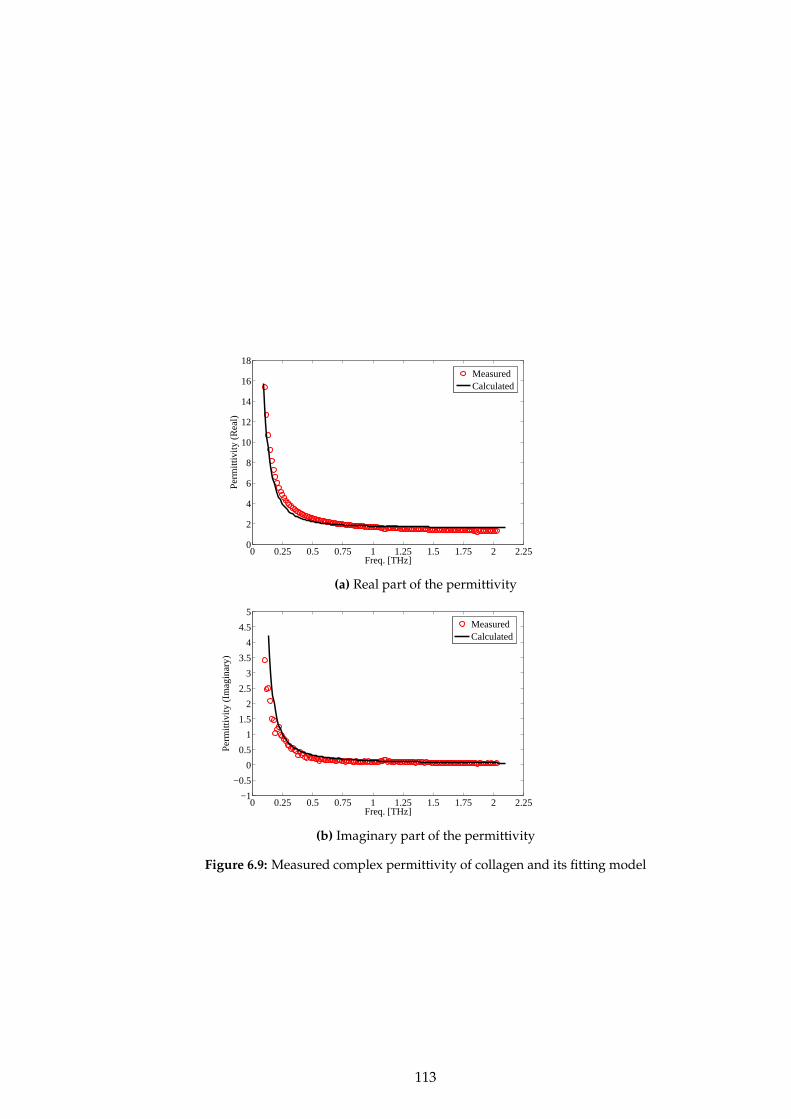
0 0.25 0.5 0.75 1 1.25 1.5 1.75 2 2.250
2
4
6
8
10
12
14
16
18
Freq. [THz]
Per
mitt
ivity
(R
eal)
MeasuredCalculated
(a) Real part of the permittivity
0 0.25 0.5 0.75 1 1.25 1.5 1.75 2 2.25−1
−0.5
0
0.5
1
1.5
2
2.5
3
3.5
4
4.5
5
Freq. [THz]
Per
mitt
ivity
(Im
agin
ary)
MeasuredCalculated
(b) Imaginary part of the permittivity
Figure 6.9: Measured complex permittivity of collagen and its fitting model
113

6.5 Comparison with the Proposed Model
This section is a supplement of the work in Chapter 4. Based on the previous work, the
absorption coefficient of collagen at the band of interest can be obtained. Then using
the equation 10lgeαd with d as 1mm, the corresponding path loss can be calculated,
shown in Fig. 6.10. Also, the rough power loss can be obtained by the equation:
20lgEsample
Eholder through the measured data, also shown in Fig. 6.10. Then using the least
square optimisation method,the fitting models of both results can be obtained, also
shown in Fig. 6.10. We can see that the differences between both losses go larger with
the rise of the frequency. It is mainly due to the fact that when the frequency goes up,
the SNR would fall down which would introduce more error. On the other hand, the
theoretical losses do not include the reflection loss of the air-TPX interfaces and the
TPX-sample interfaces.
0.4 0.6 0.8 1 1.2 1.4 1.60
2.5
5
7.5
10
12.5
15
17.5
20
22.5
25
Freq. [THz]
Pow
er L
oss
[dB
]
CalculatedMeasured
Figure 6.10: Comparison of the measured power losses to the theoretical ones of thesample with thickness of 1 mm with their fitting models
6.6 Summary
In this chapter, the EM/optical parameters of cultivated collagen are measured with
the THz Time Domain Spectroscopy (THz-TDS) system and compared with the avail-
able data, showing that the collagen is not enough to represent the performance of the
epidermis at the band of interest. At the same time, a double Debye model of collagen
114

at THz band was also introduced by studying the measured results, followed by the
validation of the model proposed in previous chapters.
115
References
[1] A. Fitzgerald, E. Berry, N. Zinov’ev, S. Homer-Vanniasinkam, R. Miles, J. Chamberlain,and M. Smith, “Catalogue of human tissue optical properties at terahertz frequencies,”Journal of Biological Physics, vol. 29, no. 2-3, pp. 123–128, 2003.
[2] E. Berry, A. J. Fitzgerald, N. N. Zinov’ev, G. C. Walker, S. Homer-Vanniasinkam, C. D.Sudworth, R. E. Miles, J. M. Chamberlain, and M. A. Smith, “Optical properties of tis-sue measured using terahertz-pulsed imaging,” in Medical Imaging 2003. InternationalSociety for Optics and Photonics, 2003, pp. 459–470.
[3] D. Lipscomb, I. Echchgadda, X. G. Peralta, and G. J. Wilmink, “Determination of theoptical properties of melanin-pigmented human skin equivalents using terahertz time-domain spectroscopy,” vol. 8585, 2013.
[4] A. Markelz, A. Roitberg, and E. Heilweil, “Pulsed terahertz spectroscopy of dna, bovineserum albumin and collagen between 0.1 and 2.0 thz,” Chemical Physics Letters, vol. 320,no. 1, pp. 42–48, 2000.
[5] M. He, A. K. Azad, S. Ye, and W. Zhang, “Far-infrared signature of animal tissues char-acterized by terahertz time-domain spectroscopy,” Optics Communications, vol. 259, no. 1,pp. 389–392, 2006.
[6] C. Hua, M. Shi-Hua, Y. Wen-Xing, W. Xiu-Mei, and W. Xiao-Zhou, “The diagnosis of hu-man liver cancer by using thz fiber-scanning near-field imaging,” Chinese Physics Letters,vol. 30, no. 3, p. 030702, 2013.
[7] T. Bowman, M. El-Shenawee, and S. G. Sharma, “Terahertz spectroscopy for the char-acterization of excised human breast tissue,” in Microwave Symposium (IMS), 2014 IEEEMTT-S International. IEEE, 2014, pp. 1–4.
[8] B. C. Truong, H. D. Tuan, A. J. Fitzgerald, V. P. Wallace, and H. T. Nguyen, “A dielectricmodel of human breast tissue in terahertz regime,” Biomedical Engineering, IEEE Transac-tions on, vol. 62, no. 2, pp. 699–707, 2015.
[9] P. C. Ashworth, E. Pickwell-MacPherson, E. Provenzano, S. E. Pinder, A. D. Purushotham,M. Pepper, V. P. Wallace et al., “Terahertz pulsed spectroscopy of freshly excised humanbreast cancer,” Optics express, vol. 17, no. 15, pp. 12 444–12 454, 2009.
[10] R. Pethig, “Dielectric properties of biological materials: Biophysical and medical applic-ations,” Electrical Insulation, IEEE Transactions on, no. 5, pp. 453–474, 1984.
[11] C. Gabriel, S. Gabriel, and E. Corthout, “The dielectric properties of biological tissues: I.literature survey,” Physics in medicine and biology, vol. 41, no. 11, p. 2231, 1996.
[12] S. Gabriel, R. Lau, and C. Gabriel, “The dielectric properties of biological tissues: Ii. meas-urements in the frequency range 10 hz to 20 ghz,” Physics in medicine and biology, vol. 41,no. 11, p. 2251, 1996.
[13] ——, “The dielectric properties of biological tissues: Iii. parametric models for the dielec-tric spectrum of tissues,” Physics in medicine and biology, vol. 41, no. 11, p. 2271, 1996.
[14] C. C. Johnson and A. W. Guy, “Nonionizing electromagnetic wave effects in biologicalmaterials and systems,” Proceedings of the IEEE, vol. 60, no. 6, pp. 692–718, 1972.
[15] D. Grischkowsky, S. Keiding, M. Van Exter, and C. Fattinger, “Far-infrared time-domainspectroscopy with terahertz beams of dielectrics and semiconductors,” JOSA B, vol. 7,no. 10, pp. 2006–2015, 1990.
[16] O. Sushko, “Terahertz dielectric study of bio-molecules using time-domain spectrometryand molecular dynamics simulations,” Ph.D. dissertation, School of Electronic Engineer-ing and Computer Science, Queen Mary University of London, March 2014.
[17] O. Sushko, K. Shala, R. Dubrovka, and R. Donnan, “Revised metrology for enhancedaccuracy in complex optical constant determination by thz-time-domain spectrometry,”JOSA A, vol. 30, no. 5, pp. 979–986, 2013.
[18] H. C. B. Skjeie, “Terahertz time-domain spectroscopy,” July 2012.[19] M. Born and E. Wolf, Principles of optics: electromagnetic theory of propagation, interference
and diffraction of light. Cambridge university press, 1999.[20] L. Duvillaret, F. Garet, and J.-L. Coutaz, “A reliable method for extraction of material
116

parameters in terahertz time-domain spectroscopy,” Selected Topics in Quantum Electronics,IEEE Journal of, vol. 2, no. 3, pp. 739–746, 1996.
[21] ——, “Highly precise determination of optical constants and sample thickness in tera-hertz time-domain spectroscopy,” Applied optics, vol. 38, no. 2, pp. 409–415, 1999.
[22] W. Withayachumnankul, B. Ferguson, T. Rainsford, S. Mickan, and D. Abbott, “Simplematerial parameter estimation via terahertz time-domain spectroscopy,” Electronics Let-ters, vol. 41, no. 14, pp. 800–801, 2005.
[23] K. Yaws, D. Mixon, and W. Roach, “Electromagnetic properties of tissue in the opticalregion,” in Biomedical Optics (BiOS) 2007. International Society for Optics and Photonics,2007, pp. 643 507–643 507.
[24] P. M. Corridon, R. Ascazubi, C. Krest, and I. Wilke, “Time-domain terahertz spectroscopyof artificial skin,” in Biomedical Optics 2006. International Society for Optics and Photon-ics, 2006, pp. 608 007–608 007.
[25] E. Pickwell, B. Cole, A. Fitzgerald, M. Pepper, and V. Wallace, “In vivo study of humanskin using pulsed terahertz radiation,” Physics in Medicine and Biology, vol. 49, no. 9, p.1595, 2004.
[26] H. J. Liebe, G. A. Hufford, and T. Manabe, “A model for the complex permittivity of waterat frequencies below 1 thz,” International Journal of Infrared and Millimeter Waves, vol. 12,no. 7, pp. 659–675, 1991.
[27] S. Smye, J. Chamberlain, A. Fitzgerald, and E. Berry, “The interaction between terahertzradiation and biological tissue,” Physics in medicine and biology, vol. 46, no. 9, p. R101,2001.
[28] E. Pickwell, B. Cole, A. Fitzgerald, V. Wallace, and M. Pepper, “Simulation of terahertzpulse propagation in biological systems,” Applied Physics Letters, vol. 84, no. 12, pp. 2190–2192, 2004.
[29] J. Kindt and C. Schmuttenmaer, “Far-infrared dielectric properties of polar liquids probedby femtosecond terahertz pulse spectroscopy,” The Journal of Physical Chemistry, vol. 100,no. 24, pp. 10 373–10 379, 1996.
[30] B. C. Truong, H. D. Tuan, H. H. Kha, and H. T. Nguyen, “Debye parameter extractionfor characterizing interaction of terahertz radiation with human skin tissue,” BiomedicalEngineering, IEEE Transactions on, vol. 60, no. 6, pp. 1528–1537, 2013.
[31] J. Barthel and R. Buchner, “High frequency permittivity and its use in the investigationof solution properties,” Pure and Applied Chemistry, vol. 63, no. 10, pp. 1473–1482, 1991.
[32] M. Lazebnik, D. Popovic, L. McCartney, C. B. Watkins, M. J. Lindstrom, J. Harter, S. Se-wall, T. Ogilvie, A. Magliocco, T. M. Breslin et al., “A large-scale study of the ultraw-ideband microwave dielectric properties of normal, benign and malignant breast tissuesobtained from cancer surgeries,” Physics in Medicine and Biology, vol. 52, no. 20, p. 6093,2007.
[33] T. Yilmaz, R. Foster, and Y. Hao, “Towards accurate dielectric property retrieval of biolo-gical tissues for blood glucose monitoring,” Microwave Theory and Techniques, IEEE Trans-actions on, vol. 62, no. 12, pp. 3193–3204, Dec 2014.
[34] M. Clerc, Particle swarm optimization. John Wiley & Sons, 2010, vol. 93.[35] R. C. Eberhart and Y. Shi, “Particle swarm optimization: developments, applications and
resources,” in Evolutionary Computation, 2001. Proceedings of the 2001 Congress on, vol. 1.IEEE, 2001, pp. 81–86.
117
Chapter 7
Conclusion and Future Work
7.1 Conclusion
Nano communication has driven great research interests since its proposal in 2008 as
it will enable a plenty of applications in many fields, not only healthcare and monitor-
ing, but also industrial development and environment-protection. Although the study
of Nano-Network Communication is still at its early phase, it is generally believed that
the research work on the hardware-oriented research and communication-focused in-
vestigations on EM communication paradigm of Nano-Communication is essential
which could pave the road and make the future work much more convenient.
In this thesis, the main focus was put on the fundamental study of the body-centric
nano-communication, especially the in-body one. Based on this aim, the channel
model of THz wave in human tissues was studied and investigated, showing the
potential of THz band (0.1 − 10 THz) as the working band for EM paradigm. It is
generally believed that when the operation band goes higher, the skin model with
roughness interfaces should be investigated because both the wavelength and rough-
ness will be of the same order of magnitude; thus, a new model with 3-D sinc interface
was proposed based on the study of the similar one with 3-D sine interface. During the
study, we found the data-base of the parameters of human tissues was not sufficient,
118
so the measurement of parameters of human tissues was conducted.
7.2 Key Contributions
The major contributions of this work are summarised as follows:
• In chapter 4, a 3-D numerical model of THz nano-communicational channel has
been applied for in-body scenarios and validated by the analytical model. Chan-
nel characteristics and the system capacity for different human tissues have been
calculated. The comparison between the numerical and analytical results are
conducted, showing a good agreement compared with the total path loss and the
reliability of the proposed numerical model. Meanwhile, the proposed model
paves the way to the further studies considering more body structures and tis-
sue properties. In the meantime, the noise model has been applied to calculate
the capacity for different power allocation which indicates that for the Gaussian
shaped pulse the capacity can reach and maintain 100 Tbps for the distance up
to several millimetres which indicates the promising future of the application of
the EM paradigm to the body-centric nano-communication.
• In chapter 5, 3-D stratified skin models are built to investigate the wave propaga-
tion from the under-skin to skin surface. Then, the influence of the rough inter-
face between different skin layers is investigated by introducing two detailed
skin models with different interfaces (i.e.,3-D sine function and 3-D sinc func-
tion). The mean and deviation of the power losses for both models are com-
pared with the common flat model, showing that it is possible to transmit the
signal through the skin since the power loss is just around -80 dB at 700 µm and
the general flat model can be applied to do the rough research since the differ-
ence is always less than 4 dB. And the effects of the sweat duct on the wave
propagation is also analysed. The results show great potential of the THz waves
on sensing and communicating.
• In chapter 6, the EM/optical parameters of collagen, the main building mater-
ial of skin are measured with the THz Time Domain Spectroscopy (THz-TDS)
119

system at Queen Mary University of London to obtain the electromagnetic para-
meters with the aim to enrich the database with the cooperation of Blizard In-
stitute, London UK. At the same time, the double Debye model of the dielectric
parameters at the band of interest was also studied and the validation of the
proposed channel model was done.
7.3 Future Work
In line with the work presented, the future research directions which would make
potential and natural progression to complete the studies in the thesis are summarised:
Measurement on the parameters of the human tissues
Although several optical parameters are provided, it is still not enough. First, the ex-
periment was conducted long time ago and the number of tissues was limited. Second,
the samples were mainly from one old male which lower the credibility of the results.
Therefore, it is necessary to redo the experiments to get the parameters of interest by
measuring more samples from different people.
Safety issues: heating problems of THz wave
Safety issue is always the main consideration when people talks about nano-network,
especially when the nano-devices are applied to the in-body scenario. For THz com-
munication, heating problem was the main concern in the academic field. Therefore,
the study of the THz wave heating effects on the human tissue would be conducted to
make the standard and requirement for communicating or sensing.
Interaction between the nano-devices and the surrounding environment
From the study of the models of nerve system and skin, it seems dispensable to study
the detailed model when the size of the functional devices goes down to milli/nano-
scale. The interaction between the environment and the devices should be study to
make sure the devices function normal.
120

Simulating body-centric nano-networks using the state-of-art simulator
Although there are lots of communication paradigms for nano-communication, the
study on interaction between each two different communications, for example the
EM communication and the molecular communication, is still missing. It is generally
believed that by emerging all the communications together the nano-network would
be much more flexible and powerful. With the comprehensive simulator proposed in
IEEE P1906.1 based on the ns-3 platform in mind, different communication schemes
would be studied by comparing to the EM one. And at the same time, the relationship
between them and EM method should be further studied.
121
Appendix A
Applications of
Nano-Communication [1, 2]
There are a great numbers of potential applications of nano-networks, which can be
mainly divided into four groups: biomedical, environmental, industrial and military
[1, 2]. Additionally, the applications of nano-networks are not limited into these four
domains; and they also can be used extensively into other fields like consumer elec-
tronics, life style and home appliances because nano-technologies have an essential
role in the manufacturing process of several devices.
A.1 Biomedical Applications
A large number of direct applications of nano-networks are related to the biological
field. Biological models encourage the use of nano-technologies to interact with or-
gans and tissues because the most molecules, proteins, DNA and the major compon-
ents of cells are almost at the nano-scale. Thus, it is clear that the advantages of nano-
networks are in terms of the size, bio-compatibility and bio-stability of both the device
and network. By controlling the system components at molecular level, nano-sensors
can provide an interface between biological phenomenal and electronic nano-devices
to complete the communication of nano-networks.
• Bio-hybrid implants: the aim is to support or substitute components such as
122
nervous tracks or some lost tissues [3, 4] because nano-networks can provide
friendly interfaces between the implant and the human body. Restoration of
central nervous system tracks is the most possible application of bio-hybrid im-
plants.
• Genetic engineering: manipulation and modification of nano-structures such as
molecular sequences and genes can be achieved by nano-machines; therefore,
using nano-networks can expand the potential applications in genetic engineer-
ing.
• Immune system support: like the bio-immune system, the artificial immune sys-
tem will help the organism fight against virus with the aid of a collection of
nano, micro and macro systems, including sensors and actuators, acting in a co-
ordinated way to identify and control foreign and pathogen elements. At the
nano-network, nano-machines will be used to detect or eliminate procedures.
They could realize tasks of localization and response to malicious agents and
cells [5, 6], such as cancer cells, resulting in a less aggressive and invasive treat-
ments compared to the existing ones.
• Health monitoring system: the concentration of sodium, glucose and oxygen in
blood [7], cholesterol level [8], cancer bio-markers [9] or other infectious agents
[10] can be checked by nano-sensors. For example, one can use a tattoo-like
sensor to monitor the glucose level instead of pricking his finger several times a
day [7]. [9] also provides an overview of the bio-sensor technology which are be-
ing developed and researched for cancer markers diagnosis. The need to deliver
the information retrieved by these nano-sensors or systems to relevant actors
require the set-up of nano-networks which can provide the proper level of con-
nectivity to complete the communication between the nano-devices or deliver
the sensed information from nano-systems to micro-systems.
• Drug delivery systems: nano-sensors can be utilized to monitor a specific sub-
stance, then nano-actuators can be used to carry out some simple tasks like re-
leasing a specific drug in some unreachable areas of human body [11]. [1] de-
scribes the general idea: a distributed nano-networks of nano-sensors and nano-
actuators can work cooperatively to decide whether or not to release a given
123
drug to control the intra-cranial pressure, a chemical compound to dissolve a
clot in an artery, or an engineered antibody to improve the immunologic system
of humans in front of new diseases; and they work with cooperative schemes
to make the decision on the fly. At the same time, all these data can be collec-
ted and remotely monitored by doctors. For instance, if the system is used to
compensate metabolism diseases like diabetes, nano-sensors and smart glucose
reservoirs or producers can work in a cooperative way to support regulating
mechanisms [12]. This system can also be used to help mitigate the effects of
neuro-degenerative diseases by delivering neurotransmitters or specific drugs
[13].
A.2 Environmental Applications
It is said that the original idea of nano-networks is from biological systems found
in nature, so the nano-sensor or nano-actuator can be applied to achieve some goals
which current technologies could not deal with. Some possible applications are as
follows:
• Bio-degradation: take the garbage handling, a thorny problem around the world,
as an example, with the aid of the nano-networks, the garbage can be sensed and
tagged by different material so that it can be located and processed by the smart
nano-actuators [1].
• Bio-control: it is well-known that plants can release some chemical composites
to the air to attract the predators of the insect or regulate their blooming among
different plantation [14, 15]. Nano-chemical sensors can be used to detect such
chemical composites to monitor the on-going process in the field. When insects
appear, nano-actuators can be used to release the natural volatiles to attract the
predators of the insects or to release the chemical composites to control the be-
haviour of the insects because some pheromone can trigger certain behaviour on
animals in nature.
• Air pollution control: like bio-degradation, nano-networks can be used to mon-
itor the air. If possible, nano-filters can be applied to purify the air [16].
124

A.3 Industrial Applications
The emphasis is put on the intra-body application of nano-network; but at the same
time, nano-networks can also be used in industries ranging from flexible and stretch-
able electronic devices [17] to new fictionalized nano-materials for intelligent self-
cleaning anti-microbial textiles [18].
• Product quality control: Similar to health monitoring applications, nano-networks
can be applied to the product quality control. Nano-sensors can be used to detect
small bacterial and toxic components which cannot be detected by the traditional
technologies [19] while the nano-actuator can be used to kill them or removing
them.
• Intelligent office: The interconnection of nano-devices with existing communic-
ation networks, ultimately Internet, will supply new interceding applications
which will have great influence on the way we live. If everything is attached
with a nano-sensor which is allowed to connect to the Internet permanently, the
user can keep track of all its professional and personal belongings in an effort-
less way. Ultimately, these nano-sensors can be connected seamlessly to create a
smart working environment or living environment.
A.4 Military Applications
Communication among the nano-device makes the applications of nanotechnology in
military field practical, which are shown as follows:
• Nuclear, biological and chemical defences: nano-sensors can be deployed over
the battlefield or targeted areas to detect aggressive chemical and biological
agents and coordinate with the nano-actuators to make accurate defensive re-
sponse [20]. Nano-networks can also be used in Customer to detect if there is
unauthorized entrance of chemical, biological or radiological materials.
• Nano-fictionalized equipment: similar to the environment control, nano-networks
can be taken advantage of in the uniform or the camouflage. For example, equip-
ment can be manufactured with advanced materials containing nano-networks
125

that can self-regulate the temperature underneath soldiers’ clothes [21] and even
detect whether the soldier has been injured to take initial treatment, or change
the color of the cloth to camouflage the soldier like the lizard.
126
References
[1] I. F. Akyildiz and J. M. Jornet, “Electromagnetic wireless nanosensor networks,” NanoCommunication Networks, vol. 1, no. 1, pp. 3–19, 2010.
[2] I. F. Akyildiz, F. Brunetti, and C. Blazquez, “Nanonetworks: A new communicationparadigm,” Computer Networks, vol. 52, no. 12, pp. 2260–2279, 2008.
[3] K. E. Drexler, Nanosystems: molecular machinery, manufacturing, and computation. JohnWiley & Sons, Inc., 1992.
[4] R. A. Freitas, “What is nanomedicine?” Nanomedicine: Nanotechnology, Biology and Medi-cine, vol. 1, no. 1, pp. 2–9, 2005.
[5] C.-J. Chen, D. Y. Haik, and J. Chatterjee, “Development of nanotechnology for biomedicalapplications,” in Emerging Information Technology Conference, 2005. IEEE, 2005, pp. 4–pp.
[6] R. A. Freitas, “Nanotechnology, nanomedicine and nanosurgery,” International Journal ofSurgery, vol. 3, no. 4, pp. 243–246, 2005.
[7] J. M. Dubach, D. I. Harjes, and H. A. Clark, “Fluorescent ion-selective nanosensors forintracellular analysis with improved lifetime and size,” Nano Letters, vol. 7, no. 6, pp.1827–1831, 2007.
[8] J. Li, T. Peng, and Y. Peng, “A cholesterol biosensor based on entrapment of cholesteroloxidase in a silicic sol-gel matrix at a prussian blue modified electrode,” Electroanalysis,vol. 15, no. 12, pp. 1031–1037, 2003.
[9] I. E. Tothill, “Biosensors for cancer markers diagnosis,” in Seminars in cell & developmentalbiology, vol. 20, no. 1. Elsevier, 2009, pp. 55–62.
[10] P. Tallury, A. Malhotra, L. M. Byrne, and S. Santra, “Nanobioimaging and sensing ofinfectious diseases,” Advanced drug delivery reviews, vol. 62, no. 4, pp. 424–437, 2010.
[11] R. Fernandez-Pacheco, J. G. Valdivia, and M. R. Ibarra, “Magnetic nanoparticles for localdrug delivery using magnetic implants,” in Micro and Nano Technologies in Bioanalysis.Springer, 2009, pp. 559–569.
[12] R. A. Freitas, “Pharmacytes: An ideal vehicle for targeted drug delivery,” Journal of Nanos-cience and Nanotechnology, vol. 6, no. 9-10, pp. 2769–2775, 2006.
[13] B. Wowk, “Cell repair technology,” Cryonics, vol, pp. 21–30, 1988.[14] M. Heil and J. Ton, “Long-distance signalling in plant defence,” Trends in plant science,
vol. 13, no. 6, pp. 264–272, 2008.[15] C. M. Pieterse and M. Dicke, “Plant interactions with microbes and insects: from molecu-
lar mechanisms to ecology,” Trends in plant science, vol. 12, no. 12, pp. 564–569, 2007.[16] J. Han, J. Fu, and R. B. Schoch, “Molecular sieving using nanofilters: past, present and
future,” Lab on a Chip, vol. 8, no. 1, pp. 23–33, 2008.[17] J. Rogers, “Materials and mechanics for stretchable electronics-from electronic eye cam-
eras to conformal brain monitors,” in Solid-State Sensors, Actuators and Microsystems Con-ference, 2009. TRANSDUCERS 2009. International. IEEE, 2009, pp. 1602–1603.
[18] D. Tessier, I. Radu, and M. Filteau, “Antimicrobial fabrics coated with nano-sized silversalt crystals,” in NSTI Nanotech, vol. 1, 2005, pp. 762–764.
[19] J. W. Aylott, “Optical nanosensorsan enabling technology for intracellular measure-ments,” Analyst, vol. 128, no. 4, pp. 309–312, 2003.
[20] H. Dai, “Carbon nanotubes: Synthesis, structure, properties and application,” Topics inApplied Physics, 2001.
[21] M. Endo, T. Hayashi, Y. A. Kim, and H. Muramatsu, “Development and application ofcarbon nanotubes,” Japanese Journal of Applied Physics, vol. 45, no. 6R, p. 4883, 2006.
127

Appendix B
Matlab Code of Optical/EM
Parameters Extraction
B.1 Principle of nlinfit( ) function
Nonlinear regression: beta = nlinfit(X,Y,modelfun, beta0) returns a vector of estim-
ated coefficients for the nonlinear regression of the responses in Y on the predictors
in X using the model specified by modelfun. The coefficients are estimated using
iterative least squares estimation, with initial values as beta0.
B.2 Matlab Code
128

129
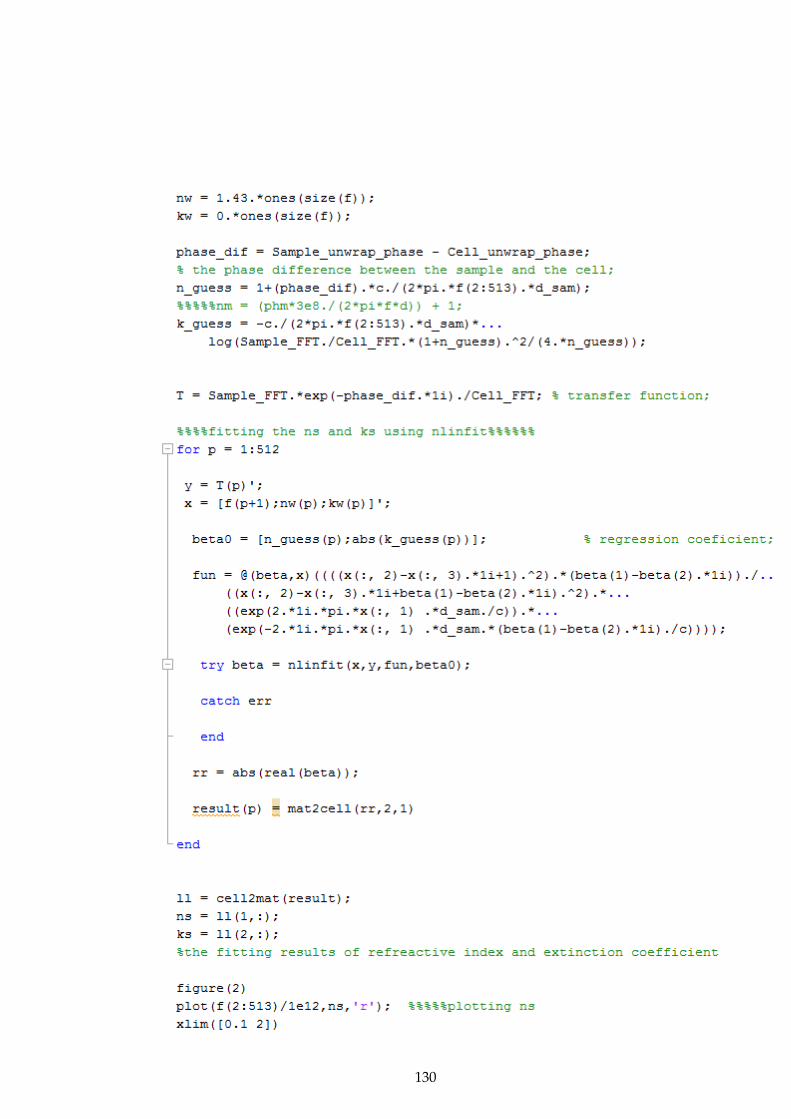
130

131
Copyright © 2022 FDOKUMEN