Mechanical characterisation of in vivo human skin using a 3D force-sensitive micro-robot and finite...
27
1 Mechanical characterisation of in vivo human 1 skin using a 3D force-sensitive micro-robot and 2 finite element analysis 3 Cormac Flynn, Andrew Taberner, Poul Nielsen 4 Auckland Bioengineering Institute, 70 Symonds Street, Auckland, New Zealand 5 +64 9 373 7599 ext 85360 6 +64 9 367 715 7 [email protected] 8 www.bioeng.auckland.ac.nz 9 Abstract 10 The complex mechanical properties of skin have been the subject of much study in recent years. 11 Several experimental methods developed to measure the mechanical properties of skin in vivo, such as 12 suction or torsion, are unable to measure skin’s anisotropic characteristics. An experiment 13 characterising the mechanical properties of in vivo human skin using a novel force-sensitive micro- 14 robot is presented. The micro-robot applied in-plane deformations to the anterior forearm and the 15 posterior upper arm. The behaviour of the skin in each area is highly nonlinear, anisotropic, and 16 viscoelastic. The response of the upper arm skin is very dependent on the orientation of the arm. A 17 finite element model consisting of an Ogden strain energy function and quasi-linear viscoelasticity was 18 developed to simulate the experiments. An orthogonal initial stress field, representing the in vivo skin 19 tension, was used as an additional model parameter. The model simulated the experiments accurately 20 with an error-of-fit of 17.5% for the anterior lower forearm area, 6.5% for the anterior upper forearm 21 and 9.3% for the posterior upper arm. The maximum in vivo tension in each area determined by the 22 model was 6.2 Nm -1 in the anterior lower forearm, 11.4 Nm -1 in anterior upper forearm and 5.6 Nm -1 in 23 the posterior upper arm. The results also show that a finite element model with a neo-Hookean strain 24 energy function cannot simulate the experiments with the same accuracy. 25 Human skin; Anisotropy; Viscoelasticity; In vivo tension; Constitutive Modelling 26 Nomenclature 27 FA, FB, FC Forces measured at each force transducer 28 RX, RY, RZ Reaction force components at probe tip 29 w Distance from centroid to apex of triangle formed by the transducers 30 h Perpendicular distance between probe tip and base of rigid frame 31 W Strain energy 32 μ, α Ogden function material parameters 33 λ1, λ2, λ3 Principal stretches 34
Transcript of Mechanical characterisation of in vivo human skin using a 3D force-sensitive micro-robot and finite...

1
Mechanical characterisation of in vivo human 1
skin using a 3D force-sensitive micro-robot and 2
finite element analysis 3
Cormac Flynn, Andrew Taberner, Poul Nielsen 4
Auckland Bioengineering Institute, 70 Symonds Street, Auckland, New Zealand 5
+64 9 373 7599 ext 85360 6
+64 9 367 715 7
www.bioeng.auckland.ac.nz 9
Abstract 10
The complex mechanical properties of skin have been the subject of much study in recent years. 11
Several experimental methods developed to measure the mechanical properties of skin in vivo, such as 12
suction or torsion, are unable to measure skin’s anisotropic characteristics. An experiment 13
characterising the mechanical properties of in vivo human skin using a novel force-sensitive micro-14
robot is presented. The micro-robot applied in-plane deformations to the anterior forearm and the 15
posterior upper arm. The behaviour of the skin in each area is highly nonlinear, anisotropic, and 16
viscoelastic. The response of the upper arm skin is very dependent on the orientation of the arm. A 17
finite element model consisting of an Ogden strain energy function and quasi-linear viscoelasticity was 18
developed to simulate the experiments. An orthogonal initial stress field, representing the in vivo skin 19
tension, was used as an additional model parameter. The model simulated the experiments accurately 20
with an error-of-fit of 17.5% for the anterior lower forearm area, 6.5% for the anterior upper forearm 21
and 9.3% for the posterior upper arm. The maximum in vivo tension in each area determined by the 22
model was 6.2 Nm-1 in the anterior lower forearm, 11.4 Nm-1 in anterior upper forearm and 5.6 Nm-1 in 23
the posterior upper arm. The results also show that a finite element model with a neo-Hookean strain 24
energy function cannot simulate the experiments with the same accuracy. 25
Human skin; Anisotropy; Viscoelasticity; In vivo tension; Constitutive Modelling 26
Nomenclature 27
FA, FB, FC Forces measured at each force transducer 28
RX, RY, RZ Reaction force components at probe tip 29
w Distance from centroid to apex of triangle formed by the transducers 30
h Perpendicular distance between probe tip and base of rigid frame 31
W Strain energy 32
μ, α Ogden function material parameters 33
λ1, λ2, λ3 Principal stretches 34

2
p Lagrange multiplier representing hydrostatic pressure 35
J Volume ratio 36
C10 Neo-Hookean function material parameter 37
Te Elastic stress component 38
gR Reduced relaxation function 39
P
1g , G
1τ Prony series parameters 40
σX, σY. Initial pre-stress in X and Y directions 41
model
iR Reaction force at probe tip calculated from model 42
exp
iR Reaction force at probe tip measured in experiment 43
Introduction 44
Human skin is a complex material, which exhibits nonlinear stress-strain, anisotropic, 45
and viscoelastic characteristics (Daly 1982;Schneider 1982;Silver et al. 2001 Har-Shai 46
et al. 1996; Kvistedal and Nielsen 2009). In addition, skin in vivo is in tension, which 47
varies according to location, age, and person (Alexander and Cook 1977). The 48
measurement of the mechanical properties of skin in vivo is important in many diverse 49
areas: The mechanical properties are an indicator of the state of health of the tissue 50
(Wilkes et al. 1973); Accurate knowledge of the mechanical properties of skin would 51
allow for the improved design of artificial skin (Bellamy et al. 2003); An accurate 52
model of in vivo skin would be useful in developing strategies to improve the healing 53
of acute or chronic wounds (Cacou and Muir 1995) and designing surgical incision 54
patterns to minimise scarring (Lott-Crumpler and Chaudhry 2001). 55
Several experimental methods have been developed to measure the mechanical 56
properties of skin in vivo. These methods include applying uniaxial or biaxial tension 57
(Wan Abas 1994), suction (Delalleau et al. 2008;Diridollou et al. 2000;Hendriks et al. 58
2006;Khatyr et al. 2006), torsion (Batisse et al. 2002), and normal indentation 59
(Pailler-Mattei et al. 2008; Delalleau et al. 2006) to the skin under study. Some of 60
these methods, such as biaxial tension, apply in-plane deformations in only one or two 61
directions. Suction, torsion, and normal indentation tests are unable to measure the 62
skin’s anisotropy due to the axisymmetric nature of the tests. In order to characterise 63
the complex mechanical properties of skin, it is necessary to apply a rich set of 64
deformations to the region of interest. 65

3
Various constitutive models have been used to simulate in vivo experiments of skin. 66
Many of these models assume skin to be an isotropic, linear elastic material (Zahouani 67
et al. 2009 Diridollou, et al. 2000, Pailler-Mattei, et al. 2008, Khatyr, et al. 2006). In 68
these cases, the skin is often characterised by a Young’s modulus and Poisson’s ratio. 69
Delalleau et al. (2008) used two Young’s moduli to characterise skin in suction tests – 70
one represented the stiffness of skin at low strains and the other represented the 71
stiffness of skin at higher strains. Representing a highly nonlinear material such as 72
skin using a Young’s modulus in a linear or quasi-linear model is a very simplified 73
approach. Hendriks et al. (2006) used an extended Mooney-Rivlin strain energy 74
function to model the response of skin in suction tests. While the model simulated the 75
nonlinear response of skin with reasonable accuracy, they assumed skin to be an 76
isotropic elastic material. This model, as well as many others in the literature, ignores 77
the tension inherent in living skin. The in vivo tension has been shown to be an 78
important parameter when modelling the behaviour of skin around scars and sutured 79
wounds (Cerda 2005, Flynn and McCormack 2008b, Cavicchi et al. 2009). Evans 80
(2009) recently used an Ogden strain energy function with a pre-strain parameter to 81
simulate in-plane deformations of forearm skin. The initial strain parameter 82
represented the in vivo tension. However, the model ignored the anisotropy present in 83
skin. Bischoff et al. (2000) simulated in vivo extensometer test data from Gunner et al. 84
(1979) using an Arruda-Boyce strain energy function with an anisotropic pre-stress. 85
They also demonstrated the ability to model anisotropic in vitro test data using an 86
isotropic strain energy function with an anisotropic stress distribution. 87
All the models mentioned so far have also ignored the viscoelastic properties of skin. 88
Viscoelasticity can be modelled using a state-variable approach where history 89
dependent variables are determined using evolution equations for their time-rates of 90
change (Rubin et al. 1998, Bergstrom and Boyce 2001). The quasi-linear 91
viscoelasticity approach of Fung (1993) has been widely used to model viscoelasticity 92
in a variety of soft tissues including skin. It has modelled the hysteresis observed in 93
biaxial tests of in vitro human skin (Shoemaker et al. 1986) and simulated accurately 94
stress relaxation tests of porcine skin (Bischoff 2006). This approach can simulate 95
viscoelastic effects with a minimum number of parameters. 96
This paper details the characterisation of the mechanical properties of the skin of 97
different areas of the arm using in vivo experiments and finite element analyses. The 98
experimental apparatus and procedure are first outlined, followed by a description of 99

4
the finite element models and nonlinear optimisation procedures. The paper 100
demonstrates the ability of an Ogden strain energy function with viscoelasticity and 101
an anisotropic pre-stress to accurately capture the behaviour of the skin of the arm. 102
Materials and methods 103
Laboratory Experiment 104
The experimental set-up consists of a novel force-sensitive micro-robot that applied 105
controlled deformations to the skin, and a support plate upon which to rest the arm 106
under study (Fig. 1). 107
The micro-robot has three parallel axes, each driven by a voice-coil actuator (BEI 108
KIMCO LA10-12-027A), a moving platform, three force transducers (FSS1500NC, 109
Honeywell, Freeport Illinois, USA), three linear position transducers (RDC1014, 110
ALPS, Campbell California, USA), a rigid frame, and a probe (Fig. 2). Each axis is 111
guided by a precision linear slide (IKO BSP 730SL). On top of each axis, there is a 112
short rod with a hemispherical end. Underneath the moving platform are three v-113
grooves, each of which sits on top of the rod of an axis (Label B on Fig. 2(b)). A 114
magnet on each axis and v-groove keeps the moving platform connected to the axes. 115
The position transducers measure the displacement of each actuator. They had a 116
repeatability of 63 μm and a sensitivity of about 0.5 V/mm. The linearity of the 117
devices was within ±0.5%. The linear transducers were calibrated by displacing each 118
axis in steps of 50 μm using a micrometer gauge with a resolution of 10 μm. The 119
voltage output was measured for each step and a linear equation relating voltage to 120
displacement was found. The force transducers had a repeatability of 0.1 N and a 121
sensitivity of 0.12 mV/g. The linearity of the transducers was ±1.5%. They were 122
calibrated by placing weights ranging from 0.1 to 14 N on them. The voltage output 123
for each applied weight was recorded and a linear equation relating the output voltage 124
to the applied force was found. 125
The force transducers are fixed to the moving platform, each at the apex of a 15 mm 126
equilateral triangle. A v-groove underneath each leg of the rigid frame sits on the 127
plunger of the force-transducer (Label A on Fig. 2(b)). Two magnets, positioned on 128
the bottom of the rigid frame and the top of the moving board, keep the rigid frame in 129
place (Label C on Fig. 2(b)). A 4 mm diameter cylindrical probe is attached to the tip 130
of the rigid frame. Knowing the force measured by each force transducer enables the 131

5
force vector applied at the probe-tip to be calculated using a straightforward static 132
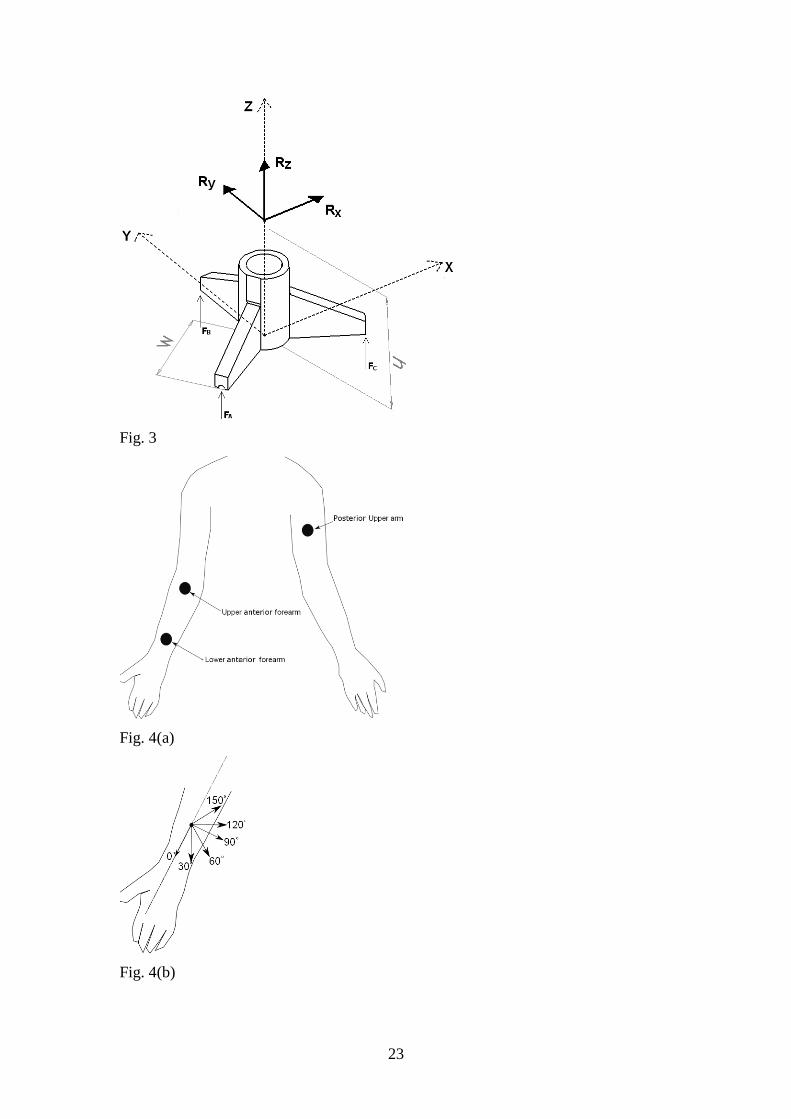
analysis of the frame in Fig. 3: 133
C
B
A
Z
Y
X
F
F
F
hwhwhw
hwhw
R
R
R
111
2323
202
(1)
where RX, RY, RZ are the X, Y, and Z components of the reaction force at the probe tip, 134
FA, FB, FC are forces measured at each force transducer, w is the distance from the 135
centroid to an apex of the triangle formed by the three force transducers and h is the 136
perpendicular distance between the probe tip and the base of the rigid frame (Fig. 3). 137
The displacement of the probe tip was calculated from the displacement of the three 138
axes using a forward kinematics algorithm. The details of the algorithm are in the 139
appendices. 140
A LabView software interface (National Instruments, Austin, USA) allowed the user 141
to control the motion of the actuators and store the acquired data. A signal is sent from 142
the motion control card (NI 7358, National Instruments, Austin, USA) and amplified 143
to drive the voice coil actuators. The signals from the position and force transducers 144
are read by the data acquisition cards (NI PCI-6221, National Instruments, Austin, 145
USA). The position signals of the actuators are also fed back to the motion control 146
card giving closed-loop control. The resolution of the probe displacement was 50 μm 147
and the resolution of the force measured at the probe tip was 30 mN. 148
The support plate was positioned above the micro-robot. Two restraining straps were 149
used to prevent unwanted movement of the arm. A 40 mm diameter hole was located 150
in the centre of the support plate. The area of skin under study was above this hole. 151
Double-sided tape was placed around the edge of the hole so that the skin in contact 152
with the edge of the hole did not move. The inside edge of the tape matched the edge 153
of the 40 mm diameter hole. 154
The tests were performed on three areas of the right arm – the back of the upper arm, 155
the upper anterior forearm, and the lower anterior forearm (Fig. 4(a)). The arm of the 156
volunteer was rested on a support with the area of interest facing downwards. The 157
cylindrical probe was attached to the surface of the skin using liquid cyanoacrylate 158
adhesive. The adhesive was uniformly placed on the probe surface only. The actuators 159
moved the probe such that the surface of the skin was subject to an in-plane cyclical 160
deformation with a peak-to-peak amplitude of about 1.5 mm and a frequency of 0.1 161

6
Hz. Three cycles were performed to pre-condition the skin. The time, displacement, 162
and the reaction force at the probe tip were recorded for each cycle. The deformation 163
was repeated in directions 0, 30, 60, 90, 120, and 150o relative to the longitudinal axis 164
of the arm (Fig. 4(b)). The experiments were repeated three times. 165
Finite Element Model 166
Geometry and boundary conditions 167
A finite element model of the experiment was created using ABAQUS/Standard 168
Version 6.7.1 (SIMULIA, Providence, RI) (Fig. 5(a)). A circular skin area of diameter 169
40 mm was modelled. This represented the skin located within the hole on the support 170
plate. When the probe displacement was 0 and 90o relative to the longitudinal axis of 171
the arm, the problem was assumed to be symmetrical and so only half the domain was 172
modelled (Fig. 5(b)). In those two cases, symmetrical boundary conditions were 173
placed along the appropriate sides. The edge of the domain was restricted from 174
moving in all degrees of freedom. A 4 mm diameter area in the centre of the domain 175
(referred to as the probe contact area) was partitioned to represent the area of contact 176
between the probe and the skin. The domain was meshed using linear quadrilateral 177
and trilateral shell elements. The thickness of the shell elements were 1.5 mm 178
representing the average thickness of the skin on the arm (Reihsner et al. 1995). The 179
full models contained 2012 elements and 2039 nodes, while the symmetrical models 180
contained 1016 elements and 1064 nodes. The mesh density was doubled until there 181
was convergence in the reaction forces of the nodes in the probe area of the model. 182
Constitutive model 183
An Ogden strain energy function was used as the constitutive model of skin 184
12
3212 JpW
(2)
where: μ and α are material parameters; λ1, λ2, λ3 are the principal stretches; p is a 185
Lagrange multiplier representing hydrostatic pressure; and J is the volume ratio, 186
which is given by the determinant of the deformation gradient. 187
For comparison purposes, a neo-Hookean strain energy function was also used in the 188
constitutive model of skin for some of the simulations 189

7
12
3
2
2
2
110 JpCW (3)
where C10 is a material parameter. 190
The total stress in the specimen is assumed to be equal to an elastic stress, 191
WtTe , due to the instantaneous tissue response decreased by a viscous 192
component depending on the past history. From Fung (1993), the stress at time t is 193
given by 194
tR
ee dg
tTtTtT0
)(
(4)
where gR(t) is the reduced relaxation function, which characterises the material’s 195
viscoelastic response. gR (t) is represented by a Prony series as follows: 196
G1τP
1 1g1)(t
R etg
(5)
where P
1g and G
1τ are material parameters. 197
Analysis procedure 198
The finite element models were solved using an implicit quasi-static algorithm 199
available in ABAQUS/Standard through the *VISCO keyword. A suggested initial 200
time increment of 0.02 seconds was specified. The maximum time step allowed was 201
0.2 seconds. The default convergence criteria in ABAQUS/Standard were used. 202
An initial stress was applied to the domain in the X and Y directions representing the 203
in vivo tension inherent in living skin. This pre-stress was applied to the model using 204
the *INITIAL CONDITIONS, TYPE=STRESS facility in ABAQUS. A stress field is 205
imposed on each element in the model in its initial reference state. The amount of pre-206
stress was determined through the nonlinear optimization procedure, which is 207
described in the next section. The displacement of the probe was simulated by 208
applying appropriate displacement boundary conditions to the nodes within the probe 209
contact area. The displacement and speed of the probe in the finite element analysis 210
were the same as the displacement and speed of the probe in the corresponding 211
experiment. The reaction force of the probe in the model was found by summing the 212
reaction forces of all the nodes within the probe area of the finite element mesh. 213

8
Nonlinear Optimisation 214
For each location of the arm, there were 6 model parameters to determine – the four 215
material parameters μ, α, P
1g , G
1τ , and the initial stress in the X and Y directions σX and 216
σY. The parameter values that best fit the model to the pre-conditioned experimental 217
data were found using the nonlinear optimisation techniques. The lsqnonlin function 218
in MATLAB Version 7.5 (The MathWorks, Inc., Natick, MA, USA), which uses a 219
trust-region method, was used to minimise the following objective function in a least-220
squares sense 221
n
i
i
model
ii RRF1
2exp)()( xx (6)
where n is the number of data points (about 330 for this study), x is a vector 222
representing the model parameters, )(xmodel
iR is the probe reaction force calculated 223
from the model and exp
iR is the measured experimental probe reaction force at the ith 224
datapoint. 225
Results 226
A typical probe-tip force-displacement curve from the experiments is shown in Fig. 6. 227
For all skin areas tested, the response was highly nonlinear and contained significant 228
hysteresis. Also, the difference between the first and second loading cycle was much 229
greater than the difference between the second and third loading cycle. This indicated 230
that the skin was almost preconditioned after the first cycle. 231
The force-displacement response on the posterior upper arm was anisotropic (Fig. 232
7(a)). The response was stiffest when the probe was displaced in a direction 90o to the 233
longitudinal axis of the arm and least stiff when the probe was displaced along the 234
longitudinal axis of the arm. When the arm was bent 90o, the response was more 235
isotropic than when the arm was straight (Fig. 7(b)). The force response was slightly 236
stiffer when the probe displacement was along the longitudinal axis of the arm. There 237
was less anisotropy in the force-displacement curves for the anterior upper forearm 238
(Fig. 7(c)). The responses for all the directions were similar with a peak probe-tip 239
force of 1.6 N at a displacement of about 1.5 mm. Only the 0 and 90o directions are 240
shown for clarity. For the anterior lower forearm, the response in the 90o direction 241
was stiffest, while the response in the 0o direction was the least stiff (Fig. 7(d)). 242

9
For the posterior upper arm and the anterior lower forearm, the reaction force at 1.4 243
mm probe displacement was a maximum when the angle of displacement was 90o 244
(Fig. 8). For angles of displacement greater or less than 90o, the reaction force at 1.4 245
mm decreased monotonically. For the anterior upper forearm, the reaction force at 1.4 246
mm probe displacement was a maximum when the displacement angle was 150o. For 247
displacement angles greater or less than 150o, the reaction force decreased 248
monotonically. 249
Comparing the overall response of the different skin areas, the anterior upper forearm 250
was the stiffest, followed by the posterior upper arm (Fig. 9). The skin of the anterior 251
lower forearm was the least stiff of the three areas. For tip displacements up to 0.5 252
mm, the tangent stiffness of the anterior upper forearm was about 0.6 Nmm-1; the 253
tangent stiffness of the upper arm was 0.2 Nmm-1; and the stiffness of the lower 254
anterior forearm was 0.1 Nmm-1. For tip displacements from 1.2 mm to 1.5 mm, the 255
tangent stiffness of the anterior upper forearm and upper arm was about 1.8 Nmm-1 256
and the tangent stiffness of the anterior upper forearm was 1.2 Nmm-1. 257
Model parameters were found using nonlinear optimisation that best fit the finite 258
element analyses to the experiments. The results of the simulations are shown along 259
with the experimental results in Fig. 7(a) to Fig. 7(d), while the model parameters for 260
each skin area are listed in Table 1. The pre-strain that is equivalent to the calculated 261
pre-stress is also listed. The error-of-fit of the model to the experiment was calculated 262
for each case. The error-of-fit is defined as 263
%100exp
1
exp
N
i
i
N
i
i
model
i
R
RR
fitofError (7)
There was a good match between all the experimental and finite element results with 264
error-of-fits ranging from 6.5% for the anterior upper forearm to 17% for the anterior 265
lower forearm. For the posterior upper arm, the material parameters determined when 266
the arm was straight were also used for the case when the arm was bent. Only the pre-267
stress was varied in the nonlinear optimisation. A good fit was found with an error of 268
7.2% between the experimental and model results for the bent arm by changing only 269
the pre-stress in the skin. The reaction forces predicted by the models at 1.4 mm probe 270

10
displacement for different angles of displacement are compared with the experimental 271
results in Fig. 8. 272
The constitutive model using the neo-Hookean strain energy function was fit to the 273
upper arm data with an error-of-fit of 34.8% (Fig. 10). The material parameters used 274
to fit the model are displayed in Fig. 10. 275
Discussion 276
Skin forms the outermost layer of the human body and, because of its high visibility 277
and importance, it has been studied in many areas of science and technology such as 278
biomechanics, medicine, forensics, cosmetology and computer animation. In many of 279
these applications, it is important to have accurate models of skin that capture its 280
complex mechanical properties. Therefore, it is essential that experiments measuring 281
the mechanical properties of skin be able to quantify its nonlinear, anisotropic and 282
viscoelastic characteristics in vivo. 283
The experiments in this research measured the force response of different areas of in 284
vivo skin when subject to in-plane deformations. For all areas of the arm tested, the 285
skin behaviour was nonlinear and viscoelastic. The posterior upper arm and the 286
anterior lower forearm also showed significant anisotropy. The experimental method 287
in this research using a novel three-dimensional force-sensitive micro-robot is a 288
significant improvement over previous experimental protocols such as suction, normal 289
indentation, and torsion. With those protocols, the anisotropic characteristics of skin 290
cannot be measured. 291
The experimental data was simulated accurately using finite element models with an 292
Ogden strain energy function and quasi-linear viscoelasticity. The model captured the 293
nonlinear force response of the skin in all areas. It also simulated accurately the 294
hysteresis observed in the experiments, as well as any anisotropic characteristics. The 295
errors-of-fit ranged from 6.5% for the anterior upper forearm to 17.5% for the anterior 296
lower forearm (Table 1). When determining the material parameters in the nonlinear 297
optimisation, the pre-stress in the X and Y directions were also used as model 298
parameters. To the best of the authors’ knowledge this approach has not been used 299
when fitting models to in vivo experimental data on human skin. This allowed us to 300
accurately fit an isotropic constitutive model to anisotropic experimental data. 301

11
It must be noted that the objective function in Equation 6 will tend to weight the 302
fitting towards the higher displacement region of the curves because the errors in this 303
region are proportionally larger. An objective function that calculated the percentage 304
error at each data point was investigated for one of the cases. This resulted in a better 305
fit at lower displacements at the expense of a worse fit at higher displacements. The 306
overall error-of-fit was greater than when objective function in equation 6 was used. 307
The choice of objective function would depend on what region of the curve the study 308
is interested in, i.e. in the low strain or high strain regions. 309
The Ogden material parameters determined in this study lie within the range of values 310
reported in other studies. Evans and Holt (2009) report values in the region of μ=130 311
Pa and α=26 from studies on forearm skin (Note that their reported μ=10 Pa needs to 312
be converted as a different form of the Ogden strain energy function was used). 313
Shergold and Fleck (2004) found μ=0.1 MPa and α=9 from in vitro tensile tests of 314
lower abdomen skin. The values of μ and α varied significantly for the different parts 315
of the arm tested in this study. It is probable that there would also be significant 316
variations between individuals. The need to undertake a programme of testing many 317
individuals and body regions as suggested by Evans and Holt (2009) is reiterated here. 318
The neo-Hookean strain energy function was unable to simulate the experimental data 319
with the same accuracy as the Ogden model (Fig. 10). The model failed to capture the 320
nonlinear response observed in the experiments and had an error-of-fit of 34% when 321
simulating the deformation of the upper arm skin. This compares with an error-of-fit 322
of 9.3% when the Ogden model is used to simulate the deformation of the same 323
region. Therefore, the proposed model represents a significant improvement over 324
previous in vivo models of skin. Models that characterise skin using a Young’s 325
modulus (Zahouani, et al. 2009 Diridollou, et al. 2000, Pailler-Mattei, et al. 2008, 326
Khatyr, et al. 2006) or a neo-Hookean strain energy function (Delalleau, et al. 2008) 327
are unable to simulate accurately the experimental data in this research. 328
For the posterior upper arm area, the force response was measured when the arm was 329
straight and when the arm was bent 90o (Fig. 7(a) and Fig. 7(b)). The model was able 330
to fit the experimental data for both arm configurations with the same Ogden and 331
viscoelastic material parameters. Only the pre-stress in the skin model was changed 332
when the arm was bent. According to the model, the pre-stress in the direction of the 333
longitudinal axis increased from 1.1 kPa when the arm was straight to 5.6 kPa when 334
the arm was bent (Table 1). The pre-stress in the orthogonal direction increased 335

12
slightly from 3.9 kPa to 5.1 kPa. This result supports the hypothesis that it is only the 336
tension in the skin that changes when a limb moves from one position to another. It 337
also highlights the importance to note the orientation of the body when performing 338
experiments to measure mechanical properties of skin in vivo. 339
The change in the corresponding pre-strain calculated in the model when bending the 340
arm was 0.05 in the longitudinal direction and 0.0 in the transverse direction (Table 341
1). A rough estimation of the induced strain when bending the arm was made by 342
measuring the change in dimensions of a rectangle drawn on the posterior upper arm. 343
From this, the strain along the longitudinal axis of the arm when it was moved from a 344
straight to a bent position was determined to be about 0.04. The corresponding strain 345
in the transverse direction was 0.01. More accurate determinations of strain will be 346
made in the future using digital image correlation techniques. 347
The proposed model has a significant advantage over other previous models in that it 348
provides an estimate of the in vivo tension in skin. Many other in vivo models do not 349
include in vivo tension as a parameter (Pailler-Mattei, et al. 2008; Hendriks, et al. 350
2006). There is a relative paucity of in vivo skin tension data in the literature. The in 351
vivo tensions estimated in the present research can be compared with values found in 352
the literature in Table 2. The in vivo tensions for the anterior upper forearm are 353
slightly lower than the tensions measured by Diridollou et al. (2000) and Jacquet et al. 354
(2008). The present study represents an improvement because an estimate of the in 355
vivo tension in two orthogonal directions is provided. Diridollou et al. (2000) 356
performed suction tests so could not estimate the in vivo tension in various directions 357
due to the isotropic nature of the test. Qualitatively, the present results for the anterior 358
upper forearm are comparable to the results of de Jong (1995). While de Jong (1995) 359
estimates an in vivo tension higher than the present study, the in vivo tension in the 360
direction of the longitudinal axis (36 Nm-1) is greater than the in vivo tension in the 361
transversal direction (14 Nm-1), in agreement with the present study. The pre-strains 362
that correspond to the pre-stresses ranged from 0.02 to 0.1 (Table 1). These are lower 363
than the pre-strains of 0.2 reported by Evans and Holt (2009). As discussed earlier, 364
further studies on a large number of individuals need to be undertaken to explain 365
variations. The direction of the maximum in vivo tension measured at each point on 366
the arm in this study approximately agreed with the accepted directions of the Langer 367
or relaxed skin tension lines at those points (Fig. 11). The relaxed skin tension lines at 368
the anterior lower forearm and posterior upper arm are aligned 90o to the longitudinal 369

13
axis of the arm. On the anterior upper forearm, they are aligned approximately 30o to 370
the longitudinal axis of the arm. 371
The uniqueness of the identified model parameters in this study needs to be 372
established. Ogden et al (2004) showed that it is possible to fit a model to 373
experimental data accurately using multiple sets of model parameters. They found 374
multiple ‘optimum’ sets of data when fitting models to simple tension and equibiaxial 375
tension separately. For the optimisation procedure in this study, a richer set of 376
experimental data was used. When determining the model parameters at each arm 377
location, we fit the model to four data sets simultaneously (the probe was displaced in 378
directions 0, 30, 60 and 90o relative to the longitudinal axis of the arm). Using 379
multiple data sets simultaneously would improve the identification of model 380
parameters. Ogden et al (2004) also used Ogden strain energy functions with 6 and 8 381
model parameters, whereas the Ogden strain energy function used in this study 382
contained 2 model parameters. The uniqueness of model parameters is not limited to 383
the Ogden strain energy function. It is also an issue with other models such as the 384
Mooney-Rivlin function (Criscione 2003). Using as rich a set of experimental data as 385
possible will increase the identifiability of the parameters of any material model. 386
There are several simplifying assumptions in the finite element model of skin in the 387
present study. The skin is assumed to be a flat single homogeneous layer, whereas 388
skin is a multi-layer material with each layer having a significant effect on the overall 389
mechanical properties of the composite (Flynn and McCormack 2008a;Hendriks, et 390
al. 2006;Magnenat-Thalmann et al. 2002). In addition, the anchoring of the skin to the 391
underlying structure has been ignored. This means that any shearing effects between 392
the layers have been neglected. If a multi-layer model and mechanical anchorage were 393
included, it is probable that the actual material stiffness of the skin in the model would 394
be reduced, i.e. μ and α in the Ogden strain energy equation would decrease. Only the 395
skin that lay within the boundary of the hole in the support plate was modelled. Soft 396
tissue outside this area, the underlying layers, in particular, may have a significant 397
effect on the force response. Material anisotropy, which is present in skin (Lanir and 398
Fung 1974), has been ignored. The anisotropic response was modelled by applying an 399
anisotropic pre-stress in the simulations. Incorporation of an anisotropic constitutive 400
equation, such as one proposed by Lanir (1983), may improve the agreement between 401
the experimental and model results. However, using a more complex anisotropic 402
constitutive model presents additional challenges in relation to identifying unique 403

14
material parameters and the in vivo tension field. A sufficiently rich set of 404
experimental data will be needed to determine all the model parameters. 405
The model was fit to pre-conditioned experimental data. The viscoelastic model is too 406
simple to simulate the pre-conditioning effect observed in the experiments. Future 407
work will present a model that will simulate pre-conditioning accurately. 408
For the anterior lower forearm area, the model did not match the experimental data as 409
well as the other skin areas (Error-of-fit 17.5%). Examining Fig. 9, the experimental 410
force response for the anterior lower forearm is the most nonlinear of the three areas. 411
The one-term Ogden model may not be sufficient to capture the high nonlinearity 412
observed in the lower forearm area. A higher order Ogden or Arruda-Boyce strain 413
energy function may simulate the experimental data in this area more accurately. 414
Future developments to the experimental method would include the ability to measure 415
the strain field of the deformed surface of the skin. This can be achieved using three-416
dimensional digital image correlation methods. It is also planned to deform the skin 417
using multiple probes. Both these developments will provide a very rich set of data, 418
which can be used to accurately characterise the mechanical properties of skin in vivo. 419
Acknowledgements 420
The authors would like to acknowledge the contribution of Albert Chen in the design and testing of 421
earlier versions of the micro-robot. We wish to thank Peter Blythe for technical assistance in the design 422
and production of the device. 423
Appendix: forward kinematics algorithm 424
The geometry of the problem is shown in Fig. 12. For given axes displacements, the 425
tip of each axis (A, B, and C) is given by pA, pB, and pC. The length of the sides of the 426
triangle ABC are 427
BA
AC
CB
pp
pp
pp
c
b
a
(8)
We can now find the lengths from each apex of the triangle ABC to the centroid of the 428
moving platform xcent. From geometrical considerations and use of the cosine rule, the 429
lengths xA, xB and xC are found by solving the following system of equations: 430

15
BABA
CACA
CBCB
xxxxc
xxxxb
xxxxa
222
222
222
(9)
From the cosine rule, α, the angle between the lines AG and AC, is given by 431
bx
bxx
a
ca
2cos
2221 (10)
A local coordinate system is formed with the origin at A, the 'x axis along AC and 432
the 'z axis normal to the moving platform. The centroid of the moving platform in the 433
local coordinate system,'
centx , is then given by 434
0
sin
cos'
A
A
' x
x
Acent px (11)
The location of the probe tip in the local coordinate system is given by 435
dz
' 0
0'
centxP (12)
'P is then transformed to the global coordinate system to give the location of the 436
probe tip P. 437
This algorithm was verified by comparing its results to the results of 438
COSMOSMotion (Structural Research and Analysis Corporation, Concord, USA) 439
simulations of solid models of the micro-robot.440

16
References 441
Alexander H and Cook TH (1977) Accounting for natural tension in the mechanical testing of human 442
skin. J Investig Dermatol 69:310-314 443
Batisse D, Bazin R, Baldeweck T, Querleux B and Lévêque J-L (2002) Influence of age on the 444
wrinkling capacities of skin. Skin Res Technol 8:148-154 445
Bellamy K, Limbert G, Waters MG and Middleton J (2003) An elastomeric material for facial 446
prostheses: Synthesis, experimental and numerical testing aspects. Biomaterials 24:5061-5066 447
Bergstrom JS and Boyce MC (2001) Constitutive modeling of the time-dependent and cyclic loading of 448
elastomers and application to soft biological tissues. Mechanics of Materials 33:523-530 449
Bischoff JE (2006) Reduced parameter formulation for incorporating fiber level viscoelasticity into 450
tissue level biomechanical models. Annals of Biomedical Engineering 34:1164-1172 451
Bischoff JE, Arruda EM and Grosh K (2000) Finite element modeling of human skin using an 452
isotropic, nonlinear elastic constitutive model. J Biomech 33:645-652 453
Cacou C and Muir IFK (1995) Effects of plane mechanical forces in wound healing in humans. J Roy 454
Coll Surg Edin 40:38-41 455
Cavicchi A, Gambarotta L and Massabò R (2009) Computational modeling of reconstructive surgery: 456
The effects of the natural tension on skin wrinkling. Finite Elements in Analysis and Design 45:519-457
529 458
Cerda E (2005) Mechanics of scars. J Biomech 38:1598-1603 459
Criscione JC (2003) Rivlin's Representation Formula is Ill-Conceived for the Determination of 460
Response Functions via Biaxial Testing. Journal of Elasticity 70:129-147 461
Daly CH (1982) Biomechanical properties of dermis. J Investig Dermatol 79:17s-20s 462
de Jong LAM (1995) Pre-tension and Anisotropy in Skin: Modelling and Experiments. Dissertation, 463
Eindhoven University of Technology 464
Delalleau A, Josse G, Lagarde J-M, Zahouani H and Bergheau J-M (2006) Characterization of the 465
mechanical properties of skin by inverse analysis combined with the indentation test. J Biomech 466
39:1603-1610 467
Delalleau A, Josse G, Lagarde JM, Zahouani H and Bergheau JM (2008) A nonlinear elastic behavior 468
to identify the mechanical parameters of human skin in vivo. Skin Res Technol 14:152-164 469
Diridollou S, Patat F, Gens F, Vaillant L, Black D, Lagarde JM, Gall Y and Berson M (2000) In vivo 470
model of the mechanical properties of the human skin under suction. Skin Res Technol 6:214-221 471
Evans SL (2009) On the implementation of a wrinkling, hyperelastic membrane model for skin and 472
other materials. Comp Method Biomech Biomed Eng 12:319 - 332 473
Evans SL and Holt CA (2009) Measuring the mechanical properties of human skin in vivo using digital 474
image correlation and finite element modelling. Journal of Strain Analysis for Engineering Design 475
44:337-345 476
Flynn C and McCormack BAO (2008a) Finite element modelling of forearm skin wrinkling. Skin Res 477
Technol 14:261-269 478
Flynn C and McCormack BAO (2008b) A simplified model of scar contraction. J Biomech 41:1582-479
1589 480

17
Fung YC (1993) Biomechanics:Mechanical Properties of Living Tissues. Springer-Verlag, New York 481
Gunner CW, Hutton WC and Burlin TE (1979) The mechanical properties of skin in vivo - a portable 482
hand-held extensometer. Brit J Dermatol 100:161-163 483
Har-Shai Y, Bodner SR, Egozy-Golan D, Lindenbaum ES, Ben-Izhak O, Mitz V and Hirshowitz B 484
(1996) Mechanical properties and microstructure of the superficial musculoaponeurotic system. Plast 485
Reconstr Surg 98:59-70 486
Hendriks FM, Brokken D, Oomens CWJ, Bader DL and Baaijens FPT (2006) The relative 487
contributions of different skin layers to the mechanical behavior of human skin in vivo using suction 488
experiments. Med Eng Phys 28:259-266 489
Jacquet E, Josse G, Khatyr F and Garcin C (2008) A new experimental method for measuring skin's 490
natural tension. Skin Res Technol 14:1-7 491
Khatyr F, Imberdis C, Varchon D, Lagarde J-M and Josse G (2006) Measurement of the mechanical 492
properties of the skin using the suction test. Skin Res Technol 12:24-31 493
Kvistedal YA and Nielsen PMF (2009) Estimating material parameters of human skin in vivo. 494
Biomech Model Mech 8:1-8 495
Lanir Y (1983) Constitutive equations for fibrous connective tissues. J Biomech 16:1-12 496
Lanir Y and Fung YC (1974) Two-dimensional mechanical properties of rabbit skin--II. Experimental 497
results. J Biomech 7:171-174 498
Lott-Crumpler DA and Chaudhry HR (2001) Optimal patterns for suturing wounds of complex shapes 499
to foster healing. J Biomech 34:51-58 500
Magnenat-Thalmann N, Kalra P, Leveque JL, Bazin R, Batisse D and Querleux B (2002) A 501
computational skin model: Fold and wrinkle formation. IEEE Transactions on Information Technology 502
in Biomedicine 6:317-323 503
MerckSource(2007) Langer Lines. In: Dorlands Medical Dictionary. Elsevier. Available via 504
http://mercksource.org/pp/us/cns/cns_hl_dorlands_split.jsp?pg=/ppdocs/us/common/dorlands/dorland/f505
ive/000060422.htm. Accessed 29 Oct 2009 506
Ogden RW, Saccomandi G and Sgura I (2004) Fitting hyperelastic models to experimental data. 507
Computational Mechanics 34:484-502 508
Pailler-Mattei C, Bec S and Zahouani H (2008) In vivo measurements of the elastic mechanical 509
properties of human skin by indentation tests. Med Eng Phys 30:599-606 510
Reihsner R, Balogh B and Menzel EJ (1995) Two-dimensional elastic properties of human skin in 511
terms of an incremental model at the in vivo configuration. Med Eng Phys 17:304-313 512
Rubin MB, Bodner SR and Binur NS (1998) An elastic-viscoplastic model for excised facial tissues. J 513
Biomech Eng 120:686-689 514
Schneider D (1982) Viscoelasticity and tearing strength of the human skin. Dissertation, University of 515
California 516
Shergold OA and Fleck NA (2004) Mechanisms of deep penetration of soft solids, with application to 517
the injection and wounding of skin. Proceedings of the Royal Society A: Mathematical, Physical and 518
Engineering Sciences 460:3037-3058 519

18
Shoemaker PA, Schneider D, Lee MC and Fung YC (1986) A constitutive model for two-dimensional 520
soft tissues and its application to experimental data. J Biomech 19:695-702 521
Silver FH, Freeman JW and DeVore D (2001) Viscoelastic properties of human skin and processed 522
dermis. Skin Res Technol 7:18-23 523
Wan Abas WAB (1994) Biaxial tension test of human skin in vivo. Bio-Med Mater Eng 4:473-486 524
Wilkes GL, Brown IA and Wildnauer RH (1973) The biomechanical properties of skin. Crc Cr Rev 525
Biom Eng 1:453-495 526
Zahouani H, Pailler-Mattei C, Sohm B, Vargiolu R, Cenizo V and Debret R (2009) Characterization of 527
the mechanical properties of a dermal equivalent compared with human skin in vivo by indentation and 528
static friction tests. Skin Res Technol 15:68-76 529

19
Figure Legends
Fig. 1 Experimental set-up. Inset figure shows the probe attached to the skin of the anterior upper
forearm.
Fig. 2 (a) Force-sensitive micro-robot (b) Exploded view of top section of micro-robot
Fig. 3 Calculating the reaction force vector at the probe tip (RX,RY,RZ) from the forces measured from
the force transducers, FA, FB, FC
Fig. 4 (a) The three areas of the right arm that were studied – anterior lower forearm, anterior upper
forearm and posterior upper arm. (b) At each site the probe was displaced in 5 different directions
relative to the longitudinal axis of the arm
Fig. 5 Finite element models of experiment. When the probe displacement is in a direction 30 and 60o
relative to the longitudinal axis of the arm, a full model is used (a); for 0 and 90o directions a
symmetrical model suffices (b). The edge of the domain is fixed in all degrees of freedom representing
the contact between skin and the double-sided tape on the edge of the hole of the support plate. An
initial pre-stress is applied in the X and Y directions. The nodes in the shaded section in the centre of
the domain representing the probe contact area are displaced in the X-Y plane.
Fig. 6 Three force-displacement cycles for the upper arm. The probe was displaced in a direction 90o to
the longitudinal axis of the right arm
Fig. 7 Comparison of experimental and model force-displacement curves for in-plane deformation of
skin on different parts of the upper arm. The model parameters are in Table 1. (a) Posterior upper arm
(straight); (b) Posterior upper arm (arm bent 90o); (c) Anterior upper forearm; (d) Anterior lower
forearm.
Fig. 8 Variation of the reaction force at 1.4 mm tip displacement with angle of tip displacement relative
to the longitudinal axis of the arm.
Fig. 9 Comparison of force response for the different skin areas. All data is for a probe displacement in
a direction 90o to the longitudinal axis of the arm.
Fig. 10 Comparison of experimental and neo-Hookean model force-displacement curves for in-plane
deformation of skin on the posterior upper arm. Model parameters: C1= 0.02197 MPa; P
1g = 0.46496
G1 = 1.86102; σX= 0.00006 MPa; σY= 0.05167 MPa
Fig. 11 Langer lines of the (a) posterior and (b) anterior areas of the right arm (Image adapted from
MerckSource (2007))
Fig. 12 Kinematic skeleton of the micro-robot

20
Table 1 Ogden, Prony series and initial stress parameters used to fit finite element analyses to the average
of the experimental data. The equivalent nominal pre-strain is also displayed.
μ
(MPa)
α P
1g G1 σX
(MPa)
σY
(MPa)
Equivalent
strain
Error
(%)
εX εY
Posterior upper
arm (Straight)
0.0096 35.993 0.3398 1.685 0.0011 0.0039 0.02 0.06 9.29
Posterior upper
arm (Bent)
0.0096 35.993 0.3398 1.685 0.0056 0.0051 0.07 0.06 7.23
Anterior upper
forearm
0.0398 33.452 0.398 0.757 0.0076 0.0054 0.04 0.03 6.51
Anterior lower
forearm
0.0026 35.883 0.459 0.828 0.0012 0.0041 0.06 0.1 17.5

21
Table 2 In vivo skin tensions reported in the literature
Study Experiment
Type
Region In vivo tension (N/m)
Longitudinal
axis
Transversal
axis
Diridollou et al (2000) Suction Anterior Forearm 12.35 -
Jacquet et al (2008) Extensiometry Forearm 15 -
de Jong (1995) Extensiometry Forearm 36 14
Present Study Multi-axial
in-plane
traction
Anterior lower forearm 1.8 6.15
Present Study “ Anterior upper forearm 11.4 8.1
Present Study “ Posterior upper arm
(Straight)
1.65 5.85
Present Study “ Posterior upper arm
(Bent)
8.4 7.65

22
Fig. 1
Fig. 2(a)
Fig. 2(b)
23
Fig. 3
Fig. 4(a)
Fig. 4(b)

24
Fig. 5(a)
Fig. 5(b)
Fig. 6

25
Fig. 7(a)
Fig. 7(b)
Fig. 7(c)

26
Fig. 7(d)
Fig. 8
Fig. 9

27
0 0.2 0.4 0.6 0.8 1 1.2 1.4 1.6 1.80
0.2
0.4
0.6
0.8
1
1.2
1.4
Magnitude Tip Displacement (mm)
Magnitude T
ip F
orc
e (
N)
Experiment 0o
Model 0o
Experiment 900
Model 900
Error-of-fit 34.8%
Fig. 10
Fig. 11(a)
Fig. 11(b)
Fig. 12


![Menschenhaut [Human skin]](https://static.fdokumen.com/doc/165x107/6326d24f24adacd7250b1364/menschenhaut-human-skin.jpg)