THE ROLE OF CRITERIA IN T
240
ANGLIA RUSKIN UNIVERSITY FACULTY OF SCIENCE AND TECHNOLOGY BUILDING SUSTAINABILITY ASSESSMENT SCHEMES: THE ROLE OF CRITERIA IN TRANSLATING AIMS INTO EFFECT COLIN HOBART A thesis in partial fulfilment of the requirements of Anglia Ruskin University for the degree of Doctor of Philosophy (PhD) Submitted: December 2019
-
Upload
khangminh22 -
Category
Documents
-
view
2 -
download
0
Transcript of THE ROLE OF CRITERIA IN T
ANGLIA RUSKIN UNIVERSITY
FACULTY OF SCIENCE AND TECHNOLOGY
BUILDING SUSTAINABILITY ASSESSMENT SCHEMES: THE ROLE OF CRITERIA IN
TRANSLATING AIMS INTO EFFECT
COLIN HOBART
A thesis in partial fulfilment of
the requirements of Anglia Ruskin University
for the degree of Doctor of Philosophy (PhD)
Submitted: December 2019

i
ACKNOWLEDGEMENTS
My thanks to the Department of Engineering and the Built Environment for financial
support in relation to my tuition fees and to the numerous university employees that
facilitated my data collection. Special thanks are also due to my supervisory team past
and present, Professor Keith Jones, Dr Carlos Jimenez-Bescos, Dr Richard Moore, Dr
Fred Sherratt and Dr Nezhapi-Dellé Odeleye for your enthusiasm and advice throughout
this project. Thank you most of all to my lovely family for your unwavering support.

ii
ANGLIA RUSKIN UNIVERSITY
ABSTRACT
FACULTY OF SCIENCE AND TECHNOLOGY
DOCTOR OF PHILOSOPHY
BUILDING SUSTAINABILITY ASSESSMENT SCHEMES: THE ROLE OF CRITERIA IN
TRANSLATING AIMS INTO EFFECT
COLIN HOBART
October 2019
Building sustainability assessment schemes (BSAS) such as BREEAM and LEED are used to generate a comprehensive design stage assessment of the sustainability of a building. Their use as a means of setting sustainability standards for new and refurbished buildings has achieved international political and commercial acceptance. However, BSAS are widely criticised within academic literature for lacking either a sound theoretical basis or empirical evidence of success. To be effective in their assumed role, BSAS must reliably differentiate buildings in terms of sustainability. In practice the broad range of indicators employed, the range of building types assessed and the lack of any feedback loop make quantitative assessment of efficacy challenging. Consequently, after over 20 years of use it remains unclear to what extent BSAS are effective in stimulating either specific or general sustainability improvements in buildings. This knowledge gap is addressed in this study, through examination of the application of the energy, water and health and wellbeing sections of the BREEAM scheme, to four recently constructed university buildings. A review of assessment reports is combined with a post-occupancy evaluation to enable intended cause and effect paths to be identified and validated. Through examination of this data understanding of previously proposed theoretical limitations is expanded. This facilitates identification of both theoretical and observed strengths and weaknesses within the individual criteria employed. The underlying importance of well-configured criteria in producing overall effect clearly emerges. This allows specific recommendations to be made for their improvement in terms of appropriateness of content, appeal to users, potential for robust evidencing, scope and complexity. Although produced using a single BSAS, the above recommendations have potential to be generalised across similar scheme formats. The research methodology employed has potential to be replicated, with certain refinements, across a range of scheme and building types. The increased understanding of BSAS criteria generated by this study and its potential expansion offer great potential to improve the functional capabilities of BSAS. Given the global importance of managing the sustainability of the built environment and the current lack of any viable alternative to BSAS, any such improvement should be of great interest to scheme operators and policy makers alike. Key words: assessment methods, building assessment, environmental assessment, sustainability assessment, assessment criteria
iii
TABLE OF CONTENTS
Acknowledgements i
Abstract ii
Table of Contents iii
List of Figures vi
List of Tables ix
CHAPTER 1 – INTRODUCTION 1
1.1 Context 1
1.2 Problems 3
1.3 Research approach outline 5
1.4 Thesis structure 5
CHAPTER 2 – LITERATURE REVIEW 6
2.1 Building sustainability assessment schemes – The historical context 6
2.2 Sustainability and the triple bottom line 10
2.3 Measuring the sustainability of buildings 15
2.4 The accuracy and efficacy of BSAS 18
2.5 BSAS and the performance gap 19
2.6 The business context for BSAS 20
2.7 Assessment methodology 26
2.8 Conceptual framework 31
CHAPTER 3 – METHODOLOGY 35
3.1 Research design 35
3.1.1 – Theoretical perspectives 35
3.1.2 – Methodology 36
3.1.3 – Case study design - Theoretical considerations 39
3.1.4 – BREEAM 40
iv
3.1.5 – Data requirements 43
3.1.5.1 – Research objectives 1 and 2 43
3.1.5.2 – Research objective 3 44
3.1.5.3 – Research objective 4 49
3.2 Practical application and reflections 52
3.2.1 – The justification for selection of the case study buildings 52
3.2.2 – Case study design - Practical application) 54
3.2.3 – Benchmarking 69
3.3 Ethical considerations 77
3.3.1 – Ethical principles 77
3.3.2 – Institutional ethics approval 79
CHAPTER 4 – RESULTS 80
4.1 Description of case study buildings 80
4.1.1 – General building characteristics 80
4.1.2 – Building function and facilities 81
4.1.3 – Building setting, configuration and construction 83
4.1.4 – Building environmental services 91
4.2 Review of BREEAM scheme characteristics 96
4.3 Energy 104
4.3.1 – Introduction 104
4.3.2 - Energy performance of case study buildings 104
4.3.3 – The application and impact of particular BREEAM criteria 115
4.3.4 – Summary 125
4.4 Water 127
4.4.1 – Introduction 127
4.4.2 – Water consumption in case study buildings 127
4.4.3 – The application and impact of particular BREEAM criteria 130
v
4.4.4 – Summary 138
4.5 Internal Environmental Quality 139
4.5.1 – Introduction 139
4.5.2 – Internal environmental quality in case study buildings 139
4.5.3 – The application and impact of particular BREEAM criteria 155
4.5.4 – Summary 178
CHAPTER 5 – DISCUSSION 179
5.1 – Knowledge gap and research aim 179
5.2 – Case study findings 179
5.3 – Contribution to knowledge 189
5.4 – Criteria configuration 192
5.5 – Criteria complexity and scope 198
5.6 – Recommendations for improved effectiveness 199
CHAPTER 6 – CONCLUSION 204
6.1 – Knowledge gap and research findings 204
6.2 – Recommendations 208
6.3 – Contribution to knowledge 210
References 212
Appendix A - BREEAM issues and associated themes
Appendix B – Building user survey questionnaire
vi
LIST OF FIGURES
Figure 2.1.1 – BSAS timeline (Koepke et al., 2010)
Figure 2.2.1 – The three spheres of sustainability (Vanderbilt University, 2013)
Figure 2.2.2 – Strong sustainability (Cato, 2009)
Figure 2.2.3 – The four pillars of sustainability (Partal, 2013)
Figure 2.6.1 – Motives for undergoing a green retrofit (Lockwood, C. 2008)
Figure 2.6.2 – “Main motivation” for using a BREEAM assessment by stakeholder
(Parker, 2012)
Figure 2.8.1 –Conceptual framework indicating the theoretical limitations of building
sustainability assessment schemes
Figure 3.1.1 – Total number of UK certificates issued by scheme (Aug 2012) (BRE,
2012)
Figure 3.1.2 – Number of UK BREEAM certificates awarded by year (BRE, 2012)
Figure 3.1.3 – Total number of certificates issued worldwide by scheme (Aug 2012)
(BRE, 2012)
Figure 3.1.4 – Framework for assessing the efficacy of BSAS credits and associated
criteria
Figure 3.2.1 – Summary of data collection methods used to address research methods
Figure 3.2.2 – Response data for BUS study by building
Figure 3.2.3 – Relationship between design predictions and actual energy use (RIBA,
2017)
Figure 4.1.1 – Use of space by percentage of total GIFA for case study buildings
Figure 4.1.2 - Use of “occupied areas” by percentage of total GIFA for case study
buildings
Figure 4.1.3 – Ground Floor Plan Building A
Figure 4.1.4 – Ground Floor Plan Building B
Figure 4.1.5 – Ground Floor Plan Building C
Figure 4.1.6 – Ground Floor Plan Building D
Figure 4.1.7 – Ventilation and cooling strategy by floor area

vii
Figure 4.1.8 – Ventilation and cooling strategy by “occupied” floor area
Figure 4.2.1 – BREEAM certificate ratings issued under BREEAM 2008 and later (all
building types) (BRE, 2017)
Figure 4.2.2 - BREEAM certificate ratings issued under BREEAM 2008 and later
(‘bespoke’ assessments) (BRE, 2017)
Figure 4.2.3 - BREEAM certificate ratings issued under BREEAM 2008 and later (‘higher
education’’ assessments) (BRE, 2017)
Figure 4.2.4 – BREEAM rated projects by certificate type (BRE, 2017)
Figure 4.3.1 – Metered electricity and gas consumption for Building A
Figure 4.3.2 – Metered electricity consumption for Building B (no gas installed)
Figure 4.3.3 – Metered electricity and gas consumption for Building C
Figure 4.3.4 – Metered gas consumption for Building D (electricity not available)
Figure 4.3.5 - Metered electricity consumption for Building D (2014)
Figure 4.3.6 – Comparison of metered energy consumption with DEC data
Figure 4.3.7 – Metered energy consumption for case study buildings compared with
relevant benchmarks
Figure 4.3.8 – Metered carbon emissions for case study buildings compared with EPC
values and relevant benchmarks
Figure 4.3.9 – BREEAM Energy credits achieved as a proportion of the total available
Figure 4.4.1 – Metered water consumption for Building B
Figure 4.4.2 – Metered water consumption for Building C
Figure 4.4.3 – Annual water consumption for Buildings B and C relative to benchmark
data
Figure 4.4.4 – BREEAM Water credits as a proportion of the total available
Figure 4.5.1 – Statistically significant Pearson’s correlation values between Comfort and
other variables (p<0.05)
Figure 4.5.2 – Statistically significant Pearson’s correlation values between Productivity
and other variables (p<0.05)
Figure 4.5.3 – Statistically significant Pearson’s correlation values between Health and
other variables (p<0.05)

viii
Figure 4.5.4 – BREEAM Health and Wellbeing credits as a proportion of the total
available
Figure 5.3.1 – Theoretical and observed limitations of BSAS content and process
Figure 5.4.1 – Factors determining the effectiveness of credit criteria
Figure 5.5.1 – Influence of criteria complexity and score on content, evidence and
appeal
ix
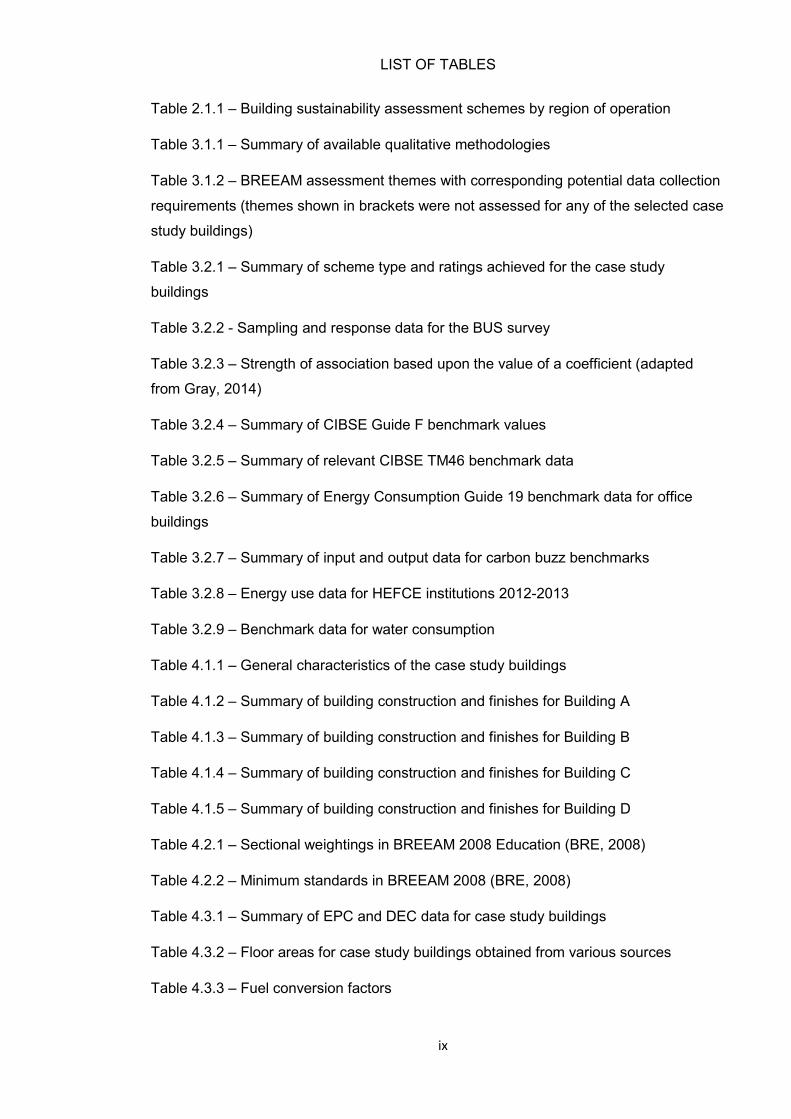
LIST OF TABLES
Table 2.1.1 – Building sustainability assessment schemes by region of operation
Table 3.1.1 – Summary of available qualitative methodologies
Table 3.1.2 – BREEAM assessment themes with corresponding potential data collection
requirements (themes shown in brackets were not assessed for any of the selected case
study buildings)
Table 3.2.1 – Summary of scheme type and ratings achieved for the case study
buildings
Table 3.2.2 - Sampling and response data for the BUS survey
Table 3.2.3 – Strength of association based upon the value of a coefficient (adapted
from Gray, 2014)
Table 3.2.4 – Summary of CIBSE Guide F benchmark values
Table 3.2.5 – Summary of relevant CIBSE TM46 benchmark data
Table 3.2.6 – Summary of Energy Consumption Guide 19 benchmark data for office
buildings
Table 3.2.7 – Summary of input and output data for carbon buzz benchmarks
Table 3.2.8 – Energy use data for HEFCE institutions 2012-2013
Table 3.2.9 – Benchmark data for water consumption
Table 4.1.1 – General characteristics of the case study buildings
Table 4.1.2 – Summary of building construction and finishes for Building A
Table 4.1.3 – Summary of building construction and finishes for Building B
Table 4.1.4 – Summary of building construction and finishes for Building C
Table 4.1.5 – Summary of building construction and finishes for Building D
Table 4.2.1 – Sectional weightings in BREEAM 2008 Education (BRE, 2008)
Table 4.2.2 – Minimum standards in BREEAM 2008 (BRE, 2008)
Table 4.3.1 – Summary of EPC and DEC data for case study buildings
Table 4.3.2 – Floor areas for case study buildings obtained from various sources
Table 4.3.3 – Fuel conversion factors
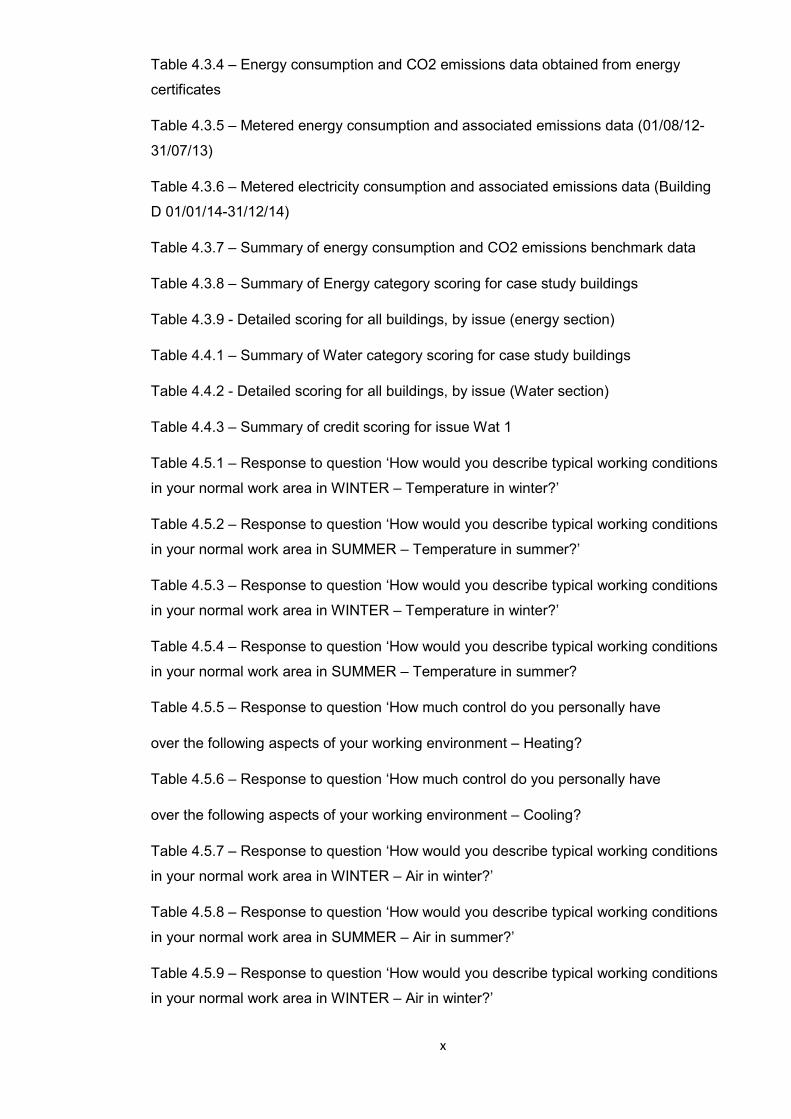
x
Table 4.3.4 – Energy consumption and CO2 emissions data obtained from energy
certificates
Table 4.3.5 – Metered energy consumption and associated emissions data (01/08/12-
31/07/13)
Table 4.3.6 – Metered electricity consumption and associated emissions data (Building
D 01/01/14-31/12/14)
Table 4.3.7 – Summary of energy consumption and CO2 emissions benchmark data
Table 4.3.8 – Summary of Energy category scoring for case study buildings
Table 4.3.9 - Detailed scoring for all buildings, by issue (energy section)
Table 4.4.1 – Summary of Water category scoring for case study buildings
Table 4.4.2 - Detailed scoring for all buildings, by issue (Water section)
Table 4.4.3 – Summary of credit scoring for issue Wat 1
Table 4.5.1 – Response to question ‘How would you describe typical working conditions
in your normal work area in WINTER – Temperature in winter?’
Table 4.5.2 – Response to question ‘How would you describe typical working conditions
in your normal work area in SUMMER – Temperature in summer?’
Table 4.5.3 – Response to question ‘How would you describe typical working conditions
in your normal work area in WINTER – Temperature in winter?’
Table 4.5.4 – Response to question ‘How would you describe typical working conditions
in your normal work area in SUMMER – Temperature in summer?
Table 4.5.5 – Response to question ‘How much control do you personally have
over the following aspects of your working environment – Heating?
Table 4.5.6 – Response to question ‘How much control do you personally have
over the following aspects of your working environment – Cooling?
Table 4.5.7 – Response to question ‘How would you describe typical working conditions
in your normal work area in WINTER – Air in winter?’
Table 4.5.8 – Response to question ‘How would you describe typical working conditions
in your normal work area in SUMMER – Air in summer?’
Table 4.5.9 – Response to question ‘How would you describe typical working conditions
in your normal work area in WINTER – Air in winter?’
xi
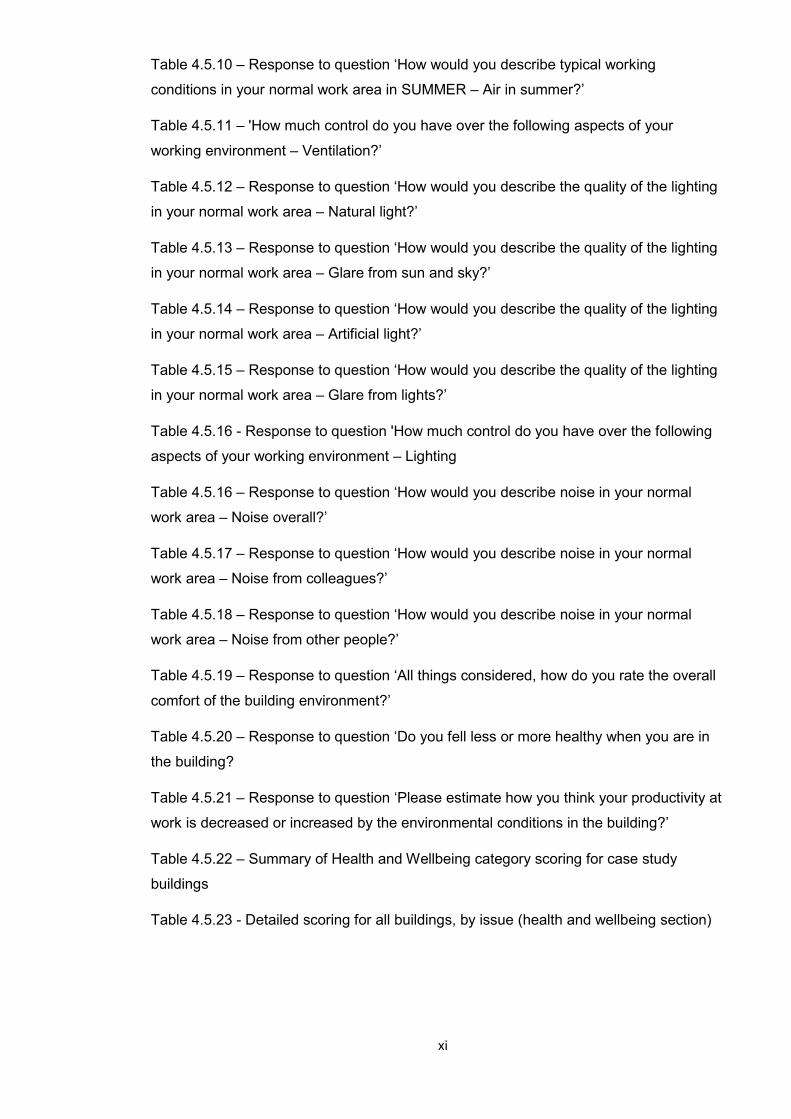
Table 4.5.10 – Response to question ‘How would you describe typical working
conditions in your normal work area in SUMMER – Air in summer?’
Table 4.5.11 – 'How much control do you have over the following aspects of your
working environment – Ventilation?’
Table 4.5.12 – Response to question ‘How would you describe the quality of the lighting
in your normal work area – Natural light?’
Table 4.5.13 – Response to question ‘How would you describe the quality of the lighting
in your normal work area – Glare from sun and sky?’
Table 4.5.14 – Response to question ‘How would you describe the quality of the lighting
in your normal work area – Artificial light?’
Table 4.5.15 – Response to question ‘How would you describe the quality of the lighting
in your normal work area – Glare from lights?’
Table 4.5.16 - Response to question 'How much control do you have over the following
aspects of your working environment – Lighting
Table 4.5.16 – Response to question ‘How would you describe noise in your normal
work area – Noise overall?’
Table 4.5.17 – Response to question ‘How would you describe noise in your normal
work area – Noise from colleagues?’
Table 4.5.18 – Response to question ‘How would you describe noise in your normal
work area – Noise from other people?’
Table 4.5.19 – Response to question ‘All things considered, how do you rate the overall
comfort of the building environment?’
Table 4.5.20 – Response to question ‘Do you fell less or more healthy when you are in
the building?
Table 4.5.21 – Response to question ‘Please estimate how you think your productivity at
work is decreased or increased by the environmental conditions in the building?’
Table 4.5.22 – Summary of Health and Wellbeing category scoring for case study
buildings
Table 4.5.23 - Detailed scoring for all buildings, by issue (health and wellbeing section)
1
CHAPTER 1 – INTRODUCTION
1.1 Context
The built environment is unsustainable. Modern buildings make use of large quantities
of finite materials at construction stage, consuming fossil fuels through every phase of
their life. Consequently, buildings are understood to be responsible for around 30% of
greenhouse gas emissions worldwide (UNEP, 2009). However, their broader impact in
terms of sustainability is more complex and wide-ranging. Buildings exist in a social,
economic, environmental and cultural context. They require land, consume water,
generate waste, affect transport patterns and utilise materials that are extracted from the
ground, grown or fabricated across international boundaries. Providing valuable space
for social and cultural activity to take place and positively contributing to local and global
economies. Through their construction, use, maintenance and demolition, buildings
therefore have both positive and negative effects. However, their overall environmental
impacts are generally negative.
If management requires measurement, then a means of assessing sustainability is
needed to facilitate a transformation from a state of un-sustainability as described above,
to a state of future sustainability (Pitts, 2004). The nature of this future state remains
unclear, making objective measurement difficult. In spite of this, over the past 20 years
the use of design stage criteria-based assessment methods has achieved a
considerable level of political and commercial acceptance (Cole, 2005). Such Building
Sustainability Assessment Schemes (BSAS) are typically configured to provide a
comprehensive, design stage assessment, based upon compliance with a checklist of
indicators (Ding, 2008; Happio and Viitaniemi, 2008). Schemes such as the Building
Research Establishment Environmental Assessment Method (BREEAM) and Leadership
in Energy and Environmental Design (LEED) have achieved widespread international
recognition and there are at least 65 different BSAS currently in global operation. BSAS
are arguably the only recognised means of measuring the overall sustainability of
buildings and as such they have potential to make an important contribution to managing
the wider sustainability of society. However, despite their considerable and growing up-
take BSAS are widely criticised within academic literature for lacking either a sound
theoretical basis or empirical evidence of efficacy (Cole, 2005).

2
A widely cited limitation of BSAS is their reliance on “indicators” as a basis for applying
dimensionless, numerical scoring systems (Ding, 2008; Beradi, 2011). Indicators are, by
definition, an incomplete means of assessment. The subjective nature of their selection
is amply evidenced by the variations in content observed across different schemes. A
further closely linked limitation is the use of checklists. These are typically employed on
a “balanced scorecard” approach (Barlow, 2011) and therefore allow buildings to be
rewarded for achievement in certain areas, whilst remaining un-assessed in others.
BSAS are also highly reliant upon design stage evidence to demonstrate compliance
(Cole, 2005). These evidence requirements can be complex and may generate a
substantial and unwelcome additional burden for project team members (Alwaer and
Kirk, 2012). Perhaps most significantly of all, assessing sustainability based upon
design stage evidence is an inherently uncertain method, with academic post-occupancy
evaluation consistently demonstrating that design can be a poor predictor of
performance in the construction industry (Bordass et al., 2001; Johnston et al., 2015;
Menezes et al. 2012). Sitting alongside these procedural challenges, BSAS must
additionally operate in a complex commercial context (Cole, 2005). The option to select
indicators from a checklist, the burden of gathering evidence and reliance upon design
documentation to predict performance provide project teams with both the scope and
motivation to manipulate the application of a scheme to align with their own commercial
and reputational aims.
Application of BSAS is typically an interactive process, in which a construction project
team can actively select which credits they will attempt to evidence for their building.
Credit may be achieved through verification of existing compliance, in which case the
scheme acts as an assessment tool. Project teams do however have the option to alter
the building design, construction or procurement process, or even location, to achieve
the required number of credits (Cole, 2005). The targeting of a particular scheme rating
in this manner may be motivated by individual aspirations or a desire to demonstrate
corporate social responsibility. Alternatively, a particular rating may be required to meet
standards dictated by town planning authorities and government funding bodies (Parker,
2012). In either case, where a particular rating level is sought, BSAS cease to act as an
assessment method and instead become a de-facto performance specification for
sustainability (Beradi, 2011). In this role, BSAS may act as a tool for market
transformation, both for buildings themselves and the many material components and
service providers that contribute to their creation. In this scenario, powerful commercial
forces come in to play, particularly where certification level is a contractual or statutory
requirement. As such, both project teams and the wider construction supply chain will
3
inevitably be required to reconcile the requirements of BSAS certification with their
existing functional, aesthetic and commercial aims.
1.2 Problems
By contrast with theoretical commentary, empirical research relating to the efficacy of
BSAS is extremely limited. Research by Haroglu (2013) suggests that BSAS may be a
relatively effective means of implementing design change; it is however increasingly
understood that design stage modelling is an unreliable indicator of in-use performance
(Johnston et al., 2015; Menezes et al. 2012). The combination of commercial context,
reliance on design stage assessment, diverse and difficult to measure metrics and a lack
of built in post occupancy evaluation make the existence of a “performance gap” for
BSAS highly plausible. Furthermore, whilst attempts to compare the sustainability of
certificated and non-certificated buildings are few, such work as has been carried out is
not encouraging. In one instance, Scofield (2009) carried out a review of in-use energy
consumption of buildings, which concluded that LEED certificated buildings performed
no better statistically in terms of area weighted energy use than non-rated buildings. In
a second study, Monfared and Sharples (2011) found that perceptions of health and
wellbeing (a key BREEAM metric) actually reduced when a building population was
transferred to a new BREEAM “excellent” building.
A particular problem associated with assessing BSAS performance is that expectations
are not typically clearly expressed. When considered against recognised definitions
modern buildings are typically highly unsustainable (Birkeland, 2008). Therefore,
although awarding an “excellent” or “gold” rating to a building implies a substantial
improvement, without a defined baseline, the expected quantitative improvement cannot
be known. This lack of established benchmarks considered alongside variations in
building characteristics presents considerable challenges from a research perspective.
Although typically undefined within scheme literature, the use of a nominal scale for
ratings and a lack of comparability of scores or ratings across schemes suggest that
assessment is intended to be relative (Brandon and Lombardi, 2011). A certificated
building should perhaps therefore be expected to be “sustainable” only in comparison to
a typical notional building sharing similar fundamental characteristics such as location,
layout, purpose and usage patterns. This view clearly informed the research approach
employed by Monfared and Sharples (2013), which consisted of a longitudinal study of a
population of office workers during their transfer from one building to another. This study
4
provides robust results for the specific building considered, however sourcing similar and
willing populations across a range of different building types and locations would likely
prove challenging. Quantitative analysis of data across a large number of buildings
presents a potential alternative approach to overcoming variations in building
characteristics, however such datasets are rarely available in practice. The quantitative
findings produced by Scofield (2009) were possible only through reinterpretation of data
originally published by LEED to demonstrate a causal link with reduced energy use.
Routine, robust, collection of even simple data such as energy consumption is unusual
and may be commercially sensitive; large scale collection of data relating to the
“comprehensive” assessment offered by BSAS simply does not, currently, occur. In
summary, despite the long standing and expanding global use of BSAS as a means of
managing sustainability of buildings, there is little evidence to suggest they are fit for
purpose. Without a robust theoretical basis or empirical validation, further work is
needed to understand their efficacy in terms of assessment and their appropriateness for
setting standards, along with their suitability as tools for stimulating market change.
Poorly performing BSAS at best represent a significant waste of resources and at worst
will result in inadequately designed buildings being presented as exemplars. The aim
and objectives of this research are set out below:
Knowledge gap
● The design and construction stage interventions promoted by BSAS do not
appear to be a reliable means of improving overall building performance and
whilst a number of general theoretical weaknesses have been identified within
these methodologies, the particular factors limiting their effectiveness are
currently poorly understood.
Research aim
● To increase evidence of the relationship between building sustainability,
assessment schemes and building performance.
Research objectives
1 To assess BSAS content, by examining the operational effect of applying
individual criteria in certified buildings.
2 To assess BSAS methodology, by examining the manner in which individual
criteria have been applied during the design and construction of certified
buildings.
3 To assess whether a BSAS rating is a useful sustainability differentiator, by
comparing the in-use performance of certified buildings with established
benchmarks.
5
4 To generate recommendations for increasing the efficacy of BSAS, based upon
an improved understanding of the link between content, methodology and
building performance.
1.3 Research approach outline
Given the difficulty in obtaining secondary data relating to BSAS, a top down approach
to analysis has been identified as being problematic. In common with other studies
relating to suspected performance gaps, this study therefore approaches validation and
examination of BSAS from the bottom up, using a case study based methodology
(Bordass et al., 2001; Johnston et al., 2015). Case studies allow for both close
examination of the application of BSAS and post occupancy evaluation to determine its
effects. This approach cannot robustly demonstrate whether BSAS will produce their
purported effects in general; it can however provide insight as to whether individual
scheme criteria were effective in particular instances. The potential power of this
approach lies in the examination of a wide range of criteria, combined with a capacity to
determine intent, process and resulting effect with a high degree of certainty. Although
still present, the influence of variations in building characteristic diminish somewhat in
this scenario as it is the relative effect which the scheme has on building design and
performance that is being examined. Thus, whilst it may not be possible to establish that
a particular criterion will produce a general effect across a range of buildings, it will be
possible to say that particular criteria can produce a positive effect in a specific building.
Furthermore, it will be possible to demonstrate that criteria may have no effect on a
building. Equally as importantly, detailed mechanical examination of a BSAS method in
application has provided an opportunity to establish why particular criteria are more or
less effective. This, in turn, produces potential for generalisations to be made regarding
criteria configuration, from which recommendations for improvement may be drawn.
1.4 Thesis structure
The remainder of this thesis describes the realisation of the research proposal described
above. A detailed summary of existing pertinent literature is set out in Chapter 2, whilst
Chapter 3 sets out my chosen methodology. Chapter 4 summarises the results, which
are discussed in relation to the existing literature in Chapter 5. My conclusions are set
out in Chapter 6.
6
CHAPTER 2 – LITERATURE REVIEW
This chapter comprises a critical review and summary of existing literature relating to the
context, aims, characteristics and limitations of Building Sustainability Assessment
Schemes.
2.1 Building sustainability assessment schemes – The historical context
Successive industrial and technical revolutions over the past two centuries have
profoundly altered society in much of the world (Freeman, 2001) and with the resulting
urbanisation and population increase, coupled with the changing needs of industry and
commerce, massive demand has been stimulated for buildings of all kinds (Wheeler,
2004). Mechanisation and the availability of cheap fossil fuels have additionally changed
the nature of construction (Yudelson, 2009), altering the economic landscape in favour
of high performance (though finite and energy intensive) materials such as: brick, glass,
concrete, steel and aluminium. Meanwhile, technical innovations such as domestic
electricity, central heating, air conditioning and telecommunications have increased both
the utility of buildings and the comfort expectations of users (Beaufoy, 1993). This has
resulted in a trend towards more complex buildings with higher associated embodied
energy, energy usage and maintenance requirements. Consequently, the expansion
and maintenance of the modern built environment now consumes significant quantities
of land, materials and energy.
However, growth and intensification of construction activity has occurred against a
background of increasing awareness of its negative impacts (Sonneborn, 2007). From
the 1960s, expanding exploitation of material and energy resources and the pollution
often associated with it has emerged as a significant political issue. Furthermore, the
1970s oil crisis both highlighted the political perils of over reliance on fossil fuels for
energy and provided a preview of future energy scarcity. It was, however, in the 1980s,
against the background of a continuing rise in world population, that the wider concepts
of sustainability and global carrying capacity began to be widely debated. Since this
time, the built environment has come under considerable scrutiny (Pitts, 2004; Brandon
and Lombardi, 2011). Its direct influence in terms of land, material and energy use is
both significant and highly visible. Additionally, development may influence transport
patterns and help facilitate many other industrial and domestic activities. Construction is
also viewed as an area of relatively flexible demand, perhaps having greater potential for

7
improvement than other significant sectors such as industry and transportation (IPCC,
2007; Beradi, 2011). As such, buildings sit at the heart of many decisions influencing
sustainability and systematic methods of measuring their environmental impact have,
therefore, become highly desirable (Bell and Morse, 2003; Brandon and Lombardi,
2011).
In 1990 the Building Research Establishment Environmental Assessment Method
(BREEAM) was launched in the UK by the Building Research Establishment (then a
government funded executive agency) and is widely credited as being the first to offer a
holistic/comprehensive assessment of a building’s environmental sustainability (Crawley
and Aho, 1999; Cole, 2005; Ding, 2008; Haapio and Viitaniemi, 2008). Although
nominally voluntary, the scheme was supported by the UK Government in its
development and implementation, and made a pre-requisite for many government
funded buildings. It was also applied to other privately funded buildings through the
town planning system. Cole (2005) suggests that early assessment methods such as
BREEAM filled a niche within a wider emerging culture of performance assessment at
this time. Interestingly, however, although support for sustainability assessment
methods was doubtless a response to a growing unease about the environmental impact
of construction, it was perhaps equally driven by a need to evaluate the novel
construction techniques and materials being developed to respond to it (Crawley and
Aho, 1999; Haapio and Viitaniemi, 2008). In part, therefore, BREEAM was created as a
response to differentiate holistically sustainable “green” buildings (Beaufoy, 1993) from
those which may have been “green-washed” through the addition of features such as
solar panels or timber cladding, purely to increase their appeal to planners, prospective
owners, tenants or users (Cole, 2005). Credibility has always been a stated objective of
BREEAM. This assumed role of policing both designers and contractors continues to
frame this and other similar schemes in current times.
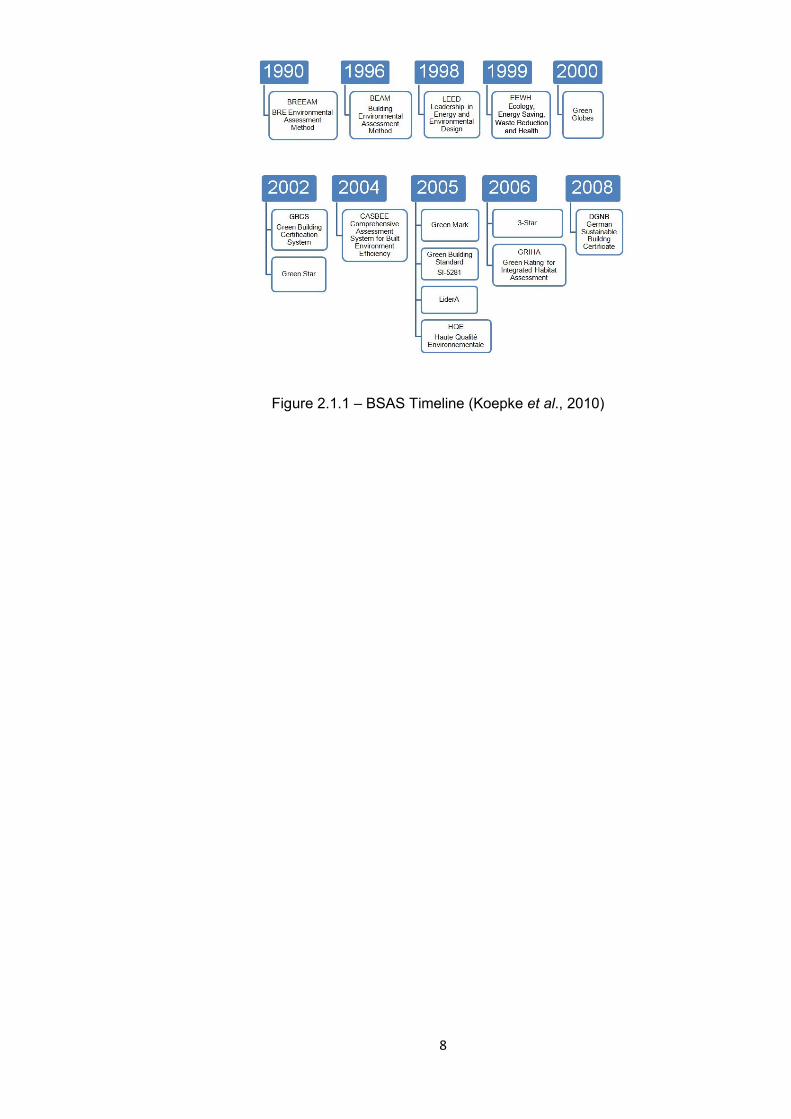
BREEAM was subsequently emulated in a number of developed countries, with many
similar schemes introduced at national level (Figure 2.1.1). Additionally, with the
continuing industrialisation of global society and increasing concern about global
warming, a growing number of emerging economies now operate assessment schemes.
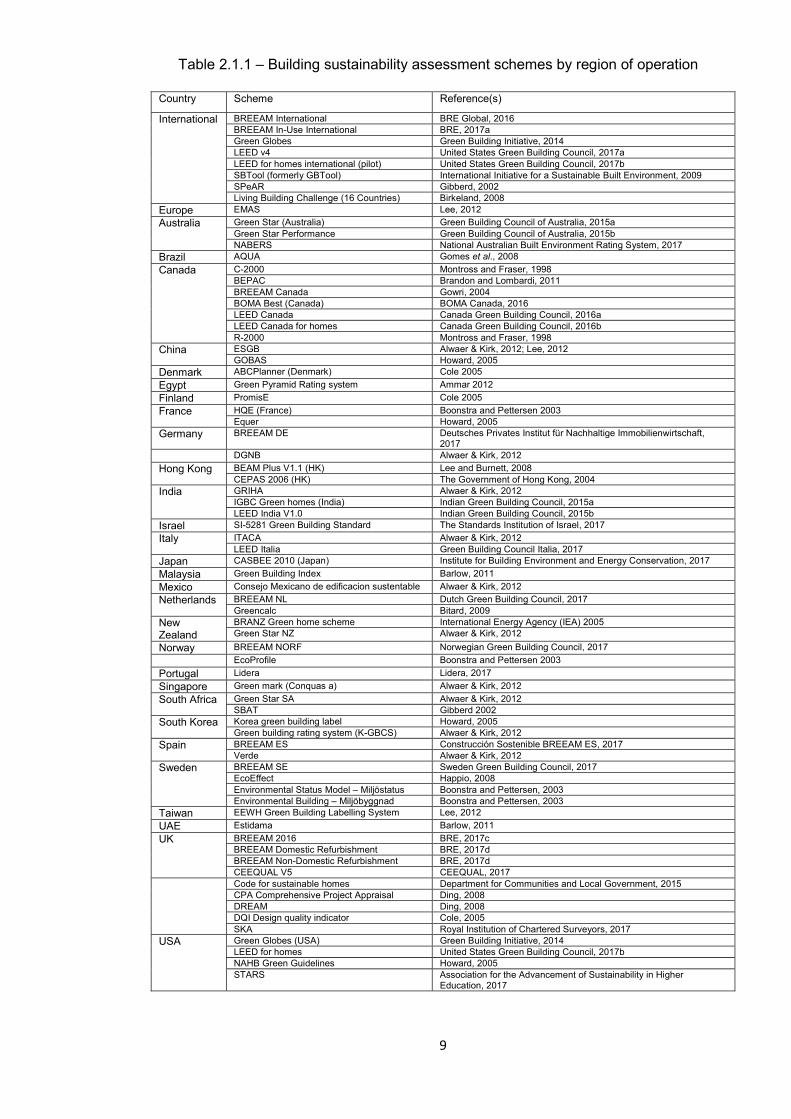
A review of academic literature has identified reference to 65 current and commercially
available building sustainability assessment schemes, operating across 29 countries
internationally (Table 2.1.1).
8
Figure 2.1.1 – BSAS Timeline (Koepke et al., 2010)
9
Table 2.1.1 – Building sustainability assessment schemes by region of operation
Country Scheme Reference(s)
International BREEAM International BRE Global, 2016 BREEAM In-Use International BRE, 2017a Green Globes Green Building Initiative, 2014 LEED v4 United States Green Building Council, 2017a LEED for homes international (pilot) United States Green Building Council, 2017b SBTool (formerly GBTool) International Initiative for a Sustainable Built Environment, 2009 SPeAR Gibberd, 2002 Living Building Challenge (16 Countries) Birkeland, 2008
Europe EMAS Lee, 2012
Australia Green Star (Australia) Green Building Council of Australia, 2015a Green Star Performance Green Building Council of Australia, 2015b NABERS National Australian Built Environment Rating System, 2017
Brazil AQUA Gomes et al., 2008
Canada C-2000 Montross and Fraser, 1998 BEPAC Brandon and Lombardi, 2011 BREEAM Canada Gowri, 2004 BOMA Best (Canada) BOMA Canada, 2016 LEED Canada Canada Green Building Council, 2016a LEED Canada for homes Canada Green Building Council, 2016b R-2000 Montross and Fraser, 1998
China ESGB Alwaer & Kirk, 2012; Lee, 2012 GOBAS Howard, 2005
Denmark ABCPlanner (Denmark) Cole 2005
Egypt Green Pyramid Rating system Ammar 2012
Finland PromisE Cole 2005
France HQE (France) Boonstra and Pettersen 2003 Equer Howard, 2005
Germany BREEAM DE Deutsches Privates Institut für Nachhaltige Immobilienwirtschaft, 2017
DGNB Alwaer & Kirk, 2012
Hong Kong BEAM Plus V1.1 (HK) Lee and Burnett, 2008 CEPAS 2006 (HK) The Government of Hong Kong, 2004
India GRIHA Alwaer & Kirk, 2012 IGBC Green homes (India) Indian Green Building Council, 2015a LEED India V1.0 Indian Green Building Council, 2015b
Israel SI-5281 Green Building Standard The Standards Institution of Israel, 2017
Italy ITACA Alwaer & Kirk, 2012 LEED Italia Green Building Council Italia, 2017
Japan CASBEE 2010 (Japan) Institute for Building Environment and Energy Conservation, 2017
Malaysia Green Building Index Barlow, 2011
Mexico Consejo Mexicano de edificacion sustentable Alwaer & Kirk, 2012
Netherlands BREEAM NL Dutch Green Building Council, 2017 Greencalc Bitard, 2009
New Zealand
BRANZ Green home scheme International Energy Agency (IEA) 2005 Green Star NZ Alwaer & Kirk, 2012
Norway BREEAM NORF Norwegian Green Building Council, 2017
EcoProfile Boonstra and Pettersen 2003
Portugal Lidera Lidera, 2017
Singapore Green mark (Conquas a) Alwaer & Kirk, 2012
South Africa Green Star SA Alwaer & Kirk, 2012 SBAT Gibberd 2002
South Korea Korea green building label Howard, 2005 Green building rating system (K-GBCS) Alwaer & Kirk, 2012
Spain BREEAM ES Construcción Sostenible BREEAM ES, 2017 Verde Alwaer & Kirk, 2012
Sweden BREEAM SE Sweden Green Building Council, 2017 EcoEffect Happio, 2008 Environmental Status Model – Miljöstatus Boonstra and Pettersen, 2003 Environmental Building – Miljöbyggnad Boonstra and Pettersen, 2003
Taiwan EEWH Green Building Labelling System Lee, 2012
UAE Estidama Barlow, 2011
UK BREEAM 2016 BRE, 2017c BREEAM Domestic Refurbishment BRE, 2017d BREEAM Non-Domestic Refurbishment BRE, 2017d CEEQUAL V5 CEEQUAL, 2017
Code for sustainable homes Department for Communities and Local Government, 2015 CPA Comprehensive Project Appraisal Ding, 2008 DREAM Ding, 2008 DQI Design quality indicator Cole, 2005 SKA Royal Institution of Chartered Surveyors, 2017
USA Green Globes (USA) Green Building Initiative, 2014 LEED for homes United States Green Building Council, 2017b NAHB Green Guidelines Howard, 2005 STARS Association for the Advancement of Sustainability in Higher
Education, 2017

10
2.2 Sustainability and the triple bottom line
The assessment methods under consideration in this project are explicitly concerned
with sustainability as a concept. Therefore, it is desirable and appropriate that the
origins and development of the concept are explored. Perhaps the most enduring and
widely quoted definition of sustainability was generated by the United Nations World
Commission on Environment and Development chaired by Gro Harlem Brundtland. The
Commission was formed in 1983, with three objectives:
1. To re-examine critical environment and development issues and to formulate
realistic proposals for dealing with them.
2. To propose new forms of international co-operation in the direction of needed
changes, on issues that will influence policies and events.
3. To raise the levels of understanding and commitment to actions of: individuals,
voluntary organisations, businesses, institutes and governments.
In April 1987 the Commission published its report “Our Common Future” (United Nations
World Commission on Environment and Development, 1987), which included the
following definition of sustainable development:
“Humanity has the ability to make development sustainable – to ensure that it meets the needs of the present without compromising the ability of future generations to meet their own needs.”
Written against a background of drought-triggered famine in Africa and the explosion of
the Chernobyl nuclear reactor, the report presents a pre-dominantly anthropocentric
viewpoint, and is focused upon maintaining the ability of the Earth to support its
increasing human population, whilst simultaneously improving living standards. Our
Common Future proposes “the possibility for a new era of economic growth, one that
must be based upon policies that sustain and expand the environmental resource base.”
At a similar time Dr Karl-Henrick Robert led a group of Swedish scientists to form the
Natural Step, which was launched in Sweden in 1989. Aiming to establish consensus,
the Natural Step set down a framework for a society built upon basic incontrovertible

11
scientific principles. This framework is as follows, and has subsequently been widely
adopted as a guiding principal by scientists and corporations worldwide (Robert, 2002):
In the sustainable society, nature is not subject to systematically increasing:
1. Concentrations of substances extracted from the Earth’s crust.
2. Concentrations of substances produced by society.
3. Degradation by physical means; and in that society:
4. Human needs are met worldwide.
The Brundland definition of sustainable development is categorised by some as weak
sustainability because it is framed in terms of human needs, without aspiration to
conserve the environment for its own sake (Bell and Morse, 2003; Jaeger, 2005). The
Natural Step also has a regard for human need, but is based upon first achieving a
steady state situation in the context of the wider environment. Our Common Future
emphasises development and the dynamic nature of society, accepting both population
growth and future technological innovation along the path to an uncertain state of future
sustainability. Meanwhile, The Natural Step describes a theoretical destination and
encourages organisations to chart a path towards it. It is worth noting that although the
terms “sustainability” and “sustainable development” are often used interchangeably,
development is explicit only in the Brundtland definition. Conversely, The Natural Step
emphasise a steady state and advances a binary position for sustainability i.e.
something is either sustainable or it is not (McElroy, 2011). Robinson (2004) suggests
that academics have come to favour the term “sustainability”, whereas, governments
and the private sector may prefer “sustainable development”. This may in part be a
question of scope, as development of a single organisation or country may be achieved
quite readily (at the expense of others). Whereas development at a global scale implies
that additional resources must be found. Brandon and Lombardi (2011) suggest that
sustainability must in reality occupy a range of possibilities with a spectrum of views.
These range from a desire to find a technical fix only where issues threaten human
wellbeing, to a “conserve at all costs” approach.
Both the Brundtland and the Natural Step definitions of sustainability emphasise the
continuation of society, however the focus for action is arguably one of moderating
environmental impact. Elkington (1987) develops this thinking somewhat by introducing

12
the concept of the Triple Bottom Line and defines sustainability as “the principal of
ensuring that our actions today do not limit the range of economic, social and
environmental options open to future generations.” Significantly in this definition,
economic, social and environmental sustainability are laid down as a minimum
requirement and this alters the emphasis from one of making sacrifices to preserving the
environment, to that of seeking a “win, win, win situation”. Elkington (1987) applies this
concept specifically to business and suggests that the future operating environment for
companies will be one of sustainable capitalism where successful businesses must
operate in an environmentally and socially sustainable manner, as well as being
economically viable. Increasing awareness of environmental and social issues within
the general public combined with growing media scrutiny of business transactions is
characterised as “the global goldfish bowl”. This will, it is argued, lead to great
commercial advantage in aligning the values of a business with those of its prospective
customers and workers. Elkington (1987) also suggests that the same public awareness
of social and environmental issues will lead to increased statutory governance of
markets, giving those businesses that pre-empt these future constraints further
advantage. This voluntary balancing of economic interest with environmental and social
issues has subsequently had significant influence on business theory and is commonly
expressed as corporate social responsibility (CSR). Jones (2012) characterises the
evolution of CSR in terms of three ages. Firstly, “The Age of Image, 1990-2000” in
which businesses reacted to a growing interest in how they conduct their affairs by
creating new communication strategies to establish a favourable image i.e. green
washing. Secondly, “The Age of Advantage, 2000-2010” in which, with increasing
transparency, those companies which genuinely made their business more socially
responsible begin to gain market advantage. Thirdly, “The Age of Damage, 2010 to
present” in which public expectations have increased to such an extent, that failure to act
in a socially responsible manner may actively jeopardise the survival of a business.
The triple bottom line has now become an established concept within politics (Stern,
2009). This has been nowhere more apparent than in the international response to the
threat of global warming, which arguably began in earnest with the Kyoto Protocol
(UNFCCC, 1998). Here an environmental concern (global warming) has resulted in a
demand to reduce the use of fossil fuels. This reduction has the potential to produce
economic and social hardship. However, it is acknowledged that unchecked global
warming may itself bring great economic and social hardship as well (Stern, 2009).
Hence the problem becomes one of international triple bottom line accounting, albeit
within a context which is greatly confused by scientific uncertainty and national game
theory. A key argument posed by Elkington (1987) is that individuals in modern society

13
can exert considerable influence on business and government. Elkington (1987) refers
to these long-term changes in culture as “deep currents”. However, in the face of the
complex and uncertain situation described above, individuals may respond to these
deep currents in a range of ways. Many environmental problems are forms of social
dilemma, situations in which acting from self- nterest harms the greater whole, or results
in a “tragedy of the commons”. Hence an individual may support sustainable principles
in theory, without supporting them in any practical sense (Koger and Scott, 2007). Guy
and Moore (2005) also note that major historical changes in building codes, for example,
were largely introduced in response to catastrophic fires and outbreaks of disease,
whereas making changes to incorporate sustainability requires a degree of collective
foresight. Such foresight must contend with uncertainty and whilst some may be
prepossessed to assume the worst and act (or demand action) accordingly, others may
favour the status quo and demand certainty before acting. Nevertheless, it is probable
that to some extent most businesses and governments are influenced by individual
opinions at a policy level. Added to this, there may also be a need to consider the
influence of individuals at operational level and acknowledge that decisions relating to
the built environment may be informed by both. In the context of building sustainability
assessment methods this potentially points to schemes operating on a number of levels;
for example, simultaneously being backed by government as a means of achieving
carbon emission reduction targets, being used by a corporation to satisfy its CSR policy
and perhaps being demanded by a local business manager to enhance staff morale.
The concept of the triple bottom line is most commonly represented by a Venn diagram
(Figure 2.2.1), where environmental, social and economic considerations overlap to
describe a zone within which a “win, win, win” situation is possible. Alternatively
Wheeler (2004) (Figure 2.2.2), proposes a nested model by emphasising that the
economy operates within society and that society may itself only operate within the
confines of the environment as a whole. This reinforces the concept of a carrying
capacity for the environment, beyond which, no further human development is possible.
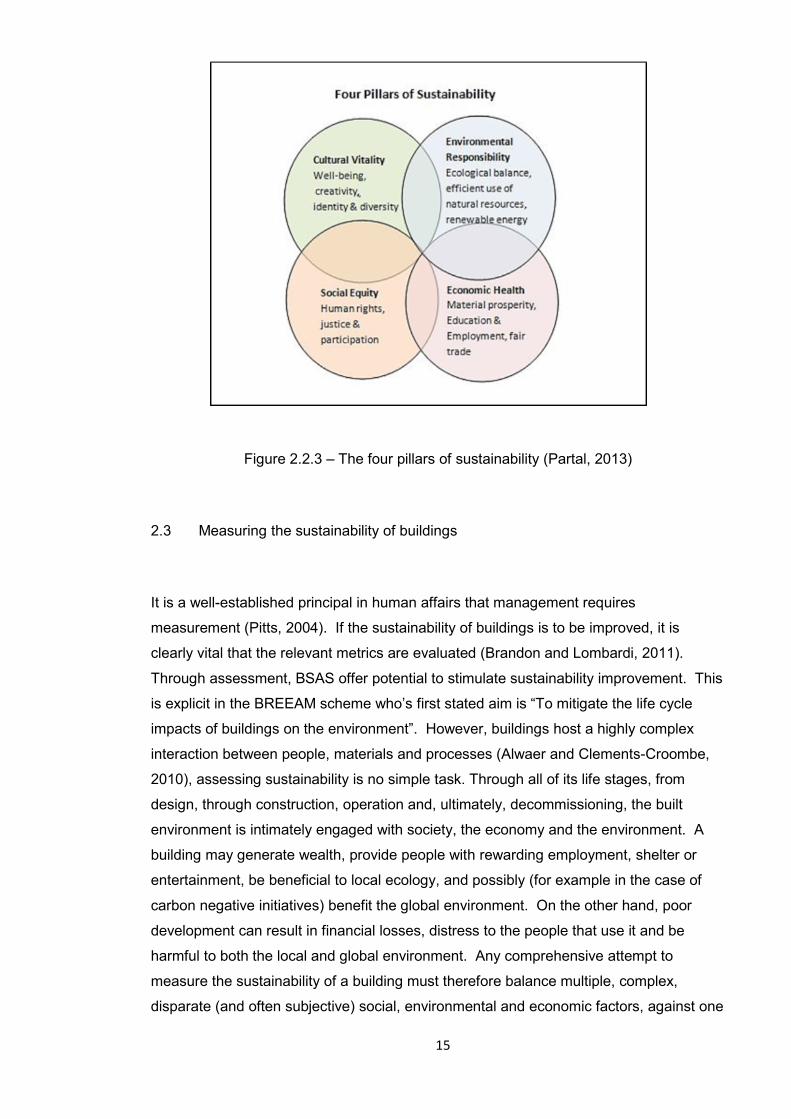
An additional alternative also put forward is “the four pillars of sustainability”, which
incorporates cultural vitality as a further essential aspect of a sustainable society
(Hawkes, 2001; Partal, 2013) (Figure 2.2.3). This concept has been particularly adopted
and promoted by United Cities and Local Governments (2010) who justify inclusion of
culture as the fourth pillar of sustainability through identifying a need for “a healthy safe
tolerant and creative society (rather than merely a financially prosperous one)”. This
concept is similarly justified by Hawkes (2001), when he states that “there are many
values informing our society that run counter to those based simply on the production of
goods — that instead focus on good”.

14
Figure 2.2.1 – The Three Spheres of Sustainability (Vanderbilt University, 2013)
Figure 2.2.2 – Strong Sustainability (Cato, 2009)
15
Figure 2.2.3 – The four pillars of sustainability (Partal, 2013)
2.3 Measuring the sustainability of buildings
It is a well-established principal in human affairs that management requires
measurement (Pitts, 2004). If the sustainability of buildings is to be improved, it is
clearly vital that the relevant metrics are evaluated (Brandon and Lombardi, 2011).
Through assessment, BSAS offer potential to stimulate sustainability improvement. This
is explicit in the BREEAM scheme who’s first stated aim is “To mitigate the life cycle
impacts of buildings on the environment”. However, buildings host a highly complex
interaction between people, materials and processes (Alwaer and Clements-Croombe,
2010), assessing sustainability is no simple task. Through all of its life stages, from
design, through construction, operation and, ultimately, decommissioning, the built
environment is intimately engaged with society, the economy and the environment. A
building may generate wealth, provide people with rewarding employment, shelter or
entertainment, be beneficial to local ecology, and possibly (for example in the case of
carbon negative initiatives) benefit the global environment. On the other hand, poor
development can result in financial losses, distress to the people that use it and be
harmful to both the local and global environment. Any comprehensive attempt to
measure the sustainability of a building must therefore balance multiple, complex,
disparate (and often subjective) social, environmental and economic factors, against one

16
another. It must also attempt to predict the future, with the on-going impacts of a
building in use (and even the manner of its ultimate demolition) being assumed and
balanced against its impacts during construction. If it is noted that, in addition to direct
use of resources, a building will further influence its occupant’s transport patterns, water
use and waste production, then the environmental impacts of a building can be seen to
be as complex as it is significant. Life cycle analysis techniques may be used to analyse
partial elements of this calculation, for example by considering the embodied carbon of a
building in relation to its emissions over an assumed life cycle. Despite being complex
and relying on numerable assumptions and approximations, life cycle analysis itself can
provide only a small component of the holistic evaluation proffered by building
sustainability assessment schemes (Beradi, 2011; Ding 2008). In fact, many BSAS go
further still in considering the wider social and cultural impacts of buildings, for example,
it’s effectual use on the long term health of its occupants and surrounding buildings
(Beradi, 2011). In this case, it is not purely the impact of buildings that is being
assessed, but perhaps rather the extent to which they support sustainable patterns of
living for society (Cole, 2005).
Given the conceptual complexity described above, it is perhaps unsurprising that a lack
of agreement remains as to what constitutes sustainability in a construction context.
Guy and Moore (2005) note that “Three decades of debate about sustainable
architecture and a search for some form of consensus around universal best
environmental practice appear to have failed”. Consequently since 1990, numerous
different building sustainability assessment schemes have been developed, each
seeking to improve on those already available. In 2006 the International Standards
Organisation issued measures relating to such schemes (ISO, 2006), setting out a
general framework for operation. An international standard also exists for establishing
scope (ISO, 2011), and further work is ongoing within the European Union (BSI, 2010;
Hakkinen, 2012) to standardise measurement metrics and facilitate easier comparison
between schemes. Nevertheless, fundamental differences persist between schemes in
terms of formulation and scope (Cole, 2005). Significant differences also exist in terms
of detail. In reality, BSAS cannot consider every pertinent issue within their scope
described above, not only because of the administrative burden this would place, but
also because many aspects could not practically be estimated to an acceptable degree
of accuracy (Brandon and Lombardi, 2011). Therefore, to simplify the task, rather than
attempting to measure every impact, “comprehensive” methods rely on a system of
“indicators” instead. These indicators are a selection of distinct criteria, chosen by the
scheme operator to provide an indication of the wider sustainability of the building,
against which a building can be more easily evaluated (Bell and Morse, 2003; Brandon

17
and Lombardi, 2011). Indicators are typically grouped into categories relating to different
aspects of sustainability. Categories vary between schemes, but typically include the
following as a core (Beradi, 2011):
● Site selection
● Energy efficiency
● Water efficiency
● Materials and resources
● Indoor environmental quality
● Waste and pollution
Further to this, additional categories may also be included depending upon the scheme.
In particularly Beradi (2011) identifies “innovation” (LEED & BREEAM), “construction
management” (BREEAM), “mitigation and off-site solar energy” (CASBEE) and “cultural
perception of sustainability” (SBTool). The indicators together form a checklist, against
which a building can be rated and compared with others. Indicator selection can be
seen to be at once subjective and also fundamental in determining the rating achieved
by a building. On comparing the most popular sustainable building assessment
schemes in current use, it can be seen that although they share many general themes,
there are significant differences in emphasis (Beradi, 2011). At a macro level, schemes
vary as to whether they account for social and economic issues as well as environmental
ones; at the other end of the spectrum, the variation in detailed requirements within
individual criteria is also significant (Cole, 2005; Ding, 2008; Hakkinen, 2012). If weight
is given to the argument that scheme requirements may drive change, then indicator
selection also has the potential to steer the course of that change (for example by
promoting incremental technological improvements above innovation, or vice versa).
Schemes therefore have an in-built “viewpoint” regarding the development of sustainable
construction and corresponding potential to influence it.
The sustainability of a building is therefore a dynamic and complex metric.
Measurement is subjective in terms of scope and definition and is additionally
approached by BSAS using limited indicators of performance. This perhaps explains the
current existence of numerous different BSAS. It also provides justification for
questioning the robustness of the results generated; a view which is further supported

18
both by a failure of scheme operators to declare margin of error (Haapio and Viitaniemi,
2008) and a lack of facility to compare results across different assessment methods
(Alwaer and Kirk, 2012). Based on this analysis, although BSAS can and do contain
measurement within them, they do not produce an overall measure of sustainability.
Instead they provide an assessment of sustainability that is founded upon verifiable
measurable issues, but is relative, unitless and subjective.
2.4 The accuracy and efficacy of BSAS
For BSAS to stimulate improvements in the sustainability of buildings, they must first
provide a tolerably accurate assessment of the metrics they are assessing. The level of
accuracy required to effect change, and its link with efficacy is however currently
unclear. Relative, unitless measurement of progress along a pathway with an uncertain
endpoint does not sit comfortably with many academic commentators who question the
merit of producing ratings without benchmarks or proven cause and effect models
(Alwaer and Kirk, 2012). Conversely, Poveda (2011) accepts this situation, describing
BSAS as “practical undertakings in evaluation and decision making”. Similarly, Cole
(2005) suggests that accuracy and precision must relate to the purpose for which the
ratings are being generated, and the schemes may serve different purposes for different
stakeholders. As already discussed, although assessment implies objective evaluation,
BSAS are often conceived with the aim of effecting change. This is evidenced by
schemes typically being entirely positive, in that they reward sustainable features where
they exist, but seldom deduct credits for poor performance (GB Tool is an exception to
this (Alwaer et al., 2007; Alwaer and Kirk, 2012)). It is also reflected in the ratings
themselves, which are typically overwhelmingly positive eg “good”, “very good”,
“excellent”, “outstanding” (BREEAM) or “silver”, “gold”, “platinum” (LEED). This is
perhaps an inevitable situation for voluntary schemes, as aspirational standards are
hardly likely to be set at levels of poor or fair. Schemes are however designed to
communicate something to the outside world (Beradi, 2011), and the way in which
results may be perceived and understood is important.
Complexity is a further issue any method must address when provide a rating for wider
dissemination. In particular, methods must provide comparison between projects and
may also demonstrate compliance with standards. The mechanics of any successful
method is therefore concerned with reducing an issue of almost boundless scope, into
an outcome that can be understood by as wide a portion of society as possible whilst
19
also maintaining an acceptable level of accuracy and objectivity. As already noted,
when a building is rated by a BSAS as “very good”, it does not mean that the building is
actually sustainable against a recognised benchmark (Haapio and Viitaniemi, 2008). In
the absence of such recognised benchmarks (Hakkinen, 2012), it may still be helpful to
determine that a building rated “very good” is more sustainable (or less unsustainable)
than one that is rated as “good”. Yudelson (2009) proposes that zero net impact should
be the starting point for sustainable design and emphasises reductions in absolute
terms. Birkeland (2008) supports this view and suggests that the terminology used by
assessment methods is akin to encouraging people to “smoke light cigarettes to improve
their health”. Guy and Moore (2004) accept that construction practice must follow a
pathway to sustainability where change is incremental and lessons are learnt along the
way, and it is this pretext which the majority of assessment methods appear to support.
Unfortunately, although quantitative research relating to the practical efficacy of BSAS in
measuring and producing sustainability improvement has been extremely limited, such
evidence as is available suggests that their efficacy in producing or measuring even
relative change cannot be relied upon. Scofield (2009), for example, analysed energy
performance data provided by the scheme operators for LEED, and found “no overall
statistical difference between energy use in LEED and non-LEED buildings”.
Meanwhile, in relation to social sustainability, Monfared and Sharples (2011) studied the
effect of measures in the BREEAM scheme designed to improve occupant comfort.
They found that of 2000 staff moved from a conventional UK office building into a new
BREEAM “excellent” rated building, just 20% felt that their comfort had increased, whilst
38% stated that it had decreased. Finally Turner and Arif (2012) conducted a pilot study
to evaluate the effect of BREEAM in terms of economic business value and employee
morale, and found that “Many of the users could not quantify the benefits of occupying a
BREEAM “excellent” building” and that “Many of the features of BREEAM attained in the
early stages appear to be lost in translation or do not have the desired impact on the
building occupants as originally envisaged”.
2.5 BSAS and the performance gap
A study by Haroglu (2013) suggests that BREEAM is relatively effective in affecting
design change. Unfortunately however, it is increasingly understood that building design
parameters routinely fail to produce corresponding performance, unless supported by a
post occupancy evaluation feedback loop. The PROBE studies (CIBSE, 2017b)
20
conducted in the 1990’s made use of systematic building performance evaluation. The
scope of this is particularly pertinent to BSAS, as they combine quantitative data
including energy and water use with a building occupant survey designed to assess user
health and comfort. The building occupant survey used for these studies was Building
User Studies (BUS), who made use of Likert scales to generate a statistical picture of
qualitative building performance. The results of individual studies were analysed by
BUS and the benchmarks produced used a rolling sample of 50 buildings. These results
show that building services often substantially fail to deliver their designed performance
and that this is due to a range of factors including poor installation and commissioning,
incorrect operation and inaccurate assumptions about building occupant behaviour.
Ongoing research carried out by Leeds Beckett University since 2005 (Johnston et al.,
2015) has similarly demonstrated that due to a range of factors the fabric energy
efficiency of new homes in the UK routinely falls substantially short of design
performance. This includes incorrect design assumptions, poor workmanship and
product substitution. Meanwhile, analysis of data collected through the Carbon Buzz
Project (2017) by Menezes et al. (2012) indicates that buildings typically use 60-85%
more electricity in-use than predicted at design stage. Incorrect assumptions relating to
building occupation is suggested as a specific contributing factor to this. Therefore,
there is ample evidence to suggest that design calculations represent a poor prediction
of building performance. It is also apparent that a lack of routine use of POE for
buildings allows poor performance to persist undetected. BSAS are a form of design-
based predictor of performance but attempt a far more complex assessment of
sustainability than that assessed by the Probe studies. This ranges across multiple,
disparate and sometimes conflicting considerations. They also similarly lack an integral
POE feedback loop. In the case of energy performance, academic research has begun
to fill this gap, with detailed POE now being used as a basis for developing
improvements both for performance itself and accuracy of prediction. However, BSAS
are significantly more complex, with their multiple assessment considerations having
been described as a cat’s cradle of cause and effect (Leaman, 1999). Notwithstanding
this, carefully considered POE making use of appropriate benchmarks surely has similar
potential to provide greater understanding of both the accuracy and efficacy of BSAS.
2.6 The business context for BSAS
Aside from the technical challenges associated with implementing sustainability
improvement using BSAS, a wider commercial context should also be considered.
Research suggests that there is a movement within the commercial sector towards

21
building a more sophisticated business case for sustainable buildings (Edwards, 2003;
Sayce, 2010; Hayes, 2012). However, this comprises a number of overlapping and at
times conflicting areas. In some cases sustainability improvements are driven directly by
statutory requirements (such as Building Regulations or Planning Policy). In this event
the business case for sustainable buildings becomes a matter of legal compliance. A
similar situation exists where compliance with sustainability standards is linked to
government funding. This is a significant factor in the UK, where town planning
requirements or funding links were cited by construction clients as being the “main
motivation” for carrying out a BREEAM assessment in 49% of cases (Parker, 2012).
Long-term financial resilience may be a further associated consideration where the
legislative landscape is expected to change over time, with incoming construction
standards, or carbon taxes having the potential to turn an otherwise acceptable building
into an economic liability. Examples of such issues currently affecting building stock in
the UK are the introduction of a minimum energy efficiency requirement for rented
buildings (Energy Act 2011), and the difficulty of obtaining insurance for buildings in
flood risk areas (Pottinger and Tanton, 2012).
Operational cost savings are often cited by academic commentators as being a major
potential benefit in association with sustainable buildings (Edwards, 2003; Preiser and
Vischer, 2003; MacMillan, 2004; Baird, 2010). By incorporating sustainability into a
design brief it is argued that significant long-term financial savings can be generated.
This will translate into increased capital and or rental value. These material benefits
may be usefully categorised as follows:
● Energy use – selection of natural ventilation strategies and use of thermal mass
where appropriate, along with additional capital investment in efficient plant and
thermal fabric insulation resulting in a long-term saving in energy costs.
● Water use – water efficient appliances, grey water re-use and/or rainwater
collection are used to reduce consumption and generate a long term saving in
water costs.
● Staff productivity – provision of a health and comfortable work environment may
improve productivity and reduce absenteeism associated with poor working
conditions and sick building syndrome.
22
Such benefits may be significant. The City of Melbourne invested AUS$11.3m on
additional sustainable features in an AUS$29.9m base build, projecting that the
additional investment in the “Council House 2” building would be recouped within 6 years
(City of Melbourne, 2013). In the UK, the property investment fund Climate Change
Capital actively target energy savings in their buildings based on a maximum pay back
period of 5 years. Following this strategy they report that they have achieved an
average 25% saving of energy costs in buildings they have purchased, achieved by a
combination of tenant engagement and light touch improvements (Mockett, 2012). Of
the above measures however, staff productivity has potentially the widest interest to
business. Preiser and Vischer (2003) estimate that staff wages comprise 80% of the
lifetime expenditure associated with a typical office building. Any increase in productivity
therefore offers significant business advantage. Increasing the availability of natural
light, reducing recirculation of air and giving occupants greater control over heating and
cooling being widely cited as having potential to improve staff morale and reduce staff
absence (MacMillan, 2004). Interestingly, these features could all be viewed as
desirable in any building. The reason they are considered sustainable add-ons suggests
that the business case for implementing them is uncertain. Additional capital investment
for energy or water efficiency measures may appear sensible when taken in isolation,
however the opportunity cost of this capital expenditure must also be considered.
Furthermore the timescale over which savings will be realised may be uncertain and
many businesses may prefer to limit their short-term liability in preference to generating
potential future cost savings. This situation may be further complicated when design
decisions are taken by a developer with no vested interest in running costs, or where
leases dictate that such investment will be carried out by the owner, but that the tenant
will benefit (CIBSE, 2017b). Such improvements may additionally be complex and
produce uncertain results. Increasing natural light may involve fundamental changes to
building configuration; increasing the supply of fresh air may be expensive in terms of
additional heating and cooling requirements, and occupant control of heating and cooling
can generate conflict in open plan environments. Without the impetus provided by
BSAS, many building users may therefore prefer to focus their resources on core
business areas before choosing to construct, refurbish or relocate to a building in the
hope of reducing utility bills or boosting their staff performance.
A third distinct and potentially significant area concerning the business case for
sustainability is reputation and brand value. As previously discussed, businesses mainly
gain commercial advantage by aligning their practices with the expectations of their staff
and/or customers (Elkington, 1997; Haddock-Fraser and Tourelle, 2010). Where staff or
customers are concerned about sustainability, businesses may therefore wish to
23
demonstrate leadership in this field. Success is dependent upon being seen to “do the
right thing”, and effective communication of strategies is therefore essential. Sustainable
buildings may contribute to this in a number of ways:
● Publicity –incorporating sustainable features into new or existing buildings may
generate positive publicity, possibly increasing brand awareness and loyalty.
● Reputation – as part of a wider CSR policy, occupying demonstrably more
sustainable buildings may enhance brand-value and increase brand loyalty.
● Staff morale – distinct from the potential material health benefits. Investing in
high quality buildings may also provide a psychological boost to staff, potentially
improving both productivity and retention.
One leading example of a business using sustainability improvements to buildings to
enhance brand value in the UK is retailer Marks and Spencer’s. Their “Plan A” sets out
an on-going scheme to increase the sustainability of their business. Through this they
claim to have already achieved one aspiration for all of their stores, which is to be
operating on a carbon neutral basis (Marks and Spencer, 2017).
A business case for sustainability assessment of buildings may therefore be built on a
number of quite separate bases. A survey of businesses carrying out LEED certified
green retrofits in the US (Lockwood, 2008) reveals, for example, motivation spread
across the factors illustrated below (Figure 2.6.1), with indoor environmental quality
ranking equal first with corporate environmental commitment. Only 31% expected an
increased capital value and just 19% expected increased occupancy rates. Parker
(2012) found that UK building owner-occupiers gave “main motivations” for undertaking
a BREEAM assessment across a similar range of issues, with 76% citing funding or
legislative requirements and 38% organisational or CSR factors. Again, commercial
gain appears to have been a significant driver for only a minority of users (13%).

24
Figure 2.6.1 – Motives for undergoing a green retrofit (Lockwood, C. 2008)
The relationship between building users and BSAS is therefore a complex one. Some
organisations require a sustainable building based on a quantitative business case,
others will have had BSAS certification imposed on them by government and some are
using the building as a means of communicating with their customers. In theory, BSAS
offer a mechanism to effect all three of these requirements founded on an ability to
quantitatively differentiate buildings in terms of their sustainability. However, It is
apparent that for many users the certification is primarily sought (for legislative, funding
or CSR purposes) rather than any improvement in building performance. As such, not
only is POE lacking within BSAS but there is additionally little motivation for many owner
occupiers to attempt to measure the performance of their own buildings. This
disconnection between scheme aims and user motivation is critical. Suggesting not only
that assessment of the effects of BSAS is lacking, but also that popularity may exist
completely independently of efficacy.
Unfortunately, the disconnection identified above is not limited to building users. Further
uncertainty is introduced when it is considered that the parties involved in constructing or
managing buildings may also be significantly removed from those making use of them.
BSAS are based upon implementing design change and the approach of the design and
construction stage project team will therefore also be fundamental to their successful

25
application. This is usefully illustrated by Parker (2012) who found that the main
motivation for using BREEAM was perceived quite differently by a range of scheme
participants (Figure 2.6.2).
Figure 2.6.2 – “Main Motivation” for using a BREEAM assessment by stakeholder
(Parker 2012)
In this scenario, triple bottom line benefits will not always accrue to the same parties as
the costs, and vice versa. This may produce tension if the financial viability of a project
is championed mainly by its promoters (internal to the construction process), whilst the
social and environmental viability is driven by government or end users by means of
planning laws, regulations or contracts (external to the construction process). Elkington
(1987) challenges this view by suggesting that operations may benefit from taking social
and environmental concerns “on board” (making them internal to the construction
process). The effect is however likely to be somewhat less than perfect in reality, both
because it relies on consumers and employees being perfectly informed and also
because not all operations will be sufficiently sensitive to public opinion to counteract
commercial pressures. Used correctly, a BSAS gives construction project teams the
means to conduct a triple bottom line evaluation using their detailed knowledge of the
project, and bring these decisions into the daylight for onwards communication to
external players. It is clear, however, that commercial tensions may fundamentally
26
disrupt this process. Construction teams are likely to be motivated to provide
certification at minimum cost not only to the project as a whole, but also to their
individual organisations. Potential therefore exists for BSAS to be manipulated by
construction project teams and this is supported by a survey of BREEAM users
conducted by Parker (2012), which reports that 88% of respondents sometimes,
frequently or always “target credits which do not add value to the project”.
2.7 Assessment methodology
Given the complex socio-political context described above, the methodology by which
BSAS are implemented arguably has great potential to influence their efficacy as well as
their content. Subjective selection of indicators for use in schemes gives each BSAS a
starting “viewpoint”, however selection and validation of credits within that scheme may
be just as significant in determining their impact on performance outcomes. When
considering the application of BSAS, a requirement for simple results, based on detailed
objective analysis, gives rise to a number of practical issues, not least of which is
transparency. The broad scope of “comprehensive assessment” dictates that BSAS
utilise a large number of indicators. Many of the criteria are themselves also both
complex and technical in nature; for example the assessor’s manual for BREEAM 2011
comprises 406 pages (BRE, 2013), and requires reference to many other technical
publications. Furthermore, the scoring for different credits is commonly weighted so that
credits in one category may contribute more to the final result than those in another
(Ding, 2008; Beradi 2011). This complexity may be seen as necessary and
commensurate with the ambition of the task at hand, however it also gives rise to a
situation whereby no single stakeholder is realistically capable of understanding the full
calculation, giving rise to the final result. This is not an unusual situation in modern
construction that already relies widely on a team approach, with specialists often coming
together to produce a final product that may not be fully understood by any one player.
It does however call into question the degree to which those advocating or responding to
these schemes are realistically able to appreciate what is being assessed.
The results of an assessment may be presented in a variety of ways, with varying levels
of detail depending upon the intended recipient (Becker, 2004). Schemes often break
credits down into categories, and this may allow some further analysis of results,
additionally some schemes such as CASBEE and CEPAS express results in a way that
allows differentiation between performance or human factors, and environmental
27
impacts (Cole, 2005). To be meaningful, however, this information requires that the
reader is fully conversant with the detail of the scheme, including the administrative
burden attached to various credits. As previously discussed, the fact that a credit has
not been achieved may simply mean that the administrative burden was considered too
high, rather than that it was unachievable. This detailed knowledge is unlikely to be held
by any party other than those actively involved in obtaining assessments, i.e. a member
of a design team, or well-informed client. Beyond this select group, parties are likely to
be reliant simply upon the rating itself, which may be a number of stars (Green Star),
silver, gold, platinum (LEED), or pass, good, very good, excellent, outstanding
(BREEAM). This headline result may be expressed on a numeric scale, such as a
percentage of possible points scored and may be further broken down into various
categories. In general though, it is arguably very difficult to appreciate assessment
schemes at the meso level which would perhaps, benefit the most influential
stakeholders (i.e. those commissioning and using buildings). This analysis further
supports a picture of disengagement between the scheme and those who most
fundamentally support it, with potential for the scheme to effectively operate as a black
box (Alwaer and Kirk, 2012), without the benefit of feedback from its advocates and
users.
Given the emphasis placed on certification by users and the complex commercial arena
within which they operate, credibility and verification could be viewed as fundamental
requirements for any successful BSAS although these aspects can generate conflict at a
practical level. Credibility requires that indicators are evaluated in a robust way.
Indicators may therefore be selected by scheme operators for the ease with which they
can be evaluated and verified (for example using an existing tool or methodology), rather
than because they are the most representative. Linked to this, verification for new build
and refurbishment projects tends to focus on design compliance, both because it is far
simpler to determine than actual performance over time and also because it allows
compliance to be established at an appropriate time for conclusion of statutory,
contractual and financial project matters. As a result, and given the previously
discussed lack of inherent provision or demand for POE, it is unusual for the
performance of the building in use to be compared to design stage predictions (Alwaer
and Kirk, 2012; Cole, 2005). Verification also suggests an administrative burden, both
for the scheme operator, and for the scheme users, which must ultimately translate into
financial administration costs that have no direct benefit to the project. In practice, this
administrative burden will manifest itself in registration and certification fees needed to
meet the costs of the scheme operator, along with professional costs incurred by the
project team in producing evidence of compliance. In most schemes, a third party
28
assessor is also required, to provide verification on behalf of the scheme operator,
attracting additional fees (BRE, 2013; USGBC, 2017a).
Additionally, and more subtly, the administrative burden attached to achieving
compliance for a particular credit may significantly influence the choice of credits
attempted, leading to a situation whereby sustainability gains are targeted by users
according to their ease of attainment, rather than their value to that particular project or
user (Hakkinen, 2012). Certain criteria within an assessment may lend themselves more
readily to inclusion in existing design briefs and specifications than others. Thus if a
certain generic workmanship standard may contribute to achieving a particular credit,
then it is a simple matter for a design consultant to incorporate it into their base
specification. Conversely, where criteria can only be achieved using a project specific
design solution the relevant designer must incorporate solutions as the design develops.
These may involve unexpected design time and from the building user or promoter’s
point of view there is also a danger that the scheme requirements (unless they
themselves are intimately acquainted with them) may form a hidden parallel
specification. There is potential tension in this case for designers, who must either
consult their clients very closely, or risk incorporating features into the project that the
client may not ultimately support. Designers and contractors may face similar
challenges in relation to material selection; for example, most schemes include
requirements for responsible sourcing of materials and encourage the use of materials
with low life cycle impacts in terms of greenhouse gases and other pollution. This
provides incentive for suppliers or component manufacturers to accommodate these
requirements into their products and has the potential to manipulate markets so that
more responsible material sourcing becomes the industry norm (Cole 2005). However,
this is a somewhat immature market area (Beradi, 2011) and environmental certification
may be far easier to obtain for some products than for others, hence favouring certain
materials or products regardless of their wider suitability. In this case there is a similar
danger where addressing scheme criteria detracts from making good basic design
decisions. So, although assessment may drive specification change in a positive way, it
is also possible in the complex interactions of a design process that the easiest path to
compliance may in fact be one which least engages with the needs of the building end
user. Favouring instead the procedural and construction issues that interfere least with
the original design intent (Beradi, 2011).
In addition to the practical difficulties that may be involved in complying with certain
credits there will also be a financial consideration. Many environmental assessment

29
schemes ignore economics within their criteria, however the financial implications of
achieving a rating may go well beyond the administrative costs already discussed. In
some instances, it may be possible for the sustainability of buildings to be improved at
zero or even negative cost. More commonly, schemes reward design changes for which
there is no simple economic argument, and henceforth act to manipulate the underlying
economics of construction. For many schemes this market transformation is a stated
aim (Lee et al., 2002), and may be effected in a number of different ways. In some
cases scheme requirements may simply balance capital and operating costs, for
example by encouraging increased use of insulation which will pay for itself many times
over in reduced on-going fuel costs. Alternatively, requirements may act to increase
standards to bring about social or environmental benefits, for example by encouraging
planting schemes to benefit local wildlife. Finally, it may encourage the use of innovative
or specialised products in the hope that this will reduce future costs by bringing
economies of scale to bear. The increase in project costs linked to these factors has
been openly discussed by scheme operators (BRE and Cyrill Sweett, 2005). However,
these estimates belie a rather complex situation, as the various discreet improvements
rewarded by the scheme will also each have greater or lesser synergy with the practical
requirements of the various parties. This situation may be further complicated by
contractual arrangements, particularly where credit selection changes during the design
process (for example certain credits may require additional design time, where others
may attract additional construction cost). As such, although in theory designers will aim
to satisfy those requirements that most provide the greatest cost/benefit for the end user,
a situation may also develop whereby requirements are targeted based on the simple
capital cost to the project, or even to particular parties.
That some credits are more difficult or expensive to achieve than others is perhaps
inevitable, but it would be unwise to ignore this issue, as credits which are not attempted
because they are too expensive can produce no benefit. In LEED, for example,
research by Beradi (2011) identifies compliance rates varying very significantly between
categories, from the lowest at 38% for “Energy and atmosphere”, to the highest at 66%
for “Innovation and design process”. Therefore, it is possible to crudely surmise that the
scheme is effecting almost twice as much change in terms of the construction process,
than in climate change, and it would be of interest to discover the extent to which this
may be driven by scheme users seeking to minimise compliance costs. Lee et al. (2002)
suggest that credits could be weighted according to cost and difficulty to combat this
effect. However, this would represent a significant change of emphasis from the current
picture of assessment contributing to sustainability improvements, to one where market
transformation becomes the primary aim.
30
The administrative burden associated with obtaining a rating and the pressures that
practical considerations may have on the way that scheme requirements are
approached has already been discussed. Added to this, however, it is worth briefly
discussing the practicalities of obtaining a rating. There is broad agreement that early
consideration of scheme requirements is beneficial (Ding, 2008; Hakkinen, 2012), but
many assessment schemes are paper based (Cole, 2005) and predominantly passive.
The requirements of BREEAM, for example, are contained in a manual format and given
that such fundamental decisions such as the location of the site are assessed, these
requirements must be understood in its entirety at the outset if the maximum rating is to
be achieved. Alwaer and Kirk (2012) suggest “a key function of sustainability
assessment should be to distinguish objectively between the performance of different
courses of action”. Hakkinen (2012) similarly highlights a need for design tools, and
Ding (2008) likewise suggests that assessment methods concerned with new build or
refurbishment projects are “most useful during the design phase”. Paper manuals may
additionally not sit well with normal design practice, which can be rather linear in nature
and often proceeds by tackling issues in order of importance, returning to review earlier
decisions only reluctantly (Barlow, 2011). The professional team involved at this early
stage must therefore be fully conversant with the scheme, or must employ somebody
who is. Similarly, at project completion, validation of results generally occurs all at once
when all features are in place, providing potential for last minute disappointment if
requirements have been misunderstood or incorrectly implemented, or if evidence has
not been collected correctly. The paper manual format has been much emulated and is
still widely employed, however web based technology is also available (Cole, 2005) with
Green Globes for example operating as an online process (Green Building Initiative,
2014). It remains to be seen whether this may be employed to mitigate the problems
described above. Perhaps allowing methods to be employed in a more interactive
manner, even as a design tool. Regardless of format, there does, in any case, appear to
be an argument for aligning certification for new construction more closely with the
design process, for example by adopting a series of stage approvals rather than a single
final evaluation. Barlow (2011) explores this idea by aligning particular BREEAM credits
with particular Royal Institute of British Architects (RIBA) design stages. As it stands,
this approach does not yet appear to have been adopted by any mainstream scheme
operator. The nature of a criteria based assessment also generally dictates a checklist
approach (Bell and Morse, 2003). Meeting these requirements results in credits being
awarded which contribute to a final total and in turn dictate the rating achieved. Certain
requirements may be mandatory, but generally speaking the user is free to select those
credits which most appeal to them, and ignore those most problematic. This “balanced

31
scorecard” approach is a significant strength of these schemes as it means that projects
which may have inherently unsustainable features could still engage with the scheme
and achieve a rating by improving other aspects of their design or operation (Barlow,
2011). It also allows scheme operators to include the criteria they want to without unduly
restricting their customer base. On the other hand, where methods are used in an active
fashion, there is a potential for design itself to follow a checklist approach; indeed, if a
building is to achieve a top rating under a scheme then the design team must, arguably,
proceed in this manner. This is perhaps no accident, with Cole (2005) noting that the
building industry is notoriously risk averse and prefers “simple, unambiguous messages
regarding what to do, rather than why it should be done”. Schemes can therefore
perhaps be seen to provide an industry definition of what constitutes a “green” building
(Cole, 2005), albeit this may be incompatible with achieving a pathway towards a
sustainable built environment as described by Guy and Moore (2004). A particular
problem with this approach is that designing to satisfy a list of criteria merely ensures
alignment with the limited viewpoint of the scheme and may ignore important features
that it was simply not felt practical to include. Additionally, schemes are typically
dominated by threshold criteria, which reward attainment of a minimum standard, often
with no credit given for further achievement (Becker, 2004). Perhaps more importantly,
designing to a checklist may impact both the quality and creativity of design. Innovative
buildings may find it difficult to achieve ratings where schemes focus on mitigation rather
than adaptation (Cole, 2005; Birkeland, 2008). In light of this, Oehlkers (2008) notes in
relation to LEED that the scheme was not meant to hold back eco conscious designers
but rather to transform the conventional building.
2.8 Conceptual framework
The literature review has provided reason to challenge the theoretical basis for using
criteria-based, design stage assessment to determine sustainability. It also brings into
question the practical effectiveness of BSAS in producing measurable improvements in
use and the accuracy of design stage predictions of performance in general. Post
occupancy evaluation is not inherent to any of the schemes identified. Furthermore it
appears that for many stakeholders certification is their primary aim, with building
performance being a secondary consideration. It is also apparent that schemes are
open to gaming by key construction team members including designers and speculative
developers for whom BSAS criteria must vie with a range of commercial considerations.
As such, the true value of these assessments to policy makers is highly uncertain.
Given the current widespread and increasing reliance on BSAS to measure and

32
demonstrate sustainability in buildings, further research targeting this knowledge gap is
essential.
As summarised in Figure 2.8.1, BSAS aim to improve building sustainability by
influencing design and construction using a checklist of indicators. A certificate or rating
is then awarded based upon an assessment of compliance with this checklist (in the
case of BREEAM certification may be awarded at “Design” and/or “Post Completion”
stage). In practice, there are however a number of significant factors which may work to
frustrate this process. On a technical level, the use of indicators is by its very nature an
imprecise means of predicting performance. Further increasing uncertainty is
demonstrated when allowing project teams a choice of indicators and requiring them to
produce their own evidence to demonstrate compliance. Overarching these practical
difficulties, commercial pressure may act as a powerful incentive for gaming by project
teams, whilst a lack of post occupancy evaluation prevents the use of feedback to
measure and improve performance on an empirical basis.
Figure 2.8.1 – Conceptual framework indicating the theoretical limitations of building
sustainability assessment schemes

33
A study is therefore required which examines the extent to which these theoretical
difficulties may be contributing to the empirical shortcomings observed by researchers
including Scofield (2008), Monfared and Sharples (2011) and Turner and Arif (2012).
This will require a detailed investigation of the key processes indicated; that is, an
assessment of the indicators used and an understanding of how they are applied and
evidenced in practice. To provide context for these activities, it is also desirable to
measure the impact of these activities on the performance of the building in use. The
knowledge gap, research aim and research objectives may therefore be summarised as
follows:
Knowledge gap
● The design and construction stage interventions promoted by BSAS do not
appear to be a reliable means of improving overall building performance and
whilst a number of general theoretical weaknesses have been identified within
these methodologies, the particular factors limiting their effectiveness are
currently poorly understood.
Research aim
● To increase evidence of the relationship between building sustainability
assessment schemes and building performance.
Research objectives
1. To assess BSAS content, by examining the operational effect of applying
individual criteria in certified buildings.
2. To assess BSAS methodology, by examining the manner in which individual
criteria have been applied during the design and construction of certified
buildings
3. To assess whether a BSAS rating is a useful sustainability differentiator, by
comparing the in-use performance of certified buildings with established
benchmarks.
4. To generate recommendations for increasing the efficacy of BSAS, based upon
an improved understanding of the link between content, methodology and
building performance.

34
Addressing the knowledge gap and resulting research aim will require close examination
of certified, occupied buildings. The research objectives require both that the overall
performance in use of those certified buildings is measured, and that the realisation and
operational effects of individual criteria are examined. Combined analysis of these will
allow an assessment to be made of both whether and why certification produces a more
sustainable building.
35
CHAPTER 3 – METHODOLOGY
This chapter describes and justifies the research design, including epistemology,
theoretical perspective, methodology and methods. A reflective description of the data
collection process is then given, followed by a review of the ethical considerations.
3.1 Research Design
3.1.1 Theoretical perspectives
This study is concerned with the impact that applying a sustainability assessment
process to a building at design stage has on its in-use performance. The research aim
and objectives require an examination of the assessment process, its direct effects on
the physical manifestation of a building and the cumulative result of these multiple
effects on particular aspects of building performance. A positivist perspective has been
adopted and the research aims and objectives will be addressed through empirical
enquiry (Gray, 2014). It is the tangible elements of the process and outcomes that will
form the core of the analysis, the overarching aim of the research being one of improving
measurable outcomes. An interpretivist stance was rejected and the study does not
seek to examine the value or meaning attributed to assessment, sustainability or building
performance. Therefore, although the influence of human behaviour on both the
assessment process and the performance of buildings is acknowledged, these will be
treated as a contextual factor for the purposes of this research. This approach is in line
with key research that has informed the research aims (Bordass et al., 2001; Scofield,
2009; Monfared and Sharples, 2011; Menezes et al., 2012; Turner and Arif, 2012;
Johnston et al., 2016) and is considered appropriate for extending it. Failure to fully
consider the influence of culture and society is, nevertheless, a limitation. A particular
consequence of this limitation is that the degree to which the study results might be
impacted by variations in culture across regions or countries has not been assessed.
36
3.1.2 Methodology
As set out in Chapter 2, the literature review suggests that the application of BSAS
standards is failing to produce the expected sustainability improvements in buildings.
Analysis of the literature has also generated a number of theories as to why this might
be the case i.e.
1. The use of indicators weakens the potential for assessment to influence building
performance
2. The checklist approach adopted by BSAS is open to misuse/gaming by design
teams
3. The choice of target credits may be influenced by the administrative burden of
the evidence requirements
4. Commercial pressures may dictate the choice of credits, particularly where
scheme aims diverge from client aims
5. The lack of systematic POE presents the possibility of a “performance gap”
Testing these theories deductively would require an experimental approach. An
established means of achieving this would be to construct a hypothesis relating to each
theory and test it statistically using quantitative data (Gray, 2014). This methodology
has the potential to produce robust results, but requires access to suitable data.
Unfortunately the data required to examine the effectiveness of a useful range of
individual assessment criteria is not typically collected or reported, either by building
occupants or researchers. Indeed, a failure to incorporate POE into BSAS has itself
been identified in Chapter 2 as an important theoretical limitation. It is also a
characteristic of these schemes that buildings are awarded a very simplistic
“certification”, without public dissemination of the procedure or detailed scoring
supporting the result (Alwaer and Kirk, 2012). Furthermore, both assessment and
building performance data may be commercially or reputationally sensitive, making it
less likely to be shared, even where it is collected. This lack of existence and
dissemination of data has undoubtedly contributed to the existence of the identified
knowledge gap and is not easily surmountable. To achieve the research aim it has
therefore been necessary to consider combining experimentation with alternative,
qualitative approaches (Gray, 2014). The suitability of a number of potential qualitative
methodologies have been considered as summarised in Table 3.1.1.
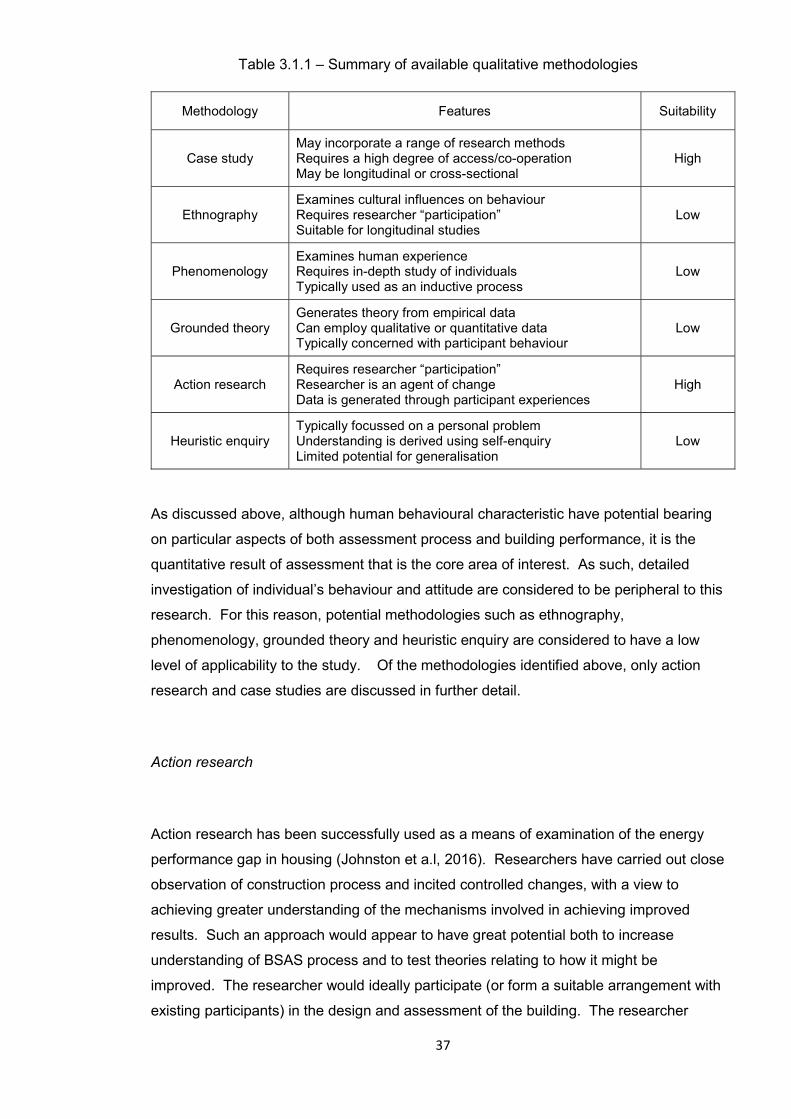
37
Table 3.1.1 – Summary of available qualitative methodologies
Methodology Features Suitability
Case study May incorporate a range of research methods Requires a high degree of access/co-operation May be longitudinal or cross-sectional
High
Ethnography Examines cultural influences on behaviour Requires researcher “participation” Suitable for longitudinal studies
Low
Phenomenology Examines human experience Requires in-depth study of individuals Typically used as an inductive process
Low
Grounded theory Generates theory from empirical data Can employ qualitative or quantitative data Typically concerned with participant behaviour
Low
Action research Requires researcher “participation” Researcher is an agent of change Data is generated through participant experiences
High
Heuristic enquiry Typically focussed on a personal problem Understanding is derived using self-enquiry Limited potential for generalisation
Low
As discussed above, although human behavioural characteristic have potential bearing
on particular aspects of both assessment process and building performance, it is the
quantitative result of assessment that is the core area of interest. As such, detailed
investigation of individual’s behaviour and attitude are considered to be peripheral to this
research. For this reason, potential methodologies such as ethnography,
phenomenology, grounded theory and heuristic enquiry are considered to have a low
level of applicability to the study. Of the methodologies identified above, only action
research and case studies are discussed in further detail.
Action research
Action research has been successfully used as a means of examination of the energy
performance gap in housing (Johnston et a.l, 2016). Researchers have carried out close
observation of construction process and incited controlled changes, with a view to
achieving greater understanding of the mechanisms involved in achieving improved
results. Such an approach would appear to have great potential both to increase
understanding of BSAS process and to test theories relating to how it might be
improved. The researcher would ideally participate (or form a suitable arrangement with
existing participants) in the design and assessment of the building. The researcher
38
would then monitor (and perhaps intervene) in the construction of the building, and carry
out POE following occupation. Such a project would however require a considerable
time commitment. From inception a building might typically take a year or more to
design and a further year to construct. At least one further year would then ideally be
required to allow performance data to accrue (Preiser and Vischer, 2003). A minimum
three year data collection process would therefore be needed, with the additional risk of
this being extended due to unforeseen delays to design, construction or occupation.
Such timescales are unfortunately inconsistent with the practical requirements of this
project.
Case studies
Case studies are an investigation of a contemporary phenomenon in its real life context
(Yin, 1984) and allow for highly detailed examination and analysis. When applied to a
whole building, they are capable of generating large volumes of data, often within a well
understood and well defined setting (Thomas, 2011). Case studies have been employed
in key supporting literature used to generate the research aim. The Probe studies
(Bordass et al., 2001a) in particular, make use of case studies that include POE of
individual buildings to identify specific performance shortfalls, combined with detailed
analysis of the building as a whole. These multiple sources of evidence are then used
as a basis to comment on more general underlying problems with building design and
operation. Given the lack of access to existing data, case studies arguably provide the
only practical means of gathering robust primary data with which to address the chosen
research objectives. Case studies may additionally be applied in a cross-sectional
manner, allowing data to be collected at a point in time (Schell, 1992) and thereby
limiting the required data collection period. These two factors make this technique highly
suitable for this project and were key factors in its selection. There are however a
number of limitations inherent in the approach. The method can be resource intensive,
due to the need to collect and analyse multiple sources of primary and secondary data.
Resource requirements therefore limit the number of case studies that can be practically
studied. Meanwhile, case study selection is also critical to the representativeness of the
data produced. Selection of case studies is often necessarily purposeful, and may
therefore be based on practical considerations such as location and ease of access, as
well as their representativeness. This may be viewed as a positive factor, allowing high
quality reliable data to be obtained (Thomas, 2011). However, because case study data
is context dependant, care must be taken when generalising (Schell, 1992; Thomas,
2011). It is therefore understood that any assertions resulting from case study data must

39
be founded on high quality data in a well understood context, rather than statistical
analysis (Rose and Manley, 2011; Yin, 2014).
3.1.3 Case study design - Theoretical considerations
Addressing the research aim requires that both an assessment and its subject building
are examined, in order to better understand their interrelationship. Research objectives
1 and 2 are concerned with the effects and means of applying an assessment to a
particular building. These require both access to assessment scheme report
documentation and detailed knowledge of the physical manifestation of the associated
buildings. Research objective 3 requires that data be collected relating to pertinent
elements of building performance. Research objective 4 relies on triangulating the
qualitative and quantitative data to comment on the significance of limitations identified
from the literature and to propose mitigation measures relating to these. As such, a
predominantly “explanatory” case study approach has been used to test existing
explanations as to why BSAS are failing to reliably ensure improved sustainability
performance. Notwithstanding this, case study data may also be used both to describe
and test theories (Schell, 1997) and although not a primary aim, there is potential for the
data collected to also identify further reasons for poor performance (a “descriptive”
output).
As discussed above, collection of detailed data through unrestricted access is a key
strength of the case study approach, whilst obtaining such access is a noted challenge.
A leading requirement for case study selection in this instance was therefore that access
be available for collection of high quality primary building performance data. It was also
desirable that case study buildings be recently constructed, to provide insight into the
most up to date assessment methods possible. Multiple case studies were desirable, for
a number of reasons. Multiple case studies increase the depth of data where case
studies are similar, or broaden the data where they significantly differ. Comparing data
from different settings increases certainty and the potential for replication and
generalisation, whilst examining different sets of data limits project risk by avoiding
relying exclusively on one setting (Yin, 2014). Multiple case studies also mitigate an
important problem associated with case studies; that gaining a detailed understanding in
a single context may lead a researcher to overestimate their overall understanding of an
issue (Guthrie, 2010). Four case studies were used for this project, representing a
compromise between the breadth and depth of information desired, the need to cross

40
reference data across settings, and the resources available. Each case study comprises
a recently constructed building and its associated sustainability assessment and these
were purposefully selected in conjunction with a university estates management team.
The assessment scheme applied to the study buildings was BREEAM in every cases;
the use of multiple schemes was rejected on the grounds that this would have
unacceptably increased the scope of the project. The use of alternative established
schemes such as LEED or CASBEE was also rejected, primarily because their use in
the UK is so limited that obtaining access to multiple buildings with certification under
these schemes, within realistic travel distances for data collection, would have been
extremely challenging. The national and international relevance of BREEAM is
discussed in detail in Section 3.1.4 below, whilst the detailed characteristics of the
buildings themselves are discussed in Section 4.1.
3.1.4 BREEAM
As discussed above, for primarily practical reasons, the selected case study buildings
have all been assessed using the BREEAM scheme, this being the most used scheme
in the UK by some margin (Figure 3.1.1). BREEAM is, additionally, considered a good
proxy for BSAS in general, for a number of reasons. It has substantial and expanding
UK uptake (Figure 3.1.2) and is internationally significant in terms of certification
numbers (Figure 3.1.3). BREEAM also offers a “global” version (BRE Global, 2016) and
has additionally been specifically franchised to 8 other countries including the USA,
Germany and Spain. Only LEED currently has a greater global reach and whilst
theoretically suitable, its low uptake in the UK would have made availability of case
studies extremely limited.

41
Figure 3.1.1 – Total number of UK certificates issued by scheme (Aug 2012)
Figure 3.1.2 – Number of UK BREEAM certificates awarded by year (BRE, 2012)
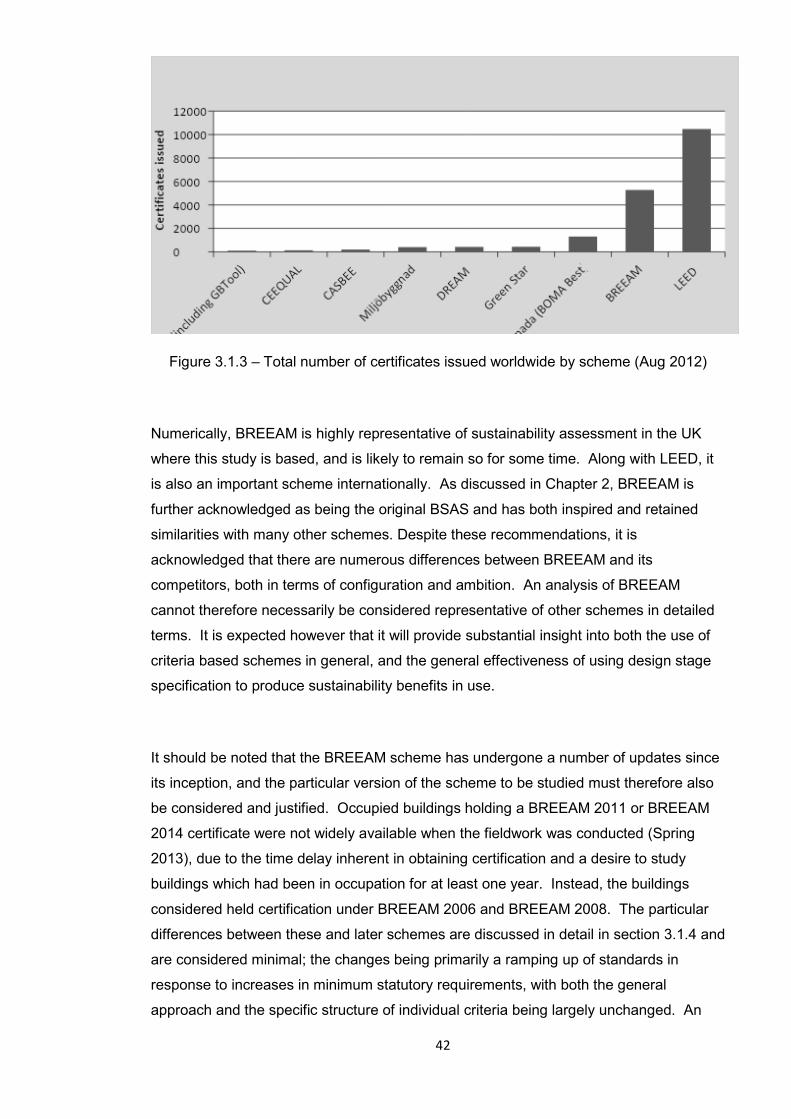
42
Figure 3.1.3 – Total number of certificates issued worldwide by scheme (Aug 2012)
Numerically, BREEAM is highly representative of sustainability assessment in the UK
where this study is based, and is likely to remain so for some time. Along with LEED, it
is also an important scheme internationally. As discussed in Chapter 2, BREEAM is
further acknowledged as being the original BSAS and has both inspired and retained
similarities with many other schemes. Despite these recommendations, it is
acknowledged that there are numerous differences between BREEAM and its
competitors, both in terms of configuration and ambition. An analysis of BREEAM
cannot therefore necessarily be considered representative of other schemes in detailed
terms. It is expected however that it will provide substantial insight into both the use of
criteria based schemes in general, and the general effectiveness of using design stage
specification to produce sustainability benefits in use.
It should be noted that the BREEAM scheme has undergone a number of updates since
its inception, and the particular version of the scheme to be studied must therefore also
be considered and justified. Occupied buildings holding a BREEAM 2011 or BREEAM
2014 certificate were not widely available when the fieldwork was conducted (Spring
2013), due to the time delay inherent in obtaining certification and a desire to study
buildings which had been in occupation for at least one year. Instead, the buildings
considered held certification under BREEAM 2006 and BREEAM 2008. The particular
differences between these and later schemes are discussed in detail in section 3.1.4 and
are considered minimal; the changes being primarily a ramping up of standards in
response to increases in minimum statutory requirements, with both the general
approach and the specific structure of individual criteria being largely unchanged. An

43
analysis of the general effectiveness of BREEAM 2006 and 2008 is therefore considered
to be highly representative of all manifestations, up to and including the current versions.
3.1.5 Data requirements
BSAS offer a comprehensive sustainability rating, constructed using a large number of
discreet and disparate indicators (Brandon and Lombardi, 2011). The construction of
this rating is complex and, crucially, lacks a unifying metric of measurement. Because of
this, measuring the extent to which the rating differentiates a building from standard
practice in quantitative terms is highly problematic. To address the research objectives,
an alternative approach is therefore required. The configuration of BREEAM described
in detail in section 4.2 is broadly similar to many other BSAS. It consists of a
dimensionless scoring mechanism, based upon compliance with criteria and credits,
grouped into categories and added to give an overall rating. As noted above, the lack of
a verifiable metric for the overall rating makes comparison of rated and non-rated
buildings in terms of their BREEAM score meaningless. In order to produce a
measurement framework to support the research objectives, a thorough, bottom up
analysis of the scheme contents was therefore required, in order to understand what
differences might be expected to be observed between a rated and non-rated building.
3.1.5.1 Research objectives 1 and 2
Examination of the impacts of assessment on a building in use firstly required that the
case study buildings be examined to confirm whether the design interventions for which
the building achieved credits are evident. Secondly, the case studies needed to reveal
whether those design interventions which are evident have produced a sustainability
benefit. Achieving these objectives provides essential context for the quantitative data
examination through research objective 3, contributing in turn to the ability to suggest
improvements as required to satisfy research objective 4. These contextual information
requirements were based upon techniques used successfully for the Probe Studies
(Bordass et al., 2001b), with the significant additional requirement that the BREEAM
documentation be examined in detail. The following techniques were therefore
employed:

44
● Review of building design information
● Walk through surveys of occupied buildings
● Formal and informal interviews with buildings and facilities managers
● Review of BREEAM reports
Considered together, these have produced a detailed picture of which elements of the
BREEAM scheme were applied and evidenced in each of the case study buildings, and
the extent to which this influenced the as-built design.
3.1.5.2 Research objective 3
Research objective 3 is concerned with quantitative, in-use, sustainability and will be
addressed through building performance evaluation (BPE). As discussed in Chapter 2
BSAS are concerned with multiple performance metrics; the BREEAM scheme versions
used to assess the case study buildings include a total of 110 different assessment
issues and some analysis was therefore required to establish which elements of building
performance should and could be measured. To establish the data requirements, both
the stated aim and the criteria for each scheme credit were examined in detail, in order
that the assessment theme (or themes) could be identified. Collating these themes for
each BREEAM category reveals the full scope of themes assessed and therefore the
material differences that might be expected to result from scoring credits within that
category (refer appendix A). Combining all themes sets out the differentiation that
should be evident for a building complying with the scheme as a whole. Analysis of
appendix A reveals that 63 distinct themes were identified, some of which appear in
multiple categories. This analysis provides us with a list of building characteristics
against which a building with a 100% BREEAM rating should outperform equivalent non-
rated buildings. Full realisation of research objective 3 would require that performance
in each of these areas be both measured, and compared to a suitable benchmark.
Table 3.1.1 therefore lists the 63 identified themes, and identifies a potential data
collection method for each. The viability of each of these data collection methods is
discussed in turn, below.

45
Table 3.1.2 – BREEAM assessment themes with corresponding potential data collection
requirements (themes shown in brackets were not assessed for any of the selected case
study buildings)
Themes (63) Potential data collection method Construction stage site impacts (environmental and social) Embodied carbon of construction materials Pollution associated with construction materials Monitoring and minimising construction waste Use of recycled aggregates for construction Brownfield development Contamination remediation Maintaining / improving site biodiversity (Foundation design) (Re-use of building elements) (Using a BREEAM consultant)
Design and construction stage data collection methods
Pedestrian and cyclist safety Incidence and fear of crime Legionella Flood risk (Safe and effective fume cupboards) (Refrigerant global warming potential)
Statistical analysis of event incidence
Energy efficiency of building services CO2 emissions (regulated energy) Monitoring of energy use Renewable energy (Energy efficiency of building fabric) (Energy efficiency of domestic appliances) (Energy efficiency of IT equipment)
Energy consumption monitoring
Water efficiency in-use Monitoring of water use Water leak detection/mitigation Water for irrigation (Water re-use) (Water for vehicle cleaning)
Water consumption monitoring
Mechanical ventilation Daylighting View out Artificial lighting Natural ventilation Thermal comfort Acoustics (External pollutants)
Building user studies survey
Promotion of sustainable construction Public transport provision and information Proximity to amenities Cyclist facilities Car parking
Building user transport survey
Building functionality Building aesthetics Traffic impact Community relations Building maintenance requirements Recycling of building waste (in use) NOx emissions Light pollution Noise pollution CO2 levels Volatile organic compounds (Cost effective maintenance and operation) (Accessibility) (Chilled drinking water) (External amenity space) (Compaction of recyclable building waste (in use)) (Composting of building waste (in use)) (Tenant’s floor finishes) (External amenity space) (External educational space)
Specialised data collection methods required

46
Design and construction stage data collection methods
Eleven themes have been identified which relate to the manner in which the building is
designed and/or constructed, or the nature of materials embodied within the structure.
These themes do not lend themselves to post occupancy evaluation, as they are not
readily measurable within the completed building. Inclusion of these themes within the
scope of the project would require the use of a longitudinal study monitoring the design
and construction of the building, in addition to measuring its performance in use. Such a
study would require a data collection period of at least 3-4 years, which was not feasible
within the timescales of this project. These themes were not therefore suitable for
assessment.
Statistical analysis of event incidence
Six themes relate to reduction of risk for relatively uncommon events, such as on-site
injuries to pedestrians and cyclists, flooding of local watercourses, and accidental
escape of refrigerant gases. A case study approach does not lend itself to examination
of these themes, which would instead require relevant data for a large number of
BREEAM certified buildings. As in-use data is not routinely recorded or collected as part
of the BREEAM process, this would need to be gathered by the project team. This
would be a significant undertaking, and may also be hindered by the sensitivity of the
information, which generally relates to negative incidents. As such, assessment of these
issues was not considered to be feasible within the timescale and resources of the
project.
Energy consumption monitoring
Seven themes relate to energy consumption within the building in-use. Energy
consumption monitoring is considered compatible with the proposed case study
approach, subject to the metering arrangements in place within the occupied buildings.
A range of energy consumption data benchmarks is also in existence, making these
themes suitable for assessment. .

47
Water consumption monitoring
Six themes relate to water consumption within the building in-use. Water consumption
monitoring is considered compatible with the proposed case study approach, subject to
the metering arrangements in place within the occupied buildings. A range of water
consumption data benchmarks is also in existence, making these themes suitable for
assessment. .
Building user survey
Eight themes relate to the internal environmental quality of the building. BREEAM
addresses these themes under the wider category of “Health and Wellbeing” and it is
therefore implicit that the overarching reason for improving the internal environment is
intended to be for the subjective benefit of building users. A post occupancy survey of
building users was therefore identified as an appropriate means of data collection. As
described in further detail in section 3.2.2, the use of a standardised survey method
additionally provides benchmark data, making these themes suitable for detailed
assessment within the study.
Building user transport survey
Five themes might be addressed through the use of a building user transport survey.
However, variations in the road and public transport environment surrounding individual
buildings are likely to be highly influential in any results. As such, although useful
national benchmark information is available in relation to transport behaviour, meaningful
comparison with this would require the examination of a data from a large cross section
of BREEAM certified buildings. As previously noted, such data is not routinely collected,
and would be beyond the scope of the project to assemble. As such, these themes were
not considered suitable for assessment as part of this study.

48
Specialised data collection methods
A further 20 themes have been identified, which would each require an additional stand-
alone data collection method to be mobilised. These themes are not suitable for
assessment within this study, because they each require substantial additional
resources, whilst returning data in relation to just one BREEAM issue.
Non-uptake of BREEAM issues
In addition to the difficulty of assessing and benchmarking certain themes described
above, the configuration of the scheme additionally means that only a proportion are
tackled for each building. A building achieving a “very good” rating under BREEAM
need only attempt a proportion of the available credits. Collecting data in relation to all
themes is therefore unlikely unless a large number of buildings are studied. In practice,
a significant number of BREEAM issues were not targeted for any of the case study
buildings, and as a result no assessment was made of the effect in relation to these.
Twenty themes are identified as relating to these issues and are indicated in brackets in
Table 3.1.5. This limitation is unavoidable, being inherent to both the case study
approach, and the assessment methodology. The impact on the study results is
however minimal, as a large number of issues remained to be assessed. The impact of
this feature of the assessment on its results is however potentially significant, and is
discussed in detail in Chapter 4.
Post occupancy evaluation
Based on the analysis presented above, building energy monitoring, building water
monitoring, and a building user survey were applied to the case study buildings. These
were expected to provide performance data for comparison with recognised benchmarks
in relation to 14 key themes as follows:
● Energy efficiency of building services
● CO2 emissions (regulated energy)
● Monitoring of energy use
● Water efficiency in-use
49
● Monitoring of water use
● Water leak detection/mitigation
● Water for irrigation
● Mechanical ventilation
● Daylighting
● View out
● Artificial lighting
● Natural ventilation
● Thermal comfort
● Acoustics
This data will therefore provide a basis for evaluating the degree to which BREEAM
certification is an effective differentiator of performance in 14 of 62 themes identified
within the BREEAM assessment scheme. These themes account for 26% of available
credits, concentrated in the Energy, Water and Health and Wellbeing categories. Whilst
incomplete, a detailed examination of these three key categories, conducted across
multiple buildings and against recognised benchmarks will make a substantial
contribution to furthering research objective 3.
3.1.5.3 Research Objective 4
Research objective 4 is concerned with examining the link between scheme content,
methodology and building performance. A framework for such an examination is
presented in Figure 3.1.4. This framework considers the efficacy of a particular BSAS
criterion at 5 levels as follows:
● Level 1 (Selection) - The credit is targeted by the user
● Level 2 (Compliance) – The credit produces a design change
● Level 3 (Delivery) – The credit produces a performance benefit for the building
● Level 4 (Tactical) – The credit produces a wider sustainability benefit
● Level 5 (Strategic) – The credit contributes to the stated aim(s) of the BSAS
Adopting this framework, it follows that selection of a credit is a pre-requisite for
producing a design change, which is in turn a pre-requisite for improving building
performance, and so on. In effect, scheme criteria must pass over a series of hurdles
before they will be effective within the stated aims of the BSAS.

50
BREEAM credit Hea 01 is used as an example to illustrate this proposal. The stated aim
of the credit is “to give building users sufficient access to daylight”. If the credit is not
targeted, or if no change is effected in the completed building then no improvement in
daylight levels can be attributed to the influence of the scheme. If however the intended
change is achieved and evidenced in the completed building, then this evidence
contributes to certification. At this point the BSAS process is complete and it is deemed
that application of the criteria has improved the daylighting within the building. This
improvement is however assumed, and is not tested through the normal application of
BREEAM. Furthermore, the scheme provides no evidence that improved daylighting
has produced a measurable building performance benefit, will contribute to the wider
sustainability of society, or contribute to achieving the proffered benefit of the
assessment scheme. As indicated in Figure 3.1.4, this research project is concerned
primarily with furthering understanding of criteria impact at level 3. As noted in Chapter
2, research (Haroglu, 2013) suggests that BSAS are relatively effective at producing
design change, but that there has been little objective examination of whether these
design changes produce their intended benefits. An exploratory case study used in
conjunction with this framework provides a means of examining these links and
presenting an assessment as to whether implementation of particular criteria have
produced their intended effects in particular cases. Comparison of more or less effective
criteria will be used to identify strengths and weaknesses with the scheme methodology
and content, and hence produce recommendations for improvements.

51
Figure 3.1.4 - Framework for assessing the efficacy of BSAS credits and associated criteria

52
3.2 – Practical application and reflections
3.2.1 Justification for selection of the case study buildings
The use of a case study approach and its design are justified and discussed in sections
3.1.2 and 3.1.3 respectively. Purposeful selection of case studies has been identified as
both a potential weakness and a potential strength of the approach and an explanation
of this process therefore follows. Selection of buildings owned by the university in which
the researcher was based was considered advantageous in terms of arranging access,
which is a key constraint for case study research. Buildings were also required which
had been in occupation for at least one full year and which held the most recent
BREEAM certification possible. This further reinforced the desire to use university
buildings, as a number of recently constructed buildings were available, all of which had
achieved BREEAM certification. Having identified a number of buildings meeting these
essential requirements, the following secondary aspects were considered:
● Location
● Situation
● Use
● Rating
● Size
The general location of the buildings available was the East Anglia Region of the UK.
Using buildings in a similar location was convenient in practical terms and ensured that
environmental conditions were broadly similar, allowing for example direct comparisons
to be made in terms of energy consumption for heating and cooling. Although broadly
representative of many areas of the UK, this region is relatively densely populated, low
lying and dry, and these factors were considered where relevant. The particular
situation of the buildings is more variable. As described in detail in Chapter 4, two
buildings are in city centre locations, whilst two are on sub-urban campuses. This
variation has allowed some interesting comparisons to be made, however it must also be
acknowledged that rural situations were not represented.
Being university owned, the use of the buildings is broadly similar, consisting primarily of
teaching, research and office space. Making use of different building types such as

53
industrial units, hospitals or prisons would have extended the range of the research,
however it would also have reduced the depth of data and made it far more difficult to
draw comparisons between buildings. Overall, it is considered that the variation in use
across the selected buildings is adequate to represent a wide range of higher education
buildings, but that generalisation to other building types should be carried out with
caution. This project should therefore be considered primarily an evaluation of BREEAM
as applied to university buildings, although it is likely that many similar issues may apply
across different building types.
In terms of BREEAM rating, all buildings achieved a “very good” standard. This results
directly from university policy in force at the time of construction that required this as a
minimum standard. As discussed in Section 3.1.3, “very good” is the most widely
achieved certificate and is therefore relatively representative of assessments generally.
Representativeness could have been improved by including one or more buildings with
an excellent rating, as this is also a commonly achieved certificate. Using buildings with
higher ratings would probably also have increased the range of issues for which credits
were achieved, and therefore the scope of the analysis, and this might be considered for
any future work. The particular BREEAM score and rating certified for the four case
study buildings is summarised in Table 3.2.1. Note that whilst BREEAM allows for both
design stage and post-construction stage assessment, these may be achieved
independently of one another. Two of the case study buildings obtained design stage
certificates, one obtained only a post-construction stage certificate, and one obtained
both. This variation appears to be reasonably typical of the wider picture, as discussed
in section 4.2.
Table 3.2.1 – Summary of scheme type and ratings achieved for the case study
buildings
Case study Assessment scheme Design stage rating /
certificate
Post-construction
stage rating /
certificate
Building A BREEAM 2008 Bespoke 59% “Very Good” 57% “Very Good”
Building B BREEAM 2008 Bespoke Not awarded 61% “Very Good”
Building C BREEAM 2008 Education 59% “Very Good” Not awarded
Building D BREEAM 2006 Bespoke 58% “Very Good” Not awarded
Of the variables considered above, size is arguably the only one in which significant
variation is apparent across the buildings, with floor areas ranging from 450m2 to
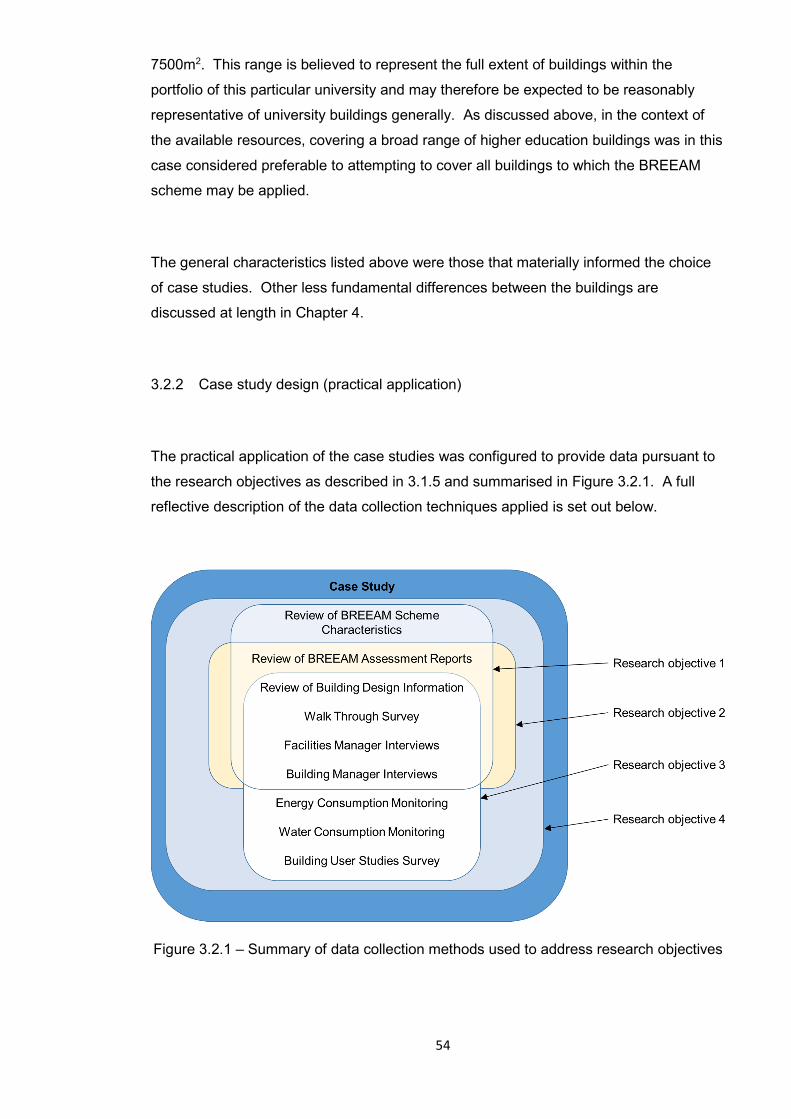
54
7500m2. This range is believed to represent the full extent of buildings within the
portfolio of this particular university and may therefore be expected to be reasonably
representative of university buildings generally. As discussed above, in the context of
the available resources, covering a broad range of higher education buildings was in this
case considered preferable to attempting to cover all buildings to which the BREEAM
scheme may be applied.
The general characteristics listed above were those that materially informed the choice
of case studies. Other less fundamental differences between the buildings are
discussed at length in Chapter 4.
3.2.2 Case study design (practical application)
The practical application of the case studies was configured to provide data pursuant to
the research objectives as described in 3.1.5 and summarised in Figure 3.2.1. A full
reflective description of the data collection techniques applied is set out below.
Figure 3.2.1 – Summary of data collection methods used to address research objectives
55
Review of BREEAM Scheme Characteristics
A full review was carried out of the BREEAM scheme content, application process and
outcomes, as presented in Section 4.2. In addition to the review of literature described
in Chapter 2, the data presented is based on a combination of publicly available scheme
information (BRE, 2006; BRE, 2008a; BRE, 2008b) and a comprehensive set of
outcome data disclosed to the researcher by the BRE (BRE, 2012)
Review of BREEAM assessment reports
A successful BREEAM assessment results in a certificate being issued by the scheme
operator. This certificate includes the following information:
• Building name and address
• The overall BREEAM score
• The overall BREEAM rating
• The scheme version
The certificates for the case study buildings were obtained from the University Estates
department and in the case of Building C, a copy was also displayed in the building
foyer. The certificates do not however provide any breakdown of the building score in
terms of scoring across particular sections, or within individual issues. To obtain a
detailed record of the assessment it was necessary to source a copy of the submissions
made to the scheme operator by the BREEAM assessors. These proved quite difficult to
obtain in practice. Only one of these reports had been held on file by the University. A
further report was obtained via the main contractor, and the remaining two came direct
from the BREEAM assessor. In one case it was necessary to trace the BREEAM
assessor to his new place of work to obtain the report, as no records had been held by
his previous employer. The difficulty experienced in obtaining these reports has wider
methodological significance for this area of research, as it is apparent that any larger
scale analysis of the application of the BREEAM scheme would likely be significantly
hampered by the focus of end users on certification, rather than process. The reports
obtained appear to follow a standard template for Buildings A, B and C and include the
BRE logo, whilst that obtained for Building D appeared to use an in-house style. All
provided similar information as follows:
56
• Summary of certification information including overall score and
relevant stakeholders
• General information about the BREEAM scheme
• General information about the BREEAM scoring and rating system
• Project team and building details
• Summary of the building’s assessment performance (by section)
• Detailed assessment of building performance (by individual credit)
Each also included reference to appendices including “BREEAM Assessment Tool and
Calculator Print-Outs”, however these were missing from all reports excepting that for
Building A.
The level of information obtained was therefore generally good, however a number of
ambiguities were noted. The general descriptions of the buildings contained within the
reports were often inaccurate. This was particularly the case in terms of the building
services strategies. The reasons for this are unknown, but were remedied in practice by
visual verification of details wherever possible, backed up by reference to as-built
drawings and/or discussions with facilities management staff. The floor areas described
within the reports were also often considerably at variance with those from other
sources. As a result the floor areas of all buildings were measured from as-built
drawings. This ensured that appropriate areas were used for analysis based on the
observed use of the building, and also that an appropriate and consistent measurement
method was used (typically gross internal floor area (GIFA)). Finally there are a number
of arithmetical errors in the scoring summary shown in the report for Building D, however
the scoring within the detailed sections, and the overall score for certification did appear
to be correct.
Review of Building Design Information
The study is concerned with the effect of BSAS on buildings in use, and a full systematic
review of design information was not therefore considered necessary. Nevertheless, as-
built architectural drawings were obtained for all buildings. These provided useful
contextual information relating to the general construction buildings, were helpful in
57
planning the building occupant surveys and provided particular information used for
analysis of results, such as floor areas.
Walk through survey
A walk through survey was conducted for each building. This typically took place on the
same day as the Building User Survey, although further visits were also carried out as
required, to clarify particular issues. Notes and photographs were used to
confirm/record the situation of the building (including the use of adjacent areas) and the
external configuration, lighting, condition and materials used. Internally, the following
specific information was recorded for every accessible room:
● Room function
● Wall, floor and ceiling finishes
● Furniture and equipment
● Heating/cooling sources, controls and current operation
● Ventilation sources, controls and current operation
● Daylighting sources, blinds/shading types and controls
● Artificial lighting type, controls and operation
● Acoustic conditions and control measures
Collection of this information for all rooms was relatively time consuming, but is
considered an essential part of the post occupancy evaluation. These observations
provided some useful context for consideration of specific issues, particularly relating to
the building servicing strategies, much of which differed from that described in the
BREEAM reports. The understanding of the use of the rooms provided by the
observations, although limited by being collected at a point in time, was also useful in
better understanding building user survey results and comments collected in those same
areas.
Facilities manager interviews
In addition to the experience of building occupants, the experience of facilities
management staff is considered of great interest in evaluating the effectiveness of a

58
building in use. The BREEAM criteria themselves include remarkably little direct
reference to facilities management, and this is perhaps indicative of its focus on the
design and construction phase. Nevertheless a great many of the design features
promoted by the scheme require ongoing professional input to maintain their
effectiveness. This is particularly the case for building services, where an appropriate
level of technical support may be pivotal in the success of more complex systems
(Bordass et al., 2001a). Additionally facilities management act as an interface between
the building and its non-technical users, are therefore in a unique position to evaluate
both its day to day performance and its longer term viability.
In practice, the level of engagement achieved with facilities management staff was
variable. For Buildings B and C it was not possible to arrange interviews. In the case of
Building C this was due to staff availability, however for Building B the reason given was
a lack of involvement in the building. Specifically, for Building B, the hospital facilities
management team appeared to believe that the first point of contact for facilities
management issues for the building was the University, although the University facilities
management team believed the opposite to be true. For Buildings A and D however the
day to day management is carried out by the University facilities management team, and
these individuals contributed a significant amount of time to assisting with the study.
This included a three hour long round table discussion relating to particular aspects of
the BREEAM assessments, attended by the Assistant Director of Building Services,
Maintenance Manager, Environment Manager, Sustainability Engineer and Clerk of
Works. A structured approach was taken with the researcher first explaining the aim of
each BREEAM “issue” before asking contributors to numerically rate both the
importance of the aim to them as professionals and the extent to which it had been met
on each of the case study buildings. In practice, the time allowed for only a small
proportion of issues to be discussed and no structured analysis of the results has
therefore been possible. The approach did however prove very successful in generating
discussion and the detailed insight that was gained arguably could not have been
obtained in any other way. Extending this exploratory investigation to cover all issues on
all buildings would potentially have been extremely rewarding, however as noted above
it was very time consuming in practice. Some refinement of this technique would
perhaps therefore be helpful for future investigations. Pertinent information obtained
during the discussions is presented informally within the analysis of relevant BREEAM
issues, throughout Chapter 4.
59
Building manager interviews
In addition to the facilities management teams, three of the four buildings also had a
nominated building manager. These individuals were senior administrative or academic
staff whose role included a liaison function with facilities management. In contrast with
facilities management staff these individuals were based full time in the building, and
had in every case been present since initial occupation. The building managers were
asked to comment in relation to a range of factors relevant to particular BREEAM issues.
The discussions were therefore exploratory and targeted primarily at providing context
for the technical investigations. Open-ended questioning was combined with an informal
conversational approach. In some cases, no significant new insight was gained,
however for one particular building it became clear that the building manager’s
experience of the building services contrasted considerably with the impression provided
by facilities management. In this case facilities management had reported that their
input into the building since its occupation had been extremely minimal, and that they
had responded to occasional minor problems reported by the occupants but were not
closely involved in the day to day running. The building manager however described a
serious problem with the heating for the building that had been ongoing since first
occupation, and was still to be properly resolved after three years. A number of other
significant services related issues were also described, including problems with the lift,
lighting and the hearing induction loop. In addition to this, following a discussion with the
researcher regarding overheating, it transpired that the building occupants were
unaware that the building was fitted with additional natural ventilation in the form of
windcatchers.
Energy consumption monitoring
Energy monitoring is commonly used in POE and was appropriate for this project, given
that BREEAM has significant content related to reducing building energy consumption
and its related CO2 emissions. As discussed in detail in Chapter 4, the case study
buildings were powered by various combinations of mains gas, mains electricity and, in
one instance, photovoltaic panels. Energy consumption was also moderated in
particular cases by the use of building level combined heat and power plant, and air
source heat pumps. Utility meters were in place in all buildings to measure overall
consumption of gas and electricity, and at least one full year’s data was obtained, in all
cases. A single reading was generally obtained for the building as a whole. Data was

60
obtained from facilities management teams and was based either on monthly manual
meter reads (Buildings B and C) or pulsed readings collected by the BMS at 15 or 30
minute intervals (Buildings A and D). Additionally Building D is believed to export
electricity generated by its photovoltaic panels to the grid, although no meter data was
available to quantify this. The data obtained for the buildings is described and analysed
in detail in Chapter 4.
Sub metering of particular energy uses within a building is also commonly employed in
commercial buildings, and is promoted by BREEAM. For the case study buildings,
however, although electricity sub-metering was believed to be installed in several of the
case study buildings, it was in all cases either non-functional, or unmonitored. Electricity
consumption data relating to particular uses such as lighting or lifts would have been
useful in analysing the success of certain issues. Carrying out early intervention to
commission existing sub-meters, or to install temporary sub-metering would therefore be
an improvement for consideration, if this research was to be extended or replicated.
In addition to analysing actual energy consumption, reference has also been made to
the Energy Performance Certificate (EPC) for each building, and to the Display Energy
Certificate (DEC). The EPC includes predictive greenhouse gas emissions data based
upon design information, and the emissions rate predicted by the EPC forms the basis
for awarding a number of BREEAM credits. The emissions rate is expressed as
kilograms of CO2 per square metre of total useful floor area, per annum
(kgCO2/m2.year). Note that total useful floor area equates to gross internal area as
defined by the Royal Institute of Chartered Surveyors (RICS, 2015). This “Building
Emission Rate” (BER) is calculated using modelling software approved for use under UK
building regulations, and accounts for regulated energy use’ only, as used by fixed
internal and external lighting systems, heating, hot water, air conditioning and
mechanical ventilation (NBS, 2014). Note that the software makes use of design values
for the thermal performance for the building fabric, but excludes emissions relating to
other unregulated energy use, such as power for equipment, processes and general
plug loads. The EPC’s for Buildings A, B and D were obtained either from the University
or from the UK government online register (Department for Communities and Local
Government, 2017). No EPC appears to have been registered for Building C, despite
this being a mandatory requirement of Building Regulations.
61
A building DEC includes energy consumption data expressed as kilowatt hours per
square metre of total useful floor area (kWh/m2.year). It also indicates the total CO2
emissions for the building, presented in graphical form. The energy data includes both
regulated and unregulated use, and is obtained from metered readings where these are
available, or estimates where they are not. The CO2 emissions are calculated based
upon the energy data and therefore also include both regulated and unregulated use. It
is a statutory requirement to obtain and display a DEC for public buildings greater than
500m2 in floor area (DCLG, 2015) however there is currently no requirement that the
building meet any particular energy or emissions standard. DEC data is not used by
BREEAM, however as discussed in Chapter 4 it does provide a useful point of reference
when assessing building energy use. The DEC certificates for buildings A, C and D
were obtained from the UK government online register (DCLG, 2017). Building B
requires no DEC, as it has a floor area of less than 500m2.
It should be noted that whilst the data associated with the EPC and DEC certificates
obtained for the building provides useful contextual information, the ratings themselves
are of limited value. Both EPC’s and DEC’s generate a numerical rating for the building,
which are dimensionless and are presented in similar ways in both cases, being banded
from A-G. They are however calculated in quite different ways, and are not comparable.
For EPC’s, the asset ratings is calculated by the following formula (DCLG, 2008):
EPCAssetrating 50 ∗BERSER
Where BER (building emission rate) represents the design emissions for the building
and SER (standard emission rate) represents the design emissions for a similar
“notional” building designed to meet the 2002 version of the Building Regulations. For
DEC’s the operational rating is calculated as follows (DCLG, 2015):
DECAssetrating 100 ∗ActualCO2emissionsAverageCO2emissions
Where ‘Average CO2 emissions’ for a particular building function are taken from
benchmarks for existing buildings, produced by CIBSE (2009). The DEC asset rating is
62
therefore the buildings CO2 emissions expressed as a percentage of those for a typical
existing buildings of similar use.
Water consumption monitoring
Water consumption monitoring was desirable as BREEAM has significant content
relating to reducing water use. Water used in the case study buildings is understood to
be exclusively derived from mains supply; no form of water harvesting or recycling was
apparent either in building designs or the buildings in use. Consumption data was
obtained from facilities management teams and was provided in the form of manual
monthly readings for Buildings B and C. No readings were however available for
Buildings A or D, due to faulty meters. In the case of Building A the fiscal utility meter
had been faulty since installation, in the case of Building D it was the University’s own
meter for the building which had, again, been faulty since installation. The data obtained
is described and analysed in Chapter 4. As for energy, BREEAM also promotes the use
of sub-metering for water consumption, however no sub-meters are understood to have
be installed in the case study buildings.
Building Use Studies survey
Analysis of the BREEAM scheme (Appendix A) identified that the requirements of a
significant proportion of BREEAM issues might be expected to produce effects and
benefits intended to improve conditions for building users. This is particularly the case
within the health and wellbeing section, where the expected benefit is often explicit. It is
also implicit for a number of other issues across the remaining sections, including
management, energy, materials, land use and ecology, and pollution. The particular
potential benefits include issues relating to thermal comfort, air quality, lighting,
acoustics and views out, as well as safety issues relating to contamination, pedestrian
safety and fear of crime.
To assess the success of these issues it was considered necessary to engage with
building users. Users for the case study buildings may be divided into those who are
based in the buildings, and those who visit them to use particular facilities. The former
are generally employees of the organisations occupying the buildings, whilst the latter
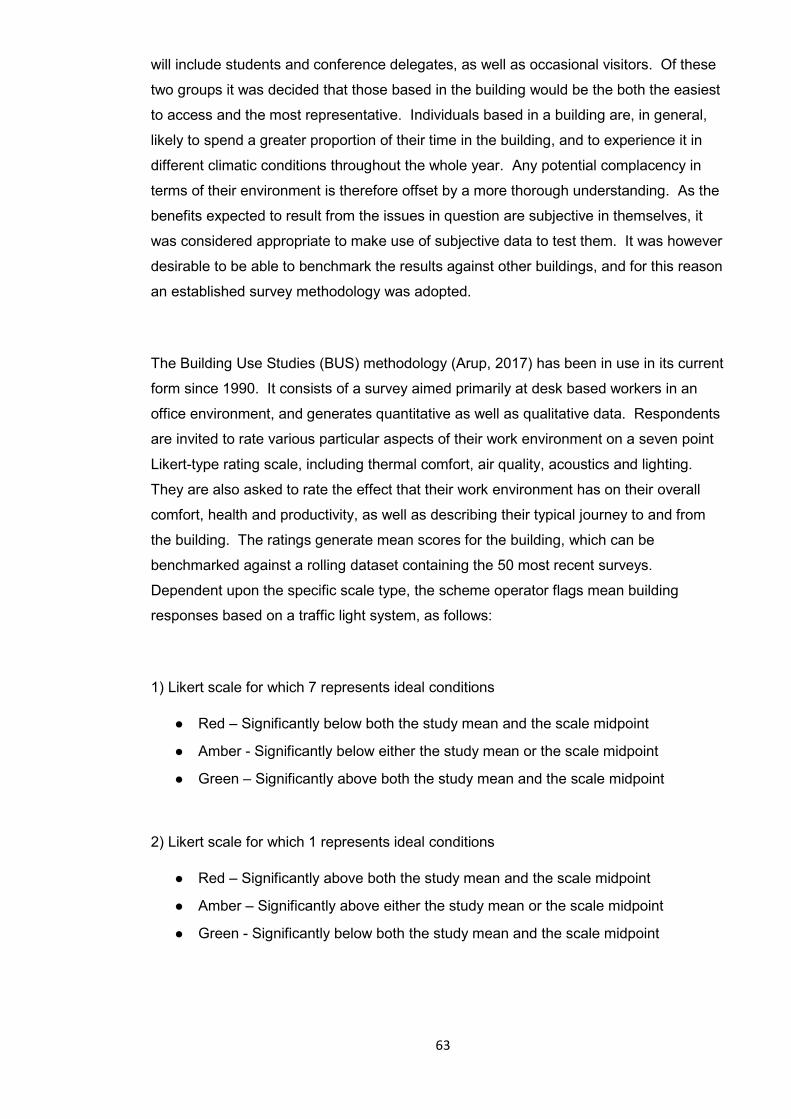
63
will include students and conference delegates, as well as occasional visitors. Of these
two groups it was decided that those based in the building would be the both the easiest
to access and the most representative. Individuals based in a building are, in general,
likely to spend a greater proportion of their time in the building, and to experience it in
different climatic conditions throughout the whole year. Any potential complacency in
terms of their environment is therefore offset by a more thorough understanding. As the
benefits expected to result from the issues in question are subjective in themselves, it
was considered appropriate to make use of subjective data to test them. It was however
desirable to be able to benchmark the results against other buildings, and for this reason
an established survey methodology was adopted.
The Building Use Studies (BUS) methodology (Arup, 2017) has been in use in its current
form since 1990. It consists of a survey aimed primarily at desk based workers in an
office environment, and generates quantitative as well as qualitative data. Respondents
are invited to rate various particular aspects of their work environment on a seven point
Likert-type rating scale, including thermal comfort, air quality, acoustics and lighting.
They are also asked to rate the effect that their work environment has on their overall
comfort, health and productivity, as well as describing their typical journey to and from
the building. The ratings generate mean scores for the building, which can be
benchmarked against a rolling dataset containing the 50 most recent surveys.
Dependent upon the specific scale type, the scheme operator flags mean building
responses based on a traffic light system, as follows:
1) Likert scale for which 7 represents ideal conditions
● Red – Significantly below both the study mean and the scale midpoint
● Amber - Significantly below either the study mean or the scale midpoint
● Green – Significantly above both the study mean and the scale midpoint
2) Likert scale for which 1 represents ideal conditions
● Red – Significantly above both the study mean and the scale midpoint
● Amber – Significantly above either the study mean or the scale midpoint
● Green - Significantly below both the study mean and the scale midpoint
64
3) Likert scale for which 3 represents ideal conditions
● Red – Further departed from the scale midpoint than the study mean
● Amber – Significantly departs from the scale midpoint but betters the study mean
● Green – Does not significantly depart from the scale midpoint
Opportunity is also provided to make qualitative comments, including suggestions for
improvements. This methodology was considered to be manageable in that a single
researcher can typically carry out a full building survey in a single day. It is also
manageable for respondents, who may complete the form within as little as five minutes.
Finally, the survey produces numerical responses which may be quantitatively analysed,
as well as allowing for richer qualitative statements for a number of sections (Arup, 2017;
Turpin-Brookes, 2006). A copy of the survey is appended (Appendix B)
The BUS methodology was used under licence, and as such was conducted in full, and
in accordance with the instructions and suggestions provided. The survey does include
a number of questions not directly relevant to this study, for example questions are
asked in relation to provision of desk space and storage. These comprise around 15%
of the overall questionnaire. This was undesirable from an ethical point of view, as
answering these questions does not directly contribute to the study. It was however only
through the use of a standard questionnaire that responses could be benchmarked, and
omitting these questions would have both invalidated the survey licence, and distorted
the benchmark data for future users. As suggested by the licensee, the surveys were
distributed to staff in person, in paper form. Because of the small number of staff in
Building B, the survey date was arranged specifically to ensure that all staff were
present. For the remaining buildings the surveys were carried out on either Tuesdays or
Wednesdays; these being recommended by the licensee as days for which maximum
attendance is likely in office buildings in general. Given that the case study buildings
were in use by educational establishments, consideration was also given to term times,
with both academic holiday periods and exam periods being avoided. A number of
passes were made through the building across the day, to maximise coverage, this
being particularly helpful in Buildings C and D, where a large proportion of staff were
engaged in teaching and therefore away from their desks for part of the day. In each
case, following the visit, a web version of the survey was distributed by email, in an
attempt to capture those that were not present in the building on the day.
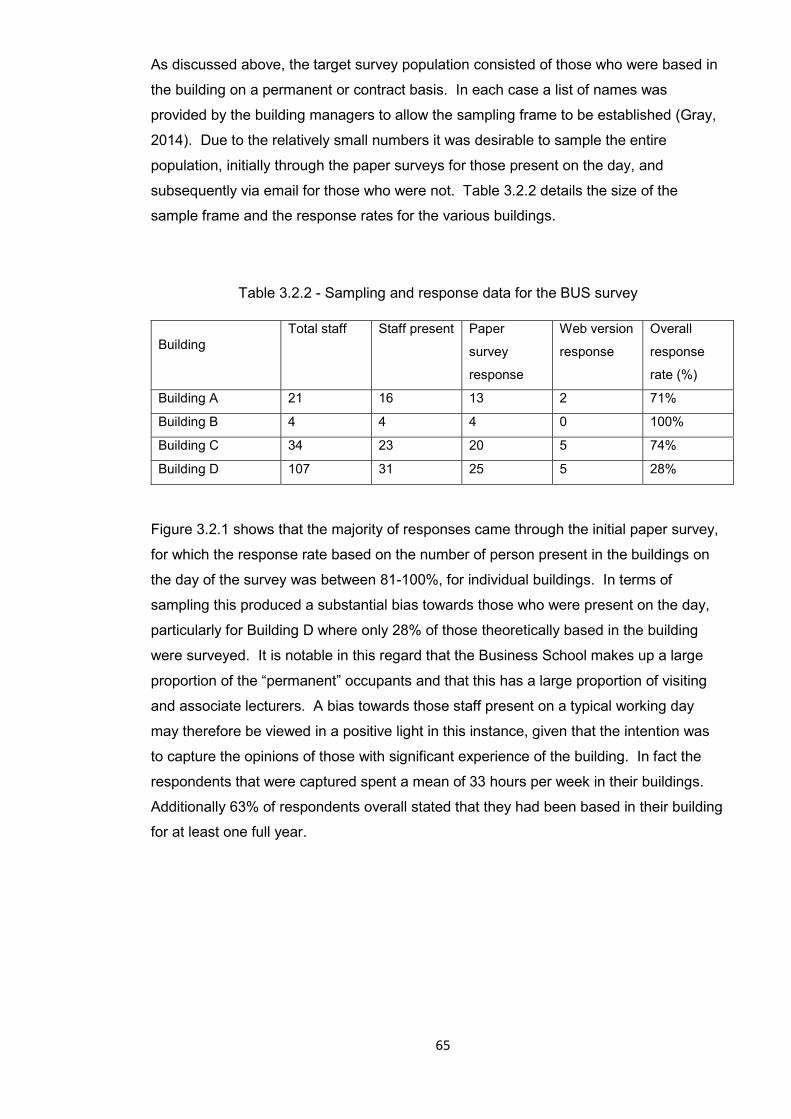
65
As discussed above, the target survey population consisted of those who were based in
the building on a permanent or contract basis. In each case a list of names was
provided by the building managers to allow the sampling frame to be established (Gray,
2014). Due to the relatively small numbers it was desirable to sample the entire
population, initially through the paper surveys for those present on the day, and
subsequently via email for those who were not. Table 3.2.2 details the size of the
sample frame and the response rates for the various buildings.
Table 3.2.2 - Sampling and response data for the BUS survey
Building Total staff Staff present Paper
survey
response
Web version
response
Overall
response
rate (%)
Building A 21 16 13 2 71%
Building B 4 4 4 0 100%
Building C 34 23 20 5 74%
Building D 107 31 25 5 28%
Figure 3.2.1 shows that the majority of responses came through the initial paper survey,
for which the response rate based on the number of person present in the buildings on
the day of the survey was between 81-100%, for individual buildings. In terms of
sampling this produced a substantial bias towards those who were present on the day,
particularly for Building D where only 28% of those theoretically based in the building
were surveyed. It is notable in this regard that the Business School makes up a large
proportion of the “permanent” occupants and that this has a large proportion of visiting
and associate lecturers. A bias towards those staff present on a typical working day
may therefore be viewed in a positive light in this instance, given that the intention was
to capture the opinions of those with significant experience of the building. In fact the
respondents that were captured spent a mean of 33 hours per week in their buildings.
Additionally 63% of respondents overall stated that they had been based in their building
for at least one full year.

66
Figure 3.2.2 – Response data for the BUS survey by building
It should be noted that the samples are relatively small in absolute terms, particularly for
Building B. This is perhaps an inevitable consequence of excluding students from
assessment in buildings where a significant proportion of space is given over to teaching
activity. Care must therefore be taken in analysing the results, although for this study a
smaller number of high quality responses was considered more appropriate than a larger
number of lower quality ones. Finally it should be noted that although benchmarking
increases potential for statistical analysis, the material details of the other buildings in
the set were not divulged. The representativeness of the data cannot therefore be
accurately assessed, and comparisons with buildings in general should be viewed
accordingly.
In practice the survey methodology was straightforward to carry out and the quality of
responses was generally high. A number of respondents did complain however that the
survey was too long, and it appeared to the researcher that it often typically took
considerably longer than the stated minimum of 5 minutes to complete. The layout of
the form also appears to have caused difficulties for some respondents. For example
one particular set of questions relating to control of services is grouped in in a corner of
the page, and was attempted by less than 50% of respondents. Overall however the
survey was invaluable in evaluating a large number of highly relevant factors, in a user
friendly, structured, and resource-efficient manner.
In addition to using survey data to describe the performance of the case study buildings,
it was also possible to interrogate the data to establish possible relationships between
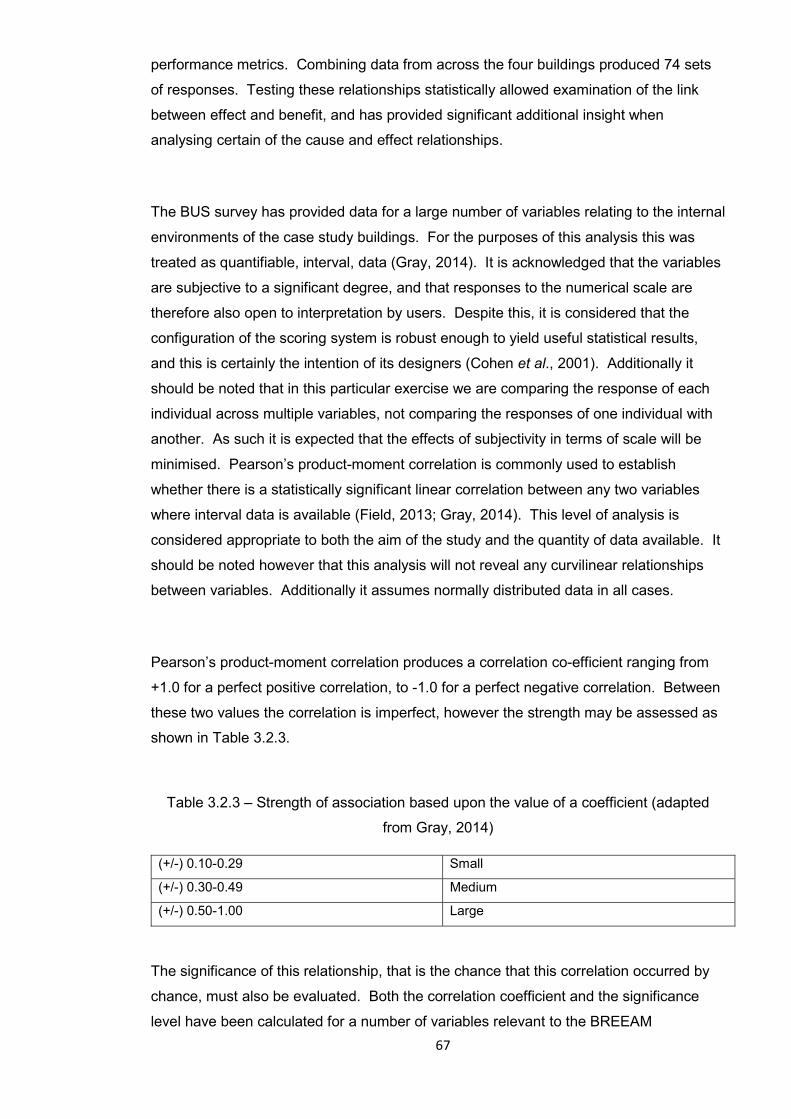
67
performance metrics. Combining data from across the four buildings produced 74 sets
of responses. Testing these relationships statistically allowed examination of the link
between effect and benefit, and has provided significant additional insight when
analysing certain of the cause and effect relationships.
The BUS survey has provided data for a large number of variables relating to the internal
environments of the case study buildings. For the purposes of this analysis this was
treated as quantifiable, interval, data (Gray, 2014). It is acknowledged that the variables
are subjective to a significant degree, and that responses to the numerical scale are
therefore also open to interpretation by users. Despite this, it is considered that the
configuration of the scoring system is robust enough to yield useful statistical results,
and this is certainly the intention of its designers (Cohen et al., 2001). Additionally it
should be noted that in this particular exercise we are comparing the response of each
individual across multiple variables, not comparing the responses of one individual with
another. As such it is expected that the effects of subjectivity in terms of scale will be
minimised. Pearson’s product-moment correlation is commonly used to establish
whether there is a statistically significant linear correlation between any two variables
where interval data is available (Field, 2013; Gray, 2014). This level of analysis is
considered appropriate to both the aim of the study and the quantity of data available. It
should be noted however that this analysis will not reveal any curvilinear relationships
between variables. Additionally it assumes normally distributed data in all cases.
Pearson’s product-moment correlation produces a correlation co-efficient ranging from
+1.0 for a perfect positive correlation, to -1.0 for a perfect negative correlation. Between
these two values the correlation is imperfect, however the strength may be assessed as
shown in Table 3.2.3.
Table 3.2.3 – Strength of association based upon the value of a coefficient (adapted
from Gray, 2014)
(+/-) 0.10-0.29 Small
(+/-) 0.30-0.49 Medium
(+/-) 0.50-1.00 Large
The significance of this relationship, that is the chance that this correlation occurred by
chance, must also be evaluated. Both the correlation coefficient and the significance
level have been calculated for a number of variables relevant to the BREEAM

68
assessment process. The BUS survey produced interval data for 48 variables. Of these
variables the following are not considered to be measured by BREEAM and have
therefore been excluded:
● Cleaning (how do you rate the cleaning?)
● Availability of meeting rooms
● Suitability of storage arrangements
● Furniture (how do you rate the usability of the furniture at your desk or normal
work area?)
● Space at desk (do you have enough space at your desk or normal work area?)
For the purposes of this analysis, it was additionally necessary to exclude those
variables where a midpoint indicates an ideal situation, for example where temperature
is rated from “too cold” to “too hot”. This resulted in the following variable being
excluded:
● Temperature in winter/summer (too hot-too cold)
● Air in winter/summer (still-draughty)
● Air in winter/summer (dry-humid)
● Noise from colleagues/other people/other inside/outside (too little-too much)
● Natural light (too little-too much)
● Artificial light (too little-too much)
Where questions were configured such that a high score indicated a negative the sign of
the scoring was manually reversed, in particular:
● Temperature in winter/summer (stable-varies through the day)
● Air in winter/summer (odourless-stuffy)
● Air in winter/summer (fresh-stuffy)
● Glare from sun and sky (none-too much)
● Glare from artificial lights (none-too much)
These remaining 30 variables were analysed for correlation, using SPSS (Statistical
Package for the Social Sciences) software. 100% of the “large”, and over 96% of the
“medium” correlations are statistically significant, indicating that the sample size was

69
generally large enough to capture these relationships. Note that the non-significant
medium correlations identified relate in all cases to the effectiveness of facilities
management support, a question which only 36 out of the 77 respondents answered.
Of the “small” correlations, however, less than 10% are statistically significant. This
suggests that more responses would be required to usefully examine these weaker
relationships. The results obtained are discussed in detail in section 4.5.2.
Principal component analysis was considered, to analyse whether comfort, health or
productivity could be positively identified as latent variables. The data set of 77
participants was however rather small for these purposes, there being an expectation
that 10-15 participants per variable may be required to produce good results (Field,
2013). Additionally there were a significant number of missing values within responses,
which reduced the data to just 24 complete sets for listwise comparison. Running an
initial analysis using SPSS served to identify a number of variables with very limited
correlation to the wider data set, in particular:
● Temperature stability (both summer and winter)
● Control over services
● Odourlessness of air (both summer and winter)
● Freshness of air in winter
The analysis was re-run without these variables, and whilst the Kaiser-Meyer-Olkin
measure of sampling adequacy of 0.768 suggested a good sampling adequacy overall,
sampling adequacy for the individual variables was below 0.5 in most cases. Excluding
all of these variables would have rendered the output meaningless and the exercise was
therefore abandoned.
3.2.3 Benchmarking
In order to comment on the measured building performance it was necessary to consider
and select appropriate benchmarks for energy consumption, water consumption and
internal environmental quality.
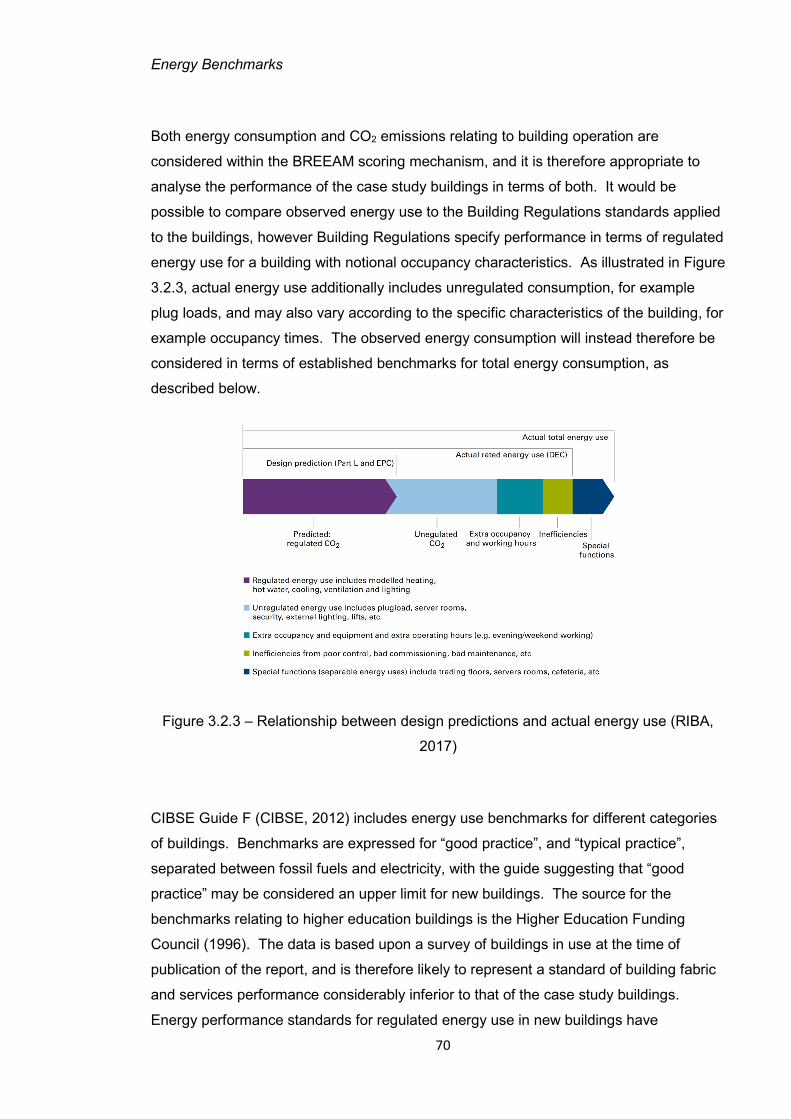
70
Energy Benchmarks
Both energy consumption and CO2 emissions relating to building operation are
considered within the BREEAM scoring mechanism, and it is therefore appropriate to
analyse the performance of the case study buildings in terms of both. It would be
possible to compare observed energy use to the Building Regulations standards applied
to the buildings, however Building Regulations specify performance in terms of regulated
energy use for a building with notional occupancy characteristics. As illustrated in Figure
3.2.3, actual energy use additionally includes unregulated consumption, for example
plug loads, and may also vary according to the specific characteristics of the building, for
example occupancy times. The observed energy consumption will instead therefore be
considered in terms of established benchmarks for total energy consumption, as
described below.
Figure 3.2.3 – Relationship between design predictions and actual energy use (RIBA,
2017)
CIBSE Guide F (CIBSE, 2012) includes energy use benchmarks for different categories
of buildings. Benchmarks are expressed for “good practice”, and “typical practice”,
separated between fossil fuels and electricity, with the guide suggesting that “good
practice” may be considered an upper limit for new buildings. The source for the
benchmarks relating to higher education buildings is the Higher Education Funding
Council (1996). The data is based upon a survey of buildings in use at the time of
publication of the report, and is therefore likely to represent a standard of building fabric
and services performance considerably inferior to that of the case study buildings.
Energy performance standards for regulated energy use in new buildings have

71
increased considerably in the UK during the period following publication; the maximum
elemental wall u-value allowable for new buildings of a wall was, for example, reduced
by 33% between 1995 and 2002 (HMSO, 1995; NBS, 2002) and the overall modelled
regulated energy performance of new buildings was further reduced by 40% between
2002 and 2010 (NBS, 2010). Conversely, although limited data is available to
substantiate this, unregulated energy use, particularly related to plug loads and
information technology in buildings is believed to have increased considerably over the
same period (CIBSE, 2012). Additionally it has not been possible to obtain a copy of the
original report, making an evaluation of the methodology impossible. Notwithstanding
these significant limitations, these benchmarks remain in current use and form the basis
of DEC evaluations as described below. Some relevant benchmarks from CIBSE Guide
F are summarised in Table 3.2.4, however due to the range of uses observed in the
case studies, including a significant amount of circulation space, no attempt has been
made to convert these to an overall building level benchmarks.
Table 3.2.4 – Summary of CIBSE Guide F benchmark values
Good practice Typical practice
Fossil fuels (kWh/m2.yr)
Electricity (kWh/m2.yr)
Fossil fuels (kWh/m2.yr)
Electricity (kWh/m2.yr)
Higher education 1
Lecture room (arts)
100 67 120 76
Lecture room (science)
110 113 132 129
Science laboratory
110 155 132 175
Offices 2
Air conditioned (standard)
97 128 178 226
Naturally vented (open plan)
79 54 151 85
1 Based upon gross floor area 2 Based upon treated floor area (excludes unheated spaces)
CIBSE TM46 2008 (CIBSE, 2008) describes the methodology for calculating the energy
use benchmarks which appear on DEC’s. These benchmarks are based on the data
presented in CIBSE Guide F, however the building categories are somewhat simplified.
Provision is also included for benchmarks for specific buildings to be adjusted for local
weather, and/or exceptionally long occupancy periods. As noted above the benchmarks
are based upon historic information, and whilst considered appropriate for comparing
existing buildings for statutory purposes, they do not take account of recent increases in
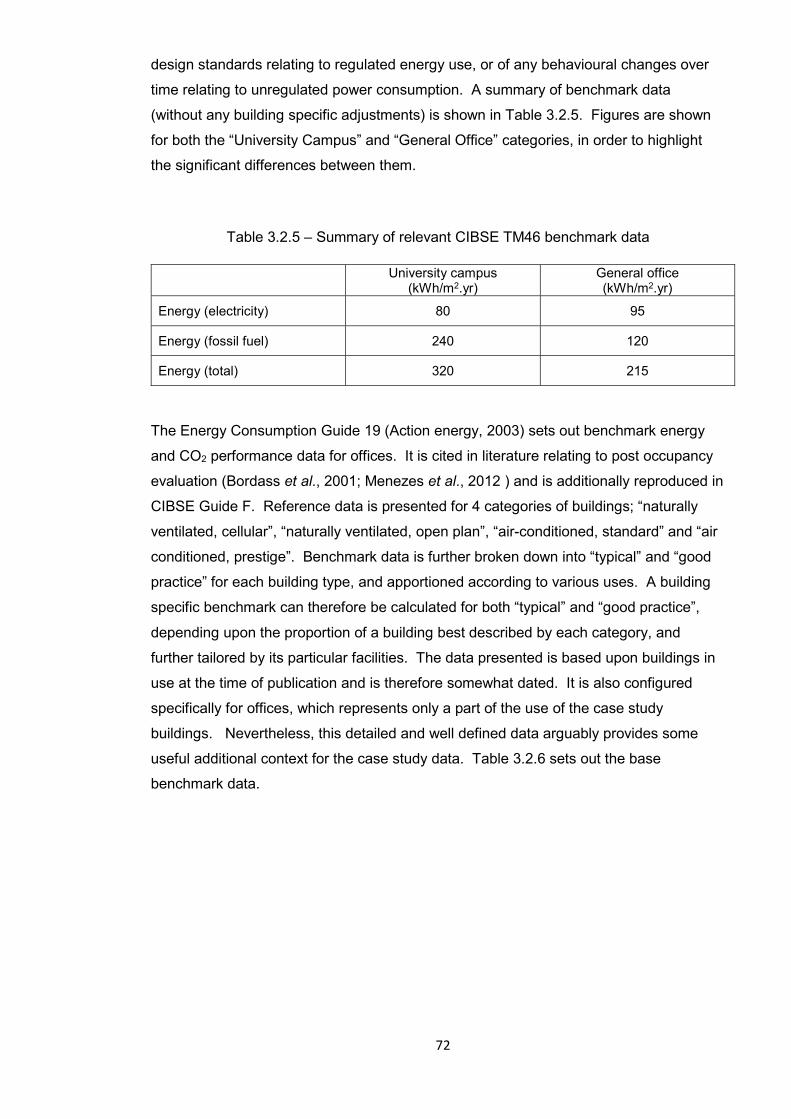
72
design standards relating to regulated energy use, or of any behavioural changes over
time relating to unregulated power consumption. A summary of benchmark data
(without any building specific adjustments) is shown in Table 3.2.5. Figures are shown
for both the “University Campus” and “General Office” categories, in order to highlight
the significant differences between them.
Table 3.2.5 – Summary of relevant CIBSE TM46 benchmark data
University campus
(kWh/m2.yr) General office (kWh/m2.yr)
Energy (electricity) 80 95
Energy (fossil fuel) 240 120
Energy (total) 320 215
The Energy Consumption Guide 19 (Action energy, 2003) sets out benchmark energy
and CO2 performance data for offices. It is cited in literature relating to post occupancy
evaluation (Bordass et al., 2001; Menezes et al., 2012 ) and is additionally reproduced in
CIBSE Guide F. Reference data is presented for 4 categories of buildings; “naturally
ventilated, cellular”, “naturally ventilated, open plan”, “air-conditioned, standard” and “air
conditioned, prestige”. Benchmark data is further broken down into “typical” and “good
practice” for each building type, and apportioned according to various uses. A building
specific benchmark can therefore be calculated for both “typical” and “good practice”,
depending upon the proportion of a building best described by each category, and
further tailored by its particular facilities. The data presented is based upon buildings in
use at the time of publication and is therefore somewhat dated. It is also configured
specifically for offices, which represents only a part of the use of the case study
buildings. Nevertheless, this detailed and well defined data arguably provides some
useful additional context for the case study data. Table 3.2.6 sets out the base
benchmark data.

73
Table 3.2.6 – Summary of Energy Consumption Guide 19 benchmark data for office
buildings
Energy consumption (kWh/m2.yr)
Naturally Ventilated Open Plan
Air Conditioned Standard
Air Conditioned Prestige
Good practice
Typical practice
Good practice
Typical practice
Good practice
Typical practice
Heating and hot water 79 151 97 178 107 210
Cooling 1 2 14 31 21 41
Humidification 0 0 8 18 12 23
Fans pumps controls 4 8 30 60 36 67
Lighting 22 38 27 54 29 60
Office Equipment 20 27 23 31 23 32
Catering, gas 0 0 0 0 7 9
Catering, elec 3 5 5 6 13 15
Other electricity 4 5 7 8 13 15
Computer room 0 0 14 18 87 105
Total fossil fuel 79 151 97 178 114 210
Total electricity 54 85 128 226 234 358
Total energy 133 236 225 404 348 568
The Carbon Buzz project (RIBA, 2017) is a web platform which collects in-use energy
consumption data for existing buildings. Data is uploaded by building users and made
available anonymously, in area weighted form, to others. It is possible to aggregate this
data and thereby obtain a benchmark for a particular building type. As a data source the
website has the significant advantage of reflecting current levels of unregulated energy
use, having been first launched in 2008. It does not however provide any indication of
the age of the buildings surveyed, or the thermal efficiency of their fabric or building
services. The data input process is additionally un-moderated, there is no sampling
strategy, and the reliability of individual contributions is impossible to verify. Generating
benchmark data using Carbon Buzz also proved to be quite problematic in practice, due
to the limitations placed on analysing the data. It appears to be impossible for example
to aggregate energy use by fuel type, despite this being split for individual entries. Also,
although a range of building types are catered for in terms of inputting data, it is not
possible to filter results in the same detail. Hence although “university campus building”
is a building category, results can only be filtered to the level of “education” buildings,
74
which includes a range of other categories including schools. For this reason, results for
both “education” and “office” have been extracted, on the basis that the case study
buildings are arguably as similar to offices as they are to schools. Additionally, both the
education and office data sets included significant outlying results. For example the
education data set included a CO2 result of 697,935 kg/m2.yr as against an average of
around 79kg/m2.yr. As results are presented graphically in the form of a bar chart there
is no ready means to modify the data to exclude these. Additionally the outliers distort
the scale of the graph, and in the case of the value for CO2 noted above this effect was
so extreme that it was impossible to distinguish the other values. Finally it should be
noted that although there is provision for filtering results for other features such as size
and ventilation strategy, these filters appeared to have little or no effect in practice,
suggesting that this data has not been provided for all buildings. Details of the
benchmarks generated using Carbon Buzz are summarised in Table 3.2.7.
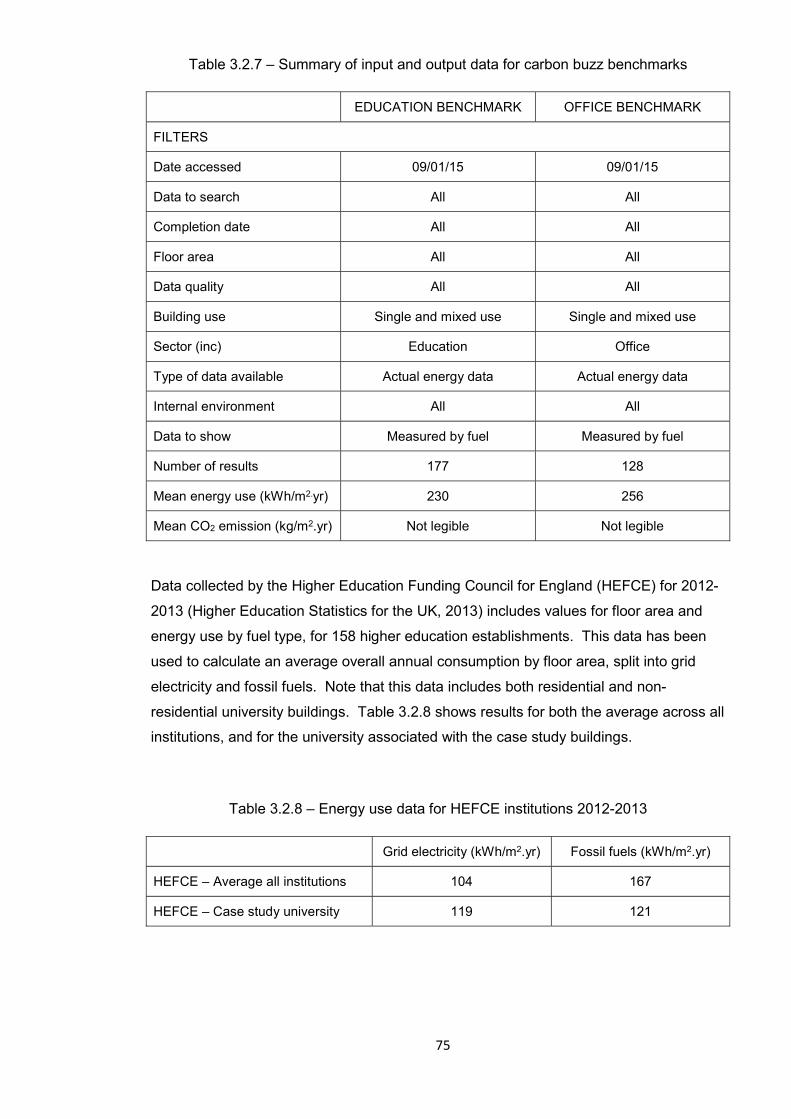
75
Table 3.2.7 – Summary of input and output data for carbon buzz benchmarks
EDUCATION BENCHMARK OFFICE BENCHMARK
FILTERS
Date accessed 09/01/15 09/01/15
Data to search All All
Completion date All All
Floor area All All
Data quality All All
Building use Single and mixed use Single and mixed use
Sector (inc) Education Office
Type of data available Actual energy data Actual energy data
Internal environment All All
Data to show Measured by fuel Measured by fuel
Number of results 177 128
Mean energy use (kWh/m2.yr) 230 256
Mean CO2 emission (kg/m2.yr) Not legible Not legible
Data collected by the Higher Education Funding Council for England (HEFCE) for 2012-
2013 (Higher Education Statistics for the UK, 2013) includes values for floor area and
energy use by fuel type, for 158 higher education establishments. This data has been
used to calculate an average overall annual consumption by floor area, split into grid
electricity and fossil fuels. Note that this data includes both residential and non-
residential university buildings. Table 3.2.8 shows results for both the average across all
institutions, and for the university associated with the case study buildings.
Table 3.2.8 – Energy use data for HEFCE institutions 2012-2013
Grid electricity (kWh/m2.yr) Fossil fuels (kWh/m2.yr)
HEFCE – Average all institutions 104 167
HEFCE – Case study university 119 121

76
Water consumption benchmarks
Predicted water use is considered within the BREEAM scoring mechanism and it is
therefore appropriate to analyse the performance of the case study buildings in this
respect. The metered water consumption described above will therefore be compared to
a number of benchmarks as described below. Benchmark data for water use in
buildings is often stated per person, however occupancy is difficult to define in many
building types, and this is particularly the case for the case study buildings.
Consumption by floor area provides a practical alternative in this instance, with this
approach also being supported by the literature (Construction Industry Research and
Information Association, 2006). The benchmark data from the sources discussed below
is summarised in Table 3.2.9.
Table 3.2.9 – Benchmark data for water consumption
Source Benchmark
(m3/m2.yr)
CIRIA 2006 – Typical office 0.6
CIRIA 2006 – Best practice office 0.4
Watermark report 2003 – Typical higher education 0.62
Watermark report 2003 – Best practice higher education 0.40
HEFC 2014 – Average for all HEFC universities 0.74
HEFC 2014 – Average for case study university 0.33
Water key performance indicators and benchmarks for offices and hotels (CIRIA, 2006)
includes water consumption benchmarks for offices, based upon data obtained from UK
water supply companies for 222 existing large offices in 2002-2003. Although relevant
only to office areas, the report includes a detailed discussion of water benchmarking
techniques and includes thorough statistical analysis of results. Of particular interest is
the finding that for office buildings, water consumption showed an extremely strong
correlation with floor area, with simple linear regression indicating correlation R2 =
0.9875.
The Watermark Report (Office of Government Commerce, 2003) was produced for the
UK government and evaluates water use based upon consumption data obtained from
government buildings. Benchmarks are presented for 15 categories of building,
including higher and further education (based upon 127 buildings).

77
Data collected by the Higher Education Funding Council for 2012-2013 (HESA, 2013)
includes values for non-domestic floor area and non-domestic water use, for 158 higher
education establishments. This data has been used to calculate an average overall
yearly water consumption by floor area.
3.3 Ethical considerations
3.3.1 Ethical principles
Ethical principles applicable to research may be categorised as falling within four main
areas as follows (Gray, 2014):
● Avoid harm to participants
● Ensure informed consent of participants
● Respect the privacy of participants
● Avoid the use of deception
The chosen research methodology requires interaction with a number of participant
organisations and individuals, and a strategy is therefore required to ensure that their
needs are adequately considered. The research design requires that surveys be carried
out with building occupants, and that building managers and facilities managers are
interviewed. All three groups will comprise employees of the organisation operating the
building (there is no requirement to interact with students). Permission was obtained to
invite these individuals to participate from the university estates manager, and from the
senior staff member within each building. By liaising with senior administrative staff
within each building it was further possible to establish that building occupants were in
all cases at least 18 years old, and did not include vulnerable groups of people.
Avoiding harm to participants
Whilst the research design does not present any potential to cause physical harm to
participants, the risk of causing mental distress required consideration. Building
occupants were asked to comment in detail on their work environment, which brings with
it the possibility of consequential criticism or victimisation from others within their
78
organisation. Building managers and facilities managers were asked to comment on
operational matters relating to their work which, similarly, may open them to criticism or
victimisation from others. In either case, both the risk and severity of harm were
considered to be small, and were further reduced by ensuring that responses are
effectively anonymised and securely stored. Survey participants were not therefore
asked to give their names, whilst the identity of building managers and facilities
managers were coded by job title at the point of data collection. The identity of the case
study buildings was similarly coded, and no details have been recorded regarding their
names or specific locations. Following collection, data has been stored on the university
server, being password protected and therefore accessible only to the research team.
The research findings are not expected to be such that disclosing the identity of any of
the organisations involved in the research is either necessary or useful, as the research
is focussed on the application of Building Sustainability Assessment Schemes
themselves.
Overall, such risk as does exist of reputational harm to participating individuals or
organisations is considered to be limited and manageable through appropriate data
collection and handling, and judicious presentation of findings. Whilst not participating
directly, the potential for reputational damage to organisations operating BSAS (and
BREEAM in particular) will also be similarly considered. In the latter case particularly,
the quality of the research will be key to ensuring that any risk is balanced by the
potential for improvement in the application and effectiveness of BSAS, the benefit of
which might reasonably be expected to accrue to these same organisations (Gray 2014).
Informed consent
Informed consent was obtained from all individuals participating in the research. As
there was no need to engage with young or vulnerable participants, the use of printed
participant information sheets and associated consent forms was considered
appropriate. These were supplemented by providing opportunity for discussion with the
researcher in person (before and during data collection), and by subsequently leaving
the researcher’s email and telephone contact details with participants.
79
Participant information sheets were configured to be concise and easy to understand,
and included core essential information, as follows:
● The aims of the research and who is conducting it
● Who is being asked to participate and what will be required of them
● That participation is voluntary and that there is a right of withdrawal
● How the collected data will be stored and anonymised
Participant privacy
Privacy was protected through making it clear through the informed consent process
described above, that participation in the research was voluntary, that responses to
individual questions were voluntary, and that participants had a right of withdrawal at any
time. As described above, all data was anonymised and requests for personal data
were limited to gender and age range. Where survey forms were emailed to
participants, “work” email addresses were used as provided by their employers. Contact
details were not linked to the data collected, or retained by the researcher.
Deception
There was no requirement to employ deception within the research design. The
research aim and methods were clearly and fully described to participants as part of the
informed consent process.
3.3.2 Institutional Ethics Approval
The project was granted approval by the Anglian Ruskin University Faculty of Science
and Technology Research Ethics Panel on 18th April 2013.
80
CHAPTER 4 - RESULTS
This chapter contains a description of the case study buildings, including their location,
function, layout and building services arrangements. The structure of the BREEAM
scheme assessment which has been applied to them is also summarised, following
which the buildings’ performance in terms of energy use, water use and internal
environmental quality is described. Finally the effect that each BREEAM criterion has
had on the buildings is examined by cross referencing the scheme assessment reports
with the physical manifestation of the buildings and their performance in use.
4.1 – Description of Case Study Buildings
This section set out a detailed picture of the physical manifestation of the case study
buildings. This has been produced by means of a desktop study (including review of
architectural design drawings), supplemented where needed by walk through surveys,
building manager interviews and facilities manager interviews.
4.1.1 General building characteristics
The case study buildings are all recently constructed and have a higher education
function, with links to a single university. Buildings A and D are owned and operated by
the university, although they are located on different campuses. Building B operates as
a joint venture between the university and a hospital university trust, and is located on
the hospital site. Building C is a joint venture with a further education college, and is
located on the college campus.
The buildings are located across four sites within a 40km radius, in the East Anglia
region of the UK. The buildings were all procured on a design and build basis, with the
university estates and facilities department assuming the role of project client in each
case. The day to day operation and maintenance of the buildings is however a local
function. Buildings A and D are maintained by the university estates department,
Building B is maintained under a private contract managed by the hospital estates team,
and Building C is maintained by the on-site college facilities management team.
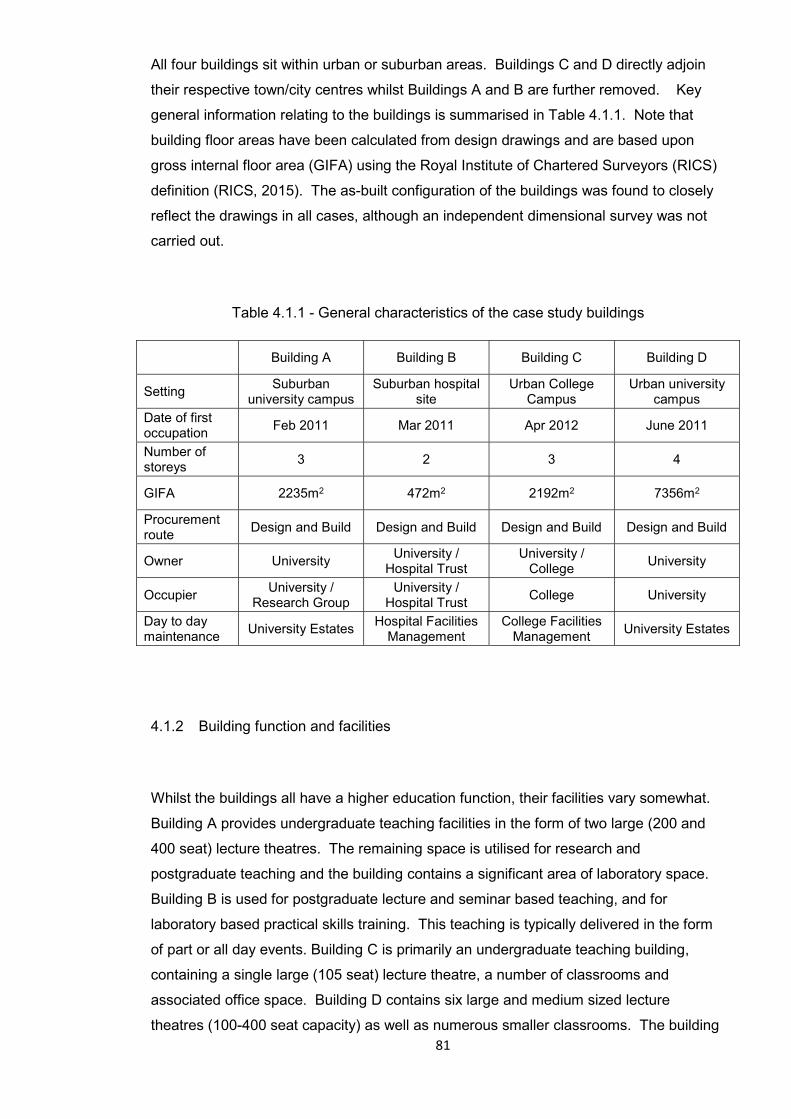
81
All four buildings sit within urban or suburban areas. Buildings C and D directly adjoin
their respective town/city centres whilst Buildings A and B are further removed. Key
general information relating to the buildings is summarised in Table 4.1.1. Note that
building floor areas have been calculated from design drawings and are based upon
gross internal floor area (GIFA) using the Royal Institute of Chartered Surveyors (RICS)
definition (RICS, 2015). The as-built configuration of the buildings was found to closely
reflect the drawings in all cases, although an independent dimensional survey was not
carried out.
Table 4.1.1 - General characteristics of the case study buildings
Building A Building B Building C Building D
Setting Suburban
university campus Suburban hospital
site Urban College
Campus Urban university
campus
Date of first occupation
Feb 2011 Mar 2011 Apr 2012 June 2011
Number of storeys
3 2 3 4
GIFA 2235m2 472m2 2192m2 7356m2
Procurement route
Design and Build Design and Build Design and Build Design and Build
Owner University University /
Hospital Trust University /
College University
Occupier University /
Research Group University /
Hospital Trust College University
Day to day maintenance
University Estates Hospital Facilities
Management College Facilities
Management University Estates
4.1.2 Building function and facilities
Whilst the buildings all have a higher education function, their facilities vary somewhat.
Building A provides undergraduate teaching facilities in the form of two large (200 and
400 seat) lecture theatres. The remaining space is utilised for research and
postgraduate teaching and the building contains a significant area of laboratory space.
Building B is used for postgraduate lecture and seminar based teaching, and for
laboratory based practical skills training. This teaching is typically delivered in the form
of part or all day events. Building C is primarily an undergraduate teaching building,
containing a single large (105 seat) lecture theatre, a number of classrooms and
associated office space. Building D contains six large and medium sized lecture
theatres (100-400 seat capacity) as well as numerous smaller classrooms. The building

82
is used for small conferences and seminars as well as for undergraduate teaching.
There is additionally a large open access IT space within the building, which serves the
campus as a whole. The office space is occupied primarily by the business school and
supports both teaching and research activity. Buildings A, C and D all contain small
commercial café outlets, while Building D also has a medium sized (94m2) commercial
kitchen. All buildings contain domestic scale kitchen/tea point facilities for staff, as well
as sanitary conveniences.
The use of space in the buildings is illustrated in Figure 4.1.1, based upon net room
areas. Teaching space include lecture theatres, classrooms and open access IT suites,
whilst office space includes areas such as meeting rooms. Laboratory space is that
used for practical academic applications, whether for teaching or research purposes.
The proportion of service space is in all cases significant, ranging from 36% in Building A
to 49% in Building C. The latter areas are often discounted by the BREEAM scheme,
which makes use of the term “occupied areas” in its assessment. Occupied area is
defined as “A room or space within the assessed building that is likely to be occupied for
30 minutes or more by a building user” (BRE, 2008a). Figure 4.1.2 therefore also shows
the allocation of space for these “occupied areas”, which excludes circulation and
general service areas, but includes the commercial kitchen in Building D. Figures 4.1.1
and 4.1.2 demonstrate that the four buildings, whilst all having a “university” usage,
display considerable variation in the manner in which they are used by that university.
Figure 4.1.1 Use of space by percentage of total GIFA for case study buildings

83
Figure 4.1.2 Use of “occupied areas” by percentage of total GIFA for case study
buildings
4.1.3 Building setting, configuration and construction
Building A
Building A is a medium sized three storey building. It is situated in a quiet setting on the
edge of a 9 hectare university campus, approximately 1.5km from the nearby city centre.
It is detached and sits in its own modestly sized landscaped area. The building is
broadly cuboid in shape and is of medium weight construction. The building structure is
of steel with a concrete ground floor and composite steel and concrete upper floors. For
the upper floors the building envelope comprises insulated render, fixed to a lightweight
frame, with a concrete blockwork inner leaf. At ground floor, external walls are insulated
cavity blockwork, painted externally and plaster finished internally. Glazed areas are
formed using double glazed aluminium windows, doors and curtain walling. The lecture
theatres are accessible from both the ground and first floors. The ground floor also
contains the café and administrative office areas. The research office and laboratory
spaces are located on the upper floors. A semi-enclosed plant area is located on the
roof. The ground floor plan is shown in Figure 4.1.3 and key construction information is
summarised in Table 4.1.2.
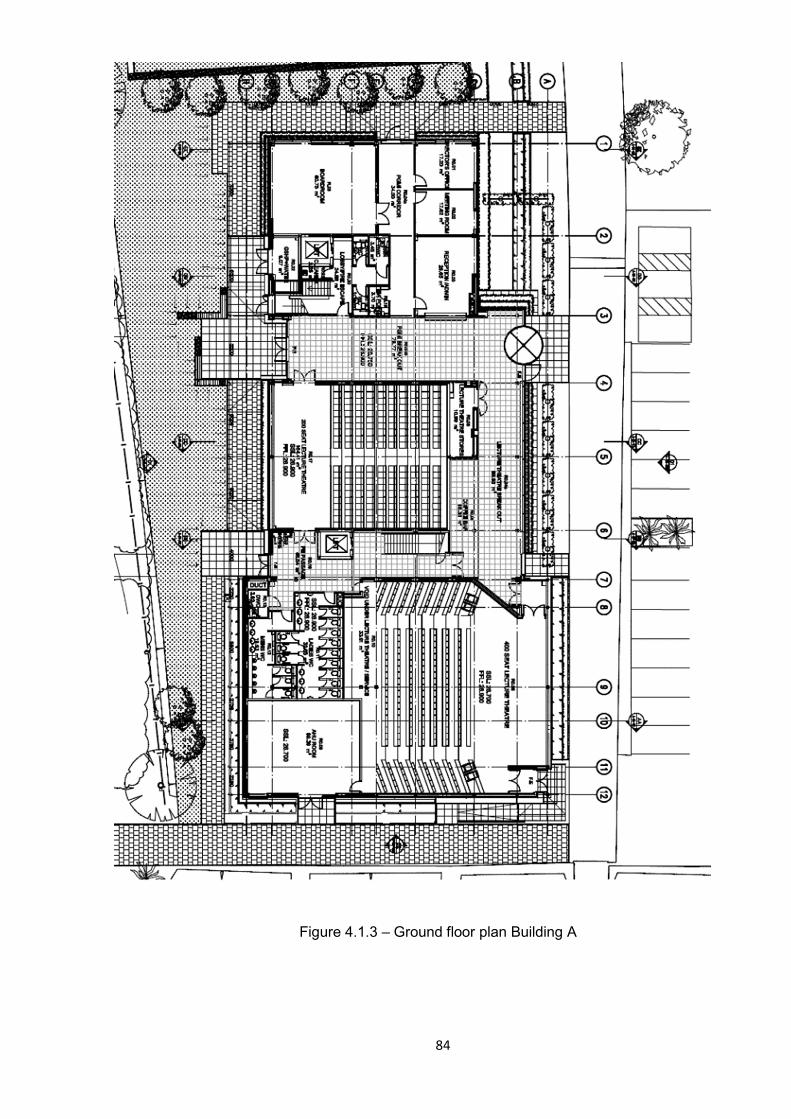
84
Figure 4.1.3 – Ground floor plan Building A
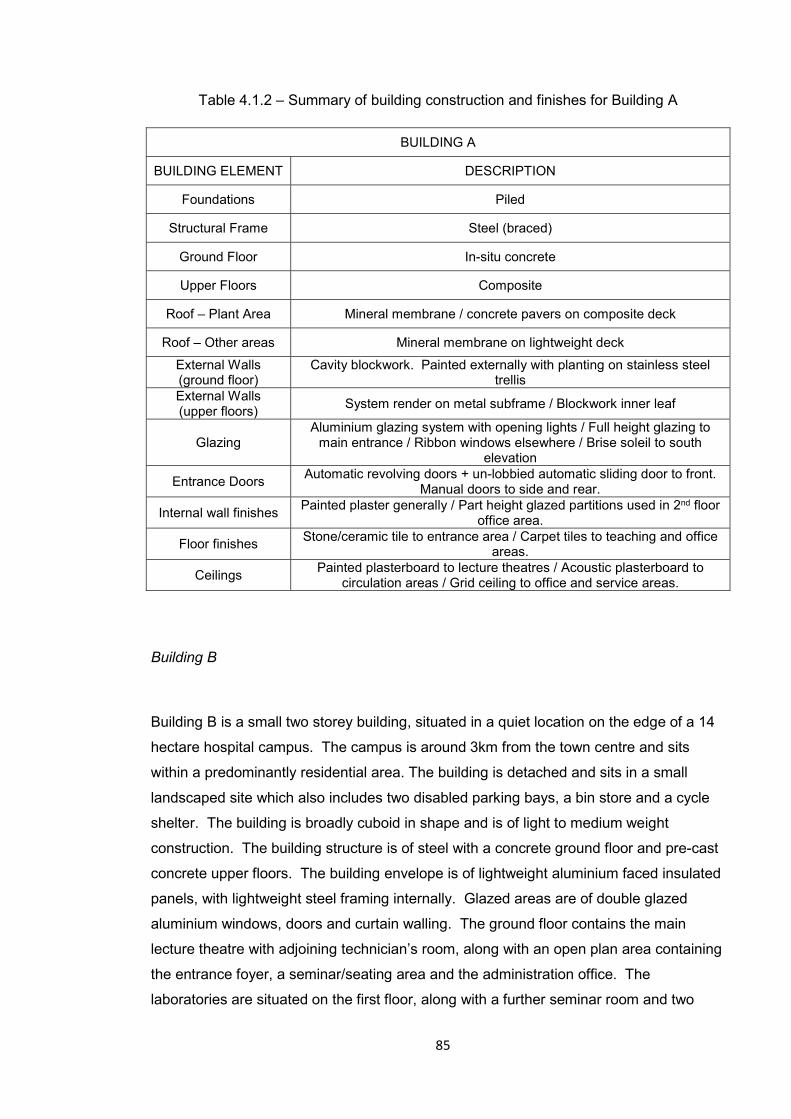
85
Table 4.1.2 – Summary of building construction and finishes for Building A
BUILDING A
BUILDING ELEMENT DESCRIPTION
Foundations Piled
Structural Frame Steel (braced)
Ground Floor In-situ concrete
Upper Floors Composite
Roof – Plant Area Mineral membrane / concrete pavers on composite deck
Roof – Other areas Mineral membrane on lightweight deck
External Walls (ground floor)
Cavity blockwork. Painted externally with planting on stainless steel trellis
External Walls (upper floors)
System render on metal subframe / Blockwork inner leaf
Glazing Aluminium glazing system with opening lights / Full height glazing to
main entrance / Ribbon windows elsewhere / Brise soleil to south elevation
Entrance Doors Automatic revolving doors + un-lobbied automatic sliding door to front.
Manual doors to side and rear.
Internal wall finishes Painted plaster generally / Part height glazed partitions used in 2nd floor
office area.
Floor finishes Stone/ceramic tile to entrance area / Carpet tiles to teaching and office
areas.
Ceilings Painted plasterboard to lecture theatres / Acoustic plasterboard to
circulation areas / Grid ceiling to office and service areas.
Building B
Building B is a small two storey building, situated in a quiet location on the edge of a 14
hectare hospital campus. The campus is around 3km from the town centre and sits
within a predominantly residential area. The building is detached and sits in a small
landscaped site which also includes two disabled parking bays, a bin store and a cycle
shelter. The building is broadly cuboid in shape and is of light to medium weight
construction. The building structure is of steel with a concrete ground floor and pre-cast
concrete upper floors. The building envelope is of lightweight aluminium faced insulated
panels, with lightweight steel framing internally. Glazed areas are of double glazed
aluminium windows, doors and curtain walling. The ground floor contains the main
lecture theatre with adjoining technician’s room, along with an open plan area containing
the entrance foyer, a seminar/seating area and the administration office. The
laboratories are situated on the first floor, along with a further seminar room and two
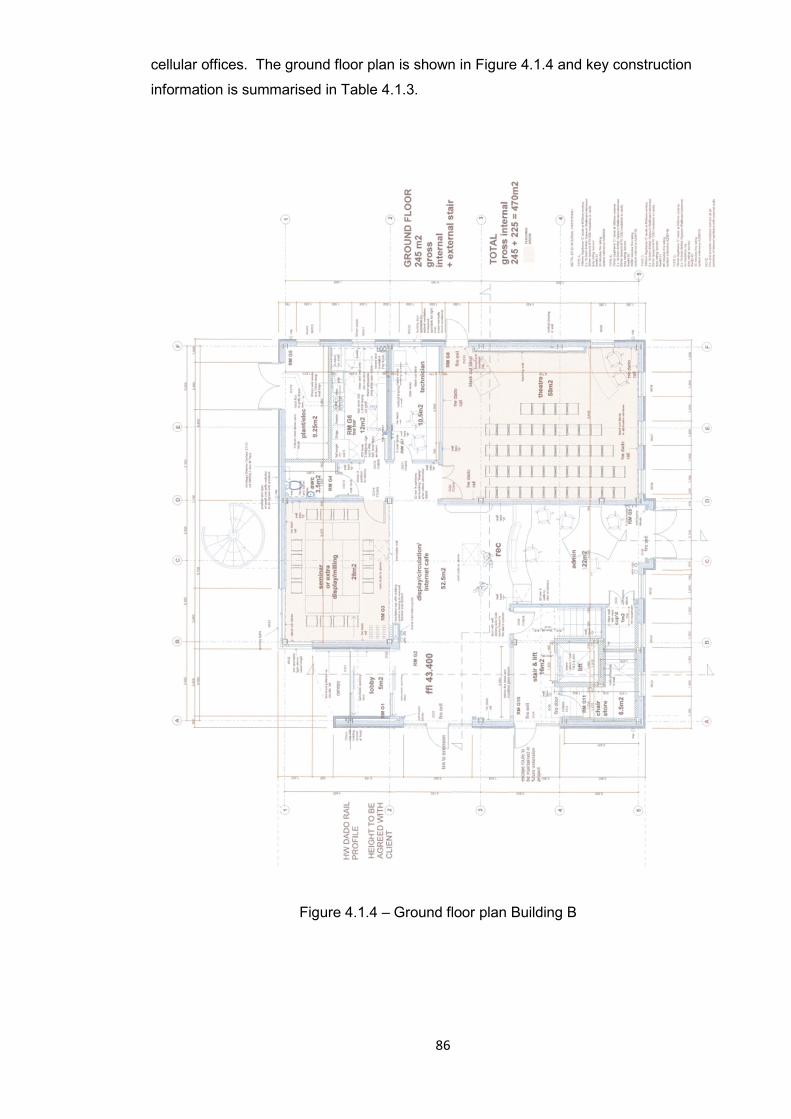
86
cellular offices. The ground floor plan is shown in Figure 4.1.4 and key construction
information is summarised in Table 4.1.3.
Figure 4.1.4 – Ground floor plan Building B
87
Table 4.1.3 – Summary of building construction and finishes for Building B
BUILDING B
BUILDING ELEMENT DESCRIPTION
Foundations Unknown
Structural Frame Steel
Ground Floor In-situ concrete
Upper Floors Precast concrete
Roof Metal standing seam / timber structure
External Walls Insulated composite panel / lightweight steel frame inner leaf.
Glazing Aluminium glazing system with opening lights.
Entrance Doors Automatic lobbied sliding doors to main entrance / Manual doors to side
and rear.
Internal wall finishes Painted plaster / Sliding partition between laboratories.
Floor finishes Stone/ceramic tile to lobby and stairwell / Vinyl to laboratories / Carpet tiles
elsewhere.
Ceilings Grid ceiling throughout.
Building C
Building C is a medium sized three storey building, situated on a further education (FE)
college campus, close to a main road and less than 100m from the nearby town centre.
The building is detached and sits on a tightly constrained site facing the main college car
park, which was re-constructed as part of the project and is included in the BREEAM
assessment. Further temporary car parking exists to the rear. A large cycle shelter is
also indicated on drawings, however this had not been constructed and the area was
vacant at the time of the researcher’s visits. The building is broadly cuboid in shape and
is of relatively heavy weight construction. The building structure is of concrete and steel,
incorporating concrete shear walls. It has a concrete ground floor and pre-cast concrete
upper floors. The building envelope is a combination of standing seam metal cladding
on a lightweight frame to the rear and facing brickwork to the ends, whilst the front
(north) elevation is predominantly glazed. Glazed areas are of double glazed aluminium
windows, doors and curtain walling. The building houses a large lecture theatre
accessible at first and second floor. The entrance foyer is large with a café, open stairs
and a triple height atrium space. Classrooms and office spaces are situated on all
floors. The ground floor plan is shown in Figure 4.1.5 and key construction information
is summarised in Table 4.1.4

88
Figure 4.1.5 - Ground floor plan Building C
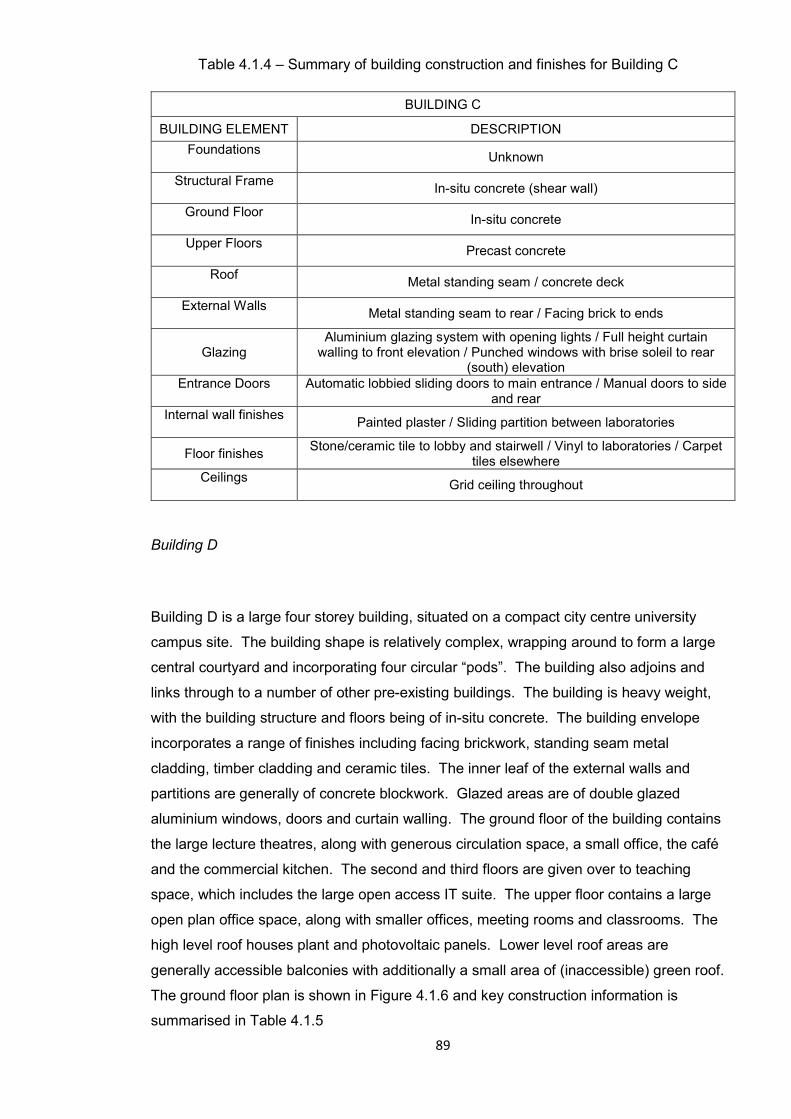
89
Table 4.1.4 – Summary of building construction and finishes for Building C
BUILDING C
BUILDING ELEMENT DESCRIPTION
Foundations
Unknown
Structural Frame
In-situ concrete (shear wall)
Ground Floor
In-situ concrete
Upper Floors
Precast concrete
Roof
Metal standing seam / concrete deck
External Walls
Metal standing seam to rear / Facing brick to ends
Glazing Aluminium glazing system with opening lights / Full height curtain
walling to front elevation / Punched windows with brise soleil to rear (south) elevation
Entrance Doors
Automatic lobbied sliding doors to main entrance / Manual doors to side and rear
Internal wall finishes
Painted plaster / Sliding partition between laboratories
Floor finishes Stone/ceramic tile to lobby and stairwell / Vinyl to laboratories / Carpet
tiles elsewhere Ceilings
Grid ceiling throughout
Building D
Building D is a large four storey building, situated on a compact city centre university
campus site. The building shape is relatively complex, wrapping around to form a large
central courtyard and incorporating four circular “pods”. The building also adjoins and
links through to a number of other pre-existing buildings. The building is heavy weight,
with the building structure and floors being of in-situ concrete. The building envelope
incorporates a range of finishes including facing brickwork, standing seam metal
cladding, timber cladding and ceramic tiles. The inner leaf of the external walls and
partitions are generally of concrete blockwork. Glazed areas are of double glazed
aluminium windows, doors and curtain walling. The ground floor of the building contains
the large lecture theatres, along with generous circulation space, a small office, the café
and the commercial kitchen. The second and third floors are given over to teaching
space, which includes the large open access IT suite. The upper floor contains a large
open plan office space, along with smaller offices, meeting rooms and classrooms. The
high level roof houses plant and photovoltaic panels. Lower level roof areas are
generally accessible balconies with additionally a small area of (inaccessible) green roof.
The ground floor plan is shown in Figure 4.1.6 and key construction information is
summarised in Table 4.1.5

90
Figure 4.1.6 – Ground floor plan Building D
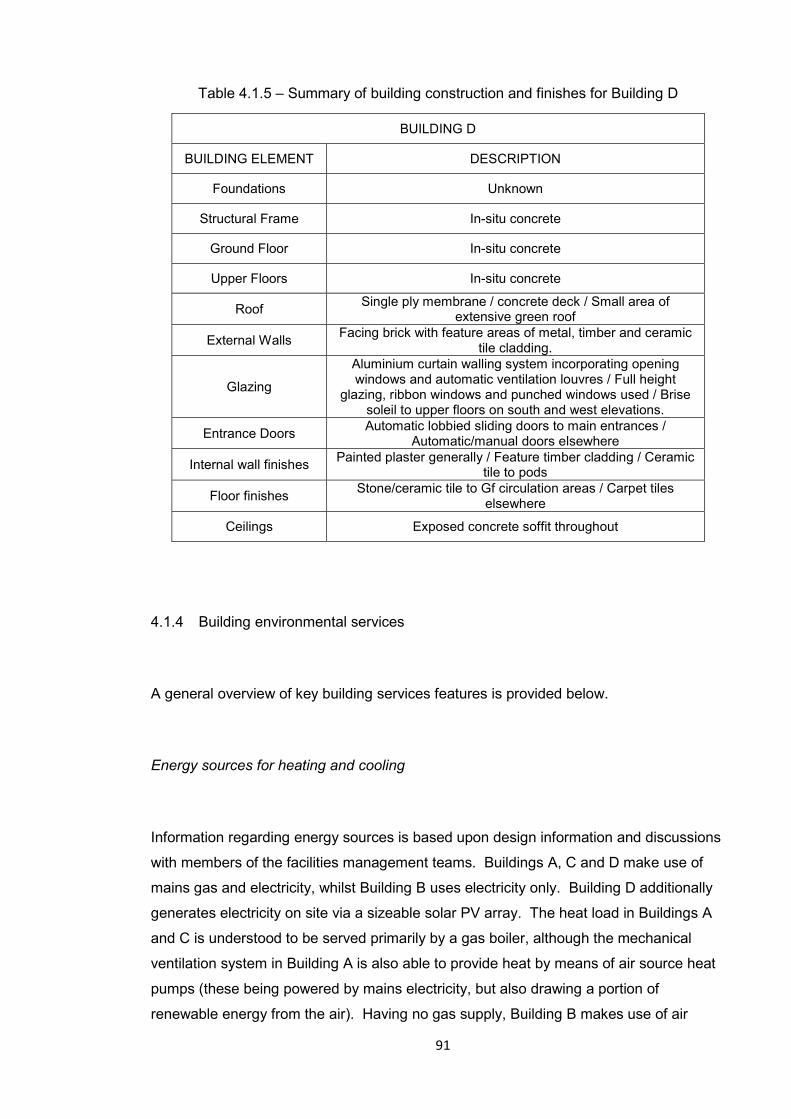
91
Table 4.1.5 – Summary of building construction and finishes for Building D
BUILDING D
BUILDING ELEMENT DESCRIPTION
Foundations Unknown
Structural Frame In-situ concrete
Ground Floor In-situ concrete
Upper Floors In-situ concrete
Roof Single ply membrane / concrete deck / Small area of
extensive green roof
External Walls Facing brick with feature areas of metal, timber and ceramic
tile cladding.
Glazing
Aluminium curtain walling system incorporating opening windows and automatic ventilation louvres / Full height
glazing, ribbon windows and punched windows used / Brise soleil to upper floors on south and west elevations.
Entrance Doors Automatic lobbied sliding doors to main entrances /
Automatic/manual doors elsewhere
Internal wall finishes Painted plaster generally / Feature timber cladding / Ceramic
tile to pods
Floor finishes Stone/ceramic tile to Gf circulation areas / Carpet tiles
elsewhere
Ceilings Exposed concrete soffit throughout
4.1.4 Building environmental services
A general overview of key building services features is provided below.
Energy sources for heating and cooling
Information regarding energy sources is based upon design information and discussions
with members of the facilities management teams. Buildings A, C and D make use of
mains gas and electricity, whilst Building B uses electricity only. Building D additionally
generates electricity on site via a sizeable solar PV array. The heat load in Buildings A
and C is understood to be served primarily by a gas boiler, although the mechanical
ventilation system in Building A is also able to provide heat by means of air source heat
pumps (these being powered by mains electricity, but also drawing a portion of
renewable energy from the air). Having no gas supply, Building B makes use of air
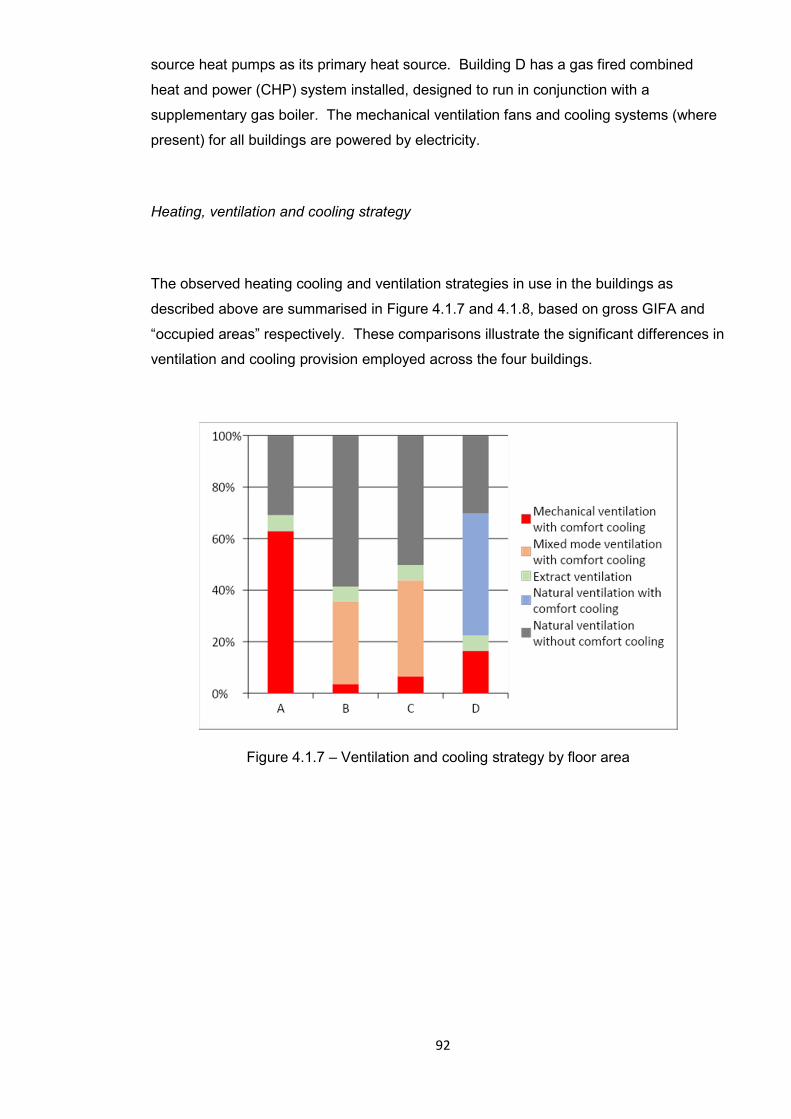
92
source heat pumps as its primary heat source. Building D has a gas fired combined
heat and power (CHP) system installed, designed to run in conjunction with a
supplementary gas boiler. The mechanical ventilation fans and cooling systems (where
present) for all buildings are powered by electricity.
Heating, ventilation and cooling strategy
The observed heating cooling and ventilation strategies in use in the buildings as
described above are summarised in Figure 4.1.7 and 4.1.8, based on gross GIFA and
“occupied areas” respectively. These comparisons illustrate the significant differences in
ventilation and cooling provision employed across the four buildings.
Figure 4.1.7 – Ventilation and cooling strategy by floor area
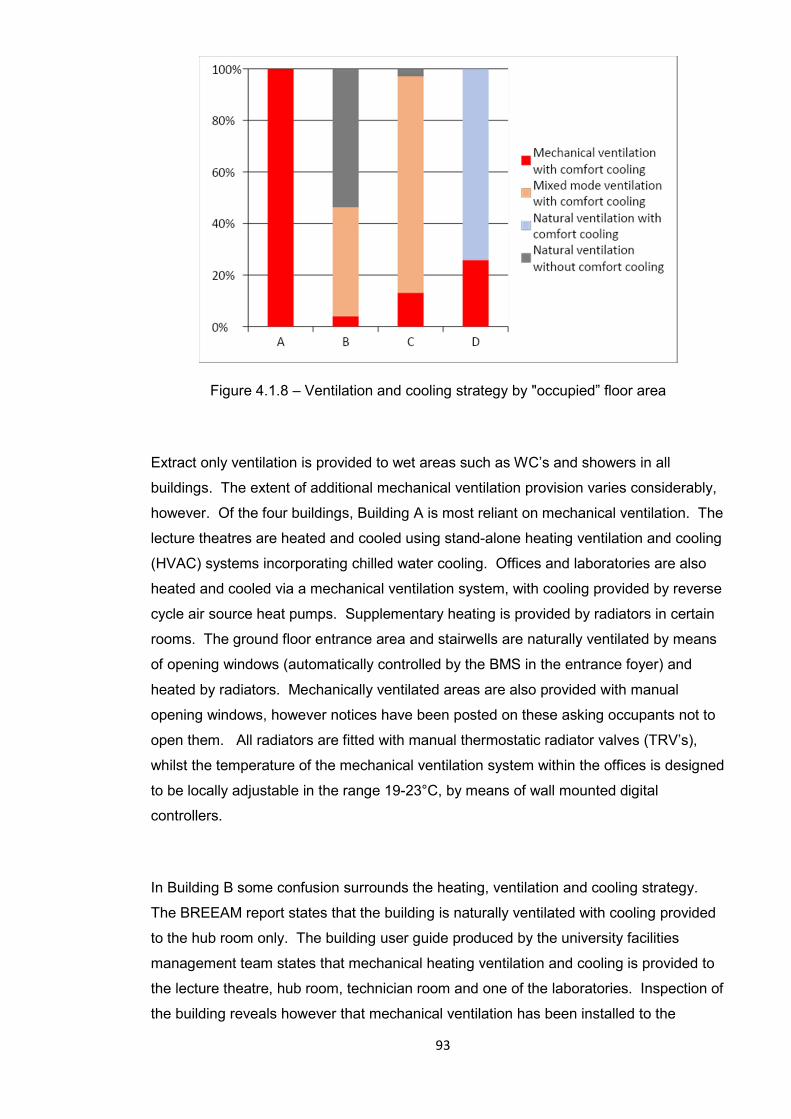
93
Figure 4.1.8 – Ventilation and cooling strategy by "occupied” floor area
Extract only ventilation is provided to wet areas such as WC’s and showers in all
buildings. The extent of additional mechanical ventilation provision varies considerably,
however. Of the four buildings, Building A is most reliant on mechanical ventilation. The
lecture theatres are heated and cooled using stand-alone heating ventilation and cooling
(HVAC) systems incorporating chilled water cooling. Offices and laboratories are also
heated and cooled via a mechanical ventilation system, with cooling provided by reverse
cycle air source heat pumps. Supplementary heating is provided by radiators in certain
rooms. The ground floor entrance area and stairwells are naturally ventilated by means
of opening windows (automatically controlled by the BMS in the entrance foyer) and
heated by radiators. Mechanically ventilated areas are also provided with manual
opening windows, however notices have been posted on these asking occupants not to
open them. All radiators are fitted with manual thermostatic radiator valves (TRV’s),
whilst the temperature of the mechanical ventilation system within the offices is designed
to be locally adjustable in the range 19-23°C, by means of wall mounted digital
controllers.
In Building B some confusion surrounds the heating, ventilation and cooling strategy.
The BREEAM report states that the building is naturally ventilated with cooling provided
to the hub room only. The building user guide produced by the university facilities
management team states that mechanical heating ventilation and cooling is provided to
the lecture theatre, hub room, technician room and one of the laboratories. Inspection of
the building reveals however that mechanical ventilation has been installed to the
94
majority of the ground floor, including the open plan area containing the seminar room,
foyer and administration office. The additional provision was evidenced by grilles in the
ceiling along with a digital controller in the seminar room, which also indicated that the
system was operating. On the first floor there was no evidence of mechanical
ventilation, however the laboratories and seminar room were provided with windcatchers
in addition to opening windows. Control panels were evident for the windcatchers,
however there was no positive indication that they were operational. It should be noted
that the building manager was unaware of the existence of either the mechanical
ventilation in the foyer area, or the windcatchers at first floor, and was instead making
use of opening windows to ventilate these areas. The building has no gas supply and
space heating is generated by air source heat pumps, and delivered both by an
underfloor heating system, and via the mechanical ventilation system where present.
Local temperature control is provided for both the underfloor heating system and the
mechanical ventilation.
In Building C there is also some confusion regarding the servicing strategy. The
BREEAM report states that the building is naturally ventilated with cooling provided to
“localised specialist areas only eg server rooms”. The building user guide supports this,
stating that the building is heated by radiator and trench heating and is “generally
naturally ventilated”, with no mention made of mechanical cooling. Inspection reveals
however that mechanical ventilation is actually provided to the majority of rooms, and
that a temperature control dial is also installed in each of these rooms. Additional heating
is provided by means of trench heating to north facing rooms, and radiators to south
facing rooms and circulation areas. Radiators have been provided with TRV controls,
which appeared to be linked to the BMS in classrooms (manual elsewhere). The large
lecture theatre is provided with a stand-alone mechanical heating ventilation and cooling
system. It should be noted however that manually opening windows were also provided
to most rooms, and were in widespread use on the days of the researcher’s visits,
suggesting a mixed mode ventilation strategy. Several automatically opening windows
were also in evidence to the south elevation of the entrance foyer, and in two cellular
offices at ground floor.
Building D is provided with HVAC for its medium and large teaching spaces, but relies
on natural ventilation elsewhere. This natural ventilation is provided by a combination of
manually opened windows and automatically opening louvers. Trench heating is
provided for the majority of areas, with radiators also used in some stairwells and
lobbies. Chilled beams provide comfort cooling to the naturally ventilated classrooms
95
and offices. The heating, cooling and ventilation louvers are centrally controlled by
means of the BMS, however local override switches are provided for some ventilation
louvers. The building is of concrete frame construction and features exposed soffits
designed to moderate peak summer temperatures through mobilisation of thermal mass.
Lighting
The majority of “occupied” spaces within the case study buildings are provided with
glazing which provides significant potential for natural lighting. Exceptions to this are the
large (200+ seat) lecture theatres in Buildings A, C and D (5 in total), which are either
windowless or have a single small window at high level. The 4 medium sized (100 seat)
lecture theatres in Building D also have reduced window provision (less than 5% of floor
area), as does the dance space, whilst the ground floor office and the commercial
kitchen have no external lighting whatsoever; for the office and kitchen the configuration
of the building makes provision of external windows impossible, however for the lecture
theatres the reduced level of natural lighting appears to be a specific design intention.
Artificial lighting within the buildings is generally achieved by means of ceiling mounted
fittings making use of either compact fluorescent or strip fluorescent bulbs. In Building D
these are incorporated into the chilled beam array where present. The larger lecture
theatres are typically also provided with secondary lighting arrays such as wall washers
and/or low level lighting. Light switching arrangements are a combination of manual
switches and proximity sensors, and are discussed in detail in section 4.3. External
lighting is generally achieved by means of building mounted fittings, with Building C
additionally featuring extensive bollard and column lighting to the car park area.
Hot and cold water services / wastewater
Water and wastewater services are provided in the case study buildings to serve toilet
areas and kitchens. In Building C showers are also provided. A range of water
efficiency measures were evident across the buildings. Buildings B and C make use of
dual flush toilets, Buildings A and D are fitted with waterless urinals and Buildings A, B
and C have washbasin taps controlled by electronic proximity sensors. The buildings
are served by incoming mains water and outgoing mains drainage. Hot water is
96
understood to be generated primarily by means of gas fired boilers in Buildings A, C and
D, and by electricity in Building B. No rainwater or greywater harvesting is in use in the
buildings.
Acoustics
Buildings A and B are situated in relatively quiet campus locations. Building C is
however situated close to an urban dual carriageway and also has a large car park
directly to its front. Building D is situated on a campus, but fronts on to a large and busy
courtyard which forms the main external social space for the site. Resistance to break-in
noise is in all cases provided by the building fabric and therefore has potential to be
significantly compromised in those building areas reliant on natural ventilation.
Noise transfer between rooms is also mitigated by the building fabric. The construction
of internal partitions is understood to be predominantly lightweight (stud partitions) in
Buildings A and B, and medium to heavy weight (concrete blockwork or in-situ reinforced
concrete) in Buildings C and D. Building C also makes use of sliding room dividers in
several locations.
Acoustic reverberation time (and therefore speech intelligibility) are controlled in certain
areas of Building D by acoustic panels suspended from ceilings. This provision is
understood to be required in response to the widespread use of exposed concrete
ceilings in the building. In the remaining buildings ceiling tiles are more normally used,
with dedicated acoustic panelling being used only in large lecture theatres and certain
circulation areas.
4.2 Review of BREEAM scheme characteristics
The case study buildings were assessed using the BREEAM scheme. A description of
BREEAM assessment structure, scoring and ratings therefore follows. This information
has been obtained by direct reference to the BREEAM assessor manuals relating to
each scheme version (BRE, 2006; BRE, 2008; BRE, 2011; BRE, 2014). The scheme
description focuses on BREEAM 2008, as this is most relevant to the case study

97
buildings, however the differences between BREEAM 2008 and other versions are also
discussed.
When assessed under the BREEAM 2008 scheme a building is awarded a “rating
benchmark” depending upon the total % score accrued as follows:
Unclassified <30%
Pass ≥30%
Good ≥45%
Very Good ≥55%
Excellent ≥70%
Outstanding ≥85%
The overall assessment is spilt into nine “environmental sections” as follows, along with
a tenth “innovation section”:
1) Management
2) Health and Wellbeing
3) Energy
4) Transport
5) Water
6) Materials
7) Waste
8) Land Use & Ecology
9) Pollution
10) Innovation

98
Each “section” is in turn split into a number of “issues” numbered as follows:
1) Management - Man 01-12
2) Health and Wellbeing - Hea 01-17
3) Energy - Ene 01-20
4) Transport - Tra 01-08
5) Water - Wat 01-06
6) Materials - Mat 01-07
7) Waste - Wst 01-05
8) Land Use and Ecology - LE 01-08
9) Pollution - Pol 01-08
10) Innovation - Inn 01-10
Each of these issues contains one or more “credits” and each credit has a number of
corresponding “criteria”. Fulfilling the relevant criteria leads to a credit being gained.
Credits are then weighted depending upon which section they are achieved in and the
particular scheme version, to make a contribution to the total score, for example as
shown in Table 4.2.1
Table 4.2.1 – Sectional weightings in BREEAM 2008 Education (BRE, 2008)
SECTION Credits available Section Weighting
Management 10 12%
Health &Wellbeing 14 15%
Energy 21 19%
Transport 10 8%
Water 6 6%
Materials 12 12.5%
Waste 7 7.5%
Land Use & Ecology 10 10%
Pollution 12 10%
Innovation 10 10%
When the appropriate criteria have been fulfilled, evidence must be submitted to a third
party BREEAM assessor. The assessor is employed as part of the project team and has
responsibility for checking compliance and collating evidence which is then submitted to
BRE for final validation. Compliance may be demonstrated both at “design stage”
(leading to an “interim certificate”) and at “post-construction stage” (leading to a “final
certificate”). The design stage assessment is based upon design information, whilst at
post-construction stage additional evidence is collated which is intended to demonstrate
99
that features incorporated at design stage have been implemented at construction stage.
This takes the form of either on-site inspection and a review of construction records. A
certificate may be obtained at either or both stages.
At both design and post-construction stages, weighted credits are totalled to give a
percentage score, which in turn determines the “rating” achieved. In practice however,
the scoring mechanism is rather complicated; note for example that the maximum score
achievable is actually 110%, as the 10% available for innovation is considered additional
to the basic score accrued for the environmental sections. It is also apparent that credits
have different value in different sections, not only because the sections are weighted
overall, but also because there are different numbers of credits making up each section.
In addition some credits apply only to certain building types, so that the number of
credits in each section (and therefore their individual value) also varies depending on the
use of the building, and even the particular facilities it may contain. The overall effect can
be significant, for example for Building A (assessed under BREEAM 2008 Bespoke
scheme) each credit in the Transport section contributed 0.62% to the overall score,
whereas each credit in the waste section contributed 1.25%. Furthermore each issue is
composed of a varying number of credits, and each credit is composed of a varying
number of criteria. For example in the BREEAM 2008 Education scheme issue Man 01
contains two credits determined by a total of 10 criteria. Meanwhile, for issue Ene 01, 15
credits are determined by just three criteria. Finally, in terms of credit selection, users
are free in general to choose using a “balanced scorecard” approach. There are
however a small number of minimum standards relating to particular ratings. These are
credits which must be complied with, for each rating level. The minimum standards for
BREEAM 2008 are as shown in Table 4.2.2.

100
Table 4.2.2 – Minimum standards in BREEAM 2008 (BRE, 2008)
BREEAM Issue
BREEAM Rating / Minimum number of credits
PASS
GOOD
VERY GOOD
EXCELLENT
OUTSTANDING
Man 1 – Commissioning 1 1 1 1 2
Man 2 - Considerate Constructors - - - 1 2
Man 4 - Building user guide - - - 1 1
Man 9 - Publication of building information (BREEAM Education) - - - - 1
Man 10 - Development as a learning resource (BREEAM Education) - - - - 1
Hea 4 - High frequency lighting 1 1 1 1 1
Hea 12 - Microbial contamination 1 1 1 1 1
Ene 1 - Reduction of CO2 emissions - - - 6 10
Ene 2 - Sub-metering of substantial energy uses - - 1 1 1
Ene 5 - Low or zero carbon technologies - - - 1 1
Wat 1 - Water consumption - 1 1 1 2
Wat 2 - Water meter - 1 1 1 1
Wst 3 - Storage of recyclable waste - - - 1 1
LE 4 - Mitigating ecological impact - - 1 1 1
Up until and including BREEAM 2008, schemes were sub-divided depending upon
building type. The bespoke scheme used at this time additionally allowed assessors
flexibility to determine which issues to apply to a particular building, and also allow an
issue to be applied to part of a building on a pro-rata basis. Scoring within the bespoke
versions is therefore further complicated, as there is scope for varying numbers of
credits in each section and for the attainment of partial credits. When BREEAM 2008
was superseded by BREEAM 2011 a single scheme document was introduced which
was applicable to all building types. This greatly reduced the training requirement for
BREEAM assessors, who had previously been obliged to achieve accreditation for each
building type individually. In terms of the assessments themselves however the change

101
was not significant, as differences in the application of individual issues and criteria to
particular building types remained, albeit contained within a single document.
BREEAM 2011 has in turn been superseded by BREEAM 2014, however neither of
these versions arguably represents a significant change in substance or approach.
Individual criteria have been altered in terms of detail, primarily to remain in advance of
statutory standards (in particular the energy efficiency standards contained in Building
Regulations). The scoring framework, certification process and document format have
however remained largely unchanged, as have the many of the criteria themselves.
Some structural difference is however evident between these schemes and the
BREEAM 2006 version. In particular the sections are configured differently, as is the
notation for the individual issues. Detailed analysis reveals however that the content of
the clauses in this scheme is typically extremely similar, and in many cases identical.
The primary effect of these differences occurs within the section weightings, which are
significantly different, however the individual issues, although referenced in a different
way, are generally directly interchangeable with those in BREEAM 2008. The
similarities existing between these versions of BREEAM which relate to new construction
work and major refurbishment work should not be confused with BREEAM In-use, which
was first released in 2009 and is applicable to buildings already in occupation. This
scheme does have significantly different parameters, purpose and application to the
original scheme, and has not therefore considered relevant to this study. In particular
BREEAM in-use is not currently used as a policy tool to influence the design and
construction of new buildings.
The BRE publishes details of BREEAM certificates issued under BREEAM 2008 and
later schemes (BRE, 2017b). Analysis of this data reveals that 5568 BREEAM
certificates have been issued since the scheme’s inception, of which 71% relate to
buildings in the UK. The distribution of ratings is illustrated for all schemes, the bespoke
scheme, and the higher education scheme, respectively (Figures 4.2.1 – 4.2.3). Note
that “other” ratings consist of an amalgamation of “pass”, “unclassified” and “acceptable”.
Overall, “very good” is the most commonly awarded rating, accounting for 58% of all
certificates issued. A similar picture exists for certificates issued under the bespoke
scheme. Within the higher education scheme “excellent” is the most awarded rating
(48%) with “very good” representing 39% of certificates.

102
Figure 4.2.1 – BREEAM certificate ratings issued under BREEAM 2008 and later (all
building types) (BRE, 2017)
Figure 4.2.2 - BREEAM certificate ratings issued under BREEAM 2008 and later
(‘bespoke’ assessments) (BRE, 2017)
Figure 4.2.3 - BREEAM certificate ratings issued under BREEAM 2008 and later (‘higher
education’’ assessments) (BRE, 2017)
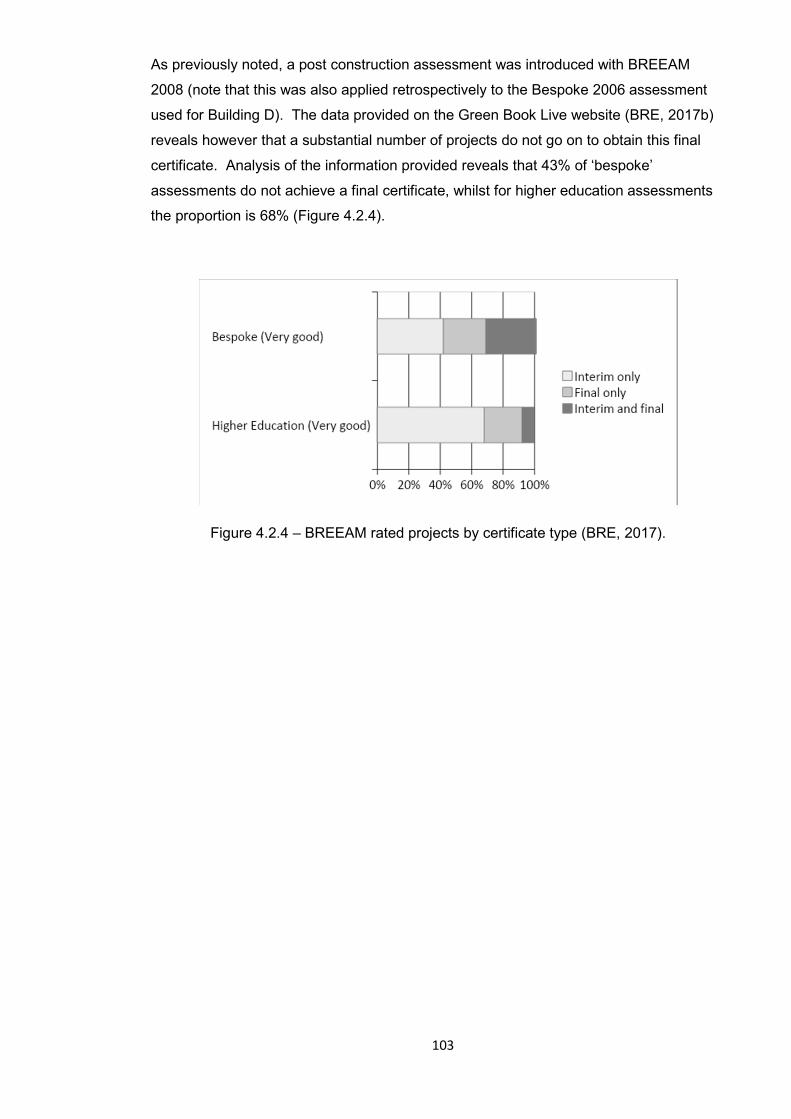
103
As previously noted, a post construction assessment was introduced with BREEAM
2008 (note that this was also applied retrospectively to the Bespoke 2006 assessment
used for Building D). The data provided on the Green Book Live website (BRE, 2017b)
reveals however that a substantial number of projects do not go on to obtain this final
certificate. Analysis of the information provided reveals that 43% of ‘bespoke’
assessments do not achieve a final certificate, whilst for higher education assessments
the proportion is 68% (Figure 4.2.4).
Figure 4.2.4 – BREEAM rated projects by certificate type (BRE, 2017).
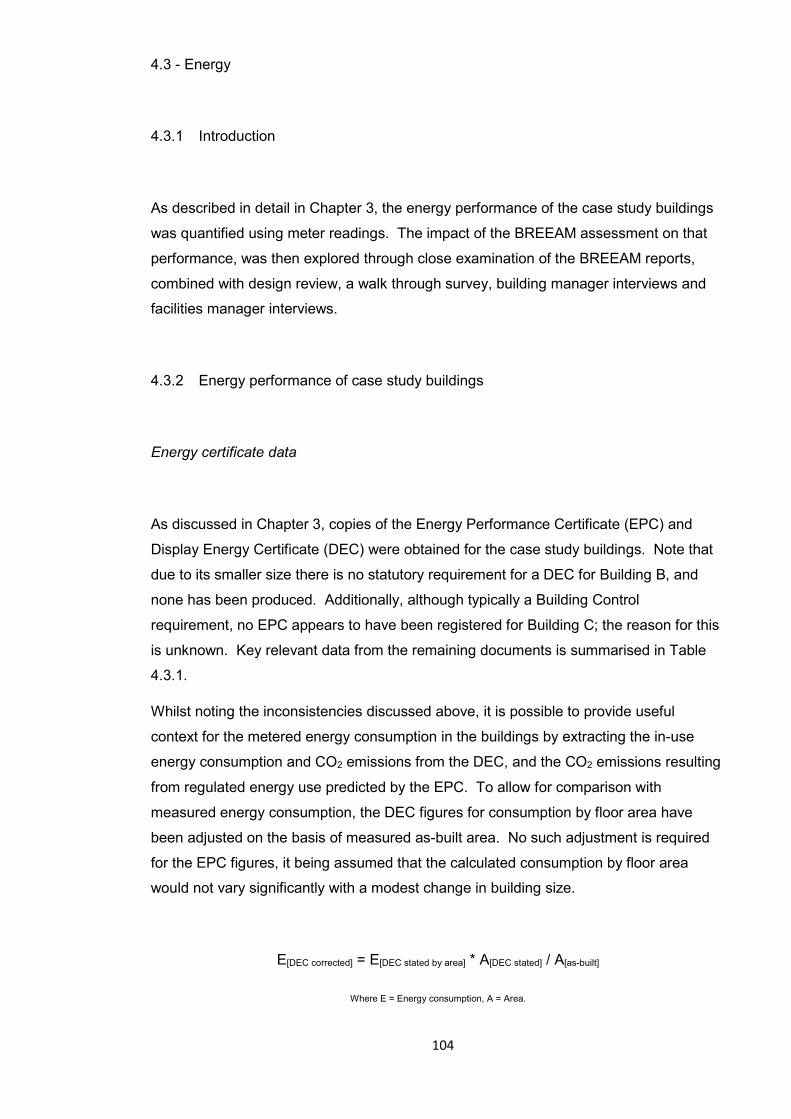
104
4.3 - Energy
4.3.1 Introduction
As described in detail in Chapter 3, the energy performance of the case study buildings
was quantified using meter readings. The impact of the BREEAM assessment on that
performance, was then explored through close examination of the BREEAM reports,
combined with design review, a walk through survey, building manager interviews and
facilities manager interviews.
4.3.2 Energy performance of case study buildings
Energy certificate data
As discussed in Chapter 3, copies of the Energy Performance Certificate (EPC) and
Display Energy Certificate (DEC) were obtained for the case study buildings. Note that
due to its smaller size there is no statutory requirement for a DEC for Building B, and
none has been produced. Additionally, although typically a Building Control
requirement, no EPC appears to have been registered for Building C; the reason for this
is unknown. Key relevant data from the remaining documents is summarised in Table
4.3.1.
Whilst noting the inconsistencies discussed above, it is possible to provide useful
context for the metered energy consumption in the buildings by extracting the in-use
energy consumption and CO2 emissions from the DEC, and the CO2 emissions resulting
from regulated energy use predicted by the EPC. To allow for comparison with
measured energy consumption, the DEC figures for consumption by floor area have
been adjusted on the basis of measured as-built area. No such adjustment is required
for the EPC figures, it being assumed that the calculated consumption by floor area
would not vary significantly with a modest change in building size.
E[DEC corrected] = E[DEC stated by area] * A[DEC stated] / A[as-built]
Where E = Energy consumption, A = Area.
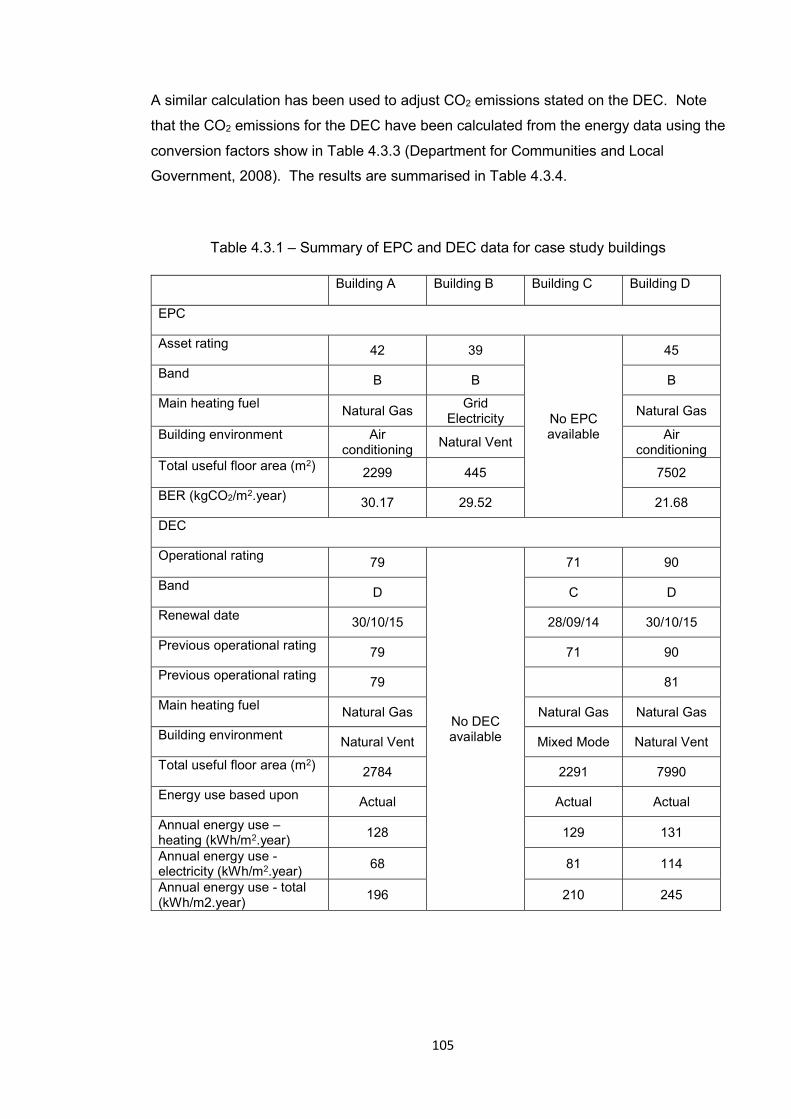
105
A similar calculation has been used to adjust CO2 emissions stated on the DEC. Note
that the CO2 emissions for the DEC have been calculated from the energy data using the
conversion factors show in Table 4.3.3 (Department for Communities and Local
Government, 2008). The results are summarised in Table 4.3.4.
Table 4.3.1 – Summary of EPC and DEC data for case study buildings
Building A Building B Building C Building D
EPC
Asset rating 42 39
No EPC available
45
Band B B B
Main heating fuel Natural Gas
Grid Electricity
Natural Gas
Building environment Air conditioning
Natural Vent Air
conditioning Total useful floor area (m2) 2299 445 7502
BER (kgCO2/m2.year) 30.17 29.52 21.68
DEC
Operational rating 79
No DEC available
71 90
Band D C D
Renewal date 30/10/15 28/09/14 30/10/15
Previous operational rating 79 71 90
Previous operational rating 79 81
Main heating fuel Natural Gas Natural Gas Natural Gas
Building environment Natural Vent Mixed Mode Natural Vent
Total useful floor area (m2) 2784 2291 7990
Energy use based upon Actual Actual Actual
Annual energy use – heating (kWh/m2.year)
128 129 131
Annual energy use - electricity (kWh/m2.year)
68 81 114
Annual energy use - total (kWh/m2.year)
196 210 245

106
Table 4.3.2 – Floor areas for case study buildings obtained from various sources
Floor area (m2) Building A Building B Building C Building D
EPC (TUFA) 2299 445 - 7502
DEC (TUFA) 2784 - 2291 7990
As-built drawings (TUFA)
2235 472 2192 7356
Note: TUFA = Total Useful Floor Area
Table 4.3.3 – Fuel conversion factors
Fuel CO2 conversion factor (kgCO2/kWh)
Grid electricity 0.550
Natural gas 0.194
Table 4.3.4 – Energy consumption and CO2 emissions data obtained from energy
certificates
Source Building A Building B Building C Building D
Energy (kWh/m2/yr)
DEC (Gas) 159 N/A 135 131
DEC (Electricity) 85 N/A 85 114
DEC (Total) 244 N/A 219 275
C02 (kg/m2/yr)
EPC (Total) 30 31 N/A 21
DEC (Gas) 31 N/A 26 25
DEC (Electricity) 47 N/A 47 63
DEC (Total) 78 N/A 73 88

107
Measured energy consumption data
As discussed above, metered gas and electricity consumption data was obtained for all
buildings. Unfortunately the fiscal electricity meter for Building D serves multiple
buildings and it was not initially possible to obtain measurements, although as described
below, sub-metering was later installed for this building. The available data is
summarised in Table 4.3.5, expressed in terms of yearly consumption per square metre
of floor area. For consistency, the “as-built” treated floor areas listed in Table 4.3.2 have
been used to calculate these figures. The monitoring period was 01/08/12 to 31/07/13.
This period was selected as it represents a full year period for which data is available for
Buildings A, B and C and during which time all buildings are understood to have been
fully occupied and in normal use. Recorded degree days for heating (15.5°C) over this
period were 2380 (BizEE, 2016), representing 97% of the 20 year running average
provided for normalisation (Vesma, 2016). This indicates a broadly typical period in
terms of heating load, and no normalisation of data has therefore been carried out. CO2
emissions have been calculated using the fuel conversion factors in Table 4.3.3.
Table 4.3.5 – Metered energy consumption and associated emissions data (01/08/12-31/07/13)
Fuel Building A Building B Building C Building D
Energy consumption
Gas (kWh/m2/yr) 178 N/A 198 151
Electricity (kWh/m2/yr) 191 199 90 Unknown
Total (kWh/m2/yr) 369 199 288 Unknown
CO2 emissions
Gas (kg/m2/yr) 34 N/A 38 29
Electricity (kg/m2/yr) 105 109 49 Unknown
Total (kg/m2/yr) 140 109 88 Unknown
Figures 4.3.1-4.3.4 illustrate the monthly electricity and gas consumption pattern for
each building. Data is presented for the core monitoring period, with data outside of this
period also shown in grey where available, to provide context. Buildings A and C show a
relatively even use of electricity through the year, with gas use varying seasonally. The
lack of increase in electricity use in summer indicates that the mechanical cooling
believed to be installed in these buildings may not be being used extensively. There is

108
however a general increase in electricity use in Building C year on year, with usage over
the monitoring period being just 72% of that in the following year. Building B is
electrically heated and displays a seasonal variation which suggesting that around half
of energy use may be related to this. Gas use for Building D also shows the expected
seasonal variation, but additionally includes a significant spike in February 2013 which is
not apparent for the other buildings. The facilities management team were unable to
offer a specific explanation for this, although they did cite various ongoing difficulties with
correct operation of the CHP plant, which is gas-fired. As previously noted no
electricity data is available for Building D, for this period.
Figure 4.3.1 – Metered electricity and gas consumption for Building A
Figure 4.3.2 - Metered electricity consumption for Building B (no gas installed)
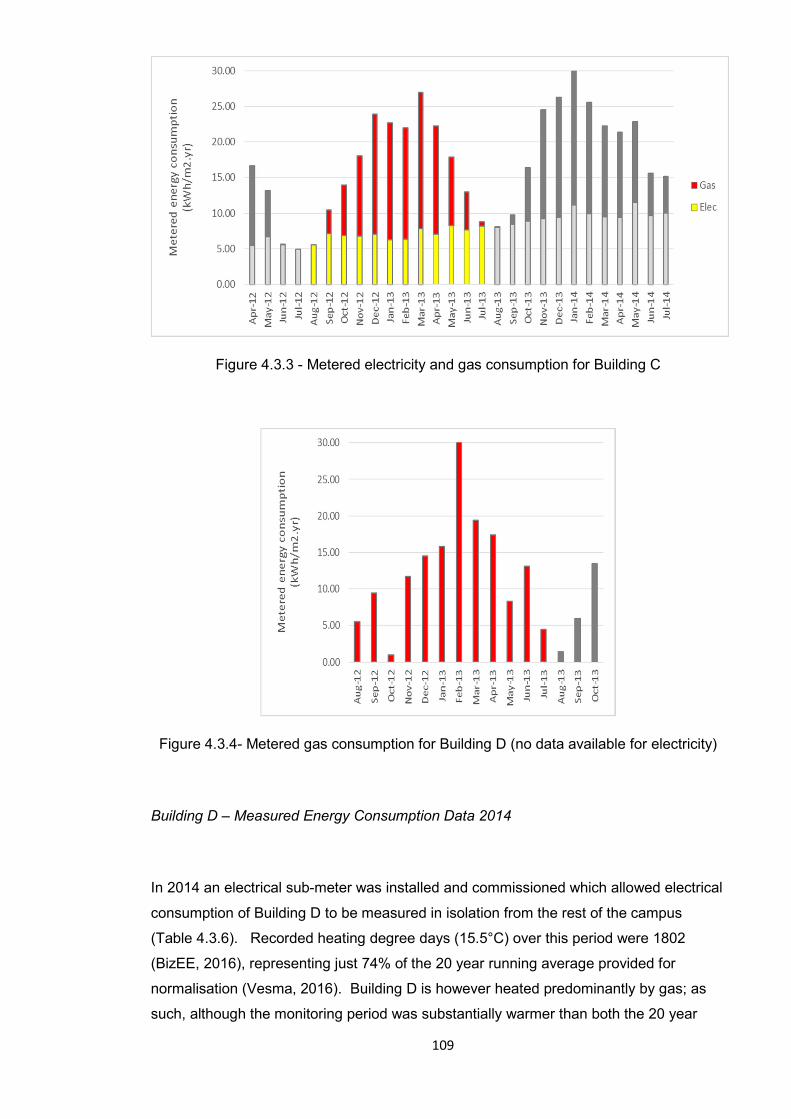
109
Figure 4.3.3 - Metered electricity and gas consumption for Building C
Figure 4.3.4- Metered gas consumption for Building D (no data available for electricity)
Building D – Measured Energy Consumption Data 2014
In 2014 an electrical sub-meter was installed and commissioned which allowed electrical
consumption of Building D to be measured in isolation from the rest of the campus
(Table 4.3.6). Recorded heating degree days (15.5°C) over this period were 1802
(BizEE, 2016), representing just 74% of the 20 year running average provided for
normalisation (Vesma, 2016). Building D is however heated predominantly by gas; as
such, although the monitoring period was substantially warmer than both the 20 year
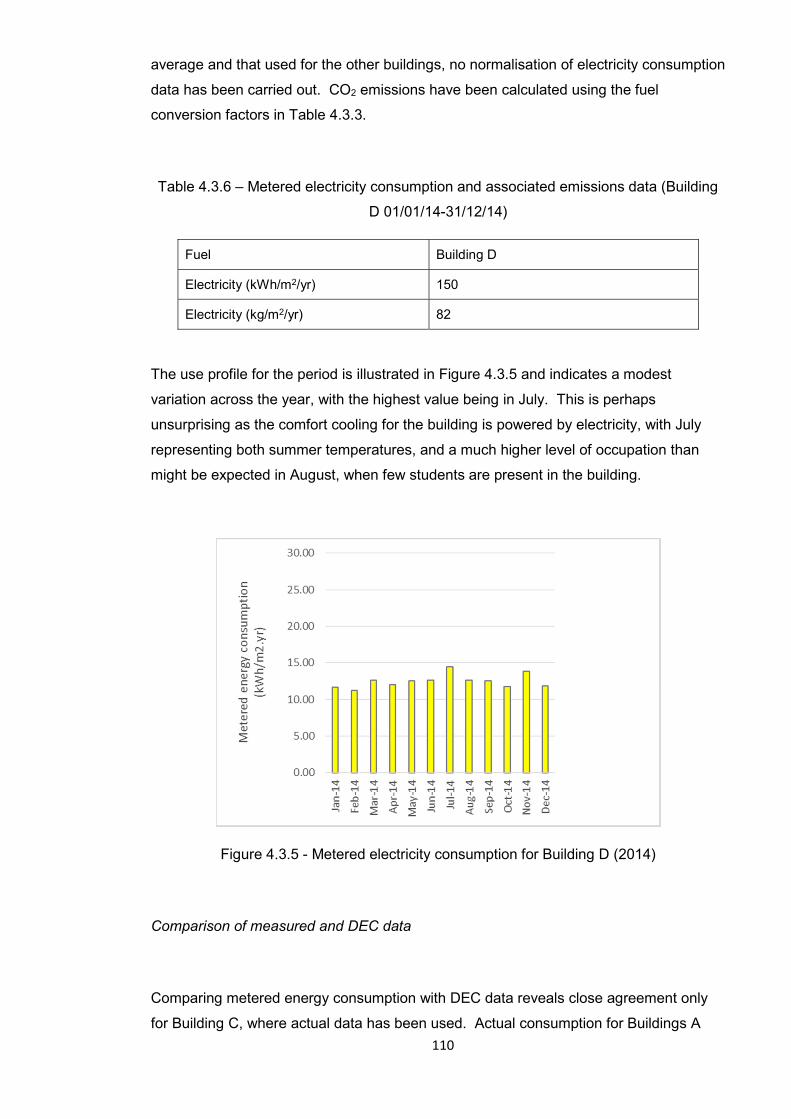
110
average and that used for the other buildings, no normalisation of electricity consumption
data has been carried out. CO2 emissions have been calculated using the fuel
conversion factors in Table 4.3.3.
Table 4.3.6 – Metered electricity consumption and associated emissions data (Building
D 01/01/14-31/12/14)
Fuel Building D
Electricity (kWh/m2/yr) 150
Electricity (kg/m2/yr) 82
The use profile for the period is illustrated in Figure 4.3.5 and indicates a modest
variation across the year, with the highest value being in July. This is perhaps
unsurprising as the comfort cooling for the building is powered by electricity, with July
representing both summer temperatures, and a much higher level of occupation than
might be expected in August, when few students are present in the building.
Figure 4.3.5 - Metered electricity consumption for Building D (2014)
Comparison of measured and DEC data
Comparing metered energy consumption with DEC data reveals close agreement only
for Building C, where actual data has been used. Actual consumption for Buildings A

111
and D is significantly higher than that reported for the DEC, particularly for electricity use
in Building A. This appears to be due to the means of calculating the consumption used
to generate the DEC’s, which the estates management team confirmed is based upon
area weighted data for the campus as a whole and is not therefore representative of any
particular building. Given the observed discrepancies and the lack of clarity regarding
information sources, the DEC energy consumption data will not be considered further.
Metered consumption will instead be used to evaluate the performance of the buildings.
Figure 4.3.6 – Comparison of metered energy consumption with DEC data
Performance of buildings against energy and CO2 emissions benchmarks
The energy consumption and carbon emissions benchmarks discussed in Chapter 3 are
summarised in Table 4.3.7. Figures 4.3.7 and 4.3.8 compare the metered energy
consumption and CO2 emissions for the case study buildings with these benchmarks. In
terms of existing buildings generally it can be seen that there is broad agreement
between the energy consumption data collected by HEFCE and that collected by Carbon
Buzz. Comparing the HEFCE data of 2012-2013 with the CIBSE TM46 benchmark for

112
University Campus buildings based on data from 1996, the HEFCE data is indicating
greater electricity consumption, but only 50% of the gas use. This is perhaps
unsurprising given that, as discussed Chapter 3, increases in building fabric and
services efficiency standards over this time would be expected to considerably reduce
heating load, whilst an increased density of computing equipment over the same period
may be expected to increase electricity use. In terms of the ECG 19 benchmarks the
average HEFCE building is showing a similar split between electricity and fossil fuels as
a “typical” naturally ventilated office (approximately 35:65), with consumption overall
being around 15% higher for the HEFCE data.
Table 4.3.7 – Summary of energy consumption and CO2 emissions benchmark data
Benchmark Electricity (kWh/m2yr)
Fossil fuel (kWh/m2
yr)
Total (kWh/m2
yr)
CO2 (Kg/m2.yr)
CIBSE TM46 - University campus 80 240 320 91
CIBSE TM46 - General office 95 120 215 76
ECG 19 - NV open plan office (typical) 85 151 236 76
ECG 19 - NV open plan office (good practice)
54 79 133 45
ECD 19 - AC standard office (typical) 226 178 404 159
ECD 19 - AC standard office (good practice)
128 97 225 89
Carbon buzz - Education Unknown Unknown 230 Unknown
Carbon buzz - Office Unknown Unknown 256 Unknown

113
Figure 4.3.7 – Metered energy consumption for case study buildings compared with
relevant benchmarks
Figure 4.3.8 – Metered carbon emissions for case study buildings compared with EPC
values and relevant benchmarks
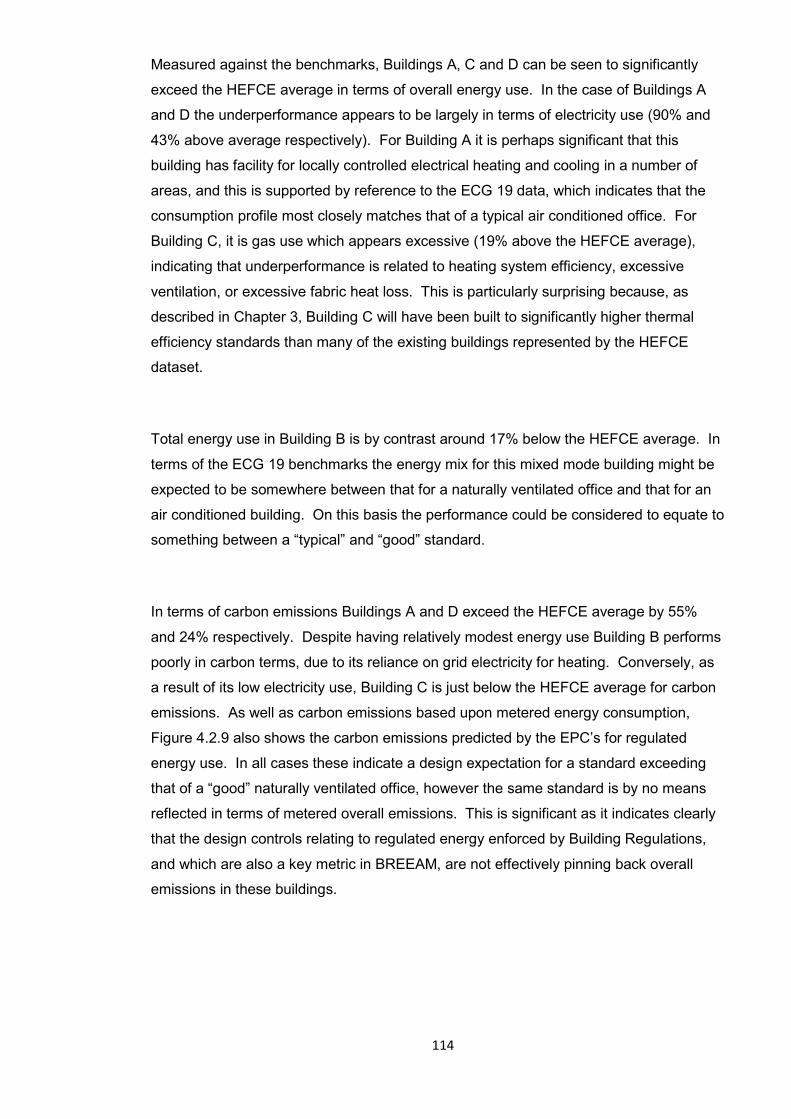
114
Measured against the benchmarks, Buildings A, C and D can be seen to significantly
exceed the HEFCE average in terms of overall energy use. In the case of Buildings A
and D the underperformance appears to be largely in terms of electricity use (90% and
43% above average respectively). For Building A it is perhaps significant that this
building has facility for locally controlled electrical heating and cooling in a number of
areas, and this is supported by reference to the ECG 19 data, which indicates that the
consumption profile most closely matches that of a typical air conditioned office. For
Building C, it is gas use which appears excessive (19% above the HEFCE average),
indicating that underperformance is related to heating system efficiency, excessive
ventilation, or excessive fabric heat loss. This is particularly surprising because, as
described in Chapter 3, Building C will have been built to significantly higher thermal
efficiency standards than many of the existing buildings represented by the HEFCE
dataset.
Total energy use in Building B is by contrast around 17% below the HEFCE average. In
terms of the ECG 19 benchmarks the energy mix for this mixed mode building might be
expected to be somewhere between that for a naturally ventilated office and that for an
air conditioned building. On this basis the performance could be considered to equate to
something between a “typical” and “good” standard.
In terms of carbon emissions Buildings A and D exceed the HEFCE average by 55%
and 24% respectively. Despite having relatively modest energy use Building B performs
poorly in carbon terms, due to its reliance on grid electricity for heating. Conversely, as
a result of its low electricity use, Building C is just below the HEFCE average for carbon
emissions. As well as carbon emissions based upon metered energy consumption,
Figure 4.2.9 also shows the carbon emissions predicted by the EPC’s for regulated
energy use. In all cases these indicate a design expectation for a standard exceeding
that of a “good” naturally ventilated office, however the same standard is by no means
reflected in terms of metered overall emissions. This is significant as it indicates clearly
that the design controls relating to regulated energy enforced by Building Regulations,
and which are also a key metric in BREEAM, are not effectively pinning back overall
emissions in these buildings.
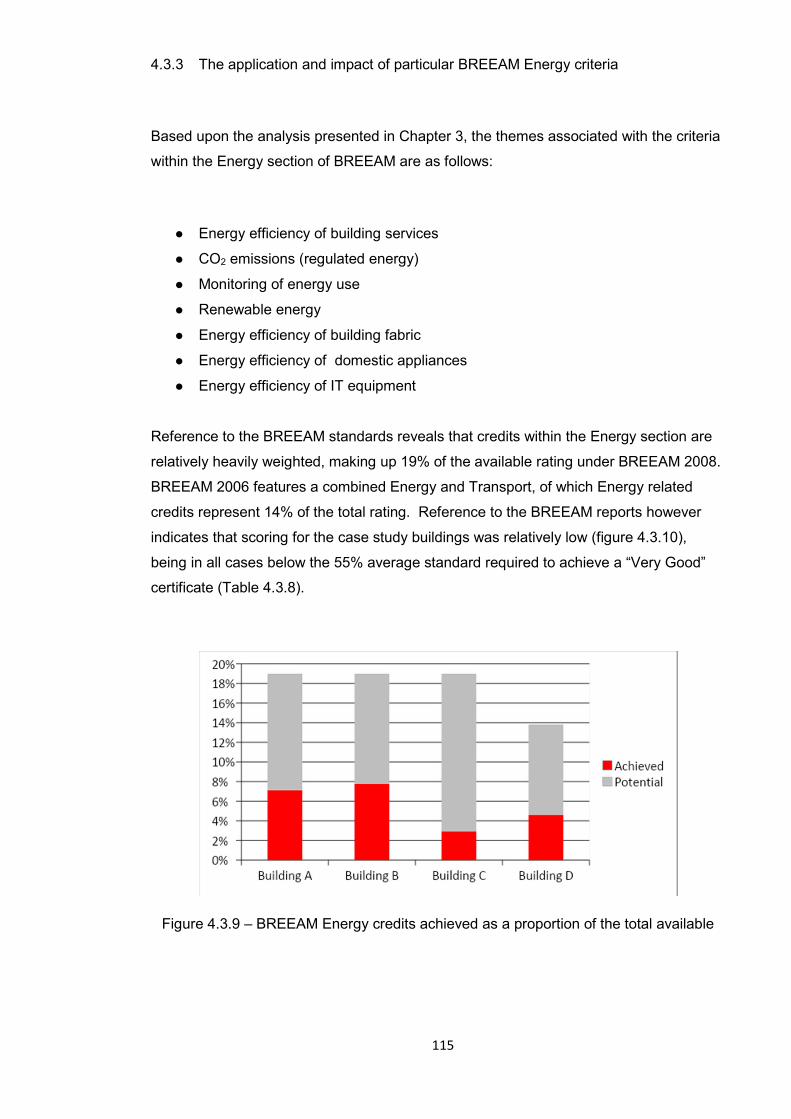
115
4.3.3 The application and impact of particular BREEAM Energy criteria
Based upon the analysis presented in Chapter 3, the themes associated with the criteria
within the Energy section of BREEAM are as follows:
● Energy efficiency of building services
● CO2 emissions (regulated energy)
● Monitoring of energy use
● Renewable energy
● Energy efficiency of building fabric
● Energy efficiency of domestic appliances
● Energy efficiency of IT equipment
Reference to the BREEAM standards reveals that credits within the Energy section are
relatively heavily weighted, making up 19% of the available rating under BREEAM 2008.
BREEAM 2006 features a combined Energy and Transport, of which Energy related
credits represent 14% of the total rating. Reference to the BREEAM reports however
indicates that scoring for the case study buildings was relatively low (figure 4.3.10),
being in all cases below the 55% average standard required to achieve a “Very Good”
certificate (Table 4.3.8).
Figure 4.3.9 – BREEAM Energy credits achieved as a proportion of the total available
116
Table 4.3.8 – Summary of Energy category scoring for case study buildings
Building
A B C D
Number of Energy issues assessed 7 5 9 4
Energy credits available 24 22 26 21
Energy credits achieved 9 9 4 7
Proportion of Energy credits achieved 38% 41% 15% 33%
As summarised in Table 4.3.9, a total of 20 different Energy issues were identified,
however many were deemed “not applicable” to some or all of the case study buildings.
This was either because they are not assessed for the particular building type in general,
or because the buildings do not contain particular features (for example a swimming
pool). In all, the case study buildings achieved credits across a total of 5 issues,
addressing the following themes:
● Energy efficiency of building services
● CO2 emissions (regulated energy)
● Monitoring of energy use
● Renewable energy
● Energy efficiency of building fabric
Through analysis of the available collected data, both the manner in which each of these
issues were applied, and the likely performance effect for the case study buildings is
described below.
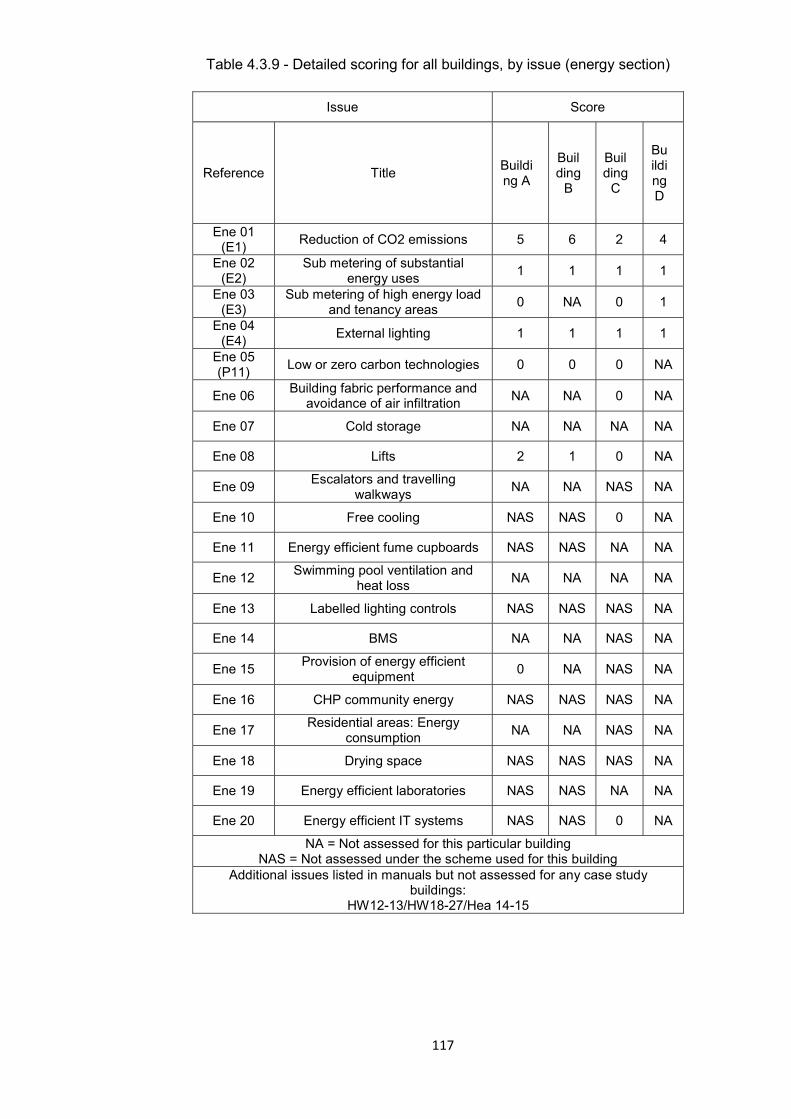
117
Table 4.3.9 - Detailed scoring for all buildings, by issue (energy section)
Issue Score
Reference Title Building A
Building
B
Building
C
Building D
Ene 01 (E1)
Reduction of CO2 emissions 5 6 2 4
Ene 02 (E2)
Sub metering of substantial energy uses
1 1 1 1
Ene 03 (E3)
Sub metering of high energy load and tenancy areas
0 NA 0 1
Ene 04 (E4)
External lighting 1 1 1 1
Ene 05 (P11)
Low or zero carbon technologies 0 0 0 NA
Ene 06 Building fabric performance and
avoidance of air infiltration NA NA 0 NA
Ene 07 Cold storage NA NA NA NA
Ene 08 Lifts 2 1 0 NA
Ene 09 Escalators and travelling
walkways NA NA NAS NA
Ene 10 Free cooling NAS NAS 0 NA
Ene 11 Energy efficient fume cupboards NAS NAS NA NA
Ene 12 Swimming pool ventilation and
heat loss NA NA NA NA
Ene 13 Labelled lighting controls NAS NAS NAS NA
Ene 14 BMS NA NA NAS NA
Ene 15 Provision of energy efficient
equipment 0 NA NAS NA
Ene 16 CHP community energy NAS NAS NAS NA
Ene 17 Residential areas: Energy
consumption NA NA NAS NA
Ene 18 Drying space NAS NAS NAS NA
Ene 19 Energy efficient laboratories NAS NAS NA NA
Ene 20 Energy efficient IT systems NAS NAS 0 NA
NA = Not assessed for this particular building NAS = Not assessed under the scheme used for this building
Additional issues listed in manuals but not assessed for any case study buildings:
HW12-13/HW18-27/Hea 14-15
118
Ene 1 (E1) - Reduction of CO2 Emissions
Issue aim: “To recognise and encourage buildings that are designed to
minimise the CO2 emissions associated with their operational energy
consumption (BREEAM, 2008)”.
Up to 15 credits are available for demonstrating reductions in modelled CO2, relative to
the minimum standards of Building Regulations. This issue makes use of the CO2
emissions modelling required to satisfy Building Regulations, and “piggybacks” on it by
making direct use of the output generated, as a differentiator. As such, the credits
reward a wide range of possible design interventions relating to reducing the energy
consumption of building services, using low carbon energy sources for building services,
on-site generation of electricity, and/or improving the thermal performance and
airtightness of the building fabric. No specific guidance is provided as to how
improvements should be achieved, and success is therefore dependent upon the
application of pre-existing expertise within the project team. The modelling upon which
the issue is based excludes unregulated energy use, and the issue therefore only
partially addresses the stated aim of minimising CO2 emissions associated with
operational energy consumption.
The case study buildings achieved varying amounts of credits for this issue, as follows:
● Building A – 5 credits
● Building B – 6 credits
● Building C – 2 credits
● Building D – 4 credits
A review of the BREEAM reports suggests that credits have been awarded based upon
appropriate modelling output. For buildings A and B as-built calculations have been
used, whilst for Buildings C and D assessment is based upon design stage output. For
Building A the assessor additionally reports carrying out a visual inspection as follows.
“During the site visit, the fundamental design principles that the building was
based on were checked to confirm that they had been installed (e.g.
119
ventilation strategy, heating systems and low energy lighting). It was visually
confirmed that these have been installed in accordance with the original
design drawings and specification. A representative of the main contractor
confirmed that there were no significant design changes and that technical
criteria applicable to the credit award have been fulfilled”.
Full post occupation verification of the modelling input was not feasible, both because
the calculations were not made available, and because the study was not configured to
assess the required parameters i.e. u-values, airtightness, ventilation heat loss, and the
size and energy efficiency of heating, hot water, ventilation, energy generation and
cooling plant. As discussed in section 4.1.4, it was however possible to identify a
number of significant general inconsistencies between the building services strategies
described in the BREEAM reports, and those in operation in the case study buildings:
1. Building A is designed to for a mixed mode ventilation strategy, however the
majority of the building appears to be fully mechanically vented in practice
(notices having been posted throughout the building asking occupants not to
open windows).
2. Building B is described in the BREEAM report as being naturally vented, however
mechanical ventilation has been installed to the majority of the ground floor area.
3. Building B is provided with windcatchers to the 1st floor, however the building
manager was unaware of their presence
4. Building C is described in the BREEAM report as naturally vented, however
mechanical ventilation has been installed in the majority of rooms.
As the case study buildings have all achieved credits under this issue, it should be
expected that their CO2 emissions resulting from regulated energy will be lower than
those of a similar property designed to the minimum standard stipulated by Building
Regulations Part L 2006. The precise expected performance improvement is not
possible to calculate without access to the modelling data, as the minimum standard
varies according to assumptions made relating to the split between heating and hot
water, and lighting loads. For reference however, a building achieving 6 credits under
this issue (an asset rating of 40) would be expected to produce approximately 25% less
CO2 annually from regulated energy use, than the same building achieving 2 credits (an
asset rating of 53).
120
Ene 2 (E2) - Sub-metering of substantial energy uses
Issue aim: “To recognise and encourage the installation of energy sub-
metering that facilitates the monitoring of in use energy consumption”.
One credit is available where accessible, labelled sub-meters are installed for the
following:
● Space Heating
● Domestic Hot Water
● Humidification
● Cooling
● Fans (major)
● Lighting
● Small Power
● Other major energy-consuming items where appropriate
All four case study buildings have systems which require sub-metering under this issue.
This credit is mandatory for certification at “Very Good” standard. All buildings
attempted and achieved the credit.
● Building A – 1 credit
● Building B – 1 credit
● Building C – 1 credit
● Building D – 1 credit
Review of the BREEAM reports reveals that credits have generally been awarded based
upon design drawings and specification clauses, supplemented in some cases by
statements of compliance from main contractors. In Building A, compliance was
additionally verified by inspection of the distribution board, combined with as-installed
drawings provided by the installer.
As previously noted, it was not possible to obtain any electrical sub-metering data for the
case study buildings. The facilities management team for Buildings A and D confirmed
121
that whilst sub-metering had been specified for both buildings, it was in every case either
faulty, or had not been properly commissioned i.e. was not visible on the BMS. For
Building B the hospital facilities management team were unaware of the presence of
sub-meters, again indicating that meters were either missing or defective, or had not
been linked to the BMS. For Building C the facilities management team were similarly
unaware of the presence of sub-meters, and obtain their energy use data via manual
reads from the fiscal meter.
The aim of the credit is that monitoring of in-use energy consumption is facilitated. It can
also reasonably be inferred that such monitoring might be used to control and possibly
reduce electricity use, as part of an ongoing management strategy. In the case study
buildings however, no monitoring appears to have taken place, and no related
improvement should therefore be expected.
Ene 3 (E3) - Sub-metering of High Energy Load and Tenancy Areas (Sub-metering of
areas/tenancy)
Issue aim: “To recognise and encourage the installation of energy sub-
metering that facilitates the monitoring of in use energy consumption by
tenant or end user”.
One credit is available where accessible, labelled sub-meters are installed for differently
tenanted areas, or for different function areas or departments within the building.
Relevant function areas include:
● Computer suites
● Lecture halls
● Conference rooms
● Laboratories
All four case study buildings have function areas which require sub-metering under this
issue. The credit was achieved for Building D, but not for Buildings A and C. The issue
was not assessed for Building B (no reason was provided for this in the BREEAM
report).

122
● Building A – 0 credit
● Building B – Not assessed
● Building C – 0 credit
● Building D – 1 credit
Review of the BREEAM report for Building D reveals that the credit was awarded on the
basis of a letter from the designer, and a schematic design drawing. However, as
previously noted, it was not possible to obtain any electrical sub-metering data for this
building. The facilities management team for Building D confirmed that whilst sub-
metering had been specified for the building, it was in every case either faulty, or had not
been properly commissioned i.e. was not visible on the BMS.
The aim of the credit is that monitoring of in-use energy consumption is facilitated. It can
also reasonably be inferred that such monitoring might be used to control and possibly
reduce electricity use, as part of an ongoing management strategy. In the case study
buildings however, no monitoring appears to have taken place, and no related
improvement should therefore be expected.
Ene 4 (E4) - External lighting
Issue aim: “To recognise and encourage the specification of energy-efficient
light fittings for external areas of the development”.
One credit is available where external lighting meets minimum standards of luminous
efficacy, and is prevented from operating in the daytime by a photocell and/or time
switch control. Buildings A, B and D have a small amount of building mounted external
lighting. Building C includes a large car park is included within the assessment area,
which has a substantial amount of bollard and column lighting.
123
All buildings achieved the credit.
● Building A – 1 credit
● Building B – 1 credit
● Building C – 1 credit
● Building D – 1 credit
Review of BREEAM reports reveals that the credit was generally awarded based upon a
combination of design specification (for the controls) and written assurances from
designers and/or main contractors (for the efficacy). For Building A, this was
supplemented by a site inspection by the assessor, who was able to verify the fitting
type, and the presence of a photocell.
It was not possible to verify the precise efficacy of installed light fittings or the presence
of effective controls, using the research methods applied. There was however no
evidence of conspicuously high energy feature or floodlighting in use on any building;
neither were any external lights observed to be on during the daytime. Due to the
absence of working sub-meters within the buildings it was not possible to isolate the
energy use for external lighting.
The aim of the credit is to specify energy efficient light fittings for external areas. It does
not however seek to limit the quantity of external lighting, which was very large for
Building C and very small for the remaining case study buildings. Neither does the
stipulation of “energy efficient” lighting arguably represent a change from standard
practice, with compliant fluorescent and sodium vapour lamps being routinely used for
external utility lighting. It is therefore expected that adherence to the criteria would result
a large reduction in overall electricity only in comparison to buildings which make
significant use of feature lighting, or those for which lighting is used during the daytime.

124
Ene 08 - Lifts
Issue aim: “To recognise and encourage the specification of energy-efficient
transportation systems” (BRREAM, 2008)
One credit is available where a “transport demand analysis” is conducted to optimise the
number and size of lifts provided, and that at least two lift strategies are considered and
the most energy efficient specified. A second credit is available where the three most
beneficial of the following energy saving features are incorporated into the chosen lift
system:
a. The lifts operate in a stand-by mode during off-peak and idle periods. For
example the power side of the lift controller and other auxiliary equipment such
as lift car lighting and ventilation fan switch off when the lift is not in motion.
b. Where lift motors use a drive controller capable of variable-speed, variable-
voltage, variable-frequency control of the drive motor.
c. The lift has a regenerative unit so that energy generated by the lift (due to
running up empty and down full) is returned back to the grid or used elsewhere
on site.
d. The lift car uses energy-efficient lighting and display lighting (>60 Lumens/watt or
fittings that consume less than 5W e.g. LEDS).
All buildings have at least one lift installed. Two credits were achieved for Building A,
one for Building B and none for Building C. The credit was not assessed for Building D.
● Building A – 2 credits
● Building B – 1 credit
● Building C – 0 credit
● Building D – Not assessed
Review of BREEAM reports indicates that the credits for Building A were awarded based
upon a transport demand analysis and design provided by the lift manufacturer. The
installation was also visually inspected by the BREEAM assessor. Information provided
in relation to the second credit confirms that this lift contains:

125
● Stand-by mode during off-peak and idle periods.
● Drive controller capable of variable-speed, variable-voltage, and variable-
frequency control of the drive motor.
● Energy-efficient lighting and display lighting (<50l/watt)
For Building B compliance appears to be based upon an informal assessment by the
services engineer, which concludes that due to the small building size the lift is sized to
meet disabled access requirements in lieu of demand. The installed lift is deemed to be
“the most energy efficient available” but no evidence is referenced which substantiates
this. For Building C manufacturer’s information has been provided to justify the lift
specification on energy efficiency grounds, however the credit is withheld as no demand
analysis has been carried out.
It appears that the energy efficiency of the lifts has been considered in Buildings A, B
and C, although the demand analysis does not appear to be particularly robust (being
either generated by the lift supplier, or based upon a qualitative judgement by the design
team). Due to a lack of functioning sub-metering it is not possible to make any
meaningful assessment of their energy performance in use.
Selecting the most energy efficient of two unspecified lift strategies does not appear to
be a robust method of reducing in-use energy consumption, given that the parties
defining the options and making the selection have a direct commercial link to the
project. The incorporation of particular energy saving features as required to achieve
the second credit may however be expected to reduce energy consumption to some
degree. A small reduction in unregulated energy use may therefore be expected to be
observed for Building A, although neither the predicted energy consumption nor the
magnitude of the expected savings are stated in the BREEAM report.
4.3.4 Summary
No overall aim is stated for the BREEAM Energy section, however examination of the
criteria suggests that the intention is to differentiate certified buildings on the basis of
their energy demand, and the resulting CO2 emissions. The building energy monitoring
suggests however that no clear positive differentiation is evident for the case study

126
buildings, for either parameter. Despite being designed to exceed current building
control energy standards, only one of the four building displayed a (modest) reduction in
energy use by floor area, compared to the existing stock of education buildings.
Similarly only one building (not the same one) displays lower CO2 emissions than the
HEFCE average.
127
4.4 - Water
4.4.1 Introduction
As described in detail in Chapter 3, the water consumption of the case study buildings
was quantified using meter readings. The impact of BREEAM on that performance was
then explored through close examination of the BREEAM reports, combined with design
review, a walk through survey, building manager interviews and facilities manager
interviews.
4.4.2 Water consumption in case study buildings
Measured water consumption data
As discussed in Chapter 3, monthly water consumption data was provided by the
facilities management teams for Buildings B and C, in the form of manual monthly meter
reads. No data was available for Buildings A and D, and in both cases the facilities
management team confirmed that the meters for the buildings had been faulty since
installation. The water supply for all buildings is understood to be exclusively mains fed
and no water sub-metering has been installed in any building. The monthly consumption
data supplied for Buildings B and C is represented in Figures 4.4.1 and 4.4.2. Data bars
coloured blue represent the same 12 month period used for the electricity consumption
monitoring, with additional data shown in grey. As for energy consumption, data is
presented relative to building floor area.
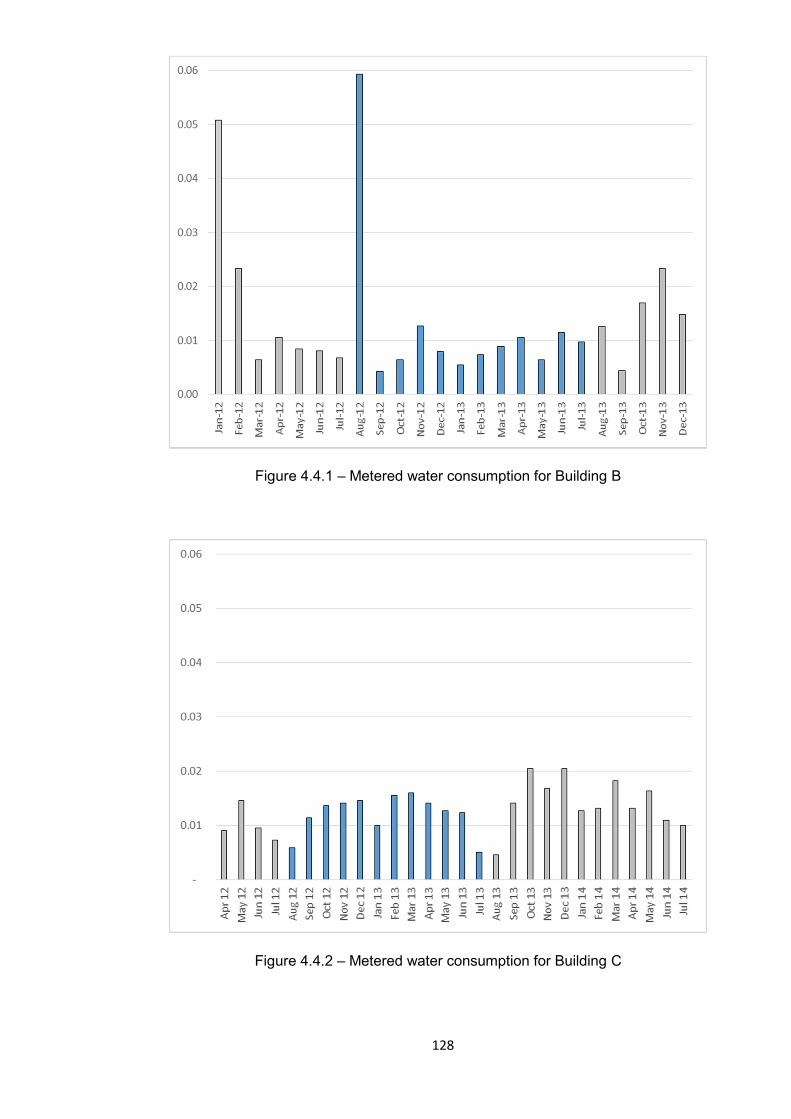
128
Figure 4.4.1 – Metered water consumption for Building B
Figure 4.4.2 – Metered water consumption for Building C
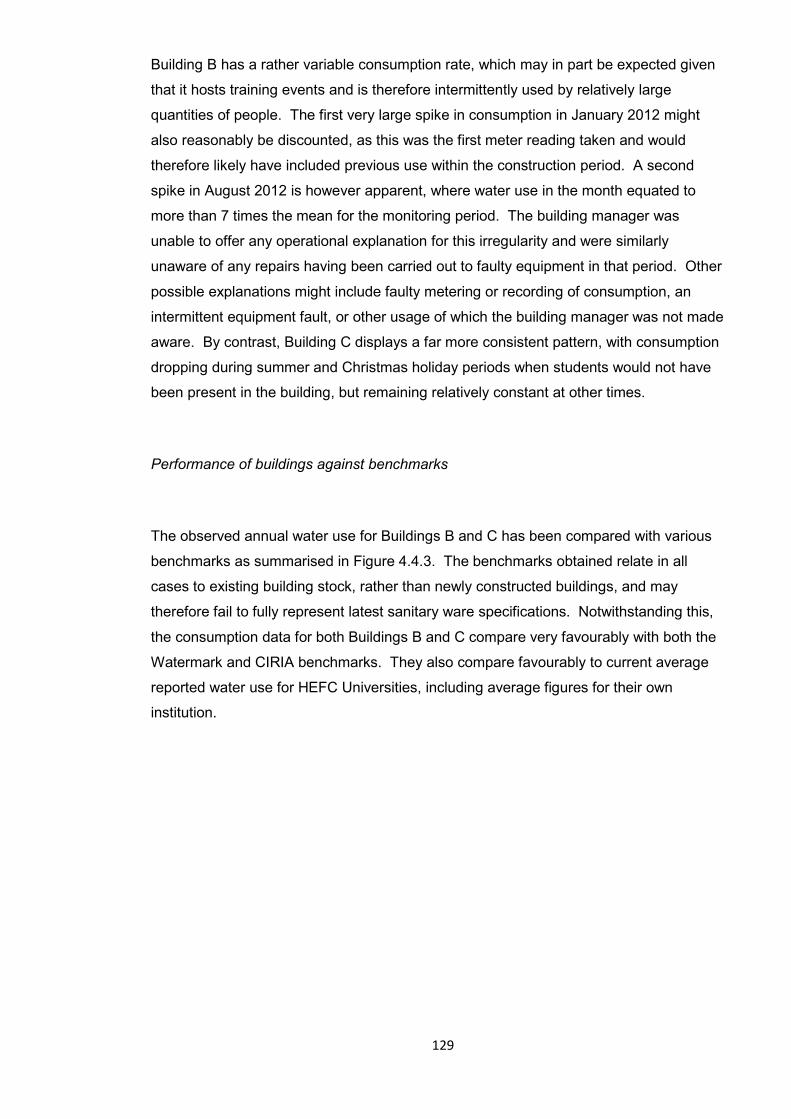
129
Building B has a rather variable consumption rate, which may in part be expected given
that it hosts training events and is therefore intermittently used by relatively large
quantities of people. The first very large spike in consumption in January 2012 might
also reasonably be discounted, as this was the first meter reading taken and would
therefore likely have included previous use within the construction period. A second
spike in August 2012 is however apparent, where water use in the month equated to
more than 7 times the mean for the monitoring period. The building manager was
unable to offer any operational explanation for this irregularity and were similarly
unaware of any repairs having been carried out to faulty equipment in that period. Other
possible explanations might include faulty metering or recording of consumption, an
intermittent equipment fault, or other usage of which the building manager was not made
aware. By contrast, Building C displays a far more consistent pattern, with consumption
dropping during summer and Christmas holiday periods when students would not have
been present in the building, but remaining relatively constant at other times.
Performance of buildings against benchmarks
The observed annual water use for Buildings B and C has been compared with various
benchmarks as summarised in Figure 4.4.3. The benchmarks obtained relate in all
cases to existing building stock, rather than newly constructed buildings, and may
therefore fail to fully represent latest sanitary ware specifications. Notwithstanding this,
the consumption data for both Buildings B and C compare very favourably with both the
Watermark and CIRIA benchmarks. They also compare favourably to current average
reported water use for HEFC Universities, including average figures for their own
institution.
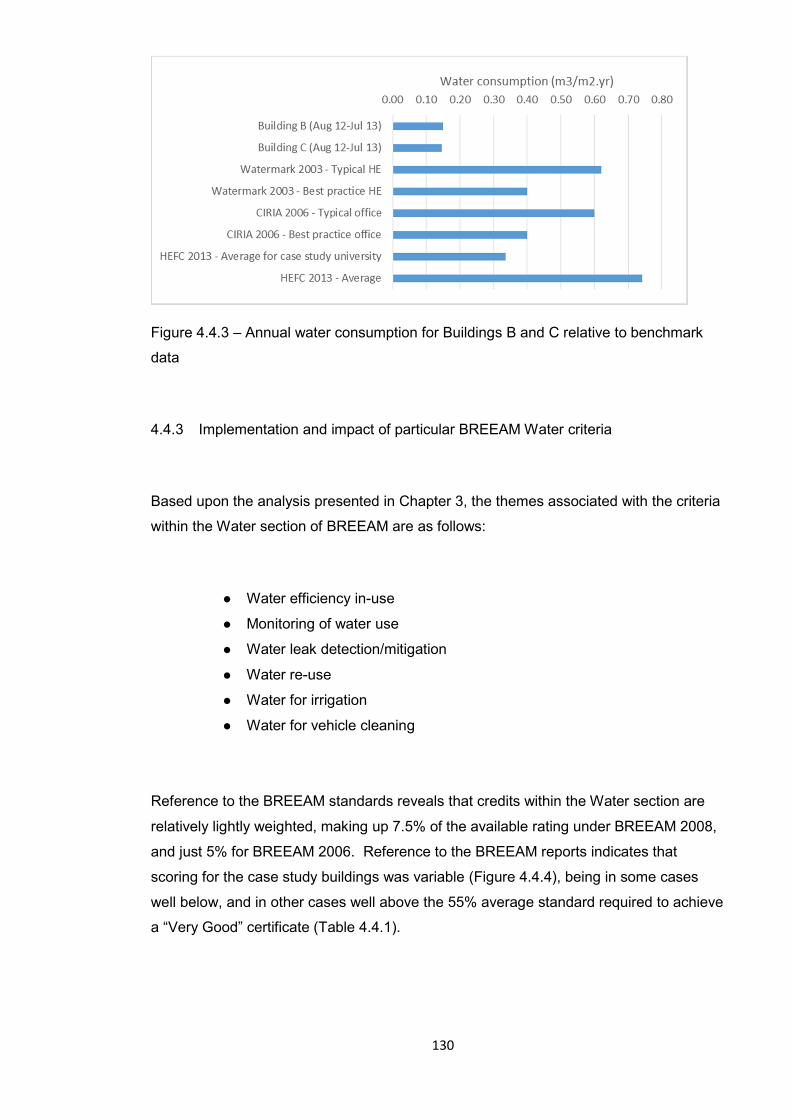
130
Figure 4.4.3 – Annual water consumption for Buildings B and C relative to benchmark
data
4.4.3 Implementation and impact of particular BREEAM Water criteria
Based upon the analysis presented in Chapter 3, the themes associated with the criteria
within the Water section of BREEAM are as follows:
● Water efficiency in-use
● Monitoring of water use
● Water leak detection/mitigation
● Water re-use
● Water for irrigation
● Water for vehicle cleaning
Reference to the BREEAM standards reveals that credits within the Water section are
relatively lightly weighted, making up 7.5% of the available rating under BREEAM 2008,
and just 5% for BREEAM 2006. Reference to the BREEAM reports indicates that
scoring for the case study buildings was variable (Figure 4.4.4), being in some cases
well below, and in other cases well above the 55% average standard required to achieve
a “Very Good” certificate (Table 4.4.1).

131
Figure 4.4.4 – BREEAM Water credits as a proportion of the total available
Table 4.4.1 – Summary of Water category scoring for case study buildings
Building
A B C D
Number of Water issues assessed 6 6 6 6
Water credits available 8 8 8 8
Water credits achieved 7 3 7 5
Proportion of Water credits achieved 88% 38% 88% 63%
As summarised in Table 4.4.2, a total of 7 different Water issues were identified,
although one related to vehicle wash facilities, which were not present in any of the case
study buildings. In all, the case study buildings achieved credits across a total of 5
issues, addressing the following themes:
● Water efficiency in-use
● Monitoring of water use
● Water leak detection/mitigation
● Water for irrigation

132
Through analysis of the available collected data, both the manner in which each of these
issues were applied, and the likely performance effect for the case study buildings is
described below.
Table 4.4.2 - Detailed scoring for all buildings, by issue (water section)
Issue Score
Reference Title
Buil
din
g A
Buil
din
g B
Buil
din
g C
Buil
din
g D
Wat 01
(W1) Water consumption 2 1 3 2
Wat 02
(W2) Water meter 1 1 1 1
Wat 03
(W3) Major leak detection 1 0 1 0
Wat 04
(W4) Sanitary supply cut off 1 0 1 1
Wat 05
(W5) Water recycling 0 0 0 0
Wat 06
(W6) Water irrigation systems 1 1 1 1
Wat 07 Vehicle wash NA NA NAS NA
NA = Not assessed for this particular building NAS = Not assessed under the scheme used for this building

133
Wat 1 (W1) – Water consumption
Issue aim: “To minimise the consumption of potable water in sanitary
applications by encouraging the use of low water use fittings” (BRE, 2008).
For BREEAM 2008, two credits are available in relation to WC flush volumes. Where
the “effective flush volume” is 4.5l or less a single credit is scored. Where the “effective
flush volume” is 3l or less, or where a WC having an “effective flush volume” of 4.5l or
less is fitted with a “delayed action inlet valve”, a second credit is awarded. “Effective
flush volume” for dual flush WC’s is based upon a ratio of full flush to reduced flush of
1:3, giving a standard 6/4l dual flush toilet an “effective flush volume” of 4.5l. A “delayed
action inlet valve” is one which prevents the cistern re-filling until it has completely
emptied. A third credit is available where the BREEAM “Water Calculation Tool” is used
to calculate the water saving generated by using the following, with the two most
effective being employed throughout the building:
● Taps having a 6l/min maximum flow rate and being either spray, push, lever, or
electronically controlled.
● Showers having a maximum flow rate of 9l/min
● Urinals that are waterless, ultra low flush, or which are fitted with presence
detection
● Baths of 100l capacity with taps which stop automatically when the bath is full
Three credits are also available for BREEAM 2006, calculated based upon similar use of
reduced water sanitaryware.
1 credit is a mandatory minimum requirement for a “very good” rating. The case study
buildings achieved varying amounts of credits for this issue, as shown in Table 4.4.3. A
review of the BREEAM reports reveals that credits have been awarded based upon a
combination of design specification clauses and manufacturers information. For Building
A, the assessor has additionally visited the building and checked the installed products.
For Building B the PCR is based upon photographs and purchase orders provided by the
main contractor. By means of the walk through survey it was possible to verify that the
provision matched the specification in general terms, although no measurement of
specific flush volumes or flow rates was carried out.

134
Table 4.4.3 – Summary of credit scoring for BREEAM issue Wat 1
Credit 1 Credit 2 Credit 3 Total credits
achieved
Building A 4l flush WC’s Not achieved
Waterless urinals Low flow taps with proximity
sensors
2
Building B 3/6l dual flush
WC’s Not achieved Not achieved 1
Building C 2/4l dual flush WC’s
Low flow taps and urinals fitted
with proximity sensors
3
Building D Electronic sensor
taps and waterless urinals
Not achieved Not achieved 1
A relatively robust level of evidence has been provided in relation to the credits
achieved, and the presence of many of the specified features were additionally
confirmed by the researcher. The credits achieved in the buildings might therefore be
expected to result in a reduction in water use in sanitary applications. In these buildings,
that might be expected to form a significant proportion of total water use, although other
potential uses do exist, particularly the laboratories in Buildings A and B, and the
commercial kitchen in Building D.
Wat 2 (W2) – Water meter
Issue aim: “To ensure water consumption can be monitored and managed
and therefore encourage reductions in water consumption” (BRE, 2008).
1 credit is available where a pulsed output water meter is provided on the incoming
water supply to the building. Additional meters are required for swimming pools or
plumbed-in laboratory process.
135
All case study buildings achieved the credit, as follows:
Building A – 1 credit
Building B – 1 credit
Building C – 1 credit
Building D – 1 credit
Review of the BREEAM reports reveals that the credit has in all cases been awarded,
based upon the presence of a pulsed water meter on design drawings and/or in
specification clauses. For Building A, as-installed drawings were additionally provided
by the contractor, whilst for Building B installation was confirmed in a letter from the main
contractor. As previously discussed, it was not possible to obtain water consumption
data for all case study buildings. The facilities management team for Buildings A and D
confirmed that whilst metering had been specified for both buildings, it was in both cases
either faulty, or had not been properly commissioned i.e. was not visible on the BMS.
For Buildings B and C meter readings provided by the facilities management teams were
based on manual reads of the utility company meter. In neither building were the
facilities management team aware of the presence of a pulsed output water meter, again
indicating that meters were either missing or defective, or had not been linked to the
BMS.
Given that the building facilities management teams were in all cases unable to access
pulsed metering data, no effect should be expected in connection with the credits
achieved under this issue.
Wat 3 (W3) – Major leak detection
Issue aim: “To reduce the impact of major water leaks that may otherwise go
undetected” (BRE, 2008).
One credit is available where a leak detection system with an audible alarm is installed
along the incoming water supply, between the building and the site boundary.

136
The case study buildings achieved credits under this issue as follows:
Building A – 1 credit
Building B – 0 credits
Building C – 1 credit
Building D – 0 credits
Review of BREEAM reports reveals that credits have been awarded based upon
drawings, specification clauses, and statements of intent from installers. For Building A,
the contractor provided a copy of their BMS operations manual confirming the inclusion
of leak detection. As previously discussed, however, the water meter for Buildings A has
been dysfunctional since installation. As the leak detection system described is reliant
on pulsed output from this meter, that the criteria does not therefore appear to have
been properly applied. The proposed system for Building C is similarly reliant on a
pulsed output from meters. The facilities management team were unable to access
meter reads for this building via the BMS, and were additionally unaware of the
existence of leak detection facility.
Information provided by the facilities management teams for Buildings A and C suggest
that no major leak detection is in operation for these buildings. No effect should
therefore be expected in connection with the credits achieved under this issue.
Wat 4 (W4) – Sanitary supply cut off
Issue aim: “To reduce the risk of minor leaks in toilet facilities” (BRE, 2008).
One credit is available where presence detection is installed which shuts off the water
supply to toilet areas, when they are unoccupied.
137
The case study buildings achieved credits under this issue as follows:
Building A – 1 credit
Building B – 0 credits
Building C – 1 credit
Building D – 1 credit
Review of the BREEAM reports reveals that credits have been awarded based upon
drawings, specification clauses, and statements of intent from designers. For Building A,
as-installed drawings were additionally provided by the contractor. The researcher
noted the presence of detectors in WC areas but was unable to positively confirm
whether they were in operation.
Shutting off the water supply to toilet areas in periods of non-occupation might be
expected to reduce the impact of any leaks that did occur (although not the risk of them
occurring, as is suggested by the issue aim). A reduction in annual water consumption
might therefore be expected in connection with the credits achieved.
Wat 6 (W6) – Water irrigation systems
Issue aim: “To reduce the consumption of potable water for ornamental
planting and landscape irrigation” (BRE, 2008).
One credit is available where either a zoned drip feed irrigation system with rainstat is
installed, or where plants are watered using reclaimed water, or where planting does not
require an automatic irrigation system.

138
All of the case study buildings achieved this credit:
Building A – 1 credit
Building B – 1 credit
Building C – 1 credit
Building D – 1 credit
Review of the BREEAM reports reveals that credits for the buildings were awarded
based upon statements from designers relating to the proposed irrigation strategy. For
Building A, the designers state that landscaping is to be watered by the university
gardeners, using bowsers filled from a central rainwater collection system. For Buildings
B and D no irrigation was deemed to be required, and for Building C the planting was
expected to be watered “by precipitation or manual watering”. The researcher did not
observe automatic irrigation systems in use on any buildings.
No automatic watering systems were specified or installed in the case study buildings. A
reduction in water consumption might therefore be expected in comparison to buildings
with planting areas which do make use of automatic watering systems.
4.4.4 Summary
No overall aim is stated for the BREEAM Water section, however examination of the
criteria suggests that the intention is to differentiate certified buildings on the basis of
their demand for potable water. Water consumption data was unavailable for two of the
four case study buildings, due to the absence of functioning metering on Buildings A and
D. Results for Buildings B and C reveal however excellent performance, exceeding all
benchmarks and in each case demonstrating consumption by floor area of just 20% of
the HEFCE average.

139
4.5 – Internal Environmental Quality
4.5.1 Introduction
A building occupant survey (BUS) was used to measure the perceived internal
environmental quality of the case study buildings, and its effect on the health and
wellbeing of building occupants. This data was further supported by a walk through
survey, design review, and interviews with facilities management staff and building
managers, all as described in detail in Chapter 3. The results are presented below,
alongside the survey benchmarks. The likely impact of BREEAM on the observed
performance is then explored through close examination of the BREEAM reports for the
buildings.
4.5.2 Internal environmental quality in case study buildings
Heating, ventilation and cooling
Survey results relating to thermal conditions (Tables 4.5.1 - 4.5.6) are split into summer
and winter. Only Building C exceeds the BUS benchmark mean for overall comfort in
both summer and winter. For Building B, winter thermal comfort is coded “red”, meaning
that the building mean is statistically significantly below both the scale midpoint and
benchmark mean. Closer examination of the results reveals that this mean is much
reduced by a score of 2 awarded by the building manager, who also reported in
interview that the building heating had failed totally during the first winter of operation,
before the remaining respondents were present. This result therefore appears to
indicate a specific commissioning problem, rather than an ongoing issue. Meanwhile,
Buildings A is coded “red” for summer comfort, with the table indicating a broad
distribution of responses. Further analysis indicates that the mean score for the 7
occupants based in the main communal 1st floor research office is just 2.28, whereas the
average rating for the remaining areas is 6. In this case a perceived problem therefore
exists with summer overheating within a particular room (which has large areas of south
east facing) and does not appear to occur in other occupied areas. Building D is also
flagged “red” in summer for thermal comfort, despite more than a third of respondents
rating the temperature at the scale midpoint i.e. neither too hot or too cold. As for
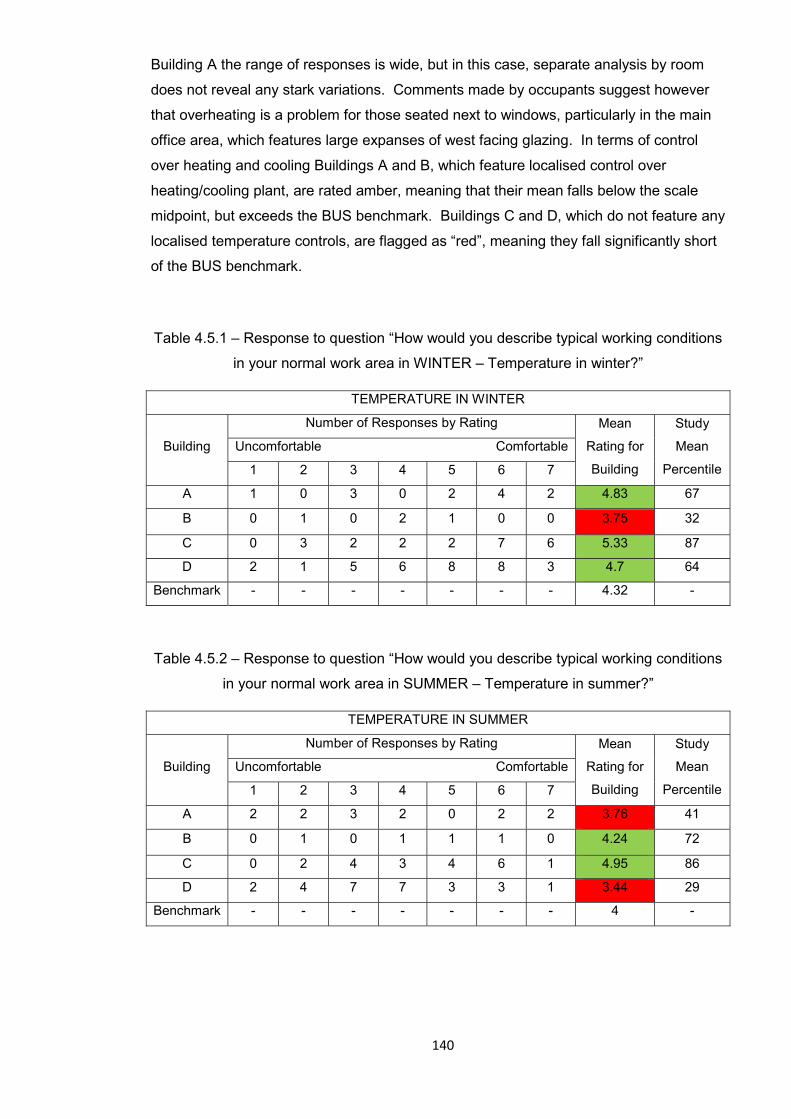
140
Building A the range of responses is wide, but in this case, separate analysis by room
does not reveal any stark variations. Comments made by occupants suggest however
that overheating is a problem for those seated next to windows, particularly in the main
office area, which features large expanses of west facing glazing. In terms of control
over heating and cooling Buildings A and B, which feature localised control over
heating/cooling plant, are rated amber, meaning that their mean falls below the scale
midpoint, but exceeds the BUS benchmark. Buildings C and D, which do not feature any
localised temperature controls, are flagged as “red”, meaning they fall significantly short
of the BUS benchmark.
Table 4.5.1 – Response to question “How would you describe typical working conditions
in your normal work area in WINTER – Temperature in winter?”
TEMPERATURE IN WINTER
Building
Number of Responses by Rating Mean
Rating for
Building
Study
Mean
Percentile
Uncomfortable Comfortable
1 2 3 4 5 6 7
A 1 0 3 0 2 4 2 4.83 67
B 0 1 0 2 1 0 0 3.75 32
C 0 3 2 2 2 7 6 5.33 87
D 2 1 5 6 8 8 3 4.7 64
Benchmark - - - - - - - 4.32 -
Table 4.5.2 – Response to question “How would you describe typical working conditions
in your normal work area in SUMMER – Temperature in summer?”
TEMPERATURE IN SUMMER
Building
Number of Responses by Rating Mean
Rating for
Building
Study
Mean
Percentile
Uncomfortable Comfortable
1 2 3 4 5 6 7
A 2 2 3 2 0 2 2 3.76 41
B 0 1 0 1 1 1 0 4.24 72
C 0 2 4 3 4 6 1 4.95 86
D 2 4 7 7 3 3 1 3.44 29
Benchmark - - - - - - - 4 -
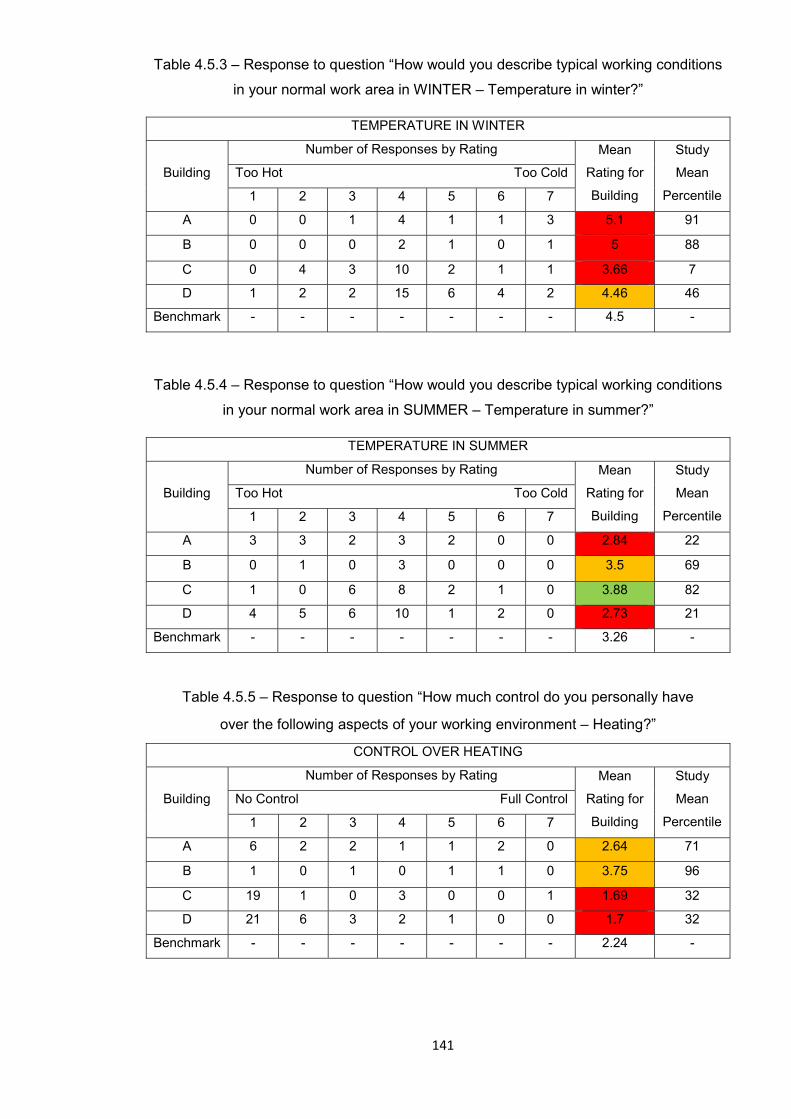
141
Table 4.5.3 – Response to question “How would you describe typical working conditions
in your normal work area in WINTER – Temperature in winter?”
TEMPERATURE IN WINTER
Building
Number of Responses by Rating Mean
Rating for
Building
Study
Mean
Percentile
Too Hot Too Cold
1 2 3 4 5 6 7
A 0 0 1 4 1 1 3 5.1 91
B 0 0 0 2 1 0 1 5 88
C 0 4 3 10 2 1 1 3.66 7
D 1 2 2 15 6 4 2 4.46 46
Benchmark - - - - - - - 4.5 -
Table 4.5.4 – Response to question “How would you describe typical working conditions
in your normal work area in SUMMER – Temperature in summer?”
TEMPERATURE IN SUMMER
Building
Number of Responses by Rating Mean
Rating for
Building
Study
Mean
Percentile
Too Hot Too Cold
1 2 3 4 5 6 7
A 3 3 2 3 2 0 0 2.84 22
B 0 1 0 3 0 0 0 3.5 69
C 1 0 6 8 2 1 0 3.88 82
D 4 5 6 10 1 2 0 2.73 21
Benchmark - - - - - - - 3.26 -
Table 4.5.5 – Response to question “How much control do you personally have
over the following aspects of your working environment – Heating?”
CONTROL OVER HEATING
Building
Number of Responses by Rating Mean
Rating for
Building
Study
Mean
Percentile
No Control Full Control
1 2 3 4 5 6 7
A 6 2 2 1 1 2 0 2.64 71
B 1 0 1 0 1 1 0 3.75 96
C 19 1 0 3 0 0 1 1.69 32
D 21 6 3 2 1 0 0 1.7 32
Benchmark - - - - - - - 2.24 -

142
Table 4.5.6 – Response to question “How much control do you personally have
over the following aspects of your working environment – Cooling?”
CONTROL OVER COOLING
Building
Number of Responses by Rating Total
Number of
Responses
Mean
Rating for
Building
No Control Full Control
1 2 3 4 5 6 7
A 6 2 2 2 1 1 0 2.5 59
B 1 0 1 0 2 0 0 3.5 92
C 18 1 1 3 0 0 1 1.78 22
D 16 6 5 3 3 0 0 2.19 41
Benchmark - - - - - - - 2.42 -
Survey results relating to ventilation (Tables 4.5.7 - 4.5.11) are also split into summer
and winter conditions. Buildings A and B met or exceeded the benchmark expectation
for freshness of air, although particular occupants rated Building A as being stuffy in
winter. Further analysis again reveals a split between occupants of the main research
office in Building A (mean = 5.71) and those in other areas (mean = 3). Buildings C
and D perform less well and are flagged “red” for ventilation, being considered
particularly stuffy in winter and summer respectively. When considered in relation to the
ventilation strategies employed, predominantly mechanically ventilated Building A
performs well whilst predominantly naturally ventilated Building D performs poorly. The
results for the mixed mode Buildings B and C are however variable. In terms of control,
the mixed mode buildings performed best, presumably due to the presence of opening
windows in these buildings. Meanwhile, Buildings A and D are flagged “red”, despite
being provided with local control of their mechanical vent (Building A) and vent louvres
(Building D), indicating that occupants may be more comfortable operating opening
windows than operating mechanical controls.
Table 4.5.7 – Response to question “How would you describe typical working conditions
in your normal work area in WINTER – Air in winter?”
AIR IN WINTER
Building
Number of Responses by Rating Mean
Rating for
Building
Study
Mean
Percentile
Fresh Stuffy
1 2 3 4 5 6 7
A 1 3 2 4 0 2 0 3.41 6
B 2 2 0 0 0 0 0 1.5 1
C 0 1 2 7 5 3 2 4.72 71
D 1 2 3 15 9 2 0 3.87 26
Benchmark - - - - - - - 4.24 -
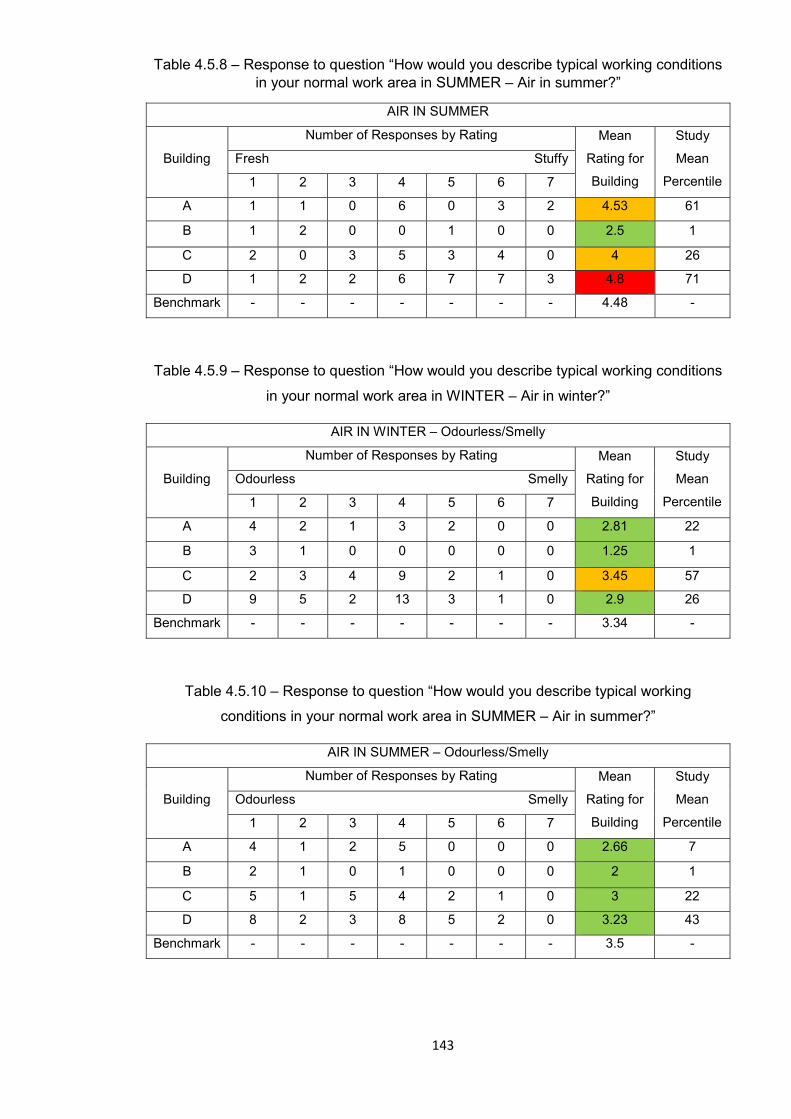
143
Table 4.5.8 – Response to question “How would you describe typical working conditions in your normal work area in SUMMER – Air in summer?”
AIR IN SUMMER
Building
Number of Responses by Rating Mean
Rating for
Building
Study
Mean
Percentile
Fresh Stuffy
1 2 3 4 5 6 7
A 1 1 0 6 0 3 2 4.53 61
B 1 2 0 0 1 0 0 2.5 1
C 2 0 3 5 3 4 0 4 26
D 1 2 2 6 7 7 3 4.8 71
Benchmark - - - - - - - 4.48 -
Table 4.5.9 – Response to question “How would you describe typical working conditions
in your normal work area in WINTER – Air in winter?”
AIR IN WINTER – Odourless/Smelly
Building
Number of Responses by Rating Mean
Rating for
Building
Study
Mean
Percentile
Odourless Smelly
1 2 3 4 5 6 7
A 4 2 1 3 2 0 0 2.81 22
B 3 1 0 0 0 0 0 1.25 1
C 2 3 4 9 2 1 0 3.45 57
D 9 5 2 13 3 1 0 2.9 26
Benchmark - - - - - - - 3.34 -
Table 4.5.10 – Response to question “How would you describe typical working
conditions in your normal work area in SUMMER – Air in summer?”
AIR IN SUMMER – Odourless/Smelly
Building
Number of Responses by Rating Mean
Rating for
Building
Study
Mean
Percentile
Odourless Smelly
1 2 3 4 5 6 7
A 4 1 2 5 0 0 0 2.66 7
B 2 1 0 1 0 0 0 2 1
C 5 1 5 4 2 1 0 3 22
D 8 2 3 8 5 2 0 3.23 43
Benchmark - - - - - - - 3.5 -
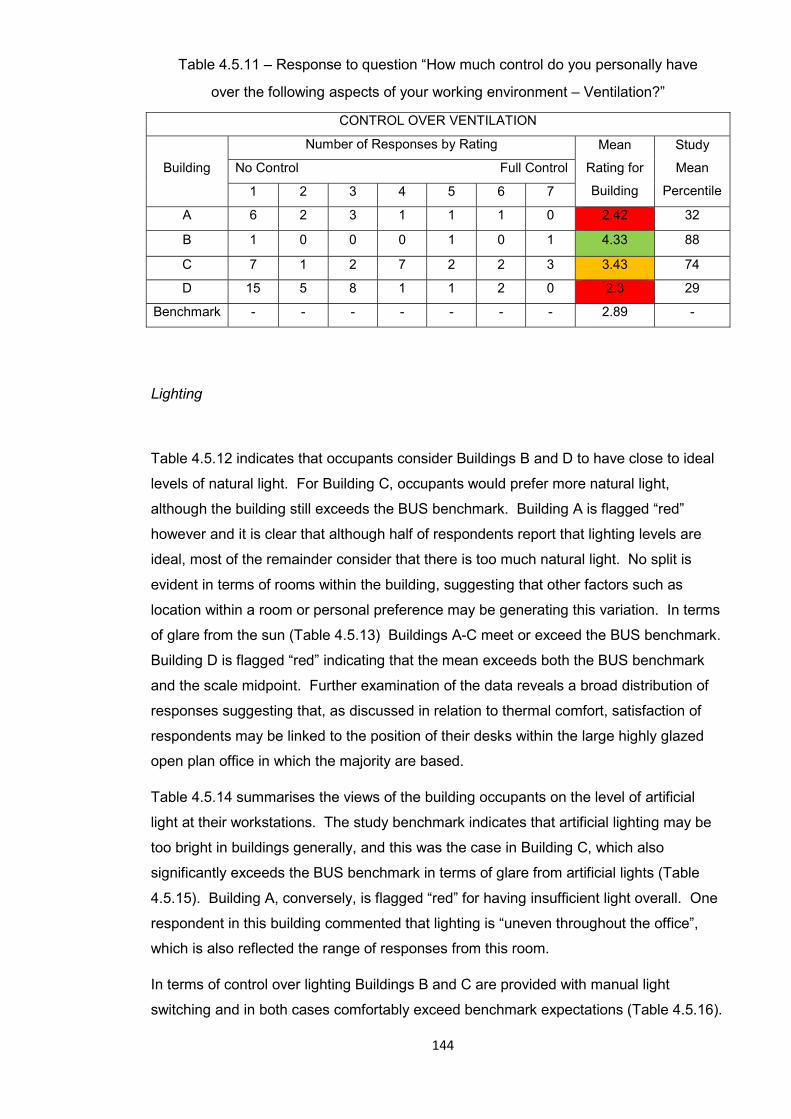
144
Table 4.5.11 – Response to question “How much control do you personally have
over the following aspects of your working environment – Ventilation?”
CONTROL OVER VENTILATION
Building
Number of Responses by Rating Mean
Rating for
Building
Study
Mean
Percentile
No Control Full Control
1 2 3 4 5 6 7
A 6 2 3 1 1 1 0 2.42 32
B 1 0 0 0 1 0 1 4.33 88
C 7 1 2 7 2 2 3 3.43 74
D 15 5 8 1 1 2 0 2.3 29
Benchmark - - - - - - - 2.89 -
Lighting
Table 4.5.12 indicates that occupants consider Buildings B and D to have close to ideal
levels of natural light. For Building C, occupants would prefer more natural light,
although the building still exceeds the BUS benchmark. Building A is flagged “red”
however and it is clear that although half of respondents report that lighting levels are
ideal, most of the remainder consider that there is too much natural light. No split is
evident in terms of rooms within the building, suggesting that other factors such as
location within a room or personal preference may be generating this variation. In terms
of glare from the sun (Table 4.5.13) Buildings A-C meet or exceed the BUS benchmark.
Building D is flagged “red” indicating that the mean exceeds both the BUS benchmark
and the scale midpoint. Further examination of the data reveals a broad distribution of
responses suggesting that, as discussed in relation to thermal comfort, satisfaction of
respondents may be linked to the position of their desks within the large highly glazed
open plan office in which the majority are based.
Table 4.5.14 summarises the views of the building occupants on the level of artificial
light at their workstations. The study benchmark indicates that artificial lighting may be
too bright in buildings generally, and this was the case in Building C, which also
significantly exceeds the BUS benchmark in terms of glare from artificial lights (Table
4.5.15). Building A, conversely, is flagged “red” for having insufficient light overall. One
respondent in this building commented that lighting is “uneven throughout the office”,
which is also reflected the range of responses from this room.
In terms of control over lighting Buildings B and C are provided with manual light
switching and in both cases comfortably exceed benchmark expectations (Table 4.5.16).

145
Building A meanwhile makes use of presence detection to control lighting in office areas
and is flagged “red” with a mean score significantly below benchmark (this mean
reduces further to 2.0 for the main research office taken in isolation). Building D makes
use of a mixture of manual light switching in smaller rooms and presence detection in
large offices and lecture theatres. Building D meets the benchmark performance for the
building overall, however the mean for the main open plan office taken in isolation is
2.65, which is significantly below the benchmark expectation.
Table 4.5.12 – Response to question “How would you describe the quality of the lighting
in your normal work area – Natural light?”
NATURAL LIGHT – Too Little / Too Much
Building
Number of Responses by Rating Mean
Rating for
Building
Study
Mean
Percentile
Too Little Too Much
1 2 3 4 5 6 7
A 0 0 1 7 1 4 1 4.78 99
B 0 0 0 3 0 0 0 4 63
C 1 1 6 11 2 0 2 3.86 52
D 3 4 2 19 3 2 0 4.06 66
Benchmark - - - - - - - 3.77 -
Table 4.5.13 – Response to question “How would you describe the quality of the lighting
in your normal work area – Glare from sun and sky?”
GLARE FROM SUN AND SKY – None / Too Much
Building
Number of Responses by Rating Mean
Rating for
Building
Study
Mean
Percentile
None Too Much
1 2 3 4 5 6 7
A 3 3 1 2 2 2 1 3.57 46
B 1 0 0 0 2 0 0 3.66 48
C 4 3 2 9 3 1 1 3.45 41
D 4 6 0 12 6 5 0 4.16 72
Benchmark - - - - - - - 3.69 -

146
Table 4.5.14 – Response to question “How would you describe the quality of the lighting
in your normal work area – Artificial light?”
ARTIFICIAL LIGHT – Too Little / Too Much
Building
Number of Responses by Rating Mean
Rating for
Building
Study
Mean
Percentile
Too Little Too Much
1 2 3 4 5 6 7
A 0 2 1 10 1 0 0 3.71 4
B 0 0 0 3 0 0 0 4 15
C 0 0 0 12 7 1 3 4.77 89
D 0 2 1 21 4 4 1 4.03 16
Benchmark - - - - - - - 4.33 -
Table 4.5.15 – Response to question “How would you describe the quality of the lighting
in your normal work area – Glare from lights?”
GLARE FROM LIGHTS – None / Too Much
Building
Number of Responses by Rating Mean
Rating for
Building
Study
Mean
Percentile
None Too Much
1 2 3 4 5 6 7
A 3 4 0 7 0 0 0 2.78 7
B 1 0 0 2 0 0 0 3 12
C 4 1 0 12 4 0 2 3.9 79
D 5 3 1 14 4 4 1 3.63 59
Benchmark - - - - - - - 3.5 -
Table 4.5.16 - Response to question “How much control do you have over the following
aspects of your working environment – Lighting”
CONTROL OVER LIGHTING
Building
Number of Responses by Rating Mean
Rating for
Building
Study
Mean
Percentile
No Control Full Control
1 2 3 4 5 6 7
A 7 1 0 3 1 2 0 2.71 37
B 0 1 0 1 1 0 1 4.5 84
C 7 0 1 7 4 1 4 3.69 56
D 14 3 4 7 0 2 3 2.93 41
Benchmark - - - - - - - 3.24 -

147
Acoustics
Table 4.5.17 shows that occupants of Buildings A, C and D experience too much noise
from colleagues. This problem is particularly acute in Buildings A and D, where the
majority of respondents are based in large open plan offices. Noise from other people is
also considered excessive in Buildings A, B and D (Table 4.5.18). For Building B
comments indicate that this is a direct result of the building arrangement which has the
office area open to the main ground floor breakout space.
Table 4.5.17 – Response to question “How would you describe noise in your normal
work area – Noise from colleagues?”
NOISE FROM COLLEAGUES – Too Little / Too Much
Building
Number of Responses by Rating Mean
Rating for
Building
Study
Mean
Percentile
Too Little Too Much
1 2 3 4 5 6 7
A 1 0 0 5 2 4 2 4.92 97
B 0 0 0 4 0 0 0 4 25
C 0 3 1 11 4 2 2 4.4 64
D 0 1 3 12 10 4 3 4.74 96
Benchmark - - - - - - - 4.24 -
Table 4.5.18 – Response to question “How would you describe noise in your normal
work area – Noise from other people?”
NOISE FROM OTHER PEOPLE – Too Little / Too Much
Building
Number of Responses by Rating Mean
Rating for
Building
Study
Mean
Percentile
Too Little Too Much
1 2 3 4 5 6 7
A 0 0 1 6 2 3 1 4.76 81
B 0 0 0 2 1 0 1 5 92
C 0 2 2 12 4 2 1 4.22 34
D 0 1 2 11 10 6 2 4.74 96
Benchmark - - - - - - - 4.41
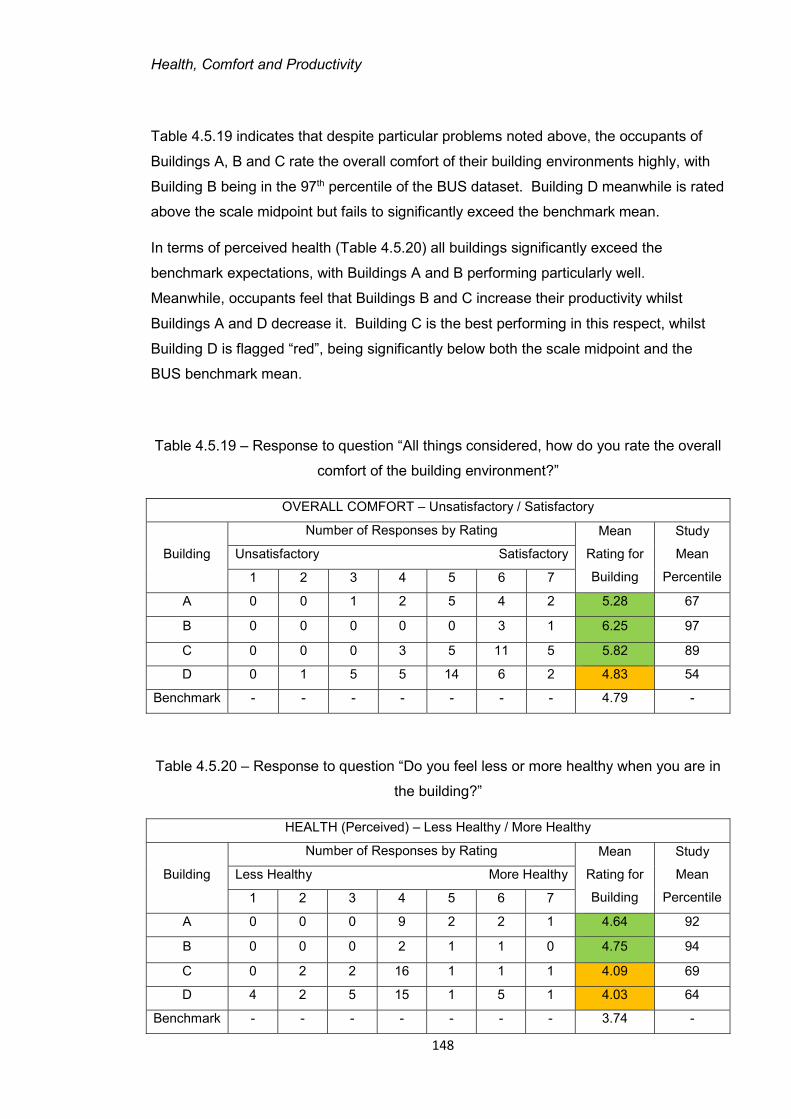
148
Health, Comfort and Productivity
Table 4.5.19 indicates that despite particular problems noted above, the occupants of
Buildings A, B and C rate the overall comfort of their building environments highly, with
Building B being in the 97th percentile of the BUS dataset. Building D meanwhile is rated
above the scale midpoint but fails to significantly exceed the benchmark mean.
In terms of perceived health (Table 4.5.20) all buildings significantly exceed the
benchmark expectations, with Buildings A and B performing particularly well.
Meanwhile, occupants feel that Buildings B and C increase their productivity whilst
Buildings A and D decrease it. Building C is the best performing in this respect, whilst
Building D is flagged “red”, being significantly below both the scale midpoint and the
BUS benchmark mean.
Table 4.5.19 – Response to question “All things considered, how do you rate the overall
comfort of the building environment?”
OVERALL COMFORT – Unsatisfactory / Satisfactory
Building
Number of Responses by Rating Mean
Rating for
Building
Study
Mean
Percentile
Unsatisfactory Satisfactory
1 2 3 4 5 6 7
A 0 0 1 2 5 4 2 5.28 67
B 0 0 0 0 0 3 1 6.25 97
C 0 0 0 3 5 11 5 5.82 89
D 0 1 5 5 14 6 2 4.83 54
Benchmark - - - - - - - 4.79 -
Table 4.5.20 – Response to question “Do you feel less or more healthy when you are in
the building?”
HEALTH (Perceived) – Less Healthy / More Healthy
Building
Number of Responses by Rating Mean
Rating for
Building
Study
Mean
Percentile
Less Healthy More Healthy
1 2 3 4 5 6 7
A 0 0 0 9 2 2 1 4.64 92
B 0 0 0 2 1 1 0 4.75 94
C 0 2 2 16 1 1 1 4.09 69
D 4 2 5 15 1 5 1 4.03 64
Benchmark - - - - - - - 3.74 -

149
Table 4.5.21 – Response to question “Please estimate how you think your productivity at
work is decreased or increased by the environmental conditions in the building?”
PRODUCTIVITY – Decreased / Increased
Building
Number of Responses by Rating Mean
Rating for
Building
Study
Mean
Percentile
Less Healthy More Healthy
-40% -30% -20% -10% 0 10% 20% 30% 40%
A 0 2 2 1 3 1 4 0 0 -1.53 41
B 0 0 0 0 2 2 0 0 0 5 73
C 0 1 0 2 9 3 5 3 0 7.27 81
D 1 1 4 9 6 2 4 0 1 -5.17 21
Benchmark - - - - - - - - - 0.56 -
Summary of case study building performance – Internal environment
As previously noted, although the areas of Building A occupied by survey responders
are designed for a mixed mode ventilation strategy, it appears that they are operated as
fully mechanically vented. The ventilation also provides heating and cooling, the former
being supplemented by radiators in some areas. The building is reported to have good
air quality, however the main office is highly glazed and is uncomfortably hot in summer.
Control over temperature is poor in absolute terms, but exceeds the benchmark
expectation. Many occupants consider that the building has too much natural light,
however this does not appear to result in excessive glare, indicating that the blinds are
effective. Conversely the survey suggests strongly that too little artificial lighting has
been provided in the building, and that too little control is provided over it. Occupants
rate the building as being satisfactory overall in terms of noise, however there does
appear to be a particular problem with noise from colleagues and other people. This is
supported by a number of comments received, particularly in relation to noise from
telephone calls in the main open plan office area. Overall, the building performs well in
relation to benchmark means, and is considered healthy and comfortable. This does not
appear to translate into a positive effect in terms of perceived productivity however, and
there are some particular environmental problems in the building, notably that of summer
overheating and noise from colleagues and other people.
Building B was designed to be predominantly naturally vented, however the completed
building includes mechanical ventilation to the ground floor, where a mixed mode
150
ventilation strategy appears to be in operation, combined with electric underfloor heating.
Occupants consider the air quality to be excellent all year round, and thermal comfort
levels in summer exceed benchmark expectations. In winter the building is considered
uncomfortably cold however, and the building manager reports that serious problems
were experienced with the underfloor heating system in the first two winters. Following a
series of interventions this does now however appear to be functioning correctly, and
terms of personal control over heating and cooling the building scores well against the
benchmark. The building reportedly performs well with respect to the amounts of both
natural and artificial light, and provides relatively good control over the latter. There is a
particular problem in relation to “noise from others”, which is likely to result from the main
office being open plan with the conference breakout area. Overall however, occupants
are highly satisfied in relation to acoustics. Of the case study buildings, this one is most
highly rated in terms of overall comfort and health, and also significantly exceeds the
benchmark mean for perceived effect on productivity.
Building C was initially conceived as a naturally ventilated building, however mechanical
ventilation has been added to many offices and classrooms during the design process.
Air quality in summer is reportedly good, however the building is considered
uncomfortably hot, stuffy and smelly in winter. Personal control of heating and cooling is
very limited, with more than 70% of respondents selecting the lowest possible rating in
each case. Discussions with occupants suggest that temperature control dials provided
in rooms are entirely ineffective, and that the only means of changing the temperature in
the building is by telephoning the facilities manager. Natural light levels appear to be
satisfactory, however the levels of artificial lighting are considered too high, which also
translates to problems with glare. Acoustically the building exceeds benchmark
expectations in general, although occupants consider that there is too much noise from
colleagues, with some commenting particularly that it is sometimes difficult to
concentrate in the larger offices. The building performs best out of the case study
buildings in terms of perceived effect on productivity, and also exceeds the benchmark
mean for health and overall comfort. The internal environment appears to be generally
good, aside from the particular issue relating to poor air quality and overheating in
winter.
Aside from the lecture theatres, Building D is entirely naturally vented, with ventilation
being provided by automatically controlled low level louvres, rather than opening
windows. Heating is provided by automatically controlled radiators and trench heating,
whilst cooling Building D is by means of chilled beams. Air quality is good in winter,
151
although some occupants complained of draughts from the low level ventilators. The
main office areas are highly glazed and in summer the temperature is reported to be
uncomfortably hot and variable. Control over both heating and cooling falls below
benchmark expectations. Whilst the artificial lighting is considered good, occupants
report the amount of natural to be excessive, with glare from the sun a problem. The
building fails to meet the benchmark mean in terms of noise, with noise from colleagues
and other people an issue. Noise from outside is also a problem for this building, with a
number of comments being received relating to break in noise from the external
courtyard and from the adjacent school. Building D was rated the lowest of the four in
terms of overall comfort, health and effect on productivity, and falls significantly below
benchmark expectations for the latter. Artificial lighting levels are considered ideal, but
in other areas the internal environment is considered relatively poor; summer
overheating, glare, noise and cold draughts in winter being particular areas of
dissatisfaction.
Comparison of case study building performance – Internal environment
Table 4.5.22 ranks the performance of the buildings relative to each other and to the
benchmark mean, for the various aspects of internal environment that were considered.
Performance can be seen to be rather variable, with no building exceeding benchmark
expectation in all categories. Building B performs well, being the best performing
building in 7 out of 10 categories, and exceeding the benchmark mean in 9 out of 10.
For other buildings performance is more variable, with Building D for example exceeding
the benchmark mean in only 6 out of 10 categories.
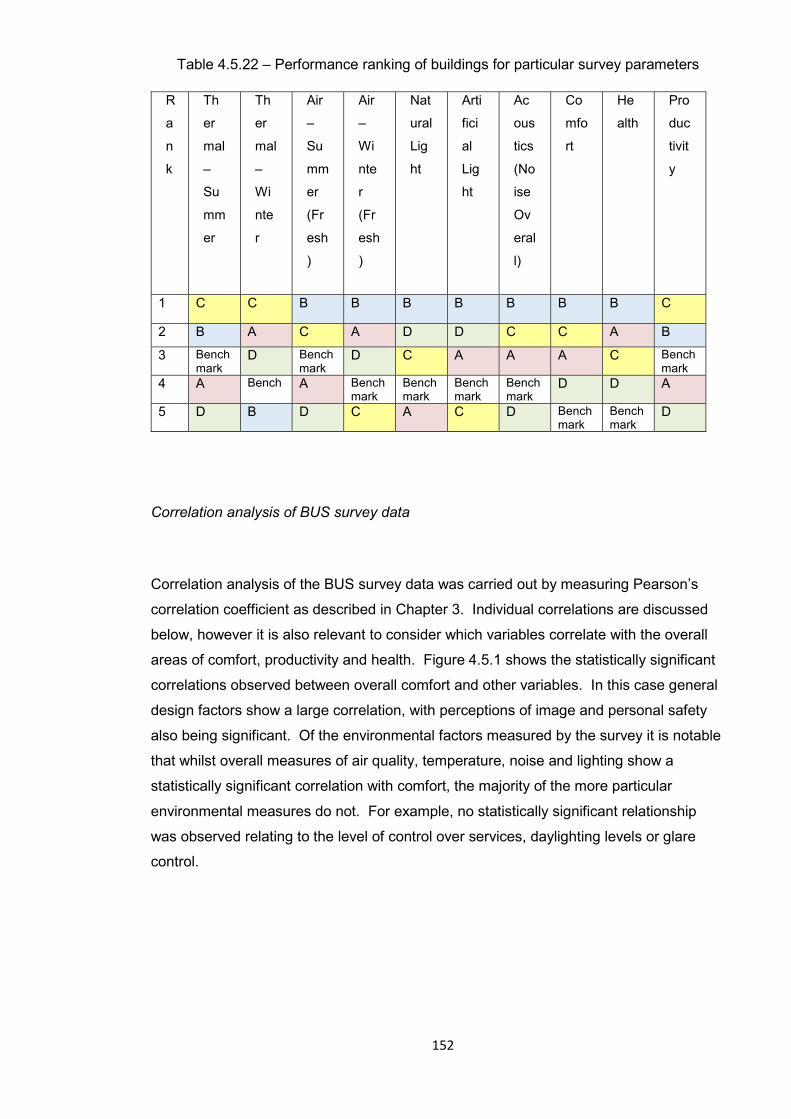
152
Table 4.5.22 – Performance ranking of buildings for particular survey parameters
R
a
n
k
Th
er
mal
–
Su
mm
er
Th
er
mal
–
Wi
nte
r
Air
–
Su
mm
er
(Fr
esh
)
Air
–
Wi
nte
r
(Fr
esh
)
Nat
ural
Lig
ht
Arti
fici
al
Lig
ht
Ac
ous
tics
(No
ise
Ov
eral
l)
Co
mfo
rt
He
alth
Pro
duc
tivit
y
1 C C B B B B B B B C
2 B A C A D D C C A B
3 Benchmark
D Benchmark
D C A A A C Benchmark
4 A Bench A Benchmark
Benchmark
Benchmark
Benchmark
D D A
5 D B D C A C D Benchmark
Benchmark
D
Correlation analysis of BUS survey data
Correlation analysis of the BUS survey data was carried out by measuring Pearson’s
correlation coefficient as described in Chapter 3. Individual correlations are discussed
below, however it is also relevant to consider which variables correlate with the overall
areas of comfort, productivity and health. Figure 4.5.1 shows the statistically significant
correlations observed between overall comfort and other variables. In this case general
design factors show a large correlation, with perceptions of image and personal safety
also being significant. Of the environmental factors measured by the survey it is notable
that whilst overall measures of air quality, temperature, noise and lighting show a
statistically significant correlation with comfort, the majority of the more particular
environmental measures do not. For example, no statistically significant relationship
was observed relating to the level of control over services, daylighting levels or glare
control.
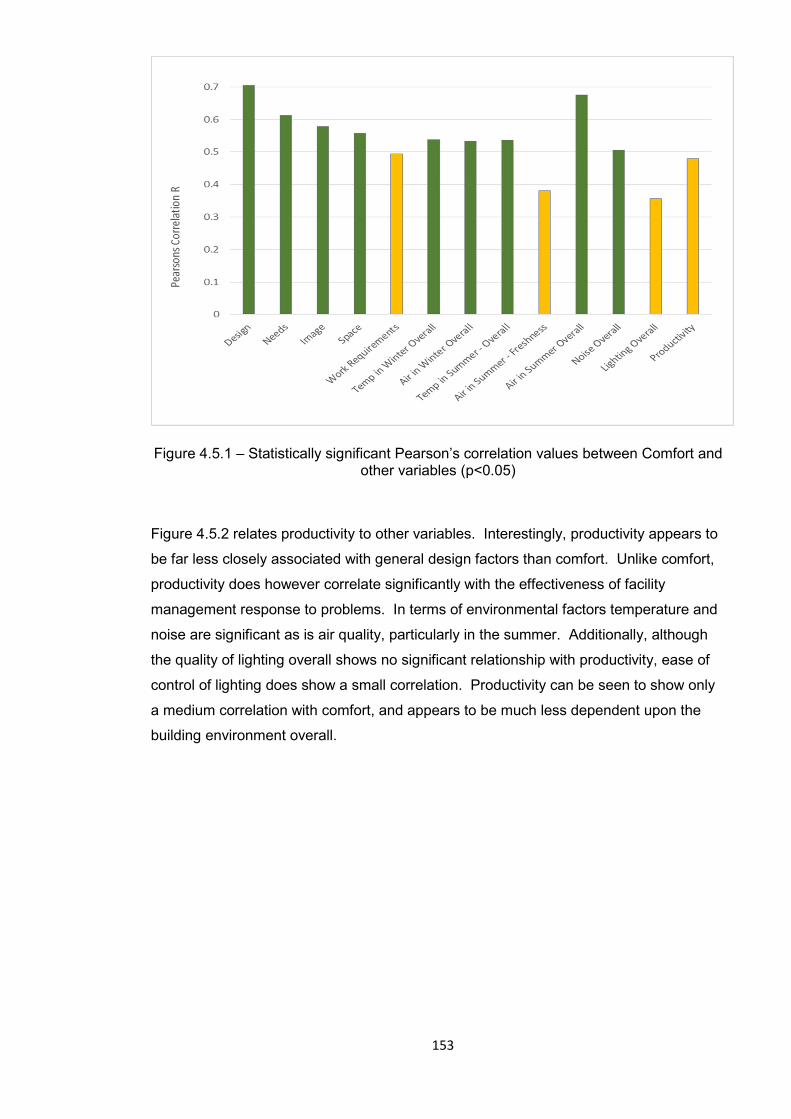
153
Figure 4.5.1 – Statistically significant Pearson’s correlation values between Comfort and other variables (p<0.05)
Figure 4.5.2 relates productivity to other variables. Interestingly, productivity appears to
be far less closely associated with general design factors than comfort. Unlike comfort,
productivity does however correlate significantly with the effectiveness of facility
management response to problems. In terms of environmental factors temperature and
noise are significant as is air quality, particularly in the summer. Additionally, although
the quality of lighting overall shows no significant relationship with productivity, ease of
control of lighting does show a small correlation. Productivity can be seen to show only
a medium correlation with comfort, and appears to be much less dependent upon the
building environment overall.
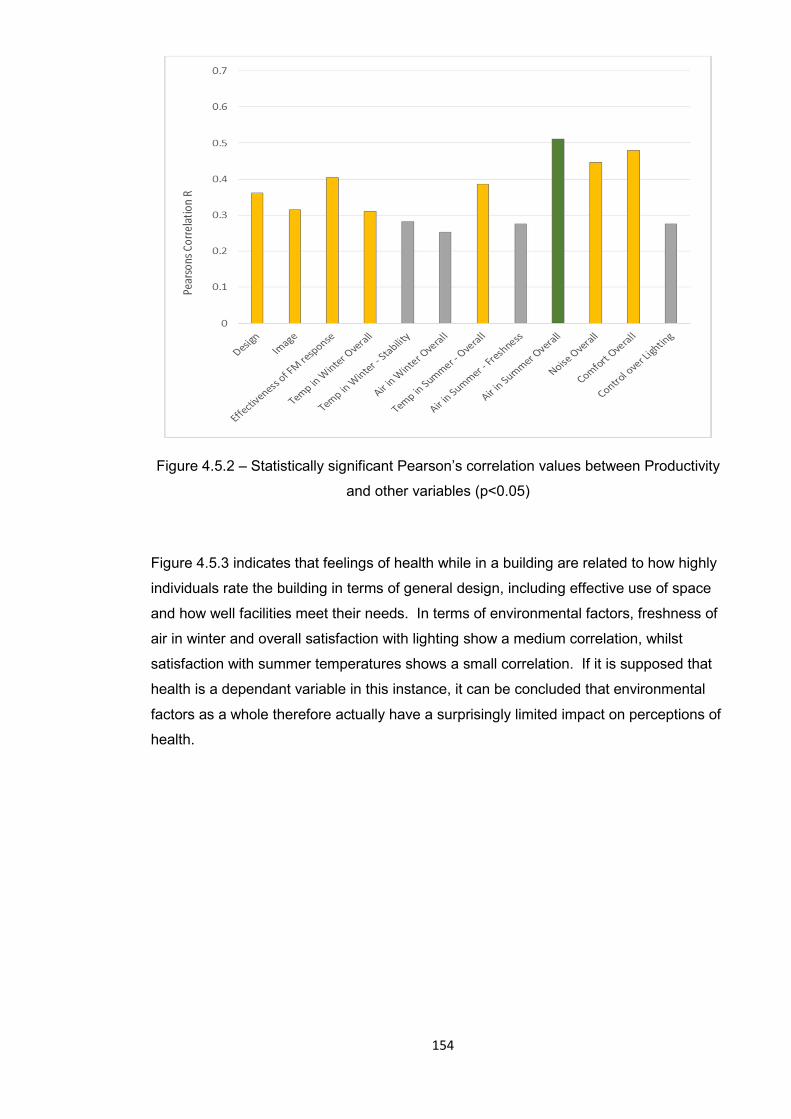
154
Figure 4.5.2 – Statistically significant Pearson’s correlation values between Productivity
and other variables (p<0.05)
Figure 4.5.3 indicates that feelings of health while in a building are related to how highly
individuals rate the building in terms of general design, including effective use of space
and how well facilities meet their needs. In terms of environmental factors, freshness of
air in winter and overall satisfaction with lighting show a medium correlation, whilst
satisfaction with summer temperatures shows a small correlation. If it is supposed that
health is a dependant variable in this instance, it can be concluded that environmental
factors as a whole therefore actually have a surprisingly limited impact on perceptions of
health.

155
Figure 4.5.3 – Statistically significant Pearson’s correlation values between Health and
other variables (p<0.05)
Overall, and as might be expected, there are some significant correlations between key
environmental quality variables, and comfort. It should be noted however that many
particular environmental factors do not appear to be linked to comfort at all. Productivity
shows correlations with many of these same key environmental variables, and with
comfort itself. No such clear relationship is however evident between health and the
general quality of internal environment, although certain particular aspects do correlate
to some extent. Of all of the variables only “temperature in summer overall” displays a
statistically significant effect on comfort, productivity and health, suggesting that avoiding
summer overheating is likely to be a key factor is achieving occupant satisfaction.
Perhaps most interestingly, in terms of the assumptions embedded in many BSAS, no
significant relationship is revealed between health and comfort, or health and
productivity.
4.5.3 Application and impact of particular BREEAM Health and Wellbeing criteria
Based upon the analysis presented in Chapter 3, the themes associated with the criteria
within the Health and Wellbeing section of BREEAM are as follows:
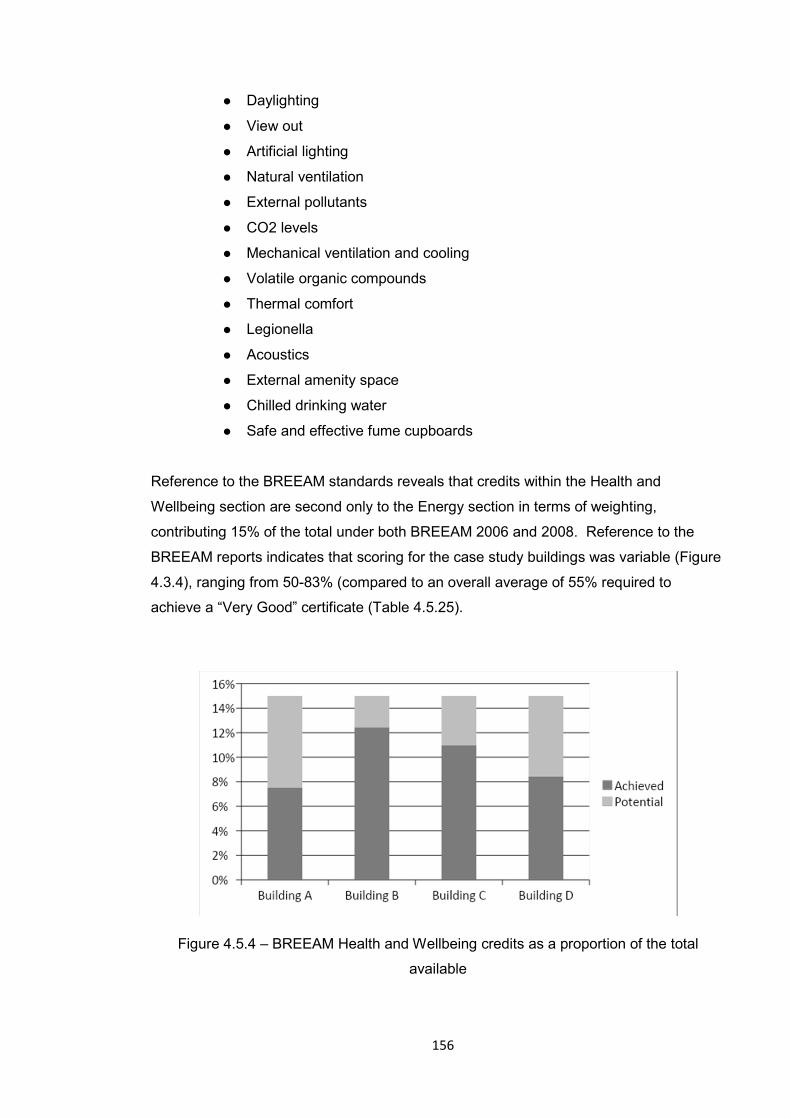
156
● Daylighting
● View out
● Artificial lighting
● Natural ventilation
● External pollutants
● CO2 levels
● Mechanical ventilation and cooling
● Volatile organic compounds
● Thermal comfort
● Legionella
● Acoustics
● External amenity space
● Chilled drinking water
● Safe and effective fume cupboards
Reference to the BREEAM standards reveals that credits within the Health and
Wellbeing section are second only to the Energy section in terms of weighting,
contributing 15% of the total under both BREEAM 2006 and 2008. Reference to the
BREEAM reports indicates that scoring for the case study buildings was variable (Figure
4.3.4), ranging from 50-83% (compared to an overall average of 55% required to
achieve a “Very Good” certificate (Table 4.5.25).
Figure 4.5.4 – BREEAM Health and Wellbeing credits as a proportion of the total
available
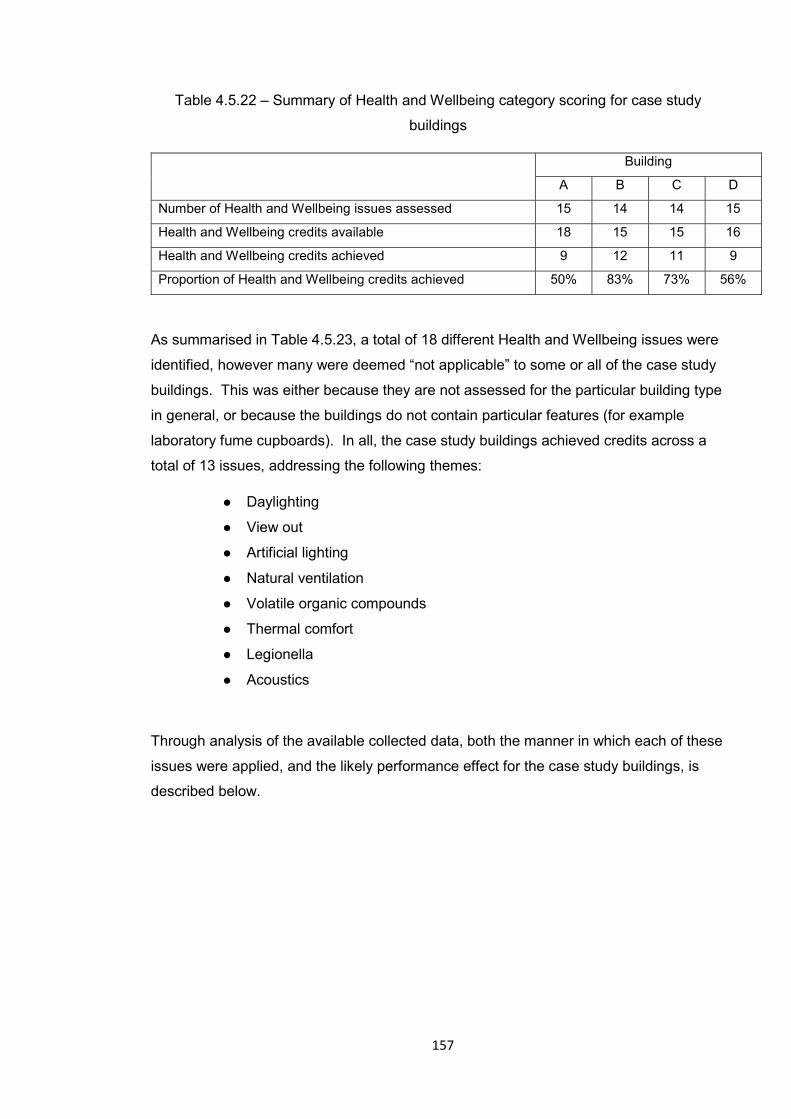
157
Table 4.5.22 – Summary of Health and Wellbeing category scoring for case study
buildings
Building
A B C D
Number of Health and Wellbeing issues assessed 15 14 14 15
Health and Wellbeing credits available 18 15 15 16
Health and Wellbeing credits achieved 9 12 11 9
Proportion of Health and Wellbeing credits achieved 50% 83% 73% 56%
As summarised in Table 4.5.23, a total of 18 different Health and Wellbeing issues were
identified, however many were deemed “not applicable” to some or all of the case study
buildings. This was either because they are not assessed for the particular building type
in general, or because the buildings do not contain particular features (for example
laboratory fume cupboards). In all, the case study buildings achieved credits across a
total of 13 issues, addressing the following themes:
● Daylighting
● View out
● Artificial lighting
● Natural ventilation
● Volatile organic compounds
● Thermal comfort
● Legionella
● Acoustics
Through analysis of the available collected data, both the manner in which each of these
issues were applied, and the likely performance effect for the case study buildings, is
described below.

158
Table 4.5.23 - Detailed scoring for all buildings, by issue (health and wellbeing section)
Issue Score
Reference Title Buildin
g A Buildin
g B Buildin
g C Buildin
g D
Hea 01 (HW1)
Daylighting 0 1 0 0
Hea 02 (HW2)
View out 1 1 1 1
Hea 03 (HW5)
Glare control 1 1 1 1
Hea 04 (HW4)
High frequency lighting 1 1 1 1
Hea 05 (HW5)
Internal and external lighting levels
1 1 1 1
Hea 06 (HW6/7)
Lighting zones and controls 1 1 1 2
Hea 07 (HW8)
Potential for natural ventilation 0 1 0 0
Hea 08 (HW9/10/11)
Indoor air quality 0 0 0 1
Hea 09 Volatile organic compounds 0 1 1 NA
Hea 10 (HW14)
Thermal comfort 0 1 1 1
Hea 11 (HW15)
Thermal zoning 1 1 1 0
Hea 12 (HW16)
Microbial contamination 1 1 1 1
Hea 13 (HW17/M24)
Acoustic performance 2 2 2 0
Hea 14 Office space NAS NAS NAS NAS
Hea 15 Outdoor space NA NAS NA NAS
Hea 16 Drinking water NA NA NAS NAS
Hea 17 Specification of laboratory fume
cupboard 0 NA NA NA
Hea 18 Containment level 2 and 3
laboratories 0 NA NAS NA
NA = Not assessed for this particular building NAS = Not assessed under the scheme used for this building
Additional issues listed in manuals but not assessed for any case study buildings: HW12-13, 18-27
159
Hea 01 (HW1) - Daylighting
Issue aim: “To give building users sufficient access to daylight” (BRE, 2008)
A credit is available where the building is designed to meet prescribed standards of
daylighting. The standard is based upon achieving an average daylight factor of at least
2%, with additional requirements also applied relating to uniformity of lighting and
provision of a view of the sky. The standard applies to “occupied areas” generally, with
more stringent requirements for areas where desk based activities are expected. Under
the BREEAM 2006 Bespoke scheme, 100% of this area must comply. For BREEAM
2008 Bespoke the figure is 80%, whilst for higher education buildings assessed under
the Education 2008 scheme the value is 60%. For the latter, a second credit is
available where the standard is met for 80% of occupied areas. Under the 2008
Bespoke scheme, the provision of daylight must additionally be designed in accordance
with a number of particular technical documents.
The case study buildings achieved credits under this issue as follows:
Building A – 0 credit
Building B – 1 credit
Building C – 0 credit
Building D – 0 credit
A review of the BREEAM report shows that the credit was awarded for Building B based
upon compliance in more than 80% of occupied areas (the main reception/breakout area
was deemed non-compliant as it did not meet room depth criteria). The credit is
evidenced based upon correspondence and daylighting calculations produced by the
services engineer, along with relevant design drawings. The post construction validation
consists of an email from the main contractor stating that the building has been
constructed in accordance with these drawings.
160
A comprehensive audit trail therefore appears to exist in relation to the credit for Building
B. Potential weaknesses exist in this audit trail however; for example the calculations do
not appear to have been verified by the BREEAM assessor. Additionally, using the main
contractor to verify whether the building has been constructed in accordance with these
calculations lacks robustness, given that if any design changes did occur after the
calculations were carried out they would incur direct costs for re-calculation, as well as
risking non-compliance.
The issue is configured to deliver minimum levels of daylighting to all, or most, of those
areas within the building where occupants spend significant amounts of time. As
discussed above, the results of the building occupant survey indicate that occupants
consider levels of natural light to be close to ideal in Buildings B and D, slightly too low in
Building C, and too high in Building A. Levels of daylighting exceed the survey
benchmark levels in all cases. The aim of the issue therefore appears to have been
substantially met in all buildings, although only Building B has achieved a credit. Review
of the BREEAM reports indicates that for Buildings A, C and D the credit was not
attempted (no daylighting calculations were produced). One possible reason for this is
that these buildings all contain large lecture theatres, which have little or no glazing and
are therefore unlikely to have complied.
Hea 02 (HW2) - View Out
Issue aim: “To allow occupants to refocus their eyes from close work and
enjoy an external view, thus reducing the risk of eyestrain and breaking the
monotony of the indoor environment” (BRE, 2008)
One credit is available where the configuration of the building allows an “adequate view
out” from all “relevant building areas”. Relevant building areas are defined as those
which will contain workstations, benches or desks. Note that, unlike issue Hea 1, lecture
theatres appear to be excluded from the assessment. For the Bespoke 2006 scheme an
“adequate view out” is defined as a view from desk height, of a window within 7m
providing an external view of something at least 10 metres beyond it. For the 2008
versions, the view must instead be of a wall within 7m, having at least 20% window
openings.

161
The case study buildings achieved credits under this issue as follows:
Building A – 1 credit
Building B – 1 credit (offices and skills laboratory only)
Building C – 1 credit
Building D – 1 credit (small computer suites only)
The case study buildings are relatively highly glazed and the majority of areas provided
with desks have generous allocation of windows. Building B and D were awarded an
area weighted credit for complying in certain areas only, as indicated. A review of the
BREEAM reports indicates that the issue has been assessed directly by the BREEAM
assessor, based upon design drawings. For Building A, spot checks were additionally
carried out on site by the BREEAM assessor, as part of the post construction review.
For Building B the main contractor provided an email to confirm that the building had
been constructed in accordance with the drawings submitted. In this case the credit
requirements are very straightforward and appear to have been correctly applied. It is
notable that the requirement has been considerably reduced between BREEAM 2006
and BREEAM 2008, the latter requiring only that desks are within 7m of a wall with a
minimum of 20% glazed area.
The aim of the issue is clearly explained within the BREEAM guidance, being to reduce
eyestrain and visual monotony for those working at a desk. The requirement itself does
not appear particularly robust however, particularly for the BREEAM 2008 scheme,
where the criteria do not call for line of sight to a window, or for there to be anything
visible through the windows on which eyes could be re-focused. No justification is
provided for the limit of 7m. The aim suggests that the “view” provided might be
expected to produce beneficial effects in terms of the health and comfort of occupants.
In Buildings A, B and C survey respondents are all based in compliant areas, whereas
for Building D the opposite is true. For the case study buildings this is broadly consistent
with the results of the Building User Survey, for which Building D is the most poorly rated
in terms of health and comfort.
162
Hea 03 (HW3) - Glare control
Issue aim: “To reduce problems associated with glare in occupied areas
through the provision of adequate controls” (BRE, 2008)
One credit is available where an “occupant-controlled shading system” is provided on all
windows, glazed doors and rooflights in “relevant” building areas. For the BREEAM
Bespoke 2008 assessment there is a further requirement that in all other “occupied
areas” the potential for “disabling glare” must be designed out by means of brise-soleil,
low eaves, or bioclimatic design that provides shading from high level summer and low
level winter sun. As previously noted, “relevant areas” are those containing desks,
benches or workstations (excluding lecture theatres); “occupied areas” are those likely to
occupied by periods of 30 minutes or more. No definition is provided for “disabling
glare”.
The case study buildings achieved credits under this issue as follows:
Building A – 1 credit
Building B – 1 credit
Building C – 1 credit
Building D – 1 credit
A review of the BREEAM reports indicates that only the first part of the credit has been
applied for the bespoke assessments. All buildings are therefore expected to have
occupant controlled shading to “relevant areas”, however the additional requirement for
control of “disabling glare” in other areas has not been deemed applicable to these
buildings. No explanation was given for this.
The evidence submitted consists of design drawings, specifications and schedules,
along with various emails from consultants and main contractors confirming particular
points of detail. For Building A, it was noted that the blinds were not installed at the time
163
of the post construction site visit, with the credit instead being awarded based upon
subsequent assurances provided by the project architect. For Building B, post
construction validation was provided in the form of an email from the main contractor.
Observations of the case study buildings confirmed that roller blinds were installed to all
“occupied areas” within the case study buildings. These were manually operated in
most instances, and where motorised blinds were provided they were locally controlled.
Manual vertical strip blinds were observed in the laboratories in Building B only. The
university facilities management team confirmed that they rate both the importance and
effectiveness of glare control highly, saying “We have put effort into finding a blind that
suits our needs. We have nominated contractors and a strong specification”.
The aim of the issue is to reduce problems associated with glare. These problems are
not defined, but might reasonably be expected to include difficulty in using computer
screens, and general visual discomfort. A high level of satisfaction in relation to glare
might therefore be expected, contributing in turn to a general improvement in health,
comfort and productivity. The aim of the issue appears to have been partially achieved
for the case study buildings. Blinds are in place, however the survey results do not
suggest that the case study buildings are performing significantly better than other
buildings, with Building D performing significantly worse. This may not be surprising
given that blinds can only block glare, and do not deal with its source. Additionally the
survey does not demonstrate any strong correlation between glare and either health,
comfort or productivity. This indicates that whilst occupants consider that glare is
present, it does not appear to be impacting on them in any significant way. Lowering
blinds may blinds may therefore be successful in counteracting the effects of glare in the
buildings, but without influencing the amount and orientation of glazing, it is not clear that
the criteria dictate anything over and above the minimum practical provision required for
any office area.
Hea 04 (HW4) - High Frequency Lighting
Issue aim: “To reduce the risk of health problems related to the flicker of
fluorescent lighting” (BRE, 2008)
One credit is available where all fluorescent and compact fluorescent lamps are fitted
with high frequency ballasts. The reasons given for this are that lights fitted with these
164
do not produce visible flicker or audible buzzing, and may improve energy efficiency by
up to 10%.
The issue represents a “minimum standard” for a “very good” rating and is therefore
compulsory. All case study buildings achieved the credit.
Building A – 1 credit
Building B – 1 credit
Building C – 1 credit
Building D – 1 credit
Review of the BREEAM reports indicates that the credit has been awarded based on
specification clauses. For Building A, spot checks were also carried out on site by the
BREEAM assessor as part of the post construction review, whilst for Building B post
construction validation was provided in the form of an email from the main contractor.
Analysis of the BREEAM criteria suggest that the specific aim of the credit is to eliminate
flicker and buzz from fluorescent lighting, leading to an improvement in health for
occupants. Whilst the building user survey results do not assess light flicker or buzz
directly, the case study buildings do in all cases exceed the survey benchmark in terms
of the perceived effect the building on occupant health. It is also suggested that a
reduction in electricity consumption should be expected, although this appears to be
tangential to the issue aim. As previously discussed, the overall energy performance of
the buildings is unexceptional, whilst the data collected is not sufficient to identify a
marginal reduction in lighting energy use.
Hea 05 (HW5) - Internal and external lighting levels
Issue aim: “To ensure lighting has been designed in line with best practice
for visual performance and comfort” (BRE, 2008)
165
One credit is available where the internal artificial lighting for the building is designed to
meet the minimum illuminance levels specified in the CIBSE Code for Lighting 2006
(CIBSE, 2006) (CIBSE Code for Lighting 2002 (CIBSE, 2002) in the case of the Bespoke
2006 scheme). For areas where computer screens are regularly used, the internal
lighting design must also comply with particular parts of CIBSE Lighting Guide 7 (CIBSE,
2007), relating to avoidance of glare from artificial lighting. For external areas, artificial
lighting must meet the illuminance values specified in CIBSE Lighting Guide 6.
The case study buildings achieved credits under this issue as follows:
Building A – 1 credit
Building B – 1 credit
Building C – 1 credit
Building D – 1 credit
Review of the BREEAM reports reveals that compliance for Buildings A, B and D is
based upon direct replication of the BREEAM requirement in a specification clause
and/or a letter or email from a project team member confirming that the design and
installation is compliant. Only for Building C were the specific lux values required in
each area included in the specification and marked on the layout drawings. For Building
A, spot checks by the BREEAM assessor, and an email from the electrical contractor
confirm that the installation was installed in accordance with the design. The above
appears to represent a very weak level of evidence, as it relies almost exclusively on
general assurances from the construction team. Only for Building C were some of the
specific requirements of the issue (i.e. the internal illuminance levels) included in the
design information provided as evidence.
The stated aim of the issue is to provide “best practice” “visual performance and
comfort”, through adherence to CIBSE standards relating to light levels and prevention
of glare. It is therefore expected that building occupants will express satisfaction in
relation to the artificial lighting provision. This appears to be the case in Buildings B and
D, for which occupants report close to ideal levels of lighting at their work station, and
below benchmark incidence of glare. In Building A however, occupants report that there
is too little artificial light, whilst in Building C there is far too much. Glare from artificial
166
lighting is also reported to be a problem in Building C. The survey does not provide data
in relation to the external artificial lighting provision.
Hea 06 (HW6 / HW7) - Lighting zones and controls
Issue aim: “To ensure occupants have easy and accessible control over
lighting within each relevant building area” (BRE, 2008)
One credit is available where internal artificial lighting is zoned to allow “separate
occupant control” within rooms, to suit varying occupancy. In particular it is required that
office areas are split into lighting zones covering no more than four workstations, and
that workstations next to windows are separately zoned. In “seminar and lecture rooms”,
presentation and audience areas must be separately zoned. Specific additional
requirements are listed for lecture theatres. “Separate occupant control” is defined as
“Light switches/controls for a particular area/zone of the building that can be accessed
and operated by the individual(s) occupying that area/zone. Such controls will be located
within, or within the vicinity of, the zone/area they control.”
The case study buildings achieved credits under this issue as follows:
Building A – 1 credit
Building B – 1 credit
Building C – 1 credit
Building D – 1 credit
Evidence presented for the Buildings is predominantly in the form of design drawings,
supplemented by various letters and emails to clarify particular points. Additional
validation is provided for Building A in the form of spot checks on site by the BREEAM
assessor at post construction review, along with an email from the electrical contractor.
For Building B post construction validation is provided by an email from the main
contractor. Reference to the notes for Buildings A-C makes it clear that the BREEAM
assessors consider presence detection and/or daylight sensors to be a form of occupant
control, although this is not explicit in the BREEAM scheme requirements. The
167
correspondence required to clarify the design information in each case suggests that the
design information submitted did not provide the level of detail required to confirm the
switching arrangements in the buildings. This in turn suggests a rather weak level of
verification, based upon general assurances from the construction team, rather than
specific design solutions. It also suggests that installers may not have been provided
with sufficient information to achieve a compliant installation. Observations by the
researcher on site revealed a rather confusing picture in terms of light switching. In
Buildings A, B and C single unlabelled rocker switches were provided to smaller rooms,
which allowed the user to cycle through various modes. These modes did not however
always result in a different pattern of lighting, suggesting either that the modes were
disabled, or possibly that they related to changing the lighting automation settings.
Larger lecture theatres typically had multiple unmarked switches of the same type. In
Building D small panels are typically provided with five numbered buttons and additional
buttons marked with up and down arrows. Of these, three buttons had a visible effect on
the room lighting, achieving all on, all off and part on. The remaining buttons had no
observable effect. In the larger office areas in Buildings A and D no light switches were
evident to the researcher and the building managers were additionally unable to advise
the location of these.
The aim of the credit is clear in providing easy control of lighting within office and
teaching spaces, although the intended “health and wellbeing” effect is not made explicit.
Good control over artificial lighting might be expected, however the categorisation of
presence detection and/or daylight sensors as occupant control is considered likely to
reduce the impression of control significantly. This is particularly the case in the large
office areas in which many survey respondents were based in Buildings A and D, and in
which no switching was evident. These expectations are consistent with the survey
results, which indicate that levels of control were significantly below benchmark levels in
Buildings A and D. Control was above benchmark levels in Buildings B and C, although
only in Building B did results exceed the scale midpoint.
Hea 07 (HW8) - Potential for natural ventilation
Issue aim: “To recognise and encourage adequate cross flow of air in
naturally ventilated buildings and flexibility in air-conditioned / mechanically
ventilated buildings for future conversion to a natural ventilation strategy”
(BRE, 2008)

168
One credit is available where “occupied areas” of the building are provided with an
adequate source of natural ventilation. This may be achieved by providing a specified
ratio of opening windows/internal floor area, or by using an approved design tool. For
the 2008 scheme versions there must additionally be at least two levels of ventilation,
controllable by building users. Under the Education scheme, ventilation must also meet
the requirements of Building Bulletin 101 (BB101) (Education Funding Agency, 2014),
with any mechanical actuators also being fully modulating and silent in operation.
The case study buildings achieved credits under this issue as follows:
Building A – 0 credit
Building B – 1 credit
Building C – 0 credit
Building D – 0 credit
Evidence presented for the Building B is in the form of design drawings and windows
schedules. Post construction validation is provided by an email from the main
contractor, attaching as-built drawings and window schedules. The researcher observed
however that the only natural ventilation to the technician’s room adjacent to the main
lecture theatre is an external door. This appears to have been considered satisfactory
by the assessor, but would seem to be inadequate in practice. The researcher
additionally noted that opening windows in the main upstairs laboratory were
substantially blocked by equipment trolleys and shelving. The building manager was
furthermore unaware of the presence of windcatchers provided in both this laboratory
and upstairs meeting room (the controls for which appeared in any case to be
ineffective).
For Building A the BREEAM report states that the credit was not sought because
“certain rooms within the building would not have sufficient window opening areas to
achieve the credit and therefore mechanical ventilation is being provided (e.g. lecture
theatres).” For Building C the assessor notes that although opening windows are
provided, “comfort cooling is supplied to the majority of areas to comply with BB101.”
For Building D the report notes that “Due to the deep plan of the building the appropriate
169
window areas requirement will not be achievable.” The comment in relation to Building
C appears nonsensical, as the presence of comfort cooling does not prevent the credit
being achieved. The comment in relation to Building D is also surprising, given that the
majority of the building is designed to be naturally ventilated.
The provision of adequate natural ventilation facility might expected to contribute to good
air quality in Building B. Conversely, failure to achieve the same in Building D (which is
a substantially naturally ventilated building) might be expected to result in poor air
quality. Air quality in Buildings A and C are unlikely to be affected, as opening windows
are supplemented by mechanical ventilation in occupied areas. These predictions align
generally with the survey results, which indicate good year round air quality in Building B
and “stuffy” summer conditions in Building D. The poor air quality in the laboratory in
Building B is not represented in the survey results, as no respondents have their work
stations located in that room. The problems in this room do not in any case suggest
inadequate design, but rather a lack of appreciation of the ventilation strategy by the
building manager.
Hea 08 (HW9/10/11) - Indoor air quality
Issue aim: “To reduce the risk to health associated with poor indoor air
quality / To ensure adequate indoor air quality” (BRE, 2008)
One credit is available under all schemes where, for naturally ventilated buildings,
ventilation openings are required to be at least 10m from “sources of external pollution”.
For buildings incorporating mechanical ventilation, inlets and exhausts must be at least
10m apart, and additionally at least 20m from “sources of external pollution”. “Sources
of external pollution” are defined as including roads, car parks and building services
outlets. For the 2008 Education scheme buildings are additionally required to comply
with the criteria contained within Building Bulletin 101. For the 2008 scheme there is
also a requirement to provide a minimum 12l/s/p of fresh air to office areas, and to install
CO2 monitoring to areas such as auditoria. For the Bespoke 2006 scheme two separate
credits are available. The first under issue HW10 requires the provision of CO2
monitoring to areas including auditoria. The second under issue HW11 requires
provision of a minimum 12l/s/p fresh air to offices, compliance with CIBSE Guide B2
(CIBSE 2016), and limiting room depths in naturally ventilated areas.

170
The case study buildings achieved credits under this issue as follows:
Building A – 0 credit
Building B – 0 credit
Building C – 0 credit
Building D – 1 credit (HW10)
For Building A the BREEAM assessors report notes that the credit cannot be achieved
due to the proximity of the nearby car park. For Buildings B and D the report notes that
the required separation between inlets and outlet will not be achieved.” For Building C
the report states simply that the credit has not been targeted. For the CO2 related credit
in Building D, design stage compliance is based upon a clause from the mechanical
services specification which calls for CO2 monitoring to be installed in return air
ductwork. The specification is extremely general however and makes no reference to
which locations this is to be applied to.
The aim of the credit is to improve internal air quality by reducing recirculation of building
air, reducing intake of vehicle fumes into the building and avoiding excessive build-up of
CO2. Where achieved, this might be expected to improve air quality in the building,
providing increased levels of health, comfort and productivity. The credit achieved for
Building D relates particularly to CO2 levels in auditoria, and some improvement in
productivity in particular might therefore be expected in these areas. Failure to specify
the scope of the CO2 monitoring in the design throws significant doubt, however, on
where and whether it has in fact been installed. Verification of this facility would require
a detailed technical investigation beyond the scope of this study. The Building User
Survey results show that Building D is rated the most poorly out of the case study
buildings, in terms of health comfort and productivity. The survey does however relate
primarily to building occupant desk spaces, and does not ask particularly about
conditions in lecture theatres.
171
Hea 09 - Volatile organic compounds
Issue aim: “To recognise and encourage a healthy internal environment
through the specification of internal finishes and fittings with low emissions of
volatile organic compounds (VOC’s)” (BRE, 2008)
One credit is available where prescribed standards are met for a number of common
building products relating to their potential for emission of VOC’s, and toxic substances
more generally. These include manufactured timber products such as plywood and
MDF, floor coverings such as vinyl and carpet, ceiling tiles, wall coverings, adhesives,
paints and varnishes.
The case study buildings achieved credits under this issue as follows:
Building A – 0 credit
Building B – 1 credit
Building C – 1 credit
Building D – N/A
For Building A the design stage credit was awarded based upon the issue requirements
being incorporated into the Architect’s specification. At post construction review the
main contractor has provided product data sheets to demonstrate compliance for some
of the materials used, however these did not cover all relevant materials and so the
credit has been withheld. For Building B the credit has been awarded based upon a
letter from the project architect stating that the requirement will be communicated to
“tenderers”. The post construction validation consists of an email from the main
contractor stating that they have complied with the requirement, along with inclusion of
manufacturer’s information for two particular products. For Building C, manufacturer’s
literature has been provided for a number of particular products, along with a general
assurance from the main contractor that the standards will be complied with. The issue
was not assessed for Building D. The level of evidence presented for both Buildings B
and C appears to be extremely weak. The specific requirements in relation to the credit
do not appear to have been incorporated into the design information, and no
172
independent checks appear to have been carried out in relation to the products actually
used. There is additionally no straightforward means of checking the providence of
products such as paint and plywood once they have been installed, and therefore little
prospect of detection should products not meet the requirements.
The aim of the credit relates explicitly to providing a healthy internal environment.
However, the combination of highly specific credit requirements and a very weak level of
design information and verification places doubt on the correct execution of the
requirements. Testing for VOC’s within the buildings is possible, but beyond the
resources of this study. Post construction verification of the products used in the
building is also problematic. All case study buildings exceed the survey benchmark in
relation to perceptions of health, however the study does not provide adequate data with
which to examine any possible link with volatile organic compounds.
Hea 10 (HW14) - Thermal comfort
Issue aim: “To ensure, with the use of design tools, that appropriate thermal
comfort levels are achieved” (BRE, 2008)
One credit is available where thermal modelling demonstrates that the building can
deliver thermal comfort in occupied spaces to meet the criteria set out in CIBSE Guide A
(CIBSE, 2015a). The modelling must be selected and used in accordance with CIBSE
AM11 (CIBSE 2015b). CIBSE Guide A prescribes temperature ranges applicable to
areas including lecture theatres, seminar rooms, teaching spaces and offices.
The case study buildings achieved credits under this issue as follows:
Building A – 0 credit
Building B – 1 credit
Building C – 1 credit
Building D – 1 credit
173
For Building A, the BREEAM report confirms that compliant thermal modelling was
carried out, but that the building did not comply in certain limited areas of the second
floor. Curiously the report goes on to state “This is due to the reliance on natural
ventilation and the lightweight structure.”, although as previously described the majority
of the building is mechanically ventilated and cooled. For Building B the credit has been
awarded based upon modelling results produced by the services engineer. Post
construction validation is provided in the form of an email from the contractor confirming
that the building has been constructed in accordance with the drawings. For Building C,
the services engineer’s specification states that thermal modelling has been carried out
in accordance with the requirements. The report notes that as a result of this analysis,
comfort cooling was added to the majority of rooms. For Building D the credit is
awarded based upon a letter from the services engineer, and a summary of the
modelling. An audit trail has therefore been provided in each case. There does not
however appear to be any independent scrutiny of either the choice of modelling tool, or
the calculations themselves; factors which may significantly affect the results (Bordass et
al., 2001; Menezes, 2012).
The aim of the credit is to achieve “appropriate” thermal comfort. Above benchmark
satisfaction relating to thermal comfort might therefore be expected in Buildings B, C and
D. Failure to examine the input parameters as part of the assessment might however be
expected to reduce the effectiveness of the criteria in practice, particularly as it is clear
that fundamentally erroneous information has been used for Building A. The BUS
measured thermal comfort of occupants directly and suggests that whilst generally
satisfactory, there are particular areas of concern. Building C is considered too hot in
winter, with analysis suggesting that inadequate control of temperature was provided for
the building. Meanwhile, Building D suffers from overheating in summer, suggesting that
the modelling conducted did not accurately reflect either the design or operation of that
building, in use.
Hea 11 (HW15) - Thermal zoning
Issue aim: “To recognise and encourage the provision of user controls which
allow independent adjustment of heating/cooling systems within the building”
(BRE, 2008)

174
One credit is available where the heating and cooling systems are designed to allow
occupant control of zoned areas within “occupied spaces”. The zoning must allow for
“separate control of each perimeter area (i.e. within 7m of each external wall) and the
central zone (i.e. over 7m from the external walls)”. The controls must be located in or
close to the space they relate to.
The case study buildings achieved credits under this issue as follows:
Building A – 1 credit
Building B – 1 credit
Building C – 1 credit
Building D – 0 credit
Review of the BREEAM report for Building A reveals that design stage compliance was
based on proximity to individual heating/cooling sources, and notes that “Most occupied
spaces have been designed to operate as a single temperature zone. In the smaller
rooms there are no areas over 7m from the radiators or VRF units”. This statement
would however translate to a maximum 14m x14m zone, and does not clearly
demonstrate compliance. For the large lecture theatres the report notes that
“temperature sensors have been located throughout the space linked to the heat
emitters to control the temperature so it is even for the whole space”; again it is unclear
that this demonstrates compliance, as no separate occupant control is suggested. At
post construction stage the assessor visited the site but it appears that the installation
was incomplete. Compliance was ultimately based upon as-built drawings provided by
the services sub-contractor. These reportedly indicated TRV’s to all radiators, occupant
controls for VRF units, and occupant controls for the lecture theatres, although no
evidence of the latter was found during the researcher’s visit. For Building B,
compliance is based upon heating layouts indicating thermostats in each room, along
with a photo of an installed thermostat. No mention is made of the cooling, although
controls were observed for these during the researcher’s visit. For Building C the
assessors report begins by stating that “the assessor is permitted to make a reasonable
judgement regarding the requirement to separately zone parts of rooms over 7m from
the external wall. We judge that in an 8m deep room a single heating zone is sufficient”.
The report goes on to describe the proposed heating and cooling system based upon
the mechanical engineers specification and radiator schedules, and “notes” and
175
drawings received by email from the services engineer. This describes a system with
TRV’s to radiators, room thermostats for trench heating and room thermostats for chilled
beams and the design stage credit is awarded on this basis. In the operational building
however the researcher observed that the TRV’s in the classrooms appeared to be
centrally controlled, and that no thermostats appear to have been installed for the trench
heating. Additionally the chilled beams have been replaced by mechanical ventilation
which, although provided with temperature control dials, was widely believed by
occupants to be fully centrally controlled. Overall, the evidence provided for compliance
appears rather weak. The design stage assessment for Buildings A and C is vague and
includes some significant interpretation of the requirements. The post construction
stage verification is also weak, relying on contractors as-built drawings in the case of
Building A and a single photo in the case of Building B.
The aim of the credit is clearly to achieve a greater level of control over temperature for
building users. The potential benefits of this are not stated, however it appears
reasonable to expect that this is intended to improve thermal comfort, and therefore
general comfort, health and productivity. The criteria do not appear to have been
implemented in Building C, and no effect is therefore anticipated in that building.
Buildings A and B do appear to be at least partly compliant, and some positive effect
may therefore be expected. Control over heating and cooling is directly assessed by the
building user survey. In this respect Building C performs very poorly in terms of control,
with over 70% of occupants indicated that they had “no control” over heating and
cooling. Buildings A and B fared better and significantly exceed the benchmark mean in
respect to control of heating and cooling. The absolute level of control is still relatively
low however, with neither exceeding the scale midpoint, and with over 40% of
respondents in Building A awarding the minimum possible rating. As detailed in section
4.1, the provision for control in Building C appears to have been largely removed through
the design and build process. In Building A controls have remained although the cooling
provision appears to be at least partly controlled by facilities management. In Building B
only one occupant experiences significant problems with control, perhaps indicating a
specific rather than a general problem.
Hea 12 (HW16) - Microbial contamination
Issue aim: “To ensure the building services are designed to reduce the risk
of legionellosis in operation” (BRE, 2008)

176
One credit is available where all water systems in the building comply with Health and
Safety Executive’s “Legionnaires' disease - The control of legionella bacteria in water
systems. Approved code of practice and guidance 2000” (HSE, 2010). Additionally,
where humidification units are specified they must be of the steam humidification type.
The approved code of practice includes general provisions in relation to the design of
both domestic hot and cold water systems, and to evaporative cooling units, both of
which are present in all four case study buildings
The issue represents a minimum standard for a “very good” rating and is therefore
compulsory. All case study buildings achieved this credit.
Building A – 1 credit
Building B – 1 credit
Building C – 1 credit
Building D – 1 credit
Review of the BREEAM reports shows that compliance is in all cases evidenced in the
form of a general specification clause and/or a letter of confirmation from the designer
and/or installer to the effect that the design complies with the approved code of practice.
Similarly the designers have in each case confirmed that no humidification plant has
been specified. This level of evidence appears very weak, as it does not include details
of the specific provisions made, or include any third party scrutiny of designs or
installations.
The aim of the credit is to reduce the risk of the bacteria legionellosis occurring in the
building water systems. However, as the code of practice represents a legal minimum
standard, and as the evidence provided to support this compliance is limited to general
assurances from the designers and/or installers, there does not appear to be any reason
to suppose that this issue has delivered any additional benefit or certainty in terms of
prevention of legionellosis for the case study buildings. Building managers reported zero
occurrence of legionellosis related illness across the four buildings which, whilst positive,
is not unexpected, as the incidence of legionnaires disease is not widespread; Naik et al.
177
(2012) report 235 case of legionnaires disease in England and Wales in 2011, of which
around 50% were believed to have resulted from foreign travel.
Hea 13 (HW17/M24) - Acoustic performance
Issue aim: “To ensure the acoustic performance of the building meets the
appropriate standards for its purpose” (BRE, 2008)
One credit is available where specified indoor ambient noise levels are achieved for a
range of room types. These standards must be verified by means of post completion
testing carried out by a qualified acoustician. A second credit is available where
specified reverberation times are achieved for areas “used for speech”, with this
performance again to be verified post completion. The requirements relate to a range of
rooms in the case study buildings, including offices, meeting rooms, teaching rooms,
lecture theatres and laboratories.
The case study buildings achieved credits under this issue as follows:
Building A – 2 credits
Building B – 2 credit (area weighted)
Building C – 2 credit
Building D – 0 credit
Review of BREEAM reports reveals that design compliance for Building A is evidenced
by means of a report produced by an acoustician, coupled with a report produced by the
Architect confirming that the design is in accordance with the acoustician’s
recommendations. Post completion testing results indicated a failure in two particular
instances relating to duct noise. The credit was however awarded, based upon a
commitment received from the contractor to rectify and re-test these areas. For Building
B compliance is evidenced by means of an acoustician’s report and post completion
testing. For the first credit the lecture theatre and technicians room did not comply,
whilst for the second credit only the lecture theatre and seminar rooms were assessed.

178
Partial weighted credits were therefore awarded for each. For Building C design stage
compliance was evidenced by means of a Stage D acousticians report providing general
suggestions in connection with compliance with Building Bulletin 93 (BB93) (EFA, 2003)
supplemented by an email from the same acoustician stating that particular parts of the
requirements had been satisfied. The evidence provided for Building B appears
relatively robust, as it includes advice and testing carried out by a third party
professional. The evidence for Building A is similarly robust, with the exception that the
credit was awarded despite some test failures. The evidence for Building C is much
weaker, as it relies on general assurances and includes no post completion testing
results.
The aim of the credit is to achieve “appropriate acoustic performance”. Reference to the
criteria reveals that the specific intention is to achieve particular standards in relation to
break-in noise and speech legibility. In terms of break-in noise in office areas there is
evidence to suggest that this issue may have had a positive effect, with the buildings
achieving the credit all exceeding benchmark expectations in terms of noise overall.
Additionally no comments were received in relation to break in noise for these buildings,
whereas five were received for the building which did not achieve it (Building D). It is
notable however that the issue does not attempt to address noise generated within the
rooms themselves. This was a significant issue across the case study buildings and
may be an area in which the issue could be further improved.
4.5.4 Summary
No overall aim is stated for the BREEAM Health and Wellbeing section, however
examination of the criteria suggests that the intention is to differentiate certified buildings
on the basis of good internal environmental quality, supplemented by some particular
additional issues relating to provision of chilled drinking water, external amenity space,
and safety of fume cupboards. The study data indicates that three of the four buildings
significantly exceeded benchmark expectations for comfort, but that only two exceed
benchmark expectations in relation to the perceived effect of the building on occupant
health.

179
CHAPTER 5 - DISCUSSION
This section begins with a summary of the knowledge gap and research aim, followed by
detailed exploration of the case study findings. The contribution to knowledge is then
articulated. Following this, the implications for criteria configuration are discussed and
recommendations are then put forward for their improvement.
5.1 Knowledge gap and research aim
Despite representing the pre-eminent model for measuring the sustainability of new and
refurbished buildings and by association, the setting of minimum standards and
subsequent market transformation, BSAS have been widely criticised in academic
literature from both a theoretical and empirical standpoint (Cole, 2005). The design and
construction stage interventions promoted by BSAS do not appear to be a reliable
means of improving overall building performance (Scofield, 2009; Monfared and
Sharples, 2011) and whilst a number of general theoretical weaknesses have been
identified within these methodologies, the particular factors limiting their effectiveness
are currently poorly understood. This knowledge gap has been addressed through close
examination of the content, application and impacts of a particular BSAS when applied
to four case study buildings. The links between content, methodology and results have
been examined in relation to energy use, water use and internal environmental quality,
with a view to identifying failures within the assessment process; in particular challenging
the assumptions that design change is accurately manifested within completed buildings
and that physical changes reliably translate to improved sustainability in use. Greater
understanding of these potential failure modes provides a platform for generating
recommendations for increasing the effectiveness of BSAS.
5.2 Case study findings
Addressing research objectives 1, 2 and 3 has generated a body of data which
describes the particular BSAS design criteria applied to each case study building, the
physical manifestation of those design criteria and the in-use performance of the
building. For each criterion, this data has been analysed with a view to testing whether
180
the design intervention has been correctly implemented and if so, whether it has
produced its intended effect. This analysis was attempted for criteria ranging across 23
different BREEAM “issues” relating to energy use, water use and internal environmental
quality. As discussed in detail in Chapter 3 this analysis represents just a portion of the
104 issues assessed under BREEAM 2008. With the scope of the analysis being
primarily limited by the availability of research resource. The analysis has additionally
been applied to just 4 buildings, all located in the same country and with a broadly
similar use profile. Notwithstanding these limitations, robust conclusions have been
possible in relation to the application of particular criteria to particular buildings. In
certain cases it has also been possible to comment upon the likely impact of these
interventions on overall building performance.
By establishing the presence of a feature or equipment within a building it has often
been possible to determine the physical manifestation of a design intervention with a
high degree of certainty. This has typically been achieved by cross referencing the
compliance evidence presented in the BREEAM assessment reports with walk through
surveys and discussion with building mangers and facilities management teams. In
other cases, for example, where the feature or equipment is hidden from view, it has
instead been necessary to infer its existence through examination of building
performance metrics. In still other instances, even where features or equipment are
visibly installed, it has been necessary to look to building performance data to
demonstrate that they are producing their intended effect. Examining the link between
physical manifestation and performance effect has proven more challenging than
establishing physical manifestation alone. A particular limitation in this regard was the
lack of functioning energy and water sub-meters within the buildings. This omission is
itself relevant to the study as it indicates a failure to correctly implement BREEAM
criteria, which in the case of basic electricity sub-metering, are compulsory for BREEAM
rated buildings. It has limited the scope to analyse the efficiency of particular aspects of
a building, which would have supported further analysis in respect of certain criteria.
Analysis in relation to water use was limited further still, with just two of the four case
study buildings having functioning whole building metering. Finally, although a range of
benchmark data sets are available for both energy and water use as discussed in
Chapter 3, their respective quality, contemporariness and applicability to the case study
building types are highly variable.
When considering performance in terms of internal environmental quality the data
collected was far more granular, with BUS survey respondents being asked to comment
181
specifically on a range of performance metrics. The main limitation of this data was that
it relied on human perception to generate information for quantitative analysis. Thus
although data was collected in a highly structured manner and benchmarked against a
robust dataset, personal preference will inevitably have influenced results. This
limitation was of particular significance for the smaller buildings and especially for
Building B, which has just four permanent staff. Overall, conclusions in relation to how
criteria have manifested themselves in the buildings are generally more certain than
those relating to the resulting effect on performance. This has created important
potential for bias in the results. It has been far easier in practice to demonstrate that a
criteria has had no effect on building performance (typically because the relevant feature
or equipment has not been installed) than to prove that it has had an effect. This is
reflected in the findings, which relate largely to observed failures. With only limited
references made to building upon observed successes.
Energy
Analysis of the BREEAM criteria reveals that differentiation in relation to Energy was
attempted through assessment of regulated energy use, augmented by particular
additional elements that are principally concerned with fixed services. Through sub-
metering, there was also an aspiration for improved facility to monitor energy use. Of
the 20 Energy issues, just five were attempted across all case study buildings. The aims
of these particular issues relate to reducing regulated energy use, provision of energy
sub-metering, the use of energy efficient fittings and controls for external lighting, and
the energy efficient design of lifts. The criteria making up these issues rely on a range of
strategies for their application, which the investigation suggests have various strengths
and weaknesses.
The use of statutory modelling to reduce regulated energy use (Ene 1) is an example of
a BREEAM requirement that is both complex and applied at a whole building level. It
piggybacks upon established external regulation. In this case resulting in a
“performance specification” which rewards results, regardless of method. This approach
has the advantage that a minimal administrative burden is applied, as the modelling
activity is already required to achieve Building Regulations compliance. Using this
method, design teams also have scope to introduce substantial design improvements
and the flexibility to choose those that are most practical and cost effective. On the
other hand, the accuracy with which design stage energy modelling predicts

182
performance in use, is known to be poor (Menezes et al., 2012), henceforth it is
uncertain to what extent the particular chosen improvements will be effective. The
awarding of credits in relation to this issue also lacks transparency, as the parameters
upon which the modelling is based are not communicated within the BREEAM reports.
Furthermore, it is technically difficult to verify many of the parameters and assumptions
embedded in these credits at completion stage and the suggestion that for Building A the
issue was effectively validated using a “post completion” visual inspection, carried out by
the BREEAM inspector, is considered to be fanciful. Such validation would, in reality,
require a line-by-line check of the modelling calculations, followed by robust construction
stage monitoring and/or post completion testing. Finally, the use of statutory modelling
promotes reductions in carbon emissions resulting from regulated energy use, whilst
failing to address unregulated consumption.
Conversely, the requirement that lift numbers, size and type are based upon energy
efficiency (Ene 8) is an example of a BREEAM requirement that rewards method,
regardless of result. This approach is also complex but is focussed on a particular
building element i.e. the lifts. It has the advantage of being non-prescriptive, and
therefore gives designers maximum flexibility to align enhancements with the wider
needs of the project. Calling upon designers to consider and justify their lift design in
terms of energy would appear to represent good practice. Encouraging the choice of lift
strategy purely on the basis of energy efficiency seems however to be a flawed
approach and ignores the commercial and operational factors which are also likely to be
important to project teams. In practice, with no clear framework being provided by
BREEAM for the assessment, the issue appears to be open to commercial manipulation.
In particular, asking consultants to generate two options and then choosing the one with
the lowest projected energy use does not seem a robust means of prioritising energy
efficiency over other considerations. The value of this process was further undermined
for the case study buildings by its implementation, which in two buildings was based on
an “informal assessment” by the services engineers. In no case was the decision
process communicated within the BREEAM report, making verification of its effect
impossible.
Finally, a number of criteria were simple and focussed, being applied in the form of
relatively straightforward specification enhancements. Particular features were
specified, that is; electric sub-meters (Ene 2 and 3), high efficacy external light fittings,
photocell controls (Ene 4) and various energy saving design features for lifts (Ene 8).
These requirements have the advantage of being “bolt on” requirements which

183
designers are able to add without significant impact on the wider design. The expected
improvements may also be clearer and more readily verified, when compared to credits
that relate to modelling or other complex design processes. The lack of inherent
consideration of the specific buildings when awarding these credits can however limit
their impact. For example three of the case study buildings were awarded credits for
using energy efficient bulbs on a very small number of external light fittings. Verification
may additionally be hampered by technical complexity, for example it was not possible
for the researcher to check whether the stated energy saving features had indeed been
embedded in the lift machinery. Similarly, whilst a number of electric sub-meters do
appear to have been fitted in the case study buildings, failure to properly commission
them has subsequently rendered them useless.
In summary, therefore, BREEAM “Very Good” certification does not appear to be a
robust differentiator in terms of Energy use or CO2 emissions, for the case study
buildings. A number of specific potential reasons for this have been identified, which
might be summarised as follows:
● The criteria are not applicable, for example none of the buildings contained a
swimming pool.
● The criteria are not always attempted. Overall uptake of credits from the section
was variable, ranging from 15-41%. Non-of the buildings attempted the credit
relating to Low or zero carbon technologies, despite all of them making use of
them.
● The criteria are not robustly configured, for example the use of design stage
modelling of regulated energy use is known to be a poor predictor of actual
energy use.
● The criteria are limited in scope, in that the criteria are focussed primarily on fixed
building services (for which energy efficiency is already a regulatory
consideration), whilst largely ignoring issues such as portable equipment and
occupancy patterns.
● The criteria are weakly defined, for example the requirement to define two
options for lifts and select the most energy efficient is not a robust means of
ensuring low energy use.
● The criteria does not address significant aspects of energy consumption for the
particular building, for example the use of high efficacy external lighting produces
little or no benefit where the lighting is limited in scope.
184
● The criteria are difficult for the BREEAM assessor to verify, for example the
presence of energy control features in lifts
● The criteria assume subsequent effective commissioning, for example the linking
of electrical sub-meters to the BMS.
● The criteria are not configured to directly reduce energy consumption. For
example, installing electrical sub-meters will not necessarily result in a reduction
in use.
Water
Analysis of the BREEAM criteria reveals that differentiation in relation to Water use is
based upon control of consumption for sanitary conveniences, irrigation and vehicle
washing. This is supported by particular requirements relating to water metering, water
re-use and leak detection and minimisation. Of the seven Water issues, five were
applied to the case study buildings. The aims of these particular issues related to
provision of low water use sanitary ware fittings, provision of a BMS compatible water
meter, leak detection on incoming services, leak control in toilet areas, and the
specification of landscaped areas not requiring automatic watering systems.
The criteria used in the Water section are universally simple in technical terms.
Reduction in day-to-day water use for sanitary conveniences is the only whole-building
issue within the category, for which improvement is sought through specification of a
comprehensive range of sanitary ware, based upon manufacturers data (Wat 1). This
approach is considered to be robust in terms of its likely effectiveness, is simple to enact
using existing specification documents and is open to verification both during and after
construction. The remaining criteria are of the “bolt on” type. These can be defined as
technically simple, independent of other design considerations and focussed on
particular building elements. Restrictions on the provision of automatic watering
systems (Wat 6) are straightforward to specify and verify, although their effectiveness as
a benchmarking measure is contingent on an assumption that the use of non-conforming
irrigation systems is common. The remaining measures relate to the provision of a
pulsed water meter (Wat 2), leak detection on incoming water supplies (Wat 3) and
automatic shut off valves for supplies to sanitary areas (Wat 4). These are also
straightforward to specify, but being located largely in service spaces are more difficult to
verify. The effectiveness of these credits is also less certain because of the
assumptions embedded within them. Wat 2 is reliant upon a link between water
metering and consumption. Similarly Wat 3 and Wat 4 will only be effective if and when
185
a leak occurs. These criteria are also sensitive to commissioning failure. This is
evidenced by the fact that none of the case study buildings scoring credits in relation to
pulsed water meters or major leak detection were found to have operational systems in
practice.
The water use by floor area measured for Buildings B and C was substantially below all
of the benchmarks considered, including the average for other buildings operated by the
same university. As such BREEAM “very good” certification appears to demonstrate
robust differentiation for these buildings in terms of Water use. It is notable however that
Buildings B and C consume very similar amounts of water by floor area, despite them
scoring quite different numbers of credits (Building C scored 7 credits in the section,
whilst Building B scored 3). Additionally, two of the nine available credits have
demonstrated to be entirely ineffective across all four buildings. A number of specific
potential reasons for this variation in performance have been identified, which might be
summarised as follows:
● The criteria are not applicable, for example, none of the case study buildings had
a vehicle washing facility.
● The criteria are not always attempted. Overall uptake of credits from the section
was variable, ranging from 38-88%. None of the buildings attempted the credit
related to Water recycling.
● The criteria do not address significant aspects of water consumption for the
particular building. For example, restriction on the design of automatic watering
systems for buildings, for which low maintenance landscaping was perhaps
always intended.
● The criteria relate to mitigation of risk rather than impacting on routine
performance. For example, the “major leak detection” system specified would
reduce water consumption only in the event that a leak occurred in the
underground pipework between the building and its nominal site boundary.
● The criteria assume subsequent effective commissioning, for example, the linking
of pulsed water meters and leak detection systems to the BMS.
● The criteria are not configured to directly reduce water consumption. For
example, making a water meter capable of being linked to a BMS system will not
necessarily result in a reduction in water use.

186
Internal Environmental Quality
Analysis of the BREEAM criteria reveals that differentiation in relation to Health and
Wellbeing was attempted through assessment of a broad suite of environmental metrics.
Of the 18 Health and Wellbeing issues, 12 were applied to some or all of the case study
buildings. The aims of these particular issues relate to: providing high levels of day
lighting whilst minimising glare, providing views out of the building for desk based staff,
providing adequate and controllable artificial lighting, providing potential for natural
ventilation, minimising internal and external air pollution, providing good thermal comfort,
preventing legionellosis and controlling break-in noise and reverberation. The strategies
used where applied to the whole building, but the criteria are polarised between highly
simplistic and highly technically complexity. The investigation suggests that each of
these approaches has a number of strengths and weaknesses, as follows.
The criteria applied to the case study buildings for the Health and Wellbeing section
were universally applied at a whole building level. Many are awarded based upon
relatively technically complex criteria and typically rely on pre-existing third party best
practice guidance and/or certification. These criteria include calculation of building wide
day lighting factors (Hea1), designing artificial lighting to achieve particular illuminance
values (Hea 5), application of dynamic thermal modelling (Hea 10), application of
standards relating to legionellosis (Hea 12), and design for and testing of acoustic
performance factors (Hea 13). These credits constitute a performance specification, and
by making use of third party guidelines they are able to mobilise respected good practice
standards. However, they do fully rely upon correct understanding and application of
best practice by the design team. The BREEAM standards do not prescribe how the
standards are to be achieved and the design solutions do not appear to have been
scrutinised in detail by the BREEAM assessors. For the case study buildings this is
reflected in a generally weak level of verification. Across these technically complex
issues, credits were often awarded based upon direct reproduction of the BREEAM
clause in the design specification, in many cases even this was not carried out. Instead,
the credit was awarded based upon a side letter or email from the design consultant
responsible. Only for the acoustic performance was any verification testing carried out,
and even in this case a failed test was considered adequate, based upon an assurance
from the contractor that the problem would be rectified.
187
By contrast, other criteria are relatively simple from a technical point of view. For
example, particular criteria relating to adequacy of the view out (Hea 2), zoning for
lighting (Hea 6), potential for natural ventilation (Hea 7), indoor air quality (Hea 8) and
thermal zoning controls (Hea 11) are based on very simple and rigid dimensional
requirements. A view out is, for example, determined to be adequate where desks are
within 7m of a wall with at least 20% of glazed area. Meanwhile, glare prevention is
achieved through a straightforward provision of window blinds (Hea 3) and avoidance of
light flicker and buzz is achieved through use of high frequency ballasts (Hea 4). These
criteria are clearly configured primarily for simplicity of application and do not require or
accommodate a high level of judgement by the design team. Some such as the
provision of blinds are “bolt-on” requirements needing only an additional specification
clause to incorporate, along with the necessary budget. Others such as requirements
for natural ventilation include fundamental requirements in terms of building
configuration. The simplicity of the requirements provides the BREEAM assessor with
more scope to assess the evidence provided, although in reality this was still found to be
extremely weak in some cases. For example it was necessary for the designer of
Building D to write to the BREEAM assessor to assure them that appropriate zoned light
switching would be installed, as this was not apparent from either the specification or
drawings. Simplicity of requirement also led in some cases to credits perhaps being
unreasonably withheld. For example, the credits for having a “view out” were withheld
for large areas of Building D purely because rooms were 7.5m wide instead of 7m,
despite the universal provision of highly glazed elevations providing expansive views
over the university campus.
Overall, the issue criteria for the Health and Wellbeing section can be characterised as a
mixture of highly technical performance specification based on established third party
guidance and/or calculations, and very simple requirements based on either building
geometry, or provision of simple equipment. The aims of the individual issues are
generally clear, however they also relate largely to subjective environmental metrics. It
was possible to measure some relevant aspects of the internal building environment
directly using the building user survey, and in many cases the case study buildings
performed well. However, results were usually inconsistent across buildings, providing
limited evidence to suggest that achievement of credits is a guarantee of above-average
performance. Overall, performance of the case study buildings was also mixed, with
only three buildings exceeding benchmark expectations for comfort and only two
exceeding benchmark expectation for perceived effect on occupant health. A number of
specific potential reasons for this mixed performance have been identified, which might
be summarised as follows:
188
● The criteria are not applicable, for example only one of the buildings contained
fume cupboards.
● The criteria are not always attempted. Overall uptake of credits from the section
was variable, ranging from 50-83%. None of the buildings attempted the credit
relating to indoor air quality.
● The criteria are not configured to directly improve health and wellbeing. For
example, the study indicates only a weak or moderate correlation with health for
just three particular aspects of internal environment, and no correlation at all with
comfort overall.
● The criteria are not robustly configured. For example the geometric requirements
relating to a “view out” do not guarantee a view out if they are conformed to, nor
necessarily preclude one if they are not.
● Assurances of compliance by designers, or general specification clauses, have
been widely accepted as evidence, in lieu of appropriate design information. For
example in respect to intended light switching arrangements.
● The criteria are poorly configured, for example acoustic criteria are focussed on
preventing noise travelling between rooms, whereas building occupants in the
case study buildings complained primarily about noise from colleagues located
within the same workspace.
● The criteria may be difficult for the BREEAM assessor to verify, for example the
level of volatile organic compounds present in building materials.
● The criteria were not supported by subsequent effective commissioning, for
example the presence of inoperable heating controls in Building C.
● The criteria are not coordinated, for example the use of blinds to control glare is
not consistent either with providing adequate day lighting, or providing a view out.
● The criteria may describe common, rather than best, practice. For example, the
provision of blinds on office windows.
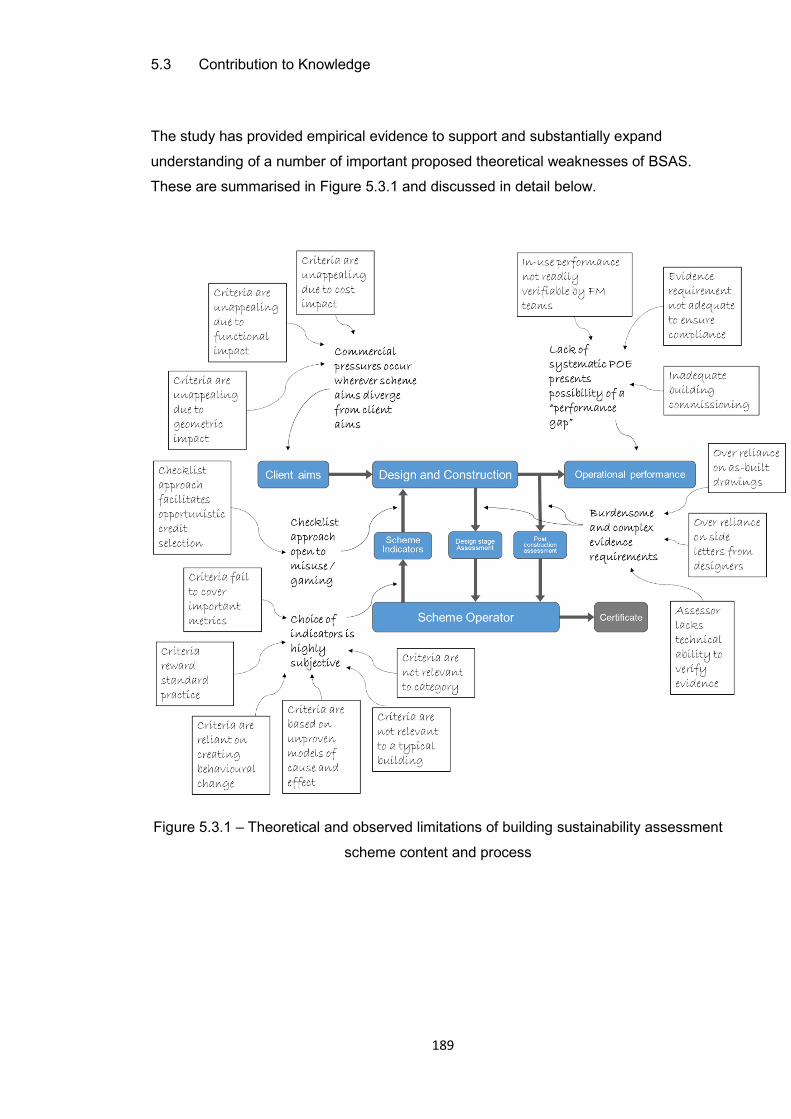
189
5.3 Contribution to Knowledge
The study has provided empirical evidence to support and substantially expand
understanding of a number of important proposed theoretical weaknesses of BSAS.
These are summarised in Figure 5.3.1 and discussed in detail below.
Figure 5.3.1 – Theoretical and observed limitations of building sustainability assessment
scheme content and process
190
Choice of indicators is highly subjective
Literature review suggests that indicators are an imperfect means of assessment, being
both incomplete by definition and subjectively selected (Brandon and Lombardi, 2011).
These weaknesses of content were illustrated clearly in elements of the BREEAM
scheme analysed in relation to the case study buildings. There were, for example,
important metrics which the scheme completely failed to address; most notably perhaps
through energy credits being awarded almost entirely in relation to regulated use, with
unregulated use being largely discounted. In other instances, scheme criteria lacked
impact because they rewarded standard construction practice, such as installing blinds
on office windows; in others they failed to generate improvement because they related to
unusual features, such as car washing facilities, which were not present in the case
study buildings. More subtly, the effectiveness of many criteria was reliant upon
unproven models of cause and effect. For example, the BUS survey data for the case
study buildings fails to establish a correlation between perceptions of internal
environmental quality and perceived health. If, as suggested by this data, improvements
to IEQ do not significantly improve health, then the configuration of the majority of the
BREEAM Health and Wellbeing section cannot produce its intended effect. Similarly, a
large portion of BREEAM Energy section credits are based on the EPC rating of the
building which has been proven by multiple research projects to be an unreliable
predictor of energy use. A further important specific example of reliance on weak causal
links is evident in criteria relying upon creating behavioural change to achieve an effect.
An example from the study criteria is that of rewarding installation of energy and water
sub-metering, as a means of reducing consumption, without stipulating any form of
ongoing framework for their application.
Commercial pressures occur wherever scheme aims diverge from client aims / Checklist
approach is open to misuse/gaming
The potential for construction project teams to manipulate the checklist approach by
selecting BSAS criteria on the basis of expediency is widely purported in the literature
(Cole, 2005). Potential clearly exists for project teams to target the criteria which most
appeals to them, whether because they are the cheapest to implement or because they
have the least impact on function. As the research methodology did not provide direct
access to the design process, the results of this behaviour were not directly observed.
These pressures were however indirectly evident in the study, most notably where

191
criteria were not met despite being apparently closely aligned with the building design.
For example, the credit for providing a view out was not achieved in Building D purely
due to a small number of rooms being 7.5m wide, rather than 7m maximum stipulated by
the criteria. Although the majority of the building provides excellent views out, and
despite the fact that this credit could have been achieved by changing the shape of
these rooms, it was not pursued. The credit relating to potential for natural ventilation
was also not achieved for this building, also due to the building being considered by
BREEAM to be too deep in plan and despite it having been designed to operate as such.
Similarly, day lighting credits were not achieved for Buildings A and D, purely because
large windows were not provided in lecture theatres. These examples highlight the
impact of wider client concerns such as functionality, site geometry and town planning
consents in driving credit selection. As distinct from other criteria which failed to produce
an effect, in the examples cited above, the aims of the BREEAM criteria were apparently
achieved without meeting the criteria; a case of assessment underestimating building
performance.
Burdensome and complex evidence requirements / Lack of systematic post occupancy
evaluation presents the possibility of a “performance gap”
Failure to incorporate POE into BSAS is considered a fundamental theoretical weakness
of the approach; without this feedback any opportunity for objective assessment and
improvement is lost (Alwaer and Kirk, 2012). Schemes instead rely on submission of
“evidence” to prove that criteria have been correctly implemented and it is additionally
proposed by some commentators that this may produce an unreasonable burden on a
project. Analysis of the case study buildings supports this proposition indirectly, in two
ways. Firstly, the stated evidence requirements of BREEAM were, in many instances
clearly inadequate to robustly demonstrate compliance. Certain credits, such as those
relating to the efficiency of installed lifts had no post-construction evidence requirement
at all and were entirely based upon a design stage statement of intent. In other cases
the evidence requirement, whilst substantial, was simply inadequate to demonstrate
compliance; for example, credits relating to limiting VOC levels were awarded based on
submission of a suite of manufacturer’s data sheets for a wide range of materials, but
lacked any mechanism for testing whether these were in fact the actual materials
installed. Secondly, even where evidence requirements were theoretically robust,
assessors appear to have been able to award credits based on a lesser standard. At
design stage this was evident in the routine use of side letters from project team
members confirming that certain features had been incorporated in the design. This
192
approach suggests strongly that these features were not clear in the design
documentation itself, and as an example in the case of light switching, observed to be
poorly implemented. At post-construction stage confirmation of adoption of criteria were
similarly routinely provided by side letters from contractors, confirming that particular
design criteria had been complied with. For Building B in particular, the BREEAM
assessor does not appear to have visited the building at all.
5.4 Criteria Configuration
Scheme criteria represent a critical link in the BSAS process and examination of their
implementation has revealed that their effectiveness may be significantly frustrated by
their configuration. Following analysis of the study data in the context of the theoretical
failing identified in the literature, content, appeal and evidence emerge as key efficacy-
determining characteristics. Furthermore, a high degree of interdependency is noted,
with criteria content being seen to determine the assessment methodology used and
vice versa. These aspects of criteria are considered in further detail below.
Content
In order to differentiate buildings on grounds of sustainability, the substantive content of
criteria must be selected to produce or recognise a particular effect in a completed
building. Each issue within the BREEAM scheme has a stated aim. Therefore it is
reasonable to expect that this would be fulfilled by the criteria contained within it. It is
also reasonable to expect that the result will align with the wider aim implied by the
category name. Surprisingly, examination of the criteria for the case study buildings
suggests that neither alignment of the criteria with the specific aims, nor their implied
wider sustainability impact can be taken for granted. On a very basic level it is noted
that many issue aims were not achieved because the criteria related to features that
were not present in the case study buildings; for example 8 out of 20 issues within the
Energy section were not applicable to any of the case study buildings. In other cases,
criteria failed to meet their stated aim by rewarding standard design approaches. For
example, case study buildings were awarded credits based upon the absence of
arguably unusual features, such as automatic irrigation systems (Wat 06 – Water
irrigation systems), or the inclusion of commonplace features, such as office blinds (Hea
3 – Glare control). Similarly, credit was also awarded for features regardless of their
193
extent, for example, the use of low energy external light fittings, which numbered just two
on Building A. Scope was also impacted in some cases by a lack of appropriate criteria,
for example, criteria within the Energy category of BREEAM almost entirely fail to
address unregulated energy loads. The impact of some individual criteria were
additionally negated through failure to establish a benchmark against which the
associated stated aim might be measured; for example, issue “Ene 8 – Lifts” calls for
consultants to model two design options for lifts and select the one with the lowest
energy consumption without requiring these options to be related in any way to baseline
practice. Other issues have stated aims that have rather uncertain, indirect, links to
wider sustainability impacts. For example, the awarding of credits relating to the
installation of electric and water sub-metering (Ene 2 – sub-metering of substantial
energy uses / Wat 2 – Water meter), the effects of which are predicated upon building
users subsequently employing monitoring as an aid to reducing consumption. Similarly,
two of the five issues attempted within the Water section relate to mitigation of the effect
of leaks (Wat 3 – Major leak detection / Wat 4 – Sanitary supply shut off), without also
assessing whether such leaks might be expected to occur in a particular building. More
fundamentally, the Health and Wellbeing section of BREEAM appears to be substantially
founded upon an assumption that occupant health can be improved by increasing
comfort, although analysis for the case study buildings shows that there was no
observable correlation between these two metrics. In line with this finding, a clear
majority of the internal environmental factors addressed by issues examined within the
Health and Wellbeing category failed to produce any perceivable effect on occupant
health.
Appeal
Few of the examined credits within BREEAM have mandatory threshold levels. There is
therefore considerable scope for project teams to choose which criteria they wish to
adopt. This is arguably a fundamental handicap in ensuring overall effect, as poor
performance in relation to credits that are not attempted may reduce or completely offset
good performance in those areas for which credits are awarded. In this context, the
“appeal” of criteria has the potential to significantly impact both the scope and the
degree of effect. The consequences of such flexibility are empirically apparent in the
assessments for the case study buildings; for example, the average uptake of credits for
the case study building in the Health and Wellbeing section (66% (range 50-83%)) was
more than double that in the Energy section (32% (range 15-38%)). The effect of
“appeal” on the uptake of particular credits was also evident within categories; for
194
example all four buildings scored the credit relating to “Wat 6 - Water irrigation systems”,
which was achieved in all cases by omission; meanwhile none attempted the credit for
“Wat 5 - Water recycling systems”, which requires a substantive provision, and comes
with cost and space requirements attached to it. Explicit evidence of the relationship
between appeal and design constraints was also encountered in assessment reports.
For example, the credit relating to issue “Hea 07 - Potential for natural ventilation” was
not attempted for Building D due to many of the rooms being “too deep in plan”, despite
this having been designed (and operated) as an entirely naturally ventilated building. In
this case changing the configuration of the rooms was rejected because it conflicted with
the broader project aims. In other cases credits were not attempted because they failed
to align with the operational design intent. For example, three case study buildings
failed to achieve a credit for issue “Hea 1 – Daylighting”, purely through a failure to
provide glazing within large lecture theatres. In all cases the provision of additional
windows in these areas was feasible, but was inconsistent with the intended functional
use of the space. Conversely, some credits appear to have been appealing despite
having no apparent alignment with operational design intent. For example, all buildings
achieved credits in relation to provision of electrical sub-metering (Ene 2 – Sub-metering
of substantial energy uses), although none of these were ultimately found to be in
operational use. Whilst not explicitly stated within the assessment reports, such criteria,
which call for small, inexpensive, “bolt on” items may perhaps therefore be more
appealing than those requiring the wider design layout or function of the building to be
altered.
Evidence
The use of BSAS as performance standards, particularly in connection with statutory
approvals, necessitates the use of a robust certification process. The BREEAM scheme
calls for project teams to submit extensive and specific “evidence” in support of their
application. This is reviewed by a licensed BREEAM assessor. There are separate
requirements depending upon whether it is “design” or “post construction” stage
certification that is being sought. Examination of the evidence submitted for the case
study buildings suggests however that the nature of these evidence requirements
represents a third critical factor in determining the potential effectiveness of criteria. An
observed weakness in many cases was that full and effective validation of design stage
evidence required considerable technical knowledge and/or a detailed understanding of
the project. For example, issue “Hea 10 - Thermal comfort“ requires that buildings
achieve modelled thermal performance complying with CIBSE Guide A, using a
195
modelling methodology selected and used in accordance with CIBSE AM11. Rigorous
independent verification of the results of such modelling would require that the BREEAM
assessor have a working knowledge of the standards and chosen modelling technique
and be able to interrogate the results with reference to the building design parameters.
In practice, this credit was awarded based upon receipt of either a copy of the modelling
results (Buildings B and D), or a specification clause stating that such modelling has
been carried out (Building C). This appears less than satisfactory and it is noted that
occupants reported significant levels of discomfort in terms of thermal conditions in all
three of these buildings. In other cases, the scope of the specified evidence was itself
insufficient, particularly in relation to enhancements to building services equipment.
Evidence for these items generally related to demonstrating inclusion of the equipment,
either in the design, or as a physical manifestation. This often proved inadequate to
ensure that the equipment was operational in practice. For example, heating controls
were provided in rooms throughout Building C in order to comply with criteria contained
in issue “Hea 11 - Thermal Zoning”, however these were discovered to have been
bypassed in operation, with temperature instead being controlled centrally by the
facilities manager. More generally, and despite the existence of a compulsory BREEAM
credit “Man 1 – Commissioning” achieved by all buildings, poor commissioning of
services appears to have been responsible for failure of various items of equipment in
use. Examples of this included inoperable windcatchers in Building B (Hea 07 -
Potential for natural ventilation), electrical sub-meters which could not be read by the
BMS in Buildings A and D (Ene 2 - Sub-metering of substantial energy uses), and non-
functioning water leak detection systems in Buildings A and C (Wat 3 – Major leak
detection). It was apparent that ensuring correct realisation of the design intent was also
hampered in some cases by physical access limitations. This is directly acknowledged
in the BREEAM standards in some cases, which either do not list any post construction
evidence requirements (Ene 8 – Lifts), or rely on very weak evidence such as as-built
drawings (Wat 4 – Sanitary supply shut off). In other cases evidence requirements were
substantial, but still failed to provide effective verification. For example, to achieve a
post construction stage credit for “Hea 9 – Volatile organic compounds” it was necessary
to submit a manufacturer’s confirmation of VOC content for a wide range of selected
materials, based on specific testing regimes. There was no requirement to demonstrate
that these were the actual materials used in the building. Finally, it is apparent from
reviewing the assessment reports that considerable variation exists in relation to
interpretation of evidence requirements. There were many examples of design stage
evidence being provided in the form of side letters or emails from consultants. For
example light switching arrangements required in relation to “Hea 6 - Lighting zones and
controls” required additional clarification in the form of letters or emails from consultants
for all four buildings. Such clarifications suggest that the design information is
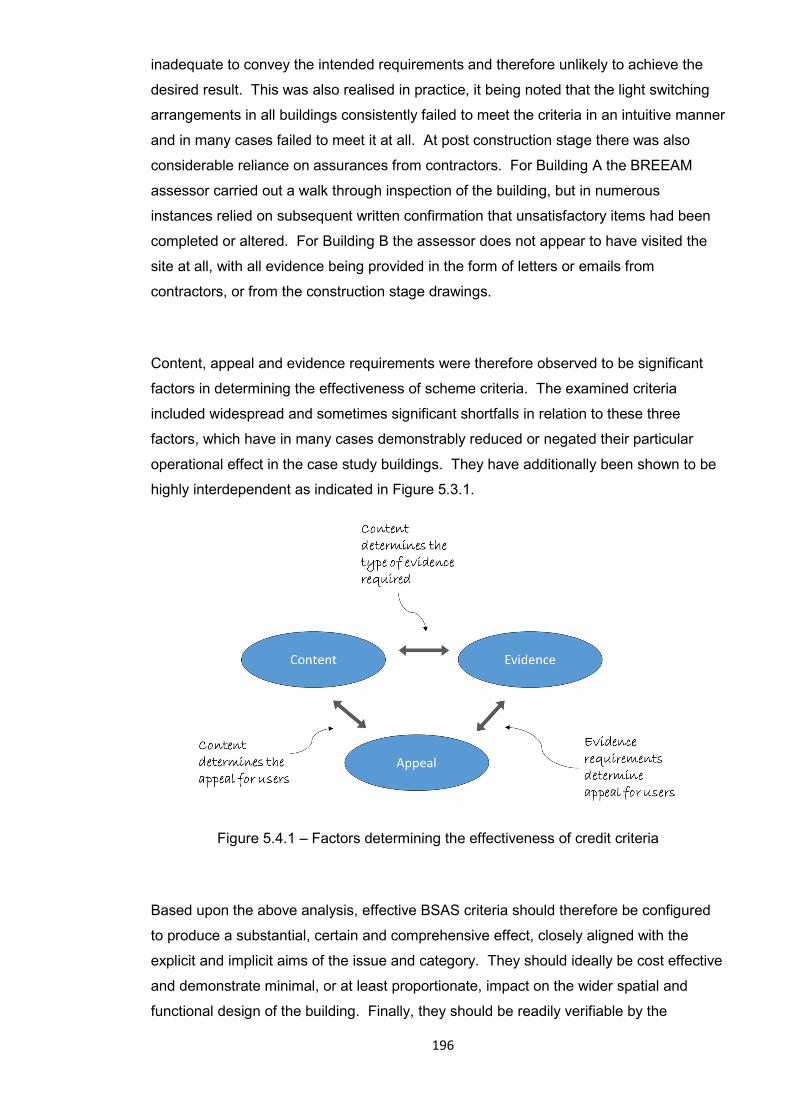
196
inadequate to convey the intended requirements and therefore unlikely to achieve the
desired result. This was also realised in practice, it being noted that the light switching
arrangements in all buildings consistently failed to meet the criteria in an intuitive manner
and in many cases failed to meet it at all. At post construction stage there was also
considerable reliance on assurances from contractors. For Building A the BREEAM
assessor carried out a walk through inspection of the building, but in numerous
instances relied on subsequent written confirmation that unsatisfactory items had been
completed or altered. For Building B the assessor does not appear to have visited the
site at all, with all evidence being provided in the form of letters or emails from
contractors, or from the construction stage drawings.
Content, appeal and evidence requirements were therefore observed to be significant
factors in determining the effectiveness of scheme criteria. The examined criteria
included widespread and sometimes significant shortfalls in relation to these three
factors, which have in many cases demonstrably reduced or negated their particular
operational effect in the case study buildings. They have additionally been shown to be
highly interdependent as indicated in Figure 5.3.1.
Figure 5.4.1 – Factors determining the effectiveness of credit criteria
Based upon the above analysis, effective BSAS criteria should therefore be configured
to produce a substantial, certain and comprehensive effect, closely aligned with the
explicit and implicit aims of the issue and category. They should ideally be cost effective
and demonstrate minimal, or at least proportionate, impact on the wider spatial and
functional design of the building. Finally, they should be readily verifiable by the
197
BREEAM assessor, and recognisable to building managers and occupants once the
building is in use. In particular, the best criteria would be those that avoid or minimise
the following shortcomings:
Content
● Not (collectively) comprehensive for a category
● Not aligned with the category
● Not applicable in a typical building
● Rewards standard practice
● Relies on an indirect effect (eg behavioural requirement)
● Relies on unproven/disproven pathway (unreliable)
Appeal
● Unappealing due to disproportionate functional impact
● Unappealing due to disproportionate geometrical impact
● Unappealing due to disproportionate cost impact
Evidence
● Evidence requirement is not comprehensive and/or relevant
● Assessor lacks technical knowledge to verify design stage evidence
● Failure to incorporate relevant evidence into design information
● Post construction evidence relies on as-built drawings or assurances from
installers (hidden or undistinguishable features)
● Effect relies on subsequent commissioning
● Not readily verifiable by facilities managers or users in an operational building
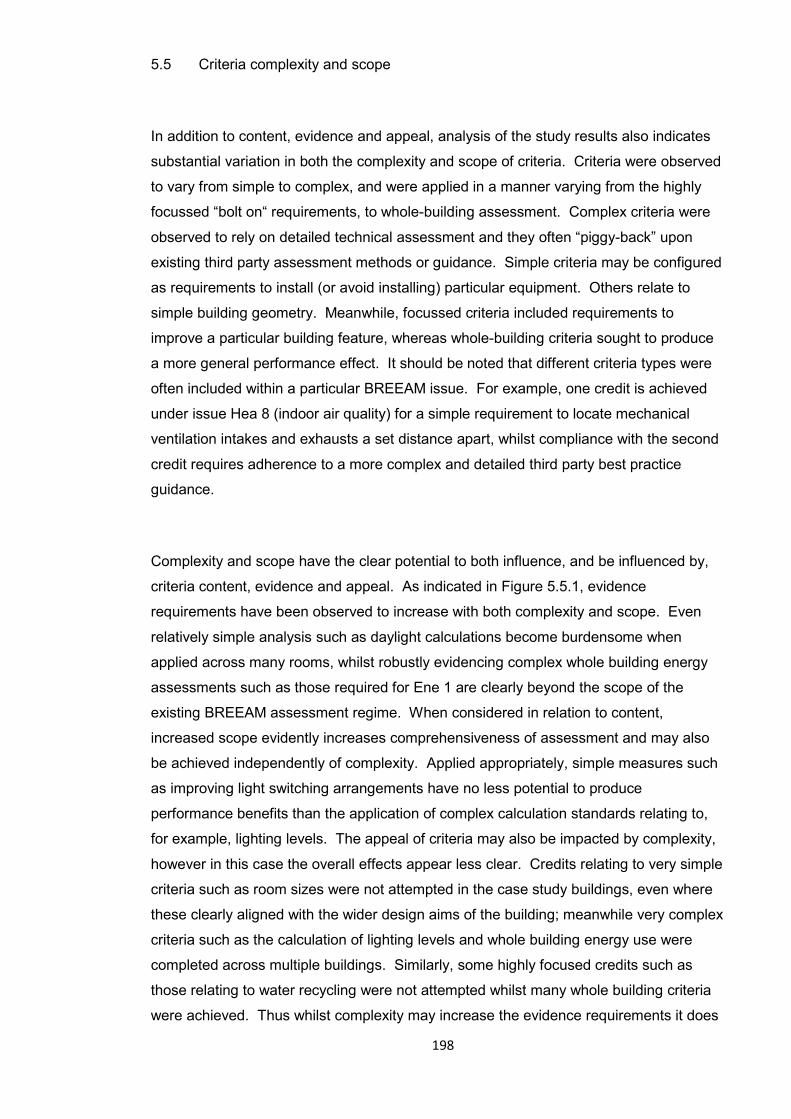
198
5.5 Criteria complexity and scope
In addition to content, evidence and appeal, analysis of the study results also indicates
substantial variation in both the complexity and scope of criteria. Criteria were observed
to vary from simple to complex, and were applied in a manner varying from the highly
focussed “bolt on“ requirements, to whole-building assessment. Complex criteria were
observed to rely on detailed technical assessment and they often “piggy-back” upon
existing third party assessment methods or guidance. Simple criteria may be configured
as requirements to install (or avoid installing) particular equipment. Others relate to
simple building geometry. Meanwhile, focussed criteria included requirements to
improve a particular building feature, whereas whole-building criteria sought to produce
a more general performance effect. It should be noted that different criteria types were
often included within a particular BREEAM issue. For example, one credit is achieved
under issue Hea 8 (indoor air quality) for a simple requirement to locate mechanical
ventilation intakes and exhausts a set distance apart, whilst compliance with the second
credit requires adherence to a more complex and detailed third party best practice
guidance.
Complexity and scope have the clear potential to both influence, and be influenced by,
criteria content, evidence and appeal. As indicated in Figure 5.5.1, evidence
requirements have been observed to increase with both complexity and scope. Even
relatively simple analysis such as daylight calculations become burdensome when
applied across many rooms, whilst robustly evidencing complex whole building energy
assessments such as those required for Ene 1 are clearly beyond the scope of the
existing BREEAM assessment regime. When considered in relation to content,
increased scope evidently increases comprehensiveness of assessment and may also
be achieved independently of complexity. Applied appropriately, simple measures such
as improving light switching arrangements have no less potential to produce
performance benefits than the application of complex calculation standards relating to,
for example, lighting levels. The appeal of criteria may also be impacted by complexity,
however in this case the overall effects appear less clear. Credits relating to very simple
criteria such as room sizes were not attempted in the case study buildings, even where
these clearly aligned with the wider design aims of the building; meanwhile very complex
criteria such as the calculation of lighting levels and whole building energy use were
completed across multiple buildings. Similarly, some highly focused credits such as
those relating to water recycling were not attempted whilst many whole building criteria
were achieved. Thus whilst complexity may increase the evidence requirements it does
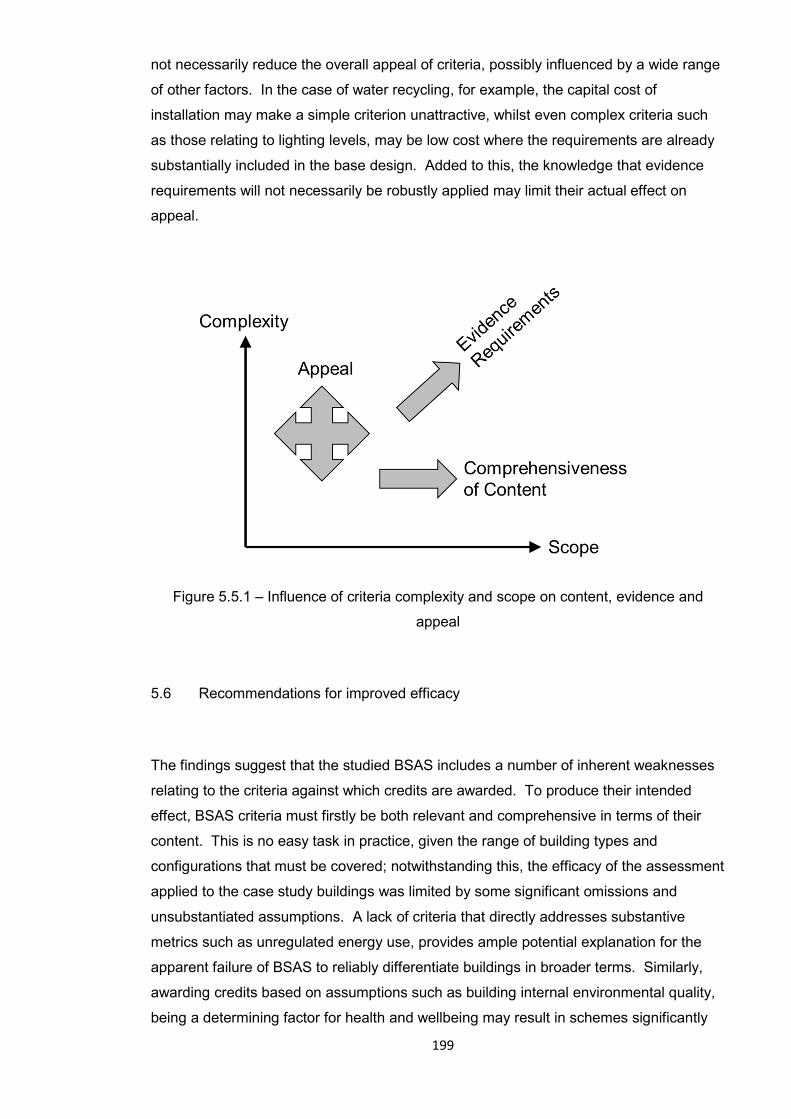
199
not necessarily reduce the overall appeal of criteria, possibly influenced by a wide range
of other factors. In the case of water recycling, for example, the capital cost of
installation may make a simple criterion unattractive, whilst even complex criteria such
as those relating to lighting levels, may be low cost where the requirements are already
substantially included in the base design. Added to this, the knowledge that evidence
requirements will not necessarily be robustly applied may limit their actual effect on
appeal.
Figure 5.5.1 – Influence of criteria complexity and scope on content, evidence and
appeal
5.6 Recommendations for improved efficacy
The findings suggest that the studied BSAS includes a number of inherent weaknesses
relating to the criteria against which credits are awarded. To produce their intended
effect, BSAS criteria must firstly be both relevant and comprehensive in terms of their
content. This is no easy task in practice, given the range of building types and
configurations that must be covered; notwithstanding this, the efficacy of the assessment
applied to the case study buildings was limited by some significant omissions and
unsubstantiated assumptions. A lack of criteria that directly addresses substantive
metrics such as unregulated energy use, provides ample potential explanation for the
apparent failure of BSAS to reliably differentiate buildings in broader terms. Similarly,
awarding credits based on assumptions such as building internal environmental quality,
being a determining factor for health and wellbeing may result in schemes significantly
200
over-promising on their effects. The findings further confirm that even where criteria are
well selected and configured, the scheme content will not produce its intended effect
unless it is both targeted by project teams, and effectively evidenced by assessors. In
practice this too was observed to be rather uncertain. Appeal in particular was seen to
be highly dependent upon the alignment of criteria with the wider design aims and
functional requirements, such as the building geometry. Meanwhile, evidencing was
seen to be simple for some criteria and highly challenging for others. In practice, many
examples of poor evidencing were noted, either because the requirements were not
robust, or because they were not rigorously applied. Appeal and evidence were further
noted to be influenced by the scope and complexity of the criteria applied. Many criteria
were applied at the whole building level, however in other cases, multiple highly
focussed credits were instead used to replace or augment the whole building
assessment. This approach was evidently undermined by the high degree of flexibility
provided in choosing credits, resulting in less appealing sections losing their overall
impact. In terms of complexity, “piggy-backing” on complex third party standards
created criteria that was theoretically comprehensive, but which in practice acted as a
“black box”, with no practical means provided for assessors to evidence them.
The occurrence and avoidance of these observed limitations may be illustrated clearly
through examination of two particular key BREEAM criteria. Based on the findings set
out above, Wat 1 and Ene 1 are examples of issues that respectively typify highly
effective and highly problematic criteria. Comparison of these two issues, as applied to
the case study buildings, clearly shows how the detailed make-up of criteria can
fundamentally determine their overall impact. The criteria that constitute issue Wat 1
(Water consumption) align closely with the properties identified as being desirable
across the study results, being comprehensive, simple and readily evidenced. As
described in detail in Chapter 4, up to three credits are available under this issue. These
are awarded based upon criteria calling for the installation of various items of water
efficient sanitary ware i.e. WC’s, basin taps, urinals, showers and baths. Whilst
exclusions apply for taps provided for certain specialist applications, the base load water
consumption of a building relating to its sanitary operations is comprehensively covered.
The equipment specified clearly exceeds standard practice and acts directly to reduce
water use, without relying on tangential impacts such as behavioural change. Certainty
of effect is provided through direct reference to manufacturer’s specification documents,
and as the criteria relates only to substitution of one fitting for another, the wider design
impact is minimal. The evidence requirements are also straightforward; these being a
copy of relevant design information at design stage and visual inspection or copies of
purchase orders at post construction stage. Furthermore, the fact that the equipment in
201
question remains substantially visible in the completed building and is used by
occupants on a daily basis providing excellent ongoing opportunity for ensuring their
correct and continued operation. On this basis, and notwithstanding the apparent
shortcomings of many of the remaining issues in the water section, it is perhaps
unsurprising that the two cases study buildings for which data was available substantially
exceeded relevant benchmarks in relation to water consumption.
The strengths of the Wat 1 criteria described above contrast starkly with the equivalent
issue within the Energy section i.e. Ene 1 (reduction of CO2 emissions). The criteria for
this issue lack comprehensiveness, are complex and do not contain effective evidence
requirements. Credits are awarded based upon the CO2 index taken from the building’s
EPC certificate, derived in turn from the SAP calculation. In this case, the effect relates
only to the parameters considered by SAP, relating primarily to building services and
fabric, thereby failing to achieve a comprehensive scope including unregulated energy
use or occupancy levels or patterns. Even within this much-reduced scope, the effect is
considered uncertain as SBEM is designed as a compliance rather than a modelling tool
and is known to be a poor predictor of actual performance. Opportunities for improving
the CO2 index exist across a swathe of design factors ranging from equipment to
building layout, so the wider design impact associated with scoring these credits may be
considered proportionate. The evidence requirement is also notionally straightforward
as it “piggy-backs” upon the existing Building Control regime. Research suggests
however that adequate interrogation does not always occur within this existing system
and no framework is provided to assist BREEAM assessors with further effective
validation of the calculations. Finally, reliance on such a range of factors, many of which
are not readily visible in the completed building, is likely to make monitoring by building
managers highly challenging, and intuitive monitoring by occupants largely impossible.
Energy use within a university building is more complex and arguably far more difficult to
predict and control than water use. Nevertheless, based on the comparison presented
above and the wider findings of this study, it is possible to suggest some improvements
to the criteria for issue Ene 1. Firstly the lack of comprehensiveness of the content could
be addressed simply by renaming the “Energy” section of BREEAM to make it clear that
it only assesses energy relating to building services. Omitting unregulated energy from
the assessment removes a major component of the inaccuracy associated with using
SAP as a predictor of overall energy use. From a logical point of view, omitting
unregulated energy use from the assessment is readily justifiable, as it is the
sustainability of the building that is being assessed, rather than the behaviour of its
202
occupants. Variation in regulated energy use resulting from occupancy patterns could
similarly be justifiably disregarded for the same reason. Within this reduced scope, the
major residual factor driving inaccuracy in energy modelling is a failure to construct and
commission buildings in accordance with their design. Addressing this known problem
would arguably produce a far more robust sustainability benefit than the existing strategy
of awarding criteria based on modelling output alone. Therefore. criteria might instead
be configured to ensure that key elements of the modelling input, such as building
geometry and heating unit efficiencies were identified and verified by the assessor. As
has been noted for issue Wat 1, physical observation of installed equipment can be a
robust means of evidencing correct implementation of design. Such evidence has the
further crucial benefit of being easily verified post-occupancy by the building or facilities
managers.
The Health and Wellbeing section of BREEAM has no equivalent wide ranging, whole
building assessment issue to compare with Wat 1 and Ene 1; issues instead deal
individually with the different elements of internal environmental quality. Nevertheless,
these issues collectively share similar failings to those noted in relation to Ene 1.
Comprehensiveness of effect is most notably lacking, there being no evidence that the
criteria combined to produce any improvement in health and wellbeing in the study
building occupants. As for Ene 1, this shortfall could perhaps most simply be improved
by renaming the section to align it with the criteria, which relate more accurately to
internal environmental quality than health and wellbeing. Similar problems were also
observed in relation to reliance on complex third party guidance and modelling to
produce effects, for example as required for issue Hea 10 (Thermal comfort). As for the
energy modelling used for Ene 1, the Hea 10 criteria dictate the application of the
method and award credits according to the result, without providing a framework to
assist the assessor in verifying the process. Where reliance on modelling is
unavoidable, a framework could introduced similar to that proposed for Ene 1. This
would allow the critical assumptions embedded in the calculations to be identified and
checked as physical entities. Not only would this provide a means for assessors to
effectively evidence the criteria, it would also generate a set of defined building
parameters which could be usefully passed on to facilities managers.
The criteria used for issue Wat 1 demonstrates that BSAS criteria can be configured with
the appropriate content that does not disproportionately impact building function. Such
criteria are not only straightforward to evidence, but can also be identified and monitored
by facilities management teams. Meanwhile, criteria such as those used for Ene 1 align

203
poorly with both the aims of the BSAS and the wider aims of building designers. Such
criteria may additionally be difficult to evidence and offer no assistance in terms of
ongoing monitoring by those managing the building in occupation. It is acknowledged
that the disparate measurement metrics assessed by BSAS will require a range of
approaches. It appears however that significant compromises have been made in terms
of robustness in the studied scheme, in order to cover pertinent areas of sustainability.
Avoiding the range of specific pitfalls for criteria identified in section 5.4 therefore
represents only one component of the recommendations that emerge from this study.
Further to the need for improved criteria through which to assess and improve buildings,
there is perhaps an equally pressing need to balance the scope of assessment schemes
with their efficacy. A scheme may therefore need to be configured to assess “energy
used for building services” and “internal environmental quality”, rather than “energy” and
“health and wellbeing”. Aspects of building sustainability that are problematic to
measure may have to be excluded, or different approaches developed. Alternatively, the
resources devoted to assessing and evidencing schemes may have to be increased,
potentially incorporating post occupancy evaluation, where more straightforward means
do not exist.
204
CHAPTER 6 – CONCLUSION
This chapter begins with a brief introduction summarising the research context. This is
followed by a summary of the research objectives and corresponding findings.
Recommendations are suggested for improving the configuration of BSAS criteria. The
limitations of the study and recommendations for further research are also discussed.
Finally, the contribution to knowledge is summarised.
6.1 Knowledge gap and research findings
BSAS have achieved significant and increasing uptake, since their inception 20 years
ago. Early schemes have been updated and adapted to suit changing expectations and
new technologies. Schemes have also proliferated internationally, both through the
start-up of new national schemes and adaptation of leading schemes such as BREEAM
and LEED to different regions. As a result, around 65 BSAS are now in operation
globally. However, this widespread general acceptance of BSAS has occurred against a
background of considerable academic criticism and fundamental theoretical limitations
have been identified relating to the general approach employed. The use of indicators
as a basis for assessment introduces considerable subjectivity into scheme content,
whilst the paucity of minimum requirements provides excessive freedom for designers to
target certain areas of performance over others. Reliance on design standards to
generate a rating is considered to be unreliable in general and can additionally create an
excessive administrative burden for project teams. Overarching these concerns is the
commercial context, which may motivate project teams to select credits for reasons of
design or production expediency, rather than because they will provide the most benefit
in the completed building. In empirical terms, such limited research as has been carried
out so far has failed to demonstrate that BSAS reliably produces measurable
improvement in operational buildings. Further work in this field is hampered by a
number of factors. Schemes do not generally incorporate a post occupancy evaluation
and quantitative measurement of their impacts is restricted by a requirement for wide-
ranging, often commercially sensitive, performance data. Furthermore, benchmarking is
complicated by the fact that ratings are typically both highly specific to the particular
building type and awarded independently of key operational factors such as opening
hours and intensity of use. For these reasons, a lack of knowledge exists in relation to
the effect that specifying a BSAS rating for a building has on its sustainability in use.
205
Furthermore, not only is it unclear to what extent sustainability is increased in certificated
buildings, but the success of otherwise of the critical mechanisms employed pursuant to
this aim have also remained largely unexamined. This study has addressed this
knowledge gap using robust empirical data, gathered using a case study approach.
The study findings confirm that subjective selection of indicators can result in less than
comprehensive criteria for the section within which they are grouped. For example, the
energy section of BREEAM substantially fails to address unregulated energy use.
Certain indicators were also observed to rely on unsubstantiated models of cause and
effect. For example, it is assumed that improving particular elements of internal
environmental quality will increase occupant “health and wellbeing”. Others relied on
uncertain impacts relating to behavioural change. For example, the reduction of water
use through the provision of sub-metering. Still further indicators contained criteria that
were satisfied by inclusion of standard building features, such as blinds on office
windows. Conversely, others were achieved through non-inclusion of relatively unusual
features such as automatic irrigation systems. The gaming of the checklist approach
was also evident in the case studies, with selection of credits by project teams observed
to be highly skewed. One building, for example, achieved just 15% of available credit
within the Energy section and 88% in relation to Water. In some instances criteria were
additionally clearly avoided, despite being closely aligned with the building design. This
occurred particularly where they were dependent upon rigid geometrical requirements.
For example, one case study building failed to target credits relating to “potential for
natural ventilation” or “view out”, despite having been designed as a substantially
naturally ventilated building, with excellent views out. Conversely, the criteria which
reward the addition of small scale, inexpensive, “bolt-on” items of equipment were
observed to be incorporated regardless of need. For example, credits were achieved in
all buildings for incorporating zoned light switching, despite this requirement being
absent from design documentation in every case.
Further difficulties were observed in relation to effective evidencing of criteria
requirements. The role of the assessor in verification was, in practice, seen to be rather
limited. At the design stage, criteria were routinely evidenced through side letters sent
from designers to assessor, confirming that particular required features had or would be
included. This indicates either assessor’s lacked the technical knowledge to interpret
relevant design information, or that requirements had not in fact been included in the
original design documentation. A similar situation also appeared to exist at construction
stage. Of the two buildings achieving “post-construction” certification, one received a

206
single visit from the assessor, whilst the other was not inspected at all. “Post
construction” evidence was largely affected through the use of “as-built” drawings, or
side letters received from contractors. Where inspection did take place, identified
shortfalls such as failed acoustic tests were similarly closed out following assurances
from the project team that items would be rectified. It was further noted that in some
cases important criteria such as energy modelling metrics were not, in any case,
realistically verifiable in the completed building. For certain criteria, post-construction
evidence requirements were entirely absent, for example, in relation to the energy
efficient design of lifts. In addition to the potential impact on verification, this inclusion of
criteria with no realistic post-construction verification can also be seen to seriously limit
the ability of users or facilities management teams to manage the systems following
occupation. Elsewhere, even where verification was theoretically straightforward, criteria
was often seen to be focussed on the installation of features or equipment, without
properly addressing commissioning. For example, although credits were achieved for all
four buildings rewarding them for installing a pulsed water meter, only two were found to
have working water meters post occupancy, neither of which delivered pulsed outputs.
Similarly all case study buildings scored credits for installation of electrical sub-meters,
of which none whatsoever were found to be operable in practice.
Three characteristics were therefore identified as being key to determining the success
or otherwise of criteria in producing an effect in a complete and occupied building.
Firstly, the content of criteria is critical, in two respects. At a detailed level, criteria
content must align closely with the relevant aspects of sustainability that are purportedly
being addressed. Reliance upon unproven or uncertain models of cause and effect,
particularly relating to creating behavioural change, are likely to limit impact. Similarly,
criteria that reward either standard building practice or the omission of unusual features
are unlikely to generate substantial sustainability benefits. In addition, the overall
comprehensiveness of content is crucial to generating impact. Excessive freedom to
target credits regardless of category produces potential for certain aspects of
sustainability to be largely neglected. At the same time, many credits are rendered
ineffective because they relate to features that are not present within the building. Thus,
although the full range of criteria for a particular BREEAM section may present as
relatively comprehensive, this is not necessarily reflected in actual assessments, for
which non-applicable and un-attempted credits will necessarily have no impact.
Secondly, the appeal of credits to project teams can be seen to be fundamentally
important, particularly where a high degree of discretion is allowed in criteria selection.
Appeal may be particularly reduced where criteria include rigid geometric requirements
or adversely impact the functional use of the building. High financial cost associated
207
with adding or upgrading features will also clearly reduce appeal, whilst the opposite is
likely to be true of criteria associated with omissions of, or reductions in, facilities.
Criteria that is not attempted because they are unappealing will, by definition, have no
impact on the completed building. Conversely, criteria that are appealing because they
require little or no change to the existing design intent will also fail to produce
substantive benefits. Thirdly, the evidence requirements of criteria have great potential
to support or limit their effect in a completed building. Without evidence requirements
that are correctly configured to validate the criteria and fully reflected in design
documentation, any resulting impact becomes highly uncertain. Furthermore, effective
evidencing is dependent upon the resources and technical capabilities of assessors.
Where assessors are reliant upon assurances given in side letters from designers or
contractors then it is questionable as to whether the intended results will be achieved.
Similarly, unless site visits are carried out by assessors, a potentially valuable aspect of
verification is lost. A particular further frustration related to evidencing is that the effects
of many criteria are dependent upon good commissioning; thus an item of equipment
may be visually installed at the point of certification, but may not be operational. In some
cases such commissioning problems may be obvious at handover and be naturally
rectified by building users or facilities management teams. In other instances problems
will be less easily identified or corrected, which may result in the intended benefits being
lost.
Content, appeal and evidence of criteria as discussed above do not exist in isolation.
Evidence requirements are dictated by content and may have a substantive effect on the
appeal of criteria, as will content itself. Successful configuration of criteria in a checklist-
based scheme can therefore be viewed as a balancing act; content must be
comprehensive and appropriate but must additionally be appealing to project teams and
straightforwardly evidenced by assessors. In attempting this task, two further important
characteristics emerged in respect to criteria, those of scope and complexity. A high
degree of variation was observed in terms of scope. Many criteria are applied at a whole
building level, particularly those relating to internal environmental quality, whilst others
relate closely to specific systems or reward the addition of stand-alone “bolt-on” items of
equipment. Complexity of criteria was also seen to be highly variable. Where
requirements relate to specific items of equipment then criteria may be relatively
straightforward. Similarly, very simple geometrical requirements can be used to
demonstrate compliance. Conversely, other criteria called for adherence to additional
specialist design standards or modelling requirements, which may be both extensive and
technical. Broadly speaking, whole-building criteria can be seen to provide a greater
contribution to comprehensiveness of content than stand-alone items, but these also
208
tend to increase evidence requirements. Complexity also raises evidence requirements,
but without improving content. Meanwhile, appeal was observed to be largely
independent of scope and complexity in practice, indicating that these may be
subservient to previously identified factors such as cost, building function and geometry.
Overall, simple, whole building criteria were observed to have the greatest potential to
produce comprehensive, reliably evidenced scheme content.
6.2 Recommendations
The use of BSAS is expanding. Schemes continue to proliferate internationally, whilst
established methods such as BREEAM and LEED are increasing their global reach.
The format has already demonstrated enduring appeal and BSAS remains the best
available means of assessing the overall sustainability of a building. In spite of this, they
lack either a robust theoretical basis or an inherent feedback mechanism and the
findings of this study indicate that they are therefore fundamentally reliant upon well-
designed criteria to translate their aims into effect. A detailed bottom-up examination of
three key sections of the BREEAM 2008 scheme has found that the criteria within were
highly variable in their configuration, contained various theoretical shortfalls and were, in
certain cases, evidently ineffective.
As discussed in detail in Chapter 5, the efficacy of criteria are dependent upon their
collective content, their appeal to scheme users and their evidence requirements.
Effective criteria must have content that addresses each category in a comprehensive
manner, is consistently and closely aligned with the assessment category and is
applicable to a typical building. These criteria must either appeal to construction project
teams by being aligned with the wider purpose of the building or else the scheme must
incorporate mandatory minimum thresholds. They must also rely on evidence that is
robust, appropriate, properly incorporated into design information and readily verifiable
both by scheme assessors and facilities managers. Conversely, criteria that has content
which rewards standard industry practice, or which relies on uncertain, unproven or
disproven causal relationships can produce little or no differentiation in terms of
sustainability. Those that are unappealing to construction project teams due to
disproportionate functional, geometrical or cost impact are similarly rendered ineffective
through non-selection. Meanwhile, the effect of criteria relying on evidence that the
scheme assessor is not technically qualified to comment upon, or which is otherwise
founded on assurances from construction project team members, may be reduced

209
through non-compliance. As previously noted, successful criteria must therefore
balance comprehensiveness of content with their appeal to project teams and be readily
evidenced. The best criteria will also have broad scope and seek to limit complexity.
These requirements have additionally been illustrated through direct comparison of
BREEAM issues Wat 1 and Ene 1. The criteria for Wat 1 demonstrates appropriate
content, high appeal and robust evidencing in the case study buildings. Meanwhile, the
content of Ene 1 was seen to be based upon a limited, poorly performing methodology,
had limited appeal and was effectively impossible to robustly evidence. Wat 1 is
additionally based on simple evidence requirements, whilst those for Ene 1 are highly
complex.
The recommendations for criteria configuration set out above represent a draft
framework for examination of BSAS criteria more generally. It is acknowledged that
these are based on an examination of the criteria making up just 23 issues within the
BREEAM 2006 and 2008 schemes. As such, although the observations made are
readily generalizable, it is acknowledged that they have been formulated based upon
examination of a single, superseded scheme version. Potential therefore exists to
usefully expand these findings through wider examination including other Building
Sustainability Assessment Schemes. Such expansion could be readily affected using a
range of case studies, ideally across a number of countries. Reflection upon this study
suggests however that various refinements to the research approach would be
desirable. In terms of the selection of case studies, a high degree of cooperation and
openness from building owners, managers and facilities management teams is noted as
being highly beneficial. It would therefore be beneficial to agree a level of assistance not
only to the building owner, but also to the building manager and facilities manager, prior
to the final selection of case studies. This would mitigate the isolated shortfalls in
information experienced in this regard, by this study. Similarly, certain high level
technical checks should ideally be carried out, to establish how the required data would
be collected. Failure, for example, to pre-verify the existence of functioning water
meters in the case study buildings resulted in a substantial shortfall in data. A further
final and unexpected practical difficulty experienced with this study, was that of obtaining
the BREEAM reports. These were not accessible through the BRE and had not been
held on file by the building owner. In practice these reports were eventually obtained
through individual assessors, which in one case required tracking a person to a new
place of work. Without the report, no useful analysis of the building would have been
possible. Obtaining these or equivalent documents prior to final case study selection
can therefore also be seen to be essential. In terms of methodology, expanding the
scope of criteria examined is desirable but can be expected to significantly increase

210
resource demands and introduce requirements for additional research methods. A
longitudinal study would also increase resource requirement, but would offer scope to
cover a greater range of criteria, perhaps including direct observation of the design and
construction process. This approach would also yield results relevant to more recent
scheme versions. Finally it is noted that whilst the BUS survey employed to analyse
perceptions of internal environmental quality in this study was a useful tool, it is highly
targeted towards an office environment. As such, the relatively small number of
permanent staff within academic buildings resulted in limited sample sizes in some
buildings, and correspondingly limited scope for statistical analysis. Similar studies for
other buildings where office staff do not make up the majority would also need to
consider this difficulty, and ensure that a suitable alternative method was available.
6.3 Contribution to knowledge
If BSAS are to be effective in their now established role as policy tools then they must
produce consistent and appropriate effects, closely aligned with their aims, and reflective
of the certification awarded. Such efficacy is currently in doubt and the study findings
build upon wide ranging academic commentary outlining the theoretical shortfalls of
BSAS. With this study, these proposed limitations have been observed and documented
in practice for the first time, both validating and expanding existing understanding. More
importantly, examination of contemporaneous validation reports combined with post
occupancy evaluation has revealed the hitherto unrecognised importance of criteria in
exacerbating or reducing these limitations. The BSAS format has, indeed, been found to
be inherently weak as an assessment method, relying as it does on design stage
consideration of indicators. It is arguably these very weaknesses that have allowed it to
establish itself as the only practical and accepted method of differentiating buildings in
terms of sustainability. Indicators allow assessment to be at least nominally
comprehensive, whilst the use of design stage assessment allows certification to be
awarded at completion of the building contract. Both of these factors are fundamentally
necessary for assessment to be attractive as a means of standard setting by policy
makers.
The findings of this study provide ample explanation for inconsistent performance
suggested by existing empirical studies. Certain observed criteria were poorly contrived
in terms of their content and many had clearly not been robustly evidenced. Still more
were not attempted because they were inherently unattractive to project teams. In
211
addition to this there were other criteria for which the opposite was true, and for which a
clear chain of cause and effect was evident, linking the application of the criteria to
material sustainability improvements in the occupied building. The study findings
suggest that scheme operators wishing to optimise their performance should review the
configuration of their criteria and consider whether the balance between content, appeal
and evidence is, in each case, correct. This may require alternative indicators being
sought, or even a general downgrading of the range of sustainability aspects covered by
assessment. The validation regime for schemes may also require some reconfiguration,
to ensure that evidencing is improved. In any case, such a review should be urgently
demanded by the policy makers currently reliant on BSAS to drive improvements in
building sustainability. Finally more research is undoubtedly required, in order that the
initial findings of this study can be examined in context of a range of schemes.

212
Reference List
Action Energy (2003) Energy Consumption Guide 19 – Energy Use in Offices. Available at: www.cibse.org/.../ECG19-Energy-Use-in-Offices-(formerly-ECON19).pdf.aspx (Accessed 9th June 2017).
Ali-Toudert, F. (2008) From green buildings to sustainable urban settlements: a new assessment method, PLEA 2008 - 25th Conference on Passive and Low energy Architecture. Dublin, 22nd-24th October. Dublin: PLEA.
Alwaer, H., & Kirk, D. (2012) Building sustainability assessment methods, Engineering sustainability, 165(4) pp. 241-253.
Alwaer, H. and Clements-Croome, D. (2010) Key performance indicators (KPIs) and priority setting in using the multi-attribute approach for assessing sustainable intelligent buildings, Building and Environment, 45 (2010), pp.799-807.
Alwaer, H., Sibley, M. and Lewis, J. (2007) Different Stakeholder Perceptions of Sustainability Assessment, Architectural Science Review, 51 (1), pp.48-59.
Ammar, M. (2012) Evaluation of the Green Egyptian Pyramid. Alexandria Engineering Journal, 51(4), pp.293-304.
Arup (2017) Building Use Studies Methodology. Available at: http://www.busmethodology.org/history/ (Accessed 12 May 2017).
Association for the Advancement of Sustainability in Higher Education (AASHE) (2017) STARS. Available at: https://stars.aashe.org/ (Accessed 26 May 2017).
Baird, G. (2010). Sustainable Buildings in Practice What the Users Think. London: Routledge.
Barlow, S. (2011) Guide to BREEAM. London: RIBA.
BizEE (2016) Degree Days.net - Custom Degree Day Data. Available at: http://www.degreedays.net/ (Accessed 14 Jan 2017).
Beaufoy, H. (1993) “The Green Office in Britain: A Critical Analysis”, Journal of Design History, 6 (3), pp.199-207.

213
Bell, S. and Morse, S. (2003) Measuring Sustainability - Learning by Doing. Toronto: Earthscan.
Becker, J. (2004) “Making sustainable development evaluations work”, Sustainable Development, 12 (4), pp.200-211.
Beradi, U. (2011) “Sustainability assessment in the construction sector: Rating systems and rated buildings”, Sustainable Development, 20, pp411-424.
Bitard, P. (2009) Scope for international cooperation on green building standards. Available at: http://grips-public.mediactive.fr/knowledge_base/dl/858/orig_doc_file/ (Accessed 9 June 2017).
Birkeland, J. (2008) Positive Development. London: Earthscan.
Boonstra, C., & Pettersen, T. (2003) Tools for environmental assessment of existing buildings. Available at: www.bvsde.paho.org/bvsaia/fulltext/tools.pdf (Accessed 9 July 2017).
BOMA Canada (2016) About BOMA Best. Available at: http://bomacanada.ca/bomabest/aboutbomabest/ (Accessed 26 May 2017).
Bordass, B., Leaman, A., Ruyssevelt, P. (2001a) “Assessing building performance in use 3: energy performance of the Probe buildings.”, Building research and Information, 29(2), pp 114-128.
Bordass, B., Leaman, A., Ruyssevelt, P. (2001b) “Assessing building performance in use 5: conclusions and implications”, Building research and Information, 29(2), pp 144-157.
Brandon, P. and Lombardi, P. (2011) Evaluating Sustainable Development in the Built Environment. Oxford: Wiley-Blackwell.
British Standards Institute (BSI). (2010). BS-EN 15643-1:2010 Sustainability of construction works - sustainability assessment of buildings. Part 1: general framework. London: BSI.
Building Research Establishment (BRE) and Cyril Sweett. (2005) Putting a price on sustainability. Watford: Watford : BRE Trust.
Building Research Establishment (BRE) (2006) Bespoke BREEAM Assessment. Watford:BRE.
214
Building Research Establishment (BRE) (2008a) BREEAM Scheme Document SD 5051 BREEAM Education 2008. Watford:BRE.
Building Research Establishment (BRE) (2008b) BREEAM Scheme Document SD 5067 BREEAM Bespoke 2008. Watford:BRE.
Building Research Establishment (BRE) (2011) BREEAM New Construction Technical Manual SD 5073. Watford:BRE.
Building Research Establishment (BRE) (2012) Email to Colin Hobart. 28 March
Building Research Establishment (BRE) (2013) BREEAM New Construction. Available at: http://www.breeam.org/ (Accessed 20 May 2017).
Building Research Establishment (BRE) Global. (2016). BREEAM International New Construction 2016. Available at: http://www.breeam.com/BREEAMInt2016SchemeDocument/ (Accessed 20 May 2017).
Building Research Establishment (BRE). (2017a). BREEAM In-use International. Available at: http://www.breeam.com/in-use (Accessed 20 May 2017).
Building Research Establishment (BRE) (2017b) Green Book Live. Available at: http://www.greenbooklive.com/ (Accessed 12 May 2017).
Building Research Establishment (BRE) (2017c). BREEAM New Construction. Available at: http://www.breeam.com/new-construction (Accessed 26 May 2017).
Building Research Establishment (BRE) (2017d) Refurbishment and fit out. Available at: http://www.breeam.com/uk-refurbishment-and-fit-out-standards (Accessed 26 May 2017).
Canada Green Building Council (2016a) LEED: The international mark of excellence. Available at: http://www.cagbc.org/CAGBC/LEED/About_LEED/CAGBC/Programs/LEED/_LEED.aspx?hkey=01b3d086-d0a4-42cf-9e61-7830d801c019 (Accessed 26 May 2017).
Canada Green Building Council (2016b) LEED Canada for Homes. Available at: https://www.cagbc.org/@/CAGBC/LEED/GreenHomes/CAGBC/Programs/LEED/GreenHomes/Green_Homes.aspx?hkey=c4fbaa4b-53e3-4694-8c42-67f570f84869 (Accessed 26 May 2017).
Cato, S. (2009). Green Economics. London: Earthscan

215
Chartered Institution of Building Services Engineers (CIBSE) (2002) CIBSE Code for Lighting 2002. CIBSE: London
Chartered Institution of Building Services Engineers (CIBSE) (2006). CIBSE Code for Lighting 2006. CIBSE: London
Chartered Institution of Building Services Engineers (CIBSE) (2007). CIBSE Lighting Guide 7. CIBSE:London
Chartered Institution of Building Services Engineers (CIBSE) (2008). TM46: Energy Benchmarks. CIBSE: London
Chartered Institution of Building Services Engineers (CIBSE) (2009). TM48: Use of Climate Change Data in Building Simulation. CIBSE: London
Chartered Institution of Building Services Engineers (CIBSE) (2012). GVF CIBSE Guide F: Energy Efficiency in Buildings. CIBSE:London
Chartered Institution of Building Services Engineers (CIBSE) (2015a). GVA/15 CIBSE Guide A: Environmental Design. CIBSE:London
Chartered Institution of Building Services Engineers (CIBSE) (2015b). AM11 Building Performance Modelling 2015. CIBSE:London
Chartered Institution of Building Services Engineers (CIBSE) (2016). GVB2/16 CIBSE Guide B2: Ventilation and Ductwork 2016. CIBSE: London
Chartered Institution of Building Services Engineers (CIBSE) (2017b) Probe – Post occupancy Studies. Available at: http://www.cibse.org/knowledge/building-services-case-studies/probe-post-occupancy-studies (Accessed 12 May 2017).
City of Melbourne. (2013). CH2 Facts and Figures. Available at: http://www.melbourne.vic.gov.au (Accessed 10 May 2015).
Civil Engineering Environmental Quality Assessment and Award Scheme (CEEQUAL) (2017) CEEQUAL. Available at: http://www.ceequal.com/ (Accessed 26 May 2017).
Construction Industry Research and Information Association (CIRIA) (2006) Water key performance indicators and benchmarks for offices and hotels. Available at: http://www.ciria.org/ProductExcerpts/C657.aspx (Accessed 19 May 2017).

216
Cole, R. (2005) Building environmental assessment methods: Redefining intentions and roles. Building Research & Information, 35(5), 455-467.
Construcción Sostenible BREEAM ES (2017) BREEAM ES. Available at: http://www.breeam.es/ (Accessed 26 May 2017)
Crawley, D. and Aho, I. (1999) Building environmental assessment methods: Applications and development trends. Building Research & Information, 24(4-5), 300-308.
Creswell, J. (2009) Research Design – Qualitative, Quantitative and Mixed Method Approaches. USA: Sage
Department for Communities and Local Government (2008) The Government’s methodology for the production of Operational Ratings, Display Energy Certificates and Advisory Reports. Available at: https://www.gov.uk/government/publications/government-methodology-for-producting-operational-ratings-display-energy-certificates-and-advisory-reports (Accessed 12 May 2017).
Department for Communities and Local Government (2015). 2010 to 2015 government policy: energy efficiency in buildings. Available at: https://www.gov.uk/government/publications/2010-to-2015-government-policy-energy-efficiency-in-buildings/2010-to-2015-government-policy-energy-efficiency-in-buildings#appendix-6-energy-performance-of-buildings (Accessed 19 May 2017).
Department for Communities and Local Government (2017) The Non-Domestic Energy Performance Register. Available at: https://www.ndepcregister.com/ (Accessed 19 May 2017).
Deutsches Privates Institut für Nachhaltige Immobilienwirtschaft (DIFNI) (2017) BREEAM. Available at: http://www.difni.de/leistungen/breeam.html (Accessed 26 May 2017).
Ding, G. (2008). The role of environmental assessment tools. Journal of Environmental Management, 86, 451-464.
Dutch Green Building Council (2017) Over BREEAM. Available at: https://www.breeam.nl/over-breeam (Accessed 26 May 2017).
Edwards, B. (2003). Green buildings pay. London: London : Spon Press.
Education Funding Agency (EFA) (2003) Building Bulletin 93: Acoustic Design of Schools: A Design Guide. Available at:

217
https://www.gov.uk/government/publications/bb93-acoustic-design-of-schools-performance-standards#history (Accessed 19 May 2017).
Elkington, J. (1997) Cannibals with forks – The triple bottom line of 21st century business. Oxford: Capstone.
Energy Act 2011. Available at http://www.legislation.gov.uk/ukpga/2011/16/contents/enacted (Accessed: 12 May 2017).
Field, A. (2013) Discovering Statistics Using IBM SPSS Statistics. Sage: London
Freeman, C. and Louca, F. (2001). As Time Goes By : From the Industrial Revolutions to the Information Revolution. Oxford, GBR: Oxford University Press, UK
Gibberd, J. (2002) The Sustainable Building Assessment Tool: Assessing how buildings can support sustainability in developing countries. The Built Environment Professions Convention. Johannesburg, 1-3 May. Available at: https://pdfs.semanticscholar.org/ba1d/c72071e7a4b77884b033a07e892cef55fb02.pdf (Accessed 16 June 2017).
Gomes, V., Gomes da Silva, M., Lamberts, R., Takaoka, M. and Sangoi de Oliveira, M. (2008). Sustainable Building in Brazil. World Sustainable Building Conference (SB08). Melbourne, 21-25 September. Available at: www.iisbe.org/sbconferences/Brazil_SB_Report_SB08.pdf (Accessed 16 June 2017).
Government of Hong Kong Special Administrative Region Building Department (2004) Comprehensive Environmental Performance Assessment Scheme for Buildings. Available at: http://www.bd.gov.hk/english/documents/index_CEPAS.html (Accessed 26 May 2017).
Gowri, K. (2004) Green Building Rating Systems: an overview. ASHRAE Journal. 46 11 p56
Gray, D. (2014) Doing Research in the Real World. Sage: London
Green Building Council of Australia (GBCA) (2015a) Green Star. Available at: http://new.gbca.org.au/green-star/ (Accessed 20 May 2017).
Green Building Council of Australia (GBCA) (2015b) Green Star Performance. Available at: http://new.gbca.org.au/green-star/rating-system/performance/ (Accessed 20 May 2017).
218
Green Building Council Italia (2017) LEED Italia. Available at: http://www.gbcitalia.org/page/show/leed-italia--3?locale=it (Accessed 26 May 2017).
Green Building Initiative (2014) Green Globes Certification. Available at: https://www.thegbi.org/green-globes-certification/ (Accessed 20 May 2017).
Guthrie, G. (2010) Basic Research Methods: An Entry to Social Science Research. Sage: India.
Guy, S. and Moore, S.A. eds. (2004) Sustainable Architectures: Cultures and Natures in Europe and North America. Oxford:Spon Press.
Haapio, A. and Viitaniemi, P. (2008) A critical review of building environmental assessment tools. Environmental Impact Assessment Review, (28), pp.469-482.
Haddock-Fraser, J. and Tourelle, M. (2010) Corporate Motivations for Environmental Sustainable Development: Exploring the Role of Consumers in Stakeholder Engagement. Business Strategy and the Environment, 19, pp.527-542.
Hakkinen, T. (2012) Sustainability and performance assessment and benchmarking of buildings. Espoo: VVT Technical Research Centre of Finland.
Haroglu, H. (2013). The impact of Breeam on the design of buildings. Engineering Sustainability, (166) pp.11-19.
Hawkes, J. (2001). The Fourth Pillar of Sustainability: Culture’s essential role in public planning. Common Ground Publishing: Melbourne
Hayes, N. (2012). The business case for sustainable buildings - Green premium. [Powerpoint] E.C.Harris. November.
Health and Safety Executive (HSE) (2010) Legionnaires' disease - The control of legionella bacteria in water systems. Approved code of practice and guidance 2000. HSE: London.
Higher Education Funding Council for England (HEFCE). (1996). Energy management study in the higher education sector Management Review Guide. HEFCE: Bristol.
Higher Education Statistics for the UK (HESA) (2013) Higher Education Statistics for the UK 2015/2016. Available at: https://www.hesa.ac.uk/data-and-analysis/publications/higher-education-2015-16 (Accessed 20 May 2016).
219
HMSO (1995) Approved Document L – Conservation of Fuel and Power, 1995 Edition. London: HMSO.
Howard, N. (2005). Building environmental assessment methods: in practice. World Sustainable Building Conference, Tokyo (SB05), Vol. 27, p. 29.
Intergovernmental Panel on Climate Change (IPCC) (2007) IPCC Fourth Assessment Report: Climate Change 2007. Cambridge: Cambridge University Press.
International Energy Agency (IEA) (2005) IEA Annex 31 - Energy related environmental impact of buildings. Available at: http://www.iisbe.org/annex31/index.html (Accessed 16 June 2017).
Indian Green Building Council (2015a) IGBC Rating Systems. Available at: https://igbc.in/igbc/redirectHtml.htm?redVal=showratingSysnosign (Accessed 26 May 2017).
Indian Green Building Council (2015b) LEED. Available at: https://igbc.in/igbc/redirectHtml.htm?redVal=showLeednosign (Accessed 26 May 2017).
Institute for Building Environment and Energy Conservation (IBEC) (2017) CASBEE. Available at: http://www.ibec.or.jp/CASBEE/english/ (Accessed 26 May 2017).
International Initiative for a Sustainable Built Environment (iiSBE) (2009) SBTool. Available at: http://www.iisbe.org/sbmethod (Accessed 20 May 2017).
International Standards Organization (ISO) (2006) ISO/TS 21931-1:2006 Sustainability in building construction - Framework for methods of assessment for environmental performance of construction works - Part 1: Buildings. Geneva: ISO.
International Standards Organization ISO (2011) ISO 21929-1:2011. Sustainability in building construction - sustainability indicators - Part 1. Geneva: ISO.
Jaeger, W. (2005) Environmental Economics for Tree Huggers and Other Skeptics. Washington DC: Island Press:
Johnston, D. Farmer, M. Brooke-Peat, and Miles-Shenton, D. (2016) Bridging the domestic building fabric performance gap. Building Research & Information, 44(2) pp.147-159.

220
Jones, D. (2012) Who cares wins: why good business is better business. Harlow: Pearson Educational.
Koepke, K., Portalatin, M., Roskoski, M., Shouse, T. (2010). Green Building Rating Systems. Texas: IFMA Foundation.
Koger, S. and Scott, B. (2007) Psychology and Environmental Sustainability: A Call for Integration. Teaching of Psychology, 34(1) pp.10-18.
Leaman, A. and Bordass, B. (1999) Productivity in buildings: the `killer’ variables. Building Research and Information, 27(1) pp.4–19.
Lee, W., Chau, F., Yik, J. and Burnett, M., (2002) On the study of the credit-weighting scale in a building environmental assessment scheme. Building and Environment, 37 pp.1385-1396.
Lee, W. and Burnett, J. (2008) Benchmarking energy use assessment of HK-BEAM, BREEAM and LEED. Building and Environment. 43 pp.1882-1891.
Lee, W. (2012) Benchmarking energy use of building environmental assessment schemes. Energy and Buildings, 45 pp.326-334.
Lidera (2017) Voluntary system for assessment of sustainable construction. Available at: http://www.lidera.info/ (Accessed 23 June 2017).
Lockwood, C., (2008). The dollars and sense of green retrofits. Available at: http://www.sustainablecitiesinstitute.org/topics/buildings-and-energy/green-building-101/the-dollars-and-sense-of-green-retrofits (Accessed 9 June 2017).
McElroy (2011) Re-casting the triple bottom line: Introducing Context Based Sustainability Measurement and Reporting [Powerpoint]. Available at: www.sustainableorganizations.org/Recasting-TBL.pdf (Accessed 16 June 2017).
MacMillan, S., Editor (2004) Designing Better Buildings. Oxford: Taylor and Francis.
Marks and Spencer (2017) Plan A report 2017. Available at: http://planareport.marksandspencer.com/ (Accessed: 2013, 13th May).
Menezes, A., Cripps, A., Bouchlaghem, D., Buswell, R. (2012) Predicted vs. actual energy performance of non-domestic buildings: Using post-occupancy evaluation data to reduce the performance gap. Applied Energy, 97 pp.355–364.
221
Miller, N., Spivey, J., and Florance, A. (2008) Does green Pay Off? Journal of Real Estate Portfolio Management, 14(4) pp.385-399
Mockett, T. (2012). Integrating Sustainability in Real Estate Investment. Available at: www.bre.co.uk/filelibrary/events/40%20Percent%202012/Tim_Mockett.pdf (Accessed 10 May, 2013).
Monfared, I. and Sharples, S. (2011) Occupants’ perceptions and expectations of a green office building: a longitudinal case study. Architectural Science Review, 54(4) pp.344-355.
Montross, C. and Fraser, M. (1998) Building design for a sustainable future. 1998 ACEEE Summer Study on Energy Efficiency in Buildings, Pacific Grove, CA (US), 23-28 August.
National Building Specification (NBS) (2006) Approved Document L2A – Conservation of Fuel and Power, 2006 Edition. London: RIBA.
National Building Specification (NBS) (2010) Approved Document L2A – Conservation of Fuel and Power, 2010 Edition. London: RIBA.
National Building Specification (NBS) (2014) Approved Document L2A – Conservation of Fuel and Power, 2013 Edition. London: RIBA.
National Australian Built Environment Rating System (NABERS) (2017) NABERS. Available at: https://nabers.gov.au/public/webpages/home.aspx (Accessed 20 May 2017).
Naik, F.C., Zhao, H., Harrison, T.G. and Phin, N. (2012) Legionnaires’ disease in England and Wales, 2011. Health Protection Report/Respiratory Archives.
Norwegian Green Building Council (2017) BREEAM NOR. Available at: http://ngbc.no/ (Accessed 26 May 2017).
Oehlkers, J. ed., Ebrary, I. (2008) Emerald architecture case studies in green building. New York: McGraw-Hill.
Office of Government Commerce (OGC). (2003) Final Watermark Project Report. Available at: https://www.coloradowaterwise.org/Resources/Documents/ICI_toolkit/docs/.../uk-final-report.pdf (Accessed 19 May 2017).
Parker, J. (2012) The value of BREEAM. London: BSRIA.

222
Partal, A. (2013) Impact Assessment: A Tool to Assist Cultural Sustainable Development. People and the Planet 2013 Conference: Transforming the Future, Melbourne, 2-4 July. Melbourne: RMIT
Pitts, A. (2004) Planning and Design Strategies for Sustainability and Profit. Oxford: Elsevier.
Portalatin, M., Koepke, K., Roskoski, M. and Shouse, T. (2010) Green Building Rating Systems. Oxford: Oxford University Press.
Pottinger, G., & Tanton, A. (2012). Flooding and commercial property investment - what is the risk? European Real Estate Society 19th Annual Conference. Edinburgh. 13-16 June.
Poveda, C. (2011) A Review of Sustainability Assessment and Sustainability/Environmental Rating Systems and Credit Weighting Tools. Journal of Sustainable Development, 4(6) pp.36-55.
Preiser, W. and Vischer, J. (2003) Assessing Building Performance. Oxford: Elsevier.
Robert, K. (2002) The Natural Step Story – Seeding a Quiet Revolution. Canada: New Society Publishers.
Robinson, J. (2004) Squaring the circle? Some thoughts on the idea of sustainable development. Ecological Economics, (48) pp.369-384.
Rose, T. and Manley, K. (2011) Motivation toward financial incentive goals on construction projects. Journal of Business Research, 64 pp.765–773.
Royal Institute of British Architects (RIBA) (2017) Carbon Buzz. Available at: http://www.carbonbuzz.org/ (Accessed 16 June 17)
Royal Institution of Chartered Surveyors (RICS) (2013) RICS draft guidance note - sustainability and commercial property valuation. Available: https://consultations.rics .org (Accessed 26 March 2013).
Royal Institution of Chartered Surveyors (RICS) (2015) RICS Property Measurement 1st Edition May 2015. RICS: London
Royal Institution of Chartered Surveyors (RICS) (2017) SKA Rating. Available at: http://www.rics.org/uk/knowledge/ska-rating-/ (Accessed 26 May 2017).
223
Sayce, S. (2010). Is sustainability reflected in commercial property prices? London: RICS.
Scofield, J. (2009) Do LEED-certified buildings save energy? Not really… Energy and Buildings 41 pp.1386–1390.
Sev, A. (2009) How can the construction industry contribute to sustainable development? A conceptual framework. Sustainable Development, 17(3) pp.161-173.
Schell, C. (1992) The Value of the Case Study as a Research Strategy, Manchester: Manchester Business School.
Sonneborn, L. (2007) The Environmental Movement : Protecting Our Natural Resources. New York: Chelsea House.
The Standards Institution of Israel (2017) SI-5281 Sustainable Construction (Green Construction). Available at: https://portal.sii.org.il/eng/qualityauth/certificationtypes/greenbuild/5281/ (Accessed 26 May 2017).
Stern, N. (2009). The global deal: climate change and the creation of a new era of progress and prosperity. New York: Public Affairs.
Sweden Green Building Council (2017) BREEAM SE. Available at: https://www.sgbc.se/var-verksamhet/breeam (Accessed 26 May 2017).
Thomas, G. (2011) How to do your case study. London: Sage
Turpin‐Brooks, S. and Viccars, G. (2006) The development of robust methods of post occupancy evaluation. Facilities, 24(5) pp.177-196.
Turner, N. and Arif, M. (2012) BREEAM Excellent: Business Value Vs Employee Morale. Journal of Physics, Conference Series 364.
United Nations Environment Programme (UNEP) (2009). Buildings and climate change - summary for decision makers. Milan: UNEP.
United Nations Framework Convention on Climate Change (UNFCCC). (1998) Kyoto Protocol to the United Nations Framework Convention on Climate Change Available at: https://unfccc.int/resource/docs/convkp/kpeng.pdf (Accessed 9 June 2017).
224
United Nations World Commission on Environment and Development (1987) Our Common Future (Brundtland Report). Oxford: Oxford University Press.
United States Green Building Council (USGBC) (2012) LEED projects list. Available at: http://new.usgbc.org/projects (Accessed 12 October, 2012).
United States Green Building Council (USGBC) (2017a) LEED v4. Available at: http://www.usgbc.org/resources/leed-v4-user-guide (Accessed 20 May 2017).
United States Green Building Council (USGBC) (2017b) LEED for homes international. Available at: http://www.usgbc.org/articles/leed-homes-international-market-update-2016 (Accessed 20 May 2017).
Vanderbilt University (2013) What is Sustainability? Available at: http://www.vanderbilt.edu/sustainvu (Accessed 10 May 2013).
Vesma (2016) Degree Day Data. Available at: http://www.vesma.com/ddd/ (Accessed 14th Jan 2017)
Wheeler, S. (2004) Planning for sustainability - creating liveable, equitable and ecological communities. London: Routledge.
Yin, R. (2014) Case Study Research: Design and Methods. London:Sage.
Yudelson, J. (2009) Green Building Trends: Europe. Washington:Island.

Appendix A – BREEAM issues and associated themes (BRE, 2006; BRE, 2008)
BREEAM issue Themes
BR
EE
AM
200
8
Ref
eren
ce
BR
EE
AM
200
6
Ref
eren
ce
MANAGEMENT Man 01 M1 Commissioning Mechanical ventilation
Artificial lighting Natural ventilation Thermal comfort Safe and effective fume cupboards Monitoring of energy use Construction stage site impacts (environmental and social) Energy efficiency of building services Water efficiency in-use Foundation design Building functionality Building aesthetics Traffic impact Community relations Incidence and fear of crime Promotion of sustainable construction Cost effective maintenance and operation Accessibility
Man 02 M4 Considerate Constructors Man 03 M5 Construction Site Impacts Man 04 M12 Building User Guide Man 05 Site Investigation Man 06 M8 Consultation Man 07 Shared Facilities Man 08 Security Man 09 Publication of building
information Man 10 M16 Development as a learning
resource Man 11 Ease of maintenance Man 12 Life cycle costing Man 14 Inclusivity M24 Post construction testing -
Acoustics
HEALTH AND WELLBEING Hea 01 HW1 Daylighting Daylighting
View out Artificial lighting Natural ventilation External pollutants CO2 levels Mechanical ventilation and cooling Volatile organic compounds Thermal comfort Legionella Acoustics External amenity space Chilled drinking water Safe and effective fume cupboards
Hea 01 HW2 View out Hea 03 HW3 Glare control Hea 04 HW4 High frequency lighting Hea 05 HW5 Internal and external lighting
levels Hea 06 HW6/7 Lighting zones and controls Hea 07 HW8 Potential for natural ventilation Hea 08 HW9 Indoor air quality HW10 Indoor air quality (CO2) HW11 Ventilation rates Hea 09 Volatile organic compounds Hea 10 HW14 Thermal comfort Hea 11 HW15 Thermal zoning Hea 12 HW16 Microbial contamination Hea 13 HW17 Acoustic performance Hea 15 Outdoor space Hea 16 Drinking water Hea 17 Specification of laboratory fume
cupds Hea 18 Containment level 2 and 3
laboratories ENERGY Ene 01 E1 Reduction of CO2 emissions CO2 emissions (regulated energy)
Renewable energy Ene 02 E2 Sub metering of substantial energy uses
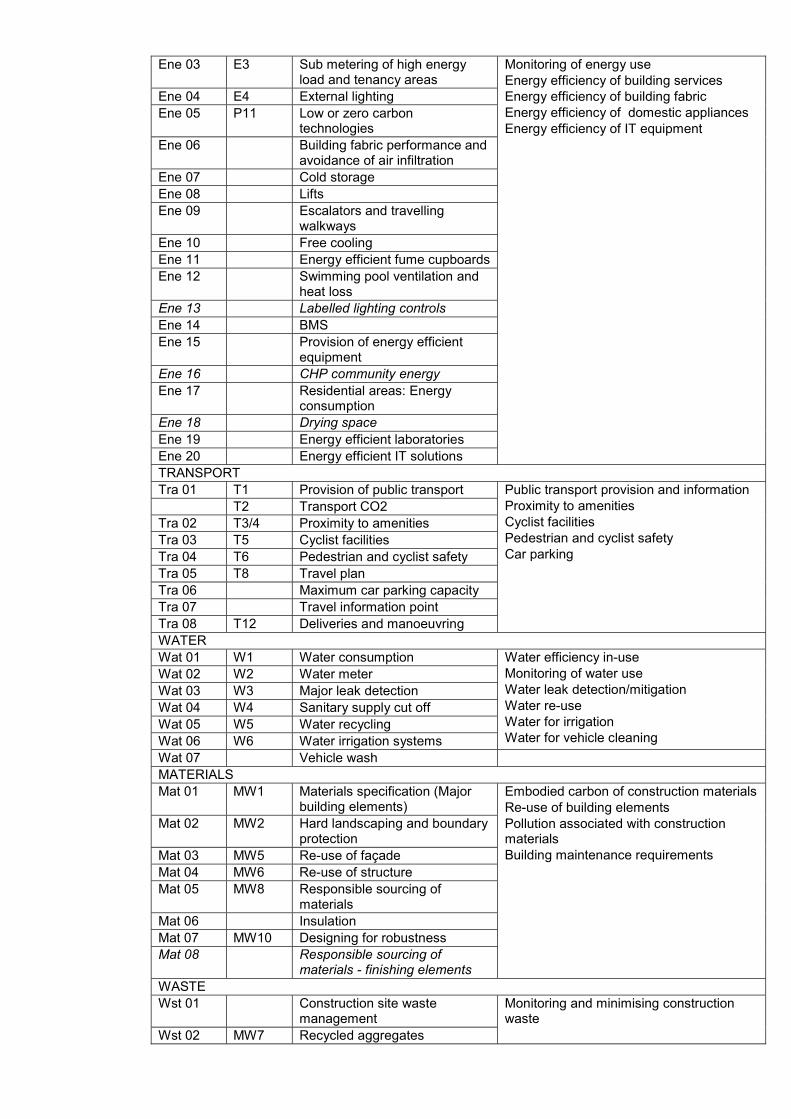
Ene 03 E3 Sub metering of high energy load and tenancy areas
Monitoring of energy use Energy efficiency of building services Energy efficiency of building fabric Energy efficiency of domestic appliances Energy efficiency of IT equipment
Ene 04 E4 External lighting Ene 05 P11 Low or zero carbon
technologies Ene 06 Building fabric performance and
avoidance of air infiltration Ene 07 Cold storage Ene 08 Lifts Ene 09 Escalators and travelling
walkways Ene 10 Free cooling Ene 11 Energy efficient fume cupboards Ene 12 Swimming pool ventilation and
heat loss Ene 13 Labelled lighting controls Ene 14 BMS Ene 15 Provision of energy efficient
equipment Ene 16 CHP community energy Ene 17 Residential areas: Energy
consumption Ene 18 Drying space Ene 19 Energy efficient laboratories Ene 20 Energy efficient IT solutions TRANSPORT Tra 01 T1 Provision of public transport Public transport provision and information
Proximity to amenities Cyclist facilities Pedestrian and cyclist safety Car parking
T2 Transport CO2 Tra 02 T3/4 Proximity to amenities Tra 03 T5 Cyclist facilities Tra 04 T6 Pedestrian and cyclist safety Tra 05 T8 Travel plan Tra 06 Maximum car parking capacity Tra 07 Travel information point Tra 08 T12 Deliveries and manoeuvring WATER Wat 01 W1 Water consumption Water efficiency in-use
Monitoring of water use Water leak detection/mitigation Water re-use Water for irrigation Water for vehicle cleaning
Wat 02 W2 Water meter Wat 03 W3 Major leak detection Wat 04 W4 Sanitary supply cut off Wat 05 W5 Water recycling Wat 06 W6 Water irrigation systems Wat 07 Vehicle wash MATERIALS Mat 01 MW1 Materials specification (Major
building elements) Embodied carbon of construction materials Re-use of building elements Pollution associated with construction materials Building maintenance requirements
Mat 02 MW2 Hard landscaping and boundary protection
Mat 03 MW5 Re-use of façade Mat 04 MW6 Re-use of structure Mat 05 MW8 Responsible sourcing of
materials Mat 06 Insulation Mat 07 MW10 Designing for robustness Mat 08 Responsible sourcing of
materials - finishing elements WASTE Wst 01 Construction site waste
management Monitoring and minimising construction waste
Wst 02 MW7 Recycled aggregates
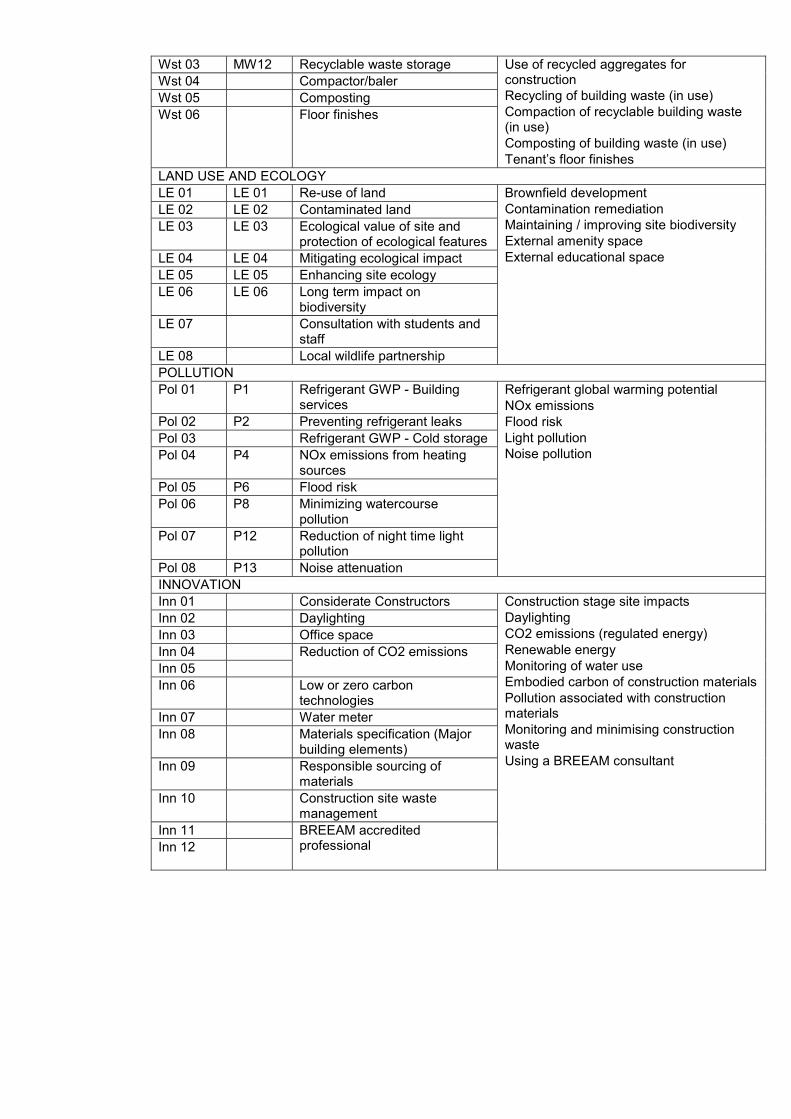
Wst 03 MW12 Recyclable waste storage Use of recycled aggregates for construction Recycling of building waste (in use) Compaction of recyclable building waste (in use) Composting of building waste (in use) Tenant’s floor finishes
Wst 04 Compactor/baler Wst 05 Composting Wst 06 Floor finishes
LAND USE AND ECOLOGY LE 01 LE 01 Re-use of land Brownfield development
Contamination remediation Maintaining / improving site biodiversity External amenity space External educational space
LE 02 LE 02 Contaminated land LE 03 LE 03 Ecological value of site and
protection of ecological features LE 04 LE 04 Mitigating ecological impact LE 05 LE 05 Enhancing site ecology LE 06 LE 06 Long term impact on
biodiversity LE 07 Consultation with students and
staff LE 08 Local wildlife partnership POLLUTION Pol 01 P1 Refrigerant GWP - Building
services Refrigerant global warming potential NOx emissions Flood risk Light pollution Noise pollution
Pol 02 P2 Preventing refrigerant leaks Pol 03 Refrigerant GWP - Cold storage Pol 04 P4 NOx emissions from heating
sources Pol 05 P6 Flood risk Pol 06 P8 Minimizing watercourse
pollution Pol 07 P12 Reduction of night time light
pollution Pol 08 P13 Noise attenuation INNOVATION Inn 01 Considerate Constructors Construction stage site impacts
Daylighting CO2 emissions (regulated energy) Renewable energy Monitoring of water use Embodied carbon of construction materials Pollution associated with construction materials Monitoring and minimising construction waste Using a BREEAM consultant
Inn 02 Daylighting Inn 03 Office space Inn 04 Reduction of CO2 emissions
Inn 05 Inn 06 Low or zero carbon
technologies Inn 07 Water meter Inn 08 Materials specification (Major
building elements) Inn 09 Responsible sourcing of
materials Inn 10 Construction site waste
management Inn 11 BREEAM accredited
professional
Inn 12

Appendix B – Building user survey questionnaire