The response of NW Iberian vegetation to North Atlantic climate oscillations during the last 65 kyr
17
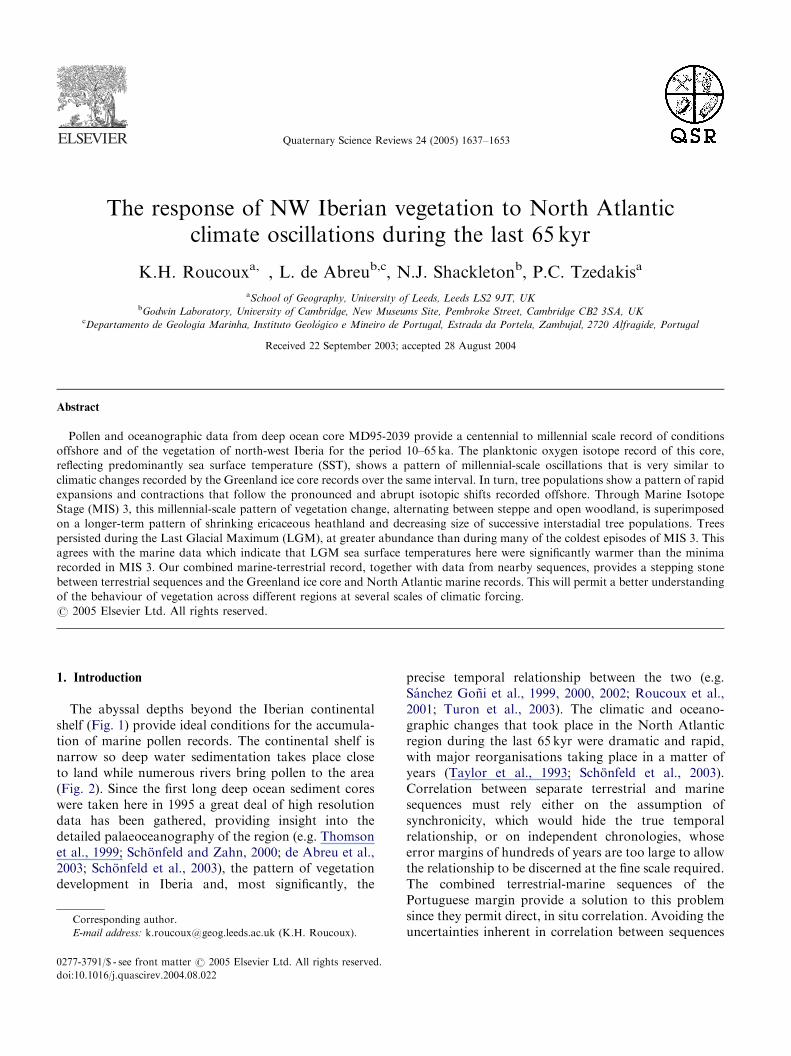
Quaternary Science Reviews 24 (2005) 1637–1653 The response of NW Iberian vegetation to North Atlantic climate oscillations during the last 65 kyr K.H. Roucoux a, , L. de Abreu b,c , N.J. Shackleton b , P.C. Tzedakis a a School of Geography, University of Leeds, Leeds LS2 9JT, UK b Godwin Laboratory, University of Cambridge, New Museums Site, Pembroke Street, Cambridge CB2 3SA, UK c Departamento de Geologia Marinha, Instituto Geolo´gico e Mineiro de Portugal, Estrada da Portela, Zambujal, 2720 Alfragide, Portugal Received 22 September 2003; accepted 28 August 2004 Abstract Pollen and oceanographic data from deep ocean core MD95-2039 provide a centennial to millennial scale record of conditions offshore and of the vegetation of north-west Iberia for the period 10–65 ka. The planktonic oxygen isotope record of this core, reflecting predominantly sea surface temperature (SST), shows a pattern of millennial-scale oscillations that is very similar to climatic changes recorded by the Greenland ice core records over the same interval. In turn, tree populations show a pattern of rapid expansions and contractions that follow the pronounced and abrupt isotopic shifts recorded offshore. Through Marine Isotope Stage (MIS) 3, this millennial-scale pattern of vegetation change, alternating between steppe and open woodland, is superimposed on a longer-term pattern of shrinking ericaceous heathland and decreasing size of successive interstadial tree populations. Trees persisted during the Last Glacial Maximum (LGM), at greater abundance than during many of the coldest episodes of MIS 3. This agrees with the marine data which indicate that LGM sea surface temperatures here were significantly warmer than the minima recorded in MIS 3. Our combined marine-terrestrial record, together with data from nearby sequences, provides a stepping stone between terrestrial sequences and the Greenland ice core and North Atlantic marine records. This will permit a better understanding of the behaviour of vegetation across different regions at several scales of climatic forcing. r 2005 Elsevier Ltd. All rights reserved. 1. Introduction The abyssal depths beyond the Iberian continental shelf (Fig. 1) provide ideal conditions for the accumula- tion of marine pollen records. The continental shelf is narrow so deep water sedimentation takes place close to land while numerous rivers bring pollen to the area (Fig. 2). Since the first long deep ocean sediment cores were taken here in 1995 a great deal of high resolution data has been gathered, providing insight into the detailed palaeoceanography of the region (e.g. Thomson et al., 1999; Scho¨nfeld and Zahn, 2000; de Abreu et al., 2003; Scho¨nfeld et al., 2003), the pattern of vegetation development in Iberia and, most significantly, the precise temporal relationship between the two (e.g. Sa´nchez Gon˜i et al., 1999, 2000, 2002; Roucoux et al., 2001; Turon et al., 2003). The climatic and oceano- graphic changes that took place in the North Atlantic region during the last 65 kyr were dramatic and rapid, with major reorganisations taking place in a matter of years (Taylor et al., 1993; Scho¨nfeld et al., 2003). Correlation between separate terrestrial and marine sequences must rely either on the assumption of synchronicity, which would hide the true temporal relationship, or on independent chronologies, whose error margins of hundreds of years are too large to allow the relationship to be discerned at the fine scale required. The combined terrestrial-marine sequences of the Portuguese margin provide a solution to this problem since they permit direct, in situ correlation. Avoiding the uncertainties inherent in correlation between sequences ARTICLE IN PRESS 0277-3791/$ - see front matter r 2005 Elsevier Ltd. All rights reserved. doi:10.1016/j.quascirev.2004.08.022 Corresponding author. E-mail address: [email protected] (K.H. Roucoux).
-
Upload
independent -
Category
Documents
-
view
1 -
download
0
Transcript of The response of NW Iberian vegetation to North Atlantic climate oscillations during the last 65 kyr
ARTICLE IN PRESS
0277-3791/$ - se
doi:10.1016/j.qu
�CorrespondE-mail addr
Quaternary Science Reviews 24 (2005) 1637–1653
The response of NW Iberian vegetation to North Atlanticclimate oscillations during the last 65 kyr
K.H. Roucouxa,�, L. de Abreub,c, N.J. Shackletonb, P.C. Tzedakisa
aSchool of Geography, University of Leeds, Leeds LS2 9JT, UKbGodwin Laboratory, University of Cambridge, New Museums Site, Pembroke Street, Cambridge CB2 3SA, UK
cDepartamento de Geologia Marinha, Instituto Geologico e Mineiro de Portugal, Estrada da Portela, Zambujal, 2720 Alfragide, Portugal
Received 22 September 2003; accepted 28 August 2004
Abstract
Pollen and oceanographic data from deep ocean core MD95-2039 provide a centennial to millennial scale record of conditions
offshore and of the vegetation of north-west Iberia for the period 10–65 ka. The planktonic oxygen isotope record of this core,
reflecting predominantly sea surface temperature (SST), shows a pattern of millennial-scale oscillations that is very similar to
climatic changes recorded by the Greenland ice core records over the same interval. In turn, tree populations show a pattern of rapid
expansions and contractions that follow the pronounced and abrupt isotopic shifts recorded offshore. Through Marine Isotope
Stage (MIS) 3, this millennial-scale pattern of vegetation change, alternating between steppe and open woodland, is superimposed
on a longer-term pattern of shrinking ericaceous heathland and decreasing size of successive interstadial tree populations. Trees
persisted during the Last Glacial Maximum (LGM), at greater abundance than during many of the coldest episodes of MIS 3. This
agrees with the marine data which indicate that LGM sea surface temperatures here were significantly warmer than the minima
recorded in MIS 3. Our combined marine-terrestrial record, together with data from nearby sequences, provides a stepping stone
between terrestrial sequences and the Greenland ice core and North Atlantic marine records. This will permit a better understanding
of the behaviour of vegetation across different regions at several scales of climatic forcing.
r 2005 Elsevier Ltd. All rights reserved.
1. Introduction
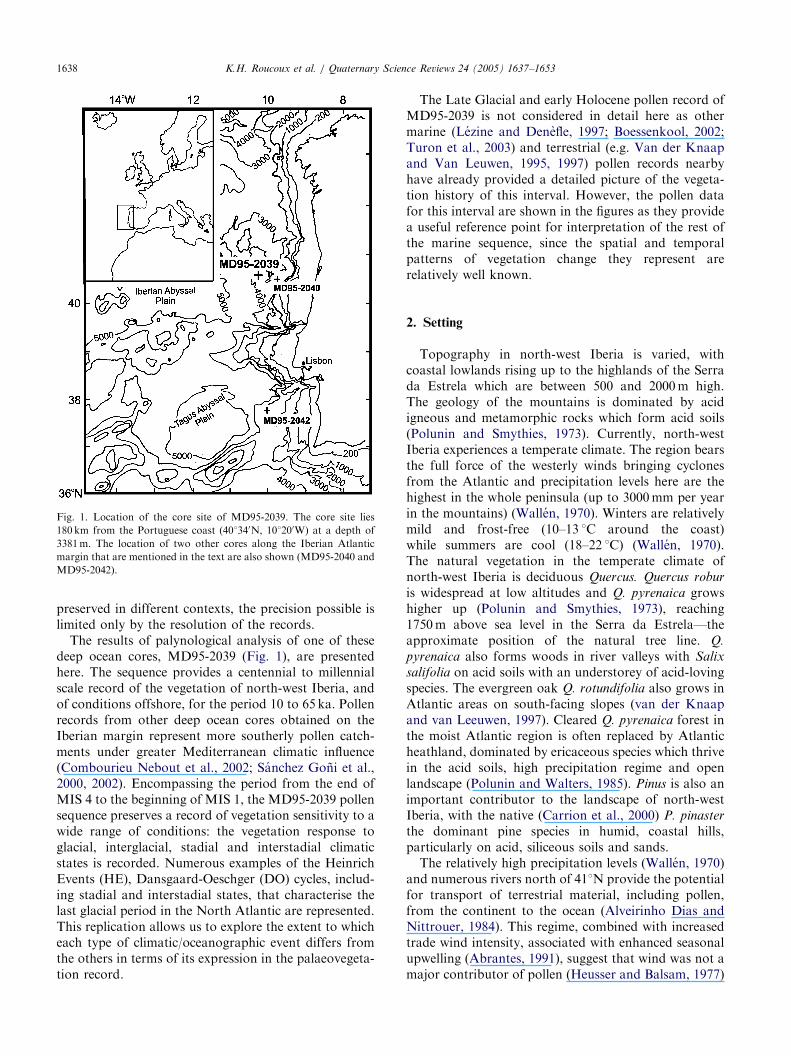
The abyssal depths beyond the Iberian continentalshelf (Fig. 1) provide ideal conditions for the accumula-tion of marine pollen records. The continental shelf isnarrow so deep water sedimentation takes place closeto land while numerous rivers bring pollen to the area(Fig. 2). Since the first long deep ocean sediment coreswere taken here in 1995 a great deal of high resolutiondata has been gathered, providing insight into thedetailed palaeoceanography of the region (e.g. Thomsonet al., 1999; Schonfeld and Zahn, 2000; de Abreu et al.,2003; Schonfeld et al., 2003), the pattern of vegetationdevelopment in Iberia and, most significantly, the
e front matter r 2005 Elsevier Ltd. All rights reserved.
ascirev.2004.08.022
ing author.
ess: [email protected] (K.H. Roucoux).
precise temporal relationship between the two (e.g.Sanchez Goni et al., 1999, 2000, 2002; Roucoux et al.,2001; Turon et al., 2003). The climatic and oceano-graphic changes that took place in the North Atlanticregion during the last 65 kyr were dramatic and rapid,with major reorganisations taking place in a matter ofyears (Taylor et al., 1993; Schonfeld et al., 2003).Correlation between separate terrestrial and marinesequences must rely either on the assumption ofsynchronicity, which would hide the true temporalrelationship, or on independent chronologies, whoseerror margins of hundreds of years are too large to allowthe relationship to be discerned at the fine scale required.The combined terrestrial-marine sequences of thePortuguese margin provide a solution to this problemsince they permit direct, in situ correlation. Avoiding theuncertainties inherent in correlation between sequences
ARTICLE IN PRESS
Fig. 1. Location of the core site of MD95-2039. The core site lies
180 km from the Portuguese coast (401340N, 101200W) at a depth of
3381m. The location of two other cores along the Iberian Atlantic
margin that are mentioned in the text are also shown (MD95-2040 and
MD95-2042).
K.H. Roucoux et al. / Quaternary Science Reviews 24 (2005) 1637–16531638
preserved in different contexts, the precision possible islimited only by the resolution of the records.The results of palynological analysis of one of these
deep ocean cores, MD95-2039 (Fig. 1), are presentedhere. The sequence provides a centennial to millennialscale record of the vegetation of north-west Iberia, andof conditions offshore, for the period 10 to 65 ka. Pollenrecords from other deep ocean cores obtained on theIberian margin represent more southerly pollen catch-ments under greater Mediterranean climatic influence(Combourieu Nebout et al., 2002; Sanchez Goni et al.,2000, 2002). Encompassing the period from the end ofMIS 4 to the beginning of MIS 1, the MD95-2039 pollensequence preserves a record of vegetation sensitivity to awide range of conditions: the vegetation response toglacial, interglacial, stadial and interstadial climaticstates is recorded. Numerous examples of the HeinrichEvents (HE), Dansgaard-Oeschger (DO) cycles, includ-ing stadial and interstadial states, that characterise thelast glacial period in the North Atlantic are represented.This replication allows us to explore the extent to whicheach type of climatic/oceanographic event differs fromthe others in terms of its expression in the palaeovegeta-tion record.
The Late Glacial and early Holocene pollen record ofMD95-2039 is not considered in detail here as othermarine (Lezine and Denefle, 1997; Boessenkool, 2002;Turon et al., 2003) and terrestrial (e.g. Van der Knaapand Van Leuwen, 1995, 1997) pollen records nearbyhave already provided a detailed picture of the vegeta-tion history of this interval. However, the pollen datafor this interval are shown in the figures as they providea useful reference point for interpretation of the rest ofthe marine sequence, since the spatial and temporalpatterns of vegetation change they represent arerelatively well known.
2. Setting
Topography in north-west Iberia is varied, withcoastal lowlands rising up to the highlands of the Serrada Estrela which are between 500 and 2000m high.The geology of the mountains is dominated by acidigneous and metamorphic rocks which form acid soils(Polunin and Smythies, 1973). Currently, north-westIberia experiences a temperate climate. The region bearsthe full force of the westerly winds bringing cyclonesfrom the Atlantic and precipitation levels here are thehighest in the whole peninsula (up to 3000mm per yearin the mountains) (Wallen, 1970). Winters are relativelymild and frost-free (10–13 1C around the coast)while summers are cool (18–22 1C) (Wallen, 1970).The natural vegetation in the temperate climate ofnorth-west Iberia is deciduous Quercus. Quercus robur
is widespread at low altitudes and Q. pyrenaica growshigher up (Polunin and Smythies, 1973), reaching1750m above sea level in the Serra da Estrela—theapproximate position of the natural tree line. Q.
pyrenaica also forms woods in river valleys with Salix
salifolia on acid soils with an understorey of acid-lovingspecies. The evergreen oak Q. rotundifolia also grows inAtlantic areas on south-facing slopes (van der Knaapand van Leeuwen, 1997). Cleared Q. pyrenaica forest inthe moist Atlantic region is often replaced by Atlanticheathland, dominated by ericaceous species which thrivein the acid soils, high precipitation regime and openlandscape (Polunin and Walters, 1985). Pinus is also animportant contributor to the landscape of north-westIberia, with the native (Carrion et al., 2000) P. pinaster
the dominant pine species in humid, coastal hills,particularly on acid, siliceous soils and sands.The relatively high precipitation levels (Wallen, 1970)
and numerous rivers north of 411N provide the potentialfor transport of terrestrial material, including pollen,from the continent to the ocean (Alveirinho Dias andNittrouer, 1984). This regime, combined with increasedtrade wind intensity, associated with enhanced seasonalupwelling (Abrantes, 1991), suggest that wind was not amajor contributor of pollen (Heusser and Balsam, 1977)
ARTICLE IN PRESS
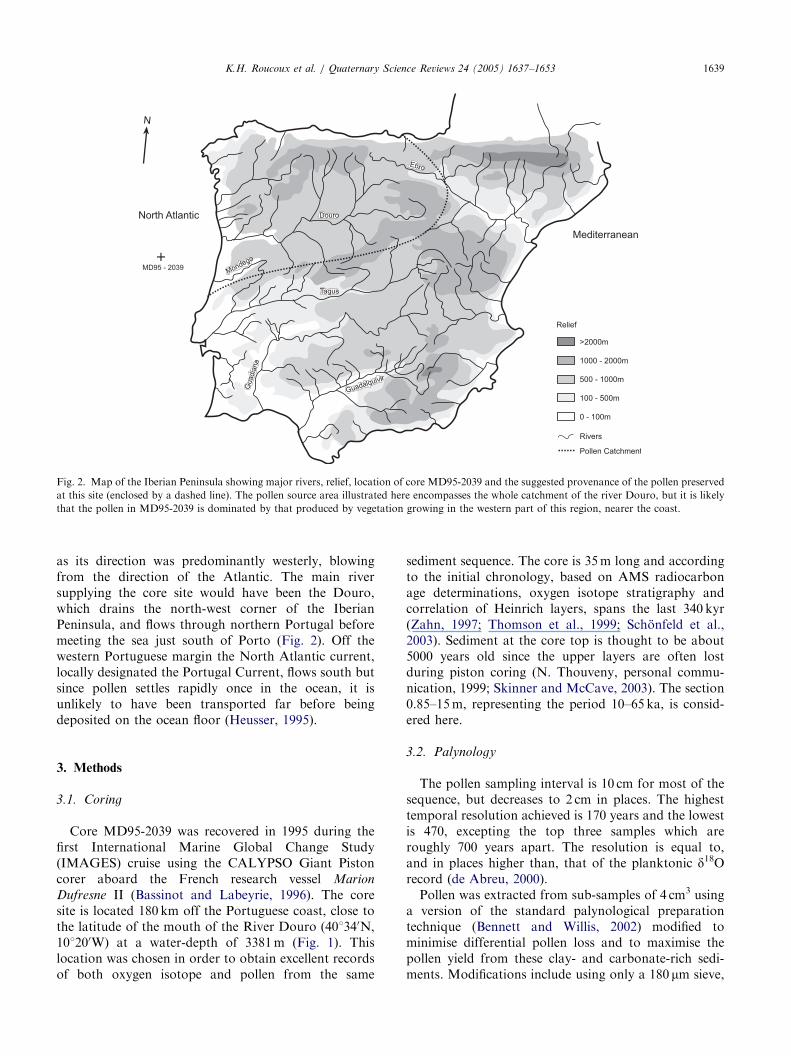
Fig. 2. Map of the Iberian Peninsula showing major rivers, relief, location of core MD95-2039 and the suggested provenance of the pollen preserved
at this site (enclosed by a dashed line). The pollen source area illustrated here encompasses the whole catchment of the river Douro, but it is likely
that the pollen in MD95-2039 is dominated by that produced by vegetation growing in the western part of this region, nearer the coast.
K.H. Roucoux et al. / Quaternary Science Reviews 24 (2005) 1637–1653 1639
as its direction was predominantly westerly, blowingfrom the direction of the Atlantic. The main riversupplying the core site would have been the Douro,which drains the north-west corner of the IberianPeninsula, and flows through northern Portugal beforemeeting the sea just south of Porto (Fig. 2). Off thewestern Portuguese margin the North Atlantic current,locally designated the Portugal Current, flows south butsince pollen settles rapidly once in the ocean, it isunlikely to have been transported far before beingdeposited on the ocean floor (Heusser, 1995).
3. Methods
3.1. Coring
Core MD95-2039 was recovered in 1995 during thefirst International Marine Global Change Study(IMAGES) cruise using the CALYPSO Giant Pistoncorer aboard the French research vessel Marion
Dufresne II (Bassinot and Labeyrie, 1996). The coresite is located 180 km off the Portuguese coast, close tothe latitude of the mouth of the River Douro (401340N,101200W) at a water-depth of 3381m (Fig. 1). Thislocation was chosen in order to obtain excellent recordsof both oxygen isotope and pollen from the same
sediment sequence. The core is 35m long and accordingto the initial chronology, based on AMS radiocarbonage determinations, oxygen isotope stratigraphy andcorrelation of Heinrich layers, spans the last 340 kyr(Zahn, 1997; Thomson et al., 1999; Schonfeld et al.,2003). Sediment at the core top is thought to be about5000 years old since the upper layers are often lostduring piston coring (N. Thouveny, personal commu-nication, 1999; Skinner and McCave, 2003). The section0.85–15m, representing the period 10–65 ka, is consid-ered here.
3.2. Palynology
The pollen sampling interval is 10 cm for most of thesequence, but decreases to 2 cm in places. The highesttemporal resolution achieved is 170 years and the lowestis 470, excepting the top three samples which areroughly 700 years apart. The resolution is equal to,and in places higher than, that of the planktonic d18Orecord (de Abreu, 2000).Pollen was extracted from sub-samples of 4 cm3 using
a version of the standard palynological preparationtechnique (Bennett and Willis, 2002) modified tominimise differential pollen loss and to maximise thepollen yield from these clay- and carbonate-rich sedi-ments. Modifications include using only a 180 mm sieve,
ARTICLE IN PRESSK.H. Roucoux et al. / Quaternary Science Reviews 24 (2005) 1637–16531640
cold acid digestion, and omitting acetolysis. In order tofurther concentrate the pollen of marine sedimentsamples it is common practice to remove other fineparticles by sieving through a 7 or 10 mm nylon meshbefore HF treatment (Heusser and Stock, 1984; Jemmettand Owen, 1990; Sanchez Goni et al., 1999). Thisproduces clean residues with high pollen concentrations.However, experiments comparing pollen counts ofsieved and unsieved residues show that sieving resultsin an unacceptable level of differential pollen loss(Roucoux, 2000). Gramineae pollen appears to experi-ence the most dramatic losses as the result of sieving.This is understandable since these grains are small,smooth and often crumpled and thus more likely to passbetween the woven threads of the nylon mesh than arelarger grains. Such an effect has previously beenobserved for Alnus pollen by Jemmett and Owen(1990). Hence, although sieving would speed up thepollen counting process, we consider that the resultingdistortion to the pollen spectra is unacceptable.Identifications were carried out to the lowest taxonomic
level possible with reference to Moore et al. (1991), Reille(1992) and the pollen reference collection held by theGodwin Institute for Quaternary Research in Cambridge.To take into account the over-representation of Pinus
pollen that is so characteristic of marine sediments(Heusser, 1995) the percentage calculation sum includedall pollen and spores except Pinus and a minimum of 150non-Pinus grains were counted. The total number of grainscounted ranges from 300 to 2000, making these countsstatistically representative (Maher, 1972).
3.3. Palaeoceanography
Determination of oxygen isotope ratios has beencarried out on both benthic and planktonic foramini-fera. The benthic d18O record (Zahn, 1997; Thomson etal., 1999) is based on Cibicidoides wuellerstorfi, andprovides the broad marine isotopic stratigraphy of thecore (Thomson et al., 1999) which has recently beenrefined by Schonfeld et al. (2003). The planktonic d18Orecord of de Abreu (2000), based on Globigerina
bulloides, has a sampling interval of 10 cm and providesa combined signal of sea surface temperature, seasurface salinity and global continental ice volume (seeResults section for the interpretation of this signal).Lithic particles of quartz, feldspar, calcite, dolomite,basalt and hematite, inferred to represent probable icerafted debris, have been counted in the sediment fractionlarger than 250 mm (Roucoux et al., 2001; de Abreu et al,2003; Schonfeld et al., 2003).
3.4. Chronology
The planktonic d18O signal of MD95-2039 recordsmillennial-scale variability in sea surface conditions off
Portugal throughout MIS 2 and 3 that is very similar tothe climatic oscillations preserved by the d18O record of theGreenland Ice Core Project (GRIP) core from centralGreenland (Johnsen et al., 2001) (Fig. 3). Both show thecharacteristic rapid alternation between warmer intersta-dial episodes and colder stadial episodes, the Dansgaard-Oeschger cycles (Dansgaard et al., 1993). A link betweenNorth Atlantic surface conditions and Greenland climatehas been suggested by Bond et al. (1993) who consider theDO oscillations recorded in the ice cores to be synchro-nous with oscillations in North Atlantic SST since bothareas are under the influence of north–south migrations ofthe polar front. Furthermore, since the beginning of eachGreenland interstadial is very abrupt, taking place withindecades (Lang et al., 1999; Severinghaus and Brook, 1999),the polar front must have migrated northward extremelyrapidly, making climatic change from south to northacross the North Atlantic effectively synchronous(Shackleton et al., 2000). Shackleton et al. (2000) havealready shown that planktonic d18O records of thePortuguese margin match the Greenland ice d18O recordswith remarkable fidelity, and have developed a Greenland-based timescale for marine core MD95-2042 by using theinterstadial transitions as tie-points. Here we use the samerationale to develop an age model for MD95-2039 basedon the updated GRIP time scale (Johnsen et al., 2001). Wehave identified equivalent points in the planktonic d18Oand GRIP d18O records at the mid-points of seventeencold-to-warm transitions for use as age-control points(Roucoux et al., 2001) (Fig. 3). The resulting age-depthrelationship agrees closely with that of Schonfeld et al.(2003) whose chronostratigraphy for this core is based onAMS radiocarbon dates, correlation of Heinrich layerswith other dated North Atlantic sequences, and correla-tion of planktonic and benthic oxygen isotope curves withmarine reference sequences (Imbrie et al., 1984; Martinsonet al., 1987) and with other well dated cores from thePortuguese margin (Bard et al., 1987; Cayre et al., 1999;Schonfeld and Zahn, 2000). It would also be possible topresent our data on the slightly different GISPII timescalebut we have chosen GRIP in this instance, and in anearlier paper on MD95-2039 (Roucoux et al. 2001),because we consider the chronology to be superior as ittakes into account changes in ice accumulation rate(Johnsen et al., 2001).
4. Results
4.1. Marine proxy results
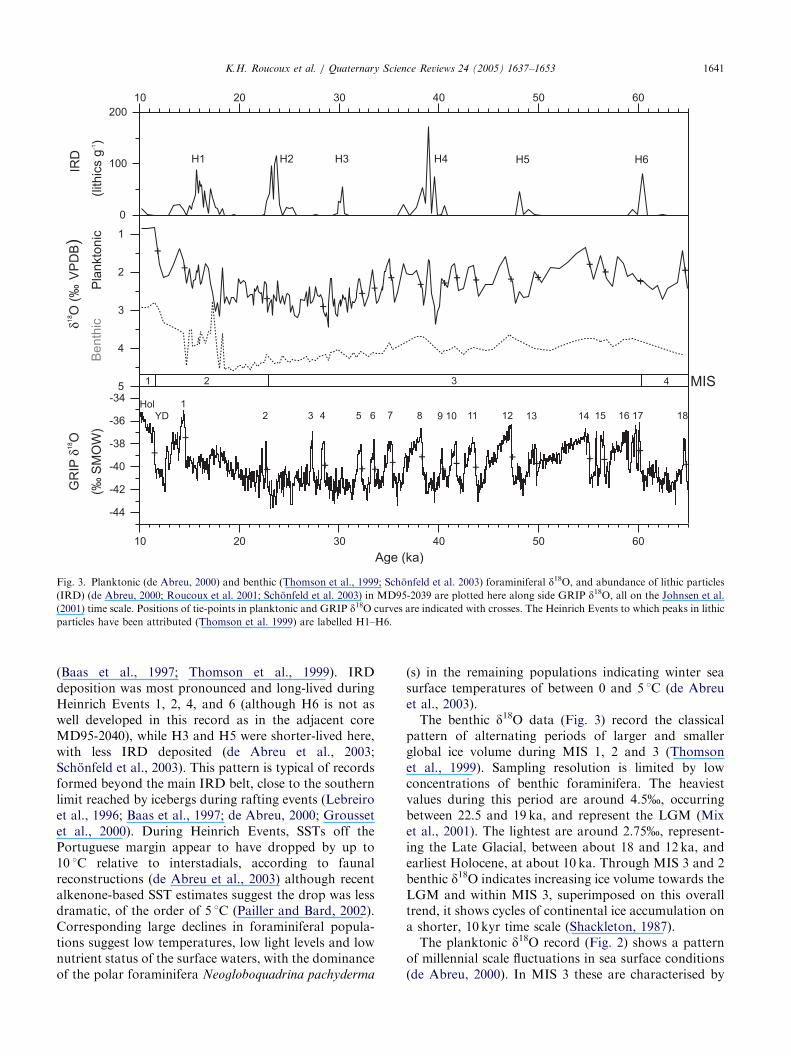
The lithic record shows six peaks in ice rafted debris(IRD) (Fig. 3), documenting the presence of icebergs atthe core site (Schonfeld et al., 2003). On the basis oftheir lithological, biological and physical characteristics,these layers are correlated with Heinrich Events 1–6
ARTICLE IN PRESS
Fig. 3. Planktonic (de Abreu, 2000) and benthic (Thomson et al., 1999; Schonfeld et al. 2003) foraminiferal d18O, and abundance of lithic particles(IRD) (de Abreu, 2000; Roucoux et al. 2001; Schonfeld et al. 2003) in MD95-2039 are plotted here along side GRIP d18O, all on the Johnsen et al.(2001) time scale. Positions of tie-points in planktonic and GRIP d18O curves are indicated with crosses. The Heinrich Events to which peaks in lithicparticles have been attributed (Thomson et al. 1999) are labelled H1–H6.
K.H. Roucoux et al. / Quaternary Science Reviews 24 (2005) 1637–1653 1641
(Baas et al., 1997; Thomson et al., 1999). IRDdeposition was most pronounced and long-lived duringHeinrich Events 1, 2, 4, and 6 (although H6 is not aswell developed in this record as in the adjacent coreMD95-2040), while H3 and H5 were shorter-lived here,with less IRD deposited (de Abreu et al., 2003;Schonfeld et al., 2003). This pattern is typical of recordsformed beyond the main IRD belt, close to the southernlimit reached by icebergs during rafting events (Lebreiroet al., 1996; Baas et al., 1997; de Abreu, 2000; Groussetet al., 2000). During Heinrich Events, SSTs off thePortuguese margin appear to have dropped by up to10 1C relative to interstadials, according to faunalreconstructions (de Abreu et al., 2003) although recentalkenone-based SST estimates suggest the drop was lessdramatic, of the order of 5 1C (Pailler and Bard, 2002).Corresponding large declines in foraminiferal popula-tions suggest low temperatures, low light levels and lownutrient status of the surface waters, with the dominanceof the polar foraminifera Neogloboquadrina pachyderma
(s) in the remaining populations indicating winter seasurface temperatures of between 0 and 5 1C (de Abreuet al., 2003).The benthic d18O data (Fig. 3) record the classical
pattern of alternating periods of larger and smallerglobal ice volume during MIS 1, 2 and 3 (Thomsonet al., 1999). Sampling resolution is limited by lowconcentrations of benthic foraminifera. The heaviestvalues during this period are around 4.5%, occurringbetween 22.5 and 19 ka, and represent the LGM (Mixet al., 2001). The lightest are around 2.75%, represent-ing the Late Glacial, between about 18 and 12 ka, andearliest Holocene, at about 10 ka. Through MIS 3 and 2benthic d18O indicates increasing ice volume towards theLGM and within MIS 3, superimposed on this overalltrend, it shows cycles of continental ice accumulation ona shorter, 10 kyr time scale (Shackleton, 1987).The planktonic d18O record (Fig. 2) shows a pattern
of millennial scale fluctuations in sea surface conditions(de Abreu, 2000). In MIS 3 these are characterised by
ARTICLE IN PRESSK.H. Roucoux et al. / Quaternary Science Reviews 24 (2005) 1637–16531642
rapid shifts to lighter values (over a few tens to hundredyears) followed by more gradual change to heaviervalues (over hundreds to thousands of years). Thispattern of stadial and interstadial events is characteristicof high resolution records from the North Atlanticduring the last glacial cycle (e.g. Bond et al., 1993), andthey are thought to coincide with the DO oscillationsdescribed in the Greenland ice core records (Bondet al., 1993; Shackleton et al., 2000). Heavy planktonicd18O values, combined with an abundance of polarforaminifera (de Abreu et al., 2003), coincide withpeaks in North Atlantic IRD and represent surfacecooling associated with ice rafting (Heinrich events).Although melting icebergs would have led to a decreasein surface salinity and lighter d18O, here and in coresfurther south, this effect was much smaller than theeffect of the dramatic drop in temperature on forami-niferal d18O values (Cayre et al., 1999). An exception isthe isotopically light value that coincides with the largeIRD peak of Heinrich Event 4 (H4), with heavier valuesto either side within the span of H4 IRD deposition. It isplausible that this peak was caused by isotopic depletionassociated with meltwater, but it coincides with aspike in arboreal pollen (Fig. 5) suggesting that theremay be reworked material in this sample (Roucouxet al., 2001). Hence, the planktonic d18O record isinterpreted as dominantly a sea surface temperaturesignal. Intervening heavy planktonic d18O excursions(DO stadials) recorded here are not accompanied byIRD, implying that surface waters cooled but there wereno icebergs at this latitude. Although Greenland icecores record similar temperature drops at each stadialinterval (Dansgaard et al., 1993; Grootes and Stuiver,1997), icebergs and polar water reached this far south inthe North Atlantic only during Heinrich Events(Thomson et al., 1999; Cayre et al., 1999; SanchezGoni et al., 2000). The intervening DO stadials wereaccompanied by small outbreaks of icebergs, reachingabout 501N and depositing much less IRD (Bond andLotti, 1995). In MIS 2, up to H1, oscillation in d18Ovalues is much more subdued, indicating less dramaticchanges in SST, although millennial scale fluctuationscontinue. The transition to MIS 1, the Holocene,follows and although the typical Late Glacial patternis not as clear as in some other records from thePortuguese margin (e.g. Bard et al., 1987; Turonet al., 2003), the overall warming and interruptionof that trend by a number of cold oscillations, thelast and most pronounced of which is the YoungerDryas, are visible (de Abreu et al., 2003; Schonfeld et al.,2003).
4.2. Palynological results
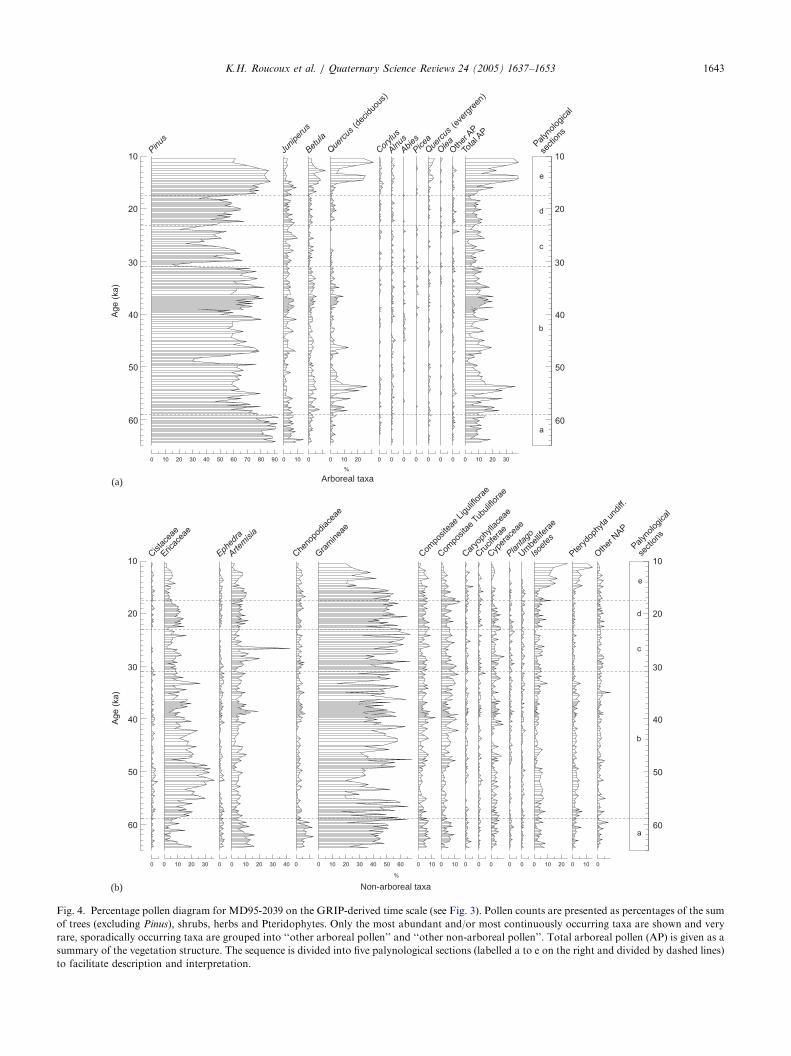
The pollen data are presented in Fig. 4. Pollenconcentration varies between 5000 and 30,000 grains/
cm3. The most striking feature of the pollen record is therapid and dramatic variability in vegetation. Pinus
dominates the pollen spectra throughout, remainingwell above 50% for the most part. Leaving Pinus aside,herbaceous taxa (non-arboreal pollen, NAP) dominate.They consist mainly of Ericaceae, Gramineae, Compo-sitae, Artemisia, Cyperaceae, Chenopodiaceae, Isoetes
and trilete spores; NAP never falls below 60%. Arborealpollen (AP) is mainly composed of Juniperus, Betula,deciduous Quercus and, in the upper part of thesequence, evergreen Quercus (Quercus ilex-type).A pollen sequence characterised by such rapid
oscillation as MD95-2039 does not lend itself naturallyto division into biostratigraphic assemblage zones. Avery large number of short zones would need to beestablished if they were to meet the requirements of atrue biozonation scheme (Hedberg, 1976), and theresulting scheme would not aid in describing the data(Roucoux, 2000). Instead the description and interpre-tation of the data below is organised into five sections onthe basis of gross structural features of the vegetationhistory, summarised by the AP curve (Fig. 4). Eachdivision is also characterised by particular patterns andvalues of planktonic isotope ratios, and could equallywell have been derived from this proxy record ofoffshore conditions. The sections and their characteristicpollen signatures are described below.(a) 65– 59 ka: From initially quite high values (both
around 20%), AP and Ericaceae fall in abundance andsteppe taxa (Artemisia and Chenopodiaceae) increasesharply. AP percentages then remain low (10%) andshow rapid variability of relatively small amplitude.Temperate trees are rare and Juniperus is the dominantarboreal taxon, with values up to 12%. Steppe taxamake a significant contribution to the non-arborealcomponent with Artemisia reaching 15% and Cheno-podiaceae 10%. This section coincides with the end ofMIS 4.(b) 59– 31 ka: This section is characterised by high
amplitude, millennial scale fluctuations in AP. Decid-uous Quercus is the main contributor, reaching 30%near the beginning of the section at around 54 ka, then itdecreases towards the end, eventually attaining valuessimilar to Juniperus and Betula with peaks of between5% and 10% by about 35 ka. Ericaceae follow a similarpattern overall, reaching their highest values at 51.5 ka(35%), then decreasing gradually throughout the rest ofthe section. At the millennial scale, Ericaceae showfluctuations that coincide with those of Quercus but areof lower amplitude. Oscillations in Pinus percentagesfollow those of Quercus and Ericaceae. There are twomajor declines in Pinus (also present in Ericaceae andQuercus) and these coincide with Heinrich Events 4 and5. Artemisia and Chenopodiaceae percentages are loweroverall than in the preceding section. This sectionrepresents the first two-thirds of MIS 3.
ARTICLE IN PRESS
Arboreal taxa
Non-arboreal taxa
(a)
(b)
Fig. 4. Percentage pollen diagram for MD95-2039 on the GRIP-derived time scale (see Fig. 3). Pollen counts are presented as percentages of the sum
of trees (excluding Pinus), shrubs, herbs and Pteridophytes. Only the most abundant and/or most continuously occurring taxa are shown and very
rare, sporadically occurring taxa are grouped into ‘‘other arboreal pollen’’ and ‘‘other non-arboreal pollen’’. Total arboreal pollen (AP) is given as a
summary of the vegetation structure. The sequence is divided into five palynological sections (labelled a to e on the right and divided by dashed lines)
to facilitate description and interpretation.
K.H. Roucoux et al. / Quaternary Science Reviews 24 (2005) 1637–1653 1643
ARTICLE IN PRESSK.H. Roucoux et al. / Quaternary Science Reviews 24 (2005) 1637–16531644
ARTICLE IN PRESSK.H. Roucoux et al. / Quaternary Science Reviews 24 (2005) 1637–1653 1645
(c) 31– 23 ka: This section has lower percentages ofAP, the main component of which is Juniperus, reaching10%, while deciduous Quercus pollen is very scarce, andabsent in the upper part. Ericaceae percentages arerelatively low throughout. Pinus shows lower percen-tages overall, with three major decreases. Those at 30.5and 24 ka coincide with Heinrich Events 2 and 3,respectively but the decrease at 26.6 ka does not appearto be associated with ice rafting at this site. Artemisia
reaches its highest percentages of the whole record withpeaks of 20% and 42%. This section coincides with thelater part of MIS 3.(d) 23– 17.5 ka: AP increases here relative to the section
below. Variability is subdued with no severe minima untilthe very end: AP values oscillate between 5% and 12%.The main component is Juniperus, with smaller amountsof Betula and deciduous Quercus. Ericaceae and Pinus
percentages are also higher than in the preceding sectionuntil the end when, like AP, they decrease. This dropcoincides with the onset of Heinrich Event 1. Artemisia
and Chenopodiaceae continue at relatively high percen-tages, at around 10% and 5%, respectively. This sectioncoincides approximately with the LGM in MIS 2.(e) 17.5– 10 ka: The topmost section is characterised
by a dramatic rise in AP, though it begins slowly, withsome strong oscillations that correspond with thepattern of planktonic d18O values. Temperate andMediterranean taxa increase dramatically at the expenseof herbs. AP is dominated by deciduous Quercus whichreaches 25% in the first peak, and 32% in the second,the greatest abundance of the whole record. Betula,Corylus, Alnus, evergreen Quercus and Pteridophytesalso reach their highest values here. Pinus pollen alsoreaches high percentages, but does not show the strongoscillation that Quercus does. Ericaceae continue todecrease throughout this section. In between the twopeaks in arboreal percentages, Betula and Artemisia
increase markedly. This section includes the transitionto MIS 1. Above this pollen concentrations are too lowfor pollen analysis to be feasible.
5. Interpretation of pollen data
The vegetation development indicated for north–westIberia between 10 and 65 ka is outlined below section by
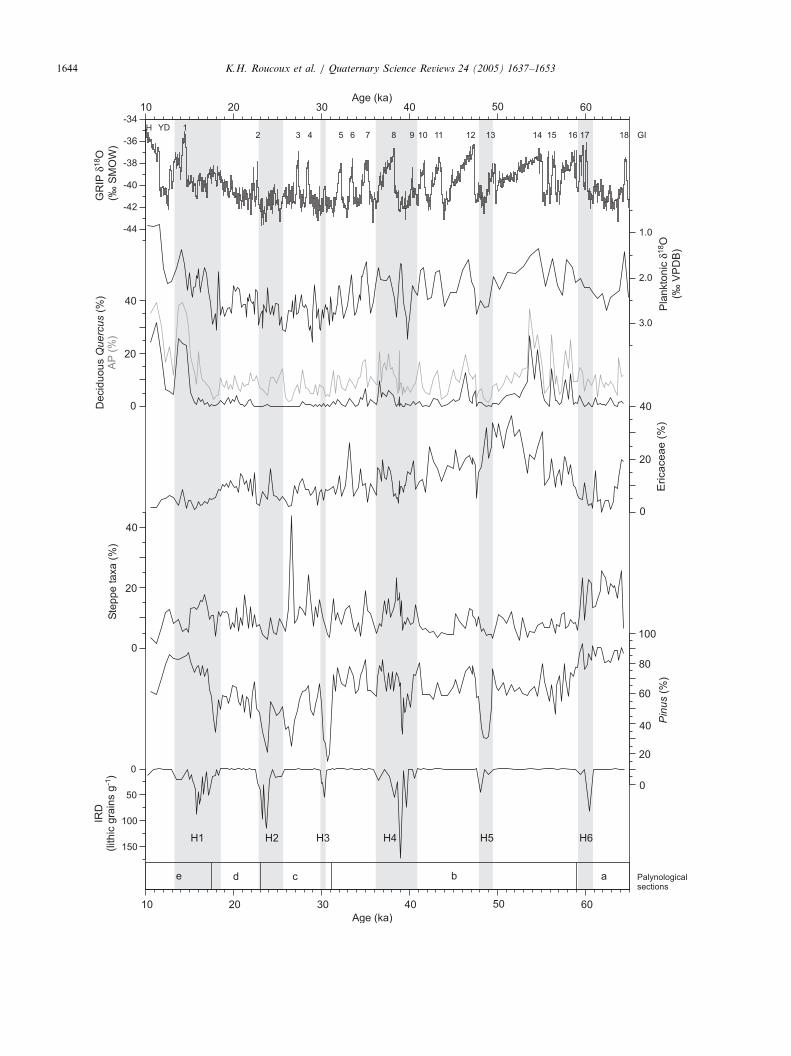
Fig. 5. Results of key pollen taxa and marine proxy data from MD95-2039 pl
Quercus is the most abundant thermophilous tree, and requires a moist and w
of high precipitation (Bannister, 1965, 1966; Rose et al., 1996), and represen
strong pattern in response to offshore temperature changes during MIS 3 an
Steppe taxa include Artemisia, Chenopodiaceae and Ephedra, groups of spec
plotted on a reversed y-axis so that ‘‘down’’ indicates colder conditions. T
deposition are marked across the figure in grey. GRIP d18O is also shownDansgaard et al. (1993) (GI—Greenland Interstadial).
section, along with climatic inferences and the relation-ship to conditions offshore as established by in situcorrelation with the marine proxy data from the samecore. Percentage records for key pollen taxa are shownalongside the marine data from MD95-2039 and theGRIP d18O record in Fig. 5.
5.1. Correspondence of pollen data to marine proxy
records
Comparison of the pollen record with the marineisotope curves reveals some close correspondences(Fig. 5). The arboreal pollen curve shows a similarmillennial scale variability as the planktonic d18O curve.Intervals with heavy d18O, the Heinrich and DO stadialevents, coincide with lower percentages of arboreal,Ericaceae and Pinus pollen. The short-lived episodes oflight d18O, which are equivalent to the DO interstadials,correspond to higher percentages of these pollen types.Increases in AP and d18O are synchronous to within theresolution of the record, although peaks in arborealpollen tend to be reached shortly after peaks in lightnessof d18O. These patterns are illustrated in Figs. 4 and 5and are described in detail below.(a) 65– 59 ka: The open landscape suggested by low
AP values in the largest part of this section probably hadsmall tree and shrub populations, of mainly Juniperus
scrub, while the landscape was dominated by steppetaxa (Artemisia, Chenopodiaceae and Ephedra) andGramineae. The abundance of steppe taxa indicatesthat the climate was dry and cold while the absence oflarge oscillations in the pollen spectra suggest that theclimate was relatively stable compared with the periodafter 59 ka. These conclusions are consistent withconditions offshore since planktonic d18O values arerelatively heavy indicative of low SST (after an initiallight peak which coincides with a greater abundance oftrees and heathland). The decline in tree population sizeat 60.5 ka coincides with H6 and indicates a period ofincreased climatic severity (colder and drier conditions)on land, coinciding with significant SST reduction andhigh percentages of N. pachyderma (s) (de Abreu, 2000).However, since tree populations were already smallhere, the pollen signal is relatively insensitive to climaticdeterioration; an apparently minor drop in tree pollendoes not necessarily reflect a minor climatic decline.
otted on the GRIP-derived time scale (Johnsen et al., 2001). Deciduous
arm climate (Jones, 1959). Ericaceae are also indicative of warmth and
t Atlantic heathland. Pinus, albeit strongly over-represented, shows a
d is therefore included here (note the different y-axis scale for Pinus).
ies that tolerate arid conditions (Munoz Sobrino et al., 2001). IRD is
he Heinrich Events are labelled H1 to H6 and these periods of IRD
(Johnsen et al., 2001) and is numbered according to the system of

ARTICLE IN PRESSK.H. Roucoux et al. / Quaternary Science Reviews 24 (2005) 1637–16531646
(b) 57– 31 ka: The high amplitude fluctuations in APand Ericaceae in this part of the record indicate repeatedexpansion and contraction of tree and heath popula-tions and thus a succession of warmer, wetter inter-stadial intervals alternating with cooler, drier stadialintervals. These coincide with the alternation of warmand cold conditions offshore.Successive interstadials experienced smaller and smal-
ler Quercus expansions through MIS 3. Similarly, anoverall decline in Ericaceae implies a decrease inheathland extent over this interval. Thus, successiveinterstadials appear to have become cooler and drierthrough this period. This pattern is repeated on ashorter time scale between the Heinrich Events of MIS3, with the first interstadial tree population expansionbeing the largest, followed by several smaller expansions(Fig. 6). Since the difference in SST (as indicated byplanktonic d18O) between interstadials is small, it doesnot appear to be great enough to account for thedifferences in the size of tree populations, and so otherfactors are likely to be at work (see Section 6).During the longest and most pronounced periods of
expanded tree populations (Greenland interstadials 14,12, 8, and 1, the Late Glacial Interstadial (Dansgaardet al., 1993)), other thermophilous tree taxa, includingAlnus, Corylus and evergreen Quercus, increased inabundance, but remained minor components of thevegetation (Fig. 4). Pteridophytes also increased inabundance during many of the interstadial tree popula-tion expansions. Growing in moist, shady environments,Pteridophytes are likely to have been associated withwoodland cover, forming the ground layer. However,during none of the MIS 3 interstadials do Pteridophytesreach the abundance of the Late Glacial and earliestHolocene, perhaps suggesting that woodland remainedrather open for the most part.Periods of expanded woodland did not last long; on
most occasions, woodland contraction began immedi-ately after its maximum extent was reached. Contractionwas more gradual in the longest warm intervals, clearlyvisible in interstadials 14, 12, 10, 8 and 7 (Fig. 5), but thesampling resolution precludes elucidation of this patternin shorter-lived interstadial intervals. Rapid climaticwarming and more gradual cooling is also apparent inthe planktonic d18O record here. It is characteristic ofNorth Atlantic climatic variability of this time with bothsea surface temperatures (e.g. Bond et al., 1993) andtemperatures over Greenland (Dansgaard et al., 1993)showing this saw-tooth pattern.The most dramatic decreases in the extent of the Pinus
population coincide with Heinrich Events 4 and 5(Fig. 5). (This also applies to Heinrich Events 2 and 3in the next section up-core). Most of the Pinus declinesthat correspond to DO stadials with no ice-raftingoffshore, are much less dramatic, even though Quercus
percentages drop to zero in some cases. This represents
differences in the tolerance limits of different species.SST declines during DO stadials led to Quercus
population collapse and shrinking Ericaceae and Pinus
populations. During the more extreme SST declinesassociated with Heinrich Events, Quercus populationswere affected just as severely but Ericaceae and Pinus
populations were more strongly reduced, suggesting thatHeinrich Events gave rise to more severe, colder anddrier, climatic conditions on land.(c) 31– 23 ka: The pollen data suggest an open, herb-
dominated vegetation with increased areas of steppe andabsence of moisture-requiring thermophiles indicatingan arid, cold climate; this is consistent with offshoreconditions which were cooler overall than in the sectionbelow. Two of the three drops in Pinus and Ericaceaethat occur here coincide with Heinrich Events but themajor decrease at 26.5 ka does not appear to coincidewith ice rafting (see Section 6). This is the end of MIS 3and appears to be the coldest, most arid part of theperiod under consideration. Conditions offshore werecooler overall than before 31 ka although the benthicisotope curve indicates that the global glacial maximumis not reached until later.(d) 23– 17.5 ka: Pollen evidence pointing to slightly
larger tree and heath populations and the return ofdeciduous Quercus suggest that during this interval thecold, arid conditions of the preceding period became lesssevere. This also appears to be a climatically stableperiod, with no major oscillations in tree populations tosuggest climate fluctuations. This period corresponds tothe LGM, between 19 and 23 ka (Mix et al., 2001), andthe climate appears to have been rather warmer andmoister in Iberia than during many stadial events ofMIS 3. This pattern corresponds closely to the relativelywarm temperatures recorded offshore (de Abreu, 2000;Pailler and Bard, 2002) and also over Greenland(Dansgaard et al., 1993) in this interval, adding weightto the notion that the traditional LGM, while doubtlessmarking the largest extent of the great ice sheets, did notnecessarily see the most severe climatic conditionseverywhere. The decrease in tree and heath populationstowards the end of this period indicates climatic coolingand drying that coincides with the start of H1.(e) 17.5– 10 ka: The slow expansion of tree popula-
tions during the early part of this period indicatesgradual climatic amelioration, though populationsremained small while the ice-rafting of H1 continuedoffshore. Meanwhile, Pinus populations appear to haveexpanded rapidly. The ensuing dramatic expansion oftree populations, including Mediterranean as well astemperate tree taxa, coincides with a reduction in ice-rafting and reflects the climatic warming of the LateGlacial Interstadial (GI 1). The subsequent contractionof temperate tree populations represents the YoungerDryas cooling, followed by a re-expansion of treepopulations with the increase in temperatures at the
ARTICLE IN PRESS
(a) (b) (c)
(d) (e) (f)
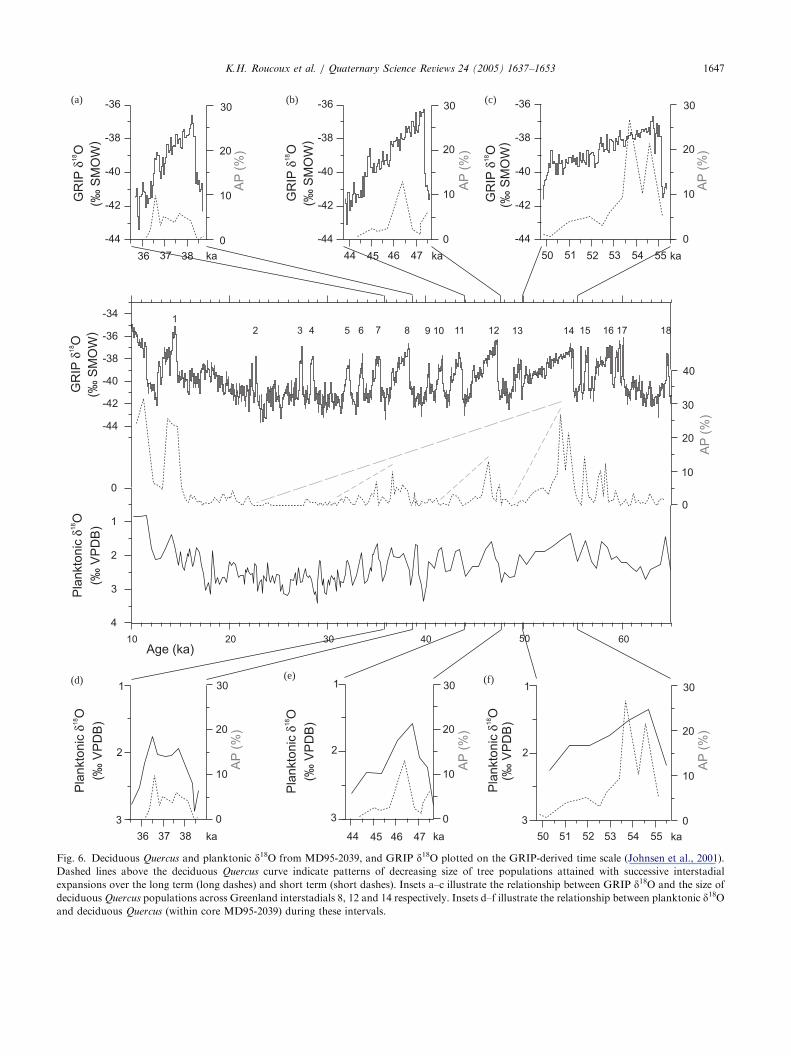
Fig. 6. Deciduous Quercus and planktonic d18O from MD95-2039, and GRIP d18O plotted on the GRIP-derived time scale (Johnsen et al., 2001).Dashed lines above the deciduous Quercus curve indicate patterns of decreasing size of tree populations attained with successive interstadial
expansions over the long term (long dashes) and short term (short dashes). Insets a–c illustrate the relationship between GRIP d18O and the size ofdeciduous Quercus populations across Greenland interstadials 8, 12 and 14 respectively. Insets d–f illustrate the relationship between planktonic d18Oand deciduous Quercus (within core MD95-2039) during these intervals.
K.H. Roucoux et al. / Quaternary Science Reviews 24 (2005) 1637–1653 1647
ARTICLE IN PRESSK.H. Roucoux et al. / Quaternary Science Reviews 24 (2005) 1637–16531648
start of the Holocene. The extent of heathland continuesto decrease overall during this time, somewhat para-doxically given its earlier ecological affinities. However,we consider that although the abundance of thermo-philes (Quercus and Pteridophytes) (Fig. 3), indicate aclimate that was warm and moist enough for Ericaceoustaxa to grow, they were out-competed and shaded outby the vigorously expanding Quercus woods (Bannister,1965, 1966; Rose et al., 1996). Again, these patterns intree population expansion and contraction coincide withequivalent patterns in sea surface conditions offshoreand in the GRIP ice core record.
6. Discussion
6.1. The land– ocean climate connection
MD95-2039 provides a record of the effect that theclimatic and oceanographic changes of the last glacialperiod had on the north-west Iberian vegetation and it isclear that vegetation change was closely related toclimatic change in the North Atlantic on both long(orbital) and short (millennial to centennial) time scales.
6.2. Long-term patterns
Through MIS 3, roughly 59–23 ka, the decliningextent of tree population expansions and the overallshrinking of Ericaceous heathland indicate cooling anddrying in Iberia that coincides with the long-term globalclimatic trends of increasing ice volume (Shackleton,1987), falling insolation (Berger, 1978) and decreasingatmospheric carbon dioxide concentration (Yiou et al.,1991). A combination of falling temperatures and CO2levels and increased aridity would have combined tomake trees less competitive at high altitude, restrictingtrees and heath to ever-smaller areas (Watts et al., 2000),reaching a minimum extent between 31 and 23 ka.Between about 23 and 19 ka, the persistence of larger
tree populations including deciduous Quercus, indicatesa warm, moist climate relative to most stadial events ofMIS 3 despite this being the time of maximum globalcontinental ice volume. This is also seen in sequenceselsewhere in southern Europe (Follieri et al., 1998;Galanidou et al., 2000; Watts et al., 1996, 2000;Tzedakis et al., 2002), which record relatively large treepopulations, with arboreal pollen values intermediatebetween those of stadial and interstadial events of thepreceding 30 kyr. Across southern Europe, the mostsevere climatic conditions were not encountered duringthe LGM but during the Heinrich Events. The relativelywarm and moist climatic regime in southern Europeduring the LGM is consistent with oceanographicconditions in the North Atlantic at the time. Surfacewaters at mid-latitudes remained warm between 18 and
25 ka, a factor that was instrumental in building thegreat northern ice sheets (Ruddiman and McIntyre,1981a, b). Sea surface temperature reconstructions fromthe Portuguese margin (Cayre et al., 1999; de Abreu,2000; Pailler and Bard, 2002; de Abreu et al., 2003), theAlboran Sea (Cacho et al., 1999), and the mid-Atlanticat the same latitude (Chapman and Shackleton, 1998) allrecord winter temperatures of 12–15 1C at the LGM.This is only about 5 1C cooler than at present andbetween 5 and 10 1C warmer than during HeinrichEvents (Pailler and Bard, 2002). It is also likely that highwinter insolation combined with the relatively highsalinity of surface waters during this period kept theocean free of winter sea ice, at least as far north as 501N(Ruddiman and McIntyre, 1981a, b; Bond and Lotti,1995). From the evidence for continued growth ofthermophilous trees in Iberia (and in Italy and Greece)we can infer that the climatic effects of the warm glacialocean were translated downstream to southern Europe.Here, beyond the direct influence of the growing icesheet, westerly winds carrying moisture from the NorthAtlantic across the continent supplied adequate moist-ure to allow small populations of trees to persist.After the LGM, the dramatic spread of woodland
indicates an increase in temperature and moistureavailability in Portugal that coincides with decreasingglobal ice volume, increasing insolation, rising carbondioxide levels and, locally, rising temperatures offshorethat mark the start of the Holocene.
6.3. Short-term patterns
Superimposed on the long-term patterns, the responseof Iberian vegetation to centennial and millennial scaleevents is also recorded in our data. Thermophilous treepopulations experienced many rapid and short-livedfluctuations in extent which coincided with oscillationsin offshore temperatures. Responses of tree populationswere synchronous with offshore warming, to within theresolution of the record, tree populations expandingrapidly and immediately to abrupt warming. Treepopulation contractions were more gradual, reflectingthe more gentle slope of the saw-tooths during thecooling phase of each interstadial. Cold sea surfacetemperatures off Iberia during stadial intervals wouldhave lowered air temperatures and decreased thepotential for evaporation off the North Atlantic, leadingto increased aridity downwind. Offshore warming, onthe other hand, would increase evaporation and result ina warmer, wetter climate for Iberia. The contrastbetween stadial and interstadial climates would havebeen further enhanced by atmospheric circulationpatterns and temperature gradients offshore. Duringstadial intervals, when the North Atlantic Polar Frontwas situated further south, the steep north–southtemperature gradients established had the effect of
ARTICLE IN PRESSK.H. Roucoux et al. / Quaternary Science Reviews 24 (2005) 1637–1653 1649
intensifying westerly winds across southern Europe(Chapman and Shackleton, 1998).
6.4. Interstadial intervals
The vegetation record of MD95-2039 is sensitive tothe rapid oscillations in North Atlantic climatic/oceanographic oscillations, recording the DO cycles indetail. In terrestrial pollen records from regions furthernorth, only the most pronounced interstadials registerany change in vegetation away from its glacial steppe-tundra state (Woillard, 1978; Reille and de Beaulieu,1990; van Andel and Tzedakis, 1998). In Iberiasignificant expansion of tree populations took placerapidly at every interstadial warming recorded offshore.The rapid response to abrupt climatic ameliorationsuggests the local persistence of temperate tree popula-tions during the cold stadial episodes. For example,deciduous Quercus responded immediately to intersta-dial warming, even following a period of completeabsence from the pollen record, such as during HeinrichEvent 3. Remaining populations may have been toosmall, or too far removed from the pollen catchment ofMD95-2039 to register in the marine pollen spectra. In amarine core to the south (MD95-2042), small amountsof deciduous Quercus pollen are present throughout thestadial intervals of MIS 3 (Sanchez Goni et al., 2002)suggesting that Quercus populations large enough toregister in the marine pollen record persisted in southernPortugal during the coldest episodes. Temperate trees inIberia were probably restricted to low and middleelevations, in sheltered river valleys, where adequatemoisture and relative warmth could have allowed themto survive (Carrion and van Geel, 1999; Carrion, 2002).These records lend support to previous suggestions thattemperate trees persisted in Iberia during the last glacialperiod (Turner and Hannon, 1988; Carrion and vanGeel, 1999; Carrion, 2002) and push the record ofIberian temperate refugia further back in time, to thebeginning of MIS 3.Although offshore temperature increases and wood-
land expansions were synchronous, during the two mostpronounced interstadials (GI 14 and 12) tree popula-tions did not reach their maximum extent until aftermaximum SSTs had been attained, indicating thatconditions remained tolerable for trees to grow eventhough cooling was already taking place offshore(Fig. 5d–f). A comparison of GRIP and the MD95-2039 pollen record also shows this difference in therelative timing of maximum warmth and maximum treepopulation extent for all three of the most pronouncedMIS 3 interstadials (GI 14, 12 and 8) (Fig. 6a–c). Thelongest continuation of warmth in Iberia after coolinghad begun offshore and over Greenland occurred afterGI 14 when tree populations, dominated by deciduousQuercus, continued to expand for 1500 years (Fig. 6c).
A possible explanation for this pattern is that theclimate of north-west Iberia did in fact cool whileGreenland and offshore temperatures fell, but theprocess of tree population expansion continued untiltemperature and precipitation once more dropped belowa certain threshold. The time taken to reach thisthreshold varied between 500 and 1500 years for thethree most pronounced interstadial events.Long term cooling and drying in Iberia, reflecting
global climatic trends, certainly contributed to thedecreasing size of Quercus populations attained withsuccessive interstadial warmings through MIS 3. How-ever, the different extent of Quercus expansions thatoccurred at interstadials between Heinrich Events ismore difficult to explain since the differences in localSST between interstadials appear to have been small,and differences in atmospheric CO2, global ice volumeand insolation would also have been small across theseshort periods. So what caused Quercus expansion todiffer so much from one interstadial to the next? Thesize of tree populations could have been partiallycontrolled by the duration of interstadial warmth asthere appears to be a relationship between the durationof warm conditions offshore (and over Greenland) andthe magnitude of Quercus population expansion.Between H6 and H5, H5 and H4, and H4 and H3,the longest interstadials, immediately following eachHeinrich Event, led to development of the largestQuercus populations, while the shorter ones thatfollowed only allowed small populations to develop.
6.5. Stadial intervals
During MIS 3 the greater decline of Pinus populationsduring Heinrich Events 2, 3, 4 and 5, compared with DOstadial intervals when there was no ice offshore, suggeststhat climatic conditions were more severe during theHeinrich Events. Both Heinrich Events and DO stadialsare associated with a weakening or shutdown of NorthAtlantic Deep Water (NADW) formation in theNorwegian Sea, and thus a weakening or shutdown ofthe thermohaline circulation (Rasmussen et al., 1996;Stocker, 1999). During Heinrich Events, near orcomplete shut down (Stocker, 1999) led to the pro-nounced southward extension of polar water and ice toat least the latitude of southern Portugal (Zahn, 1997;Cayre et al., 1999; Thomson et al., 1999; de Abreu, 2000)and a flow of polar water into the Mediterranean(Cacho et al., 1999). During DO stadials weakenedthermohaline circulation caused a southward shift of thepolar front, but it did not move as far south as duringHeinrich events (Bond and Lotti, 1995; Ruddiman andMcIntyre, 1981a, b). Both kinds of event were muchcolder than interstadials due to a combination of coldwaters offshore and intensified westerly winds. HeinrichEvents led to even colder and certainly drier conditions
ARTICLE IN PRESSK.H. Roucoux et al. / Quaternary Science Reviews 24 (2005) 1637–16531650
in Iberia because cooler sea surface temperatures (Paillerand Bard, 2002) and ice offshore caused evaporation offthe ocean to be reduced even further, while winds at thislatitude were intensified to an even greater degree by theproximity of the polar front (Chapman and Shackleton,1998).The decrease in Pinus at 26.5 ka at first appears
exceptional as it neither coincides with an IRD peak norwith a heavy planktonic d18O excursion in MD95-2039,as the other strong decreases do. However, othersequences from the Portuguese margin record a dropin SST that was as dramatic as those experienced duringHeinrich Events 1–3. In MD95-2040, a significantincrease in left-coiling N. pachyderma occurs around26 ka (GISP2-based time scale), before the main peak inIRD that represents H2 (de Abreu et al., 2003). InMD95-2042, alkenone-based SST reconstructions regis-ter a temperature drop to 13.3 1C around 26 ka (GISP2-based time scale) which coincides with the first of twopeaks in magnetic susceptibility that correspond to H2(Pailler and Bard, 2002). Thus, although no ice rafting isrecorded at the MD95-2039 site at 26.5 ka, polar waterwas present offshore, probably representing the earlystages of H2. This appears to have led to climaticdeterioration on land that was as severe as when icerafting was recorded here.The difference in severity between cold events with
and without ice offshore is also recorded in marinepollen sequences south of our site. Cores MD95-2043and ODP Site 976, located in the Alboran Sea record thevegetation response of southern Spain. Incursions ofpolar water through the Strait of Gibraltar into theMediterranean during Heinrich Events caused theseepisodes to be much drier (indicated by greaterexpansion of steppe vegetation in the catchment) thanthe DO stadials which had no associated polar waterincursions (Combourieu Nebout et al., 2002; SanchezGoni et al., 2002). The marine pollen record from coreMD95-2042 on the Portuguese margin (Fig. 1) (SanchezGoni et al., 2000) shows that in south-west Portugal,although the difference between Heinrich Events andDO stadials is less pronounced than in either north-westPortugal or southern Spain, declines in deciduousQuercus and Ericaceae populations were nonethelessslightly greater during Heinrich Events than during ice-free stadials. Pinus, on the other hand, decreasedby a similar, small amount in each type of stadial. Acombination of being further south and nearer to theAtlantic moisture source appears to have allowed largerpopulations of Quercus, Ericaceae and Pinus, to persistin south-west Portugal than in the north-west orsouthern Spain during Heinrich Events.Although the precise responses of the vegetation in
southern Spain and north and south west Portugal differfrom each other in detail, because of their differenttemperature and moisture regimes, the vegetation across
all of these regions shares the significant characteristic ofan immediate and marked response to abrupt climatic/oceanographic change in the North Atlantic. Coresoffshore from each of these regions all record treepopulation expansions that were synchronous with theabrupt SST increases at the start of interstadialintervals, and tree population contractions as tempera-tures offshore decreased. Since we have evidence forsynchronicity for both the North Atlantic (Roucoux etal. 2001; Sanchez Goni et al., 2000) and Mediterranean(Sanchez Goni et al., 2002) regions, it is reasonable toassume that vegetation across the whole of the Iberianpeninsula responded to abrupt climatic changes in thesame way. Thus, we can regard the marine pollenrecords as a stepping stone from terrestrial pollensequences to North Atlantic records and, by extension,Greenland records, providing a basis for sound land–ocean correlation in the future.
7. Conclusions
1.
Vegetation in Iberia responds to long term, orbitalscale forcing as seen in the benthic curve. Thistranslates to decreasing Quercus and Ericaceae,probably due to a general increase in aridity and/orcooling.2.
Vegetation in Iberia also responds immediately(within the resolution of the record) to SST changeson millennial time scales during MIS 3. Increases intemperatures offshore translate to increased treecover on land and vice versa. This rapid response tointerstadial warming supports previous assertionsthat thermophilous taxa persisted in Iberian refugiathroughout the last glacial period.3.
The extent of woodland during a given interstadialseems to depend on the duration of the interstadial aswell as its timing in relation to orbital scale trends.4.
While HEs and DO stadials are apparently similarlysevere in terms of air temperatures over Greenland,their oceanographic expression is different at thelatitude of Portugal, with more severe cooling duringHEs. This has a major effect on the vegetation: HEssee a more dramatic decrease in thermophilous taxathan DO stadials.5.
Our results show that marine pollen data has thepotential to be used as a stepping stone in thecorrelation of terrestrial sequences with ocean and icecore records.Acknowledgements
This work forms part a contribution to IMAGES andis part of PAGES (Past Global Changes), a core projectof the IGBP (International Geosphere–Biosphere
ARTICLE IN PRESSK.H. Roucoux et al. / Quaternary Science Reviews 24 (2005) 1637–1653 1651
Programme). The work of K.R. formed part of a Ph.D.project funded by the Natural Environment ResearchCouncil and carried out at the Godwin Institute forQuaternary Research, University of Cambridge. Thework of L.A. formed part of a Ph.D. project funded bythe Fundac- ao para Ciencia e a Tecnologia, Portugal,also carried out at the Godwin Institute. The researchvessel Marion Dufresne and the IMAGES project aresupported by the French agencies Ministere de l’Educa-tion Nationale, de la Recherche et de la Technologie(MENRT), Terres Australes et Antarctiques Franc-aises(TAAF), Centre National de la Recherche Scientifique(CNRS), Institut National de Sciences de l’Univers(INSU), and Institut Franc-ais pur la Recherche et laTechnologie Polaire (IFRTP). We thank R. Zahn forproviding the material from MD95-2039 for this study,M. Hall of the Godwin Institute for carrying out stableisotope measurements and I. Lawson for comments onthe manuscript.
References
Abrantes, F., 1991. Increased upwelling off Portugal during the last
glaciation: diatom evidence. Marine Micropaleontology 17,
285–310.
Alveirinho Dias, J.M., Nittrouer, C.A., 1984. Continental shelf
sediments off northern Portugal. Continental Shelf Research 3,
147–165.
Baas, J.H., Mienert, J., Abrantes, F., Prins, M.A., 1997. Late
Quaternary sedimentation on the Portuguese continental margin:
climate-related processes and products. Palaeogeography, Palaeo-
climatology, Palaeoecology 130, 1–23.
Bannister, P., 1965. Biological Flora of the British Isles, Erica cinerea
L. Journal of Ecology 53, 527–542.
Bannister, P., 1966. Biological Flora of the British Isles, Erica tetralix
L. Journal of Ecology 54, 795–813.
Bard, E., Arnold, M., Maurice, P., Duprat, J., Moyes, J., Duplessy,
J.-C., 1987. Retreat velocity of the North Atlantic polar front
during the last deglaciation determined by 14C accelerator mass
spectrometry. Nature, 791–794.
Bassinot, F., Labeyrie, L., 1996. IMAGES 101. Institut Franc-ais pour
la Recherche et la Technologie Polaires, Plouzane, 217pp.
Bennett, K.D., Willis, K.J., 2002. Pollen. In: Smol, J.P., Birks, H.J.B.,
Last, W.M. (Eds.), Tracking Environmental Change Using Lake
Sediments, Volume 3: Terrestrial, Algal, and Siliceous Indicators.
Kluwer Academic Publishers, Dordrecht, The Netherlands.
Berger, A.L., 1978. Long term variations of daily insolations and
Quaternary climatic changes. Journal of Atmospheric Sciences 35,
2362–2367.
Boessenkool, K.P., 2002. Environmental changes in the North Atlatnic
region during the last deglaciation. LPP Contributions Series No.
15, 128pp.
Bond, G., Lotti, R., 1995. Iceberg discharges into the North Atlantic
on millennial time scales during the last glaciation. Science 267,
1005–1010.
Bond, G., Broecker, W., Johnsen, S., McManus, J., Labeyrie, L.,
Jouzel, J., Bonani, G., 1993. Correlations between climate records
from the North Atlantic sediments and Greenland ice. Nature 365,
143–147.
Cacho, I., Grimalt, J.O., Pelejero, C., Canals, M., Sierro, F.J., Flores,
J.A., Shackleton, N.J., 1999. Dansgaard-Oeschger and Heinrich
event imprints in Alboran Sea paleotemperatures. Paleoceanogra-
phy 14, 698–705.
Carrion, J.S., 2002. Patterns and processes of Late Quaternary
environmental change in a montane region of southwestern
Europe. Quaternary Science Reviews 21, 2047–2066.
Carrion, J.S., van Geel, B., 1999. Fine resolution Upper Weichselian
and Holocene palynological record from Navarres (Valencia,
Spain) and a discussion about factors of Mediterranean forest
succession. Review of Palaeobotany and Palynology 106, 209–236.
Carrion, J.S., Navarro, C., Navarro, J., Munuera, M., 2000. The
distribution of cluster pine (Pinus pinaster) in Spain as derived from
palaeoecological data: relationships with phytosociological classi-
fication. Holocene 10, 243–252.
Cayre, O., Lancelot, Y., Vincent, E., Hall, M., 1999. Palaeoceano-
graphic reconstructions from planktonic foraminifers off the
Iberian margin: temperature, salinity and Heinrich Events.
Paleoceanography 14, 384–396.
Chapman, M.R., Shackleton, N.J., 1998. Millennial-scale fluctuations
in North Atlantic heat flux during the last 150,000 years. Earth and
Planetary Science Letters 159, 57–70.
Combourieu Nebout, N., Turon, J.L., Zahn, R., Capotondi, L.,
Londeix, L., Pahnke, K., 2002. Enhanced aridity and atmospheric
high-pressure stability over the western Mediterranean during
the North Atlantic cold events of the past 50 kyr. Geology 30,
863–866.
Dansgaard, W., Johnsen, S.J., Clauser, H.B., Dahl, J., Gundestrup,
N.S., Hommer, C.U., Huidberg, C.S., Steffensen, J.P., Svernb-
jornsdottir, A.E., Jouzel, J., Bond, G., 1993. Evidence for general
instability of past climate from a 250 kyr ice-core record. Nature
364, 218–220.
de Abreu, L., 2000. High-resolution palaeoceanography off Portugal
during the last two glacial cycles. Ph.D. Thesis, University of
Cambridge, 366pp.
de Abreu, L., Shackleton, N.J., Schonfeld, J., Hall, M., Chapman,
M.R., 2003. Millennial-scale oceanic climate variability off the
Western Iberian margin during the last two glacial periods. Marine
Geology 196, 1–20.
Follieri, M., Giardini, M., Magri, D., Sadori, L., 1998. Palynostrati-
graphy of the last glacial period in the volcanic region of central
Italy. Quaternary International 47/48, 3–20.
Galanidou, N., Tzedakis, P.C., Lawson, I.T., Frogley, M.R., 2000. A
revised chronological framework and palaeoenvironmental frame-
work for the Kastrista rockshelter, north-west Greece. Antiquity
74, 349–355.
Grootes, P.M., Stuiver, M., 1997. Oxygen 18/16 variability in
Greenland snow and ice with 10-3- to 105-year resolution. Journal
of Geophysical Research 102, 26,455–26,470.
Grousset, F.E., Pujol, C., Labeyrie, L., Auffret, G., Boelaert, A., 2000.
Were the North Atlantic Heinrich events triggered by the behavior
of the European ice sheets? Geology 28 (2), 123–126.
Hedberg, H.D. (Ed.), 1976. International Stratigraphic Guide. Wiley,
New York 200pp.
Heusser, L.E., 1995. Pollen stratigraphy and paleoecologic interpreta-
tion of the 160-k.y. record from Santa Barbara basin, Hole 893A.
In: Kennett, J.P., Baldauf, J.G., Lyle, M. (Eds.), Proceedings of the
Ocean Drilling Program, Scientific Results. 146 (Part 2): College
Station, TX (Ocean Drilling Program), pp. 265–280.
Heusser, L.E., Balsam, W.L., 1977. Pollen distribution in the NE
Pacific Ocean. Quaternary Research 7, 45–62.
Heusser, L.E., Stock, C.E., 1984. Preparation techniques for concen-
trating pollen from marine sediments and other sediments with low
pollen density. Palynology 8, 225–227.
Imbrie, J., Hayes, J.D., Martinson, D.G., McIntyre, A., Mix, A.C.,
Morely, J.J., Pisias, N.G., Prell, W.L., Shackleton, N.J., 1984. The
orbital theory of Pleistocene climate: support from a revised
chronology of the marine d18O record. In: Berger, A., Imbrie, J.,
ARTICLE IN PRESSK.H. Roucoux et al. / Quaternary Science Reviews 24 (2005) 1637–16531652
Hays, J., Kukla, G., Saltzman, B. (Eds.), Milankovitch and
Climate. Reidel, Dordrecht, pp. 269–306.
Jemmett, G., Owen, J.A.K., 1990. Where has all the pollen gone?
Review of Palaeobotany and Palynology 64, 205–211.
Johnsen, S.J., Dahl-Jensen, D., Gundestrup, N., Steffensen, J.P.,
Claussen, H.B., Miller, H., Masson-Delmotte, V., Sveinbjorns-
dottir, A.E., White, J., 2001. Oxygen isotope and palaeotempera-
ture records from six Greenland ice-core stations: Camp Century,
Dye-3, GRIP, GISP2, Renland and NorthGRIP. Journal of
Quaternary Science 14, 299–307.
Jones, E.W., 1959. Quercus L. Biological Flora of the British Isles.
Journal of Ecology 47, 169–222.
Lang, C., Leuenberger, M., Schwander, J., Johnsen, S., 1999. 16 1C
rapid temperature variation in central Greenland 70,000 years ago.
Science 286, 934–937.
Lebreiro, S.M., Moreno, J.C., McCave, I.N., Weaver, P.P.E., 1996.
Evidence for the Heinrich layers off Portugal (Tore Seamount:
391N, 121W). Marine Geology 131, 47–56.
Lezine, A-M., Denefle, M., 1997. Enhanced anticyclonic circulation in
the eastern North Atlantic during cold intervals of the last
deglaciation inferred from deep-sea pollen records. Geology 25,
19–122.
Maher Jr., L.J., 1972. Nomograms for computing 0.95 confidence
limits of pollen data. Review of Palaeobotany and Palynology 13,
85–93.
Martinson, D.G., Pisias, N.G., Hays, J.D., Imbrie, T.C., Shackleton,
N.J., 1987. Age dating and the orbital theory of the ice ages:
development of a high resolution 0–300,000-year chronostratigra-
phy. Quaternary Research 27, 2–29.
Mix, A.C., Bard, E., Schneider, R., 2001. Environmental processes of
the ice age: land, oceans, glaciers (EPILOG). Quaternary Science
Reviews 20, 627–657.
Moore, P.D., Webb, J.A., Collinson, M.E., 1991. Pollen Analysis. 2nd
ed. Blackwell, Oxford, UK 216pp.
Munoz Sobrino, C., Ramil-Rego, P., Rodrıguez Guitian, M.A., 2001.
Vegetation in the mountains of northwest Iberia during the last
glacial–interglacial transition. Vegetation History and Archaeo-
botany 10, 7–21.
Pailler, D., Bard, E., 2002. High frequency palaeoceanographic
changes during the past 140,000 years recorded by the organic
matter in sediments off the Iberian Margin. Palaeogeography,
Palaeoclimatology, Palaeoecology 181, 431–452.
Polunin, O., Smythies, B.E., 1973. Flowers of South-West Europe, a
Field Guide. Oxford University Press, Oxford 480pp.
Polunin, O., Walters, M., 1985. A Guide to the Vegetation of Britain
and Europe. Oxford University Press, Oxford 238pp.
Rasmussen, T.L., Thomsen, E., van Weering, T.C.E., Labeyrie, L.,
1996. Rapid changes in surface and deep water conditions at the
Faroe Margin during the last 58,000 years. Paleoceanography 11
(6), 757–771.
Reille, M., 1992. Pollen et Spores d’Europe et d’Afrique du Nord.
Laboratoire de Botanique Historique et Palynologie, Marseille
520pp.
Reille, M., de Beaulieu, J.-L., 1990. Pollen analysis of a long upper
Pleistocene continental sequence in a Velay maar (Massif Central,
France). Palaeogeography, Palaeoclimatology and Palaeoecology
80, 35–48.
Rose, R.J., Bannister, P., Chapman, S.B., 1996. Biological Flora of the
British Isles, Erica cilliaris L. Journal of Ecology 84, 617–825.
Roucoux, K.H., 2000. Millennial scale vegetation and climate
variability in north-west Iberia during the last glacial stage.
Ph.D. Thesis, University of Cambridge, 267pp.
Roucoux, K.H., Shackleton, N.J., de Abreu, L., Schonfeld, J.,
Tzedakis, P.C., 2001. Combined marine proxy and pollen analyses
reveal rapid vegetation response to North Atlantic millennial-scale
climate oscillations. Quaternary Research 56, 128–132.
Ruddiman, W.F., McIntyre, A., 1981a. Oceanic mechanisms for
amplification of the 23,000-year ice-volume cycle. Science 212,
617–627.
Ruddiman, W.F., McIntyre, A., 1981b. The North Atlantic Ocean
during the last deglaciation. Palaeogeography, Palaeoclimatology,
Palaeoecology 35, 145–214.
Sanchez Goni, M.F., Eynaud, F., Turon, J.L., Shackleton, N.J., 1999.
High resolution palynological record off the Iberian Margin: direct
direct land-sea correlation for the Last Interglacial complex. Earth
and Planetary Science Letters 171, 123–137.
Sanchez Goni, M.F., Turon, J-L., Eynaud, F., Gendreau, S., 2000.
European climatic response to millennial-scale changes in the
atmosphere-ocean system during the last glacial period. Quatern-
ary Research 54, 394–403.
Sanchez Goni, M.F., Cacho, I., Turon, J-L., Guiot, J., Sierro, F.J.,
Peypouquet, J-P., Grimalt, J.O., Shackleton, N.J., 2002. Synchro-
neity between marine and terrestrial responses to millennial scale
climatic variability during the last glacial period in the Mediterra-
nean region. Climate Dynamics 19, 95–105.
Schonfeld, J., Zahn, R., 2000. Late Glacial to Holocene history of the
Mediterranean outflow. Evidence from benthic foraminiferal
assemblages and stable isotopes at the Portuguese margin.
Palaeogeography, Palaeoclimatology, Palaeoecology 159, 85–111.
Schonfeld, J., Zahn, R., de Abreu, L., 2003. Surface and deep water
response to rapid climate changes at the Western Iberian Margin.
Global and Planetary Change 36, 237–264.
Severinghaus, J.P., Brook, E.J., 1999. Abrupt climate change at the
end of the last glacial period inferred from trapped air in polar ice.
Science 286, 930–934.
Shackleton, N.J., 1987. Oxygen isotopes, ice volume and sea level.
Quaternary Science Reviews 6, 183–190.
Shackleton, N.J., Hall, M.A., Vincent, E., 2000. Phase relationships
between millennial-scale events 64,000–24,000 years ago. Paleocea-
nography 15, 565–569.
Skinner, L.C., McCave, I.N., 2003. Analysis and modelling of gravity
and piston coring based on soil mechanics. Marine Geology 199,
181–204.
Stocker, T.F., 1999. Past and future reorganisations in the climate
system. Quaternary Science Reviews 19, 301–319.
Taylor, K.C., Lamorey, G.W., Doyle, G.A., Alley, R.B., Grootes,
P.M., Mayewski, P.A., White, J.W.C., Barlow, L.K., 1993. The
flickering switch of Late Pleistocene climate change. Nature 361,
432–436.
Thomson, J., Nixon, S., Summerhayes, C.P., Schonfeld, J., Zahn, R.,
Grootes, P., 1999. Implications for sedimentation changes on the
Iberian margin over the last two glacial/interglacial transitions
from 230Th(excess) systematics. Earth and Planetary Science Letters
165, 255–270.
Turner, C., Hannon, G.E., 1988. Vegetational evidence for late
Quaternary climatic changes in southwest Europe in relation to
the influence of the North Atlantic Ocean. Philosophical Transac-
tions of the Royal Society of London B 318, 451–485.
Turon, J.-L., Lezine, A.-M., Denefle, M., 2003. Land-sea correlations
for the last glaciation inferred from a pollen and dinocyst record
from the Portuguese margin. Quaternary Research 59, 88–96.
Tzedakis, P.C., Lawson, I.T., Frogley, M.R., Hewitt, G.M., Preece,
R.C., 2002. Buffered tree population changes in a Quaternary
refugium: evolutionary implications. Science 297, 2044–2047.
van Andel, T.H., Tzedakis, P.C., 1998. Priority and opportunity:
reconstructing the European Middle Palaeolithic climate and
Landscape. In: Bailey, J. (Ed.), Science in Archaeology: An
Agenda for the Future. English Heritage, London, pp. 37–45.
van der Knaap, W.O., van Leeuwen, J.F.N., 1995. Holocene
vegetation succession and degradation as responses to climatic
change and human activity in the Serra da Estrela, Portugal.
Review of Palaeobotany and Palynology 89, 153–211.
ARTICLE IN PRESSK.H. Roucoux et al. / Quaternary Science Reviews 24 (2005) 1637–1653 1653
van der Knaap, W.O., van Leeuwen, J.F.N., 1997. Late Glacial and
early Holocene vegetation succession, altitudinal zonation, and
climate change in the Serra da Estrela, Portugal. Review of
Palaeobotany and Palynology 97, 239–285.
Wallen, C.C. (Ed.), 1970. World Survey of Climatology, vol. 5:
Climates of Northern and Western Europe. Elsevier, Amsterdam
253pp.
Watts, W.A., Allen, J.R.M., Huntley, B., 1996. Vegetation history and
palaeoclimate of the last glacial period at Logo Grande di
Monticchio, southern Italy. Quaternary Science Reviews 15,
133–153.
Watts, W.A., Allen, J.R.M., Huntley, B., 2000. Palaeoecology of three
interstadial events during oxygen-isotope stages 3 and 4: a
lactustrine record from Lago Grandi di Monticchio, southern
Italy. Palaeogeography, Palaeoclimatology, Palaeoecology 155,
83–93.
Woillard, G.M., 1978. Grande Pile peat bog: a continuous pollen
record for the last 140,000 years. Quaternary Research 9, 1–21.
Yiou, P., Genthon, C., Ghil, M., Jouzel, J., Le Treut, H., Barnola,
J.M., Lorius, C., Korotkevitch, Y.N., 1991. High frequency
paleovariability in climate and in CO2 levels from Vostock ice-
core records. Journal of Geophysical Research 96, 20,365–20,378.
Zahn, R., 1997. North Atlantic thermohaline circulation during the
last glacial period: evidence for coupling between meltwater events
and convective instability in sediment cores from the southern
Portuguese margin. GEOMAR Report 63, 1–133.