The Nanticoke shoreline diffusion experiment, June 1978—III. Ground-based air quality measurements
9
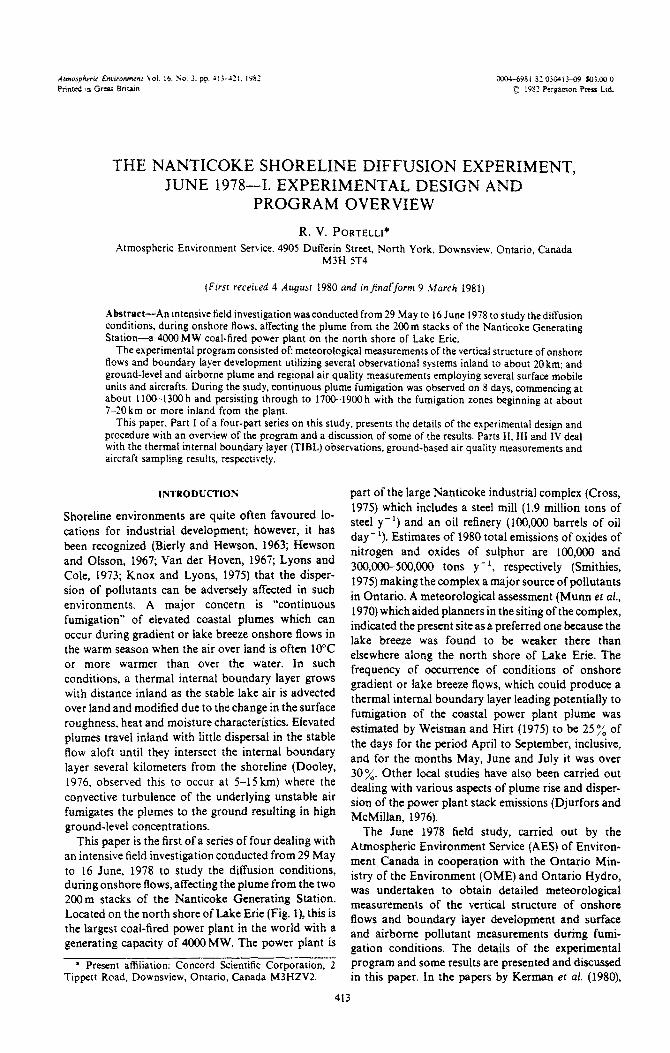
THE NANTICOKE SHORELINE DIFFUSION EXPERIMENT, JUNE 1978-I. EXPERIMENTAL DESIGN AND PROGRAM OVERVIEW R. V. PORTELLI* Atmospheric Environment Service. 4905 Dufferin Street, North York. Downsview, Ontario, Canada M3H ST4 tFirsr rereiced 4 &gust 1980 and ~~~~uf~o~~ 9 .%iorch 1981) Abstract-An intensive field investigation was conducted from 29 May to 16 June 1978 co study thediffusion conditions, during onshore ROWS, affecting the plume from the 200 m stacks of the Nanticoke Generating Station-a 4000 MW coal-fired power plant on the north shore of Lake Erie. The experimental program consisted of: meteorologicai measurements of the vertical structure of onshore flows and boundary layer development utilizing several observational systems inland to about 20 km; and ground-level and airborne plume and regional air quality measurements employing several surface mobile units and aircrafts. During the study, continuous plume fumigation was observed on 8 days, commencing at about 1 IO@-1300 h and persisting through to 1700-1900 h with the fumigation zones beginning at about 7-20 km or more inland from the plant. This paper, Part I of a four-part series on this study, presents the details of the experimental design and procedure with an overview of the program and a discussion of some of the results. Parts II, III and IV deal with the thermal internal boundary layer (TIBL) observations, ground-based air quality measurements and aircraft sampling results, respectiGely1 INTRODUCTION Shoreline environments are quite often favoured lo- cations For industrial development; however, it has been recognized (Bierly and Hewson, 1963; Hewson and Olsson, 1967; Van der Hoven, 1967; Lyons and Cole, 1973; Knox and Lyons, 1975) that the disper- sion of pollutants can be adversely affected in such environments. A major concern is “continuous fumigation” of elevated coastal plumes which can occur during gradient or lake breeze onshore flows in the warm season when the air over land is often 10°C or more warmer than over the water. In such conditions, a thermal internal boundary layer grows with distance inland as the stable lake air is advected over land and modified due to the change in the surface roughness, heat and moisture characteristics. Elevated plumes travel iniand with little dispersal in the stable flow aloft until they intersect the internal boundary layer several kilometers from the shoreline (Dooley, 1976. observed this to occur at 5-15 km) where the convective turbulence of the underlying unstable air fumigates the plumes to the ground resulting in high ground-level concentrations. This paper is the first of a series of four dealing with an intensive field investigation conducted from 29 May to 16 June, 1978 to study the diffusion conditions, during onshore flows, affecting the plume from the two 200m stacks of the Nanticoke Generating Station. Located on the north shore of Lake Erie (Fig. l), this is the largest coal-fired power plant in the world with a generating capacity of 4000 MW. The power plant is * Present affiliation: Concord Scientific Corporation, 2 Tipp-ett Road, Downsview, Ontario, Canada M3HZV2. part of the large Nanticoke industrial complex (Cross, 1975) which includes a steel mill (1.9 million tons of steel y - ‘) and an oil refinery (100,000 barrels of oil day- ‘). Estimates of 1980 total emissions of oxides of nitrogen and oxides of sulphur are l~,~ and 3oO,OOO-500,000 tons y- I, respectively (Smithies, 1975) making the complex a major source of pollutants in Ontario. A meteorological assessment (Munn er al., 1970) which aided planners in the siting of the complex, indicated the present site asa preferred one because the lake breeze was found to be weaker there than eisewhere along the north shore of Lake Erie. The frequency of occurrence of conditions of onshore gradient or lake breeze flows, which could produce a thermal internal boundary layer leading potentially to Fumigation of the coastal power plant plume was estimated by Weisman and Hirt (1975) to be 25 % of the days for the period April to September, inclusive, and for the months May, June and July it was over 30%. Other local studies have also been carried out dealing with various aspects of plume rise and disper- sion of the power plant stack emissions (Djurfors and McMillan, 1976). The June 1978 field study, carried out by the Atmospheric Environment Service (AES) of Environ- ment Canada in cooperation with the Ontario Min- istry of the Environment (OME) and Ontario Hydro, was undertaken to obtain detailed meteorological measurements of the vertical structure of onshore flows and boundary layer development and surface and airborne pollutant measurements during fumi- gation conditions. The details of the experimental program and some results are presented and discussed in this paper. In the papers by Kerman et al. (1980), 413
-
Upload
michiganstate -
Category
Documents
-
view
4 -
download
0
Transcript of The Nanticoke shoreline diffusion experiment, June 1978—III. Ground-based air quality measurements
THE NANTICOKE SHORELINE DIFFUSION EXPERIMENT, JUNE 1978-I. EXPERIMENTAL DESIGN AND
PROGRAM OVERVIEW
R. V. PORTELLI*
Atmospheric Environment Service. 4905 Dufferin Street, North York. Downsview, Ontario, Canada M3H ST4
tFirsr rereiced 4 &gust 1980 and ~~~~uf~o~~ 9 .%iorch 1981)
Abstract-An intensive field investigation was conducted from 29 May to 16 June 1978 co study thediffusion conditions, during onshore ROWS, affecting the plume from the 200 m stacks of the Nanticoke Generating Station-a 4000 MW coal-fired power plant on the north shore of Lake Erie.
The experimental program consisted of: meteorologicai measurements of the vertical structure of onshore flows and boundary layer development utilizing several observational systems inland to about 20 km; and ground-level and airborne plume and regional air quality measurements employing several surface mobile units and aircrafts. During the study, continuous plume fumigation was observed on 8 days, commencing at about 1 IO@-1300 h and persisting through to 1700-1900 h with the fumigation zones beginning at about 7-20 km or more inland from the plant.
This paper, Part I of a four-part series on this study, presents the details of the experimental design and procedure with an overview of the program and a discussion of some of the results. Parts II, III and IV deal with the thermal internal boundary layer (TIBL) observations, ground-based air quality measurements and aircraft sampling results, respectiGely1
INTRODUCTION
Shoreline environments are quite often favoured lo- cations For industrial development; however, it has been recognized (Bierly and Hewson, 1963; Hewson and Olsson, 1967; Van der Hoven, 1967; Lyons and Cole, 1973; Knox and Lyons, 1975) that the disper- sion of pollutants can be adversely affected in such environments. A major concern is “continuous fumigation” of elevated coastal plumes which can occur during gradient or lake breeze onshore flows in the warm season when the air over land is often 10°C or more warmer than over the water. In such conditions, a thermal internal boundary layer grows with distance inland as the stable lake air is advected over land and modified due to the change in the surface roughness, heat and moisture characteristics. Elevated plumes travel iniand with little dispersal in the stable flow aloft until they intersect the internal boundary layer several kilometers from the shoreline (Dooley, 1976. observed this to occur at 5-15 km) where the convective turbulence of the underlying unstable air fumigates the plumes to the ground resulting in high ground-level concentrations.
This paper is the first of a series of four dealing with an intensive field investigation conducted from 29 May to 16 June, 1978 to study the diffusion conditions, during onshore flows, affecting the plume from the two 200m stacks of the Nanticoke Generating Station. Located on the north shore of Lake Erie (Fig. l), this is the largest coal-fired power plant in the world with a generating capacity of 4000 MW. The power plant is
* Present affiliation: Concord Scientific Corporation, 2 Tipp-ett Road, Downsview, Ontario, Canada M3HZV2.
part of the large Nanticoke industrial complex (Cross, 1975) which includes a steel mill (1.9 million tons of steel y - ‘) and an oil refinery (100,000 barrels of oil day- ‘). Estimates of 1980 total emissions of oxides of nitrogen and oxides of sulphur are l~,~ and 3oO,OOO-500,000 tons y- I, respectively (Smithies, 1975) making the complex a major source of pollutants in Ontario. A meteorological assessment (Munn er al.,
1970) which aided planners in the siting of the complex, indicated the present site asa preferred one because the lake breeze was found to be weaker there than eisewhere along the north shore of Lake Erie. The frequency of occurrence of conditions of onshore gradient or lake breeze flows, which could produce a thermal internal boundary layer leading potentially to Fumigation of the coastal power plant plume was estimated by Weisman and Hirt (1975) to be 25 % of the days for the period April to September, inclusive, and for the months May, June and July it was over 30%. Other local studies have also been carried out dealing with various aspects of plume rise and disper- sion of the power plant stack emissions (Djurfors and McMillan, 1976).
The June 1978 field study, carried out by the Atmospheric Environment Service (AES) of Environ- ment Canada in cooperation with the Ontario Min- istry of the Environment (OME) and Ontario Hydro, was undertaken to obtain detailed meteorological measurements of the vertical structure of onshore flows and boundary layer development and surface and airborne pollutant measurements during fumi- gation conditions. The details of the experimental program and some results are presented and discussed in this paper. In the papers by Kerman et al. (1980),
413
41-l R. V. PORTELLI
EXPERISlESTAL PROGRAY
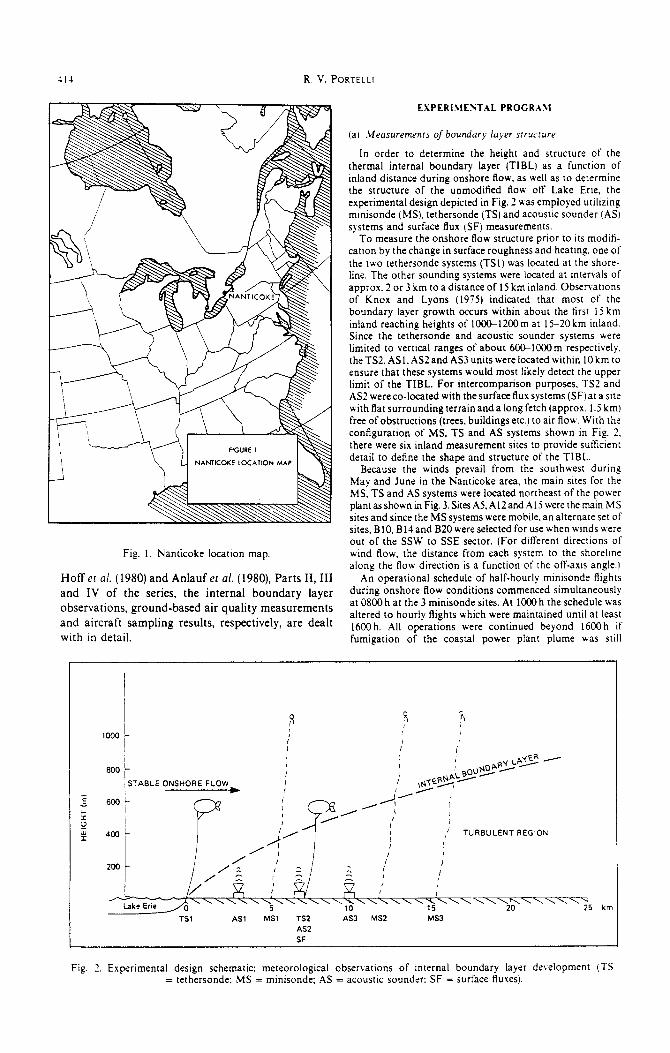
In order to determine the height and structure of the thermal internal boundary layer (TIBL) as a function of inland distance during onshore flow. as well as to determine the structure of the unmodified Ron off Lake Erie, the experimental design depicted in Fig. 2 uas employed utilizing minisonde (MS), tethersonde (TS) and acoustic sounder (AS) systems and surface flux (SF) measurements.
To measure the onshore flow structure prior to its modifi- cation by the change in surface roughness and heatmg. one of the two tethersonde systems (TSl) was located at the shore- line. The other soundin! systems were located at intervals of approx. 2 or 3 km to a distance of 15 km inland. Observations of Knox and Lyons (1975) indicated that most of the boundary layer growth occurs within about the first 15 km inland reachmg heights of 1OOC12OOm at 15-20 km inland. Since the tethersonde and acoustic sounder systems were limited to vertical ranges of about 600-1COOm respectively, theTSZ.ASI.ASZand AS3 unitswereiocated within 1Okm to ensure that these systems would most likely detect the upper limit of the TIBL. For intercomparison purposes, TS2 and AS2 wereco-located with the surface flux systems (SF)at a site with flat surrounding terrain and a long fetch (approx. 1.5 km) free of obstructions (trees. buildings etc.) to air flow. With the configuration of MS, TS and AS systems shown in Fig. 2. there were six inland measurement sites to provide suficient detail to define the shape and structure of the TIBL.
Fig. I. Nanticoke location map
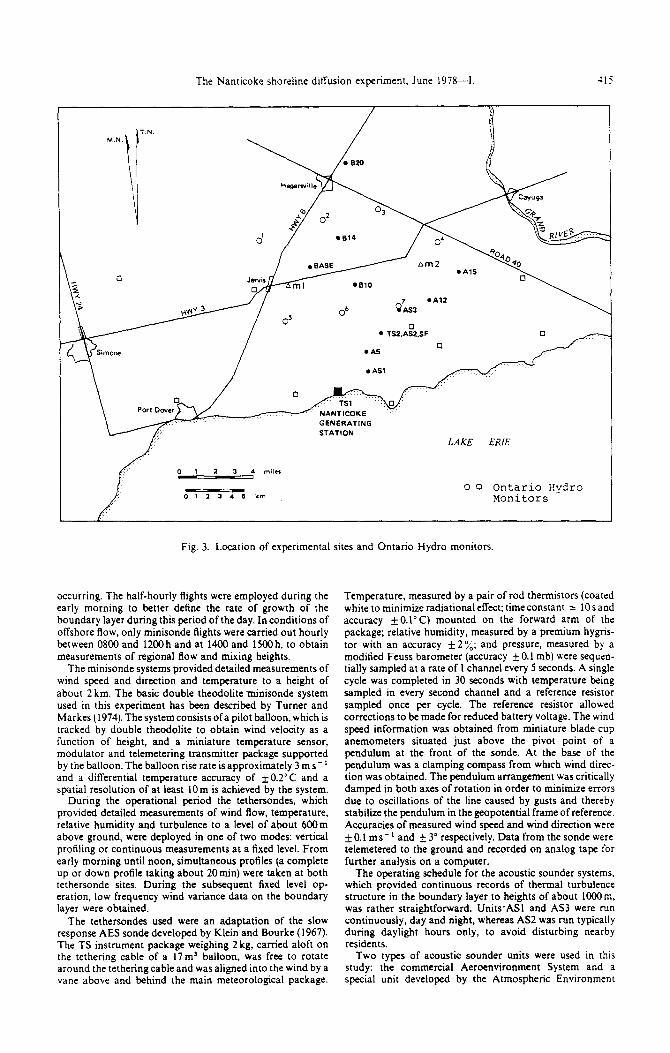
Because the winds prevail from the southwest during May and June in the Nanticoke area, the main sites for the MS. TS and AS systems were located northeast of the power plant as shoun in Fig. 3. Sites AS, AI2 and Al5 were the main MS sites and since the MS systems were mobile, an alternate set of sites, BlO, Bl? and B20 were selected for use when winds were out of the SW to SSE sector. (For different directions of wind flow, the distance from each system to the shoreline along the flow direction is a function of the off-axis angle.)
An operational schedule of half-hourly numsonde Alghts Hoff er al. (1980) and Anlauf et al. (1980), Parts II, III and IV of the series, the internal boundary layer during onshore flow conditions commenced simultaneously
observations, ground-based air quality measurements at 0800 h at the 3 minisonde sites. At 1000 h the schedule was
and aircraft sampling results, respectively, are dealt altered to hourly flights which were maintained until at least
with in detail. 1600 h. All operations were continued beyond 1600 h if fumigation of the coastal power plant plume was still
800 - STABLE ONSHORE FLOW
TURBULENT REGION
TSl AS1
25 km
MS1 TSZ AS3 MS2 MS3
AS2
SF
Fig. 2. Experimental design schematic: meteorological observations of internal boundary layer development (TS = tethersonde: MS = minisonde: AS = acoustic sounder: SF = surface fluxes).
The Nanticoke shoreline ditfusion experiment, June 1978-I. 115
7
QAS3
*Al2
0 l TSZ,ASI.SF
GENERATING STATION
LAKE ERIE
2 3 4 mi,*r
012315 Lrn 0 CJ Ontario Hvdro
Monitors
Fig. 3. Location of experimental sites and Ontario Hydro monitors.
occurring. The half-hourly flights were employed during the early morning to better define the rate of growth of the boundary layer during this period of the day. In conditions of offshore flow, only minisonde flights were carried out hourly between 0800 and 1200 h and at 1400 and 1500 h, to obtain measurements of regional flow and mixing heights.
The minisonde systems provided detailed measurements of wind speed and direction and temperature to a height of about 2 km. The basic double theodolite minisonde system used in this experiment has been described by Turner and Markes (1974). The system consists ofa pilot balloon, which is tracked by double theodolite to obtain wind velocity as a function of height, and a miniature temperature sensor, modulator and telemetering transmitter package supported by the balloon. The balloon rise rate is approximately 3 m s- ’ and a differential temperature accuracy of +O.Z”C and a spatial resolution of at least 10m is achieved by the system.
During the operational period the tethersondes, which provided detailed measurements of wind tlow, temperature, relative humidity and turbulence to a level of about 600m above ground, were deployed in one of two modes: vertical profiling or continuous measurements at a fixed level. From early morning until noon, simultaneous profiles (a complete up or down profile taking about 20min) were taken at both tethersonde sites. During the subsequent fixed level op- eration, low frequency wind variance data on the boundary layer were obtained.
The tethersondes used were an adaptation of the slow response AES sonde developed by Klein and Bourke (1967). The TS instrument package weighing 2 kg, carried aloft on the tethering cable of a 17m’ balloon, was free to rotate around the tethering cable and was aligned into the wind by a vane above and behind the main meteorological package.
Temperature, measured by a pair of rod thermistors (coated white to minimize radiational effect: time constant 2 10 sand accuracy kO.l’C) mounted on the forward arm of the package; relative humidity, measured by a premium hygris- tor with an accuracy +2%; and pressure, measured by a modified Feuss barometer (accuracy + 0.1 mb) were sequen- tially sampled at a rate of 1 channel every 5 seconds. A single cycle was completed in 30 seconds with temperature being sampled in every second channel and a reference resistor sampled once per cycle. The reference resistor allowed corrections to be made for reduced battery voltage. The wind speed information was obtained from miniature blade cup anemometers situated just above the pivot point of a pendulum at the front of the sonde. At the base of the pendulum was a clamping compass from which wind direc- tion was obtained. The pendulum arrangement was critically damped in both axes of rotation in order to minimize errors due to oscillations of the line caused by gusts and thereby stabilize the pendulum in the geopotential frame of reference. Accuracies of measured wind speed and wind direction were +O.l ms-* and + 3” respectively. Data from the sonde were telemetered to the ground and recorded on analog tape for further analysis on a computer.
The operating schedule for the acoustic sounder systems, which provided continuous records of thermal turbulence structure in the boundary layer to heights of about 1000 m, was rather straightforward. I_Jnits*ASl and AS3 were run continuously, day and night, whereas AS2 was run typically during daylight hours only, to avoid disturbing nearby residents.
Two types of acoustic sounder units were used in this study: the commercial Aercenvironment System and a special unit developed by the Atmospheric Environment
416 R. V. P ‘ORTELLI
Service. The simplercommercial unit was employed at sites ASI and AS3 while the larger AES unit was located at the AS2 site. Some of the characteristics of these systems are identified below for each site:
ASl. AS3 AS2
Maximum output acoustic power (W) 10 315 Pulse length (IO-’ s) 100 45 Frequency (kHz) I.6 1.25 Antenna diameter (m) 1.33 2.0 Effective antenna area (m*) 1.1
In the surface flux program the objective was twofold. Firstly, estimates of the fluxes of momentum and sensible and latent heat near the surface were required to correlate with the growth of the boundary layer. Secondly, it was desirable to estimate the flux of sulphur dioxide to the surface during onshore conditions when the plume was generally overhead (to be discussed la!er in the plumejAir Quality Measure- ments section). For this purpose, a tower borne profiling system, a fast response sonic anemometer, solar radiation equipment and a laser scintillometer were deployed. The operational schedule for the surface flux (SF) program consisted of continuous measurements from about 0800 to 1700 h during cases of onshore flow.
The gradient data required by the energy partitioning method of calculating sensible heat flux were obtained by differential psychrometry with platinium resistanceelements. The lowest elements were adjusted to maintain a position just above the crop surface (winter wheat) and-varied in height between 50cm and 90cm during the course of the experiment. The upper level elements were adjusted to maintain a spacing of approx. 2 m. In addition to the wet and dry bulb temperatures, wind speed was measured at the same
two levels with miniature Cassella anemometers. Ambient air temperature and vapour pressure were obtained from measurements at the lowest level. Radiation was measured on a separate nearby stand. Incoming and reflected solar radiation were measured with Kipp solarimeters. The net radiation was measured with a .Middleton Funk-type net radiometer at a fixed height of 1.5, above the ground surface. During the experiment the height above the wheat surface varied from 0.5 to l.Om. Surface temperature was measured radiometrically with a Barnes PRT-5 infrared thermometer mounted on the same stand as the radiation instrument.
The eddy correlation measurements were obtained with a three component sonic anemometer thermometer (Model PAT313A manufactured by Kaigo Denki Co. Ltd., Tokyo. Japan). The theory and use of sonic anemometer thermo- meters has been described by Kaimal and Businger (1963) and Mitsata (1966). The physical set-up for the scintillometer heat flux experiment (to estimate surface heat flux from path- averaged measurements of scintillations of monochromatic light emitted by a laser (Wyngaard. 1978)) consisted of illuminating the detector at a 70m distance by a He-Ne 5 MW laser. Without a sighting apparatus to align the laser and detector during daylight conditions. the path length could not be increased beyond 70m. The RMS of the logarithm of the intensity of the sampled laser signal is proportional to the turbulent intensity represented by Ci. the refractive index structure function. This variance data was taken with a 1 s time constant, displayed on chart records. and later averaged to yield 0.5 h estimates of turbulent intensity, from which heat flux estimates were made.
In addition to the above. a base station (see BASE in Fig. 3) was operated as the control centre with an on-site forecast office where standard hourly surface meteorological observ- ations were made. Also, observations of wind speed and direction at IO. 30 and 85 m were available from the Ontario Hydro tower at this site, which is operated routinely.
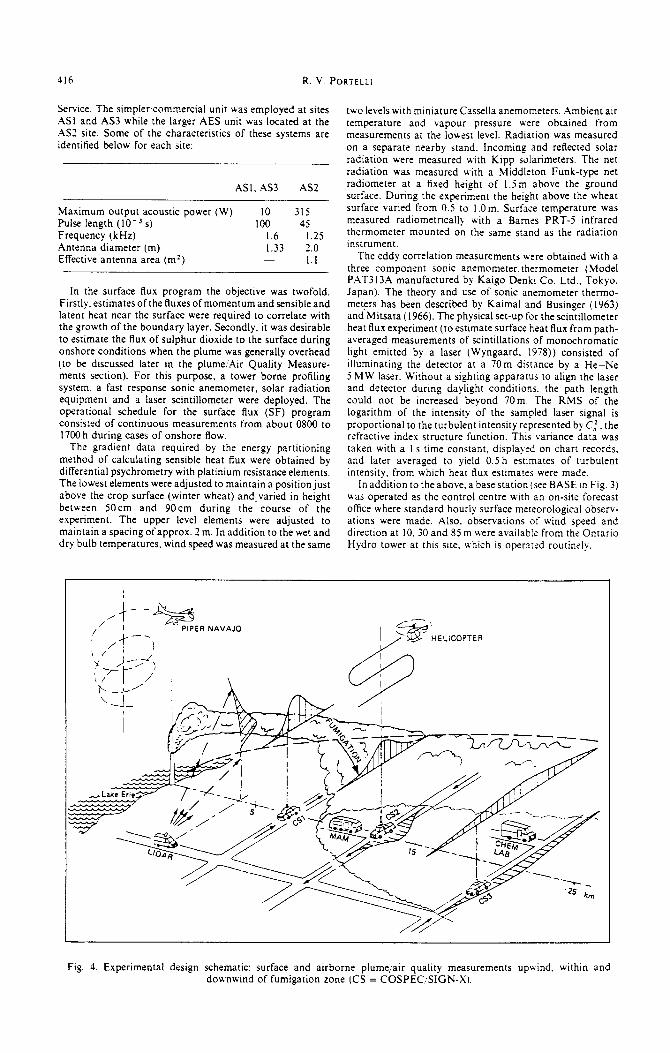
Fig. 4. Experimental design schematic: surface and airborne plume/air quality measurements upwind. within and downwind of fumigation zone (CS = COSPEC,,SIGN-X).
The Nanticoke shoreline diffusion experiment. June 1978-I. 417
(b) Plume, air gualtry measurements
Figure 4 illustrates the experimental design employed to obtain groundbased and airborne plume ‘air quality measure- ments during conditions of onshore flows which led to fumigation of the power plant plume. The systems shown here obtained mobile or in-siru mode observations. A unit such as the LIDAR, although a mobile vehicle, is identified as an in-situ monitor since data is acquired in the stationary mode.
Observations of plume rise and dispersion characteristics were made primarily by the AES laser radar (LIDAR) system and three Barringer Correlation Spectrometer (COSPEC) units identified as CS. The LIDAR unit, which consists of a 1.0 J ruby laser system (described by Hoff and Froude. 1979) operated from a mobile van, obtained in-situ measurements of particulate plume bearing, rise and dispersion (ur and u:) as a function of downwind distance. Operationally. from about 0800 h on, scans through the plume were made at a set azimuth for about l/2 h and the scans were then combined to form a l,2h composite profile of the plume cross-section.
The COSPEC units (CS I. CS2, and CS3) were mounted in vehicles and obtained mobile measurements of vertically integrated SO, (the sensor uses the U.V. absorption of zenith sky radiation to determine the total SO, burden overhead) at three downwind locations. Unit CSI traversed under the plume in the prefumigation zone. within about 7 km of the plant, where the plume was generally in stable flow. Units CS2 and CS3 made traverses in the fumigation zone. typically at distances of I I and 16 km from the plant, although several traverses were made at distances of up to 40km downwind. Due to the excellent network of roads in the Nanticoke area it was possible to effectively monitor the plume overhead while it was heading in almost any direction over land. Plume dispersion statistics as a function of downwind distance were obtained by averaging, typically over lj2 h periods. the plume profiles along road traverses which were projected onto a plane normal to the axis of the plume. The technique em- ployed here and for the determination of mass emissions of SO, have been described bv Millan er al. i 1976) and HolTer ul. (19?8). The COSPEC vehi&es CS2 and i7S.3 also had Sign-X SO2 monitors to obtain the ground level distribution of SO, simultaneously with the overhead SO, burden while traversing Since the plume from the Nanticoke power plant was often invisible, the CS units were used to identify plume location and provide in real-time the approximate lateral extent and location of centre mass aloft in addition to identifying ground impingement zones.
Measurements of ground-level concentrations of SO, and other contaminants were made by the Ontario Ministry of the Environment (OME) Mobile Air Monitorina Laboratorv (MAM) and the AES chemistry laboratory @HEM LAB). These vehicles were directed by radio to the expected or identified fumigation zone to monitor in an in-situ mode. With changes in the TIBL height and wind direction, the resultant movement of the fumigation zone required, at times, frequent re~sitioning of these units although moni- toring was generally maintained for periods of one hour or more.
The CHEM LAB unit monitored SO, and 0, using Teco Model 43 and Monitor Labs Model 8410 analysers, re- spectively. The MAM unit contained permanently installed analysers for gaseous pollutants (SO,. NO., H,S, SO, 0, total hydrocarbons and methane) and particulate pollutants (sulphates, nitrates, metal and light scattering particles). The unit also included meteorological instrumentation for moni- toring wind speed, direction, relative humidity, temperature, barometric pressure and solar radiation. Further, to monitor for peroxyacetylnitrate (PAN) a gas chromatograph with an electron capture detector was added for this study. A probe located about 5 m above ground level sampled air at a flow rate of 0.2mJmin-’ and with the anaiysers connected directly to a Hewlett-Packard 9830A calculator, real-time data acquisition and analysis was possible. A complete
description of the XtrZM unit equipment is contained in an Ontario Ministry of the Environment (1978) report. Co- calibration of the MAM and CHE.M LAB monitors was carried out in the field.
The two remaining mobile monitoring units in the plume air quality measurement program (Fig. 4) are the twin engine Piper Navajo aircraft and the Helicopter. In-plume SO, measurements during onshore flow fumigation con- ditions were made by the two aircraft to determine the vertical distribution of SO, at various downwind distances and the oxidation rate of sulphur dioxide to sulphate. In addition. the Piper Navajo made measurements of SO,. O,, light scattering coefficient b,, and particulate sulphate over Lake Erie to determine the pollutant levels being transported into the Nanticoke area with southerly flows. Measurements over land were also made downwind of the power plant.
The Helicopter SO, program (a joint OME Ontario Hydro activity supported by AES) consisted of traverses. typically at 5 different elevations repeated 3 times, in a plane roughly perpendicular to the plume axis at specified downwind distances from the plant (from 3 to 43 km). covering the plume in the pre-fumigation and fumigation zones and further downwind. The Helicopter instrument piatform used to measure SO2 is described in Part IV (Anlaufr: ‘il.. 1982).
For the Piper Navajo aircraft program operated by AES two different flight patterns were employed to obtain ambient atmospheric pollutant concentrations. Over Lake Erie, spirals were flown between 200 and 30OOm above mean sea level (MSL) and over land between 310 and 2ooO m above ground. These spirals. flown at predetermined locations. provided vertical profiles of continuously measured temperature, relative humidity, 0, and b,,. The sssond flight pattern consisted of horizontal traverses 20 to 50 km in length at different elevations (typically in an E-W direction and roughly of one hour duration) made both over Lake Erie and over land downwind of the power plant. Dunng these traverses, filter sampling techniques provided measurements of SO2 and particulate sulphate as well as the continuous measurements mentioned above. The details of the aircraft instrument platform and sampling procedure are contained in Part IV (Anlauf er af., 1982).
In addition to the above mobile monitoring equipment, air quality measurements at fixed sites were also made. As mentioned earlier, AES monitored SO, continuously from about 0900 h UD to 1800 h at the fixed SF site (see Fie. 3) for the purpose of estimating downward SO, fluxes and’ de- position velocities from measured concentration gradients near the surface. Using sensible heat as a tracer. the mass flux of sulphur dioxide was determined from the SO1 gradient. Differential SO, measurements were made with a Meloy Model SA 285 analyser by switching every 3 min between the lower air intake level just above the crop surface and the upper intake 2 m above the lower one. The sensible heat flux was determined from gradient data using the ener_q- partition- ing method (the Bowen ratio technique) and the deposition velocity was defined by the ratio of the downwind mass flux of SO, to the mean concentration (average of upper and lower level concentrations). Part III (Hotf cr <ii., 19511 contains further details on the measurement technique.
The other fixed air quality monitors which comprised part of the program were the I6 stations in Ontario Hydro’s continuously operating network which monitor SO, with Phillips analysers. These station sites are identified in Fig. 3 and those with open circles numbered I-7 have been denoted as such for a discussion of observations to follow. The continuous SO, measurements averaged and reported on an hourly basis (Ontario Hydro, 1978).
This completes the general discussion on the design of the experiment. Further details are contained in the experimental data report {Porrrlli. I982)and following this paper in Part II (Kerman et a!.. 1982). Part III (Hoff er tif.. 1981)and Part IV (Anlauf et al.. 1982i.
118 R. V. PORTELLI
DISCUSSION OF REWLT
During the study period, gradient or lake breeze flows which transported the Nanticoke power plant plume inland occurred on 8 days: 29, 30 iMay; 1,4, 6. 12, 15 and 16 June. On 10 and 11 June the plant was not operating lessentialiy zero weekend load) and on the other days, weather conditions were poor or the plume was travelling otTshore in northerly flows. The ground-based meteorological and air quality observ- ational systems were fully operational throughout most of 8 days mentioned above. Simultaneous plume observations by at least six of the eight ground based air quaiity monitoring systems were achieved on all of these days providing good data overlap. The airborne sampling coverage was not as complete, however, due to aircraft difficulties. The Piper Navajo made flights on all of the eight days except for 29 and 30 May. The helicopter sampling unit was available for 6, 1.5 and 16 June. In addition, and coincident with one of the more interesting experimental days an AES routine ART (Aerial Radiation Thermometer) flight was made over Lake Erie on I June to obtain lake surface temperatures.
In general. the findings are as follows. On each of the 8 days cited above, fumigation of the coastal power plant plume was observed. The onset of fumigation typically occurred at 1100-1300 h, when the TIBL had built up to plume height, and persisted through to 1700-1900 h, when decay of the TIBL led to decoup- ling of the plume from the surface layer. The near- shore edge of fumigation zones began about 7 to 20 km or more from the plant, which are greater inland distances than observed by Dooley (1976). The fumig- ation zone was also found to shift toward or away from the plant as the TIBL built up and decayed during the day and on some days the zone rotated about the plant in a clockwise direction as a result of wind shifts, which on days with Iight gradient flows was attributed primarily to the Coriolis force acting on the lake breeze. As expected the areas most con- sistently fumigated were found to be in the N to NE sector from the plant.
Of the 8 days of fumigation observations, 2 were selected for detailed presentation in this series of papers. Data coverage on 1 and 6 June was considered better than on other days and two interesting and distinctly different fumigation conditions existed: on 1 June, light gradient flow allowed for a lake breeze which veered with time of day resulting in a systematic clockwise rotation of the fumigation zone; on 6 June, moderate south-westerly gradient flow with little variation in wind direction throughout the day main- tained fumigation to a relatively fixed zone. An overview of the results depicting the 6-7 hour coastal fumigation episode of I June follows.
June 1 began with light N-NE gradient winds, due to a weak ridge of high pressure over the area, which carried the power plant plume offshore prior to 0900 h. After 0900h, the land-water air temperature dif- ference grew from about 3.5-l 1’ C (at 1700 h) de-
veloping a lake breeze onshore flow which transported the plume infand. The initial inland plume heading was NNW and as the day progressed the plume bearing shifting through N to NE with the clockwise rotation of the advecting winds (influence of of the Coriolis force).
Since information on the temporal and spatial distribution of the TIBL is critical to the understand- ing (and m~elIing) of coastal fumigation, a concerted effort was made in this study to observe TIBL characteristics as closely as possible. Measurements of the Nanticoke boundary Layer profile e.g. Fig. 5 of Part II (I June) exhibit. in general, a parabolic growth with inland distance and compare well with observ- ations of Knox and Lyons (1975). Further details and a fuller theoretical treatment of the boundary layer structure are given by Porteili (1979) and Kerman er ~1. (1982).
With internal boundary layers such as those of 1 June, a coastal power plant plume would need to rise rather high to avoid fumigation. The LIDAR plume rise observations at Nanticoke, presented by Hoff et al. (1982), are shown to be in good agreement with Briggs’ plume rise formulae. For the 1 June case, the observations indicate plume rise of about 150 to 210 m above stack top (in stable onshore flow) at 1 to 3 km from the plant with plume depths (4~:) of 240 to 320m. Thus, with a mean plume height above stack base of roughly 350 to 410 m and the observed TIBL profiles. the situation which caused fumigation is clearly evident.
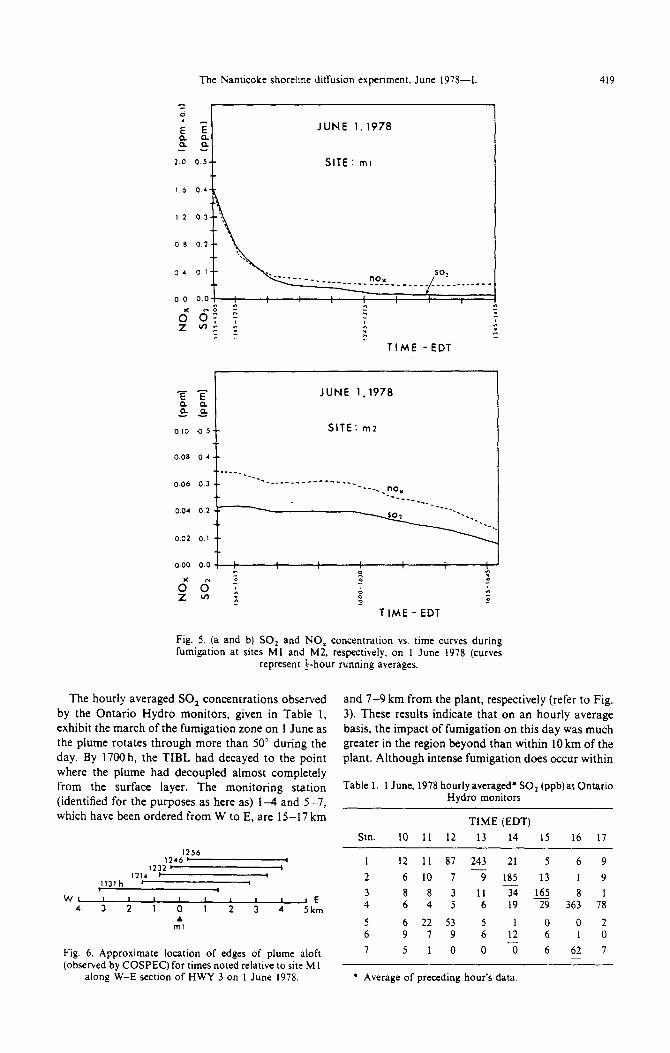
Observations of fumigation on 1 June commenced in the 1000-I 100 h period and continued through to 1700 h. Figures (a) and (b) present the SO, and NO, concentrations observed by the MAM unit in a fumigation zone at sites Ml and M2, respectively (refer to Fig. 3). These curves represent i-h running averages over the continuous observation periods (an average was computed every minute for the previous 30 min). Figure 5(a) indicates that the monitoring unit arrived and began sampling at site Ml during an intense fumigation: the maximum instantaneous SO, concentration observed was 0.98 ppm and the maxi- mum i-h average of 0.41 ppm occurred in the first )-h period. Later at site M2, less intense fumigation was observed: the maximum instantaneous SO2 was 0.43 ppm and the maximum average of 0.22 ppm also occurred in the first i-h period. It should be noted that the power plant was generating an average of about 1300MW ( - l/3 total capacity) on this day with an SO, emission rate of approx. 6ocx)gs- I. Concentrations fall off at both sites (much more rapidly at Ml than M2) as the plume swings eastward. Figure 6 shows the approximate position of the plume aloft as observed by COSPEC, relative to site Ml on HWY 3, as the plume rotates through approx. 15 degrees from 1130 to 1300 h. The strong positive correlation between NO,c and SO, concentration in Figs 6(a) and (b) should also be noted: the correlation coefficient for the entire study was found to be 0.99.
E -I JUNE 1.1978
::
0.5 SITE : ml
TIME -EDT
JUNE 1.1978
Q.5-- SITE: mz
0.08
0.06
002
0.00
P
Fig 5. (a and b) SO, and NO, concentration vs. time curves during fumigation at sites MI and M2, respectively, on 1 June 1978 (curves
represent f-hour running averages.
The Nanticoke shorehne diffusion experiment. June 197S-I. 419
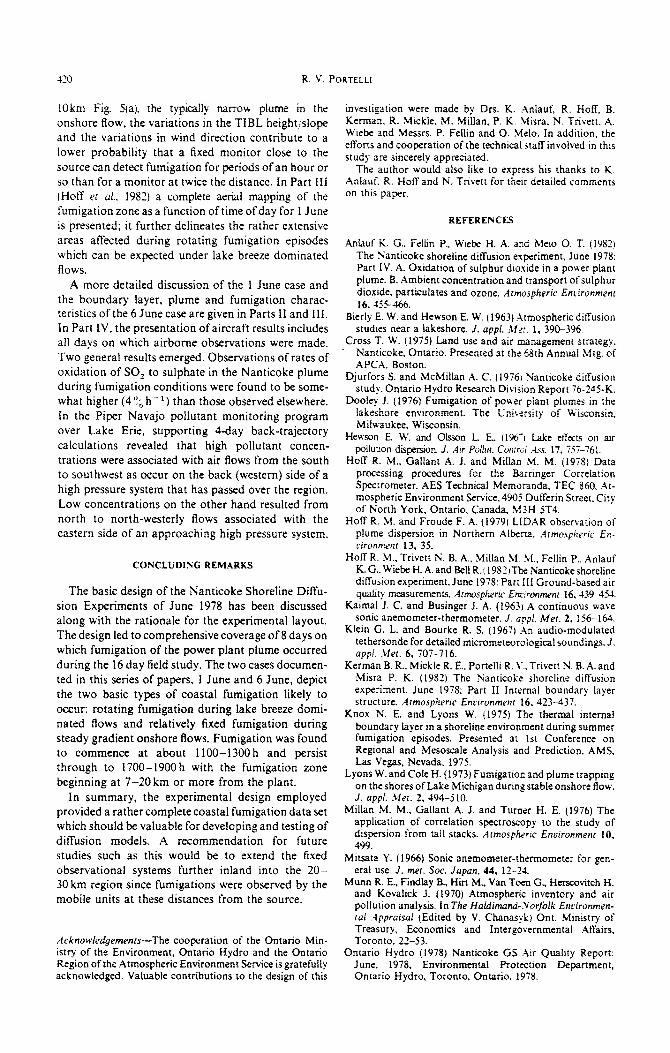
The hourly averaged SO, concentrations observed by the Ontario Hydro monitors, given in Table 1, exhibit the march of the fumigation zone on 1 June as the plume rotates through more than 50' during the day. By 1700 h, the TIBL had decayed to the point where the plume had decoupled almost completely from the surface layer. The monitoring station (identified for the purposes as here as) l-4 and 5-7, which have been ordered from W to E, are 15-17 km
Fig. 6. Approximate location of edges of plume aloft (observed by COSPEC) for times noted relative to site Ml
along W-E section of HWY 3 on 1 June 1978.
and 7-9 km from the plant, respectively (refer to Fig. 3). These results indicate that on an hourly average basis, the impact of fumigation on this day was much greater in the region beyond than within 10 km of the plant. Although intense fumigation does occur within
Table 1. 1 June, 1978 hourly averaged* SO, (ppb) at Ontario Hydro monitors
TIME (EDT) Stn. 10 11 12 13 14 15 16 17
1 12 11 87 243 21 5 6 9
2 6 10 7 -? 185 13 1 9
3 8 8 3 11 34 165 8 4 6 4 5 6 19 29 363 7:
5 6 22 53 5 1 0 0 2 6 9 7 9 6 12 6 1 0
7 5 1 0 0 -7i 6 62 7 -
l Average of preceding hour’s data.
420 R. V. PORTELLI
lOkm Fig. 5(a). the typicaiiy narrow plume in the onshore flow, the variations in the TIBL height/slope and the variations in wind direction contribute to a lower probability that a fixed monitor close to the source can detect fumigation for periods of an hour or so than for a monitor at twice the distance. In Part III (Hoff er n[., 1982) a complete aerial mapping of the fumigation zone as a function of time of day for 1 June is presented; it further delineates the rather extensive areas affected during rotating fumigation episodes which can be expected under lake breeze dominated Rows.
A more detailed discussion of the i June case and the boundary layer, plume and fumigation charac- teristics of the 6 June case are given in Parts II and III. In Part IV, the presentation of aircraft results includes all days on which airborne observations were made. Two general results emerged. Observations of rates of oxidation of SO, to sulphate in the Nanticoke plume during fumigation conditions were found to be some- what higher (4 o’, h- ‘) than those observed elsewhere. In the Piper Navajo pollutant monitoring program over Lake Erie, supporting 4-day back-trajectory calculations revealed that high pollutant concen- trations were associated with air flows from the south to southwest as occur on the back (western) side of a high pressure system that has passed over the region. Low concentrations on the other hand resulted from north to north-westerly flows associated with the eastern side of an approaching high pressure system.
CONCLUDING REMARKS
The basic design of the Nanticoke Shoreline Diffu- sion Experiments of June 1978 has been discussed along with the rationale for the experimental layout. The design led to comprehensive coverage of 8 days on which fumigation of the power plant plume occurred during the 16 day field study. The two cases documen- ted in this series of papers, 1 June and 6 June, depict the two basic types of coastal fumigation likely to occur: rotating fumigation during lake breeze domi- nated flows and relativety fixed fumigation during steady gradient onshore flows. Fumigation was found to commence at about 1100-1300 h and persist through to I700-19OOh with the fumigation zone beginning at 7-20 km or more from the plant.
In summary, the experimental design employed provided a rather complete coastal fumigation data set which should be valuable for developing and testing of diffusion models. A r~ommendation for future studies such as this would be to extend the fixed observational systems further inland into the 20- 30 km region since fumigations were observed by the mobile units at these distances from the source.
Acknowledgemenu-The cooperation of the Ontario Min- istry of the Environment, Ontario Hydro and the Ontario Region of the Atmosphe~c Environment Service is gratefully acknowledged. Valuable contributions to the design of this
investigation were made by Drs. K. Anlauf, R. Hoff, B. Kerman. R. Mickle. M. Millan, P. K. Misra. N. Trivett. A. Wiebe and Messrs. P. Fellin and 0. Melo. In addition, the efforts and cooperation of the technical staff involved in this study are sincerely appreciated.
The author would &so like to express his thanks to K. Anlauf. R. Hoff and N. Trivett for their detailed comments on this paper.
REFERENCES
Anlauf K. G.. Fe&n P.. Wiebe H. A. and Melo 0. T. (1982) The Wanticoke shoreline diffusion experiment, June 1978: Part IV. A. Oxidation of sulphur dioxide in a power plant plume. B. Ambient concentration and transport ofsulphur dioxide, particufates and ozone. rtrmospheric ~~riro~~enz 16.455-466.
Bierly E. W. and Hewson E. W. (1963) Atmospheric diffusion studies near a lakeshore. J. appl. Ms. 1, 390-396.
Cross T. W. (1975) Land use and air management strategy. Nanticoke, Ontario. Presented at the 68th Annual Mtg. of APCA, Boston.
Djurfors S. and McMillan A. C. (19761 Nanticoke diffusion study. Ontario Hydro Research DivGon Report 76-245-K.
Doolev J. (1976) Fumigation of Dower Dlant nlumes in the lakeihork environment. The ‘Uni*er\ity df Wtsconsin. Milu-aukee. Wisconsin.
Hewson E. W. and Olsson L E (196-l Lake effects on air polluuon disFrsion. J. Air Pulirrr. Cofliroi ;I.ss. 17. 757-761.
HoB R. IM., Gaflant A. J. and Millan .M. M. (1978) Data processing procedures for the Barringer Correlation Spectrometer. AES Technical Memoranda, TEC 860. At- mospheric Environment Service.4901 Dufferin Street. City of North York. Ontario. Canada, M3H 5T4.
Hoff R. 41. and Froude F. A. (1979) LiDAR observation of plume dispersion in Northern Albena. Atmo.+leric En- fironnwnt 13, 35.
Hoff R. >I.. Trivet1 N. B. A.. Millan M. ht., Fellin P.. Anlauf K. G.. Wiebe H. A. and Bell R. I 1982 tThe Nanticoke shoreline difiusion experiment. June 1978: Part III Ground-based air quality rn~~urernen~. ArmosphPric Enrironmenr 16,139X&.
Kaimal J. C. and Businger J. A. (1963) A continuous wase sonic anemometer-thermometer. J. uppl. &fer. 2. 156-164.
Klein G. L. and Bourke R. S. (1967) An audio-modulated tethersonde for detailed micrometeorological soundings. J. appi. Mer. 6, 707-716.
Kerman B. R.. Mickie R. E., Porte& R. V.. Trivett N. B.A. and Misra P. K. (19S2) The Nanticoke shoreline diffusion experiment. June 1978: Part II Internal boundary layer structure. Atmospheric Encironmrtzr 16. 423-437.
Knox N. E. and Lyons W. (1975) The thermal internal boundary layer in a shoreiine environment during summer fumigation episodes. Presented at 1st Conference on Regional and Mesoscale Analysis and Prediction, AMS, Las Vegas, Nevada, 1975.
Lyons W. and Cole H. (1973) Fumigation and plume trapping on the shores of Lake Michigan during stable onshore flow. J. uppI. .Mer. 2, 494-510.
Millan M. M.. Gallant A. J. and Turner H. E. (1976) The application of correlation spectroscopy 10 the study of dispersion from tail stacks. Atmosphzr~c E~~iro~~e~r 10. 499.
Mitsata Y. (1966) Sonic anemometer-thermometer for gen- eral use. J. met. Sot. Japan. 44, 12-24.
MUM R. E., Findlay B., Hirt M., Van Toen G., Herscovitch H. and Kovalick f. (1970) Atmospheric inventory and air pollution analysis. In The ~u~di~~-.~~r~o~k Enrironmen- tol Appraisal (Edited by V. Chanas)-k) Ont. Ministry of Treasury, Economics and Intergovernmental Affairs, Toronto, 22-53.
Ontario Hydro (1978) Nanticoke GS Air Quality Report: June. 1978. Environmental Protestion Department, Ontario Hydro, Toronto, Ontario, 1978.

The Nanticoke shoreline diffusion experiment, June 1978-L 421
Ontano Ministry of the Environment (1978) Ambient Air Survey in the Nanticoke Area, 1978. ARB-TDA report no. 54-78, Toronto, Ontario.
Portelli R. V. (1979) The Nanticoke study: experimental investigation of diffusion from tall stacks in a shoreline environment. Presented at the 10th NATOjCCMS In- ternational Technical Meeting on Air Pollution Modeling and its Application, Rome, Italy, Oct. 1979.
Portelli R. V. (1981) The Nanticoke shoreline diffusion experiment, June 1978: experimental data report. Report in preparation, Atmospheric Environmental Service, City of North York, Ontario.
Smithies W. R. (1975) Evaluation of air management stra- tegies for the Nanticoke development. Presented at the
68th Annual Mtg. of APCA. Boston. Turner H. E. and Markes J. (1974) A minisonde system for
atmospheric profiles. Report ARQT-l-74. Atmospheric Environment Service. 4905 Dufferin Street, Ctty of North York, Ontario, M3H 5T4.
Van der Hoven I. (1967) Atmospheric transport and diffusion at coastal sites. iVUCl. SajI 7. 49@499.
Weisman B. and Hirt M. (1975) Dtspersion governed by the thermal internal boundary layer. Presented at the 68th Annual Mtg. of the APCA, Boston.
Wyngaard J. C. (1978) An optical heat flux experiment: AMS. Proceedings of the Fourth Symposium on Meteorological Observations and Instrumentation held in Denver, Colorado.