
A Lithium Oxythioborosilicate Solid Electrolyte Glass with ...
Upload
independentCategory
view
0download
0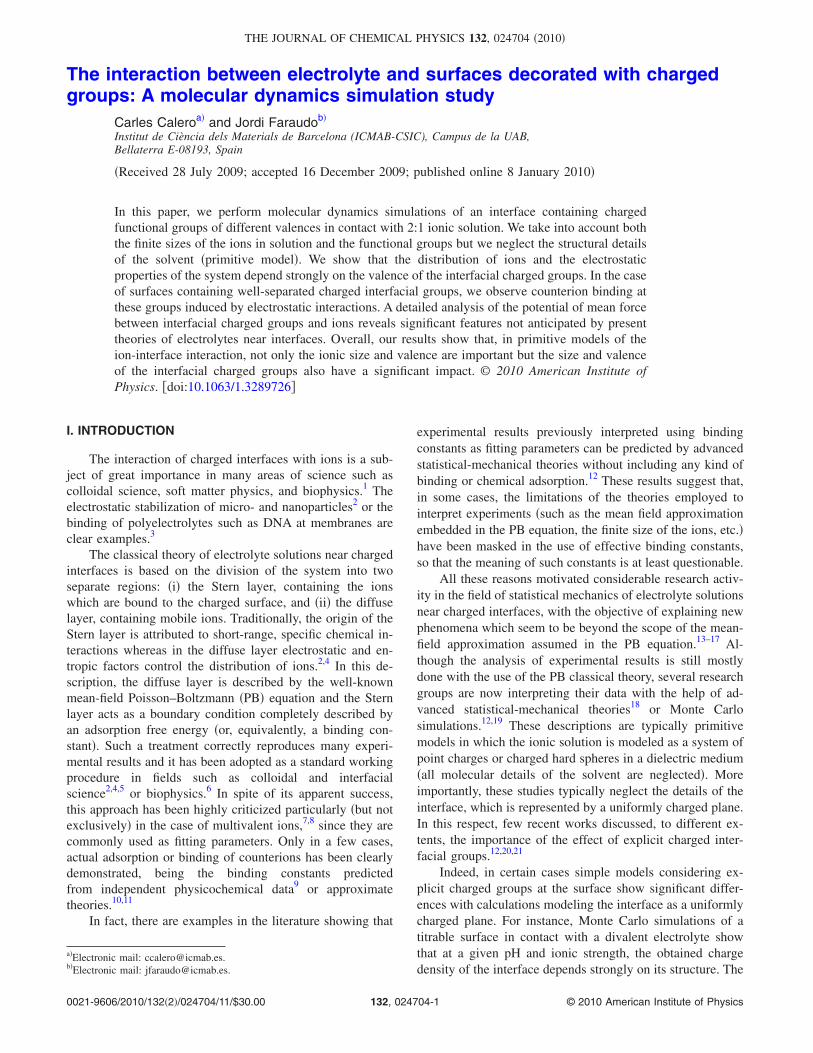
The interaction between electrolyte and surfaces decorated with chargedgroups: A molecular dynamics simulation study
Carles Caleroa� and Jordi Faraudob�
Institut de Ciència dels Materials de Barcelona (ICMAB-CSIC), Campus de la UAB,Bellaterra E-08193, Spain
�Received 28 July 2009; accepted 16 December 2009; published online 8 January 2010�
In this paper, we perform molecular dynamics simulations of an interface containing chargedfunctional groups of different valences in contact with 2:1 ionic solution. We take into account boththe finite sizes of the ions in solution and the functional groups but we neglect the structural detailsof the solvent �primitive model�. We show that the distribution of ions and the electrostaticproperties of the system depend strongly on the valence of the interfacial charged groups. In the caseof surfaces containing well-separated charged interfacial groups, we observe counterion binding atthese groups induced by electrostatic interactions. A detailed analysis of the potential of mean forcebetween interfacial charged groups and ions reveals significant features not anticipated by presenttheories of electrolytes near interfaces. Overall, our results show that, in primitive models of theion-interface interaction, not only the ionic size and valence are important but the size and valenceof the interfacial charged groups also have a significant impact. © 2010 American Institute ofPhysics. �doi:10.1063/1.3289726�
I. INTRODUCTION
The interaction of charged interfaces with ions is a sub-ject of great importance in many areas of science such ascolloidal science, soft matter physics, and biophysics.1 Theelectrostatic stabilization of micro- and nanoparticles2 or thebinding of polyelectrolytes such as DNA at membranes areclear examples.3
The classical theory of electrolyte solutions near chargedinterfaces is based on the division of the system into twoseparate regions: �i� the Stern layer, containing the ionswhich are bound to the charged surface, and �ii� the diffuselayer, containing mobile ions. Traditionally, the origin of theStern layer is attributed to short-range, specific chemical in-teractions whereas in the diffuse layer electrostatic and en-tropic factors control the distribution of ions.2,4 In this de-scription, the diffuse layer is described by the well-knownmean-field Poisson–Boltzmann �PB� equation and the Sternlayer acts as a boundary condition completely described byan adsorption free energy �or, equivalently, a binding con-stant�. Such a treatment correctly reproduces many experi-mental results and it has been adopted as a standard workingprocedure in fields such as colloidal and interfacialscience2,4,5 or biophysics.6 In spite of its apparent success,this approach has been highly criticized particularly �but notexclusively� in the case of multivalent ions,7,8 since they arecommonly used as fitting parameters. Only in a few cases,actual adsorption or binding of counterions has been clearlydemonstrated, being the binding constants predictedfrom independent physicochemical data9 or approximatetheories.10,11
In fact, there are examples in the literature showing that
experimental results previously interpreted using bindingconstants as fitting parameters can be predicted by advancedstatistical-mechanical theories without including any kind ofbinding or chemical adsorption.12 These results suggest that,in some cases, the limitations of the theories employed tointerpret experiments �such as the mean field approximationembedded in the PB equation, the finite size of the ions, etc.�have been masked in the use of effective binding constants,so that the meaning of such constants is at least questionable.
All these reasons motivated considerable research activ-ity in the field of statistical mechanics of electrolyte solutionsnear charged interfaces, with the objective of explaining newphenomena which seem to be beyond the scope of the mean-field approximation assumed in the PB equation.13–17 Al-though the analysis of experimental results is still mostlydone with the use of the PB classical theory, several researchgroups are now interpreting their data with the help of ad-vanced statistical-mechanical theories18 or Monte Carlosimulations.12,19 These descriptions are typically primitivemodels in which the ionic solution is modeled as a system ofpoint charges or charged hard spheres in a dielectric medium�all molecular details of the solvent are neglected�. Moreimportantly, these studies typically neglect the details of theinterface, which is represented by a uniformly charged plane.In this respect, few recent works discussed, to different ex-tents, the importance of the effect of explicit charged inter-facial groups.12,20,21
Indeed, in certain cases simple models considering ex-plicit charged groups at the surface show significant differ-ences with calculations modeling the interface as a uniformlycharged plane. For instance, Monte Carlo simulations of atitrable surface in contact with a divalent electrolyte showthat at a given pH and ionic strength, the obtained chargedensity of the interface depends strongly on its structure. The
a�Electronic mail: [email protected]�Electronic mail: [email protected].
THE JOURNAL OF CHEMICAL PHYSICS 132, 024704 �2010�
0021-9606/2010/132�2�/024704/11/$30.00 © 2010 American Institute of Physics132, 024704-1

charge density predicted by a model explicitly including in-terfacial charged groups of finite size is larger than that pre-dicted by a model considering surface point charges or auniformly charged surface.21 Also, recent molecular dynam-ics �MD� simulations of a realistic model with atomic reso-lution of silica nanochannels in contact with a divalentelectrolyte22 show that the explicit effect of interfacialcharged groups is important in the case of divalent cationssuch as Ca2+ or Mg2+. In particular, it is shown that divalentcations are electrostatically bound to interfacial silanolgroups, an important feature which cannot be resolved byusing models neglecting all details of the structure of theinterface. The electrostatic binding at the interface is evenmore pronounced in the case of interfaces containing multi-valent groups. A particularly interesting case is thedimiristoyl-phosphatidic acid phospholipid, which plays arelevant role in signaling processes in biological membranes.This phospholipid has a switchable charge �0, −1e, or −2e�in biological conditions, which is employed to bind divalentcations to membranes with a particularly high affinity.23
Even the case of interfaces containing charged groups withcharges as large as q=−4e is possible. This is the case forexample of the phosphatidylinositol 4,5-bisphosphate lipid�also known as PIP2�, a biologically active membrane lipidwhich has a charge between −2e and −4e depending on theenvironmental conditions.24 MD simulations of these com-plex systems11,23,24 suggest that the properties of the interfa-cial groups play an important role in the process of cationbinding �rather than the averaged surface charge density�.However, due to the complexity of the models with atomicresolution considered in these simulations, it is very difficultto disentangle this effect from other, more complex processessuch as hydrogen bonding, solvent effects, etc.
Our aim in this work is to analyze the electrostatic bind-ing of divalent cations to interfaces with explicit interfacialcharged groups using the simplest possible model. In thatway, we can complement previous theoretical works focusedon the analysis of very specific systems with atomic reso-lution. Our goal is to obtain more general properties of thesesystems rather than a detailed modeling of a particular, veryspecific system. We discuss in detail the relation between thepresence of explicit interfacial charged groups and the elec-trostatic binding of cations at the interface. We also analyzethe influence of the charge of explicit interfacial charges onthe average electrostatic properties of the system, discussingthe limitations of previous theories to describe this process.
The paper is organized as follows. In Sec. II, the modeland the technical details of the simulations are described indetail. In Sec. III, we analyze the interaction between ionsand the charged interfacial groups, discussing both static anddynamic aspects. In Sec. IV we discuss electrostatic proper-ties �mainly electrostatic potential profiles�. We end the paperin Sec. V with the conclusions.
II. MODEL AND SIMULATION METHODS
All the results presented in this paper are obtained fromMD simulations of a simple system of an interface contain-ing explicit charged groups in contact with 2:1 electrolyte.
We have chosen to perform MD simulations rather thanMonte Carlo simulations �more usual in this area of research�because MD simulations will allow us to obtain not onlyequilibrium properties but also an insight on dynamical as-pects, which are also relevant. In the following subsections,we will describe in detail the model considered and themethods employed to carry out the simulations and theiranalysis. The general reader, not interested in simulation de-tails, may perhaps skip this section and go directly to theresults presented in Sec. III.
A. Definition of the model
The model of the interface considered in this work isshown schematically in Fig. 1. The charged interface consistsof NI fixed discrete interfacial charges, qI, whose centers arelocated on the plane z=0 with x and y coordinates in thecorners of a two-dimensional square lattice of side a. Belowthese interfacial groups there is a perfectly reflecting impen-etrable wall emulating a solid substrate. The interface is incontact with a 2:1 electrolyte solution �counterions of charge+2e and coions of charge −e�. We consider the solvent�water� as a structureless dielectric medium with �r=78, as itis done in the so-called primitive model of electrolytes.25
The finite size of ions is also taken into account in theprimitive model of electrolytes. Typically, this is done byconsidering a hard-sphere interaction potential between ions,although the specific form of the interaction potential is notessential provided that it is a strongly repulsive potential
��
��
��
��
��
��
���
��
���
���
���
���
��� ���
��
��
FIG. 1. Top panel: cartoon of the model considered in our simulations. Thecharged interfacial groups are located on top of an impenetrable wall at theXY-plane. The charged surface is in contact with a 2:1 electrolyte in aqueoussolution located in the region z�0. Bottom panel: snapshot from actual MDsimulations with �0=−0.1 e /nm2 and qI=−2e. Black spheres represent in-terfacial groups with charge −1e, orange spheres are counterions withcharge 2e and white spheres are coions with charge −1e. The snapshot wasgenerated using the VMD software �Ref. 28�.
024704-2 C. Calero and J. Faraudo J. Chem. Phys. 132, 024704 �2010�

with an interaction range adjusted to the size of the ions. Inthis work, we will consider that each pair of particles i , j�being i an ion and j another ion or a fixed interfacial charge�separated a distance rij interacts with a Lennard-Jones inter-action with a cutoff at rij =�LJ,
u�rij� = 4����LJ
rij�12
− ��LJ
rij�6�, rij � �LJ. �1�
The interaction potential defined in this way is continuous atrij =�LJ and highly repulsive in all the domain where it isemployed �rij ��LJ�. In all our simulations we set the samevalues �LJ=3 Šand �=1 kJ /mol.26 We performed testsimulations of bulk 2:1 electrolyte comparing our simulationresults with those reported in Ref. 25 for the primitive modeland no differences were observed.
B. Simulation details
MD simulations in the canonical ensemble were carriedout with the LAMMPS �21 May 2008 version�27 package run-ning in the Centro de Supercomputación de Galicia�CESGA� supercomputing center. All the simulations wereperformed at room temperature �T=300 K� in the canonicalensemble using the Nose–Hoover thermostat, with a relax-ation constant of 0.5 ps. The mass of the ions was set to beequal to 20 g/mol for both coions and counterions �this valueis irrelevant for the equilibrium properties of the system,affecting only the dynamics�. The equations of motion weresolved with the help of the velocity Verlet algorithm employ-ing a timestep of 0.005 ps.
The simulation box contains a symmetric system con-sisting of two interfaces �modeled as described in the previ-ous subsection� located at z=0 and z=Lz containing NI fixedinterfacial groups of charge qI, N2+ counterions of charge 2e,and N− coions with charge −e. The overall system is neutral,so we have 2NIqI=2eN2+−eN−. The values of Lz are alwaysselected to be large enough so that any interaction betweenthe two interfaces is negligible and the central region of thesimulation box �of at least several nanometers� can be con-sidered as bulk electrolyte. All the results presented in thispaper will be symmetrized in the z-direction since the twocopies of the interface are equivalent, simply representingtwo states of the same system.
The values of N2+ and N− employed in each simulationwere selected in order to obtain the desired concentration cB
in this aforementioned central region in which the electrolyte
can be considered as bulk electrolyte. The exact values ofN2+ and N− needed to obtain a desired value cB are notknown a priori. They are determined in a series of trial anderror simulations in which these quantities were varied untilthe desired value of cB is obtained. The employed procedureis as follows. In each run, we compute the density profile ofboth counterions and coions as a function of z averaged overthe x and y directions. In the central region of the simulationbox, at large enough distances from both interfaces, the den-sity profiles of counterions and coions are constant �exceptfor very slight fluctuations� and related exactly by a factor of2 due to the charge asymmetry. Since the separation betweenthe two interfaces is always very large, this central region �ofseveral nm size� can be considered bulk electrolyte and itsaverage ion concentration is taken as cB. This method is notas costly as it might apparently seem, since our simulationsrun of this simplified model do not require computationalresources as big as those required in more realistic models.
Periodic boundary conditions were applied along the di-rections parallel to the interfaces �x- and y-directions�, butnot in the z-direction. The size of the simulation box in the xand y directions is assumed equal in all simulations and willbe denoted by L. In all our simulations, we will considerlarge values of L since the effects under study are essentiallyinterfacial rather than bulk effects, so that large areas areneeded in order to obtain good statistics. The electrostaticinteractions were computed using a version of the Ewaldsummation technique developed for interfacial systems,which takes into account both the periodicity in the x- andy-directions and the lack of periodic conditions in thez-direction. We found that the program works optimallywhen performing a significant part of the calculation of theelectrostatic interactions in the real space, so we employed acutoff of 8 nm.
We considered different simulation series in order to dis-cuss the effect of the relevant physical quantities �chargedensity, charge of interfacial groups, ion concentration�. Theparameters employed in all the simulations �charge and sepa-ration of the interfacial groups, number of particles, size ofsimulation box, etc.� are summarized in Tables I–III. Thefirst series �Table I� corresponds to four simulations withdifferent values of qI. The separation a between the interfa-cial groups was adjusted so that the bare surface charge den-sity, defined as
TABLE I. Parameters for the simulation series 1. These simulations correspond to the same bare surface chargedensity �0=−0.1 e /nm2 and electrolyte concentration cB=0.04M but different charge and surface numberdensity of interfacial groups. It can be checked that the electroneutrality condition, given by 2NIqI=2eN2+
−eN−, is satisfied.
qI
�e�a
�nm��0
�e /nm2�L
�nm�Lz
�nm� N2+ N− NI
cB
�M� T /�t
�0.1 1 �0.1 20 83 840 1600 400 0.04 1.5�106
�0.5 2.24 �0.1 44.8 35.8 1800 3200 400 0.04 0.4�106
�1 3.17 �0.1 47.5 7.1 500 550 225 0.04 0.5�106
�2 4.47 �0.1 67 9.3 1350 1800 225 0.04 0.5�106
024704-3 Ions at decorated interfaces J. Chem. Phys. 132, 024704 �2010�
�0 =qI
a2 = qINI
L2 , �2�
is maintained constant. Also, the number of ions N2+ and N−
was adjusted so that the bulk ion concentration cB is equal inall the simulations of series 1. A second series of simulations�see Table II� has been also performed with different valuesof the bulk concentration of ions �cB� and fixed values of �0
and qI. Finally, series 3 �Table III� corresponds to runs simi-lar to those of the series 1 or 2 but using a different valueof �0.
The equilibration time employed in our simulations de-pends on the different cases under study due to the verydifferent sizes of the simulation box and number of particlesconsidered. In any case, it was determined from observingthe stabilization of the different physical quantities relevantof the system. In all cases it was between 105 and 5�105
time steps. The number of time steps employed in the pro-duction runs was also different from case to case and wasdetermined by ensuring that the noise and fluctuations in thetime averaged physical quantities discussed in this workwere reduced as much as possible. The values employed ineach case are also given in Tables I–III. The total computa-tional time employed in the simulations of Tables I–III canbe estimated as 8�104 h.
III. PAIRING BETWEEN INTERFACIAL CHARGESAND COUNTERIONS
A. Correlations and potential of mean force
A first effect of having explicit charged groups at theinterface �instead of the uniformly charged plane usually
considered in theoretical studies� is the possibility of corre-lations between interfacial groups and ions. In the movie ofour simulations �see Ref. 29� it is easy to observe counteri-ons spending significant amounts of time in close contactwith interfacial groups. These correlations are also clearlyseen in the snapshot of Fig. 1. A quantitative description ofthis effect can be made by computing from the simulationsthe two particle correlation function g�2��r1 ,r2� between aninterfacial group at position r1 and a counterion at positionr2. Also, an alternative �but equivalent� view is obtained byinterpreting the correlations as due to an effective interactionbetween interfacial groups and cations originated by the so-called potential of mean force w�r1 ,r2�, defined by30
g�2��r1,r2� = exp− w�r1,r2�/kBT� . �3�
Several examples for the g�2��r1 ,r2� function computed fromsimulations are shown in Figs. 2 and 3. Overall, the resultsshow that there is a prominent peak near the separations ofclosest approach �3 Å� between the interfacial groups and thecounterions. The effect is stronger at larger values of qI andalso at larger �0, indicating the larger correlations betweeninterfacial groups and counterions induced by stronger elec-trostatic interactions. In all cases, the distribution of ionsaround interfacial charges has axial symmetry around theZ-axis, as it is clearly seen in the examples shown in Fig. 2.As can be observed in Figs. 2 and 3, correlations are signifi-cant only at a thin shell of 2–3 Å around the interfacialgroups and the function g�2� can be considered to dependonly on the separation r between counterions and interfacialgroups. Therefore, the potential of mean force can be con-sidered a function of the separation r= �r1−r2 � only,w�r1 ,r2� w�r�.
TABLE II. Parameters for the simulation series 2. These simulations correspond to the same bare surface chargedensity �0=−0.1 e /nm2 and the same charge of the interfacial groups �qI=−e� but different electrolyte con-centrations. It can be checked that the electroneutrality condition, given by 2NIqI=2eN2+−eN−, is satisfied.
qI
�e�a
�nm��0
�e /nm2�L
�nm�Lz
�nm� N2+ N− NI
cB
�M� T /�t
�1 3.17 �0.1 47.5 9.5 500 550 225 0.02 1�106
�1 3.17 �0.1 47.5 7.1 750 1050 225 0.06 1�106
�1 3.17 �0.1 47.5 7.1 1250 2050 225 0.1 1�106
�1 3.17 �0.1 47.5 7.1 2250 4050 225 0.21 1�106
�1 3.17 �0.1 47.5 8.1 3450 6450 225 0.3 0.5�106
�1 3.17 �0.1 47.5 14.2 9600 18 750 225 0.48 0.3�106
�1 3.17 �0.1 47.5 10.1 9600 18 750 225 0.65 0.5�106
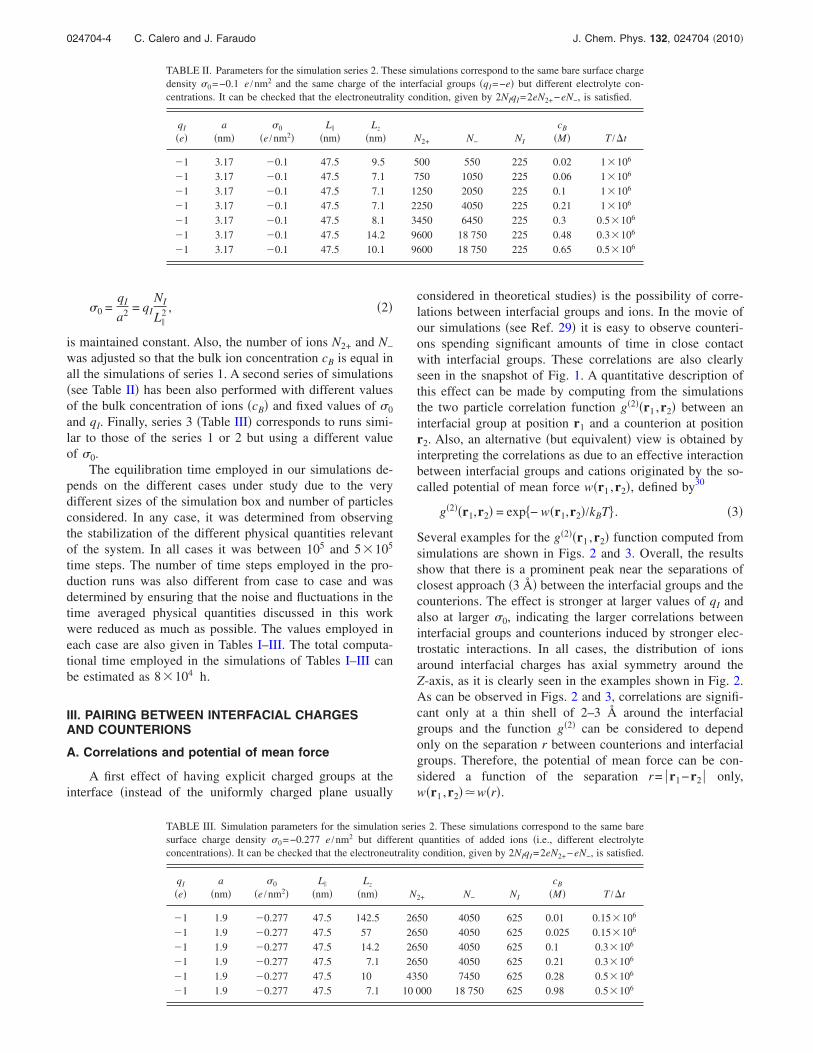
TABLE III. Simulation parameters for the simulation series 2. These simulations correspond to the same baresurface charge density �0=−0.277 e /nm2 but different quantities of added ions �i.e., different electrolyteconcentrations�. It can be checked that the electroneutrality condition, given by 2NIqI=2eN2+−eN−, is satisfied.
qI
�e�a
�nm��0
�e /nm2�L
�nm�Lz
�nm� N2+ N− NI
cB
�M� T /�t
�1 1.9 �0.277 47.5 142.5 2650 4050 625 0.01 0.15�106
�1 1.9 �0.277 47.5 57 2650 4050 625 0.025 0.15�106
�1 1.9 �0.277 47.5 14.2 2650 4050 625 0.1 0.3�106
�1 1.9 �0.277 47.5 7.1 2650 4050 625 0.21 0.3�106
�1 1.9 �0.277 47.5 10 4350 7450 625 0.28 0.5�106
�1 1.9 �0.277 47.5 7.1 10 000 18 750 625 0.98 0.5�106
024704-4 C. Calero and J. Faraudo J. Chem. Phys. 132, 024704 �2010�

Two illustrative examples for the potential of meanforce, computed from the simulations with the help ofEq. �3�, are shown in Fig. 4, corresponding to very differentconditions. In both cases, the values of �w�r�� at contact�r=3 Å� are larger than kBT, indicating a strong interactionbetween counterions and interfacial groups. However, thisinteraction decays rapidly; typically, �w�r�� decays below kBTfor distances of the order of 0.5 nm. We computed the decaydistance lkT, defined through w�lkT�=−kBT, for simulationswith �0=−0.1 e /nm2 �Table IV� and �0=−0.277 e /nm2
�Table V� as a function of electrolyte concentration �all thesecases correspond to qI=−e�. Let us recall that the typicaldecay distance for the potential of mean force is alwaysmuch smaller than one would naively expect. The typicallength scale of electrostatic interactions between oppositelycharged ions �of valences q+ and q−� in solution is given byq+q−lB, where lB=e2 /4��0�rkBT is the Bjerrum length
�around 0.71 nm in water at standard conditions�. In oursimulations, we obtain typical values of lkT between 4–6 Å,much smaller than the value �1.4 nm expected from theBjerrum length concept. It is also worth noting that lkT de-cays strongly with electrolyte concentration, an interestingfeature which is not accounted for in current theories of in-teraction between charged interfacial groups and ions.10
Interestingly, it is possible to obtain a simple analyticalfit for the potential of mean force w�r� valid for short sepa-rations between counterions and interfacial groups. Since inall our simulations the separations between interfacial groupsare an order of magnitude larger than the distances at whichw�r� is significant, we can assume that counterions interactwith effective interfacial entities consisting of charges ofvalue −eZI
eff and a background constant potential w0. In thisapproximation, we can write
FIG. 2. Projection of the distribution function g�2��r+ ,rI� on the plane of theinterface. �a� �0=−0.1 e /nm2, cB=0.02M, qI=−1e; �b� �0=−0.277 e /nm2,cB=0.28M, qI=−1e; �c� �0=−0.1 e /nm2, cB=0.48M, qI=−1e;�d� �0=−0.1 e /nm2, cB=0.04M, qI=−2e.
FIG. 3. Plot of the two particle correlation function g�2��r+ ,rI�between counterions and interfacial groups in cylindrical coordinatesRI+, z+ for different simulations. �a� �0=−0.1 e /nm2, cB=0.02M,qI=−1e; �b� �0=−0.277 e /nm2, cB=0.28M, qI=−1e;�c� �0=−0.1 e /nm2, cB=0.48M, qI=−1e; �d� �0=−0.1 e /nm2, cB=0.04M,qI=−2e.
−3
−2
−1
0
1
2 4 6 8 10 12 14 16
w(r
)/kT
r(Å)
(A)
−12.45/r + 1.45
−1.5
−1
−0.5
0
0.5
2 4 6 8 10 12 14 16
w(r
)/kT
r(Å)
(B)
−6.11/r + 0.42
−1.5
−1
−0.5
0
0.5
2 4 6 8 10 12 14 16
w(r
)/kT
r(Å)
(B)
−6.11/r + 0.42
FIG. 4. Potential of mean force as a function of the distance between theinterfacial charges and counterions for different cases. We also show thecomparison with a fit of the form given by Eq. �4� �see text for a discussion�.�a� Case with �0=−0.277 e /nm2, cB=0.21M, qI=−1e. �b� Case with�0=−0.1 e /nm2, cB=0.04M, qI=−0.5e.
TABLE IV. Dependence of the effective parameters ZIeff and w0 of the po-
tential of mean force �Eq. �4�� with the electrolyte concentration cB at fixedvalues of the bare surface charge ��0=−0.1 e /nm2� and charge of the inter-facial groups �qI=−1e�.
cB
�M�lkT
�Å� w0 e−w0 ZIeff
0.02 6.8 0.87 0.42 0.890.04 6.7 0.75 0.47 0.850.06 6.3 0.88 0.41 0.860.1 5.8 1.16 0.31 0.90.21 5.3 1.35 0.26 0.890.3 5.0 1.46 0.23 0.880.48 4.6 1.71 0.18 0.890.65 4.5 1.75 0.17 0.87
024704-5 Ions at decorated interfaces J. Chem. Phys. 132, 024704 �2010�
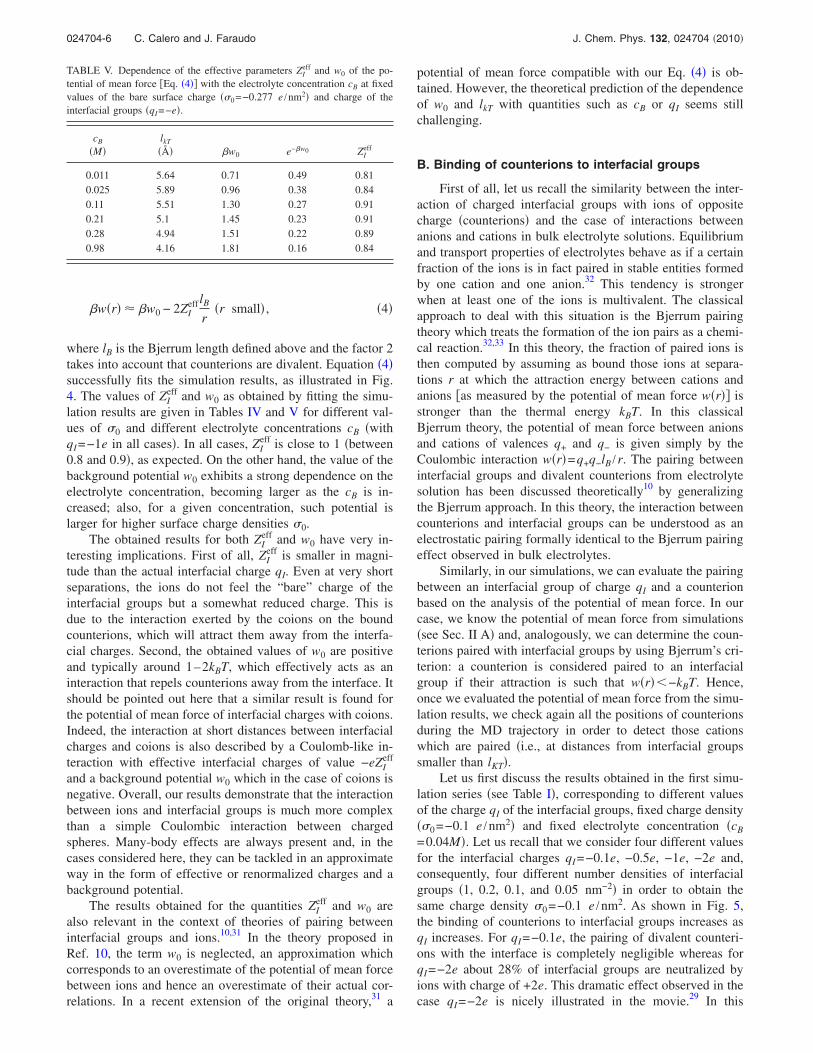
w�r� � w0 − 2ZIeff lB
r�r small� , �4�
where lB is the Bjerrum length defined above and the factor 2takes into account that counterions are divalent. Equation �4�successfully fits the simulation results, as illustrated in Fig.4. The values of ZI
eff and w0 as obtained by fitting the simu-lation results are given in Tables IV and V for different val-ues of �0 and different electrolyte concentrations cB �withqI=−1e in all cases�. In all cases, ZI
eff is close to 1 �between0.8 and 0.9�, as expected. On the other hand, the value of thebackground potential w0 exhibits a strong dependence on theelectrolyte concentration, becoming larger as the cB is in-creased; also, for a given concentration, such potential islarger for higher surface charge densities �0.
The obtained results for both ZIeff and w0 have very in-
teresting implications. First of all, ZIeff is smaller in magni-
tude than the actual interfacial charge qI. Even at very shortseparations, the ions do not feel the “bare” charge of theinterfacial groups but a somewhat reduced charge. This isdue to the interaction exerted by the coions on the boundcounterions, which will attract them away from the interfa-cial charges. Second, the obtained values of w0 are positiveand typically around 1–2kBT, which effectively acts as aninteraction that repels counterions away from the interface. Itshould be pointed out here that a similar result is found forthe potential of mean force of interfacial charges with coions.Indeed, the interaction at short distances between interfacialcharges and coions is also described by a Coulomb-like in-teraction with effective interfacial charges of value −eZI
eff
and a background potential w0 which in the case of coions isnegative. Overall, our results demonstrate that the interactionbetween ions and interfacial groups is much more complexthan a simple Coulombic interaction between chargedspheres. Many-body effects are always present and, in thecases considered here, they can be tackled in an approximateway in the form of effective or renormalized charges and abackground potential.
The results obtained for the quantities ZIeff and w0 are
also relevant in the context of theories of pairing betweeninterfacial groups and ions.10,31 In the theory proposed inRef. 10, the term w0 is neglected, an approximation whichcorresponds to an overestimate of the potential of mean forcebetween ions and hence an overestimate of their actual cor-relations. In a recent extension of the original theory,31 a
potential of mean force compatible with our Eq. �4� is ob-tained. However, the theoretical prediction of the dependenceof w0 and lkT with quantities such as cB or qI seems stillchallenging.
B. Binding of counterions to interfacial groups
First of all, let us recall the similarity between the inter-action of charged interfacial groups with ions of oppositecharge �counterions� and the case of interactions betweenanions and cations in bulk electrolyte solutions. Equilibriumand transport properties of electrolytes behave as if a certainfraction of the ions is in fact paired in stable entities formedby one cation and one anion.32 This tendency is strongerwhen at least one of the ions is multivalent. The classicalapproach to deal with this situation is the Bjerrum pairingtheory which treats the formation of the ion pairs as a chemi-cal reaction.32,33 In this theory, the fraction of paired ions isthen computed by assuming as bound those ions at separa-tions r at which the attraction energy between cations andanions �as measured by the potential of mean force w�r�� isstronger than the thermal energy kBT. In this classicalBjerrum theory, the potential of mean force between anionsand cations of valences q+ and q− is given simply by theCoulombic interaction w�r�=q+q−lB /r. The pairing betweeninterfacial groups and divalent counterions from electrolytesolution has been discussed theoretically10 by generalizingthe Bjerrum approach. In this theory, the interaction betweencounterions and interfacial groups can be understood as anelectrostatic pairing formally identical to the Bjerrum pairingeffect observed in bulk electrolytes.
Similarly, in our simulations, we can evaluate the pairingbetween an interfacial group of charge qI and a counterionbased on the analysis of the potential of mean force. In ourcase, we know the potential of mean force from simulations�see Sec. II A� and, analogously, we can determine the coun-terions paired with interfacial groups by using Bjerrum’s cri-terion: a counterion is considered paired to an interfacialgroup if their attraction is such that w�r��−kBT. Hence,once we evaluated the potential of mean force from the simu-lation results, we check again all the positions of counterionsduring the MD trajectory in order to detect those cationswhich are paired �i.e., at distances from interfacial groupssmaller than lKT�.
Let us first discuss the results obtained in the first simu-lation series �see Table I�, corresponding to different valuesof the charge qI of the interfacial groups, fixed charge density��0=−0.1 e /nm2� and fixed electrolyte concentration �cB
=0.04M�. Let us recall that we consider four different valuesfor the interfacial charges qI=−0.1e, −0.5e, −1e, −2e and,consequently, four different number densities of interfacialgroups �1, 0.2, 0.1, and 0.05 nm−2� in order to obtain thesame charge density �0=−0.1 e /nm2. As shown in Fig. 5,the binding of counterions to interfacial groups increases asqI increases. For qI=−0.1e, the pairing of divalent counteri-ons with the interface is completely negligible whereas forqI=−2e about 28% of interfacial groups are neutralized byions with charge of +2e. This dramatic effect observed in thecase qI=−2e is nicely illustrated in the movie.29 In this
TABLE V. Dependence of the effective parameters ZIeff and w0 of the po-
tential of mean force �Eq. �4�� with the electrolyte concentration cB at fixedvalues of the bare surface charge ��0=−0.277 e /nm2� and charge of theinterfacial groups �qI=−e�.
cB
�M�lkT
�Å� w0 e−w0 ZIeff
0.011 5.64 0.71 0.49 0.810.025 5.89 0.96 0.38 0.840.11 5.51 1.30 0.27 0.910.21 5.1 1.45 0.23 0.910.28 4.94 1.51 0.22 0.890.98 4.16 1.81 0.16 0.84
024704-6 C. Calero and J. Faraudo J. Chem. Phys. 132, 024704 �2010�

movie, it can be clearly seen how a large amount of counte-rions remains in close contact with the interfacial groupsmoving around them. An interesting conclusion of this analy-sis is that we expect that an interface with qI=−2e will be-have as effectively less charged than a surface with the samecharge density �0 but smaller qI �for example, it will gener-ate a smaller electrostatic potential, as we will see in the nextsection�. This is due to the fact that surfaces with higher qI
are more prone to pairing with counterions thereby reducingthe effective charge of the interface �i.e., the charge account-ing for all objects bound to the interface�. In the commonlyfound case of qI=−1e, we found that around 11% of interfa-cial groups are paired with divalent counterions, so we canestimate an apparent reduction of 22% in the interfacialcharge. These results demonstrate the existence of substantialeffects due to explicit charged groups at interfaces. Obvi-ously, these effects cannot be modeled by considering a uni-formly charged interface.
Let us now discuss how pairing or binding of counteri-ons depends on electrolyte concentration �the “adsorption”isotherm�. In Fig. 5 we show the results corresponding to the
number of paired counterions per interfacial group Nads /NI inthe cases �0=−0.1 e /nm2 and �0=−0.277 e /nm2 as a func-tion of electrolyte concentration �these results correspond tothe simulations with parameters in Tables II and III�. In allcases here, we consider the most commonly found case ofqI=−1e. The obtained binding isotherms are similar for bothcases, being the pairing always larger for larger �0 �at thesame electrolyte concentration cB�. It is not difficult to showthat the relation between the amount of paired counterionsand the bulk concentration can be understood as a kind ofLangmuir–Stern adsorption isotherm. The reasoning is asfollows. According to the Bjerrum criterion employed here toidentify paired counterions, the number of paired counterionscan be calculated formally by integration of the counteriondistribution from the distance of contact between interfacialgroups and counterions �denoted by r0, in our case r0=3 Å�and the distance lkT at which w�lkT�=−kBT,
Nads
NI= cB�
r0
lkT
2�g�2��r�r2dr = cB2��r0
lkT
e−w�r�/kBTr2dr .
�5�
Taking into account the approximation for the potential ofmean force w�r� given by Eq. �4� �which is an excellentapproximation within the integration limits appearing inEq. �5�� we obtain
Nads
NI= cBe−w0/kBTKI, �6�
where KI plays the role of a binding constant �expressed inunits inverse of those employed in the concentration cB�. It isgiven by
KI = 2�lkT3 �
1
lkT/r0 1
4e−2ZIefflB/lkTd . �7�
Typical values for KI obtained from Eq. �7� and the values inTables IV and V are around 3M−1 to 4M−1 �for example,using ZI
eff=0.9, lkT=0.5 nm, r0=0.3 nm, and lB=0.71 nm,we obtain KI=3.2M−1�. It should be noted that the factore−w0 appearing in Eq. �6� is always smaller than 1 in oursimulations, significantly reducing the transfer of counterionsto the interface expected from the binding constant KI. Infact, this factor decreases strongly with increasing concentra-tion, being around 0.2 for cB�0.2M �see Tables IV and V�.Hence, the product e−w0KI �which is what really governs thetransfer of counterions from bulk to the interface� decreasesfrom typical values around 1.5M−1 to 2M−1 for low concen-trations to values around 0.4M−1 to 0.6M−1 at high cB con-centrations.
It is interesting to compare our result, given by Eqs. �6�and �7�, with the classical, semiempirical Langmuir–Sternadsorption isotherm widely employed in colloid and surfacescience. In this Stern layer approximation, the coverage �due to binding of ions of charge q to an interface at surfacepotential �0 is given by
0
0.05
0.1
0.15
0.2
0.25
0.3
0 0.5 1 1.5 2
NB
ound
/NI
|qI| (e)
0.1
0.15
0.2
0.25
0.3
0.001 0.01 0.1 1
NB
ound
/NI
Electrolyte Concentration (M)
(a)
(b)
FIG. 5. Top panel: dependence of the number of counterions paired tointerfacial groups with the charge qI of the interfacial groups. The barecharge density of the interface is �0=−0.1 e /nm2 and the bulk concentra-tion of electrolyte is cB=0.04M. Bottom panel: dependence of the number ofcounterions paired to interfacial groups �of charge qI=−e� with the bulkconcentration of electrolyte obtained by MD simulations. Circles correspondto simulations with �0=−0.1 e /nm2 and the squares correspond to�0=−0.277 e /nm2.
024704-7 Ions at decorated interfaces J. Chem. Phys. 132, 024704 �2010�

� = cBe−q�0/kBTKads, �8�
where Kads is a binding constant usually interpreted as re-flecting the short-range chemical interactions between thesubstrate and the ions. Note that in this Langmuir-Sternmodel, �0 depends on electrolyte concentration cB and it istypically calculated employing the PB equation. The com-parison of our result, given by Eqs. �6� and �7�, with theclassical semiempirical description given by Eq. �8� is quitesuggestive. Both results have the same mathematical form,with the electrostatic pairing appearing in our simulationsplaying a role equivalent to that of short-range chemicalforces in the classical model. Also, the background potentialw0 appearing in the analysis of the simulations formallyplays the role of the surface potential of the classical theory.In our case, however, w0 contains the effect of ion-ion cor-relations and cannot be predicted from a simple mean-fieldtheory. Consequently, although the absolute value of the sur-face potential �0 typically decreases with increasing cB con-centration �due to electrostatic screening�, w0 increases withincreasing concentration, thereby slowing down binding ofcations.
C. Residence times in the paired state
The analysis developed so far gives a static view of theinteraction between counterions and interfacial groups. Ob-viously, the pairing process is dynamic and, after becomingpaired for some time, ions “desorb” and return to the elec-trolyte. In Fig. 7 we show the distribution of residence timesof counterions in the paired state for the case with �0=−0.1 e /nm2, cB=0.04M, and two different charges for theinterfacial groups �qI=−e and qI=−2e�. For the sake of com-parison, we also show the residence times of counterions indifferent regions, as shown in Fig. 6. Region 1 includes allthe counterions which are bound to the interfacial groups,i.e., all the counterions at a distance r from a interfacialgroup such that w�r��−kBT. This region is a spherical shellaround the interfacial groups with a radius given by lkT �re-call that examples of values of lkT for several cases are givenin Tables IV and V�. Regions 2 and 3 correspond to slabs ofwidth lkT parallel to the interface �and excluding region 1�.The histograms shown in Fig. 7 correspond to the probabilitydensity that a particle spends a time t in each region �all thehistograms have a bin of size 100 �t�. The results indicatethat the most likely events are the fast incursions in and outof a given region �tresidence�200�t�. However, for counteri-ons entering the shell surrounding the interfacial charges �re-gion 1� there is also a significant probability of dwelling
there for much longer times ��105�t�. This tail in the prob-ability density is caused by those counterions bound to theinterfacial charges which eventually escape due to collisionswith other counterions �nice examples of these collisions canbe seen in the movie�.29 The comparison of the results fordifferent regions shows that counterions bound to interfacialcharges stay longer times in region 1 than in regions 2 and 3.The behavior of counterions in regions 2 and 3 is very simi-lar, indicating that the effect of the interface in residencetimes is only relevant for bound ions. Also, the comparisonbetween Figs. 7�a� and 7�b� shows that the residence times ofbound ions are significantly longer for interfacial groupswith qI=−2e than for qI=−1e; this evidences the fact that thebinding of a counterion with an interfacial group withq=−2e is stronger than for the case qI=−1e.
IV. ELECTROSTATIC PROPERTIES
In this section we show that the electrostatic propertiesof the interface �for example, the profiles of ions or the elec-trostatic potential� may depend significantly on the charge qI
of the interfacial groups. We report results in which surfaceswith the same bare charge density �0 in contact with thesame electrolyte solution give rise to significantly differentionic profiles and electrostatic potentials depending on thevalue of the interfacial charge qI. This challenges the generalidea according to which such electrostatic properties areunivocally determined by the surface charge density of theinterface and the ion bulk concentration.
In order to simplify the discussion, we will focus on aparticular case with low surface charge density, fixed at thevalue of �0=−0.1 e /nm2 and fixed low bulk electrolyte con-
FIG. 6. Cartoon showing the different regions in which the system is di-vided in the analysis of residence times. Region 1 is a spherical shell ofradius lkT �see text� around the interfacial groups; regions 2 and 3 corre-spond to slabs of width lkT parallel to the interface �and excluding region 1�.
1e-07
1e-06
1e-05
0.0001
0.001
0.01
0 0.08 0.16 0.24 0.32
Pro
babi
lity
dens
ity
Number of timesteps (X 105)
(A)
qI =-1e
1e-07
1e-06
1e-05
0.0001
0.001
0.01
0 0.2 0.4 0.6 0.8
Pro
babi
lity
dens
ity
Number of timesteps (X 105)
(B)
qI =-2e
1e-07
1e-06
1e-05
0.0001
0.001
0.01
0 0.2 0.4 0.6 0.8
Pro
babi
lity
dens
ity
Number of timesteps (X 105)
(B)
qI =-2e
FIG. 7. Probability density vs the counterion residence time in the regionsurrounding the interfacial charges �solid line� and in several contiguouslayers parallel to the interface �first layer: dotted-dashed line; second layer:dashed line; third layer: dotted line�. Case �a� corresponds to the case with�0=−0.1 e /nm2, cB=0.04M, and qI=−1e. Case �b� corresponds to the casewith �0=−0.1 e /nm2, cB=0.04M, and qI=−2e.
024704-8 C. Calero and J. Faraudo J. Chem. Phys. 132, 024704 �2010�

centration �cB=0.04M�. The parameters employed in thesimulations are those given in Table I. The value of �0 em-ployed is of the same order of magnitude as the charge den-sities of most latex colloids �see for example the colloidsemployed in Ref. 9� but it is much smaller than that found inhighly charged systems such as silica/water interfaces12 orcertain phospholipid monolayers.23 It is also convenient tofocus our discussion to this low concentration situation �cB
=0.04M�, since it is an easier situation to interpret �note thatin the case of higher concentrations, bulk electrolyte solu-tions containing divalent ions may present significant non-ideal behavior�. After discussing in detail this example, wewill briefly discuss how the obtained results depend on dif-ferent choices for �0 and cB.
In Fig. 8, we show the charge density profiles + and −
due to counterions of charge +2e and coions of charge −e asa function of the coordinate perpendicular to the interface�z�, averaged over the parallel �x and y� coordinates. Notethat as z increases, the overall charge density � −+ +� ap-proaches neutrality, as expected �of course, the overall sys-tem is also neutral, with the differences in charge densitybetween anions and cations being compensated by the chargeof the interface, see Table I�. The density profiles corre-sponding to the cases qI=−0.1e and qI=−0.5e are almostidentical, revealing no effect of the discrete nature of inter-facial charged groups. The case qI=−1e shows small butnoticeable differences with the cases qI=−0.1e andqI=−0.5e and the case qI=−2e shows strong differences withthe other cases. Therefore, our simulation results show thatsurfaces with the same charge density ��0=−0.1 e /nm2� incontact with the same ionic solution originate different ionicdistributions, depending on qI.
From the results shown in Fig. 8, we may suspect thatthe electrostatic potential will also be different for surfaceswith the same charge density in contact with the same ionicsolution but different qI. In order to check this conjecture in
our simulations, we computed the average electrostatic po-tential V�z� from our simulation results, by integrating nu-merically the Poisson equation:
− �r�0d2V
dz2 = +�z� + −�z� , �9�
where +�z� and −�z� are the charge density profiles fromions shown in Fig. 8. The origin of potential was taken at thecenter of the simulation box, so that the bulk electrolyte is atV=0. The results, �shown in Fig. 9� demonstrate that electro-static potentials depend significantly on the charge of theinterfacial groups �recall that in all cases we have the samevalue of �0�. As �qI� increases, the electrostatic potential isless negative near the surface due to the higher pairing ofpositive ions with the negative interfacial groups �recall herethe results of Sec. III B�. For example, the magnitude of thepotential obtained near the surface in the case qI=−1e isabout 50% larger than that obtained in the case qI=−2e.Also, the electrostatic potential obtained in the caseqI=−0.1e is significantly more negative than the result ob-tained in the case qI=−1e. The results of Fig. 9 have a veryinteresting physical consequence; an interface with a surfacecharge density �0 arising from interfacial groups withqI=−2e behaves as effectively less charged than a surfacewith the same �0 arising from qI=−1e.
At this point, it is interesting to compare our simulationresults with the predictions of the classical PB equation, typi-cally employed to analyze electrostatic potentials in experi-ments. The PB equation for the case of 2:1 electrolyte reads
− �r�0d2VPB
dz2 = 2e exp�−2eVPB�z�
kBT� − e exp� eVPB�z�
kBT� .
�10�
Equation �10� has to be supplemented with the boundaryconditions VPB�z→��=0 and
0
0.04
0.08
0.12
0.16
0.2
5 10 15 20 25 30 35
|ρ+|,
|ρ−|
(e/n
m3 )
z (Å)
qI =−0.1e
0
0.04
0.08
0.12
0.16
0.2
5 10 15 20 25 30 35
|ρ+|,
|ρ−|(
e/nm
3 )
z (Å)
qI =−0.5e
0
0.04
0.08
0.12
0.16
0.2
5 10 15 20 25 30 35
|ρ+|,
|ρ−|(
e/nm
3 )
z (Å)
qI =−1e
0
0.04
0.08
0.12
0.16
0.2
5 10 15 20 25 30 35
|ρ+|,
|ρ−|(
e/nm
3 )
z (Å)
qI =−2e
0
0.04
0.08
0.12
0.16
0.2
5 10 15 20 25 30 35
|ρ+|,
|ρ−|(
e/nm
3 )
z (Å)
qI =−2e
FIG. 8. Absolute value of the charge density profiles �in e /nm3� of coions� −�z� dashed lines� and counterions � +�z� solid lines� for the simulationswith �0=−0.1 e /nm2 and cB=0.04M. Each panel corresponds to differentcharges and separations between interfacial groups, all corresponding to thesame charge density of �0=−0.1 e /nm2. From left to right and top tobottom, we have qI=−0.1e, qI=−0.5e, qI=−1e, and qI=−2e.
−20
−15
−10
−5
0
0 5 10 15 20 25 30 35 40
V(m
V)
z (Å)
MD qI = −0.1eMD qI = −0.5e
MD qI = −1eMD qI = −2e
FIG. 9. Electrostatic potential �mV� as a function of the distance to theinterface z �Å� for series 1, with �0=−0.1 e /nm2, cB=0.04M, and differentvalues of the interfacial charge qI. Circles correspond to the results calcu-lated from MD simulations. Solid lines are the profiles obtained by using thePB equation supplemented by the boundary condition of four differenteffective charges.
024704-9 Ions at decorated interfaces J. Chem. Phys. 132, 024704 �2010�

− �r�0dVPB
dz�z = 0� = � . �11�
In the classical theory, � includes both bound ions and thebare charge of the interface2 �the so-called Stern layer ap-proximation�,
� = �0�1 −2e
�qI�Nads
NI� . �12�
In the experimental practice, the unknown ratio of adsorbedcations Nads /NI is related to cB by postulating an adsorptionisotherm of some form �e.g., a Langmuir isotherm�.2 In ourpresent case, the most physically transparent option is toconsider directly the values of Nads /NI determined in Sec.III B �see Fig. 5�. In Fig. 9 we show the results obtained bynumerical solution of Eqs. �10�–�12� using the MATHEMATICA
6.0�R� software. Interestingly, the PB equation describeswith good approximation the decay of the electrostatic po-tential. Conversely, our results imply that if the electrostaticpotential profile is known, the classical approach based onthe use of the PB equation with a surface charge density � asa fitting parameter correctly estimates the actual charge ofthe interface and therefore the amount of adsorbed counteri-ons. It has to be emphasized that, in this particular case, thebulk concentration of ions is small and deviations from PB infact occur at larger electrolyte concentrations. In Fig. 10 weshow both the simulation results and the calculations result-ing from Eqs. �10�–�12� in the case qI=−1e, cB=0.1M, andtwo different values of �0. In both cases �see Fig. 10�, the PBequation is unable to reproduce correctly the obtained elec-trostatic potential. In other words, given these electrostaticpotential profiles, the classical approach cannot be employedto determine the surface charge density and the amount ofcounterions adsorbed at the interface, even in a situation withsmall bare surface charge density. This result is not unex-pected, since it is well known that the PB equation is suitableto describe the bulk behavior of 2:1 electrolyte solutions onlyat very low concentrations.25 Even at moderate concentra-tions, strong ion-ion correlations cause strong deviations
from the mean-field approximation assumed in the PB equa-tion. Hence, deviations from PB must be expected in thecases considered in Fig. 10 and the classical approach is notsuitable for the determination of the charge density of theinterface.
V. CONCLUSIONS
In this work, we studied via MD simulations systemsconsisting of an interface charged by discrete groups in con-tact with a 2:1 ionic solution. We employed a primitivemodel for the electrolyte, in which the solvent is a structure-less medium characterized by its dielectric constant and thecharges �including the interfacial groups� are modeled ascharged spheres.
One of the most striking conclusions from our work isthat important physical quantities such as the electrostaticpotential show a strong dependence on the way the electriccharge is distributed on the charged surface. Indeed, we ob-tain that, for the same surface charge density of the interface�0 and bulk concentration of the electrolyte cB, both the den-sity and the electrostatic potential profiles exhibit significantdifferences for different values of the charge of the interfa-cial groups qI �see Fig. 9�. Of course, these effects cannot bereproduced by usual theories of electrified interfaces, whichtypically assume the approximation of a uniformly chargedsurface.
We have been able to explain such a dependence of thesystem’s properties on the surface nanostructure by makinguse of the notion of binding between counterions and inter-facial charges, in analogy to the Bjerrum pairing theory ofelectrolyte solutions. We computed the potential of meanforce w�r� between counterions and interfacial charges fromthe simulations results and considered bound those counteri-ons with attraction energies greater than kBT. We found thatelectrostatic correlations between explicit interfacial groupsand counterions induce significant structural pairing associ-ated also with long residence times of ions near the interfa-cial groups. Interestingly, as qI increases �maintaining �0
fixed�, the number of bound counterions increases so thesurface become effectively less charged.
Remarkably, once the number of adsorbed counterions isdetermined, the PB equation successfully reproduces theelectrostatic potential profiles mentioned above in the case oflow surface charge density and low electrolyte concentration.In a more general context, our findings suggest that, if theelectrostatic potential is known �from experiments or simu-lations�, the classical approach based on the use of the PBequation and a Stern layer can be employed to correctly de-duce the amount of adsorbed counterions. However, at largerelectrolyte concentrations �0.1M�, deviations from PB equa-tion are found due to the lack of ideality in the bulk behaviorof 2:1 electrolyte at these concentrations.
Also, we have been able to obtain a highly suggestiveanalytical approximation for the potential of mean force atshort separations between counterions and interfacial groups.It contains two terms: a Coulomb-like form with an effectiveinterfacial charge slightly smaller than the actual one and aconstant background potential acting against the binding of
−25
−20
−15
−10
−5
0
0 5 10 15 20 25 30 35 40
V(m
V)
z (Å)
σ0 =−0.277e/nm2
σ0 = −0.1e/nm2
FIG. 10. Average electrostatic potential �mV� for qI=−1e, cB=0.1M, and�0=−0.1 e /nm2, −0.277 e /nm2. Circles correspond to the results calcu-lated from MD simulations. Solid lines are the profiles obtained by using thePB equation supplemented by the boundary condition of effective interfacialcharge �see text�.
024704-10 C. Calero and J. Faraudo J. Chem. Phys. 132, 024704 �2010�

counterions to the interfacial groups. In contrast with the firstterm, it describes a many body interaction with the rest of thesystem, as evidenced by its strong dependency on the elec-trolyte concentration cB. Efforts to theoretically predict themagnitude of this background potential are under way.31
Finally, we would like to emphasize that some care hasto be taken in extrapolating our results �obtained in a simpli-fied primitive model� to real systems in which solvent-related effects could be relevant. Of course, our model ap-plies only to situations in which hydration effects orhydrophobic interactions are not essential. For example,Monte Carlo simulations of primitive models in the samespirit as the one described here successfully predict the prop-erties of systems such as silica nanochannels.12 However, inother cases, primitive models are unable to provide even aqualitative description of electrostatic interactions. This isthe case of very thin soap films, in which the anomalousdielectric behavior of interfacial water34 induces a hydrationforce of electrostatic origin which cannot be described byprimitive models.35
ACKNOWLEDGMENTS
The authors acknowledge endless useful discussionswith A. Travesset �Iowa State University, US�. We also ac-knowledge discussions with S. Madurga during the RICI IIIconference �July 2009, Granada, Spain�. This work is sup-ported by the Spanish Government �Grant No. FIS2009-13370-C02-02� and Generalitat de Catalunya �Grant No.2009SGR164�. C.C. is supported by the JAE-doc program ofthe Spanish National Research Council �CSIC�. We acknowl-edge computer resources and technical assistance providedby the CESGA Supercomputing Center.
1 Electrostatic Effects in Soft Matter and Biophysics, NATO Science Series�Mathematics, Physics and Chemistry� Vol. 46, edited by C. Holm, P.Kekicheff, and R. Podgornik �Springer, Berlin, 2001�.
2 J. Lyklema, Fundamentals of Interface and Colloid Science �Academic,New York, 1991�, Vol. 2.
3 W. M. Gelbart, R. F. Bruinsma, P. A. Pincus, and V. A. Parsegian, Phys.Today 53, 38 �2000�.
4 R. J. Hunter, Zeta Potential in Colloid Science, 3rd ed. �Academic,New York, 1988�.
5 J. M. Bloch and W. Yun, Phys. Rev. A 41, 844 �1990�.
6 S. McLaughlin, Annu. Rev. Biophys. Biophys. Chem. 18, 113 �1989�;G. Cevc, Biochim. Biophys. Acta 1031, 311 �1990�.
7 J. Lyklema, Colloids Surf., A 291, 3 �2006�.8 J. Lyklema, Adv. Colloid Interface Sci. 147–148, 205 �2009�.9 A. Martín-Molina, C. Calero, J. Faraudo, M. Quesada-Pérez, A. Traves-set, and R. Hidalgo-Álvarez, Soft Matter 5, 1350 �2009�.
10 A. Travesset and D. Vaknin, Europhys. Lett. 74, 181 �2006�.11 J. Faraudo and A. Travesset, J. Phys. Chem. C 111, 987 �2007�.12 C. Labbez, B. Jönsson, M. Skarba, and M. Borkovec, Langmuir 25, 7209
�2009�.13 R. Kjellander, T. Åkesson, B. Jönson, and S. Marcelja, J. Chem. Phys.
97, 1424 �1992�.14 Y. S. Jho, M. Kanduc, A. Naji, R. Podjornik, M. W. Kim, and P. A.
Pincus, Phys. Rev. Lett. 101, 188101 �2008�.15 Y. Levin, Rep. Prog. Phys. 65, 1577 �2002�.16 R. R. Netz, Eur. Phys. J. E 5, 557 �2001�; H. Boroudjerdi, Y.-W. Kim, A.
Naji, R. R. Netz, X. Schlagberger, and A. Serr, Phys. Rep. 416, 129�2005�.
17 B. I. Shklovskii, Phys. Rev. E 60, 5802 �1999�; A. Y. Grosberg, T. T.Nguyen, and B. I. Shklovskii, Rev. Mod. Phys. 74, 329 �2002�.
18 A. Martín-Molina, M. Quesada-Pérez, F. Galisteo-González, and R.Hidalgo-Álvarez, J. Phys. Chem. B 106, 6881 �2002�; J. Chem. Phys.118, 4183 �2003�.
19 A. Martín-Molina, J. A. Maroto-Centeno, R. Hidalgo-Álvarez, and M.Quesada-Pérez, Colloids Surf., A 319, 103 �2008�.
20 S. Madurga, A. Martín-Molina, E. Vilaseca, F. Mas, and M. Quesada-Pérez, J. Chem. Phys. 126, 234703 �2007�.
21 S. Madurga, J. L. Garcés, E. Companys, C. Rey-Castro, J. Salvador, J.Galceran, E. Vilaseca, J. Puy, and F. Mas, Theor. Chem. Acc. 123, 127�2009�.
22 C. D. Lorenz and A. Travesset, Phys. Rev. E 75, 061202 �2007�; C. D.Lorenz, P. S. Crozier, J. A. Anderson, and A. Travesset, J. Phys Chem. C112, 10222 �2008�.
23 J. Faraudo and A. Travesset, Biophys. J. 92, 2806 �2007�.24 C. D. Lorenz, J. Faraudo, and A. Travesset, Langmuir 24, 1654 �2008�.25 R. Kjellander, Colloid J. 69, 20 �2007�.26 Tests using other values for �LJ were done which assured that the results
obtained discussed below do not depend on the value of such parameter�if it is within a reasonable range�.
27 S. J. Plimpton, J. Comput. Phys. 117, 1 �1995�.28 W. Humphrey, A. Dalke, and D. J. Schulten, J. Mol. Graphics 14.1, 33
�1996�.29 See supplementary material at http://dx.doi.org/10.1063/1.3289726 for a
movie of the simulations.30 J. P. Hansen and I. R. McDonald, Theory of Simple Liquids �Academic,
London, 1986�.31 A. Travesset and S. Vangaveti, J. Chem. Phys. 131, 185102 �2009�.32 R. A. Robinson and R. H. Stokes, Electrolyte Solutions �Dover, New
York, 1959�.33 M. E. Fisher and D. M. Zuckerman, J. Chem. Phys. 109, 7961 �1998�; D.
M. Zuckerman, M. E. Fisher, and B. P. Lee, Phys. Rev. E 56, 6569�1997�.
34 J. Faraudo and F. Bresme, Phys. Rev. Lett. 92, 236102 �2004�.35 J. Faraudo and F. Bresme, Phys. Rev. Lett. 94, 077802 �2005�.
024704-11 Ions at decorated interfaces J. Chem. Phys. 132, 024704 �2010�
Copyright © 2022 FDOKUMEN