Effectiveness of impedance parameters for muscle quality ...
Upload
univ-lemansCategory
view
0download
0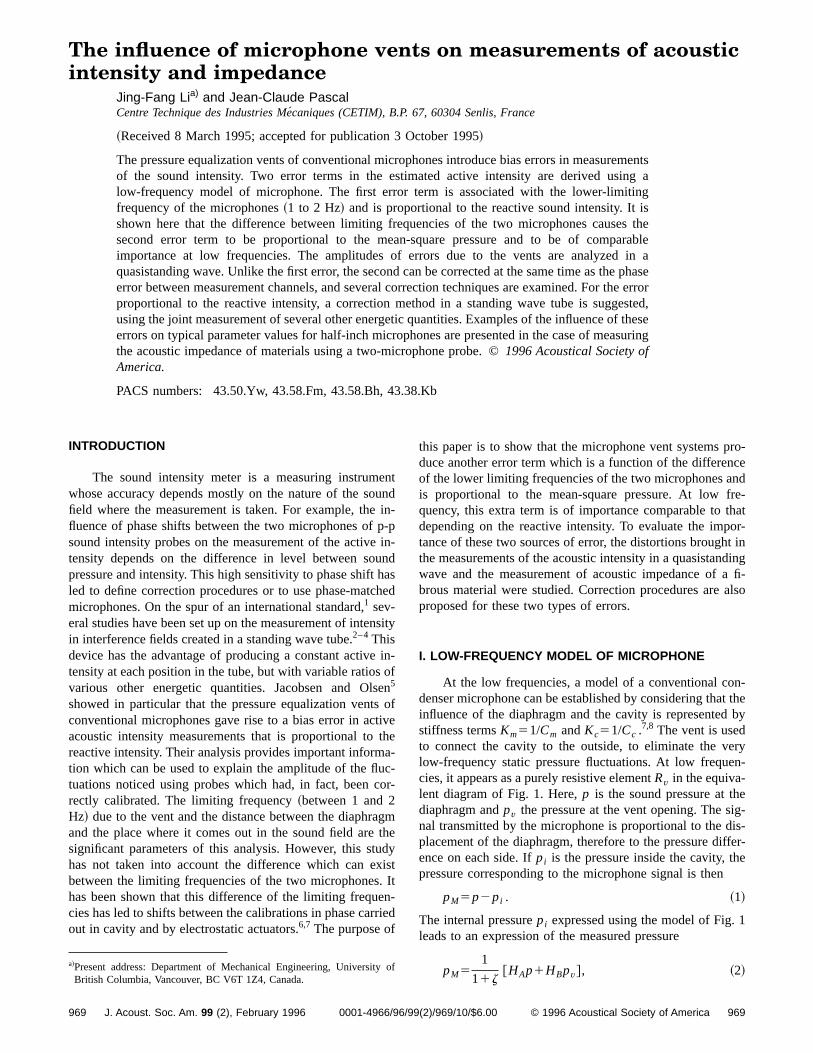
The influence of microphone vents on measurements of acousticintensity and impedance
Jing-Fang Lia) and Jean-Claude PascalCentre Technique des Industries Me´caniques (CETIM), B.P. 67, 60304 Senlis, France
~Received 8 March 1995; accepted for publication 3 October 1995!
The pressure equalization vents of conventional microphones introduce bias errors in measurementsof the sound intensity. Two error terms in the estimated active intensity are derived using alow-frequency model of microphone. The first error term is associated with the lower-limitingfrequency of the microphones~1 to 2 Hz! and is proportional to the reactive sound intensity. It isshown here that the difference between limiting frequencies of the two microphones causes thesecond error term to be proportional to the mean-square pressure and to be of comparableimportance at low frequencies. The amplitudes of errors due to the vents are analyzed in aquasistanding wave. Unlike the first error, the second can be corrected at the same time as the phaseerror between measurement channels, and several correction techniques are examined. For the errorproportional to the reactive intensity, a correction method in a standing wave tube is suggested,using the joint measurement of several other energetic quantities. Examples of the influence of theseerrors on typical parameter values for half-inch microphones are presented in the case of measuringthe acoustic impedance of materials using a two-microphone probe. ©1996 Acoustical Society ofAmerica.
PACS numbers: 43.50.Yw, 43.58.Fm, 43.58.Bh, 43.38.Kb
eou
peuhch
n
eosestitaucco
atudx.enrr
y
INTRODUCTION
The sound intensity meter is a measuring instrumwhose accuracy depends mostly on the nature of the sfield where the measurement is taken. For example, thefluence of phase shifts between the two microphones ofsound intensity probes on the measurement of the activtensity depends on the difference in level between sopressure and intensity. This high sensitivity to phase shiftled to define correction procedures or to use phase-matmicrophones. On the spur of an international standard,1 sev-eral studies have been set up on the measurement of intein interference fields created in a standing wave tube.2–4Thisdevice has the advantage of producing a constant activtensity at each position in the tube, but with variable ratiosvarious other energetic quantities. Jacobsen and Ol5
showed in particular that the pressure equalization ventconventional microphones gave rise to a bias error in acacoustic intensity measurements that is proportional toreactive intensity. Their analysis provides important informtion which can be used to explain the amplitude of the fltuations noticed using probes which had, in fact, beenrectly calibrated. The limiting frequency~between 1 and 2Hz! due to the vent and the distance between the diaphrand the place where it comes out in the sound field aresignificant parameters of this analysis. However, this sthas not taken into account the difference which can ebetween the limiting frequencies of the two microphoneshas been shown that this difference of the limiting frequcies has led to shifts between the calibrations in phase caout in cavity and by electrostatic actuators.6,7 The purpose of
a!Present address: Department of Mechanical Engineering, UniversitBritish Columbia, Vancouver, BC V6T 1Z4, Canada.
969 J. Acoust. Soc. Am. 99 (2), February 1996 0001-4966/96/9
ntndin--pin-ndased
sity
in-fnofvehe--r-
gmheyistIt-ied
this paper is to show that the microphone vent systems pro-duce another error term which is a function of the differenceof the lower limiting frequencies of the two microphones andis proportional to the mean-square pressure. At low fre-quency, this extra term is of importance comparable to thatdepending on the reactive intensity. To evaluate the impor-tance of these two sources of error, the distortions brought inthe measurements of the acoustic intensity in a quasistandingwave and the measurement of acoustic impedance of a fi-brous material were studied. Correction procedures are alsoproposed for these two types of errors.
I. LOW-FREQUENCY MODEL OF MICROPHONE
At the low frequencies, a model of a conventional con-denser microphone can be established by considering that theinfluence of the diaphragm and the cavity is represented bystiffness termsKm51/Cm andKc51/Cc .
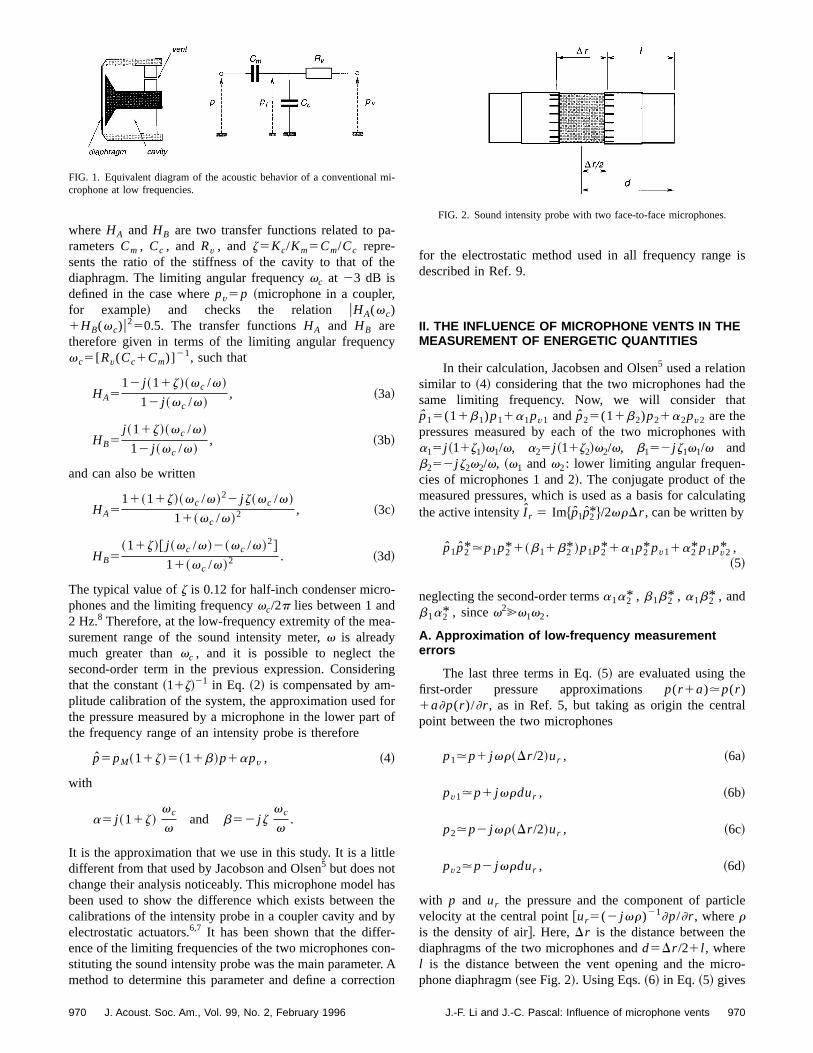
7,8 The vent is usedto connect the cavity to the outside, to eliminate the verylow-frequency static pressure fluctuations. At low frequen-cies, it appears as a purely resistive elementRv in the equiva-lent diagram of Fig. 1. Here,p is the sound pressure at thediaphragm andpv the pressure at the vent opening. The sig-nal transmitted by the microphone is proportional to the dis-placement of the diaphragm, therefore to the pressure differ-ence on each side. Ifpi is the pressure inside the cavity, thepressure corresponding to the microphone signal is then
pM5p2pi . ~1!
The internal pressurepi expressed using the model of Fig. 1leads to an expression of the measured pressure
pM51
11z@HAp1HBpv#, ~2!of
9699(2)/969/10/$6.00 © 1996 Acoustical Society of America
a
th
,
c
-
a
eri-fort
tle
htbr-onrt
m
whereHA andHB are two transfer functions related to prametersCm , Cc , andRv , and z5Kc/Km5Cm/Cc repre-sents the ratio of the stiffness of the cavity to that ofdiaphragm. The limiting angular frequencyvc at 23 dB isdefined in the case wherepv5p ~microphone in a couplerfor example! and checks the relation uHA(vc)1HB(vc)u
250.5. The transfer functionsHA and HB aretherefore given in terms of the limiting angular frequenvc5[Rv(Cc1Cm)]
21, such that
HA512 j ~11z!~vc /v!
12 j ~vc /v!, ~3a!
HB5j ~11z!~vc /v!
12 j ~vc /v!, ~3b!
and can also be written
HA511~11z!~vc /v!22 j z~vc /v!
11~vc /v!2, ~3c!
HB5~11z!@ j ~vc /v!2~vc /v!2#
11~vc /v!2. ~3d!
The typical value ofz is 0.12 for half-inch condenser microphones and the limiting frequencyvc/2p lies between 1 and2 Hz.8 Therefore, at the low-frequency extremity of the mesurement range of the sound intensity meter,v is alreadymuch greater thanvc , and it is possible to neglect thsecond-order term in the previous expression. Considethat the constant~11z!21 in Eq. ~2! is compensated by amplitude calibration of the system, the approximation usedthe pressure measured by a microphone in the lower pathe frequency range of an intensity probe is therefore
p5pM~11z!5~11b!p1apv , ~4!
with
a5 j ~11z!vc
vand b52 j z
vc
v.
It is the approximation that we use in this study. It is a litdifferent from that used by Jacobson and Olsen5 but does notchange their analysis noticeably. This microphone modelbeen used to show the difference which exists betweencalibrations of the intensity probe in a coupler cavity andelectrostatic actuators.6,7 It has been shown that the diffeence of the limiting frequencies of the two microphones cstituting the sound intensity probe was the main parametemethod to determine this parameter and define a correc
FIG. 1. Equivalent diagram of the acoustic behavior of a conventionalcrophone at low frequencies.
970 J. Acoust. Soc. Am., Vol. 99, No. 2, February 1996
-
e
y
-
ng
rof
ashey
-. Aion
for the electrostatic method used in all frequency range isdescribed in Ref. 9.
II. THE INFLUENCE OF MICROPHONE VENTS IN THEMEASUREMENT OF ENERGETIC QUANTITIES
In their calculation, Jacobsen and Olsen5 used a relationsimilar to ~4! considering that the two microphones had thesame limiting frequency. Now, we will consider thatp15(11b1)p11a1pv1 and p25(11b2)p21a2pv2 are thepressures measured by each of the two microphones witha15j ~11z1!v1/v, a25j ~11z2!v2/v, b152j z1v1/v andb252j z2v2/v, ~v1 andv2: lower limiting angular frequen-cies of microphones 1 and 2!. The conjugate product of themeasured pressures, which is used as a basis for calculatingthe active intensityI r 5 Im$p1p2* %/2vrDr , can be written by
p1p2*.p1p2*1~b11b2* !p1p2*1a1p2* pv11a2* p1pv2* ,~5!
neglecting the second-order termsa1a2* , b1b2* , a1b2* , andb1a2* , sincev2@v1v2.
A. Approximation of low-frequency measurementerrors
The last three terms in Eq.~5! are evaluated using thefirst-order pressure approximations p(r1a).p(r )1a]p(r )/]r , as in Ref. 5, but taking as origin the centralpoint between the two microphones
p1.p1 jvr~Dr /2!ur , ~6a!
pv1.p1 jvrdur , ~6b!
p2.p2 jvr~Dr /2!ur , ~6c!
pv2.p2 jvrdur , ~6d!
with p and ur the pressure and the component of particlevelocity at the central point@ur5(2 jvr)21]p/]r , whereris the density of air#. Here,Dr is the distance between thediaphragms of the two microphones andd5Dr /21 l , wherel is the distance between the vent opening and the micro-phone diaphragm~see Fig. 2!. Using Eqs.~6! in Eq. ~5! gives
i-
FIG. 2. Sound intensity probe with two face-to-face microphones.
970J.-F. Li and J.-C. Pascal: Influence of microphone vents
ropdss
t
iena
dw
cng
-
ic
s
p1p2*.p1p2*22 Im$a11a2* %vr~Dr1 l !I r22 Im$b11b2* %
3vrDrI r1 j2 Im$a12a2* %vr lJr
1 j Im$a11a2* %F upu22S vrDr
2 D 2S 112l
Dr D uur u2G1 j Im$b11b2* %F upu22S vrDr
2 D 2uur u2G , ~7!
with
Im$a12a2* %52S ~11z0!v0
v1Dz
Dv
4v D , ~8a!
Im$a11a2* %5~11z0!Dv
v1Dz
v0
v, ~8b!
Im$b11b2* %52S z0Dv
v1Dz
v0
v D , ~8c!
where v05~v11v2!/2, Dv5v12v2, z05~z11z2!/2, andDz5z12z2. The microphone manufacturers10 consider thatthe stiffness added by the cavity is between 5% and 10%the total stiffness for existing half-inch condenser micphones. In the absence of other information on the dissions ofz among the same type of microphone, we consithat z050.12 andDz50.05 are typical values. Under theconditions, only the termDzDv can be neglected. From theconsiderations, the imaginary part of expression~7! leads tothe measured active intensity expression
I r5Im$ p1p2* %
2vrDr5 I r1C1Jr1C2
upu2
2rc2C3
rcuur u2
2, ~9a!
with coefficients
C15l
DrIm$a12a2* %.~11z0!
v0
v
2l
Dr, ~9b!
C25Im$a11a2* %1Im$b11b2* %
kDr5
Dv/v
kDr, ~9c!
C352kd Im$a11a2* %1kDr Im$b11b2* %
4
5DvDr
4c1@~11z0!Dv1Dzv0#
l
2c. ~9d!
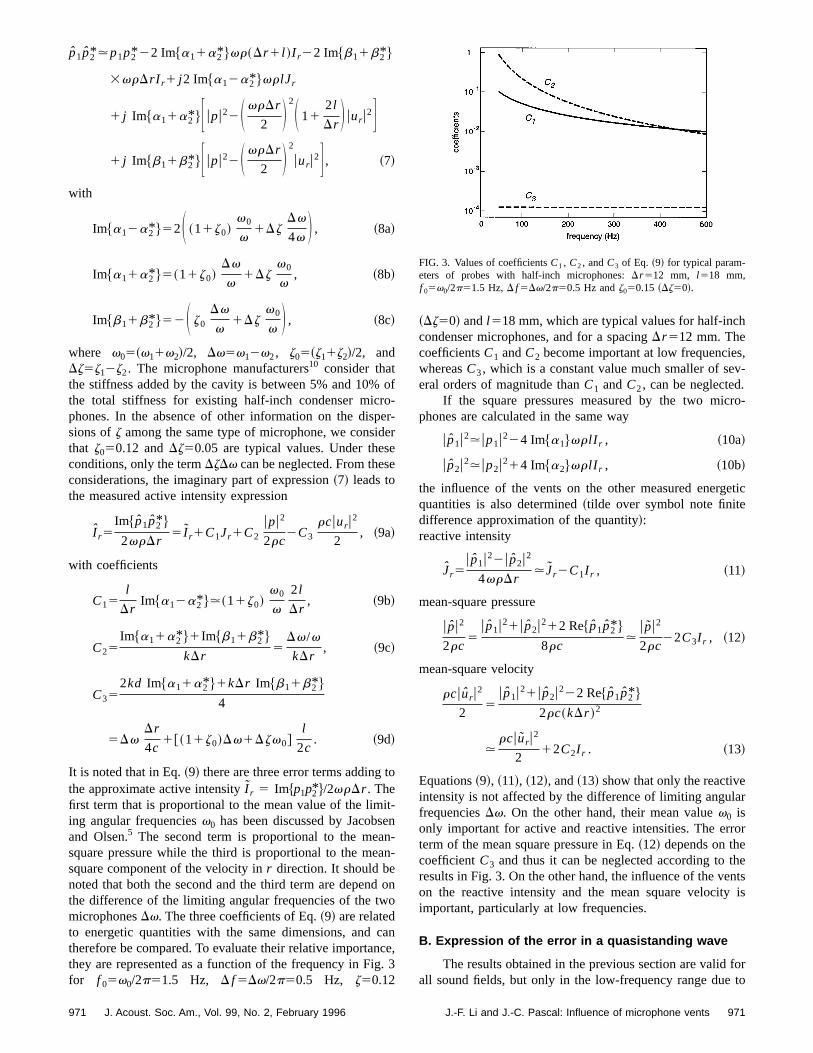
It is noted that in Eq.~9! there are three error terms addingthe approximate active intensityI r 5 Im$p1p2* %/2vrDr . Thefirst term that is proportional to the mean value of the liming angular frequenciesv0 has been discussed by Jacobsand Olsen.5 The second term is proportional to the measquare pressure while the third is proportional to the mesquare component of the velocity inr direction. It should benoted that both the second and the third term are depenthe difference of the limiting angular frequencies of the tmicrophonesDv. The three coefficients of Eq.~9! are relatedto energetic quantities with the same dimensions, andtherefore be compared. To evaluate their relative importathey are represented as a function of the frequency in Fifor f 05v0/2p51.5 Hz, D f5Dv/2p50.5 Hz, z50.12
971 J. Acoust. Soc. Am., Vol. 99, No. 2, February 1996
of-er-eree
o
t-n-n-
ono
ance,. 3
~Dz50! andl518 mm, which are typical values for half-inchcondenser microphones, and for a spacingDr512 mm. ThecoefficientsC1 andC2 become important at low frequencies,whereasC3, which is a constant value much smaller of sev-eral orders of magnitude thanC1 andC2, can be neglected.
If the square pressures measured by the two microphones are calculated in the same way
u p1u2.up1u224 Im$a1%vr l I r , ~10a!
u p2u2.up2u214 Im$a2%vr l I r , ~10b!
the influence of the vents on the other measured energetquantities is also determined~tilde over symbol note finitedifference approximation of the quantity!:reactive intensity
Jr5u p1u22u p2u2
4vrDr. Jr2C1I r , ~11!
mean-square pressure
u pu2
2rc5
u p1u21u p2u212 Re$ p1p2* %
8rc.
u pu2
2rc22C3I r , ~12!
mean-square velocity
rcuur u2
25
u p1u21u p2u222 Re$ p1p2* %
2rc~kDr !2
.rcuur u2
212C2I r . ~13!
Equations~9!, ~11!, ~12!, and~13! show that only the reactiveintensity is not affected by the difference of limiting angularfrequenciesDv. On the other hand, their mean valuev0 isonly important for active and reactive intensities. The errorterm of the mean square pressure in Eq.~12! depends on thecoefficientC3 and thus it can be neglected according to theresults in Fig. 3. On the other hand, the influence of the venton the reactive intensity and the mean square velocity isimportant, particularly at low frequencies.
B. Expression of the error in a quasistanding wave
The results obtained in the previous section are valid forall sound fields, but only in the low-frequency range due to
FIG. 3. Values of coefficientsC1, C2, andC3 of Eq. ~9! for typical param-eters of probes with half-inch microphones:Dr512 mm, l518 mm,f 05v0/2p51.5 Hz,D f5Dv/2p50.5 Hz andz050.15 ~Dz50!.
971J.-F. Li and J.-C. Pascal: Influence of microphone vents

do
ty
rth
na
ti,n
b
n.
the approximations used. In a waveguide, the quasistanfield has the advantage of producing, depending on the ption, different ratios between the energetic quantities. Gu11
presented an analysis of the influence of the vent in thisof field as a function of the parameterv0. This approach istaken here to observe the change in measurement ewithout low-frequency approximations. By expressingpressure and the particle velocity in the form
p~r !5A@e2 jkr1Rejkr #
and ~14!
ur~r !5j
vr
]p~r !
]r5
A
rc@e2 jkr2Rejkr #,
with k5v/c and the complex reflection coefficieR5uRueju, the exact expressions of the main energetic qutities are
I r1 jJr512 pur*5
uAu2
2rc@~12uRu2!1 j2uRusin~2kr1u!#,
~15!
upu2
2rc5
uAu2
2rc@11uRu212uRucos~2kr1u!#, ~16!
rcuur u2
25
uAu2
2rc@11uRu222uRucos~2kr1u!#. ~17!
To calculate the effect of the vent on the measured quantithe same process as in the previous section is adoptedthe terms of Eq.~5! are evaluated exactly using expressio~14!, that is,
p15p~r2Dr /2!, ~18a!
pv15p~r2d!, ~18b!
p25p~r1Dr /2!, ~18c!
pv25p~r1d!. ~18d!
Under these conditions Eq.~5! enables us to write
I r5Im$ p1p2* %
2rckDr5
uAu2
2rckDr H ~12uRu2!sin kDr
12 Im$a12a2* %uRusin~2kr1u!sin kl
1Im$a11a2* %F ~11uRu2!coskS d1Dr
2 D12uRucos~2kr1u!coskS d2
Dr
2 D G1Im$b11b2* %
3@~11uRu2!coskDr12uRucos~2kr1u!#J . ~19!
Now, a low-frequency approximation can be obtainedputting sinkDr'kDr , sinkl'kl, and coskDr'cosk(d1Dr /2)'cosk(d2Dr /2)'1. It corresponds to that found ithe previous section@Eq. ~9! with C350#, i.e., by using Eqs~15! to ~17!,
I r'I r1~11z0!v0
v
2l
DrJr1
Dv/v
kDr
upu2
2rc. ~20!
972 J. Acoust. Soc. Am., Vol. 99, No. 2, February 1996
ingsi-ype
rorse
tn-
es,buts
y
By putting coskDr5cos2 kD/22sin2 kD/2 and 15cos2 kD/21sin2 kD/2 and developing the terms cosk(d6Dr /2) in Eq.~19!, we obtain a valid expression in all frequency range
I r5I xsin kDr
kDr1Im$a12a2* %Jr
sin kl
kDr1Im$a11a2* %
3S upu2
2rc
coskd cos~kDr /2!
kDr
2rcuur u2
2
sin kd sin~kDr /2!
kDr D1Im$b11b2* %
3S upu2
2rc
cos2~kDr /2!
kDr2
rcuur u2
2
sin2~kDr /2!
kDr D , ~21!
in which the energetic quantities are those of Eqs.~15!, ~16!,and ~17!. The trigonometric functions are obviously associ-ated with the use of finite difference approximations. Theusual approximation errors for the various energetic quanti-ties are given in Ref. 7 but they do not correspond herecompletely to expressions of Eq.~21!. Consider the approxi-mate expressions of the pressure and ther component ofvelocity, which are determined by known pressures at twopoints with a spacinga in the direction of a progressive orstanding plane wave
p@a#5p~r2a/2!1p~r1a/2!
25p~r !cos
ka
2, ~22a!
ur@a#5
p~r1a/2!2p~r2a/2!
2 jvra5ur~r !
sin ka/2
ka/2. ~22b!
The approximate expression of active and reactive intensitiesfor two microphones with a separation distanceDr can behence deduced using Eqs.~22a! and ~22b! by settinga5Dr
I r@Dr #1 j J r
@Dr #5 12 p
@Dr #ur@Dr #*
51
2pur*
cos~kDr /2!sin~kDr /2!
kDr /2
51
2pur*
sin kDr
kDr. ~22c!
Using the notation in Eq.~22!, we can write Eq.~21! in termsof the separation distance between two points in the pressurefield as follows:
I r5 I r@Dr #1C1Jr
@ l #1Im$a11a2* %
kDr
p@Dr #p@2d#*
2rc
1Im$b11b2* %
kDr
p@Dr #p@Dr #*
2rc2kd
2Im$a11a2* %
3rcur
@Dr #ur@2d#*
22kDr
4Im$b11b2* %
3rcur
@Dr #ur@Dr #*
2. ~23!
At low frequency, this last equation is equivalent to the ap-proximation~9!, but it is also valid in a quasistanding waveover the whole useful frequency range of the sound intensity
972J.-F. Li and J.-C. Pascal: Influence of microphone vents
guranes
e
,
e
itwhhr,
a
eaf
w-
f
meter. It makes relation~19! comprehensible, by showinthat the energetic quantities on which the error of measment of I r depends, come from operations by finite diffeences performed between ‘‘sensors’’ having different spings. By ‘‘sensors,’’ we consider here all separate elemethe vents as well as the diaphragms, which are sensitivsound pressure. For example, the mean-square pressuremean-square velocities related to the parametersa in Eq.~23! are obtained from approximations by finite differencbetween the two diaphragms with a distance ofDr apart andthe two vents with a distance of 2d apart. At the same timethese same quantities related to parametersb are determinedonly by finite differences between the diaphragms, wherthe reactive intensity comes from mean-square pressureferences between the diaphragm and the vent opening wdistance ofl apart for each microphone. It can also be shothat Eq.~23! may be generalized to all types of field, on tcondition that, at measuring points, we have the relationssimilar to Eqs.~22a! and ~22b!. It must be noted, howevethat expressions like Eq.~23! are only valid if the model ofmicrophone described in the diagram in Fig. 1 remainsceptable.
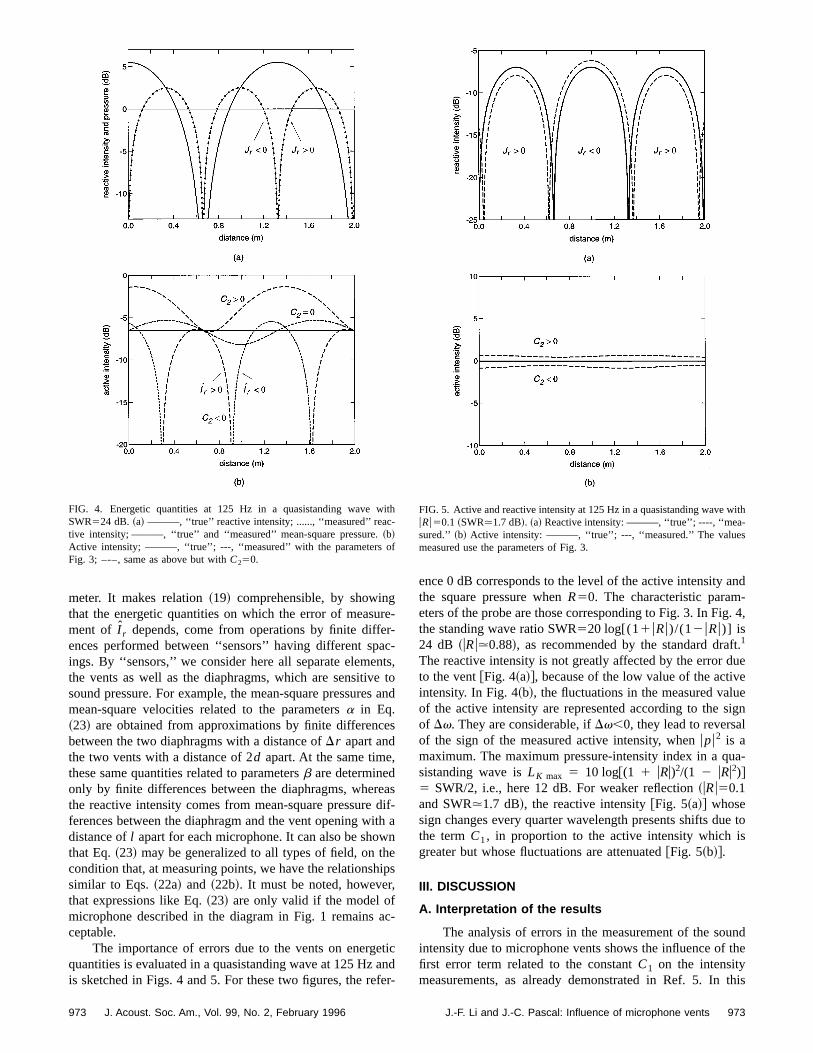
The importance of errors due to the vents on energquantities is evaluated in a quasistanding wave at 125 Hzis sketched in Figs. 4 and 5. For these two figures, the re
FIG. 4. Energetic quantities at 125 Hz in a quasistanding waveSWR524 dB. ~a! ———, ‘‘true’’ reactive intensity; ......, ‘‘measured’’ reactive intensity; ———, ‘‘true’’ and ‘‘measured’’ mean-square pressure.~b!Active intensity; ———, ‘‘true’’; ---, ‘‘measured’’ with the parameters oFig. 3; –-–, same as above but withC250.
973 J. Acoust. Soc. Am., Vol. 99, No. 2, February 1996
re--c-ts,toand
s
asdif-h aneips
c-
ticnder-
ence 0 dB corresponds to the level of the active intensity andthe square pressure whenR50. The characteristic param-eters of the probe are those corresponding to Fig. 3. In Fig. 4,the standing wave ratio SWR520 log[(11uRu)/(12uRu)] is24 dB ~uRu.0.88!, as recommended by the standard draft.1
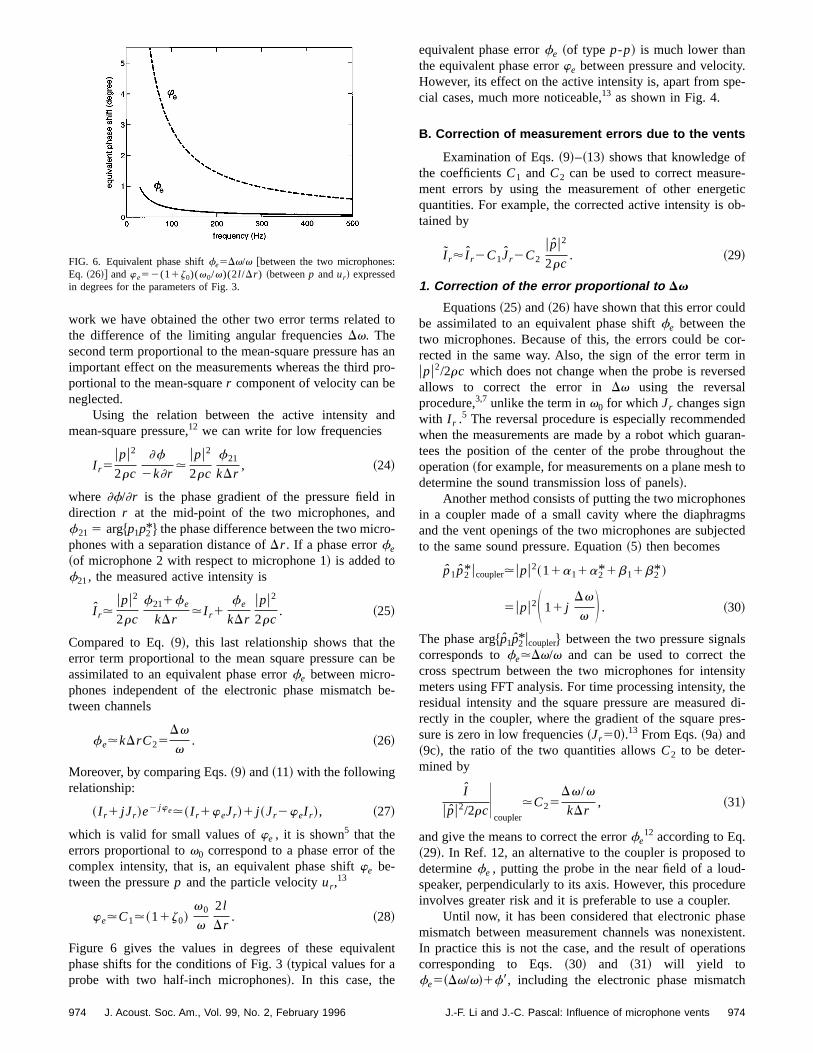
The reactive intensity is not greatly affected by the error dueto the vent@Fig. 4~a!#, because of the low value of the activeintensity. In Fig. 4~b!, the fluctuations in the measured valueof the active intensity are represented according to the signof Dv. They are considerable, ifDv,0, they lead to reversalof the sign of the measured active intensity, whenupu2 is amaximum. The maximum pressure-intensity index in a qua-sistanding wave isLK max 5 10 log@(1 1 uRu)2/(1 2 uRu2)#5 SWR/2, i.e., here 12 dB. For weaker reflection~uRu50.1and SWR.1.7 dB!, the reactive intensity@Fig. 5~a!# whosesign changes every quarter wavelength presents shifts due tothe termC1, in proportion to the active intensity which isgreater but whose fluctuations are attenuated@Fig. 5~b!#.
III. DISCUSSION
A. Interpretation of the results
The analysis of errors in the measurement of the soundintensity due to microphone vents shows the influence of thefirst error term related to the constantC1 on the intensitymeasurements, as already demonstrated in Ref. 5. In this
ithFIG. 5. Active and reactive intensity at 125 Hz in a quasistanding wave withuRu50.1 ~SWR.1.7 dB!. ~a! Reactive intensity: ———, ‘‘true’’; ----, ‘‘mea-sured.’’ ~b! Active intensity: ———, ‘‘true’’; ---, ‘‘measured.’’ The valuesmeasured use the parameters of Fig. 3.
973J.-F. Li and J.-C. Pascal: Influence of microphone vents
sp
n
ido
e
e
le
:
work we have obtained the other two error terms relatedthe difference of the limiting angular frequenciesDv. Thesecond term proportional to the mean-square pressure haimportant effect on the measurements whereas the thirdportional to the mean-squarer component of velocity can beneglected.
Using the relation between the active intensity amean-square pressure,12 we can write for low frequencies
I r5upu2
2rc
]f
2k]r.
upu2
2rc
f21
kDr, ~24!
where ]f/]r is the phase gradient of the pressure fielddirection r at the mid-point of the two microphones, anf215 arg$p1p2* % the phase difference between the two micrphones with a separation distance ofDr . If a phase errorfe
~of microphone 2 with respect to microphone 1! is added tof21, the measured active intensity is
I r.upu2
2rc
f211fe
kDr.I r1
fe
kDr
upu2
2rc. ~25!
Compared to Eq.~9!, this last relationship shows that therror term proportional to the mean square pressure canassimilated to an equivalent phase errorfe between micro-phones independent of the electronic phase mismatchtween channels
fe.kDrC25Dv
v. ~26!
Moreover, by comparing Eqs.~9! and~11! with the followingrelationship:
~ I r1 jJr !e2 jwe.~ I r1weJr !1 j ~Jr2weI r !, ~27!
which is valid for small values ofwe , it is shown5 that the
errors proportional tov0 correspond to a phase error of thcomplex intensity, that is, an equivalent phase shiftwe be-tween the pressurep and the particle velocityur ,
13
we.C1.~11z0!v0
v
2l
Dr. ~28!
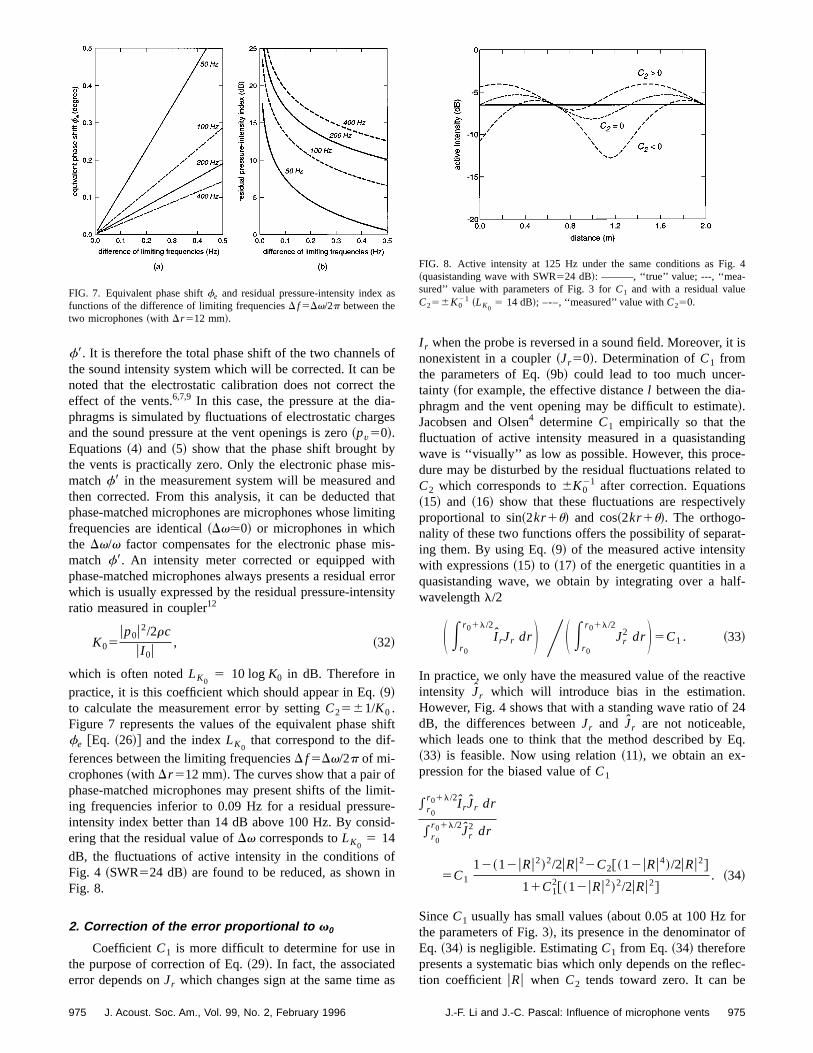
Figure 6 gives the values in degrees of these equivaphase shifts for the conditions of Fig. 3~typical values for aprobe with two half-inch microphones!. In this case, the
FIG. 6. Equivalent phase shiftfe5Dv/v @between the two microphonesEq. ~26!# andwe52(11z0)(v0/v)(2l /Dr ) ~betweenp andur! expressedin degrees for the parameters of Fig. 3.
974 J. Acoust. Soc. Am., Vol. 99, No. 2, February 1996
to
anro-
d
n
-
be
be-
nt
equivalent phase errorfe ~of type p-p! is much lower thanthe equivalent phase errorwe between pressure and velocity.However, its effect on the active intensity is, apart from spe-cial cases, much more noticeable,13 as shown in Fig. 4.
B. Correction of measurement errors due to the vents
Examination of Eqs.~9!–~13! shows that knowledge ofthe coefficientsC1 andC2 can be used to correct measure-ment errors by using the measurement of other energeticquantities. For example, the corrected active intensity is ob-tained by
I r' I r2C1Jr2C2
u pu2
2rc. ~29!
1. Correction of the error proportional to Dv
Equations~25! and~26! have shown that this error couldbe assimilated to an equivalent phase shiftfe between thetwo microphones. Because of this, the errors could be cor-rected in the same way. Also, the sign of the error term inupu2/2rc which does not change when the probe is reversedallows to correct the error inDv using the reversalprocedure,3,7 unlike the term inv0 for which Jr changes signwith I r .
5 The reversal procedure is especially recommendedwhen the measurements are made by a robot which guaran-tees the position of the center of the probe throughout theoperation~for example, for measurements on a plane mesh todetermine the sound transmission loss of panels!.
Another method consists of putting the two microphonesin a coupler made of a small cavity where the diaphragmsand the vent openings of the two microphones are subjectedto the same sound pressure. Equation~5! then becomes
p1p2* ucoupler.upu2~11a11a2*1b11b2* !
5upu2S 11 jDv
v D . ~30!
The phase arg$p1p2* ucoupler% between the two pressure signalscorresponds tofe.Dv/v and can be used to correct thecross spectrum between the two microphones for intensitymeters using FFT analysis. For time processing intensity, theresidual intensity and the square pressure are measured di-rectly in the coupler, where the gradient of the square pres-sure is zero in low frequencies~Jr50!.13 From Eqs.~9a! and~9c!, the ratio of the two quantities allowsC2 to be deter-mined by
I
u pu2/2rcUcoupler
.C25Dv/v
kDr, ~31!
and give the means to correct the errorfe12 according to Eq.
~29!. In Ref. 12, an alternative to the coupler is proposed todeterminefe , putting the probe in the near field of a loud-speaker, perpendicularly to its axis. However, this procedureinvolves greater risk and it is preferable to use a coupler.
Until now, it has been considered that electronic phasemismatch between measurement channels was nonexistent.In practice this is not the case, and the result of operationscorresponding to Eqs.~30! and ~31! will yield tofe5~Dv/v!1f8, including the electronic phase mismatch
974J.-F. Li and J.-C. Pascal: Influence of microphone vents
bt
yinht
ih
s
d
n
s
g
o
-
e
.
c-
s
f8. It is therefore the total phase shift of the two channelsthe sound intensity system which will be corrected. It cannoted that the electrostatic calibration does not correcteffect of the vents.6,7,9 In this case, the pressure at the diaphragms is simulated by fluctuations of electrostatic chargand the sound pressure at the vent openings is zero~pv50!.Equations~4! and ~5! show that the phase shift brought bthe vents is practically zero. Only the electronic phase mmatchf8 in the measurement system will be measured athen corrected. From this analysis, it can be deducted tphase-matched microphones are microphones whose limifrequencies are identical~Dv.0! or microphones in whichthe Dv/v factor compensates for the electronic phase mmatch f8. An intensity meter corrected or equipped witphase-matched microphones always presents a residual ewhich is usually expressed by the residual pressure-intenratio measured in coupler12
K05up0u2/2rc
uI 0u, ~32!
which is often notedLK0 5 10 logK0 in dB. Therefore inpractice, it is this coefficient which should appear in Eq.~9!to calculate the measurement error by settingC2561/K0 .Figure 7 represents the values of the equivalent phase sfe @Eq. ~26!# and the indexLK0 that correspond to the dif-ferences between the limiting frequenciesD f5Dv/2p of mi-crophones~with Dr512 mm!. The curves show that a pair ofphase-matched microphones may present shifts of the liming frequencies inferior to 0.09 Hz for a residual pressurintensity index better than 14 dB above 100 Hz. By consiering that the residual value ofDv corresponds toLK0 5 14dB, the fluctuations of active intensity in the conditions oFig. 4 ~SWR524 dB! are found to be reduced, as shown iFig. 8.
2. Correction of the error proportional to v0
CoefficientC1 is more difficult to determine for use inthe purpose of correction of Eq.~29!. In fact, the associatederror depends onJr which changes sign at the same time a
FIG. 7. Equivalent phase shiftfe and residual pressure-intensity index afunctions of the difference of limiting frequenciesD f5Dv/2p between thetwo microphones~with Dr512 mm!.
975 J. Acoust. Soc. Am., Vol. 99, No. 2, February 1996
ofehe-es
s-dating
s-
rrority
hift
it-e--
f
s
I r when the probe is reversed in a sound field. Moreover, it inonexistent in a coupler~Jr50!. Determination ofC1 fromthe parameters of Eq.~9b! could lead to too much uncer-tainty ~for example, the effective distancel between the dia-phragm and the vent opening may be difficult to estimate!.Jacobsen and Olsen4 determineC1 empirically so that thefluctuation of active intensity measured in a quasistandinwave is ‘‘visually’’ as low as possible. However, this proce-dure may be disturbed by the residual fluctuations related tC2 which corresponds to6K0
21 after correction. Equations~15! and ~16! show that these fluctuations are respectivelyproportional to sin~2kr1u! and cos~2kr1u!. The orthogo-nality of these two functions offers the possibility of separat-ing them. By using Eq.~9! of the measured active intensitywith expressions~15! to ~17! of the energetic quantities in aquasistanding wave, we obtain by integrating over a halfwavelengthl/2
S Er0
r01l/2
I rJr dr D YS Er0
r01l/2
Jr2 dr D 5C1 . ~33!
In practice, we only have the measured value of the reactivintensity Jr which will introduce bias in the estimation.However, Fig. 4 shows that with a standing wave ratio of 24dB, the differences betweenJr and Jr are not noticeable,which leads one to think that the method described by Eq~33! is feasible. Now using relation~11!, we obtain an ex-pression for the biased value ofC1
* r0r01l/2I r Jr dr
* r0r01l/2Jr
2 dr
5C1
12~12uRu2!2/2uRu22C2@~12uRu4!/2uRu2#
11C12@~12uRu2!2/2uRu2#
. ~34!
SinceC1 usually has small values~about 0.05 at 100 Hz forthe parameters of Fig. 3!, its presence in the denominator ofEq. ~34! is negligible. EstimatingC1 from Eq.~34! thereforepresents a systematic bias which only depends on the refletion coefficient uRu when C2 tends toward zero. It can be
FIG. 8. Active intensity at 125 Hz under the same conditions as Fig. 4~quasistanding wave with SWR524 dB!: ———, ‘‘true’’ value; ---, ‘‘mea-sured’’ value with parameters of Fig. 3 forC1 and with a residual valueC256K0
21 ~LK0 5 14 dB!; –-–, ‘‘measured’’ value withC250.
975J.-F. Li and J.-C. Pascal: Influence of microphone vents
netTtaea
eua
seed
s
eb
niv
e
compensated by the following definition of the estimatorC1
C152uRu2
4uRu2212uRu4S Er0r01l/2
I r Jr dr D YS Er0
r01l/2
Jr2 dr D ,
~35!
which in the case where SWR524 dB, is equivalent toC15C1[120.2639C2][110.0321C1
2]21. For a residualvalue ofC2 corresponding to an indexLK0 of 14 dB and astanding wave ratio of 24 dB,C1 can be determined withrelative uncertainty of about61%, depending upon the sigof the residual phase. However, other uncertainties dustatistical errors and to the practical implementation of ingration operations will be involved and must be studied.reduce the bias, one might be tempted to increase the sing wave ratio, but other problems due to the disturbancthe field by the presence of the probe become preponder4
The use of a tube with two active terminations constitutedtwo mobile loudspeakers14 allows most of the problems to bresolved, provided that the distance between the two lospeakers does not correspond to a multiple of hwavelengths, as discussed in Ref. 4.
C. Consequences on the impedance measurements
The active and reactive intensities can be used to demine the impedance of acoustic materials15,16 and the radia-tion impedance of the sources.17,18The influence of the ventmust be taken into consideration for these measuremtaken close to the sources or the materials, in sound fiwith a large reactive component produced by the near fielthe reflections.
The normalized acoustic impedance is defined by
Z5p
rcur5
pur*
rcurur*5
I r1 jJrrcuur u2/2
. ~36!
The expression for measured impedance is obtained by urelations~9!, ~11!, ~13!, and~27! in the previous equation
Z5I r1 j J r
rcuur u2/2.S Ze2 jC11C2
upu2/2rc
rcuur u2/2D
3S 112C2
I rrcuur u2/2
D 21
, ~37!
which leads to
Z.Ze2 jC11C2uZu2
112C2 Re$Z%. ~38!
For the determination of the characteristic impedanceZM ofa material, the sound impedanceZ(L) measured at a distancL ~Fig. 9! is brought to the surface of the material testedmaking the hypothesis of a plane-wave model7 when thesource is at large distance from the sample
ZM5Z~0!5Z~L !coskL2 j sin kL
coskL2 j Z~L !sin kL. ~39!
For a spherical wave, the reflection model of Nobile aHayek19 should be used, possibly in an approximat
976 J. Acoust. Soc. Am., Vol. 99, No. 2, February 1996
of
toe-ond-ofnt.by
d-lf-
ter-
nts,ldsor
ing
y
de
form.20 Champoux and L’Espe´rance21 have studied the errorsdue to finite difference approximations on the determinationof impedance. They notice that this error is less importantthan that for the intensity at high frequencies. This is naturalwith regard to Eqs.~22! and~36!, since the error onI r1 jJris partly compensated by the error onuur u
2. Nevertheless, itis advisable to note that the expression of the impedance inRefs. 20 and 21 does not explicitly show up the energeticquantities, but it is possible to show that it is strictly equiva-lent to that of Eq.~36!.15,16 As for the intensity, the finitedifference errors are not taken into account here, and themeasured impedance of Eq.~38! is expressed in terms of theestimated impedance from finite difference approximations.
To evaluate the vent influence on this measurement, wedefine an impedance model of acoustic material. The imped-anceZM of a fibrous material of thicknessh50.05 m placedon a rigid surface is given by
ZM5ZC coth~GCh!, ~40!
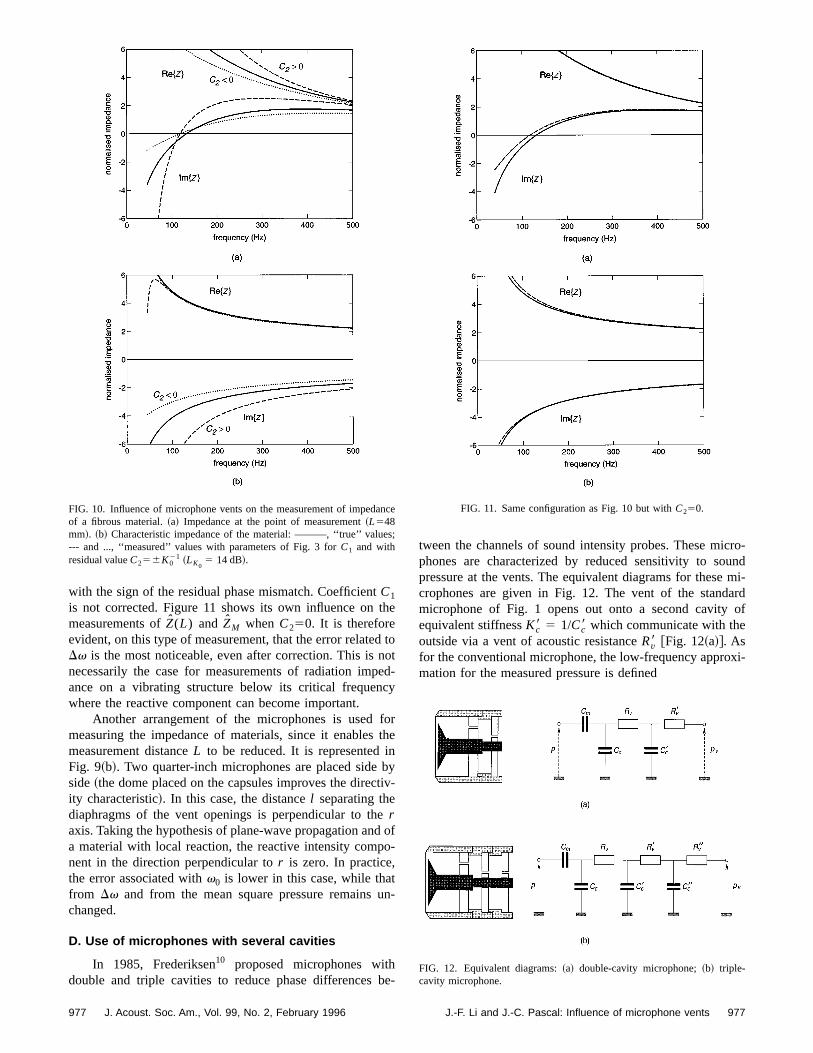
whereZC is the normalized characteristic impedance of aninfinite thickness of material andGC its propagation constantdetermined by the model of Delany and Bazley22 using theparameters obtained by regression23 for a mineral wool withan air flow resistivityR1530 000 Ns/m4. This impedanceZMis then used to calculate the acoustic impedance at a distancL from the material on the basis of a plane-wave propaga-tion. It is this impedance model that serves as reference forthe determination of the measured impedance from Eq.~38!.Figure 10 shows the influence of the distortions produced bythe microphone vents on the measurement of impedanceZ(L) at a distanceL from a fibrous material@Fig. 10~a!# andon the determination of its characteristic impedanceZM us-ing Eq. ~39! @Fig. 10~b!#. Taking into account the typicalparameters of Fig. 3 leads to sign inversions when theequivalent phase errorfe , becomes equal tof21, in this caseabout 170 Hz. Therefore, the probe cannot be used below250 Hz without correction of the influence ofDv. The curvesin Fig. 10 therefore correspond to a probe corrected for thecoefficient C2 whose residual pressure-intensity index isLK0 5 14 dB (C256K0
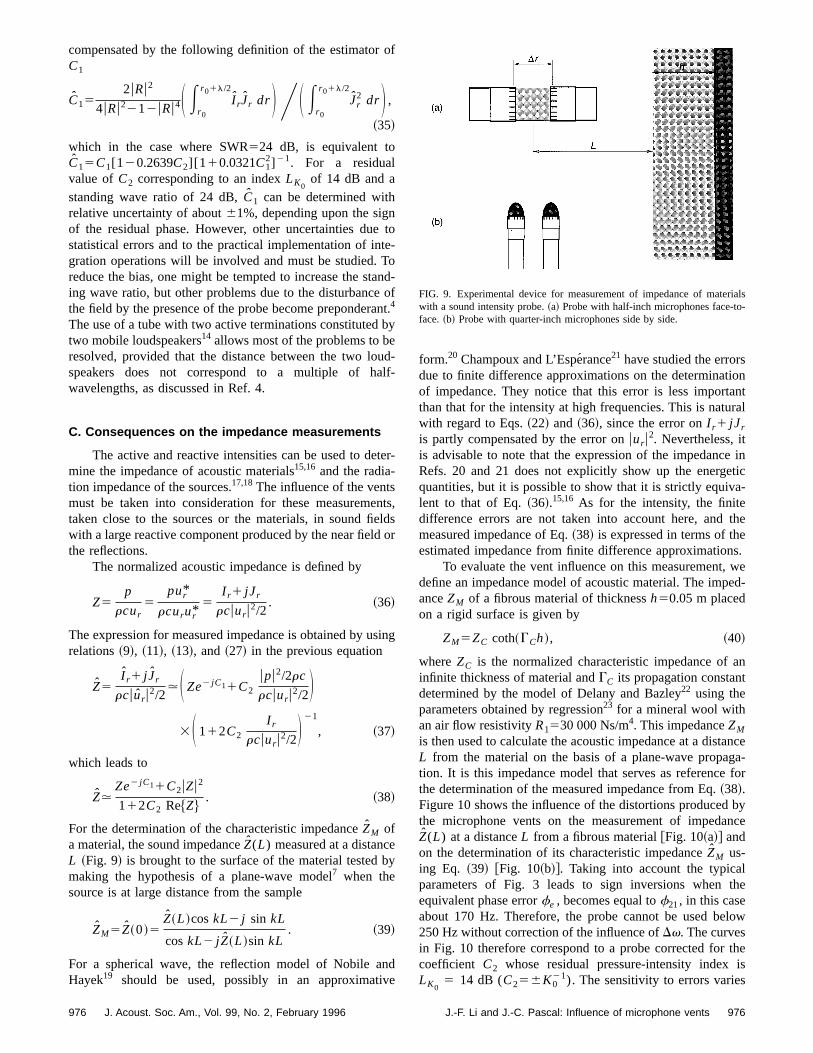
21). The sensitivity to errors varies
FIG. 9. Experimental device for measurement of impedance of materialswith a sound intensity probe.~a! Probe with half-inch microphones face-to-face.~b! Probe with quarter-inch microphones side by side.
976J.-F. Li and J.-C. Pascal: Influence of microphone vents
th
dnpec
f
inbct
edpo
tu
hb
-di-
an
s
with the sign of the residual phase mismatch. CoefficientC1is not corrected. Figure 11 shows its own influence onmeasurements ofZ(L) and ZM whenC250. It is thereforeevident, on this type of measurement, that the error relateDv is the most noticeable, even after correction. This isnecessarily the case for measurements of radiation imance on a vibrating structure below its critical frequenwhere the reactive component can become important.
Another arrangement of the microphones is usedmeasuring the impedance of materials, since it enablesmeasurement distanceL to be reduced. It is representedFig. 9~b!. Two quarter-inch microphones are placed sideside~the dome placed on the capsules improves the direity characteristic!. In this case, the distancel separating thediaphragms of the vent openings is perpendicular to thraxis. Taking the hypothesis of plane-wave propagation ana material with local reaction, the reactive intensity comnent in the direction perpendicular tor is zero. In practice,the error associated withv0 is lower in this case, while thafrom Dv and from the mean square pressure remainschanged.
D. Use of microphones with several cavities
In 1985, Frederiksen10 proposed microphones witdouble and triple cavities to reduce phase differences
FIG. 10. Influence of microphone vents on the measurement of impedof a fibrous material.~a! Impedance at the point of measurement~L548mm!. ~b! Characteristic impedance of the material: ———, ‘‘true’’ value--- and ..., ‘‘measured’’ values with parameters of Fig. 3 forC1 and withresidual valueC256K0
21 ~LK0 5 14 dB!.
977 J. Acoust. Soc. Am., Vol. 99, No. 2, February 1996
e
tootd-y
orthe
yiv-
of-
n-
e-
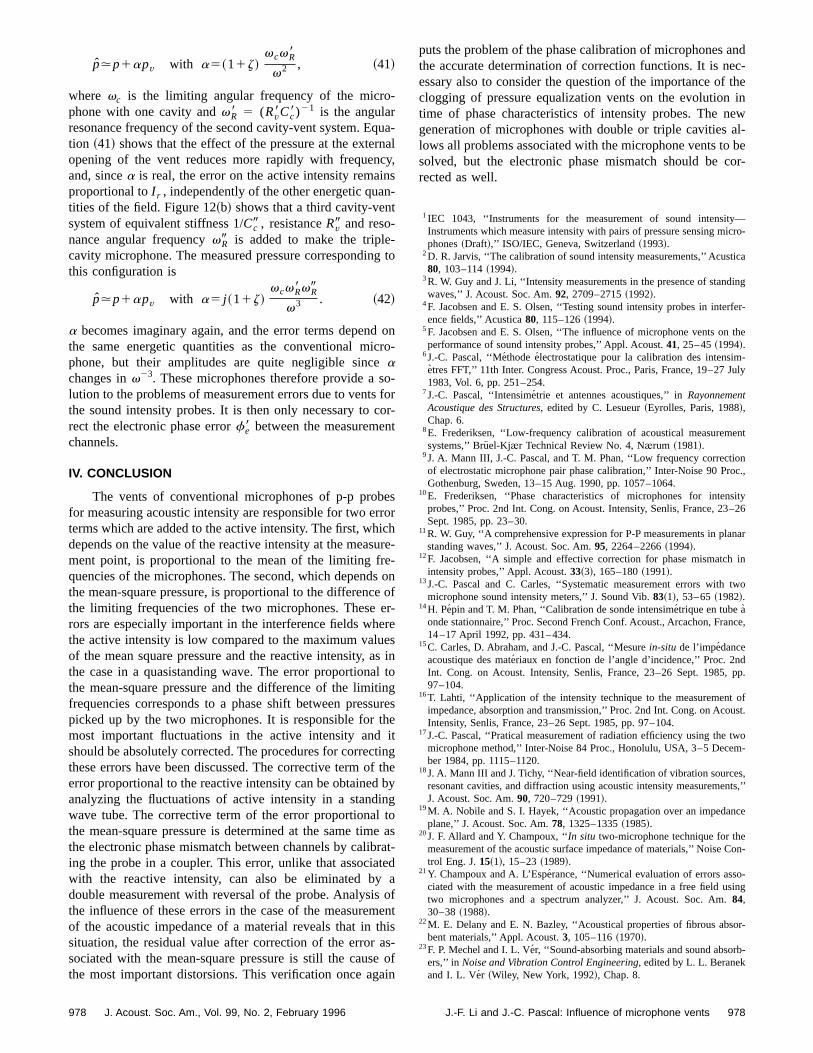
tween the channels of sound intensity probes. These microphones are characterized by reduced sensitivity to sounpressure at the vents. The equivalent diagrams for these mcrophones are given in Fig. 12. The vent of the standardmicrophone of Fig. 1 opens out onto a second cavity ofequivalent stiffnessKc8 5 1/Cc8 which communicate with theoutside via a vent of acoustic resistanceRv8 @Fig. 12~a!#. Asfor the conventional microphone, the low-frequency approxi-mation for the measured pressure is defined
ce
;
FIG. 11. Same configuration as Fig. 10 but withC250.
FIG. 12. Equivalent diagrams:~a! double-cavity microphone;~b! triple-cavity microphone.
977J.-F. Li and J.-C. Pascal: Influence of microphone vents
o
o
erc
e
iu
b
t
re
h
p.p1apv with a5~11z!vcvR8
v2 , ~41!
where vc is the limiting angular frequency of the micro-phone with one cavity andvR8 5 (Rv8Cc8)
21 is the angularresonance frequency of the second cavity-vent system. Eqtion ~41! shows that the effect of the pressure at the externopening of the vent reduces more rapidly with frequencand, sincea is real, the error on the active intensity remainproportional toI r , independently of the other energetic quantities of the field. Figure 12~b! shows that a third cavity-ventsystem of equivalent stiffness 1/Cc9 , resistanceRv9 and reso-nance angular frequencyvR9 is added to make the triple-cavity microphone. The measured pressure correspondingthis configuration is
p.p1apv with a5 j ~11z!vcvR8vR9
v3 . ~42!
a becomes imaginary again, and the error terms dependthe same energetic quantities as the conventional micphone, but their amplitudes are quite negligible sinceachanges inv23. These microphones therefore provide a slution to the problems of measurement errors due to ventsthe sound intensity probes. It is then only necessary to crect the electronic phase errorfe8 between the measuremenchannels.
IV. CONCLUSION
The vents of conventional microphones of p-p probfor measuring acoustic intensity are responsible for two erterms which are added to the active intensity. The first, whidepends on the value of the reactive intensity at the measument point, is proportional to the mean of the limiting frequencies of the microphones. The second, which dependsthe mean-square pressure, is proportional to the differencethe limiting frequencies of the two microphones. These erors are especially important in the interference fields whethe active intensity is low compared to the maximum valuof the mean square pressure and the reactive intensity, athe case in a quasistanding wave. The error proportionalthe mean-square pressure and the difference of the limitfrequencies corresponds to a phase shift between presspicked up by the two microphones. It is responsible for thmost important fluctuations in the active intensity andshould be absolutely corrected. The procedures for correctthese errors have been discussed. The corrective term oferror proportional to the reactive intensity can be obtainedanalyzing the fluctuations of active intensity in a standinwave tube. The corrective term of the error proportionalthe mean-square pressure is determined at the same timthe electronic phase mismatch between channels by calibing the probe in a coupler. This error, unlike that associatwith the reactive intensity, can also be eliminated bydouble measurement with reversal of the probe. Analysisthe influence of these errors in the case of the measuremof the acoustic impedance of a material reveals that in tsituation, the residual value after correction of the error asociated with the mean-square pressure is still the causethe most important distorsions. This verification once aga
978 J. Acoust. Soc. Am., Vol. 99, No. 2, February 1996
ua-aly,s-
to
onro-
-forr-t
sorhre--onofr-ress intongreseitingtheygoe asat-daofentiss-ofin
puts the problem of the phase calibration of microphones andthe accurate determination of correction functions. It is nec-essary also to consider the question of the importance of theclogging of pressure equalization vents on the evolution intime of phase characteristics of intensity probes. The newgeneration of microphones with double or triple cavities al-lows all problems associated with the microphone vents to besolved, but the electronic phase mismatch should be cor-rected as well.
1IEC 1043, ‘‘Instruments for the measurement of sound intensity—Instruments which measure intensity with pairs of pressure sensing micro-phones~Draft!,’’ ISO/IEC, Geneva, Switzerland~1993!.
2D. R. Jarvis, ‘‘The calibration of sound intensity measurements,’’ Acustica80, 103–114~1994!.
3R. W. Guy and J. Li, ‘‘Intensity measurements in the presence of standingwaves,’’ J. Acoust. Soc. Am.92, 2709–2715~1992!.
4F. Jacobsen and E. S. Olsen, ‘‘Testing sound intensity probes in interfer-ence fields,’’ Acustica80, 115–126~1994!.
5F. Jacobsen and E. S. Olsen, ‘‘The influence of microphone vents on theperformance of sound intensity probes,’’ Appl. Acoust.41, 25–45~1994!.
6J.-C. Pascal, ‘‘Me´thode electrostatique pour la calibration des intensim-etres FFT,’’ 11th Inter. Congress Acoust. Proc., Paris, France, 19–27 July1983, Vol. 6, pp. 251–254.
7J.-C. Pascal, ‘‘Intensime´trie et antennes acoustiques,’’ inRayonnementAcoustique des Structures, edited by C. Lesueur~Eyrolles, Paris, 1988!,Chap. 6.
8E. Frederiksen, ‘‘Low-frequency calibration of acoustical measurementsystems,’’ Bruel-Kj,r Technical Review No. 4, N,rum ~1981!.
9J. A. Mann III, J.-C. Pascal, and T. M. Phan, ‘‘Low frequency correctionof electrostatic microphone pair phase calibration,’’ Inter-Noise 90 Proc.,Gothenburg, Sweden, 13–15 Aug. 1990, pp. 1057–1064.
10E. Frederiksen, ‘‘Phase characteristics of microphones for intensityprobes,’’ Proc. 2nd Int. Cong. on Acoust. Intensity, Senlis, France, 23–26Sept. 1985, pp. 23–30.
11R. W. Guy, ‘‘A comprehensive expression for P-P measurements in planarstanding waves,’’ J. Acoust. Soc. Am.95, 2264–2266~1994!.
12F. Jacobsen, ‘‘A simple and effective correction for phase mismatch inintensity probes,’’ Appl. Acoust.33~3!, 165–180~1991!.
13J.-C. Pascal and C. Carles, ‘‘Systematic measurement errors with twomicrophone sound intensity meters,’’ J. Sound Vib.83~1!, 53–65~1982!.
14H. Pepin and T. M. Phan, ‘‘Calibration de sonde intensime´trique en tube a`onde stationnaire,’’ Proc. Second French Conf. Acoust., Arcachon, France,14–17 April 1992, pp. 431–434.
15C. Carles, D. Abraham, and J.-C. Pascal, ‘‘Mesurein-situ de l’impedanceacoustique des mate´riaux en fonction de l’angle d’incidence,’’ Proc. 2ndInt. Cong. on Acoust. Intensity, Senlis, France, 23–26 Sept. 1985, pp.97–104.
16T. Lahti, ‘‘Application of the intensity technique to the measurement ofimpedance, absorption and transmission,’’ Proc. 2nd Int. Cong. on Acoust.Intensity, Senlis, France, 23–26 Sept. 1985, pp. 97–104.
17J.-C. Pascal, ‘‘Pratical measurement of radiation efficiency using the twomicrophone method,’’ Inter-Noise 84 Proc., Honolulu, USA, 3–5 Decem-ber 1984, pp. 1115–1120.
18J. A. Mann III and J. Tichy, ‘‘Near-field identification of vibration sources,resonant cavities, and diffraction using acoustic intensity measurements,’’J. Acoust. Soc. Am.90, 720–729~1991!.
19M. A. Nobile and S. I. Hayek, ‘‘Acoustic propagation over an impedanceplane,’’ J. Acoust. Soc. Am.78, 1325–1335~1985!.
20J. F. Allard and Y. Champoux, ‘‘In situ two-microphone technique for themeasurement of the acoustic surface impedance of materials,’’ Noise Con-trol Eng. J.15~1!, 15–23~1989!.
21Y. Champoux and A. L’Espe´rance, ‘‘Numerical evaluation of errors asso-ciated with the measurement of acoustic impedance in a free field usingtwo microphones and a spectrum analyzer,’’ J. Acoust. Soc. Am.84,30–38~1988!.
22M. E. Delany and E. N. Bazley, ‘‘Acoustical properties of fibrous absor-bent materials,’’ Appl. Acoust.3, 105–116~1970!.
23F. P. Mechel and I. L. Ve´r, ‘‘Sound-absorbing materials and sound absorb-ers,’’ in Noise and Vibration Control Engineering, edited by L. L. Beranekand I. L. Ver ~Wiley, New York, 1992!, Chap. 8.
978J.-F. Li and J.-C. Pascal: Influence of microphone vents
Copyright © 2022 FDOKUMEN