
The Influence of Cholesterol on the Properties and Permeability of Hypericin Derivatives in Lipid...
15
rXXXX American Chemical Society A dx.doi.org/10.1021/ct100528u | J. Chem. Theory Comput. XXXX, XXX, 000–000 ARTICLE pubs.acs.org/JCTC The Influence of Cholesterol on the Properties and Permeability of Hypericin Derivatives in Lipid Membranes Emma S. E. Eriksson and Leif A. Eriksson* School of Chemistry, National University of Ireland;Galway, Galway, Ireland b S Supporting Information ABSTRACT: The promising photosensitizing properties of hypericin, a natural quinine substituted with hydroxyl and alkyl groups, have led to the proposal that it can be utilized in photodynamic therapy. Neither the detailed mechanism behind the powerful action of hypericin, arising as a result of light excitation, nor the intracellular localization and transportation of the molecule is yet fully understood. The behavior of hypericin derivatives in a pure dipalmitoylphosphatidylcholine (DPPC) lipid membrane has recently been studied theoretically by means of molecular dynamics simulations. Natural membranes however contain many important constituents;cholesterol being one of the most essential;that influence the function and structure of the membrane, and thereby also the behavior of drug molecules therein. In the present study, we investigated hypericin and its brominated derivatives in membranes containing 9 and 25 mol % cholesterol. The results show that the presence of cholesterol in the membrane affects the permeability of the hypericin molecules and does so differently for the various molecules in the two membranes. Hypericin containing one bromine was found to exhibit the lowest free energy profile for the transport process into the lipids, and also the highest permeability coefficients, indicating that this molecule displays the fastest and easiest diffusion in the membranes. All three molecules were found to accumulate most preferably close to the polar headgroup region in both membranes. 1. INTRODUCTION 1.1. Cholesterol in Lipid Membranes. Cholesterol (Figure 1) is an important compound in nature, possessing many essential properties, not only as precursor to several vitamins and hormones but also as an important constituent in biological membranes, besides phospholipids and glycolipids, in which it for example increases mechanical strength, regulates phase behavior, and reduces the passive permeability of water and other small molecules. The cholesterol molecule is made up of three groups that have all proven essential for their effect on membranes: the fused rigid steroid rings, the hydroxyl group attached to one of the rings, and the short flexible hydrocarbon chain. 1 Although intracellular synthesis of cholesterol takes place in the endoplasmic reticulum (ER) and external choles- terol is transported to the lysosomes where it is hydrolyzed, the majority of the cellular cholesterol is found in the plasma membrane, 2 and an equilibrium process in which cholesterol is being transported between the cell membrane and the cytosol has been proposed. 3 Cholesterol is found in a wide range of concentrations in various animal membranes, normally around 20-30 mol %, but plasma membranes of some cells contain up to 50 mol %. 4 In membranes in which the cholesterol concentration is high (>25 mol %), an additional phase exists besides the solid-ordered and liquid-disordered ones: the liquid-ordered phase. 5,6 In this phase, the lipids are translationally disordered and conformationally ordered, i.e., a combination of the two other phases in which the lipids are either completely ordered or disordered. In the liquid- ordered state, both ordering 7,8 and condensing 9,10 effects caused by cholesterol are observed. Cholesterol has also been exten- sively studied in the controversial field of lipid rafts and its presence in those. Lipid rafts are dynamic liquid-ordered domains made up by cholesterol, sphingolipids, and proteins important in, for example, signaling. 11 1.2. Computational Studies of Cholesterol-Containing Membranes. Basic initial computational studies of cholesterol/ lipid membranes were performed more than two decades ago 12-14 and have been followed by numerous more extended and detailed studies carried out by Monte Carlo (MC) and molec- ular dynamics (MD) simulation techniques in recent years. The improvement of computers and algorithms has enabled progres- sion to study larger systems, including more than 1000 lipids, and the use of longer simulation time scales. 15,16 Many proper- ties of cholesterol-containing membranes as seen experimentally have been reproduced theoretically, thereby also enabling the evaluation of detailed properties that are difficult to observe experimentally. It has been clearly shown, both experimentally and theoreti- cally, that cholesterol has a crucial effect on the properties of the membrane and that the cholesterol concentration plays an important role. A wide range of concentrations of cholesterol has been included in the computational studies to cover for the occurrence in natural membranes. Cholesterol has an ordering and condensing effect, two features that are closely related and that have been observed in numerous computational studies at varying cholesterol concentrations. 15-22 The ordering and con- densing effect results in a decreased membrane surface area and thereby a reduced area per lipid. Chui et al. performed simula- tions of DPPC bilayers with cholesterol concentrations ranging from 4 to 50 mol % and found a linear relationship between Received: September 15, 2010
-
Upload
independent -
Category
Documents
-
view
6 -
download
0
Transcript of The Influence of Cholesterol on the Properties and Permeability of Hypericin Derivatives in Lipid...
rXXXX American Chemical Society A dx.doi.org/10.1021/ct100528u | J. Chem. Theory Comput. XXXX, XXX, 000–000
ARTICLE
pubs.acs.org/JCTC
The Influence of Cholesterol on the Properties and Permeabilityof Hypericin Derivatives in Lipid MembranesEmma S. E. Eriksson and Leif A. Eriksson*
School of Chemistry, National University of Ireland;Galway, Galway, Ireland
bS Supporting Information
ABSTRACT:The promising photosensitizing properties of hypericin, a natural quinine substituted with hydroxyl and alkyl groups,have led to the proposal that it can be utilized in photodynamic therapy. Neither the detailed mechanism behind the powerful actionof hypericin, arising as a result of light excitation, nor the intracellular localization and transportation of the molecule is yet fullyunderstood. The behavior of hypericin derivatives in a pure dipalmitoylphosphatidylcholine (DPPC) lipid membrane has recentlybeen studied theoretically by means of molecular dynamics simulations. Natural membranes however contain many importantconstituents;cholesterol being one of the most essential;that influence the function and structure of the membrane, and therebyalso the behavior of drug molecules therein. In the present study, we investigated hypericin and its brominated derivatives inmembranes containing 9 and 25 mol % cholesterol. The results show that the presence of cholesterol in the membrane affects thepermeability of the hypericin molecules and does so differently for the various molecules in the two membranes. Hypericincontaining one bromine was found to exhibit the lowest free energy profile for the transport process into the lipids, and also thehighest permeability coefficients, indicating that this molecule displays the fastest and easiest diffusion in the membranes. All threemolecules were found to accumulate most preferably close to the polar headgroup region in both membranes.
1. INTRODUCTION
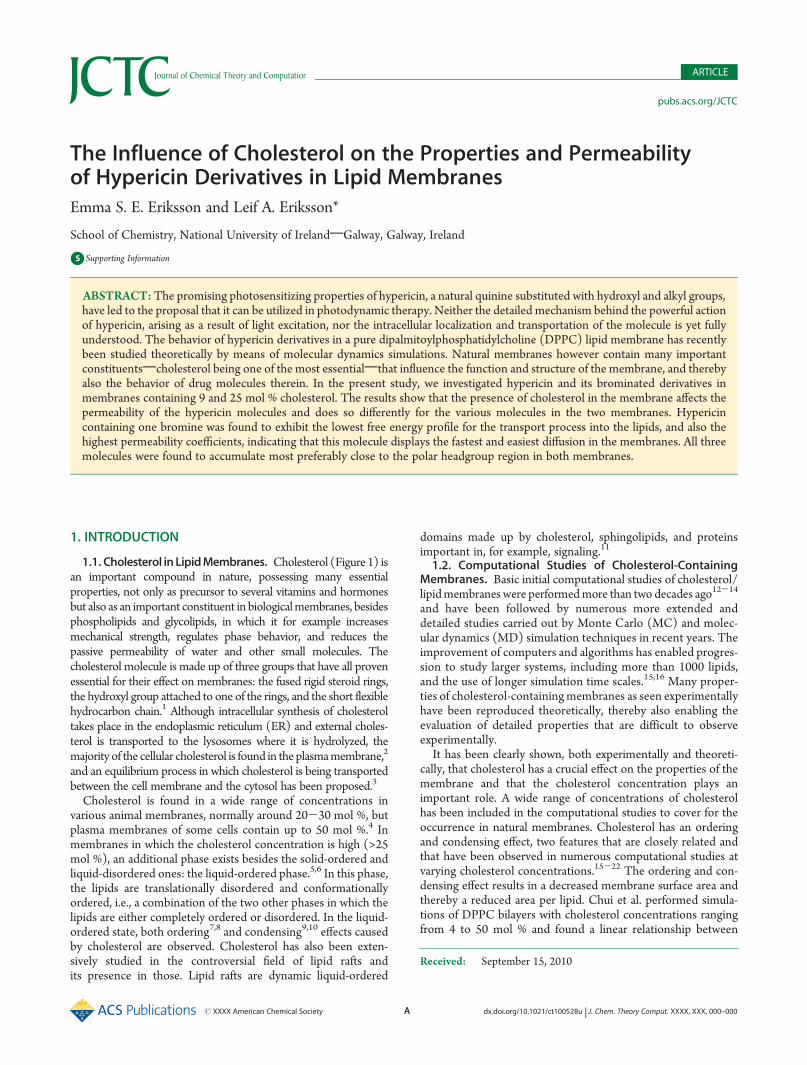
1.1. Cholesterol inLipidMembranes. Cholesterol (Figure 1) isan important compound in nature, possessing many essentialproperties, not only as precursor to several vitamins and hormonesbut also as an important constituent in biologicalmembranes, besidesphospholipids and glycolipids, in which it for example increasesmechanical strength, regulates phase behavior, and reduces thepassive permeability of water and other small molecules. Thecholesterol molecule is made up of three groups that have all provenessential for their effect on membranes: the fused rigid steroid rings,the hydroxyl group attached to one of the rings, and the short flexiblehydrocarbon chain.1 Although intracellular synthesis of cholesteroltakes place in the endoplasmic reticulum (ER) and external choles-terol is transported to the lysosomes where it is hydrolyzed, themajority of the cellular cholesterol is found in the plasmamembrane,2
and an equilibrium process in which cholesterol is being transportedbetween the cell membrane and the cytosol has been proposed.3
Cholesterol is found in a wide range of concentrations invarious animal membranes, normally around 20-30 mol %, butplasma membranes of some cells contain up to 50 mol %.4 Inmembranes in which the cholesterol concentration is high (>25mol %), an additional phase exists besides the solid-ordered andliquid-disordered ones: the liquid-ordered phase.5,6 In this phase,the lipids are translationally disordered and conformationallyordered, i.e., a combination of the two other phases in which thelipids are either completely ordered or disordered. In the liquid-ordered state, both ordering7,8 and condensing9,10 effects causedby cholesterol are observed. Cholesterol has also been exten-sively studied in the controversial field of lipid rafts andits presence in those. Lipid rafts are dynamic liquid-ordered
domains made up by cholesterol, sphingolipids, and proteinsimportant in, for example, signaling.11
1.2. Computational Studies of Cholesterol-ContainingMembranes. Basic initial computational studies of cholesterol/lipidmembranes were performedmore than two decades ago12-14
and have been followed by numerous more extended anddetailed studies carried out by Monte Carlo (MC) and molec-ular dynamics (MD) simulation techniques in recent years. Theimprovement of computers and algorithms has enabled progres-sion to study larger systems, including more than 1000 lipids,and the use of longer simulation time scales.15,16 Many proper-ties of cholesterol-containingmembranes as seen experimentallyhave been reproduced theoretically, thereby also enabling theevaluation of detailed properties that are difficult to observeexperimentally.It has been clearly shown, both experimentally and theoreti-
cally, that cholesterol has a crucial effect on the properties of themembrane and that the cholesterol concentration plays animportant role. A wide range of concentrations of cholesterolhas been included in the computational studies to cover for theoccurrence in natural membranes. Cholesterol has an orderingand condensing effect, two features that are closely related andthat have been observed in numerous computational studies atvarying cholesterol concentrations.15-22 The ordering and con-densing effect results in a decreased membrane surface area andthereby a reduced area per lipid. Chui et al. performed simula-tions of DPPC bilayers with cholesterol concentrations rangingfrom 4 to 50 mol % and found a linear relationship between
Received: September 15, 2010
B dx.doi.org/10.1021/ct100528u |J. Chem. Theory Comput. XXXX, XXX, 000–000
Journal of Chemical Theory and Computation ARTICLE
increased cholesterol concentration and a decrease in area perlipid at cholesterol concentrations in the range of 12-50mol %.21 However, Tu et al. showed that a cholesterol concen-tration of 12.5 mol % had no significant effect on the conforma-tion and packing of the hydrocarbon chains.23 Smondyrev andBerkowitz observed that the cholesterol molecules exhibit alarger tilt when the concentration is low, whereas at higherconcentrations, in which the hydrocarbon tails are more orderedand extended, cholesterol displays a reduced tilt.17 A reduction inelectron density in the center of the DPPC bilayer was alsoobserved with higher cholesterol concentrations as well as anincrease in hydrophobic thickness,17 supported by neutron-scattering experiments on DMPC bilayers.24
Martinez-Seara et al. recently published a detailed study of theunique structural functionality of cholesterol in its ability toinitiate the liquid-ordered phase.25 They showed that, at con-centrations below ∼30 mol %, the cholesterol molecules avoidlocations adjacent to each other but prefer locations separated by∼1 nm, i.e., located in the second coordination shell. It was alsofound that triangular connections between neighboring choles-terol molecules exist, as opposed to demethylated cholesterol(missing the two off-plane methyl groups; Dchol) for whichlinear connections exist. The two faces of cholesterol were alsostudied in detail, and it was shown that ordering and condensingwas less pronounced in membranes with Dchol, indicating thatthe off-plane methyl groups were essential for the unique proper-ties of cholesterol.26
Overall, unsaturated lipids show weaker interaction withcholesterol than saturated ones, and condensation and orderingis consequently less evident.27 Solvation of saturated lipid chainsoccurs most preferably with the smoothR face of cholesterol, theflat side with no substituents.20 In lipids containing one saturatedand one unsaturated chain, cholesterol is preferably solvated bythe saturated acyl chain.28 For unsaturated chains, however, the βface induces higher ordering.27 Even lipid chains not neighboringany cholesterol in the system20 or within a radius of at least a fewnanometers28 were found to display higher order than in a purelipid bilayer. The position of the double bond in unsaturatedlipids has been shown to significantly influence the interactionswith cholesterol regarding condensing and ordering, with thedouble bond located in themiddle of the lipid acyl chain resultingin the smallest effects, whereas when located at the end of thechain, it resulted in larger effects.29,30
Niemel€a et al. recently used three large membrane systems(1024 lipids in each) with varying unsaturated palmitoyloleoyl-phosphatidylcholine (POPC), palmitoylsphingomyelin, andcholesterol composition in order to study lipid rafts.16 Two of the
systems represented membranes with coexistent liquid-orderedand liquid-disordered domains as a result of high cholesterolcontent. They confirmed that the raft domain membranes mostlikely influence the function of membrane proteins, mainly due tosignificant differences in pressure profiles compared to the liquid-disordered single phase membrane.Water molecules penetrate deeper into the bilayer interior in
cholesterol-containing membranes and can therefore form hy-drogen bonds with the hydroxyl group of cholesterol.19 Thenumber of possible hydrogen bonds also depends on the depth atwhich cholesterol is located, and this in turn depends on the lipidcomposition in the bilayer. In a DPPC bilayer, the cholesterolmolecules are located deeper into the lipid interior than in aDMPC bilayer, and the number of hydrogen bonds with water isconsequently reduced in the DPPC membrane.18,26 At lowcholesterol concentrations, the number of hydrogen bonds withwater is lower than at higher concentrations, as a result of thecholesterol molecules being able to locate deeper inside theDPPC bilayer.17 Pure saturated lipid membranes are howevernot frequently found in nature; membranes are usually com-posed of mixtures of different lipids, unsaturated ones beingmorecommon than saturated, and other components. However, puresaturated lipid membranes are commonly utilized as computationalmodels mainly due to a lack of experimental data for unsaturatedlipids, which make parametrization a difficult issue. The fact thatmost lipids have at least one saturated chain also makes the choice ofsaturated lipids useful. It is however worth emphasizing that thecomputational studies discussed herein were performed usingdifferent programs, force fields, and lipid compositions. Thesedifferences can slightly influence the results.1.3. Permeation of Molecules in Cholesterol-Containing
Membranes. Cholesterol was shown to reduce the permeabilityof ions and small molecules such as Naþ, Kþ, Cl-, and glucosethrough lipid membranes.31 It was also discovered that thepermeability of water is reduced in cholesterol-containing mem-branes and that this depends on the cholesterol concentration.32
There are only a few studies performed on the unique behavior ofdrug molecules in lipid membranes containing cholesterol, as mostof the theoretical and experimental focus has been directed intostudying the effect of cholesterol itself on various lipid membranes.An experimental study performed on model membranes showedthat cholesterol decreases the permeability of large drug moleculesmainly due to the condensing effect of cholesterol on themembrane.33 This condensation may in particular affect large andrigid drug molecules. Molecular interactions between the drugmolecule and cholesterol can also delay the permeation throughthe membrane, such as has been shown for small nonsteroidal anti-inflammatory drugs.34 Several studies have confirmed that choles-terol strongly influences the interactions between peptides (drugs aswell as endogenous compounds) and the membrane.35-38
Drug interactions with cholesterol are important also becauseof the fact that many drugs are transported in the body byliposomes and lipoproteins. Liposomes are commonly used inthe drug delivery of both hydrophilic and hydrophobic drugs, asthey contain an aqueous core surrounded by a circled lipid bilayerthat can contain a significant amount of cholesterol. Hydropho-bic drugs that are administered into the bloodstream can bind tolipoproteins, which are the natural cholesterol transporters in thebody, and can, in those, interact with the cholesterol molecules.With the use of computational methods making it possible to
reproduce many of the features of cholesterol in membranes, thebehavior of small molecules such as drugs in these can be studied
Figure 1. Chemical structure of the cholesterol molecule.
C dx.doi.org/10.1021/ct100528u |J. Chem. Theory Comput. XXXX, XXX, 000–000
Journal of Chemical Theory and Computation ARTICLE
as well. Such studies can promote the design of drugs withdesirable properties.1.4. Hypericin. We have in a recent study investigated the
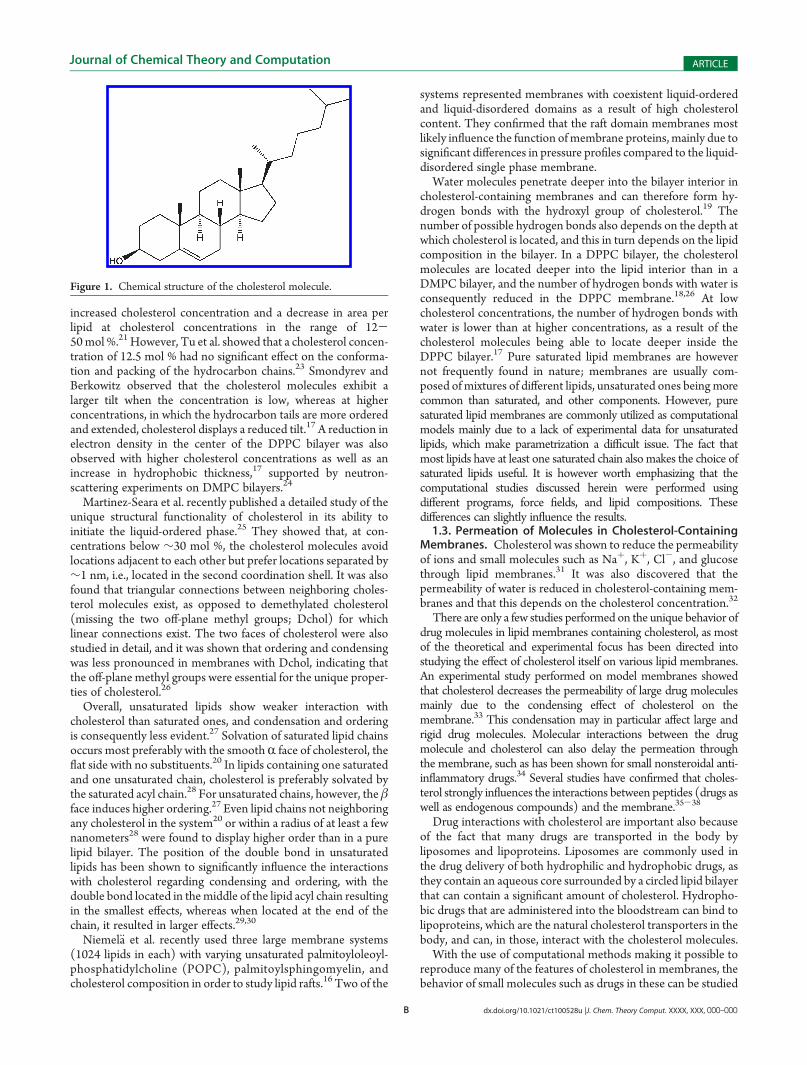
behavior of the potent photodynamic drug hypericin (Hy;Figure 2) with no, one (Hy-Br; position I, Figure 2), and fourbromines (Hy-4Br; positions I-IV, Figure 2) in a pure DPPCbilayer using molecular dynamics simulations.39
Hypericin is a natural compound found in theHypericum species,whose advantageous medical properties have been known forseveral thousand years. Besides the well-known antidepressiveproperties ofHypericum extracts,40 it has been found that hypericinpossesses antiviral41-46 and antitumor47-50 properties, as a resultof the formation of reactive oxygen species (ROS) such as singletoxygen upon light excitation, indicating that the compound couldbe used in photodynamic therapy (PDT). Hypericin has also beensuccessful in the field of photophysical diagnosis of early stagetumors, as it accumulates specifically in tumor tissue fromwhich thefluorescence of the drug can be detected.51-53
The interest in making the hypericin molecule a more effectivephotodynamic drug has led to modifications such as halogena-tion. Bromination of hypericin increases the formation of ROSdue to enhanced intersystem crossing from the first excitedsinglet state to the triplet state54,55 and has shown potentialphototoxic activity against viruses.56 Hypericin has been found invarious cell compartments; however, the exact cellular target aswell as the transport into the cell and its action of cell destruction isstill to be elucidated. However, there seems to be a preference forhypericin to accumulate in lipid membranes due to its hydrophobiccharacter, where it can initiate lipid peroxidation.57,58
In a recently published study, it was proposed that cholesterolis the major reason why hypericin selectively accumulates in lipidmembranes.59 A high amount of hypericin was found to localizein raft domains rich in cholesterol rather than in less orderedregions rich in lipids. The emission spectrum suggests interac-tions between cholesterol and the π electrons of hypericin,resulting in effective packing of the two molecules due to thecommon planar structure. These results indicate that hypericinmost likely can enter the cell membrane through diffusion;however, in the presence of lipoproteins such as low-densitylipoproteins in the blood, these can be likely carriers of hypericinand can also assist in cell-entering.60-62 Lipoproteins, as thenatural carriers of cholesterol in the body, are in that senseimportant in the aspect of possible cholesterol interactions withthe drug.In our previous molecular dynamics study of hypericin deriv-
atives in pure DPPC lipid bilayers, we found a strong preference
for the hypericin molecules to accumulate in the bilayer, close tothe polar headgroups and the interface between the lipids andwater, a location that enables interactions between the hydroxylgroups of hypericin and water.39 The largest gain in free energyfor the transfer process of moving from water into the lipids aswell as the fastest diffusion through the membrane was shown forHy-Br, indicating that this molecule would have the highestprobability to penetrate the membrane and reach the interior ofthe cell. Experimentally, it has been shown that halogenateddrugs display larger permeability coefficients through lipidmembranes.63
In order to extend the previous study, we are herein includingcholesterol in the membrane model. The study was performedon two cholesterol/lipid membrane systems, one containing alow concentration (9 mol %) cholesterol and one containing ahigher concentration (25 mol %) cholesterol, and with the samehypericin derivatives as in the previous study (Hy, Hy-Br, andHy-4Br; Figure 2). The present study was performed using amembrane model containing twice as many lipids and with twiceas long production runs compared to the previous one.
2. COMPUTATIONAL METHODOLOGY
The molecular dynamics program GROMACS (version4.0.4)64 was used throughout the study, together with the unitedatom GROMACS force field. The membrane model used was adipalmitoylphosphatidylcholine (DPPC) bilayer consisting of128 lipids and 3655 water molecules that had been equilibrated65
and simulated for 100 ns.66-68 This membrane model contains alarger number of lipids than the model used in our previousstudy; however the number of water molecules is more or less thesame, leading to a thinner water phase in the present model.
The cholesterol structure was first geometry optimized usingthe Gaussian program69 at the B3LYP/6-31G(d,p) level oftheory. Using the coordinates obtained in the quantum optimi-zations, the topology of the cholesterol molecule was obtainedusing the PRODRG software70 through its Web server [http://davapc1.bioch.dundee.ac.uk/prodrg/], which generates topolo-gies based on the GROMOS87 force field. Mulliken chargesobtained from the optimization were assigned to the cholesterolmolecule, and small charge groups with total charges close tozero were used. Thereafter, the structure was minimized by thesteepest descent algorithm followed by a 100 ps equilibrationsimulation with a time step of 0.5 fs.
Two cholesterol/DPPC bilayers were constructed, one with9 mol % (cholesterol/lipid ratio 12:116) and one with 25 mol %(cholesterol/lipid ratio 32:96) cholesterol, by randomly replac-ing lipid molecules with cholesterol in the membrane model.The same number of lipids was replaced in each monolayer. Themembranes were minimized using steepest descent and equili-brated for 5 ns at 100 K. A simulated annealing simulation wasthen performed to increase the temperature from 100 to 500 Kand then reduce it to 323 K, in steps of 50 K and 100 ps. The twomembranes were equilibrated 20 ns at 323 K.
During the initial simulated annealing of the cholesterol/DPPC systems, the structures and conformations of the mem-branes were seriously disrupted and the increase in kinetic energyresulting from the heating generated the lipids in a highly flexibledisordered state. This led to the possibility for the cholesterolmolecules to move around in the membrane, both within andin-between the monolayers. In the membrane containing32 cholesterol molecules (25 mol %), with initially 16 in each
Figure 2. The hypericin molecule with numbers indicating wherebromine substitution was modeled (I, Hy-Br; I-IV, Hy-4Br).

D dx.doi.org/10.1021/ct100528u |J. Chem. Theory Comput. XXXX, XXX, 000–000
Journal of Chemical Theory and Computation ARTICLE
monolayer, some cholesterol molecules moved in-between themonolayers, resulting in 14 cholesterol molecules in one mono-layer and 18 in the other. In the system with 9 mol % cholesterol,the 12 cholesterol molecules stayed in their respective mono-layers (six in each) during all simulations.
The geometries of the hypericin molecules were generated asoutlined above for cholesterol and the topologies obtained usingthe PRODRG software. Mulliken atomic charges obtained fromthe geometry optimizations, as well as small charge groups, wereassigned to the molecules. As bromine is not parametrized in theGROMOS87 force field, Lennard-Jones and ligand parametersfor chlorine were used instead. For the DPPC phospholipids, astandard united atom force field was applied,71 and for water, weused the SPC model.72 Parameters used for the cholesterol andhypericin molecules are provided in the Supporting Information.
Six independent simulations were performed, one for eachneutral hypericin derivative (Hy, Hy-Br, and Hy-4Br) in each ofthe two membranes. Two hypericin molecules of each derivativewere inserted into the membrane model, one in the outer regionof the water phase and one in the middle of the lipid phase. Thesystems were equilibrated for 200 ns, followed by 100 nsproduction runs in which the system trajectories were collectedevery 0.8 ps. During the equilibrations, the hypericin moleculesmoved into the lipids at different stages of the simulations. Allsimulations were performed using a time step of 2 fs. In a set oftest simulations, 10 hypericin (Hy only) molecules were alsostudied in the two membranes. All 10 molecules were initiallyinserted into the water phase, and the behavior of the moleculeswas monitored.
In all simulations, the isothermal-isobaric ensemble (NPT) atT = 323 K and p = 1 bar was used. The temperature and pressurewere held constant using a Nos�e-Hoover thermostat73,74 with acoupling constant of 0.1 ps and a semi-isotropic Parrinello-Rahman barostat75,76 with a coupling constant of 1 ps. A particlemesh Ewald scheme77,78 was used to calculate the electrostaticinteractions with a 10 Å cutoff for the real space. The same cutoffwas used for van der Waals interactions (Lennard-Jones terms).Bond lengths were constrained using the LINCS algorithm.79
Analyses were performed on the equilibration runs to verifyequilibration convergence and on the production runs from whichall reported data were obtained.
A potential of mean force formalism was used to calculate freeenergy profiles for hypericin molecules across the lipid bilayer(the direction of the z axis). The z component of the force, Fz,acting on the molecule at certain constrained distances betweenthe molecule and the bilayer (DPPC) center of mass wascollected at different positions along the z axis. The free energyfor the transfer process between zi and zf is written as
ΔG ¼ Gzf -Gzi ¼ -Z zf
zi
ÆFzæz dz ð1Þ
where the bracket means an average over the forces collected ateach constrained distance. To calculate the free energy profile forthe translocation of each molecule, 34 constrained simulationswere performed in which the hypericin molecule was located atpositions differing by 0.1 nm along the z axis direction. Thestarting points for the simulations were sampled from theprevious nonconstrained simulations. To sample the points inthe middle of the bilayer, where the molecules were never locatedduring the unconstrained simulations, a weak force was used topush the molecule toward the bilayer middle, choosing the value
of the force so as to make the least perturbation possible on thebilayer system.
At each point in water (9 mol % cholesterol: 2.8-3.3 nm fromthe bilayer center; 25 mol % cholesterol: 3.1-3.3 nm from thebilayer center) equilibration was performed for at least 3 ns,followed by a production run of 4 ns. Inside the lipid bilayer(9 mol % cholesterol: 0-2.7 nm from the bilayer center; 25mol %cholesterol: 0-3.0 nm from the bilayer center), an increase in thesampling was needed due to the slower motion of the molecules,and therefore, each point was equilibrated for at least 4.7 ns and aproduction run of 10 ns followed. For someof the systemswith thehypericin molecules located within or close to the headgroupregion, it was difficult to reach an equilibrated system due tocompeting interactions with the hypericins from the lipids andwater. The thinner water phase in the present membrane modelreduces the number of constrained simulations as the maximumdistance to the bilayer center used herein was 3.3 nm, compared to4.0 nm in our previous pure DPPC study. In the more condensed25 mol % cholesterol membrane, the water phase is thicker thanin the lower cholesterol membrane (as discussed below), andadditional frames further out into the water phase could inprinciple have been included. However, in order to compare theresults from the two membranes, the same number of frameswas employed for both systems. The constrained simulations inthe 25 mol % cholesterol membrane were run with the z boxlength fixed, whereas for the 10 mol % cholesterol membrane,this was not possible.
The force acting on the hypericin center of mass was collectedat every time step during the production run. A SHAKEalgorithm80 was used to constrain the distance between thecenter of mass of the bilayer and the hypericin molecules (themolecules were constrained in the z direction but allowed torotate). In the 25 mol % cholesterol membrane, in which the twomonolayers contained different numbers of cholesterol mole-cules, the constrained hypericin molecule was located in themonolayer containing the most cholesterol (18).
The permeability is defined as the current density divided bythe concentration gradient across the membrane. The proceduredeveloped by Marrink and Berendsen81 was adopted to calculatethe permeability coefficients, based on the fluctuation dissipationtheorem and using the deviation of the instantaneous force,F(z,t), from the average force acting on the molecule obtainedduring the constrained dynamics:
ΔFðz, tÞ ¼ Fðz, tÞ- ÆFðz, tÞæ ð2ÞThe local time-dependent friction coefficient, ξ, can be calculatedfrom the following autocorrelation function:
ξðz, tÞ ¼ ÆΔFðz, tÞΔFðz, 0Þæ=RT ð3Þwhere T is the absolute temperature and R is the gas constant. Byintegrating the friction coefficient, one can obtain the diffusioncoefficient, D:
DðzÞ ¼ RT=ξðzÞ ¼ ðRTÞ2=Z ¥
0ÆΔFðz, tÞΔFðz, 0Þæ dt ð4Þ
This function was fitted to a double exponential using a nonlinearfitting procedure81 in order to integrate the autocorrelation of theforce fluctuations:
CðtÞ ¼ A0 expð- t=τ0ÞþA1 expð- t=τ1Þ ð5Þ

E dx.doi.org/10.1021/ct100528u |J. Chem. Theory Comput. XXXX, XXX, 000–000
Journal of Chemical Theory and Computation ARTICLE
This translates to themoleculesmoving inside the lipid bilayer ontwo distinct time scales, corresponding to the two decay times τ0and τ1, one fast and one slow.
The permeability coefficient, P, can be calculated by integrat-ing over the local resistances across the membrane, R(z). R(z) isobtained by dividing the exponential of the previously calculatedfree energies, ΔG(z), by the diffusion coefficients, D(z):
1=P ¼Z
RðzÞ dz ¼Z zf
zi
expðΔGðzÞ=kTÞDðzÞ dz ð6Þ
Interaction between cholesterol molecules at the two concentra-tions and for each different hypericin system was monitoredthrough radial distribution functions (RDF), as were interactionbetween cholesterol and DPPC molecules. The data reveal thatthe concentration of cholesterol in the current systems is too lowfor the cholesterols to interact directly;instead they all form afirst and even a second coordination shell of DPPC molecules,before the nearest cholesterol molecule appears (COM distancesaround 1 nm);in agreement with the findings of Martinez-Searaet al.25 No specific effects from the different hypericins wereobserved. The RDFs are provided in the Supporting Information.
3. RESULTS
The fact that cholesterol molecules were exchanged betweenthe monolayers in the 25 mol % cholesterol bilayer during thesimulated annealing is an interesting observation. Flip-floppingof cholesterol is an important natural process and has experi-mentally been demonstrated to occur with a half-time of <1 s.82
Coarse-grained MD simulations estimated the rate of possibleflip-flops to be in the same range.83 Umbrella sampling MDsimulations and atomisticMD simulations have also been appliedto study possible flip-flopping of cholesterol.84 The most prob-able flip-flop path for cholesterol was calculated with a modifiedstring method and was found to involve the cholesterol moleculefirst tilting and then moving to the bilayer center. The free energybarrier for the flip-flop in the DPPC bilayer was found to behigher than in diarachidonylphosphatidylcholine (DAPC), butlower than in POPC. However, spontaneous flip-flops of cho-lesterol have not yet been observed during MD simulation“production runs”, although for ketosterol this phenomenonhas been detected in atomistic MD simulations.85 Note that theflip-flops observed in the present study occurred during thesimulated annealing, in which the temperature was significantlyhigher than under normal conditions, resulting in more move-ment in the system that gives rise to a possible exchange ofmolecules between the monolayers. No spontaneous flip-flopswere observed during the simulations at constant temperature(323 K).
In Figure 3, we show snapshots from the production simula-tions of the two membranes with hypericin. In the membranewith 9 mol % cholesterol, the lipid and cholesterol molecules arefree to move to a larger extent, and the molecules are tilted morethan in the bilayer with higher cholesterol content. The hydro-carbon tails of both the lipids and the cholesterol molecules are ina disordered state. The condensing effect of cholesterol is clearlyseen in the 25 mol % cholesterol membrane, and the hydro-carbon tails of the lipids and the cholesterol molecules are moreordered and more aligned to the bilayer normal. The increasedthickness of the water phase, as a result of the decreasedmembrane surface area, is also clearly visible in the 25 mol %
cholesterol membrane. The condensing effect is due to thesmaller size of a cholesterol molecule relative to DPPC, andconsequently, with higher cholesterol content, the effect is morepronounced. The cholesterol molecule is shorter than a DPPCmolecule and can therefore fit tightly in-between two DPPCmolecules, often with its hydroxyl group in the level of thecarbonyl group of the DPPC molecules. The condensing effectcan also be displayed as the area per lipid, which decreases withan increasing concentration of cholesterol. The area per DPPClipid was calculated by subtracting from the total area permonolayer the total area occupied by cholesterol moleculesand dividing the difference by the number of lipids in one mono-layer. We used the area per cholesterol molecule (=32 Å2)obtained from X-ray diffraction experiments,86 assuming thatthe cholesterol area remained constant, whereas the area per lipidwas taken as an average over the last 10 ns of the equilibrationof the membranes. For the 9 mol % cholesterol membrane,the area per lipid was estimated to be 59.7 Å2 and, in the 25mol %cholesterol membrane, 48.1 Å2 in the monolayer with 18cholesterol molecules and 50.8 Å2 in the monolayer with 14cholesterol molecules. Smondyrev and Berkowitz used the sameapproach to calculate the area per lipid in membranes with 11and 50 mol % cholesterol, giving 58.3 Å2 and 44.7/46.5 Å2,respectively.17 In a pure DPPC membrane, the average area perlipid has been measured to be 61.6 Å2.87 Our generated data thusfit well into this range.
The hypericin molecules entered the membranes at differentstages of the equilibration simulations. However, the sameequilibration time (200 ns) was used for all six systems, and bythat time all of the molecules were well inside the lipids. Duringthe equilibrations, the molecules were free to enter any of the twomonolayers, from the water or from the center of the bilayer. Inthe case of Hy in the 9 mol % cholesterol membrane and Hy-4Brin the 25 mol % cholesterol membrane, the two molecules endedup in the same monolayer. However, the molecules were notinteracting, as the minimum distance between the two moleculesduring the production runs was overall larger than the van derWaals cutoff of 10 Å. Neither of the hypericin molecules crossedthe center of the bilayer or returned into the water phase afterentering the monolayer region.
In the 9 mol % cholesterol membrane, all three hypericinderivatives entered the lipids in regions where the local choles-terol concentration was low. The reason for this behavior mightbe that the local density is lower in the regions where there are no
Figure 3. Snapshots from the simulations of two hypericin molecules in(A) 9 mol % and (B) 25 mol % cholesterol membranes. Cholesterolmolecules are displayed in yellow.

F dx.doi.org/10.1021/ct100528u |J. Chem. Theory Comput. XXXX, XXX, 000–000
Journal of Chemical Theory and Computation ARTICLE
cholesterol molecules, making it easier for the large hypericinmolecules to incorporate. In the 25 mol % cholesterol mem-brane, this behavior was harder to determine with certainty dueto the overall higher cholesterol concentration.
The minimum distance between any pair of atoms from eitherof the two hypericin molecules in each simulation and any of thecholesterol molecules was investigated during the productionsimulations (Figures 4 and 5) to explore if the hypericinmolecules were able to interact with the cholesterol molecules.In the membrane with 9 mol % cholesterol, the minimum distancebetweenHy and cholesterol was in the range 0.25-1.25 nm, with anaverage distance of 0.56 nm. The distance between Hy-Br andHy-4Br and cholesterol fluctuated more frequently than for Hy,varying between 0.2 and 1.3 nm for Hy-Br and between 0.2 and1.1 nm for Hy-4Br, with an average distance of 0.63 nm for bothmolecules. In the 25 mol % cholesterol membrane, the distance
between the hypericin molecules and cholesterol displayed lessvariation, with distances in the range of 0.2-1.0 nm and anaverage for Hy of 0.46 nm; for Hy-Br, 0.64 nm; and for Hy-4Br,0.73 nm. All average distances are summarized in Table 1. TheHy molecules are obviously the ones located closest to choles-terol in both membranes, and in the 25 mol % cholesterolmembrane, the minimum distance between Hy and cholesterolis shorter than in the 9 mol % cholesterol membrane. For Hy-Br,there is no significant difference between the two membranes,whereas forHy-4Br theminimumdistance is longer in the 25mol%cholesterol membrane, nearly 3 Å longer than for Hy in the samemembrane. We emphasize, however, that the trends observedshould be taken with some caution given the limited amountof data.
Density profiles for the different systems are displayed inFigure 6 and show that the probability to find the hypericin
Figure 4. Minimum distance (nm) between any pair of atoms of a hypericin molecule (A, Hy; B, Hy-Br; C, Hy-4Br) and a cholesterol molecule duringthe production simulations in the 9 mol % cholesterol membrane.
Figure 5. Minimum distance (nm) between any pair of atoms of a hypericin molecule (A, Hy; B, Hy-Br; C, Hy-4Br) and a cholesterol molecule duringthe production simulations in the 25 mol % cholesterol membrane.
G dx.doi.org/10.1021/ct100528u |J. Chem. Theory Comput. XXXX, XXX, 000–000
Journal of Chemical Theory and Computation ARTICLE
molecules close to the polar headgroups and the interfacebetween the lipids and water is high. This being the densestregion of the bilayer, it would not be favorable for the large andinflexible hypericin molecules to accumulate if it was not for thepossibility to interact with water while still being embedded inthe lipids. This is discussed further in connection with the radialdistribution functions below. Comparing the two membranesreveals that Hy is found overall slightly closer to the lipid/waterinterface in the 9 mol % cholesterol membrane. For Hy-Br, themolecule that enters the lipids from water (right peak) ends upcloser to the lipid/water interface than the molecule that wasinitially positioned in the middle of the bilayer. This is seen inboth membranes. Hy-4Br displays wider density profiles than Hyand Hy-Br, in both membranes, and moves closer to the bilayercenter than any of the others. This results in less interaction withwater and is supported by observations made in a pure DPPCmembrane.39 Concluded from the density profiles is that at leastone of the two Hy and Hy-Br molecules in each simulation islocated closer to the lipid/water interface in the 9 mol %cholesterol membrane. Similar density profiles have been foundfor smaller drug molecules such as psoralens and 5-aminolevu-linic acid and derivatives thereof; however, these molecules werelocated slightly closer to the bilayer center.88,89
In natural membranes, unsaturated lipids are important con-stituents, especially in the formation of raft domains. Due to theuse of saturated lipids in the present study, possible interactionsbetween the hypericin molecules and unsaturated lipids, as wellas between cholesterol and unsaturated lipids was not accountedfor, which could affect the partition and behavior of the mole-cules. It has been found that cholesterol interacts stronger withsaturated lipids than unsaturated ones, resulting in more pro-nounced effects on the structure of the membrane, includingcondensing and ordering aspects.27 Consequently, this affects thebehavior of small molecules, such as hypericin, in the mem-branes. As an initial study of the behavior of hypericin derivativesin cholesterol containingmembranes, and to enable comparisonswith earlier work on hypericin in purely saturated bilayers, weused saturated lipids also in the present study. As a next step, inorder to follow up this study, unsaturated lipids would beincluded for comparison.
In cholesterol-containing membranes, the lipids are moreordered and their tails more aligned to the bilayer normal,compared to in a pure DPPC membrane. This results in a largerbilayer thickness and is seen by comparing the DPPC densityprofile for the 25 mol % cholesterol membrane in Figure 6 withthe DPPC density profiles for the pure lipid membrane.39 Thebilayer thickness is increased by a few Ångstroms in the choles-terol-containing membrane. In the 9 mol % cholesterol mem-brane, the bilayer thickness is approximately the same as in thepure DPPC membrane. However, the fact that the bilayerthickness is increased does not necessarily mean that eachmonolayer thickness is increased in the 25 mol % cholesterolmembrane but is rather a result of the monolayers being more
separated, resulting in a decrease in density in the center of thebilayer (Figure 6). These findings are in agreement with previousobservations that the hydrophobic thickness is increased and theelectron density in the center of the bilayer is decreased incholesterol-containing membranes.17,24 In the 9 mol % choles-terol membrane, the monolayer separation is similar to the one inthe pure DPPCmembrane, indicated by the higher density in thebilayer center. The increased free space in the middle of the 25mol % cholesterol membrane could be expected to result in areduced probability of locating the hydrophobic hypericin mol-ecules in that region, even more than in the more compactmembranes. This is supported by the calculated free energyprofiles for the transport process through the membrane and isfurther discussed below.
A test set of simulations with 10 hypericin (Hy) moleculesinitially placed in the water region of the two systems providedinformation about interactions between the molecules (data notshown). It was clear that in the water phase the molecules tend tostack together due to the nonfavorable polar environment.Previous studies have confirmed that hypericin molecules inter-act with each other in solution, forming dimers when theconcentration is low90 andH aggregates of at least four moleculespositioned face to face when the concentration is higher.91 It isclear from the simulations performed herein that the hypericinmolecules interact strongly with each other in conformations ofeither two or four molecules in the water phase; however,whether dimers or H aggregates are predominantly formed isdifficult to determine due to the high degree of movement in thesystem. The aggregation did not seem to affect the ability to enterthe lipids, and the molecules remained stacked together alsowithin the lipids, indicating that these interactions are favorablealso in a nonpolar environment. It has previously been observedthat the photodynamic properties of hypericin are altered byaggregation, resulting in a decreased singlet oxygen yield,90 anissue that needs to be considered if the hypericinmolecules are tobe activated by light within a membrane.
Radial distribution functions between oxygen atoms on thehypericin derivatives and hydrogen atoms in the surroundingwater (Figure 7A) and between polar hydrogen atoms on thehypericin derivatives and oxygen atoms in the surrounding water(Figure 7B) were calculated for both membranes. The first peakin both figures (at ∼0.18 nm) corresponds to a hydrogen bond.The following peak in Figure 7A corresponds to a secondhydrogen in the same water molecule or a second solvationshell, whereas the second peak in Figure 7B corresponds to asecond solvation shell of water. Following this, there is anincrease in amplitude of the radial distribution functions as moreand more water molecules are included in shells of higher order.
The peaks corresponding to hydrogen bonds suggest that thehypericin molecules, to a greater or smaller extent, interact withwater as they accumulate in the region close to the interfacebetween the lipids and water. In a pure DPPCmembrane, a cleartrend was observed for the radial distribution functions, with Hydisplaying the highest radial distribution functions overall, fol-lowed by Hy-Br and Hy-4Br, respectively.39 Such a clear trendcannot be observed in the cholesterol-containing membranes. Inthe 9 mol % cholesterol membrane, Hy-Br displays the highestradial distribution function for a hydrogen bond between oxygenatoms on hypericin and hydrogen atoms in water followed by Hyand Hy-4Br, respectively. This feature can be explained by thefinding that one of the Hy-Br molecules was located very close tothe lipid water interface, as seen in the density profiles. However,
Table 1. Average Distances (in nm) between Any Pair ofAtoms of a Hypericin Molecule and a Cholesterol MoleculeInside the Two Membranes during the Production Runs
molecule 9 mol % cholesterol 25 mol % cholesterol
Hy 0.56 0.46
Hy-Br 0.63 0.64
Hy-4Br 0.63 0.73

H dx.doi.org/10.1021/ct100528u |J. Chem. Theory Comput. XXXX, XXX, 000–000
Journal of Chemical Theory and Computation ARTICLE
Hy displays the highest radial distribution function for a hydro-gen bond between hydrogen atoms of hypericin and oxygenatoms in water, albeit very low, followed by even lower ampli-tudes for Hy-Br and Hy-4Br. In the 25 mol % cholesterolmembrane, Hy displays the highest radial distribution functionfor a hydrogen bond between oxygen atoms on hypericin andhydrogen atoms in water followed by Hy-Br and Hy-4Br at equalamplitudes, whereas Hy and Hy-Br display the highest radialdistribution functions for hydrogen bonds between hydrogenatoms of hypericin and oxygen atoms in water. Common for allmembranes, with and without cholesterol, is that Hy-4Br overalldisplays the lowest radial distribution functions. This is explained
by the fact that this molecule was moving closer to the bilayermiddle during the simulations in both membranes, hence redu-cing the ability to interact with water.
The mean-square displacement (MSD)92 reveals details aboutthe movements of a molecule inside the bilayer and is defined by
MSDðtÞ ¼ Æj rBðtÞ- rBð0Þj2æ ð7Þ
where rB(0) and rB(t) are the positions of a particle at time t = 0 andat a certain time t.
The brackets indicate a time average over all similar particlesand over different time origins along the simulation. The Einstein
Figure 6. Density profiles for two hypericin derivatives (A, Hy; B, Hy-Br; C, Hy-4Br) in the DPPC bilayer with 9% cholesterol (left) and 25%cholesterol (right).

I dx.doi.org/10.1021/ct100528u |J. Chem. Theory Comput. XXXX, XXX, 000–000
Journal of Chemical Theory and Computation ARTICLE
relation allows for the calculation of the diffusion coefficient,D, atsufficiently long simulation times:92
D ¼ limtf¥
12dt
ÆjriðtÞ- rið0Þj2æ ð8Þ
where d is the dimensionality of the space.This way, one can obtain the MSD for the molecules moving
in the bilayer plane (d = 2) and along the bilayer normal (d = 1),respectively. The MSD provides a measure of the averagedistance a molecule travels in the system, and the growth rateof the MSD depends on how often the molecule collides, i.e., ameasure of the ease of diffusion of the molecule.
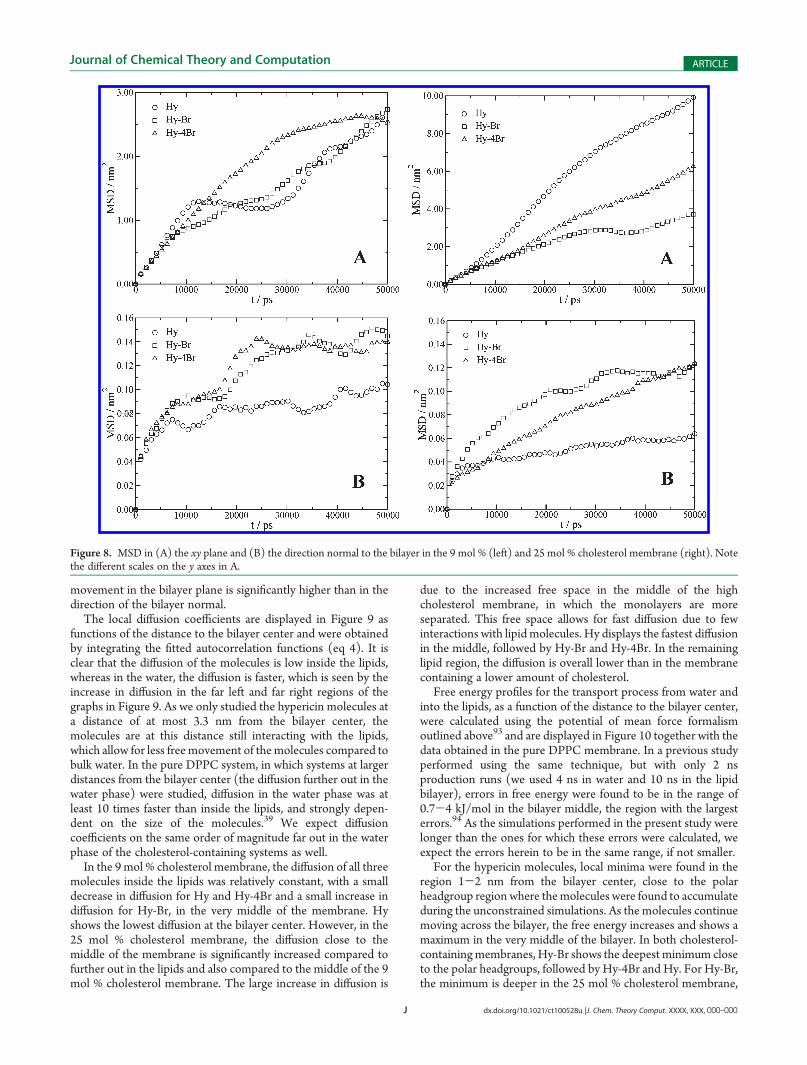
Like other molecules diffusing in confined media, the hyper-icin molecules never reach the Einsteinian limit of properdiffusion within the limited time of the simulation, and anom-alous diffusion occurs where MSD is proportional to tn, with0 < n < 1. The implication is that a direct comparison withexperimental diffusion coefficients cannot be made. However, onthe basis of the MSD, one can state which molecules have ahigher or lower diffusive regime. The MSDs of the hypericinderivatives in the bilayer plane and along the normal of thebilayer (z direction) in the two membranes are displayed inFigure 8A and B, respectively. The addition of a bromine atom tothe hypericin molecule does not significantly affect the move-ment in the bilayer plane in the 9 mol % cholesterol membrane,whereas the addition of four bromine atoms makes the molecule
movemore easily. Despite the fact that Hy-4Br is heavier than thetwo other molecules, its movement in the bilayer plane is fasterdue to a lower propensity of forming hydrogen bonds with water,as seen above. In the 25 mol % cholesterol membrane, however,the movement in the bilayer plane is highest for Hy, followed byHy-4Br and Hy-Br, and the movement of both Hy and Hy-4Br isconsiderably higher here than in the membrane of lowercholesterol concentration. This situation does not reflect thehydrogen bond capability with water, as it was shown above thatHy exhibits the highest radial distribution functions in the 25mol%cholesterol membrane. The movement of all molecules in thebilayer plane of the 9 mol % cholesterol membrane is slower thanin a pureDPPCmembrane.39 Themovement of Hy in the bilayerplane of the 25 mol % cholesterol membrane is similar to that ina pure DPPC membrane, whereas for Hy-Br and Hy-4Br themovement is slower.
The MSDs for the molecules along the bilayer normal of thetwo membranes are displayed in Figure 8B. This movement is, asopposed to the movement in the bilayer plane, finite and shouldhence be interpreted with caution. The MSD profiles in thedirection of the bilayer normal of the 9 mol % cholesterolmembrane are similar, and on the same order of magnitude, asthe ones obtained in a pure DPPC membrane, displaying theslowest movement for Hy and similar, yet faster, movement forHy-Br and Hy-4Br,39 and overall slightly faster than in the25 mol % cholesterol membrane. It is clearly seen that the
Figure 7. Radial distribution functions between (A) oxygen atoms on the hypericin derivatives and hydrogen atoms in the surrounding water and (B)polar hydrogen atoms on the hypericin derivatives and oxygen atoms in the surrounding water in the 9mol % (left) and 25mol % cholesterol membranes(right).
J dx.doi.org/10.1021/ct100528u |J. Chem. Theory Comput. XXXX, XXX, 000–000
Journal of Chemical Theory and Computation ARTICLE
movement in the bilayer plane is significantly higher than in thedirection of the bilayer normal.
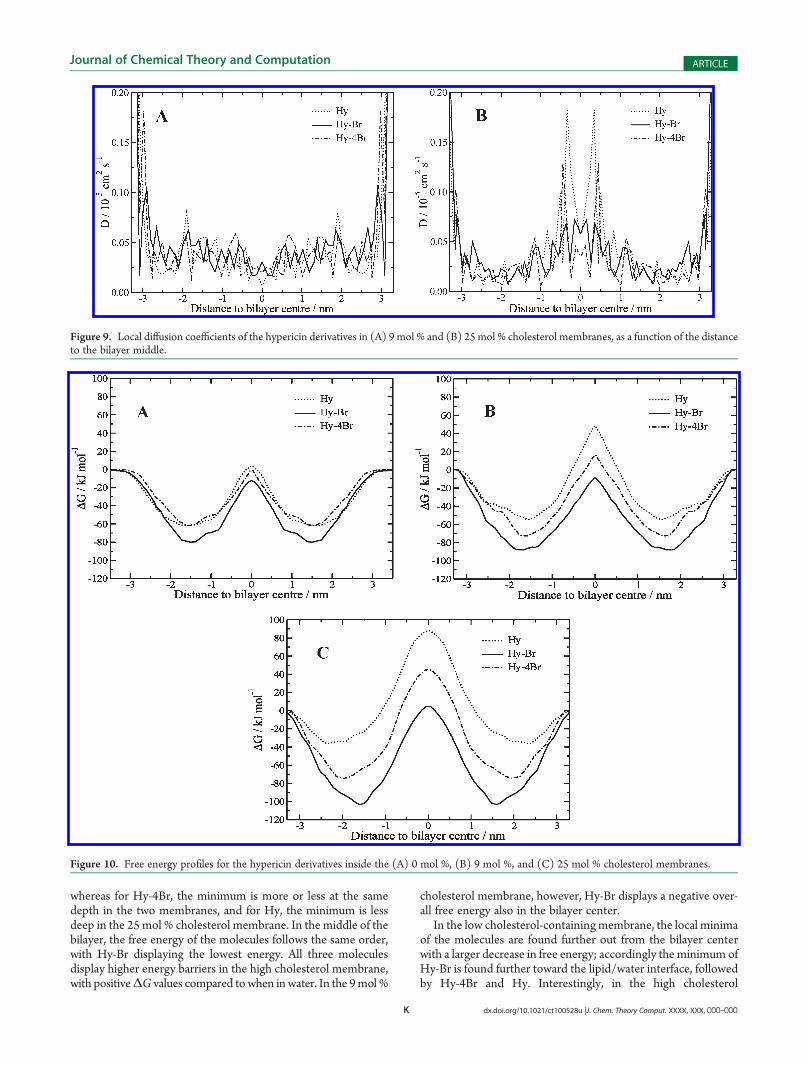
The local diffusion coefficients are displayed in Figure 9 asfunctions of the distance to the bilayer center and were obtainedby integrating the fitted autocorrelation functions (eq 4). It isclear that the diffusion of the molecules is low inside the lipids,whereas in the water, the diffusion is faster, which is seen by theincrease in diffusion in the far left and far right regions of thegraphs in Figure 9. As we only studied the hypericin molecules ata distance of at most 3.3 nm from the bilayer center, themolecules are at this distance still interacting with the lipids,which allow for less free movement of themolecules compared tobulk water. In the pure DPPC system, in which systems at largerdistances from the bilayer center (the diffusion further out in thewater phase) were studied, diffusion in the water phase was atleast 10 times faster than inside the lipids, and strongly depen-dent on the size of the molecules.39 We expect diffusioncoefficients on the same order of magnitude far out in the waterphase of the cholesterol-containing systems as well.
In the 9 mol % cholesterol membrane, the diffusion of all threemolecules inside the lipids was relatively constant, with a smalldecrease in diffusion for Hy and Hy-4Br and a small increase indiffusion for Hy-Br, in the very middle of the membrane. Hyshows the lowest diffusion at the bilayer center. However, in the25 mol % cholesterol membrane, the diffusion close to themiddle of the membrane is significantly increased compared tofurther out in the lipids and also compared to the middle of the 9mol % cholesterol membrane. The large increase in diffusion is
due to the increased free space in the middle of the highcholesterol membrane, in which the monolayers are moreseparated. This free space allows for fast diffusion due to fewinteractions with lipidmolecules. Hy displays the fastest diffusionin the middle, followed by Hy-Br and Hy-4Br. In the remaininglipid region, the diffusion is overall lower than in the membranecontaining a lower amount of cholesterol.
Free energy profiles for the transport process from water andinto the lipids, as a function of the distance to the bilayer center,were calculated using the potential of mean force formalismoutlined above93 and are displayed in Figure 10 together with thedata obtained in the pure DPPC membrane. In a previous studyperformed using the same technique, but with only 2 nsproduction runs (we used 4 ns in water and 10 ns in the lipidbilayer), errors in free energy were found to be in the range of0.7-4 kJ/mol in the bilayer middle, the region with the largesterrors.94 As the simulations performed in the present study werelonger than the ones for which these errors were calculated, weexpect the errors herein to be in the same range, if not smaller.
For the hypericin molecules, local minima were found in theregion 1-2 nm from the bilayer center, close to the polarheadgroup region where themolecules were found to accumulateduring the unconstrained simulations. As the molecules continuemoving across the bilayer, the free energy increases and shows amaximum in the very middle of the bilayer. In both cholesterol-containingmembranes, Hy-Br shows the deepest minimum closeto the polar headgroups, followed by Hy-4Br and Hy. For Hy-Br,the minimum is deeper in the 25 mol % cholesterol membrane,
Figure 8. MSD in (A) the xy plane and (B) the direction normal to the bilayer in the 9 mol % (left) and 25 mol % cholesterol membrane (right). Notethe different scales on the y axes in A.
K dx.doi.org/10.1021/ct100528u |J. Chem. Theory Comput. XXXX, XXX, 000–000
Journal of Chemical Theory and Computation ARTICLE
whereas for Hy-4Br, the minimum is more or less at the samedepth in the two membranes, and for Hy, the minimum is lessdeep in the 25 mol % cholesterol membrane. In the middle of thebilayer, the free energy of the molecules follows the same order,with Hy-Br displaying the lowest energy. All three moleculesdisplay higher energy barriers in the high cholesterol membrane,with positiveΔG values compared to when in water. In the 9mol %
cholesterol membrane, however, Hy-Br displays a negative over-all free energy also in the bilayer center.
In the low cholesterol-containingmembrane, the local minimaof the molecules are found further out from the bilayer centerwith a larger decrease in free energy; accordingly the minimum ofHy-Br is found further toward the lipid/water interface, followedby Hy-4Br and Hy. Interestingly, in the high cholesterol
Figure 9. Local diffusion coefficients of the hypericin derivatives in (A) 9 mol % and (B) 25 mol % cholesterol membranes, as a function of the distanceto the bilayer middle.
Figure 10. Free energy profiles for the hypericin derivatives inside the (A) 0 mol %, (B) 9 mol %, and (C) 25 mol % cholesterol membranes.
L dx.doi.org/10.1021/ct100528u |J. Chem. Theory Comput. XXXX, XXX, 000–000
Journal of Chemical Theory and Computation ARTICLE
membrane, the opposite situation is observed. Here, the mini-mum lies closer to the bilayer center with a larger decrease in freeenergy, generating the minimum of Hy-Br significantly closer tothe bilayer center than the two other molecules.
The free energy maxima of the molecules in the 25 mol %cholesterol membrane are clearly more rounded than the narrowmaxima found with a lower cholesterol concentration. This is dueto the fact that, as discussed above, the two monolayers are moreseparated in the membrane with higher cholesterol content.The free space in the middle of the membrane is also responsiblefor the larger increase in free energy in this region compared toin themembrane with a lower cholesterol content. The free spaceconstitutes a less hydrophobic region offering less possibleinteractions with lipids, in which it is not favorable for thehydrophobic molecules to be located, and thereby generating alarge increase in free energy for transport process into/acrossthat region.
In the pure DPPC bilayer, Hy-Br was also found to display thelowest overall change in free energy along the bilayer normal(Figure 10A).39 In the 9 mol % cholesterol membrane, Hy-Brand Hy-4Br show deeper free energy minima in the headgroupregion compared to the pure DPPC membrane, whereas Hydisplays an increase. In themiddle of the bilayer, the free energy isincreased (more positive) for all three molecules. Only Hy-Brstill displays a negative free energy, however slightly less negative
than without cholesterol present. Hy-4Br, which displayed asmall negative change in free energy in the middle of the pureDPPC membrane, is now on the positive side. In the 25 mol %cholesterol membrane, the same pattern is seen when comparingwith the pure DPPC membrane, although with larger overallchanges than in the 9mol % cholesterol membrane. It is clear thatHy is most negatively affected by the inclusion of cholesterol inthe membrane, displaying a significant increase in free energyboth in the middle of the bilayer and close to the polar head-groups.
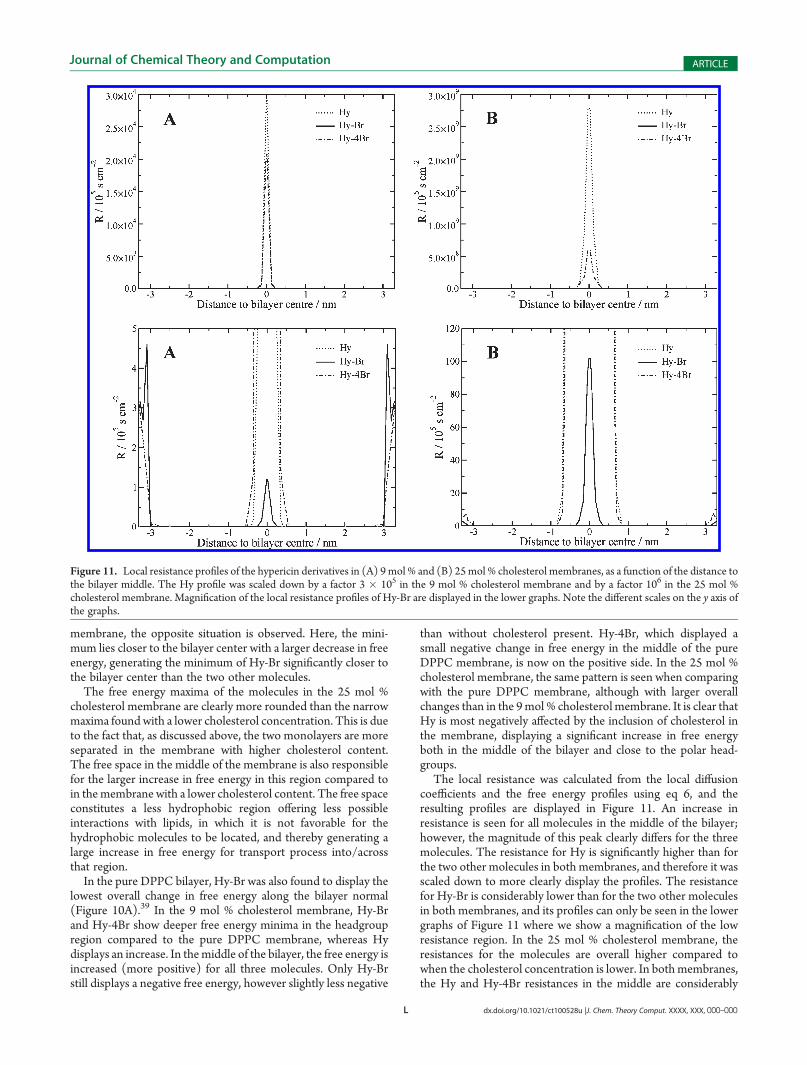
The local resistance was calculated from the local diffusioncoefficients and the free energy profiles using eq 6, and theresulting profiles are displayed in Figure 11. An increase inresistance is seen for all molecules in the middle of the bilayer;however, the magnitude of this peak clearly differs for the threemolecules. The resistance for Hy is significantly higher than forthe two other molecules in both membranes, and therefore it wasscaled down to more clearly display the profiles. The resistancefor Hy-Br is considerably lower than for the two other moleculesin both membranes, and its profiles can only be seen in the lowergraphs of Figure 11 where we show a magnification of the lowresistance region. In the 25 mol % cholesterol membrane, theresistances for the molecules are overall higher compared towhen the cholesterol concentration is lower. In both membranes,the Hy and Hy-4Br resistances in the middle are considerably
Figure 11. Local resistance profiles of the hypericin derivatives in (A) 9mol % and (B) 25mol % cholesterol membranes, as a function of the distance tothe bilayer middle. The Hy profile was scaled down by a factor 3 � 105 in the 9 mol % cholesterol membrane and by a factor 106 in the 25 mol %cholesterol membrane. Magnification of the local resistance profiles of Hy-Br are displayed in the lower graphs. Note the different scales on the y axis ofthe graphs.
M dx.doi.org/10.1021/ct100528u |J. Chem. Theory Comput. XXXX, XXX, 000–000
Journal of Chemical Theory and Computation ARTICLE
higher than in the water phase, as is seen in the lower graphs ofFigure 11. For Hy-Br, however, the resistance in the middle ishigher than in water in the 25 mol % cholesterol membrane,whereas in the 9 mol % cholesterol membrane, the resistance inthe middle is lower than that in water. The free energy is themajor contributor to the shape of the resistance profiles, with anincrease in free energy giving an increase in resistance. Thelowest free energy of Hy-Br in the middle of the membranetherefore generates the lowest resistance, and the opposite forHy. The molecules exhibit higher resistances in the middleof the cholesterol-containing membranes than in a pure DPPCmembrane.39
Permeability coefficients were calculated by integrating theresistance profiles across the bilayer and are displayed in Table 2.In both cholesterol-containing membranes, the permeationdecreases in the order Hy-Br > Hy-4Br > Hy, in agreement withthe findings in a pure DPPCmembrane,39 for which data are alsoincluded in Table 2. In the 25 mol % cholesterol membrane, thepermeation is overall slower than when the cholesterol concen-tration is lower. The difference in permeation of Hy-Br in the twocholesterol-containing membranes is only 1 order of magnitude,whereas for the two other molecules, the difference is signifi-cantly larger. The permeation of Hy-Br is not considerablyaffected by the inclusion of cholesterol, when compared to thatin a pure DPPC membrane.39 In fact, the permeation in the lowcholesterol membrane is slightly faster than in the pure DPPCmembrane. For the two other molecules, the permeation isconsiderably reduced compared to the pure DPPC membrane.As mentioned above, the resistance, and thereby the permeabil-ity, strongly depends on the free energy, and with an increase inenergy follows a decrease in permeation. This supports thefinding of Hy-Br displaying the fastest permeation (large perme-ability coefficient) as it exhibits the lowest free energy, both closeto the polar headgroups and in the center of the bilayer. Hy-Brwas also displaying the largest movement in the z direction of thebilayer, as seen above. These results suggest that Hy-Br mostlikely would have the highest probability of penetrating theplasma membrane and reach the interior of the cell, whereasthe two other molecules would be more prone to residing in themembrane and from there cause photodamage.
Experimentally, it has been shown that halogenated drugs displaylarger permeability coefficients through lipid membranes;63 how-ever, the permeability of the molecules can also be reduced by theaddition of large and heavy substituents. This can explain thereduced permeability of tetra-brominated hypericin compared withthe monobrominated one.
The finding that Hy displays the slowest diffusion in themembranes can be explained by the fact that this molecule wasfound to reside closer to cholesterol molecules in both mem-branes, and it also forms hydrogen bonds to the water phase.Even though the distance between Hy and cholesterol was nevershort enough to allow direct interactions, the ordering of the
lipids close to cholesterol molecules can affect the permeability ofthe hypericin molecule.
4. CONCLUSIONS
The behavior of hypericin, a natural compound possessingphotodynamic properties, and its mono- and tetra-brominatedderivatives was studied in DPPC lipid membranes containing 9and 25 mol % cholesterol, respectively, by means of moleculardynamics simulations. The three molecules were found toaccumulate in the region close to the polar headgroups of thelipids, close to the interface between the lipids and water. Thislocation enables interactions between the hydroxyl groups of thehypericin molecules and water, supported by hydrogen bondsfound in the radial distribution functions. Overall, the hypericinmolecules in the 25 mol % cholesterol membrane were foundslightly closer to the bilayer middle than in the low cholesterolmembrane. With a high amount of cholesterol present in themembrane, the two monlayers are slightly separated and allowfor fast diffusion in that region. However, this region also offersfewer lipid interactions with the hydrophobic hypericin mole-cules, making it a nonfavorable location to reside in, indicated bythe large increase in free energy for the transport process of themolecules into that region. Close to the polar headgroups, wherethe hypericin molecules were found to accumulate, the freeenergy profiles showed local minima. The size of these minima wasdependent on the molecule and the amount of cholesterol in themembrane. The permeability coefficients were overall lower in thehigh cholesterol membrane. Hy-Br displayed the largest decrease infree energy both in the middle of the bilayer and close to theheadgroups, as well as the highest permeability coefficients in bothmembranes. This indicates that thismolecule would have the highestprobably to penetrate a plasma membrane, independently of thecholesterol concentration, and reach the interior of a cell. The twoother molecules, in particular Hy, exhibit significantly lower perme-ability and are expected to be found within the membrane.
’ASSOCIATED CONTENT
bS Supporting Information. Cholesterol topology, hyperi-cin topology, Hy-Br topology, Hy-4Br topology, evolution of thearea per lipid during the last 10 ns of the equilibration of thecholesterol containing membranes, and RDFs for DPPC-Choland Chol-Chol center-of-mass during production runs (100 ns)for each membrane and each hypericin system. This material isavailable free of charge via the Internet at http://pubs.acs.org.
’AUTHOR INFORMATION
Corresponding Author*E-mail: [email protected].
’ACKNOWLEDGMENT
The National University of Ireland;Galway is gratefullyacknowledged for financial support. We also acknowledge Dr.Daniel dos Santos (Univ. of Lisbon) for valuable discussions.
’REFERENCES
(1) De Kruyff, B.; De Greef, W. J.; Van Eyk, R. V. W.; Demel, R. A.;Van Deene, L. Biochim. Biophys. Acta 1973, 298, 479–499.
(2) Lange, Y.; Swaisgood, M. H.; Ramos, B. V.; Steck, T. L. J. Biol.Chem. 1989, 264, 3786–3793.
Table 2. Permeability Coefficients (in cm/s) of the HypericinDerivatives inside the Membranes without and with Cholesterol
molecule
0 mol %
cholesterol399 mol %
cholesterol
25 mol %
cholesterol
Hy 4.21� 10-4 8.25� 10-12 1.63� 10-17
Hy-Br 4.94� 10-3 5.49� 10-3 4.12� 10-4
Hy-4Br 1.51� 10-3 3.31� 10-6 6.93� 10-11
N dx.doi.org/10.1021/ct100528u |J. Chem. Theory Comput. XXXX, XXX, 000–000
Journal of Chemical Theory and Computation ARTICLE
(3) Bretscher, M. S.; Munro, S. Science 1993, 261, 1280–1281.(4) Sackmann, E. In Structure and dynamics of membranes;
Lipowsky, R., Sackmann, E., Eds.; Elsevier: Amsterdam, 1995; pp1-62.(5) Ipsen, J. H.; Karlstr€om, G.; Mouritsen, O. G.; Wennerstr€om, H.;
Zuckermann, M. J. Biochim. Biophys. Acta 1987, 905, 162–172.(6) Vist, M. R.; Davis, J. H. Biochemistry 1990, 29, 451–464.(7) Boggs, J. M.; Hsia, J. C. Biochim. Biophys. Acta 1972, 290, 32–42.(8) Oldfield, E.; Meadows, M.; Rice, D.; Jacobs, R. Biochemistry
1978, 17, 2727–2740.(9) Marsh, D.; Smith, I. C. P. Biochim. Biophys. Acta 1973, 298, 133–
144.(10) Yeagle, P. L. Biochim. Biophys. Acta 1985, 822, 267–287.(11) Simons, K.; Toomre, D.Nat. Rev. Mol. Cell Biol. 2000, 1, 31–39.(12) Scott, H. L.; Kalaskar, S. Biochemistry 1989, 28, 3687–3691.(13) Scott, H. L. Biophys. J. 1991, 59, 445–455.(14) Edholm, O.; Nyberg, A. M. Biophys. J. 1992, 63, 1081–1089.(15) Hofs€ass, C.; Lindahl, E.; Edholm, O. Biophys. J. 2003, 84, 2192–
2206.(16) Niemel€a, P. S.; Ollila, S.; Hyv€onen, M. T.; Karttunen, M.;
Vattulainen, I. PLos Comput. Biol. 2007, 3, 304–312.(17) Smondyrev, A. M.; Berkowitz, M. L. Biophys. J. 1999, 77, 2075–
2089.(18) Pasenkiewicz-Gierula, M.; R�og, T.; Kitamura, K.; Kusumi, A.
Biophys. J. 2000, 78, 1376–1389.(19) Chiu, S. W.; Jakobsson, E.; Scott, H. L. J. Chem. Phys. 2001, 114,
5435–5443.(20) R�og, T.; Pasenkiewicz-Gierula, M. Biophys. J. 2001, 81, 2190–
2202.(21) Chiu, S. W.; Jakobsson, E.; Mashl, R. J.; Scott, H. L. Biophys. J.
2002, 83, 1842–1853.(22) Falck, E.; Patra,M.; Karttunen,M.; Hyv€onen,M. T.; Vattulainen,
I. Biophys. J. 2004, 87, 1076–1091.(23) Tu, K. C.; Klein, M. L.; Tobias, D. J. Biophys. J. 1998, 75, 2147–
2156.(24) Douliez, J. P.; Leonard, A.; Dufourc, E. J. J. Phys. Chem. 1996,
100, 18450–18457.(25) Martinez-Seara, H.; R�og, T.; Karttunen, M.; Vattulainen, I.;
Reigada, R. PLos One paper: e11162, pages 1-11.(26) R�og, T.; Pasenkiewicz-Gierula, M.; Vattulainen, I.; Karttunen,
M. Biophys. J. 2007, 92, 3346–3357.(27) R�og, T.; Pasenkiewicz-Gierula, M. Biochimie 2006, 88, 449–
460.(28) Pitman, M. C.; Suits, F.; MacKerell, A. D.; Feller, S. E.
Biochemistry 2004, 43, 15318–15328.(29) Martinez-Seara, H.; R�og, T.; Pasenkiewicz-Gierula, M.;
Vattulainen, I.; Karttunen, M.; Reigada, R. J. Phys. Chem. B 2007,111, 11162–11168.(30) Martinez-Seara,H.; R�og,T.; Pasenkiewicz-Gierula,M.;Vattulainen,
I.; Karttunen, M.; Reigada, R. Biophys. J. 2008, 95, 3295–3305.(31) Papahadjopoulos, D.; Nir, S.; Ohki, S. Biochim. Biophys. Acta
1972, 266, 561–583.(32) Finkelstein, A.; Cass, A. Nature 1967, 216, 717–718.(33) Zhao, L. Y.; Feng, S. S. J. Colloid Interface Sci. 2006, 300, 314–
326.(34) Gere-Paszti, E.; Farkas, O.; Prodan, M.; Forgacs, E. Chromato-
graphia 2003, 57, 599–604.(35) S€oderlund, T.; Lehtonen, J. Y. A.; Kinnunen, P. K. J. Mol.
Pharmacol. 1999, 55, 32–38.(36) Ghannam, M. M.; Mady, M. M.; Khalil, W. A. Biophys. Chem.
1999, 80, 31–40.(37) Prenner, E. J.; Lewis, R.; Jelokhani-Niaraki, M.; Hodges, R. S.;
McElhaney, R. N. Biochim. Biophys. Acta Biomembr. 2001, 1510, 83–92.(38) Ji, S. R.; Wu, Y.; Sui, S. F. J. Biol. Chem. 2002, 277, 6273–6279.(39) Eriksson, E. S. E.; dos Santos, D. J. V. A.; Guedes, R. C.;
Eriksson, L. A. J. Chem. Theory Comput. 2009, 5, 3139–3149.(40) Linde, K.; Mulrow, C. D.; Berner, M.; Egger, M. Cochrane
Database Syst. Rev. 2005, 73.
(41) Meruelo, D.; Lavie, G.; Lavie, D. Proc. Natl. Acad. Sci. U.S.A.1988, 85, 5230–5234.
(42) Lopezbazzocchi, I.; Hudson, J. B.; Towers, G. H. N. Photochem.Photobiol. 1991, 54, 95–98.
(43) Hudson, J. B.; Lopezbazzocchi, I.; Towers, G. H. N. Antivir. Res.1991, 15, 101–112.
(44) Degar, S.; Prince, A.M.; Pascual, D.; Lavie, G.; Levin, B.;Mazur,Y.; Lavie, D.; Ehrlich, L. S.; Carter, C.; Meruelo, D. AIDS Res. Hum.Retrovir. 1992, 8, 1929–1936.
(45) Moraleda, G.;Wu, T. T.; Jilbert, A. R.; Aldrich, C. E.; Condreay,L. D.; Larsen, S. H.; Tang, J. C.; Colacino, J. M.; Mason, W. S. AntiviralRes. 1993, 20, 235–247.
(46) Lenard, J.; Rabson, A.; Vanderoef, R. Proc. Natl. Acad. Sci. U.S.A.1993, 90, 158–162.
(47) Thomas, C.; Pardini, R. S. Photochem. Photobiol. 1992, 55, 831–837.
(48) Andreoni, A.; Colasanti, A.; Colasanti, P.; Mastrocinque, M.;Riccio, P.; Roberti, G. Photochem. Photobiol. 1994, 59, 529–533.
(49) VanderWerf, Q.M.; Saxton, R. E.; Chang, A.; Horton, D.; Paiva,M. B.; Anderson, J.; Foote, C.; Soudant, J.; Mathey, A.; Castro, D. J.Laryngoscope 1996, 106, 479–483.
(50) Liu, C. D.; Kwan, D.; Saxton, R. E.; McFadden, D. W. J. Surg.Res. 2000, 93, 137–143.
(51) D’Hallewin, M. A.; De Witte, P. A.; Waelkens, E.; Merlevede,W.; Baert, L. J. Urol. 2000, 164, 349–351.
(52) D’Hallewin, M. A.; Kamuhabwa, A. R.; Roskams, T.; De Witte,P. A. M.; Baert, L. BJU Int. 2002, 89, 760–763.
(53) Pytel, A.; Schmeller, N. Urology 2002, 59, 216–219.(54) Delaey, E.; Zupko, I.; Chen, B.; Derycke, A.; Van Laar, F.;
De Vos, D.; De Witte, P. Int. J. Oncol. 2003, 23, 519–524.(55) Guedes, R. C.; Eriksson, L. A. J. Photochem. Photobiol. Chem.
2006, 178, 41–49.(56) Hudson, J. B.; Delaey, E.; de Witte, P. A. Photochem. Photobiol.
1999, 70, 820–822.(57) Senthil, V.; Jones, L. R.; Senthil, K.; Grossweiner, L. I. Photo-
chem. Photobiol. 1994, 59, 40–47.(58) Chaloupka, R.; Obsil, T.; Plasek, J.; Sureau, F. Biochim. Biophys.
Acta Biomembr. 1999, 1418, 39–47.(59) Ho, Y. F.; Wu, M. H.; Cheng, B. H.; Chen, Y. W.; Shih, M. C.
Biochim. Biophys. Acta Biomembr. 2009, 1788, 1287–1295.(60) Chen, B.; Xu, Y.; Roskams, T.; Delaey, E.; Agostinis, P.;
Vandenheede, J. R.; de Witte, P. Int. J. Canc. 2001, 93, 275–282.(61) Kascakova, S.; Refregiers, M.; Jancura, D.; Sureau, F.; Maurizot,
J. C.; Miskovsky, P. Photochem. Photobiol. 2005, 81, 1395–1403.(62) Mukheriee, P.; Adhikary, R.; Halder, M.; Petrich, J. W.;
Miskovsky, P. Photochem. Photobiol. 2008, 84, 706–712.(63) Gerebtzoff, G.; Li-Blatter, X.; Fischer, H.; Frentzel, A.; Seelig, A.
ChemBioChem 2004, 5, 676–684.(64) Hess, B.; Kutzner, C.; van der Spoel, D.; Lindahl, E. J. Chem.
Theor. Comput. 2008, 4, 435–447.(65) Tieleman, D. P.; Berendsen, H. J. C. J. Chem. Phys. 1996, 105,
4871-4880.(66) Patra, M.; Karttunen, M.; Hyv€onen, M. T.; Falck, E.; Lindqvist,
P.; Vattulainen, I. Biophys. J. 2003, 84, 3636–3645.(67) Patra,M.; Karttunen,M.; Hyv€onen,M. T.; Falck, E.; Vattulainen,
I. J. Phys. Chem. B 2004, 108, 4485–4494.(68) Biological Physics & Soft Condensed Matter Group of
Prof. Mikko Karttunen, Dept. of Applied Mathematics, University ofWestern Ontario, SoftSimu - Downloads Zone. http://www.apmaths.uwo.ca/∼mkarttu/downloads.shtml, File: dppc-128-100.pdb (accessedJan 2009).
(69) Frisch, M. J.; Trucks, G. W.; Schlegel, H. B.; Scuseria, G. E.;Robb, M. A.; Cheeseman, J. R.; Vreven, T.; Kudin, K. N.; Burant, J. C.;Millam, J. M.; Iyengar, S. S.; Tomasi, J.; Barone, V.; Mennucci, B.; Cossi,M.; Scalmani, G.; Rega, N.; Petersson, G. A.; Nakatsuji, H.; Hada, M.;Ehara, M.; Toyota, K.; Fukuda, R.; Hasegawa, J.; Ishida, M.; Nakajima,T.; Honda, Y.; Kitao, O.; Nakai, H.; Klene, M.; Li, X.; Knox, J. E.;Hratchian, H. P.; Cross, J. B.; Adamo, C.; Jaramillo, J.; Gomperts, R.;

O dx.doi.org/10.1021/ct100528u |J. Chem. Theory Comput. XXXX, XXX, 000–000
Journal of Chemical Theory and Computation ARTICLE
Stratmann, R. E.; Yazyev, O.; Austin, A. J.; Cammi, R.; Pomelli, C.;Ochterski, J. W.; Ayala, P. Y.; Morokuma, K.; Voth, G. A.; Salvador, P.;Dannenberg, J. J.; Zakrzewski, V. G.; Dapprich, S.; Daniels, A. D.; Strain,M. C.; Farkas, O.; Malick, D. K.; Rabuck, A. D.; Raghavachari, K.;Foresman, J. B.; Ortiz, J. V.; Cui, Q.; Baboul, A. G.; Clifford, S.;Cioslowski, J.; Stefanov, B. B.; Liu, G.; Liashenko, A.; Piskorz, P.;Komaromi, I.; Martin, R. L.; Fox, D. J.; Keith, T.; Al-Laham, M. A.;Peng, C. Y.; Nanayakkara, A.; Challacombe, M.; Gill, P. M. W.; Johnson,B.; Chen, W.; Wong, M. W.; Gonzalez, C.; Pople, J. A. Gaussian 03,Revision B.02; Gaussian, Inc.: Pittsburgh, PA, 2003.(70) Schuttelkopf, A. W.; van Aalten, D. M. Acta Crystallogr., Sect. D
2004, 60, 1355–1363.(71) Lavie, G.; Mazur, Y.; Lavie, D.; Prince, A. M.; Pascual, D.;
Liebes, L.; Levin, B.; Meruelo, D. Transfusion 1995, 35, 392–400.(72) Berendsen, H. J. C.; Postma, J. P. M.; van Gunsteren, W. F.;
Hermans, J. In Intermolecular Forces; Reidel Publishing Company:Dordrecht, The Netherlands, 1981.(73) Nose, S. Mol. Phys. 1984, 52, 255–268.(74) Hoover, W. G. Phys. Rev. 1985, 31, 1695–1697.(75) Parrinello, M.; Rahman, A. J. Appl. Phys. 1981, 52, 7182–7190.(76) Nose, S.; Klein, M. L. Phys. Rev. Lett. 1983, 50, 1207–1210.(77) Darden, T.; York, D.; Pedersen, L. J. Chem. Phys. 1993, 98,
10089–10092.(78) Essmann, U.; Perera, L.; Berkowitz, M. L.; Darden, T.; Lee, H.;
Pedersen, L. G. J. Chem. Phys. 1995, 103, 8577–8593.(79) Hess, B.; Bekker, H.; Berendsen, H. J. C.; Fraaije, J. J. Comput.
Chem. 1997, 18, 1463–1472.(80) Ryckaert, J. P.; Ciccotti, G.; Berendsen, H. J. C. J. Comput. Phys.
1977, 23, 327–341.(81) Marrink, S. J.; Berendsen, H. J. C. J. Phys. Chem. 1994, 98,
4155–4168.(82) Steck, T. L.; Ye, J.; Lange, Y. Biophys. J. 2002, 83, 2118–2125.(83) Bennett, W. F. D.; MacCallum, J. L.; Hinner, M. J.; Marrink,
S. J.; Tieleman, D. P. J. Am. Chem. Soc. 2009, 131, 12714–12720.(84) Jo, S.; Rui, H. A.; Lim, J. B.; Klauda, J. B.; Im,W. J. Phys. Chem. B
2010, 114, 13342–13348.(85) R�og, T.; Stimson, L.M.; Pasenkiewicz-Gierula, M.; Vattulainen,
I.; Karttunen, M. J. Phys. Chem. B 2008, 112, 1946–1952.(86) Engelman, D. M.; Rothman, J. E. J. Biol. Chem. 1972, 247,
3694–3697.(87) Smondyrev, A. M.; Berkowitz, M. L. J. Comput. Chem. 1999, 20,
531–545.(88) dos Santos, D. J. V. A.; Eriksson, L. A. Biophys. J. 2006, 91,
2464–2474.(89) Erdtman, E.; dos Santos, D. J. V. A.; L€ofgren, L.; Eriksson, L. A.
Chem. Phys. Lett. 2008, 463, 178–182.(90) Burel, L.; Jardon, P. J. Chim. Phys. Phys. 1996, 93, 300–316.(91) Falk, H.; Meyer, J. Monatsh. Chem. 1994, 125, 753–762.(92) Allen, M. P.; Tildesley, D. J. Computer Simulation of Liquids;
Oxford University Press: Oxford, U. K., 1990.(93) Paci, E.; Ciccotti, G.; Ferrario, M.; Kapral, R. Chem. Phys. Lett.
1991, 176, 581–587.(94) Bemporad, D.; Essex, J. W.; Luttmann, C. J. Phys. Chem. B 2004,
108, 4875–4884.