Permeability of Uniformly Graded 3D Printed Granular Media
12
1. Introduction Estimation of permeability of porous media is of vital importance in many geophysics-related scientific fields, such as hydrogeology, geotechnical engineering, earth science, and petroleum engineering. As a main category of porous media (Higdon & Ford, 1996), granular materials received more attention owing to their significant prevalence in various engineering applications. Granular porous media are composed of solid matrix skeleton formed by bounded or contacting grains, and pores with narrow constraints. Natural and artificial examples are widely encountered in weakly cementitious rocks in sandstone (Sun et al., 2011), sands in geotechnical structures (Chapuis, 2004), fault gouge of seismic events (C. Wang et al., 2019), and shale soils around multilayered reservoirs (Zheng et al., 2018). For these media, permeability is a key parameter for describing their transport and hydro-mechanical re- sponses. Seelheim (1880) stated that in porous media flow permeability correlates to the square value of its characteristic pore diameter. Since then, many models for predicting permeability coefficients have been proposed based on empirical relations (Hazen, 1892; Shepherd, 1989), Poiseuille capil- lary tubes (Carman, 1956; Mortensen et al., 2005), statistical regression (Feng et al., 2019; J. P. Wang et al., 2017), and effective hydraulic radius (Carman, 1956; Costa, 2006). Due to the complexity of pore network, it is challenging to rigorously formulate a satisfactory theoretical relation between viscous flow resistance and intrinsic geometry properties of granular porous media. As a result, most of such theoretical models start with some measurable intrinsic first-principle geometrical factors, including sieve-determined grading, void ratio, and porosity (Chapuis & Aubertin, 2003; Hazen, 1892; Johnson et al., 1986; Ren & Santamarina, 2018). Among these, one of the widely adopted models is the Kozeny-Carman equation (e.g., Carrier, 2003): Abstract The present work explores water permeability of uniformly graded irregular grains using 3D printing with controlled shapes and fractal morphological features at low Reynold's number for viscous flow. From large amount of real 3D granular morphological data, a scaling law, in terms of fractal dimension, is found to be followed. With this universal law, sand grains with controlled fractal morphological features are generated using Spherical Harmonics, and then created using 3D printing technique for water permeability tests. A modified Kozeny-Carman equation is proposed through more accurate determination of specific area, as a function of relative roughness and fractal dimension, than approximation using the volume-equivalent sphere. By isolating the contributions from specific area, the shape coefficient is found to be insensitive to particle morphology. Through benchmarking the model prediction against experiments from both this work and past literature, we demonstrate the validity and wide applicability of the modified Kozeny-Carman equation. Plain Language Summary The shape of grains can influence the way how water transports inside a granular material. This study uses 3D printing technique to well control grain shapes. The grain morphology is captured through combinations of relative roughness and fractal dimension, relevant to a wide range of geomaterials. We revisit the classical permeability equation with the prior knowledge of the grain shape. It is found that the model coefficients used in the permeability equation, usually obtained through fitting against experiment measurement, do indeed contain key intrinsic morphological information. WEI ET AL. © 2021. American Geophysical Union. All Rights Reserved. Permeability of Uniformly Graded 3D Printed Granular Media Deheng Wei 1 , Zhongzheng Wang 1,2 , Jean-Michel Pereira 2 , and Yixiang Gan 1 1 The University of Sydney, School of Civil Engineering, Sydney, NSW, Australia, 2 Navier, Ecole des Ponts, Univ Gustave Eiffel, CNRS, Marne-la-Vallée, France Key Points: • 3D printed mono-sized yet different-shaped particles of scaling morphology features from real grains are used for permeability test • Via more accurate area than that of the volume-equivalent sphere method, Kozeny-Carman shape factor is found insensitive to grains shapes • The Kozeny-Carman equation is modified using two compressed shape factors, that is, fractal dimension and relative roughness Supporting Information: • Supporting Information S1 Correspondence to: Y. Gan, [email protected] Citation: Wei, D., Wang, Z., Pereira, J.-M., & Gan, Y. (2021). Permeability of uniformly graded 3D printed granular media. Geophysical Research Letters, 48, e2020GL090728. https://doi. org/10.1029/2020GL090728 Received 10 SEP 2020 Accepted 4 JAN 2021 10.1029/2020GL090728 RESEARCH LETTER 1 of 12
-
Upload
khangminh22 -
Category
Documents
-
view
3 -
download
0
Transcript of Permeability of Uniformly Graded 3D Printed Granular Media
1. IntroductionEstimation of permeability of porous media is of vital importance in many geophysics-related scientific fields, such as hydrogeology, geotechnical engineering, earth science, and petroleum engineering. As a main category of porous media (Higdon & Ford, 1996), granular materials received more attention owing to their significant prevalence in various engineering applications. Granular porous media are composed of solid matrix skeleton formed by bounded or contacting grains, and pores with narrow constraints. Natural and artificial examples are widely encountered in weakly cementitious rocks in sandstone (Sun et al., 2011), sands in geotechnical structures (Chapuis, 2004), fault gouge of seismic events (C. Wang et al., 2019), and shale soils around multilayered reservoirs (Zheng et al., 2018). For these media, permeability is a key parameter for describing their transport and hydro-mechanical re-sponses. Seelheim (1880) stated that in porous media flow permeability correlates to the square value of its characteristic pore diameter. Since then, many models for predicting permeability coefficients have been proposed based on empirical relations (Hazen, 1892; Shepherd, 1989), Poiseuille capil-lary tubes (Carman, 1956; Mortensen et al., 2005), statistical regression (Feng et al., 2019; J. P. Wang et al., 2017), and effective hydraulic radius (Carman, 1956; Costa, 2006). Due to the complexity of pore network, it is challenging to rigorously formulate a satisfactory theoretical relation between viscous flow resistance and intrinsic geometry properties of granular porous media. As a result, most of such theoretical models start with some measurable intrinsic first-principle geometrical factors, including sieve-determined grading, void ratio, and porosity (Chapuis & Aubertin, 2003; Hazen, 1892; Johnson et al., 1986; Ren & Santamarina, 2018).
Among these, one of the widely adopted models is the Kozeny-Carman equation (e.g., Carrier, 2003):
Abstract The present work explores water permeability of uniformly graded irregular grains using 3D printing with controlled shapes and fractal morphological features at low Reynold's number for viscous flow. From large amount of real 3D granular morphological data, a scaling law, in terms of fractal dimension, is found to be followed. With this universal law, sand grains with controlled fractal morphological features are generated using Spherical Harmonics, and then created using 3D printing technique for water permeability tests. A modified Kozeny-Carman equation is proposed through more accurate determination of specific area, as a function of relative roughness and fractal dimension, than approximation using the volume-equivalent sphere. By isolating the contributions from specific area, the shape coefficient is found to be insensitive to particle morphology. Through benchmarking the model prediction against experiments from both this work and past literature, we demonstrate the validity and wide applicability of the modified Kozeny-Carman equation.
Plain Language Summary The shape of grains can influence the way how water transports inside a granular material. This study uses 3D printing technique to well control grain shapes. The grain morphology is captured through combinations of relative roughness and fractal dimension, relevant to a wide range of geomaterials. We revisit the classical permeability equation with the prior knowledge of the grain shape. It is found that the model coefficients used in the permeability equation, usually obtained through fitting against experiment measurement, do indeed contain key intrinsic morphological information.
WEI ET AL.
© 2021. American Geophysical Union. All Rights Reserved.
Permeability of Uniformly Graded 3D Printed Granular MediaDeheng Wei1 , Zhongzheng Wang1,2, Jean-Michel Pereira2 , and Yixiang Gan1
1The University of Sydney, School of Civil Engineering, Sydney, NSW, Australia, 2Navier, Ecole des Ponts, Univ Gustave Eiffel, CNRS, Marne-la-Vallée, France
Key Points:• 3D printed mono-sized yet
different-shaped particles of scaling morphology features from real grains are used for permeability test
• Via more accurate area than that of the volume-equivalent sphere method, Kozeny-Carman shape factor is found insensitive to grains shapes
• The Kozeny-Carman equation is modified using two compressed shape factors, that is, fractal dimension and relative roughness
Supporting Information:• Supporting Information S1
Correspondence to:Y. Gan,[email protected]
Citation:Wei, D., Wang, Z., Pereira, J.-M., & Gan, Y. (2021). Permeability of uniformly graded 3D printed granular media. Geophysical Research Letters, 48, e2020GL090728. https://doi.org/10.1029/2020GL090728
Received 10 SEP 2020Accepted 4 JAN 2021
10.1029/2020GL090728RESEARCH LETTER
1 of 12
Geophysical Research Letters
kC SK C
K
1 110
2
3
2
, (1)
where γ and μ are unit weight and viscosity of permeant, respectively, CK-C the Kozeny-Carman shape co-efficient, S0 specific surface area (i.e., surface area per unit volume of particles), ε porosity, k (L/T) the coef-ficient of permeability, or hydraulic conductivity, depending on both intrinsic properties of porous media
and fluid, and K (L2) the permeability only correlated with porous structures. For water at 20°C, equals
9.93 × 10⁴ 1/cm s. Intuitively, contacts between grains may result in decreasing wet area, through which water flows. However, contact area is negligible when compared with the total surface area, especially for natural rough particles (Wei et al., 2020). Accompanied with Kozeny-Carman equation (Carman, 1956), the concept of tortuosity, defined as the length ratio of effective flow path to porous sample in direction of flow, is also proposed to indicate dimensionless length of fluid element flowing through pore space (David, 1993; Ghanbarian et al., 2013). Grains with the same shapes and porosity can form rather random packings, and thus different tortuosity. Such randomness may hinder the generality of tortuosity in deterministic models to predict permeability coefficients. Although many assumptions have been implemented in the original derivation of Kozeny-Carman equation, its agreement with experimental results has been widely observed (Chikhi et al., 2014; Philipse & Pathmamanoharan, 1993). As said by Wolfgang Pauli, “God made the bulk; the surface was invented by the devil.” The accurate measurement of surface area in porous media can be difficult, since many solid surfaces can exhibit multiscale features. (Barclay & Buckingham, 2009; Mollon & Zhao, 2012). With the emergent of various techniques to estimate S0, as discussed in the review paper by Santamarina et al. (2002), a wide range of CK-C have been observed for grains of different morphology features. The value of CK-C is found to be around 5 for monodispersed spheres (Carman, 1937). For peat beds and mixture of fibrous and granular beds, the corresponding CK-C are 3.4 and 12.81, respectively (Li & Gu, 2005; Mathavan & Viraraghavan, 1992). To exclude the effects of particle grading on estimating CK-C, in-vestigations are carried out using mono-sized aspherical aggregates of identical shapes, such as symmetric spiky combinations of spheres and ellipsoids (Malinouskaya et al., 2009; Thies-Weesie et al., 1995), while in reality shapes of each sand are not identical.
Particle shape can be described at three distinctive yet correlated length scales, namely, aspect ratio for particle size, roundness for local corner, and the finest roughness (Barrett, 1980). Dimensionless shape parameters have also been defined across these three scales. Castillo et al. (2015) experimentally estimated CK-C of two types of super-ellipsoid-like cubes, that is, solid hematite cubes and hollow microporous silica cubes, of which sizes and shapes are similar, but roughness features are different. They found that CK-C of rough microporous cubes was about 12% higher, revealing the notable effects of microscopic roughness on it. With the development of optical equipment for high-resolution 3D surficial data, finding a shape index existing in more- or full-length morphology is possible. Fractal dimension, accompanied by relative rough-ness, is a candidate, which may unify global surface morphology across multiple length scales (Barclay & Buckingham, 2009; Renard et al., 2013).
In this work, the effect of particle shapes on permeability of porous media is experimentally investigated via hydraulic conductivity tests, as done in classical soil mechanics (Craig, 2004). Realistic particles with controlled fractal dimension are generated using Spherical harmonics (Wei et al., 2020), which are then printed using 3D printers. A modified Kozeny-Carman equation is proposed by incorporating the fractal dimension and relative roughness, two key morphological parameters for a wide range of geomaterials. Through comparing the model with experimental results and data from literature, we then assess the ability of the proposed model to capture the influence of particle shapes on permeability of granular materials.
2. Spherical Harmonic Reconstruction2.1. Reconstruction of Natural Grains
For spherical surfaces, through 3D Fourier Transformation, any function set on the surface can be repre-sented as a sum of Spherical Harmonic (SH) function, ,m
nY , for its orthogonality. SH function has been
WEI ET AL.
10.1029/2020GL090728
2 of 12
Geophysical Research Letters
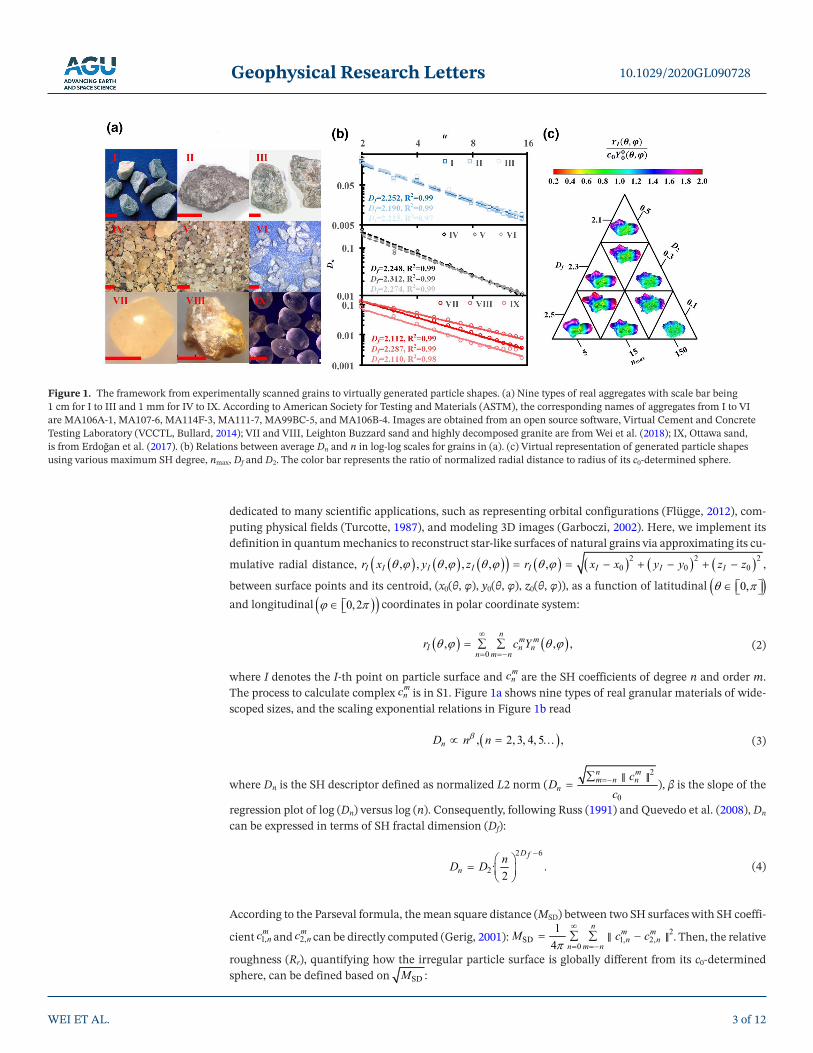
dedicated to many scientific applications, such as representing orbital configurations (Flügge, 2012), com-puting physical fields (Turcotte, 1987), and modeling 3D images (Garboczi, 2002). Here, we implement its definition in quantum mechanics to reconstruct star-like surfaces of natural grains via approximating its cu-
mulative radial distance, 2 2 20 0 0, , , , , ,I I I I I I I Ir x y z r x x y y z z ,
between surface points and its centroid, (x0(θ, φ), y0(θ, φ), z0(θ, φ)), as a function of latitudinal 0, and longitudinal 0,2 coordinates in polar coordinate system:
0
, , ,n
m mI n n
n m nr c Y
(2)
where I denotes the I-th point on particle surface and mnc are the SH coefficients of degree n and order m.
The process to calculate complex mnc is in S1. Figure 1a shows nine types of real granular materials of wide-
scoped sizes, and the scaling exponential relations in Figure 1b read
, 2, 3, 4, 5 ,nD n n (3)
where Dn is the SH descriptor defined as normalized L2 norm (2
0
n mm n n
nc
Dc
‖ ‖), β is the slope of the
regression plot of log (Dn) versus log (n). Consequently, following Russ (1991) and Quevedo et al. (2008), Dn can be expressed in terms of SH fractal dimension (Df):
2 6
2· .2
Df
nnD D
(4)
According to the Parseval formula, the mean square distance (MSD) between two SH surfaces with SH coeffi-
cient 1,mnc and 2,
mnc can be directly computed (Gerig, 2001): 2
SD 1, 2,0
14
nm mn n
n m nM c c
‖ ‖ . Then, the relative
roughness (Rr), quantifying how the irregular particle surface is globally different from its c0-determined sphere, can be defined based on SDM :
WEI ET AL.
10.1029/2020GL090728
3 of 12
Figure 1. The framework from experimentally scanned grains to virtually generated particle shapes. (a) Nine types of real aggregates with scale bar being 1 cm for I to III and 1 mm for IV to IX. According to American Society for Testing and Materials (ASTM), the corresponding names of aggregates from I to VI are MA106A-1, MA107-6, MA114F-3, MA111-7, MA99BC-5, and MA106B-4. Images are obtained from an open source software, Virtual Cement and Concrete Testing Laboratory (VCCTL, Bullard, 2014); VII and VIII, Leighton Buzzard sand and highly decomposed granite are from Wei et al. (2018); IX, Ottawa sand, is from Erdoğan et al. (2017). (b) Relations between average Dn and n in log-log scales for grains in (a). (c) Virtual representation of generated particle shapes using various maximum SH degree, nmax, Df and D2. The color bar represents the ratio of normalized radial distance to radius of its c0-determined sphere.
Geophysical Research Letters
2 2max 2 62max
220 00 0
14 · .
2,
n n mDfm n nn
nr n
c nR Dc Y
‖ ‖ (5)
Details of derivation and determination of Df and Rr are provided in S2. S3 is referred to for the method of generating randomly shaped particles of given D2 and Df via stochastic m
nc . It has been confirmed that virtual and real particle shapes can have nearly identical shape parameters (e.g., the difference between their mean parameters are all within 2%), as long as their corresponding D2 and Df are the same (Wei et al., 2018).
2.2. Approximation of Volume and Surface Area
Since the surface can be implicitly approximated by SH expansion in Equation 1, grain volume (V) and surface area (S), directly relevant to S0 in Kozeny-Carman equation, can be computed and denoted by m
nc . For SH-generated surface of maximum SH degree, nmax, one particle has (nmax +1)2 complex numbers. We set nmax to 15, which is sufficient in depicting morphology features finer than roundness-length scale of nmax = 8 (Zhao et al., 2017). Notably, as shown in Figure 1c, the applied nmax scales for depicting rougher grain morphology. Via comparing the surface area between SH-approximated and computer tomography (CT)-based grain shapes, Zhou et al. (2017) found the approximate nmax for rough HDG particles are higher than smooth LBS particles. Computational wise, it is expected there is always space to improve, so nmax can be higher. However, the length scale of input morphology features is limited by 3D printing resolution. Further reasons for selecting nmax = 15 as the cut-off length to calculate S0 can be found in Sections 3 and 4.
Considering the volume element in polar coordinate system, sin · ·dV r d rd dr , V can be rigidly determined,
, 22
0 0 0, sin .
r
V r d d dr
(6)
By inserting Equation 2 into Equation 6,
V c c D n
Vn
n
n D f
V
03
0
03
22
2 62
636 2
max
c Rr03
2
61 3
, (7)
where 0nV is the volume of its 0c -determined sphere with radius, 0
0 0 00 0 ,
2cc Y
, ΔV is the changed
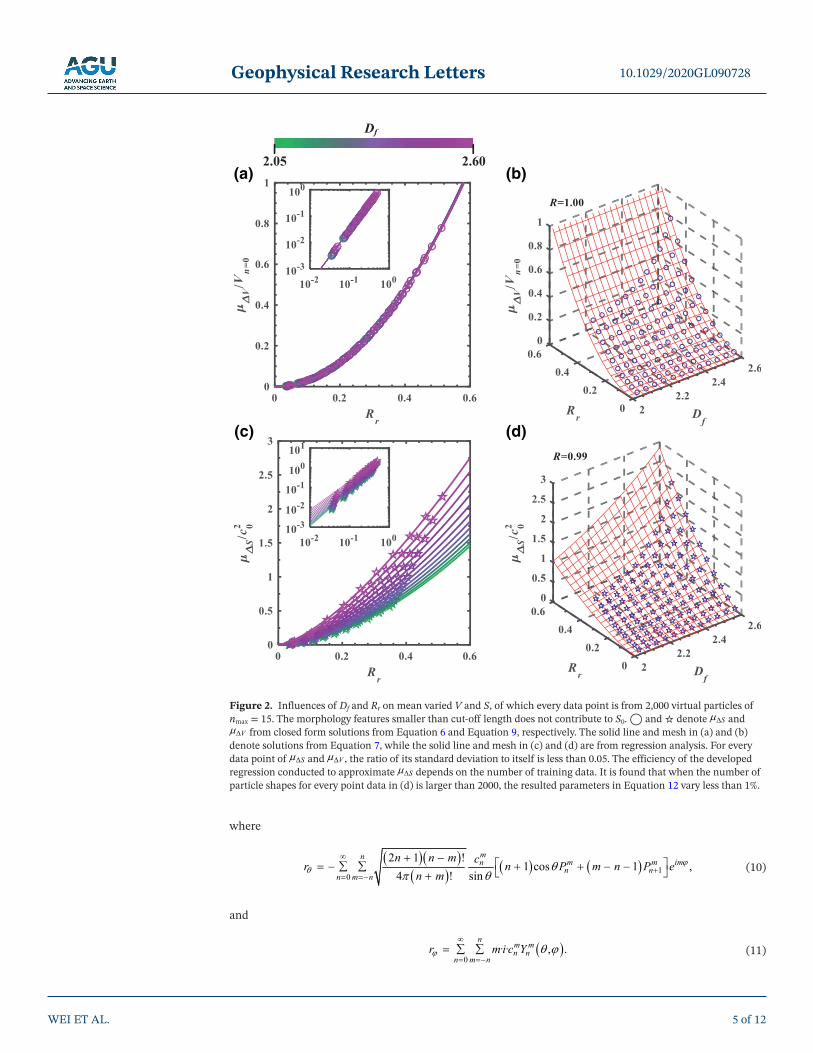
volume of V. To check the integration accuracy of Equation 6, 2,000 virtual shapes are generated for various sets of Df and Rr, and the mean ΔΔ VV can be calculated. It is found that the ratios of standard deviation to its corresponding ΔV are less than 0.05. From Figures 2a and 2b, V does depend on Df, while the depend-ence can be entirely caught by Rr, indicating the reasonableness of Equation 7.
A surface element on curved surface is based on its local differential properties in Cartesian coordinate system:
,dS X X d d
(8)
where , ,X x y z
is the surface normal vector, and subscripts denote partial differential items. The unit
surface normal vector is X X
X X
, the components of which are expanded in S4. Accordingly, the analyti-
cal solution of SH-generated surface area is
22 22 2 2
0 0· sin sin ,S r r r r d d
(9)
WEI ET AL.
10.1029/2020GL090728
4 of 12
Geophysical Research Letters
where
1
0
2 1 !1 cos 1 ,
4 ! sin
mnm m imnn n
n m n
n n m cr n P m n P en m
(10)
and
0
· · , .n
m mn n
n m nr m i c Y
(11)
WEI ET AL.
10.1029/2020GL090728
5 of 12
Figure 2. Influences of Df and Rr on mean varied V and S, of which every data point is from 2,000 virtual particles of nmax = 15. The morphology features smaller than cut-off length does not contribute to S0. ◯ and ☆ denote ΔS and ΔV from closed form solutions from Equation 6 and Equation 9, respectively. The solid line and mesh in (a) and (b)
denote solutions from Equation 7, while the solid line and mesh in (c) and (d) are from regression analysis. For every data point of ΔS and ΔV , the ratio of its standard deviation to itself is less than 0.05. The efficiency of the developed regression conducted to approximate ΔS depends on the number of training data. It is found that when the number of particle shapes for every point data in (d) is larger than 2000, the resulted parameters in Equation 12 vary less than 1%.
Df
2.05 2.60(a) (b)
(d)(c)
Geophysical Research Letters
Although in Equation 9 a closed-from expression of S is derived, the representation is too complicated to directly relate to Df and Rr. Similar to the treatment with V, S is split into two parts: 0 ΔnS S S . From Figure 2c and Figure S1, power laws between the mean ΔΔ SS , Df and Rr can be clearly seen. As a simpli-fication, regression analysis is used to define S as a combined function of the two,
S c c R D c RSn
r f
S
r
02
0
02 2 3 874
02 2
201
20
.
Df3 874. . (12)
Figure 2d indicates the efficiency of Equation 12 in approximating S. Notably, the ranges of Rr or D2 and Df ( 2 0, 0.3D , 2, 2.6fD ), in which the regression is conducted, are much larger than those of real sands, as in Figure 1b. Considering the high value of R-square, it is reasonable to directly apply Equation 12 to approximate surface area of SH-generated surfaces in subsequent studies.
3. 3D Printed Grains and Water Permeability ExperimentsIn recent years, for the capability of producing particles with controlled morphology and material prop-erties, 3D printing (Jiang et al., 2020) are becoming popular in studies of granular mechanics (Gupta et al., 2019; Ju et al., 2019; Miskin & Jaeger, 2013) and hydraulic conductivity (Adamidis et al., 2020; Fang et al., 2018; Suzuki et al., 2017). However, many studies just consider regular aspherical shapes for idealiza-tion (Athanassiadis et al., 2014; Murphy et al., 2019). Meanwhile, for irregular shapes most 3D printed par-ticles are produced as one-to-one of CT data for estimating whether they can capture real granular behavior. As pointed by the pioneering work on 3D printable geomaterials (Hanaor et al., 2016), except for printing resolution and materials, progress can be dedicated to geometrical model of printed grains. The following advantages can be obtained: (i) input morphological and statistical parameters are extracted from real ones; (ii) as many as desired realistic particle morphology features are depicted, such as coexistence of smoothed faces, angularity and branching; (iii) ready to study effects induced by varying morphology. Looking back to Figure 1, all of the mentioned advantages can be achieved via our proposed SH framework.
In this work, a poly-jet layer-printing 3D printer (Objet Eden 250) with horizontal and vertical resolutions of 4 and 32 μm was used. For more information on the printer and printing materials, please refer to the rel-evant study (Hanaor et al., 2016). Each batch containing 2,000 particles, placed by 40 rows and 50 columns in one layer, is printed. As suggested by Adamidis et al. (2020), with the help of 3D printing (the resolutions are 16 and 40 μm in horizontal and vertical resolutions), shape parameters of printed grains of size equal around 2 mm are within 5% difference from input geometries, proved by X-Ray CT images. With SH coef-ficients from Section 2.1, we import polar coordinates of icosahedron-based geodesic structure with 1,280 triangular faces into Equation 2 to generate STereolithography (STL) input files suitable for 3D printing. The reason why surfaces composed of 1,280 faces are selected is that the triangle edge length should be larger than the printing resolution for printing all given geometry features. Edges connecting adjacent vertices of such surficial meshes have a spherical angle of about 0.14. The depicted grain morphology is influenced by both the number of vertices on the surface and nmax. Considering the relation between a proper angle
resolution (Δ) and any given n (Jekeli, 1996; Jekeli et al., 2007), Δ n , and the vertical printing resolu-
tion, the finest morphology features, which can be successfully printed, are determined by nmax up to about 30, since , 1mmIr . This being said, there are two main reasons why nmax = 15 is selected: (i) when removing supporting wax after printing, NaOH solution may corrode finer grain surface features; (ii) for
Df < 2.75, when nmax = 15, in S6 it is proved that Rr depending S0 has converged and is less than 6 2
22 ·11 4
Df
f
DD
.
Furthermore, we align the longest particle dimension with vertical direction to optimally exploit the print-ing resolution.
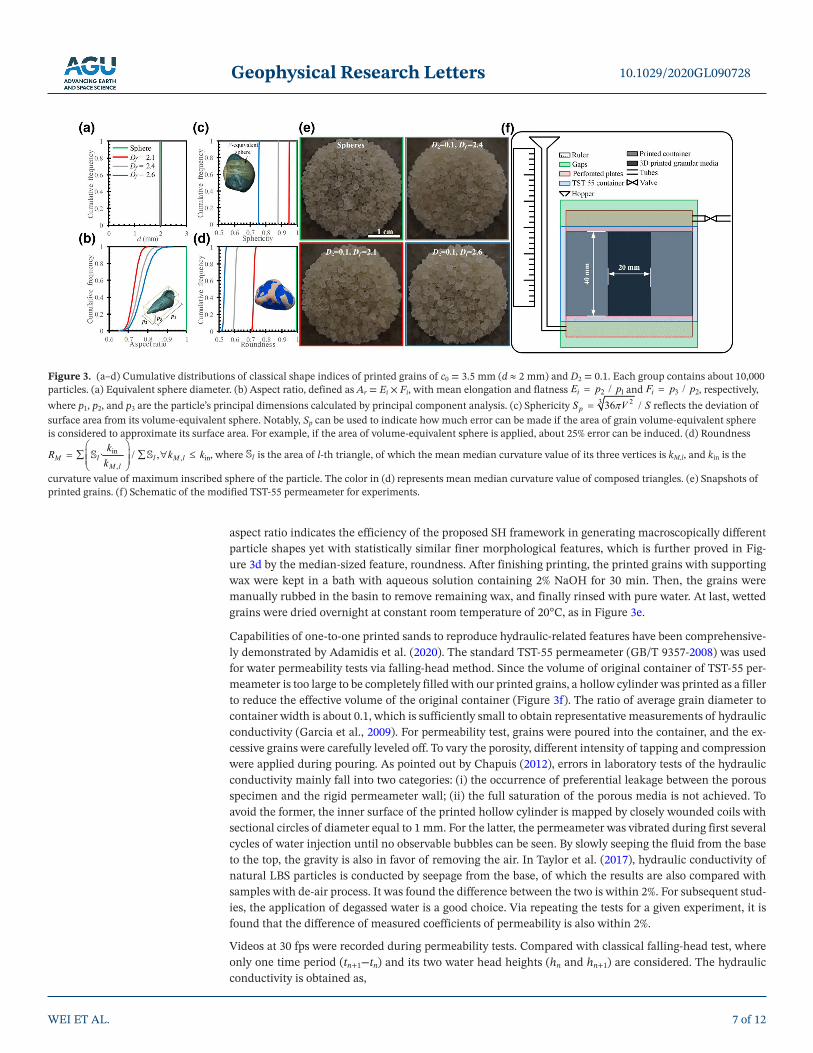
Figures 3a–3d illustrates the cumulative distributions of input shape indices for four groups of particles with the same c0 = 3.5 mm. The nonuniformly shaped particles have D2 = 0.1, close to those of fine ag-gregates in Figures 1a and 1b. It can be seen that the printed particles have uniform gradings (Figure 3a), and their sphericity is also uniform within a group, consistent with Equations 5, 7 and 12. The variation in
WEI ET AL.
10.1029/2020GL090728
6 of 12
Geophysical Research Letters
aspect ratio indicates the efficiency of the proposed SH framework in generating macroscopically different particle shapes yet with statistically similar finer morphological features, which is further proved in Fig-ure 3d by the median-sized feature, roundness. After finishing printing, the printed grains with supporting wax were kept in a bath with aqueous solution containing 2% NaOH for 30 min. Then, the grains were manually rubbed in the basin to remove remaining wax, and finally rinsed with pure water. At last, wetted grains were dried overnight at constant room temperature of 20°C, as in Figure 3e.
Capabilities of one-to-one printed sands to reproduce hydraulic-related features have been comprehensive-ly demonstrated by Adamidis et al. (2020). The standard TST-55 permeameter (GB/T 9357-2008) was used for water permeability tests via falling-head method. Since the volume of original container of TST-55 per-meameter is too large to be completely filled with our printed grains, a hollow cylinder was printed as a filler to reduce the effective volume of the original container (Figure 3f). The ratio of average grain diameter to container width is about 0.1, which is sufficiently small to obtain representative measurements of hydraulic conductivity (Garcia et al., 2009). For permeability test, grains were poured into the container, and the ex-cessive grains were carefully leveled off. To vary the porosity, different intensity of tapping and compression were applied during pouring. As pointed out by Chapuis (2012), errors in laboratory tests of the hydraulic conductivity mainly fall into two categories: (i) the occurrence of preferential leakage between the porous specimen and the rigid permeameter wall; (ii) the full saturation of the porous media is not achieved. To avoid the former, the inner surface of the printed hollow cylinder is mapped by closely wounded coils with sectional circles of diameter equal to 1 mm. For the latter, the permeameter was vibrated during first several cycles of water injection until no observable bubbles can be seen. By slowly seeping the fluid from the base to the top, the gravity is also in favor of removing the air. In Taylor et al. (2017), hydraulic conductivity of natural LBS particles is conducted by seepage from the base, of which the results are also compared with samples with de-air process. It was found the difference between the two is within 2%. For subsequent stud-ies, the application of degassed water is a good choice. Via repeating the tests for a given experiment, it is found that the difference of measured coefficients of permeability is also within 2%.
Videos at 30 fps were recorded during permeability tests. Compared with classical falling-head test, where only one time period (tn+1−tn) and its two water head heights (hn and hn+1) are considered. The hydraulic conductivity is obtained as,
WEI ET AL.
10.1029/2020GL090728
7 of 12
Figure 3. (a–d) Cumulative distributions of classical shape indices of printed grains of c0 = 3.5 mm (d ≈ 2 mm) and D2 = 0.1. Each group contains about 10,000 particles. (a) Equivalent sphere diameter. (b) Aspect ratio, defined as Ar = Ei × Fi, with mean elongation and flatness 2 1/iE p p and 3 2/iF p p , respectively, where p1, p2, and p3 are the particle’s principal dimensions calculated by principal component analysis. (c) Sphericity 23 36 /pS V S reflects the deviation of surface area from its volume-equivalent sphere. Notably, Sp can be used to indicate how much error can be made if the area of grain volume-equivalent sphere is considered to approximate its surface area. For example, if the area of volume-equivalent sphere is applied, about 25% error can be induced. (d) Roundness
in, in
,· / ,M l l M l
M l
kR k kk
, where l is the area of l-th triangle, of which the mean median curvature value of its three vertices is kM,l, and kin is the
curvature value of maximum inscribed sphere of the particle. The color in (d) represents mean median curvature value of composed triangles. (e) Snapshots of printed grains. (f) Schematic of the modified TST-55 permeameter for experiments.
Geophysical Research Letters
1 1
· ·ln ,·
n
n n n
a l hkA t t h
(13)
then we modify it as
1
1
· ln ln· ,n nn
n n
a l h hkA t t
(14)
where a and A are the areas of the tube and the porous sample cross-section, respectively, and n is the frame number of the video. By using all the data during each permeability test (typically several hundreds of frames), k can be determined by fitting the slopes in (lnh)−t curves. Seven representative experiments were conducted for each group of grain type at each porosity, and the invariance to mean ratio is less than 5%, indicating good repeatability of experiments.
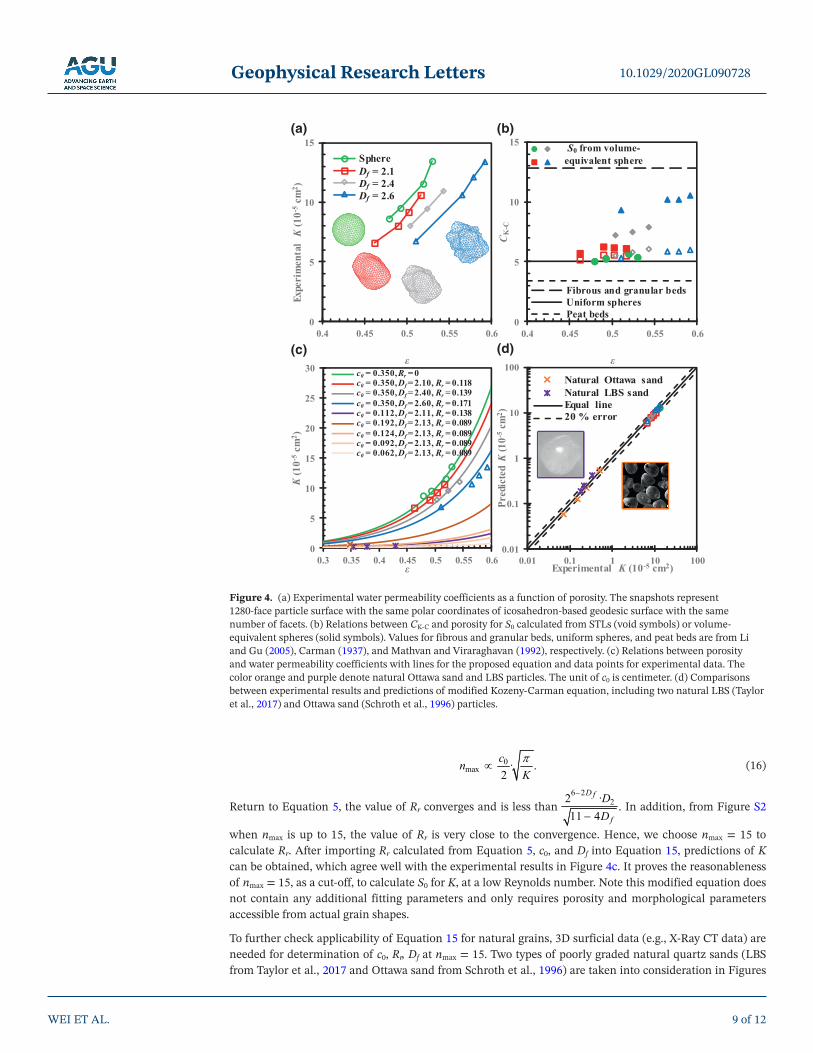
4. Results and Modified Kozeny-Carman EquationFigure 4a shows the measured absolute coefficients of water permeability, K, as a function of porosity ε for different particle shapes. With the increase of Df, the tortuosity of pores in porous media of same ε becomes higher, resulting in lower K. Some studies have revised Kozeny-Carman equation based on the specific grad-
ing to approximate pore diameter, such as in Chapuis (2004) with
0.78253
210 22.4622· ·
1k D
, where D10
is the 10% finer particle size. This approach is not applicable to the current work, because the gradings of our four types of printed grains are deemed equal, as shown in Figure 3a.
Since printed grains are reconstructed along vertices of 1280-triangle-based icosahedron geodesic struc-tures, S and V can be directly calculated and the corresponding S0 can be readily obtained. Figure 4b com-pares CK-C calculated by importing measured permeability into Equation 1. It is surprising that the shape factor, CK-C, is insensitive to particle shapes from spheres to highly irregular shapes with Df = 2.6. However, if S0 is approximated based on volume-equivalent spheres, an increase in CK-C is observed for irregular particles. Here, we propose that the increase is the manifestation of the errors from calculation of S0. The value of CK-C of printed spheres is about 5.5, within the relevant experimental values 5.0–6.4 for mono-sized spheres (Carman, 1956). This consistency in CK-C of mono-sized spheres proves the adequacy of our exper-iments to measure permeability.
Via electrokinetic analysis of complex anion adsorption, Hanaor et al. (2014) concluded that particle sur-face area is unlimited. If so, K would approach to zero, which is certainly problematic. According to Koch and Brady (1985) and Durlofsky and Brady (1987), the decay length, called Brinkman screening length, of viscous flow velocity disturbance in fixed spherical granular porous media roughly equals K . This decay length can be regarded as the cut-off length for effects of surface roughness on the near flow field, below which surface features will have limited effect on the permeability (Castillo et al., 2015). Thus, only mor-phological features of length beyond such length is considered into S0. Note that the roughness of printed grains is deemed the same and the 3D printer resolution is 32 μm, which is in the same order of magnitude as mean triangular edge length (≈136 μm) of printed triangle-based grains, as well as the decay length (≈20 μm). We fit data points of printed spheres in Figure 4b to get CK-C for the roughness generated by the printer. Substituting Equations 7 and 12 into Equation 1, the modified Kozeny-Carman equation is
22 2 30
2 2
3.8742
1 31· .5.5 1
36 1 · ·20
r
r f
c RK k
R D
(15)
Notably, Rr is dependent on nmax, which can be related to the decay length with
0 00 0
max max, ,IK r c Y
n n ,
WEI ET AL.
10.1029/2020GL090728
8 of 12
Geophysical Research Letters
0max · .
2cn
K
(16)
Return to Equation 5, the value of Rr converges and is less than 6 2
22 ·11 4
Df
f
DD
. In addition, from Figure S2
when nmax is up to 15, the value of Rr is very close to the convergence. Hence, we choose nmax = 15 to calculate Rr. After importing Rr calculated from Equation 5, c0, and Df into Equation 15, predictions of K can be obtained, which agree well with the experimental results in Figure 4c. It proves the reasonableness of nmax = 15, as a cut-off, to calculate S0 for K, at a low Reynolds number. Note this modified equation does not contain any additional fitting parameters and only requires porosity and morphological parameters accessible from actual grain shapes.
To further check applicability of Equation 15 for natural grains, 3D surficial data (e.g., X-Ray CT data) are needed for determination of c0, Rr, Df at nmax = 15. Two types of poorly graded natural quartz sands (LBS from Taylor et al., 2017 and Ottawa sand from Schroth et al., 1996) are taken into consideration in Figures
WEI ET AL.
10.1029/2020GL090728
9 of 12
Figure 4. (a) Experimental water permeability coefficients as a function of porosity. The snapshots represent 1280-face particle surface with the same polar coordinates of icosahedron-based geodesic surface with the same number of facets. (b) Relations between CK-C and porosity for S0 calculated from STLs (void symbols) or volume-equivalent spheres (solid symbols). Values for fibrous and granular beds, uniform spheres, and peat beds are from Li and Gu (2005), Carman (1937), and Mathvan and Viraraghavan (1992), respectively. (c) Relations between porosity and water permeability coefficients with lines for the proposed equation and data points for experimental data. The color orange and purple denote natural Ottawa sand and LBS particles. The unit of c0 is centimeter. (d) Comparisons between experimental results and predictions of modified Kozeny-Carman equation, including two natural LBS (Taylor et al., 2017) and Ottawa sand (Schroth et al., 1996) particles.
S0 from volume-equivalent sphere
Fibrous and granular beds
Peat bedsUniform spheres
0
5
10
15
0.4 0.45 0.5 0.55 0.6
CK-C
ε
0.01
0.1
1
10
100
0.01 0.1 1 10 100
detciderPK(10-5cm
2 )
Experimental K (10-5 cm2)
Natural Ottawa sandNatural LBS sandEqual line20 % error
0
5
10
15
20
25
30
0.3 0.35 0.4 0.45 0.5 0.55 0.6
K(10-5cm
2 )
ε
c0 = 0.350,Rr =0c0 = 0.350,Df=2.10, Rr =0.118c0 = 0.350,Df=2.40, Rr =0.139c0 = 0.350,Df=2.60, Rr =0.171c0 = 0.112,Df=2.11, Rr =0.138c0 = 0.192,Df=2.13, Rr =0.089c0 = 0.124,Df=2.13, Rr =0.089c0 = 0.092,Df=2.13, Rr =0.089c0 = 0.062,Df=2.13, Rr =0.089
0
5
10
15
0.4 0.45 0.5 0.55 0.6
latnemirepxE
K(10-5cm
2 )
ε
SphereDf = 2.1Df = 2.4Df = 2.6
(a)
(c)
(b)
(d)
Geophysical Research Letters
4c and 4d, where Rr and Df are calculated from Figure 1b, sample VII and IX, respectively. Although there is no perfectly uniform grading of the two sands, predicted values are close to experimental values. The model validated by data of natural sands appears to be appropriate over three orders of magnitudes of water permeability coefficient. It is possible that the proposed equation is not appropriate for well graded grains, because packing structures or pore distributions can significantly differ from those of uniform gradings. How grain grading distribution affects the validity of the equation deserves future studies. In this study, only statistical morphological features (Rr and Df) and volume are uniform, but other shape parameters lay in a wide range, as in Figure 3b, which could also alter pore structures. This may explain why the proposed model can hold for Cu (grading uniform coefficient) up to 1.5. To the best knowledge of the authors, it is the first time to experimentally study permeability coefficients of nonspherical uniform grains with focus on whether the shape coefficient in Kozeny-Carman equation is dependent on grain shapes, when effects of roughness are isolated. Surprisingly, the Kozeny-Carman shape coefficient is insensitive to particle shapes, contrary to what has been widely suggested before. Although via hydraulic conductivity tests such insen-sitivity is found, how much it can be generalized to other types of porous media with global multiscale morphology features, such as fibrous structures, needs further research.
5. ConclusionsWith the help of 3D printing, at low Reynold's number the present work explores coefficients of permeabil-ity of uniformly graded irregular grains with controlled shapes and fractal morphological features. The re-sults indicate that particle shape does influence permeability coefficients; that is, with the increase of fractal dimension only above a moderate roughness length scale, induced high tortuosity can slow water seeping through granular porous media of the same porosity. A modified Kozeny-Carman equation is proposed by incorporating the specific surface area calculated based on spherical harmonics, where it is derived as a function of particle size, relative roughness and fractal dimension. It is found that the shape coefficient in Kozeny-Carman equation is insensitive to particle shapes, ranging from spheres to significantly irregular shapes of high fractal dimension equal to 2.6. We also check the applicability of the proposed model on poorly graded natural grains by comparing with data in the literature. Good agreements are observed. The current work provides the first experimental study on permeability of uniformly graded aspherical grains with controlled particle shapes and fractal morphological features, and advances the understanding of their correlations. Extensive research on how the combined effects of grain sizes and shapes affect the proposed permeability model prediction should be performed in future studies. To better solve this outstanding issue, appropriately quantifying stochasticity of tortuosity, which is for pore structures that fluids flow through, may be necessary in deterministically predictive models of permeability coefficients.
Data Availability StatementThe data and codes relevant to this study can be found in http://doi.org/10.5281/zenodo.4387218.
ReferencesAdamidis, O., Alber, S., & Anastasopoulos, I. (2020). Assessment of three-dimensional printing of granular media for geotechnical appli-
cations. Geotechnical Testing Journal, 43(3), 20180259.Athanassiadis, A. G., Miskin, M., Kaplan, P., Rodenberg, N., Lee, S. H., Merritt, J., et al. (2014). Particle shape effects on the stress response
of granular packings. Soft Matter, 10(1), 48–59.Barclay, D. R., & Buckingham, M. J. (2009). On the shapes of natural sand grains. Journal of Geophysical Research, 114(B2), B02209.
https://doi.org/10.1029/2008JB005993Barrett, P. J. (1980). The shape of rock particles: A critical review. Sedimentology, 27(3), 291–303.Bullard, J. W. (2014). Virtual cement and concrete testing laboratory: Version 9.5 user guide (No Special Publication NIST SP-1173). https://
doi.org/10.6028/NIST.SP.1173Carman, P. C. (1937). Fluid flow through a granular bed. Transactions of the Institution of Chemical Engineers, 15, 150–167.Carman, P. C. (1956). Flow of gases through porous media. London, UK: Butterworths Scientific Publications.Carrier, W. D., III. (2003). Goodbye, Hazen; hello, Kozeny-Carman. Journal of Geotechnical and Geoenvironmental Engineering, 129(11),
1054–1056.Castillo, S. I., Thies-Weesie, D. M., & Philipse, A. P. (2015). Formation and liquid permeability of dense colloidal cube packings. Physical
Review E, 91(2), 022311.Chapuis, R. P. (2004). Predicting the saturated hydraulic conductivity of sand and gravel using effective diameter and void ratio. Canadian
Geotechnical Journal, 41(5), 787–795.
WEI ET AL.
10.1029/2020GL090728
10 of 12
AcknowledgmentsWe thank Dr. Junxing Zheng and Dr. Quan Sun from Iowa State University for providing us relations between Dn and n in Figure 1b. We thank Dr. Bowei Yu from the University of Sydney for help and guidance in experimental set-ups. Dr. Behzad Ghanbarian from Kansas State University and Dr. Budi Zhao from University College Dublin are thanked for leading us to the pa-pers, Schroth et al. (1996) and Taylor et al. (2017). Instructive comments from two reviewers are also greatly acknowledged.
Geophysical Research Letters
Chapuis, R. P. (2012). Predicting the saturated hydraulic conductivity of soils: A review. Bulletin of Engineering Geology and the Environ-ment, 71(3), 401–434.
Chapuis, R. P., & Aubertin, M. (2003). On the use of the Kozeny Carman equation to predict the hydraulic conductivity of soils. Canadian Geotechnical Journal, 40(3), 616–628.
Chikhi, N., Coindreau, O., Li, L. X., Ma, W. M., Taivassalo, V., Takasuo, E., et al. (2014). Evaluation of an effective diameter to study quench-ing and dry-out of complex debris bed. Annals of Nuclear Energy, 74, 24–41.
Costa, A. (2006). Permeability-porosity relationship: A reexamination of the Kozeny-Carman equation based on a fractal pore-space geom-etry assumption. Geophysical Research Letters, 33(2), L02318. https://doi.org/10.1029/2005GL025134
Craig, R. F. (2004). Craig's soil mechanics, London, UK: Taylor & Francis Publishing.David, C. (1993). Geometry of flow paths for fluid transport in rocks. Journal of Geophysical Research, 98(B7), 12267–12278.Durlofsky, L. J., & Brady, J. F. (1987). Analysis of the Brinkman equation as a model for flow in porous media. Physics of Fluids, 30(11),
3329–3341.Erdoğan, S. T., Forster, A. M., Stutzman, P. E., & Garboczi, E. J. (2017). Particle-based characterization of Ottawa sand: Shape, size, miner-
alogy, and elastic moduli. Cement and Concrete Composites, 83, 36–44.Fang, Y., Elsworth, D., Ishibashi, T., & Zhang, F. (2018). Permeability evolution and frictional stability of fabricated fractures with specified
roughness. Journal of Geophysical Research: Solid Earth, 123(11), 9355–9375. https://doi.org/10.1029/2018JB016215Feng, S., Vardanega, P. J., Ibraim, E., Widyatmoko, I., & Ojum, C. (2019). Permeability assessment of some granular mixtures. Géotech-
nique, 69(7), 646–654.Flügge, S. (2012). Practical quantum mechanics, Berlin, Germany: Springer Science & Business Media.Garboczi, E. J. (2002). Three-dimensional mathematical analysis of particle shape using X-ray tomography and spherical harmonics: Ap-
plication to aggregates used in concrete. Cement and Concrete Research, 32(10), 1621–1638.Garcia, X., Akanji, L. T., Blunt, M. J., Matthai, S. K., & Latham, J. P. (2009). Numerical study of the effects of particle shape and polydisper-
sity on permeability. Physical Review E, 80(2), 021304.GB/T 9357-2008, Instrument for soil test-Permeameter. (2008). General administration of quality supervision, inspection and quar-
antine of the People's Republic of China & standardization administration. Retrieved from http://openstd.samr.gov.cn/bzgk/gb/newGbInfo?hcno=902BACD0C9CB814080656150DD1BD5BA
Gerig, G., Styner, M., Jones, D., Weinberger, D., & Lieberman, J. (2001). Shape analysis of brain ventricles using spharm (pp. 171–178). Pro-ceedings IEEE Workshop on Mathematical Methods in Biomedical Image Analysis (MMBIA 2001), IEEE.
Ghanbarian, B., Hunt, A. G., Ewing, R. P., & Sahimi, M. (2013). Tortuosity in porous media: a critical review. Soil science society of America journal, 77(5), 1461–1477.
Gupta, R., Salager, S., Wang, K., & Sun, W. (2019). Open-source support toward validating and falsifying discrete mechanics models using synthetic granular materials—Part I: Experimental tests with particles manufactured by a 3D printer. Acta Geotechnica, 14(4), 923–937.
Hanaor, D. A. H., Gan, Y., Revay, M., Airey, D. W., & Einav, I. (2016). 3D printable geomaterials. Géotechnique, 66(4), 323–332.Hanaor, D. A. H., Ghadiri, M., Chrzanowski, W., & Gan, Y. (2014). Scalable surface area characterization by electrokinetic analysis of
complex anion adsorption. Langmuir, 30(50), 15143–15152.Hazen, A. (1892). Some physical properties of sands and gravels (24th Annual Report, pp. 539–556). Boston, MA: State Board of Health.Higdon, J. J., & Ford, G. D. (1996). Permeability of three-dimensional models of fibrous porous media. Journal of Fluid Mechanics, 308(1),
341–361.Jekeli, C. (1996). Spherical harmonic analysis, aliasing, and filtering. Journal of Geodesy, 70(4), 214–223.Jekeli, C., Lee, J. K., & Kwon, J. H. (2007). On the computation and approximation of ultra-high-degree spherical harmonic series. Journal
of Geodesy, 81(9), 603–615.Jiang, L., Yoon, H., Bobet, A., & Pyrak-Nolte, L. J. (2020). Mineral fabric as a Hidden variable in fracture formation in layered media.
Scientific Reports, 10(1), 1–9.Johnson, D. L., Koplik, J., & Schwartz, L. M. (1986). New pore-size parameter characterizing transport in porous media. Physical Review
Letters, 57(20), 2564.Ju, Y., Ren, Z., Li, X., Wang, Y., Mao, L., & Chiang, F. P. (2019). Quantification of hidden whole-field stress inside porous geomaterials via
three-dimensional printing and photoelastic testing methods. Journal of Geophysical Research: Solid Earth, 124(6), 5408–5426. https://doi.org/10.1029/2018JB016835
Koch, D. L., & Brady, J. F. (1985). Dispersion in fixed beds. Journal of Fluid Mechanics, 154, 399–427.Li, J., & Gu, Y. (2005). Coalescence of oil-in-water emulsions in fibrous and granular beds. Separation and Purification Technology, 42(1),
1–13.Malinouskaya, I., Mourzenko, V. V., Thovert, J. F., & Adler, P. M. (2009). Random packings of spiky particles: Geometry and transport
properties. Physical Review E, 80(1), 011304.Mathavan, G. N., & Viraraghavan, T. (1992). Coalescence/filtration of an oil-in-water emulsion in a peat bed. Water Research, 26(1), 91–98.Miskin, M. Z., & Jaeger, H. M. (2013). Adapting granular materials through artificial evolution. Nature Materials, 12(4), 326–331.Mollon, G., & Zhao, J. (2012). Fourier–Voronoi-based generation of realistic samples for discrete modeling of granular materials. Granular
Matter, 14(5), 621–638.Mortensen, N. A., Okkels, F., & Bruus, H. (2005). Reexamination of Hagen-Poiseuille flow: Shape dependence of the hydraulic resistance
in microchannels. Physical Review E, 71(5), 057301.Murphy, K. A., Dahmen, K. A., & Jaeger, H. M. (2019). Transforming mesoscale granular plasticity through particle shape. Physical Review
X, 9(1), 011014.Philipse, A. P., & Pathmamanoharan, C. (1993). Liquid permeation (and sedimentation) of dense colloidal hard-sphere packings. Journal
of Colloid and Interface Science, 159(1), 96–107.Quevedo, R., Mendoza, F., Aguilera, J. M., Chanona, J., & Gutierrezlopez, G. F. (2008). Determination of senescent spotting in banana
(Musa cavendish) using fractal texture Fourier image. Journal of Food Engineering, 84(4), 509–515.Renard, F., Candela, T., & Bouchaud, E. (2013). Constant dimensionality of fault roughness from the scale of micro-fractures to the scale
of continents. Geophysical Research Letters, 40(1), 83–87. https://doi.org/10.1029/2012GL054143Ren, X. W., & Santamarina, J. C. (2018). The hydraulic conductivity of sediments: A pore size perspective. Engineering Geology, 233, 48–54.Russ, J. C. (1991). Fractal surfaces. Berlin, Germany: Springer Plenum Press.Santamarina, J. C., Klein, K. A., Wang, Y. H., & Prencke, E. (2002). Specific surface: Determination and relevance. Canadian Geotechnical
Journal, 39(1), 233–241.
WEI ET AL.
10.1029/2020GL090728
11 of 12
Geophysical Research Letters
Schroth, M. H., Istok, J. D., Ahearn, S. J., & Selker, J. S. (1996). Characterization of Miller-similar silica sands for laboratory hydrologic studies. Soil Science Society of America Journal, 60(5), 1331–1339.
Seelheim, F. (1880). Methoden zur Bestimmung der Durchlässigkeit des Bodens. Zeitschrift für Analytische Chemie, 19(1), 387–418.Shepherd, R. G. (1989). Correlations of permeability and grain size. Groundwater, 27(5), 633–638.Sun, W., Andrade, J. E., Rudnicki, J. W., & Eichhubl, P. (2011). Connecting microstructural attributes and permeability from 3D tomo-
graphic images of in situ shear-enhanced compaction bands using multiscale computations. Geophysical Research Letters, 38(10), L10302. https://doi.org/10.1029/2011GL047683
Suzuki, A., Watanabe, N., Li, K., & Horne, R. N. (2017). Fracture network created by 3-D printer and its validation using CT images. Water Resources Research, 53(7), 6330–6339. https://doi.org/10.1002/2017WR021032
Taylor, H., Osullivan, C., Sim, W. W., & Carr, S. J. (2017). Sub-particle-scale investigation of seepage in sands. Soils and Foundations, 57(3), 439–452.
Thies-Weesie, D. M., Philipse, A. P., & Kluijtmans, S. G. (1995). Preparation of sterically stabilized silica-hematite ellipsoids-sedimentation, permeation, and packing properties of prolate colloids. Journal of Colloid and Interface Science, 174(1), 211–223.
Turcotte, D. L. (1987). A fractal interpretation of topography and geoid spectra on the Earth, Moon, Venus, and Mars. Journal of Geophys-ical Research, 92(B4), E597–E601.
Wang, C., Elsworth, D., & Fang, Y. (2019). Ensemble shear strength, stability, and permeability of mixed mineralogy fault gouge recovered from 3D granular models. Journal of Geophysical Research: Solid Earth, 124(1), 425–441. https://doi.org/10.1029/2018JB016066
Wang, J. P., François, B., & Lambert, P. (2017). Equations for hydraulic conductivity estimation from particle size distribution: A dimen-sional analysis. Water Resources Research, 53(9), 8127–8134. https://doi.org/10.1002/2017WR020888
Wei, D. H., Wang, J., Nie, J., & Zhou, B. (2018). Generation of realistic sand particles with fractal nature using an improved spherical har-monic analysis. Computers and Geotechnics, 104, 1–12.
Wei, D. H., Zhai, C. P., HANAOR, D., & Gan, Y. X. (2020). Contact behavior of simulated rough spheres generated with spherical harmon-ics. International Journal of Solids and Structures, 193, 54–68.
Zhao, B. D., Wei, D. H., & Wang, J. F. (2017). Particle shape quantification using rotation-invariant spherical harmonic analysis. Géotechnique Letters, 7(2), 190–196. http://dx.doi.org/10.1680/jgele.17.00011
Zheng, J., Ju, Y., & Wang, M. (2018). Pore-scale modeling of spontaneous imbibition behavior in a complex shale porous struc-ture by pseudopotential lattice Boltzmann method. Journal of Geophysical Research: Solid Earth, 123(11), 9586–9600. https://doi.org/10.1029/2018JB016430
Zhou, B., Wang, J., & Wang, H. (2017). Three-dimensional sphericity, roundness and fractal dimension of sand particles. Géotechnique, 68(1), 18–30.
WEI ET AL.
10.1029/2020GL090728
12 of 12