Cholesterol Distribution in Living Cells: Fluorescence Imaging Using Dehydroergosterol as a...
11
Cholesterol Distribution in Living Cells: Fluorescence Imaging Using Dehydroergosterol as a Fluorescent Cholesterol Analog Sushmita Mukherjee,* Xiaohui Zha,* Ira Tabas, # and Frederick R. Maxfield* *Department of Biochemistry, Cornell University Medical College, New York, New York 10021, and # Departments of Medicine and Anatomy and Cell Biology, College of Physicians and Surgeons, Columbia University, New York, New York 10032 USA ABSTRACT Cholesterol is an important constituent of most mammalian cell membranes and its concentration in various cellular membranes is tightly regulated. Although there is much information about cholesterol distribution and trafficking in cells, it is primarily derived from indirect measurements, and the results obtained using different approaches are often conflicting. A cholesterol analog that faithfully mimics the properties of cholesterol and can be followed in living cells would thus be very useful. In this study, we report the fluorescence imaging of such an analog, dehydroergosterol (DHE), in living cells. DHE differs from cholesterol in having three additional double bonds and an extra methyl group. In model systems, DHE closely mimics the behavior of native cholesterol. Using triple-labeling studies, we show that DHE colocalizes extensively with endocytosed transferrin, an endocytic recycling compartment marker, and with a marker for the trans-Golgi network, Tac-TGN38. This distribution of DHE is qualitatively similar to that observed when cells are labeled with the fluorescent cholesterol-binding polyene antibiotic, filipin, although there are differences in apparent proportions of DHE and filipin that are localized at the plasma membrane. Another cholesterol derivative, 25-NBD-cholesterol, has a structure that is compromised by the presence of a bulky NBD group and does not distribute to the same organelles as DHE or filipin. In addition, we show in this manuscript that kinetic processes can be followed in living cells by monitoring recovery of DHE fluorescence in a photobleached region over time. Our observations provide evidence for the presence of a large intracellular cholesterol pool in the endocytic recycling compartment and the trans-Golgi network that might play important roles in the trafficking of lipids, lipid-anchored proteins, and transmembrane proteins that preferentially partition into cholesterol-enriched membrane do- mains. In addition, this intracellular cholesterol pool might be involved in the maintenance of cellular cholesterol homeostasis. INTRODUCTION Most mammalian cells contain cholesterol as a component of their cellular membranes. Cholesterol levels in cells are stringently controlled, and while it is necessary for cell survival, excess cholesterol can lead to cytotoxic effects (Tabas, 1997). In model membrane systems cholesterol organization within a bilayer as well as its effects on host bilayer properties have been found to be a complex function of the host membrane composition and the precise amount of cholesterol present (Almeida et al., 1993; Vaz and Almeida, 1993; Harris et al., 1995; Mukherjee and Chatto- padhyay, 1996; Silvius et al., 1996; Ahmed et al., 1997). This, in addition to the fact that cholesterol preferentially interacts with a subset of membrane lipids and proteins (Yeagle, 1985; Schroeder et al., 1995), has given rise to the idea of specialized microdomains (or “rafts”) that might play important roles in several cellular functions such as signaling, adhesion, and motility (Simons and Ikonen, 1997). Indeed, structurally and kinetically distinct choles- terol-rich and -poor domains have been detected in cellular membranes (Schroeder et al., 1991). In addition to such functionally important regionalization within a bilayer, cholesterol has been reported to be distrib- uted heterogeneously among various intracellular mem- branes. By several estimates, as high as 80 –90% of total cellular cholesterol is present at the plasma membrane at steady state (Lange, 1991). On the contrary, the endoplas- mic reticulum and mitochondrial inner membranes contain very little cholesterol (Severs, 1982; Lange, 1991). This observation, a priori, is difficult to reconcile with the rapid flip-flop and spontaneous intermembrane transfer rates ob- served for cholesterol in model membranes (Yeagle, 1985; Schroeder et al., 1995), which should act to scramble and randomize cholesterol composition of all cellular mem- branes. Thus, in order to understand the functional roles of cholesterol in mammalian cells, it is important to under- Received for publication 23 March 1998 and in final form 16 July 1998. Address reprint requests to Frederick R. Maxfield, Department of Bio- chemistry, Cornell University Medical College, 1300 York Avenue, New York, NY 10021. Tel.: 212-746-6405; Fax: 212-746-8875; E-mail: [email protected]. S. Mukherjee and X. Zha contributed equally to this study. This paper is dedicated to the memory of Dr. Fred Fay (University of Massachusetts), who was a pioneer in the application of digital imaging microscopy to solve problems in cell biology and physiology. His insight- ful advocacy of the use of cooled CCD cameras and his efforts to optimize detectors for biological applications contributed significantly to the tech- nology that made this study possible. Abbreviations used: DHE, dehydroergosterol (D 5,7,9(11)22 -ergostatetraen- 3b-ol); ACAT, acyl CoA:cholesterol acyltransferase; CHO, Chinese ham- ster ovary; DIC, differential interference contrast; DMSO, dimethylsulfox- ide; DOPC, dioleoylphosphatidylcholine; ERC, endocytic recycling compartment; FITC, fluorescein isothiocyanate; HMG-CoA reductase, hy- droxymethylglutaryl CoA reductase; HPLC, high performance liquid chro- matography; MitoTracker Red, chloromethyl X-rosamine; 22-NBD-cho- lesterol, 22-(N-(7-nitrobenz-2-oxa-1,3-diazol-4-yl)amino)-23,24-bisnor-5- cholen-3b-ol; 25-NBD-cholesterol, 25-[N-[(7-nitrobenz-2-oxa-1,3-diazol- 4-yl)-methyl]amino]-27-norcholesterol; PBS, phosphate buffered saline; Tf, transferrin; TGN, trans-Golgi network; UV, ultraviolet. © 1998 by the Biophysical Society 0006-3495/98/10/1915/11 $2.00 1915 Biophysical Journal Volume 75 October 1998 1915–1925
-
Upload
visva-bharati -
Category
Documents
-
view
0 -
download
0
Transcript of Cholesterol Distribution in Living Cells: Fluorescence Imaging Using Dehydroergosterol as a...
Cholesterol Distribution in Living Cells: Fluorescence Imaging UsingDehydroergosterol as a Fluorescent Cholesterol Analog
Sushmita Mukherjee,* Xiaohui Zha,* Ira Tabas,# and Frederick R. Maxfield**Department of Biochemistry, Cornell University Medical College, New York, New York 10021, and #Departments of Medicine andAnatomy and Cell Biology, College of Physicians and Surgeons, Columbia University, New York, New York 10032 USA
ABSTRACT Cholesterol is an important constituent of most mammalian cell membranes and its concentration in variouscellular membranes is tightly regulated. Although there is much information about cholesterol distribution and trafficking incells, it is primarily derived from indirect measurements, and the results obtained using different approaches are oftenconflicting. A cholesterol analog that faithfully mimics the properties of cholesterol and can be followed in living cells wouldthus be very useful. In this study, we report the fluorescence imaging of such an analog, dehydroergosterol (DHE), in livingcells. DHE differs from cholesterol in having three additional double bonds and an extra methyl group. In model systems, DHEclosely mimics the behavior of native cholesterol. Using triple-labeling studies, we show that DHE colocalizes extensively withendocytosed transferrin, an endocytic recycling compartment marker, and with a marker for the trans-Golgi network,Tac-TGN38. This distribution of DHE is qualitatively similar to that observed when cells are labeled with the fluorescentcholesterol-binding polyene antibiotic, filipin, although there are differences in apparent proportions of DHE and filipin that arelocalized at the plasma membrane. Another cholesterol derivative, 25-NBD-cholesterol, has a structure that is compromisedby the presence of a bulky NBD group and does not distribute to the same organelles as DHE or filipin. In addition, we showin this manuscript that kinetic processes can be followed in living cells by monitoring recovery of DHE fluorescence in aphotobleached region over time. Our observations provide evidence for the presence of a large intracellular cholesterol poolin the endocytic recycling compartment and the trans-Golgi network that might play important roles in the trafficking of lipids,lipid-anchored proteins, and transmembrane proteins that preferentially partition into cholesterol-enriched membrane do-mains. In addition, this intracellular cholesterol pool might be involved in the maintenance of cellular cholesterol homeostasis.
INTRODUCTION
Most mammalian cells contain cholesterol as a componentof their cellular membranes. Cholesterol levels in cells arestringently controlled, and while it is necessary for cellsurvival, excess cholesterol can lead to cytotoxic effects(Tabas, 1997). In model membrane systems cholesterolorganization within a bilayer as well as its effects on host
bilayer properties have been found to be a complex functionof the host membrane composition and the precise amountof cholesterol present (Almeida et al., 1993; Vaz andAlmeida, 1993; Harris et al., 1995; Mukherjee and Chatto-padhyay, 1996; Silvius et al., 1996; Ahmed et al., 1997).This, in addition to the fact that cholesterol preferentiallyinteracts with a subset of membrane lipids and proteins(Yeagle, 1985; Schroeder et al., 1995), has given rise to theidea of specialized microdomains (or “rafts”) that mightplay important roles in several cellular functions such assignaling, adhesion, and motility (Simons and Ikonen,1997). Indeed, structurally and kinetically distinct choles-terol-rich and -poor domains have been detected in cellularmembranes (Schroeder et al., 1991).
In addition to such functionally important regionalizationwithin a bilayer, cholesterol has been reported to be distrib-uted heterogeneously among various intracellular mem-branes. By several estimates, as high as 80–90% of totalcellular cholesterol is present at the plasma membrane atsteady state (Lange, 1991). On the contrary, the endoplas-mic reticulum and mitochondrial inner membranes containvery little cholesterol (Severs, 1982; Lange, 1991). Thisobservation, a priori, is difficult to reconcile with the rapidflip-flop and spontaneous intermembrane transfer rates ob-served for cholesterol in model membranes (Yeagle, 1985;Schroeder et al., 1995), which should act to scramble andrandomize cholesterol composition of all cellular mem-branes. Thus, in order to understand the functional roles ofcholesterol in mammalian cells, it is important to under-
Received for publication 23 March 1998 and in final form 16 July 1998.
Address reprint requests to Frederick R. Maxfield, Department of Bio-chemistry, Cornell University Medical College, 1300 York Avenue, NewYork, NY 10021. Tel.: 212-746-6405; Fax: 212-746-8875; E-mail:[email protected].
S. Mukherjee and X. Zha contributed equally to this study.
This paper is dedicated to the memory of Dr. Fred Fay (University ofMassachusetts), who was a pioneer in the application of digital imagingmicroscopy to solve problems in cell biology and physiology. His insight-ful advocacy of the use of cooled CCD cameras and his efforts to optimizedetectors for biological applications contributed significantly to the tech-nology that made this study possible.
Abbreviations used:DHE, dehydroergosterol (D5,7,9(11)22-ergostatetraen-3b-ol); ACAT, acyl CoA:cholesterol acyltransferase; CHO, Chinese ham-ster ovary; DIC, differential interference contrast; DMSO, dimethylsulfox-ide; DOPC, dioleoylphosphatidylcholine; ERC, endocytic recyclingcompartment; FITC, fluorescein isothiocyanate; HMG-CoA reductase, hy-droxymethylglutaryl CoA reductase; HPLC, high performance liquid chro-matography; MitoTracker Red, chloromethyl X-rosamine; 22-NBD-cho-lesterol, 22-(N-(7-nitrobenz-2-oxa-1,3-diazol-4-yl)amino)-23,24-bisnor-5-cholen-3b-ol; 25-NBD-cholesterol, 25-[N-[(7-nitrobenz-2-oxa-1,3-diazol-4-yl)-methyl]amino]-27-norcholesterol; PBS, phosphate buffered saline;Tf, transferrin; TGN,trans-Golgi network; UV, ultraviolet.
© 1998 by the Biophysical Society
0006-3495/98/10/1915/11 $2.00
1915Biophysical Journal Volume 75 October 1998 1915–1925
stand cholesterol trafficking mechanisms vis-a`-vis the prin-ciples governing its distribution and retention within andamong membranes.
Several methods are available to study cholesterol distri-bution and trafficking in cells (reviewed in Liscum andDahl, 1992; Liscum and Underwood, 1995). However, allthese methods are rather indirect, and although they providesignificant information about cellular cholesterol distribu-tion and trafficking, often suffer from serious limitations(Liscum and Dahl, 1992; Liscum and Underwood, 1995).Thus, a reliable analog of cholesterol that can be easilyfollowed in a living cell would provide a very useful ex-perimental tool to address questions regarding cholesteroldistribution in unperturbed cells. Fluorescent cholesterolanalogs offer such a possibility, since they can be followedby fluorescence microscopy, which has the advantage ofbeing able to study a relatively large population of cells,while providing quantitative information about the spatialdistribution of a fluorescent molecule that can be followedin real time.
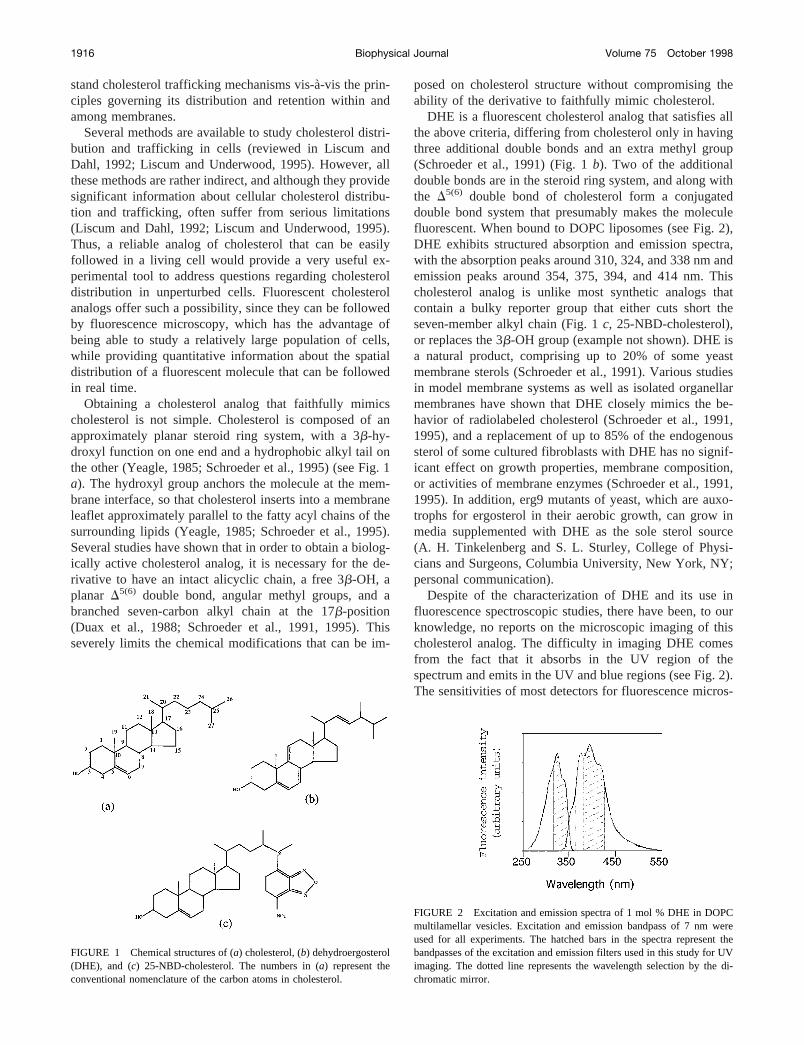
Obtaining a cholesterol analog that faithfully mimicscholesterol is not simple. Cholesterol is composed of anapproximately planar steroid ring system, with a 3b-hy-droxyl function on one end and a hydrophobic alkyl tail onthe other (Yeagle, 1985; Schroeder et al., 1995) (see Fig. 1a). The hydroxyl group anchors the molecule at the mem-brane interface, so that cholesterol inserts into a membraneleaflet approximately parallel to the fatty acyl chains of thesurrounding lipids (Yeagle, 1985; Schroeder et al., 1995).Several studies have shown that in order to obtain a biolog-ically active cholesterol analog, it is necessary for the de-rivative to have an intact alicyclic chain, a free 3b-OH, aplanar D5(6) double bond, angular methyl groups, and abranched seven-carbon alkyl chain at the 17b-position(Duax et al., 1988; Schroeder et al., 1991, 1995). Thisseverely limits the chemical modifications that can be im-
posed on cholesterol structure without compromising theability of the derivative to faithfully mimic cholesterol.
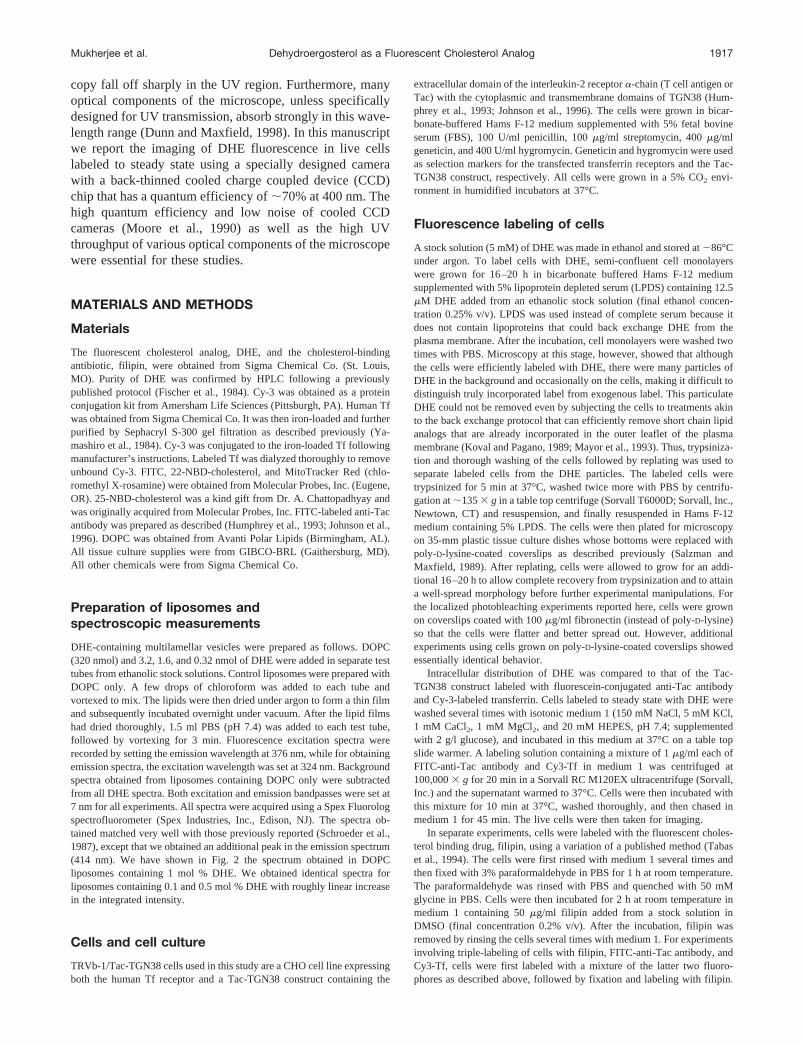
DHE is a fluorescent cholesterol analog that satisfies allthe above criteria, differing from cholesterol only in havingthree additional double bonds and an extra methyl group(Schroeder et al., 1991) (Fig. 1b). Two of the additionaldouble bonds are in the steroid ring system, and along withthe D5(6) double bond of cholesterol form a conjugateddouble bond system that presumably makes the moleculefluorescent. When bound to DOPC liposomes (see Fig. 2),DHE exhibits structured absorption and emission spectra,with the absorption peaks around 310, 324, and 338 nm andemission peaks around 354, 375, 394, and 414 nm. Thischolesterol analog is unlike most synthetic analogs thatcontain a bulky reporter group that either cuts short theseven-member alkyl chain (Fig. 1c, 25-NBD-cholesterol),or replaces the 3b-OH group (example not shown). DHE isa natural product, comprising up to 20% of some yeastmembrane sterols (Schroeder et al., 1991). Various studiesin model membrane systems as well as isolated organellarmembranes have shown that DHE closely mimics the be-havior of radiolabeled cholesterol (Schroeder et al., 1991,1995), and a replacement of up to 85% of the endogenoussterol of some cultured fibroblasts with DHE has no signif-icant effect on growth properties, membrane composition,or activities of membrane enzymes (Schroeder et al., 1991,1995). In addition, erg9 mutants of yeast, which are auxo-trophs for ergosterol in their aerobic growth, can grow inmedia supplemented with DHE as the sole sterol source(A. H. Tinkelenberg and S. L. Sturley, College of Physi-cians and Surgeons, Columbia University, New York, NY;personal communication).
Despite of the characterization of DHE and its use influorescence spectroscopic studies, there have been, to ourknowledge, no reports on the microscopic imaging of thischolesterol analog. The difficulty in imaging DHE comesfrom the fact that it absorbs in the UV region of thespectrum and emits in the UV and blue regions (see Fig. 2).The sensitivities of most detectors for fluorescence micros-
FIGURE 1 Chemical structures of (a) cholesterol, (b) dehydroergosterol(DHE), and (c) 25-NBD-cholesterol. The numbers in (a) represent theconventional nomenclature of the carbon atoms in cholesterol.
FIGURE 2 Excitation and emission spectra of 1 mol % DHE in DOPCmultilamellar vesicles. Excitation and emission bandpass of 7 nm wereused for all experiments. The hatched bars in the spectra represent thebandpasses of the excitation and emission filters used in this study for UVimaging. The dotted line represents the wavelength selection by the di-chromatic mirror.
1916 Biophysical Journal Volume 75 October 1998
copy fall off sharply in the UV region. Furthermore, manyoptical components of the microscope, unless specificallydesigned for UV transmission, absorb strongly in this wave-length range (Dunn and Maxfield, 1998). In this manuscriptwe report the imaging of DHE fluorescence in live cellslabeled to steady state using a specially designed camerawith a back-thinned cooled charge coupled device (CCD)chip that has a quantum efficiency of;70% at 400 nm. Thehigh quantum efficiency and low noise of cooled CCDcameras (Moore et al., 1990) as well as the high UVthroughput of various optical components of the microscopewere essential for these studies.
MATERIALS AND METHODS
Materials
The fluorescent cholesterol analog, DHE, and the cholesterol-bindingantibiotic, filipin, were obtained from Sigma Chemical Co. (St. Louis,MO). Purity of DHE was confirmed by HPLC following a previouslypublished protocol (Fischer et al., 1984). Cy-3 was obtained as a proteinconjugation kit from Amersham Life Sciences (Pittsburgh, PA). Human Tfwas obtained from Sigma Chemical Co. It was then iron-loaded and furtherpurified by Sephacryl S-300 gel filtration as described previously (Ya-mashiro et al., 1984). Cy-3 was conjugated to the iron-loaded Tf followingmanufacturer’s instructions. Labeled Tf was dialyzed thoroughly to removeunbound Cy-3. FITC, 22-NBD-cholesterol, and MitoTracker Red (chlo-romethyl X-rosamine) were obtained from Molecular Probes, Inc. (Eugene,OR). 25-NBD-cholesterol was a kind gift from Dr. A. Chattopadhyay andwas originally acquired from Molecular Probes, Inc. FITC-labeled anti-Tacantibody was prepared as described (Humphrey et al., 1993; Johnson et al.,1996). DOPC was obtained from Avanti Polar Lipids (Birmingham, AL).All tissue culture supplies were from GIBCO-BRL (Gaithersburg, MD).All other chemicals were from Sigma Chemical Co.
Preparation of liposomes andspectroscopic measurements
DHE-containing multilamellar vesicles were prepared as follows. DOPC(320 nmol) and 3.2, 1.6, and 0.32 nmol of DHE were added in separate testtubes from ethanolic stock solutions. Control liposomes were prepared withDOPC only. A few drops of chloroform was added to each tube andvortexed to mix. The lipids were then dried under argon to form a thin filmand subsequently incubated overnight under vacuum. After the lipid filmshad dried thoroughly, 1.5 ml PBS (pH 7.4) was added to each test tube,followed by vortexing for 3 min. Fluorescence excitation spectra wererecorded by setting the emission wavelength at 376 nm, while for obtainingemission spectra, the excitation wavelength was set at 324 nm. Backgroundspectra obtained from liposomes containing DOPC only were subtractedfrom all DHE spectra. Both excitation and emission bandpasses were set at7 nm for all experiments. All spectra were acquired using a Spex Fluorologspectrofluorometer (Spex Industries, Inc., Edison, NJ). The spectra ob-tained matched very well with those previously reported (Schroeder et al.,1987), except that we obtained an additional peak in the emission spectrum(414 nm). We have shown in Fig. 2 the spectrum obtained in DOPCliposomes containing 1 mol % DHE. We obtained identical spectra forliposomes containing 0.1 and 0.5 mol % DHE with roughly linear increasein the integrated intensity.
Cells and cell culture
TRVb-1/Tac-TGN38 cells used in this study are a CHO cell line expressingboth the human Tf receptor and a Tac-TGN38 construct containing the
extracellular domain of the interleukin-2 receptora-chain (T cell antigen orTac) with the cytoplasmic and transmembrane domains of TGN38 (Hum-phrey et al., 1993; Johnson et al., 1996). The cells were grown in bicar-bonate-buffered Hams F-12 medium supplemented with 5% fetal bovineserum (FBS), 100 U/ml penicillin, 100mg/ml streptomycin, 400mg/mlgeneticin, and 400 U/ml hygromycin. Geneticin and hygromycin were usedas selection markers for the transfected transferrin receptors and the Tac-TGN38 construct, respectively. All cells were grown in a 5% CO2 envi-ronment in humidified incubators at 37°C.
Fluorescence labeling of cells
A stock solution (5 mM) of DHE was made in ethanol and stored at286°Cunder argon. To label cells with DHE, semi-confluent cell monolayerswere grown for 16–20 h in bicarbonate buffered Hams F-12 mediumsupplemented with 5% lipoprotein depleted serum (LPDS) containing 12.5mM DHE added from an ethanolic stock solution (final ethanol concen-tration 0.25% v/v). LPDS was used instead of complete serum because itdoes not contain lipoproteins that could back exchange DHE from theplasma membrane. After the incubation, cell monolayers were washed twotimes with PBS. Microscopy at this stage, however, showed that althoughthe cells were efficiently labeled with DHE, there were many particles ofDHE in the background and occasionally on the cells, making it difficult todistinguish truly incorporated label from exogenous label. This particulateDHE could not be removed even by subjecting the cells to treatments akinto the back exchange protocol that can efficiently remove short chain lipidanalogs that are already incorporated in the outer leaflet of the plasmamembrane (Koval and Pagano, 1989; Mayor et al., 1993). Thus, trypsiniza-tion and thorough washing of the cells followed by replating was used toseparate labeled cells from the DHE particles. The labeled cells weretrypsinized for 5 min at 37°C, washed twice more with PBS by centrifu-gation at;1353 g in a table top centrifuge (Sorvall T6000D; Sorvall, Inc.,Newtown, CT) and resuspension, and finally resuspended in Hams F-12medium containing 5% LPDS. The cells were then plated for microscopyon 35-mm plastic tissue culture dishes whose bottoms were replaced withpoly-D-lysine-coated coverslips as described previously (Salzman andMaxfield, 1989). After replating, cells were allowed to grow for an addi-tional 16–20 h to allow complete recovery from trypsinization and to attaina well-spread morphology before further experimental manipulations. Forthe localized photobleaching experiments reported here, cells were grownon coverslips coated with 100mg/ml fibronectin (instead of poly-D-lysine)so that the cells were flatter and better spread out. However, additionalexperiments using cells grown on poly-D-lysine-coated coverslips showedessentially identical behavior.
Intracellular distribution of DHE was compared to that of the Tac-TGN38 construct labeled with fluorescein-conjugated anti-Tac antibodyand Cy-3-labeled transferrin. Cells labeled to steady state with DHE werewashed several times with isotonic medium 1 (150 mM NaCl, 5 mM KCl,1 mM CaCl2, 1 mM MgCl2, and 20 mM HEPES, pH 7.4; supplementedwith 2 g/l glucose), and incubated in this medium at 37°C on a table topslide warmer. A labeling solution containing a mixture of 1mg/ml each ofFITC-anti-Tac antibody and Cy3-Tf in medium 1 was centrifuged at100,0003 g for 20 min in a Sorvall RC M120EX ultracentrifuge (Sorvall,Inc.) and the supernatant warmed to 37°C. Cells were then incubated withthis mixture for 10 min at 37°C, washed thoroughly, and then chased inmedium 1 for 45 min. The live cells were then taken for imaging.
In separate experiments, cells were labeled with the fluorescent choles-terol binding drug, filipin, using a variation of a published method (Tabaset al., 1994). The cells were first rinsed with medium 1 several times andthen fixed with 3% paraformaldehyde in PBS for 1 h atroom temperature.The paraformaldehyde was rinsed with PBS and quenched with 50 mMglycine in PBS. Cells were then incubated for 2 h atroom temperature inmedium 1 containing 50mg/ml filipin added from a stock solution inDMSO (final concentration 0.2% v/v). After the incubation, filipin wasremoved by rinsing the cells several times with medium 1. For experimentsinvolving triple-labeling of cells with filipin, FITC-anti-Tac antibody, andCy3-Tf, cells were first labeled with a mixture of the latter two fluoro-phores as described above, followed by fixation and labeling with filipin.
Mukherjee et al. Dehydroergosterol as a Fluorescent Cholesterol Analog 1917
Fluorescence microscopy and quantitativeimage analysis
Fluorescence microscopy and digital image acquisition were carried outusing a Leica DMIRB microscope (Leica Mikroscopie und SystemeGmbH, Germany) equipped with a Princeton Instruments (Princeton, NJ)cooled CCD camera driven by Image-1/MetaMorph Imaging System soft-ware (Universal Imaging Corporation, PA). All images were acquiredusing a high-magnification oil immersion objective (633 magnification,1.4 numerical aperture). For the experiments presented here, it was essen-tial to optimize the throughput of the microscope in the UV region of thespectrum. This was achieved, in part, by using a lamp housing from Leicawith a collecting lens that had high transmittance characteristics in the UVregion. DHE and filipin were imaged using a specially designed filter cubeobtained from Chroma Technology Corp. (Brattleboro, VT) [335-nm(20-nm bandpass) excitation filter, 365-nm longpass dichromatic filter, and405-nm (40-nm bandpass) emission filter; see Fig. 2]. The detection of UVfluorescence of DHE was made possible by the use of a camera with aback-thinned CCD chip (Princeton Instruments Frame Transfer Pentamaxcamera with a 5123 512 back-thinned EEV chip; model 512EFTB). Thiscamera has;70% quantum efficiency at 400 nm. In the triple-labelstudies, FITC-anti-Tac and 25-NBD-cholesterol were imaged using a stan-dard fluorescein filter cube [470-nm (20-nm bandpass) excitation filter,510-nm longpass dichromatic filter, and 537-nm (23-nm bandpass) emis-sion filter] and Cy3-Tf and MitoTracker Red using a standard rhodaminefilter cube [535-nm (50-nm bandpass) excitation filter, 565-nm longpassdichromatic filter, and 610-nm (75-nm bandpass) emission filter]. Since theCCD camera used in this study has a fast readout rate (;15 frames/s for a512 3 512 image), the focal plane in all cases was chosen by real-timefocusing on a video monitor using DIC optics. This was especially impor-tant in DHE imaging since it photobleached readily when excited by UVlight. In case of 25-NBD-cholesterol fluorescence, extensive cross-over ofsignal to the red (MitoTracker) channel was observed. The cross-overfraction was rather high for optimal mathematical correction. To overcomethis constraint, we first acquired the NBD image, bleached it by keepingthe shutter open for 1 min, and then acquired the MitoTracker Red andDHE images, in that order. In control experiments, we ensured that 1-minphotobleaching with 470-nm excitation light bleached NBD fluorescencecompletely, with no effect on MitoTracker Red or DHE fluorescence.
For a quantitative estimate of the fraction of DHE or filipin fluorescencethat is in the perinuclear region versus on the plasma membrane, thefollowing methodology was used. The images were first corrected forbackground by subtracting a background value from the entire image. Thebackground intensity was estimated from several intensity measurementsin regions of the coverslip that did not contain any cells. The backgroundintensity rarely exceeded 10% of the maximum pixel intensity, and wasfound to be quite uniform both within a coverslip as well as among severalcoverslips investigated on the same day. After background correction, abox (6 3 6 pixel dimension) was placed in the perinuclear fluorescentstructure and three additional boxes of identical dimensions were placed onthe plasma membrane. Average intensity in each box was determined, thevalues obtained from the three plasma membrane boxes were averaged, anda ratio of this averaged pixel intensity on the plasma membrane to that inthe intracellular fluorescent compartment was determined. This measure-ment was repeated for;20 cells from experiments done on two differentdays. This approach was also utilized to ensure photobleaching and fluo-rescence recovery by monitoring ratios in the bleached region and com-paring it with those obtained from unbleached regions. Examples of suchmeasurements are shown in Fig. 8. These measurements ensured that anychanges in fluorescence intensity ratio after localized photobleaching orrecovery was not simply because of a general photobleaching of the sampledue to multiple image acquisitions.
For visual output purposes, the digital images were clipped to therelevant eight bits, transferred to a MacIntosh Power PC, intensity-mappedthrough logarithmic look-up tables (luts) using Adobe Photoshop, andprinted on a dye sublimation printer (SpectraStar Dsx, General ParametricsCorporation, CA).
RESULTS
DHE and filipin labeling of CHO cells
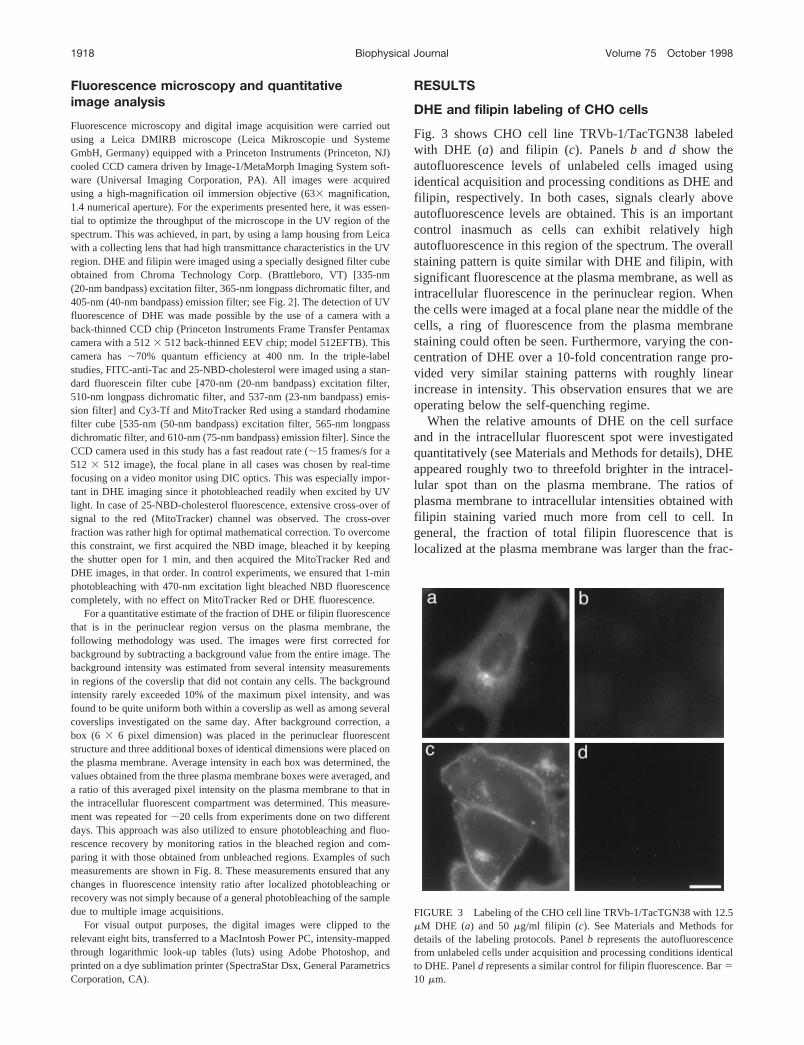
Fig. 3 shows CHO cell line TRVb-1/TacTGN38 labeledwith DHE (a) and filipin (c). Panelsb and d show theautofluorescence levels of unlabeled cells imaged usingidentical acquisition and processing conditions as DHE andfilipin, respectively. In both cases, signals clearly aboveautofluorescence levels are obtained. This is an importantcontrol inasmuch as cells can exhibit relatively highautofluorescence in this region of the spectrum. The overallstaining pattern is quite similar with DHE and filipin, withsignificant fluorescence at the plasma membrane, as well asintracellular fluorescence in the perinuclear region. Whenthe cells were imaged at a focal plane near the middle of thecells, a ring of fluorescence from the plasma membranestaining could often be seen. Furthermore, varying the con-centration of DHE over a 10-fold concentration range pro-vided very similar staining patterns with roughly linearincrease in intensity. This observation ensures that we areoperating below the self-quenching regime.
When the relative amounts of DHE on the cell surfaceand in the intracellular fluorescent spot were investigatedquantitatively (see Materials and Methods for details), DHEappeared roughly two to threefold brighter in the intracel-lular spot than on the plasma membrane. The ratios ofplasma membrane to intracellular intensities obtained withfilipin staining varied much more from cell to cell. Ingeneral, the fraction of total filipin fluorescence that islocalized at the plasma membrane was larger than the frac-
FIGURE 3 Labeling of the CHO cell line TRVb-1/TacTGN38 with 12.5mM DHE (a) and 50mg/ml filipin (c). See Materials and Methods fordetails of the labeling protocols. Panelb represents the autofluorescencefrom unlabeled cells under acquisition and processing conditions identicalto DHE. Paneld represents a similar control for filipin fluorescence. Bar510 mm.
1918 Biophysical Journal Volume 75 October 1998
tion of DHE fluorescence at the plasma membrane. Wediscuss the possible reasons for a such a difference later. Itshould also be noted that while both DHE and filipin showqualitatively similar staining patterns, the cell surface mor-phology is compromised in case of cells labeled with filipin,and the cells appear to bleb extensively. The small brightspots on the cell surface in the filipin-labeled field oftencorresponded to folded-over or partly detached membranefragments. This is an artifact of the fixation procedure,because similar blebbing is observed in unlabeled cells(detected by DIC) or DHE-labeled cells when they are alsoput through the same fixation protocol (data not shown).
25-NBD-cholesterol and DHE distributions differsignificantly in CHO cells
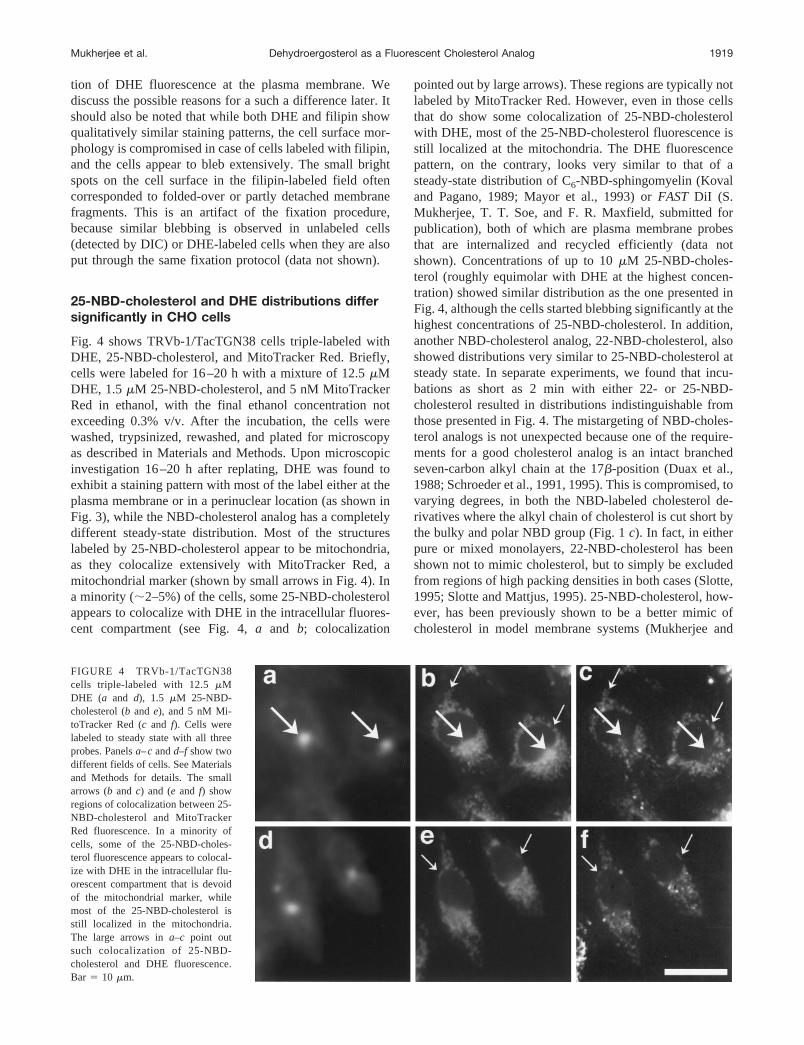
Fig. 4 shows TRVb-1/TacTGN38 cells triple-labeled withDHE, 25-NBD-cholesterol, and MitoTracker Red. Briefly,cells were labeled for 16–20 h with a mixture of 12.5mMDHE, 1.5mM 25-NBD-cholesterol, and 5 nM MitoTrackerRed in ethanol, with the final ethanol concentration notexceeding 0.3% v/v. After the incubation, the cells werewashed, trypsinized, rewashed, and plated for microscopyas described in Materials and Methods. Upon microscopicinvestigation 16–20 h after replating, DHE was found toexhibit a staining pattern with most of the label either at theplasma membrane or in a perinuclear location (as shown inFig. 3), while the NBD-cholesterol analog has a completelydifferent steady-state distribution. Most of the structureslabeled by 25-NBD-cholesterol appear to be mitochondria,as they colocalize extensively with MitoTracker Red, amitochondrial marker (shown by small arrows in Fig. 4). Ina minority (;2–5%) of the cells, some 25-NBD-cholesterolappears to colocalize with DHE in the intracellular fluores-cent compartment (see Fig. 4,a and b; colocalization
pointed out by large arrows). These regions are typically notlabeled by MitoTracker Red. However, even in those cellsthat do show some colocalization of 25-NBD-cholesterolwith DHE, most of the 25-NBD-cholesterol fluorescence isstill localized at the mitochondria. The DHE fluorescencepattern, on the contrary, looks very similar to that of asteady-state distribution of C6-NBD-sphingomyelin (Kovaland Pagano, 1989; Mayor et al., 1993) orFAST DiI (S.Mukherjee, T. T. Soe, and F. R. Maxfield, submitted forpublication), both of which are plasma membrane probesthat are internalized and recycled efficiently (data notshown). Concentrations of up to 10mM 25-NBD-choles-terol (roughly equimolar with DHE at the highest concen-tration) showed similar distribution as the one presented inFig. 4, although the cells started blebbing significantly at thehighest concentrations of 25-NBD-cholesterol. In addition,another NBD-cholesterol analog, 22-NBD-cholesterol, alsoshowed distributions very similar to 25-NBD-cholesterol atsteady state. In separate experiments, we found that incu-bations as short as 2 min with either 22- or 25-NBD-cholesterol resulted in distributions indistinguishable fromthose presented in Fig. 4. The mistargeting of NBD-choles-terol analogs is not unexpected because one of the require-ments for a good cholesterol analog is an intact branchedseven-carbon alkyl chain at the 17b-position (Duax et al.,1988; Schroeder et al., 1991, 1995). This is compromised, tovarying degrees, in both the NBD-labeled cholesterol de-rivatives where the alkyl chain of cholesterol is cut short bythe bulky and polar NBD group (Fig. 1c). In fact, in eitherpure or mixed monolayers, 22-NBD-cholesterol has beenshown not to mimic cholesterol, but to simply be excludedfrom regions of high packing densities in both cases (Slotte,1995; Slotte and Mattjus, 1995). 25-NBD-cholesterol, how-ever, has been previously shown to be a better mimic ofcholesterol in model membrane systems (Mukherjee and
FIGURE 4 TRVb-1/TacTGN38cells triple-labeled with 12.5mMDHE (a and d), 1.5 mM 25-NBD-cholesterol (b and e), and 5 nM Mi-toTracker Red (c and f). Cells werelabeled to steady state with all threeprobes. Panelsa–candd–f show twodifferent fields of cells. See Materialsand Methods for details. The smallarrows (b and c) and (e and f) showregions of colocalization between 25-NBD-cholesterol and MitoTrackerRed fluorescence. In a minority ofcells, some of the 25-NBD-choles-terol fluorescence appears to colocal-ize with DHE in the intracellular flu-orescent compartment that is devoidof the mitochondrial marker, whilemost of the 25-NBD-cholesterol isstill localized in the mitochondria.The large arrows ina–c point outsuch colocalization of 25-NBD-cholesterol and DHE fluorescence.Bar 5 10 mm.
Mukherjee et al. Dehydroergosterol as a Fluorescent Cholesterol Analog 1919
Chattopadhyay, 1996); This does not appear to be the casewhen CHO cells are labeled to steady state with this probe.
DHE and filipin staining show high cholesterolconcentrations in the plasma membrane, ERC,and TGN of CHO cells
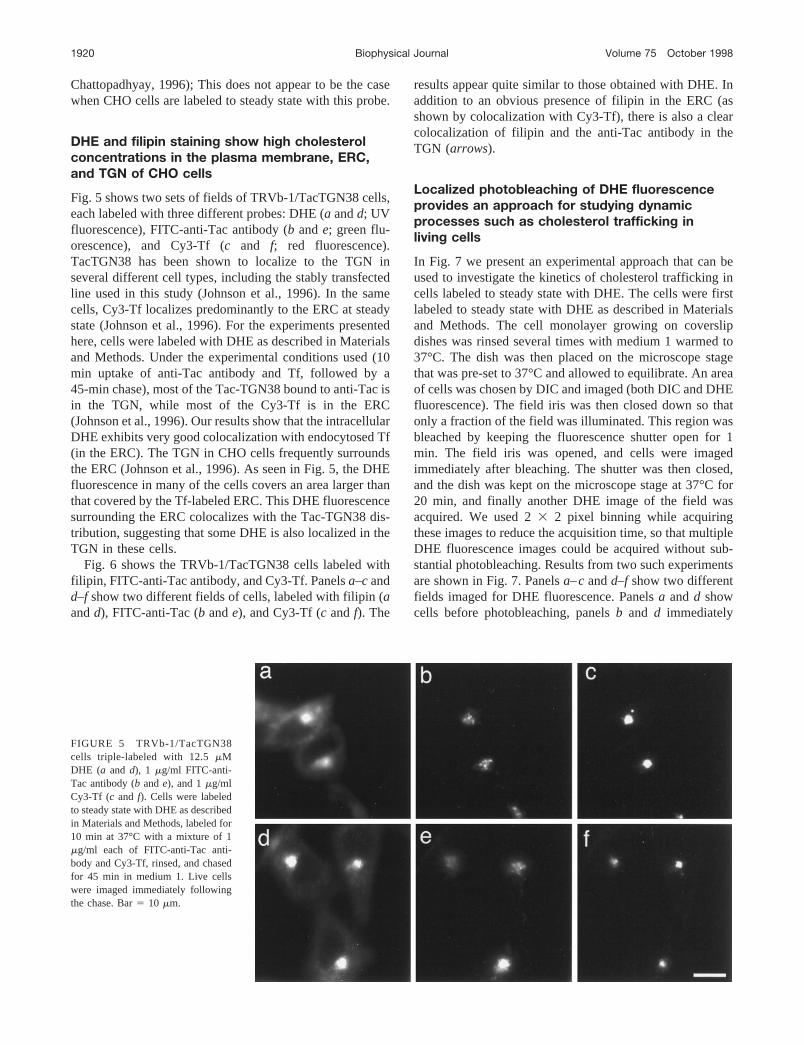
Fig. 5 shows two sets of fields of TRVb-1/TacTGN38 cells,each labeled with three different probes: DHE (a andd; UVfluorescence), FITC-anti-Tac antibody (b ande; green flu-orescence), and Cy3-Tf (c and f; red fluorescence).TacTGN38 has been shown to localize to the TGN inseveral different cell types, including the stably transfectedline used in this study (Johnson et al., 1996). In the samecells, Cy3-Tf localizes predominantly to the ERC at steadystate (Johnson et al., 1996). For the experiments presentedhere, cells were labeled with DHE as described in Materialsand Methods. Under the experimental conditions used (10min uptake of anti-Tac antibody and Tf, followed by a45-min chase), most of the Tac-TGN38 bound to anti-Tac isin the TGN, while most of the Cy3-Tf is in the ERC(Johnson et al., 1996). Our results show that the intracellularDHE exhibits very good colocalization with endocytosed Tf(in the ERC). The TGN in CHO cells frequently surroundsthe ERC (Johnson et al., 1996). As seen in Fig. 5, the DHEfluorescence in many of the cells covers an area larger thanthat covered by the Tf-labeled ERC. This DHE fluorescencesurrounding the ERC colocalizes with the Tac-TGN38 dis-tribution, suggesting that some DHE is also localized in theTGN in these cells.
Fig. 6 shows the TRVb-1/TacTGN38 cells labeled withfilipin, FITC-anti-Tac antibody, and Cy3-Tf. Panelsa–c andd–f show two different fields of cells, labeled with filipin (aandd), FITC-anti-Tac (b ande), and Cy3-Tf (c andf). The
results appear quite similar to those obtained with DHE. Inaddition to an obvious presence of filipin in the ERC (asshown by colocalization with Cy3-Tf), there is also a clearcolocalization of filipin and the anti-Tac antibody in theTGN (arrows).
Localized photobleaching of DHE fluorescenceprovides an approach for studying dynamicprocesses such as cholesterol trafficking inliving cells
In Fig. 7 we present an experimental approach that can beused to investigate the kinetics of cholesterol trafficking incells labeled to steady state with DHE. The cells were firstlabeled to steady state with DHE as described in Materialsand Methods. The cell monolayer growing on coverslipdishes was rinsed several times with medium 1 warmed to37°C. The dish was then placed on the microscope stagethat was pre-set to 37°C and allowed to equilibrate. An areaof cells was chosen by DIC and imaged (both DIC and DHEfluorescence). The field iris was then closed down so thatonly a fraction of the field was illuminated. This region wasbleached by keeping the fluorescence shutter open for 1min. The field iris was opened, and cells were imagedimmediately after bleaching. The shutter was then closed,and the dish was kept on the microscope stage at 37°C for20 min, and finally another DHE image of the field wasacquired. We used 23 2 pixel binning while acquiringthese images to reduce the acquisition time, so that multipleDHE fluorescence images could be acquired without sub-stantial photobleaching. Results from two such experimentsare shown in Fig. 7. Panelsa–candd–f show two differentfields imaged for DHE fluorescence. Panelsa andd showcells before photobleaching, panelsb and d immediately
FIGURE 5 TRVb-1/TacTGN38cells triple-labeled with 12.5mMDHE (a and d), 1 mg/ml FITC-anti-Tac antibody (b ande), and 1mg/mlCy3-Tf (c and f). Cells were labeledto steady state with DHE as describedin Materials and Methods, labeled for10 min at 37°C with a mixture of 1mg/ml each of FITC-anti-Tac anti-body and Cy3-Tf, rinsed, and chasedfor 45 min in medium 1. Live cellswere imaged immediately followingthe chase. Bar5 10 mm.
1920 Biophysical Journal Volume 75 October 1998
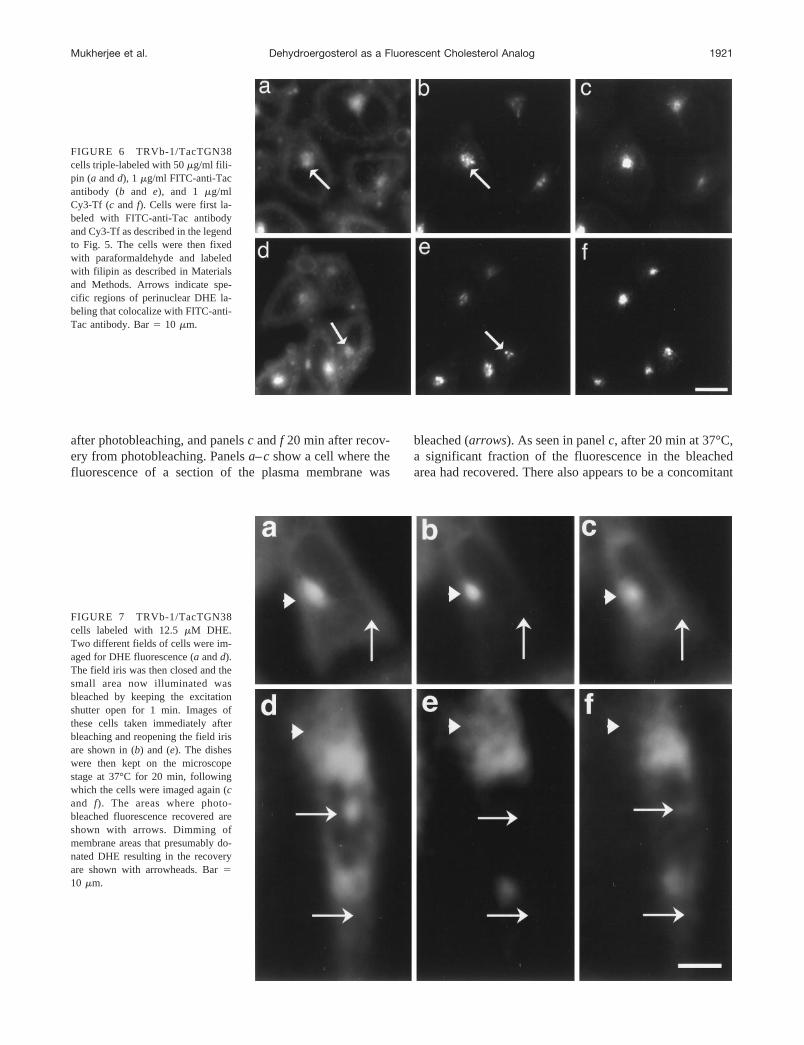
after photobleaching, and panelsc andf 20 min after recov-ery from photobleaching. Panelsa–cshow a cell where thefluorescence of a section of the plasma membrane was
bleached (arrows). As seen in panelc, after 20 min at 37°C,a significant fraction of the fluorescence in the bleachedarea had recovered. There also appears to be a concomitant
FIGURE 6 TRVb-1/TacTGN38cells triple-labeled with 50mg/ml fili-pin (a andd), 1 mg/ml FITC-anti-Tacantibody (b and e), and 1 mg/mlCy3-Tf (c and f). Cells were first la-beled with FITC-anti-Tac antibodyand Cy3-Tf as described in the legendto Fig. 5. The cells were then fixedwith paraformaldehyde and labeledwith filipin as described in Materialsand Methods. Arrows indicate spe-cific regions of perinuclear DHE la-beling that colocalize with FITC-anti-Tac antibody. Bar5 10 mm.
FIGURE 7 TRVb-1/TacTGN38cells labeled with 12.5mM DHE.Two different fields of cells were im-aged for DHE fluorescence (a andd).The field iris was then closed and thesmall area now illuminated wasbleached by keeping the excitationshutter open for 1 min. Images ofthese cells taken immediately afterbleaching and reopening the field irisare shown in (b) and (e). The disheswere then kept on the microscopestage at 37°C for 20 min, followingwhich the cells were imaged again (cand f). The areas where photo-bleached fluorescence recovered areshown with arrows. Dimming ofmembrane areas that presumably do-nated DHE resulting in the recoveryare shown with arrowheads. Bar510 mm.
Mukherjee et al. Dehydroergosterol as a Fluorescent Cholesterol Analog 1921
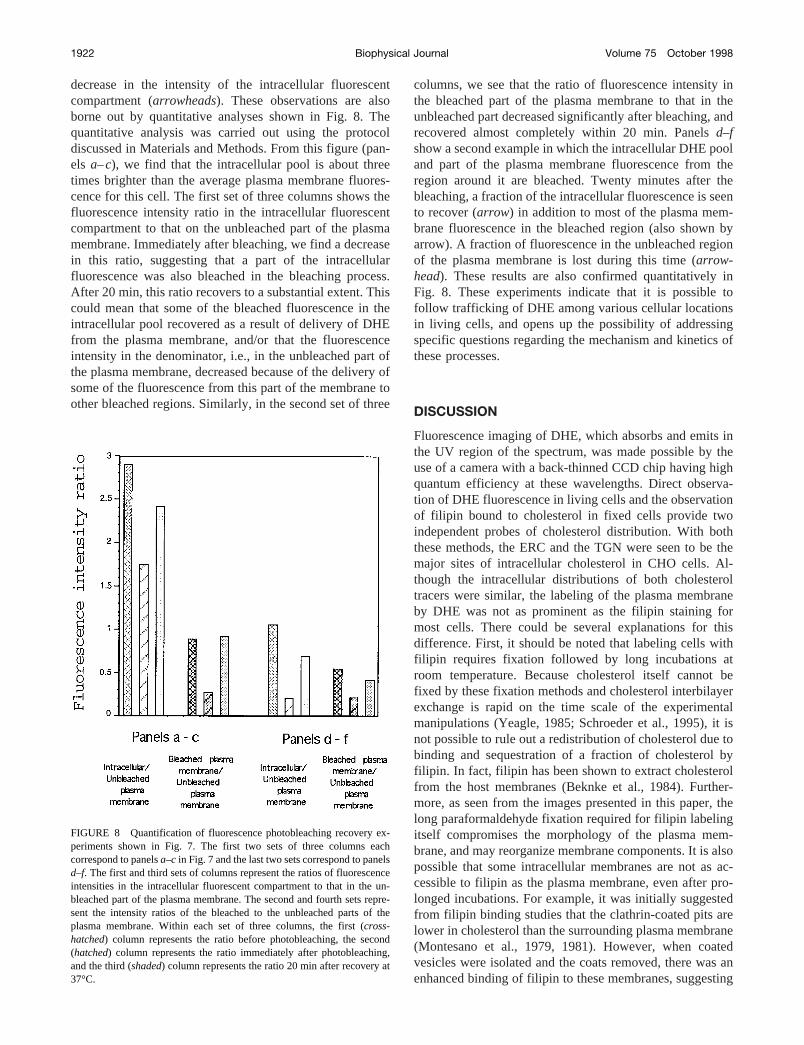
decrease in the intensity of the intracellular fluorescentcompartment (arrowheads). These observations are alsoborne out by quantitative analyses shown in Fig. 8. Thequantitative analysis was carried out using the protocoldiscussed in Materials and Methods. From this figure (pan-els a–c), we find that the intracellular pool is about threetimes brighter than the average plasma membrane fluores-cence for this cell. The first set of three columns shows thefluorescence intensity ratio in the intracellular fluorescentcompartment to that on the unbleached part of the plasmamembrane. Immediately after bleaching, we find a decreasein this ratio, suggesting that a part of the intracellularfluorescence was also bleached in the bleaching process.After 20 min, this ratio recovers to a substantial extent. Thiscould mean that some of the bleached fluorescence in theintracellular pool recovered as a result of delivery of DHEfrom the plasma membrane, and/or that the fluorescenceintensity in the denominator, i.e., in the unbleached part ofthe plasma membrane, decreased because of the delivery ofsome of the fluorescence from this part of the membrane toother bleached regions. Similarly, in the second set of three
columns, we see that the ratio of fluorescence intensity inthe bleached part of the plasma membrane to that in theunbleached part decreased significantly after bleaching, andrecovered almost completely within 20 min. Panelsd–fshow a second example in which the intracellular DHE pooland part of the plasma membrane fluorescence from theregion around it are bleached. Twenty minutes after thebleaching, a fraction of the intracellular fluorescence is seento recover (arrow) in addition to most of the plasma mem-brane fluorescence in the bleached region (also shown byarrow). A fraction of fluorescence in the unbleached regionof the plasma membrane is lost during this time (arrow-head). These results are also confirmed quantitatively inFig. 8. These experiments indicate that it is possible tofollow trafficking of DHE among various cellular locationsin living cells, and opens up the possibility of addressingspecific questions regarding the mechanism and kinetics ofthese processes.
DISCUSSION
Fluorescence imaging of DHE, which absorbs and emits inthe UV region of the spectrum, was made possible by theuse of a camera with a back-thinned CCD chip having highquantum efficiency at these wavelengths. Direct observa-tion of DHE fluorescence in living cells and the observationof filipin bound to cholesterol in fixed cells provide twoindependent probes of cholesterol distribution. With boththese methods, the ERC and the TGN were seen to be themajor sites of intracellular cholesterol in CHO cells. Al-though the intracellular distributions of both cholesteroltracers were similar, the labeling of the plasma membraneby DHE was not as prominent as the filipin staining formost cells. There could be several explanations for thisdifference. First, it should be noted that labeling cells withfilipin requires fixation followed by long incubations atroom temperature. Because cholesterol itself cannot befixed by these fixation methods and cholesterol interbilayerexchange is rapid on the time scale of the experimentalmanipulations (Yeagle, 1985; Schroeder et al., 1995), it isnot possible to rule out a redistribution of cholesterol due tobinding and sequestration of a fraction of cholesterol byfilipin. In fact, filipin has been shown to extract cholesterolfrom the host membranes (Beknke et al., 1984). Further-more, as seen from the images presented in this paper, thelong paraformaldehyde fixation required for filipin labelingitself compromises the morphology of the plasma mem-brane, and may reorganize membrane components. It is alsopossible that some intracellular membranes are not as ac-cessible to filipin as the plasma membrane, even after pro-longed incubations. For example, it was initially suggestedfrom filipin binding studies that the clathrin-coated pits arelower in cholesterol than the surrounding plasma membrane(Montesano et al., 1979, 1981). However, when coatedvesicles were isolated and the coats removed, there was anenhanced binding of filipin to these membranes, suggesting
FIGURE 8 Quantification of fluorescence photobleaching recovery ex-periments shown in Fig. 7. The first two sets of three columns eachcorrespond to panelsa–c in Fig. 7 and the last two sets correspond to panelsd–f. The first and third sets of columns represent the ratios of fluorescenceintensities in the intracellular fluorescent compartment to that in the un-bleached part of the plasma membrane. The second and fourth sets repre-sent the intensity ratios of the bleached to the unbleached parts of theplasma membrane. Within each set of three columns, the first (cross-hatched) column represents the ratio before photobleaching, the second(hatched) column represents the ratio immediately after photobleaching,and the third (shaded) column represents the ratio 20 min after recovery at37°C.
1922 Biophysical Journal Volume 75 October 1998
that the coats were somehow restricting the access of filipinto the coated pits (Steer et al., 1984). False-negative cyto-chemical results using filipin as a tracer for cellular choles-terol has also been reported by other authors (Pelletier andVitale, 1994).
Alternatively, although DHE has been shown in severalinstances to mimic cholesterol distribution (Fischer et al.,1984; Schroeder et al., 1987, 1991, 1995), the three addi-tional double bonds and the extra methyl group could resultin alterations in the conformation of the molecule relative tocholesterol (e.g., an alteration in ring puckering and a partialloss of the flexibility of the seven-membered alkyl chain).These alterations could, in turn, result in somewhat differentinteractions of this derivative with the bilayer compared tonative cholesterol. In fact, subtle differences in the lateraldistribution of cholesterol, ergosterol, and DHE in modelmembranes at steady state has been previously reported (Liuet al., 1997). Furthermore, it is not clear whether DHE canbe esterified and metabolized in mammalian cells as effi-ciently as native cholesterol. Inadequate metabolic turnoverof DHE in these cells may affect the overall cholesterolhomeostatic mechanisms, resulting in its altered steady-state distribution. Despite these potential complications,however, it is encouraging to note that both DHE and filipinshow similar ERC/TGN distributions in these cells.
Implications of the ERC/TGN cholesterol pool incellular cholesterol homeostasis
Results presented here in Figs. 5 and 6 show that a verylarge fraction of the intracellular cholesterol pool is local-ized in the ERC and the TGN. This observation is veryinteresting, since it corroborates and extends several previ-ous findings. For example, it is known that cells regulatetheir total cholesterol content as well as inter-organellardistribution rather stringently (Brown and Goldstein, 1986;Liscum and Dahl, 1992). This homeostasis appears to op-erate primarily by a balance between cholesterol biosynthe-sis, which is determined by the turnover of the rate-limitingenzyme HMG-CoA reductase in a cholesterol-responsivemanner, and the esterification and storage of excess choles-terol by the enzyme ACAT (Brown and Goldstein, 1986;Liscum and Dahl, 1992). However, ACAT is predominantlylocalized at the ER membrane that contains a very smallfraction of total cellular cholesterol. In addition, ACAT hasbeen previously shown to be activated by an increase in thetotal cholesterol pool at the plasma membrane, and notdirectly by the cholesterol released in the lysosomes frominternalized lipoproteins (Xu and Tabas, 1991). One ques-tion that has remained unanswered is how the ER-residentACAT senses cholesterol buildup at the plasma membrane.Since both the TGN and the ERC are intracellular sites thatcontinually exchange membrane with the plasma membrane(Mukherjee et al., 1997), these sites appear to be idealtargets for triggering ACAT activation in response to cho-lesterol buildup at the plasma membrane. Indeed, the Golgi
apparatus and the TGN have been previously implicated asorganelles playing an important role in cellular cholesterolhomeostasis (Coxey et al., 1993; Hasumi et al., 1993; Men-dez, 1995). In addition, a recent report suggests that recy-cling endosomes isolated from rat livers may be involved inthe cell surface delivery of lipoprotein-derived cholesterol(Hornick et al., 1997). It is possible that direct cholesteroldelivery occurs from the ERC and/or TGN membrane to theramified ER in the pericentriolar region where both ERCand TGN reside in CHO cells. Such cholesterol deliverymay occur by direct access of the ER-resident ACAT activesite to cholesterol in the ERC or the TGN membrane (due tospatial proximity), or it might involve desorption and de-livery of cholesterol to ACAT either by passive diffusion oraided by sterol-binding proteins. Recently, it has beenshown by immunofluorescence that there is a non-ER poolof ACAT that concentrates in the juxtanuclear region ofmacrophages (Khelef et al., 1998). Studies are in progress todetermine whether this concentration of ACAT near thenucleus is in the ERC or the TGN. In addition, it should benoted that some recent studies suggest that a fraction oflipoprotein-derived cholesterol may be directly esterified byACAT without going through the plasma membrane(Neufeld et al., 1996; Underwood et al., 1998). The poolof ACAT that catalyzes such esterification has not beencharacterized.
Implication of ERC/TGN cholesterol localizationin intracellular trafficking of lipid analogs andlipid-anchored proteins
In addition to the maintenance of cellular cholesterol ho-meostasis, the large intracellular cholesterol pool localizedat the ERC of CHO cells might explain some other recentobservations regarding the trafficking of lipids and lipid-anchored proteins in these cells. We have recently shownthat lipid analogs with identical headgroup chemistry andvarying solely in the composition of their hydrophobic tails(chain length or unsaturation), traffic to different intracel-lular locations in CHO cells after being endocytosed. Wehave also shown that this differential trafficking of the lipidanalogs can be explained by their preference to partitioninto membrane domains of varying motional characteristicsand/or curvatures (S. Mukherjee, T. T. Soe, and F. R. M.Maxfield, submitted for publication) and can be modulatedby altering cellular cholesterol contents (S. Mukherjee andF. R. Maxfield, unpublished observations). It is known fromextensive studies in model membrane systems that the pre-cise amount of cholesterol in a membrane bilayer stronglyaffects the formation and the properties of lateral membranedomains (Almeida et al., 1993; Silvius et al., 1996). Thus,by placing a significant fraction of cellular cholesterol in theERC, our results rationalize the presence of lateral mem-brane domains of varying properties in the organelles alongthe endocytic pathway.
Similarly, data from our laboratory have shown that al-though GPI-anchored proteins are internalized into cells at
Mukherjee et al. Dehydroergosterol as a Fluorescent Cholesterol Analog 1923
approximately similar rates as other membrane markerssuch as short chain fluorescent sphingomyelin analogs, theyare retained;3 times longer in the ERC before they arerecycled (Mayor, et al., 1998). Interestingly, this enhancedretention can be countered if cells are grown under condi-tions where their intracellular cholesterol pool is depletedby ;40%. This observation strongly suggests a role forcholesterol in the retention of the GPI-anchored proteins inthe ERC. The observation that the ERC is indeed anorganelle that is enriched in cholesterol is supportive ofthis organelle playing a role in the selective retention ofcertain molecules, thereby affecting their overall kineticsof trafficking.
In conclusion, we show that cholesterol distribution andtrafficking can be followed in living cells by using choles-terol analogs such as DHE. Such analogs offer an extremelypowerful tool to address unresolved questions regarding therole of cholesterol in the structural modulation of bilayerproperties, as well as its functional implications.
We thank Dr. A. Chattopadhyay (Centre for Cellular and Molecular Biol-ogy, Hyderabad, India) for the kind gift of 25-NBD-cholesterol, Dr. W. G.Mallet (Cornell University Medical College, NY) for the FITC labeledanti-Tac antibody, and Paul Mellman of Chroma Technology for assistancewith the UV filters. S.M. acknowledges a postdoctoral fellowship from theNorman and Rosita Winston Foundation for Biomedical Research.
This work was supported by Grant DK27083 from the National Institutesof Health and by a grant from the Human Frontiers Science Program.
REFERENCES
Ahmed, S. N., D. A. Brown, and E. London. 1997. On the origin ofsphingolipid/cholesterol-rich detergent-insoluble cell membranes: phys-iological concentrations of cholesterol and sphingolipid induce forma-tion of a detergent-insoluble, liquid-ordered lipid phase in model mem-branes.Biochemistry. 36:10944–10953.
Almeida, P. F. F., W. L. C. Vaz, and T. E. Thompson. 1993. Percolationand diffusion in three-component lipid bilayers: effect of cholesterol onan equimolar mixture of two phosphatidylcholines.Biophys. J.64:399–412.
Beknke, O., J. Tranum-Jensen, and B. van Deurs. 1984. Filipin as acholesterol probe. I. Morphology of filipin-cholesterol interaction inlipid model systems.Eur. J. Cell Biol.35:189–199.
Brown, M. S., and J. L. Goldstein. 1986. A receptor-mediated pathway forcholesterol homeostasis.Science. 232:34–47.
Coxey, R. A., P. G. Pentchev, G. Campbell, and E. J. Blanchette-Mackie.1993. Differential accumulation of cholesterol in Golgi compartments ofnormal and Niemann-Pick type C fibroblasts incubated with LDL: acytochemical freeze-fracture study.J. Lipid Res.34:1165–1176.
Duax, W. L., Z. Wawrzak, J. F. Griffin, and C. Cheer. 1988. Sterolconformation and molecular properties.In Biology of Cholesterol. P. L.Yeagle, editor. CRC Press, Boca Raton, Florida. 1–18.
Dunn, K., and F. R. Maxfield. 1998. Ratio imaging instrumentation.Methods Cell Biol.56:217–236.
Fischer, R. T., F. A. Stephenson, A. Shafiee, and F. Schroeder. 1984. Delta5,7,9(11)-Cholestatrien-3-b-ol: a fluorescent cholesterol analogue.Che-mis. Phys. Lipids. 36:1–14.
Harris, J. S., D. E. Epps, S. R. Davio, and F. J. Kezdy. 1995. Evidence fortransbilayer, tail-to-tail cholesterol dimers in dipalmitoylglycerophos-phocholine liposomes.Biochemistry. 34:3851–3857.
Hasumi, K., S. Naganuma, J. Koshizawa, H. Mogi, and A. Endo. 1993.Stimulation of acyl-CoA:cholesterol acyltransferase activity by brefeldinA in macrophage J774 cells.Biochim. Biophys. Acta. 1167:155–158.
Hornick, C. A., D. Y. Hui, and J. G. De Lamatre. 1997. A role forretrosomes in intracellular cholesterol transport from endosomes to theplasma membrane.Am. J. Physiol.273:C1075–C1081.
Humphrey, J. S., P. J. Peters, L. C. Yuan, and J. S. Bonifacino. 1993.Localization of TGN38 to the trans-Golgi network: involvement of acytoplasmic tyrosine-containing sequence.J. Cell Biol.120:1123–1135.
Johnson, A. O., R. N. Ghosh, K. W. Dunn, R. Garippa, G. Park, S. Mayor,F. R. Maxfield, and T. E. McGraw. 1996. Transferrin receptor contain-ing the SDYQRL motif of TGN38 causes a reorganization of therecycling compartment but is not targeted to the TGN.J. Cell Biol.135:1749–1762.
Khelef, N., X. Buton, N. Beatini, H. Wang, V. Meiner, T.-Y. Chang, R. V.Farese, Jr., F. R. Maxfield, and I. Tabas. 1998. Immunolocalization ofACAT in macrophages.J. Biol. Chem.273:11218–11224.
Koval, M., and R. E. Pagano. 1989. Lipid recycling between the plasmamembrane and intracellular compartments: transport and metabolism offluorescent sphingomyelin analogues in cultured fibroblasts.J. Cell Biol.108:2169–2181.
Lange, Y. 1991. Disposition of intracellular cholesterol in human fibro-blasts.J. Lipid Res.32:329–339.
Liscum, L., and N. K. Dahl. 1992. Intracellular cholesterol transport.J. Lipid Res.33:1239–1254.
Liscum, L., and K. W. Underwood. 1995. Intracellular cholesterol transportand compartmentation.J. Biol. Chem.270:15443–15446.
Liu, F., I. P. Sugar, and P. L. Chong. 1997. Cholesterol and ergosterolsuperlattices in three-component liquid crystalline lipid bilayers as re-vealed by dehydroergosterol fluorescence.Biophys. J.72:2243–2254.
Mayor, S., J. F. Presley, and F. R. Maxfield. 1993. Sorting of membranecomponents from endosomes and subsequent recycling to the cell sur-face occurs by a bulk flow process.J. Cell Biol. 121:1257–1269.
Mayor, S., S. Sabharanjak, and F. R. Maxfield. 1998. Cholesterol-dependent retention of GPI-anchored proteins in endosomes.EMBO J.17:4626–4638.
Mendez, A. J. 1995. Monensin and brefeldin A inhibit high densitylipoprotein-mediated cholesterol efflux from cholesterol-enriched cells.Implications for intracellular cholesterol transport.J. Biol. Chem.270:5891–5900.
Montesano, R., A. Perrelet, P. Vassalli, and L. Orci. 1979. Absence offilipin-sterol complexes from large coated pits on the surface of culturecells.Proc. Natl. Acad. Sci. U.S.A.76:6391–6395.
Montesano, R., P. Vassalli, and L. Orci. 1981. Structural heterogeneity ofendocytic membranes in macrophages as revealed by the cholesterolprobe, filipin. J. Cell Sci.51:95–107.
Moore, E. D. W., P. L. Becker, K. E. Fogarty, D. A. Williams, and F. S.Fay. 1990. Ca21 imaging in single living cells: theoretical and practicalissues.Cell Calcium. 11:157–179.
Mukherjee, S., and A. Chattopadhyay. 1996. Membrane organization atlow cholesterol concentrations: a study using 7-nitrobenz-2-oxa-1,3-diazol-4-yl-labeled cholesterol.Biochemistry. 35:1311–1322.
Mukherjee, S., R. N. Ghosh, and F. R. Maxfield. 1997. Endocytosis.Physiol. Rev.77:759–803.
Neufeld, E. B., A. M. Cooney, J. Pitha, E. A. Dawidowicz, N. K. Dwyer,P. G. Pentchev, and E. J. Blanchette-Mackie. 1996. Intracellular traf-ficking of cholesterol monitored with a cyclodextrin.J. Biol. Chem.271:21604–21613.
Pelletier, R. M., and M. L. Vitale. 1994. Filipin vs. enzymatic localizationof cholesterol in guinea pig, mink, and mallard duck testicular cells.J. Histochem. Cytochem.42:1539–1554.
Salzman, N. H., and F. R. Maxfield. 1989. Fusion accessibility of endo-cytic compartments along the recycling and lysosomal endocytic path-ways in intact cells.J. Cell Biol. 109:2097–2104.
Schroeder, F., Y. Barenholz, E. Gratton, and T. E. Thompson. 1987. Afluorescence study of dehydroergosterol in phosphatidylcholine bilayervesicles.Biochemistry. 26:2441–2448.
Schroeder, F., J. R. Jefferson, A. B. Kier, J. Knittel, T. J. Scallen, W. G.Wood, and I. Hapala. 1991. Membrane cholesterol dynamics: choles-terol domains and kinetic pools.Proc. Soc. Exp. Biol. Med.196:235–252.
1924 Biophysical Journal Volume 75 October 1998
Schroeder, F., J. K. Woodford, J. Kavecansky, W. G. Woods, and C.Joiner. 1995. Cholesterol domains in biological membranes.Mol.Membr. Biol.12:113–119.
Severs, N. J. 1982. Cholesterol distribution and structural differentiation inthe sarcoplasmic reticulum of rat cardiac muscle cells. A freeze-fracturecytochemical investigation.Cell Tissue Res.224:613–624.
Silvius, J. R., D. del Giudice, and M. Lafleur. 1996. Cholesterol at differentbilayer concentrations can promote or antagonize lateral segregation ofphospholipids of differing acyl chain length.Biochemistry. 35:15198–15208.
Simons, K., and E. Ikonen. 1997. Functional rafts in cell membranes.Nature. 387:569–572.
Slotte, J. P. 1995. Lateral domain formation in mixed monolayers contain-ing cholesterol and dipalmitoylphosphatidylcholine or N-palmitoyl-sphingomyelin.Biochim. Biophys. Acta. 1235:419–427.
Slotte, J. P., and P. Mattjus. 1995. Visualization of lateral phases incholesterol and phosphatidylcholine monolayers at the air/water inter-face—a comparative study with two different reporter molecules.Bio-chim. Biophys. Acta1254:22–29.
Steer, C. J., M. Bisher, R. Blumenthal, and A. C. Steven. 1984. Detectionof membrane cholesterol by filipin in isolated rat liver coated vesicles isdependent upon removal of the clathrin coat.J. Cell Biol. 99:315–319.
Tabas, I. 1997. Free cholesterol-induced cytotoxicity. A possible contrib-
uting factor to macrophage foam cell necrosis in advanced atheroscle-rotic lesions.Trends Cardiovasc. Med.7:256–263.
Tabas, I., X. Zha, N. Beatini, J. N. Myers, and F. R. Maxfield. 1994. Theactin cytoskeleton is important for the stimulation of cholesterol ester-ification by atherogenic lipoproteins in macrophages.J. Biol. Chem.269:22547–22556.
Underwood, K. W., N. L. Jacobs, A. Howley, and L. Liscum. 1998.Evidence for a cholesterol transport pathway from lysosomes to theendoplasmic reticulum that is independent of the plasma membrane.J. Biol. Chem.273:4266–4274.
Vaz, W. L. C., and P. F. F. Almeida. 1993. Phase topology and percolationin multi-lipid bilayers: is the biological membrane a domain mosaic?Curr. Opin. Struct. Biol.3:482–488.
Xu, X. X., and I. Tabas. 1991. Lipoproteins activate acyl-coenzymeA:cholesterol acyltransferase in macrophages only after cellular choles-terol pools are expanded to a critical threshold level.J. Biol. Chem.266:17040–17048.
Yamashiro, D. J., B. Tycko, S. R. Fluss, and F. R. Maxfield. 1984.Segregation of transferrin to a mildly acidic (pH 6.5) para-Golgi com-partment in the recycling pathway.Cell. 37:789–800.
Yeagle, P. L. 1985. Cholesterol and the cell membrane.Biochim. Biophys.Acta 822:267–287.
Mukherjee et al. Dehydroergosterol as a Fluorescent Cholesterol Analog 1925