Fluorescence investigation of laterally phase-separated cholesterol ...
158
A Fluorescence Investigation of Laterally Phase-Separated Cholesterol Rich Domains in Model Lipid Membranes Using the Membrane Probe 1-myristoyl-2-[12-[(5-dimethylamino-1- naphthalenesulfonyl)amino]dodecanoyl]-sn-Glycero-3-phosphocholine A Thesis Submitted to the Faculty of Drexel University by Gregory Marshall Troup in partial fulfillment of the requirements for the degree of Doctor of Philosophy May 2004
-
Upload
khangminh22 -
Category
Documents
-
view
2 -
download
0
Transcript of Fluorescence investigation of laterally phase-separated cholesterol ...
A Fluorescence Investigation of Laterally Phase-Separated Cholesterol Rich
Domains in Model Lipid Membranes Using the Membrane Probe
1-myristoyl-2-[12-[(5-dimethylamino-1-
naphthalenesulfonyl)amino]dodecanoyl]-sn-Glycero-3-phosphocholine
A Thesis
Submitted to the Faculty
of
Drexel University
by
Gregory Marshall Troup
in partial fulfillment of the
requirements for the degree
of
Doctor of Philosophy
May 2004


ii
Dedications
This work is dedicated to my parents George and Dorothy Troup.

iii
Acknowledgements
I would to like to thank my wife Cécilia; her love and support have been
invaluable to my completion of my doctoral degree. I would also like to thank my
research colleagues in the Wrenn Lab: Manasa Gudheti and Andrew Guarino for
making the lab a great place to work. I would like to thank Dr. Steven Wrenn and
the faculty of the Chemical Engineering Department for giving me the
opportunity to pursue my graduate studies here at Drexel University. I would like
to acknowledge all my fellow graduate students in past and present.

iv
Table of Contents List of Tables.......................................................................................................... ix List of Figures ......................................................................................................... x Abstract .................................................................................................................xii CHAPTER 1: Introduction...................................................................................... 1 List of References............................................................................................... 3 CHAPTER 2: Background ...................................................................................... 4 2.1 Lipid Phases in Single Component Phospholipid Bilayers .................... 4 2.1.1 Gel Phase.......................................................................................... 4 2.1.2 Liquid Crystalline Phase .................................................................. 4 2.1.3 Ripple Phase ..................................................................................... 5 2.2 Lipid Phases in Cholesterol-Phospholipid Bilayers ................................. 5 2.2.1 Cholesterol in Phospholipid Bilayers ............................................... 6 2.2.2 Maximum Solubility and Nucleation ............................................... 6 2.3 Models for Cholesterol Distributions in Phospholipid Bilayers .............. 7 2.3.1 Random Distribution Model............................................................. 7 2.3.2 Condensed Complex Model ............................................................. 8 2.3.3 Superlattice Model ........................................................................... 8 2.4 Cholesterol and Phase Separation in Biological Membranes................... 9 2.4.1 Rafts................................................................................................ 10 2.4.2 Detergent Resistant Membrane Fragments .................................... 10 2.4.3 Immiscible Cholesterol Domains ................................................... 11 2.5 Multi-lamellar Vesicle (MLV) preparation............................................ 12 2.5.1 Film Deposition Method ................................................................ 12
v
2.5.2 Modified Rapid Solvent Exchange Method ................................... 12 2.6 Fluorescence Spectroscopy .................................................................... 13 2.6.1 Steady-state Fluorescence Spectroscopy........................................ 13 2.6.2 Time-resolved Fluorescence Spectroscopy .................................... 14 2.6.3 Analysis of Time-resolved Fluorescence Spectroscopy................. 15 2.6.4 Time-resolved Emission Spectroscopy (TRES)............................. 16 2.7 Fluorescence Resonance Energy Transfer (FRET) ................................ 16 2.8 FRET in Membranes .............................................................................. 18 2.8.1 Homogeneous Solution Theory...................................................... 18 2.8.2 Theory for Known Probability Distributions ................................. 19 2.8.3 Non-random Distributions............................................................... 20 List of References............................................................................................. 23 CHAPTER 3: Research Goals............................................................................... 26 CHAPTER 4: DANSYL Temperature Studies ..................................................... 28 4.1 Introduction ............................................................................................ 28 4.2 Theory .................................................................................................... 31 4.3 Materials and Methods ........................................................................... 36 4.3.1 Chemicals ....................................................................................... 36 4.3.2 Preparation of Multi-lamellar Vesicles (MLV).............................. 36 4.3.3 Fluorescence Experiments.............................................................. 39 4.3.4 DANSYL Temperature Study:(sets A & B)................................... 39 4.3.5 FRET Efficiency as a Function of Acceptor Loading: (set C) ....... 40 4.3.6 Analysis of Experimental Data....................................................... 40

vi
4.4 Results .................................................................................................... 41 4.4.1 DANSYL T-Studies Egg-PC MLV’s (set A)................................. 41 4.4.2 DANSYL T-Studies DMPC MLV(set B) ...................................... 42 4.4.3 Determination of Phase Boundaries In DMPC/Chol systems........ 43 4.4.4 FRET Studies DMPC FRET(Set C)............................................... 43 4.4.5 Domain Model FRET calculations................................................. 45 4.5 Discussion .............................................................................................. 48 4.5.1 DANSYL Temperature Studies...................................................... 48 4.5.2 FRET Studies ................................................................................. 49 4.5.3 FRET Modeling.............................................................................. 50 List of References............................................................................................. 63 CHAPTER 5: FRET Simulations.......................................................................... 66 5.1 Introduction ............................................................................................ 66 5.2 Simulations............................................................................................. 69 5.2.1 Simulation Details .......................................................................... 69 5.2.2 Calculation of Simulated Energy Transfer Efficiency Data........... 73 5.2.3 Analytical Modeling of Simulated FRET Data .............................. 76 5.3 Results .................................................................................................... 79 5.3.1 Simulations of Known Distributions.............................................. 79 5.3.2 Model Predictions and Comparison with Simulation Results........ 80 5.4 Discussion .............................................................................................. 84 5.4.1 Effect of Domain Size and Donor Partition Coefficient ................ 84 5.4.2 Analytical Model Evaluation.......................................................... 85

vii
List of References............................................................................................. 95 CHAPTER 6: DANSYL TRES Studies................................................................ 97 6.1 Introduction ............................................................................................ 97 6.2 Background ............................................................................................ 99 6.3 Materials and Methods ......................................................................... 101 6.3.1 Chemicals ..................................................................................... 101 6.3.2 Preparation of Multi-lamellar Vesicles (MLV)............................ 101 6.3.3 Fluorescence Measurements......................................................... 102 6.3.4 Steady-state DANSYL Temperature Studies ............................... 103 6.3.5 Cobalt Quenching Water Penetration Studies .............................. 103 6.3.6 Nitroxide Quenching DANSYL Depth Studies ........................... 104 6.3.7 Time-resolved Emission Spectra (TRES) Measurements ............ 104 6.3.8 Analysis of Experimental Data..................................................... 105 6.4 Results .................................................................................................. 107 6.4.1 Steady-state Fluorescence Characterization of DANSYL in DMPC-
Cholesterol MLV......................................................................... 107 6.4.2 DASNYL Steady-state Emission Spectra .................................... 107 6.4.3 Steady-state Excitation Spectra .................................................... 108 6.4.4 Time-resolved Emission Spectra Studies of DANSYL in DMPC-
Cholesterol MLV......................................................................... 109 6.4.5 DANSYL Quenching Studies in DMPC-Cholesterol MLV ....... 111 6.4.6 Aqueous Quenching with 10mM Co2+ ........................................ 112 6.4.7 Site Specific DANSYL Quenching with 5-DOXYL-PC and 16-
DOXYL-PC................................................................................. 113 6.4.8 DANSYL Penetration Depth Estimation Using Parallax Analysis114

viii
6.5 Discussion ............................................................................................ 116 6.5.1 DANSYL Steady-state Cholesterol Induced Blue Shifts are Caused
by Time-dependent Solvent Effects and the Formation of ICT States ........................................................................................... 116
6.5.2 The Depth of DANSYL Probe within the Membrane is Dependent
on Cholesterol Concentration and Temperature and Membrane Phase Behavior ............................................................................ 119
6.6 Summary .............................................................................................. 121 List of References........................................................................................... 135 CHAPTER 7: Recommendations........................................................................ 138 7.1 Introduction .......................................................................................... 138 7.2 DANSYL Studies in Biological Colloids............................................. 138 7.3 FRET Studies ....................................................................................... 139 7.4 Visualization of Cholesterol Domains: AFM Studies .......................... 139 7.5 Small Angle X-Ray Diffraction Studies to Determine Phase Diagram141 VITA ................................................................................................................... 143

ix
List of Tables Table 4.1 Summary of sample mixtures, compositions and experimental analysis
used in this study................................................................................... 38
Table 4.2 DMPC/cholesterol phase boundaries determined by the DANSYL methodology described in the study compared to ESR data [9] and FRAP data [18].................................................................................... 47
Table 5.1 Summary of simulation input parameters. D is the known domain
diameter, DLR is the donor mole fraction, ALR is the acceptor mole fraction, and KpD is the donor partition coefficient............................. 75
Table 5.2 Comparison of the domain diameter estimated from fitting the
analytical FRET model (diameter estimated using Eqs. (5)-(8), d) to the exact simulated lattice FRET data (D). We also report the sum of the squared errors (SSQE) and the percent error for each simulation. 82
Table 5.3 Best fit domain diameters and the SSQE for simulation C4 FRET data
(known KpD =25 and known domain dimeter=15.6 nm) as a function of the assumed donor partition coefficient. ......................................... 83

x
List of Figures Figure 2.1 Diagram of lipid phases for pure phospholipids in excess water. . 22 Figure 4.1 Energy transfer geometries: The distance of closest approach for
membranes without (1) and with (2) domains. ............................ 53 Figure 4.2 DMPC/Cholesterol experimental phase diagram from reference
[18]. Redrawn from reference [28]............................................... 54 Figure 4.3 DANSYL emission spectra in Egg-PC MLV as a function of
increasing cholesterol mole percentage. ...................................... 55 Figure 4.4 DANSYL Response of emission profile to heating in Egg-PC
MLV. ........................................................................................... 56 Figure 4.5 DANSYL Response of emission profile to heating in DMPC MLV.
....................................................................................................... 57 Figure 4.6 DANSYL emissions maximum as a function of temperature in
DMPC/cholesterol MLV for 15(a), 20(b),and 25(c)mole% cholesterol. .................................................................................. 58
Figure 4.7 The efficiency of energy transfer as a function of acceptor loading
(ALR) for the 40mole% DMCP/chol sample of set C. ............... 60 Figure 4.8 Estimation of Domain Sizes: the efficiency of energy transfer is
shown as function of acceptor loading (ALR) for the 40mole percent DMPC/chol sample of set B. ............................................ 61
Figure 4.9 Effect of donor partition coeffeicient on the calculated best fit. . 62 Figure 5.1 Hypothetical phase diagram for DMPC/cholesterol membranes. 88 Figure 5.2 Examples of typical mono-disperse domain and probe
configurations for a DMPC-cholesterol bilayer containing 40mole% cholesterol, as simulated in the lattice model. ............ 89
Figure 5.3 Energy transfer geometries: the distance of closest approach is
depicted for membranes (1) without and (2) with domains. ......... 90 Figure 5.4 Percent efficiency of energy transfer versus acceptor to lipid ratio
for (a) KpD=1, (b) KpD=50, and (c) KpD=200 for simulated membrane bilayers with immiscible cholesterol domains. ......... 91

xi
Figure 5.5 Effect of donor partition coefficient on the efficiency of energy transfer in a 40mole% cholesterol DMPC lattice model membrane with 15.6nm immiscible cholesterol domains. ............................ 92
Figure 5.6 Simulated efficiency of energy transfer data for membrane
containing 27.1 nm diameter domains. ....................................... 93 Figure 5.7 Best fit domain diameters as a function the assumed donor
partition coefficient for a simulated membrane with 15.6 nm diameter domains and KpD set to 25.(simulation C4) ................. 94
Figure 6.1 The chemical structure of the DANSYL and n-DOXYL-PC
probes. ....................................................................................... 123 Figure 6.2 Steady-state spectra of DANYL in DMPC-cholesterol MLV. ... 124 Figure 6.3 Steady-state spectral characterization of DANYL in DMPC-
cholesterol MLV.......................................................................... 125 Figure 6.4 Time resolved emission spectral characterization of DANSYL-
DMPC as a function of cholesterol loading and temperature. .. 126 Figure 6.5 Characteristic relaxed and un-relaxed DANSYL spectra. .......... 127 Figure 6.6 Mean spectral relaxation time as a function of cholesterol loading
and temperature. ........................................................................ 128 Figure 6.7 Cholesterol alleviates DANSYL quenching by 10 mM aqueous
CoCl2 in DMPC MLV. .............................................................. 129 Figure 6.8 DANSYL quenching ratio as a function of cholesterol loading in
DMPC-cholesterol MLV. .......................................................... 130 Figure 6.9 Evidence of the DANSYL probe residing at multiple depths in
DMPC-cholesterol MLV. . ......................................................... 132 Figure 6.10 DANSYL resides at deep locations within the bilayer at 30°C and
shallow locations in the bilayer at 60°C at high cholesterol loadings. .................................................................................... 134
Figure 7.1 Illustration of AFM height analysis of immiscible cholesterol
domains in a supported bilayer.................................................... 142

xii
Abstract A Fluorescence Investigation of Laterally Phase Separated Cholesterol Rich
Domains in Model Lipid Membranes Using the Membrane Probe 1-myristoyl-2-[12-[(5-dimethylamino-1-naphthalenesulfonyl)amino]dodecanoyl]-
sn-Glycero-3-phosphocholine Gregory M. Troup
Steven P. Wrenn, Ph.D.
This work utilizes the fluorescence properties of the membrane probes 1-
acyl-2-[12-[(5-dimethylamino-1-naphthalenesulfonyl)amino]dodecanoyl]-sn-
Glycero-3-phosphocholine (DANSYL), and ergosta-5,7,9(11),22-tetraen-3β-ol
(ERGO) to detect and characterize laterally phase-separated, cholesterol-rich
domains in 1,2-dimyristoyl-sn-glycero-3-phosphocholine (DMPC)/cholesterol,
and egg lecithin(Egg-PC)/cholesterol model membrane systems. Specifically, the
DANSYL membrane probe shows evidence of lateral phase separations in
DMPC/Cholesterol and Egg-PC/Cholesterol membrane mixtures and can reveal
liquid-ordered to liquid-disordered phase boundaries. Fluorescence resonance
energy transfer from ERGO to DANSYL is used to characterize the size of the
putative laterally phase separated cholesterol-rich domains in model membrane
systems. The DANSYL red shifting data provides evidence for the presence of a
lateral phase separation in the cholesterol regime that was thought to be only in
the liquid ordered phase. Simulations were conducted using two vertically-
coupled square two-dimensional lattices to simulate membrane bilayers
containing a uniform size distribution of cholesterol immiscible domains of a
predetermined size distribution. We substitute cholesterols and phospholipids
with their fluorescent analogs and calculate the efficiency of energy transfer as a

xiii
function of acceptor concentration for four membrane configurations. We show
that the FRET model yields good size estimates for domains that range between 1
and 25 nm. We also find that the assumed fluorophore configuration in the FRET
model leads to a constant under-prediction of these values. Finally, we
demonstrate that when two parameters are open to the fit, the FRET model
adequately predicts the donor partition coefficient in addition to the domain size.
Finally, we present a steady-state and time-resolved fluorescence emission spectra
analysis of the membrane probe 1-myristoyl-2-[12-[(5-dimethylamino-1-
naphthalenesulfonyl)amino]dodecanoyl]-sn-Glycero-3-phosphocholine
(DANSYL) in 1,2-dimyristoyl-sn-glycero-3-phosphocholine and cholesterol
multi-lamellar vesicles prepared by modified rapid solvent exchange. We report
that the dose-dependent cholesterol-induced blue shifts in the steady-state
fluorescence emission spectra in 1,2-dimyristoyl-sn-glycero-3-phosphocholine
multi-lamellar vesicles are due to complex solvent effects that include time-
dependent dipolar relaxation, and the formation of internal charge transfer states.
A key finding of this study is identification of two distinguishable DANSYL
populations existing at both shallow and deep locations in membrane, these two
DANSYL populations are evidence of the presence of laterally phase separated
domains.


1
CHAPTER 1: Introduction
Cholesterol is a necessary component in the cellular membranes of
mammals, but it is also related to deadly diseases that plague mankind such as
gallstone disease and heart disease. This dual role of cholesterol has lead to
numerous studies involving cholesterol and its effects. In particular the effect of
cholesterol on the properties of biological membranes has been an area of intense
investigation, and despite over fifty years of research a clear picture has still not
emerged [1]. Of recent interest is the role that cholesterol plays on membrane
phase behavior, specifically in the formation of discrete laterally phase-separated
functional domains termed rafts. Rafts are hypothesized to play important roles in
lipid and protein sorting. Experimental evidence for these proposed rafts suggest
that they are enriched in cholesterol [2]. Another raft type structure has been
recently reported to exist in natural membranes termed immiscible cholesterol
domains [3]. Immiscible cholesterol domains are a tail-to-tail cholesterol-only
phase existing in the membrane. These cholesterol–rich, and pure cholesterol
laterally phase separated domains may be important in the nucleation mechanism
of cholesterol from phospholipid membranes, which is presently not well
understood, but the finding of pure cholesterol domains suggests that the
nucleation pathway includes lateral phase separation. Pure cholesterol domains
have also been identified in ocular lens fiber cells and shown to be important for
maintaining lens transparency [4]. Again, these findings show how cholesterol
can be both helpful and harmful to humans. An understanding of cholesterol

2
induced laterally phase separated domains in model membrane systems will be
valuable in understanding the role that such similar domains such as rafts may
play in natural membranes and lead to an improved understanding of cholesterol
related diseases as well as normal cell function.

3
List of References
[1] L. Feingold, 1993. Cholesterol in Membrane Models. CRC Press, Boca Raton.
[2] D.A. Brown, E. London, 1998, Functions of lipid rafts in biological membranes. Annu. Rev. Cell Dev. Biol. 14:111-136.
[3] T. N. Tulenko, M. Chen, P. E. Mason, and R. Preston-Mason, 1998. Physical effects of cholesterol on arterial smooth muscle membranes: evidence of immiscible cholesterol domains and alterations in bilayer width during atherogenesis. J. Lipid Research. 39:947-956. [4] R. Preston Mason, Thomas N. Tulenko and Robert F. Jacob, 2003. Direct evidence for cholesterol crystalline domains in biological membranes: role in human pathobiology. Biochimica et Biophysica Acta (BBA) - Biomembranes, 1610, 2, 198-207.

4
CHAPTER 2: Background
2.1 Lipid phases in single component phospholipid bilayers
Single component phospholipid bilayer membranes at high water content
can exist in three phases: the gel phase, the ripple phase, and the liquid crystalline
phase, depending on temperature. The gel and liquid crystalline phases are
characterized by the configurations of the phospholipid acyl chains. A rippled
appearance at the bilayer surface characterizes the ripple phase. A discussion of
the characteristics of the single component lipid phases is given in following
subsections.
2.1.1 Gel Phase
In the gel phase the phospholipid acyl chains are in the all trans
configuration as opposed to the gauche configuration [1]. The all trans
configuration allows the phospholipid acyl chains to be maximally extended. The
maximum extension of the acyl chains allows lipid molecules to tightly pack. The
tight packing of the acyl chains gives this phase its gel like nature. This phase is
also characterized by an increased bilayer thickness compared to the liquid
crystalline phase.
2.1.2 Liquid Crystalline Phase
The liquid crystalline phase is what is thought to be the phase of most of
the lipids in natural membranes [1]. The phospholipid acyl chains in the liquid
crystalline phase contain mostly gauche configurations [1]. The gauche

5
configurations give this phase a high degree of disorder in the acyl chain region of
the bilayer. The acyl chain disorder gives this phase its fluid like nature.
2.1.3 Ripple Phase
Electron micrograph studies show a bilayer phase that has a “rippled”
surface, which is termed the ripple phase [1]. The ripple phase occurs between
the gel and liquid crystalline phase in temperature. Raman scattering data show
that in DPPC membrane ripple phases the acyl chains are mostly in the all trans
configuration [2].
2.2 Lipid phases in cholesterol-phospholipid bilayers
The presence of cholesterol alters the above phases somewhat, thus a
different terminology exists for lipid phases present in phospholipid-cholesterol
mixtures. A phase with similar properties to the gel phase in cholesterol-
phospholipid membranes is termed the solid ordered phase (so), and a phase with
similar properties to the liquid crystalline phase is termed the liquid disordered
phase (ld). In cholesterol-phospholipid membranes a new lipid phase emerges
called the liquid ordered phase (lo). The lo phase is rich in cholesterol, resulting in
the phospholipid acyl chains being extended and tightly packed. However, the lo
phase has a high degree of lateral mobility. Model membrane systems comprised
of phospholipids and cholesterol have been shown to exhibit regions of two-phase
co-existence, where the ld phase is in equilibrium with the lo phase [3]. In these
model systems, the phase separation is not an infinite bulk macroscopic phase
separation. Rather the ld/ lo phase equilibrium is a discrete or dispersed phase
6
within a continuous phase. Both the lo phase and the ld phase can be the dispersed
phase depending on the relative amounts of each phase.
2.2.1 Cholesterol in phospholipid bilayers
In addition to lipids, animal cell membranes also contain cholesterol. X-
ray scattering data show that cholesterol positions itself normal to the plane of the
bilayer, with the hydroxyl group near the ester carbonyl of the phospholipid [4].
Raman scattering data shows that no hydrogen bond is formed with this carbonyl
group [5]. Cholesterol is known to have a dual role in terms of membrane
fluidity. Cholesterol acts to fluidize solid-like membranes, but reduces the
fluidity of liquid-like membranes. This behavior is well known, but the cause is
less certain. 2H-NMR experiments show that cholesterol strongly affects the
order parameter along the length of the phospholipid hydrocarbon chain [6]. FT-
IR experiments have shown that above the main transition temperature,
cholesterol decreases the amount of gauche rotamers in the phospholipid
hydrocarbon chain, and just the opposite is observed below the main transition
temperature [7].
2.2.2 Maximum Solubility and Nucleation
Cholesterol alone is not capable of forming a stable bilayer. Thus, there is
a maximum solubility of cholesterol in phospholipid bilayers. Estimates of the
maximum solubility of cholesterol in phosphatidylcholine and
phophatidylethanolamine bilayers have been recently reported to be 66-mole
percent and 51-mole percent cholesterol respectively [8]. The maximum

7
solubility is a strong function of the head group size and charge, but independent
of acyl chain length [8]. At cholesterol concentrations above the solubility limit,
cholesterol monohydrate crystals constitute an additional equilibrium phase. This
macroscopic solubility limit is an apparent limit in the sense that the detection of a
macroscopic cholesterol crystal in the aqueous phase does not preclude the
membrane from having a certain capacity for stable crystals within the bilayer.
Conceptually this is similar to the presence of a membrane on the CMC of a
surfactant. The mechanism by which cholesterol nucleates from cholesterol
phospholipid bilayers is currently not well understood, but the finding of
immiscible cholesterol domains suggests that crystalline cholesterol can exist in
membranes. Therefore it is reasonable to hypothesize that the membrane is the
site of cholesterol nucleation, and once stable cholesterol nuclei are formed, the
addition of more cholesterol causes the nuclei to grow to critical size and
precipitate out of the membrane. Crystal growth in the aqueous space is most
likely the rate-limiting step for the optical detection of cholesterol crystals.
2.3 Models for Cholesterol Distributions in Phospholipid Bilayers
Several cholesterol distribution models of membrane structure have been
proposed. A discussion of these distribution models is given in the following
subsections.
2.3.1 Random Distribution Model
The simplest model for how cholesterol distributes in phospholipid
bilayers is a random distribution. This model is applied successfully to

8
cholesterol phospholipid bilayers at low cholesterol concentrations. At
intermediate and high cholesterol concentrations, much evidence suggests that the
distribution is not random [9].
2.3.2 Condensed Complex Model
This model theorizes that cholesterol and phospholipids react at specific
stoichiometric proportions to form a condensed complex; or a new liquid phase in
equilibrium with the liquid disordered phase in cholesterol/phospholipid bilayers
[10]. The cholesterol to phospholipid stiochiometries that have been proposed for
these complexes are 1:4, 2:7, 1:3, 1:2, 2:3,and 1:1 [10]. In support of this theory,
investigators have reported discontinuities in the fluorescence properties of
various membrane probes as function of cholesterol composition in phospholipid
cholesterol membranes that correspond to the putative complex compositions [11-
14].
2.3.3 Superlattice Model
This theory hypothesizes that in cholesterol phospholipid membranes,
cholesterol molecules stay as far apart from one another as possible, leading to
non-random distributions. The molecular interactions leading to these non-
random cholesterol distributions could be described as unfavorable cholesterol-
cholesterol interactions, or favorable cholesterol-phospholipid interactions. The
idea of cholesterol favoring phospholipids stems from the phospholipid head
groups shielding the cholesterol hydroxyl groups from the aqueous space, and the
favorable van der Waals interactions between the cholesterol molecule and the

9
phospholipid acyl chains. The superlattice model proposes that lipids adopt non-
random lateral distributions in membranes, allowing only a limited number of
compositions of each component in a membrane [15]. The superlattice
arrangements are proposed to be energetically favorable packing configurations,
making them minimum energy structures. Therefore membrane compositions
would tend to settle on a superlattice compositions rather than intermediate
compositions [15]. These superlattice compositions are the compositions of
laterally phase-separated domains that are in dynamic equilibrium with the bulk
lipid phase [15]. Superlattice domains of different compositions can be in
equilibrium with one another [15].
2.4 Cholesterol and Phase Separation in Biological Membranes
Up to 90% of all cholesterol can be found in the plasma membrane of
mammalian cells [16]. The cholesterol content of animal cell plasma membranes
has been estimated to be between 25 mole% and 50 mole% cholesterol [17].
Cholesterol phospholipid interactions in terms of lateral phase separations could
play an important role in biological membrane structure and function. Laterally
phase separated domains known as rafts are hypothesized to exist in biological
membranes, and are thought to be important for protein sorting, lipid sorting, and
protein stabilization [18]. Membrane fragments called “detergent resistant
membranes” (DRMs) have been isolated from natural membranes [18]. These
DRMs are believed to be evidence of rafts in natural membranes. Furthermore,
recently reported immiscible cholesterol domains in natural and model
membranes are evidence of lateral phase separations in membranes [19].
10
2.4.1 Rafts
Rafts are thought to be discrete laterally phase separated functional
domains in equilibrium with the fluid phase in cell membranes. This is the origin
of the term raft, where the discrete phase are “rafts” floating in an ocean of the
continuous phase. Rafts are hypothesized to exist in biological membranes, and
are thought to be involved in protein sorting and lipid sorting, as well as protein
stabilization [18]. The functions of rafts involve the selective partitioning of
specific lipids and proteins into these discrete phases and the facilitation of
interactions between them, for example proteins that need to work together may
co-locate within a raft domain as opposed to randomly diffusing around the
membrane surface. Alternatively, ordered lipid microenvironment like in
cholesterol-sphingomyelin rafts may effect protein conformations and thus
function. Cholesterol and sphingomyelin rafts are thought to functionally
important in animal cell plasma membranes [20].
2.4.2 Detergent Resistant Membrane Fragments
Detergent resistant membranes (DRM) are fragments of natural plasma
membranes found to be resistant to detergent solubillization. Since detergents
solubilize “fluid-like” membranes, these fragments are evidence that biological
membranes are not all in the liquid crystalline state [18]. When analyzed, these
DRM, were found to be enriched with both cholesterol and sphingomyelin [18].
The acyl chains in these detergent resistant membrane fragments were in a state
similar to acyl chains in the liquid ordered state found in model membrane
systems [18]. As may be expected, liquid ordered phases from model membrane

11
systems also show partial resistance to detergent solubility [18]. Therefore,
detergent resistant membrane fragments have been the best experimental evidence
for the existence of lipid rafts in biological membranes. However, because single-
phase membranes with properties intermediate to the liquid ordered and the liquid
crystalline phases have shown partial detergent insolubility, DRM do not serve as
proof that rafts exist [18].
2.4.3 Immiscible Cholesterol Domains
There has been a recent report of a tail-to-tail cholesterol only bilayer
phase in natural membranes detected by small angle X-ray diffraction, this phase
was shown to be reversibly disrupted and reformed by heating and cooling [19].
The presence of these immiscible cholesterol domains appeared at cholesterol to
phospholipid ratios above 0.8:1 in extracted smooth muscle cell membranes [19].
An increase in the bilayer thickness preceded the formation of these immiscible
cholesterol domains [19]. Existence of immiscible cholesterol domains was also
demonstrated in a phospholipid-cholesterol model membrane system at
cholesterol to phospholipid ratio of 1:1, by the same small angle X-ray diffraction
technique [19]. These immiscible cholesterol domains fall under the general
description of rafts, being a dispersed phase in a continuous phase, but are
fundamentally different than other proposed raft structures in that they are
comprised only of cholesterol. Immiscible cholesterol domains may have
important roles in cholesterol related diseases like gallstone disease, and heart
disease serving as nuclei for cholesterol monohydrate crystals.

12
2.5 Multi Lamellar Vesicle (MLV) preparation
We are studying cholesterol induced laterally phase separated cholesterol
domains and are interested in knowing if sample preparation techniques have an
effect on the formation and properties of these domains. The two MLV
preparations techniques that will be utilized and compared in this project are the
film deposition method and the modified rapid solvent exchange method. The
details of these two methods are explained in the following subsections.
2.5.1 Film deposition method
In the film deposition method of MLV preparation phospholipids and
cholesterol are dissolved in organic solvents such as chloroform to form stock
solutions. Appropriate amounts of these stock solutions are mixed to give the
desired lipid and cholesterol concentrations. The solvents are then typically
removed under a stream of nitrogen. Sometimes the resulting films are placed
under a vacuum to remove any residual solvent. The deposited lipid films are
then hydrated in aqueous buffer. This technique is currently in wide use despite
recent evidence that cholesterols and phospholipids can potentially de-mix in the
solid film state, and may give rise to cholesterol crystals below the macroscopic
cholesterol solubility limit [21].
2.5.2 Modified rapid solvent exchange method
The method of rapid solvent exchange involves the direct transfer of lipids
and cholesterol from an organic solvent directly to an aqueous buffer. This is
achieved by mixing the lipids and cholesterol in chloroform directly into aqueous

13
buffer, and the two-phase mixture is vortexed under a vacuum to remove the
organic phase. The original technique involved injecting the lipids and
cholesterol in the organic phase into the evacuated volume of the vortexing
aqueous buffer [21], but was later modified to directly mixing the aqueous and
organic phases before vortexing and applying vacuum [22].
2.6 Fluorescence Spectroscopy
Fluorescence spectroscopy is a useful tool in investigating membrane
phase behavior. Fluorescent membranes probes depending on their structure can
partition into different regions of a membrane. Fluorescent probes incorporated
into membranes can be detected in as low as pico-molar amounts [1]. There are
two types of fluorescence spectroscopy, steady-state and time-resolved, and
different information can be obtained from each. A technique in fluorescence
spectroscopy called fluorescence resonance energy transfer (FRET) allows the
measurement of distances on the nanometer length scale. This ability has led to
the widespread use of FRET as a spectroscopic ruler [23].
2.6.1 Steady-State Fluorescence Spectroscopy
In steady state fluorescence the sample is excited with a continuous light
source and the emission intensity is measured for a finite time period on the order
of seconds. During this finite time period fluorescent molecules called
fluorophores are excited repeatedly and decay repeatedly, and the measured
fluorescence intensity is an average of all of the excitations and decays of all of

14
the fluorophores in the path of the light source. Thus steady state fluorescence
spectroscopy yields sample-averaged spectra.
2.6.2 Time Resolved Fluorescence Spectroscopy
In time resolved fluorescence spectroscopy the sample is excited with a
short pulse of light at a specific wavelength, and the fluorescence intensity of
emission at a specific wavelength is measured as a function of time, on the
nanosecond scale, after the excitation. This is called the fluorescence decay.
Fluorescence decays are analyzed by proposing physical models for the
fluorescence decay function. These models are fit to the experimental data to
extract the model parameters. Time resolved spectroscopy has the ability to
distinguish between different populations of fluorophores in the same sample. If
fluorescent molecules are in a homogeneous environment, then a single
exponential decay model is expected to describe the fluorescence decay:
I t( ) exp( t / )= −α τ (1)
where α is a constant proportional to intensity of the excitation source, and τ is
the fluorescence lifetime of the fluorophores in the sample. Qualitatively, the
fluorescence lifetime is the average time the fluorophores spend in the excited
state, and is a strong function of the physical environment of the fluorophores.
Likewise if fluorophores are partitioned between two distinct environments within
a sample, then a double exponential decay model describes the fluorescence
decay:
I t t t( ) exp( / ) exp( / )= − + −α τ α τ1 1 2 2 (2)

15
where the α’s are proportional to the fractions of fluorophores in each
environment, and the τ’s are the decay times in each environment.
2.6.3 Analysis of Time Resolved Fluorescence Spectroscopy
Two experiments must be conducted to calculate fluorescence decay
parameters. The first experiment is the acquisition of the samples measured
response M(t). The second experiment is the acquisition of the instrument
response function L(t). The instrument response function represents the response
of the lamp pulse and the electronics of the detection system. The measured
response M(t) is the convolution of the fluorescence decay I(t) with the instrument
response function L(t). The fluorescence decay function is calculated by a
method called iterative re-convolution. In iterative re-convolution a mathematical
model of the fluorescence decay function is proposed and this model is
numerically convoluted with the instrument response function to yield a
calculated response function C(t). Then the calculated response function is
compared to the measured response function, and the parameters of the decay
model are varied until a best fit of the calculated response to the measured
response is obtained. The quality of fit is judged by the value of the chi squared
(χ2) parameter defined as:
χσ
22
1
21= −
=∑
kk
n
M t C t( ( ) ( )) (3)
where n is the total number of discrete data points, k is the kth point, σk is the
standard deviation of the kth point, M(t) is the measured response, C(t) is the
calculated response

16
A fit is considered to be good if χ2 is between 0.9 and 1.2. Another determination
of the quality of the fit is a plot of the weighted residuals. If there is a systematic
deviation in the residuals then the model should be rejected. In model-based
analysis it is not possible to validate a decay model, but is possible to reject decay
models on their failure to adequately describe the data.
2.6.4 Time Resolved Emission Spectroscopy (TRES)
Time resolved emission spectroscopy is a useful tool for studying the
dynamics of macromolecules. Time resolved emission spectra (TRES) represent
the fluorescence emission spectra as a function of time during the decay of
fluorescence from the excited state to the ground state. TRES is particularly
useful in the study of the interactions of polar fluorophores with their
environment. With TRES it is possible to decouple the effects of solvent polarity
and dipolar relaxation, or the molecular motions of the solvent and fluorescent
probe molecules.
2.7 Fluorescence Resonance Energy Transfer (FRET)
FRET is the migration of excited state energy from an initially excited
donor molecule to an acceptor molecule. The energy transfer results from an
intermolecular long-range dipole-dipole coupling interaction. These interactions
can transfer excited state energy over distances of about 10 to 100 angstroms [24].
The efficiency of energy transfer is a function of the separation distance between
the donor and the acceptor molecules, the degree of overlap of the donor emission
spectra with the acceptor adsorption spectra, the quantum yield of the donor, and

17
the relative orientation of the transition dipoles [25]. The rate of energy transfer
is given by
kRrT
D=
1 06
τ (4)
where τD is the fluorescence lifetime of the donor without the acceptor, and R0 is
called the Forster distance, which is the distance at which the efficiency of energy
transfer is 50%. The Förster distance can be calculated from the following
equation:
(R n QD03 2 49 78 10= × −. κ )J ( )λ
dλ
(5)
where κ is the orientation factor, n is the refractive index of the medium, QD is the
quantum yield of the donor molecule. J(λ) is the overlap integral and quantifies
the spectral overlap of the donor emission and acceptor adsorption. The overlap
integral can be calculated by
J FD A( ) ( ) ( )λ λ ε λ λ=∞
∫ 4
0
(6)
where FD(λ) is the normalized emission spectra of the donor, λ in the wavelength,
and εA is the extinction coefficient of the acceptor.
The efficiency of energy transfer can be calculated as
Ek
kT
D T=
+−τ 1 (7)
Finally using the expression for the rate of energy transfer, the efficiency can be
recast in terms of the Forster distance and the separation distance of the donor and
acceptor molecules.

18
ER
R r=
+06
06 6 (8)
This theory is based on a single donor and a single acceptor pair at a fixed and
does not apply to donors and acceptors that are free to diffuse.
2.8 FRET in Membranes
Classical FRET is well established as a “spectroscopic ruler” for
measuring the fixed distance between physically linked donors and acceptor
molecules [26]. In membranes molecules are free to diffuse, thus energy transfer
donors and acceptors are not at a fixed distance. In biological membranes
typically fluorescent groups are attached to lipid molecules and energy transfer
can occur from donors to multiple acceptors, and each donor will have a different
distribution of acceptors around it. In this scenario the concentration of acceptors
and the lateral distribution of lipids and phases become the significant factors, and
the notion of separation distance does not apply. If the donors and acceptors are
able to diffuse significantly during the excited state lifetime of the donor, then
energy transfer theory becomes very complex. Analytical solutions exist for a
few special cases, and Monte-Carlo methods are used to investigate more
complex situations.
2.8.1 Homogeneous solution theory
For situations where the donors and acceptors are immobile during the
excited state lifetime of the donor, and if the Forster distance is small enough to
neglect energy transfer across the bilayer then the energy transfer theory for
unlinked donors and acceptors randomly distributed in a 2-D homogenous

19
solution has been applied to membranes [27]. The donor fluorescence decay
function in the presence of acceptors is calculated as:
I tt
ct
DAD D
( ) exp/
= − −
τ τ
1 3
(9)
where c is a constant related to the surface density of the acceptors [27].
2.8.2 Theory for known probability distributions
Analytical solutions exist for known probability distributions for immobile
donors and acceptors in bilayers that account for excluded area around the donors,
transfer across the bilayer, and membrane curvature [23,28]. The general form of
the donor fluorescence decay function is
I t I S tDA DA( ) exp[ ( )]= − ⋅0 σ (10)
where S(t) represents the portion of the decay due to energy transfer.
S(t) for a random distribution in 2-D is infinite plane with a distance of closest
approach rC is given by the expression.
S t t R r rdrDrC
( ) [ exp[ ( / )( / ) ]]= − − ⋅∞
∫ 1 06τ 2π (11)
The efficiency of energy transfer E is then calculated by integrating the donor
fluorescence decay function in the presence of acceptors and the donor
fluorescence decay function in the absence of acceptors according to:
EI t d
I t dt
DA
D
= −
∞
∞
∫
∫1 0
0
( )
( )
t (12)

20
where ID(t) is the donor decay function in the absence of energy acceptors, and is
given by equation (1) assuming the donor decay is single exponential.
2.8.3 Non-random distributions
Analytical solutions do not exist for complex multi-phase membrane
systems. Systems of arbitrary complexity can be studied by using Monte-Carlo
methods [29]. Monte-Carlo methods are used to simulate species and probe
distributions in the membrane. The simulated fluorescence decay is calculated
using the FRET theory for a donor-acceptor pair at a fixed distance, and adding
up the contributions from every donor and acceptor distance in the system to
generate the decay function. The decay law for a donor j ρjDA(t) in the presence
of multiple acceptors at various distances is given by:
ρτ τjDA
i i
i
jkk
N
tt t R
R
A
( ) exp exp=−
−
=
∏ 0
6
1 (13)
where τi is the fluorescence lifetime of the donor in environment i without the
presence of the acceptors, NA is the total number of acceptors, R0i is the Forster
distance in environmenti, Rjk is the distance between donorj and acceptork, and ND
is the number of donors. The decay function IDA(t) for donors in the presence of
the acceptors is obtained by summing up all the contributions from all the
acceptors to each donor:
I tN
tDAD
jDAj
N D
( ) ( )==∑1
1ρ
(14)

21
The donor only decay function assuming single exponential decay is described by
equation (1). Once the decay functions are generated the efficiency of energy
transfer is calculated using equation (12) by numerically integrating the simulated
decay curves.

22
Gel Phase Ripple Phase Liquid Crystalline Phase
Figure 2.1 Diagram of lipid phases for pure phospholipids in excess water.

23
List of References [1] Gennis, 1989. Biomembranes Molecular Structure and Function. Springer-Verlag. New York. [2] J.A. Lucy, Q.F. Ahkong, 1986, An Osmotic Model for the Fusion of Biological Membranes. FEBS Lett. 199, 1-11. [3] L. M.S. Loura, A. Fedorov, M. Prieto, 2001, Fluid-Fluid Membrane Micro heterogeneity: A Fluorescence Energy Transfer Study, Biophysical J., 80, 776-788. [4] D.L. Worcester, N.P. Franks, 1976, Structural Analysis ofnHydrated Egg Lecithin and Cholesterol Bilayers 2 Neutron Diffraction. J.Mol. Biol. 100, 359-378. [5] S. F. Bush, R.G. Adams, I.W. Levin, 1980, Structural Reorganizations in Lipid Bilayer Systems: Effect of Hydration and Sterol Addition on Raman Spectra of DPPC Multilayers. Biochemistry 19, 4429-4436. [6] E. Oldfield, D. Chapman, 1972, Dynamics of Lipids in Membranes: Heterogeneity and the Role of Cholesterol. FEBS Lett. 23, 285-297. [7] M. A. Cortijo, A. Alonzo, J.C. Gomez-Fernandez, D. Chapman, 1982, Intrinsic Protein-Lipid Interactions: Infrared Spectroscopic Studies of Gramacidin A, Bacteriorhodopsin, and Ca2+-ATPase in Biomembranes and Reconstituted Systems. J. Mol. Biol. 157, 597-618. [8] J. Huang, J.T. Buboltz, G.W. Feigenson, 1999, Maximum solubility of cholesterol in phosphatidylcholine and phosphatidylethanolamine bilayers. Biochim, Biophys, Acta, 1417. 89-100. [9] P. Lee, G. Chong, 1994, Evidence for Regular Distribution of Sterols in Liquid Crystalline Phosphatidylcholine Bilayers. Proc. Nat. Acad. Sci. U.S.A. 91. 21. 10069-10073. [10] A. Radhakrishnan, H.M. McConnell, 1999, Condensed Complexes of Cholesterol and Phospholipids. Biophysical J. 77, 1507-1517. [11] J.A. Vitranen, M. Ruonala, M. Vauhkonen, P. Somerharju, 1995. Lateral organization of liquid-crystalline cholesterol-dimyristroyl phosphatidylcholine bilayers. Evidence for domains with hexagonal and centered rectangular cholesterol superlattices. Biochemistry. 34, 11568-11581.
24
[12] M.M. Wang, I.P. Sugar, P.L. Chong, 1998, Role of the sterol Superlattice in the partitioning of the antifungal drug nystatin into lipid membranes. Biochemistry. 37, 11797-11805. [13] D. Tang, W. van Der Meer, S.-Y.S. Cheng, 1995, Evidence for a regular distribution of cholesterol in phospholipid bilayers from diphenylhexatriene fluorescence. Biophysics J., 68, 1944-1951. [14] T. Parassassi, A.M. Giusti, M. Raimondi, E. Gratton, 1995, Abrupt modifications of phospholipid bilayer properties at critical cholesterol concentrations. Biophysics J., 68, 1895-1902. [15] P. Somerharju, J.A. Virtanen, K.H. Cheng,1999, Lateral Organization of Membrane Lipids: The Superlattice view. Biochim, Biophys, Acta. 1440, 32-48. [16] Y. Lange, B.V. Ramos, 1983, Analysis of the distribution of cholesterol in the intact cell. J. Biol. Chem. 258. 15130-15134. [17] K. Bloch, 1991, Cholesterol: The evolution of structure and function in: D.V. Vance, J.E. Vance, Biochemistry of Lipids, Lipoproteins and Membranes. Elsevier, Amsterdam. Pp. 363-381. [18] D.A. Brown, E. London, 1998, Functions of Lipid Rafts in Biological Membranes. Annu. Rev. Cell Dev. Biol. 14, 111-136. [19] T. N. Tulenko, M. Chen, P. E. Mason, and R. Preston-Mason, 1998. Physical effects of cholesterol on arterial smooth muscle membranes: evidence of immiscible cholesterol domains and alterations in bilayer width during atherogenesis. J. Lipid Research. 39:947-956. [20] E. London and D. A. Brown, 2000. Insolubility of lipids in triton x-100: physical origin and relationship to sphingolipid/cholesterol membrane domains (rafts). Biochim, Biophys, Acta, 1508. 182-195. [21] J. Buboltz, and G. W. Feigenson, 1999. A novel strategy for the preparation of liposomes: rapid solvent excgange. Biochimica et Biophysica Acta (BBA) - Biomembranes, 1417, 232-245. [22] Tokumasu, F., Jin, A. J., Feigenson, G. W., Dvorak, J. A., 2003. Atomic force microscopy of nanometric liposome adsorption and nanoscopic membrane domain formation. Ultramicroscopy 97, 217-227. [23] L. Stryer, 1978, Fluorescence Energy Transfer as a Spectroscopic Ruler, Annu. Rev. Biochem. 47, 819-846.

25
[24] X. F. Wang and B. Herman, 1996, Fluorescence imaging spectroscopy and microscopy, Chemical Analysis Series Vol. 137. Wiley & Sons Inc., New York. [25] J. R. Lakowicz, 1999, Principles of fluorescence spectroscopy, Plenum, New York. [26] B. K.K. Fung, and L. Stryer, 1978. Surface density determination in membranes by fluorescence energy transfer. Biochemistry, 17,24:5241-5248. [27] P. Lianos, G. Duportail, 1993, Time resolved fluorescence fractal analysis in lipid aggregates, Biophys. Chem. 48, 293-299. [28] T.G. Dewey and G.G. Hammes. Biophys. J. 32 (1980) 1023-1035. [29] B. Snyder, E. Freire,1982, Fluorescence Energy Transfer In Two Dimensions: A Numeric Solution for Random and Nonrandom Biophys. J., 40, 137-148.

26
CHAPTER 3: Research Goals
The goals of this research effort are the development of fluorescence
techniques for the detection and characterization of laterally phase-separated
cholesterol domains in model membranes. We are also interested in the effects of
laterally phase separated cholesterol domains on the molecular motions of water
and phospholipids in the membrane. To achieve these goals we will apply
fluorescence energy transfer methods for detection and characterization of
laterally phase-separated domains in DMPC-cholesterol membranes, and time
resolved emission spectroscopy to investigate the molecular motions of water and
lipids in the membrane. We will utilize a combination of fluorescent probes in
the following specific objectives:
Detection and characterization of cholesterol domains in lipid membranes
with DANSYL-PC and Förster resonance energy transfer methods in
DMPC/cholesterol model membranes.
Analytical and numerical modeling of the lateral distribution of
fluorescence energy transfer probes in membranes that exhibit lateral
phase separations.
Application of time resolved emission spectroscopy to determine the
mechanism of the DANSYL-PC spectral sensitivity to cholesterol and
laterally phase separated domains.

27

28
CHAPTER 4: DANSYL Temperature Studies
4.1 Introduction
Evidence that natural membranes are not completely in a liquid crystalline
state has emerged, leading to a hypothesis that laterally phase separated domains,
termed ‘rafts,’ exist in natural membranes [1]. Rafts are hypothesized to play a
role in signal transduction, protein stabilization, lipid and protein sorting, and
membrane fusion [1-3]. Some of the evidence for the raft hypothesis comes from
detergent resistant membranes (DRM), which are fragments of natural plasma
membranes found to be resistant to detergent solubilization. Analysis of the
DRM reveals that they are enriched with both cholesterol and sphingomyelin [4].
Owing to the cholesterol enrichment, the acyl chains of the lipids in these
rafts appear to be in a state similar to the liquid-ordered (lo) phase, which has been
positively identified in several model membrane systems comprising a single
phospholipid species and cholesterol [5]. The lo phase occurs above a certain
cholesterol loading, which varies with (e.g.) temperature and phospholipid
species, and arises because of the well known ‘condensation’ effect of cholesterol
[6]. The lo phase coexists with a liquid-disordered (ldo) phase over a certain
composition range, and this coexistence implies a lateral phase separation within
the membrane. A similar lateral phase separation occurs in cholesterol-free
membranes comprising multiple, but immiscible, phospholipid species such as the
binary mixture of dimyristoylphosphatidylcholine (DMPC) and
distearoylphosphatidylcholine. [7].

29
Given their biological relevance, numerous physical chemical studies have
been performed on monolayer and bilayer membranes comprised of
phospholipids and cholesterol [6]. Surprisingly, a clear understanding of these
membrane systems is lacking. Indeed, the maximum solubility of cholesterol in
lipid bilayers remains a matter of debate [8]. It is clear that lateral phase
separation is possible in these systems and that immiscible, cholesterol-rich
phases can and do form [9], but more recent evidence suggests that the well
known lo phase does not tell the whole story. For example, there is evidence that
condensed complexes of cholesterol and phospholpids form and, under certain
conditions, yield a separate phase within the membrane [10]. Additional evidence
points to the existence of immiscible domains, or clusters, comprised entirely of
cholesterol [11]. The latter cholesterol domains, which are not merely cholesterol-
enriched but are believed to comprise a pure (tail-to-tail) cholesterol bilayer phase
as determined by small angle X-ray diffraction, are observed to ‘melt’ upon
heating but form again spontaneously upon cooling, suggesting that they
constitute an equilibrium membrane phase [11].
The existence of pure cholesterol domains within membranes is a
potentially very important finding. One reason is that such domains would serve
as sub-critical nuclei in biliary vesicles, the aggregation of which would facilitate
rapid cholesterol nucleation when the pre-existing, but sub-critical, nuclei collide.
This would account for the striking observation that vesicle aggregation is a
prerequisite for nucleation of cholesterol crystals, regardless of the cholesterol
loading, in gallstone pathogenesis [12]. A similar mechanism might also be at

30
play in atherosclerosis. Cholesterol crystals are recognized as a hallmark of
advanced atherosclerotic plaques [13], but the source of crystalline cholesterol is
unknown. There is evidence to suggest that cholesterol crystals nucleate from
low density lipoproteins (LDL) in the extracellular space [14] and that LDL
aggregation is observed to play an important role. If pure cholesterol domains
exist in the LDL monolayer, then the pro-nucleating effect of LDL aggregation is
easily understood.
We are interested in cholesterol nucleation from biological colloids and
developed the first fluorescence assay that detects cholesterol nucleation from
phospholipid-cholesterol vesicles [15]. The assay involves energy transfer from
dehydroergosterol (ERGO) to dansylated lecithin (DANSYL), which are
fluorescent analogs of the native lipids cholesterol and phosphotidylcholine,
respectively. We have used the assay to quantify nucleation in the presence of the
pro-aggregating enzyme, phospholipase C [15] and the bile salt, sodium
taurocholate [12]. In developing the assay for nucleation, we observed evidence
of what we described as a possible “lateral phase separation of cholesterol and
ERGO within the vesicle bilayer” which, if present, could be viewed as “the first
step in nucleation” [15]. We now show further evidence for the existence of pure
cholesterol domains in phospholipid-cholesterol membranes.

31
4.2 Theory
Fluorescence resonance energy transfer is well described for systems
comprising single donor and acceptor pairs at a fixed distance. The situation in
membranes is more complex and involves energy transfer from donors to multiple
acceptors. Moreover, a different distribution of acceptors surrounds each donor,
and these complexities must be considered when evaluating energy transfer in the
present study.
Theories exist for known probability distributions of acceptors around
donors in membrane bilayers that account for excluded area around the donors,
transfer across the bilayer, and membrane curvature [16,17]. Briefly, the theories
state that the general form of the donor fluorescence decay function is:
)](exp[)/exp()( 00 tStItI DADA ⋅−−= στ (1)
where I0DA is the initial fluorescence intensity of the donor in the presence of an
acceptor, IDA(t) is the fluorescence intensity of the donor in the presence of an
acceptor at any time, t, τ0 is the fluorescence lifetime of the donor in the absence
of acceptor, σ is the acceptor surface density, and S(t) represents the portion of the
decay due to energy transfer. For a random distribution in two-dimensional
infinite plane, S(t) is given by
∫∞
⋅−−=a
rdrrRttS πτ 2]])/)(/(exp[1[)( 600 (2)

32
where the lower limit of integration, a, is the so-called ‘distance of closest
approach’ and is estimated to be the average molecular diameter of the donor and
acceptor molecules. R0 is the Förster distance, which is ~50 Å for the ERGO-
DANSYL pair, and r is the actual distance between the donor and acceptor. The
efficiency of energy transfer, E, is then calculated the ratio of IDA(t) and the donor
fluorescence decay function in the absence of acceptors, ID(t), according to:
EI t d
I t dt
DA
D
= −
∞
∞
∫
∫1 0
0
( )
( )
t (3)
dttItI DD ⋅−⋅= )/exp()( 00 τ (4)
ID (t) is often best described by a single exponential decay. Combination of Eqs.
1-4 than gives the efficiency of energy transfer from a donor to a random
distribution of acceptor, within an infinite plane.
∫∞ ⋅⋅−⋅−−
⋅∫
⋅⋅−=
∞
⋅−
0
21
0
60
0
011 dteeE a
rRt
drret πστ
τ
τ (5)
We now extend this theory to account for lateral phase separation of
cholesterol-rich domains in membranes and make four simplifying assumptions:

33
1) donors are at the center of domains 2) acceptors are completely excluded from
the domains, 3) the shape of the domains is disk-like, and 4) the domains are
symmetric along the plane of the bilayer. Energy transfer results from donors in
the center of discrete domains to acceptors in the continuous phase and from
donors in the continuous phase to acceptors in the continuous phase, and the
efficiency of energy transfer is calculated for a donor in each environment. The
observed efficiency of energy transfer is the weighted average of the efficiency of
energy transfer in each environment based on the relative fractions of donors in
each phase. The two donor environments are shown schematically in Fig. 4.1.
The situation is described mathematically by Eq. 6, which now includes an
additional term to account for energy transfer across a bilayer of thickness h.
∫∞
⋅⋅
−+⋅⋅
−−−
⋅∫∫
⋅⋅−=
∞
⋅−∞
⋅−
0
2121
0
2
60
0
1
60
0
011 dteeE
LL
rRt
LL
rRt
drredrret ππσ
τ
ττ
τ (6)
The two limits of integration (LL1 and LL2) depend on the type of phase
in which the energy transfer takes place. The ‘distance of closest approach’ of the
donor and acceptors in the continuous phase is approximately the average
molecular diameter of the donor and acceptor, (so LL1=a), while in the domains
the ‘distance of closest approach’ equals the domain radius n.(LL1=n) In the
continuous phase acceptors can reside directly beneath a donor so that LL2 is

34
given by the bilayer thickness h. When a donor is in a domain, which acceptors in
the opposite monolayer are restricted and LL2 is given as (n2+h2)1/2 .
Given this description of E in each phase, all that remains is to estimate
the relative amounts of each phase. Specifically, it is necessary to know the
relative amounts of donor in each phase. By material balance, the relative amount
of donor in the continuous phase is
)*/( CCDDCC XXKpKpX +−=φ (8)
where XC is the mole fraction of lipids in the continuous phase and KpD is the
donor partition coefficient.(KpD = xD2/xD1)
The predicted efficiency of energy transfer (EPRED) is then a weighted
linear combination of energy transfer in the continuous (EC) and discrete (ED)
phases.
DCCCPRED EEE ⋅−+⋅= )1( φφ (9)
The only unknowns in the above model are the distance of closest approach and
the donor partition coefficient. We anticipate that if cholesterol domains are
present, then the donor will have a strong preference for the domains.
Accordingly have set the value of KpD to 50. We will show that the choice of

35
KpD does not impact the conclusions of this study, and only slightly affects the
estimated domain sizes. Thus the only fitted parameter in the study is the distance
of closest approach. The model will be used to test for domains in the following
manner. If no domains are present, the maximal efficiency of energy transfer will
be relatively high, and the distance of closest approach will be on the order of one
molecular diameter. In the event that domains are formed, an estimate of their
size will be obtained via a best (i.e. minimized least squares) fit of the domain
radius, n.
Footnote:
The presence of domains in this study is determined not from energy transfer but
from analysis of the DANSYL emission properties in the absence of ERGO. The
energy transfer model described herein is used as a complementary technique to
confirm the existence of the domains and to provide and estimate of their size.

36
4.3 Materials and Methods
4.3.1 Chemicals
DMPC, Cholesterol, ERGO, Chloroform, Methanol, Egg-PC, KCl, NaN3,
Na2HPO4, NaCl, CaCl2, and HEPES were purchased from Sigma Chemical Co.
(Sigma-Aldrich Saint Louis, MO). DANSYL was purchased from Avanti Polar
Lipids, Inc. (Alabaster, AL). Lipids and chemicals were used without further
purification.
4.3.2 Preparation of multilamellar vesicles (MLV)
Stock solutions of DMPC, cholesterol, and ERGO were dissolved
separately in chloroform to give final concentrations of 5mg/mL, 1mg/mL, and
5mg/mL respectively. DANSYL was dissolved in methanol to yield a stock
solution concentration of 1mg/mL. The stock solutions were mixed in varying
proportions so as to give the described compositions (listed in Table 1). The
mixing was done in 20mL scintillation vials, and the solvent removed under a
stream of nitrogen in a rotary evaporator. The samples were then placed in a
vacuum oven at room temperature and vacuum of 28 inches of Hg for 24 hours.
After solvent removal the lipid films were hydrated with the appropriate amount
of buffer to give a total concentration of 0.05mg/mL. Samples were then vortex
mixed for 5 minutes followed by indirect bath sonication at 30°C for 15 minutes.
The buffer used for the DMPC experiments was 10mM phosphate buffer, pH 7.3,
containing 50mM KCl and 0.02wt % NaN3. The buffer used for the Egg-PC

37
experiments was 0.15M NaCl, 5mM CaCl2, 5mM HEPES, and 0.02wt% NaN3,
pH=7.3.
Three sets of samples were prepared. Set A comprised Egg-
PC/cholesterol mixtures with cholesterol mole loadings varying from 0 to 65%.
To these mixtures the DANSYL labeled lipids were added to give a ALR of 0.03.
Set A was analyzed by a DANSYL temperature study in order to detect the
presence of lateral phase separations. Set B comprised DMPC-cholesterol
mixtures with cholesterol mole loadings varying from 0 to 50 mole%. To these
mixtures the DANSYL labeled lipid was added to give a DANSYL(acceptor) to
lipid ratio (ALR) of 0.03. Set B was analyzed by a DANSYL temperature study
to detect the presence of lateral phase separations. Set C comprised of 40mole%
cholesterol DMPC mixtures in which 5% of the total sterol was substituted with
ERGO, mixed with varying amount of DANSYL to give ALR ratios ranging from
0 to 0.10. Set C was analyzed by FRET in order to measure the efficiency of
energy transfer and to provide an estimate of any detected domains. The samples
sets prepared in this study are summarized in table 1.0.

38
Table 4.1 Summary of sample mixtures, compositions and experimental analysis used in this study
Mixture DANSYL ERGO Mole %Cholesterol ALR Analysis
A Egg-
PC/Ch
yes no 0,10,20,30,40,45,50,
55,60,65
0.03 DANSYL
T-Study
B DMPC/Ch yes no 0,5,10,15,20,25,35,4
0,45,50
0.03 DANSYL
T-Study
C DMPC/Ch yes yes 40
0,0.02,0.04
,
0.06,0.08,0
.10,
0.12
FRET
ALR-Study

39
4.3.3 Fluorescence Experiments
All fluorescence measurements were made using a steady state
fluorescence spectrometer (Photon Technology International, Ontario Canada,
model Q-5/W-601). The temperature of the sample chamber was controlled to
±0.5°C via a circulating water bath, and the temperature was continuously
monitored with a cuvette thermometer (Fisher Corp., Philadelphia, PA. model #
15-078J).
4.3.4 DANSYL Temperature Study:(sets A & B)
The DANSYL fluorescence emission spectrum was recorded for each
sample in sets A and B as a function of temperature. For samples in set C, the
temperature was varied from 28°C to 48°C in 10°C intervals. For the samples in
set B the temperature was varied from 30°C to 60°C in 5°C intervals, except with
the fifteen, twenty and twenty-five mole percent cholesterol samples, for which
the temperature was varied in 1°C intervals. The difference in temperature range
between the two sets relates to the difference in the main transition temperature
for the different phospholipids used (i.e. 24°C for DMPC and an average if 11°C
for Egg-PC). The DANSYL labeled MLV were excited at 300nm, and the
emission spectrum was recorded in the wavelength range 400nm to 550nm. Fig.
4.2 shows the DMPC/cholesterol compositions and temperatures used in this
study indicated as filled circles superimposed on the experimental phase diagram
determined by Almida and colleagues [18].

40
4.3.5 FRET Efficiency as a function of acceptor loading: (set C)
The ERGO emission was recorded as a function of DANSYL loading at
30°C and 60°C for set C. The acceptor to lipid ratio was varied from 0.00 to 0.12
in the 40mole% cholesterol DMPC MLV. The ERGO and DANSYL labeled
MLV were excited at 300nm and the emission was recorded in the wavelength
range 325nm to 550nm.
4.3.6 Analysis of experimental data
DANSYL emission spectra were smoothed and the absolute maximums
were identified [19]. The data shown in Figs. 4.3 and 4.4, are the averages of
five measurements taken over a ten minute period at each temperature.
The experimental efficiency of energy transfer, Emeas, is determined from
measured steady state fluorescence intensities according to:
D
DAmeas F
FE −= 1 (10)
where FDA is the ERGO fluorescence emission intensity at 373nm in the presence
of DANSYL, and FD is the ERGO fluorescence emission intensity at 373nm in
the absence of DANSYL.
The measured lo / ldo phase boundaries were determined by fitting the DANSYL
emission maxima as a function of temperature in a piecewise continuous fashion.
For a given cholesterol loading, the temperature corresponding to the
discontinuity in the piecewise curve fit was varied. The temperature which
yielded the best fit to the data, minimizing errors via, the method of least squares,

41
was identified as the lo to ldo transition temperature at the given cholesterol
loading.
4.4 Results
4.4.1 DANSYL T-Studies Egg-PC MLV’s (set A)
Fig. 4.3 shows the DANSYL fluorescence emission spectra for Egg-PC
MLV as a function of cholesterol loading at room 28°C. In the absence of
cholesterol, the DANSYL emission maximum occurs at 515nm. The DANSYL
emission maximum remains fixed until the cholesterol loading of 30mole%.
Beyond 30mole% cholesterol, the DANSYL emission maximum decreases (i.e.
blue shifts). By 65mole% cholesterol, the DANSYL emission maximum has
decreased to 470nm. The DANSYL emission maxima respond to heating (i.e. a
temperature jump from 28ºC to 48ºC differently depending on the cholesterol
loading. Fig. 4.4 shows the DANSYL emission maximum as a function of
cholesterol loading at 28ºC and 48ºC, and the data are separated into three distinct
zones. Zone Ι spans from 0mole% to 30mole% cholesterol, Zone ΙΙ spans from
30mole% to 55mole% cholesterol, and Zone ΙΙΙ continues from 55mole% to
65mole% cholesterol. Zone Ι is characterized by a slight blue shift in the
DANSYL emission maximum as a function of cholesterol at 28ºC, with a small
increase in the DANSYL emission maxima upon heating to 48ºC. In Zone ΙΙ the
DANSYL emission maxima show an increasing blue shift as a function of
increased cholesterol loading at 28ºC. Upon heating to 48ºC the DANSYL
emission maxima in Zone ΙΙ (red) shift to longer wavelengths. Zone ΙΙΙ shows the
blue shifted emission maxima that only slight increase as a function of increased

42
cholesterol loadings at 28ºC. When heated to 48ºC the DANSYL emission
maxima in Zone III little to no shift to longer wavelengths. It is interesting to
note that the 28ºC original profile of emission maxima verses cholesterol loading
was recovered upon cooling. Indeed, profiles nearly identical to those shown in
Fig.4.3 for both 28ºC and 48ºC were obtained through three heating and cooling
cycles.
4.4.2 DANSYL T-Studies DMPC MLV(set B)
Given that Egg-PC contains a mixture of phospholipids (and hence a
binary T vs. chol phase diagram does not apply) the above studies were carried
out in a DMPC/Chol system. The DANSYL emission maximum is shown in Fig.
4.5 as a function of cholesterol loading at 30ºC and 60ºC for DMPC MLV’s. As
in the Egg-PC system, distinct zones emerge. It is interesting to note that
boundary between Zones I and II as drawn in Fig. 4.5, corresponds exactly to the
lo / ldo phase boundary. At 30°C in the absence of cholesterol the DANSYL
emission maximum occurs at 511nm, and the DANSYL emission maximum
steadily decreases as the cholesterol loading is increased to a value of 509nm at
25mole% cholesterol.(Zone I) Beyond 25mole% cholesterol the DANSYL
emission maximum decreases sharply and somewhat linearly with added
cholesterol until 40mole% at 30ºC.(Zone II). Similar to the Egg-PC system,
heating to 60ºC in Zone I causes a small yet noticeable increase (i.e. red shift) in
the DANSYL emission maxima. Also like the Egg-PC system, the magnitude of
the red shift becomes more significant in Zone II.
43
4.4.3 Determination of Phase Boundaries In DMPC/Chol systems
Upon closer examination of the red shift data in Zone I, it became
apparent that the data might yield insights regarding the lo to ldo phase transition.
Accordingly the DANSYL spectrum of three samples in Zone I, which contained
cholesterol loadings (i.e. 15,20,25mole%) placing them in the two phase region
(i.e. lo + ldo), were measured as a function of temperature in 1ºC intervals for each
of these three samples. Fig. 4.6 shows the DANSYL emission maximum versus
temperature for each of these three samples. Each sample exhibits a DANSYL
emission profile that increases nearly linearly with cholesterol and then reaches a
plateau. The data for each cholesterol loading were fit with piecewise continuous
functions and the temperature corresponding to the discontinuity was varied so as
to achieve the best (i.e. least squared error) fits. Best fits are shown as solid lines,
and the temperature yielding the best fits are indicated (dashed lines) as points
A,B,C for 15, 20, and 25 mole percent cholesterol respectively. This point
corresponds to the lo to ldo phase boundaries shown by ∆’s in Fig. 4.2. Table II
compares the lo to ldo phase boundary temperatures obtained by the DANSYL
profiles in Fig. 4.6 with generally accepted values obtained by other techniques.
4.4.4 FRET Studies DMPC FRET(Set C)
To characterize length scale of the ERGO/DANSYL probe separation,
FRET experiments were conducted accordingly. The steady state fluorescence
emission spectra were recorded for the 40mole% cholesterol DMPC MLV as a
function of increasing DANSYL substitution; the measured efficiency of energy
transfer was calculated according to equation 10. DANSYL acceptor to lipid

44
ratio’s used in this study are listed in table 1. The measured efficiency of energy-
transfer as a function of DANSYL acceptor to lipid ratio for the 40mole%
cholesterol DMPC model membranes at 30ºC and 60ºC are shown in Fig. 4.7.

45
4.4.5 Domain model FRET calculations
To test the hypothesis that cholesterol is randomly distributed in the
membrane at 40mole% cholesterol in DMPC MLV the 30°C and the 60°C
efficiency of energy transfer data as a function of acceptor to lipid ratio (ALR)
was fit to equation 6. In order to calculate the acceptor surface density σ from the
ALR the average area per molecule must be estimated. The average cross
sectional area of a cholesterol molecule and a DMPC molecule is 38 Å2 and 68 Å2
respectively [20,21]. Weighting the areas based on the cholesterol mole
percentage gives and average area per molecule of 56 Å2 for a 40-mole%
cholesterol membrane. In the system studied ERGO is the donor and DANSYL is
the acceptor. The Forster distance for the ERGO and DANSYL is about 50 Å,
and the ERGO unquenched fluorescence lifetime is on the order of 1 nanosecond
[22]. The calculated efficiency of energy transfer as a function of ALR for
different values of the distance of closest approach is shown in Fig. 4.8. The
30°C data was best fit by Eq. 6 with a distance of closest approach of 102 Å,
while the 60°C data was best fit by Eq. 6 with a distance of closest approach of 96
Å.
To test for the presence of immiscible cholesterol domains Eqs. 6-9 were
fit to the 30°C efficiency of energy transfer as a function of ALR data. To use
Eqs. 6-9 several model parameters must be estimated or experimentally obtained.
The distance of closest approach in the continuous phase is estimated as the
average of the molecular diameters of a cholesterol and DMPC molecule and is
7.85 Å . The bilayer thickness h is estimated to be 36 Å [21]. To determine the

46
fraction of donor in each phase, the phase boundaries and the donor partition
coefficient must be known. The phase boundaries of the putative domains are not
known, assuming the domains are immiscible cholesterol domains then the right
side phase boundary is unity. To set a lower limit on the left side phase boundary,
the lo / ldo phase boundary is used. The phase boundaries of the putative
immiscible cholesterol domains at 30°C are assumed to be xc1=0.28 and
xc2=1.00, this gives the fraction the membrane in the continuous phase by the
inverse lever rule at 40mole% cholesterol to be 0.833. The phase boundaries of
the putative immiscible cholesterol domains at 60°C are assumed to be xc1=0.34
and xc2=1.00, this gives the fraction the membrane in the continuous phase by the
inverse lever rule at 40mole% cholesterol to be 0.896. The calculated efficiency
of energy transfer as a function of immiscible cholesterol domain radius with an
assumed donor partition coefficient (KpD) equal to 50 is shown in Fig. 4.9. The
30°C data was best fit by an immiscible cholesterol domain radius of 110 Å. The
60°C data was best fit by as immiscible cholesterol domain radius of 111 Å with a
KpD of 50. The effect of the assumed donor partition coefficient on the best fit
estimated domain radius for the 30°C fret data is shown in Fig. 4.9.

47
Table 4.2 DMPC/cholesterol phase boundaries determined by the DANSYL methodology described in the study compared to ESR data [9] and FRAP data [18]
Mole
%Cholesterol
DANSYL Data °C ESR Data °C FRAP data °C
15 42 42 42
20 46 45 45
25 48 47 55

48
4.5 Discussion
4.5.1 DANSYL Temperature Studies
The finding of this study was the identification of cholesterol domains.
These domains were observed in Egg-PC systems, in which a blue shift in the
DANSYL emission maximum was observed upon the addition of cholesterol.
The blue shift was dose dependent, and results from a decrease in polarity with
added cholesterol. The decrease in polarity is not necessarily a direct
consequence of the presence of cholesterol. Rather the cholesterol likely acts
indirectly via a condensation effect to inhibit passive diffusion and reduce the
accessibility of DANSLY to water [23-26]. The effect of heating on the initial
DANSYL blue shift indicated the presence of immiscible cholesterol domains.
Not only were the changes observed reversible, which suggests an equilibrium
phase, but also the red shift is not present at high (i.e. 65mole%) cholesterol.
These results are consistent with melting of domains in Zone II. The temperature
of 48°C in Zone III is too low to melt the domains. One possibility is that these
results simply represent the well known lo to ldo phase transition in PC/Cholesterol
membranes. However, given the lack of a phase diagram for the mixture of PC’s
inherent with Egg-PC, it is not possible to determine if this interpretation is
accurate.
Accordingly, the tests were repeated with DMPC/Cholesterol mixtures, a
PC for which the phase-diagram (Temperature vs. Cholesterol) is known [18].
Comparing the DANSYL blue shift as a function of cholesterol loading with the
experimental phase diagram for DMPC/Cholesterol mixture shows that the large

49
blue shift in the DANSYL emission maximum occurring beyond 30mole%
cholesterol does not correlate with the lo / ldo two-phase region.
Analysis of the DANSYL emission maximum heating curves for the 15,
20, 25mole% samples that lie in the two-phase liquid ordered liquid disordered
region show that the onset of the plateau in the DANSYL emission maximum as a
function of temperature is consistent with lo to ldo phase transition boundary in the
two phase region of Fig. 4.2. The phase boundaries determined by the DANSYL
breakpoints compared to ESR and FRAP data are shown in table 2. The
DANSYL results are consistent with phase boundaries determined by ESR and
FRAP techniques [9,18]. These data clearly demonstrate the ability of the
DANSYL probe to detect lateral phase separations in model membranes.
4.5.2 FRET Studies
Further supporting the existence of cholesterol domains comes from the
efficiency of energy transfer data for the 40 mole% cholesterol in DMPC MLV as
an increase in the efficiency of energy transfer (see Fig. 4.7) as a function of the
acceptor to lipid ratio, upon heating from 30ºC to 60ºC. Furthermore, the overall
low efficiency (%E < 55%, see Fig. 4.7) of energy transfer observed for the high
acceptor loadings used in this study shows that close proximity of ERGO and
DANSYL is inhibited. The increase in the efficiency of energy transfer upon
being heated is consistent with an acceptor-poor laterally phase separated domain
being partially melted and allowing closer ERGO to DANSYL contact at 60ºC
thus accounting for the higher quenching when the domains are disrupted. This
interpretation is based on evidence that the acceptor poor domains separate the

50
donors in the domains from the acceptors in the acceptor-rich continuous phase.
The melting of the domains allows closer contact of the probes and more efficient
energy transfer. Without a phase change the efficiency of energy transfer would
remain constant as a function of increasing temperature for all acceptor-to-lipid
ratios. The DANSYL moiety is slightly polar, thus it will not preferentially
partition into a cholesterol-rich condensed phase, thus lending to the acceptor-
poorness of the cholesterol domains.
4.5.3 FRET Modeling
Analysis of the efficiency of energy transfer data as a function of acceptor
loading can provide insight on the size of the laterally phase separated domains.
The random distribution model (Eqn. 6) with a distance of closest approach on the
order of probe molecular diameters predicts that the efficiency of energy transfer
should be nearly 100% for most of the acceptor loadings used in this study, while
the experimental FRET data is below 55% energy transfer efficiency for all of the
acceptor loading s used in this study. The experimental FRET data was only
adequately described by Eqn. 6 with the distance of closest approach of 135
Å(~17 molecular diameters) for the 30°C data and 129 Å(~16 molecular
diameters) for the 60°C data. This analysis suggest the presence of laterally phase
separated domains that are extremely acceptor poor as would be the case for
immiscible cholesterol domains, and that the domain size is on the order of 270 Å
in diameter. Also the action of heating the membranes partially disrupts the
domain phase as seen by the lower distance of closest approach in the 60°C data
as compared to the 30°C data.

51
Adapting the energy transfer model (Eqn. 6-9) for lateral phase separation
gave better fits to the experimental data than random distribution model (Eq. 6),
thus making lateral phase separation of immiscible cholesterol domains a
plausible explanation for the low efficiency of energy transfer seen at high
acceptor loadings seen in the 40-mole% cholesterol FRET data. At 30°C the best-
fit domain radius is 144 Å with a donor partition coefficient of 50(see Fig. 4.9).
The assumed value of the donor partition coefficient does not greatly affect the
value of the determined domain radius, varying from 190 Å to 135 Å as KpD went
from 10 to 1000, but not all values of KpD adequately described the data, thus
making the estimated domain radius a weak function of assumed donor partition
coefficient.
In summary, we provide a novel technique to access the formation of
immiscible cholesterol domains in membranes in real time. In our study, artificial
membrane bilayers were constructed using cholesterol and Egg-PC or DMPC to
analyze the ability of the membrane probes ERGO and DANSYL to report on the
formation of cholesterol domains. The formation of these domains goes beyond
mere academic curiosity since we have previously shown, using X-Ray
diffraction techniques that smooth muscle cell membranes isolated from the
arterial wall are enriched with cholesterol very early in the development of
atherosclerotic lesions in cholesterol-fed rabbits [27]. In the Chen study, in-vivo
enrichment of the cell membrane with cholesterol paralleled the increase in serum
cholesterol levels resulted in a marveled increase in membrane bilayer width(54-

52
63 Å, ie 17%!). We further demonstrated [11] that the membrane demonstrates a
free cholesterol saturation limit,(~70 mole % in-vivo) beyond which lateral phase
separation occurs resulting in the formation of immiscible cholesterol domains.
The impact that these domains have on cell function is not clear, but we suggest
that they give rise to the formation of the crystalline cholesterol clefts typically
found in mature atherosclerotic plaques. The application of ERGO and DANSYL
fluorescence should permit the analysis of cholesterol nucleation in living cells.

53
(1) WITHOUT DOMAINS
BILAYERhD
D
D
DD
E
a
(2) DOMAINS
BILAYERhE
DD
D
D
n
(n2 +h
2 )1/2
Figure 4.1 Energy transfer geometries: The distance of closest approach for membranes without (1) and with (2) domains. (1) When no domains are present, molecular diffusion allows the donor ERGO (E) and the acceptor DANSYL (D) to come within one molecular diameter(a). (2) The presence of a domain within the bilayer which excludes the acceptor and increases the distance of closest approach to the size of the domain radius (n).

54
10
20
30
40
50
60
0.00 0.10 0.20 0.30 0.400
Mole fraction Cholesterol
Tem
pera
ture
(o C)
ldo ldo + lo l0
Figure 4.2 DMPC/Cholesterol experimental phase diagram from reference [18]. Filled circles denote the compositions and temperatures used in this study (set B). Along the lines with arrows, temperature was varied in 1°C intervals. ∆ denotes the liqid ordered to liquid disordered phase boundaries as determined from piecewise continuous fits of DANSYL emission maxima in this study. Redrawn from reference [28].

55
0
50
100
150
200
250
400 450 500 550
Emission Wavelength (nm)
Fluo
resc
ence
Inte
nsity
(a.u
.)
Increased Cholesterol Loading
0%
40%
65%
Figure 4.3 DANSYL emission spectra in Egg-PC MLV as a function of increasing cholesterol mole percentage. In the absence of cholesterol, DANSYL exhibits an emission maximum at 515 nm. The DANSYL emission maximum remains fixed until the cholesterol loading 30mole%. Beyond 30mole% cholesterol, the DANSYL emission maximum blue shifts to shorter wavelengths. At 65mole% cholesterol, the DANSYL emission maximum has decreased to 470nm.

56
460
470
480
490
500
510
520
530
0 20 40 60 80Mole % Cholesterol
DA
NSY
L Em
issi
on M
axim
um (n
m)
Intital 28 CHeated 48 CCooled 28 C
I II III
Red
Shi
ft
Res
idua
l Blu
e S
hift
Figure 4.4 DANSYL Response of emission profile to heating in Egg-PC MLV. The data of Fig. 4.3 are re-plotted as the DANSYL emission maximum versus cholesterol loading at 28°C(◊). Also shown is the DANSYL emission profile obtained after heating to 48°C( ), and three Zones emerge. In Zone I, for which there is little to no blue shift as a function of cholesterol loading @ 28°C, heating produces a small but noticeable increase (i.e. red shift) in the DANSYL emission wavelength. In Zone II, for which the 28°C emission wavelength decreases (blue shift) nearly linearly with cholesterol loading, heating produces a significant red shift that increases in direct proportion to the cholesterol loading. In Zone III, for the blue shift @ 28°C was maximal and did not vary with cholesterol, heating had little to no effect. Nearly identical DANSYL emission profiles to these shown here were obtained through three heating and cooling cycles.
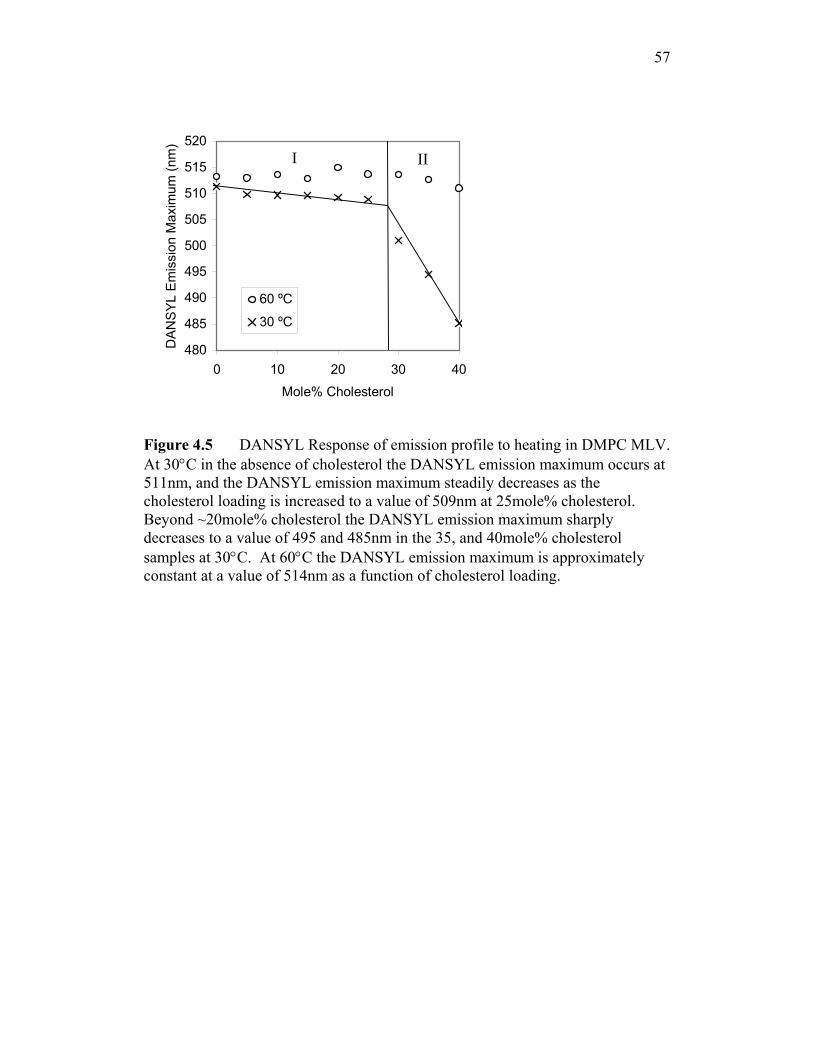
57
480
485
490
495
500
505
510
515
520
0 10
M
DA
NS
YL
Em
issi
on M
axim
um (n
m)
60 ºC
30 ºC
II
Figure 4.5 DANSYAt 30°C in the absenc511nm, and the DANScholesterol loading is Beyond ~20mole% chdecreases to a value ofsamples at 30°C. At 6constant at a value of
I
20 30 40
ole% Cholesterol
L Response of emission profile to heating in DMPC MLV. e of cholesterol the DANSYL emission maximum occurs at YL emission maximum steadily decreases as the
increased to a value of 509nm at 25mole% cholesterol. olesterol the DANSYL emission maximum sharply 495 and 485nm in the 35, and 40mole% cholesterol 0°C the DANSYL emission maximum is approximately
514nm as a function of cholesterol loading.

58
506
508
510
512
514
516
30 40 50 60
T(°C)
nm
a
A
506
508
510
512
514
516
30 40 50 60
T(°C)
nm
b
B
506
508
510
512
514
516
30 40 50 60
T(°C)
nm
c
C
Figure 4.6 DANSYL emissions maximum as a function of temperature in DMPC/cholesterol MLV for 15(a), 20(b),and 25(c)mole% cholesterol. The DANSYL emission maximum at 30ºC occurs at 510, 509, and 509 nanometers for the 15, 20, 25mole% samples, respectively. The DANSYL maximum emission wavelength increases linearly with temperature and then remains constant at a value of 513nm beginning at 42ºC, 46ºC, and 48ºC for the 15, 20, 25mole%

59
cholesterol samples respectively. Best fits are shown as solid lines, and the temperature yielding the best fits are indicated (dashed lines) as points A,B,C for 15, 20, and 25 mole percent cholesterol respectively.
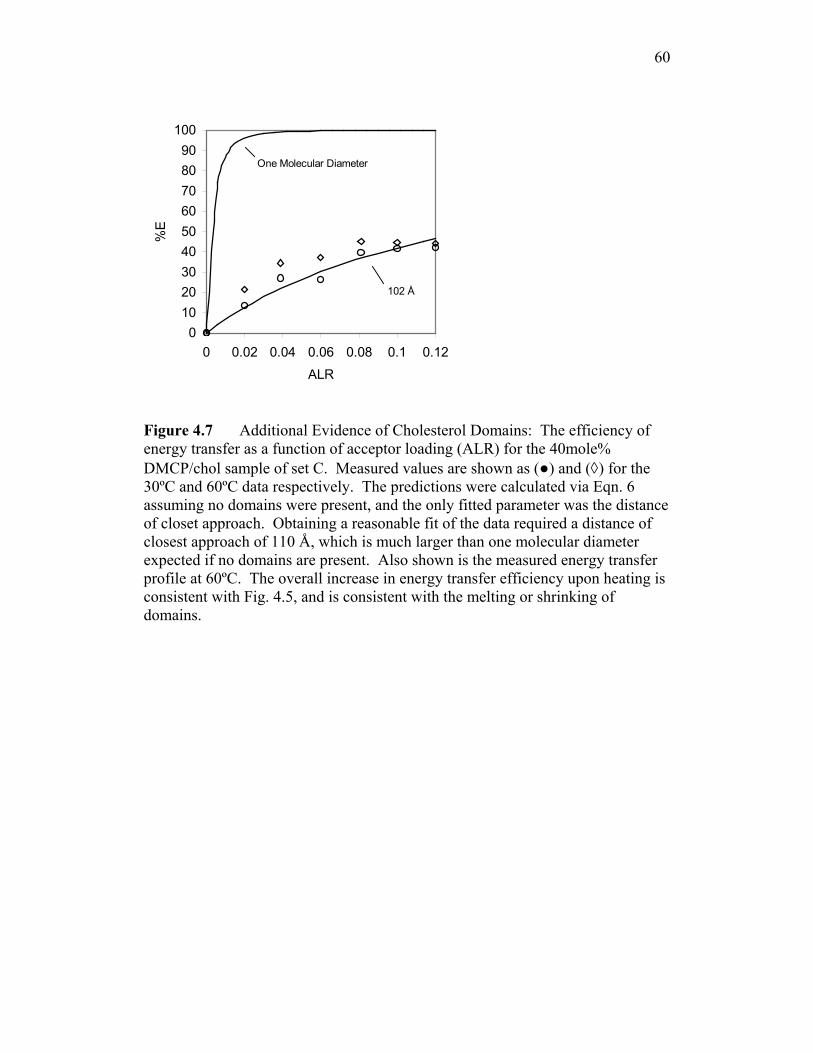
60
0102030405060708090
100
0 0.02 0.04 0.06 0.08 0.1 0.12
ALR
%E
One Molecular Diameter
102 Å
Figure 4.7 Additional Evidence of Cholesterol Domains: The efficiency of energy transfer as a function of acceptor loading (ALR) for the 40mole% DMCP/chol sample of set C. Measured values are shown as (●) and (◊) for the 30ºC and 60ºC data respectively. The predictions were calculated via Eqn. 6 assuming no domains were present, and the only fitted parameter was the distance of closet approach. Obtaining a reasonable fit of the data required a distance of closest approach of 110 Å, which is much larger than one molecular diameter expected if no domains are present. Also shown is the measured energy transfer profile at 60ºC. The overall increase in energy transfer efficiency upon heating is consistent with Fig. 4.5, and is consistent with the melting or shrinking of domains.

61
0102030405060708090
100
0 0.02 0.04 0.06 0.08 0.1 0.12
ALR
%E
One Molecular Diameter75 Å
110 Å
150 Å
Figure 4.8 Estimation of Domain Sizes: the efficiency of energy transfer is shown as function of acceptor loading (ALR) for the 40mole percent DMPC/chol sample of set B. Experimentally determined values are shown as filled circles. Predicted energy transfer efficiency profiles are shown as solid lines, as calculated with equation 6 for varying domain radii. Also shown is the profile that is expected if no domains are present. The low amount of energy transfer efficiency ( less than 50%), regardless of the acceptor loading, is strong evidence of domains formation and confirms the earlier DANSYL temperature studies. A best fit of the data suggests that the size of the domains is on the order of 220 Å in diameter.
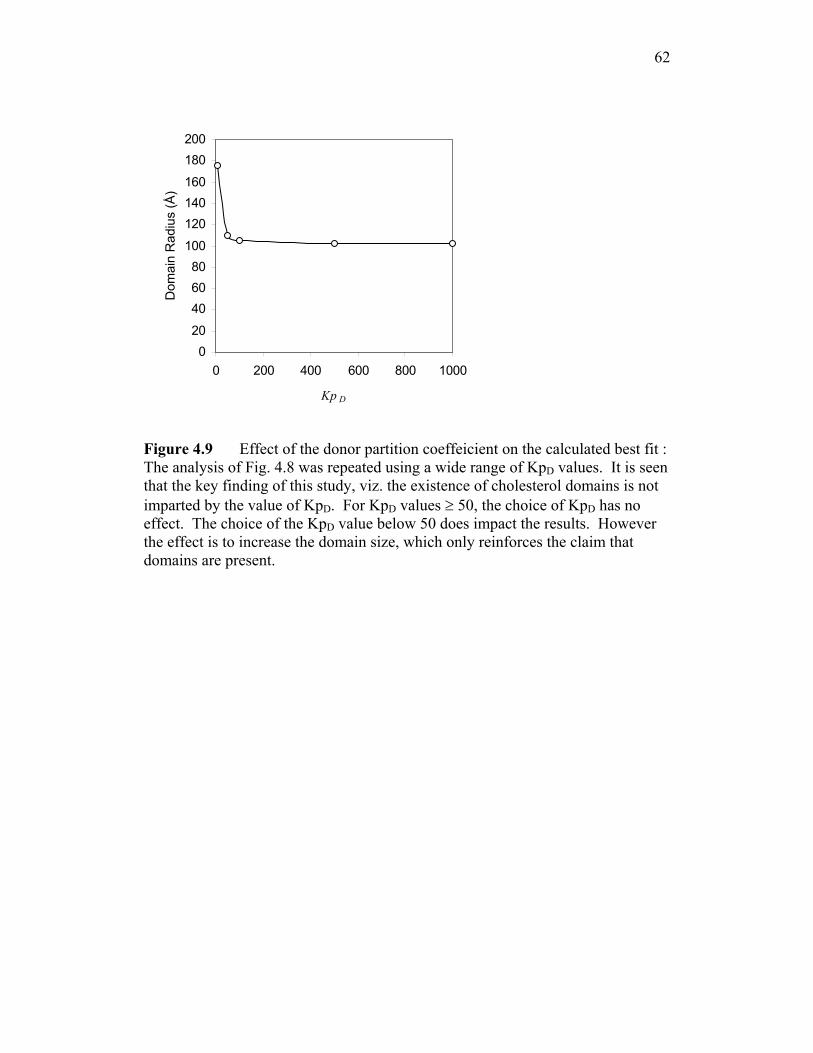
62
020
406080
100
120140160
180200
0 200 400 600 800 1000
Kp D
Dom
ain
Rad
ius
(Å)
Figure 4.9 Effect of the donor partition coeffeicient on the calculated best fit : The analysis of Fig. 4.8 was repeated using a wide range of KpD values. It is seen that the key finding of this study, viz. the existence of cholesterol domains is not imparted by the value of KpD. For KpD values ≥ 50, the choice of KpD has no effect. The choice of the KpD value below 50 does impact the results. However the effect is to increase the domain size, which only reinforces the claim that domains are present.

63
List of References
[1] D.A. Brown, E. London, 1998, Functions of lipid rafts in biological membranes. Annu. Rev. Cell Dev. Biol. 14:111-136. [2] T. Cinek and V. Horejsi, 1992. Immunol. 149:2262-2270. [3] K. Simons and E. Ikonen, 1997. Nature. 387:569-572. [4] D. A. Brown and, E. London 2000. Insolubility of lipids in triton x-100: physical origin and relationship to sphingolipid/cholesterol membrane domains (rafts). Biochim, Biophys, Acta, 1508. 182-195. [5] M. R. Vist, and J. H. Davis, 1990. Phase equilibria of cholesterol/dipalmitoylphosphatidylcholine mixtures: 2H nuclear magnetic resonance and differential scanning calorimetry. Biochemistry. 29:451-464. [6] Feingold, L. 1993. Cholesterol in Membrane Models. CRC Press, Boca Raton. [7] C. Leidy, W. F. Wolkers, K. Jorgensen, O. G. Mouritsen, and J. H. Crowe, 2001. Lateral organization and domain formation in a two-component lipid membrane system. Biophysical J., 80:1819-1828. [8] Huang, J.T. Buboltz, G.W. Feigenson, 1999, Maximum solubility of cholesterol in phosphatidylcholine and phosphatidylethanolamine bilayers. Biochim, Biophys, Acta, 1417. 89-100. [9] B. Sankaram and T.E. Thomposon, 1991. Cholesterol-induced fluid phase immiscibility in membranes. Proc. Natl. Acad. Sci. U.S.A. 88:8686-8690. [10] A. Radhakrishnan, H.M. McConnell, 1999, Condensed Complexes of Cholesterol and Phospholipids. Biophysical J. 77, 1507-1517. [11] T. N. Tulenko, M. Chen, P. E. Mason, and R. Preston-Mason, 1998. Physical effects of cholesterol on arterial smooth muscle membranes: evidence of immiscible cholesterol domains and alterations in bilayer width during atherogenesis. J. Lipid Research. 39:947-956. [12] S. P. Wrenn, M. Gudheti, A. N. Veleva, E. W. Kaler, and S. P. Lee. 2001. Characterization of model bile using fluorescence energy transfer from dehydroergosterol to dansylated lecithin. J. Lipid Research. 42:923-934.

64
[13] V. Fuster, L. Badimon, J.J. Badimon, and J.H. Chesebro, 1992. Mechanisms of disease: The pathogenesis of coronary artery disease and the acute coronary syndromes. The New England Journal of Medicine. 326,4:242-250. [14] J. R. Guyton, 1995. The role of lipoproteins in atherogenesis. Advances in Experimental Medicine and Biology. 369:29-38. [15] S. P. Wrenn, E. W. Kaler, and S. P. Lee, 1999. A fluorescence energy transfer study of lecithin-cholesterol vesicles in the presence of phospholipase C. J. Lipid Research. 40:1483-1494. [16] B. K.K. Fung, and L. Stryer, 1978. Surface density determination in membranes by fluorescence energy transfer. Biochemistry, 17,24:5241-5248. [17] T.G. Dewey and G.G. Hammes, 1980. Calculation of fluorescence energy transfer on surfaces. Biophys. J.,32:1023-1035., [18] P.F.F. Almeida, W.L.C. Vaz, and T.E. Thomposon, 1992. Lateral diffusion in the liquid phases of dimyristoylphosphatidylcholine/cholesterol lipid bilayers: a free volume analysis. Biochemistry. 31:6739-6747. [19] Savitsky and Golay, 1964. Anal. Chem. 36, 1627-1639. [20] P. Somerharju, J.A. Virtanen, K.H. Cheng,1999, Lateral Organization of Membrane Lipids: The Superlattice view. Biochim, Biophys, Acta. 1440, 32-48. [21] J. F. Nagle, and S.Tristram-Nagle, 2000. Struture of lipid bilayers. Biochim, Biophys, Acta. 1469, 159-195. [22] F. Schroeder, Y. Barenholz, E. Gratton, and T.E. Thomposon, 1987. A fluorescence study of dehydroergosterol in phosphatidylcholine bilayer vesicles. Biochemistry, 26:2441-2448. [23] A.S.Waggoner and L. Stryer, 1970. Fluorescent probes of biological membranes. Proc. Natl. Acad. Sci. U.S.A. 67:579-589. [24] K. Kachel, E. Ansuncion-Pulzalan, and E. London. 1998. The location of fluorescence probes with charged groups in model membranes. Biochim. Biophys. Acta. 1374:63-76. [25] E. Ansuncion-Pulzalan, K. Kachel, and E. London. 1998. Groups with polar characteristics can locate at both shallow and deep locations in membranes: the behavior of Dansyl and other related probes. Biochemistry. 37:4603-4611.

65
[26] D. Bartlett, M. Glaser, and R. Welti. 1997. Membrane penetration depth and lipid phase preference of acyl-labeled dansyl phosphatidylcholines in phosphatidylcholine vesicles. Biochim. Biophys. Acta. 1328:48-54. [27] M. Chen, R. P. Mason, and T. N. Tulenko, 1995. Atherosclerosis alters the composition, structure and function of arterial smooth muscle cell plasma membranes. Biochim. Biophys. Acta-Molecular Basis for Disease. 1272,2:101-112. [28] L. M. S. Loura, A. Fedorov, and M. Prieto, 2001. Fluid-fluid membrane microheterogeneity: A fluorescence resonance energy transfer study. Biophysical Journal. 80:776-788.

66
CHAPTER 5: FRET Simulations
5.1 Introduction
Immiscible cholesterol domains (ICD) are laterally phase-separated pure
cholesterol bilayer clusters that are thought to play a role in atherosclerosis [1].
Experimental evidence for ICD has been reported in rabbit arterial smooth muscle
membranes by X-Ray diffraction, [2,3] identifying these domains as potential
precursors to cholesterol crystals that appear in atherosclerotic plaques. These
findings suggest that the membrane may be a site of cholesterol nucleation and
that the nucleation pathway includes a lateral phase separation of cholesterol
within the membrane. We recently developed a fluorescence-based assay to study
nucleation of cholesterol in biological colloids such as biliary vesicles [4,5], and
low density lipoproteins (unpublished results). The assay tracks fluorescence
energy transfer from ergosta-5,7,9(11), 22-tetraen-3β-ol (ERGO) to 1-acyl-2-[12-
[(5-dimethylamino-1-naphthalenesulfonyl)amino]dodecanoyl]-sn-Glycero-3-
phosphocholine (DANSYL), and nucleation is signaled by and alleviation of
energy transfer as the fluorophores become separated [4,5]. Our assay also
showed evidence that nucleation of cholesterol proceeds via lateral phase
separation within the membrane, which may explain the strong catalytic effect of
vesicles on the time of appearance of macroscopic cholesterol crystals in super
saturated bile [6]. We recently conducted a fluorescence-based investigation of
DMPC/cholesterol model membranes using DANSYL-labeled phospholipids,
which are sensitive to membrane phase behavior, we reported reversible spectral

67
DANSYL shifts consistent with the presence of laterally-phase-separated ICD [7].
To confirm the presence of these domains and estimate their size in 40mole%
cholesterol DMPC membranes we used Förster resonance energy transfer
(FRET). In addition to being a well-established spectroscopic ruler extensively
used for measuring nanometer distances between physically-linked donors and
acceptors, [8], FRET has been used to investigate membrane systems that exhibit
lateral phase separation [9-13]. Whereas the classical application of FRET entails
a single separation distance between the donor and the acceptor, complexities
arise in biological membranes. Specifically, the population of donors transfers
energy to multiple unlinked acceptors, leading to a distribution of separation
distances [14-18]. These complications combined with the fact that energy is
transferred to acceptors in the continuous phase from donors both within domains
and within the continuous phase, prompted us to make several refinements to the
classical theory, along with several simplifying assumptions in analyzing our data.
The purpose of this investigation is to test the ability of our modified
FRET model to estimate the size of laterally-phase-separated ICD in model
membranes. We use a lattice model to simulate membrane bilayers with a
predetermined uniform size distribution of cholesterol immiscible domains. We
then substitute cholesterols and phospholipids with their fluorescent analogs and
calculate the efficiency of energy transfer as a function of acceptor concentration
in these lattices. The simulated efficiency of energy transfer as a function of
acceptor concentration data is then fitted with the analytical FRET model using
the domain size as the only fitting parameter. We assess the adequacy of the

68
model by comparing the best fit domain size to the exact input size. Finally, to
test whether the model can also predict partitioning of donors among domains and
the continuous phase, probes, we include a donor partition coefficient as a second
fitting parameter and again compare the fitted results with the input values.
69
5.2 Simulations
Lattice models are well established for studying the lateral distributions of
membrane components [19,20]. Here we use two vertically-coupled 2-
dimensional square lattices to simulate a section of a membrane bilayer with a
mono-disperse size distribution of ICD of predetermined sizes. We then generate
simulated FRET data analogous to data we obtain experimentally, which consist
of measures of the efficiency of energy transfer as a function of acceptor
concentration, for each of four domain size distributions.
5.2.1 Simulation Details
The two leaflets of a membrane bilayer are represented by two coupled
100x100 square lattices, where each lattice site can be occupied by either a
phospholipid or a cholesterol molecule. To confirm the adequacy of the 100x100
lattice, the lattice size was increased to 200x200. This setup led to a significant
increase in computational time, while the average efficiency of energy transfer
remained the same to within 1%. Although the larger lattice yielded a 50%
decrease in the standard deviation, the 100x100 size was deemed more suitable
and more practical. Moreover, the efficiency of energy transfer is proportional to
the inverse sixth power of the probe separation distance, and so is effective over a
distance about five times the Förster distance [14]. As the Förster distance (that is
the distance at which energy transfer efficiency is 50%) for the ERGO/DANSYL
FRET pair is 5 nm [21], the 100x100 molecule lattice is 82 nm wide and hence

70
16.4 times the Förster distance, is sufficiently large to capture the full range of
possible FRET interactions.
The lattice spacing is determined by the concentration-weighted, average
diameter of phospholipid (0.94nm) and cholesterol (0.70nm) molecules [22].
Accordingly, the 40mole% membrane cholesterol concentration used in this study
leads to a grid spacing of 0.82 nm. The bilayer thickness is held constant at 4 nm,
based on experimental determinations of the thickness of DMPC bilayers [22].
Fig. 5.1 shows a sketch of the phase diagram for DMPC/cholesterol
membranes, where the cross-hatched area represents our hypothesized extension
of the well-established phase boundaries in the white area [23]. Because this
phase diagram is known below 33 mole%, we propose that the transition to ICD
must occur at a cholesterol concentration greater than that at the liquid
ordered/liquid disordered phase boundary. Accordingly, the left hand phase
boundary is set to 33mole% cholesterol, while the right hand phase boundary is
set to unity, as dictated by the inverse lever rule and the fact that the ICD are pure
cholesterol. The maximum concentration of cholesterol in PC membranes has
recently been reported to be 66mole%, beyond which macroscopic cholesterol
monohydrate crystals are detectable [24]. This solubility limit, which is indicated
by the symbol X’C, is an “apparent limit”. Indeed, if cholesterol nucleation occurs
within the membrane as we hypothesize, then the membrane has the capacity to
retain stable crystallites (detectable by X-Ray diffraction [1], FRET w/ERGO and
DANSYL [7], and multiphoton imaging [25]) at concentrations lower than the
macroscopic solubility limit. That is, ICD constitute an equilibrium phase within

71
the membrane at cholesterol mole fractions less than X’C. At higher cholesterol
mole fractions the ICD exceed a critical size, leading to the macroscopic
precipitation of cholesterol from the membrane. The overall sterol mole fraction
concentration (both ERGO and cholesterol) in these simulations is set at 0.40.
With the total number of molecules in the simulation fixed by the lattice size and
the overall sterol concentration specified, the amounts of each phase is determined
by the inverse lever rule.
After square domains of a fixed size are randomly placed on the lattice with
periodic boundary conditions, phospholipid and cholesterol molecules are
randomly placed on the lattices according to their mole fractions in each phase.
Unlike the continuous phase, for which the lipid distribution in each leaflet is
independent, the cholesterol domains span the bilayers and are thus symmetric.
With the lateral distributions of phases and lipids specified, the next step is to
incorporate the fluorescent probes into the simulations. This corresponds to the
experimental use of the cholesterol analog donor ERGO and the phospholipid
analog acceptor DANSYL. The mole fraction of donors is held constant at 0.01,
while the acceptor mole fraction is varied from 0 to 0.05 to mimic FRET
experiments. Based on the specified donor mole fraction and a partition
coefficient (defined below), cholesterols in each phase are then randomly selected
and replaced by FRET donors. The same process is carried out for the
substitution of phospholipids for acceptor molecules. In the present study, the
discrete phase is (ICD) pure cholesterol so specification of an acceptor partition
coefficient is not needed. Fig. 5.2 shows typical ICD configurations for four

72
sample simulated membranes containing a total cholesterol mole fraction of 0.40
(only top leaflet shown). Ten such configurations were generated for each mole
fraction, and simulation results reported herein are the averages of the multiple
configurations. Phospholipids are depicted in dark blue, cholesterols in light blue,
donors in yellow, and acceptors in red. The domains shown have hydrodynamic
diameters of 27.1 nm (a), 15.6 nm (b), 9.86 nm (c), and 4.96 nm (d). These sizes
correspond to approximately 5, 3, 2, and 1 times the Förster distance of the
EGRO/DANSYL FRET pair, respectively.
Table 1 lists input parameters used in each simulation performed in this
study. D is the domain diameter in nm, the donor to lipid ratio (DLR) is the donor
mole fraction, the acceptor to lipid ratio (ALR) is the acceptor mole fraction, and
KpD is the donor partition coefficient given by the ratio of the mole fraction of
donors in the ICD phase to the continuous phase.

73
5.2.2 Calculation of Simulated Energy Transfer Efficiency Data
A coordinate system is defined and the distance between every donor and
acceptor is calculated assuming periodic boundary conditions. We impose an
interaction cutoff of 25 nm (beyond which interactions are negligible) for donors
in the lattice to acceptors in the periodic regions. The fluorescence decay function
for a single donor, j, in the presence of multiple acceptors at various distances,
ρjDA(t) is given by:
∏=
τ−
τ−
=ρAN
k jkjDA R
Rttt1
60
00expexp)(
(1)
where τ0 is the fluorescence lifetime of the unquenched donor, NA is the total
number of acceptors, R0 is the Förster distance, Rjk is the distance between donor j
and acceptor, k, and t is time [9]. The average donor decay function IDA(t) in the
presence of acceptors is then:
I tN
tDAD
jDAj
N D
( ) ( )==∑1
1ρ
(2)
where ND is the number of donors. The fluorescence decay function for a donor
in the absence of acceptors ID(t) is modeled as a single exponential decay.

74
dtttI D ⋅τ−= )/exp()( 0 (3)
After the decay functions are calculated from the known probe distributions in the
membrane lattices, the efficiency of energy transfer is calculated by numerically
integrating the decay functions according to:
EI t d
I t dt
DA
D
= −
∞
∞
∫
∫1 0
0
( )
( )
t (4)
Using Eqs. (1)-(4), it is possible to calculate the efficiency of energy transfer in
systems of unlimited complexity so long as the spatial locations of all donors and
acceptors are known (as they are in these simulations). As these exact locations
cannot be determined in experimental FRET studies of unlinked donors and
acceptors in membranes, analytical FRET models become necessary to interpret
experimental data.

75
Table 5.1 Summary of simulation input parameters. D is the known domain diameter, DLR is the donor mole fraction, ALR is the acceptor mole fraction, and KpD is the donor partition coefficient.
Simulation D (nm) DLR x103 ALR x103 KpD
A1 4.93 1 1,2,5,10,20,30,40,50 1
A2 4.93 1 1,2,5,10,20,30,40,50 50
A3 4.93 1 1,2,5,10,20,30,40,50 200
B1 9.86 1 1,2,5,10,20,30,40,50 1
B2 9.86 1 1,2,5,10,20,30,40,50 50
B3 9.86 1 1,2,5,10,20,30,40,50 200
C1 15.6 1 1,2,5,10,20,30,40,50 1
C2 15.6 1 1,2,5,10,20,30,40,50 5
C3 15.6 1 1,2,5,10,20,30,40,50 10
C4 15.6 1 1,2,5,10,20,30,40,50 25
C5 15.6 1 1,2,5,10,20,30,40,50 50
C6 15.6 1 1,2,5,10,20,30,40,50 200
D1 27.1 1 1,2,5,10,20,30,40,50 1
D2 27.1 1 1,2,5,10,20,30,40,50 50
D3 27.1 1 1,2,5,10,20,30,40,50 200

76
5.2.3 Analytical Modeling of Simulated FRET Data
We have previously described a theory accounting for lateral phase
separation of cholesterol-rich domains in membranes [7]. Briefly, that work made
four simplifying assumptions: 1) donors are at the center of domains 2) acceptors
are completely excluded from the domains, 3) the shape of the domains is disk-
like, and 4) the domains are symmetric along the plane of the bilayer [7]. Energy
transfer occurs in two ways: 1) from donors in the center of discrete domains to
acceptors in the continuous phase and 2) from donors in the continuous phase to
acceptors in the continuous phase. The efficiency of energy transfer is calculated
for one donor in each environment, and the overall efficiency of energy transfer is
calculated as the weighted average of the efficiency of energy transfer in each
environment, based on the relative fractions of donors in each phase. The
formulation is described mathematically by Eq. (5), where τ0 is the fluorescence
lifetime of the unquenched donor, t is time, r is distance, and R0 is the Förster
distance.
∫∞
⋅⋅
−+⋅⋅
−−−
⋅∫∫
⋅⋅−=
∞
⋅−∞
⋅−
0
2121
0
2
60
0
1
60
0
011 dteeE
LL
rRt
LL
rRt
drredrret ππσ
τ
ττ
τ (5)
The acceptor surface density (σ), which is the concentration of acceptors per unit
area of membrane, is related to ALR by the following expression, where Ac is the
average cross sectional area of a lipid molecule [26].

77
σ=ALR/(Ac) (6)
The two lower limits of integration used in Eq. 5 (LL1 and LL2) correspond to the
distance of closest approach (DCA) between donor and acceptor. The values of
LL1 and LL2 depend on the type of phase in which the energy transfer takes place.
In the continuous phase, migration of the fluorophores is unrestricted, and the
DCA is approximately the average molecular diameter, a, of the donor and
acceptor (so LL1=a) within a leaflet. Also, acceptors can reside directly beneath
a donor so that LL2 is given by the bilayer thickness h. On the other hand,
domains exclude acceptors so that the DCA equals the domain radius, n (LL1=n)
and across the leaflet is given by LL2=(n2+h2)1/2. Fig. 5.3 shows a schematic of
the energy transfer geometries for donors in each environment.
Given this description of E in each phase, we now need to estimate the relative
amounts of donors and acceptors in each phase. By a material balance, the
relative amount of donor in the continuous phase is:
)/( CCDDCC XXKpKpX +⋅−=φ (7)
where XC is the mole fraction of lipids in the continuous phase and KpD is the
donor partition coefficient. (KpD = xD2/xD1, where xD2 and xD1 are the mole
fractions of donors in the domain phase and continuous phase respectively)

78
The predicted efficiency of energy transfer (EPRED) is then a weighted average of
the energy transfer in the continuous (EC) and discrete (ED) phases.
DCCCPRED EEE ⋅−+⋅= )1( φφ (8)
We will now test the efficiencies of energy transfer predicted by Eqs. (5)-(8) with
the simulated FRET data from the known distributions in the lattice model from
Eqs. (1)-(4).

79
5.3 Results
5.3.1 Simulations of Known Distributions
To explore the effects of the size of laterally phase separated cholesterol
immiscible domains on the efficiency of energy transfer between a cholesterol
analog donor and a lipid analog acceptor, a lattice simulation of DMPC-
cholesterol membranes was used to generate predetermined size distributions of
ICD. FRET experiments were mimicked by holding the donor mole fraction
constant and varying acceptor concentration in 40mole% cholesterol DMPC
lattice model membranes with mono disperse immiscible cholesterol domains
whose hydrodynamic diameters were 4.96 nm, 9.86 nm, 15.6 nm, and 27.1 nm.
Eqs. (1)-(4) were then used to calculate the exact efficiency of energy transfer.
The effect of the donor partition coefficient on the energy transfer efficiency as a
function of acceptor loading profiles was studied by varying the amount of donors
in each phase to correspond to donor partition coefficient values of 1, 50, and 200.
Fig. 5.4 shows the simulated efficiency of energy transfer as a function of ALR
for each of the four domain size using three donor partition coefficients (a)
KpD=1, (b) KpD=50, and (c) KpD=200. For KpD=1 (simulations A1, B1, C1, and
D1), shown in Fig. 5.4a, the energy transfer efficiency increases by approximately
90% from ALR=0 to ALR=0.02, and remains constant or increases slightly above
ALR=0.02, regardless of the domain size. The energy transfer efficiencies at
ALR=0.05 are 97.0, 96.7, 95.8, and 93.6 percent for membranes A1, B1, C1, and
D1 respectively. Increasing the domain size from 4.93 nm to 27.1 nm only
changes the efficiency of energy transfer at ALR=0.05 by 3.5%. Fig. 5.4b

80
(simulations A2, B2, C5, and D2) shows that the FRET profiles are strongly
dependent on the domain size at KpD=50. Specifically, the efficiencies of energy
transfer at ALR=0.05 are 96.4, 92.3, 81.4, and 61.5 percent for membranes A2,
B3, C5, and D2 respectively. Fig. 5.4c (simulations A3, B3, C6, and D3) shows a
similar dependence on domain size when KpD=200. The efficiencies of energy
transfer at ALR=0.05 are 96.2, 91.9, 81.9, and 60.0 percent for membranes A3,
B3, C6, and D3, respectively. The difference between the KpD=50 and KpD=200
data is approximately 12%.
Fig. 5.5 shows the sensitivity of energy transfer efficiency to the donor
partition coefficient. Shown is percent energy transfer versus acceptor to lipid
ratio for six values of KpD in a simulated membrane with ICD that are 15.6 nm in
diameter. (1(C1), 5(C2), 10(C3), 25(C4), 50(C5), and 200(C6)) Increasing KpD
systematically lowers the efficiency of energy transfer.
5.3.2 Model Predictions and Comparison with Simulation Results
To test the ability of the analytical FRET model to fit actual FRET data,
with the purpose of estimating domain sizes, the predictions of Eqs. (5)-(8) are
compared with the simulation results (i.e. Eqs (1)-(4) applied to known
distributions from the lattice model). All of the simulated FRET data sets in Table
1 were fit with Eqs. (5)-(8) by minimizing the sum of the squared errors (SSQE).
The lower limits of integration (LL1 and LL2) in the continuous phase were fixed
at 0.82 nm (average molecular diameter) and 4 nm (bilayer thickness). The donor
partition coefficients were set to the input values, thus the only parameter left
open to the fit is the domain radius, n, which appears in the lower limits of

81
integration in the domain phase. The ’best fit’ domain diameters (d=2n) along
with their corresponding SSQE and percent error values are shown in Table 2.
Fig. 5.6 shows the simulated data for the membrane with 27.1 nm diameter
domains at KpD=1, KpD=50, and KpD=200 (simulations D1, D2, and D3). Solid
lines are the best fits of the analytical FRET model, which yielded domain
diameters of 12.0, 12.8, and 13.0 nm for KpD=1, 50, and 200, respectively.
To test the ability of the FRET model to predict the donor partition coefficient in
addition to the domain size, the lattice model FRET data with domains of known
diameter (15.6 nm) and known partition coefficient (KpD=25) (simulation C4),
were fit with Eqs. (5)-(8) in the usual fashion, leaving the domain radius open to
the fit. However, the fitting process was repeated using five different values of
KpD , and Fig. 5.7 displays the best fit domain size as a function of these assumed
KpD values. The estimated domain size is a strong function of the assumed donor
partition coefficient in the range (KpD=1-5), but this dependence is much weaker
for KpD >=10. Table 3 shows the values of the estimated domain diameter and
the SSQE for the assumed KpD values:1, 5, 10, 25, 200. Note that the best
estimate of the actual domain size occurs when KpD=5, but the best numerical
description of the simulation C4 data that is, lowest SSQE=17.5 is obtained with
an assumed KpD=25. This is a general result; namely the best fit accurately
reports the value of KpD while underestimating the actual domain size. The C4
data is shown here merely as an example.

82
Table 5.2 Comparison of the domain diameter estimated from fitting the analytical FRET model (the diameter estimated using Eqs. (5)-(8), d) to the exact simulated lattice FRET data (D). We also report the sum of the squared errors (SSQE) and the percent error for each simulation.
input input Output
Simulation KpD D(nm) d(nm) SSQE %error
A1 1 4.93 5 14.1 1.42
A2 50 4.93 4.6 11.3 -6.69
A3 200 4.93 4.6 7.7 -6.69
B1 1 9.86 7.4 9.1 -24.9
B2 50 9.86 7.4 12.7 -24.9
B3 200 9.86 7.2 13.8 -27.0
C1 1 15.6 8.6 21.6 -44.9
C2 5 15.6 9.4 22.6 -39.7
C3 10 15.6 11.4 12.0 -26.9
C4 25 15.6 9.2 17.5 -41.0
C5 50 15.6 9.4 37.5 -39.7
C6 200 15.6 9.6 20.7 -38.5
D1 1 27.1 12 36.3 -55.7
D2 50 27.1 12.8 63.9 -52.8
D3 200 27.1 13 114.7 -52.0

83
Table 5.3 Best fit domain diameters and the SSQE for simulation C4 FRET data (known KpD =25 and known domain dimeter=15.6 nm) as a function of the assumed donor partition coefficient. KpD d(nm) SSQE
1 62 985
5 13.4 97.9
10 10.8 29.5
25 9.2 17.5
50 8 94.8
200 8.2 26.2

84
5.4 Discussion
Membrane bilayers were simulated as coupled two-dimensional lattices
with total cholesterol fractions of 40 mole percent, and immiscible cholesterol
domains of diameters ranging from 4.96 nm to 27.1 nm were inserted.
Fluorescence resonance energy transfer experiments using a cholesterol analog
donor and a phospholipid analog acceptor were simulated by introducing these
analogs into the lattice according to their respective partition coefficient in each
phase. Plots of the exact efficiency of energy transfer (average of 10 simulations)
as a function of acceptor concentration were generated for four membrane
configurations. The simulated data sets were then fit with an analytical FRET
model that predicts energy transfer efficiency and is used to estimate domain size
from experimental data analogous to that generated by the lattice model.
Simulations were preformed at a constant domain size with increasing values of
the donor partition coefficient to quantify the effects of preferential probe
separation on the efficiency of energy transfer.
5.4.1 Effect of Domain Size and Donor Partition Coefficient
As the size of the laterally phase-separated domains increases, the
efficiency of energy transfer is systematically lowered. This is due to the fact that
the acceptors are completely excluded from the domains, which leads to an
increased separation distance and thus a lowered energy transfer efficiency.
However, the sensitivity to size depends on the donor partition coefficient. When

85
the donor partition coefficient is unity, the effect of increasing the domain size is
small because energy transfer in the continuous phases dominates. As the value
of KpD increases, the contribution to the overall energy transfer from donors in
domains also increases. By material balance, one recognizes that at values of KpD
> 8.3, more donors are in the domains than in the continuous phase. Accordingly,
energy transfer from donors in the domains dominates at KpD values greater that
10, and increases in KpD beyond 50 exhibit little effect (Figs. 5.5 and 5.7). It
should be appreciated that the large domain sizes and donor partition coefficients
act synergistically. Any donor in a domain larger than 5xR0 will be unable to
participate in energy transfer, and the number of donors affected depends on KpD.
5.4.2 Analytical Model Evaluation
The analytical FRET model is able to estimate the size of immiscible
cholesterol domains fairly well for the simulated membranes with 4.93 nm and
9.86 nm diameter domains. The respective percent errors in the size estimation
are approximately 7% and 25%, regardless of the donor partition coefficient used
to generate the simulated FRET data. When estimating the size of 15.6 nm and
27.1 nm domains, the errors were 40% and 55%, respectively. This increased
error is due to the fact that FRET is most sensitive for determining length scales
that are near the Förster distance, and ineffective for length scales larger than five
times the Förster distance. Therefore, while FRET can be used to test for the
presence of lateral phase separations, the determination of the size of the domains
is limited to domains smaller than 25 nm for the ERGO/DANSYL pair. Another

86
limitation arises from the assumption that the donors are located in the center of
the domains, which leads to systematic under-predictions of the size of the ICD.
We have recently used this FRET model to estimate the size of immiscible
cholesterol domains in 40mole% cholesterol DMPC membranes to between 10
nm and 20 nm [7]. In that work the measured FRET efficiencies were less than
50%, even at the highest acceptor loadings. Here, the limiting FRET efficiency is
determined by simulation to be approximately 60% (27.1 nm domains,
ALR=0.05). This disagreement potentially means that the distance of closest
approach of ERGO and DANSYL in the continuous phase is greater than one
molecular diameter, as is implicitly the case in our lattice model simulations.
Regardless, the present study validates the use of our analytical model in
determining the domain sizes used in our experimental system, as these sizes (10
nm-20 nm) fall within the range of FRET sensitivity of the ERGO/DANSYL
FRET pair, and suggests that the error associated with our size estimation is
approximately 40%-50%.
In addition, we show that the FRET model can also be used to estimate the
donor partition coefficient. If the donor partition coefficient is not known it can
be left open in the fit. Fig. 5.7 shows the best-fit domain size from the domain
model for increasing values of KpD, and Table 3 shows the SSQE for assumed
KpD. It is evident from Fig. 5.7 that best fit domain size is a weak function of the
assumed partition coefficient for values of KpD >=10. The lowest SSQE in Table
3 corresponds to KpD=25, the value that was used to generate the data, which

87
justifies leaving both the domain size and KpD as free parameters in the fitting of
experimental data where neither is known.
We expect that the domain model and FRET methodology described in
this work can be extended to the analysis of other systems that display lateral
phase separation. The first requirement for these applications is that acceptors
must be excluded from the discrete phase. Secondly, reliable size estimates are
subject to the limitations imposed by the Förster distance, making this technique
best-suited for studying the initial birth or nucleation of a discrete phase whose
domain sizes are expected to range between 1nm and 25 nm.

88
1.00.9
20
40
60
00.0 0.1 0.2 0.3 0.4 0.5 0.6 0.7 0.8
LD
LD + LO
SO SO + LO
LO + ICD
X*C
XCHOL
Tem
pera
ture
o C
&Macroscopic Crystals
LO + ICD
LO
Figure 5.1 Hypothetical phase diagram for DMPC/cholesterol membranes. The hatched section shows our hypothetical extension of the established phase diagram in the white area. This study focuses on the two-phase region where immiscible cholesterol domains coexist with the liquid ordered phase. The dashed line is the cholesterol concentration (X`C) above which macroscopic cholesterol crystals can be detected. LD is the liquid disordered phase, LO is the liquid ordered phase, SO is the solid ordered phase, and ICD is the immiscible cholesterol domain phase.

89
Figure 5.2 Examples of typical mono-disperse domain and probe configurations for a DMPC-cholesterol bilayer containing 40mole% cholesterol, as simulated in the lattice model. Phospholipid is shown in dark blue, cholesterol in light blue, donors in yellow, and acceptors in red. Because the domains span the bilayers, only the top leaflet is shown. The cholesterol concentrations in the continuous phase are 33mole% and the discrete phase is pure cholesterol. The hydrodynamic diameters of the domains are (top left) 27.1 nm, (bottom left) 15.6 nm, (top right) 9.86 nm, and, (bottom right) 4.96 nm. KpD=1, DLR=0.01, and ALR=0.02.

90
(1) Membranes without domains
Bilayer thicknesshD
D
D
DD
E
a
(2) Membranes with domains
Bilayer thicknesshE
DD
D
D
n
(n2 +h
2 )1/2
Figure 5.3 Energy transfer geometries: the distance of closest approach is depicted for membranes (1) without and (2) with domains.

91
(a)
0
20
40
60
80
100
0 0.01 0.02 0.03 0.04 0.05ALR
%E
(b)
0102030405060708090
100
0 0.01 0.02 0.03 0.04 0.05ALR
%E
(c)
0102030405060708090
100
0 0.01 0.02 0.03 0.04 0.05
ALR
%E
Figure 5.4 Percent efficiency of energy transfer versus acceptor to lipid ratio for (a) KpD=1, (b) KpD=50, and (c) KpD=200 for simulated membrane bilayers with immiscible cholesterol domains. Domains have the following sizes:4.93 nm(∗), 9.86 nm(∆), 15.6 nm(□) and 27.1 nm(♦) in diameter.

92
0102030405060708090
100
0 0.01 0.02 0.03 0.04 0.05
ALR
%E
Increasing Kp D
Figure 5.5 Effect of donor partition coefficient on the efficiency of energy transfer in a 40mole% cholesterol DMPC lattice model membrane with 15.6nm immiscible cholesterol domains. (◊) KpD=1, (∆) KpD=5, (×) KpD=10, (ο) KpD=25, (□) KpD=50, (+) KpD=200.

93
0102030405060708090
100
0 0.01 0.02 0.03 0.04 0.05
ALR
%E
12.0 nm
12.8 nm
13.0 nm
Figure 5.6 Simulated efficiency of energy transfer data for membrane containing 27.1 nm diameter domains. (□) KpD=1, (ο) KpD=50, (∆) KpD=200. The solid lines are the best fits of the simulated data with equations (5)-(8).

94
0
10
20
30
40
50
60
70
0 25 50 75 100 125 150 175 200
Kp D
Dom
ain
Dia
met
er (n
m)
*
Figure 5.7 Best fit domain diameters as a function the assumed donor partition coefficient for a simulated membrane with 15.6 nm diameter domains and KpD set to 25.(simulation C4) The best fit domain diameter is a weak function of the assumed partition coefficient for KpD>10. The point * reflects the known diameter and partition coefficient. Whereas the best estimate of the domain size occurs with assumed KpD=5, the best fit (i.e. lowest SSQE) occurs with an assumed KpD=25. Thus the analytical FRET model reports the exact KpD value while underestimating the domain size.

95
List of References
[1] T. N. Tulenko, M. Chen, P. E. Mason, and R. Preston-Mason,. J. Lipid Research. 39 (1998) 947-956. [2] R. Preston Mason, Thomas N. Tulenko and Robert F. Jacob. Biochim. Biophys. Acta 1610 (2003) 198-207. [3] M. Chen, R. P. Mason, and T. N. Tulenko. Biochim. Biophys. Acta 1272 (1995) 101-112. [4] S. P. Wrenn, M. Gudheti, A. N. Veleva, E. W. Kaler, and S. P. Lee. J. Lipid Res. 42 (2001) 923-934. [5] S. P. Wrenn, E. W. Kaler, and S. P. Lee. J. Lipid Res. 40 (1999) 1483-1494. [6] Chen-Lun Lui and William I. Higuchi. Biochim. Biophys. Acta 1588 (2003) 15-25. [7] G.M. Troup, T.N. Tulenko, S.P. Lee, S.P. Wrenn. Coll. Surf. B 29 (2003) 217-231. [8] L. Stryer. Annu. Rev. Biochem. 47 (1978) 819-846. [9] L. M.S. Loura, A. Fedorov, M. Prieto. Biophys. J. 80 (2001) 776-788. [10] L. M.S. Loura, A. Fedorov, M. Prieto. Biochim. Biophys. Acta 1151 (2001) 236-243. [11] L. M.S. Loura, A. Fedorov, M. Prieto. Biophys. J. 71 (1996) 1823-1836. [12] S. Pedersen, K. Jorgensen, T.R. Baekmark, O.G. Mouritsen. Biophys. J. 71, (1996) 554-560. [13] T.G. Dewey and M.M. Datta. Biophys. J. 56, (1989) 415-420. [14] Lakowicz, J.R. Kluwer Academic/Plenum Publishers, New York. (1999). [15] T.G. Dewey and G.G. Hammes. Biophys. J. 32 (1980) 1023-1035. [16] P.K. Wolber and B.S. Hudson. Biophys. J. 28 (1979) 197-210. [17] T.N. Estep and T.E. Thompson. Biophys. J. 26 (1979) 195-208. [18] B. Snyder, E. Freire. Biophys. J, 40 (1982) 137-148.

96
[19] B. Snyder, E. Freire. Proc. Acad. Sci. U.S.A. 77 (1980), 4055-4059. [20] Merz, K.M. and Roux, B. Birkhauser Boston. (1996). [21] S. Wrenn, Ph.D. thesis, University of Delaware, 1999. [22] J. F. Nagle, and S.Tristram-Nagle. Biochim. Biophys. Acta 1469 (2000) 159-195. [23] P.F.F. Almeida, W.L.C. Vaz, and T.E. Thomposon. Biochemistry 31 (1992) 6739-6747. [24] J. Huang, J.T. Buboltz, G.W. Feigenson. Biochim. Biophys. Acta 1417 (1999) 89-100. [25] Avery L. McIntosh, Adalberto M. Gallegos, Barbara P. Atshaves, Stephen M. Storey, Deepak Kannoju, and Friedhelm Schroeder. J. Biol. Chem. 278 (2003) 6384-6403. [26] B. K.K. Fung, and L. Stryer. Biochem. 17 (24) (1978) 5241-5248.

97
CHAPTER 6: DANSYL TRES Studies
6.1 Introduction
The effect of cholesterol on the properties of model membranes has been
an area of intense investigation because of the role cholesterol plays in human
disease. Model membrane systems are important because they serve as platforms
for the systematic study of cholesterol-related-diseases such as atherosclerosis and
gallstone pathogenesis. Currently, cholesterol-rich, laterally phase-separated,
liquid-ordered domains in model membrane systems are under investigation
because they serve as a model for rafts in natural membranes [1]. In natural
membranes, rafts are hypothesized to be involved in signal transduction, protein
stabilization, protein and lipid sorting, and membrane fusion [2]. Additionally a
laterally phase-separated, cholesterol-only phase termed “immiscible cholesterol
domains” has been reported to exist in natural and model membranes [3]. This
finding of pure cholesterol domains suggests that cholesterol-induced laterally,
phase separated domains might be involved in the nucleation mechanism of
cholesterol from phospholipid bilayers, possibly serving as pre-nuclei for
macroscopic cholesterol crystals.
Fluorescence spectroscopy is capable of studying the dynamics of
fluorescent molecules and their local environments on the nanosecond time scale
[4], and therefore has found application in the investigation of phospholipid-
cholesterol mixtures. In particular, the membrane probe 1-myristoyl-2-[12-[(5-
dimethylamino-1-naphthalenesulfonyl)amino]dodecanoyl]-sn-Glycero-3-

98
phosphocholine (DANSYL) and related probes have been used in membrane
studies because of their sensitivity to solvent polarity [5-7], as well as in
numerous studies as both a Förster energy transfer donor [8,9] and acceptor [6,10-
13]. The DANSYL fluorophore has been shown to give blue-shifted emission
spectra in non-polar solvents such as chloroform and toluene and red-shifted
emission spectra in polar solvents such as ethanol and methanol [14]. We have
previously shown that the temperature dependence of the polarity-induced
DANSYL steady-state spectral shifts can be used to determine the liquid-ordered
(lo) to liquid-disordered (ld) phase transition boundaries in model lipid membranes
[6]. There we extrapolated the successful analysis of DANSYL steady-state
spectral shifts in determining known membrane phase behavior (lo and ld phase
boundaries in DMPC-cholesterol MLV) to detect the presence of laterally phase-
separated cholesterol-rich domains in DMPC MLV at high cholesterol loadings
(Xchol > 0.30) [6,15].
Here we perform a steady-state and time-resolved emission spectra study
of the fluorescent properties of tail-labeled DANSYL DMPC in DMPC MLV
prepared by modified rapid solvent exchange [16,17] as a function of cholesterol
concentration at 30°C and 60°C. We are interested in determining the physical
mechanism behind the DANSYL spectral sensitivity to cholesterol and membrane
phase behavior in model membranes. Specifically, we seek to identify the causes
of the large spectral shifts in the DANSYL steady-state emission spectra at high
cholesterol loadings, and the effects of cholesterol on the DANSYL membrane
penetration depth in DMPC MLV. Finally, we use our current findings to

99
examine critically our previous results on the use of DANSYL for the detection of
cholesterol-rich laterally phase-separated domains in model membranes. The
results herein suggest that the DANSYL sensitivity to cholesterol is due to
complex time-dependent solvent effects and identify two separate DANSYL
populations in DMPC-cholesterol mixtures with cholesterol mole fractions above
0.30. We also find that the DANSYL membrane penetration depth in DMPC
MLV is dependent on cholesterol composition and temperature.
6.2 Background
Shifts in fluorescence spectra sometimes arise from solvent effects. For
example, the well-known Stokes shift results from the energy lost in the excited
state due to collisions with solvent molecules. Solvents effects can be classified
into three categories: general solvent effects, specific solvent effects, and specific
probe effects. General solvent effects are attributable to energy loss due to
solvent reorganization around the excited state dipole of the fluorophore, which is
typically complete prior to fluorescence emission. This is the case for many non-
viscous solvents where the time scale for solvent relaxation is on the order of 10-10
sec. In relatively more viscous environments, such as phospholipid membranes,
the time scale of spectral relaxation can be comparable to the time scale of
fluorescence emission (10-8-10-9 sec), and the time dependence of spectral
relaxation can affect the steady-state spectral shifts. In this case, fluorescence
emission can occur simultaneously from un-relaxed, partially relaxed, and
completely relaxed states. Specific solvent effects are the result of chemical
bonds between the fluorophore and the solvent. For example hydrogen bonding is

100
a specific solvent effect that stabilizes the excited state prior to solvent relaxation
and fluorescence emission, resulting in lower energy fluorescence emission.
Specific probe effects are inherent to a fluorophore and are characterized by a
conformational change in the fluorophore molecular structure. Examples of
specific probe effects are the formation of an internal charge transfer (ICT) state
and the formation of a twisted internal charge transfer (TICT) state. Fluorophores
possessing both electron donating and electron accepting groups can form ICT
states in polar environments during the excited state lifetime of the probe. As the
name implies, a TICT state is an ICT state that also includes the physical
rearrangement of functional groups on the probe. Both ICT and TICT states are
low energy states and result in lower energy fluorescence emission.
Time-dependent solvent relaxation, specific solvent effects, and specific
probe effects in steady-state fluorescence spectroscopy are typically studied with
time-resolved emission spectroscopy (TRES) [4]. TRES is fundamentally
different from steady-state fluorescence emission spectroscopy in that the
excitation source is modified in either the time or the frequency domain. In
addition, the fluorescence intensity can be measured as a function of both
emission wavelength and time during the decay from the excited state to the
ground state. The ability of TRES to measure the decay of fluorescence emission
on the nanosecond time-scale has lead to its widespread use for the study of time-
dependent solvent relaxation as well as specific solvent and probe effects [18-20].
Two simplified models for time-dependent solvent effects are the continuous
model and the two-state model. The continuous model analysis of TRES is

101
characterized by spectra of constant shape shifting in wavelength space as a
function of time. Therefore, the continuous model is used to describe time-
dependent dipolar relaxation [20]. The two-state model analysis of TRES
describes the rise and fall of a locally excited state and a relaxed state as a
function of time. The locally excited state and the relaxed state appear as two
separate peaks in wavelength space; initially only the locally excited state is
observed, and at long times the relaxed state rises and decays. Consequently, the
two-state model has found use in the detection of specific solvent and specific
probe effects [20].
6.3 Materials and Methods
6.3.1 Chemicals
DMPC, Cholesterol, CoCl2, NaCl, HEPES, NaN3, and CaCl2, were
purchases from Sigma Chemical Co. (Sigma-Aldrich, St. Louis, MO). DANSYL,
5-DOXYL-PC, and 16-DOXYL-PC were purchased from Avanti Polar Lipds,
Inc. (Alabaster, AL). All chemicals were used without further purification. The
structures of DANSYL, 5-DOXYL-PC, and 16-DOXYL-PC are shown in Fig.
6.1.
6.3.2 Preparation of Multi-lamellar Vesicles (MLV)
Multi-lamellar vesicles were prepared by the method of modified rapid
solvent exchange. [16,17] Briefly, DMPC, cholesterol, DANSYL, 5-DOXYL-
PC, and 16-DOXYL-PC were dissolved in chloroform to form stock solutions.
Appropriate amounts of these stock solutions were mixed to give the desired

102
compositions, and this mixture was added to 3 mL of aqueous buffer that was
preheated to 60°C in a 30 mL flat bottom vial. The mixture was then vortexed
and exposed to a vacuum of 25 inches of Hg for 5 minutes. Hot air (200°F) is
blown on the vial to minimize evaporative cooling during solvent removal. An
additional 7 mL of 60°C aqueous buffer is then added, and the samples are stored
at room temperature for 24 hrs before use. The maximum solvent volume is
always less than 300 µL. The buffer used in this work contains 0.15 M NaCl, 5
mM CaCl2, 5 mM HEPES, and 0.02 wt% NaN3, pH 7.4. The total lipid
concentration of the resulting membrane suspensions is in all cases 0.65 mM.
6.3.3 Fluorescence Measurements
All steady-state fluorescence measurements were made on a Photon
Technology International Inc. model A-710 with the bandpass set to 2 nm. The
excitation wavelength was 337 nm, and the fluorescence emission was measured
in one nm intervals from 357 nm to 657 nm for all tests. All steady-state
fluorescence spectra are uncorrected for the color shift inherent in the detection
system. All time-resolved fluorescence measurements were recorded on a Photon
Technology International model C-71(time domain, stroboscopic system). The
excitation source was a pulsed nitrogen laser operating at 337 nm with a
frequency of 10 Hz and a band pass of 10 nm. The temperature of the sample
chamber was controlled to ±0.5°C via a circulating water bath, and the
temperature was monitored with a cuvette thermometer (Fisher Corp.,
Philadelphia, PA. model # 15-078J).

103
6.3.4 Steady-state DANSYL Temperature Studies
To determine the effects of cholesterol composition and temperature on
the DANSYL photo physics, DANSYL was incorporated into DMPC-cholesterol
mixtures with the following cholesterol mole fractions: 0, 0.05, 0.10, 0.15, 0.20,
0.25, 0.30, 0.35, 0.40, 0.45, 0.50, 0.55, and 0.60. The DANSYL mole fraction in
all the mixtures is 0.01. The steady state emission spectra and excitation spectra
were recorded at both 30°C and 60°C for all the samples. Excitation spectra were
recorded at emission wavelengths of 550 nm and 450 nm. The excitation was
varied in 1 nm intervals from 280 nm to 425 nm and from 230 nm to 300 nm for
the 550 nm and 450 nm emission wavelengths respectively.
6.3.5 Cobalt Quenching Water Penetration Studies
To determine the effect of cholesterol composition and temperature on
water penetration into the membrane, 10 mM of CoCl2 was incorporated in the
aqueous buffer, and the pH was adjusted to 7.4. This CoCl2 concentration was
selected as it is sufficiently high to give efficient quenching and sufficiently low
to ensure solubility in the aqueous buffer at pH=7.4. DMPC-cholesterol mixtures
(in the buffer containing 10 mM CoCl2) at the following cholesterol mole
fractions were prepared: 0, 0.05, 0.10, 0.15, 0.20, 0.25, 0.30, 0.35, 0.40, 0.45,
0.50, 0.55, and 0.60. The steady-state emission spectra for this sample set were
recorded at 30°C.

104
6.3.6 Nitroxide Quenching DANSYL Depth Studies
To estimate the membrane penetration depth of DANSYL, 0.10 mole
fractions of 5-DOXYL-PC and 16-DOXYL-PC were incorporated separately in to
DMPC-cholesterol mixtures with the following cholesterol mole fractions: 0,
0.05, 0.10, 0.15, 0.20, 0.25, 0.30, 0.35, 0.40, 0.45, 0.50, 0.55, and 0.60. The
steady-state emission spectra and excitation spectra were recorded at both 30°C
and 60°C.
6.3.7 Time-resolved Emission Spectra (TRES) Measurements
To maximize wavelength resolution, apparent TRES were recorded
directly utilizing a time domain stroboscopic detection system. The TRES
presented in this work are apparent TRES, meaning that the measured
fluorescence intensity data has not been corrected for two effects, 1) the color
shift introduced by the detection system and 2) convolution with the excitation
pulse. Recognizing that these two effects are present the data will be interpreted
in terms of relative changes and not as absolute values. The convolution effect is
expected to decrease the resolution of the TRES somewhat, but we will show that
the physics controlling the spectral shifting are significant enough to be readily
detectable. The fluorescence intensity was measured in 2 nm intervals between
357 nm and 657 nm at delay times of 38, 39, 41, 44, 49, 59, 79, and 99 ns. These
delay times correspond to approximately 0, 1, 3, 6, 11, 21, 41, and 61 ns after the
excitation pulse. Time zero is defined as the leading edge of the measured
response function. The reported data at each wavelength are the average of
fifteen separate excitation pulses.

105
6.3.8 Analysis of Experimental Data
All DANSYL spectra were smoothed and normalized [21]. As the
DANSYL fluorescence emission and excitation spectra are highly unstructured,
we employ the spectral center of gravity (SCG) and the spectral half width (SHW)
as defined by Eqs. 1 and 2 to characterize the spectra.
∫
∫∞
∞
⋅
⋅⋅=
0
0
)(
)(
λλ
λλλ
dFI
dFISCG (1)
∫
∫∞
∞
⋅
⋅−=
0
0
2
)(
)()(
λλ
λλλ
dFI
dFISCGSHW (2)
The rate of spectral relaxation is quantified by tracking the SCG as a
function of time after the excitation pulse, SCG(t). SCG(t) is calculated according
to Eq. 1 for each delay time after the excitation pulse, where FI(λ) is the number
of photons per nanometer interval. Changes in spectral shape as a function of
time are quantified by tracking the SHW as a function of time after the excitation
pulse, SHW(t) is calculated with Eq. 2 for each delay time.
The time course of the SCG can be fit by the method of non-linear least squares to
extract the spectral relaxation times according to the following equation.

106
))/exp()/exp(()()( 22110 rr ttSCGSCGSCGtSCG τβτβ −⋅+−⋅⋅−+= ∞∞ (3)
Where SCG∞ is the SCG at infinite time, SCG0 is the initial SCG when t equals
zero, t is time, β1 and β2 are exponential pre-factors, and τr1 and τr2 are the
spectral relaxation times. Finally, the mean relaxation time, ⟨τSR⟩, is given by
2211 rrSR τ⋅β+τ⋅β=τ (4)
The DANSYL fluorescence quenching induced by the aqueous Cobalt and
the site-specific n-DOXYL-PC quenchers are quantified by the quenching ratio,
RQ, defined by Eq. 5, where FI(550nm) is the quenched fluorescence intensity at
550 nm, and FI0(550nm) is the unquenched fluorescence intensity at 550 nm.
)550()550(
0 nmFInmFIRQ = (5)
The depths of the DANSYL probe in the membrane are estimated using
parallax analysis, and are calculated using Eq. 6, where Zcf is the distance of the
probe from the center of the bilayer, Lc1 is the distance of the shallow quencher to
the bilayer center, F1 is the fluorescence intensity of the probe in the presence of
the shallow quencher, F2 is the fluorescence intensity of the probe in the presence
of the deep quencher, C is the quencher concentration in number of molecules per
unit area, and L21 is the distance between the shallow and deep quenchers [22].

107
21221211 2/)/)/ln(( LLCFFLZ ccf ⋅−⋅−+= π (6)
6.4 Results
6.4.1 Steady-state Fluorescence Characterization of DANSYL in DMPC-Cholesterol MLV
To demonstrate the effects of cholesterol on steady-state fluorescence
spectral properties of DANSYL in DMPC MLV we measured the DANSYL
steady-state emission spectra and the steady-state excitation spectra as a function
of cholesterol loading at both 30°C and 60°C. The DANSYL fluorescence
emission and excitation spectra are highly unstructured, meaning that they display
no distinct vibrational structure and so yield a single broad peak. Therefore, the
DANSYL fluorescence spectra lend themselves readily to analysis with the SCG
and SHW as defined by Eq. 1 and Eq. 2.
6.4.2 DASNYL Steady-state Emission Spectra
The smoothed and normalized DANSYL steady-state emission spectra are
plotted in Fig. 6.2 for all of the cholesterol concentrations used in this study at
30°C (Fig. 6.2a) and 60°C (Fig. 6.2b). In Fig. 6.3a the SCG, is plotted as a
function of cholesterol concentration at both 30°C and 60°C in DMPC-cholesterol
MLV. The DANSYL steady-state spectral sensitivity to cholesterol in model
lipid membranes is readily observed in Fig. 6.3a, as a dose-dependent blue shift in
the SCG at 30°C. At 30°C the DANSYL SCG is 514 nm at Xchol=0 and decreases

108
to 511 nm by Xchol=0.15. The DANSYL SCG decreases approximately linearly
from 507 nm at Xchol=0.20 to a value of 479 nm at Xchol=0.60. Upon heating to
60°C a complete alleviation of the blue shift is observed at low cholesterol
loadings and a partial alleviation of the blue shift is observed at high cholesterol
loadings by the systematic increase in the SCG as function of cholesterol loading.
Specifically, at 60°C the DANSYL SCG remains at a constant value of 520 nm
over the range Xchol=0 to Xchol=0.25, then decreases approximately linearly from
520 nm at Xchol=0.30 to a value of 484 nm at Xchol=0.60.
To determine if the addition of cholesterol induces a shape change in the
DANSYL steady-state emission spectra, the SHW, as defined by Eq. 2 is
calculated and plotted as a function of cholesterol mole fraction in Fig. 6.3b at
30°C and 60°C. At 30°C the SHW of the DANSYL spectra is approximately
constant at a value of 47 nm at cholesterol mole fractions between Xchol=0 and
Xchol=0.30 as a function of cholesterol concentration, at cholesterol concentrations
higher the Xchol=0.30 the DANSYL spectra slightly narrows systematically to a
value of 43 nm. Upon heating to 60°C the DANYSL emission spectra widens to
a values of 47 nm at high cholesterol loadings. This narrowing of the spectra at
high cholesterol loadings at 30°C and the subsequent widening upon heating to
60°C is the first indication that specific effects may be occurring in the system.
6.4.3 Steady-state Excitation Spectra
The DANSYL probe has two absorption bands as seen in Fig. 6.2c and
Fig. 6.2d. The first band is centered at 340 nm, and the second band is centered at
260 nm. Fig. 6.3c shows the SCG of the 340 nm and 260 nm absorption bands as

109
a function of cholesterol loading at both 30°C and 60°C, while in Fig. 6.3d is
plotted the SHW of the 340 nm and 260 nm absorption bands as a function of
cholesterol loading at both 30°C and 60°C. The lack of any spectral shifting or
shape changes in the excitation spectra suggest that electronic polarization is not
contributing to the observed cholesterol dose dependent DANSYL steady-state
emission blue shifts. Electron redistribution occurs on the absorption time scale
and would be detectable by spectral changes in the absorption spectra as a
function of cholesterol concentration and temperature.
6.4.4 Time-resolved Emission Spectra Studies of DANSYL in DMPC-Cholesterol MLV
To explore the possibility that time-dependent solvent effects are
contributing to the DANSYL steady-state cholesterol dose dependent blue shift
we measured the DANSYL TRES for DMPC bilayer mixtures with increasing
amounts of cholesterol, in 10 mol.% increments, in the range 0-60mol.% at 30C°
and 60°C. In Fig. 6.4a the DANSYL SCG is plotted as a function of time in
DMPC-cholesterol MLV at 30°C. The general trend in these data is the emission
is initially blue, and shifts to longer wavelength (red shifted) emission at later
times. At 30°C the SCG at the moment of excitation (Fig. 6.4a, t=38 ns) are 487
nm, 486 nm, 490 nm, 487 nm, 482 nm, 475 nm, and 470 nm for the 0, 0.10, 0.20,
0.30, 0.40, 0.50, and 0.60 cholesterol mole fraction samples, respectively. Fig.
6.4a clearly shows that above a cholesterol mole fraction of 0.30 the DANYSL
probe does not reach a relaxed state, the SCG is still increasing at 99 ns.
Examples of un-relaxed (t=38 ns) and relaxed (t=79) ns DANSYL spectra are

110
plotted in Fig. 6.5 for the 0mol.% cholesterol sample at 30°C. The intrinsic
fluorescence decay time of the DANSYL probe is ~11 ns. Thus even after
approximately six times the intrinsic decay time, the spectral relaxation is
incomplete at 30°C.
Fig. 6.4b shows the DANSYL SCG as a function of delay time in DMPC-
cholesterol MLV at 60°C. At 60°C the SCG at the moment of excitation (Fig.
6.4b, t=38 ns) are 498 nm, 498 nm, 498 nm, 496 nm, 490 nm, 481 nm, and 474
nm for the 0, 0.10, 0.20, 0.30, 0.40, 0.50, and 0.60 cholesterol mole fraction
samples respectively.
It is difficult to measure reliably the TRES at delay times greater than 60
ns after the excitation because the signal to noise ratio is too low, especially at the
lower cholesterol concentrations because DANSYL fluorescence intensity
increases with increasing cholesterol concentrations [6].
The rate of spectral relaxation is quantified by fitting the time course of the SCG
as a function of time after the excitation pulse with Eq. 3. The best fit parameters
are then used to calculate the mean spectral relaxation time using Eq. 4. The
mean spectral relaxation time as a function of cholesterol loading at 30°C and
60°C is plotted in Fig. 6.6. At 30°C the mean spectral relaxation time increases
from 3.07 ns at Xchol=0 to 3.50 ns at Xchol=0.20, then increases dramatically from
4.24 ns at Xchol=0.30 to a value of 14.17 ns at Xchol=0.60. Upon heating to 60°C
the mean spectral relaxation time at Xchol=0 is 1.31 ns and increases slightly to a
value of 1.95 ns at Xchol=0.30, then increases linearly to a value of 11.44 ns by
Xchol=0.60. The rate of solvent relaxation is governed by the mobility of the

111
molecules in the solvent shell surrounding the DANSYL probe, as well as the
mobility of the DANSYL-labeled phospholipids within the membrane.
To determine if the DANSYL TRES are undergoing a time-dependent
shape change we calculated the SHW as function of time during the fluorescence
decay. Fig. 6.4c shows the DANSYL SHW as a function of time after the
excitation pulse in DMPC-cholesterol MLV at 30°C. At 30°C and low
cholesterol loadings (Xchol< 0.30) the general behavior is that the spectra narrows
rapidly and remains constant thereafter. At intermediate and high cholesterol
loadings (Xchol ≥ 0.30) there is a widening of the spectra at intermediate times (41
ns to 59 ns) followed by a slight decrease at long times (t > 59 ns). These data
clearly reveal a time-dependent shape change, a behavior attributable to the
presence of specific probe and solvent effects such as hydrogen bonding or the
formation of internal charge transfer states [20]. This is evidence of at least two
distinct excited state populations of DANSYL in DMPC-cholesterol MLV at
cholesterol mole fractions between 0.30 and 0.60. Fig. 6.4d shows the DANSYL
SHW as a function of time after the excitation pulse in DMPC-cholesterol MLV at
60°C. Upon being heated from 30°C to 60°C the same trend in the time course of
the SHW is observed, but the widening of the spectra at intermediate times occurs
for Xchol ≥ 0.40 compared to Xchol ≥ 0.30 at 30°C.
6.4.5 DANSYL Quenching Studies in DMPC-Cholesterol MLV
The purpose of these quenching studies is to estimate the DANSYL
penetration depth into the membrane, and to determine the ability of water to
penetrate into the membrane. To determine the effects of cholesterol and

112
temperature on the location of the DANSYL probe within the membrane we
measured the DANSYL steady-state fluorescence emission spectra in DMPC-
cholesterol MLV in the presence of 5-DOXYL-PC and 16-DOXYL-PC as a
function of cholesterol loading at 30°C and 60°C. The amount of quenching is
quantified by the quenching ratio, RQ, defined by Eq. 5. The DANSYL
membrane penetration depth is estimated by using the 5-DOXYL-PC and 16-
DOXYL-PC quenching ratio data to calculate Zcf, the probe distance from the
center of the bilayer. To approximate the ability of water to penetrate the
membrane as a function of cholesterol loading we measured the DANSYL steady-
state fluorescence emission spectra in the presence of the aqueous quencher
CoCl2.
6.4.6 Aqueous Quenching with 10mM Co2+
Fig. 6.7a shows the quenching ratio, (RQ), calculated with Eq. 5, as a
function of cholesterol loading at 30°C in DMPC-cholesterol MLV. At Xchol=0
RQ is 0.72 and increases linearly with increases cholesterol loading to a value of
1.02 (complete alleviation of quenching) at Xchol=0.30. In the cholesterol
concentration range of Xchol=0.35-0.60, RQ is approximately a constant value of
0.93. The systematic increase in RQ over the cholesterol mole fraction range 0 to
0.30 suggests that the addition of cholesterol inhibits the ability of the aqueous
Cobalt quencher to access the DANSYL probe in the bilayer, and the ability to
quench is slightly restored at cholesterol mole fractions above 0.30. In Fig. 6.7b
the SCG as a function of cholesterol loading at 30°C is shown for the 10 mM
CoCl2 (□) and the un-quenched (◊) DANSYL sample sets. The 10 mM CoCl2

113
induces 1.5 nm blue shift at Xchol =0 and decreases with increased cholesterol
loading to a value of 0.4 nm at Xchol=0.30. At cholesterol mole fractions above
0.30 10 mM CoCl2 does not induce a blue shift in the SCG.
6.4.7 Site Specific DANSYL Quenching with 5-DOXYL-PC and 16-DOXYL-PC
Fig. 6.8 shows the quenching ratio as a function of cholesterol loading
with 5-DOXYL-PC(◊) and 16-DOXYL-PC(□) at 30°C(Fig. 6.8a) and 60°C(Fig.
6.8b). For 5-DOXYL-PC at 30°C and Xchol=0 the quenching ratio is 0.50 and
decreases approximately linearly with increased cholesterol loading to a value of
0.25 at Xchol=0.20. The quenching ratio remains at a constant value of 0.25 over
the cholesterol concentration range Xchol=0.20 to Xchol=0.40. At cholesterol
concentrations above Xchol=0.40, RQ increases with increasing cholesterol
concentration to a value of 0.63 at Xchol=0.60. For 16-DOXYL-PC at 30°C the
quenching ratio at Xchol=0 and is 0.69, and decreases with increasing cholesterol
loading to a value of 0.53 at Xchol=0.20. In the cholesterol concentration range
Xchol=0.20 to Xchol=0.35 the quenching ratio is constant at a value of 0.54. At
Xchol=0.40 the quenching ratio is 0.40 and decreases with increasing cholesterol
concentration to a value of 0.34 at Xchol=0.60. At 60°C for 5-DOXYL-PC the
quenching ratio decreases approximately linearly from a value of 0.45 at Xchol=0
to a value of 0.33 at Xchol=0.60. Upon being heated to 60°C the quenching ratio
for 16-DOXYL-PC is 0.67 at Xchol=0 and slightly decreases with increasing
cholesterol loading to a value of 0.58 at Xchol=0.20. The quenching ratio remains
at an approximately constant value of 0.61 over the cholesterol concentration

114
range of Xchol=0.20 to Xchol=0.45, and then decreases with increasing cholesterol
loading to a value of 0.39 at Xchol=0.60.
To determine if the DANSYL probe is existing at multiple depths we
examine the steady-state spectral shifting induced by the 5-DOXYL-PC and 16-
DOXYL-PC relative to the unquenched SCG. In Fig. 6.9 the SCG as a function of
cholesterol concentration at both 30°C (Fig, 6.9a) and 60°C (Fig. 6.9b) is plotted
for the 5-DOXYL-PC (□), 16-DOXYL-PC (∆), and the unquenched DANSYL (◊)
sample sets. The 5-DOXYL-PC induces a discernible blue shift from the
unquenched DANSYL SCG at all cholesterol concentrations used in this study,
while the 16-DOXYL-PC induces a red shift of similar magnitude in the SCG as
compared to the unquenched DANSYL sample set at both 30°C and 60°C. These
spectral shifts induced by the 5-DOXYL-PC and the 16-DOXYL-PC suggest that
the DANSYL probe is accessible to both the quenchers and may be residing at
both shallow and deep locations within the bilayer over the cholesterol mole
fraction range of 0 to 0.60.
6.4.8 DANSYL Penetration Depth Estimation Using Parallax Analysis
Fig.6.10 shows the distance from the center of the bilayer for the
DANSYL probe in DMPC-cholesterol MLV as a function of cholesterol loading
at 30°C (◊) and 60°C (□) calculated from the 5-DOXYL-PC (shallow) and 16-
DOXYL-PC (deep) quenching data using parallax analysis (Eq. 6) [22]. The
distance of the shallow quencher to the center of the bilayer, Lc1 in Eq. 6, is set to
12.15 Å, and the distance between the shallow and deep quenchers, L21 in Eq. 6, is
set to 9 Å for the calculation of the DANSYL distance from the bilayer center, Zcf,

115
as a function of cholesterol loading [23]. At 30°C the calculated distance from
the bilayer center is 11.7 Å at Xchol=0 and increases steadily to a value of 18.1 Å
at Xchol=0.30. At cholesterol concentrations beyond Xchol=0.30 and 30°C Zcf
decreases sharply with increasing cholesterol loading to a value of 0.1 Å at
Xchol=0.60. At 60°C the DANSYL distance from the center of the bilayer at
Xchol=0 is 12.5 Å and increases somewhat linearly with increased cholesterol
loading to a value of 16.9 Å at Xchol=0.50. At cholesterol mole fractions greater
than 0.50 the Zcf decreases sharply with increased cholesterol loading to a value of
7.7 Å by Xchol=0.60. Given that the parallax analysis reports that the DANSYL
probe resides at shallow depths within the membrane in the 0 to 0.30 cholesterol
mole fraction range, the alleviation of quenching by CoCl2 in that range may be
due to the cholesterol-induced condensation of the head group area and the
consequent dehydration of the interface region, but is consistent with DANSYL
existing at multiple depths within the bilayer.

116
6.5 Discussion
In this work we preformed a steady-state and time-resolved emission
spectra study of the fluorescent properties of the membrane probe DANSYL in
DMPC MLV prepared by modified rapid solvent exchange as a function of
cholesterol concentration at 30°C and 60°C. We characterized both the steady-
state and TRES data by calculating the SCG and the SHW with Eq. 1 and Eq. 2
respectively. The rate of spectral relaxation was quantified by fitting the TRES
SCG(t) data with Eq. 3 and calculating the mean spectral relaxation time with Eq.
4. We also performed fluorescence quenching studies utilizing CoCl2 as an
aqueous quencher and 5-DOXYL-PC and 16-DOXYL-PC as site specific
quenchers located at the fifth and sixteenth carbon along the phospholipid acyl-
chains. The purpose of this investigation was to determine the molecular
mechanism of the DANSYL steady-state fluorescence spectral sensitivity to
cholesterol concentration, temperature, and phase behavior in model lipid
membranes.
6.5.1 DANSYL Steady-state Cholesterol Induced Blue Shifts are Caused by Time-dependent Solvent Effects and the Formation of ICT States
Four factors determine the SCG of the steady-state emission spectra of
DANSYL in DMPC-cholesterol MLV: 1) the energy of the un-relaxed state, 2)
the energy of the relaxed state, 3) the rate of spectral relaxation, and 4) the
formation of ICT states. The energies of the un-relaxed and the relaxed state
reflect the polarity of the local environment surrounding the DANSYL probe.
The SCG data at the moment of excitation (t=38 ns, Fig. 6.4a and Fig. 6.4b) is the
117
most representative of the un-relaxed state. From Fig. 6.4 we can see that the
polarity of the local environment surrounding the DANSYL probe remains
relatively constant over the cholesterol mole fraction range of Xchol=0 to
Xchol=0.30 by the approximately constant value of the SCG at un-relaxed state at
38 ns and only a 3 nm shift in the SCG at the relaxed state at 79 ns (which is
consistent with a slight decrease in the local polarity), despite a liquid-disordered
to liquid-ordered phase transition (the lo and ld phase boundaries are
approximately Xchol=0.075 and Xchol=0.28 in DMPC MLV at 30°C) [24]. These
results confirm that the DANSYL probe prefers the liquid disordered phase to the
liquid ordered phase and is consistent with other reports that DANSYL prefers the
fluid phase in 1,2-dipalmitoyl-sn-glycero-3-phosphocholine and 1,2-dilinoleoyl-
sn-glycero-3-phosphocholine lipid mixtures [14]. At Xchol > 0.30 the energies of
the un-relaxed and relaxed states increases, which is consistent with a decrease in
local polarity around the DANSYL probe at these cholesterol concentrations.
The rate of spectral relaxation is governed by the mobility of the solvent
molecules in the shell surrounding the DANSYL probe, and is also coupled to the
mobility of the labeled macromolecule. Therefore, diffusion limitations of the
solvent and probe will affect the rate of spectral relaxation. The rapid red shift in
the SCG trajectories of the TRES data at low cholesterol concentrations (see Fig.
6.4) is due to water reorganization around the DANSYL excited state. The mean
relaxation times observed at high cholesterol concentrations are still due to the
movement of water but also are representative of macromolecular and acyl-chain
motions. Solvent relaxation is an interaction between a polar fluorescent probe

118
and polar solvent molecules and therefore non-polar molecules do not directly
contribute to the process. Rather non-polar molecules, in this case the
phospholipid acyl-chains and cholesterol act indirectly as diffusion barriers to
water movement surrounding the DANSYL probe. Our results show that water
and DANSYL are still interacting at high cholesterol compositions in DMPC
MLV.
Analysis of the spectral shape as a function of time was used to determine
whether the DANSYL spectral relaxation process is best described by the
continuous model, or the two-state model, and to detect for the presence of ICT
states [20]. At 30°C, we find that at low and intermediate cholesterol loadings
(Xchol < 0.30) the relaxation process is best described by the continuous model,
while at high cholesterol loadings (Xchol > 0.30), we observe evidence of two-state
model behavior. In all cases studied, however, the relaxation process in neither
purely continuous nor purely two-state, but rather exhibits attributes of both
models. We interpret these data as follows: at low cholesterol loadings, most of
the DANSYL probe is in a polar environment and forms ICT states. The
DANSYL probe has an electron accepting sulfonyl group and an electron
donating amino group, and could allow for multiple conformations of ICT states.
The presence of the water stabilizes the ICT states of the DANSYL probe. The
ICT states have lower energies than the native state, thus the emission is red
shifted. The distinct lack of spectral shifts in the steady-state absorption spectra is
evidence that the specific interactions are only occurring in the excited state, and
this points strongly towards the formation of ICT states over hydrogen bonding as

119
hydrogen bonding is expected to also occur in the ground state [4]. At cholesterol
loadings of Xchol=0.30 and above the DANSYL probe exists in two distinct forms;
an ICT state and a native state (non-ICT state). The native state is in a non-polar
environment, so that any ICT states formed are not stabilized and the resulting
fluorescence emission is of higher energy (i.e. more blue). These results lead us
to suspect that the ICT state emission originates from DANSYL located at
shallow depths in the membrane, and likewise the native state emission is from
DANSYL located in the hydrophobic core. The stabilization of the ICT state is
very rapid (on the order of ~3 ns), while the spectral relaxation around the native
state is slower (~10 to 15 ns). When most of the DANSYL emission is from the
native state, the slow rate of spectral relaxation dominates the steady-state
emission spectra.
6.5.2 The Depth of DANSYL Probe within the Membrane is Dependent on Cholesterol Concentration and Temperature and Membrane Phase Behavior To test our hypothesis that the DANSYL is located at shallow depths in
the bilayer at low cholesterol concentrations and resides at deep locations at high
cholesterol concentrations we performed fluorescence quenching studies to
estimate the DANSYL location in the membrane as a function of cholesterol
loading and temperature. The results of the parallax analysis (See Fig. 6.10) show
that the DANSYL membrane penetration depth is dependent on cholesterol
concentration and temperature. The initial rise in Zcf over the Xchol=0 to
Xchol=0.30 is perhaps surprising because both the 5-DOXYL-PC, and the 16-
DOXYL-PC data suggest that DANSYL resides deeper within the membrane with
120
increased cholesterol loading over this composition range. However, the parallax
analysis used in this study does not take into account that the addition of
cholesterol can increase the bilayer thickness by 10-15% [25]. The DANSYL
probe might be at the same depth relative to the bilayer surface, but farther from
the bilayer center, as a result of the cholesterol-driving condensation effect.
Furthermore, the parallax analysis supports the hypothesis that heating causes the
DANSYL probe to reorient closer to the bilayer surface by the increase in Zcf at
Xchol > 0.30 upon heating to 60°C. Our findings are consistent with other studies
reporting that DANSYL-labeled phospholipids locate near the hydrophilic-
hydrophobic interface in pure 1,2-dioleoyl-sn-glycero-3-phosphocholine
membranes [26,23]. Other researchers have reported that tail-labeled DANSYL
phospholipids and other polar groups have also been shown to exist at multiple
depths in pure 1,2-dioleoyl-sn-glycero-3-phosphocholine model membranes [14].
Our most compelling evidence of DANSYL residing at both shallow and deep
locations in DMPC-cholesterol bilayers comes from the spectral shifts induced by
the 5-DOXYL-PC (induces blue shift) and 16-DOXYL-PC (induces red shift) at
all cholesterol concentration used in this study (see Fig 6.9). These data suggest
that most of the DANSYL is residing at shallow depths in this low cholesterol
region and that the high fluidity of the membrane allows for rapid solvent
relaxation, even for DANSYL residing deep within the hydrophobic core.
Although our DANSYL TRES analysis shows no evidence of two-state model
behavior (i.e. two separate distinguishable DANSYL populations) for DMPC
MLV below Xchol=0.30, the data in Fig. 6.9 demonstrates clearly that the

121
DANYSL is accessible to both the 5-DOXYL-PC and the 16-DOXYL-PC.
Alternatively, at low cholesterol concentrations, the DANSYL is able to move up
and down within the bilayer dynamically on a time scale comparable to the
intrinsic decay time of ~11 ns and interact with both the shallow and deep
quenchers. The results of study support the existence of laterally phase separated
cholesterol rich domains in DPMC MLV at cholesterol concentrations above
Xchol=0.30 in DMPC MLV.
Our results presented in this work and our previous study (Troup et al.,
2003) are more consistent with the condensed cholesterol complex [27] and
superlattice [28] models of the lateral distribution of cholesterol and phospholipid
within the membrane then the umbrella model [17]. While we suspect these
laterally phase separated cholesterol rich domains are an equilibrium phase it is
possible that they represent a dynamic phase that has a lifetime of a least on the
order of 10 ns to be detectable by DANSYL.
6.6 Summary
The key findings of this investigation are: 1) the identification of two-state
model behavior in the DANSYL TRES data for DMPC-cholesterol mixtures with
cholesterol mole fractions above 0.30, and 2) the DANSYL membrane
penetration depth is dependent on cholesterol concentration and temperature. The
first finding is important because the analysis of TRES data confirms that two
separate populations of DANSYL are in coexistence with each other, and supports
the existence of laterally phase separated cholesterol-rich domains in DMPC
MLV at cholesterol concentrations above the lo and ld phase coexistence region.

122
The first DANSYL population is in a polar environment and the fluorescence
emission is from ICT states. The second DANSYL population is in a non-polar
environment and cannot form ICT states and the resulting fluorescence emission
is from the native state (non-ICT state). The results of the DANSYL quenching
studies support the findings of the TRES studies by showing that the DANSYL
resides at shallow depths at low cholesterol loadings and penetrates deeper into
the membrane at higher cholesterol loadings.

123
(a)
H2C-PO4(CH2)2N(CH3)3
- +
O
CH3(CH2)12-C-O-CH
SO2NH-(CH2)11-C-O-CH2
O
N(CH3)2
(b)
H2C-PO4(CH2)2N(CH3)3
- +
O
CH3(CH2)14-C-O-CH
CH3CH2-C-(CH2)3-C-O-CH2
N-OO O
CH3H3C
(c)
H2C-PO4(CH2)2N(CH3)3
- +
O N-O
O
CH3(CH2)14-C-O-CH
CH3CH2-C-(CH2)14-C-O-CH2
O
CH3H3C
Figure 6.1 The chemical structure of the DANSYL and n-DOXYL-PC probes. (a) DANSYL, (b) 5-DOXYL-PC, (c) 16-DOXYL-PC.

124
0
0.2
0.4
0.6
0.8
1
1.2
420 460 500 540 580
wavelength (nm)
Rel
ativ
e In
tens
ity(a)Increased Cholesterol Loading
0
0.2
0.4
0.6
0.8
1
1.2
420 460 500 540 580
wavelength (nm)
Rel
ativ
e in
tens
ity
(b)Increased Cholesterol Loading
0
0.2
0.4
0.6
0.8
1
1.2
220 260 300 340 380 420
wavelength (nm)
Rel
ativ
e In
tens
ity(d)
0
0.2
0.4
0.6
0.8
1
1.2
220 260 300 340 380 420
wavelength (nm)
Rel
ativ
e In
tens
ity
(c)
Figure 6.2 Steady-state fluorescence spectra of DANYL in DMPC-cholesterol MLV. (a) steady state emission spectra as a function of cholesterol loading at 30°C, (b) steady state emission spectra as a function of cholesterol loading at 60°C. (c) steady state excitation spectra as a function of cholesterol loading at 30°C, (d) steady state excitation spectra as a function of cholesterol loading at 60°C.

125
470
480
490
500
510
520
530
0 0.1 0.2 0.3 0.4 0.5 0.6
Xchol
SCG
(nm
)
(a)
EMISSION30
40
50
60
0 0.1 0.2 0.3 0.4 0.5 0.6Xchol
SHW
(nm
)
(b)
EMISSION
200
250
300
350
400
0 0.1 0.2 0.3 0.4 0.5 0.6
Xchol
SCG
(nm
)
(c)
EXCITATION
0
10
20
30
40
0 0.1 0.2 0.3 0.4 0.5 0.6
Xchol
SHW
(nm
)
EXCITATION
(d)
Figure 6.3 Steady-state fluorescence spectral characterization of DANYL in DMPC-cholesterol MLV. (a) Spectral center of gravity of the steady state emission spectra as a function of cholesterol loading, (◊) 30°C, (□) 60°C. (b) Spectral half width of the steady state emission spectra as a function of cholesterol loading, (◊) 30°C, (□) 60°C. (c) Spectral center of gravity of the steady state excitation spectra as a function of cholesterol loading, (◊) 30°C 550 nm, (□) 60°C 550 nm, (∆) 30°C 450 nm, (×) 60°C 450 nm. (d) Spectral half width of the steady state excitation spectra as a function of cholesterol loading, (◊) 30°C 550 nm, (□) 60°C 550 nm, (∆) 30°C 450 nm, (×) 60°C 450 nm.

126
460
470
480
490
500
510
520
530
30 50 70 90 110
time(ns)SC
G(n
m)
(b)
30
32
34
36
38
40
42
44
46
30 50 70 90 110
time(ns)
SHW
(nm
)
(d)
460
470
480
490
500
510
520
530
30 50 70 90 110
time(ns)
SCG
(nm
)
(a)
30
32
34
36
38
40
42
44
46
30 50 70 90 110
time(ns)
SHW
(nm
)
(c)
Figure 6.4 Time resolved emission spectral characterization of DANSYL-DMPC as a function of cholesterol loading and temperature. DANSYL spectral center of gravity as a function of time at (a) 30°C, (b) 60°. DANSYL spectral half width as a function of time at (c) 30°C, (d) 60°. (◊) Xchol=0, (□) Xchol=0.10, (∆) Xchol=0.20, (×) Xchol=0.30, (∗) Xchol=0.40, (○) Xchol=0.50, (+) Xchol=0.60.

127
0
0.2
0.4
0.6
0.8
1
1.2
420 460 500 540 580
wavelength(nm)
Rel
ativ
e In
tens
ityUn-relaxed
SpectraRelaxedSpectra
Figure 6.5 Characteristic relaxed and un-relaxed DANSYL spectra. DANSYL Time resolved emission spectra in 0mol.% cholesterol DMPC MLV at 30°C for delay times of 38 ns and 79 ns. The TRES at 38 ns is representative of the un-relaxed spectra and the TRES at 79 ns is representative of the relaxed spectra.

128
0
2
4
6
8
10
12
14
16
0 0.1 0.2 0.3 0.4 0.5 0.6
Xchol
mea
n re
laxa
tion
time(
ns)
Figure 6.6 Mean spectral relaxation time as a function of cholesterol loading and temperature. Calculated from Eq. 4, from the best-fit parameters from fitting the apparent TRES spectral center of gravity data with Eq. 3, (◊) 30°C, (□) 60°C.

129
0.6
0.7
0.8
0.9
1
1.1
1.2
1.3
1.4
0 0.1 0.2 0.3 0.4 0.5 0.6Xchol
R Q(a)
470
480
490
500
510
520
530
0 0.1 0.2 0.3 0.4 0.5 0.6
Xchol
(b) (n
m)
SCG
Figure 6.7 Cholesterol alleviates DANSYL quenching by 10 mM aqueous CoCl2. (a) DANSYL quenching ratio (RQ) as a function of cholesterol loading using 10 mM Co2+ as an aqueous quencher, (◊) 30°C, (b) DANSYL SCG as a function of cholesterol loading in DMPC MLV at 30°C, (◊) no quencher, (□) 10 mM CoCl2.

130
0
0.1
0.2
0.3
0.4
0.5
0.6
0.7
0.8
0.9
1
0 0.1 0.2 0.3 0.4 0.5 0.6
Xchol
R Q
(b)
0
0.1
0.2
0.3
0.4
0.5
0.6
0.7
0.8
0.9
1
0 0.1 0.2 0.3 0.4 0.5 0.6
Xchol
R Q
(a)
Figure 6.8 DANSYL site specific quenching data. DANSYL quenching ratio as a function of cholesterol loading in DMPC-cholesterol MLV using the site-

131
specific quencher (◊) 5-DOXYL-PC, and 16-DOXYL-PC (□), at 30°C(a) and 60°C(b).

132
470
480
490
500
510
520
530
0 0.1 0.2 0.3 0.4 0.5 0.6
Xchol
SCG
(nm
)
(a) Figure 6.9 Evidence of the DANSYL probe residing at multiple depths in DMPC-cholesterol MLV. The spectral center o f gravity (SCG) is plotted as a function of cholesterol mole fraction in DMPC-cholesterol MLV at 30°C(a) and 60°C(b), (◊) no quencher, (□) 5-DOXYL-PC, (∆) 16-DOXYL-PC. The 5-DOXYL-PC induces a blue shift in the SCG as a function of cholesterol loading,
470
480
490
500
510
520
530
0 0.1 0.2 0.3 0.4 0.5 0.6
Xchol
SCG
(nm
)
(b)

133
while the 16-DOXYL-PC induces a red shift in the SCG as a function of cholesterol loading.

134
0
2
4
6
8
10
12
14
16
18
20
0 0.1 0.2 0.3 0.4 0.5 0.6
Xchol
Zcf(
Å)
Figure 6.10 DANSYL resides at deep locations within the bilayer at 30°C and shallow locations in the bilayer at 60°C at high cholesterol loadings. Zcf, the DANSYL distance from the center of the bilayer as a function of cholesterol loading using parallax analysis in DMPC-cholesterol MLV at (◊) 30°C, (□) 60°C. The increase in Zcf at low cholesterol loadings is due to the addition of cholesterol increasing the bilayer thickness and the sharp decrease of Zcf at high cholesterol loadings demonstrates that the DANSYL is residing deeper in the membrane at 30°C. Upon heating to 60°C the DANSYL locates at shallow depths in the membrane at high cholesterol concentrations.

135
List of References [1] Loura, L. M. S., Fedorov, A., Prieto, M., 2001. Fluid-fluid membrane micro heterogeneity: A fluorescence energy transfer study. Biophys. J. 80, 776-788. [2] Brown, D. A., London, E., 1998. Functions of lipid rafts in biological membranes. Annu. Rev. Cell Dev. Biol. 14, 111-136. [3] Tulenko, T. N., Chen, M., Mason, P. E., Mason, R. P., 1998. Physical effects of cholesterol on arterial smooth muscle membranes: Evidence of immiscible cholesterol domains and alterations in bilayer width during atherogenesis. J. Lip. Res. 39, 947-956. [4] Lakowicz, J. R., 1999. Principles of fluorescence spectroscopy, Plenum, New York. [5] Bernik, D. L., Negri, R. M., 1998. Local polarity at the polar head level of lipid vesicles using dansyl fluorescent probes. J. Coll. Int. Sci. 203, 97-105. [6] Troup, G. M., Tulenko, T. N., Lee, S. P., Wrenn, S. P., 2003. Detection and characterization of laterally phase separated cholesterol domains in model lipid membranes, Coll. Surf. B 29, 217-231. [7] Gudheti, M. V., Gonzalez, Y. I., Lee, S. P., Wrenn, S. P., 2003. Interaction of apolipoprotein A-I with lecithin-cholesterol vesicles in the presence of phospholipase C. Biochim. Biophys. Acta 1635, 127-141. [8] Wu, P., and Brand, L., 1994, Review-resonance energy transfer: Methods and applications, Anal. Biochem. 218:1-13. [9] Fairclough, R. H., and Cantor, C. R., 1978, The use of singlet energy transfer to study macromolecular assemblies, Methods Enzymol. 48:347-379. [10] Wrenn, S. P., Kaler, E. W., Lee, S. P., 1999. A fluorescence energy transfer study of lecithin- cholesterol vesicles in the presence of phospholipase C. J. Lipid Res. 40, 1483-1494. [11] Wrenn, S. P., Gudheti, M., Veleva, A. N., Kaler, E. W., Lee, S. P., 2001. Characterization of model bile using fluorescence energy transfer from dehydroergosterol to dansylated lecithin. J. Lipid Res. 42, 923-934. [12] Guarino, A. J., Tulenko, T. N., Wrenn, S. P., 2004. Cholesterol crystal nucleation from enzymatically modified low-density lipoproteins: Combined effect of sphingomyelinase and cholesterol esterase. Biochemistry 43, 1685-1693.

136
[13] John, K., Kubelt, J., Muller, P., Wustner, D., Herrmann, A., 2002. Rapid transbilayer movement of the fluorescent sterol dehydroergosterol in lipid membranes. Biophys. J. 83, 1525-1534. [14] Bartlett, D., Glaser, M., Welti, R., 1997. Membrane penetration depth and lipid phase preference of acyl-labeled dansyl phosphatidylcholine vesicles. Biochim. Biophys. Acta 1328, 48-54. [15] Troup, G. M., Tulenko, T. N., Lee, S. P., Wrenn, S. P., 2004. Estimating the size of laterally phase separated cholesterol domains in model membranes with Förster resonance energy transfer: a simulation study. Coll. Surf. B 33, 57-65. [16] Buboltz, J., Feigenson, G. W., 1999. A novel strategy for the preparation of liposomes: Rapid solvent exchange. Biochim. Biophys. Acta 1417, 232-245. [17] Tokumasu, F., Jin, A. J., Feigenson, G. W., Dvorak, J. A., 2003. Atomic force microscopy of nanometric liposome adsorption and nanoscopic membrane domain formation. Ultramicroscopy 97, 217-227. [18] Hutterer, R., Schneider, F. W., Lanig, H., Hof, M., 1997. Solvent relaxation behavior of n-anthroyloxy fatty acids in PC-vesicles and paraffin oil: a time-resolved emission spectra study. Biochim. Biophys. Acta 1323, 195-207. [19] Parasassi, T., De Stasio, G., d’Ubaldo, A., Gratton, E., 1990. Phase fluctuation in phospholipid membranes revealed by Laurdan fluorescence. Biophys. J. 57, 1179-1186. [20] Lakowicz, J. R., Cherek, H., Laczko, G., Gratton, E., 1984. Time-resolved fluorescence emission spectra of labeled phospholipids vesicles, as observed using multi-frequency phase-modulation fluoromerty. Biochim. Biophys. Acta 777, 183-193. [21] Savitsky, A., Golay, M. J. E., 1964. Smoothing and differentiation of data by simplified least squares procedures. Anal. Chem. 36, 1627-1639. [22] Chattopadhyay, A., London, E., 1988. Spectroscopic and ionization properties of N-(7-nitrobenz-2-oxa-1,3-diazol-4-yl)-labeled lipids in model membranes. Biochim. Biophys. Acta 938, 24-34. [23] Kachel, K., Asuncion-Punzalan, E., London, E., 1998. The location of fluorescence probes with charged groups in model membranes. Biochim. Biophys. Acta 1374, 63-76. [24] Almeida, P. F. F., Vaz, W. L. C., Thomposon, T. E.,1992. Lateral diffusion in the liquid phases of dimyristoylphosphatidylcholine/cholesterol lipid bilayers: a free volume analysis. Biochem. 31, 6739-6747.

137
[25] Nezil, F. A., Bloom, M., 1992. Combined influence of cholesterol and synthetic amphiphillic peptides upon bilayer thickness in model membranes. Biophys. J. 61, 1176-1183. [26] Asuncion-Punzalan, E., Kachel, K., London, E., 1998. Groups with polar characteristics can locate at both shallow and deep locations in membranes: the behavior of dansyl and related probes. Biochem. 37, 4603-4611. [27] Radhakrishnan, A., McConnell, H.M., 1999, Condensed Complexes of Cholesterol and Phospholipids. Biophys. J. 77, 1507-1517. [28] Somerharju, P., Virtanen, J.A., Cheng, K.H., 1999, Lateral Organization of Membrane Lipids: The Superlattice view. Biochim. Biophys. Acta 1440, 32-48. [29] Huang, J., Feigenson, G. W., 1999. A microscopic interaction model of maximum solubility of cholesterol in lipid bilayers. Biophys. J. 76, 2142-2157.

138
CHAPTER 7: Recommendations
7.1 Introduction
The overall goals of this work as outlined in chapter 3 were to develop
fluorescence techniques to detect and estimate the size of laterally phase separated
cholesterol domains in model membrane systems, and to determine the molecular
mechanism of the DANSYL steady state spectral sensitivity to cholesterol and
membrane phase behavior. While those goals were largely met in this work, in
this section I will describe my recommendations for future studies involving
laterally phase-separated cholesterol domains in model membranes.
7.2 DANSYL Studies in Biological Colloids
Now that we have a deeper understanding of how tail-labeled DANSYL
probes behave in model membranes that contain cholesterol, we can use it to
study other colloidal particles that contain cholesterol such as lecithin and
cholesterol bile salt mixed micelles and lipoprotein type colloidal particles. Any
future studies that include DANSYL will require nitroxide quenching studies to
determine the location of the DANSYL probe within the system under all
experimental conditions. Also quenching studies with an aqueous quencher will
be useful in determining the water access to the DANSYL. This cannot be
stressed enough, as shown in chapter 6 the DANYSL photo physics are highly
complex.

139
7.3 FRET Studies
The DANSYL was shown to somewhat unsuitable as an energy transfer
acceptor because of the time dependent solvent effects overlapping with the donor
emission, thus making time-resolved FRET analysis too complicated for practical
application. Another FRET acceptor for ERGO needs to be identified that has
constant spectral properties in colloidal particles. This will allow time-resolved
FRET studies to be preformed that will offer additional information that steady
state FRET studies can not provide. This will also lend it self to using the FRET
simulations described in chapter 5 to test the effects of lateral phase separation
(preferential probe segregation) on the recovered parameters from the FRET
decay models outlined in chapter 2. The simulated decays generated from the
probe distributions in the membrane lattice model can have Poisson noise added
to them, and then be convoluted with an experimental lamp pulse. The simulated
measured response functions can then be analyzed with the simplified FRET
models described in chapter 2 to extract the model parameters. Comparisons can
then be made with the extracted decay parameters from experimental decays
parameters. The FRET simulations described in chapter 5 can be used to study
FRET in colloidal particles with geometries other than bilayer, for example: rod-
like micelles or lipoprotein like particles.
7.4 Visualization of Cholesterol Domains: AFM Studies
Visualization will be the ultimate evidence for the existence of the
laterally phase-separated domains in model membranes. Atomic Force
microscopy offers some interesting possibilities in the study of cholesterol

140
nucleation as well as in domain formation. The first phase of these future studies
includes imaging of DMPC supported bilayers as a function of cholesterol loading
to detect the presence of cholesterol-rich laterally phase separated domains and to
characterize their properties (size and number) as a function of increasing
cholesterol loading. The second phase is to use the supported membrane model
system to study the effect of the pro-nucleating agents such as bile salts on the
morphology of the supported bilayers by AFM visualization. AFM technology
can allow the effects of pro-nucleating agents on supported membrane bilayers to
be visualized in real time, or at least as fast as the AFM can scan the sample area.
Bile salt micelles are known to supersaturate cholesterol bilary phospholipid
vesicles by preferentially removing phospholipid to form mixed micelles, and
thus leaving the resultant membrane fragments enriched in cholesterol. This
action of the pro nucleating bile salts will induce cholesterol nucleation. By
imaging the supported membrane bilayers before and after bile salt treatment the
effect of cholesterol super-saturation on the membrane morphology can be
viewed.
Supported membrane bilayers will be prepared by the method of vesicle
fusion. Briefly, 75 micro-liters of the SUV in aqueous buffer solution pH=7.3
will be pipetted onto freshly cleaved mica surfaces. Then the samples will be
heated to 60 degree C for one hour, and then allowed to cool to room temperature.
The excess SUV and MLV will be rinsed off with buffer solution leaving a
supported membrane bilayer. If fluid phase lipids cannot be supported, we will
use DPPC instead of DMPC. Supported membrane bilayers will be prepared as

141
described above and AFM imaging will be preformed as a function of cholesterol
concentration ranging from 30mole% cholesterol to 65mole%cholesterol.
Cholesterol immiscible domains will be detected by the differences in the bilayers
thickness of the laterally phase separated regions. A tail-to-tail cholesterol bilayer
domain will be about 3.5 nanometers thick, while the bilayer thickness in the
continuous phase is expected to be about 5.0 nanometers thick. A 1.5 nanometer
thickness is in the detectable range of AFM resolution.
7.5 Small Angle X-Ray Diffraction Studies to Determine Phase Diagram
To determine the temperature and composition range over which
cholesterol domains exist in model lipid membranes a rigorous small angle X-Ray
study should be performed. The suggested studies would include the preparation
of cholesterol containing DMPC multi lamellar vesicles in one mole percent
cholesterol intervals over the 0-66mol.% cholesterol range. The studies should
initially be conducted at 37°C and then be extended to a wider temperature range.
The phase diagram generated from these studies can than be compared with the
DANSYL results reported in chapter 4 and chapter 6 and the recommended AFM
studies described above. The indication that cholesterol domains are present is a
d-spacing of 34 Å which is the tail-to-tail length of a cholesterol bilayer spanning
domain. DMPC-cholesterol MLV will be prepared by the method of modified
rapid solvent exchange as described in chapter 2.

142
3.0
0.25 0.50 0.75 µm
-3.0
0nm
Figure 7.1 Illustration of AFM height analysis of immiscible cholesterol domains in a supported bilayer.

143
VITA
Gregory M. Troup was born on November 18th 1971, at Abington
Memorial Hospital in Abington Pennsylvania. In 1990, he graduated from
Hatboro-Horsham Senior High School in Pennsylvania. After which he worked
as a professional musician playing the drums and went to school part-time,
earning an Associates Degree in general studies from the Montgomery County
Community College in 1994. Then he enrolled at the New Mexico Institute of
Mining and Technology, and graduated with honors with a B.S. in Chemical
Engineering in 1998. While at the New Mexico Institute of Mining and
Technology he was awarded a summer student research appointment at Los
Alamos National Lab, in Los Alamos, NM, and got his first experience in
engineering research. After which he worked as a student researcher for one year
at Sandia National Laboratories in Albuquerque, NM. During his tenure at the
National Labs, he decided that he wanted to pursue a career in engineering
research. In 1999, he enrolled in the Chemical Engineering graduate program at
Drexel University, PA. to work with Dr. Steven P. Wrenn. While at Drexel
University he was awarded the prestigious Koerner Fellowship in 2002, won the
excellence in graduate research award in 2003, and published several first author
scientific manuscripts in peer reviewed journals.