
The Impact Wear Behavior of Large Rocks on Slurry Pump ...
34
The Impact Wear Behavior of Large Rocks on Slurry Pump Materials and Equipment. Robert J. Visintainer V.P. of Engineering and R&D GIW Industries Inc. Dan Wolfe Sr. Associate – Mechanical Syncrude Canada Ltd. Dredging Summit & Expo 2015, Houston, Texas
-
Upload
khangminh22 -
Category
Documents
-
view
1 -
download
0
Transcript of The Impact Wear Behavior of Large Rocks on Slurry Pump ...

The Impact Wear Behavior of Large Rocks on Slurry Pump Materials and Equipment.
Robert J. VisintainerV.P. of Engineering and R&D
GIW Industries Inc.
Dan WolfeSr. Associate – Mechanical
Syncrude Canada Ltd. Dredging Summit & Expo 2015, Houston, Texas

Erosive Wear MechanismsImpact and Sliding
R. Visintainer and D. Wolfe Dredging Summit & Expo 20152
Impact and Sliding wear are the primary modes of erosion in slurry handling equipment.
Impact wear dependent on:– Particle velocity and mass.– Other particle properties.– Material properties.
Sliding wear dependent on:– Force and velocity of the
sliding bed.– Particle size and abrasivity.
Impact wear
Sliding bed wear

Typical Wear PerformanceSliding Wear
R. Visintainer and D. Wolfe Dredging Summit & Expo 20153
Sliding wear is the the most common mode of wear in slurry pumps.
Typical “sand dune” appearance of worn surfaces.
Dominates wear performance in most cases, even in the slurry pump impeller.

Typical Wear PerformanceImpact Wear
R. Visintainer and D. Wolfe Dredging Summit & Expo 20154
Impact wear is more limited in slurry pump applications.
Typical “frosted” appearance. Wear back of the impeller
vane the most usual problem. Leads to loss of head as vane
length and overlap are lost. Most common in unprocessed
slurry streams, such as dredging and hydrotransport of as-mined material.
Large river rock dredge
Oil sands hydrotransport

Typical Wear Performance Impact Wear Dominance
R. Visintainer and D. Wolfe Dredging Summit & Expo 20156
Usually occurs only with significant topsize > 75 mm.
Limiting size may be smaller for more dense solids (i.e. metal ore concentrates).
For accurate wear prediction in these cases, experimental data on impact wear with large solids is needed.
Application Solids typeSolids
Top sizeSlurry
SG Comment
Cutter dredge service Bedrock
up to 500 mm
1.2 – 1.4 Concentration of coarse solids is high.
River rock dredging River rock 200 to
300 mm 1.2 – 1.4 Solids are rounded.
Oil Sands hydrotransport
Silica rock and oil sand
lumps
125 to 150 mm 1.5 – 1.6
Bi-modal solids size distribution (sand + lumps).
Lumps approx. 2% concentration by volume.
Coarse grinding mill discharge
Metal ore > 75 mm 1.3 to 1.6Broad solids size
distribution, however, solids SG may be higher than 2.7.
Table 1. Applications where impact wear is often seen to limitslurry pump parts life.

Design of the ExperimentSome questions:
R. Visintainer and D. Wolfe Dredging Summit & Expo 20157
• How do various materials rank against each other under heavy impact?
• Do the wear mechanisms undergo a significant change with large solids?
• Are some materials unsuitable, due to limited strength or toughness?
• How important is material strength relative to hardness?
• Does the theoretical, third power relationship between velocity and impact wear hold true?

Design of the ExperimentSolids
R. Visintainer and D. Wolfe Dredging Summit & Expo 20158
Locally obtained granite “rip-rap”.
Hand sorted through a 6”x6” (150mm) grizzly.

Design of the ExperimentFlow Passage
R. Visintainer and D. Wolfe Dredging Summit & Expo 20159
Experiment consisted of 2” (50 mm) bars of wear material inserted vertically into a 20” (508 mm) pipeline.
Five samples were run simultaneously, spaced at intervals of 15 ft (4.5 m).
Slurry flow velocities:– 20, 25, 30 and 33 ft/s– (6.1, 7.6, 9.1 and 10 m/s)

Design of the ExperimentWear Test Samples
R. Visintainer and D. Wolfe Dredging Summit & Expo 201510
A. High chrome white ironB. Chrome-moly white ironC. Hypereutectic, high carbide
content, white ironD. GIW WD29G® white iron (w/
high strength, lower hardness)E. GIW Endurasite® white iron (w/
increased hardenability)F. 80 % tungsten carbide insertG. 88 % tungsten carbide insertH. Laser cladded tungsten carbide
hard facingI. 4140 low alloy steel
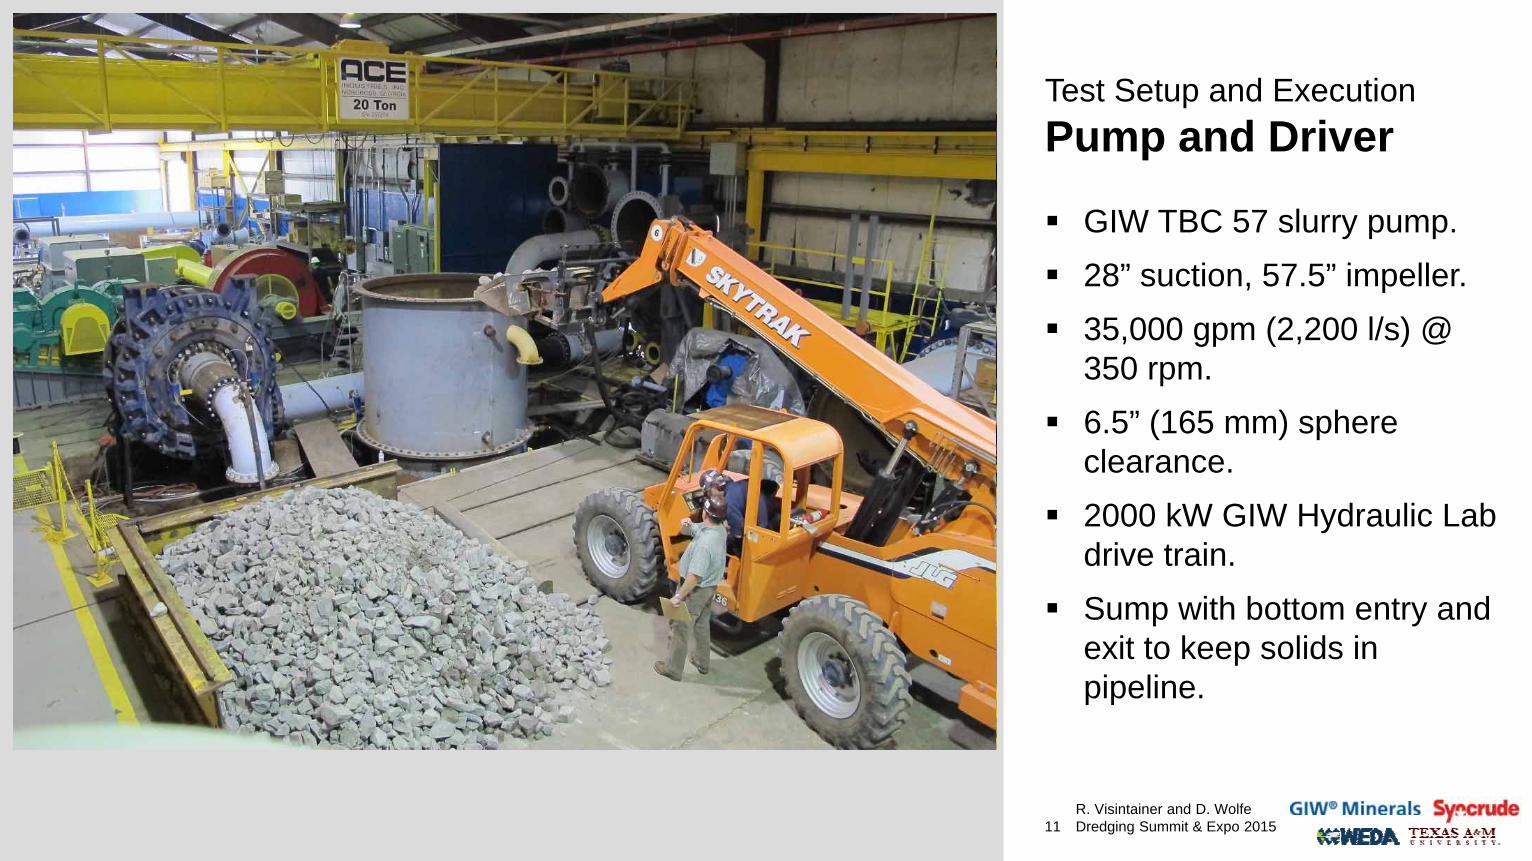
Test Setup and ExecutionPump and Driver
R. Visintainer and D. Wolfe Dredging Summit & Expo 201511
GIW TBC 57 slurry pump. 28” suction, 57.5” impeller. 35,000 gpm (2,200 l/s) @
350 rpm. 6.5” (165 mm) sphere
clearance. 2000 kW GIW Hydraulic Lab
drive train. Sump with bottom entry and
exit to keep solids in pipeline.
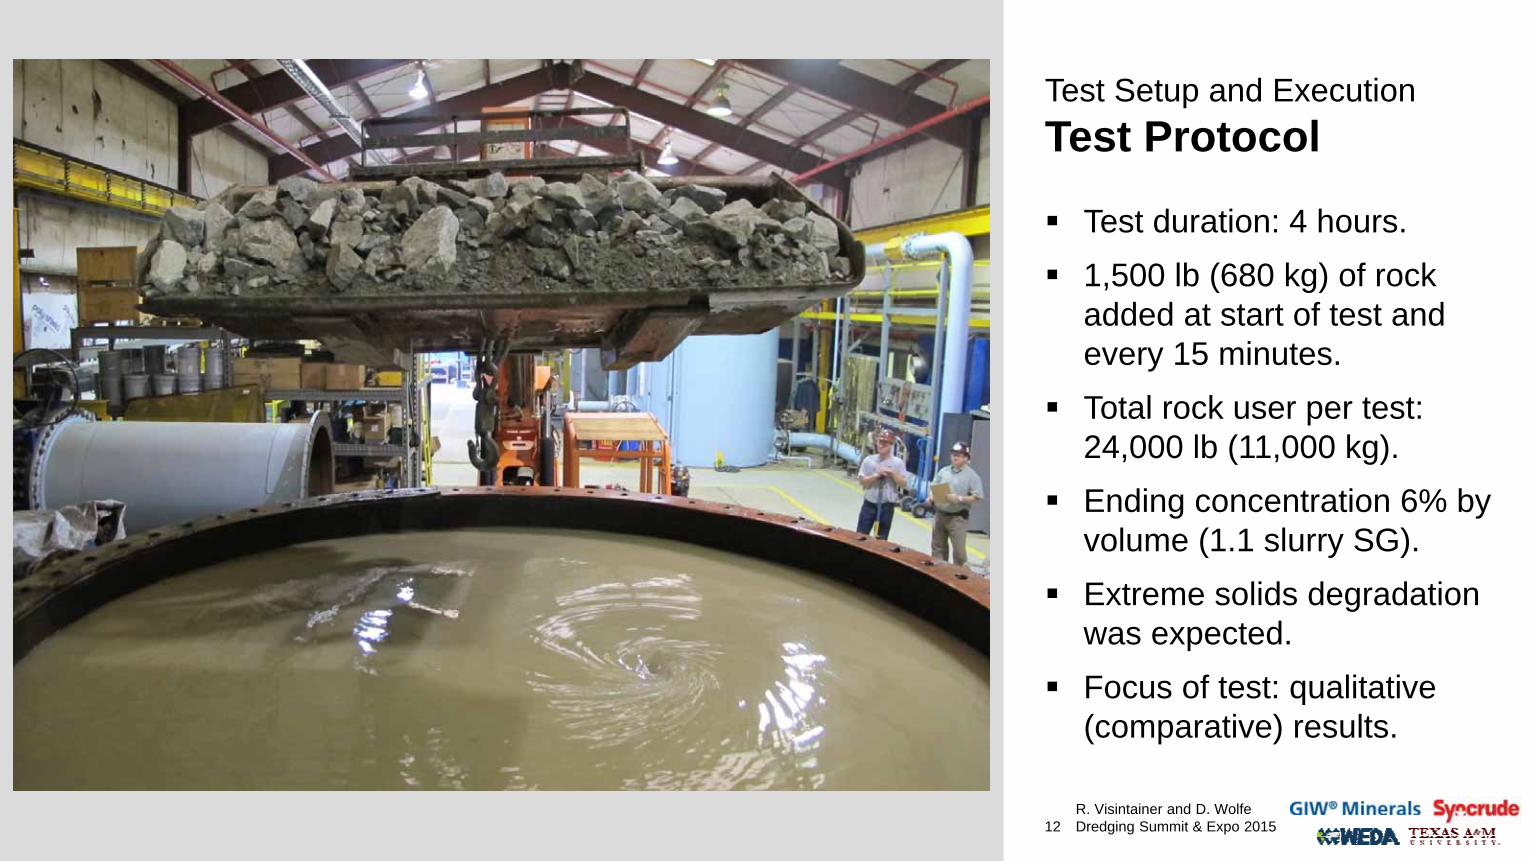
Test Setup and ExecutionTest Protocol
R. Visintainer and D. Wolfe Dredging Summit & Expo 201512
Test duration: 4 hours. 1,500 lb (680 kg) of rock
added at start of test and every 15 minutes.
Total rock user per test: 24,000 lb (11,000 kg).
Ending concentration 6% by volume (1.1 slurry SG).
Extreme solids degradation was expected.
Focus of test: qualitative (comparative) results.

Test Setup and ExecutionSampling Technique
R. Visintainer and D. Wolfe Dredging Summit & Expo 201515
6.5 ft (2 m) section of pipe was used to “cut a sample” of the slurry.
Recirculating solids deposit in the pipe after a “hard stop”.
For qualitative examination only.
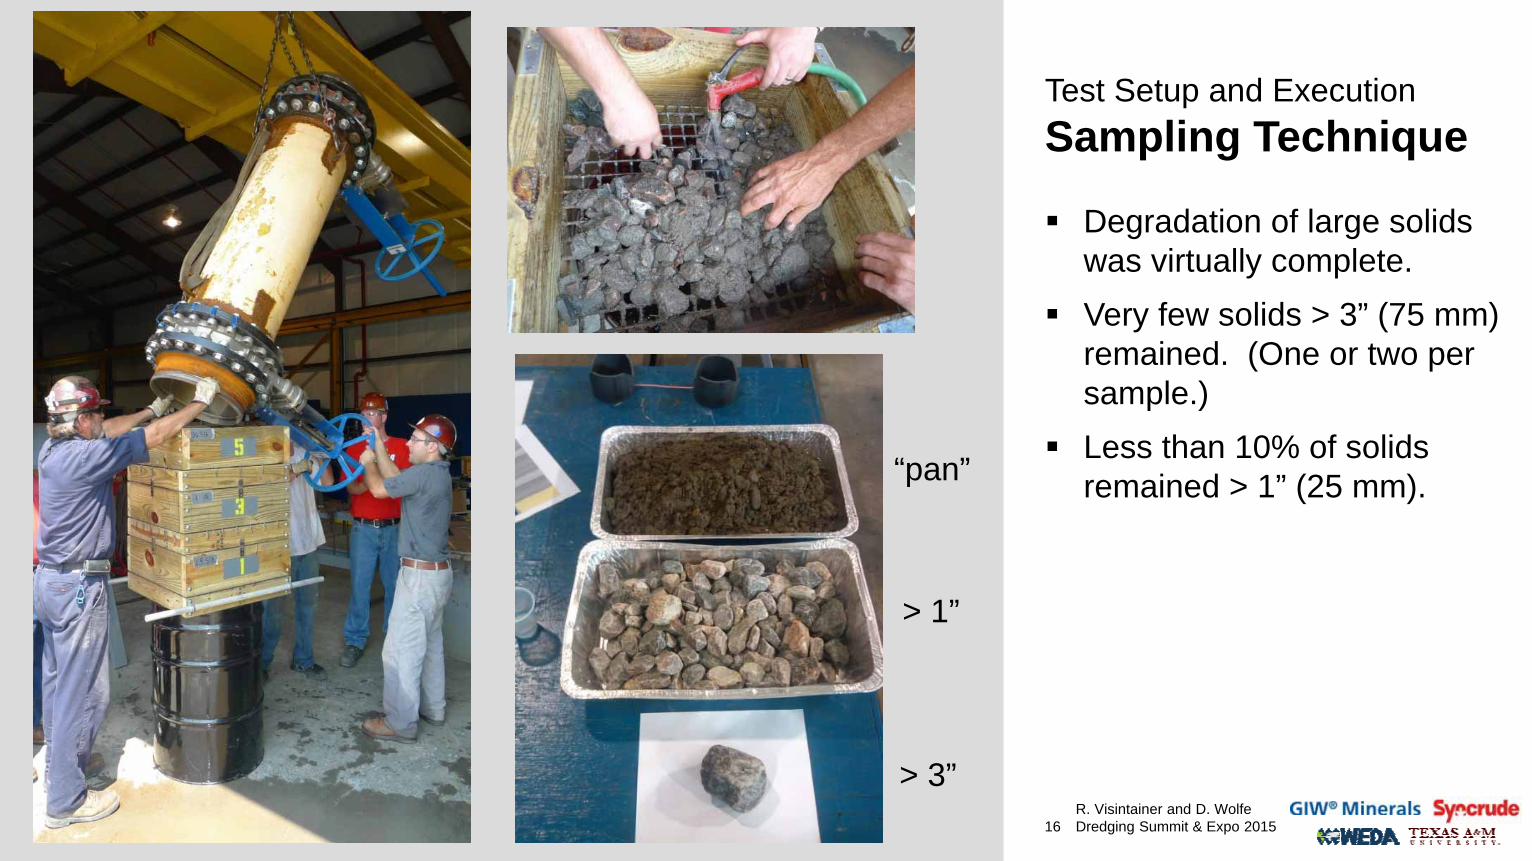
Test Setup and ExecutionSampling Technique
R. Visintainer and D. Wolfe Dredging Summit & Expo 201516
Degradation of large solids was virtually complete.
Very few solids > 3” (75 mm) remained. (One or two per sample.)
Less than 10% of solids remained > 1” (25 mm).
> 3”
> 1”
“pan”

Results and DiscussionChallenges
R. Visintainer and D. Wolfe Dredging Summit & Expo 201517
Many challenges were encountered during testing, including:
Occasional breaking of the test samples.
Plugging of the impeller.
Wear of pipe elbows.
Making sense of the data.

Results and DiscussionRelative Wear Rates
R. Visintainer and D. Wolfe Dredging Summit & Expo 201518
Key learnings• Hardness dominated in most
cases over strength.• Some tungsten carbide
grades experienced spalling, however …
• … properly supported tungsten carbide inserts of certain grades showed outstanding performance.
4140 Steel
High Strength White Iron
High Chrome White Iron
80% Tungsten Carbide Insert

Results and DiscussionRelative Wear Rates
R. Visintainer and D. Wolfe Dredging Summit & Expo 201519
Baseline = 1.0 for HCWI. Based on volumetric loss. Pre-test hypothesis:
stronger materials might do better than hard materials under severe impact wear.
Actual result: Harder wear materials did better in most cases.
MaterialRelative impactwear resistance
Comments
4140 Steel 0.21
WD29G White Iron 0.72 Ave. hardness 495 HBN
High Chrome White Iron 1.00 Baseline. Ave. hardness 627 HBN
88% Tungsten Carbide 1.11 Most volume loss due to chipping. Tested at 10 m/s only.
Chrome-Moly White Iron 1.17 Ave. hardness 654 HBN
Endurasite White Iron 1.25 Ave. hardness 677 HBN
Hypereutectic White Iron 1.42 Tested at 9.1 m/s only. Ave. hardness 729 HBN
Tungsten Carbide Cladding 1.65 Tested at 7.6 m/s only
80% Tungsten Carbide 5.29 No large scale chipping seen up to 10 m/s.
Table 2. Summary of relative impact wear resistance againstlarge solids

Results and DiscussionComparison with Sliding Wear
R. Visintainer and D. Wolfe Dredging Summit & Expo 201520
Based on previously executed “Coriolis” type sliding wear tests.
ESP = (S – L ) 2 r CO ( Q/h ) / W
where:ESP = specific energy(S-L) = solids – liquid density = rotational velocityr = radius of wearCO = volumetric concentr. ( Q/h ) = channel flow / heightW = wear rate

Results and DiscussionComparison with Sliding wear
R. Visintainer and D. Wolfe Dredging Summit & Expo 201521
In some cases, harder and more brittle materials did better in sliding than impact, relative to the baseline High Chrome White Iron.
With other materials, the comparison is less clear.
More study is needed to validate and explain these trends.
Material Relative impact wear resistance
Relative sliding wear resistance in Coriolis wear test with 600 micron sand.
4140 Steel 0.21 0.05
WD29G White Iron 0.72 0.75
High Chrome White Iron 1.00 1.00
88% Tungsten Carbide 1.11 na
Chrome-Moly White Iron 1.17 1.25
Endurasite White Iron 1.25 1.5
Hypereutectic White Iron 1.42 0.95
Tungsten Carbide Cladding 1.65 6.10
80% Tungsten Carbide 5.29 2.15
Table 3. Comparison of relative rock impact vs. sand slidingwear resistance.
Material Relative impact wear resistance
Relative sliding wear resistance in Coriolis wear test with 600 micron sand.
4140 Steel 0.21 0.05
WD29G White Iron 0.72 0.75
High Chrome White Iron 1.00 1.00
88% Tungsten Carbide 1.11 na
Chrome-Moly White Iron 1.17 1.25
Endurasite White Iron 1.25 1.5
Hypereutectic White Iron 1.42 0.95
Tungsten Carbide Cladding 1.65 6.10
80% Tungsten Carbide 5.29 2.15

Results and DiscussionVelocity Dependence
R. Visintainer and D. Wolfe Dredging Summit & Expo 201522
Typical velocity dependence for impact wear is to the third power.
Based on the physics of impact energy transfer.
WI = C * E * N
Where:
WI = Impact wear rate (volumetric loss / unit time).
C = Wear coefficient (volumetric loss / unit energy), a property of the material.
E = Impact energy (energy / particle impact), proportional to particle velocity2
N = Number of impacts (particle impacts / unit time), proportional to particle velocity, assuming constant concentration.

Results and DiscussionVelocity Dependence
R. Visintainer and D. Wolfe Dredging Summit & Expo 201523
Observed velocity exponent of 1.7 (average) was much less than 3, however …
… complete degradation of the large solids effectively eliminated number of impacts as a variable.
In other words, the number of impacts (N) was about the same for each test, regardless of velocity, since the number of particles was fixed.
Correcting for this increases the observed exponent to 2.7.

Results and DiscussionVelocity Dependence
R. Visintainer and D. Wolfe Dredging Summit & Expo 201524
In fact, higher velocity tests will actually produce fewer impacts per test, since the impact force is greater and degradation will occur more quickly.
If this correction is assumed to be equivalent to an exponent of 0.3 (arbitrary) the expected third power exponent is achieved.
NOTE: Results shown here have been normalized to HCWI at lowest velocity.

Results and DiscussionVelocity Dependence
R. Visintainer and D. Wolfe Dredging Summit & Expo 201525
The above analysis is validated (in a qualitative way) by the result of the 4140 alloy steel, which should follow the third power dependence on velocity, being a standard ductile material with no specialized or brittle properties.

Impeller Wear PredictionThe Model
R. Visintainer and D. Wolfe Dredging Summit & Expo 201526
• Used to predict impact wear along the length of the vane.
• Requires a reference wear rate (calibration coefficient) for a similar slurry at a particular velocity.
• Linear correction for tonnage.
• Calibrations from impact wear experiments:o Velocity exponent, ExpVo Material resistance, Wrel
Where:
WVL = Impact wear rate (impeller vane loss / unit time)
CVL = Vane wear coefficient (hours / unit vane length) for reference slurry, tonnage and impact velocity.
TPHref = Reference solids transport rate (tonnes per hour)
TPHa = Actual solids transport rate in the system to be modeled
VIref = Reference vane impact velocity (meters / second)
VIa = Actual vane impact velocity (meters / second)
ExpV = Exponent of impact velocity
Wrel = Relative material impact wear resistance compared to high chrome white iron (Ref Table 2)

Impeller Wear PredictionThe Model
R. Visintainer and D. Wolfe Dredging Summit & Expo 201527
Actual impact velocity VI is the vector sum of the inlet flow velocity and vane leading edge speed
Where:
WVL = Impact wear rate (impeller vane loss / unit time)
CVL = Vane wear coefficient (hours / unit vane length) for reference slurry, tonnage and impact velocity.
TPHref = Reference solids transport rate (tonnes per hour)
TPHa = Actual solids transport rate in the system to be modeled
VIref = Reference vane impact velocity (meters / second)
VIa = Actual vane impact velocity (meters / second)
ExpV = Exponent of impact velocity
Wrel = Relative material impact wear resistance compared to high chrome white iron (Ref Table 2)

Impeller Wear PredictionThe Application
R. Visintainer and D. Wolfe Dredging Summit & Expo 201528
First application of model in Oil Sands hydrotransport. Large solids, up to 5” (125mm).
Steady conditions and good data collection.
Short life allowed for quick results.
High cost of downtime helped drive funding of project (c.a. $100,000 / hr).
New Impeller
Almost new
(< 2000 hrs)
Vane Leading Edge
Vane Leading Edge
Large particle impact wear on vane leading edgesLarge particle impact wear on vane leading edges

Impeller Wear PredictionCalculated results
R. Visintainer and D. Wolfe Dredging Summit & Expo 201529
57.5” pump used to determine calibration coefficient CVL
Result validated by known results with a 67” impeller.
Model then used to predict performance of new 84” design for a target 6000 operating life.
All with same inlet diameter. Key result: A large impeller at
the same head and suction diameter could achieve a significant increase in wear life.

Impeller Wear PredictionCalculated results
R. Visintainer and D. Wolfe Dredging Summit & Expo 201530
• Head is proportional to the circumferential velocity at the vane outlet.
• Therefore, impeller rotational speed decreases as the vane outlet diameter increases.
• If the inlet diameter remains constant, reduced rotational speed means reduced inlet edge impact velocities.
• The larger diameter also allows a longer vane, further increasing wear life.

Impeller Wear PredictionField Performance
R. Visintainer and D. Wolfe Dredging Summit & Expo 201531
84” pump rebuilt at 5400 hours due to required maintenance outage for other equipment.
Based on remaining vane length, minimum life of 6500 hours would have been met.
Velocity dependence exponent of 2.85 best fits the actual field data.
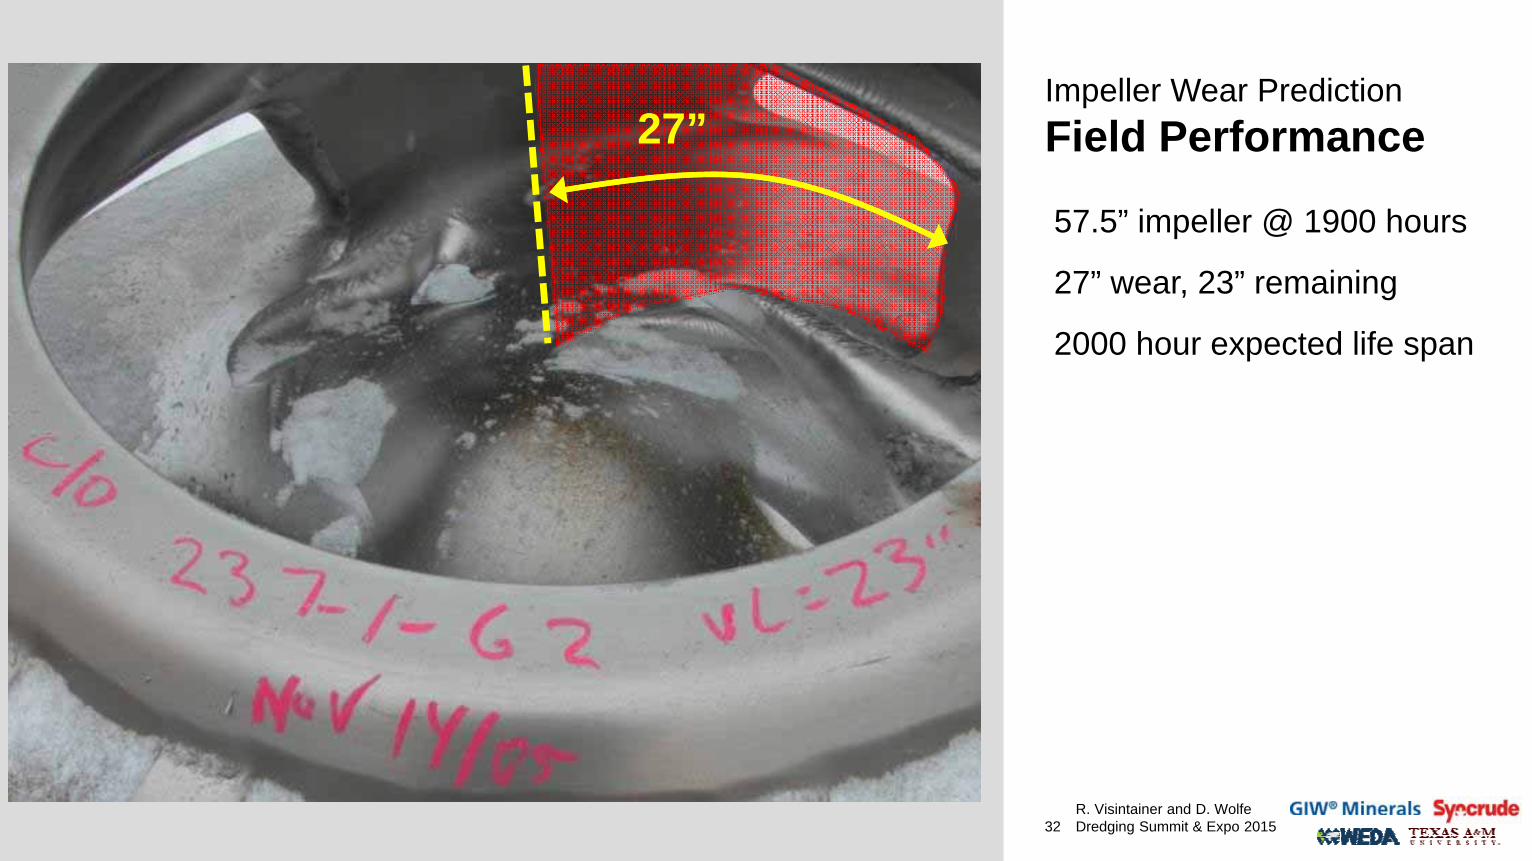
Impeller Wear PredictionField Performance
R. Visintainer and D. Wolfe Dredging Summit & Expo 201532
57.5” impeller @ 1900 hours
27” wear, 23” remaining
2000 hour expected life span
27”

Impeller Wear PredictionField Performance
R. Visintainer and D. Wolfe Dredging Summit & Expo 201533
84” impeller @ 2950 hours
9” wear, 72” remaining
9”

Impeller Wear PredictionField Performance
R. Visintainer and D. Wolfe Dredging Summit & Expo 201534
84” impeller @ 5400 hours
26-33” wear, 49-56” remaining
> 6500 hour expected life span
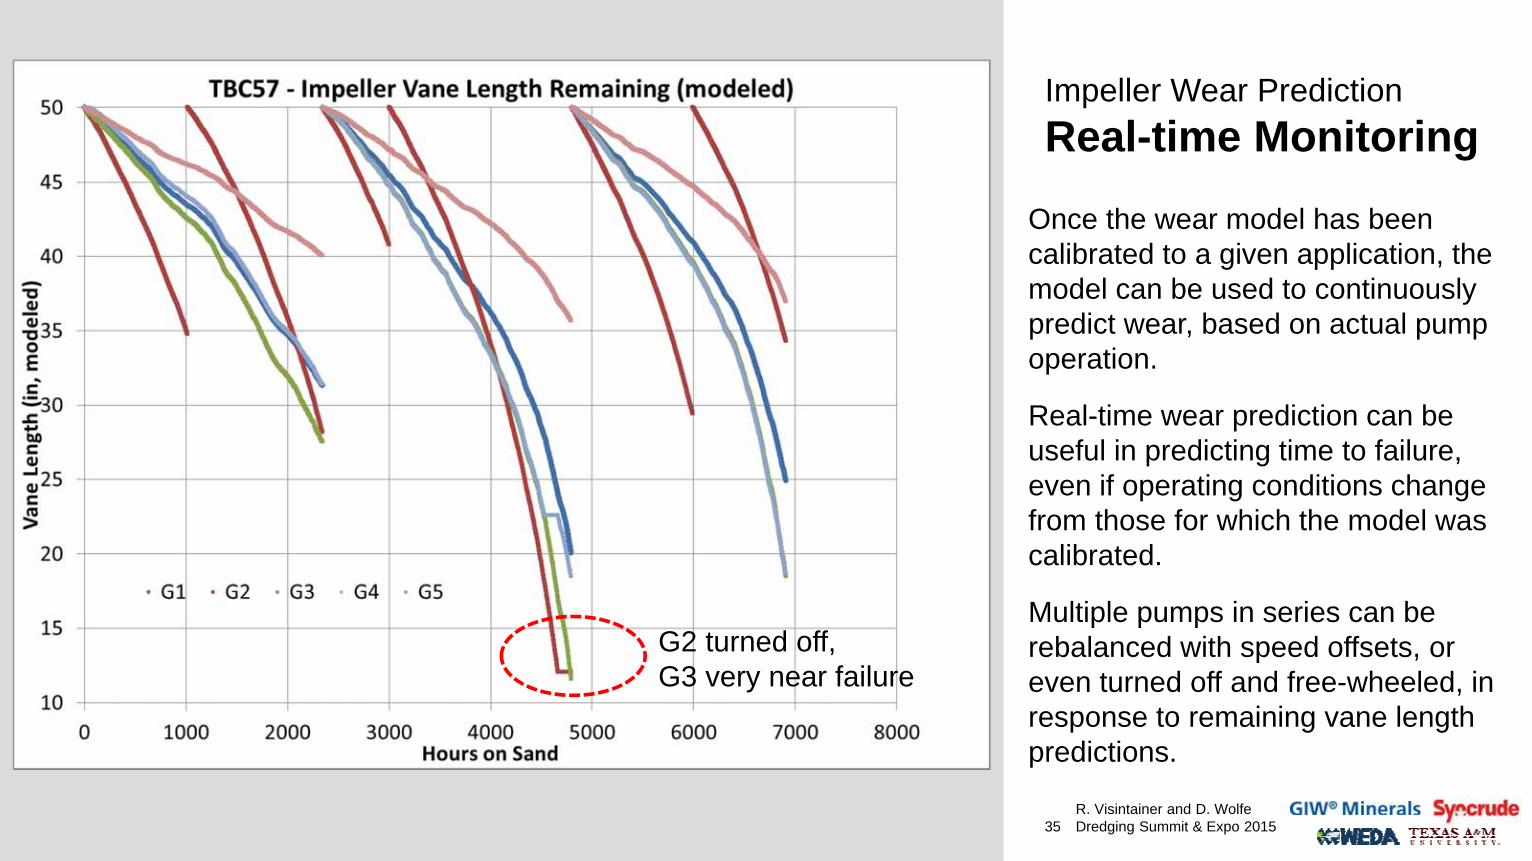
Impeller Wear PredictionReal-time Monitoring
R. Visintainer and D. Wolfe Dredging Summit & Expo 201535
Once the wear model has been calibrated to a given application, the model can be used to continuously predict wear, based on actual pump operation.
Real-time wear prediction can be useful in predicting time to failure, even if operating conditions change from those for which the model was calibrated.
Multiple pumps in series can be rebalanced with speed offsets, or even turned off and free-wheeled, in response to remaining vane length predictions.
G2 turned off,G3 very near failure

Summary and Conclusions
R. Visintainer and D. Wolfe Dredging Summit & Expo 201536
• Slurry pump wear materials under heavy impact loading differed from their typical sliding wear performance, although many similar trends were observed.
• In particular, wear performance correlated to hardness in many cases, although the degree of correlation was different.
• The exponent of velocity dependence on wear was found to be in the range of 2.7 to 3.0, which is similar to the expected theoretical result of 3.0 for impact wear in general.

Summary and Conclusions
R. Visintainer and D. Wolfe Dredging Summit & Expo 201537
• An impeller vane wear model was developed based on an incremental calculation of wear as a function of impact velocity over time.
• The model was validated by field results in oil sands hydrotransport, where rock and lump top size reaches 5”.
• The back calculated velocity dependence seen when using this model to evaluate field results was on average 2.85.
• Large increases in the pump maintenance interval can be achieved in cases where vane impact wear dominates by converting to a larger, slower runner pump of the same inlet size.


![Rocks and Minerals.ppt [Read-Only]](https://static.fdokumen.com/doc/165x107/633751f86fd2e64f8d0df5b5/rocks-and-mineralsppt-read-only.jpg)


