Effects of Slurry Particles on Silicon Dioxide CMP
11
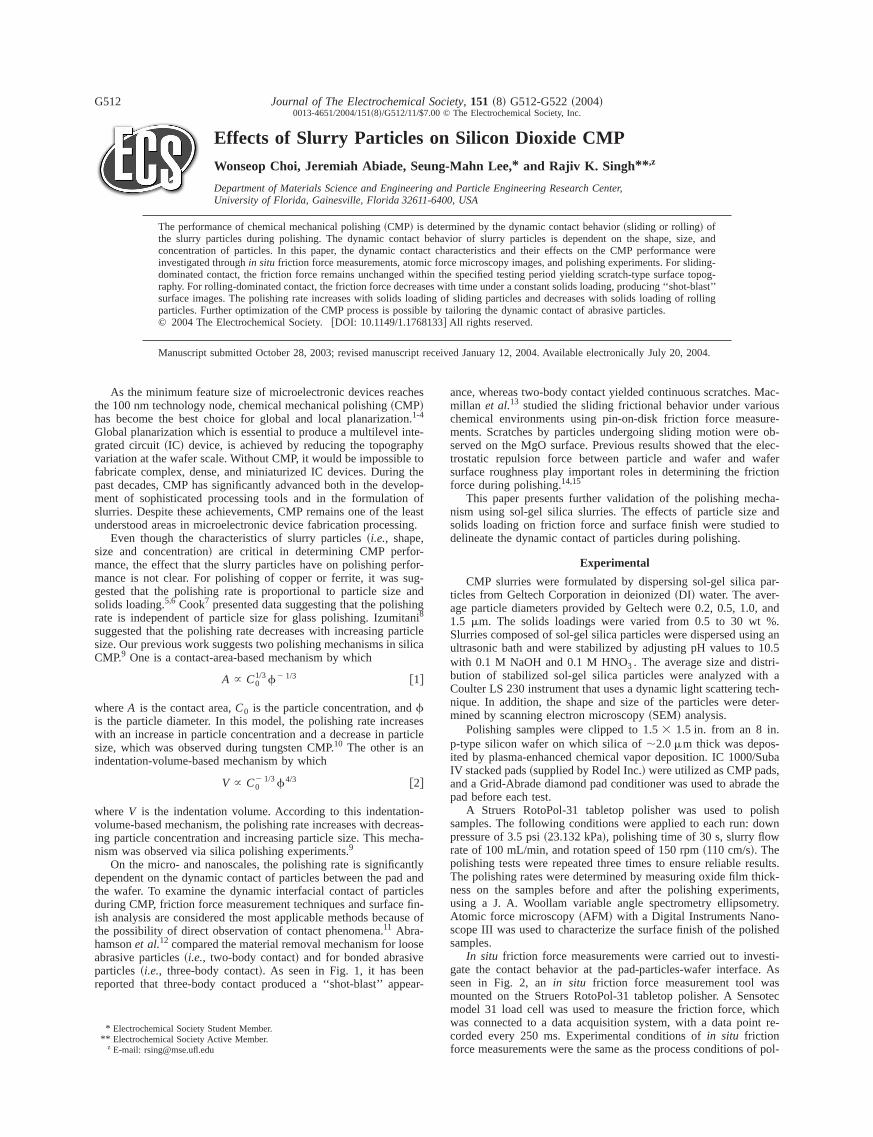
Effects of Slurry Particles on Silicon Dioxide CMP Wonseop Choi, Jeremiah Abiade, Seung-Mahn Lee,* and Rajiv K. Singh** ,z Department of Materials Science and Engineering and Particle Engineering Research Center, University of Florida, Gainesville, Florida 32611-6400, USA The performance of chemical mechanical polishing ~CMP! is determined by the dynamic contact behavior ~sliding or rolling! of the slurry particles during polishing. The dynamic contact behavior of slurry particles is dependent on the shape, size, and concentration of particles. In this paper, the dynamic contact characteristics and their effects on the CMP performance were investigated through in situ friction force measurements, atomic force microscopy images, and polishing experiments. For sliding- dominated contact, the friction force remains unchanged within the specified testing period yielding scratch-type surface topog- raphy. For rolling-dominated contact, the friction force decreases with time under a constant solids loading, producing ‘‘shot-blast’’ surface images. The polishing rate increases with solids loading of sliding particles and decreases with solids loading of rolling particles. Further optimization of the CMP process is possible by tailoring the dynamic contact of abrasive particles. © 2004 The Electrochemical Society. @DOI: 10.1149/1.1768133# All rights reserved. Manuscript submitted October 28, 2003; revised manuscript received January 12, 2004. Available electronically July 20, 2004. As the minimum feature size of microelectronic devices reaches the 100 nm technology node, chemical mechanical polishing ~CMP! has become the best choice for global and local planarization. 1-4 Global planarization which is essential to produce a multilevel inte- grated circuit ~IC! device, is achieved by reducing the topography variation at the wafer scale. Without CMP, it would be impossible to fabricate complex, dense, and miniaturized IC devices. During the past decades, CMP has significantly advanced both in the develop- ment of sophisticated processing tools and in the formulation of slurries. Despite these achievements, CMP remains one of the least understood areas in microelectronic device fabrication processing. Even though the characteristics of slurry particles ~i.e., shape, size and concentration! are critical in determining CMP perfor- mance, the effect that the slurry particles have on polishing perfor- mance is not clear. For polishing of copper or ferrite, it was sug- gested that the polishing rate is proportional to particle size and solids loading. 5,6 Cook 7 presented data suggesting that the polishing rate is independent of particle size for glass polishing. Izumitani 8 suggested that the polishing rate decreases with increasing particle size. Our previous work suggests two polishing mechanisms in silica CMP. 9 One is a contact-area-based mechanism by which A } C 0 1/3 f 2 1/3 @1# where A is the contact area, C 0 is the particle concentration, and f is the particle diameter. In this model, the polishing rate increases with an increase in particle concentration and a decrease in particle size, which was observed during tungsten CMP. 10 The other is an indentation-volume-based mechanism by which V } C 0 2 1/3 f 4/3 @2# where V is the indentation volume. According to this indentation- volume-based mechanism, the polishing rate increases with decreas- ing particle concentration and increasing particle size. This mecha- nism was observed via silica polishing experiments. 9 On the micro- and nanoscales, the polishing rate is significantly dependent on the dynamic contact of particles between the pad and the wafer. To examine the dynamic interfacial contact of particles during CMP, friction force measurement techniques and surface fin- ish analysis are considered the most applicable methods because of the possibility of direct observation of contact phenomena. 11 Abra- hamson et al. 12 compared the material removal mechanism for loose abrasive particles ~i.e., two-body contact! and for bonded abrasive particles ~i.e., three-body contact!. As seen in Fig. 1, it has been reported that three-body contact produced a ‘‘shot-blast’’ appear- ance, whereas two-body contact yielded continuous scratches. Mac- millan et al. 13 studied the sliding frictional behavior under various chemical environments using pin-on-disk friction force measure- ments. Scratches by particles undergoing sliding motion were ob- served on the MgO surface. Previous results showed that the elec- trostatic repulsion force between particle and wafer and wafer surface roughness play important roles in determining the friction force during polishing. 14,15 This paper presents further validation of the polishing mecha- nism using sol-gel silica slurries. The effects of particle size and solids loading on friction force and surface finish were studied to delineate the dynamic contact of particles during polishing. Experimental CMP slurries were formulated by dispersing sol-gel silica par- ticles from Geltech Corporation in deionized ~DI! water. The aver- age particle diameters provided by Geltech were 0.2, 0.5, 1.0, and 1.5 mm. The solids loadings were varied from 0.5 to 30 wt %. Slurries composed of sol-gel silica particles were dispersed using an ultrasonic bath and were stabilized by adjusting pH values to 10.5 with 0.1 M NaOH and 0.1 M HNO 3 . The average size and distri- bution of stabilized sol-gel silica particles were analyzed with a Coulter LS 230 instrument that uses a dynamic light scattering tech- nique. In addition, the shape and size of the particles were deter- mined by scanning electron microscopy ~SEM! analysis. Polishing samples were clipped to 1.5 3 1.5 in. from an 8 in. p-type silicon wafer on which silica of ;2.0 m m thick was depos- ited by plasma-enhanced chemical vapor deposition. IC 1000/Suba IV stacked pads ~supplied by Rodel Inc.! were utilized as CMP pads, and a Grid-Abrade diamond pad conditioner was used to abrade the pad before each test. A Struers RotoPol-31 tabletop polisher was used to polish samples. The following conditions were applied to each run: down pressure of 3.5 psi ~23.132 kPa!, polishing time of 30 s, slurry flow rate of 100 mL/min, and rotation speed of 150 rpm ~110 cm/s!. The polishing tests were repeated three times to ensure reliable results. The polishing rates were determined by measuring oxide film thick- ness on the samples before and after the polishing experiments, using a J. A. Woollam variable angle spectrometry ellipsometry. Atomic force microscopy ~AFM! with a Digital Instruments Nano- scope III was used to characterize the surface finish of the polished samples. In situ friction force measurements were carried out to investi- gate the contact behavior at the pad-particles-wafer interface. As seen in Fig. 2, an in situ friction force measurement tool was mounted on the Struers RotoPol-31 tabletop polisher. A Sensotec model 31 load cell was used to measure the friction force, which was connected to a data acquisition system, with a data point re- corded every 250 ms. Experimental conditions of in situ friction force measurements were the same as the process conditions of pol- * Electrochemical Society Student Member. ** Electrochemical Society Active Member. z E-mail: [email protected] Journal of The Electrochemical Society, 151 ~8! G512-G522 ~2004! 0013-4651/2004/151~8!/G512/11/$7.00 © The Electrochemical Society, Inc. G512
Transcript of Effects of Slurry Particles on Silicon Dioxide CMP
Journal of The Electrochemical Society, 151 ~8! G512-G522~2004!0013-4651/2004/151~8!/G512/11/$7.00 © The Electrochemical Society, Inc.
G512
Effects of Slurry Particles on Silicon Dioxide CMPWonseop Choi, Jeremiah Abiade, Seung-Mahn Lee,* and Rajiv K. Singh** ,z
Department of Materials Science and Engineering and Particle Engineering Research Center,University of Florida, Gainesville, Florida 32611-6400, USA
The performance of chemical mechanical polishing~CMP! is determined by the dynamic contact behavior~sliding or rolling! ofthe slurry particles during polishing. The dynamic contact behavior of slurry particles is dependent on the shape, size, andconcentration of particles. In this paper, the dynamic contact characteristics and their effects on the CMP performance wereinvestigated throughin situ friction force measurements, atomic force microscopy images, and polishing experiments. For sliding-dominated contact, the friction force remains unchanged within the specified testing period yielding scratch-type surface topog-raphy. For rolling-dominated contact, the friction force decreases with time under a constant solids loading, producing ‘‘shot-blast’’surface images. The polishing rate increases with solids loading of sliding particles and decreases with solids loading of rollingparticles. Further optimization of the CMP process is possible by tailoring the dynamic contact of abrasive particles.© 2004 The Electrochemical Society.@DOI: 10.1149/1.1768133# All rights reserved.
Manuscript submitted October 28, 2003; revised manuscript received January 12, 2004. Available electronically July 20, 2004.
ches
on.inte-phyle tog theelopn oflea
ing.,r-rfor-
sug-and
hingtaniarticlsilica
asesrticle
n
on-creacha-
antlyd aniclese fin-use
osee
enear-
. Mac-usure-
e ob-elec-afer
ction
cha-andd to
par--, and%.
ng an10.5
tri-th atech-eter-
.-
/Subas,e the
olishown
esults.hick-
ents,etry.-
lished
esti-e. Asassotechichnt re-
of pol-
As the minimum feature size of microelectronic devices reathe 100 nm technology node, chemical mechanical polishing~CMP!has become the best choice for global and local planarizati1-4
Global planarization which is essential to produce a multilevelgrated circuit~IC! device, is achieved by reducing the topogravariation at the wafer scale. Without CMP, it would be impossibfabricate complex, dense, and miniaturized IC devices. Durinpast decades, CMP has significantly advanced both in the devment of sophisticated processing tools and in the formulatioslurries. Despite these achievements, CMP remains one of theunderstood areas in microelectronic device fabrication process
Even though the characteristics of slurry particles~i.e., shapesize and concentration! are critical in determining CMP perfomance, the effect that the slurry particles have on polishing pemance is not clear. For polishing of copper or ferrite, it wasgested that the polishing rate is proportional to particle sizesolids loading.5,6 Cook7 presented data suggesting that the polisrate is independent of particle size for glass polishing. Izumi8
suggested that the polishing rate decreases with increasing psize. Our previous work suggests two polishing mechanisms inCMP.9 One is a contact-area-based mechanism by which
A } C01/3f2 1/3 @1#
whereA is the contact area,C0 is the particle concentration, andfis the particle diameter. In this model, the polishing rate increwith an increase in particle concentration and a decrease in pasize, which was observed during tungsten CMP.10 The other is aindentation-volume-based mechanism by which
V } C02 1/3f4/3 @2#
whereV is the indentation volume. According to this indentativolume-based mechanism, the polishing rate increases with deing particle concentration and increasing particle size. This menism was observed via silica polishing experiments.9
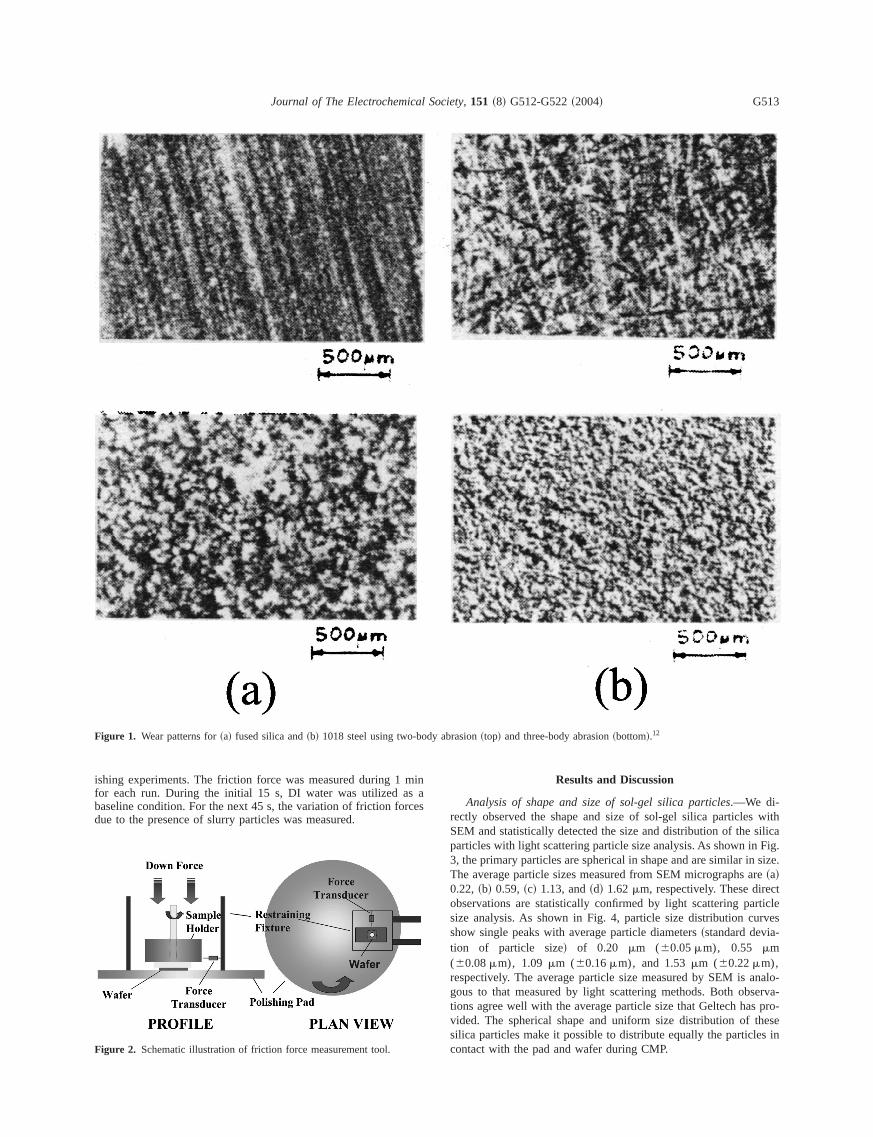
On the micro- and nanoscales, the polishing rate is significdependent on the dynamic contact of particles between the pathe wafer. To examine the dynamic interfacial contact of partduring CMP, friction force measurement techniques and surfacish analysis are considered the most applicable methods becathe possibility of direct observation of contact phenomena.11 Abra-hamsonet al.12 compared the material removal mechanism for loabrasive particles~i.e., two-body contact! and for bonded abrasivparticles ~i.e., three-body contact!. As seen in Fig. 1, it has bereported that three-body contact produced a ‘‘shot-blast’’ app
* Electrochemical Society Student Member.** Electrochemical Society Active Member.
z E-mail: [email protected]
-
st
e
s-
d
of
ance, whereas two-body contact yielded continuous scratchesmillan et al.13 studied the sliding frictional behavior under variochemical environments using pin-on-disk friction force measments. Scratches by particles undergoing sliding motion werserved on the MgO surface. Previous results showed that thetrostatic repulsion force between particle and wafer and wsurface roughness play important roles in determining the friforce during polishing.14,15
This paper presents further validation of the polishing menism using sol-gel silica slurries. The effects of particle sizesolids loading on friction force and surface finish were studiedelineate the dynamic contact of particles during polishing.
Experimental
CMP slurries were formulated by dispersing sol-gel silicaticles from Geltech Corporation in deionized~DI! water. The average particle diameters provided by Geltech were 0.2, 0.5, 1.01.5 mm. The solids loadings were varied from 0.5 to 30 wtSlurries composed of sol-gel silica particles were dispersed usiultrasonic bath and were stabilized by adjusting pH values towith 0.1 M NaOH and 0.1 M HNO3 . The average size and disbution of stabilized sol-gel silica particles were analyzed wiCoulter LS 230 instrument that uses a dynamic light scatteringnique. In addition, the shape and size of the particles were dmined by scanning electron microscopy~SEM! analysis.
Polishing samples were clipped to 1.53 1.5 in. from an 8 inp-type silicon wafer on which silica of;2.0mm thick was deposited by plasma-enhanced chemical vapor deposition. IC 1000IV stacked pads~supplied by Rodel Inc.! were utilized as CMP padand a Grid-Abrade diamond pad conditioner was used to abradpad before each test.
A Struers RotoPol-31 tabletop polisher was used to psamples. The following conditions were applied to each run: dpressure of 3.5 psi~23.132 kPa!, polishing time of 30 s, slurry flowrate of 100 mL/min, and rotation speed of 150 rpm~110 cm/s!. Thepolishing tests were repeated three times to ensure reliable rThe polishing rates were determined by measuring oxide film tness on the samples before and after the polishing experimusing a J. A. Woollam variable angle spectrometry ellipsomAtomic force microscopy~AFM! with a Digital Instruments Nanoscope III was used to characterize the surface finish of the posamples.
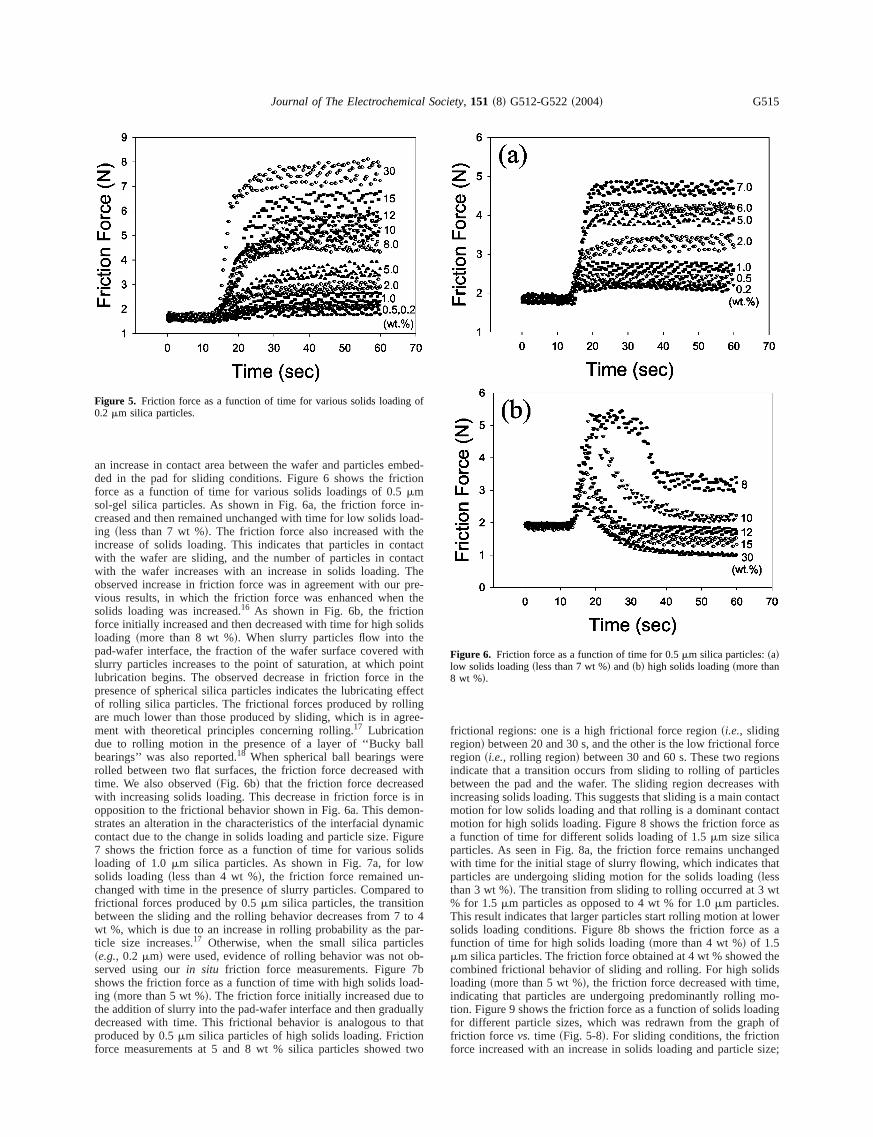
In situ friction force measurements were carried out to invgate the contact behavior at the pad-particles-wafer interfacseen in Fig. 2, anin situ friction force measurement tool wmounted on the Struers RotoPol-31 tabletop polisher. A Senmodel 31 load cell was used to measure the friction force, wwas connected to a data acquisition system, with a data poicorded every 250 ms. Experimental conditions ofin situ frictionforce measurements were the same as the process conditions
mins arces
withsilicaFig.size.rectrticlerves-
nalo-erva-pro-
heses in
body
Journal of The Electrochemical Society, 151 ~8! G512-G522~2004! G513
ishing experiments. The friction force was measured during 1for each run. During the initial 15 s, DI water was utilized abaseline condition. For the next 45 s, the variation of friction fodue to the presence of slurry particles was measured.
Figure 1. Wear patterns for~a! fused silica and~b! 1018 steel using two-
Figure 2. Schematic illustration of friction force measurement tool.
Results and Discussion
Analysis of shape and size of sol-gel silica particles.—We di-rectly observed the shape and size of sol-gel silica particlesSEM and statistically detected the size and distribution of theparticles with light scattering particle size analysis. As shown in3, the primary particles are spherical in shape and are similar inThe average particle sizes measured from SEM micrographs a~a!0.22,~b! 0.59,~c! 1.13, and~d! 1.62mm, respectively. These direobservations are statistically confirmed by light scattering pasize analysis. As shown in Fig. 4, particle size distribution cushow single peaks with average particle diameters~standard deviation of particle size! of 0.20 mm (60.05mm), 0.55 mm(60.08mm), 1.09 mm (60.16mm), and 1.53mm (60.22mm),respectively. The average particle size measured by SEM is agous to that measured by light scattering methods. Both obstions agree well with the average particle size that Geltech hasvided. The spherical shape and uniform size distribution of tsilica particles make it possible to distribute equally the particlecontact with the pad and wafer during CMP.
abrasion~top! and three-body abrasion~bottom!.12

ande-ishingr canulting-
s.iousheafere foriningurryromrfacedcesdded
ausingthe
ding.ber ofea ofn fric-ed to
ight
Journal of The Electrochemical Society, 151 ~8! G512-G522~2004!G514
Analysis of in situ friction force as a function of particle sizesolids loading.—In situ monitoring of interfacial interactions btween pad, particles, and wafer is essential to analyze the polmechanism. The interfacial contact of pad, particles, and wafebe altered as a function of particle size and solids loading, resin a variation of friction force. Therefore,in situ friction force measurements can provide an insight into the polishing mechanism
Figure 5 shows the friction force as a function of time for varsolids loading of 0.2mm silica particles. During the initial 15 s, tfriction force was measured with just DI water between the wand the pad. Particle-free slurries were utilized as a baselincomparison with the friction force measured for abrasive-contaslurries. During the following 15 s, the abrasive-containing slflowed into the pad-wafer interface, elevating the friction force fthe baseline to higher levels. Particles inserted into the intebetween pad and wafer form three-body contact~pad, particles, anwafer!, enhancing the friction force. Finally, average friction forwere saturated with time in the range of 30-60 s. Particles embein a soft pad slide on the wafer surface at a constant speed, ca constant friction force. While particles are in contact withwafer, the friction force increases with the increase of solids loaThe increase of solids loading leads to an increase in the numparticles in contact with the wafer, enlarging the total contact arparticles between the wafer and pad. Therefore, the increase ition force due to an increase in solids loading may be attribut
mm.
Figure 3. SEM micrograph of silica particles:~a! 0.2, ~b! 0.5, ~c! 1.0, and~d! 1.5Figure 4. Size distribution of silica particles measured by dynamic lscattering.
mbetion
in-loadhentacttactThepre-the
nolidsewithointthe
ffectingree-
allrewith
edis inon-amicigurelidsw-
ed tonto 4
par-lesob-7bad-touallythat
ontwo
orceonsles
s withntacttact
as
ngedhat
wt.wer
as a
thelidse,mo-dingh ofnsize;
of
Journal of The Electrochemical Society, 151 ~8! G512-G522~2004! G515
an increase in contact area between the wafer and particles eded in the pad for sliding conditions. Figure 6 shows the fricforce as a function of time for various solids loadings of 0.5mmsol-gel silica particles. As shown in Fig. 6a, the friction forcecreased and then remained unchanged with time for low solidsing ~less than 7 wt %!. The friction force also increased with tincrease of solids loading. This indicates that particles in cowith the wafer are sliding, and the number of particles in conwith the wafer increases with an increase in solids loading.observed increase in friction force was in agreement with ourvious results, in which the friction force was enhanced whensolids loading was increased.16 As shown in Fig. 6b, the frictioforce initially increased and then decreased with time for high sloading ~more than 8 wt %!. When slurry particles flow into thpad-wafer interface, the fraction of the wafer surface coveredslurry particles increases to the point of saturation, at which plubrication begins. The observed decrease in friction force inpresence of spherical silica particles indicates the lubricating eof rolling silica particles. The frictional forces produced by rollare much lower than those produced by sliding, which is in agment with theoretical principles concerning rolling.17 Lubricationdue to rolling motion in the presence of a layer of ‘‘Bucky bbearings’’ was also reported.18 When spherical ball bearings werolled between two flat surfaces, the friction force decreasedtime. We also observed~Fig. 6b! that the friction force decreaswith increasing solids loading. This decrease in friction forceopposition to the frictional behavior shown in Fig. 6a. This demstrates an alteration in the characteristics of the interfacial dyncontact due to the change in solids loading and particle size. F7 shows the friction force as a function of time for various soloading of 1.0mm silica particles. As shown in Fig. 7a, for losolids loading~less than 4 wt %!, the friction force remained unchanged with time in the presence of slurry particles. Comparfrictional forces produced by 0.5mm silica particles, the transitiobetween the sliding and the rolling behavior decreases from 7wt %, which is due to an increase in rolling probability as theticle size increases.17 Otherwise, when the small silica partic~e.g., 0.2 mm! were used, evidence of rolling behavior was notserved using ourin situ friction force measurements. Figureshows the friction force as a function of time with high solids loing ~more than 5 wt %!. The friction force initially increased duethe addition of slurry into the pad-wafer interface and then graddecreased with time. This frictional behavior is analogous toproduced by 0.5mm silica particles of high solids loading. Frictiforce measurements at 5 and 8 wt % silica particles showed
Figure 5. Friction force as a function of time for various solids loading0.2 mm silica particles.
d-
-
frictional regions: one is a high frictional force region~i.e., slidingregion! between 20 and 30 s, and the other is the low frictional fregion~i.e., rolling region! between 30 and 60 s. These two regiindicate that a transition occurs from sliding to rolling of particbetween the pad and the wafer. The sliding region decreaseincreasing solids loading. This suggests that sliding is a main comotion for low solids loading and that rolling is a dominant conmotion for high solids loading. Figure 8 shows the friction forcea function of time for different solids loading of 1.5mm size silicaparticles. As seen in Fig. 8a, the friction force remains unchawith time for the initial stage of slurry flowing, which indicates tparticles are undergoing sliding motion for the solids loading~lessthan 3 wt %!. The transition from sliding to rolling occurred at 3% for 1.5mm particles as opposed to 4 wt % for 1.0mm particlesThis result indicates that larger particles start rolling motion at losolids loading conditions. Figure 8b shows the friction forcefunction of time for high solids loading~more than 4 wt %! of 1.5mm silica particles. The friction force obtained at 4 wt % showedcombined frictional behavior of sliding and rolling. For high soloading~more than 5 wt %!, the friction force decreased with timindicating that particles are undergoing predominantly rollingtion. Figure 9 shows the friction force as a function of solids loafor different particle sizes, which was redrawn from the grapfriction force vs. time ~Fig. 5-8!. For sliding conditions, the frictioforce increased with an increase in solids loading and particle
Figure 6. Friction force as a function of time for 0.5mm silica particles:~a!low solids loading~less than 7 wt %! and~b! high solids loading~more than8 wt %!.

h anse ofthe
par-easeticlesrticleistri-
onlaferd-esur-h isadingthemain
agesced
rsely-
icle
Journal of The Electrochemical Society, 151 ~8! G512-G522~2004!G516
whereas, in rolling conditions, the friction force decreased witincrease in solids loading and particle size. Clearly, the responfriction force to solids loading and particle size is dependent ondynamic condition of slurry particles.
For sliding slurry particles, the effect of solids loading andticle size on friction force can be explained as follows. The incrof solids loading leads to an increase in the number of parcontacting the pad and the wafer. Increasing the amount of paat the pad-wafer interface results in a more uniform pressure dbution at the wafer surface~for constant down pressure!.19,20 Thefriction force as measured by us has been assumed to arisefrom regions of pad-wafer contact and particle on pad-wcontact.21 For smaller particles~0.2mm!, the increase in solids loaing results in an increase in total contact area~Eq. 1!. This increasin the number of particles available for polishing at the waferface results in a more uniform distribution of pressure, whicevidenced by a reduction in surface roughness as solids loincreases~see Fig. 10, 14a!. However, the pressure distributed onabrasive particles remains sufficient to ensure that particles reembedded in the polishing pad. As evidenced by the AFM im~Fig. 10!, particles embedded in the polishing pad produscratches on the surface due to sliding motion.
In the particle size range~0.5-1.5mm!, wherein a transition fromsliding to rolling motion occurred, the contact area scales invewith particle size~Eq. 1!. The transition from rolling to sliding oc
Figure 7. Friction force as a function of time for 1.0mm silica particles:~a!low solids loading~less than 4 wt %! and~b! high solids loading~more than5 wt %!.
Figure 8. Friction force as a function of time for 1.5mm silica particles:~a!low solids loading~less than 3 wt %! and~b! high solids loading~more than5 wt %!.
s
y
Figure 9. Friction force as a function of solids loading for different partsizes.
asesin-
rfacer surhich
e off ei-ialndi-n be-wafeplainlidsreastwee
alida
ss th
raphyim-
ip anteral
ofd-ds evi-
rialfore,alongre alsown invepad.
on theenceasily
ion ofafers
w,servedlishederetheere inhown
Journal of The Electrochemical Society, 151 ~8! G512-G522~2004! G517
curs at lower solids loading conditions as the particle size increAs discussed for 0.2mm particles, for constant down pressure,creasing the amount of slurry particles at the pad-wafer interesults in a reduction in the pressure per particle at the wafeface. Zhao and Shi have produced a theoretical CMP model in wthe material removal mechanism is dependent on the existencthreshold pressure.22 This threshold pressure marks the onset other rolling or sliding motion. According to their work, materremoval at the wafer surface should be negligible for rolling cotions. Appreciable removal rates are expected when the frictiotween the pad and particle exceeds that between particle andsurface. The surface area of the particles may be utilized to exthe appearance of the sliding-to-rolling transition at lower soloading conditions as particle size increases. Surface area decas particle size increases, resulting in less interaction area beparticle and opposing surfaces~pad and/or wafer!. Via in situ fric-tion force measurements, we were able to give experimental vtion of the prediction of threshold pressure during CMP.
Effect of particle size and solids loading on surface finishe.—The surface finish of polished samples can be considered asurface topography produced during CMP. The surface topogof polished samples was measured by AFM, in which surfaceages are taken by scanning the sample relative to the probing tmeasuring the deflection of the cantilever as a function of la
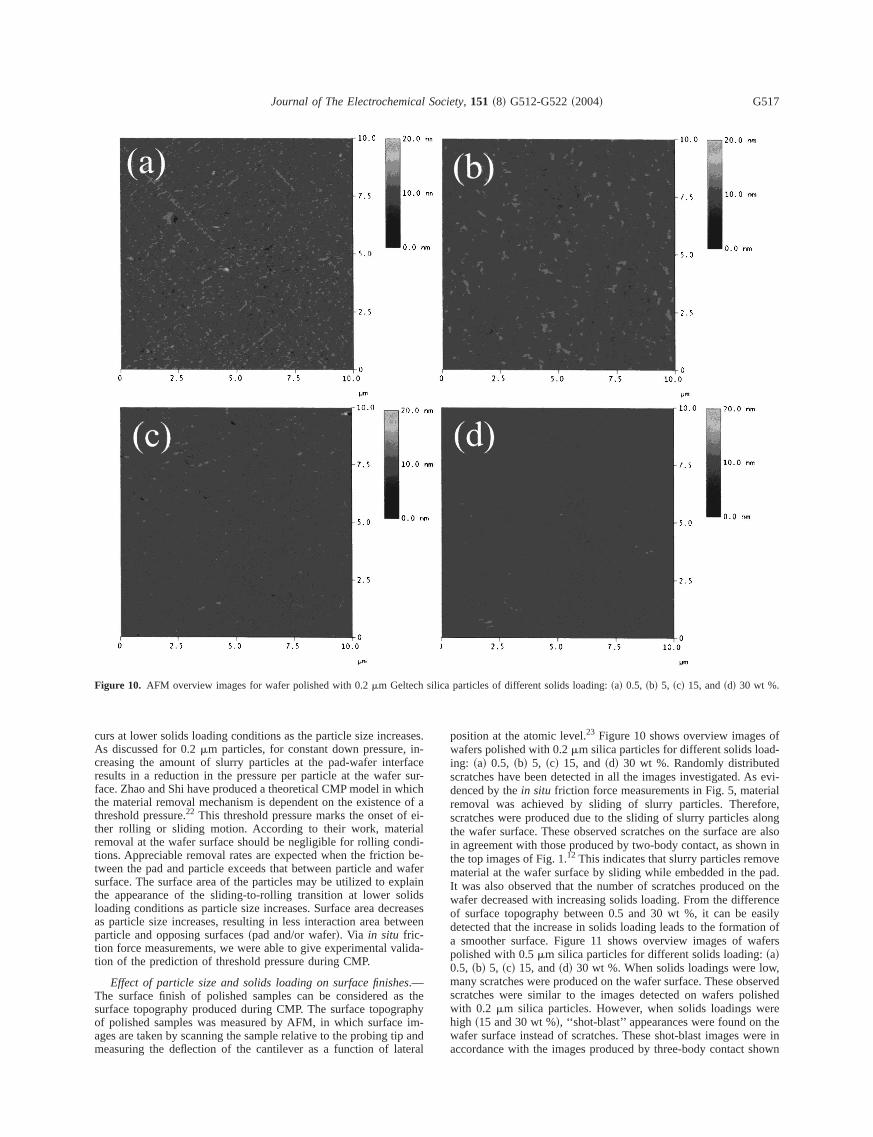
Figure 10. AFM overview images for wafer polished with 0.2mm Geltech
.
-
a
r
esn
-
e
d
position at the atomic level.23 Figure 10 shows overview imageswafers polished with 0.2mm silica particles for different solids loaing: ~a! 0.5, ~b! 5, ~c! 15, and~d! 30 wt %. Randomly distributescratches have been detected in all the images investigated. Adenced by thein situ friction force measurements in Fig. 5, materemoval was achieved by sliding of slurry particles. Therescratches were produced due to the sliding of slurry particlesthe wafer surface. These observed scratches on the surface ain agreement with those produced by two-body contact, as shothe top images of Fig. 1.12 This indicates that slurry particles remomaterial at the wafer surface by sliding while embedded in theIt was also observed that the number of scratches producedwafer decreased with increasing solids loading. From the differof surface topography between 0.5 and 30 wt %, it can be edetected that the increase in solids loading leads to the formata smoother surface. Figure 11 shows overview images of wpolished with 0.5mm silica particles for different solids loading:~a!0.5, ~b! 5, ~c! 15, and~d! 30 wt %. When solids loadings were lomany scratches were produced on the wafer surface. These obscratches were similar to the images detected on wafers powith 0.2 mm silica particles. However, when solids loadings whigh ~15 and 30 wt %!, ‘‘shot-blast’’ appearances were found onwafer surface instead of scratches. These shot-blast images waccordance with the images produced by three-body contact s
particles of different solids loading:~a! 0.5, ~b! 5, ~c! 15, and~d! 30 wt %.
silica
on.e to
llingshot-ermeeetheove
tst %
micbe-
con-1.0
0.5ouslytion oher o
ering.pol-
dr
phiret %indi-tact.
ousr pol-blasthes, a. Also,oothhowslids
asedding
Journal of The Electrochemical Society, 151 ~8! G512-G522~2004!G518
in the bottom of Fig. 1.12 Similar contact images were observedsurfaces produced by a rolling sphere for three-body contact23 Inaddition, as seen in Fig. 6b, the decrease of friction force durolling of slurry particles was observed. This indicates that roparticles move freely between the pad and the wafer, yieldingblast surfaces. It is interesting to observe the phenomena at intdiate solids loading conditions~i.e., 5 wt %!. For the intermediatcondition of solids loading, scratch images were observed togwith a shot-blast appearance. This indicates that material is remby two different dynamic motions~i.e., sliding and rolling! duringpolishing. As seen in Fig. 6b,in situ friction force measuremendetected the coexistence of two dynamic contact motions at 8 wDespite the different critical solids loading at which two dynacontact motions coexist, it is possible to detect the transitiontween predominantly sliding contact and predominantly rollingtact. Figure 12 shows overview images of a wafer polished withmm silica particles for different solids loading:~a! 0.5, ~b! 2, ~c! 15,and~d! 30 wt %. An overview image of the wafers polished withwt % particles shows numerous scratches. As mentioned previwe assume that scratches are produced due to the sliding moparticles. Both scratches and shot-blast features appear togetthe surface of wafers polished with 2 wt % particles~Fig. 12b!.
Figure 11. AFM overview images for the wafer polished with 0.5mm G30 wt %.
-
rd
.
,fn
Significant plastic deformation is shown along a band 0.3-0.5mmwide. These tracks also exhibit considerable cracking and cratThese plastic deformations, which were not shown on wafersished with small particles~0.2 and 0.5mm!, may only be produceby large silica particles. Macmillanet al.13 also showed a similaSEM picture of the track that was produced by a sliding sapball. An overview image of a wafer polished with 15 and 30 wparticles clearly showed a series of shot-blast regions, whichcates the rolling of particles observed during three-body conFigure 13 shows overview images of a wafer polished with 1.5mmsilica particles for different solids loading:~a! 0.5, ~b! 2, ~c! 15, and~d! 30 wt %. For 0.5 wt %, polished surfaces with numerscratches are apparent. However, overview images of a wafeished with 2 wt % particles shows a predominance of shot-regions rather than scratches. For 15 wt %, instead of scratcmostly shot-blast appearance is observed on the wafer surfaceoverview images of a wafer polished at 30 wt % show a smwafer surface with a shallow shot-blast appearance. Figure 14 sthe root-mean-square~rms! surface roughness as a function of soloading for various particle sizes:~a! 0.2, ~b! 0.5, ~c! 1.0, and~d! 1.5mm. For 0.2mm silica particles, the surface roughness decrewith an increase in solids loading. However, for low solids loa
silica particles of different solids loading:~a! 0.5, ~b! 5, ~c! 15, and~d!
eltech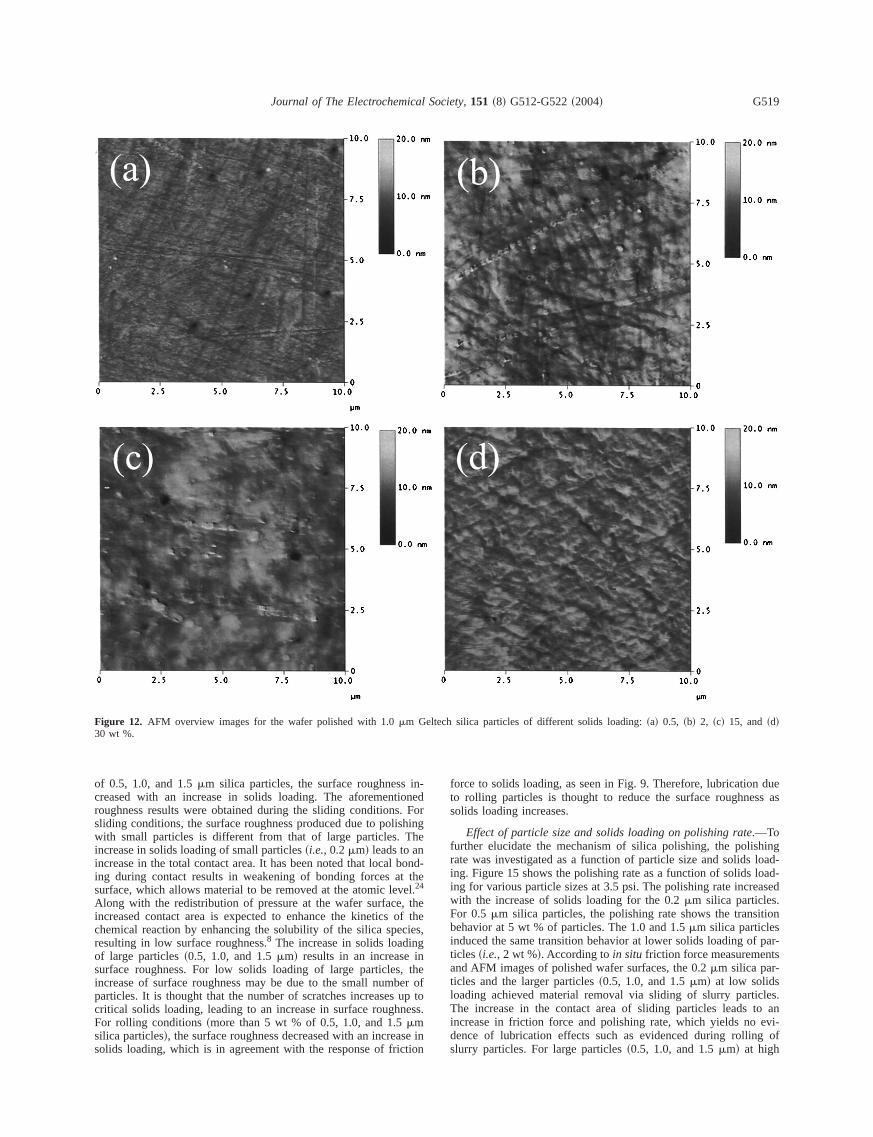
in-ioned. Forshinghe
bondt theel.
, theof thcies,g
in, theber oup toness
se intion
duess as
hingload-load-ased.ition
f par-ts
les.to anevi-g of
Journal of The Electrochemical Society, 151 ~8! G512-G522~2004! G519
of 0.5, 1.0, and 1.5mm silica particles, the surface roughnesscreased with an increase in solids loading. The aforementroughness results were obtained during the sliding conditionssliding conditions, the surface roughness produced due to poliwith small particles is different from that of large particles. Tincrease in solids loading of small particles~i.e., 0.2mm! leads to anincrease in the total contact area. It has been noted that localing during contact results in weakening of bonding forces asurface, which allows material to be removed at the atomic lev24
Along with the redistribution of pressure at the wafer surfaceincreased contact area is expected to enhance the kineticschemical reaction by enhancing the solubility of the silica speresulting in low surface roughness.8 The increase in solids loadinof large particles~0.5, 1.0, and 1.5mm! results in an increasesurface roughness. For low solids loading of large particlesincrease of surface roughness may be due to the small numparticles. It is thought that the number of scratches increasescritical solids loading, leading to an increase in surface roughFor rolling conditions~more than 5 wt % of 0.5, 1.0, and 1.5mmsilica particles!, the surface roughness decreased with an increasolids loading, which is in agreement with the response of fric
Figure 12. AFM overview images for the wafer polished with 1.0mm G30 wt %.
-
e
f
.
force to solids loading, as seen in Fig. 9. Therefore, lubricationto rolling particles is thought to reduce the surface roughnesolids loading increases.
Effect of particle size and solids loading on polishing rate.—Tofurther elucidate the mechanism of silica polishing, the polisrate was investigated as a function of particle size and solidsing. Figure 15 shows the polishing rate as a function of solidsing for various particle sizes at 3.5 psi. The polishing rate increwith the increase of solids loading for the 0.2mm silica particlesFor 0.5mm silica particles, the polishing rate shows the transbehavior at 5 wt % of particles. The 1.0 and 1.5mm silica particlesinduced the same transition behavior at lower solids loading oticles~i.e., 2 wt %!. According toin situ friction force measuremenand AFM images of polished wafer surfaces, the 0.2mm silica par-ticles and the larger particles~0.5, 1.0, and 1.5mm! at low solidsloading achieved material removal via sliding of slurry particThe increase in the contact area of sliding particles leadsincrease in friction force and polishing rate, which yields nodence of lubrication effects such as evidenced during rollinslurry particles. For large particles~0.5, 1.0, and 1.5mm! at high
h silica particles of different solids loading:~a! 0.5, ~b! 2, ~c! 15, and~d!
eltec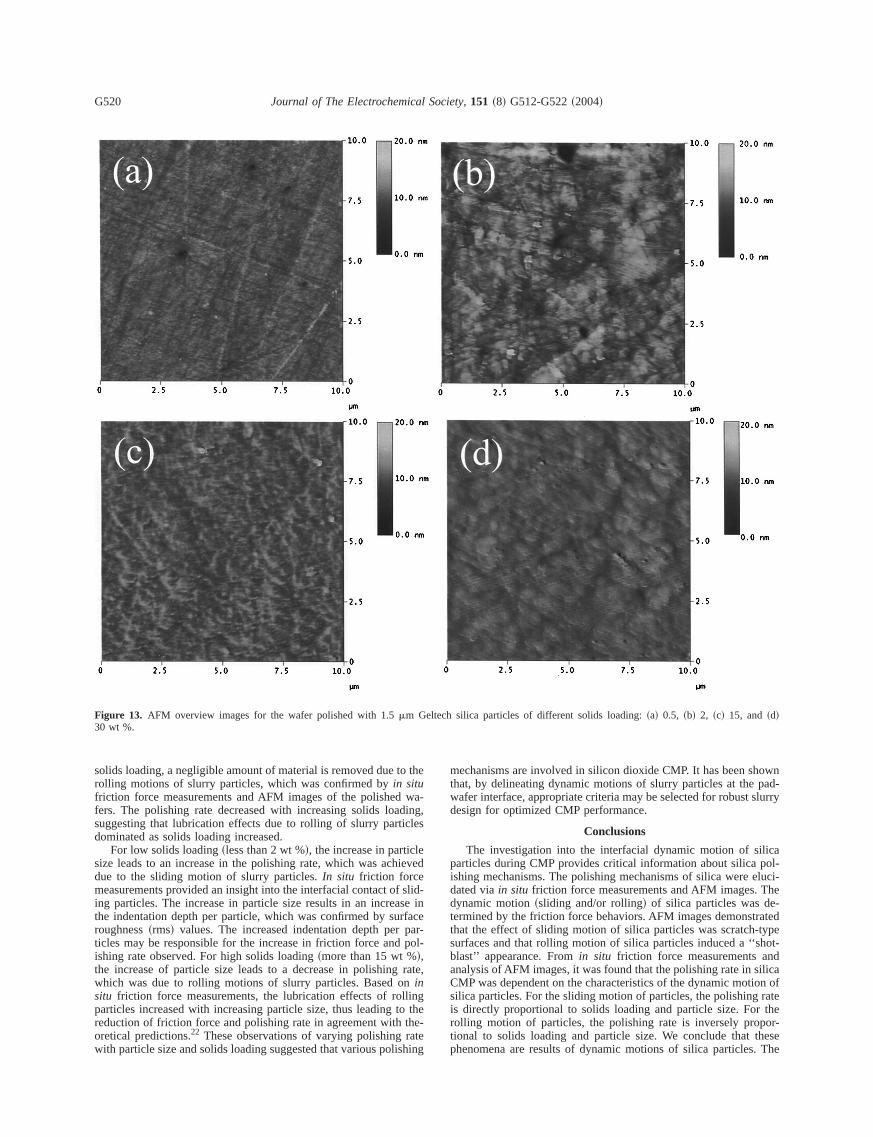
o the
wa-dingcles
leieved
slid-se inrfacepar-pol-
ratenlingo thethe-ateshing
ownpad-lurry
licapol-luci-
The-atedtypehot-ndilicaion ofratetheor-
hese. The
Journal of The Electrochemical Society, 151 ~8! G512-G522~2004!G520
solids loading, a negligible amount of material is removed due trolling motions of slurry particles, which was confirmed byin situfriction force measurements and AFM images of the polishedfers. The polishing rate decreased with increasing solids loasuggesting that lubrication effects due to rolling of slurry partidominated as solids loading increased.
For low solids loading~less than 2 wt %!, the increase in particsize leads to an increase in the polishing rate, which was achdue to the sliding motion of slurry particles.In situ friction forcemeasurements provided an insight into the interfacial contact ofing particles. The increase in particle size results in an increathe indentation depth per particle, which was confirmed by suroughness~rms! values. The increased indentation depth perticles may be responsible for the increase in friction force andishing rate observed. For high solids loading~more than 15 wt %!,the increase of particle size leads to a decrease in polishingwhich was due to rolling motions of slurry particles. Based oinsitu friction force measurements, the lubrication effects of rolparticles increased with increasing particle size, thus leading treduction of friction force and polishing rate in agreement withoretical predictions.22 These observations of varying polishing rwith particle size and solids loading suggested that various poli
Figure 13. AFM overview images for the wafer polished with 1.5mm G30 wt %.
,
,
mechanisms are involved in silicon dioxide CMP. It has been shthat, by delineating dynamic motions of slurry particles at thewafer interface, appropriate criteria may be selected for robust sdesign for optimized CMP performance.
Conclusions
The investigation into the interfacial dynamic motion of siparticles during CMP provides critical information about silicaishing mechanisms. The polishing mechanisms of silica were edated viain situ friction force measurements and AFM images.dynamic motion~sliding and/or rolling! of silica particles was determined by the friction force behaviors. AFM images demonstrthat the effect of sliding motion of silica particles was scratch-surfaces and that rolling motion of silica particles induced a ‘‘sblast’’ appearance. Fromin situ friction force measurements aanalysis of AFM images, it was found that the polishing rate in sCMP was dependent on the characteristics of the dynamic motsilica particles. For the sliding motion of particles, the polishingis directly proportional to solids loading and particle size. Forrolling motion of particles, the polishing rate is inversely proptional to solids loading and particle size. We conclude that tphenomena are results of dynamic motions of silica particles
h silica particles of different solids loading:~a! 0.5, ~b! 2, ~c! 15, and~d!
eltec
lish-xis-
e mo-rkthat
rticle,d
f this
-
c.,
c.
rious
ticle
Journal of The Electrochemical Society, 151 ~8! G512-G522~2004! G521
Figure 14. Surface roughness~rms! as a function of solids loading for va
Figure 15. Polishing rate as a function of solids loading for different parsize.
observed polishing behavior provides further insight into the poing mechanism while confirming theoretical predictions of the etence of a threshold pressure that determines dynamic particltion ~sliding and/or rolling! at the pad-wafer interface. Further wois needed to quantitatively determine the threshold pressuremarks the onset of sliding or rolling motion.
Acknowledgments
The authors acknowledge the financial support of the PaEngineering Research Center~PERC! at the University of Floridathe National Science Foundation~NSF! grant EEC-94-02989, anthe Industrial Partners of the PERC.
The University of Florida assisted in meeting the publication costs oarticle.
References
1. J. M. Steigerwald, S. P. Murarka, and R. J. Gutmann,Chemical-Mechanical Planarization of Microelectronic Materials, John Wiley & Sons, New York~1997!.
2. K. D. Beyer,IBM Micronews,5, 40 ~1999!.3. L. Shon-Roy,Solid State Technol.,43, 67 ~2000!.4. R. K. Singh, R. Bajaj, M. Moinpour, and M. Meuris,Mater. Res. Soc. Symp. Pro
613 ~2001!.5. R. Jairath, M. Desai, M. Stell, R. Tolles, and D. Scherber-Brewer,Mater. Res. So
Symp. Proc.,337, 121 ~1994!.6. Y. Xie and B. Bhushan,Wear,200, 281 ~1996!.7. L. M. Cook,J. Non-Cryst. Solids,120, 152 ~1990!.
particle sizes:~a! 0.2, ~b! 0.5, ~c! 1.0, and~d! 1.5 mm.

d
dgil,
.
001-Ryan,
.
Journal of The Electrochemical Society, 151 ~8! G512-G522~2004!G522
8. T. Izumitani, inTreatise on Materials Science and Technology, M. Tomozawa anR. Doremus, Editors, p. 115, Academic Press, New York~1979!.
9. U. Mahajan, M. Bielmann, and R. K. Singh,Mater. Res. Soc. Symp. Proc.,566, 27~1999!.
10. M. Bielmann, Masters Thesis, University of Florida, Gainesville, FL~1998!.11. U. Mahajan, M. Bielmann, and R. K. Singh,Electrochem. Solid-State Lett.,2, 80
~1999!.12. G. R. Abrahamson, E. J. Duwell, and W. J. Mcdonald,J. Tribol., 113, 249 ~1991!.13. N. H. Macmillan, R. D. Huntington, and A. R. C. Westood,J. Mater. Sci.,9, 697
~1974!.14. K. Rajan, R. K. Singh, J. Adler, U. Mahajan, Y. Rabinovich, and B. M. Mou
Thin Solid Films,529, 308 ~1997!.15. S. Ramarajan, Y. Li, M. Hariharaputhiran, Y.-S. Her, and S. V. Babu,Electrochem
Solid-State Lett.,3, 232 ~2000!.
16. W. Choi, S.-M. Lee, and R. K. Singh, in Chemical-Mechanical Polishing 2Advances and Future Challenges, Edited by S. V. Babu, K. C. Cadien, J. G.and H. Yano, Mater. Res. Soc. Proc. M5.1, MRS, San Francisco, CA~2001!.
17. B. Bhushan,Introduction to Tribology, John Wiley & Sons, New York~2002!.18. D. Myers,Surface, Interfaces, and Colloids: Principles and Applications, 2nd ed
p. 454, John Wiley & Sons, New York~1999!.19. Y. Zhao and L. Chang,Wear,1, 9026~2001!.20. S. Timoshenko and J. N. Goodier,Theory of Elasticity, p. 174, McGraw-Hill, New
York ~1951!.21. W. Choi, S.-M. Lee, J. Abiade, and Rajiv K. Singh,J. Electrochem. Soc.,151,
G367 ~2004!.22. B. Zhao and F. Shi,Electrochem. Solid-State Lett.,2, 145 ~1999!.23. E. Meyer,Prog. Surf. Sci.,41, 3 ~1992!.24. Y. Morii, K. Yamuchi, and K. Endo,Precis. Eng.,9, 123 ~1987!.