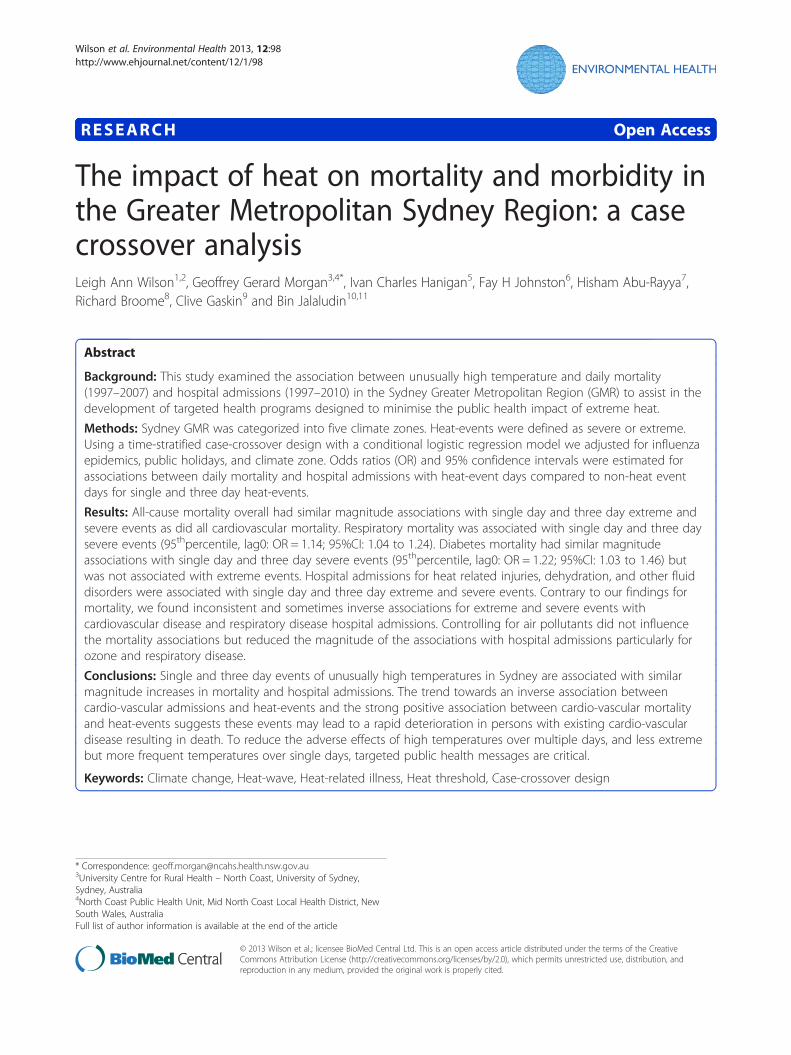
The impact of heat on mortality and morbidity in the Greater Metropolitan Sydney Region: a case...
14
RESEARCH Open Access The impact of heat on mortality and morbidity in the Greater Metropolitan Sydney Region: a case crossover analysis Leigh Ann Wilson 1,2 , Geoffrey Gerard Morgan 3,4* , Ivan Charles Hanigan 5 , Fay H Johnston 6 , Hisham Abu-Rayya 7 , Richard Broome 8 , Clive Gaskin 9 and Bin Jalaludin 10,11 Abstract Background: This study examined the association between unusually high temperature and daily mortality (1997–2007) and hospital admissions (1997–2010) in the Sydney Greater Metropolitan Region (GMR) to assist in the development of targeted health programs designed to minimise the public health impact of extreme heat. Methods: Sydney GMR was categorized into five climate zones. Heat-events were defined as severe or extreme. Using a time-stratified case-crossover design with a conditional logistic regression model we adjusted for influenza epidemics, public holidays, and climate zone. Odds ratios (OR) and 95% confidence intervals were estimated for associations between daily mortality and hospital admissions with heat-event days compared to non-heat event days for single and three day heat-events. Results: All-cause mortality overall had similar magnitude associations with single day and three day extreme and severe events as did all cardiovascular mortality. Respiratory mortality was associated with single day and three day severe events (95 th percentile, lag0: OR = 1.14; 95%CI: 1.04 to 1.24). Diabetes mortality had similar magnitude associations with single day and three day severe events (95 th percentile, lag0: OR = 1.22; 95%CI: 1.03 to 1.46) but was not associated with extreme events. Hospital admissions for heat related injuries, dehydration, and other fluid disorders were associated with single day and three day extreme and severe events. Contrary to our findings for mortality, we found inconsistent and sometimes inverse associations for extreme and severe events with cardiovascular disease and respiratory disease hospital admissions. Controlling for air pollutants did not influence the mortality associations but reduced the magnitude of the associations with hospital admissions particularly for ozone and respiratory disease. Conclusions: Single and three day events of unusually high temperatures in Sydney are associated with similar magnitude increases in mortality and hospital admissions. The trend towards an inverse association between cardio-vascular admissions and heat-events and the strong positive association between cardio-vascular mortality and heat-events suggests these events may lead to a rapid deterioration in persons with existing cardio-vascular disease resulting in death. To reduce the adverse effects of high temperatures over multiple days, and less extreme but more frequent temperatures over single days, targeted public health messages are critical. Keywords: Climate change, Heat-wave, Heat-related illness, Heat threshold, Case-crossover design * Correspondence: [email protected] 3 University Centre for Rural Health – North Coast, University of Sydney, Sydney, Australia 4 North Coast Public Health Unit, Mid North Coast Local Health District, New South Wales, Australia Full list of author information is available at the end of the article © 2013 Wilson et al.; licensee BioMed Central Ltd. This is an open access article distributed under the terms of the Creative Commons Attribution License (http://creativecommons.org/licenses/by/2.0), which permits unrestricted use, distribution, and reproduction in any medium, provided the original work is properly cited. Wilson et al. Environmental Health 2013, 12:98 http://www.ehjournal.net/content/12/1/98
Transcript of The impact of heat on mortality and morbidity in the Greater Metropolitan Sydney Region: a case...
Wilson et al. Environmental Health 2013, 12:98http://www.ehjournal.net/content/12/1/98
RESEARCH Open Access
The impact of heat on mortality and morbidity inthe Greater Metropolitan Sydney Region: a casecrossover analysisLeigh Ann Wilson1,2, Geoffrey Gerard Morgan3,4*, Ivan Charles Hanigan5, Fay H Johnston6, Hisham Abu-Rayya7,Richard Broome8, Clive Gaskin9 and Bin Jalaludin10,11
Abstract
Background: This study examined the association between unusually high temperature and daily mortality(1997–2007) and hospital admissions (1997–2010) in the Sydney Greater Metropolitan Region (GMR) to assist in thedevelopment of targeted health programs designed to minimise the public health impact of extreme heat.
Methods: Sydney GMR was categorized into five climate zones. Heat-events were defined as severe or extreme.Using a time-stratified case-crossover design with a conditional logistic regression model we adjusted for influenzaepidemics, public holidays, and climate zone. Odds ratios (OR) and 95% confidence intervals were estimated forassociations between daily mortality and hospital admissions with heat-event days compared to non-heat eventdays for single and three day heat-events.
Results: All-cause mortality overall had similar magnitude associations with single day and three day extreme andsevere events as did all cardiovascular mortality. Respiratory mortality was associated with single day and three daysevere events (95thpercentile, lag0: OR = 1.14; 95%CI: 1.04 to 1.24). Diabetes mortality had similar magnitudeassociations with single day and three day severe events (95thpercentile, lag0: OR = 1.22; 95%CI: 1.03 to 1.46) butwas not associated with extreme events. Hospital admissions for heat related injuries, dehydration, and other fluiddisorders were associated with single day and three day extreme and severe events. Contrary to our findings formortality, we found inconsistent and sometimes inverse associations for extreme and severe events withcardiovascular disease and respiratory disease hospital admissions. Controlling for air pollutants did not influencethe mortality associations but reduced the magnitude of the associations with hospital admissions particularly forozone and respiratory disease.
Conclusions: Single and three day events of unusually high temperatures in Sydney are associated with similarmagnitude increases in mortality and hospital admissions. The trend towards an inverse association betweencardio-vascular admissions and heat-events and the strong positive association between cardio-vascular mortalityand heat-events suggests these events may lead to a rapid deterioration in persons with existing cardio-vasculardisease resulting in death. To reduce the adverse effects of high temperatures over multiple days, and less extremebut more frequent temperatures over single days, targeted public health messages are critical.
Keywords: Climate change, Heat-wave, Heat-related illness, Heat threshold, Case-crossover design
* Correspondence: [email protected] Centre for Rural Health – North Coast, University of Sydney,Sydney, Australia4North Coast Public Health Unit, Mid North Coast Local Health District, NewSouth Wales, AustraliaFull list of author information is available at the end of the article
© 2013 Wilson et al.; licensee BioMed Central Ltd. This is an open access article distributed under the terms of the CreativeCommons Attribution License (http://creativecommons.org/licenses/by/2.0), which permits unrestricted use, distribution, andreproduction in any medium, provided the original work is properly cited.
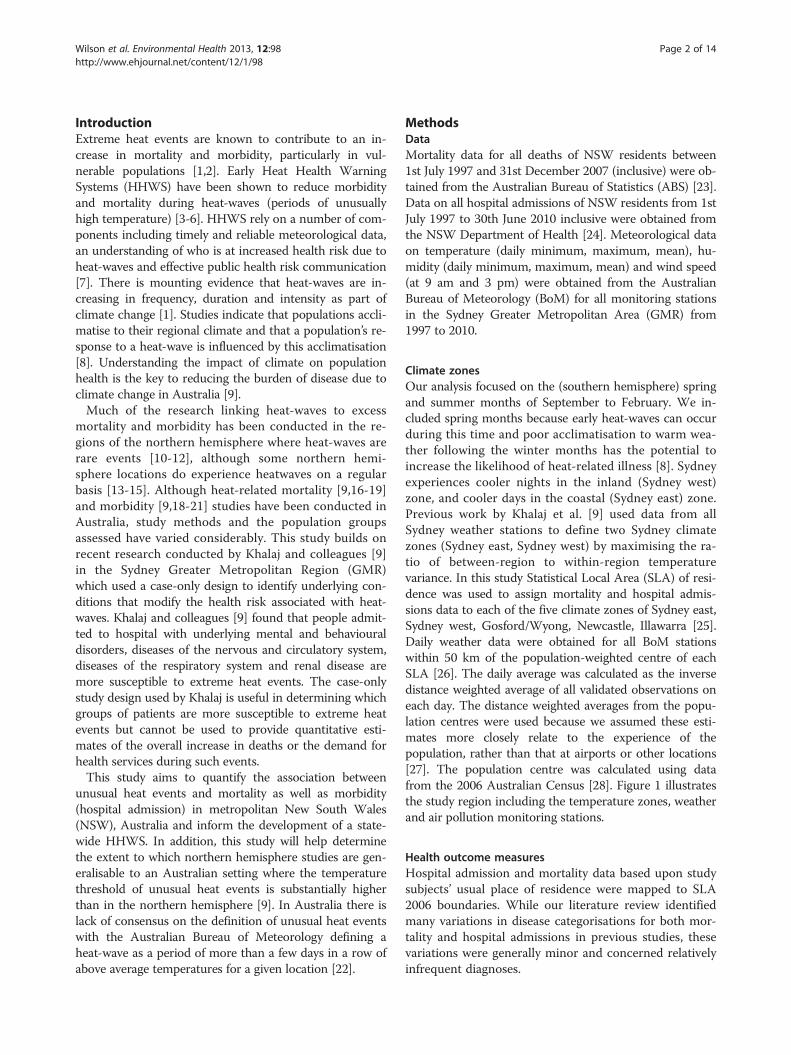
Wilson et al. Environmental Health 2013, 12:98 Page 2 of 14http://www.ehjournal.net/content/12/1/98
IntroductionExtreme heat events are known to contribute to an in-crease in mortality and morbidity, particularly in vul-nerable populations [1,2]. Early Heat Health WarningSystems (HHWS) have been shown to reduce morbidityand mortality during heat-waves (periods of unusuallyhigh temperature) [3-6]. HHWS rely on a number of com-ponents including timely and reliable meteorological data,an understanding of who is at increased health risk due toheat-waves and effective public health risk communication[7]. There is mounting evidence that heat-waves are in-creasing in frequency, duration and intensity as part ofclimate change [1]. Studies indicate that populations accli-matise to their regional climate and that a population’s re-sponse to a heat-wave is influenced by this acclimatisation[8]. Understanding the impact of climate on populationhealth is the key to reducing the burden of disease due toclimate change in Australia [9].Much of the research linking heat-waves to excess
mortality and morbidity has been conducted in the re-gions of the northern hemisphere where heat-waves arerare events [10-12], although some northern hemi-sphere locations do experience heatwaves on a regularbasis [13-15]. Although heat-related mortality [9,16-19]and morbidity [9,18-21] studies have been conducted inAustralia, study methods and the population groupsassessed have varied considerably. This study builds onrecent research conducted by Khalaj and colleagues [9]in the Sydney Greater Metropolitan Region (GMR)which used a case-only design to identify underlying con-ditions that modify the health risk associated with heat-waves. Khalaj and colleagues [9] found that people admit-ted to hospital with underlying mental and behaviouraldisorders, diseases of the nervous and circulatory system,diseases of the respiratory system and renal disease aremore susceptible to extreme heat events. The case-onlystudy design used by Khalaj is useful in determining whichgroups of patients are more susceptible to extreme heatevents but cannot be used to provide quantitative esti-mates of the overall increase in deaths or the demand forhealth services during such events.This study aims to quantify the association between
unusual heat events and mortality as well as morbidity(hospital admission) in metropolitan New South Wales(NSW), Australia and inform the development of a state-wide HHWS. In addition, this study will help determinethe extent to which northern hemisphere studies are gen-eralisable to an Australian setting where the temperaturethreshold of unusual heat events is substantially higherthan in the northern hemisphere [9]. In Australia there islack of consensus on the definition of unusual heat eventswith the Australian Bureau of Meteorology defining aheat-wave as a period of more than a few days in a row ofabove average temperatures for a given location [22].
MethodsDataMortality data for all deaths of NSW residents between1st July 1997 and 31st December 2007 (inclusive) were ob-tained from the Australian Bureau of Statistics (ABS) [23].Data on all hospital admissions of NSW residents from 1stJuly 1997 to 30th June 2010 inclusive were obtained fromthe NSW Department of Health [24]. Meteorological dataon temperature (daily minimum, maximum, mean), hu-midity (daily minimum, maximum, mean) and wind speed(at 9 am and 3 pm) were obtained from the AustralianBureau of Meteorology (BoM) for all monitoring stationsin the Sydney Greater Metropolitan Area (GMR) from1997 to 2010.
Climate zonesOur analysis focused on the (southern hemisphere) springand summer months of September to February. We in-cluded spring months because early heat-waves can occurduring this time and poor acclimatisation to warm wea-ther following the winter months has the potential toincrease the likelihood of heat-related illness [8]. Sydneyexperiences cooler nights in the inland (Sydney west)zone, and cooler days in the coastal (Sydney east) zone.Previous work by Khalaj et al. [9] used data from allSydney weather stations to define two Sydney climatezones (Sydney east, Sydney west) by maximising the ra-tio of between-region to within-region temperaturevariance. In this study Statistical Local Area (SLA) of resi-dence was used to assign mortality and hospital admis-sions data to each of the five climate zones of Sydney east,Sydney west, Gosford/Wyong, Newcastle, Illawarra [25].Daily weather data were obtained for all BoM stationswithin 50 km of the population-weighted centre of eachSLA [26]. The daily average was calculated as the inversedistance weighted average of all validated observations oneach day. The distance weighted averages from the popu-lation centres were used because we assumed these esti-mates more closely relate to the experience of thepopulation, rather than that at airports or other locations[27]. The population centre was calculated using datafrom the 2006 Australian Census [28]. Figure 1 illustratesthe study region including the temperature zones, weatherand air pollution monitoring stations.
Health outcome measuresHospital admission and mortality data based upon studysubjects’ usual place of residence were mapped to SLA2006 boundaries. While our literature review identifiedmany variations in disease categorisations for both mor-tality and hospital admissions in previous studies, thesevariations were generally minor and concerned relativelyinfrequent diagnoses.
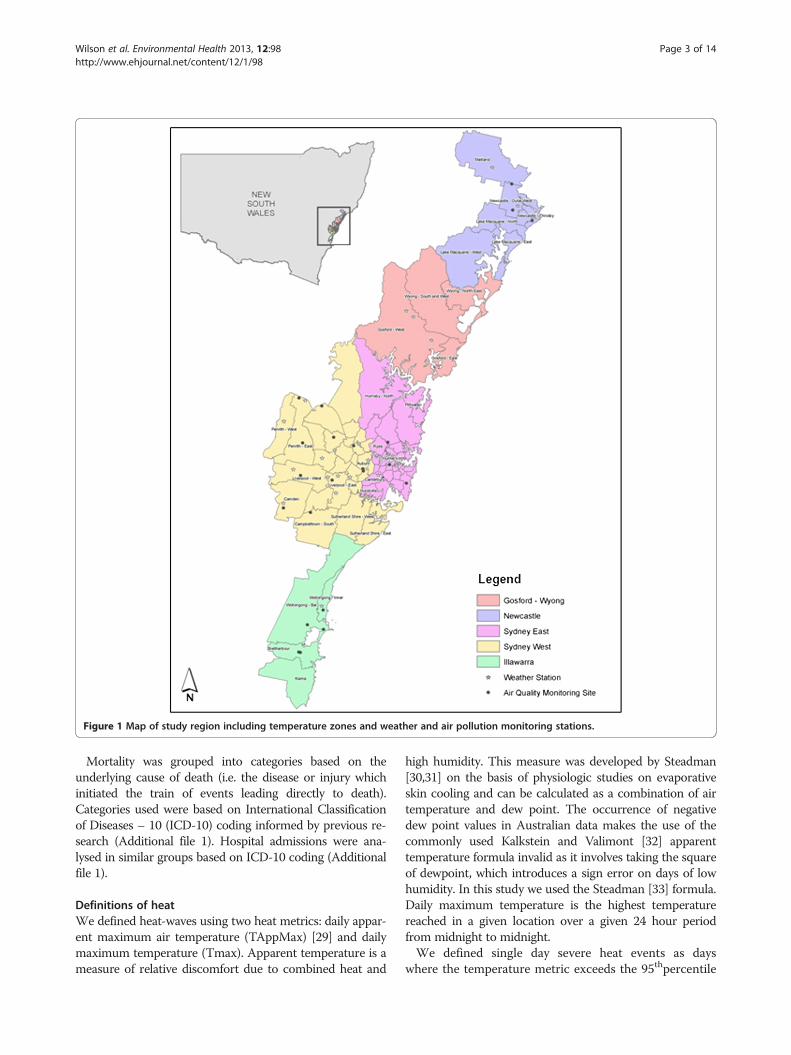
Figure 1 Map of study region including temperature zones and weather and air pollution monitoring stations.
Wilson et al. Environmental Health 2013, 12:98 Page 3 of 14http://www.ehjournal.net/content/12/1/98
Mortality was grouped into categories based on theunderlying cause of death (i.e. the disease or injury whichinitiated the train of events leading directly to death).Categories used were based on International Classificationof Diseases – 10 (ICD-10) coding informed by previous re-search (Additional file 1). Hospital admissions were ana-lysed in similar groups based on ICD-10 coding (Additionalfile 1).
Definitions of heatWe defined heat-waves using two heat metrics: daily appar-ent maximum air temperature (TAppMax) [29] and dailymaximum temperature (Tmax). Apparent temperature is ameasure of relative discomfort due to combined heat and
high humidity. This measure was developed by Steadman[30,31] on the basis of physiologic studies on evaporativeskin cooling and can be calculated as a combination of airtemperature and dew point. The occurrence of negativedew point values in Australian data makes the use of thecommonly used Kalkstein and Valimont [32] apparenttemperature formula invalid as it involves taking the squareof dewpoint, which introduces a sign error on days of lowhumidity. In this study we used the Steadman [33] formula.Daily maximum temperature is the highest temperaturereached in a given location over a given 24 hour periodfrom midnight to midnight.We defined single day severe heat events as days
where the temperature metric exceeds the 95thpercentile
Table 1 Covariates included in statistical models
Exposurevariable
Definition
TempMax (TMax)(°C)
Same day temperature max - lag0, lag1, lag2, lag3,av (lags0-2)
DewPointMax (°C) Same day dew point temperature max– lag0
Flu Epidemic(0,1)
Binary variable coded as 1 if influenza hospitaladmission rates were < 90th percentile andotherwise 0
TempAppMax(TAppMax)
Same day Apparent Temperature Max - lag0, lag1,lag2, lag3, av(lags0-3)
School holiday Binary variable coded as 1 if school holidays andotherwise 0. Only included in childhood asthmamodels.
Public holiday Binary variable coded as 1 if public holiday andotherwise 0.
Region Dummy variable/s for regions
Wilson et al. Environmental Health 2013, 12:98 Page 4 of 14http://www.ehjournal.net/content/12/1/98
of the monthly distribution for the study period in thatzone. Similarly, three day severe heat events are definedas days when the three day moving average (lags 0–2)exceeds the 95thpercentile. We then defined single dayextreme events as days when the temperature metric ex-ceeds the 99thpercentile of the monthly distribution forthe study period in that zone, and three day extremeevents (or heat-waves), as days when the three day mov-ing average (lags 0–2) exceeds the 99thpercentile. Theassociation between mortality and hospital admissionswith severe events provides information on the healtheffects associated with relatively regular heat events (onaverage nine events during spring and summer eachyear), while the association with extreme events providesinformation on the health effects that occur during lessfrequent heat events (on average two events per year).Additional sensitivity analyses which assessed four alter-
native heat event definitions for associations with mortal-ity from 1) all causes, 2) all cardiovascular disease and 3)all respiratory disease were conducted. These alternativeheat-wave definitions were proposed by the AustralianBureau of Meteorology and the NSW Ministry of Healthto capture the integrated experience of high temperaturesover multiple days. The Excess Heat Factor (EHF) indexproposed by Nairn et al. [34] calculates the differencebetween the 3 day moving average (lags 0–2) of daily aver-age temperature and the prior 30 day moving average (lags3–32). This is then amplified by the difference of the threeday average and the 95th percentile of daily averagetemperatures. Days with an EHF > 1 are defined as “heat-wave” days (EHF severe). As EHF > 1 occurs relativelyfrequently we also defined “extreme heat-wave” days asEHF > 80 percentile value (EHF extreme). The third defin-ition which is NSW specific (NSW1) [35] identifies a heatwave as two consecutive days greater than the 95th per-centile of maximum temperature for a given month. Thefourth definition, also NSW specific (NSW2), proposesthat a heat wave is any three day period with greater thanthe 90th percentile of maximum temperatures for thatmonth in addition to a moving average of greater than27°C maximum temperature for the 3 day period.
Statistical analysesWe used a time-stratified case-crossover design, in whicheach case is their own control [36]. Comparisons weremade between the ‘event’ day (the day the case was admit-ted to hospital or died) and several referent ‘non-event’days, with measured and unmeasured potential confound-ing factors such as age and smoking status controlled bydesign. The referent days were selected from the samemonth and year and matched by day of week to the healthoutcome. This time-stratified method of selecting com-parison days ensures unbiased conditional logistic regres-sion estimates and avoids bias resulting from time trends
in examination of the environmental exposures [37]. Weused conditional logistic regression models to calculateodds ratios (OR) and 95% confidence intervals (CI) formortality and hospital admission on extreme heat days(lag0, lag1, lag2, lag3, lag 0–2 days) compared to otherdays, adjusted for potential confounders and stratified byzone (ie: including an indicator for zone). The covariateswere chosen a priori based on our literature review andwere included in all models.To control for influenza in the model we included a
dummy variable for daily counts of influenza admissions(ICD 10: J09 – J18) greater than the 90thpercentile of theSydney GMR distribution. Single days within an influ-enza event lasting several days/weeks may dip below the90thpercentile and we included these days as influenzaevent days. In addition, an indicator variable was addedto the model to account for public holidays. School holi-days were also included as an indicator variable whenhospital admissions for asthma was the outcome as thisgroup includes a substantial proportion of children.Table 1 summarises the covariates included in the statis-tical model (Table 1).Air pollution concentrations may also be elevated during
extreme and severe heat events and so potential confound-ing by air pollution was assessed by conducting sensitivityanalyses that included air pollutants (PM10 (24 hour aver-age), PM2.5 (24 hour average), NO2 (1 hour maximum) andO3 (1 hour maximum)) separately in the models. Data onair pollutants were obtained from the NSW Office of En-vironment and Heritage. Daily region-wide average air pol-lution concentrations were calculated using daily data fromall available monitoring stations in each of the five zones(monitoring stations: Sydney east, n = 4; Sydney west, n = 7;Gosford/Wyong, n = 0; Newcastle, n = 3; Illawarra, n = 3).Gosford/Wyong did not have any monitoring stations sothose from the neighbouring city of Newcastle were used.
Wilson et al. Environmental Health 2013, 12:98 Page 5 of 14http://www.ehjournal.net/content/12/1/98
ResultsTemperature distributions varied across the five climatezones studied and summary statistics including temp-erature thresholds are presented in Table 2. Themonthly 95thpercentile thresholds in Sydney east rangedfrom 27.6°C in September to 32.8°C in January, while inSydney west they ranged from 28.5°C in September to35.4°C in January. Figure 2 shows heat event days asdefined by the 99thpercentile and 95thpercentile forSydney east for the period 1997 to 2007, as well as thefour alternative heat wave definitions.As the focus of this study is to inform the development
of a HHWS, comparisons were made between mortalityand hospital admissions associated with rare occurrencesof single day and three day extreme heat events, and thoseof the more frequent single day and three day severe heatevents. Results from the statistical model (without control-ling for air pollutants) are reported. Including air pollut-ants in the model had little influence on the mortalityresults but did influence some results for hospital admis-sions and these are highlighted in the text.We found broadly similar associations between mortal-
ity and hospital admissions with single day events as wellas three day events (lag 0 – 2). The largest single day lagwas generally same day (lag0) although this did vary forhospital admissions. The results were also similar for ex-treme heat events and severe heat events defined usingdaily maximum temperature and daily maximum apparenttemperature. The magnitude of the associations betweenthe rare extreme events (99thpercentile definition) and themore frequent severe events (95thpercentile definition)was also generally similar. The magnitude of the associa-tions was generally similar for all-age and 65 + years. Theasthma hospital admissions results are reported for child-hood asthma (1–14 years) and adult asthma (15–64 years)rather than all age asthma hospital admissions due to thedifferent epidemiology of asthma in children and adults.The associations for mortality and hospital admissionswith severe heat events (95thpercentile threshold) and ex-treme heat events (99thpercentile threshold) defined usingmaximum daily temperature are summarized in Table 3and Table 4 respectively. The results highlighted in thetext below are generally for single day severe events as theresults for multiple day severe events and single and mul-tiple day extreme events were usually similar. Results are
Table 2 Descriptive temperature statistics by region over the
Daily temperature (°C) Min Max Mean 95th pe
Sydney East 11.3 43.0 21.9
Sydney West 10.8 43.3 22.4
Newcastle 9.4 42.0 21.6
Gosford 11.0 43.3 20.8
Illawarra 10.9 41.8 22.1
presented in parentheses as percentile threshold, lag: (OR:95% LCI – 95% UCI).All-cause mortality had similar magnitude associations
with single day and three day extreme and severe events(95thpercentile lag0 (1.06: 1.03 – 1.09)). All cause hospitaladmissions also showed similar small magnitude associa-tions with three day and single day extreme and severeevents (95thpercentile, lag0 (1.02: 1.01 – 1.03)) althoughonly the association with three day extreme events rem-ained when ozone was included in the model (Table 5).Mortality from disorders of fluid, electrolyte and acid–
base balance had large magnitude associations for singleday (lag 1 day) and three day extreme and severe events(95thpercentile, lag1 (4.94:2.16 – 11.29)). However, mortal-ity from dehydration was only weakly associated with singleday (lag 1 day) and three day severe events (95thpercentile,lag1 (1.54: 0.93 – 2.53)) and not with extreme events. Asexpected we found large magnitude associations with hos-pital admissions for heat related injury and illness withsingle day and three day severe and extreme events(95thpercentile, lag0 (12.05: 8.91 – 16.30)) although control-ling for air pollution approximately halved the magnitudeof these associations. Three day and single day extreme andsevere events showed similar magnitude associations withhospital admissions for dehydration (95thpercentile, lag0(1.77: 1.60 – 1.97)) and admissions for disorders of fluid,electrolyte and acid base balance (95thpercentile, lag0(1.27:1.14 – 1.42)), while controlling for ozone marginallyreduced the magnitude of these associations.Cardiovascular mortality was associated with single day
and three day extreme and severe events and the magni-tude of these associations were larger for multiple dayevents compared to single day events (95thpercentile, lag0(1.06: 1.01 – 1.12)) and these results were reflected in is-chaemic heart disease mortality (95thpercentile, lag0 (1.07:1.01 – 1.14)). Cerebrovascular disease mortality was associ-ated with three day extreme events (99thpercentile, lag0-2(1.15: 0.98 – 1.34)) but not single day extreme events,nor was it associated with three day or single day severeevents. We found all cardiovascular admissions were in-versely associated with single day extreme and severe heatevents lagged 1 day (95thpercentile, lag1(0.96: 0.94 – 0.98)and these inverse associations were reflected in IHD(95thpercentile, lag1(0.96:0.93 – 0.98)) and cerebrovasculardisease (95thpercentile, lag1(0.97: 0.88 – 0.97)).
study periods (1997 to 2010)
rcentile range (min – max) 99th percentile range (min – max)
27.6 – 32.8 30.5 – 36.7
28.2 – 35.4 31.5 – 41.4
26.8 – 32.5 29.9 – 36.4
26.3 – 29.6 28.6 – 33.9
27.9 – 33.6 31.3 – 37.2

Figure 2 Heat event days as defined by the 99th percentile and 95th percentile for Sydney East for the period 1997 to 2007, as well asthe four alternative heat wave definitions.
Table 3 Daily mortality statistics by cause of death in greater metropolitan Sydney regions 28th Feb 1997 – 2007
Cause of death (ICD-10) Greater Metropolitan Sydney Region
Daily deaths by cause
Min (Range) Max (Range) Median (Range)
All causes (ICD-10 A00 – R99) 0 – 16 14 – 62 4 – 33
Cardiac arrest (ICD-10 I46) 0 – 0 1 – 2 0 – 0
Ischaemic heart diseases (ICD-10 I20 – 125.9) 0 – 0 5 – 16 1 – 6
CVD (ICD-10 I00 – 199.9) 0 – 3 8 – 34 0 – 3
Cardiovascular disease (ICD-10 I01 – I51.9) 0 – 1 6 – 24 1 – 9
Atrial fibrillation (ICD-10 I48 – I48.9) 0 – 0 2 – 3 0 – 0
Myocardial infarct (ICD-10 I21 – I22.9) 0 – 0 5 – 11 0 – 3
Congestive heart failure (ICD-10 I50 – I50.9) 0 – 0 2 – 5 0 – 0
Cerebrovascular disease (ICD-10 I60 – I69.9) 0 – 0 4 – 15 0 – 4
Stroke (ICD-10 I64 – I64.9) 0 – 0 3 – 6 0 – 1
Respiratory disorders (ICD-10 J00 – J99.9) 0 – 0 3 – 6 0 – 3
COPD (ICD-10 J40 – J44.9 or ICD-10 J47 – J47.9) 0 – 0 3 – 6 0 – 1
Pneumonia (ICD-10 J12 – J18.9) 0 – 0 2 – 6 0 – 0
Mental disorders (ICD-F00 – F99.9) 0 – 0 2 – 8 0 – 1
Mental (substance abuse) (ICD-F10 – F19.9) 0 – 0 2 – 4 0 – 0
Dementia (ICD-10 F00 – F03.9) 0 – 0 2 – 8 0 – 0
Diabetes mellitus (ICD-E10 – E14.9) 0 – 0 2 – 4 0 – 0
Schizophrenia (ICD-F20 – F29) 0 – 0 2 – 4 0 – 0
Suicide (ICD-10 ×60 – ×84.9 or Y870) 0 – 0 2 – 4 0 – 0
Dehydration (ICD-10 E86 – E86.9) 0 – 0 1 – 2 0 – 0
Disorders of fluid balance (ICD-10 E86 – E86.9) 0 – 0 1 – 2 0 – 0
Renal failure (ICD-10 N17 – N19.9) 0 – 0 2 – 4 0 – 0
Wilson et al. Environmental Health 2013, 12:98 Page 6 of 14http://www.ehjournal.net/content/12/1/98
Table 4 Daily hospital admission statistics by condition in greater metropolitan Sydney region
Condition (ICD-10) Greater Metropolitan Sydney Region
Daily admissions by cause
Min (Range) Max (Range) Median (Range)
All causes (ICD-10 A00 – R99) 24 – 206 113 – 515 63 – 333
Cardiac arrest (ICD-10 I46) 0 – 0 2 – 4 0 – 0
Ischaemic heart diseases (ICD-10 I20 – 125.9) 0 – 4 15 – 37 4 – 17
CVD (ICD-10 I00 – 199.9) 1 – 20 27 – 90 10 – 52
Cardiovascular disease (ICD-10 I01 – I51.9) 0 – 13 23 – 68 7 – 38
Cerebrovascular disease (ICD-10 I60 – I69.9) 0 – 0 7 – 21 1 – 8
Respiratory disorders (ICD-10 J00 – J99.9) 0 – 14 22 – 93 7 – 43
COPD (ICD-10 J40 – J44.9 or ICD-10 J47 – J47.9) 0 – 1 11 – 35 2 – 9
Pneumonia (ICD-10 J12 – J18.9) 0 – 2 8 – 31 1 – 10
Asthma All Ages 0 – 2 8 – 48 1 – 8.5
Mental disorders (ICD-F00 – F99.9) 0 – 9 15 – 56 4 – 25
Mental (substance abuse) (ICD-F10 – F19.9) 0 – 0 6 – 26 1 – 7
Dementia (ICD-10 F00 – F03.9) 0 – 0 3 – 7 0 – 1
Schizophrenia (ICD-F20 – F29) 0 – 0 6 – 20 0 – 6
Renal failure (ICD-10 N17 – N19.9) 0 – 0 4 – 8 0 – 2
Urolithiasis (ICD-10 N20– N23) 0 – 0 6 – 17 0 – 4.5
Dehydration (ICD-10 E86 – E86.9) 0 – 0 4 – 7 0 – 1
Disorders of fluid balance (ICD-10 E87 – E87.8) 0 – 0 4 – 7 0 – 1
Diabetes mellitus (ICD-E10 – E14.9) 0 – 0 6 – 17 1 – 5
Heat related injuries (ICD-10 T67 – T67.9) 0 – 0 2 – 8 0 – 0
Neurotic /Somatic/Stress (ICD-10 F40 – F48) 0 – 0 5 – 23 1 – 3
Table 5 Odds ratios of mortality associated with severe and extreme heat (95th/99th percentile) in Sydney GMR
Deaths Single day 3 day event
(Lag0) (Lag0-2)
OR (95%CI) OR (95%CI)
95th percentile 99th percentile 95th percentile 99th percentile
All cause All Age 1.06 (1.03 - 1.09) 1.07 (1.02 – 1.13) 1.06 (1.04 - 1.09) 1.09 (1.03 – 1.15)
65+ 1.05 (1.02 - 1.08) 1.05 (0.99 - 1.12) 1.05 (1.02 - 1.08) 1.09 (1.03 - 1.15)
All cardiovascular All Age 1.06 (1.01 - 1.12) 1.07 (0.97 - 1.18) 1.11 (1.06 - 1.17) 1.17 (1.06 - 1.29)
65+ 1.06 (1.01 - 1.12) 1.09 (0.98 - 1.20) 1.11 (1.05 - 1.17) 1.20 (1.08 - 1.32)
IHD All Age 1.07 ( 1.01 - 1.14) 1.12 (1.01 - 1.26) 1.12 (1.06 - 1.18) 1.15 ( 1.03 - 1.29)
65+ 1.06 (1.00 - 1.13) 1.13 (1.01 - 1.27) 1.10 (1.04 - 1.18) 1.17 (1.04 - 1.32)
All respiratory All Age 1.14 (1.04 - 1.24) 1.08 (0.91 - 1.29) 1.08 (0.99 - 1.18) 0.99 (0.83 - 1.19)
65+ 1.13 (1.03 - 1.23) 1.09 (0.91 - 1.30) 1.07 (0.97 - 1.17) 0.97 (0.80 - 1.18)
Diabetes All Age 1.22 (1.03 - 1.46) 1.13 (0.81 - 1.58) 1.16 (0.97 - 1.39) 0.88 (0.59 - 1.32)
65+ 1.26 (1.05 - 1.51) 1.20 (0.83 - 1.70) 1.14 (0.94 - 1.39) 0.92 (0.60 - 1.40)
Renal failure All Age 1.18 (0.95 - 1.45) 1.14 (0.75 - 1.73) 1.09 (0.88 - 1.35) 0.89 (0.54 - 1.46)
65+ 1.17 (0.94 - 1.45) 1.08 (0.69 - 1.67) 1.05 (0.83 - 1.31) 0.90 (0.54 - 1.50)
Mental disorders All Age 1.10 (0.95 - 1.27) 0.88 (0.64 - 1.20) 1.04 (0.90 - 1.21) 0.93 (0.68 - 1.28)
65+ 1.07 (0.91 - 1.27) 0.82 (0.58 - 1.16) 0.98 (0.83 - 1.16) 0.81 (0.56 - 1.66)
Disorders of fluid balance All Age 1.10 (0.46 - 2.63) 1.98 (0.49 - 8.06) 2.53 (1.18 - 5.41) 5.63 (1.62 - 19.56)
65+ 1.02 (0.39 - 2.60) 2.37 (0.55 - 10.17) 2.37 (1.00 - 5.61) 0.66 (0.23 - 1.97)
Wilson et al. Environmental Health 2013, 12:98 Page 7 of 14http://www.ehjournal.net/content/12/1/98
Wilson et al. Environmental Health 2013, 12:98 Page 8 of 14http://www.ehjournal.net/content/12/1/98
Respiratory mortality was associated with single day andthree-day severe events, but not with extreme events at(95thpercentile, lag0 (1.14: 1.04 – 1.24). Pneumonia mortal-ity was associated with single day extreme and severeevents lag2 days (95thpercentile, lag2 (1.25:1.05 – 1.49) butnot three day severe or extreme events. COPD mortalitywas associated with single day severe events (95thpercentile,lag0 (1.18:1.05 – 1.33), with a weaker association with threeday severe events, while extreme events were not associatedwith COPD. Hospital admissions for all respiratory disor-ders were not associated with extreme events althoughthere was a small magnitude association with three day andsingle day severe events (95thpercentile, lag 0 (1.03:1.01 –1.05)). While these results were reflected in pneumoniaadmissions and COPD admissions the associations weregenerally weak and inconsistent. These weak associationswith respiratory outcomes were generally eliminated whenair pollutants were included in the models, particularlyozone and nitrogen dioxide. We found in inverse associ-ation between childhood asthma admissions and single daysevere and extreme events (95thpercentile, lag0 (0.94: 0.89 –1.01)). Controlling for air pollutants generally magnifiedthis inverse association, particularly for ozone and nitrogendioxide, such that three day severe and extreme events werealso inversely associated with childhood asthma (heat +ozone model; 95thpercentile, lag0-2 (0.91: 0.84 – 0.98)).Adult asthma admissions were inversely associated withboth single day and three day extreme and severe eventsand controlling for air pollution generally give similar re-sults (95thpercentile, lag0 (0.92: 0.84 – 1.02)).Mortality from renal failure was not associated with ex-
treme or severe events. Three day and single day extremeand severe events were associated with hospital admissionsfor disorders of the renal system with the strongest singleday associations at lag1 and lag2 days (95thpercentile, lag1(1.08: 1.05 – 1.12)). Controlling for air pollutants in themodel reduced the magnitude and strength of these associ-ations. Hospital admissions for urolithiasis (kidney stones)was associated with three day and single day extreme andsevere events (95thpercentile, lag1 (1.18:1.02 – 1.25)). Ad-missions for renal failure were associated with three day ex-treme and severe events as well as single day severe eventsbut not extreme events (95thpercentile, lag0 (1.26: 1.16 –1.38)) although controlling for air pollutants reduced themagnitude of the associations with severe events and elimi-nated the association with three day extreme events.Diabetes mortality was associated with single day se-
vere events (95thpercentile, lag0 (1.22:1.03 – 1.46) andweakly associated with three day severe events, but wasnot associated with extreme events. Hospital admissionsfor diabetes were associated with similar magnitude as-sociations with three day and single day extreme and se-vere events (95thpercentile, lag0 (1.12: 1.06 – 1.18)).Controlling for air pollutants generally gave similar
magnitude associations for diabetes hospitalisations al-though the strength of these associations was reducedwith three day extreme and severe events.Deaths from all mental disorders were not associated
with extreme or severe events for the all-ages group butwere associated with single day extreme and severeevents in the under 65 years age group lag 2 days(99thpercentile, lag2 (2.84: 1.24 – 6.52) and 95thpercen-tile, lag2 (1.53: 1.10 – 2.14)). Deaths from mental dis-orders (substance abuse) showed similar magnitudeassociations with single day and three day severe events(95thpercentile, lag0 (1.38: 1.01 – 1.88)) as well as singleday extreme events at lag1 and lag 2 days (99thpercentile,lag1 (2.30: 1.19 – 4.44)) but not three day extremeevents. Deaths from suicide were not associated with ex-treme events although there was a weak association withsingle day severe events lagged 3 days which only oc-curred in the under 65 year age group (95thpercentile,lag3 (1.19: 0.98 – 1.44)). Mortality from dementia wasinversely associated with single day severe and extremeevents lagged 3 days, but not three day events (95thper-centile, lag3, (0.83: 0.68 – 0.99)). Similarly, organic men-tal disorders were inversely associated with single daysevere and extreme events lagged 3 days, but not threeday events (95thpercentile, lag3 (0.85: 0.71 – 1.02)).Hospital admissions for all mental and behavioural dis-
orders showed small magnitude associations with threeday and single day extreme and severe events with thestrongest single day association at lag1 days (95thpercen-tile, lag1 (1.02:1.00 – 1.05) (Table 6). While these resultswere reflected in various categories of hospital admis-sions for mental and behavioural disorders the associa-tions were generally weak and inconsistent. Hospitaladmissions for mood disorders were weakly associatedwith three day and single day severe events (95thpercen-tile, lag1 (1.06:1.00 – 1.12)). Admissions for mentaldisorders related to substance abuse were weakly associ-ated with three day and single day extreme events(99thpercentile, lag0 (1.08: 0.97 – 1.20)). Admissions fordementia were associated with single day severe events(95thpercentile, lag0 (1.14:0.99 – 1.31)) as were admis-sions for neurotic/ somatic/ stress (95thpercentile, lag0,(1.06:0.99 – 1.14)). There was no consistent pattern ofchange in results for mental disorder admissions whenair pollutants were included in the model with the mag-nitude of some associations decreasing, for example, de-mentia with ozone included in model (95thpercentile,lag0 (1.08:0.92 – 1.28)). While the magnitude of somemental disorder admissions associations increased, forexample, mental disorders related to substance abuse andPM2.5 (heat model: 99thpercentile, lag0-2 (1.06: 0.96 – 1.18);heat + PM2.5 model: 99thpercentile, lag0-2 (1.11: 0.99 –1.25)). As hospital admissions for mental and behaviouraldisorders are unlikely to be causally related to air pollution,
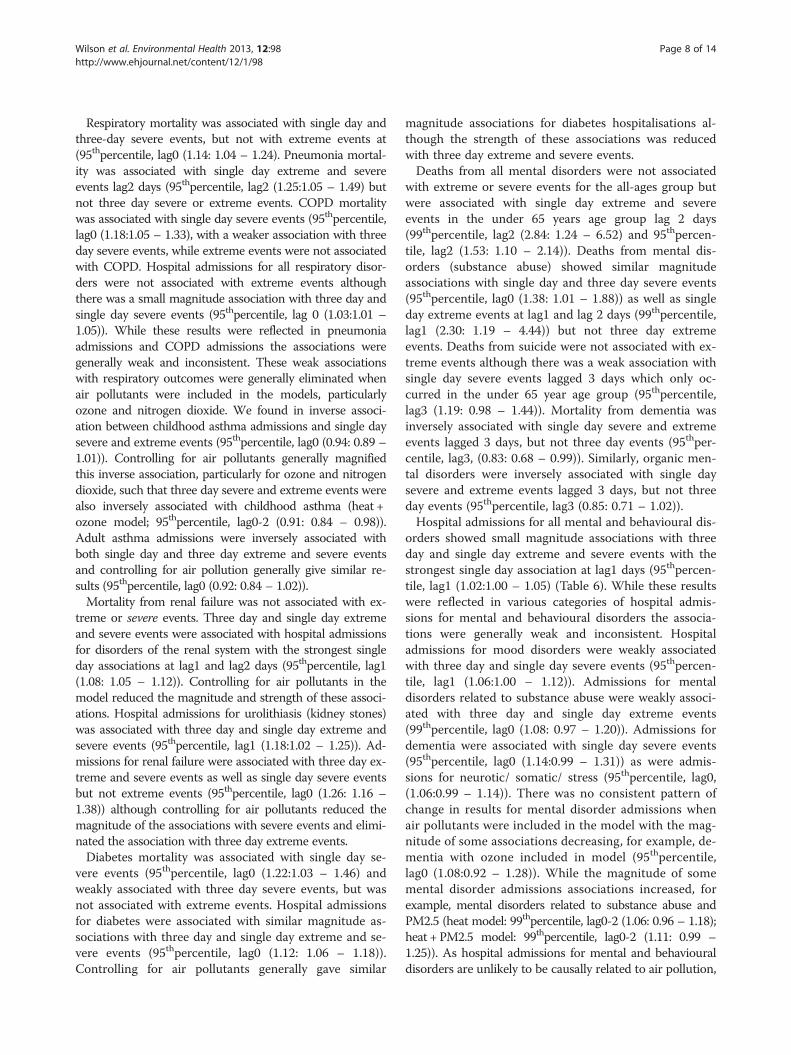
Table 6 Odds ratios of hospitalisations associated with severe and extreme heat (95th/99th percentile) in Sydney GMR
Hospital admissions Single day 3 day event
(Lag0) (Lag0-2)
OR (95%CI) (95%CI)
95th percentile 99th percentile 95th percentile 99th percentile
All cause All Age 1.02 (1.01 - 1.03) 1.01 (1.00 - 1.02) 1.02 (1.01 - 1.03) 1.03 (1.02 - 1.05)
65+ 1.04 (1.03 - 1.06) 1.03 (1.01 - 1.06) 1.03 (1.02 - 1.04) 1.05 (1.03 - 1.07)
All cardiovascular All Age 1.01 (0.99 - 1.03) 0.98 (0.94 - 1.03) 0.98 (0.96 - 1.00) 0.98 (0.94 - 1.03)
65+ 1.01 (0.93 - 0.98) 0.98 (0.93 - 1.04) 0.97 (0.95 - 1.00) 0.96 (0.91 - 1.02)
IHD All Age 1.04 (0.86 - 1.24) 1.00 (0.93 - 1.06) 0.99 (0.96 - 1.00) 1.00 (0.93 - 1.06)
65+ 1.02 (0.98 - 1.06) 1.02 (0.94 - 1.11) 0.99 (0.95 - 1.03) 0.99 (0.91 - 1.07)
All respiratory All Age 1.03 (0.96 - 1.06) 0.98 (0.94 - 1.03) 1.03 (1.01 - 1.05) 1.01 (0.97 - 1.06)
65+ 1.07 (1.04 - 1.10) 1.03 (0.96 - 1.09) 1.08 (1.04 - 1.11) 1.07 (1.01 - 1.14)
Pneumonia All Age 1.04 (1.00 - 1.08) 0.97 (0.89 - 1.06) 1.05 (1.01 - 1.09) 1.10 (1.01 - 1.20)
65+ 1.06 (1.00 - 1.12) 1.01 (0.90 - 1.13) 1.09 (1.03 - 1.15) 1.12 (1.00 - 1.25)
Asthma 1 - 14 yrs 0.94 (0.89 - 1.01) 0.92 (0.80 - 1.04) 0.93 (0.87 - 0.98) 0.89 (0.79 - 1.01)
15 - 64 yrs 0.96 (0.88 - 1.04) 0.86 (0.72 - 1.04) 0.95 (0.87 - 1.04) 0.80 (0.66 - 0.97)
COPD All Age 1.06 (1.01 - 1.10) 1.05 (0.97 - 1.14) 1.06 (1.02 - 1.11) 1.06 (0.97 - 1.15)
65+ 1.07 (1.03 - 1.13) 1.03 (0.94 - 1.14) 1.07 (1.02 - 1.13) 1.03 (0.93 - 1.14)
Diabetes All Age 1.12 (1.06 - 1.18) 1.16 (1.03 - 1.30) 1.07 (1.01 - 1.04) 1.14 (1.01 - 1.29)
65+ 1.12 (1.03 - 1.21) 1.18 (0.99 - 1.39) 1.06 (0.97 - 1.15) 1.15 (0.95 - 1.37)
All renal disorders All Age 1.04 (1.01 - 1.10) 1.01 (0.94 - 1.08) 1.14 (1.04 - 1.11) 1.19 (1.12 - 1.27)
65+ 1.09 (1.04 - 1.14) 1.01 (0.91 - 1.12) 1.12 (1.07 - 1.17) 1.26 (1.15 - 1.40)
Urolithiasis All Age 1.01 (0.95 - 1.07) 1.05 (0.97 - 1.14) 1.15 (1.08 - 1.22) 1.32 (1.18 - 1.50)
65+ 1.07 (0.91 - 1.25) 0.90 (0.63 - 1.29) 1.31 (1.12 - 1.53) 1.79 (1.34 - 2.40)
Mental disorders All Age 1.01 (0.98 - 1.04) 1.08 (0.97 - 1.20) 1.03 (1.00 - 1.05) 1.05 (0.99 - 1.10)
65+ 1.03 (0.96 - 1.09) 0.94 (0.81 - 1.09) 1.09 (1.02 - 1.16) 1.05 (0.91 - 1.20)
Dehydration All Age 1.78 (1.60 - 1.97) 2.16 (1.80 - 1.60) 1.72 (1.56 - 1.91) 2.32 (1.91 - 2.81)
65+ 1.85 (1.63 - 2.09) 2.08 (1.64 - 2.64) 1.78 (1.51 - 2.02) 2.15 (1.68 - 2.76)
Heat related illness and injury All Age 12.05 (8.91 - 16.30) 18.76 (11.38 - 30.93) 1.77 (1.60 - 1.97) 10.35 (6.09 - 17.59)
65+ 19.47 (11.71 - 32.36) No data 7.05 (4.69 - 10.60) No data
Disorders of fluid balance All Age 1.27 (1.14 - 1.42) 1.50 (1.20 - 1.86) 1.19 (1.06 - 1.33) 1.49 (1.19 - 1.86)
65+ 1.25 (1.10 - 1.42) 1.51 (1.18 - 1.93) 1.16 (1.02 - 1.32) 1.50 (1.16 - 1.94)
Wilson et al. Environmental Health 2013, 12:98 Page 9 of 14http://www.ehjournal.net/content/12/1/98
the change in the association with these outcomes suggestsco-linearity may be influencing the ability of the model toassess the independent effects of heat and air pollution.Additional analyses that assessed the four alternative
heatwave definitions designed to integrate the effect ofhigh temperature over multiple days with all-cause, car-diovascular and respiratory mortality gave similar magni-tude associations with these outcomes as the simplerheat wave definitions reported here.
DiscussionWe found that single day and three day severe heat eventswere associated with increased mortality and hospital ad-mission in the Sydney GMR as well as less frequent andmore intense extreme heat events. Our study found
broadly similar results irrespective of the definition andmetric (maximum temperature or apparent temperature)used to define heat events, consistent with the finding ofKhalaj et al. and Barnett et al. [9,38]. While air pollutiondoes not appear to confound the association between mor-tality and heat events, we found evidence of confoundingby air pollution with some hospital admissions out-comes, particularly respiratory outcomes and ozone.The associations for some hospital admissions outcomesthat were influenced by controlling for air pollutants inthe statistical model are unlikely to be causally related toair pollution, for example heat related injury. This sug-gests that co-linearity between air pollutants and heatevents may be influencing the ability of the model to as-sess the independent effects of heat and air pollution.
Wilson et al. Environmental Health 2013, 12:98 Page 10 of 14http://www.ehjournal.net/content/12/1/98
Our findings suggest mortality from disorders associ-ated with fluid imbalance, as well as cardiovascular dis-ease, pneumonia, COPD, diabetes, and mental disordersrelated to substance abuse are associated with heatevents. As expected heat events were associated withsubstantial increases in hospital admissions for dehydra-tion, other disorders of fluid, electrolyte and acid basebalance, and heat related injury. We also found that heatevents were associated with hospital admissions for renaldisease, diabetes, and mental and behavioural disorders.These increases in mortality and hospitalisation duringheat events place an additional load on already stretchedemergency services, hospitals and the health system.As expected hospital admission for heat related injury,
disorders of fluid balance and dehydration had largemagnitude associations with both single day and threeday extreme and severe events. While deaths from dehy-dration were only weakly associated with severe eventswe found a large magnitude association with other fluiddisorders and both severe and extreme events.We found mortality and hospital admissions for men-
tal disorders were associated with both single day andthree day extreme and severe heat events. Deaths fromall mental and behavioural disorders were associatedwith single day extreme and severe events in the under65 year age group but not the all-age group. This wasreflected in associations for hospital admissions for allmental and behavioural disorders with extreme and se-vere events. There was some consistency in the resultsfor mortality and hospital admissions for mental disor-ders related to substance abuse with both outcomes as-sociated with extreme events and mortality associatedwith severe events. The results for other sub categoriesof mortality and admissions for mental disorders weremixed. While we found inverse associations for mortalityfrom organic mental disorders and dementia mainly withsingle day severe events these outcomes had very lowdaily counts with limited statistical power. We foundweak positive associations with hospital admissions formood, dementia, and somatic/neurotic/stress disordersand mainly single day severe events. Associations be-tween heat events and mental and behavioural disordershave been found elsewhere [11,39]. A study in Adelaide,Australia found heat-waves were associated with mortalitydue to a range of mental health disorders [40]. The in-creased intensity and duration of heat-waves in Adelaidemay explain the weaker associations with mortality wefound in Sydney. Psychotropic drugs are commonly usedby people with mental and behavioural disorders and thesedrugs may interfere with body temperature regulation toexacerbate the effects of heat-waves [39]. In Khalaj’s recentSydney study, an association between hospital admissionfor mental and behavioural disorders, as both a primarydiagnoses (compared with persons admitted for other
conditions) and as an underlying diagnosis, (comparedwith persons admitted who did not have the condition) [9]was found. We found a weak association between suicidein the under 65 year age group and single day severeevents. This result should be treated with caution as manypapers have explored links between suicide and temp-erature and produced conflicting results [41-44]. Somestudies have found a decreased suicide risk with increasingtemperature [41], while in others an increased risk was ob-served [42]. One study found a U-shaped response with el-evated suicide risk on extremely cold and warm days [43].Our study contributes to the emerging literature in thisarea.We found hospital admissions for renal failure, dia-
betes and urolithiasis were associated with extreme andsevere heat events. While mortality from renal failurewas not associated with heat events the small number ofdeaths coded to renal failure limit the statistical powerof the analysis to find an association if one was present.A recent study in France found heat waves were associ-ated with renal failure and that these effects were largerin elderly patients [45]. It is reasonable to assume thatthese associations may be related to increased fluid lossand subsequent altered fluid balance and dehydration.While diabetes hospital admissions were associated
with singe day and three day severe and extreme events,diabetes mortality was only weakly associated with singleday and three day severe events. Once again the smallnumber of deaths coded to diabetes limits the statisticalpower of the analysis to find an association if one werepresent. Disturbances to the fluid balance resulting fromhigh temperature could also be a contributing factor tothe observed associations with diabetes [46].Cardiovascular disease mortality and the related out-
comes of IHD and cerebrovascular disease were associatedwith single day and three severe and extreme events. Con-versely we found weak inverse associations with single dayextreme and severe events for all cardiovascular admis-sions, as well as IHD and cerebrovascular disease admis-sions. This suggests that heat events may lead to a rapiddeterioration in existing cardiovascular disease resulting indeath, and that this may occur during rare extreme eventsas well as the more frequent severe events. European stud-ies have similarly found an association between heat-waves and cardiovascular mortality but not for hospitaladmissions where cardiovascular disease was the primarycause [47-51]. Khalaj’s 2010 Sydney case-only study didnot find any association between heat-waves and hospitaladmissions for cardiovascular disease as the primary diag-nosis (compared with persons admitted for other condi-tions) but did find an association with cardiovasculardisease as an underlying diagnosis (compared with personsadmitted who did not have the condition). This suggeststhat an underlying condition of cardiovascular disease
Wilson et al. Environmental Health 2013, 12:98 Page 11 of 14http://www.ehjournal.net/content/12/1/98
modifies the effect of heat on hospital admissions for arange of other conditions [9,52].Whilst respiratory mortality was associated with single
day and three day severe events, it was generally not asso-ciated with extreme events, although once again the smallnumber of deaths coded to respiratory mortality limits thestatistical power of the analysis to find an association ifone were present, especially for less frequent extremeevents. While respiratory hospital admissions were associ-ated with heat events all associations were eliminatedwhen we controlled for the effects of air pollution, particu-larly ozone. Air pollution is associated with respiratorymorbidity [53-55] and studies suggest that ozone can con-found the association with heat for cardiovascular and re-spiratory outcomes [56]. Air pollution concentrations areinfluenced by weather and ozone in particular is correlatedwith temperature [57]. Heat and air pollution may have in-dependent effects of respiratory outcomes however co-linearity may be influencing the ability of our statisticalmodel to assess the independent effects of heat and airpollution and work is starting to emerge exploring theissue of confounding and effect modification of heat by airpollution [58]. More broadly, our finding that the effectsof heat on some hospital admissions disease groups aresensitive to the effect of air pollution, particularly O3 andNO2, is consistent with previous work that identified thisphenomenon in the 2003 heatwave in France [59].We found an inverse association with single day and
three day extreme events for childhood asthma, and forboth severe and extreme events for adult asthma.Asthma time series data, particularly for children, is dif-ficult to model [60]. Probably because children are morelikely to experience frequent respiratory epidemics andbecause school holidays influence hospital admissionrates [61]. The protective effect for asthma may also bedue to the warm moist air associated with heat eventsin Sydney’s temperate climate. Asthma is known to bytriggered by inhaling cold dry air, and in an experimen-tal study, warm moist air has been shown to protect theairway disruption associated with exercise [62]. It is alsopossible that on very hot days, people with asthma stayinside more, and are reluctant to exercise due to con-cerns for triggering an asthma attack. A recent Sydneycase-only study found heat waves were associated withincreased hospital admissions with respiratory diseaseas an underlying diagnosis (compared with persons ad-mitted who did not have the condition) suggesting thatan underlying condition of respiratory disease modifiesthe effect of heat on hospital admissions for a range ofother conditions [9].Our sensitivity analyses suggest that, at least for mortal-
ity, the use of heatwave metrics designed to reflect mul-tiple day events that meet detailed heatwave criteriaproduce broadly similar results to those found with single
day heat metrics such as maximum daily air temperature,or a simple 3 day moving average.The key strengths of this study include our use of long
mortality and hospital admission time series, the widerange of diagnosis groups assessed our adjustment for thepotential confounding effects of humidity and our assess-ment of the influence of air pollution on the heat associa-tions. As with similar ecological time series studies wewere limited by the lack of more detailed individual leveldata on exposure including other potential confoundingfactors such as the use of air conditioning during heatevents, Similar to many other studies of the effects of heaton mortality or hospitalisation we used a time stratifiedcase crossover analysis that has the benefit of controllingfor the effects of unmeasured confounding factors that donot vary over time by design. An alternative statistical ap-proach would be to use Poisson regression time seriesanalysis. A recent paper by Guo et al. suggests that casecrossover designs may not control for autocorrelation aseffectively as time series analysis when assessing air pollu-tion effects on mortality due in part to lack of control forseasonal effects. However, the generalizability of theseconcerns to our study assessing the effects of extreme heatin interrupted time series analyses of spring and summermonths, and to our study location is unclear [63]. The dif-ferent exposure metrics, different lag effects and largerange of mortality and hospitalisation outcomes assessedin our study introduces the potential problem of multiplecomparisons. This results in an increased probability ofdetecting a statistically significant finding by chance aloneand the greater potential for spurious results to be re-ported. One approach to multiple testing suggests usingmore stringent P-values to account for the larger numberof comparisons being conducted, although this can causemore problems than it intends to solve and no correctionfor multiple comparisons was made in our study [64]. Al-though this increased the chances of finding spuriousassociations, it reduced the chances of missing any im-portant associations. Our results summary focuses on con-sistent lag effects rather than statistically significant effectswith erratic lag structures.This study highlights the increased risk of hospitalisation
and death during heat events from cardiovascular disease,diabetes and mental health disorders. These chronic condi-tions are an important issue in today’s society [65]. Theaged population are at increased risk of heat-related illnessfrom a range of factors including decreased thermore-gulation and an increased prevalence of chronic diseasesdisease, and these factors contribute to the increased riskof heat related death [66,67]. Many health agencies includ-ing the NSW Ministry of Health have implemented pro-grams to improve management of chronic disease in thehope of reducing potentially avoidable admissions [68].This study provides similar results to research conducted
Wilson et al. Environmental Health 2013, 12:98 Page 12 of 14http://www.ehjournal.net/content/12/1/98
in the Northern Hemisphere regarding the effect of heat-waves on levels of mortality and morbidity and outlinesthe importance of including HHWS and heat managementplans as part of chronic disease management.
ConclusionsThe purpose of this study was to provide data in theAustralian context which will inform the development of aHeatwave Health Warning System for NSW. The findingsof this study indicate that days with unusually high ambi-ent temperatures increase mortality and hospitalisationfrom a range of conditions. Ebi and colleagues highlightedthe costs and benefits of the establishment of a HHWS inPhiladephia, with the benefits of implementing a HHWSfar outweighing the costs [6]. We identified increases inmortality and morbidity for a range of conditions on bothsingle and three day severe and extreme events, and aHHWS in NSW based on these thresholds would need tobe activated on average one or two times per year for ex-treme events and around ten times per year for more fre-quent severe events. Compliance with a HHWS is acritical factor in maximising the protective effect of thewarning system and frequent alerts may reduce compli-ance in the target population. It is recommended that inNSW the HHWS be implemented at the first one or twooccurrences of temperatures above the 95th percentile ofaverage monthly temperature (severe event level) from thebeginning of spring (September) and thereafter at all oc-currences of temperatures above the 99th percentile ofaverage monthly temperature (extreme event level) untilthe end of summer (February) in order to maximise healthprotection and reduce complacency. Public health mes-sages associated with all heat health warnings shouldemphasise the importance of maintaining hydration, par-ticularly for people who have chronic diseases whether thetemperature be severe or extreme.
Additional file
Additional file 1: ICD-10 Codes used in analysis.
AbbreviationsBoM: Bureau of meteorology; COPD: Chronic obstructive pulmonary disease;GMR: Greater metropolitan region; HHWS: Heatwave health warning system;ICD – 10: International classification of diseases (Version 10); LGA: Localgovernment area; NSW: New South Wales, Australia; SLA: Statistical local area;TMax: Maximum daily temperature; T(App)Max: Apparent maximum dailytemperature.
Competing interestsThe authors declare that they have no competing interests.
Authors’ contributionsGM, FJ and BJ conceived and developed the overall study and conductedthe data reviews. LW helped develop the study, assisted with data analysisand prepared the manuscript. IH developed the analysis methods andconducted data analysis. HA-Y conducted data analysis. RB and CG critically
reviewed the manuscript and provided advice during study development. Allauthors read and approved the final manuscript.
AcknowledgmentsThe authors would like to acknowledge the contributions made by GlenisLloyd, NSW Health and the members of the Heatwave Health WarningSystem steering Committee. Funding for this project was provided throughNSW Health and Department of Environment Climate Change and Water.
Author details1Faculty of Health Science, University of Sydney, Sydney, Australia. 2School ofScience and Health, University of Western Sydney, Sydney, Australia.3University Centre for Rural Health – North Coast, University of Sydney,Sydney, Australia. 4North Coast Public Health Unit, Mid North Coast LocalHealth District, New South Wales, Australia. 5National Centre forEpidemiology and Population Health, Australian National University, Acton,Australia. 6Menzies Research Institute, University of Tasmania, Hobart,Australia. 7Centre for Epidemiology and Research, NSW Health, Sydney,Australia. 8Health Protection New South Wales, Sydney, Australia. 9NSWCancer Institute, Sydney, Australia. 10School of Public Health and CommunityMedicine, University of New South Wales, Sydney, Australia. 11Centre forResearch, Evidence Management and Surveillance, South Western SydneyLocal Health District, Sydney, Australia.
Received: 8 January 2013 Accepted: 23 October 2013Published: 15 November 2013
References1. Intergovernmental Panel on Climate Change (IPCC): Summary for
Policymakers. In Climate Change 2007: The Physical Science Basis.Contribution of Working Group I to the Fourth Assessment Report of theIntergovernmental Panel on Climate Change. Edited by Solomon SD, Qin M,Manning Z, Chen M, Marquis KB, Avery M, Tignor, Miller HL. 2007:5. ipcc.ch/pdf/assessment-report/ar4/wg1/ar4-wg1-spm.pdf.
2. Kovats RS, Hajat S: Heat stress and public health: a critical review. AnnuRev Public Health 2008, 29:41–55.
3. Kilbourne EM: Heat-related illness: current status of prevention efforts.Am J Prev Med 2002, 22:328–329.
4. Bernard SM, McGeehin MA: Municipal heat wave response plans. Am JPublic Health 2004, 94:1520–1522.
5. Nogueira PJ: Examples of heat health warning systems: Lisbon’s ICAROsurveillance system, summer of 2003. In Extreme Weather Events and PublicHealth Responses. Edited by Kirch WMB, Bertollini R. Darmstadt, Germany:Springer-Verlag; 2005:141–160.
6. Ebi K, Tiesberg TJ, Kalkstein LS, Robinson L, Weiher RF: Heat watch/warningsystems save lives: estimated costs and benefits for Philadelphia1995 – 1998. Am Meteorol Soc 2004:1067–1073.
7. Sheridan SC, Kalkstein LS: Progress in heat watch-warning system technology.Bull Am Meteorol Soc 2004, 85:1931–1941.
8. Anderson BG, Bell ML: Weather-related mortality: How heat, cold andheat waves affect mortality in the United States. Epidemiology 2009,20:205–213.
9. Khalaj B, Lloyd G, Sheppeard V, Dear K: The health impacts of heatwavesin five regions of New South Wales, Australia: a case-only analysis.Int Arch Environ Health 2010, 83:833–842.
10. Garssen J, Harmsen C, de Beer J: The effect of the summer 2003 heatwave on mortality in the Netherlands. Eurosurveillance 2005, 10:pii-577.
11. Johnson H, Kovats RS, McGregor G, Stedman J, Gibbs M, Walton H: Theimpact of the 2003 heat wave on mortality and hospital admissions inEngland. Health Stat Q 2005, 25:6–11.
12. Fouillet A, Rey G, Laurent F, Pavillion G, Bellec S, Guihenneuc-Jouyaux C,Clavel J, Jougla E, Hemon D: Excess mortality related to the august 2003heat wave in France. Int Arch Occup Environ Health 2006, 80:16–24.
13. Knowlton K, Rotkin-Ellman M, King G, Margolis HG, Smith D, Solomon G:The 2006 California heat wave: impacts on hospitalisations andemergency department visits. Environ Health Perspect 2009, 94:1520–1522.
14. Hayhoe K, Sheridan S, Kalkstein L, Greene S: Climate change, heat waves,and mortality projections for Chicago. J Great Lakes Res 2010, 36:65–73.
15. Kalkstein L, Sheridan S: The social impacts of the heat–health watch/warningsystem in Phoenix, Arizona: assessing the perceived risk and response ofthe public. Int J Biometeorol 2007, 52:43–55. doi:10.1007/s00484-006-0073-4.
Wilson et al. Environmental Health 2013, 12:98 Page 13 of 14http://www.ehjournal.net/content/12/1/98
16. Guest CS, Willson K, Woodward AJ, et al: Climate and mortality inAustralia: retrospective study, 1979–1990, and predicted impacts in fivemajor cities in 2030. Clim Res 1999, 13:1–15.
17. McMichael AJ: Human health and climate change in oceania: a riskassessment. In Commonwealth Department of Ageing. Canberra, ACT.Australia: Commonwealth Department of Ageing; 2003.
18. Nitschke M, Tucker GR, Bi P: Morbidity and mortality during heatwaves inmetropolitan Adelaide. Med J Aust 2007, 187:662–665.
19. Bi P, Parton KA, Wang J, Donald K: Temperature and direct effects onpopulation health in Brisbane, 1986–1995. J Environ Health 2008,70:48–53.
20. Vaneckova P, Beggs PJ, Jacobson CR: Spatial analysis of heat-relatedmortality among the elderly between 1993 and 2004 in Sydney,Australia. Soc Sci Med 2010, 70:293–304.
21. Hansen AL, Bi P, Ryan P, Nitschke M, Pisaniello D, Tucker G: The effects ofheat waves on hospital admissions for renal disease in a temperate cityof Australia. Int J Epidemiol 2008, 37:1359–1366.
22. Australian Bureau of Meteorology: 2012. http://reg.bom.gov.au/announcements/media_releases/nsw/2004febnsw.shtm.
23. Australian Bureau of Statistics: Causes of Death Australia (3303.0). AustralianBureau of Statistics. Commonwealth of Australia; 2011.
24. NSW Department of Health: Inpatient Statistics Collection (ISC). SydneyAustralia: NSW Government; 2010.
25. Wilmore A: Population Weighted Concordance Between ASGC VersionsBetween 1998 and 2005 with ASGC 2006, NSW Health Department, 2006.Sydney Australia: NSW Government; 2006.
26. National Climate Centre of the Bureau of Meteorology: National ClimateCentre of the Bureau of Meteorology: Daily or three hourly weather data forBureau of Meteorology stations. Australia: Government of Victoria; 2010.
27. Dear K, Ranmuthugala G, Kjellström T, Skinner C, Hanigan I: Effects oftemperature and ozone on daily mortality during the August 2003 heatwave in France. Arch Env Occup Health 2005, 60:205–212.
28. Australian Bureau of Statistics, 2007: Australian Bureau of Statistics. AustralianCensus 2006 Basic Community Profiles for Census Collector’s Districts Data Pack(Cat No. 2069.0.30.001 Second Release). Canberra, Australia: Commonwealthof Australia; 2007.
29. Nicholls N, Skinner C, Loughnan M, Tapper N: Temperature ThresholdsAssociated with Increased Mortality in ten Major Population Centres in RuralVictoria. Monash University: Melbourne; 2009.
30. Steadman RG: The assessment of sultriness: part I: a temperature-humidity index based on human physiology and clothing science. J ApplMeteorol 1979, 18:861–873.
31. Steadman RG: The assessment of sultriness: part II: effect of wind, extraradiation. And barometric pressure on apparent temperature. J ApplMeteorol 1979, 18:874–884.
32. Kalkstein LS, Valimont KM: An evaluation of summer discomfort in theUnited States using a relative climatological index. Bulletin of theAmerican Meteorological Society 1986, 7:842–848.
33. Steadman RG: Norms of apparent temperature in Australia. Aust MeteorolMag 1994, 43. http://www.bom.gov.au/amm/docs/1994/steadman.pdf.
34. Nairn J, Fawcett R, Ray D: Defining and Predicting Excessive Heat Events, aNational System. Centre for Australian Weather and Climate ResearchModelling Workshop 2009. Melbourne: Modelling & Understanding HighImpact Weather; 2009. http://www.cawcr.gov.au/events/modelling_workshops/workshop_2009/papers/NAIRN.pdf.
35. Broome R: NSW Ministry of Health (pers communication). NSW Health; 2011.36. Jaakkola JJ: Case-crossover design in air pollution epidemiology. Eur
Respir J Suppl 2003, 40:81s–5s.37. Janes H, Sheppard L, Lumley T: Case-crossover analyses of air pollution
exposure data: referent selection strategies and their implications forbias. Epidemiology 2005, 16:717–26.
38. Barnett AG, Tong S, Clements AC: What measure of temperature is thebest predictor of mortality? Environ Res 2010, 110:604–11.
39. García-Pina R, Tobías Garcés A, Sanz Navarro J, Navarro Sánchez C,García-Fulgueiras A: Effect of weather temperature on hospitalemergencies in the Region of Murcia, Spain, throughout the 2000–2005and its use in epidemiological surveillance. Rev Esp Salud Publica 2008,82:153–66.
40. Hansen A, Bi P, Nitschke M, Ryan P, Pisaniello D, Tucker D: The effects ofheatwaves on mental health in a temperate Australian city. EnvironHealth Perspect 2008, 116:1369–1375.
41. Dixon P, Kalkstein A: Climate-suicide relationships: a research problem inneed of geographic methods and cross-disciplinary perspectives.Geography Compass 2009, 3:1–14.
42. Tsai J-F: Socioeconomic factors outweigh climate in the regionaldifference of suicide death rate in Taiwan. Psychiatry Res 2010, 179:212–6.
43. Kim Y, Kim H, Kim D-S: Association between daily environmentaltemperature and suicide mortality in Korea (2001–2005). Psychiatry Res2011, 186:390–6.
44. Wang Y, Wang D, Wang X: Suicide and meteorological factors in Huhhot,Inner Mongolia. Crisis: The Journal of Crisis Intervention and SuicidePrevention 1997, 18:115–7.
45. Josseran L, Caillère N, Brun-Ney D, Rottner J, Filleul L, Brucker G, Astagneau P:Syndromic surveillance and heat wave morbidity: a pilot study based onemergency departments in France. BMC Med Inform Decis Mak 2009, 9:14.doi:10.1186/1472-6947-9-14.
46. Timiras P: Physiological Basis of Ageing and Geriatrics. 4th edition. CRC Press;2007. ISBN ISBN-10: 0849373050.
47. Hausfater P, Doumenc B, Chopin S, Le Manach Y, Santin A, Dautheville S,Patzak A, Hericord P, Mégarbane B, Andronikof M, Terbaoui N, Riou B:Elevation of cardiac troponin I during non-exertional heat-relatedillnesses in the context of a heatwave. Crit Care 2010, 14:R99.
48. Mastrangelo G, Hajat S, Fadda E, Buja A, Fedeli U, Spolaore P: Contrastingpatterns of hospital admissions and mortality during heat waves: aredeaths from circulatory disease a real excess or an artifact?Med Hypotheses 2006, 66:1025–1028.
49. Diaz J, Linares C: Impact of extreme temperatures on daily mortality inMadrid (Spain) among the 45–64 age-group. Int J Biometeorol 2006,50:342–348. doi:10.1007/s00484-006-0033-z.
50. Kovats RS, Hajat S, Wilkinson P: Contrasting patterns of mortality andhospital admissions during hot weather and heat waves in GreaterLondon, UK. Occup Environ Med 2004, 61:898–898.
51. Morgan G, Sheppeard V, Khalaj B, Ayyar A, Lincoln D, Jalaludin B, et al: Theeffects of bushfire smoke on daily mortality and hospital admissions inSydney, Australia, 1994 to 2002. Epidemiology 2010, 21:47–55.
52. Wang XY, Barnett AG, Yu W, FitzGerald G, Tippett V, Aitken P, Neville G,McRae D, Verrall K, Tong S: The impact of heatwaves on mortality andemergency hospital admissions from non-external causes in Brisbane. Occ EnvMed Online: Australia; 2010. doi:10.1136/oem.2010.062141.
53. Simpson R, Williams G, Petroeschevsky A, et al: The short-term effects of airpollution on hospital admissions in four Australian cities. Aust NZ J PublicHealth 2005, 29:213–221.
54. Simpson R, Williams G, Petroeschevsky A, et al: The short-term effects of airpollution on mortality in four Australian cities. Aust N Z J Public Health2005, 29:205–212.
55. Knowlton K, Rosenthal JE, Hogrefe C, Lynn B, Gaffin S, Goldberg R, et al:Assessing ozone-related health impacts under a changing climate.Environ Health Perspect 2004, 112:1557–1563.
56. Derwent RG: Atmospheric chemistry. In Air Pollution and Health. Edited byHolgate S, Samet J, Koren H. New York: Academic Press; 1999.
57. Ren C, Williams GM, Morawska L, Mengersen K, Tong S: Ozone modifiesassociations between temperature and cardiovascular mortality: analysisof the NMMAPS data. Occup Environ Med 2008, 65:255–260.
58. Schwartz J, Spix C, Touloumi G, et al: Methodological issues in studies ofair pollution and daily counts of deaths or hospital admissions. JEpidemiol Community Health 1996, 50:S3–S11.
59. Filleul L, Cassadou S, Médina S, Fabres P, Lefranc A, Eilstein D, Le Tertre A,Pascal L, Chardon B, Blanchard M, et al: The relation between temperature,ozone, and mortality in nine French cities during the heat wave of 2003.Environ Health Perspect 2006, 114:1344–1347.
60. Storr J, Lenney W: School holidays and admissions with asthma. Arch DisChild 1989, 64:103–107.
61. Lincoln D, Morgan G, Sheppeard V, Jalaludin B, Corbett S, Beard J: Return toschool after term holidays is associated with increased hospital admissionsfor childhood asthma in Sydney, Australia. Public Health 2006, 120:854–862.
62. Bolger C, Tufvesson E, Anderson SD, et al: The effect of inspired airconditions on exercise-induced bronchoconstriction and urinary CC16levels in athletes. J Appl Physiol 2011, 111:1059–1065.
63. Guo Y, Barnett AG, Zhang Y, Tong S, Yu W, Pan X: The short-term effect ofair pollution on cardiovascular mortality in Tianjin, China: comparison oftime series and case–crossover analyses. Sci Total Environ 2010,2010(409):300–306.
Wilson et al. Environmental Health 2013, 12:98 Page 14 of 14http://www.ehjournal.net/content/12/1/98
64. Rothman KJ: No adjustments are needed for multiple comparisons.Epidemiology 1990, 1:43–46.
65. Australian Institute of Health and Welfare: Ageing and aged care inAustralia. In July 2008. Canberra, Australia: Commonwealth of Australia;2008:1–45.
66. Wilson L, Black DA, Veitch C: Heatwaves and the elderly: the role of theGP in reducing morbidity. Aust Fam Physician 2011, 40:637–40.
67. Astrom DO, Forsberg B, Rocklov J: Heat wave impact on morbidity andmortality in the elderly population: a review of recent studies.Maturitas 2011, 69:99–105.
68. NSW Ministry of Health (2012): Chronic care management program. 2012.http://www0.health.nsw.gov.au/cdm/severe_chronic_disease_management_program.asp.
doi:10.1186/1476-069X-12-98Cite this article as: Wilson et al.: The impact of heat on mortality andmorbidity in the Greater Metropolitan Sydney Region: a case crossoveranalysis. Environmental Health 2013 12:98.
Submit your next manuscript to BioMed Centraland take full advantage of:
• Convenient online submission
• Thorough peer review
• No space constraints or color figure charges
• Immediate publication on acceptance
• Inclusion in PubMed, CAS, Scopus and Google Scholar
• Research which is freely available for redistribution
Submit your manuscript at www.biomedcentral.com/submit