Underdoped cuprates, manifestations of boson-fermion crossover ...
69
1 Underdoped cuprates, manifestations of boson-fermion crossover, ‘quantum oscillations’ and the robust fractional quantum Hall state = 2 / 5 John A. Wilson H. H. Wills Physics Laboratory University of Bristol Bristol BS8 1TL, U.K. Abstract The quantum oscillation data accruing from a whole variety of underdoped HTSC systems and physical measurements has almost universally been presented in very classical terms following the Lifshitz-Kosevich formulation for Fermi-Landau quasiparticles, quantized into vortices and Landau levels under the high applied magnetic fields. The Fermi surface, as allegedly monitored, always emerges as being a very small fraction of the large parent Fermi surface detected at higher doping. This then calls for some Fermi surface reconstruction to have occurred, as from a charged density wave, etc. etc.. The present paper refutes this reciprocal space approach for the underdoped HTSC cuprates, and shows that many of the more recent detailed works taking this line are not consistent with the data. The present author introduced an alternative real-space interpretation of these matters a couple of years ago. This was in terms of interaction there of the vortex array with the stripe array, using a 2D modelling of the latter. That approach has in the present paper been revised somewhat and copes well with addressing the wide variety of new data now available. The paper pursues and justifies the BEC/BCS, two-subsystem, negative-U based modelling advocated earlier for the HTSC cuprates, along with the strength and geometry of the striping acquired in a strong magnetic field. A wide variety of recent experiments are expounded in these terms to support an overall appreciation of a situation far from being appropriately treated within a Fermi- Landau quasiparticle framework. Indeed it is demonstrated that the universality of the ‗QO‘ observations ensues from the highly correlated physics of the fractional quantum Hall effect. The data all point to FQHE state with filling factor = 2 / 5 . This particular state in its genesis and expression finds a much greater alignment with the BEC/BCS crossover condition and the proximity of the HTSC materials to Mott-Anderson localization than does any model for the prevailing inhomogeneous electronic conditions which appeals to well-metallized Fermi- Landau quasiparticle physics. ———— arXiv:1104.5364 v2 (xx.10.11). {v1 submitted 04.11} - v1 submitted to J. Phys.: Condens. Matter, April 2011; (CM/392643/TOP/117). e-mail: john.a.wilson @bris.ac.uk
-
Upload
khangminh22 -
Category
Documents
-
view
1 -
download
0
Transcript of Underdoped cuprates, manifestations of boson-fermion crossover ...

1
Underdoped cuprates, manifestations of boson-fermion crossover, ‘quantum
oscillations’ and the robust fractional quantum Hall state = 2/5
John A. Wilson
H. H. Wills Physics Laboratory
University of Bristol
Bristol BS8 1TL, U.K.
Abstract
The quantum oscillation data accruing from a whole variety of underdoped HTSC systems
and physical measurements has almost universally been presented in very classical terms
following the Lifshitz-Kosevich formulation for Fermi-Landau quasiparticles, quantized into
vortices and Landau levels under the high applied magnetic fields. The Fermi surface, as
allegedly monitored, always emerges as being a very small fraction of the large parent Fermi
surface detected at higher doping. This then calls for some Fermi surface reconstruction to
have occurred, as from a charged density wave, etc. etc.. The present paper refutes this
reciprocal space approach for the underdoped HTSC cuprates, and shows that many of the
more recent detailed works taking this line are not consistent with the data. The present
author introduced an alternative real-space interpretation of these matters a couple of years
ago. This was in terms of interaction there of the vortex array with the stripe array, using a 2D
modelling of the latter. That approach has in the present paper been revised somewhat and
copes well with addressing the wide variety of new data now available. The paper pursues
and justifies the BEC/BCS, two-subsystem, negative-U based modelling advocated earlier for
the HTSC cuprates, along with the strength and geometry of the striping acquired in a strong
magnetic field. A wide variety of recent experiments are expounded in these terms to support
an overall appreciation of a situation far from being appropriately treated within a Fermi-
Landau quasiparticle framework. Indeed it is demonstrated that the universality of the ‗QO‘
observations ensues from the highly correlated physics of the fractional quantum Hall effect.
The data all point to FQHE state with filling factor = 2/5. This particular state in its genesis
and expression finds a much greater alignment with the BEC/BCS crossover condition and
the proximity of the HTSC materials to Mott-Anderson localization than does any model for
the prevailing inhomogeneous electronic conditions which appeals to well-metallized Fermi-
Landau quasiparticle physics.
————
arXiv:1104.5364 v2 (xx.10.11). {v1 submitted 04.11}
- v1 submitted to J. Phys.: Condens. Matter, April 2011; (CM/392643/TOP/117).
e-mail: john.a.wilson @bris.ac.uk

2
Contents
§1. Introduction to area of concern. p3
§2. Background to Boson-Fermion (B-F) crossover modelling of HTSC cuprates. p4
§3. Critique of the application of standard electron-hole modelling to low T, high H
transport properties of underdoped HTSC cuprates. p5
§4. Recent experimental results bearing on the form and nature of charge striping. p8
4.1. Background to striping, with special reference to incommensurate 1T/2H-TaS2/Se2. p8
4.2. Areal versus linear diffraction contrast. p9
4.3. 1q versus 2q discommensuration structuring. p10
4.4. The dynamics of stripe behaviour: the electrical noise studies of Caplan et al. [59]. p12
4.5. The dynamics of stripe behaviour: Y-124 NMR/NQR studies of Suter et al. [61,62]. p13
4.6. dc jogging and anisotropies in diffraction: neutron scattering studies of Hinkov
et al. [49]. p14
§5. The alteration wrought by application of a magnetic field on underdoped HTSC
systems. p16
5.1. Introduction to some problems within the present literature. p16
5.2. High-field results of Tranquada et al on LBCO p = ⅛ [79a]. p17
5.3. High-pressure results of Tranquada and colleagues on LBCO p≈⅛ [80]. p18
5.4. Beyer et al’s STS evidence of magnetic-field-enhanced stripe order in YBa2Cu3O7
[81]. p18
§6. The oscillations detected in underdoped HTSC samples are dictated by real space
and not reciprocal space physics. p21
6.1. Recap of where we have reached, including a first look at the QO results. p21
6.2. Tc dips, stoichiometries, precise p-values, and stripe periodicities. p23
6.3. Remarkable consequences regarding conditions behind 'quantum oscillation’ results p24
6.4. The matching of the original data to the new appreciation. p26
6.5. Developments in QO work from Ramshaw et al. [102] and Riggs et al. [103]. p27
§7. Regarding attainment of the FQHE state with filling factor = 2/5. p28
7.1. Compound behaviour of the electronic specific heat in the study of Riggs et al. [103] p28
7.2. Clarification of the revised mode of oscillation numerology. p30
7.3. Geometry of the vortex array in HTSC material in increasingly strong magnetic field. p30
7.4 Sebastian et al’s recent conveyance [115/6] of the fault lines in the QO scenario. p33
7.5. The nature of the FQHE state. p34
Conclusions p36
Table 1 (for p24).
References and first author index.
Figure captions and Figures 1-17.
3
§1. Introduction to area of concern.
The consequences of boson-fermion (B-F) crossover in relation to high temperature
superconductivity (HTSC) have been probed theoretically for a considerable time now [1-6].
The mixed-valent (II/III - ―hole-doped‖) superconducting cuprates have over a yet longer
period been presented by the current author as embracing such a situation, established there
within a negative-U setting [7-10 and refs. therein]. In the past two or three years attention
regarding these electronically inhomogeneous HTSC systems has been drawn back into re-
examination of the basic transport properties, both as functions of temperature and magnetic
field, with the field variable now being extended up to very high values [11-13]. This fresh
attention follows striking revelations made initially via AMRO and subsequently via dHS/dHVA
quantum oscillation techniques, first on samples of high hole content, p, and then duly
working back into the underdoped regime [14-19]. While strongly overdoped material exhibits
evidence of fairly conventional if clearly correlated Fermi liquid behaviour, increasingly strong
departure from such behaviour is met with for p values below ~0.25. It has accordingly been
particularly disconcerting to see a great many recent publications look toward rather
conventional treatments of the Fermiology in the HTSC cuprate systems in samples for which
p is ~ 0.13 or less. Such works, both experimental and theoretical, have sought to account
for the data gathered there simply in terms of band-folding and conventional Fermiology,
entertaining rather standard notions of SDW, CDW or stripe phase formation for what is
underway [20-25]. In my earlier paper on this matter [27] I proposed a radically different real
space scenario of how such an oscillatory signal might arise. This involves the ratcheted
passage of flux vortices between field-enhanced stripe domains. The present paper marks a
certain revision of that appreciation that focusses now not so much on the stripe domain‘s
size as upon its hole content. A detailed argument is developed of how the underdoped
samples with p 0.10 do not support Fermi liquid behaviour, but are instead representatives
of the Fractional Quantum Hall condition (FQHE) = 2/5. The latter is one highly appropriate
to the resonant Feshbach state long advocated by the author as origin of the HTSC
phenomena [7-10, 26-28].
Section 3 in the present work emphasizes the way in which the standard electrical
transport behaviour stands reinterpretion in terms of coexisting fermions (coherent and
incoherent) and bosons. Section 4 endeavours to supply a more detailed appreciation of the
stripe state condition developing in these underdoped HTSC materials in the pseudogap
regime. Section 5 looks at the enhancement of that stripe condition secured under
application of a strong magnetic field. Section 6 reworks the real-space understanding of the
‗quantum oscillation‘ data forthcoming from HTSC material with p ~ 0.1 and indicates how it is
not compatible with a CDW/SDW Fermi Surface reconstruction scenario. Section 7 explores
the appreciation gained in Section 6 that all these results are a consequence of the adoption
of the FQHE = 2/5 state, and relates this state of affairs to the B-F crossover event within the
negative-U environment afforded by the mixed-valent cuprates.

4
§2. Background to Boson-Fermion (B-F) crossover modelling of HTSC cuprates.
Already I have laid out in very considerable detail how I advocate interpretation of all
HTSC cuprate data to proceed, whether issuing from photoemission and scanning tunnelling
microscopy [see 26], transport and quantum oscillations [see 27], or pump/probe and optical
experiments [see 28]. Throughout this interpretative work a critical concentration of pc =
0.185, flagged up a dozen years ago now within the thermodynamic studies by Loram et al.
[29], stands as the hole concentration at which the superconducting condensation energy per
Cu atom comes to a sharply cusped maximum. It constitutes the ‗hole doping‘ level below
which the quasiparticles, starting with those on the band structural saddles, incur a significant
incoherence even at low temperatures. In the B-F modelling this incoherence is presented as
the consequence of a chronic scattering in mixed-valent HTSC cuprates associated with the
degeneracy in play there between the primary quasiparticles and the negative-U instigated
local-pair bosons. This strong scattering takes on two forms: (1) the e-on-e-to-b scattering of
boson creation, origin of the strong T2 contribution to (T) witnessed over a wide range of p to
either side of pc, and (2) the h-on-(uncondensed)-b scattering, source of a strong and
extensive T-linear contribution to (T) in evidence down to notably low T [27]. By Tc(pc) the
above two strong scattering processes have become of very comparable intensity [12]. The
critical concentration pc stands as that at which the production and maintenance of active
bosons is most favoured. In addition to supplying maximum condensation energy per Cu
atom, Є, to the overall condensate, pc is the composition upholding maximum superfluid
number density, ns, as has been evidenced from SR penetration depth measurements [30].
Maximum Tc arrives, by contrast, at the slightly reduced p value of 0.16. Below this latter
composition Tc declines linearly with ns. The condensation energy on the other hand falls
away much more sharply than does Tc(p) [29], and right from pc, as the instigating negative-U
state is abstracted to greater binding energy, U(p). The quasiparticles of the Fermi surface,
beginning with those in the saddle regions, individually start to de-cohere and gap under the
prevailing chronic e-e and e-b scattering. The associated move towards Mott-Anderson
localization fosters the general loss of coherence and introduces additional strong scattering
as T, this with falling p progressively extending up to very high temperatures, as first was
reported back in 1987 by Gurvitch and Fiory [31]. With the reduction in p and the growing
pseudogapping to the quasiparticle DOS as local-pair binding energy, U(p), and charge
trapping energy, £(p), each augment, the superconducting gap parameter,(p), itself retreats
steadily from its maximum – this the so-called ‗gapping dichotomy‘, much in evidence in a
wide variety of experiments on underdoped HTSC samples [26-28].
With the above perception as to what is driving pseudogapping in the underdoped
(sub p = 0.185) regime, it seems quite inconceivable how standard Fermiology might be
deemed appropriate to account for the recently extracted high-field quantum oscillation results
from low-p samples. In [27] I previously have set out how such low temperature data from
underdoped HTSC samples would support interpretation as coming not from standard,

5
maximal orbit, k-space-based periodicities in 1/B (after the Lifshitz-Kosevich formulation
elaborated for conventional metals) but instead from a quantized real-space sourcing.
The latter scenario incorporates a 2D stripe-phase appreciation [32,33] of the
situation prevailing in the underdoped mixed-valent cuprates under charge segregation and
superlattice formation prior even to any application of a magnetic field. In the striping process
the 45°-oriented square domains there become filled by divalent cuprate coordination units
(9CuII
0), with the latter domains bounded by walls holding alternately spaced hole-bearing
coordination units (8CuIII
0) [8,32]. The negative-U local pairs (
10CuIII
2–) materializing at
appropriately sited CuIII coordination units are free then to propagate over the mixed-valent
peripheries of the domains. By contrast the spins and charges within their divalent inner
regions become progressively gapped and confined as p and/or T are reduced and one
approaches Mott-Anderson localization. For as long as the spins prefer local RVB spin-
pairing and avoid LRO antiferromagnetic order, the coupled ensemble of fermionic pairs and
local pair bosons avoids strong spin-flip pair-breaking within the globally permeating
superconducting condensate. Note that while the pseudogap energy varies wildly with
precise location, STM discloses that the superconducting (inner) gap is effectively
homogeneous [34, fig.2a]. At all temperatures below Tc some proportion both of the local-pair
bosons and of the fermionic quasiparticles continue, nonetheless, to exist outside the
condensate. Local pairs in fact remain able to form in the immediate vicinity of the negative-U
centres on the domain boundaries up to well beyond Tc – and indeed beyond the Nernst
regime and even T*. They transiently are generated up to the highest temperatures, and
ultimately one witnesses in these underdoped samples taken to values above the Mott-
Ioffe-Regel limit (i.e. into full incoherence).
Note in the real space understanding of the quantum oscillation results advanced in
[27], the 1/B oscillations (realized in applied fields Happ>Hirrev) have been proposed to arise as
the number of ‗stripe‘ domains becomes shed, one by one in ratchet fashion, from the
footprint, F(H), allotted to each flux vortex at any specific Happ, within a still quantized
magnetic flux array. Prior to turning to develop this model and the wealth of new information
in this area continuing to accumulate from STM, ARPES and QO work, it first is advantageous
to examine how the details of the very recent high-field measurements of and RH reported
by Hussey and coauthors in [13] are to be accommodated within the above scenario.
§3. Critique of the application of standard electron-hole modelling to low T, high H
transport properties of underdoped HTSC cuprates.
As is divulged by the steady conversion of the Hall and Seebeck coefficients at low
temperatures from ‗hole‘ towards ‗electron‘ behaviour observed universally with underdoped
HTSC cuprates under high magnetic fields (typically > 30 tesla), some two-component
approach would seem called for. What those two components might be then becomes the
question. As is noted above much modelling of the high-field quantum oscillation (QO) results
has to date revolved around band-folding under the presumed impress of rather conventional

6
SDW or CDW/PLD formation. A prime problem with all such interpretations is that the n-type,
small area segments of Fermi surface seemingly implicated by the QO data would then issue
precisely from those parts of the original large Fermi surface wherein the quasiparticle states
undergo their greatest scattering and loss of coherence. Hence why such states should go
forward to dominate the high-field transport is highly questionable. Despite this fundamental
objection, raised previously in [27], the examination and interpretation offered in [13] has, as
elsewhere, proceeded in this vein.
When one takes the two components involved in sourcing the data of [13] to be
standardly reconfigured hole and electron quasiparticles, one is drawn to make application of
the quasi-classical equations for the net longitudinal and transverse (Hall) resistivities
(h + e) + he(hRh2 + eRe
2).H
2
xx(H) = ¯¯¯¯¯¯¯¯¯¯¯¯¯¯¯¯¯¯¯¯¯¯¯¯¯¯¯
(h + e)2 + h
2e
2(Rh – Re)
2.H
2 ,
(h2Rh – e
2Re) – h
2e
2RhRe(Rh – Re).H
2
xy(H) = ¯¯¯¯¯¯¯¯¯¯¯¯¯¯¯¯¯¯¯¯¯¯¯¯¯¯¯¯¯¯¯¯ .H
(h + e)
2 + h
2e
2(Rh – Re)
2.H
2 .
In order to render analysis of the high-field data along these lines tractable, one has to
presume that the numbers of particles involved here are field-independent, as too their
mobilities. Moreover, as was addressed in [13], one must be aware of the possible
complications inserted by the chain carriers for the material specifically under investigation
here - namely YBa2Cu4O8 (Tc,H=0 = 80 K, p ≈ 1/8), – featuring too in the early QO work of
[16a,b]. The Hall data of [13] have been obtained with H//c, I//a, and VH//b (b being the chain
direction). Experimentally one finds that beyond ~40 tesla (where the system passes, it is
being claimed, into the ‗normal state‘ condition) both xx and xy become essentially straight-
line functions of H, with the electron conductivity (within this standard approach) becoming
dominant here at low temperatures over the hole conductivity. The full xy data set collected
in [13] is reproduced in figure 1. Figure 2 presents associated xx and xy data for three
selected temperatures, together with fittings made in the above high-field region, plus their
extrapolation back into the ordinarily superconducting low-field region. All fittings are
executed simultaneously for both and RH in keeping with the above pair of equations. From
this overall view the authors of reference [13] proceed then to extract as functions of
temperature the two individual component carrier contributions that best are able to provide
the above levels of fitting to the high-field data xx,xy(T,H) in the straight segments H > ~40 T.
Before examining how they attempt to account for the outcome to their two-component
separation accomplished in [13,figure 3], here reproduced in the present figure 3 with slight
modification, let us first take a look at how the boson-fermion crossover model can cope with
supplying for this data a seemingly more appropriate two-component description.
For the moment let us set aside the matter of stripe formation (be this diagonal-
square or otherwise) and here concentrate upon the parent state carriers. Firstly we have the
fermions of the heavily pseudogapped large Fermi surface, hole-like in character wherever

7
and whenever relating still to coherent quasiparticles encompassing the ‘,’ location.
Secondly we have that subset of local-pair and induced bosons which, within the crossover
modelling, still reside outside any bosonic condensate under the given conditions of T, H and
the specific level of underdoping p (here ~1/8). We accordingly shall associate h and Rh in
the underdoped material with the residual coherent fermion content, and e and Re with the
above bosons together with any incoherent fermions. The bosons, being not subject to the
state single-occupancy constraint of Fermi statistics, will of course always respond as
negatively charged carriers. Inspection of figure 3 would from this viewpoint (a figure that
recall is anchored in the large-H regime of figure 1) indicate that up beyond 100 K the bosonic
contribution, e, to the overall conductivity, xx, is tending to zero. The mobility/coherency of
maintained bosons is by that stage becoming much reduced. In due course the hole-like
fermions come to dominate , despite their own contribution h to xx itself dropping off as
1/(o + AT2), a outcome of the strong fermion-on-fermion scattering proximate to the negative-
U centres and the transient boson generation. Rh, the contribution of the coherent fermions to
the overall Hall coefficient RH, becomes, once above 30 K and at these high fields, more or
less independent of temperature. Upon passing down through this same temperature range
from 100 K to 30 K, e, the bosonic contribution to xx, climbs approximately as 1/T as a result
of the reduction in phase space open to boson-fermion scattering. For the given p, the actual
number of free bosons and incoherent electrons across the above temperature range remains
quite appreciable and accordingly in this material these will make rather limited contribution to
RH.
Once below 30 K it becomes very apparent from figure 3 that a totally new regime of
behaviour is being entered into. The fermionic hole component starts to register exponential
removal. This comes from two sources. Firstly many more quasiparticles are experiencing
conversion to bosonic local pairs (10
CuIII2–
). Secondly at these low temperatures more and
more of the remaining fermions become trapped polaronically into weak localization. The
observed rather sharp commencement could well be coupled to the onset of pinned 2D
striping within the prevailing conditions of low T and high H (at the current p ~1/8). Not only
does h diminish exponentially, but, in the first instance, Rh pointedly veers strongly upwards.
While such changes are occurring to the fermionic hole content, what of the bosonic
behaviour? The bosonic contribution e, growing hitherto as 1/T, now plateaus out below 20
K. Possibly stripe pinning to contiguous dopant centres and a growing confinement of the
bosons to and within the stripes stand responsible for such capping of e at low T. An
additional matter is whether the onset of stripe and carrier pinning and trapping becomes
advanced in the present (T,H,p) conditions by the field vortices themselves settling into a
regular square array, responding to the geometry of the square stripe domain array. One
sees Re begin at the same juncture below 35 K (and H>35 T) to move toward larger values,
as if the active bosons are being abstracted into the superconducting condensate. Ultimately
Re, as with e, levels out towards helium temperatures, implying that a capped residue of

8
bosons to remain both untrapped and outside the condensate. Under these low temperature
conditions, Rh, by now largely deriving from the residual near-nodal carriers, wheels around
towards zero in superconductive fashion – the global condition evident in figure 2a for T=20 K
once H<25 tesla.
§4. Recent experimental results bearing on the form and nature of charge striping.
4.1. Background to striping, with special reference to incommensurate 1T and 2H TaS2/Se2.
Since in the above, and again in what follows, the concept of organized structuring of
the inhomogeneity inherent in the ‗doped‘ mixed-valent HTSC systems pervades the
discussion, we must examine how the latest research embellishes understanding of the
‗striped‘ construction, be this one-dimensional, as most have adhered to [35], or two-
dimensional, as I have long advanced [32,33] (see also a Ginzburg-Landau study to appear
from Melikyan & Norman). Around this latter distinction lies, I believe, the key to
understanding very many of the puzzles presented by the underdoped cuprate materials and
especially now the quantum oscillation data [15-19].
Many speak of the above ‗incommensurate‘ charge and spin ordering apparent in
elastic and especially inelastic neutron [36] and X-ray scattering [37] experiments in terms of
charge and spin density wave formation, as if dictated by the Fermi surface geometry and the
‗nesting‘ thereof. However three points call for recognition here: (1) the essentially circular
Fermi surface lacks strong nesting characteristics; (2) the incoherency of the Fermi sea, i.e.
lack of sharpness to the Fermi surface, particularly within its potentially better nested
segments, the saddles; (3) the appearance of comparably ‗incommensurate‘ diffraction from
the related non-metallic mixed-valent nickelate systems [38], addressed earlier in [32,§3.3].
The latter results point to the most likely origin of the attempted structural organization in the
mixed-valent cuprates being lattice strain. This develops when, at the local level, the charge
inhomogeneity finds itself expressed as differences in chemical bonding within the differently
charge-loaded coordination units. The structural differences imposed here by the dz2 and
dx2-y
2 states of the d(eg)p-* set upon the on-coordination-unit-based, Cu-O interaction
become very marked. They require to be addressed on a local basis [32(§3.3)] in terms of
the Jahn-Teller effect, active within our current systems/structures at d7 and d
9. The lattice
response to the local interaction is evidenced in statistical fashion by the EXAFS-monitored
variability in nearest-neighbour Cu-O bond length [39], and still more directly so in STM-
acquired scans of the lattice array which display highly local electronic characteristics [40].
The pseudogap behaviour shows much greater sensitivity here to local circumstances than
does the more collective superconductive ‗inner‘ gapping of low temperatures.
What structurally orders, or attempts to, within the cuprates is not the actual location
of the dopant/substituent atoms themselves but the deficit charge content that issues from the
latter, in conjunction with concomitant organization of the spin array. Because the order is
primarily a product of the outer (conduction) electrons, the associated diffraction data become

9
more evanescent and of a lower magnitude than in the case of structural ordering in an alloy
such as Cu/Au or Cu10Sb3, in which the atomic volume/mass differences between ordering
components are very marked. Cu10Sb3, as it happens, yields an identical diffraction pattern to
layer-structured 1T3-TaS2 – the subscript 3 here denotes the low temperature, 3-by-1 rotated,
√13ao, hexagonal (bar stacking) superlattice condition [41,42]. This ‗commensurate‘ order of
1T3-TaS2 follows higher temperature states designated 1T2 and 1T1, strongly
‗discommensurate‘ and ‘incommensurate‘ respectively. The latter phase in this 5d1
delocalized metal demonstrably does relate back to the Fermi surface, and accordingly
warrants treatment in terms primarily of Fermi surface nesting and CDW formation. However,
even with TaS2, the 1T2 state reveals in its temperature evolution a strong participation of the
lattice in the electronic processes. The ‗discommensurate‘ nature of 1T2-TaS2 is observed to
be one of successive domains of ‗locked-in‘ lattice commensuration (based upon rotated 13-
atom clustering) set around by phase-slip boundaries [43,44]. The rather narrow width of
those boundaries is a marker of the continued drive in 1T2 to cluster formation. At higher
temperatures however, as was intimated above, the superstate wavevector within unrotated
1T1-TaS2 can via Ti substitution be forced away from such commensuration and then
manifestly does reflect the gradually changing dimensions of the Fermi surface, so justifying
the CDW label. In the alternative 2H polytypic form of TaS2 one again discovers a CDW/PLD
state to arise at reduced temperature, now of suitably modified wavevector and appreciably
lower amplitude. This time at low temperatures the 2H polytype shows commensurate lock-in
to the lattice at 3ao, following what was at first perceived as a simple incommensurate
condition [41]. However once more the onset phase proves discommensurate [45]. The
diffraction pattern via its weak, higher-order, spotting manifests such a state of affairs - easy
to miss or neglect. What proved highly fortuitous as regards experimental observation of this
discommensurate phase in 2H-TaSe2 was that the two-sandwich stacking of the 2H polytype
confers hexagonal symmetry breakage upon the resulting CDW structures, commensurate
regions becoming very slightly orthorhombic. This symmetry breakage brings to dark-field
imaging electron microscopy strong areal brightness contrast between appropriate near-
neighbour domains, within an overall ‗double-hexagonal‘ domain geometry. I do not wish to
proceed further into the details of this history other than to point to three matters of immediate
relevance now to the HTSC situation: namely (1) areal vs linear diffraction contrast, (2) 2D vs
1D domain structuring, (3) the dynamics appertaining to the discommensurate condition.
4.2. Areal versus linear diffraction contrast.
In connection with point (1) it is evident a disappointingly small amount of low
temperature, transmission electron microscopy has been undertaken on underdoped HTSC
systems to probe these important questions. Clearly greater obstacles to such work exist
here than was the case with layered, stoichiometric, hexagonal 2H-TaSe2. Notwithstanding,
BSCCO, particularly when underdoped, offers clear potential. Early TEM work on overdoped
Tl2Ba2CuO6+ from Hewat et al [46] uncovered structural complexities which it would be

10
extremely difficult for other techniques to pick up, involving microtwinning of a type quite
distinct from the basic orthorhombic twinning. Detail recorded by the surface probes of STM
on CNCOC and subsequently BSCCO, and termed there ‗checker-boarding‘ [47], similarly
emphasizes the HTSC materials to be structurally more complex at the micro-level than many
are willing to embrace. From the observed wave-vectors it is apparent the ‗checker-boarding'
reported in [48] is not the charge/spin ‗striping‘ probed in bulk diffraction experiments, whether
using synchrotron X-rays or neutrons.
4.3. 1q versus 2q discommensuration structuring.
In connection with point (2) I never have been convinced that the latter diffraction
techniques directly reveal the striping in the HTSC cuprates to be other than two-dimensional.
Considering that virtually all the HTSC families are orthorhombic, a one-dimensional aspect to
the incommensurate diffraction features in question might not have been overly surprising.
Both 1T- and 2H-TaS2 do in fact initially exhibit upon warming a 1q as distinct from multi-q
ICDW variant [42]. The IC diffraction from under-doped as from optimally-doped YBCO-123
is however, despite the presence of the chains and even for detwinned crystals, always
(pseudo-)tetragonal in disposition [49]: the important recent work from Hinkov et al in this
regard will be addressed in detail below. Customarily with LBCO and derivatives it has been
asserted that the observed 2D aspect to the overall diffraction pattern is the outcome simply
of a ‗crossed‘ projection from successive 1D layering in the multi-layered, low temperature
structural phases (LTO and LTT) [35]. However HgBa2CuO4+ [50] and Bi2Sr2CuO6+ do not
have this complication to appeal to and yet show 2D symmetry in their diffraction.
When originally drawing up 2D patterning of seemingly appropriate stripe structures
for the HTSC materials in [51,8] I adopted the ‗natural‘ course of aligning those stripes in the x
and y (saddle or antinodal) directions, this being in keeping with the detected axial orientation
of the spot displacement vectors, , away from the primary (,) locations set by the 2-by-2
antiferromagnetic diffraction spotting of the undoped parents. In [51] I pointed out that this AF
order entails a face-centred spin geometry which means many diffraction spots (e.g. 1,0)
become forbidden for the primary structure and the same likewise will follow for the visibility of
the derivative IC satellites. It soon was realized though that, as with the multi-q structuring of
the discommensurations (dc‘s) in 2H-TaSe2, it should be possible to have 45°-inclined,
‗partial‘ phase-slip boundaries capable of generating the relevant diffraction, as set out earlier
in [32]. Two such ‗partial‘ phase-slip boundaries stand equivalent to one of the original type in
bringing to = ⅛ material axial spin-repeat over an (approximately) 8ao lattice period, as
detected experimentally (but see §6.2). Moreover this revised organization of the stripes
holds the potential to account [32] for the Magnetic Circular Dichroism (MCD) data of
Kaminski et al [52], without necessitating any recourse to the local current-loop model
advocated by Varma and colleagues [53]. In the 45° stripe modelling the appropriate
magnetic/time reversal symmetry breaking comes from compliance of the local spin
orientation within the domains to the stripes themselves under magneto-elastic coupling. The
11
latter action, it would appear, derives from strong Jahn-Teller coupling associated with the
dominantly d9 coordination unit loading (
9CuII
0) of the domain interiors. The resulting majority
clockwise and anti-clockwise circulations of the locally AF spin alignments within successive
45°-oriented domains turns out to be precisely as has been deduced by Fine directly from the
neutron diffraction pattern [54], and that within the presentation of [32] is a direct product of
the hole charge ordering of the domain walls.
In figure 1 of [32] I illustrated the situation for p = 1/8 (when taken to conform to
commensurate geometry = 1/8), and this figure now is reproduced in figure 4, although
employing a slightly different mode of representation of the frozen charge and spin array.
Figure 5 makes analogous representation of the = 1/7 case, here for charge loading p =
8/72
or 0.1632, i.e. just beyond Tcmax
(p). Note in 2D it is not possible to construct a regular pattern
of the current type wherein = 1/7 can be matched to hole content p =
7/72. Furthermore note
that within the patterning of Figure 5 the geometry of hole accommodation around the rotated
domain corners is of two distinct dispositions, only the entire 7aox7ao square defining the full
charge-ordered repeat. Figure 6 portrays in like fashion the case for 9ao geometry, where
now the hole content at p = 9/92 does become regularly spaced, although once more
exhibiting different hole dispositions around its cell-centre and cell-corner dc crossings.
An important point to register here is that despite the regular patterning of fig. 4 at =
1/8 and p =
8/82
being geometrically very attractive, recent refined neutron work on LBCO [55]
has affirmed what had been implicit in work on LSCO [56,51] – namely that, contrary to
general acceptance, there is in fact for (La2-xBaX)CuO4 at x = p = 1/8 no full commensurate
lock-in to = 1/8: rather the experimentally measured value lies significantly below
1/8. This
is a matter for which solution was offerred in [51], and is one to which we shall return in due
course in §6.2 in connection with the quantum oscillation results.
Before leaving the matter of 2D vs. 1D as regards true representation of the
experimental diffraction information, attention finally is drawn to Azzouz and coworkers‘ [57]
recently reworked analysis of the HTSC cuprate diffraction data in terms of spiral
antiferromagnetism, this quite independent of my own [32] or Fine‘s [54] deliberations. As
was intimated above, my understanding is that such an exclusively magnetic view is not in
fact appropriate to the present situation. The same would go for regarding the magnetic array
as an example of a Skyrmionic lattice [58] should one tie that term to its original sense of
arising from the Dzyaloshinskii-Moriya magnetic interaction within a non-centrosymmetric
host. The dominant physics in the HTSC case surely is not magnetic but derives from charge
segregation within a mixed-valent system barely removed from the Mott-Anderson transition.
The neutron-sensed areal magnetic ordering in underdoped HTSC materials largely is
impressed by the linear, neutron-invisible, charge ordering and its associated lattice strain
arising from the very strong J.T. effect. Anisotropic forces due to magneto-elastic coupling
impose the chiral spin geometry. The domains are, remember, only ~25 Å across. One
additionally needs to keep in mind here the S=½ nature of the Cu(II) spins, their strong p-d

12
hybridization at the termination of the 3d (1st T.M.) series, their RVB potential, and the
invariably frustrated form to their 3D coupling, to perceive why overplaying consideration of
standard magnetism and downplaying its spin-gapping is dangerous. A spin gap of 10 meV
is, recall, equivalent to 120 K. The development of site charge differentiation stands
paramount in governing the nature of the pseudogap condition from which HTSC springs.
4.4. The dynamics of stripe behaviour: the electrical noise studies of Caplan et al. [59].
We now come to point (3) regarding the stability of the stripe array. It is clear from
the diffraction information that for most HTSC materials (away from low-p LBCO and its RE-
substituted derivatives) striping is not ordinarily frozen in, temporally or spatially, to procure
stable, long-range structuring. The diffraction data, nevertheless, from spot widths do make
evident that quite appreciable correlation times and lengths are building. A very revealing
additional measure of the meso-scale order developing quite sharply once below ~ 270 K is to
be gained from examination of the associated extra electrical noise experienced there at very
low frequencies.
Caplan et al [59] have made a close study of this electrical noise – in particular of the
excitation energies involved, of its magnetic sensitivity, of matters such as aging and
hysteresis, and above all of the ―large-fluctuator‖ characteristics that appertain to the
stabilizing stripe condition. These authors have monitored the 1/f noise over 8 octaves from
0.3 to 112 Hz, presenting their data in octave-compressed bands. Appropriately low thermal
rates of change (~0.2 K/min) were used. The clarity of detail reported in the paper derives
from the tiny volume and refined nature of their samples. The films are grown on SrTiO3 and
LaAlO3 by laser deposition, are just 30 nm thick, and are photo-lithographically configured
and ion-milled to be ~2 to 3 m wide and 15 m long. These films then have been post-
annealed in low pressure O2 to obtain the desired levels of underdoping (Tc running from 30 K
to 85 K in the various YBCO and Ca-substituted YBCO samples examined). The type of
meso-scale activity which their observations would signal we earlier have witnessed directly in
the electron microscope and recorded on video (unfortunately BetaMax) some 30 years ago
for the case of the dc arrays in 2H-TaSe2. 18 frames drawn from that video are included in
ref. [60]. Typically these are spaced at 1 to 10 second intervals. The latter snapshots afford
but a very limited glimpse of the activity witnessed on screen as the dc array fluctuates and
pins at every possible level, from minute rapid adjustment to occasional avalanches. Flip-
flopping of the dcs between more strongly pinned locations frequently was in evidence. The
dcs are strongly susceptible to capture at their ‗head‘ by some hidden pinning agent, and very
often dc‘s would return to snag upon these same points during thermal cycling. Remember in
the above dark-field images that out-of-contrast features (areal diamond strings bounded by
dc‘s) run in the other two complementary hexagonal directions to define these singularities. It
was found that as is altered slightly with temperature change new dc‘s would arise. The
general perception was that the latter nucleated from defects and then would extend

13
‗longitudinally‘, rather than for new dc‘s to ‗compact in‘ from the edge of the sample
‗transversely‘.
The fact that all this activity in 2H-TaSe2 manifests itself, as now is detected in YBCO,
at remarkably low frequency levels is a marker of the extended nature of the fluctuators and
of the significant size of the energy barriers being surmounted. By performing a Boltzmann
analysis of the change in flip-flopping dwell-time ratios for an isolated fluctuator active still
between 108 K and 100 K, Caplan et al have in [59] been able to evaluate a typical state free
energy difference of about 37 meV (or 4½ kT). This energy stands a factor of 10 smaller than
the typical activation energy associated with the general 1/f noise augmentation encountered
up in the onset range from 260 K to 220 K. A Boltzmann activation energy of ≈ 0.4 eV was
there determined, this coupled to an attempt frequency ~ 1010
-1011
Hz, suitably phononic in
range and expressing the simple thermal kinetics of the extra 1/f noise generation. Despite
the rapid increase in electrical 1/f noise met with near 250 K, the conductivity itself is less
sharply altered, improving slightly as this activity is quelled and the striping becomes better
organized. At lower temperatures the application of a magnetic field sees the noise level step
up, due to further improvement to stripe organization, as more free energy becomes
squeezed out of the material‘s magnetic subsystem under the spin-organizing field.
4.5. The dynamics of stripe behaviour: the NMR/NQR studies of Suter et al. [61,62] on Y-124.
The above noise studies of Caplan et al [59] are by no means the first time rapid
onset of charge activity around 200 K has been identified. The NMR/NQR work of Suter et al.
[61][62] back just prior to 2000 affords a case in point, of particular relevance now since it
relates to YBa2Cu4O8, the underdoped stoichiometric material playing such a key role in the
‗quantum oscillation‘ saga. Suter et al.‘s first paper disclosed, via the diverse measures of
site Knight shift, relaxation rate and anisotropy, a unified spin-fluid active over all sites and
exhibiting marked modification once below 200 K. The latter changes were demonstrated to
be primarily not magnetic in nature, but of strongly quadrupolar (i.e. charge) origin. Because
a change is evident too in field-free NQR data in addition to NMR, clearly this is not reliant
upon the presence of a magnetic field (for the NMR work Happ was 9 tesla). The NQR
changes proved particularly pronounced both for the chain and the planar copper sites, and
indeed for the O(4) oxygen between them, as would signal a J-T.-type lattice fluctuation
involved with hole transfer from the chains to the planes. For the planar Cu(2) site both Kc
and Q deviate sharply upwards below 200 K, whilst the relaxation rate at O(4) steps
downward. The fluctuation time-scale was estimated as lying here in the range 10–9
to 10–5
sec. What fraction of this extra fluctuational activity is ascribable to magnetism and what to
charge very cunningly was separated in the second of Suter et al.’s papers [62]. There
through use of 17
O-enriched (I=5/2) samples they examine the planar O2,3 response at 9 T
employing a novel double-irradiation technique. In this the central (-1/2,
1/2) transition is
saturated by the application of an appropriate additional stimulating r.f. field. A significant
intensity enhancement is then uncovered for the (-3/2,-
1/2) transition over the signal as

14
recorded within the conventional spin-echo procedure. Normal spin-echo data are dominated
by the (-1/2,
1/2) magnetic fluctuations. (These were the ones pursued by Millis, Monien and
Pines in their integrated treatment of the original NMR and neutron scattering data [63]). The
Suter enhancement in the (-3/2,-
1/2) signal exhibits a strong rise from 200 K down to Tc,
followed by a sharp collapse. The very marked //c versus ┴c anisotropy detected below 200
K in overall O2,3 relaxation rate was adjudged to arise within the new quadrupolar relaxation
channel. The latter‘s magnitude was appreciated as being far too high to issue from
individual quasiparticle activity. Moreover it displays the wrong temperature dependence to
be due to phonons. The above remarkably strong, collective, quadrupolar response from the
planar oxygen sites speaks very strongly of stripe fluctuations, just as now do the new
electrical noise data [59] – a topic that back in 2000 was not of foremost regard.
Why the above phenomena should appear so much stronger with YBa2Cu4O8 than for
YBa2Cu3O7- becomes now an interesting matter (see [61] fig 12). Perhaps the stripes are
better defined in Y-124 than in non-stoichiometric Y-123. As yet we have no neutron or
synchrotron X-ray inelastic scattering work on Y-124 to affirm this. In the next section we
shall examine what the role of the application of a magnetic field might be in this respect.
4.6. dc jogging and anisotropies in diffraction: neutron scattering studies of Hinkov et al. [49].
To finish this present section we insert next into the discussion very revealing
inelastic neutron scattering results from underdoped YBCO-123, recently released by Hinkov
and coworkers [49] and already alluded to above. These data relate to the discerned level of
a,b basal-plane stripe anisotropy present in that system.
Extracting information from the neutron-probed susceptibility excitation spectrum
‘‘(Q,) in HTSC material never is straightforward due to the multiplicity of processes which it
enfolds. RVB-driven spin-coupling forces gapping to develop in AF spin-wave excitation
extending right up towards 50 meV. Only beyond the latter energy does behaviour akin to
that seen in the Mott-insulating parents become re-established. Below this energy residual
spin excitation in fact remains in evidence but deriving from the more complex (circulatory)
magnetic coupling associated with the striping arrays. The low energy fade out in stripe
definition (as registered using neutrons) indicates this order too is spin-gapped excitation-
wise. Many low-dimensional copper compounds experience comparable limitations upon
their magnetic susceptibility imposed by their S=½ spin-count and by the high level here of p-
d hybridization. These generic effects are now compounded by the superconductivity,
pointedly as a consequence of this superconductivity having its own multi-component nature.
Beginning considerably above Tc, spectral weight becomes gathered into the
‗magnetic resonance peak‘ centred upon (,). Its energy of ~ 5–5½ kTc (41 meV for YBCO7)
associates it directly, within the strong-coupling scenario of the resonant crossover
superconductivity, to an excitonic, pair-breaking, spin-flip in the condensate – global below Tc,
but increasingly local above. The instigating local pairs lie themselves at a somewhat deeper
binding energy (see fig. 2 in [10] and fig. 1 in [26a]): ~ –55 meV for the case of YBCO7. At

15
such an energy one encounters in addition the soft phonon-coupled mode sited in the saddle
regions out toward (,0), etc., and associated with local pair formation [64,10]. Those local
pairs which remain outside the condensate manifest their own modal excitations. The first of
these, as was discussed by Casas et al. [65], exhibits rather strong upward linear dispersion
(i.e. to decreased binding), and it crosses ‗EF‘ well prior to reaching the zone centre. This
particular mode has, it is claimed (see fig.1 in [10] and figs.3,4 in [66]), been mistaken in
many scanning tunnelling spectroscopy works [34,40] for the Bogoliubovons of a more
standard superconductivity. A second collective mode, likewise of (,0) starting point, but
now showing much smaller dispersion, extends back into the long wavelength regions toward
the zone centre: its origin has been discussed by Belkhir and Randeria [67]. This latter A1g
symmetry mode is, as has been noted above, widely registered in electronic Raman [68],
infrared [69] and ARPES [70] spectral work, it being strongly coupled with the A1g optical
phonons [71]. Very recently this second, much more weakly dispersing, mode has been
detected in addition in spin-polarized neutron scattering by Li and colleagues [72a] on
HgBa2CuO4+ The latter material, although very attractive to work with in many ways, has the
disadvantage of jamming all these various modal features into a very narrow energy range. Li
et al have examined both optimally and underdoped HBCO, and, as one might anticipate, find
this mode to adjust to slightly higher binding energy with reduction in p. Its excitations then
appropriately remain in evidence to somewhat higher temperature, in line with the customary
behaviour of the pseudogap [66]. Alas this is not the final mode to demand untangling from
the neutron scattering data because there still remains the ‗downward‘ dispersing mode
emerging from the resonance peak. The stability here of the induced d-wave pairs relative to
EF is decreased on moving from the ,0 saddles and their associated pair creation ‗hot spots‘.
It is to scattering from this last mode to which now we direct attention for it rapidly
overlays the scattering from the stripes. Indeed many have read the two as one unified
process and have often lumped them together, along with the ‗upward‘ dispersing spin waves
(from approximately the same energy in YBCO), under the unenlightening label ‗hourglass‘.
This unfortunate conglomeration of scattering does not help when seeking to find how the
striping dissipates towards higher excitation energies, much as spin gapping does not help in
viewing how striping might harden up towards lower ones. The new work from Hinkov et al.
[49] using 94% detwinned YBCO6.6 goes a considerable way toward clarifying these matters.
The chains in YBCOx extend in the b direction. For YBCO6.6 diffraction spotting from
the striping becomes first resolvable at energies below Eres (here = 38 meV) and at
temperatures once under about 230 K [see fig. 6a in 49]. This spotting is much the more
apparent in the a* direction, corresponding to better defined diffraction ‗objects‘ aligned in the
perpendicular direction, i.e. parallel to b, the structural chain direction (see fig. 3a in [49] for
E=23 meV at 3 K). With respect to neutrons those ‗objects‘ are not the charge stripes
themselves but the spin domains between them. In our figure 4 above we have shown that
the counter-circulatory spin patterns in n.n. domains define a spin supercell of two
interpenetrating fcc sublattices (as in NaCl) 8aox8ao in size; i.e. the spin spotting is indeed

16
rendered axial and with incommensuration vector ≈ 0.12ao*, etc.. We now can appreciate
why the a*-axis spotting in YBCO is so much more pronounced than the corresponding b*-
axis spotting (see [49], fig.3d). It is due not to an intrinsically 1D aspect to the source of
diffraction, but to a superior level of organization of this 8ao periodicity in supercell geometry
when the cell edges and lattice chains run parallel. When mutually perpendicular the level of
perfection of the supercell periodicity stands much poorer. A cell repeat that in the b direction
ought to be 9ao readily fluctuates or ‗jogs‘ to 8…10ao (figure 7a). That means the degree of
definition in the neutron scattering of spotting along b* is much the more diffuse (see [49]
fig.17 bottom left). The bottom right panel within the same figure indicates the stripes still to
be clearly in evidence at 70 K, i.e. somewhat above Tc (61 K) for this underdoped sample.
Indeed figure 6 in this very detailed and carefully worked paper tracks how the stripe
diffraction intensity steadily fades away above Tc only finally to disappear close to 200 K,
perfectly in line with earlier discussion in this section. The paper permits the view that stripe
incommensurability parameter can be held as being near invariant for all T and .
We will move forward now to look at the effect of high magnetic fields upon such
stripe arrays.
§5. The alteration wrought by application of a magnetic field on underdoped HTSC
systems.
5.1. Introduction to some problems within the present literature.
It long has been known when one comes to measure the Hall coefficient for
underdoped HTSC hole systems that RH(T) shows first indication of changing sign from
positive to negative well in advance of the onset of superconductivity [73]. This is not the
product simply of the magnetic field since it is a tendency that is in evidence too with the field-
free measure of the Seebeck coefficient [74]. Furthermore it is not simply a move to the
standard superconductive shorting out of all voltage signals, because the transfer becomes
more marked whenever in a strong magnetic field able to suppress Tc [75]. Pointedly Tc
likewise becomes significantly suppressed where striping is strongly frozen in, the classic
case being LBCO in the vicinity of p = 1/8 although all HTSC systems indicate a comparable
tendency [74c]. With striping involved in all these observations (as too in the many
associated spin, charge and lattice diffraction effects [8,76,77]), it manifestly is not justified to
disregard its presence and consequences when addressing the quantum oscillation data from
underdoped HTSC material forthcoming at fields beyond 30 tesla [15-19]. This is the tack I
followed in [27] and in this I am not alone. For example Norman and colleagues [20] turn to
stripe formation to produce an electron pocket of about the perceived size. However, as
stressed in [27], this element of reconstructed Fermi surface would issue from the axial
saddles, precisely where the earlier-discussed incoherent behaviour is centred. This troubling
result itself arrives from an adherence to Tranquada‘s long-held assertion that the charge-
and spin-stripe ordering geometry is 1D in form, with the stripes running basally in one or

17
other principal axial direction [35a], an opinion hardened up through Kivelson and coworkers‘
analogy with nematic liquid crystals [35b].
As was pointed out above, our contrasting rotated 2D geometry has the benefit of
setting the easy conduction mixed-valent domain boundaries in the nodal as against the
antinodal directions. Such geometry sustains, furthermore, alternately sensed Cu(II) spin
circulation within neighbouring domain interiors [33 fig. 2b] – see present fig.4.
One bar to hinder widespread acceptance of the latter view came with the
observation made by Fauqué et al. [78] that despite underdoped YBCO-123 indeed supplying
clear evidence, under probing by spin-polarized neutrons, of some unusual form of weak
magnetic order, that order was in the first instance reported as bringing change only to the net
intensity at the principal Bragg spots. These results clearly then cannot be ascribable to
simple antiferromagnetism, whether of the Néel type or of the IC SDW variety. The adduced
canting of the moments out of the basal plane and their small (site-averaged) magnitude
(~0.1 B) indeed would suggest something more exotic. The initially perceived absence of
change to the stripe satellite peaks prompted Varma to develop a homogeneous, on-
coordination-unit interpretation of Kaminski et al.‘s time-reversal symmetry-breaking magnetic
circular dichroism data in terms of circulating micro-currents within each and every Cu-O
coordination unit [53]. However the latest spin-polarized neutron work from Li, Balédent,
Fauqué, Bourges et al. on Hg-1201/LSCO [72] would indicate that there do in fact arise
changes in the satellite IC peak region, apparent once below ~ 250 K/120 K. Accordingly I
feel happy to continue with the diagonal stripe domain model when assessing what is afoot in
the QO experiments.
Before revisiting the QO results, it is important to incorporate next the results of two
more recent papers coming from Tranquada and coworkers. The first of these relates to
transport work on LBCO (p = 1/8) undertaken in magnetic fields of up to 9 tesla [79]. The
second paper relates to the same system but now to structural and charge order work,
conducted there under pressures of up to 3 GPa and employing synchrotron X-ray rather than
neutron diffraction [80]. In §5.4 we then shall fold-in recent scanning tunnelling work from
Beyer et al. [81] on optimally-doped YBCO-123 performed in magnetic fields of up to 6 tesla.
5.2. The high-field results of Tranquada et al. on LBCO p = 1/8 [79a].
As mentioned already above, the Seebeck coefficient in this material becomes negative
in advance of a superconductivity that here in LBCO is only rather tenuously exhibited. Under
a field of 9 tesla any trace of the latter quickly becomes suppressed to liquid helium
temperatures to uncover a now much-extended range of negative S. What is emphasized
with figure 1a in [79a] is that the transfer to negative values occurs sharply in this case at 54
K. This temperature is that at which the basic LBCO crystal structure converts from the LTO
to the LTT phase under modified tilting of the Cu-O octahedra, converting from single-axis to
double-axis geometry, and the space group changing from #64 (orthorhombic Cmca, or rather
Abma) to #138 (tetragonal P42/ncm) [82]. The latter - note now enlarged - group contains

18
both diagonal glide planes and screw diads. The new crystal structure would look to develop
in response to the stabilizing diagonal striping – a point returned to in §§5.3 and 5.4.
Figures 1b and 1c in [79a] present the changes which arise in the basal and c-axis
resistivities upon adoption of the LTT structuring. For both directions a small upward step is
evident, as the Fermi surface becomes further trimmed under the supercell-induced gapping
here experienced near p = 1/8. ab at this temperature and composition is, note, ~ 130 -
cm, implying that, even as the fermions within the domains begin to localize, the carriers in
the stripes themselves, both fermions and bosons, must remain still fairly mobile (see §3
above). Where this system really manifests marked conduction problems once below 54 K is
in the c-axis direction. Conductivity in this direction would ordinarily be governed by the much
superior band dispersion of the saddle states, but the latter states, of course, are precisely
where at low temperatures the quasiparticles are being subjected to loss of coherence.
Accordingly c climbs very steeply upon cooling, and, as is to be seen from fig. 1c of [79a],
comes by 10 K in a field of 9 T to reach ~2 -cm, a most un-band-like value.
Correspondingly for YBCO6.67 (p≈1/8) no c-axis far-IR plasma response is in evidence optically
at 8 K, whether at 9 T or 0 T [79c], and likewise with underdoped LSCO and BSCCO [83].
5.3. High-pressure results of Tranquada and colleagues on LBCO p ≈ 1/8 [80].
Frequently one hears voiced the criticism that stripes only materialize in LBCO (p≈1/8)
with the crystal structure shift from the LTO to the LTT phase, as against the option that the
LTT phase marks compliance of the lattice to the growth in charge ordering, 2D in form. At
room pressure static charge order and the structural change do indeed arrive at the same
onset temperature of 54 K. Under applied pressure, however, it now is found possible very
clearly to demonstrate that the charge order, once beyond a critical pressure of Pc = 1.77
GPa, actually is able to persist through into the HTT structure, both LTT and LTO structuring
being eliminated beyond this pressure for all T. In this illuminating high pressure work the
charge stripe order has been sensed directly by turning to synchrotron X-ray diffraction as
opposed to neutron diffraction, a course of action that earlier was followed by Niemöller et al
[84] in their examination of x=0.15 (La,Nd,Sr)2CuO4 (see discussion in §3.4 of [32]).
In the charge-ordered condition within the HTT crystal phase being now accessed in
LBCO p=1/8 above Pc, it is revealed in [80] that, although the diffraction does become
somewhat more diffuse, a correlation length ~80 Å nonetheless remains in evidence even at
2.7 GPa. The Tc(P) and TCO(P) plots look set to intersect at 15 GPa, by which pressure (as
can be ascertained directly) Tc will have risen to 18 K (see inset to fig. 1 in [80]). The latter,
notwithstanding, remains little more than half the Tc value exhibited by LSCO p=1/8, for which
stripe formation is less strongly frozen in.
5.4. Beyer et al.’s STS evidence of magnetic-field-enhanced stripe order in YBa2Cu3O7 [81].
19
The natural effect of a magnetic field upon the HTSC systems, as has been
demonstrated using neutron scattering by both Lake et al. [77] and by Gilardi et al. [85], is to
promote decoupling of RVB spin-pairing and to bring transfer toward an ever more local spin
state. The change entails sharper differentiation between those sites sitting within the interior
of a stripe domain and those on the stripes themselves. The former become more
consolidated as 9CuII
0, with the
8CuIII
0 holes – plus their negative-U bosonic double-loadings
10CuIII
2– – segregated to the mixed-valent domain boundaries. The condition is illuminated
using the neutron diffraction probe, which under increasing H reveals a fall in the spin gap
magnitude and a build-up in antiferromagnetic coupling and (spiral) spin-ordering, conveyer of
the earlier noted rise in . Additionally it precipitates rather rapid depression of the
superconductivity over a sizeable composition range around p = 1/8 as commensuration
effects mount.
As p is increased beyond 0.125, the (average) stripe periodicity has to adjust from
8ao to 7ao, but the latter commensurate geometry is not actually gained until the hole content
p exceeds 0.156 (see fig.4 in [32]). Gilardi et al. examined p=0.17 LSCO and there a 7ao
superlatticing clearly had become established [85]. The new paper from Beyer et al. [81]
deals now with fully oxidized YBCO7 (Tc=93 K), for which p ≈ 0.165. This scanning tunnelling
spectroscopy (STS) work encourages one likewise to proceed with the 7ao superlattice
arrangement illustrated earlier in figure 5, wherein ideally p = 8/7
2 or 0.1632.
Let us examine figure by figure what Beyer et al actually record, free initially of
interpretation. Their fig 1a is a standard zero-field plot of tunnelling conductance versus
voltage bias at three selected temperatures, 6 K, 77 K and 102 K. The latter trace from ~10 K
above Tc is here virtually featureless. The other two traces each display a pair of gaps. The
primary gap of magnitude 2 = 40 meV, being of the superconducting gap size, accordingly
carries the gap parameter label sc. At almost twice this energy there exists a shoulder, given
here parameter label eff. Of these two zero-field features, sc is much the more spatially
homogeneous, exhibiting a spread in values half that found for eff (fig.1bc and 1ef). The two
features, nevertheless, bear such intimate interrelation that one may presume to decompose
eff through eff2 = sc
2 + VCO
2, with VCO (=32 meV) being taken to refer to a coexisting
‗density wave‘ state.
Under a magnetic field of 2 tesla spectral changes arise, the form of which very much
depends upon whether one is scanning within a flux vortex or between vortices (fig.1d). The
sc gap alone is witnessed to arise within the latter regions, whilst the larger composite eff
gapping feature is measured inside the vortices, this distinction being rather sharply
demarcated (see figures 2c,d). Figures 2a (H=2 T) and 2b (H=4.5 T) disclose that the spatial
array of flux vortices is itself rather disorganized here at 6 K under applied fields of these
magnitudes, the array already not holding to the classic regular hexagonal form. The vortex
haloes clearly are larger (~50 Å at 6 T) than is expected from the assessed superconducting
coherence length sc. Furthermore the individual conductance spectra acquired from a wide

20
selection of spatial pixels never supply any indication of a zero-bias peak of the form seen
with conventional superconductors. Figure 4 emphasizes further the non-conventional nature
of the STS data. There, while the individual gap energies sc and VCO themselves alter rather
little with field strength (they run parallel), their relative spectral weights quickly crossover
(Ishoulder increasing as Isc falls). This is not just due to spectral broadening, because the two
features each broaden in identical manner with H (fig.4c). A considerable amount of the
above is not entirely unexpected and has in part been reported previously in the early STM
work of Maggio-Aprile et al. [86], etc. (see also Fischer et al. [87]). What is really new and
important now in Beyer et al.‘s paper all has been crammed into the diverse parts of figure 3,
the unravelling of which will make evident why the above energy label V carries the suffix CO
for ‗charge order‘.
Figure 3 of [81] reports a Fourier transform study in basal reciprocal space obtained
from spatially-integrated conductance data and it entails difference mapping between the
field-applied and field-zero conditions. The primary tunnelling data are gathered from an area
roughly 1000 Å square at 6 K under fields of 0 and 5 tesla (at which field the vortex spacing
has just dropped below 200 Å). The FT-derived q-spot patterns of figures 3a, b and c refer
respectively to tunnelling energies of (i) –10 meV, (ii) –20 meV, and (iii) the energy-
integrated tunnelling signal from –1 to –30 meV. Recall here that sc = –20 meV. The upper
parts of figures 3d and 3e relate to anti-nodal (axial) behaviour in the various plots given
therein, whilst their lower parts relate to the corresponding nodal (diagonal) behaviour. What
actually are presented in figure 3d of [81] are intensity slices from three FT difference maps
such as those of figures 3a-c, traversing first axially from to (2,0) and then secondly
diagonally from towards (,). Next in figure 3e the various q-peaks featuring in these
traces are tracked individually as functions of the tunnelling bias energy down to about 40
meV. These plots disclose both dispersive and non-dispersive components. Finally figure 3f
selects the non-dispersive component signals and examines their symmetry characteristics
with regard to bias voltage sign - whether they are symmetric or anti-symmetric. Remember
all the above relates to the FT difference maps for the changes incurred between 0 T and 5 T.
From this plethora of observations let us begin with two features which we shall not
dwell on subsequently. Firstly there is the strongly energy-dispersive response of the nodal
feature, vector q7. That was the feature originally concentrated upon by Hoffmann, McElroy
and colleagues in their STS work of [88] and subsequently generalized in [89,90]. The
discussion by those particular workers was in terms there of Bogoliubovon modes and
scattering interference between symmetry-equivalent positions spaced apart on the Fermi
surface by such wavevectors. In contrast, the current author elected to attribute these (qi)
dispersive modes to local-pair bosons excited outside the condensate (see [10],[28b] and
[91]). Within the above FT maps there next occurs the strong feature present at (,etc.,
and which is clearly associated with the spin-pairing singlet-triplet spin-flip. The latter is, one
recalls, much enhanced under the applied 5 tesla field. For our present purposes where real

21
interest lies now is with the residue of non-dispersive, periodic features found to dominate the
intra-vortex signal, and accordingly too strongly field-enhanced.
What then are the wavevectors associated with the three, non-dispersive, field-
promoted, charge/spin/structural modulations sensed here within the vortices and manifesting
such direct response to the site tunnelling currents? Using the pseudo-tetragonal basal lattice
constant, a, for convenience, the following are the wavevectors as given in [81]:
axially - Q= (0, 0.28 ± 0.02)/a , and Q= (0, 0.56 ± 0.06)
/a ,
diagonally - Q = (0.15 ± 0.01, 0.15 ± 0.01)/a , (together with symmetry equivalents).
Rewriting these more succinctly and informatively we have
Q= (0, 0.14)2
/a , Q= (0, 0.28)2
/a , Q = (0.15, 0.15)½.2
/a .
Immediately within the accuracy of measurement one recognizes that this is
Q= (0, 1/7)
2/a and Q= (0,
2/7)
2/a (axially directed),
with Q = (1/7,
1/7)
1/2.
2/a (diagonally directed),
making |Q = 1/7.(
1/√2.
2/a) (see FT cut in lower fig.3d of [81]).
Accordingly = 7a , = 3½a , both axially directed,
and = 7.√2a , diagonally directed.
There can be little doubt then here that we are dealing in optimally-doped YBCO-123 at 4 K
and 5 T with a 7a x 7a superlattice. The task is to identify the precise nature of the current
modulations , , and .
Bearing on this we have the above mentioned bias-voltage ± symmetry status to
consider beyond simply the wavevectors themselves. Beyer and coworkers [81] find the FT
of the difference signal at Q to exhibit a large antisymmetric component to the tunnelling
intensity with repect to bias voltage sign. By contrast Q is dominantly symmetric wrt ±,
whilst Q is symmetry neutral. Thus we see that Q (in part) and Q relate to the true spin
array period within the field-enhanced diagonally-striped structure, whilst Q is identified as
the charge wavevector for the patterning, portrayed above in figure 5.
§6. The oscillations detected in underdoped HTSC samples are dictated by real space
and not reciprocal space physics.
6.1 Recap of where we have reached, including a first look at the QO results.
§3 showed that recent transport data on underdoped HTSC materials are better
treated by a two-component scenario that is based on hole quasiparticles (from the nodal
regions) and local pair bosons (created from the electrons in the saddle regions of the basic
FS), rather than by two oppositely signed sets of fermionic Landau quasiparticles drawn from
a reconstituted Fermi surface with attribution to SDWs, DDW‘s, CDW‘s/stripes, or whatever.
§4 affirmed the existence of fluctuating stripes in all these systems. The drive to
stripe formation is valence segregation, not Fermiology, and the geometry of the array being

22
settled into is 2D in form, not 1D. The resulting Skyrmionic-like (essentially antiferromagnetic)
spin array sports a very small overall moment plus a spin canting under a lattice coupling
which emanates from Jahn-Teller induced strain at the stripe boundaries. The stripes settle in
slowly below ~ 200 K and are a manifestation of the pseudogapping. The latter, however, is
rather more fundamentally based, resulting from on the one hand proximity to the Mott
transition and on the other from dynamic local pair generation in the prevailing B-F crossover
circumstance. Only at lower temperatures ~130 K does a substantial, quasi-static, local pair
population establish itself, capable of generating the observed Nernst effect [92].
§5 showed that stripe formation becomes more pronounced in a strong magnetic
field. The fermions become more local in character, and that finds expression both in
transport and magnetic behaviour reminiscent of the changes wrought by Zn substitution [93].
At fields above 30 T, the stripe domain interiors begin transferring into the normal state, with
the mobile pairs more and more confined to the stripes and the residual coherent
quasiparticles to the F.S. nodes. Incoherent fermions join the uncondensed local pair bosons
as negative quasi-classical particles.
Upon this localizing milieu now have been unleashed the ‗quantum oscillation‘
techniques, the outcome regarding which I already have forcibly expressed my misgivings in
[27]. There I indicated how the observed 1/Bm oscillatory data could arrive via a very different
route to that advocated in [14-19] and subsequently in [24,25,94-96]. The proposed real
space route invokes the stripe array affording a ratchet release to the passage of flux vortices
across the stripes themselves as the field strength is changed. Besides the 1/Bm form upheld
in this modelling of the oscillations (running numbers m) and the general magnitude of the
evaluated peak series ‗head fields‘ Bm=1(p) being close to those signalled experimentally, a
change in B1(p) linear in sample doping p also was supported. A strict linearity between B1(p)
and p would, if experimentally affirmed, speak strongly against any fermiologically based
scenario since the detail of the reconstructed Fermi surfaces at different p, and in particular
from different systems like 123 and 124, never is going to be so simply and uniformly
constrained. Remember in this regard the as-reported F.S. pocket cross-sections all emerge
consistently as only ~2% of the parent Brillouin zone area.
In the postscript to [27] I pointed to Audouard et al [19b] having just made report for
YBCO6.5 of a basic B1(p) peak being flanked by two lesser peaks, and that these three would
support a linearity B1(p) p if the fundamental peak for p = 1/10 were to be regarded as
straddled by secondary signals from p = 1/11 and p =
1/9. An analogous triplet set of B1
values of 460, 532 and 602 T more recently have been reported by Sebastian et al [94] for a
higher Tc 123-YBCOx and these likewise would support a simple linear relation, appertaining
now to p = 1/10,
1/9, 1/8 were the quoted fields to be taken as 478, 531 and 596 T – these
latter are deemed to lie within reasonable experimental bounds. The above flanking features
might be comprehended as due to doping inhomogeneity within the sample, but more likely
are due to jogging within the striping array, as illustrated earlier in fig.7a. Such jogged
segments occur far more readily in a direction perpendicular to the chains in YBCOx than

23
parallel to them, as signalled in §4.6 regarding the recent neutron work from Hinkov et al. [49].
As is illustrated in fig.7b the resulting adjustments to the domain geometry will yield domain
areas/hole contents interrelated in the above fashion. It is felt such sourcing of these widely
reported triplet features is far less forced than it is being invited to rely upon c-axis variance in
the cross-sections of the two proposed Fermi cylinders, especially when it is required that two
of the four extremal areas be identical. Furthermore a couple of the adduced effective
masses also emerge from the out-workings of the Lifshitz-Kosevich treatment as identical, viz.
≈ 1.6 me , – a value well below that previously found even in highly overdoped samples [14]!
Despite such pitfalls being sidestepped by the real-space ratchet scenario ventured in
[27], something now is appreciated as demanding amendment within that exposition. This
relates (in part) to the p-values employed in its development - and in particular for YBCO-124.
Although the three B1(p) values figuring in table 1 of [27] express a linear progression with p –
reflecting in this the way they were evaluated – they do not afford the desired extrapolation
through the origin; the (implied) gradient is too steep. To begin with it is evident p for YBCO-
124 requires pushing up to around 1/8 from my originally inserted value of
1/9.
It is most unfortunate in this work that we have to deal with the two YBCO systems,
for which there are the complications interposed by the chains in arriving at the p values
specific to the planes. Reliance upon the Tc(p) plot underscores this problem – the marked
dipping evident here, as in most of the HTSC systems, occurs over precisely the underdoped
p range currently in question. It will be of benefit now to examine some of this ‗unwanted‘
detail more closely.
6.2. Tc dips, stoichiometries, precise p-values, and stripe periodicities.
Hücker et al. have presented recently in [55] a detailed study of the stripe order in
(La2-xBax)CuO4 across the range 0.095<x<0.155 in which striping is most in evidence and
where the dip of Tc(p) away from simple parabolic variance arises. Hücker et al.‘s X-ray and
neutron as well as static magnetization measurements, all undertaken on high quality single
crystal samples, permit the developments in charge and spin ordering now to be better
assessed. For all compositions within the dip range the onset of frozen charge order occurs
at slightly higher temperatures than does the spin order. Recall that in LBCO this frozen
order is enmeshed with the basic crystal structure transformations LTO/LTLO → LTT [55, fig.
10]. What at this stage I wish to emphasize is presented in figure 8, an amplified version of
fig.15 in [55] containing their empirical findings as to how xBa is related to x, the
incommensurability k-space parameter (as a fraction of 2/ao). Because of the simple way in
which the hole content is generated in this system, there is little problem here in equating xBa
with p (provided one ensures that the oxygen content is kept strictly at -O4). Figure 8
strikingly discloses that, in spite of received wisdom, there is no lock-in here at p = 1/8 to =
1/8. Indeed a value of
1/8 is not in fact reached much prior to p(Tc
max). The data in fig.8
would for p = 1/8, by contrast, support a value of 0.118. That number amounts to (
1/8+
1/9)/2,

24
one earlier in evidence with LSCO and HBCO as being the p value at which Tc(p) is most
depressed — not 0.125. One observes from fig.8 that the actual doping level for which we do
attain the simple relation (p) = p is (from this data at least) p = 1/9. Thus our earlier figure 4
was not describing reality here, whilst figure 6 would seem to be. Such a result could suggest
for the ‗QO‘-directed scenario proposed one ought to employ as unit area, D(p)2, not the
single domain size but perhaps twice this (≡ axial supercell area), if not 4 domains, bearing in
mind the true charge arrangement and spin chirality repeat pattern. The monotonic form to
(p) in evidence in fig.8, however, would imply that the more important parameter here is not
so much the supercell area D(p)2 as the supercell hole count N(p). One observes from
figure 8 that just as point (p = 1/8, =
1/8) did not sit on the empirical curve, neither too does
(p = 1/10, =
1/10) — again a popular misconception. Where in fact does equal
1/10 is for p
= 9/10
2, at which hole loading, as may be seen from figure 9, a regular site-alternation within
the stripes is procured for accommodation of these 9 holes per cell.
How much more intricate now might one expect the situation to be in chain-bearing
YBCO-123? The indication from figure 10 is considerably so. That figure plots out YBCO
data abstracted from table 1 in a recent paper released by LeBoeuf et al [97] on high-field Hall
measurements. It manifests the anticipated break in behaviour relating planar hole-fraction,
p, to the net oxygen stoichiometry -Ox, – defective within the chain region of the structure. p
has been gauged here via the customary practice of measuring Tc(p) together with its
assayed departure from the idealized parabolic form set by the wings of the curve, a
procedure first formulated by Presland and Tallon [98]. Figure 11 displays the empirical Tc vs
-Ox information collected by LeBoeuf et al in [97], plotted up now on the same scale as figure
10. Figures 10 and 11 are each so significantly different in gradient at oxygen contents below
6.50 and above 6.66 as to warrant the view that phase immiscibility arises here somewhere
between -O6.56 and -O6.66. From figures 10 and 11 the two-phase region is adjudged to be
centred precisely on where p = 0.118, the mean of 1/9 and
1/8. This state of affairs would
account for why so many researchers specify their YBCOx sample stoichiometry as being -
O6.56. We have come to exactly the same point then as with the 214 family. No monotonic
quantity, let alone linear quantity, can run through this range of underdoping other than p
itself. Although D(p)2 and N(p) of course are intimately related, N(p) is accordingly set to be
the primary quantity as regards the physics. This conclusion will be something to watch out
for now as we turn finally to consider the 'quantum oscillation‘ results.
6.3. Remarkable consequences regarding the conditions behind the 'quantum oscillation’
results.
It is necessary first to appreciate just what was being proposed in my original
treatment of this matter in [27]. Below I have set this out carefully in tabular form so as to be
able to refer precisely to where it now stands in need of revision.
25
At this point I introduce into development of the argument the collection of B1(p) data
contained in a review of QO work just published by Vignolle et al [99]. There a set of B1(p)
points is presented, seemingly linear in p, linked by the dotted line and now reproduced here
in figure 12. This plot incorporates a point for Y-124. The latter, however, when as in [99]
ascribed to p = 0.14, drags this line away significantly from extrapolation through the graph‘s
origin. As has been expressed above and earlier in [27] I believe the above p-value for Y-124
(additionally employed by the authors of [16]) is, however, appreciably too large. While the p
value of 0.11 I was drawn into using in [27] is definitely too low, I am persuaded still to drop
the value substantially to 0.128. That now will permit the line through the B1(p) data points to
extrapolate to the origin as desired. A quite underdoped p-value like 0.128 stands, as was
emphasized in [27], in better keeping with the very large pressure coefficient dTc/dP exhibited
by Y-124, for which Tc rises from 80 K to 110 K under 30 kB [100]. In regard to the further
point positioned in [99] at p = 0.12, a value of 0.116 would place that data point within the
awkward mixed-phase regime (and close to the revised line!). The gradient for the new
origin-incorporating B1(p) line appearing in figure 12 takes on now the value of 5170 tesla per
planar Cu. Before showing that this is a particularly significant value, we should return to
table 1 and examine again the course of action I pursued in [27].
In that table equation (1) serves to define N(p) and D(p), while equation (3) defines
M(p) and equation (5) defines (p). Equation (7) introduces the extrapolated ‗head fields‘ with
m=1 which top the experimentally detected sequences of fields Bm(p), B1(p) being here
deemed directly proportional to p. That was presumed in [27] and one judges it affirmed now
in the collected data. In [27] I crucially also presumed 1(p), the number of fluxons per
‗superunit‘ under fields B1(p), to be unity. With this latter assumption all fields Bm(p) would
stand, as evaluated, about a factor of four below those observed or extrapolated from the
‗quantum oscillation‘ experiments [15-19] - upon (i) the applicable area D(p)2 being taken as
the entire supercell area and (ii) the standard flux quantum, o, being adopted. In [27] in
order to ‗recover‘ this factor of 4, I accordingly transferred from the full supercell area to the
stripe domain area (a first factor of 2) and then employed as flux quantum 2o rather than o.
The latter change secured the second factor of 2, it then being necessary for one to have to
go to twice the applied field to accumulate the requisite number of vortices appropriate to
operate the flux ratchet process and match the observed data. When proceeding in this way,
as is to be seen from table 1 in [27], it was found necessary additionally to drop the p value
taken for YBCO-124 down to 0.111. This latter ‗adjustment‘, as signalled above, I now am
persuaded is somewhat excessive. A value of 0.128 would appear much more appropriate
because as noted, the 124 point then sits on the heavy straight line in figure 12 through
Vignolle et al.‘s collected data [99] holding extrapolation through to the origin.
Let us back-track at this point concerning the assumption that as regards a domain
1(p) = 1, and revert to the relevant area D(p)2 as being the entire area of the stripe supercell,
and furthermore retain standard flux quantum, o. In equation (8) of table 1 we now pursue
the alternative prescription to making 1(p) unity of instead accepting that 1(p) =

26
(c1/o).N(p). The number of fluxons per cell 1(p) then is fixed not so much by the cell area
D(p)2 as by its actual hole content N(p). (N.B. N(p) = p.D(p)
2, with D(p)
2 here in nm
2). With
c1 experimentally set as 5170 tesla per Cu (p=1) and with o = 2067 tesla nm2, this leads to
the striking outcome 1(p)/N(p) = 2.50. One now is encouraged here to replace 2.50 by
integer fraction =5/2 (whereupon c1 becomes 5167) and to assert that, very remarkably, we
look to be making contact with the physics of the fractional quantum Hall effect (FQHE).
Within that topic = 5/2 flux tubes per relevant charge constitutes a fairly stable circumstance
appropriate to Abelian ‗filling factor‘ = 1/ = 2/5. We attempt below in §7 to understand how
such a situation could come about within the present context.
6.4. The matching of the original data to the new appreciation.
Before closing this section, however, it is vital now to affirm how well this new
assessment of the action indeed copes with accommodating the actual ‗QO‘ data. Figure 13
records how Bm(p) steps down through the integer m series at each p under the above 5/2
prescription for the ‗head fields‘ B1(p). (Just how such a stepped 1/m sequence continues to
materialize will be dealt with shortly.) The way one actually is able more readily to relate to
the experimental data is in fact to plot 1/Bm(p) against p (or better N(p)/D(p)2), as made clear
by figure 14. The universal curves there become equally spaced at any given p, and thus by
measuring the average spacing in the experimental traces between successive oscillations it
immediately becomes possible closely to ascertain a sample‘s p value. If we take the
example of Jaudet et al.‘s YBCO-123 1/Bm(p) data [18] as basis of the present figure 15, we
see the trace from its periodic spacing of 0.00185 T-1
achieves accommodation in figure 14 at
p = 0.1045. Upon reference to figure 10 the latter p value is, one finds, appropriate to an
oxygen content of 6.53 rather than to the 6.51 cited by Jaudet et al.. From figure 11 their
stated Tc value of 57 K similarly would lie 4 K lower than the value expected of the higher -Ox
value. The ‗head field‘ of 540 T (=10/0.01850) is however identical to what was cited in [18]
from the Fourier analysis of their oscillatory trace. It would be good now to have reliable
results for even lower p, and Sebastian et al. in [101] recently have reported work in this
direction. However, when we come to examine the extensive experimental trace in the upper
inset to their figure 2B, claimed as being for -O6.50, that data with its spacing of 0.00210 T-1
would appear upon proceeding in the above manner to relate p = 0.0975, appropriate from
our figure 10 to -O6.515. (The relevant numbers are B10=50.50 T (B10-1
=0.01980 T-1
); B9=56.12
T (B9-1
=0.01782 T-1
); B8=63.13 T (B8-1
=0.01584 T-1
); B7=72.15 T (B7-1
=0.01386 T-1
); B6=84.17
T (B6-1
=0.01188 T-1
)). The above combination of B1(p)=505 T, p=0.0975 and x=6.515 is not
indeed as represented in [101, fig.7A], but it does accord precisely with the lowermost point in
the current figure 12 containing LeBoeuf et al.‘s values [97].
Turning to the more contentious case of Y-124, figure 16 presents the ‗QO‘ data of
Yelland et al. [16b] as marked up now with the appropriate 1/Bm values supplied by our figure
14 for the experimentally observed oscillation spacing 0.001515 T-1
. The latter directly

27
specifies p for YBa2Cu4O8 as being 0.1277. The ‗head field‘ is identified as being 10/0.01515
or 660 T, and once more this matches the value in [16b] of 660±15 T extracted by Fourier
analysis of their limited data set. The above emphasizes then how all the above numbers
become dictated in a very direct manner without manifesting any of the variability inevitable
under a nesting scenario.
The Y-124 data in [16b] from Yelland et al. and in [16a] from Bangura et al. were in
figure A.2 of [27] presented alongside each other, and that figure draws attention now to an
important feature of these various oscillatory traces not emphasized so far; namely their
relative phasing at head field B1(p). The relative trace phasings alter with the actual
techniques and properties used to supply the information – with the de Haas-Shubnikov
measurements of Bangura et al., or the frequency change in the inductance measurements of
Yelland et al., or the magnetization in de Haas-van Alphen measurements, etc, etc.. We note
in Bangura‘s 124 work that the above identified fields reveal their traces to be of simple
sine-wave phasing ( =0) (upon going from low field to high field). Thus when reading their
Bm trace from left to right they specify ‗– to +‘ crossover points, but when so reading a 1/Bm
trace they would specify ‗+ to –‗ crossover points. By contrast the inductance technique of
Yelland et al. sees these same Bm(p) in their 1/B trace fall at ‗+ to –‗ crossover points in their
f signal; i.e. the data display phasing = relative to the = 0 sinusoidal phasing of the
data. Note Bangura et al.‘s Bm trace appearing in [16a,fig.2] runs from m=13 ‗+ to –‗
crossover field at its left-hand to m=11 at its right-hand, whilst Yelland‘s 1/Bm trace in [16b,
fig.2] runs from ‗+ to –‗ crossover field m=8 at its left-hand end through to m=12 at its right.
The relative phasing shifts between these various traces accordingly are seen to carry
interesting information regarding the physics of signal generation, a matter we return to in §7.
6.5. Developments in QO work from Ramshaw et al. [102] and Riggs et al. [103].
It is time now to look at a couple of more recent ‗QO‘ papers that bring something
new and significant to the problem, released very recently by Ramshaw et al. [102] and by
Riggs et al. [103]. The former is of the de Haas-Shubnikov () type and upon examining
the bottom trace in figure 3 of [102] we see a 1/B trace with spacing ~0.00186 T-1
, with B10
specified by the first ‗– to +‘ crossover point from the left. That would locate B1 in the vicinity
of 535 T, making p near 0.103 and x near 6.53, very close to the situation with Jaudet et al.‘s
results of [18] discussed above. This is not too surprising as the new results come from the
same group. Ramshaw et al. once again point out that their trace manifests, through its
beats, the added presence of two weaker components having B1 near 475 and 600 T, the
triplet situation we have drawn attention to already. Ramshaw et al. have collected a much
wider bank of data than before, including using a range of sample tilt angles of up to 55°.
With this information the authors attempt a novel global fit to their entire data set, adhering in
this to the regular Lifschitz-Kosevich formulation. One outcome of the analysis is that the
dominant B1 component emerges with a slightly downshifted value of 526 T, the subdominant
component then being cited as B1 = 478T. Their tilt experiments were triggered by the notion

28
that the signal splitting arises from c-axis warping of the F.S., as was commented upon
earlier. However I would once more point out that, as with Sebastian‘s work, the triplet of B1
values 473.5:526:584.5 takes the integer ratio 9:10:11. Ramshaw et al. proceed next to
consider the signal nodes manifest under sample tilting, all as based upon a fermiological
interpretation, with the changes witnessed here ascribed to field-induced spin-splitting for the
two components dealt with. The match to the data is not good at high tilts. It leaves one
feeling this is not the direction to pursue. The de Haas-Shubnikov measurements actually
were conducted in this experiment with both and H parallel to c. c is barely coherent in
underdoped samples even in zero field (0.5 -cm at 40 K), and as we have observed a strong
field strengthens striping and localization greatly. Wen et al.‘s recent study on p = 0.092
LBCO [104] serves to emphasize what a lethal combination the above is for underdoped
material with respect both to normal state c-axis quasiparticle behaviour and to any
interplanar Josephson tunnelling of pairs. Perhaps the most important conclusion that
Ramshaw et al. [102] procure from their study of the contributory Zeeman splitting factor to
the overall oscillation amplitude analysis is that the relevant spin g-factor is close to 2. Why
this is significant is because with H//c as here, it cannot relate to the majority of sites in the
interior of the domains if the spins are locked by the 'SDW‗ into the planes, as indicated in our
figures 4-6 and 9. For these g would be close to zero. This throws responsibility then for the
g=2 ‗free-spin‘ response being registered here upon the unconstrained spins within the stripes
themselves.
The recent paper from Riggs et al. [103] (conducted upon YBCO-123 of very
comparable oxygen content to Ramshaw et al.‘s) proceeds now in making very apparent that
the above standard view is indeed unsupportable. It introduces something really new by
looking not at transport or magnetically related oscillations, but by going to the heart of the
free energy problem to monitor field-induced oscillations in the specific heat. Once again this
new work uncovers two components to the overall signal, but of a very different and highly
illuminating form to be examined now in §7.
§7. Regarding attainment of the FQHE state with filling factor = 2/5.
7.1. The compound behaviour of the electronic specific heat in the study of Riggs et al. [103].
The spacing in Riggs et al.‘s [103] oscillatory Cpel(H) trace is at 0.00188 T
–1 very
close to that above in Ramshaw et al.‘s [102] / trace. In figure 2B of Riggs‘ paper the top
(1K) B trace runs from m=17 at the left to m=12 at the right, and, note, the relevant fields now
specify Cp minima:
m 17 16 15 14 13 12 11 & 1
Bm 31.19 33.13 35.34 37.85 40.75 44.13 48.12 531.9 T
1/Bm 0.03206 0.03018 0.02830 0.02642 0.02454 0.02266 0.02078 0.001880 T-1.
With this 0.00188 T–1
spacing, the associated values of p=0.103 and x=6.53 again stand as
slightly different from the experimentally difficult to ascertain values of p=0.118 and x=6.56
provided in the paper. The above tabulated values in fact are fairly similar to those presented

29
at the beginning of this matter in 2007 by Doiron-Leyraud and colleagues [17a] measuring
field-induced oscillations in the Hall coefficient for an underdoped Y-123 sample. In the case
of [17a] the corresponding set of values is:
m 9 10 11 12 13 & 1
1/Bm 0.01629 0.01810 0.01991 0.02172 0.02353 0.001810 T-1
Bm 61.38 55.25 50.23 46.04 42.50 552.5 T ,
with the spacing at 0.00181 T–1
now supporting p=0.107 and x=6.535. Very significantly,
since it relates to the matter in hand, the fields here specify, as in the Riggs‘ Cp data (at 1K),
minima in the RH oscillatory trace.
Near 3K the Cpel trace in [103] actually sign-inverts (see lower traces in fig. 2B, and
fig. 2C), with the heat capacity then becoming greatest not halfway through a field cycle but at
its beginning. Apart from this phenomenon and the higher ‗order‘ m to which the large Cp
oscillations are able to be followed, the situation thus far would appear very like what has
gone before. However the most notable aspect of the Cp data is that the above oscillatory
component to the electronic specific heat (that T) arrives on top of an underlying
contribution growing monotonically as √H right from H=0. This latter is the form of variation to
characterize d-wave superconductive gapping of a Fermi surface [105], with the pairs first
disrupted by the field sitting in the vicinity of the nodal gaps, – i.e. with dx2-y
2 having k near the
diagonal 45 directions. In the present scenario such pairs propagate perpendicular and
parallel to our 2D domain walls. What is most striking is that this √H contribution continues
completely unchanged in form and magnitude right through the irreversibility field near 25
tesla at which the vortex array melts and the oscillatory component to Cpel emerges, just as
for all previous ‘QO‘ techniques. The melting of the vortex array, as further explored recently
in transport and spin susceptibility measurements made on LBCO(p = 0.095) by Wen et al.
[104], brings entry into a resistive condition. The latter of itself does not, however, destroy the
pairing, just the coherence of those pairs, so that, for example, Josephson-type effects are
lost. Much as when T>Tc, so here too the presence of magnetic fields in excess of 25 tesla
admits pairing phenomena still such as the extensive precursor Nernst, Seebeck, Hall,
diamagnetic and dielectric properties [75,104,106].
It is evident from the assessed rather low magnitude of o,oel – 1.85 mJ mole
-1 K
-2,
rising only to 5 mJ mole-1
K-2
by 45 T – that the Fermionic quasiparticle content in the system
never is great enough to relate here to a Fermi surface fully reconstructed into a field-
hardened SDW/CDW condition [107] (let alone to the parent state). The gapping is more
elementary, established in the disordered, micro-inhomogenous, underdoped, mixed-valent
cuprates by proximity to the Mott-Anderson state, and in particular by what is going on in the
stripes. As Riggs et al. argue, the two key components to Cpel relate not to two independent
bits of the system, as with some customary two-phase condition, but to the much more
intimate state of domain wall and domain interior. If we look to the domain interior to support
the more standard √H component to the overall signal, then the oscillatory component must
be an expression of what is afoot at the domain wall, to which, within the present modelling,

30
the charge holes (8CuIII
0) and their bosonic double-loadings (
10CuIII
2–) have become
segregated. Moreover the latter region in the system is that to which the magnetic vortices
appear drawn after the vortex lattice melts. In the real space attribution of the oscillations
their sourcing has to derive from the changed interaction of the vortices with the charge of the
stripes as the magnetic field is advanced beyond Hirr. The great benefit of these specific heat
measurements has been to disclose continuity with what is happening prior to Hirr, and to
associate melting and restructuring of the vortex lattice with what comes beyond – the
oscillatory behaviour.
Referring back now to the transport work of [13] in §3 one is able securely to endorse
the two-carrier decomposition made there in terms now of charge motion across and along
the diagonal stripes, hole-like and electron-like hopping respectively.
7.2. Clarification of the revised mode of oscillation numerology.
From figure 12, with its gradient of 2½ flux tubes per relevant unit hole concentration,
one would have, by p = 1, flux tubes of 2½o to every such active hole (this being that against
which p Is appraised). From what has been said above, this points within each supercell
appertaining to doping p to 2½ flux tubes (units of o) through the one such site in situ there;
i.e. flux (5176 T x D(p)2) ≡ 2½ tubes (of size of o) to each p supercell.
For simplicity let us consider now the specific supercell circumstance of figure 6, one which
falls on the line in figure 8 and for which the relevant concentration p = 9/9
2 = 0.111. The
supercell hole content, in this case of 9 holes, occupies the 9 yellow (8CuIII
0) stripe sites within
the pair of crossed diagonals of the 9x9 cell. Here, when under a field then 9-fold diminished
in strength to 574 T, the one of these 9 hole sites adjudged to afford the natural choice to
bear the above 2½o flux-tube allotment is that located at the stripe crossing point. This is
the circumstance then to define m=1 ‗head field‘ B1(p=1/9). For the m=2 stage, at one half the
B1(1/9) field strength, only every second supercell will stand so decorated, at m=3 just every
third supercell, and so on. When we pass here from the m=n to the m=n+1 condition as the
applied field lessens, this structuring alteration supplies the ratcheted change in the observed
‗QO‘ signal, attributable to a seesawing of the chemical potential. Just what the actual
geometry of the ‗dilution‘ patterning of supercells is going to be adopted is not evident here
(see figure 5 in [27] for possible geometries in relation to the case of m = 13, – though note
the stepping unit refers now to supercells, not domains). In particular note the above stepping
in the signal-generating dilution process automatically will stand proportional to 1/B, not 1/B2.
We must look next at how far the above assessment is matched by direct knowledge
of the geometry of the vortex array, its symmetry and its scaling.
7.3. Geometry of the vortex array in HTSC material in increasingly strong magnetic fields.
At low fields (~1 mT) the vortex array can be directly imaged in the electron
microscope via Bitter pattern decoration using cobalt smoke, and it takes there the classic

31
hexatic form, provided defect pinning is slight [108]. Using small-angle neutron scattering
(SANS), this general form has been demonstrated to persist to ~0.25 T, by which field the
inter-vortex spacing, s, has been reduced to ~1000 Å, a spacing just beginning to register
against the stripe spacings portrayed earlier. In figure 6 for p = 0.09 the stripe spacing stands
at 25 Å. This signals the interaction of the vortices with the surrounding nanoscale order
could now begin to become as significant as the inter-vortex forces that brought about the
original hexagonal close-packing. Indeed in fields above 0.25 T it has been determined for
several HTSC systems that the hexagonal array starts adjusting towards a square one, while
still remaining within the ‗vortex solid‘ state. White et al. [109] by means of SANS on
YBa2Cu3O7 at 2 K report discrete jumps there in the course of compliance of the vortex array
to the lattice, these recorded at 2 and 6.7 T. Reibelt et al. [110] also for YBCO7 have
detected by magnetization and magneto-caloric measurements such an event near 1 T.
Gilardi et al. [111], pursuing SANS on LSCO x=0.17, have made there the additional highly
significant observation that, as square geometry is taken on by the vortex array above 0.8 T,
the orientation of that square arrangement is not axial but acquires the 45° orientation of the
stripes, as can be ascertained from figure 2b of [111] (in line with the current figure 6).
A yet further observation of considerble significance has been reported in the very
recent paper from Yuan Li et al. [112] relating to SANS work on HgBa2CuO4+ crystals. In
that tetragonal material they find that the vortex array, even while still triangular in form, locks
on to either the a- or b-axis directions in equal proportions to supply a 12-spotted diffraction
ring. What next occurs is particularly telling. Beyond 0.2 T this diffraction pattern rapidly
fades away in intensity as 1/B to disappear completely by 0.4 T, with no vortex array
diffraction signal re-emerging prior to the limiting field available to Li of 4 T. The latter field is,
note, still well below the array-melting field, Hirr. Y. Li et al.’s observation would support the
idea that all the flux vortices have become withdrawn from the bulk to anchor themselves
randomly to the stripes. The reader is able in figure 4 of the paper from L. Li et al. on LSCO
[113] to view an example of the typical HTSC vortex phase diagram as projected upon the x-
H plane. In order to access the ‗vortex liquid‘ phase (at which point vortex-antivortex pairings
emerge under local phase fluctuations) one needs to proceed for x = 0.10 at T < 1K to fields
in excess of 25 T – precisely those fields employed now in the ‗quantum oscillation‘
experiments. Under these conditions the vortices are become so compacted by the applied
field and so reorganized by the stripes that the very notion of flux vortices requests
replacement by one of flux tubes attached to specific composite carriers as mooted above.
Let us proceed now below with further consideration of the case for p = 9/9
2, which
sits in the middle of the ‘QO‘ regime, and for which we have the rudimentary, frozen
representation of figure 6. We shall employ this figure as basis towards examination of how
application of a strong magnetic field develops the situation. For the numerically amenable
and attainable case of the m=9 oscillation, we find applying figure 14 that the relevant
reciprocal field strength here is 1/0.01575 tesla
-1; i.e. B9(p=0.111) is 63.5 tesla. Upon

32
employing (for a square array) B9(1/9) = 2½o/s9(
1/9)
2 (with s the intervortex spacing
expressed in nanometers and o = 2067 tesla nm2) s9(
1/9)
2 emerges as 81.3 nm
2, giving s9(
1/9)
as 9.02 nm. With ao = 3.85 Å this spacing would amount to 23.4 basic Cu-Cu unit cells. It will
be more advantageous in perceiving what is afoot to transfer attention now to the assessed
head-field conditions, for which B1(1/9) is 571 T and s1(
1/9) becomes 30.08 A or 7.81ao. Note
the latter spacing has in fact passed somewhat below 9ao, a matter now clearly to require
explanation.
In figure 17 an extended view of figure 6 is presented incorporating several of the
9aox9ao supercells. The interior sections of the domains have for simplicity been filled in
here, the two tones of blue marking the opposed chirality of their spin ordering. In addition
the centre site of the 9ao supercell has been translated from having a vacant site at the stripe
crossing point there to featuring a Cu atom. The hole at the latter Cu site will be that
assigned to carry the 2½o flux vortex allottment, represented by the large circle. For the
(externally assessed) B1(1/9) field of 571 T we have argued above that every such site in the
supercell array is so decorated. The spacing of these points would be expected of course to
be 9ao – hence the above surprise that the experimentally indicated value should appear
somewhat less than this. We shall proceed, however, by presuming that the vortex spacing is
indeed here 9ao (i.e. one at the centre of each supercell) and assert that the
measured/applied field must be somewhat greater than the field as it is experienced by the
material internally. This relaxation in the vortex separation from the calculated value of 7.81ao
to the true value of 9ao then demands that the applied field strength must exceed the internal
field strength in the ratio -
B1app
(1/9) = 9.00
2 = 81
B1int
(1/9) 7.81
2 61 ; i.e. with B1
app = 571 T one has B1
int = 430 T.
The above can be rewritten as B1app
(1/9) = B1
int(1/9).(1 +
20/61). If we suppose this reduction of
Bint
below Bapp
is due to a screening process and one that is directly proportional to the
sourcing site concentration, n (in nm-2
), then we mayre-write this expression in the form -
B1int
= B1app
– 2n.o (the reason for the factor of 2 will be apparent shortly).
We now have 430 = 571 – 2n.o ,
from which n = 141/2o = 0.0341 nm-2
or 3.41 Å-2
. If we express this concentration as
N/D(p)2 in terms of the supercell unit, it yields the ratio
52/81 for the fraction of Cu sites
contributing here to the above magnetic screening. What are the other 29 sites involved in?
If the screening response issues from the fermions in the middle of the domains, hard
up against Mott insulation, then the sites that now we are addressing have to be those of the
stripes (17 sites per supercell) in conjunction with those contiguous sites intimately interactive
with the stripes at their crossing points. The latter provide the 12 remaining sites, 4 around
the supercell-centre stripe-crossing point and 8 around the cell-corner crossing point. The
function of such d9 (
9CuII
0) sites has throughout my previous works on HTSC
[7,8,10,32,71,114,etc.] been presented as being to double-load the active yellow hole sites
33
8CuIII
0 to
10CuIII
2–. The latter local-pair bosons are perceived as bearing a resonant
(Feshbach) relation with the chemical potential, this set principally by the majority species
(9CuII
0) of the blue regions in our two-subsystem mixed-valent material. This key degeneracy
is achieved in negative-U fashion. It is ascribable to the d-shell-filling attained at the high-
valent site in the course of double-loading, and it involves many-body accommodation of the
energy level in question to the acquired p6d
10 electron complement. The ready interchange of
electron pairs possible between these doubly-loaded sites and the domain interior sites is
what yields a superconductivity that is global in character, i.e. of one unified Tc. This is
comparable with the situation under homogeneous BCS/BEC crossover as it obtains in the
optically trapped dilute gas systems. However with the HTSC cuprates, the systems, being
chemically inhomogeneous, allow the local-pair binding energy and BCS-related gap energies
to diverge in the ‗underdoped‘ regime below pc = 0.185, the former going up, the latter coming
down. It is in this underdoped regime, wherein the two subsystems are disengaging, that the
presently challenged ‗quantum oscillation‘ experiments are being conducted. The localizing
circumstances mean the d9-loaded coordination units of the blue region consolidate their
fermionic character and the d8- and d
10-loaded units, likewise, their bosonic character. The
nearer to pc the less well defined the quantum statistics will become.
As particle exchange is lost between the domain interior and the stripes at low
temperatures (and high fields), promoted by the inherent disorder of the mixed-valent
chemical system, all 62 sites within the blue region will take onboard just one electron. If read
as the filling of an entire band of fermion states, as though the situation were homogeneous,
this amounts to the perceived fermionic filling factor of 1/2.
62/81 - or just short of 0.4.
It has to be recognized that the above electrons, although indeed fermions, are far
from being standard Fermi-Landau quasiparticles holding weak mutual interaction. Yet these
are the electrons purportedly to uphold standard quantum oscillation behaviour, pursuant
upon Fermi surface nesting and charge density wave reconstruction of the FS geometry.
7.4 Sebastian et al.’s recent conveyance [115/6] of the fault lines in the QO scenario.
In attempting to consolidate a Fermi-Landau quasiparticle description of the QO data,
Sebastian et al. in [115] have made a very extensive study of the temperature dependence of
the results, and demonstrate them to adhere very closely to a Fermi-Dirac prescription of the
DOS in the vicinity of EF. Hence what oscillates near EF is electron dominated. However this
is by no means synonymous with those electrons being Fermi-Landau quasiparticles. The
result however for Sebastian et al. precludes any further attention to FQHE physics, following
the perception that the quantum statistics there is always complex. Similar rejection follows of
any circumstance heavily involved with the lattice, as with Alexandrov‘s polaron/bipolaron
conjecture [117]. However the latter has not prevented the authors of [115,25b] turning to
CDW reconstruction of the F.S., this in spite of their sensitive analysis failing to reveal any
such thing (no change in go). As we have witnessed, striping and FQHE behaviour in the
underdoped cuprates are in fact largely transient and electronic – electronic behaviour that is

34
a highly correlated, many-body one among the fermions with relatively little participation by
the lattice, unlike for a standard CDW/PSD.
The above confusion is added to yet further in the latest detailed release from
Sebastian et al. [116]. The preceeding analysis was accomplished by examining the
evolution as a function of temperature of the ‗even‘ moments of the precise waveform specific
to the fundamental component in the oscillatory behaviour, the T behaviour of which was
meticulously tracked between 0.1 and 18 K for fields of betweeen 30 and 55 T. The new
analysis now in [116,25b] turns to look at the comparative behaviour between the
fundamental component and the second harmonic as extracted from the experimental trace,
this here secured over a wider range of field, though more limited temperature range, and
accumulating data now for sample tilt angles of up to 60°.
What emerges from this remarkable body of data is the striking result that, for all
the amplitude of the second harmonic varies simply as the square of the fundamental
frequency, and that the two component signals remain strictly in phase, even through = 54°
where the fundamental manifests a ‗spin-zero‘. The two components clearly monitor the
same physics. Such a result is not what is to be expected of a standard Fermi liquid, wherein
the chemical potential is effectively fixed within the field-oscillation signal-production by the
large reservoir of states in the general vicinity of EF. The latter makes for closer to sinusoidal
form in the variation of the amplitude. The new observation, by contrast, supports a
circumstance in which signal generation proceeds in a strikingly saw-tooth manner, with the
chemical potential not being so buffered, but itself oscillating markedly as the applied field is
altered. It is the sort of change to be expected for the scenario advocated earlier, as the
particles of the striping features transit from or to the flux lattice ‗footprint‘ in markedly
discontinuous fashion as the field is ramped up or down. This transfer impinges on
fundamental and second harmonic alike, yielding common angular response. It is not too
remarkable then that the effective mass variance of the second harmonic with T/B is found
not to be of classic form, its effective mass emerging in fact as 25% lower than that for the
fundamental.
The detailed analysis which Sebastian et al. provide permits one additionally to assert
that the oscillation source contributing here to the overall signal constitutes the one and only
element: there is no further ‗complementary‘ segment as in a ‗bipolar‘ hole and electron Fermi
surface reconstruction scenario. Riggs et al.’s specific heat data [103], discussed earlier in
§7.1, strongly suggested this, and indeed too that the segment of F.S. sensed was nodal in its
disposition in the zone, this in keeping with the Fermi surface arcs prescription of
photoemission devination. That precisely the same oscillatory periods now materialize in the
Seebeck and Hall coefficient responses [74,97], despite the latter coefficients being
negatively signed, is not a problem here. In the present understanding of how these
oscillations arise, all the carriers respond in the same fashion as the chemical potential
ratchets too and fro with B, so bringing a common oscillation frequency, dictated at each p by
the FQHE physics lying behind what is portrayed in figures 12-14.

35
Accordingly then we have need to address what it is about the underdoped mixed-
valent HTSC systems and FQHE theory which sets up this encounter between the two hot
topics of highly correlated solid state physics. One will need to recall here that the physics
behind fractional QHE behaviour is quite distinct from that behind integral QHE behaviour.
7.5. The nature of the FQHE state.
Quantum Hall physics and particularly fractional quantum Hall physics is the preserve
of exotic interactions [118] and the playground of high-level theorists, which hitherto I have
neither felt drawn to, nor am well-equiped to stray. However it has become clear of late that
the topic has begun to impinge on the realm of materials far beyond semiconductors and
quantum dot edge-states, and in particular on that of non-standard superconductors. When
the paper from Sato and Fujimoto [119] was published in November 2010, with its
uncompromising title ‗Existence of Majorana Fermions and Topological Order in Nodal (d-
wave) Superconductors with Spin-Orbit Interaction in Exterrnal Magnetic Fields‘, it was no
longer possible shun the topic. This was even closer to the HTSC matter than had been
Yang and Zhai‘s 2008 paper [120] entitled ‗Quantum Hall Transition near a Feshbach
Resonance in a Rotating Trap‘. In November 2010 there came too Ferguson and Goldart‘s
paper [121] on time reversal symmetry (TRS) breaking and the p-wave superconductivity in
Sr2RuO4, with discussion there of the existence of domain walls between regions of opposing
chirality, of chiral charge currents, and of the appearance of non-integral fluxons at domain
wall bends. The conjunction of attractive interactions, the absence of TRS, the vortex liquid
state, the Feshbach resonance, BCS/BEC crossover, and the quantum Hall state
recommended likewise the 2009 paper from Nikolić [122]. However, because of the details of
just what abbreviated modelling was being carried through each time in these papers, the
theoretical outcome never appeared clear-cut nor of specific relevance to the HTSC cuprate
materials. Where the problem came more sharply into focus was with the deliberations of the
current paper. Clearly the FQHE situation for filling factor = 2/5 was the point at which to
direct one‘s attention, and to track down how the details for such a specific case might uphold
what was being encountered in the underdoped, mixed-valent cuprates. This meant
attempting to make contact with Milanović and Papić‘s 2010 paper [123] (‗The transition from
two-component 332 Halperin state to one-component Jain state at filling factor = 2/5‘), and
especially with its 2007 predecessor from Simon, Rezayi, Cooper and Berdnikov [124]
(‗Construction of a paired wavefunction for spinless electrons at filling fraction = 2/5‗). It is
there in particular that the nature of the proposed wavefunction for the ‗Gaffnian‘ state,
intermediate between at low p the more highly correlated Haldane 332 state and at somewhat
higher p the Jain heirarchy state, would now look so appropriate to what is being met with in
the underdoped HTSC cuprates. Those characteristics are the highly local (negative-U)
interactions, the well-developed two-subsystem nature of the environment – not just
geometrically with regard to the stripes, but also the extant boson/fermion, BEC/BCS
crossover situation – this all at a time of enhanced two-dimensionality and proximity to the

36
Mott-Anderson transition. As hole doping is transiting p = 1/9 we know there is occurring rapid
modification in the tunnelling characteristics, not only between domains and stripes, but also
in the third dimension. One of the features of the theoretical analysis presented in [124] is its
greater simplicity and directness for flat toroidal geometry, and that is afforded too by the
current square 2D striping loops.
What then do Simon et al. [124] emerge with as appropriate many-body wavefunction
for the = 2/5 situation?
While a great many FQHE filling factors relate to states covered by the so-called
hierarchy or Jain state wavefunctions, requiring Abelian statistics, some like the = 1/2 state
are more exotic. For the latter well-known case the Moore-Read Pfaffian ground state is
appropriate. The wavefunctions are of a type pioneered by Laughlin, now generalized to the
new circumstance regarding the summed angular momentum of the particles, fermions and
bosons, that contribute towards forming the ground state. The particles moreover become
composite in the presence of added magnetic flux. Such states become labelled by the
relevant projection operators, employed here as Hamiltonians, and that relate to the specific
character and content of the state. The Pfaffian state bears the label P32, the Haffnian for =
1/3 with fermions bears P3
4, and sandwiched between these at =
2/5 comes the Gaffnian,
with label P33. These latter states are notably associated with partial particle pairing and with
three-body interactions at a point. The paper examines how the Gaffnian wavefunction can
be connected through as a ‗correlator‘ to conformal field theory (CFT). The Moore-Read
Pfaffian is described in this way by the Ising or M(4,3) minimal model. For the more
generalized Gaffnian state we must proceed to M(5,3), which uniquely covers the proposed
state. It emerges that CFT M(5,3) is non-unitary. This would indicate the state not to be a
true phase but from its further properties to represent a crossover quantum critical range
between two flanking states of high similarity (‗overlap‘), the one to high p being the Jain
state. To lower p the state appears to be a Read-Rezayi state or the Haldane state 332. All
these states are associated with pairing, the Jain state being more BCS-like, the lower p state
more local-pair-like, it being dictated by shorter range interaction than Coulombic. The
Gaffnian‘s intermediary condition is characterized not only by its topology and degeneracy but
also by its dynamic character, incorporating the first excited Landau level.
I had at one point thought of including a longer section regarding this highly technical,
highly relevant piece of research, but the present paper is already plenty long enough to
frighten away readers. The paper from Simon et al will have to speak for itself: it calls for
being read closely more than once. It is clearly written, well developed and, from my own
position, highly comforting, in being highly cited, – it is a very theoretical piece. What from my
own perspective appears most significant is that it describes a state that is 3-body in nature
and highly dynamic, most suited to describing BEC/BCS crossover — or in my own terms the
double-loading charge fluctuations 8CuIII
0 +
9CuII
0 +
9CuII
0 →
10CuIII
2– +
8CuII
1+ +
8CuII
1+.

37
Conclusions
Accordingly, echoing the manner in which we started out on this present paper, I
cannot at all follow the way in which Chang and colleagues have felt obliged in their latest
work [126] to address the high-field transport data from underdoped HTSC material. In [13] it
was the Hall data on Y-124 that was in question. In the work of LeBoeuf et al. [17,97], Chang
et al. [77b], Daou et al. [74] and Laliberté et al. [125] it was successively the Hall, Seebeck
and Nernst effect results on Y-123 that were dealt with. Now, in the latest release by Chang
et al. [126] from the same Canadian/French grouping, it is the observed anisotropy of the
Nernst effect results which is closely followed, tracked as a function of temperature over the
full range below 300 K in magnetic fields of up to 30 T. In the material there being examined
(123-YBCO, =6.66, p=0.12, Tc=66 K) the latter field of 30 tesla is sufficient to access the
vortex liquid state down to low T. The persistent drive witnessed under high fields and low
temperatures into a negative signing of RH, S and continues in [126] to be ascribed there to
dominant, high mobility, quasiparticles from a small, stripe-phase reconstructed, Fermi
surface pocket. In all cases one remains reliant upon the same ubiquitously complicit pocket
of high mobility electrons, amounting to but a very small fraction of the parent B.Z. and
sporting a Fermi temperature of just 400 K or 30 meV. This outcome is proposed regardless
of whether we are dealing with Y-123, or with Y-124, or, as is now acknowledged in the new
paper, Eu-substituted LSCO over the p range where the striping is strongly frozen in.
In a crossover, negative-U-based, Feshbach resonance the combination of bosons
and fermions is one which develops its weighting as a function of temperature and applied
field, due to Mott-Anderson localization effects and to the enhancement of striping in a strong
magnetic field. The development in geometric segregation in the mixed-valent situation of the
doped HTSC systems mounts not only as p falls but also as Happ rises. This constitutes a
more complex circumstance than the homogeneous BEC/BCS form of crossover encountered
in the optically trapped, dilute gas problem. The present strongly two-subsystem environment
is one able to carry the superconductivity to the remarkable heights witnessed. It is one that
too would take the physics of the correlated fractional quantum Hall effect into a much
heightened thermal regime (seemingly 20 K). The filling level imposed by the doping level of
close to = 2/5 is one very suited to upholding this exotic – potentially very exotic – highly
correlated condition. It is a condition strongly emergent in the numerology of the quantum
oscillation data itself, and it straightforwardly accounts for why the results are so universal and
yet so confined all at the same time. The very small bits of Fermi surface so widely attributed
to FS reconstruction under classic CDW behaviour are a myth. The size of the observed
frequencies does not derive from k-space quantization but from real-space quantization and a
simple counting process. That counting is of magnetic vortices on the one hand and of ‗holes‘
into stripes on the other. It is the real-space interaction between these two arrays, vortices
and stripes, that leads directly to the oscillatory signals. There are no highly mobile, weakly
interacting, Fermi-Landau quasiparticles in these systems at low temperature and high fields.

38
The signs of the carriers are not dictated by Fermi surface curvature and band masses. The
interplay is between coherent and incoherent states, between condensed and uncondensed
pairs, and between pairs that partake of local double-loading and those induced pairs that are
more BCS-like in nature. The results of [13], where we started, constitute a prime example of
the outworking of this complexity.
Only in the narrow range between p ~ 0.090 and 0.135 is the level of metallicity vis-à-
vis the Mott-Anderson transition suited to sustaining the fractional quantum Hall condition
outlined above. To either end of this range the quantum oscillatory behaviour simply fades
away in amplitude, whilst still holding to an oscillatory period rigidly predetermined by figure
14. These periods are ones conceived directly in real space and are not the product of some
Fermi surface nesting, k-space-dictated process. What has been described is most
appropriate to the BEC/BCS crossover understanding of cuprate HTSC behaviour.
Acknowledgements
My continued thanks go to members of the HTSC grouping in Bristol for enduring my
line of attack on HTSC matters well past retirement, and to Prof. Nigel Hussey in particular for
permitting me to see and play around with their data prior to publication. I would like too to
thank many of the students within the group for keeping me young and argumentative, in
particular Mr Chris Lester. Thanks finally are due to the University for a recent extension of
my SRF appointment to 2013.

39
TABLE 1 (for p24) Definition of terms
● p = N(p)/D(p)2 . …… (1) N(p), hole content in ‗square supercell‘.
D(p), ‗supercell‘ edge in basic units ao (nm) p, fraction within supercell of unit cells bearing holes.
● B(p) = (p)/A(p) , …… (2)
≡ M(p).o/(n.D(p)2). …… (3) M(p), no. of fluxons through n supercells
(standard fluxon o = h/2e = 2067 T nm2).
● Divide (3) by (1) -
B(p) = M(p) .o . …… (4)
p n.N(p)
● With M(p)/n = (p) …… (5) Number of fluxons through one ‗supercell‘.
reach
B(p) = (p).o . …… (6) (- just standard definitions so far). p N(p) ● But experimentally B1(p) = c1.p . …… (7) B1(p) being characterizing ‗head fields‘ to
sequences Bm(p) = B1(p)/m (m integer). ● Comparing (7) with (6) we have for all p
c1 = 1(p).o , …… (8) making 1(p)/N(p) = for any p. N(p)
● Need to evaluate 1(p)
where 1(p) = M1(p)/n (- (p) some rational fraction) .
● Is 1(p) = 1 under any set p ? — as was taken in [27] (- so making = 1/N(p)),
i.e. all head fields B1(p) would see the situation ‗one fluxon through one supercell‘.
● Then at rational fractional fields Bm(p) B1(p)/m (m – running integer),
one would have Bm(p) = 1/m ·(o/D(p)2) ,
e.g. at field m = 9 would have to go to 9 ‗supercells‘ to embrace one fluxon,
– the ‗fluxon footprint‘ ₣( p) = 9.
● Free energy ratchet sequence proceeds then as B1(p)/m
with B1(p) = o/D(p)2.
● The above (besides = 1/N) presumes standard fluxons = o , rather than o/2, etc.,
- and also note ‗supercell‘ area D(p)2 is not as yet actually specified.
● Questions arising regarding this original procedure in [27]:
Relating to eqn 2 (i) Is true unit flux here indeed o ?
Relating to eqn 1 (ii) What is to be used for ‗supercell‘ unit area D(p)
2 ?
Relating to eqn 8 (iii) Is 1(p) really appropriately selected as being 1 ?
N.B. in (8) a) o is explicitly present, and N(p) is very closely related to D(p)2.
Is 1(p) primarily dictated by D(p)2 or by N(p) ?
b) Empirically determined value of c1 is 5170 tesla per active centre. (see fig.12 for YBCOx, but c1 probably same for all HTSC systems.)
40
References
[1] Friedberg R and Lee T D 1989 Phys. Rev. B 40 6745.
[2] Micnas R, Ranninger J and Robszkiewicz S 1990 Rev. Mod. Phys. 62 113.
Romano A 2001 Phys. Rev. B 64 125101.
Domanski T and Ranninger J 2004 Phys. Rev. B 70 184503 and 184513.
Micnas R, Robaszkiewicz S and Bussmann-Holder A 2005 Struct. Bond. 114 13-69.
[3] Chien C C, He Y, Chen Q and Levin K 2009 arXiv:0901.3151.
Chen Q, Stajic J, Tan S and Levin K 2005 Physics Reports 412 1-88.
Chen Q, Stajic J and Levin K 2005 arXiv:cond-mat/0508603,
published in 2006 Low Temp. Phys. 32 406 — 2006 Fiz. Nizk.Temp. 32 538.
[4] de Llano M and Tolmachev V V 2003 Physica A 317 546.
[5] Toschi A, Barone P, Capone M and Castellani C 2005 New J. Phys. 7 7.
[6] Garg A, Krishnamurthy H R and Randeria M 2005 Phys. Rev. B 72 024517.
[7] Wilson J A 1988 J. Phys.:Solid State Phys. 21 2067-2102.
Wilson J A 1989 Int. J. Mod. Phys. B3 691-710.
[8] Wilson J A and Zahrir A 1997 Rep. Prog. Phys. 60 941-1024.
[9] Wilson J A 2000 J. Phys:Condens. Matter 12 R517-R547.
Wilson J A 2001 J. Phys:Condens. Matter 12 R945-R977.
[10] Wilson J A 2004 Philos. Mag. 84 2183-2216.
[11] Cooper R A, Wang Y, Vignolle B, Lipscombe O J, Hayden S M, Tanabe Y, Adachi T,
Koike Y, Nohara M, Takagi H, Proust C and Hussey N E 2009 Science 323 603.
[12] Hussey N E 2008 J. Phys.: Condens. Matter 20 123201.
Hussey N E, Cooper R A, Xu X, Wang Y, Mouzopoulou I, Vignolle B and Proust C
2011 Phil. Trans. Roy. Soc. A369 1626, (2009 arXiv:0912.2001).
[13] Rourke P M C, Bangura A F, Proust C, Levallois J, Doiron-Leyraud N, LeBoeuf D,
Taillefer L, Adachi S, Sutherland M L and Hussey N E
2010 Phys. Rev. B 82 020514(R)
[14] Abdel-Jawad M, Kennett M P, Balicas L, Carrington A, Mackenzie A P, McKenzie R H
and Hussey N E 2006 Nature Phys. 2 821.
Abdel-Jawad M, Balicas L, Carrington A, Charmant J P H, French M M J and Hussey N E
2007 Phys. Rev. Lett. 99 107002.
French M M J, Analytis J G, Carrington A, Balicas L and Hussey N E
2009 New J. Phys. 11 055057.
[15] Vignolle B, Carrington A, Cooper R A, French M M J, Mackenzie A P, Jaudet C,
Vignolles D, Proust C and Hussey N E 2008 Nature 455 952.
[16] Bangura A F, Fletcher J D, Carrington A, Levallois J, Nardone M, Vignolle B, Heard P J,
Doiron-Leyraud N, LeBoeuf D, Taillefer L, Adachi S, Proust C and Hussey N E
2008 Phys. Rev. Lett 100 047004.
Yelland E A, Singleton J, Mielke C H, Harrison N, Balakirev F F, Dabrowski B and
Cooper J R 2008 Phys. Rev. Lett 100 047003.

41
[17] Doiron-Leyraud N, Proust C, LeBoeuf D, Levallois J, Bonnemaison J-B, Liang R,
Bonn D A, Hardy W N and Taillefer L 2007 Nature 447 565.
LeBoeuf D, Doiron-Leyraud N, Levallois J, Daou R, Bonnemaison J-B, Hussey N E,
Balicas L, Ramshaw B J, Liang R, Bonn D A, Hardy W N, Adachi S, Proust C and
Taillefer L 2007 Nature (London) 450 533.
[18] Jaudet C, Vignolles D, Audouard A, Levallois J, LeBoeuf D, Doiron-Leyraud N,
Vignolle B, Nardone M, Zitouni A, Liang R, Bonn D A, Hardy W N, Taillefer L and
Proust C 2008 Phys. Rev. Lett. 100 187005.
[19] Sebastian S E, Harrison N, Palm E, Murphy T P, Mielke C H, Liang R, Bonn D A,
Hardy W N and Lonzarich G G 2008 Nature 454 200.
Audouard A, Jaudet C, Vignolles D, Liang R, Bonn D A, Hardy W N, Taillefer L and
Proust C 2009 Phys. Rev. Lett. 103 157003.
[20] Millis A J and Norman M R 2007 Phys. Rev. B 76 220503(R).
Norman M R and Lin J 2010 Phys. Rev. B 82 060509(R).
[21] Chakravarty S and Kee H-Y 2008 Proc. Natl. Acad. Sci. USA 105 8835.
[22] Ossadnik M, Honerkamp C, Rice T M and Sigrist M 2008 Phys. Rev. Lett. 101 256405.
[23] Moon E G and Sachdev S 2009 Phys. Rev. B 80 035117.
[24] Taillefer L 2009 J. Phys.: Condens. Matter 21 164212.
[25] Sebastian S E, Harrison N, Mielke C H, Liang R, Bonn D A, Hardy W N and
Lonzarich G G 2010 Proc. Natl. Acad. Sci. 107 6175.
Sebastian S, Harrison N and Lonzarich G G 2011 Phil. Trans. Roy. Soc. A 369 1687.
[26] Wilson J A 2007 J. Phys.:Condens. Matter 19 106224 (15pp).
Wilson J A 2008 arXiv:0804.3045.
[27] Wilson J A 2009 J. Phys.:Condens. Matter 21 245702 (16pp).
[28] Wilson J A 2007 J. Phys.:Condens. Matter 19 466210 (10pp).
Wilson J A 2008 J. Phys.:Condens. Matter 20 385210 (10pp).
[29] Loram J W, Luo J, Cooper J R, Liang W Y, Tallon J L 2001 J. Phys. Chem. Solids 62 59.
[30] Uemura Y J 2000 Int. J. Mod. Phys. B 14 3703.
Panagopoulos C, Xiang T, Anukool W, Cooper J R, Wang Y S and Chu C W
2003 Phys. Rev. B 67 220502.
Anukool W, Barakat S, Panagopoulos C and Cooper J R 2009 Phys. Rev. B 80 024516.
[31] Gurvitch M and Fiory A T 1987 Phys. Rev. Lett. 59 1337.
[32] Wilson J A 2006 J. Phys.:Condens. Matter 18 R69-R99.
[33] Wilson J A 2008 J. Phys.:Condens. Matter 20 015205 (9pp).
[34] McElroy K, Lee D-H, Hoffman J E, Lang K M, Lee J, Hudson E W, Eisaki H, Uchida S
and Davis J C 2005 Phys. Rev. Lett. 94 197005.
[35] Tranquada J M, Sternieb B J, Axe J D, Nakamura Y and Uchida S
1995 Nature (London) 375 561.
Kivelson S A, Bindloss I P, Fradkin E, Oganesyan V, Tranquada J M, Kapitulnik A and
Howald C 2003 Rev. Mod. Phys. 75 1201.

42
[36] Tranquada J M, Basov D N, LaForge A J and Schafgans A A
2009 Phys. Rev. B 81 060506R.
Haug D, Hinkov V, Sidis Y, Bourges P, Christensen N B, Ivanov A, Keller T, Lin C T and
Keimer B 2010 New J. Phys. 12 105006.
[37] Niemöller T, Ichikawa N, Frello T, Hunnefeld H, Andersen N H, Uchida S, Schneider J R
and Tranquada J M 1999 Eur. Phys. J. B 12 509.
[38] Ghazi M E, Spencer P D, Wilkins S B, Hatton P D, Mannix D, Prabhakaran D,
Boothroyd A T and Cheong S-W 2004 Phys. Rev. B 70 144507.
Freeman P G, Enderle M, Hayden S M, Frost C D, Yao D X, Carlson E W,
Prabhakaran D and Boothroyd A T 2009 Phys. Rev B 80 144523.
[39] Saini N L, Oyanagi H and Bianconi A 2004 J. Supercond. 17 103.
[40] McElroy K, Lee J, Slezak J A, Lee D-H, Eisaki H, Uchida S and Davis J C
2005 Science 309 1048.
Alldredge J W, Lee J, McElroy K, Wang M, Fujita K, Kohsaka Y, Taylor C, Eisaki H,
Uchida S, Hirschfeld P J and Davis J C 2008 Nature Phys. 4 319, (for supplementary
data see arXiv:0801.0087).
[41] Wilson J A, diSalvo F J and Mahajan S 1975 Adv. in Phys. 24 117-201.
[42] Withers R L and Wilson J A 1986 J. Phys. C: Sol. St. Phys. 19 4809-4845.
[43] Wilson J A 1990 J. Phys.:Condens. Matter 2 1683-1704.
[44] Wu X-L and Lieber C M 1989 Science 243 1703.
[45] Fung K K, McKernan S, Steeds J W and Wilson J A
1981 J. Phys. C:Solid State 14 5417-5432.
[46] Hewat E A, Bordet P, Capponi J J, Chaillout C, Chenavas J, Godinho M, Hewat A W,
Hodeau J L and Marezio M 1988 Physica C 156 375.
[47] Hanaguri T, Lupien C, Kohsaka Y, Lee D-H, Azuma M, Takano M, Takagi H and
Davis J C 2004 Nature 430 1001.
[48] Kohsaka Y, Taylor C, Fujita K, Schmidt A, Lupien C, Hanaguri T, Azuma M, Takano M,
Eisaki H, Takagi H, Uchida S and Davis J C 2007 Science 315 1380.
Lawler M J, Fujita K, Lee J, Schmidt A R, Kohsaka Y, Kim C K, Eisaki H, Davis J C,
Sethna J P and Kim E-A 2010 Nature 466 347
*[49]Hinkov V, Keimer B, Ivanov A, Bourges P, Sidis Y and Frost C D 2010 arXiv:1006.3278.
Y ohC ,G uY ,X oahZ [05]٭-C, Chabot-Couture G, Barišić N, Bourges P, Kaneko N, Li Y,
Motoyama E M, Vajk O P and Greven H 2011 SLAC-PUB-12400 (to Adv. Material).
[51] Wilson J A 1998 J. Phys.:Condens. Matter 10 3387-3410.
[52] Kaminski A, Rosenkranz S, Fretwell H M, Campuzano J C, Li Z, Raffy H, Cullen W G,
You H, Olson C G, Varma C M and Höchst H 2002 Nature 416 610.
*[53] He Y and Varma C M 2010 arXiv:1008.3182.
(Note here the NQR null results of Strässle et al 2011 Phys. Rev. Lett. 106 097003.)
[54] Fine B V 2007 Phys. Rev B 87 060504.
[55]Hücker M, v Zimmermann M, Gu G D, Xu Z J, Wen J S, Xu G, Kang H J, Zheludev A and

43
Tranquada J M 2011 Phys., Rev. B 83 104506.
[56] Sakita S, Suzuki T, Nakamura F, Nohara M, Maeno Y and Fujita T
1996 Physica B 219+220 216.
[57] Azzouz M, Ramakko B W and Presenza-Pitman G
2010 J. Phys.:Condens. Matter 22 345605.
*[58]Rößler U K, Leonov A A and Bogdanov A N 2010 arXiv:1009.4849.
[59] Caplan D S, Orlyanchik V, Weissman M B, Van Harlingen D J, Fradkin E H, Hinton M J
and Lemberger T R 2010 Phys. Rev. Lett. 104 177001.
[60] McKernan S, Steeds J W and Wilson J A 1982 Physica Scripta 26 T1 74.
[61] Suter A, Mali M, Roos J, Brinkmann D, Karpinski J and Kaldis E
1997 Phys. Rev. B 56 5542.
[62] Suter A, Mali M, Roos J and Brinkmann D 2000 Phys. Rev. Lett. 84 4938.
[63] Millis A J, Monien H and Pines D 1990 Phys. Rev. B 42 167.
[64] Chung J-H, Egami T, McQueeney RJ, Yethiraj M, Arai M, Yokoo T, Petrov Y, Mook H M,
Endoh Y, Tajima S, Frost C and Dogan F 2003 Phys. Rev. B 67 014517.
Reznik D, Pintschovius L, Reichardt W, Endoh Y, Hiraka H, Tranquada J M, Tajima S,
Uchiyama S and Masui T 2009 J. Low Temp. Phys. 131 417.
[65] Casas M, de Llano M, Puente A, Rigo A and Solis M A
2002 Solid State Commun. 123 101.
[66] Wilson J A 2008 J. Phys.:Condens. Matter 20 385210 (10pp).
[67] Belkhir L and Randeria M 1994 Phys. Rev. B 49 6829.
[68] Masui T, Hiramachi T, Nagasao K and Tajima S 2009 Phys. Rev. B 79 014511.
[69] LaForge A D, Padilla W J, Burch K S, Li Z Q, Schafgans A A, Segawa K, Ando Y and
Basov D N 2009 Phys. Rev. B 79 104516
[70] Bogdanov P V, Lanzara A, Kellar S A, Zhou X Z, Lu E D, Zheng W J, Gu G,
Shimoyama J-I, Kishio K, Ikeda H, Yoshizaki R, Hussain Z and Shen Z X
2000 Phys. Rev. Lett. 85 2581
Valla T, Federov A V, Johnson P D, Li Q, Gu G D and Koshizuka N
2000 Phys. Rev. Lett. 85 828.
[71] Wilson J A 2009 J. Phys.:Condens. Matter 21 495703 (10pp).
[72] Li Y, Balédent V, Yu G, Barišić N, Hradil K, Mole R A, Sidis Y, Steffens P, Zhao X,
Bourges P and Greven M 2010 Nature 468 283. (HBCO)
Balédent V, Fauqué B, Sidis Y, Christensen N B, Pailhès S, Conder K, Pomjakushina E,
Mesot J and Bourges P 2010 Phys. Rev. Lett. 105 027004. (LSCO)
[73] Adachi T, Kitajima N and Koike Y 2011 Phys. Rev. B 83 060506(R).
[74] Daou R, Cyr-Choiniere O, Laliberte F, LeBooeuf D, Doiron-Leyraud N, Yan J Q, Zhou J S
and Goodenough J B 2009 Phys. Rev. B 79 180505(R).
Farbod M, Giblin S, Bennett M and Wilson J A
2000 J. Phys.:Condensed Matter 12 2043.
Wilson J A and Farbod M 2000 Supercond. Sci. & Technol. 13 307-322.

44
[75] Chang J, Daou R, Proust C, LeBoeuf D, Doiron-Leyraud N, Laliberté F, Pingault B,
Ramshaw B J, Liang R, Bonn D A, Hardy W N, Takagi H, Antunes A B, Sheikin I,
Behnia K and Taillefer L 2010 Phys. Rev. Lett. 104 057005.
[76] Wilson J A 1998 J. Phys.: Condens. Matter 10 3387-3410.
[77] Lake B, Lefmann K, Christensen N B, Aeppli G, McMorrow D F, Vorderwisch P, Smeibidl P,
Mangkorntong N, Sasagawa T, Nohara M and Takagi H 2005 Nature Materials 4 658.
Chang J, Schnyder A P, Gilardi R, Rønnow H M, Pailhès S, Christensen N B,
Niedermayer Ch, McMorrow D F, Hiess A, Stunault A, Enderle M, Lake B, Sobolev O,
Momono N, Oda M, Ido M, Mudry C and Mesot J 2007 Phys. Rev. Lett. 98 077004.
[78] Fauqué B, Sidis Y Hinkov V, Pailhès S, Lin S, Chaud X and Bourges P
2006 Phys. Rev. Lett. 96 197001.
Li Y, Balédent V, Barisic N, Cho Y, Fauqué B, Sidis Y, Yu G, Zhao Y X, Bourges P and
Greven M 2008 Nature 455 372.
[79]Tranquada J M, Basov D N, LaForge A J and Schafgans A A
2010 Phys. Rev B 81 060506(R).
Tranquada J M, Gu G D, Hücker M, Jie Q, Kang H-J, Klingeler R, Li Q, Tristan N,
Wen J S, Xu G Y, Xu Z J, Zhou J & v Zimmermann M 2008 Phys. Rev. B 78 174529.
LaForge A D, Padilla W J, Burch K S, Li Z Q, Schafgans A A, Segawa K, Ando Y and
Basov D N 2008 Phys. Rev. Lett. 101 097008.
[80] Hücker M, v Zimmermann M, Debessai M, Schilling J S, Tranquada J M and Gu G D
2009 Phys. Rev. Lett. 104 057004.
[81] Beyer A D, Grinolds M S, Teague M L, Tajima S and Yeh N-C 2009 EPL 87 37005.
[82] Axe J D and Crawford M K 1994 J. Low Temp. Phys. 95 271.
Wu T and Fossheim K 1993 Phys. Rev. B 48 16751.
Kimura H, Noda Y, Goka H, Fujita M, Yamada K and Shirane G
2005 J. Phys. Soc. Jpn. 74 445.
[83] Schafgans A A, LaForge A D, Dordevic S V, Qazilbash M M, Padilla W J, Burch K S,
Li Z Q, Komiya S, Ando Y and Basov D N 2010 Phys. Rev. Lett. 104 157002.
Shibata Y, Tohyama T and Maekawa S 2001 Phys. Rev. B 64 054519.
[84] Niemöller T, Ichikawa N, Frello T, Hunnefeld H, Andersen N H, Uchida S, Schneider J R
and Tranquada J M 1999 Eur. Phys. J. B 12 509.
[85] Gilardi R, Hiess A, Monomo N, Oda M, Ido M and Mesot J 2004 Europhys. Lett. 66 840.
[86] Maggio-Aprile L, Renner C, Erb A, Walker E and Fischer Ø
1995 Phys. Rev. Lett. 75 2754.
[87] Fischer Ø, Kugler M, Maggio-Aprile I and Berthod C 2007 Rev. Mod. Phys. 79 353.
[88] Hoffman J E, McElroy K, Lee D-H, Lang K M, Eisaki H, Uchida S and Davis J C,
2002 Science 297, 1148.
[89] McElroy K, Lee J, Slezak J A, Lee D-H, Eisaki H, Uchida S and Davis J C
2005 Science 309 1048.
Alldredge J W, Lee J, McElroy K, Wang M, Fujita K, Kohsaka Y, Taylor C, Eisaki H,

45
Uchida S, Hirschfeld P J and Davis J C 2008 Nature Phys. 4 319;
(see arXiv:0801.0087 for supplementary data).
[90] Hanaguri T, Kohsaka Y, Davis J C, Lupien C, Yamada I, Azuma M, Takano M, Ohishi K,
Ono M and Takagi H 2007 Nature Phys. 3 865..
Hanaguri T, Kohsaka Y, Ono M, Maltseva M, Coleman P, Yamada I, Azuma M,
Takano M, Ohishi K and Takagi H 2009 Science 323 923.
[91] Wilson J A 2009 arXiv:0903.3549.
[92] Wang Y, Li L and Ong N P 2006 Phys. Rev. B 73 024510.
Martin I and Panagopoulos C 2010 Europhys. Lett. 91 67001.
*[93]Suchaneck A, Hinkov V, Haug D, Schulz L, Bernhard C, Ivanov A, Hradil K, Lin C T,
Bourges P, Keimer B and Sidis Y 2010 arXiv:1004.2139.
Lubashevsky Y, Garg A, Sassa Y, Shi M and Kanigel A
2010 Phys. Rev. Lett. 106 047002.
[94] Sebastian S E, Harrison N, Goddard P A, Altarawneh M M, Mielke C H, Liang R,
Bonn D A, Hardy W N, Andersen O K & Lonzarich G G 2010 Phys Rev B 81 214524.
[95] Singleton J, de la Cruz C, McDonald R D, Li S, Altarawneh M, Goddard P, Franke I,
Rickel D, Mielke C H, Yao X and Dai P 2010 Phys. Rev. Lett. 104 086403.
[96] Harrison N and McDonald R D 2009 J. Phys.:Condens. Matter 21 192201.
*[97]LeBoeuf D, Doiron-Leyraud N, Vignolle B, Sutherland M, Ramshaw B J, Levallois J,
Daou R, Laliberté F, Cyr-Choinière O, Chang J, Jo Y J, Balicas L, Liang R, Bonn D A,
Hardy W N, Proust C and Taillefer L 2010 arXiv:1009.2078.
[98] Tallon J L and Flower N E 1993 Physica C 204 237.
[99] Vignolle B, Vignolles D, LeBoeuf D, Lepault S, Ramshaw B, Liang R, Bonn D A,
Hardy W N, Doiron-Leyraud N, Carrington A, Hussey N E, Taillefer L and Proust C
2011 Comptes Rendues Physique 12 446..
[100] Scholz J J, van Eenige E N, Wijngaarden R J and Griessen R
1992 Phys. Rev. B 45 3077.
[101] Sebastian S E, Harrison N, Altarawneh M M, Mielke C H, Liang R, Bonn D A,
Hardy W N and Lonzarich G G 2010 Proc. Nat. Acad. Sci. (USA) 107 6175.
[102] Ramshaw B J, Vignolle B, Day J, Liang R, Hardy W N, Proust C and Bonn D A
2010 Nature Physics 7 234.
[103] Riggs S C, Vafek O, Kemper J B, Betts J B, Migliori A, Hardy W N, Liang R, Bonn D A
and Boebinger G S 2011 Nature Physics 7 332.
*[104] Wen J, Jie Q, Li Q, Hücker M, v. Zimmermann M, Xu Z, Singh D K, Zhang L, Gu G and
Tranquada J M 2010 arXiv:1009.0031.
[105] Volovik G 1993 JETP Letters 58 457.
Vekhter I, Hirschfeld P J and Nicol E J 2001 Phys. Rev. B 64 064513.
[106] Dubroka A, Rössle M, Kim K W, Malik V K, Munzar D, Basov D N, Schafgans A A,
Moon S J, Lin C T, Haug D, Hinkov V, Keimer B, Wolf Th, Storey J G, Tallon J L and
Bernhard C 2011 Phys. Rev. Lett. 106 047006.
46
*[107] Yao H, Lee D-H and Kivelson S 2011 arXiv:1103.2115.
[108] Sasaki K, Grigorieva I, Bagnell K, Midgley P, Mori T, Wilson J A and Steeds J W
1993 Jpn J. Appl. Phys. 32 L990.
[109] White J S, Hinkov V, Heslop R W, Lycett R J, Forgan E M, Bowell C, Strässle S,
Abrahamsen A B, Laver M, Dewhurst C D, Kohlbrecher J, Gavilano J L, Mesot J,
Keimer B and Erb A 2009 Phys. Rev. Lett. 102 097001.
*[110] Reibelt M, Weyeneth S, Erb A and Schilling A 2010 arXiv:1003.4688.
[111] Gilardi R, Mesot J, Drew A, Divakar U, Lee S L, Forgan E M, Zaharko O, Conder K,
Aswal V K, Dewhurst C D, Cubitt R, Momono N and Oda M
2002 Phys. Rev. Lett. 88 217003.
*[112] Li Y, Egetenmeyer N, Gavilano J L, Barisić N and Greven M 2010 arXiv:1012.0732.
[113] Li L, Checkelsky J G, Komiya S, Ando Y and Ong N P 2007 Nature Physics 3 311.
[114] Wilson J A 2010 J. Phys.: Condens. Matter 22 203201 (27pp).
[115] Sebastian S E, Harrison N, Altarawneh M M, Liang R, Bonn D A, Hardy W N and
Lonzarich G G 2010 Phys. Rev. B 81 140505(R).
*[116] Sebastian S E, Harrison N, Altarawneh M M, Liang R, Bonn D A, Hardy W N and
Lonzarich G G 2011 arXiv:1103.4180.
[117] Alexandrov A S 2008 J. Phys.: Cond. Mat. 20 192202.
[118] Stern A 2010 Nature 464 187.
{119] Sato M and Fujimoto S 2010 Phys. Rev. Lett. 105 217001.
[120] Yang K and Zhai H 2008. Phys. Rev. Lett 100 030404.
*[121] Ferguson D G and Goldbart P M 2010 arXiv:1011.2765.
[122] Nikolić P 2009 Phys. Rev. B 79 144507.
[123] Milovanović M V and Papić Z 2010 Phys. Rev B 82 035316.
[124] Simon S H, Rezayi E H, Cooper N R and Berdnikov I 2007 Phys. Rev. B 75 075317.
*[125] Laliberté F, Chang J, Doiron-Leyraud N, Hassinger E, Daou R, Rondeau M, Ramshaw
B J, Liang R, Bonn D A, Hardy W N, Pyon S, Takayama T, Takagi H, Sheikin I,
Malone L, Proust C, Behnia K and Taillefer L 2011 arXiv:1102.0984.
*[126] Chang J, Doiron-Leyraud N, Laliberte F, Daou R, LeBoeuf D, Ramshaw B J, Liang R,
Bonn D A, Hardy W N, Proust C Sheikin I, Behnia K and Taillefer L
2011 arXiv:1103.3044.

47
Index of first authors
Abde 14a Abde 14b Adac 73 Alld 40b Alld 89b Alex 117 Anuk 30c Audo 19b Axe 82a Azzo 57 Balé 72b Bang 16a Belk 67 Beye 81 Bogd 70 Capl 59 Casa 65 Chak 21 Chan 75 Chan 77b Chan 126 Chen 3b,c Chien 3a Chun 64a Coop 11 Daou 74 DeLla 4 Doir 17a Doma 2c Dubr 106 Fauq 78a Ferg 121 Fine 54 Fisc 87 Free 38b Frei 1 Fren 14c Fung 45 Garg 6 Ghaz 38a Gila 85 Gila 111 Gurv 31 Hana 47 Hana 90a Hana 90b Harr 96 Haug 36b He&V 53a Hewa 46 Hink 49 Hoff 88 Hück 55 Huck 80 Hus08 12a Hus09 12b Jaud 18 Kami 52
Kimu 82c Kive 35b Kohs 48a LaFo 69 LaFo 79c Lake 77a Lalib 125 Lawl 48b LeBo 17b LeBo 17c LeBo 97 Li L 113 Li Y 72 Li Y 78b Li Y 112 Lora 29 Luba 93b Magg 86 Mart 92b Masu 68 McEl 34 McEl 40 McEl 89a McKe 60 Micn 2a Micn 2d Mill 20a Mill 63 Milo 123 Moon 23 Niko 122 Niem 37a Niem 84 Norm 20b Ossa 22 Pana 30b Rams 102 Reib 110 Rezn 64b Rigg 103 Roma 2b Röss 58 Rour 13 Sain 39 Saki 56 Sasa 108 Sato 119 Scha 83a Scho 100 Seba 19a Seba 25ab Seba 94 Seba 101 Seba 115 Seba 116 Shib 83b Simo 124 Sing 95
Ster 118 Strä 53b Such 93a Sute 61 Sute 62 Tail 24 Tall 98 Tisc 5 Tran 35a Tran 36a Tran 79a Tran 79b Uemu 30a Vekh 105b Vign 15 Vign 99 Volo 105a Wang 92a Wen 104 Whit 109 Wi&Wi 42 Wils 98 Wils 88 7a Wils89 7b Wils90 43 W&Z97 8 Wils98 76 Wils00 9a Wils01 9b Wils04 10 Wils06 32 Wils07 26a Wils07 28a Wils08 26b Wils08 33 Wils08 66 Wils09 27 Wils09 71 Wils09 91 Wils10 114 WilsDM 41 Wu T 82b Wu&L 44 Yang 120 Yao 107 Yell 16b Zhao 50

48
Figure Captions
Figure 1. (p6)
A full collection is presented in [13] of (a) xx(H,T) magnetoresistance and (b) xy(H,T) Hall
data from the underdoped compound YBa2Cu4O8 obtained by Rourke et al in fields of up to 60
tesla for temperatures below 70 K. The Hall data have been reproduced here with slight
modification. Even at very low temperatures bulk superconductivity is lost above 40 tesla.
The most striking feature observed in the high-field, low-temperature region is that the
material‘s Hall resisitvity has become negative, as against the positive sign of standard
conditions. Between 20 K and 40 K this crossover is seen in progress. Such a sign change
has been widely reported for other underdoped, mixed-valent HTSC materials in which
standard Fermi liquid behaviour is being surrendered under the resonant B-F scattering and
encroaching Mott localization. [Reproduced with permission of APS Publishing]
Figure 2. (p6)
Standard and Hall planar resistivities xx and xy for YBCO-124 as functions of applied
magnetic field at three selected temperatures 20, 30 and 40 K, from Rourke et al [13]. The
vertical arrows mark the point of entry into the xx-linear high-field regime at each
temperature. The dashed lines indicate extrapolations back to T = 0 K made in accord with
the two semiclassical equations given in the text, for this pre-superconductive (mixed state)
underdoped behaviour. [Reproduced with permission of APS Publishing]
Figure 3. (p6)
The decomposition performed by Rourke et al in [13] into positively and negatively signed
charge components to and RH deemed operative for the underdoped 124 material,
executed as a function of T and relating to the pre-superconductive, high-field regime. These
components are simultaneously constrained to satisfy both the RH(T) and (T) equations
given in the text. [Reproduced with permission of APS Publishing]
Figure 4. (p10) (colour on line)
Frozen representation of charge stripes and spin domains in the CuO2 planes for an idealized
circumstance with supercell wavevector = 1/8 and hole count p =
1/8, when allotted diagonal
2D geometry as in [32]. The small dots mark the location of the copper atoms and the
colouring marks the enclosing oxygen coordination units. The d8 holes (
8CuIII
0 - in yellow/light
grey) are shown segregated into the stripes, and alternate there with spin-free d9 sites (
9CuII
0 -
in green/mid-grey). The bulk of d9 coordination units freezing into the domain interiors are
shown in blue/dark grey. The circulatory spin patterns manifested within the latter are as far
as possible antiferromagnetic in alignment, and take on opposite overall chirality between
neighbouring domains. Regarding this spin array the stripe directions constitute a mirror, but
the primary x and y axes do not. This time reversal symmetry breaking away from the simple,
non-striped, parent structure has in [33] been held responsible for the magnetic circular
dichroism detected in [52] and later works. The 8CuIII
0 hole sites are host to the bosonic
double-loadings 10
CuIII2–
, these perceived as being near-resonant with EF [7,ff].

49
Figure 5. (p10) (colour on line)
Similar representation to that employed in figure 4 now made for the parameters = 1/7, p =
8/7
2 (i.e. 0.1632, just beyond Tcmax
(p)). Note now that the arrangements of both holes and
spins around the supercell‘s centre and corners differ here, unlike in figure 4. In each figure,
however, the phase break in the antiferromagnetic spin alignment along the primary axes
between domains amounts to ao.
Figure 6. (p11) (colour on line)
Similar representation to those in figs. 4 and 5, but made now for = 1/9, p =
9/9
2, both and p
taking here the same value, as with fig.4. In figure 6 though, as in fig. 5, the arrangements
around cell centre and cell corners are distinct. Also as in fig. 5, for such odd-number-edged
supercells their domain centres do not fall at a copper atom.
Figure 7. (p16) (colour on line)
a) Stylized conception of jogging in supercell wall geometry and how this affects diffuseness
of resulting diffraction. The chain or b direction in YBCOx is the direction of prevalent wall
periodicity faulting, bringing weak diffuse b* diffraction spotting [49]. Here defect cells of size
(10x9) and (8x9) arise within the regular (9x9) supercell array – with focus here on the areas.
b) Revised conception of what jogging accomplishes, with focus now upon hole content of
the stripe circuits around the basic and jog-modified domains. The base supercell here is
9aox9ao in which the stripe domain circuits at p = 9/92 contain 9 holes. The unit jogging
illustrated produces circuits then of 8 and of 10 holes in the jogged region of stripe
displacement.
Figure 8. (p23)
Development of figure 15d from [55] by Hücker et al on the striped state of (La2-xBax)CuO4.
The figure shows the monotonic (at this level step-free) increase of the (H=0)
incommensurability parameter with Ba content x across the range where for this system Tc
displays a very marked dip. In LBCO x may be taken with good confidence as closely
identifying planar hole concentration p. The following features stand out; (i) no lock-in at p =
1/8 to =
1/8; (ii) p =
1/9, =
1/9 does sit on the curve; (iii) p =
1/10, =
1/10 however does not;
(iv) p = 9/10
2, = 1/10 though does; (v) exceeds
1/8 only beyond p = 0.1563. The large
circled crosses mark commensurate stripe conditions of the type presented in figures 4-6:
cross F E D C B A
conc. p 8/7
2
10/8
2
1/2(
1/9+
1/8)
9/9
2 9/10
2 10/12
2
= 0.1632 0.1563† 0.1181 0.1111 0.0900 0.0694
see fig.5 [32,fig.4] text fig.6 fig.9 ‡ .
† This condition involves five-hole clusters at both cell-corner and cell-centre dc. crossing points. It is
feasibly where Tc maximizes [32].
‡ It is possible for the condition to involve similarly constituted five-hole clusters – although now isolated
along the stripes.

50
Figure 9. (p24) (colour on line)
Representation like those made in figs 4 to 6 but now for the situation = 1/10, p =
9/10
2. This
experimentally favoured array possesses a strictly alternating sequence within the stripes of
yellow and green sites, although, note, the cell centres and cell corners again have distinct
geometries as in figs. 5 and 6.
Figure 10. (p24)
Plot of data assembled in LeBoeuf et al [97] for underdoped YBCOx-123 of adduced planar
hole concentration p vs. oxygen content x. As with the related data in figure 11 it is apparent
a two-phase situation arises between -O6.560 and -O6.666 over which the p value remains
anchored at 0.1180, the mean of 1/9 and
1/8. The plot gradients are quite different across this
break, below which p clearly bears regular numeric form, i.e. does not signal any complex
fermiological input.
Figure 11. (p24)
Plot of data assembled in LeBoeuf et al [97] for underdoped YBCOx-123 of Tc vs oxygen
content x. Again it is apparent a two-phase situation arises between -O6.560 and -O6.666 over
which the p value remains anchored at 0.1180, the mean of 1/9 and
1/8. Both this figure and
figure 10 indicate that the low p condition starts to be unstable above -O6.500 at which p is very
close to 1/11. The greatest depression in Tc from simple parabolic form looks to occur at -
O6.666. Tc finally drops to zero close to -O6.300.
Figure 12. (p24)
Plot of a series of ‗head fields‘ B1(p) in tesla for variously underdoped YBCO-123 specimens
and YBCO-124 as deduced from the QO experiments. The data have been assembled in a
very recent review by Vignolle et al [99]. The as-given points have been linked there by the
dotted line. My own direct space interpretation of events would steepen this line to the solid
one incorporating the origin. The latter line is much supported upon shifting the YBCO-124
point substantially to the left to p = 0.128 (see text) and marginally moving the point below
from 0.12 to 0.116 (i.e. into the two-phase regime of YBCO-123; see text). The gradient of
the new line, from its axial crossing points (0.09,465) and (0.135,700), is seen to take on the
very telling value of 2.50 flux tubes per Cu (p=1); i.e. (465/o)/0.09 = (700/o)/0.135 = 2.50.
Figure 13. (p26)
The linear relation between Bm(p) and p for a group of oscillation-specifying integers, m,
falling within the experimental field range, under the global constraint that the gradient of the
m=1 line B1(p)/o vs p is 5/2 for all underdoped HTSC systems, i.e. c1 = 5167 tesla per planar
Cu (p=1). Here then we find B10 at p = 0.1 holds a value of 51.67 tesla.
Figure 14. (p26)
Reciprocal inversion of the information given in figure 13 to supply 1/Bm(p) vs p plots for the
relevant m as indicated. The specified values of 1/Bm(p) given at p = 0.105 and 0.128 relate
to experimental work on Y-123 and Y-124 and are dealt with in figures 15 and 16 respectively.

51
Figure 15. (p26)
The field-oscillatory magnetic torque data of Jaudet et al [18] obtained from a Y-123 sample
with p near 1/10. The vertical lines mark out the period of the oscillation as being 0.001845 T
-1
and pick out locations close to the trace minima when made to accord with a 1/Bm(p) value of
0.01845 at m = 10. This implies, in compliance with figure 14, a ‗head field‘ of 542 T and a
planar p value of 0.105. The detailed values referring to this trace are
m 10 11 12 13 14 15 16 & 1
1/Bm 0.01845 0.02029 0.02214 0.02398 0.02583 0.02767 0.02952 0.001845 T-1
Bm 54.20 49.27 45.17 41.69 38.71 36.13 33.88 542 T .
In this magnetic torque trace the above features relate to = – sinusoidal phasing (see
text). [Data re-presented with permission of APS Publishing]
Figure 16. (p26)
The field-oscillatory inductance signal from Y-124 recorded by Yelland et al [16b]. The
vertical lines mark out the period as being 0.001515 T-1
, and identify locations 1/Bm close to
sine 180° etc., to accord with a value of 0.01515 T-1
at m = 10. This fixes the ‗head field‘ as
being 660 T and the planar p value for Y-124 as 0.1277 so gaining compliance with figure 14
and the modification made in figure 12. Recall from table 1
B1(p)/o = (c1/o).p = ((p)/N(p)).p = 5/2.p ,
so p = 660
/2067 x 2/5 = 0.1277 .
The detailed values referring to this trace are
m 8 9 10 11 12 13 14 & 1
1/Bm 0.01212 0.01363 0.01515 0.01666 0.01818 0.01969 0.02121 0.001515 T-1
Bm 82.51 73.37 66.00 60.02 55.00 50.79 47.15 660.2 T .
In this inductance trace the above 1/Bm features relate to = sinusoidal phasing (see text).
[Data re-presented with permission of APS Publishing]
Figure 17. (p32) (colour on line)
An applied field of 571 T in conjunction with a flux quantum of 5/2o would, with a more
standard superconductor, be expected to generate a square vortex array of spacing 30.1 Å.
For the present HTSC material, this field becomes screened internally to 430 T, associated
for the same 5/2o quantum with a flux spacing now of 34.6 Å or 9ao. This spacing brings
commensuration with the striping supercell; the 5/2o flux-tube is taken as being closely
associated with the stripe crossing-point coordination unit central to the 9ao-by-9ao supercell
as it is drawn here (compare fig.6). The array of such vortices, marked in the figure by large
circles, defines the m=1 ‗head field‘ condition appertaining to externally appraised field 571 T.
By oscillation order number m=9 there remains just a single vortex central to the group of 9
supercells indicated, this occurring at applied field B9(1/9) = 571/9 or 63.5 T. The above
5/2o
flux quantum is associated with FQHE filling factor = 2/5.

52

53

54

55

56

57
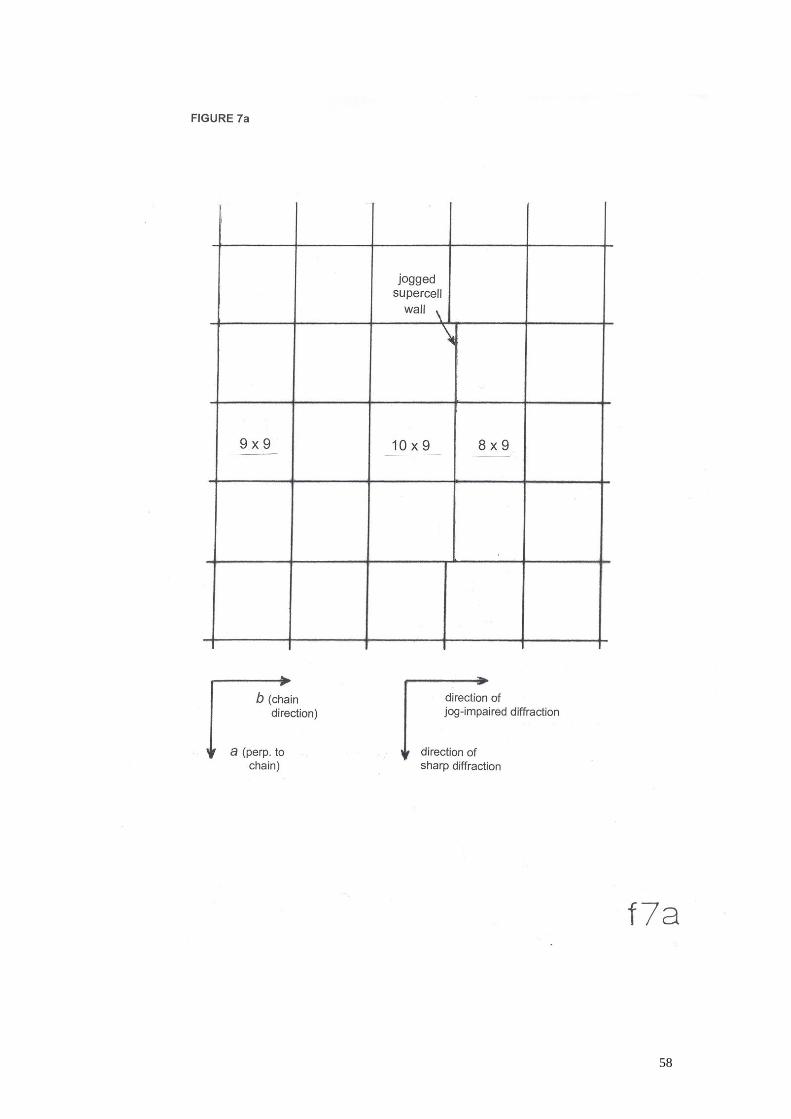
58

59
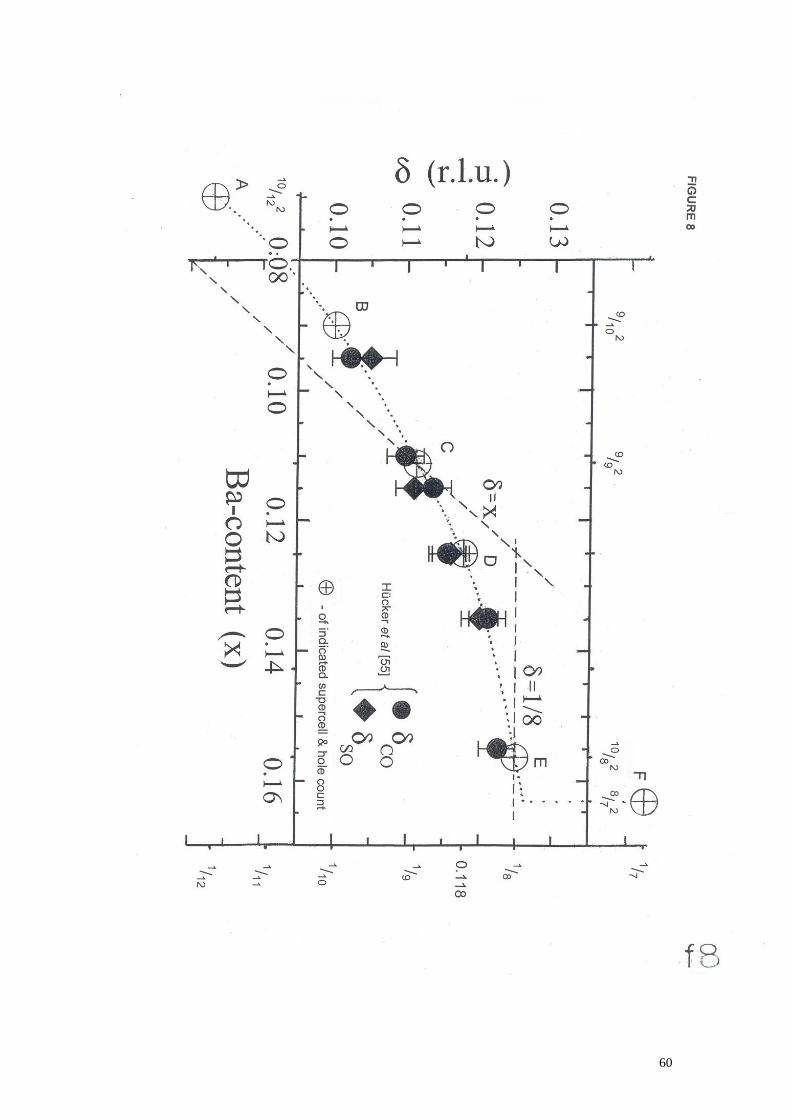
60
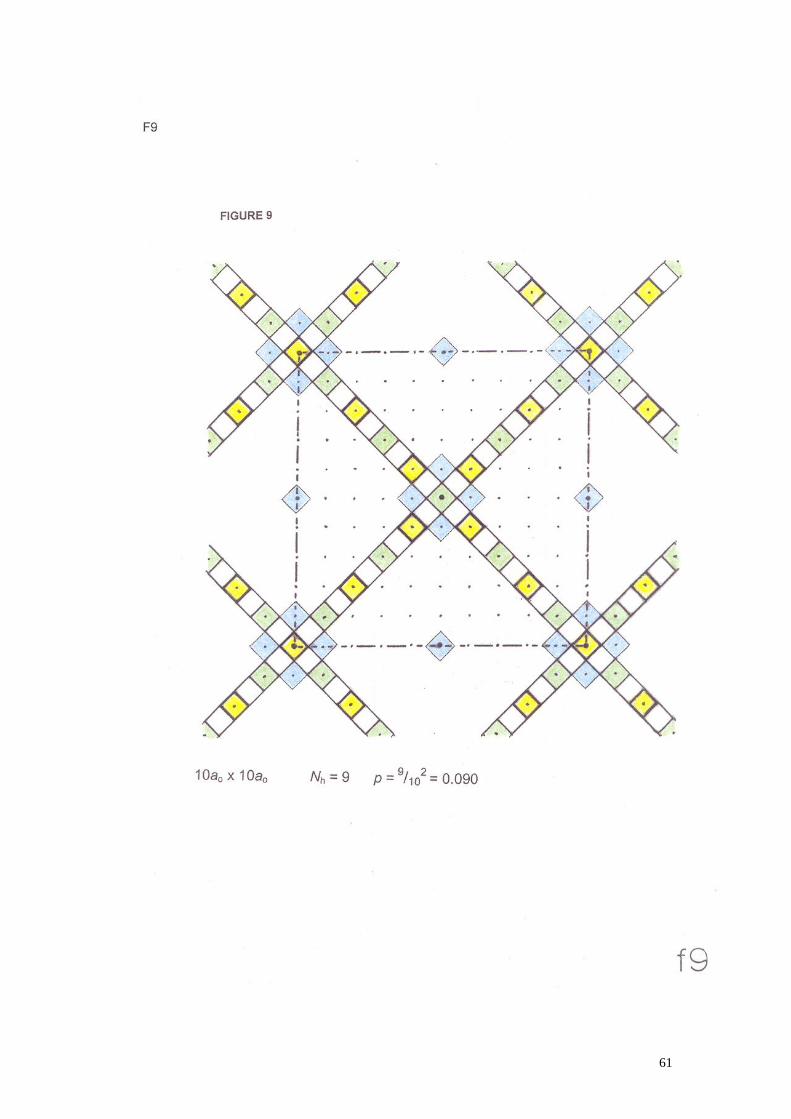
61

62
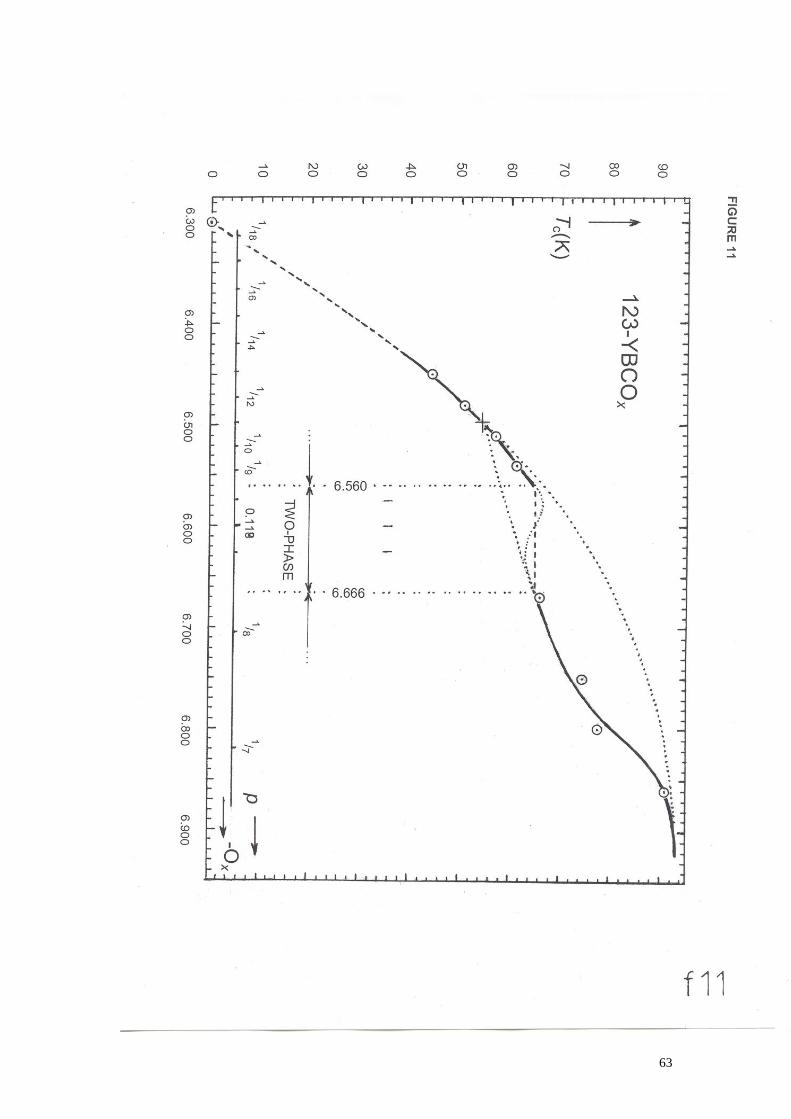
63

64
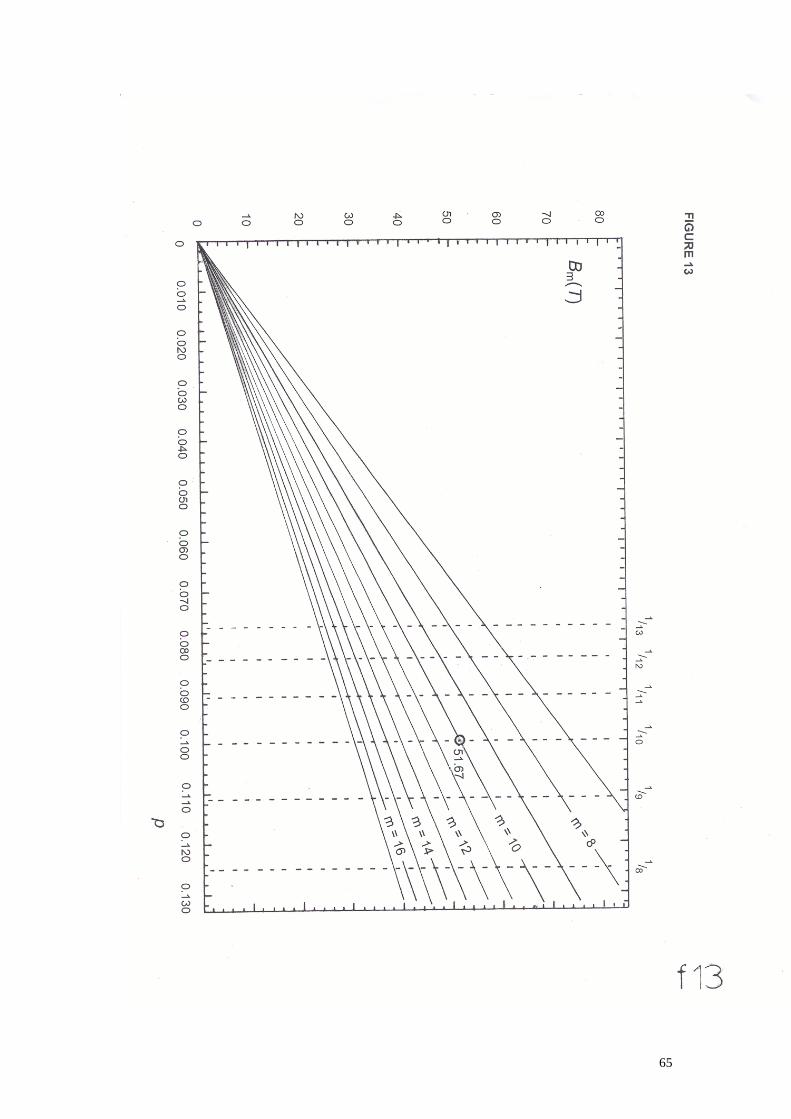
65

66

67

68

69