The Fidelity Requirements for Fixed Wing Flight Simulator Training
76
The Fidelity Requirements for Fixed Wing Flight Simulator Training Final Report Author: James E. Pattison 200683406 Supervisor: Prof. J. F. Ralph Assessor: Prof. S. Maskell Date: 30 April 2014 I confirm that I have read and understood the University’s definitions of plagiarism, collusion and the fabrication of data from the Code of Practice on Assessment. I confirm that I have not committed plagiarism or fabrication of data when completing the attached piece of work, nor have I colluded with any other student in the preparation and production of this work. Signed__________________________ Date________________
Transcript of The Fidelity Requirements for Fixed Wing Flight Simulator Training
The Fidelity Requirements for Fixed Wing Flight Simulator Training Final Report
Author: James E. Pattison 200683406 Supervisor: Prof. J. F. Ralph Assessor: Prof. S. Maskell Date: 30 April 2014
I confirm that I have read and understood the University’s definitions of plagiarism, collusion and the fabrication of data from the Code of Practice on Assessment. I confirm that I have not committed plagiarism or fabrication of data when completing the attached piece of work, nor have I colluded with any other student in the preparation and production of this work.
Signed__________________________ Date________________
i
Summary This report examines the role of Flight Simulation towards the training of modern-day pilots,
and specifically seeks to increase its involvement in the General Aviation sector. It highlights
the improvements Flight Simulation has brought to flight safety over the years, but also
recognises the crucial fact that the vast majority of pilots in training do not receive any
Flight Simulator training as part of a standard training programme. The report looks at the
considerable benefits of simulator training towards both low hour General Aviation pilots as
well as the potential cost saving benefits for Flight Training Organisations. The report
analyses how vital the advancement in Flight Simulation has been over the last decade, and
also how critically important it is in relation to flight safety, specifically towards General
Aviation. Flight Simulation is an ever increasing and investable prospect, due to such rapid
advancements in research and technology in the aviation industry as a whole. This change is
only noticeable in large FTOs; generally there has been no change in the way small GA
schools operate. Flight Simulation has considerably reduced the cost of flight training for
large FTOs whilst also improving safety. It is the aim of this report to recommend that the
same standards should also be demanded in the General Aviation sector. This report
deduces the high viability towards the use of Flight Simulation as a practical means to
reducing the accident rate in the General Aviation sector and concludes by outlining
methods for further research building on the findings presented in this report.

ii
Acknowledgements The author would like to thank Dr Elias Griffith for his kind assistance and help with MATLAB
code. Thanks also goes to Professor Jason Ralph and Dr Mark White for their continuous day
to day help as well as Professor Simon Maskell for providing insight into continuing this
product into the summer as part of the Universities Student Business Incubation Unit
scheme, where a £500 grant has been applied for. Thanks should also go to the author’s
colleague Tom Burton, for loaning his IMU to this project and for allowing the first unit test
to be in a real aircraft. Finally the author would also like to thank Professor Kenneth
Edwards from the Universities Industrial Advisory Board for his guidance and introduction to
external contacts in the aviation industry.
iii
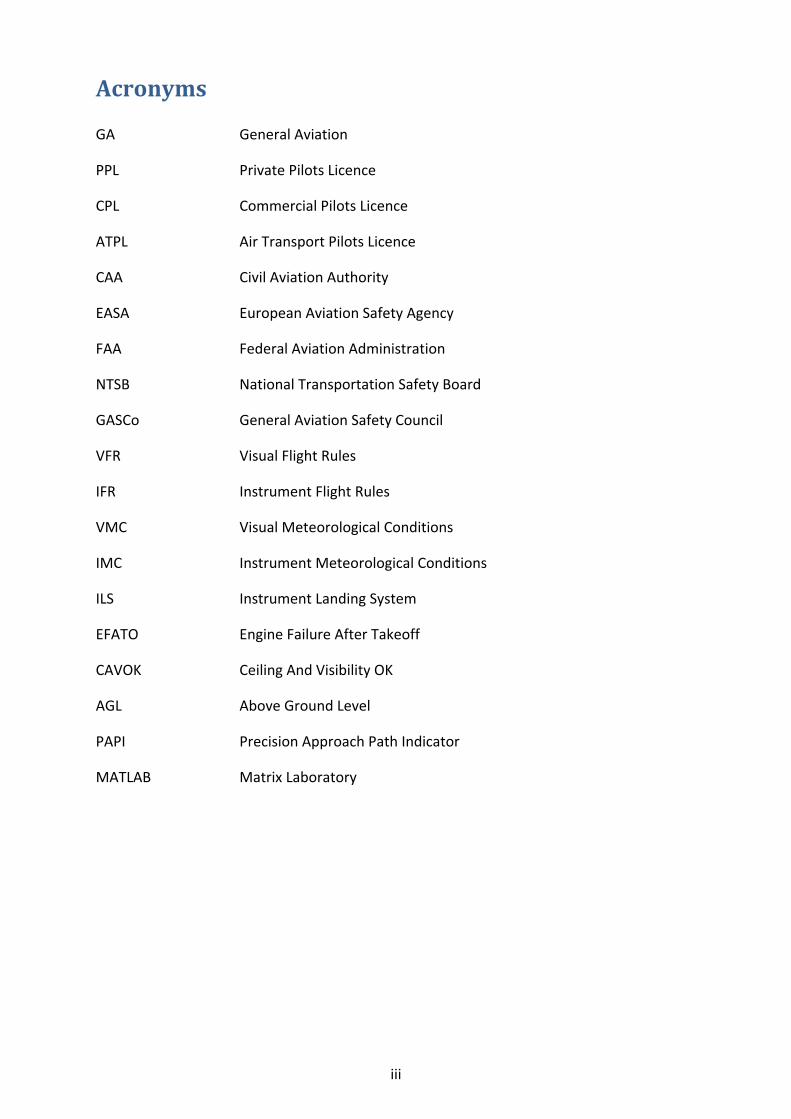
Acronyms GA General Aviation
PPL Private Pilots Licence
CPL Commercial Pilots Licence
ATPL Air Transport Pilots Licence
CAA Civil Aviation Authority
EASA European Aviation Safety Agency
FAA Federal Aviation Administration
NTSB National Transportation Safety Board
GASCo General Aviation Safety Council
VFR Visual Flight Rules
IFR Instrument Flight Rules
VMC Visual Meteorological Conditions
IMC Instrument Meteorological Conditions
ILS Instrument Landing System
EFATO Engine Failure After Takeoff
CAVOK Ceiling And Visibility OK
AGL Above Ground Level
PAPI Precision Approach Path Indicator
MATLAB Matrix Laboratory
iv
Table of Contents
Summary ..................................................................................................................................... i
Acknowledgements .................................................................................................................... ii
Acronyms .................................................................................................................................. iii
1. Introduction ........................................................................................................................... 1
1.1 Background ....................................................................................................................... 1
1.2 Aims and Objectives ..................................................................................................... 3
1.3 Project Approach .......................................................................................................... 3
1.4 Industrial relevance, real-world applicability and scientific impact ............................. 4
2. Literature Review ................................................................................................................... 6
2.1 Introduction ...................................................................................................................... 6
2.2 Review of Research Papers .............................................................................................. 7
2.2.1 General Aviation Accidents ....................................................................................... 7
2.2.2 Transfer of Training ................................................................................................. 11
2.2.3 The General Aircraft Flight Simulation Device ........................................................ 13
2.2.4 The Role of Flight Simulation in Pilot Training ........................................................ 13
2.2.5 Training Effectiveness .............................................................................................. 15
2.3 Discussion of Future Research Opportunities ................................................................ 16
2.4 Closure ............................................................................................................................ 17
3. Theory .................................................................................................................................. 18
3.1 The Flight Simulation Device .......................................................................................... 18
3.1.1 The Composition of the FSD .................................................................................... 18
3.1.2 The Mathematical Model of the FSD ...................................................................... 19
3.2 The Flight Model Components ....................................................................................... 20
4. Design ................................................................................................................................... 21
4.1 The Flight Simulation Device (FSD) ................................................................................ 21
4.2 The Inertial Measurement Unit (IMU) ........................................................................... 23
5. Experimental Method .......................................................................................................... 24
5.1 Stage 1 – Aircraft Model Development .......................................................................... 24
5.2 Stage 2 – Simulator Testing ............................................................................................ 25
5.2.1 Development of Standard Training Profile .............................................................. 25
v
5.2.2 Simulator Integration .............................................................................................. 25
5.2 Stage 3 – Aircraft Testing ............................................................................................... 28
6. Results and Discussion ......................................................................................................... 30
6.1 Results ............................................................................................................................ 30
6.1.1 Flight Test 1 ............................................................................................................. 30
6.1.2 Flight Test 2 ............................................................................................................. 32
6.1.3 Flight Test 3 ............................................................................................................. 34
6.1.4 Flight Test 4 ............................................................................................................. 35
6.1.5 Flight Test 5 ............................................................................................................. 39
6.1.6 Flight Test 6 ............................................................................................................. 41
6.2 Discussion ....................................................................................................................... 43
6.2.1 Discussion of Flight Testing ..................................................................................... 43
6.2.2 The Circuit Importance ............................................................................................ 45
6.2.3 Limitations ............................................................................................................... 46
7. Conclusions and Recommendations .................................................................................... 48
Works Cited .............................................................................................................................. 49
Appendix A ............................................................................................................................... 52
Appendix B ............................................................................................................................... 53
Appendix C ............................................................................................................................... 55
Appendix D ............................................................................................................................... 56
Appendix D ............................................................................................................................... 60
Appendix E ............................................................................................................................... 61
Appendix E ............................................................................................................................... 62
Appendix F ............................................................................................................................... 65
Appendix G ............................................................................................................................... 68
1
1. Introduction With the ever increasing role of Flight Simulation in Commercial and Military Aviation, it is
becoming essential to find a viable means of measuring the training effectiveness gained, in
order to influence the introduction of such technology into the General Aviation sector.
Here, a brief background is presented on the different areas of aviation and their respective
simulator involvement towards flight training. The literature review focuses on previous
research undertaken in the field in order to relate the project to current problems in
General Aviation training. This includes research towards the fidelity requirements for fixed
wing Flight Simulation and also the potential benefits of this synthetic training towards
reducing accident rates in General Aviation.
1.1 Background Undoubtedly Flight Simulation has had a major influence on improving safety for civil
operations and is now regarded as a standard means of training for new and current pilots.
The largest operators of Flight Simulators in aviation are the airlines; they are used as type
converter trainers and also as a platform for the compulsory bi-annual checks all pilots must
undertake. Flight Simulators are a widely accepted training mechanism in the commercial
environment. Large commercial simulators cost in excess of £6M and they are closely
regulated by the airlines themselves and aviation authorities in order to ensure they meet
strict training requirements. As well as having a strong influence on improving safety across
the board, Flight Simulators also provide a considerable cost saving advantage. This makes
them an attractive proposition for airlines that spend hundreds of thousands of pounds
training their pilots each year. There have been significant technological advances in
simulation over the past few years, leading to a reduction in cost of simulation hardware
and improved performance. Currently this change is only noticeable in the civil sector. Thus
this technology has the potential for wider applications and to be expanded and
implemented into other sectors of the aviation industry.
These advances are only noticeable in the civil sector as they are focussed on the large
‘Level-D’ standard simulators. These are full motion simulators used by airlines and the
military; they have no comparison to small General Aviation ‘part task trainers’ or PTTs.
These PTTs range from simple computer-based models of specific aircraft systems to full-
scale replicas of cockpits, for initial familiarisation work with the aircraft.
‘The international Full Flight Simulator Level-D standard (the highest current standard)
requires a motion platform capable of moving the simulator cab in all six degrees of freedom
and an outside world visual system giving 150 x 40 degrees of view to each pilot. Military
Flight Simulators are more variable in design but most military transport aircraft and many
military helicopter simulators are based on the civil FFS design.’ [1]
2
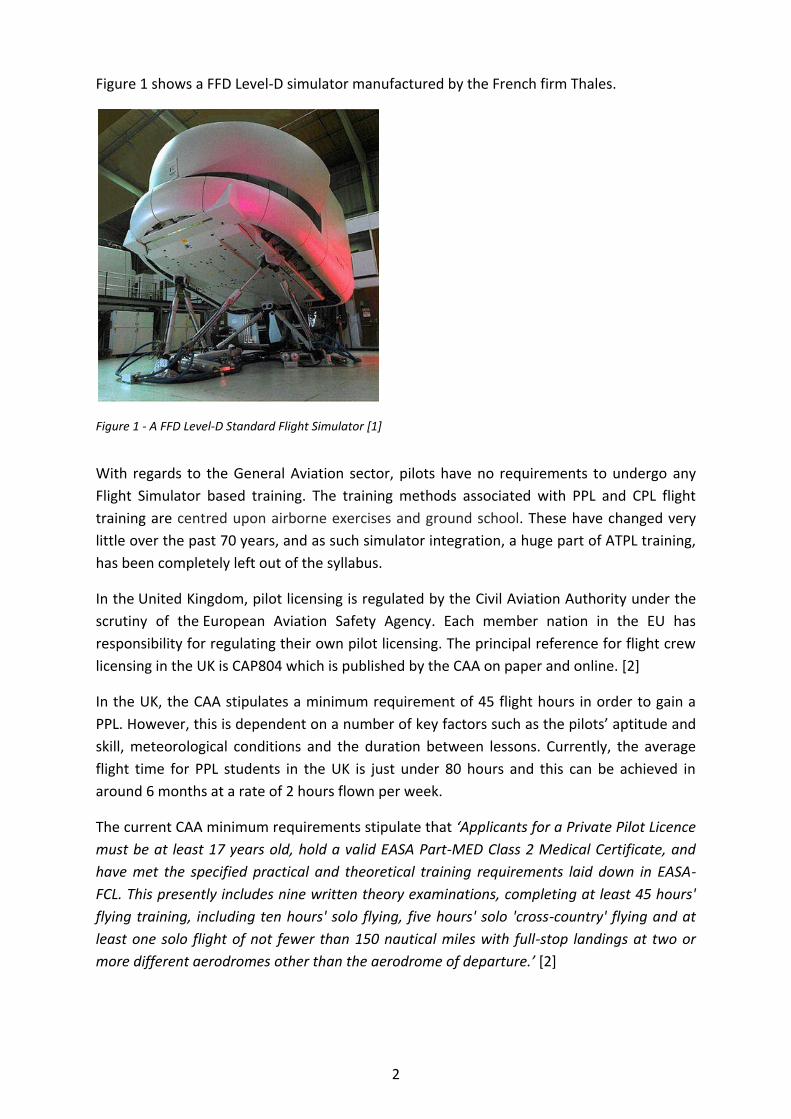
Figure 1 shows a FFD Level-D simulator manufactured by the French firm Thales.
Figure 1 - A FFD Level-D Standard Flight Simulator [1]
With regards to the General Aviation sector, pilots have no requirements to undergo any
Flight Simulator based training. The training methods associated with PPL and CPL flight
training are centred upon airborne exercises and ground school. These have changed very
little over the past 70 years, and as such simulator integration, a huge part of ATPL training,
has been completely left out of the syllabus.
In the United Kingdom, pilot licensing is regulated by the Civil Aviation Authority under the
scrutiny of the European Aviation Safety Agency. Each member nation in the EU has
responsibility for regulating their own pilot licensing. The principal reference for flight crew
licensing in the UK is CAP804 which is published by the CAA on paper and online. [2]
In the UK, the CAA stipulates a minimum requirement of 45 flight hours in order to gain a
PPL. However, this is dependent on a number of key factors such as the pilots’ aptitude and
skill, meteorological conditions and the duration between lessons. Currently, the average
flight time for PPL students in the UK is just under 80 hours and this can be achieved in
around 6 months at a rate of 2 hours flown per week.
The current CAA minimum requirements stipulate that ‘Applicants for a Private Pilot Licence
must be at least 17 years old, hold a valid EASA Part-MED Class 2 Medical Certificate, and
have met the specified practical and theoretical training requirements laid down in EASA-
FCL. This presently includes nine written theory examinations, completing at least 45 hours'
flying training, including ten hours' solo flying, five hours' solo 'cross-country' flying and at
least one solo flight of not fewer than 150 nautical miles with full-stop landings at two or
more different aerodromes other than the aerodrome of departure.’ [2]
3
1.2 Aims and Objectives Aim:
To research the effectiveness of training for specific scenarios of flight, in order to measure
how much training time on a simulator can benefit real-world flight training with regards to
overall safety.
Objectives:
• To research the effectiveness of training for specific scenarios of flight and identify critical operational areas that pilots experience problems with during training.
• To investigate problem areas and examine how pilots could be more effectively
trained with the use of Flight Simulation.
• To measure how much training on a simulator can benefit real-world flight training, with regards to overall safety as well as the cost saving benefit.
• To enhance the existing training framework for GA pilots, building on the document
ICAO9625.
1.3 Project Approach The first stage involved selecting a group of pilots that were suitable for this level of testing.
Both novice and instructor pilots were chosen. Novice pilots who had completed the circuit
ground school were deemed of an acceptable level by the flying school to take part in the
exercises. These pilots were subsequently immersed in the challenging environment of the
visual circuit at Liverpool airport. Current problems and/or challenge areas were identified
with the aid of an instructor from Liverpool Flying School. This instructor also verified testing
techniques of the project to ensure they conformed to the standard PPL syllabus. Learning
outcomes were measured by plotting recorded simulator data in MATLAB against real world
data. Consequently existing methods and safety could be improved by measuring pilot
performance in a multitude of training scenarios. Finally the most efficient form of training
was implemented into a specific training scenario, with overall performance re-assessed.
The overall aim of testing and evaluation was to reduce accident rates and improve safety
by rectifying current issues with the use of a simulator. Currently flight training is heavily
biased towards large commercial aircraft training requirements, and there is little aid for
small GA pilots wishing to learn to fly. GA pilots have the highest accident rate, as they have
low hours and less training. This equates to an overall lack of flying experience. Critical
operational areas that novice pilots experience are to be identified and an appropriate
alternate training method developed. The final aim is to help reduce accident rates and
improve safety. Learning outcomes were measured with the aim of improving existing
methods and safety. Finally the most efficient form of training was implemented into a
specific training scenario, with overall performance re-assessed.
4
1.4 Industrial relevance, real-world applicability and scientific impact Currently there is a massive problem in aviation, within 40 to 70 hours most pilots earn their
private pilot’s licence. After this phase students leave their instructors and enter ‘The Killing
Zone, discovered by Dr. Paul Craig a seasoned pilot, experienced flight instructor and author.
He is a long striving promoter of improving flight training and flight safety and has spoken
widely on the subject.
This killing zone is a period from 50 to 350 hours, and is widely considered a vital time in
order for pilots to gain experience for a potential future career in aviation. It is in this deadly
zone that most pilots are killed than all other periods combined. [3] If critical operational
areas that pilots regularly report problems with are scrutinised, then more effective
methods can be devised. This would benefit Flight Training Organisations (FTOs) around the
world and there is huge interest and investment in this area. Takeoff accidents have been
shown to be caused by three main categories; improper aircraft configuration, a
minimalistic approach to pilot planning and engine failure. When considered together,
takeoffs and landings only account for a very small proportion of the overall flight time, but
they are the most accident prone of any other groups by far.
Regarding real-world applicability, the project builds upon the ICAO document ICAO 9625 –
The Manual of Criteria for the Qualification of Flight Simulators. This manual describes how
simulators that represent aircraft can be used as well as outlining the recommended fidelity
requirements for specific units or elements of flight training that have the potential for
simulator involvement. [4] One of the objectives of this project is to examine the
applicability of ICAO9625 aiming to enhance the existing framework for GA pilots. Currently
ICAO9625 is a guidance document and pilots do not have to abide by it. Listed below are the
current vague guidelines towards fidelity and Flight Simulation.
• None or Not Applicable (N);
• Generic (G);
• Representative (R); and
• Specific (S). [4]
With future research it is hoped to produce an equivalent document that is mandatory for
flight training, instead of an advisory document. This will provide exact descriptions of the
fidelity level required for operations. This project builds upon the current document and
aims to enhance the existing framework for GA pilots in particular and define succinct
parameters for the application of fidelity to flight training scenarios. An interesting point to
note is that to train a pilot in the RAF, costs the taxpayer £1M each due to the depth of
training and knowledge required. Simon Maskell from QinetiQ estimated that the cost to
the taxpayer of a soldier killed in action is also around the £1M mark. Therefore if
potentially life threatening situations can be recreated with the use of a synthetic Flight

5
Simulation Device then this gives scope to applying the idea to industry. Improvements to
safety and also significant cost saving advantages are highly appealing to training providers
and flight training schools alike, in terms of improvements in training as well as the potential
reduction for loss of live giving scope to industrial applications to this project.
6
2. Literature Review
2.1 Introduction The following question will be answered in this literature review:
What research has previously been undertaken on the fidelity requirements for fixed
wing Flight Simulator training?
The use of a ‘Simulator’ is a broad generalisation of any machine that provides pilot training,
so some limitations were applied in order to narrow down the literature that is available on
this subject.
However, it must be noted that previous research in this highly specific field is extremely
limited, with respect to the training effectiveness of low cost Flight Simulation. Minimal
research has been pursued in a Flight Test environment specifically involving General
Aviation; therefore there is a reduced amount of available knowledge in the discipline but
still comparisons can be drawn between research papers.
The following limitations were applied to this literature review:
Only fixed wing aircraft
Only single piston engine aircraft
Only General Aviation simulation
Only low cost Flight Simulation Devices
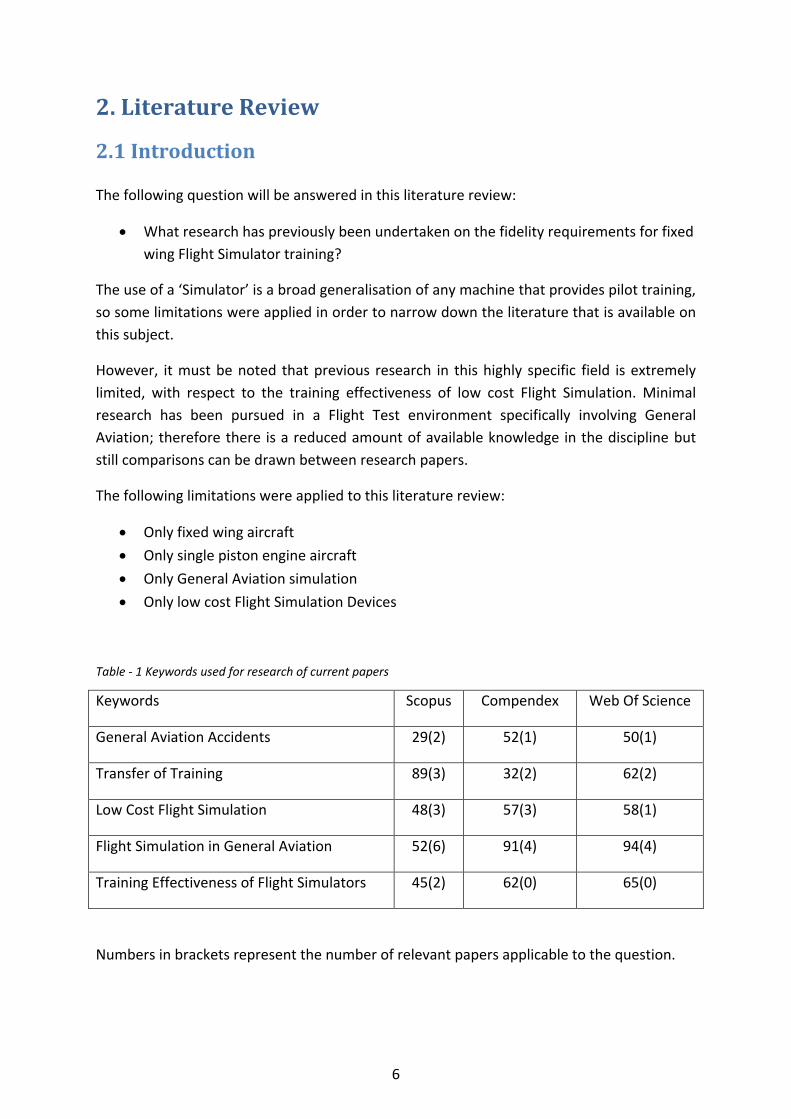
Table - 1 Keywords used for research of current papers
Keywords Scopus Compendex Web Of Science
General Aviation Accidents 29(2) 52(1) 50(1)
Transfer of Training 89(3) 32(2) 62(2)
Low Cost Flight Simulation 48(3) 57(3) 58(1)
Flight Simulation in General Aviation 52(6) 91(4) 94(4)
Training Effectiveness of Flight Simulators 45(2) 62(0) 65(0)
Numbers in brackets represent the number of relevant papers applicable to the question.
7
2.2 Review of Research Papers
2.2.1 General Aviation Accidents A key factor in this project was drawing on information presented in a book entitled The
Killing Zone. The author states that pilots who currently have between 50-350 flight hours,
are more likely to be involved in a fatal accident, than other pilots with more or less
experience. The book combines NTSB accident investigation reports and statistics to provide
a compelling argument to support this theory. The author draws particular attention to
various stages of flight that this group of pilots owe particular care and attention to, due to
their varying levels of experience. [5]
It is this cohort of pilots that have the greatest accident rate and whilst there is evidence to
suggest Flight Simulator training reduces accident rates for airlines, the accident for General
Aviation has remained fairly constant over the past 25 years.
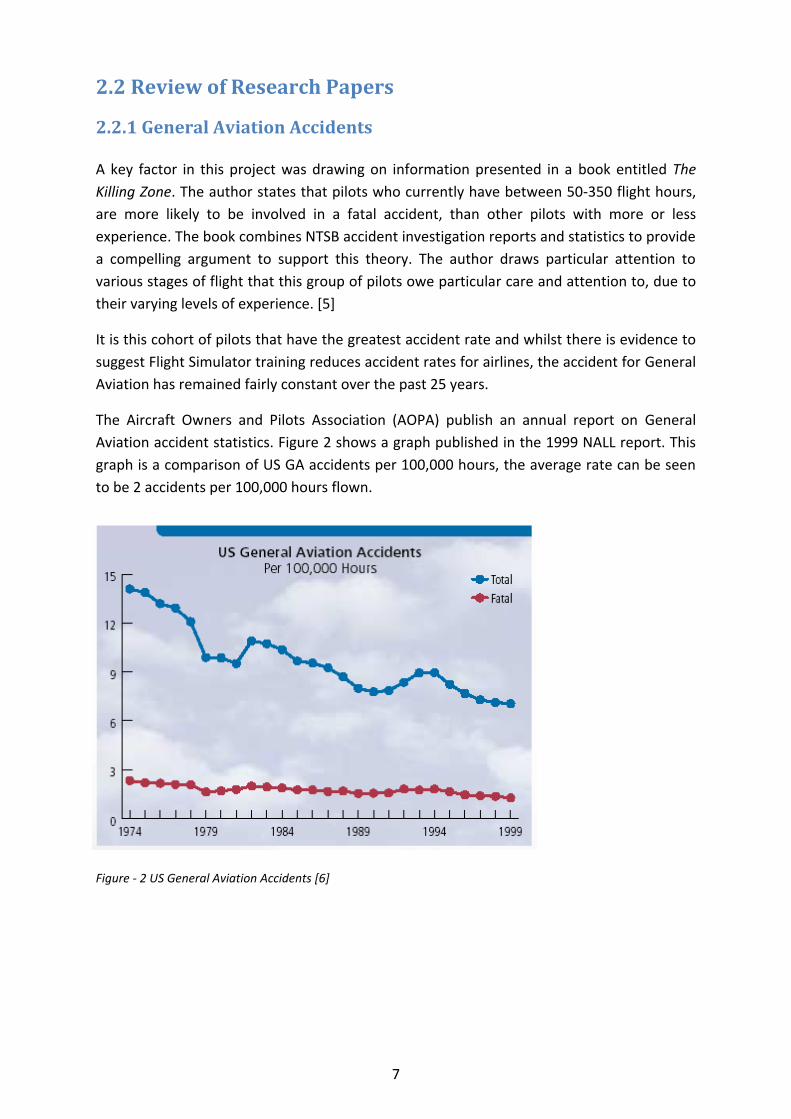
The Aircraft Owners and Pilots Association (AOPA) publish an annual report on General
Aviation accident statistics. Figure 2 shows a graph published in the 1999 NALL report. This
graph is a comparison of US GA accidents per 100,000 hours, the average rate can be seen
to be 2 accidents per 100,000 hours flown.
Figure - 2 US General Aviation Accidents [6]
8
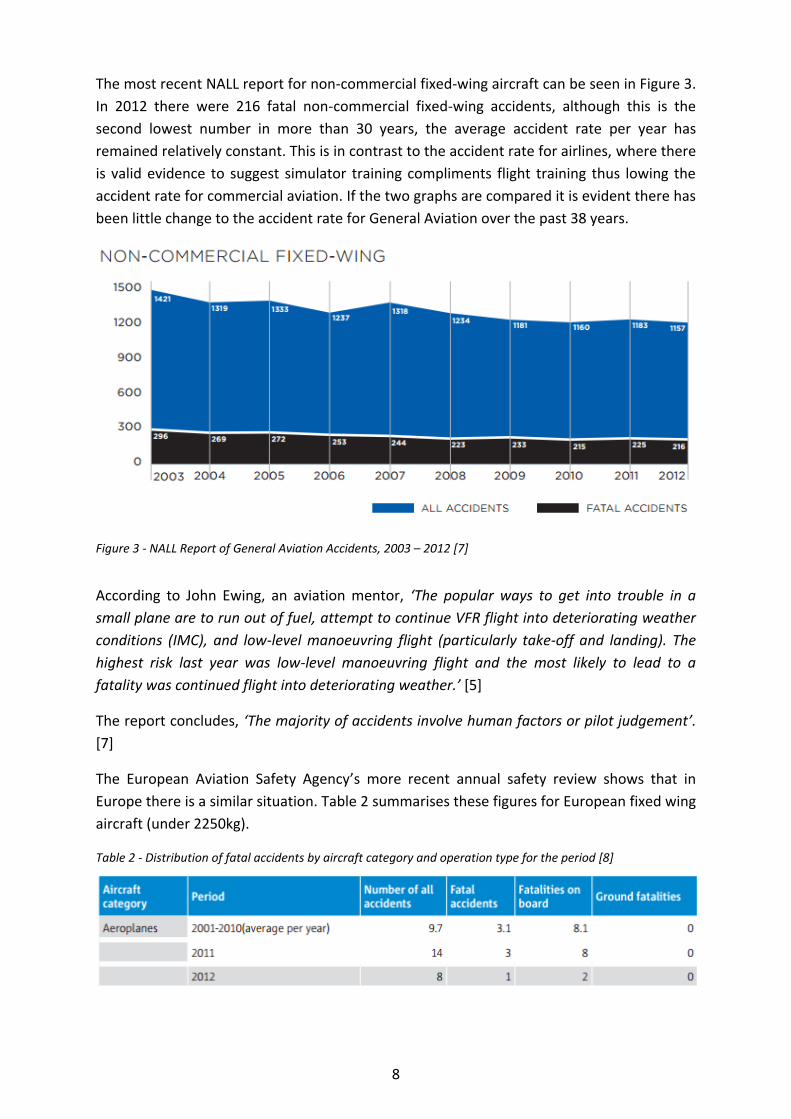
The most recent NALL report for non-commercial fixed-wing aircraft can be seen in Figure 3.
In 2012 there were 216 fatal non-commercial fixed-wing accidents, although this is the
second lowest number in more than 30 years, the average accident rate per year has
remained relatively constant. This is in contrast to the accident rate for airlines, where there
is valid evidence to suggest simulator training compliments flight training thus lowing the
accident rate for commercial aviation. If the two graphs are compared it is evident there has
been little change to the accident rate for General Aviation over the past 38 years.
Figure 3 - NALL Report of General Aviation Accidents, 2003 – 2012 [7]
According to John Ewing, an aviation mentor, ‘The popular ways to get into trouble in a
small plane are to run out of fuel, attempt to continue VFR flight into deteriorating weather
conditions (IMC), and low-level manoeuvring flight (particularly take-off and landing). The
highest risk last year was low-level manoeuvring flight and the most likely to lead to a
fatality was continued flight into deteriorating weather.’ [5]
The report concludes, ‘The majority of accidents involve human factors or pilot judgement’.
[7]
The European Aviation Safety Agency’s more recent annual safety review shows that in
Europe there is a similar situation. Table 2 summarises these figures for European fixed wing
aircraft (under 2250kg).
Table 2 - Distribution of fatal accidents by aircraft category and operation type for the period [8]
9
The basis behind the introduction of recurrent checks for General Aviation is the same as in
civil aviation. This is the ability to expose pilots to serious emergency-type situation with the
use of a synthetic flight training device. The main use of Flight Simulation training is to
ensure the pilot is sufficiently competent in every-day aspects of flight, but the simulator
can be also used to expose a pilot to potentially catastrophic scenarios which could lead to
the loss of an aircraft and lives. Normally these scenarios cannot be safely replicated in a
real aircraft and so few GA pilots will have experienced them.
The following situations can be replicated in a General Aviation simulator, thus exposing the
pilot to:
• EFATO.
• Deteriorating weather during VFR flight conditions.
• A potential landing field divert leading to an increased pilot workload.
• Fuel management and navigation planning, for example strong tailwinds/headwinds.
• Spatial disorientation, for example when there is no obvious horizon.
• An array of potential cross-wind situations on landing.
• Incipient spin, for example on the final stages of the approach caused by a turn that was
too severe.
• Sudden wind shear on the final stages of an approach and downdraughts caused by
thunderstorms.
Allerton drew reference to an important survey, where the flight conditions involving the
loss of a Piper Saratoga at sea were replicated in a Flight Simulator at Cranfield University.
The accident details are available in NTSB identification report NYC99MA178 [9]
The report states: ‘With visibility reducing to between 5 and 8 nautical miles on a dark night,
the pilot descended from 5500 feet overland to 2200 feet over water. The pilot was non
instrument-rated and the haze conditions at the time resulted in a complete loss of the visual
horizon. The report states that the pilot became disorientated and subsequently crashed into
the sea with the loss of all occupants. The report also cites a section entitled Instrument
Flying – Coping with Illusions in Flight, from FAA advisory circular 61-27C, which states
‘spatial disorientation as a result of continued VFR flight into adverse weather conditions, is
regularly near the top of the cause/factor list in annual statistics on fatal aircraft accidents’.
A study by Barr-Gill [10] showed that pilot workload can become high during single-pilot
operations in General Aviation aircraft as a consequence of the dynamics of light aircraft.

10
Figure 4 - Visibility 8 nm over land [6] Figure 5 - Visibility 8 nm over sea [6]
These flight conditions were replicated in one of the Flight Simulators at Cranfield University.
With a visibility of 8 nautical miles over land at an altitude of 5000 feet, sufficient visual cues
are available to discern the horizon, as shown in Figure 4. However, over sea, it is impossible
to detect the horizon and the pilot is effectively reduced to IFR conditions, as shown in Figure
5. It is speculated that a significant proportion of current PPL pilots would also experience
difficulties with these conditions in a Flight Simulator, although these pilots would hope to
avoid encountering these flight conditions.
It was also noted that a simulator exercise to demonstrate the seriousness of this situation
might provide more of a deterrent to pilots than a pamphlet or a paragraph in an advisory
circular.’ [6]
This statement is an important point to note, as running a simulator exercise of this kind
would be cheap and economical for flight schools to operate on a large scale basis as part of
a PPL or CPL training program. For any pilot who experiences this exercise, the
complications of entering IMC without the proper training or experience would be
reinforced in any pilots’ mind more than a simple paragraph of information.
In reference [11] Bruckhart studied a group of pilots, and concluded that accident rates
could be reduced by 40% after simulated exposure to potentially fatal scenarios was
increased as part of a flight training programme. [11]
11
2.2.2 Transfer of Training Although Flight Simulators are widely accepted as valid training tools in the aviation
industry, people continue to raise doubts as to their limitations in the so called transfer of
learning. It has been established that modern Flight Simulators are most useful as
procedural trainers, this enables pilots ‘to be trained with verisimilitude of simulation and
transfer effectiveness’ [12] theoretically enabling them to fly a real aircraft.
In a recently published discussion paper by The Royal Aeronautical Societies Flight
Simulation Group, The impact of Flight Simulation in aerospace, it was stated that ‘The
effectiveness of a training task is the ‘training transfer’ resulting from training in a synthetic
device compared with that in an aircraft, often measured as the ratio of the number of hours
of airborne training that can be replaces with training in a simulators. Studies have shown
that, for certain tasks, high levels of training transfer can be achieved with low-fidelity
training devices.’ [13]
In reference [14] Roessingh conducted a study on the Transfer of Manual Flying Skills from
PC-Based Simulation to Actual Flight—Comparison of In-Flight Measured Data and Instructor
Ratings.
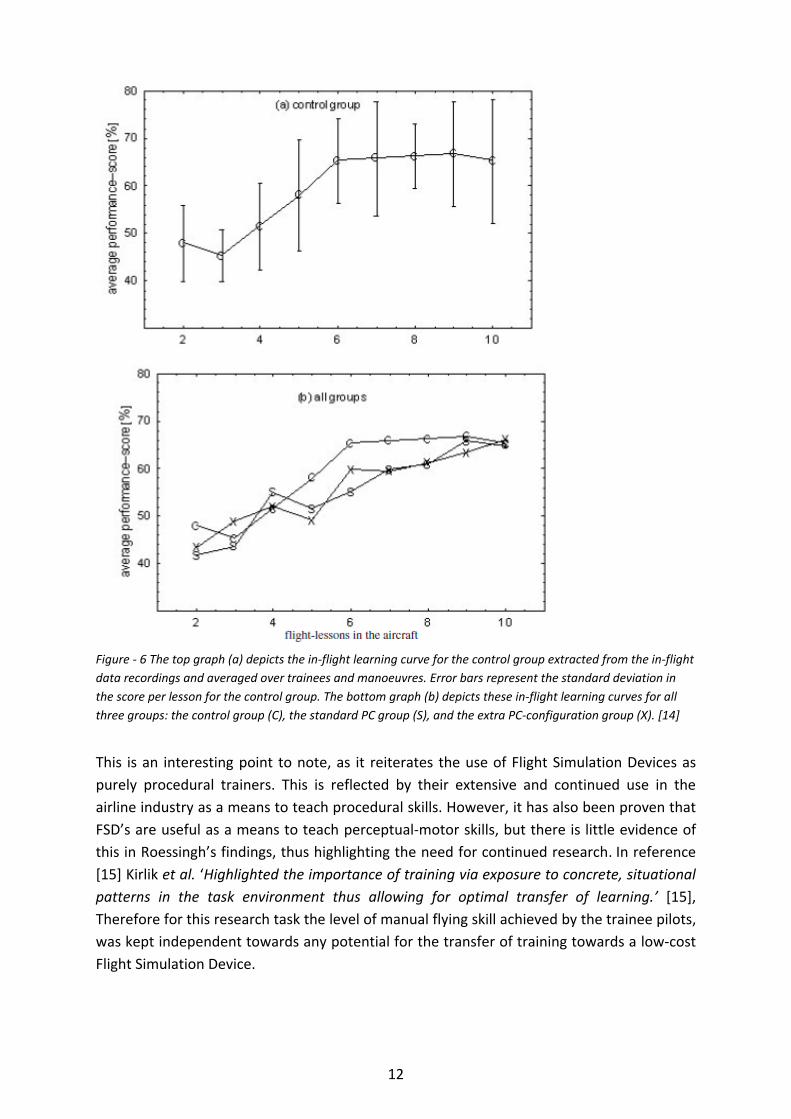
The results of the average performance score (%) between group (a) – the control group and
group (b) – all groups are shown in Figure 6.
The author reported that they ‘Analysed learning curves—on the basis of in-flight recorded
data—of three different groups that received training in manual flying skills (aerobatics).
Each group was subjected to a different type of ground training preceding each flight lesson,
that is, no simulation for the C group, standard PC simulation for the S group, and PC
simulation with extra features for the X group. The accuracy of flight profiles for all aerobatic
manoeuvres was analysed, during 189 flight lessons (all flight lessons except the first
introductory lesson for each trainee) on the basis of 25 predefined criteria for the
manoeuvres to be flown in terms of altitude, acceleration, speed, roll angle, pitch angle, and
heading. All three groups demonstrated a comparable level of skill at the beginning of the
training and comparable progress per lesson of approximately 3% per lesson of the
maximum attainable score. Despite the 500 min extra ground training of the S and the X
group, no significant increments or decrements in the level of manual flying skills were found
as a result of the skills that were acquired with the simulation on the ground. Thus, there
was neither negative transfer nor positive transfer of manual flying skills learned during the
simulation lessons.’ [14]
12
Figure - 6 The top graph (a) depicts the in-flight learning curve for the control group extracted from the in-flight
data recordings and averaged over trainees and manoeuvres. Error bars represent the standard deviation in
the score per lesson for the control group. The bottom graph (b) depicts these in-flight learning curves for all
three groups: the control group (C), the standard PC group (S), and the extra PC-configuration group (X). [14]
This is an interesting point to note, as it reiterates the use of Flight Simulation Devices as
purely procedural trainers. This is reflected by their extensive and continued use in the
airline industry as a means to teach procedural skills. However, it has also been proven that
FSD’s are useful as a means to teach perceptual-motor skills, but there is little evidence of
this in Roessingh’s findings, thus highlighting the need for continued research. In reference
[15] Kirlik et al. ‘Highlighted the importance of training via exposure to concrete, situational
patterns in the task environment thus allowing for optimal transfer of learning.’ [15],
Therefore for this research task the level of manual flying skill achieved by the trainee pilots,
was kept independent towards any potential for the transfer of training towards a low-cost
Flight Simulation Device.
13
2.2.3 The General Aircraft Flight Simulation Device
2.2.3.1 The Flight Simulation Device (FSD)
In the conference paper, The Research on the General Aircraft Flight Simulation Device, the
authors critically analyse the in depth knowledge required behind building an FSD. This
proved to be crucial background reading for any project, as an FSD cannot be improved if
the processes behind its creation are not fully understood.
The FSD is primarily used to simulate the aircraft’s real-time flying environment and motion
state in various flight conditions. It is composed of the computer simulated cockpit, the
sound system and the visual system [16]. The Flight Simulation Device plays an
indispensable role in pilot training courses. Its key benefits include having low-energy power
consumption, high efficiency, high economy, and above all safety. As training with a Flight
Simulation Device is not limited by the training field or the weather condition [17], this
makes it an ideal tool for cultivating aeronautical staff, both the General Aviation staff and
special operation staff in the utilisation of a Flight Simulation Device in training courses. [18]
The composition of the FSD is discussed in detail in the following theory section.
2.2.4 The Role of Flight Simulation in Pilot Training
2.2.4.1 Commercial Simulator Training
ATPL training has strict regulations including simulator integration as part of a flight training
program, and the flight crews undergo recurrent checks every 6 months. Flight crews are
able to practise emergency drills and likely scenarios they may encounter can be reproduced
in a safe environment. The aim is to prepare crews for all eventualities in the hope that
should these skills ever be required, flight crews will have had the highest level of training
possible and so will be able to react accordingly and handle the situation with an increased
level of safety.
These simulators are exact replicas of the aircraft, with identical flight management
systems, avionics and displays. The level of fidelity in these so called ‘Level-D’ simulators is
noteworthy as the aircraft dynamics, motion systems and visual systems are almost identical
to flying the real aircraft. In order to ensure these simulators conform to the international
standards of fidelity, they are closely regulated by the airlines as well as the aviation
regulatory authorities. [6]
2.2.4.2 General Aviation Training
As previously mentioned, General Aviation has a very different approach to pilot training. It
is centred upon an almost historic flight training syllabus and has no simulator integration as
part of a standard course. A key point to note is that simulator training in the GA sector has
been limited to instrumental procedural trainers, usually used for IFR training. This includes
ILS approaches and various other navigational approaches incorporating navigational aids.
14
Simulators are not usually incorporated into a PPL’s flight training course, except for
procedural work, but it is important to note this is entirely voluntary as pilot qualification is
ultimately determined by the hours flown.
In the paper, The Case for Flight Simulation in General Aviation, Allerton noted that there
have been a few instances where instrument flight trainers have been accepted ‘Based on a
credits scheme, amounting to recognition of a few hours Flight Simulator training as the
equivalent of airborne training.’ He also noted that ‘Unlike airline pilots, licence renewal is
mainly based on hours flown rather than an assessment of piloting skill.’ This means that
unlike ATPL training very few pilots, if any, actually receive any simulator training as part of
a PPL or CPL course as there is no requirement for it from the regulating aviation
authorities. [6]
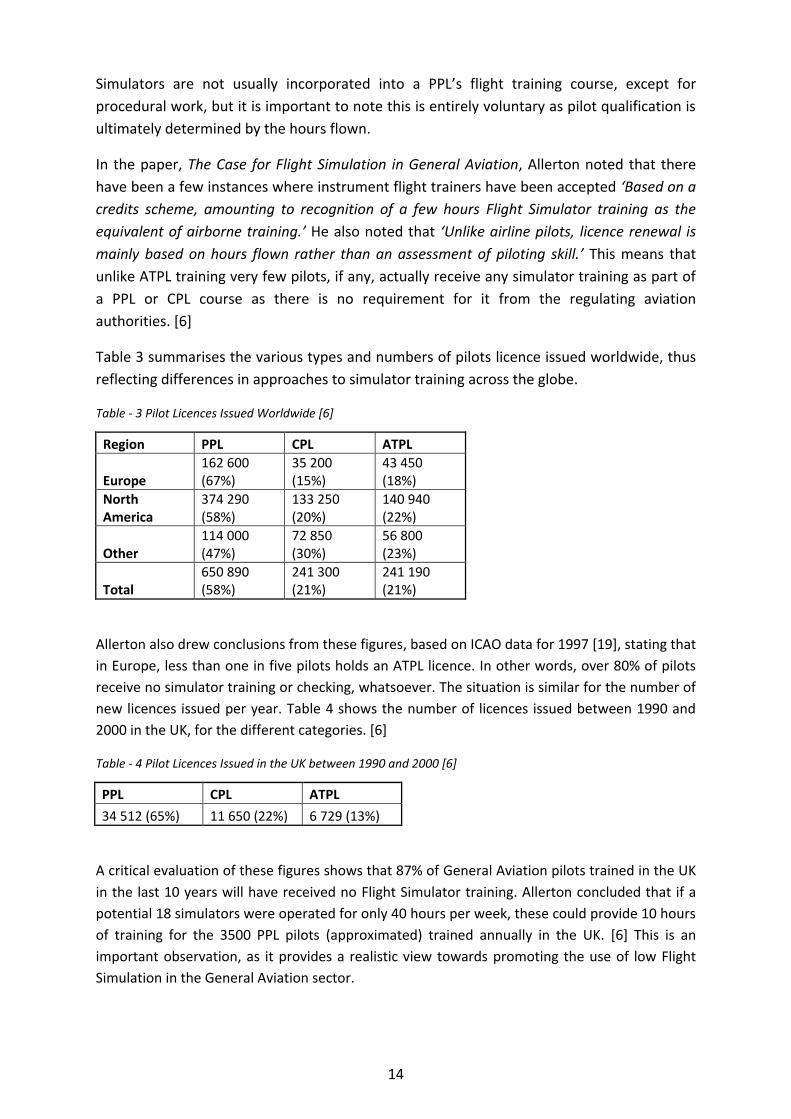
Table 3 summarises the various types and numbers of pilots licence issued worldwide, thus
reflecting differences in approaches to simulator training across the globe.
Table - 3 Pilot Licences Issued Worldwide [6]
Region PPL CPL ATPL
Europe 162 600 (67%)
35 200 (15%)
43 450 (18%)
North America
374 290 (58%)
133 250 (20%)
140 940 (22%)
Other 114 000 (47%)
72 850 (30%)
56 800 (23%)
Total 650 890 (58%)
241 300 (21%)
241 190 (21%)
Allerton also drew conclusions from these figures, based on ICAO data for 1997 [19], stating that
in Europe, less than one in five pilots holds an ATPL licence. In other words, over 80% of pilots
receive no simulator training or checking, whatsoever. The situation is similar for the number of
new licences issued per year. Table 4 shows the number of licences issued between 1990 and
2000 in the UK, for the different categories. [6]
Table - 4 Pilot Licences Issued in the UK between 1990 and 2000 [6]
PPL CPL ATPL
34 512 (65%) 11 650 (22%) 6 729 (13%)
A critical evaluation of these figures shows that 87% of General Aviation pilots trained in the UK
in the last 10 years will have received no Flight Simulator training. Allerton concluded that if a
potential 18 simulators were operated for only 40 hours per week, these could provide 10 hours
of training for the 3500 PPL pilots (approximated) trained annually in the UK. [6] This is an
important observation, as it provides a realistic view towards promoting the use of low Flight
Simulation in the General Aviation sector.

15
2.2.5 Training Effectiveness Flight training devices have been utilised for pilot training for over 70 years. Due to rapid
advancements in computer technology and microprocessors, simulation technology has
improved dramatically and the benefits of simulation have become accepted by airlines and
military organisations. During this time a number of studies have been lead into the
effectiveness of training.
In reference [6] Allerton observed that there is still ‘No substantial body of knowledge to
predict or measure the effectiveness of flight training devices’. Therefore, conducting
measurements in order to determine an FSD’s effectiveness proved a challenge during this
research project. This is due to;
• ‘The only method to measure training effectiveness is to conduct a series of trials
comparing the performance of sets of subjects who are given simulator training with
equivalent sets of subjects who receive no simulator training.
• Training effectiveness can be measured in terms of the quality of training or in terms of
cost effectiveness, typically the financial savings accruing from transferring the training from
an aircraft to a synthetic training device.
• It is impractical to use commercial Flight Simulation facilities in research programmes. At
the same time, the cost of simulation facilities has discouraged the participation of
universities in research programmes.’ [6]
Allerton also observes that due to this apparent lack of understanding of the application of
simulation, a resultant emphasis on simulator fidelity has been relied upon in airline
simulation. It is also noted that this simulator fidelity ‘requirement’ is often independent of
cost or training benefit, as there is an assumption that training effectiveness is directly
proportional to the cost of a simulator, despite any evidence to support this statement.
Therefore, there is resistance to adopt low-cost training devices which is reinforced by an
apparent lack of understanding on the subject. Figure 7 shows a graphical representation of
the fidelity vs. cost dilemma. In reference [20] Duncan stated it is evident that with ever
increasing investment, fidelity can only be improved to a certain point. Where after one can
expect a reduction in return in performance of the simulation device.
Figure 7 - A graphical representation of the fidelity versus cost dilemma [20]
16
2.3 Discussion of Future Research Opportunities Research was also conducted in order to identify potential future research opportunities.
Tau theory came about when trying to work out how pilots manage to judge their approach
to the runway or even round an obstacle e.g. low flying. Somehow they need a certain
capacity in order to judge and anticipate their future path in the aircraft. Critically when
flying low level, pilots need to make continuous adjustments in speed, height and heading.
M. Jump found coherent tau relationships. ‘Pilots used the same constant rate of change of
tau strategy to perform approach and landing manoeuvres’, he reports. ‘They can 'tau'
down onto the runway visually or using cockpit instrument displays.’ [21]
This built on the survey paper The tau of flight control [22], in which the author proposes a
new ‘Tao’. This is a new concept and understanding of how pilots reach what they want to
achieve with an aircraft. Tau is suggested as being based on the ‘time to close on a goal, or
close a gap τ(t).’ This project has the potential to build on the initial hypothesis of τ-theory
whilst utilising Flight Simulation methods. [22]
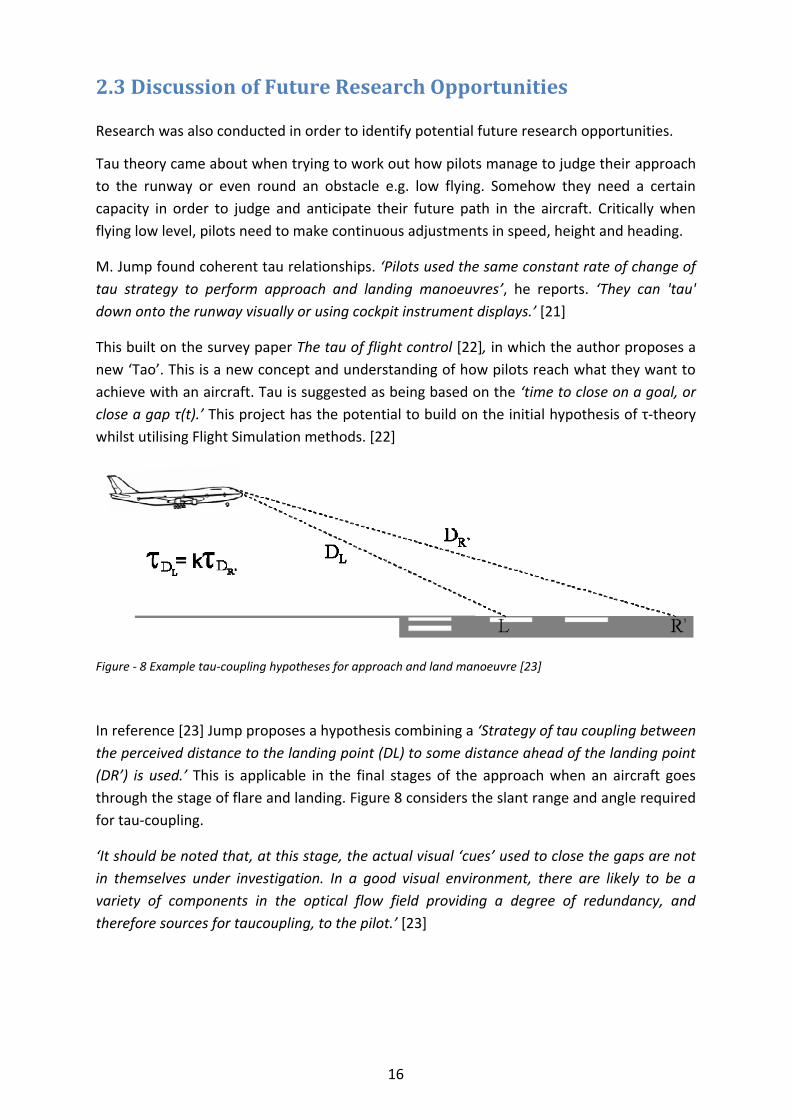
Figure - 8 Example tau-coupling hypotheses for approach and land manoeuvre [23]
In reference [23] Jump proposes a hypothesis combining a ‘Strategy of tau coupling between
the perceived distance to the landing point (DL) to some distance ahead of the landing point
(DR’) is used.’ This is applicable in the final stages of the approach when an aircraft goes
through the stage of flare and landing. Figure 8 considers the slant range and angle required
for tau-coupling.
‘It should be noted that, at this stage, the actual visual ‘cues’ used to close the gaps are not
in themselves under investigation. In a good visual environment, there are likely to be a
variety of components in the optical flow field providing a degree of redundancy, and
therefore sources for taucoupling, to the pilot.’ [23]
17
2.4 Closure In answer to the question ‘What research has previously been undertaken on the fidelity
requirements for fixed wing Flight Simulator training?’ the literature review affirms that
there has been widespread research conducted towards the use of large scale Flight
Simulation Devices in the airline industry. However, there have been few research
programmes investigating the application of low cost synthetic training devices towards the
General Aviation industry.
The paper The Case for Flight Simulation in General Aviation [6] is the most significant study
to date and therefore the most applicable and influential paper to this research project. The
author critically analyses this specialist field and summarises ‘The application of synthetic
training in General Aviation lags some twenty years behind other sectors. If the benefits of
simulation, which have been so successful in airline training, could be applied to General
Aviation, then there are enormous potential improvements in the quality of training and in
aviation safety, by exploiting the advances afforded by computer technology. However, this
approach to flight training needs to be supported by objective studies to quantify these
benefits and, more importantly, to establish the limitations of synthetic training, particularly
in areas where the use of Flight Simulation results in negative transfer of training.’ [6]
Therefore, it is important that progress is made in this area with the overall aim of reducing
the accident rate for General Aviation. This is due to a general lack of understanding of the
subject and also inconsistencies in findings of particular research papers, for example in
reference [14]. Here it was concluded that neither negative nor positive transfer of flying
skills could be proven as a result of simulated lessons, thus reiterating the need for
continued research into this specialised field and highlighting opportunities for potential
future research.
18
3. Theory
The focal aim is to research and identify the effectiveness of current training on specific
scenarios, and to measure the learning outcome. Once this is achieved, improvements can
be made to existing methods thus improving overall safety. As an end result a pilot’s
chances of making it through the Killing Zone are increased - theoretically. An initial
prognosis suggests that that safety amongst pilots with between 50-350 hours can be
increased through the use of Flight Simulation. This is achieved by scrutinising problematic
areas novice pilots routinely experience problems with, and improving existing flight training
methods, through the use of Flight Simulation.
3.1 The Flight Simulation Device
3.1.1 The Composition of the FSD In reference [18] the authors note that although most FSDs have their own individual
system structure, they still have the similar overall basic framework and system components
in common. An abridged version of a FSD’s key systems is as follows;
‘The aircraft flying dynamics simulation system
The aircraft flying dynamics simulation system is a critical system in the FSD, not only
because it is the most important part to ensure the simulation resemblance, but it also acts
as a data source to drive other systems.
The visual simulation system
The visual simulation system can provide spatial positions, flying environments and
battlefield data for the pilot. According to statistics on flight-simulation-practice relative
importance for dynamic or visual simulation, the more manoeuvrable the aircraft is the
better visual simulation system is needed.’ [18]
John Cox, a retired airline captain with U.S. Airways and experienced safety advisor,
explained that;
‘Takeoff and landing are when the airplane is in closer proximity to the ground. Additionally,
this is when the speed is slower, more manoeuvring is occurring, and there are more
airplanes in the airspace.
According to Boeing statistical studies, 16% of fatal accidents occur during takeoff and initial
climb, while 29% occur during the approach and landing.’ [24]
Therefore it must be noted that for non-military aircraft, especially with respect to General
Aviation, the visual simulation is far more important in simulating the correct fidelity for the
takeoff and landing phase of flight.
19
‘The computer simulation system
The computer simulation system plays an essential role in the FSD. Its main purpose is to
calculate the models of the aircraft dynamics system and other systems, as well as manage
and control the flying simulation system.
The aircraft acceleration and overload simulation system
This system is used to simulate the effect of aircraft acceleration and overload system. It
needs to provide a simulated movable cockpit based on the multi-degree-of-freedom motion
platform.
The sound and noise simulation system
The sound and noise simulation system is a key part of any FSD as it is vital in increasing the
fidelity of the simulation system.’ [18]
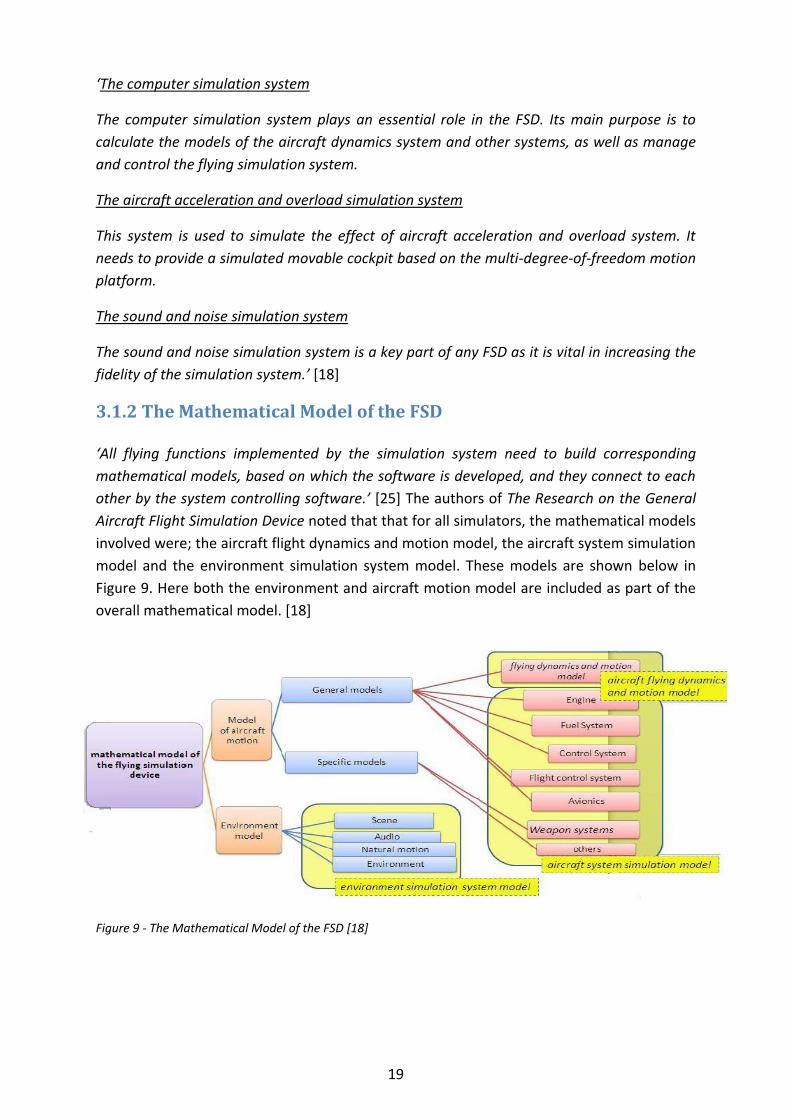
3.1.2 The Mathematical Model of the FSD ‘All flying functions implemented by the simulation system need to build corresponding
mathematical models, based on which the software is developed, and they connect to each
other by the system controlling software.’ [25] The authors of The Research on the General
Aircraft Flight Simulation Device noted that that for all simulators, the mathematical models
involved were; the aircraft flight dynamics and motion model, the aircraft system simulation
model and the environment simulation system model. These models are shown below in
Figure 9. Here both the environment and aircraft motion model are included as part of the
overall mathematical model. [18]
Figure 9 - The Mathematical Model of the FSD [18]
20
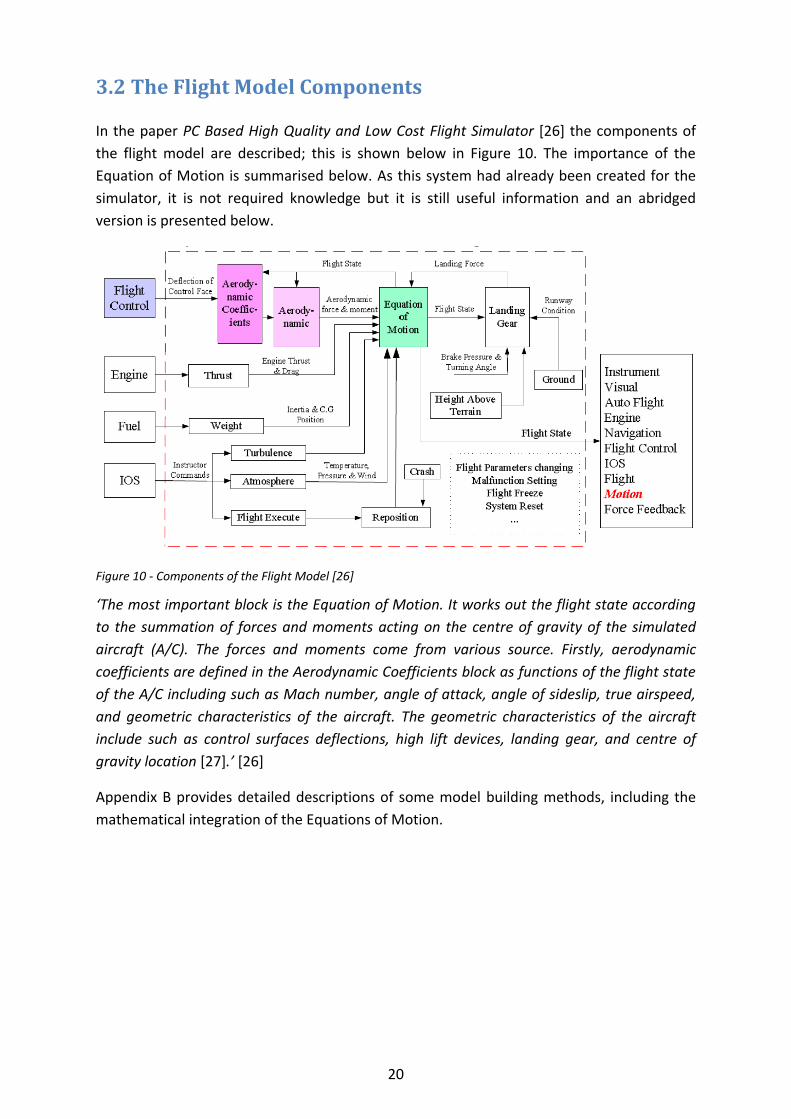
3.2 The Flight Model Components In the paper PC Based High Quality and Low Cost Flight Simulator [26] the components of
the flight model are described; this is shown below in Figure 10. The importance of the
Equation of Motion is summarised below. As this system had already been created for the
simulator, it is not required knowledge but it is still useful information and an abridged
version is presented below.
Figure 10 - Components of the Flight Model [26]
‘The most important block is the Equation of Motion. It works out the flight state according
to the summation of forces and moments acting on the centre of gravity of the simulated
aircraft (A/C). The forces and moments come from various source. Firstly, aerodynamic
coefficients are defined in the Aerodynamic Coefficients block as functions of the flight state
of the A/C including such as Mach number, angle of attack, angle of sideslip, true airspeed,
and geometric characteristics of the aircraft. The geometric characteristics of the aircraft
include such as control surfaces deflections, high lift devices, landing gear, and centre of
gravity location [27].’ [26]
Appendix B provides detailed descriptions of some model building methods, including the
mathematical integration of the Equations of Motion.

21
4. Design
4.1 The Flight Simulation Device (FSD) The synthetic Flight Simulation Device used was a Piper PA-38-112 Tomahawk simulator,
registration G-LFSD. On September 9th 2006, this aircraft was involved in a crash at
Hawarden airport due to a heavy landing caused by wind shear on the final stages of the
approach to Runway 21. This resulted in the aircraft being written off and donated to the
FlightLab at The University of Liverpool.
Appendix A contains a CAA published chart for Hawarden Airfield, this site of the crash. The
approach to Runway 21 can be seen in the northern sector of the chart, with the arrow
dictating the approach made to the runway on the day of the crash.
Since then, the aircraft shell has been converted into a low fidelity, low cost FSD for
University research purposes. Work began on G-LFSD in the summer of 2011 to convert it to
a static simulator. At present the simulator offers the primary flight controls of pitch, roll
and yaw as well as controls for flaps, trim, throttle and mixture. A new radio stack has been
installed but it not yet functioning. This is the next stage of construction, as well as the
integration of a full instrument panel into the simulator and the improvement of the wrap
around visuals.
The FSD runs the Flight Simulation software X-Plane 9 in conjunction with an instructor’s
station. This allows research into low fidelity procedural work to be carried out at low cost,
making it an ideal device for the testing and evaluation of current and experimental flight
training methods. As part of the project the simulator has been upgraded with the addition
of 4 screens giving a 180’ field of view for the pilot.
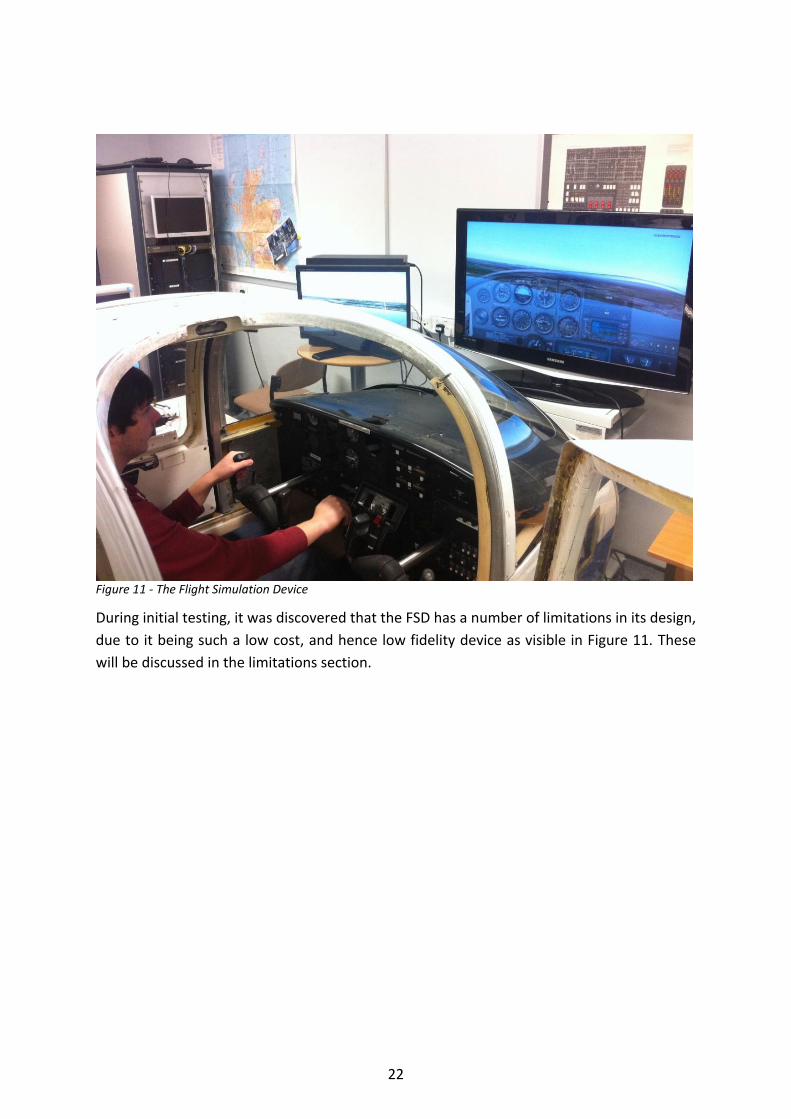
Figure 11 shows the aircraft after conversion to a basic FSD with the main forward view
displayed on a TV screen and one of the 4 additional screens visible.
22
Figure 11 - The Flight Simulation Device
During initial testing, it was discovered that the FSD has a number of limitations in its design,
due to it being such a low cost, and hence low fidelity device as visible in Figure 11. These
will be discussed in the limitations section.
23
4.2 The Inertial Measurement Unit (IMU) In order to measure the effect prior training on a synthetic simulation device has on pilot
performance, an IMU was integrated into a Flying School aircraft. This IMU is an entirely
separate project, but the overall aim was to develop a low cost flight data recording pack
that can be used in support of on-going final year project Flight Simulation and modelling
projects.
Flight modelling and simulation projects typically require access to Flight Test data in order
to carry out model validation studies to provide confidence in the use of the model for
research. Data sets can be sparse, especially for General Aviation (rotary and fixed wing)
aircraft as well as vintage aircraft. These aircraft feature in current research and in order to
provide the data for these projects, this project aimed to develop a low cost solution to
flight data acquisition. The student used existing hardware and also carried out a review of
emerging hardware including tablet based applications in order to develop this capability.
The project also examined the feasibility of application of the kit to other areas e.g.
UAV/Model testing, this makes it an ideal tool for verifying the effect synthetic simulation
has on pilot training.
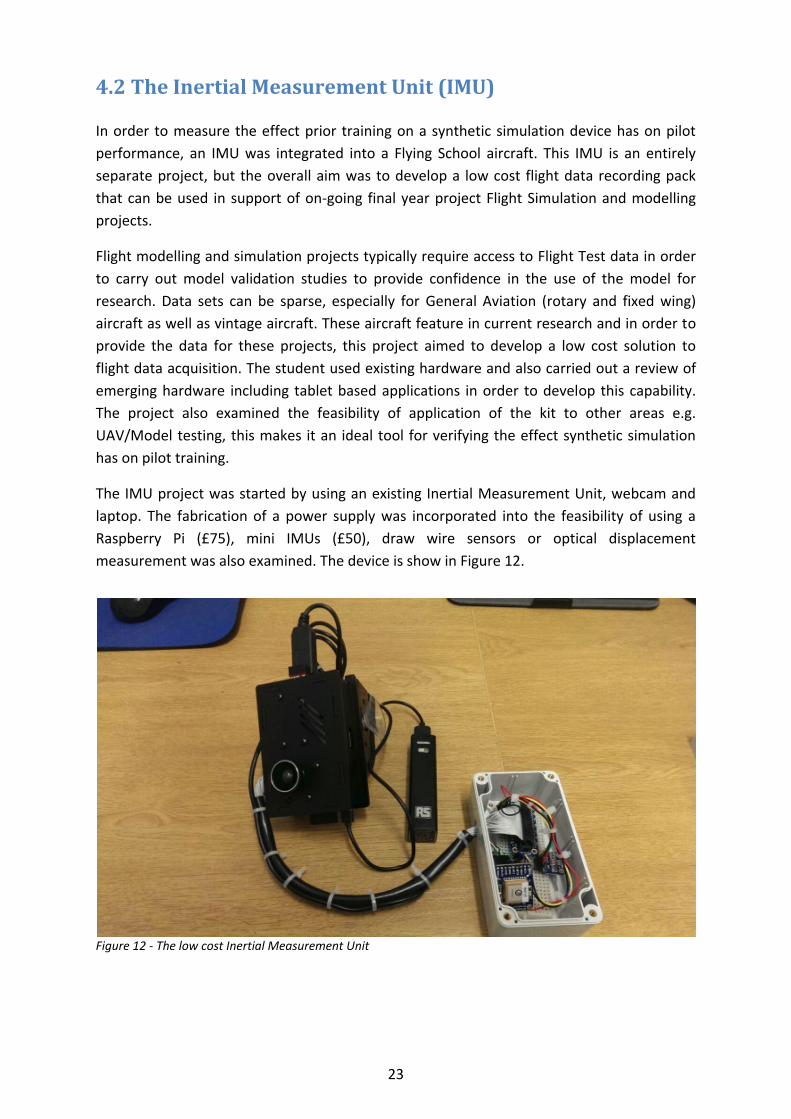
The IMU project was started by using an existing Inertial Measurement Unit, webcam and
laptop. The fabrication of a power supply was incorporated into the feasibility of using a
Raspberry Pi (£75), mini IMUs (£50), draw wire sensors or optical displacement
measurement was also examined. The device is show in Figure 12.
Figure 12 - The low cost Inertial Measurement Unit
24
5. Experimental Method
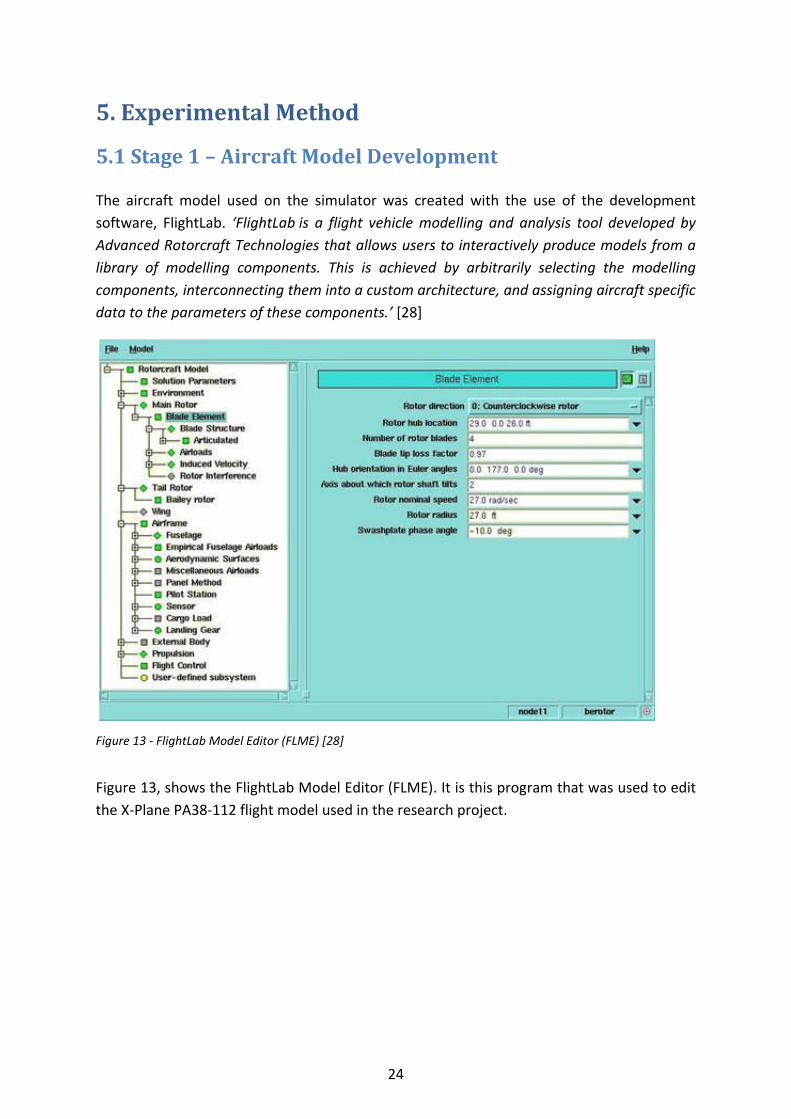
5.1 Stage 1 – Aircraft Model Development The aircraft model used on the simulator was created with the use of the development
software, FlightLab. ‘FlightLab is a flight vehicle modelling and analysis tool developed by
Advanced Rotorcraft Technologies that allows users to interactively produce models from a
library of modelling components. This is achieved by arbitrarily selecting the modelling
components, interconnecting them into a custom architecture, and assigning aircraft specific
data to the parameters of these components.’ [28]
Figure 13 - FlightLab Model Editor (FLME) [28]
Figure 13, shows the FlightLab Model Editor (FLME). It is this program that was used to edit
the X-Plane PA38-112 flight model used in the research project.
25
5.2 Stage 2 – Simulator Testing
5.2.1 Development of Standard Training Profile During Stage 1 testing, two candidates were used during this preliminary period in order to
develop a suitable training plan for the PA38-112 simulator. Each candidate was a first year
pilot studies student and had; 10 hours of previous flight time, completed at least a single
landing without instructor input and had not previously flown in the visual circuit. The
training profile developed is shown in Appendix B. The purpose of developing this briefing is
to ensure all candidates receive the same technical briefing with regards to how the visual
circuit should be flow. This training plan was then approved by an instructor from Liverpool
Flying School in order to ensure it confirmed to the standard PPL syllabus.
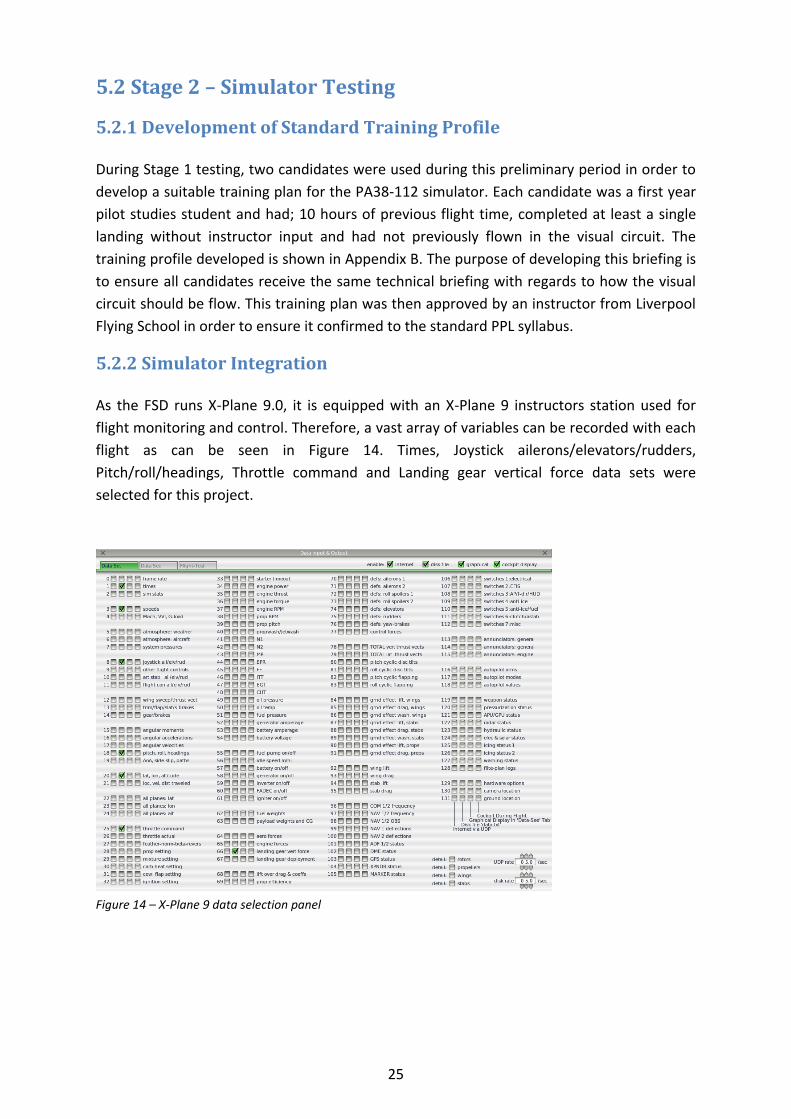
5.2.2 Simulator Integration As the FSD runs X-Plane 9.0, it is equipped with an X-Plane 9 instructors station used for
flight monitoring and control. Therefore, a vast array of variables can be recorded with each
flight as can be seen in Figure 14. Times, Joystick ailerons/elevators/rudders,
Pitch/roll/headings, Throttle command and Landing gear vertical force data sets were
selected for this project.
Figure 14 – X-Plane 9 data selection panel
26
When developing the experimental test method, it must be noted that exact defined
parameters are required in order to lower the general factors. When analysing stages of
flight, there many variables that must be either eliminated or kept constant throughout, in
order to ensure the reliability of the experiment. These are as follows;
Pilots must be up to circuit standard and have received the prior ground school
briefing from Liverpool Flying School Instructors.
Only the visual circuit was examined. This covers Exercises 12 and 13 in the PPL flight
training syllabus as shown in Figure 15.
A standard training profile for flying the circuit was briefed to each pilot before the
exercise (Appendix C).
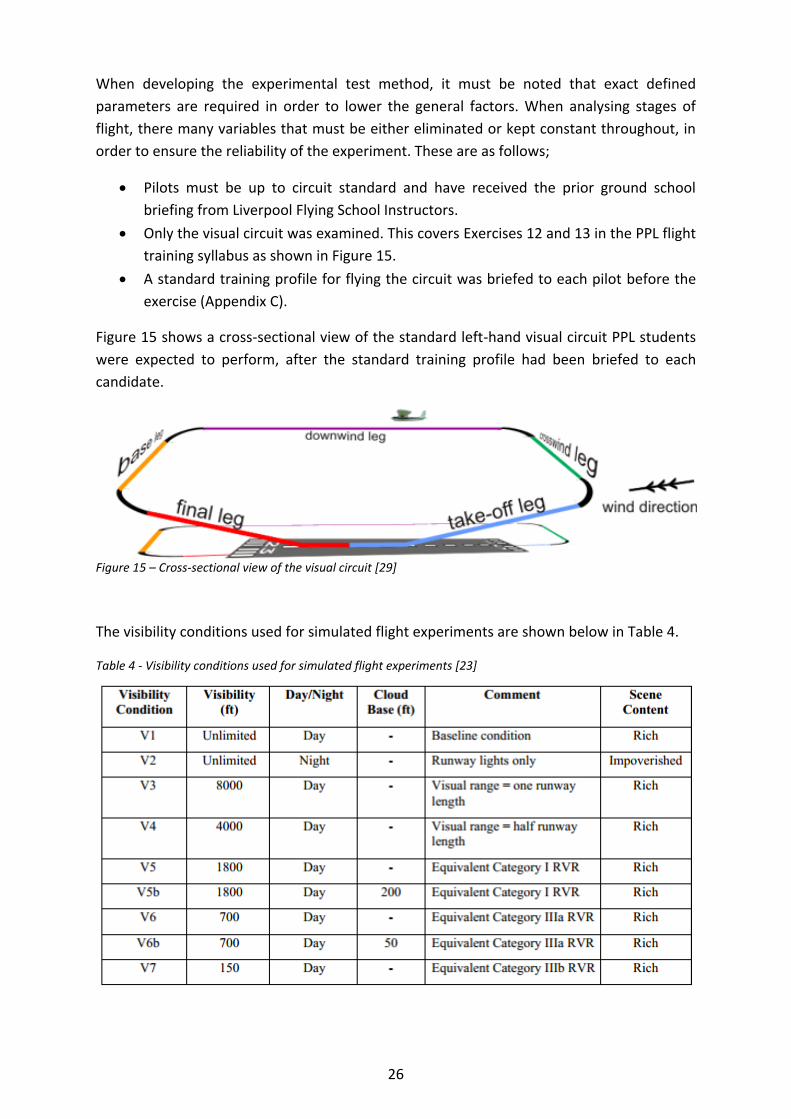
Figure 15 shows a cross-sectional view of the standard left-hand visual circuit PPL students
were expected to perform, after the standard training profile had been briefed to each
candidate.
Figure 15 – Cross-sectional view of the visual circuit [29]
The visibility conditions used for simulated flight experiments are shown below in Table 4.
Table 4 - Visibility conditions used for simulated flight experiments [23]
27
During this stage of testing, the simulated weather was set to CAVOK and the visibility
condition was V1. As can be seen from Table 4, V1 sets a visibility of unlimited in daylight
conditions with no cloud coverage; this is regarded as the ‘Baseline condition’.
CAVOK is defined as:
‘Ceiling and Visibility are OK; specifically,
(1) There are no clouds below 5000 feet above aerodrome level (AAL) or minimum sector
altitude (whichever is higher) and no cumulonimbus or towering cumulus;
(2) Visibility is at least 10 kilometres (6 statute miles); and
(3) No current or forecast significant weather such as precipitation, thunderstorms,
shallow fog or low drifting snow.’ [30]
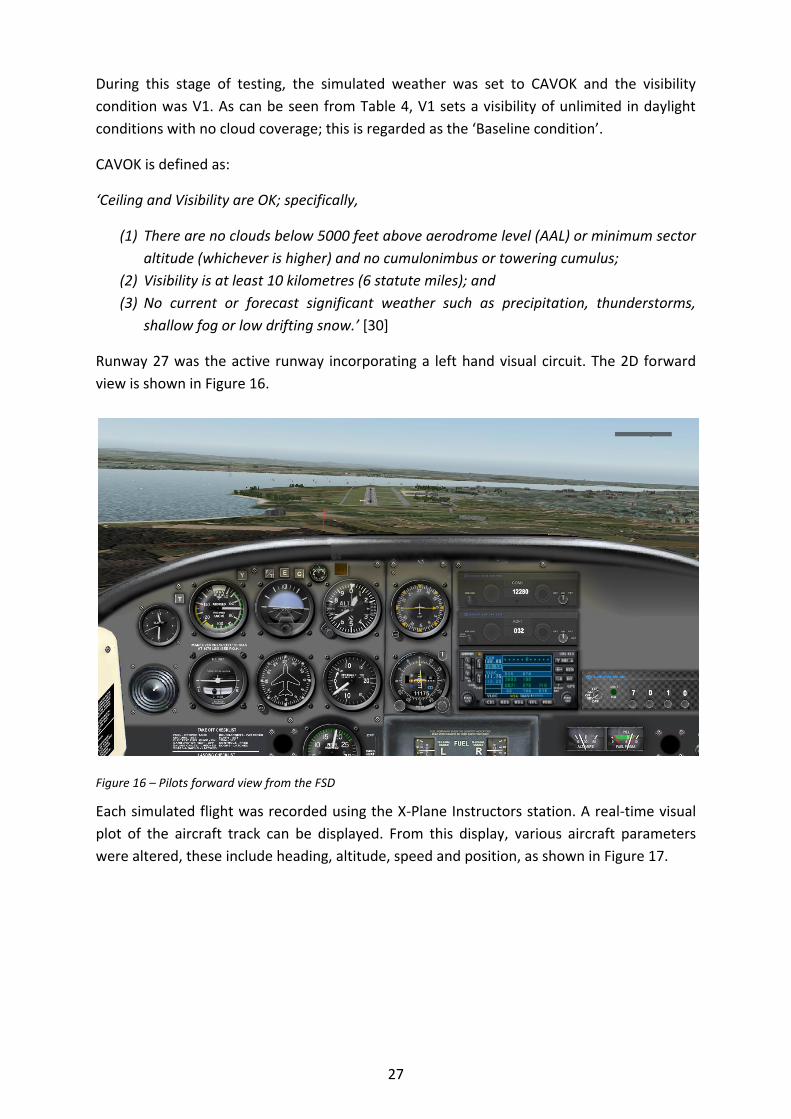
Runway 27 was the active runway incorporating a left hand visual circuit. The 2D forward
view is shown in Figure 16.
Figure 16 – Pilots forward view from the FSD
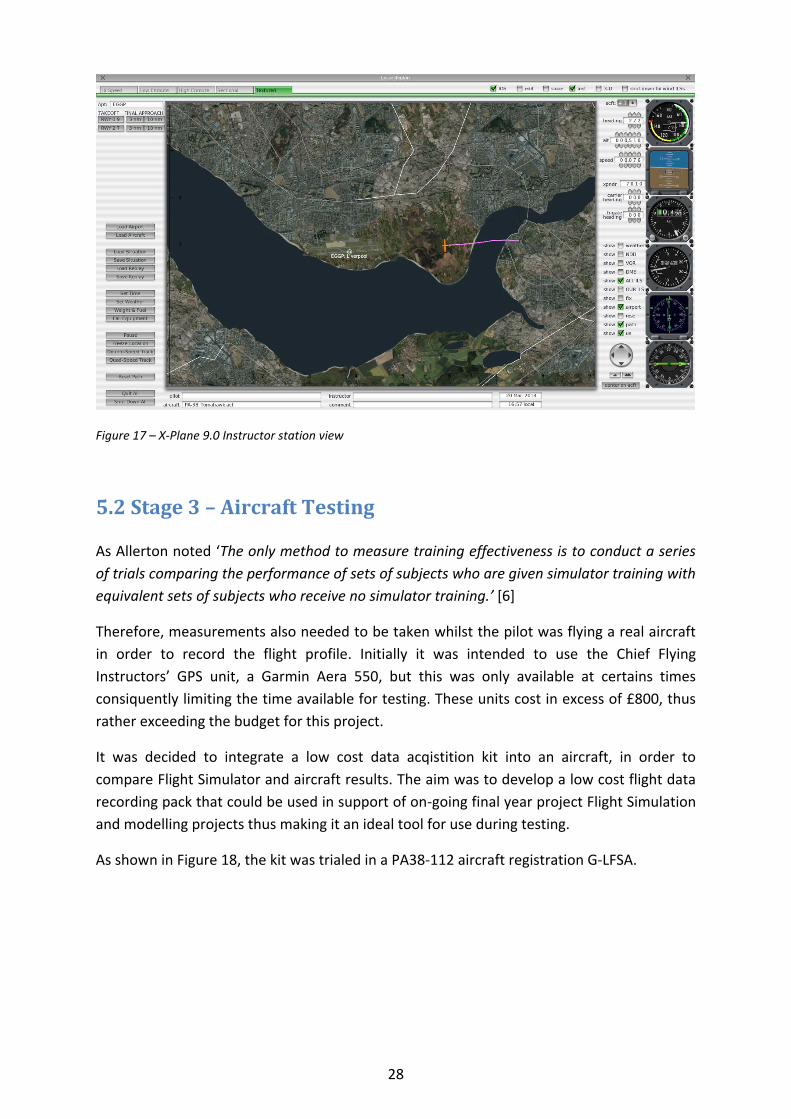
Each simulated flight was recorded using the X-Plane Instructors station. A real-time visual
plot of the aircraft track can be displayed. From this display, various aircraft parameters
were altered, these include heading, altitude, speed and position, as shown in Figure 17.
28
Figure 17 – X-Plane 9.0 Instructor station view
5.2 Stage 3 – Aircraft Testing As Allerton noted ‘The only method to measure training effectiveness is to conduct a series
of trials comparing the performance of sets of subjects who are given simulator training with
equivalent sets of subjects who receive no simulator training.’ [6]
Therefore, measurements also needed to be taken whilst the pilot was flying a real aircraft
in order to record the flight profile. Initially it was intended to use the Chief Flying
Instructors’ GPS unit, a Garmin Aera 550, but this was only available at certains times
consiquently limiting the time available for testing. These units cost in excess of £800, thus
rather exceeding the budget for this project.
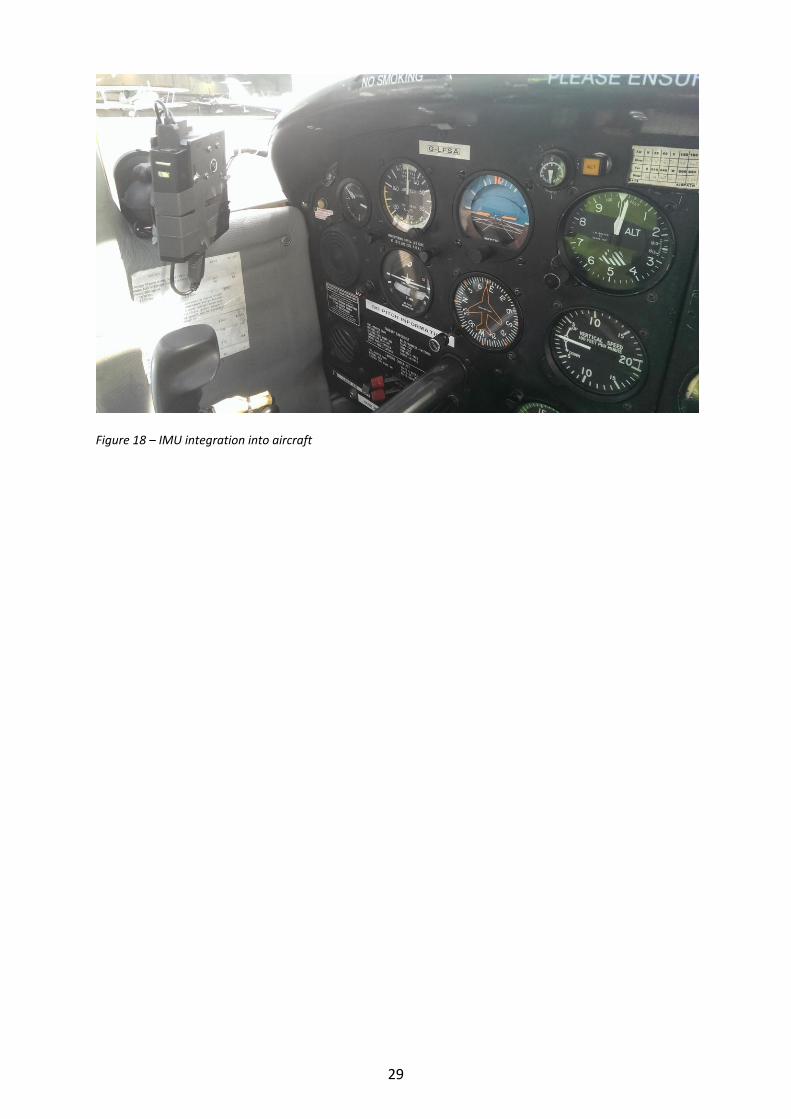
It was decided to integrate a low cost data acqistition kit into an aircraft, in order to
compare Flight Simulator and aircraft results. The aim was to develop a low cost flight data
recording pack that could be used in support of on-going final year project Flight Simulation
and modelling projects thus making it an ideal tool for use during testing.
As shown in Figure 18, the kit was trialed in a PA38-112 aircraft registration G-LFSA.
29
Figure 18 – IMU integration into aircraft
30
6. Results and Discussion In this section, the results from all simulator sessions will be presented; the aircraft Flight
Test and following simulator session will also be discussed.
MATLAB 2013b was used in order to take the outputted .txt file from X-Plane and convert it
into a usable .csv file, after which data could be plotted in order to draw comparisons
between sets of data. The full code is presented in Appendix D.
The MATLAB code shows how a .txt to .csv conversion is able to be carried out in order to
plot the flight data and also how the file can be altered to stipulate the number of simulator
input files to be processed by changing, i, in the section for n=1:i
Therefore filenames can be generated for any amount of Flight Simulator outputted text
files 'flightData_%i'
filenameTemplate = 'flightData_%i';
for n=1:1
In this example the output of running the file is;
text filename = flightData_1.txt
csv filename = flightData_1.csv
6.1 Results In total, 6 individual Flight Tests were carried out of which 5 were simulator sessions and 1
was a Flight Test in a real aircraft. The results are as follows;
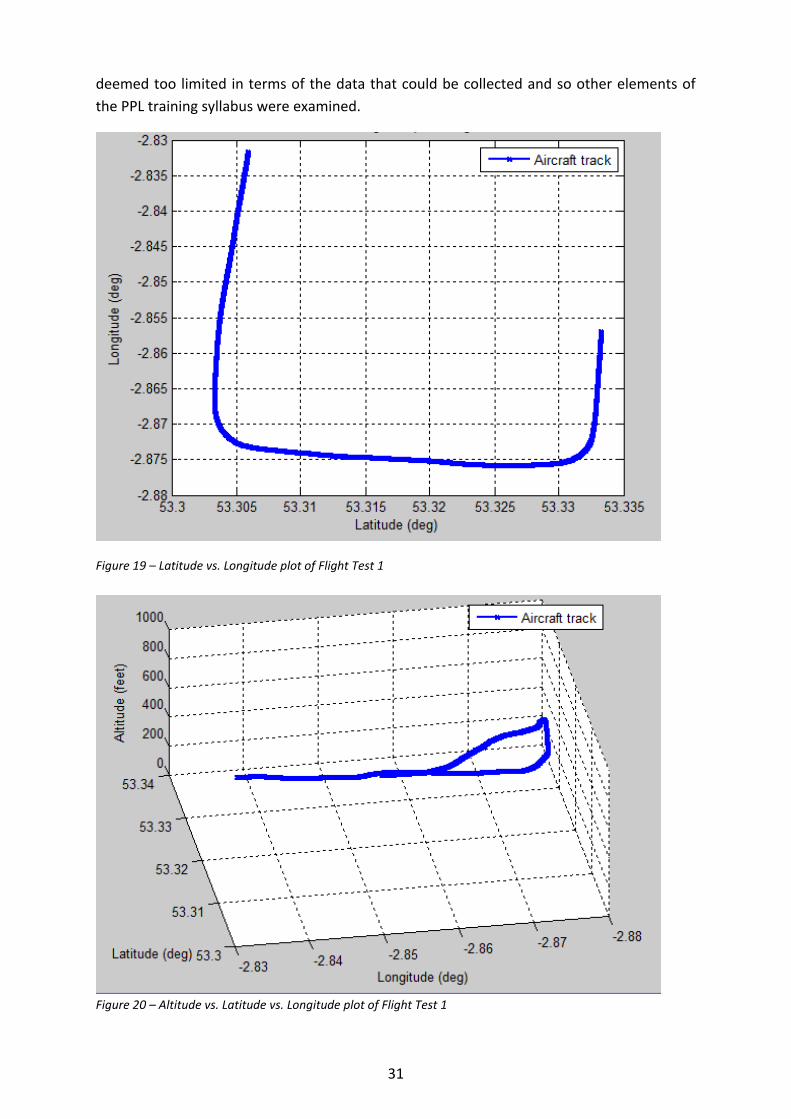
6.1.1 Flight Test 1 During the first Flight Test, the weather was CAVOK (Ceiling and Visibility are OK) and time
was set to local. The aircraft was handed to the pilot at 1000ft AGL, 90kts and on downwind
to Runway 09. On handover the pilot proceeded to manoeuvre the aircraft for landing by
turning and descending onto right base. Once this was achieved, the aircraft was set up for
a standard visual approach whilst adhering to the standard PPL syllabus. Once the aircraft
had touched down and come to a stop the test was ended.
The aim of the initial test was to investigate the aspect of flight to be examined, for this
flight a single pilot was used. The flight data recorded is show below. Appendixes E and F
provide a snapshot of the raw .txt flight data and the .txt to .csv file conversion respectively.
Initially the project only looked at the landing stage of an aircraft. After Flight Test 1 this was
31
deemed too limited in terms of the data that could be collected and so other elements of
the PPL training syllabus were examined.
Figure 19 – Latitude vs. Longitude plot of Flight Test 1
Figure 20 – Altitude vs. Latitude vs. Longitude plot of Flight Test 1
32
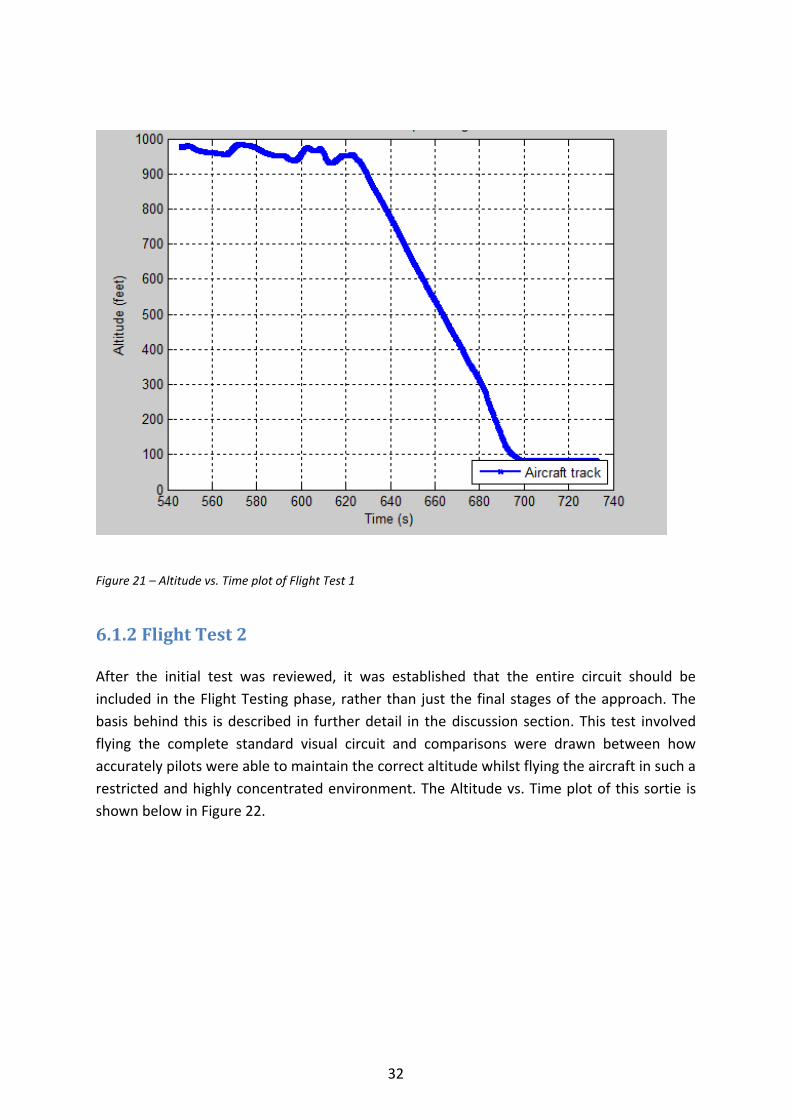
Figure 21 – Altitude vs. Time plot of Flight Test 1
6.1.2 Flight Test 2 After the initial test was reviewed, it was established that the entire circuit should be
included in the Flight Testing phase, rather than just the final stages of the approach. The
basis behind this is described in further detail in the discussion section. This test involved
flying the complete standard visual circuit and comparisons were drawn between how
accurately pilots were able to maintain the correct altitude whilst flying the aircraft in such a
restricted and highly concentrated environment. The Altitude vs. Time plot of this sortie is
shown below in Figure 22.
33
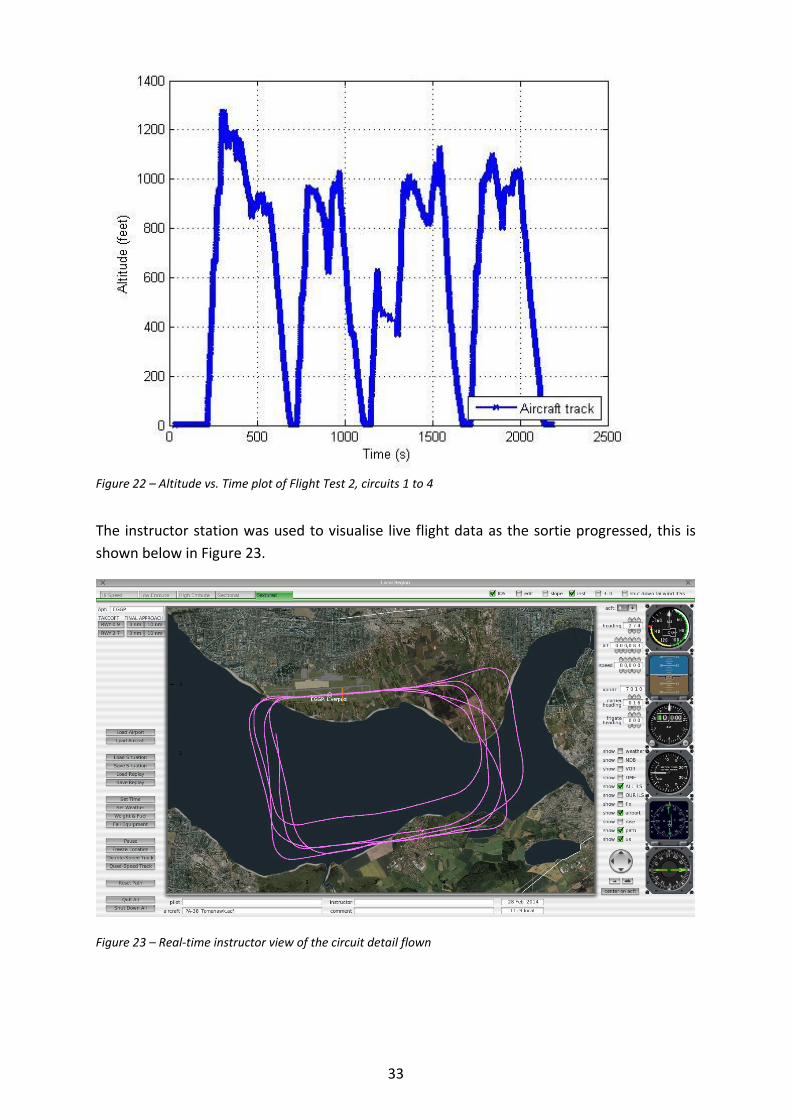
Figure 22 – Altitude vs. Time plot of Flight Test 2, circuits 1 to 4
The instructor station was used to visualise live flight data as the sortie progressed, this is
shown below in Figure 23.
Figure 23 – Real-time instructor view of the circuit detail flown

34
It is evident that from this test, the pilot manage to fly the aircraft more accurately the more
the circuit was flown. The first circuit climbed to 1200ft, 200ft above normal circuit altitude,
with the final circuit achieving a much smoother top-of-climb averaging around the 1000ft
mark. The final circuit has been enlarged in order to show the vast improvement from the
initial circuit flown. It is evident that with increased simulator time, the procedural element
of the circuit can be vastly improved than that of a pilot who receives no prior training.
Figure 24 – Altitude vs. Time plot of Flight Test 2, final circuit
6.1.3 Flight Test 3 This test involved testing a similar pilot of equal experience and according to the flight
instructor, this pilot is of the same ability as the pilot in Test 1 and 2 and eventually Tests 5
and 6 and 7. This pilot did not have any prior simulator training and experienced problems
with the low fidelity of the FSD. The Altitude vs. Time plot of the circuits plot is shown in
Figure 25.
35
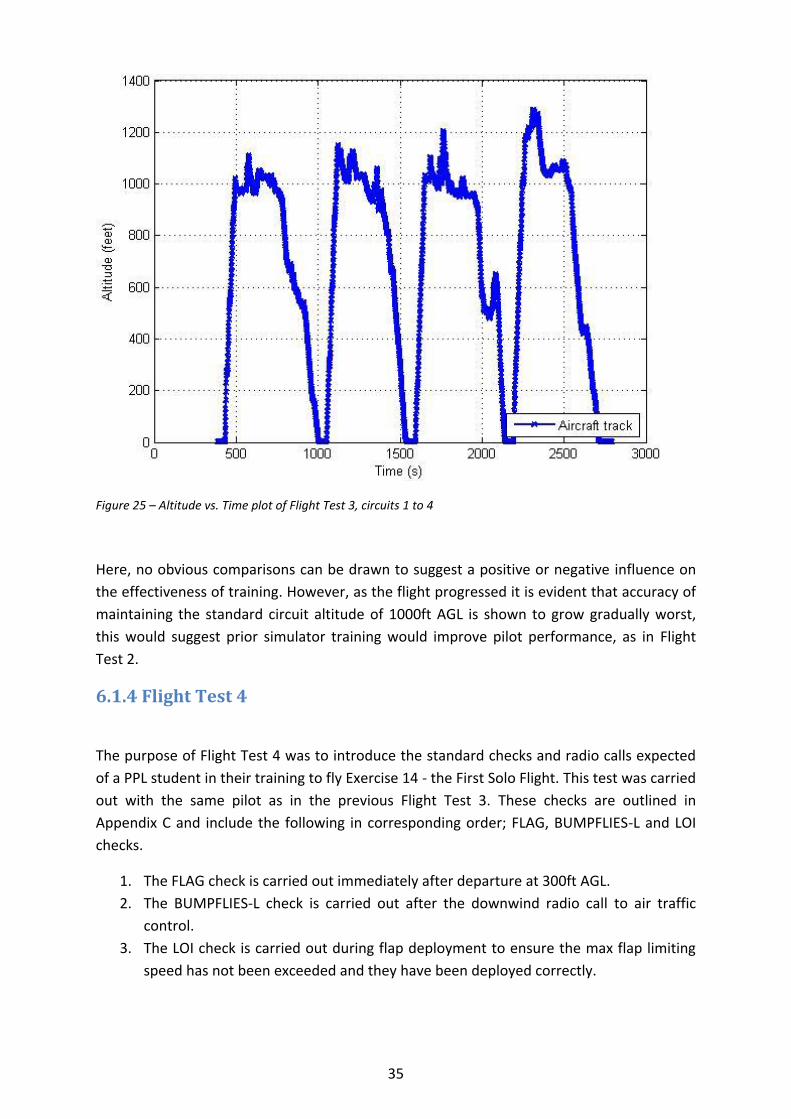
Figure 25 – Altitude vs. Time plot of Flight Test 3, circuits 1 to 4
Here, no obvious comparisons can be drawn to suggest a positive or negative influence on
the effectiveness of training. However, as the flight progressed it is evident that accuracy of
maintaining the standard circuit altitude of 1000ft AGL is shown to grow gradually worst,
this would suggest prior simulator training would improve pilot performance, as in Flight
Test 2.
6.1.4 Flight Test 4
The purpose of Flight Test 4 was to introduce the standard checks and radio calls expected
of a PPL student in their training to fly Exercise 14 - the First Solo Flight. This test was carried
out with the same pilot as in the previous Flight Test 3. These checks are outlined in
Appendix C and include the following in corresponding order; FLAG, BUMPFLIES-L and LOI
checks.
1. The FLAG check is carried out immediately after departure at 300ft AGL.
2. The BUMPFLIES-L check is carried out after the downwind radio call to air traffic
control.
3. The LOI check is carried out during flap deployment to ensure the max flap limiting
speed has not been exceeded and they have been deployed correctly.
36
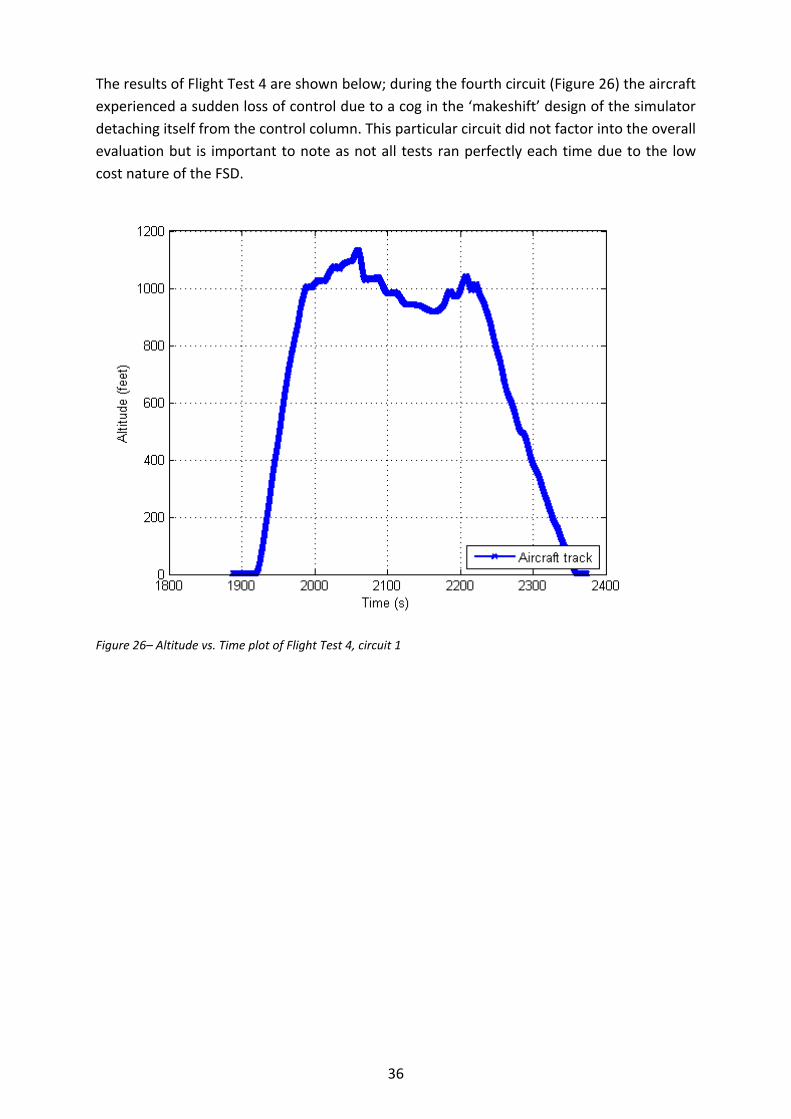
The results of Flight Test 4 are shown below; during the fourth circuit (Figure 26) the aircraft
experienced a sudden loss of control due to a cog in the ‘makeshift’ design of the simulator
detaching itself from the control column. This particular circuit did not factor into the overall
evaluation but is important to note as not all tests ran perfectly each time due to the low
cost nature of the FSD.
Figure 26– Altitude vs. Time plot of Flight Test 4, circuit 1
37
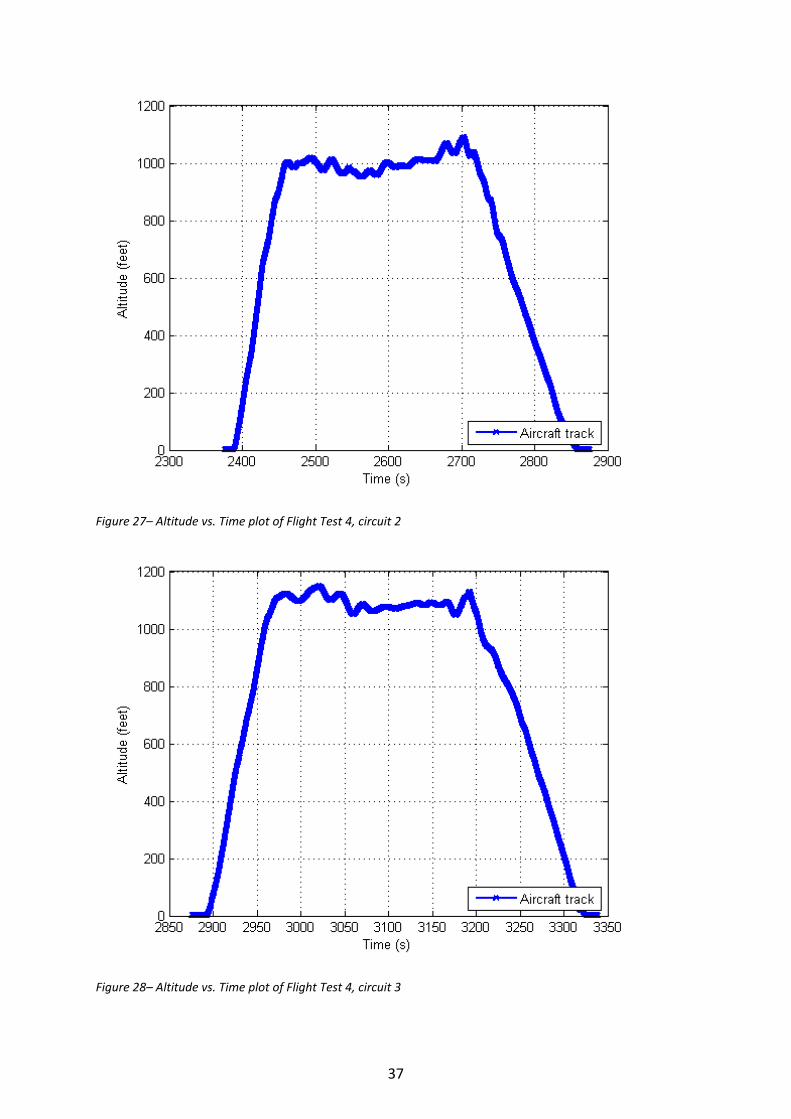
Figure 27– Altitude vs. Time plot of Flight Test 4, circuit 2
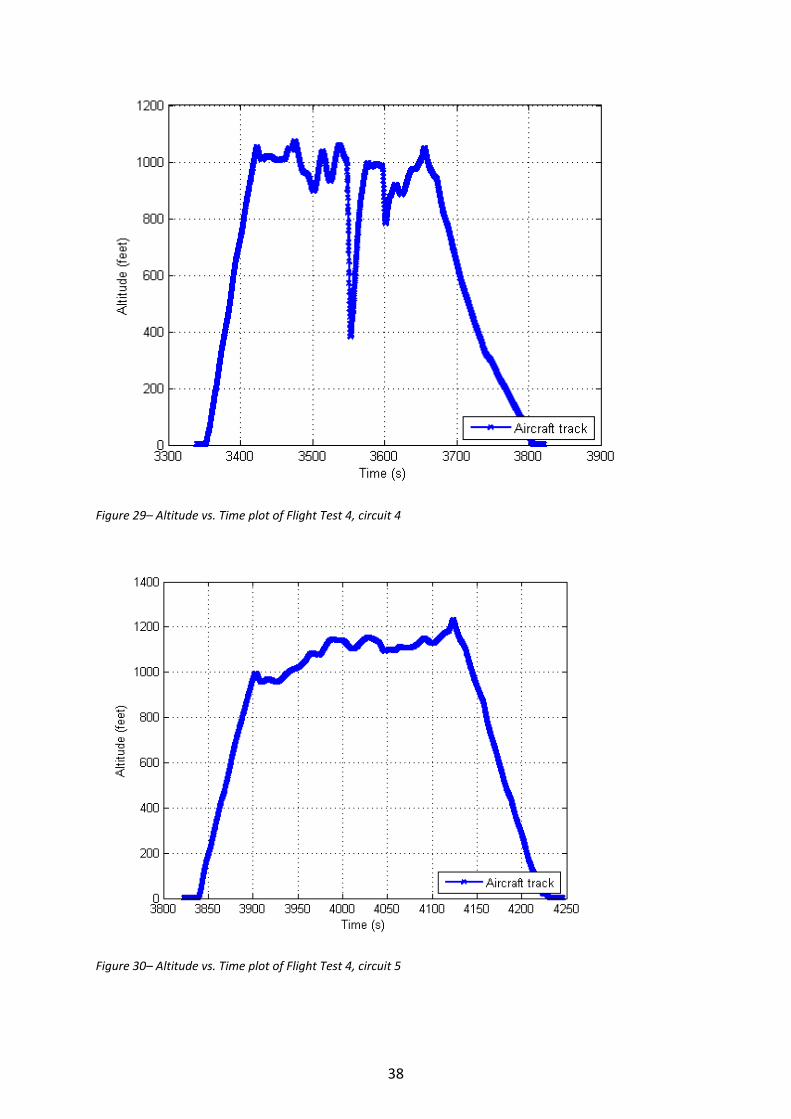
Figure 28– Altitude vs. Time plot of Flight Test 4, circuit 3
38
Figure 29– Altitude vs. Time plot of Flight Test 4, circuit 4
Figure 30– Altitude vs. Time plot of Flight Test 4, circuit 5
39
From this data it is evident that initially accuracy of maintaining altitude is poor as the
altitude fluctuates between +/- 200ft but by circuit 3 this has dramatically improved. The
major factor in this test was the incident of circuit 4 where, due to no fault of the pilot, the
aircraft lost 600ft and had to be climbed back up to normal circuit altitude by applying full
power and so checks were not executed as methodically as they normally would be. This
had a detrimental effect to the final circuit, where pilot fatigue also influenced performance
due to the circuit being such a high workload environment. Therefore, it was deemed
unnecessary to carry out further testing after an hour’s circuit detail and the test was
ended.
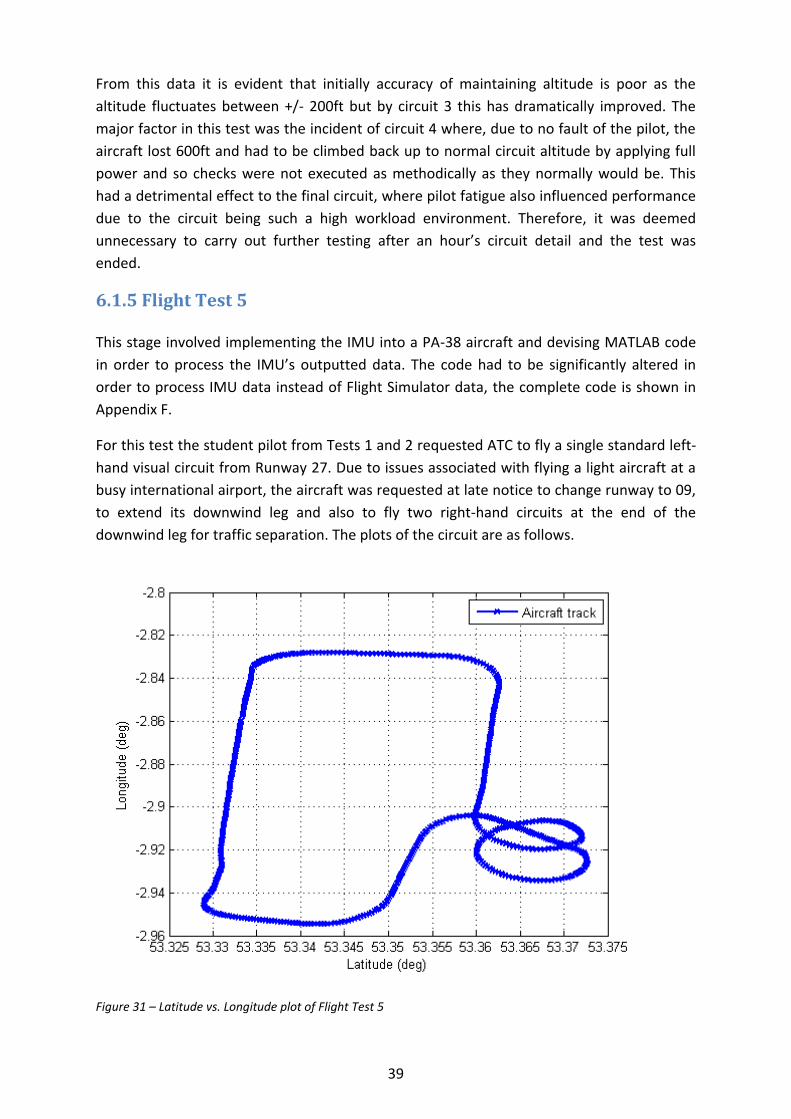
6.1.5 Flight Test 5 This stage involved implementing the IMU into a PA-38 aircraft and devising MATLAB code
in order to process the IMU’s outputted data. The code had to be significantly altered in
order to process IMU data instead of Flight Simulator data, the complete code is shown in
Appendix F.
For this test the student pilot from Tests 1 and 2 requested ATC to fly a single standard left-
hand visual circuit from Runway 27. Due to issues associated with flying a light aircraft at a
busy international airport, the aircraft was requested at late notice to change runway to 09,
to extend its downwind leg and also to fly two right-hand circuits at the end of the
downwind leg for traffic separation. The plots of the circuit are as follows.
Figure 31 – Latitude vs. Longitude plot of Flight Test 5
40
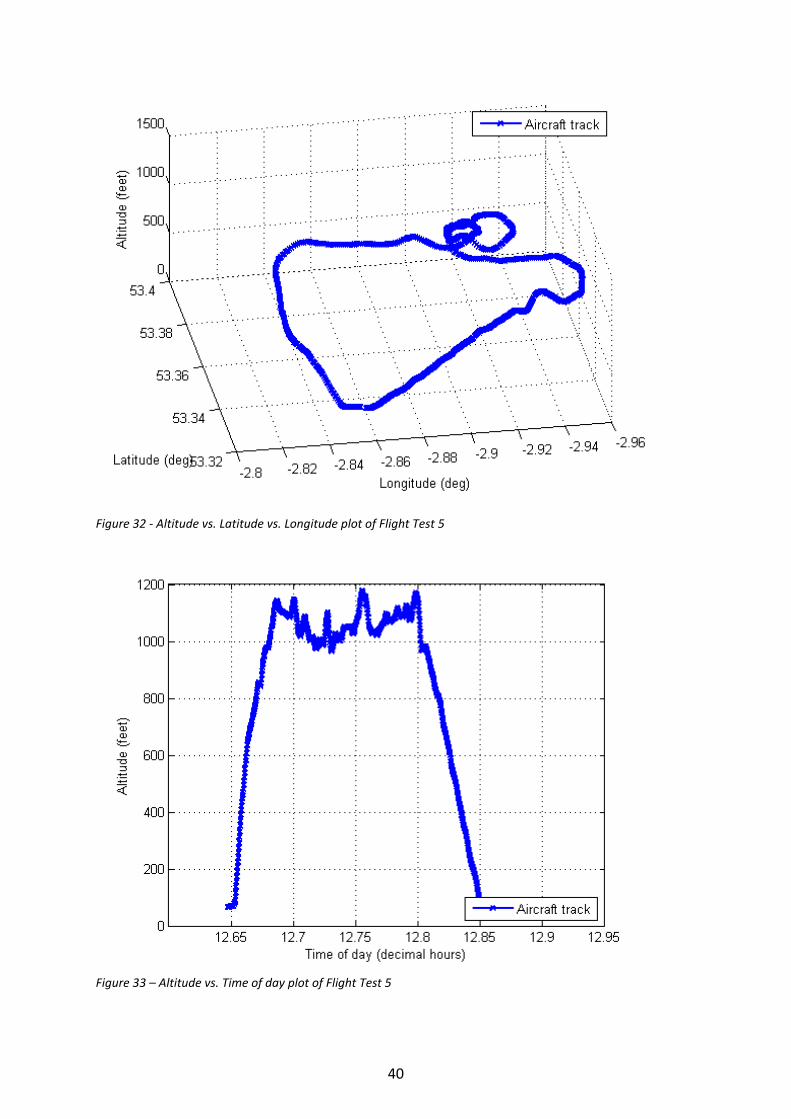
Figure 32 - Altitude vs. Latitude vs. Longitude plot of Flight Test 5
Figure 33 – Altitude vs. Time of day plot of Flight Test 5
41
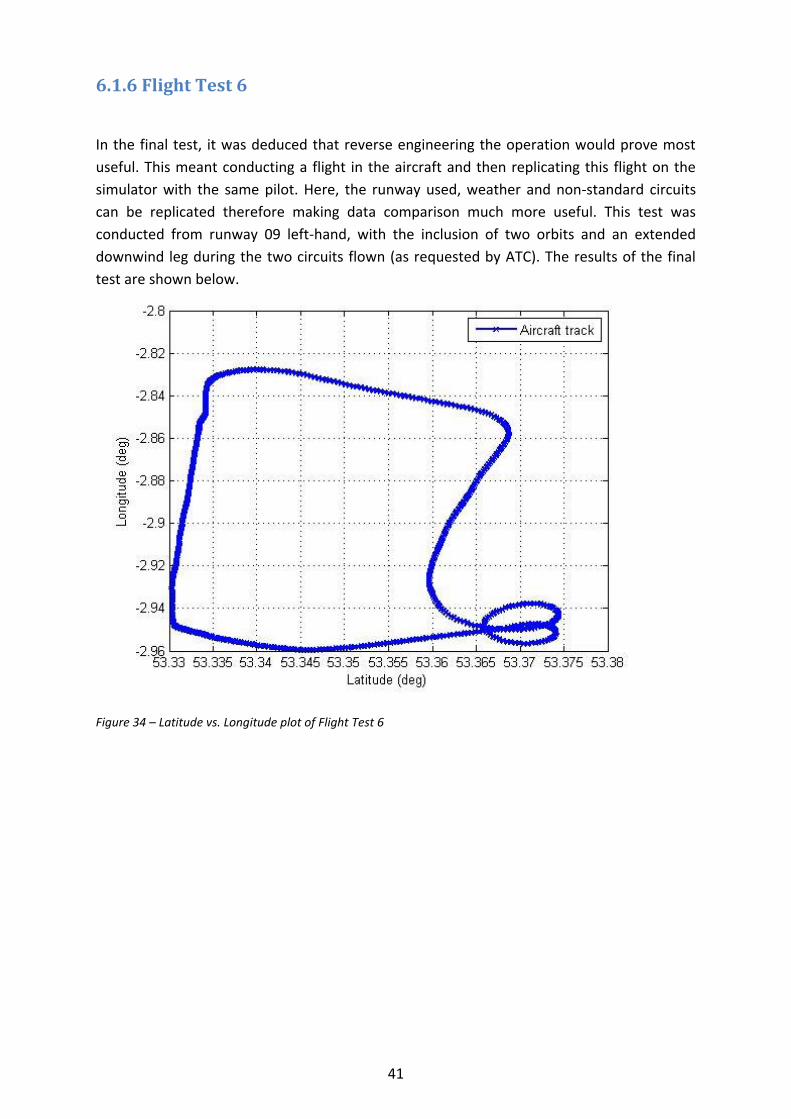
6.1.6 Flight Test 6
In the final test, it was deduced that reverse engineering the operation would prove most
useful. This meant conducting a flight in the aircraft and then replicating this flight on the
simulator with the same pilot. Here, the runway used, weather and non-standard circuits
can be replicated therefore making data comparison much more useful. This test was
conducted from runway 09 left-hand, with the inclusion of two orbits and an extended
downwind leg during the two circuits flown (as requested by ATC). The results of the final
test are shown below.
Figure 34 – Latitude vs. Longitude plot of Flight Test 6
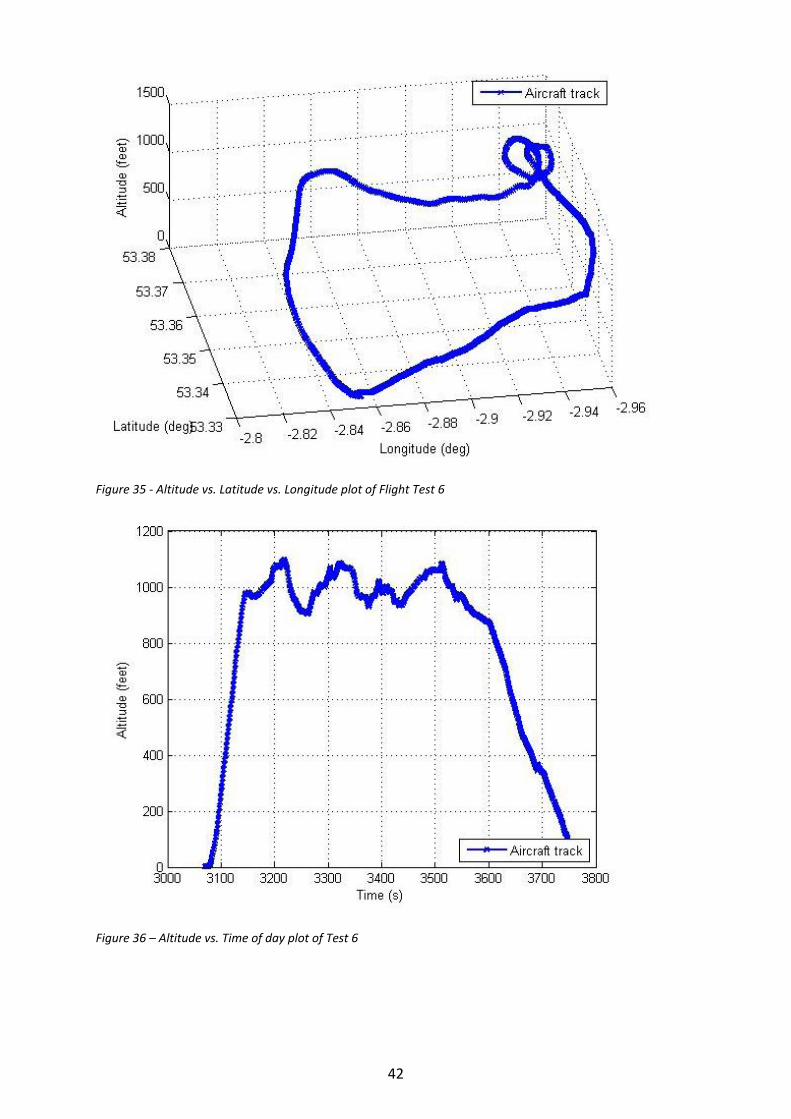
42
Figure 35 - Altitude vs. Latitude vs. Longitude plot of Flight Test 6
Figure 36 – Altitude vs. Time of day plot of Test 6

43
6.2 Discussion
6.2.1 Discussion of Flight Testing As discussed in Flight Test 6, initially pilots were tested on the FSD and then subjected to the
real aircraft, this was an airworthy PA38-112 Tomahawk owned by Liverpool Flying School. It
was then discovered that due to the unpredictable nature of flying at an international
airport, predicting an aircraft sortie is extremely difficult. This is due to a number of factors;
Runway 09 or 27 could be used; this is often changed at last minute. This is depicted
in Figure 37, standard circuit, and Figure 38, non-standard circuit.
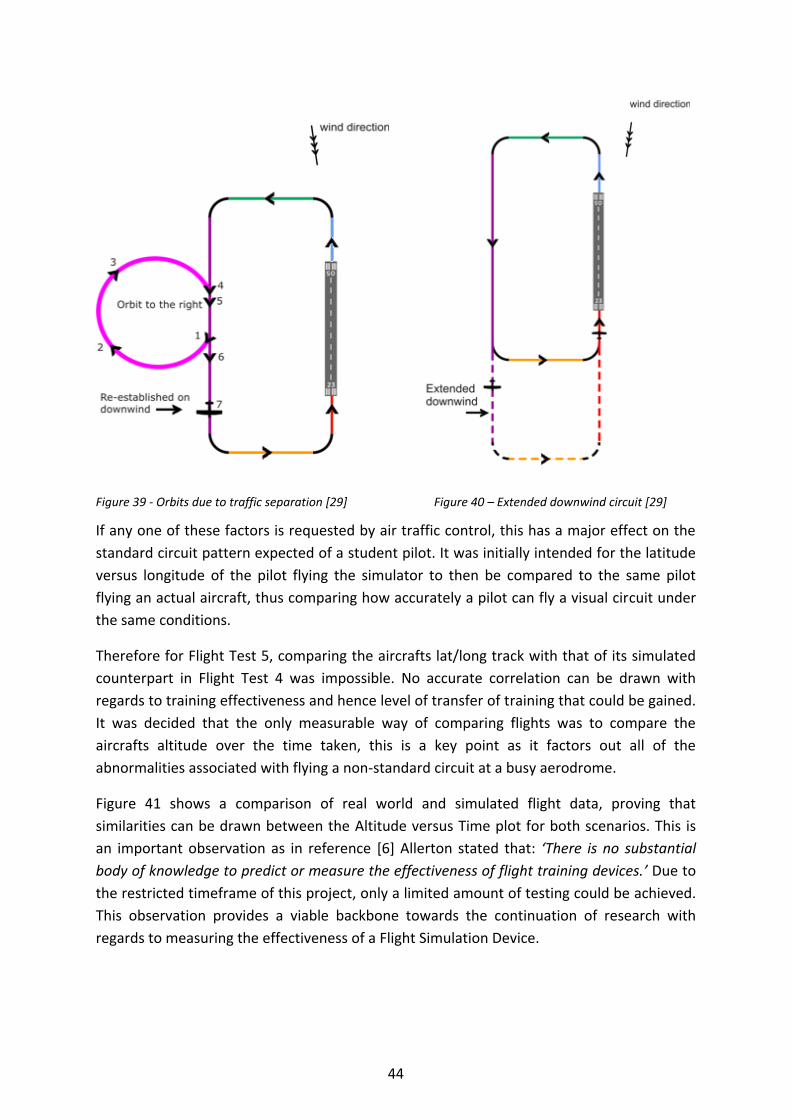
Due to other more high priority traffic than single engine piston aircraft flying in a
circuit, the aircraft is often asked to carry out a number of orbits at the end of the
downwind leg, as shown in Figure 39.
Also for traffic separation the aircraft is routinely asked to extend its downwind leg,
leading to the final approach commencing at 1000ft rather than the standard 700ft,
as shown in Figure 40.
Bad weather causes a pilot to fly a low level circuit; here the aerodrome must always
be kept in visual range and it is flown at 500ft. This leads to the circuit taking on an
oval pattern rather than a standard rectangular pattern at a non-standard altitude.
Figure 37 – Standard left-hand circuit [29] Figure 38 - Non-Standard right-hand circuit [29]
44
Figure 39 - Orbits due to traffic separation [29] Figure 40 – Extended downwind circuit [29]
If any one of these factors is requested by air traffic control, this has a major effect on the
standard circuit pattern expected of a student pilot. It was initially intended for the latitude
versus longitude of the pilot flying the simulator to then be compared to the same pilot
flying an actual aircraft, thus comparing how accurately a pilot can fly a visual circuit under
the same conditions.
Therefore for Flight Test 5, comparing the aircrafts lat/long track with that of its simulated
counterpart in Flight Test 4 was impossible. No accurate correlation can be drawn with
regards to training effectiveness and hence level of transfer of training that could be gained.
It was decided that the only measurable way of comparing flights was to compare the
aircrafts altitude over the time taken, this is a key point as it factors out all of the
abnormalities associated with flying a non-standard circuit at a busy aerodrome.
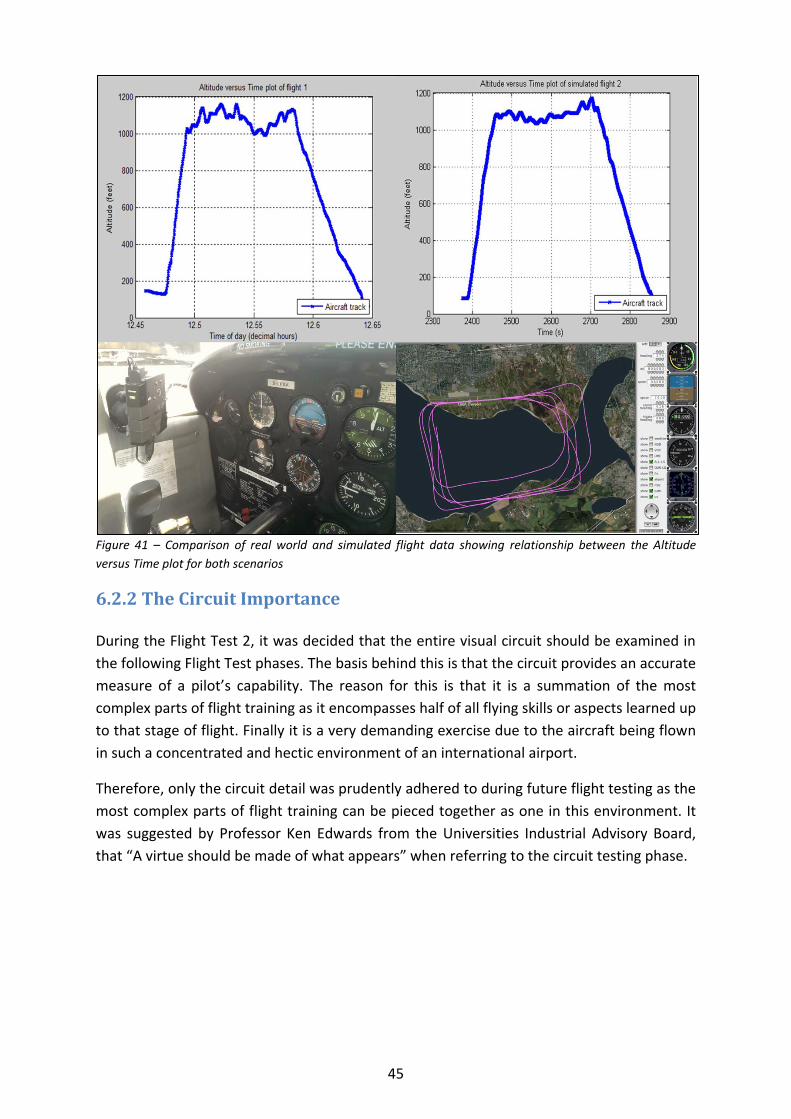
Figure 41 shows a comparison of real world and simulated flight data, proving that
similarities can be drawn between the Altitude versus Time plot for both scenarios. This is
an important observation as in reference [6] Allerton stated that: ‘There is no substantial
body of knowledge to predict or measure the effectiveness of flight training devices.’ Due to
the restricted timeframe of this project, only a limited amount of testing could be achieved.
This observation provides a viable backbone towards the continuation of research with
regards to measuring the effectiveness of a Flight Simulation Device.
45
Figure 41 – Comparison of real world and simulated flight data showing relationship between the Altitude
versus Time plot for both scenarios
6.2.2 The Circuit Importance During the Flight Test 2, it was decided that the entire visual circuit should be examined in
the following Flight Test phases. The basis behind this is that the circuit provides an accurate
measure of a pilot’s capability. The reason for this is that it is a summation of the most
complex parts of flight training as it encompasses half of all flying skills or aspects learned up
to that stage of flight. Finally it is a very demanding exercise due to the aircraft being flown
in such a concentrated and hectic environment of an international airport.
Therefore, only the circuit detail was prudently adhered to during future flight testing as the
most complex parts of flight training can be pieced together as one in this environment. It
was suggested by Professor Ken Edwards from the Universities Industrial Advisory Board,
that “A virtue should be made of what appears” when referring to the circuit testing phase.
46
6.2.3 Limitations Throughout the course of the project, the limitations of the simulation device were obvious
during early stage testing. As a result pilots, instructors and any other bodies involved in the
project provided feedback on any limitations they discovered.
It was immediately apparent that the weather either needed to be kept constant at CAVOK
or set to real world. Initial testing suggested that the fidelity level of the simulator in
conjunction with X-Plane was not sufficient in order to generate realistic current weather
conditions. This was reflected in the final Test Flight 6, where simulator conditions were set
to mimic the previous aircraft sortie during Flight Test 5.
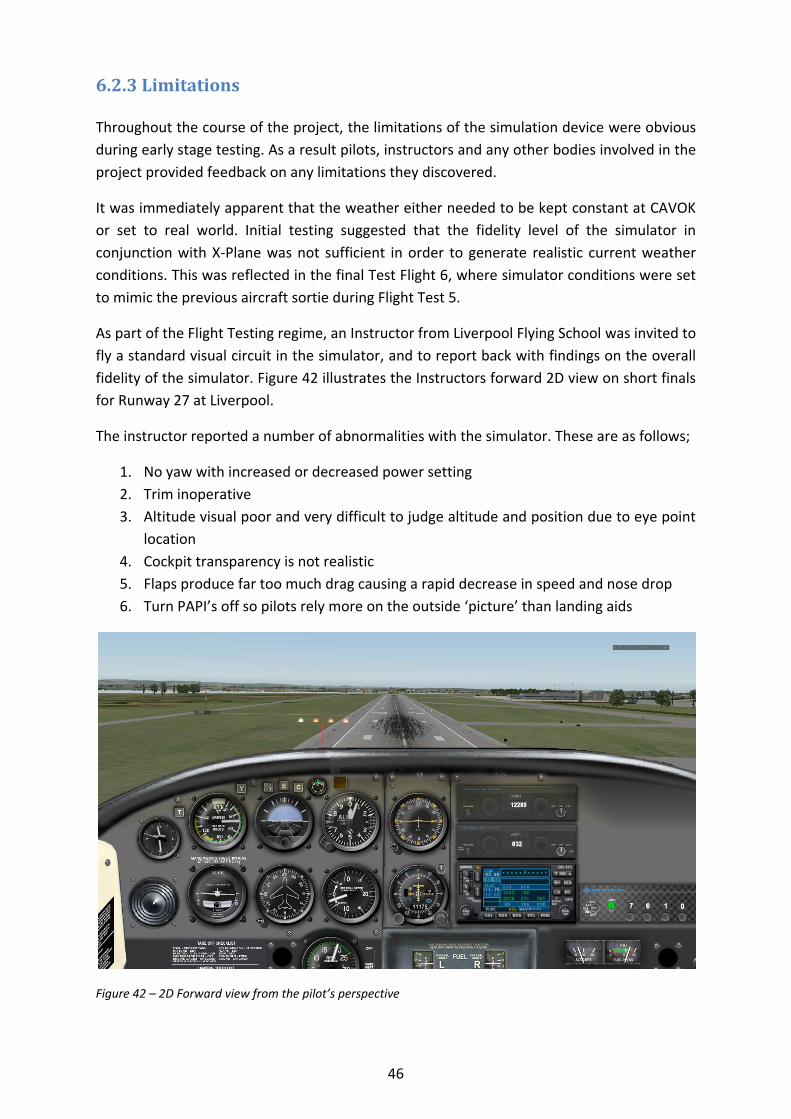
As part of the Flight Testing regime, an Instructor from Liverpool Flying School was invited to
fly a standard visual circuit in the simulator, and to report back with findings on the overall
fidelity of the simulator. Figure 42 illustrates the Instructors forward 2D view on short finals
for Runway 27 at Liverpool.
The instructor reported a number of abnormalities with the simulator. These are as follows;
1. No yaw with increased or decreased power setting
2. Trim inoperative
3. Altitude visual poor and very difficult to judge altitude and position due to eye point
location
4. Cockpit transparency is not realistic
5. Flaps produce far too much drag causing a rapid decrease in speed and nose drop
6. Turn PAPI’s off so pilots rely more on the outside ‘picture’ than landing aids
Figure 42 – 2D Forward view from the pilot’s perspective

47
These limitations of the PA-38 simulator became apparent during testing. The lack of
vibration caused an overall lack of feeling for the pilot, leading to reduced fidelity. Secondly,
even though 4 extra screens had been added, the visual display is still very limited giving a
degraded field of view. This was most noticeable when pilots were required to pick a feature
and then turn the aircraft onto it; many of them misjudged this due to the lack of visual
acuity. It is fundamentally important this is rectified as it is vital to maintain excellent special
awareness at all times in the visual circuit, especially at a busy aerodrome such as Liverpool.
Thirdly, it was noted that the visual cueing of the simulator is sufficiently less than the real
aircraft, giving a noticeable deterioration on pilot performance. This is mainly due to
acceleration cues being poor. In response, there is the potential for the inclusion of motion
within the simulator. It was noted that the simulators effectiveness would improve
drastically if a motion base was added, as motion and increased visual acuity have the effect
of increasing pilot workload, hence an increased potential for more realistic results. Finally
the aircraft model has been described only as ‘partially realistic’. The model rolls too fast
when in reality the PA-38 is rather sluggish. This problem can be dealt with by altering the
model characteristics in FlightLab.
48
7. Conclusions and Recommendations In summary, the overall scope of the study has been achieved by building on the current
level of research in this specialised area, but there is still a long way to go with regards to
convincing flight training organisations and regulators alike to include simulator based
training as part of an approved PPL or CPL training programme.
The project aimed to; research the effectiveness of training for specific scenarios of flight and identify critical operational areas that pilots experience problems with during training, investigate problem areas and examine how pilots could be more effectively trained with the use of Flight Simulation, measure how much training on a simulator can benefit real-world flight training, with regards to overall safety as well as the cost saving benefit and finally enhance the existing training framework for GA pilots, building on the document ICAO9625. These aims have been achieved to a limited extent as the flight simulation device used throughout could only ever achieve a very low level of fidelity, hence results reflected this limitation. However, it is important to remember that this synthetic simulator was built for the sole purpose of promoting the research into low cost Flight Simulation Devices. Therefore, there is a trade-off between spending extortionate amounts for a high quality simulator, and simply spending enough in order to adequately train pilots for procedural work whilst increasing overall. If a medium can be found with relation to the cost versus fidelity of a synthetic General Aviation simulator, it is hoped that with future research the overall safety of General Aviation can be improved. Correct implementation is vital and lessons can be learnt from civil and military training programmes with close emphasis paid to the period following a pilot gaining their PPL or CPL, as described in ‘The Killing Zone’. The ultimate aim being to integrate simulator based training as part of a PPL course. Therefore it is vitally important that research is continued towards quantifying the effectiveness of low cost flight training devices, in order to expand the knowledge base surrounding the subject. The main observation throughout testing is that the visual cueing is rather poor; this
includes the acceleration cues and the flight model itself and it was suggested that for
further research the aircraft model should be reworked by measuring the dimensions of a
PA-38 and recreating it in The FLIGHTLAB Model Editor (FLME). This is beyond the scope of
this project and would be more applicable as another project for continuation on the
findings presented in this report.
Recommendations for future research include;
Increasing the visual acuity by installing more displays to increase the fidelity as low
cost
Adding a motion base to give the pilot a sensation of manual input force
Implementing force feedback on the controls so input can be felt rather than judged
Increasing the visual scene image quality of the flight simulation software
49
Works Cited
[1] Wikipedia, “Flight simulator,” [Online]. Available:
http://en.wikipedia.org/wiki/Flight_simulator. [Accessed 13 04 13].
[2] “Pilot licensing in the United Kingdom,” [Online]. Available:
http://en.wikipedia.org/wiki/Pilot_licensing_in_the_United_Kingdom. [Accessed 11 04
2014].
[3] P. A. Craig, The Killing Zone - How and Why Pilots Die, New York: McGraw-Hill, 2001.
[4] “ICAO9625 - Manual of Criteria for the Qualification of Flight Simulators,” [Online].
Available: www.asti-usa.com/commercial/ICAO_9625_3rd_Edition.pdf. [Accessed 10 12
2013].
[5] J. Ewing, “Aviation Mentor,” 12 10 2006. [Online]. Available:
http://aviationmentor.blogspot.co.uk/2006/10/killing-zone.html. [Accessed 11 04 2014].
[6] D. J. Allerton, “The Case for Flight Simulation in General Aviation,” The Aeronautical
Journal, vol. 106, no. 1065, pp. 607-618, 2002.
[7] AIR SAFETY INSTITUTE, “2011-2012 GA Accident Scorecard,” 2013. [Online]. Available:
http://www.aopa.org/-
/media/Files/AOPA/Home/Pilot%20Resources/Safety%20&%20Proficiency/Accident%20
Analysis/Nall%20Report/ASI%20GA%20Scorecard%202011_2012.pdf. [Accessed 12 04
2014].
[8] EASA, “EASA Annual Safety Review 2012,” 2012. [Online]. Available:
http://www.easa.europa.eu/system/files/dfu/EASA-Annual-Safety-Review-2012.pdf.
[Accessed 16 04 2014].
[9] NTSB, “NTSB Report NYC99MA178,” 07 06 2000. [Online]. Available:
http://www.ntsb.gov/aviationquery/brief.aspx?ev_id=20001212X19354. [Accessed 2014
04 16].
[10] B.-G. A. a. S. R. F, “Longitudinal Flying Qualities Criteria for Single-pilot Instrument Flight
Operations,” Journal of Aircraft, vol. 23, pp. 111-117, 1986.
[11] B. J. E, “Analysis of Changes in the Pilot Population and General Aviation Accidents,”
Aviation, Space and Environmental Medicine, vol. 63, pp. 75-79, 1992.
[12] R. SN, “Concepts and definitions. Ch in Aviation Psychology.,” Iowa State University Press,
50
1980, pp. 3-10.
[13] The Royal Aeronautical Society, “The impact of flight simulation in aerospace,” Royal
Aeronautical Society Flight Simulation Group, 2009.
[14] J. J. M. Roessingh, “Transfer of Manual Flying Skills From PC-Based Simulation to Actual
Flight - Comparison of In-Flight Measured Data and Instructor Ratings,” The International
Journal of Aviation Psychology, vol. 15, no. 1, pp. 67-90, 2005.
[15] K. A, W. N, F. AD and N. K, “Supporting perception in the service of dynamic decision
making,” Human Factors, vol. 38, no. 1, pp. 288-299, 1996.
[16] T. Zhong-xiang and W. Xiao-dong, “Development and Prospect of Flight Simulation
Technology,” Flight Dynamics, vol. 20, pp. 5-8, 2001.
[17] W. Jun, L. Tiemin and G. Liwen, “Computed-torque control for a moving flight simulator
platform.,” Journal of Tsinghua University (Science and Technology), vol. 8, pp. 1405-
1408, 2006.
[18] Y. Wang, C. Zhang, H. Liu and Z. Wu, “The Research on the General Aircraft Flight
Simulation,” in Third Pacific-Asia Conference on Circuits, Communications and System
(PACCS), 2011.
[19] Anon, “ ICAO Statistical Yearbook. Doc. 9180/23,” October 1999.
[20] J. Duncan, “Fidelity Versus Cost and Its Effect on Modeling & Simulation,” 2006.
[21] K. Harvey, “Like the birds & bees,” [Online]. Available:
http://www.liv.ac.uk/researchintelligence/issue30/visualguidance.html. [Accessed 10 12
2013].
[22] G. D. Padfield, “The Tau of flight control,” 2011.
[23] M. Jump and G. D. Padfield, “Tau Flare or not Tau Flare: that is the question: Developing
Guidelines for an Approach and Landing Sky Guide,” 2005.
[24] J. Cox, “Ask the Captain: Are takeoffs and landings more dangerous?,” 26 08 2003.
[Online]. Available:
http://www.usatoday.com/story/travel/columnist/cox/2013/08/26/ask-the-captain-
danger-takeoffs-landings/2693891/. [Accessed 15 04 2014].
[25] Z. JI-fu, “Research on Flight Simulation Based on Object-Oriented Technology,”
Changchun, 2009.
51
[26] Z. Lei and a. L. H. Jiang Hongzhou, “PC Based High Quality and Low Cost Flight Simulator,”
in International Conference on Automation and Logistics, Jinan, 2007.
[27] C. J. Atkinson, “Development of an Aerodynamic Table Lookup System and Landing Gear
Model for the Cal Poly Flight Simulator,” 2002. [Online]. Available:
http://aerosim.calpoly.edu/media/cms_page_media/15/Chris%20Atkinson%20-
%20Senior%20Project.pdf. [Accessed 24 04 2014].
[28] “ART FlightLab,” Advanced Rotorcraft Technology Inc., [Online]. Available:
http://www.flightlab.com/flightlab.html. [Accessed 2013 12 12].
[29] PPL-Flight-Training.com, “Flying Circuits : Take-off, Approach & Landing,” [Online].
Available: http://www.ppl-flight-training.com/circuits-briefing.html. [Accessed 22 04
2014].
[30] “CAVOK,” [Online]. Available: http://en.wiktionary.org/wiki/CAVOK. [Accessed 09 12
2013].
[31] C. A. Authority, “ATC Surveillance Minimum Altitude Chart - ICAO,” [Online]. Available:
http://www.nats-uk.ead-
it.com/public/index.php%3Foption=com_content&task=blogcategory&id=76&Itemid=12
5.html. [Accessed 12 12 2013].
[32] B. a. F. L. Stevens, “Aircraft Control and Simulation,” John Wiley & Sons, New York, 1992.
[33] The Mathsworks, “Aerospace Blockset for Simulink,” in MATLAB USER’S GUIDE, 2005.
[34] Y. H. a. K. Boyle, Antennas: From Theory to Practice, Wiley-Blackwell, 2008.
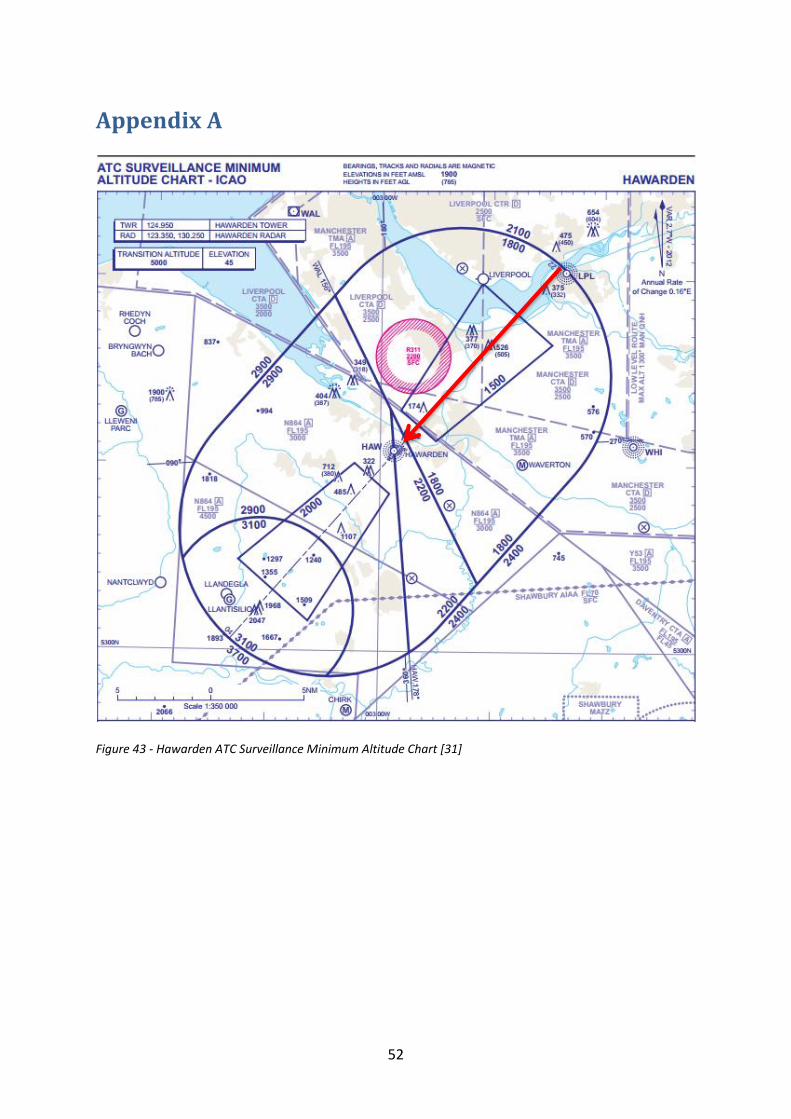
52
Appendix A
Figure 43 - Hawarden ATC Surveillance Minimum Altitude Chart [31]
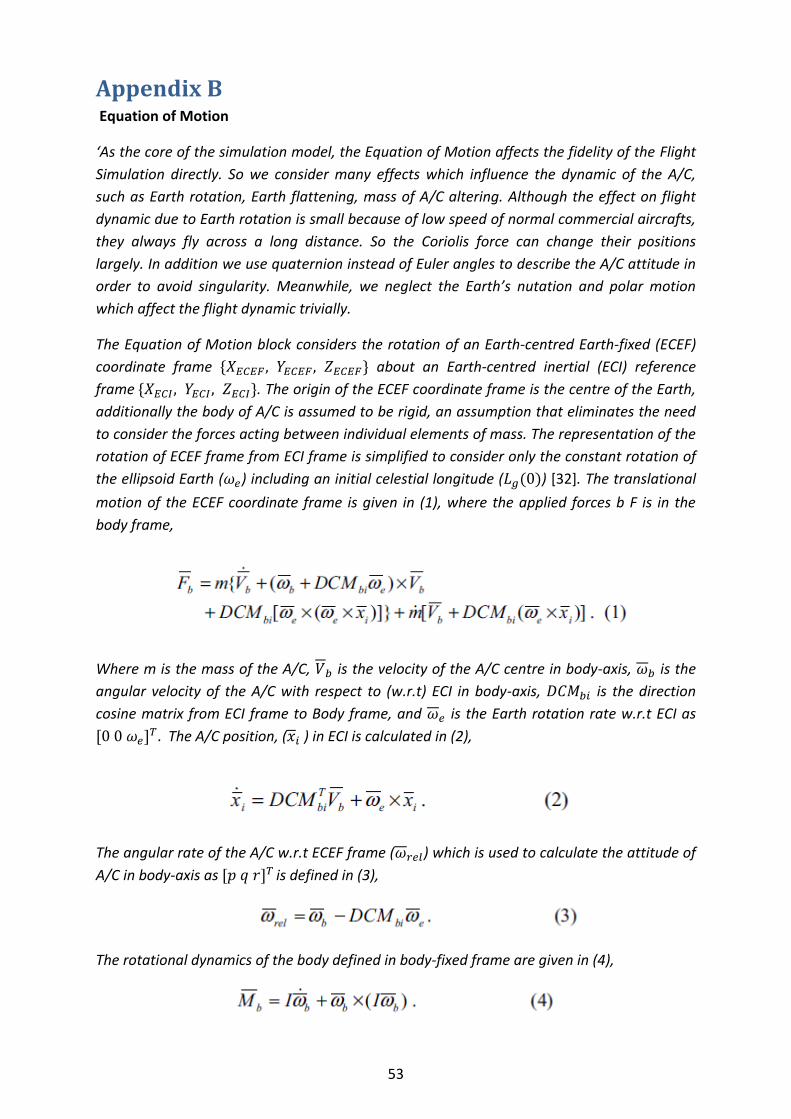
53
Appendix B Equation of Motion
‘As the core of the simulation model, the Equation of Motion affects the fidelity of the Flight
Simulation directly. So we consider many effects which influence the dynamic of the A/C,
such as Earth rotation, Earth flattening, mass of A/C altering. Although the effect on flight
dynamic due to Earth rotation is small because of low speed of normal commercial aircrafts,
they always fly across a long distance. So the Coriolis force can change their positions
largely. In addition we use quaternion instead of Euler angles to describe the A/C attitude in
order to avoid singularity. Meanwhile, we neglect the Earth’s nutation and polar motion
which affect the flight dynamic trivially.
The Equation of Motion block considers the rotation of an Earth-centred Earth-fixed (ECEF)
coordinate frame about an Earth-centred inertial (ECI) reference
frame . The origin of the ECEF coordinate frame is the centre of the Earth,
additionally the body of A/C is assumed to be rigid, an assumption that eliminates the need
to consider the forces acting between individual elements of mass. The representation of the
rotation of ECEF frame from ECI frame is simplified to consider only the constant rotation of
the ellipsoid Earth ( ) including an initial celestial longitude ( ) [32]. The translational
motion of the ECEF coordinate frame is given in (1), where the applied forces b F is in the
body frame,
Where m is the mass of the A/C, is the velocity of the A/C centre in body-axis, is the
angular velocity of the A/C with respect to (w.r.t) ECI in body-axis, is the direction
cosine matrix from ECI frame to Body frame, and is the Earth rotation rate w.r.t ECI as
The A/C position, ( ) in ECI is calculated in (2),
The angular rate of the A/C w.r.t ECEF frame ( ) which is used to calculate the attitude of
A/C in body-axis as is defined in (3),
The rotational dynamics of the body defined in body-fixed frame are given in (4),
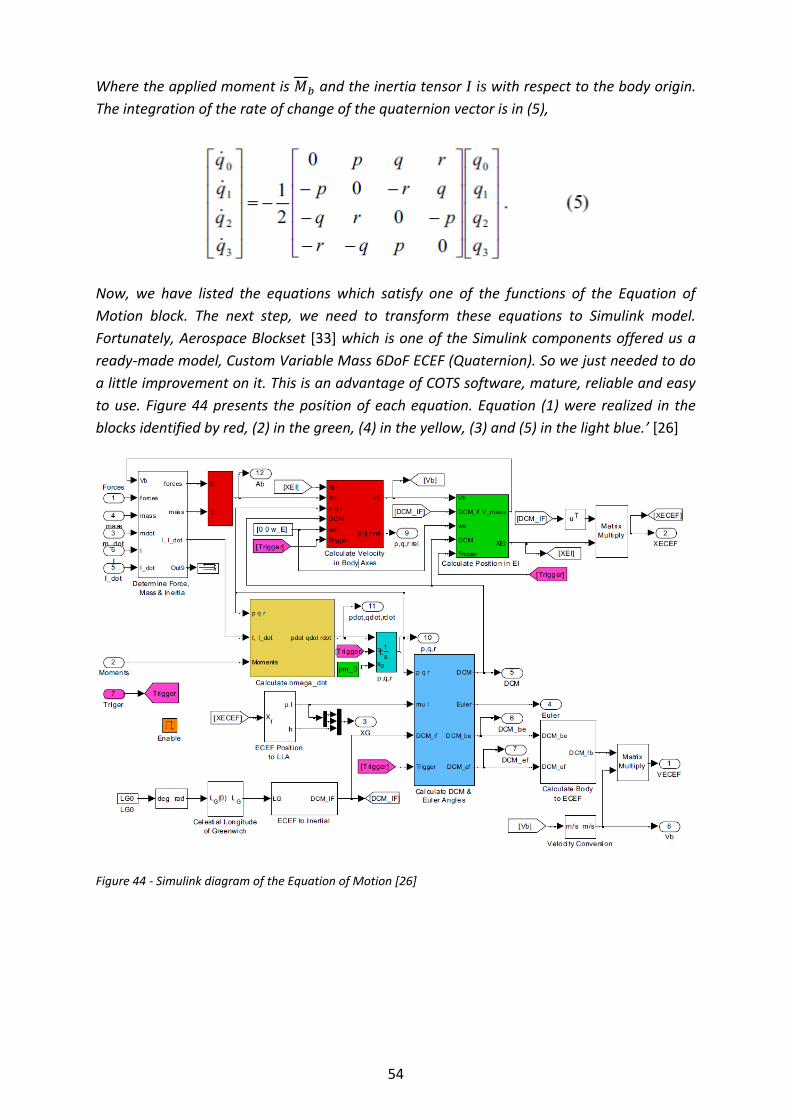
54
Where the applied moment is and the inertia tensor I is with respect to the body origin.
The integration of the rate of change of the quaternion vector is in (5),
Now, we have listed the equations which satisfy one of the functions of the Equation of
Motion block. The next step, we need to transform these equations to Simulink model.
Fortunately, Aerospace Blockset [33] which is one of the Simulink components offered us a
ready-made model, Custom Variable Mass 6DoF ECEF (Quaternion). So we just needed to do
a little improvement on it. This is an advantage of COTS software, mature, reliable and easy
to use. Figure 44 presents the position of each equation. Equation (1) were realized in the
blocks identified by red, (2) in the green, (4) in the yellow, (3) and (5) in the light blue.’ [26]
Figure 44 - Simulink diagram of the Equation of Motion [26]

55
Appendix C Standard circuit brief for PA38-121 Tomahawk
Aircraft state; Clean On threshold 0kts Parking brake on Tasks; 1. Release parking brake, apply full power and rotate at 65kts. 2. Maintain standard climb out at 70kts. 3. Shoulder check FLAG check @ 500ft. 4. Crosswind turn at 700ft, climbing turn no more than 15’ angle of bank. 5. Level off at 1000ft applying Attitude Power Trim (APT) to then maintain 90kts. 6. Turn onto downwind and conduct BUMPFLIES-L downwind checks. 7. Using Power Attitude Trim (PAT), decent and turn onto left base applying 1 stage of flap with LOI check. 8. Turn onto finals maintaining a normal decent rate at 70kts, applying the second stage with LOI check. 9. Flare the aircraft and reduce power to idle. 10. Apply breaks to reach a stop then apply parking break. 11. End flight. Aircraft Checks FLAG Flaps Landing Light Altimeter Gear BUMPFLIES-L Breaks Undercarriage Mixture Pitch Fuel Location Instruments Engine Safety Landing Light LOI Limitation Operation Indication
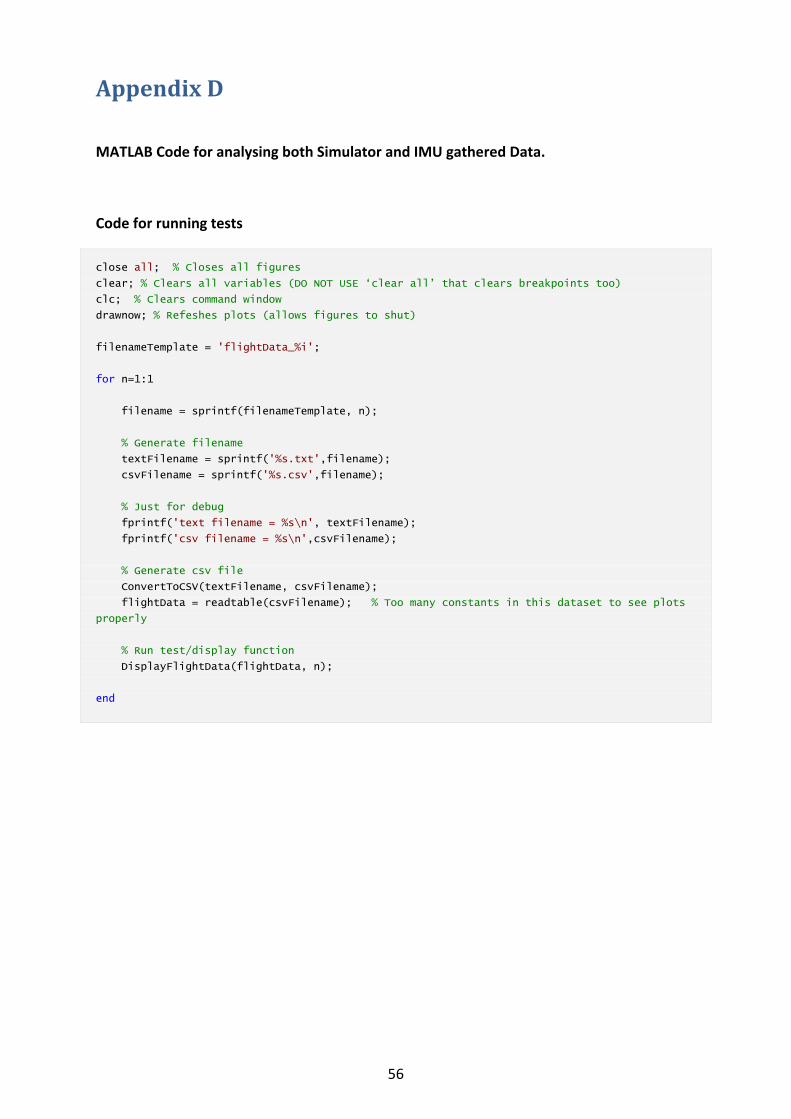
56
Appendix D
MATLAB Code for analysing both Simulator and IMU gathered Data.
Code for running tests
close all; % Closes all figures
clear; % Clears all variables (DO NOT USE ‘clear all’ that clears breakpoints too)
clc; % Clears command window
drawnow; % Refeshes plots (allows figures to shut)
filenameTemplate = 'flightData_%i';
for n=1:1
filename = sprintf(filenameTemplate, n);
% Generate filename
textFilename = sprintf('%s.txt',filename);
csvFilename = sprintf('%s.csv',filename);
% Just for debug
fprintf('text filename = %s\n', textFilename);
fprintf('csv filename = %s\n',csvFilename);
% Generate csv file
ConvertToCSV(textFilename, csvFilename);
flightData = readtable(csvFilename); % Too many constants in this dataset to see plots
properly
% Run test/display function
DisplayFlightData(flightData, n);
end

57
Code for converting the simulator or IMU output file from .txt to .csv
function [] = ConvertToCSV(textFilename, csvFilename)
fid1 = fopen(textFilename, 'r');
if (fid1>=0)
% Read flight sim file
txt = char(fread(fid1).');
if (strfind(txt,'|')) % If it has the bars
% ORDER IS VERY IMPORTANT
txt = strrep(txt, ' __',''); % remove leading double underscores
txt = strrep(txt, ' _',''); % remove leading underscores
txt = strrep(txt, ',','_'); % convert commas to underscores
txt = strrep(txt, '___','_'); % convert triple underscores to singles
txt = strrep(txt, '__','_'); % convert double underscores to singles
txt = strrep(txt, '|',','); % replace | with comma
txt = strrep(txt, ' ',''); % remove spaces
% txt = strrep(txt, 13,''); % remove extra line feeds
end
fclose(fid1);
% Write to new CSV file
fid2 = fopen(csvFilename, 'wt');
if (fid2>=0)
fwrite(fid2, txt);
fclose(fid2);
end
end
end
Code for displaying the function DisplayFlightData
function [] = DisplayFlightData(dataTable, dataIndex)
DisplayFlightData_map(dataTable, dataIndex, 10*dataIndex+1);
DisplayFlightData_3D(dataTable, dataIndex, 10*dataIndex+2);
DisplayFlightData_alt(dataTable, dataIndex, 10*dataIndex+3);
end
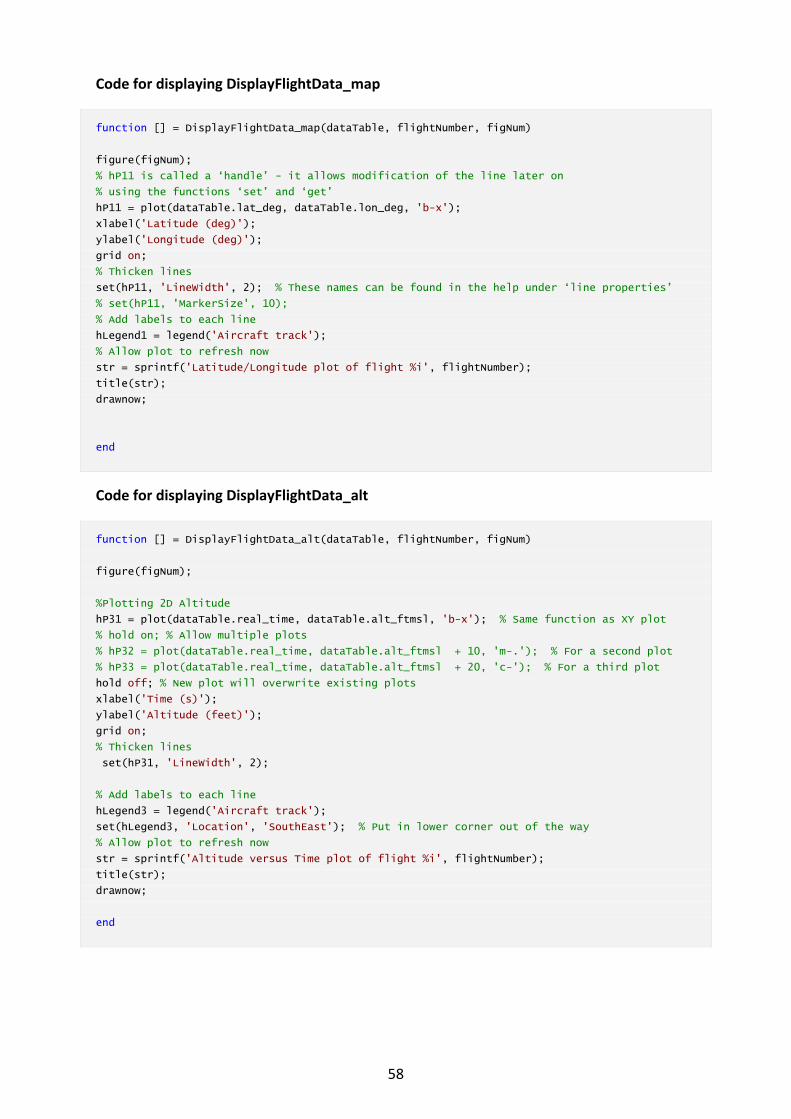
58
Code for displaying DisplayFlightData_map
function [] = DisplayFlightData_map(dataTable, flightNumber, figNum)
figure(figNum);
% hP11 is called a ‘handle’ - it allows modification of the line later on
% using the functions ‘set’ and ‘get’
hP11 = plot(dataTable.lat_deg, dataTable.lon_deg, 'b-x');
xlabel('Latitude (deg)');
ylabel('Longitude (deg)');
grid on;
% Thicken lines
set(hP11, 'LineWidth', 2); % These names can be found in the help under ‘line properties’
% set(hP11, 'MarkerSize', 10);
% Add labels to each line
hLegend1 = legend('Aircraft track');
% Allow plot to refresh now
str = sprintf('Latitude/Longitude plot of flight %i', flightNumber);
title(str);
drawnow;
end
Code for displaying DisplayFlightData_alt
function [] = DisplayFlightData_alt(dataTable, flightNumber, figNum)
figure(figNum);
%Plotting 2D Altitude
hP31 = plot(dataTable.real_time, dataTable.alt_ftmsl, 'b-x'); % Same function as XY plot
% hold on; % Allow multiple plots
% hP32 = plot(dataTable.real_time, dataTable.alt_ftmsl + 10, 'm-.'); % For a second plot
% hP33 = plot(dataTable.real_time, dataTable.alt_ftmsl + 20, 'c-'); % For a third plot
hold off; % New plot will overwrite existing plots
xlabel('Time (s)');
ylabel('Altitude (feet)');
grid on;
% Thicken lines
set(hP31, 'LineWidth', 2);
% Add labels to each line
hLegend3 = legend('Aircraft track');
set(hLegend3, 'Location', 'SouthEast'); % Put in lower corner out of the way
% Allow plot to refresh now
str = sprintf('Altitude versus Time plot of flight %i', flightNumber);
title(str);
drawnow;
end
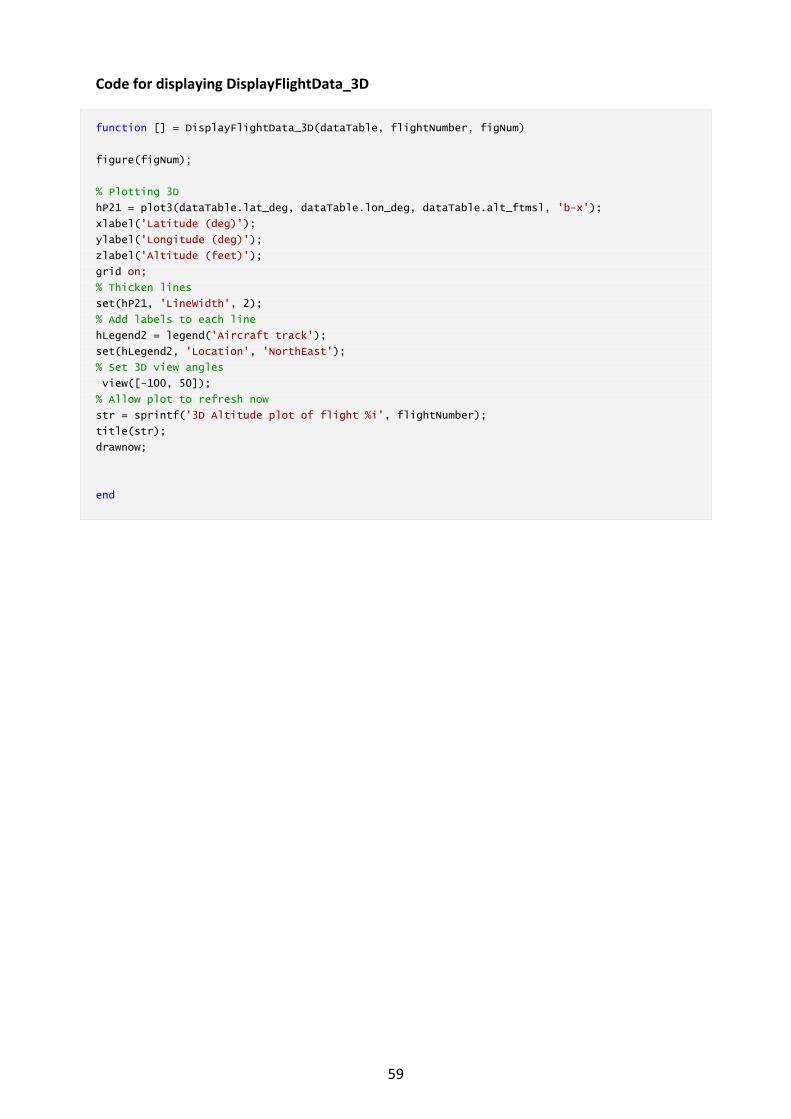
59
Code for displaying DisplayFlightData_3D
function [] = DisplayFlightData_3D(dataTable, flightNumber, figNum)
figure(figNum);
% Plotting 3D
hP21 = plot3(dataTable.lat_deg, dataTable.lon_deg, dataTable.alt_ftmsl, 'b-x');
xlabel('Latitude (deg)');
ylabel('Longitude (deg)');
zlabel('Altitude (feet)');
grid on;
% Thicken lines
set(hP21, 'LineWidth', 2);
% Add labels to each line
hLegend2 = legend('Aircraft track');
set(hLegend2, 'Location', 'NorthEast');
% Set 3D view angles
view([-100, 50]);
% Allow plot to refresh now
str = sprintf('3D Altitude plot of flight %i', flightNumber);
title(str);
drawnow;
end
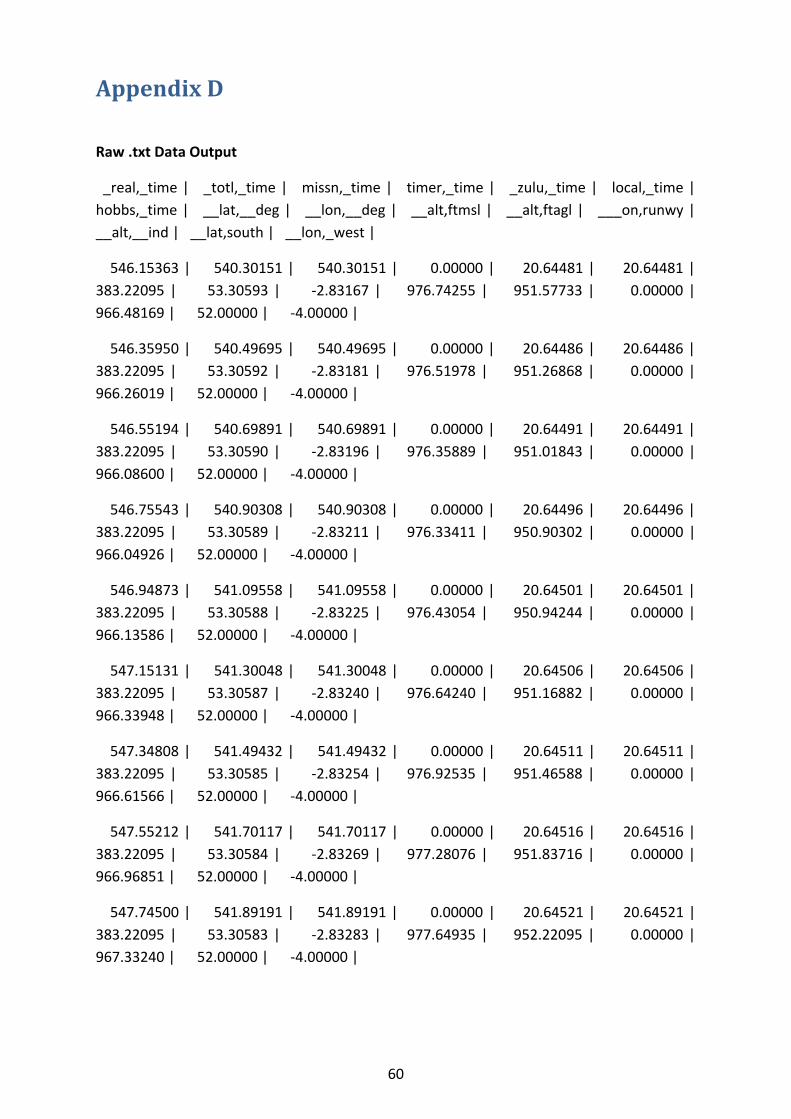
60
Appendix D
Raw .txt Data Output
_real,_time | _totl,_time | missn,_time | timer,_time | _zulu,_time | local,_time |
hobbs,_time | __lat,__deg | __lon,__deg | __alt,ftmsl | __alt,ftagl | ___on,runwy |
__alt,__ind | __lat,south | __lon,_west |
546.15363 | 540.30151 | 540.30151 | 0.00000 | 20.64481 | 20.64481 |
383.22095 | 53.30593 | -2.83167 | 976.74255 | 951.57733 | 0.00000 |
966.48169 | 52.00000 | -4.00000 |
546.35950 | 540.49695 | 540.49695 | 0.00000 | 20.64486 | 20.64486 |
383.22095 | 53.30592 | -2.83181 | 976.51978 | 951.26868 | 0.00000 |
966.26019 | 52.00000 | -4.00000 |
546.55194 | 540.69891 | 540.69891 | 0.00000 | 20.64491 | 20.64491 |
383.22095 | 53.30590 | -2.83196 | 976.35889 | 951.01843 | 0.00000 |
966.08600 | 52.00000 | -4.00000 |
546.75543 | 540.90308 | 540.90308 | 0.00000 | 20.64496 | 20.64496 |
383.22095 | 53.30589 | -2.83211 | 976.33411 | 950.90302 | 0.00000 |
966.04926 | 52.00000 | -4.00000 |
546.94873 | 541.09558 | 541.09558 | 0.00000 | 20.64501 | 20.64501 |
383.22095 | 53.30588 | -2.83225 | 976.43054 | 950.94244 | 0.00000 |
966.13586 | 52.00000 | -4.00000 |
547.15131 | 541.30048 | 541.30048 | 0.00000 | 20.64506 | 20.64506 |
383.22095 | 53.30587 | -2.83240 | 976.64240 | 951.16882 | 0.00000 |
966.33948 | 52.00000 | -4.00000 |
547.34808 | 541.49432 | 541.49432 | 0.00000 | 20.64511 | 20.64511 |
383.22095 | 53.30585 | -2.83254 | 976.92535 | 951.46588 | 0.00000 |
966.61566 | 52.00000 | -4.00000 |
547.55212 | 541.70117 | 541.70117 | 0.00000 | 20.64516 | 20.64516 |
383.22095 | 53.30584 | -2.83269 | 977.28076 | 951.83716 | 0.00000 |
966.96851 | 52.00000 | -4.00000 |
547.74500 | 541.89191 | 541.89191 | 0.00000 | 20.64521 | 20.64521 |
383.22095 | 53.30583 | -2.83283 | 977.64935 | 952.22095 | 0.00000 |
967.33240 | 52.00000 | -4.00000 |

61
Appendix E
Raw .txt to .CSV Conversion
real_t
ime
totl_t
ime
missn
_time
timer
_time
zulu
_tim
e
local
_time
hobbs
_time
lat_d
eg
lon_
deg
alt_ft
msl
alt_ft
agl
on_r
unwy
alt_in
d
lat_s
outh
lon_
west
546.1
5363
540.3
0151
540.3
0151
0.000
00
20.6
4481
20.64
481
383.2
2095
53.3
0593
-
2.83
167
976.7
4255
951.5
7733
0.000
00
966.4
8169
52.0
0000
-
4.00
000
546.3
5950
540.4
9695
540.4
9695
0.000
00
20.6
4486
20.64
486
383.2
2095
53.3
0592
-
2.83
181
976.5
1978
951.2
6868
0.000
00
966.2
6019
52.0
0000
-
4.00
000
546.5
5194
540.6
9891
540.6
9891
0.000
00
20.6
4491
20.64
491
383.2
2095
53.3
0590
-
2.83
196
976.3
5889
951.0
1843
0.000
00
966.0
8600
52.0
0000
-
4.00
000
546.7
5543
540.9
0308
540.9
0308
0.000
00
20.6
4496
20.64
496
383.2
2095
53.3
0589
-
2.83
211
976.3
3411
950.9
0302
0.000
00
966.0
4926
52.0
0000
-
4.00
000
546.9
4873
541.0
9558
541.0
9558
0.000
00
20.6
4501
20.64
501
383.2
2095
53.3
0588
-
2.83
225
976.4
3054
950.9
4244
0.000
00
966.1
3586
52.0
0000
-
4.00
000
547.1
5131
541.3
0048
541.3
0048
0.000
00
20.6
4506
20.64
506
383.2
2095
53.3
0587
-
2.83
240
976.6
4240
951.1
6882
0.000
00
966.3
3948
52.0
0000
-
4.00
000
547.3
4808
541.4
9432
541.4
9432
0.000
00
20.6
4511
20.64
511
383.2
2095
53.3
0585
-
2.83
254
976.9
2535
951.4
6588
0.000
00
966.6
1566
52.0
0000
-
4.00
000
547.5
5212
541.7
0117
541.7
0117
0.000
00
20.6
4516
20.64
516
383.2
2095
53.3
0584
-
2.83
269
977.2
8076
951.8
3716
0.000
00
966.9
6851
52.0
0000
-
4.00
000
547.7
4500
541.8
9191
541.8
9191
0.000
00
20.6
4521
20.64
521
383.2
2095
53.3
0583
-
2.83
283
977.6
4935
952.2
2095
0.000
00
967.3
3240
52.0
0000
-
4.00
000
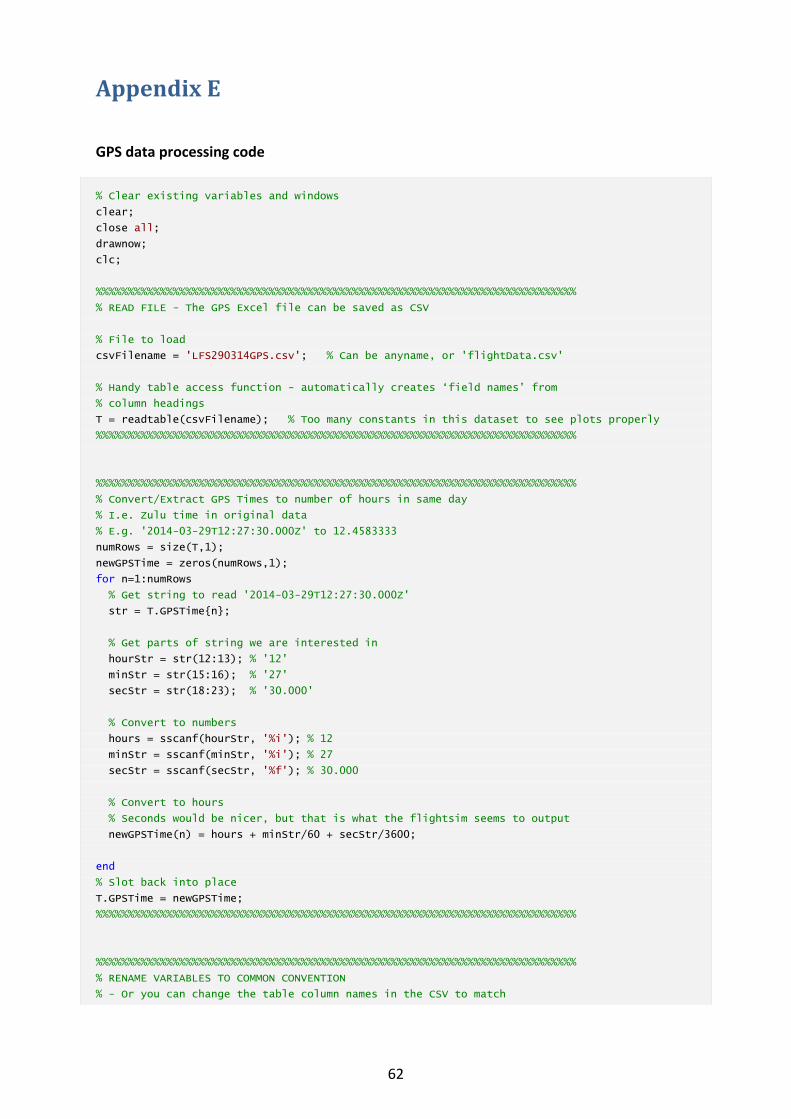
62
Appendix E
GPS data processing code
% Clear existing variables and windows
clear;
close all;
drawnow;
clc;
%%%%%%%%%%%%%%%%%%%%%%%%%%%%%%%%%%%%%%%%%%%%%%%%%%%%%%%%%%%%%%%%%%%%%%%%%%%
% READ FILE - The GPS Excel file can be saved as CSV
% File to load
csvFilename = 'LFS290314GPS.csv'; % Can be anyname, or 'flightData.csv'
% Handy table access function - automatically creates ‘field names’ from
% column headings
T = readtable(csvFilename); % Too many constants in this dataset to see plots properly
%%%%%%%%%%%%%%%%%%%%%%%%%%%%%%%%%%%%%%%%%%%%%%%%%%%%%%%%%%%%%%%%%%%%%%%%%%%
%%%%%%%%%%%%%%%%%%%%%%%%%%%%%%%%%%%%%%%%%%%%%%%%%%%%%%%%%%%%%%%%%%%%%%%%%%%
% Convert/Extract GPS Times to number of hours in same day
% I.e. Zulu time in original data
% E.g. '2014-03-29T12:27:30.000Z' to 12.4583333
numRows = size(T,1);
newGPSTime = zeros(numRows,1);
for n=1:numRows
% Get string to read '2014-03-29T12:27:30.000Z'
str = T.GPSTime{n};
% Get parts of string we are interested in
hourStr = str(12:13); % '12'
minStr = str(15:16); % '27'
secStr = str(18:23); % '30.000'
% Convert to numbers
hours = sscanf(hourStr, '%i'); % 12
minStr = sscanf(minStr, '%i'); % 27
secStr = sscanf(secStr, '%f'); % 30.000
% Convert to hours
% Seconds would be nicer, but that is what the flightsim seems to output
newGPSTime(n) = hours + minStr/60 + secStr/3600;
end
% Slot back into place
T.GPSTime = newGPSTime;
%%%%%%%%%%%%%%%%%%%%%%%%%%%%%%%%%%%%%%%%%%%%%%%%%%%%%%%%%%%%%%%%%%%%%%%%%%%
%%%%%%%%%%%%%%%%%%%%%%%%%%%%%%%%%%%%%%%%%%%%%%%%%%%%%%%%%%%%%%%%%%%%%%%%%%%
% RENAME VARIABLES TO COMMON CONVENTION
% - Or you can change the table column names in the CSV to match
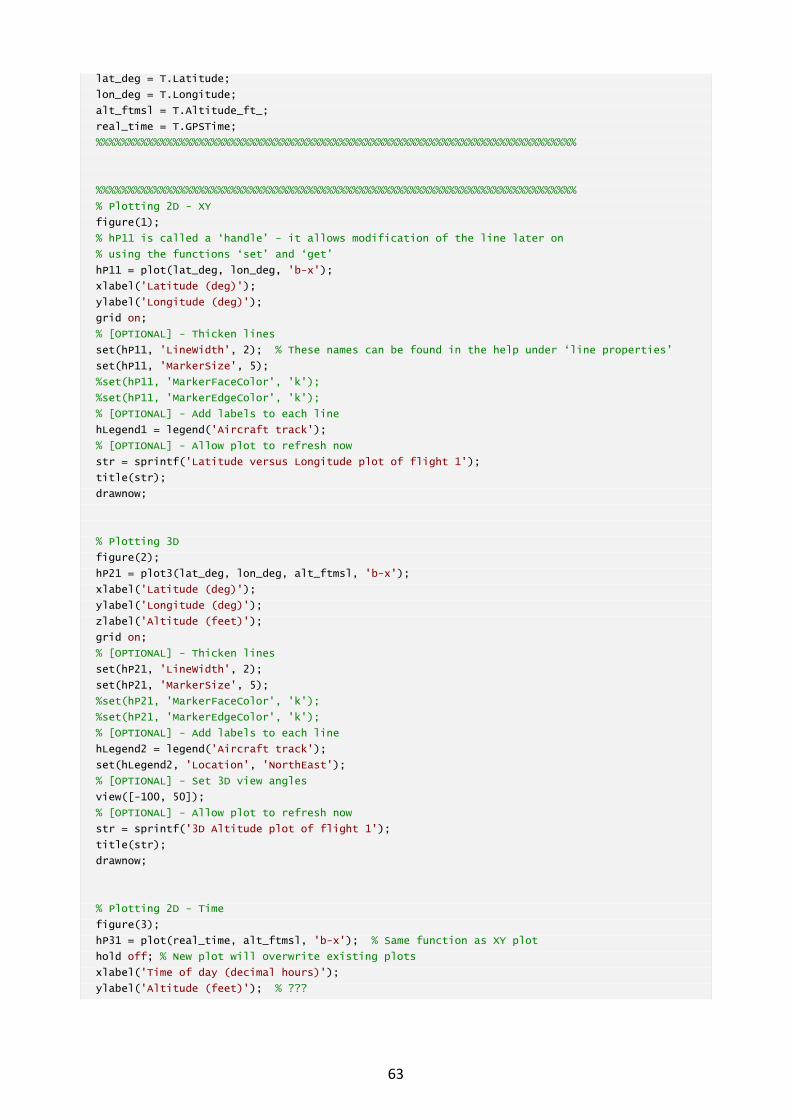
63
lat_deg = T.Latitude;
lon_deg = T.Longitude;
alt_ftmsl = T.Altitude_ft_;
real_time = T.GPSTime;
%%%%%%%%%%%%%%%%%%%%%%%%%%%%%%%%%%%%%%%%%%%%%%%%%%%%%%%%%%%%%%%%%%%%%%%%%%%
%%%%%%%%%%%%%%%%%%%%%%%%%%%%%%%%%%%%%%%%%%%%%%%%%%%%%%%%%%%%%%%%%%%%%%%%%%%
% Plotting 2D - XY
figure(1);
% hP11 is called a ‘handle’ - it allows modification of the line later on
% using the functions ‘set’ and ‘get’
hP11 = plot(lat_deg, lon_deg, 'b-x');
xlabel('Latitude (deg)');
ylabel('Longitude (deg)');
grid on;
% [OPTIONAL] - Thicken lines
set(hP11, 'LineWidth', 2); % These names can be found in the help under ‘line properties’
set(hP11, 'MarkerSize', 5);
%set(hP11, 'MarkerFaceColor', 'k');
%set(hP11, 'MarkerEdgeColor', 'k');
% [OPTIONAL] - Add labels to each line
hLegend1 = legend('Aircraft track');
% [OPTIONAL] - Allow plot to refresh now
str = sprintf('Latitude versus Longitude plot of flight 1');
title(str);
drawnow;
% Plotting 3D
figure(2);
hP21 = plot3(lat_deg, lon_deg, alt_ftmsl, 'b-x');
xlabel('Latitude (deg)');
ylabel('Longitude (deg)');
zlabel('Altitude (feet)');
grid on;
% [OPTIONAL] - Thicken lines
set(hP21, 'LineWidth', 2);
set(hP21, 'MarkerSize', 5);
%set(hP21, 'MarkerFaceColor', 'k');
%set(hP21, 'MarkerEdgeColor', 'k');
% [OPTIONAL] - Add labels to each line
hLegend2 = legend('Aircraft track');
set(hLegend2, 'Location', 'NorthEast');
% [OPTIONAL] - Set 3D view angles
view([-100, 50]);
% [OPTIONAL] - Allow plot to refresh now
str = sprintf('3D Altitude plot of flight 1');
title(str);
drawnow;
% Plotting 2D - Time
figure(3);
hP31 = plot(real_time, alt_ftmsl, 'b-x'); % Same function as XY plot
hold off; % New plot will overwrite existing plots
xlabel('Time of day (decimal hours)');
ylabel('Altitude (feet)'); % ???

64
grid on;
set(hP31, 'LineWidth', 2);
set(hP31, 'MarkerSize', 5);
%set(hP31, 'MarkerFaceColor', 'k');
%set(hP31, 'MarkerEdgeColor', 'k');
% [OPTIONAL] - Add labels to each line
hLegend3 = legend('Aircraft track');
set(hLegend3, 'Location', 'SouthEast'); % Put in lower corner out of the way
% [OPTIONAL] - Allow plot to refresh now
str = sprintf('Altitude versus Time plot of flight 1');
title(str);
drawnow;
%%%%%%%%%%%%%%%%%%%%%%%%%%%%%%%%%%%%%%%%%%%%%%%%%%%%%%%%%%%%%%%%%%%%%%%%%%%
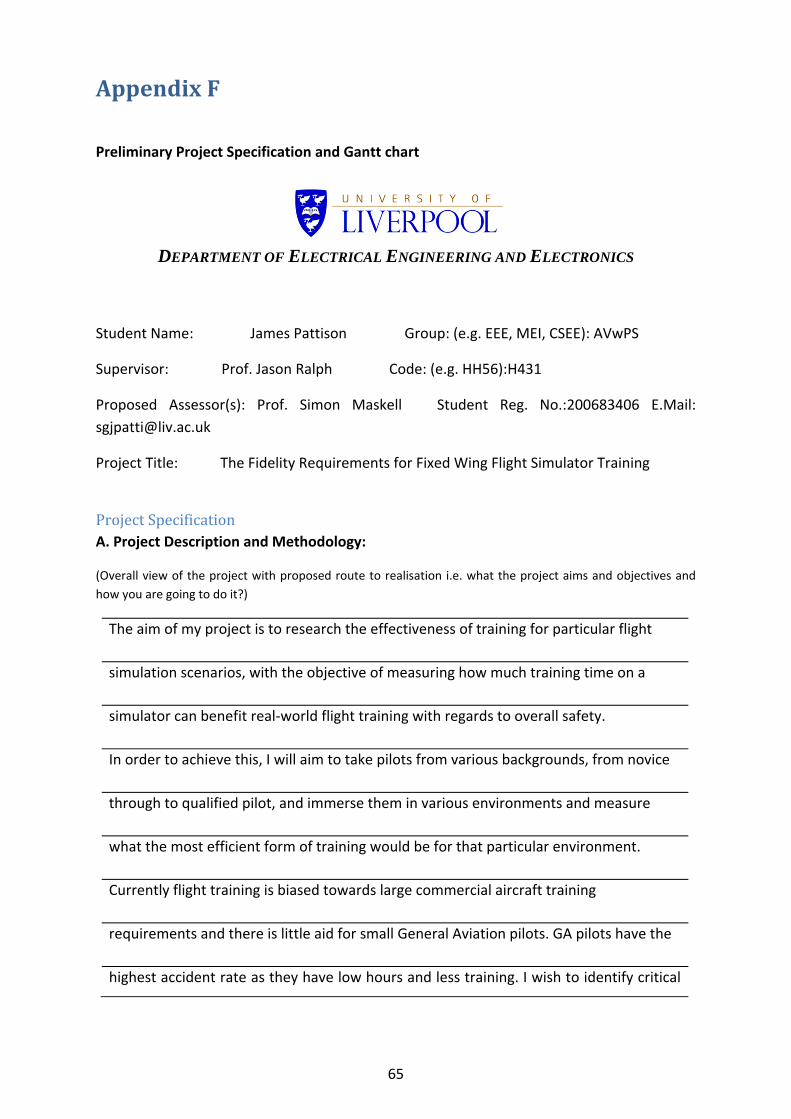
65
Appendix F
Preliminary Project Specification and Gantt chart
DEPARTMENT OF ELECTRICAL ENGINEERING AND ELECTRONICS
Student Name: James Pattison Group: (e.g. EEE, MEI, CSEE): AVwPS
Supervisor: Prof. Jason Ralph Code: (e.g. HH56):H431
Proposed Assessor(s): Prof. Simon Maskell Student Reg. No.:200683406 E.Mail:
Project Title: The Fidelity Requirements for Fixed Wing Flight Simulator Training
Project Specification
A. Project Description and Methodology:
(Overall view of the project with proposed route to realisation i.e. what the project aims and objectives and
how you are going to do it?)
The aim of my project is to research the effectiveness of training for particular flight
simulation scenarios, with the objective of measuring how much training time on a
simulator can benefit real-world flight training with regards to overall safety.
In order to achieve this, I will aim to take pilots from various backgrounds, from novice
through to qualified pilot, and immerse them in various environments and measure
what the most efficient form of training would be for that particular environment.
Currently flight training is biased towards large commercial aircraft training
requirements and there is little aid for small General Aviation pilots. GA pilots have the
highest accident rate as they have low hours and less training. I wish to identify critical
66
operational areas that pilots experience problems with and how they could be
more effectively trained.
B. Project Tasks and Milestones: (indicate the tasks and milestones that should be achieved and their
expected dates) (e.g. Understanding of theory, designs of circuits, construction of circuits, software
specifications, working demonstrations etc.)
Tasks
Understanding of theory in relation to Human Factors
Relate to ICAO 9625 Manual of criteria for the Qualification of Flight Simulators
Identify units/elements of flight training to be examined in order to develop training scenario
Identify fidelity levels and associate with units/elements (Aircraft, Cueing, Environment simulation)
Milestones
Interim presentation - Semester 1 Week 4
Interim report - Semester 1 Week 11 - Aim to complete half of all work
Simulator test – Semester 1
Bench inspection – Semester 2 Week 10
Final thesis – Semester 2 Week 12
C. Project Deliverables: (Indicate what should be completed at the end of the project)
(e.g. This list should indicate what will be presented / demonstrated at the final bench inspections)
Specific learning & training targets for specific units/elements of flight training with
tailored simulator training
Guidance on appropriate fidelity requirements biasing towards GA rather than
large aircraft
Identify issues in training and tailor to training scenarios in order to improve safety
Aim to produce an effective simulator training profile to maximise training benefit
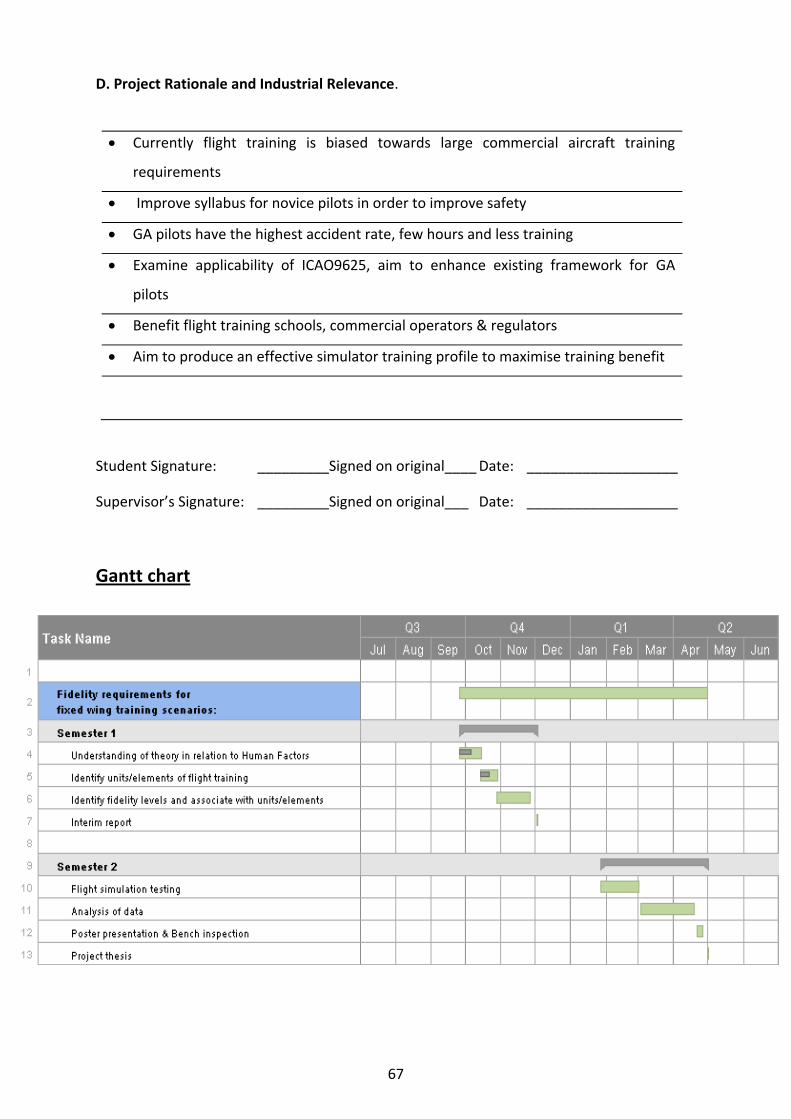
67
D. Project Rationale and Industrial Relevance.
Currently flight training is biased towards large commercial aircraft training
requirements
Improve syllabus for novice pilots in order to improve safety
GA pilots have the highest accident rate, few hours and less training
Examine applicability of ICAO9625, aim to enhance existing framework for GA
pilots
Benefit flight training schools, commercial operators & regulators
Aim to produce an effective simulator training profile to maximise training benefit
Student Signature: _________Signed on original____ Date: ___________________
Supervisor’s Signature: _________Signed on original___ Date: ___________________
Gantt chart
68
Appendix G
Revised Preliminary Project Specification and Gantt chart
DEPARTMENT OF ELECTRICAL ENGINEERING AND ELECTRONICS
Student Name: James Pattison Group: (e.g. EEE, MEI, CSEE): AVwPS
Supervisor: Prof. Jason Ralph Code: (e.g. HH56):H431
Proposed Assessor(s): Prof. Simon Maskell Student Reg. No.:200683406 E.Mail:
Project Title: The Fidelity Requirements for Fixed Wing Flight Simulator Training
Project Specification
A. Project Description and Methodology:
(Overall view of the project with proposed route to realisation i.e. what the project aims and objectives and
how you are going to do it?)
This project aims to research the effectiveness of training for particular flight
simulation scenarios, with the objective of measuring how much training time on a
simulator can benefit real-world flight training with regards to overall safety.
In order to achieve this, pilots from various backgrounds will be taken, from novice
through to qualified pilot, and immersed in various environments. Following this
measurements would be taken in order to determine the most efficient form of training
would be for that particular environment. Currently flight training is biased towards
commercial aircraft training requirements and there is little aid for small general
(GA) aviation pilots. GA pilots have the highest accident rate as they have low hours and
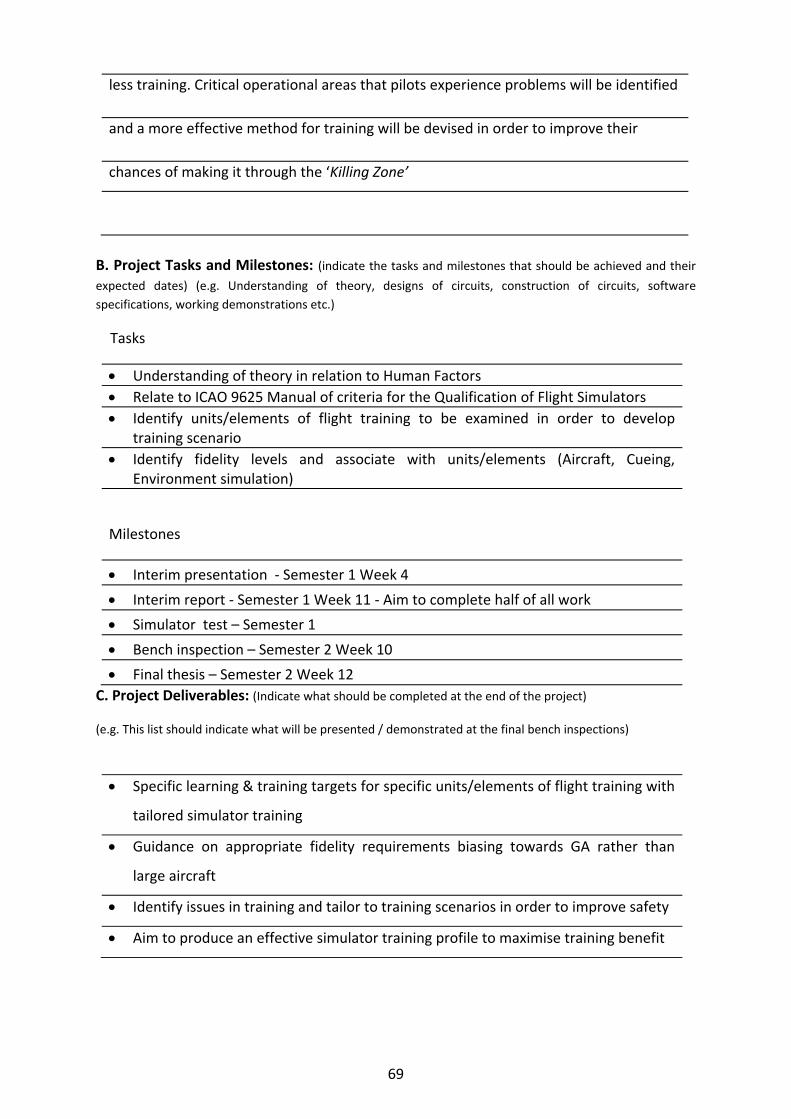
69
less training. Critical operational areas that pilots experience problems will be identified
and a more effective method for training will be devised in order to improve their
chances of making it through the ‘Killing Zone’
B. Project Tasks and Milestones: (indicate the tasks and milestones that should be achieved and their
expected dates) (e.g. Understanding of theory, designs of circuits, construction of circuits, software
specifications, working demonstrations etc.)
Tasks
Understanding of theory in relation to Human Factors
Relate to ICAO 9625 Manual of criteria for the Qualification of Flight Simulators
Identify units/elements of flight training to be examined in order to develop training scenario
Identify fidelity levels and associate with units/elements (Aircraft, Cueing, Environment simulation)
Milestones
Interim presentation - Semester 1 Week 4
Interim report - Semester 1 Week 11 - Aim to complete half of all work
Simulator test – Semester 1
Bench inspection – Semester 2 Week 10
Final thesis – Semester 2 Week 12
C. Project Deliverables: (Indicate what should be completed at the end of the project)
(e.g. This list should indicate what will be presented / demonstrated at the final bench inspections)
Specific learning & training targets for specific units/elements of flight training with
tailored simulator training
Guidance on appropriate fidelity requirements biasing towards GA rather than
large aircraft
Identify issues in training and tailor to training scenarios in order to improve safety
Aim to produce an effective simulator training profile to maximise training benefit
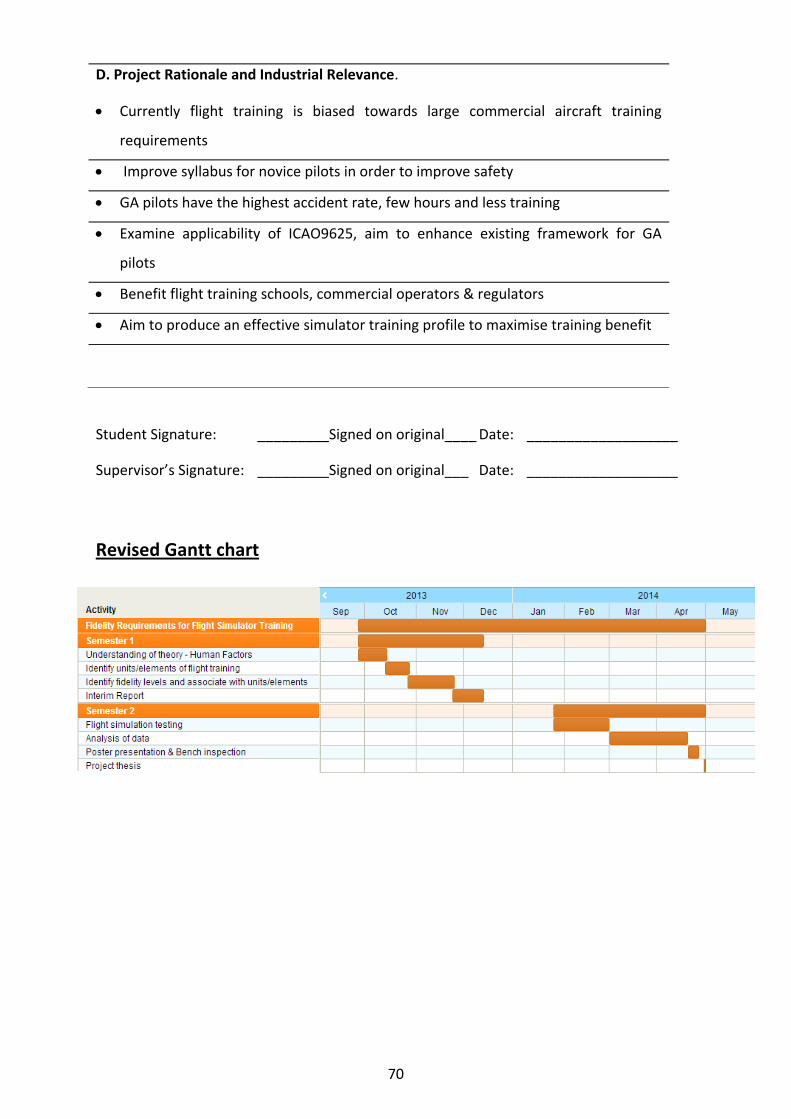
70
Student Signature: _________Signed on original____ Date: ___________________
Supervisor’s Signature: _________Signed on original___ Date: ___________________
Revised Gantt chart
D. Project Rationale and Industrial Relevance.
Currently flight training is biased towards large commercial aircraft training
requirements
Improve syllabus for novice pilots in order to improve safety
GA pilots have the highest accident rate, few hours and less training
Examine applicability of ICAO9625, aim to enhance existing framework for GA
pilots
Benefit flight training schools, commercial operators & regulators
Aim to produce an effective simulator training profile to maximise training benefit