
The Environmental Effects of Water Damages - DiVA portal
80
IN DEGREE PROJECT INDUSTRIAL ENGINEERING AND MANAGEMENT, SECOND CYCLE, 30 CREDITS , STOCKHOLM SWEDEN 2019 The Environmental Effects of Water Damages Assessing the CO2e footprint of water damage resolution methods from a life cycle perspective ADAM ORRE AXEL PERS KTH ROYAL INSTITUTE OF TECHNOLOGY SCHOOL OF INDUSTRIAL ENGINEERING AND MANAGEMENT
-
Upload
khangminh22 -
Category
Documents
-
view
0 -
download
0
Transcript of The Environmental Effects of Water Damages - DiVA portal
IN DEGREE PROJECT INDUSTRIAL ENGINEERING AND MANAGEMENT,SECOND CYCLE, 30 CREDITS
, STOCKHOLM SWEDEN 2019
The Environmental Effectsof Water DamagesAssessing the CO2e footprint of water damage resolution methods from a life cycle perspective
ADAM ORRE
AXEL PERS
KTH ROYAL INSTITUTE OF TECHNOLOGYSCHOOL OF INDUSTRIAL ENGINEERING AND MANAGEMENT

The Environmental Effects of Water Damages
Assessing the CO2e footprint of water damage resolution methods from a life cycle
perspective
by
Adam Orre Axel Pers
Master of Science Thesis TRITA-ITM-EX 2019:302 KTH Industrial Engineering and Management
Industrial Management SE-100 44 STOCKHOLM
Vattenskador och dess effekter på miljön
En undersökning av koldioxidavtrycket från vattenskadehanteringsmetoder utifrån ett
livscykelsperspektiv
av
Adam Orre Axel Pers
Examensarbete TRITA-ITM-EX 2019:302 KTH Industriell teknik och management
Industriell ekonomi och organisation SE-100 44 STOCKHOLM

Master of Science Thesis TRITA-ITM-EX 2019:302
The Environmental Effects of Water Damages: Assessing the CO2e footprint of water damage
resolution methods from a life cycle perspective
Adam Orre
Axel Pers
Approved
2019-06-04 Examiner
Niklas Arvidsson Supervisor
Fabian Levihn Commissioner
Polygon Group Contact person
Caroline Finslo
Abstract This study assesses the primary drivers of CO2e footprint for three types of water damage resolution methods and identifies relevant focus areas to support a reduced environmental footprint from water damage restoration. To face the global challenge of climate change, mitigation actions need to be taken on a broad level, with the reduction of greenhouse gas emissions from buildings being a key part. Although the number of environmental assessments of buildings is increasing, there is a lack of scientific literature quantifying the CO2e footprint of water damages, which makes it difficult for stakeholders in the industry to make sound decisions in order to combat climate change. In particular, this relates to the various methods that can be applied to resolve water damages. Therefore, this study conducts an attributional life cycle assessment of the CO2e footprint of three actual water damages, resolved using different methods requiring various degrees of material replacement. The study finds that both the total CO2e footprint and its main drivers vary significantly depending on the selected method. It further finds that the choice of method is crucial in order to reduce the CO2e footprint from water damage restoration, more specifically that a higher degree of material reuse, enabled by drying of damaged materials, appears to be preferred where applicable. Keywords LCA, life cycle assessment, water damage, water damage restoration, CO2e footprint
Examensarbete TRITA-ITM-EX 2019:302
Vattenskador och dess effekter på miljön: En undersökning av koldioxidavtrycket från vattenskadehanteringsmetoder utifrån ett
livscykelsperspektiv
Adam Orre
Axel Pers
Godkänt
2019-06-04 Examinator
Niklas Arvidsson Handledare
Fabian Levihn Uppdragsgivare
Polygon Group Kontaktperson
Caroline Finslo
Sammanfattning Denna studie undersöker de huvudsakliga faktorerna som påverkar det koldioxidavtryck som kan kopplas till tre typer av hanteringsmetoder av vattenskador, samt identifierar relevanta områden att fokusera på för att minska den miljömässiga effekten från vattenskadehantering. Flertalet åtgärder behöver genomföras för att möta utmaningen med klimatförändringar, och att minska växthusgaser kopplade till byggnader är att anse som en viktig del av detta. Trots att antalet miljöstudier relaterade till byggnader ökar är antalet vetenskapliga studier kopplade till CO2e från vattenskador begränsat, vilket gör det svårt för intressenter i industrin att fatta välgrundade beslut. I synnerhet är detta relaterat till de olika metoder som kan användas för att hantera skadorna. Av den anledningen genomför denna studie en livscykelanalys med bokföringsmetodik för att undersöka koldioxidavtrycket från tre faktiska vattenskador. Dessa har åtgärdats med olika hanteringssmetoder vilket medför en variation i den mängd material som behöver bytas ut. Studien konstaterar att både det totala avtrycket samt de huvudsakliga drivarna varierar betydligt beroende på vilken metod som använts. Vidare konstateras att valet av metod är avgörande för att kunna minska mängden CO2e från vattenskadehantering, mer specifikt att en högre grad av materialåteranvädning, möjliggjort av torkning av skadade delar, förefaller vara att föredra när det är tillämpbart. Nyckelord LCA, livscykelanalys, vattenskada, vattenskadehantering, koldioxidavtryck, CO2e-avtryck


Contents
1 Introduction 11.1 Explicit problem statement . . . . . . . . . . . . . . . . . . . . . . . . . . . . . . . 31.2 Purpose . . . . . . . . . . . . . . . . . . . . . . . . . . . . . . . . . . . . . . . . . . 41.3 Research questions . . . . . . . . . . . . . . . . . . . . . . . . . . . . . . . . . . . . 41.4 Delimitations . . . . . . . . . . . . . . . . . . . . . . . . . . . . . . . . . . . . . . . 41.5 Outline . . . . . . . . . . . . . . . . . . . . . . . . . . . . . . . . . . . . . . . . . . 5
2 Background 62.1 Literature review . . . . . . . . . . . . . . . . . . . . . . . . . . . . . . . . . . . . . 62.2 Phases of a general life cycle assessment . . . . . . . . . . . . . . . . . . . . . . . . 82.3 Life cycle assessment for buildings . . . . . . . . . . . . . . . . . . . . . . . . . . . 112.4 Uncertainty and sensitivity analyses . . . . . . . . . . . . . . . . . . . . . . . . . . 122.5 Empirical setting - Case descriptions . . . . . . . . . . . . . . . . . . . . . . . . . . 13
3 Methodology 203.1 Life cycle assessment context: defining the analytical framework . . . . . . . . . . 213.2 Data collection methodology . . . . . . . . . . . . . . . . . . . . . . . . . . . . . . 243.3 Overview of collected data . . . . . . . . . . . . . . . . . . . . . . . . . . . . . . . . 273.4 Assumptions regarding the collected data . . . . . . . . . . . . . . . . . . . . . . . 303.5 Description of uncertainty management and sensitivity analysis . . . . . . . . . . . 31
4 Results and analysis 344.1 Results and case specific comments . . . . . . . . . . . . . . . . . . . . . . . . . . . 344.2 General findings . . . . . . . . . . . . . . . . . . . . . . . . . . . . . . . . . . . . . 444.3 Reflection around impact from assumptions . . . . . . . . . . . . . . . . . . . . . . 464.4 Comparison to previous studies . . . . . . . . . . . . . . . . . . . . . . . . . . . . . 464.5 Impact of external developments . . . . . . . . . . . . . . . . . . . . . . . . . . . . 49
5 Conclusion 515.1 Answers to research questions and scientific contribution . . . . . . . . . . . . . . . 515.2 Suggestions for further studies . . . . . . . . . . . . . . . . . . . . . . . . . . . . . . 53
A Environmental product data for building material 60
i

List of Figures
1.1 The general process for resolving a water damage . . . . . . . . . . . . . . . . . . . 21.2 Illustrative view of the spectrum of water damage resolution methods . . . . . . . 3
2.1 Number of search results per publication year between 2009-2018 for Web of Sciencesearches related to LCA . . . . . . . . . . . . . . . . . . . . . . . . . . . . . . . . . 6
2.2 Illustration of the LCA framework and its iterative design . . . . . . . . . . . . . . 92.3 The stages and information modules of a building’s life cycle, according to EN 15804 112.4 Blueprint of the water damaged bathroom in Case A - Reconstruct only . . . . . . 152.5 Composition of the room construction in Case A - Reconstruct only . . . . . . . . 152.6 Blueprint of the water damaged bathroom in Case B - Dry & Reconstruct . . . . . 172.7 Composition of the room construction in Case B - Dry & Reconstruct . . . . . . . 172.8 Blueprint of the water damaged bathroom in Case C - Dry only . . . . . . . . . . . 192.9 Composition of the room construction in Case C - Dry only . . . . . . . . . . . . . 19
3.1 The specific system boundary for the water damage restoration process used in thisstudy . . . . . . . . . . . . . . . . . . . . . . . . . . . . . . . . . . . . . . . . . . . . 23
4.1 Breakdown of production of new material for Case A - Reconstruct only . . . . . . 364.2 CO2e footprint per m2 per uncertainty and sensitivity scenario for Case A - Recon-
struct only . . . . . . . . . . . . . . . . . . . . . . . . . . . . . . . . . . . . . . . . 374.3 Distribution of CO2e footprint per uncertainty and sensitivity scenario, and WDR
process step for Case A - Reconstruct only . . . . . . . . . . . . . . . . . . . . . . . 374.4 Breakdown of production of new material for Case B - Dry & Reconstruct . . . . . 394.5 CO2e footprint per m2 per uncertainty and sensitivity scenario for Case B - Dry &
Reconstruct . . . . . . . . . . . . . . . . . . . . . . . . . . . . . . . . . . . . . . . . 404.6 Distribution of CO2e footprint per uncertainty and sensitivity scenario, and WDR
process step for Case B - Dry & Reconstruct . . . . . . . . . . . . . . . . . . . . . 414.7 CO2e footprint per m2 per uncertainty and sensitivity scenario for Case C - Dry only 434.8 Distribution of CO2e footprint per uncertainty and sensitivity scenario, and WDR
process step for Case C - Dry only . . . . . . . . . . . . . . . . . . . . . . . . . . . 434.9 Illustrative example of the change in kg CO2e footprint per m2 for the Nordic and
European electricity mixes, given a reduction to fully carbon-free electricity generation 49
ii

List of Tables
2.1 Results presented in an environmental assessment of water damages by SvenskFörsäkring . . . . . . . . . . . . . . . . . . . . . . . . . . . . . . . . . . . . . . . . . 7
2.2 Typical LCIA activities and corresponding questions . . . . . . . . . . . . . . . . . 10
3.1 Overview of data collection methodologies per data category . . . . . . . . . . . . 253.2 Demolished and replaced material for Case A - Reconstruct only . . . . . . . . . . 283.3 Electricity usage and transportation data for Case A - Reconstruct only . . . . . . 283.4 Demolished and replaced material for Case B - Dry & Reconstruct . . . . . . . . . 293.5 Electricity usage and transportation data for Case B - Dry & Reconstruct . . . . . 293.6 Electricity usage and transportation data for Case C - Dry only . . . . . . . . . . . 293.7 Summary of the CO2e footprint factors for new materials, electricity and trans-
portation used in the base scenarios, including the sources used . . . . . . . . . . . 303.8 Input data for uncertainty analysis of production of new material . . . . . . . . . . 333.9 Input data for sensitivity analysis of use of electricity . . . . . . . . . . . . . . . . . 33
4.1 CO2e footprint per data category and WDR process step in kg and as percentageof the total footprint for Case A - Reconstruct only (base scenario) . . . . . . . . . 35
4.2 CO2e footprint per data category and WDR process step in kg per m2 and aspercentage of the total footprint for Case A - Reconstruct only (base scenario) . . 35
4.3 CO2e footprint per data category and WDR process step in kg and as percentageof the total footprint for Case B - Dry & Reconstruct (base scenario) . . . . . . . . 38
4.4 CO2e footprint per data category and WDR process step in kg per m2 and aspercentage of the total footprint for Case B - Dry & Reconstruct (base scenario) . 39
4.5 CO2e footprint per data category and WDR process step in kg and as percentageof the total footprint for Case C - Dry only (base scenario) . . . . . . . . . . . . . 42
4.6 CO2e footprint per data category and WDR process step in kg per m2 and aspercentage of the total footprint for Case C - Dry only (base scenario) . . . . . . . 42
iii

Glossary
List of Acronyms
CO2e . . . . . . . . . . . . . . . . . . . . . . . . . . . . . . . . . . . . . . . . . . . . . . . . . . . . . . . . . . . . . . . . . . . Equivalent CO2
EPD . . . . . . . . . . . . . . . . . . . . . . . . . . . . . . . . . . . . . . . . . . . . . . . .Environmental Product Declaration
GHG . . . . . . . . . . . . . . . . . . . . . . . . . . . . . . . . . . . . . . . . . . . . . . . . . . . . . . . . . . . . . . . . . . .Greenhouse Gas
LCA . . . . . . . . . . . . . . . . . . . . . . . . . . . . . . . . . . . . . . . . . . . . . . . . . . . . . . . . . . . . . Life Cycle Assessment
LCI . . . . . . . . . . . . . . . . . . . . . . . . . . . . . . . . . . . . . . . . . . . . . . . . . . . . . . . . . . . . . . . . Life Cycle Inventory
LCIA . . . . . . . . . . . . . . . . . . . . . . . . . . . . . . . . . . . . . . . . . . . . . . . . . . . . .Life Cycle Impact Assessment
PDR . . . . . . . . . . . . . . . . . . . . . . . . . . . . . . . . . . . . . . . . . . . . . . . . . . . . . Property Damage Restoration
WDR . . . . . . . . . . . . . . . . . . . . . . . . . . . . . . . . . . . . . . . . . . . . . . . . . . . . . . . Water Damage Restoration
English to Swedish translation of technical vocabulary
Baseboard . . . . . . . . . . . . . . . . . . . . . . . . . . . . . . . . . . . . . . . . . . . . . . . . . . . . . . . . . . . . . . . . . . . . . Golvlist
Ceramic tiles . . . . . . . . . . . . . . . . . . . . . . . . . . . . . . . . . . . . . . . . . . . . . . . . . . . . . . . . . . . . Kakel/klinker
Concrete . . . . . . . . . . . . . . . . . . . . . . . . . . . . . . . . . . . . . . . . . . . . . . . . . . . . . . . . . . . . . . . . . . . . . . . .Betong
Coupling . . . . . . . . . . . . . . . . . . . . . . . . . . . . . . . . . . . . . . . . . . . . . . . . . . . . . . . . . . . . . . . . . . Rörkoppling
Floor drain . . . . . . . . . . . . . . . . . . . . . . . . . . . . . . . . . . . . . . . . . . . . . . . . . . . . . . . . . . . . . . . . . Golvbrunn
Floor drain sealing cuff . . . . . . . . . . . . . . . . . . . . . . . . . . . . . . . . . . . . . . . . . . . . .Brunnsmanschett
Grout . . . . . . . . . . . . . . . . . . . . . . . . . . . . . . . . . . . . . . . . . . . . . . . . . . . . . . . . . . . . . . . . . . . . . . . . . Kakelfog
Gypsum plasterboard . . . . . . . . . . . . . . . . . . . . . . . . . . . . . . . . . . . . . . . . . . . . . . . . . . . . . . .Gipsskiva
Low-density fibreboard . . . . . . . . . . . . . . . . . . . . . . . . . . . . . . . . . . . . . . . . . . . . . . . . . .Träfiberskiva
Mineral wool . . . . . . . . . . . . . . . . . . . . . . . . . . . . . . . . . . . . . . . . . . . . . . . . . . . . . . . . . . . . . . . .Mineralull
Plastic mat . . . . . . . . . . . . . . . . . . . . . . . . . . . . . . . . . . . . . . . . . . . . . . . . . . . . . . . . . . . . . Våtrumsmatta
Plastic wallpaper . . . . . . . . . . . . . . . . . . . . . . . . . . . . . . . . . . . . . . . . . . . . . . . . . . . . . . . Våtrumstapet
iv

Screed . . . . . . . . . . . . . . . . . . . . . . . . . . . . . . . . . . . . . . . . . . . . . . . . . . . . . . . . . . Självutjämnande massa
Spackling paste . . . . . . . . . . . . . . . . . . . . . . . . . . . . . . . . . . . . . . . . . . . . . . . . . . . . . . . . . . . . . . . . Spackel
Subfloor . . . . . . . . . . . . . . . . . . . . . . . . . . . . . . . . . . . . . . . . . . . . . . . . . . . . . . . . . . . . . . . . . . . . . Undergolv
System of joists . . . . . . . . . . . . . . . . . . . . . . . . . . . . . . . . . . . . . . . . . . . . . . . . . . . . . . . . Mellanbjälklag
Tile adhesive . . . . . . . . . . . . . . . . . . . . . . . . . . . . . . . . . . . . . . . . . . . . . . . . . . . . . . . . . . . . . . . .Fästmassa
Wall studs . . . . . . . . . . . . . . . . . . . . . . . . . . . . . . . . . . . . . . . . . . . . . . . . . . . . . . . . . . . . . . . . . . . Regelvägg
Waterproofing membrane . . . . . . . . . . . . . . . . . . . . . . . . . . . . . . . . . . . . . . . . . . . . . . . . . . . Tätskikt
v


Acknowledgements
We would like to thank Fabian Levihn, our supervisor at KTH. Yourguidance has been highly supportive and our discussions around theaverage Nordic electricity mix have been very insightful. We would alsolike to thank Polygon Group for being transparent about the company’sprocesses and being open to share data for the research. In particular,we would like to point out the solid support from Caroline Finslo, MariaWallin, Camilla Annerling Barck, Jonas Granath and Jonas Rönnqvist.Without your input, it would probably not have been possible to conductthis study. Lastly, we would like to thank our families and friends forthe encouragement throughout these five years.

Chapter 1
Introduction
Global climate change is perhaps one of the greatest challenges in modern time. It is a majorinternational issue requiring urgent resolution to mitigate potential effects such as rising sea levelsand increased severity of extreme weather. The rise in atmospheric CO2 concentration is describedas the largest contributor to the ongoing surface warming,[1] and there is a 97% consensus inpublished climate research that recent global warming is caused by humans.[2][3] Furthermore,in its Fifth Assessment Report (AR5), the Intergovernmental Panel on Climate Change (IPCC)highlights that continued greenhouse gas emissions will result in additional warming and change allcomponents in the climate system, and that substantial and sustained reduction of these emissionsis required to limit climate change.[1] As a consequence, actions are taken to decelerate and reducethe negative effects humans have on the climate. For example, the Paris Agreement[4] and theUnited Nations Sustainable Development Goals,[5] in particular Goal 13 Climate Action, highlightthe importance of meeting the global threat through international collaboration.
Buildings represent one of the main contributors to global CO2 emissions driven by the raw ma-terials and energy required throughout their life cycles.[6] They should thus be considered a keycomponent in the process of limiting climate change. Leading up to the 2015 United NationsClimate Change Conference, the Swedish government launched the initiative Fossil Free Sweden(SE: Fossilfritt Sverige), with the intention of making Sweden one of the world’s first fossil fuelfree welfare states.[7] Following this initiative, several of Sweden’s leading construction companiessigned a strategic roadmap that supports the industry in reaching the goals set up in Fossil FreeSweden, with the target of a climate neutral construction industry by 2045. Among other things,the roadmap states that the construction industry have a substantial potential in moving towardsa more circular system were reusing and recycling of materials are important enablers.[8]
The concept of Circular Economy (CE) is gaining increased attention and is currently promotedby both businesses and governments worldwide to cope with the economic and environmental chal-lenges of the traditional linear take-make-dispose model.[9][10][11][12][13][14] It is "loosely basedon a fragmented collection of ideas derived from a variety of scientific disciplines and semi-scientificconcepts"[14, p. 545] such as industrial ecology and cradle-to-cradle. On a high level, advocatesof the concept suggest that efficiency measures alone are insufficient to counter the challenges inthe linear model such as production chain waste, end-of-life waste and energy requirements; suchmeasures will simply delay the severity of the problems. Instead, a complete change to the system
1

CHAPTER 1. INTRODUCTION
is suggested where focus, among other things, is placed on intentionally designing out waste. Akey idea behind this concept is to facilitate for methods such as product reuse, recycling and re-manufacturing, which are suggested to generally require less energy and resources than traditionalmethods.[13]
This study focuses on water damage restoration (WDR), a service that can increase circularityrelated to buildings by enabling reuse of damaged materials after a water damage. This is donethrough drying of damaged materials rather than full demolition and reconstruction. The generalprocess for resolving water damages is illustrated in Figure 1.1. It starts after a potential waterdamage is identified. An inspector, typically a WDR technician or a builder, visits the prop-erty to assess the damage severity and prepares a plan suggesting suitable efforts to resolve thedamage. This is referred to as the inspection phase. Subsequently in the demolition phase, mate-rials requiring removal are removed, based on the previously presented but often slightly modifiedplan. Typically this affects those materials that are severely damaged and beyond rescue and aretherefore demolished and replaced. However, the demolition phase in some cases also includesuncovering of materials, i.e. temporary removal of materials that are often later reused. Whenthis is done, it is usually to secure an effective drying process. Following demolition, the dryingphase is initiated where suitable machines, for example dehumidifiers and fans, are used to lowerthe moisture to normal levels. The machines are installed and left at the property to run untilthe technician returns and takes measurements of the moisture levels. Depending on the situa-tion, it might subsequently be necessary to conduct further demolishing and/or dry for a longerperiod of time. Once however normal moisture levels are reached, the machines are removed andthe reconstruction phase starts, in which demolished materials are replaced and the property isrestored.
Figure 1.1: The general process for resolving a water damage. Not all steps are necessarily coveredin each damage. For example, some water damages can be resolved purely through drying, withoutthe need for demolition and reconstruction.
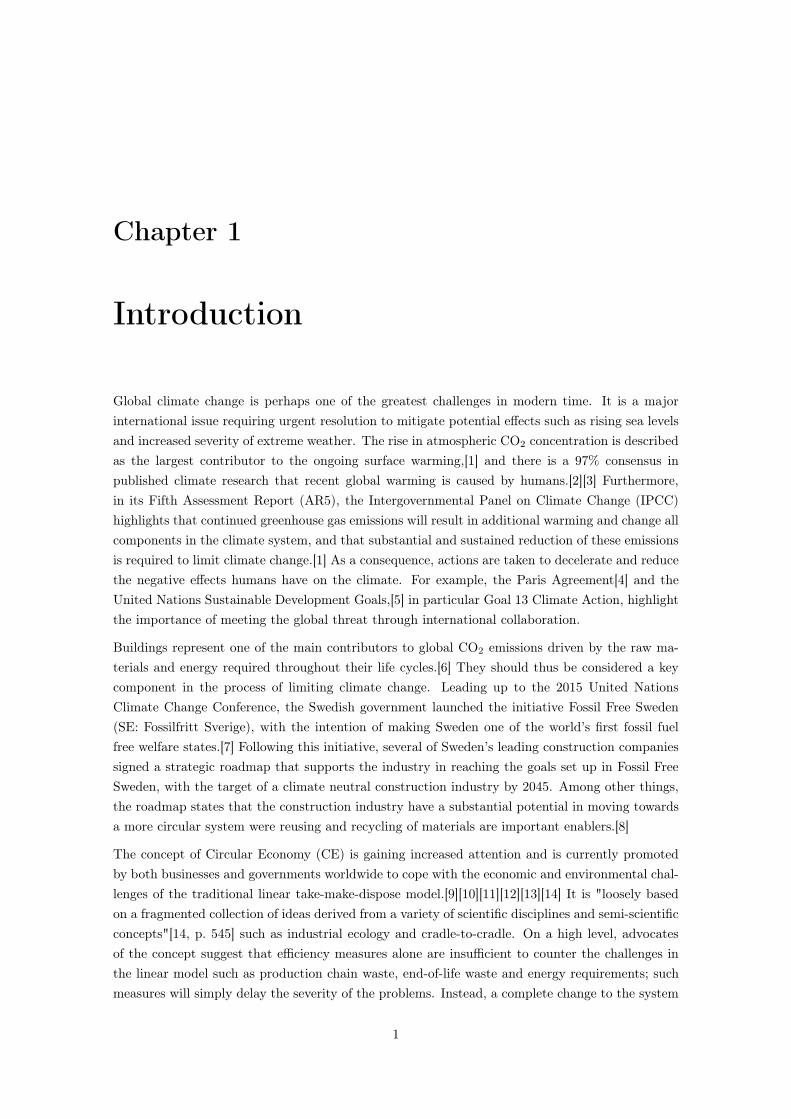
Given the general process illustrated in Figure 1.1, there are in practice different ways in whicha particular water damage can be resolved. For example, some damages are resolved purely bydemolishing material and later replacing it during reconstruction, whereas others are resolvedsolely by drying, i.e. without the need for replacing materials. In this thesis, the different waysof resolving water damages are referred to as different water damage resolution methods. Eachresolution method can on a high level be placed on a spectrum as illustrated by Figure 1.2. Thefurther to the left of the spectrum, the higher the degree of demolition and replacement of materialis. To the very left, all damaged material, and often adjacent materials as well, is replaced and nodrying is conducted. Progressing to the right, the amount of drying increases, enabling a higherdegree of reuse.
2
CHAPTER 1. INTRODUCTION
Figure 1.2: Illustrative view of the spectrum of water damage resolution methods.
Relating WDR to CE, a higher degree of drying as opposed to demolition and reconstructionshould result in lower energy use and thus lower equivalent CO2 (CO2e)1 footprint, driven by itenabling reuse of materials, rather than disposal and replacement of them. In order to test thishypothesis, it should be considered relevant to assess the full life cycle CO2e footprint of variouswater damage resolution methods. Few granular studies assessing the CO2e footprint from waterdamages and/or comparing the footprint from different resolution methods have been made, whichis detailed in Chapter 2.1. It is therefore an interesting topic to research, both from an academicperspective and to provide scientifically based insights to the industry.
This study uses the Life Cycle Assessment (LCA) framework to analyze the CO2e footprint fromvarious water damage resolution methods. The tool can increase understanding and awarenessamong decision makers regarding the environmental footprint from certain systems, which is nec-essary to enable sound decisions.[10] The method stands out in its focus on full product/servicelife-cycles, from raw material extraction to end-of-life management, as opposed to other methodssuch as Strategic Environmental Assessment, Environmental Impact Assessment and Environmen-tal Risk Assessment.[15] For WDR, this implies assessing each activity across the process illustratedin Figure 1.1, for example covering transportation of people and materials, electricity used for dry-ing, and environmental footprint related to the demolished and new material. The LCA methodenables highlighting of which of these activities are the main drivers of CO2e, and can thus facilitateand improve decisions to reduce the environmental footprint.
1.1 Explicit problem statement
As introduced, climate change is an urgent issue where reduction of greenhouses gas emissions frombuildings has a key role. In order to solve this issue, actions need to be taken on multiple fronts.In Sweden alone, approximately 70,000 water damages occurred during 2017,[16] arguably withan effect on the CO2e footprint of buildings. These water damages can as mentioned be resolvedthrough different methods, and the respective CO2e footprint from these methods should differ aswell. However, there is a lack of scientific quantification around how the CO2e footprint varies,depending on which water damage resolution method is used, including what the main factorsdriving the footprint are. This is further detailed in Chapter 2.1. Since academic literature islimited, stakeholders in the water damage restoration industry, for example insurance companies,property owners and property damage restoration companies, lack the underlying support that isrequired in order to prioritize and take relevant actions to reduce to impact on the environment.The main problem of this thesis is thus that due to the lack of scientific support around what drives
1CO2e is a way to, in a common unit, represent the effect greenhouse gases have on global warming. The
respective gases’ effects are transformed to present the equivalent effect CO2 would have.
3

CHAPTER 1. INTRODUCTION
the CO2e footprint related to water damage restoration, the involved stakeholders have a limitedability to make sound decisions in order to reduce CO2e and combat climate change.
1.2 Purpose
The purpose of this study is to quantify the environmental footprint of different water damageresolution methods from a CO2e perspective by conducting a life cycle assessment, which is requiredto enable sound decision making to combat climate change. It further serves to investigate whatactions can be taken to reduce the CO2e footprint from water damages. The intended audienceof the findings are companies within the water damage restoration industry, property owners,insurance companies, and other stakeholders in water damage restoration processes.
1.3 Research questions
The study’s first research question tackles the problem of a lack of scientific quantification aroundthe main drivers of CO2e footprint for different water damage resolution methods:
“What are the primary drivers of CO2e footprint for different water
damage resolution methods given a life cycle perspective?”
The results from the first research question should increase the transparency to enable sounddecisions around the actions to be taken in order to reduce the CO2e footprint related to waterdamage restoration. To facilitate this further, a subsequent discussion is held regarding what theseactions could be, and is guided by the second research question:
"What areas are relevant to focus on in order to reduce the CO2e
footprint related to water damage restoration?"
As mentioned, the number and the granularity of previous studies around environmental analysesconcerning water damages is limited. As a result, this study also develops a methodology to enableanswering the research questions.
1.4 Delimitations
The study is delimited by the following factors:
• The study only assesses the CO2e footprint, and does thus exclude other types of categorieswith additional potential environmental effects.
• The study considers three real-life cases in detail, rather than scoping the full industry, whichcan limit the generalizability of the results.
• The three real-life cases are limited to damages in bathrooms, as it is one of the most commonroom types where water damages occur. As bathrooms are quite unique in their materialcomposition, this could also limit the generalizability of the study. In particular, none of thethree bathrooms included wooden constructions that had to be replaced. Given the CO2e
4
CHAPTER 1. INTRODUCTION
uptake of wood, the results would therefore probably be different should such constructionshave required replacement.
• Focus is on residential buildings rather than commercial or other types of buildings, primarilydue to data availability.
• The study is primarily centered around Sweden, for example regarding the assessed real-lifecases, although some aspects such as electricity mixes and data regarding CO2e footprintconnected to the production of material can be considered international.
• The water damages considered in this study originate from inside the house, for example fromleaking pipes or coupling points. Damages originating from floods are thus not considered,as those are another type of damage that often require a different resolution method.
1.5 Outline
The next chapters are structured as follows:
• Chapter 2 - BackgroundReviews previous literature connected to water damages and environmental emissions. Sub-sequently gives a theoretical overview of the general Life Cycle Assessment framework aswell as description of how LCAs are performed on buildings. Further provides backgroundconcerning uncertainty and sensitivity analyses. Lastly presents the empirical setting bydescribing the three real life water damage cases that are assessed in the study.
• Chapter 3 - MethodologyIntroduces the key aspects of the LCA in this study including system boundary, functionalunit and method for life cycle impact assessment. It further describes the methodology fordata collection and presents the collected input data used to calculate the CO2e footprint,including assumptions. Lastly presents the method, data collection and used input data, forthe uncertainty and sensitivity analyses.
• Chapter 4 - Results and analysisPresents the results from the LCA along with analysis and interpretation for all cases, relatingback to the research questions. Further discusses general findings and compares the resultsto previous studies. Also conducts a qualitative assessment of potential future changes fromexternal developments.
• Chapter 5 - ConclusionSummarizes the findings, provides explicit answers to the research questions, describes con-tribution to literature, and presents suggestions for further studies.
5

Chapter 2
Background
Life Cycle Assessment (LCA) is a technique designed to assess the environmental aspects of aproduct or service throughout its entire life-cycle. It covers every step of the life-cycle, from theacquisition of raw materials, to the production and use phases, end-of-life treatment, and finallyto recycling and disposal. The technique arose as a response to the increasing interest in under-standing the effects different products and services have on the environment.[17] Since the idea’sformation in the 1960s,[18] it has been further developed and the methodological robustness hasincreased.[15] The first international standard describing the principles of an LCA was publishedin 1997.[19] This has subsequently been updated (ISO 14040)[17] and been complemented by amore granular version (ISO 14044),[20] further detailing the concept. Moreover, a European Stan-dard (EN 15804) was first published in 2012, and revised in 2013, which among other thingsdefines LCAs for construction products and services.[21] Most LCA studies on buildings basetheir methodology on ISO 14040 with some variations to suit their specific needs.[22] Additionally,many studies also use EN 15804 to further support the methodology with a building specific LCAframework.[23][24][25]
2.1 Literature review
Scientific literature related to LCAs is increasing, which is illustrated by Figure 2.1. In particular,LCAs performed on buildings have increased significantly over the last 10 years.[26][24]
550 751 862
2009
2010
2013
2011
2012
2016
2014
2015
2017
2018
1,152 1,311
1,895 1,630
2,261 2,606
2,844
45 67 71 116 133
167 226
300 314 349
2014
2013
2016
2009
2012
2010
2011
2015
2017
2018
(b) Search string: ”life cycle assessment” AND ”building%” (a) Search string: ”life cycle assessment”
Figure 2.1: Number of search results per publication year between 2009-2018 for Web of Sciencesearches related to LCA. Accessed in April 2019.
6
CHAPTER 2. BACKGROUND
Although the number of LCAs related to buildings is increasing, life cycle processes such as repara-tions and replacements, including water damages, are often simplified or overlooked.[27][28] Lookingat water damages in particular, it is clear that the literature is quite sparse. Using the search string"water damage" AND "LCA" in Science Direct only yields 23 results (as of April 2019). Of the23 results, only one is considered to be relevant to this thesis. The rest cover other problems suchas water damages to asphalt. Additional literature can be found connected to flood damages andLCAs.[29][30][31][32] Although flood damages are out of scope in this study, as stated in Chapter1.4, the articles are still considered as they are used as inspiration for the methodology. Matthewset.al.[30] emphasize the importance the choice of environmental material data has on the results inLCA studies similar to this thesis, i.e. the selection of sources related to data on demolished andreplaced materials. Further, Hennequin et.al.[31] describe an approach to achieve the most repre-sentative data available by creating their own hybrid dataset from several different data sources.The approach uses specific environmental material data when possible, but is supplemented withgeneric data when necessary.
There are several Swedish reports covering indoor water damages.[33][34][35][36] All of them focuson investigating causes for water damages and how the damages can be prevented. Two of thereports[33][34] discuss the topic of environmental emissions caused by water damages. They statethat water damages have a significant effect on the environment as greenhouse gases directly andindirectly are released during the damage resolution process. Both of the reports[33][34] discussprevention of water damages as a means to mitigate the negative impact the resolution process hason the environment. The second one[34] also suggests that some resolution methods could resultin reduced emissions.
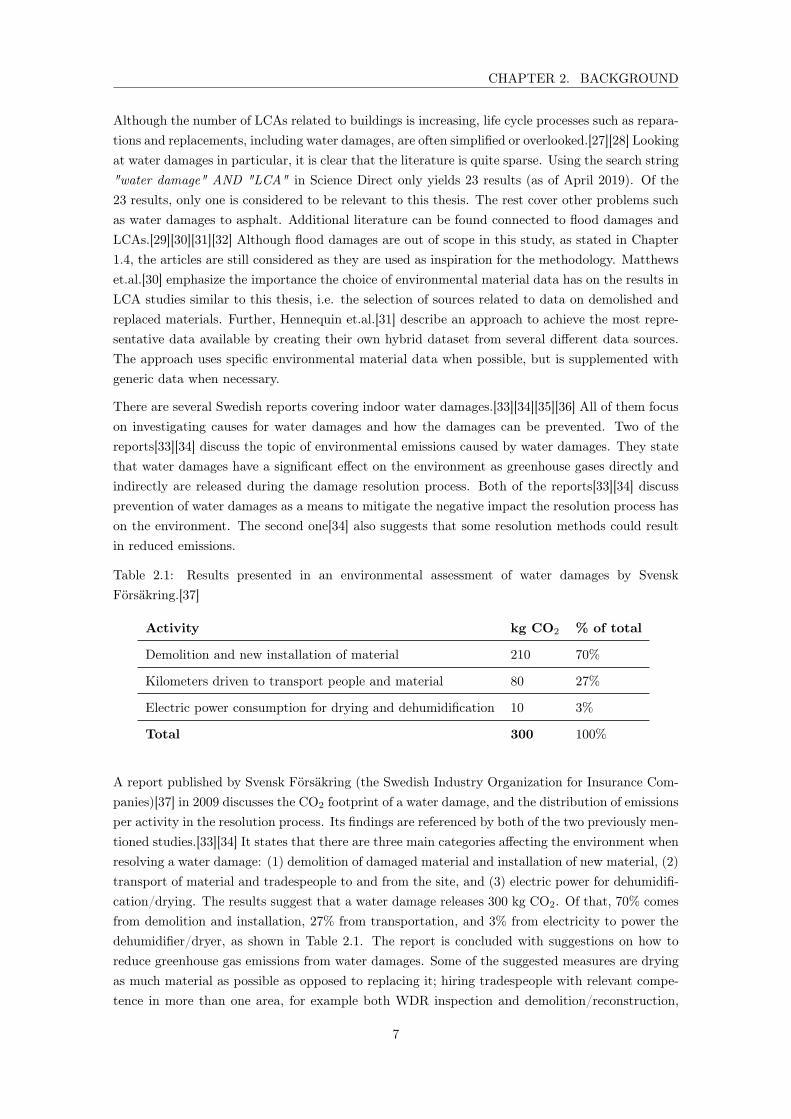
Table 2.1: Results presented in an environmental assessment of water damages by SvenskFörsäkring.[37]
Activity kg CO2 % of total
Demolition and new installation of material 210 70%
Kilometers driven to transport people and material 80 27%
Electric power consumption for drying and dehumidification 10 3%
Total 300 100%
A report published by Svensk Försäkring (the Swedish Industry Organization for Insurance Com-panies)[37] in 2009 discusses the CO2 footprint of a water damage, and the distribution of emissionsper activity in the resolution process. Its findings are referenced by both of the two previously men-tioned studies.[33][34] It states that there are three main categories affecting the environment whenresolving a water damage: (1) demolition of damaged material and installation of new material, (2)transport of material and tradespeople to and from the site, and (3) electric power for dehumidifi-cation/drying. The results suggest that a water damage releases 300 kg CO2. Of that, 70% comesfrom demolition and installation, 27% from transportation, and 3% from electricity to power thedehumidifier/dryer, as shown in Table 2.1. The report is concluded with suggestions on how toreduce greenhouse gas emissions from water damages. Some of the suggested measures are dryingas much material as possible as opposed to replacing it; hiring tradespeople with relevant compe-tence in more than one area, for example both WDR inspection and demolition/reconstruction,
7
CHAPTER 2. BACKGROUND
to avoid unnecessary journeys to the damaged property; and choosing materials with low carbonfootprint when reconstructing.
The report by Svensk Försäkring[37] estimates the average Swedish water damage CO2 footprintbased on aggregated historical data. Its input consists of 700 kg of demolition waste, 700 kg ofnew materials, 200 km of tradespeople transport, 150 km of material transport, and 1000 kWh ofelectricity use for dehumidification/drying. The CO2 data that was used for building materialscomes from the IVL (Swedish Environmental Research Institute) material database available atthe time of the assessment. For electricity use, the Swedish electricity production mix at the timewas applied, although the exact numbers are not presented.
The report can probably provide a reasonable estimation of the average Swedish water damage, butit lacks in presenting the details relevant to consider if conducting a granular estimation. This alsocomplicates comparability. For example, one can assume that there is a correlation between thesize of the affected room and the water damage’s environmental footprint. As the size of the roomfor an average water damage is not presented, it is difficult to conduct an accurate comparisonto the results. In addition, it is also plausible that water damages differ in their environmentalfootprint depending on which room they occur in. For example, a damage occurring in a bathroomwith ceramic tiles would likely be more CO2 heavy than one without any tiles. Furthermore, eventhough IVL by many is considered a credible source to collect data from, it would be interestingto see the material types Svensk Försäkring uses for their calculations and what the correspondingCO2 footprints are. This would facilitate replication of the methodology and increase the relevanceof a comparison. To summarize, the report probably makes a fair estimation of the CO2 footprintfrom an average Swedish water damage, but it could nevertheless have been strengthened by a morenuanced approach together with an increased transparency concerning its methodology.
A second estimation of the environmental effects from Swedish water damages is presented througha simplified calculation of the CO2e footprint from resolving water damages in kitchens, publishedby IVL.[23] The calculations are seen as simplified as they only include emissions from the produc-tion of new materials and electricity used for dehumidification and drying, ignoring the transporta-tion and other aspects. The study assesses the CO2e footprint of a water damage for five differentbuilding systems across four types of damage severity levels, as part of a life cycle assessment of anentire building. The results ranges from 148 kg CO2e to 884 kg CO2e depending on material com-position, the affected room’s layout and damage severity. This is in the same order of magnitudeas the results from Svensk Försäkring,[37] but it also illustrates that the CO2e footprint can varydepending on the damage. Presented in relation to the size of the damaged room, the footprintvaries from 7 kg CO2e per square meter to 38 kg CO2e per square meter. It is however importantto note that due to the varying size of the assessed systems in terms of square meters, a relativelyhigh total CO2e footprint did not necessarily correspond to a relatively high CO2e footprint persquare meter in the IVL study.
2.2 Phases of a general life cycle assessment
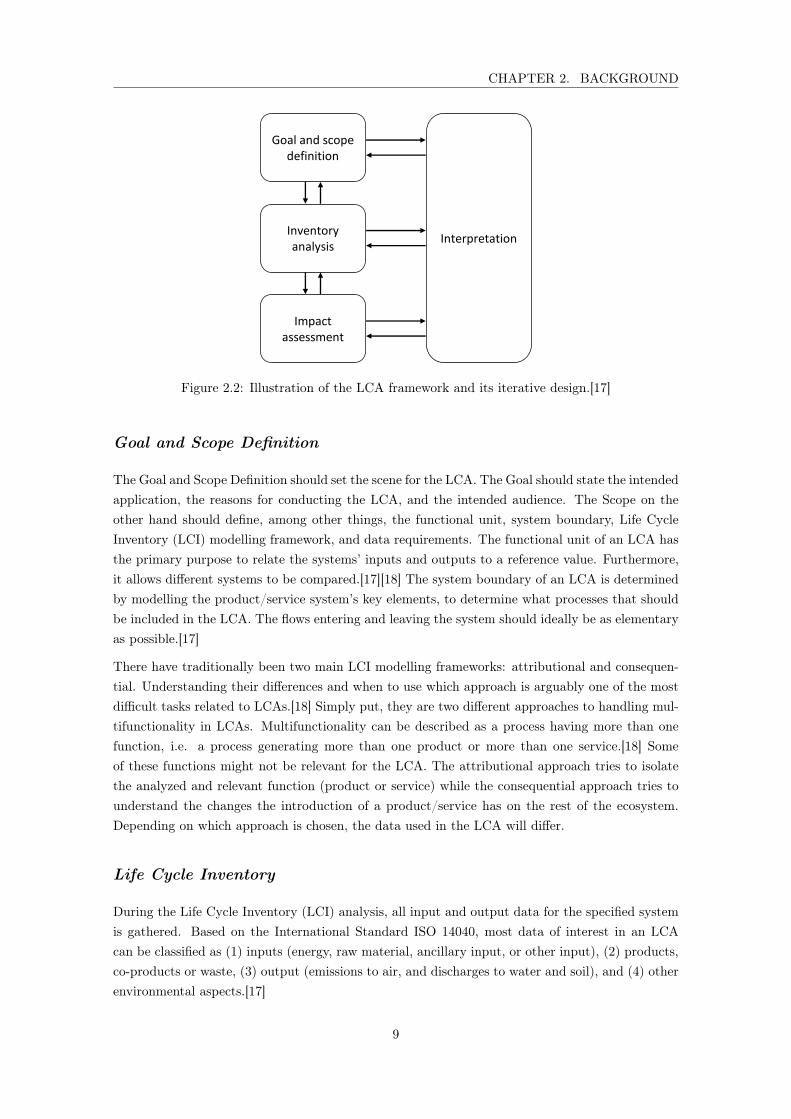
According to the two ISO Standards,[17][20] LCA is an iterative technique that is comprised offour phases illustrated in Figure 2.2: Goal and Scope Definition, Life Cycle Inventory Analysis,Life Cycle Impact Assessment, and Interpretation.
8
CHAPTER 2. BACKGROUND
Interpretation
Goal and scope definition
Impact assessment
Inventory analysis
Figure 2.2: Illustration of the LCA framework and its iterative design.[17]
Goal and Scope Definition
The Goal and Scope Definition should set the scene for the LCA. The Goal should state the intendedapplication, the reasons for conducting the LCA, and the intended audience. The Scope on theother hand should define, among other things, the functional unit, system boundary, Life CycleInventory (LCI) modelling framework, and data requirements. The functional unit of an LCA hasthe primary purpose to relate the systems’ inputs and outputs to a reference value. Furthermore,it allows different systems to be compared.[17][18] The system boundary of an LCA is determinedby modelling the product/service system’s key elements, to determine what processes that shouldbe included in the LCA. The flows entering and leaving the system should ideally be as elementaryas possible.[17]
There have traditionally been two main LCI modelling frameworks: attributional and consequen-tial. Understanding their differences and when to use which approach is arguably one of the mostdifficult tasks related to LCAs.[18] Simply put, they are two different approaches to handling mul-tifunctionality in LCAs. Multifunctionality can be described as a process having more than onefunction, i.e. a process generating more than one product or more than one service.[18] Someof these functions might not be relevant for the LCA. The attributional approach tries to isolatethe analyzed and relevant function (product or service) while the consequential approach tries tounderstand the changes the introduction of a product/service has on the rest of the ecosystem.Depending on which approach is chosen, the data used in the LCA will differ.
Life Cycle Inventory
During the Life Cycle Inventory (LCI) analysis, all input and output data for the specified systemis gathered. Based on the International Standard ISO 14040, most data of interest in an LCAcan be classified as (1) inputs (energy, raw material, ancillary input, or other input), (2) products,co-products or waste, (3) output (emissions to air, and discharges to water and soil), and (4) otherenvironmental aspects.[17]
9

CHAPTER 2. BACKGROUND
The LCI phase is in most cases quite complex as it often includes many different materials thatmust be accounted for. In some cases the data is unreliable and sometimes even missing.[19] Inaddition, as discussed in Chapter 2.1, the material source selection is important.[30] As a result,the LCI phase should be considered critical.
Life Cycle Impact Assessment
The Life Cycle Impact Assessment (LCIA) should aim at creating an understanding of the environ-mental impact for the different components identified in the LCI. According to ISO 14044,[20] threeactivities should be included in every LCA and each can be considered in relation to a question.These activities and questions are indicated in Table 2.2.
Table 2.2: Typical LCIA activities and corresponding questions.
# Activity[20, p. 16] Corresponding question[18, p. 169]
(1)"Selection of impact categories,category indicators andcharacterization models"
"Which impacts do I need to assess?"
(2)"Assignment of LCI results tothe selected impact categories(classification)"
"Which impact(s) does each LCI results contribute to?"
(3)"Calculation of categoryindicator results(characterization)"
"How much does each LCI result contribute?"
The impact categories are a set of environmental issues that the LCI results can be assignedto, e.g. eutrophication of water bodies, acidification of lakes, or climate change. They shouldbe selected in accordance to the previously defined goal and scope. This selection of impactcategories is an important part of an LCA as it determines which environmental aspects areassessed. Category indicators are the quantifiable representation of an impact category. Forclimate change, an example would be infrared radiative forcing,[20] i.e. the difference betweensunlight absorbed by Earth and the energy that is radiated back to space. The characterizationmodel states the factor with which it is possible to convert the LCI data to the unit of the categoryindicator.[20] It is thus used in the two following steps to assign the results from the LCI withthe impacts connected to the impact categories. In practice, these steps are most often automatedusing LCA software and explicit answers to each step are not presented.[18] Instead it is morecommon to only mention what impact categories are in focus and thereafter present the resultsfrom the characterization. In a literature review focusing on LCAs on building refurbishment,[24] itis found that most studies focus on several impact categories. The most common of them are globalwarming potential, primary energy, eutrophication potential and acidification potential. However,some of the studies chose to focus only on one specific impact category.
10

CHAPTER 2. BACKGROUND
Interpretation
The interpretation phase should discuss the results from the previous phases on the foundationformed in the Goal and Scope Definition.[17] The nature of an LCA is iterative, and therefore,the results from one phase might lead to a revision of an earlier phase.[20] For example, the datacollected in the LCI could result in that the scope of the study must be updated. Following this,the Interpretation phase is present in each step of the LCA, as illustrated in Figure 2.2.
2.3 Life cycle assessment for buildings
According to the European Standard EN 15804,[21] the life cycle of a building can be divided into4 stages: Product stage, Construction process stage, Use stage, and End of Life stage. Each stagecontains specific information modules that cover certain aspects of the building life cycle. Thesemodules, including how they follow each other, are illustrated in Figure 2.3.
PRODUCT stage
CONSTRUCTION PROCESS stage
USE stage
END OF LIFE stage
Operational energy use
Operational water use
A 1-3 A 4-5 B 1-7 C 1-4
Raw
mat
eria
l su
ppy
Tran
spor
t
Man
ufac
turin
g
Tran
spor
t
Cons
truc
tion
inst
alla
tion
proc
ess
Use
Refu
rbish
men
t
Repl
acem
ent
Repa
ir
Mai
nten
ance
Disp
osal
De-c
onst
ruct
ion
dem
oliti
on
Tran
spor
t
Was
te
proc
essin
g
A1 A2 A3 A4 A5 B1 B3 B2 C3 C4 C1 C2 B4 B5
B6
B7
Figure 2.3: The stages and information modules of a building’s life cycle, according to EN 15804.[21]
The Product stage, which covers the three information modules A1 Raw material supply, A2Transport, and A3 Manufacturing, describes how the calculations of the environmental emissionsof building materials should be carried out. Using a wooden plank as an example, the Productstage starts with the timber harvesting (A1) and continues when the timber is transported to thesawmill (A2) where it is further processed into its final form (A3). During this process, all outputflows such as fuel for forestry machines and transportation, and manufacturing of packaging, mustbe accounted for and aggregated to the final accumulated environmental emissions.[21]
The Construction process stage handles the transportation of building materials to the constructionsite (A4) and the installation of them into the building (A5).[21] This stage could for exampleinclude the fuel for transports and the associated energy flows from the construction site such aslighting, heating and air-conditioning.
The Use stage is best divided into two sub-stages: B1-B5 and B6-B7. The first sub-stage coversall environmental aspects resulting from everyday use (B1), such as substance release from facadesor floors. It also covers all the work that must be performed on a building from when constructionis complete until it gets demolished or de-constructed (B2-B5), such as maintenance (B2), repairof damaged or broken components (B3), replacement of worn components (B4), and larger scale
11
CHAPTER 2. BACKGROUND
refurbishments (B5). The second sub-stage (B6-B7) covers operational energy and water use overthe buildings lifetime.[21]
The fourth and final stage, the End of Life stage, covers either the building as a whole when it hasreached its end of life, or a specific component that does not provide any further functionality to thebuilding. During the End of Life stage, all components, products, debris, etc. are at first consideredas waste. However, the material reaches what is called the end-of-waste stage if it (1) can be usedfor a specific purpose, (2) fulfills the technical and legislative requirements for that purpose, (3)there exists a market demand for it, and (4) the use of it will not lead to harmful human healthor negative environmental effects. Therefore, the materials are either in the waste state or theend-of-waste state. To obtain the potential environmental emissions for the End of Life stage, theemissions from the Deconstruction module (C1), such as fuel for machines; Transportation (C2);Waste processing (C3), which covers reuse, recycling and energy recovery; and lastly the Wastedisposal (C4), are summed up. Only components that have reached the end-of-waste stage can beconsidered for the Waste processing (C3) information module.[21]
The focus for most of the recent LCAs of buildings is on the emissions associated with the op-erational phase of the building and the embodied energy from the construction phase.[26] TheUse phase of buildings accounts for the majority of the environmental emissions, mostly due tothe long operational life phase that is assumed for buildings.[22] The largest share of emissionsfrom this phase comes from energy production for electricity and in particular heating.[38][39] Asfor the embodied energy coming from the construction materials, a Scottish LCA on residentialbuildings[40] concluded that of the initial embodied energy, 61% came from concrete, 14% fromceramic tiles, and 13% from timber.
2.4 Uncertainty and sensitivity analyses
Managing uncertainty from the sources used in an LCA is important in order to improve the ro-bustness of a study and its conclusions.[18] An LCA typically consists of multiple input parameterswith various degree of uncertainty, resulting in a need for analyzing uncertainty and sensitivity aspart of the interpretation. The two types of analyses are defined according to ISO 14044[20, p. 22]as follows:
• Uncertainty analysis: "a procedure to determine how uncertainties in data and assump-tions progress in the calculations and how they affect the reliability of the results of theLCIA."
• Sensitivity analysis: "a procedure to determine how changes in data and methodologicalchoices affect the results of the LCIA."
The uncertainty that should be assessed can be defined as "the discrepancy between a measuredor calculated quantity and the true value of that quantity".[15, p. 14] The uncertainty is furthersuggested to primarily depend on three sources: data, choices and relations. The uncertaintyfrom data sources could for example arise from different secondary data sets applying differentmethods for calculating the CO2e footprint for equivalent products. The uncertainty connected tochoices could on the other hand be the result of a wrongly determined system boundary. Lastly,
12

CHAPTER 2. BACKGROUND
the relation uncertainty could appear due to a linear relation being assumed between two factors,when in reality the relation is of another nature.[15]
There are three main ways in which uncertainty can be dealt with: the scientific way, the socialway, and the statistical way.[15] The scientific way handles uncertainty by collecting more data,spending more time on decision making, and finding more suitable relations between connectedfactors. Although this approach certainly reduces uncertainty, it is not always an option as mostLCA studies are restricted by time and/or budget.[18] The social way aims to solve the problemof uncertainty by discussing it and striving towards a consensus with important and relevantstakeholders. This method should be used with caution as the reached consensus can stand inconflict with rationale and scientific reasoning.[41] The statistical way differs from the previouslymentioned methods as it does not try to reduce uncertainty. Instead, it rather deals with it andincorporates it in the analysis. This can be achieved in multiple ways such as running Monte Carlosimulations or creating probability distributions based on the uncertainties. However, the moststraightforward way is to vary parameters and test different scenarios, for example comparing thedifferent outcomes maximum and minimum fuel efficiency have on the equation. Regardless ofwhich method is used, the most important thing is often just to clearly declare the uncertaintiesthat are present in the study.[18]
The most used definition for sensitivity in the LCA context is that it is a measure for the changein output of the LCA model created by a certain change in input.[18] A model’s sensitivity istherefore assessed by feeding it with varying inputs, similar to the statistical way of uncertaintyassessment. The difference is that the data is assumed to have no uncertainty. Instead the LCAmodel is provided with predefined data points to investigate what happens to the output of themodel, in accordance with the definition of sensitivity.
2.5 Empirical setting - Case descriptions
This study assesses three recent actual water damages resolved on the Swedish market within 12months of each other during 2018 and 2019. The specific cases are chosen based on discussions withwater damage technicians and other employees at a property damage restoration (PDR) company,i.e. a company that among other things works with WDR. The purpose of this is to assess relevantand, to the extent possible, representative cases. The damages occurred in bathrooms and wereresolved in three different ways. They are labeled as Case A, Case B and Case C. Case A wasresolved purely by reconstruction through demolition and replacement of materials, i.e. it did notinclude the drying step. On the other side of the spectrum, Case C was resolved purely by drying,i.e. it did not include the demolition and reconstruction steps. Lastly, Case B included all stepsin the general WDR process, i.e. a combination of both reconstruction and drying.
As has been introduced, water damages differ, for example concerning cause of damage, severity,and resolution method, making it important to select relevant cases for assessment. It is relevant toassess bathrooms as it is one of the room types most likely to be subjected to a water damage. As anexample, around one third of Swedish water damages in houses occur in bathrooms. The remainingtwo thirds are approximately evenly split across kitchens and other rooms respectively.[42]
13

CHAPTER 2. BACKGROUND
2.5.1 Case A - Reconstruct only
Case summary
• Inspection: A WDR technician visited the site and inspected the property, judging thatthe outer layers of floor and walls, and the floor drain should be removed.
• Demolition: The outer layers of the floor and walls, and the floor drain were demolishedand disposed of.
• Drying: No drying was conducted as the uncovered material was dry.
• Reconstruction: The demolished material was replaced.
Detailed description
The first case occurred in a 3.40 m2 bathroom with a ceiling height of 2.40 m. It was caused bywater leaking through the floor around the floor drain. It is unknown exactly how long the leakagehad been ongoing. Water leaked through the plastic mat, a type of flooring used in rooms such asbathrooms to protect underlying materials from moisture. High moisture levels were found belowthe mat in relation to the floor drain, indicated by the shaded blue area in Figure 2.4. As a result,it was decided that both the plastic mat, covering the floor, and the plastic wallpaper, coveringthe walls, should be removed.
The floor was made up of concrete with the plastic mat placed directly on top, as indicated byFigure 2.5. The wall to the top of Figure 2.4, opposite to the door, was made up of concrete,gypsum plasterboard and plastic wallpaper, illustrated by Figure 2.5a. The outer layers of thewalls to the left, right and bottom of Figure 2.4 were also of gypsum plasterboard and plasticwallpaper, but the central construction consisted of a wooden wall studs, illustrated by Figure2.5b.
The damage was resolved by initially removing the external pipes and couplings, the floor drain,and the outer layers of the floor and walls. Concrete with high moisture levels adjacent to thefloor drain was also removed. It was thereafter concluded that no further material or structureshad above threshold moisture levels. As a result, the room was reconstructed without any needfor drying. The pipes and couplings were reused whereas the other materials were disposed of andreplaced.
14

CHAPTER 2. BACKGROUND
Figure 2.4: Blueprint of the water damaged bathroom in Case A - Reconstruct only. High moisturelevels were identified in the underlying concrete floor in relation to the floor drain, indicated bythe shaded blue area.
(a) (b)
Conc
rete
Wal
l stu
d
Gypsum plasterboard
Gypsum plasterboard
Figure 2.5: Composition of the room construction in Case A - Reconstruct only.
15

CHAPTER 2. BACKGROUND
2.5.2 Case B - Dry & Reconstruct
Case summary
• Inspection: A WDR technician inspected the property suggesting demolition of walls andfloor. A follow-up inspection after the initial demolition was conducted, suggesting drying ofconcrete.
• Demolition: All layers of walls and floor were demolished down to the concrete base.
• Drying: Concrete was dried.
• Reconstruction: Previously demolished materials were replaced and reconstructed.
Detailed description
The second case occurred in a 2.97 m2 bathroom with a ceiling height of 2.40 m. Damage occurrencedate and duration is unknown, but it was caused by a leakage in the waterproofing membrane onthe floor, a material used to protect the underlying floor from water and moisture. It resultedfrom a floor drain sealing cuff not functioning properly, leading to water spreading under thewaterproofing membrane. Ceramic tiles on the wall had cracked and increased moisture levelswere observed in both the underlying concrete floor as well as in some parts of the wall. Theaffected floor areas are indicated in Figure 2.6 by the shaded blue area whereas the affected wallareas are indicated by the dotted red line.
The underlying floor was made of concrete, covered by a waterproofing membrane and lastly ofceramic tiles. This construction is illustrated by Figure 2.7. The wall opposite the door, the topone in Figure 2.6, was constructed using concrete, gypsum plasterboard, waterproofing membraneand ceramic tiles. This is illustrated by Figure 2.7a. The remaining walls had the same outerlayers but the inner structure was made up of wooden wall studs, illustrated by Figure 2.7b.
The damage was resolved by a combination of demolition, drying and reconstruction. A WDRtechnician initially inspected the damage and concluded that it was likely that the floor wasdamaged. Most of the outer floor and wall layers were removed after which a follow-up inspectionconcluded that the initial hypothesis was true. The remaining flooring and wall coverings wereremoved down to the concrete and wall studs. After drying the concrete floor, it was discoveredthat parts of the concrete wall were also affected by the water. Thus further drying had to beconducted before the bathroom was reconstructed using new materials.
16

CHAPTER 2. BACKGROUND
Figure 2.6: Blueprint of the water damaged bathroom in Case B - Dry & Reconstruct. Highmoisture levels were identified in the underlying concrete floor, indicated by the shaded blue area.Ceramic tiles had cracked and high moisture levels were also identified in the wall, indicated bythe dotted red line.
(a) (b)
Conc
rete
Waterproofing membrane
Gyps
um
plas
terb
oard
Gyps
um
plas
terb
oard
Waterproofing membrane
Wal
l stu
d
Figure 2.7: Composition of the room construction in Case B - Dry & Reconstruct.
17
CHAPTER 2. BACKGROUND
2.5.3 Case C - Dry only
Case summary
• Inspection: A WDR technician inspected the property 14 days after damage occurrenceand immediately began drying without demolition.
• Demolition: No demolition was done but the wall was uncovered by temporarily removingbaseboards.
• Drying: Gypsum plasterboard walls were dried by forcing air into the wall structure usinga dehumidifier.
• Reconstruction: No reconstruction was conducted but previously removed baseboards werereattached.
Detailed description
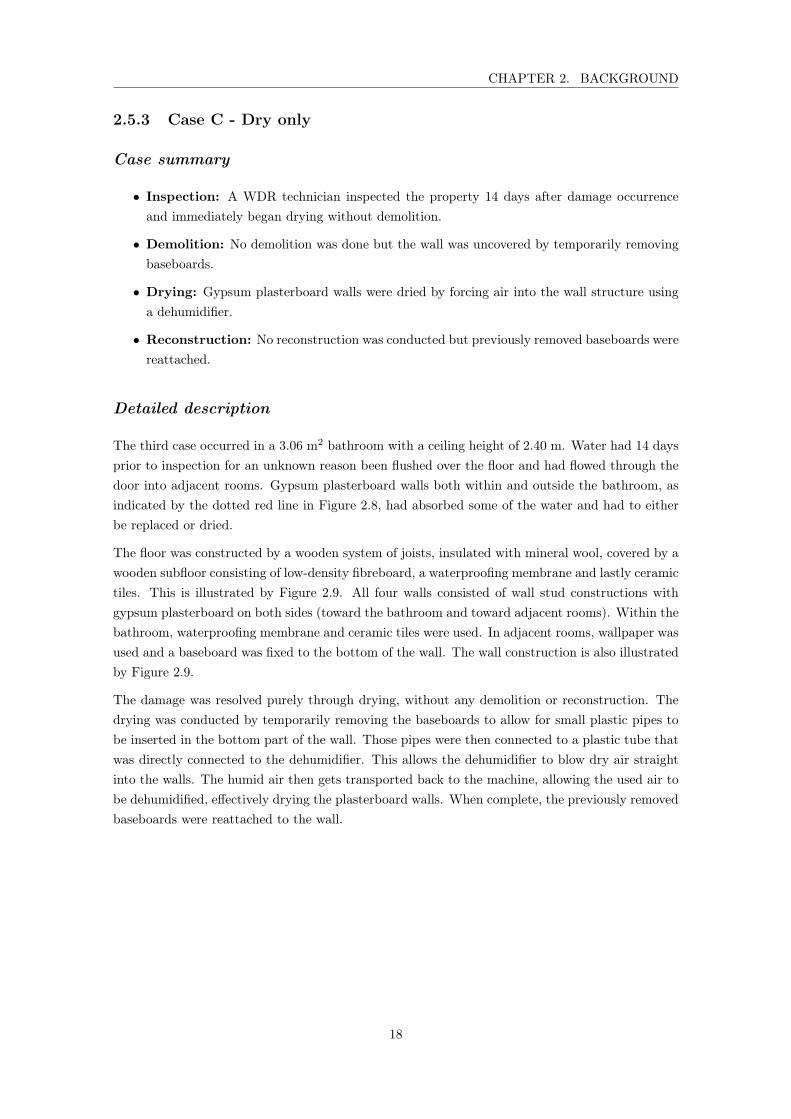
The third case occurred in a 3.06 m2 bathroom with a ceiling height of 2.40 m. Water had 14 daysprior to inspection for an unknown reason been flushed over the floor and had flowed through thedoor into adjacent rooms. Gypsum plasterboard walls both within and outside the bathroom, asindicated by the dotted red line in Figure 2.8, had absorbed some of the water and had to eitherbe replaced or dried.
The floor was constructed by a wooden system of joists, insulated with mineral wool, covered by awooden subfloor consisting of low-density fibreboard, a waterproofing membrane and lastly ceramictiles. This is illustrated by Figure 2.9. All four walls consisted of wall stud constructions withgypsum plasterboard on both sides (toward the bathroom and toward adjacent rooms). Within thebathroom, waterproofing membrane and ceramic tiles were used. In adjacent rooms, wallpaper wasused and a baseboard was fixed to the bottom of the wall. The wall construction is also illustratedby Figure 2.9.
The damage was resolved purely through drying, without any demolition or reconstruction. Thedrying was conducted by temporarily removing the baseboards to allow for small plastic pipes tobe inserted in the bottom part of the wall. Those pipes were then connected to a plastic tube thatwas directly connected to the dehumidifier. This allows the dehumidifier to blow dry air straightinto the walls. The humid air then gets transported back to the machine, allowing the used air tobe dehumidified, effectively drying the plasterboard walls. When complete, the previously removedbaseboards were reattached to the wall.
18

CHAPTER 2. BACKGROUND
Figure 2.8: Blueprint of the water damaged bathroom in Case C - Dry only. High moisture levelswere identified in the plasterboard walls both within and outside the bathroom, indicated by thedotted red lines.
Wal
l stu
d
Waterproofing membrane
Gypsum plasterboards
Wooden subfloor
Figure 2.9: Composition of the room construction in Case C - Dry only.
19

Chapter 3
Methodology
This study conducts an attributional life cycle assessment (LCA) on the resolution of three actualwater damages in bathrooms, which are differentiated by the resolution method used in each case.The LCA framework is used as it enables estimation of the full life cycle CO2e footprint while alsohighlighting the key drivers. Since the main focus of the study is to assess the primary drivers forCO2e footprint from various resolution methods, it takes an attributional approach towards LCImodelling. This type of approach is relevant to apply when asking a question of the type "Whatenvironmental impact can be attributed to product X?"[18, p. 94] In this study, product X refersto the three different resolution methods. Simultaneously, part of the analysis discusses marginalenvironmental effects. Therefore, aspects of the consequential approach are also present in thestudy.
To enable modelling of the service’s full life cycle, research was initially conducted to developa thorough understanding of the water damage restoration (WDR) process, including the mainactivities. This was achieved through numerous informal interviews with various employees ata property damage restoration (PDR) company, i.e. a company that among other things workswith WDR. The general WDR process has already been introduced in Chapter 1. The study alsoselected three cases, introduced and described in Chapter 2.5, based on discussions with waterdamage technicians and other employees at the PDR company, with the purpose of assessingrelevant and, to the extent possible, representative cases.
Based on the initial research and the general WDR process, the study creates an analytical frame-work which is used as a base for data collection, presentation of results, and further analysis. Asan LCA is conducted, the analytical framework is embodied by the system boundary, based on thedefinitions provided by international LCA standards.[17][20][21] The applied system boundary andthe reasoning behind it is presented in Chapters 3.1.1 and 3.1.2. Following the definition of thesystem boundary, the study defines the functional unit and Life Cycle Impact Assessment (LCIA).This is detailed in Chapters 3.1.3 and 3.1.4. These chapters describe the form the input datashould be on and how the calculations are made.
Based on the above, the study subsequently collects data to enable calculation of the CO2e footprintof the different water damage resolution methods. A description of the collection methods isdetailed in Chapter 3.2. Two types of data is collected to enable the CO2e footprint calculation:
20

CHAPTER 3. METHODOLOGY
case specific data and CO2e footprint factors. Both these two data types are considered input dataand the actual result is the computation of the CO2e footprint. As such, the input data is presentedas part of the Methodology whereas the results are presented in Chapter 4. The case specific datais presented in Chapter 3.3.1 and includes the relevant data points that are necessary to describethe water damage restoration process for each case. This includes kg of material data, kWh ofelectricity used, and km of transportation. For each of the cases, recorded data from the PDRcompany’s databases is used in combination with input from the technicians and the constructioncompanies who worked on the respective cases. The CO2e footprint factors are multiplied withthe corresponding case specific data to derive the total CO2e footprint. This data is presented inChapter 3.3.2 and is of secondary nature.
Assumptions are made for some of the input data. These are described in Chapter 3.4 and furtherdiscussed in relation to the results in Chapter 4.3.
The study also implements various measures to deal with uncertainty, including uncertainty andsensitivity analyses. The methodology for this is described in Chapter 3.5.1. The data collection forthese analyses and the input data used is detailed in Chapters 3.5.2 and 3.5.3 respectively.
3.1 Life cycle assessment context: defining the analytical
framework
3.1.1 General system boundary based on Standard EN 15804
This thesis argues that the system boundary suggestions for B3 Repair and B4 Replacementpresented in EN 15804[21] should be combined in order to accurately form a system boundary forthe general water damage restoration process. These information modules are included in Figure2.3 in Chapter 2.3. In a study by IVL,[23] water damages are only considered part of the B4Replacement module. It can be argued that this is a relevant information module to describe thedemolition and reconstruction steps. However, this thesis does in contrast to the IVL study suggestthat the B3 Repair module should be used as a complement to B4 in order to also capture thedrying step. The main argument for this is that the drying of a damaged part or component canbe seen as a form of reparation, enabling reuse of it. By definition, it thus implies that the part orcomponent is not replaced.
While this study suggests to combine B3 and B4 when assessing a water damage, it is simultane-ously relevant to note that the Standard EN 15804[21] refers to the construction of a new building.This thesis on the other hand only focuses on water damages, not the full building life cycle. Itis therefore important to define for which materials, new or substituted, the end-of-life processesshould be considered. A literature review of building refurbishments,[24] which are similar to re-pairs and replacements, highlights that many studies often exclude the end-of-life stage completely.In addition, for the ones that do include it, the considered materials differ. Three of the studies con-sidered the substituted materials, one study considered both new and replaced materials and twostudies did not clearly define which were considered. The literature review however simultaneouslyasserts that a difference should be made between LCAs focusing purely on the refurbishment of abuilding, versus the new construction of a building, where for the prior, new instead of substituted
21

CHAPTER 3. METHODOLOGY
material should be considered. A key argument for this is that "[i]f only substituted materialsare considered in the LCA of building refurbishments, the environmental impact produced at theend-of-life of the new materials will not be accounted, and therefore a gap will be produced."[24,p. 298] Further, the substituted materials can be considered already accounted for as their end-of-life emissions will happen regardless of the refurbishment scenario. The same argumentation canbe made for water damages. As a result, this thesis combines the system boundary suggestions forB3 and B4,[21] but defines the end-of-life aspect to consider new materials instead of substitutedones. On a general level, the boundary for the water damage restoration process is thus defined asfollows:
• The repair and replace processes including:
– Use of related water and energy
– The production of new materials and ancillary materials
– The production and transportation aspects and emissions from any wastage of materialsduring the repair and replace processes
• The transportation of the new materials and ancillary materials, including productionaspects and emissions from any material wastage during the transportation
• The end-of-life processes of any waste from the repair/replace and transportation processes,including the new materials and ancillary materials
3.1.2 Specific system boundary for this study
The specific system boundary, i.e. the analytical framework this study uses to structure data col-lection, results and analysis, is defined to capture the activities generally conducted to resolve awater damage. It is based on the general water damage restoration process description, illustratedby Figure 1.1 in Chapter 1, and covers the Repair & replace, Transportation, and End-of-life pro-cesses, based on the guidance from the B3 Repair and B4 Replacement information modules[21] aswell as suggestions for end-of-life choices[24] concerning the material, as discussed in Chapter 3.1.1.Figure 3.1 illustrates the boundary including the main data categories and their inclusion acrossthe water damage restoration process steps. The Repair & replace processes include energy usagein terms of use of electricity required for drying, and fuel consumption related to transportation ofWDR technicians as well as other tradespeople. In this study, other tradespeople includes builders,electricians, plumbers and carpet layers. The CO2e footprint from production of new materialused in the reconstruction phase is also included. This could for example be the production of anew gypsum plasterboard used to replace a damaged one.
Transportation of material, both new and demolished, is considered under the Transportationprocess. For new material, it concerns transportation from retailer to the property. For demol-ished material, it concerns transportation from the damaged property to the waste managementstation.
The End-of-life process is considered for demolition waste of new material. The argument forconsidering new instead of substituted material is presented in Chapter 3.1.1 and relates to thisstudy focusing purely on water damages. This decision probably has minor effects on the CO2e
22

CHAPTER 3. METHODOLOGY
footprint for this specific study as it is assumed that new and substituted parts are of the samematerials, which is further detailed in Chapter 3.4.
Inspection Demolition Drying Reconstruction
Repair & replace
Transport
End-of-life Demolition waste of new material
Transportation of WDR technicians
Transportation of other tradespeople
Use of electricity
Transportation of material
Production of new material
Process Data category
Water damage identified
Water damage resolved
Figure 3.1: The specific system boundary for the water damage restoration process used in thisstudy, including the relation to the WDR process steps and considered data categories having aCO2e footprint.
Aspects excluded from the assessed system
In contrast to the above mentioned factors placed within the system boundary, there are a numberof aspects that are deliberately excluded. Multiple-use equipment ranging from dehumidifiersand fans to drills and hammers likely have an impact on emissions, if part of their life cycle CO2efootprint is attributed to a single water damage. However, these are excluded given the combinationof (1) the complexity to accurately estimate the CO2e footprint for each equipment from a life cycleperspective and (2) the expected low CO2e footprint per use in relation to other factors such asproduction of new material. Furthermore, disposable materials, such as small PVC pipes used fordrying, are excluded due to low usage volume combined with limited CO2e footprint per unit. Forexample, a pipe weighing 3 grams has a CO2e footprint of around 9 g,[43] and only a few of thoseare required for drying. In addition, previous environmental assessments of water damages[23][37]have also excluded disposable materials. Furthermore, potential change in energy consumptionas a result of replaced parts or components is also not considered. The reason behind this is theassumption that new and substituted parts or components are of the same material, and doesthus not impact the future energy consumption. Lastly, two aspects concerning transportation ofmaterials are disregarded: transportation of new material from manufacturing plants to retailers,and transportation of waste material from the waste management station to the waste processingstation and final disposal. There are three main reasons for this. First of all, the data sourcesfor materials used in this study rarely include these two aspects of the product’s environmentalfootprint. Second, when it is declared, the CO2e footprint is for most products small in relation toother aspects such as raw material acquisition and manufacturing. Third, the material quantitiesused in the three cases of this study are relatively small compared to typical total quantities ofmaterial shipped from manufacturers to retailers, and from the waste management station to the
23

CHAPTER 3. METHODOLOGY
waste processing station. Consequently, it is assumed that this exclusion does not drasticallyimpact the results.
3.1.3 Functional unit
This study uses square meter as the functional unit to enable comparability towards a commonunit. In practice, this is reflected by dividing the total CO2e footprint of a case by the size of thedamaged room. Square meter is relevant to apply since it is the most typical unit to use whenassessing buildings.[22] As is shown by reviewing the previously introduced study from SvenskFörsäkring,[37] it is difficult to make valid comparisons when a common unit is not used to presentthe results. When it is used however, as for example in the LCA from IVL,[23] comparability isfacilitated. In addition to presenting the results per square meter, the total CO2e footprint is alsoprovided.
3.1.4 Impact assessment
The impact assessment reflects back to Table 2.2 in Chapter 2.2. The assessed impact category isclimate change and the final form of the category indicator results for this impact category shouldbe kg of CO2e per functional unit ((1) in Table 2.2). Since the CO2e factors are already assignedto the impact category, i.e. written on the form kg CO2e per relevant unit, which is furtherexplained in Chapter 3.2, no further classification is required ((2) in Table 2.2). The relevantunit varies depending on input data type. First, for Use of electricity, it is kWh. Second, forTransportation of WDR technicians, Transportation of other tradespeople and Transportation ofmaterial, it is km. Third, for Production of new material and Demolition waste of new material,it is kg. The characterization ((3) in Table 2.2), i.e. the calculation of category indicator results,is done by multiplying the case specific data with the respective CO2e footprint factors, i.e. theCO2e footprint value per relevant unit, and subsequently aggregating these values for each case.The resulting CO2e footprint per case is lastly converted to the form of CO2e per m2.
3.2 Data collection methodology
The specific system boundary illustrated in Figure 3.1 is used to structure the data collection. Ingeneral, two types of data is required: case specific data and CO2e footprint factors. The unitsand collection methods for both data types are summarized in Table 3.1, divided across each datacategory introduced in the system boundary.
24

CHAPTER 3. METHODOLOGY
Table 3.1: Overview of data collection methodologies per data category.
Case specific data CO2e footprint factorsData category Type Collection method Type Collection method
Use ofelectricity
kWh / case PDR company databases kg CO2e / kWh Reports, governmental sources
Transportation ofWDR technicians
km / case Discussion with WDR technician kg CO2e / km Governmental reports
Transportation ofother tradespeople
km / case Discussion with builder / assumptions kg CO2e / km Governmental reports
Production ofnew material
kg / case PDR company databases kg CO2e / kg Established databases and reports
Transportation ofmaterial
km / case Discussion with builder kg CO2e / km Governmental reports
Demolition waste ofnew material
kg / case PDR company databases kg CO2e / kg Established databases and reports
3.2.1 Collection of case specific data
The units and the collection methods for the case specific data vary depending on the data category.First, for use of electricity, the kWh consumed for each case is required and is collected fromPDR company databases. Second, for transportation of WDR technicians, transportation of othertradespeople, and transportation of material, the km driven per case is required. To achievethis, the number of visits is collected and assumptions, detailed in Chapter 3.4, are made toconvert it to km. For transportation of WDR technicians, the data is collected by discussing therespective cases with the responsible technicians. For transportation of other tradespeople, thedata concerning visits from builders is collected from discussing the cases with the responsibleconstruction company, whereas for remaining tradespeople, it is based on assumptions derivedfrom discussion with both the WDR technicians and builders, detailed further in Chapter 3.4.For transportation of material, the data is collected by discussing the respective cases with theresponsible construction company. Third, for production of new material and demolition wasteof new material, the kg of building/waste material is required. This is collected from the PDRcompany databases.
3.2.2 Collection of CO2e footprint factors
The CO2e footprint factors are collected on the form kg CO2e per relevant unit (kWh, km orkg material, depending on data category). All of this data comes from secondary sources. Forproduction of new material and demolition waste of new material, the data is collected fromestablished public databases and reports. This is further detailed below under the heading New
materials. For use of electricity, the data is collected from reports and governmental sources,further detailed below under the heading Electricity. For transportation of WDR technicians,transportation of other tradespeople, and transportation of material, the data is collected fromgovernmental reports. This is further detailed below under the heading Transportation.
25

CHAPTER 3. METHODOLOGY
New materials
The CO2e footprint factors for material data used in the study comes from a collection of estab-lished databases and reports that have compiled CO2e data for common building materials. Theprimary source used is Environdec, a website run by EPD International AB, a company ownedby IVL (the Swedish Environmental Research Institute). EPD International’s purpose is to createa public collection of Environmental Product Declarations (EPDs).[44] An EPD is a documentthat "communicates verifiable, accurate, non-misleading environmental information for productsand their applications."[21, p. 5] EPD International only publishes EPDs that have been criticallyreviewed by an independent third party to ensure credibility. Further, all construction productsincluded in the Environdec database are aligned with EN 15804,[21][45] and are typically brokendown across the information modules illustrated in Figure 2.3 in Chapter 2.3. The extent of theEPDs vary. Some only include the product stage (A1-A3), while others provide information fromcradle to grave (A1-C4). For the data category production of new material, this thesis only con-siders the product stage (A1-A3) as input from EPDs. For the category demolition waste of new
material, it only considers part of the end-of-life stage (C3-C4) as input from EPDs. Therefore, itis important to exclude the other stages provided by EPDs that are not considered for productionof new material or demolition waste of new material.
As the Environdec database does not include the full list of materials relevant for this study, ad-ditional supplementary sources are used, similar to how Hennequin et. al.[31] created a hybriddataset. A report created by VTT Technical Research Centre of Finland[46] summarizing EPDinformation for approximately 50 common European building materials is used as well as Ökobau-dat,[47] a German platform for collection of LCA data of building materials. Both of these sourcesalso follow EN 15804.[21]
Electricity
This study uses the average Nordic electricity mix between 2012-2016 as CO2e footprint factorto derive the CO2e footprint from use of electricity. An electricity mix for a certain region is themix of energy sources used for electricity. As different countries and regions use different energysources, the respective CO2e footprints vary. For example, a region using a higher share of coal willhave a higher CO2e footprint compared to one with a higher share of hydro power. The Nordic mixis relevant to apply to account for electricity trade in the region.[48] If applying the Swedish mix,the results would likely indicate a skewed picture of the CO2e footprint as the Swedish productionhas a lower CO2e footprint per kWh compared to the consumption,[49] which is based not only onthe Swedish production but also from production in other countries.
When applying electricity mixes, it is important to be aware that the value of the mix relies heavilyon the method used to calculate it. For example, a study identified that different sources provideddifferent values for the same country and the same year, depending on them using different method-ologies.[49] The average Nordic electricity mix used in this thesis is calculated by aggregating allemission factors from all production units in the Nordics, and then adding the emissions fromimports of electricity from other countries.[50][51] Whether or not it is the best method to usewhen calculating the Nordic electricity mix is not for this thesis to answer. However, as it is themethod used by Stockholms stad, it should be considered sufficient. Further, this thesis also finds
26

CHAPTER 3. METHODOLOGY
that it is difficult to find up to date figures of the Nordic electricity mix from other sources. BothIVL and Profu, two research institutes in Sweden that historically have performed these kinds ofcalculations, were contacted to try to obtain these figures. However, both companies stated thatthere is limited recently updated publicly available material in this area.
Average electricity mixes are appropriate to use when following an attributional approach but forconsequential approaches, marginal processes such as the marginal increase in CO2e from addedelectricity consumption should instead be used.[18] Therefore, it is relevant to use the averagemixes for the base scenarios, but when discussing the results from a consequential perspective,which is done as part of Chapter 4.2, the study instead uses marginal mixes. This data is collectedfrom a report published by IVL.[52] Marginal mixes are often larger than average mixes, driven bythe fact that when a product or service consuming marginal electricity is introduced to the market,the short-term demand for electricity changes. This change in demand must be met through theuse of energy sources that can be directly controlled. In the short-term, the marginal increase ismost often covered by the combustion of natural gas, thus resulting in a higher CO2e footprintthan the average electricity mix.[18]
Transportation
For all transportation data categories, the CO2e footprint factor, or CO2e footprint per km, is basedon calculations conducted by the Swedish Energy Agency,[53] and considers the average emissionsper driven kilometer for a car running on fuel with an octane rating of 95 (95 RON).
3.3 Overview of collected data
3.3.1 Case specific data
As introduced in Chapter 3.2, the case specific data for the actual water damages is accessedfrom the PDR company databases, covering factors such as electricity consumption and materialquantities. It is further supplemented by input from both the technician and the constructioncompany who worked on the respective cases. The following tables summarize the case specificdata that was collected and is used as input to calculate the CO2e footprint for each case, structuredaccording to the data categories defined in the system boundary (see Figure 3.1 in Chapter 3.1.2).Tables 3.2 and 3.4 refer to the data categories production of new material and demolition waste ofnew material for Case A and Case B respectively. Tables 3.3, 3.5 and 3.6 refer to use of electricityand the three transportation data categories, for Case A, Case B and Case C respectively. Fortransportation, the data is indicated in terms of number of visits, and is converted to km basedon the assumptions which are further detailed in Chapter 3.4. Note that since Case C does notinclude any demolition or replacement of material, it does not cover aspects related to productionof new material or demolition waste of new material.
27

CHAPTER 3. METHODOLOGY
Case A - Reconstruct only
Table 3.2: Demolished and replaced material for Case A - Reconstruct only. The data is used asinput for production of new material and demolition waste of new material.
Part of room Material Quantity
Wall Spackling paste 31 kg
Wall Plastic wallpaper 25 kg
Floor Concrete 6 kg
Floor Spackling paste 9 kg
Floor Screed 126 kg
Floor Plastic mat 15 kg
Other Floor drain (plastic) 2 kg
Total 214 kg
Table 3.3: Electricity usage and transportation data for Case A - Reconstruct only.
Data category Description Inspection Demolition Drying ReconstructionUse of electricity kWh used for drying - - - -Transportation of WDR technicians # visits WDR technician 1 - - -
Transportation of other tradespeople
# visits builders - 2 - 2# visits electricians - 1 - 1# visits plumbers - 1 - 1# visits carpet layers - - - 1
Transportation of material# trips to deliver material - - - 1# trips to dispose of material - 1 - -
28

CHAPTER 3. METHODOLOGY
Case B - Dry & Reconstruct
Table 3.4: Demolished and replaced material for Case B - Dry & Reconstruct. The data is usedas input for production of new material and demolition waste of new material.
Part of room Material Quantity
Wall Gypsum plasterboard 169 kg
Wall Waterproofing membrane 19 kg
Wall Tile adhesive 33 kg
Wall Ceramic tiles (walls) 281 kg
Wall Grout 18 kg
Floor Concrete 6 kg
Floor Screed 110 kg
Floor Waterproofing membrane 4 kg
Floor Tile adhesive 8 kg
Floor Ceramic tiles (floor) 56 kg
Floor Grout 5 kg
Other Floor drain (cast iron) 2 kg
Total 711 kg
Table 3.5: Electricity usage and transportation data for Case B - Dry & Reconstruct.
Data category Description Inspection Demolition Drying ReconstructionUse of electricity kWh used for drying - - 1,104 -Transportation of WDR technicians # visits WDR technician 2 - 4 -
Transportation of other tradespeople
# visits builders - 4 - 6# visits electricians - 1 - 1# visits plumbers - 1 - 1# visits carpet layers - - - 1
Transportation of material# trips to deliver material - - - 1# trips to dispose of material - 1 - -
Case C - Dry only
Table 3.6: Electricity usage and transportation data for Case C - Dry only.
Data category Description Inspection Demolition Drying ReconstructionUse of electricity kWh used for drying - - 77 -Transportation of WDR technicians # visits WDR technician 1 - 1 -
Transportation of other tradespeople
# visits builders - - - -# visits electricians - - - -# visits plumbers - - - -# visits carpet layers - - - -
Transportation of material# trips to deliver material - - - -# trips to dispose of material - - - -
29

CHAPTER 3. METHODOLOGY
3.3.2 CO2e footprint factors
As introduced, the study uses a combination of sources to determine the CO2e footprint factors ofmaterials, electricity and transportation, indicated by Table 3.7. Structured based on the systemboundary, New materials in Table 3.7 refer to production of new material and demolition wasteof new material. These factors vary depending on which material is demolished and used forreconstruction, and the exact values are therefore indicated in Appendix A. To clarify however,for a particular material, the same factor is used across all cases. Electricity refers to use ofelectricity and the same value is applied across all cases. Transportation refers to transportationof WDR technicians, transportation of other tradespeople, and transportation of material. Just asfor electricity, the same factor is applied across all cases.
Table 3.7: Summary of the CO2e footprint factors for new materials, electricity and transportationused in the base scenarios, including the sources used.
Type Source Value UnitNewmaterials
Environdec, VTT & ÖkobaudatDifferent dependingon material2
g CO2e / kg
Electricity (Nordicelectricity mix)
Miljöförvaltningen[54] 62.9 g CO2e / kWh
Transportation(emissions for 95RON car in SE)
Energimyndigheten[53] 239.0 g CO2e / km
In Chapter 4.2, the study briefly discusses the effect a consequential perspective to the assessmentwould have. When doing so, it considers the Nordic marginal mix presented in a study publishedby IVL.[52] The considered value is 1 kg CO2e per kWh.
3.4 Assumptions regarding the collected data
The study makes a number of assumptions with a varying degree of assumed impact on the results.First of all, the materials used for replacement are assumed to be of the same type as the demolishedmaterials. Consequently there is no difference in neither CO2e uptake of the replaced material, northe energy consumption of the building. In practice, one could argue that the damaged material canbe replaced by a more energy efficient one and/or one with a higher CO2e uptake, thus impactingthe total CO2e emissions. Such an analysis is however out of scope for this thesis.
The study secondly assumes that the distance driven to the damaged property is the same forWDR technicians as well as for other tradespeople. These industries can be considered local andthe study has not found a clear argument for why WDR technicians and other tradespeople shouldlive in or be based at drastically different locations. The value is estimated to 10 km one way, i.e.20 km per visit, based on collected data from the PDR company. For transportation of material, 15km per trip is assumed, both for delivery of new material and transportation of demolished material
2Material data is presented in Appendix A
30

CHAPTER 3. METHODOLOGY
to waste disposal. The latter is based on a study from IVL[55] which bases the assumptions onprevious studies. For the prior, it is assumed to be the same as for the latter.
With a similar reasoning as concerning the average distance per visit, the study thirdly assumesthat tradespeople and WDR technicians use the same car model running on petrol, which wasindicated in Table 3.7 in Chapter 3.3.2.
Further, while the distance travelled per visit as well as the car type is considered equal, the numberof times tradespeople visit a property often differ from the number of times a WDR technician visitsit. For all tradespeople excluding WDR technicians and builders, assumptions are made regardingthe number of visits in each process step based on informal interviews with the participating WDRtechnician and construction company in each case.
Lastly, assumptions are made for the CO2e footprint factors for demolition waste of new material,corresponding to information modules C3 and C4, for some materials where environmental prod-uct data was not available. The assumptions concern the materials spackling paste, screed, tileadhesive, grout and waterproofing membrane. Demolition waste from spackling paste, screed, tileadhesive and grout are assumed to have zero emissions as they do not contain organic materials.The CO2e footprint from demolition waste for the waterproofing membrane is for this study alsoassumed to be zero, driven by its low required mass compared to other included material (3% ofthe total mass in Case B).
3.5 Description of uncertainty management and sensitivity
analysis
3.5.1 Methodology for uncertainty management and sensitivity analy-
sis
The study combines the scientific, social and statistical ways of dealing with uncertainty,[15] asintroduced in Chapter 2.4. The scientific way is adopted in the research for CO2e footprint factorsof building materials. For a particular material, there typically exists a range of sources varyingin their specification of environmental emissions despite considering similar products. An LCAreleased in 2015 exemplifies this by comparing the LCA data for concrete from two differentdatabases, finding a range between 0.07-0.11 kg CO2e per kg concrete and 0.10-0.13 kg CO2eper kg concrete respectively.[55] Given this uncertainty, this thesis researches several sources ofenvironmental data for the materials with the highest contribution to total CO2e footprint for CaseA and Case B, the cases which include production of new material, thus following the scientificway of dealing with uncertainty.
Some of the input data is discussed and decided together with important and relevant stakeholders,thus following the social way of dealing with uncertainty. In particular, this relates to the numberof visits made by (1) WDR technicians and (2) other tradespeople, as introduced in Chapter 3.2.1.For the prior, each case was discussed with the technician responsible for handling the respectivewater damage, and it was concluded how many visits were made and to which WDR process stepthey should be allocated. For the latter, a discussion was held with the responsible constructioncompany to enable valid input for the number of visits from builders. For remaining tradespeople, a
31

CHAPTER 3. METHODOLOGY
discussion was held with both the responsible technician and the responsible construction companyto decide on a reasonable estimate, as described in Chapter 3.4.
The statistical way of dealing with uncertainty is applied through an uncertainty analysis onthe CO2e footprint factors for production of new material. As mentioned, the study researchesmultiple sources of environmental data for key materials. This enables an analysis to assess howdifferences in input, i.e. the CO2e footprint per kg building material, affects the output, i.e. thetotal CO2e footprint for a particular case. Since there is uncertainty in the underlying data, this isan example of an uncertainty analysis. In a similar manner, but through a sensitivity analysis, thestudy analyzes different CO2e footprint factors for use of electricity. It does so by testing variouselectricity mixes which have different CO2e footprint per kWh, depending on the assessed countryor region, and also potential changes in CO2e footprint of future electricity production.
The uncertainty and sensitivity analyses tests two scenarios each towards the base scenario: a lowscenario and a high scenario. This only includes changing the CO2e footprint factors for productionof new material and use of electricity. For production of new material, the low scenario includes thelower values for CO2e footprint per kg building material whereas the high scenario uses the highervalues. The input data used is defined in Chapter 3.5.3, and the scenarios are labeled Material
only in Chapter 4. For use of electricity, the low scenario is given by a potential future electricityproduction mix based on estimates of how the Nordic energy system may look in 2050, and thehigh scenario is given by the European mix. The data used for the sensitivity analysis is alsodetailed in Chapter 3.5.3, and the scenarios are labeled Electricity only in Chapter 4. The futureenergy system is used as it presents how the emissions from electricity use might change over thecoming years and how that will affect the total and relative emissions from water damages. TheEuropean mix is used as it provides a scenario for how the same damages differ in emissions whenassessed in other European countries. Lastly, the combination of the two analyses, Material only
and Electricity only, is also assessed and is labeled Electricity + Material in Chapter 4.
The study also conducts a more qualitative sensitivity analysis to discuss potential future changesto the results based on external developments. The discussion around this is detailed in Chapter4.5. It centers around potential changes concerning three key components of WDR: productionof new material, use of electricity and transportation. The purpose of this discussion is to derivehigh level conclusions based on the societal trends and to provide inspiration to further analysesthat can be conducted in the area.
3.5.2 Collection of data for uncertainty and sensitivity analyses
As only the CO2e footprint factors are changed for production of new material and use of electricity,the data collection for the uncertainty and sensitivity analyses only includes that type of data. Assuch, the case specific data and CO2e footprint factors for remaining data categories are keptconstant. For production of new material, the same sources are used as for the base scenarios, i.e.Environdec, VTT, and Ökobaudat. For use of electricity, the low scenario, i.e. the 2050 Nordicelectricity mix, is based on a report published by IVL.[23] For the high scenario, i.e. the Europeanmix, the five year average (2012-2016) from the European Energy Agency is used.[56] It is worthto mention that this mix is reported in CO2 rather than CO2e, but as the main purpose of thesensitivity analysis using that mix is to test for potential differences across countries, the order of
32

CHAPTER 3. METHODOLOGY
magnitude rather than the exact value is the key aspect. Therefore, this study uses the CO2 valueas a proxy for CO2e.
3.5.3 Data for uncertainty and sensitivity analyses
The uncertainty analysis of production of new material uses the values indicated by Table 3.8. Asmentioned, this data is collected from the same sources as have been previously introduced, i.e.Environdec, VTT and Ökobaudat. The sensitivity analysis of use of electricity uses the factorsindicated by Table 3.9, collected from the sources as described in Chapter 3.5.2.
Table 3.8: Input data for uncertainty analysis of production of new material. The data is displayedin kg CO2e per kg building material.
Inclusion in analysis Material Low scenario Base scenario High scenario
Tested
Ceramic tiles (floor) 0.319 0.613 0.694Ceramic tiles (wall) 0.319 0.613 0.694Gypsum plasterboard 0.136 0.247 0.272Plastic mat 2.502 2.679 3.219Plastic wallpaper 2.502 2.679 3.219Screed 0.184 0.210 0.357Spackling paste 0.110 0.465 0.503Tile adhesive 0.465 0.930 1.110
Not tested
Concrete 0.097Floor drain (cast iron) 1.654Floor drain (plastic) 2.841Grout 0.930Waterproofing membrane 1.430
Table 3.9: Input data for sensitivity analysis of use of electricity. The data is displayed in g CO2eper kWh.
Scenario Electricity mix g CO2e/kWh
Low scenario Nordic (2050) 16.00
Base scenario Nordic (2012-2016 average) 62.92
High scenario European (2012-2016 average) 323.50
33

Chapter 4
Results and analysis
4.1 Results and case specific comments
For each of the cases, the results are presented in the form of tables and charts in Chapters4.1.1, 4.1.2 and 4.1.3. The tables follow same same structure as defined by the system boundary,illustrated by Figure 3.1 in Chapter 3.1.2. As such, the results are presented per data categoryand WDR process step. For Case A and Case B, further breakdown is also provided of the datacategory Production of new material in the form of a chart. The uncertainty and sensitivityanalyses are also presented in charts, but shows the aggregated values rather than being brokendown across the data categories and WDR process steps. To facilitate the discussion, all theseresults are commented continuously throughout Chapters 4.1.1, 4.1.2 and 4.1.3, in relation to therespective tables and charts.
4.1.1 Case A - Reconstruct only
For Case A, production of new material followed by transportation of other tradespeople appearto be the two main drivers of CO2e footprint during the water damage restoration process, asindicated by Tables 4.1 and 4.2. In the base scenario, the prior stands for 72% of the total emissions,equivalent to 158.5 kg CO2e, or 46.6 kg CO2e per m2. The latter equates to 43.0 kg CO2e in totalor 12.7 kg CO2e per m2, i.e. 19%. Combined, the data categories are thus responsible for 91%of the total footprint. The remainder is divided between transportation of WDR technicians,transportation of new material and demolition waste of new material. As no drying is conductedfor Case A, use of electricity does not contribute to the overall CO2e footprint.
Assessing the contribution across the WDR process steps, it is logical that reconstruction standsfor close to 90% of the total CO2e footprint. This is the step to which production of new material isallocated. In addition, it includes around half of the total number of visits from other tradespeople.It is also reasonable to argue that the lack of drying results in reconstruction having a relativelyhigher share of the CO2e footprint, as is further discussed around Case B and Case C.
34

CHAPTER 4. RESULTS AND ANALYSIS
Table 4.1: CO2e footprint per data category and WDR process step in kg and as percentage of thetotal footprint for Case A - Reconstruct only (base scenario).
Process Data category Inspection Demolition Drying Reconstruction Total
Use of electricity - - - - -
Transportation of WDR technicians
4.8(2%) - - -
4.8(2%)
Transportation of other tradespeople -
19.1(9%) -
23.9(11%)
43.0(19%)
Production of new material - - -
158.5(72%)
158.5(72%)
TransportTransportation of material -
3.6(2%) -
3.6(2%)
7.2(3%)
End-of-lifeDemolition waste of new material - - -
8.2(4%)
8.2(4%)
Total4.8
(2%)22.7
(10%) -194.2(88%)
221.7(100%)
Repair & replace
Table 4.2: CO2e footprint per data category and WDR process step in kg per m2 and as percentageof the total footprint for Case A - Reconstruct only (base scenario).
Process Data category Inspection Demolition Drying Reconstruction Total
Use of electricity - - - - -
Transportation of WDR technicians
1.4(2%) - - -
1.4(2%)
Transportation of other tradespeople -
5.6(9%) -
7.0(11%)
12.7(19%)
Production of new material - - -
46.6(72%)
46.6(72%)
TransportTransportation of material -
1.1(2%) -
1.1(2%)
2.1(3%)
End-of-lifeDemolition waste of new material - - -
2.4(4%)
2.4(4%)
Total1.4
(2%)6.7
(10%) -57.1
(88%)65.2
(100%)
Repair & replace
The drivers of CO2e footprint from production of new material is centered around a few materialscontributing to more than 95% of the data category’s total footprint. The total mass of materialused is 214 kg and the total CO2e footprint attributed to the category is as mentioned approx-imately 158 kg. As is indicated by Figure 4.1, the plastic wallpaper and plastic mat stand formore than two thirds (67.7%) of the data category’s footprint. It can be argued that the highcontribution is primarily driven by a, at least in the context, high CO2e contribution per kg ofbuilding material (2.68 kg CO2e per kg plastic wallpaper or plastic mat), but to some extent alsothe quantity of used material (40 kg, equivalent to 18.7% of the total mass). Subsequent to theplastic wallpaper and plastic mat, screed stands for 16.7% of the total CO2e footprint of production
35

CHAPTER 4. RESULTS AND ANALYSIS
of new material. It has a footprint of 0.21 kg CO2e per kg building material, i.e. significantly lowercompared to the plastic material. However, 126 kg or 58.9% of the total mass of building materialis required; i.e. the required quantity of screed seems to be the main driver. Lastly, spacklingpaste used for walls and floors stands for 11.7% of the data category’s CO2e footprint. 40 kg isrequired, i.e. the same as for the plastic wallpaper and plastic mat. To summarize the above,it seems wise to investigate (1) how the CO2e footprint per kg plastic wallpaper and plastic matcan be reduced, for example by assessing potential substitute materials, and (2) how to reduce therequired quantity of screed.
3.7% 18.7%
11.7%
11.7% 58.9% 7.0%
4.0% 16.7% 25.4% 42.3%
214
158
Other Plastic wallpaper
Spackling paste Plastic mat
Screed
Building material (% of total kg)
CO2e footprint (% of total kg CO2e)
CO2e footprint factor (kg CO2e per kg building material)
2.68 2.68 0.21 0.47 0.78
Figure 4.1: Breakdown of production of new material for Case A - Reconstruct only: kg CO2eper kg building material, distribution of kg building material, and kg CO2e footprint per material.Other includes concrete and floor drain (plastic).
Transportation of people contributes to roughly 21% of the total CO2e footprint for Case A, mainlydriven by the number of visits from other tradespeople, rather than from WDR technicians. Forthe specific case, a WDR technician only visited the property once, which was during inspection,and it is thus reasonable that transportation of other tradespeople has the main impact. For thisdata category, it seems as if the number of visits is driven by multiple different tradespeople groupshaving to visit the property. This includes builders, electricians, plumbers and carpet layers. Tolower the CO2e footprint from transportation of people, it would therefore be interesting to assesshow the number of visits can be reduced. One suggestion is to strive for a higher degree of crosscompetence among tradespeople. It means that for example a builder could also have the sameskills as an electrician. This would reduce the number of stakeholders that need to be involved,and thus also potentially reduce the number of unique visits. Increasing cross competence is alsobrought up as a possible improvement measure by Svensk Försäkring in the report assessing CO2
footprint from Swedish water damages.[37]
Analyzing the results through an uncertainty analysis of materials with the highest CO2e footprintindicates some uncertainty in the results, where the high scenario shows approximately 33% higherCO2e footprint compared to the low scenario. As mentioned, no drying is conducted and theanalysis testing different electricity mixes does therefore not have any effect on the results. However,testing different CO2e footprint factors for the largest contributors, as described in Chapter 3.5,shows that the low scenario has 11% lower footprint compared to the base scenario, whereas thehigh scenario on the other hand has 19% higher footprint. As is indicated by Figure 4.2, thisequates to a CO2e footprint of 58.0 kg per m2 for the low scenario, and 77.4 kg CO2e per m2 forthe high scenario. This implies that the total footprint for the resolution of this water damageranges from 197.0 kg CO2e to 263.2 kg CO2e. Regarding the distribution of CO2e footprint per data
36

CHAPTER 4. RESULTS AND ANALYSIS
65.2
High
65.2 65.2
Low Low Low
58.0
High
77.4
Base
65.2
High Base Base
65.2 77.4
58.0
0% 0% -11% +19% -11% +19%
Electricity only Material only Electricity + Material
Figure 4.2: CO2e footprint per m2 per uncertainty and sensitivity scenario for Case A - Reconstructonly.
category, the production of new material seems to range from 68% to 76% of the total footprint, asillustrated by Figure 4.3. As the other categories are unchanged in terms of input, it is reasonablethat their relative contribution changes in opposite direction relative their size. For transportationof other tradespeople, this means that the contribution ranges between 16% to 22% of the totalCO2e footprint.
19%
19%
19%
22%
19%
16%
22%
19%
16%
72%
72%
72%
68%
72%
76%
68%
72%
76%
4%
4%
4%
4%
4%
3%
4%
4%
3%
Base 2%
3% 2%
3%
High
Low
3%
2%
2%
3%
Low
High
2% Base
Low
2%
4%
2%
3% High
4%
3%
3% 2% Base
2%
Use of electricity
Transportation of WDR technicians
Transportation of material Transportation of other tradespeople
Production of new material Demolition waste of new material
Electricity only
Material only
Electricity + Material
Figure 4.3: Distribution of CO2e footprint per uncertainty and sensitivity scenario, and WDRprocess step for Case A - Reconstruct only.
Although the results vary as shown by the uncertainty and sensitivity analyses, it can be arguedthat they are fairly certain in terms of order of magnitude. The CO2e footprint ranges between58 to 77 kg CO2e per m2, 197 to 263 kg in total, and the main drivers appears to be productionof new material and transportation of people. To reduce greenhouse gas emissions for the specific
37

CHAPTER 4. RESULTS AND ANALYSIS
case, it would be interesting to focus on identifying alternatives to the materials with the highestcontribution, in particular the plastic wallpaper and the plastic mat. It would also be relevantto try to reduce the number of visits from tradespeople, for example by striving towards a higherdegree of cross competence.
4.1.2 Case B - Dry & Reconstruct
The main driver for Case B is also the production of new materials. Of the total emissions at548.1 kg CO2e (184.5 kg CO2e per m2), 67% originates from the production of new materialsinstalled following the demolition of the room, as shown by Tables 4.3 and 4.4. Following newmaterials, transportation of other tradespeople and use of electricity show similar levels of impacts,both corresponding to 13% of the total CO2e emissions. The rest of the emissions comes fromtransportation of WDR technicians (5%), transportation of material (1%), and demolition wasteof new materials (1%). Following this distribution, it is reasonable that the reconstruction WDRprocess step accounts for more than three quarters (76%) of the total emissions, as both productionof new materials and the largest share of transportation of tradespeople are included in this step,similar to the reasoning around Case A.
Table 4.3: CO2e footprint per data category and WDR process step in kg and as percentage of thetotal footprint for Case B - Dry & Reconstruct (base scenario).
Process Data category Inspection Demolition Drying Reconstruction Total
Use of electricity - -69.5
(13%)-
69.5(13%)
Transportation of WDR technicians
9.6(2%)
-19.1(3%)
-28.7(5%)
Transportation of other tradespeople
-28.7(5%)
-43.0(8%)
71.7(13%)
Production of new material
- - -367.7(67%)
367.7(67%)
TransportTransportation of material
-3.6
(1%)-
3.6(1%)
7.2(1%)
End-of-lifeDemolition waste of new material
- - -3.4
(1%)3.4
(1%)
Total9.6
(2%)32.3(6%)
88.6(16%)
417.7(76%)
548.1(100%)
Repair & replace
Ceramic tiles, covering both walls and floor, contribute with the highest footprint of the newmaterials. They account for 56.2% combined, or 46.9% and 9.3% respectively, of all emissionsfrom production of new material. The main driver behind this appears to be the required quantitycorresponding to close to half of the total mass of building material used. In addition, compared tothe other materials in the case, ceramic tiles also have an, for the case, above average CO2e footprintfactor of 0.61 kg CO2e per kg. These aspects are further illustrated in Figure 4.4. Following theceramic tiles, gypsum plasterboards and tile adhesive are the two materials contributing the mostto the CO2e footprint. The gypsum plasterboards have a CO2e footprint of 0.25 kg CO2e per kgproduced material, i.e. one of the lowest among the materials in Case B. However, the required
38

CHAPTER 4. RESULTS AND ANALYSIS
Table 4.4: CO2e footprint per data category and WDR process step in kg per m2 and as percentageof the total footprint for Case B - Dry & Reconstruct (base scenario).
Process Data category Inspection Demolition Drying Reconstruction Total
Use of electricity - -23.4
(13%) -23.4
(13%)
Transportation of WDR technicians
3.2(2%) -
6.4(3%) -
9.7(5%)
Transportation of other tradespeople -
9.7(5%) -
14.5(8%)
24.1(13%)
Production of new material - - -
123.8(67%)
123.8(67%)
TransportTransportation of material -
1.2(1%) -
1.2(1%)
2.4(1%)
End-of-lifeDemolition waste of new material - - -
1.2(1%)
1.2(1%)
Total3.2
(2%)10.9(6%)
29.8(16%)
140.6(76%)
184.5(100%)
Repair & replace
5.8% 39.5%
368
19.8% 3.2% 7.9% 23.8%
8.9% 13.2% 46.9% 9.3% 10.4% 11.3%
711
Gypsum plasterboard
Ceramic tiles (wall) Tile adhesive
Ceramic tiles (floor)
Waterproofing membrane
Other
0.61 0.25 0.93 0.61 1.43 0.34
Building material (% of total kg)
CO2e footprint (% of total kg CO2e)
CO2e footprint factor (kg CO2e per kg building material)
Figure 4.4: Breakdown of production of new material for Case B - Dry & Reconstruct: kg CO2eper kg building material, distribution of kg building material, and kg CO2e footprint per material.Other includes grout, concrete, screed and floor drain (cast iron).
quantity, corresponding to 23.8% of the total weight, drives up the total CO2e footprint to 11.3%of the total material emissions. On the contrary to gypsum plasterboards, tile adhesive standsfor a relatively smaller part of the total weight (5.8%), but has a higher environmental effect perkg produced material at 0.93 kg CO2e per kg, resulting in 10.4% of the total material emissions.To prioritize the reduction of overall emissions resulting from the new materials, it is based onthe above reasonable to state that one should first address the emissions resulting from the useof ceramic tiles. When doing so, it would be interesting to investigate how the quantity can bereduced, and if tiles or substitute products with lower CO2e footprint can be used.
The combination of all transportation categories (transportation of WDR technicians, transporta-tion of other tradespeople, and transportation of materials) corresponds to close to 20% of theCO2e emissions. Builders account for the largest amount of visits at a total of 10 times (4 duringdemolition, and 6 during reconstruction). From the discussions with the construction company, itis clear that this can be seen as a normal amount of visits for a damage of this type and magnitude.The WDR technician however had to visit the damaged property more times than typical for this
39

CHAPTER 4. RESULTS AND ANALYSIS
type of damage. There are two reasons for this: (1) an extra inspection to assess the full damagemagnitude had to be made after the initial inspection and demolition, and (2) it was not clearwhat parts of the room had to be dried and how long the drying process would take. To exemplify,it only became evident that the concrete wall had to be dried after the initial drying of the floorwas done.
The damaged wall could potentially have been discovered earlier in the process, which would havereduced the number of visits, but overall, given the multitude of tradespeople groups required toresolve a typical water damage today, a certain number of unique visits is required. This generallylimits the possibility of lowering the total number of visits. For example, the WDR techniciandid as mentioned have to wait for builders to make the initial demolition before making the fulldamage assessment. This extra inspection could potentially have been avoided if the technicianhad the possibility to perform the task of the builder or vice versa. Continuing on a general level,as is also discussed around Case A, a possible way to reduce the number of visits to the damagesite could be to promote cross competence among tradespeople, i.e. enabling them to performmultiple or all parts of the water damage restoration process.
Use of electricity accounts for 13% of the CO2e footprint. Testing various electricity mixes througha sensitivity analysis, as described in Chapter 3.5, makes it evident that type of used mix plays asizable part of the results. The three scenarios show that if all other parameters are fixed, the totalCO2e footprint per m2 ranges between 167.1 kg (-9% from the base scenario) to 281.4 kg (+52%from the base scenario), as shown in the left section of Figure 4.5. When using the Nordic 2050mix, the electricity usage share of the total CO2e footprint drops from 13% in the base scenario to4%, illustrated by Figure 4.6. On the other side of the spectrum, the European mix results in thedata category accounting for 43% of the total CO2e emissions.
184.5
High Low High Base
281.4
High Base
120.0
203.1
Low Base Low
167.1 137.5
184.5 184.5
300.0 -9% +52%
-26% +10%
-35% +63%
Electricity only Material only Electricity + Material
Figure 4.5: CO2e footprint per m2 per uncertainty and sensitivity scenario for Case B - Dry &Reconstruct.
Compared to the test of electricity mix, the uncertainty analysis that fixes all parameters but thematerial data yields a bigger percentage difference for the low scenario, but a smaller differencefor the high scenario, also illustrated in Figure 4.5. The low scenario decreases the CO2e footprintwith 26% and the high scenario increases the footprint with 10%.
Combining the tests of electricity usage and material highlights the multiplying effect the cases
40

CHAPTER 4. RESULTS AND ANALYSIS
have on each other. The results range between -35% to +63% towards the base scenario. As isapparent from the right section of Figure 4.5, it is simultaneously fairly safe to assert that there isnot excessive uncertainty concerning the order of magnitude of the CO2e footprint, and that theCO2e footprint lies somewhere in the range of 120 kg per m2 to 300 kg per m2, or 356 kg to 891kg for the entire room.
13%
43%
17%
13%
12%
5%
13%
40%
6%
5%
7%
5%
5%
8%
5%
14%
13%
9%
18%
13%
12%
20%
13%
8%
74%
67%
44%
56%
67%
70%
64%
67%
47%
1%
1%
0%
1%
1%
1%
1%
1%
0%
1%
High
1%
Base
4% Low
1%
1%
3%
High
2%
2% Low
Base
3%
Base
1%
1% High
Low
1%
Use of electricity
Production of new material Transportation of WDR technicians
Transportation of material Transportation of other tradespeople
Demolition waste of new material
Electricity only
Material only
Electricity + Material
Figure 4.6: Distribution of CO2e footprint per uncertainty and sensitivity scenario, and WDRprocess step for Case B - Dry & Reconstruct.
The resulting CO2e footprint for Case B can be concluded as being driven mainly by the productionof new materials. Of the material, ceramic tiles has the highest impact with more than half of thetotal emissions originating from this material category. However, as is apparent from the sensitivityanalysis, electricity could potentially have a higher impact if the water damage occurs in anothercountry. For example, when testing European electricity mix, the use of electricity has almost thesame amount of impact as the production of new material. As the electricity used for resolving aparticular water damage cannot be controlled, one could instead aim to make the drying processmore effective and efficient in order to reduce the overall CO2e footprint from electricity. It isalso clear that to reduce the environmental effect from water damages similar to Case B, focusshould be on identifying alternative, low CO2e footprint materials that can substitute the currentmaterials with the highest total footprint, in particular the ceramic tiles.
4.1.3 Case C - Dry only
The CO2e footprint for Case C is solely driven by use of electricity for drying and transportationof WDR technicians. At 14.4 kg CO2e, or 4.7 kg CO2e per m2, the case has significantly lowerfootprint compared to Case A and Case B, driven by the fact that neither new material norinvolvement of other tradespeople was required. As shown by Tables 4.5 and 4.6, transportationof WDR technicians stands for two thirds of the CO2e footprint and use of electricity stands for
41

CHAPTER 4. RESULTS AND ANALYSIS
the remaining third. Seen across the WDR process steps, inspection stands for one third of thefootprint, caused by the first visit from the WDR technician to inspect the site and install themachines used for drying. The drying step stands for the remaining two thirds, driven by theelectricity used for drying (77 kWh) as well as a visit from the WDR technician to pick up themachines when the drying was completed. Demolition and reconstruction clearly does not haveany impact since no material was demolished and reconstructed.
Table 4.5: CO2e footprint per data category and WDR process step in kg and as percentage of thetotal footprint for Case C - Dry only (base scenario).
Process Data category Inspection Demolition Drying Reconstruction Total
Use of electricity - -4.8
(34%) -4.8
(34%)
Transportation of WDR technicians
4.8(33%) -
4.8(33%) -
9.6(66%)
Transportation of other tradespeople - - - - -
Production of new material - - - - -
TransportTransportation of material - - - - -
End-of-lifeDemolition waste of new material - - - - -
Total4.8
(33%) -9.6
(67%) -14.4
(100%)
Repair & replace
Table 4.6: CO2e footprint per data category and WDR process step in kg per m2 and as percentageof the total footprint for Case C - Dry only (base scenario).
Process Data category Inspection Demolition Drying Reconstruction Total
Use of electricity - -1.6
(34%) -1.6
(34%)
Transportation of WDR technicians
1.6(33%) -
1.6(33%) -
3.1(66%)
Transportation of other tradespeople - - - - -
Production of new material - - - - -
TransportTransportation of material - - - - -
End-of-lifeDemolition waste of new material - - - - -
Total1.6
(33%) -3.1
(67%) -4.7
(100%)
Repair & replace
42

CHAPTER 4. RESULTS AND ANALYSIS
Base High Low High
4.7
11.3
4.7
Base
4.7
11.3
High Base Low Low
3.5 4.7 4.7
3.5
-25% +139%
0% 0%
-25% +139%
Electricity only Material only Electricity + Material
Figure 4.7: CO2e footprint per m2 per uncertainty and sensitivity scenario for Case C - Dry only.
In relative measures, the choice of electricity mix has a significant impact on the results for CaseC. As is indicated by Figure 4.7, the results vary from -25% relative the base scenario when usingthe Nordic 2050 electricity mix, to +139% when using the European mix. In terms of distribution,the share originating from electricity varies from 11% in the low scenario to 72% in the highscenario, as illustrated by Figure 4.8. As this study is centered around Sweden, it is fair to saythat the European mix seems aggressive. To enable generalization for future studies however, itsimultaneously highlights the importance of choosing a relevant mix for the particular area that isassessed. Another important note is that although the variance appears large in percentage terms,the CO2e footprint only ranges from -1.2 kg per m2 to +6.6 kg per m2 relative the base scenario,or -3.6 kg to +20.1 kg for the entire damage. In a case where more drying is needed however, theeffect in kg would clearly have been higher as well.
11%
34%
72%
34%
34%
34%
11%
34%
72%
89%
66%
28%
66%
66%
66%
89%
66%
28%
Base
Low
Base
High
Low
High
Low
Base
High
Transportation of material Use of electricity Transportation of other tradespeople
Transportation of WDR technicians Production of new material Demolition waste of new material
Electricity only
Material only
Electricity + Material
Figure 4.8: Distribution of CO2e footprint per uncertainty and sensitivity scenario, and WDRprocess step for Case C - Dry only.
43
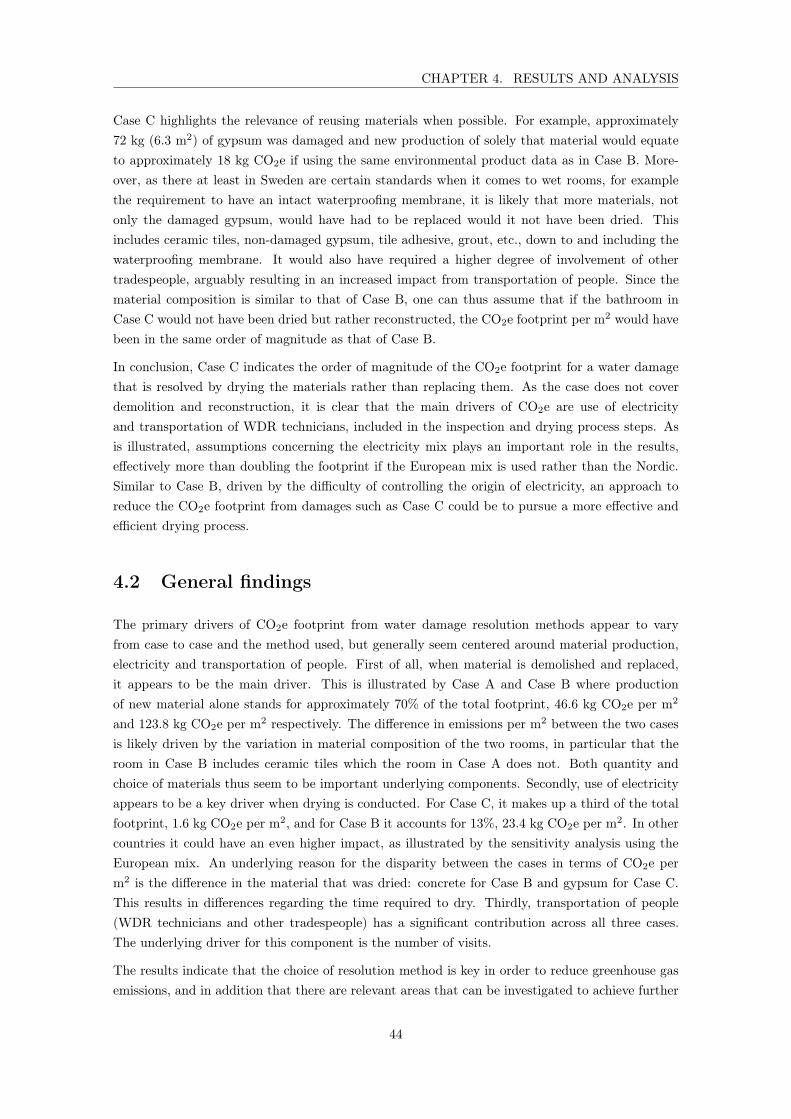
CHAPTER 4. RESULTS AND ANALYSIS
Case C highlights the relevance of reusing materials when possible. For example, approximately72 kg (6.3 m2) of gypsum was damaged and new production of solely that material would equateto approximately 18 kg CO2e if using the same environmental product data as in Case B. More-over, as there at least in Sweden are certain standards when it comes to wet rooms, for examplethe requirement to have an intact waterproofing membrane, it is likely that more materials, notonly the damaged gypsum, would have had to be replaced would it not have been dried. Thisincludes ceramic tiles, non-damaged gypsum, tile adhesive, grout, etc., down to and including thewaterproofing membrane. It would also have required a higher degree of involvement of othertradespeople, arguably resulting in an increased impact from transportation of people. Since thematerial composition is similar to that of Case B, one can thus assume that if the bathroom inCase C would not have been dried but rather reconstructed, the CO2e footprint per m2 would havebeen in the same order of magnitude as that of Case B.
In conclusion, Case C indicates the order of magnitude of the CO2e footprint for a water damagethat is resolved by drying the materials rather than replacing them. As the case does not coverdemolition and reconstruction, it is clear that the main drivers of CO2e are use of electricityand transportation of WDR technicians, included in the inspection and drying process steps. Asis illustrated, assumptions concerning the electricity mix plays an important role in the results,effectively more than doubling the footprint if the European mix is used rather than the Nordic.Similar to Case B, driven by the difficulty of controlling the origin of electricity, an approach toreduce the CO2e footprint from damages such as Case C could be to pursue a more effective andefficient drying process.
4.2 General findings
The primary drivers of CO2e footprint from water damage resolution methods appear to varyfrom case to case and the method used, but generally seem centered around material production,electricity and transportation of people. First of all, when material is demolished and replaced,it appears to be the main driver. This is illustrated by Case A and Case B where productionof new material alone stands for approximately 70% of the total footprint, 46.6 kg CO2e per m2
and 123.8 kg CO2e per m2 respectively. The difference in emissions per m2 between the two casesis likely driven by the variation in material composition of the two rooms, in particular that theroom in Case B includes ceramic tiles which the room in Case A does not. Both quantity andchoice of materials thus seem to be important underlying components. Secondly, use of electricityappears to be a key driver when drying is conducted. For Case C, it makes up a third of the totalfootprint, 1.6 kg CO2e per m2, and for Case B it accounts for 13%, 23.4 kg CO2e per m2. In othercountries it could have an even higher impact, as illustrated by the sensitivity analysis using theEuropean mix. An underlying reason for the disparity between the cases in terms of CO2e perm2 is the difference in the material that was dried: concrete for Case B and gypsum for Case C.This results in differences regarding the time required to dry. Thirdly, transportation of people(WDR technicians and other tradespeople) has a significant contribution across all three cases.The underlying driver for this component is the number of visits.
The results indicate that the choice of resolution method is key in order to reduce greenhouse gasemissions, and in addition that there are relevant areas that can be investigated to achieve further
44

CHAPTER 4. RESULTS AND ANALYSIS
reductions. Although the three cases are different and are thus not fully comparable, it is clear thatwhen no demolition or reconstruction is conducted, as illustrated by Case C, the CO2e footprintis significantly lower, as compared to Case A and Case B. As proposed in Chapter 4.1.3, the CO2efootprint of Case C would likely have been in the same order of magnitude as Case B if the bathroomwould firstly have been demolished, followed by drying and subsequently reconstruction. Decidingto solely dry the damage can thus theoretically be said to have reduced the CO2e footprint. Arelevant effort to make in order to reduce greenhouse gas emissions therefore seems to strive towardsa higher degree of drying and reuse, in contrast to demolition and reconstruction. This is in linewith what was found in the report from Svensk Försäkring.[37] It also relates back to the conceptof circular economy where a higher degree of reuse is said to reduce the need for energy andresources. In addition to this, further improvements could be made by making the drying processmore effective and/or efficient. Effectiveness could be increased by improving the drying techniqueand efficiency could be strengthened by making the machines used for drying more energy efficient.Both these factors should reduce the amount of electricity required for drying.
Although it appears as if the dry only resolution method should be preferred over the othermethods, it is important to note that the particular method is not applicable to all cases. Itwas for example not an option for Case B as water had already leaked behind the waterproofingmembrane. The magnitude of that damage could seemingly not have been lower since the leak hadbeen ongoing for a longer period of time. In general however, it is probably reasonable to assertthat a damage that is identified and inspected early can more often be resolved through onlydrying rather than complete reconstruction, compared to one that has remained unidentified for alonger period of time. The longer the wait, the more water gets absorbed by surrounding materialsand the higher the risk becomes that microbes such as mold start growing. For damages such asCase B that require reconstruction, additional efforts can however still be made. As introduced inChapters 4.1.1 and 4.1.2, this for example relates to material and transportation. For materials,greenhouse gas emissions could be reduced if low impact materials are used instead, and/or ifquantities can be reduced. Here, initial focus is suggested to be on the materials with the highestcontribution. For bathrooms such materials could be plastic wallpapers and mats, or ceramic tiles.For transportation, the number of visits can potentially be reduced by promoting cross competenceamong the involved tradespeople.
As stated, striving towards a higher share of water damages resolved by drying should reducethe CO2e footprint through avoidance of both demolition and reconstruction of as much materialas possible. However, if more water damages would be resolved by drying, it is important totake a consequential approach and consider the impact that the marginal increase of electricityconsumption has on the analysis. Focusing on Case C and changing its electricity mix to themarginal mix calculated by IVL,[52] introduced in Chapter 3.3.2, increases the total CO2e footprintsixfold, from 14.4 kg CO2e to 86.6 kg CO2e. This illustrates the impact that the marginal increase inelectricity has on the overall CO2e footprint and showcases the importance of having a consequentialperspective when suggesting an action over another. Even though the CO2e footprint increasessignificantly, it is still smaller than the other cases where material is demolished and replaced.Therefore, when looking at these specific cases it is still preferable to strive for more drying, evenwhen using a marginal electricity mix.
45
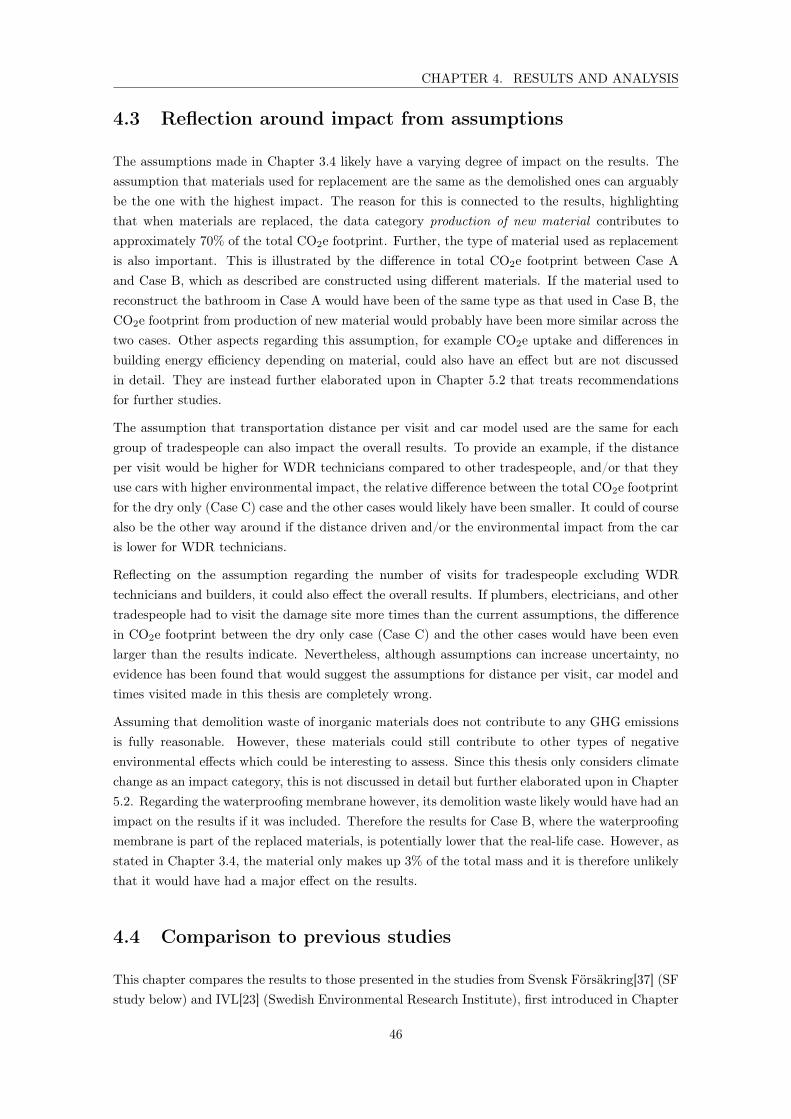
CHAPTER 4. RESULTS AND ANALYSIS
4.3 Reflection around impact from assumptions
The assumptions made in Chapter 3.4 likely have a varying degree of impact on the results. Theassumption that materials used for replacement are the same as the demolished ones can arguablybe the one with the highest impact. The reason for this is connected to the results, highlightingthat when materials are replaced, the data category production of new material contributes toapproximately 70% of the total CO2e footprint. Further, the type of material used as replacementis also important. This is illustrated by the difference in total CO2e footprint between Case Aand Case B, which as described are constructed using different materials. If the material used toreconstruct the bathroom in Case A would have been of the same type as that used in Case B, theCO2e footprint from production of new material would probably have been more similar across thetwo cases. Other aspects regarding this assumption, for example CO2e uptake and differences inbuilding energy efficiency depending on material, could also have an effect but are not discussedin detail. They are instead further elaborated upon in Chapter 5.2 that treats recommendationsfor further studies.
The assumption that transportation distance per visit and car model used are the same for eachgroup of tradespeople can also impact the overall results. To provide an example, if the distanceper visit would be higher for WDR technicians compared to other tradespeople, and/or that theyuse cars with higher environmental impact, the relative difference between the total CO2e footprintfor the dry only (Case C) case and the other cases would likely have been smaller. It could of coursealso be the other way around if the distance driven and/or the environmental impact from the caris lower for WDR technicians.
Reflecting on the assumption regarding the number of visits for tradespeople excluding WDRtechnicians and builders, it could also effect the overall results. If plumbers, electricians, and othertradespeople had to visit the damage site more times than the current assumptions, the differencein CO2e footprint between the dry only case (Case C) and the other cases would have been evenlarger than the results indicate. Nevertheless, although assumptions can increase uncertainty, noevidence has been found that would suggest the assumptions for distance per visit, car model andtimes visited made in this thesis are completely wrong.
Assuming that demolition waste of inorganic materials does not contribute to any GHG emissionsis fully reasonable. However, these materials could still contribute to other types of negativeenvironmental effects which could be interesting to assess. Since this thesis only considers climatechange as an impact category, this is not discussed in detail but further elaborated upon in Chapter5.2. Regarding the waterproofing membrane however, its demolition waste likely would have had animpact on the results if it was included. Therefore the results for Case B, where the waterproofingmembrane is part of the replaced materials, is potentially lower that the real-life case. However, asstated in Chapter 3.4, the material only makes up 3% of the total mass and it is therefore unlikelythat it would have had a major effect on the results.
4.4 Comparison to previous studies
This chapter compares the results to those presented in the studies from Svensk Försäkring[37] (SFstudy below) and IVL[23] (Swedish Environmental Research Institute), first introduced in Chapter
46
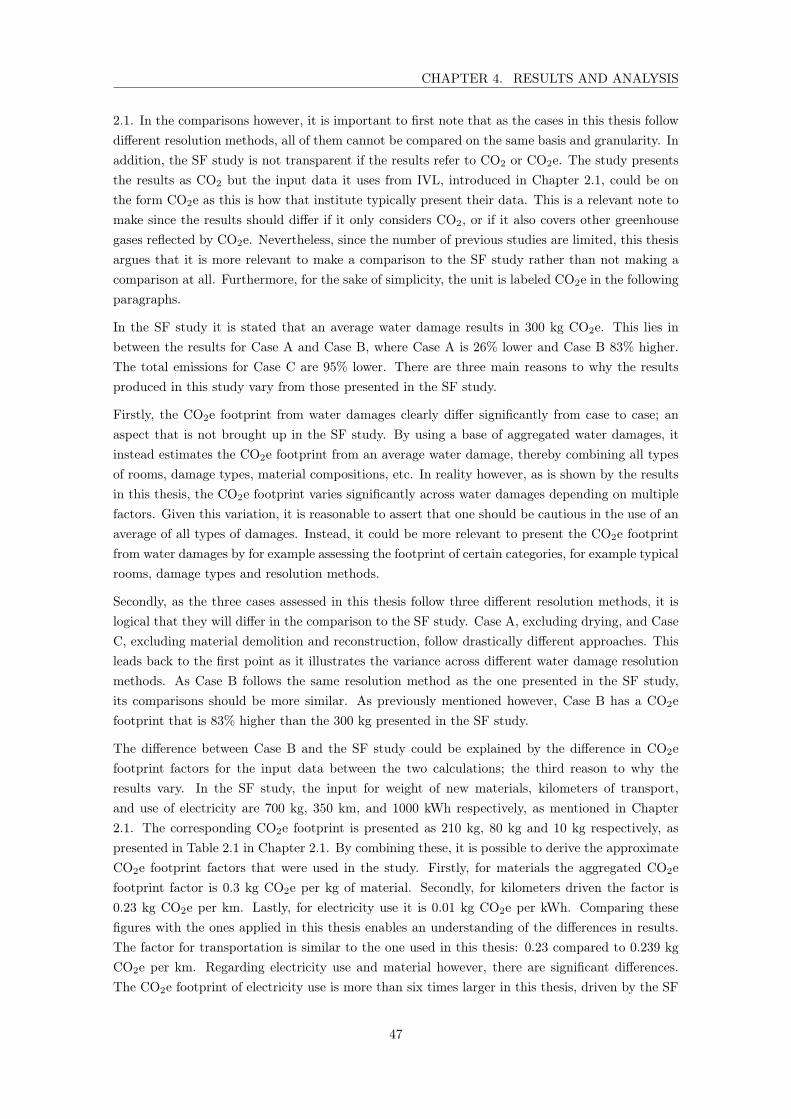
CHAPTER 4. RESULTS AND ANALYSIS
2.1. In the comparisons however, it is important to first note that as the cases in this thesis followdifferent resolution methods, all of them cannot be compared on the same basis and granularity. Inaddition, the SF study is not transparent if the results refer to CO2 or CO2e. The study presentsthe results as CO2 but the input data it uses from IVL, introduced in Chapter 2.1, could be onthe form CO2e as this is how that institute typically present their data. This is a relevant note tomake since the results should differ if it only considers CO2, or if it also covers other greenhousegases reflected by CO2e. Nevertheless, since the number of previous studies are limited, this thesisargues that it is more relevant to make a comparison to the SF study rather than not making acomparison at all. Furthermore, for the sake of simplicity, the unit is labeled CO2e in the followingparagraphs.
In the SF study it is stated that an average water damage results in 300 kg CO2e. This lies inbetween the results for Case A and Case B, where Case A is 26% lower and Case B 83% higher.The total emissions for Case C are 95% lower. There are three main reasons to why the resultsproduced in this study vary from those presented in the SF study.
Firstly, the CO2e footprint from water damages clearly differ significantly from case to case; anaspect that is not brought up in the SF study. By using a base of aggregated water damages, itinstead estimates the CO2e footprint from an average water damage, thereby combining all typesof rooms, damage types, material compositions, etc. In reality however, as is shown by the resultsin this thesis, the CO2e footprint varies significantly across water damages depending on multiplefactors. Given this variation, it is reasonable to assert that one should be cautious in the use of anaverage of all types of damages. Instead, it could be more relevant to present the CO2e footprintfrom water damages by for example assessing the footprint of certain categories, for example typicalrooms, damage types and resolution methods.
Secondly, as the three cases assessed in this thesis follow three different resolution methods, it islogical that they will differ in the comparison to the SF study. Case A, excluding drying, and CaseC, excluding material demolition and reconstruction, follow drastically different approaches. Thisleads back to the first point as it illustrates the variance across different water damage resolutionmethods. As Case B follows the same resolution method as the one presented in the SF study,its comparisons should be more similar. As previously mentioned however, Case B has a CO2efootprint that is 83% higher than the 300 kg presented in the SF study.
The difference between Case B and the SF study could be explained by the difference in CO2efootprint factors for the input data between the two calculations; the third reason to why theresults vary. In the SF study, the input for weight of new materials, kilometers of transport,and use of electricity are 700 kg, 350 km, and 1000 kWh respectively, as mentioned in Chapter2.1. The corresponding CO2e footprint is presented as 210 kg, 80 kg and 10 kg respectively, aspresented in Table 2.1 in Chapter 2.1. By combining these, it is possible to derive the approximateCO2e footprint factors that were used in the study. Firstly, for materials the aggregated CO2efootprint factor is 0.3 kg CO2e per kg of material. Secondly, for kilometers driven the factor is0.23 kg CO2e per km. Lastly, for electricity use it is 0.01 kg CO2e per kWh. Comparing thesefigures with the ones applied in this thesis enables an understanding of the differences in results.The factor for transportation is similar to the one used in this thesis: 0.23 compared to 0.239 kgCO2e per km. Regarding electricity use and material however, there are significant differences.The CO2e footprint of electricity use is more than six times larger in this thesis, driven by the SF
47
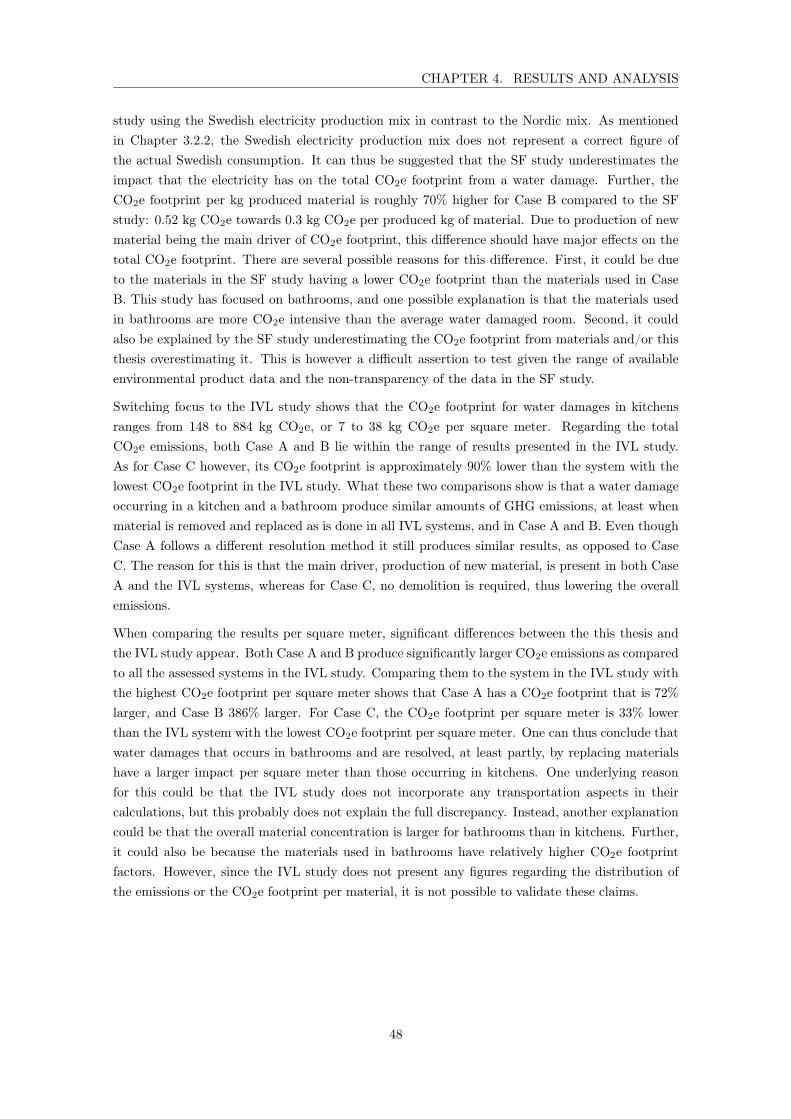
CHAPTER 4. RESULTS AND ANALYSIS
study using the Swedish electricity production mix in contrast to the Nordic mix. As mentionedin Chapter 3.2.2, the Swedish electricity production mix does not represent a correct figure ofthe actual Swedish consumption. It can thus be suggested that the SF study underestimates theimpact that the electricity has on the total CO2e footprint from a water damage. Further, theCO2e footprint per kg produced material is roughly 70% higher for Case B compared to the SFstudy: 0.52 kg CO2e towards 0.3 kg CO2e per produced kg of material. Due to production of newmaterial being the main driver of CO2e footprint, this difference should have major effects on thetotal CO2e footprint. There are several possible reasons for this difference. First, it could be dueto the materials in the SF study having a lower CO2e footprint than the materials used in CaseB. This study has focused on bathrooms, and one possible explanation is that the materials usedin bathrooms are more CO2e intensive than the average water damaged room. Second, it couldalso be explained by the SF study underestimating the CO2e footprint from materials and/or thisthesis overestimating it. This is however a difficult assertion to test given the range of availableenvironmental product data and the non-transparency of the data in the SF study.
Switching focus to the IVL study shows that the CO2e footprint for water damages in kitchensranges from 148 to 884 kg CO2e, or 7 to 38 kg CO2e per square meter. Regarding the totalCO2e emissions, both Case A and B lie within the range of results presented in the IVL study.As for Case C however, its CO2e footprint is approximately 90% lower than the system with thelowest CO2e footprint in the IVL study. What these two comparisons show is that a water damageoccurring in a kitchen and a bathroom produce similar amounts of GHG emissions, at least whenmaterial is removed and replaced as is done in all IVL systems, and in Case A and B. Even thoughCase A follows a different resolution method it still produces similar results, as opposed to CaseC. The reason for this is that the main driver, production of new material, is present in both CaseA and the IVL systems, whereas for Case C, no demolition is required, thus lowering the overallemissions.
When comparing the results per square meter, significant differences between the this thesis andthe IVL study appear. Both Case A and B produce significantly larger CO2e emissions as comparedto all the assessed systems in the IVL study. Comparing them to the system in the IVL study withthe highest CO2e footprint per square meter shows that Case A has a CO2e footprint that is 72%larger, and Case B 386% larger. For Case C, the CO2e footprint per square meter is 33% lowerthan the IVL system with the lowest CO2e footprint per square meter. One can thus conclude thatwater damages that occurs in bathrooms and are resolved, at least partly, by replacing materialshave a larger impact per square meter than those occurring in kitchens. One underlying reasonfor this could be that the IVL study does not incorporate any transportation aspects in theircalculations, but this probably does not explain the full discrepancy. Instead, another explanationcould be that the overall material concentration is larger for bathrooms than in kitchens. Further,it could also be because the materials used in bathrooms have relatively higher CO2e footprintfactors. However, since the IVL study does not present any figures regarding the distribution ofthe emissions or the CO2e footprint per material, it is not possible to validate these claims.
48
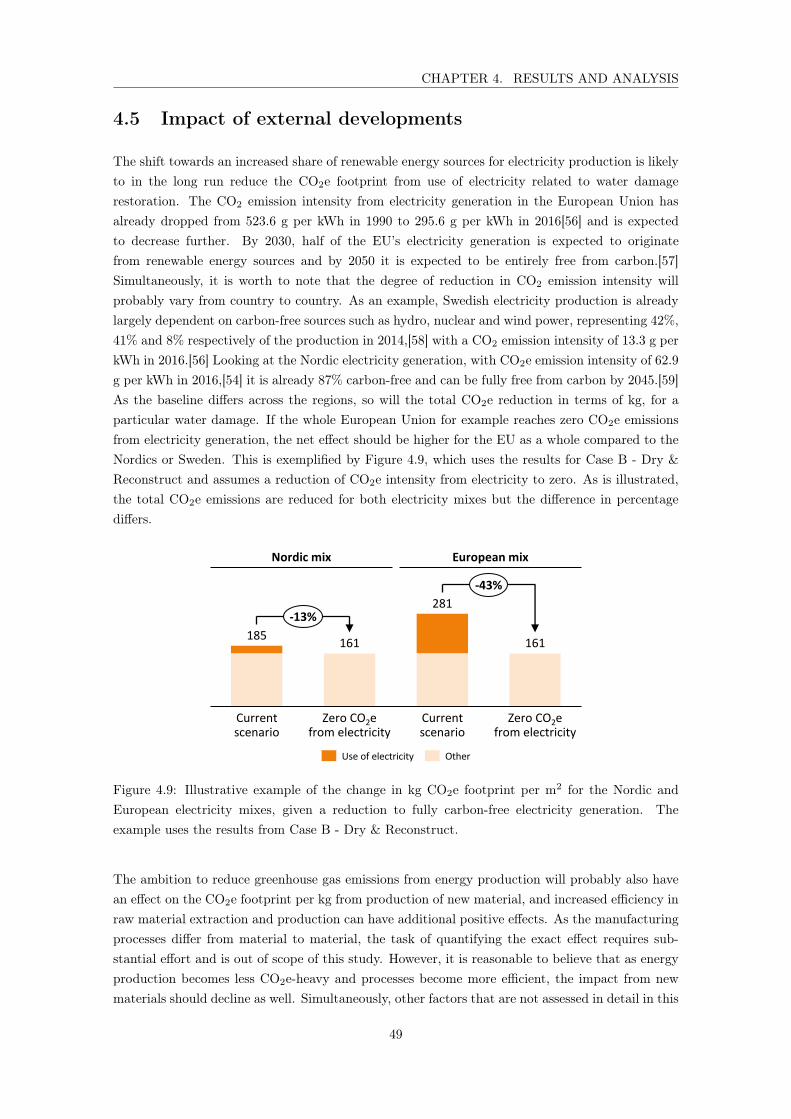
CHAPTER 4. RESULTS AND ANALYSIS
4.5 Impact of external developments
The shift towards an increased share of renewable energy sources for electricity production is likelyto in the long run reduce the CO2e footprint from use of electricity related to water damagerestoration. The CO2 emission intensity from electricity generation in the European Union hasalready dropped from 523.6 g per kWh in 1990 to 295.6 g per kWh in 2016[56] and is expectedto decrease further. By 2030, half of the EU’s electricity generation is expected to originatefrom renewable energy sources and by 2050 it is expected to be entirely free from carbon.[57]Simultaneously, it is worth to note that the degree of reduction in CO2 emission intensity willprobably vary from country to country. As an example, Swedish electricity production is alreadylargely dependent on carbon-free sources such as hydro, nuclear and wind power, representing 42%,41% and 8% respectively of the production in 2014,[58] with a CO2 emission intensity of 13.3 g perkWh in 2016.[56] Looking at the Nordic electricity generation, with CO2e emission intensity of 62.9g per kWh in 2016,[54] it is already 87% carbon-free and can be fully free from carbon by 2045.[59]As the baseline differs across the regions, so will the total CO2e reduction in terms of kg, for aparticular water damage. If the whole European Union for example reaches zero CO2e emissionsfrom electricity generation, the net effect should be higher for the EU as a whole compared to theNordics or Sweden. This is exemplified by Figure 4.9, which uses the results for Case B - Dry &Reconstruct and assumes a reduction of CO2e intensity from electricity to zero. As is illustrated,the total CO2e emissions are reduced for both electricity mixes but the difference in percentagediffers.
Current scenario
Current scenario
Zero CO2e from electricity
Zero CO2e from electricity
185 161
281
161
-13%
-43%
Nordic mix European mix
Use of electricity Other
Figure 4.9: Illustrative example of the change in kg CO2e footprint per m2 for the Nordic andEuropean electricity mixes, given a reduction to fully carbon-free electricity generation. Theexample uses the results from Case B - Dry & Reconstruct.
The ambition to reduce greenhouse gas emissions from energy production will probably also havean effect on the CO2e footprint per kg from production of new material, and increased efficiency inraw material extraction and production can have additional positive effects. As the manufacturingprocesses differ from material to material, the task of quantifying the exact effect requires sub-stantial effort and is out of scope of this study. However, it is reasonable to believe that as energyproduction becomes less CO2e-heavy and processes become more efficient, the impact from newmaterials should decline as well. Simultaneously, other factors that are not assessed in detail in this
49

CHAPTER 4. RESULTS AND ANALYSIS
study, for example resource scarcity, can become increasingly important, especially for materialsthat are difficult to recycle. This relates back to the concept of circular economy and the relevanceof reusing materials.
The CO2e footprint from the transportation aspect of WDR is also likely to be impacted by futuredevelopments, in particular the increasing share of electric vehicles (EV). A clear effect is theasserted lower CO2e footprint from EVs as compared to conventional internal combustion enginevehicles (ICEV). A study from 2016 comparing EVs towards similar sized ICEVs from a life cycleperspective found that the EVs had 20-27% lower CO2e footprint.[60] The study uses an Europeanelectricity mix and the CO2e benefit is likely higher for regions with a lower CO2e emission intensityper kWh. As the share of EVs increases, it is reasonable to assume that so will the share of EVsused for transportation related to WDR. The International Energy Agency estimates that thestock of EVs could reach 130-228 million globally by 2030,[61] and 4 million in the Nordics.[62] ForSweden in particular, the agency estimates roughly 1.5 million EVs by 2030, equivalent to a marketshare of almost 35%.[62] Although there are other important aspects to consider, for example anincreasing demand for battery materials such as nickel, cobalt and lithium,[61] the increase in theshare of EVs combined with their relatively lower CO2e impact is likely to have an effect on theWDR industry and reduce the CO2e footprint from water damages.
Overall, there are multiple external factors that in the future will probably change the CO2eemissions related to all types of water damage resolution methods. From a qualitative standpoint,it seems reasonable that the CO2e footprint of a particular water damage will be reduced for eachof the three main drivers: use of electricity, production of new material, and transportation. Thisis driven by the global trend towards reduced greenhouse gas emissions. Detailing the footprintand distribution of each driver would require an extensive analysis and is out of scope for thisstudy. Overall however, as Case C seems to require less electricity and transportation comparedto Case A and Case B, and additionally does not require any new materials, it can be argued thatit should remain a beneficial resolution method in the future as well.
50

Chapter 5
Conclusion
5.1 Answers to research questions and scientific contribu-
tion
To answer the first research question, this study finds that the main drivers of CO2e footprintfrom a life cycle perspective vary significantly depending on water damage resolution method.This is a key finding compared to the previous assessments of water damages published by SvenskFörsäkring[37] and IVL,[23] which only assess the Dry & Reconstruct method. On a general levelhowever, production of new material, use of electricity and transportation of tradespeople seemto be the most significant categories. This is similar to what was found by Svensk Försäkringand is a relevant contribution as that report was published back in 2009. In two of the assessedcases, where materials were replaced, more than two thirds of the total CO2e footprint could beattributed to the production of new material. For the case where no material was replaced, thetotal CO2e footprint can be attributed to transportation and use of electricity, accounting for twothirds and one third respectively of the total emissions.
Efforts are made to reduce the CO2e footprint from buildings, with life cycle assessments being anincreasingly used tool to increase the transparency of the environmental effect of different typesof options. This is illustrated by the increasing number of scientific publications in Figure 2.1 inChapter 2.1. Simultaneously, as highlighted in Chapter 2.1, repair and replace processes are oftenoverlooked in LCAs of buildings.[27][28] This includes water damage restoration. By developing atransparent methodology for the life cycle assessment of water damages, including identification ofthe key drivers of CO2e footprint, this thesis adds to the academic field of LCAs of buildings. Themethodology developed to assess the CO2e footprint of water damage restoration can be replicatedin future studies to facilitate the consideration of such events in a building’s full life cycle. Thiswould require inclusion of a damage frequency element as well as a potential modification of inputdata to, for example, fit a particular construction or country. However, having a well-foundedmethodology including system boundary should be useful to increase the robustness of futureLCAs of buildings.
To answer the second research question, the study shows that to reduce the greenhouse gas emis-sions related to water damage restoration, the choice of resolution method is vital. This has been
51
CHAPTER 5. CONCLUSION
previously suggested as a possible way to reduce GHG emissions[34][37] but without any substan-tial support to the claim. The results in this thesis however creates such support by indicating thatwhen possible, one should aim to dry rather than demolish and reconstruct, which enables reuseof materials and thereby no need for production of new materials. This assertion should probablyalso hold in the future given the target to reduce GHG emissions from electricity, as discussed inChapter 4.5. Further actions can still clearly be beneficial to pursue, for example the minimizationof the number of unique visits from tradespeople, as well as increased effectiveness and efficiencyrelated to the drying of water damages. Also, when demolition and reconstruction is necessary,it should be relevant to assess how to reduce the impact from production of new material, forexample through the use of low CO2e footprint materials. On a general level however, the keyunderlying decision seems to be the choice of resolution method.
As previous academic reports[33][34][35][36] typically focus on how to prevent water damages,this thesis also adds to literature as it assesses how the CO2e footprint can be reduced for waterdamages that have already occurred. It is reasonable to believe that prevention is a relevant actionthat can help reduce the total CO2e footprint from water damages. However, the previous studiesfail to address potential mitigations to reduce the footprint of damages that have already occurred.As it will likely take time to reduce the number of damages through prevention efforts, this thesisprovides a relevant contribution to literature by discussing how the CO2e footprint can be reducedfor damages that are not prevented.
This study focuses on identifying the key drivers of CO2e footprint from water damages anddiscusses potential actions that can be taken to reduce the environmental effect and combat climatechange. This increases the academic support and thus facilitates for stakeholders in the WDRindustry, such as insurance companies and property damage restoration companies, to make sounddecisions and guide industry in a more sustainable direction. Simultaneously, it is important tonote that the shift will not occur by itself as there are still barriers that need to be overcome.One potential issue that is not discussed in detail in this study is the potential vested interestsamong stakeholders involved in the water damage restoration process. In particular, some of thetradespeople groups such as builders have an economic interest in demolition and reconstruction asthis is their core business. As an increased focus on drying reduces the need for these activities, itis not unreasonable to assume that these groups might oppose the shift. Another important issueis the economic aspect. Since there are mainly companies making the decision on which resolutionmethod to use, it is fair to assume that purely a more environmentally sustainable approach willnot be sufficient to change the industry; there also needs to be an economic incentive. This studydoes not try to quantify the economical differences between water damage resolution methods.However, the significant reduction in material replacement enabled by drying could also reduce theoverall costs.
Taking a step back and viewing the results from a larger perspective, it is relevant to note thatreducing the CO2e footprint from water damages is one out of many smaller problems that areimportant to solve in order to combat the larger problem climate change. A fairly simplifiedcalculation using the base scenarios for Case A and Case B, and the approximately 70,000 annualwater damages occurring in Sweden, equates to a total footprint from all Swedish damages ofapproximately 16,000 to 38,000 tonnes CO2e per year. This corresponds to around 0.02-0.06% ofthe annual total of 62.6 million tonnes CO2e[63] emissions originating from the Swedish economy.This figure should not be neglected only due to it seeming small; it still equates to around 60,000
52

CHAPTER 5. CONCLUSION
round trips between Stockholm and New York, based on the Carbon Emissions Calculator fromthe International Civil Aviation Organization.[64] Instead, it highlights the need for tackling theissue of climate change on multiple fronts.
5.2 Suggestions for further studies
Since the number of studies concerning CO2e footprint from water damages is limited, this studyhas taken an approach to identify a relevant methodology for CO2e quantification in order to deriveconclusions regarding the key drivers as well as potential actions to reduce the footprint. As thestudy is limited to this scope, there are numerous topics that would be interesting to assess infuture studies based on the findings presented in this thesis. Overall, it would be interesting to usea larger database of damages categorized based on room type, damage type and resolution methodin order to draw conclusions based on a more significant data set.
A follow-up study could for example widen the scope by assessing additional impact categories suchas eutrophication potential, ozone depletion potential, and acidification potential. It could alsoassess other types of damages, for example other types of rooms, material types, damage severity,and property types (e.g. commercial buildings such as hotels). Addressing these parameters shouldbe considered relevant since they are likely to have an impact on the variance in environmentalfootprint from water damages.
It would be particularly relevant to assess the effect of replacing damaged inorganic materials withwooden materials, as firstly no wooden constructions are considered in this thesis, and secondlywooden components bind CO2e during use and can be used for energy once disposed of. This couldpotentially shift the results as it would change the overall CO2e uptake of the construction, and itwould therefore be interesting to evaluate how this would impact the choice of resolution method.Another aspect of replacing one type of damaged material with another type of material would beto assess the change in energy efficiency of the building. If a water damage results in replacing thedamaged components with a material with better insulation properties but with a higher CO2efootprint, it would in the short term increase the total CO2e footprint. In the long run however,this solution could result in an overall lower CO2e footprint as the energy consumption of thebuilding would be reduced.
Since the reuse of material appears to be a key enabler to lowering CO2e emissions from waterdamages, it would be interesting to detail how material replacement can be reduced in practice.From this study, it seems as if the avoidance of material demolition and reconstruction through aproper drying technique can support a lower environmental footprint. A follow-up study could thuscenter around detailing which types of damages can be resolved without the need for demolitionand reconstruction, which can increase the transparency in the industry. That type of study shouldprobably take a consequential approach in order to accurately capture how CO2e footprint changewhen switching resolution methods. Furthermore, such a study could also assess how damages canbe prevented completely, for example through new technology, which should lower the need fordemolition and reconstruction and thus reduce the CO2e footprint even further.
In addition to more granular studies on the current situation, it would be interesting to build onthe qualitative discussion in Chapter 4.5 regarding future impacts from external developments. It
53

CHAPTER 5. CONCLUSION
seems reasonable that external factors will support the reduction of CO2e footprint from waterdamages in the long term, but it would be interesting to assess how this develops over time and howthe major drivers might change going forward. Such a study could take a consequential approachand test various scenarios over a time period. This could facilitate identification of proactiveactions to enable further reductions of the CO2e footprint.
Although outside the scope of environmental assessment, a last suggestion would be to addressadditional aspects as well, for example economical and social, to enable the choice of resolutionmethod to be optimized based on all relevant parameters. From the economical view, it could forexample be interesting to assess a potential correlation between resolution method and damagecost. From the social view, it could on the other hand relate to the impact various resolutionmethods have on the lives of the involved stakeholders. Such an analysis would provide a moreholistic view to the overall problem of resolving a water damage.
54

Bibliography
[1] T.F. Stocker et al. Climate Change 2013: The Physical Science Basis. Contribution of Work-
ing Group I to the Fifth Assessment Report of the Intergovernmental Panel on Climate
Change. Cambridge, United Kingdom and New York, NY, USA: IPCC, 2013.[2] John Cook et al. “Quantifying the consensus on anthropogenic global warming in the scientific
literature”. In: Environmental Research Letters 8.2 (June 2013), pp. 1–7. issn: 1748-9326. doi:10.1088/1748-9326/8/2/024024.
[3] John Cook et al. “Consensus on consensus: a synthesis of consensus estimates on human-caused global warming”. In: Environmental Research Letters 11.4 (Apr. 2016), pp. 1–7. issn:1748-9326. doi: 10.1088/1748-9326/11/4/048002.
[4] Paris Agreement. United Nations. 2015. url: https://unfccc.int/process-and-meetings/the-paris-agreement/the-paris-agreement (visited on 02/01/2019).
[5] United Nations General Assembly. Transforming our world: the 2030 Agenda for Sustainable
Development. United Nations, Sept. 2015.[6] Renz, Andreas and Zafra Solas, Manuel. Shaping the Future of Construction: A Breakthrough
in Mindset and Technology. World Economic Forum, May 2016.[7] Deklaration från aktörer. Fossilfritt Sverige. url: http://fossilfritt-sverige.se/om-
fossilfritt-sverige/deklaration-fran-aktorer/ (visited on 02/25/2019).[8] Färdplan för fossilfri konkurrenskraft - Bygg- och anläggningssektorn. Fossilfritt Sverige,
2018.[9] Patrizia Ghisellini, Catia Cialani, and Sergio Ulgiati. “A review on circular economy: the
expected transition to a balanced interplay of environmental and economic systems”. In:Journal of Cleaner Production 114 (Feb. 2016), pp. 11–32. issn: 0959-6526. doi: 10.1016/j.jclepro.2015.09.007.
[10] Francesco Pomponi and Alice Moncaster. “Circular economy for the built environment: Aresearch framework”. In: Journal of Cleaner Production 143 (Feb. 2017), pp. 710–718. issn:0959-6526. doi: 10.1016/j.jclepro.2016.12.055.
[11] Martin Geissdoerfer et al. “The Circular Economy – A new sustainability paradigm?” In:Journal of Cleaner Production 143 (Feb. 2017), pp. 757–768. issn: 0959-6526. doi: 10.1016/j.jclepro.2016.12.048.
[12] Jouni Korhonen, Antero Honkasalo, and Jyri Seppälä. “Circular Economy: The Concept andits Limitations”. In: Ecological Economics 143 (Jan. 2018), pp. 37–46. issn: 0921-8009. doi:10.1016/j.ecolecon.2017.06.041.
[13] Ellen MacArthur Foundation. Towards the Circular Economy - Economic and business ra-
tionale for an accelerated transition. Ellen MacArthur Foundation, 2013.
55

BIBLIOGRAPHY
[14] Jouni Korhonen et al. “Circular economy as an essentially contested concept”. In: Journal
of Cleaner Production 175 (Feb. 2018), pp. 544–552. issn: 0959-6526. doi: 10.1016/j.
jclepro.2017.12.111.[15] Göran Finnveden et al. “Recent developments in Life Cycle Assessment”. In: Journal of En-
vironmental Management 91.1 (2009), pp. 1–21. issn: 0301-4797. doi: 10.1016/j.jenvman.2009.06.018.
[16] Inträffade skador per år. Svensk Försäkring. 2017. url: https://www.svenskforsakring.se/statistik/skadeforsakring/hem--villa-foretags--och-fastighetsforsakring/
hem--villa-fritids--bat--rese--och-foretagsforsakring-arsvis-1985-/ (visitedon 02/01/2019).
[17] Environmental management – Life cycle assessment – Principles and framework (ISO 14040:2006).2nd ed. International Organization for Standardization (ISO). 2006.
[18] Michael Z. Hauschild, Ralph K. Rosenbaum, and Stig Irving Olsen, eds. Life Cycle Assess-
ment: Theory and Practice. Cham, Switzerland: Springer International Publishing, 2018.isbn: 978-3-319-56474-6. doi: 10.1007/978-3-319-56475-3.
[19] Nicolas Francart. “Buildings in municipal climate change mitigation strategies: towards lifecycle thinking”. Licentiate thesis. KTH Royal Institute of Technology, 2019. isbn: 978-91-7873-112-1. doi: 10.13140/RG.2.2.24767.15527.
[20] Environmental management – Life cycle assessment – Principles and framework (ISO 14044:2006).International Organization for Standardization (ISO). 2006.
[21] Sustainability of construction works – Environmental product declarations – Core rules for the
product category of construction products (EN 15804:2012+A1:2013). European Committeefor Standardization (CEN). 2013.
[22] Ahmad Faiz Abd Rashid and Sumiani Yusoff. “A review of life cycle assessment method forbuilding industry”. In: Renewable and Sustainable Energy Reviews 45 (May 2015), pp. 244–248. issn: 1364-0321. doi: 10.1016/j.rser.2015.01.043.
[23] Martin Erlandsson et al. Minskad klimatpåverkan från nybyggda flerbostadshus: LCA av fem
byggsystem. IVL, 2018.[24] Alberto Vilches, Antonio Garcia-Martinez, and Benito Sanchez-Montañes. “Life cycle assess-
ment (LCA) of building refurbishment: A literature review”. In: Energy and Buildings 135(Jan. 2017), pp. 286–301. issn: 0378-7788. doi: 10.1016/j.enbuild.2016.11.042.
[25] Bernardette Soust-Verdaguer, Carmen Llatas, and Antonio García-Martínez. “Simplificationin life cycle assessment of single-family houses: A review of recent developments”. In: Building
and Environment 103 (July 2016), pp. 215–227. issn: 0360-1323. doi: 10.1016/j.buildenv.2016.04.014.
[26] Chirjiv Kaur Anand and Ben Amor. “Recent developments, future challenges and new re-search directions in LCA of buildings: A critical review”. In: Renewable and Sustainable
Energy Reviews 67 (Jan. 2017), pp. 408–416. issn: 1364-0321. doi: 10.1016/j.rser.2016.09.058.
[27] Aneurin Grant and Robert Ries. “Impact of building service life models on life cycle assess-ment”. In: Building Research & Information 41.2 (Apr. 2013), pp. 168–186. issn: 0961-3218.doi: 10.1080/09613218.2012.730735.
[28] Aneurin Grant, Robert Ries, and Charles Kibert. “Life Cycle Assessment and Service LifePrediction”. In: Journal of Industrial Ecology 18.2 (Apr. 2014), pp. 187–200. issn: 1088-1980.doi: 10.1111/jiec.12089.
56

BIBLIOGRAPHY
[29] Elizabeth Matthews, Carol J. Friedland, and Fatemeh Orooji. “Optimization of Sustainabil-ity and Flood Hazard Resilience for Home Designs”. In: Procedia Engineering 145 (2016),pp. 525–531. issn: 1877-7058. doi: 10.1016/j.proeng.2016.04.040.
[30] Elizabeth C. Matthews, Carol J. Friedland, and Fatemeh Orooji. “Integrated environmen-tal sustainability and resilience assessment model for coastal flood hazards”. In: Journal of
Building Engineering 8 (Dec. 2016), pp. 141–151. issn: 2352-7102. doi: 10.1016/j.jobe.2016.08.002.
[31] Thomas Hennequin et al. “A framework for performing comparative LCA between repairingflooded houses and construction of dikes in non-stationary climate with changing risk offlooding”. In: Science of the Total Environment 642 (Nov. 2018), pp. 473–484. issn: 0048-9697. doi: 10.1016/j.scitotenv.2018.05.404.
[32] Ali Tighnavard Balasbaneh, Abdul Kadir Bin Marsono, and Adel Gohari. “Sustainable ma-terials selection based on flood damage assessment for a building using LCA and LCC”.In: Journal of Cleaner Production 222 (June 2019), pp. 844–855. issn: 0959-6526. doi:10.1016/j.jclepro.2019.03.005.
[33] Helena Pålsson and Sandra Peterson. “Skadeförebygg, vad och varför? - en studie av skade-förebyggande verksamhet hos försäkringsbolag på den svenska marknaden avseende byggnad-srelaterade skador”. Master thesis. Chalmers University of Technology, 2007.
[34] Jakob Sahlén. “Översvämningsskador – drivkrafter, utmaningar och möjligheter för ett utökatskadeförebyggande arbete – en fallstudie på Länsförsäkringar Skåne, Eslövs kommun, Lundskommun, Lomma kommun och Staffanstorps kommun”. Master thesis. Lund University, 2011.
[35] Lovisa Hjalmarsson and Ayna Aydogdyeva. “Utredning av vattenskadetrender: Hur kan an-talet vattenskador minskas?” Bachelor thesis. KTH Royal Institute of Technology, 2015.
[36] Sara Nordstrand. “Riskbedömning av golv i våtutrymmen”. KTH Royal Institute of Technol-ogy, 2003.
[37] CO2 emissions associated with the management of water and fire damage in the Nordic
countries. Svensk Försäkring (at the time Försäkringsförbundet), 2009.[38] Chris Scheuer, Gregory A Keoleian, and Peter Reppe. “Life cycle energy and environmental
performance of a new university building: modeling challenges and design implications”. In:Energy and Buildings 35.10 (Nov. 2003), pp. 1049–1064. issn: 0378-7788. doi: 10.1016/S0378-7788(03)00066-5.
[39] Kevin Van Ooteghem and Lei Xu. “The life-cycle assessment of a single-storey retail buildingin Canada”. In: Building and Environment 49 (Mar. 2012), pp. 212–226. issn: 0360-1323.doi: 10.1016/j.buildenv.2011.09.028.
[40] M. Asif, T. Muneer, and R. Kelley. “Life cycle assessment: A case study of a dwelling home inScotland”. In: Building and Environment 42.3 (Mar. 2007), pp. 1391–1394. issn: 0360-1323.doi: 10.1016/j.buildenv.2005.11.023.
[41] Göran Finnveden and Lars-Gunnar Lindfors. “On the Nordic Guidelines for Life Cycle As-sessment”. In: The International Journal of Life Cycle Assessment 1.1 (Mar. 1996), pp. 45–48. issn: 0948-3349. doi: 10.1007/BF02978635.
[42] Vattenskadeundersökningen 2017. Vattenskadecentrum, 2018.[43] Ökobaudat. Sewer pipe PVC. 2017.[44] EPD International AB. IVL. url: https://www.ivl.se/toppmeny/om-ivl/dotterbolag-
och-samagda-anlaggningar/epd-international-ab.html (visited on 03/19/2019).
57

BIBLIOGRAPHY
[45] The International EPD R� System. EPD International AB. url: https://www.environdec.com/The-International-EPD-System/ (visited on 04/09/2019).
[46] Antti Ruuska. Carbon footprint for building products - ECO2 data for materials and products
with the focus on wooden building products. VTT, 2013.[47] Zukunft Bauen, Forschung für die Praxis | Volume 11, ÖKOBAUDAT, Basis for the building
life cycle assessment. Federal Institute for Research on Building Urban Affairs and SpatialDevelopment.
[48] Jenny Gode et al. Miljövärdering av el ur ett systemperspektiv. IVL, 2009.[49] Alberto Moro and Laura Lonza. “Electricity carbon intensity in European Member States:
Impacts on GHG emissions of electric vehicles”. In: Transportation Research Part D 64 (2017),pp. 5–14. issn: 1361-9209.
[50] Adi Musabasic and Örjan Lönngren. Stockholms stads utsläppsberäkningar av växthusgaser.Miljöförvaltningen, 2009.
[51] Rapportering av energianvändning och utsläpp av växthusgaser 2011 samt ny beräkningsme-
todik. Miljöförvaltningen (Stockholms stad), 2011.[52] Martin Hagberg et al. Miljövärdering av energilösningar i byggnader (etapp 2) Metod för
konsekvensanalys. IVL, 2017.[53] Drivmedel 2017 redovisning av uppgifter enligt drivmedelslagen och hållbarhetslagen. En-
ergimyndigheten, 2017.[54] Rapportering av energianvändningen och växthusgasutsläppen 2018. Miljöförvaltningen (Stock-
holms stad), 2018.[55] Carolina Liljenström et al. Byggandets klimatpåverkan: Livscykelberäkning av klimatpåverkan
och energianvändning för ett nyproducerat energieffektivt flerbostadshus i betong. IVL, 2015.[56] Overview of electricity production and use in Europe. European Energy Agency. 2018. url:
https : / / www . eea . europa . eu / data - and - maps / indicators / overview - of - the -
electricity-production-2/assessment-4 (visited on 04/06/2019).[57] Achieving global leadership in renewable energies (European Commission - Fact Sheet). Eu-
ropean Commission, 2016.[58] Karin Byman. Electricity production in Sweden - IVA’s Electricity Crossroads project. Stock-
holm: IVA, 2016.[59] Nordic Energy Technology Perspectives 2016 - Cities, flexibility and pathways to carbon-
neutrality. International Energy Agency, 2016.[60] Linda Ager-Wick Ellingsen, Bhawna Singh, and Anders Hammer Strømman. “The size and
range effect: lifecycle greenhouse gas emissions of electric vehicles”. In: Environmental Re-
search Letters 11.5 (2016). doi: 10.1088/1748-9326/11/5/054010.[61] Global EV Outlook 2018 - Towards cross-modal electrification. International Energy Agency,
2018.[62] Nordic EV Outlook 2018 - Insights from leaders in electric mobility. International Energy
Agency, 2018.[63] Greenhouse gas emissions unchanged in 2017. Statistiska Centralbyrån (EN: Statistics Swe-
den), 2018. url: https : / / www . scb . se / en / finding - statistics / statistics - by -
subject-area/environment/environmental-accounts-and-sustainable-development/
system-of-environmental-and-economic-accounts/pong/statistical-news/environmental-
accounts--emissions-to-air-q4-2017-and-preliminary-statistics-for-2017/ (vis-ited on 05/08/2019).
58

BIBLIOGRAPHY
[64] Carbon Emissions Calculator. International Civil Aviation Organization (ICAO). url: https://www.icao.int/environmental-protection/CarbonOffset/Pages/default.aspx (vis-ited on 05/08/2019).
59

AP
PEN
DIX
A.Envir
onm
entalproduct
data
for
buildin
gm
ateria
l
Mat
eria
lSe
nsit
ivity
scen
ario
EP
Dna
me
EP
Dnu
mber
A1-
A3
(kg
CO
2e/
kg)
C3-
C4
(kg
CO
2e/
kg)
Sour
ceC
omm
ent
Low
Ston
ewar
eti
les
glaz
ed-
0.31
9-
Öko
baud
at
Cer
amic
tile
sB
ase
Cer
amic
tile
s(V
TT
)-
0.61
3-
VT
T
Hig
hC
eram
icti
les
(Öko
baud
at)
-0.
694
0.00
939
Öko
baud
atE
nd-o
f-life
valu
esus
edas
C3-
C4
for
allc
eram
icti
les
Con
cret
eB
ase
Bet
onde
rD
ruck
fest
igke
itsk
lass
eC
30/3
7-
0.09
70.
0005
75Ö
koba
udat
Floo
rdr
ain
(cas
tir
on)
Bas
eG
rey
cast
iron
part
-1.
654
0.00
0968
2Ö
koba
udat
Floo
rdr
ain
(pla
stic
)B
ase
Sew
erpi
peP
VC
;-
3.01
32.
724
Öko
baud
at
Gro
utB
ase
PC
IFl
exfu
gR �
-0.
93-
Öko
baud
at
Low
Rig
ips
Bau
plat
teim
pr.
RB
I-
12,5
mm
-0.
136
-Ö
koba
udat
Gyp
sum
plas
terb
oard
Bas
eG
ypro
cR �N
orm
al–
Stan
dard
Pla
ster
boar
d12
.5m
m38
80.
247
0.00
148
Env
iron
dec
End
-of-l
ifeva
lues
used
asC
3-C
4fo
ral
lgy
psum
plas
terb
oard
s
Hig
hD
alsa
nG
ypsu
mP
last
erbo
ard
-A
1C
orex
358
0.27
2-
Env
iron
dec
60
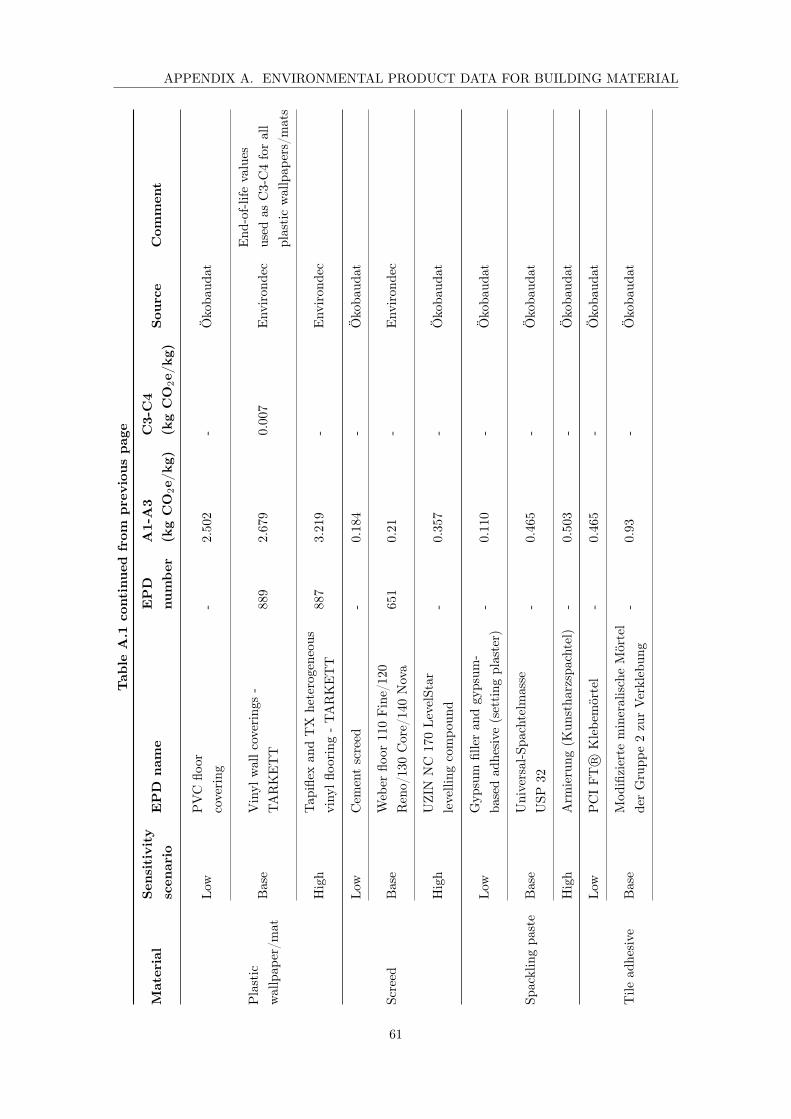
APPENDIX A. ENVIRONMENTAL PRODUCT DATA FOR BUILDING MATERIAL
Tab
leA
.1co
ntin
ued
from
prev
ious
page
Mat
eria
lSe
nsit
ivity
scen
ario
EP
Dna
me
EP
Dnu
mber
A1-
A3
(kg
CO
2e/
kg)
C3-
C4
(kg
CO
2e/
kg)
Sour
ceC
omm
ent
Low
PV
Cflo
orco
veri
ng-
2.50
2-
Öko
baud
at
Pla
stic
wal
lpap
er/m
atB
ase
Vin
ylw
allc
over
ings
-TA
RK
ET
T88
92.
679
0.00
7E
nvir
onde
cE
nd-o
f-life
valu
esus
edas
C3-
C4
for
all
plas
tic
wal
lpap
ers/
mat
s
Hig
hTa
pifle
xan
dT
Xhe
tero
gene
ous
viny
lfloo
ring
-TA
RK
ET
T88
73.
219
-E
nvir
onde
c
Low
Cem
ent
scre
ed-
0.18
4-
Öko
baud
at
Scre
edB
ase
Web
erflo
or11
0Fi
ne/1
20R
eno/
130
Cor
e/14
0N
ova
651
0.21
-E
nvir
onde
c
Hig
hU
ZIN
NC
170
Leve
lSta
rle
velli
ngco
mpo
und
-0.
357
-Ö
koba
udat
Low
Gyp
sum
fille
ran
dgy
psum
-ba
sed
adhe
sive
(set
ting
plas
ter)
-0.
110
-Ö
koba
udat
Spac
klin
gpa
ste
Bas
eU
nive
rsal
-Spa
chte
lmas
seU
SP32
-0.
465
-Ö
koba
udat
Hig
hA
rmie
rung
(Kun
stha
rzsp
acht
el)
-0.
503
-Ö
koba
udat
Low
PC
IFT
R �K
lebe
mör
tel
-0.
465
-Ö
koba
udat
Tile
adhe
sive
Bas
eM
odifi
zier
tem
iner
alis
che
Mör
tel
der
Gru
ppe
2zu
rV
erkl
ebun
g-
0.93
-Ö
koba
udat
61

APPENDIX A. ENVIRONMENTAL PRODUCT DATA FOR BUILDING MATERIAL
Tab
leA
.1co
ntin
ued
from
prev
ious
page
Mat
eria
lSe
nsit
ivity
scen
ario
EP
Dna
me
EP
Dnu
mber
A1-
A3
(kg
CO
2e/
kg)
C3-
C4
(kg
CO
2e/
kg)
Sour
ceC
omm
ent
Tile
adhe
sive
Hig
hM
odifi
zier
tem
iner
alis
che
Mör
tel
der
Gru
ppe
3zu
rV
erkl
ebun
g-
1.11
-Ö
koba
udat
Wat
erpr
oofin
gm
embr
ane
Bas
eM
apei
-M
apel
asti
cW
ater
stop
-1.
43-
Env
iron
dec
62


www.kth.se