The Effects of Moisture Content on Digestate-Derived Biochar
41
REPORT ON INDUSTRIAL TRAINING AT The Leibniz Institute for Agricultural Technology, Potsdam, Berlin, Germany. Submitted by Rishabh Ghotge 110909184 In partial fulfillment of the requirements for the award of the degree of BACHELOR OF ENGINEERING IN MECHANICAL ENGINEERING DEPARTMENT OF MECHANICAL AND MANUFACTURING ENGINEERING MANIPAL INSTITUTE OF TECHNOLOGY (A Constituent Institution of Manipal University) MANIPAL – 576104, KARNATAKA, INDIA August 2014
-
Upload
uni-oldenburg -
Category
Documents
-
view
4 -
download
0
Transcript of The Effects of Moisture Content on Digestate-Derived Biochar

REPORT ON
INDUSTRIAL TRAINING
AT
The Leibniz Institute for Agricultural Technology,
Potsdam, Berlin, Germany.
Submitted by
Rishabh Ghotge
110909184
In partial fulfillment of the requirements for the award of the degree of
BACHELOR OF ENGINEERING
IN
MECHANICAL ENGINEERING
DEPARTMENT OF MECHANICAL AND MANUFACTURING ENGINEERING
MANIPAL INSTITUTE OF TECHNOLOGY
(A Constituent Institution of Manipal University)
MANIPAL – 576104, KARNATAKA, INDIA
August 2014
Department of Mechanical and Manufacturing Engineering, MIT, Manipal 2
Contents
Acknowledgements……………………………………………………………..3
1) Introduction……………………………………………………………....4
2) Objectives………………………………………………………………...9
3) Work Performed………………………………………………………...10
4) Inferences and Discussion……………………………………………....37
Bibliography……………………………………………………………………39

Department of Mechanical and Manufacturing Engineering, MIT, Manipal 3
Acknowledgements
There are a lot of people to whom I am greatly indebted for the successful
completion of this report. I would like to thank my guides, Dr. Jan Mumme and Dr.
Toufiq Reza for their immense contributions and wonderful advice. I would like to
express my profound gratitude to Benjamin Wirth, Ulf Lüder, Maja Werner and
Laureen Herklotz for their valuable guidance in the laboratories and office. I am
immensely grateful to Tobias Hübner, Limbania Aliaga, Buse Atila, Ezgi Erdogan,
Anke Pfeiffer, Anke Kemnitz, Jessica Nover and the entire staff at ATB Potsdam for
their help, kindness and support during my stay there.
I would also like to thank the IAESTE teams in both MIT, Manipal and
Potsdam for making my stay in Germany possible and highly enjoyable as well as my
parents and teachers whose early lessons have always stood me in good stead.
-Rishabh Ghotge

Department of Mechanical and Manufacturing Engineering, MIT, Manipal 4
1.0 Introduction
1.1 What is Biochar?
Biochar is a black, friable and highly porous substance obtained after the incomplete
combustion of biomass. It can be made in a process very similar to that of the production of
charcoal. The main method of production of biochar at present is pyrolysis: the heating of a
substance in a closed container in the absence of oxygen, though the process and yield vary
with time, temperature, type of feedstock used, influencing catalysts and other affecting
factors. Biochar has been known for more than a century but interest in it has increased in
recent years because it is thought to offer sustainable solutions to global food requirement,
waste management and recycle, alternative fuel and climate change.
The term biochar was coined by Peter Read and has since come into popular usage, though
biochar is often referred to as agrichar. Biochar was included in the draft agenda for the
Copenhagen Climate negotiations in 2009 and has been a topic of considerable research in
fields like agriculture, mechanical, chemical and process engineering, biotechnology and
climate studies all over the world.
1.2 Origins
Scientists in the 1870s discovered areas of soil in the Amazon Rainforests that differed in
colour from the surrounding soils. Though the regular Amazonian soil was generally reddish,
highly weathered and bleached, possessing very little organic matter, these soils tended to be
darker in colour and were found to contain higher percentages of carbon. Further analysis of
the soil revealed that the presence of this carbon was not a natural process as had been
previously thought, but in fact, the result of the incorporation of incompletely burned
charcoal-like matter by early Amazonian inhabitants who lived in the region between 500
and 2500 years ago. Broken pieces of pottery found at the soil sights were one of the
indicators of the anthropogenic origins of the darker soil. This soil came to be known as
Terra Preta (“black soil” or “dark earth” in Portuguese). Today, the soil is well known in
Brazil for its fertility and is often dug up and sold.
In other parts of the world, biochar or variants of it have traditionally been used to increase
agricultural yields. Leibig (1878) reported the Chinese practice of covering waste biomass
with soil and then burning it for several days until a dark, nutrient- rich soil was produced.
Department of Mechanical and Manufacturing Engineering, MIT, Manipal 5
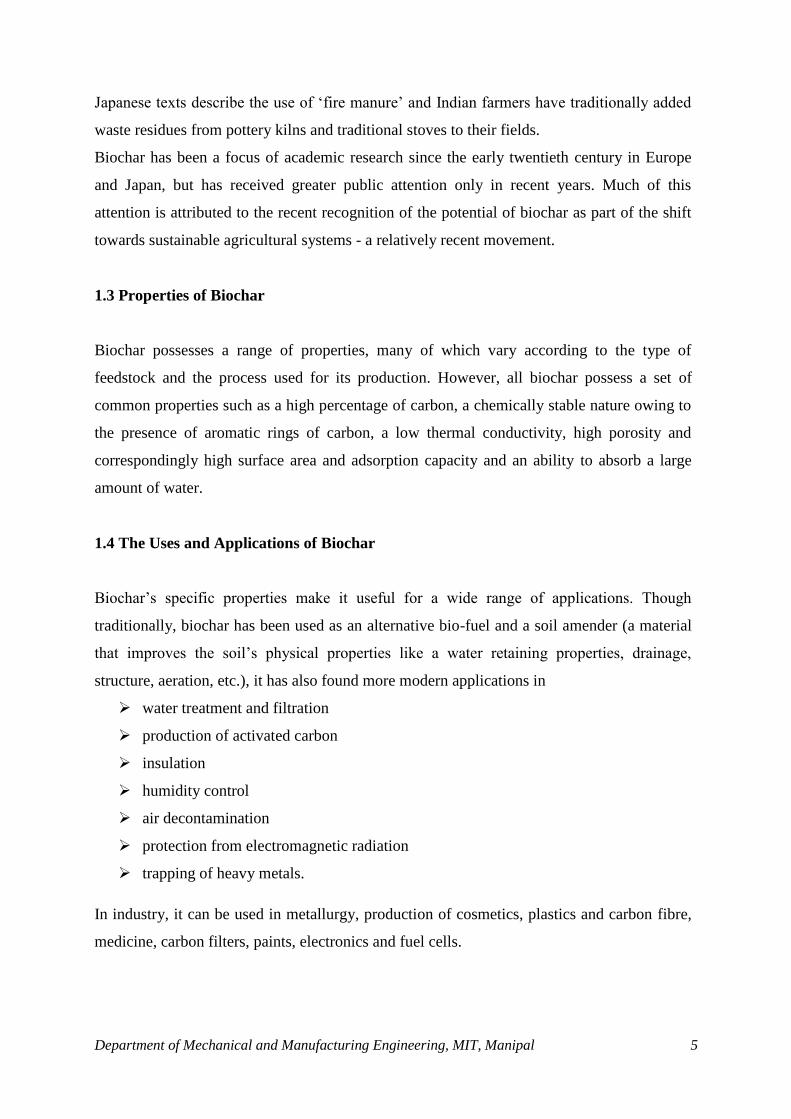
Japanese texts describe the use of ‘fire manure’ and Indian farmers have traditionally added
waste residues from pottery kilns and traditional stoves to their fields.
Biochar has been a focus of academic research since the early twentieth century in Europe
and Japan, but has received greater public attention only in recent years. Much of this
attention is attributed to the recent recognition of the potential of biochar as part of the shift
towards sustainable agricultural systems - a relatively recent movement.
1.3 Properties of Biochar
Biochar possesses a range of properties, many of which vary according to the type of
feedstock and the process used for its production. However, all biochar possess a set of
common properties such as a high percentage of carbon, a chemically stable nature owing to
the presence of aromatic rings of carbon, a low thermal conductivity, high porosity and
correspondingly high surface area and adsorption capacity and an ability to absorb a large
amount of water.
1.4 The Uses and Applications of Biochar
Biochar’s specific properties make it useful for a wide range of applications. Though
traditionally, biochar has been used as an alternative bio-fuel and a soil amender (a material
that improves the soil’s physical properties like a water retaining properties, drainage,
structure, aeration, etc.), it has also found more modern applications in
water treatment and filtration
production of activated carbon
insulation
humidity control
air decontamination
protection from electromagnetic radiation
trapping of heavy metals.
In industry, it can be used in metallurgy, production of cosmetics, plastics and carbon fibre,
medicine, carbon filters, paints, electronics and fuel cells.
Department of Mechanical and Manufacturing Engineering, MIT, Manipal 6
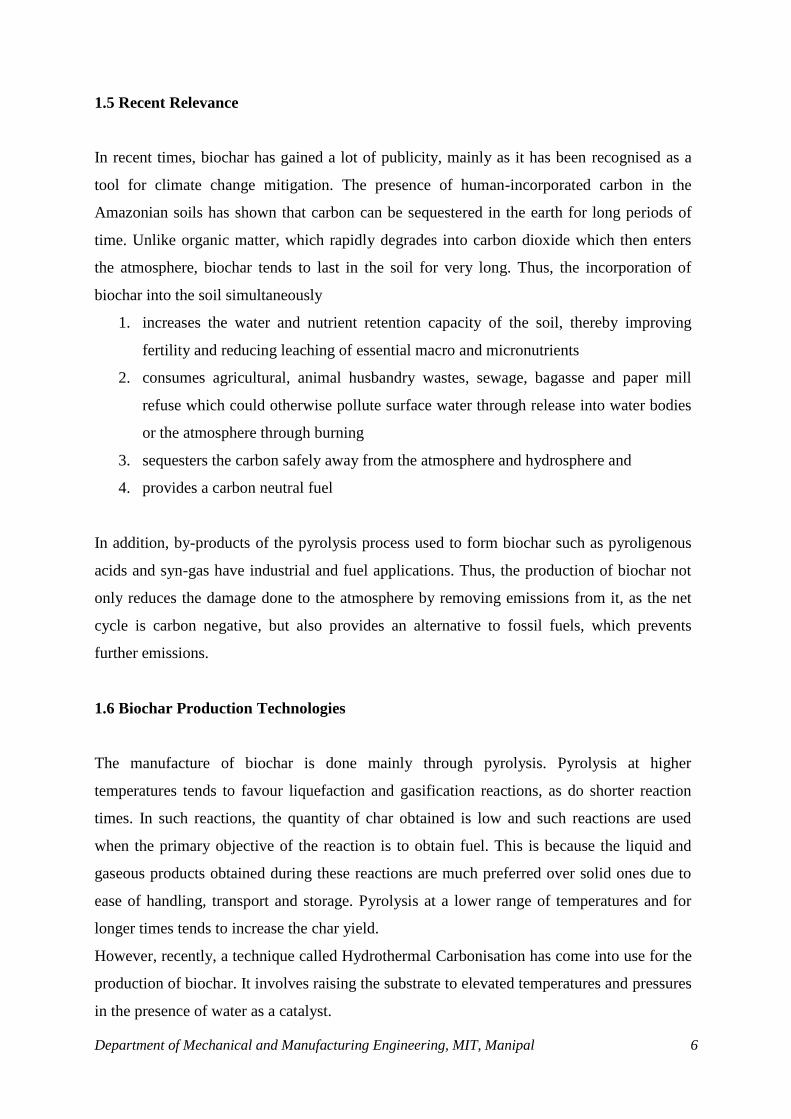
1.5 Recent Relevance
In recent times, biochar has gained a lot of publicity, mainly as it has been recognised as a
tool for climate change mitigation. The presence of human-incorporated carbon in the
Amazonian soils has shown that carbon can be sequestered in the earth for long periods of
time. Unlike organic matter, which rapidly degrades into carbon dioxide which then enters
the atmosphere, biochar tends to last in the soil for very long. Thus, the incorporation of
biochar into the soil simultaneously
1. increases the water and nutrient retention capacity of the soil, thereby improving
fertility and reducing leaching of essential macro and micronutrients
2. consumes agricultural, animal husbandry wastes, sewage, bagasse and paper mill
refuse which could otherwise pollute surface water through release into water bodies
or the atmosphere through burning
3. sequesters the carbon safely away from the atmosphere and hydrosphere and
4. provides a carbon neutral fuel
In addition, by-products of the pyrolysis process used to form biochar such as pyroligenous
acids and syn-gas have industrial and fuel applications. Thus, the production of biochar not
only reduces the damage done to the atmosphere by removing emissions from it, as the net
cycle is carbon negative, but also provides an alternative to fossil fuels, which prevents
further emissions.
1.6 Biochar Production Technologies
The manufacture of biochar is done mainly through pyrolysis. Pyrolysis at higher
temperatures tends to favour liquefaction and gasification reactions, as do shorter reaction
times. In such reactions, the quantity of char obtained is low and such reactions are used
when the primary objective of the reaction is to obtain fuel. This is because the liquid and
gaseous products obtained during these reactions are much preferred over solid ones due to
ease of handling, transport and storage. Pyrolysis at a lower range of temperatures and for
longer times tends to increase the char yield.
However, recently, a technique called Hydrothermal Carbonisation has come into use for the
production of biochar. It involves raising the substrate to elevated temperatures and pressures
in the presence of water as a catalyst.

Department of Mechanical and Manufacturing Engineering, MIT, Manipal 7
1.7 Biochar and the Leibniz Institut fϋr Agrartechnik (Leibniz Institute for
Agricultural Engineering)
The Leibniz Institute for Agricultural Engineering Potsdam-Bornim (ATB), Germany is a
partly public and partly privately funded institute which was founded in 1992. Today, it is
one of Europe’s leading research institutes, contributing to scientific expertise in a wide
range of fields including material and energetic use of biomass, technology assessment in
agriculture, quality and safety of food and feed and precision farming. Their special focus on
the interaction between biomass production and climate in order to establish a sustainable
bio-based economy in terms of both materials and energy provides a base for decision
makers in policy, agriculture and industry across the world. ATB’s high quality scientific
infrastructure and interdisciplinary approach to research has been instrumental in the
furthering of current understanding of agricultural systems and the role of technology in
them.
The APECS (Anaerobic Pathways to Renewable Energies and Carbon Sinks) team within
ATB focuses on the production of biochar from a variety of feedstock. The current research
includes the following:
Comparison of possible methods for the carbonization of digestate
Characterization and quantification of the properties of the biochar obtained
Optimization of required properties
Quantification of the end effect of biochar as a soil additive
Evaluation of the manufacturing process in terms of performance, economy and
environmental impact.
This project is part of the APECS team’s research to further study the effect of variation of
input in the biochar production process on the quality and quantity of the yield obtained. The
tests have been conducted at a small scale level in order to obtain information that could help
in larger scale pyrolysis models and machines being produced.
Department of Mechanical and Manufacturing Engineering, MIT, Manipal 8
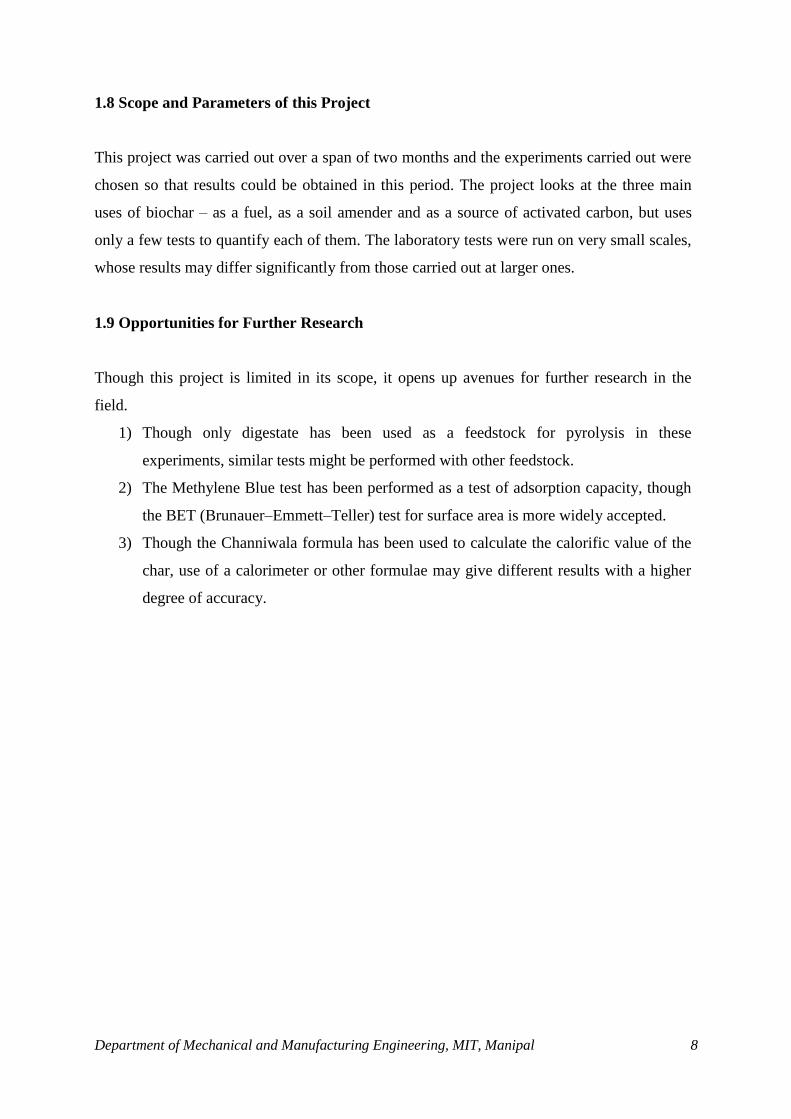
1.8 Scope and Parameters of this Project
This project was carried out over a span of two months and the experiments carried out were
chosen so that results could be obtained in this period. The project looks at the three main
uses of biochar – as a fuel, as a soil amender and as a source of activated carbon, but uses
only a few tests to quantify each of them. The laboratory tests were run on very small scales,
whose results may differ significantly from those carried out at larger ones.
1.9 Opportunities for Further Research
Though this project is limited in its scope, it opens up avenues for further research in the
field.
1) Though only digestate has been used as a feedstock for pyrolysis in these
experiments, similar tests might be performed with other feedstock.
2) The Methylene Blue test has been performed as a test of adsorption capacity, though
the BET (Brunauer–Emmett–Teller) test for surface area is more widely accepted.
3) Though the Channiwala formula has been used to calculate the calorific value of the
char, use of a calorimeter or other formulae may give different results with a higher
degree of accuracy.

Department of Mechanical and Manufacturing Engineering, MIT, Manipal 9
2.0 Objectives of the Project
Primary Objective:
The aim of this project is to quantify the influence and the extent of influence of moisture
content on the quality of digestate-derived pyrolysis biochar in terms of:
1) Measurement of Calorific value
2) Measurement of Water Holding Capacity
3) Eco-toxicity test
4) Measurement of the Methylene Blue Number
Secondary Objectives:
1) To gain insight into the process of pyrolysis
2) To receive training in research methodology and project management
3) To gain practical experience and exposure to work environments
Department of Mechanical and Manufacturing Engineering, MIT, Manipal 10
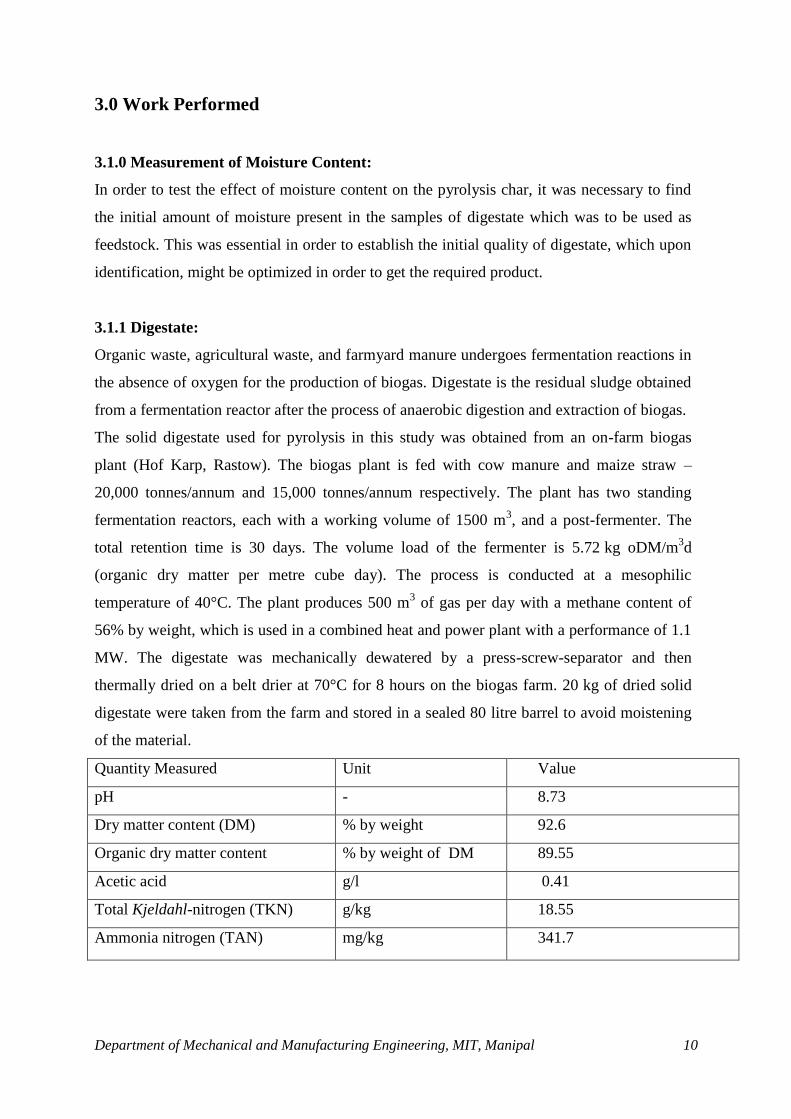
3.0 Work Performed
3.1.0 Measurement of Moisture Content:
In order to test the effect of moisture content on the pyrolysis char, it was necessary to find
the initial amount of moisture present in the samples of digestate which was to be used as
feedstock. This was essential in order to establish the initial quality of digestate, which upon
identification, might be optimized in order to get the required product.
3.1.1 Digestate:
Organic waste, agricultural waste, and farmyard manure undergoes fermentation reactions in
the absence of oxygen for the production of biogas. Digestate is the residual sludge obtained
from a fermentation reactor after the process of anaerobic digestion and extraction of biogas.
The solid digestate used for pyrolysis in this study was obtained from an on-farm biogas
plant (Hof Karp, Rastow). The biogas plant is fed with cow manure and maize straw –
20,000 tonnes/annum and 15,000 tonnes/annum respectively. The plant has two standing
fermentation reactors, each with a working volume of 1500 m3, and a post-fermenter. The
total retention time is 30 days. The volume load of the fermenter is 5.72 kg oDM/m3d
(organic dry matter per metre cube day). The process is conducted at a mesophilic
temperature of 40°C. The plant produces 500 m3 of gas per day with a methane content of
56% by weight, which is used in a combined heat and power plant with a performance of 1.1
MW. The digestate was mechanically dewatered by a press-screw-separator and then
thermally dried on a belt drier at 70°C for 8 hours on the biogas farm. 20 kg of dried solid
digestate were taken from the farm and stored in a sealed 80 litre barrel to avoid moistening
of the material.
Quantity Measured Unit Value
pH - 8.73
Dry matter content (DM) % by weight 92.6
Organic dry matter content % by weight of DM 89.55
Acetic acid g/l 0.41
Total Kjeldahl-nitrogen (TKN) g/kg 18.55
Ammonia nitrogen (TAN) mg/kg 341.7
Department of Mechanical and Manufacturing Engineering, MIT, Manipal 11
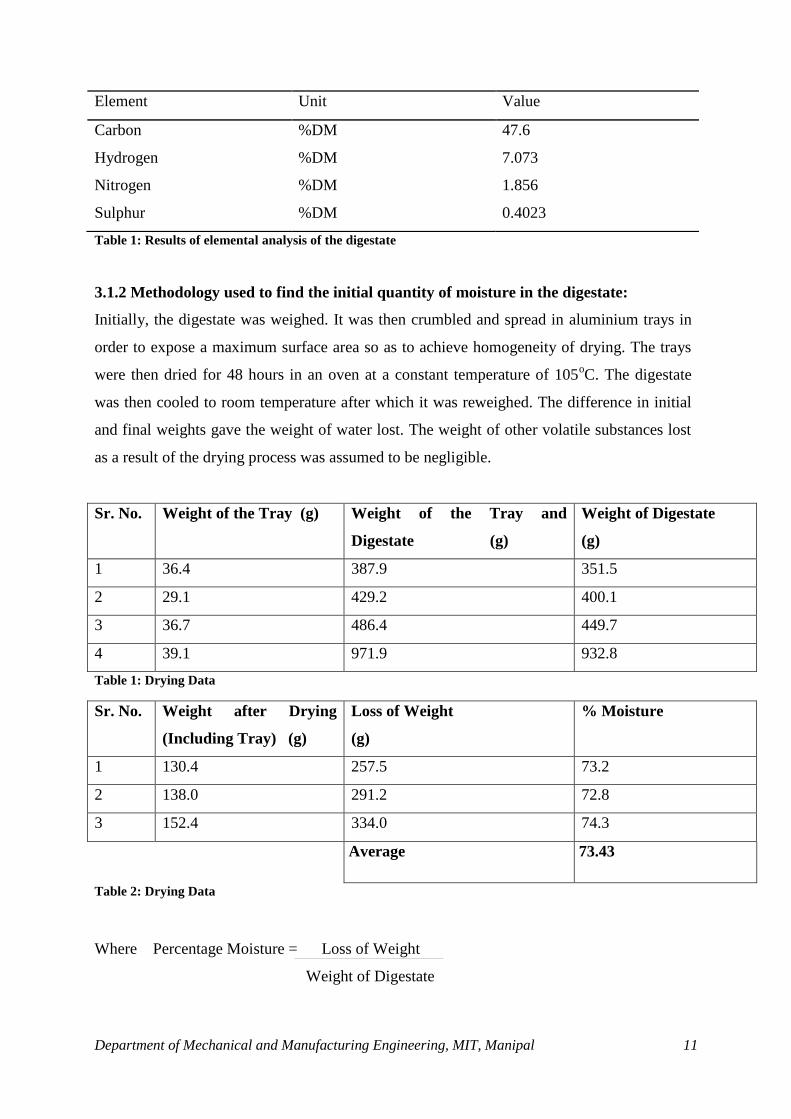
Table 1: Results of elemental analysis of the digestate
3.1.2 Methodology used to find the initial quantity of moisture in the digestate:
Initially, the digestate was weighed. It was then crumbled and spread in aluminium trays in
order to expose a maximum surface area so as to achieve homogeneity of drying. The trays
were then dried for 48 hours in an oven at a constant temperature of 105oC. The digestate
was then cooled to room temperature after which it was reweighed. The difference in initial
and final weights gave the weight of water lost. The weight of other volatile substances lost
as a result of the drying process was assumed to be negligible.
Sr. No. Weight of the Tray (g) Weight of the Tray and
Digestate (g)
Weight of Digestate
(g)
1 36.4 387.9 351.5
2 29.1 429.2 400.1
3 36.7 486.4 449.7
4 39.1 971.9 932.8
Table 1: Drying Data
Sr. No. Weight after Drying
(Including Tray) (g)
Loss of Weight
(g)
% Moisture
1 130.4 257.5 73.2
2 138.0 291.2 72.8
3 152.4 334.0 74.3
Average 73.43
Table 2: Drying Data
Where Percentage Moisture = Loss of Weight
Weight of Digestate
Element Unit Value
Carbon %DM 47.6
Hydrogen %DM 7.073
Nitrogen %DM 1.856
Sulphur %DM 0.4023
Department of Mechanical and Manufacturing Engineering, MIT, Manipal 12
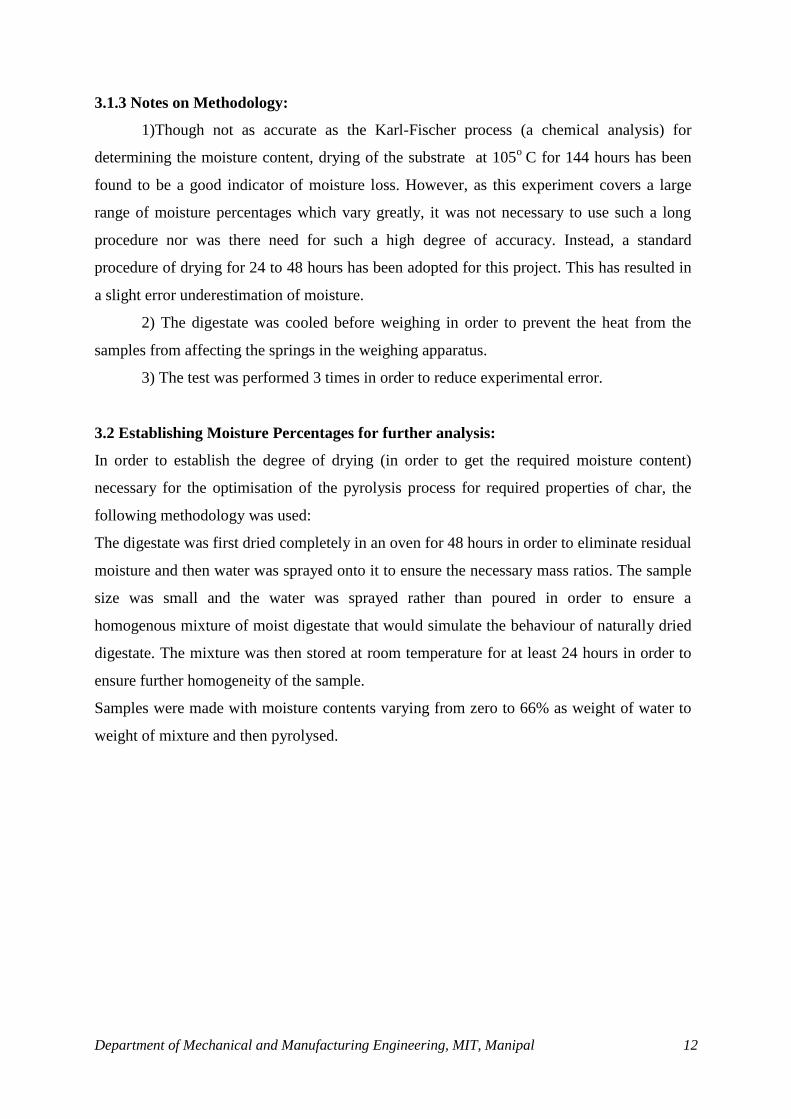
3.1.3 Notes on Methodology:
1)Though not as accurate as the Karl-Fischer process (a chemical analysis) for
determining the moisture content, drying of the substrate at 105o
C for 144 hours has been
found to be a good indicator of moisture loss. However, as this experiment covers a large
range of moisture percentages which vary greatly, it was not necessary to use such a long
procedure nor was there need for such a high degree of accuracy. Instead, a standard
procedure of drying for 24 to 48 hours has been adopted for this project. This has resulted in
a slight error underestimation of moisture.
2) The digestate was cooled before weighing in order to prevent the heat from the
samples from affecting the springs in the weighing apparatus.
3) The test was performed 3 times in order to reduce experimental error.
3.2 Establishing Moisture Percentages for further analysis:
In order to establish the degree of drying (in order to get the required moisture content)
necessary for the optimisation of the pyrolysis process for required properties of char, the
following methodology was used:
The digestate was first dried completely in an oven for 48 hours in order to eliminate residual
moisture and then water was sprayed onto it to ensure the necessary mass ratios. The sample
size was small and the water was sprayed rather than poured in order to ensure a
homogenous mixture of moist digestate that would simulate the behaviour of naturally dried
digestate. The mixture was then stored at room temperature for at least 24 hours in order to
ensure further homogeneity of the sample.
Samples were made with moisture contents varying from zero to 66% as weight of water to
weight of mixture and then pyrolysed.
Department of Mechanical and Manufacturing Engineering, MIT, Manipal 13
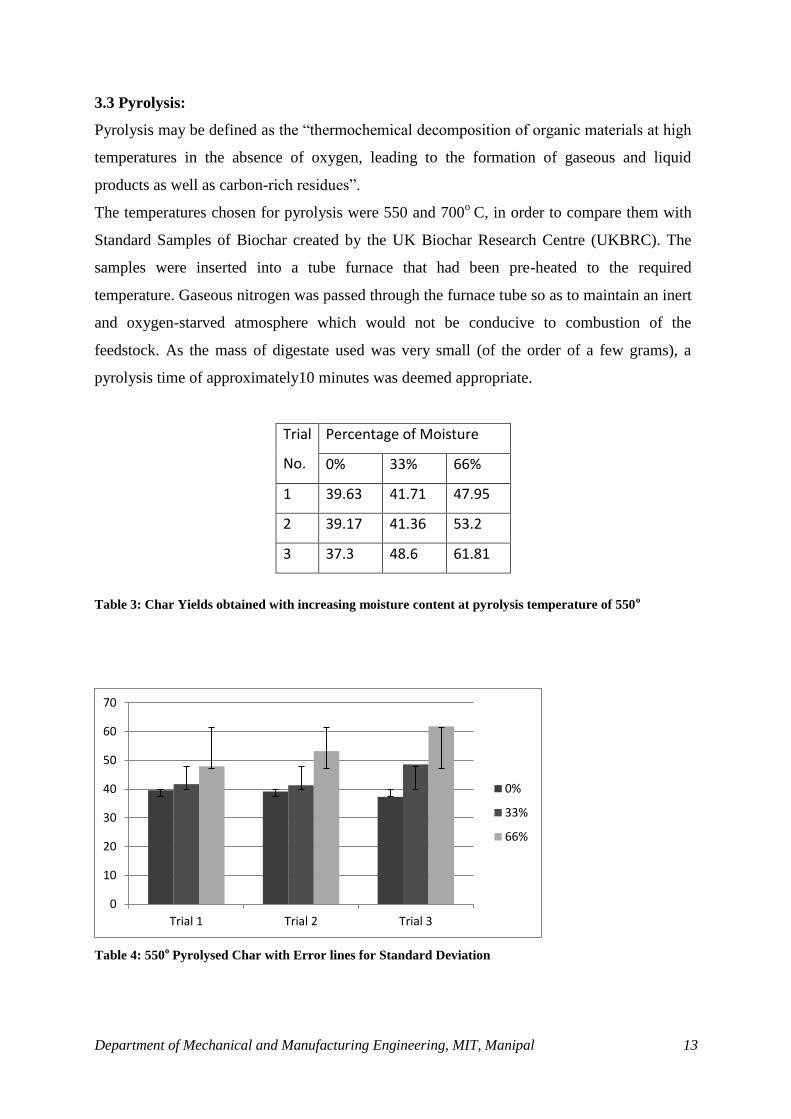
3.3 Pyrolysis:
Pyrolysis may be defined as the “thermochemical decomposition of organic materials at high
temperatures in the absence of oxygen, leading to the formation of gaseous and liquid
products as well as carbon-rich residues”.
The temperatures chosen for pyrolysis were 550 and 700o
C, in order to compare them with
Standard Samples of Biochar created by the UK Biochar Research Centre (UKBRC). The
samples were inserted into a tube furnace that had been pre-heated to the required
temperature. Gaseous nitrogen was passed through the furnace tube so as to maintain an inert
and oxygen-starved atmosphere which would not be conducive to combustion of the
feedstock. As the mass of digestate used was very small (of the order of a few grams), a
pyrolysis time of approximately10 minutes was deemed appropriate.
Trial
No.
Percentage of Moisture
0% 33% 66%
1 39.63 41.71 47.95
2 39.17 41.36 53.2
3 37.3 48.6 61.81
Table 3: Char Yields obtained with increasing moisture content at pyrolysis temperature of 550o
Table 4: 550o Pyrolysed Char with Error lines for Standard Deviation
0
10
20
30
40
50
60
70
Trial 1 Trial 2 Trial 3
0%
33%
66%
Department of Mechanical and Manufacturing Engineering, MIT, Manipal 14
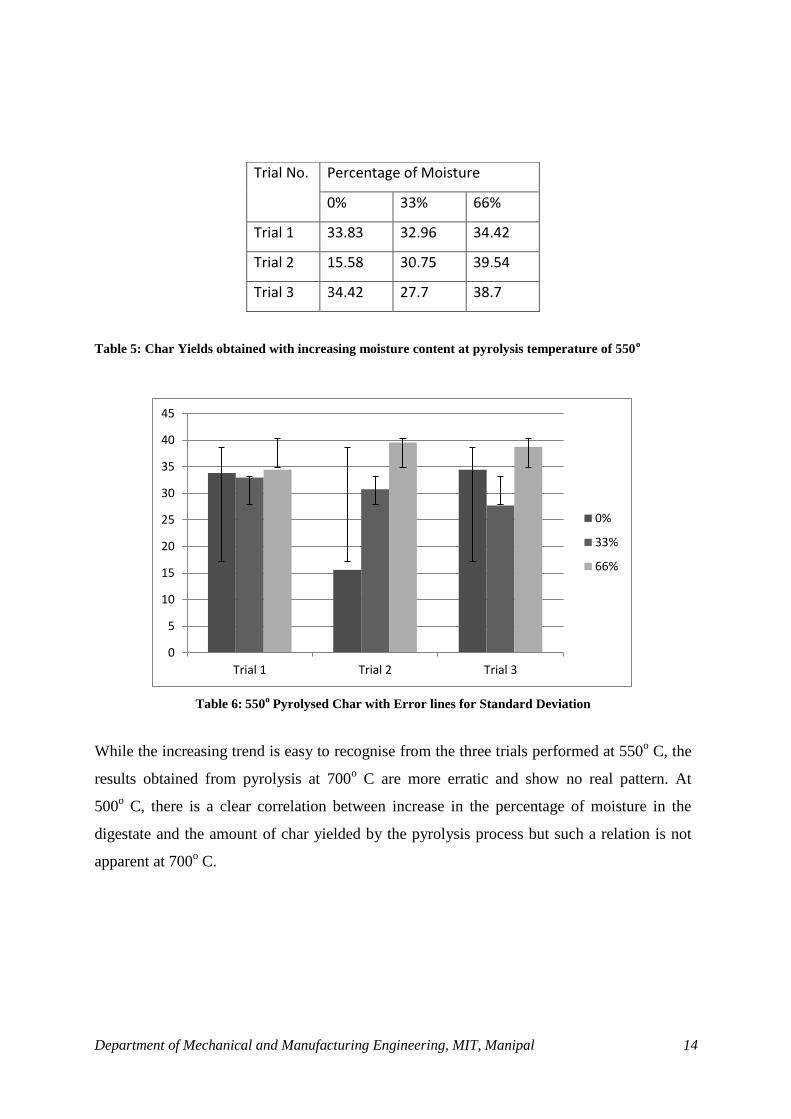
Table 5: Char Yields obtained with increasing moisture content at pyrolysis temperature of 550o
Table 6: 550o Pyrolysed Char with Error lines for Standard Deviation
While the increasing trend is easy to recognise from the three trials performed at 550o C, the
results obtained from pyrolysis at 700o C are more erratic and show no real pattern. At
500o C, there is a clear correlation between increase in the percentage of moisture in the
digestate and the amount of char yielded by the pyrolysis process but such a relation is not
apparent at 700o C.
0
5
10
15
20
25
30
35
40
45
Trial 1 Trial 2 Trial 3
0%
33%
66%
Trial No. Percentage of Moisture
0% 33% 66%
Trial 1 33.83 32.96 34.42
Trial 2 15.58 30.75 39.54
Trial 3 34.42 27.7 38.7

Department of Mechanical and Manufacturing Engineering, MIT, Manipal 15
3.4.0 Water Holding Capacity Testing:
3.4.1 Introduction:
The water holding capacity of a given soil type is the amount of water that it can hold or
retain against the force of gravity: an important agronomic parameter. Soils with higher
water holding capacities tend to retain moisture for longer periods of time, increasing its
availability for root absorption. Also, there is less seepage and wastage of water, reducing the
irrigation required. Since a large percentage of plant nutrients are water soluble, the drainage
of water from the top soil layers results in a loss of nutrients available for use by crops. This
results in a direct loss of soil fertility, as well as contamination of groundwater, thus affecting
the water supply available for future irrigation requirements as well as making it unfit for
human consumption. Higher water holding capacities are hence a desirable property in soil
as they help in nutrient and moisture retention, reduce the need for irrigation and fertilizers
and protect groundwater from contamination.
The water holding capacity of a soil is also an indicator of other physical properties of the
soil like surface area, particle size, particle size distribution and quantity of organic matter in
it. Generally smaller size clay particles with larger surface areas have better water retention
capacities than loamy and sandy soils in that order. The water holding capacity of soils also
increases with the amount of organic matter in them owing to the affinity that organic matter
has for water.
3.4.2 Terminology in the Water Holding Capacity Experiment
Saturation: The saturation point is reached when all the inter-granular spaces in the
soil are completely filled with water.
Field Capacity: When the excess water is allowed to drain away due to gravity, and
the remaining water is held by the soil against gravity, the soil is at field capacity.
Permanent Wilting Point: The point at which there is no water available for plant
intake is called the permanent wilting point. At this point, plants begin to wilt and do
not recover. However, there is still water in the soil, though it adheres too tightly to
the soil particles for plant to be able to use it.
Department of Mechanical and Manufacturing Engineering, MIT, Manipal 16
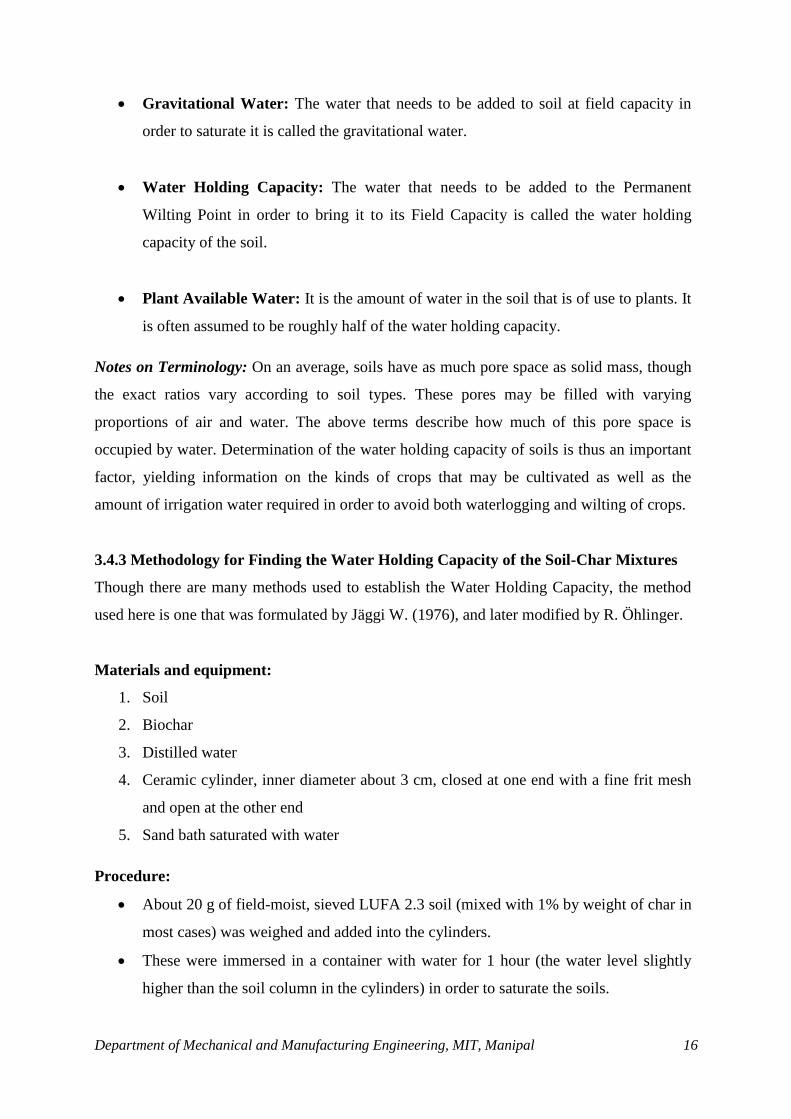
Gravitational Water: The water that needs to be added to soil at field capacity in
order to saturate it is called the gravitational water.
Water Holding Capacity: The water that needs to be added to the Permanent
Wilting Point in order to bring it to its Field Capacity is called the water holding
capacity of the soil.
Plant Available Water: It is the amount of water in the soil that is of use to plants. It
is often assumed to be roughly half of the water holding capacity.
Notes on Terminology: On an average, soils have as much pore space as solid mass, though
the exact ratios vary according to soil types. These pores may be filled with varying
proportions of air and water. The above terms describe how much of this pore space is
occupied by water. Determination of the water holding capacity of soils is thus an important
factor, yielding information on the kinds of crops that may be cultivated as well as the
amount of irrigation water required in order to avoid both waterlogging and wilting of crops.
3.4.3 Methodology for Finding the Water Holding Capacity of the Soil-Char Mixtures
Though there are many methods used to establish the Water Holding Capacity, the method
used here is one that was formulated by Jäggi W. (1976), and later modified by R. Öhlinger.
Materials and equipment:
1. Soil
2. Biochar
3. Distilled water
4. Ceramic cylinder, inner diameter about 3 cm, closed at one end with a fine frit mesh
and open at the other end
5. Sand bath saturated with water
Procedure:
About 20 g of field-moist, sieved LUFA 2.3 soil (mixed with 1% by weight of char in
most cases) was weighed and added into the cylinders.
These were immersed in a container with water for 1 hour (the water level slightly
higher than the soil column in the cylinders) in order to saturate the soils.
Department of Mechanical and Manufacturing Engineering, MIT, Manipal 17
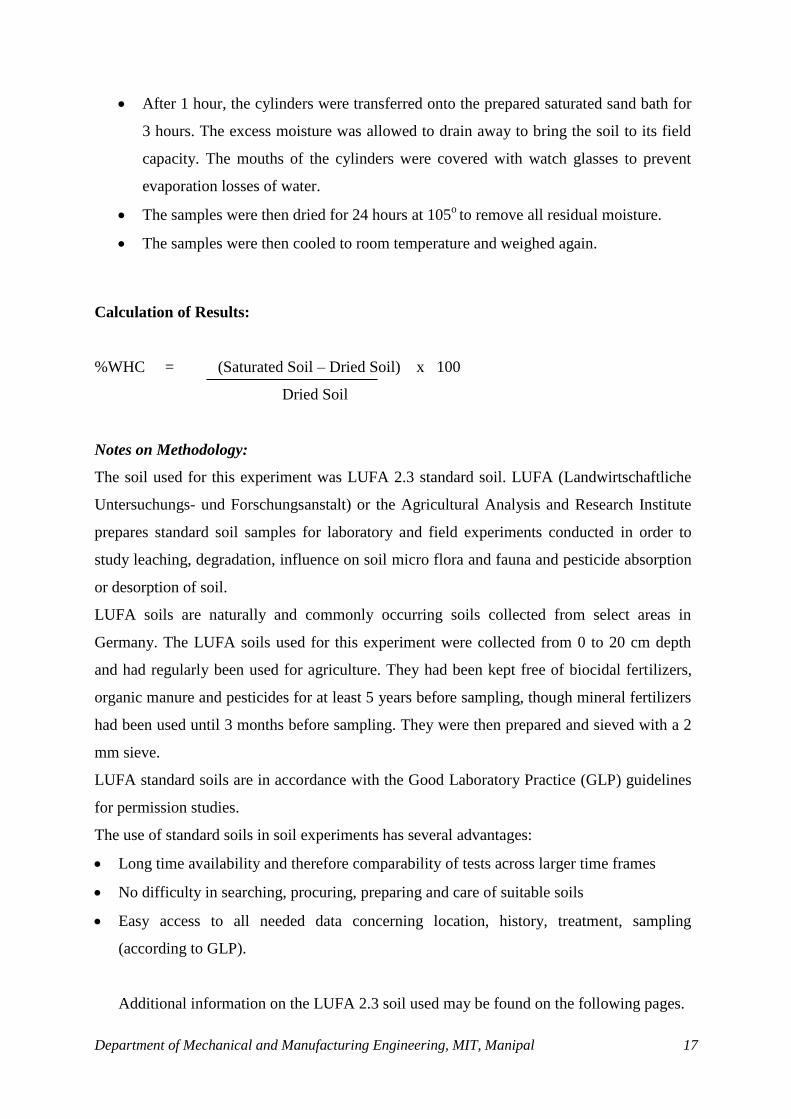
After 1 hour, the cylinders were transferred onto the prepared saturated sand bath for
3 hours. The excess moisture was allowed to drain away to bring the soil to its field
capacity. The mouths of the cylinders were covered with watch glasses to prevent
evaporation losses of water.
The samples were then dried for 24 hours at 105o to remove all residual moisture.
The samples were then cooled to room temperature and weighed again.
Calculation of Results:
%WHC = (Saturated Soil – Dried Soil) x 100
Dried Soil
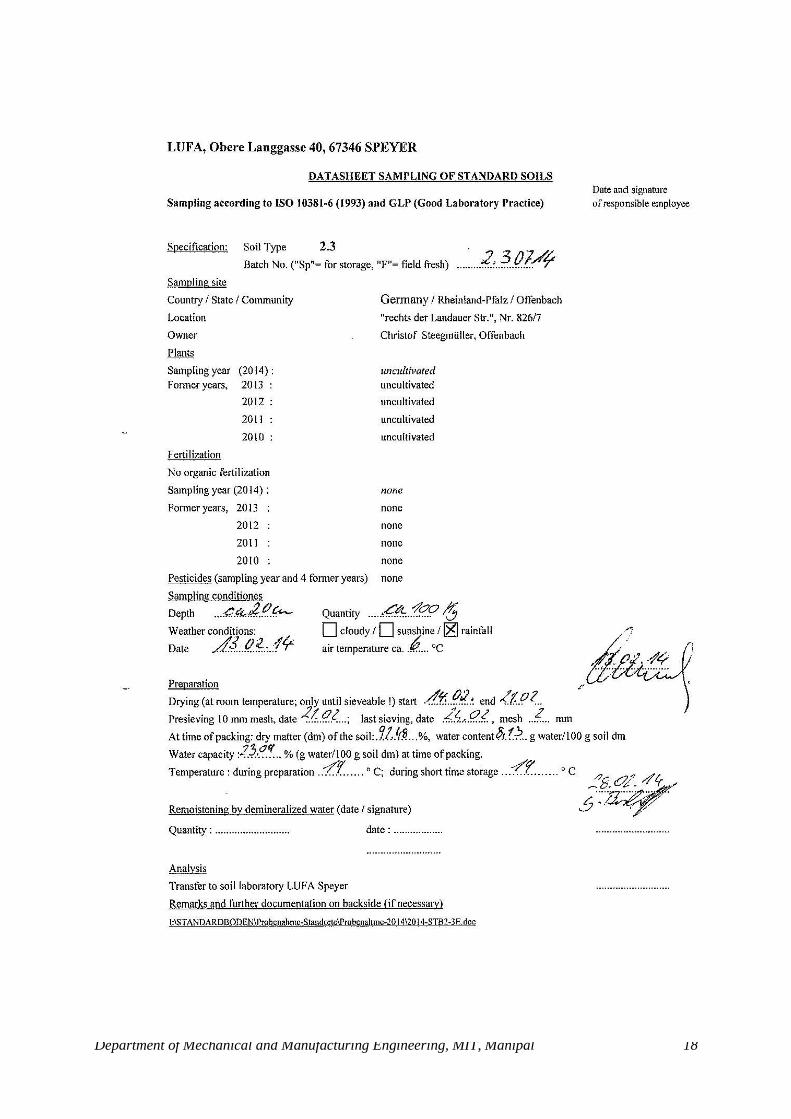
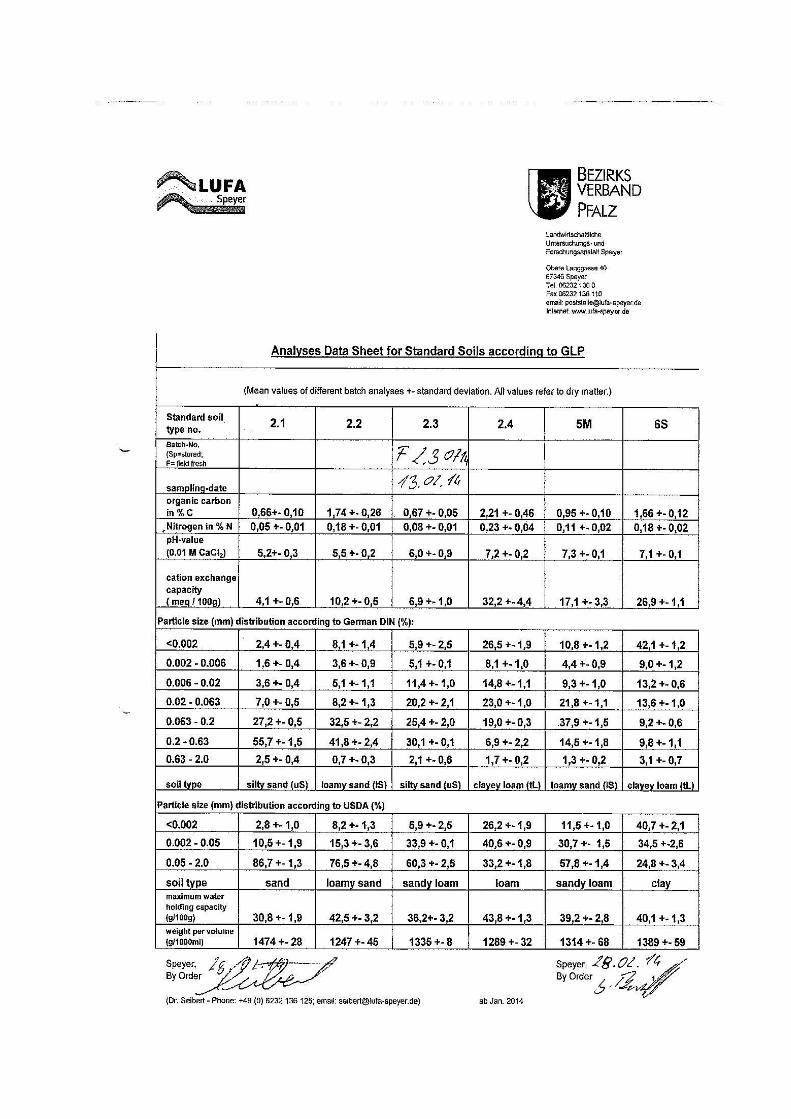
Notes on Methodology:
The soil used for this experiment was LUFA 2.3 standard soil. LUFA (Landwirtschaftliche
Untersuchungs- und Forschungsanstalt) or the Agricultural Analysis and Research Institute
prepares standard soil samples for laboratory and field experiments conducted in order to
study leaching, degradation, influence on soil micro flora and fauna and pesticide absorption
or desorption of soil.
LUFA soils are naturally and commonly occurring soils collected from select areas in
Germany. The LUFA soils used for this experiment were collected from 0 to 20 cm depth
and had regularly been used for agriculture. They had been kept free of biocidal fertilizers,
organic manure and pesticides for at least 5 years before sampling, though mineral fertilizers
had been used until 3 months before sampling. They were then prepared and sieved with a 2
mm sieve.
LUFA standard soils are in accordance with the Good Laboratory Practice (GLP) guidelines
for permission studies.
The use of standard soils in soil experiments has several advantages:
Long time availability and therefore comparability of tests across larger time frames
No difficulty in searching, procuring, preparing and care of suitable soils
Easy access to all needed data concerning location, history, treatment, sampling
(according to GLP).
Additional information on the LUFA 2.3 soil used may be found on the following pages.
Department of Mechanical and Manufacturing Engineering, MIT, Manipal 18
Department of Mechanical and Manufacturing Engineering, MIT, Manipal 19
Department of Mechanical and Manufacturing Engineering, MIT, Manipal 20
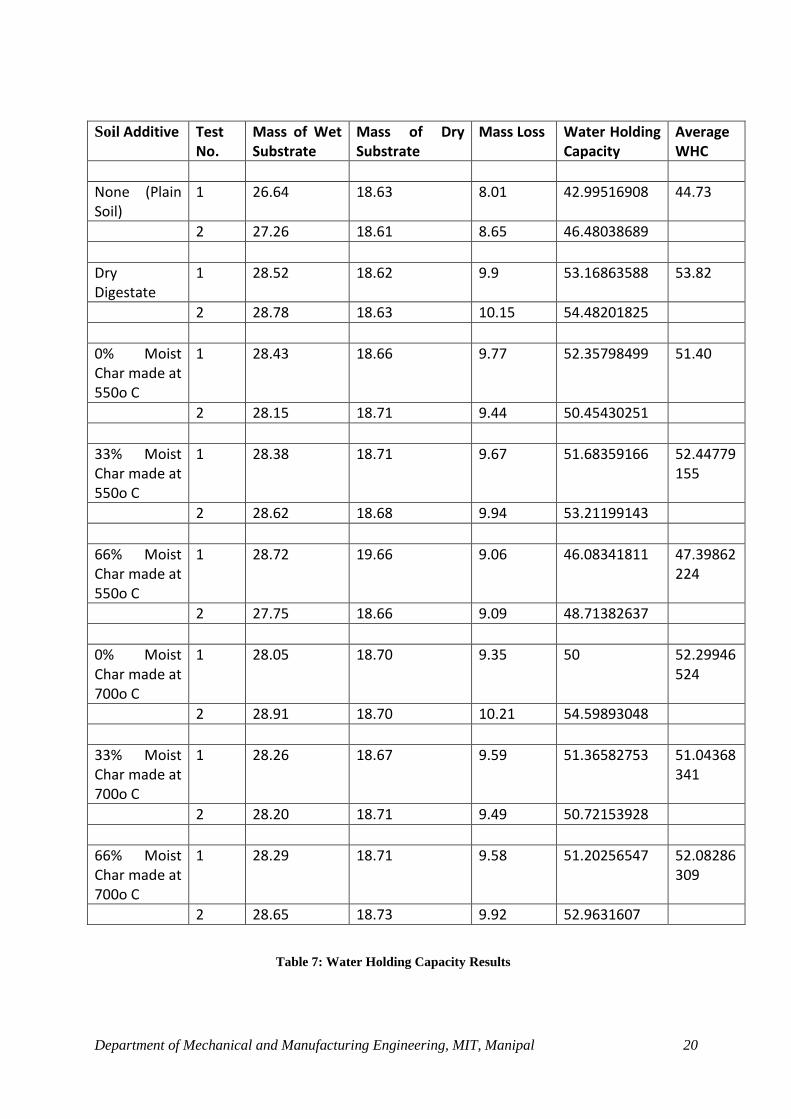
Soil Additive Test No.
Mass of Wet Substrate
Mass of Dry Substrate
Mass Loss Water Holding Capacity
Average WHC
None (Plain Soil)
1 26.64 18.63 8.01 42.99516908 44.73
2 27.26 18.61 8.65 46.48038689
Dry Digestate
1 28.52 18.62 9.9 53.16863588 53.82
2 28.78 18.63 10.15 54.48201825
0% Moist Char made at 550o C
1 28.43 18.66 9.77 52.35798499 51.40
2 28.15 18.71 9.44 50.45430251
33% Moist Char made at 550o C
1 28.38 18.71 9.67 51.68359166 52.44779155
2 28.62 18.68 9.94 53.21199143
66% Moist Char made at 550o C
1 28.72 19.66 9.06 46.08341811 47.39862224
2 27.75 18.66 9.09 48.71382637
0% Moist Char made at 700o C
1 28.05 18.70 9.35 50 52.29946524
2 28.91 18.70 10.21 54.59893048
33% Moist Char made at 700o C
1 28.26 18.67 9.59 51.36582753 51.04368341
2 28.20 18.71 9.49 50.72153928
66% Moist Char made at 700o C
1 28.29 18.71 9.58 51.20256547 52.08286309
2 28.65 18.73 9.92 52.9631607
Table 7: Water Holding Capacity Results
Department of Mechanical and Manufacturing Engineering, MIT, Manipal 21
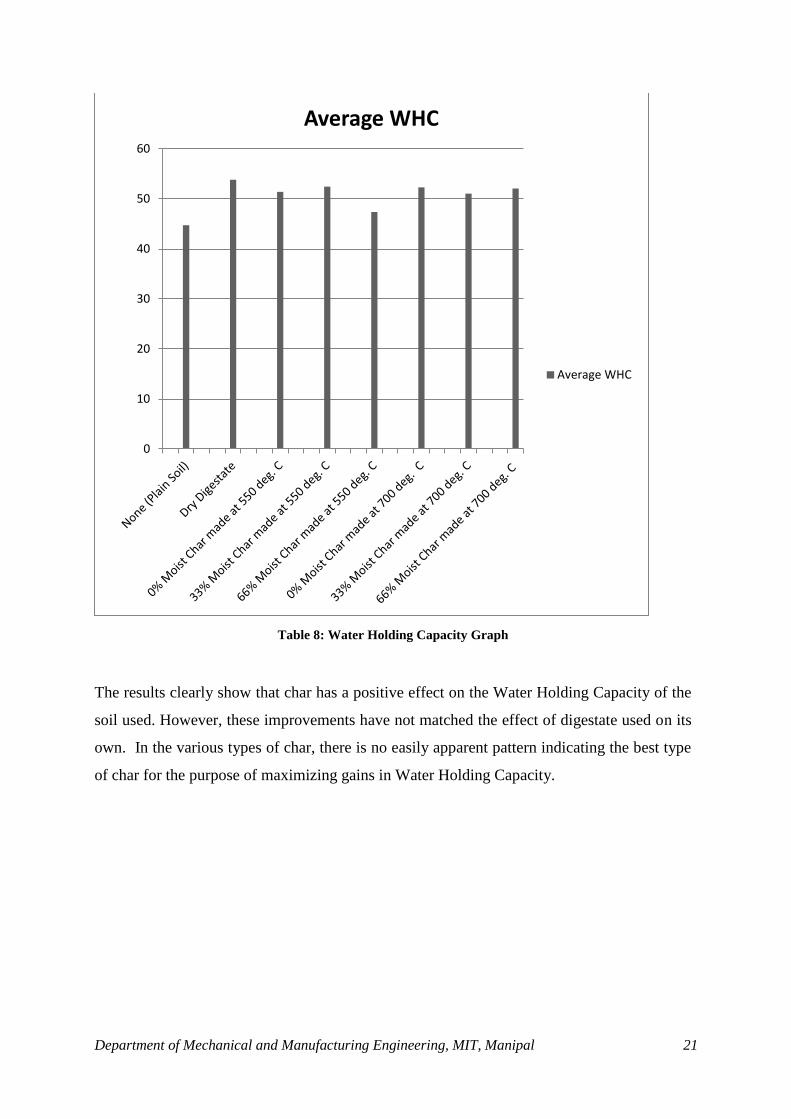
Table 8: Water Holding Capacity Graph
The results clearly show that char has a positive effect on the Water Holding Capacity of the
soil used. However, these improvements have not matched the effect of digestate used on its
own. In the various types of char, there is no easily apparent pattern indicating the best type
of char for the purpose of maximizing gains in Water Holding Capacity.
0
10
20
30
40
50
60
Average WHC
Average WHC
Department of Mechanical and Manufacturing Engineering, MIT, Manipal 22
3.5.0 Eco- Toxicity Test with Cress Seeds:
Though biochar has been found to improve the water-holding capacity of soils, it may have
other unknown influences on plant growth. It is essential to study and understand these
influences with a view to optimize the manufacturing process to maximise gains and
minimise harm to the soil or crops. Though the terra preta soils in the Amazons have shown
amazing results as soil amenders, the ways that laboratory-produced biochar could affect
seeds, germination, root growth, microbial activity, soil temperatures, soil conductivity and
soil emissions are still being researched. An entire overview of all the ways in which biochar
could affect the soil, the irrigation patterns, the groundwater cycle, crop yields and
agricultural patterns being far beyond the scope of this project, a short experiment has been
performed to test the effect that the biochar has on cress seeds when mixed into the soil. The
test is a preliminary indicator for potential toxicity of substances in the soil as well as soil
amending materials.
Ecotoxicity is a measure of the negative influence that a substance has on eco-systems. The
eco-toxicity test performed with cress gives the effect that the char has on cress germination,
but gives no information about the causes for inhibition, the type of influence (physical,
chemical, biological, etc.). Thus, the test has been designed to give a rough idea of the kind
of effect that biochar will have on plant life when used as a soil amender.
3.5.1 Methodology: The test used is a standard European test for phytotoxicity in
accordance with DIN EN 16086-2.
Materials
Soil or ground coal mixture
Cress seeds (Lepidium sativum)
Distilled water
Beakers, spatulas, tweezers
Petri dishes
Parafilm

Department of Mechanical and Manufacturing Engineering, MIT, Manipal 23
Procedure:
The soil or soil-carbon mixture was adjusted to 60% of its pre-determined Water
Holding Capacity.
Approximately 50 g of moist soil mixture was weighed in the Petri dishes (3
replicates)
10 cress seeds were arranged in a row in each Petri dish.
The petri dish was then sealed and made air-tight with parafilm.
The petri dishes were incubated vertically (at about 70-80 ° angle) in an incubator at
25 ° C for 72 hours in complete darkness.
Fig 1: Side and Front Views of Experimental Set-up
Evaluation
The number of germinated seeds was counted and the mean germination rate
determined.
The root length was measured in mm, on which basis the Munoo-Liisa vitality index
was calculated.

Department of Mechanical and Manufacturing Engineering, MIT, Manipal 24
Calculations:
1) AGR = GR1 + GR2 + GR3
3
Where GR - germination rate (percentage of germinated seeds per plate)
AGR - average germination rate
2)
Where CVG - coefficient of variation of the rate of germination
3)
Where RLP - root length per plant
RL - root length
NGS - Number of germinated seeds
4) ARLP = RLP1 +RLP2 + RLP3
3
Where ARLP - average root length per plant
5)
Where CVR - coefficient of variance of root length
Department of Mechanical and Manufacturing Engineering, MIT, Manipal 25
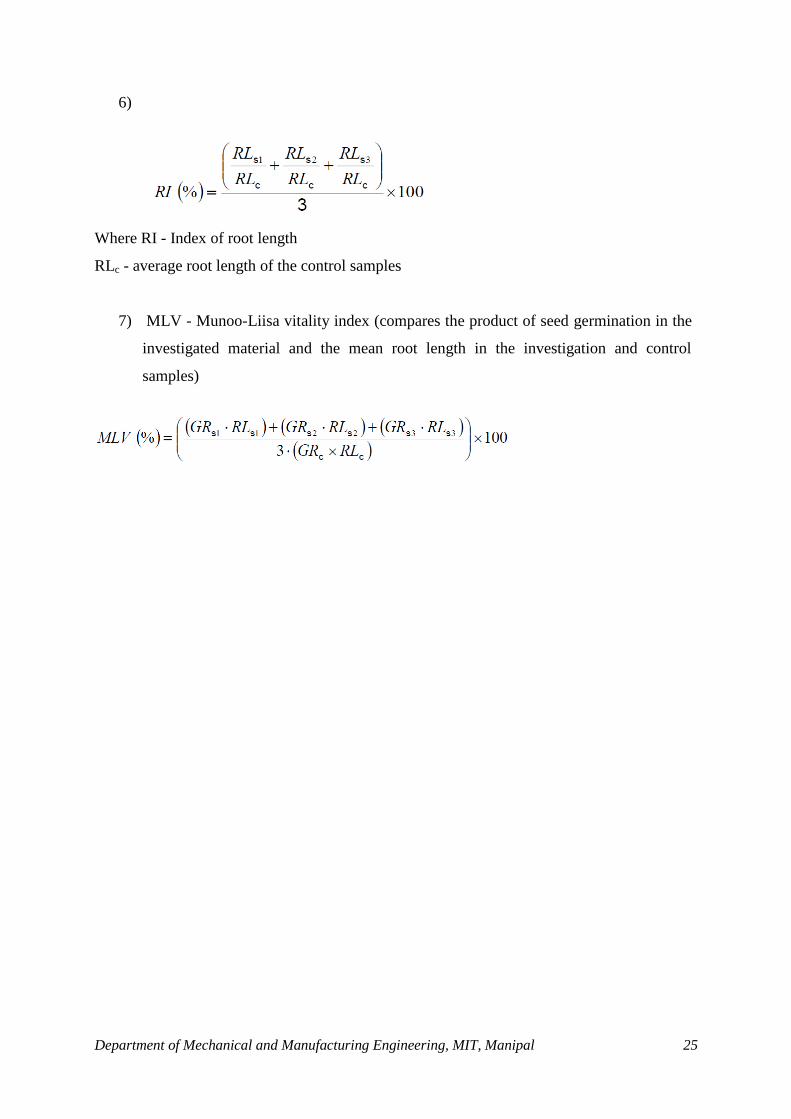
6)
Where RI - Index of root length
RLc - average root length of the control samples
7) MLV - Munoo-Liisa vitality index (compares the product of seed germination in the
investigated material and the mean root length in the investigation and control
samples)

Department of Mechanical and Manufacturing Engineering, MIT, Manipal 26
Results:
Soil Additive
Germination Rate (GR) Average Germination Rate (AGR)
Coefficient of Variation of the rate of Germination
Average Root Length per Plant
Coefficient of Variance of Root Length
1 2 3 1 2 3
None 80% 80% 90% 83.33% 5.66% 40.75 46.75 47 6.44%
Dried Digestate
40% 20% 80% 46.67% 53.45% 40 31.5 42.37 12.30%
0% Moist Digestate (550o C)
70% 90% 90% 83.33% 11.31% 33 31.89 46.89 18.32%
33% Moist Digestate (550o C)
80% 100% 90% 90.00% 9.07% 32.5 68.1 53.44 28.45%
66% Moist Digestate (550o C)
90% 80% 100% 90.00% 9.07% 39.22 47.75 23.5 27.28%
0% Moist Digestate (700o C)
40% 60% 20% 40.00% 40.82% 36.75 26.33 15 34.13%
33% Moist Digestate (700o C)
50% 40% 60% 50.00% 16.33% 44.2 68.75 40.67 24.39%
66% Moist Digestate (700o C)
10% 30% 20% 20.00% 40.82% 28 29.33 55 33.19%
Table 9: Root Length Data

Department of Mechanical and Manufacturing Engineering, MIT, Manipal 27
Table 11: Graphical Representation of Plant Vitality Results
Discussion: The results indicate that char can either have a positive or deleterious effect on
plant vitality. Certain chars can have a beneficial influence, especially those formed at lower
temperatures. The results also indicate that the vitality of plants is maximised when the initial
moisture content of the digestate is around 33% before pyrolysis.
00.05
0.10.15
0.20.25
0.30.35
0.40.45
Munoo Liisa Vitality Index
Munoo Liisa Vitality Index
Soil Additive Index of
Root Length
Munoo Liisa
Vitality Index
Dried Digestate 84.67% 16.68%
0% Moist Digestate (550o C) 83.11% 27.90%
33% Moist Digestate (550o C) 114.54% 42.21%
66% Moist Digestate (550o C) 82.14% 28.79%
0% Moist Digestate (700o C) 58.06% 9.94%
33% Moist Digestate (700o C) 114.22% 21.97%
66% Moist Digestate (700o C) 83.52% 6.71%
Table 10: Plant Vitality Data
Department of Mechanical and Manufacturing Engineering, MIT, Manipal 28
3.6.0 Biochar: Use as a source of Activated Carbon:
Activated Carbon is a form of carbon with a very high surface area due to the presence of
low-volume micropores on its surface. It is manufactured by the exposure of materials with
high carbon content (coal, charcoal, coir, etc.) to steam or chemicals at elevated temperature.
Due to its extraordinarily large surface area and correspondingly high adsorption capability,
it is useful over a wide range of applications.
It is used in medicine in order to re-absorb ingested poisons, as a filter for water and gas
purification as well as in distilleries, as a catalyst in fuel cells and for metal extraction.
Increasingly, biochar is being seen as a source of highly porous carbonaceous material for
the production of activated carbon in place of fossil fuel sources.
The Methylene Blue Number is a widely accepted test for the determination of the
adsorption capacity of activated carbon. The test involves the decolourisation of the dye
Methylene Blue due to the immersion of the adsorbing substance in it. The substance adsorbs
the methylene blue particles, leading to a loss of colour of the solution. This colour loss can
be used to determine the concentration of the solution and the decrease in concentration is a
measure of the adsorbing capacity of the substance.
The change in colour, known as the degree of extinction, is measured using a
spectrophotometer, which can identify the intensity of a specific wavelength of light. The
wavelength chosen for the test is 600nm, the wavelength of light at which the stock solution
of methylene blue was found to have maximum intensity.
3.6.1 Terminology:
The methylene blue number is defined as the maximum amount of methylene blue
adsorbed by one gram of activated carbon (AC).
Department of Mechanical and Manufacturing Engineering, MIT, Manipal 29
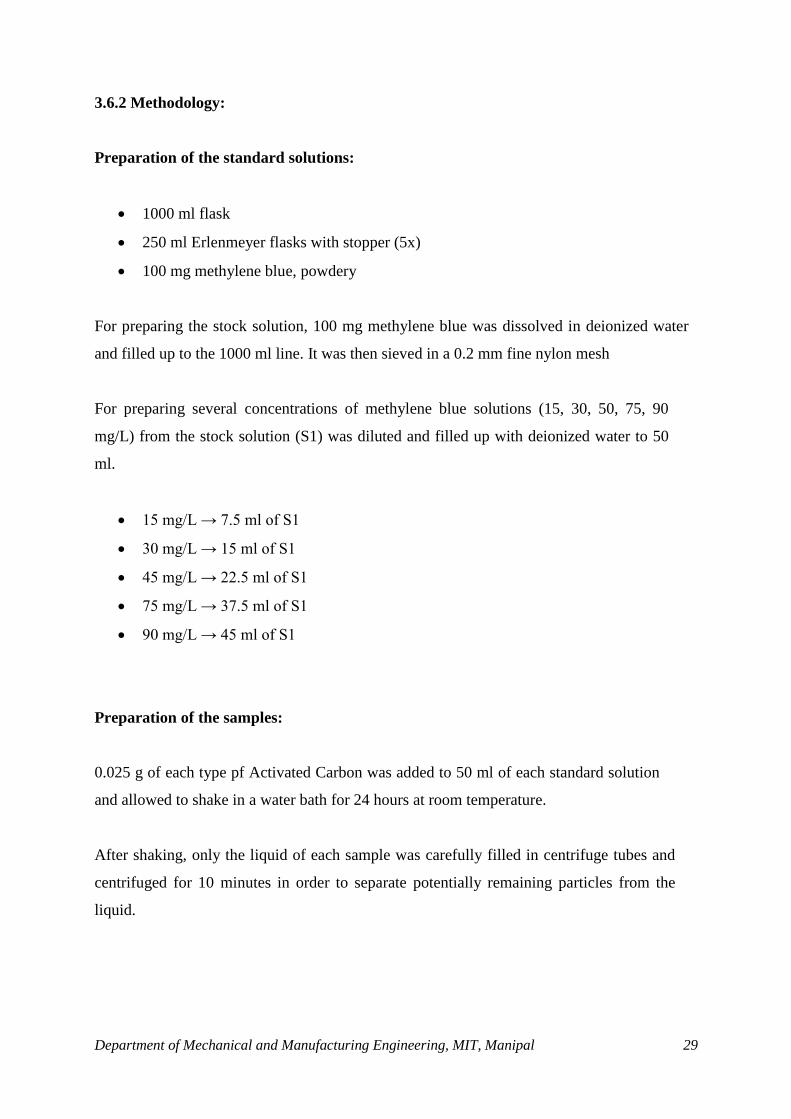
3.6.2 Methodology:
Preparation of the standard solutions:
1000 ml flask
250 ml Erlenmeyer flasks with stopper (5x)
100 mg methylene blue, powdery
For preparing the stock solution, 100 mg methylene blue was dissolved in deionized water
and filled up to the 1000 ml line. It was then sieved in a 0.2 mm fine nylon mesh
For preparing several concentrations of methylene blue solutions (15, 30, 50, 75, 90
mg/L) from the stock solution (S1) was diluted and filled up with deionized water to 50
ml.
15 mg/L → 7.5 ml of S1
30 mg/L → 15 ml of S1
45 mg/L → 22.5 ml of S1
75 mg/L → 37.5 ml of S1
90 mg/L → 45 ml of S1
Preparation of the samples:
0.025 g of each type pf Activated Carbon was added to 50 ml of each standard solution
and allowed to shake in a water bath for 24 hours at room temperature.
After shaking, only the liquid of each sample was carefully filled in centrifuge tubes and
centrifuged for 10 minutes in order to separate potentially remaining particles from the
liquid.
Department of Mechanical and Manufacturing Engineering, MIT, Manipal 30
UV/Visible Spectrophotometer:
The sample liquids and also the standard solutions were filled into cuvettes. Initially, a blank
which in this case was deionized water, was measured. Then the wavelengths λ of the
standard solution with the highest concentration were identified and the wavelength with the
highest value of extinction was identified. The extinctions of all the samples and standard
solutions were then gauged relative to the blank in terms of intensity of this chosen
wavelength.
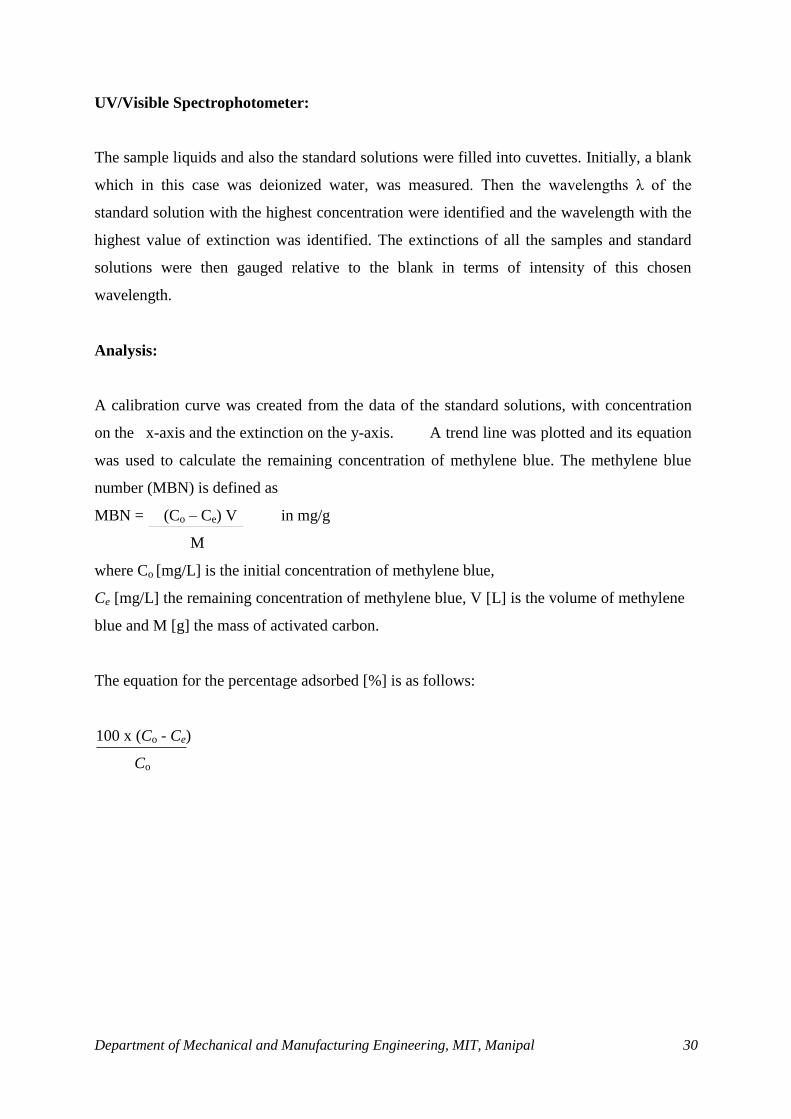
Analysis:
A calibration curve was created from the data of the standard solutions, with concentration
on the x-axis and the extinction on the y-axis. A trend line was plotted and its equation
was used to calculate the remaining concentration of methylene blue. The methylene blue
number (MBN) is defined as
MBN = (Co – Ce) V in mg/g
M
where Co [mg/L] is the initial concentration of methylene blue,
Ce [mg/L] the remaining concentration of methylene blue, V [L] is the volume of methylene
blue and M [g] the mass of activated carbon.
The equation for the percentage adsorbed [%] is as follows:
100 x (Co - Ce)
Co
Department of Mechanical and Manufacturing Engineering, MIT, Manipal 31
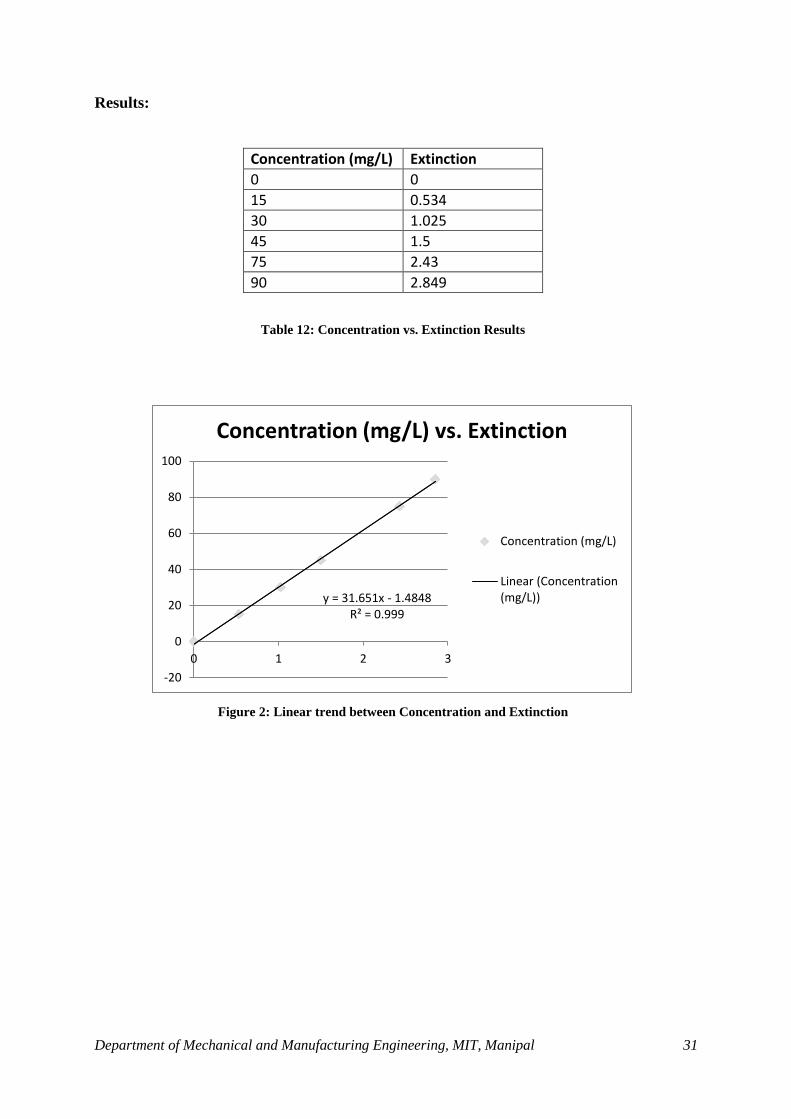
Results:
Concentration (mg/L) Extinction
0 0
15 0.534
30 1.025
45 1.5
75 2.43
90 2.849
Table 12: Concentration vs. Extinction Results
Figure 2: Linear trend between Concentration and Extinction
y = 31.651x - 1.4848 R² = 0.999
-20
0
20
40
60
80
100
0 1 2 3
Concentration (mg/L) vs. Extinction
Concentration (mg/L)
Linear (Concentration(mg/L))
Department of Mechanical and Manufacturing Engineering, MIT, Manipal 32
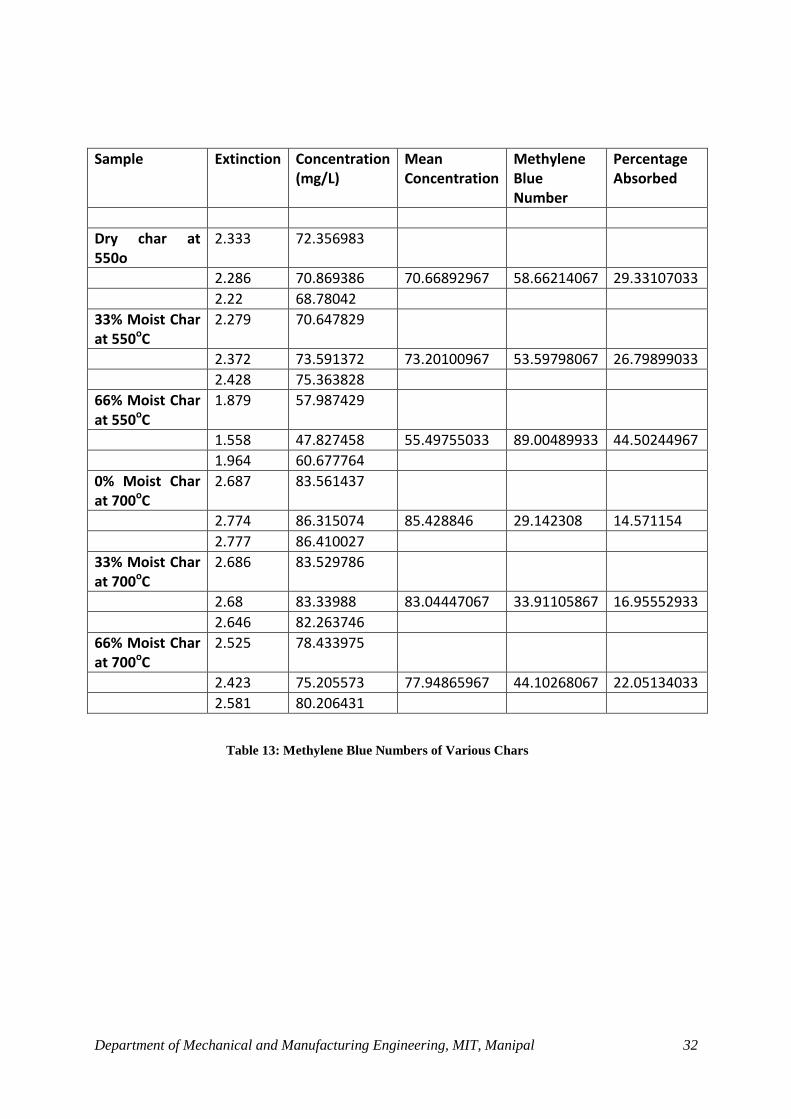
Sample Extinction Concentration (mg/L)
Mean Concentration
Methylene Blue Number
Percentage Absorbed
Dry char at 550o
2.333 72.356983
2.286 70.869386 70.66892967 58.66214067 29.33107033
2.22 68.78042
33% Moist Char at 550oC
2.279 70.647829
2.372 73.591372 73.20100967 53.59798067 26.79899033
2.428 75.363828
66% Moist Char at 550oC
1.879 57.987429
1.558 47.827458 55.49755033 89.00489933 44.50244967
1.964 60.677764
0% Moist Char at 700oC
2.687 83.561437
2.774 86.315074 85.428846 29.142308 14.571154
2.777 86.410027
33% Moist Char at 700oC
2.686 83.529786
2.68 83.33988 83.04447067 33.91105867 16.95552933
2.646 82.263746
66% Moist Char at 700oC
2.525 78.433975
2.423 75.205573 77.94865967 44.10268067 22.05134033
2.581 80.206431
Table 13: Methylene Blue Numbers of Various Chars
Department of Mechanical and Manufacturing Engineering, MIT, Manipal 33
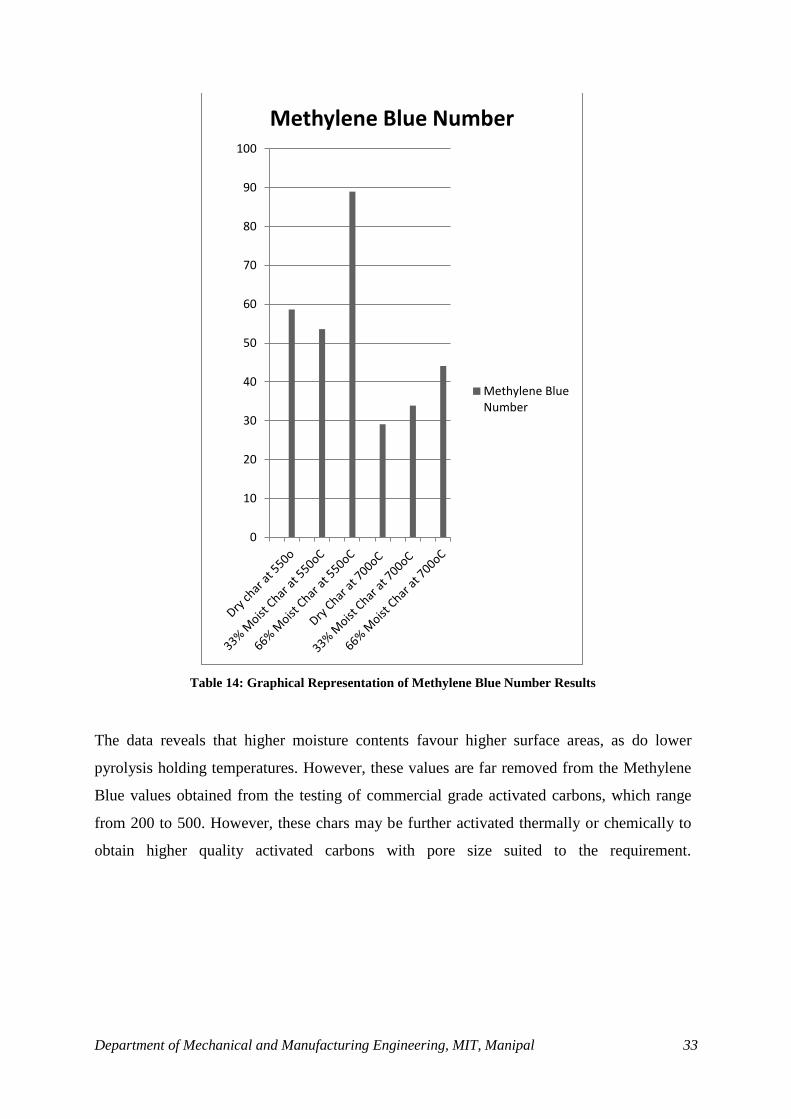
Table 14: Graphical Representation of Methylene Blue Number Results
The data reveals that higher moisture contents favour higher surface areas, as do lower
pyrolysis holding temperatures. However, these values are far removed from the Methylene
Blue values obtained from the testing of commercial grade activated carbons, which range
from 200 to 500. However, these chars may be further activated thermally or chemically to
obtain higher quality activated carbons with pore size suited to the requirement.
0
10
20
30
40
50
60
70
80
90
100
Methylene Blue Number
Methylene BlueNumber
Department of Mechanical and Manufacturing Engineering, MIT, Manipal 34
3.7.0 Measure of Calorific Value:
Biochar, with its high carbon content and similarity in composition to fossil-fuel coal and
charcoal, has a lot of potential as a source of solid fuel. Because of its organic origins, it is a
renewable fuel. In addition, the carbon emissions released through the combustion of biochar
were absorbed from the atmosphere using photosynthesis, making the process carbon neutral
over a span of many years. It can also be used with existing infrastructure in thermal
powerplants, simplifying the possibility of a switch from fossil fuels.
The calculation of the calorific value is important in terms of understanding the use of
biochar as a fossil fuel alternative as well as in the energy balance of the charring process.
The feasibility of biochar usage as fuel depends on the ratio of the amount of energy that it
yields to the amount of energy required for its synthesis.
3.7.1 Terminology:
Calorific Value: It is the heat generated upon the combustion of a unit weight of the
specified fuel.
Lower Calorific Value (Net Heating Value): It is the quantity of heat released when a unit
weight of fuel, initially at 25o C undergoes complete combustion and all the reaction products
are returned to 150o C. It assumes that the latent heat of vaporisation of the water in the
reaction products is not recovered.
Gross Calorific Value (Higher Heating Value): It is the quantity of heat released when a
unit weight of fuel, initially at 25o C undergoes complete combustion and all the reaction
products are returned to 25o C. It takes into account the latent heat of vaporisation of the
water in the reaction products.
Department of Mechanical and Manufacturing Engineering, MIT, Manipal 35
3.7.2 Methodology:
Many investigations into the nature of coals, biomass and organically derived fuels such as
biochar have revealed as many as 31 empirical formulae for the calculation of the HHV
(Higher Heating Value) of the fuel based on its elemental composition. The first one was
suggested by Dulong (1880) and is still in use, though it has been modified many times.
Channiwala and Parikh put forward a formula in 2002 based on the study of 22 such
correlations. It is supposed to be applicable to almost any fuel and it has been confirmed that
it is applicable to biochar (Kieseler et.al, 2013). It is given below:
HHV = 0.3491 C + 1.1783 H + 0.1005 S - 0.1034 O - 0.0151 N - 0.0211 ash.
However, the ash percentage was not calculated and the residual percentage was assumed to
be the oxygen percentage.
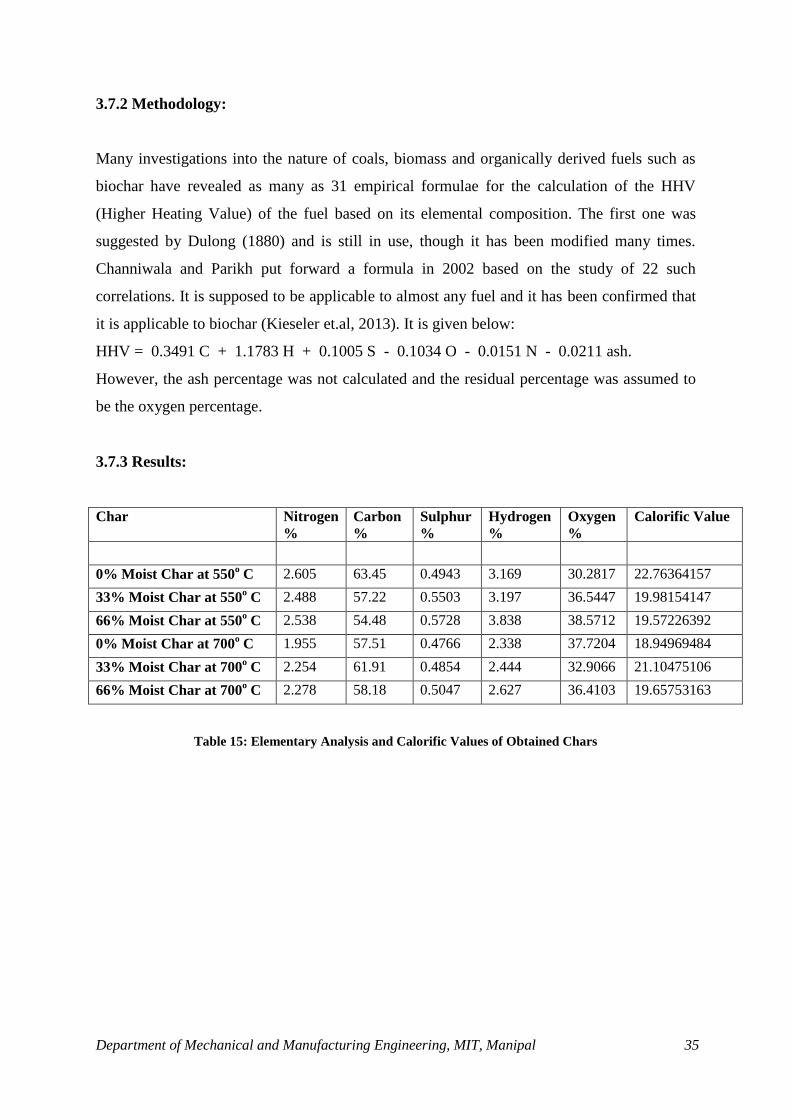
3.7.3 Results:
Char Nitrogen
%
Carbon
%
Sulphur
%
Hydrogen
%
Oxygen
%
Calorific Value
0% Moist Char at 550o C 2.605 63.45 0.4943 3.169 30.2817 22.76364157
33% Moist Char at 550o C 2.488 57.22 0.5503 3.197 36.5447 19.98154147
66% Moist Char at 550o C 2.538 54.48 0.5728 3.838 38.5712 19.57226392
0% Moist Char at 700o C 1.955 57.51 0.4766 2.338 37.7204 18.94969484
33% Moist Char at 700o C 2.254 61.91 0.4854 2.444 32.9066 21.10475106
66% Moist Char at 700o C 2.278 58.18 0.5047 2.627 36.4103 19.65753163
Table 15: Elementary Analysis and Calorific Values of Obtained Chars

Department of Mechanical and Manufacturing Engineering, MIT, Manipal 36
Table 16: Trend line displaying decreasing calorific value with temperature and moisture rise
3.7.4 Inference: Though the pattern obtained is not obviously apparent, the insertion of the
trendline displays the tendency of the calorific value of the chars to decrease. This may be
attributed to either the decrease in carbon and hydrogen percentages or to the increase in
oxygen content.
0
5
10
15
20
25
0% MoistChar at
550 deg. C
33% MoistChar at
550 deg. C
66% MoistChar at
550 deg. C
0% MoistChar at
700 deg. C
33% MoistChar at
700 deg. C
66% MoistChar at
700 deg. C
Calorific Value
Calorific Value
Linear (Calorific Value)
Department of Mechanical and Manufacturing Engineering, MIT, Manipal 37
4.0 Inferences and Discussion:
The data explores the possibilities for biochar use for its three main identified purposes,
namely as fuel, as a soil amender and as a source of activated carbon.
4.1 Fuel:
The calorific value of the chars obtained is comparable to that of average quality coals (in the
lignite and bituminous range) and has a higher value than wood, but is still less than charcoal.
However, it must be kept in mind that the feedstock used was the digestate obtained from the
slurry of a biogas plant, during which process, energy had already been extracted from the
agricultural waste. The use of this digestate for biochar production is an added bonus.
The char obtained is a viable alternate solid fuel, provided that it can be manufactured on the
scales required. It will provide better quality fuels to those who rely on firewood, preventing
deforestation while simultaneously making use of agricultural and domestic residues. Also,
since no food crops are being utilized and no extra land is being brought under cultivation for
specific biochar production, the food vs. fuel controversies are avoided. However, care must
be taken that excessive diversion of carbonaceous matter from fields do not affect the natural
carbon cycles and enough organic material is saved for composting, mulching and other
methods of returning carbon to the soil.
The results reveal a higher calorific value for chars that have lower moisture contents and
lower temperatures, suggesting that digestate should be initially dried before undergoing low
temperature pyrolysis.
4.2 Soil Amendment:
Biochar has clearly been shown to improve the Water Holding Capacity of the soil, thus
improving its ability to retain moisture ensuring survival of crops in spite of lower rainfall or
irrigation. The fact that dried digestate was found to improve the Water Holding Capacity of
the soil better than any of the chars is countermanded by the loss in plant vitality that was
found to be the result of addition of dried digestate to the soil. However, though one variety
of char improved plant vitality, a majority of them did not, suggesting that further research
needs to be done in order to identify the characteristics of the chars that cause them to
Department of Mechanical and Manufacturing Engineering, MIT, Manipal 38
influence plant growth.
Considerable research is going on currently on methods of mixing chars with compost,
manure, fertilizers or even effective micro-organisms to give them fertilizing properties in
addition to their soil amendment properties.
4.3 Surface Area:
Though the surface area is of great importance in terms of soil amendment also, it is also an
indicator of the possibility of using the char as a source of activated carbon, an important
adsorbing material, which is extensively used in medicine, pharmaceuticals and the chemical
industry.
The surface area of the chars obtained by the pyrolysis of digestate was not to be as good as
commercial grade activated carbon, requiring further thermal of chemical treatment for the
expansion of pore size. However, digestate derived coal is potentially a source of high grade
activated carbon.
Department of Mechanical and Manufacturing Engineering, MIT, Manipal 39
Bibliography:
1. Owens, Fred and Soderlund, Steve - Methods for Measuring Moisture Content
of Grains and Implications for Research and Industry.
2. CarbonZero Project Switzerland - Origin of Biochar - Terra Preta
(http://www.biochar.info/biochar.terra-preta.cfml)
3. Biochar India - Discovering Biochar use and practices (Sept, 2013)
(http://www.biocharindia.com/)
4. Schmidt, Hans-Peter, Ithaka Journal for Ecology, Winegrowing and Climate
Farming (Dec 2012) (http://www.ithaka-journal.net/55-anwendungen-von-
pflanzenkohle?lang=en)
5. Final Report : Review of the plant growth and weed propagule tests used in the
PAS100 specification for quality compost , WRAP, UK (2009)
(http://www2.wrap.org.uk/downloads/Review_of_the_plant_growth_and_weed_p
ropagule_tests_used_in_the_PAS100_specification_for_quality_compost.43f0907
9.6964.pdf)
6. Norum, Rodney A. and Miller, Melanie - Measuring Fuel Moisture Content in
Alaska: Standard Methods and Procedures, General Technical Report, Forest
Service, United States Department of Agriculture.
7. Austin, Anna - A New Climate Change Mitigation Tool, Biomass Magazine.
8. Ernsting, Almuth and Smolker, Rachel - Biochar for Climate Change
Mitigation: Fact or Fiction, Feb 2009.
9. Lehmann, Johannes and Joseph, Stephen - Biochar for Environmental
Management: Science and Technology, Earthscan Publishers, 2009.
10. Bridgwater, A.V. and Grassi, G. – Biomass Pyrolysis Liquids Upgrading and
Utilisation, Elsevier Science Publishers, England (1991).
11. Morris, Emma – Black is the New Green, Nature, Vol. 442 (10th
August 2006).
12. Haefele, Stephan M. – Black Soil, Green Rice, Rice Today, (June 2007)
13. Özçimen, Didem – An Approach to the Characterization of Biochar and Bio-oil,
Bioengineering Department, Yildiz Technical University, Turkey.
14. Funke, A., Mumme, J. , Koon, M. , Diakite´, M. - Cascaded production of
biogas and hydrochar from wheat straw: Energetic potential and recovery of
carbon and plant nutrients, Elsevier (2013)
15. Funke, Axel, Reebs, Felix and Kruse, Andrea - Experimental comparison of
hydrothermal and vapothermal carbonization, Elsevier (2013).
Department of Mechanical and Manufacturing Engineering, MIT, Manipal 40
16. Zhang, Yuanhui - Hydrothermal Liquefaction to Convert Biomass into Crude
Oil, Blackwell Publishing (2010)
17. Inyang, Mandu, Gao, Bin, Pullammanappallil, Pratap , Ding, Wenchuan,
Zimmerman, Andrew R. - Biochar from anaerobically digested sugarcane
bagasse, Elsevier (2010)
18. Mumme, Jan, Eckervogt, Lion, Pielert, Judith, Diakité, Mamadou, Rupp,
Fabian, Kern, Jürgen -Hydrothermal carbonization of anaerobically digested
maize silage, Elsevier (2011)
19. Libra, Judy A., Ro, Kyoung S, Kammann, Claudia, Funke, Axel , Berge,
Nicole D, Neubauer, York, Titirici, Maria-Magdalena, Fühner, Christoph,
Bens, Oliver, Kern, Jürgen and Emmerich, Karl-Heinz - Hydrothermal
carbonization of biomass residuals: a comparative review of the chemistry,
processes and applications of wet and dry pyrolysis, Biofuels (2011)
20. Sukiran , Mohamad Azri, Kheang, Loh Soh, Bakar, Nasrin Abu and May, Choo
Yuen - Production and Characterization of Bio-Char from the Pyrolysis of
Empty Fruit Bunches, American Journal of Applied Sciences (2011)
21. Reza, M. Toufiq, Becker, Wolfgang, Sachsenheimer, Kerstin and Mumme, Jan -
Hydrothermal carbonization (HTC): Near infrared spectroscopy and partial
least-squares regression for determination of selective components in HTC solid
and liquid products derived from maize silage, Elsevier, 2014.
22. Schouten, Socrates, van Groenigen, Jan W., Oenema, Oene and Cayuela, Maria
L. - Bioenergy from cattle manure? Implications of anaerobic digestion and
subsequent pyrolysis for carbon and nitrogen dynamics in soil, Bioenergy
(2012).
23. Reza, M. Toufiq, Andert, Janet, Wirth, Benjamin, Busch, Daniela, Pielert,
Judith, Lynam, Joan G. and Mumme, Jan - Hydrothermal Carbonization of
Biomass for Energy and Crop Production, Appl. Bioenergy (2014).
24. Agronomy Department, University of Florida – Dry and Organic Matter
(http://agronomy.ifas.ufl.edu/research/forage-evaluation-support-laboratory/dry-
and-organic-matter/)
25. Agvise Laboratories, USA – Water Holding Capacity
(http://www.agvise.com/educational-articles/water-holding-capacity/)
26. Acharya, Madhu Sudan, Rauchecker, Markus and Wu, Wie - Determination of
water absorption and water holding capacities of different soil mixtures with
MINIDRAIN system to enhance the plant growth, Geophysical Research Vol.
16, Institute of Geotechnical Engineering, University of Natural Resources and
Life Sciences (BOKU), Vienna, Austria (2014)
Department of Mechanical and Manufacturing Engineering, MIT, Manipal 41
27. Sheppard, Jessica (Avon Catchment Council) and Hoyle, Fran (Department of
Agriculture and Food, Western Australia) – Water Availability
(https://s3.amazonaws.com/soilquality-production/fact_sheets/12/original/Phys_-
_Water_Availability_web.pdf)
28. Zhang X, Xia X, Ivanov I, Huang X, Logan BE - Enhanced activated carbon
cathode performance for microbial fuel cell by blending carbon black ,
Department of Civil & Environmental Engineering, Penn State University
(Feb 2014)
(http://www.ncbi.nlm.nih.gov/pubmed/24422458)
29. Norit Activated Carbon– What is Activated Carbon?
(http://www.norit.com/carbon-academy/introduction/)