The Combined Effect of Biochar and Mineral Fertilizer ... - MDPI
22
Citation: Useviˇ ci ¯ ut˙ e, L.; Baltr ˙ enait ˙ e-Gedien ˙ e, E.; Feizien ˙ e, D. The Combined Effect of Biochar and Mineral Fertilizer on Triticale Yield, Soil Properties under Different Tillage Systems. Plants 2022, 11, 111. https:// doi.org/10.3390/plants11010111 Academic Editors: Othmane Merah, Purushothaman Chirakkuzhyil Abhilash, Magdi T. Abdelhamid, Hailin Zhang and Bachar Zebib Received: 28 November 2021 Accepted: 27 December 2021 Published: 30 December 2021 Publisher’s Note: MDPI stays neutral with regard to jurisdictional claims in published maps and institutional affil- iations. Copyright: © 2021 by the authors. Licensee MDPI, Basel, Switzerland. This article is an open access article distributed under the terms and conditions of the Creative Commons Attribution (CC BY) license (https:// creativecommons.org/licenses/by/ 4.0/). plants Article The Combined Effect of Biochar and Mineral Fertilizer on Triticale Yield, Soil Properties under Different Tillage Systems Luiza Useviˇ ci ¯ ut˙ e 1, *, Edita Baltr ˙ enait˙ e-Gedien˙ e 1 and Dalia Feizien ˙ e 2 1 Research Institute of Environmental Protection, Vilnius Gediminas Technical University, Saul˙ etekio al. 11, LT-10223 Vilnius, Lithuania; [email protected] 2 Lithuanian Research Centre for Agriculture and Forestry, Institute of Agriculture, Instituto al. 1, Akademija, LT-58344 K˙ edainiai, Lithuania; [email protected] * Correspondence: [email protected]; Tel.: +370-64130080 Abstract: This study examined the effect of study time, biochar dose, and fertilization-tillage system on the improvement of sandy loam physical-chemical properties and triticale grain yield. The soil properties (water holding capacity (WHC), wettability, moisture content (MC), organic matter content (SOM), pH, and electrical conductivity (EC) were monitored in short time intervals (after 3, 6, 12, and 24 months). Soil was tilled in two methods (shallow ploughless tillage and direct drilling), fertilized with nitrogen, phosphorus, and potassium (NPK) fertilizers, and amended with three hydrophobic pine wood biochar doses (0 t/ha; 5 t/ha; 15 t/ha). It was found that 15 t/ha biochar dose had the highest effect on the soil’s physical-chemical properties improvement (SOM increased by 33.7%, pH—by 6.84%, EC—by 23.4%, WHC—by 8.48%, and MC—by 21.8%) compared to the variants without biochar. Direct drilling, fertilization with NPK fertilizers and 15 t/ha biochar dose significantly influenced the rise of soil’s physical-chemical properties and triticale yield (3.51 t/ha). Keywords: low-temperature biochar; Cambisols; mineral fertilizers; ploughless shallow tillage; direct drilling; pine wood; triticale 1. Introduction The surface properties of soil have a high practical impact. They are closely interde- pendent. It is well known that many processes of interaction between soil particles with the outer environment occur through water which usually surrounds these particles in natural conditions. Interaction between solid material and liquid phases is one of the most important soil processes which include physical, chemical, and biological functions of soil [1]. Wettability is one of the most often occurring phenomena which arise between the surface boundaries of different phases [2]. It is a fundamental property controlling the wetting of plane and granular solid materials. Compared with the plane surfaces of the solid, wettability of granular materials has additional complexity of different level rough- ness effects (particle level or particle agglomeration level). The wettability of soil affects hydrological functions of soil systems including infiltration, preferential flow, and runoff. Control of surface wettability is equally important in various industrial applications [3]. Life and agricultural sciences pay much attention to the soil infiltration problem when the occurrence of hydrophobicity of soil decreases or temporarily weakens infiltration, which enhances runoff, erosion, or sedimentation of the surface. It is known that soil wettability depends on its number of mineral/organic compounds and composition, fractions of different structures (sand, clay particles). Previous studies [2] found that the mineral part of the soil is characterized by the hydrophilic surface properties and organic matter which is described by the amphiphilic compounds and nonpolar organic components of the surface adsorbed on the surface of the particles and thus governing hydrophobicity of the soil solid phase. Free lipids including fatty acids, alcohols, alkanes, and suberin which are excreted from the plant roots all together contribute to the Plants 2022, 11, 111. https://doi.org/10.3390/plants11010111 https://www.mdpi.com/journal/plants
-
Upload
khangminh22 -
Category
Documents
-
view
0 -
download
0
Transcript of The Combined Effect of Biochar and Mineral Fertilizer ... - MDPI

�����������������
Citation: Useviciute, L.;
Baltrenaite-Gediene, E.; Feiziene, D.
The Combined Effect of Biochar and
Mineral Fertilizer on Triticale Yield,
Soil Properties under Different Tillage
Systems. Plants 2022, 11, 111. https://
doi.org/10.3390/plants11010111
Academic Editors: Othmane Merah,
Purushothaman Chirakkuzhyil
Abhilash, Magdi T. Abdelhamid,
Hailin Zhang and Bachar Zebib
Received: 28 November 2021
Accepted: 27 December 2021
Published: 30 December 2021
Publisher’s Note: MDPI stays neutral
with regard to jurisdictional claims in
published maps and institutional affil-
iations.
Copyright: © 2021 by the authors.
Licensee MDPI, Basel, Switzerland.
This article is an open access article
distributed under the terms and
conditions of the Creative Commons
Attribution (CC BY) license (https://
creativecommons.org/licenses/by/
4.0/).
plants
Article
The Combined Effect of Biochar and Mineral Fertilizer onTriticale Yield, Soil Properties under Different Tillage SystemsLuiza Useviciute 1,*, Edita Baltrenaite-Gediene 1 and Dalia Feiziene 2
1 Research Institute of Environmental Protection, Vilnius Gediminas Technical University, Sauletekio al. 11,LT-10223 Vilnius, Lithuania; [email protected]
2 Lithuanian Research Centre for Agriculture and Forestry, Institute of Agriculture, Instituto al. 1, Akademija,LT-58344 Kedainiai, Lithuania; [email protected]
* Correspondence: [email protected]; Tel.: +370-64130080
Abstract: This study examined the effect of study time, biochar dose, and fertilization-tillage systemon the improvement of sandy loam physical-chemical properties and triticale grain yield. The soilproperties (water holding capacity (WHC), wettability, moisture content (MC), organic matter content(SOM), pH, and electrical conductivity (EC) were monitored in short time intervals (after 3, 6, 12,and 24 months). Soil was tilled in two methods (shallow ploughless tillage and direct drilling),fertilized with nitrogen, phosphorus, and potassium (NPK) fertilizers, and amended with threehydrophobic pine wood biochar doses (0 t/ha; 5 t/ha; 15 t/ha). It was found that 15 t/ha biochardose had the highest effect on the soil’s physical-chemical properties improvement (SOM increasedby 33.7%, pH—by 6.84%, EC—by 23.4%, WHC—by 8.48%, and MC—by 21.8%) compared to thevariants without biochar. Direct drilling, fertilization with NPK fertilizers and 15 t/ha biochar dosesignificantly influenced the rise of soil’s physical-chemical properties and triticale yield (3.51 t/ha).
Keywords: low-temperature biochar; Cambisols; mineral fertilizers; ploughless shallow tillage; directdrilling; pine wood; triticale
1. Introduction
The surface properties of soil have a high practical impact. They are closely interde-pendent. It is well known that many processes of interaction between soil particles withthe outer environment occur through water which usually surrounds these particles innatural conditions. Interaction between solid material and liquid phases is one of the mostimportant soil processes which include physical, chemical, and biological functions ofsoil [1]. Wettability is one of the most often occurring phenomena which arise betweenthe surface boundaries of different phases [2]. It is a fundamental property controlling thewetting of plane and granular solid materials. Compared with the plane surfaces of thesolid, wettability of granular materials has additional complexity of different level rough-ness effects (particle level or particle agglomeration level). The wettability of soil affectshydrological functions of soil systems including infiltration, preferential flow, and runoff.Control of surface wettability is equally important in various industrial applications [3].Life and agricultural sciences pay much attention to the soil infiltration problem when theoccurrence of hydrophobicity of soil decreases or temporarily weakens infiltration, whichenhances runoff, erosion, or sedimentation of the surface.
It is known that soil wettability depends on its number of mineral/organic compoundsand composition, fractions of different structures (sand, clay particles). Previous studies [2]found that the mineral part of the soil is characterized by the hydrophilic surface propertiesand organic matter which is described by the amphiphilic compounds and nonpolarorganic components of the surface adsorbed on the surface of the particles and thusgoverning hydrophobicity of the soil solid phase. Free lipids including fatty acids, alcohols,alkanes, and suberin which are excreted from the plant roots all together contribute to the
Plants 2022, 11, 111. https://doi.org/10.3390/plants11010111 https://www.mdpi.com/journal/plants

Plants 2022, 11, 111 2 of 22
hydrophobicity of soil [4]. Some organic fractions which are related to the hydrophobicityof soil are humic acids, aliphatic fractions, and plant debris [5]. Minerals forming soil areconsidered wettable, since the free surface energy of inorganic soil particles is generallyhigher than water’s, and their contact angle values are usually close to 0◦. In nature, thehydrophobicity of soil develops due to the formation of hydrophobic organic compounds orsoil drying. On the other hand, a study driven by Vogelmann et al. [6] found that soil havingthe least amount of organic carbon had the highest severity of hydrophobicity; therefore,it can be stated that hydrophobicity is more related to the origin of these compoundsbut not with the amount. Hydrophobicity of soil is most usually considered as a naturalphenomenon that occurs on the surface of sandy soils affected by wildfires or on the uppersoil layers affected by some fungi species [7]. A study driven by Gonzalez-Penaloza [8]confirmed that higher hydrophobicity of soil is related to the course (sand) soil particles.Coarse structure soils have a lower surface area (in sandy soils from 0.01 to 0.1 m2/g) thanfine structure soils (in clay soils from 5 to 750 m2/g), and some amount of hydrophobicorganic compounds can induce higher hydrophobicity of coarse structure soil compared tofine structure soil due to its low specific surface area. Meanwhile, clay particles supportthe reduction in soil hydrophobicity by covering hydrophobic surfaces. This phenomenon(hydrophobicity of soil) can be found in different granular composition soils from manylocations and climatic conditions, from sandy to clay soils, from slightly to severely erodedsoils, from very acidic to strongly alkaline soils, from fertile to infertile soils [9].
The hydrophobicity of soil is related to other factors, such as the content of soilmoisture as well pH [7]. Since hydrophobic compounds causing its hydrophobicity areof organic origin, some studies showed that there was no relation between the severityof the soil hydrophobicity and the amount of soil organic matter (SOM) [10]. However,Vogelmann et al. [6] found this link whilst with low coefficients of determination whichprevent from making satisfactory forecasts of the possible occurrence of this phenomenonaccording to the amount of SOM. Diehl [11] determined that hydrolysis–condensationreactions of carboxylic and phenolic groups of SOMs can increase their wettability. Eventhough it is partly agreed of the origin of SOM compounds causing the hydrophobicity ofsoil, a precise mechanism of this phenomenon is still uncertain [12].
The wettability of soil can alter with time and it can affect soil geomorphological andhydrological processes. According to Doerr et al. [13], this variation depends on the amountof soil moisture and is related to wetting/drying cycles which originate due to seasonalvariation of soil moisture. It is also important to note that the phenomenon of soil hydropho-bicity does not occur constantly, since its maximal intensity is reached during the driestseasons and it can decrease or totally vanish during wet seasons [14]. Hubbert et al. [15]found the variation of soil hydrophobicity from average to severe hydrophobic when thesoil was wet in the wintertime and when it had low moisture content during the summerseason. A prolonged soil drying period increases the hydrophobicity level and, therefore,requires long soil re-wetting periods due to the restoration of soil wetting properties. Somestudies showed that soil moisture had a strong negative correlation with the severity ofhydrophobicity [16].
Previous studies found that variation of soil surface properties is highly impacted bythe soil management practices, application of biochar, and fertilization with mineral fertiliz-ers. Intensive soil tillage reduces the content of organic matter, induces the hydrophobicityof soil’s solid phase, and decreases the amount of water-stable aggregates—they governthe degradation of the structure of soil and impact the water flow processes through thesoil profile [2]. Excessive decomposition of pellets can decrease soil porosity and aeration.Meanwhile, excessive usage of chemical fertilizers can induce many problems, such as theloss of nutrients, surface runoff, acidification or alkalinization of the soil, decrease of benefi-cial microbial populations [17]. These problems can be diminished after the application ofbiochar through the avoidance of soil compaction. Another advantage of biochar is that itcan reduce the demand for fertilizers/excrements/compost and improve the retention ofmoisture, which decreases the need for frequent irrigation. Conservative tillage practices

Plants 2022, 11, 111 3 of 22
typically result in higher soil organic matter, reduced erosion, increased infiltration, andincreased water-stable aggregates compared to traditional tillage practices. The impact ofbiochar on the soil quality in different management systems is not well understood yet.
Triticale is a hybrid of wheat and rye that has been harvested due to a combinationof positive wheat properties (yield efficiency, grain quality) and rye properties (diseaseresistance and durability) [18]. Triticale has been found to grow better than wheat inpoor-quality soils. To date, triticale is mainly grown as fodder, cover crop, and for biogasproduction. Triticale is considered an interesting species that can be useful for cultivationeven in unfavorable biotic and abiotic conditions [19]. Compared to wheat, triticale adaptsbetter to a variety of soil and environmental conditions and can provide higher grain yields.Several factors influence the yield of triticale grains: local climatic and soil properties, up-take of mineral components, and appropriate methods of plant protection against diseases,pests, and weeds.
At present, there is not much information on the factors influencing triticale yield. Inorder to improve tillage practices, it is necessary to identify soil properties that controlthe variation of triticale grain yield. This study was conducted to determine the variationof selected soil physical and chemical properties from the field study and to evaluate thesoil property that could explain the triticale grain yield. The objective of this study wasto determine the effect of hydrophobic pinewood biochar dose and tillage-fertilizationsystem on the improvement of sandy loam physical-chemical properties and triticale yield.Hypothesis—direct drilling, fertilization with NPK fertilizers, and 15 t/ha biochar dosehas the highest effect on the improvement of sandy loam physical-chemical properties andtriticale yield. Detailed and accurate information about the soil allows more precise controlof soil properties and more cost-effective distribution of soil amendments.
2. Materials and Methods2.1. Plot Description, Scheme
The experiment was conducted in the Institute of Agriculture at Lithuanian ResearchCentre for Agriculture and Forestry and in the Research Institute of Environmental Pro-tection at Vilnius Gediminas Technical University (Vilnius Tech). The investigation wasconducted in 2019–2021 (55◦23′ N and 23◦51′ E) in the long-term (20 years) soil tillage-fertilization systems field experiment. The soil was sandy loam (Endocalcari-EpihypogleyicCambisol (FAO, 1998)). According to soil texture, this soil had the highest amount (53.7%) ofsand (2–0.05 mm) particles, average amount (32.6%) of silt (0.05–0.002 mm) particles, andthe lowest (13.7%) amount (<0.002 mm) of clay particles.
Research scheme:Factor A—soil tillage-fertilization system:
• S-1—ploughless shallow tillage (stubble cultivation at 10–12 cm + pre-sowing cultiva-tion at 5–6 cm) and no fertilization with NPK fertilizers;
• S-2—ploughless shallow tillage and fertilization with NPK fertilizers;• M-1—direct drilling (soil not tilled, direct drilling with disc drill having a rotary tiller)
and no fertilization with NPK fertilizers;• M-2—direct drilling and fertilization with NPK fertilizers.
Factor B—biochar dose:
• 0 t/ha;• 5 t/ha;• 15 t/ha.
Factor C—date of the investigation:
• 3 months;• 6 months;• 12 months;• 24 months.

Plants 2022, 11, 111 4 of 22
Biochar was incorporated into the soil before the sowing of summer triticale (Triticum xSecale) (on the 16 April 2019) during direct drilling with disc drill having a rotary tiller. Thetarget yield of the summer triticale was 5 t/ha. Pine wood biochar (450 ◦C, 2 h) was used inthe field experiment. Mineral fertilizers were applied: ammonium nitrate (34.5%), granularsuperphosphate (19%), and potassium chloride (60%). The experiment was arranged in arandomized complete block design with three replications (details of the experiment).
According to the meteorological data, March was the coldest month in the studiedperiod of time (March-August) on the average (3.3 ◦C; long-term average –0.6 ◦C), and Junewas the warmest month (20.6 ◦C; long-term average 15.7 ◦C). There was no precipitationin April (long-term average is 37.6 mm), and the highest amount of precipitation was inAugust (35.67 mm; long-term average 73.2 mm) (Figure 1). In the summer season, Junewas the driest month (20.6 ◦C and 5.37 mm); therefore, during the experiment, soil becamecompletely dry, and at the end of summer (in August) the highest amount of precipitationwas observed compared to the overall studied period.
Plants 2022, 11, x FOR PEER REVIEW 4 of 22
• 3 months; • 6 months; • 12 months; • 24 months.
Biochar was incorporated into the soil before the sowing of summer triticale (Triticum x Secale) (on the 16 April 2019) during direct drilling with disc drill having a rotary tiller. The target yield of the summer triticale was 5 t/ha. Pine wood biochar (450 °C, 2 h) was used in the field experiment. Mineral fertilizers were applied: ammonium nitrate (34.5%), granular superphosphate (19%), and potassium chloride (60%). The experiment was arranged in a randomized complete block design with three replications (details of the experiment).
According to the meteorological data, March was the coldest month in the studied period of time (March-August) on the average (3.3 °C; long-term average –0.6 °C), and June was the warmest month (20.6 °C; long-term average 15.7 °C). There was no precipitation in April (long-term average is 37.6 mm), and the highest amount of precipitation was in August (35.67 mm; long-term average 73.2 mm) (Figure 1). In the summer season, June was the driest month (20.6 °C and 5.37 mm); therefore, during the experiment, soil became completely dry, and at the end of summer (in August) the highest amount of precipitation was observed compared to the overall studied period.
Figure 1. Average monthly temperature (°C) and amount of precipitation (mm) according to every month 10-day data from Dotnuva meteorological station, n = 3.
2.2. Soil Sampling and Methodology for Hydro-Physical and Chemical Properties Determination Soil samples were collected in four periods: 3, 6, 12, and 24 months after biochar
application. Soil chemical and hydro-physical analyses were performed in the Research Institute of Environmental Protection. Soil samples were taken using a soil auger from every treatment from 0–15 cm soil layer. Plant residues were removed from samples before the analysis. Soil samples were dried in ambient conditions at 20 °C temperature and sieved through a 2 mm diameter sieve. The particle size distribution in soil samples was determined by using the volumetric particle size distribution method [20]. The wettability of soil was assessed by using the water drop penetration time test which is required for the complete drop infiltration [21]. The water holding capacity (WHC) of soil was determined and calculated according to the Formula (1) [22]. WHC = mass − massmass × 100% (1)
0
10
20
30
40
50
60
70
0
5
10
15
20
25
March April May June July August
Prec
ipita
tion,
mm
Air
tem
pera
ture
, °C
Air temperature, °CPrecipitation, mm
Figure 1. Average monthly temperature (◦C) and amount of precipitation (mm) according to everymonth 10-day data from Dotnuva meteorological station, n = 3.
2.2. Soil Sampling and Methodology for Hydro-Physical and Chemical Properties Determination
Soil samples were collected in four periods: 3, 6, 12, and 24 months after biocharapplication. Soil chemical and hydro-physical analyses were performed in the ResearchInstitute of Environmental Protection. Soil samples were taken using a soil auger fromevery treatment from 0–15 cm soil layer. Plant residues were removed from samples beforethe analysis. Soil samples were dried in ambient conditions at 20 ◦C temperature andsieved through a 2 mm diameter sieve. The particle size distribution in soil samples wasdetermined by using the volumetric particle size distribution method [20]. The wettabilityof soil was assessed by using the water drop penetration time test which is required for thecomplete drop infiltration [21]. The water holding capacity (WHC) of soil was determinedand calculated according to the Formula (1) [22].
WHC =masssaturated −massdry
massdry× 100% (1)
The soil moisture content (MC) was calculated according to Formula (2) [22]:
MC =masswet −massdry
massdry× 100% (2)
The soil pH was determined in soil: water suspension at ratio 1:1 using a pH meter [23].The soil electrical conductivity (µs/cm) was also determined in soil: water suspension atratio 1:1 according to the volume and using an electrical conductivity meter. The results of

Plants 2022, 11, 111 5 of 22
electrical conductivity represent the concentration of salt in the water of soil pores. The soilorganic matter (SOM) was determined using the soil combustion method which is justifiedby dry (at 105 ◦C) soil combustion (at 550 ◦C), when constant sample weight is gained.The amount of SOM was calculated according to the mass difference before and after thecombustion [24].
2.3. Biochar Production and Methodology for Determination of Its Physical-Chemical Properties
Biochar was produced from pine wood biomass at 450 ◦C temperature and 2 h holdingtime in a muffle furnace (SNOL2000/2002, SnolTherm, Utena, Lithuania). For the analysisof the water drop penetration time test, 10 small droplets (0.04 mL) were laid down onthe plane and dry biochar surface using a laboratory pipette, and time for the completewater drop penetration time (WDPT) was assessed. Biochar wettability can be classifiedas: hydrophilic (WDPT < 5 s), slightly hydrophobic (WDPT 5–60 s), strongly hydrophobic(WDPT 60–600 s), severely hydrophobic (WDPT 600–3600 s) and extremely hydrophobic(WDPT > 3600 s) [21]. For the determination of biochar pH, samples were mixed with0.1 N KCl solution at a ratio of 1:10 [25]. After 10 min of shaking, the pH in biocharsuspension was determined using a pH meter. For biochar electrical conductivity analysis,20 g of the sample was placed in 200 mL of desalinated water and shaken for 1 h andthen the solution was filtrated. Electrical conductivity was assessed in filtered waterusing a conductometer [26]. The biochar cation exchange capacity was analyzed using theammonium acetate exchange method. Biochar elemental composition (C, H, N, O, S) wasdetermined using a EuroEA3000-Single analyzer (EuroVector, Milan, Italy) [27]. The sample(dried and milled of 0.5–3 mg) was weighted directly into the small capsule which then wasplaced into the elemental analyzer. Concentration of potentially toxic elements (Pb, Zn, Cu,Cr, Cd and Ni) in biochar was analyzed using an atomic absorption spectrometer (AAS)(Buck Scientific, Norwalk, CA, USA). Dry biochar samples were combusted at 450 ◦C for2.5 h until ashes. Then, every sample of 0.5 g was weighted and mixed with 3 mL of 65% ofnitric acid and 9 mL of 37% of hydrochloric acid. After that, the solution was placed intothe Milestone ETHOS acid digestion system (Milestone Srl, Milan, Italy). After the process,the obtained solution was placed into the flask, filtered, and diluted with deionized wateruntil 50 mL [27]. After the filtration, the concentration of potentially toxic elements wasdetermined using the AAS [28]. The biochar surface functional groups were determinedusing Fourier-transform infrared spectroscopy (FTIR) when wavelengths from 4000 to450 cm−1 were used [29]. The biochar specific surface area was analyzed according toN2-Brunauer-Emmett-Teller (BET) theory and BET analyzer (Quantachrome Instruments,Boynton Beach, FL, USA) [30].
2.4. Comparative Characteristics of Pine Wood Biochar Physical-Chemical Properties
Pine wood low-temperature (450 ◦C) origin biochar had a high hydrophobicity feature(WDPT = 1810 s) which was higher compared to birch wood and hemp biochar, butlower than pine bark biochar (Figure 2a). Hydrophobic biochar in this study had a lowspecific surface area (2.77 m2/g; Figure 2d), low O content (3.39%; Figure 2f), high ashcontent (16.6%; Figure 2b), high electrical conductivity (8.28 µs/cm; Figure 2c), higher Cconcentration (88.7%; Figure 2e) and slightly higher pH (8.53; Table 1) compared to slightlyhydrophobic birch wood and hemp biochar types and extremely hydrophobic pine barkbiochar. The high hydrophobicity of pine wood biochar can be related to higher ash contentwhich blocks pore space and inhibits water entry through the biochar surface.

Plants 2022, 11, 111 6 of 22
Plants 2022, 11, x FOR PEER REVIEW 6 of 22
pine bark biochar. The high hydrophobicity of pine wood biochar can be related to higher ash content which blocks pore space and inhibits water entry through the biochar surface.
(a) (b)
(c) (d)
(e) (f)
Figure 2. The comparison of physical-chemical properties of different biochar types, made from pine wood, birch wood, pine bark and hemp (450 °C, 2 h): (a) wettability (s), (b) ash content (%), (c) electrical conductivity (mS/cm), (d) specific surface area (m2/g), (e) C content (%), (f) O content (%), n = 3.
Table 1. Physical-chemical properties of low-temperature pine wood biochar, n = 3, ±standard deviation.
Initial Feedstock
Pyrolysis Temperature
( °𝐂)
Holding Time
(h) pHKCl
Water Holding Capacity
(%)
H (%)
N (%)
Cation Exchange Capacity
(cmolc/kg) Pine wood 450 2 8.53 ± 0.13 449 ± 8.08 11.07 ± 0.19 0.25 ± 0.006 0.68 ± 0.11
1810
7180
17.7 2.670
1000
2000
3000
4000
5000
6000
7000
8000
Pine wood(this study)
Pine bark Birch wood Hemp
Wet
tabi
lity,
s
Severely hydrophobicSlightly hydrophobic
Extremely hydrophobic
0
2
4
6
8
10
12
14
16
18
Pine wood (thisstudy)
Pine bark Birch wood Hemp
Ash
cont
ent,
%
Severely hydrophobic
Slightly hydropho
bic
0
1
2
3
4
5
6
7
8
9
Pine wood(this study)
Pine bark Birch wood Hemp
Elec
tric
al co
nduc
tivity
, m
S/cm
Severely hydrophobic
0
5
10
15
20
25
30
35
40
45
Pine wood(this study)
Pine bark Birch wood Hemp
Spec
ific s
urfa
ce a
rea,
m2 /g
Severely hydrophobic
Hydrophilic
7072747678808284868890
Pine wood(this study)
Pine bark Birch wood Hemp
C c
onte
nt, %
Severelyhydrophobic
0
5
10
15
20
25
Pine wood(this study)
Pine bark Birch wood Hemp
O c
onte
nt, %
Severelyhydrophobic
Figure 2. The comparison of physical-chemical properties of different biochar types, made from pinewood, birch wood, pine bark and hemp (450 ◦C, 2 h): (a) wettability (s), (b) ash content (%), (c) electricalconductivity (mS/cm), (d) specific surface area (m2/g), (e) C content (%), (f) O content (%), n = 3.
Table 1. Physical-chemical properties of low-temperature pine wood biochar, n = 3,±standard deviation.
InitialFeedstock
PyrolysisTemperature
(◦C)
HoldingTime
(h)pHKCl
WaterHoldingCapacity
(%)
H(%)
N(%)
CationExchangeCapacity
(cmolc/kg)
Pine wood 450 2 8.53 ± 0.13 449 ± 8.08 11.07 ± 0.19 0.25 ± 0.006 0.68 ± 0.11
H—hydrogen; N—nitrogen.
Biochar types with higher initial ash content are less suitable for the soil amendmentdue to high amounts of potentially toxic elements (PTEs) which can cause soil pollution [31].

Plants 2022, 11, 111 7 of 22
According to concentrations of potentially toxic elements, analyzed pine wood biocharcorresponded to standard biochar quality considered in the European Biochar Certificate(EBC) in the case of five PTEs: Pb concentration was by 3.83 times lower compared to thestandard biochar quality according to the maximum permissible Pb concentration (MPC,150 mg/kg), Zn was 1.23 times lower, Cr was 8.39 lower, Cu was 3.89 times lower and Niwas 5.36 times lower (Figure 3a,b). According to cadmium concentration (2.48 mg/kg),the analyzed biochar slightly exceeded standard biochar quality limits according to theMPC (1.5 mg/kg). Some researchers claimed that Zn, Cu, and Pb are stabilized into thebiochar [31]. For the long-term biochar application into the soil, it has to be carefullyanalyzed due to potentially toxic elements (PTEs) which can accumulate into the soil.According to the European Biochar Certificate, biochar cannot exceed the limit values ofPTEs having an intention for its incorporation into the soil [32].
Plants 2022, 11, x FOR PEER REVIEW 7 of 22
H—hydrogen; N—nitrogen.
Biochar types with higher initial ash content are less suitable for the soil amendment due to high amounts of potentially toxic elements (PTEs) which can cause soil pollution [31]. According to concentrations of potentially toxic elements, analyzed pine wood biochar corresponded to standard biochar quality considered in the European Biochar Certificate (EBC) in the case of five PTEs: Pb concentration was by 3.83 times lower compared to the standard biochar quality according to the maximum permissible Pb concentration (MPC, 150 mg/kg), Zn was 1.23 times lower, Cr was 8.39 lower, Cu was 3.89 times lower and Ni was 5.36 times lower (Figure 3a,b). According to cadmium concentration (2.48 mg/kg), the analyzed biochar slightly exceeded standard biochar quality limits according to the MPC (1.5 mg/kg). Some researchers claimed that Zn, Cu, and Pb are stabilized into the biochar [31]. For the long-term biochar application into the soil, it has to be carefully analyzed due to potentially toxic elements (PTEs) which can accumulate into the soil. According to the European Biochar Certificate, biochar cannot exceed the limit values of PTEs having an intention for its incorporation into the soil [32].
(a) (b)
Figure 3. Concentrations of potentially toxic elements (mg/kg) in pine wood biochar: (a) lead (Pb), zinc (Zn) and copper (Cu), (b) chromium (Cr), cadmium (Cd) and nickel (Ni), n = 3.
Biochar had eight peaks which shows the existence of some functional groups in the biochar structure: alcoholic –OH (3442 cm−1), acidic C=O (1684 cm−1), aromatic C=C (1684 cm−1, 1584 cm−1, 1429 cm−1), anhydride C–O (1174 cm−1) and aromatic C–H (805 cm−1, 879 cm−1, 752 cm−1) (Figure 4). FTIR spectrum of initial biochar showed strongly condensed biochar structure which can be seen from intensive C=C ring region [33]. It shows the growth of biochar aromaticity during the pyrolysis process. A rise in the peak at 879 cm−1 wavenumbers is related to C–H group deformations.
050
100150200250300350400450
Pb Zn Cu
Con
cent
ratio
n of
PTE
s (m
g/kg
, DW
) in
pine
woo
d bi
ocha
r
Pb, MPC Zn, MPC Cu, MPC
0102030405060708090
100
Cr Cd Ni
Con
cent
ratio
n of
PTE
s (m
g/kg
, D
W) i
n pi
ne w
ood
bioc
har
Cr, MPC Cd, MPC Ni, MPC
Figure 3. Concentrations of potentially toxic elements (mg/kg) in pine wood biochar: (a) lead (Pb),zinc (Zn) and copper (Cu), (b) chromium (Cr), cadmium (Cd) and nickel (Ni), n = 3.
Biochar had eight peaks which shows the existence of some functional groups inthe biochar structure: alcoholic –OH (3442 cm−1), acidic C=O (1684 cm−1), aromaticC=C (1684 cm−1, 1584 cm−1, 1429 cm−1), anhydride C–O (1174 cm−1) and aromatic C–H(805 cm−1, 879 cm−1, 752 cm−1) (Figure 4). FTIR spectrum of initial biochar showed stronglycondensed biochar structure which can be seen from intensive C=C ring region [33]. Itshows the growth of biochar aromaticity during the pyrolysis process. A rise in the peak at879 cm−1 wavenumbers is related to C–H group deformations.
Plants 2022, 11, x FOR PEER REVIEW 8 of 22
Figure 4. FTIR spectrum of low-temperature pine wood biochar, n = 1.
2.5. Statistical Analysis Descriptive statistics (average value, standard deviation, maximum value, minimum
value) was assessed using Microsoft Excel 2016 software. For the determination of a significant difference between treatments (different combinations of three factors: research date, tillage-fertilization system, and biochar rate) hydro-physical and chemical properties the three-factorial ANOVA was performed (package STATISTICA Base (version 6). Differences among studied groups were significant at p < 0.05 and p < 0.01. Additionally, the least significant difference (LSD05) was presented [29]. Correlation between soil hydro-physical and chemical properties and wettability which was expressed as intensity of absorption in hydrophilic functional groups was performed using Pearson correlation analysis [34]. Pearson’s correlation analysis of hydro-physical and chemical properties (soil organic matter, pH, electrical conductivity, water holding capacity, and moisture content) and C–O functional group intensity (a.u.) of soil were conducted using the SPSS software package (SPSS Inc., Chicago, IL, USA).
3. Results 3.1. Soil Organic Matter Content
Assessing the effect of time on soil organic matter (SOM) content, average data showed that after 24 months it was 6.14% lower than after 3 months, but 26% higher than after 12 months. Fertilization with nitrogen, phosphorus, and potassium (NPK) fertilizers resulted in higher SOM, which was 10.4% and 26.6% higher to unfertilized soil groups (in S and M tillage systems, respectively). On average, the application of 5 t/ha biochar dose increased SOM by 19.7%, and 15 t/ha by 33.7%, compared to the control groups (without biochar) (Figure 5).
0
0.1
0.2
0.3
0.4
0.5
0.6
0.7
0.8
0.9
500150025003500
Abs
orba
nce (
a.u.
)
Wavenumber (cm–1)
16851584
14291174879
875752
3442
Figure 4. FTIR spectrum of low-temperature pine wood biochar, n = 1.

Plants 2022, 11, 111 8 of 22
2.5. Statistical Analysis
Descriptive statistics (average value, standard deviation, maximum value, minimumvalue) was assessed using Microsoft Excel 2016 software. For the determination of a signifi-cant difference between treatments (different combinations of three factors: research date,tillage-fertilization system, and biochar rate) hydro-physical and chemical properties thethree-factorial ANOVA was performed (package STATISTICA Base (version 6). Differencesamong studied groups were significant at p < 0.05 and p < 0.01. Additionally, the leastsignificant difference (LSD05) was presented [29]. Correlation between soil hydro-physicaland chemical properties and wettability which was expressed as intensity of absorptionin hydrophilic functional groups was performed using Pearson correlation analysis [34].Pearson’s correlation analysis of hydro-physical and chemical properties (soil organic mat-ter, pH, electrical conductivity, water holding capacity, and moisture content) and C–Ofunctional group intensity (a.u.) of soil were conducted using the SPSS software package(SPSS Inc., Chicago, IL, USA).
3. Results3.1. Soil Organic Matter Content
Assessing the effect of time on soil organic matter (SOM) content, average data showedthat after 24 months it was 6.14% lower than after 3 months, but 26% higher than after12 months. Fertilization with nitrogen, phosphorus, and potassium (NPK) fertilizersresulted in higher SOM, which was 10.4% and 26.6% higher to unfertilized soil groups (in Sand M tillage systems, respectively). On average, the application of 5 t/ha biochar doseincreased SOM by 19.7%, and 15 t/ha by 33.7%, compared to the control groups (withoutbiochar) (Figure 5).
Plants 2022, 11, x FOR PEER REVIEW 9 of 22
Figure 5. Influence of biochar on the amount of organic matter in different tillage-fertilization systems (S—ploughless shallow tillage, M—direct drilling, 1—unfertilized, 2—fertilized) after 3, 6, 12, and 24 months from the beginning of the experiment, n = 2.
The influence of biochar dose on SOM was significant in all tillage-fertilization systems (p < 0.05) (Table 2). Biochar usage in a direct drilling system (M) was more promising and had a greater effect on SOM compared to shallow ploughless tillage (S). If in the S system 5 t/ha biochar dose increased SOM by 5.63–11.7%, and the rate of 15 t/ha—by 26.9–22.2% (in S-1 and S-2 systems, respectively), then in the M system—18–41.3% and 29–54.8% (in M-1 and M-2 systems, respectively) compared to variants without biochar. 15 t/ha biochar dose determined the best SOM conditions only when it was used in combination with mineral fertilizers in both tillage systems (S—4.89% and M—6.48%, respectively). Regardless of the tillage-fertilization system, the biochar effect on SOM was most promising after 6 months, since SOM content was 51.6–75.5% higher in all variants compared to variants without biochar addition. After 3, 6, 12, and 24 months, variant with direct drilling + fertilization + 15 t/ha biochar dose (M-2) had the highest SOM (6.69%; 10.9%; 3.72%; 5.01%, respectively).
Table 2. Variance analysis of soil organic matter content, n=3.
Factors and Their Interactions F-Fact Least Significant Difference LSD05
Probability P
Factor A—soil tillage-fertilization system
363.23 ** 0.044 0.000000
Factor B—biochar dose 880.85 ** 0.036 0.000000 Factor C—date of investigation 1319.57 ** 0.044 0.000000
A × C 334.3 ** 0.083 0.000000 B × C 235.48 ** 0.076 0.000000 A × B 76.59 ** 0.076 0.000000
A × B × C 52.6 ** 0.125 0.000000 **—p < 0.01.
0
2
4
6
8
10
12
3 6 12 24 3 6 12 24 3 6 12 24 3 6 12 24
S-1 S-2 M-1 M-2
Soil
orga
nic
mat
ter
cont
ent,
%
Time, months
0 t/ha 5 t/ha 15 t/ha
Figure 5. Influence of biochar on the amount of organic matter in different tillage-fertilization systems(S—ploughless shallow tillage, M—direct drilling, 1—unfertilized, 2—fertilized) after 3, 6, 12, and24 months from the beginning of the experiment, n = 2.
The influence of biochar dose on SOM was significant in all tillage-fertilization systems(p < 0.05) (Table 2). Biochar usage in a direct drilling system (M) was more promising andhad a greater effect on SOM compared to shallow ploughless tillage (S). If in the S system5 t/ha biochar dose increased SOM by 5.63–11.7%, and the rate of 15 t/ha—by 26.9–22.2%(in S-1 and S-2 systems, respectively), then in the M system—18–41.3% and 29–54.8% (in M-1and M-2 systems, respectively) compared to variants without biochar. 15 t/ha biochar dose

Plants 2022, 11, 111 9 of 22
determined the best SOM conditions only when it was used in combination with mineralfertilizers in both tillage systems (S—4.89% and M—6.48%, respectively). Regardless of thetillage-fertilization system, the biochar effect on SOM was most promising after 6 months,since SOM content was 51.6–75.5% higher in all variants compared to variants withoutbiochar addition. After 3, 6, 12, and 24 months, variant with direct drilling + fertilization +15 t/ha biochar dose (M-2) had the highest SOM (6.69%; 10.9%; 3.72%; 5.01%, respectively).
Table 2. Variance analysis of soil organic matter content, n = 3.
Factors and Their Interactions F-Fact Least SignificantDifference LSD05
Probability P
Factor A—soiltillage-fertilization system 363.23 ** 0.044 0.000000
Factor B—biochar dose 880.85 ** 0.036 0.000000
Factor C—date of investigation 1319.57 ** 0.044 0.000000
A×C 334.3 ** 0.083 0.000000
B×C 235.48 ** 0.076 0.000000
A× B 76.59 ** 0.076 0.000000
A× B×C 52.6 ** 0.125 0.000000**—p < 0.01.
3.2. Soil pH
Based on the average data, after 24 months soil pH was 11.8% higher than after3 months. Fertilization with NPK fertilizers resulted in lower pH, which was 13.6% and16.9% lower in the fertilized groups compared to unfertilized (in S and M systems, respec-tively). A 5 t/ha biochar dose increased soil pH by 1.72% and 15 t/ha—by 6.84%, comparedto the variants without biochar (Figure 6).
Plants 2022, 11, x FOR PEER REVIEW 10 of 22
3.2. Soil pH Based on the average data, after 24 months soil pH was 11.8% higher than after 3
months. Fertilization with NPK fertilizers resulted in lower pH, which was 13.6% and 16.9% lower in the fertilized groups compared to unfertilized (in S and M systems, respectively). A 5 t/ha biochar dose increased soil pH by 1.72% and 15 t/ha—by 6.84%, compared to the variants without biochar (Figure 6).
Figure 6. Influence of biochar on soil pH changes in different tillage-fertilization systems (S—ploughless shallow tillage, M—direct drilling, 1—unfertilized, 2—fertilized) after 3, 6, 12, and 24 months from the beginning of the experiment, n = 2.
Regardless of the tillage-fertilization system, after 3, 6, 12, and 24 months 15 t/ha biochar dose increased soil pH by 12.5%, 5.88%, 5.75%, and 3.98%, respectively. Biochar effect on soil pH was significant in all tillage-fertilization systems (p < 0.05) (Table 3). Biochar usage in the M system was more promising than in S. In the M system 15 t/ha biochar dose increased soil pH by 8.79–19.1% (M-1 and M-2) compared to the control group. After 6, 12, and 24 months of biochar incorporation, direct drilling soil had the highest pH (7.31; 7.82; 7.99, respectively).
Table 3. Variance analysis of soil pH, n = 3.
Factors and Their Interactions F-Fact Least Significant Difference LSD0.5
Probability P
Factor A—soil tillage-fertilization system
2383.28 ** 0.024 0.000000
Factor B—biochar dose 361.74 ** 0.02 0.000000 Factor C—investigation date 789.9 ** 0.024 0.000000
A × C 31.07 ** 0.046 0.000000 B × C 22.69 ** 0.042 0.000000 A × B 135.28 ** 0.042 0.000000
A × B × C 8.87 ** 0.069 0.000000 **—p < 0.01.
3.3. Soil Electrical Conductivity After 24 months soil electrical conductivity (EC) was on average 82.3% lower than
after 3 months. Fertilization with NPK fertilizers resulted in higher soil EC. Fertilization
44.5
55.5
66.5
77.5
88.5
9
3 6 12 24 3 6 12 24 3 6 12 24 3 6 12 24
S-1 S-2 M-1 M-2
Soil
pH
Time, months
0 t/ha 5 t/ha 15 t/ha
Figure 6. Influence of biochar on soil pH changes in different tillage-fertilization systems(S—ploughless shallow tillage, M—direct drilling, 1—unfertilized, 2—fertilized) after 3, 6, 12, and24 months from the beginning of the experiment, n = 2.
Regardless of the tillage-fertilization system, after 3, 6, 12, and 24 months 15 t/habiochar dose increased soil pH by 12.5%, 5.88%, 5.75%, and 3.98%, respectively. Biochareffect on soil pH was significant in all tillage-fertilization systems (p < 0.05) (Table 3).Biochar usage in the M system was more promising than in S. In the M system 15 t/habiochar dose increased soil pH by 8.79–19.1% (M-1 and M-2) compared to the control group.

Plants 2022, 11, 111 10 of 22
After 6, 12, and 24 months of biochar incorporation, direct drilling soil had the highest pH(7.31; 7.82; 7.99, respectively).
Table 3. Variance analysis of soil pH, n = 3.
Factors and Their Interactions F-Fact Least SignificantDifference LSD0.5
Probability P
Factor A—soiltillage-fertilization system 2383.28 ** 0.024 0.000000
Factor B—biochar dose 361.74 ** 0.02 0.000000
Factor C—investigation date 789.9 ** 0.024 0.000000
A×C 31.07 ** 0.046 0.000000
B×C 22.69 ** 0.042 0.000000
A× B 135.28 ** 0.042 0.000000
A× B×C 8.87 ** 0.069 0.000000**—p < 0.01.
3.3. Soil Electrical Conductivity
After 24 months soil electrical conductivity (EC) was on average 82.3% lower thanafter 3 months. Fertilization with NPK fertilizers resulted in higher soil EC. Fertilizationgoverned 82.1% and 141% higher soil EC compared to unfertilized soil (in S and M systems,respectively). A 5 t/ha biochar dose increased EC by 13% and 15 t/ha—by 23.4%, comparedto the variants without biochar (Figure 7).
Plants 2022, 11, x FOR PEER REVIEW 11 of 22
governed 82.1% and 141% higher soil EC compared to unfertilized soil (in S and M systems, respectively). A 5 t/ha biochar dose increased EC by 13% and 15 t/ha—by 23.4%, compared to the variants without biochar (Figure 7).
Figure 7. Influence of biochar on the changes of soil electrical conductivity in different tillage-fertilization systems (S—ploughless shallow tillage, M—direct drilling, 1—unfertilized, 2—fertilized) after 3, 6, 12, and 24 months from the beginning of the experiment, n = 2.
Regardless of the tillage-fertilization system, after 12 months 5 t/ha and 15 t/ha biochar doses increased soil EC by 9.15–21.6%. The influence of biochar on soil EC was essential in all tillage-fertilization systems (p < 0.05) (Table 4). 15 t/ha biochar dose increased soil EC by 28.3–15.8% in the S system (both without fertilization and fertilization, respectively), and in the M system—by 33.9–23.8% compared to variants without biochar. Usage of a 15 t/ha biochar dose in combination with mineral fertilizers determined the highest soil EC in the M system (289 µs/cm). After 3 and 24 months after biochar incorporation, soil variant with direct drilling + fertilization + 15 t/ha biochar dose had the highest EC (752 µs/cm; 137.6 µs/cm).
Table 4. Variance analysis of soil electrical conductivity, n = 3.
Factors and Their Interactions F-Fact Least Significant Difference LSD0.5
Probability P
Factor A—soil tillage-fertilization system 345.21 ** 6.82 0.000000
Factor B—biochar dose 29.46 ** 5.57 0.000000 Factor C—investigation date 1755.79 * 6.82 0.000000
A × C 145.69 ** 12.9 0.000000 B × C 3.54 ** 11.8 0.000000 A × B 4.72 ** 11.8 0.000000
A × B × C 6.61 ** 19.3 0.000000 **—p < 0.01; *—p < 0.05.
Thus, the results demonstrate that tillage and fertilization, by directly determining the physical condition of the soil, also determine its electrical conductivity and plant
0
100
200
300
400
500
600
700
800
900
3 6 12 24 3 6 12 24 3 6 12 24 3 6 12 24
S-1 S-2 M-1 M-2
Soil
elec
tric
al c
ondu
ctiv
ity, µ
s/cm
Time, months
0 t/ha 5 t/ha 15 t/ha
Figure 7. Influence of biochar on the changes of soil electrical conductivity in different tillage-fertilization systems (S—ploughless shallow tillage, M—direct drilling, 1—unfertilized, 2—fertilized)after 3, 6, 12, and 24 months from the beginning of the experiment, n = 2.
Regardless of the tillage-fertilization system, after 12 months 5 t/ha and 15 t/ha biochardoses increased soil EC by 9.15–21.6%. The influence of biochar on soil EC was essential inall tillage-fertilization systems (p < 0.05) (Table 4). 15 t/ha biochar dose increased soil EC by28.3–15.8% in the S system (both without fertilization and fertilization, respectively), and inthe M system—by 33.9–23.8% compared to variants without biochar. Usage of a 15 t/habiochar dose in combination with mineral fertilizers determined the highest soil EC in the

Plants 2022, 11, 111 11 of 22
M system (289 µs/cm). After 3 and 24 months after biochar incorporation, soil variantwith direct drilling + fertilization + 15 t/ha biochar dose had the highest EC (752 µs/cm;137.6 µs/cm).
Table 4. Variance analysis of soil electrical conductivity, n = 3.
Factors and Their Interactions F-Fact Least SignificantDifference LSD0.5
Probability P
Factor A—soiltillage-fertilization system 345.21 ** 6.82 0.000000
Factor B—biochar dose 29.46 ** 5.57 0.000000
Factor C—investigation date 1755.79 * 6.82 0.000000
A×C 145.69 ** 12.9 0.000000
B×C 3.54 ** 11.8 0.000000
A× B 4.72 ** 11.8 0.000000
A× B×C 6.61 ** 19.3 0.000000**—p < 0.01; *—p < 0.05.
Thus, the results demonstrate that tillage and fertilization, by directly determining thephysical condition of the soil, also determine its electrical conductivity and plant nutritionconditions. Both soil type and land usage have a significant influence on the overallmacroporosity, its surface area, and the distribution of pores belonging to the macroporegroup. Accordingly, the number of macropores, as well as the number of mesopores andtheir distribution, is an important factor in determining the amount of water in those poresand their electrical conductivity [35,36].
Based on the soil salinity classes, the studied soil groups were characterized as non-saline, as EC values for all groups ranged from 0 to 2 dS/m (from 0.04 dS/m in M-1 after12 months to 0.75 dS/m in M-2 after 3 months). Soils with an EC less than 2 dS/m areconsidered non-saline and this does not affect many cereal yields and soil microbiologicalprocesses. Even mild to moderate salinity can inhibit grain growth. Salts are a naturalcomponent of the soil, but when the concentration of salts in the soil is high, especiallyclose to the roots of plants, the roots attract and absorb less moisture [37]. When the salinityof the soil is high enough, the plant will dry out and die, regardless of the amount of extrawater used.
3.4. Surface Functional Groups of Soil
According to the results of FTIR analysis, after 3 months from biochar application, inboth S and M systems, FTIR spectra were similar and had such functional groups: alcoholic–OH (3626 cm−1), alkoxy C–O (1023–1084 cm−1), aromatic C–H (777–873 cm−1) and C=C(1643 cm−1) (Figure 8). Comparing fertilized soils amended with different biochar rates, itwas observed that in both tillage systems the 5 t/ha biochar rate caused the highest numberof functional groups (due to the higher intensity of infrared radiation absorption) and15 t/ha rate determined the least amount. Meanwhile, in unfertilized soil of the S system,absorption peaks were stronger at 1023–1084 cm−1 and 466–522 cm−1 wavenumbers under5 t/ha rate application. In the M system, all absorption peaks were stronger when a 15 t/habiochar rate was used. We suppose that soil fertilization governs more stable soil structurein different soil tillage systems irrespective of biochar application; meanwhile, the chemicalstructure of unfertilized soil strongly varied independently of the biochar rate.

Plants 2022, 11, 111 12 of 22
Plants 2022, 11, x FOR PEER REVIEW 12 of 22
nutrition conditions. Both soil type and land usage have a significant influence on the overall macroporosity, its surface area, and the distribution of pores belonging to the macropore group. Accordingly, the number of macropores, as well as the number of mesopores and their distribution, is an important factor in determining the amount of water in those pores and their electrical conductivity [35,36].
Based on the soil salinity classes, the studied soil groups were characterized as non-saline, as EC values for all groups ranged from 0 to 2 dS/m (from 0.04 dS/m in M-1 after 12 months to 0.75 dS/m in M-2 after 3 months). Soils with an EC less than 2 dS/m are considered non-saline and this does not affect many cereal yields and soil microbiological processes. Even mild to moderate salinity can inhibit grain growth. Salts are a natural component of the soil, but when the concentration of salts in the soil is high, especially close to the roots of plants, the roots attract and absorb less moisture [37]. When the salin-ity of the soil is high enough, the plant will dry out and die, regardless of the amount of extra water used.
3.4. Surface Functional Groups of Soil According to the results of FTIR analysis, after 3 months from biochar application, in
both S and M systems, FTIR spectra were similar and had such functional groups: alco-holic –OH (3626 cm−1), alkoxy C–O (1023–1084 cm−1), aromatic C–H (777–873 cm−1) and C=C (1643 cm−1) (Figure 8). Comparing fertilized soils amended with different biochar rates, it was observed that in both tillage systems the 5 t/ha biochar rate caused the highest number of functional groups (due to the higher intensity of infrared radiation absorption) and 15 t/ha rate determined the least amount. Meanwhile, in unfertilized soil of the S sys-tem, absorption peaks were stronger at 1023–1084 cm−1 and 466–522 cm−1 wavenumbers under 5 t/ha rate application. In the M system, all absorption peaks were stronger when a 15 t/ha biochar rate was used. We suppose that soil fertilization governs more stable soil structure in different soil tillage systems irrespective of biochar application; meanwhile, the chemical structure of unfertilized soil strongly varied independently of the biochar rate.
(a) (b)
Figure 8. Impact of biochar on the soil surface functional groups in different tillage-fertilization sys-tems after 3 months from biochar application: (a) S—ploughless shallow tillage, (b) direct drilling, 1—unfertilized, 2—fertilized, n = 2.
The –OH group in soil is related with kaolinite clay minerals (3694, 3620, 3526 cm−1), Si–O group with silicates (1031 cm−1) and Al–Al–OH with aluminium compounds (913 cm−1) [38]. Similarly, in this study, peaks at 3626, 3416, 1023, and 873 cm−1 wavenumbers
0
0.2
0.4
0.6
0.8
1
1.2
1.4
1.6
500150025003500
Abs
orba
nce (
a.u.
)
Wavenumber (cm–1)
S-1, 0 t/haS-1, 5 t/haS-1, 15 t/haS-2, 0 t/haS-2, 5 t/haS-2, 15 t/ha
3626 23592337 16431084
1023873777
695522
4663416
Figure 8. Impact of biochar on the soil surface functional groups in different tillage-fertilizationsystems after 3 months from biochar application: (a) S—ploughless shallow tillage, (b) direct drilling,1—unfertilized, 2—fertilized, n = 2.
The –OH group in soil is related with kaolinite clay minerals (3694, 3620, 3526 cm−1), Si–Ogroup with silicates (1031 cm−1) and Al–Al–OH with aluminium compounds (913 cm−1) [38].Similarly, in this study, peaks at 3626, 3416, 1023, and 873 cm−1 wavenumbers were ob-served and it shows the existence of O, H, Al, and Si compounds in the soil structure. Thepeak at 471 cm−1 wavenumbers is related to the amount of Si [39]. FTIR spectra of soilsshowed deposition of aluminosilicates on the incorporated biochar. FTIR spectra demon-strate that all studied soil groups undistinguished of hydrophobic C–H methyl and methy-lene functional groups (absence of peaks at 2920 cm−1 and 2860 cm−1, respectively [40]).Meanwhile, C–O functional groups (peaks occur at 1600–1740 cm−1 wavenumbers) arerelated to hydrophilicity. In our experiment, they were found in all soil groups (peaks at1643 cm−1 wavenumber). Soil hydrophilicity increases with an increase in the density ofpolar functional groups (such as –OH, –COOH, and –NH2), but decreases with the increaseof density of nonpolar functional groups (–CH3 and =CH2) [41].
3.5. Soil Water Holding Capacity
After 24 months, soil water holding capacity (WHC) was on average 29.6% higherthan after 3 months. Fertilization resulted in a slightly higher soil WHC in the M system,which was 0.72% higher than without fertilization. Incorporation of 5 t/ha biochar doseincreased WHC by 4.27% and 15 t/ha by 8.48%, compared to the variants without biochar(Figure 9).
Regardless of the tillage-fertilization system, after 3, 6, 12, and 24 months 15 t/habiochar dose increased WHC significantly more than 5 t/ha (by 16.2%, 3.18%, 6.88%, and9.25%). Thus, the positive effect of both doses on the increase in soil WHC continued—itremained significantly higher at a 15 t/ha dose. The influence of biochar on WHC wassignificant in all tillage-fertilization systems (p < 0.05) (Table 5). The usage of biochar in Mwas more promising for increasing WHC. In the S system (both without fertilization andfertilization), 15 t/ha biochar dose increased WHC by 12.4–5.69% in the M system in com-parison with variants without biochar. After 3, 12, and 24 months, the variant with directdrilling + 15 t/ha biochar dose had the highest WHC (54.4%, 61.1%, 67.2%). In summary, itcan be seen that over time, soil WHC enhancement by biochar gradually increases.

Plants 2022, 11, 111 13 of 22
Plants 2022, 11, x FOR PEER REVIEW 13 of 22
were observed and it shows the existence of O, H, Al, and Si compounds in the soil struc-ture. The peak at 471 cm−1 wavenumbers is related to the amount of Si [39]. FTIR spectra of soils showed deposition of aluminosilicates on the incorporated biochar. FTIR spectra demonstrate that all studied soil groups undistinguished of hydrophobic C–H methyl and methylene functional groups (absence of peaks at 2920 cm−1 and 2860 cm−1, respectively [40]). Meanwhile, C–O functional groups (peaks occur at 1600–1740 cm−1 wavenumbers) are related to hydrophilicity. In our experiment, they were found in all soil groups (peaks at 1643 cm−1 wavenumber). Soil hydrophilicity increases with an increase in the density of polar functional groups (such as –OH, –COOH, and –NH2), but decreases with the in-crease of density of nonpolar functional groups (–CH3 and =CH2) [41].
3.5. Soil Water Holding Capacity After 24 months, soil water holding capacity (WHC) was on average 29.6% higher
than after 3 months. Fertilization resulted in a slightly higher soil WHC in the M system, which was 0.72% higher than without fertilization. Incorporation of 5 t/ha biochar dose increased WHC by 4.27% and 15 t/ha by 8.48%, compared to the variants without biochar (Figure 9).
Figure 9. Influence of biochar on changes of soil water holding capacity in different tillage-fertiliza-tion systems (S—shallow no-till tillage, M—direct sowing, 1—unfertilized, 2—fertilized) after 3, 6, 12, and 24 months from the beginning of the experiment, n = 2.
Regardless of the tillage-fertilization system, after 3, 6, 12, and 24 months 15 t/ha bi-ochar dose increased WHC significantly more than 5 t/ha (by 16.2%, 3.18%, 6.88%, and 9.25%). Thus, the positive effect of both doses on the increase in soil WHC continued—it remained significantly higher at a 15 t/ha dose. The influence of biochar on WHC was significant in all tillage-fertilization systems (p < 0.05) (Table 5). The usage of biochar in M was more promising for increasing WHC. In the S system (both without fertilization and fertilization), 15 t/ha biochar dose increased WHC by 12.4–5.69% in the M system in com-parison with variants without biochar. After 3, 12, and 24 months, the variant with direct drilling + 15 t/ha biochar dose had the highest WHC (54.4%, 61.1%, 67.2%). In summary, it can be seen that over time, soil WHC enhancement by biochar gradually increases.
0
10
20
30
40
50
60
70
80
3 6 12 24 3 6 12 24 3 6 12 24 3 6 12 24
S-1 S-2 M-1 M-2
Soil
wat
er h
oldi
ng c
apac
ity, %
Time, months
0 t/ha 5 t/ha 15 t/ha
Figure 9. Influence of biochar on changes of soil water holding capacity in different tillage-fertilizationsystems (S—shallow no-till tillage, M—direct sowing, 1—unfertilized, 2—fertilized) after 3, 6, 12, and24 months from the beginning of the experiment, n = 2.
Table 5. Variance analysis of soil water holding capacity, n = 3.
Factors and Their Interactions F-Fact Least SignificantDifference LSD0.5
Probability P
Factor A—soiltillage-fertilization system 3.3 ** 0.324 0.000000
Factor B—biochar dose 199.26 ** 0.265 0.000000
Factor C—investigation date 1004.82 * 0.324 0.000000
A× B 34.4 ** 0.612 0.000000
B×C 13.27 ** 0.562 0.000000
A× B 4.89 ** 0.562 0.000000
A× B×C 3.28 ** 0.917 0.000000**—p < 0.01; *—p < 0.05.
It is known that WHC and water availability to plants in clayey and sandy loams canbe improved with biochar addition [42]. A study driven by Yu et al. [43] showed that ahigh percentage of biochar in soil mixture dramatically increases soil WHC. These resultssuggest that biochar has the potential to mitigate droughts and increase crop yields insandy loam [43]. Novak et al. [44] reported an increase in the WHC of sandy loam with2% of biochar made from grass. It was estimated that when the sandy loam WHC was16%, yellow pine biochar was able to retain 2.7 times its mass (=270%). A study drivenby Yu et al. [43] showed that biochar increased soil WHC by 1.7% of its mass each time1% biochar was added. The results of these studies are important since biochar is anefficient medium for increasing soil irrigation efficiency, mitigating runoff, and reducingnon-point agricultural pollution. The ability of biochar to increase soil WHC is particularlyimportant in drought-prone areas. Some studies have not shown a significant effect ofbiochar incorporation on moisture retention in sandy loam and coarse-textured sandy soilin field studies. This may have been due to the special hydrophobicity of the biochar, whichprevented water from infiltrating the biochar pores. The efficiency of biochar in increasing

Plants 2022, 11, 111 14 of 22
soil water retention will decrease if biochar is hydrophobic; however, the hydrophobicityof biochar is often removed after environmental exposure.
When assessing the impact of tillage methods on increasing soil WHC, some studiesindicate that non-cultivated agriculture is more favorable. An 8-year study driven byRaczkowski et al. [45] evaluating sandy loam showed that no-till farming developedhigher bulk density, lower total porosity, and macroporosity, but higher capillary porosity(microporosity) and WHC than conventional farming.
3.6. Soil Moisture Content
Based on average data, after 24 months, soil moisture content (MC) was 872% higherthan after 3 months. Fertilization resulted in 6.52% higher MC in the M system than withoutfertilization. In the shallow ploughless tillage system, MC was on average 7.36% lower infertilized soil compared without fertilization. The incorporation of 5 t/ha biochar increasedMC by 10.7% and 15 t/ha—by 21.8%, compared to the variants without biochar (Figure 10).
Plants 2022, 11, x FOR PEER REVIEW 15 of 22
Figure 10. Influence of biochar on changes in soil moisture content in different tillage-fertilization systems (S—shallow no-till, M—direct sowing, 1—unfertilized, 2—fertilized) after 3, 6, 12, and 24 months from the beginning of the experiment, n = 2.
Regardless of the tillage-fertilization system, after 3, 6, 12, and 24 months, 15 t/ha biochar dose increased MC significantly more compared to 5 t/ha dose (by 133%; 52.9%; 13.8%; 14.8%). The influence of biochar on MC was significant in all tillage-fertilization systems (p < 0.05), except for the combined effect of different factors (Table 6). The usage of biochar in the M system was more promising for increasing soil MC than S. If in the shallow ploughless tillage + fertilization system 15 t/ha biochar dose increased MC by 21.2%, then in the direct drilling system—by 27.7% compared to variants without biochar. After 3, 6 and 12 months the highest soil MC was obtained with direct drilling + fertiliza-tion + 15 t/ha biochar dose (1.8%; 7.28%; 16.9%). Soil moisture retention is generally higher in a no-tillage system than in conventional tillage. Non-arable agriculture has the ad-vantage of preserving the soil from wind erosion and promoting the retention of soil mois-ture.
Table 6. Variance analysis of soil moisture content, n = 3.
Factors and Their Interactions F-Fact Least Significant Difference LSD0.5 Probability P
Factor A—soil tillage-fertilization system 18.91 ** 0.273 0.000000 Factor B—biochar dose 27.68 ** 0.223 0.000000
Factor C—investigation date 1452.77 * 0.273 0.000000 A × C 11.19 ** 0.514 0.000000 B × C 1.26 0.472 0.282342 A × B 0.57 0.472 0.754204
A × B × C 0.3 0.771 0.997114 **—p < 0.01; *—p < 0.05.
3.7. Soil Wettability Based on soil wettability results, it can be seen that all the studied soil groups in M
and S systems showed high wettability (WDPT ≤ 1 s) or slight hydrophobicity (WDPT = 2) after 6 months and after 12 months (Table 7). According to Chenu et al. [5], soils with instantaneous wettability (WDPT ≤ 1 s) are considered hydrophilic. It can be stated that
02468
101214161820
3 6 12 24 3 6 12 24 3 6 12 24 3 6 12 24
S-1 S-2 M-1 M-2
Soil
moi
stur
e co
nten
t, %
Time, months
0 t/ha 5 t/ha
Figure 10. Influence of biochar on changes in soil moisture content in different tillage-fertilizationsystems (S—shallow no-till, M—direct sowing, 1—unfertilized, 2—fertilized) after 3, 6, 12, and24 months from the beginning of the experiment, n = 2.
Regardless of the tillage-fertilization system, after 3, 6, 12, and 24 months, 15 t/habiochar dose increased MC significantly more compared to 5 t/ha dose (by 133%; 52.9%;13.8%; 14.8%). The influence of biochar on MC was significant in all tillage-fertilizationsystems (p < 0.05), except for the combined effect of different factors (Table 6). The usageof biochar in the M system was more promising for increasing soil MC than S. If in theshallow ploughless tillage + fertilization system 15 t/ha biochar dose increased MC by21.2%, then in the direct drilling system—by 27.7% compared to variants without biochar.After 3, 6 and 12 months the highest soil MC was obtained with direct drilling + fertilization+ 15 t/ha biochar dose (1.8%; 7.28%; 16.9%). Soil moisture retention is generally higher in ano-tillage system than in conventional tillage. Non-arable agriculture has the advantage ofpreserving the soil from wind erosion and promoting the retention of soil moisture.

Plants 2022, 11, 111 15 of 22
Table 6. Variance analysis of soil moisture content, n = 3.
Factors and Their Interactions F-Fact Least SignificantDifference LSD0.5
Probability P
Factor A—soiltillage-fertilization system 18.91 ** 0.273 0.000000
Factor B—biochar dose 27.68 ** 0.223 0.000000
Factor C—investigation date 1452.77 * 0.273 0.000000
A×C 11.19 ** 0.514 0.000000
B×C 1.26 0.472 0.282342
A× B 0.57 0.472 0.754204
A× B×C 0.3 0.771 0.997114**—p < 0.01; *—p < 0.05.
3.7. Soil Wettability
Based on soil wettability results, it can be seen that all the studied soil groups in Mand S systems showed high wettability (WDPT ≤ 1 s) or slight hydrophobicity (WDPT = 2)after 6 months and after 12 months (Table 7). According to Chenu et al. [5], soils withinstantaneous wettability (WDPT ≤ 1 s) are considered hydrophilic. It can be stated thatthe influence of biochar, fertilization, and tillage methods on soil wettability is stablefor 6 months period. Other studies have estimated that, over time, soil organic matterfills the pores of biochar and reduces its specific surface area. Ren et al. [46] found thatafter 0.5 years the surface area of biochar in agricultural soil increased and after 1.5 yearsdecreased. Biochar, which has a higher specific surface area, has better sorption for water.
Table 7. Soil wettability assessed by water drop penetration time test under ploughless shallow tillageunfertilized (S-1) and fertilized (S-2), direct drilling unfertilized (M-1) and fertilized (M-2) soil, n = 3.
Soil Tillage-Fertilization System M-1 M-2 S-1 S-2
Biochar Dose,Research Date
0t/ha
5t/ha
15t/ha
0t/ha
5t/ha
15t/ha
0t/ha
5t/ha
15t/ha
0t/ha
5t/ha
15t/ha
3 months ≤1 ≤1 ≤1 ≤1 ≤1 ≤1 ≤1 ≤1 ≤1 ≤1 ≤1 ≤1
6 months ≤1 ≤1 ≤1 ≤1 ≤1 ≤1 ≤1 ≤1 ≤1 ≤1 ≤1 ≤1
12 months 2 2 2 1 1 1 2 2 2 1 1 1
24 months 1 1 1 1 1 1 1 1 1 1 1 1
S—ploughless shallow tillage; M—direct drilling.
A study driven by Ojeda et al. [47] assessed that after 1 year, the soil-biochar mixturewas considered hydrophilic because the contact degree values were less than 90◦. Therewere no differences between collection times and this suggests that the impact of biocharon soil wettability is stable over a 1-year period. When comparing the control soil with thebiochar mixtures, wettability was not significantly affected by the biochar dose.
3.8. Triticale Grain Yield and Correlation Analysis
The results showed a significant benefit of soil fertilization with NPK mineral fertilizersfor triticale grain yield in both tillage systems (Figure 11). Significant differences betweenfertilized and non-fertilized soil groups were found when evaluating both tillage methods(p < 0.05). The highest yield of standard moisture triticale grain (3.51 t/ha) was determinedin the system of direct drilling, fertilization, and 15 t/ha biochar dose (Figure 11a). Thisresult may have been due to better nutritional conditions of the plants in the fertilizedsoil, which was determined by the usage of liquid fertilizers. Macro- (N, P, K, Ca) andmicroelements (Cu, Mn, Zn, B, Fe, Mo) also play an important role in plant growth anddevelopment, which in turn increases plant growth and yield. The incorporation of biochar

Plants 2022, 11, 111 16 of 22
resulted in an increase in triticale yield in all tillage-fertilization systems, the largest ofwhich was in the case of direct drilling and non-fertilization at 5 and 15 t/ha biochar rates(36.8% and 42.8%, respectively).
Plants 2022, 11, x FOR PEER REVIEW 16 of 22
the influence of biochar, fertilization, and tillage methods on soil wettability is stable for 6 months period. Other studies have estimated that, over time, soil organic matter fills the pores of biochar and reduces its specific surface area. Ren et al. [46] found that after 0.5 years the surface area of biochar in agricultural soil increased and after 1.5 years de-creased. Biochar, which has a higher specific surface area, has better sorption for water.
Table 7. Soil wettability assessed by water drop penetration time test under ploughless shallow tillage unfertilized (S-1) and fertilized (S-2), direct drilling unfertilized (M-1) and fertilized (M-2) soil, n = 3.
Soil Tillage-Fertilization System M-1 M-2 S-1 S-2
Biochar Dose, Research Date
0 t/ha
5 t/ha
15 t/ha
0 t/ha
5 t/ha
15 t/ha
0 t/ha
5 t/ha
15 t/ha
0 t/ha
5 t/ha
15 t/ha
3 months ≤1 ≤1 ≤1 ≤1 ≤1 ≤1 ≤1 ≤1 ≤1 ≤1 ≤1 ≤1 6 months ≤1 ≤1 ≤1 ≤1 ≤1 ≤1 ≤1 ≤1 ≤1 ≤1 ≤1 ≤1
12 months 2 2 2 1 1 1 2 2 2 1 1 1 24 months 1 1 1 1 1 1 1 1 1 1 1 1
S—ploughless shallow tillage; M—direct drilling.
A study driven by Ojeda et al. [47] assessed that after 1 year, the soil-biochar mixture was considered hydrophilic because the contact degree values were less than 90°. There were no differences between collection times and this suggests that the impact of biochar on soil wettability is stable over a 1-year period. When comparing the control soil with the biochar mixtures, wettability was not significantly affected by the biochar dose.
3.8. Triticale Grain Yield and Correlation Analysis The results showed a significant benefit of soil fertilization with NPK mineral ferti-
lizers for triticale grain yield in both tillage systems (Figure 11). Significant differences between fertilized and non-fertilized soil groups were found when evaluating both tillage methods (p < 0.05). The highest yield of standard moisture triticale grain (3.51 t/ha) was determined in the system of direct drilling, fertilization, and 15 t/ha biochar dose (Figure 11a). This result may have been due to better nutritional conditions of the plants in the fertilized soil, which was determined by the usage of liquid fertilizers. Macro- (N, P, K, Ca) and microelements (Cu, Mn, Zn, B, Fe, Mo) also play an important role in plant growth and development, which in turn increases plant growth and yield. The incorporation of biochar resulted in an increase in triticale yield in all tillage-fertilization systems, the larg-est of which was in the case of direct drilling and non-fertilization at 5 and 15 t/ha biochar rates (36.8% and 42.8%, respectively).
(a) (b)
0
1
2
3
4
5
0 5 15
Triti
cale
gra
in y
ield
, t/h
a
Biochar dose, t/ha
Fertilized with NPK Non-fertilized with NPK
0
1
2
3
4
5
0 5 15
Triti
cale
gra
in y
ield
, t/h
aBiochar dose, t/ha
Fertilized with NPK Non-fertilized with NPK
Figure 11. Triticale grain yield of standard moisture: (a) M—direct drilling; (b) S—shallow plough-less tillage.
A study driven by Terzic et al. [48] similarly found that the mean triticale yieldwas lowest in the unfertilized control group (2.06 t/ha) and significantly higher in thefertilized groups (4.05 t/ha, NP2K effect; 4.11 t/ha, NP1K effect). In the mentioned study,the highest grain yield was obtained in the NP1K variant (120 kg/ha nitrogen fertilizercontent; 60 kg/ha phosphorus (P2O5) fertilizer content, and 60 kg/ha potassium (K2O)fertilizer content). Study driven by Gebremedhin et al. [49] showed that the incorporationof biochar into the soil increases the yield of wheat grain and straw by 15.7% and 16.5%,respectively. A study driven by Bielski et al. [19] showed that the control group (withoutnitrogen fertilizers), which was 3.17 t/ha, had the lowest triticale yield. The highest yieldwas observed in the effect group of the highest amount of nitrogen fertilizers (160 kg/ha)in the first study year (2013), which amounted to 5.17 t/ha. The grain yield of wintertriticale strongly depended on the weather conditions during the whole study year andon the amount of nitrogen fertilizers. Previous authors pointed out that the triticale yielddepended not only on fertilization but also on weather conditions. Some researchers pointout that air is one of the most important factors influencing grain yields. A study driven byGibson et al. [50] showed that the application of nitrogen fertilizers (33 kg/ha) increasedthe yield of triticale grain by 64% compared to the control group and reached 3.7 mg/haafter 2 years.
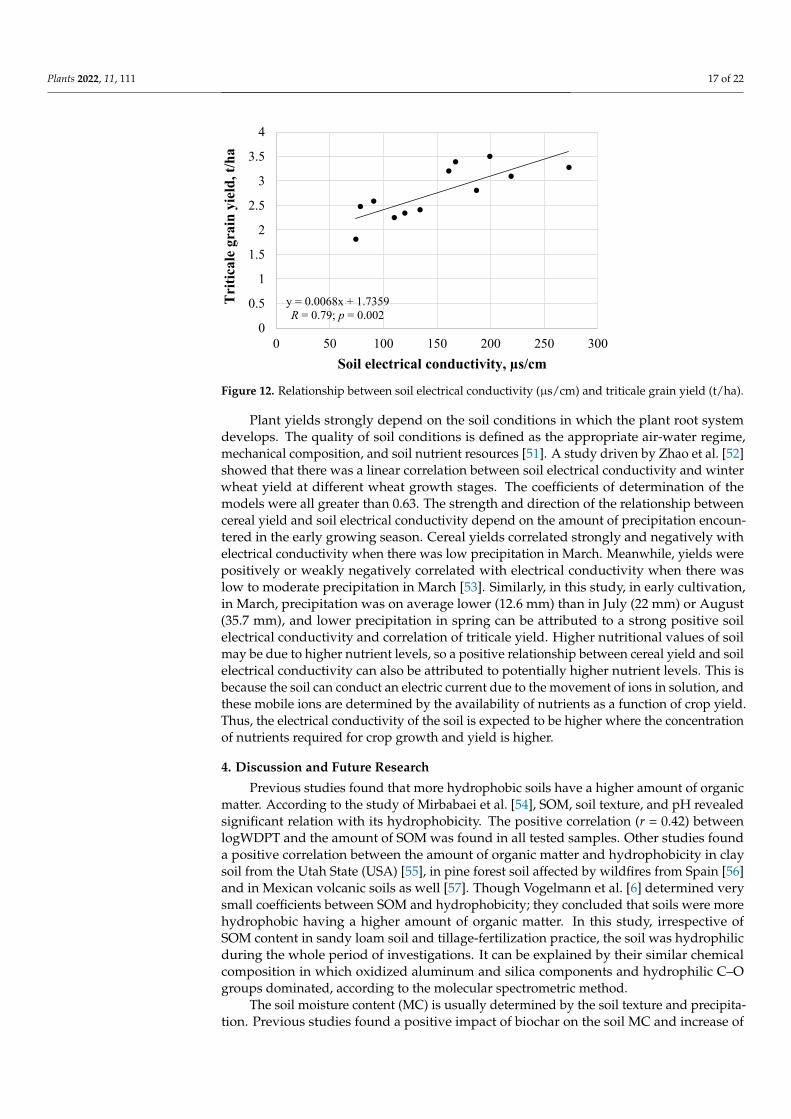
Pearson correlation analysis showed a significant relationship between triticale grainyield and its soil electrical conductivity (R = 0.79; R2 = 0.62; p = 0.002) (Figure 12). Asthe electrical conductivity of the soil increased, the yield of triticale also increased. Soilelectrical conductivity can provide guidelines for assessing soil productivity. Therefore,in the future, it is necessary to clarify the mechanisms between the transfer of macro-and micronutrients to agricultural crops from soils improved with mineral fertilizers incombination with biochar.
Plants 2022, 11, 111 17 of 22
Plants 2022, 11, x FOR PEER REVIEW 17 of 22
Figure 11. Triticale grain yield of standard moisture: (a) M—direct drilling; (b) S—shallow plough-less tillage.
A study driven by Terzic et al. [48] similarly found that the mean triticale yield was lowest in the unfertilized control group (2.06 t/ha) and significantly higher in the fertilized groups (4.05 t/ha, NP2K effect; 4.11 t/ha, NP1K effect). In the mentioned study, the highest grain yield was obtained in the NP1K variant (120 kg/ha nitrogen fertilizer content; 60 kg/ha phosphorus (P2O5) fertilizer content, and 60 kg/ha potassium (K2O) fertilizer con-tent). Study driven by Gebremedhin et al. [49] showed that the incorporation of biochar into the soil increases the yield of wheat grain and straw by 15.7% and 16.5%, respectively. A study driven by Bielski et al. [19] showed that the control group (without nitrogen fer-tilizers), which was 3.17 t/ha, had the lowest triticale yield. The highest yield was observed in the effect group of the highest amount of nitrogen fertilizers (160 kg/ha) in the first study year (2013), which amounted to 5.17 t/ha. The grain yield of winter triticale strongly depended on the weather conditions during the whole study year and on the amount of nitrogen fertilizers. Previous authors pointed out that the triticale yield depended not only on fertilization but also on weather conditions. Some researchers point out that air is one of the most important factors influencing grain yields. A study driven by Gibson et al. [50] showed that the application of nitrogen fertilizers (33 kg/ha) increased the yield of triticale grain by 64% compared to the control group and reached 3.7 mg/ha after 2 years.
Pearson correlation analysis showed a significant relationship between triticale grain yield and its soil electrical conductivity (R = 0.79; R2 = 0.62; p = 0.002) (Figure 12). As the electrical conductivity of the soil increased, the yield of triticale also increased. Soil elec-trical conductivity can provide guidelines for assessing soil productivity. Therefore, in the future, it is necessary to clarify the mechanisms between the transfer of macro- and mi-cronutrients to agricultural crops from soils improved with mineral fertilizers in combi-nation with biochar.
Figure 12. Relationship between soil electrical conductivity (µs/cm) and triticale grain yield (t/ha).
Plant yields strongly depend on the soil conditions in which the plant root system develops. The quality of soil conditions is defined as the appropriate air-water regime, mechanical composition, and soil nutrient resources [51]. A study driven by Zhao et al. [52] showed that there was a linear correlation between soil electrical conductivity and winter wheat yield at different wheat growth stages. The coefficients of determination of the models were all greater than 0.63. The strength and direction of the relationship be-tween cereal yield and soil electrical conductivity depend on the amount of precipitation encountered in the early growing season. Cereal yields correlated strongly and negatively with electrical conductivity when there was low precipitation in March. Meanwhile,
y = 0.0068x + 1.7359R = 0.79; p = 0.002
0
0.5
1
1.5
2
2.5
3
3.5
4
0 50 100 150 200 250 300
Triti
cale
gra
in y
ield
, t/h
a
Soil electrical conductivity, µs/cm
Figure 12. Relationship between soil electrical conductivity (µs/cm) and triticale grain yield (t/ha).
Plant yields strongly depend on the soil conditions in which the plant root systemdevelops. The quality of soil conditions is defined as the appropriate air-water regime,mechanical composition, and soil nutrient resources [51]. A study driven by Zhao et al. [52]showed that there was a linear correlation between soil electrical conductivity and winterwheat yield at different wheat growth stages. The coefficients of determination of themodels were all greater than 0.63. The strength and direction of the relationship betweencereal yield and soil electrical conductivity depend on the amount of precipitation encoun-tered in the early growing season. Cereal yields correlated strongly and negatively withelectrical conductivity when there was low precipitation in March. Meanwhile, yields werepositively or weakly negatively correlated with electrical conductivity when there waslow to moderate precipitation in March [53]. Similarly, in this study, in early cultivation,in March, precipitation was on average lower (12.6 mm) than in July (22 mm) or August(35.7 mm), and lower precipitation in spring can be attributed to a strong positive soilelectrical conductivity and correlation of triticale yield. Higher nutritional values of soilmay be due to higher nutrient levels, so a positive relationship between cereal yield and soilelectrical conductivity can also be attributed to potentially higher nutrient levels. This isbecause the soil can conduct an electric current due to the movement of ions in solution, andthese mobile ions are determined by the availability of nutrients as a function of crop yield.Thus, the electrical conductivity of the soil is expected to be higher where the concentrationof nutrients required for crop growth and yield is higher.
4. Discussion and Future Research
Previous studies found that more hydrophobic soils have a higher amount of organicmatter. According to the study of Mirbabaei et al. [54], SOM, soil texture, and pH revealedsignificant relation with its hydrophobicity. The positive correlation (r = 0.42) betweenlogWDPT and the amount of SOM was found in all tested samples. Other studies founda positive correlation between the amount of organic matter and hydrophobicity in claysoil from the Utah State (USA) [55], in pine forest soil affected by wildfires from Spain [56]and in Mexican volcanic soils as well [57]. Though Vogelmann et al. [6] determined verysmall coefficients between SOM and hydrophobicity; they concluded that soils were morehydrophobic having a higher amount of organic matter. In this study, irrespective ofSOM content in sandy loam soil and tillage-fertilization practice, the soil was hydrophilicduring the whole period of investigations. It can be explained by their similar chemicalcomposition in which oxidized aluminum and silica components and hydrophilic C–Ogroups dominated, according to the molecular spectrometric method.
The soil moisture content (MC) is usually determined by the soil texture and precipita-tion. Previous studies found a positive impact of biochar on the soil MC and increase of

Plants 2022, 11, 111 18 of 22
water holding capacity (WHC) which was better expressed in sandy soils. It was shown thatsoils having a higher fraction of clay particles gained less benefit from the incorporation ofbiochar compared to sandy soils [58]. The meta-analysis of 103 studies showed a higherbiochar effect on sandy soils than clay soils and on acidic soils than on neutral soils [59].A positive impact of biochar on the increase in the soil WHC was determined in AmazonAnthrosol which was 18% higher compared to the soil without biochar [60]. It confirmsthe idea that demand for soils irrigation could potentially decrease after the applicationof biochar. It was also determined that biochar having a sufficient amount of humic com-pounds can increase soil WHC [61]. The potential of biochar to retain moisture in the soilis significant and it is very important in agricultural regions where climate change willfurther impact its water resources. Assessing the soil tillage impact on the soil WHC, it hada tendency to increase in zero-tillage (direct drilling into untilled and/or into minimumtilled soil) and at the same time, it increased available water content for plants [62]. A studydriven by Fernandez-Ugalde et al. [63] found that the water retention of soil was up to23% higher in zero-tillage compared to conventional tillage. Similarly, in this study, directdrilling revealed better results of the WHC—it was 11% higher compared to ploughlessshallow tillage.
Inherently, biochar is a very porous material and, when its initial hydrophobicityis lost, it potentially oxidizes, absorbs, and retains water [58]. A study driven by Yiet al. [64] which used low-temperature (400 ◦C) hydrophobic poultry excrement biocharand hydrophilic agricultural sandy soil mixture found that even small amounts of biocharamendment into the soil increased its hydrophobicity (variation of contact angles from8◦ in the control soil and until 20◦ after 2% of biochar addition). However, when biocharwas additionally washed with deionized water and heated at the temperature of 105 ◦Cfor 24 h, it rendered from hydrophobic to hydrophilic. Therefore, the hydrophilicity ofhydrophobic pine wood biochar and hydrophilic soil mixture can be explained by theimpact of natural abiotic factors (higher precipitation and higher average air temperature)in this study. Hajnos et al. [65] studied how the wettability of soils differed according to thewater drop penetration time (WDPT) test and found that peat soil (Haplosol) had higherWDPT than 1 h, which shows their extreme hydrophobicity, meanwhile, mineral soil hadWDPT less than 5 s and then classified as hydrophilic [65]. Obtained results confirmed thestatements that constantly soils with permanent plant cover have lower wettability thanarable agricultural soils. Hydrophobicity of soils is increased by the plants’ excreted oilsand waxes which are hardly decomposed. The wettability of soil also heavily depends onits mineral composition. Lourenco et al. [66], using the method of contact angle analysis,found that sulphides among 21 soil minerals were characterized as hydrophobic (>99◦),meanwhile silicates showed a hydrophilic tendency which varied from 0◦ (quartz) until 54◦
(calcite). In this experiment, the FTIR analysis showed that silicates were the dominant soilmineral group: it showed the strongest peaks at 1023 cm−1 wavenumber which indicatethe presence of Si–O compounds. Exactly silica tetrahedron (SiO4)4− is a fundamental unitof all silicates.
Long-term experiments, evaluating the impact of different biochar types, applicationrates, tillage-fertilization systems, and soil types on the agronomical efficiency can bethe ideal way to test whether the interaction between soil structure and water can bepermanently affected by the addition of biochar. Grassy biomass feedstock comparedto widely available woody feedstocks can offer more positive results on the availablewater content for plants [67]. Hemp can be one of such feedstocks and, according tothis study, the low-temperature (450 ◦C) hemp biochar had a higher specific surface area(BET = 39.4 m2/g) and wettability (WDPT = 2.67 s) compared to biochar types madefrom other feedstocks. It is likely that interactions between biochar-soil develop with timewhen biochar further oxidizes and contributes to the formation and stabilization of soilaggregates. Soil aggregates are an important part since they govern the stability of organicmatter; improve the structure of their pores and the solid part [68]. The selection of biochartypes and rates is an important agricultural measure for sustainable soil usage.

Plants 2022, 11, 111 19 of 22
5. Conclusions
The combined effect of 15 t/ha biochar dose and NPK fertilizers in a direct drillingsystem improved soil’s physical-chemical properties and the triticale yield (3.51 t/ha) themost. This can be explained by better nutritional conditions for plants from fertilized soildue to the incorporation of macroelements (N, P, K) with fertilizers and microelements(Zn, Cu) with biochar addition, which increases plant growth and yield. A significant rela-tionship was found between triticale grain yield and soil electrical conductivity when thecorrelation coefficient was 0.79. This indicates that with higher soil electrical conductivity,the soil contains more nutrients leading to better triticale growth and grain yields. Basedon average data from the whole 24-month experiment, 15 t/ha biochar dose increased soilorganic matter content by 33.7%, pH—6.84%, electrical conductivity—23.4%, water reten-tion capacity by 8.48%, and moisture content by 21.8% compared to the variants withoutbiochar. Irrespective of hydrophobic biochar dose, the analyzed sandy loam remainedhydrophilic or slightly hydrophobic after 24 months due to low water drop penetrationtimes (1–2 s). Its hydrophilicity can be attributed to hydrophilic hydroxide (–OH) andsilicon oxide (Si–O) functional groups, which were found using infrared spectrum at 3626,3416, 1023, and 466 cm−1 wavenumber.
Author Contributions: L.U. prepared original draft of the manuscript; performed analysis of biocharand soil physical-chemical properties; partly wrote the methodological part of the manuscript;processed data; E.B.-G. supervised the work and reviewed the manuscript; D.F. did the statisticalanalysis of the data and reviewed and edited the manuscript. All authors have read and agreed tothe published version of the manuscript.
Funding: This research did not receive any specific grant from funding agencies in the public,commercial, or not-for-profit sectors.
Institutional Review Board Statement: Not applicable.
Informed Consent Statement: Not applicable.
Data Availability Statement: All data included in the main text.
Acknowledgments: We would like to thank the scientific community of the Lithuanian ResearchCentre for Agriculture and Forestry for direct technical help, intellectual discussions about theresearch and changes made to this article.
Conflicts of Interest: The authors declare that they have no known competing financial interest orpersonal relationships that could have appeared to influence the work reported in this paper.
References1. Woche, S.K.; Goebel, M.O.; Mikutta, R.; Schurig, C.; Kaestner, M.; Guggenberger, G.; Bachmann, J. Soil wettability can be explained
by the chemical composition of particle interfaces-An XPS study. Sci. Rep. 2017, 7, 42877. [CrossRef] [PubMed]2. Bykova, G.S.; Tyugai, Z.; Yu Milanovskiy, E. Wettability of soil surface as a property of solid phase studied for Chernozems of
Kursk region. IOP Conf. Ser. Earth Environ. Sci. 2019, 368, 012010. [CrossRef]3. Lourenço, S.D.N.; Saulick, Y.; Zheng, S.; Kang, H.; Liu, D.; Lin, H.; Yao, T. Soil wettability in ground engineering: Fundamentals,
methods, and applications. Acta Geotech. 2018, 13, 1–14. [CrossRef]4. Mao, J.; Nierop, K.G.J.; Dekker, S.C.; Dekker, L.W.; Chen, B. Understanding the mechanisms of soil water repellency from
nanoscale to ecosystem scale: A review. J. Soil. Sediment. 2019, 19, 171–185. [CrossRef]5. Chenu, C.; Le Bissonnais, Y.; Arrouays, D. Organic matter influence on clay wettability and soil aggregate stability. Soil Sci. Soc.
Am. J. 2000, 64, 1479–1486. [CrossRef]6. Vogelmann, E.S.; Reichert, J.M.; Reinert, D.J.; Mentges, M.I.; Vieira, D.A.; de Barros, C.A.P.; Fasinmirin, J.T. Water repellency in
soils of humid subtropical climate of Rio Grande do Sul, Brazil. Soil Till. Res. 2010, 110, 126–133. [CrossRef]7. Vogelmann, E.S.; Reichert, J.M.; Prevedello, J.; Awe, G.O. Hydro-physical processes and soil properties correlated with origin of
soil hydrophobicity. Ciênc. Rural. 2013, 43, 1582–1589. [CrossRef]8. Gonzalez-Penaloza, A.; Cerda, A.; Zavala, L.M.; Jordan, A.; Gimenez-Morera, A.; Arcenegui, V. Do conservative agriculture
practices increase soil water repellency? A case study in citrus-cropped soils. Soil Tillage Res. 2012, 124, 233–239. [CrossRef]9. Müller, K.; Deurer, M. Review of the remediation strategies for soil water repellency. Agric. Ecosyst. Environ. 2011, 144, 208–221.
[CrossRef]

Plants 2022, 11, 111 20 of 22
10. Jaramillo, J.D.F. Repelencia Al Agua En Suelos: Con Enfasis En Andisoles De Antioquia; Universidad Nacional de Colombia: Medellin,Colombia, 2004; p. 197.
11. Diehl, D. Soil water repellency: Dynamics of heterogeneous surfaces. Colloid. Surf. A Physicochem. Eng. Asp. 2013, 432, 8–18.[CrossRef]
12. Amer, A.; Schaumann, G.E.; Diehl, D. The effect of pH modification on wetting kinetics of a naturally water-repellent coniferousforest soil. Eur. J. Soil Sci. 2017, 68, 317–326. [CrossRef]
13. Doerr, S.H.; Shakesby, R.A.; Walsh, R.P.D. Soil water repellency: Its causes, characteristics and hydro-geomorphological signifi-cance. Earth Sci. Rev. 2000, 51, 33–65. [CrossRef]
14. Keizer, J.J.; Doerr, S.H.; Malvar, M.C.; Ferreira, A.J.D.; Pereira, V.M.F.G. Temporal and spatial variations in topsoil water repellencythroughout a crop-rotation cycle on sandy soil in north-central Portugal. Hydrol. Process. 2007, 21, 2317–2324. [CrossRef]
15. Hubbert, K.R.; Wohlgemuth, P.M.; Beyers, J.L.; Narog, M.G.; Gerrard, R. Post-fire soil water repellency, hydrologic response, andsediment yield compared between grass-converted and chaparral watersheds. Fire Ecol. 2012, 8, 143–162. [CrossRef]
16. Vogelmann, E.S.; Reichert, J.M.; Prevedello, J.; Awe, G.O.; Cerdà, A. Soil moisture influences sorptivity and water repellency oftopsoil aggregates in native grasslands. Geoderma 2017, 305, 374–381. [CrossRef]
17. Han, S.H.; An, J.Y.; Hwang, J.; Kim, S.B.; Park, B.B. The effects of organic manure and chemical fertilizer on the growth andnutrient concentrations of yellow poplar (Liriodendron tulipifera Lin.) in a nursery system. For. Sci. Technol. 2016, 12, 137–143.
18. Wojcik-Gront, E.; Studnicki, M. Long-term yield variability of triticale (x Triticosecale Wittmack) tested using a CART model.Agriculture 2021, 11, 92. [CrossRef]
19. Bielski, S.; Romaneckas, K.; Šarauskis, E. Impact of nitrogen and boron fertilization on winter triticale productivity parameters.Agronomy 2020, 10, 279. [CrossRef]
20. Hallin, I.L.; Douglas, P.; Doerr, S.H.; Bryant, R. The effect of addition of a wettable biochar on soil water repellency. Eur. J. Soil Sci.2015, 66, 1063–1073. [CrossRef]
21. Głab, T.; Palmowska, J.; Zaleski, T.; Gondek, K. Effect of biochar application on soil hydrological properties and physical qualityof sandy soil. Geoderma 2016, 281, 11–20. [CrossRef]
22. Brischke, C.; Wegener, F.L. Impact of water holding capacity and moisture content of soil substrates on the moisture content ofwood in terrestrial microcosms. Forests 2019, 10, 485. [CrossRef]
23. Motuzas, A.J.; Buivydaite, V.; Danilevicius, V.; Šleinys, R. Mokslo Ir Enciklopediju Leidykla; Dirvotyra: Vilnius, Lithuania, 1996;p. 375.
24. Buivydaite, V.; Motuzas, A. Pagrindines dirvožemio fizikines savybes. In Geologijos Pagrindu Ir Dirvotyros Laboratoriniai Darbai;Vytautas Magnus University: Kaunas, Lithuania, 2000; pp. 44–48.
25. Ronsse, F.; van Hecke, S.; Dickinson, D.; Prins, W. Production and characterization of slow pyrolysis biochar: Influence offeedstock type and pyrolysis conditions. GCB Bioenergy 2013, 5, 104–115. [CrossRef]
26. Komkiene, J.; Baltrenaite, E. Biochar as adsorbent for removal of heavy metal ions [Cadmium(II), Copper(II), Lead(II), Zinc(II)]from aqueous phase. Int. J. Environ. Sci. Technol. 2016, 13, 471–482. [CrossRef]
27. European Biochar Foundation (EBC). Guidelines for a Sustainable Production of Biochar; European Biochar Foundation: Arbaz,Switzerland, 2012. Available online: http://european-biochar.org (accessed on 1 August 2021).
28. Pundyte, N.; Baltrenaite, E.; Pereira, P.; Paliulis, D. Anthropogenic effects on heavy metals and macronutrients accumulation insoil and wood of Pinus sylvestris L. J. Environ. Eng. Landsc. Manag. 2011, 19, 34–43.
29. Huang, M.; Zhou, X.; Chen, J.; Cao, F.; Jiang, L.; Zou, Y. Interaction of changes in pH and urease activity induced by biocharaddition affects ammonia volatilization on an acid paddy soil following application of urea. Comm. Soil Sci. Plant Anal. 2017, 48,107–112. [CrossRef]
30. Baltrenas, P.; Baltrenaite, E.; Kleiza, J.; Švediene, J. A biochar-based medium in the biofiltration system: Removal efficiency,microorganism propagation, and the medium penetration modeling. J. Air Waste Manag. Assoc. 2016, 66, 673–686. [CrossRef][PubMed]
31. Pituello, C.; Francioso, O.; Simonetti, G.; Pisi, A.; Torreggiani, A.; Berti, A.; Morari, F. Characterization of chemical–physical,structural and morphological properties of biochars from biowastes produced at different temperatures. J. Soil. Sediment. 2015, 15,792–804. [CrossRef]
32. Hilber, I.; Bastos, A.C.; Loureiro, S.; Soja, G.; Marsz, A.; Cornelissen, G.; Bucheli, T.D. The different faces of biochar: Contaminationrisk versus remediation tool. J. Environ. Eng. Landsc. Manag. 2017, 25, 86–104. [CrossRef]
33. Abdulrazzaq, H.; Jol, H.; Husni, A.; Abu-Bakr, R. Characterization and Stabilisation of Biochars Obtained from Empty FruitBunch, Wood, and Rice Husk. BioResources 2014, 9, 2888–2898. [CrossRef]
34. Zheng, Y.; Han, X.; Li, Y.; Yang, J.; Li, N.; An, N. Effects of biochar and straw application on the physicochemical and biologicalproperties of paddy soils in Northeast China. Sci. Rep. 2019, 9, 16531. [CrossRef]
35. Kochiieru, M.; Feiziene, D.; Feiza, V.; Volungevicius, J.; Velykis, A.; Slepetiene, A.; Deveikyte, I.; Seibutis, V. Freezing-thawingimpact on aggregate stability as affected by land management, soil genesis and soil chemical and physical quality. Soil Till. Res.2020, 203, 104705. [CrossRef]
36. Kochiieru, M.; Lamorski, K.; Feiza, V.; Feiziene, D.; Volungevicius, J. The effect of soil macroporosity, temperature and watercontent on CO2 efflux in the soils of different genesis and land management. Zemdirbyste 2018, 105, 291–298. [CrossRef]

Plants 2022, 11, 111 21 of 22
37. Eltarazov, S. Soil Salinity Assessment In Syrdarya Province, Uzbekistan. Master’s Thesis, Wageningen University And ResearchCentre, Wageningen, The Netherlands, 2016.
38. Qayyum, M.F.; Steffens, D.; Reisenauer, H.P.; Schubert, S. Biochars influence differential distribution and chemical composition ofsoil organic matter. Plant Soil Environ. 2014, 60, 337–343.
39. Wang, Y.; Xiao, X.; Chen, B. Biochar Impacts on Soil Silicon Dissolution Kinetics and their Interaction Mechanisms. Sci. Rep. 2018,8, 1–11.
40. Šimon, T. Characterisation of soil organic matter in long-term fallow experiment with respect to the soil hydrophobicity andwettability. Soil Water Res. 2007, 3, 96–103. [CrossRef]
41. Zemfira, T.; Milanovskiy, E. The contact angle of wetting of the solid phase of soil before and after chemical modification. EurasianJ. Soil Sci. (EJSS) 2015, 4, 191–197. [CrossRef]
42. Widowati, S.; Hidayati, K.; Wahyu, F. Soil amendment impact to soil organic matter and physical properties on the three soiltypes after second corn cultivation. AIMS Agric. Food 2020, 5, 150–168. [CrossRef]
43. Yu, O.-Y.; Raichle, B.; Sink, S. Impact of biochar on the water holding capacity of loamy sand soil. Int. J. Energy Environ. Eng. 2013,4, 44. [CrossRef]
44. Novak, J.M.; Lima, I.; Xing, B.; Gaskin, J.W.; Steiner, C.; Das, K.C.; Ahmedna, M.; Rehrah, D.; Watts, D.W.; Busscher, W.J.; et al.Characterization of designer biochar produced at different temperatures and their effects on a loamy sand. Ann. Environ. Sci.2009, 3, 195–206.
45. Raczkowski, C.; Mueller, J.P.; Busscher, W.J.; Bell, M.C.; McGraw, M.L. Soil physical properties of agricultural systems in alarge-scale study. Soil Till. Res. 2012, 119, 50–59. [CrossRef]
46. Ren, X.; Sun, H.; Wang, F.; Zhang, P.; Zhu, H. Effect of aging in field soil on biochar’s properties and its sorption capacity. Environ.Pollut. 2018, 242, 1880–1886. [CrossRef]
47. Ojeda, G.; Mattana, S.; Avila, A.; Alcaniz, J.M.; Volkmann, M.; Bachmann, J. Are soil-water functions affected by biocharapplication? Geoderma 2015, 249–250, 1–11. [CrossRef]
48. Terzic, D.; Rajicic, V.; Popovic, V.; Jevtic, S. Effect of long term fertilization on grain yield and yield components of winter triticale.J. Anim. Plant Sci. 2018, 28, 830–836.
49. Gebremedhin, G.H.; Haileselassie, B.; Berhe, D.; Belay, T. Effect of biochar on yield and yield components of wheat andpost-harvest soil properties in Tigray, Ethiopia. Fertil. Pestic. 2015, 6, 2.
50. Gibson, L.R.; Nance, C.D.; Karlen, D.L. Winter Triticale Response to Nitrogen Fertilization when Grown after Corn or Soybean.J. Agron. 2007, 99, 49–58. [CrossRef]
51. Biberdzic, M.; Barac, S.; Lalevic, D.; Djikic, A. Influence of soil tillage system on soil compaction and winter wheat yield. Chil. J.Agric. Res. 2020, 80, 80–89. [CrossRef]
52. Zhao, Y.; Li, M.; Zhang, J. Correlation between soil electrical conductivity and winter wheat yield. Trans. Chin. Soc. Agric. Eng.2009, 25, 34–37.
53. Kravchenko, A.; Thelen, K.D.; Bullock, D.G.; Miller, N.R. Relationship among crop grain yield, topography, and soil electricalconductivity studied with cross-correlograms. J. Agron. 2003, 95, 1132–1139. [CrossRef]
54. Mirbabaei, S.M.; Shahrestani, M.S.; Zolfaghari, A.; Abkenar, K.T. Relationship between soil water repellency and some of soilproperties in northern Iran. Catena 2013, 108, 26–34. [CrossRef]
55. Mataix-Solera, J.; Doerr, S.H. Hydrophobicity and aggregate stability in calcareous topsoils from fire-affected pine forests insoutheastern Spain. Geoderma 2004, 118, 77–88. [CrossRef]
56. Varela, M.E.; Benito, E.; de Blas, E. Impact of wildfires on surface water repellency in soils of northwest Spain. Hydrol. Process.2005, 19, 3649–3657. [CrossRef]
57. Zavala, L.M.; González, F.A.; Jordán, A. Fire-induced soil water repellency under different vegetation types along the Atlanticdune coast-line in SW Spain. Catena 2009, 79, 153–162. [CrossRef]
58. Atkinson, C.J.; Fitzgerald, J.D.; Hipps, N.A. Potential mechanisms for achieving agricultural benefits from biochar application totemperate soils: A review. Plant Soil 2010, 337, 1–18. [CrossRef]
59. Alotaibi, K.D.; Schoenau, J.J. Addition of biochar to a sandy desert soil: Effect on crop growth, water retention and selectedproperties. Agronomy 2019, 9, 327. [CrossRef]
60. Glaser, B.; Lehmann, J.; Zech, W. Ameliorating physical and chemical properties of highly weathered soils in the tropics withcharcoal-A review. Biol. Fertil. Soils 2002, 35, 219–230. [CrossRef]
61. Piccolo, A.; Pietramellara, G.; Mbagwu, J.S.C. Effects of coal derived humic substances on water retention and structural stabilityof mediterranean soils. Soil Use Manag. 1996, 12, 209–213. [CrossRef]
62. Alam, M.K.; Islam, M.M.; Salahin, N.; Hasanuzzaman, M. Effect of tillage practices on soil properties and crop productivity inwheat-mungbean-rice cropping system under subtropical climatic conditions. Sci. World J. 2014, 2014, 1–15. [CrossRef]
63. Fernandez-Ugalde, O.; Virto, I.; Bescansa, P.; Imaz, M.J.; Enrique, A.; Karlen, D.L. No-tillage improvement of soil physical qualityin calcerous, degradation-prone, simarid soils. Soil Tillage Res. 2009, 106, 29–35. [CrossRef]
64. Yi, S.C.; Witt, B.; Guo, M.; Chiu, P.; Imhoff, P.T. Wettability of poultry litter biochars at variable pyrolysis temperature and theirimpact on soil wettability and water retention relationships. In Proceedings of the Conference American Geophysical Union FallMeeting, San Francisco, CA, USA, 3–7 December 2012.
65. Hajnos, M.; Calka, A.; Jozefaciuk, G. Wettability of mineral soils. Geoderma 2013, 206, 63–69. [CrossRef]

Plants 2022, 11, 111 22 of 22
66. Lourenço, S.D.N.; Woche, S.K.; Bachmann, J.; Saulick, Y. Wettability of crushed air-dried minerals. Geotech. Lett. 2015, 5, 173–177.[CrossRef]
67. Burrell, L.D.; Zehetner, F.; Rampazzo, N.; Wimmer, B.; Soja, G. Long-term effects of biochar on soil physical properties. Geoderma2016, 282, 96–102. [CrossRef]
68. Wanniarachchi, D.; Cheema, M.; Thomas, R.; Kavanagh, V.; Galagedara, L. Impact of soil amendments on the hydraulicconductivity of boreal agricultural podzols. Agriculture 2019, 9, 133. [CrossRef]