The effects of freezing, boiling and degreasing on the microstructure of bone
12
HOMO - Journal of Comparative Human Biology 65 (2014) 131–142 Contents lists available at ScienceDirect HOMO - Journal of Comparative Human Biology j o urnal homepage: www.elsevier.com/locate/jchb The effects of freezing, boiling and degreasing on the microstructure of bone S.L. Lander ∗ , D. Brits, M. Hosie School of Anatomical Sciences, Faculty of Health Sciences, University of the Witwatersrand, Johannesburg 2193, South Africa a r t i c l e i n f o Article history: Received 23 October 2012 Accepted 7 September 2013 a b s t r a c t The histology of bone has been a useful tool in research. It is com- monly used to estimate the age of an individual at death, to assess if the bone is of human or non-human origin and in trauma analysis. Factors that affect the histology of bone include age, sex, population affinity and burning to name but a few. Other factors expected to affect bone histology are freezing, boiling and degreasing but very little information is available for freezing and the effect thereof, and it is unknown if boiling and degreasing affects bone histology. The aim of this study was to assess the effects of freezing, freezing and boiling, and freezing, boiling and degreasing on the histological structure of compact bone. Five cadaver tibiae were frozen at −20 ◦ C for 21 days followed by segments being boiled in water for three days and degreased in trichloroethylene at 82 ◦ C for three days. Anterior midshaft sections were prepared as ground sections and for Scanning Electron Microscopy (SEM). Quantitatively, there were no significant differences between freezing, boiling and degreasing; however, qualitative differences were observed using SEM. After being frozen the bone displayed cracks and after boiling the bones displayed erosion pits on the surface. It is suggested that further research, using different durations and temperatures for boiling and freezing be undertaken on bone samples representing different ages and various skeletal elements. © 2013 Elsevier GmbH. All rights reserved. ∗ Corresponding author. Tel.: +27 724465881. E-mail address: [email protected] (S.L. Lander). 0018-442X/$ – see front matter © 2013 Elsevier GmbH. All rights reserved. http://dx.doi.org/10.1016/j.jchb.2013.09.006
Transcript of The effects of freezing, boiling and degreasing on the microstructure of bone

HOMO - Journal of Comparative Human Biology 65 (2014) 131–142
Contents lists available at ScienceDirect
HOMO - Journal of ComparativeHuman Biology
j o urnal homepage: www.elsev ier .com/ locate / j chb
The effects of freezing, boiling and degreasingon the microstructure of bone
S.L. Lander ∗, D. Brits, M. HosieSchool of Anatomical Sciences, Faculty of Health Sciences, University of the Witwatersrand, Johannesburg2193, South Africa
a r t i c l e i n f o
Article history:Received 23 October 2012Accepted 7 September 2013
a b s t r a c t
The histology of bone has been a useful tool in research. It is com-monly used to estimate the age of an individual at death, to assess ifthe bone is of human or non-human origin and in trauma analysis.Factors that affect the histology of bone include age, sex, populationaffinity and burning to name but a few. Other factors expected toaffect bone histology are freezing, boiling and degreasing but verylittle information is available for freezing and the effect thereof,and it is unknown if boiling and degreasing affects bone histology.The aim of this study was to assess the effects of freezing, freezingand boiling, and freezing, boiling and degreasing on the histologicalstructure of compact bone. Five cadaver tibiae were frozen at −20 ◦Cfor 21 days followed by segments being boiled in water for threedays and degreased in trichloroethylene at 82 ◦C for three days.Anterior midshaft sections were prepared as ground sections andfor Scanning Electron Microscopy (SEM). Quantitatively, there wereno significant differences between freezing, boiling and degreasing;however, qualitative differences were observed using SEM. Afterbeing frozen the bone displayed cracks and after boiling the bonesdisplayed erosion pits on the surface. It is suggested that furtherresearch, using different durations and temperatures for boilingand freezing be undertaken on bone samples representing differentages and various skeletal elements.
© 2013 Elsevier GmbH. All rights reserved.
∗ Corresponding author. Tel.: +27 724465881.E-mail address: [email protected] (S.L. Lander).
0018-442X/$ – see front matter © 2013 Elsevier GmbH. All rights reserved.http://dx.doi.org/10.1016/j.jchb.2013.09.006

132 S.L. Lander et al. / HOMO - Journal of Comparative Human Biology 65 (2014) 131–142
Introduction
The histological structure of compact bone consists of long cylindrical Haversian systems, alsoknown as osteons, that have circumferentially arranged lamellae and a centrally placed Haversiancanal which runs longitudinally through the compact bone (Kramer and Allan, 2005; Robling and Stout,1999). The histomorphometry of bone has been used to estimate the age of an individual at death(Robling and Stout, 2000; Rösing et al., 2007; Singh and Gunberg, 1970), whether a bone fragmentis human or non-human (Hillier and Bell, 2007), and to assess differences between the sexes andpopulations in bioarchaeology and in trauma analysis (Ubelaker, 1998).
Many factors affect the histological interpretations of bone such as the sectioning angle, specificbone examined and bone portion sampled, where Haversian systems, for example, can be described asoval or elliptic in shape if not sectioned perpendicularly. Additionally different skeletal elements areknown to vary histologically with differences in Haversian system sizes observed between ribs, femoraand fibulae (Evans and Bang, 1966; Pirock et al., 1966). Similarly, a single bone can exhibit randomand systematic histological differences as it is seen in areas with and without muscle attachments,where an increased number of Haversian systems are present where muscles insert (Currey, 2003).Other factors include age (Curtis and Nawrocki, 2010; Hillier and Bell, 2007; Singh and Gunberg, 1970;Smith and Walker, 1964), sex (Currey, 2003; Hillier and Bell, 2007; Mulhern and Van Gerven, 1997),pathology (Schultz, 2001), diagenesis (Hollund et al., 2012; Jans et al., 2002) and burning (Cattaneoet al., 1999). For example, females have larger Haversian systems while males have more numerousHaversian systems (Hillier and Bell, 2007) and when assessing burnt bone it is found that shrinkageof the bone occurs at specific temperatures (Cattaneo et al., 1999).
The dry storage of skeletal collections found in some museums and universities is due to the clean-ing and preparation of bone for analytical research in forensic science, zoology and anthropology, toname but a few disciplines (Simonsen et al., 2011). The preparation of bone requires specific proce-dures and particular techniques to ensure good quality dry bones that can provide researchers witha plethora of information. Frequently used methods to prepare dry bones include boiling, degreasingand bleaching which removes all the soft tissue and fat present. These techniques or combination oftechniques might affect the appearance of bone as research has shown that dehydration that occursbetween 100 ◦C and 600 ◦C, results in severe cracks and fractures (Shipman et al., 1984; Thompson,2004). Moreover, little information on the effects of boiling and degreasing temperatures is availableand as research on bone is done in institutions that employ these techniques, it is important to assesssuch effects, if any.
Small animal specimens such as cats and chickens are often frozen prior to dissection and undergosubsequent boiling and degreasing, instead of being embalmed. Similarly, cadavers and forensicremains are often frozen for short periods of time prior to analyses. Research on frozen bone has shownan area enlargement of cells and nuclei, osteocytes disappearing, collagen disorganization (Andradeet al., 2008) and cracking found around the centre of the Haversian canal due to liquid expansion(Tersigni, 2007). However, no information is available on the effects of freezing in conjunction withboiling and degreasing on bone histomorphometry. It is thus important that all these preparationtechniques (freezing, boiling, degreasing) are assessed consecutively to establish if bone that hadbeen frozen, boiled and degreased shows any microscopic alterations that could potentially affectthe conclusions drawn from the bone microstructure. Therefore, the aim of this study was to assessthe effects of freezing, freezing and boiling, and freezing, boiling and degreasing on the histologicalstructure of compact bone.
Materials and methods
Five left tibiae were dissected from randomly selected cadavers housed at the School of AnatomicalSciences, University of the Witwatersrand at the onset of this research. The demographic informationof these individuals i.e., age, sex and ancestry, is known and is documented in Table 1. The ages of theselected cadavers ranged between 66 and 92 years with an average of 82.2 and SD = 10.5 years. Theseages are in line with the normal acquisition ages seen for white individuals at the University of theWitwatersrand, which are most often represented by elderly individuals (Dayal et al., 2009). After the

S.L. Lander et al. / HOMO - Journal of Comparative Human Biology 65 (2014) 131–142 133
Table 1Demographic information of the sample.
Individual no. Age Sex Population affinity
61 92 Male Black64 85 Male White65 90 Female White68 66 Male White69 78 Male White
tibiae were removed, they were cleaned using water, a scrubbing sponge and dissecting instrumentsbefore being sawn in half using an electric saw. Sections were removed from the anterior midshaft ofthe proximal half of the tibiae for the preparation of control sections: 1–2 mm sections were removedfor the preparation of ground sections and 3–4 mm sections were removed for Scanning ElectronMicroscopy (SEM) samples. Thereafter the proximal and distal halves were frozen at −20 ◦C for 21days after which bone sections were removed for ground section and SEM preparation. The tibiaewere frozen for 21 days in line with suggestions by Tersigni (2007) to allow for direct comparisons ofthe histomorphological results, however it should be noted that situations might arise where bonesare frozen for shorter or longer periods of time. The temperature of −20 ◦C was chosen as this is thestandard freezing temperature set for most deep freezers and would be used for the storage of bone.
Following the 21 days of freezing, the bones were thawed and the distal halves of the tibiae wereboiled in water for three days according to the established processing procedures of the School ofAnatomical Sciences, University of the Witwatersrand (Mr. J. Mekwa, personal communication) andsectioned as described above. Following the maceration (boiling) procedures the remaining distalportions of the tibiae were degreased in trichloroethylene at 82 ◦C for three days.
Ground sections were prepared according to stipulations by Maat et al. (2001) where P220 water-proof abrasive paper was attached to a glass slide with Vaseline and sections were manually groundby hand in distilled water until the sections became reasonably thin. The sections were washed twicein distilled water to remove the dirt particles from the sections and allowed to air-dry for 7 days beforebeing mounted onto slides and coverslipped using Entellan. Once the specimen had been mounted atransect line was drawn down the middle of each ground section from the most anterior aspect of thesection to the most posterior aspect. Using a Zeiss Axioskop 2 Plus Microscope at 100× magnification,three consecutive images were taken from the anterior margin of the section closest to the transectline and using Adobe Photoshop Cs2 version 9 each image was overlaid with a random number samp-ling grid (Fig. 1). Using a random number table to select the squares on the image with the overlaidsampling grid, three randomly selected Haversian systems found to be lying in the selected squareswere measured. Using Image J version 1.44p (Rasband, 1997–2008) the diameter at the broadest partof the Haversian system (maximum Haversian system diameter) and the Haversian canal (maximumHaversian canal diameter) were measured and perpendicularly to these measurements, the diame-ter at the narrowest part of the Haversian system (minimum Haversian system diameter) and theHaversian canal (minimum Haversian canal diameter) were measured (Fig. 1). Each measurementwas repeated three times by the same observer, consecutively in order to obtain a measurement aver-age. The minimum, maximum, mean and standard deviations for each of the measurements werecalculated using PAST (Hammer et al., 2001). The mean area of the Haversian systems and Haver-sian canals were also calculated from the measurements using the formula: area = �(½ × maximumdiameter)(½ × minimum diameter) to compare with the literature available for the tibia where themean area was used (Francis, 1999–2010).
To determine the effects of the preparation techniques on the histomorphometry of bone a two-wayfactorial ANOVA was used to compare the measurements described above between the individuals,between the preparation techniques and the interaction between the individual and the prepara-tion technique. A Tukey HSD post hoc test was run to determine where the significant differenceslay. These statistical tests were run in R version 2.12.1 (The R Foundation for Statistical Computing;www.r-project.org) with a significance of p = 0.05. To accommodate for intra and inter-observer error

134 S.L. Lander et al. / HOMO - Journal of Comparative Human Biology 65 (2014) 131–142
Fig. 1. A ground section image that was overlaid with a random number sampling grid displaying maximum and minimummeasurements of the Haversian system and Haversian canal.
the initial observer as well as an independent researcher re-measured 10% of the original data whichwere averaged and tested similar to the above using a two-way factorial ANOVA.
Scanning Electron Microscopy was used to assess the surface of the bones for any changes poten-tially related to the freezing, boiling and degreasing techniques. This was done by comparing the bonesurface of each of the control samples to the surface of the respective frozen bone sections. The frozensection surfaces were subsequently compared with the surfaces of the boiled bone and the boiledbones surfaces were finally compared with the degreased bone surfaces. Any structural differencessuch as cracks and irregularities or anomalies were noted. The segments prepared for SEM were fixedin 2.5% glutaraldehyde in 0.2 M phosphate buffer, pH 7.4 for 3 h. Thereafter the segments were washedin 0.1 M phosphate buffer, pH 7.4 for 5 min three times over and dehydrated in alcohol. The segmentswere placed in a dessicator for 40 h and mounted onto aluminium stubs. Images were taken of thesurface of the bone using the FEI Quanta 400F Environmental Scanning Electron Microscope (ESEM).
Results
Table 2 displays the descriptive statistics for the minimum and maximum diameter measurementsof the Haversian systems and the Haversian canals for the control, frozen, boiled, and degreasedsamples. It also illustrates the relative sizes of the Haversian systems and Haversian canals as wellas how they compare to their mean values for these samples. The control, frozen and boiled sam-ple had been standardized before the degreased sample was added at a later stage resulting in asmaller sample size. Means for the maximum diameter of the Haversian systems for the control,frozen, boiled and degreased samples were 0.243, 0.246, 0.256 and 0.253 mm, respectively. The meanfor the minimum diameter of the Haversian systems for the control, frozen, boiled and degreased

S.L. Lander
et al.
/ H
OM
O -
Journal of
Comparative
Hum
an Biology
65 (2014)
131–142
135
Table 2Descriptive statistics for the measurements of Haversian systems from the control, frozen, boiled and degreased samples (mm).
Control (n = 222) Frozen (n = 222) Boiled (n = 222) Degreased (n = 141)
Min Max Mean SD Min Max Mean SD Min Max Mean SD Min Max Mean SD
Maximum diameter of Haversian system 0.096 0.464 0.243 0.069 0.082 0.515 0.246 0.076 0.106 0.551 0.256 0.067 0.115 0.488 0.253 0.064Minimum diameter of Haversian system 0.056 0.339 0.190 0.053 0.073 0.360 0.193 0.060 0.104 0.355 0.198 0.049 0.090 0.384 0.189 0.047Maximum diameter of Haversian canal 0.011 0.230 0.074 0.040 0.019 0.256 0.079 0.048 0.018 0.251 0.079 0.042 0.022 0.246 0.073 0.036Minimum diameter of Haversian canal 0.009 0.162 0.055 0.029 0.012 0.194 0.058 0.034 0.013 0.214 0.059 0.031 0.015 0.163 0.054 0.024
136 S.L. Lander et al. / HOMO - Journal of Comparative Human Biology 65 (2014) 131–142
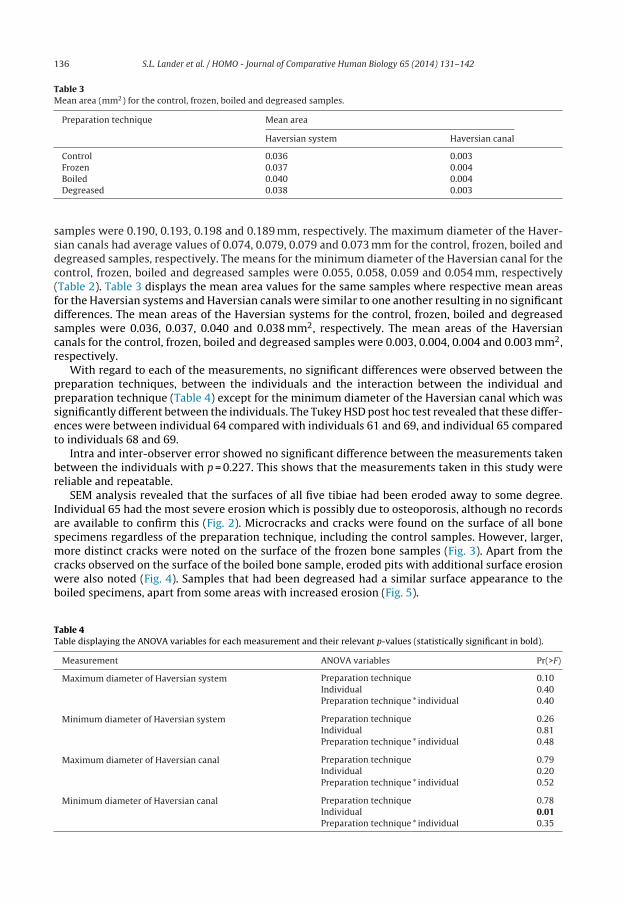
Table 3Mean area (mm2) for the control, frozen, boiled and degreased samples.
Preparation technique Mean area
Haversian system Haversian canal
Control 0.036 0.003Frozen 0.037 0.004Boiled 0.040 0.004Degreased 0.038 0.003
samples were 0.190, 0.193, 0.198 and 0.189 mm, respectively. The maximum diameter of the Haver-sian canals had average values of 0.074, 0.079, 0.079 and 0.073 mm for the control, frozen, boiled anddegreased samples, respectively. The means for the minimum diameter of the Haversian canal for thecontrol, frozen, boiled and degreased samples were 0.055, 0.058, 0.059 and 0.054 mm, respectively(Table 2). Table 3 displays the mean area values for the same samples where respective mean areasfor the Haversian systems and Haversian canals were similar to one another resulting in no significantdifferences. The mean areas of the Haversian systems for the control, frozen, boiled and degreasedsamples were 0.036, 0.037, 0.040 and 0.038 mm2, respectively. The mean areas of the Haversiancanals for the control, frozen, boiled and degreased samples were 0.003, 0.004, 0.004 and 0.003 mm2,respectively.
With regard to each of the measurements, no significant differences were observed between thepreparation techniques, between the individuals and the interaction between the individual andpreparation technique (Table 4) except for the minimum diameter of the Haversian canal which wassignificantly different between the individuals. The Tukey HSD post hoc test revealed that these differ-ences were between individual 64 compared with individuals 61 and 69, and individual 65 comparedto individuals 68 and 69.
Intra and inter-observer error showed no significant difference between the measurements takenbetween the individuals with p = 0.227. This shows that the measurements taken in this study werereliable and repeatable.
SEM analysis revealed that the surfaces of all five tibiae had been eroded away to some degree.Individual 65 had the most severe erosion which is possibly due to osteoporosis, although no recordsare available to confirm this (Fig. 2). Microcracks and cracks were found on the surface of all bonespecimens regardless of the preparation technique, including the control samples. However, larger,more distinct cracks were noted on the surface of the frozen bone samples (Fig. 3). Apart from thecracks observed on the surface of the boiled bone sample, eroded pits with additional surface erosionwere also noted (Fig. 4). Samples that had been degreased had a similar surface appearance to theboiled specimens, apart from some areas with increased erosion (Fig. 5).
Table 4Table displaying the ANOVA variables for each measurement and their relevant p-values (statistically significant in bold).
Measurement ANOVA variables Pr(>F)
Maximum diameter of Haversian system Preparation technique 0.10Individual 0.40Preparation technique * individual 0.40
Minimum diameter of Haversian system Preparation technique 0.26Individual 0.81Preparation technique * individual 0.48
Maximum diameter of Haversian canal Preparation technique 0.79Individual 0.20Preparation technique * individual 0.52
Minimum diameter of Haversian canal Preparation technique 0.78Individual 0.01Preparation technique * individual 0.35

S.L. Lander et al. / HOMO - Journal of Comparative Human Biology 65 (2014) 131–142 137
Fig. 2. An SEM image illustrating the surface erosion of the control bone sample for individual 65.
Fig. 3. An SEM image illustrating the surface cracks with white arrows for the bone sample of individual 64 that had beenfrozen.
Discussion
Histological bone research in forensic sciences, zoology and anthropology often requires the useof dry skeletal remains to assess age, trauma, pathology and human or non-human origin. The resultsof such research are however greatly affected by the preservation of the microstructure of the bone

138 S.L. Lander et al. / HOMO - Journal of Comparative Human Biology 65 (2014) 131–142
Fig. 4. An SEM image demonstrating erosion and pits on the surface of the bone sample of individual 69 after being frozen andboiled.
Fig. 5. An SEM image illustrating the additional erosion on the surface of the bone of individual 69 after being frozen, boiledand degreased.
which is affected by factors such as pathology (Schultz, 2001), diagenesis (Hollund et al., 2012; Janset al., 2002) and potentially the bone preparation techniques employed when preparing dry skeletalremains. This study was aimed at describing the potential effects of the various preparation techniqueson the histomorphology and surface anatomy of bone using ground sections and SEM.

S.L. Lander et al. / HOMO - Journal of Comparative Human Biology 65 (2014) 131–142 139
Ground sections
When the mean values for each measurement were compared between the control, frozen, boiledand degreased samples they were found to be very similar. The average measurements increasedslightly from control to frozen to macerated, however none of the differences were statistically sig-nificant. Many studies have assessed the Haversian system sizes found in ribs and femora (Burr et al.,1990; Currey, 1964; Hattner et al., 1965; Hillier and Bell, 2007; Jowsey, 1966; Landeros and Frost, 1964;Pfeiffer, 1998; Pfeiffer et al., 2006; Takahashi et al., 1965) but very little research has been done on theHaversian system sizes found in the tibia. As Haversian system size differs between the bones of thebody (Evans and Bang, 1967), the mean Haversian system and Haversian canal sizes of this study couldnot be directly compared with those values reported for ribs and femora. However in comparison, themean Haversian system area and Haversian canal area obtained by Pfeiffer et al. (2006) for femora andribs illustrated that the mean Haversian system area for the tibia was larger than the mean Haversiansystem area of the ribs and similar to the mean Haversian system area of the femora. Likewise, themean Haversian canal area for the tibia was also larger than the mean Haversian canal area of the riband similar to the mean Haversian canal area of the femora. This suggests that weight-bearing bonessuch as the tibia and femur have larger Haversian system and Haversian canal sizes compared to othernon-weight-bearing bones such as ribs, however further research is needed.
The average Haversian system areas calculated for the control, frozen, boiled and degreased samplesin the current study compare well with the values reported by Black et al. (1974) for the tibiae with amean Haversian system area ranging from 0.040 to 0.069 mm2 depending on the individual. Thompsonand Galvin (1983) also reported values for the tibiae with a mean Haversian system area of 0.036 mm2
for their sample for individuals less than 35 years and a mean Haversian system area of 0.030 mm2 forindividuals older than 35 years. Interestingly, the mean Haversian system area values obtained in thisstudy compared well with the mean Haversian system area for their sample of individuals less than35 years and not for their sample of individuals greater than 35 years.
Similarly the mean Haversian canal areas observed in the current study also fall within the rangesreported by Black et al. (1974) with a mean Haversian canal area ranging from 0.003 to 0.040 mm2
between the individuals. Thompson and Galvin (1983) on the other hand, though they had similarvalues for both samples less than 35 years of 0.0022 mm2 and greater than 35 years of 0.0023 mm2,produced values slightly lower than the values observed in the current study. It is important to notethat mean Haversian system size varies based on age, sex and population affinity (Enlow, 1966; Hillierand Bell, 2007; Singh and Gunberg, 1970), which could explain the differences observed in the highervariations found between individuals in Black et al. (1974) and lower variations found in Thompsonand Galvin (1983). However, overall the Haversian system and Haversian canal areas in this studywere similar to those in the literature.
The above mentioned studies describe Haversian system and Haversian canal sizes as measuredfrom dry bone, however, not all authors mention which preparation techniques had been used to cleanthe skeletal remains. This emphasises the importance of the assessment of the effects of preparationtechniques as not all authors are aware of the maceration techniques employed and the effects thereofon the bone microstructure.
In this study, no significant differences were observed between specimens that were preparedwith different preparation techniques. Similarly Tersigni (2007) also reported no significant differencebetween control samples and frozen bone samples. The mean minimum Haversian canal diameterof the frozen section of the current study (0.058 mm) compares well to the frozen Haversian canalmeasurement (0.056 mm) reported by Tersigni (2007). Unfortunately it is not clear which exact mea-surements of the Haversian canals were taken by Tersigni (2007). For the boiled and degreased samplesvery little information is available and more research is needed in this regard.
The minimum diameter of the Haversian canals showed a statistically significant differencebetween the individuals in this study. As discussed previously, bone microstructure can be affected bya number of factors such as age, sex, population affinity, disease and socio-economic status to namebut a few (Arabi et al., 2004; Enlow, 1966; Hillier and Bell, 2007; Singh and Gunberg, 1970). Factorsthat affect bone microstructure, particularly between individuals, result in Haversian systems thatdiffer in size, shape and number. The difference in the minimum diameter of the Haversian canals is

140 S.L. Lander et al. / HOMO - Journal of Comparative Human Biology 65 (2014) 131–142
suggested to be related to the presence of presumable osteoporosis in one individual among the fivestudied. Osteoporosis affects the microstructure of bone in that the Haversian canal makes up a greaterpercentage of the overall area of the Haversian system, resulting in an overall increase in Haversiancanal size which subsequently causes bone porosity with an increase in age (Curtis and Nawrocki,2010; McCalden et al., 1993; Wang et al., 2003).
Scanning Electron Microscopy
SEM highlighted microcracks and cracks on the surface of all the bone samples (Fig. 3). Micro-cracks are commonly observed due to a number of factors such as indicators of fatigue in corticalbone (Sobelman et al., 2004), increase in mechanical loading (Martin, 2007), implications of skeletalfragility and stress fractures (O’Brien et al., 2005), and tension and compression forces due to musclemovement (Currey, 2003). Furthermore, a decrease in the strength and fitness of the bone as well as adecrease in fracture resistance have also been associated with the development of microcracks on thebone surface (Yin et al., 2009). The larger cracks observed on the surface of the bone were howeverthought to be a result of the bone being frozen. Tersigni (2007) also noted cracks on the surface of thefrozen bone, similar to what was observed in the current study, however, the cracks described in theTersigni’s (2007) study around the Haversian canals were not observed. This was due to the sectionbeing ground and not sectioned with a diamond blade. Grinding the bone creates artefacts such asgrooves or markings on the section’s surface that prevent possible cracks from being identified evenif they were present.
In comparison the bones in the Tersigni’s (2007) study were frozen at 0 ◦C for 21 days whereas inAndrade et al.’s (2008) study the bone was frozen at much lower temperatures (−20 ◦C and −70 ◦C)for an increased period of time (30, 60, 90 and 120 days). At 0 ◦C the only microstructural changesseen were the microcracks found around the centre of the Haversian canals compared with the lowertemperatures where more microstructural changes were seen such as lacunar expansion as well asexpansion and rupture of cellular and nuclear membranes (Andrade et al., 2008). It could be concludedfrom Andrade et al.’s (2008) work that the effects of freezing did not differ with temperature but ratherwith the length of time the bone was frozen and because no significant cracks were seen at 21 days itcan be concluded that no alterations will occur if bone is frozen for a shorter period of time.
The boiled sample had a similar surface appearance to the frozen sample with the addition of theformation of pits due to boiling, in areas that already had surface erosion (Fig. 4). The surface erosioncreated weak spots and with the heat of the water caused the formation of pits which penetratedinto the cortex of the bone. Since the individuals in this study were older, it has been suggested thatyounger individuals were assessed for the presence of this surface erosion. The degreased samplesrevealed a similar surface appearance to the boiled samples with both the boiled samples and thedegreased samples revealing additional surface erosion after being boiled and a more advanced state ofsurface erosion, including an increase in pit size, after being degreased (Fig. 5). Since the temperaturesof both the water and the trichloroethylene were high, 100 ◦C and 87 ◦C, it is likely that the heatfrom both liquids aggravated the erosion that was already present making it more prominent. Incomparison to burnt bone at temperatures of 20–185 ◦C the cortical bone surface was wavy and hadno pit formation, although at higher temperatures, 185–285 ◦C, tiny pores did appear (Shipman et al.,1984). This illustrates overall that the cracks present on the bone surface are artefact due to freezingand that the surface erosion and formation of pits are due to the bone health of the individual duringlife.
Conclusion
There was no significant difference in the histological structure of the bone samples that had beenfrozen, boiled, and degreased. However, the surface of the frozen bone revealed insignificant cracksand the boiled bone revealed the formation of pits and further erosion.
It is suggested that a similar study be done using a larger sample size that includes youngerindividuals and that bone samples should be further investigated with regard to using different tem-peratures in boiling and freezing, and for different time periods. Additionally, the histomorphology

S.L. Lander et al. / HOMO - Journal of Comparative Human Biology 65 (2014) 131–142 141
of bone appears to be unaffected by preparation techniques. However, when conclusions are beingmade regarding the surface of the bone, researchers are cautioned if no information regarding thepreparation techniques and the effects thereof are available.
Acknowledgements
Special thanks to the staff, technical assistants and fellow colleagues at the School of AnatomicalSciences, University of the Witwatersrand, who assisted with the dissections, maceration procedure,image analysis, statistical support, morphometric analysis and for re-measuring the data for intra-observer error. The authors would also like to acknowledge the valuable contributions made by thereviewers that have significantly improved this manuscript.
References
Andrade, M.G.S., Sa, C.N., Marchionni, A.M.T., dos Santos Calman de Bittencourt, T.C.B., Sadigursky, M., 2008. Effects of freezingon bone histological morphology. Cell Tissue Bank 9, 279–287.
Arabi, A., Nabulsi, M., Maalouf, J., Choucair, M., Khalife, H., Vieth, R., El-Hajj Fuleiham, G.E., 2004. Bone mineral density by age,gender, pubertal stages and socioeconomic status in healthy Lebanese children and adolescents. Bone 35, 1169–1179.
Black, J., Mattson, R., Korostoff, E., 1974. Haversian osteons: size, distribution, internal structure and orientation. J. Biomed.Mater. Res. 8, 299–319.
Burr, D.B., Ruff, C.B., Thompson, D.D., 1990. Patterns of skeletal histological change through time: comparison of an ArchaicNative American population with modern populations. Anat. Rec. 226, 307–313.
Cattaneo, C., DiMartino, S., Scali, S., Craig, O.E., Grandi, M., Sokol, R.J., 1999. Determining the human origin of fragments of burntbone: a comparative study of histological, immunological and DNA techniques. Forensic Sci. Int. 102, 181–191.
Currey, J.D., 1964. Some effects of aging in human Haversian systems. J. Anat. 98, 69–75.Currey, J., 2003. The many adaptations of bone. J. Biomech. 36, 1487–1495.Curtis, J.M., Nawrocki, S.P., 2010. Skeletal aging using frontal bone histomorphometrics. In: Latham, K.E., Finnigan, M. (Eds.),
Age Estimation of the Human Skeleton. Charles C. Thomas Publisher Ltd., Illinois, pp. 216–231.Dayal, M.R., Kegley, A.D.T., Strkalj, G., Bidmos, M.A., Kuykendall, K.L., 2009. The history and composition of the Raymond A. Dart
Collection of human skeletons at the University of the Witwatersrand, Johannesburg, South Africa. Am. J. Phys. Anthropol.140, 324–335.
Enlow, D.H., 1966. An evaluation of the use of histology in forensic medicine and anthropology. In: Evans, F.G. (Ed.), Studies onthe Anatomy and Function of Bones and Joints. Springer, Berlin, pp. 93–112.
Evans, F., Bang, S., 1966. Physical and histological differences between human fibular and femoral compact bone. In: Evans, F.(Ed.), Studies on the Anatomy and Function of Bones and Joints. Springer, Berlin, pp. 142–155.
Evans, F.G., Bang, S., 1967. Differences and relationships between the physical properties and the microscopic structure ofhuman femoral, tibia and fibular cortical bone. Am. J. Anat. 120, 79–88.
Francis, S.E., 1999–2010. Area of an Ellipse. Math Fun Facts, http://www.math.hmc.edu/funfacts (15.10.11).Hammer, Ø., Harper, D.A.T., Ryan, P.D., 2001. PAST: paleontological statistics software package for education and data analysis.
Palaeontol. Electron. 4, 1–9.Hattner, R., Landeros, O., Frost, H.M., 1965. Are there cell behaviour modes that are unaffected by aging? Henry Ford Hosp. Med.
Bull. 13, 33–39.Hillier, M.L., Bell, L.S., 2007. Differentiating human bone from animal bone: a review of histological methods. J. Forensic Sci. 52,
249–263.Hollund, H.I., Jans, M.M.E., Collins, M.J., Kars, H., Joosten, I., Kars, S.M., 2012. What happened here? Bone histology as a tool
in decoding the postmortem histories of archaeological bone from Castricum, The Netherlands. Int. J. Osteoarchaeol. 22,537–548.
Jans, M.M.E., Kars, H., Nielsen-Marsh, C.M., Smith, C.I., Nord, A.G., Arthur, P., Earl, N., 2002. In situ preservation of archaeologicalbone: a histological study within a multidisciplinary approach. Archaeometry 44, 343–352.
Jowsey, J., 1966. Studies of Haversian systems in man and some animals. J. Anat. 4, 857–864.Kramer, B., Allan, J.C., 2005. The structure of bone and cartilage. In: Fundamentals of Human Osteology. LexisNexis, South Africa,
pp. 3–17.Landeros, O., Frost, H.M., 1964. The cross section size of the osteon. Henry Ford Hosp. Med. Bull. 12, 517–525.Maat, G.J.R., Van Den Bos, R.P.M., Aarents, M., 2001. Manual preparation of ground sections for the microscopy of natural bone
tissue: update and modification of Frost’s rapid manual method. Int. J. Osteoarchaeol. 11, 366–374.Martin, R.B., 2007. The importance of mechanical loading in bone biology and medicine. J. Musculoskelet. Neuronal Interact. 7,
48–53.McCalden, R.W., McGeough, J.A., Barker, M.B., Court-Brown, C.M., 1993. Age-related changes in the tensile properties of cor-
tical bone. The relative importance of changes in porosity, mineralization, and microstructure. J. Bone Joint Surg. Am. 75,1193–1205.
Mulhern, D., Van Gerven, D., 1997. Patterns of femoral bone remodeling dynamics in a medieval Nubian population. Am. J. Phys.Anthropol. 104, 133–146.
O’Brien, F.J., Brennan, O., Kennedy, O.D., Lee, T.C., 2005. Microcracks in cortical bone: how do they affect bone biology? Curr.Osteoporos. Rep. 3, 39–45.
Pfeiffer, S., 1998. Variability in osteon size in recent human populations. Am. J. Phys. Anthropol. 106, 219–227.
142 S.L. Lander et al. / HOMO - Journal of Comparative Human Biology 65 (2014) 131–142
Pfeiffer, S., Crowder, C., Harrington, L., Brown, M., 2006. Secondary osteon and Haversian canal dimensions as behaviouralindicators. Am. J. Phys. Anthropol. 131, 460–468.
Pirock, D., Ramser, J., Takahashi, H., Villaneuva, A., 1966. Normal histological, tetracycline and dynamic parameters in human,mineralized bone section. Henry Ford Hosp. Med. J. 14, 195–218.
Rasband, W.S., 1997–2008. ImageJ. U.S. National Institutes of Health, Bethesda, MD, USA, http://rsb.info.nih.gov/ij/ (accessed17.07.11).
Robling, A.D., Stout, S.D., 1999. Morphology or the drifting osteon. Cells Tissues Organs 164, 192–204.Robling, A.G., Stout, S.D., 2000. Histomorphometry of human cortical bone: applications to age estimation. In: Katzenberg, M.A.,
Saunders, S.D. (Eds.), Biological Anthropology of the Human Skeleton. second ed. John Wiley & Sons, Inc., Hoboken, NJ, pp.149–166.
Rösing, F.W., Graw, M., Marré, B., Ritz-Timme, S., Rothschild, M.A., Rötzscher, K., Schmeling, A., Schroder, I., Geserick, G., 2007.Recommendations for the forensic diagnosis of sex and age from skeletons. HOMO – J. Comp. Hum. Biol. 58, 75–89.
Schultz, M., 2001. Paleohistology of bone: a new approach to the study of ancient diseases. Yearbook Phys. Anthropol. 44,106–147.
Shipman, P., Foster, G., Schoeninger, M., 1984. Burnt bones and teeth: an experimental study of color, morphology, crystalstructure and shrinkage. J. Archaeol. Sci. 11, 307–325.
Simonsen, K.P., Rasmussen, A.R., Mathisen, P., Borup, F., 2011. A fast preparation of skeletal materials using enzyme maceration.J. Forensic Sci. 56, 480–484.
Singh, I.J., Gunberg, D.L., 1970. Estimation of age at death in human males from quantitative histology of bone fragments. Am.J. Phys. Anthropol. 33, 373–382.
Smith, R., Walker, R., 1964. Femoral expansion in aging women: implications for osteoporosis and fractures. Science 145,156–157.
Sobelman, O.S., Gibeling, J.C., Stover, S.M., Hazelwood, S.J., Yeh, O.C., Shelton, D.R., Martin, R.B., 2004. Do microcracks decreaseor increase fatigue resistance in cortical bone? J. Biomech. 37, 1295–1303.
Takahashi, H., Epker, B., Frost, H.M., 1965. Relation between age and size of osteons in man. Henry Ford Hosp. Med. Bull. 13,25–31.
Tersigni, M.A., 2007. Frozen human bone: a microscopic investigation. J. Forensic Sci. 52, 16–20.Thompson, T.J.U., 2004. Recent advances in the study of burned bone and their implications for forensic anthropology. Forensic
Sci. Int. 146S, S203–S205.Thompson, D.D., Galvin, C.A., 1983. Estimation of age at death by tibial osteon remodeling in an autopsy series. Forensic Sci. Int.
22, 203–211.Ubelaker, D.H., 1998. Evolving role of microscope in forensic anthropology. In: Reichs, K.J. (Ed.), Forensic Osteology: Advances
in the Identification of Human Remains. Charles C. Thomas, Springfield, pp. 514–532.Wang, X.D., Li, X.O., Shen, X.M., Agrawal, C.M., 2003. Age-related changes of noncalcified collagen in human cortical bone. Ann.
Biomed. Eng. 31, 1365–1371.Yin, L., Venkatesan, S., Kalyanasundaram, S., Qin, Q., 2009. Effect of microstructure on micromechanical performance of dry
cortical bone tissues. Mater. Charact. 60, 1424–1431.