The Effects of Capital Structure on Profitability of Listed Firms ...
16
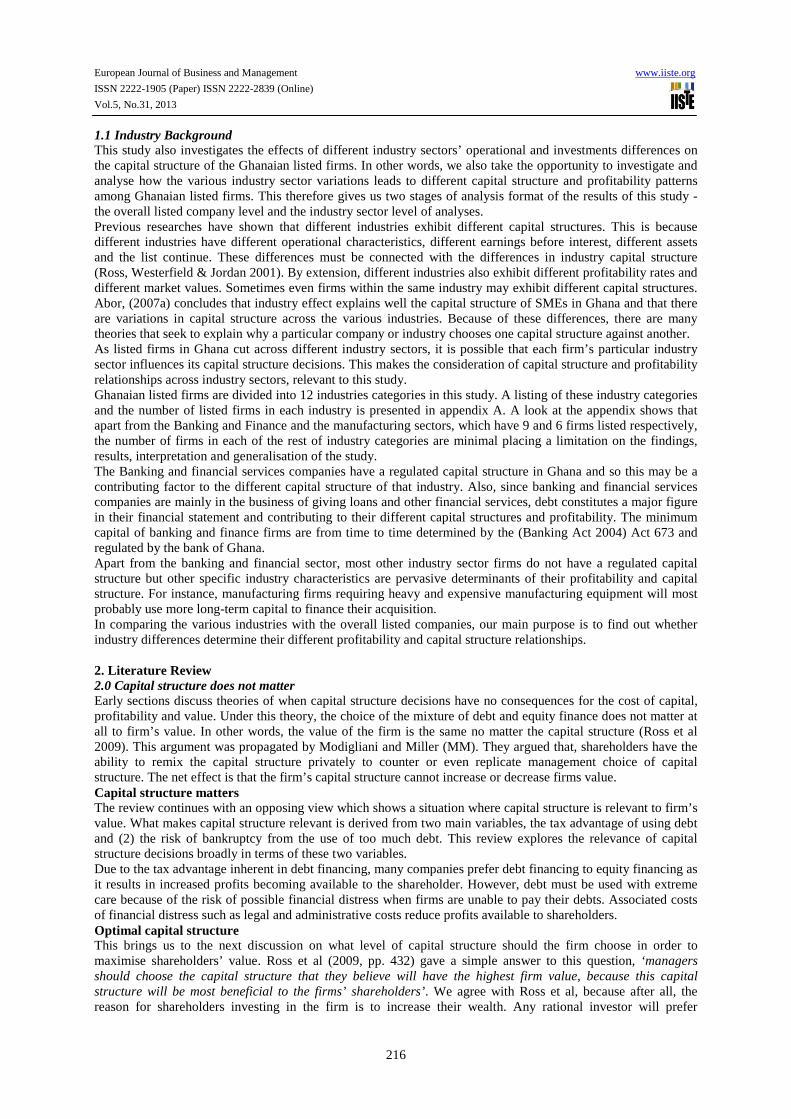
European Journal of Business and Management www.iiste.org ISSN 2222-1905 (Paper) ISSN 2222-2839 (Online) Vol.5, No.31, 2013 215 The Effects of Capital Structure on Profitability of Listed Firms in Ghana Albert Amponsah Addae 1* Michael Nyarko-Baasi 1 Daniel Hughes 2 1. Methodist University college Ghana, Department of Banking and Finance, Box DC 940 Dansoman- Accra *Email: [email protected] / [email protected] 2. Accounting Plus Box OS 1106, Osu-Accra ABSTRACT The study investigated the relationship between capital structure and profitability of listed firms in Ghana during the five year period from 2005 to 2009. Literature review on the relationship between the firms’ profitability and capital structure showed that there is either a positive, negative or neutral relationship between profitability and capital structure. It also showed there is no conclusive evidence of what should be the optimal capital. Regression analysis was used to investigate the relationship between capital structure and profitability. Also, average profitability and debt ratios were used to determine whether Ghanaian listed firms depended on debt or not. Similar to Abor (2005) study, the results revealed that, there is a statistically significant positive relationship between profitability and short term debt and a significantly negative relationship between profitability and long term debt. However, the results revealed a statistically negative relationship between profitability and total debt contrary to Abor (2005) study. The results also revealed that, Ghanaian listed firms relied more on short term debt than long term debt. The average short term debt to total capital ratio was 52% and long-term debt to total capital ratio was 11%. 1. Introduction Capital structure decision is the choice of a firm’s mixture of sources of financing, made up of debt and equity financing. Ross, Westerfield, & Jordan (2001, pp. 367) defined a firm’s capital structure decision as ‘the choice of how much debt a firm should have relative to equity’. They argued that capital structure is a reflection of a firm’s borrowing policy. It refers to the mix of long term debt and equity financing (Brealey, Myers, & Marcus, 2009). Abor (2005, pp. 438) defined capital structure as a ‘mix of different securities’. The above definitions have one thing in common, that is. the firm’s capital structure decision is its choice of debt-equity ratio. At the heart of capital structure decisions is the search for the optimal capital structure which is the level of capital that maximises profitability and shareholders' value. The search for the optimal capital structure has led to theories like the trade-off, pecking order and agency theories. To date, there is still no consensus on what the optimal capital structure should be. Abor (2005, pp. 438) agreed when he said, ‘Despite the theoretical appeal of capital structure, researchers in financial management have not found the optimal capital structure’. The terms ‘firm’s value’, ‘shareholders’ value’, ‘shareholders’ wealth’ and ‘profitability’ are used interchangeably in this study as they all constitute measures that depict wealth creation for shareholders. For instance, profitable firms are usually more beneficial to shareholders than loss-making firms. Similarly, a change in firm’s value results in the change in shareholders’ value. Ross et al (2009, pp. 432) supported this idea when they made the following statement, ‘Managers should choose the capital structure that they believe will have the highest firm value, because this capital structure will be most beneficial to the firm’s shareholders’. The Capital structure decision of a business is important because a poor decision can affect a firm’s profitability leading to a decrease in shareholders’ value and vice versa. The overriding objective of financial decisions is to maximise the wealth of shareholders. In other words, the objective of a firm’s financial decisions is to increase the value of its shares (or the price of stock). As Ross, Westerfield, & Jordan, (2001, pp. 12) puts it, the goal of financial decisions is to ‘maximise the market value of existing owners’ equity’. According to them, ‘good financial decisions increase the market value of the owners’ equity and poor financial decisions decrease it’. The effect that capital structure decisions have on profitability and firm value is that, it increases value through the present value of tax savings from the use of debt. Intuitively, this may imply that firms should use 100% debt to maximise their value. But we would understand from this study that, excessive use of debt may lead to a reduction in value because of the increasing possibility of financial distress and possible downgrading of the firm’s credit rating. Therefore the possible effects of capital structure policy are that it can increase both gains and losses of the firm. It is a ‘double edged sword’ Ross, Westerfield, & Jordan (2001, pp. 367). The primary objective of this study is to investigate the effects of capital structure decisions on the profitability of listed firms in Ghana during the five year period from 2005 to 2009 under the topic, ‘The effects of capital structure on profitability of listed firms in Ghana’. The study seeks to find out how Ghanaian listed firms have used their capital structure decisions to create or destroy shareholders’ value, in terms of profitability. brought to you by CORE View metadata, citation and similar papers at core.ac.uk provided by International Institute for Science, Technology and Education (IISTE): E-Journals
-
Upload
khangminh22 -
Category
Documents
-
view
5 -
download
0
Transcript of The Effects of Capital Structure on Profitability of Listed Firms ...
European Journal of Business and Management www.iiste.org
ISSN 2222-1905 (Paper) ISSN 2222-2839 (Online)
Vol.5, No.31, 2013
215
The Effects of Capital Structure on Profitability of Listed Firms in Ghana
Albert Amponsah Addae1* Michael Nyarko-Baasi 1 Daniel Hughes2 1. Methodist University college Ghana, Department of Banking and Finance, Box DC 940 Dansoman- Accra
*Email: [email protected] / [email protected] 2. Accounting Plus Box OS 1106, Osu-Accra
ABSTRACT The study investigated the relationship between capital structure and profitability of listed firms in Ghana during the five year period from 2005 to 2009. Literature review on the relationship between the firms’ profitability and capital structure showed that there is either a positive, negative or neutral relationship between profitability and capital structure. It also showed there is no conclusive evidence of what should be the optimal capital. Regression analysis was used to investigate the relationship between capital structure and profitability. Also, average profitability and debt ratios were used to determine whether Ghanaian listed firms depended on debt or not. Similar to Abor (2005) study, the results revealed that, there is a statistically significant positive relationship between profitability and short term debt and a significantly negative relationship between profitability and long term debt. However, the results revealed a statistically negative relationship between profitability and total debt contrary to Abor (2005) study. The results also revealed that, Ghanaian listed firms relied more on short term debt than long term debt. The average short term debt to total capital ratio was 52% and long-term debt to total capital ratio was 11%. 1. Introduction Capital structure decision is the choice of a firm’s mixture of sources of financing, made up of debt and equity financing. Ross, Westerfield, & Jordan (2001, pp. 367) defined a firm’s capital structure decision as ‘the choice of how much debt a firm should have relative to equity’. They argued that capital structure is a reflection of a firm’s borrowing policy. It refers to the mix of long term debt and equity financing (Brealey, Myers, & Marcus, 2009). Abor (2005, pp. 438) defined capital structure as a ‘mix of different securities’. The above definitions have one thing in common, that is. the firm’s capital structure decision is its choice of debt-equity ratio. At the heart of capital structure decisions is the search for the optimal capital structure which is the level of capital that maximises profitability and shareholders' value. The search for the optimal capital structure has led to theories like the trade-off, pecking order and agency theories. To date, there is still no consensus on what the optimal capital structure should be. Abor (2005, pp. 438) agreed when he said, ‘Despite the theoretical appeal of capital structure, researchers in financial management have not found the optimal capital structure’. The terms ‘firm’s value’, ‘shareholders’ value’, ‘shareholders’ wealth’ and ‘profitability’ are used interchangeably in this study as they all constitute measures that depict wealth creation for shareholders. For instance, profitable firms are usually more beneficial to shareholders than loss-making firms. Similarly, a change in firm’s value results in the change in shareholders’ value. Ross et al (2009, pp. 432) supported this idea when they made the following statement, ‘Managers should choose the capital structure that they believe will have the highest firm value, because this capital structure will be most beneficial to the firm’s shareholders’. The Capital structure decision of a business is important because a poor decision can affect a firm’s profitability leading to a decrease in shareholders’ value and vice versa. The overriding objective of financial decisions is to maximise the wealth of shareholders. In other words, the objective of a firm’s financial decisions is to increase the value of its shares (or the price of stock). As Ross, Westerfield, & Jordan, (2001, pp. 12) puts it, the goal of financial decisions is to ‘maximise the market value of existing owners’ equity’. According to them, ‘good financial decisions increase the market value of the owners’ equity and poor financial decisions decrease it’. The effect that capital structure decisions have on profitability and firm value is that, it increases value through the present value of tax savings from the use of debt. Intuitively, this may imply that firms should use 100% debt to maximise their value. But we would understand from this study that, excessive use of debt may lead to a reduction in value because of the increasing possibility of financial distress and possible downgrading of the firm’s credit rating. Therefore the possible effects of capital structure policy are that it can increase both gains and losses of the firm. It is a ‘double edged sword’ Ross, Westerfield, & Jordan (2001, pp. 367). The primary objective of this study is to investigate the effects of capital structure decisions on the profitability of listed firms in Ghana during the five year period from 2005 to 2009 under the topic, ‘The effects of capital structure on profitability of listed firms in Ghana’. The study seeks to find out how Ghanaian listed firms have used their capital structure decisions to create or destroy shareholders’ value, in terms of profitability.
brought to you by COREView metadata, citation and similar papers at core.ac.uk
provided by International Institute for Science, Technology and Education (IISTE): E-Journals
European Journal of Business and Management www.iiste.org
ISSN 2222-1905 (Paper) ISSN 2222-2839 (Online)
Vol.5, No.31, 2013
216
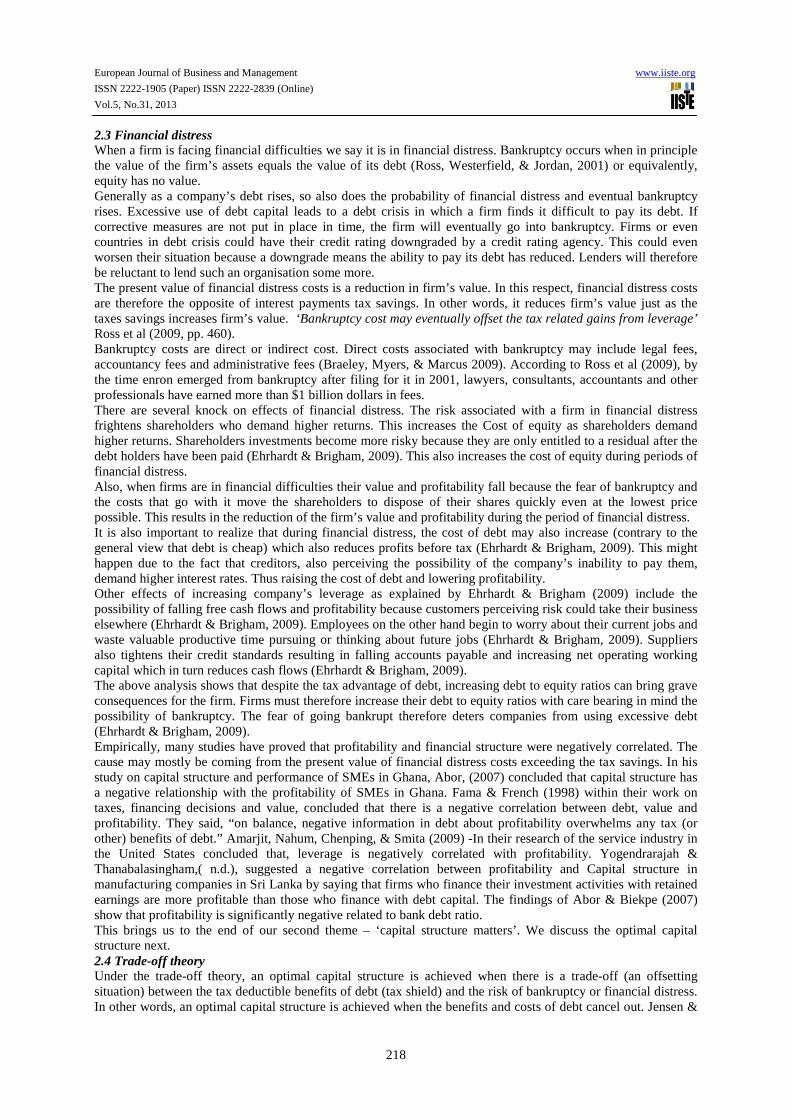
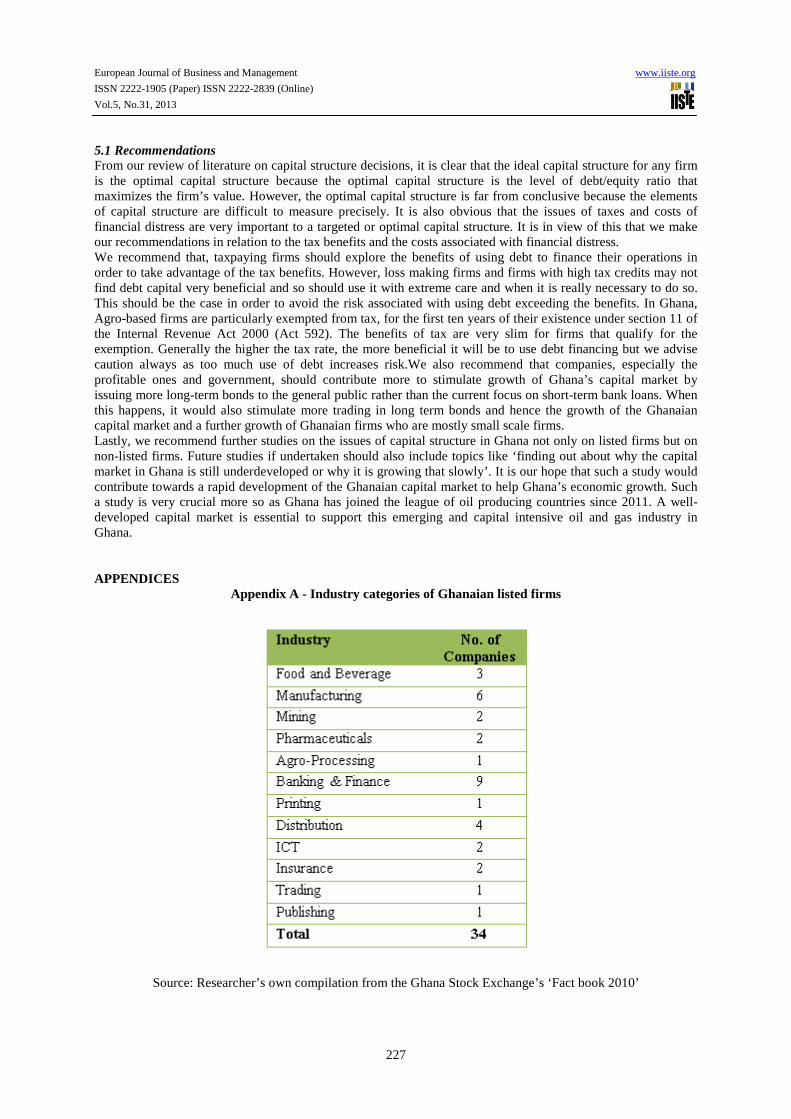
1.1 Industry Background This study also investigates the effects of different industry sectors’ operational and investments differences on the capital structure of the Ghanaian listed firms. In other words, we also take the opportunity to investigate and analyse how the various industry sector variations leads to different capital structure and profitability patterns among Ghanaian listed firms. This therefore gives us two stages of analysis format of the results of this study - the overall listed company level and the industry sector level of analyses. Previous researches have shown that different industries exhibit different capital structures. This is because different industries have different operational characteristics, different earnings before interest, different assets and the list continue. These differences must be connected with the differences in industry capital structure (Ross, Westerfield & Jordan 2001). By extension, different industries also exhibit different profitability rates and different market values. Sometimes even firms within the same industry may exhibit different capital structures. Abor, (2007a) concludes that industry effect explains well the capital structure of SMEs in Ghana and that there are variations in capital structure across the various industries. Because of these differences, there are many theories that seek to explain why a particular company or industry chooses one capital structure against another. As listed firms in Ghana cut across different industry sectors, it is possible that each firm’s particular industry sector influences its capital structure decisions. This makes the consideration of capital structure and profitability relationships across industry sectors, relevant to this study. Ghanaian listed firms are divided into 12 industries categories in this study. A listing of these industry categories and the number of listed firms in each industry is presented in appendix A. A look at the appendix shows that apart from the Banking and Finance and the manufacturing sectors, which have 9 and 6 firms listed respectively, the number of firms in each of the rest of industry categories are minimal placing a limitation on the findings, results, interpretation and generalisation of the study. The Banking and financial services companies have a regulated capital structure in Ghana and so this may be a contributing factor to the different capital structure of that industry. Also, since banking and financial services companies are mainly in the business of giving loans and other financial services, debt constitutes a major figure in their financial statement and contributing to their different capital structures and profitability. The minimum capital of banking and finance firms are from time to time determined by the (Banking Act 2004) Act 673 and regulated by the bank of Ghana. Apart from the banking and financial sector, most other industry sector firms do not have a regulated capital structure but other specific industry characteristics are pervasive determinants of their profitability and capital structure. For instance, manufacturing firms requiring heavy and expensive manufacturing equipment will most probably use more long-term capital to finance their acquisition. In comparing the various industries with the overall listed companies, our main purpose is to find out whether industry differences determine their different profitability and capital structure relationships. 2. Literature Review 2.0 Capital structure does not matter Early sections discuss theories of when capital structure decisions have no consequences for the cost of capital, profitability and value. Under this theory, the choice of the mixture of debt and equity finance does not matter at all to firm’s value. In other words, the value of the firm is the same no matter the capital structure (Ross et al 2009). This argument was propagated by Modigliani and Miller (MM). They argued that, shareholders have the ability to remix the capital structure privately to counter or even replicate management choice of capital structure. The net effect is that the firm’s capital structure cannot increase or decrease firms value. Capital structure matters The review continues with an opposing view which shows a situation where capital structure is relevant to firm’s value. What makes capital structure relevant is derived from two main variables, the tax advantage of using debt and (2) the risk of bankruptcy from the use of too much debt. This review explores the relevance of capital structure decisions broadly in terms of these two variables. Due to the tax advantage inherent in debt financing, many companies prefer debt financing to equity financing as it results in increased profits becoming available to the shareholder. However, debt must be used with extreme care because of the risk of possible financial distress when firms are unable to pay their debts. Associated costs of financial distress such as legal and administrative costs reduce profits available to shareholders. Optimal capital structure This brings us to the next discussion on what level of capital structure should the firm choose in order to maximise shareholders’ value. Ross et al (2009, pp. 432) gave a simple answer to this question, ‘managers should choose the capital structure that they believe will have the highest firm value, because this capital structure will be most beneficial to the firms’ shareholders’. We agree with Ross et al, because after all, the reason for shareholders investing in the firm is to increase their wealth. Any rational investor will prefer

European Journal of Business and Management www.iiste.org
ISSN 2222-1905 (Paper) ISSN 2222-2839 (Online)
Vol.5, No.31, 2013
217
financial decisions that increase his wealth to the maximum. This capital structure is the optimal level of capital structure. Conclusion We then reach a conclusion. According to Ross et al (2009), ‘the firms’ value after capital structure changes can either be (1) greater than original firm value, (2) equal to original firm value and (3) less than original firm value’. 2.1 Capital Structure Without Taxes MM proposition I Miller and Modigliani (MM) in their seminal work on capital structure theory in 1958 concluded that debt is irrelevant to the value of the firm. For this theory to hold water, the tax advantage and the risk of using debt must cancel out exactly. This also means if the tax advantage is nil, then the risk disadvantage must also be nil for the theory to hold. The argument MM were making is that, no matter the mix of debt and equity in the firm’s capital structure, there is no effect on the firm’s market value, profitability and cost of capital. By extension, the capital structure of the firm is irrelevant in making shareholders richer or poorer. To put it in the words of Ross et al (2009, pp. 435), ‘the value of the firm is always the same under different capital structures’ One major argument made by MM to support their debt irrelevant theory is that since shareholders are capable of lending or borrowing on the same terms as the firm, they can easily replicate the capital structure of the firm. Management will therefore not be doing for shareholders what they (shareholders) cannot do for themselves. For instance, if a shareholder invests in a levered firm, he receives a certain pay-off from the levered firm. Alternatively, the shareholder could borrow from the bank and invest in an unlevered firm and the pay-off would be the same as from the levered firm. MM argued that if these two alternative investment strategies will leave the shareholder with the same pay-off, managers will neither be creating nor destroying shareholders wealth by borrowing on their behalf because shareholders could do so themselves. This lead MM to conclude that, the value of the unlevered firm is the same as the value of the levered firm. This MM result implies for instance that, if the levered firm is priced too high, rational investors will prefer to invest in an unlevered firm and borrow on their own account. This MM result is expressed by Ross et al (2009, pp. 436) as ‘as long as individuals borrow and (lend) on the same terms as the firm, they can duplicate the effects of corporate leverage on their own’. 2.2 Capital Structure With Taxes In the previous section we concluded that debt is irrelevant to profitability and value because MM ignored the tax advantage of debt among other assumptions. In this section, we add tax to the MM propositions to show how firm’s profitability and value will change. We start by first criticising MM’s assumptions to give us a reason to remove them. Unrealistic MM assumptions MM came under various criticisms later because their assumptions largely proved unrealistic. The assumption of a tax free economy is unrealistic because there is hardly any country in the world that is tax free. For instance Ghana is not a tax free economy. The assumption of no transaction costs and efficient markets are also very unrealistic because most investors use advisors who charge brokerage fees for their services. Even if an investor does not use the services of a broker he still incurs cost like communications, transport costs and other related costs before making their investments. MM ignored the possibility of a financial distress but evidence around the world show this is an unrealistic assumption. For instance Enron and WorldCom, who were actually in financial distress but tried to cover up through fraudulent financial reporting, eventually went into bankruptcy in early 2000s. The advent of the world economic downturn also saw many businesses collapse around the world. All these show that MM assumptions are unrealistic. Taxes and MM proposition I MM had to backtrack subsequently, in 1963 after the receipt of several criticisms. This led to the relaxing of their ‘tax free economy assumption’. The result was that debt financing is now a relevant factor in determining firm’s profitability and value. Company tax a relevant variable to debt policy because interest cost of debt is allowed for tax purposes in many jurisdictions of the world. In Ghana, interest is tax-deductible under section 14 of the Internal revenue Act, 2000 (Act 592). This law applies to all Ghanaian firms except those specifically exempted. Since interest payments are tax deductible, it reduces company tax or amounts due to the government thus saving up more cash for the shareholders. This implies the tax advantage of debt leads to increasing returns on equity (ROE) and value. For instance, assuming corporate tax is 25%, then every cedi (Cedi is the Ghanaian currency) of debt would add at least 25 pesewas (pesewas is the Ghanaian currency in decimals) to the value of the firm. Therefore debt is relevant to value once the tax benefit is recognized.
European Journal of Business and Management www.iiste.org
ISSN 2222-1905 (Paper) ISSN 2222-2839 (Online)
Vol.5, No.31, 2013
218
2.3 Financial distress When a firm is facing financial difficulties we say it is in financial distress. Bankruptcy occurs when in principle the value of the firm’s assets equals the value of its debt (Ross, Westerfield, & Jordan, 2001) or equivalently, equity has no value. Generally as a company’s debt rises, so also does the probability of financial distress and eventual bankruptcy rises. Excessive use of debt capital leads to a debt crisis in which a firm finds it difficult to pay its debt. If corrective measures are not put in place in time, the firm will eventually go into bankruptcy. Firms or even countries in debt crisis could have their credit rating downgraded by a credit rating agency. This could even worsen their situation because a downgrade means the ability to pay its debt has reduced. Lenders will therefore be reluctant to lend such an organisation some more. The present value of financial distress costs is a reduction in firm’s value. In this respect, financial distress costs are therefore the opposite of interest payments tax savings. In other words, it reduces firm’s value just as the taxes savings increases firm’s value. ‘Bankruptcy cost may eventually offset the tax related gains from leverage’ Ross et al (2009, pp. 460). Bankruptcy costs are direct or indirect cost. Direct costs associated with bankruptcy may include legal fees, accountancy fees and administrative fees (Braeley, Myers, & Marcus 2009). According to Ross et al (2009), by the time enron emerged from bankruptcy after filing for it in 2001, lawyers, consultants, accountants and other professionals have earned more than $1 billion dollars in fees. There are several knock on effects of financial distress. The risk associated with a firm in financial distress frightens shareholders who demand higher returns. This increases the Cost of equity as shareholders demand higher returns. Shareholders investments become more risky because they are only entitled to a residual after the debt holders have been paid (Ehrhardt & Brigham, 2009). This also increases the cost of equity during periods of financial distress. Also, when firms are in financial difficulties their value and profitability fall because the fear of bankruptcy and the costs that go with it move the shareholders to dispose of their shares quickly even at the lowest price possible. This results in the reduction of the firm’s value and profitability during the period of financial distress. It is also important to realize that during financial distress, the cost of debt may also increase (contrary to the general view that debt is cheap) which also reduces profits before tax (Ehrhardt & Brigham, 2009). This might happen due to the fact that creditors, also perceiving the possibility of the company’s inability to pay them, demand higher interest rates. Thus raising the cost of debt and lowering profitability. Other effects of increasing company’s leverage as explained by Ehrhardt & Brigham (2009) include the possibility of falling free cash flows and profitability because customers perceiving risk could take their business elsewhere (Ehrhardt & Brigham, 2009). Employees on the other hand begin to worry about their current jobs and waste valuable productive time pursuing or thinking about future jobs (Ehrhardt & Brigham, 2009). Suppliers also tightens their credit standards resulting in falling accounts payable and increasing net operating working capital which in turn reduces cash flows (Ehrhardt & Brigham, 2009). The above analysis shows that despite the tax advantage of debt, increasing debt to equity ratios can bring grave consequences for the firm. Firms must therefore increase their debt to equity ratios with care bearing in mind the possibility of bankruptcy. The fear of going bankrupt therefore deters companies from using excessive debt (Ehrhardt & Brigham, 2009). Empirically, many studies have proved that profitability and financial structure were negatively correlated. The cause may mostly be coming from the present value of financial distress costs exceeding the tax savings. In his study on capital structure and performance of SMEs in Ghana, Abor, (2007) concluded that capital structure has a negative relationship with the profitability of SMEs in Ghana. Fama & French (1998) within their work on taxes, financing decisions and value, concluded that there is a negative correlation between debt, value and profitability. They said, “on balance, negative information in debt about profitability overwhelms any tax (or other) benefits of debt.” Amarjit, Nahum, Chenping, & Smita (2009) -In their research of the service industry in the United States concluded that, leverage is negatively correlated with profitability. Yogendrarajah & Thanabalasingham,( n.d.), suggested a negative correlation between profitability and Capital structure in manufacturing companies in Sri Lanka by saying that firms who finance their investment activities with retained earnings are more profitable than those who finance with debt capital. The findings of Abor & Biekpe (2007) show that profitability is significantly negative related to bank debt ratio. This brings us to the end of our second theme – ‘capital structure matters’. We discuss the optimal capital structure next. 2.4 Trade-off theory Under the trade-off theory, an optimal capital structure is achieved when there is a trade-off (an offsetting situation) between the tax deductible benefits of debt (tax shield) and the risk of bankruptcy or financial distress. In other words, an optimal capital structure is achieved when the benefits and costs of debt cancel out. Jensen &

European Journal of Business and Management www.iiste.org
ISSN 2222-1905 (Paper) ISSN 2222-2839 (Online)
Vol.5, No.31, 2013
219
Meckling, (1976 cited in Melinda & Cristina, n.d.), stated that, ‘firms select optimal capital structure by examining the net tax advantage of debt financing by comparing debt advantages’. This implies that the optimal capital structure is the one that gives the best tax advantage to the firm. The optimal capital structure under the trade-off theory is therefore the capital structure level that maximizes the tax benefits of debt and minimizes the costs of financial distress. 2.5 Pecking Order theory Another approach to the optimal capital structure study is the pecking order theory. According to Brealey, Myers, & Marcus (2009), in applying the pecking order theory, management prefers internally generated funds to externally generated ones. If external debt is ever required, debt finance is preferred to equity finance. In other words, managers rank their order of financing in order of internally generated finance, and then externally generated finance with debt ranking before equity. Managers use this order or ranking in an attempt to preserve the value of the firm and more importantly to counter the wrong signals of issuing equity in the first place. Managers must rank the order of generating funds this way because, when a firm requires capital, issuing shares may send the wrong signals that can lead to a fall in firm value. When new shares are issued, investors suspect the shares may be overpriced and refuse to buy, thus bringing down the value of the shares (Braeley, Myers, & Marcus 2009). This is usually caused by a misunderstanding of the current profitability and future prospects of the firm. Investors get this signals from the issue of shares because, rational people would not sell anything for less than its value, so the true value of the shares (in the thinking of the shareholder) might be lower than what management is selling for now, Ehrhardt & Brigham (2009). Managers try to avoid such (probably wrong) signals to shareholders by using internal funds as much as possible. Managers are led to prioritize their source of funds because of this signalling theory, to maximize profitability and value. 2.6 Agency Theory One other theory used to predict the optimal structure is the agency theory. Since shareholders are separated from the management of businesses, an agency relationship is created. This also creates a conflict of interest situation called the agency problem. According to the agency problem, whilst managers seek their own best interest, shareholders will be expecting them to work towards maximising the value of their investment. We find that these opposing interests can eventually lead to situations that predicts the optimal capital structure. The agency problem leads to indiscriminate expenditure by managers who have enough cash at their disposal. This supported by Ehrhardt & Brigham, 2009, when they stated that, the agency problem is created because management may have enough cash to spend on their pet projects rather than on value maximizing projects. For instance, managers with excess cash may spend them on things like flashy offices, corporate jets, and things of that nature which does little to maximize shareholders wealth, (Ehrhardt & Brigham, 2009). On the other hand, managers with very little cash are not in the position to be that wasteful. The central issues in agency theory are therefore how to resolve the ‘fight’ for the control of firm resources between managers and shareholders (Roy & Mingfang). Some theories have suggested a strategy of increasing the use of debt capital in order to reduce the agency cost problem. Abor (2007) study concluded that, agency issues may have led SMEs to pursue high debt policies leading to lower performance. The reason for this is that, the risk of financial distress from increasing the use of debt may encourage managers to reduce wasteful spending. According to (Roy & Mingfang), the agency problem suggests the use of debt contracts as the main means of transfering wealth to investors. This may be because, it deters wasteful spending, and therefore increasing amounts available to shareholders. Again, according to (Roy & Mingfang), the use of debt makes wasteful management focus on debt repayments in order to avoid bankruptcy from the inability to pay. The survival of the business therefore becomes a big concern for managers. 3. Methodology Data used for this study primarily came from the Ghana Stock Exchange (GSE) published work, ‘the fact book 2010 edition’. The fact book is published by the GSE regularly and contains financial and other relevant data about all listed firms in Ghana, stock brokers and other licensed members of the GSE. It also contains information about the stock exchange performance and company profiles of all listed companies as at the date of publication. Apparently, financial statement data used for this study is mainly secondary data as opposed to primary data. Our population for this study is particularly not very large and there would not have been any significant problems of cost and time if we used the entire population as our sample. However, similar to Abor’s study of 2005, all our sampled firms had to fulfil three basic criteria; firstly all of the selected firms should have been listed on the GSE as at 31 December 2009. Secondly, none of them should be delisted during the period under investigation and thirdly, all five year financial statements must be available for all companies to be included in the study. Only one company did not satisfy this set criteria for selection (because it had only four years’

European Journal of Business and Management www.iiste.org
ISSN 2222-1905 (Paper) ISSN 2222-2839 (Online)
Vol.5, No.31, 2013
220
accounts available) and was dropped. Our sample therefore constituted 34 out of 35 listed companies with 170 financial statements for a period of five years ending 31 December 2009. Variables The primary variables we are investigating in this study are the profitability (the dependent variable) and capital structure (the independent variable) ratios. 3.1 Profitability Ratios In this study, our profitability ratio is defined as the return on equity (ROE). This is defined as earnings before interest and tax (EBIT) divided by Equity (Share capital and reserves). Equity equals the company’s net assets (Assets minus Liabilities). We use EBIT because it is independent of leverage effects of the capital structure decisions and it does not include the effects of interest and taxes. 3.2 Capital structure Ratios We used three capital structure ratios in this study - the short-term debt to the total capital ratio; Long-term debt to total capital ratio and Total debt to total capital ratio. Short-term debt is taken as all items included in the current liability section of the listed company’s financial statement. Long-term debt includes items listed as non-current liabilities and total debt is the addition of short-term and long-term debt. Total capital equals the sum of equity, long and short term debt which also equals the total asset of the company. The reason for investigating three capital structure ratios is to ensure that the different capital structure of all listed firms in Ghana as well as their different industry variations are reflected properly in this study. Previous research including (Abor, 2005) has shown that Ghanaian firms relied more on short term debt than long term debt. Some Ghanaian firms also do not use long term debt at all. So in order to ensure that at least one leverage ratio could be calculated for each listed firm, the leverage ratios have been split in this way. It also means that for each firm that did not use long-term debt, total debt includes only short term debt. 3.3 Control variables To ensure the accuracy of the results of our regression model we used two more variables as control variables. The control variables are not the subject of this study. They are only included to ensure that the results of the regression reflect the reality as much as possible. We used these control variables to reflect the fact that the level of EBIT of listed firms not only depends on capital structures but also on their size and level of sales. These control variables are therefore not explicitly considered in our results analysis. Log of sales and sales-growth were control variable included in the regression model to ensure that the results of regression are not biased. The sales growth rate was obtained by calculating the rates for the five years for each sampled company separately. That is. the growth rate was obtained for each company over four years by taking the first year as the base and calculating how sales have grown over the next four years. A panel data analysis methodology is the main analytical tool used to capture data for capital structure and profitability. This methodology involves pooling observations on a cross-section of units over several time periods. 3.4 Regression Analysis Generally, the regression analysis was used to investigate the relationship between capital structure and profitability of Ghanaian listed firms. We also used the analysis to investigate whether the relationship between capital structure and profitability is positive or negative and how Ghanaian listed firms had depended on debt financing. Lastly, the results of dependency on debt gave us an indication of how the trade-off, pecking order and the agency theories applied to Ghanaian listed firms. Similar to Abor (2005), the relationship between Capital structure and profitability was predicted in the following 3 regression models: ROEi,t = β0 + β1SDAi,t + β2SIZEi,t + β3SGi,t + ëi,t Regression 1 ROEi,t = β0 + β1LDA i,t + β2SIZEi,t + β3SGi,t + ëi,t Regression 2 ROEi,t = β0 + β1DA i,t + β2SIZEi,t + β3SGi,t + ëi,t Regression 3 Where: ROEi,t is EBIT divided by equity for firm i in time t , SDAi,t is short-term debt divided by total capital for firm i in time t, LDAi,t is Long-term debt divided by total capital for firm i in time t, DAi,t is total debt divided by total capital for firm i in time t, SIZEi,t is log of sales for firm i in time t, SGi,t is Sales growth for firm i in time t, ëi,t is the error term, β0 is the intercept, β1,β2 and β3 are the slope coefficients Regression 1 is used to predict the relationship between profitability and short-term debt, regression 2 is used to predict the relationship between profitability and long-term debt and regression 3 is used to predict the relationship between profitability and total debt.

European Journal of Business and Management www.iiste.org
ISSN 2222-1905 (Paper) ISSN 2222-2839 (Online)
Vol.5, No.31, 2013
221
4. Findings/Results Having discussed the methodology for this study in the last section, we present our findings in this section under two main categories: Average profitability and capital structure ratios and the regression model results. Average Profitability and Capital Ratios The average annual profitability and capital ratios for Ghanaian listed companies is summarised in table 4. Table 4 presents information that was used to evaluate how Ghanaian listed firms have been profitable on one hand and how they have depended on debt in terms of their average capital structure ratios on the other hand.
Table 1 Average Profitability and Capital structure ratios
Column 1 of table 1 presents categories at the overall listed company and at the industry levels. Column 2 presents average return on equity for each category and the next three columns present information about the average capital structures ratios during the period. 4.1 Regression Model Results The regression model results’ slope coefficients for the 3 independent variables are summarized in Table 2. The table also summarizes how statistically significant is the regression results. The regression coefficients in table 2 were used to explain the relationship between profitability and capital structure of Ghanaian listed firms during the period under study. Where the coefficient is positive, there is a positive relationship between Capital structure and profitability and where it is negative, we have a negative relationship.
Table 2 Regression model results
Industry categories Return on Equity (ROE)
Short-term Debt (SDA)
Long-Term (LDA) Total Debt (DA)
Overall listed companies 15% 52% 11% 63% Agro processing 5% 8% 0% 8% Banking & Finance 37% 77% 11% 88% Distribution 22% 57% 6% 63% Food & Beverage 26% 47% 6% 52% ICT -25% 58% 3% 61% Insurance 15% 37% 9% 47% Manufacturing 0% 40% 16% 56% Mining -7% 27% 23% 51% Pharmaceuticals 18% 21% 2% 23% Printing -17% 36% 49% 84% Publishing 48% 55% 7% 62% Trading -27% 79% 6% 85%
Regression Coefficients
Industry Categories Regression 1
Result (Significance level = 1%)
Regression 2
Result (Significance level = 1%)
Regression 3
Result (Significance level = 1%)
Overall listed companies 0.1115 Significant -0.4302 Significant -0.0665 significant
Agro processing 2.6780 Not Significant 0.0000 Not significant 2.6780 Not Significant
Banking & Finance 0.5428 significant -0.4970 Not significant 3.0390 Not Significant
Distribution 0.6842 significant -1.1173 Not significant 0.5815 Not Significant
Food & Beverage -0.9990 significant -1.9537 Not significant -1.1959 significant
ICT -2.1140 Not Significant -20.5309 Not significant -2.0828 Not Significant
Insurance 0.1407 Not Significant 0.0238 Not significant 0.2494 Not Significant
Manufacturing 0.4186 Not Significant -0.9429 Significant -0.6843 significant
Mining -1.0993 Not Significant 1.0557 Not significant -1.3254 Not Significant
Pharmaceuticals 0.1846 Significant -0.4804 Not significant 0.1119 significant
Printing 14.2099 Not Significant -2.3313 Not significant -2.6077 Not Significant
Publishing 0.5600 Not Significant -3.0751 Not significant 0.4068 Not Significant
Trading -10.7878 Not Significant 8.4469 Not significant 7.1126 Not Significant
European Journal of Business and Management www.iiste.org
ISSN 2222-1905 (Paper) ISSN 2222-2839 (Online)
Vol.5, No.31, 2013
222
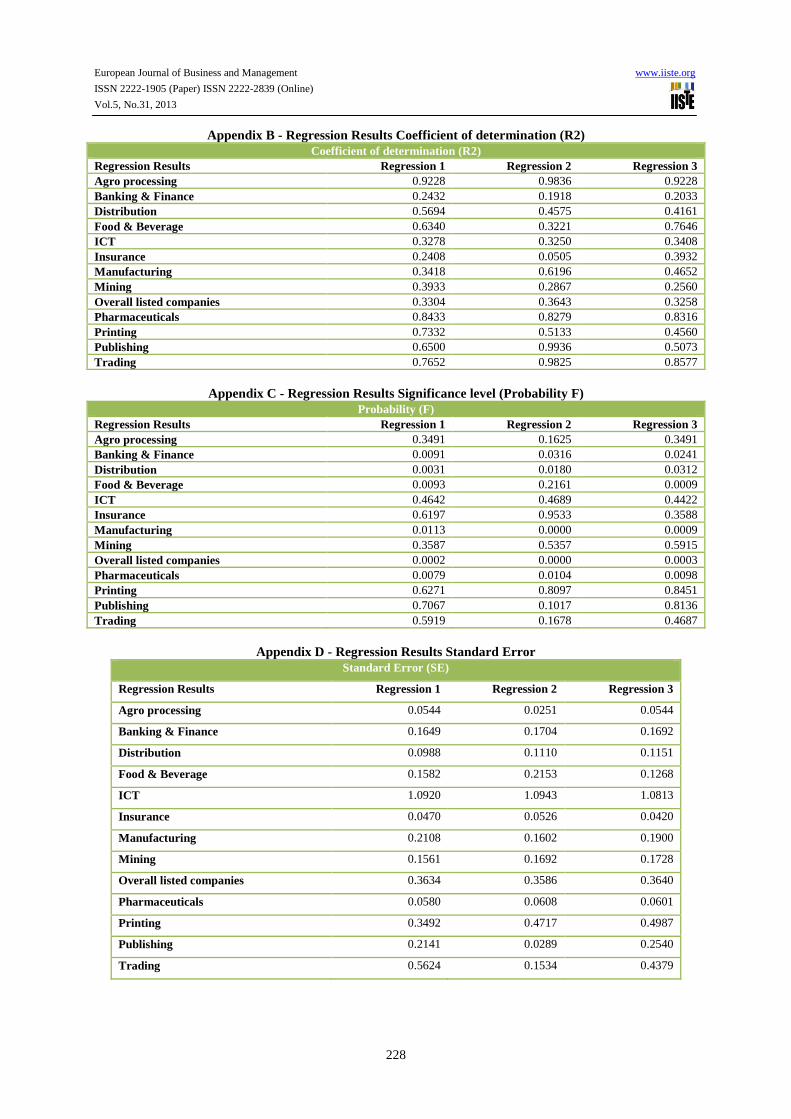
Column 1 shows the industry categories. Column 2 shows the regression coefficients for regression 1 (relationship between profitability and short-term debt). This column presents numbers that shows the relationship between profitability and short-term debt. This same explanation applies to regression 2 (relationship between profitability and long-term debt) in column 4 and regression 3 (relationship between profitability and total debt) in column 6. Columns 3, 5 and 7 show the statistical significance of our regression model results. The regression Coefficient of determination (R2) is presented in Appendix B. The R2 represents how much of the dependent variable (profitability ratio) is explained by the independent variables (the debt ratios). The higher these figures, the better the independent variables explain the dependent variable and therefore, the stronger the relationship between the variables as indicated by the slope coefficients. This study, set a significance level (or F probability) of 1%. This is translated to mean that, we expect to have 99% confidence in the results of our regression model. A lower than 1% significance level is therefore by interpretation means a higher than 99% confidence level. What we are saying is that, there is therefore no statistical relationship if our F probability is higher than 1% and vice versa. The Standard Error (SE) of regression is presented in Appendix D. The standard error could be interpreted just like the standard deviation. It also represents how strong is the relationship between the dependent (profitability ratios) and the independent variables (debt ratios). More specifically, It represents how much of actual variables deviate from the values as predicted by regression model results. In other words, it shows how far actual values deviates from values predicted by the regression equation. The smaller this value, the higher would be precision of the relationship between the variables and vice versa. In this regard, the standard error gives additional information about the strength of the association between capital structure and profitability. Overall Listed Company Analysis Table 1 & 2 summarises the results of this study. Our results and discussions are therefore limited by our set significance level. Significance levels, coefficient of determination and standard errors which are other regression results metrics that explains how strong the relationships are, are presented in Appendices B, C and D. 4.2 Relationship between profitability and short-term debt The results of regression 1 show that there is a statistically significant positive relationship between profitability and short-term debt of Ghanaian listed firms similar to the findings of Abor (2005). This means that for Ghanaian listed firms, increasing the short-term debt is associated with increases in profitability and vice versa. The result also implies that short-term debt is relatively cheap for Ghanaian listed firm hence the use of it is associated with increasing profitability. The result implies that the present value of the tax benefit of short-term debt exceeded the associated risk resulting in increasing profitability. Since interest payments from short-term debt are tax deductible the tax bill is lower resulting in higher profits becoming available to shareholders hence the positive relationship. However, for the Ghanaian situation, most short-term debt is non-interest bearing or bear very low interest as they are mostly trade creditors and not bank loans. In fact, with the exception of the banking and finance sectors, 74% of all listed companies’ short-term debt was made up of ‘trade creditors and accruals’ which are to a large extent non-interest bearing debts. The tax savings effect of short-term debt may therefore be minimal. 4.3 Dependence on short-term debt The results of the average short-term debt and profitability shows that 52% of Ghanaian listed firms’ operations and assets were financed with short-term debt. This implies that Ghanaian listed firms generally depended on short-term debt to finance their operations, consistent with Abor (2005) study. Similar to reasons given by Abor (2005), this implies that, Ghanaian listed firms relied more on short-term debt than long-term debt because of difficulties in securing cheap long-term loans from Ghanaian financial institutions which in turn was due to the fact that the Ghanaian long-term capital market is not much developed. Average profitability measures reveals that annual return on equity (ROE) of Ghanaian listed firms during the five year period of study was (15%) which is 22 percentage points lower compared to Abor (2005). This drastic reduction was most likely due to the slowdown of economic activities in the country caused by the effects of the global economic down turn that occurred during the late 2000s. Recall from our literature review that the return on equity (ROE) depends on the firm’s earnings before interest and the state of the economic conditions. No doubt therefore the state of economic conditions has led to falling profits during the period. However, it is our view that Ghanaian listed firms were still profitable during the period because 15% profit margin is not particularly bad. Risk free interest rate during the period was around 10%. On that basis we conclude that Ghanaian listed firms had been profitable during the period of study in spite of the drastic fall in profitability. 4.4 Relationship between profitability and long-term debt The results of regression 2, (relationship between profitability and long-term debt) show a significantly significant negative relationship between profitability and long-term debt of Ghanaian listed firms consistent

European Journal of Business and Management www.iiste.org
ISSN 2222-1905 (Paper) ISSN 2222-2839 (Online)
Vol.5, No.31, 2013
223
with Abor (2005) findings. This means the increase in long-term debt was associated with decreasing profitability for Ghanaian listed firms and vice versa. This also implies that, for Ghanaian firms, long-term debt capital is relatively expensive because the use of it is associated with falling profits. This negative association of long-term debt with profitability implies the risk associated with long-term debt exceeded the tax benefits. It appears the tax savings from debt is minimal being overtaken by the costs. Again, we should not rule out the additional effects of the world economic downturn on firm’s profitability. In the Ghanaian context long-term debt is mostly interest bearing because they are mostly always obtained from banks and financial institutions who almost always charge interest. Also due to the underdevelopment of the Ghanaian capital market, assessing long-term capital is difficult and expensive. In sum both expensive long-term debt and negative economic conditions contributed to falling profitability of Ghanaian listed firms during the period of study 4.5 Dependence on long-term debt The results of the average long-term and profitability show that Ghanaian listed firms financed 11% of their operations and assets with long-term debt. This implies that Ghanaian listed firms did not depend on long-term debt during the period of study. The reason for the less dependence on long-term debt is because it is a very expensive source of financing in Ghana and so Ghanaian listed firms prefer to finance their operations with short-term debt which is relatively cheaper. Ghanaian firms have therefore used long-term debt sparingly to avoid the risk associated with it. Also, though interest payments are tax deductible, the high interest charges put many listed company off reducing the tax benefits associated with it. Again, another reason for the less use of long-term debt capital emanates from the under-developed nature of the capital market in Ghana. This nature of the market also made access to long-term funding very difficult driving up the cost and further hindering Ghanaian listed firms from using long-term debt. 4.6 Relationship between profitability and total debt The results of regression 3 (relationship between profitability and total debt) shows a statistically significant negative relationship between total debt and profitability of Ghanaian firms contrary to the findings of Abor (2005). This implies that total debt have been more expensive for Ghanaian listed firms than the period covered by Abor (2005) Compared to Abor (2005) there was a significant increase in the use of debt capital during the period of study (63% of total assets) compared to Abor (2005) study (59% of total assets). It appears the high cost of debt which is largely due to the use of long term in particular, has led to significant reduction in profit margins during the period, apart from the effects of the global economic down turn resulting in the negative correlation between profitability and total debt. 4.7 Dependence on total debt Average total debt and profitability reveals that Ghanaian listed firms financed their operations and assets with 63% of total debt compared to Abor (2005) study (59%). This result confirms that Ghanaian listed firms largely depended on debt capital as opposed to equity capital to finance operations and assets. Clearly Ghanaian listed firms’ dependence on debt is not because debt was cheap but the use of it was associated with falling profits. Rather the use of long-term debt far exceeded the risk of short-term debt and the total effect is falling profitability from the use of total debt. 4.8 Applicability of the agency, pecking order and trade-off theories From the literature review, we understood that the agency problem was as a result of conflicts of interest between management and shareholders. That is, where shareholders expect management to maximise their wealth, management rather engages in spending activities that may reduce wealth. Generally, there was no evidence of the agency problem in Ghanaian listed firms. Also, the pecking order theory ranked sources of capital in the order of internally generated funds, debt capital and then the last resort, equity. The theory appears to give emphasis to internally generated funds which is a form of equity. Since our analysis reveals that Ghanaian firms depended on debt, we conclude that the pecking order theory did not apply to Ghanaian listed firms. The trade-off theory predicts the optimal capital as a trade-off between the tax benefits and costs of financial distress. The theory predicts that profitable firms depend on debt. The theory appears to apply to Ghanaian listed firms. For the Ghanaian listed firms risk from debt mainly came from the use of long-term debt rather than short-term debt, because of the negative correlation between profitability and long-term debt. But long-term debt constituted just a small part of debt overall (11%) compared to short-term debt (52%). We had earlier mentioned that average profitability overall for Ghanaian listed firms was 15%. Though drastically lower than Abor (2005), it is not really a bad performance for firms faced with economic downturn. We would therefore not be wrong to say Ghanaian listed firms were profitable during the period of study.

European Journal of Business and Management www.iiste.org
ISSN 2222-1905 (Paper) ISSN 2222-2839 (Online)
Vol.5, No.31, 2013
224
The above leads us to a very important observation that Ghanaian firms use of debt is consistent with the trade-off theory which predicts that profitable firms depend on debt financing to maximise profitability. If we agree that Ghanaian firms were profitable and depended on debt, we are as well not wrong to say the trade-off theory applied to Ghanaian firms during this period of study. Industry Variations 4.9 Relationship between Profitability and short-term debt The results of regression 1 (relationship between profitability and short-term debt) shows a statistically significant positive relationship between profitability and short term debt for the banking & finance, distribution, and the pharmaceutical industry sectors consistent with the overall industry level results. Alternatively, the results show there was no statistically significant positive relationship between profitability and short-term debt for the Agro-food, ICT, insurance, manufacturing, mining, printing, publishing, food & Beverage and trading results. This implies that 25% of all Ghanaian listed firm industries results were consistent with the overall listed firm result whilst 75% were not. There is therefore a wide disparity between the results at the overall listed company stage and at the industry sector stage. This disparity is most likely due to industry differences overriding the net effect of tax benefits and risk of financial distress associated with short-term debt. This result also suggests that for the majority of industries their short-term debt structure does not matter to their profitability. In other words, whatever short-term debt that they carry, is irrelevant to their profitability. But given the fact that all the related companies are taxable under the internal revenue act (Act 592) of Ghana and short-term debt related interest payments are tax deductible, one cannot reach that conclusion. For this majority of industry sectors, the tax benefits and the risk of debt associated with short-term debt appear to cancel out and therefore have no significant effect on their profitability. The different industry characteristics have therefore combined to literally erode any significant positive or negative effects on their profitability. In other words, though the use of short-term debt matters to the individual firms within industries, collectively the different industries’ characteristics have brought in benefits and risks that seem to cancel out the effects of short-term debt. Considering generally some industry differences, the insurance industry for instance, mostly depends on premiums to finance their operations which are readily available. For the food & beverage sector, though initial set up costs are likely to be high, subsequent operations are likely to come from short-term loans or from ploughed back profits. The trading industries on the other hand mostly sell on cash basis and so should have lower cash flow problems. The Agro based industries are taxed after 10 year of a tax holidays with some limited exceptions under the Ghanaian tax law. This situation may result in different profits being available to the shareholders of agro-based industries during the ten year tax holidays compared to other industry sectors. The results of our average debt ratios presented in table 4 show that the Agro-based industry actually placed more reliance on equity (92% of total assets) than debt financing. This may probably be because the tax benefits effects of debt are non-existent for the first ten years. Profitability was high for the banking and finance (37%), publishing (48%) and the distribution (22%) sectors exceeding the overall listed company average of 15%. The banking and finance sector for instance have low liquidity problems because they take deposits from even the smallest cash customer. For the publishing sector, short-term debt proved a very cheap source of financing because using it is associated with high profitability, though one cannot rule out the effects of the industry characteristics on their 48% profitability which is 33 percentage points above the overall listed company average. The ICT (-25%) and the trading (-27%) industries posted lower profits than the overall listed company. This also implies excess risk form the use of debt for these sectors. The ICT industry for instance requires investment in capital intensive equipment and a well-developed internet infrastructure in the country. Unfortunately the sector seems to develop rather slowly because of the lack of the needed capital which also affects their profitability. For the trading industry which posted a very high average short-term debt (79%) but heavy losses, it appears also that the risk far outstripped the benefits of short-term debt for the sector business was bad during the period of study. However, the pharmaceutical industry’s average profit of 18%, a 3 percentage points higher than overall profits despite posting a lower than average short-term debt than the overall. This means that though the industry enjoyed the benefits of short-term debt, profits must have been affected positively by the industry differences so as post a higher than expected average profits for the industry, Obviously the above analysis reveals that industry differences have a lot to do with their capital structure and profitability. It is therefore not surprising that the result is different from the result of the overall listed firm stage.

European Journal of Business and Management www.iiste.org
ISSN 2222-1905 (Paper) ISSN 2222-2839 (Online)
Vol.5, No.31, 2013
225
4.10 Dependence on short-term debt The results of average short-term debt show that 42% of all industry sectors used short-term debt in excess of 50% or inversely 58% of all industry sectors used short term debt less than 50%. This implies a less dependence on short-term debt at the industry stage compared to the overall listed company stage. This difference is yet another confirmation of different profitability and capital structure due to industry differences. Particularly, the distribution (57%), banking and finance (77%), ICT industry (58%), the publishing sector (55%) and the trading sector (79%) all exceeded the overall average. On other hand, the food & Beverage (47%), the pharmaceutical (21%), Agro-based industry (8%), the insurance industry (37%), the manufacturing industry (40%), the mining sector (27%) and the printing sector (36%) recorded average short-term debts less than the overall listed company average of 52%. Among these industries some actually used more equity than debt implying they rather depended on equity. These are the pharmaceuticals (77%), Agro-processing (92%) and the Insurance (53%). The above analysis implies that at the industry level, the percentage of industries that depended on short-term debt was lower at the industry stage. In other words, individual industry’s dependence on short-term debt was lower in terms of their average short-term debt compared to the overall result. This once again shows that the different industry structures have something to do with their different capital structures. 4.11 Relationship between profitability and long-term debt The results of regression 2 (relationship between profitability and long-term debt) shows a statistically significant negative relationship between profitability and long-term debt consistent with the overall listed firm result for only the manufacturing sector. The rest of the twelve industry categories, show no significant relationship between profitability and long-term debt. This imply that only 8% of Ghanaian listed company result was consistent with the overall listed company result. Majority of industry sectors (92%) therefore showed no significant relationship between profitability and long-term debt. The result implies that, for the manufacturing sector, the long-term debt have been relatively expensive, thus employing long-term debt is associated with falling profitability. Alternatively, the results imply that for the majority of industries, employing long-term debt is irrelevant to their profitability. Intuitively, this also confirms that, at the industry level, Ghanaian listed firms depended less on long-term liability, consistent with Abor (2005). The results imply that the risk of using long-term debt exceeded the tax benefits for the manufacturing industry. The lack of the required long-term capital, unfavourable economic conditions as well as the specific industry characteristics have all contributed to the increased risk for the manufacturing sector during the period of study. The manufacturing sector is therefore the greatest contributor to the negative relationship between profitability and long-term debt at the overall listed company level. Also once again industry differences are showing up in log-term capital structure and profitability for Ghanaian listed firms. 4.12 Dependency on long-term debt The results of average long-term debt for the industries shows that all industries recorded a lower than 50% long-term debt confirming that Ghanaian listed firms depended less on long-term debt even at the industry level. Average long-term debt ratios show that at least 33% of all industry sectors depended more on long-term debt than the overall average or inversely 67% used less of long term debt. The above confirms what we already know in that Ghanaian listed firms depend less on long-term debt even at the industry level or inversely, used more short-term debt consistent with the overall listed company results. This is also consistent with Abor (2005). This because for Ghanaian listed firms, long term debt is a very expensive source capital hence the use of it is associated with falling profits. 4.13 Relationship between profitability and total debt The results of regression 3 (relationship between profitability and total debt) show that only the food & beverage and the manufacturing sectors showed a statistical negative correlation between profitability and total debt consistent with the overall listed level results. This shows that at the industry level total debt was relatively more expensive exceeding any tax benefits. The result also revealed that, with the exception of the pharmaceutical industry which showed a statistically positive relationship between profitability and debt, the rest of industries showed no significant relationship. This implies that for the majority of industries total debt is irrelevant to their profitability contrary to overall listed company result. The cause of this once again is coming from the effects of industry differences on capital structure and firm’s profitability. Average profitability measures presented in table 4 show that the highest industry performer during the period was the publishing sector (49%) outperforming the overall listed company average performance by 34 percentage points. This figure is also higher than Abor (2005) and may mean that the publishing industry was the least affected by the economic down turn during the period.

European Journal of Business and Management www.iiste.org
ISSN 2222-1905 (Paper) ISSN 2222-2839 (Online)
Vol.5, No.31, 2013
226
The lowest performing industry during the period was the trading industry (-27%) indicating the worst affected industry by the economic down turn. In all five industry sectors performed better at the industry level than the overall listed companies’ level. These are the banking and finance (37%), distributions (22%), food and beverage (26%), pharmaceuticals (18%) and publishing (48%) sectors. Seven industries performed worse than the overall listed companies level performance. These are the agro-processing (5%), information and communications technology (ICT) (-25%), insurance (15%), manufacturing (-0.23%), mining (-7%), printing (-17%), and trading (-27%) industry sectors. The above shows that industry differences have effect on Ghanaian listed firm’s profitability and total debt. 4.14 Dependence on total debt The results of average total debt shows that majority of industries (75%) recorded total debts exceeding 50% of total capital implying that Ghanaian listed firms have depended on total debt consistent with the overall listed company result. The highest industry depending on debt was the banking and finance industry (85%) and the least dependent on debt was agro-processing industry (8%). This result is not surprising because the banking and finance industry is practically in the business of borrowing to pay for investments. For the agro-based industry, the result confirms the reluctance of Ghanaian banks to give loans to the industry. 33% of industries exceeded the overall average whilst 67% fall short of the overall average of 63%. In all eight out of the five industries posted positive gains during the period confirming the listed Ghanaian firms were profitable during the period despite negative effects of the world economic crisis. The above analysis reveals that though Ghanaian firms were less profitable during times when economic conditions were not favourable, compared to Abor (2005), they relied heavily on debt. This shows Ghanaian firms relied heavily on debt during periods of harsh economic conditions to get them out of financial difficulties. The average profitability and debt ratios analysis was consistent with the trade-off theory of capital structure which predicts that profitable firms rely heavily on debt. Here though Ghanaian firms were less profitable than earlier because of the falling economic conditions, they were still profitable and have relied on debt capital to leverage their profits and get them out of hard economic times. It also appears the tax benefit of debt is largely not the reason for the Ghanaian firms heavy use of debt during the period because if that is the case, there would be heavier use of long term debt since short term debt in Ghana are mostly non-interest bearing and so offer no or less tax benefits. Rather there was heavier dependence on short-term debt to reduce the possibility of financial failures during the period of the economic down turn. 5. Conclusions and Recommendations This study is about the relationship between Capital structure and profitability of Ghanaian listed firms during the five year period from 2005 to 2009. The findings and analysis were limited by the accuracy of data obtained from the Ghana Stock exchange’s 2010 fact book and by the significance level of the regression model used. The results revealed that, there was a statistically significant positive relationship between short-term debt and profitability. There was a similar result at the industry sector level, for the Banking & Finance, Distribution, Pharmaceuticals, and Food & Beverage. The rest of the industries showed a different result. The results also showed there was a statistically negative relationship between profitability and long term debt. Only the manufacturing industry showed a similar result at the industry level. The rest of the other industries showed a statistically no significant relationship between profitability and long-term debt. Lastly, the results revealed a statistically significant negative relationship between profitability and total debt at the overall listed company level. There was a similar result at the mining and food and beverage industries. However, for the pharmaceutical industry, the results showed a significantly positive relationship between profitability and total debt whilst the results for the rest of industry sectors showed no significant relationship between profitability and total debt. Overall, the result suggests that Ghanaian listed firms had depended on short-term debt more than long-term debt. This clearly exposes the apparent undeveloped nature of the Ghanaian long-term capital market compared to most of the advanced countries like the UK, America, Japan, Canada, France and Germany. The results also revealed that profitable firms depend on debt capital to manage their operations. However at the industry sector level, only 42% of all industries depended on short-term debt. On the contrary, the results showed that three industries namely, pharmaceuticals, Agro-processing, Insurance actually relied more on equity finance than debt capital. The results generally confirmed that, the motivation for capital structure decisions by Ghanaian listed firms was not the tax benefits of debt but rather the overriding objective of overcoming the effects of the world economic downturn which affected their profitability. The result also suggested the trade-off theory applied to the capital structure of Ghanaian listed firms. However there was no evidence that the pecking order and the agency costs theory applied to Ghanaian listed firms during the period of study.
European Journal of Business and Management www.iiste.org
ISSN 2222-1905 (Paper) ISSN 2222-2839 (Online)
Vol.5, No.31, 2013
227
5.1 Recommendations From our review of literature on capital structure decisions, it is clear that the ideal capital structure for any firm is the optimal capital structure because the optimal capital structure is the level of debt/equity ratio that maximizes the firm’s value. However, the optimal capital structure is far from conclusive because the elements of capital structure are difficult to measure precisely. It is also obvious that the issues of taxes and costs of financial distress are very important to a targeted or optimal capital structure. It is in view of this that we make our recommendations in relation to the tax benefits and the costs associated with financial distress. We recommend that, taxpaying firms should explore the benefits of using debt to finance their operations in order to take advantage of the tax benefits. However, loss making firms and firms with high tax credits may not find debt capital very beneficial and so should use it with extreme care and when it is really necessary to do so. This should be the case in order to avoid the risk associated with using debt exceeding the benefits. In Ghana, Agro-based firms are particularly exempted from tax, for the first ten years of their existence under section 11 of the Internal Revenue Act 2000 (Act 592). The benefits of tax are very slim for firms that qualify for the exemption. Generally the higher the tax rate, the more beneficial it will be to use debt financing but we advise caution always as too much use of debt increases risk.We also recommend that companies, especially the profitable ones and government, should contribute more to stimulate growth of Ghana’s capital market by issuing more long-term bonds to the general public rather than the current focus on short-term bank loans. When this happens, it would also stimulate more trading in long term bonds and hence the growth of the Ghanaian capital market and a further growth of Ghanaian firms who are mostly small scale firms. Lastly, we recommend further studies on the issues of capital structure in Ghana not only on listed firms but on non-listed firms. Future studies if undertaken should also include topics like ‘finding out about why the capital market in Ghana is still underdeveloped or why it is growing that slowly’. It is our hope that such a study would contribute towards a rapid development of the Ghanaian capital market to help Ghana’s economic growth. Such a study is very crucial more so as Ghana has joined the league of oil producing countries since 2011. A well-developed capital market is essential to support this emerging and capital intensive oil and gas industry in Ghana. APPENDICES
Appendix A - Industry categories of Ghanaian listed firms
Source: Researcher’s own compilation from the Ghana Stock Exchange’s ‘Fact book 2010’
European Journal of Business and Management www.iiste.org
ISSN 2222-1905 (Paper) ISSN 2222-2839 (Online)
Vol.5, No.31, 2013
228
Appendix B - Regression Results Coefficient of determination (R2) Coefficient of determination (R2)
Regression Results Regression 1 Regression 2 Regression 3 Agro processing 0.9228 0.9836 0.9228 Banking & Finance 0.2432 0.1918 0.2033 Distribution 0.5694 0.4575 0.4161 Food & Beverage 0.6340 0.3221 0.7646 ICT 0.3278 0.3250 0.3408 Insurance 0.2408 0.0505 0.3932 Manufacturing 0.3418 0.6196 0.4652 Mining 0.3933 0.2867 0.2560 Overall listed companies 0.3304 0.3643 0.3258 Pharmaceuticals 0.8433 0.8279 0.8316 Printing 0.7332 0.5133 0.4560 Publishing 0.6500 0.9936 0.5073 Trading 0.7652 0.9825 0.8577
Appendix C - Regression Results Significance level (Probability F) Probability (F)
Regression Results Regression 1 Regression 2 Regression 3 Agro processing 0.3491 0.1625 0.3491 Banking & Finance 0.0091 0.0316 0.0241 Distribution 0.0031 0.0180 0.0312 Food & Beverage 0.0093 0.2161 0.0009 ICT 0.4642 0.4689 0.4422 Insurance 0.6197 0.9533 0.3588 Manufacturing 0.0113 0.0000 0.0009 Mining 0.3587 0.5357 0.5915 Overall listed companies 0.0002 0.0000 0.0003 Pharmaceuticals 0.0079 0.0104 0.0098 Printing 0.6271 0.8097 0.8451 Publishing 0.7067 0.1017 0.8136 Trading 0.5919 0.1678 0.4687
Appendix D - Regression Results Standard Error Standard Error (SE)
Regression Results Regression 1 Regression 2 Regression 3
Agro processing 0.0544 0.0251 0.0544
Banking & Finance 0.1649 0.1704 0.1692
Distribution 0.0988 0.1110 0.1151
Food & Beverage 0.1582 0.2153 0.1268
ICT 1.0920 1.0943 1.0813
Insurance 0.0470 0.0526 0.0420
Manufacturing 0.2108 0.1602 0.1900
Mining 0.1561 0.1692 0.1728
Overall listed companies 0.3634 0.3586 0.3640
Pharmaceuticals 0.0580 0.0608 0.0601
Printing 0.3492 0.4717 0.4987
Publishing 0.2141 0.0289 0.2540
Trading 0.5624 0.1534 0.4379

European Journal of Business and Management www.iiste.org
ISSN 2222-1905 (Paper) ISSN 2222-2839 (Online)
Vol.5, No.31, 2013
229
References Abor, J. (2005) The effect of capital structure on profitability: an empirical analysis of listed firms in Ghana.
Journal of Risk Finance. Vol. 6 No.5, pp.438 - 445. Abor, J. (2007) Debt Policy and Performance of SMEs; Evidence from Ghanaian and South African Firms.
Journal of Risk Finance. Vol. 8 No. 4, pp.364-379. Abor, J. (2007a) Industry classification and the capital structure of Ghanaian Firms. Studies in Economics and
Finance. Vol. 24 No. 3, pp.207-219. Abor, J. (2008) Determinants of the capital structure of Ghanaian Firms. African Economic Research
Consortium (AERC) Research Paper 176. Abor, J., & Biekpe, N. (2005) What determines the capital structure of Listed Firms in Ghana. African Finance
Journal. Vol 7, Part 1, pp.37-48. Abor, J., & Biekpe, N. (2007) Small business reliance on banking and finance in Ghana. Emerging Markets
Finance and Trade. Vol. 43, No. 4, pp.93-102. Amarjit, G., Nahum, B., Chenping, P., & Smita, B. (2009) The determinants of Capital structure in the service
industry: evidence from United States. The Open Business Journal. No. 2, pp.48-53. Berger & di Patti (2002) Capital Structure and Firm Performance: A New Approach to Testing Agency
Theory and an Application to the Banking Industry Brealey, R. A., Myers, S. C., & Marcus, A. J. (2009) Fundamentals of Corporate Finance. 6th ed. pp. 440-
463. New York, McGrawHill/Irwin. Bryman, A. (n.d.). Triangulation. Ehrhardt, M. C., & Brigham, E. F. (2009). Corporate Finance: A focused approach. Cengage Learning Inc. Fama, & French. (1998, June). financeprofessor.com. [Internet],Available from:
http://www.financeprofessor.coml> [Accessed November 7, 2011] Greener, S. (2008). Business Research Methods. Ventus Publishing ApS. Hadlock, C.J. and James, C.M. (2002), “Do banks provide financial slack?”, Journal of Finance,Vol. 57, pp.
1383-420.Quoted in: Abor, J. (2005) The effect of capital structure on profitability: an empirical analysis of listed firms in Ghana. Journal of Risk Finance. Vol. 6 Iss: 5, p. 441.
Internal revenue Act 2000, Act 592, Ghana. Li-Ju, C., & Shun-Yu, C. (2011) A Discussion on Capital Structure –by the Three-Year Period Longitudinal
Mediation Analysis Model. Middle Eastern Finance and Economics. Issue 14, pp.109-118. (Melinda & Cristina, n.d.). Risk and profitability as capital structure determinants Modigliani, F. And Miller, M.H. (1958). The Cost of Capital, Corporate Finance and the Theory of
Investment, American Economic Review, 48, 261-97Miller, M., & Modigliani, M. (1958). Modigliani, F. And Miller, M.H. (1963). Corporate Income Taxes and the Cost of Capital: A Correction,
American Economic Review, 53, 433-43 Rafique, M. (2011, June). Effect Of Profitability & Financial Leverage On Capital Structure: A Case Of
Pakistan’S Automobile Industry:. Economics and Finance Review, Vol. 1 (4), 50-58. Ross, S. A., Westerfield, R. W., Jaffe, J. F., & Jordan, B. D. (2009). Corporate Finance: Core principles and
applications. 2nd ed. New York, McGraw-Hill Irwin. Ross, S. A., Westerfield, R. W., & Jordan, B. D. (2001) Essentials of corporate finance. 3rd ed. New York,
McGraw-Hill. Yogendrarajah, R., & Thanabalasingham, S. (n.d.) The effect of profit margin on capital structure:
Manufacturing companies of Colombo Stock Exchange (CSE), Sri Lanka. Zikmund, W. G., Babin, B. J., Carr, J. C., & Griffin, M. (2010). Business Reseach Methods. 8th ed. South-
Western, Cengage Learning.
This academic article was published by The International Institute for Science,
Technology and Education (IISTE). The IISTE is a pioneer in the Open Access
Publishing service based in the U.S. and Europe. The aim of the institute is
Accelerating Global Knowledge Sharing.
More information about the publisher can be found in the IISTE’s homepage:
http://www.iiste.org
CALL FOR JOURNAL PAPERS
The IISTE is currently hosting more than 30 peer-reviewed academic journals and
collaborating with academic institutions around the world. There’s no deadline for
submission. Prospective authors of IISTE journals can find the submission
instruction on the following page: http://www.iiste.org/journals/ The IISTE
editorial team promises to the review and publish all the qualified submissions in a
fast manner. All the journals articles are available online to the readers all over the
world without financial, legal, or technical barriers other than those inseparable from
gaining access to the internet itself. Printed version of the journals is also available
upon request of readers and authors.
MORE RESOURCES
Book publication information: http://www.iiste.org/book/
Recent conferences: http://www.iiste.org/conference/
IISTE Knowledge Sharing Partners
EBSCO, Index Copernicus, Ulrich's Periodicals Directory, JournalTOCS, PKP Open
Archives Harvester, Bielefeld Academic Search Engine, Elektronische
Zeitschriftenbibliothek EZB, Open J-Gate, OCLC WorldCat, Universe Digtial
Library , NewJour, Google Scholar