The Case of Indian Listed Companies.
239
Determinants and Consequences of the Quality of Forward-Looking Information Disclosure: The Case of Indian Listed Companies. By Mansor Ali Mansor Alnabsha A thesis submitted in partial fulfilment for the requirements for the degree of Doctor of Philosophy at the University of Central Lancashire February 2019
-
Upload
khangminh22 -
Category
Documents
-
view
1 -
download
0
Transcript of The Case of Indian Listed Companies.

Determinants and Consequences of the Quality of
Forward-Looking Information Disclosure: The Case of
Indian Listed Companies.
By
Mansor Ali Mansor Alnabsha
A thesis submitted in partial fulfilment for the requirements for
the degree of Doctor of Philosophy at the University of Central
Lancashire
February 2019

i
STUDENT DECLARATION FORM
1. Concurrent registration for two or more academic awards
I declare that while registered as a candidate for the research degree, I have not been
a registered candidate or enrolled student for another award of the University or
other academic or professional institution
2. Material submitted for another award
I declare that no material contained in the thesis has been used in any other
submission for an academic award and is solely my own work
3. Collaboration
Where a candidate’s research programme is part of a collaborative project, the thesis
must indicate in addition clearly the candidate’s individual contribution and the
extent of the collaboration. Please state below:
This study is my own work and has not been used in any collaborative project.
Signature of Candidate
Print name: Mansor Ali Alnabsha
Type of Award Doctor of Philosophy
School Business School

ii
Abstract
This study aims to examine the determinants and consequences of the Quality of Forward-
looking Information Disclosure (QFLID) among non-financial Indian listed companies.
Following objectives are accomplished in this study: Firstly, to investigate the association
between Corporate Governance mechanisms (CG) and QFLID. Secondly, to investigate the
impact of QFLID on Firm Value (FV) and lastly, to investigate the impact of QFLID on the
Accuracy of Analysts’ Earnings Forecast (ACUAF). The study uses a sample of 2120
observations of non-financial companies listed on the Bombay Stock Exchange (BSE) from
2006 to 2015. To measure QFLID, this study adopted a multidimensional framework designed
by Beretta & Bozzolan (2008). Both the quantity and the richness dimensions are considered
in this framework.
Regarding the first objective, the results indicate that board size, frequency of board meetings,
board independence, female presence on the board, frequency of audit committee meetings,
independence of the audit committee and female presence on the audit committee have positive
associations with the QFLID. These results are in line with the perspectives of the agency,
signalling and resource-dependence theories. However, the study found that CEO duality,
blockholder ownership, institutional ownership, promoters’ ownership, audit committee size
and audit committee financial expertise have no relationship with the QFLID.
To achieve the second objective, the empirical results found that QFLID is positively and
significantly associated with FV, which is consistent with the agency and signalling theory
perspectives. Thus, firms with high QFLID increase FV more than those with a low QFLID.
Concerning the third objective, the analyses indicate that QFLID is positively associated with
ACUAF, meaning that firms with high QFLID increase ACUAF as compared to those with
low QFLID. This result supports the signalling theory, suggesting that managers increase FLID
as it reduces information asymmetry and improves ACUAF.
The current study also conducted a series of tests to check the robustness of the main results.
The findings of these additional and robustness tests provide evidence that the essential
findings of this study are robust and unchanged.

iii
Statement of Copyright
“The copyright of this thesis rests with the author. It is not allowed to download or to
forward/distribute the text or part of it without the previous written agreement and information
derived from it should be acknowledged”.
Mansor Ali Alnabsha
Mansor Alnabsha

iv
Acknowledgement
“In the name of Allah, most Gracious, most merciful”
First and foremost, I express my deep gratitude to Almighty God for giving me immense strength, good
health and confidence to complete this study. Secondly, I would like to express my deep gratitude and
thanks to my first supervisor, Dr. Zakaria Ali Aribi for his valuable guidance, being a great source of
enthusiasm, motivation and encouragement throughout this study. I am extremely thankful for his
precious time spent on reading and commenting on drafts. He has always been there to listen, to counsel
and support, and this has had a great impact on my thinking, allowing me to shape appropriate ideas
into research. I was very lucky to be one of his students.
Thirdly, I would like to express my deepest gratitude to Dr. Mitchell Larson, University of Central
Lancashire (UCLan), Business School, for his guidance, comments, and support. Fourthly, I am most
thankful to the Librarian and members of staff within the University of Central Lancashire Business
School and all staff in the Research Office for their ongoing support and all the facilities they have
provided for the execution of my work. I deeply value the support and help they have rendered.
Fifthly, my sincere thanks to the Libyan Ministry of Higher Education, the Libyan Cultural Affairs
Office in London, and Asmaria University, to which I belong, for giving me this chance and sponsoring
me to study for a Doctorate at the University of Central Lancashire. I would like to take this opportunity
to thank a number of people whose invaluable assistance and support have made this research study a
reality. I would also like to acknowledge all my fellow PhD candidates, colleagues and friends at UCLan
Business School for their invaluable support during my studies and their kindness.
Last, but not least, I would like to express my special appreciation to my beloved mother, my brothers,
my sisters, my wife, my son and my daughter for their unlimited source of love, encouragement, prayers
and support over the years. I am also thankful to all my friends in Libya and the UK for their help,
support and encouragement. My special apologies go to anyone who might have directly or indirectly
contributed to this study, but who have accidentally not been explicitly acknowledged.

v
Dedication
This work is dedicated to the memory of my father who passed away during my MSc studies;
may Allah bless him, Amiin. To my beloved Mother, my brothers, my sisters, my wife, my
son, my daughter, my friends and everyone who have shared this dream with me.

vi
Table of Contents
Abstract ...................................................................................................................................... ii
Statement of Copyright ............................................................................................................ iii
Acknowledgement .................................................................................................................... iv
Dedication .................................................................................................................................. v
Table of Contents ...................................................................................................................... vi
List of Tables ............................................................................................................................. x
List of Figures ........................................................................................................................... xi
Abbreviations ........................................................................................................................... xii
Chapter One: Introduction ......................................................................................................... 1
1.1 Research Overview .......................................................................................................... 1
1.2 Research Motivations ....................................................................................................... 5
1.3 Research Aim and Objectives .......................................................................................... 8
1.4 Research Methodology ..................................................................................................... 9
1.5 Research Contributions .................................................................................................. 10
1.6 Structure of the Study ..................................................................................................... 11
Chapter Two: Literature Review (FLID) ................................................................................. 14
2.1. Introduction ................................................................................................................... 14
2.2. Concept and Definition of FLID ................................................................................... 14
2.3. Nature of FLID .............................................................................................................. 16
2.4. Motivations of FLID ..................................................................................................... 16
2.5. Usefulness of FLID ....................................................................................................... 18
2.6. The quality of FLID ...................................................................................................... 19
2.7. Determinants of FLID ................................................................................................... 21
2.8. Empirical Literature of FLID ........................................................................................ 24
2.8.1. Empirical Studies of CG and FLID ........................................................................ 24
2.8.2. Empirical Studies of FLID and FV......................................................................... 37

vii
2.8.3. Empirical Studies of FLID and ACUAF ................................................................ 41
2.9. Research Gap................................................................................................................. 43
2.10. Summary ..................................................................................................................... 45
Chapter Three: Theoretical Framework and Hypotheses Development .................................. 47
3.1. Introduction ................................................................................................................... 47
3.2. Theories ......................................................................................................................... 47
3.2.1. Agency Theory ....................................................................................................... 47
3.2.2. Signalling Theory ................................................................................................... 50
3.2.3. Resource Dependence Theory ................................................................................ 52
3.2.4. Stakeholder Theory ................................................................................................. 53
3.3. Research Hypotheses Development .............................................................................. 55
3.3.1. Hypotheses Related to CG and QFLID .................................................................. 55
3.3.2. Hypothesis Related to QFLID and FV ................................................................... 69
3.3.3. Hypothesis Related to QFLID and ACUAF ........................................................... 71
3.4. Conclusion ..................................................................................................................... 74
Chapter Four: Methodology ..................................................................................................... 75
4.1. Introduction ................................................................................................................... 75
4.2. Research Methodology .................................................................................................. 75
4.2.1. Research Philosophy............................................................................................... 76
4.2.2. Research strategies ................................................................................................. 77
4.2.3. Research approach .................................................................................................. 78
4.3. Sample Selection Procedure and Data Collection ......................................................... 81
4.3.1. Sample Selection Procedure ................................................................................... 81
4.3.2. Data Collection ....................................................................................................... 83
4.4. Measurement of the Research Variables ....................................................................... 83
4.4.1. Measuring the QFLID ............................................................................................ 83
4.4.2. Measuring the FV ................................................................................................... 96

viii
4.4.3. Measuring the Accuracy of Analysts’ forecast (ACUAF) ..................................... 97
4.4.2. Measuring the Independent Variable (CG variables) ............................................. 99
4.4.3. Measuring the Control Variables (firm characteristics) ....................................... 100
4.5. Research Empirical Models ........................................................................................ 109
4.6. Empirical Procedures of Data Analysis: ..................................................................... 110
4.6.1. Preliminary Analysis ............................................................................................ 110
4.6.2. Multivariate Analysis ........................................................................................... 111
4.6.3. Additional Analyses and Robustness Test............................................................ 113
4.7. Chapter Summary ........................................................................................................ 114
Chapter Five: CG Mechanisms and QFLID .......................................................................... 115
5.1. Introduction ................................................................................................................. 115
5.2. Descriptive Statistics of the Regression Variables ...................................................... 115
5.3. Multicollinearity .......................................................................................................... 120
5.4. Multivariate Analysis .................................................................................................. 123
5.4.1. Findings and Discussion of CG and QFLID ........................................................ 124
5.5. Aditional Analysis: .................................................................................................. 138
5.6. Endogeneity Problems ................................................................................................ 140
5.7. Summary ..................................................................................................................... 143
Chapter Six: The consequences of QFLID ............................................................................ 144
6.1. Introduction ................................................................................................................. 144
6.2. Descriptive Statistics ................................................................................................... 144
6.3. Multicollinerity............................................................................................................ 146
6.4. The Impact of QFLID on FV ...................................................................................... 149
6.5. The impact of QFLID on ACUAF .............................................................................. 152
6.6. Additional Analyses .................................................................................................... 155
6.7. Robustness Test ........................................................................................................... 157
6.8. Endogeneity Problems ................................................................................................ 160

ix
6.9. Summary ..................................................................................................................... 163
Chapter Seven: Conclusion .................................................................................................... 165
7.1. Introduction ................................................................................................................. 165
7.2. Study’s Findings .......................................................................................................... 165
7.2.1. Findings Related to CG and QFLID ..................................................................... 165
7.2.2. Findings Related to QFLID and FV ..................................................................... 167
7.2.3. Findings Related to QFLID and ACUAF ............................................................. 168
7.3. Research Contribution ................................................................................................. 169
7.4. Study’s Implications .................................................................................................... 170
7.5. Study’s Limitation ....................................................................................................... 172
7.6. Suggestions for Future Research ................................................................................. 173
References .............................................................................................................................. 175
Appendices ............................................................................................................................. 212

x
List of Tables
Table 4. 1 Sample selection ..................................................................................................... 82
Table 4. 2 Final sample sorted by industry .............................................................................. 82
Table 4. 3 Summary of Cronbach’s Alpha test for FLID index .............................................. 92
Table 4. 4 Definition and measurement of variables ............................................................. 108
Table 5. 1 Descriptive statistics ............................................................................................. 119
Table 5. 2 Pearson Correlation Matrix: CG Mechanism and Control Variables ................... 121
Table 5. 3 Multicollinearity test results Variance Inflation Factor (VIF) .............................. 122
Table 5. 4 Regression analysis of the association between CG mechanisms and QFLID ..... 136
Table 5. 5 Summary of the Hypothesis Results Related to CG and QFLID ......................... 137
Table 5. 6 Regression analysis of the association between CG mechanisms and QFLID ..... 139
Table 5. 7 Instrumental variables Two-Stage (2SLS) regression model based on QFLID ... 142
Table 6. 1 Descriptive statistics ............................................................................................ 146
Table 6. 2 Correlation Matrix (QFLID and TQ ratio). ......................................................... 147
Table 6. 3 Correlation Matrix (QFLID and ACUAF)........................................................... 148
Table 6. 4 VIF Test Results (QFLID and TQ ratio). ............................................................ 148
Table 6. 5 VIF Test Results (QFLID and ACUAF).............................................................. 149
Table 6. 6 Regression analysis of the association between QFLID and the TQ ratio. ......... 152
Table 6. 7 Regression analysis of the association between QFLID and ACUAF ................ 155
Table 6. 8 Regression analysis of the association between High and Low QFLID and TQ ratio
................................................................................................................................................ 156
Table 6. 9 Regression analysis of the association between (High and Low) QFLID and ACUAF
................................................................................................................................................ 157
Table 6. 10 Regression analysis of the association between QFLID and MC ...................... 159
Table 6. 11 Regression analysis of the association between QFLID and DISAF ................ 160
Table 6. 12 Instrumental variables Two-Stage regression model based on TQ ratio. .......... 162
Table 6. 13 Instrumental variables Two-Stage regression model based on ACUAF. .......... 163

xi
List of Figures
Figure 3. 1 Theoretical Framework of Determinants and Consequences of QFLID ............... 73
Figure 4. 1 The research methodology ................................................................................... 76
Figure 4. 2 The Multidimensional Framework of QFLID ...................................................... 85 . . . . . . . . . . . . . . . . . . . . . . . . . . . . . . . . . . . . . . . . . . . . . . . . . . . . . . . . . . . . . . . . . . . . . . . . . . . . . . . . . . . . . . . . . . . . . . . . . . . . . . . . . . . . . . . . . . . . . . . . . . . . . . . . . . . . . . . . . . . . . . . . . . . . . . . . . . . . . . . . . . . . . . . . . . . . . . . . . . . . . . . . . . . . . . . . . . . . . . . . . . . . . . . . . . . . . . . . . . . . . . . . . . . . . . . . . . . . . . . . . . . . . . . . . . . . . . . . . . . . . . . . . . . . . . . . . . . . . . . . . . . . . . . . . . . . . . . .. . . . .
. . . . . . . . . . . . . . . . . . . . . . . . . . . . . . . . . . . . . . . . . . . . . . . . . . . . . . . . . . . . . . . . . . . . . . . . . . . . . . . . . . . . . . . . . . . . . . . . . . . . . . . . . . . . . . . . . . . . . . . . . . . . . . . . . . . . . . . . . . . . . . . . . . . . . . . . . . . . . . . . . . . . . . . . . . . . . . . . . . . . . . . . . . . . . . . . . . . . . . . . . . . . . . . . . . . . . . . . . . . . . . . . . . . . . . . . . . . . . . . . . . . . . . . . . . . . . . . . . . . . . . . . . . . . . .

xii
Abbreviations
ACUAF Accuracy of Analyst’s Earnings Forecast
AEPS Actual Earnings Per Share
ACSIZE Audit Committee Size
ACFEXP Audit Committee Financial Expertise
ACM Audit Committee Meetings
BSIZE Board Size.
BI Board Independence.
BSE Bombay Stock Exchange.
BloOwn Blockholder Ownership.
LM Breusch-Pagan Lagrange multiplier
CICA Canadian Institute of Chartered Accountants
BD CEO Duality.
CEO Chief Executive Officer.
COV Coverage
CG Corporate Governance
CSR Corporate Social Responsibility.
DEP Depth
DISAF Dispersion of Analysts’ Earnings Forecast
DIS Dispersion
ES Economic Sign
ECB European Central Bank
ED Estimated Disclosure
FASB Financial Accounting Standards Board.
GROW Firm Growth Ratio
FV Firm Value
CSIZE Firm’s Size.
LEVE Firm’s Leverage Ratio.
LIQU Firm’s Liquidity.

xiii
PROF Firm’s Profitability.
FLID Forward-Looking Information Disclosures.
FBM Frequency of Board Meeting
FPB Female Presence on the Board
FPAC Female Presence on the Audit Committee
GAAP Generally Accepted Accounting Principles.
H Hypothesis.
IAC Independence of the Audit Committee
ICGC Indian Corporate Governance Code
ISE Istanbul Stock Exchange
FISIN International Securities Identification Number.
IAS International Accounting Standards.
IASB International Accounting Standards Board.
IFRS International Financial Reporting Standards.
InsOwn Institutional Ownership.
ICAEW Institute of Chartered Accountants of England and Wales
ICAI Institute of Chartered Accountants of India
ICWAI Institute of Cost and Work Accountants of India
ISA International Standards on Auditing
IV Instrumental Variables.
IndTyp Industry type
MC Market Capitalisation
. . . . . . . . . . . . . . . . . . . . . . . . . . . . . . . . . . . . . . . . . . . . . . . . . . . . . . . . . . . . . . . . . . . . . . . . . . . . . . . . . . . . . . . . . . . . . . . . . . . . . . . . . . . . . . . . . . . . . . . . . . . . . . . . . . . . . . . . . . . . . . . . . . . . . . . . . . . . . . . . . . . . . . . . . . . . . . . . . . . . . . . . . . . . . . . . . . . . . . . . . . . . . . . . . . . . . . . . . . . . . . . . . . . . . . . . . . . . . . . . . . . . . .
. . . . . . . . . . . . . . . . . . . . . . . . . . . . . . . . . . . . . . . . . . . . . . . . . . . . MD&A Management Disclosure and Analysis
MAF Median Analysts’ Forecast of Earnings
NSE National Stock Exchange
NYSE New York Stock Exchange.
OLS Ordinary Least Squares.
OD Observed Disclosure
OTL Outlook Profile
ProOwn Promoters Ownership
QFLID Quality of Forward-looking Information Disclosures.

xiv
QD Quantity Dimension
Q-Q plot Quantile-Quantile Test.
R&D Research and Development costs.
ROA Return on Assets.
RQD Relative Quantity Disclosure
RCN Richness Dimension
ɛ Residual Values.
α β Regression Parameters.
STRQD Standardised Quantity Disclosure
S&P Standard and Poor’s (American Stock Market Index).
SEBI Security Exchange Board of India
SP Share Price
TOM Type of Measure
TQ ratio Tobin’s Q ratio
2SLS Two-Stage Regression.
VIF Variance Inflation Factor.
WID Width . . . . . . . . . . . . . . . . . . . . . . . . . . . . . . . . . . . . . . . . . . . . . . . . . . . . . . . . . . . . . . . . . . . . . . . . . . . . . . . . . . . . . . . . . . . . . . . . . . . . . . . . . . . . . . . . . . . . . . . . . . . . . . . . . . . . . . . . . . . . . . . . . . . . . . . . . . . . . . . . . . . . . . . . . . . . . . . . . . . . . . . . . . . . . . . . . . . . . . . . . . . . . . . . . . . . . . . . . . . .
. . . . . . . . . . . . . . . . . . . . . . . . . . . . . . . . . . . . . . . . . . . . . . . . . . . . . . . . . . . . . . . . . . . . . . . . . . . . . .

1
Chapter One: Introduction
This chapter covers the introduction of the current study. It is split into six sections. Section
1.1 provides a brief overview and background of the research. Section 1.2 explains the study
motivations. Section 1.3 sheds light on the research aim and objectives. Section 1.4 outlines
the research methodology. Section 1.5 addresses the contribution of the study and Section 1.6
reports the structure of the thesis.
1.1 Research Overview
Corporate disclosure is a significant research area that has attracted many accountancy
researchers since the beginning of the 1960s (Hussainey & Al‐Najjar, 2012). It plays a vital
role in mitigating the issue of information asymmetry among all parties and reducing agency
costs. Annual reports of a company are comprised of two disclosure types: Mandatory and
Voluntary. Mandatory disclosure is compulsory for companies as multiple regulations and laws
force companies to disclose a minimum amount of information that has to be revealed to users.
Voluntary disclosure is further information that is reported by the company in their annual
report, which exceeds the compulsory information. Although voluntary disclosure is
information that is not legally required, it helps companies to promote a better image and also
helps them to increase stakeholders’ confidence (Alnabsha, Abdou, Ntim, & Elamer, 2017;
Meek, Roberts, & Gray, 1995a).
Voluntary disclosure consists of two types: backward-looking information and forward-
looking information disclosure (FLID) (Aljifri & Hussainey, 2007). FLID is an essential
element of voluntary disclosure (Hassanein & Hussainey, 2015; Menicucci, 2013a). FLID
contains information regarding a company’s future forecast (Aljifri & Hussainey, 2007). It
helps investors to evaluate a company’s future performance and increases their capability to

2
make rational investment decisions (Kieso, Weygandt, & Warfield, 2010). FLID also deals
with non-financial information, such as uncertainties and risks. FLID has been defined in the
literature by a number of authors. For instance, Hussainey (2004, p. 38) defines FLID as
“information on predictions related to current and future plans to assist users of financial
statement and other shareholders about firm’s future performance”. FLID is defined as
“information or any forecast that assists to make assessments about the future; it comprises
estimates of opportunities, management’s strategy and risks and predictions data” (Celik, Ecer,
& Karabacak, 2006, p. 200). Similarly, FLID is defined as “information on future estimates
that help users to evaluate company’s future performance” (Menicucci, 2013c, p. 1668).
Likewise, FLID is defined as “corporate forecasts based on the future of the firm and provide
valuable financial information to its owners who are concerned about its future performance ”
(Alkhatib, 2014, p. 858).
Recently, several official pronouncements have asserted the importance of FLID for financial
information users. For instance, the Canadian Institute of Chartered Accountants (CICA) in
2002, and the Institute of Chartered Accountants of England and Wales (ICAEW) in 2003
recommended that firms’ annual financial reports should provide more FLID in order to meet
users’ needs, which leads to creating long-term value. However, mere disclosure (low quality
information) may have a negative impact on the market decisions (Botosan, 2004). If low
quality information is reported by the manager, it will not enhance the judgments of financial
decision makers and other stakeholders (Dhaliwal, Radhakrishnan, Tsang, & Yang, 2012).
Thus, managers should provide high quality FLID to help users make their investment
decisions.
Prior studies have suggested several determinants of disclosure in general. It is also argued that
CG is a key determinant of FLID (Alkhatib, 2014; Hassanein & Hussainey, 2015; Kuzey, 2018;
Mousa & Elamir, 2018; Wang & Hussainey, 2013). Although no empirical study has examined

3
the impact of CG on QFLID, Aksu & Kosedag (2006) suggest that companies with high CG
standards may have a better chance of providing high quality informative disclosure. CG assists
in reducing information asymmetry by using adequate monitoring measures, such as adding
more independent directors (Ebrahim & Fattah, 2015; El-Masry, Elbahar, & AbdelFattah,
2016). In India, the Mandatory Corporate Governance Code was put in place in the year 2000
by the Security Exchange Board of India (SEBI) and obliged all companies listed on the
Bombay Stock Exchange (BSE) and other stock exchanges to disclose certain levels of
information in their financial reports (Sharma & Singh, 2009).
Earlier studies, which examined the association between CG mechanisms and FLID, provide
mixed results. For instance, Navarro & Urquiza (2015) found a positive impact of independent
directors on FLID, although other researchers found no association between the two variables
(Aljifri, Alzarouni, Ng, & Tahir, 2014; Ebrahim & Fattah, 2015; Kuzey, 2018; O’Sullivan,
Percy, & Stewart, 2008; Uyar & Kilic, 2012). Wang & Hussainey (2013) found a negative
association between CEO duality and FLID, while Navarro & Urquiza (2015) showed that
CEO duality has no association with FLID. Wang & Hussainey (2013) and Navarro & Urquiza
(2015) reveal that board size is positively related to FLID, whereas Kuzey (2018) and Liu
(2015) reported no association between BSIZE and FLID. Al-Najjar & Abed (2014) found
block holder ownership is negatively linked with FLID, while Alqatamin et al. (2017) found
no significant association between block holder ownership and FLID.
These contradictory results might be because of measurement of FLID. The majority of earlier
studies which examined the relationship between CG and FLID used quantity as a proxy to
measure the quality of disclosure (Al-Najjar & Abed, 2014; Alsaeed, 2006; Cooke, 1989;
Haniffa & Cooke, 2002; Hossain, Ahmed, & Godfrey, 2005; Hossain & Reaz, 2007; Inchausti,
4
1997; Singhvi & Desai, 1971; Wallace, Naser, & Mora, 1994). Botosan (2004) and Urquiza et
al. (2009) argued that the quantity of information disclosed does not necessary imply its quality.
A closer look at the inconsistent results reveals that they can be reconciled if one can evaluate
the quality of FLID. Therefore, the current study has a strong incentive to examine the
relationship between CG and QFLID. Given the contradiction of prior studies’ findings, and
the importance of the association between CG and FLID for market participants and academics,
more research is needed. To the best of the researcher’s knowledge, no previous research
examined the impact of CG on the QFLID in developing countries, particularly in India.
Consequently, this study adopted a multidimensional framework to measure the QFLID for
examining the impact of CG on QFLID among Indian listed companies.
It is also interesting to note that the main aim of FLID is to provide users and stakeholders with
beneficial information about a company’s future performance, and also to improve a firm’s
decision making capability regarding its investments (Healy & Palepu, 2001; Kieso et al., 2010;
Menicucci, 2013c; Singhvi & Desai, 1971). Aljifri & Hussainey (2007) indicate that FLID is
usful in different contexts, such as the firm value (FV) and the accuracy of analyst forecasts
(ACUAF). Firstly, few studies have examined the association between the FLID and FV and
they reported mixed results (Bravo, 2015; Hassanein & Hussainey, 2015; Wang & Hussainey,
2013). However, no study has examined the quality of FLID in relation to FV. Thus, this
study’s purpose is to bridge this potential knowledge gap and examine the link between QFLID
and FV among Indian companies. Secondly, Lang & Lundholm (1996) highlight that financial
analysts are an essential part of the capital market. They mentioned that analyst forecast
contains information on earnings forecast, buying and selling guidance and other useful
information for managers, brokers and investors. A limited number of studies have examined
the link between FLID and ACUAF (Bozzolan, Trombetta, & Beretta, 2009). However, no

5
study considered the quality of FLID in relation to ACUAF. Therefore, in order to fill this gap,
the present research examined the impact of QFLID on ACUAF among Indian listed
companies.
1.2 Research Motivations
This research is motivated by several considerations. Firstly, FLID is beneficial for companies
as it helps them to reduce information asymmetry (Alkhatib, 2014). When there is less
information asymmetry between the company and its stakeholders, it enables the company to
become more transparent and improve its decision making process. Beretta & Bozzolan (2004)
highlight that the presence of FLID in annual reports of companies improves their overall
credibility. On the other hand, a few studies suggest that FLID is not beneficial for companies
due to various reasons (Aljifri & Hussainey, 2007). For instance, the downside of FLID
mentioned is that it provides competitors of a company with useful information related to the
future that can affect the position of the company. Moreover, some of the information related
to the future is not easy to predict and it can lead companies to lawsuits. By looking at the pros
and cons of FLID, it creates a motivation to research further in this area.
Secondly, some prior studies adopted quantity as a proxy to measure the quality of FLID (Al-
Najjar & Abed, 2014; Bozzolan et al., 2009; Hassanein & Hussainey, 2015; Hussainey,
Schleicher, & Walker, 2003; Mathuva, 2012b; Qu et al., 2015; Wang & Hussainey, 2013).
Botosan (2004) argued that although quantity and quality are inseparable and difficult to
measure, information quantity disclosed does not necessarily imply quality. Additionally, since
it is difficult to measure disclosure quality due to issues of objectivity, the measurement of
FLID quantity needs to be paralleled by quality measurement in order to clearly understand the
QFLID. Beretta & Bozzolan (2008) supported this view and highlighted that it is not adequate
to use the extent of disclosure (i.e. quantity of disclosure) to represent its quality. Therefore,

6
this study uses a multidimensional approach to measure the quality, as it covers both
dimensions, quantity and richness, to provide a better understanding.
Thirdly, although prior studies have attempted to examine the effect of FLID on its
consequences (FV and ACUAF), they have not taken the quality of FLID into consideration
(Bozzolan et al., 2009; Bravo, 2015; Hassanein & Hussainey, 2015; Kent & Ung, 2003; Wang
& Hussainey, 2013). Thus, this study considers the quality of FLID and investigates its impact
on both FV and ACUAF. In order to fill the potential gap in this area, it is interesting to
investigate the association between QFLID and both FV and ACUAF.
Finally, most of the previous studies, whether related to CG and FLID or to FLID and both FV
and ACUAF, are conducted in developed countries (Agyei-Mensah, 2017; Al-Najjar & Abed,
2014; Bozzolan et al., 2009; Hassanein & Hussainey, 2015; Mathuva, 2012b; O’Sullivan et al.,
2008; Wang & Hussainey, 2013). Thus, not much is known about these relationships in
developing countries. Furthermore, evidences found by previous literature in the developed
nations may not be helpful in understanding the association in developing nations, due to
differences in environment and standards between these nations (Anglin, Edelstein, Gao, &
Tsang, 2013). Siddiqui (2010) points out that most of the developing countries have poor
infrastructure and enforcement is not up to standard. Based on this, the present research is
motivated to investigate determinants and consequences of QFLID in India.
This study focuses on India context for following reasons. Firstly, India is a rapidly growing
economy and attracted many foreign investments to increase its growth rate substantially
(Arora & Athreye, 2002; Prasad, Rogoff, Wei, & Kose, 2005). As India is a developing
country, CG has been a central issue as, earlier, the enforcement of corporate laws in India
remained under scrutiny. The World Bank (2004) report, which is based on codes and standards
observance, reported that India observes the majority of the principles and can perform better

7
in areas such as enforcement of laws, insider trading and dealing with certain violations of the
Companies Act.
Secondly, India has a different ownership structure, which entails promoters and non-
promoters ownership. According to the Securities and Exchange Board of India (SEBI), a
promoter is defined as an individual or group of individuals who control the firm or act as an
instrument in the formulation of a plan or programme pursuant to which the securities are
offered to the public and those named in the prospectus as promoters (Ganguli & Agrawal,
2009; Kumar & Singh, 2013). Promoter ownership is considered to be several types of
investors, including individuals, family members and corporate bodies (Selarka, 2005). To
protect the interest of the investing community, laws and regulations in India require that
promoters should have more than 20% of the post issue share capital (Ganguli & Agrawal,
2009). Kumar & Singh (2013) highlight that promoters in Indian firms raised the problem of
owner-manager control. Charumathi & Ramesh (2015a) argue that companies with a higher
promoters’ holding have less incentive for higher disclosure. Thirdly, previous studies have
also argued that several factors, for instance culture, religion and other societal norms, may
affect corporate disclosure (Gautam & Singh, 2010; Hastings, 2000). As India has different
religions and cultures, QFLID might influenced by these characteristics.
Fourthly, due to globalisation, CG is becoming an important area of consideration in India as
their interaction with investors from developed countries is increasing rapidly. The Companies
Act 1956 is an important legislation put in place for Indian companies, which enforces them to
operate accordingly. The mandatory CG code was put in place by the Securities and Exchange
Board of India (SEBI) in 2000 through Clause 49, followed by all the stock exchanges listed
companies. The SEBI uses Clause 49 to monitor CG activities of listed companies. The listing
agreement of the stock exchange in India is integrated with this clause. According to this clause,
all the companies should disclose CG information as a separate section in their annual reports.
8
There is another requirement that companies should have a brief compliance report on CG. The
report consists of nine sections, based upon the board of directors, risk management,
compensation of directors, the audit committee, board meetings, shareholders’ information,
communication means, management analysis and their discussion. The clause also requires
companies to obtain certification from the audit committee regarding meeting CG conditions,
as stated therein. The companies must attach this certificate to their annual report before
sending it to the stock exchange.
Finally, the stock market of India is comprised of 23 stock exchanges. However, there are two
main stock exchanges, which govern the market, namely the Bombay Stock Exchange (BSE)
and the National Stock Exchange (NSE). The BSE was established in 1878 and it is the oldest
stock exchange in Asia. The BSE represents about 90% of over-all Indian market capitalisation.
All the listed companies in India are required to comply with the regulations of the SEBI.
For reporting purposes, there are two professional bodies in India, namely the Institute of
Chartered Accountants of India (ICAI) and Institute of Cost and Work Accountants of India
(ICWAI). As per the ICAI, Indian companies’ reporting standards are in line with International
Financial Reporting Standards (IFRS) and International Standards on Auditing (ISA).
Based on the above evidence, as India is a developing nation, which is growing rapidly, it is
interesting to investigate the determinants and consequences of QFLID of Indian companies.
1.3 Research Aim and Objectives
This research aims to examine the determinants and consequences of QFLID in non-financial
Indian listed firms. This study seeks to achieve the following objectives:
To examine the association between CG mechanisms and QFLID among non-financial
Indian listed firms.

9
To examine the relationship between QFLID and FV among non-financial Indian listed
firms.
To investigate the association between QFLID and ACUAF among non-financial
Indian listed firms.
1.4 Research Methodology
This section discusses the research methodology used in the present study. The details and
justifications of the methodology are discussed in Chapter Four of the study. The association
between CG mechanisms and QFLID is examined in Chapter Five. To measure the QFLID,
this study adopted a multidimensional framework designed by Beattie et al (2004), which is
further developed by Beretta & Bozzolan (2008). Both the quantity dimension and the richness
dimension are considered in this framework. The second objective is to examine the
relationship between QFLID and FV in Indian listed firms. Tobin’s Q ratio (TQ ratio) is used
as the main proxy to measure FV, while market capitalisation (MC) is used as an alternative
measurement of FV to check the robustness of the main analysis. The third objective is to
examine the association between QFLID and ACUAF in Indian listed firms. In this study,
ACUAF is used as the main analysis, whereas dispersion of analysts’ earnings forecast
(DISAF) is employed as the robustness check. This study uses annual reports for CG and
QFLID data (Salama, Dixon, & Habbash, 2012), while the data regarding FV and ACUAF are
collected through the OSIRIS database which contains reliable information on listed firms.
In general, this research uses preliminary analysis, multivariate analysis and additional analysis
in data analyses. In the preliminary analysis, this research discusses the descriptive statistics
and checks for a multicollinearity problem through a correlation matrix and Variance Inflation
Factor (VIF). The study uses descriptive statistics to summarise and describe the basic features
of the data in regards to the tests of central tendency. Both a correlation matrix and the VIF

10
methods are employed to test the correlation among sample explanatory variables, as well as
to clarify the extent of linear association among two explanatory variables (Gujarati & Porter,
2011). In addition to the preliminary analysis, this research uses multivariate methods to test
the research hypotheses. The Chow test and Breusch-Pagan Lagrange multiplier (LM) are
conducted for regression models in order to decide whether the panel or pooled model is more
appropriate. Moreover, the Hausman test is conducted in order to decide between the random
and fixed effects models (Greene, 2008).
This research performed additional (alternative) analyses to check the sensitivity and the
robustness of the primary outcomes. Firstly, to confirm whether the main analysis differs or
not, the sample is split into two sub-samples (high and low QFLID). Secondly, alternative
measurements of dependent variables are used in order to examine the robustness of
preliminary outcomes. The study conducts two-stage least square regression (2SLS) and
instrumental variables (IV) to address the issue of endogeneity and to confirm whether this
issue affects the primary results or not.
1.5 Research Contributions
This study contributes to the body of knowledge in several ways. Firstly, the present study
adds a contribution to the literature in terms of determinants of FLID. It is noted that previous
researchers have addressed the relationship between CG and the level of FLID. Most of them
used the level or quantity of FLID as a proxy for its quality (Aljifri & Hussainey, 2007; Al-
Najjar & Abed, 2014; Hassanein & Hussainey, 2015; Mathuva, 2012b; Qu et al., 2015; Wang
& Hussainey, 2013). It is noted that there is no previous study, which focuses on the association
between CG and quality of FLID in developing countries, specifically in India. Thus, this study
attempts to investigate the impact of CG on QFLID in Indian non-financial listed companies.

11
Secondly, limited research has attempted to examine the association between FLID and FV
(Bravo, 2015; Hassanein & Hussainey, 2015; Kent & Ung, 2003; Wang & Hussainey, 2013).
However, these studies focused mainly on the quantity or the level of FLID. As per the
researcher’s knowledge, this is the only study, which examines the impact of the QFLID on
FV in developing countries, particularly in India. This study attempts to bridge this gap by
examining the impact of the QFLID on FV in Indian non-financial listed companies.
Thirdly, a few studies have investigated the relationship between FLID and ACUAF
(Bozzolan et al., 2009). However, no study has taken QFLID into consideration in relation to
ACUAF. Therefore, this is the first study to examine the impact of QFLID on ACUAF in a
developing country (India).
Finally, the majority of prior studies which have examined the above relationships (the
relationship between CG and FLID; the relationship between FLID and FV; and the
relationship between FLID and ACUAF) are conducted in developed countries. However, not
much is known about these relationships in developing countries. Thus, this study has bridged
this gap by examining the determinants and consequences of QFLID among Indian listed
companies.
1.6 Structure of the Study
This section explains the structure of the present research, which is comprised of seven
chapters. The study consists of the following chapters: Chapter One covers the overview and
background of the research, study motivations, study aim and objectives, methodology,
research contribution and ends with the structure of the study.
Chapter Two sheds light on the literature of FLID. It covers working definitions of FLID, its
motivations and the quality of FLID. It also reviews the empirical studies conducted to examine
FLID. The first section discusses prior studies, which examined CG with FLID. The second

12
section discusses the existing literature regarding the consequences of FLID in relation to FV
and ACUAF.
Chapter Three reviews the theoretical framework and hypotheses development. The first
section discusses various theories to explain the link between CG and voluntary disclosure and
an understanding of how voluntary disclosure links with both FV and ACUAF.
Chapter Four discusses the research methodology adopted for this study. It starts with the
research methodology, the sample of the study and data collection. It provides the explanation
and justification of methods used for measuring QFLID as a dependent variable in the first
model, as an independent variable in both the second and third models, and FV and ACUAF
as dependent variables in the second and third models respectively. Moreover, this chapter
provides three models used in the present research, together with the analysis processes.
Chapter Five discusses the results regarding the association between CG and QFLID. Several
analyses, including descriptive statistics, multicollinearity problems (using pairwise correlation
and VIF) and the multivariate analysis are used to present the results. Furthermore, this chapter
explains additional analyses to check the sensitivity and robustness of the outcomes. In
addition, the robustness or sensitivity of the outcomes was confirmed by analysing the presence
of the endogeneity problem.
Chapter Six covers the results of the association between QFLID and both FV and ACUAF.
This chapter reports the findings using descriptive statistics, followed by the multicollinearity
analysis (pairwise correlation and VIF) and multivariate analysis. Further analyses and
sensitivity analyses are also presented in this chapter to confirm the robustness of the main
results. The present study investigates whether high and low quality FLID have different
impacts on dependent variables (TQ ratio and ACUAF). Moreover, alternative measurements
of dependent variables (MC and DISAF) are used to examine the robustness of the preliminary

13
outcomes. In addition, the sensitivity of the outcomes was checked against the presence of the
issue of endogeneity.
Chapter Seven provides the conclusion of the present research. This includes the summary of
the key findings, discusses the implications of the findings, the limitations of this research and
provides recommendations for future research.

14
Chapter Two: Literature Review (FLID)
2.1. Introduction
This chapter focus on overview and the previous studies related to FLID. It is organize as
follows: Section 2.2 covers the concept and definition of FLID. Section 2.3 nature of FLID.
Section 2.4 provides motivations of FLID. Section 2.5 explains the usefulness of FLID. Section
2.6 clarifies the quality of FLID. Section 2.7 covers the determinants of FLID. Section 2.8
review the empirical literature of FLID that consists of three parts as: section 2.8.1 discusses
the empirical studies regarding CG and FLID, while section 2.8.2 discusses empirical studies
regarding FLID and FV and section 2.8.3 discusses empirical studies regarding FLID and
ACUAF. Section 2.9 research gap and finally section 2.10 presents the summary of current
chapter.
2.2. Concept and Definition of FLID
Company’s annual reports are comprised of two types of disclosure: Mandatory and Voluntary.
Mandatory disclosure is compulsory for companies as multiple regulations and laws force
companies to disclose a minimum amount of information that has to be revealed to users.
Voluntary disclosure is further information that is reported by the company in their annual
report, which exceeds the compulsory information. Additionally, voluntary disclosure is
classifiable into two categories: ‘backward-looking information’ and FLID (Hussainey, 2004).
While the past financial performance of a firm is reported using backward-looking information
whereas in FLID the information is related to the current company’s plans and their forecasts
for the future (e.g., their earnings, anticipated revenues and expected cash flow). Information
related to the future helps investors and other stakeholders to make an assessment regarding
the future financial performance of the company. FLID also deals with non-financial

15
information (e.g. uncertainties and risks that can have an impact on the projected outcomes).
As FLID is subjective so preparation of such information need professional judgement.
Previous studies identified FLID in the annual report narratives by using certain keywords like
“estimate,” “outlook,” “next,” “likely,” “anticipate,” “expect,” “believes”, “intends”, “plans”
“forecast” or other similar vocabulary (Hussainey et al., 2003; Muslu, Radhakrishnan,
Subramanyam, & Lim, 2011).
FLID has been defined in the literature by a number of authors. For instance, Hussainey (2004,
p. 38) defines FLID as “information on predictions related to current and future plans to assist
users of financial statement and other shareholders about firm’s future performance”. In the
same vein, FLID is defined as “information or any forecast that assists to make assessments
about the future; it comprises estimates of opportunities, management’s strategy and risks and
predictions data” (Celik et al., 2006, p. 200). Similarly, FLID is defined as “information on
future estimates that help users to evaluate company’s future performance” (Menicucci, 2013c,
p. 1668). Likewise, FLID is defined as “corporate forecasts based on the future of the firm and
provide valuable financial information to its owners who are concerned about its future
performance ” (Alkhatib, 2014, p. 858).
Based on the discussion above, this study defines FLID as information on future estimates that
provide users and stakeholders with beneficial information about a company’s future
performance and also improves a firm’s decision making capability regarding its investments.
Therefore, this research considers FLID to be a key tool that assists stakeholders and users of
a company’s financial reports to evaluate FV and ACUAF.

16
2.3. Nature of FLID
Previous research look at the presentation of FLID in the corporate annual report. According
to Aljifri & Hussainey (2007) and Bujaki & Zeghal (1999), FLID can be classified into various
types of inforamtion like financial and non-financial, qualitative and quantitative, good and
bad news, one year and multiple years’ forecasts information.
A number of research described the nuture of FLID in the annual report. For instant, Bujaki &
Zeghal (1999) studied the nature of FLID published in Management Discussion and Analysis
(MD&A) and analyed chairmen’s statements for fourty six Canadian firms. Their results
indicate that 19.2% of the information in MD&A and in chairmen’s statement is related to
FLID. Furthermore, the findings reveal that most of the FLID is qualitative and firm-specific.
In addition, the results indicate that good news is of higher porportion that is 97.5% of the
information as compare to bad news that represent only 2.5%. Moreover, Clarkson et al. (1994)
aruge that managers are highly likely to disclose favourable FLID mostly in annual reports. In
addition, Clatworthy & Jones (2003) found that firms tend to disclose mostly good news
regarding its performance and take credit for it whereas bad news related to its preformance is
attributed to external sources. Furthermore, Wang & Hussainey (2013) reveal that FLID in UK
firms reporting is neither verifiable or auditable as it is most comprised of good news.
2.4. Motivations of FLID
Several studies attempted to explain the motivation of companies regarding FLID. For instance,
a number of studies have asserted that FLID is use to reduce information asymmetry between
managers and investors , and to increase financial analysts’ confidence (Bujaki & Zeghal, 1999;
Lundholm & Van Winkle, 2006; Morton & Neill, 2001). Therefore, managers disclose more
FLID to increase stakeholders confidence about the firms future performance (Healy & Palepu,

17
2001). Likewise, Lundholm & Winkle (2006) argue that firms tend to disclose a greater extent
of FLID to make it more valuable and to reduce the degree of information asymmetry between
insider (managers) and outsiders (shareholders). It also help firms to take advantage of a lower
cost of capital.
Graham et al. (2005) reveals that managers in the US make a voluntary disclosure for three
reasons: i) to enhance a reputation for transparent reporting; ii) to address the insufficiencies
of mandatory disclosure; and iii) to minimize the information risk assigned to the company’s
stock. Hence, managers are more likely to disclose more FLID to the stakeholders to increase
their confidence about the company’s future performance (Singhvi and Desai 1971; Healy and
Palepu 2001). Clarkson et al. (1994) indicated that the disclosure of such information is viewed
as one measurement of financial reporting quality, suggesting that financial reports including
FLID are more likely to be percieved as qualitative.
Other studies considered that the disclosure of accounting information is essential for parties
who utilise this information in order to make rational investment decisions (Kieso et al., 2010;
Menicucci, 2013c). For example, the study by Menicucci (2013c) reported that FLID would
enhance the ability of shareholders to assess future cash flows, estimate future earnings and
make better decisions regarding their investments. In particular, current and potential investors
rely on financial information to take decisions in order to buy, sell or maintain their
investments.
In addition, Verrecchia (1983) and Verrecchia & Weber (2006) reveal that even if disclosure
is costly because of product market consequences, managers may tend to extend the level of
voluntary disclosure in order to avoid undervaluation of their shares by the capital market.
Furthermore, expanding the level of disclosure can improve intermediation for a firm’s stock
in the capital market (Core, 2001). Healy & Palepu (2001) and Walker & Tsalta (2001)
concluded that companies disclose more information because they suppose expected benefits

18
will exceed costs. Furthermore, Kieso et al. (2010) mention that FLID contain both financial
and non-financial information and it is useful for investors in their decision making process as
they pay greater attention to information related to firms future forecasts. Schleicher & Walker
(1999) and Hussainey et al. (2003) suggest that increased FLID in annual reports improves the
capital market’s ability to estimate future earnings surprises.
2.5. Usefulness of FLID
Prior studies investigated the benefits of FLID in different context. It covers issues like
corporate future performance forecast, characteristics of analyst forecast and behaviour of
stock price (Aljifri & Hussainey, 2007).
A number of research investigated the role of FLID in forecasting corporate future
performance. Clarkson et al. (1994; 1999) indicate that the inclusion of FLID in the annual
reports is much informative regarding firms future performance. Moreover, they found that
change in the extent of FLID in MD&A is positively related to the firms future performance.
That means the inclusion of FLID in MD&A provide value relevant information. Li (2010)
investigated that whether the inclusion of FLIDs in MD&A is informative about future
performance or not. The result reveal that FLID in MD&A is very informative with regards to
firms future performance. Menicucci (2013c) highlight that FLID improves shareholders
ability to assess future cash flows more efficiently, to make better future earnings estimates
and make effective investment decisions.
Prior studies also focused on examining the impact of FLID on financial analyst forecast.
Barron et al. (1999) found that a higher level of FLID regarding operations and capital
expenditure is related to analysts’ forecasts accuracy. Likewise, Walker & Tsalta (2001)
reported positive relationship between FLID and analyst forecast published in narrative
19
reporting. Furthermore, Vanstraelen et al. (2003) indicate that FLID increases accuracy of
analyst forecasts but back-ward information disclosure has no impact on it. Moreover,
Bozzolan et al. (2009) mention that FLID shed light on the anticipated influence on company
performance and it improves accuracy of analyst forecast.
Other studies investigated the association between FLID and stock market in annual reports.
For instance, Muslu et al. (2011) tested whether FLID in MD&A aid investors to predict future
earnings. Their results indicate that the greater extent of FLID in MD&A assist investors to
predict future earnings more efficiently. Furthermore, Schleicher & Walker (1999) and
Hussainey et al. (2003) found that a huge amount of FLID in narrative reporting improve
capability of stock market to predict future earnings variations. Additionally, Wang and
Hussainey (2013) provide evidence that FLID of companies who are well-governed improve
the stock market ability to predict its future earnings. Moreover, Athanasakou & Hussainey
(2014) examined the role of FLID in annual reports of companies. Their findings highlight that
investors are dependant on future oriented information to predict company’s future earnings.
2.6. The quality of FLID
The main purpose of disclosure is to provide high quality information concerning economic
entities and useful for economic decision making (Van Beest, Braam, & Boelens, 2009).
Providing high quality information is important because it will positively influence capital
providers and other stakeholders in making investment, credit, and similar resource allocation
decisions enhancing overall market efficiency (Van Beest et al., 2009).
Disclosure is a key tool of corporate accountability for investors that useful to consider when
making decisions. In releasing information, a company has to consider the quality of disclosure.
The quality is a complex and context-specific concept in nature. There are variety of ways to
define quality of voluntary accounting disclosures. King (1996) defined quality as a degree of

20
self-interested bias in disclosure. Whereas, Hopkins (1996) termed quality as the ease that
enables investors to read and evaluate the disclosed information. Wallace & Naser (1995)
stated that disclosure should first align and be suitable for purpose. Second, information must
be informative for users. Third, the firm should convey not only good news but also bad
conditions. Fourth, the financial reports should have timelines or periodic reports. Fifth, the
information is able to be read easily and understandably by users. Sixth, the information should
be related to company risks, and analysis of performance. Finally, the company should release
the information completely and comprehensively.
Furthermore, Bagnoli & Watts (2005) argued that the quality of disclosure is affected by the
managers’ intentions, which affects whether they will expose performance transparently or not.
Before presenting with the firm’s information transparently, the managers might consider what
the contents of the information that was reported will be: these contents may depend on the
quality of the information they choose to reveal, whether they are presenting bad or good news,
and whether it will trigger a firm’s value to decrease or increase.
Botosan (2004) debates that high quality disclosure is useful to the information's users in
making financial decisions. It is argued that the quality of information disclosed is high if it is
positively associated with analysts’ earnings forecast accuracy (Beretta & Bozzolan, 2008),
which suggest that disclosure quality is value relevant information to market participants
(Baek, Kang, & Park, 2004; Healy, Hutton, & Palepu, 1999). Empirical previous studies have
examined impact of FLID on FV, ACUAF, asymmetric information and firm’s reputation
(Bozzolan et al., 2009; Hassanein & Hussainey, 2015; Wang & Hussainey, 2013). Since
agency and singling theories suggest that the QFLID could be used to reduce information
asymmetries (Miller & Bahnson, 2002; Watts & Zimmerman, 1986), it can be expected that
the QFLID is useful for various stakeholders and hence include a positive phenomenon for
stock markets (Garrido-Miralles & Sanabria-García, 2014).

21
Based on above discussion, the QFLID, which is the focus of this study, can be define as value
relevant information to market participants, and it helps users for economic decision making
through reduce information asymmetries. Hence, improving both FV and ACUAF.
2.7. Determinants of FLID
Previous studies have used firms’ characteristics and CG mechanisms as determinants of FLID
(Agyei-Mensah, 2017; Agyei-Mensah & Agyei-Mensah, 2017; Aljifri & Hussainey, 2007; Al-
Najjar & Abed, 2014; Kuzey, 2018; Wang & Hussainey, 2013).
Several studies have used firms’ characteristics as determinants of FLID (Aljifri & Hussainey,
2007; Alkhatib, 2014; Beretta & Bozzolan, 2008; Celik et al., 2006; Kuzey, 2018; Mousa &
Elamir, 2018). Firm size has been used in literature as an important determinant of FLID. Since
firm size is used a proxy for political visibility, prior studies found evidence that size to have a
strong impact on disclosure (Beattie et al., 2004; Beretta & Bozzolan, 2008; Kuzey, 2018).
Kuzey (2018) and Wang & Hussainey (2013) suggest that FLID proposed to reduce
information asymmetry and mitigate agency costs. Company profitability is another variable
represented as determinants of FLID. Past research suggested that company profitability
controls the potential effects on the FLID (Alkhatib, 2014; Kuzey, 2018; Uyar & Kilic, 2012).
Signalling theory assumes that, if companies are performing well, they are liable to signal their
activities to investors (Watson, 2002). Another determinant of FLID is leverage, previous
research indicated leverage as an essential factor that may have an impact on disclosure
practices (Abraham & Cox, 2007; Ho & Wong, 2001a; Hussainey & Al-Najjar, 2011; Oyelere,
Laswad, & Fisher, 2003). Agency theory assumes that firms who have higher leverage tend to
incur higher monitoring costs (Huafang & Jianguo, 2007; Jensen & Meckling, 1976; Watson,
Shrives, & Marston, 2002). Liquidity is an indicator of the company’s ability to cover its
current obligations. Signalling theory assumes that managers of high liquidity companies tend

22
to disclose more information, as it signals their ability in managing liquidity as compared to
managers who are managing lower liquidity (Elzahar & Hussainey, 2012). Firms with a higher
growth rate may have higher information asymmetry between managers and shareholders, so
they would have more incentives to disclose voluntary information in order to reduce this
information gap (Gul & Leung, 2004). Industry type is also indicated by previous studies as a
determinant variable of FLID (Aljifri & Hussainey, 2007; Alkhatib & Marji, 2012; Beretta &
Bozzolan, 2008; Celik et al., 2006; Kuzey, 2018).
Furthermore, CG is one of the key determinants of corporate disclosure. It is also a crucial issue
that is being addressed extensively by regulators and capital market participants around the
world (El-Masry, Elbahar, & AbdelFattah, 2016). European Central Bank (ECB) (2004)
defined CG as a set of processes and procedures to which a company is managed and directed.
Gillian (2006) explained that the need of CG mechanisms is due to the separation between
capital managers and capital providers. According to Fama & Jensen (1983), CG play a key
role in monitoring and curbing managerial opportunism to make sure that shareholder’s right
are not being violated. Moreover, CG assists in reducing asymmetric information by using
adequate monitoring measures such as adding more independent directors. According to Aksu
& Kosedag (2006), companies that use high CG standards have a better chance of providing
more informative disclosure.
Most definitions of CG provided by prior literature are concerned with shareholder protection
through improving disclosure quality. According to Gillan & Starks (1998, p.4), CG is “the
system of laws, regulations and factors that controls operations at a company”. On the other
side, Donelly & Mulcahly (2008) explained CG as a set of corporate mechanism designed to
monitor managerial decisions and to make sure that corporation is operating according to the
interests of its stakeholders. El-Masry et al. (2016) argue that a more appropriate definition of
CG comprises additional components such as disclosure of board composition, including the

23
number of independent directors on the board; composition of various committees of the board;
and separation of chair of the board and CEO. The main benefit of having an effective CG
system is that it helps to build a strong financial system whether it’s company-based or market-
based, that have a huge impact on economic growth. According to Solomon (2007), CG enable
companies to control external and internal environments to ensure that all its operations are
executions according to stakeholder’s interests. By the same token, John & Senbet (1998)
highlight that CG enable stakeholders to exert control over a company by exercising their rights
as established by regulators. Due to the effective of CG lead to more transparency, all the
stakeholders like managers, creditors, suppliers, shareholders will be able to protect their
interests in the company.
The role of company disclosure quality is really important as it enable companies to reduce
information asymmetry between internal and external stakeholders. Ho et al. (2008) highlight
that if the disclosure information is accurate and reliable, then it enable investors to make
effective investments decisions. If CG companies are applied in companies then managers have
less chance to manage their interest by holding information as the quality of monitoring will
be improved. CG and voluntary disclosure are studied as accountability mechanisms (Hidalgo,
García-Meca, & Martínez, 2011). It is highlighted by Karamanou & Vafaes (2005) that
effective CG reduces the problem of information asymmetry and improve the transparency of
the firm’s operations. It is one of the most discussed and an important area of interest for both
academics and businesses. Following Cerbioni & Parbonetti (2007) and Brown et al. (2011),
due to a monitoring role of CG, it is expected that CG mechanisms and quality of firm’s
disclosure is positively associated. Based on above discussion, this study expects a positive
association between CG and quality of FLID.

24
2.8. Empirical Literature of FLID
This part review various aspects of the literature related to this study’s hypotheses. Firstly, the
association between CG mechansimes and FLID. Secondly, the relationship between FLID and
FV. Thirdly, the association between FLID and ACUAF.
2.8.1. Empirical Studies of CG and FLID
Corporate disclosure is a significant research area that has attracted many researchers in
accounting since the beginning of 1960s (Hussainey & Al‐Najjar, 2012). Extensive studies
based on developed and developing countries of corporate disclosure has been examined in the
literature. Most of them investigated the determinants of the level of disclosure and impact of
firm characteristics on observed disclosure practices, which may explain the variations in
disclosure level (e.g. Ahmed & Courtis, 1999; Aljifri et al., 2014; Chow & Wong-Boren, 1987;
Cooke, 1989; Dyduch & Krasodomska, 2017; Elzahar & Hussainey, 2012; Kolsi & Kolsi,
2017; Wang & Claiborne, 2008). Recently, number of empirical studies has investigated the
relationship between voluntary corporate disclosure and CG (Alnabsha et al., 2017; Eng &
Mak, 2003; Madhani, 2014; Madhani, 2016; Maskati & Hamdan, 2017; Samaha, Khlif, &
Hussainey, 2015; Yilmaz, Kurt-Gumus, & Aslanertik, 2017). It also there are a number of
studies investigated the relationship between CG and FLID (Agyei-Mensah, 2017; Agyei-
Mensah & Agyei-Mensah, 2017; Al-Najjar & Abed, 2014; Kuzey, 2018; Wang & Hussainey,
2013). However, no study has examined the link between CG and QFLID. Thus, in order to
develop study hypotheses this section will discuss both voluntary disclosure in general and
FLID in particular.
Firstly, previous studies used number of variables like the board of directors, audit committees,
ownership structure and firm characteristics to study the impact of CG on corporate disclosure.
Numerous studies display examples of the board of directors characteristics (Alnabsha et al.,

25
2017; Alotaibi & Hussainey, 2016a; Chen & Jaggi, 2001; Eng & Mak, 2003; Haniffa & Cooke,
2002), Audit committee (Aljifri et al., 2014; e.g. Barako, Hancock, & Izan, 2006; S. S. Ho &
Shun Wong, 2001; Samaha et al., 2015) to study the mechanism of CG. Ownership structure
have been examined as an explanatory variable in the literature of disclosure (e.g. Alhazaimeh,
Palaniappan, & Almsafir, 2014; Alnabsha et al., 2017; Ghazali & Weetman, 2006; Huafang &
Jianguo, 2007).
Several studies attempted to investigate the relationship between CG and voluntary disclosure.
For instance, Chen & Jaggi (2001) examined the association between the independence of
board directors (proxy of CG) and comprehensiveness of financial disclosure by using a sample
size of 87 companies operating in Hong Kong. The study found a positive relationship between
the ratio of independence of board directors and the extent of financial disclosure. Moreover,
it is indicated that this relationship is stronger in non-family controlled companies as compare
to family controlled companies. Similarly, Ho & Wong (2001a) studied the association
between CG and level of voluntary disclosure among listed Hong Kong firms. Their study
include CG variables like the ratio of independence of board directors, audit committee
existence, CEO duality, and the proportion of family members on the board. Their results found
a significant positive relationship between the existence of an audit committee and the level of
voluntary disclosure. They reported a negative relation between ratio of family members’ on
board and the level of voluntary disclosure. The outcome of a positive relationship between the
existence of an audit committee and level of voluntary disclosure is in line with the study
conducted by Barako et al. (2006) who study the factors that may affect voluntary disclosure
in Kenyan listed companies.
Haniffa & Cooke (2002) investigated the association between CG that’s include factors like
(board composition, cross-directorships, role duality, and the inclusion of family members,

26
financial director and non-executive chairperson on the board) and the level of voluntary
disclosure. They used a sample of 87 non-financial companies listed on the Kuala Lampur
Stock Exchange for the period 1995. The study reported a significant positive association
between two variables of CG (non-executive chairman and family members sitting on the
board) and voluntary disclosure level. Using similar sample for the year 2000, Ghazali &
Weetman (2006) attempted to examine the impact of board characteristics and ownership
structure on the level of voluntary disclosure. They found that the percentage of family
members on the board has a negative impact on the extent of voluntary disclosure and found
insignificant association between board composition and the level of voluntary disclosure.
Moreover, Gul & Leung (2004) used a sample of 385 non-financial listed companies based in
Hong Kong for the year 1996 to examine the relationship between board leadership structure
represented by CEO role duality, the ratio of independent directors on the board and the level
of voluntary disclosure. Their outcomes show a negative association of voluntary disclosure
with CEO duality and the ratio of independent directors on the board.
Chau & Gray (2002) attempted to investigate the impact of ownership structure on corporate
voluntary disclosure among 60 Hong Kong and 62 Singapore companies for the year 1997.
They found that the extent of voluntary disclosure is positively and significantly associated
with a wider ownership structure. In the same vein, using a sample of 158 listed companies in
Singapore, Eng & Mak (2003) investigated empirically the impact of CG on the extent of
voluntary disclosure. The ownership structure divided into government ownership, block
holder ownership and managerial ownership. Their outcomes indicate that the government
ownership and lower managerial ownership have a positive relationship with voluntary
disclosure, whereas there is no relationship between block holder and the extent of disclosure.

27
Ghazali & Weetman (2006) studied the impact of ownership concentration, number of
shareholders, director and government ownership on the level of voluntary disclosure. Their
outcomes show that there is significant relationship between director ownership and the level
of voluntary disclosure, while government ownership have no significant impact on voluntary
disclosure. Barako et al. (2006) investigate the effect of the level of ownership structure on
voluntary disclosure among Kenyan listed companies from 1992 to 2001. They found that the
level of institutional and foreign ownership have a positive influence on the level of voluntary
disclosure. Furthermore, Tsamenyi et al. (2007) attempted to investigate the influence of the
CG on the level of voluntary disclosure in Ghanaian companies. They found that firm size,
ownership structure and dispersion of shareholding have a significant positive relationship with
voluntary disclosure, while leverage has insignificant association.
In the same vein, Huafang & Jianguo (2007) investigated the influence of ownership structure
on the level of voluntary disclosure by using a sample size of 559 listed firms in China for the
year 2002. They found that block holder ownership and foreign listing/shares ownership is
related significantly to the level of voluntary disclosure. Whereas, state ownership, managerial
ownership and legal-person ownership have insignificant association with voluntary
disclosure. Likewise, in Taiwan, Guan et al. (2007) studied the relationship between ownership
structure and the level of disclosure. Their outcomes indicate that institutional ownership and
director ownership have a positive association with the extent of voluntary disclosure.
Cheng & Courtenay (2006) examined the association between the role of the board of directors,
board size and CEO duality on the level of voluntary disclosure using 104 firms for the year
2009. Their findings show a significant positive association between the level of voluntary
disclosure and ratio of independent non-executive directors. Similarly, Patelli & Prencipe
(2007) used a sample of 175 non-financial companies listed on the Milan Stock Exchange for

28
the year 2002 to examine the relationship between independent directors and level of voluntary
disclosure. Their outcomes revealed a positive and significant association between independent
directors and the level of voluntary disclosure. Moreover, Lim et al. (2007) used 181 companies
sample and attempted to investigate the association between board composition and the level
of voluntary disclosure. The study found a positive relationship between board composition
and the level of voluntary disclosure.
Akhtaruddin et al. (2009) studied association between CG and voluntary disclosure by using a
sample of 94 Malaysian listed companies. Several board characteristics were tested in this
study that includes board size, ratio of independence board of directors and the ratio of audit
committee members to total members on the board. The study concluded that board size and
ratio of independence board of directors have a positive and significant association with the
level of voluntary disclosure, whereas there is insignificant relationship between the proportion
of audit committee members to total members on the board and the level of voluntary
disclosure. Garcia-Meca & Sanchez-Ballesta (2010) conducted a meta-analysis by using
review of 27 empirical studies from around the world to examine the impact of the ratio of
independent directors and ownership concentration on voluntary disclosure. They found that
board independence has a positive influence on the level of voluntary disclosure, while there
is negative association between ownership concentration and corporate voluntary disclosure.
Ho & Taylor (2013) examine the relationship between CG and voluntary disclosure by utilizing
a sample of 100 Malaysian firms over three socio-economic periods: 1996, 2001 and 2006. The
result highlight a positive and significant relationship between firms’ CG structure and
voluntary disclosure. In the same vein, Allegrini & Greco (2013) studied the relationship
between CG variables and voluntary disclosure, using 177 listed Italian firms for year 2007.
Their outcomes show a positive association between board size, diligence (proxies by board

29
and audit committee total meetings) and the frequency of audit committee meetings in regards
with voluntary disclosure. There is negative association between CEO duality and corporate
voluntary disclosure. Similarly, Jouini (2013) using non-financial listed Tunisian companies
from 2004 till 2009, showed empirically that level of disclosure is explained by various factors
like CEO duality, ownership concentration and control quality proxies by the number of
auditors and presence of the Big 4 audit firms.
Aljifri et al. (2014) investigate the relationship among CG and corporate financial disclosure
among 153 listed and non-listed UAE companies. The result found that both board composition
and audit committee have no impact on voluntary disclosure. Alhazaimeh et al. (2014) provide
empirical evidence of CG influence on coporate voluntary disclosure in Jordanian companies.
The study examined five board characteristics that include board size, board composition,
board activity, non-executive directors and audit committee. The findings show there is
significant relationship between voluntary disclosure and board compensation only. Similarly,
Sartawi et al. (2014) investigated the association between board composition and voluntary
disclosure by using annual reports of listed 103 Jordanian companies for year 2012. The study
reveal that higher ownership concentration reduce voluntary disclosure but foreign and old
directors enable to improve its level.
A recent meta-analysis provided by Samaha et al. (2015) to examine the possible relationship
between characteristics of committee (board and audit) and voluntary disclosure. Using 64
empirical studies between 1997 and 2013, the study measured total disclosure score by using
capital, social and environmental disclosure. The outcome reveal that there is positive
association between board characteristics and voluntary disclosure however, CEO duality is
negatively associated with voluntary disclosure. Beekes et al. (2016) employed a sample of
more than 5,000 listed firms among 23 countries from 2003 to 2008, to examine the association
between CG, companies’ disclosure practices and equity market transparency. Their findings

30
indicate that companies who are governed efficiently are related to frequent stock market
disclosure.
Recently, Alnabsha et al. (2017) attempt to examine the influence of CG (board attributes and
ownership structure) and firm characteristics on both mandatory and voluntary disclosure by
using Libyan companies over the period 2006-2010. The results reveal that the corporate
disclosure is linked with board size, board meetings, frequency, board composition and audit
committee presence. Furthermore, they found that the disclosure level is positively linked to
firm age, auditor type, listing status, liquidity and industry type. In the same vein, Maskati &
Hamdan (2017) used a sample of 41 listed Bahrain companies to study the association between
CG and voluntary disclosure. The results highlight that voluntary disclosure is positively
associated with shareholder large ownership, board size and independence of board directors.
Similarly, Yilmaz et al. (2017) examined the possible effect of CG mechanisms on voluntary
disclosure in Turkey. This study conducted content analysis on Borsa Istanbul hospitality firms.
The results indicated that voluntary disclosure is not affected by CG mechanisms and the firms
do not satisfy CG indicators (such as board of directors and CG rules compliance report) in
their annual reports.
With a specific focus on India, using a sample of 30 technology firms listed on the BSE in
India, Kamath (2008) empirically investigated the extent of voluntary intellectual capital
disclosures in India’s emerging information, communication and technology sector as well as
the association between the extent of disclosures and firm size. The outcomes indicate a
significantly small extent of intellectual capital disclosures in Indian firms. The disclosures of
Information Technology sectors are more than any other sectors’ disclosures, however, there
is no relationship between firm size and the extent of disclosure. Nandi & Ghosh (2013)
investigated the relationship between CG, firm-level characteristics and corporate disclosure
level among Indian companies from 2000 to 2010. Their findings show a negative relationship

31
between corporate disclosure and board characteristics. Abraham et al. (2015) examined
compliance of Indian firms with both mandatory and voluntary disclosure of CG requirements
of Clause 49 of the Stock Exchange Board of India, using firms listed on the BSE-100 index
over the period 2004 to 2006. Their results indicate that Indian firms are highly compliant with
the CG disclosure requirements of Clause 49, and the disclosure increased after amendments
to this clause. Furthermore, they found private firms disclose more than firms controlled by the
government. Charumathi & Ramesh (2015b) employed the data from a 156 firm-year
observation of Indian firms listed on the National Stock Exchange (NSE) during the period
2010 to 2013. The aim of the study was to find the impact of certain determinants on the level
of voluntary disclosure. The study used the approach of disclosure index and content analysis
to measure voluntary disclosure. Leverage, firm size and institutional ownership emerged as
the main sources to determine voluntary disclosures. Similarly, Madhani (2016) used a sample
of 54 Indian listed companies for the period 2011 to 2012. The study aims to identify whether
CG and disclosure practices of private and public sector companies are significantly different.
The results indicate that there was no evidence of any significant difference in the CGD scores
of companies across various types of ownership.
Based on the above studies, it is noted that CG have an impact on corporate voluntary
disclosure. Nevertheless, the findings are mixed and there is no agreement regarding the nature
and significance of this influence for each CG mechanism. Although the outcomes of these
studies do not necessarily extend FLID practices, they are still a useful guide for the hypotheses
development, and also when considering the suitable research methods.
Secondly, prior study mainly took the determinants of FLID into consideration. For instance,
Celik et al. (2006) investigate the factors that may influence the level of FLID in annual report
and utilized a sample of 233 firms listed on Istanbul Stock Exchange (ISE) in 2004. They found
that the extent of FLID is positively and significantly related with firm size. However, FLID

32
level is negatively associated with ownership structure, foreign investment, ratio of
institutional investors and profitability. Furthermore, they found that financial performance and
ownership structure are the determinant factors affecting the level of FLID. Similarly, Aljifri
and Hussainey (2007) investigate various factors that may influence the level of FLID among
46 listed UAE companies. The outcome showed that the level of FLID is significantly and
positively associated with the degree of financial leverage, whereas profitability is related
negatively to the level of FLID.
Hussainey & Al-Najjar (2011) investigate the factors that may influence future-oriented
information in the UK annual reports. Using a sample 8098 firm-years over the period 1996-
2002, the results indicated that firm size is the key factor that affects the firms’ future-oriented
information. It also revealed that future-oriented information is affected by firm profitability
and percentage of both directors (outsider and insider) ownership. Moreover, corporate
dividend policy has a positive relationship with corporate narrative reporting. By the same
token, Mathuva (2012a) attempted to investigate the determinants of the FLID by using 91
firm-year observations during the period 2009 and 2011 among non-financial listed companies
in Nairobi. Their outcomes reveal that companies with high debt, better performance, greater
capital investment and higher foreign investment concentration have more FLID as compare
to cross-listed companies. Similarly, Uyar & Kilic (2012) studied the impact of CG attributes
on the level of FLID among publicly traded 138 Turkish corporations listed on the Istanbul
Stock Exchange (ISE) for 2010. Their findings show that firm size and auditor size are the
significant variables in explaining the level of FLID. In addition, using a sample of the top 40
firms listed on Italian Stock Exchange, Menicucci (2013a) examined the determinants of the
level of FLID in Management Commentaries in Italy. They found that profitability is
significantly associated with FLID but firm size and leverage are not significantly associated
with the extent of FLID.

33
Employing a sample of 125 firms listed on Jordanian stock exchange for 2011, Alkhatib (2014)
attempted to investigate the factors that may affect the level of FLID. Disclosure index was
adopted to measure the extent of FLID, where the value of one is given for a disclosed item
and zero if undisclosed. The findings show that auditor type, firm size and profitability is
significantly associated with FLID, but leverage has no association. Furthermore, Athanasakou
and Hussainey (2014) examine FLID credibility in annual reports. Using 10,095 annual reports
of UK non-financial listed firms over the period 1996 – 2007. The findings indicated that the
FLID is negatively related with firm value. Whereas, it is positively linked to volatility of
operations, issuance of debt, decline in performance, underperforming industry peers and miss
analysts’ earnings forecast.
Recently, Mousa & Elamir (2018) attempt to investigate the factors that may influence FLID
and used a sample of Bahraini listed firms from 2010 to 2013. They employed a disclosure
index of 56 items to measure the level of FLID. They found that firm size and leverage have
significant association whereas profitability, liquidity and industry type have insignificant
relationship with the level of FLID. In the same vein, Kuzey (2018) investigated the
determinants of FLID in integrated reporting. Using a sample of 55 non-financial firms whose
reports are available in the Integrated Reporting Examples Database in 2014. The study utilized
content analysis and disclosure index to examine the quantitative and qualitative FLID in
integrated reporting. An unweighted approach as a dichotomous variable used to measure the
existence or absence of each item (the score is assign as 1 if the firm disclosed the item at least
once, 0 otherwise). The results indicated that females on board and firm size have a positive
association with FLID, while leverage has a negative association with FLID. On the other hand,
the study failed to find any association between FLID and profitability, industry type, board
size and composition.

34
Several previous studies examine the possible relationship between CG and FLID. O’Sullivan
et al. (2008) investigate the link between CG attributes and FLID using a sample of largest 300
public listed companies in Australia for the year 2000 and 2002. Their results show that in 2000
the FLID is positively related to CG, audit quality, auditor’s meeting frequency, use of a big 6
auditor and auditor’s independence. However, in 2002 none of the CG factors are significantly
related to FLID of company.
Wang & Hussainey (2013) investigated the relationship between CG and the level of FLID
using sample of UK FTSE All-Share companies from 1996-2007. They found that CG affect
firms’ decisions regarding whether to disclose more information voluntarily or not.
Additionally, the FLID of well-governed companies enhanced their capital market ability to
expect future earnings. Their outcomes indicate that FLID has a positive relationship with firm
and board size, dividends yield, leverage and composition of board. While, FLID has a negative
correlation with profitability, managerial ownership and CEO duality. In the same vein, Al-
Najjar & Abed (2014) investigated the relationship between CG and the level of FLID in the
UK, by using the top 500 UK-listed companies. They found that firm size, independence of
audit committee, operating cash flow and cross-listing status is positively and significantly
associated with FLID. However, blockholder ownership, profitability and leverage are
negatively linked with FLID. Likewise, Navarro & Urquiza (2015) investigated the association
between board of directors’ characteristics and FLID, using a sample of 40 companies for the
year 2007. Their outcomes indicate that independent boards of directors and board size are
positively related to FLID. Whereas, CEO duality has no association with FLID. It further
highlight that independent directors are aware of the need to rise the FLID as it would help to
improve analysts’ forecasts and increase market transparency.
Liu (2015) conducted a study to investigate the possible link between mechanism of CG and
FLID among listed Chinese firms for the period 2008 till 2012. The study found that the level

35
of FLID improve due to increase in the proportion of independent directors in board and the
presence of financial expertise in audit committee. It further concluded that improvement in
FLID is not related to managerial and state ownership. Similarly, Qu et al. (2015) examined
the relationship between CG and quality of FLID among non-financial Chinese companies
listed in Shanghai and Shenzhen for the year 2010. The study use precision and accuracy as a
proxy to measure the quality of FLID, and sales forecasts as proxy for FLID. Their findings
suggest that good CG have a positive impact on sales forecast disclosure. Moreover, effective
CG tend to improve accuracy of non-financial information. Charumathi & Ramesh (2015a)
examined the determinants of the level of FLID in India. Using a sample of the Bombay Stock
Exchange (BSE) 100 companies for the years from 2010-2014, the study reveal that there was
little progress being made to improve FLID for five years. Their results reveal that the high
proportion of independent directors, firm size and profitability are positively associated with
FLID level. However, promoters’ ownership, institutional ownership and industry type have
no relationship with the level of FLID.
Recently, Agyei-Mensah & Agyei-Mensah (2017) investigated the association between CG,
corruption and FLID. Using 174 firm-year observations in listed companies among two African
countries, Botswana and Ghana for the year 2011-2013. The researchers used FLID index to
measure the level of FLID. The outcomes reveal that companies in Botswana, known as the
least corrupt country have more FLID than companies in Ghana, which is the one of the most
corrupt countries in sub-Saharan Africa. They found that FLID in Ghana is influenced by the
ratio of independent board members. On the other hand, FLID in Botswana is associated with
ownership concentration. Similarly, Agyei-Mensah (2017) attempted to examine the effect of
CG on the FLID among listed companies in Ghana. The study found that there is significant
relationship between board ownership concentration and the level of FLID.

36
Based on the above discussion, it is noted that many studies have measured level or quantity
of voluntary disclosure (Agyei-Mensah, 2017; Aljifri & Hussainey, 2007; Al-Najjar & Abed,
2014; Charumathi & Ramesh, 2015a; Hassanein & Hussainey, 2015; Hussainey et al., 2003;
Hussainey & Al-Najjar, 2011; Mathuva, 2012b; Menicucci, 2013c; Mousa & Elamir, 2018; Qu
et al., 2015; Wang & Hussainey, 2013). The majority of them have avoided measuring the
quality of disclosure and used quantity (Al-Najjar & Abed, 2014; Alsaeed, 2006; Cooke, 1989;
Haniffa & Cooke, 2002; Hossain et al., 2005; Hossain & Reaz, 2007; Inchausti, 1997; Singhvi
& Desai, 1971; Wallace et al., 1994), or precision and accuracy as a proxy for quality of
disclosure (Hui & Matsunaga, 2014; Qu et al., 2015). The problem involved in such approaches
is that the accuracy of financial disclosure may be undermined by these inappropriate
measurements. Similarly, Botosan (2004) and Urquiza et al. (2009) argued that the quantity of
information disclosed does not necessary imply its quality, also quantity and quality are
inseparable and difficult to measure. Additionally, Beretta & Bozzolan (2008) suggest that it
is not adequate to use the extent of disclosure (quantity of disclosure) to represent its quality
and adopted a multidimensional framework to measure disclosure quality. Consequently,
investigating the quality of FLID among listed non-financial companies in India is important
as Indian companies are legally obliged to reveal certain minimum information.
In contrast to the prior empirical studies that employed disclosure quantity as a proxy for its
quality, the present research challenges this proposition by measuring the quality of FLID by
adopting a multidimensional framework designed by Beattie et al (2004), which is further
developed by Beretta & Bozzolan (2008). Since both quantity and the richness dimensions are
considered in this framework.
To the best of researcher’s knowledge, no previous research examined the impact of CG on the
quality of FLID in developing countries, particularly in India. Consequently, the current study

37
attempts to investigate the impact of CG on quality of FLID in Indian non-financial listed
companies.
2.8.2. Empirical Studies of FLID and FV
Previous studies suggested that voluntary disclosure can improve FV by reducing agency
problems associated with information asymmetry (e.g. Plumlee, Brown, Hayes, & Marshall,
2015; Shi, Kim, & Magnan, 2014; Welker, 1995). Other researchers argue that disclosure
enables investors to reduce estimation risk, thereby reducing the cost of financing (Barry &
Brown, 1985; Diamond & Verrecchia, 1991; O. Kim & Verrecchia, 1994).
The empirical evidence on the impact of voluntary disclosure on FV is still inclusive, and the
results are mixed. Several studies examined the association between disclosure and FV through
its influence on the cost of capital (Botosan & Plumlee, 2002; Elzahar, Hussainey, Mazzi, &
Tsalavoutas, 2015; Kim & Shi, 2011; Plumlee, Brown, & Marshall, 2008; Plumlee et al., 2015).
However, the empirical studies that examine the direct impact of corporate voluntary disclosure
on FV are limited and have mixed results. For instance, Hassan et al. (2009) examine the
relation between the level of voluntary and mandatory disclosure and FV in Egypt over the
period 1995-2002. The study used market-to-book ratio as a measure of FV. They found no
relationship between FV and voluntary disclosure whereas mandatory disclosure is negatively
associated with FV. By contrast, Uyar & Kiliç (2012) used a sample of 129 manufacturing
firms listed on Istanbul Stock Exchange (ISE) in 2010. The study aim was to investigate the
association between voluntary disclosure and FV. The study used market-to-book ratio and
market capitalisation as proxies to measure FV. Their findings show that voluntary disclosure
is positively related to market-to-book value measure of FV, while there is no significant
association found between voluntary disclosure and market capitalisation. Belgacem & Omri
(2014) studied the impact of voluntary disclosure on FV in the Tunisian Stock Market for the
38
period 2000 till 2008. The study found insignificant relation between FV and voluntary
disclosure.
Recently, Nekhili et al. (2016) used a sample of 98 French firms to examine the influence of
Research & Development narrative disclosure on the firm’s market value of equity. For the
period 2000–2004. The association between R&D-related disclosure and market value
influenced differently. A positive relationship is found when they control for R&D
capitalization. While, a negative association found when controlling for R&D intensity. They
also find that equity-based compensation and audit committee independence are the most
important drivers for R&D narrative disclosure. By the same vein, Alotaibi & Hussainey
(2016b) investigated the influence of quantity and quality corporate social responsibility
disclosure (CSRD) on FV. Using a sample of 171 non-financial companies listed in the Saudi
stock market over the period 2013-2014. The study measured CSRD quality by following Beest
el al (2009) and capture all qualitative attributes of information quality as defined in the
conceptual framework of the IASB (2010 a). While, they used disclosure index to measure the
quantity of CSRD. Their outcomes indicate that a positive relationship between quality and
quantity of CSRD and market capitalisation. Conversely, they did not find the same outcomes
when they use either Tobin’s Q or Return on Assets (ROA) as proxies for FV. This suggests
that both quantity and quality of CSRD have the same impact on FV. Their results indicated
that the association between voluntary disclosure and FV depends on the measure of FV (e.g.,
Tobin’s Q, ROA and market capitalisation).
Few studies examined the association between the FLID and FV and the results found are either
positive or negative, hence mixed. For instance, Kent & Ung (2003) investigated the FLID
relating to earnings in Australia. The study used a sample of 100 firms listed on Australian
Stock Exchange for the year 1991-1992. They found that firms with steady earnings tend to

39
provide more FLID. In the same vein, Wang & Hussainey (2013) investigated whether the
level of FLID that are driven by governance are informative about future earnings by using a
sample of UK FTSE All-Share firms for the year 1996-2007. The results show that FLID of
firms that are governed efficiently contain value relevant information for investors. It also helps
to improve stock market ability to predict future earnings. Similarly, Muslu et al. (2014) utilised
computer-intensive techniques to investigate the properties of the quantity of FLID in the
MD&A for a large sample of 10-K filings filed with the SEC for the period 1994 to 2007. Their
results show that companies provide prospective information in the MD&A to reduce poor
information environments in the stock market. Moreover, FLID provide useful information to
the stock market as they increase the link of current stock returns with future earnings.
Nevertheless, FLID are unable to completely reduce the poor information environments for
companies with high FLID.
Furthermore, Bravo (2015) examined whether FLID and firm’s reputation cause a reduction in
stock returns by using a sample size of 73 US firms. The method of content analysis is being
used to measure FLID. The result indicate that FLID has a huge impact on capital market and
firms of sound reputation affect extensively on stock return volatility. However, Hassanein &
Hussainey (2015) examined the impact of the change of forward-looking financial disclosure
(FLFD) on FV, by using UK FTSE companies listed on the London Stock Exchange from 2005
to 2011. They found that the changes in FLFD has a negative effect on the value of poorly
performing companies, while, it has no effect on the value of well-performing companies.
Based on the review of the literature, most studies did not focus on the potential influence of
quality of disclosure on FV. Accounting research used disclosure quantity as a proxy for its
quality (Baek et al., 2004; Healy & Wahlen, 1999; Hussainey & Mouselli, 2010; Mouselli,
Jaafar, & Hussainey, 2012). Prior studies that examine the effect of the quality of corporate

40
disclosure has employed different proxies that might not directly measure disclosure quality.
For example, Healy et al. (1999) found that higher disclosure quality measured by analysts
disclosure ratings (AIMR) are related to higher stock returns. Their outcomes suggest that
companies with high quality of disclosure attract the attention of investors and analysts and
increase stock liquidity. In addition, in Korea, Baek et al. (2004) found that companies with
higher disclosure quality measured by the existence of American Depositary Receipts (ADR)
experience a smaller decrease in their value during the financial crises. In the same vein,
Hussainey & Mouselli (2010) and Mouselli et al. (2012) investigated the association between
disclosure quality and FV among UK firms. They measured disclosure quality by using the
quantity of future oriented statements. Their findings indicate that future oriented earnings
statements could explain differences in stock returns. Furthermore, a recent study by Elzahar
et al. (2015) investigated the influence of disclosure quality of Key Performance Indicators
(KPIs) on cost of capital. They measured the quality of the KPI disclosure by following ASB's
guidelines. The study reported a negative and significant association between the KPIs
disclosure and cost of capital. In addition, in the US, Plumlee et al. (2015) investigated the
association between voluntary environmental disclosures (VED) quality and FV that is
estimated by using future cash flows and cost of equity. They measured VED quality using a
disclosure index consider the type of the disclosure (positive/neutral/negative). They found that
VED quality is associated with FV through both the cash flow and the cost of equity
components.
Based on the above discussion, it is pointed out that voluntary disclosure and FV is sensitive
to the type of disclosure, and the proxy used for measuring FV. This suggests that the
association between corporate voluntary disclosure and FV is still an open empirical question.
In contrast to the prior empirical studies that employed disclosure quantity as a proxy for its
quality, the present research challenges this proposition by measuring the quality of FLID by

41
adopting a multidimensional framework designed by Beattie et al (2004), which is further
developed by Beretta & Bozzolan (2008). Both quantity and the richness dimension are
considered in this framework.
To the best of researcher knowledge, no previous research investigate the impact of the quality
of FLID on FV in developing countries, particularly in India. Consequently, the current study
attempts to bridge this gap by examining the impact of FLID quality on FV among Indian non-
financial listed companies.
2.8.3. Empirical Studies of FLID and ACUAF
Lang & Lundholm (1996) highlight that financial analysts are an essential part of capital
market. They mentioned that analyst forecast information can be used for many purposes as it
contains information on earnings forecast, buying and selling guidance and other useful
information for managers, brokers and investors. The empirical studies that examine the
relationship between voluntary disclosure and ACUAF are limited. Firstly, Lang & Lundholm
(1996) investigated the association between information disclosure and ACUAF. The study
used reports of the Financial Analyst Federation Corporate Information Committee (FAF) for
the period 1985 till 1989. The study found that firms with greater disclosure policies tend to
have larger analyst following. It also found that more informative disclosure policies lead to
high ACUAF and more likely to reduce dispersion among individual analyst forecast.
Barron et al. (1999) examined the relation between Management Discussion and Analysis
(MD&A) information quality and ACUAF. The study highlight that high quality of
Management Discussion and Analysis lead to lower dispersion and error in ACUAF.
Moreover, they found that high level of FLID regarding capital expenditure and operation is
linked with more ACUAF. Whereas, Hope (2003) investigated the relation between ACUAF
and extent of annual report disclosure by using firms from 22 countries. The study found that

42
disclosure level is positively associated with ACUAF means that analysts use disclosure as a
useful source.
Vanstraelen et al. (2003) conducted a study across three European countries that are Belgium,
German and Netherlands and examined the assoication between nonfinancial disclosure level
and analyst forecast and dispersion. They found that bigger companies tend to provide great
extent of both backward and forward looking information disclosure voluntarily. Moreover,
the study reported that high level of FLID is linked with lower dispersion and higher ACUAF.
By using data of companies from 31 countries, Dhaliwal et al. (2012) investigated the
relationship between non-financial information and ACUAF. The study used presence of stand-
alone report related to corporate social responsibility as a proxy for non-financial information
disclosure. The study found that the relationship between the two variables is much stronger in
companies and countries that are stakeholder oriented. However, the issuance of stand-alone
report is negatively associated with ACUAF.
Recently, Saleh & Roberts (2017) investigated the association between online corporate
reporting quality and analyst behaviour by using UK listed companies. The study found that
the quality is an important element to increase analyst following. However, the study found no
association between quality of online corporate reporting and analyst EPS forecast.
Regarding FLID, Bozzolan et al. (2009) used a sample of non-financial Italian, German, French
and Switzerland companies listed on New York Stock Exchange (NYSE) for year 2002 till
2004. The study conducted content analysis to FLID and investigate its impact on accuracy and
dispersion. The study presented that FLID are more efficient to improve ACUAF and reduce
dispersion.
Based on the discssion above, it is noted that there is no single study that examined the
association between QFLID and ACUAF, specifically in developing countries such as India.

43
This study objective to examine the possible relationship between these two variables among
non-financial Indian companies to fulfil this gap of literature.
2.9. Research Gap
The review of extant empirical literature reveals that existing studies on the determinants and
consequences of FLID suffer from several weaknesses. Firstly, and in terms of determinants of
FLID (CG and FLID), limited empirical studies have examined the link between CG and FLID
in different countries and provided mixed results (Aljifri & Hussainey, 2007; Al-Najjar &
Abed, 2014; Kuzey, 2018; Liu, 2015; O’Sullivan, Percy, & Stewart, 2008; Qu et al., 2015;
Uyar & Kilic, 2012); particular in India (Charumathi & Ramesh, 2015a). The majority of prior
studies have avoided measuring the quality of disclosure and used quantity (Al-Najjar & Abed,
2014; Alsaeed, 2006; Cooke, 1989; Haniffa & Cooke, 2002; Hossain, Ahmed, & Godfrey,
2005; Hossain & Reaz, 2007; Inchausti, 1997; Singhvi & Desai, 1971; Wallace, Naser, &
Mora, 1994), or precision and accuracy (Hui & Matsunaga, 2014; Qu et al., 2015) as a proxy
for quality of disclosure. Most of these studies used quantity as a proxy to measure the quality
of disclosure (Al-Najjar & Abed, 2014; Alsaeed, 2006; Cooke, 1989; Haniffa & Cooke, 2002;
Hossain et al., 2005; Hossain & Reaz, 2007; Inchausti, 1997; Singhvi & Desai, 1971; Wallace
et al., 1994). Botosan (2004) and Urquiza et al. (2009) argued that the quantity of information
disclosed does not necessarily imply its quality. Additionally, Beretta & Bozzolan (2008)
suggest that it is not adequate to use the extent of disclosure (quantity of disclosure) to represent
its quality and adopted a multidimensional framework to measure disclosure quality.
Accordingly, this study extends, as well as contributes to, the extant research by adopting a
multidimensional framework to measure the quality of FLID among listed non-financial
companies in India. Furthermore, studies examining the antecedents of CG and FLID have
mainly focused on general features of the firms (in the study) (Cooke, 1992; Waweru, 2014).

44
Consequently, this study extends and contributes to CG research by examining the impact of
thirteen CG mechanisms on the quality of FLID. In addition, in the Indian context, only
Charumathi & Ramesh (2015a) examined the association between CG and FLID, and they
focused on the quantity, rather than quality, of FLID. Thus, this study extends and contributes
to the Indian context by examining the impact of thirteen CG mechanisms on the quality of
FLID.
Secondly, few of the empirical studies examined the association between the FLID and FV;
the results found are either positive or negative, hence mixed (Bravo, 2015; Hassanein &
Hussainey, 2015; Kent & Ung, 2003; Wang & Hussainey, 2013). These mixed results might
be because of the measuring of FLID, as they only focused on the quantity of FLID rather than
the quality. For instance, Wang & Hussainey (2013) found a positive relationship between
FLID and FV, whereas Hassanein & Hussainey (2015) reported a negative association between
the change in FLIFD and FV. However, no single study has investigated the link between
QFLID and FV in general, and particularly in India. Hence, the present research focuses on the
quality of FLID by adopting a multidimensional framework, including both the quantity and
richness dimension. Based on this, the current study extends and contributes to the extant
literature by investigating the impact of QFLID on FV among listed non-financial companies
in India.
Finally, only a limited number of studies have examined the relationship between voluntary
disclosure and ACUAF in general (Barron, Kile, & O'KEEFE, 1999; Hsu & Chang, 2011; Lang
& Lundholm, 1996; Li Eng & Kiat Teo, 1999; Maaloul, Ben Amar, & Zeghal, 2016;
Vanstraelen, Zarzeski, & Robb, 2003). Only the study by Bozzolan et al. (2009), however,
examined the impact of FLID on ACUAF. They have mainly focused on the quantity of FLID
rather than its quality, and the study was conducted in four western countries (Italy, Germany,
France and Switzerland). However, no single study has investigated the link between QFLID

45
and ACUAF in general, and in India in particular. Hence, the present research focuses on the
quality of FLID by adopting a multidimensional framework, which includes both the quantity
and the richness dimension. Therefore, the present research extends as well as contributes to
the literature by examining the impact of the quality of FLID on ACUAF among non-financial
Indian listed firms.
2.10. Summary
The main objective of this research is to examine the determinants and consequences of QFLID
among non-financial Indian companies listed on BSE. This chapter provide a review of the
previous literature regarding FLID. Firstly, it review FLID through: its definitions, nature,
motivations, uesfuless, the quality of FLID and determinants of FLID. Secondly, it covers the
empirical studies regarding the impact of CG on FLID. The literature highlight that previous
studies examined the relation between CG and voluntary disclosure in general (Alhazaimeh et
al., 2014; Aljifri et al., 2014; Beekes et al., 2016; Maskati & Hamdan, 2017; Samaha et al.,
2015; Yilmaz et al., 2017). On the other hand, some studies examined the direct impact of CG
on FLID (Agyei-Mensah, 2017; Al-Najjar & Abed, 2014; Charumathi & Ramesh, 2015a; Liu,
2015; O’Sullivan et al., 2008; M. Wang & Hussainey, 2013) and found mixed results, but in
general CG influence FLID.
Finally, it reviewed the empirical studies regarding the impact of QFLID on both FV and
ACUAF. The association between corporate disclosure and FV can be indirect due to its impact
on cost of capital (Botosan & Plumlee, 2002; Elzahar et al., 2015; J. W. Kim & Shi, 2011;
Plumlee et al., 2008; Plumlee et al., 2015), or direct (Alotaibi & Hussainey, 2016b; Hassan et
al., 2009; Hassanein & Hussainey, 2015; Mendes-Da-Silva & de Lira Alves, Luiz Alberto,
2004; Patel, Balic, & Bwakira, 2002; Plumlee et al., 2008; Plumlee et al., 2015). However,
limited studies have investigated the impact of FLID on FV (Bravo, 2015; Hassanein &

46
Hussainey, 2015; Kent & Ung, 2003; Wang & Hussainey, 2013), and they found maxed
findings. Furthermore, few studies have examined the impact of voluntary disclosure on
ACUAF (Barron et al., 1999; Hope, 2003; Lang & Lundholm, 1996; Saleh & Roberts, 2017;
Vanstraelen et al., 2003). While, Bozzolan et al. (2009) investigated the association between
FLID and ACUAF.
As the initial aim of current research is to examine the determinants and consequences of
QFLID, this study measures the quality of FLID by adopting a multidimensional framework
designed by Beattie et al (2004), which is further developed by Beretta & Bozzolan (2008).
Based on the previous literature, this research expects there is impact of CG on the quality of
FLID. Furthermore, it is also expected there is impact of quality of FLID on FV and ACUAF.

47
Chapter Three: Theoretical Framework and Hypotheses Development
3.1. Introduction
This chapter review the theories and covers the study’s hypotheses development. In previous
research CG and the firm characteristics have determined FLID. On the other hand, FLID has
an impact on both FV and ACUAF. This chapter attempts to test the association between CG
and QFLID in order to identify the variables that are linked with QFLID. Furthermore, it
investigates the impact of QFLID on both FV and ACUAF.
This chapter consists of the following sections: section 3.2 covers the dominant theories related
to CG, QFLID, FV and ACUAF. Section 3.3 presents the research hypotheses development.
Section 3.4 is a summary of the present chapter.
3.2. Theories
Previous studies have used various theories to explain disclosure practices such as agency,
signalling, stakeholder, resource dependence, capital need, legitimacy and political cost
theories (Alhazaimeh et al., 2014; Alnabsha et al., 2017; Barako et al., 2006; M. Elmagrhi et
al., 2017; Elzahar & Hussainey, 2012; Ntim, Opong, & Danbolt, 2012; Ntim & Soobaroyen,
2013; Samaha, Dahawy, Hussainey, & Stapleton, 2012; Samaha et al., 2015; Wang &
Hussainey, 2013). These theories are used to inform and interpret different motivations
according to the nature of the study.
3.2.1. Agency Theory
Jensen & Meckling (1976) explain that, in the agency relationship, the principal engages with
an agent to act on its behalf. The agency relationship often leads to conflicts of interest and
information asymmetry. Conflict of interest starts when an agent acts to achieve their own
48
personal interests while making decisions and neglecting the consequences for shareholders.
Information asymmetry reflects the gap between the amount of information in the hands of the
management and that held by market participants (Fields, Lys, & Vincent, 2001). As managers
work in the firm daily, they are knowledgeable and aware of all business transactions whereas
stakeholders depend on periodic information from the company such as annual and interim
reports.
Agency theory offers an explanation on why managers disclose information voluntarily (Chow
& Wong-Boren, 1987; Cooke, 1991; Firth, 1980). Since shareholders monitor the activities of
the managers, so managers use voluntary disclosure to satisfy their shareholders and to convey
a message to them that they are acting according to their best interest (Chow & Wong-Boren,
1987; Cooke, 1991; Firth, 1980; Hossain, Perera, & Rahman, 1995). By disclosing greater and
high quality information, the uncertainties of their investors are minimised, leading to a
significant decrease in the cost of external financing (Watson et al., 2002). Quality of disclosure
is considered as one of the monitoring mechanisms used by investors. It can reduce information
asymmetry between an agent and principal, so it can lower agency costs (Huang & Zhang,
2008; Jensen & Meckling, 1976; Junker, 2005).
With regard to CG, agency theory suggests that the introduction of CG mechanisms reduces
agency costs by monitoring managerial opportunism (Haniffa & Hudaib, 2006; Lubatkin, Lane,
Collin, & Very, 2005; Solomon, 2007). Barako (2004) argues that sometimes managers do not
consider shareholders’ interests and this necessitates a CG mechanism, which ensures that
various interests are protected for the good of the firm. In accordance with agency theory
assumptions, several empirical studies use CG and firm characteristics as determinants of
corporate voluntary disclosure (Agyei-Mensah, 2017; Agyei-Mensah & Agyei-Mensah, 2017;
Ajinkya, Bhojraj, & Sengupta, 2005; Al-Najjar & Abed, 2014; Charumathi & Ramesh, 2015a;

49
Ho & Shun Wong, 2001; Hussainey & Al-Najjar, 2011; Kuzey, 2018; Lang & Lundholm,
1993; Mousa & Elamir, 2018; Wang & Hussainey, 2013). Agency theory suggest that building
an institution based on CG mechanisms helps to protect both stakeholders’ and management
interests. For example, reducing executive board members can lead to more independence of
the board (Adolf & Gardiner, 1932; Al-Janadi, Rahman, & Omar, 2013; Chen & Jaggi, 2001;
Solomon, 2007). This may enable the board members to show a greater sense of accountability
(Bebchuk & Weisbach, 2010; Conyon & He, 2011; Fama, 1980). Furthermore, board diversity
reduces information asymmetry due to increased supervision of management operation (Walt
& Ingley, 2003). Moreover, separating CEO and chairperson positions decreases agency
problems as it enforces managers to operate according to shareholders’ interests (Haniffa &
Cooke, 2002; Jensen, 1993). In addition, audit committees are considered to be a crucial
instrument to oversee managerial activities (Allegrini & Greco, 2013; Klein, 1998).
According to agency theory, managers use voluntary disclosure as a source to reduce
information asymmetry. Sheu et al., (2010) highlight that as disclosure decreases information
asymmetry among managers and stakeholders so it increases FV. Healy & Palepu (1993) point
out that managers’ better disclosure behaviour enables investors to understand their business
activities effectively and decrease uncertainty related to the company’s future performance
which may influence its share price and FV (Hassan et al., 2009). The information regarding
FLID reduces both issues of information asymmetry and agency costs (Hassanein & Hussainey,
2015). It also decreases the uncertainty surrounding a firm’s future performance and minimises
managers’ ability to gain private benefits that increase the anticipated cash flow to shareholders
(Hassanein & Hussainey, 2015). FV tends to increase due to high quality of disclosure as it
either decreases capital costs or maximises cash flows or both (Alotaibi & Hussainey, 2016b;
Elzahar et al., 2015).

50
To conclude, agency theory recommends that CG mechanisms improve overall governance and
help companies to minimise agency cost and improve both QFLID and FV (Fama & Jensen,
1983; Jensen & Meckling, 1976; Siddiqui, Razzaq, Malik, & Gul, 2013). Thus, this study seeks
to investigate the impact of CG on the QFLID and how QFLID impacts FV among non-
financial Indian listed companies. Agency theory suggests that disclosure quality improves
overall FV (Huang & Zhang, 2008; Jensen & Meckling, 1976; Junker, 2005).
3.2.2. Signalling Theory
Akerlof (1970) developed signalling theory that highlights the information asymmetry problem
and how it could be reduced by signalling more information to others (Morris, 1987). In
addition, the theory posits that investors rely on information provided by the firm
(Abhayawansa & Abeysekera, 2009). In this regard, Watts & Zimmerman (1986) mention that
managers adopt voluntary disclosure to signal information to their investors about their
operations. This theory suggests credible information should be disclosed via voluntary
disclosure. Additionally, signalling theory suggests that companies disclose more information
to decrease information asymmetry problem and signal high quality of disclosure to investors
(Alotaibi & Hussainey, 2016a; Oyelere et al., 2003). However, company managers usually
decide to disclose information only when the marginal benefits from disclosure exceed the
associated cost (Hughes, 1986).
Jensen & Meckling (1976) point out that good CG enables companies to reduce the issue of
information asymmetry. Lundholm & Myers (2002) expected that FLID of companies with
effective CG tends to have value-relevant information for investors. Prior studies predicted
negative association between voluntary disclosure and the issue of information asymmetry
(Brown, Hillegeist, & Lo, 2004; Coller & Yohn, 1997; Welker, 1995). Gordon et al., (2010)

51
argue that voluntary disclosure sends signals to the marketplace as it anticipates an increase in
a company’s net present value (NPV) which increases the value of stock.
Verrecchia (1983) reported that managers with better information signal high quality
information to the capital market and to competitors. In addition, managers in need of finance
convey positive signals to both investors and debt holders (Alotaibi & Hussainey, 2016b). More
specifically, Hussainey & Aal-Eisa (2009) show that FLID is superior to dividend information
as it reduces investor uncertainty regarding future earnings. In the same context, managers
provide more FLID to interested parties as it reduces information asymmetry, improves
owners’ confidence regarding the company’s future performance (Hassanein & Hussainey,
2015; Hossain & Hammami, 2009; Singhvi & Desai, 1971; Uyar, Kilic, & Bayyurt, 2013) and
fulfils the investors’ requirement of providing information (Wang & Hussainey, 2013).
Companies may use FLID to signal to investors that they are generating positive results related
to their profitability, which improves companies’ FV (Sun, Salama, Hussainey, & Habbash,
2010). Another advantage of using FLID by managers is that it improves ACUAF due to a
reduction in information asymmetry (Bozzolan et al., 2009; Lang & Lundholm, 1996;
Lundholm & Myers, 2002). This study expects to find positive impact of QFLID on both FV
and ACUAF.
Based on the above, it is noticed that signalling and agency theories share similar attributes as
both are associated with rational behaviour and information asymmetry issues among firms
and investors. Both theories consider disclosure as a key tool to decrease information
asymmetry (Morris, 1987). Furthermore, these theories suggest that disclosure quality
mitigates information asymmetry issues between managers and stakeholders and improves FV
and ACUAF.

52
3.2.3. Resource Dependence Theory
Resource dependence theory explains that the role of internal CG structure, that includes
directors and committees, is not just to ensure effective monitoring of managers. However,
they also connect company to critical resources that can be utilised to maximise firms’ financial
performance (Alnabsha et al., 2017; Hillman & Dalziel, 2003; Pfeffer, 1972; Pfeffer, 1973). It
suggests that companies can use CG to use such resources to improve their performance (Chen
& Roberts, 2010). Moreover, Pfeffer & Salancik (2003) mention that this theory considers the
board as a source to reduce outside uncertainty instead of just dichotomising directors as
executives and non-executives of the board. This theory highlights that CG is an important
resource for the company as it improves voluntary disclosure (Alnabsha et al., 2017).
In line with resource dependence theory, prior studies suggest that CG decreases
environmental uncertainty as directors bring different resources that are used to improve
company legitimacy which improves the firms’ performance (Hillman et al., 2000; Nicholson
& Kiel, 2007). Both board and outside directors provide necessary resources, such as their
knowledge, to the firms and represent the interest of all stakeholders. It can help the company
to gain a competitive advantage due to having a direct relationship with the environment (An,
Davey, & Eggleton, 2011; Chen & Roberts, 2010; Hillman et al., 2000; Kiel & Nicholson,
2003; Nicholson & Kiel, 2007). This theory also suggests that non-executive directors procure
external resources by their proficiency, prestige and networking (Haniffa & Cooke, 2002).
Spencer (1983) stated that the role of a non-executive director should be advisory not decision-
making, in that their experience and expertise are fully acknowledged, their advices are
influential but they should not intervene the establishment of corporate policies. In short, non-
executive directors enrich the board’s expertise primarily through advice regarding strategic
decision-making.

53
Resource dependence theory suggests that firms tend to disclose more voluntary information
to gain access to crucial resources (Amran, Lee, & Devi, 2014; Branco & Rodrigues, 2008).
Furthermore, this theory suggests that better voluntary disclosure gives companies more chance
to obtain crucial resources with better costs, which helps to build a solid reputation (Branco &
Rodrigues, 2008; Elzahar & Hussainey, 2012; Oliveira, Lima Rodrigues, & Craig, 2011;
Pfeffer & Salancik, 1978; Pirson & Turnbull, 2011). In this regard, it is argued that voluntary
disclosure reduces information asymmetry which leads to better financing, investment and
liquidity effects (Beretta & Bozzolan, 2004; Botosan, 1997; I. Brown, Steen, & Foreman,
2009). By the same token, Castanias & Helfat (2001) and Haniffa & Cooke (2002) argue that
increased disclosure reduces the concerns of stakeholders regarding managers’ strategies. This,
in turn, may lead to reduced capital restrictions, improved finance access, and to gaining
financial benefits in the future (Alnabsha et al., 2017; Cheng, Ioannou, & Serafeim, 2014;
Hoang, Abeysekera, & Ma, 2016).
To conclude, resource dependence theory suggests that the CG is a company resource,
comprised of expertise, image, and information links (Alnabsha et al., 2017; Hoang et al.,
2016). The board of directors performs a monitoring role and provides necessary resources, for
instance business contracts, experience and knowledge that improves financial performance
(Chen, 2011; Nicholson & Kiel, 2007). Furthermore, a larger board with the presence of more
independent directors could improve the company with critical competitive resources, give
constructive advices to the management, and contribute to a better monitoring system. This, in
turn can lead to improvement in QFLID.
3.2.4. Stakeholder Theory
Stakeholders are defined as “any individual or group who can influence or is influenced by the
achievement of a corporate’s aim” Freeman (1983; 2010, p. 54). According to Clarkson (1994)

54
and Rizk et al. (2008), a firm’s stakeholders can be divided into two groups: (1) primary or
powerful group comprised of all individuals who contribute to the business such as
shareholders, investors, suppliers, employees, providers and government. (2) a secondary
group, which does not essentially contribute to the survival of the business, but can affect or
be affected by a firm’s operations, for instance, society and media. Stakeholder theory is
established on the assumption that a company’s continued survival needs the support of
stakeholders. This theory assumes that the behaviour of different stakeholder groups (primary
groups) enhance management’s ability to relate corporate needs with their environments. The
more influential the stakeholder is, the more the company must adopt stakeholder management.
According to Freeman et al. (2010), it is necessary to take into consideration the interests of all
stakeholders rather than only the shareholders. Donaldson & Preston (1995) indicate that
stakeholder theory has three viewpoints, namely descriptive accuracy, instrumental power, and
managerial perspective or normative validity. The first two perspectives assume that a company
should strategically manage primary stakeholders by classifying them with the self-interest of
the organisation, whereas the normative view suggests that managers should pay attention to
all stakeholder groups.
Based on the descriptive and instrumental perspectives of stakeholder theory, corporate
disclosure is considered as a tool to manage the perception of only the primary stakeholder
group (Ullmann, 1985). Consequently, it is employed for the strategic purpose of gaining
agreement and support for the company’s continuing operation, rather than for responsibility
purposes (Deegan & Samkin, 2008). In line with this concept is the perception of the important
stakeholder group concerning the firms managed through corporate disclosure. However, the
managerial or normative stakeholder point of view demonstrates that companies have specific
duties and obligations to different stakeholders and that corporate disclosure is necessary for

55
the firm to ensure greater accountability by disclosing information to relevant stakeholders
(Guay, Kothari, & Watts, 1996).
Although this theory widely adopted in the literature, it has been criticised for several reasons.
It is not adequate to explain the dynamics, which link the company to the stakeholders (Key,
1999). It is also not justifiable and practicable to determine all stakeholders, as that may
negatively affect the welfare of the company (Etzioni, 1998; Sternberg, 1997). In addition, it
is reliant on the particular power of stakeholders and, thus, may ignore the other stakeholders
who are likely to be regarded as less important (Deegan, 2002). Therefore, the stakehoher
theory is excluded in the present research.
Since this study aims to examine the determinants and consequences of QFLID, this research
relied on agency, signalling, and resource dependence theories. These theories are more
appropriate to explain the main relationships used by this study, and more adequate for
developing the hypotheses of this study.
3.3. Research Hypotheses Development
3.3.1. Hypotheses Related to CG and QFLID
This section explains the development of the research hypotheses related to the first objective,
examining the association between CG mechanisms and QFLID in Indian listed companies
based on relevant theoretical and empirical evidence.
To examine this relationship, a total of thirteen CG related variables are taken into
consideration. The development of the hypotheses for board of directors, audit committee, and
ownership structure are as follows:

56
3.3.1.1. Board of Directors’ Characteristics
An essential element in determining voluntary disclosure is the characteristic of the board of
directors (Allegrini & Greco, 2013; Beasley, 1996; Davidson, Nemec, & Worrell, 1996;
Madhani, 2015; Maskati & Hamdan, 2017; Samaha et al., 2015). It is a key tool for
shareholders to exercise control on top management (John & Senbet, 1998). Accordingly,
board effectiveness mitigates agency costs, and enhances the firm’s transparency.
Consequently, board characteristics could influence the QFLID. The current study examines
five board characteristics, namely board size, CEO duality, board independence, frequency of
board meetings and the presence of females on the board.
3.3.1.1.1. Board Size
According to agency theory, board size is a potential variable of CG used to monitor
management performance (Allegrini & Greco, 2013; Alotaibi & Hussainey, 2016a; Fama &
Jensen, 1983). Earlier studies show that board size makes the decision-making more effective.
For instance, Laksmana (2008) highlights that a large board increases the chance of having a
diverse board that can lead to better expertise . Similarly, Samaha et al. (2012) mention that
senior executives cannot dominate prominently if the size of the board is large. Moreover, Ntim
et al. (2012) reported that companies with a large board size show high disclosure compared to
those with a small board size. On the contrary, Herman (1981) and Jensen (1993) indicate that
large board size creates issues, for example less communication and monitoring, which have a
negative impact on disclosure behaviour. According to the Resource-dependence theory
perspective, larger boards improve corporate reputation due to having a greater diversity of
experience (Alnabsha et al., 2017; Lajili & Zéghal, 2005; Linsley & Shrives, 2006).
Prior studies to examine the association between board size and voluntary disclosure provided
mixed results. Few studies found a positive association between board size and corporate

57
disclosure in general (Barako et al., 2006; Laksmana, 2008; Samaha et al., 2015), whereas
others found no association between board size and the level of disclosure (Cheng &
Courtenay, 2006; Ebrahim & Fattah, 2015; Kuzey, 2018; Lakhal, 2005; Othman, Ishak, Arif,
& Aris, 2014). On the other hand, some researchers argue that board size reduces board
effectiveness so board members feel less motivated, which can cause low levels of disclosure
(Byard, Li, & Weintrop, 2006; Cerbioni & Parbonetti, 2007; Yermack, 1996). In the Indian
context, the Indian Corporate Governance Code (ICGC) number (49) recommends that a board
of directors should comprise of at-least four members. The total number of directors (executive
and non-executive) on the board is used as a proxy to measure board size. Based on the above
discussion, the following hypothesis is formulated:
H1.1: There is a significant positive association between board size and QFLID among Indian
listed companies.
3.3.1.1.2. CEO Duality
CEO duality occurs when the Chief Executive Officer (CEO) and the Chairman of the board
of directors is the same person. According to agency and resource-dependence perspective,
CEO duality has a negative impact on disclosure and firms’ performance (Reverte, 2009). From
the agency theory perspective, separation of chairman and CEO positions reduces agency
problems as it motivates managers to work according to the interests of their shareholders
(Fama & Jensen, 1983; Haniffa & Cooke, 2002; Jensen, 1993). Similarly, the resource-
dependence theory suggests that separating CEO and board chairman positions improves a
firm’s legitimacy and stakeholders’ participation by promoting equality and fairness in the
decision making process (Alnabsha et al., 2017; Elzahar & Hussainey, 2012). It is argued that
separation between the role of chairman and CEO increases board independence and leads to
efficient monitoring and management performance (Conheady, McIlkenny, Opong, &

58
Pignatel, 2015; Donnelly & Mulcahy, 2008; Haniffa & Cooke, 2002; Jensen, 1993). Likewise,
CEO duality gives the CEO power to make decisions according to his best interests with less
interference (Haniffa & Cooke, 2002). Similarly, CEO duality creates a strong individual
power base, which might affect the efficient control exercised by the board (Donaldson &
Davis, 1991; Fama & Jensen, 1983; Jensen & Meckling, 1976).
Previous empirical studies give mixed results on CEO duality. A number of studies found that
CEO duality and voluntary disclosure is negatively associated (Allegrini & Greco, 2013; Gul
& Leung, 2004; Haniffa & Cooke, 2002; Li, Pike, & Haniffa, 2008). However, some studies
found no association between CEO duality and the level of voluntary disclosure (Aljifri et al.,
2014; Alnabsha et al., 2017; Alotaibi & Hussainey, 2016a; Babío Arcay & Muiño Vázquez,
2005; Barako et al., 2006; Cheng & Courtenay, 2006; Ghazali & Weetman, 2006; Liu, 2015).
In the Indian context, ICGC (49) recommend that if the CEO is also the chairman then half of
the board of directors should be independent. From the above, this study expects to find a
negative association between CEO duality and QFLID. The hypothesis is stated as follows:
H1.2: CEO duality and the QFLID are negatively and significantly associated among Indian
listed companies.
3.3.1.1.3. Board Independence
Independence of boards received huge interest from academic research and CG regulations
(Chen, 2011; Johanson & Østergren, 2010). Independent directors monitor management's
performance and decrease information asymmetry between managers and stakeholders
(Allegrini & Greco, 2013; Lim et al., 2007), and thereby increase the level of voluntary
disclosure (Lang & Lundholm, 1993). In addition, board independence protects shareholders
interests and reduces agency costs (Lipton & Lorsch, 1992). Furthermore, resource-
dependence theory assumes that independent directors procure external resources by their

59
proficiency, prestige and networking (Chen, 2011; R. M. Haniffa & Cooke, 2002; Nicholson
& Kiel, 2007; Tricker, 1984). In this regard, increased board independence enhances corporate
response to stakeholders’ informational needs (Lopes & Rodrigues, 2007).
Empirically, it is shown that independent directors support the board and committees by using
their experience and knowledge (Barako et al., 2006; Haniffa & Cooke, 2002). Bozec (2005)
reports that a large number of independent directors improve managerial monitoring, which
creates the possibility to hinder managerial initiatives. Accordingly, prior research on the
association between board independence and voluntary disclosure provided mixed results.
Many empirical studies found board independence and voluntary disclosure is positively
associated (Adams & Hossain, 1998; Chen & Jaggi, 2001; Cheng & Courtenay, 2006; Huafang
& Jianguo, 2007; Lim et al., 2007; Liu, 2015; Patelli & Prencipe, 2007; Samaha et al., 2015;
Wang & Hussainey, 2013), whereas, other studies found either no association (Aljifri et al.,
2014; Ebrahim & Fattah, 2015; Kuzey, 2018; O’Sullivan et al., 2008; Uyar & Kilic, 2012) or
a negative association (Barako et al., 2006; Chapple & Truong, 2015; Eng & Mak, 2003;
Ghazali & Weetman, 2006; Gul & Leung, 2004; Madhani, 2015) between two variables.
In the Indian context, ICGC (49) recommends that half of the board directors should be
independent. From the above discussion, this study expects that there is a positive association
between board independence and QFLID. Therefore, this study proposes the following
hypothesis:
H1.3: There is a significant positive association between the percentage of board independence
and the QFLID among Indian listed companies.
3.3.1.1.4. The Frequency of board meetings
The frequency of board meetings is considered to be an essential tool of CG as it enables board
directors to effectively control a company’s operations and monitor its financial reporting

60
activities (Alotaibi & Hussainey, 2016a). According to agency theory, the board of directors
has the power to monitor the decisions made by top level management, which is one of the
main bases of the decision control system (Fama & Jensen, 1983). In addition, the frequency
of board meetings highlights the commitment of the board in terms of sharing information with
management (Brick & Chidambaran, 2010). It helps to enhance managerial monitoring, which
has a positive impact on corporate disclosure (Ntim & Oseit, 2011). Whereas Carcello (2002)
mentions that board meetings’ frequency might not be beneficial in terms of shareholders’
interests, others such as Vafeas (1999) warned that the time directors spend on meetings might
be used for routine tasks like presenting management reports instead of monitoring
management performance.
Prior empirical studies found a positive association between the frequency of board meetings
and voluntary disclosure (Alnabsha et al., 2017; Barros, Boubaker, & Hamrouni, 2013; Brick
& Chidambaran, 2010; Kent & Stewart, 2008; Laksmana, 2008). Nevertheless, Alhazaimeh et
al. (2014) found no association between frequency of board meetings and voluntary disclosure.
In the Indian context, ICGC (49) recommends that a board should hold at least four meetings
a year. Following previous studies, this study expects to find a positive relationship between
QFLID and the frequency of board meetings. It examines the following hypothesis:
H1.4: There is a significant positive association between the number of meetings and the
QFLID among Indian listed companies.
3.3.1.1.5. Females’ Presence on the Board
The presence of female members on the board acts as a key tool that consolidates board
effectiveness and efficiency (Carter, Simkins, & Simpson, 2003a; Carter, D'Souza, Simkins, &
Simpson, 2010; Walt & Ingley, 2003). Gender diversity (number of female directors) is a
challenging research issue (Singh, Vinnicombe, & Johnson, 2001) and it is an important
dimension of CG (Liao, Luo, & Tang, 2015). Board gender diversity could bring several

61
benefits, such as effective decision making and exchanging and presenting new ideas (Alvarez
& McCaffery, 2000; Barako & Brown, 2008; Carter, Simkins, & Simpson, 2003b; Dowling &
Aribi, 2013). It can also give the company a competitive edge as it improves the creativity and
knowledge of the board (Watson, Kumar, & Michaelsen, 1993). According to agency theory,
board gender diversity enhances board efficiency as it prevents managers exploiting
shareholders’ wealth and improves board independence (Barako & Brown, 2008; Carter et al.,
2003b; Elzahar & Hussainey, 2012). According to the resource-dependence theory perspective,
board diversity improves the relationship between firms and the external environment by
quality disclosure that helps them to gain critical resources (Hillman et al., 2000; Pfeffer, 1972).
Empirical research examining the association between female board directors and corporate
disclosure practices showed mixed results. For instance, Barako & Brown (2008); Chapple &
Truong (2015); Kuzey (2018) and Liao et al. (2015) reported a positive association between
gender diversity and voluntary disclosure. Sartawi et al. (2014), however, found no relationship
between the two variables. In the Indian context, ICGC (49) recommends that boards should
have at least one woman director. Based on the above discussion, this study expects that the
presence of females on the board would increase QFLID. Therefore, the hypothesis is set as
follows:
H1.5: There is a significant positive association between the percentage of the presence of
females on the board and the QFLID among Indian listed companies.
3.3.1.2. Ownership Structure
Ownership structure has been also considered as a key determinant to improving CG practices
(Ebrahim & Fattah, 2015; Konijn, Kräussl, & Lucas, 2011; La Porta, Lopez-de-Silanes,
Shleifer, & Vishny, 1999). Nevertheless, empirical research on ownership structure and
voluntary corporate disclosure gives contradictory results (Bebchuk & Weisbach, 2010;

62
Ebrahim & Fattah, 2015). The following subsections cover three ownership structures within
Indian listed companies, known as block holder, institutional and promoter ownership.
3.3.1.2.1. Block holder Ownership
Block holder ownership is defined as the ratio of ordinary shares held by substantial
shareholders (that is 5% or more) (Eng & Mak, 2003; Huafang & Jianguo, 2007). As block
holders act as owner managers because they have unlimited access to information (Samaha et
al., 2012), therefore companies with concentrated ownership tend to involve less voluntarily
in compliance with CG rules (Ismail & Sinnadurai, 2012; Ntim & Soobaroyen, 2013) and
reduce information asymmetry, which decreases agency conflicts (Jensen & Meckling, 1976;
Reverte, 2009). Habbash (2010) highlights that block holder ownership includes various
investors, such as individuals, private companies, trusts, banks and more. According to agency
theory, block holder ownership reduces agency costs, therefore companies with high block
holder have less incentive to provide extra information (Al-Najjar & Abed, 2014; Eng & Mak,
2003).
Empirically, the association between block holder ownership and voluntary disclosure
reported mixed results. For instance, numerous studies found a negative association between
block holder ownership and voluntary disclosure (Al-Najjar & Abed, 2014; Garcia-Meca &
Sanchez-Ballesta, 2010; McKinnon & Dalimunthe, 1993; Mitchell, Chia, & Loh, 1995;
Schadewitz & Blevins, 1998), whereas Huafang & Jianguo (2007) and O’Sullivan et al. (2008)
found a positive relationship between these two variables. On the other hand, other authors do
not report any significant association between disclosure and ownership concentration
(Abdelbadie & Elshandidy, 2013; Alqatamin et al., 2017; Eng & Mak, 2003; Hidalgo et al.,
2011; Nekhili, Boubaker, & Lakhal, 2012; Nekhili et al., 2016).

63
Based on the above discussion, this research expects a negative relationship between block
holder ownership and QFLID. This study proposes the following hypothesis:
H1.6: There is a negative association between the level of block holder ownership and the
QFLID among Indian listed companies.
3.3.1.2.2. Institutional Ownership
It has been argued that institutional ownership plays a key role in CG structure. It oversees
managers’ discretion and improves information effectiveness presented in the capital market
(Balsam, Krishnan, & Yang, 2003; Ferreira, 2010; Koh, 2003). Agency theory highlights that
institutional ownership helps to gain effective control over the company, as managers disclose
more information to satisfy institutional shareholders thus gaining their backing to gain access
to important resources (Alnabsha et al., 2017; Al-Najjar & Abed, 2014; Charumathi & Ramesh,
2015a; Yoshikawa & Rasheed, 2009). El-Gazzar (1998) points out that higher institutional
ownership increases the motivation of managers to publish more voluntary information to
increase shareholders’ confidence. By the same token, Qu et al. (2015) reported that CG and
institutional ownership encourages managers to disclose more QFLID.
Empirically, prior studies investigated the association between institutional ownership and
voluntary disclosure. For example, Barako et al. (2006); Bushee & Noe (2000); Carson &
Simnett (1997); Guan et al. (2007); Mathuva (2012b) and Al-Bassam et al. (2015) found a
positive relationship between institutional ownership and voluntary disclosure, whereas
Alqatamin et al. (2017) found that institutional ownership and the level of disclosure are
negatively and significantly associated with each other. On the other hand, Charumathi &
Ramesh (2015a); Jouini (2013) and Wang & Hussainey (2013) reported no association between
the two variables. This study expects to find a positive association between institutional
investors and QFLID. The hypothesis is set as follows:

64
H1.7: There is a positive association between institutional ownership and the QFLID among
Indian listed companies.
3.3.1.2.3. Promoters’ Ownership
According to the Securities and Exchange Board of India (SEBI), a promoter is defined as an
individual or group of individuals who control the firm or act as an instrument in the
formulation of a plan or programme pursuant to which the securities are offered to the public
and those named in the prospectus as promoters (Ganguli & Agrawal, 2009; Kumar & Singh,
2013). Promoter ownership is considered as several types of investors, including individuals,
family members and corporate bodies (Selarka, 2005).
To protect the interest of the investing community, laws and regulations in India require that
promoters should have at least 20% of the post issue share capital. They should either
contribution at least 20% of the proposed issue or ensure shareholding of at least 20% of the
post issue capital, the participant has to be locked for at least three years. This requirement
should not be applicable if a firm remains listed for three years or more in a stock exchange
and has a track record of payment of dividend for at least three immediately preceding years
(Ganguli & Agrawal, 2009). Kumar & Singh (2013) highlight that promoters in Indian firms
raised the problem of owner-manager control. Charumathi & Ramesh (2015a) argue that
companies with a higher promoters’ holding have less incentive for higher disclosure.
Empirically, Charumathi & Ramesh (2015a) found no significant association between
promoter ownership and FLID in Indian companies. This study considers the following
hypothesis:
H1.8: There is a negative association between promoter ownership and the QFLID among
Indian listed companies.
65
3.3.1.3. Audit Committee
The audit committee is one of the important subcommittees of board of directors which
monitors the financial reporting processes; thereby it affects corporate disclosure by reducing
information asymmetry (Mangena, & Pike, 2012). Appuhami & Tashakor (2017) indicated that
the role of audit committee is to improve the picture of disclosure and prevent mangers
benefitting personally. From an agency theory perspective, an audit committee can be
considered as an instrument to reduce agency costs (Ho & Wong, 2001b; Klein, 1998),
therefore, it increases the quality of reporting (Bradbury, Mak, & Tan, 2006; Collier, 1993;
Cotter & Silvester, 2003; Nelson, Gallery, & Percy, 2010). In line with Zaman et al. (2011),
this study uses five dimensions to assess the audit committee effectiveness, namely audit
committee size, audit committee independence, frequency of audit committee meetings, audit
committee financial expertise, and number of female members on the audit committee.
3.3.1.3.1. Audit Committee Size
The audit committee improves the extent of disclosure of financial reports (Al-Janadi et al.,
2013). Agency theory highlights that companies with a good audit committee disclose more
information and reduce agency costs (Alotaibi & Hussainey, 2016a; Barako et al., 2006).
Bedard et al., (2004) indicate that committee size should be large enough to achieve effective
monitoring, although not so large as to adversely affect the decision making process.
Furthermore, research on organisational behaviour indicates that larger-sized audit committees
tend to be less productive (Alotaibi & Hussainey, 2016a; Jensen, 1993; Karamanou & Vafeas,
2005). Consequently, firms need to maintain a balance between the size of the audit committee
and its responsibilities, as a large audit committee has an ambiguous effect on the process of
monitoring (Karamanou & Vafeas, 2005).

66
With regard to empirical results, earlier studies documented a positive association between
audit committee size and voluntary disclosure (Abeysekera, 2010; Al-Bassam et al., 2015;
Albitar, 2015; Allegrini & Greco, 2013; Beasley, 1996; Hidalgo et al., 2011; Laksmana, 2008;
Li et al., 2008; Ntim, Lindop, & Thomas, 2013; O’Sullivan et al., 2008; Samaha et al., 2015).
On the other hand, Aljifri & Hussainey (2007) and Magena & Pike (2005) reported no
association between audit committee size and FLID. In the Indian context, ICGC (49)
recommends that an audit committee should have least three members. From the discussion, it
could be argued that there is a positive relationship between audit committee size and QFLID,
so the following hypothesis is formulated:
H1.9: There is a significant positive association between the audit committee size and the
QFLID among Indian listed companies.
3.3.1.3.2. Audit Committee Independence
Bedard et al. (2004) highlight that independence of the audit committee is important for a
company to operate effectively. Agency theory assumes that audit committee independence
reduces agency costs. The independence of audit committee members can significantly
contribute to the effectiveness of the committee (Xie, Davidson, & DaDalt, 2003), as it enables
the committee to achieve their objectives with greater responsibility (Abbott, Parker, & Peters,
2004). Previous studies found that independence of the audit committee improves the quality
of financial disclosure and also evaluates management performance accurately (Cerbioni &
Parbonetti, 2007; Forker, 1992; Ho & Shun Wong, 2001). Furthermore, Song & Windram
(2004) and Uzun et al. (2004) highlight that greater board independence lowers issues of
financial reporting and corporate fraud. With regard to empirical results, Aljifri et al. (2014)
and Ho & Wong (2001) found positive and significant association between audit committee
independence and FLID. In the Indian context, ICGC (49) recommends that at least two-thirds

67
of the members must be independent in the audit committee. Consequently, the above
discussion results in the following hypothesis:
H1.10: There is a positive association between audit committee independence and the QFLID
among Indian listed companies.
3.3.1.3.3. Frequency of Audit Committee Meetings
Frequent audit committee meetings enhance the effectiveness of the audit committee, and
improve the accuracy of financial statements, which leads to better audit quality (Beasley,
Carcello, Hermanson, & Neal, 2009). The frequency of audit committee meetings is considered
as the only publicly available quantitative indicator about the diligence of audit committees
(Raghunandan & Rama, 2007). Based on the agency theory, as frequent audit committee
meetings increase audit activities, hence they enable the audit committee to monitor
management activities effectively and reduce agency conflicts (Xie et al., 2003). Due to
increase in monitoring, it reduces information asymmetry and improves the extent of disclosure
activities (Nelson et al., 2010).
Earlier studies, such as Barros et al. (2013); Beasley et al. (2009); Bronson et al. (2006);
Karamanou & Vafeas (2005) and Kelton & Yang (2008) provide empirical evidence of a
positive association between the frequency of audit committee meetings and voluntary
disclosure . On the other hand, other studies found no relationship between the two variables
(Alhazaimeh et al., 2014; Matoussi, Karaa, & Maghraoui, 2004; Othman et al., 2014). In the
Indian context, ICGC (49) recommends that audit committees should organise at least four
meetings a year. Based on the above discussion, this study expects to find a positive
relationship between the frequencies of audit committee meetings with the QFLID.
Accordingly, the hypothesis below is set as follows:
68
H1.11: There is a positive association between the frequency of audit committee meetings and
the QFLID among Indian listed companies.
3.3.1.3.4. Audit Committee Financial Expertise
Audit committee expertise is an important element in decreasing financial misstatements
(Abbott et al., 2004; Beasley et al., 2009; Cohen, Krishnamoorthy, & Wright, 2004) and it
improves financial reporting quality (Chen, Firth, Gao, & Rui, 2006). An audit committee with
good expertise provides credible and high-quality information to the market (Smith, 2003). In
the same vein, an audit committee with financial expertise effectively monitors the financial
reporting process and improves disclosure activities (Liu, 2015; Mangena & Pike, 2005;
McDaniel, Martin, & Maines, 2002). Agency theory suggests that an experienced audit
committee leads to enhanced auditing activities (Fama, 1980; Fama & Jensen, 1983).
Moreover, it assumes that the audit committee is viewed as one of the monitoring agents within
a company which is instrumental in improving the quality of financial reporting (Cheng &
Courtenay, 2006; Vafeas, 2000) and useful in reducing agency costs. Zahra & Pearce (1989)
highlight that an audit committee formed of diverse skills and experience resists managerial
domination and works according to the stakeholders’ interests.
Empirical results of earlier studies reported a positive association between financial expertise
and disclosure (Abbott et al., 2004; Felo, Krishnamurthy, & Solieri, 2003; Felo & Solieri, 2009;
Kelton & Yang, 2008; Krishnan & Visvanathan, 2006; Liu, 2015; Mangena & Pike, 2005).
Therefore, this study expects to find a positive relationship between audit committee financial
expertise and QFLID, hence it proposes the following hypothesis:
H1.12: There is a positive association between audit committee financial expertise and the
QFLID among Indian listed companies.
3.3.1.3.5. Females’ Presence on the Audit Committee

69
Singh et al. (2001) point out that gender diversity (presence of women in top management) is
becoming a challenging research issue nowadays, and Liao et al. (2015) consider gender
diversity to be an important CG dimension. Recent studies highlight that the presence of
females on boards and audit committees improves corporate monitoring and enhances reporting
processes that lead to better disclosure quality (Ittonen, Miettinen, & Vähämaa, 2010; Stewart
& Munro, 2007; Thiruvadi & Huang, 2011). Based on an agency theory perspective, gender
diversity reduces the issue of information asymmetry and improves monitoring of management
activities (Carter et al., 2003a; Walt & Ingley, 2003). It also helps them to moderate the possible
conflicting anticipations of stakeholders who have different interests, hence it improves CG
(Liao et al., 2015). Empirically, Liao et al. (2015) reported a positive and significant association
between company disclosure and gender diversity. Consequently, this study expects that the
presence of women in audit committees improves QFLID. Hence, the hypothesis is as follows:
H1.13: There is a significant positive association between the percentage of females’ presence
on the audit committee and the QFLID among Indian listed companies.
3.3.2. Hypothesis Related to QFLID and FV
Previous studies examined the impact of disclosure on FV (Alotaibi & Hussainey, 2016b;
Mendes-Da-Silva & de Lira Alves, Luiz Alberto, 2004; Plumlee et al., 2015; Shi et al., 2014;
Uyar & Kiliç, 2012). However, limited studies examined the association between FLID and
FV. Nevertheless, the results of prior studies are contradictory. Wang & Hussainey (2013)
showed that FLID of well-governed companies increase the stock market’s ability to predict
future earnings, and contain value relevant information for investors. Bravo (2015) examined
whether FLID and the firm’s reputation causes a reduction in stock returns. The result indicated
that FLID has a huge impact on the capital market, and firms of sound reputation are affected
extensively by stock return volatility. However, Hassanein & Hussainey (2015) examined the

70
impact of the change of forward-looking financial disclosure (FLFD) on FV, by using UK
FTSE companies. They found that the changes in FLFD has a negative effect on the value of
poorly performing companies, while, it has no effect on the value of well-performing
companies.
According to agency and signalling theories, a high quality of disclosure enables firms to
enhance their valuation process and reduce information asymmetry among managers and
investors. Therefore, high quality disclosure increases FV, as it either reduces the cost of
capital, or maximises cash flows, or sometimes both (Alotaibi & Hussainey, 2016b; Elzahar et
al., 2015). Drawing on agency theory, FLID decreases information asymmetry and agency
costs (Hassanein & Hussainey, 2015). This, in turn, decreases the uncertainty surrounding the
firm’s future performance and, thereby, could increase the anticipated cash flow to
shareholders (Hassanein & Hussainey, 2015).
The empirical evidence about the impact of voluntary disclosure on FV is still inclusive and
gives mixed results. Some studies found that voluntary disclosure is positively related to FV
(Alotaibi & Hussainey, 2016b; Cheung, Jiang, & Tan, 2010; Elzahar et al., 2015; Mendes-Da-
Silva & de Lira Alves, Luiz Alberto, 2004; Nekhili et al., 2016; Plumlee et al., 2015; Uyar &
Kiliç, 2012; Wang & Hussainey, 2013), whereas Hassanein & Hussainey (2015) reported a
negative association between the change in FLIFD and FV. Hassan et al. (2009) found no
association between voluntary disclosure and FV.
Most of the studies examine disclosure in general and FV, and do not consider QFLID.
Moreover, no study has considered developing countries, particularly India. Based on the above
discussion, this study expects that the QFLID positively affects the FV. Consequently, the
hypothesis of this study is set as follows:
H2: There is a positive association between the QFLID and FV among Indian listed companies.

71
3.3.3. Hypothesis Related to QFLID and ACUAF
Jennings (1987) showed that management forecasts and financial analysts’ revisions have
significant associations with stock return, which confirms the management forecasts’
credibility; once this is discovered, subsequent information disclosed by the company will be
seen as credible. Lang & Lundholm (1996) highlight that financial analysts are an essential part
of capital market. They mentioned that analyst forecast information can be used for many
purposes as it contains information on earnings forecast, buying and selling guidance and other
useful information for managers, brokers and investors.
Limited studies examined the relationship between voluntary disclosure and ACUAF. Lang &
Lundholm (1996) investigated the association between information disclosure and ACUAF
and found that firms with greater disclosure policies tend to have a larger analyst following.
Similarly, Barron et al. (1999) examined the relationship between Management Discussion and
Analysis (MD&A) information quality and ACUAF and reported that a high level of FLID
regarding capital expenditure and operation is linked with more ACUAF. Vanstraelen et al.
(2003) conducted a study across three European countries and examined the assoication
between nonfinancial disclosure level and analyst forecast and dispersion. They found that the
greater extent of disclosure is associated with lower dispersion and high ACUAF.
With regard to FLID, Bozzolan et al. (2009) used a sample of non-financial Italian, German,
French and Swiss companies and discovered that FLID is more efficient to improve ACUAF
and reduce dispersion. According to the signalling theory perspective, managers signal more
information to the market to reduce information assymetry. Thus, if the managers provide more
disclosure information, it will increase analyst following and improve accuracy. Hence, it is
expected that the QFLID enhances ACUAF.
Overall, both theoretical and empirical literature reveals that analysts can obtain useful
information from voluntary disclosures to anticipate a firm’s future earnings. FLID, as a key
72
example of corporate voluntary narratives, comprises earnings-sensitive financial information
that has the potential to impact on ACUAF. Based on the above discussion of empirical studies,
it is noted that there is no single study that examined the association between QFLID and
ACUAF in developing countries such as India. This study examines the relationship between
these two variables and expects the following hypothesis:
H3: There is a positive association between the QFLID and ACUAF among Indian listed
companies.

73
Figure 3. 1 Theoretical Framework of Determinants and Consequences of QFLID
CG Mechanisms
Firm characteristics
QFLID denotes the quality of forward-looking disclosure FV denotes frim value. ACUAF denotes accuracy of
analysts forecast. BSIZE denotes board size. DP denotes the CEO duality. FBM denotes the frequency of board
meetings during the year. BI denotes the independence of board. FPB denotes the ratio of female presence on
the board of directors. BloOwn denotes blockholder ownership. InsOwn denotes institutional ownership.
ProOwn denotes promoter ownership. ACSIZE denotes audit committee size. ACM denotes the frequency of
audit committee meetings during the year. IAC denotes the independence of the audit committee. ACFEXP
denotes audit committee financial experts. FPAC is the ratio of female presence on the audit committee. LEVE
denotes the leverage ratio. PROF denotes profitability. LIQU denotes liquidity. GROW is firm growth. CSIZE
denotes Firm size. IndType denotes industry type.

74
3.4. Conclusion
The present chapter tries to give a review of the relevant theories adopted in the disclosure
literature to explain the possible association between CG and QFLID, as well as the impact of
QFLID on both FV and ACUAF. However, it is noted that no single theory is capable of giving
an explanation of corporate disclosure inclusively. The review of the relevant theoretical
framework clarifies that each theory has its own assumptions and unique perspectives to
explain the phenomenon of disclosure.
Given that the current research is concerned with the relationship between CG and QFLID, it
applies agency, signalling and resource dependence theories to inform and interpret previous
findings. Moreover, this research is concerned with the impact of QFLID on FV and ACUAF;
the agency and signalling theories are applied to explain and interpret the study results.
The research hypotheses are formed based on the integrated theoretical framework and the
empirical literature review. This chapter covers the hypotheses to examine the association
between CG and QFLID. Based on theories and the literature on CG and corporate disclosure,
the present study expects an association between CG and QFLID among non-financial Indian
companies. In addition, the current chapter illustrates the relevant hypotheses to examine the
association between QFLID and FV. Based on literature of corporate disclosure and FV, this
research expects to find a significant and positive association between QFLID and FV. Lastly,
the current study proposes a positive and significant impact of QFLID on ACUAF.

75
Chapter Four: Methodology
4.1. Introduction
The present chapter explains the research methods used in the current study. It contains the
following sections: Section 4.2 explains the research methodology. Section 4.3 focuses on the
sample selection procedures. Section 4.4 discusses the process of measuring the study’s
variables. Section 4.5 presents the empirical models of the study. Section 4.6 focuses on the
empirical procedures of data analysis. The final section, 4.7, summarises the present chapter.
4.2. Research Methodology
Howell (2012, p. 82) explained that methodology has an impact on the methods and it also
influences what knowledge needs to be considered and the consequent results of the
examination. To achieve the study objectives, this section discusses the research philosophy,
strategy, approach and the design adopted. The figure below presents the research
methodology.

76
Figure 4. 1 The research methodology
4.2.1. Research Philosophy
The most important step in organising any social science research is that the rationale for the
selection of research philosophy should be determined and explained (Saunders, 2011). Collis
& Hussey (2003) point out that research philosophy explains the approach used to collect,
analyse and utilise the data. The research philosophy refers to the assumptions of the research,
including what data need to be collected, how research is carried out, and how results can be
analysed. Positivism and interpretivism are the two key research paradigms (Bernard &
Bernard, 2012; Bryman, 2015). According to Annells (1996) the positivism approach observes
and describes a steady reality as per the objective perspective, while the interpretivism
Source: (Saunders et al. 2009).
Research
Methodology
Research
Philosophy
Research
Design
Research
Approach
Research
Strategy
Positivism
Interpretivism
Qualitative
Quantitative
Deductive
Inductive
Sample and data
collection, research
method

77
philosophy targets the differences between organising a research and the reality that must be
comprehended. The positivism approach considers that reality is objective and independent
from researchers, and observers are not part of research. The positivism philosophy involves
studying literature to determine a relevant theory (theories), and using the selected theory
(theories) to develop hypotheses. Once developed these hypotheses are tested to be either
confirmed or rejected in order to select a theory (theories) (Bryman, 2015; Saunders, 2011).
On the contrary, the interpretivism philosophy assumes that observers should not be
independent from what is being observed. This philosophy suggests that researchers need to
interact with what is being researched in order to gain a better understanding of a social
situation (Bryman, 2015; Saunders, 2011).
Research philosophies and methods are the two main concepts that are consistent in a research
paradigm. In this study, the positivism paradigm is adopted, and this approach is convenient
because this research relies mainly on companies’ annual reports to examine FLID in non-
financial Indian listed companies. According to Saunders (2011), the positivism philosophy is
more beneficial if the nature of the problem requires identifying, and factors which influence a
result need understanding. Therefore, this research adopts the positivism paradigm as it aims
to examine: (i) the impact of CG mechanisms on QFLID; (ii) the impact of QFLID on FV; and
(iii) the impact of QFLID on ACUAF, among non-financial Indian listed companies.
4.2.2. Research strategies
With regard to the methodology adopted in this study, Punch (1998) points out that it is
essential to utilise a suitable research approach to address the research issues. In social sciences,
two methods have been used, namely quantitative and qualitative. The researcher used a
quantitative approach to relate causes and to influence references to theory in order to test the
study’s hypothesis. A quantitative approach suggests a mathematical approach in which

78
collected data need to be quantified. According to Bryman (2015) and Berg (2004), the
quantitative method utilises various statistical analyses and provides solid measurement
approaches that make the findings more reliable and easier to generalise. Furthermore, this
method improves the generalisation ability as it deals with a larger sample size and is able to
be managed over a longer time period (Berg, 2004).
On the other hand, a qualitative approach takes a non-numerical, descriptive approach into
consideration to collect information to present understanding of the phenomenon (Berg, 2004).
Moreover, it considers interpretations of observations and words as it articulates reality and
makes an attempt to explain the nature of people in natural circumstances (Amaratunga, Baldry,
Sarshar, & Newton, 2002). This method utilises analysis to explore knowledge, as it is not just
limited to quantification of data (Hassanein & Hussainey, 2015). However, the qualitative
method suffers from some drawbacks. This approach uses a small sample for the analysis,
which is not sufficient to represent the whole population (Hakim, 1987). Another drawback is
that the level of reliability and transparency is comparatively lower in this method (Berg, 2004)
and this approach is time-consuming, therefore it may lead to inefficient tools being used to
provide sufficient explanations (Berg, 2004). The most convenient research approach for
positivist researchers to adopt is data-based surveys (Collis & Hussey, 2013; Saunders, 2011).
Following the positivism philosophy, this study mainly utilises quantitative data (Crotty, 1998).
To achieve the study objectives this strategy uses theories which assist the researcher to discuss
the results based on association among different variables.
4.2.3. Research approach
Concerning the research approach, research paradigms are divided into two principal research
approaches, namely deductive and inductive (Saunders & Lewis, 2009; Saunders, 2011).
According to Sekaran (2003: 37), deductive research is defined as “the process by which we

79
arrive at provide reasoned conclusion by logical generalisation of a known fact” whereas
inductive research is “a process where we observe certain phenomena and provide
conclusions”.
Robson (2002) explained that the deductive approach begins by establishing a testable
hypothesis and finishes by investigating the results of the inquiry, leading to either confirming
or adjusting the theory according to the findings. This approach enforces the need to gather
quantitative data to examine the established hypothesis, and use a well-structured methodology
to facilitate the replication of the outcome (Gill & Johnson, 2010). In other words, this approach
moves from general to specific aspects (Collis & Hussey, 2013).
On the other hand, the inductive approach begins with data collection and then moves to data
analysis, leading to formulation of the theory (Babbie, 2010). In this approach, the theory
follows the data rather than vice versa in the deductive approach (Saunders, Lewis, &
Thornhill, 2007). Collis & Hussey (2013) suggest that the inductive approach is considered as
a study that develops theory from the observations and inferences of empirical reality.
Consequently, the aim of the inductive approach is to develop a theory and underpin the
phenomena being investigated; hence it moves from specific to general.
Bryman & Bell (2007) suggest that the deductive approach, which focuses on testing a theory,
is linked with quantitative research, whereas the inductive approach (building a theory) is
associated with qualitative research. In addition, Saunders et al. (2007) state that the deductive
approach is highly associated with the positivist paradigm, while the inductive approach is
aligned with the interpretivist paradigm.
The aim of this study is to investigate the nature of corporate disclosure activities and to
examine the impact of CG mechanisms on the QFLID and both FV and ACUAF among Indian
non-financial companies. However, this study does not consider the development of a
particular theory. Therefore, the appropriate approach is deductive, because positivist research

80
often adopts a deductive approach (Collis & Hussey, 2013; Saunders, 2011). Furthermore,
previous disclosure literature provides strong evidence that deductive research is the
appropriate research approach (Barako et al., 2006; Ghazali & Weetman, 2006; Haniffa &
Cooke, 2002).
Based on the above discussion of research paradigm, the current research has adopted the
positivism paradigm. This approach is convenient because this research relies mainly on
companies’ annual reports to examine FLID in non-financial Indian listed companies since it
is investigating the actuality of a phenomenon that already exists between CG and QFLID and
between QFLID and both FV and ACUAF in Indian listed companies. Furthermore, this
research also requires the use of existing theories in developing hypotheses, which can be
rejected or confirmed according to the study results (Saunders et al., 2009). The research
method used in the present study is consistent with the quantitative strategy, based on the
positivism philosophy. This strategy uses theories that help the researcher to find a link between
study variables and achieve the research aims (Crotty, 1998). Therefore, the research strategy
is planned to examine the hypothesis through the collected data. To achieve study objectives
this strategy uses theories (agency, signalling and resource dependence theories) which assist
the researcher to discuss the results based on association among different variables. However,
as this study does not consider the development of a particular theory, the appropriate approach
is deductive, because positivist research often adopts a deductive approach (Collis & Hussey,
2013; Saunders, 2011). This research applied the deductive approach, since the study’s
hypotheses were built according to the existing literature and theories. Furthermore, consistent
with the positivists’ approach, statistical analysis techniques were used to examine these
hypotheses. This method is consistent with the main aim of this research, which is to investigate
the determinants and consequences of QFLID among Indian non-financial companies.

81
4.3. Sample Selection Procedure and Data Collection
4.3.1. Sample Selection Procedure
The initial sample is made up of the top 500 companies listed on the BSE from 2006 to 2015.
The reason for choosing this sample size is that the BSE-500 index represents approximately
93% of the total market capitalisation of the BSE, as BSE represents about 90% of over-all
Indian market capitalisation. The reason for considering a 10-year period (from 2006-2015) is
to ensure an adequate and consistent observation which strengthens the results of this study.
Following prior researchers (Al-Najjar & Abed, 2014; Alqatamin et al., 2017; Athanasakou &
Hussainey, 2014; Hui & Matsunaga, 2014; Sun et al., 2010), financial firms were excluded
from the initial sample because of their unique reporting requirements and differing disclosure
regulations. In addition, companies with missing data were excluded (Habbash, Xiao, Salama,
& Dixon, 2014). The study also excludes any companies established after 2006. In addition,
companies controlled by government and foreign companies were not considered as they
influenced by different regulations and social obligations, which may be difficult to account
for (Haldar & Rao, 2011). Thus, the final sample of this study is 212 companies. Table 4.3 and
Table 4.4 below present the final sample for the current study sorted by industry type.

82
Table 4. 1 Sample selection
BSE-500 index Number of Companies Number of
Observations
Initial sample 500 5000
Excluded:
Financial and insurance companies (94) (940)
Foreign Companies (65) (650)
Government Controlled Companies (43) (430)
Companies established after 2006 (25) (250)
Missing data (61) (610)
Final sample 212 2120
Table 4. 2 Final sample sorted by industry
Sector Number of companies Sector Ratio
Oil & Gas 21 9.91%
Services 42 19.81%
Construction 22 10.37%
Trading companies 15 7.07%
Pharmaceuticals and health care 31 14.62%
Clothes 14 6.60%
Food and Drinks 14 6.60%
Automobile & Motorcycle manufacturers 12 5.66%
Equipment 18 8.49%
Agriculture & Fishing 14 6.60%
Metals & Mining 9 4.25%
Total 212 100%
83
4.3.2. Data Collection
This study uses secondary data, i.e. annual reports, because they provide the most
comprehensive and pertinent data on an annual basis. Moreover, it is considered as a key
resource for users to evaluate voluntary disclosure information (Botosan, 1997; Lang &
Lundholm, 1993; Neu, Warsame, & Pedwell, 1998). In addition, these reports are easier to
compare across firms than other informal channels, such as direct contact with analysts or press
releases (Chang & Most, 1985; Jizi, Salama, Dixon, & Stratling, 2014). A total of 2120 annual
reports of non-financial Indian listed firms from 2006 till 2015 were collected from the BSE
and companies’ websites. In addition, the majority of companies’ annual reports are available
within the first quarter of the following fiscal year.
Data regarding QFLID and CG were manually gathered from companies’ annual reports.
Furthermore, the OSIRIS database was used as an additional source for collection of financial
data. In the case of unavailability of such information, Bloomberg was used to get the required
data.
4.4. Measurement of the Research Variables
This part focuses on the variables employed in this research and clarifies the measurement of
each variable. It begins by determining both dependent and independent variables, followed by
control variables, and then discusses how these variables are measured.
4.4.1. Measuring the QFLID
The concept of quality is quite complex, and it has a multifaceted and subjective nature (Beattie
et al., 2004). Therefore, no method or theory has enabled the researcher to develop certain
proxies to measure this concept. Beattie et al. (2004) mentioned two categories to measure
disclosure: subjective ratings and semi-objective studies. Few studies used the qualitative

84
approach also used the method of readability and linguistic analysis to measure quality of
disclosure, whereas other studies adopted quantity or level as a proxy to measure disclosure
quality (Al-Najjar & Abed, 2014; Bozzolan et al., 2009; Hassanein & Hussainey, 2015;
Hussainey et al., 2003; Mathuva, 2012b; Qu et al., 2015; Wang & Hussainey, 2013). However,
the notion of using information quantity to obtain a certain proxy for quality measurement is
unclear to evaluate whether it is suitable or not. Urquiza et al. (2009) argued that using a high
number of sentences to measure disclosure may not implicate high transparency and might not
be suitable to present higher disclosure quality.
Beattie et al. (2004) developed a valuation framework to measure voluntary disclosure that
enables researchers to measure the extent of disclosure spread across various topics. Following
Beattie’s framework (2004), Beretta & Bozzolan (2008) considered both the qualitative and
quantitative perspectives of FLID and developed a new framework. They highlighted that
disclosure quality is not limited to its magnitude, so it also consider what information is
disclosed and the topics covered in disclosure.
To measure the QFLID, this study adopted a multidimensional framework designed by Beattie
et al (2004), which is further developed by Beretta & Bozzolan (2008). Since both the quantity
dimension and the richness dimension are considered in this framework.

85
Source: (Beretta & Bozzolan, 2008)
Figure 4. 2 The Multidimensional Framework of QFLID
The following sections address these two dimensions: quantity and richness, as these
dimensions measure the QFLID.
4.4.1.1. Quantity Dimension (QD)
To measure the QFLID in annual reports, this study uses manual content analysis as the
essential measurement, quantity dimension is measured by the relative number of items
disclosed by the firm in its annual reports, which is adjusted for size and industry. Beattie et al
(2004) suggested that the standardised residuals of an ordinary least squares (OLS) regression

86
could be used as a good proxy for disclosure quantity, using industry and size as independent
variables. In this context, earlier studies supported the impact of industry and size on disclosure
quantity (Ahmed & Courtis, 1999; Beretta & Bozzolan, 2008; Urquiza et al., 2009).
The content analysis approach has been extensively utilised and is considered to be a key tool
for measuring FLID (Aljifri & Hussainey, 2007; Al-Najjar & Abed, 2014; Alqatamin et al.,
2017; Aribi & Gao, 2010; Athanasakou & Hussainey, 2014; Beattie et al., 2004; Hassanein &
Hussainey, 2015; Hussainey et al., 2003; Kuzey, 2018; Wang & Hussainey, 2013). It is defined
as “a technique used for the research of manifest content of communication and take objective,
systematic and quantitative description into consideration” (Bernard, 1952, p. 18).
Beattie et al (2004) highlighted that content analysis classifies text units into categories to draw
valid inferences, and to maintain reliability in the classification procedures. In thematic
analysis, which is also known as textual content analysis, scholars conclude inferences from
themes intrinsic to the message by systematically classifying data into categories using manual
or computerised content analysis (Jones & Shoemaker, 1994). Regarding the current study, the
content analysis method is adopted to obtain data about the QFLID, which is collected from
annual reports of non-financial Indian listed companies.
Bryman & Bell (2003) explain that content analysis is a suitable choice for quantifying data
through analysis of texts and documents, which can be easily replicated in pre-determined
categories. Furthermore, it is useful in exploratory research in cases where there is no need of
generalisations to be made and no specific theory required to be employed (Kolbe & Burnett,
1991). The rationale behind utilising content analysis is that it has many benefits, for instance
it is easy to apply, it is used for both quantitative and qualitative analysis, it deals with a textual
content and it describes the trends in communication content. To collect data from annual
reports, researchers prefer the method of content analysis due to its advantages. Various earlier
studies regarding different types of voluntary disclosure used content analysis to examine the

87
extent of the disclosure (Aribi, 2009; Chakroun & Hussainey, 2014; Habbash & Ibrahim, 2015;
Salama, Dixon, & Habbash, 2012).
Several steps are required when content analysis is used to measure FLID (Krippendorff, 1980;
Wolfe, 1991). These steps are: determining the document required for measuring disclosure;
determining the recoding unit; determining the coding mode and testing the viability of
reliability.
1. Determining the document
The crucial stage to conduct content analysis in disclosure studies is to determine the document
that will be used for the analysis. However, most of the earlier studies do not cover the
information regarding what sections of annual reports should be utilised for analysis. The focus
of this study is to measure FLID by using the annual reports of non-financial Indian listed
companies. The reason behind this is that FLID is more likely to be included in annual reports
rather than financial statements. Deciding which sections should be analysed in an annual
report is an essential stage in any content analysis study (Krippendorff, 1980). According to
Beattie et al. (2004), annual reports contain the following sections which can be utilised for
content analysis: Financial Highlights, Summary Results, Chairman’s Statement, CEO’s
Review, Financial Director’s Report and the review of the company’s finance, business and
operations. In the current study, FLID data is derived from narrative sections in firms’ annual
reports, such as Chairman’s Statement, Outlook section, Director’s Report, and Management
Discussion and Analysis (MD&A). The reason for using these sections is that they are available
in the annual reports of non-financial Indian listed companies.

88
2. Determining the recording units
The next step after determining the document is the selection of recording units. Previous
literature discussed various units such as pages, sentences, paragraphs, group of words or a
whole document can be used as a recording unit for content analysis.
Beattie et al (2004) highlighted that sentences are a large recording unit, so it is important to
divide them into text units as each group of words is a specific single piece of information and
they are meaningful according to the context. ‘Text unit’ captures a piece of information and it
is a part of the sentence (Beattie & Thomson, 2007). Previous studies criticised coding by
paragraphs, sentences and words, since different information related to the future may be
contained within the same sentence or paragraph and coding by words is considered to be
meaningless without the sentence. Based on this discussion, this study used text units as a
recording unit.
3. Determining the Coding Mode
Content analysis has been utilised in prior studies as a research method to capture different
types of information in annual reports. Previous studies used two methods to conduct content
analysis, the manual method (coded by hand) which is used in many studies (Adjaoud, Zeghal,
& Andaleeb, 2007; Alnabsha et al., 2017; Alqatamin et al., 2017; Eng & Mak, 2003; Kuzey,
2018; La Rosa & Liberatore, 2014), and the computerised method (computer-aided) which is
employed by other researchers (Elshandidy, Fraser, & Hussainey, 2013; Hussainey et al., 2003;
Merkley, 2014).
Manual content analysis is more beneficial compared to computerised content analysis as it
uses both quantitative and qualitative analyses, and it permits researchers to explain words and
phrases much better within the context (Beattie et al., 2004; Deumes, 2008). Although the
computerised content analysis saves time, effort, and allows examination of a large sample,
there are some concerns about the robustness of computer-aided content analysis. The
89
computer-aided content analysis is not an adequate method in examining the intellectual capital
disclosure in annual reports (Beattie & Thomson, 2007). Hussainey (2004:53) reported that
“Manual content analysis is more effective than computerised analysis to identify themes in
the texts.” Furthermore, computerised content analysis deals with explicit data but it is unable
to detect implicit, or tacit, meanings or items (Carney, 1972). According to Beretta & Bozzolan
(2008), manual content analysis classifies text units into categories to draw valid inferences
with the aim of quantifying the items of disclosure, or reading a narrative section to identify
and determine the information that is linked with FLID (Celik et al., 2006).
4. Determining the Categories and Selection of Keywords
To identify FLID disclosure, this study follows Barako et al. (2006) and Maali et al. (2006) and
determines four categories. Wallace and Naser (1996) and Francis et al. (2008b) argued that no
theory or consensus has been made so far regarding determining the criteria for categories that
can be used to measure the extent of the disclosure. The selection of categories can be done
either by evaluating previous literature or by investigating FLID content (Marston and Shrives
1991; Clarkson et al. 1994; Bryan 1997; Barako et al. 2006).
This study included both financial and non-financial information to determine the categories
and to generate the list of FLID items. This study follows a list of 35 forward-keywords, which
was developed by Hussainey et al. (2003). This includes words such as forecast, forthcoming,
outlook, will, and likely to create a checklist of items that can be used in this study (see
Appendix 4.1). Following earlier studies (Aljifri & Hussainey, 2007; Al-Najjar & Abed, 2014;
Alqatamin et al., 2017; Athanasakou & Hussainey, 2014; Celik et al., 2006; Charumathi &
Ramesh, 2015a; Hassanein & Hussainey, 2015; Hussainey et al., 2003; Mathuva, 2012b; Wang
& Hussainey, 2013), a list consisting of 50 FLID items, split across four categories, has been
created. The list of items and categories has been sent to certain individuals who were selected
on the basis of their knowledge and experience regarding accounting practices. The individuals

90
are in the field of either academics or accounting. The feedback confirmed the four categories
but the list of FLID items has been reduced to 34 items. This method of determining categories
and key words is in line with earlier studies (e.g. Kent and Ung 2003; Barako et al. 2006;
O’Sullivan et al. 2008; Menicucci 2013).
The results in the modified checklist are classified into four main categories, which are
consistent with prior studies of FLID (Al-Najjar & Abed, 2014; Alqatamin et al., 2017;
Bozzolan & Ipino, 2007; Hutton, Miller, & Skinner, 2003; Vanstraelen et al., 2003). The four
categories are: (1) financial information (15 items), (2) strategic information (5 items), (3)
company trend (5 items) and (4) environment information (9 items). This method is consistent
with earlier research (Al-Najjar & Abed, 2014; Alqatamin et al., 2017; Kent & Ung, 2003;
Menicucci, 2013a; O’Sullivan et al., 2008) (See Appendix 4.2).
5. Testing Reliability and Validity
To ensure credibility of content analysis, reliability and validity are the key tools. Reliability
explains “the extent to which any measuring procedure yields similar results on repeated trials”
(Carmines & Zeller, 1979, p. 11). This means that the method of content analysis is reliable to
produce similar results while different researchers measure disclosure (Marston & Shrives,
1991). On the other hand, validity points out “the extent to which any measuring instrument
measures what it is intended to measure” (Carmines & Zeller, 1979, P. 17). Neuendorf (2004)
defined reliability and validity of content analysis as the extent to which a measuring process
produces similar results in repeated trials. In the same vein, Aribi & Gao (2011) state that the
reliability and validity of content analysis are determined to ensure that different researchers
code the unit in same way which decreases the chances of inaccuracy and biases. This study
took several steps to ensure reliability and validity of content analysis: Firstly, a set of specified
and explicit coding instruments has been introduced to reduce conflicts and achieve objectivity
(Aribi & Gao, 2010). Secondly, different coders examined five annual reports to ensure that all

91
coders use the same coding procedures (Aribi & Gao, 2010; Hussainey, 2004). Finally, the
results of coding the five annual reports have been compared and reviewed by three academic
experts in the area of accounting to identify possible disagreements, to assess reliability and to
secure consistency. In this regard, clear definitions of categories and subcategories and
explicitly formulated decision rules and procedures of FLID were established and developed,
as mentioned earlier.
Internal consistency reliability is a situation where the same results of a study can be produced
by another researcher (Beattie, McInnes, & Fearnley, 2004; Beattie & Thomson, 2007). The
Cronbach’s alpha is the common measure used for internal consistency of disclosure indices.
It explains how well the data items in a variable are positively associated, and it presents the
average of associations among the items utilised to measure the variable. Consequently,
consistent with previous researchers (Allegrini & Greco, 2013; Botosan, 1997; Elshandidy,
Fraser, & Hussainey, 2013; Hassan, Romilly, Giorgioni, & Power, 2009; Jouini, 2013), this
study adopted Cronbach’s alpha to measure reliability of the FLID checklist. It has been
suggested by prior that the level of reliability of the disclosure index is reliable when the value
of coefficient of Cronbach’s alpha is 0.80 or more (Allegrini & Greco, 2013; Botosan, 1997;
Carmines & Zeller, 1979; Hassan et al., 2009; Jones & Shoemaker, 1994). Table 4-3 shows the
reliability of the sub-groups and as a whole.
As indicated in Table 4-3 the coefficient value of Cronbach’s alpha for the FLID index is
approximately 83.9%, indicating a high degree of reliability for FLID index.

92
Table 4. 3 Summary of Cronbach’s Alpha test for FLID index
Group No of items Group test
correlation
Cronbach’s
alpha
Alpha if
group deleted
Financial information 15 .879
.839
.853
Strategic information 5 .807 .802
Company trend 5 .829 .793
Environment information 9 .842 .845
Overall 34 .839
Following Beattie et al. (2004) the dimension of disclosure quantity is measured by using the
relative number of text units, which is adjusted by two factors, size and industry type, that have
been consistently found to influence the level of disclosure. The standardised residuals from
an Ordinary Least Squares (OLS) regression of the number of text units on industry and size
are used as proxy of the quantity dimension.
RQDi = ODi − EDi
Where; RQDi is relative quantity disclosure index for firmi; ODi is observed disclosure for
firmi; EDi is estimated disclosure for firmi.
Next, the RQD index is standardised (STRQD) by using the maximum and the minimum of
the relative quantity of disclosure of the firms analysed.
STRQDi = maxj RQDj − RQDi
maxj RQDj − minj RQDj
4.4.1.2. Richness Dimension (RCN)
The richness is measured by considering both the width (WID) and the depth (DEP) of
disclosure.
(1). Width (WID) relies on both coverage (COV) and dispersion (DIS) of disclosure across
subtopics.

93
i) Coverage (COV) is measured by the ratio of items (sub items) disclosed at least once, divided
by total number of items (sub items) that are taken into consideration.
COVi = 1
st ∑ INFij
st
j=1
Where; INFij Value (1) if firm i discloses information about the item j in the annual report, (0)
otherwise; st = the number of items (sub items).
ii) Dispersion of disclosure (DIS) indicates how concentrated disclosed items are among the
checklist items. DIS is measured by the concentration of the items disclosed
DISi = − ∑ Pi2
n
i=1
Where; Pi is the ratio of disclosure of item i measured by the number of items disclosed in
category i; DISi statistic will have a value between 1 and 1/n: a minimum value of 1/n when
all text units fall into one category, and a maximum value of 1 when text units are spread
equally among categories.
The arithmetic mean of both coverage (COV) and dispersion (DIS) is used to obtain the value
of width (WID):
COV and DIS indices help in estimating how information in annual reports is distributed across
themes in the disclosure checklist. Larger DIS and COV indices reveal the higher spread of
information (SPR). Thus, the current study calculates the spread as the average of COV and
DIS as follows:
WIDi = 1
2 (COVi + DISi)
(2). Depth (DEP) depends on type of measure (TOM), economic sign (ES), and outlook profile
(OTL).

94
i) Type of measure (TOM) indicates that the text unit disclosed in a firm’s annual report is
either quantitative (e.g. earnings are likely to be about USD 84-87 billion next year) or
qualitative (e.g. profits next year expected to increase 20%). TOM is measured as the ratio of
the number of text units containing a measure of the total number of text units disclosed in the
annual report.
TOMi = 1
idi ∑ TOMij
idi
j=1
Where; idi stands for the number of text units disclosed in the annual report of firmi; TOMij
has been given a value of (1) if the text units are disclosed (qualitative or quantitative) in the
annual report of firm i, (0) otherwise. The examples of text units collected from annual reports
are as follows: profits next year expected to increase by 20%, earnings are likely to be about
USD 84-87 billion next year.
ii) Economic sign (ES) is measured by counting the number of text units disclosed which
include an indication of the anticipated effect on future performance, ES is measured as a
proportion of the total number of text units disclosed in the annual report of the firm.
ESi = 1
idi ∑ ESij
idi
j=1
Where; idi stands for number of text units disclosed in the annual report of firmi.; ESij has a
value of (1) if the text units disclosed have an expected impact on the future performance of
the firm i (share price, ROA, ROE, … etc.). An example of this is that if the company adds a
new segment, thereby increasing their profitability, or if there is an increase in the income of
homebuyers that leads to counter the impact of higher interest rates. Otherwise, it has a value
of (0).

95
The outlook profile (OTL) considers the disclosures (on decisions, actions or programs) that
the management has taken and the extent of forward looking information disclosed
representing the company’s internal environment.
OTLi = 1
2
1
idi ∑ OTLij
idi
j=1
Where; OTLi is the outlook profile index for firmi.; idi represents the number of text units
disclosed by firm i.
OTLij has been allocated a value of (2) if the information disclosed in text units of the annual
report of firm i refers to decisions, actions or programs, and is forward-looking oriented which
is beneficial for investors’ forecasts (sales, earnings, revenue, income, and other financial data)
(e. g. the company will add a new segment, thereby increasing their sales).
The value is (1) if the information disclosed in text units of the annual report of firm i refers to
decisions/actions taken, actions/planned actions, or programs/actual state of business, or is
forward-looking information, and is considered as beneficial for investors’ forecasts (sales,
earnings, and other financial data). For example, inflation puts pressure on input costs which
affects earnings, or the company introduces a new segment which can boost sales. Otherwise,
it has a value of (0).
The value of Depth (DEP) is the average of three dimensions (TOM, ES and OTL).
DEPi = 1
3 (TOMi + ESi + OTLi)
The richness (RCN) dimension is the average of both Width (WID) and Depth (DEP)
dimensions:
RCNi = 1
2 (WIDi + DEPi)

96
The QFLID is obtained by averaging the Richness (RCN) dimension and the Standardised
Relative Quantity (STRQT) dimension:
QUALITYi = 1
2 (STRQDi + RCNi)
4.4.2. Measuring the FV
To investigate the impact of the QFLID on FV, this study uses Tobin’s Q (TQ ratio) as a proxy
to measure FV in the main analysis. Additionally, MC is utilised as an additional proxy for FV
to check the robustness of results. The reasons for using two measures of FV are as follows:
Firstly, there is no agreement in earlier literature that confirms the best measure of FV (Haniffa
& Hudaib, 2006; Mangena, Tauringana, & Chamisa, 2012; Ntim, Opong, & Danbolt, 2015;
Plumlee et al., 2015). Secondly, using two different proxies to measure FV provides a
robustness check for the results (Christensen, Kent, Routledge, & Stewart, 2015; Mangena et
al., 2012; Ntim & Soobaroyen, 2013; Ntim, 2015; Terjesen, Couto, & Francisco, 2016).
Thirdly, this research focuses on TQ ratio and MC because these measures are extensively
utilised in the literature (Alotaibi & Hussainey, 2016b; Hassanein & Hussainey, 2015; Kumar
& Singh, 2013; Tan, Xu, Liu, & Zeng, 2015; Uyar & Kilic, 2012), which may improve
comparability with previous studies.
Yermack (1996) defined TQ ratio (market-based measures) as the market value of equity
divided by the replacement cost. Likewise, TQ ratio is termed as the proportion of market value
to the replacement value of company’s assets (Gaio & Raposo, 2011). Haniffa & Hudaib,
(2006) mentioned that TQ ratio is used to investigate whether corporate management is using
its assets effectively in order to maximise shareholders’ wealth. TQ ratio interprets the market
expectation of economic return generated by the company’s assets (Bitner & Dolan, 1996). TQ
ratio reflects the current market value of the firm’s stock as it is a market-based measure

97
(Thomsen, Pedersen, & Kvist, 2006). It measures the extent to which a firm expects to earn a
higher than average return on invested capital (Abdullah et al., 2009).
Different authors measured TQ ratio in various ways. For instance, Yermack (1996) divided
market value by replacement cost to calculate TQ ratio, while Booth & Deli (1996) calculated
TQ ratio by dividing the market value by the total assets. Consequently, this study used TQ
ratio as a proxy to measure FV by following previous researches (Alotaibi & Hussainey, 2016b;
Hassanein & Hussainey, 2015; Kumar & Singh, 2013; Tan et al., 2015), and computes it as:
TQ ratio = (Total debt + Market value of equity)
Book value of total assets
MC is used as a second measure as it can determine FV, which is an important indicator in the
financial sector and assists to evaluate the development of a country (Alotaibi & Hussainey,
2016b; Uyar & Kilic, 2012). Following earlier studies, MC is measured as the market value of
common equity at the end of a company’s financial year. Accordingly, MC is crucial from the
viewpoint of shareholders to measure FV. In the current study, MC is an additional proxy for
measuring FV. It is vital to note that TQ ratio and MC, which are measures of FV, are
considered as the dependent variables in this research.
4.4.3. Measuring the Accuracy of Analysts’ forecast (ACUAF)
This section discusses the method used to measure ACUAF in order to examine its relation
with QFLID. Botosan (2004) indicated that if the disclosed information is of higher quality, it
assists the users of information to make financial decisions more effectively. Earlier studies
found a significant association between ACUAF and disclosure (Beretta & Bozzolan, 2008;
Bozzolan et al., 2009; Lang & Lundholm, 1996; Lee, 2017; Vanstraelen et al., 2003). The
studies highlighted that high quality disclosure assists analysts to effectively evaluate cash flow
in the future by considering better earnings forecasts.

98
From the above discussion, this study suggests that the QFLID will be high if it is positively
linked with ACUAF. Following earlier studies (Beretta & Bozzolan, 2008; Bozzolan et al.,
2009; Hope, 2003; Lang & Lundholm, 1996; Vanstraelen et al., 2003), this study measures the
ACUAF as follows:
ACUAF = - |AEPSt – MAFt| / PSt
Where,
AEPS = actual earnings per share in period t,
MAF = the median analysts’ forecast of earnings per share in period t,
SP = beginning of share price in period t
This study used Bloomberg to collect both forecasted and actual earnings per share. The
forecast accuracy is defined as the negative of the absolute value of the analyst forecast error,
deflated by stock price.
In addition, the current study used dispersion (DISAF) as an alternative measurement of
dependent variable (ACUAF) to test whether the main results are robust by applying different
measurement or not. Beretta & Bozzolan (2008) argue that the quality of disclosed information
will be high if it is negatively and significantly related to DISAF. A number of prior researchers
(Beretta & Bozzolan, 2008; Bozzolan et al., 2009; Lang & Lundholm, 1996; Lee, 2017;
Vanstraelen et al., 2003) indicated that DISAF is more likely to be low when firms publish a
high quality of information disclosure. Following Beretta & Bozzolan (2008) and Lang &
Lundholm (1996), DISAF measures as follows:
DISAF =
1
𝑗√∑ (𝐸𝑃𝑆𝑡𝑗−𝐸��𝑆𝑡)𝑗
𝟐
PP𝑡
EPSt represents analyst earnings per share, 𝐸��𝑆𝑡 is mean of earning per share, PP𝑡 is price per
share and J represents the number of analysts that are following the company.

99
4.4.2. Measuring the Independent Variable (CG variables)
This study examines several CG characteristics to determine their impact on the QFLID among
non-financial Indian listed companies. The study considers three CG mechanisms, namely:
board of directors’ characteristics, ownership structure, and audit committees as an independent
variable. These variables contribute to understanding how these mechanisms affect disclosure
practices of Indian listed non-financial companies. Each of these mechanisms is further divided
into various variables to enable a more detailed and appropriate measurement, as seen in Table
4.5.
Consistent with previous research, the explanatory variables involved in this research are
measured as follows: with regard to the board of director’s characteristics, board size (BSIZE)
is measured as the total number of board members (Al-Najjar & Abed, 2014; Elshandidy et al.,
2013; Liu, 2015; Qu et al., 2015; Wang & Hussainey, 2013). Board independence (BI) is
calculated as the proportion of the number of independent (non-executive) directors to the total
number of board members (Al-Najjar & Abed, 2014; Charumathi & Ramesh, 2015a;
Elshandidy & Neri, 2015; Liu, 2015; Qu et al., 2015). The study used a dummy variable to
measure CEO duality: (1) if the CEO of the company serves as a board chairman, (0) otherwise
(Al-Najjar & Abed, 2014; Liu, 2015; Qu et al., 2015; Wang & Hussainey, 2013). Frequency of
board meetings (FBM) is measured as the number of meetings during the year (Al-Najjar &
Abed, 2014; Liu, 2015; Qu et al., 2015; Wang & Hussainey, 2013). Female presence on the
board of directors (FPB) is measured as the number of females serving as board directors
divided by the total number of board members (Ntim & Soobaroyen, 2013; Ntim, 2015; Sartawi
et al., 2014; Ujunwa, 2012).
Concerning ownership structure, institutional ownership (Ins.Own) is computed as institutional
ownership to total owners’ ratio (Al-Najjar & Abed, 2014; Charumathi & Ramesh, 2015a; Liu,

100
2015; Qu et al., 2015; Wang & Hussainey, 2013). The proportion of block holder ownership
(at least owning 5% of total company ordinary shareholdings) is used to measure block holder
ownership (Blo.Own) (Abdelsalam & Street, 2007; Al-Najjar & Abed, 2014). Promoters’
holding (Pro.Own) was measured as the ratio of shares held by promoters (Charumathi &
Ramesh, 2015a).
Regarding audit committee characteristics, independence of audit committee (IAC) is
measured as the ratio of independent directors on the audit committee (Al-Najjar & Abed,
2014; Liu, 2015; Qu et al., 2015; Wang & Hussainey, 2013). Audit committee size (ACSIZE)
is measured as the total number of audit committee members (Al-Najjar & Abed, 2014; Liu,
2015; Qu et al., 2015; Wang & Hussainey, 2013). Audit committee meetings (ACM) is
measured as the number of meetings held during the year (Al-Najjar & Abed, 2014; Liu, 2015;
Qu et al., 2015; Wang & Hussainey, 2013). The ratio of the members with accounting
experience and financial qualifications to audit committee size is used to measure audit
committee financial expertise (ACEXP) (Al-Najjar & Abed, 2014; Liu, 2015; Qu et al., 2015;
Wang & Hussainey, 2013). Finally, the study used the number of females in the audit
committee divided by the total number of audit committee members to measure females’
presence on the audit committee (FPAC) (Sartawi et al., 2014; Thiruvadi & Huang, 2011).
4.4.3. Measuring the Control Variables (firm characteristics)
This research employs three empirical models to test the research hypotheses. In the first
model, QFLID is considered as a dependent variable, and CG as an independent variable.
However, in the second and the third models the QFLID becomes the independent variable
while the FV and ACUAF are considered dependent variables. Firm characteristics have been
widely used in prior research as control variables of FLID, FV and ACUAF. In addition, in
order to reduce potential issues related with omitted variables, including endogeneity issues,

101
this research controls for numerous variables (Ntim et al., 2013; Wooldridge, 2015). Following
previous research (Albitar, 2015; Aljifri et al., 2014; Alkhatib, 2014; Al-Najjar & Abed, 2014;
Barako, 2007; Celik et al., 2006; Hossain et al., 2005; Kent & Ung, 2003; Khlif & Hussainey,
2016; Kuzey, 2018; Liu, 2015; Uyar & Kilic, 2012; Wang & Hussainey, 2013), six control
variables have considered in this study, namely firm size, leverage, profitability, liquidity,
growth and industry type.
4.4.3.1. Firm Size
Signalling theory suggests that firms with a larger size are likely to catch the attention of
financial analysts to gain the information needed in making rational advices (Hussainey & Al-
Najjar, 2011; Wang & Hussainey, 2013). Furthermore, agency theory suggests that larger firms
perform a greater number of complex business transactions as compared to smaller companies,
and thereby are likely to incur high agency costs (Jensen & Meckling, 1976; Leftwich, Watts,
& Zimmerman, 1981; Pérez, 2004). Therefore, larger companies publish more voluntary
disclosures to decrease these costs. Empirically, several studies documented a positive
association between corporate disclosure and firm size (Albitar, 2015; Aljifri et al., 2014;
Alkhatib, 2014; Al-Najjar & Abed, 2014; Barako, 2007; Celik et al., 2006; Dembo &
Rasaratnam, 2014; Eng & Mak, 2003; Ferguson, Lam, & Lee, 2002; Haniffa & Cooke, 2002;
Hossain et al., 2005; Kent & Ung, 2003; Khlif & Hussainey, 2016; Liu, 2015; Soliman, 2013;
Uyar & Kilic, 2012; Wang & Hussainey, 2013). On the other hand, other empirical studies
reported that corporate voluntary disclosure is negatively associated with firm size (Aljifri &
Hussainey, 2007; Mathuva, 2012b; Menicucci, 2013b; O’Sullivan et al., 2008). The current
study assumes that large Indian listed companies disclose more QFLID.
Firm size is regarded as an important factor that influences FV and ACUAF (Bozzolan et al.,
2009; Eisenberg, Sundgren, & Wells, 1998; Lang & Lundholm, 1996; Samaha et al., 2012). It

102
is argued that larger companies are more likely to employ more skilled managers and large
assets base which enable them to enhance their values (Baek et al., 2004; Black, Love, &
Rachinsky, 2006; Black, Jang, & Kim, 2006; Klapper & Love, 2004). Some previous empirical
research reports a positive relationship between firm size and both FV and ACUAF (Baek et
al., 2004; Belgacem & Omri, 2014; Bozzolan et al., 2009; Hassan et al., 2009; Hassanein &
Hussainey, 2015; Lang & Lundholm, 1996; Sheu et al., 2010). Following previous studies, the
natural logarithm of total assets at the end of the year is used to measure firm size (Elshandidy
& Neri, 2015; Sartawi et al., 2014).
4.4.3.2. Profitability
In line with past research, it is suggested that company profitability controls the potential
effects on the FLID (Alkhatib & Marji, 2012; Alkhatib, 2014; Urquiza et al., 2009; Uyar &
Kilic, 2012). Signalling theory assumes that, if companies are performing well, they are liable
to signal their activities to investors (Watson, 2002). Profitable firms tend to disclose additional
information, because managers are motivated to increase disclosure to ensure their position and
it will also assist them to legitimise their continued management (Haniffa & Cooke, 2002; Ntim
& Soobaroyen, 2013). Accordingly, it is noted that high profit firms disclose more information
than those with small profits (Alkhatib & Marji, 2012; Uyar & Kilic, 2012).
Empirically, numerous previous studies found that profitability impacts significantly and
positively on voluntary disclosure (Albitar, 2015; Cerbioni & Parbonetti, 2007; Charumathi &
Ramesh, 2015a; Elshandidy & Neri, 2015; Ghazali & Weetman, 2006; Haniffa & Cooke, 2002;
Khlif & Hussainey, 2016; Mathuva, 2012b; Soliman, 2013; Wang & Hussainey, 2013),
whereas other studies documented a negative association between profitability and corporate
disclosure (Aljifri & Hussainey, 2007; Aljifri et al., 2014; Celik et al., 2006; Chen & Jaggi,
2001; Inchausti, 1997; Wallace et al., 1994). Furthermore, others reported that profitability has
103
no significant impact on disclosure practices (Ahmed & Courtis, 1999; Allegrini & Greco,
2013; Alqatamin et al., 2017; Barako et al., 2006; Elzahar & Hussainey, 2012; Uyar & Kilic,
2012). This study expects a positive and significant association between profitability and the
QFLID. Following the previous study, return on assets (ROA) (net income before tax divided
by total assets) is being used to measure profitability.
4.4.3.3. Leverage
Previous research indicated leverage as an essential factor that may have an impact on
disclosure practices (Abraham & Cox, 2007; Ho & Wong, 2001a; Hussainey & Al-Najjar,
2011; Oyelere et al., 2003). Agency theory assumes that firms who have higher leverage tend
to incur higher monitoring costs (Huafang & Jianguo, 2007; Jensen & Meckling, 1976; A.
Watson et al., 2002). To decrease these costs, companies disclose more information to show
their capability of meeting any obligations set by the creditors (Jensen & Meckling, 1976; A.
Watson et al., 2002). In addition, providing more FLID is one way of reducing the adverse
effects of the high levels of debt (Mathuva, 2012b). In the same vein, from a signalling theory
view, managers disclose more information voluntarily when the firm has a high leverage ratio
as it will attract investors and it will also signal to creditors that the company is capable of
meeting both short- and long-term requirements (Elzahar & Hussainey, 2012). Therefore, it is
expected that leverage is positively associated with the level of corporate disclosures (Wang &
Hussainey, 2013).
Several studies have indicated that leverage ratio has an impact on voluntary disclosure
(Ahmed & Courtis, 1999; Aljifri & Hussainey, 2007; Elshandidy et al., 2013; Hassan et al.,
2009; Hossain et al., 1995; Mathuva, 2012b; Merkley, 2014; O’Sullivan et al., 2008; Wang &
Hussainey, 2013), whereas others do not find any relationship between the two variables
(Abraham & Cox, 2007; Al-Najjar & Abed, 2014; Celik et al., 2006; Chow & Wong-Boren,

104
1987; Ho & Wong, 2001a; Huafang & Jianguo, 2007; Menicucci, 2013a; Nekhili et al., 2012;
Nekhili et al., 2016; Nor, Saleh, Jaffar, & Shukor, 2010; Uyar & Kilic, 2012; Wallace et al.,
1994). The link between leverage and both FV and ACUAF has mixed results. Empirically,
some past research found a negative association between leverage and both FV and ACUAF
(Banerjee, Gokarn, Pattanayak, & Sinha, 2009; Bozzolan et al., 2009; Jackling & Johl, 2009;
Kumar & Singh, 2013; Mangena et al., 2012; Uyar & Kiliç, 2012). On the other hand,
appositive relationship provided by McConnell & Servaes (1995). Following previous studies
(Al-Najjar & Abed, 2014; O’Sullivan et al., 2008), the ratio of a firm’s total long-term debt at
the end of the year to total assets at the end of year is used to measure leverage.
4.4.3.4. Liquidity
The current study utilises the company’s liquidity to control the potential effects on the QFLID.
Liquidity is an indicator of the company’s ability to cover its current obligations. Signalling
theory assumes that managers of high liquidity companies tend to disclose more information,
as it signals their ability in managing liquidity as compared to managers who are managing
lower liquidity (Elzahar & Hussainey, 2012). Wallace & Naser (1995) indicate that it is
expected that companies with a high liquidity ratio disclose more to demonstrate their ability
to meet their short-term liabilities. Furthermore, Abd-Elsalam & Weetman (2003) indicate that
high liquidity proportions lead to an increase in disclosed information, whereas agency theory
suggests that firms with a lower liquidity ratio might disclose more information to reduce
agency costs and to reassure shareholders and creditors (Wallace et al., 1994).
Empirically, several previous studies document that liquidity impacts significantly and
positively on voluntary disclosure (Camfferman & Cooke, 2002; Elshandidy et al., 2013; Ezat
& El-Masry, 2008; Samaha & Dahawy, 2010). On the other hand, other studies reported that
corporate voluntary disclosure is negatively influenced by firm liquidity (Aly, Simon, &

105
Hussainey, 2010; Menicucci, 2013c; Naser, Al-Khatib, & Karbhari, 2002; Wallace et al.,
1994), while other researchers document that liquidity has no significant impact on disclosure
practices (Agyei-Mensah, 2012; Aljifri et al., 2014; Alsaeed, 2006; Barako et al., 2006; Elzahar
& Hussainey, 2012; Mangena & Pike, 2005; Mathuva, 2012a).
Liquidity might play an important role in improving FV and ACUAF. Previous research found
significant positive association between liquidity and FV (Alotaibi & Hussainey, 2016b;
Hassanein & Hussainey, 2015). Bozzolan et al. (2009) found that liquidity has positive impact
on ACUAF, whereas Beretta & Bozzolan (2008) found no relationship between two variables.
In the current study, the ratio of the company’s current assets to current liabilities is used to
measure liquidity.
4.4.3.5. Firm growth
The survival of the firm is dependent on its growth. If the growth of the firm is higher, then the
probability of its survival will be much higher (Henry, 2008). If the opportunity regarding
growth is high for a company then it becomes more attractive and they will receive a better
valuation (Beiner, Drobetz, Schmid, & Zimmermann, 2006). The high growth rate may raise
the issue of higher information asymmetry between management and shareholders (Smith Jr &
Watts, 1992). Therefore, voluntary disclosure can be used as an incentive to reduce such issues
(Gul & Leung, 2004). It is suggested that companies with high growth tend to increase their
FLID activities which indicates both are positively associated.
According to the signalling theory, growth tends to be positively associated with disclosure
(Lev & Penman, 1990). Moreover, Frankel et al. (1995) pointed out that companies that have
high growth prospects suffer from frequent agency problems because of a higher level of
information asymmetry as compared to other companies. It is argued that firms with better
growth opportunities are more attractive and, thus, are more likely to receive better valuation
106
(Henry, 2008). Previous studies support the above argument and found that firm growth has a
positive association with FV (Haniffa & Hudaib, 2006; Henry, 2008).This study used firm
growth as a control variable and examined its association with QFLID. It is also used a control
variable for both FV and ACUAF. Hence, following prior studies firm growth is measured by
the ratio change of sales.
4.4.3.6. Industry Type
Another determinant of firm information disclosure is the type of industry (Alkhatib & Marji,
2012; Celik et al., 2006). Omar & Simon (2011) indicate that firms which are operating in
various sectors are bound to additional disclosure requirements. For example, manufacturing
firms are enforced to disclose additional information as compared to firms operating in the
service industry, because the operations of manufacturing firms are highly likely to harm the
environment. According to signalling theory, if an industry is more homogeneous, then the
companies adopt similar reporting practices (Aly et al., 2010; Malone, Fries, & Jones, 1993;
Wallace et al., 1994). In this regard, if a firm within an industry fails to follow the same
disclosure practices as compared to other firms in the same industry, this gives a signal that it
is hiding bad news (Craven & Marston, 1999; Oyelere et al., 2003).
Empirically, mixed statistically significant results are found. Previous studies found a
significant association between sector type and the extent of corporate disclosure (Ahmed &
Courtis, 1999; Aljifri, 2008; Aljifri et al., 2014; Cooke, 1992; Haniffa & Cooke, 2005;
Muttakin & Khan, 2014; Salama et al., 2012). On the other hand, others document that industry
type has no significant impact on FLID (Aljifri & Hussainey, 2007; Alqatamin et al., 2017;
Eng & Mak, 2003; Mathuva, 2012a; McNally, Eng, & Hasseldine, 1982; Raffournier, 1995;
Wallace et al., 1994). Following earlier studies (Aljifri & Hussainey, 2007; Alkhatib, 2014;
Allegrini & Greco, 2013; Elzahar & Hussainey, 2012; Mathuva, 2012a), the industrial factor

107
is predicted to influence the quality of FLID among the non-financial Indian listed companies.
Furthermore, the relationship between industry type and both FV and ACUAF supported by
past studies (Elsayed, 2007; Hope, 2003; Ntim, 2013; Wahba, 2015) which report that a firm’s
industry significantly effects its market valuation. To classify the industry type, the sample in
this study is divided into eleven types of industries and is coded from 1 to 11 (Beretta &
Bozzolan, 2008; Charumathi & Ramesh, 2015a).

108
Table 4. 4 Definition and measurement of variables
Abbreviated
name
Full name Description Data source
Dependent
variables
QFLID Quality of forward-looking
information disclosure
Ratio of FLID quality (dependent variable in model one
and independent variable in model two) measured by
multidimensional apportion
Company annual report
TQ ratio Tobin’s Q ratio (Total debt + Market value of equity) / Book value of total
assets
Osiris database
MC Market capitalization Measured as the market value of common equity at the end
of a company’s financial year
Osiris database
ACUAF Accuracy of analysts forecast Accuracy is defined as the negative of the absolute value of
the analyst forecast error, deflated by stock price
Bloomberg database
DISAF Dispersion of analysts forecast The standard deviation of the change over the fiscal year in
the median forecast from the preceding month, deflated by
the stock price as of the beginning of the fiscal year.
Bloomberg database
Independent
variables
BSIZE Board size Total number of board members Company annual report
BI Board independence Ratio of the number of independent directors divided by the
total number of board members.
Company annual report
DP CEO duality Dummy variable: (1) if the CEO of the company serves as
a board chairman, (0) otherwise
Company annual report
FBM Frequency of board meetings The number of board meetings during the year Company annual report
FPB Female presence on the board
of directors
The number of females serving as board directors divided
by the total number of board members
Company annual report
Ins.Own Institutional ownership Institutional ownership to total owners’ ratio Company annual report
Blo.Own Block holder ownership Proportion of block holder ownership (those who own at
least 5% of total company ordinary shareholdings)
Company annual report
Pro.Own Promoters ownership The ratio of shares held by promoters Company annual report
IAC Independence of the audit
committee
The ratio of independent directors on the audit committee Company annual report
ACSIZE Audit committee size The number of audit committee members Company annual report
ACM Audit committee meetings Number of meetings during the year Company annual report
ACFEXP Audit committee financial
Expertise
The ratio of the members with accounting experience and
financial qualifications to audit committee size
Company annual report
FPAC Female presence on the audit
committee
The number of females in the audit committee divided by
the total number of members of the audit committee
Company annual report
Control
variable
CSIZE Company size Measured by the natural logarithm of total assets Osiris database
PROF Profitability Measured by net income to total assets Osiris database
LIQU Liquidity Measured as the proportion of the company’s current assets
to its current liabilities
Osiris database
LEVE Leverage The ratio of a company’s total debt at the end of the year to
total assets at the end of year
Osiris database
GROW Growth Measured by the ratio change of sales Osiris database
IndType Type of industry The sample in this study is divided into eleven types of
industry and is coded from 1 to 11
Osiris database
109
4.5. Research Empirical Models
This study covers the following objectives:
1- To examine the impact of CG mechanisms on QFLID among non-financial Indian listed
companies.
2- To examine the impact of the QFLID on FV among non-financial Indian listed
companies.
3- To investigate the association between QFLID and ACUAF among non-financial
Indian listed companies.
This study used three regression models to test the hypotheses and fulfil its objectives. The first
model investigates the effect of CG mechanisms on the QFLID. The second model examines
the impact of the QFLID on FV measured by TQ ratio. The third model investigates the impact
of QFLID on ACUAF. The estimated regression models are presented as follows:
1. QFLID= β0 + β1BSIZE + β2DP + β3FM + β4BI + β5FPB + β6BloOwn + β7InsOwn
+ β8ProOwn + β9ACSIZE + β10ACM + β11IAC + β12ACFEXP + β13FPAC +
β14FCSIZE + β15IndType + β16LEVE + β17PROF + β18LIQU + β19GROW + e.
2. TQ ratio = β0 + β1QFLID + β2CSIZE + β3LEVE + β4LIQU+ β5GROW + β6IndType
+ e.
3. ACUAF = β0 + β1QFLID + β2CSIZE + β3LEVE + β4PROF + β5LIQU+ β6GROW +
β7IndType + e.
Where,
QFLID denotes the Quality of FLID; β0 denotes the constant term; TQ ratio denotes proxies
to measure firm value (FV); ACUAF denotes accuracy of analysts’ earnings forecast; BSIZE

110
denotes the board size; DP stands for CEO duality; FBM stands for the frequency of board
meetings; BI denotes the board independence; FPB denotes the ratio of female presence on the
board; BloOwn denotes block holder ownership; InsOwn denotes institutional ownership;
ProOwn denotes promoters’ ownership; ACSIZE denotes audit committee size; ACM denotes
audit committee meetings; IAC denotes Independence of audit committee; ACFEXP denotes
audit committee financial experts; FPAC denotes the ratio of female presence on the audit
committee; CSIZE denotes company size; IndType denotes industry type; PROF is
profitability; GROW stands for firm growth; LIQU denotes liquidity and e denotes the error
term.
4.6. Empirical Procedures of Data Analysis:
This section discusses three statistical techniques used in this study. These are preliminary
analysis, multivariate analysis and sensitivity analysis.
4.6.1. Preliminary Analysis
This study used three preliminary analyses termed as: descriptive statistics, univariate analysis,
and correlation matrix. Descriptive statistics summarise and describe basic features of the data
in regards to the tests of central tendency and shape of distribution on a single variable in a
reasonable way. The first statistics used for the continuous variables in a data set is known as
tests of central tendency. It is also called measures of location and includes mean, median,
standard deviation, maximum and minimum values. Both the Variance Inflation Factor (VIF)
and the correlation matrix methods test the correlation among sample explanatory variables
and clarify the level of linear association among two explanatory variables (Gujarati & Porter,
2011). A higher degree of the correlation coefficient among the explanatory variables harms
the results of the regression analysis, due to the multicollinearity issue (Grewal, Cote, &

111
Baumgartner, 2004; Gujarati, 2008; Harris & Raviv, 2006). They suggest that (at level of) ±
0.80 or higher would indicate the start of a serious multicollinearity issue that could influence
the regression findings.
4.6.2. Multivariate Analysis
There are two methods that can be used to conduct multivariate analysis: parametric and non-
parametric methods. These methods will be used by the researcher according to the nature and
characteristics of the data. Gujarati (2003) highlights five necessary assumptions that need to
be investigated before the selection of the two multivariate analysis methods. The assumptions
are as follows: (1) Linearity suggests that there is linear association between both the
explanatory and dependent variables, (2) normality assumes that the data is normally
distributed, (3) the hypothesis of heteroscedasticity assumes that the dependent variables are
constantly changed, (4) independence assumes that there should be no association among the
error terms of two or more observations and (5) multicollinearity assumes that there is no
collinearity between independent variables of the study.
In order to determine which method is appropriate for the present research (parametric or non-
parametric), several tests are checked. To investigate the problem of normality, this study
conducted a histogram test. Quantile-Quantile (Q-Q plot) test is being used to examine the
issue of linearity. To test heteroscedasticity, the study utilised Breusch-Pagan/Cook-Weisberg
and White’s general tests. Lastly, the study used pairwise Pearson correlation matrix and VIF
tests to examine the problem of independence and multicollinearity.
4.6.2.1. Panel Regression Analysis
There are three main types of data used by researchers to conduct empirical analysis. These
are: cross-sectional, time series and panel data. The cross-sectional data is based on the value
of one or more variables, collected for various entities/units used as a sample over the same

112
time period, whereas, the values of one or more variables are observed over a time period in
the time series data. Lastly, panel data is similar to cross-sectional units (companies) and
observed over time (years) (Gujarati, 2003).
The flaw of cross-sectional data analysis is that it suffers from the issue of heteroscedasticity
and auto-correlation that can have an impact on the validity of the results. Panel data analysis
overcome the issues related to cross-sectional data analysis (Petersen, 2009). It is very
beneficial as it enables researcher to measure the individual effects that are non-observable and
reduces the reliability issue of explanatory variables regarding the explanation of dependent
variables (Serrasqueiro & Nunes, 2008). Moreover, when the panel data regression model is
based on cross-sectional and time-series data, it increases the degree of freedom and data
quantity (Gaud, Jani, Hoesli, & Bender, 2005; Pesaran, Shin, & Smith, 2000).
To examine the research hypotheses of the study, regression analysis is utilised as the main
tool. There are two types of regression analysis: panel and pooled. The major difference
between them is that panel regression can differentiate among the firms and over time, which
helps the researcher to take any unobservable heterogeneity out of the sample, but pooled
regression is unable to do this (Himmelberg, Hubbard, & Palia, 1999). This study organised
various tests to make the choice between the panel and pooled regression models. Following
(Twumasi-Ankrah, Ashaolu, & Ankrah, 2015), the Chow test and the Breusch-Pagan
LaGrange Multiplier (LM) are used and, based on their results, this study chose the panel
regression model to conduct the analysis.
There are many advantages of using panel data analysis. It takes both spatial (units) and worldly
(time) scope into consideration, which is crucial to examine linear information. It is also a key
source for longitudinal data analysis, specifically when there are various sources of
information. When the perceptions for individual analysis are longer, panel data analysis has
113
various procedures that are useful to scrutinise variations in a specific type of cross-sectional
unit over a time period (Gujarati 2003; Gujarati 2008).
Panel data analysis is useful because it reduces the level of co-linearity among the variables
and also provides extra instructive information regarding the data. Due to its combination of
the cross-sectional and time series dimension, panel data regression makes the analysis more
effective and also offers flexibility. It considers certain variables that exclude heterogeneity in
the estimation process. It is also helpful in analysing complicated behavioural models such as
technological change that cannot be done by using either cross-sectional or time series analysis.
From the above discussion, this study uses panel data regression. Many studies used panel data
to study the relationship among different variables (Chih et al. 2008; García‐Meca and
Sánchez‐Ballesta 2009; Chang and Sun 2010; Yu et al. 2010; Wang and Hussainey 2013; Ben
Othman and Mersni 2014; Ali et al. 2015; Böcking et al. 2015). Random effect and fixed effect
models are the two main models of panel data regression. The random effect model assumes
that individual effects are random disturbances drawn from the probability distribution,
whereas the fixed effect model considers that the individual effect term is constant.
4.6.3. Additional Analyses and Robustness Test
This research used additional analyses to check the sensitivity of primary findings and to
confirm whether they are robust to various measurements. Firstly, the current research used
high QFLID and low QFLID firms to examine whether or not the main results differ due to
this. Secondly, different alternative measurements are used for the explanatory variables. For
instance, the study used MC (proxy to measure FV) as an alternative measurement to test
whether the main findings are robust to various measures or not. Moreover, the study used
DISAF (proxy for ACUAF) as an alternative measurement to confirm the robustness of the
main results. Finally, the current research used two-stage least squares (2SLS) (the lagged

114
value of CG mechanisms and FLID utilised as instrumental variables) to control the
endogeneity issue.
4.7. Chapter Summary
The current chapter discusses the methodology and identifies the research methods utilised to
achieve the aim and objectives of this study. The methods covered in the chapter are to examine
the relationship between CG mechanisms and the QFLID, and impact of the QFLID on both
FV and ACUAF. It explains manual content analysis and a multidimensional approach that is
used to measure the QFLID. In addition, TQ ratio and MC are used as proxies to measure FV.
Furthermore, ACUAF and DISAF are used to measure analysts’ earnings forecast. The data
analysis is achieved by employing fixed effect models of panel regression. The present research
used 212 non-financial Indian listed companies (2120 company's observations) from 2006 to
2015 to test the hypothesis. Chapter 5 will cover the methods discussed in this chapter, and
present the summary of descriptive statistics for all variables employed, to examine the impact
of CG on the QFLID among non-financial Indian listed companies and discuss the results
obtained from the multivariate analysis.

115
Chapter Five: CG Mechanisms and QFLID
5.1. Introduction
The present chapter examines the impact of CG on the QFLID in non-financial Indian listed
companies’ annual reports. Furthermore, this chapter aims to examine the research hypotheses
related to the relationship between the independent variables (CG) and the QFLID. This chapter
consists of the following sections: section 5.2 covers descriptive statistics of regression
variables. Section 5.3 presents the multicollinearity issue. Section 5.4 explains the results of
the multivariate analysis. Section 5.6 describes additional and sensitivity analyses. Section 5.6
deals with the endogeneity problem and section 5.7 covers a summary of this chapter.
5.2. Descriptive Statistics of the Regression Variables
Table 5.1 presents descriptive statistics’ results of QFLID (dependent variable), CG
(independent variable) and control variables (company characteristics).
With regard to the dependent variable (QFLID), Table 5.1 below displays that the maximum
of QFLID of the sample firms is 68% while the minimum score is 0%. This is similar to Aljifri
and Hussainey (2007), as their study found that the maximum FLID score among UAE
companies is 70% and the minimum FLID score is 0%. This range shows that a variation exists
among Indian listed companies in their decision-making process regarding FLID. The overall
mean of QFLID is 50.70%, higher than the average found in Charumathi & Ramesh’s (2015)
study, as the study found the overall mean of FLID in Indian companies was 42.12%. Notably,
the average is closer to Sartawi et al. (2014), who found that the overall mean of voluntary
disclosure in Jordanian companies was 49%. Furthermore, the current study employed a
median value of 51.49% to classify high and low QFLID, similar to Nalikka’s (2009) value of
50.46% for listed Finnish companies.

116
Regarding boards of directors, the average board size is around 10 members, ranging from 24
to 4 members. This indicates that Indian companies comply with the Indian Corporate
Governance Code (ICGC) number (49), which recommends that a board of directors should
comprise of at-least four members. It is similar to the results of Jackling & Johl (2009), who
reported that the mean value of board size is 9.56, with a minimum of 4 and a maximum of 18
members among Indian listed companies. Moreover, the result is relatively comparable with
the previous results of Darko et al. (2016), who found that the average board size is around 9
among Ghanaian companies. With reference to CEO duality, approximately 44% of CEOs in
companies serve as board chairman. This is in line with ICGC (49), which indicates that if the
CEO is also the chairman then half of the board of directors should be independent. The result
is relatively higher than the mean value provided by Jackling & Johl (2009), who reported 35%
among Indian listed companies. On the other hand, Chau & Gray (2010) reported an overall
mean of 54% among Hong Kong listed companies, higher than this study’s result.
Furthermore, the results found that the average proportion of independent directors is 53%,
with a range from 16% to 92%. This highlights that almost half of the board directors are
independent. This is consistent with ICGC number (49), which stated that half of the board
directors should be independent. This finding is quite similar to Charumathi & Ramesh
(2015a), as the study reported a 50.62% average proportion of independent directors in Indian
listed companies, ranging from 12.45% to 80%. Table 5.1 reports that the average number of
board meetings is approximately 6 per year and ranges from 4 to 17 meetings. It is in line with
ICGC number (49), which recommends that a board should hold at least four meetings a year.
Similar to this study result, Jackling & Johl (2009) found the mean value of the number of
board meetings among Indian companies is 6. With regard to females’ presence on the board,
the mean value is about 5.7% and the range is from 0% to 75%. The results indicate that Indian
companies do not comply with ICGC number (49) because it recommends that boards should

117
have at least one woman director. This outcome is quite similar to Perryman et al. (2016), who
reported that the overall mean of females on boards is 5%.
In terms of ownership structure, the overall mean of block holder ownership is about 29% and
ranges between 0% and 82%. Furthermore, the overall mean of institutional ownership is 22%
and ranges from 0% to 70%, which is similar to Charumathi & Ramesh (2015a), who reported
that the mean of institutional ownership of Indian companies is 30.14%. The overall mean of
promoters’ ownership is approximately 53.41% and ranges from 0% to 97%. This result is
similar to the findings of Charumathi & Ramesh (2015a) and Ganguli & Agrawal (2009), who
reported 54.185% and 52.954% as overall means among Indian companies, respectively.
Regarding audit committees, the study found that the average audit committee size is 4
members and ranges from 3 to 8 members. The result follows ICGC number 49 as it suggests
that an audit committee should have least three members. This result is in line with Darko et
al. (2016), who provided the mean value of 4 among Ghanian companies. This study found the
mean value of the number of audit committee meetings is 5, with a range of 1 to 12. This result
meets the benchmark of ICGC number (49), which mentions that audit committees should
organise atleast four meetings a year. As compared to Darko et al. (2016), the mean value of
this study is lower, as they reported an overall mean of 7 among Ghanian companies. The
descriptive results reported that the proportion of audit committee independence is about 83%,
ranging from 25% to 100%. This figure complies with ICGC number (49), which indicates that
at least two-thirds of the members must be independent in the audit committee. Moreover, the
mean value of the proportion of audit committee who have financial expertise is about 94%,
and the range is from 25% to 100% respectively. The average number of females’ presence in
audit committees is approximately 4.2%, with a maximum of 75% and minimum of 0%. This

118
outcome is closer to Ujunwa et al. (2012) who found that, among Nigerian firms, the average
number of females on committees is 4.6%.
In terms of control variables the average company size (measured as natural log of total assets)
is 7.595252, ranging widely from 5.115201 to 9.744242. The value found is lower as compared
to Darko et al.’s (2016) findings, who found that the overall mean value is 8.202602 among
Ghanian companies. In addition, leverage ranges from .00036% to 99%. The mean value of
leverage is 51.96%. This is similar to the findings of Hassanein & Hussainey (2015), who
reported that the overall mean is 52.70% among UK listed companies. However, the result is
lower than the mean value reported by Ganguli & Agrawal (2009), who reported that the
average among Indian companies is 85.5%. Furthermore, profitability ranges from -84% (loss)
to 99% (profit) with a mean of 10%. Table 5.1 reports an overall mean of 2% of liquidity
(current ratio), and ranges from 0.13 to 22. This outcome is similar to the findings of Hassanein
& Hussainey (2015), who reported a mean value of 1.61% among UK listed companies.
GROW ranges from -.49 to 2.57 with a mean of .25. Concerning the industry type, the
minimum and maximum values range from 1 to 11 respectively.

119
Table 5. 1 Descriptive statistics
Variable N Mean Median SD. Max Min
QFLID 2120 .5070467 .5149583 .0764422 .6852885 0
BSIZE 2120 10.76415 10 3.174943 24 4
DP 2120 .4429245 0 .4968489 1 0
FBM 2120 6.096698 6 1.921682 17 4
BI 2120 .5375833 .5333333 .1220746 .9230769 .1666667
FPB 2120 .0570695 0 .0911046 .75 0
BloOwn 2120 .2905447 .28 .1617609 .82 0
InsOwn 2120 .2277695 .21 .1330907 .7 0
ProOwn 2120 .5341775 .5237 .1637402 .976 0
ACSIZE 2120 4.011792 4 .9400896 8 3
ACM 2120 4.825389 4 1.431699 12 1
IAC 2120 .8308458 .8 .1491018 1 .25
ACFEXP 2120 .9435579 1 .1121762 1 .25
FPAC 2120 .0428279 0 .1022903 .75 0
LEVE 2120 .5196675 .5610039 .2319884 .9933107 .0003641
LIQU 2120 2.050434 1.6 1.676653 22 .13
PROF 2120 .1016844 .0859759 .1019813 .991509 -.84
GROW 2012 .2578197 .1900197 .330587 2.571437 -.4916848
CSIZE 2120 7.595252 7.557725 .6993978 9.744242 5.115201
IndType 2120 4.662736 4 2.795015 11 1 . . . . . . . . . . . . . . . . . . . . . . . . . . . . . . . . . . . . . . . . . . . . . . . . . . . . . . . . . . . . . . . . . . . . . . . . . . . . . . . . . . . . . . . . . . . . . . . . . . . . . . . . . . . . . . . . . . . . . . . . . . . . . . . . . . . . . . . . . . . . . . . . . . . . . . . . . . . . . . . . . . . . . . . . . . . . . . . . . . . . . . . . . . . . . . . . . . . . . . . . . . . . . . . . . . . . . . . . . . . . . . . . . . . . . . . . . . . . . . . . . . . . . . . . . . . . . . . . . . . . . . . . . . . . . . . . . . . . . . . . . . . . . . .
QFLID stands for quality of forward-looking disclosure. BSIZE is board size, measured as number of board
members. DP is the role duality, a dummy variable: value of 1 is given if company’s CEO serves as a board
chairman, 0 otherwise. FBM is frequency of board meetings during the year. BI presents board independence,
measured as the ratio of number of independent non-executive directors to the total number of board members.
FPB is the ratio of females’ presence on the board of directors. BloOwn is blockholder ownership, measured by
the ratio of shares held by blockholder (5% or more). InsOwn is institutional ownership, measured by the ratio
of shares held by institutional. ProOwn is promoter ownership, measured by the ratio of shares held by promoters.
ACSIZE is audit committee size, measured by the number of audit committee members. ACM is the frequency of
audit committee meetings during the year. IAC is the independence of the audit committee, measured by the ratio
of independent non-executive directors on the audit committee. ACFEXP is audit committee financial experts,
measured by the ratio of audit committee members with financial experience to audit committee size. FPAC is the
ratio of females’ presence in the audit committee. LEVE is the leverage ratio, measured by the ratio of a firm’s
total debt at the end of the year to total assets at the end of year. LIQU is liquidity, measured as the ratio of the
company’s current assets to its current liabilities. PROF is profitability. GROW is firm growth, measured by the
change of sales. CSIZE is Firm size, measured by the natural logarithm of total assets. IndType is industry type,
the sample in this study is divided into eleven types of industry and is coded from 1 to 11.
120
5.3. Multicollinearity
Multicollinearity is an issue that arises when a linear relationship exists (i.e. a high degree of
correlation) among two or more independent variables. Due to this issue, it is difficult to
distinguish the individual impacts of explanatory variables, which may have high differences
(Murray, 2005; O’brien, 2007). In addition, high multicollinearity leads to high standard errors,
diminished power, and large confidence intervals (Garson, 2012). To check for a
multicollinearity issue among explanatory variables, this study utilised a correlation matrix and
variance inflation factors (VIF) with tolerance values.
The correlation matrix is an effective instrument for examining the association among
explanatory variables. Regarding the cut-off correlation percentage, there is a difference in
views among researchers (Alsaeed, 2006). Some researchers, such as Tabachnick et al. (2001),
consider 70% as serious correlation, whereas others consider 80% as the correlation cut-off
point (Alsaeed (2006); Gujarati (2003; 2008) . Table 5.2 presents the correlation matrix among
all explanatory independent variables used in the present study. The results presented in Table
5.2 highlight that block holder ownership and promoters’ ownership is highly correlated, with
a coefficient of 68.21%. The result is lower than the cut-off point which indicates that a
multicollinearity issue is not present among these variables (Gujarati, 2008; Tabachnick et al.,
2001).
Secondly, this study uses VIF and Tolerance tests to examine whether independent variables
are highly correlated or not. Gujarati (2009), Field (2009), and Gujarati (2003), indicate that if
the value of VIF is more than 10 and the tolerance coefficient is greater than 10%, there is an
issue. The results presented in Table 5.3 show that a multicollinearity problem is non-existent
among explanatory variables. The maximum value of VIF is 2.28 and its mean is 1.39,
indicating no multicollinearity issue.
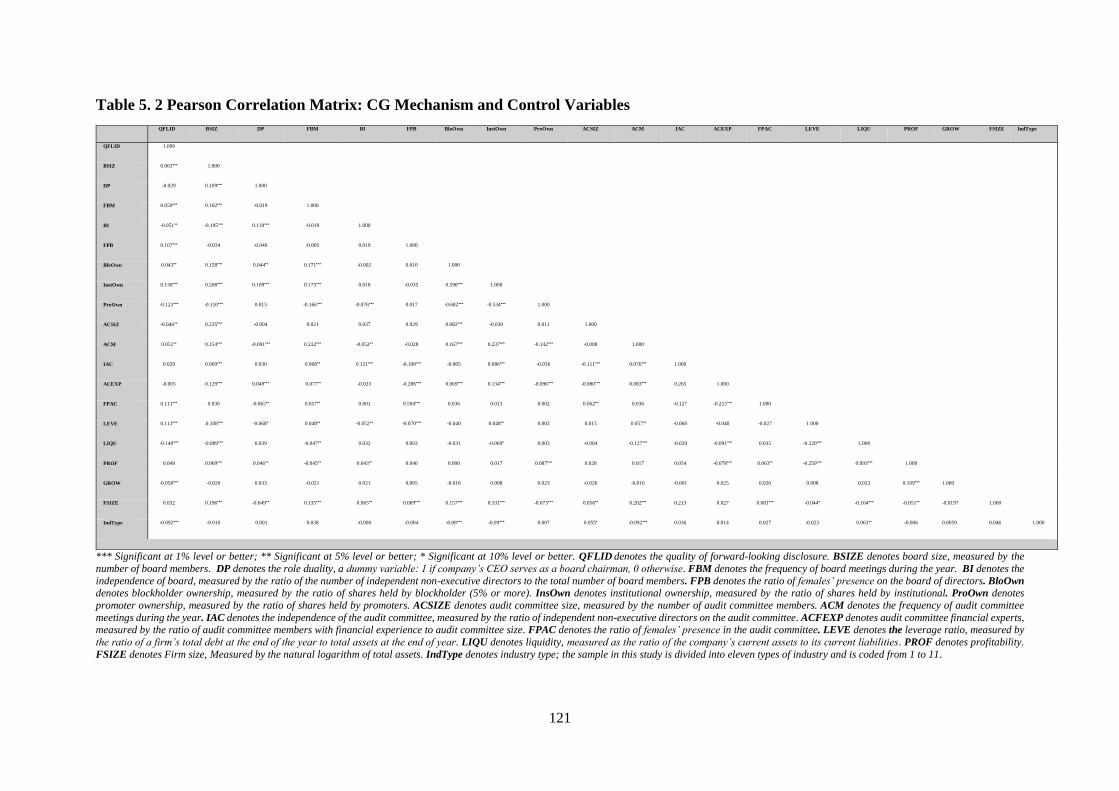
121
Table 5. 2 Pearson Correlation Matrix: CG Mechanism and Control Variables
*** Significant at 1% level or better; ** Significant at 5% level or better; * Significant at 10% level or better. QFLID denotes the quality of forward-looking disclosure. BSIZE denotes board size, measured by the
number of board members. DP denotes the role duality, a dummy variable: 1 if company’s CEO serves as a board chairman, 0 otherwise. FBM denotes the frequency of board meetings during the year. BI denotes the
independence of board, measured by the ratio of the number of independent non-executive directors to the total number of board members. FPB denotes the ratio of females’ presence on the board of directors. BloOwn denotes blockholder ownership, measured by the ratio of shares held by blockholder (5% or more). InsOwn denotes institutional ownership, measured by the ratio of shares held by institutional. ProOwn denotes
promoter ownership, measured by the ratio of shares held by promoters. ACSIZE denotes audit committee size, measured by the number of audit committee members. ACM denotes the frequency of audit committee
meetings during the year. IAC denotes the independence of the audit committee, measured by the ratio of independent non-executive directors on the audit committee. ACFEXP denotes audit committee financial experts,
measured by the ratio of audit committee members with financial experience to audit committee size. FPAC denotes the ratio of females’ presence in the audit committee. LEVE denotes the leverage ratio, measured by the ratio of a firm’s total debt at the end of the year to total assets at the end of year. LIQU denotes liquidity, measured as the ratio of the company’s current assets to its current liabilities. PROF denotes profitability.
FSIZE denotes Firm size, Measured by the natural logarithm of total assets. IndType denotes industry type; the sample in this study is divided into eleven types of industry and is coded from 1 to 11.
QFLID BSIZ DP FBM BI FPB BloOwn InstOwn ProOwn ACSIZ ACM IAC ACEXP FPAC LEVE LIQU PROF GROW FSIZE IndType
QFLID 1.000
BSIZ 0.063*** 1.000
DP -0.029 0.109*** 1.000
FBM 0.059*** 0.102*** -0.019 1.000
BI -0.051** -0.195*** 0.119*** -0.019 1.000
FPB 0.107*** -0.034 -0.040 -0.005 0.019 1.000
BloOwn 0.043** 0.158*** 0.044** 0.171*** -0.002 0.010 1.000
InstOwn 0.130*** 0.208*** 0.109*** 0.175*** 0.018 -0.035 0.590*** 1.000
ProOwn -0.123*** -0.110*** 0.013 -0.166*** -0.076*** 0.017 -0.682*** -0.534*** 1.000
ACSIZ -0.046** 0.235*** -0.004 0.021 0.037 0.029 0.082*** -0.030 0.011 1.000
ACM 0.051** 0.154*** -0.091*** 0.212*** -0.052** -0.028 0.167*** 0.237*** -0.142*** -0.008 1.000
IAC 0.029 0.069*** 0.030 0.068** 0.121*** -0.108*** -0.005 0.086*** -0.036 -0.111*** 0.076*** 1.000
ACEXP -0.005 0.129*** 0.049*** 0.077** -0.023 -0.286*** 0.069*** 0.134*** -0.096*** -0.080*** 0.083*** 0.265 1.000
FPAC 0.111*** 0.030 -0.065** 0.057** 0.001 0.594*** 0.036 0.013 0.002 0.062** 0.036 -0.127 -0.215*** 1.000
LEVE 0.113*** .0.108*** -0.068* 0.048** -0.052** -0.070*** -0.040 0.048** 0.002 0.015 0.057** -0.060 -0.040 -0.027 1.000
LIQU -0.140*** -0.089*** 0.039 -0.047** 0.032 0.003 -0.031 -0.069* 0.003 -0.004 -0.127*** -0.029 -0.091*** 0.035 -0.220*** 1.000
PROF 0.049 0.069*** 0.046** -0.045** 0.043** 0.040 0.000 0.017 0.087*** 0.028 0.017 0.054 -0.078*** 0.063** -0.259*** 0.093*** 1.000
GROW -0.058*** -0.020 0.033 -0.021 0.021 0.005 -0.016 0.008 0.023 -0.026 -0.016 -0.001 0.025 0.020 0.008 0.023 0.109*** 1.000
FSIZE 0.032 0.196*** -0.049** 0.135*** 0.065** 0.069*** 0.157*** 0.331*** -0.073*** 0.056** 0.202*** 0.213 0.027 0.081*** -0.044* -0.164*** -0.051** -0.0197 1.000
IndType -0.092*** -0.010 0.001 0.038 -0.000 -0.004 -0.08*** -0.09*** 0.007 0.055* -0.092*** 0.036 0.014 0.027 -0.023 0.063** -0.006 0.0059 0.046 1.000
. . . . . . . . . . . . . . . . . . . . . . . . . . . . . . . . . . . . . . . . . . . . . . . . . . . . . . . . . . . . . . . . . . . . . . . . . . . . . . . . . . . . . . . . . . . . . . . . . . . . . . . . . . . . . . . . . . . . . . . . . . . . . . . . . . . . . . . . . . . . . . . . . . . . . . . . . . . . . . . . . . . . . . . . . . . . . . . . . . . . . . . . . . . . . . . . . . . . . . . . . . . . . . . . . . . . . . . . . . . . . . . . . . . . . . . . . . . . . . . . . . . . . . . . . . . . . . . . . . . . . . . . . . . . . . . . . . . . . . . . . . . . . . . . . . . . .

122
Table 5. 3 Multicollinearity test results Variance Inflation Factor (VIF)
Variable VIF Tolerance 1/VIF
BSIZE 1.32 0.756636
DP 1.18 0.846992
FBM 1.11 0.898419
BI 1.25 0.799386
FPB 1.64 0.608042
BloOwn 2.28 0.439205
InsOwn 1.97 0.506835
ProOwn 2.15 0.465632
ACSIZE 1.15 0.868373
ACM 1.16 0.859807
IAC 1.19 0.836952
ACFEXP 1.24 0.806656
FPAC 1.60 0.624095
LEVE 1.21 0.823965
LIQU 1.12 0.889079
PROF 1.16 0.862205
GROW 1.02 0.980308
CSIZE 1.36 0.733489
IndType 1.05 0.952526
Mean VIF 1.38 . . . . . . . . . . . . . . . . . . . . . . . . . . . . . . . . . . . . . . . . . . . . . . . . . . . . . . . . . . . . . . . . . . . . . . . . . . . . . . . . . . . . . . . . . . . . . . . . . . . . . . . . . . . . . . . . . . . . . . . . . . . . . . . . . . . . . . . . . . . . . . . . . . . . . . . . . . . . . . . . . . . . . . . . . . . . . . . . . . . . . . . . . . . . . . . . . . . . . . . . . . . . . . . . . . . . . . . . . . . . . . . . . . . . . . . . . . . . . . . . . . . . . . . . . . . . . . . . . . . . . . . . . . . . . . . . . . .
123
5.4. Multivariate Analysis
The researcher examined several tests to select the best model for the study. Following
Twumasi-Ankrah et al. (2015), this study used the Chow test to choose either the panel data
model or the pooled data model. In doing so, Twumasi-Ankrah et al. (2015) indicate that if F-
test of Chow test is significant (F-value <0.05) then the null hypothesis will be rejected,
meaning that the panel data model is better than the pooled model, and vice versa. The findings
of Chow test show that F-test is significant at 1% level (see Appendix 5.1). Therefore, this
study uses the panel data model to examine the association between the independent variable
(CG mechanisms) and the dependent variable (QFLID). There are two types of panel data
regression models: fixed effects model and random effects model. Regarding the error term,
both models have various assumptions.
The random effect assumes that individual effects are random disturbances drawn from the
probability distribution. However, the fixed effect model suggests that the individual effect
term is constant. In panel data, the same cross-sectional units are surveyed over time as they
have space (Damodar N.. Gujarati, 2003). The Hausman’s test is used in the current study to
decide between the random and fixed effects models (Greene, 2008). The result of the
Hausman’s test in this study indicates that it is significant (P-Value = 0.000), accordingly, fixed
effect models are preferred (see Appendix 5.2).
Table 5.4 presents the outcomes related to regression analysis of the fixed effects model.
QFLID is a dependent variable, while CG mechanisms (board size, CEO duality, number of
board meetings, board independence, females’ presence on the board, blockholder ownership,
institution ownership, promoters’ ownership, audit committee size, audit committee
independence, audit committee financial expertise, audit committee meetings and females on
the audit committee) are independent variables. The company’s characteristics (firm size,

124
profitability, leverage, liqudity, firm growth and industry type) are control variables included
in the regression model.
Table 5.4 reports 𝑅2 value of 48.39%, which means that the independent variable explains
48.3% of the variation of dependent variables including six company characteristics as control
variables. In social science research, a result of more than 20% is highly acceptable (Abd-
Elsalam & Weetman, 2003; Aljifri et al., 2014). Furthermore, this result is in line with the
previous studies, such as Haniffa & Cooke (2002) at 46% and Akhtaruddin (2005) at 56%.
Table 5.4 also indicates that the P-Value is highly significant (0.001), indicating that this model
has a good explanatory power for the model utilised in the primary analysis.
5.4.1. Findings and Discussion of CG and QFLID
This section discusses CG mechanisms, followed by the control variables. Table 5.4 illustrates
a comparison of the results of the panel data. The study examined CG mechanisms (board
characteristics, audit committee, and ownership structure) by employing a multivariate
analysis. The results show that CG variables are associated with QFLID.
5.4.1.1. Board Characteristics
The current study examined five board characteristics, namely board size, CEO duality,
frequency of board meetings, board independence and female presence on the board.
Board Size (BSIZE)
The results presented in Table 5.4 exhibit that BSIZE is significantly and positively associated
with QFLID at 1% significance level (coef. = .0013898, t = 3.39, p < 0.001), hence H1.1 of
the study is accepted. The result suggests large board sizes tend to be more effective.
Consequently, it is expected that firms with a larger BSIZE disclose more QFLID as compared
to smaller BSIZE. The findings are in line with the agency theory perspective, which highlights

125
that senior executives are unable to dominate boards of a larger size, hence these boards
disclose greater information (Allegrini & Greco, 2013; Alnabsha et al., 2017; Fama & Jensen,
1983; John & Senbet, 1998; Samaha et al., 2012). Likewise, the result is compatible with the
resource dependence theory, which assumes that larger boards disclose higher quality
information than smaller boards. Due to greater diversity in large boards, it improves overall
corporate disclosure activities (Abeysekera, 2010; Adams & Ferreira, 2007; Alnabsha et al.,
2017; Lajili & Zéghal, 2005). Empirically, this outcome is compatible with several studies
which reported a positive association between BSIZE and extent of disclosure (Barako et al.,
2006; Hussainey & Al-Najjar, 2011; Laksmana, 2008; Samaha et al., 2015; Wang &
Hussainey, 2013). However, several studies reported no association between BSIZE and FLID,
for example Alhazaimeh et al. (2014); Arcay and Muiño (2005); Cheng and Courtenay (2006);
Kuzey (2018) and Liu (2015).
CEO Duality (DP)
Regarding DP, Table 5.4 shows no significant relationship between DP and QFLID (coef. =
.0001386, t = 0.05, p < 0.959). This outcome suggests that separation between the positions of
CEO and chairman in Indian companies is unable to explain the variation in QFLID. Therefore,
this result rejects hypothesis H1.2, which expected a significant negative association between
DP and QFLID.
In relation to the theoretical underpinnings, this outcome is not in line with agency and
resource-dependence theory, which assume that DP has a negative impact on corporate
disclosure and its performance. From an agency theory perspective, separation of chairman and
CEO positions reduces agency problems as it encourages managers to make decisions
according to shareholders’ interests (Fama & Jensen, 1983; Haniffa & Cooke, 2002; Jensen,
1993). Similarly, the resource-dependence theory suggests that separating the positions of CEO
and board chairman can improve information disclosed voluntarily because DP can negatively

126
affect the board’s disclosure policies due to a power of position (Alnabsha et al., 2017; Elzahar
& Hussainey, 2012). Empirically, this result is in line with previous research (Aljifri et al.,
2014; Alnabsha et al., 2017; Alotaibi & Hussainey, 2016a; Babío Arcay & Muiño Vázquez,
2005; Barako et al., 2006; Cheng & Courtenay, 2006; Ghazali & Weetman, 2006; Liu, 2015),
who found no significant association between DP and disclosure. However, the result is not
compatible with other prior studies (Allegrini & Greco, 2013; Gul & Leung, 2004; Haniffa &
Cooke, 2002; Li et al., 2008) who reported a significant and negative association between DP
and level of disclosure.
Board Independence (BI)
With regard to BI, in Table 5.4 the regression results show that the proportion of board
independence is positively and significantly associated with the QFLID at 5% level of
significance (coef. = .0158821, t = 2.01, p < 0.030). Hence, this finding supports hypothesis
H1.3, which expects to find a positive relationship between BI and the QFLID. This result is
in line with the argument that independent directors act as a mechanism to monitor
management's performance and decrease the information asymmetry between managers and
owners (Lim et al., 2007). This positive association is consistent with the theoretical
underpinnings derived from the agency and resource dependence theories. From the agency
theory perspective, the existence of independent directors can decrease information asymmetry
between managers and owners (Allegrini & Greco, 2013; Fama & Jensen, 1983; Jensen &
Meckling, 1976). Furthermore, resource dependence theory assumes that independent directors
obtain external resources through their proficiency, prestige and networking, hence providing
various resources such as business contracts, experience and expertise, which lead to improve
strategic decision-making of the company (Chen, 2011; Haniffa & Cooke, 2002; Nicholson &
Kiel, 2007; Tricker, 1984). A board consisting of more independent directors enables

127
companies to get hold of crucial resources that can help them to gain a competitive advantage
and improve the overall monitoring of management activities, hence improving QFLID.
This result is in line with prior studies (Adams & Hossain, 1998; Chen & Jaggi, 2001; Cheng
& Courtenay, 2006; Elshandidy & Neri, 2015; Huafang & Jianguo, 2007; Jallow, Hussainey,
& Aljifri, 2012; Lim et al., 2007; Liu, 2015; Patelli & Prencipe, 2007; Samaha et al., 2015;
Wang & Hussainey, 2013), which reported BI is positively and significantly associated with
voluntary disclosure. On the other hand, this finding contradicts other researchers who found
either no association between the two variables (Aljifri et al., 2014; Ebrahim & Fattah, 2015;
Kuzey, 2018; O’Sullivan et al., 2008; Uyar & Kilic, 2012), or negatively associated with each
other (Barako et al., 2006; Chapple & Truong, 2015; Eng & Mak, 2003; Ghazali & Weetman,
2006; Gul & Leung, 2004; Madhani, 2015).
Frequency of Board Meetings (FBM)
As presented in Table 5.4, there is a positive and significant association between the coefficient
of the FBM and QFLID at 1% significance level (coef. = .0016248, t = 3.95, p < 0.000). As
expected, this finding supports hypothesis H1.4, which expects to find a significant and positive
relationship between the FBM and the QFLID. This result is compatible with the argument that
a higher frequency of meetings improves managerial monitoring, thereby leading to a positive
influence on disclosure quality (Alnabsha et al., 2017; Alotaibi & Hussainey, 2016a), and
positively impacts on corporate performance (Carcello et al., 2002). Theoretically, this finding
can be explained by the agency theory perspective; an increase in the frequency of board
meetings enables the board to monitor management activities more effectively, hence reducing
agency conflicts (Xie et al., 2003). Increased monitoring reduces information asymmetry and
agency costs, thereby leading to increased disclosure (Nelson et al., 2010). Empirically, this
finding is in line with previous research (Alnabsha et al., 2017; Barros et al., 2013; Brick &

128
Chidambaran, 2010; Kent & Stewart, 2008; Laksmana, 2008) who report a positive relationship
between these two variables.
Female Presence on the Board (FPB)
Table 5.4 presents that the coefficient of FPB is positively and significantly associated with the
QFLID at 1% level of significance (coef. = . 0467019, t = 3.48, p < 0.001). This result supports
the alignment of interest hypothesis H1.5, which proposes a positive relationship between the
FPB and the QFLID among Indian listed companies. It supports the idea that FPB explains the
disclosure practices in annual reports of companies (Gibbins, Richardson, & Waterhouse,
1990). This result is according to the perspective of the agency theory, which assumes that
board gender diversity enhances board efficiency and prevents managers exploiting
shareholders’ wealth by improving board independence.(Barako & Brown, 2008; Carter et al.,
2003b; Elzahar & Hussainey, 2012). Similarly, from a resource-dependence theory
perspective, board diversity improves the relationship between companies and their external
environment which leads to improved disclosure quality (Hillman et al., 2000; Pfeffer, 1972).
In the same vein, prior studies suggest that the presence of female directors on a board increases
reporting transparency (Bear, Rahman, & Post, 2010; T. Donaldson & Preston, 1995; Estélyi
& Nisar, 2016), and improves the reliability of the board and corporate legitimacy (Ashforth
& Gibbs, 1990; Liao et al., 2015).
Empirically, the significant and positive result is consistent with Barako & Brown (2008);
Chapple & Truong (2015); Kuzey (2018) and Liao et al. (2015) who reported a positive and
significant association between gender diversity and voluntary disclosure. Sartawi et al. (2014),
however, found no relationship between the two variables.

129
5.4.1.2. Ownership Structure
Ownership structure has been suggested as an important determinant of better CG practices
(Konijn et al., 2011; La Porta et al., 1999). Nevertheless, prior study results on the relationship
between ownership structure and voluntary disclosure are inconclusive (Bebchuk & Weisbach,
2010). The sections below discuss ownership structures: block ownership; institutional
ownership and promoters’ ownership and their relationship with QFLID.
Blockholder Ownership (BloOwn)
The statistical results shown in Table 5.4 indicate that BloOwn is not associated with the
QFLID in the annual reports of Indian companies (coef. = -. 0066745, t = -1.50, p < 0.125).
The result highlights no significant association between BloOwn and the QFLID, hence rejects
hypothesis H1.6, which expects to find a negative association between them. Theoretically, the
result related to BloOwn conflicts with the agency theory perspective, which suggests that
BloOwn is estimated to reduce the probability of introducing more voluntary disclosure in
annual reports (Eng & Mak, 2003). This finding is in line with previous studies (Abdelbadie &
Elshandidy, 2013; Alqatamin et al., 2017; Eng & Mak, 2003; Hidalgo et al., 2011; Nekhili et
al., 2012; Nekhili et al., 2016) who found no significant association between disclosure and
BloOwn. However, the finding is inconsistent with some previous studies which found a
negative association between BloOwn and voluntary disclosure (Al-Najjar & Abed, 2014;
Garcia-Meca & Sanchez-Ballesta, 2010; McKinnon & Dalimunthe, 1993; Mitchell et al., 1995;
Schadewitz & Blevins, 1998).
Institutional Ownership (InsOwn)
With respect to the InsOwn, Table 5.4 shows the influence of InsOwn on the QFLID (coef. =
-.0126049, t = -0.25, p < 0.212). The result shows that the InsOwn has no impact on the
QFLID. Accordingly, the statistical result does not empirically support the hypothesis H1.7:

130
which proposes a positive and significant relationship between InsOwn and the QFLID.
Theoretically, this finding is not in line with the agency theory, which assumes that managers
disclose more information to reduce mangers’ and institutional shareholders’ conflicts
(Alnabsha et al., 2017; Yoshikawa & Rasheed, 2009). It is also against the view that companies
with large InsOwn suffer less from agency problems (Shleifer & Vishny, 1986). In the same
vein, the insignificant association is not in line with the view that institutional investors benefit
by monitoring the disclosure process because of their huge stake (Barako et al., 2006).
This result is consistent with prior studies such as Charumathi & Ramesh (2015a); Jouini
(2013) and Wang & Hussainey (2013) who reported no association between InsOwn and the
FLID. However, it conflicts with Barako et al. (2006); Guan et al. (2007); Mathuva (2012b)
and Al-Bassam et al. (2015) who found a positive relationship between InsOwn and voluntary
disclosure. Alqatamin et al. (2017) found a negative and significant association between
InsOwn and the extent of FLID.
Promoters’ Ownership (ProOwn)
Regarding the coefficient of ProOwn, the result found no association between ProOwn and the
QFLID among Indian companies (coef. = . 0153797, t = 1.49, p < 0.136). This finding does
not confirm that companies with higher promoters’ holdings have less incentive to disclose
more information (Charumathi & Ramesh, 2015a). Hence, hypothesis H1.8 is rejected, which
assumes negative relationship between level of ProOwn and QFLID. The insignificant finding
is compatible with Charumathi & Ramesh (2015a) who found no significant association
between ProOwn and FLID levels in Indian companies.
5.4.1.3. Audit Committee
The audit committee is the most important subcommittee of the board of directors. It monitors
the reporting processes of financial and non-financial information; therefore, it could affect the

131
corporate disclosure by reducing the information asymmetry (Li et al., 2012). From the
perspective of agency theory, the audit committee can be considered as an instrument to reduce
agency costs (Ho & Wong, 2001b; Klein, 1998). In line with Zaman et al. (2011), this study
used five dimensions to assess the audit committee effectiveness, namely audit committee size,
audit committee independence, frequency of audit committee meetings, audit committee
financial expertise, and ratio of females on the audit committee.
Audit Committee Size (ACSIZE)
With respect to ACSIZE, Table 5.4 indicates that the coefficient estimate on ACSIZE is
insignificant with the QFLID (coef. = -.0093003, t = -1.33, p < 0.183). Accordingly, the result
of the current study does not support hypothesis H1.9, which postulates a significant positive
relationship between ACSIZE and the QFLID among Indian listed companies. Theoretically,
it is against the predictions of agency theory, which suggests that companies with an efficient
audit committee disclose more information to reduce agency costs (Alotaibi & Hussainey,
2016a; Barako et al., 2006). Empirically, this result is in line with the findings reported by
Aljifri & Hussainey (2007) and Magena & Pike (2005), who found no association between
ACSIZE and FLID. However, the result is not in line with previous research (Abeysekera,
2010; Al-Bassam et al., 2015; Albitar, 2015; Allegrini & Greco, 2013; Beasley, 1996; Hidalgo
et al., 2011; Laksmana, 2008; Li et al., 2008; Ntim et al., 2013; O’Sullivan et al., 2008; Samaha
et al., 2015) which found a significant and positive relationship between ACSIZE and the
extent of disclosure.
Audit Committee Independence (IAC)
Table 5.4 illustrates that the IAC is positively and significantly associated with the QFLID at
a 10% significance level (coef. = . 0013521, t = 1.66, p < 0.097). This result is in line with the
argument that the IAC can improve the quality of disclosure to ensure the accurate evaluation
of management performance (Cerbioni & Parbonetti, 2007; Forker, 1992; Ho & Shun Wong,
132
2001). Hence, this result accepts hypothesis H1.10, which proposes a significant and positive
relationship between IAC and the QFLID. This result supports the agency theory perspective,
that audit committee independence reduces agency costs, hence improving the extent of FLID.
This result matches with earlier studies, such as Aljifri et al. (2014) and Ho & Wong (2001),
who reported a positive and significant relationship between IAC and the extent of FLID.
Frequency of Audit Committee Meetings (ACM)
The regression results of the study found a strong positive and significant association between
ACM and QFLID at 1% level of significance (coef. = . 0017793, t = 2.89, p < 0.004). As
expected, this finding supports hypothesis H1.11, which expects to find a positive relationship
between the variables. This result highlights that ACM is a source to provide managers with
useful information continuously. Moreover, ACM improves monitoring of financial
statements, assures their accuracy, and improves audit quality (Beasley et al., 2009). In other
words, as ACM increases monitoring, so it generates a higher quality of financial reporting (G.
Chen et al., 2006). Theoretically, this finding can be explained by the agency theory; a rising
audit committee activity, represented by frequency of meetings, enables an audit committee to
improve its monitoring which reduces agency costs (Xie et al., 2003). Increased monitoring
reduces information asymmetry and lowers agency costs, hence leading to increased disclosure
(Nelson et al., 2010). Empirically, the positive and significant finding supports the results of
previous studies such as Barros et al. (2013); Beasley et al. (2009); Bronson et al. (2006);
Karamanou & Vafeas (2005) and Kelton & Yang (2008). However, this finding is inconsistent
with Alhazaimeh et al. (2014); Madi et al. (2014) ; Othman et al. (2014) who reported no
association between these two variables.

133
Audit Committee Financial Expertise (ACEXP)
Regarding ACEXP, Table 5.4 shows no significant relationship between ACEXP and the
QFLID (coef. = .0039175, t = 0.37, p < 0.710), meaning that the financial expertise of audit
committees does not reflect the QFLID in the annual reports of Indian companies. Accordingly,
the study rejects hypothesis H1.12, which expects to find a positive association between
ACEXP and the QFLID. This outcome is not in line with agency theory, which assumes that
the experienced audit committee is viewed as one of the monitoring agents within a company
which improves the quality of financial reporting (Fama, 1980; Fama & Jensen, 1983; Vafeas,
2000) and is useful in reducing agency costs (Archambeault, DeZoort, & Hermanson, 2008).
In the same vein, this result is not in line with the argument that the audit committee’s financial
expertise acts as a valuable tool in reducing financial misstatements (Abbott et al., 2004;
Beasley et al., 2009; Cohen et al., 2004) and evaluating the quality of financial reporting (Chen
et al., 2006; Cohen et al., 2004).
Empirically, this result is incompatible with past studies (Abbott et al., 2004; Kelton & Yang,
2008; Krishnan & Visvanathan, 2006; Liu, 2015; Smith, 2003) who found a positive and
significant association between ACEXP and disclosure.
Female Presence on the Audit committee (FPAC)
Table 5.4 reports a positive and significant relationship between FPAC and the QFLID at a
10% significance level (coef. = . 0186448, t = 1.70, p < 0.090). Therefore, the study accepts
hypothesis H1.13, which expects significant positive relationship between FPAC and the
QFLID among Indian listed companies. Additionally, the result supports agency theory, which
suggests gender diversity improves monitoring of management operations and reduces the
issue of information asymmetry (Carter et al., 2003a; Walt & Ingley, 2003). It also plays a vital
role in attaining crucial resources from dominant stakeholders (Ntim & Soobaroyen, 2013) and
raising the board’s reliability and the legitimacy of the company (Bear et al., 2010).

134
5.4.1.2. Control Variables (Firm-Specific Characteristics)
This study uses six corporate characteristics, namely Firm size (CSIZE), Leverage (LEVE),
Profitability (PRO), Liquidity (LIQUID), Growth (GROW) and Industry type (IndType) as
control variables. Table 5.4 presents statistical results of company characteristics derived by
using the panel data model. The multivariate findings reported that three firm-specific
characteristics (size, profitability, growth and liquidity) are significantly associated with the
QFLID, while leverage and industry type are not significant with the QFLID in Indian listed
companies.
The result of CSIZE coefficient shows that CSIZE is positively and significantly associated
with the QFLID (coef. = . 070423, t = 32.80, p < 0.000). This result is compatible with earlier
research (Albitar, 2015; Aljifri et al., 2014; Alkhatib, 2014; Al-Najjar & Abed, 2014; Barako,
2007; Celik et al., 2006; Dembo & Rasaratnam, 2014; Eng & Mak, 2003; Ferguson et al., 2002;
Haniffa & Cooke, 2002; Hossain et al., 2005; Kent & Ung, 2003; Khlif & Hussainey, 2016;
Liu, 2015; Soliman, 2013; Uyar & Kilic, 2012; Wang & Hussainey, 2013) who provide
evidence of a positive influence of CSIZE on corporate disclosure.
The regression result of PRO coefficient, in Table 5.4, illustrates that PRO has a positive and
significant impact on the QFLID among Indian companies at the level of 1% (coef. = .0243281,
t = 3.14, p < 0.002). The result of the current study is in line with prior research which found
a positive relationship between PRO and corporate disclosure (Albitar, 2015; Cerbioni &
Parbonetti, 2007; Charumathi & Ramesh, 2015a; Ghazali & Weetman, 2006; M. Haniffa &
Cooke, 2002; Khlif & Hussainey, 2016; Mathuva, 2012b; Soliman, 2013; Wang & Hussainey,
2013). Regarding LEVE, the results in Table 5.4 present no significant relationship between
LEVE and the QFLID in the annual reports of Indian companies (coef. = -.0032019, t = -0.64,
p < 0.524). The finding of the study is consistent with earlier research (Abraham & Cox, 2007;
Al-Najjar & Abed, 2014; Celik et al., 2006; Chow & Wong-Boren, 1987; Ho & Wong, 2001a;

135
Huafang & Jianguo, 2007; Menicucci, 2013a; Nekhili et al., 2012; Nekhili et al., 2016; Nor et
al., 2010; Uyar & Kilic, 2012; Wallace et al., 1994) which found no significant relationship
between LEVE and the extent of disclosure in annual reports.
In respect to LIQU, the regression result in Table 5.4 shows that LIQU and the QFLID is
negatively and significantly associated at a 1% significance level in annual reports of Indian
companies (coef. = -.0015061, t = -3.43, p < 0.001). The outcome of the present research is
compatible with Wallace et al. (1994); Naser et al. (2002) and Menicucci (2013c) who provide
evidence of negative association between LIQU and disclosure level. With regard to growth
the regression result in Table 5.4 shows that GROW and the QFLID is negatively and
significantly associated at a 1% significance level in annual reports of Indian companies (coef.
= -.005453, t = -3.08, p < 0.001). Regarding IndType, Table 5.4 shows that IndType is
insignificantly associated with QFLID in annual reports of Indian companies (coef. = .
0000221, t = 0.06, p < 0.949). The finding supports the results of Aljifri & Hussainey (2007);
Alqatamin et al. (2017); Eng & Mak (2003); and Mathuva (2012b).

136
Table 5. 4 Regression analysis of the association between CG mechanisms and QFLID
QFLID Coefficient Std. Err t- Statistics P ItI [95% Conf. Interval
. .. . . . . . . . . . . . . . . . . . . . . . . . . . . . . . . . . . . . . . . . . . . . . . . . . . . . . . . . . . . . . . . . . . . . . . . . . . . . . . . . . . . . . . . . . . . . . . . . . . . . . . . . . . . . . . . . . . . . . . . . . . . . . . . . . . . . . . . . . . . . . . . . . . . . . . . . . . . . . . . . . . . . . . . . . . . . . . . . . . . . . . . . . . . . . . . . . . . . . . . . . . . . . . . . . . . . . . . . . . . . . . . . . . . . . . . . . . . . . . . . . . . . . . . . . . . . . . . . . . . . . . . . . . . . . . . . . . . . . . . . . . . . .
BSIZE .0013898 .0004104 3.39 0.001*** .0005848 .0021947
DP .0001386 .0026724 0.05 0.959 -.0051026 .0053797
FBM .0016248 .0004115 3.95 0.000*** .0008178 .0024318
BI .0158821 .0079019 2.01 0.030** .0003847 .0313795
FPB .0467019 .0134034 3.48 0.001*** .0204148 .072989
BloOwn -.0066745 .0089365 -1.50 0.125 -.0031852 .0232016
InsOwn .0126049 .0101036 1.25 0.212 .0324203 .0072105
ProOwn -.0153797 .0103019 -1.49 0.136 -.0048245 .0355839
ACSIZE -.0093003 .0069778 -1.33 0.183 -.0229854 .0043848
ACM .0017793 .0006161 2.89 0.004*** .000571 .0029876
IAC .0013521 .0008138 1.66 0.097* -.000244 .0029483
ACFEXP .0039175 .0105508 0.37 0.710 -.0246101 .016775
FPAC .0186448 .0109832 1.70 0.090* -.0028956 .0401852
LEVE -.0032019 .0050227 -0.64 0.524 -.0130525 .0066487
PROF .0243281 .007742 3.14 0.002*** .0091443 .0395119
LIQU -.0015061 .0004394 -3.43 0.001*** -.0023678 -.0006443
GROW -.005453 .0017699 -3.08 0.002*** -.0089242 -.0019819
CSIZE .070423 .0021511 32.74 0.000*** .0662043 .0746418
IndType .0000221 .0003454 0.06 0.949 -.0006552 .00006994
R². Adjusted 0.4839
P. Value 0.0001 . . . . . . . . . . . . . . . . . . . . . . . . . . . . . . . . . . . . . . . . . . . . . . . . . . . . . . . . . . . . . . . . . . . . . . . . . . . . . . . . . . . . . . . . . . . . . . . . . . . . . . . . . . . . . . . . . . . . . . . . . . . . . . . . . . . . . . . . . . . . . . . . . . . . . . . . . . . . . . . . . . . . . . . . . . . . . . . . . . . . . . . . . . . . . . . . . . . . . . . . . . . . . . . . . . . . . . . . . . . . . . . . . . . . . . . . . . . .
QFLID denotes the quality of forward-looking disclosure. BSIZE denotes board size, measured by the number
of board members. DP denotes the CEO duality, a dummy variable: 1 if company’s CEO serves as a board
chairman, 0 otherwise. FBM denotes the frequency of board meetings during the year. BI denotes the
independence of board, measured by the ratio of the number of independent non-executive directors to the total
number of board members. FPB denotes the ratio of females’ presence on the board of directors. BloOwn denotes
blockholder ownership, measured by the ratio of shares held by blockholder (5% or more). InsOwn denotes
institutional ownership, measured by the ratio of shares held by institutional. ProOwn denotes promoter
ownership, measured by the ratio of shares held by promoters. ACSIZE denotes audit committee size, measured
by the number of audit committee members. ACM denotes the frequency of audit committee meetings during the
year. IAC denotes the independence of the audit committee, measured by the ratio of independent non-executive
directors on the audit committee. ACFEXP denotes audit committee financial experts, measured by the ratio of
audit committee members with financial experience to audit committee size. FPAC is the ratio of females’
presence in the audit committee. LEVE denotes the leverage ratio, measured by the ratio of a firm’s total debt
at the end of the year to total assets at the end of year. PROF denotes profitability. LIQU denotes liquidity,
measured as the ratio of the company’s current assets to its current liabilities. GROW is firm growth. CSIZE
denotes Firm size, measured by the natural logarithm of total assets. IndType denotes industry type; the sample
in this study is divided into eleven types of industry and is coded from 1 to 11.
*** Significant at the 1% level or better; ** Significant at the 5% level or better; * Significant at the 10% level
or better.

137
Table 5. 5 Summary of the Hypothesis Results Related to CG and QFLID
No Hypothesis Expected Relation
H1.1 There is a significant positive association between board size
and QFLID among Indian listed companies.
Accepted
H1.2 CEO duality and the QFLID are negatively and significantly
associated among Indian listed companies.
Rejected
H1.3 There is a significant positive association between the
percentage of board independence and the QFLID among
Indian listed companies.
Accepted
H1.4 There is a significant positive association between the number
of meetings and the QFLID among Indian listed companies.
Accepted
H1.5 There is a significant positive association between the
percentage of the presence of females on the board and the
QFLID among Indian listed companies.
Accepted
H1.6 There is a negative association between the level of block
holder ownership and the QFLID among Indian listed
companies.
Rejected
H1.7 There is a positive association between institutional ownership
and the QFLID among Indian listed companies.
Rejected
H1.8 There is a negative association between promoter ownership
and the QFLID among Indian listed companies.
Rejected
H1.9 There is a significant positive association between the audit
committee size and the QFLID among Indian listed
companies.
Rejected
H1.10 There is a positive association between audit committee
independence and the QFLID among Indian listed companies.
Accepted
H1.11 There is a positive association between the frequency of audit
committee meetings and the QFLID among Indian listed
companies.
Accepted
H1.12 There is a positive association between audit committee
financial expertise and the QFLID among Indian listed
companies.
Rejected
H1.13 There is a significant positive association between the
percentage of females’ presence on the audit committee and
the QFLID among Indian listed companies.
Accepted

138
5.5. Aditional Analysis:
To examine the robustness of the obtained outcomes, additional sensitivity tests are performed
to check the robustness of the prime analysis and, therefore, to confirm the reliability of the
findings. Sensitivity analysis is meant to examine how sensitive the findings are towards using
alternative model specifications or changing the statistical tests in the determination of the
QFLID. In order to avoid the correlation between block holder ownership (BloOwn) and
promoters’ ownership (ProOwn), as well as to examine whether the main findings are changed
or not, Model 1 of Table 5.4 is re-estimated by excluding block holder ownership (BloOwn) as
reported in Table 5.6.
Table 5.6 shows that the results of the impact of CG mechanisms and some of the control
variables on the QFLID after excluding BloOwn are consistent with the primary findings
presented in Table 5.4, showing that the main findings are reliable and robust under the
exclusion of BloOwn. This confirms that excluding BloOwn does not have an emotional impact
on the primary findings of CG mechanisims and other control variables on the QFLID, which
is similar to the primary finding. Overall, the results reported in Table 5.7 remain essentially
the same as those contained in the main model of Table 5.4.

139
Table 5. 6 Regression analysis of the association between CG mechanisms and QFLID
QFLID Coefficient Std. Err t- Statistics P ItI [95% Conf. Interval
. .. . . . . . . . . . . . . . . . . . . . . . . . . . . . . . . . . . . . . . . . . . . . . . . . . . . . . . . . . . . . . . . . . . . . . . . . . . . . . . . . . . . . . . . . . . . . . . . . . . . . . . . . . . . . . . . . . . . . . . . . . . . . . . . . . . . . . . . . . . . . . . . . . . . . . . . . . . . . . . . . . . . . . . . . . . . . . . . . . . . . . . . . . . . . . . . . . . . . . . . . . . . . . . . . . . . . . . . . . . . . . . . . . . . . . . . . . . . . . . . . . . . . . . . . . . . . . . . . . . . . . . . . . . . . . . . . . . . . . . . . . . . . .
BSIZE .0014276 .0004105 3.48 0.001*** .0006226 .0022326
DP .0001358 .0026544 0.12 0.961 -.0055215 .00489
FBM .0016248 .0004115 3.95 0.000*** .0008178 .0024318
BI .0158821 .0079019 2.01 0.028** .0003847 .0313795
FPB .0467019 .0134034 3.69 0.000*** .0204148 .072989
InsOwn .0100361 .097431 1.03 0.303 .0291444 .0090722
ProOwn -.014596 .0096762 -1.51 0.132 -.0043812 .0335731
ACSIZE -.0093003 .0069778 -1.33 0.125 -.0229854 .0043848
ACM .0017793 .0006161 2.89 0.004*** .000571 .0029876
IAC .0013521 .0008138 1.66 0.097* -.000244 .0029483
ACFEXP .0039175 .0105508 0.37 0.828 -.0246101 .016775
FPAC .0186448 .0109832 1.70 0.090* -.0028956 .0401852
LEVE -.0032019 .0050227 -0.54 0.592 -.0130525 .0066487
PROF .0243281 .007742 3.08 0.005*** .0091443 .0395119
LIQU -.0015061 .0004394 -3.43 0.002*** -.0023678 -.0006443
GROW -.005453 .0017699 -3.08 0.002*** -.0089242 -.0019819
CSIZE .070423 .0021511 32.74 0.000*** .0662043 .0746418
IndType .0000973 .0003456 0.29 0.774 -.0006552 .00006994
R². Adjusted 0.4832
P. Value 0.0001 . . . . . . . . . . . . . . . . . . . . . . . . . . . . . . . . . . . . . . . . . . . . . . . . . . . . . . . . . . . . . . . . . . . . . . . . . . . . . . . . . . . . . . . . . . . . . . . . . . . . . . . . . . . . . . . . . . . . . . . . . . . . . . . . . . . . . . . . . . . . . . . . . . . . . . . . . . . . . . . . . . . . . . . . . . . . . . . . . . . . . . . . . . . . . . . . . . . . . . . . . . . . . . . . . . . . . . . . . . . . . . . . . . . . . . . . . . . .
QFLID denotes the quality of forward-looking disclosure. BSIZE denotes board size, measured by the number
of board members. DP denotes the CEO duality, a dummy variable: 1 if company’s CEO serves as a board
chairman, 0 otherwise. FBM denotes the frequency of board meetings during the year. BI denotes the
independence of board, measured by the ratio of the number of independent non-executive directors to the total
number of board members. FPB denotes the ratio of females’ presence on the board of directors. InsOwn denotes
institutional ownership, measured by the ratio of shares held by institutional. ProOwn denotes promoter
ownership, measured by the ratio of shares held by promoters. ACSIZE denotes audit committee size, measured
by the number of audit committee members. ACM denotes the frequency of audit committee meetings during the
year. IAC denotes the independence of the audit committee, measured by the ratio of independent non-executive
directors on the audit committee. ACFEXP denotes audit committee financial experts, measured by the ratio of
audit committee members with financial experience to audit committee size. FPAC is the ratio of females’
persence in the audit committee. LEVE denotes the leverage ratio, measured by the ratio of a firm’s total debt
at the end of the year to total assets at the end of year. PROF denotes profitability. LIQU denotes liquidity,
measured as the ratio of the company’s current assets to its current liabilities. GROW is firm growth. CSIZE
denotes Firm size, measured by the natural logarithm of total assets. IndType denotes industry type; the sample
in this study is divided into eleven types of industry and is coded from 1 to 11.
*** Significant at the 1% level or better; ** Significant at the 5% level or better; * Significant at the 10% level
or better.
140
5.6. Endogeneity Problems
If one or more variables are linked with error terms, that leads to endogeneity problems (Gippel,
Smith, & Zhu, 2015; Reeb, Sakakibara, & Mahmood, 2012; Schultz, Tan, & Walsh, 2010).
The validity of findings from regression results becomes contradictory in the presence of
endogeneity (Larcker & Rusticus, 2010; Wintoki, Linck, & Netter, 2012).
As stated by Wang & Hussainey (2013), a positive relationship between CG and extent of FLID
may occur due to imperfectly measured factors, hence impacting both governance and
disclosure. Ammann et al. (2011a) highlight that an endogeneity problem makes it difficult to
examine the impact of CG on corporate voluntary disclosure and financial performance.
There are three main errors that occur due to endogeneity, termed as: simultaneity, omitted
variables and measurement errors (Brown & Hillegeist, 2007; Choi, Lee, & Park, 2013;
Moumen, Othman, & Hussainey, 2015; Ntim et al., 2013; Reeb et al., 2012; Schultz et al.,
2010). Firstly, the error of simultaneity occurs when a dependent variable affects one or more
explanatory variables (Choi, Kwak, & Choe, 2010; Gippel et al., 2015; McKnight & Weir,
2009; Ntim et al., 2012; Schultz et al., 2010). Secondly, the omission of variables arises when
some unobserved omitted variables that are involved in regression that are have an impact on
the association of two or more variables; such omitted variables are difficult to quantify (Ntim
et al., 2012; Schultz et al., 2010; Wooldridge, 2015). Finally, if the key variables are not
measured accurately, the study will lead to measurement error (Gippel et al., 2015; Larcker &
Rusticus, 2010; Omar & Simon, 2011). The endogeneity problem must be taken into
consideration as it leads to inefficient, inconsistent and biased inferences while examining the
relationship between CG mechanisms and the QFLID.
In order to address endogeneity problems, earlier research has used two econometric methods
(Ammann, Oesch, & Schmid, 2011b; Beiner et al., 2006; Carter et al., 2003b; Moumen et al.,
2015; Ntim et al., 2012; Ntim, 2015; Sheu et al., 2010; Shi et al., 2014). Firstly, employing a
141
lagged structure to tackle the simultaneity error and omitted variables (Ammann et al., 2011b;
Elmagrhi et al., 2016; Ntim et al., 2012). Then, an Instrumental Variable (IV) is used to deal
with issues occurring due to measurement errors and omitted variables (Black et al., 2006;
Renders, Gaeremynck, & Sercu, 2010). Based on this, the present study uses the lagged values
of the endogenous independent variable (CG) as an IV to investigate whether or not the
endogeneity issue affects the relationship between CG and the QFLID.
The study conducts Durbin and Wu-Hausman tests to examine whether there is an existence of
biasedness for independent and endogenous variables (Beiner et al., 2006; Elmagrhi et al.,
2016; Gujarati, 2008; Moumen et al., 2015; Ntim, 2015). The test presents that the null
hypothesis which expects no endogeneity between CG (independent variable) and FLID
(dependent variable) is rejected (see appendix 5.3). Therefore, the existence of such a problem
may affect the findings thus leading to ineffective, biased and inconsistent results. The result
of the two-stage (2SLS) regression of CG on QFLID is reported in Table 5.7.
Table 5.7 presents that coefficients of explanatory variables in the lagged model have similar
significance and magnitude as the un-lagged structure estimation model in Table 5.4. The
findings of the instrumental variable two-stage model are compatible with the main outcomes
presented in Table 5.4, indicating that an endogeneity problem between CG mechanisims and
QFLID does not impact the primary findings of CG mechanisims and other control variables
on the QFLID. Overall, the robustness analyses denote that the findings of the present research
are fairly robust.

142
Table 5. 7 Instrumental variables Two-Stage (2SLS) regression model based on QFLID
QFLID Coefficient Std. Err t- Statistics P ItI [95% Conf. Interval
. . . . . . . . . . . . . . . . . . . . . . . . . . . . . . . . . . . . . . . . . . . . . . . . . . . . . . . . . . . . . . . . . . . . . . . . . . . . . . . . . . . . . . . . . . . . . . . . . . . . . . . . . . . . . . . . . . . . . . . . . . . . . . . . . . . . . . . . . . . . . . . . . . . . . . . . . . . . . . . . . . . . . . . . . . . . . . . . . . . . . . . . . . . . . . . . . . . . . . . . . . . . . . . . . . . . . . . . . . . . . . . . . . . . . . . . . .
BSIZE .0002798 .0007359 2.38 0.051** -.0011625 .0017221
DP .0023848 .004175 0.57 0.568 -.0105676 .005798
FBM .0017658 .00013543 1.98 0.090* .0008887 .0044202
BI .0557027 .0200437 2.78 0.005*** .0949877 .0164178
FPB .0807793 .0311046 2.60 0.009*** .0198155 .1417431
BloOwn .0093216 .0089365 1.30 0.218 -.041852 .033201
InsOwn .0260493 .0161367 1.45 0.115 .0324987 .0172675
ProOwn -.0153797 .0115437 -2.34 0.097* -.1401675 -.0660728
ACSIZE -.0038572 .0028155 -1.37 0.171 -.0093754 .001661
ACM .0012761 .0018369 1.69 0.087* .0048763 .0023242
IAC .0012407 .0016019 1.50 0.099* -.008976 .0538174
ACFEXP .0044971 .0206511 0.22 0.828 -.0359782 .0449725
FPAC .073406 .0275177 2.67 0.008*** .0194722 .1273397
LEVE .0298324 .0077671 0.84 0.000*** .146091 .0450556
PROF .0680175 .0173358 3.92 0.000*** .03404 .101995
LIQU -.0056774 .001024 -5.54 0.000*** -.0076844 -.0036704
GROW -.005453 .0017699 -3.01 0.009*** -.0089242 -.0019819
CSIZE .0021485 .0027809 0.77 0.440 .0075989 .0033019
IndType .0000568 .0034348 0.14 0.880 -.0006678 .00006765
. . . . . . . . . . . . . . . . . . . . . . . . . . . . . . . . . . . . . . . . . . . . . . . . . . . . . . . . . . . . . . . . . . . . . . . . . . . . . . . . . . . . . . . . . . . . . . . . . . . . . . . . . . . . . . . . . . . . . . . . . . . . . . . . . . . . . . . . . . . . . . . . . . . . . . . . . . . . . . . . . . . . . . . . . . . . . . . . . . . . . . . . . . . . . . . . . . . . . . . . . . . . . . . . . . . . . . . . . . . . . . . . . . . . . . . . . . . .
R². Adjusted 0.3645
P. Value 0.0001
QFLID denotes the quality of forward-looking disclosure. BSIZE denotes board size, measured by the number
of board members. DP denotes the CEO duality, a dummy variable: 1 if company’s CEO serves as a board
chairman, 0 otherwise. FBM denotes the frequency of board meetings during the year. BI denotes the
independence of board, measured by the ratio of the number of independent non-executive directors to the total
number of board members. FPB denotes the ratio of females’ presence on the board of directors. BloOwn denotes
blockholder ownership, measured by the ratio of shares held by blockholder (5% or more). InsOwn denotes
institutional ownership, measured by the ratio of shares held by institutional. ProOwn denotes promoter
ownership, measured by the ratio of shares held by promoters. ACSIZE denotes audit committee size, measured
by the number of audit committee members. ACM denotes the frequency of audit committee meetings during the
year. IAC denotes the independence of the audit committee, measured by the ratio of independent non-executive
directors on the audit committee. ACFEXP denotes audit committee financial experts, measured by the ratio of
audit committee members with financial experience to audit committee size. FPAC is the ratio of females’
presence in the audit committee. LEVE denotes the leverage ratio, measured by the ratio of a firm’s total debt
at the end of the year to total assets at the end of year. PROF denotes profitability. LIQU denotes liquidity, measured as the ratio of the company’s current assets to its current liabilities. GROW is firm growth. CSIZE
denotes Firm size, measured by the natural logarithm of total assets. IndType denotes industry type; the sample
in this study is divided into eleven types of industry and is coded from 1 to 11.
*** Significant at the 1% level or better; ** Significant at the 5% level or better; * Significant at the 10% level
or better.

143
5.7. Summary
To achieve the first objective of the current research, this chapter examines the association
between CG mechansims and QFLID in non-financial Indian listed companies for the period
2006-2015. In doing so, this study used three CG mechanisms, namely board of directors’
characteristics (board size, CEO duality, board meeting, board independence and presence of
female members on the board), ownership structure (blockholder ownership, institution
ownership and promoters’ ownership) and audit committee (audit committee size, audit
committee independence, audit committee financial expertise, audit committee meetings and
females’ presence on the audit committee). Furthermore, this study uses the firm’s
characteristics (firm size, profitability, leverage, liqudity, growth and industry type) as control
variables to include in the regression model. In general, the results show that CG variables are
associated with QFLID. Moreover, the study uses previous literature and theoretical framework
related to CG mechanisms and QFLID to explain the result of the regression model.
Additionally, the findings related to endogeneity problems showed no impact on the main
statistical analysis. Sensitivity analysis confirms the consistency and generalisation of this
study’s findings.

144
Chapter Six: The consequences of QFLID
6.1. Introduction
The present chapter focuses on the consequences of QFLID and addresses the second and third
objectives. In doing so, the chapter is classified into two sections. The first section, 6.4, deals
with the second objective, examining the impact of QFLID on FV. The second section, 6.5,
deals with the third objective, examining the impact of QFLID on ACUAF. To achieve this
purpose, this chapter begins with descriptive statistics in section 6.2, followed by
multicollinearity in section 6.3. Section 6.4 discusses the results and dissection of examining
the impact of QFLID on FV. Section 6.5 covers the results and dissection of examining the
impact of QFLID on ACUAF. Moreover, section 6.6 provides additional analyses. Section 6.7
provides the robustness test. Section 6.8 deals with the endogeneity problem and, finally, the
chapter ends with the summary in section 6.9.
6.2. Descriptive Statistics
The total number of observations; mean, median, standard deviation, minimum and maximum
values for all variables utilised in this study, are presented in Table 6.1.
Regarding the dependent variable TQ ratio (as proxy for FV), Table 6.1 illustrates that the TQ
ratio ranges from 0.011 to 9.787 with an average of 1.940 for the overall sample, and with a
median of 1.415. This finding is closer to the result of Ganguli & Agrawal (2009), who reported
a value of 2.083 and 1.778 value for the mean and median of the TQ ratio respectively, among
Indian listed companies. Likewise, this outcome is consistent with the findings of Clacher et
al. (2008), who documented that the overall mean of the TQ ratio is 1.38 among UK listed
companies. Similarly, Darko et al. (2016) reported that the average of the TQ ratio is 1.45
among Ghanaian listed firms. In addition, the result is relatively similar to the finding of Chung

145
et al. (2015), who report that the mean value is 1.40 among Taiwanese companies and ranges
from 0.29 to 12.87.
Concerning the dependent variable ACUAF, Table 6.1 illustrates that the ACUAF ratio ranges
from -.767 to .000 with an average of -.036 for the overall sample, and with a median of -.002.
The result is relatively similar to the findings of Lang & Lundholm (1996) who report that the
mean value is -.042.
In terms of the independent variable (QFLID), the maximum FLID score is 68% while the
minimum score is 0%, which is similar to the results of Aljifri and Hussainey (2007). They
reported that value of FLID ranges from 0% to 70% among UAE firms. The mean value of the
QFLID is 50.70%, which is higher than the averages reported by Bozanic et al (2013);
Charumathi & Ramesh (2015a) and Menicucci (2013c), who documented that the overall mean
of FLID is 31.4%, 42.12% and 32.5% in US, Indian and Italian companies respectively.
Notably, the average is closer to Sartawi et al. (2014), who reported that the overall mean of
voluntary disclosure in Jordanian companies was 49%. Furthermore, the median value of
QFLID is 51.49%, which is closer to Nalikka’s (2009) score of 50.46% among Finnish listed
companies.
Regarding control variables (firm characteristics); the average company size is 7.595252
ranging widely from 5.115201 to 9.744242. In addition, leverage ranges from .00036% to 99%,
with a mean leverage value of 51.96%. The table also shows that the overall mean of liquidity
(current ratio) is 2%, with a minimum value of 0.13 and a maximum value of 22. Furthermore,
profitability ranges from -84% (loss) to 99% (profit) with a mean of 10%. GROW ranges from
-.49 to 2.57 with a mean of .25. Concerning the industry type, the minimum and maximum
values are 1 and 11, respectively.
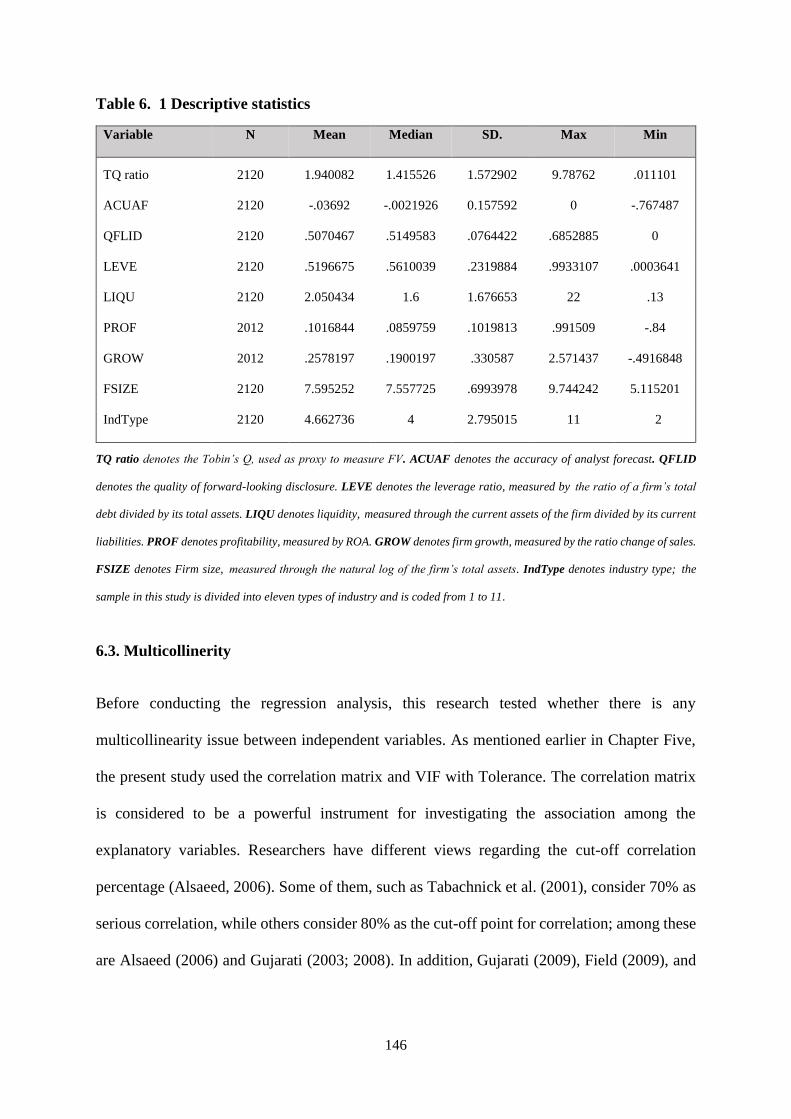
146
Table 6. 1 Descriptive statistics
Variable N Mean Median SD. Max Min
. . . . . . . . . . . . . . . . . . . . . . . . . . . . . . . . . . . . . . . . . . . . . . . . . . . . . . . . . . . . . . . . . . . . . . . . . . . . . . . . . . . . . . . . . . . . . . . . . . . . . . . . . . . . . . . . . . . . . . . . . . . . . . . . . . . . . . . . . . . . . . . . . . . . . . . . . . . . . . . . . . . . . . . . . . . . . . . . . . . . . . . . . . . . . . . . . . . . . . . . . . . . . . . . . . . . . . . . . . . . . . . . . . . . . . . . . . . . . . . . . . . . . . . . . . . . . . . . . . . . . . . . . . . . . . . . . . . . . . . . . . . . . . . . . . . . .
TQ ratio 2120 1.940082 1.415526 1.572902 9.78762 .011101
ACUAF 2120 -.03692 -.0021926 0.157592 0 -.767487
QFLID 2120 .5070467 .5149583 .0764422 .6852885 0
LEVE 2120 .5196675 .5610039 .2319884 .9933107 .0003641
LIQU 2120 2.050434 1.6 1.676653 22 .13
PROF 2012 .1016844 .0859759 .1019813 .991509 -.84
GROW 2012 .2578197 .1900197 .330587 2.571437 -.4916848
FSIZE 2120 7.595252 7.557725 .6993978 9.744242 5.115201
IndType 2120 4.662736 4 2.795015 11 2
. . . . . . . . . . . . . . . . . . . . . . . . . . . . . . . . . . . . . . . . . . . . . . . . . . . . . . . . . . . . . . . . . . . . . . . . . . . . . . . . . . . . . . . . . . . . . . . . . . . . . . . . . . . . . . . . . . . . . . . . . . . . . . . . . . . . . . . . . . . . . . . . . . . . . . . . . . . . . . . . . . . . . . . . . . . . . . . . . . . . . . . . . . . . . . . . . . . . . . . . . . . . . . . . . . . . . . . . . . . . . . . . . . . . . . . . . . . . . . . . . . . . . . . . . . . . . . . . . . . . . . . . . . . . .
TQ ratio denotes the Tobin’s Q, used as proxy to measure FV. ACUAF denotes the accuracy of analyst forecast. QFLID
denotes the quality of forward-looking disclosure. LEVE denotes the leverage ratio, measured by the ratio of a firm’s total
debt divided by its total assets. LIQU denotes liquidity, measured through the current assets of the firm divided by its current
liabilities. PROF denotes profitability, measured by ROA. GROW denotes firm growth, measured by the ratio change of sales.
FSIZE denotes Firm size, measured through the natural log of the firm’s total assets. IndType denotes industry type; the
sample in this study is divided into eleven types of industry and is coded from 1 to 11.
6.3. Multicollinerity
Before conducting the regression analysis, this research tested whether there is any
multicollinearity issue between independent variables. As mentioned earlier in Chapter Five,
the present study used the correlation matrix and VIF with Tolerance. The correlation matrix
is considered to be a powerful instrument for investigating the association among the
explanatory variables. Researchers have different views regarding the cut-off correlation
percentage (Alsaeed, 2006). Some of them, such as Tabachnick et al. (2001), consider 70% as
serious correlation, while others consider 80% as the cut-off point for correlation; among these
are Alsaeed (2006) and Gujarati (2003; 2008). In addition, Gujarati (2009), Field (2009), and

147
Gujarati (2003), highlight that if the VIF value is greater than 10 and the coefficient of
Tolerance is above 10%, multicollinearity is expected to be a problem.
Tables 6.2 and 6.3 below illustrate the correlation matrix between independent variables
(QFLID and control variables). The results presented in Tables 6.2 and 6.3 illustrate that the
highest correlations are between the LEVE and LIQU, with a coefficient of 22.1%, and between
LEVE and PROF, with a coefficient of 25.9%, respectively. These are less than the cut-off
correlation percentage, indicating that there is no multicollinearity between independent
variables (Gujarati, 2008; Tabachnick et al., 2001). Therefore, the problem of multicollinearity
does not exist among the data set used in these models. Furthermore, the outcomes of the VIF
test, reported in Tables 6.4 and 6.5, show that the maximum values of VIF are very low (1.11)
and (1.05), with means of 1.15 and 1.07, respectively. Thus, the findings of the VIF test confirm
that the multicollinearity problem does not exist in these models.
Table 6. 2 Correlation Matrix (QFLID and TQ ratio).
TQ ratio QFLID LEVE LIQU GROW FSIZE IndType
TQ ratio 1.000 . . . . . . . . . . . . . . . . . . . . . . . . . . . . . . . . . . . . . . . . . . . . . . . . . . . . . . . . . . . . . . . . . . . . . . . . . . . . . . . . . . . . . . . . . . . . . . . . . . . . . . . . . . . . . . . . . . . . . . . . . . . . . . . . . . . . . . . . . . . . . . . . . . . . . . . . . . . . . . . . . . . . . . . . . . . . . . . . . . . . . . . . . . . . . . . . . . . . . . . . . . . . . . . . . . . . . . . . . .
QFLID 0.024 1.000 . . . . . . . . . . . . . . . . . . . . . . . . . . . . . . . . . . . . . . . . . . . . . . . . . . . . . . . . . . . . . . . . . . . . . . . . . . . . . . . . . . . . . . . . . . . . . . . . . . . . . . . . . . . . . . . . . . . . . . . . . . . . . . . . . . . . . . . . . . . . . . . . . . . . . . . . . . . . . . . . . . . . . . . . . . . . . . . . . . . . .
LEVE -0.005 0.113*** 1.000
LIQU 0.052** -0.140*** -0.221*** 1.000
GROW -0.028 0.058** 0.008 0.109*** 1.000
FSIZE -0.191*** 0.032 -0.044* -0.164*** -0.019 1.000
IndType 0.013*** -0.092** -0.098** 0.008 0.005 -0.001 1.000
. . . . . . . . . . . . . . . . . . . . . . . . . . . . . . . . . . . . . . . . . . . . . . . . . . . . . . . . . . . . . . . . . . . . . . . . . . . . . . . . . . . . . . . . . . . . . . . . . . . . . . . . . . . . . . . . . . . . . . . . . . . . . . . . . . . . . . . . . . . . . . . . . . . . . . . . . . . . . . . . . . . . . . . . . . . . . . . . . . . . . . . . . . . . . . . . . . . . . . . . . . . . . . . . . . . . . . . . . . . . . . . . . . . . . . . . . . . . . . . . . . . . . . . . . . . . . . . . . . . . . . . . . . . . . . . . . . . . . . . . . . . . . . . . . . . . .
TQ ratio denotes the Tobin’s Q, uses as proxy to measure FV. QFLID denotes the quality of forward-looking disclosure.
LEVE denotes the leverage ratio, measured by the ratio of a firm’s total debt divided by its total assets. LIQU denotes
liquidity, measured through the current assets of the firm divided by its current liabilities. PROF denotes profitability,
measured by ROA. GROW denotes firm growth, measured by the ratio change of sales. FSIZE denotes Firm size, measured
through the natural log of firm’s total assets. IndType denotes industry type, the sample in this study is divided into eleven
types of industry and is coded from 1 to 11. *** Significant at the 0.01 level; ** Significant at the 0.05 level; * Significant at
the 0.10 level.

148
Table 6. 3 Correlation Matrix (QFLID and ACUAF).
ACUAF QFLID LEVE LIQU PROF GROW FSIZE IndType
ACUAF 1.000 . . . . . . . . . . . . . . . . . . . . . . . . . . . . . . . . . . . . . . . . . . . . . . . . . . . . . . . . . . . . . . . . . . . . . . . . . . . . . . . . . . . . . . . . . . . . . . . . . . . . . . . . . . . . . . . . . . . . . . . . . . . . . . . . . . . . . . . . . . . . . . . . . . . . . . . . . . . . . . . . . . . . . . . . . . . . . . . . . . . . . . . . . . . . . . . . . . . . . . . . . . . . . . . . . . . . . . . . . . . . . . . .
QFLID 0.076** 1.000 . . . . . . . . . . . . . . . . . . . . . . . . . . . . . . . . . . . . . . . . . . . . . . . . . . . . . . . . . . . . . . . . . . . . . . . . . . . . . . . . . . . . . . . . . . . . . . . . . . . . . . . . . . . . . . . . . . . . . . . . . . . . . . . . . . . . . . . . . . . . . . . . . . . . . . . . . . . . . . . . . . . . . . . . . . . . . . . . . . . . . . . . . . . . .
LEVE -0.020 0.113*** 1.000 . . . . . . . . . . . . . . . . . . . . . . . . . . . . . . . . . . . . . . . . . . . . . . . . . . . . . . . . . . . . . . . . . . . . . . . . . . . . . . . . . . . . . . . . . . . . . . . . . . . . . . . . . . . . . . . . . . . . . . . . . . . . . . . . . . . . . . . . . . . . . . . . . . . . . . . . . ..
LIQU 0.017 -0.140*** -0.221*** 1.000
PROF -0.002 0.049** -0.259*** 0.093*** 1.000
GROW 0.004 0.058** 0.008 0.109*** 0.023 1.000
FSIZE -0.006 0.032 -0.044* -0.164*** -0.051* -0.019 1.000
IndType 0.010*** -0.092** -0.098** 0.000** 0.023 0.005 -0.001 1.000
ACUAF denotes the accuracy of analyst forecast. QFLID denotes the quality of forward-looking disclosure. LEVE denotes
the leverage ratio, measured by the ratio of a firm’s total debt divided by its total assets. LIQU denotes liquidity, measured
through the current assets of the firm divided by its current liabilities. PROF denotes profitability, measured by ROA. GROW
denotes firm growth, measured by the ratio change of sales. FSIZE denotes Firm size, measured through the natural log of
the firm’s total assets. IndType denotes industry type, the sample in this study is divided into eleven types of industry and is
coded from 1 to 11. *** Significant at the 0.01 level; ** Significant at the 0.05 level; * Significant at the 0.10 level.
Table 6. 4 VIF Test Results (QFLID and TQ ratio).
Variable VIF Tolerance 1/VIF
. . . . . . . . . . . . . . . . . . . . . . . . . . . . . . . . . . . . . . . . . . . . . . . . . . . . . . . . . . . . . . . . . . . . . . . . . . . . . . . . . . . . . . . . . . . . . . . . . . . . . . . . . . . . . . . . . . . . . . . . . . . . . . . . . . . . . . . . . . . . . . . . . . . . . . . . . . . . . . . . . . . . . . . . . . . . . . . . . . . . . . . . . . . . . . . . . . . . . . . . . . . . . . . . . . . . . . . . . . . . . . . . . . . . . . . . . . . . . . . . . . . . . . . . . . . . . . . . . . . . . . . . . . . . . . . . . . .
QFLID 1.04 0.963706
LEVE 1.08 0.927782
LIQU 1.11 0.897190
GROW 1.02 0.984619
CSIZE 1.04 0.965688
IndType 1.02 0.984619
Mean VIF 1.05
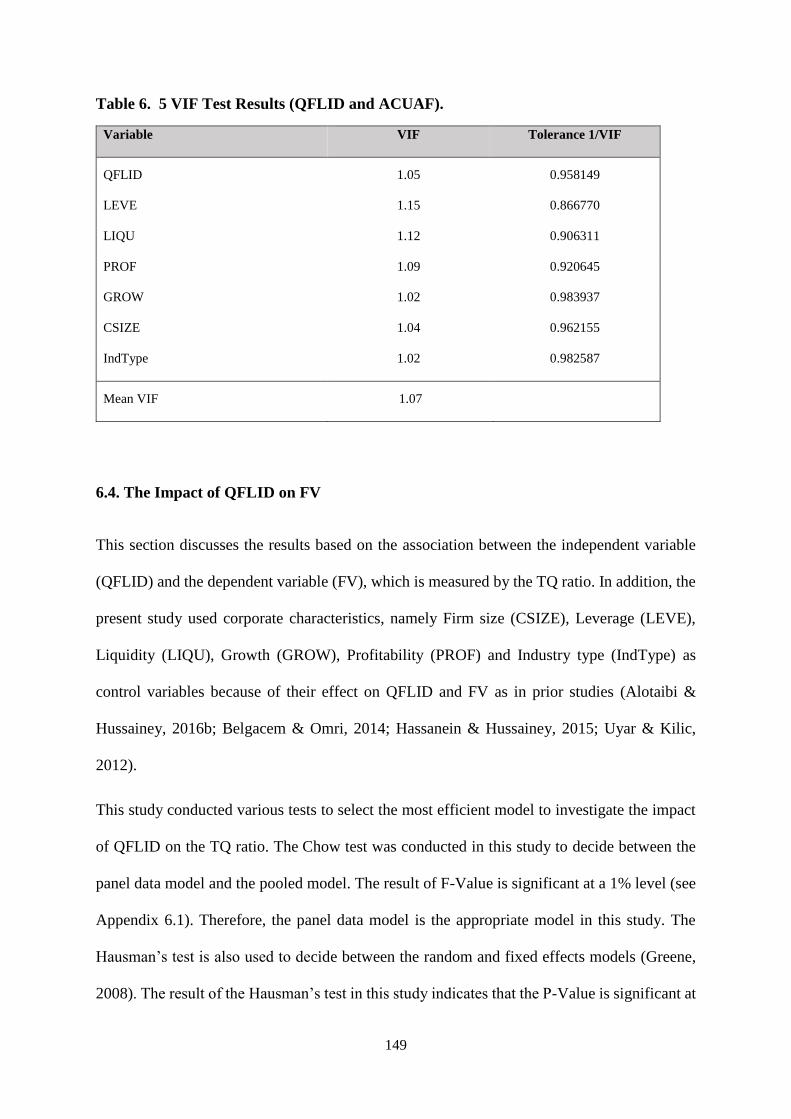
149
Table 6. 5 VIF Test Results (QFLID and ACUAF).
Variable VIF Tolerance 1/VIF
. . . . . . . . . . . . . . . . . . . . . . . . . . . . . . . . . . . . . . . . . . . . . . . . . . . . . . . . . . . . . . . . . . . . . . . . . . . . . . . . . . . . . . . . . . . . . . . . . . . . . . . . . . . . . . . . . . . . . . . . . . . . . . . . . . . . . . . . . . . . . . . . . . . . . . . . . . . . . . . . . . . . . . . . . . . . . . . . . . . . . . . . . . . . . . . . . . . . . . . . . . . . . . . . . . . . . . . . . . . . . . . . . . . . . . . . . . . . . . . . . . . . . . . . . . . . . . . . . . . . . . . . . . . . . . . . . . .
QFLID 1.05 0.958149
LEVE 1.15 0.866770
LIQU 1.12 0.906311
PROF 1.09 0.920645
GROW 1.02 0.983937
CSIZE 1.04 0.962155
IndType 1.02 0.982587
. . . . . . . . . . . . . . . . . . . . . . . . . . . . . . . . . . . . . . . . . . . . . . . . . . . . . . . . . . . . . . . . . . . . . . . . . . . . . . . . . . . . . . . . . . . . . . . . . . . . . . . . . . . . . . . . . . . . . . . . . . . . . . . . . . . . . . . . . . . . . . . . . . . . . . . . . . . . . . . . . . . . . . . . . . . . . . . . . . . . . . . . . . . . . . . . . . . . . . . . . . . . . . . . . . . . . . . . . . . . . . . . . . . . . . . . . . . . . . . . . . . . . . . . . . . . . . . . . . . . . . . . . . . . . . . . . . .
Mean VIF 1.07
6.4. The Impact of QFLID on FV
This section discusses the results based on the association between the independent variable
(QFLID) and the dependent variable (FV), which is measured by the TQ ratio. In addition, the
present study used corporate characteristics, namely Firm size (CSIZE), Leverage (LEVE),
Liquidity (LIQU), Growth (GROW), Profitability (PROF) and Industry type (IndType) as
control variables because of their effect on QFLID and FV as in prior studies (Alotaibi &
Hussainey, 2016b; Belgacem & Omri, 2014; Hassanein & Hussainey, 2015; Uyar & Kilic,
2012).
This study conducted various tests to select the most efficient model to investigate the impact
of QFLID on the TQ ratio. The Chow test was conducted in this study to decide between the
panel data model and the pooled model. The result of F-Value is significant at a 1% level (see
Appendix 6.1). Therefore, the panel data model is the appropriate model in this study. The
Hausman’s test is also used to decide between the random and fixed effects models (Greene,
2008). The result of the Hausman’s test in this study indicates that the P-Value is significant at

150
a 1% level (P-Value = 0.000) and, hence, the null hypotheses (fixed effects) is accepted.
Accordingly, the fixed effect model is preferred (see Appendix 6.3).
Table 6.6 illustrates that the value of R2 is 18.12%. The R2 value shows that the combination
of the independent variables (QFLID), with the company characteristics as control variables,
demonstrate 18.12% of variation in the dependent variable (FV). This result is considered
favourable compared with similar studies, such as Hassanein & Hussainey (2015) at R2
14.51%. Table 6.6 also indicates that the P-Value is significantly higher (0.001), indicating that
this model has a good explanatory power for the model utilised in the primary analysis.
To examine the second objective of this study, Table 6.6 shows that the coefficient of QFLID
is significantly and positively associated with the TQ ratio (coef. = 5.156462, t = 5.63, p <
0.000). As expected, this finding provides evidence that FV should be increased as a result of
quality of FLID through either decreasing the cost of capital, or increasing the cash flow to its
shareholders, or both (Elzahar et al., 2015). Consequently, firms with a high QFLID are more
likely to increase FV than those with a low QFLID. The study finding is also consistent with
suggestions that a positive influence in terms of enhanced disclosure upon firm valuation,
through the mitigation of information asymmetry between managers and shareholders (Healy
et al., 1999). Furthermore, this finding is in line with the argument that the quality of disclosure
is value-relevant information to market participants (Baek et al., 2004; Healy et al., 1999). This
finding supports the hypothesis H2, that there is a positive and significant association between
QFLID and FV in Indian listed companies. Accordingly, the current study accepts hypothesis
H2.
In relation to theoretical underpinning, the result of QFLID on FV is consistent with the agency
theory, suggesting that the information released by FLID mitigates the information asymmetry,
which leads to reduction in the agency costs (Hassanein & Hussainey, 2015; Kuzey, 2018).
This decreases the uncertainty related to a firm’s future performance and thereby minimises

151
the private benefits that controlling shareholders and management could possibly use to
increase the anticipated cash flow to shareholders, which leads to higher FV (Hassanein &
Hussainey, 2015; Kuzey, 2018; Sheu et al., 2010). In addition, the study result is in line with
the signalling theory, which assumes that managers disclose more FLID to mitigate information
asymmetry between managers and investors, also among the stock market participants, hence
improve FV (Elzahar & Hussainey, 2012; Kuzey, 2018; Wang & Hussainey, 2013).
Empirically, the result of QFLID on the TQ ratio is in line with several previous studies
(Cheung et al., 2010; Elzahar et al., 2015; Mendes-Da-Silva & de Lira Alves, Luiz Alberto,
2004; Nekhili et al., 2016; Plumlee et al., 2015; Uyar & Kiliç, 2012; Wang & Hussainey, 2013)
who found a positive association between voluntary disclosure and FV.
Concerning control variables, as can be seen in Table 6.6 the regression result shows that the
coefficients of CSIZE and LIQU are positively and significantly associated with the TQ ratio
(coef. = 1.452718, t = 13.85, p < 0.000), (coef. = .0300039, t = 1.70, p < 0.088), respectively.
On the other hand, the coefficients of LEVE, GROW and IndType have no relationship with
the TQ ratio (coef. = . 0283899, t = 0.14, p < 0.886), (coef. = -.0630588, t = -0.89, p < 0.376),
(coef. = . 0183764, t = 1.33, p < 0.182), respectively.

152
Table 6. 6 Regression analysis of the association between QFLID and the TQ ratio.
TQ ratio Coefficient Std. Err t- Statistics P ItI [95% Conf. Interval
. . . . . . . . . . . . . . . . . . . . . . . . . . . . . . . . . . . . . . . . . . . . . . . . . . . . . . . . . . . . . . . . . . . . . . . . . . . . . . . . . . . . . . . . . . . . . . . . . . . . . . . . . . . . . . . . . . . . . . . . . . . . . . . . . . . . . . . . . . . . . . . . . . . . . . . . . . . . . . . . . . . . . . . . . . . . . . . . . . . . . . . . . . . . . . . . . . . . . . . . . . . . . . . . . . . . . . . . . . . . . . . . . . . . . . . . . . . . .
QFLID 5.156462 .9159874 5.63 0.000*** 3.360008 6.952915
LEVE .0283899 .1987695 0.14 0.886 -.3614409 .4182207
LIQU .0300039 .0175977 1.70 0.088* .0645169 .0045091
GROW -.0630588 .0711498 -.89 0.376 -.2025986 .076481
CSIZE 1.452718 .1048622 13.85 0.000*** 1.658376 1.24706
IndType .0183764 .0137708 1.33 0.182 -.0086311 .0453839
. . . . . . . . . . . . . . . . . . . . . . . . . . . . . . . . . . . . . . . . . . . . . . . . . . . . . . . . . . . . . . . . . . . . . . . . . . . . . . . . . . . . . . . . . . . . . . . . . . . . . . . . . . . . . . . . . . . . . . . . . . . . . . . . . . . . . . . . . . . . . . . . . . . . . . . . . . . . . . . . . . . . . . . . . . . . . . . . . . . . . . . . . . . . . . . . . . . . . . . . . . . . . . . . . . . . . . . . . . . . . . . . . . . . . . . . .
R². Adjusted 0.1812
P. Value 0.001
. . . . . . . . . . . . . . . . . . . . . . . . . . . . . . . . . . . . . . . . . . . . . . . . . . . . . . . . . . . . . . . . . . . . . . . . . . . . . . . . . . . . . . . . . . . . . . . . . . . . . . . . . . . . . . . . . . . . . . . . . . . . . . . . . . . . . . . . . . . . . . . . . . . . . . . . . . . . . . . . . . . . . . . . . . . . . . . . . . . . . . . . . . . . . . . . . . . . . . . . . . . . . . . . . . . . . . . . . . . . . . . . . . . . . . . . . . . . . . . . . . . . . . . . . . . . . . . . . . . . . . . . . . . . . . . . . . . . . . . . . . . . . . . . . . . . . . . . . .
TQ ratio denotes the Tobin’s Q, used as proxy to measure FV. QFLID denotes the quality of forward-looking disclosure.
LEVE denotes the leverage ratio, measured by the ratio of a firm’s total debt divided by its total assets. LIQU denotes
liquidity, measured through the current assets of the firm divided by its current liabilities. GROW denotes firm growth,
measured by the ratio change of sales. FSIZE denotes Firm size, measured through the natural log of the firm’s total assets.
IndType denotes industry type; the sample in this study is divided into eleven types of industry and is coded from 1 to 11.
6.5. The impact of QFLID on ACUAF
This section discusses the findings of the statistical analysis to examine the association between
the independent variable of QFLID and the dependent variable ACUAF in the main analysis.
Following prior studies (Barron et al., 1999; Beretta & Bozzolan, 2008; Bozzolan et al., 2009;
Lang & Lundholm, 1996), the present study uses corporate characteristics, namely Firm size
(CSIZE), Leverage (LEVE), Liquidity (LIQU), Growth (GROW), Profitability (PROF) and
Industry type (IndType) as control variables to examine the relationship between the QFLID
and ACUAF.
Before examining the impact of QFLID on ACUAF, some tests are considered to select the
best model for the current study. These are the same tests described in the above section. The
Chow test is conducted in this study to decide between the panel data model and the pooled

153
model. The result shows the F-Value is significant at 1% (see Appendix 6.2). Therefore, the
panel data model is the appropriate model in this study. The fixed effects model and the random
effects model are two of the main types of panel data regression models. These two models are
based on various assumptions about the error term. The Hausman’s test is used to decide
between the random and fixed effects models (Greene, 2008). The result of the Hausman’s test
indicates that it is significant (P-Value = 0.000) and hence the null hypotheses (fixed-effects)
is accepted. Accordingly, the fixed effect model is preferred (see Appendix 6.4).
The results of the fixed-effects panel regression presented in Table 6.7 illustrate that the value
of R2 is 45.95%. The R2 value shows that the combination of the independent variables
(QFLID), with company characteristics as control variables, demonstrate 45.95% of variation
in the dependent variable (ACUAF). This result is considered favourable compared with
similar studies, such as Beretta & Bozzolan (2008), Lang & Lundholm (1996) and Vanstraelen
et al. (2003). Table 6.7 also indicates that the P-Value is highly significant (0.001), implying
that this model has a good explanatory power for the model utilised in the primary analysis.
To examine the third objective of this research, Table 6.7 shows that the coefficient of QFLID
is positively and significantly associated with ACUAF (coef. = .0018376, t = 2.06, p < 0.039).
As expected, this finding is consistent with the argument that the quality of information
disclosed is high if it is statistically significant and positively correlated with ACUAF (Beretta
& Bozzolan, 2008), which suggest that disclosure quality is value-relevant information to
market participants (Baek et al., 2004; Healy et al., 1999). This suggests that when companies
disclose higher QFLID, it improves ACUAF. Accordingly, this outcome can help users to
evaluate the QFLID when making their decisions, which is a positive event for stock markets.
Therefore, companies with higher QFLID are more likely to increase ACUAF than those
having lower QFLID. This finding supports the hypothesis H3, which proposed that the QFLID

154
is positively associated with ACUAF in Indian listed companies. Accordingly, the current
study accepts hypothesis H3.
Theoretically, the result of the impact of QFLID on ACUAF is consistent with the signalling
theory, suggesting that managers increase FLID disclosure as it reduces information
asymmetry and improves the accuracy of analysts’ forecasts (Bozzolan et al., 2009; Lang &
Lundholm, 1996; Lundholm & Myers, 2002). By the same token, Lang & Lundholm (1996)
indicate that there is negative relationship between disclosure of information and information
asymmetry, which helps financial analysts to increase the accuracy of earnings forecasts.
Empirically, the positive result of QFLID on ACUAF is in line with several previous studies
(Beretta & Bozzolan, 2008; Bozzolan et al., 2009; Vanstraelen et al., 2003) who found that
corporate disclosure has a positive impact on ACUAF.
In terms of control variables, in Table 6.7 the regression result shows that the coefficients of
CSIZE, PROF and GROW are positively and significantly associated with ACUAF (coef. =
.0748772, t = 36.68, p < 0.000), (coef. = .0266883, t = 3.39, p < 0.001), (coef. = .0055945, t
= 3.11, p < 0.002), respectively. However, the coefficient of LIQU is negatively and
significantly associated with the ACUAF (coef. = -.0018308, t = -4.14, p < 0.000). On the
other hand, the regression outcomes show that the coefficient of IndType is found to be
insignificant related to the ACUAF (coef. = . 0000377, t = .11, p < 0.914).

155
Table 6. 7 Regression analysis of the association between QFLID and ACUAF
ACUAF Coefficient Std. Err t- Statistics P ItI [95% Conf. Interval
QFLID .0018376 .0008901 2.06 0.039** .0000919 .0035833
LEVE -.0042729 .0050558 -0.85 0.398 -.0141884 .0056427
LIQU -.0018308 .0004423 -4.14 0.000*** -.0026982 -.0009633
PROF .0266883 .0078788 3.39 0.001*** .0112364 .0421402
GROW .0055945 .0017984 3.11 0.002*** .0091216 .0020675
CSIZE .0748772 .0020413 36.68 0.000*** .0708737 .0788807
IndType .0000377 .00035 .11 0.914 -.0006488 .0007242
R². Adjusted 0.4595 . . . . . . . . . . . . . . . . . . . . . . . . . . . . . . . . . . . . . . . . . . . . . . . . . . . . . . . . . . . . . . . . . . . . . . . . . . . . . . . . . . . . . . . . . . . . . . . . . . . . . . . . . . . . . . . . . . . . . . . . . . . . . . . . . . . . . . . . . . . . . . . . . . . . . . . . . . . . . . . . . . . . . . . . . . . . . . . . . . . . . . . . . . . . . . . . . . . . .
P. Value 0.001 . . . . . . . . . . . . . . . . . . . . . . . . . . . . . . . . . . . . . . . . . . . . . . . . . . . . . . . . . . . . . . . . . . . . . . . . . . . . . . . . . . . . . . . . . . . . . . . . . . . . . . . . . . . . . . . . . . . . . . . . . . . . . . . . . . . . . . . . . . . . . . . . . . . . . . . . . . . . . . . . . . . . . . . . . . . . . . . . . . . . . . . . . . . . . . . . . . . . .
. . . . . . . . . . . . . . . . . . . . . . . . . . . . . . . . . . . . . . . . . . . . . . . . . . . . . . . . . . . . . . . . . . . . . . . . . . . . . . . . . . . . . . . . . . . . . . . . . . . . . . . . . . . . . . . . . . . . . . . . . . . . . . . . . . . . . . . . . . . . . . . . . . . . . . . . . . . . . . . . . . . . . . . . . . . . . . . . . . . . . . . . . . . . . . . . . . . . . . . . . . . . . . . . . . . . . . . . . . . . . . . . . . . . . . . . . . . . . . . . . . . . . . . . . . . . . . . . . . . . . . . . . . . . . . . . . . .
ACUAF denotes the accuracy of analysts’ forecast. QFLID denotes the quality of forward-looking disclosure. LEVE denotes
the leverage ratio, measured by the ratio of a firm’s total debt divided by its total assets. LIQU denotes liquidity, measured
through the current assets of the firm divided by its current liabilities. PROF denotes profitability, measured by ROA. GROW
denotes firm growth, measured by the ratio change of sales. FSIZE denotes Firm size, measured through the natural log of
the firm’s total assets. IndType denotes industry type; the sample in this study is divided into eleven types of industry and is
coded from 1 to 11. *** Significant at the 0.01 level; ** Significant at the 0.05 level; * Significant at the 0.10 level.
6.6. Additional Analyses
In order to provide reasonable assurance that the primary findings in Tables 6.6 and 6.7 are
robust, further analyses are required to investigate the robustness of the main findings. The
current study tests whether the dependent variables (TQ ratio and ACUAF) can differ
influenced by high QFLID and low QFLID or not. Following the study by Chung et al. (2015),
the present research identifies high QFLID firms as firm-years which have a QFLID score
higher than the median of all samples, while low QFLID firms are identified as firm-years
which have a QFLID score less than the median of all samples.

156
Columns 1 and 2 of Table 6.8 present the results of the regressions of both high and low QFLID
on FV (TQ ratio), while outcomes of the regression of both high and low QFLID on ACUAF
are presented separately in columns 1 and 2 of Table 6.9, respectively.
Tables 6.8 and 6.9 shows the results of the effect of the QFLID, by dividing the sample into
high and low QFLID, and some of the control variables on both TQ ratio and ACUAF (as
dependent variables) are consistent with the main results reported in Tables 6.6 and 6.7,
respectively. These findings suggest that firms with high QFLID enhance both FV and ACUAF
compared to firms with low QFLID and vice versa. This means that the main findings are
reliable and robust under the category of high and low QFLID.
Table 6. 8 Regression analysis of the association between (High and Low) QFLID and
TQ ratio
High Quality Low Quality
TQ ratio Coefficients t- Statistics P-Value Coefficients t- Statistics P-Value
QFLID 8.108124 5.63 0.000*** 2.995285 2.34 0.020**
LEVE -.019632 -0.03 0.979 .294655 1.01 0.310
LIQU .0010448 0.32 0.748 -.041743 -1.86 0.063*
GROW -.7493740 -0.93 0.235 -.6238504 -0.85 0.421
CSIZE -1.156785 -7.63 0.000*** -1.739223 -11.16 0.000***
IndType .0264393 1.44 0.150 .0279877 1.38 0.169
R². Adjusted 0.1986 0.2211
P. Value 0.001 0.001
TQ ratio denotes the Tobin’s Q, used as proxy to measure FV. QFLID denotes the quality of forward-looking disclosure.
LEVE denotes the leverage ratio, measured by the ratio of a firm’s total debt divided by its total assets. LIQU denotes
liquidity, measured through the current assets of the firm divided by its current liabilities. PROF denotes profitability,
measured by ROA. GROW denotes firm growth, measured by the ratio change of sales. FSIZE denotes Firm size, measured
through the natural log of the firm’s total assets. IndType denotes industry type; the sample in this study is divided into eleven
types of industry and is coded from 1 to 11.

157
Table 6. 9 Regression analysis of the association between (High and Low) QFLID and
ACUAF
High Quality Low Quality
ACUAF Coefficients t- Statistics P-Value Coefficients t- Statistics P-Value
QFLID .0044222 1.99 0.047** .0016107 1.66 0.097*
LEVE -.032816 -5.14 0.000*** .0379515 4.94 0.000***
LIQU -.0019364 -3.33 0.001*** -.0013225 -2.11 0.035**
PROF .0316254 3.38 0.001*** .0269033 1.97 0.049**
GROW .0083537 3.77 0.000*** .0059325 2.15 0.032**
CSIZE .0659645 24.46 0.000*** .0766436 22.55 0.000***
IndType .0001612 .38 0.707 -.0006117 -1.04 0.300
R². Adjusted 0.4562 0.4378
P. Value 0.001 0.001
. . . . . . . . . . . . . . . . . . . . . . . . . . . . . . . . . . . . . . . . . . . . . . . . . . . . . . . . . . . . . . . . . . . . . . . . . . . . . . . . . . . . . . . . . . . . . . . . . . . . . . . . . . . . . . . . . . . . . . . . . . . . . . . . . . . . . . . . . . . . . . . . . . . . . . . . . . . . . . . . . . . . . . . . . . . . . . . . . . . . . . . . . . . . . . . . . . . . . . . . . . . . . . . . . . . . . . . . . . . . . . . . . . . . . . . . . . . . . . . . . . . . . . . . . . . . . . . . . . . . . . . . . . . . . . . . . . .
ACUAF denotes the accuracy of analyst forecast. QFLID denotes the quality of forward-looking disclosure. LEVE denotes
the leverage ratio, measured by the ratio of a firm’s total debt divided by its total assets. LIQU denotes liquidity, measured
through the current assets of the firm divided by its current liabilities. PROF denotes profitability, measured by ROA. GROW
denotes firm growth, measured by the ratio change of sales. FSIZE denotes Firm size, measured through the natural log of
firm’s total assets. IndType denotes industry type, the sample in this study is divided into eleven types of industry and is coded
from 1 to 11. *** Significant at the 0.01 level; ** Significant at the 0.05 level; * Significant at the 0.10 level.
6.7. Robustness Test
This section used alternative measurement for the dependent variables that used in the main
analysis in order to robust essential results. Firstly, previous studies have used market
capitalization (MC) as proxy to measure FV (Alotaibi & Hussainey, 2016b; Anam, Fatima, &
Majdi, 2011; Uyar & Kiliç, 2012). Based on this. This study used MC as alternative
measurement of dependent variable (FV) in order to test whether main results are robustness
by applying different measurement or not. The findings of fixed-effects panel regression
analysis of QFLID and the control variables on the MC are presented in Table 6.10. Regression

158
analysis indicates that the value of R² is 31.52%, which is less than the results of Alotaibi &
Hussainey (2016b). Furthermore, Table 6.10 reported that the P-Value is significantly higher
(0.001). The finding shows that the QFLID and MC is positively and significantly associated
(coef. = 2.205913, t = 4.06, p < 0.000), suggesting that firms with high QFLID is more likely
to increase MC compared to those firms with low QFLID. This finding is confirms the main
analysis reported in Table 6.6.
Secondly, the current study used dispersion (DISAF) as alternative measurement of dependent
variable (ACUAF) in order to test whether main results are robustness by applying different
measurement or not. Beretta & Bozzolan (2008) argue that the quality of information disclosed
by the firm will be high if it is negatively and significantly related to DISAF. A number of prior
researchers (Beretta & Bozzolan, 2008; Bozzolan et al., 2009; Lang & Lundholm, 1996; Lee,
2017; Vanstraelen et al., 2003) indicating that DISAF is likely to decrease when firms publish
high quality of information disclosure. Based on this, an alternative measure of the dependent
variable (DISAF) is used to test whether the main results are robust to different measures or
not. Table 6.11 presents the results generated by fixed-effects panel regression analysis of
QFLID and control variables on the DISAF. The result reported that the value of R² is 45.88%,
which is similar to the results of (Beretta & Bozzolan, 2008; Lang & Lundholm, 1996;
Vanstraelen et al., 2003). Table 6.8 also indicates that the P-Value is highly significant (0.001).
The results show that the QFLID is negatively and significantly associated with DISAF (coef.
= -.0016227, t = -1.81, p < 0.07), suggesting that high QFLID enable companies to help
financial analysts to reduce DISAF compared to those firms with low QFLID. The findings are
in line with the primary analysis and confirms the argument that the quality of FLID is high
when it is negatively and significantly related to DISAF (Beretta & Bozzolan, 2008). This
confirm that the results are consistent with the primary results presented in Table 6.7.

159
The above discussion highlighted that the outcomes regarding the impact of QFLID and some
control variables on both MC and DISAF (as an alternative measure for dependent variables)
are in line with the essential results presented in Tables 6.6 and 6.7, respectively. This suggests
that the main findings are reliable and robust under using MC and DISAF as alternative
measures.
Table 6. 10 Regression analysis of the association between QFLID and MC
MC Coefficient Std. Err t- Statistics P ItI [95% Conf. Interval
QFLID 2.205913 .2736708 4.06 0.000*** 1.669186 2.74264
LEVE .3785414 .0599187 2.32 0.014** -.4960546 .2610282
LIQU .0098817 .0053383 1.85 0.064* -.0005878 .0203512
GROW -.0087217 .021592 -.40 0.686 -.0510682 .0336248
CSIZE .3478507 .0311423 11.17 0.000*** .2867741 .4089274
IndType .0035237 .0041789 .84 0.399 -.0046721 .0117195
R². Adjusted 0.3152 . . . . . . . . . . . . . . . . . . . . . . . . . . . . . . . . . . . . . . . . . . . . . . . . . . . . . . . . . . . . . . . . . . . . . . . . . . . . . . . . . . . . . . . . . . . . . . . . . . . . . . . . . . . . . . . . . . . . . . . . . . . . . . . . . . . . . . . . . . . . . . . . . . . . . . . . . . . . . . . . . . . . . . . . . . . . . . . . . . . . . . . . . . . . . . . . . . . . .
. . . . . . . . . . . . . . . . . . . . . . . . . . . . . . . . . . . . . . . . . . . . . . . . . . . . . . . . . . . . . . . . . . . . . . . . . . . . . .
P. Value 0.001 . . . . . . . . . . . . . . . . . . . . . . . . . . . . . . . . . . . . . . . . . . . . . . . . . . . . . . . . . . . . . . . . . . . . . . . . . . . . . . . . . . . . . . . . . . . . . . . . . . . . . . . . . . . . . . . . . . . . . . . . . . . . . . . . . . . . . . . . . . . . . . . . . . . . . . . . . . . . . . . . . . . . . . . . . . . . . . . . . . . . . . . . . . . . . . . . . . . . .
. . . . . . . . . . . . . . . . . . . . . . . . . . . . . . . . . . . . . . . . . . . . . . . . . . . . . . . . . . . . . . . . . . . . . . . . . . . . . .
. . . . . . . . . . . . . . . . . . . . . . . . . . . . . . . . . . . . . . . . . . . . . . . . . . . . . . . . . . . . . . . . . . . . . . . . . . . . . . . . . . . . . . . . . . . . . . . . . . . . . . . . . . . . . . . . . . . . . . . . . . . . . . . . . . . . . . . . . . . . . . . . . . . . . . . . . . . . . . . . . . . . . . . . . . . . . . . . . . . . . . . . . . . . . . . . . . . . . . . . . . . . . . . . . . . . . . . . . . . . . . . . . . . . . . . . . . . . . . . . . . . . . . . . . . . . . . . . . . . . . . . . . . . . . . . . . . .
MC denotes the market capitalization, measured as the market value of common equity of a firm’s operations at the end of the
year. QFLID denotes the quality of forward-looking disclosure. LEVE denotes the leverage ratio, measured by the ratio of a
firm’s total debt divided by its total assets. LIQU denotes liquidity, measured through the current assets of the firm divided
by its current liabilities. PROF denotes profitability, measured by ROA. GROW denotes firm growth, measured by the ratio
change of sales. FSIZE denotes Firm size, measured through the natural log of firm’s total assets. IndType denotes industry
type, the sample in this study is divided into eleven types of industry and is coded from 1 to 11. *** Significant at the 0.01
level; ** Significant at the 0.05 level; * Significant at the 0.10 level.

160
Table 6. 11 Regression analysis of the association between QFLID and DISAF
DISAF Coefficient Std. Err t- Statistics P ItI [95% Conf. Interval
QFLID -.0016227 .0008951 -1.81 0.070* -.0033781 .0001328
LEVE -.0031498 .0055797 -0.95 0.494 -.013423 .0058795
LIQU -.0027348 .0008936 -3.13 0.002*** -.0026962 -.0009608
PROF .0266494 .0078809 3.11 0.002*** .0011933 .0421055
GROW .0056044 0017989 3.77 0.002*** .0091324 .0020764
CSIZE .0249022 .0056589 20.69 0.000*** .0087378 .0789065
IndType .0005867 .0003501 .23 0.784 -.0007586 .0005768
R². Adjusted 0.4588
P. Value 0.001
. . . . . . . . . . . . . . . . . . . . . . . . . . . . . . . . . . . . . . . . . . . . . . . . . . . . . . . . . . . . . . . . . . . . . . . . . . . . . . . . . . . . . . . . . . . . . . . . . . . . . . . . . . . . . . . . . . . . . . . . . . . . . . . . . . . . . . . . . . . . . . . . . . . . . . . . . . . . . . . . . . . . . . . . . . . . . . . . . . . . . . . . . . . . . . . . . . . . . . . . . . . . . . . . . . . . . . . . . . . . . . . . . . . . . . . . . . . . . . . . . . . . . . . . . . . . . . . . . . . . . . . . . . . . . . . . . . . . . . . . . . . . . . . . . . . . . . . . . .
DISAF denotes the dispersion of analyst forecast. QFLID denotes the quality of forward-looking disclosure. LEVE denotes
the leverage ratio, measured by the ratio of a firm’s total debt divided by its total assets. LIQU denotes liquidity, measured
through the current assets of the firm divided by its current liabilities. PROF denotes profitability, measured by ROA. GROW
denotes firm growth, measured by the ratio change of sales. FSIZE denotes Firm size, measured through the natural log of
firm’s total assets. IndType denotes industry type, the sample in this study is divided into eleven types of industry and is coded
from 1 to 11. *** Significant at the 0.01 level; ** Significant at the 0.05 level; * Significant at the 0.10 level.
6.8. Endogeneity Problems
When one or more variables are linked with the errors terms, it leads to endogeneity problem
(Gippel et al., 2015; Reeb et al., 2012; Schultz et al., 2010). This problem raises concerns
regarding validity of the results generated from regression model (Larcker & Rusticus, 2010;
Wintoki et al., 2012).
Earlier literature suggests three main causes for endogeneity problems that are: simultaneity,
omitted variables and measurement errors (Brown & Hillegeist, 2007; Choi et al., 2013;
Moumen et al., 2015; Ntim et al., 2013; Reeb et al., 2012; Schultz et al., 2010).

161
Furthermore, earlier studies reported that the models utilized to examine corporate disclosure
and FV suffer from endogeneity problem (Moumen et al., 2015; Sheu et al., 2010; Shi et al.,
2014)
In order to address endogeneity problems, prior studies have used two econometric methods
(Ammann et al., 2011a; Ntim et al., 2012; Renders et al., 2010). The first method uses a lagged
structure that deals with omitted variables and simultaneity problems (Ammann et al., 2011a;
Ntim et al., 2012). Instrumental Variable (IV) is used as a second method, which deals with
potential issues generated by measurement errors and omitted variables (Black et al., 2006;
Renders et al., 2010). The lagged values of endogenous independent variable (FLID) as an
instrumental variable is used in this study to examine whether the endogeneity problem have
an impact on the relation between the QFLID and both TQ ratio and ACUAF or not.
Similarly, Durbin and Wu-Hausman tests were carried out to check whether bias for the
endogenous and independent variables exists (Beiner et al., 2006; Gujarati, 2008; Moumen et
al., 2015; Ntim, 2015). The results show that the null hypothesis of no endogeneity between
QFLID as the independent variable and both TQ ratio and ACUAF as the dependent variables
is rejected (see appendix 6.5 and 6.6). Accordingly, the existence of this problem might be
affecting the findings, making them ineffective, biased and inconsistent. Therefore, IV and
2SLS with lagged QFLID are utilized to control for the endogeneity problem.
The outcomes of the 2SLS regression of QFLID with both TQ ratio and ACUAF are reported
in Table 6.12 and 6.13, respectively. After controlling for the endogeneity, the coefficient of
QFLID is significantly and positively associated with TQ ratio (coef. = 1.4851, t = 2.80, p <
0.005), confirming that the results are in line with the main results reported in Table 6.6.
Concerning the control variables, the results reported in Table 6.12 display similar outcomes
to those reported in Table 6.6. In addition, the coefficient of QFLID is significantly and
positively associated with ACUAF (coef. = .943684, t = 3.10, p < 0.002), indicating that the

162
result are consistent with the main findings presented in Table 6.7. Regarding control variables,
the results presented in Table 6.13 are in line with the results reported in Table 6.7.
In summary, the findings of 2SLS regression for both models are consistent with the primary
outcomes reported in Tables 6.6 and 6.7, respectively, showing that the endogeneity problem
between QFLID and both TQ ratio ACUAF does not affect the main findings of the QFLID
and other control variables. Overall, the analyses showed that the main results are robust to
potential endogeneity problems.
Table 6. 12 Instrumental variables Two-Stage regression model based on TQ ratio.
TQ ratio Coefficient Std. Err t- Statistics P ItI [95% Conf. Interval
QFLID 1.4851 .5306596 2.80 0.005*** .4450262 2.525174
LEVE .0283899 .1442455 1.01 0.311 -.3614409 .4182207
LIQU .0399881 .0175977 1.70 0.046** .0006568 .0793194
GROW -.0547355 .0854289 -0.74 0.450 -.3754069 .0734859
CSIZE .710535 .051752 13.73 0.000*** .811967 .609103
IndType .0061653 .0114599 0.54 0.591 -.0162957 .0286262
R². Adjusted 0.1559
P. Value 0.001
TQ ratio denotes the Tobin’s Q, uses as proxy to measure FV. QFLID denotes the quality of forward-looking disclosure.
LEVE denotes the leverage ratio, measured by the ratio of a firm’s total debt divided by its total assets. LIQU denotes
liquidity, measured through the current assets of the firm divided by its current liabilities. PROF denotes profitability,
measured by ROA. GROW denotes firm growth, measured by the ratio change of sales. FSIZE denotes Firm size, measured
through the natural log of firm’s total assets. IndType denotes industry type, the sample in this study is divided into eleven
types of industry and is coded from 1 to 11. *** Significant at the 0.01 level; ** Significant at the 0.05 level; * Significant at
the 0.10 level.

163
Table 6. 13 Instrumental variables Two-Stage regression model based on ACUAF.
ACUAF Coefficient Std. Err t- Statistics P ItI [95% Conf. Interval
QFLID .943684 .2847436 3.10 0.002*** .5855964 1.701771
LEVE -.1308763 .0811368 -1.61 0.107 -.2899015 .0281489
LIQU -.0128814 .0110128 -1.17 0.242 -.0087033 -.0344661
PROF .1806162 .1794306 1.01 0.314 .5322937 .1710613
GROW .009561 .0534505 .18 0.858 -.0952 .1143219
CSIZE .0009203 .0002891 3.18 0.001*** .0014869 .0003537
IndType .0006364 .0255224 0.02 0.980 -.0493866 .0506594
R². Adjusted 0.3586
P. Value 0.001
ACUAF denotes the accuracy of analyst forecast. QFLID denotes the quality of forward-looking disclosure. LEVE denotes
the leverage ratio, measured by the ratio of a firm’s total debt divided by its total assets. LIQU denotes liquidity, measured
through the current assets of the firm divided by its current liabilities. PROF denotes profitability, measured by ROA. GROW
denotes firm growth, measured by the ratio change of sales. FSIZE denotes Firm size, measured through the natural log of
the firm’s total assets. IndType denotes industry type; the sample in this study is divided into eleven types of industry and is
coded from 1 to 11.
6.9. Summary
The current chapter presents the empirical findings of usefulness of QFLID in order to achieve
the third and fourth objectives, thus this chapter is divided into two parts. The first part
examines the association between QFLID and FV in non-financial Indian listed companies for
the period 2006-2015. In doing so, this study used the TQ ratio as proxy to measure FV in the
main analysis. The result showed that QFLID and the TQ ratio are positively and significantly
associated. This outcome is consistent with the perspective of agency and signalling theories
that managers tend to disclose more FLID to reduce the issue of information asymmetry and
improve stakeholders’ confidence regarding a company’s future performance. This, in turn,
improves FV (Hassanein & Hussainey, 2015; Wang & Hussainey, 2013). Furthermore,

164
high/low QFLID is used as an additional analysis. The results of the effect of the QFLID, by
dividing the sample into high and low quality, and some of the control variables on the TQ
ratio are in line with the essential results. The additional analysis confirmed that the main
results are reliable and robust under high and low QFLID. Moreover, MC is used as an
alternative measure of dependent variable (FV) to examine whether these results are robust to
the main outcomes or not. The findings of the impact of the QFLID on MC confirm the essential
results. Finally, the outcome regarding the endogeneity problem confirmed the results of the
main analysis.
The second part examines the association between QFLID and ACUAF in non-financial
Indian listed companies for the period 2006-2015. In doing so, this study used the ACUAF in
the main analysis. The resutls indicated that QFLID and ACUAF are positively and signifanctly
associated with each other. The study finding is in line with signalling theory; managers
disclose more FLID to mitigate asymmetric information and thus increase the accuracy of
analysts’ forecasts (Lundholm & Myers, 2002; Wang & Hussainey, 2013). In addition, high
and low QFLID are used as additional analyses. The outcomes of the effect of the QFLID, by
dividing the sample into high and low quality, and some of the control variables on ACUAF
are consistent with the main results. The results confirmed that the main findings are robust
and reliable under both high and low QFLID. Moreover, the present research used DISAF as
an alternative measurement of dependent variable to examine whether these findings are robust
to the main results or not. The outcomes of the impact of the QFLID on DISAF confirm the
argument that the quality of FLID will be high when it has a negative and significant
relationship with DISAF (Beretta & Bozzolan, 2008). This suggests that the main findings are
reliable and robust by using DISAF. Finally, dealing with endogeneity problems, the results
confirm the outcomes of the main analysis.
165
Chapter Seven: Conclusion
7.1. Introduction
This chapter provides a summary of this study. The current research covers the following
objectives: firstly, to investigate the association between CG mechanisms and QFLID;
secondly, to investigate the impact of QFLID on FV; thirdly, to examine the impact of QFLID
on ACUAF. To achieve these objectives, this study adopts a multidimensional framework to
measure the quality of FLID, based on a sample of 212 non-financial Indian listed companies
over the period 2006-2015. Thus, this chapter is organised as follows: section 7.2 summarises
the study’s findings; section 7.3 provides reserch contribution; section 7.4 highlights the
limitations of this study; section 7.5 describes this study’s implications and section 7.6 suggests
future research related to this study.
7.2. Study’s Findings
To achieve the purpose of this research, the empirical study objectives were addressed in
chapters five and six. The next sections provide the main findings of the two empirical chapters.
7.2.1. Findings Related to CG and QFLID
The first objective of the study is to examine the association between CG (the board of
director’s characteristics, ownership structure and audit committee) and QFLID. In order to
achieve this objective, thirteen hypotheses were developed. This research adopts both
univariate and multivariate analyses to investigate the relationship between CG and QFLID.
The regression analyses show mixed results (significant and insignificant association) between
CG explanatory variables and QFLID among Indian companies.

166
The statistical results show that CG mechanisms and firm characteristics affect QFLID. Four
out of five board characteristics (Board size, board meetings frequency, board independence
and female presence on the board) were found as significantly and positively associated with
QFLID. This indicates that hypotheses H1.1, H1.3, H1.4, and H1.5 are accepted. However, the
findings indicate that CEO duality is not related to QFLID, meaning that hypothesis H1.2 is
rejected. In addition, this study examines three ownership structures, termed as block holder,
institutional and promoter’s ownership, in relation to QFLID. The results show that none of
these structures are associated with QFLID. This means that hypotheses H1.6, H1.7 and H1.8
are not supported.
Concerning the audit committee, three variables (independence of the audit committee,
frequency of audit committee meetings and female presence on the audit committee) have
positive and significant associations with QFLID. This means that this study accepts
hypotheses H1.10, H1.11 and H1.13. However, the study found that audit committee size and
audit committee financial expertise have no relationship with the QFLID, meaning that
hypotheses H1.9 and H1.12 are rejected. With regard to control variables, firm size and
profitability have a positive relationship with QFLID, whereas liquidity and growth have a
negative association with QFLID. On the other hand, leverage and industry type have no
relationship with QFLID.
The results that relate to hypotheses H1.1, H1.3, H1.4, H1.5 H1.10, H1.11 and H1.13 are in
line with the theoretical framework of this study, which is based on the agency, signalling and
resource-dependence theories. These theories recommend that CG mechanisms improve
overall governance and help companies to minimise agency costs and reduce information
asymmetry (Alnabsha et al., 2017; Fama & Jensen, 1983; Hafsi & Turgut, 2013; Jensen &
Meckling, 1976; Siddiqui et al., 2013). In the same vein, good CG leads to a higher quality of
disclosure (Elzahar et al., 2015; Hui & Matsunaga, 2014), which leads to an increase in QFLID

167
In terms of the endogeneity problems, the study tested whether the presence of an endogeneity
problem affected the results. The study found that an endogeneity problem has no effect on
examining the association between CG and QFLID, as the main results are consistent and
robust.
7.2.2. Findings Related to QFLID and FV
The second objective of the current research is to investigate the influence of QFLID on FV.
In order to achieve this objective, hypothesis H2 was developed. H2 expects a positive link
between the QFLID and FV. The regression results of this study show that the coefficient of
QFLID is positively and significantly associated with the TQ ratio (proxy for FV). Therefore,
this study accepts hypothesis H2. This finding supports the argument that FV should be
increased as a result of quality of FLID, either through decreasing the cost of capital, increasing
the cash flow to its shareholders, or both (Elzahar et al., 2015). This means that QFLID
improves FV. Consequently, firms with a high QFLID increase FV more than those with a low
QFLID.
The result of the impact of QFLID on FV is consistent with the agency theory, suggesting that
the information released by FLID mitigates information asymmetry, which leads to reduced
agency conflicts between managers and stakeholders (Hassanein & Hussainey, 2015; Kuzey,
2018). It also decreases uncertainty about a firm’s future performance and minimises the
opportunities for management to gain private benefits, hence resulting in higher FV (Hassanein
& Hussainey, 2015; Kuzey, 2018; Sheu et al., 2010). Moreover, this finding is in line with the
signalling theory, which assumes that managers disclose more FLID to mitigate information
asymmetry between managers and investors, as well as among the stock market participants,
hence improving FV (Elzahar & Hussainey, 2012; Kuzey, 2018; Wang & Hussainey, 2013).

168
This study splits the sample into two parts: high quality FLID and low quality FLID. The
findings confirm the primary analysis. Furthermore, this study uses market capitalisation (MC)
as an alternative measurement of the dependent variable (FV) to test the robustness of the main
results. The result reveals a positive and significant association between QFLID and MC,
confirming that the main findings are reliable and robust to the alternative measurement of FV.
In terms of an endogeneity problem, the study results indicate that the main analysis is robust
and is not affected by the problem of endogeneity between QFLID and TQ ratio.
7.2.3. Findings Related to QFLID and ACUAF
The third objective of the present research is to investigate the impact of QFLID on ACUAF,
addressed in Chapter Six. In order to achieve this objective, hypothesis H3 was formulated,
which has expected a positive association between the QFLID and ACUAF. Both univariate
and multivariate analyses are used to test this hypothesis. The regression findings show that
the coefficient of QFLID is positively and significantly associated with ACUAF. Therefore,
this study accepts hypothesis H3. This finding confirms the argument that the quality of
information disclosed is high if it is statistically significant and positively correlated with
ACUAF (Beretta & Bozzolan, 2008), which suggests that disclosure quality is value-relevant
information to market participants (Baek et al., 2004; Healy et al., 1999). Therefore, firms with
high QFLID increase ACUAF as compared to those with low QFLID. This result is consistent
with the signalling theory, suggesting that managers increase FLID disclosure as it reduces
information asymmetry and improves the accuracy of analysts’ forecast (Bozzolan et al., 2009;
Lang & Lundholm, 1996; Lundholm & Myers, 2002).
The study divides the sample into two parts, high QFLID and low QFLID, and examines its
impact on ACUAF to test the robustness of the main findings. The results confirm the main
findings. In addition, this study uses dispersion of analysts’ earnings forecast (DISAF) as an

169
alternative measurement of ACUAF to test whether the main results are robust or not by
applying different measurements. The result indicates that the QFLID is positively and
significantly associated with DISAF, which confirms the robustness of the main results. The
study confirms that the main results are not affected by the problem of endogeneity between
QFLID and ACUAF.
7.3. Research Contribution
This study contributes to the body of knowledge in several ways. Firstly, the present study
adds a contribution to the literature in terms of determinants of FLID. It is noted that previous
researchers have addressed the relationship between CG and the level of FLID. Most of them
used the level or quantity of FLID as a proxy for its quality (Aljifri & Hussainey, 2007; Al-
Najjar & Abed, 2014; Hassanein & Hussainey, 2015; Mathuva, 2012b; Qu et al., 2015; Wang
& Hussainey, 2013). It is noted that there is no previous study which focuses on the association
between CG and quality of FLID in developing countries, specifically in India. Thus, this study
attempts to investigate the impact of CG on QFLID in Indian non-financial listed companies.
Secondly, limited research has attempted to examine the association between FLID and FV
(Bravo, 2015; Hassanein & Hussainey, 2015; Kent & Ung, 2003; Wang & Hussainey, 2013).
However, these studies focused mainly on the quantity or the level of FLID. As per the
researcher’s knowledge, this is the only study which examines the impact of the QFLID on FV
in developing countries, particularly in India. This study attempts to bridge this gap by
examining the impact of the QFLID on FV in Indian non-financial listed companies.
Thirdly, a few studies have investigated the relationship between FLID and ACUAF
(Bozzolan et al., 2009). However, no study has taken QFLID into consideration in relation to
ACUAF. Therefore, this is the first study to examine the impact of QFLID on ACUAF in a
developing country (India).

170
Finally, the majority of the prior studies which have examined the above relationships (the
relationship between CG and FLID; the relationship between FLID and FV; and the
relationship between FLID and ACUAF) were conducted in developed countries. However,
not much is known about these relationships in developing countries. Thus, this study has
bridged this gap by examining the determinants and consequences of QFLID among Indian
listed companies.
7.4. Study’s Implications
This study provides significant implications for practitioners, policy makers and academics.
Firstly, this research offers important implications for the practitioners of annual reports in
Indian companies. Practitioners may understand the roles and importance of CG to improve
QFLID. Furthermore, the results of this study provide evidence that the QFLID affects FV.
The results may be useful for different users to make effective decisions regarding a firm’s
future performance. Regulators can consider the importance of QFLID and improve financial
reporting quality which will enable them to increase FV. It also provides guidance for Indian
companies’ managers that they should consider QFLID to increase FV. This provides an
important implication for managers of Indian companies; they should pay more attention to
QFLID as it will help them to build investors’ confidence by providing valuable information.
It also implies that shareholders and other stakeholders should evaluate QFLID as it will
improve the decision-making process. In addition, with regard to the effect of QFLID on
ACUAF, the results can help financial analysts to see how QFLID increases ACUAF and
affects capital market decisions. As higher QFLID enables generation of high quality financial
reporting, the market considers published information more trustworthy and credible when
making decisions. This study also provides necessary implications for annual report users of

171
Indian companies and other developing nations. Publishing QFLID may improve the
relationship between managers and stakeholders, as it reduces information assymetry.
Secondly, this study has many policy implications. The results of this study could have
important implications for regulatory bodies within India. For instance, enhancing the
understanding of the impact of CG on QFLID may help regulators and authorities, particularly
in India, to improve their regulations on the roles and the code of CG. This means that
regulators should pay more attention regarding the roles of CG to ensure the standard of quality
information in financial reporting. Furthermore, this study has policy implications for standard
setters and regulators to continue improving the guidance and frameworks to assist firms to
provide high-quality financial reporting and FLID. There should be certain guidelines set for
Indian companies’ managers, while preparing disclosure information, to ensure it is of high
standard and show how QFLID can help them to gain investors’ confidence. In addition, the
stock market authorities can use this study’s results to evalute current QFLID and take certain
steps to improve both QFLID and financial disclosure quality. The findings can help academics
to further investigate FLID and its role in improving FV and ACUAF. This research covers
various issues related to QFLID, CG mechanisms, FV and ACUAF; there has been limited
research done on these issues, especially in developing countries such as India. Therefore, it
contains guidance for developing countries’ regulatory bodies and authorities to evalute the
importance of these issues.
Finally, this study also contains important implications for academics and future researchers.
The empirical evidence on the effect of CG on QFLID may present a stepping-stone for future
research to consider the role of CG on the quality of voluntary disclosure, in general, and
QFLID in particular, for increasing QFLID to protect investors. Moreover, QFLID is important
for increasing both FV and ACUAF, as different stakeholders raise an issue related to the

172
definition of disclosure quality, since different users have different perspectives of disclosure
quality. Accordingly, the QFLID needs to be taken into consideration by further research.
7.5. Study’s Limitation
This research made several contributions to the previous studies and assures that all the
objectives were achieved. However, this study recognises that it suffers from various
limitations, discussed below
Firstly, one of the limitations of this study is that the sample size is restricted to only non-
financial Indian firms listed on the BSE-500 index. It does not take financial companies into
consideration due to their distinct characteristics of financial statements, as explained in the
methodology chapter. Hence, the generalisation of this study’s results may be limited due to
this issue. However, this exclusion is in line with the previous studies (Al-Najjar & Abed, 2014;
Alqatamin et al., 2017; Athanasakou & Hussainey, 2014; Hui & Matsunaga, 2014). As Patelli
& Prencipe (2007) highlight that the extent of disclosure differs across countries, so the
findings of this study regarding QFLID may not be suitable for companies operating in other
countries. However, previous studies have given strong evidence that may enable the
generalisation of this study’s results to a large number of developing countries that have same
the standards and regulations.
This study used a single country, India, as its sample. As India is a developing country, this is
an important contribution, as most of the earlier studies were conducted in developed countries.
However, this distinct feature limits the generalisation of the results. Due to the use of a single
country, more research in other developing nations is required. Nonetheless, this is the first
study conducted in India, so it significantly contributes to the body of knowledge.

173
Secondly, the data collected for the analysis in this study is mainly from annual reports, which
are available on firms’ websites, and from other databases. Therefore, any issues or problems
of significance which affect the QFLID might have a negative impact on the validity of the
research results. However, Botosan (1997 p. 331) recognises that annual reports are the most
reliable and trustworthy information source. The use of annual reports is in line with the
previous studies (Adjaoud et al., 2007; Alnabsha et al., 2017; Alqatamin et al., 2017; Eng &
Mak, 2003; Kuzey, 2018; La Rosa & Liberatore, 2014).
Thirdly, further limitations might be linked to the scoring procedures of the FLID index. This
research follows the procedures that were broadly used in prior research. As clarified in the
methodology chapter, this research employs a scoring process that is considered to be
subjective. Conversely, every effort is made by the current study to minimise subjectivity
which might affect the findings.
Finally, the models which are used to test the study hypotheses are likely to suffer from the
omission of particular variables, leading to a factor bias related to CG, QFLID, FV and
ACUAF. However, this research has taken several steps to decrease the occurrence possibility
of this problem, including tests for the fixed or random effects models, using alternative
measurements, robustness tests and controlling endogeneity problems. Adopting various
methods is in line with the earlier studies (Beiner et al., 2006; Gippel et al., 2015; Ntim et al.,
2015; Schultz et al., 2010; Wintoki et al., 2012).
7.6. Suggestions for Future Research
This study highlights potential areas that can be used by future researchers to conduct further
research. Firstly, as this research examines the association between CG mechanisms and
QFLID among non-financial Indian firms listed on the BSE-500 index, any future research can
focus on financial companies to provide a broader understanding of the association between
174
QFLID and CG mechanisms. This would significantly contribute to the literature of both
QFLID and CG. This research also investigates the association between QFLID and both FV
and ACUAF, therefore it suggests that future research can examine this relationship by taking
financial firms into consideration to provide comprehensive understanding of these areas. Since
the current study focuses on the impact of QFLID on both FV and ACUAF, it will be more
interesting for future research to examine the impact of QFLID on earnings management.
Based on the researcher’s knowledge, no other study has examined this relationship.
Secondly, the current study investigates the relationship between QFLID and CG mechanisms.
However, future research could consider examining the influence of CG mechanisms by using
other voluntary disclosure contexts, such as the quality of corporate social responsibility
disclosure. In addition, this research investigates the association between CG mechanisms and
QFLID but it does not examine the relationship between CG and both FV and ACUAF. It
would be interesting to conduct a study to investigate the impact of CG mechanisms on FV and
ACUAF, as it would provide new insight information for academics and regulators.
Finally, this study focuses on only one country: India. The current study’s designs can be
conducted in other nations. Since previous studies have argued that a number of factors such
as culture, religion and other societal norms may influence FLID (Gautam & Singh, 2010;
Hastings, 2000), the present study might be an interesting topic for future research. This may
also encourage academic researchers to examine the influence of countries’ characteristics.
India has different environmental contexts, religions, and cultures as one of the developing
nations. Therefore, future research might expand the present research’s designs by using
samples from different nations in the analysis. Cross-country analysis might offer wider
evidence in terms of managers’ incentives to disclose more QFLID which would increase both
FV and ACUAF. This would provide a better understanding and contribute significantly to the
body of knowledge.

175
References
Abbott, L. J., Parker, S., & Peters, G. F. (2004). Audit committee characteristics and
restatements. Auditing: A Journal of Practice & Theory, 23(1), 69-87.
Abdelbadie, R., & Elshandidy, T. (2013). Determinants of voluntary disclosure on R&D
expenditures: Evidence from the UK R&D intensive industries. British Accounting and
Finance Annual,
Abdelsalam, O. H., & Street, D. L. (2007). Corporate governance and the timeliness of
corporate internet reporting by UK listed companies. Journal of International Accounting,
Auditing and Taxation, 16(2), 111-130.
Abd-Elsalam, O. H., & Weetman, P. (2003). Introducing international accounting standards to
an emerging capital market: Relative familiarity and language effect in egypt. Journal of
International Accounting, Auditing and Taxation, 12(1), 63-84.
Abeysekera, I. (2010). The influence of board size on intellectual capital disclosure by kenyan
listed firms. Journal of Intellectual Capital, 11(4), 504-518.
Abhayawansa, S., & Abeysekera, I. (2009). Intellectual capital disclosure from sell-side analyst
perspective. Journal of Intellectual Capital, 10(2), 294-306.
Abraham, S., & Cox, P. (2007). Analysing the determinants of narrative risk information in
UK FTSE 100 annual reports. The British Accounting Review, 39(3), 227-248.
Abraham, S., Marston, C. and Jones, E., 2015. Disclosure by Indian companies following
corporate governance reform. Journal of Applied Accounting Research, 16(1), pp.114-
137.
Adams, M., & Hossain, M. (1998). Managerial discretion and voluntary disclosure: Empirical
evidence from the new zealand life insurance industry. Journal of Accounting and Public
Policy, 17(3), 245-281.
Adams, R. B., & Ferreira, D. (2007). A theory of friendly boards. The Journal of Finance,
62(1), 217-250.
Adjaoud, F., Zeghal, D., & Andaleeb, S. (2007). The effect of board's quality on performance:
A study of canadian firms. Corporate Governance: An International Review, 15(4), 623-
635.
Adolf, B., & Gardiner, M. (1932). The Modern Corporation and private property.
Cambridge/Mass,

176
Agyei-Mensah, B. K. (2012). Association between firm-specific characteristics and levels of
disclosure of financial information of rural banks in the ashanti region of ghana. Journal
of Applied Finance and Banking, 2(1), 69.
Agyei-Mensah, B. K. (2017). Forward-looking information disclosure and corporate
governance: Empirical evidence from year 2013 listed firms in ghana.
Agyei-Mensah, B. K., & Agyei-Mensah, B. K. (2017). The relationship between corporate
governance, corruption and forward-looking information disclosure: A comparative study.
Corporate Governance: The International Journal of Business in Society, 17(2), 284-304.
Ahmed, K., & Courtis, J. K. (1999). Associations between corporate characteristics and
disclosure levels in annual reports: A meta-analysis. The British Accounting Review,
31(1), 35-61.
Ajinkya, B., Bhojraj, S., & Sengupta, P. (2005). The association between outside directors,
institutional investors and the properties of management earnings forecasts (digest
summary). Journal of Accounting Research, 43(3), 343-376.
Akerlof, G. A. (1970). The market for lemons: Quality, uncertainty and the market
mechanism”, quarterly journal of economics, vol. 84.
Akhtaruddin, M. (2005). Corporate mandatory disclosure practices in bangladesh. The
International Journal of Accounting, 40(4), 399-422.
Akhtaruddin, M., Hossain, M. A., Hossain, M., & Yao, L. (2009). Corporate governance and
voluntary disclosure in corporate annual reports of malaysian listed firms. Journal of
Applied Management Accounting Research, 7(1), 1.
Aksu, M., & Kosedag, A. (2006). Transparency and disclosure scores and their determinants
in the istanbul stock exchange. Corporate Governance: An International Review, 14(4),
277-296.
Al-Bassam, W. M., Ntim, C. G., Opong, K. K., & Downs, Y. (2015). Corporate boards and
ownership structure as antecedents of corporate governance disclosure in saudi arabian
publicly listed corporations. Business & Society, , 0007650315610611.
Albitar, K. (2015). Firm characteristics, governance attributes and corporate voluntary
disclosure: A study of jordanian listed companies. International Business Research, 8(3),
1.
Alhazaimeh, A., Palaniappan, R., & Almsafir, M. (2014). The impact of corporate governance
and ownership structure on voluntary disclosure in annual reports among listed jordanian
companies. Procedia-Social and Behavioral Sciences, 129, 341-348.

177
Al-Janadi, Y., Rahman, R. A., & Omar, N. H. (2013). Corporate governance mechanisms and
voluntary disclosure in saudi arabia. Research Journal of Finance and Accounting, 4(4),
25-35.
Aljifri, K. (2008). Annual report disclosure in a developing country: The case of the UAE.
Advances in Accounting, 24(1), 93-100.
Aljifri, K., & Hussainey, K. (2007). The determinants of forward-looking information in annual
reports of UAE companies. Managerial Auditing Journal, 22(9), 881-894.
Aljifri, K., Alzarouni, A., Ng, C., & Tahir, M. I. (2014). The association between firm
characteristics and corporate financial disclosures: Evidence from UAE companies.
Alkhatib, K. (2014). The determinants of forward-looking information disclosure. Procedia-
Social and Behavioral Sciences, 109, 858-864.
Alkhatib, K., & Marji, Q. (2012). Audit reports timeliness: Empirical evidence from jordan.
Procedia-Social and Behavioral Sciences, 62, 1342-1349.
Allegrini, M., & Greco, G. (2013). Corporate boards, audit committees and voluntary
disclosure: Evidence from italian listed companies. Journal of Management &
Governance, 17(1), 187-216.
Alnabsha, A., Abdou, H. A., Ntim, C. G., & Elamer, A. A. (2017). Corporate boards, ownership
structures and corporate disclosures: Evidence from a developing country. Journal of
Applied Accounting Research, (just-accepted), pp.00-00.
Al-Najjar, B., & Abed, S. (2014). The association between disclosure of forward-looking
information and corporate governance mechanisms: Evidence from the UK before the
financial crisis period. Managerial Auditing Journal, 29(7), 578-595.
Alotaibi, K. O., & Hussainey, K. (2016a). Determinants of CSR disclosure quantity and
quality: Evidence from non-financial listed firms in saudi arabia. International Journal of
Disclosure and Governance, 13(4), 364-393.
Alotaibi, K. O., & Hussainey, K. (2016b). Quantity versus quality: The value relevance of CSR
disclosure of Saudi companies.
Alqatamin, R., Aribi, Z. A., & Arun, T. (2017). The effect of CEOs’ characteristics on forward-
looking information. Journal of Applied Accounting Research, (just-accepted), 00-00.
Alsaeed, K. (2006). The association between firm-specific characteristics and disclosure: The
case of Saudi Arabia. Managerial Auditing Journal, 21(5), 476-496.
Alvarez, R. M., & McCaffery, E. J. (2000). Is there a gender gap in fiscal political preferences?

178
Aly, D., Simon, J., & Hussainey, K. (2010). Determinants of corporate internet reporting:
Evidence from egypt. Managerial Auditing Journal, 25(2), 182-202.
Amaratunga, D., Baldry, D., Sarshar, M., & Newton, R. (2002). Quantitative and qualitative
research in the built environment: Application of “mixed” research approach. Work Study,
51(1), 17-31.
Ammann, M., Oesch, D., & Schmid, M. M. (2011a). Corporate governance and firm value:
International evidence. Journal of Empirical Finance, 18(1), 36-55.
Ammann, M., Oesch, D., & Schmid, M. M. (2011b). Corporate governance and firm value:
International evidence. Journal of Empirical Finance, 18(1), 36-55.
Amran, A., Lee, S. P., & Devi, S. S. (2014). The influence of governance structure and strategic
corporate social responsibility toward sustainability reporting quality. Business Strategy
and the Environment, 23(4), 217-235.
An, Y., Davey, H., & Eggleton, I. R. (2011). Towards a comprehensive theoretical framework
for voluntary IC disclosure. Journal of Intellectual Capital, 12(4), 571-585.
Anam, O. A., Fatima, A. H., & Majdi, A. R. H. (2011). Effects of intellectual capital
information disclosed in annual reports on market capitalization: Evidence from bursa
malaysia. Journal of Human Resource Costing & Accounting, 15(2), 85-101.
Anglin, P., Edelstein, R., Gao, Y., & Tsang, D. (2013). What is the relationship between REIT
governance and earnings management? The Journal of Real Estate Finance and
Economics, 47(3), 538-563.
Annells, M. (1996). Grounded theory method: Philosophical perspectives, paradigm of inquiry,
and postmodernism. Qualitative Health Research, 6(3), 379-393.
Appuhami, R., & Tashakor, S. (2017). The impact of audit committee characteristics on CSR
disclosure: An analysis of australian firms. Australian Accounting Review, 27(4), 400-420.
Archambeault, D. S., DeZoort, F. T., & Hermanson, D. R. (2008). Audit committee incentive
compensation and accounting restatements. Contemporary Accounting Research, 25(4),
965-992.
Aribi, Z. (2009) An Empirical Study of Corporate Social Responsibility and its Disclosure in
Islamic Financial Institutions, PhD thesis, Edinburgh Napier University.
Aribi, Z. A., & Gao, S. (2010). Corporate social responsibility disclosure: A comparison
between islamic and conventional financial institutions. Journal of Financial Reporting
and Accounting, 8(2), 72-91.
179
Aribi, Z. A., & Gao, S. S. (2011). Narrative disclosure of corporate social responsibility in
islamic financial institutions. Managerial Auditing Journal, 27(2), 199-222.
Arora, A., & Athreye, S. (2002). The software industry and India’s economic
development. Information economics and policy, 14(2), 253-273.
Ashforth, B. E., & Gibbs, B. W. (1990). The double-edge of organizational legitimation.
Organization Science, 1(2), 177-194.
Athanasakou, V., & Hussainey, K. (2014). The perceived credibility of forward-looking
performance disclosures. Accounting and Business Research, 44(3), 227-259.
Babbie, E. (2010). The practice of social research wadsworth cengage learning. International
Edition,
Babío Arcay, M. R., & Muiño Vázquez, M. (2005). Corporate characteristics, governance rules
and the extent of voluntary disclosure in spain. Advances in Accounting, 21, 299-331.
Baek, J., Kang, J., & Park, K. S. (2004). Corporate governance and firm value: Evidence from
the korean financial crisis. Journal of Financial Economics, 71(2), 265-313.
Bagnoli, M., & Watts, S. G. (2005). Financial reporting and voluntary disclosures. Purdue
University,
Balsam, S., Krishnan, J., & Yang, J. S. (2003). Auditor industry specialization and earnings
quality. Auditing: A Journal of Practice & Theory, 22(2), 71-97.
Banerjee, A., Gokarn, S., Pattanayak, M., & Sinha, S. K. (2009). Corporate governance and
market value: Preliminary evidence from indian companies. Standard and Poor’s
Financial Services, 200(12), 2.
Barako, D. G. (2004). Voluntary Corporate Disclosure by Kenyan Companies: A Longitudinal
Exploratory Study,
Barako, D. G. (2007). Determinants of voluntary disclosures in kenyan companies annual
reports. African Journal of Business Management, 1(5)
Barako, D. G., & Brown, A. M. (2008). Corporate social reporting and board representation:
Evidence from the kenyan banking sector. Journal of Management & Governance, 12(4),
309.
Barako, D. G., Hancock, P., & Izan, H. (2006). Factors influencing voluntary corporate
disclosure by kenyan companies. Corporate Governance: An International Review, 14(2),
107-125.

180
Barron, O. E., Kile, C. O., & O'KEEFE, T. B. (1999). MD&A quality as measured by the SEC
and analysts' earnings forecasts. Contemporary Accounting Research, 16(1), 75-109.
Barros, C. P., Boubaker, S., & Hamrouni, A. (2013). Corporate governance and voluntary
disclosure in france. Journal of Applied Business Research (JABR), 29(2), 561-578.
Barry, C. B., & Brown, S. J. (1985). Differential information and security market equilibrium.
Journal of Financial and Quantitative Analysis, 20(04), 407-422.
Bear, S., Rahman, N., & Post, C. (2010). The impact of board diversity and gender composition
on corporate social responsibility and firm reputation. Journal of Business Ethics, 97(2),
207-221.
Beasley, M. S. (1996). An empirical analysis of the relation between the board of director
composition and financial statement fraud. Accounting Review, , 443-465.
Beasley, M. S., Carcello, J. V., Hermanson, D. R., & Neal, T. L. (2009). The audit committee
oversight process. Contemporary Accounting Research, 26(1), 65-122.
Beattie, V., & Thomson, S. J. (2007). Lifting the lid on the use of content analysis to investigate
intellectual capital disclosures. Paper presented at the Accounting Forum, , 31(2) 129-163.
Beattie, V., McInnes, B., & Fearnley, S. (2004). A methodology for analysing and evaluating
narratives in annual reports: A comprehensive descriptive profile and metrics for
disclosure quality attributes. Paper presented at the Accounting Forum, , 28(3) 205-236.
Bebchuk, L. A., & Weisbach, M. S. (2010). The state of corporate governance research. Review
of Financial Studies, 23(3), 939-961.
Bedard, J., Chtourou, S. M., & Courteau, L. (2004). The effect of audit committee expertise,
independence, and activity on aggressive earnings management. Auditing: A Journal of
Practice & Theory, 23(2), 13-35.
Beekes, W., Brown, P., Zhan, W., & Zhang, Q. (2016). Corporate governance, companies’
disclosure practices and market transparency: A cross country study. Journal of Business
Finance & Accounting, 43(3-4), 263-297.
Beiner, S., Drobetz, W., Schmid, M. M., & Zimmermann, H. (2006). An integrated framework
of corporate governance and firm valuation. European Financial Management, 12(2),
249-283.
Belgacem, I., & Omri, A. (2014). The value relevance of voluntary disclosure: Evidence from
tunisia stock market. International Journal of Management, Accounting and Economics,
1(5), 353-370.
181
Beretta, S., & Bozzolan, S. (2004). A framework for the analysis of firm risk communication.
The International Journal of Accounting, 39(3), 265-288.
Beretta, S., & Bozzolan, S. (2008). Quality versus quantity: The case of forward-looking
disclosure. Journal of Accounting, Auditing & Finance, 23(3), 333-376.
Berg, B. L. (2004). Methods for the social sciences. Pearson Education Inc, United States of
America.
Bernard, B. (1952). Content analysis in communication research. New York: Hafner,
Bernard, H. R., & Bernard, H. R. (2012). Social research methods: Qualitative and quantitative
approaches Sage.
Bitner, L. N., & Dolan, R. C. (1996). Assessing the relationship between income smoothing
and the value of the firm. Quarterly Journal of Business and Economics, , 16-35.
Black, B. S., Jang, H., & Kim, W. (2006). Does corporate governance predict firms' market
values? evidence from korea. The Journal of Law, Economics, and Organization, 22(2),
366-413.
Black, B. S., Love, I., & Rachinsky, A. (2006). Corporate governance indices and firms' market
values: Time series evidence from russia. Emerging Markets Review, 7(4), 361-379.
Booth, J. R., & Deli, D. N. (1996). Factors affecting the number of outside directorships held
by CEOs. Journal of Financial Economics, 40(1), 81-104.
Botosan, C. A. (1997). Disclosure level and the cost of equity capital. Accounting Review, ,
323-349.
Botosan, C. A. (2004). Discussion of a framework for the analysis of firm risk communication.
The International Journal of Accounting, 39(3), 289-295.
Botosan, C. A., & Plumlee, M. A. (2002). A re‐examination of disclosure level and the
expected cost of equity capital. Journal of Accounting Research, 40(1), 21-40.
Boyd, B. (1990). Corporate linkages and organizational environment: A test of the resource
dependence model. Strategic Management Journal, 11(6), 419-430.
Bozanic, Z., Roulstone, D. T., & Van Buskirk, A. (2013). Management earnings forecasts and
forward-looking statements. Available at SSRN 2130145,
Bozec, R. (2005). Boards of directors, market discipline and firm performance. Journal of
Business Finance & Accounting, 32(9‐10), 1921-1960.

182
Bozzolan, S., & Ipino, E. (2007). Information asymmetries and IPO underpricing: The role of
voluntary disclosure of forward-looking information in the prospectus. Available at SSRN
999518,
Bozzolan, S., Trombetta, M., & Beretta, S. (2009). Forward-looking disclosures, financial
verifiability and analysts' forecasts: A study of cross-listed european firms. European
Accounting Review, 18(3), 435-473.
Bradbury, M., Mak, Y. T., & Tan, S. (2006). Board characteristics, audit committee
characteristics and abnormal accruals. Pacific Accounting Review, 18(2), 47-68.
Branco, M. C., & Rodrigues, L. L. (2008). Factors influencing social responsibility disclosure
by portuguese companies. Journal of Business Ethics, 83(4), 685-701.
Bravo, F. (2015). Forward-looking disclosure and corporate reputation as mechanisms to
reduce stock return volatility. Revista De Contabilidad,
Brick, I. E., & Chidambaran, N. (2010). Board meetings, committee structure, and firm value.
Journal of Corporate Finance, 16(4), 533-553.
Bronson, S. N., Carcello, J. V., & Raghunandan, K. (2006). Firm characteristics and voluntary
management reports on internal control. Auditing: A Journal of Practice & Theory, 25(2),
25-39.
Brown, I., Steen, A., & Foreman, J. (2009). Risk management in corporate governance: A
review and proposal. Corporate Governance: An International Review, 17(5), 546-558.
Brown, P., Beekes, W., & Verhoeven, P. (2011). Corporate governance, accounting and
finance: A review. Accounting & Finance, 51(1), 96-172.
Brown, S., & Hillegeist, S. A. (2007). How disclosure quality affects the level of information
asymmetry. Review of Accounting Studies, 12(2-3), 443-477.
Brown, S., Hillegeist, S. A., & Lo, K. (2004). Conference calls and information asymmetry.
Journal of Accounting and Economics, 37(3), 343-366.
Bryman, A. and Bell, E., 2015. Business research methods. Oxford University Press, USA.
Bryman, A., & Bell, E. (2007). Business research methods second edition oxford university
press UK.
Bujaki, M. L., & Zeghal, D. (1999). The disclosure of future oriented information in annual
reports of canadian corporations.

183
Bushee, B. J., & Noe, C. F. (2000). Corporate disclosure practices, institutional investors, and
stock return volatility. Journal of Accounting Research, 171-202.
Byard, D., Li, Y., & Weintrop, J. (2006). Corporate governance and the quality of financial
analysts’ information. Journal of Accounting and Public Policy, 25(5), 609-625.
Camfferman, K., & Cooke, T. E. (2002). An analysis of disclosure in the annual reports of UK
and dutch companies. Journal of International Accounting Research, 1(1), 3-30.
Carcello, J. V., Hermanson, D. R., Neal, T. L., & Riley, R. A. (2002). Board characteristics
and audit fees. Contemporary Accounting Research, 19(3), 365-384.
Carmines, E. G., & Zeller, R. A. (1979). Reliability and validity. beverly hills.
Carney, T. F. (1972). Content analysis: A technique for systematic inference from
communications University of Manitoba Press.
Carson, E., & Simnett, R. (1997). Voluntary disclosure of corporate governance information
University of New South Wales, School of Accounting.
Carter, D. A., D'Souza, F., Simkins, B. J., & Simpson, W. G. (2010). The gender and ethnic
diversity of US boards and board committees and firm financial performance. Corporate
Governance: An International Review, 18(5), 396-414.
Carter, D. A., Simkins, B. J., & Simpson, W. G. (2003a). Corporate governance, board
diversity, and firm value. Financial Review, 38(1), 33-53.
Carter, D. A., Simkins, B. J., & Simpson, W. G. (2003b). Corporate governance, board
diversity, and firm value. Financial Review, 38(1), 33-53.
Castanias, R. P., & Helfat, C. E. (2001). The managerial rents model: Theory and empirical
analysis. Journal of Management, 27(6), 661-678.
Celik, O., Ecer, A., & Karabacak, H. (2006). Disclosure of forward looking information:
Evidence from listed companies on istanbul stock exchange (ISE). Investment
Management and Financial Innovations, 3(2), 197-216.
Cerbioni, F., & Parbonetti, A. (2007). Exploring the effects of corporate governance on
intellectual capital disclosure: An analysis of european biotechnology companies.
European Accounting Review, 16(4), 791-826.
Chakroun, R. & Hussainey, K. (2014). “Disclosure quality in Tunisian annual reports,”
Corporate Ownership and Control, 11(4), 58-80.

184
Chang, L. S., & Most, K. S. (1985). The perceived usefulness of financial statements for
investors' decisions Florida International University Press.
Chapple, L., & Truong, T. P. (2015). Continuous disclosure compliance: Does corporate
governance matter? Accounting & Finance, 55(4), 965-988.
Charumathi, B., & Ramesh, L. (2015a). On the determinants of forward looking disclosures by
indian companies. Indian Journal of Accounting, 47, 1.
Charumathi, B., & Ramesh, L. (2015b). On the determinants of voluntary disclosure by indian
companies. Asia-Pacific Journal of Management Research and Innovation, 11(2), 108-
116.
Chau, G. K., & Gray, S. J. (2002). Ownership structure and corporate voluntary disclosure in
hong kong and singapore. The International Journal of Accounting, 37(2), 247-265.
Chau, G., & Gray, S. J. (2010). Family ownership, board independence and voluntary
disclosure: Evidence from hong kong. Journal of International Accounting, Auditing and
Taxation, 19(2), 93-109.
Chen, C. J., & Jaggi, B. (2001). Association between independent non-executive directors,
family control and financial disclosures in hong kong. Journal of Accounting and Public
Policy, 19(4), 285-310.
Chen, G., Firth, M., Gao, D. N., & Rui, O. M. (2006). Ownership structure, corporate
governance, and fraud: Evidence from china. Journal of Corporate Finance, 12(3), 424-
448.
Chen, H. (2011). Does board independence influence the top management team? evidence from
strategic decisions toward internationalization. Corporate Governance: An International
Review, 19(4), 334-350.
Chen, J. C., & Roberts, R. W. (2010). Toward a more coherent understanding of the
organization–society relationship: A theoretical consideration for social and
environmental accounting research. Journal of Business Ethics, 97(4), 651-665.
Cheng, B., Ioannou, I., & Serafeim, G. (2014). Corporate social responsibility and access to
finance. Strategic Management Journal, 35(1), 1-23.
Cheng, E., & Courtenay, S. M. (2006). Board composition, regulatory regime and voluntary
disclosure. The International Journal of Accounting, 41(3), 262-289.
Cheung, Y., Jiang, P., & Tan, W. (2010). A transparency disclosure index measuring
disclosures: Chinese listed companies. Journal of Accounting and Public Policy, 29(3),
259-280.

185
Choi, B. B., Lee, D., & Park, Y. (2013). Corporate social responsibility, corporate governance
and earnings quality: Evidence from korea. Corporate Governance: An International
Review, 21(5), 447-467.
Choi, J., Kwak, Y., & Choe, C. (2010). Corporate social responsibility and corporate financial
performance: Evidence from korea. Australian Journal of Management, 35(3), 291-311.
Chow, C. W., & Wong-Boren, A. (1987). Voluntary financial disclosure by mexican
corporations. Accounting Review, , 533-541.
Christensen, J., Kent, P., Routledge, J., & Stewart, J. (2015). Do corporate governance
recommendations improve the performance and accountability of small listed companies?
Accounting & Finance, 55(1), 133-164.
Chung, H., Judge, W. Q., & Li, Y. (2015). Voluntary disclosure, excess executive
compensation, and firm value. Journal of Corporate Finance, 32, 64-90.
Clacher, I., Doriye, E. J., & Hillier, D. (2008). Does corporate governance matter? new
evidence from the united kingdom.
Clarkson, P. M., Kao, J. L., & Richardson, G. D. (1994). The voluntary inclusion of forecasts
in the MD&A section of annual reports. Contemporary Accounting Research, 11(1), 423-
450.
Clarkson, P. M., Kao, J. L., & Richardson, G. D. (1999). Evidence that management discussion
and analysis (MD&A) is a part of a firm's overall disclosure package. Contemporary
Accounting Research, 16(1), 111-134.
Clatworthy, M., & Jones, M. J. (2003). Financial reporting of good news and bad news:
Evidence from accounting narratives. Accounting and Business Research, 33(3), 171-185.
Cohen, J. R., Krishnamoorthy, G., & Wright, A. (2004). The corporate governance mosaic and
financial reporting quality.
Coller, M., & Yohn, T. L. (1997). Management forecasts and information asymmetry: An
examination of bid-ask spreads. Journal of Accounting Research, 35(2), 181-191.
Collier, P. (1993). Factors affecting the formation of audit committees in major UK listed
companies. Accounting and Business Research, 23(sup1), 421-430.
Collins, J., & Hussey, R. (2003). Business research. A Practical Guide for Undergraduate and
Postgraduate Students, Polgrave Macmillan, New York,
Collis, J., & Hussey, R. (2013). Business research: A practical guide for undergraduate and
postgraduate students Palgrave macmillan.

186
Conheady, B., McIlkenny, P., Opong, K. K., & Pignatel, I. (2015). Board effectiveness and
firm performance of canadian listed firms. The British Accounting Review, 47(3), 290-
303.
Conyon, M. J., & He, L. (2011). Executive compensation and corporate governance in china.
Journal of Corporate Finance, 17(4), 1158-1175.
Cooke, T. E. (1989). Disclosure in the corporate annual reports of swedish companies.
Accounting and Business Research, 19(74), 113-124.
Cooke, T. E. (1991). An assessment of voluntary disclosure in the annual reports of japanese
corporations. The International Journal of Accounting, 26(3), 174-189.
Cooke, T. E. (1992). The impact of size, stock market listing and industry type on disclosure
in the annual reports of japanese listed corporations. Accounting and Business Research,
22(87), 229-237.
Core, J. E. (2001). A review of the empirical disclosure literature: Discussion. Journal of
Accounting and Economics, 31(1-3), 441-456.
Cotter, J., & Silvester, M. (2003). Board and monitoring committee independence. Abacus,
39(2), 211-232.
Craven, B. M., & Marston, C. L. (1999). Financial reporting on the internet by leading UK
companies. European Accounting Review, 8(2), 321-333.
Crotty, M. (1998). The foundations of social research: Meaning and perspective in the
research process Sage.
Daily, C. M., Dalton, D. R., & Cannella, A. A. (2003). Corporate governance: Decades of
dialogue and data. Academy of Management Review, 28(3), 371-382.
Dalton, D. R., Daily, C. M., Johnson, J. L., & Ellstrand, A. E. (1999). Number of directors and
financial performance: A meta-analysis. Academy of Management Journal, 42(6), 674-
686.
Damodar N.. Gujarati. (2003). Basic econometrics McGraw-Hill.
Darko, J., Aribi, Z. A., & Uzonwanne, G. C. (2016). Corporate governance: The impact of
director and board structure, ownership structure and corporate control on the performance
of listed companies on the ghana stock exchange. Corporate Governance, 16(2), 259-277.
Davidson, W. N., Nemec, C., & Worrell, D. (1996). The influence of the board of directors and
financial performance on the incidence of executive plurality. Corporate Governance: An
International Review, 4(1), 11-20.

187
Deegan, C. (2002). Introduction: The legitimising effect of social and environmental
disclosures–a theoretical foundation. Accounting, Auditing & Accountability
Journal, 15(3), 282-311.
Deegan, C. M., & Samkin, G. (2008). New Zealand financial accounting. McGraw-Hill Higher
Education.
Dembo, A. M., & Rasaratnam, S. (2014). Corporate governance and disclosure in nigeria: An
empirical study. Procedia-Social and Behavioral Sciences, 164, 161-171.
Deumes, R. (2008). Corporate risk reporting: A content analysis of narrative risk disclosures
in prospectuses. The Journal of Business Communication (1973), 45(2), 120-157.
Dhaliwal, D. S., Radhakrishnan, S., Tsang, A., & Yang, Y. G. (2012). Nonfinancial disclosure
and analyst forecast accuracy: International evidence on corporate social responsibility
disclosure. The Accounting Review, 87(3), 723-759.
Diamond, D. W., & Verrecchia, R. E. (1991). Disclosure, liquidity, and the cost of capital. The
Journal of Finance, 46(4), 1325-1359.
Donaldson, L., & Davis, J. H. (1991). Stewardship theory or agency theory: CEO governance
and shareholder returns. Australian Journal of Management, 16(1), 49-64.
Donaldson, T., & Preston, L. E. (1995). The stakeholder theory of the corporation: Concepts,
evidence, and implications. Academy of Management Review, 20(1), 65-91.
Donnelly, R., & Mulcahy, M. (2008). Board structure, ownership, and voluntary disclosure in
ireland. Corporate Governance: An International Review, 16(5), 416-429.
Dowling, M., & Aribi, Z. A. (2013). Female directors and UK company acquisitiveness.
International Review of Financial Analysis, 29, 79-86.
Dyduch, J., & Krasodomska, J. (2017). Determinants of corporate social responsibility
disclosure: An empirical study of polish listed companies. Sustainability, 9(11), 1934.
Ebrahim, A., & Fattah, T. A. (2015). Corporate governance and initial compliance with IFRS
in emerging markets: The case of income tax accounting in egypt. Journal of International
Accounting, Auditing and Taxation, 24, 46-60.
Eisenberg, T., Sundgren, S., & Wells, M. T. (1998). Larger board size and decreasing firm
value in small firms. Journal of Financial Economics, 48(1), 35-54.
El-Gazzar, S. M. (1998). Predisclosure information and institutional ownership: A cross-
sectional examination of market revaluations during earnings announcement periods.
Accounting Review, , 119-129.
188
Elmagrhi, M. H., Elmagrhi, M. H., Ntim, C. G., Ntim, C. G., Wang, Y., & Wang, Y. (2016).
Antecedents of voluntary corporate governance disclosure: A post-2007/08 financial crisis
evidence from the influential UK combined code. Corporate Governance, 16(3), 507-538.
Elmagrhi, M., Ntim, C. G., Crossely, R., Malagila, J., Fosu, S., & Vu, T. (2017). Corporate
governance and dividend pay-out policy in UK listed SMEs: The effects of corporate
board characteristics.
El-Masry, A. A., Elbahar, E., & AbdelFattah, T. (2016). Corporate governance and risk
management in GCC banks.
Elsayed, K. (2007). Does CEO duality really affect corporate performance? Corporate
Governance: An International Review, 15(6), 1203-1214.
Elshandidy, T., & Neri, L. (2015). Corporate governance, risk disclosure practices, and market
liquidity: Comparative evidence from the UK and italy. Corporate Governance: An
International Review, 23(4), 331-356.
Elshandidy, T., Fraser, I., & Hussainey, K. (2013). Aggregated, voluntary, and mandatory risk
disclosure incentives: Evidence from UK FTSE all-share companies. International Review
of Financial Analysis, 30, 320-333.
Elzahar, H., & Hussainey, K. (2012). Determinants of narrative risk disclosures in UK interim
reports. The Journal of Risk Finance, 13(2), 133-147.
Elzahar, H., Hussainey, K., Mazzi, F., & Tsalavoutas, I. (2015). Economic consequences of
key performance indicators' disclosure quality. International Review of Financial
Analysis, 39, 96-112.
Eng, L. L., & Mak, Y. T. (2003). Corporate governance and voluntary disclosure. Journal of
Accounting and Public Policy, 22(4), 325-345.
Estélyi, K. S., & Nisar, T. M. (2016). Diverse boards: Why do firms get foreign nationals on
their boards? Journal of Corporate Finance, 39, 174-192.
Etzioni, A. (1998). A communitarian note on stakeholder theory 1. Business Ethics Quarterly,
8(4), 679-691.
Ezat, A., & El-Masry, A. (2008). The impact of corporate governance on the timeliness of
corporate internet reporting by egyptian listed companies. Managerial Finance, 34(12),
848-867.
Fama, E. F. (1980). Agency problems and the theory of the firm. The Journal of Political
Economy, , 288-307.

189
Fama, E. F., & Jensen, M. C. (1983). Agency problems and residual claims. Journal of Law
and Economics, , 327-349.
Felo, A. J., & Solieri, S. A. (2009). Are all audit committee financial experts created equally?
International Journal of Disclosure and Governance, 6(2), 150-166.
Felo, A. J., Krishnamurthy, S., & Solieri, S. A. (2003). Audit committee characteristics and the
perceived quality of financial reporting: An empirical analysis.
Ferguson, M. J., Lam, K. C., & Lee, G. M. (2002). Voluntary disclosure by state‐owned
enterprises listed on the stock exchange of hong kong. Journal of International Financial
Management & Accounting, 13(2), 125-152.
Ferreira, D. (2010). Board diversity Oxford, John Wiley & Sons.
Field, A. (2009). Discovering statistics using SPSS Sage publications.
Fields, T. D., Lys, T. Z., & Vincent, L. (2001). Empirical research on accounting choice.
Journal of Accounting and Economics, 31(1), 255-307.
Firth, M. (1980). Raising finance and firms' corporate reporting policies. Abacus, 16(2), 100-
115.
Forker, J. J. (1992). Corporate governance and disclosure quality. Accounting and Business
Research, 22(86), 111-124.
Frankel, R., McNichols, M., & Wilson, G. P. (1995). Discretionary disclosure and external
financing. Accounting Review, 135-150.
Freeman, R. E., Harrison, J. S., Wicks, A. C., Parmar, B. L., & De Colle, S. (2010). Stakeholder
theory: The state of the art. Cambridge University Press.
Freeman, R.E., 1983. Strategic management: A stakeholder approach. Advances in strategic
management, 1(1), pp.31-60.
Freeman, R.E., 2010. Strategic management: A stakeholder approach. Cambridge university
press.
Gaio, C., & Raposo, C. (2011). Earnings quality and firm valuation: International evidence*.
Accounting & Finance, 51(2), 467-499.
Ganguli, S. K., & Agrawal, S. (2009). Ownership structure and firm performance: An empirical
study on listed mid-cap indian companies. IUP Journal of Applied Finance, 15(12), 37-
52.

190
Garcia-Meca, E., & Sanchez-Ballesta, J. P. (2010). The association of board independence and
ownership concentration with voluntary disclosure: A meta-analysis. European
Accounting Review, 19(3), 603-627.
Garrido-Miralles, P., & Sanabria-García, S. (2014). The impact of mandatory IFRS adoption
on financial analysts’ earnings forecasts in spain. Spanish Journal of Finance and
Accounting/Revista Espanola De Financiacion Y Contabilidad, 43(2), 111-131.
Garson, G. D. (2012). Testing statistical assumptions. Asheboro, NC: Statistical Associates
Publishing,
Gaud, P., Jani, E., Hoesli, M., & Bender, A. (2005). The capital structure of swiss companies:
An empirical analysis using dynamic panel data. European Financial Management, 11(1),
51-69.
Gautam, R., & Singh, A. (2010). Corporate social responsibility practices in india: A study of
top 500 companies. Global Business and Management Research: An International
Journal, 2(1), 41-56.
Ghazali, N. A. M., & Weetman, P. (2006). Perpetuating traditional influences: Voluntary
disclosure in malaysia following the economic crisis. Journal of International Accounting,
Auditing and Taxation, 15(2), 226-248.
Gibbins, M., Richardson, A., & Waterhouse, J. (1990). The management of corporate financial
disclosure: Opportunism, ritualism, policies, and processes. Journal of Accounting
Research, , 121-143.
Gill, J., & Johnson, P. (2010). Research methods for managers Sage.
Gillan, S. L. (2006). Recent Developments in Corporate Governance: An Overview,
Gillan, S., & Starks, L. T. (1998). A survey of shareholder activism: Motivation and empirical
evidence.
Gippel, J., Smith, T., & Zhu, Y. (2015). Endogeneity in accounting and finance research:
Natural experiments as a State‐of‐the‐Art solution. Abacus, 51(2), 143-168.
Gordon, L. A., Loeb, M. P., & Sohail, T. (2010). Market value of voluntary disclosures
concerning information security. Mis Quarterly, 34(3), 567-594.
Graham, J. R., Harvey, C. R., & Rajgopal, S. (2005). The economic implications of corporate
financial reporting. Journal of Accounting and Economics, 40(1), 3-73.
Greene, W. H. (2008). The econometric approach to efficiency analysis. The Measurement of
Productive Efficiency and Productivity Growth, 1, 92-250.

191
Grewal, R., Cote, J. A., & Baumgartner, H. (2004). Multicollinearity and measurement error
in structural equation models: Implications for theory testing. Marketing Science, 23(4),
519-529.
Guan, Y., Sheu, D., & Chu, Y. (2007). Ownership structure, board of directors, and information
disclosure: Empirical evidence from taiwan IC design companies. Journal of American
Academy of Business, 11(2), 182-190.
Guay, W. R., Kothari, S. P., & Watts, R. L. (1996). A market-based evaluation of discretionary
accrual models. Journal of accounting research, 83-105.
Gujarati, D. (2003). Basic econometrics, international edition. McGraw-hills, companies.
Inc.New York, United Stated,
Gujarati, D. N. (2009). Basic econometrics Tata McGraw-Hill Education.
Gujarati, D. N., & Porter, D. C. (2011). Econometria básica-5 AMGH Editora.
Gul, F. A., & Leung, S. (2004). Board leadership, outside directors’ expertise and voluntary
corporate disclosures. Journal of Accounting and Public Policy, 23(5), 351-379.
Habbash, M. & Ibrahim, A. (2015) “Determinants of CSR disclosure from Saudi nonfinancial
listed firm.” Journal of general administration, 75,(4). (Arabic).
Habbash, M., Xiao, L., Salama, A., & Dixon, R. (2014). Are independent directors and
supervisory directors effective in constraining earnings management? Journal of Finance,
Accounting and Management, 5(1), 125.
Hafsi, T., & Turgut, G. (2013). Boardroom diversity and its effect on social performance:
Conceptualization and empirical evidence. Journal of Business Ethics, 112(3), 463-479.
Hakim, C. (1987). Research design: Strategies and choices in the design of social research
Allen and Unwin.
Haldar, A., & Rao, S. (2011). Empirical study on ownership structure and firm performance,
Indian Journal of Corporate Governance, 4(2)
Haniffa, R. M., & Cooke, T. E. (2002). Culture, corporate governance and disclosure in
malaysian corporations. Abacus, 38(3), 317-349.
Haniffa, R. M., & Cooke, T. E. (2005). The impact of culture and governance on corporate
social reporting. Journal of Accounting and Public Policy, 24(5), 391-430.

192
Haniffa, R., & Hudaib, M. (2006). Corporate governance structure and performance of
malaysian listed companies. Journal of Business Finance & Accounting, 33(7‐8), 1034-
1062.
Harris, M., & Raviv, A. (2006). A theory of board control and size. The Review of Financial
Studies, 21(4), 1797-1832.
Hassan, O. A., Romilly, P., Giorgioni, G., & Power, D. (2009). The value relevance of
disclosure: Evidence from the emerging capital market of egypt. The International Journal
of Accounting, 44(1), 79-102.
Hassanein, A., & Hussainey, K. (2015). Is forward-looking financial disclosure really
informative? evidence from UK narrative statements. International Review of Financial
Analysis, 41, 52-61.
Hastings, S. O. (2000). Asian indian “self-suppression” and self-disclosure: Enactment and
adaptation of cultural identity. Journal of Language and Social Psychology, 19(1), 85-
109.
Healy, P. M., & Palepu, K. G. (1993). The effect of firms' financial disclosure strategies on
stock prices. Accounting Horizons, 7(1), 1.
Healy, P. M., & Palepu, K. G. (2001). Information asymmetry, corporate disclosure, and the
capital markets: A review of the empirical disclosure literature. Journal of Accounting and
Economics, 31(1), 405-440.
Healy, P. M., & Wahlen, J. M. (1999). A review of the earnings management literature and its
implications for standard setting. Accounting Horizons, 13(4), 365-383.
Healy, P. M., Hutton, A. P., & Palepu, K. G. (1999). Stock performance and intermediation
changes surrounding sustained increases in disclosure. Contemporary Accounting
Research, 16(3), 485-520.
Henry, D. (2008). Corporate governance structure and the valuation of australian firms: Is there
value in ticking the boxes? Journal of Business Finance & Accounting, 35(7‐8), 912-942.
Herman, E. S. (1981). Corporate control, corporate power Cambridge University Press
Cambridge.
Hidalgo, R. L., García-Meca, E., & Martínez, I. (2011). Corporate governance and intellectual
capital disclosure. Journal of Business Ethics, 100(3), 483-495.
Hillman, A. J., & Dalziel, T. (2003). Boards of directors and firm performance: Integrating
agency and resource dependence perspectives. Academy of Management Review, 28(3),
383-396.
193
Hillman, A. J., Cannella, A. A., & Paetzold, R. L. (2000). The resource dependence role of
corporate directors: Strategic adaptation of board composition in response to
environmental change. Journal of Management Studies, 37(2), 235-256.
Himmelberg, C. P., Hubbard, R. G., & Palia, D. (1999). Understanding the determinants of
managerial ownership and the link between ownership and performance. Journal of
Financial Economics, 53(3), 353-384.
Ho, P., & Taylor, G. (2013). Corporate governance and different types of voluntary disclosure:
Evidence from malaysian listed firms. Pacific Accounting Review, 25(1), 4-29.
Ho, P., Tower, G., & Barako, D. (2008). Improving governance leads to improved corporate
communication. Corporate Ownership & Control, 5(4), 26-33.
Ho, S. S., & Shun Wong, K. (2001). A study of the relationship between corporate governance
structures and the extent of voluntary disclosure. Journal of International Accounting,
Auditing and Taxation, 10(2), 139-156.
Ho, S. S., & Wong, K. S. (2001a). A study of the relationship between corporate governance
structures and the extent of voluntary disclosure. Journal of International Accounting,
Auditing and Taxation, 10(2), 139-156.
Ho, S. S., & Wong, K. S. (2001b). A study of the relationship between corporate governance
structures and the extent of voluntary disclosure. Journal of International Accounting,
Auditing and Taxation, 10(2), 139-156.
Hoang, T. C., Abeysekera, I., & Ma, S. (2016). Board diversity and corporate social disclosure:
Evidence from vietnam. Journal of Business Ethics, , 1-20.
Hope, O. (2003). Disclosure practices, enforcement of accounting standards, and analysts'
forecast accuracy: An international study. Journal of Accounting Research, 41(2), 235-
272.
Hopkins, P. E. (1996). The effect of financial statement classification of hybrid financial
instruments on financial analysts' stock price judgments. Journal of Accounting Research,
, 33-50.
Hossain, M., & Hammami, H. (2009). Voluntary disclosure in the annual reports of an
emerging country: The case of qatar. Advances in Accounting, 25(2), 255-265.
Hossain, M., & Reaz, M. (2007). The determinants and characteristics of voluntary disclosure
by indian banking companies. Corporate Social Responsibility and Environmental
Management, 14(5), 274-288.

194
Hossain, M., Ahmed, K., & Godfrey, J. M. (2005). Investment opportunity set and voluntary
disclosure of prospective information: A simultaneous equations approach. Journal of
Business Finance & Accounting, 32(5‐6), 871-907.
Hossain, M., Perera, M. H. B., & Rahman, A. R. (1995). Voluntary disclosure in the annual
reports of new zealand companies. Journal of International Financial Management &
Accounting, 6(1), 69-87.
Howell, K. E. (2012). An introduction to the philosophy of methodology Sage.
Huafang, X., & Jianguo, Y. (2007). Ownership structure, board composition and corporate
voluntary disclosure: Evidence from listed companies in china. Managerial Auditing
Journal, 22(6), 604-619.
Huang, P., & Zhang, Y. (2008). Does enhanced disclosure really reduce agency costs? evidence
from the value of corporate cash holdings and dividends. Paper presented at the China
International Conference in Finance, in: Http://Www. Ccfr. Org. Cn/cicf2008/Download.
Php,
Hughes, P. J. (1986). Signalling by direct disclosure under asymmetric information. Journal of
Accounting and Economics, 8(2), 119-142.
Hui, K. W., & Matsunaga, S. R. (2014). Are CEOs and CFOs rewarded for disclosure quality?
The Accounting Review, 90(3), 1013-1047.
Hussainey, K. S. M. (2004). A Study of the Ability of (Partially) Automated Disclosure Scores
to Explain the Information Content of Annual Report Narratives for Future Earnings,
University of Manchester.
Hussainey, K., & Aal-Eisa, J. (2009). Disclosure and dividend signalling when sustained
earnings growth declines. Managerial Auditing Journal, 24(5), 445-454.
Hussainey, K., & Al-Najjar, B. (2011). Future-oriented narrative reporting: Determinants and
use. Journal of Applied Accounting Research, 12(2), 123-138.
Hussainey, K., & Al‐Najjar, B. (2012). Understanding the determinants of RiskMetrics/ISS
ratings of the quality of UK companies' corporate governance practice. Canadian Journal
of Administrative Sciences/Revue Canadienne Des Sciences De L'Administration, 29(4),
366-377.
Hussainey, K., & Mouselli, S. (2010). Disclosure quality and stock returns in the UK. Journal
of Applied Accounting Research, 11(2), 154-174.

195
Hussainey, K., Schleicher, T., & Walker, M. (2003). Undertaking large-scale disclosure studies
when AIMR-FAF ratings are not available: The case of prices leading earnings.
Accounting and Business Research, 33(4), 275-294.
Hutton, A. P., Miller, G. S., & Skinner, D. J. (2003). The role of supplementary statements
with management earnings forecasts. Journal of Accounting Research, , 867-890.
Inchausti, B. G. (1997). The influence of company characteristics and accounting regulation
on information disclosed by spanish firms. European Accounting Review, 6(1), 45-68.
Ismail, N., & Sinnadurai, P. (2012). Corporate governance quality and ownership concentration
type: Evidence from malaysia. Paper presented at the Business, Engineering and Industrial
Applications (ISBEIA), 2012 IEEE Symposium On, 254-257.
Ittonen, K., Miettinen, J., & Vähämaa, S. (2010). Does female representation on audit
committees affect audit fees? Quarterly Journal of Finance and Accounting, , 113-139.
Jackling, B., & Johl, S. (2009). Board structure and firm performance: Evidence from india's
top companies. Corporate Governance: An International Review, 17(4), 492-509.
Jallow, K., Hussainey, K., & Aljifri, K. (2012). Corporate governance mechanisms and capital
structure in UAE. Journal of Applied Accounting Research, 13(2), 145-160.
Jennings, R. (1987). Unsystematic security price movements, management earnings forecasts,
and revisions in consensus analyst earnings forecasts. Journal of Accounting Research, ,
90-110.
Jensen, M. C. (1993). The modern industrial revolution, exit, and the failure of internal control
systems. The Journal of Finance, 48(3), 831-880.
Jensen, M. C., & Meckling, W. H. (1976). Theory of the firm: Managerial behavior, agency
costs and ownership structure. Journal of Financial Economics, 3(4), 305-360.
Jizi, M. I., Salama, A., Dixon, R., & Stratling, R. (2014). Corporate governance and corporate
social responsibility disclosure: Evidence from the US banking sector. Journal of Business
Ethics, 125(4), 601-615.
Johanson, D., & Østergren, K. (2010). The movement toward independent directors on boards:
A comparative analysis of sweden and the UK. Corporate Governance: An International
Review, 18(6), 527-539.
John, K., & Senbet, L. W. (1998). Corporate governance and board effectiveness. Journal of
Banking & Finance, 22(4), 371-403.

196
Jones, M. J., & Shoemaker, P. A. (1994). Accounting narratives: A review of empirical studies
of content and readability. Journal of Accounting Literature, 13, 142.
Jouini, F. (2013). Corporate governance and the level of financial disclosure by tunisian firm.
Journal of Business Studies Quarterly, 4(3), 95.
Junker, L. (2005). Equity carveouts, agency costs, and firm value Springer DE.
Kamath, B., 2008. Intellectual capital disclosure in India: content analysis of “TecK”
firms. Journal of Human Resource Costing & Accounting, 12(3), pp.213-224.
Karamanou, I., & Vafeas, N. (2005). The association between corporate boards, audit
committees, and management earnings forecasts: An empirical analysis. Journal of
Accounting Research, 43(3), 453-486.
Kelton, A. S., & Yang, Y. (2008). The impact of corporate governance on internet financial
reporting. Journal of Accounting and Public Policy, 27(1), 62-87.
Kent, P., & Stewart, J. (2008). Corporate governance and disclosures on the transition to
international financial reporting standards. Accounting & Finance, 48(4), 649-671.
Kent, P., & Ung, K. (2003). Voluntary disclosure of forward-looking earnings information in
australia. Australian Journal of Management, 28(3), 273-285.
Key, S. (1999). Toward a new theory of the firm: A critique of stakeholder “theory”.
Management Decision, 37(4), 317-328.
Khlif, H., & Hussainey, K. (2016). The association between risk disclosure and firm
characteristics: A meta-analysis. Journal of Risk Research, 19(2), 181-211.
Kiel, G. C., & Nicholson, G. J. (2003). Board composition and corporate performance: How
the australian experience informs contrasting theories of corporate governance. Corporate
Governance: An International Review, 11(3), 189-205.
Kieso, D. E., Weygandt, J. J., & Warfield, T. D. (2010). Intermediate accounting: IFRS edition
John Wiley & Sons.
Kim, J. W., & Shi, Y. (2011). Voluntary disclosure and the cost of equity capital: Evidence
from management earnings forecasts. Journal of Accounting and Public Policy, 30(4),
348-366.
Kim, O., & Verrecchia, R. E. (1994). Market liquidity and volume around earnings
announcements. Journal of Accounting and Economics, 17(1), 41-67.
197
Klapper, L. F., & Love, I. (2004). Corporate governance, investor protection, and performance
in emerging markets. Journal of Corporate Finance, 10(5), 703-728.
Klein, A. (1998). Firm performance and board committee structure. The Journal of Law and
Economics, 41(1), 275-304.
Koh, P. (2003). On the association between institutional ownership and aggressive corporate
earnings management in australia. The British Accounting Review, 35(2), 105-128.
Kolbe, R. H., & Burnett, M. S. (1991). Content-analysis research: An examination of
applications with directives for improving research reliability and objectivity. Journal of
Consumer Research, 18(2), 243-250.
Kolsi, M. C., & Kolsi, M. C. (2017). The determinants of corporate voluntary disclosure policy:
Evidence from the abu dhabi securities exchange (ADX). Journal of Accounting in
Emerging Economies, 7(2), 249-265.
Konijn, S. J., Kräussl, R., & Lucas, A. (2011). Blockholder dispersion and firm value. Journal
of Corporate Finance, 17(5), 1330-1339.
Krippendorff, K. (1980). Validity in content analysis.
Krishnan, G. V., & Visvanathan, G. (2006). Does the SOX definition of an accounting expert
matter? the association between audit committee director's expertise and conservatism.
Paper presented at the Annual Meeting, at Washington, DC,
Kumar, N., & Singh, J. (2013). Effect of board size and promoter ownership on firm value:
Some empirical findings from india. Corporate Governance: The International Journal of
Business in Society, 13(1), 88-98.
Kuzey, C. (2018). Determinants of forward-looking disclosure in integrated reporting.
La Porta, R., Lopez-de-Silanes, F., Shleifer, A., & Vishny, R. (1999). The quality of
government. The Journal of Law, Economics, and Organization, 15(1), 222-279.
La Rosa, F., & Liberatore, G. (2014). Biopharmaceutical and chemical firms’ R&D disclosure,
and cost of equity: The impact of the regulatory regime. European Management Journal,
32(5), 806-820.
Lajili, K., & Zéghal, D. (2005). A content analysis of risk management disclosures in canadian
annual reports. Canadian Journal of Administrative Sciences/Revue Canadienne Des
Sciences De L'Administration, 22(2), 125-142.
Lakhal, F. (2005). Voluntary earnings disclosures and corporate governance: Evidence from
france. Review of Accounting and Finance, 4(3), 64-85.

198
Laksmana, I. (2008). Corporate board governance and voluntary disclosure of executive
compensation practices. Contemporary Accounting Research, 25(4), 1147-1182.
Lang, M. H., & Lundholm, R. J. (1996). Corporate disclosure policy and analyst behavior.
Accounting Review, , 467-492.
Lang, M., & Lundholm, R. (1993). Cross-sectional determinants of analyst ratings of corporate
disclosures. Journal of Accounting Research, , 246-271.
Larcker, D. F., & Rusticus, T. O. (2010). On the use of instrumental variables in accounting
research. Journal of Accounting and Economics, 49(3), 186-205.
Lee, D. (2017). Corporate social responsibility and management forecast accuracy. Journal of
Business Ethics, 140(2), 353-367.
Leftwich, R. W., Watts, R. L., & Zimmerman, J. L. (1981). Voluntary corporate disclosure:
The case of interim reporting. Journal of Accounting Research, , 50-77.
Lev, B., & Penman, S. H. (1990). Voluntary forecast disclosure, nondisclosure, and stock
prices. Journal of Accounting Research, , 49-76.
Lev, B., & Sunder, S. (1979). Methodological issues in the use of financial ratios. Journal of
Accounting and Economics, 1(3), 187-210.
Li, F. (2010). The information content of forward‐looking statements in corporate filings—A
naïve bayesian machine learning approach. Journal of Accounting Research, 48(5), 1049-
1102.
Li, J., Mangena, M., & Pike, R. (2012). The effect of audit committee characteristics on
intellectual capital disclosure. The British Accounting Review, 44(2), 98-110.
Li, J., Pike, R., & Haniffa, R. (2008). Intellectual capital disclosure and corporate governance
structure in UK firms. Accounting and Business Research, 38(2), 137-159.
Liao, L., Luo, L., & Tang, Q. (2015). Gender diversity, board independence, environmental
committee and greenhouse gas disclosure. The British Accounting Review, 47(4), 409-424.
Lim, S., Matolcsy, Z., & Chow, D. (2007). The association between board composition and
different types of voluntary disclosure. European Accounting Review, 16(3), 555-583.
Linsley, P. M., & Shrives, P. J. (2006). Risk reporting: A study of risk disclosures in the annual
reports of UK companies. The British Accounting Review, 38(4), 387-404.
Lipton, M., & Lorsch, J. W. (1992). A modest proposal for improved corporate governance.
The Business Lawyer, , 59-77.

199
Liu, S. (2015). Corporate governance and forward-looking disclosure: Evidence from china.
Journal of International Accounting, Auditing and Taxation, 25, 16-30.
Lopes, P. T., & Rodrigues, L. L. (2007). Accounting for financial instruments: An analysis of
the determinants of disclosure in the portuguese stock exchange. The International
Journal of Accounting, 42(1), 25-56.
Lubatkin, M. H., Lane, P. J., Collin, S., & Very, P. (2005). Origins of corporate governance in
the USA, sweden and france. Organization Studies, 26(6), 867-888.
Lundholm, R., & Myers, L. A. (2002). Bringing the future forward: The effect of disclosure on
the returns‐earnings relation. Journal of Accounting Research, 40(3), 809-839.
Lundholm, R., & Van Winkle, M. (2006). Motives for disclosure and non-disclosure: A
framework and review of the evidence. Accounting and Business Research, 36(sup1), 43-
48.
Madhani, P. M. (2014). Corporate governance and disclosure practices in india: Domestic firms
versus cross-listed firms. The IUP Journal of Corporate Governance, 13(4), 24-51.
Madhani, P. M. (2015). The impact of board characteristics on corporate governance and
disclosure practices of firms listed in indian stock exchange.
Madhani, P. M. (2016). The relationship between ownership types and corporate governance
and disclosure practices of firms listed on indian stock exchange. Browser Download this
Paper,
Madi, H. K., Ishak, Z., & Manaf, N. A. A. (2014). The impact of audit committee characteristics
on corporate voluntary disclosure. Procedia-Social and Behavioral Sciences, 164, 486-
492.
Malone, D., Fries, C., & Jones, T. (1993). An empirical investigation of the extent of corporate
financial disclosure in the oil and gas industry. Journal of Accounting, Auditing &
Finance, 8(3), 249-273.
Mangena, M., & Pike, R. (2005). The effect of audit committee shareholding, financial
expertise and size on interim financial disclosures. Accounting and Business Research,
35(4), 327-349.
Mangena, M., Tauringana, V., & Chamisa, E. (2012). Corporate boards, ownership structure
and firm performance in an environment of severe political and economic crisis. British
Journal of Management, 23(S1), S23-S41.

200
Maskati, M. M. A., & Hamdan, A. M. M. (2017). Corporate governance and voluntary
disclosure: Evidence from bahrain. International Journal of Economics and Accounting,
8(1), 1-28.
Mathuva, D. (2012a). The determinants of forward-looking disclosures in interim reports for
non-financial firms: Evidence from a developing. International Journal of Accounting and
Financial Reporting, 2(2), 125.
Mathuva, D. (2012b). The determinants of forward-looking disclosures in interim reports for
non-financial firms: Evidence from a developing country. International Journal of
Accounting and Financial Reporting, 2(2), 125-141.
Matoussi, H., Karaa, A., & Maghraoui, R. (2004). Information asymmetry, disclosure level and
securities liquidity in the BVMT. Finance India, 18, 547-558.
McConnell, J. J., & Servaes, H. (1995). Equity ownership and the two faces of debt. Journal
of Financial Economics, 39(1), 131-157.
McDaniel, L., Martin, R. D., & Maines, L. A. (2002). Evaluating financial reporting quality:
The effects of financial expertise vs. financial literacy. The Accounting Review, 77(s-1),
139-167.
McKinnon, J. L., & Dalimunthe, L. (1993). Voluntary disclosure of segment information by
australian diversified companies. Accounting & Finance, 33(1), 33-50.
McKnight, P. J., & Weir, C. (2009). Agency costs, corporate governance mechanisms and
ownership structure in large UK publicly quoted companies: A panel data analysis. The
Quarterly Review of Economics and Finance, 49(2), 139-158.
McNally, G. M., Eng, L. H., & Hasseldine, C. R. (1982). Corporate financial reporting in new
zealand: An analysis of user preferences, corporate characteristics and disclosure practices
for discretionary information. Accounting and Business Research, 13(49), 11-20.
Meek, G. K., Roberts, C. B., & Gray, S. J. (1995a). Factors influencing voluntary annual report
disclosures by US, UK and continental european multinational corporations. Journal of
International Business Studies, , 555-572.
Meek, G. K., Roberts, C. B., & Gray, S. J. (1995b). Factors influencing voluntary annual report
disclosures by US, UK and continental european multinational corporations. Journal of
International Business Studies, , 555-572.
Mendes-Da-Silva, W., & de Lira Alves, Luiz Alberto. (2004). The voluntary disclosure of
financial information on the internet and the firm value effect in companies across latin
america. Paper presented at the Universidad Navarra Barcelona, 13th International
Symposium on Ethics, Business and Society,

201
Menicucci, E. (2013a). The determinants of forward-looking information in management
commentary: Evidence from italian listed companies. International Business Research,
6(5), p30.
Menicucci, E. (2013b). The determinants of forward-looking information in management
commentary: Evidence from italian listed companies. International Business Research,
6(5), 30.
Menicucci, E. (2013c). Firms' characteristics and forward-looking information in management
commentaries of italian listed companies. African Journal of Business Management,
7(17), 1667.
Merkley, K. J. (2014). Narrative disclosure and earnings performance: Evidence from R&D
disclosures. Accounting Review, 89(2), 725-757. doi:10.2308/accr-50649
Miller, P. B., & Bahnson, P. R. (2002). Quality financial reporting.
Mitchell, J. D., Chia, C. W., & Loh, A. S. (1995). Voluntary disclosure of segment information:
Further australian evidence. Accounting & Finance, 35(2), 1-16.
Morris, R. D. (1987). Signalling, agency theory and accounting policy choice. Accounting and
Business Research, 18(69), 47-56.
Morton, R. M., & Neill, J. D. (2001). The value-relevance of current and forward-looking
accounting information subsequent to a corporate restructuring. Advances in Accounting,
18, 195-220.
Moumen, N., Othman, H. B., & Hussainey, K. (2015). The value relevance of risk disclosure
in annual reports: Evidence from MENA emerging markets. Research in International
Business and Finance, 34, 177-204.
Mousa, G. A., & Elamir, E. A. (2018). Determinants of forward-looking disclosure: Evidence
from bahraini capital market. Afro-Asian Journal of Finance and Accounting, 8(1), 1-19.
Mouselli, S., Jaafar, A., & Hussainey, K. (2012). Accruals quality vis-à-vis disclosure quality:
Substitutes or complements? The British Accounting Review, 44(1), 36-46.
Murray, M. P. (2005). Econometrics: A modern introduction Pearson Higher Education.
Muslu, V., Radhakrishnan, S., Subramanyam, K., & Lim, D. (2011). Firm’s information
environment and forward-looking disclosures in the MD&A. University of Texas at Dallas
and University of Southern California Working Paper,

202
Muslu, V., Radhakrishnan, S., Subramanyam, K.R. and Lim, D., 2014. Forward-looking
MD&A disclosures and the information environment. Management Science, 61(5),
pp.931-948.
Muttakin, M. B., & Khan, A. (2014). Determinants of corporate social disclosure: Empirical
evidence from bangladesh. Advances in Accounting, 30(1), 168-175.
Nalikka, A. (2009). Impact of gender diversity on voluntary disclosure in annual reports.
Accounting & Taxation, 1(1), 101-113.
Nandi, S., & Ghosh, S. (2013). Corporate governance attributes, firm characteristics and the
level of corporate disclosure: Evidence from the indian listed firms. Decision Science
Letters, 2(1), 45-58.
Naser, K., Al-Khatib, K., & Karbhari, Y. (2002). Empirical evidence on the depth of corporate
information disclosure in developing countries: The case of jordan. International Journal
of Commerce and Management, 12(3/4), 122-155.
Navarro, M. C. A., & Urquiza, F. B. (2015). Board of directors’characteristics and forward-
looking information disclosure strategies.
Nekhili, M., Boubaker, S., & Lakhal, F. (2012). Ownership structure, voluntary R&D
disclosure and market value of firms: The french case. International Journal of Business,
17(2), 126.
Nekhili, M., Hussainey, K., Cheffi, W., Chtioui, T., & Tchakoute-Tchuigoua, H. (2016). R&D
narrative disclosure, corporate governance and market value: Evidence from france.
Journal of Applied Business Research, 32(1), 111.
Nelson, J., Gallery, G., & Percy, M. (2010). Role of corporate governance in mitigating the
selective disclosure of executive stock option information. Accounting & Finance, 50(3),
685-717.
Neu, D., Warsame, H., & Pedwell, K. (1998). Managing public impressions: Environmental
disclosures in annual reports. Accounting, Organizations and Society, 23(3), 265-282.
Neuendorf, K. A. (2004). Content analysis: A contrast and complement to discourse analysis.
Qualitative Methods, 2(1), 33-35.
Nicholson, G. J., & Kiel, G. C. (2007). Can directors impact performance? A case‐based test
of three theories of corporate governance. Corporate Governance: An International
Review, 15(4), 585-608.

203
Nor, H. M., Saleh, N. M., Jaffar, R., & Shukor, Z. A. (2010). Corporate governance and R&D
reporting in malaysian MESDAQ market. International Journal of Economics and
Management, 4(2), 350-372.
Ntim, C. G. (2013). An integrated corporate governance framework and financial performance
in south African‐Listed corporations. South African Journal of Economics, 81(3), 373-
392.
Ntim, C. G. (2015). Board diversity and organizational valuation: Unravelling the effects of
ethnicity and gender. Journal of Management & Governance, 19(1), 167-195.
Ntim, C. G., & Oseit, K. A. (2011). The impact of corporate board meetings on corporate
performance in south africa. African Review of Economics and Finance, 2(2), 83-103.
Ntim, C. G., & Soobaroyen, T. (2013). Corporate governance and performance in socially
responsible corporations: New empirical insights from a Neo‐Institutional framework.
Corporate Governance: An International Review, 21(5), 468-494.
Ntim, C. G., Lindop, S., & Thomas, D. A. (2013). Corporate governance and risk reporting in
south africa: A study of corporate risk disclosures in the pre-and post-2007/2008 global
financial crisis periods. International Review of Financial Analysis, 30, 363-383.
Ntim, C. G., Opong, K. K., & Danbolt, J. (2012). The relative value relevance of shareholder
versus stakeholder corporate governance disclosure policy reforms in south africa.
Corporate Governance: An International Review, 20(1), 84-105.
Ntim, C. G., Opong, K. K., & Danbolt, J. (2015). Board size, corporate regulations and firm
valuation in an emerging market: A simultaneous equation approach. International Review
of Applied Economics, 29(2), 194-220.
O’brien, R. M. (2007). A caution regarding rules of thumb for variance inflation factors.
Quality & Quantity, 41(5), 673-690.
O’Sullivan, M., Percy, M., & Stewart, J. (2008). Australian evidence on corporate governance
attributes and their association with forward-looking information in the annual report.
Journal of Management & Governance, 12(1), 5-35.
Oliveira, J., Lima Rodrigues, L., & Craig, R. (2011). Risk-related disclosures by non-finance
companies: Portuguese practices and disclosure characteristics. Managerial Auditing
Journal, 26(9), 817-839.
Omar, B., & Simon, J. (2011). Corporate aggregate disclosure practices in jordan. Advances in
Accounting, 27(1), 166-186.

204
Othman, R., Ishak, I. F., Arif, S. M. M., & Aris, N. A. (2014). Influence of audit committee
characteristics on voluntary ethics disclosure. Procedia-Social and Behavioral Sciences,
145, 330-342.
Oyelere, P., Laswad, F., & Fisher, R. (2003). Determinants of internet financial reporting by
new zealand companies. Journal of International Financial Management & Accounting,
14(1), 26-63.
Padgett, C., & Shabbir, A. (2005). The UK code of corporate governance: Link between
compliance and firm performance. ICMA Centre Discussion Papers in Finance DP, 17
Parker, L. D. (2005). Social and environmental accountability research: A view from the
commentary box. Accounting, Auditing & Accountability Journal, 18(6), 842-860.
Patel, S. A., Balic, A., & Bwakira, L. (2002). Measuring transparency and disclosure at firm-
level in emerging markets. Emerging Markets Review, 3(4), 325-337.
Patelli, L., & Prencipe, A. (2007). The relationship between voluntary disclosure and
independent directors in the presence of a dominant shareholder. European Accounting
Review, 16(1), 5-33.
Patten, D. M. (1991). Exposure, legitimacy, and social disclosure. Journal of Accounting and
Public Policy, 10(4), 297-308.
Pérez, G. R. (2004). Factores explicativos de la revelación voluntaria de información sobre
fuentes de ventaja competitiva empresarial. Spanish Journal of Finance and
Accounting/Revista Española De Financiación Y Contabilidad, 33(122), 705-739.
Perryman, A. A., Fernando, G. D., & Tripathy, A. (2016). Do gender differences persist? an
examination of gender diversity on firm performance, risk, and executive compensation.
Journal of Business Research, 69(2), 579-586.
Pesaran, M. H., Shin, Y., & Smith, R. J. (2000). Structural analysis of vector error correction
models with exogenous I (1) variables. Journal of Econometrics, 97(2), 293-343.
Petersen, M. A. (2009). Estimating standard errors in finance panel data sets: Comparing
approaches. The Review of Financial Studies, 22(1), 435-480.
Pfeffer, J. (1972). Size and composition of corporate boards of directors: The organization and
its environment. Administrative Science Quarterly, , 218-228.
Pfeffer, J. (1973). Size, composition, and function of hospital boards of directors: A study of
organization-environment linkage. Administrative Science Quarterly, , 349-364.
Pfeffer, J., & Salancik, G. R. (1978). The external control of organisations. New York, 175

205
Pfeffer, J., & Salancik, G. R. (2003). The external control of organizations: A resource
dependence perspective Stanford University Press.
Pirson, M., & Turnbull, S. (2011). Corporate governance, risk management, and the financial
crisis: An information processing view. Corporate Governance: An International Review,
19(5), 459-470.
Plumlee, M., Brown, D., & Marshall, S. (2008). The impact of voluntary environmental
disclosure quality on firm value. Available at SSRN 1140221,
Plumlee, M., Brown, D., Hayes, R. M., & Marshall, R. S. (2015). Voluntary environmental
disclosure quality and firm value: Further evidence. Journal of Accounting and Public
Policy,
Prasad, E., Rogoff, K., Wei, S. J., & Kose, M. A. (2005). Effects of financial globalization on
developing countries: some empirical evidence. In India’s and China’s recent experience
with reform and growth (pp. 201-228). Palgrave Macmillan, London.
Qu, W., Ee, M. S., Liu, L., Wise, V., Carey, P., Zhou, H., & Wang, T. (2015). Corporate
governance and quality of forward-looking information: Evidence from the chinese stock
market. Asian Review of Accounting, 23(1)
Raffournier, B. (1995). The determinants of voluntary financial disclosure by swiss listed
companies. European Accounting Review, 4(2), 261-280.
Raghunandan, K., & Rama, D. V. (2007). Determinants of audit committee diligence.
Accounting Horizons, 21(3), 265-279.
Reeb, D., Sakakibara, M., & Mahmood, I. P. (2012). From the Editors: Endogeneity in
International Business Research,
Renders, A., Gaeremynck, A., & Sercu, P. (2010). Corporate‐governance ratings and company
performance: A cross‐European study. Corporate Governance: An International Review,
18(2), 87-106.
Reverte, C. (2009). Determinants of corporate social responsibility disclosure ratings by
spanish listed firms. Journal of Business Ethics, 88(2), 351-366.
Rizk, R., Dixon, R., & Woodhead, A. (2008). Corporate social and environmental reporting: a
survey of disclosure practices in Egypt. Social Responsibility Journal, 4(3), 306-323.
Robson, C. (2002). Real world research. 2nd. Edition.Blackwell Publishing.Malden,
Salama, A., Dixon, R., & Habbash, M. (2012). An examination of environmental disclosures
in UK corporate annual reports. Journal of Accounting, Business & Management, 19(1)

206
Saleh, A., & Roberts, C. (2017). The impact of online corporate reporting quality on analyst
following and properties of their EPS forecasts. Journal of Accounting and Management
Information Systems, 16(1), 59-88.
Samaha, K., & Dahawy, K. (2010). Factors influencing corporate disclosure transparency in
the active share trading firms: An explanatory study. Research in accounting in emerging
economies (pp. 87-118) Emerald Group Publishing Limited.
Samaha, K., Dahawy, K., Hussainey, K., & Stapleton, P. (2012). “The extent of corporate
governance disclosure and its determinants in a developing market: The case of Egypt.”
Advances in Accounting, 28(1), 168-178.
Samaha, K., Dahawy, K., Hussainey, K., & Stapleton, P. (2012). The extent of corporate
governance disclosure and its determinants in a developing market: The case of egypt.
Advances in Accounting, 28(1), 168-178.
Samaha, K., Khlif, H., & Hussainey, K. (2015). The impact of board and audit committee
characteristics on voluntary disclosure: A meta-analysis. Journal of International
Accounting, Auditing and Taxation, 24, 13-28.
Sartawi, I. I. M., Hindawi, R. M., Bsoul, R., & Ali, A. J. (2014). Board composition, firm
characteristics, and voluntary disclosure: The case of jordanian firms listed on the amman
stock exchange. International Business Research, 7(6), 67.
Saunders, M. L., & Lewis, P. (2009). P. and thornhill, A.(2009). Research Methods for
Business Students, 4.
Saunders, M. N. (2011). Research methods for business students, 5/e Pearson Education India.
Saunders, M., Lewis, P., & Thornhill, A. (2007). Research methods for business students (4: E
uppl.) harlow: Pearson education.
Schadewitz, H. J., & Blevins, D. R. (1998). Major determinants of interim disclosures in an
emerging market. American Business Review, 16(1), 41.
Schleicher, T., & Walker, M. (1999). Share price anticipation of earnings and management's
discussion of operations and financing. Accounting and Business Research, 29(4), 321-
335.
Schultz, E. L., Tan, D. T., & Walsh, K. D. (2010). Endogeneity and the corporate governance-
performance relation. Australian Journal of Management, 35(2), 145-163.
Selarka, E. (2005). Ownership concentration and firm value: A study from the indian corporate
sector. Emerging Markets Finance and Trade, 41(6), 83-108.

207
Serrasqueiro, Z., & Nunes, P. M. (2008). Determinants of capital structure: Comparison of
empirical evidence from the use of different estimators. International Journal of Applied
Economics, 5(1), 14-29.
Sharma, R., & Singh, F. (2009). Voluntary corporate governance disclosure: A study of
selected companies in india. IUP Journal of Corporate Governance, 8(3/4), 91.
Sheu, H., Chung, H., & Liu, C. (2010). Comprehensive disclosure of compensation and firm
value: The case of policy reforms in an emerging market. Journal of Business Finance &
Accounting, 37(9‐10), 1115-1144.
Shi, Y., Kim, J., & Magnan, M. L. (2014). Voluntary disclosure, legal institutions, and firm
valuation: Evidence from US cross-listed foreign firms. Journal of International
Accounting Research, 13(2), 57-85.
Shleifer, A., & Vishny, R. W. (1986). Large shareholders and corporate control. Journal of
Political Economy, 94(3, Part 1), 461-488.
Siddiqui, J. (2010). Development of corporate governance regulations: The case of an emerging
economy. Journal of Business Ethics, 91(2), 253-274.
Siddiqui, M. F., Razzaq, N., Malik, F., & Gul, S. (2013). Internal corporate governance
mechanisms and agency cost: Evidence from large KSE listed firms. European Journal of
Business and Management, 5(23), 103-109.
Singh, V., Vinnicombe, S., & Johnson, P. (2001). Women directors on top UK boards.
Corporate Governance: An International Review, 9(3), 206-216.
Singhvi, S. S., & Desai, H. B. (1971). An empirical analysis of the quality of corporate financial
disclosure. Accounting Review, , 129-138.
Smith Jr, C. W., & Watts, R. L. (1992). The investment opportunity set and corporate financing,
dividend, and compensation policies. Journal of Financial Economics, 32(3), 263-292.
Smith, R. (2003). Audit committees combined code guidance. London: Financial Reporting
Council,
Soliman, M. (2013). Firm characteristics and the extent of voluntary disclosure: The case of
egypt.
Solomon, J. (2007). Corporate governance and accountability John Wiley & Sons.
Song, J., & Windram, B. (2004). Benchmarking audit committee effectiveness in financial
reporting. International Journal of Auditing, 8(3), 195-205.

208
Spencer, A. (1983). On the edge of the organization: The role of the outside director John
Wiley & Sons.
Sternberg, E. (1997). The defects of stakeholder theory. Corporate Governance: An
International Review, 5(1), 3-10.
Stewart, J., & Munro, L. (2007). The impact of audit committee existence and audit committee
meeting frequency on the external audit: Perceptions of australian auditors. International
Journal of Auditing, 11(1), 51-69.
Sun, N., Salama, A., Hussainey, K., & Habbash, M. (2010). Corporate environmental
disclosure, corporate governance and earnings management. Managerial Auditing
Journal, 25(7), 679-700.
Tabachnick, B. G., Fidell, L. S., & Osterlind, S. J. (2001). Using multivariate statistics.
Tan, Y., Xu, N., Liu, X., & Zeng, C. (2015). Does forward-looking non-financial information
consistently affect investment efficiency? Nankai Business Review International, 6(1), 2-
19.
Terjesen, S., Couto, E. B., & Francisco, P. M. (2016). Does the presence of independent and
female directors impact firm performance? A multi-country study of board diversity.
Journal of Management & Governance, 20(3), 447-483.
Thiruvadi, S., & Huang, H. (2011). Audit committee gender differences and earnings
management. Gender in Management: An International Journal, 26(7), 483-498.
Thomsen, S., Pedersen, T., & Kvist, H. K. (2006). Blockholder ownership: Effects on firm
value in market and control based governance systems. Journal of Corporate Finance,
12(2), 246-269.
Tricker, R. I. (1984). Corporate governance: Practices, procedures, and powers in british
companies and their boards of directors Gower Pub Co.
Tsamenyi, M., Enninful-Adu, E., & Onumah, J. (2007). Disclosure and corporate governance
in developing countries: Evidence from ghana. Managerial Auditing Journal, 22(3), 319-
334.
Twumasi-Ankrah, S., Ashaolu, J., & Ankrah, I. (2015). HIV/AIDS scourge and economic
growth in sub-sahara africa.
Ujunwa, A. (2012). Board characteristics and the financial performance of nigerian quoted
firms. Corporate Governance: The International Journal of Business in Society, 12(5),
656-674.
209
Ujunwa, A., Okoyeuzu, C., & Nwakoby, I. (2012). Corporate board diversity and firm
performance: Evidence from nigeria. Revista De Management Comparat International,
13(4), 605.
Ullmann, A. A. (1985). Data in search of a theory: A critical examination of the relationships
among social performance, social disclosure, and economic performance of US
firms. Academy of management review, 10(3), 540-557.
Uma, S., & Roger, B. (2003). Research methods for business: A skill building approach. Book,
Urquiza, F. B., Navarro, M. C. A., & Trombetta, M. (2009). Disclosure indices design: Does it
make a difference? Revista De Contabilidad, 12(2), 253-277.
Uyar, A., & Kilic, M. (2012). Influence of corporate attributes on forward-looking information
disclosure in publicly traded turkish corporations. Procedia-Social and Behavioral
Sciences, 62, 244-252.
Uyar, A., & Kiliç, M. (2012). Value relevance of voluntary disclosure: Evidence from turkish
firms. Journal of Intellectual Capital, 13(3), 363-376.
Uyar, A., Kilic, M., & Bayyurt, N. (2013). Association between firm characteristics and
corporate voluntary disclosure: Evidence from turkish listed companies. Intangible
Capital, 9(4), 1080-1112.
Uzun, H., Szewczyk, S. H., & Varma, R. (2004). Board composition and corporate fraud.
Financial Analysts Journal, 60(3), 33-43.
Vafeas, N. (1999). Board meeting frequency and firm performance. Journal of Financial
Economics, 53(1), 113-142.
Vafeas, N. (2000). Board structure and the informativeness of earnings. Journal of Accounting
and Public Policy, 19(2), 139-160.
Van Beest, F., Braam, G., & Boelens, S. (2009). Quality of financial reporting: Measuring
qualitative characteristics. Nijmegen Center for Economics (NiCE).Working Paper, , 09-
108.
Vanstraelen, A., Zarzeski, M. T., & Robb, S. W. (2003). Corporate nonfinancial disclosure
practices and financial analyst forecast ability across three european countries. Journal of
International Financial Management & Accounting, 14(3), 249-278.
Verrecchia, R. E. (1983). Discretionary disclosure. Journal of Accounting and Economics, 5,
179-194.

210
Verrecchia, R. E., & Weber, J. (2006). Redacted disclosure. Journal of Accounting Research,
44(4), 791-814.
Wahba, H. (2015). The joint effect of board characteristics on financial performance: Empirical
evidence from egypt. Review of Accounting and Finance, 14(1), 20-40.
Walker, M., & Tsalta, A. (2001). Corporate financial disclosure and analyst forecasting
activity: Preliminary evidence for the UK Certified Accountants Educational Trust.
Wallace, R. O., Naser, K., & Mora, A. (1994). The relationship between the comprehensiveness
of corporate annual reports and firm characteristics in spain. Accounting and Business
Research, 25(97), 41-53.
Wallace, R. S. O., & Naser, K. (1995). Firm-specific determinants of the comprehensiveness
of mandatory disclosure in the corporate annual reports of firms listed on the stock
exchange of hong kong. Journal of Accounting & Public Policy, 14(4), 311-368.
Walt, N., & Ingley, C. (2003). Board dynamics and the influence of professional background,
gender and ethnic diversity of directors. Corporate Governance: An International Review,
11(3), 218-234.
Wang, K., & Claiborne, M. C. (2008). Determinants and consequences of voluntary disclosure
in an emerging market: Evidence from china. Journal of International Accounting,
Auditing and Taxation, 17(1), 14-30.
Wang, M., & Hussainey, K. (2013). Voluntary forward-looking statements driven by corporate
governance and their value relevance. Journal of Accounting and Public Policy, 32(3), 26-
49.
Watson, A., Shrives, P., & Marston, C. (2002). Voluntary disclosure of accounting ratios in the
UK. The British Accounting Review, 34(4), 289-313.
Watson, J. (2002). Comparing the performance of male-and female-controlled businesses:
Relating outputs to inputs. Entrepreneurship: Theory and Practice, 26(3), 91-101.
Watson, W. E., Kumar, K., & Michaelsen, L. K. (1993). Cultural diversity's impact on
interaction process and performance: Comparing homogeneous and diverse task groups.
Academy of Management Journal, 36(3), 590-602.
Watts, R. L., & Zimmerman, J. L. (1986). Positive accounting theory.
Welker, M. (1995). Disclosure policy, information asymmetry, and liquidity in equity
markets*. Contemporary Accounting Research, 11(2), 801-827.

211
Wintoki, M. B., Linck, J. S., & Netter, J. M. (2012). Endogeneity and the dynamics of internal
corporate governance. Journal of Financial Economics, 105(3), 581-606.
Wolfe, R. (1991). The use of content analysis to assess corporate social responsibility.
Research in Corporate Social Performance and Policy, 12, 281-307.
Wooldridge, J. M. (2015). Introductory econometrics: A modern approach Nelson Education.
Xie, B., Davidson, W. N., & DaDalt, P. J. (2003). Earnings management and corporate
governance: The role of the board and the audit committee. Journal of Corporate Finance,
9(3), 295-316.
Yermack, D. (1996). Higher market valuation of companies with a small board of directors.
Journal of Financial Economics, 40(2), 185-211.
Yilmaz, O., Kurt-Gumus, G., & Aslanertik, B. (2017). Corporate governance and voluntary
disclosure: Content analysis on borsa istanbul hospitality industry companies. Turizam,
21(1), 34-44.
Yoshikawa, T., & Rasheed, A. A. (2009). Convergence of corporate governance: Critical
review and future directions. Corporate Governance: An International Review, 17(3),
388-404.
Zahra, S. A., & Pearce, J. A. (1989). Boards of directors and corporate financial performance:
A review and integrative model. Journal of Management, 15(2), 291-334.
Zaman, M., Hudaib, M., & Haniffa, R. (2011). Corporate governance quality, audit fees and
non‐audit services fees. Journal of Business Finance & Accounting, 38(1‐2), 165-197.

212
Appendices
Appendix 4.1: List of 35 forward-looking Key words
Number Forward Key words
1 Accelerate
2 Anticipate
3 Await
4 Coming financial year(s)
5 Coming months
6 Confidence (or confident)
7 Convince
8 Current financial year
9 Envisage
10 Estimate
11 Eventual
12 Expect
13 Forecast
14 Forthcoming
15 Hope
16 Intend (or intention)
17 Likely (or unlikely)
18 Look forward (or look ahead)
19 Next
20 Novel
21 Optimistic
22 Outlook
23 Planned (or planning)
24 Predict
25 Prospect
26 Remain
27 Renew
28 Scope for (or scope to)
29 Shall
30 Shortly
31 Should
32 Soon
33 Will
34 Well placed (or well positioned)
35 Year(s) ahead
Source: (Hussainey et al. 2003, P. 277).

213
Appendix 4.2: FLID categories and items
No Item Studies which used the items
A Environmental around the
company:
1 General economic factors
affecting future business.
Abed and Al-Najjar (2014), Beretta and Bozzolan (2007),
Bozzolan and Mazzola (2007), Lim et al. (2007), Hossain
et al. (2005), Hutton et al. (2003), Vanstraelen et al. (2003),
Robb et al. (2001)
2 General industry factors
affecting future business.
Abed and Al-Najjar (2014), Beretta and Bozzolan (2007),
Bozzolan and Mazzola (2007), Hossain et al. (2005),
Hutton et al. (2003), Vanstraelen et al. (2003), Robb et al.
(2001)
3 Social factors affecting
future business
Abed and Al-Najjar (2014), Lim et al., (2007), Hutton et al.
(2003), Vanstraelen et al. (2003), Robb et al. (2001), Cahan
and Hossain (1996)
4 Firm-specific factors
affecting future business
Abed and Al-Najjar (2014), Vanstraelen et al. (2003), Robb et
al. (2001)
5 Forecast of potential future
risk.
Alqatamin et al. (2017), Abed and Al-Najjar (2014), Bozzolan
and Ipino (2007)
6 Technological factors
affecting future business
Abed and Al-Najjar (2014), Lim et al., (2007), Hossain et al.
(2005), Vanstraelen et al. (2003), Robb et al. (2001), Cahan
and Hossain (1996)
7 Legislation with future
positive or negative
consequences (political
factors affecting future
business).
Alqatamin et al. (2017), Abed and Al-Najjar (2014), Beretta
and Bozzolan (2007), Lim et al. (2007), Hossain et al. (2005),
Vanstraelen et al. (2003), Robb et al. (2001), Cahan and
Hossain (1996)
9 Competitive position.
Alqatamin et al. (2017), Vanstraelen et al. (2003), Robb et al.
(2001)
9 Discussion about firm’s next
year’s operating plans.
Abed and Al-Najjar (2014)
B Company trend:
1 Value of firm increase or
decrease
Abed and Al-Najjar (2014), Kent and Ung (2003)
2 Discussion of future industry
trend
Abed and Al-Najjar (2014), Walker and Tsalta (2001)
3 Growth or shrinkage in
market share
Abed and Al-Najjar (2014), Hossain et al. (2005), Vanstraelen
et al. (2003), Robb et al. (2001), Walker and Tsalta (2001),
Cahan and Hossain (1996)
4 Future growth rate Abed and Al-Najjar (2014), Hossain et al. (2005)
5 Forecast of production and
innovation
Abed and Al-Najjar (2014), Kent and Ung (2003), Cahan and
Hossain (1996)
C Strategic information:
1 Discussion about corporate
strategy.
Abed and Al-Najjar (2014),
2 Mission, broad objectives
and strategy to achieve broad
objective
Alqatamin et al. (2017), Abed and Al-Najjar (2014),
Vanstraelen et al. (2003), Robb et al. (2001)

214
3 Description of capital
projects
Abed and Al-Najjar (2014), Hossain et al. (2005), Clarkson et
al (1999), Cahan and Hossain (1996)
4 Discussion of future business
opportunity of disposal and
acquisition
Abed and Al-Najjar (2014), Lim et al., (2007)
5 Expansion of line of
business
Abed and Al-Najjar (2014), Hossain et al. (2005), Clarkson et
al. (1999)
D Financial information:
1 Forecast of profit Alqatamin et al. (2017)
2 Forecast of income Alqatamin et al. (2017)
3 Forecast of sales and
revenue
Alqatamin et al. (2017), Hassanein and Hussainey (2015),
Abed and Al-Najjar (2014), Hussainey and Wang (2013),
Bozzolan and Mazzola (2007), Lim et al. (2007), Hossain et
al. (2005), Mek and Eng (2003), Meek et al. (1995), Kent and
Ung (2003), Walker and Tsalta (2001), Cahan and Hossain
(1996), Clarkson et al. (1994)
4 Forecast of earning.
Hassanein and Hussainey (2015), Abed and Al-Najjar (2014),
Hussainey and Wang (2013), Bozzolan and Mazzola (2007),
Lim et al. (2007), Hossain et al. (2005), Hutton et al. (2003),
Kent and Ung (2003), Mek and Eng (2003), Walker and
Tsalta (2001), Cahan and Hossain (1996), Meek et al. (1995),
Clarkson et al. (1994)
5 Forecast of cash flows
Alqatamin et al. (2017), Hassanein and Hussainey (2015),
Abed and Al-Najjar (2014), Hussainey and Wang (2013),
Bozzolan and Mazzola (2007), Lim et al., (2007), Hossain et
al. (2005), Hutton et al. (2003), Cahan and Hossain (1996),
Meek et al. (1995), Chow and Wong-Boren (1987)
6 Forecast of investment
activities.
Hassanein and Hussainey (2015), Abed and Al-Najjar (2014),
Hussainey and Wang (2013), Bozzolan and Mazzola (2007),
Walker and Tsalta (2001)
7 Forecast of capital structure
Alqatamin et al. (2017), Hassanein and Hussainey (2015),
Abed and Al-Najjar (2014), Hussainey and Wang (2013),
Bozzolan and Mazzola (2007), Bozzolan and Ipino (2007)
8 Forecast of dividend per
share
Hassanein and Hussainey (2015), Abed and Al-Najjar (2014),
Hussainey and Wang (2013), Hossain et al. (2005), Kent and
Ung (2003), Walker and Tsalta (2001), Cahan and Hossain
(1996)
9 Forecast of Capital
expenditure
Alqatamin et al. (2017), Hassanein and Hussainey (2015),
Abed and Al-Najjar (2014), Hussainey and Wang (2013),
Hutton et al. (2003), Walker and Tsalta (2001)
10 Factors affecting future tax Hassanein and Hussainey (2015), Abed and Al-Najjar (2014),
Hussainey and Wang (2013), Clarkson et al. (1999)
11 Forecast of cost reduction Hassanein and Hussainey (2015), Abed and Al-Najjar (2014),
Hussainey and Wang (2013), Bozzolan and Mazzola (2007)
12 Forecast of losses Alqatamin et al. (2017), Hassanein and Hussainey (2015),
Abed and Al-Najjar (2014), Hussainey and Wang (2013)
13 Forecast of margin Hassanein and Hussainey (2015), Abed and Al-Najjar (2014),
Hussainey and Wang (2013)
14 Forecast of interest rate Hassanein and Hussainey (2015), Abed and Al-Najjar (2014),
Hussainey and Wang (2013)
15 Future contribution Hassanein and Hussainey (2015), Abed and Al-Najjar (2014),
Hussainey and Wang (2013)

215
Appendix 5.1: The Result of Chow Test (CG and FLID)
Appendex 5.2: The Result of Hausman’s Test (CG and FLID)
F test that all u_i=0: F(211, 1888) = 81.79 Prob > F = 0.0000
rho .92865855 (fraction of variance due to u_i)
sigma_e .02420119
sigma_u .087316
(V_b-V_B is not positive definite)
Prob>chi2 = 0.0000
= 375.37
chi2(19) = (b-B)'[(V_b-V_B)^(-1)](b-B)
Test: Ho: difference in coefficients not systematic
B = inconsistent under Ha, efficient under Ho; obtained from xtreg
b = consistent under Ho and Ha; obtained from xtreg
companytype .0000364 -.0000765 .0001129 .
size .0698989 .0635114 .0063875 .0002162
Growth -.005453 -.0059869 .0005338 .
Liquidaty -.0013653 -.0016724 .0003071 .
ROA .024128 .0208814 .0032466 .
Leverge -.0025405 .0003295 -.00287 .
GAC .0178765 .0168938 .0009827 .
ACEXP -.0015596 .0008976 -.0024572 .
IAC -.0099656 -.0114432 .0014776 .
ACM .0018843 .0017697 .0001146 .
ACSIZ .0012351 .0011111 .000124 .
ProOwn .0155141 .0085039 .0070102 .
InsOwn -.0121895 -.0099293 -.0022602 .
BloOwn .0040454 8.17e-06 .0040372 .
GB .047909 .0561815 -.0082725 .
BI .0157804 .015536 .0002444 .
FBM .0015604 .0016965 -.000136 .
DP -1.31e-06 .0004853 -.0004866 .0000877
BSIZ .0013649 .0013424 .0000224 .
fixed random Difference S.E.
(b) (B) (b-B) sqrt(diag(V_b-V_B))
Coefficients
. hausman fixed random

216
Appendix 5.3: Endogeneity (Wu-Hausman test) (CG and FLID)
Appendix 5.4: The result of normality test (CG and QFLID)
Wu-Hausman F(13,2085) = 3.85494 (p = 0.0000)
Durbin (score) chi2(13) = 49.689 (p = 0.0000)
Ho: variables are exogenous
Tests of endogeneity
. estat endog
02
46
8
De
nsity
-.6 -.4 -.2 0 .2 .4Residuals

217
Appendix 5.5: Breusch-Pagan / Cook-Weisberg test for heteroscedasticity (CG and
QFLID)
1 . estat hettest
Breusch-Pagan / Cook-Weisberg test for
heteroskedasticity Ho: Constant variance
Variables: fitted values of Accuracy
chi2(1) = 44.11
Prob > chi2 = 0.1436

218
Appendix 6.1: The Result of Chow Test (FLID and FV)
Appendix 6.2: The Result of Chow Test (QFLID and ACUAF)
F test that all u_i=0: F(211, 1902) = 16.12 Prob > F = 0.0000
rho .69412043 (fraction of variance due to u_i)
sigma_e .97450607
sigma_u 1.4680023
F test that all u_i=0: F(211, 1901) = 82.39 Prob > F = 0.0000
rho .92703586 (fraction of variance due to u_i)
sigma_e .02468786
sigma_u .08799883

219
Appendex 6.3: The Result of Hausman’s test (FLID and FV)
(V_b-V_B is not positive definite)
Prob>chi2 = 0.0000
= 49.82
chi2(6) = (b-B)'[(V_b-V_B)^(-1)](b-B)
Test: Ho: difference in coefficients not systematic
B = inconsistent under Ha, efficient under Ho; obtained from xtreg
b = consistent under Ho and Ha; obtained from xtreg
companytype .0216629 .0204903 .0011726 .0044951
size -1.447385 -.9700118 -.4773735 .0681598
Growth -.0630588 -.0504991 -.0125597 .
Liquidaty -.0357241 -.0251333 -.0105908 .0029606
Leverge -.0751075 -.134772 .0596645 .0796825
Quality 5.437819 2.197201 3.240618 .5902906
fixed random Difference S.E.
(b) (B) (b-B) sqrt(diag(V_b-V_B))
Coefficients
. hausman fixed random

220
Appendex 6.4: The Result of Hausman’s Test (FLID and ACUAF)
(V_b-V_B is not positive definite)
Prob>chi2 = 0.0000
= 604.08
chi2(7) = (b-B)'[(V_b-V_B)^(-1)](b-B)
Test: Ho: difference in coefficients not systematic
B = inconsistent under Ha, efficient under Ho; obtained from xtreg
b = consistent under Ho and Ha; obtained from xtreg
companytype .0000498 -.0000606 .0001104 .
size .0744221 .0682846 .0061375 .0002402
Growth -.0055945 -.0060975 .000503 .
Liquidaty -.0016766 -.0020016 .000325 .
ROA .0264383 .0232913 .003147 .
Leverge -.0033289 -.0006264 -.0027025 .
Quality .0017646 .0020229 -.0002583 .
fixed random Difference S.E.
(b) (B) (b-B) sqrt(diag(V_b-V_B))
Coefficients
. hausman fixed random

221
Appendix 6.5: Endogeneity (Wu-Hausman test) (FLID and FV)
Appendix 6.6: Endogeneity (Wu-Hausman test) (QFLID and ACUAF)
Wu-Hausman F(1,2097) = 7.21633 (p = 0.0073)
Durbin (score) chi2(1) = 7.2636 (p = 0.0070)
Ho: variables are exogenous
Tests of endogeneity
. estat endog
Wu-Hausman F(1,2110) = 11.591 (p = 0.0007)
Durbin (score) chi2(1) = 11.5768 (p = 0.0007)
Ho: variables are exogenous
Tests of endogeneity
. estat endog
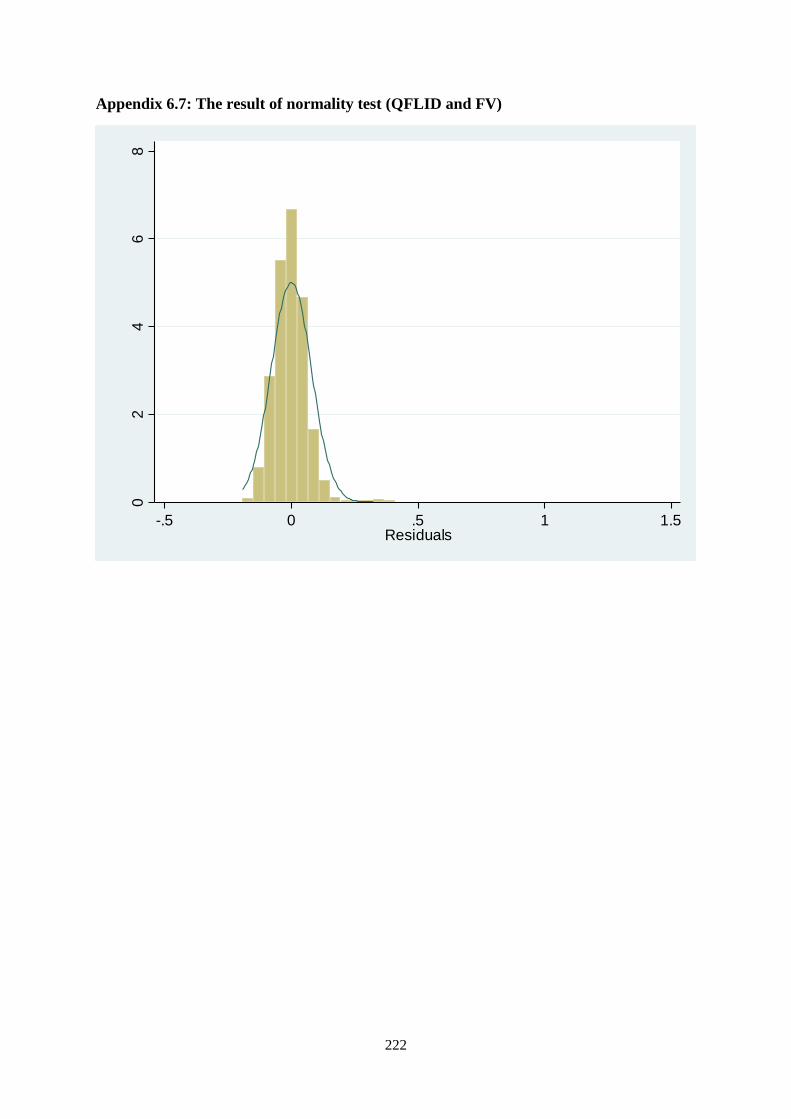
222
Appendix 6.7: The result of normality test (QFLID and FV)
02
46
8
De
nsity
-.5 0 .5 1 1.5Residuals

223
Appendix 6.8: The result of normality test (QFLID and ACUAF)
01
23
4
De
nsity
-2 -1 0 1 2Residuals

224
Appendix 6.9: Breusch-Pagan / Cook-Weisberg test for heteroscedasticity (QFLID and
FV)
Appendix 6.10: Breusch-Pagan / Cook-Weisberg test for heteroscedasticity (QFLID and
ACUAF)
1 . estat hettest
Breusch-Pagan / Cook-Weisberg test for
heteroskedasticity Ho: Constant variance
Variables: fitted values of Accuracy
chi2(1) = 2.04 Prob > chi2 = 0.1529
1 . estat hettest
Breusch-Pagan / Cook-Weisberg test for
heteroskedasticity Ho: Constant variance
Variables: fitted values of Accuracy
chi2(1) = 29.30
Prob > chi2 = 0.1678