Bankruptcy Prediction Models Applied on Companies Listed ...
19
Journal of Management and Leadership Vol 1, No. 2, November 2018 1 Bankruptcy Prediction Models Applied on Companies Listed on the Indonesian Stock Exchange (IDX) Harsono Yoewono TANRI ABENG UNIVERSITY Email: [email protected] Received: August 4 th 2018 Approved: September 28 th 2018 Abstract This study tries to determine the best BPM (bankruptcy prediction model) method in predicting the bankruptcy (delisting) event amongst the delisted companies from the IDX for the period of 2011- 2015. To verify the acuracy rate of those 4 BPMs, that is Altman, Springate, Zmijewski, and Grover, we apply these 4 BPM methods in predicting the non-bankruptcy (non-delisting) event of the paired companies used as the sample. This also mean that we need to measure the Error Type-II (ET-II). On average, the acuracy rate of 4 BPMs in predicting 7 companies NOT to be bankrupt (still-listed) was 82.14%, and coupled with the relevant ET-II at 17.86%. By restricting the prediction only on the bankruptcy (delisting) event, Altman is the best BPM method with an acuracy of 71.43%. Altman becomes the best BPM in predicting the bankruptcy (delisting) event as it has an error rate by 14.29%, lower than the Springate. Although Springate has an acuracy of 71.43%, it has an error rate higher than Altman, that is by 28.57%. Grover and Zmijewski took the third and fourth place respectively in the overall acuracy and in predicting the bankruptcy (delisting) event. By companies, the 4 BPM can predict the bankrupty (delisting) event of PWSI (Panca Wiratama Sakti), that is with ET-I = 0, but not with the delisting event of KARK (Dayaindo Resource International) whose acuracy rate was 0%.
-
Upload
khangminh22 -
Category
Documents
-
view
1 -
download
0
Transcript of Bankruptcy Prediction Models Applied on Companies Listed ...

Journal of Management and Leadership
Vol 1, No. 2, November 2018
1
Bankruptcy Prediction Models Applied on Companies Listed on the
Indonesian Stock Exchange (IDX)
Harsono Yoewono
TANRI ABENG UNIVERSITY
Email: [email protected]
Received: August 4th
2018
Approved: September 28th
2018
Abstract
This study tries to determine the best BPM (bankruptcy prediction model) method in predicting the
bankruptcy (delisting) event amongst the delisted companies from the IDX for the period of 2011-
2015. To verify the acuracy rate of those 4 BPMs, that is Altman, Springate, Zmijewski, and
Grover, we apply these 4 BPM methods in predicting the non-bankruptcy (non-delisting) event of
the paired companies used as the sample. This also mean that we need to measure the Error Type-II
(ET-II).
On average, the acuracy rate of 4 BPMs in predicting 7 companies NOT to be bankrupt (still-listed)
was 82.14%, and coupled with the relevant ET-II at 17.86%. By restricting the prediction only on
the bankruptcy (delisting) event, Altman is the best BPM method with an acuracy of 71.43%.
Altman becomes the best BPM in predicting the bankruptcy (delisting) event as it has an error rate
by 14.29%, lower than the Springate.
Although Springate has an acuracy of 71.43%, it has an error rate higher than Altman, that is by
28.57%. Grover and Zmijewski took the third and fourth place respectively in the overall acuracy
and in predicting the bankruptcy (delisting) event. By companies, the 4 BPM can predict the
bankrupty (delisting) event of PWSI (Panca Wiratama Sakti), that is with ET-I = 0, but not with the
delisting event of KARK (Dayaindo Resource International) whose acuracy rate was 0%.


Journal of Management and Leadership
Vol 1, No. 2, November 2018
3
Introduction
Bankruptcy and delisted are 2 separate events. The similarities lie in their characteristics as
verdicts. The first is a legal status made by the judges in the commercial court, either requested by
the company itself or by the third parties. The latter was made by the IDX (Indonesian Stock
Exchange, Bursa Efek Indonesia). It may be due to the self-delisting reasoning to go private or due
to the violation of listing regulations.
The bankruptcy status provides some options for the companies defaulted on the loans to
choose, to be liquidated or to be restructured, organisationally or financially. In French, failite is
defined as a situation of a company deemed to fail to pay its debt. Financially, the company is said
to be insolvent as it fails to settle one of its debt components, either the principal or the interest or
both.
In Indonesia, Law No.37 Year 2004 was issued to regulate the defaulted loans and
postponement of liabilities to service the loans. The law also provides some degree of protections to
debtors, creditors, and investors. Shall there be sufficient trusts and convictions amongst the
stakeholders of company’s sustainability, the company may wither the storm and resurrect to
operate normally.Corporate failures have become something to avoid. Early warning systems to
detect the companies to fail have been developed for decades. It is due to its catastrophic nature to
lenders, creditors, and investors. There’s nothing better to predict the probability of companies to
fail, but their financial indicators. That includes the indicators for illiquidity, insolvency,
bankruptness, or other measures.
Paul J. FitzPatrick was known as the avant garde to predict the bankruptness of 20
companies by pairing them with the surviving 20 companies within the same 20 industries.1
FitzPatrick interpreted the 13 accounting ratios and its trends as the indicators of bankruptcy. The
observation time was 3 years. In 1932, it was considered to be a complex, multiple variables
analysis. Nevertheless, it was Edward I. Altman in 1968 that known to formalize the multiple
variable analysis by applying multiple discriminant analysis within a pair-matched sample to predict
corporates to fail.2 Two years before, in 1966, with its univariate analysis, Beaver concluded that
'Cash Earnings to Total Debt' was the best ratio for signaling bankruptcy.3
Some numbers may provide early signs of the companies beginning to step into the murky waters
and troubled territories. Bankruptcy is another stage and status of troubling companies. The status
can be obtained through voluntary filing and/or imposed by a court order. Liquidation is the last
stage of life of a company. Some of liquidations don’t need bankruptcy status beforehand. Others
may also come from sustained unsuccessful attempts of the management of the troubled companies
to weather the storm. Financial distress indicators can not necessarily be the main culprit for the
management and/or the stakeholders to liquidate the company. Some non-financial figures may take
a larger role.
Bleak revenue projections, either in short-terms and/or medium-terms, that fail to meet the
schedules set over various debt restructuring efforts, may become the obvious reason to liquidate a
company. Illiquidity and insolvency have been used as the measures and indicators of financial

4
distress of any company. Some forced delisting of publicly held companies in any stock exchange
may serve as the early signs of trouble, likewise the voluntary delisting policy to make the
companies private again. Some forced delisting may originate from the authorities within the stock
exchange, the supervisory body, and/or the court.
Some forms of protection given and provided along with the bankruptcy statutes have been
alleged to be vulnerable as a means to be exploited and manipulated. Many have classified such acts
as white-collar crimes. Some fraud activities during bankruptcy protection and status are as
follows:4
1. concealment of assets,
2. concealment or destruction of documents,
3. fraudulent claims,
4. false statements or declarations (perjury),
5. fee fixing or redistribution arrangements.
Literature Review
Financial Analysis
In the Financial Accounting Standard (PSAK) No.1, the IAI (Institute of Indonesia
Chartered Accountants) defines financial statement as a structured presentation of the financial
position and financial performance of an entity. It is created to provide some degree of illustration
and figures of an entity’s financial statements to the outsiders and external parties such as investors,
lenders, creditors, suppliers, customers, employees, government, and societies in general.
The usual and standard financial statements comprise of balance sheet, assets, liabilities,
equity, cash flow, revenues and expenses, profit or loss. The analysis on financial statements shows
a company’s earning power, the past and future cash flows, debt service capability, and the
performance and accountability of the management.
Delisting
Based on the Decree of JSX’s BOD No.Kep-308/BEJ/07-2004, Rule Number I-I
(Concerning Delisting and Relisting of Securities at the Exchange) was issued and became effective
as of 19 July 2004. Delisting was defined as the delisting of securities from the securities list listed
at the Exchange; as a consequence, such shares are no longer tradable at the Exchange.
Delisting may originate from the companies listed on the Exchange. Some required
procedures are the followings: approval from the GMS (General Meeting of Shareholders), the
shares have been listed at the Exchange for a minimum period of 5 years, the company must absorb
and repurchase the shares outstanding at the price above the current market price or at par,
whichever is higher. The offered price must also include a premium of the investment return rate for
2 years. The return is calculated at equals to the initial price of shares multiply multiplied by an
average interest rate of the SBI-3 month (Certificate of Bank Indonesia), or other equivalent
government bond interest rates that prevails as of the stipulation date of the GMS resolution
concerning the Delisting.
The third option was the proper and fair value of the stock set by the appraiser, an
independent party that listed at the Bapepam and appointed by the company, or the willingly party

approved by the GMS to make the company private again. This procedure is usually coined as the
voluntary delisting of the listed company.
Table – Severity and stages of financial distress
Severity Stage Description
∇
⏬
⟱
State 0 Financial stability
State 1 Omitting or reducing dividend payments more than 40% over the previous year
State 2 Technical default and default on loan payments
State 3 Protecting under Chapter X or XI of the Bankruptcy Act
State 4 Bankruptcy and liquidation
Source: Wen-Ying Cheng, Ender Su, and Sheng-Jung Li, A Financial Distress Pre-Warning Study, 2006.
On the contrary, there is the involuntary delisting, which is termed as the delisting forced by
the Exchange. The Exchange found that the company has experienced and suffered some
condition(s) and/or an event(s) that may affect its existence and status as a listed and publicly held
company. That includes the no-sign of recovery and sufficient progress to positive outcome. A
condition that may force the Exchange to delist the company is as the company’s shares have been
suspended and only traded on the Negotiable Market for at least the last 24 months consecutively.
Bankruptcy
Bankruptcy in Indonesia was set, ruled, and regulated by the Law No.37/2004. It defines
bankruptcy as a common confiscation to the whole assets of bankrupted debtor, in which its
management and settlement is carried out by the curator supervised by the Supervisory Judge. The
legal status gets directly attached, embedded, and stamped with the company as there is a request
from the company, the creditors, and/or from the authority to suspend the obligation to settle the
outstanding debts.
In regard to the publicly held companies, Bapepam Regulation No.X.K.5 set the company in
question to disclose any information in relation to the petition of bankruptcy status. The Regulation
was set in Bapepam Decree No.Kep- 46/PM/1998, dated 14 August 1998. In 2017, this regulation
was revoked and replaced by the OJK Regulation No.30/POJK.04/2017. Issued on 21 June 2017, it
set the share repurchase activity by the public companies.
Bankruptcy Prediction Model
Bankruptcy prediction models (BPM) have been generated and developed through
theoretical and mathematical constructs. It begins with traditional statistics techniques (e.g.
discriminant analysis and logistic regression), early artificial intelligence models (e.g. artificial
neural networks), and later on the machine learning models (that support vector machines, bagging,
boosting, random forest).5 BPM has been developed to provide some substantial improvement upon
the accuracy of prediction of companies to fail financially. The names vary according to the focus,
intention, and purpose of the study. Some models have been commercially implemented such as
KMV6, EDF
7, LGD
8, Merton debt model (MDM), or elses. Rating agencies are the most common
implementers and developers.

6
Chart – Score card in S&P rating system
Source: Standard & Poor’s, Corporate Ratings Methodology: Transparency. Comparability, S&P’s Ratings Services,
McGraw Hill Financial, 20140501.
Some empirical results and research findings vary across the selection of models, variables, and the
setting of default points (Distance to Default, DtD). Many considered the structural distance to
default is timely mannered and to have some back-propagation characteristics. As is the case, to
cope with this characteristics, the MLP9 is considered to be adequate and sufficient to present as a
form of neural network analysis and to serve as the simplest and most reliable classifier.
Table – Summary of Strengths and Weaknesses of 5 credit risk measurement methodologies
S&P’s, Moody’s, Fitch Moody’s RiskCalc KMV (DtD, MDM) JP Morgan External Ratings Accounting Structural CreditMetrics CreditPortfolioView
H H L H H Detailed Customer
Specific Financial Analysis
Detailed analysis of
financials
Detailed analysis of
financials
Only debt and asset
values
Based on external ratings
which includes detailed financial analysis
Based on external
ratings which includes detailed financial analysis
M L H M H
Industry differentiation
Industry factors incorporated at time of rating
Most accounting models do not differentiate between industries
Based on market fluctuations which will vary with industry risk
Based on ratings which incorporate industry factors at time of rating
Have a specific Industry transition adjustment
L L H L M Fluctuates with market (no time delays)
No fluctuations with market
No fluctuations with market
Highly responsive to market fluctuations
No fluctuations with market
Can update industry adjustment factors from time to time
H M L L L Easy to model Ratings readily
available to researchers Relatively easy to duplicate models on a spreadsheet
Complex techniques Complex techniques Complex techniques
Accuracy High at time of rating
Lower as time passes
High at time of rating
Lower as time passes
Medium - Does
fluctuate with market but can over- or understate depending on market volatility. Calibration can improve accuracy
High at time of rating
Lower as time passes
High at time of rating
Lower as time passes
Source: David E. Allen and Robert J. Powell, Credit risk measurement methodologies, 2011. Note: H shows that the criteria in column 1 is met to a high degree, M is moderate and L is low.
The Uses and Abuses of Predictive Analytics
As a tool of predictive analytics, any BPM outcome send mixed signals to the market. The
nature of asymmetric information in the market gets easily exploited and manipulated relatively. It
is to be up or down. The choice is simply classified and coined as the scenarios.10
It can be worst
case, least case, mainstream or niche, maximum likelihood or least probabilities, certain or
uncertain, quadrants or zonation, contrary or minority reports, the changing scenes and themes.
The outcome of any prediction can lead to an inference of point estimates, nomograms,
score charts or Likert scale, tree-based methods and/or graphical decision (tree) rules. Any

predictive modelling is based on the detection theory, probability to occur, and lastly the classifiers
as the ultimate predictor and judge. Some algorithm(s) may have and had been set and accepted as
standard of measurement. Some coders familiar with it may have exploited and manipulated the
codes, particularly when they get induced and stimulated. In sum, it is a matter of time to finally
find and realise that BPM has become a tool that is easily used and abused relatively.11
PREVIOUS STUDIES
Studies on BPM Methodologies
The Altman Z-Score has paved the way for further development of corporate bankruptcy
prediction models. The option pricing model developed by Black and Scholes in 1973 and Merton
in 1974 provided the foundation upon which structural credit models were built. It was KMV the
first model to commercialise the structural bankruptcy prediction model in the late 1980s.
The Distance to Default (DtD) is not an empirically created model, but a mathematical conclusion.
It is built on some bases and assumptions such as:
1. a company will default on its financial obligations when its assets are worth less than its
liabilities.
2. asset returns are log-normally distributed (the Black-Scholes option pricing model).
Table - Predictive Ability by Decade and Method
Period Lowest Highest Method(s) used to obtain
Accuracy Accuracy Highest Accuracy
1960's 79% 92% Univariate DA [Beaver, 1966]
1970's 56% 100% Linear probability [Meyer and Pifer, 1970] MDA ([Edmister, 1972];
[Santomero and Vinso, 1977])
1980's 20% 100% MDA ([Marais, 1980]; [Betts and Behoul, 1982]; [El Hennawy and Morris,
1983]; [Izan, 1984]; [Takahashi et al.,1984]; [Frydman et al., 1985]) Recursive
partitioning algorithm [Frydman et al., 1985] Neural network [Messier and
Hansen, 1988]
1990's 27% 100% Neural networks ([Guan, 1993]; [Tsukuda and Baba, 1994]; [El-Temtamy,
1995]) Judgmental [Koundinya and Puri, 1992] Cumulative sums [Theodossiou,
1993]
2000's 27% 100% MDA [Patterson, 2001]
Source: J.L. Bellovary, D.E. Giacomino, and M.D. Akers, A Review of Bankruptcy Prediction Studies, 2007.
The DtD model has been used as the Morningstar’s Financial Health Grade for public
companies.12
In 2009, Miller found that DtD has superior ordinal and cardinal bankruptcy
prediction power within Morningstar’s universe; a more durable bankruptcy signal, but less stable
ratings than the Z-Score.13
The primary performance indicator for both the Z-Score and DtD models
is the Accuracy Ratio. The foci of financial research have shifted to seek earlier and more accurate
predictions of financial distress. It is to permit intervention prior to an actual distress event,
including bankruptcy. The inaccuracy factors may have come from the sampling biases, estimating
model form, time period selection, breadth of industry type and distress indicator choice.14
The logit and probit models of predictive accuracy are known as the 2 relatively recent
models. They are applied to a data set of known high-risk companies. The logit model (of
Marchesini, Perdue, and Bryan)15
was derived from a sample of bond defaulting versus non-

8
defaulting firms. The probit model (of Zmijewski)16
was derived from a sample of bankrupt versus
non-bankrupt industrial firms.
Table – Bankruptcy Prediction Models Typology
Period Discriminant
Analysis
Logit
Analysis
Probit
Analysis
Neural
Networks Other
1960's 2 0 0 0 1
1970's 22 1 1 0 4
1980's 28 16 3 1 7
1990's 9 16 3 35 11
2000's 2 3 0 4 3
Total 63 36 7 40 26
Source: J.L. Bellovary, D.E. Giacomino, and M.D. Akers, A Review of Bankruptcy Prediction Studies, 2007.
Note: 7 studies applied more than 1 method which could-be considered primary; this makes the number of total
studies listed to 165. “Other” methods include linear probability, judgmental, Cusp catastrophe, and Cox proportional
hazards models.
Studies on Selected BPM Methodologies
To choose the best method in predicting non-bank companies to be delisted from the IDX
during 2003-2007, Hadi and Anggraeni utilised 3 different BPM methods, that is the Altman’s,
Springate’s, and Zmijewski’s, and compared the research results. By using the logistic regression,
they concluded that the Altman model is the best delisting predictor, followed by the Springate
model, but not the Zmijewski model.17
Similar finding with different period of observation and analysis, that is between 2007-2011,
was also concluded by Savitri in 2012.18
The studies on 4 bankruptcy predicton models are
recapitulated in the following table.
Table – Gap analysis and the studies on 4 bankruptcy prediction models
Pub. Date Author (s) Industry Coys Period Significancy
Critics Hi Lo
2013 Ni Made Evi Dwi
Prihanthini dan Ratna
Sari
F&B 10 2008-2012 G A Method of inference and acuracy is
explained within the analysis.
201412 Yusni Warastuti and
Elizabeth Lucky
Maretha Sitinjak
Bank - 2006-2012 S Z NO amounts of sample; weighted
coefficients of predicting variables; method
of inference; R2 is not used as the
explaining determinants; which model is the
highest predictor. Funny way to make
conclusion.
20141210 M. Fakhri Husein and
Galuh Tri Pambekti
Daftar Efek Syariah 132 2009-2012 Z G NO cut off values, method of inference. -
acuracy.
20150313 Lili Syafitri dan Trisnadi
Wijaya
F&B INDF 2009-2013 Z, G A NO explanation about Error Type I & II
20150310 Citra Dewi Lestari Mining & Mining
Service
7 2009-2013 G S Method of inference and acuracy is
explained within the analysis. The amount of
sample was mentioned at 35, but only 7 coys
were detailed.
20150311 Enny Wahyu Puspita
Sari
Transportation 66 2009-2013 A Z Least error, NOT net acurate. Good advice
20180831 Patrisius Gerdian
Bimawiratma
Manufacturing 8 2009-2013 G A ★★★★
20150819 Anissa Agustina
Rahmadini
Telecommunication
s
FREN 2010-2014 A G NO alternative of financial distress
indicators.
2015 Queenaria Jayanti dan
Rustiana
Manufacturing 432 2008-2011 G S BPM vs voluntary auditor switching: the
relationship and causalities were unclear.
20160108 Andrianti Delisted coys 12 2010-2014 S Z ★★
201607 Abolfazl Aminian,
Hedayat Mousazade, and
Omid Imani Khoshkho
Textile, ceramic,
tile
35 2008-2013 G Z Misleading conclusion in abstract.
2016 Junaidi Islamic Bank 10 2010-2014 S, G Z Misleading conclusion and inferences.

Table – Gap analysis and the studies on 4 bankruptcy prediction models
Pub. Date Author (s) Industry Coys Period Significancy Critics
201605 Desmawati, Kamaliah,
dan Errin Yani Wijaya
Manufacturing 140 2013 - S NO method of inference. -acuracy. Z-score
in 2013. Actual delisting events in 2015.
20170526 Anis Kurniawati Jakarta Islamic
Index
12 2011-2015 A Z, G ★
201707 Niken Savitri Primasari FMCG 29 2012-2015 A G NO model estimation, method of inference, -
acuracy. Out of the blue: negative net
income, dividend payment
2017 Dimas Priambodo Mining & Mining
Service
19 2012-2015 S Z ★★★
201710 Januri, Eka Nurmala
Sari, and Armida Diyanti
Cement 3 2011-2015 Z A NO definitions of code, rank, and error type.
2017 Harsono Yoewono and
Ridwan Ali
Delisted coys 14 2011-2015 A Z ★★★★
Note: A: Altman. S: Springate. Z: Zmijewski. G: Grover.
The Altman Z-Score Model
In 1968, Altman developed an intuitive appealing scoring method when traditional ratio
analysis was losing favor with academics. By using multiple discriminant analysis (MDA), Altman
narrowed a list of 22 potentially significant ratios to 5 that, as a set, proved significant in predicting
bankruptcy in his sample of 66 corporations (33 bankruptcies and 33 non-bankruptcies).19
The scored figure is noted as Z, whilst the surviving 5 variables are working capital/total
asset; retained earnings/total asset; earnings before interest and taxes/total asset; market
capitalization/book value of debt; and sales/total asset. The weighted index for the respective 5
variables are 1.2, 1.4, 3.3, 0.64, and 1.05. It is written as Z = 1.2X1 + 1.4X2 + 3.3X3 + 0.6X4 +
1.05X5. This model has a cutoff value of Z ≤ 1.81 (bankrupt), Z ≥ 2.99 (not bankrupt), 1.81 < Z <
2.99 (grey zone). Altman later revised the numerator in the 4th
variable from market cap to book
value of equity, with the book value of debt as the denominator remained unchanged. The score was
95% acurate to predict a company to bankrupt in 1 year, and 72% acurate in 2 years.
Some known facts regarding the Altman Z-Score are as follows:
1. commonly used to gauge the financial health of all companies,
2. the most widely recognised and applied model for predicting financial distress.20
In July 2000, Altman21
published the updated version of 1968 paper and its collaboration to build
the ZETA22
model with Halderman and Narayanan in 1977. Some improvements regarding this new
model are as follows:
1. effective in classifying bankrupt companies up to 5 years prior to fail, the sample corporations of
retailers and manufacturers.
2. can classify bankruptcy above 90% acuracy 1 year prior and 70% accuracy up to 5 years.
3. outperformed alternative bankruptcy classification strategies in terms of expected cost criteria
utilising prior probabilities and explicit cost of error estimates.
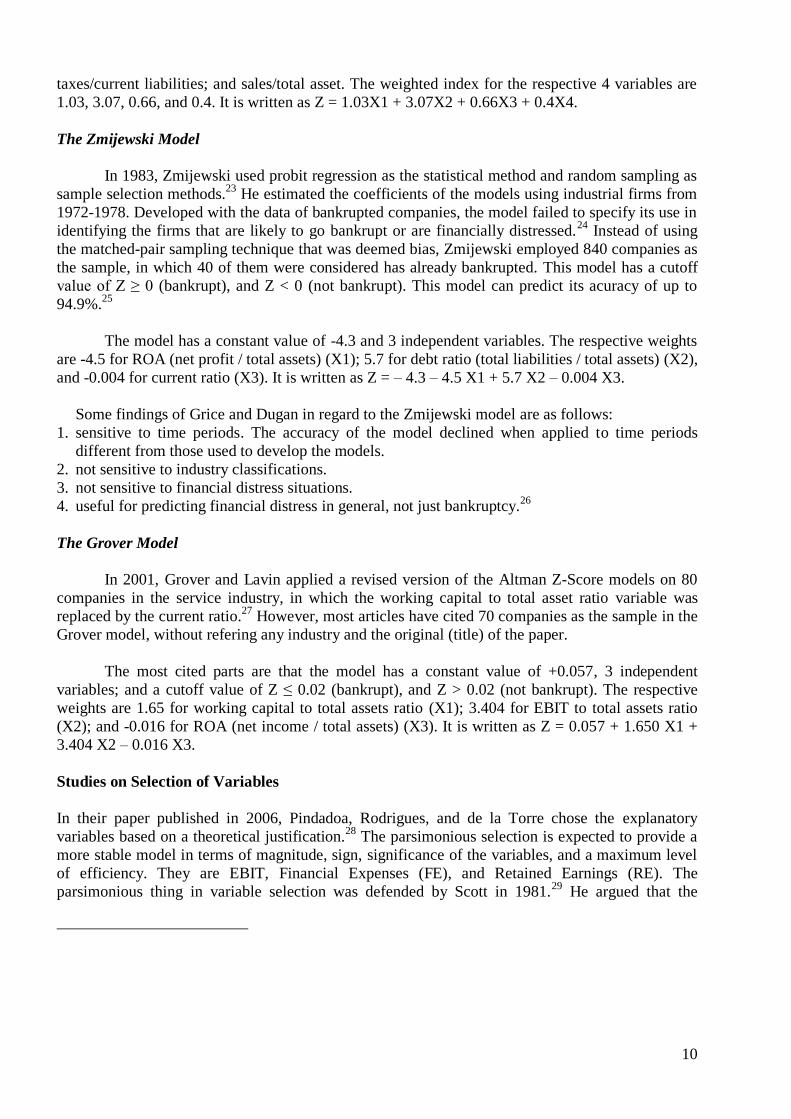
The Springate Model
In 1978, Springate utilised 40 Canadian companies as the sample and changed the earnings
variable to net profit as the numerator in 2 variables. From 19 ratios examined, only 4 variables
were known to be significant. This model has a cutoff value of Z ≤ 0.862 (bankrupt) and Z > 0.862
(not-bankrupt). This model can predict its accuracy of up to 92.5%. The surviving 4 variables are
working capital/total assets; net profit before interests and taxes/total assets; net profit before
10
taxes/current liabilities; and sales/total asset. The weighted index for the respective 4 variables are
1.03, 3.07, 0.66, and 0.4. It is written as Z = 1.03X1 + 3.07X2 + 0.66X3 + 0.4X4.
The Zmijewski Model
In 1983, Zmijewski used probit regression as the statistical method and random sampling as
sample selection methods.23
He estimated the coefficients of the models using industrial firms from
1972-1978. Developed with the data of bankrupted companies, the model failed to specify its use in
identifying the firms that are likely to go bankrupt or are financially distressed.24
Instead of using
the matched-pair sampling technique that was deemed bias, Zmijewski employed 840 companies as
the sample, in which 40 of them were considered has already bankrupted. This model has a cutoff
value of Z ≥ 0 (bankrupt), and Z < 0 (not bankrupt). This model can predict its acuracy of up to
94.9%.25
The model has a constant value of -4.3 and 3 independent variables. The respective weights
are -4.5 for ROA (net profit / total assets) (X1); 5.7 for debt ratio (total liabilities / total assets) (X2),
and -0.004 for current ratio (X3). It is written as Z = – 4.3 – 4.5 X1 + 5.7 X2 – 0.004 X3.
Some findings of Grice and Dugan in regard to the Zmijewski model are as follows:
1. sensitive to time periods. The accuracy of the model declined when applied to time periods
different from those used to develop the models.
2. not sensitive to industry classifications.
3. not sensitive to financial distress situations.
4. useful for predicting financial distress in general, not just bankruptcy.26
The Grover Model
In 2001, Grover and Lavin applied a revised version of the Altman Z-Score models on 80
companies in the service industry, in which the working capital to total asset ratio variable was
replaced by the current ratio.27
However, most articles have cited 70 companies as the sample in the
Grover model, without refering any industry and the original (title) of the paper.
The most cited parts are that the model has a constant value of +0.057, 3 independent
variables; and a cutoff value of Z ≤ 0.02 (bankrupt), and Z > 0.02 (not bankrupt). The respective
weights are 1.65 for working capital to total assets ratio (X1); 3.404 for EBIT to total assets ratio
(X2); and -0.016 for ROA (net income / total assets) (X3). It is written as Z = 0.057 + 1.650 X1 +
3.404 X2 – 0.016 X3.
Studies on Selection of Variables
In their paper published in 2006, Pindadoa, Rodrigues, and de la Torre chose the explanatory
variables based on a theoretical justification.28
The parsimonious selection is expected to provide a
more stable model in terms of magnitude, sign, significance of the variables, and a maximum level
of efficiency. They are EBIT, Financial Expenses (FE), and Retained Earnings (RE). The
parsimonious thing in variable selection was defended by Scott in 1981.29
He argued that the

selection of explanatory variables should not be based on sequential processes of elimination of
variables according to a maximum prediction capacity criterion. He also added that this method
often leads to over-adjusted models with counter-intuitive coefficient signs and results.
In 2007, Bellovary, Giacomino, and Akers made a review of bankruptcy prediction studies from
1930 onward. The most common financial ratios used as the explanatory variables can be found in
the attached Table – Factors included in five or more studies. In 2009, du Jardin made an analysis
on choosing the most relevant variables. His findings were summarised in attached 2 tables, that is:
1. Criteria used to select explanatory variables to include in bankruptcy models.
2. Typology of explanatory variables commonly used in bankruptcy prediction models in 190
studies.
Research Methodology
The methodology used in this research is quantitative descriptive research. The financial
statements of companies delisted involuntarily from the IDX for the period of 2011-2015 are the
object in this research. Companies from the financial industries are disqualified in this study. In
order to distinguish with the still listed companies, the involuntary delisted companies need to be
matched with their pair sample as a comparison. The pair companies should still be listed on the
IDX, in the same (sub) industry, having similar asset size relatively, same periods of financial
statements published, and profiting for 3 consecutive years.
Table – The delisted companies with their pairs
Delisted companies Listed companies Industry - Sub-Industry
Date Company name Ticker Ticker Company name
20141127 Asia Natural Resource Tbk ASIA AIMS Akbar Indomakmur
Stimec Tbk
Trade, Services and Investment -
Wholesale
20150121 Davomas Abadi Tbk DAVO ULTJ Ultra Jaya Milk
Industry Tbk
Consumer Goods - Food and
Beverages
20131227 Dayaindo Resource
International Tbk
KARK TURI Tunas Ridean Tbk Trade, Services and Investment -
Wholesale
20110124 New Century Development
Tbk
PTRA LAMI Lamicitra Nusantara
Tbk
Property and Real Estate
20130517 Panca Wiratama Sakti Tbk PWSI COWL Cowell Development Property and Real Estate
20131031 Surabaya Agung Industry
Pulp Tbk
SAIP SPMA Suparma Tbk Basic Industry and Chemicals -
Pulp and Paper
20120228 Suryainti Permata Tbk SIIP LPCK Lippo Cikarang Tbk Property and Real Estate
Research Variables
Table – Operationalization of research variables
Measures Short Description BPM Type
A S Z G
Liquidity WCTA Working Capital / Total Asset ✔ ✔ ✔ Profitability RETA Retained Earnings / Total Asset ✔
Profitability EBITTA Earnings Before Interest and Taxes / Total Asset ✔ ✔ ✔ L>A → MV MVEBVTL Market Value of Equity / Book Value of Total Liability ✔
Profitability STA Sales / Total Asset ✔ ✔
Profitability EBTCL Earnings Before Taxes / Current Liability ✔
Profitability NITA Net Income / Total Asset ✔ ✔ Leverage TLTA Total Liability / Total Asset ✔
Liquidity CACL Current Asset / Current Liability ✔ Note: Working Capital = Current Asset- Current Liability. MVE = total of share issued x market share price

12
Data Processing
Table – Variables used in 4 BPMs (bankruptcy prediction models) compared
Altman (1968) Springate (1978) Zmijewski (1983) Grover (2001)
Variable Weigth Variable Weigth Variable Weigth Variable Weigth Variable
Constant -4.3 0.057
x1 1.2 working capital / TA 1.03 working capital / TA -0.004 current ratio (liquidity,
volatility)
1.65 working capital / TA
x2 1.4 retained earnings /
TA
0.66 net profit before taxes /
current liabilities
x3 3.3 EBIT / TA 3.07 net profit before
interest and taxes / TA
-4.5 net profit / TA (ROA) 3.404 EBIT / TA
x4 0.6 market cap. / BV of
debt
- -0.016 net income / TA
BV of equity / BV of
debt
- 5.7 total liabilities / TA
x5 1.05 sales / TA 0.40 sales / TA
Cut-off
NB Z ≥ 2.99 Z > 0.862 Z < 0 Z > 0.02
GZ 1.81 < Z < 2.99
B Z ≤ 1.81 Z ≤ 0.862 Z ≥ 0 Z ≤ 0.02
Note: TA: total assets. BV: book value. EBIT: earnings before interest and taxes. NB: not bankrupt, GZ: grey zone. B: bankrupt.
Method of Inference
To classify the prediction is either correct or incorrect with the actual and reality status, the types of
errors are distinguished in the Table – Error type of prediction vs actual. ET-I or errors of type I is a
condition of a company predicted to be non-bankrupt (NB, non-defaults), but not actually.
Therefore, the ET-I is called α-error or false negative proportion.30
ET-I Predicted = NB and
Actual = B.
Table – Error type of prediction vs actual
Actual
Prediction ∑
B NB
B ✔ ET-I 100%
NB ET-II ✔ 100%
∑ 100% 100%
Note: B: Bankrupt. NB: Not Bankrupt. ET: Error Type.
Chart – Classification errors subject to chosen cut-off-score and rating score probability density functions for defaulters
and non-defaulters

Source: Martin Bemmann, Improving the Comparability of Insolvency Predictions, 2005.
Note: cf (1) “Chart – Probability densities of the rating scores and classification error rate” in Deutsche Bundesbank,
Approaches to the validation of internal rating system, 2003, p.70. (2) Dirk Tasche, ‘Rating and probability of default
validation’, 2005, p.37. (3) Bern Engelmann, Evelyn Hayden, and Dirk Tasche, Measuring the Discriminatory Power of
Rating Systems, 2003, p.5. (4) Günther Thonabauer (OeNB) and Barbara Nösslinger (FMA), eds, Guidelines on Credit
Risk Management. Rating Models and Validation. 2004, p.103.
ET-II or errors of type II is a condition of a company predicted to be bankrupt (B, defaults),
but not bankrupt actually. Therefore, the ET-II is called β-error or false positive proportion. ET-II
Predicted = B and Actual = NB. In short, ET-I is in relation to the number of real defaulters and
ET-II is in relation to the number of real non-defaulters. Either one, Bayesian error exists in the
examined sample or in the basic population. The so-called hit rate for a condition of ET-I=100%
and false alarm rate for ET-II might be somewhat misleading. The average of both error rates, either
weighted or not, is a matter of choice to utilise the comprehensive predictive quality measures. The
summarised measures are no longer categorial, but can be ordinal or cardinal.
Some conflict of objectives concerning the rates of ET-I or ET-II occur on all rating models.
The ET-I may be scored at 0% and ET-II at 100% simulatenously, vice versa. The trade-offs
between these two extremes are usually feasible, arbitrarily. The graphical presentation is illustrated
in the ‘Chart – Classification errors subject to chosen cut-off-score and rating score probability
density functions for defaulters and non-defaulters’.
Result
This research tries to find the best BPM (bankruptcy prediction model) method in predicting
the bankruptcy amongst the delisted companies from the IDX for the period of 2011-2015.
Therefore, ET-I becomes the relevant error type with the acuracy rate. By companies, the 4 BPM
can predict the bankrupty (delisting) event of PWSI (Panca Wiratama Sakti), that is with ET-I = 0,
but not with the delisting event of KARK (Dayaindo Resource International) whose acuracy rate
was 0%.
Table – Bankruptcy prediction by companies and methods on delisted companies
IDX Code BPM
Acuracy ET-I ET-II A S Z G
DAVO (2015) NB B NB B 50% 50% -
ASIA (2014) B B NB NB 50% 50% -
KARK (2013) GZ NB NB NB 0% 75% -
SAIP (2013) B NB NB B 50% 50% -
PWSI (2013) B B B B 100% 0% -
SIIP (2012) B B NB NB 50% 50% -
PTRA (2011) B B NB NB 50% 50% -
Acuracy 71.43% 71.43% 14.29% 42.86% 50% 46.43%
GZ 14.29% - - -
ET-I 14.29% 28.57% 85.71% 57.14%
ET-II - - - -
Note: B: Bankrupt. NB: Not Bankrupt. GZ: Grey Zone. ET: Error Type. A: Altman. S: Springate. Z: Zmijewski. G:
Grover.
Table – Bankruptcy prediction by companies and methods on listed companies
IDX Code BPM
Acuracy ET-I ET-II A S Z G
ULTJ NB NB NB NB 100% - 0%
AIMS NB NB NB NB 100% - 0%
TURI NB NB NB NB 100% - 0%
SPMA B NB NB NB 75% - 25%

14
COWL NB NB NB NB 100% - 0%
LPCK B B NB NB 50% - 50%
LAMI B B NB NB 50% - 50%
Acuracy 57.14% 71.43% 100.00% 100.00% 82.14% - 17.86%
GZ 0.00% 0.00% 0.00% 0.00%
ET-I - - - -
ET-II 42.86% 28.57% 0.00% 0.00%
Note: B: Bankrupt. NB: Not Bankrupt. GZ: Grey Zone. ET: Error Type. A: Altman. S: Springate. Z: Zmijewski. G:
Grover.
To verify the acuracy rate of those 4 BPMs in predicting the non-delisting (non-bankruptcy) event,
we found that ET-II occurs in 3 companies, that is SPMA (Suparma) by 25%, and LPCK (Lippo
Cikarang) and LAMI (Lamicitra Nusantara) by 50% each. On average, the acuracy rate of 4 BPMs
in predicting 7 companies NOT to be bankrupt (still-listed) was 82.14%, and coupled with the
relevant ET-II at 17.86%.
Conclusion
Apart from acurate prediction of bankruptcy (delisted) and not bankrupt (still-listed) by
companies, the highest overall acuracy rate in predicting the bankruptcy (delisting) and NOT-
BANKRUPT (still-listed) events occurred in 2 BPMs, that is Springate and Grover. By restricting
the prediction only on the bankruptcy (delisting) event, Altman is the best BPM method with an
acuracy of 71.43%.
Table – Accuracy and error in prediction in 4 bankruptcy prediction models: Altman, Springate, Zmijewski, Grover
Model Altman Springate Zmijewski Grover
Actual B NB Total GZ B NB Total B NB Total B NB Total
FD L
FD L FD L FD L
Prediction
B 5 3 8
5 2 7 1 0 1 3 0 3
NB 1 4 5
2 5 7 6 7 13 4 7 11
GZ 1 0 1
Correct 5 4 9
5 5 10 1 7 8 3 7 10
Sample 7 7 14
7 7 14 7 7 14 7 7 14
Acuracy 71.43 57.14 64.29
71.43 71.43 71.43 14.29 100 57.14 42.86 100 71.43
Error 14.29 42.86 35.71 7.14 28.57 28.57 28.57 85.71 0 42.86 57.14 0 78.57
Note: B: Bankrupt; NB: Not Bankrupt; GZ: Grey Zone; FD: Forced delisting; L: Listed
Altman becomes the best BPM in predicting the bankruptcy (delisting) event as it has an error rate
by 14.29%, lower than the Springate. Although Springate has an acuracy of 71.43%, it has an error
rate higher than Altman, that is by 28.57%. Grover and Zmijewski took the third and fourth place
respectively in the overall acuracy and in predicting the bankruptcy (delisting) event.
Table – Accuracy rate of bankruptcy prediction by methods
Model name Accuracy Rate
Overall Delisted Listed
Altman 64.29% 71.43% 57.14%
Springate 71.43% 71.43% 71.43%
Zmijewski 57.14% 14.29% 100.00%
Grover 71.43% 42.86% 100.00%
In general, bankruptcy prediction models (BPM) do not take the accounts of scale or score of other
financial distress indicators. Financial distress indicators should have the ability to classify which
stages of distress the companies financially.

Recommendation
BPMs should have encountered with the factors and variables, both directly and indirectly
related with the companies. The theoretical and industrial approaches from the perspectives of
Porter’s Five Forces should have been considered as well.
References
18 U.S. Code § 157, http://trac.syr.edu/laws/18/18USC00157.html
Abolfazl Aminian, Hedayat Mousazade, and Omid Imani Khoshkho, Investigate the Ability of
Bankruptcy Prediction Models of Altman, Springate, Zmijewski, and Grover in Tehran Stock
Exchange, Mediterranean Journal of Social Sciences, Vol.7, No.4, S1, July 2016. ISSN 2039-
2117 (online). ISSN 2039-9340 (print)., 201607
Andrianti, Analisis Ketepatan Model Altman, Springate, Zmijewski, Ohlson, dan Grover sebagai
Detektor Kebangkrutan (Studi Kasus pada Perusahaan yang Delisting di Bursa Efek Indonesia
(BEI) pada 2010-2014), Skripsi, Fakultas Ekonomi, Universitas Islam Negeri (UIN) Maulana
Malik Ibrahim, Malang, 20160108
Anis Kurniawati, Analisis Financial Distress dengan Model Altman, Zmijewski, Springate, dan
Grover pada Perusahaan di Jakarta Islamic Index (JII) Tahun 2011 - 2015, Skripsi, Fakultas
Ekonomi Dan Bisnis Islam, Universitas Islam Negeri Sunan Kalijaga, Yogyakarta, 20170526
Anissa Agustina Rahmadini, An Analysis of the Bankruptcy Potency of the Company with Altman
Z-Score, Springate, Zmijewski, and Grover Model (Case Study on PT Smartfren Telecom
Tbk), 2nd International Conference on Business Economics and Social Sciences (ICBESS),
20150819
Bern Engelmann, Evelyn Hayden, and Dirk Tasche, Measuring the Discriminatory Power of Rating
Systems, Discussion Paper, Series 2: Banking and Financial Supervision, No.01/2003, p.5.
http://bit.ly/2FeMYrV
Charles Roxburgh, The use and abuse of scenarios, McKinsey.com, Nov. 2009,
http://bit.ly/2HLfDGv, https://www.mckinsey.com/business-functions/strategy-and-corporate-
finance/our-insights/the-use-and-abuse-of-scenarios
Citra Dewi Lestari, Prediksi Kebangkrutan Perusahaan Mining and Mining Service dengan Model
Altman Z-Score Modifikasi, Grover, Springate, dan Zmijewski, Sekolah Tinggi Ilmu
Ekonomi Perbanas, Surabaya, 2015, 20150310
David E. Allen and Robert J. Powell, Credit risk measurement methodologies, ECU Publications,
Research Online, Edith Cowan University, 2011. 19th International Congress on Modelling
and Simulation, Perth, Australia, 20111212-16, http://mssanz.org.au/modsim2011
Desmawati, Kamaliah, dan Errin Yani Wijaya, Analisis Prediksi Kebangkrutan dengan Model
Altman, Springate, Grover, & Zmijewski pada Industri Manufaktur di BEI, Jurnal Tepak
Manajemen Bisnis, Vol.VIII, No.2, Mei 2016., 201605
Deutsche Bundesbank, Approaches to the validation of internal rating system, Monthly Report,
Sept. 2003, p.70. http://bit.ly/2D191AA
Dimas Priambodo, Analisis Perbandingan Model Altman, Springate, Grover, dan Zmijewski dalam
Memprediksi Financial Distress (Studi Empiris pada Perusahaan Sektor Pertambangan yang
Terdaftar di Bursa Efek Indonesia Periode 2012-2015), Skripsi, Fakultas Ekonomi,
Universitas Negeri Yogyakarta, 2017
Dirk Tasche, ‘Rating and probability of default validation’ in Basel Committee on Banking
Supervision, Studies on the Validation of Internal Rating Systems, Working Paper No.14,
Bank for International Settlement, rev/ed, May 2005, p.37. http://bit.ly/2Fcxg4q
Dita Wisnu Savitri, Analisis Prediktor Kebangkrutan Terbaik dengan Menggunakan Metode
Altman, Springate, dan Zmijewski pada Perusahaan Delisting dari Bursa Efek Indonesia

16
(Studi Laporan Keuangan Tahun 2007-2011), Skripsi, e-Proceedings of Management,
Universitas Telkom, Bandung, 2014.
Edward I. Altman, "Financial ratios, discriminant analysis and the prediction of corporate
bankruptcy". Journal of Finance. 23 (4) 1968: 589–609.
Edward I. Altman, Predicting Financial Distress Of Companies: Revisiting The Z-Score And Zeta®
Models, July 2000.
Edward I. Altman, R. Haldeman, and P. Narayanan, “Zeta Analysis: A New Model to Identify
Bankruptcy Risk of Corporations,” Journal of Banking & Finance, 1, 1977.
Enny Wahyu Puspita Sari, Penggunaan Model Zmijewski, Springate, Altman Z-Score, dan Grover
dalam Memprediksi Kepailitan pada Perusahaan Transportasi yang Terdaftar di Bursa Efek
Indonesia, Fakultas Ekonomi dan Bisnis, Universitas Dian Nuswantoro, 20150311
Günther Thonabauer (OeNB) and Barbara Nösslinger (FMA), eds, Guidelines on Credit Risk
Management. Rating Models and Validation. Oesterreichische Nationalbank (OeNB),
Nov.2004, p.103. http://bit.ly/2FmnY56
J. C. Neves and A. Vieira, 'Improving bankruptcy prediction with hidden layer learning vector
quantization', European Accounting Review, 15 (2), 2006:253-271.
J. Robertson and R. Mills, "The Uses and Abuses of Corporate Prediction Models." Management
Accounting, 20-22, (1991). http://bit.ly/2Eo5K0g
J. Scott, 1981. The probability of bankruptcy: A comparison of empirical predictions and theoretic
models. Journal of Banking & Finance 5, 1981: 317-344.
Jeffrey Grover and Angeline M. Lavin, Financial Ratios, Discriminant Analysis and the Prediction
of Corporate Bankruptcy: A Service Industry Extension of Altman’s Z-Score Model of
Bankruptcy Prediction, 2001 meeting of the Southern Finance Association Annual Meeting,
20010216.
Jeffrey S. Grover, Validation of a Cash Flow Model: A Non-bankruptcy Approach, School of
Business and Entrepreneurship, Nova Southeastern University. 2003.
Jodi L. Bellovary, Don E. Giacomino, and Michael D. Akers, A Review of Bankruptcy Prediction
Studies: 1930 to Present, Journal of Financial Education, Vol. 33 (Winter 2007): 1-42.
John Stephen Grice and Michael T. Dugan, The Limitations of Bankruptcy Prediction Models:
Some Cautions for the Researcher, Review of Quantitative Finance and Accounting,
Sept.2001, Vol.17, Issue 2, pp 151-166. https://doi.org/10.1023/A:1017973604789
John Stephen Grice, Sr., Reestimations of the Zmijewski and Ohlson Bankruptcy Prediction
Models, 20031030.
Julio Pindadoa, Luis Rodrigues, Chabela de la Torre, Estimating the Probability of Financial
Distress: International Evidence, 20060106, http://bit.ly/2F56M4a,
https://ssrn.com/abstract=485182 or http://dx.doi.org/10.2139/ssrn.485182
Junaidi, Pengukuran Tingkat Kesehatan dan Gejala Financial Distress pada Bank Umum Syariah di
Indonesia, Kinerja, Vol.20, No.1, 2016: 42-52., 2016
Lili Syafitri dan Trisnadi Wijaya, Analisis Komparatif dalam Memprediksi Kebangkrutan pada PT
Indofood Sukses Makmur Tbk, STIE MDP, 20150313
M. Fakhri Husein and Galuh Tri Pambekti, Precision of the models of Altman, Springate,
Zmijewski, and Grover for predicting the financial distress, Ventura, Journal of Economics,
Business, and Accountancy, Vol .7, No.3, Dec. 2014, pp.405-416, 20141210 (20140903)
Mark E. Zmijewski. "Essays on Corporate Bankruptcy." Ph.D. Dissertation, State University of
NewYork at Buffalo, 1983. http://bit.ly/2nsjhMc
Mark E. Zmijewski. "Methodological Issues Related to the Estimation of Financial Distress
Prediction Models." Journal of Accounting Research 24, 59-82, 1984.
http://bit.ly/2DOWmWv
Mark E. Zmijewski. "Methodological issues related to the estimation of financial distress prediction
models". Journal of Accounting Research 22 (Supplement), 1984:59-86.
Martin Bemmann, Improving the Comparability of Insolvency Predictions. Dresden Economics
Discussion Paper Series No. 08/2005. 20050623. http://ssrn.com/abstract=731644

Morningstar, Inc., Stock Grade Methodology for Financial Health. Morningstar Methodology
Paper. 20080326. http://bit.ly/2GLQlqL, http://bit.ly/2sVLf9j.
Ni Made Evi Dwi Prihanthini dan Ratna Sari, Analisis Prediksi Kebangkrutan dengan Model
Grover, Altman Z- Score, Springate, dan Zmijewski pada Perusahaan Food and Baverage di
BEI., E-Jurnal Akuntansi Universitas Udayana 5.3, 2013:544-560. ISSN: 2302-8556 , 2013
Niken Savitri Primasari, Analisis Altman Z-Score, Grover Score, Springate, dan Zmijewski sebagai
Signaling Financial Distress (Studi Empiris Industri Barang-Barang Konsumsi di Indonesia),
Accounting and Management Journal, Vol. 1, No. 1, July 2017, 201707
Patrisius Gerdian Bimawiratma, Analisis Akurasi Metode Altman, Grover, Springate, dan
Zmijewski dalam Memprediksi Perusahaan Delisting (Studi Empiris pada Perusahaan
Manufaktur di Bursa Efek Indonesia Periode 2009-2013), Skripsi, FE Unsada Yk, 20180831
Paul J. FitzPatrick, "A Comparison of the Ratios of Successful Industrial Enterprises with Those of
Failed Companies". The Certified Public Accountant (Oct.1932, p.598-605; Nov.1932, p.656-
662; Dec.1932, p.727-731)
Pierre du Jardin, Bankruptcy prediction models: How to choose the most relevant variables?,
Bankers, Markets & Investors, issue 98, January-February, 2009, pp.39–46. Paper No.44380,
Munich Personal RePEc Archive (MPRA), 20130215, https://mpra.ub.uni-
muenchen.de/44380/
Queenaria Jayanti dan Rustiana, Analisis Tingkat Akurasi Model-Model Prediksi Kebangkrutan
untuk Memprediksi Voluntary Auditor Switching (Studi pada perusahaan manufaktur yang
terdaftar di BEI), Modus, Vol.27, 2, 2015, 87-108. ISSN 0852-1875., 2015
R. Marchesini, G. Perdue, & V. Bryan. Applying bankruptcy prediction models to distressed high
yield bond issues. The Journal of Fixed Income, 9 (3), 2004:50-56.
Robert F. Hodgin and Roberto Marchesini, Financial Distress Models: How Pertinent Are Sampling
Bias Criticisms?, Journal of Applied Business and Economics vol. 12(4) 2011:29-35.
Syamsul Hadi dan Atika Anggraeni, Pemilihan Prediktor Delisting Terbaik (Perbandingan antara
The Zmijewski Model, The Altman Model, dan The Springate Model), Jurnal Akuntansi dan
Auditing Indonesia (JAAI), Vol.12, No.2, 2008.
Warren Miller, Comparing Models of Corporate Bankruptcy Prediction: Distance to Default vs. Z-
Score, Morningstar, Inc., July 2009.
Wen-Ying Cheng, Ender Su, and Sheng-Jung Li, A Financial Distress Pre-Warning Study by Fuzzy
Regression Model of TSE-Listed Companies, Asian Academy of Management Journal of
Accounting and Finance (AAMJAF), Vol.2, No.2, 75–93, 2006.
William H. Beaver, Financial Ratios as Predictors of Failure, Journal of Accounting Research, Vol.
4, Empirical Research in Accounting: Selected Studies 1966, pp.71-111.
Yusni Warastuti and Elizabeth Lucky Maretha Sitinjak, Analysis of Model-Based Prediction of
Bank Bankruptcy in the Banking Companies Listed in Indonesia Stock Exchange 2008-2012,
South East Asia Journal of Contemporary Business, Economics and Law, Vol. 5, Issue 1,
Dec. 2014. ISSN 2289-1560., 201412
Attachments
Table – Criteria used to select explanatory variables to include in bankruptcy models
Popularity in the literature or predictive ability assessed in previous studies 40%
Univariate analysis: t test, F test, correlation test, signs of coefficients 17%
Stepwise search + Wilks’s lambda 16%
Stepwise search + likelihood criterion 10%
Genetic algorithms, special algorithms (Relief, Tabu) 6%
Expert 4%
Methods that fit non-linear modelling techniques (such as neural networks) 3%
Other (multiple regression, regression tree, theoretical model) 4%
Source: Pierre du Jardin, Bankruptcy prediction models, 2009.

18
Table – Typology of explanatory variables commonly used by bankruptcy prediction models (BPM) in 190 studies
Variables Frequency
Financial ratio (ratio of two financial variables) 93%
Statistical variable (mean, standard deviation, variance, logarithm, factor analysis scores… calculated
with ratios or financial variables)
28%
Variation variable (evolution over time of a ratio or a financial variable) 14%
Non-financial variable (any characteristic of a company or its environment other than those related to its
financial situation)
13%
Market variable (ratio or variable related to stock price, stock return) 6%
Financial market variable (data coming a balance sheet, an income statement or any financial
documents)
5%
Source: Pierre du Jardin, Bankruptcy prediction models, 2009.
Note: The total is greater than 100 as several types of variables may have been used at the same time.
Table – Factors included in five or more studies
Factor/Consideration Number of Studies
Net income / Total assets 54
Current ratio 51
Working capital / Total assets 45
Retained earnings / Total assets 42
Earnings before interest and taxes / Total assets 35
Sales / Total assets 32
Quick ratio 30
Total debt / Total assets 27
Current assets / Total assets 26
Net income / Net worth 23
Total liabilities / Total assets 19
Cash / Total assets 18
Market value of equity / Book value of total debt 16
Cash flow from operations / Total assets 15
Cash flow from operations / Total liabilities 14
Current liabilities / Total assets 13
Cash flow from operations / Total debt 12
Quick assets / Total assets 11
Current assets / Sales 10
Earnings before interest and taxes / Interest 10
Inventory / Sales 10
Operating income / Total assets 10
Cash flow from operations / Sales 9
Net income / Sales 9
Long-term debt / Total assets 8
Net worth / Total assets 8
Total debt / Net worth 8
Total liabilities / Net worth 8
Cash / Current liabilities 7
Cash flow from operations / Current liabilities 7
Working capital / Sales 7
Capital / Assets 6
Net sales / Total assets 6
Net worth / Total liabilities 6
No-credit interval 6
Total assets (log) 6
Cash flow (using net income) / Debt 5
Cash flow from operations 5
Operating expenses / Operating income 5
Quick assets / Sales 5
Sales / Inventory 5
Working capital / Net worth 5
Source: J.L. Bellovary, D.E. Giacomino, and M.D. Akers, A Review of Bankruptcy Prediction
Studies, 2007.

Table – Descriptive statistics of the paired companies
Indicators N Delisted coys Listed coys
Min Max Mean Min Max Mean
WCTA 21 -1.849 0.496 -0.04285 0.043 0.98 0.32375
RETA 21 -6.897 0.248 -2.08735 0.035 0.522 0.21875
EBITTA 21 -1.146 0.0993 -0.07588 0.005 0.233 0.07911
MVEBVTL 21 0.007 29.216 2.64205 0.149 261.25 15.89708
STA 21 0.001 0.889 0.20689 0.147 5.535 1.35068
EBTCL 21 -8101.992 571.733 -359.166 0.005 5.121 0.52509
NITA 21 -1.074 0.123 -0.07237 0.003 0.175 0.05405
TLTA 21 0.065 2.239 0.78311 0.019 0.866 0.45663
CACL 21 0.152 1004.823 100.7215 1.158 51.413 4.32319
Valid N (listwise) 21