Assessment of Bankruptcy Risk of Large Companies - MDPI
28
Journal of Risk and Financial Management Article Assessment of Bankruptcy Risk of Large Companies: European Countries Evolution Analysis Nicoleta Bărbut , ă-Mis , u 1, * and Mara Madaleno 2 1 Department of Business Administration, “Dunarea de Jos” University of Galati, 800008 Galati, Romania 2 GOVCOPP—Research Unit in Governance, Competitiveness and Public Policy, Department of Economics, Management, Industrial Engineering and Tourism (DEGEIT), University of Aveiro, 3810-193 Aveiro, Portugal; [email protected] * Correspondence: [email protected]; Tel.: +40-724-362-007 Received: 27 January 2020; Accepted: 15 March 2020; Published: 18 March 2020 Abstract: Assessment and estimation of bankruptcy risk is important for managers in decision making for improving a firm’s financial performance, but also important for investors that consider it prior to making investment decision in equity or bonds, creditors and company itself. The aim of this paper is to improve the knowledge of bankruptcy prediction of companies and to analyse the predictive capacity of factor analysis using as basis the discriminant analysis and the following five models for assessing bankruptcy risk: Altman, Conan and Holder, Tafler, Springate and Zmijewski. Stata software was used for studying the effect of performance over risk and bankruptcy scores were obtained by year of analysis and country. Data used for non-financial large companies from European Union were provided by Amadeus database for the period 2006–2015. In order to analyse the effects of risk score over firm performance, we have applied a dynamic panel-data estimation model, with Generalized Method of Moments (GMM) estimators to regress firm performance indicator over risk by year and we have used Tobit models to infer about the influence of company performance measures over general bankruptcy risk scores. The results show that the Principal Component Analysis (PCA) used to build a bankruptcy risk scored based on discriminant analysis indices is effective for determining the influence of corporate performance over risk. Keywords: European large companies; bankruptcy risk; company performance; bankruptcy prediction; Principal Component Analysis 1. Introduction Bankruptcy and bankruptcy prediction is a very real issue worldwide both in academic research and in practice considering the evolution at a global level: the upward trend in business insolvencies continued in 2018 (increase by 10% in 2018 compared to 2017), mainly due to the surge in China by 60% and, to a lesser extent, an increase in Western Europe by 2% (Euler Hermes Economic Research 2019). In Western Europe, although a downside trend in insolvencies was recorded from 2014 to 2017, the increase mentioned by 2% in 2018 compared to 2017 was determined by different evolution by other countries: a noticeable upturn of 12% in the UK due to the Brexit-related uncertainties that added headwinds on businesses; a stabilization of insolvencies can be seen in France, Spain and Belgium, although in France in 2018, 54,751 companies went bankrupt, corresponding to a fairly high 1.3% of the active business universe (Dun & Bradstreet 2019); an increase in the Nordic countries of 10% in Sweden, 3% in Norway, 19% in Finland and 25% in Denmark. This trend comes from economic and fiscal reasons or exceptional factors, especially for Denmark and Finland. At the same time, other countries of the region registered slower declines in 2018 compared to 2017, notably the Netherlands (from -23% to -6%), Portugal (-12%), Ireland (-10%) and Germany (-4%). In Italy, 11,207 companies J. Risk Financial Manag. 2020, 13, 58; doi:10.3390/jrfm13030058 www.mdpi.com/journal/jrfm
-
Upload
khangminh22 -
Category
Documents
-
view
0 -
download
0
Transcript of Assessment of Bankruptcy Risk of Large Companies - MDPI

Journal of
Risk and FinancialManagement
Article
Assessment of Bankruptcy Risk of Large Companies:European Countries Evolution Analysis
Nicoleta Bărbut,ă-Mis, u 1,* and Mara Madaleno 2
1 Department of Business Administration, “Dunarea de Jos” University of Galati, 800008 Galati, Romania2 GOVCOPP—Research Unit in Governance, Competitiveness and Public Policy, Department of Economics,
Management, Industrial Engineering and Tourism (DEGEIT), University of Aveiro, 3810-193 Aveiro,Portugal; [email protected]
* Correspondence: [email protected]; Tel.: +40-724-362-007
Received: 27 January 2020; Accepted: 15 March 2020; Published: 18 March 2020
Abstract: Assessment and estimation of bankruptcy risk is important for managers in decisionmaking for improving a firm’s financial performance, but also important for investors that consider itprior to making investment decision in equity or bonds, creditors and company itself. The aim ofthis paper is to improve the knowledge of bankruptcy prediction of companies and to analyse thepredictive capacity of factor analysis using as basis the discriminant analysis and the following fivemodels for assessing bankruptcy risk: Altman, Conan and Holder, Tafler, Springate and Zmijewski.Stata software was used for studying the effect of performance over risk and bankruptcy scores wereobtained by year of analysis and country. Data used for non-financial large companies from EuropeanUnion were provided by Amadeus database for the period 2006–2015. In order to analyse the effectsof risk score over firm performance, we have applied a dynamic panel-data estimation model, withGeneralized Method of Moments (GMM) estimators to regress firm performance indicator overrisk by year and we have used Tobit models to infer about the influence of company performancemeasures over general bankruptcy risk scores. The results show that the Principal ComponentAnalysis (PCA) used to build a bankruptcy risk scored based on discriminant analysis indices iseffective for determining the influence of corporate performance over risk.
Keywords: European large companies; bankruptcy risk; company performance; bankruptcyprediction; Principal Component Analysis
1. Introduction
Bankruptcy and bankruptcy prediction is a very real issue worldwide both in academic researchand in practice considering the evolution at a global level: the upward trend in business insolvenciescontinued in 2018 (increase by 10% in 2018 compared to 2017), mainly due to the surge in China by 60%and, to a lesser extent, an increase in Western Europe by 2% (Euler Hermes Economic Research 2019).
In Western Europe, although a downside trend in insolvencies was recorded from 2014 to 2017,the increase mentioned by 2% in 2018 compared to 2017 was determined by different evolution byother countries: a noticeable upturn of 12% in the UK due to the Brexit-related uncertainties that addedheadwinds on businesses; a stabilization of insolvencies can be seen in France, Spain and Belgium,although in France in 2018, 54,751 companies went bankrupt, corresponding to a fairly high 1.3% ofthe active business universe (Dun & Bradstreet 2019); an increase in the Nordic countries of 10% inSweden, 3% in Norway, 19% in Finland and 25% in Denmark. This trend comes from economic andfiscal reasons or exceptional factors, especially for Denmark and Finland. At the same time, othercountries of the region registered slower declines in 2018 compared to 2017, notably the Netherlands(from −23% to −6%), Portugal (−12%), Ireland (−10%) and Germany (−4%). In Italy, 11,207 companies
J. Risk Financial Manag. 2020, 13, 58; doi:10.3390/jrfm13030058 www.mdpi.com/journal/jrfm

J. Risk Financial Manag. 2020, 13, 58 2 of 28
filed for bankruptcy in 2018, down by a significant 5.8%, but the newly-elected populist government islikely to embark on a series of populist policies that are at odds with improving the country’s operatingenvironment (Dun & Bradstreet 2019).
According to Euler Hermes Economic Research (2019), in Central and Eastern Europe, we can seeeconomies that forecast to moderate in line with the slowdown in the Eurozone, but remain robustenough to see another decrease in insolvencies, albeit at more limited time, i.e., Hungary from −18% in2018 to −11% in 2019 and the Czech Republic, respectively −17% and −10%. Romania registered arebound in insolvencies, −3% in 2018 and +3% in 2019. Other countries continued to rise in insolvencies:3% for Bulgaria in 2019 where the changes in the Insolvency law done in 2017 kept on boosting thebankruptcies of sole proprietorships, Slovakia of 16%, Poland of 5% where businesses have a structuralproblem of profitability and will face a noticeable deceleration of the economy.
Over time, researchers have tried to find diverse methods to estimate business failure: patrimonialmethod based on net working capital and treasury; financial ratios method especially based onindividual analysis of profitability, liquidity, solvency and financial autonomy; and score methodhighlighted in numerous models for which Altman (1968), Ohlson (1980), and Zmijewski (1984) modelsare the most cited ones and that are based on accounting variables (Avenhuis 2013). These bankruptcyprediction models use different explanatory variables and statistical techniques and may providevaluable information about the financial performance of the companies and their risks. More thanthat, we must mention that the predictive power of these bankruptcy prediction models differ betweencountries, sectors of activity, time periods, firms’ ages, or firms’ sizes.
There is a constant effort to use the models developed for firms in different economies, even ifdecision makers know or at least should know that assumptions used for fitting the original models areprobably not valid anymore. There is a continuous concern and preoccupation for designing modelsfor prediction risk of bankruptcy. Assessing of the level of advancement of bankruptcy predictionresearch in countries of the former Eastern Bloc, in comparison to the latest global research trendsin this area, Prusak (2018) found that the most advanced research in this area is conducted in theCzech Republic, Poland, Slovakia, Estonia, Russia, and Hungary. In addition, the best world practicesare reflected in the research provided in Poland, the Czech Republic, and Slovakia.
The main problem of the bankruptcy prediction models developed in the literature is that thesemodels cannot be generalized because these were developed using a specific sample from a specificsector, specific time period and from a specific region or country. As the above-mentioned statistics show,there are many other specific factors that increase the bankruptcies in a country: changes in economicenvironments, law frameworks, incomparability of populations of interest, etc. (Král’ et al. 2016).That is why it is necessary to adapt these models to the specificity of the sector, country or time periodanalyzed and to use combined techniques of estimation in designing these specific models.
In this paper, considering the context presented, the large companies from the European Union areanalysed. The aim of this research is twofold: to improve the knowledge of bankruptcy prediction forEuropean large companies and to analyse the predictive capacity of factor analysis, such as PrincipalComponent Analysis (PCA) using as a basis the discriminant analysis (models for assessing bankruptcyrisk, commonly used in the literature). Our paper is distinguishing from other studies by using a sampleof large companies active in the EU-28 countries in the period 2006–2015 and by own original selectionof bankruptcy prediction models (Altman, Conan and Holder, Tafler, Springate and Zmijewski) usedin the PCA analysis.
The rest of the paper is organised as follows: in Section 2, the literature review on risk, bankruptcyprediction, models and techniques used to assess and forecast the risk of bankruptcy is presented.The data and methodology are presented in the Section 3. The paper then follows with analysis ofresults and discussions in Section 4. Concluding remarks pointing out some policy implications, futureresearch suggestions and limitations of the study are discussed in the Section 5.

J. Risk Financial Manag. 2020, 13, 58 3 of 28
2. Literature Review
Financial risks show the possibility of losses arising from the failure to achieve financial objectives.The financial risks related to the financial operation of a business may take many different forms:market risks determined by the changes in commodities, stocks and other financial instrumentsprices, foreign exchange risks, interest rate risks, credit risks, financing risks, liquidity risks, cashflow risk, and bankruptcy risk. These financial risks are not necessarily independent of each other,the interdependence being recognized when managers are designing risk management systems(Woods and Dowd 2008). The importance of these risks will vary from one firm to another, in functionof the sector of activity of the firms, the firm size, development of international transactions, etc.
Bankruptcy refers to the situation in which the debtor company becomes unable to repay its debtsand can be considered to be the consequence of a company’s inability to survive market competition,reflected in terms of job losses, the destruction of assets, and in a low productivity (Aleksanyan andHuiban 2016). The risk of bankruptcy or insolvency risk shows the possibility that a company will beunable to meet its debt obligations, respectively the probability of a company to go bankrupt in thenext few years. Assessing of bankruptcy risk is important especially for investors in making equity orbond investment decisions, but also for managers in financial decision making of funding, investmentsand distribution policy. Failure prediction models are important tools also for bankers, rating agencies,and even distressed firms themselves (Altman et al. 2017).
The essential information for executive financial decisions, but also for investors decisions areprovided by financial statements. Thus, companies’ financial managers should develop the financialperformance analysis and problem-solving skills (Burns and Balvinsdottir 2005; Scapens 2006), withoutlimiting their duties in verifying accounting data (Diakomihalis 2012) in order to maintain the firmattractive for investors. The image of financial performance of companies is affected by the estimationof its position in front of investors, creditors, and stakeholders (Ryu and Jang 2004). For this estimationthere are used many indicators that reflect the company’s position such as: net working capital, nettreasury, liquidity, solvency, profitability, funding capacity, cash-flow, etc., or a mix between them,such as Z-scores.
The design of reliable models to predict bankruptcy is crucial for many decision-making processes(Ouenniche and Tone 2017). The approach used for bankruptcy prediction has evolved over timestarting to Beaver (1966, 1968) model based on univariate analysis for selected ratios and which hadvery good predictive power. Then, Altman (1968) made strides by developing a multiple discriminantanalysis model called the Z-Score model. Bankruptcy prediction models could be divided intotwo general categories depending on the type of variable used: static models (Altman 1968, 2000,2002; Taffler 1982, 1983, 1984; Ohlson 1980; Zmijewski 1984; Theodossiou 1991) or dynamic models(Shumway 2001; Hillegeist et al. 2004).
In the literature of bankruptcy prediction, the models of Altman (1968), Ohlson (1980),and Zmijewski (1984) are the most cited ones that are based on accounting variables. These bankruptcyprediction models use different explanatory variables and statistical techniques. Therefore,the predictive power of these bankruptcy prediction models differs. However, when the originalstatistical techniques are used, the accuracy rates for the models of Altman (1968), Ohlson (1980),and Zmijewski (1984) are respectively 80.6%, 93.8%, and 95.3% (Avenhuis 2013). Studying theefficacy of Altman’s z-score model in predicting bankruptcy of specialty retail firms doing business incontemporary times, Chaitanya (2005) found that all but two of the bankruptcies (94%) would havebeen accurately predicted.
Ashraf et al. (2019) found that both models by Altman (1968) and Zmijewski (1984) are stillvaluable for predicting the financial distress of emerging markets and can be used by businessmen,financial specialists, administrators, and other concerned parties who are thinking about investingin an organization and/or want to enhance their organization performance. Elviani et al. (2020)studied the accuracy of the Altman (1968), Ohlson (1980), Springate (1978) and Zmijewski (1984)models in bankruptcy predicting trade sector companies in Indonesia using binary logistic regression.

J. Risk Financial Manag. 2020, 13, 58 4 of 28
Their results proved that the most appropriate and accurate models in predicting bankruptcy of tradesector companies in Indonesia are the Springate and Altman models.
Related to methodologies used in creating bankruptcy risk models we can mention bankruptcyprediction models based on: statistical methodologies (Models of Altman 1968, 2000, 2002;Altman et al. 2017; Model of Springate 1978; Model of Conan and Holder 1979; Models of Taffler 1982,1983, 1984; Model of Fulmer et al. 1984), stochastic methodologies (Model of Ohlson 1980; Model ofZmijewski 1984; Model of Zavgren 1985; Theodossiou 1991), and artificial intelligence methodologies(Zhang et al. 1999; Kim and Han 2003; Shin et al. 2005; Li and Sun 2011) and data envelopment analysis(DEA) methodologies (Koh and Tan 1999; Cielen et al. 2004; Paradi et al. 2004; Shetty et al. 2012;Ouenniche and Tone 2017). Aziz and Dar (2006) reviewed 89 studies on the prediction of bankruptcyrisk in the period 1968–2003 in order to carry out a critical analysis of the methodologies and empiricalfindings of the application of these models across 10 different countries (Finland, Norway, Sweden,Belgium, UK, Italy, Greece, USA, Korea and Australia). They found that the multi-variable models(Z-Score) and logit were most popular in the 89 papers studied.
The multitude of models created demonstrate an intense concern for bankruptcy prediction,considering also the evolution of number of bankruptcies in the world. However, the first bankruptcymodels are still applied and provide important information. For example, Altman’s model was appliedto Jordanian companies, non-financial service and industrial companies, for the years 1990–2006.The study shows that Altman’s model has an advantage in company bankruptcy prediction, with a 93.8%average predictive ability of the five years prior to the liquidation incident (Alkhatib and Bzour 2011).Chung et al. (2008) also examined the insolvency predictive ability of different financial ratios for tenfailed financial companies during 2006–2007 in New Zealand and found that, one year prior to failure,four of the five Altman (1968) ratios were superior to other financial ratios for predicting corporatebankruptcy. In other countries, such as Romania aggregate indexes of financial performance assessmentfor the building sector companies were created (Bărbută-Misu 2009; Bărbut,ă-Mis, u and Codreanu 2014)or well-known modes, such as the Conan and Holder model were adjusted to the specificity of Romaniancompanies (Bărbută-Misu and Stroe 2010). In studies about bankruptcy prediction, in Romania waspreferred Conan and Holder (1979) model to evaluate the financial performance of the companies.
The majority of authors proposed models adapted to the specificity of the economies. Brédart (2014)developed an econometric forecasting model on United States companies using three simple and afew correlated and easily available financial ratios as explanatory variables and their results showa prediction accuracy of more than 80%. Dakovic et al. (2010) developed statistical models forbankruptcy prediction of Norwegian firms acting in the industry sector. They modelled the unobservedheterogeneity among different sectors through an industry-specific random factor in the generalizedlinear mixed model. The models developed are shown to outperform the model with Altman’s variables.
To solve the problem of bankruptcy prediction some statistical techniques such as regressionanalysis and logistic regression are used (De 2014). These techniques usually are used for the company’sfinancial data to predict the financial state of company as healthy, distressed, high probability ofbankruptcy. As we know, Altman (1968) used financial ratios and multiple discriminant analysis(MDA) to predict financially distressed companies. However, further, it was found that the usage ofstatistical techniques or MDA depends on the constraint as linear separability, multivariate normalityand independence of predictive variables (Ohlson 1980; Karels and Prakash 1987). Thus, bankruptcyprediction problem can be solved using various other types of classifiers, such as neural network thatcompared to MDA, logistic regression and k-nearest neighbour method proved a higher performance.For instance, Tam (1991) found that the neural network performs better than other prediction techniques.
Otherwise, Xu and Zhang (2009) have investigated whether the bankruptcy of certain companiescan be predicted using traditional measures, such as Altman’s Z-score, Ohlson’s (1980) O-score, and theoption pricing theory-based distance-to-default, previously developed for the U.S. market, in order tofind if these models are useful for the Japanese market. They have found that the predictive power issubstantially enhanced when these measures are combined.
J. Risk Financial Manag. 2020, 13, 58 5 of 28
In addition, Jouzbarkand et al. (2013) compiled two models for the prediction of bankruptcy,related to the Iranian economic situation. Using the logistic regression method, they studied theOhlson (1980) and Shirata (1995) models, examining and comparing the performance of these models.Their results show that models created are able to predict the bankruptcy. For classifying and rankingthe companies, they used their business law to determine the bankrupt companies and a simpleQ-Tobin to specify the solvent companies.
Discriminant analysis was the prevailing method, and the most important financial ratioscame from the solvency category, with profitability ratios also being important (Altman et al. 2017).The performance of five bankruptcy prediction models, such as Altman (1968), Ohlson (1980), Zmijewski(1984), Shumway (2001) and Hillegeist et al. (2004) was studied by Wu et al. (2010) building their ownintegrated model using a dataset for U.S.A. listed firms. Wu et al. (2010) found that Shumway’s (2001)model performed best, Hillegeist et al.’s (2004) model performed adequately, Ohlson’s (1980) andZmijewski’s (1984) models performed adequately, but their performance deteriorated over time,while Altman’s Zscore performed poorly compared with all other four models analysed. However,the integrated model outperformed the other models by combining both accounting and market data,and firms’ characteristics.
The factor analysis is often used together with other methodologies, in order to improve bankruptcyprediction models (Cultrera et al. 2017). Principal Component Analysis (PCA), the statistical procedurethat uses an orthogonal transformation to convert a set of observations of possibly correlated variablesinto a set of values of linearly uncorrelated variables called principal components started to be usedin analysis and prediction of bankruptcy risk. Adalessossi (2015) used discriminant function namedZ-scores model of Altman, financial ratio analysis, and the principal component analysis on a sample of34 listed companies from different sectors and sizes in order to find out if the three methods used in thisstudy converge toward similarity results. The comparison of the three methods indicates unanimouslythat, out of the 34 companies, only eight companies have had the best financial performances and arenot likely to go on to bankruptcy.
Onofrei and Lupu (2014) have built a quick warning model for the Romanian companies indifficulty, using the following methodologies: the Principal Components Analysis, the multivariatediscriminant analysis and the logit analysis in order to determine which are the best predictors ofbankruptcy for the Romanian companies. They found that the best predictor for the Romanian marketis the multiple discriminant analysis method with a predictive power between 68–95%, while the logitmethod registering slightly weaker results with a predictive power between 53–82%.
De (2014) developed the principal component analysis (PCA) and general regression autoassociative neural network (GRAANN) based hybrid as a one-class classifier in order to test theeffectiveness of PCA-GRAANN on bankruptcy prediction datasets of banks from Spain, Turkey, US andUK. They concluded that PCA-GRAANN can be used as a viable alternative for any one-class classifier.Checking related literature, we found that PCA is more used with artificial neural network methods forprediction bankruptcy risk where the effectiveness was proved. However, in this paper we proposedto use PCA based on the five discriminant analysis measures, i.e., Z-score determined by the followingmodels: revised Z-score Altman, Conan and Holder, Tafler, Springate and Zmijewski in order to testthe efficiency in predicting the risk of bankruptcy. Afterwards, we made use of econometric techniquesand the PCA score created by country and year to test its influence over performance. The principalcomponent analysis to build the bankruptcy risk score of the five models selected is used, since there isno consensus in the literature so as to which is the best bankruptcy prediction model. In this way wemay capture the components that will exert more impact in bankruptcy prediction.
3. Data and Methodology
In this section we describe the data and all methodologies used to assess bankruptcy risk, as wellas to create the bankruptcy risk indexes by year and country that are presented in the results section.It starts by describing the models used to assess bankruptcy risk measures, which are commonly used
J. Risk Financial Manag. 2020, 13, 58 6 of 28
in the literature and afterwards describes the Principal Component Analysis (PCA) used to create thebankruptcy risk index measures by year and country (by country, Greece had to be taken out from thesample due to missing data able to allow us to create the index for this country).
3.1. Data Description
The source of the data is Amadeus database, provided by Bureau van Dijk Electronics. In thesample we have included only large non-financial companies from the former EU-28 countries, for theperiod 2006–2015, that act in all sectors of activity (with the conclusion of the Brexit, the EU is nowwith 27 countries, instead of 28. However, UK was used because at the beginning of the analysisit belonged to the EU-28 and we will keep this representation through the article). The selectioncriteria for large companies included in the sample are in accordance with the classification of thesmall and medium enterprises (SMEs) published in Commission Recommendation of 6 May 2003(European Commission 2003) concerning the definition of micro, small and medium-sized enterprises.Thus, in order to select the large companies for EU-28 countries, as selection criteria of these companieswe used: number of employees greater than 250, total assets greater than €43 million and turnovergreater than €50 million. These criteria were applied simultaneously for the data available for thelast year included in the sample, i.e., year 2015. We found 22,581 active large companies. We did notconsider small and medium enterprises (SMEs) due to the high fluctuations over time in foundationand closing of these firms compared to large companies. Our intention was to study the risk ofbankruptcy to large companies that had a more stable activity over time. Our data period was from2006 until 2015.
Where it was applicable, because of some data missing, we deleted data for years and companieswith no available information for calculation of variables of risk of bankruptcy models. In addition, weeliminated from database the inconclusive values and outliers. Thus, remained in the study 154,459valid year-observations. However, we still worked with an unbalanced panel, due to missing yearsof data in the sample. Additionally, we have taken out from our sample all countries which didnot present a number of companies higher than 1000. From the 28 available countries we ended upworking with 20 of these countries.
3.2. Models for Assessing Bankruptcy Risk
As we mentioned in the literature review, there are numerous models for bankruptcy risk predictionbased on Z score method, but in this paper we selected the following five models: Altman’s Models(1968, 2000), Conan and Holder Model (1979), Springate’s Model (1978), Taffler’s Model (1982, 1983),Zmijewski’s Model (1984). We used these five models since these are the most referenced one’s topredict bankruptcy and have a high level of accuracy as we presented in the Section 2. There are anumber of key models that have been developed by various authors and presented in the bankruptcyprediction literature over the last three decades, but these five appear in most of the recent studieswhere bankruptcy models are tested. For these models we determined all variables necessary and theZ scores for all companies included in the sample for the period 2006–2015.
3.2.1. Altman’s Models
Altman (1968) is the dean of insolvency prediction models and the first researcher that successfullyused the step-wise multiple discriminate analysis to develop a prediction model with a high degreeof accuracy of 95%. The original study included a sample comprising 66 industrial companies,33 bankrupts and other 33 non-bankrupts for a period of analysis of 20 years (1946–1965).
The author found a total of 22 potential variables, based on data provided by annual reports ofthe companies, and by them, he retains five variables with the highest significance, as a result of usingstatistical techniques and discrimination analysis. Generally, these variables include profitability ratios,coverage ratios, liquidity ratios, capitalization ratios, and earnings variability (Altman 2000).

J. Risk Financial Manag. 2020, 13, 58 7 of 28
The final discriminant function of first Altman model (1968) takes the following form:
Z1 Altman = 0.012 X1 + 0.014 X2 + 0.033 X3 + 0.006 X4 + 0.999 X5 (1)
where:Z1 Altman = Overall Index AltmanX1 = Working Capital/Total AssetsX2 = Retained Earnings/Total AssetsX3 = Earnings Before Interest and Taxes/Total AssetsX4 = Market Value Equity/Book Value of Total DebtX5 = Sales/Total AssetsBecause this original model cannot be applied to unlisted companies in the Stock Exchange,
the model was completely re-estimated, substituting the Market Value of Equity with Book Values ofEquity in X4 (Altman 2000), resulting the Revised Z-Score Model that is used for our sample.
A Revised Z-Score Model (rza)
This change of the Market Value of Equity determined not only the change of new variable’sparameter, but determined the change of all coefficients, as well as the classification criterion andrelated cut-off scores.
The results of the revised Z-Score model with a new X4 variable is:
Z2 Altman = 0.717 X1 + 0.847 X2 + 3.107 X3 + 0.420 X4 + 0.998 X5 (2)
The description of the variable used is the following:
X1—Working Capital/Total Assets
This ratio is the measure of the net liquid assets of the firm relative to the total capitalization.Working capital is defined as the difference between current assets and current liabilities. Liquidity andsize characteristics are explicitly considered in this ratio. Ordinarily, a company experiencing consistentoperating losses will have shrinking current assets in relation to total assets.
X2—Retained Earnings/Total Assets
Retained earnings is the account which reports the total amount of reinvested earnings and/orlosses of a firm over its entire life. The account is also referred to as earned surplus. Retained earningsmay be affected by a substantial reorganization or stock dividend and for this reason, in researchstudies, some appropriate readjustments should be made to the accounts. In this ratio, the age ofthe company is considered implicitly. For example, a relatively young company will probably showa low ratio because it had not enough time to build up its cumulative profits. Therefore, it may beargued that a young company is somehow discriminated against in this analysis, and its chance ofbeing classified as bankrupt is relatively higher than another older company. That’s why we haveincluded in our sample only large companies that have a higher chance of remaining on the market.This is precisely the situation manifested in the real world because the incidence of failure is muchhigher in a company’s earlier years. Those companies with high retained earnings, relative to totalassets, have financed their assets through retention of profits and have not utilized as much debt.
X3—Earnings before Interest and Taxes/Total Assets
This ratio is a measure of the true productivity of the company’s assets, independent of anytax or leverage factors. Since a company’s ultimate existence is based on the earning power of itsassets, this ratio appears to be particularly appropriate for studies dealing with corporate failure.
J. Risk Financial Manag. 2020, 13, 58 8 of 28
Furthermore, insolvency in a bankruptcy sense occurs when the total liabilities exceed a fair valuationof the company’s assets with value determined by the earning power of the assets.
X4—Book Value of Equity/Book Value of Total Debt
Equity is measured by the Book Value of Equity divided by Total Debt, debt including both currentand long-term. The measure shows how much the firm’s assets can decline in value (measured by bookvalue of equity plus debt) before the liabilities exceed the assets and the company becomes insolvent.
X5—Sales/Total Assets
The capital-turnover ratio is a standard financial ratio illustrating the sales generating ability ofthe firm’s assets. This ratio is quite important because it is the least significant ratio on an individualbasis. Because of its unique relationship to other variables in the model, the Sales/Total Assets ratioranks second in its contribution to the overall discriminating ability of the model.
The interpretation of the Z2 Altman is:
Z2 Altman > 2.9 − Safe zone1.23 < Z2 Altman < 2.9 − Grey zoneZ2 Altman < 1.23 − Distress zone
In order to eliminate industry effects, the next change of the Z-Score model analysed thecharacteristics and accuracy of the model without variable X5—Sales/Total Assets (Altman 2002).He does this in order to minimize the potential industry effect which is more likely to take place whensuch an industry-sensitive variable as asset turnover is included. This particular model is also usefulwithin an industry where the type of financing of assets differs greatly among firms and importantadjustments, like lease capitalization, are not made (Bărbută-Misu 2017).
In particular, Altman et al. (1998) have applied this enhanced Z Score model to emerging marketscorporates, specifically Mexican firms that had issued Eurobonds denominated in US dollars. In theemerging market model, they added a constant term of +3.25 so as to standardize the scores with ascore of zero equated to a default rated bond.
3.2.2. Conan and Holder’s Model (zcc)
The Conan and Holder (1979) model was developed to analyse the degradation of the financialsituation of small and medium enterprises (SMEs). The appraisals for the proposed score functionwere based on an initial set of 50 indicators studied by the category: the asset structure, the financialdependence, the treasury, the working fund, the exploitation, the profitability, etc. Then, the formulationand model results are based on the analysis of 31 rates (financial variables), applied on 190 small andmedium enterprises acting in various fields: industry, trade, services and transport during 1970–1975.Of the 190 selected companies, 95 companies were bankrupt, and another 95 were healthy businesseswhose activities were appropriate waist and bankrupt companies.
The model developed by Conan and Holder is included in the statistical tested methods, and hasthe advantage of simplifying the calculation, so that it continues to be used today.
The Conan and Holder model is:
Z Conan and Holder = 0.24 X1 + 0.22 X2 + 0.16 X3 − 0.87 X4 − 0.10 X5 (3)
where:Z Conan and Holder = Overall Index Conan and HolderX1 = Gross Operating Surplus/Total Debts, expresses the profitability by creditors, the profit
achieved by using borrowed capital.X2 = Permanent Capital/Total Liabilities, expresses the solvency of the company on long term, a
measure of debt guarantees through permanent capital.

J. Risk Financial Manag. 2020, 13, 58 9 of 28
X3 = (Current assets − Stocks)/Total Liabilities, expresses the liquidity of the company, the capacityof paying debts by transforming into cash of receivables, financial short-term investments, cash, andcash equivalents.
X4 = Financial Expenditures/Net Sales, expresses the rate of financial expenses, the share offinancial expenses in net sales.
X5 = Personnel Expenditures/Added Value, expresses the rate of personnel costs, i.e., the share ofremuneration of the personnel by the added value of the company.
The interpretation of the Z Conan and Holder score function is as follows:
Z Conan and Holder < 0.04 − a probability of a bankruptcy risk of >65%;0.04 < Z Conan and Holder < 0.16 − a probability of bankruptcy between 30–65%;Z Conan and Holder > 0.16 − a probability of bankruptcy of <30%.
3.2.3. Springate’s Model (zs)
This Canadian business insolvency prediction model was developed in 1978 at Simon FraserUniversity by Gordon L.V. Springate, following procedures developed by Altman in the US data.Springate (1978) used step-wise multiple discriminate analysis to select four out of 19 popular financialratios that best distinguished between sound business and those that actually failed. This insolvencyprediction model achieved an accuracy rate of 92.5% using the 40 companies tested by Springate.
The Springate model takes the following form:
Z Springate = 1.03 X1 + 3.07 X2 + 0.66 X3 + 0.4 X4 (4)
Z Springate = Overall Index SpringateX1 = Working Capital/Total Assets measure of the net liquid assets of the firm relative to the
total capitalization.X2 = Earnings Before Interest and Taxes/Total Assets is a measure of the true productivity of the
firm’s assets, independent of any tax or leverage factors.X3 = Earnings before Taxes/Current Liabilities is a measure of the true productivity of the firm’s
assets, independent of any leverage factors.X4 = Sales/Total Assets illustrate the sales generating ability of the firm’s assets. It is one measure
of management’s capability in dealing with competitive condition.The interpretation of Z Springate model is:
Z Springate > 0.826, the company is performant;Z Springate <= 0.826, the company is bankrupted.
3.2.4. Taffler’s Model (ztta)
Taffler (1983) proposed a model based on an extensive survey of the vast array of data. The originalmodel was developed to analyse industrial (manufacturing and construction) companies only withseparate models developed for retail and service companies. Using computer technology, 80 carefullyselected financial ratios were calculated using accounts of all listed industrial companies failing between1968 and 1976 and 46 randomly selected solvent industrial firms (Agarwal and Taffler 2007).
This information was processed through a series of statistical methods, and the model was builtusing multivariate discriminant method. The Z-score model was derived by determining the best set ofratios which, when taken together and appropriately weighted, distinguished optimally between thetwo samples. Leverage, profitability, liquidity, capital adequacy and other parameters were evaluatedfor model creation. The model is applicable to companies in the form of joint stock companies, whoseshares were subject to public offering and traded on various stock exchanges (Belyaeva 2014).
J. Risk Financial Manag. 2020, 13, 58 10 of 28
The Z Taffler model is:
Z Taffler = 3.2 + 12.18 X1 + 2.5 X2 − 10.68 X3 + 0.029 X4 (5)
where:Z Taffler = Overall Index TafflerX1 = Profit before Tax/Current Liabilities is a measure of the true productivity of the firm’s assets,
independent of any leverage factors.X2 = Current Assets/Total Liabilities expresses the payment capacity on short-term of the company,
i.e., the ability of current assets to be converted into cash to meet the payment obligations. This ratioestimates the liquidity of the company by showing the company can pay its creditors with its currentassets if the company’s assets ever had to be liquidated.
X3 = Current Liabilities/Total Assets shows the share of a company’s assets which are financedthrough short-term debt. If the ratio is low, most of the company’s assets are financed throughequity and long-term debts. If the ratio is high, most of the company’s assets are financed throughshort-term debt.
X4 = (Quick Assets − Current Liabilities)/Daily Operating Expenses with the denominator proxiedby: (Sales − Profit Before Tax − Depreciation)/365
The interpretations of Z Taffler model is as follows:
Z Taffler > 0.3 shows that the company has good chances for performance0.2 < Z Taffler < 0.3 shows the grey zone (undefined area)Z Taffler < 0.2 shows that the company is almost bankrupt.
Thus, in the case of this model, if the computed Z Taffler score is positive, the firm is solventand is very unlikely indeed to fail within the next year. However, if its Z Taffler score is negative, itlies in the “at risk” region and the firm has a financial profile similar to previously failed businesses.The high probability of financial distress is depending on how much negative is the Z Taffler score(Agarwal and Taffler 2007).
3.2.5. Zmijewski’s Score (zzzmij)
The Zmijewski Score (Zmijewski 1984) is a bankruptcy model used to predict a firm’s bankruptcyin two years. Zmijewski (1984) criticised previous models, considering that other bankruptcy scoringmodels oversampled distressed firms and favoured situations with more complete data.
Thus, in Zmijewski (1984) study, two methodological issues are examined that are related tothe estimation of bankruptcy prediction models. The two biases are choice-based sample biasesand sample selection biases. The choice based bias is the result of over-sampling distressed firms.When a matched-pair (one-to-one match) design is for a study to predict bankruptcy, the potentialof bankruptcy is overstated. This lead to biased probabilities in the models. The sample selectionbiases occur when the probability of distress given complete data are significantly different from theprobability of distress given incomplete data (Avenhuis 2013).
The ratio used in the Zmijewski (1984) score was determined by probit analysis (probit should beregarded as probability unit) in order to construct the bankruptcy prediction model. Like the logitfunction, the probit function maps the value between 0 and 1, and, in this case, scores greater than0.5 represent a higher probability of default. The accuracy rate of the Zmijewski (1984) model for theestimation sample was 99%.
The constructed probit function with the variables and estimated coefficients from the study ofZmijewski (1984) is as follows:
Z Zmijewski = −4.336 − 4.513 X1 + 5.679 X2 + 0.004 X3 (6)
where:

J. Risk Financial Manag. 2020, 13, 58 11 of 28
Z Zmijewski = Overall Zmijewski IndexX1 = Net Income/Total Assets is a profitability ratio that measures the net income produced by
total assets during a period by comparing net income to the average total assets.X2 = Total Liabilities/Total Assets shows the share of a company’s assets which are financed
through debt. If the ratio is less than 0.5, most of the company’s assets are financed through equity. Ifthe ratio is greater than 0.5, most of the company’s assets are financed through debt.
X3 = Current Assets/Current Liabilities expresses the payment capacity on short-term ofthe company.
While Altman used the ratio Earnings before Interest and Taxes (EBIT)/Total Assets for profitability,where EBIT eliminates the effect of different capital structures and of taxation and make easier thecomparing of the firm profitability, Zmijewski (1984) used the ratio: Net Income/Total Assets, thusconsidering the effects of funding sources used and of the firm taxation.
Zmijewski (1984) classified the companies thus:
(i) Firms with probabilities greater than or equal to 0.5 were classified as bankrupt or havingcomplete data.
(ii) Firms with probabilities less than 0.5 were classified as non-bankrupt or having incomplete data.
3.3. Principal Component Analysis
There exist many indicators in financial analysis which allow to assess the risk of bankruptcyof a company (Armeanu et al. 2012; Armeanu and Cioaca 2015; Cultrera et al. 2017; Arroyave 2018;Prusak 2018).
In order to make an appropriate assessment, we need to reduce the number of indicators.A solution is indicated by Armeanu et al. (2012): using Principal Component Analysis (PCA), clusterand discriminant analysis techniques. The authors used these three methods to build a scoring functionand afterwards to identify bankrupt companies. Their sample consisted on listed companies onBucharest Stock Exchange. Heffernan (2005) points that bankruptcy risk predicting models, developedbased on discriminant analysis (like Altman and Conan-Holder) can easily mislead. This is dueto the fact that they rely on historical data, but also on the fact that the result is binary (eitherthe debtor is solvent or not). However, in the present article we consider the following possiblescenarios (Armeanu et al. 2012; Armeanu and Cioaca 2015): delays in monthly repayments, failureto pay them, failure to pay fees or penalty interest, and so on, and that is why we rely on largecompanies’ data. Discriminant analysis models may not include the state of solvency, insolvency andrestructuring at once, and we would like to infer about it using principal component analysis jointlywith discriminant analysis. PCA methods are less recognized in the literature to predict bankruptcyrisk (Cultrera et al. 2017).
We use PCA based on the five discriminant analysis measures identified previously in Section 3.2.Software Stata is used for studying the effect of performance over risk and bankruptcy scores wereobtained by year of analysis and country. Descriptive statistics of this data and Pearson correlationvalues considering country scores and year scores are presented in tables presented in Section 4.
3.4. Econometric Methodologies
In order to analyse the effects of risk scores over firm performance, we applied a dynamicpanel-data estimation model, with GMM estimators to regress earnings before interest and taxes tototal assets over risk by year. By doing so in a Generalized Method of Moments (GMM) context,we may construct more efficient estimates of the dynamic panel data model (these models contain oneor more lagged dependent variables, allowing for the modelling of a partial adjustment mechanism).In the context of panel data, we usually must deal with unobserved heterogeneity. Static models are(almost) always misspecified, because the within-group error terms are serially correlated, therebyinvalidating both point estimates and statistical inference. Conversely, dynamic models tend to be

J. Risk Financial Manag. 2020, 13, 58 12 of 28
correctly specified, because the dynamics are in the estimated part of the model rather than displacedinto the error terms, which invalidates static FE/RE estimation. Dynamic models are much richer ineconomic content by virtue of being able to distinguish short-run and long-run effects of independentvariables on dependent variables.
Additionally, we used Tobit models to infer about the influence of company performancemeasures over general bankruptcy risk scores. The Tobit model, also called a censored regressionmodel, is designed to estimate linear relationships between variables when there is either left- orright-censoring in the dependent variable. Our dependent variable is censored from both below andabove provided we have limited the risk variable to be between −3 and 3, inclusively. Tobit models topredict bankruptcy have also been used by Sigrist and Hirnschall (2019) recently. The assumption ofthe Tobit model is that there exists a latent variable Y* which follows, conditional on some covariates Xa Gaussian distribution: Y∗|X ∼ N
(F(X), σ2
). The mean F(X) is assumed to depend linearly on the
covariates X through F(X) = XTβwhere β is a set of coefficients. This latent variable Y* is observedonly if it lies in an interval. Mousavi et al. (2019) used instead of PCA, a DEA model to measurethe operational efficiency scores of Japanese companies, in the first step. In the second step, theefficiency score is used as the dependent variable in a Tobit regression to investigate whether corporategovernance variables influence the operational efficiency of firms.
4. Results and Discussion
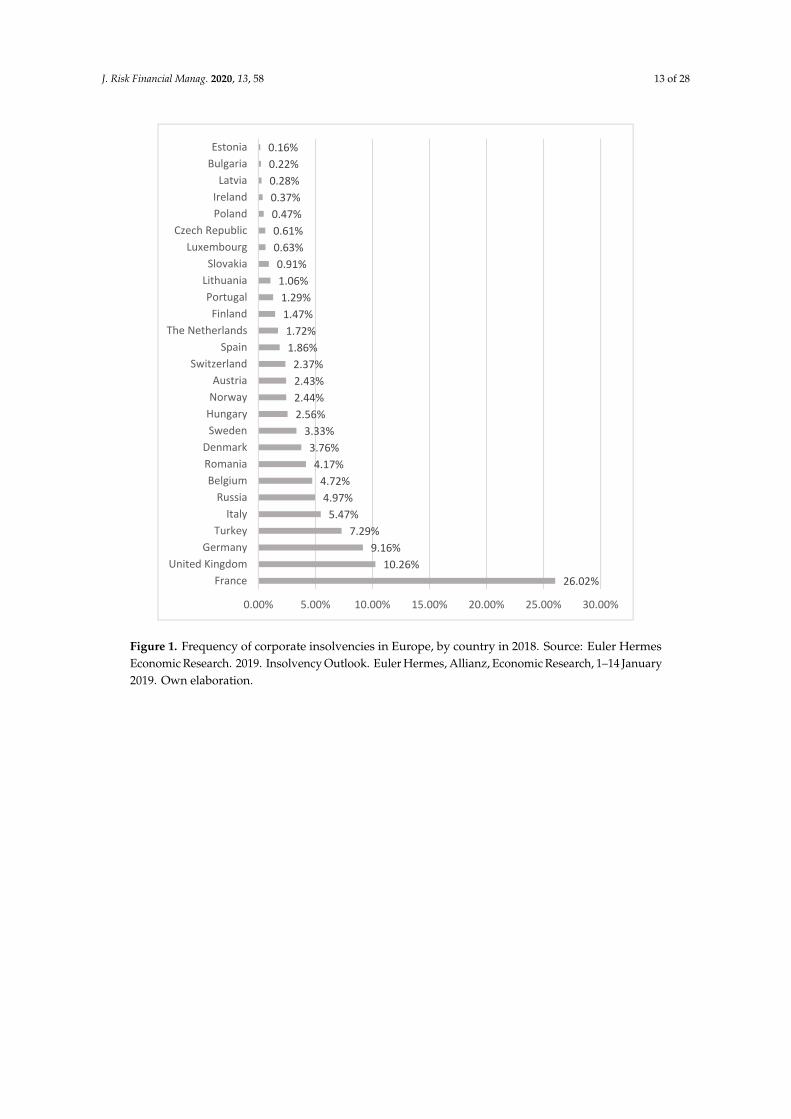
As we presented in the Section 3.1, in this study we used data from European large companieswhere insolvencies are more present. Figure 1 plots the frequency of corporate insolvencies in Europeby country for 2018 (Euler Hermes Economic Research 2019). We can see that the first place in thefrequency of bankruptcies was occupied by France (with 26.02%) corresponding to 54,965 companiesbankrupted, followed by United Kingdom with 10.26% frequency corresponding to 21,669 companiesbankrupted and 9.16% to Germany with 19,350 companies bankrupted. In our sample we used a greatpart of these countries. As we are able to observe, among countries with a high number of corporateinsolvencies were also Italy, Belgium, Romania, Denmark, Sweden, Hungary, Norway, and Austria.From the countries used in our sample, France, United Kingdom, Germany, Turkey, Italy, Belgium,Romania, Denmark and Sweden were in the top ten of the Frequency of corporate insolvencies inEurope in 2018 (Figure 1).
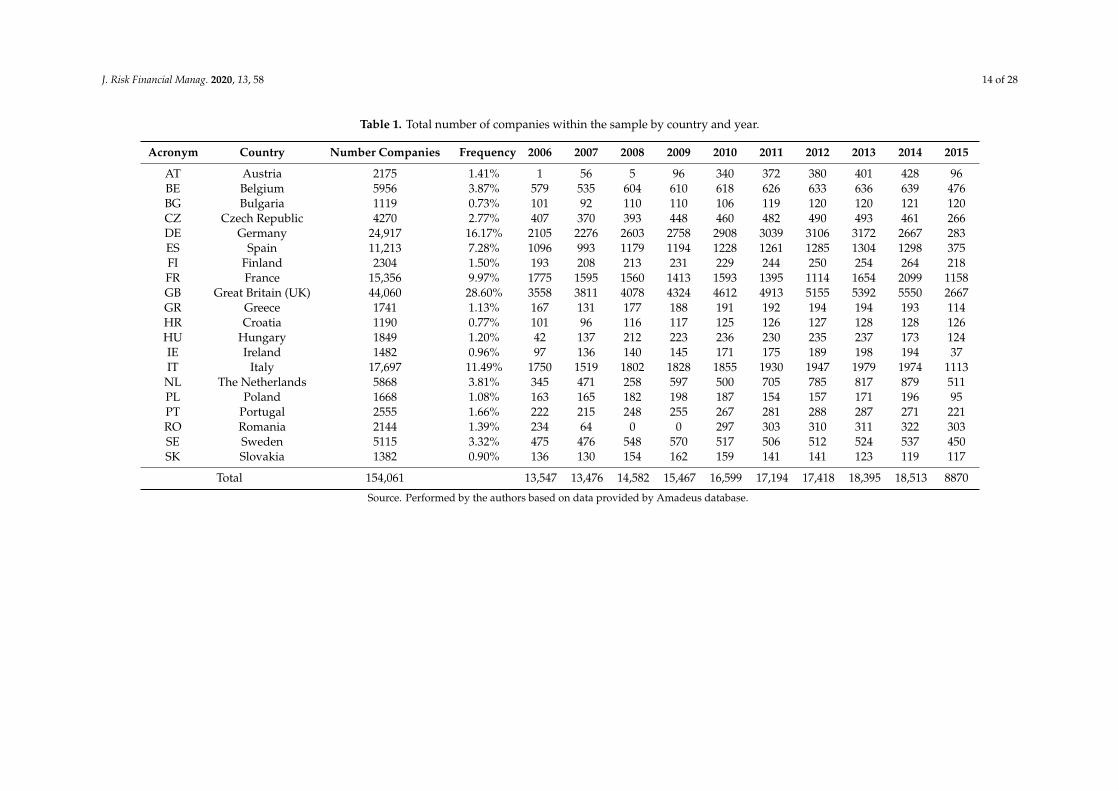
Table 1 presents the number of companies from EU-28 countries included in the sample. We canobserve that a high number of firm-year observations from large companies came from United Kingdomi.e., 28.60% of all observations analysed (also the country with the second number of bankruptcies),followed by Germany with 16.17%, Italy with 11.49%, France with 9.97% and Spain with 7.28%.Related to the number of firm-year observations of large companies by years, we can observe thatthe highest number of observations was in 2014 (18,513 companies) and 2013 (18,395 companies),respectively 12.02% and 11.94% of the sample analysed.
Table 2 presents the data descriptive statistics for the variables used for calculation of Z score forall five models used. In average, the companies from the sample show a need of exploitation capitalof 14% by the total assets, an operational profitability of 6%, a rotation speed of assets 1.48 times peryear, a current liquidity by 2.31 showing the capacity to pay debts by converting of assets in cash, theshare of financial expenditure of 0.11% by sales, the share of personnel expenses of 69% in value addedand a degree of debts of 64% by total assets. In addition, from Table 2 it is visible the disparity ofvalues of mean and standard deviation of the bankruptcy measures. Moreover, the different number ofobservations considered for both the creation of financial ratios as well as bankruptcy indicators ofinterest are clearly visible.
J. Risk Financial Manag. 2020, 13, 58 13 of 28
J. Risk Financial Manag. 2020, 13, x FOR PEER REVIEW 12 of 28
4. Results and Discussions
As we presented in the Section 3.1, in this study we used data from European large companies where insolvencies are more present. Figure 1 plots the frequency of corporate insolvencies in Europe by country for 2018 (Euler Hermes 2019). We can see that the first place in the frequency of bankruptcies was occupied by France (with 26.02%) corresponding to 54,965 companies bankrupted, followed by United Kingdom with 10.26% frequency corresponding to 21,669 companies bankrupted and 9.16% to Germany with 19,350 companies bankrupted. In our sample we used a great part of these countries. As we are able to observe, among countries with a high number of corporate insolvencies were also Italy, Belgium, Romania, Denmark, Sweden, Hungary, Norway, and Austria. From the countries used in our sample, France, United Kingdom, Germany, Turkey, Italy, Belgium, Romania, Denmark and Sweden were in the top ten of the Frequency of corporate insolvencies in Europe in 2018 (Figure 1).
Figure 1. Frequency of corporate insolvencies in Europe, by country in 2018. Source: Euler Hermes Economic Research. 2019. Insolvency Outlook. Euler Hermes, Allianz, Economic Research, January 2019, 1–14. Own elaboration.
Table 1 presents the number of companies from EU-28 countries included in the sample. We can observe that a high number of firm-year observations from large companies came from United Kingdom i.e., 28.60% of all observations analysed (also the country with the second number of bankruptcies), followed by Germany with 16.17%, Italy with 11.49%, France with 9.97% and Spain with 7.28%. Related to the number of firm-year observations of large companies by years, we can observe that the highest number of observations was in 2014 (18,513 companies) and 2013 (18,395 companies), respectively 12.02% and 11.94% of the sample analysed.
26.02%10.26%
9.16%7.29%
5.47%4.97%
4.72%4.17%
3.76%3.33%
2.56%2.44%2.43%2.37%
1.86%1.72%
1.47%1.29%1.06%0.91%
0.63%0.61%0.47%0.37%0.28%0.22%0.16%
0.00% 5.00% 10.00% 15.00% 20.00% 25.00% 30.00%
FranceUnited Kingdom
GermanyTurkey
ItalyRussia
BelgiumRomaniaDenmark
SwedenHungaryNorwayAustria
SwitzerlandSpain
The NetherlandsFinland
PortugalLithuaniaSlovakia
LuxembourgCzech Republic
PolandIreland
LatviaBulgariaEstonia
Figure 1. Frequency of corporate insolvencies in Europe, by country in 2018. Source: Euler HermesEconomic Research. 2019. Insolvency Outlook. Euler Hermes, Allianz, Economic Research, 1–14 January2019. Own elaboration.
J. Risk Financial Manag. 2020, 13, 58 14 of 28
Table 1. Total number of companies within the sample by country and year.
Acronym Country Number Companies Frequency 2006 2007 2008 2009 2010 2011 2012 2013 2014 2015
AT Austria 2175 1.41% 1 56 5 96 340 372 380 401 428 96BE Belgium 5956 3.87% 579 535 604 610 618 626 633 636 639 476BG Bulgaria 1119 0.73% 101 92 110 110 106 119 120 120 121 120CZ Czech Republic 4270 2.77% 407 370 393 448 460 482 490 493 461 266DE Germany 24,917 16.17% 2105 2276 2603 2758 2908 3039 3106 3172 2667 283ES Spain 11,213 7.28% 1096 993 1179 1194 1228 1261 1285 1304 1298 375FI Finland 2304 1.50% 193 208 213 231 229 244 250 254 264 218FR France 15,356 9.97% 1775 1595 1560 1413 1593 1395 1114 1654 2099 1158GB Great Britain (UK) 44,060 28.60% 3558 3811 4078 4324 4612 4913 5155 5392 5550 2667GR Greece 1741 1.13% 167 131 177 188 191 192 194 194 193 114HR Croatia 1190 0.77% 101 96 116 117 125 126 127 128 128 126HU Hungary 1849 1.20% 42 137 212 223 236 230 235 237 173 124IE Ireland 1482 0.96% 97 136 140 145 171 175 189 198 194 37IT Italy 17,697 11.49% 1750 1519 1802 1828 1855 1930 1947 1979 1974 1113NL The Netherlands 5868 3.81% 345 471 258 597 500 705 785 817 879 511PL Poland 1668 1.08% 163 165 182 198 187 154 157 171 196 95PT Portugal 2555 1.66% 222 215 248 255 267 281 288 287 271 221RO Romania 2144 1.39% 234 64 0 0 297 303 310 311 322 303SE Sweden 5115 3.32% 475 476 548 570 517 506 512 524 537 450SK Slovakia 1382 0.90% 136 130 154 162 159 141 141 123 119 117
Total 154,061 13,547 13,476 14,582 15,467 16,599 17,194 17,418 18,395 18,513 8870
Source. Performed by the authors based on data provided by Amadeus database.

J. Risk Financial Manag. 2020, 13, 58 15 of 28
Table 2. Variables, formulas, and descriptive statistics.
Formula Variable Obs Mean Std. Dev. Min Max
Working capital/Total assets wcta 153,459 0.14 0.76 −198.44 113.86Retained Earnings/Total Assets reta 148,986 0.24 1.29 −364.35 274.07
EBIT/Total assets ebitta 153,459 0.06 0.24 −42.14 61.11Book Value of Equity/Book Value of Total Debt bvebvtd 153,278 2.44 176.82 −657.29 50,409.00
Sales/Total assets sta 153,459 1.48 3.99 0.00 1322.52Revised Z Altman rza 148,821 3.02 75.50 −306.70 21,172.06
EBIT/Current liabilities ebitcliabil 151,123 240.93 101,682.60 −4,900,820.00 38,700,000.00Permanent capital/Total debts ppi 153,278 2.77 176.83 −656.29 50,410.00
(Current assets − Stocks)/Total Liabilities curnt 153,278 2.31 172.72 −38.15 45,178.00Financial expenditures/Sales fs 145,515 0.11 8.93 −1.11 2169.55
Personnel Expenditures/Added Value pexpenditura 140,104 0.69 3.81 −609.22 440.32Z Connan zcc 135,073 64.97 25,813.04 −1,176,196.00 9,298,852.00
Working capital/Total assets wcta_1 153,459 0.14 0.76 −198.44 113.86Earnings Before Interest and Taxes/Total Assets ebitta_1 153,459 0.06 0.24 −42.14 61.11
Earnings Before Taxes/Current Liabilities ebtcl 151,096 229.24 103,167.50 −5,151,934.00 39,400,000.00Sales/Total Assets sta_1 153,459 1.48 3.99 0.00 1322.52Z Springate Model zs 151,096 152.23 68,090.55 −3,400,276.00 26,000,000.00
Profit Before Tax/Current Liabilities pbtcl 151,096 229.24 103,167.50 −5,151,934.00 39,400,000.00Current Assets/Total Liabilities cat 153,278 2.89 219.41 −39.30 55,223.00Current Liabilities/Total Assets clt 153,459 0.43 0.75 −113.76 199.44
(Quick Assets − Current Liabilities)/(Sales − Profit Before Tax − Depreciation)/365 qaclspbtd 144,735 −792,000,000,000 301,000,000,000,000 −115,000,000,000,000,000 10,200,000Z Taffler ztta 144,730 −23,000,000,000 8740,000,000,000 −3,320,000,000,000,000 47,900,0000
Net Income/Total Assets nincomt 153,459 0.04 0.26 −62.33 26.68Total Liabilities/Total Assets tliat 153,432 0.64 1.12 −71.28 390.32
Current Assets/Current Liabilities cac 151,123 −653.97 403,912.70 −90,700,000.00 84,800,000.00Z Zmijewski zzzmij 151,118 −3.44 1615.68 −362,744.00 339,315.60
Source. Performed by the authors based on data provided by Amadeus database.
J. Risk Financial Manag. 2020, 13, 58 16 of 28
Tables A1 and A2 (at the Appendix A) presents the correlation matrix among the variables usedboth to produce the bankruptcy risk indicators and the five bankruptcy risk scores. In addition,Tables A1 and A2 presents the Pearson correlation values and statistical significance. From here it isseen that there are ratios used to produce the bankruptcy indicators which are highly correlated amongthem, significantly, with negative or positive correlation (i.e., strong positive significant correlation(0.821) between Book Value of Equity/Book Value of Total Debt and Current Assets/Total Liabilities;strong positive significant correlation (0.778) between Book Value of Equity/Book Value of Total Debtand (Current assets − Stocks)/Total Liabilities, almost perfect positive correlation (0.998) betweenEBIT/Current liabilities and Profit Before Tax/Current Liabilities etc.), but mostly have low to moderatecorrelation. However, between bankruptcy indicators constructed through discriminant analysis,correlation values are very low, and very close to zero with statistical significance.
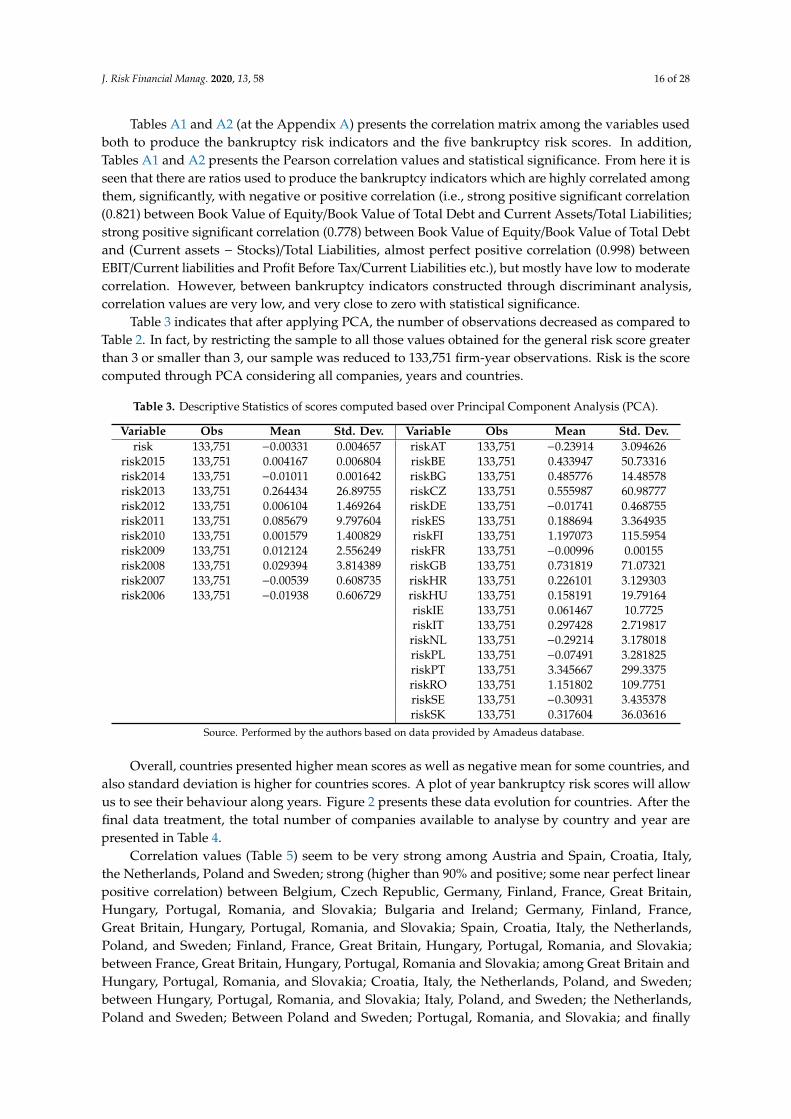
Table 3 indicates that after applying PCA, the number of observations decreased as compared toTable 2. In fact, by restricting the sample to all those values obtained for the general risk score greaterthan 3 or smaller than 3, our sample was reduced to 133,751 firm-year observations. Risk is the scorecomputed through PCA considering all companies, years and countries.
Table 3. Descriptive Statistics of scores computed based over Principal Component Analysis (PCA).
Variable Obs Mean Std. Dev. Variable Obs Mean Std. Dev.risk 133,751 −0.00331 0.004657 riskAT 133,751 −0.23914 3.094626
risk2015 133,751 0.004167 0.006804 riskBE 133,751 0.433947 50.73316risk2014 133,751 −0.01011 0.001642 riskBG 133,751 0.485776 14.48578risk2013 133,751 0.264434 26.89755 riskCZ 133,751 0.555987 60.98777risk2012 133,751 0.006104 1.469264 riskDE 133,751 −0.01741 0.468755risk2011 133,751 0.085679 9.797604 riskES 133,751 0.188694 3.364935risk2010 133,751 0.001579 1.400829 riskFI 133,751 1.197073 115.5954risk2009 133,751 0.012124 2.556249 riskFR 133,751 −0.00996 0.00155risk2008 133,751 0.029394 3.814389 riskGB 133,751 0.731819 71.07321risk2007 133,751 −0.00539 0.608735 riskHR 133,751 0.226101 3.129303risk2006 133,751 −0.01938 0.606729 riskHU 133,751 0.158191 19.79164
riskIE 133,751 0.061467 10.7725riskIT 133,751 0.297428 2.719817riskNL 133,751 −0.29214 3.178018riskPL 133,751 −0.07491 3.281825riskPT 133,751 3.345667 299.3375riskRO 133,751 1.151802 109.7751riskSE 133,751 −0.30931 3.435378riskSK 133,751 0.317604 36.03616
Source. Performed by the authors based on data provided by Amadeus database.
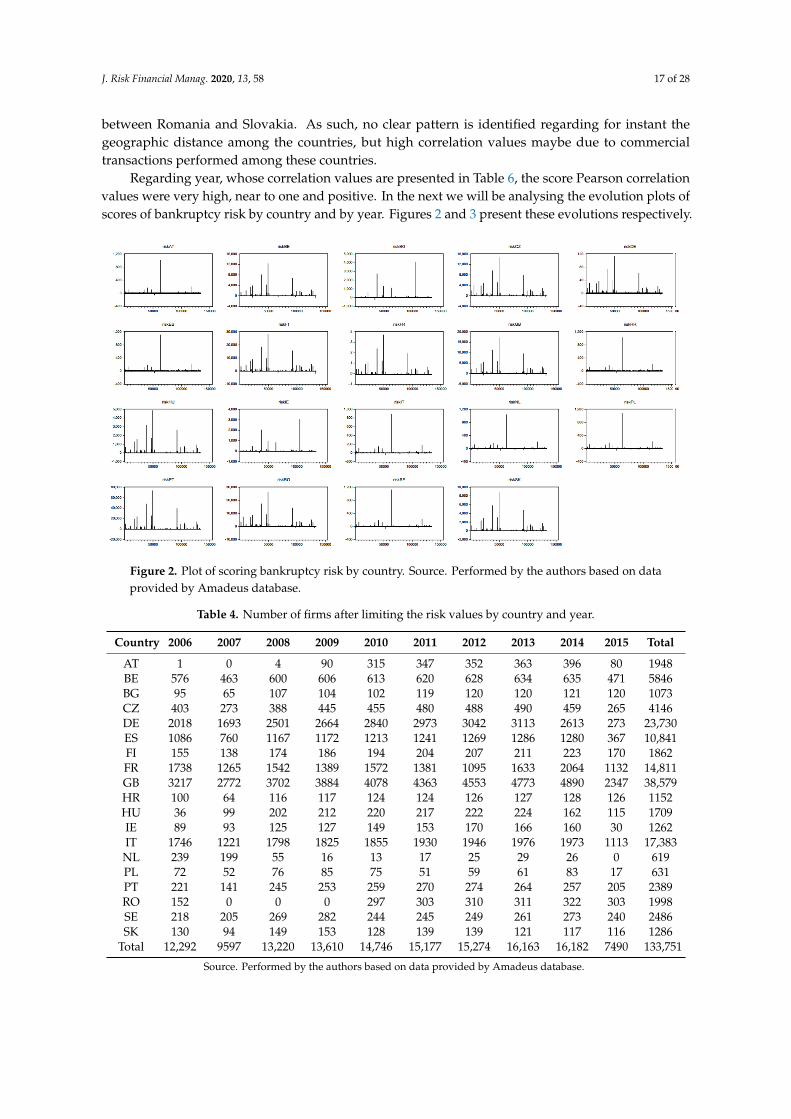
Overall, countries presented higher mean scores as well as negative mean for some countries, andalso standard deviation is higher for countries scores. A plot of year bankruptcy risk scores will allowus to see their behaviour along years. Figure 2 presents these data evolution for countries. After thefinal data treatment, the total number of companies available to analyse by country and year arepresented in Table 4.
Correlation values (Table 5) seem to be very strong among Austria and Spain, Croatia, Italy,the Netherlands, Poland and Sweden; strong (higher than 90% and positive; some near perfect linearpositive correlation) between Belgium, Czech Republic, Germany, Finland, France, Great Britain,Hungary, Portugal, Romania, and Slovakia; Bulgaria and Ireland; Germany, Finland, France,Great Britain, Hungary, Portugal, Romania, and Slovakia; Spain, Croatia, Italy, the Netherlands,Poland, and Sweden; Finland, France, Great Britain, Hungary, Portugal, Romania, and Slovakia;between France, Great Britain, Hungary, Portugal, Romania and Slovakia; among Great Britain andHungary, Portugal, Romania, and Slovakia; Croatia, Italy, the Netherlands, Poland, and Sweden;between Hungary, Portugal, Romania, and Slovakia; Italy, Poland, and Sweden; the Netherlands,Poland and Sweden; Between Poland and Sweden; Portugal, Romania, and Slovakia; and finally
J. Risk Financial Manag. 2020, 13, 58 17 of 28
between Romania and Slovakia. As such, no clear pattern is identified regarding for instant thegeographic distance among the countries, but high correlation values maybe due to commercialtransactions performed among these countries.
Regarding year, whose correlation values are presented in Table 6, the score Pearson correlationvalues were very high, near to one and positive. In the next we will be analysing the evolution plots ofscores of bankruptcy risk by country and by year. Figures 2 and 3 present these evolutions respectively.
J. Risk Financial Manag. 2020, 13, x FOR PEER REVIEW 18 of 28
Figure 2 plots the evolution of the score values obtained through PCA from the discriminant indices calculous by country. There are some countries which evidence a very similar behaviour like Belgium, Czech Republic, Finland, France, Great Britain, Hungary, Portugal, Romania, Slovakia and Germany. Another group of similar behaviour in terms of scores is that of Austria, Spain, Italy, Croatia, the Netherlands, Poland and Sweden. The two other similar countries in terms of scores are Ireland and Bulgaria.
Figure 2. Plot of scoring bankruptcy risk by country. Source. Performed by the authors based on data provided by Amadeus database.
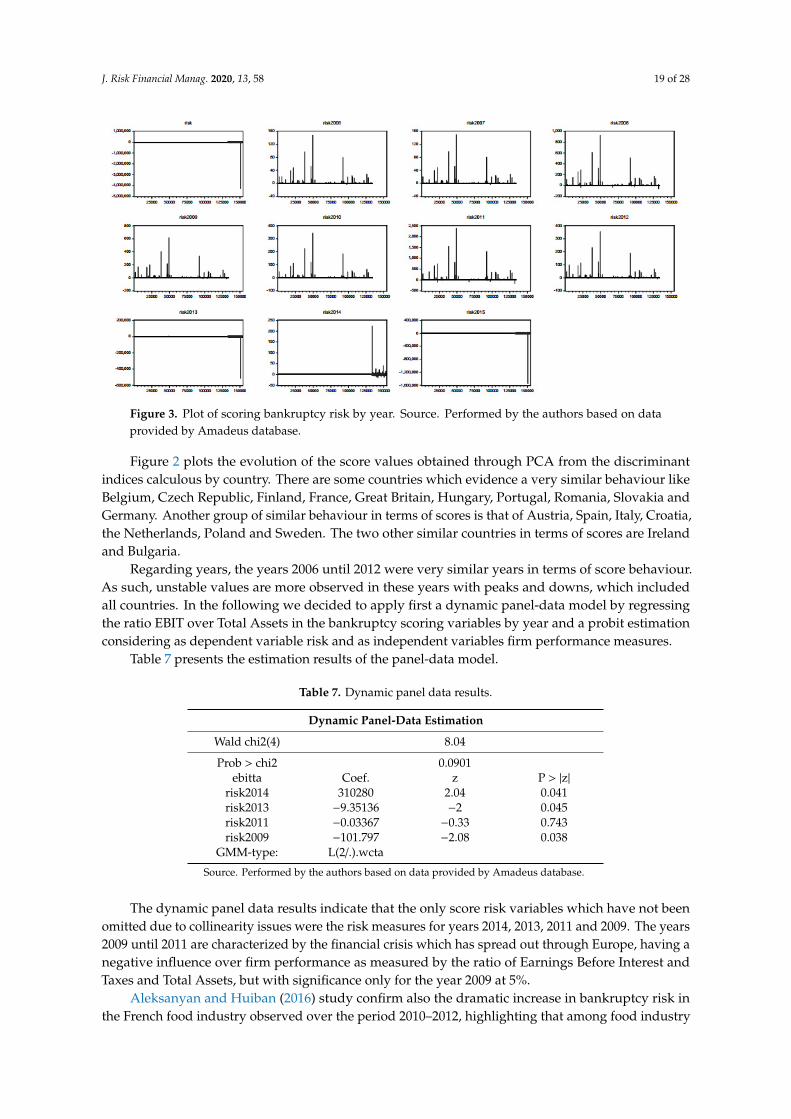
Figure 3. Plot of scoring bankruptcy risk by year. Source. Performed by the authors based on data provided by Amadeus database.
Regarding years, the years 2006 until 2012 were very similar years in terms of score behaviour. As such, unstable values are more observed in these years with peaks and downs, which included all
Figure 2. Plot of scoring bankruptcy risk by country. Source. Performed by the authors based on dataprovided by Amadeus database.
Table 4. Number of firms after limiting the risk values by country and year.
Country 2006 2007 2008 2009 2010 2011 2012 2013 2014 2015 Total
AT 1 0 4 90 315 347 352 363 396 80 1948BE 576 463 600 606 613 620 628 634 635 471 5846BG 95 65 107 104 102 119 120 120 121 120 1073CZ 403 273 388 445 455 480 488 490 459 265 4146DE 2018 1693 2501 2664 2840 2973 3042 3113 2613 273 23,730ES 1086 760 1167 1172 1213 1241 1269 1286 1280 367 10,841FI 155 138 174 186 194 204 207 211 223 170 1862FR 1738 1265 1542 1389 1572 1381 1095 1633 2064 1132 14,811GB 3217 2772 3702 3884 4078 4363 4553 4773 4890 2347 38,579HR 100 64 116 117 124 124 126 127 128 126 1152HU 36 99 202 212 220 217 222 224 162 115 1709IE 89 93 125 127 149 153 170 166 160 30 1262IT 1746 1221 1798 1825 1855 1930 1946 1976 1973 1113 17,383NL 239 199 55 16 13 17 25 29 26 0 619PL 72 52 76 85 75 51 59 61 83 17 631PT 221 141 245 253 259 270 274 264 257 205 2389RO 152 0 0 0 297 303 310 311 322 303 1998SE 218 205 269 282 244 245 249 261 273 240 2486SK 130 94 149 153 128 139 139 121 117 116 1286
Total 12,292 9597 13,220 13,610 14,746 15,177 15,274 16,163 16,182 7490 133,751
Source. Performed by the authors based on data provided by Amadeus database.

J. Risk Financial Manag. 2020, 13, 58 18 of 28
Table 5. Pearson correlation values among scoring PCA bankruptcy risk variables obtained by country.
Score riskAT riskBE riskBG riskCZ riskDE riskES riskFI riskFR riskGB riskHR riskHU riskIE riskIT riskNL riskPL riskPT riskRO riskSE riskSK
riskAT 1riskBE 0.093 *** 1riskBG 0.037 *** 0.337 *** 1riskCZ 0.093 *** 0.998 *** 0.363 *** 1riskDE 0.093 *** 0.998 *** 0.363 *** 1.000 *** 1riskES 0.997 *** 0.016 *** 0.008 *** 0.016 *** 0.016 *** 1riskFI 0.093 *** 1.000 *** 0.337 *** 0.998 *** 0.998 *** 0.016 *** 1riskFR 0.093 *** 0.998 *** 0.363 *** 1.000 *** 1.000 *** 0.016 *** 0.998 *** 1riskGB 0.093 *** 1.000 *** 0.337 *** 0.998 *** 0.998 *** 0.016 *** 1.000 *** 0.998 *** 1riskHR 1.000 *** 0.098 *** 0.039 *** 0.098 *** 0.098 *** 0.997 *** 0.098 *** 0.098 *** 0.098 *** 1riskHU 0.093 *** 0.998 *** 0.363 *** 1.000 *** 1.000 *** 0.016 *** 0.998 *** 1.000 *** 0.998 *** 0.098 *** 1riskIE 0.037 *** 0.337 *** 1.000 *** 0.363 *** 0.363 *** 0.008 *** 0.337 *** 0.363 *** 0.337 *** 0.039 *** 0.363 *** 1riskIT 0.982 *** −0.098 *** −0.032 *** −0.098 *** −0.098 *** 0.994 *** −0.098 *** −0.098 *** −0.098 *** 0.981 *** −0.098 *** −0.032 *** 1riskNL 0.997 *** 0.174 *** 0.065 *** 0.174 *** 0.174 *** 0.987 *** 0.174 *** 0.174 *** 0.174 *** 0.997 *** 0.174 *** 0.065 *** 0.963 *** 1riskPL 1.000 *** 0.085 *** 0.033 *** 0.085 *** 0.085 *** 0.998 *** 0.085 *** 0.085 *** 0.085 *** 0.999 *** 0.085 *** 0.033 *** 0.983 *** 0.996 *** 1riskPT 0.093 *** 0.998 *** 0.363 *** 1.000 *** 1.000 *** 0.016 *** 0.998 *** 1.000 *** 0.998 *** 0.098 *** 1.000 *** 0.363 *** −0.098 *** 0.174 *** 0.085 *** 1riskRO 0.093 *** 0.998 *** 0.363 *** 1.000 *** 1.000 *** 0.016 *** 0.998 *** 1.000 *** 0.998 *** 0.098 *** 1.000 *** 0.363 *** −0.098 *** 0.174 *** 0.085 *** 1.000 *** 1riskSE 0.999 *** 0.071 *** 0.029 *** 0.071 *** 0.071 *** 0.999 *** 0.071 *** 0.071 *** 0.071 *** 0.999 *** 0.071 *** 0.029 *** 0.986 *** 0.995 *** 0.999 *** 0.071 *** 0.071 *** 1riskSK 0.093 *** 0.998 *** 0.363 *** 1.000 *** 1.000 *** 0.016 *** 0.998 *** 1.000 *** 0.998 *** 0.098 *** 1.000 *** 0.363 *** −0.098 *** 0.174 *** 0.085 *** 1.000 *** 1.000 *** 0.071 *** 1
Source. Performed by the authors based on data provided by Amadeus database. Note: *, **, ***, represent statistically significant at 10%, 5% and 1%, respectively.
Table 6. Pearson correlation variables among scoring PCA bankruptcy risk variables obtained by year.
Scores risk risk2015 risk2014 risk2013 risk2012 risk2011 risk2010 risk2009 risk2008 risk2007 risk2006
risk 1risk2015 1.000 *** 1risk2014 1.000 *** 1.000 *** 1risk2013 1.000 *** 1.000 *** 1.000 *** 1risk2012 1.000 *** 1.000 *** 1.000 *** 1.000 *** 1risk2011 0.998 *** 0.998 *** 0.998 *** 0.998 *** 0.998 *** 1risk2010 1.000 *** 1.000 *** 1.000 *** 1.000 *** 1.000 *** 0.998 *** 1risk2009 1.000 *** 1.000 *** 1.000 *** 1.000 *** 1.000 *** 0.998 *** 1.000 *** 1risk2008 0.998 *** 0.998 *** 0.998 *** 0.998 *** 0.998 *** 1.000 *** 0.998 *** 0.998 *** 1risk2007 1.000 *** 1.000 *** 1.000 *** 1.000 *** 1.000 *** 0.998 *** 1.000 *** 1.000 *** 0.998 *** 1risk2006 1.000 *** 1.000 *** 1.000 *** 1.000 *** 1.000 *** 0.998 *** 1.000 *** 1.000 *** 0.998 *** 1.000 *** 1
Source. Performed by the authors based on data provided by Amadeus database. Note: *, **, ***, represent statistically significant at 10%, 5% and 1%, respectively.
J. Risk Financial Manag. 2020, 13, 58 19 of 28
J. Risk Financial Manag. 2020, 13, x FOR PEER REVIEW 18 of 28
Figure 2 plots the evolution of the score values obtained through PCA from the discriminant indices calculous by country. There are some countries which evidence a very similar behaviour like Belgium, Czech Republic, Finland, France, Great Britain, Hungary, Portugal, Romania, Slovakia and Germany. Another group of similar behaviour in terms of scores is that of Austria, Spain, Italy, Croatia, the Netherlands, Poland and Sweden. The two other similar countries in terms of scores are Ireland and Bulgaria.
Figure 2. Plot of scoring bankruptcy risk by country. Source. Performed by the authors based on data provided by Amadeus database.
Figure 3. Plot of scoring bankruptcy risk by year. Source. Performed by the authors based on data provided by Amadeus database.
Regarding years, the years 2006 until 2012 were very similar years in terms of score behaviour. As such, unstable values are more observed in these years with peaks and downs, which included all
Figure 3. Plot of scoring bankruptcy risk by year. Source. Performed by the authors based on dataprovided by Amadeus database.
Figure 2 plots the evolution of the score values obtained through PCA from the discriminantindices calculous by country. There are some countries which evidence a very similar behaviour likeBelgium, Czech Republic, Finland, France, Great Britain, Hungary, Portugal, Romania, Slovakia andGermany. Another group of similar behaviour in terms of scores is that of Austria, Spain, Italy, Croatia,the Netherlands, Poland and Sweden. The two other similar countries in terms of scores are Irelandand Bulgaria.
Regarding years, the years 2006 until 2012 were very similar years in terms of score behaviour.As such, unstable values are more observed in these years with peaks and downs, which includedall countries. In the following we decided to apply first a dynamic panel-data model by regressingthe ratio EBIT over Total Assets in the bankruptcy scoring variables by year and a probit estimationconsidering as dependent variable risk and as independent variables firm performance measures.
Table 7 presents the estimation results of the panel-data model.
Table 7. Dynamic panel data results.
Dynamic Panel-Data Estimation
Wald chi2(4) 8.04
Prob > chi2 0.0901ebitta Coef. z P > |z|
risk2014 310280 2.04 0.041risk2013 −9.35136 −2 0.045risk2011 −0.03367 −0.33 0.743risk2009 −101.797 −2.08 0.038
GMM-type: L(2/.).wcta
Source. Performed by the authors based on data provided by Amadeus database.
The dynamic panel data results indicate that the only score risk variables which have not beenomitted due to collinearity issues were the risk measures for years 2014, 2013, 2011 and 2009. The years2009 until 2011 are characterized by the financial crisis which has spread out through Europe, having anegative influence over firm performance as measured by the ratio of Earnings Before Interest andTaxes and Total Assets, but with significance only for the year 2009 at 5%.
Aleksanyan and Huiban (2016) study confirm also the dramatic increase in bankruptcy risk inthe French food industry observed over the period 2010–2012, highlighting that among food industry

J. Risk Financial Manag. 2020, 13, 58 20 of 28
sub-sectors, the meat industry was primarily responsible for the evolution of bankruptcy risk in theperiod mentioned.
The years of 2013 and 2014 were years of starting recovery, and we might infer from the resultsthat despite the negative influence of 2013 risk score over performance, in 2014 we already have apositive contribution of bankruptcy risk score over performance, both years with statistical significanceat 5%.
Table 8 reports the Tobit estimation results for general risk among countries, while Table 9 presentsthe same Tobit estimation results but this turn by country. This turn we are testing the influence ofperformance measures over risk scores since we are analysing the dependent censored variable risk.
Table 8. Tobit estimation results.
Tobit Regression: Dependent = Risk
Coef t p > t Coef t p > t
ebitta 0.00012 ** 2.05 0.041 0.00019 * 1.90 0.057sta 0.000006 0.96 0.339
wcta 0.0001 *** 3.68 0.000const −0.00332 −250.91 0.000 −0.00334 *** −213.66 0.000
LR chi2 4.19 LR chi2 18.9prob chi2 0.0406 prob chi2 0.0003
Source. Performed by the authors based on data provided by Amadeus database. Note: *, **, *** statistically significantat 10%, 5% and 1%, respectively. Ebitta = earnings before interest and taxes (ebit)/total assets; sta = sales/total assets;wcta = working capital/total assets.
Model significance was confirmed at 5% and results seem to indicate that performance measurespositively influence risk scores. Thus the higher the performance is the higher will be the risk score andas such bankruptcy risk decreases with performance, a result which was expected. Bankruptcy is oneof the most discussed topics in the literature, owing to its importance to the economy of any country.Bankruptcy costs are high and authors have tried to develop bankruptcy prediction models throughyears. Our scoring methodology through PCA applied to discriminant analysis of bankruptcy risktherefore indicates that performance is the solution to decrease this risk.
Discriminant analysis of bankruptcy risk argues that positive high values of bankruptcy riskpositions companies in the safe zone, meaning a low risk of bankruptcy or a probability of bankruptcylower than 30% (zcc index). Lower values positions firms between the grey zones or in the distresszone (see Section 3.2). Therefore, we may argue that for our sample of firms, these large companieshad good chances for performance provided their higher results, thus being non-bankrupt or withlower chances to become so. However, these results depended on the year of analysis provided thatTable 7 demonstrates that 2009, 2011 and 2013 were years of negative influence of bankruptcy riskscores over companies’ results.
Company performance variables were all statistically significant and with a positive impact overthe bankruptcy risk score in Austria, Bulgaria, Spain, Finland, Great Britain, Croatia, Ireland, Italy,The Netherlands, Portugal, Romania, and Sweden. The ratio sales to total assets had a negativeand non-significant impact over the risk score in Belgium, Czech Republic, Hungary and Slovakia.It is positive and non-significant in Poland and France. The only countries where performance(independently of its measure) did not seem to exert an influence over the bankruptcy risk score wereGermany and Poland.
Since Germany is on the top ten of the number of corporate insolvencies, this might mean thatother corporate variables despite the ones considered here to represent performance in our analysis,might be influencing bankruptcy risk scores under the years in analysis. The Principal ComponentAnalysis here employed to build a bankruptcy risk scored based on discriminant analysis indices wasfound to be effective for determining the influence of corporate performance over risk. It was usefulto understand that different countries evidence different results regarding this influence, as well as

J. Risk Financial Manag. 2020, 13, 58 21 of 28
different risk scores with respect to years reveal to be different. It could be useful to understand thisimpact in the future by using other scoring techniques, like data envelopment analysis, or even bydetailing years and countries analysis.
Table 9. Tobit estimation results by country.
Tobit Regression: Dependent = Risk
AT = Austria BE = Belgium BG = Bulgaria
Indep. Coef t p > t Coef t p > t Coef t p > t
ebitta 0.00060 *** 39.82 0.0000 −0.00017 −0.53 0.598 0.00007 *** 19.19 0.0000sta 0.000002 *** 8.01 0.0000 −0.00002 −0.89 0.375 0.000002 *** 4.30 0.0000
wcta 0.000032 *** 36.01 0.0000 0.00018 * 1.83 0.067 0.00004 *** 15.75 0.0000const −0.00337 *** −6822.46 0.0000 −0.00332 *** −74.97 0 −0.00337 *** −3544.58 0.0000
LR chi2 2114.45 4.50 646.96prob chi2 0.0000 0.2126 0.0000
CZ = Czech Republic DE = Germany ES = Spain
Indep. Coef t p > t Coef t p > t Coef t p > t
ebitta 0.00020 *** 26.54 0.0000 0.00056 0.90 0.3710 0.00007 *** 5.04 0.0000sta −0.00000 −0.77 0.4440 −0.00006 −1.09 0.2760 0.000003 * 1.93 0.0530
wcta 0.00004 *** 12.80 0.0000 0.00011 1.38 0.1660 0.00002 *** 3.12 0.0020const −0.00337 *** −2204.68 0.0000 −0.00310 *** −27.57 0.0000 −0.00337 *** −1570.65 0.0000
LR chi2 3370.88 3.62 53.54prob chi2 0.0000 0.3060 0.0000
FI = Finland FR = France GB = Great Britain (UK)
Indep. Coef t p > t Coef t p > t Coef t p > t
ebitta 0.00011 *** 19.32 0.0000 0.00102 ** 2.37 0.0180 0.00005 *** 15.28 0.0000sta 0.000004 *** 8.10 0.0000 0.00006 1.37 0.1720 0.000003 *** 6.45 0.0000
wcta 0.00003 *** 8.97 0.0000 0.00005 1.09 0.2770 0.00003 *** 15.21 0.0000const −0.00338 *** −2800.20 0.0000 −0.00345 *** −39.57 0.0000 −0.00337 *** −4094.65 0.0000
LR chi2 527.87 9.77 787.56prob chi2 0.0000 0.0206 0.0000
HR = Croatia HU = Hungary IE = Ireland
Indep. Coef t p > t Coef t p > t Coef t p > t
ebitta 0.00006 *** 10.42 0.0000 0.00014 ** 2.21 0.0270 0.00008 *** 26.52 0.0000sta 0.000004 *** 5.64 0.0000 −0.00000 −0.07 0.9450 0.000003 *** 7.28 0.0000
wcta 0.00003 *** 13.65 0.0000 0.00011 *** 4.97 0.0000 0.00003 *** 27.08 0.0000const −0.00337 *** −3219.78 0.0000 −0.00337 *** −293.47 0.0000 −0.00337 *** −5373.66 0.0000
LR chi2 476.75 34.35 1265.69
IT = Italy NL = The Netherlands PL = Poland
Indep. Coef t p > t Coef t p > t Coef t p > t
ebitta 0.00004 *** 5.25 0.0000 0.00006 *** 14.94 0.0000 0.00009 0.90 0.3710sta 0.000004 *** 4.41 0.0000 0.000003 *** 9.42 0.0000 0.000012 1.28 0.2010
wcta 0.00004 *** 11.45 0.0000 0.00003 *** 12.46 0.0000 0.00005 1.26 0.2100const −0.00338 *** −2531.81 0.0000 −0.00337 *** −4554.27 0.0000 −0.00339 *** −214.04 0.0000
LR chi2 247.05 428.15 6.47prob chi2 0.0000 0.0000 0.0909
PT = Portugal RO = Romania SE = Sweden
Indep. Coef t p > t Coef t p > t Coef t p > t
ebitta 0.00006 *** 31.90 0.0000 0.00004 *** 13.50 0.0000 0.00007 *** 30.34 0.0000sta 0.000005 *** 20.11 0.0000 0.000002 *** 5.15 0.0000 0.000002 *** 5.92 0.0000
wcta 0.00002 *** 36.12 0.0000 0.00002 *** 10.94 0.0000 0.00003 *** 19.77 0.0000const −0.00337 *** −0.0001 0.0000 −0.00337 *** −4030.59 0.0000 −0.00337 *** −4809.04 0.0000
LR chi2 2477.79 815.74 1272.57prob chi2 0.0000 0.0000 0.0000
SK = Slovakia
Indep. Coef t p > t
ebitta 0.00010 *** 3.40 0.0010sta −0.000002 −0.53 0.5970
wcta 0.00006 *** 4.65 0.0000const −0.00336 *** −539.59 0.0000
LR chi2 52.95prob chi2 0.0000
Source. Performed by the authors based on data provided by Amadeus database. Note: *, **, *** statistically significantat 10%, 5% and 1%, respectively. Ebitta = earnings before interest and taxes (ebit)/total assets; sta = sales/total assets;wcta = working capital/total assets.

J. Risk Financial Manag. 2020, 13, 58 22 of 28
5. Conclusions
The purpose of this paper was to improve the knowledge of bankruptcy prediction of companiesand to analyse the predictive capacity of factor analysis based over discriminant analysis using fivemodels for assessing bankruptcy risk well-known in the literature: Altman, Conan and Holder, Tafler,Springate and Zmijewski. We used data for non-financial large companies from Europe for the period2006–2015. In order to analyse the effects of risk scores over firm performance, we applied a dynamicpanel-data estimation model, with GMM estimators to regress firm performance indicator over risk byyear and we used Tobit models to infer about the influence of company performance measures overgeneral bankruptcy risk scores by country. In summary, results evidence that PCA used to build abankruptcy risk scored based on discriminant analysis indices is effective for determining the influenceof corporate performance over risk.
Results reveal a negative influence of risk scores over firm performance in the financial crisisyears of 2009–2011. However, bankruptcy risk scores increase performance (as measured throughthe ratio Earnings before Interest and Taxes over Total Assets) in the upcoming years of recovery,especially from 2014 onwards. These results were obtained by applying dynamic panel data estimations.Afterwards, using Tobit estimations we analyze the influence of performance measures over risk score(the variable risk was censored between three, negative and positive, inclusively). The higher theperformance the higher the risk score, meaning the lower the bankruptcy risk probability. The scoringmethodology through PCA applied to discriminant analysis of bankruptcy risk indicators used toobtain the bankruptcy risk scores by year and country highlight that higher performance is the solutionto decrease bankruptcy risk.
Therefore, and provided that bankruptcy can be caused by poor management, improper salesforecasting, inexperienced management, rapid technological advances, preference changes, and inabilityof the firm to follow as a leader in these changes, our sample of large companies in Europe and resultsobtained lead us to conclude that firms’ strategy is vital in terms of market survival. The literaturealready points that better corporate governance simultaneously improve firm performance and reducefirm risk, especially during crisis (Wang et al. 2019). Our results seem to highlight the importance ofgood corporate governance as a key indicator for firm performance and lower bankruptcy risk, withclear differences among European countries. In future works we intend to use other scoring techniquesto predict bankruptcy risk like data envelopment analysis in order to be able to understand differencesamong countries and years, and to test the performance of bankruptcy models using different riskbuild scores.
Author Contributions: Conceptualization, N.B.-M. and M.M.; methodology, N.B.-M. and M.M.; results anddiscussions, N.B.-M. and M.M.; formal analysis, N.B.-M.; resources, N.B.-M. and M.M.; data curation, M.M..;writing— N.B.-M. and M.M.; writing—review and editing, N.B.-M. and M.M. All authors have read and agreed tothe published version of the manuscript.
Funding: This work was funded by the project “Excellence, performance and competitiveness in the Research,Development and Innovation activities at “Dunarea de Jos” University of Galati”, acronym “EXPERT”, financedby the Romanian Ministry of Research and Innovation in the framework of Programme 1—Development ofthe national research and development system, Sub-programme 1.2—Institutional Performance—Projects forfinancing excellence in Research, Development and Innovation, Contract no. 14PFE/17.10.2018.
Acknowledgments: This work was supported by the SOP IEC, under Grant SMIS-CNSR 815-48745, no. 622/2014.This work was in part financially supported by the research unit on Governance, Competitiveness and PublicPolicy (UID/CPO/04058/2019), funded by national funds through FCT—Fundação para a Ciência e a Tecnologia.
Conflicts of Interest: The authors declare no conflict of interest.

J. Risk Financial Manag. 2020, 13, 58 23 of 28
Appendix A
Table A1. Pearson Correlation values.
Variable wcta reta ebitta bvebvtd sta rza ebitcliabil ppi curnt fs pexpenditura zcc wcta_1
wcta 1reta −0.256 *** 1
ebitta −0.3086 *** 0.4387 *** 1bvebvtd 0.006 ** 0.002 −0.002 1
sta −0.658 *** 0.394 *** 0.404 *** −0.004 1rza −0.029 *** 0.040 *** 0.034 *** 0.998 *** 0.055 *** 1
ebitcliabil −0.000 0.001 0.000 0.002 −0.001 0.001 1ppi 0.008 *** 0.002 −0.002 1.000 *** −0.004 0.998 *** 0.002 1
curnt 0.008 *** 0.001 −0.002 0.778 *** −0.003 0.777 *** −0.001 0.778 *** 1fs −0.002 −0.003 −0.005 * 0.019 *** −0.004 0.007 *** 0.000 0.019 *** 0.013 *** 1
pexpenditura 0.002 −0.004 −0.011 *** −0.004 0.003 −0.001 −0.000 −0.004 −0.002 −0.002 1zcc −0.000 0.001 0.000 0.005 * −0.001 0.001 1.000 *** 0.005 * −0.001 −0.000 −0.000 1
wcta_1 1.000 *** −0.256 *** −0.309 *** 0.006 ** −0.658 *** −0.029 *** −0.000 0.008 *** 0.008 *** −0.002 0.002 −0.000 1ebitta_1 −0.309 *** 0.439 *** 1.000 *** −0.002 0.404 *** 0.034 *** 0.000 −0.002 −0.002 −0.005 * −0.011 *** 0.000 −0.309 ***
ebtcl −0.000 0.001 0.000 0.002 −0.001 0.001 0.998 *** 0.002 −0.001 0.000 −0.000 0.998 *** −0.000sta_1 −0.658 *** 0.394 *** 0.404 *** −0.004 1.000 *** 0.055 *** −0.001 −0.004 −0.003 −0.004 0.003 −0.001 −0.658 ***
zs −0.000 0.001 0.000 0.002 −0.001 0.001 0.998 *** 0.002 −0.001 0.000 −0.000 0.998 *** −0.000pbtcl −0.000 0.001 0.000 0.002 −0.001 0.001 0.998 *** 0.002 −0.001 0.000 −0.000 0.998 *** −0.000cat 0.008 *** 0.001 −0.002 0.821 *** −0.003 0.819 *** −0.000 0.821 *** 0.996 *** 0.008 *** −0.002 −0.000 0.008 ***clt −0.928 *** 0.246 *** 0.350 *** −0.006 ** 0.715 *** 0.033 *** −0.001 −0.009 *** −0.005 ** −0.003 0.002 −0.001 −0.928 ***
qaclspbtd 0.000 −0.002 −0.012 *** −0.008 *** 0.000 −0.005 * 0.000 −0.009 *** 0.000 0.000 0.000 0.000 *** 0.000ztta 0.000 −0.002 −0.012 *** −0.008 *** 0.000 −0.005 * 0.000 −0.009 *** 0.000 0.000 0.000 0.998 *** 0.000
nincomt 0.012 *** 0.354 *** 0.658 *** −0.000 −0.030 *** 0.010 *** 0.001 −0.000 −0.001 −0.011 *** −0.009 *** 0.002 0.012 ***tliat −0.741 *** 0.341 *** 0.495 *** −0.006 ** 0.824 *** 0.042 *** −0.001 −0.006 ** −0.005 ** 0.000 0.002 −0.001 −0.741 ***cac −0.002 0.001 0.001 0.001 −0.000 0.000 0.337 *** 0.001 0.000 0.000 −0.000 0.337 *** −0.002
zzzmij −0.005 * 0.002 0.002 0.001 0.003 0.003 0.337 *** 0.001 0.000 0.000 −0.000 0.337 *** −0.005 *
Source. Performed by the authors based on data provided by Amadeus database. Note: *, **, *** represent statistically significant at 10%, 5% and 1% respectively.
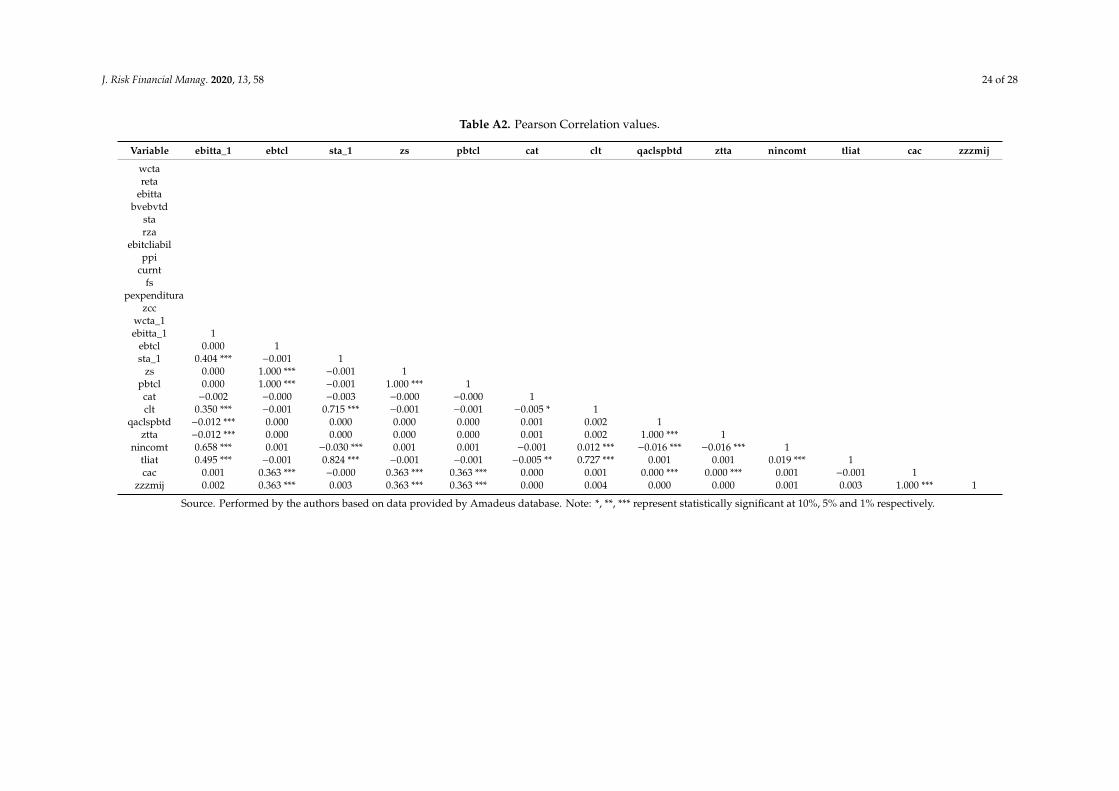
J. Risk Financial Manag. 2020, 13, 58 24 of 28
Table A2. Pearson Correlation values.
Variable ebitta_1 ebtcl sta_1 zs pbtcl cat clt qaclspbtd ztta nincomt tliat cac zzzmij
wctareta
ebittabvebvtd
starza
ebitcliabilppi
curntfs
pexpenditurazcc
wcta_1ebitta_1 1
ebtcl 0.000 1sta_1 0.404 *** −0.001 1
zs 0.000 1.000 *** −0.001 1pbtcl 0.000 1.000 *** −0.001 1.000 *** 1cat −0.002 −0.000 −0.003 −0.000 −0.000 1clt 0.350 *** −0.001 0.715 *** −0.001 −0.001 −0.005 * 1
qaclspbtd −0.012 *** 0.000 0.000 0.000 0.000 0.001 0.002 1ztta −0.012 *** 0.000 0.000 0.000 0.000 0.001 0.002 1.000 *** 1
nincomt 0.658 *** 0.001 −0.030 *** 0.001 0.001 −0.001 0.012 *** −0.016 *** −0.016 *** 1tliat 0.495 *** −0.001 0.824 *** −0.001 −0.001 −0.005 ** 0.727 *** 0.001 0.001 0.019 *** 1cac 0.001 0.363 *** −0.000 0.363 *** 0.363 *** 0.000 0.001 0.000 *** 0.000 *** 0.001 −0.001 1
zzzmij 0.002 0.363 *** 0.003 0.363 *** 0.363 *** 0.000 0.004 0.000 0.000 0.001 0.003 1.000 *** 1
Source. Performed by the authors based on data provided by Amadeus database. Note: *, **, *** represent statistically significant at 10%, 5% and 1% respectively.
J. Risk Financial Manag. 2020, 13, 58 25 of 28
References
Adalessossi, Kokou. 2015. Prediction of Corporate Bankruptcy: Evidence from West African’s SMEs. Journal ofEconomics, Finance and Accounting 2: 331–52. [CrossRef]
Agarwal, Vineet, and Richard J. Taffler. 2007. Twenty-Five Years of the Taffler Z-Score Model: Does It Really HavePredictive Ability? Accounting and Business Research 37: 285–300. [CrossRef]
Aleksanyan, Lilia, and Jean-Pierre Huiban. 2016. Economic and Financial Determinants of Firm Bankruptcy:Evidence from the French Food Industry. Review of Agricultural, Food and Environmental Studies 97: 89–108.[CrossRef]
Alkhatib, Khalid, and Ahmad Eqab Al Bzour. 2011. Predicting corporate bankruptcy of Jordanian listed companies:Using Altman and Kida Models. International Journal of Business and Management 6: 208–15. [CrossRef]
Altman, Edward I. 1968. Financial ratios, discriminant analysis and the prediction of corporate bankruptcy.The Journal of Finance XXIII: 589–609.
Altman, Edward I., John Hartzell, and Matthew Peck. 1998. Emerging Markets Corporate Bonds: A ScoringSystem. In Emerging Market Capital Flows. Part of the The New York University Salomon Center Series onFinancial Markets and Institutions Book Series (SALO, Volume 2); Boston: Springer, pp. 391–400.
Altman, Edward I. 2000. Predicting Financial Distress of Companies: Revisiting the Z-Score and Zeta ® Models.New York University. Available online: http://pages.stern.nyu.edu/~ealtman/Zscores.pdf (accessed on10 October 2019).
Altman, Edward I. 2002. Revisiting Credit Scoring Models in a Basel II Environment. In Credit Rating:Methodologies, Rationale, and Default Risk. Edited by Michael K. Ong. London: Risk Books, Availableonline: https://pdfs.semanticscholar.org/9899/c671599ca41a1310d9b5e0ed5a3953c930f0.pdf (accessed on10 October 2019).
Altman, Edward, Malgorzata Iwanicz-Drozdowska, Erkki Laitinen, and Arto Suvas. 2017. Financial DistressPrediction in an International Context: A Review and Empirical Analysis of Altman’s Z-Score Model.Journal of International Financial Managament & Accounting 28: 131–71.
Armeanu, Stefan Daniel, Georgeta Vintila, Maricica Moscalu, Maria-Oana Filipescu, and Paula Lazar. 2012.Using quantitative data analysis techniques for bankruptcy risk estimation for corporations. Theoretical andApplied Economics XIX: 97–112.
Armeanu, Stefan Daniel, and Sorin Iulian Cioaca. 2015. An assessment of the bankruptcy risk on the Romaniancapital market. Procedia Social and Behavioral Sciences 182: 535–42. [CrossRef]
Arroyave, Jackson. 2018. A comparative analysis of the effectiveness of corporate bankruptcy prediction modelsbased on financial ratios: Evidence from Colombia. Journal of International Studies 11: 273–87. [CrossRef]
Ashraf, Sumaira, Elisabete G. S. Félix, and Zélia Serrasqueiro. 2019. Do Traditional Financial Distress PredictionModels Predict the Early Warning Signs of Financial Distress? Journal of Risk and Financial Management 12: 55.[CrossRef]
Avenhuis, Jeroen O. 2013. Testing the generalizability of the bankruptcy prediction models of Altman, Ohlsonand Zmijewski for Dutch listed and large non-listed firms. Master’s Thesis, The School of Managementand Governance, University of Twente, Enschede, The Netherlands, November 13. Available online:https://essay.utwente.nl/64326/1/MSc_Oude%20Avenhuis.pdf (accessed on 25 November 2019).
Aziz, M.A., and H.A. Dar. 2006. Predicting corporate bankruptcy: Where we stand? Corporate Governance 6: 18–33.[CrossRef]
Bărbută-Misu, Nicoleta. 2009. Modelling the financial performance of the building sector enterprises—Case ofRomania. Romanian Journal of Economic Forecasting 4: 195–212.
Bărbută-Misu, Nicoleta. 2017. Assessing the Risk of Bankruptcy. Case Study on a European ManufacturingCompany. In Understanding Bankruptcy: Global Issues, Perspectives and Challenges. Chapter 4. Edited byIgnatius Ekanem. Hauppauge: Nova Science Publishers, Inc.
Bărbută-Misu, Nicoleta, and Radu Stroe. 2010. The adjustment of the Conan & Holder model to the specificity ofRomanian enterprises—A local study for building sector. Economic Computation and Economic CyberneticsStudies and Research 44: 123–40.
Bărbut,ă-Mis, u, Nicoleta, and Elena-Silvia Codreanu. 2014. Analysis and Prediction of the Bankruptcy Risk inRomanian Building Sector Companies. Ekonomika 93: 131–46. [CrossRef]

J. Risk Financial Manag. 2020, 13, 58 26 of 28
Beaver, William H. 1966. Financial Ratios as Predictors of Failure. Journal of Accounting Research 4: 71–111.[CrossRef]
Beaver, William H. 1968. Alternative Accounting Measures as Predictors of Failure. The Accounting Review43: 113–22.
Belyaeva, Elena. 2014. On a New Logistic Regression Model for Bankruptcy Prediction in the IT Branch. U.U.D.M.Project Report. p. 35. Available online: https://uu.diva-portal.org/smash/get/diva2:785084/FULLTEXT01.pdf(accessed on 15 October 2019).
Brédart, Xavier. 2014. Bankruptcy prediction model: The case of the United States. International Journal of Economicsand Finance 6: 1–7. [CrossRef]
Burns, John, and Gudrun Balvinsdottir. 2005. An institutional perspective of accountants’ new roles—Theinterplay of contradictions and praxis. European Accounting Review 14: 725–57. [CrossRef]
Cielen, Anja, Ludo Peeters, and Koen Vanhoof. 2004. Bankruptcy prediction using a data envelopment analysis.European Journal of Operational Research 154: 526–32. [CrossRef]
Conan, Joel, and Michael Holder. 1979. Variables explicatives de performances et controle de gestion dans les P.M.I.Universite Paris Dauphine [Explanatory Variables of Performance and Management Control in the SMEs]. Paris:Paris Dauphine University.
Cultrera, Loredana, Melanie Croquet, and Jeremy Jospin. 2017. Predicting bankruptcy of Belgian SMEs: A hybridapproach based on factorial analysis. International Business Research 10: 33–41. [CrossRef]
Chaitanya, Krishna. 2005. Measuring Financial Distress of IDBI Using Altman Z-Score Model. The IUP Journal ofBank Management 4: 7–17.
Chung, Kim-Choy, Shin Shin Tan, and David K. Holdsworth. 2008. Insolvency prediction model using multivariatediscriminant analysis and artificial neural network for the finance industry in New Zealand. InternationalJournal of Business and Management 3: 19–29.
Dakovic, Rada, Claudia Czado, and Daniel Berg. 2010. Bankruptcy prediction in Norway: A comparison study.Applied Economics Letters 17: 1739–46. [CrossRef]
De, Ranabir. 2014. Principal Component Analysis and General Regression Auto Associative Neural Network Hybrid asOne-Class Classifier. Kanpur: Indian Institute of Technology, Available online: https://www.idrbt.ac.in/assets/alumni/PT-2014/Ranabir%20De_Principal%20Component%20Analysis%20and%20General.pdf (accessed on5 January 2020).
Diakomihalis, Mihail. 2012. The accuracy of Altman’s models in predicting hotel bankruptcy. International Journalof Accounting and Financial Reporting 2: 96–113. [CrossRef]
Dun & Bradstreet. 2019. Global Bankruptcy Report 2019, Dun & Bradstreet Worldwide Network. Available online:https://www.bisnode.se/globalassets/global-bankruptcy-report-2019.pdf (accessed on 21 December 2019).
Elviani, Sri, Ramadona Simbolon, Zenni Riana, Farida Khairani, Sri Puspa Dewi, and Fauzi Fauzi. 2020.The Accuracy of the Altman, Ohlson, Springate and Zmejewski Models in Bankruptcy Predicting TradeSector Companies in Indonesia. Budapest International Research and Critics Institute (BIRCI-Journal) 3: 334–47.[CrossRef]
European Commission. 2003. Commission Recommendation of 6 May 2003 Concerning the Definition ofMicro, Small and Medium-Sized Enterprises. Available online: http://eur-lex.europa.eu/eli/reco/2003/361/oj(accessed on 18 December 2019).
Euler Hermes Economic Research. 2019. The View Economic Research. Availableonline: https://www.eulerhermes.com/content/dam/onemarketing/euh/eulerhermes_com/erd/publications/pdf/Global-Insolvencies-Jan19.pdf (accessed on 21 December 2019).
Fulmer, John G., Jr., James E. Moon, Thomas A. Gavin, and Michael J. Erwin. 1984. A Bankruptcy ClassificationModel for Small Firms. Journal of Commercial Bank Lending 66: 25–37.
Heffernan, Shelagh. 2005. Modern Banking. Chichester: John Wiley & Sons Ltd.Hillegeist, Stephen A., Elizabeth K. Keating, Donald P. Cram, and Kyle G. Lundstedt. 2004. Assessing the
probability of bankruptcy. Review of Accounting Studies 9: 5–34. [CrossRef]Jouzbarkand, Mohammad, Farshad S. Keivani, Mohsen Khodadadi, and Seyed R.S.N. Fahim. 2013. Bankruptcy
prediction model by Ohlson and Shirata models in Tehran Stock Exchange. World Applied Sciences Journal21: 152–56.
Karels, Gordon V., and Arun J. Prakash. 1987. Multivariate normality and forecasting for business bankruptcy.Journal of Business Finance & Accounting 14: 573–93.

J. Risk Financial Manag. 2020, 13, 58 27 of 28
Kim, Myoung-Jong, and Ingoo Han. 2003. The discovery of experts’ decision rules from qualitative bankruptcydata using genetic algorithms. Expert Systems with Applications 25: 637–46. [CrossRef]
Koh, Hian Chye, and Sen Suan Tan. 1999. A neural network approach to the prediction of going concern status.Accounting and Business Research 29: 211–16. [CrossRef]
Král’, Pavol, Milos Fleischer, Maria Stachová, Gabriela Nedelová, and Lukas Sobíšek. 2016. Corporatefinancial distress prediction of Slovak companies: Z-score models vs. alternatives. Paper presentedat the 9th Applications of Mathematics and Statistics in Economics—AMSE 2016, Banská Štiavnica, Slovakia,August 31–September 4.
Li, Hui, and Jie Sun. 2011. Predicting business failure using forward ranking-order case-based reasoning.Expert Systems with Applications 38: 3075–84. [CrossRef]
Mousavi, Mohammad Mahdi, Jamal Ouenniche, and Kaoru Tone. 2019. A comparative analysis of two-stagedistress prediction models. Expert Systems with Applications 119: 322–41. [CrossRef]
Ohlson, James A. 1980. Financial Ratios and the Probabilistic Prediction of Bankruptcy. Journal of Accounting Research18: 109–31. [CrossRef]
Onofrei, Mihaela, and Dan Lupu. 2014. The Modelling of Forecasting the Bankruptcy in Romania. MPRA Paper 95511.Munich: University Library of Munich.
Ouenniche, Jamal, and Kaoru Tone. 2017. An out-of-sample evaluation framework for DEA with application inbankruptcy prediction. Annals of Operations Research 254: 235–50. [CrossRef]
Paradi, Joseph C., Mette Asmild, and Paul C. Simak. 2004. Using DEA and worst practice DEA in credit riskevaluation. Journal of Productivity Analysis 21: 153–65. [CrossRef]
Prusak, Blazej. 2018. Review of research into enterprise bankruptcy prediction in selected Central and EasternEuropean countries. International Journal of Financial Studies 6: 60. [CrossRef]
Ryu, Kisang, and Soocheong Jang. 2004. Performance Measurements through Cash Flow Ratios and TraditionalRatios: A Comparison of Commercial and Casino Hotel Companies. Journal of Hospitality Financial Management12: 15–25. [CrossRef]
Scapens, Robert W. 2006. Understanding Management Accounting Practices: A personal journey. British AccountingReview 38: 1–30. [CrossRef]
Shetty, Udaya, T. P. M. Pakkala, and T. Mallikarjunappa. 2012. A modified directional distance formulation ofDEA to assess bankruptcy: An application to IT/ITES companies in India. Expert Systems with Applications39: 1988–97. [CrossRef]
Shin, Kyung-Shik, Taik Soo Lee, and Hyun-Jung Kim. 2005. An application of support vector machines inbankruptcy prediction model. Expert Systems with Applications 28: 127–35. [CrossRef]
Shirata, Cindy Yoshiko. 1995. Read the Sign of Business Failure. Journal of Risk and Management 23: 117–38.Shumway, Tyler. 2001. Forecasting bankruptcy more accurately: A simple hazard model. Journal of Business
74: 101–24. [CrossRef]Sigrist, Fabio, and Christoph Hirnschall. 2019. Grabit: Gradient tree-boosted Tobit models for default prediction.
Journal of Banking & Finance 102: 177–92.Springate, Gordon. 1978. Predicting the possibility of failure in a Canadian firm. Master’s Thesis, Simon Fraser
University, Burnaby, BC, Canada.Taffler, Richard J. 1982. Forecasting company failure in the UK using discriminant analysis and financial ratio data.
Journal of Royal Statistical Society Series A 145: 342–58. [CrossRef]Taffler, Richard J. 1983. The assessment of company solvency and performance using a statistical model. Accounting
and Business Research 15: 295–307. [CrossRef]Taffler, Richard J. 1984. Empirical models for the monitoring of UK corporations. Journal of Banking & Finance
8: 199–227.Tam, Kar Yan. 1991. Neural Network Models and the Prediction of Bank Bankruptcy. Omega 19: 429–45. [CrossRef]Theodossiou, Panayiotis. 1991. Alternative models for assessing the financial condition of business in Greece.
Journal of Business Finance & Accounting 18: 697–720.Xu, Ming, and Chu Zhang. 2009. Bankruptcy prediction: The case of Japanese listed companies. Review of
Accounting Studies 14: 534–58. [CrossRef]Zavgren, Christine V. 1985. Assessing the vulnerability to failure of American industrial firms: A logistic analysis.
Journal of Business Finance & Accounting 12: 19–45.

J. Risk Financial Manag. 2020, 13, 58 28 of 28
Zhang, Guoqiang, Michael Y. Hu, Eddy B. Patuwo, and Daniel C. Indro. 1999. Artificial neural networksin bankruptcy prediction: General framework and cross-validation analysis. European Journal ofOperational Research 116: 16–32. [CrossRef]
Zmijewski, Mark E. 1984. Methodological issues relating to the estimation of financial distress prediction models.Journal of Accounting Research 22: 59–82. [CrossRef]
Wang, Jo-Yu, Juo-Lien Wang, and Hui-Yu Liao. 2019. Does Corporate Governance Enhance Firm Performanceand Reduce Firm Risk? Evidence from Taiwanese Listed Companies. Journal of Economics and Management15: 61–91.
Woods, Margare, and Kevin Dowd. 2008. Financial Risk Management for Management Accountants, ManagementAccounting Guideline. Toronto: The Society of Management Accountants of Canada (CMA Canada),Durham: The American Institute of Certified Public Accountants, Inc. (AICPA), London: The CharteredInstitute of Management Accountants (CIMA), Available online: https://www.cimaglobal.com/Documents/ImportedDocuments/cid_mag_financial_risk_jan09.pdf (accessed on 25 November 2019).
Wu, Yanhui, C. Gaunt, and S. Gray. 2010. A Comparison of Alternative Bankruptcy Prediction Models. Journal ofContemporary Accounting and Economics 6: 34–45. [CrossRef]
© 2020 by the authors. Licensee MDPI, Basel, Switzerland. This article is an open accessarticle distributed under the terms and conditions of the Creative Commons Attribution(CC BY) license (http://creativecommons.org/licenses/by/4.0/).