The Effectiveness of Covert vs. Overt Brand Visibility in Video ...
129
Rochester Institute of Technology Rochester Institute of Technology RIT Scholar Works RIT Scholar Works Theses 4-29-2020 The Effectiveness of Covert vs. Overt Brand Visibility in Video The Effectiveness of Covert vs. Overt Brand Visibility in Video Advertising Advertising Mingyue Zhang [email protected] Follow this and additional works at: https://scholarworks.rit.edu/theses Recommended Citation Recommended Citation Zhang, Mingyue, "The Effectiveness of Covert vs. Overt Brand Visibility in Video Advertising" (2020). Thesis. Rochester Institute of Technology. Accessed from This Master's Project is brought to you for free and open access by RIT Scholar Works. It has been accepted for inclusion in Theses by an authorized administrator of RIT Scholar Works. For more information, please contact [email protected].
-
Upload
khangminh22 -
Category
Documents
-
view
3 -
download
0
Transcript of The Effectiveness of Covert vs. Overt Brand Visibility in Video ...
Rochester Institute of Technology Rochester Institute of Technology
RIT Scholar Works RIT Scholar Works
Theses
4-29-2020
The Effectiveness of Covert vs. Overt Brand Visibility in Video The Effectiveness of Covert vs. Overt Brand Visibility in Video
Advertising Advertising
Mingyue Zhang [email protected]
Follow this and additional works at: https://scholarworks.rit.edu/theses
Recommended Citation Recommended Citation Zhang, Mingyue, "The Effectiveness of Covert vs. Overt Brand Visibility in Video Advertising" (2020). Thesis. Rochester Institute of Technology. Accessed from
This Master's Project is brought to you for free and open access by RIT Scholar Works. It has been accepted for inclusion in Theses by an authorized administrator of RIT Scholar Works. For more information, please contact [email protected].

The Effectiveness of Covert vs. Overt Brand Visibility in Video Advertising
Mingyue Zhang
M. S. Media Arts and Technology
Rochester Institute of Technology
Advisor: Professor Christopher Bondy
A submission in partial fulfillment of the
Master of Science degree
in Media Arts & Technology
Rochester Institute of Technology
April 29, 2020
1
Abstract
This research is a mixed-methods (qualitative and quantitative) and semi-structured
(survey and interview) study on the effectiveness of covert vs. overt commercials towards the
influence of the brand attitude and purchase intention of consumers. Covert commercials are
video advertisements that present the promoted brand and sponsor unclearly, and make its
marketing nature hard to recognize at first sight. Overt commercials are video advertisements
that present the promoted brand and sponsor clearly, and disclose its sponsor and marketing
nature expressively. The survey and interview are designed to measure participants’ responses to
four commercials, either covert or overt, with regards to the AIDA model, advertising
skepticism, perceived believability, and brand attitude. This research contributes to the present
literature regarding covert and overt video advertising, and gives advertisers and businesses
valuable insights into covert commercials and their implications for improving marketing
strategies and future study.
Keywords: research, covert commercials, overt commercials, video advertising, AIDA,
advertising skepticism, perceived believability, brand attitude, marketing

2
Table of Contents
Introduction 1
Literature Review 11
Research Question and Hypotheses 23
Methodology 25
Results 35
Analysis 67
Observation and Implications 104
Conclusion 113
Glossary 118
References 120
Appendix 124
1
Introduction
With the development of the Internet and personal electronic devices, the
communications industry has experienced dynamic change. Businesses accelerate the process of
distributing promotional messages, and consumers access information more efficiently. The
more efficient the communications industry becomes, the broader range of content there is and
the more freedom the audience possesses.
Overt marketing faces the defensiveness of the consumers as it contains apparent
promotional intentions (Chan, 2019). Consumers are skeptical of the content in an advertisement
and do not want to be sold to. They end up choosing to ignore, avoid, or skip content that appears
to be advertisements. Encountering consumers’ resistance, overt marketing is not likely the most
effective means of influencing consumers.
To get around consumers’ skepticism towards advertising, companies are applying covert
marketing (Brown & Krishna, 2004). Covert marketing is less likely to promote something
directly, and therefore, may appear to be less suspicious than an overt promotion (Chan, 2019).
Consumers are likely to be less defensive when they encounter covert advertising and might
generate more positive attitudes towards covert advertisements and higher purchase intentions.
This research explores whether such opposite responses towards overt and covert marketing hold
true in the context of overt and covert commercials.
Overt and Covert Marketing
While few studies have explicitly defined overtness and covertness, specifically in
commercials or to distinguish between overt and covert commercials, some scholarly reviews

2
and legal documentations have looked into overtness and covertness in marketing as a whole and
defined the categories of covert marketing. The examination of overt and covert marketing
provides implications for comparing overtness and covertness in commercials.
In marketing, overt and covert are media modalities that indicate the two extremes of
brand visibility, which are highly visible and highly invisible, and can be used as one way to
describe a given advertisement type. On one hand, overt can be referred to as visible - the
promoted brand, sponsorship, and marketing nature are made visible without any deception at
all. On the other end, covert is the opposite to overt and can be referred to as hidden - the
promoted brand, sponsorship, and marketing nature are either expressed implicitly or totally
concealed with the intention of deceiving the audience.
Covert marketing can be categorized into at least three sets of practices, known as “the 3
Ms”: masked marketing, mole marketing, and mental marketing (Petty & Andrews, 2008).
Masked Marketing
The nature of concealed marketing involves having a disguised commercial source, or a
disguised commercial message, or having both. That is, the spokesperson, agent, or influencer
pretends to be independent from the brand, or the content does not appear to be promotional, or
both are true.
Masked Marketing Practices. The first two are Posers and Buzz and Viral Marketing,
which use disguised communicators who appear to be independent, but in fact, benefit from
promoting the product. The other four practices include Advertorials (seemingly independent or
editorial content that is promotional in nature), Ad-sults (invisible metatags that lead to
3
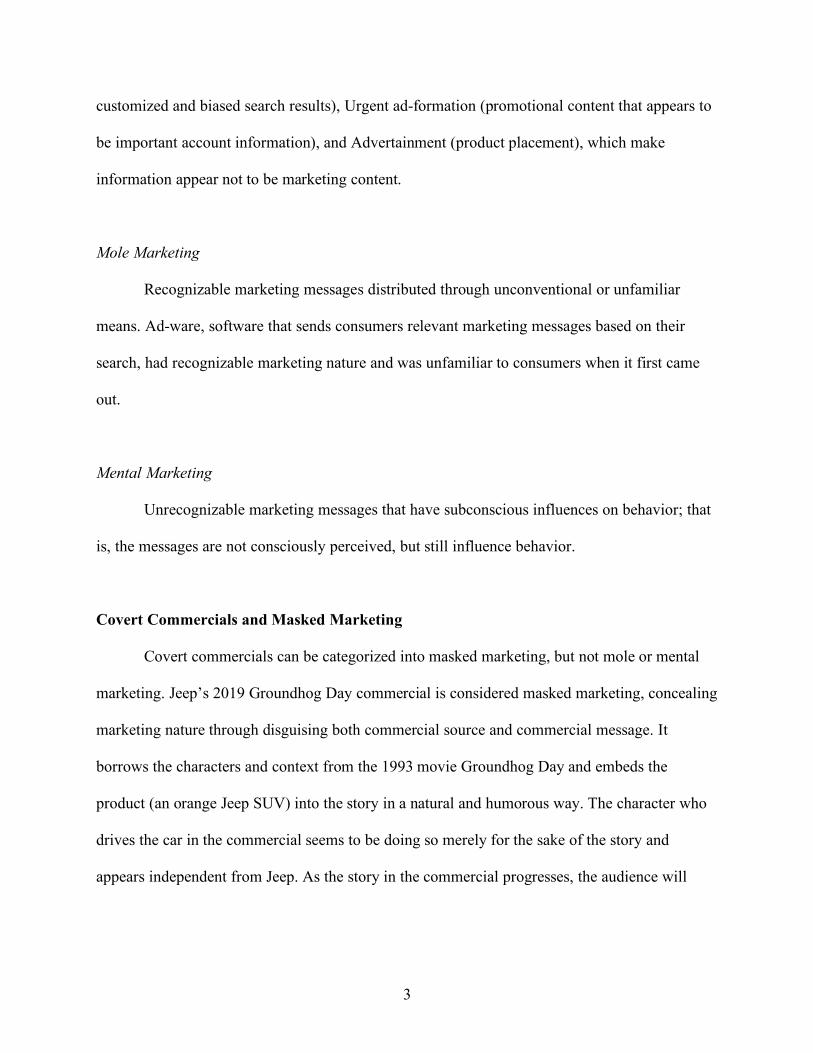
customized and biased search results), Urgent ad-formation (promotional content that appears to
be important account information), and Advertainment (product placement), which make
information appear not to be marketing content.
Mole Marketing
Recognizable marketing messages distributed through unconventional or unfamiliar
means. Ad-ware, software that sends consumers relevant marketing messages based on their
search, had recognizable marketing nature and was unfamiliar to consumers when it first came
out.
Mental Marketing
Unrecognizable marketing messages that have subconscious influences on behavior; that
is, the messages are not consciously perceived, but still influence behavior.
Covert Commercials and Masked Marketing
Covert commercials can be categorized into masked marketing, but not mole or mental
marketing. Jeep’s 2019 Groundhog Day commercial is considered masked marketing, concealing
marketing nature through disguising both commercial source and commercial message. It
borrows the characters and context from the 1993 movie Groundhog Day and embeds the
product (an orange Jeep SUV) into the story in a natural and humorous way. The character who
drives the car in the commercial seems to be doing so merely for the sake of the story and
appears independent from Jeep. As the story in the commercial progresses, the audience will
4
sooner or later realize that the commercial is not about a story related to a movie, but is intended
to promote Jeep’s vehicles.
Google’s 2020 Loretta commercial is also considered masked marketing, showing the use
of Google’s search engine and Google Photo with recognizable interfaces, while having a
narrator (an older man) recalling his memories about his late wife and trying not to forget them.
The commercial uses emotional appeals to mask the promotional message into a sentimental and
relatable story, and to attract and keep the audience. It does not intend to conceal the commercial
source by disclosing the sponsorship and the marketing nature with the demonstration of
recognizable Google interfaces throughout the video.
Commercials, whether overt or covert, do not fit the definition of either mole or mental
marketing. They cannot be categorized as mole marketing in any circumstances. Commercials’
presences are predictable: some are played on TV between programs, some are placed in midst
of a corporate website, some appear before the desired content, and some are shown in other
online media channels. Unlike Ad-ware (customized delivery of promotional messages), which
the audience does not always recognize or may have already developed better knowledge of,
commercials are shown in a more predictable way that would not surprise the audience. The
audience knows where to expect commercials and finds ways to avoid or skip them.
Although covert commercials are designed to be more subtle in their presentation of
promotional content, they are not designed to completely cover up the marketing nature, and they
can be recognized by the audience as video advertisements at some point in the videos: at the
beginning, somewhere in the middle, or at the very end. Typically, a highly overt commercial
discloses brand information early in the video. The WSFS Bank’s 2016 We Stand for Service
commercial uses an auditory cue to disclose the sponsorship and starts with the narration: “At

5
WSFS Bank, we stand for what’s possible.” The Autoavilys’s 2018 car service commercial uses
a visual cue to present the brand and opens the scene showing a physical logo sign on the wall
behind the company’s front desk. A highly covert commercial is more likely to make the
disclosure near or at the end to ensure that the audience is attracted and focuses on the story
throughout most of the video, without becoming defensive against the brand disclosure during
the viewing experience. Both Jeep’s 2019 Groundhog Day commercial and Google’s 2020
Loretta commercial reveal the logos in the last few seconds.
As demonstrated above, covert commercials can fit into only masked marketing, one of
the 3 Ms. The specifications of the definition of covert commercials, shown in Column Covert
on Table 1 in the following section (Overt vs. Covert Commercials), reflect the attributes of
masked marketing.
Overt vs. Covert Commercials
Overt commercials are a visible and traditional form of video advertisements that disclose
promotional intention expressively and promote a brand explicitly. Covert commercials are a
hidden form of video advertisements that (attempt to) conceal their marketing nature and
promote a brand implicitly. A more detailed comparison of the two forms of commercials is
presented in Table 1, elaborating on the specific conditions that help define and distinguish
between overt and covert commercials.
6
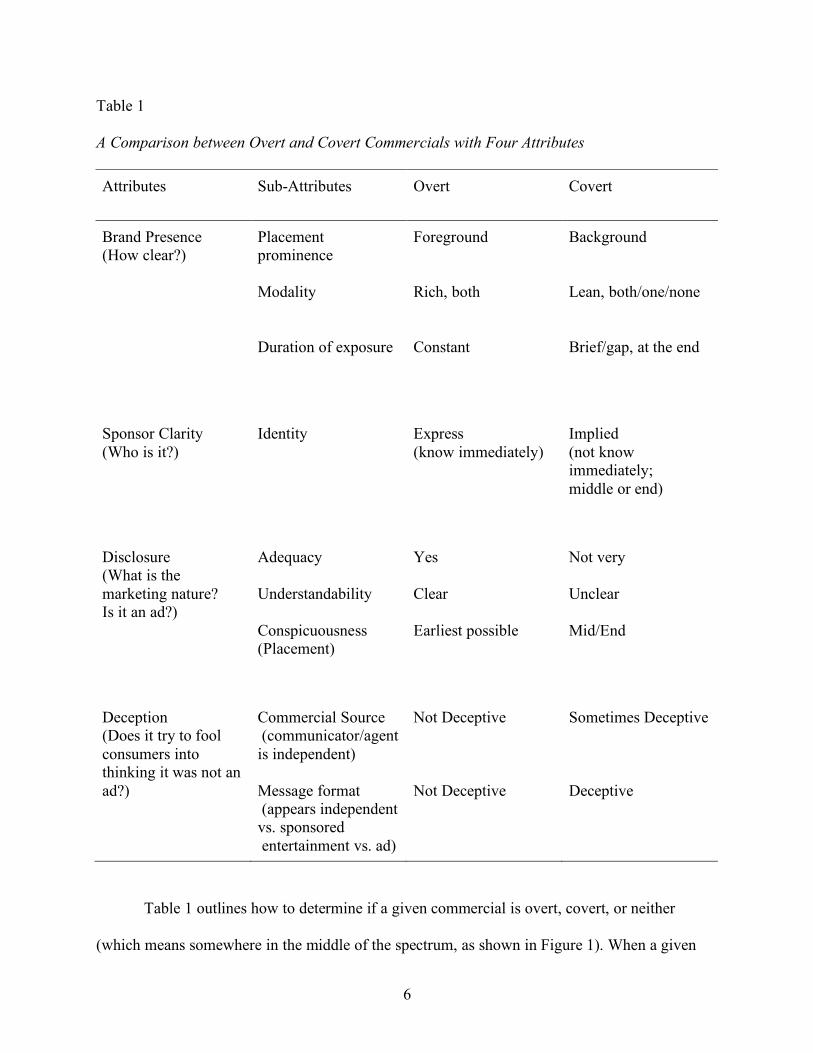
Table 1
A Comparison between Overt and Covert Commercials with Four Attributes
Attributes Sub-Attributes
Overt
Covert
Brand Presence (How clear?)
Placement prominence Modality Duration of exposure
Foreground Rich, both Constant
Background Lean, both/one/none Brief/gap, at the end
Sponsor Clarity (Who is it?)
Identity
Express (know immediately)
Implied (not know immediately; middle or end)
Disclosure (What is the marketing nature? Is it an ad?)
Adequacy Understandability Conspicuousness (Placement)
Yes Clear Earliest possible
Not very Unclear Mid/End
Deception (Does it try to fool consumers into thinking it was not an ad?)
Commercial Source (communicator/agent is independent) Message format (appears independent vs. sponsored entertainment vs. ad)
Not Deceptive Not Deceptive
Sometimes Deceptive Deceptive
Table 1 outlines how to determine if a given commercial is overt, covert, or neither
(which means somewhere in the middle of the spectrum, as shown in Figure 1). When a given
7
commercial meets the conditions of either Column Overt or Column Convert, it is considered as
either overt or covert commercials; otherwise, it is regarded as a practice placed somewhere
between overt and covert on the spectrum, as shown in Figure 1.
The definitions of overt and covert commercials in Table 1 are based on the measure of
sponsorship transparency, which is the extent to which a sponsored communication message
makes noticeable to the consumer its paid nature and the identity of the sponsor (Wojdynski,
Evans, & Hoy, 2018, p. 121). The measure sponsorship transparency identifies four dimensions
of transparency: brand presence, sponsor clarity, disclosure, and (lack of) deceptiveness
(Wojdynski, Evans, & Hoy, 2018). These four dimensions are referred to as Attributes in Table
1, and help define overt and covert commercials. The Sub-Attributes are the specified conditions
that go into the four dimensions of sponsorship transparency and were used in the work of
Ashley and Leonard (2009), Petty and Andrews (2008), Balasubramanian, Karrh, and
Patwardhan (2006), and Tomažic, Boras, Jurišic, and Lesjak (2014).
The Spectrum from Overt to Covert Marketing
Marketing consists of a broad range of advertising practices. The various advertising
practices, including but not limited to commercials and others discussed above, can be defined as
overt, covert, or something in between. Overt and covert are not binary options for defining a
given advertisement type. There is a spectrum ranging from the overt end to the covert end. An
advertisement can be somewhere in the middle of the spectrum: in the middle, closer to the overt
end, or closer to the covert end.
The degree of overtness or covertness is relative. For instance, online advergames are
considered more covert than are commercials (Petty & Andrews, 2008) and are not well-defined
8
in terms of how covert they are exactly. Further study is needed to standardize how to determine
where each advertisement practice should be placed on the spectrum, which is how much more
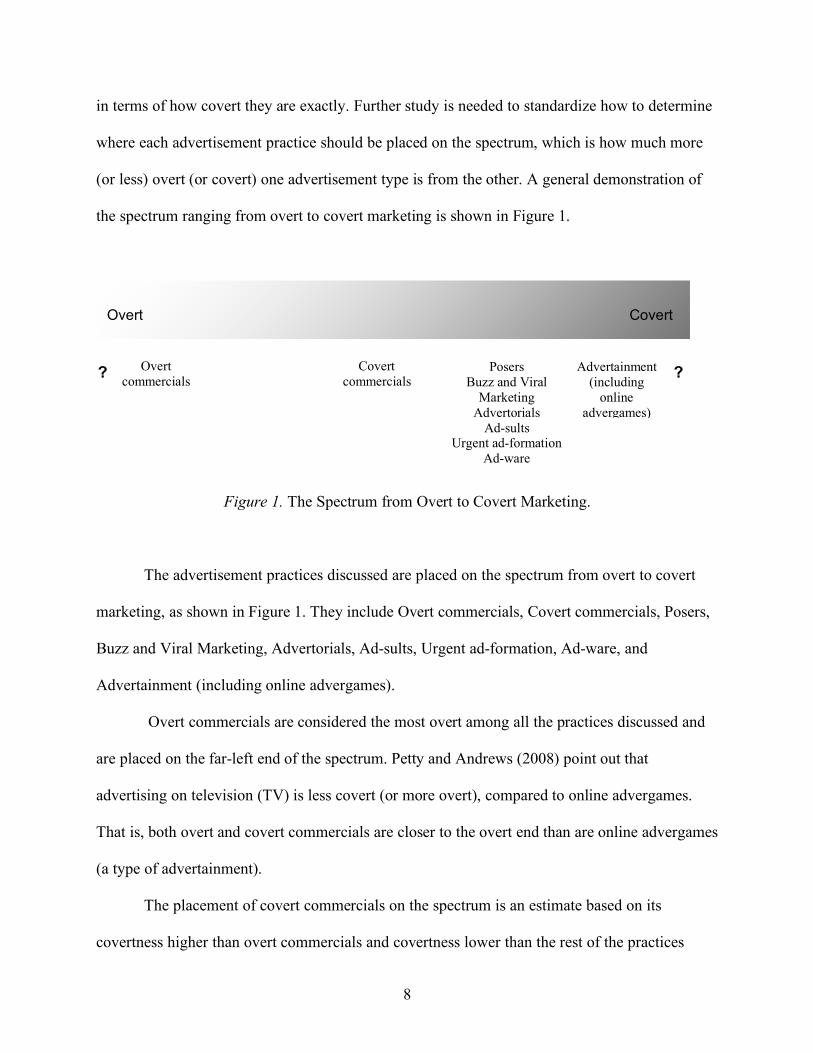
(or less) overt (or covert) one advertisement type is from the other. A general demonstration of
the spectrum ranging from overt to covert marketing is shown in Figure 1.
Figure 1. The Spectrum from Overt to Covert Marketing.
The advertisement practices discussed are placed on the spectrum from overt to covert
marketing, as shown in Figure 1. They include Overt commercials, Covert commercials, Posers,
Buzz and Viral Marketing, Advertorials, Ad-sults, Urgent ad-formation, Ad-ware, and
Advertainment (including online advergames).
Overt commercials are considered the most overt among all the practices discussed and
are placed on the far-left end of the spectrum. Petty and Andrews (2008) point out that
advertising on television (TV) is less covert (or more overt), compared to online advergames.
That is, both overt and covert commercials are closer to the overt end than are online advergames
(a type of advertainment).
The placement of covert commercials on the spectrum is an estimate based on its
covertness higher than overt commercials and covertness lower than the rest of the practices
Overt Covert
Overt commercials
Covert commercials
Posers Buzz and Viral
Marketing Advertorials
Ad-sults Urgent ad-formation
Ad-ware
Advertainment (including
online advergames)
? ?
9
mentioned. Since covert commercials are made to be more covert than overt commercials, it is
placed closer to the covert end. Covert commercials are placed farther from the covert end than
the other practices besides overt commercials because their marketing intention is still more
recognizable to the audience. Covert commercials, like overt commercials, are usually presented
to the audience in a disruptive or intrusive way as an abrupt placement between TV programs
and an undesired addition to viewers’ online experience. They also tend to give away their
marketing nature due to the necessity to disclose the brand at some point during the video; it is
the only way to make sure that the audience remembers the brand from watching it, if they are
ever interested enough not to skip the commercial.
Posers, Buzz and Viral Marketing, Advertorials, Ad-sults, Urgent ad-formation, and Ad-
ware are listed between the middle point and the covert end on the spectrum. They are more
covert than covert commercials because they are better at hiding their promotional intentions. As
discussed in the previous section (Overt and Covert Marketing), these listed practices are
categorized as masked marketing, and they conceal their marketing nature through disguised
commercial source, disguised commercial message, or both (Petty & Andrews, 2008). The order
of the list of masked marketing practices is arranged according to the order in which the practices
are discussed in this paper. It does not imply which one is more overt or covert than the others.
Few scholars discuss the relative degree of overtness and covertness of the advertisement
practices listed. The relative degree of overtness and covertness of each practice on the list is,
therefore, not validated by abundant scholarly sources.
Advertainment (including online advergame) is more covert than any of the other
advertising practices on the spectrum. Petty and Andrews (2008) argue that product placement’s
progress may lead to a blurred line between entertainment with a product placement and
10
advertising that looks like entertainment and may give rise to more active product placements in
entertainment which are harder to recognize. The envision of the blurred line and trickier product
placements suggest that advertainment is effective in concealing the marketing intention and
deceiving consumers into more accepting of the promoted brand. Advertainment (including
online advergame) is, therefore, placed closest to the covert end on the spectrum.
The two question marks on both ends indicate that this spectrum is open to more overt
and more covert examples of advertising practices than are the existing ones. The spectrum can
also be refined with the addition of more examples in between the two ends, as well.
Statement of Problem
Covert and overt marketing are two distinct approaches to influencing consumers’
perceptions. There have been disputes about and no clear evidence on which one is more
effective in the form of commercials or video advertisements towards the influence of brand
attitude and purchase intention of consumers. The lack of certainty is a negative force for
marketers and businesses who possess limited knowledge of covert brand visibility and are
uncertain about how to best deploy this form of video advertisements. They risk missing out on a
chance to increase returns on advertising costs or losing money for poor promotional planning
and execution.

11
Literature Review
This research uses the AIDA (Attention-Interest-Desire-Action) model to design its
survey and interview questions. The AIDA model is commonly used for assessing
advertisements and has been applied in studies of numerous fields, especially in marketing.
Other variables used in the research include advertising skepticism, perceived believability, and
brand attitude, as quoted in Chan (2019) and Obermiller and Spangenberg (1998).
Significance of the Research
There is a lack of research on comparing covert and overt advertising in the video format.
There have been studies on TV commercials (Aryal, 2005), TV programs (Pashootanizadeh &
Khalilian, 2018), and social media marketing (Hassan, Nadzim, & Shiratuddin, 2015), but not on
the comparison of their covert and overt versions. Research that compares covert and overt
versions of publications does not consider commercials. There are comparison studies on the
effectiveness of covert and overt advertising in recipes (Chan, 2019), blog marketing (Liljander,
Gummerus, & Söderlund, 2014), and online marketing (Lagrosen, 2005).
Chan (2019) asserts that, while there have been efforts to investigate the effect of covert
and overt advertising, it is rare to find a direct comparison between the two forms of promotions
but there have been inconsistent findings. It is suggested that future work should look into the
applicability of the conceptual model on audio-visual formats (Chan, 2019). Chan’s statements
affirm the importance of conducting research that compares covert vs. overt advertisements in
audio-visual formats based on the conceptual model or other reliable models. This research looks
into the differences (or similarities) in the effects of covert and overt advertisements in audio-
12
visual formats (video formats) based on part of Chan (2019)’s conceptual model (advertising
skepticism, perceived believability, and brand attitude) and the AIDA model. It contributes to the
present literature regarding covert and overt video advertising, and gives advertisers and
businesses valuable insights into covert commercials and their implications for improving
marketing strategies.
AIDA
The survey and interview design are based on the AIDA model to investigate the
effectiveness of covert vs. overt brand visibility in commercials. In 1898, the AIDA model was
first introduced by E. St. Elmo Lewis, who used the slogan, “Attract attention, maintain interest,
create desire” in an advertising course and later added, get action (Strong, 1925, p. 9). It
demonstrates the four stages in which advertisements persuade consumers to make a purchase
(Wijaya, 2012). AIDA is a type of Hierarchy-of-Effects model which consists of a series of steps
that show the sequential effects of advertisements on consumers in making a purchase decision
or accepting a brand, product, or innovation. To apply AIDA in the context of overt and covert
video advertising:
Attention: How the commercial attracts the attention of consumers.
Interest: How the commercial maintains the interest of consumers in the brand (or
product) or related items.
Desire: How the commercial creates the desire of consumers for the brand (or product) or
related items.
Action: How the commercial gets consumers to support the brand or purchase the
product.
13
The AIDA model is applicable in a wide range of research areas in various settings. It is
commonly applied to evaluate the effects of video-format media, such as TV commercials and
programs. The work of Rawal (2013) offers an overview of the TV commercials market. It also
provides a thorough explanation of the AIDA model and its application in the context of TV
commercials. Rawal argues that advertising campaigns are not to sell, but to gain the attention of
the audience, which eventually leads to persuasion (2013). The study substantiates the
application of the AIDA model in evaluating the effectiveness of commercials.
Similarly, Aryal (2005) looks at the effects of TV commercials in Nepal. The study
primarily aims to examine the effects of slogans, illustrations, price, quality, availability, and
premium in commercials on consumers’ recall rates. This research explores the effectiveness of
commercials if they do not specify or intentionally display these factors examined by Aryal’s
study. Aryal tests the applicability of the AIDA model and the hierarchy of the four stages in the
effects of TV commercials on the suburban and urban society of Nepal. The result confirms that
the four stages of the AIDA model take place in descending order in the context of Nepal
commercials (Aryal, 2005). This conclusion proves that AIDA is applicable in the context of TV
commercials in Nepal.
The study of Pashootanizadeh and Khalilian (2018) shows how the AIDA model can be
applied to examine the effectiveness of TV programs in persuading teenagers to use public
libraries in Iran. The researchers found that the TV programs can only complete Attention, the
first stage of the AIDA model. In the study, the Attention variable contains three steps: creativity
in the programs, desirable and interesting programs, and meeting the audiences’ expectations.
Using Friedman’s test, desirable and interesting programs ranks the highest, and persuading the
audience to use public libraries (in the Action step) ranks the lowest. The researchers conclude
14
that TV programs are not significantly effective, based on the AIDA model. This study displays
a comprehensive application of AIDA to measure the effectiveness of a form of video-format
media for a specific purpose. It substantiates the application of AIDA in this research, which also
aims to evaluate the effectiveness of a type of video-format media (video advertising or
commercials).
The AIDA model helps evaluate the effectiveness of online advertisements. Hassan,
Nadzim, and Shiratuddin (2015) examine the application of the AIDA model in social media
marketing for small businesses using a focus group method to collect qualitative data. They
assert that the AIDA model can be applied by small businesses to plan for social media
marketing. Their finding substantiates the argument of Lagrosen (2005) that the AIDA model
can be applied in the context of Internet use for marketing communication.
The AIDA model is also applicable for formulating marketing strategies. In a study on
education approach assessment, Lee and Hoffman (2015) evaluate the benefits and constraints of
the infomercial activity, an active-learning technique, by using infomercials to instruct the four
components of the AIDA model. They affirm that AIDA is tightly associated with creating
effective infomercials. That is, AIDA can be used to make infomercials effective.
Because of its long history and wide application for research purposes, especially for
investigating the effectiveness of advertisements of multiple forms and types, the AIDA model
has proven valuable for this research on covert vs. overt video advertising.
Other Models and Methods
Several other models used in advertising-related research are assessed against the AIDA
model.
15
The Association Model
The Association Model, proposed by Preston (1982), contains detailed steps of
consumers’ responses to advertisements and integrates variables that are commonly used for
research in advertising. It covers more variables than the AIDA model and is more geared
towards research purposes. The variables in the Association Model include Distribution, Vehicle
Exposure, Ad Exposure, Ad Awareness, Non-Product Awareness, Product Awareness,
Association Awareness, Association Evaluation, Product Perception, Prior Perception, Integrated
Perception, Product Evaluation, Prior Evaluation, Integrated Evaluation, Product Stimulation,
Prior Stimulation, Integrated Stimulation, and Action.
As this research focuses on the immediate mental response to an ad, it is relevant to use
the variable Association Evaluation to measure consumers’ evaluation of the items associated
with the brand or product in the ads. Association Evaluation does not overlap with any stage in
the AIDA model and is an addition to AIDA (Preston, 1982). Consumers’ assessment of the
associated items can influence their perception of the brand or product. It can also be different
from advertisers’ anticipation. While advertisers intend to associate their product with things that
they want the consumers to perceive as positive, individual consumers will evaluate the things in
different ways, not necessarily positive. With the use of Association Evaluation, this research
considers the perspectives of individual survey respondents (consumers) in addition to the
anticipation of the advertisers towards the evaluation of associated items.
Association Evaluation may also explain why covert brand visibility is or is not more
effective than overt brand visibility. It can help answer the following questions: If consumers
have a more positive evaluation of the brand or product promoted in the covert commercials,
does their evaluation of the associated items in covert commercials differ from that of the
16
associated items in overt commercials? Does this difference have any implications for the result
of the survey? If consumers have positive evaluations of the associated items in both covert and
overt commercials, would they have similar evaluations of the brand or product in both types of
commercials?
Product Evaluation and Product Stimulation are also relevant to this research; however,
they overlap with the stages in the AIDA model. Product Evaluation, referred to as the
evaluation of brand or product based on the immediate advertising input (Preston, 1982), can
take place in the Interest stage in AIDA. Product Stimulation, namely the intention to purchase,
can appear in the Desire stage in AIDA. Since AIDA is the primary model used in this research,
Product Evaluation and Product Stimulation in the Association model, through relevant, has not
been used.
Chan’s Conceptual Model
Chan (2019) conducts an experiment to compare the effectiveness of a form of covert
promotions and an overt promotion, which are product placement in recipes and traditional
advertisement. The purpose is to investigate how Perceived Believability of promotional
materials, Advertising Skepticism, and Brand Awareness affect Brand Attitude (Obermiller &
Spangenberg, 1998).
Perceived Believability refers to how consumers perceive the believability of
advertisements, measured with seven items: not convincing/convincing, not credible/credible,
unbelievable/believable, unreasonable/reasonable, dishonest/honest,
questionable/unquestionable, and not authentic/authentic (Beltramini, 1982).
17
Unbelievable/believable was referenced and revised to measure the perceived believability of
commercials to the subjects in this research: very unbelievable/very believable.
Brand Attitude refers to consumers’ attitude toward the brand promoted in the
advertisements, measured with four items: very bad/very good, very undesirable/very desirable,
likely to buy (if in the market)/not likely to buy, and very negative (feelings)/very positive
(feelings) (Obermiller & Spangenberg, 1998). Very negative (feelings)/very positive (feelings)
was selected to measure the brand attitude of subjects in this research.
Chan posits a conceptual model that summarizes the relationships between these
variables. This model is new and has only been tested on the advertisements in recipes, which are
different from video advertisements intended for this research. Therefore, Chan’s conceptual
model is less reliable than the AIDA model for this research.
Advertising Skepticism is the tendency toward disbelief of advertising claims (Obermiller
& Spangenberg, 1998). Using Advertising Skepticism as a variable in their study, Chan (2019)
suggests that consumers who are skeptical toward advertising, in general, may be more critical in
processing promotional materials. This statement is proved by the result of Chan’s study:
Participants with a low level of advertising skepticism were more likely to develop a positive
attitude toward the promoted brand when they perceived the promotional material to be
believable than when they found it not to be so believable. The difference was insignificant for
participants with a high level of advertising skepticism. Chan explains that consumers with high
Advertising Skepticism dislike being sold to or deliberately manipulated; thus, they evaluate a
brand in overt advertisements more negatively than they do those with low Advertising
Skepticism (p. 10).

18
It is uncertain whether and how much Advertising Skepticism affects consumers’ interest
in the promoted brand or product in covert and overt video advertisements. Measuring
Advertising Skepticism can help answer if more skeptical consumers are less likely to generate
Interest in the brand or product in either covert or overt commercials than are less skeptical
consumers.
DAGMAR (ACCA)
DAGMAR [Defining Advertising Goals for Measured Advertising Results] is a
marketing tool established by Colley (1961). It evaluates the outcomes of marketing campaigns
with the ACCA model. ACCA describes the mental steps that consumers pass through up to the
purchase action. The ACCA model includes four stages, which are Awareness, Comprehension,
Conviction, and Action. To apply ACCA in the context of video advertising:
Awareness: How the commercial gets consumers to know the existence of the brand or
product.
Comprehension: How the commercial lets consumers better understand the brand or
product and its benefits.
Conviction: How the commercial encourages consumers to establish the desire or need
for the brand or product.
Action: How the commercial persuades consumers to support the brand or make the
purchase.
The four stages in the ACCA model are fairly similar to the stages in the AIDA model.
Awareness in ACCA is similar to Attention in AIDA. Conviction in ACCA corresponds with
19
Desire in AIDA. Action in ACCA is the same as Action in AIDA, both referring to the purchase
behavior.
Despite the similarities between the two models, ACCA is not as suitable as AIDA for
this research on covert vs. overt brand visibility in video advertising. The Comprehension stage
in ACCA refers to consumers’ understanding and perception of the information about the
promoted brand or product presented by the advertisement. This research focuses on examining
how covert (vs. overt) brand visibility impacts consumers’ brand evaluation and attitude, not
how it impacts their knowledge of the promoted brand or product.
The managed use of video advertisements in the survey also manipulates the consumers’
understanding and perception of the product to some extent, making it unreasonable to use
Comprehension in ACCA in the study. The survey uses video advertisements that are either
covert or overt and controls how much brand or product information the ads present to the
consumers. In the two pairs of video advertisements selected for the survey, one pair (covert
commercials) contains little visible brand information, while the other pair (overt commercials)
consists of at least the brand or product name and the product appearance.
As a result of such a controlled selection of video ads, the two pairs of video ads would
provide different amounts of brand or product information. Even if some consumers are better at
recognizing the promotional intention of covert advertisements, they are still given less brand or
product information for interpretation. The insufficiency of given information would make it less
likely for skeptical consumers to understand the brand or product comprehensively than those
given the overt ads, with all other conditions unchanged. It would be unfair and unnecessary to
compare the effects of covert and overt ads on consumers’ Comprehension of the brand or
20
product. Because of the incompatibility of Comprehension with this research, it uses the AIDA
model, instead of the ACCA.
The Hierarchy-of-Effects (HOE) Model
Created by Lavidge and Steiner in 1961, the Hierarchy-of-Effects (HOE) model consists
of six steps that consumers go through before reaching the immediate sales result: Awareness,
Knowledge, Liking, Preference, Conviction, and Purchase. The six steps pass through cognitive
(rational), affective (emotional), and conative (motivational) behavioral dimensions (Lavidge &
Steiner, 1961). Except for Knowledge (information about the brand or product), the steps in the
HOE model are very similar to the AIDA stages. As is the same with reasons given in the
DAGMAR section, Knowledge is incompatible with this research; thus, the HOE model is less
helpful than the AIDA model for this research.
The Hierarchy-of-Processing (HOP) Model
Heath (2007) introduces the Hierarchy-of-Processing (HOP) model to show how
emotional content can be incorporated with rational content to produce a more effective
advertisement. This model adds to the hierarchy-of-effects models, including the AIDA model,
and emphasizes the importance of emotional content and its effects on advertising and
persuasion. It demonstrates the effects of advertising in a situation where consumers pay low
attention, but engage in passive learning due to the implicit effects of emotional content in the
advertisements.
Similar to the AIDA model, the HOP model considers the stages consumers pass through
when exposed to an ad. It, nonetheless, considers not only when consumers pay high attention to
21
the ad, but also when they pay low attention to the ad and are persuaded emotionally (Heath,
2007). The low attention situation is not within the consideration of this research. During the
survey, all participants are expected to pay high attention to the commercials. The HOP model is
not as applicable as the AIDA model for this research.
The AISDALSLove Model (Expanded from AIDA)
Wijaya (2012) analyzes the hierarchy of effects models in advertising and derives a
comprehensive model, AISDALSLove, from the AIDA model. The AISDALSLove model
covers a broader range of advertising effects on consumers by indicating four more stages of
effects in addition to the AIDA model: Search, Like/dislike, Share, and Love/hate (Wijaya,
2012).
Among the added stages, Like/dislike, Share, and Love/hate take place after Action and,
therefore, are not relevant to the focus of this research (immediate mental response after
exposure to the ads). Search refers to internal and external search. Internal search involves
consumers’ prior experience with or memory of alternative brands or products. External search
involves consumers’ collection of additional information about available brands or products
(Wijaya, 2012). Because this study does not consider either prior experience and memory or
additional information collection, Search is not relevant. Therefore, the AISDALSLove is not
applicable to this research.
EEG [Electroencephalograms]: A Neurophysiological Method
Yang et al. (2015) propose and evaluate the use of electroencephalograms (EEG), a
neurophysiological method, vs. conventional survey-based methods for studying the effects of
22
TV commercials. The researchers used two types of measures - EEG indices (happiness,
surprise, and attention) and behavioral indices (preference, short-term memory rate, and recall
rate) - and four commercials that were divided into high-ranked and low-ranked groups. It is
concluded that the EEG indices of happiness and attention may help evaluate TV commercials
(Yang et al., 2015).
The EEG indices of Happiness and Attention can be useful for this research; however,
they can be replaced by the Interest and Attention stages in the AIDA model. There is no need
for applying the EEG method for this study.
Conclusion
The AIDA model serves as the foundation of this research to investigate the effectiveness
of covert vs. overt commercials. It is applicable in a wide range of research areas in multiple
settings. It can be used to evaluate video-format media, online advertisements, marketing
strategy formulation, and more. Other relevant models and methods assessed in this section,
despite having the potential to help with the evaluation of advertisements, contain variables that
either overlap with or are not so applicable as those in the AIDA model for this research and thus
is not used in this research. Besides applying the AIDA model, this research also uses advertising
skepticism, perceived believability, and brand attitude, used in Chan (2019)’s study, to learn
about how covert vs. overt commercials affect consumers. The study contributes to the present
literature regarding covert and overt video advertising, and gives advertisers and businesses
valuable insights into covert commercials and their implications for improving marketing
strategies.
23
Research Question and Hypotheses
There have been disputes about and no clear evidence on whether covert or overt is more
effective in the practices of video advertising towards the influence of brand attitude and
purchase intention of consumers. As marketers and businesses possess limited knowledge of the
effectiveness of covert commercials and remain uncertain about how to best deploy this form of
video advertisements, they risk missing out on a chance to increase returns on advertising costs
and losing money for poor promotional planning and execution. This research addresses this
issue by investigating and comparing the effectiveness of covert and overt commercials, guided
by the following research question and the five hypotheses:
Research Question
How effective are covert commercials vs. overt commercials towards the influence of
attention, interest, desire, purchase intention, perceived believability, and brand attitude of
consumers?
Hypotheses
Five hypotheses that help answer the research question are:
H1: Covert commercials generate higher-level outcomes in all four stages of the
AIDA model than overt commercials: gain more attention, induce more interest,
create higher desire, and get stronger purchase intention.
24
H2: Covert commercials generate more positive brand attitudes than overt
commercials.
H3A: Covert commercials generate higher perceived believability than overt
commercials.
H3B: Less skeptical consumers generate a more positive brand attitude when their
perceived believability is higher; the effect is less prominent for more skeptical
consumers.
H4: More skeptical consumers generate a more negative attitude toward the brand
promoted in the overt commercials than less skeptical consumers; the difference
between more and less skeptical consumers in brand attitude is less prominent for
the brand promoted in the covert commercials.
25
Methodology
This research is a mixed-methods (qualitative and quantitative) and semi-structured
(survey and interview) study on the effectiveness of covert vs. overt commercials towards the
influence of the brand attitude and purchase intention of consumers. This chapter will cover the
research design, research procedure, research sample, and data collection and analysis.
Research Design
A review of the research on the effects of advertisements of different media and the use
of the AIDA model (Attention, Interest, Desire, and Action), and other advertising-related
models was conducted. With the literature review, key variables for measurement and analysis
were determined: AIDA advertising skepticism, perceived believability, and brand attitude. In
accordance with the variables substantiated by the literature review, a research question and five
hypotheses were developed and substantiated.
The survey and interview questions were then designed, validated by the questions and
scales used in existing research. The survey used a 7-point Likert scale for the questions
regarding AIDA, advertising skepticism, perceived believability, and brand attitude; “1” refers to
the lowest level/degree of the variable, and “7” refers to the highest level/degree of the variable
(Likert, 1932). The question regarding the variable Action from AIDA was revised to collect
data about participants’ intention of the action (purchase), rather than data on the action itself.
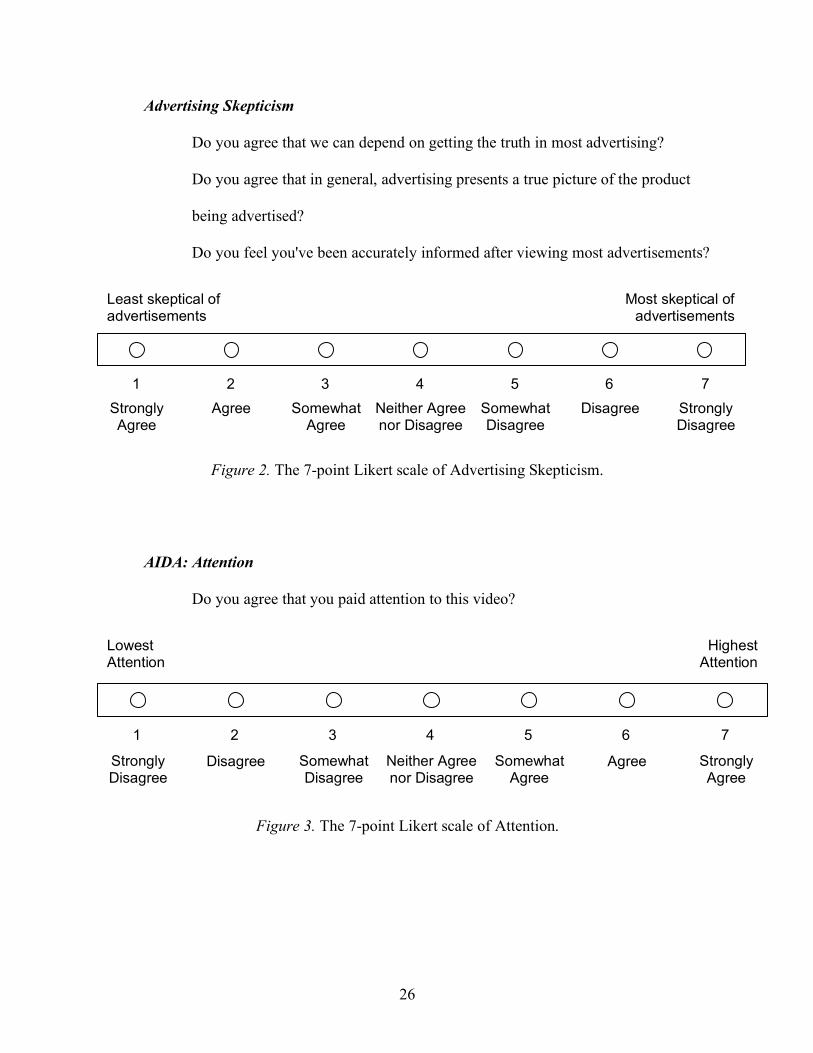
The questions and their multiple choices on a 7-point Likert scale, indicating the measure
or degree of each variable, appear below and are illustrated in Figures 2 – 8.
26
Advertising Skepticism
Do you agree that we can depend on getting the truth in most advertising?
Do you agree that in general, advertising presents a true picture of the product
being advertised?
Do you feel you've been accurately informed after viewing most advertisements?
Figure 2. The 7-point Likert scale of Advertising Skepticism.
AIDA: Attention
Do you agree that you paid attention to this video?
Figure 3. The 7-point Likert scale of Attention.
Strongly Agree
Agree Somewhat Agree
Neither Agree nor Disagree
Strongly Disagree
Disagree Somewhat Disagree
1 2 3 4 5 6 7
Least skeptical of advertisements
Most skeptical of advertisements
Strongly Disagree
Disagree Somewhat Disagree
Neither Agree nor Disagree
Strongly Agree
Agree Somewhat Agree
1 2 3 4 5 6 7
Lowest Attention
Highest Attention
27
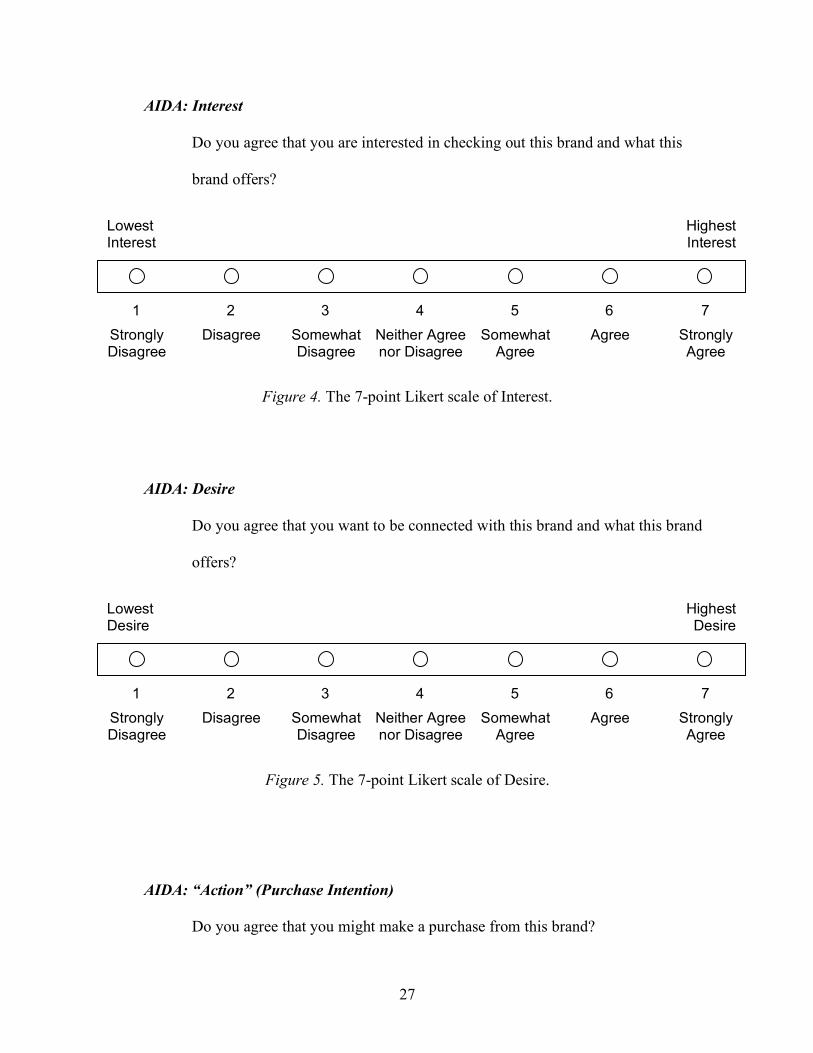
AIDA: Interest
Do you agree that you are interested in checking out this brand and what this
brand offers?
Figure 4. The 7-point Likert scale of Interest.
AIDA: Desire
Do you agree that you want to be connected with this brand and what this brand
offers?
Figure 5. The 7-point Likert scale of Desire.
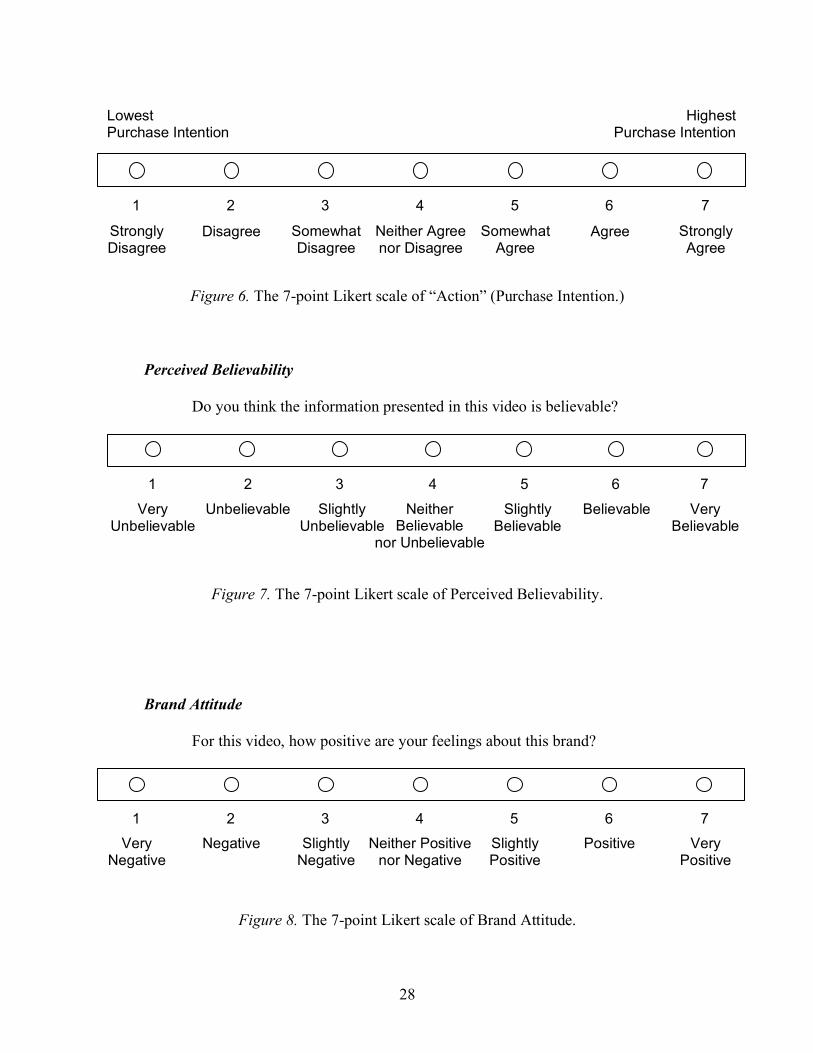
AIDA: “Action” (Purchase Intention)
Do you agree that you might make a purchase from this brand?
Strongly Disagree
Disagree Somewhat Disagree
Neither Agree nor Disagree
Strongly Agree
Agree Somewhat Agree
1 2 3 4 5 6 7
Lowest Interest
Highest Interest
Strongly Disagree
Disagree Somewhat Disagree
Neither Agree nor Disagree
Strongly Agree
Agree Somewhat Agree
1 2 3 4 5 6 7
Lowest Desire
Highest Desire
28
Figure 6. The 7-point Likert scale of “Action” (Purchase Intention.)
Perceived Believability
Do you think the information presented in this video is believable?
Figure 7. The 7-point Likert scale of Perceived Believability.
Brand Attitude
For this video, how positive are your feelings about this brand?
Figure 8. The 7-point Likert scale of Brand Attitude.
Strongly Disagree
Disagree Somewhat Disagree
Neither Agree nor Disagree
Strongly Agree
Agree Somewhat Agree
1 2 3 4 5 6 7
Lowest Purchase Intention
Highest Purchase Intention
Very Unbelievable
Unbelievable Slightly Unbelievable
Neither Believable
nor Unbelievable
Very Believable
Believable Slightly Believable
1 2 3 4 5 6 7
Very Negative
Negative Slightly Negative
Neither Positive nor Negative
Very Positive
Positive Slightly Positive
1 2 3 4 5 6 7
29
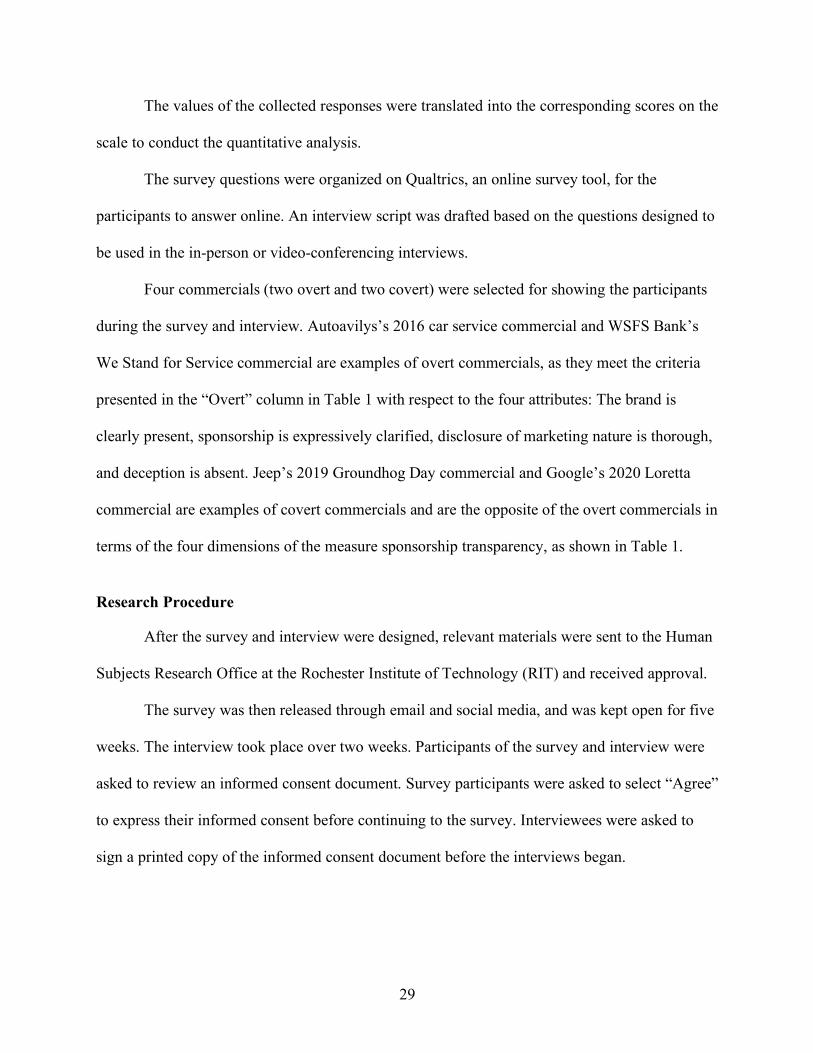
The values of the collected responses were translated into the corresponding scores on the
scale to conduct the quantitative analysis.
The survey questions were organized on Qualtrics, an online survey tool, for the
participants to answer online. An interview script was drafted based on the questions designed to
be used in the in-person or video-conferencing interviews.
Four commercials (two overt and two covert) were selected for showing the participants
during the survey and interview. Autoavilys’s 2016 car service commercial and WSFS Bank’s
We Stand for Service commercial are examples of overt commercials, as they meet the criteria
presented in the “Overt” column in Table 1 with respect to the four attributes: The brand is
clearly present, sponsorship is expressively clarified, disclosure of marketing nature is thorough,
and deception is absent. Jeep’s 2019 Groundhog Day commercial and Google’s 2020 Loretta
commercial are examples of covert commercials and are the opposite of the overt commercials in
terms of the four dimensions of the measure sponsorship transparency, as shown in Table 1.
Research Procedure
After the survey and interview were designed, relevant materials were sent to the Human
Subjects Research Office at the Rochester Institute of Technology (RIT) and received approval.
The survey was then released through email and social media, and was kept open for five
weeks. The interview took place over two weeks. Participants of the survey and interview were
asked to review an informed consent document. Survey participants were asked to select “Agree”
to express their informed consent before continuing to the survey. Interviewees were asked to
sign a printed copy of the informed consent document before the interviews began.
30
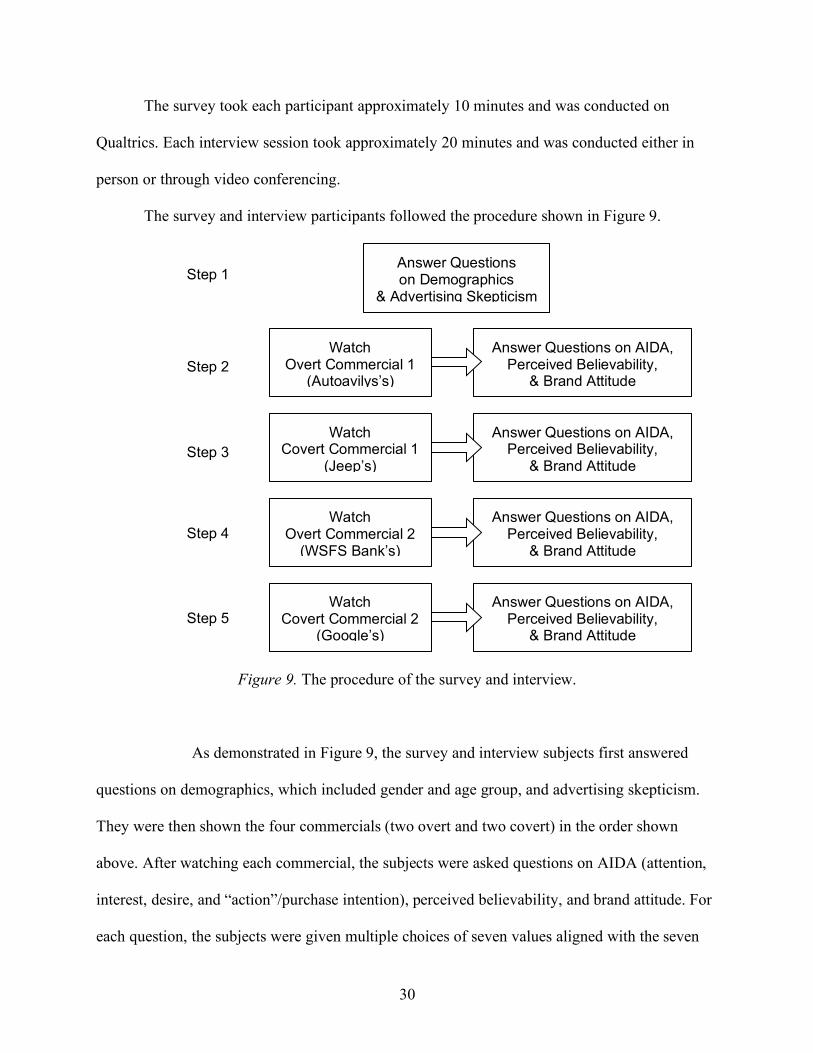
The survey took each participant approximately 10 minutes and was conducted on
Qualtrics. Each interview session took approximately 20 minutes and was conducted either in
person or through video conferencing.
The survey and interview participants followed the procedure shown in Figure 9.
Figure 9. The procedure of the survey and interview.
As demonstrated in Figure 9, the survey and interview subjects first answered
questions on demographics, which included gender and age group, and advertising skepticism.
They were then shown the four commercials (two overt and two covert) in the order shown
above. After watching each commercial, the subjects were asked questions on AIDA (attention,
interest, desire, and “action”/purchase intention), perceived believability, and brand attitude. For
each question, the subjects were given multiple choices of seven values aligned with the seven
Answer Questions on Demographics
& Advertising Skepticism
Watch Overt Commercial 1
(Autoavilys’s)
Answer Questions on AIDA, Perceived Believability,
& Brand Attitude
Answer Questions on AIDA, Perceived Believability,
& Brand Attitude
Answer Questions on AIDA, Perceived Believability,
& Brand Attitude
Watch Covert Commercial 1
(Jeep’s)
Watch Overt Commercial 2
(WSFS Bank’s)
Watch Covert Commercial 2
(Google’s)
Answer Questions on AIDA, Perceived Believability,
& Brand Attitude
Step 1
Step 2
Step 3
Step 4
Step 5

31
points on the Likert scale (as shown in Figures 2 – 8) and were instructed to choose one from
those values. The interviewees were asked the same questions in an open-ended way, and they
were allowed to elaborate on their answers when they wanted to.
32
Research Sample
Survey participants included RIT’s College of Art and Design’s students and faculty
members as well as individuals outside the campus who had access to the survey link. Six
interview subjects were recruited through personal contacts. All of the subjects were given the
incentive that two of the participants would receive a $50 Amazon gift card.
Data Collection and Analysis
Values from the multiple-choice survey were collected and exported from Qualtrics into
Google Sheets. They were translated into the corresponding scores on the 7-point Likert scale (as
demonstrated in Figures 2 – 8) for the quantitative analysis. The higher the score is, the higher
the level or degree of the variable is. The qualitative data from the interviews were recorded in
the audio form and reviewed. Common themes and key quotes were extracted and analyzed,
complementing the discussion of the survey findings.
Aggregated responses to each survey question were recorded in tables and charts shown
in the Results chapter. To test each hypothesis, the quantitative data from the survey, translated
from the values based on the 7-point scale, was organized in Google Sheets.
H1: Covert commercials generate higher-level outcomes in all four stages of
the AIDA model than overt commercials: gain more attention, induce more
interest, create higher desire, and get stronger purchase intention.
The responses to questions on AIDA (Attention, Interest, Desire, and
“Action”) were translated into quantitative data (1 to 7), based on the 7-point
Likert scale. The means of the quantitative data of the AIDA responses to each
commercial were calculated, graphed, and compared.
33
H2: Covert commercials generate more positive brand attitudes than overt
commercials.
The responses to questions on brand attitudes were translated into
quantitative data (1 to 7), based on the 7-point Likert scale. The means of the
quantitative data of the brand attitude responses to each commercial were
calculated, graphed, and compared.
H3A: Covert commercials generate higher perceived believability than
overt commercials.
The responses to questions on perceived believability were translated into
quantitative data (1 to 7), based on the 7-point Likert scale. The means of the
quantitative data of the perceived believability responses to each commercial were
calculated, graphed, and compared.
H3B: Less skeptical consumers generate a more positive brand attitude when
their perceived believability is higher; this effect is less prominent for more
skeptical consumers.
The responses to questions on advertising skepticism were translated into
quantitative data (1 to 7), based on the 7-point Likert scale. The means of the
quantitative data of each participant’s responses to the three advertising
skepticism questions were calculated. According to the means of their advertising
skepticism scores, the participants were categorized into three groups: high ad
skepticism group (more skeptical) with the means above 4, low ad skepticism
34
group (less skeptical) with the means below 4, and neutral (neither skeptical nor
non-skeptical) group with the means of 4.
For each of the three groups, the quantitative data of the perceived
believability (x-axis) and brand attitude (y-axis) responses were graphed into a
scatter chart with a trendline. The slopes of the trendlines in the three charts,
indicating the relationships between the x- and y-axis variables, were compared
using the trendline equations.
H4: More skeptical consumers generate a more negative attitude toward the
brand promoted in the overt commercials than less skeptical consumers; the
relationship is less prominent for the brand promoted in the covert
commercials.
The responses to questions on advertising skepticism and brand attitude
were translated into quantitative data (1 to 7), based on the 7-point Likert scale.
The quantitative data of the advertising skepticism (x-axis) and brand attitude (y-
axis) to each of the four commercials was graphed into a scatter chart with a
trendline. The slopes of the trendlines in the four charts, indicating the
relationships between the x- and y-axis variables, were compared using the
trendline equations.
35
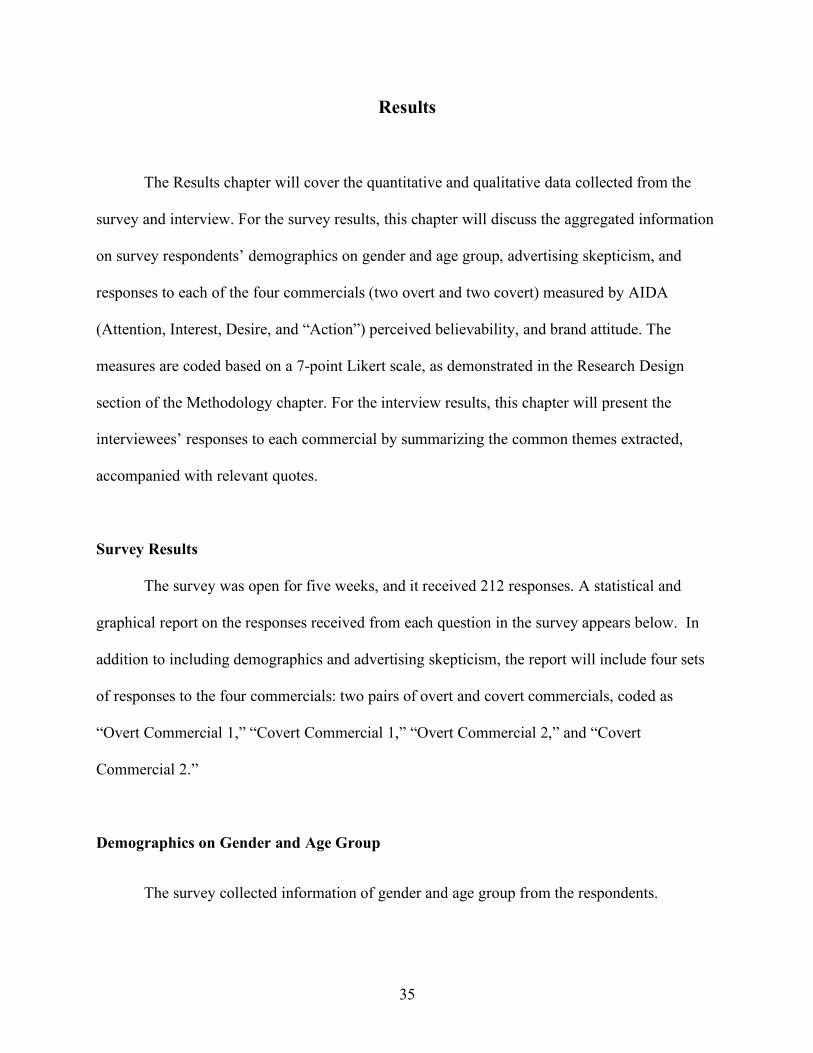
Results
The Results chapter will cover the quantitative and qualitative data collected from the
survey and interview. For the survey results, this chapter will discuss the aggregated information
on survey respondents’ demographics on gender and age group, advertising skepticism, and
responses to each of the four commercials (two overt and two covert) measured by AIDA
(Attention, Interest, Desire, and “Action”) perceived believability, and brand attitude. The
measures are coded based on a 7-point Likert scale, as demonstrated in the Research Design
section of the Methodology chapter. For the interview results, this chapter will present the
interviewees’ responses to each commercial by summarizing the common themes extracted,
accompanied with relevant quotes.
Survey Results
The survey was open for five weeks, and it received 212 responses. A statistical and
graphical report on the responses received from each question in the survey appears below. In
addition to including demographics and advertising skepticism, the report will include four sets
of responses to the four commercials: two pairs of overt and covert commercials, coded as
“Overt Commercial 1,” “Covert Commercial 1,” “Overt Commercial 2,” and “Covert
Commercial 2.”
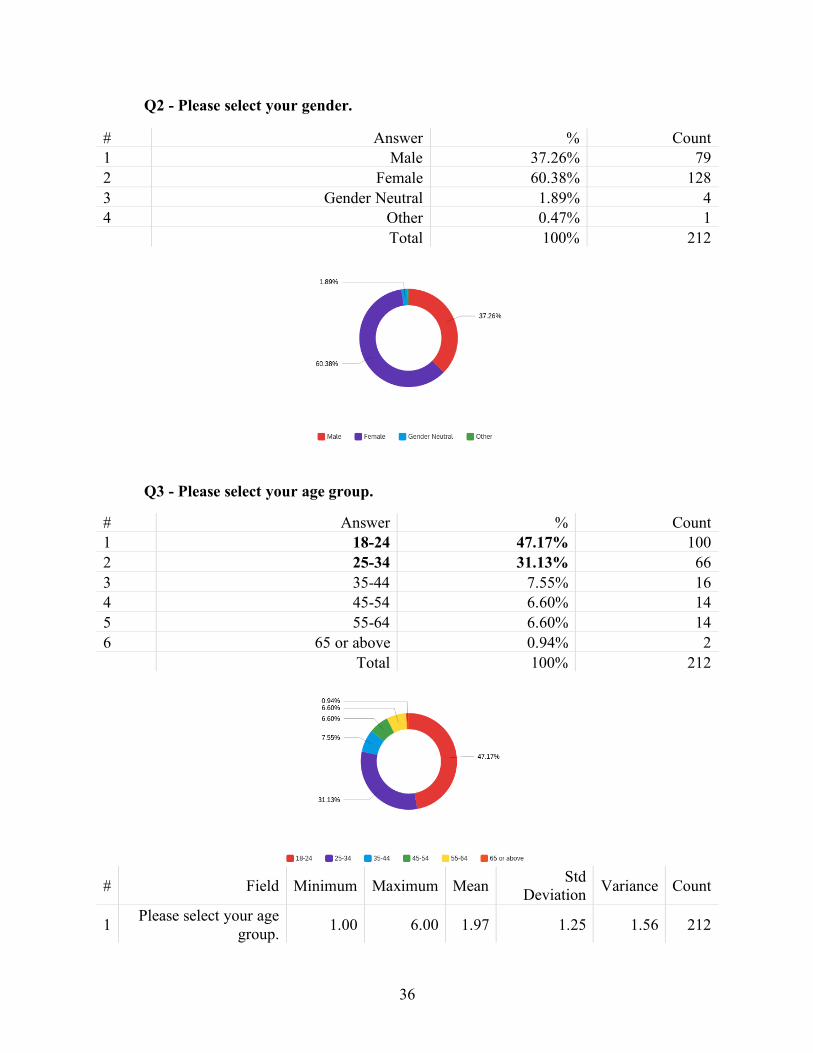
Demographics on Gender and Age Group
The survey collected information of gender and age group from the respondents.
36
Q2 - Please select your gender.
Q3 - Please select your age group.
# Field Minimum Maximum Mean Std
Deviation Variance Count
1 Please select your age group. 1.00 6.00 1.97 1.25 1.56 212
# Answer % Count 1 Male 37.26% 79 2 Female 60.38% 128 3 Gender Neutral 1.89% 4 4 Other 0.47% 1 Total 100% 212
# Answer % Count 1 18-24 47.17% 100 2 25-34 31.13% 66 3 35-44 7.55% 16 4 45-54 6.60% 14 5 55-64 6.60% 14 6 65 or above 0.94% 2 Total 100% 212

37
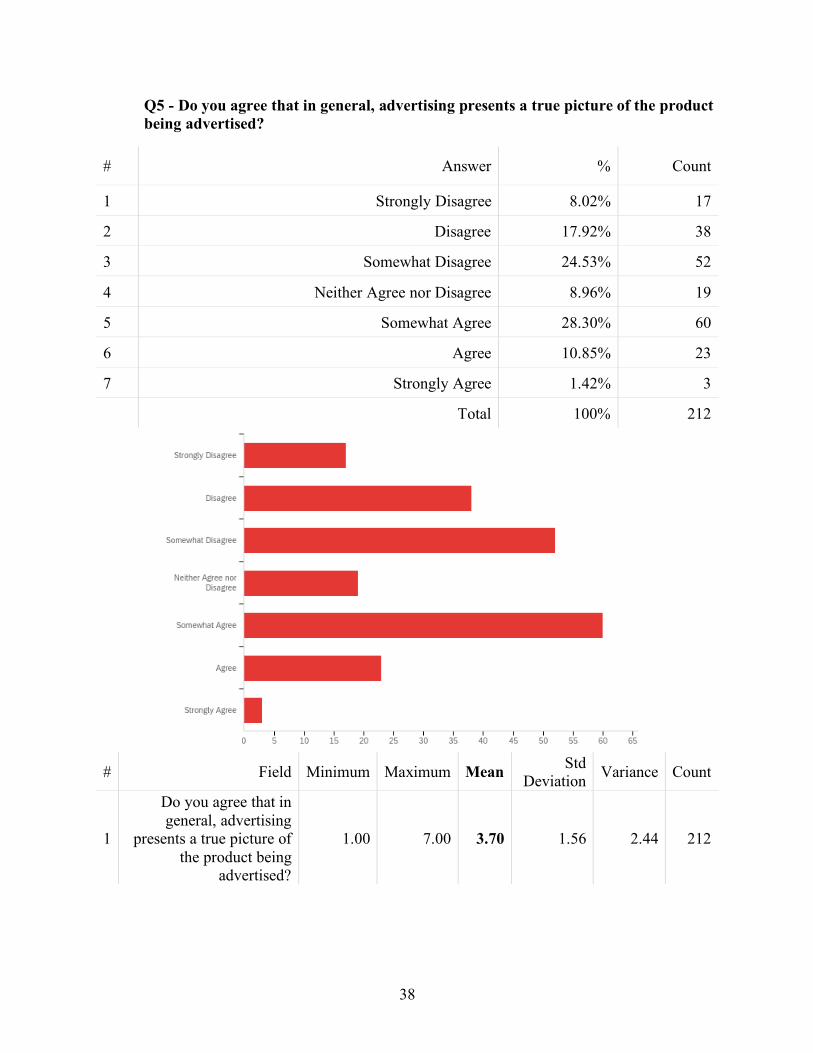
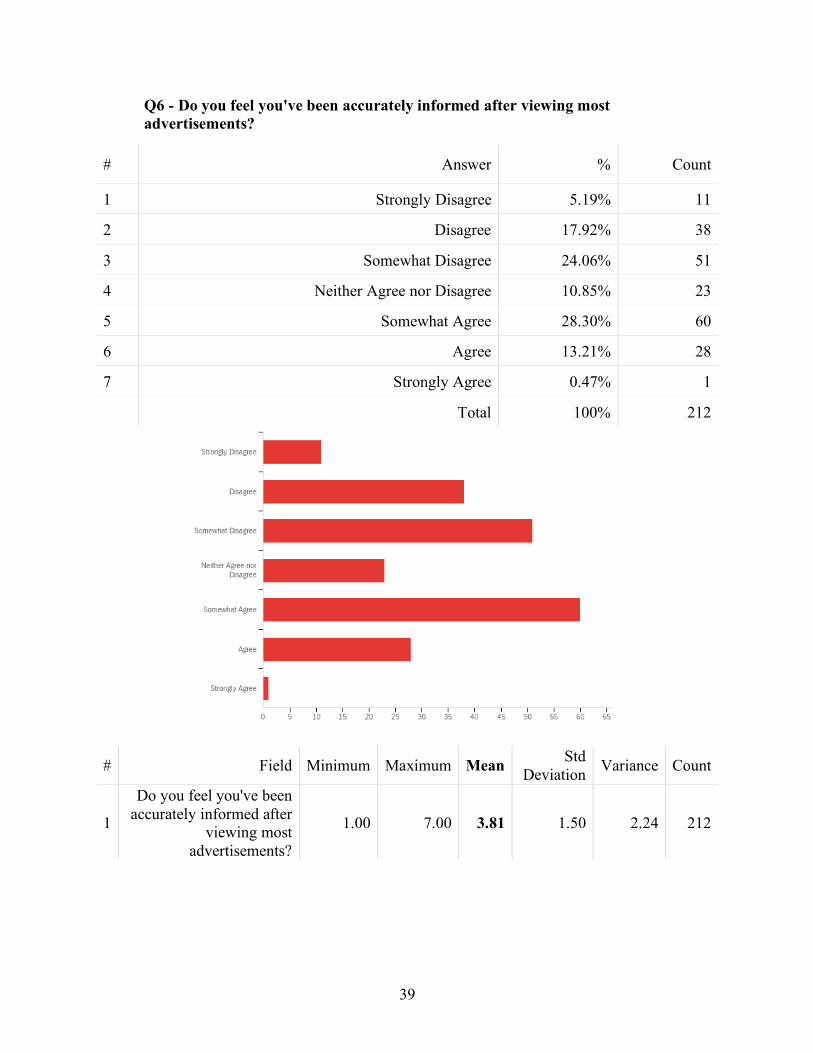
Advertising Skepticism Questions 4 - 6 collected quantitative data used to measure respondents’ advertising skepticism.
Q4 - Do you agree that we can depend on getting the truth in most advertising?
# Field Minimum Maximum Mean Std Deviation Variance Count
1 Do you agree that we can
depend on getting the truth in most advertising?
1.00 7.00 3.61 1.60 2.57 212
# Answer % Count
1 Strongly Disagree 8.49% 18
2 Disagree 21.23% 45
3 Somewhat Disagree 24.06% 51
4 Neither Agree nor Disagree 8.96% 19
5 Somewhat Agree 23.11% 49
6 Agree 12.74% 27
7 Strongly Agree 1.42% 3
Total 100% 212
38
Q5 - Do you agree that in general, advertising presents a true picture of the product being advertised?
# Field Minimum Maximum Mean Std
Deviation Variance Count
1
Do you agree that in general, advertising
presents a true picture of the product being
advertised?
1.00 7.00 3.70 1.56 2.44 212
# Answer % Count
1 Strongly Disagree 8.02% 17
2 Disagree 17.92% 38
3 Somewhat Disagree 24.53% 52
4 Neither Agree nor Disagree 8.96% 19
5 Somewhat Agree 28.30% 60
6 Agree 10.85% 23
7 Strongly Agree 1.42% 3
Total 100% 212
39
Q6 - Do you feel you've been accurately informed after viewing most advertisements?
# Field Minimum Maximum Mean Std Deviation Variance Count
1
Do you feel you've been accurately informed after
viewing most advertisements?
1.00 7.00 3.81 1.50 2.24 212
# Answer % Count
1 Strongly Disagree 5.19% 11
2 Disagree 17.92% 38
3 Somewhat Disagree 24.06% 51
4 Neither Agree nor Disagree 10.85% 23
5 Somewhat Agree 28.30% 60
6 Agree 13.21% 28
7 Strongly Agree 0.47% 1
Total 100% 212
40
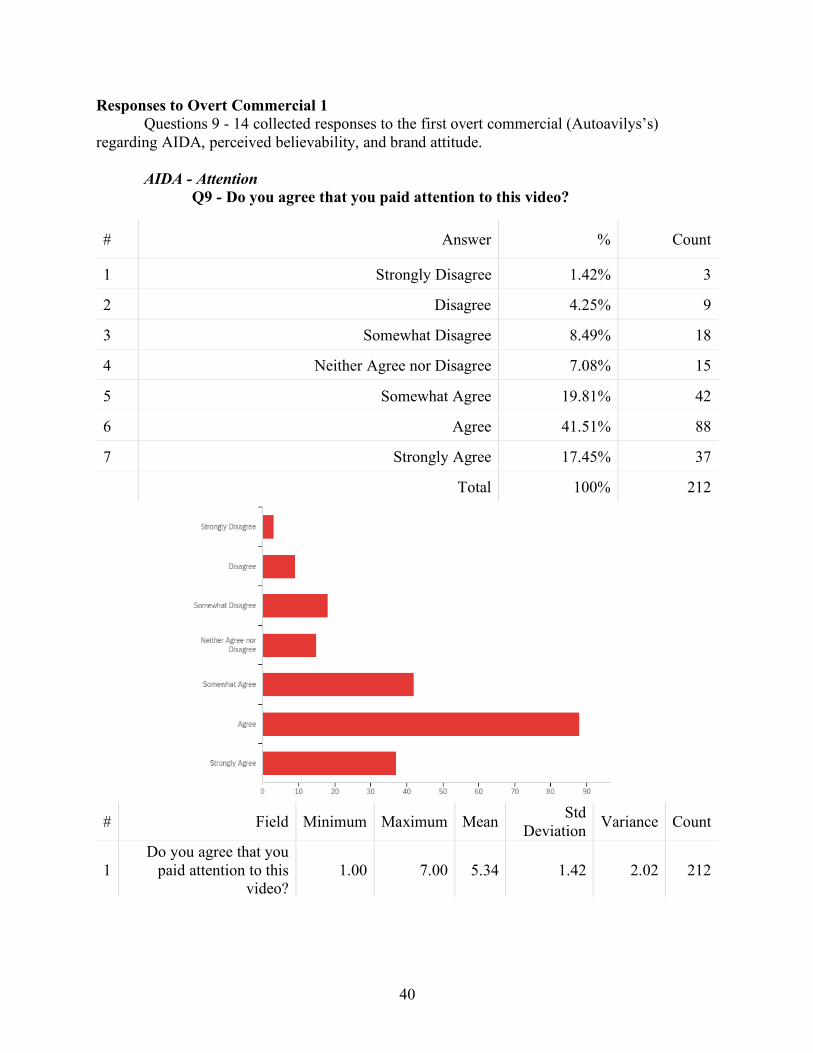
Responses to Overt Commercial 1 Questions 9 - 14 collected responses to the first overt commercial (Autoavilys’s)
regarding AIDA, perceived believability, and brand attitude.
AIDA - Attention Q9 - Do you agree that you paid attention to this video?
# Field Minimum Maximum Mean Std
Deviation Variance Count
1 Do you agree that you
paid attention to this video?
1.00 7.00 5.34 1.42 2.02 212
# Answer % Count
1 Strongly Disagree 1.42% 3
2 Disagree 4.25% 9
3 Somewhat Disagree 8.49% 18
4 Neither Agree nor Disagree 7.08% 15
5 Somewhat Agree 19.81% 42
6 Agree 41.51% 88
7 Strongly Agree 17.45% 37
Total 100% 212
41
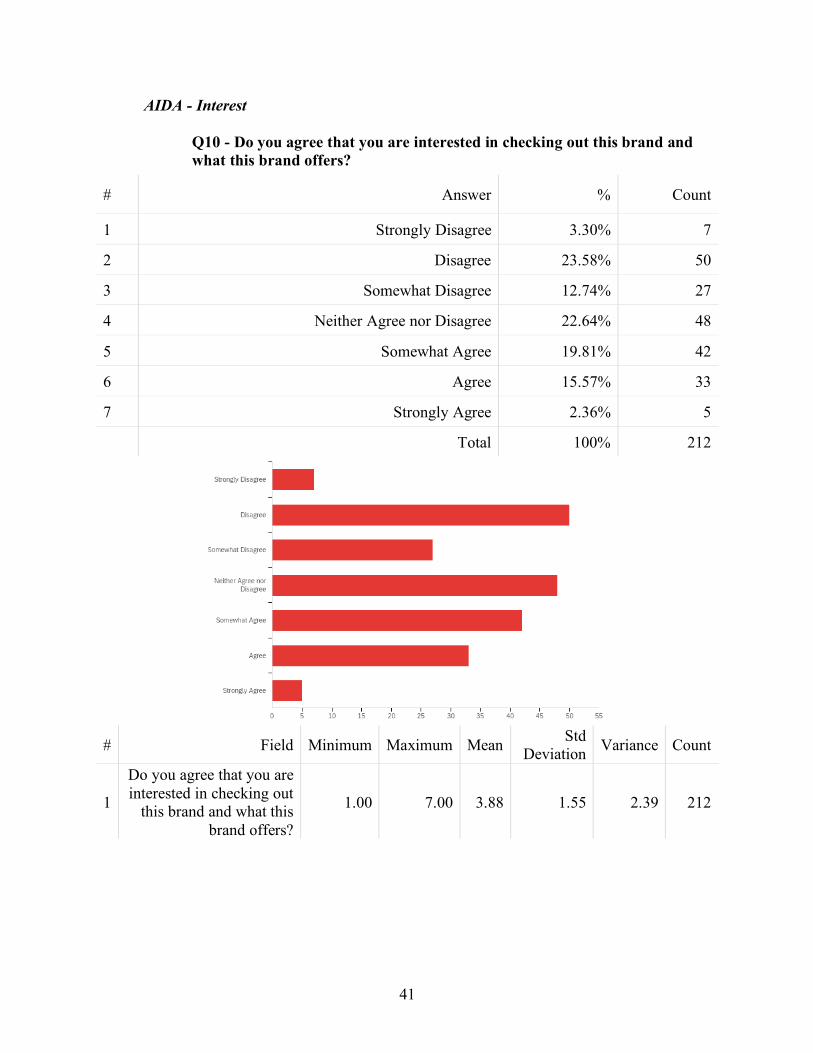
AIDA - Interest
Q10 - Do you agree that you are interested in checking out this brand and what this brand offers?
# Field Minimum Maximum Mean Std
Deviation Variance Count
1
Do you agree that you are interested in checking out
this brand and what this brand offers?
1.00 7.00 3.88 1.55 2.39 212
# Answer % Count
1 Strongly Disagree 3.30% 7
2 Disagree 23.58% 50
3 Somewhat Disagree 12.74% 27
4 Neither Agree nor Disagree 22.64% 48
5 Somewhat Agree 19.81% 42
6 Agree 15.57% 33
7 Strongly Agree 2.36% 5
Total 100% 212
42
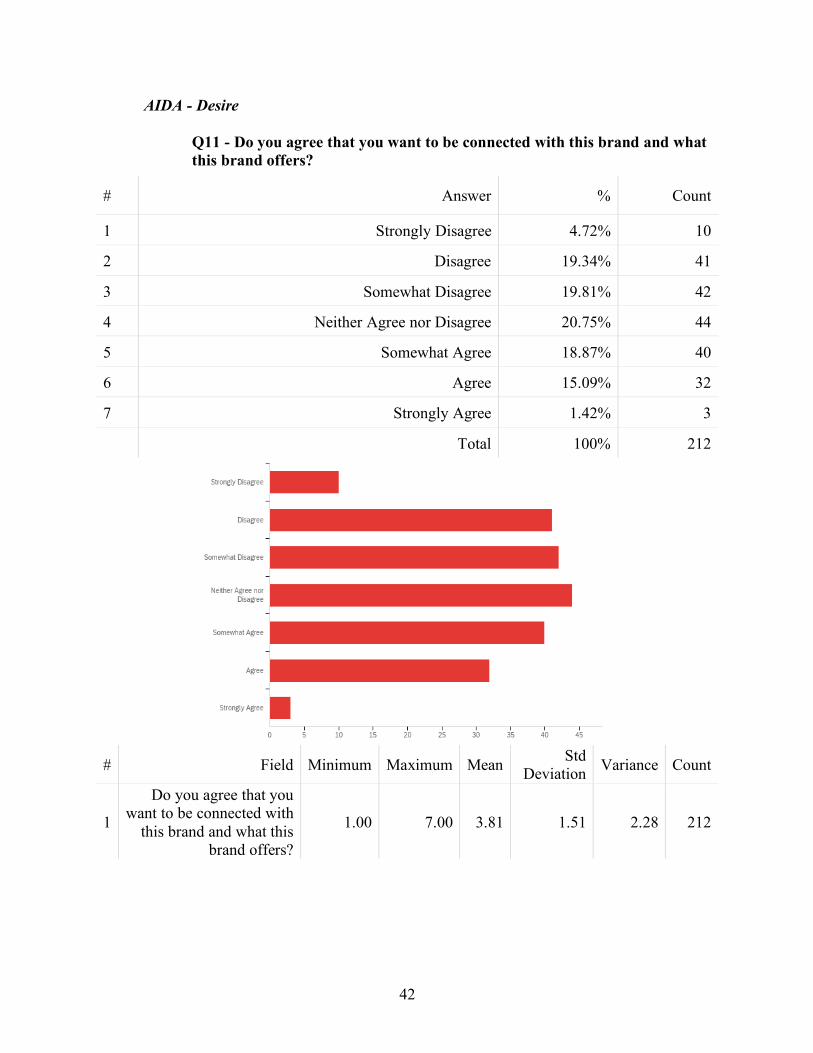
AIDA - Desire
Q11 - Do you agree that you want to be connected with this brand and what this brand offers?
# Field Minimum Maximum Mean Std
Deviation Variance Count
1
Do you agree that you want to be connected with
this brand and what this brand offers?
1.00 7.00 3.81 1.51 2.28 212
# Answer % Count
1 Strongly Disagree 4.72% 10
2 Disagree 19.34% 41
3 Somewhat Disagree 19.81% 42
4 Neither Agree nor Disagree 20.75% 44
5 Somewhat Agree 18.87% 40
6 Agree 15.09% 32
7 Strongly Agree 1.42% 3
Total 100% 212
43
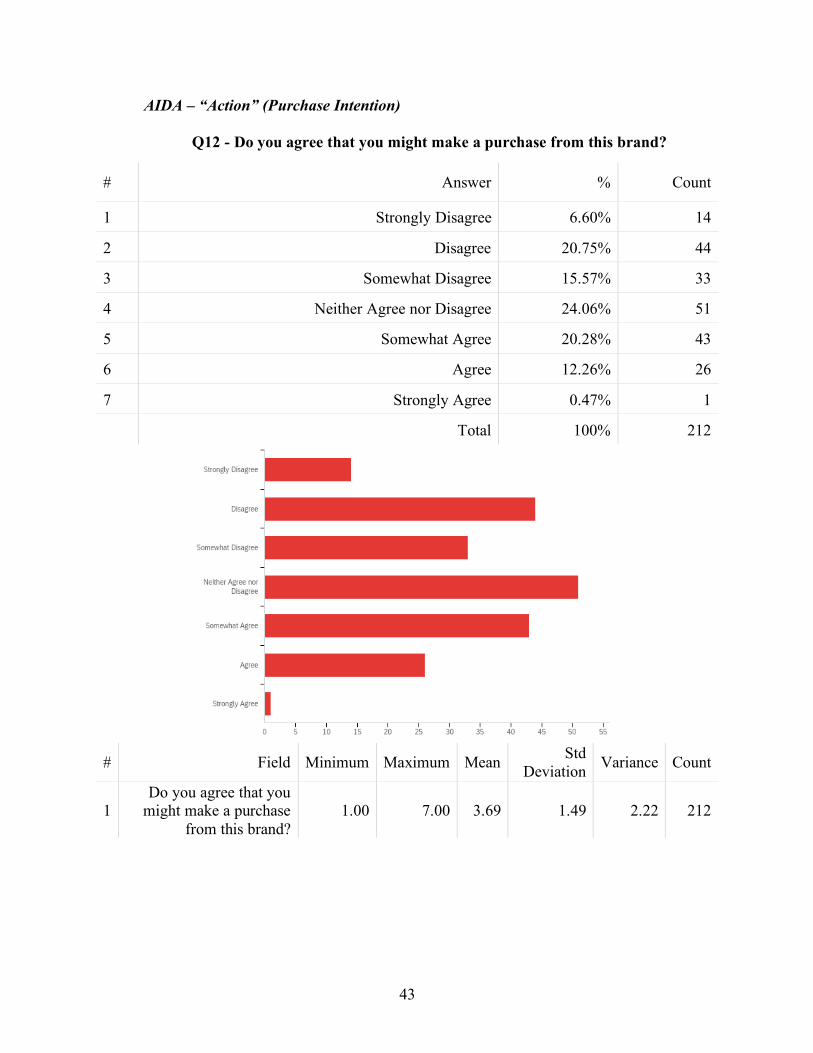
AIDA – “Action” (Purchase Intention)
Q12 - Do you agree that you might make a purchase from this brand?
# Field Minimum Maximum Mean Std
Deviation Variance Count
1 Do you agree that you
might make a purchase from this brand?
1.00 7.00 3.69 1.49 2.22 212
# Answer % Count
1 Strongly Disagree 6.60% 14
2 Disagree 20.75% 44
3 Somewhat Disagree 15.57% 33
4 Neither Agree nor Disagree 24.06% 51
5 Somewhat Agree 20.28% 43
6 Agree 12.26% 26
7 Strongly Agree 0.47% 1
Total 100% 212
44
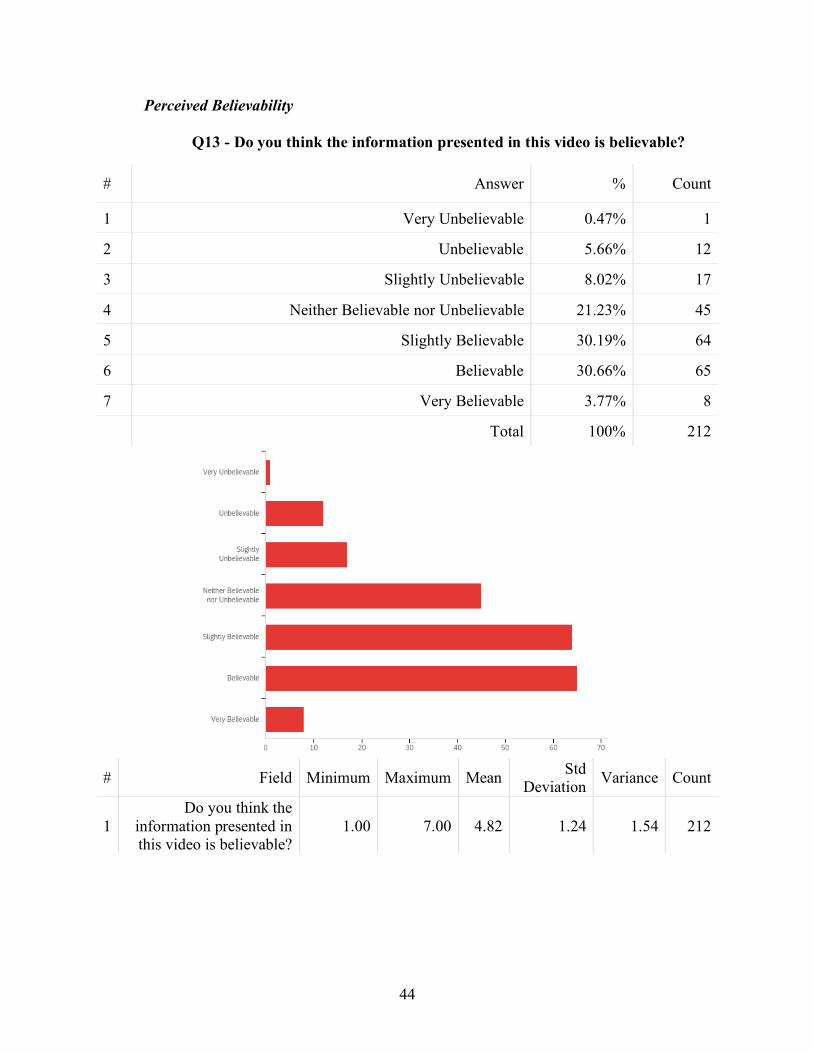
Perceived Believability
Q13 - Do you think the information presented in this video is believable?
# Field Minimum Maximum Mean Std
Deviation Variance Count
1 Do you think the
information presented in this video is believable?
1.00 7.00 4.82 1.24 1.54 212
# Answer % Count
1 Very Unbelievable 0.47% 1
2 Unbelievable 5.66% 12
3 Slightly Unbelievable 8.02% 17
4 Neither Believable nor Unbelievable 21.23% 45
5 Slightly Believable 30.19% 64
6 Believable 30.66% 65
7 Very Believable 3.77% 8
Total 100% 212
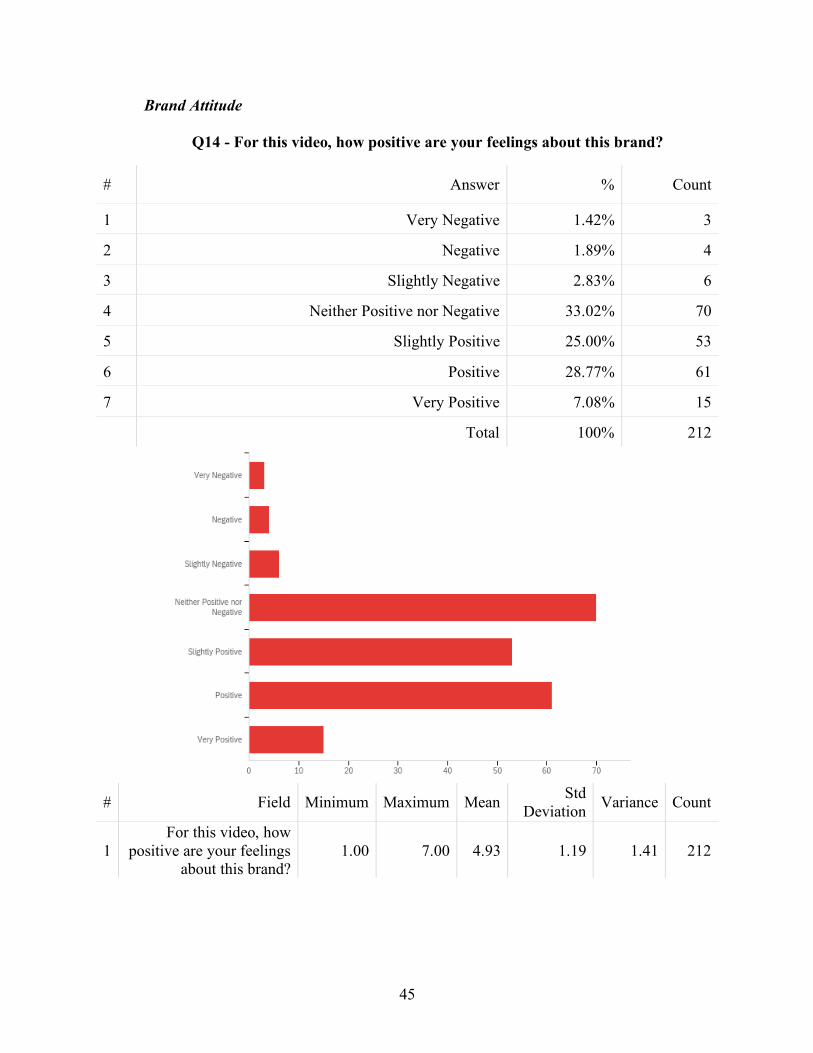
45
Brand Attitude Q14 - For this video, how positive are your feelings about this brand?
# Field Minimum Maximum Mean Std
Deviation Variance Count
1 For this video, how
positive are your feelings about this brand?
1.00 7.00 4.93 1.19 1.41 212
# Answer % Count
1 Very Negative 1.42% 3
2 Negative 1.89% 4
3 Slightly Negative 2.83% 6
4 Neither Positive nor Negative 33.02% 70
5 Slightly Positive 25.00% 53
6 Positive 28.77% 61
7 Very Positive 7.08% 15
Total 100% 212
46
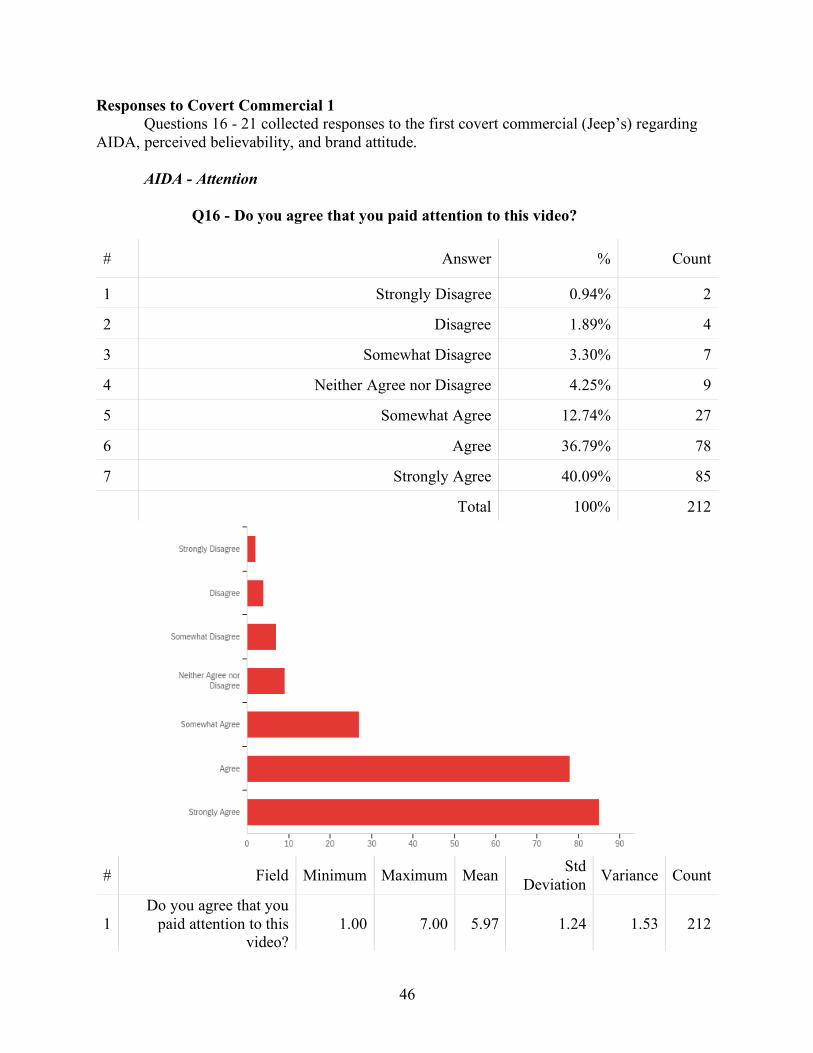
Responses to Covert Commercial 1 Questions 16 - 21 collected responses to the first covert commercial (Jeep’s) regarding
AIDA, perceived believability, and brand attitude.
AIDA - Attention
Q16 - Do you agree that you paid attention to this video?
# Field Minimum Maximum Mean Std
Deviation Variance Count
1 Do you agree that you
paid attention to this video?
1.00 7.00 5.97 1.24 1.53 212
# Answer % Count
1 Strongly Disagree 0.94% 2
2 Disagree 1.89% 4
3 Somewhat Disagree 3.30% 7
4 Neither Agree nor Disagree 4.25% 9
5 Somewhat Agree 12.74% 27
6 Agree 36.79% 78
7 Strongly Agree 40.09% 85
Total 100% 212
47
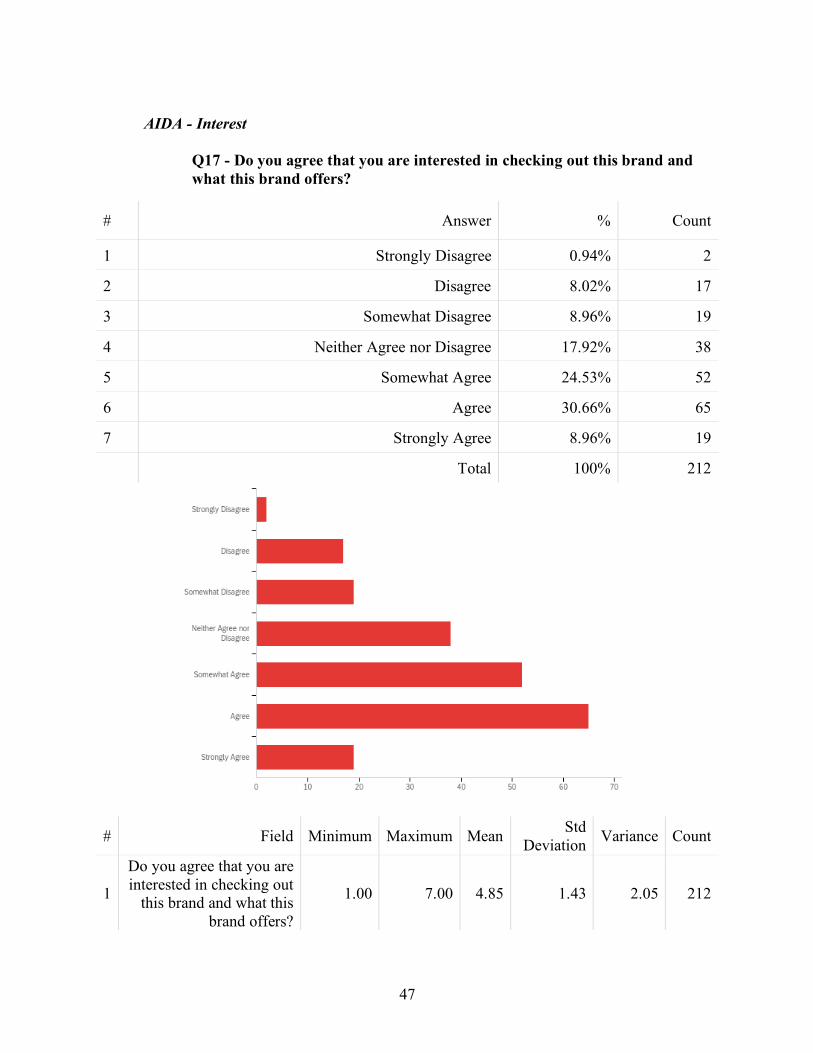
AIDA - Interest
Q17 - Do you agree that you are interested in checking out this brand and what this brand offers?
# Field Minimum Maximum Mean Std Deviation Variance Count
1
Do you agree that you are interested in checking out
this brand and what this brand offers?
1.00 7.00 4.85 1.43 2.05 212
# Answer % Count
1 Strongly Disagree 0.94% 2
2 Disagree 8.02% 17
3 Somewhat Disagree 8.96% 19
4 Neither Agree nor Disagree 17.92% 38
5 Somewhat Agree 24.53% 52
6 Agree 30.66% 65
7 Strongly Agree 8.96% 19
Total 100% 212

48
AIDA - Desire
Q18 - Do you agree that you want to be connected with this brand and what this brand offers?
# Field Minimum Maximum Mean Std
Deviation Variance Count
1
Do you agree that you want to be connected with
this brand and what this brand offers?
1.00 7.00 4.71 1.37 1.88 212
AIDA - “Action” (Purchase Intention)
# Answer % Count
1 Strongly Disagree 1.42% 3
2 Disagree 6.60% 14
3 Somewhat Disagree 10.85% 23
4 Neither Agree nor Disagree 19.81% 42
5 Somewhat Agree 29.72% 63
6 Agree 25.00% 53
7 Strongly Agree 6.60% 14
Total 100% 212
49
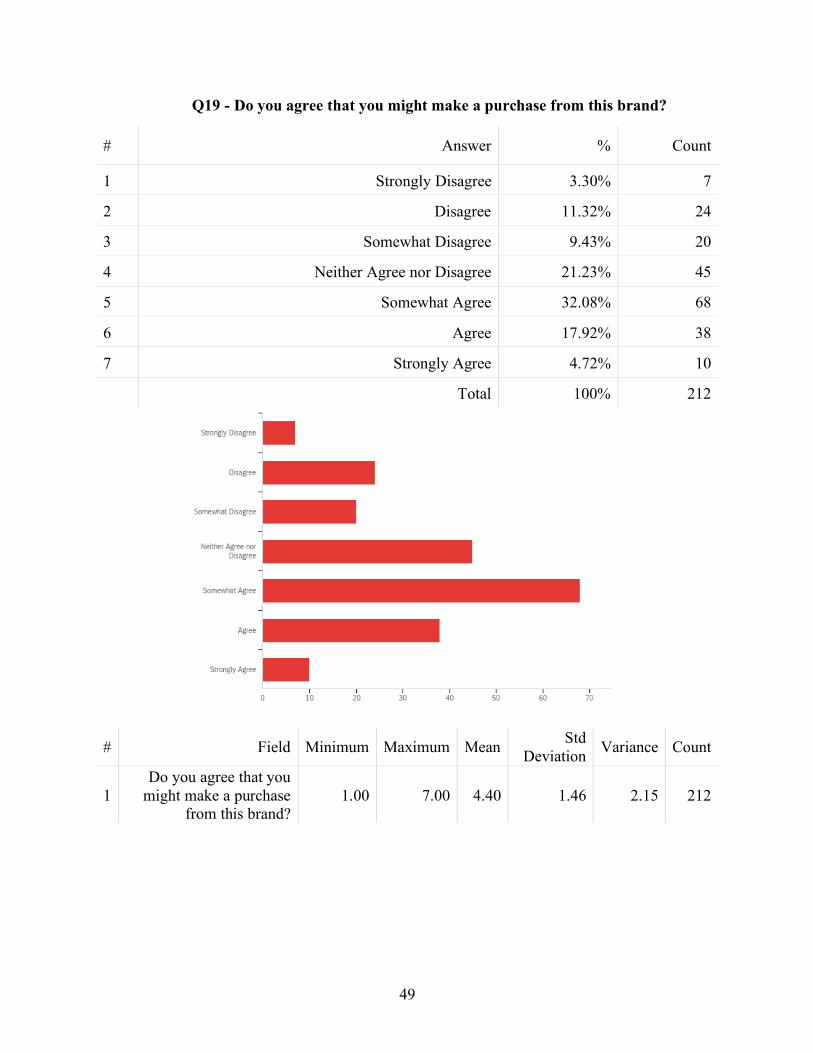
Q19 - Do you agree that you might make a purchase from this brand?
# Field Minimum Maximum Mean Std Deviation Variance Count
1 Do you agree that you
might make a purchase from this brand?
1.00 7.00 4.40 1.46 2.15 212
# Answer % Count
1 Strongly Disagree 3.30% 7
2 Disagree 11.32% 24
3 Somewhat Disagree 9.43% 20
4 Neither Agree nor Disagree 21.23% 45
5 Somewhat Agree 32.08% 68
6 Agree 17.92% 38
7 Strongly Agree 4.72% 10
Total 100% 212
50
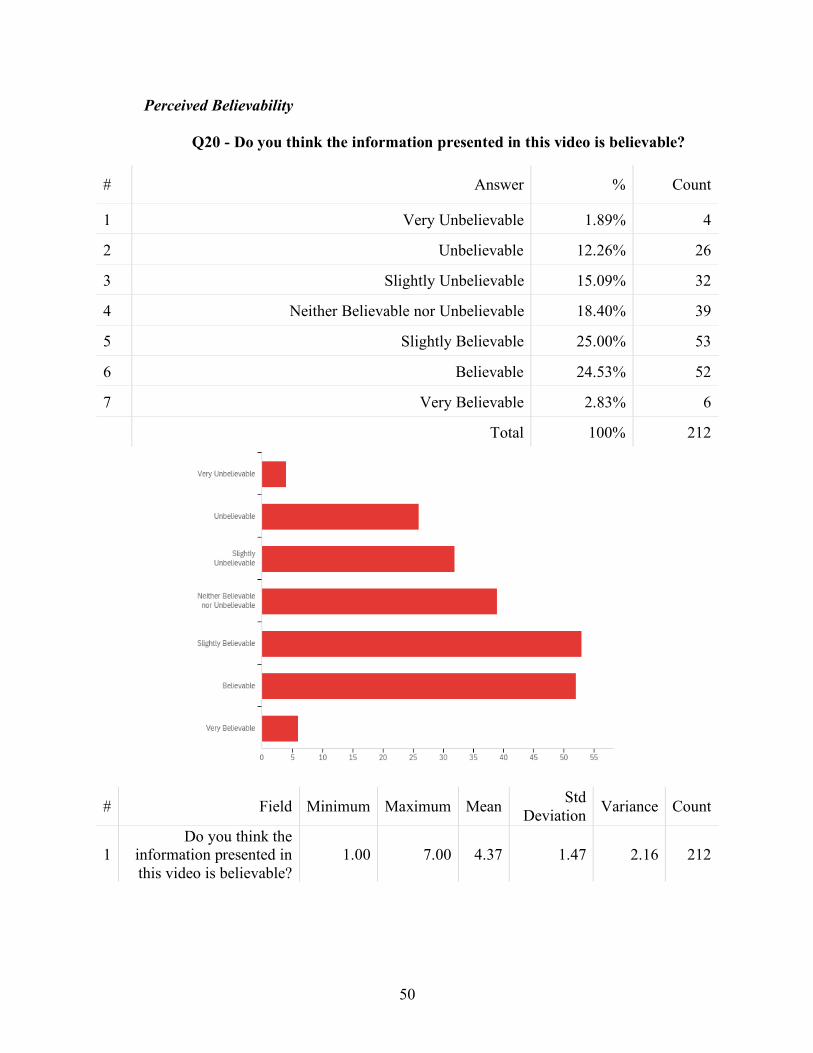
Perceived Believability
Q20 - Do you think the information presented in this video is believable?
# Field Minimum Maximum Mean Std Deviation Variance Count
1 Do you think the
information presented in this video is believable?
1.00 7.00 4.37 1.47 2.16 212
# Answer % Count
1 Very Unbelievable 1.89% 4
2 Unbelievable 12.26% 26
3 Slightly Unbelievable 15.09% 32
4 Neither Believable nor Unbelievable 18.40% 39
5 Slightly Believable 25.00% 53
6 Believable 24.53% 52
7 Very Believable 2.83% 6
Total 100% 212
51
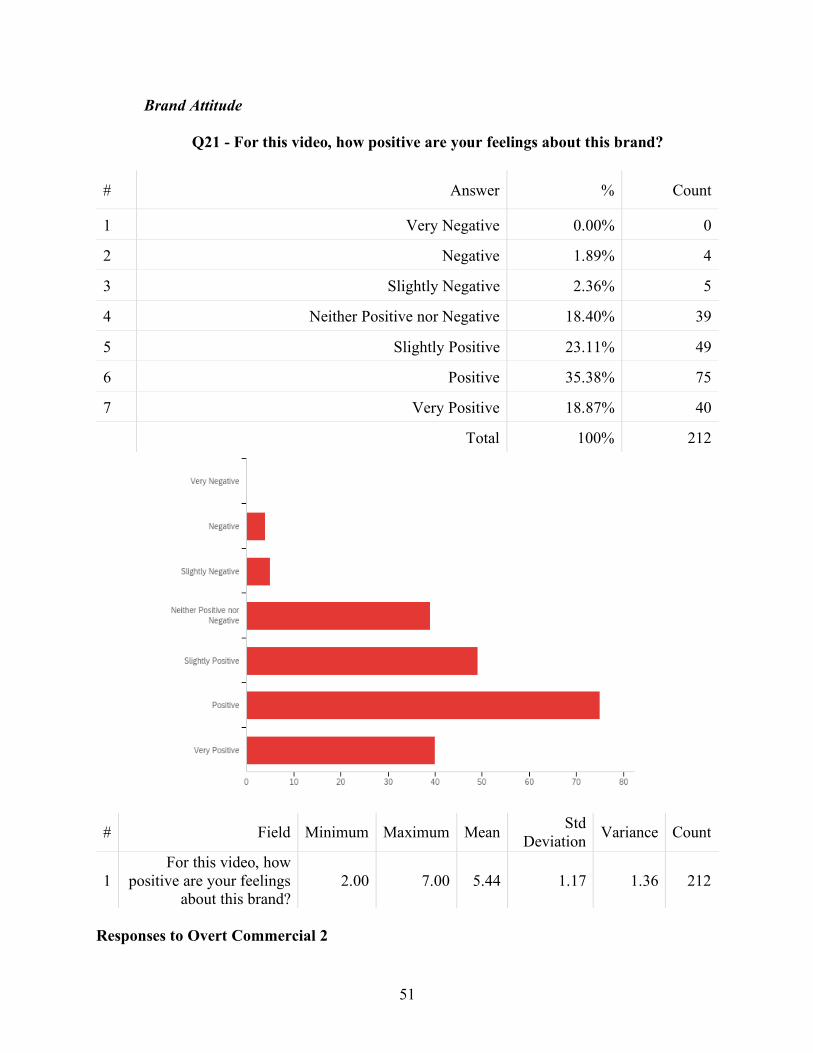
Brand Attitude Q21 - For this video, how positive are your feelings about this brand?
# Field Minimum Maximum Mean Std Deviation Variance Count
1 For this video, how
positive are your feelings about this brand?
2.00 7.00 5.44 1.17 1.36 212
Responses to Overt Commercial 2
# Answer % Count
1 Very Negative 0.00% 0
2 Negative 1.89% 4
3 Slightly Negative 2.36% 5
4 Neither Positive nor Negative 18.40% 39
5 Slightly Positive 23.11% 49
6 Positive 35.38% 75
7 Very Positive 18.87% 40
Total 100% 212

52
Questions 23 - 28 collected responses to the second overt commercial (WSFS Bank’s) regarding AIDA, perceived believability, and brand attitude.
AIDA - Attention
Q23 - Do you agree that you paid attention to this video?
# Field Minimum Maximum Mean Std Deviation Variance Count
1 Do you agree that you
paid attention to this video?
1.00 7.00 4.82 1.60 2.57 212
AIDA - Interest
# Answer % Count
1 Strongly Disagree 2.83% 6
2 Disagree 8.96% 19
3 Somewhat Disagree 9.91% 21
4 Neither Agree nor Disagree 13.68% 29
5 Somewhat Agree 25.00% 53
6 Agree 25.94% 55
7 Strongly Agree 13.68% 29
Total 100% 212

53
Q24 - Do you agree that you are interested in checking out this brand and what this brand offers?
# Field Minimum Maximum Mean Std Deviation Variance Count
1
Do you agree that you are interested in checking out
this brand and what this brand offers?
1.00 7.00 3.84 1.58 2.49 212
# Answer % Count
1 Strongly Disagree 6.13% 13
2 Disagree 20.28% 43
3 Somewhat Disagree 14.62% 31
4 Neither Agree nor Disagree 19.81% 42
5 Somewhat Agree 22.64% 48
6 Agree 14.15% 30
7 Strongly Agree 2.36% 5
Total 100% 212
54
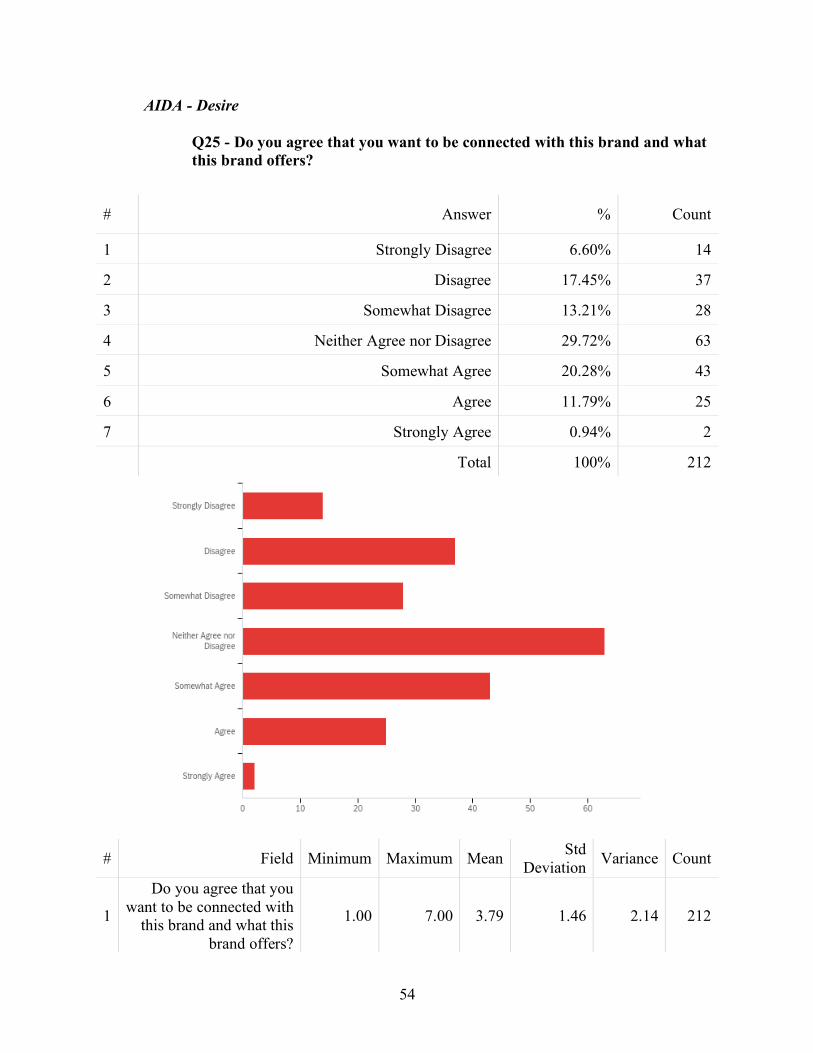
AIDA - Desire Q25 - Do you agree that you want to be connected with this brand and what this brand offers?
# Field Minimum Maximum Mean Std Deviation Variance Count
1
Do you agree that you want to be connected with
this brand and what this brand offers?
1.00 7.00 3.79 1.46 2.14 212
# Answer % Count
1 Strongly Disagree 6.60% 14
2 Disagree 17.45% 37
3 Somewhat Disagree 13.21% 28
4 Neither Agree nor Disagree 29.72% 63
5 Somewhat Agree 20.28% 43
6 Agree 11.79% 25
7 Strongly Agree 0.94% 2
Total 100% 212
55
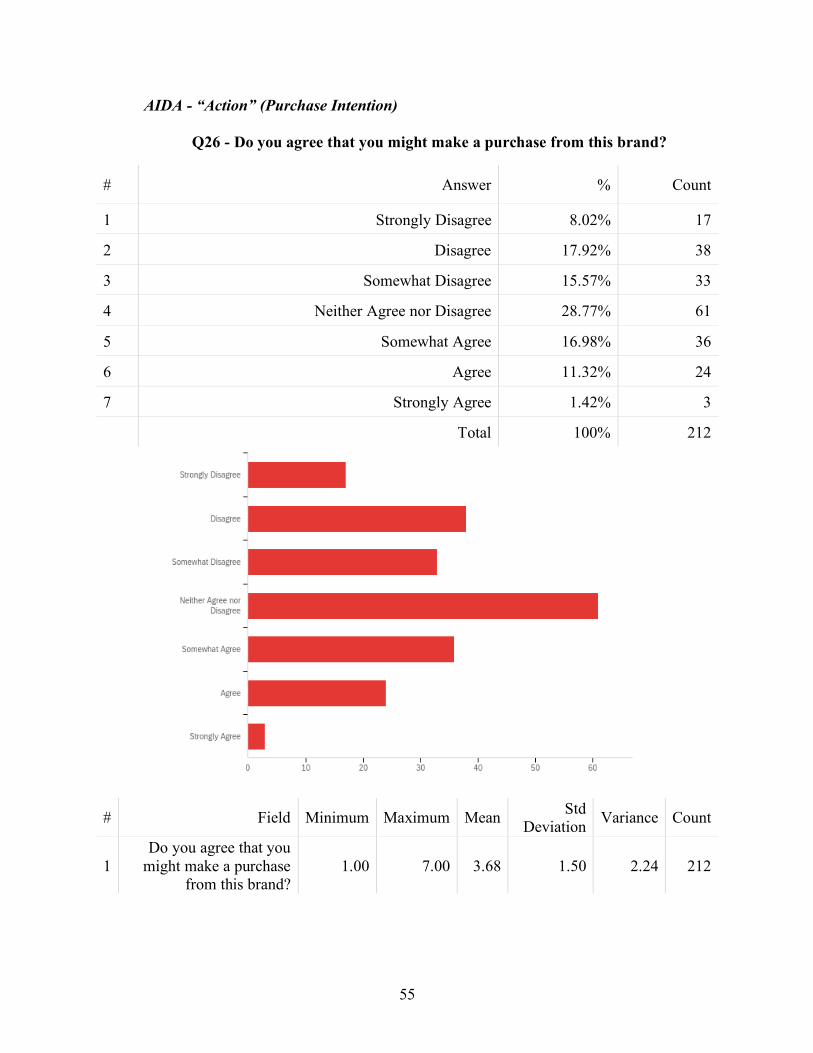
AIDA - “Action” (Purchase Intention)
Q26 - Do you agree that you might make a purchase from this brand?
# Field Minimum Maximum Mean Std Deviation Variance Count
1 Do you agree that you
might make a purchase from this brand?
1.00 7.00 3.68 1.50 2.24 212
# Answer % Count
1 Strongly Disagree 8.02% 17
2 Disagree 17.92% 38
3 Somewhat Disagree 15.57% 33
4 Neither Agree nor Disagree 28.77% 61
5 Somewhat Agree 16.98% 36
6 Agree 11.32% 24
7 Strongly Agree 1.42% 3
Total 100% 212
56
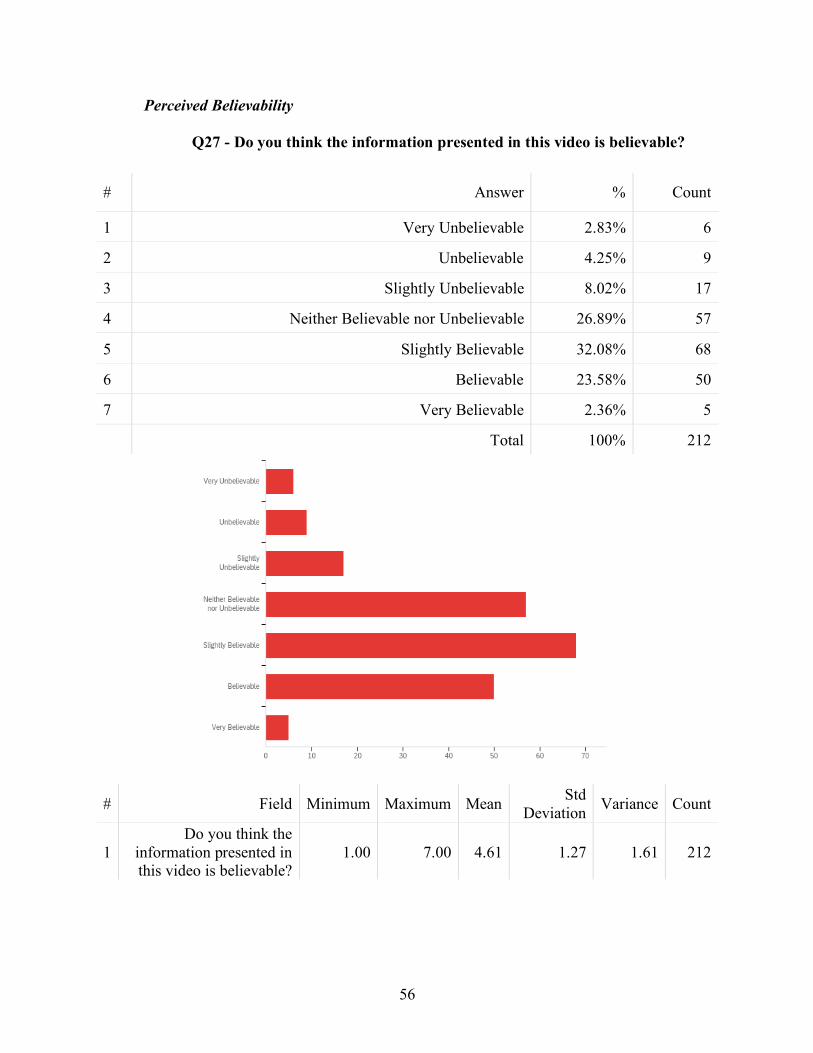
Perceived Believability
Q27 - Do you think the information presented in this video is believable?
# Field Minimum Maximum Mean Std Deviation Variance Count
1 Do you think the
information presented in this video is believable?
1.00 7.00 4.61 1.27 1.61 212
# Answer % Count
1 Very Unbelievable 2.83% 6
2 Unbelievable 4.25% 9
3 Slightly Unbelievable 8.02% 17
4 Neither Believable nor Unbelievable 26.89% 57
5 Slightly Believable 32.08% 68
6 Believable 23.58% 50
7 Very Believable 2.36% 5
Total 100% 212
57
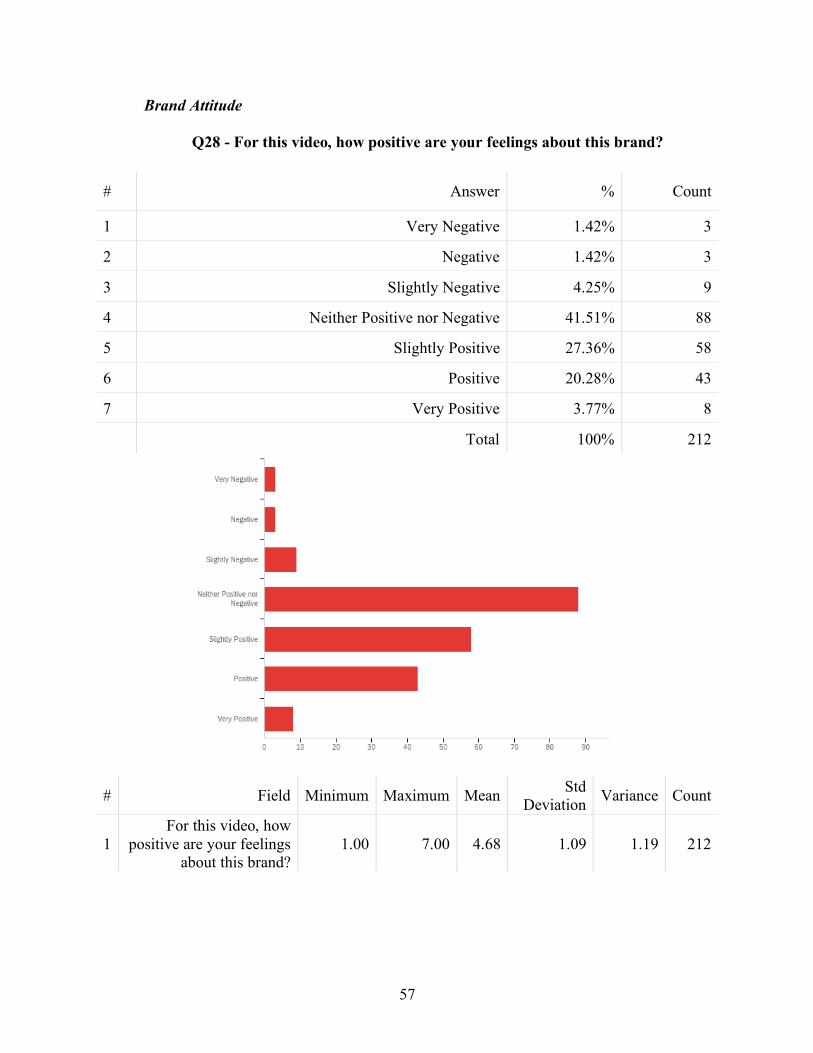
Brand Attitude Q28 - For this video, how positive are your feelings about this brand?
# Field Minimum Maximum Mean Std Deviation Variance Count
1 For this video, how
positive are your feelings about this brand?
1.00 7.00 4.68 1.09 1.19 212
# Answer % Count
1 Very Negative 1.42% 3
2 Negative 1.42% 3
3 Slightly Negative 4.25% 9
4 Neither Positive nor Negative 41.51% 88
5 Slightly Positive 27.36% 58
6 Positive 20.28% 43
7 Very Positive 3.77% 8
Total 100% 212
58
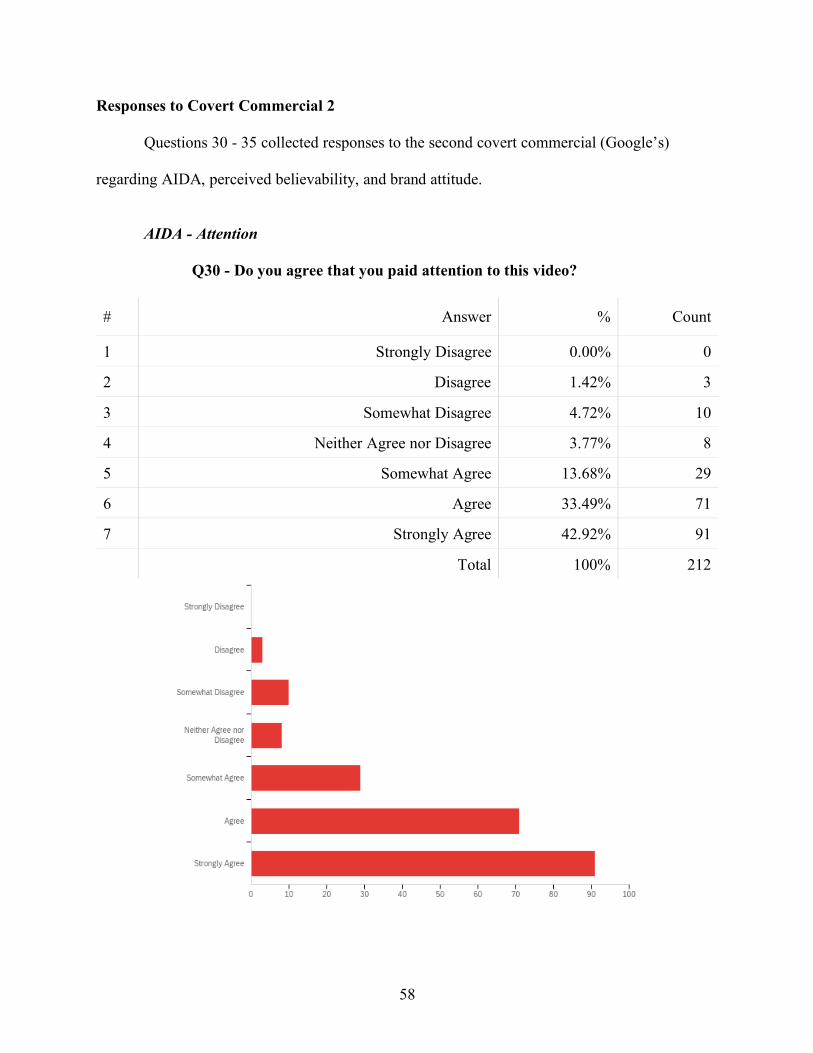
Responses to Covert Commercial 2
Questions 30 - 35 collected responses to the second covert commercial (Google’s)
regarding AIDA, perceived believability, and brand attitude.
AIDA - Attention
Q30 - Do you agree that you paid attention to this video?
# Answer % Count
1 Strongly Disagree 0.00% 0
2 Disagree 1.42% 3
3 Somewhat Disagree 4.72% 10
4 Neither Agree nor Disagree 3.77% 8
5 Somewhat Agree 13.68% 29
6 Agree 33.49% 71
7 Strongly Agree 42.92% 91
Total 100% 212
59
# Field Minimum Maximum Mean Std Deviation Variance Count
1 Do you agree that you
paid attention to this video?
2.00 7.00 6.02 1.17 1.37 212
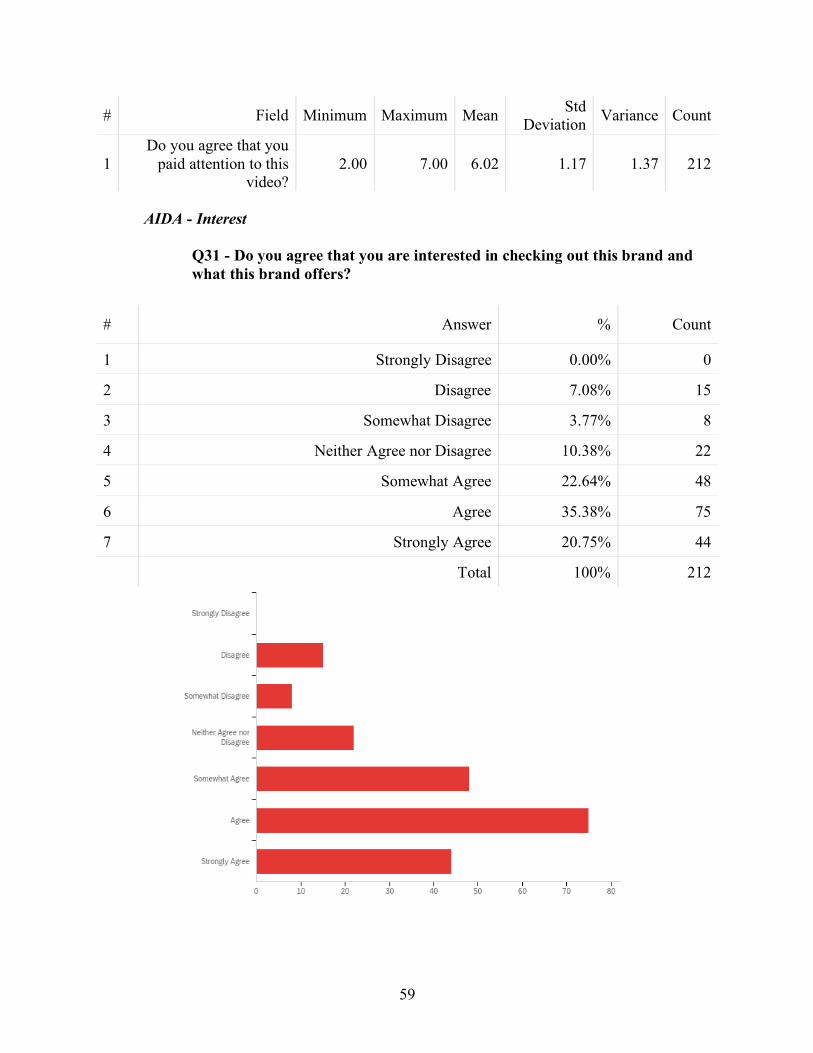
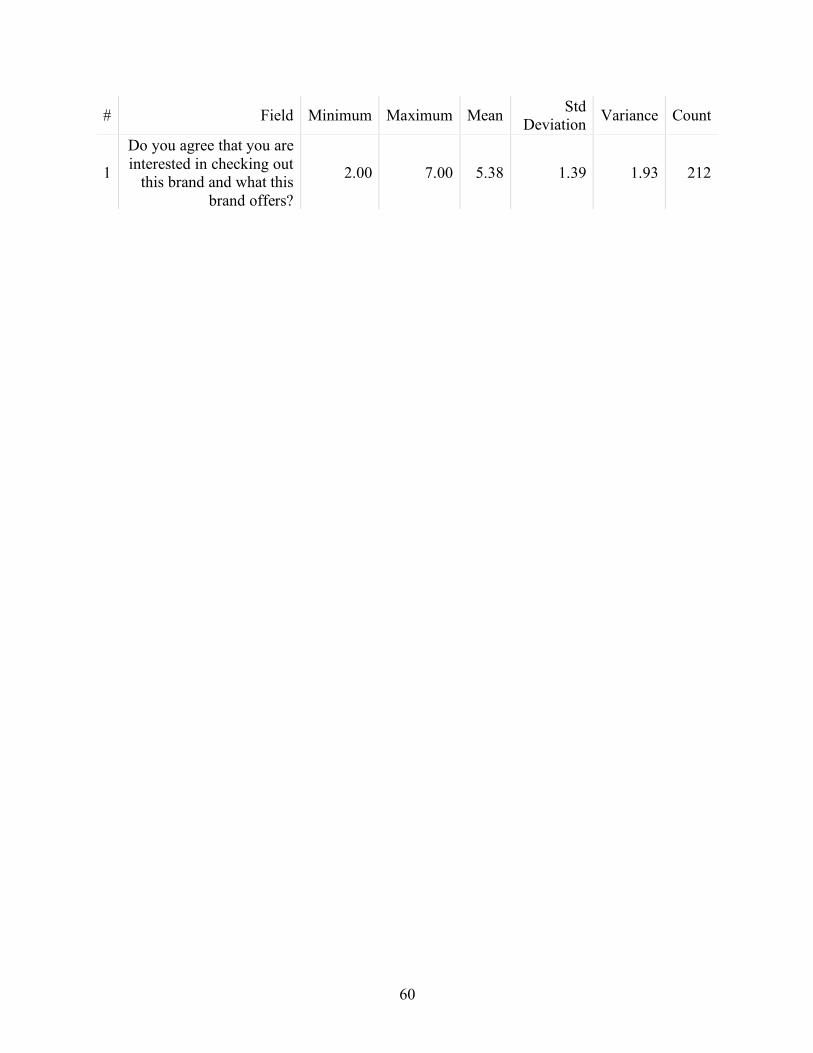
AIDA - Interest
Q31 - Do you agree that you are interested in checking out this brand and what this brand offers?
# Answer % Count
1 Strongly Disagree 0.00% 0
2 Disagree 7.08% 15
3 Somewhat Disagree 3.77% 8
4 Neither Agree nor Disagree 10.38% 22
5 Somewhat Agree 22.64% 48
6 Agree 35.38% 75
7 Strongly Agree 20.75% 44
Total 100% 212
60
# Field Minimum Maximum Mean Std Deviation Variance Count
1
Do you agree that you are interested in checking out
this brand and what this brand offers?
2.00 7.00 5.38 1.39 1.93 212
61
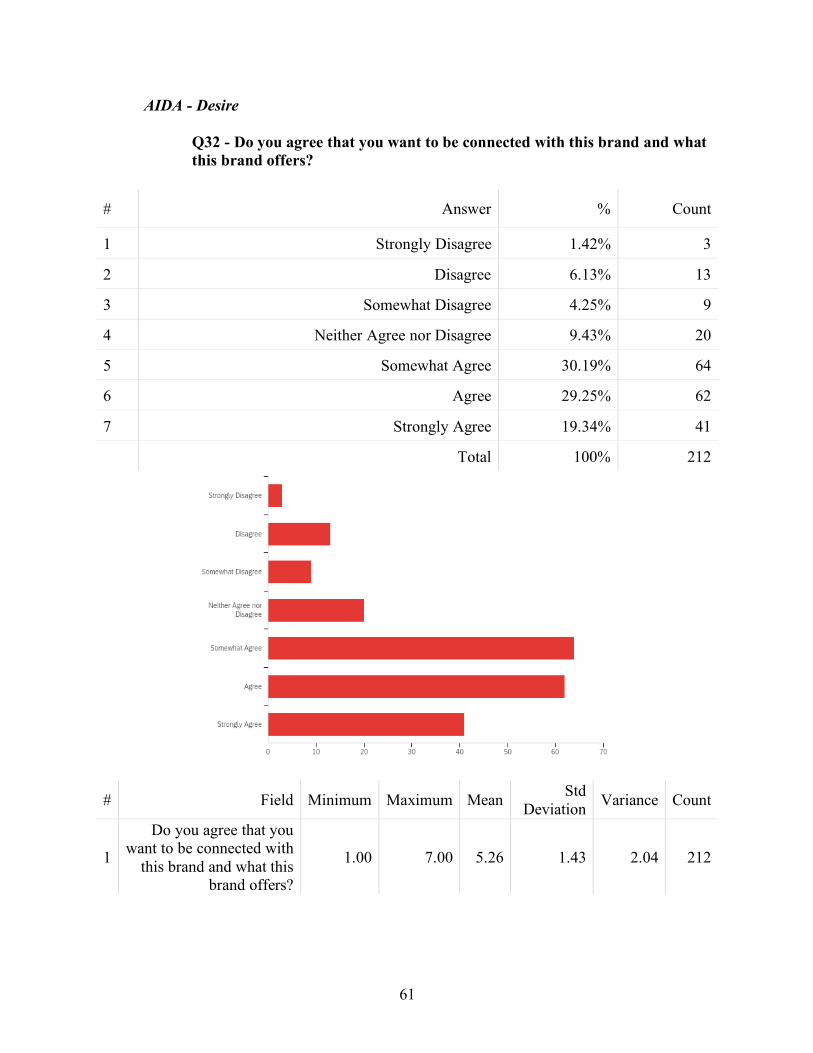
AIDA - Desire Q32 - Do you agree that you want to be connected with this brand and what this brand offers?
# Field Minimum Maximum Mean Std Deviation Variance Count
1
Do you agree that you want to be connected with
this brand and what this brand offers?
1.00 7.00 5.26 1.43 2.04 212
# Answer % Count
1 Strongly Disagree 1.42% 3
2 Disagree 6.13% 13
3 Somewhat Disagree 4.25% 9
4 Neither Agree nor Disagree 9.43% 20
5 Somewhat Agree 30.19% 64
6 Agree 29.25% 62
7 Strongly Agree 19.34% 41
Total 100% 212
62
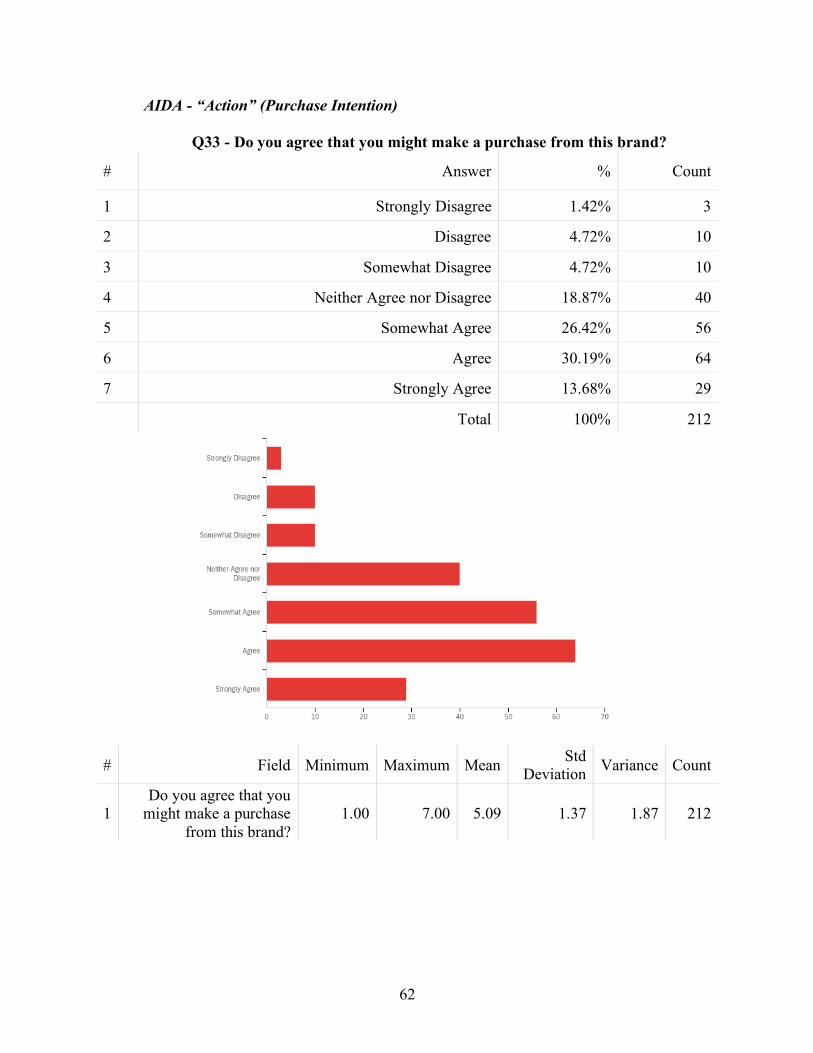
AIDA - “Action” (Purchase Intention) Q33 - Do you agree that you might make a purchase from this brand?
# Field Minimum Maximum Mean Std Deviation Variance Count
1 Do you agree that you
might make a purchase from this brand?
1.00 7.00 5.09 1.37 1.87 212
# Answer % Count
1 Strongly Disagree 1.42% 3
2 Disagree 4.72% 10
3 Somewhat Disagree 4.72% 10
4 Neither Agree nor Disagree 18.87% 40
5 Somewhat Agree 26.42% 56
6 Agree 30.19% 64
7 Strongly Agree 13.68% 29
Total 100% 212
63
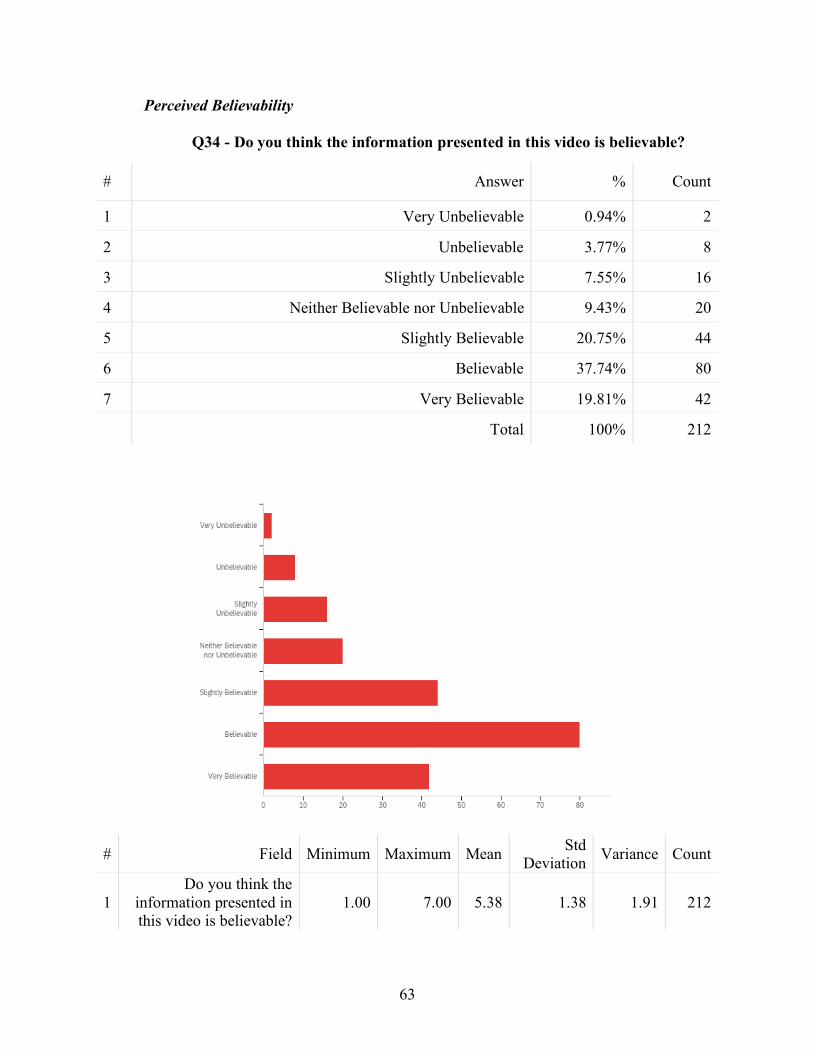
Perceived Believability Q34 - Do you think the information presented in this video is believable?
# Field Minimum Maximum Mean Std Deviation Variance Count
1 Do you think the
information presented in this video is believable?
1.00 7.00 5.38 1.38 1.91 212
# Answer % Count
1 Very Unbelievable 0.94% 2
2 Unbelievable 3.77% 8
3 Slightly Unbelievable 7.55% 16
4 Neither Believable nor Unbelievable 9.43% 20
5 Slightly Believable 20.75% 44
6 Believable 37.74% 80
7 Very Believable 19.81% 42
Total 100% 212
64
Brand Attitude
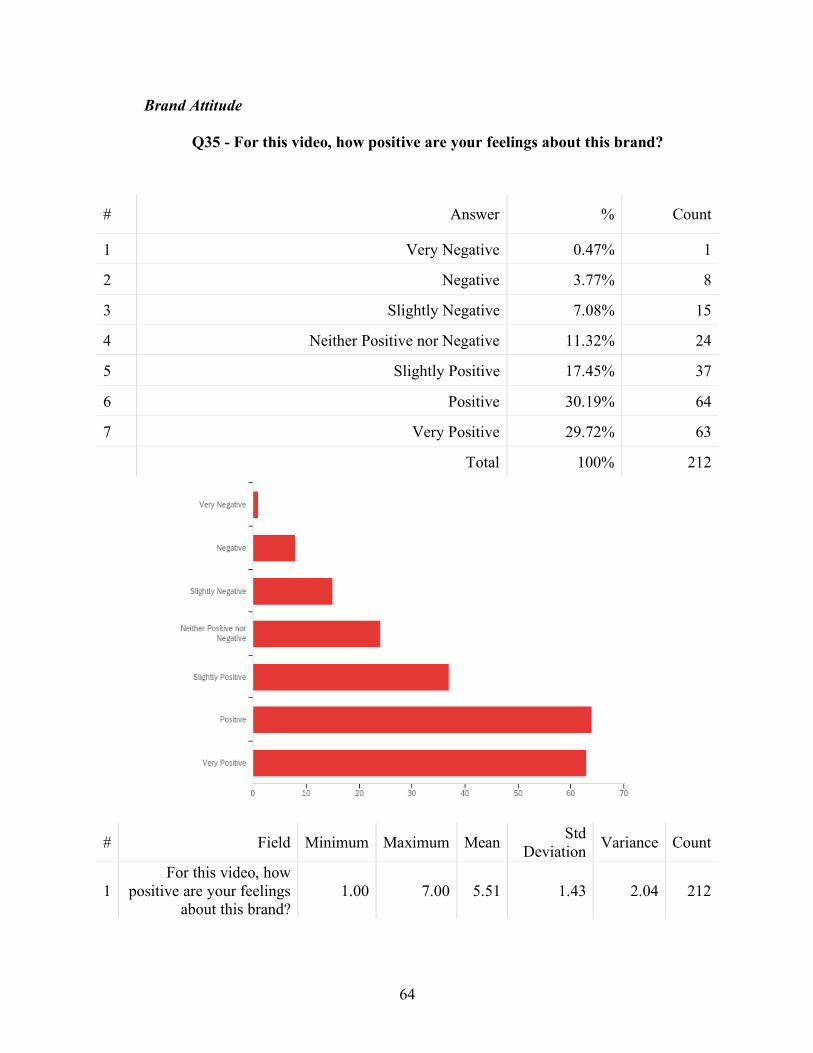
Q35 - For this video, how positive are your feelings about this brand?
# Field Minimum Maximum Mean Std Deviation Variance Count
1 For this video, how
positive are your feelings about this brand?
1.00 7.00 5.51 1.43 2.04 212
# Answer % Count
1 Very Negative 0.47% 1
2 Negative 3.77% 8
3 Slightly Negative 7.08% 15
4 Neither Positive nor Negative 11.32% 24
5 Slightly Positive 17.45% 37
6 Positive 30.19% 64
7 Very Positive 29.72% 63
Total 100% 212
65
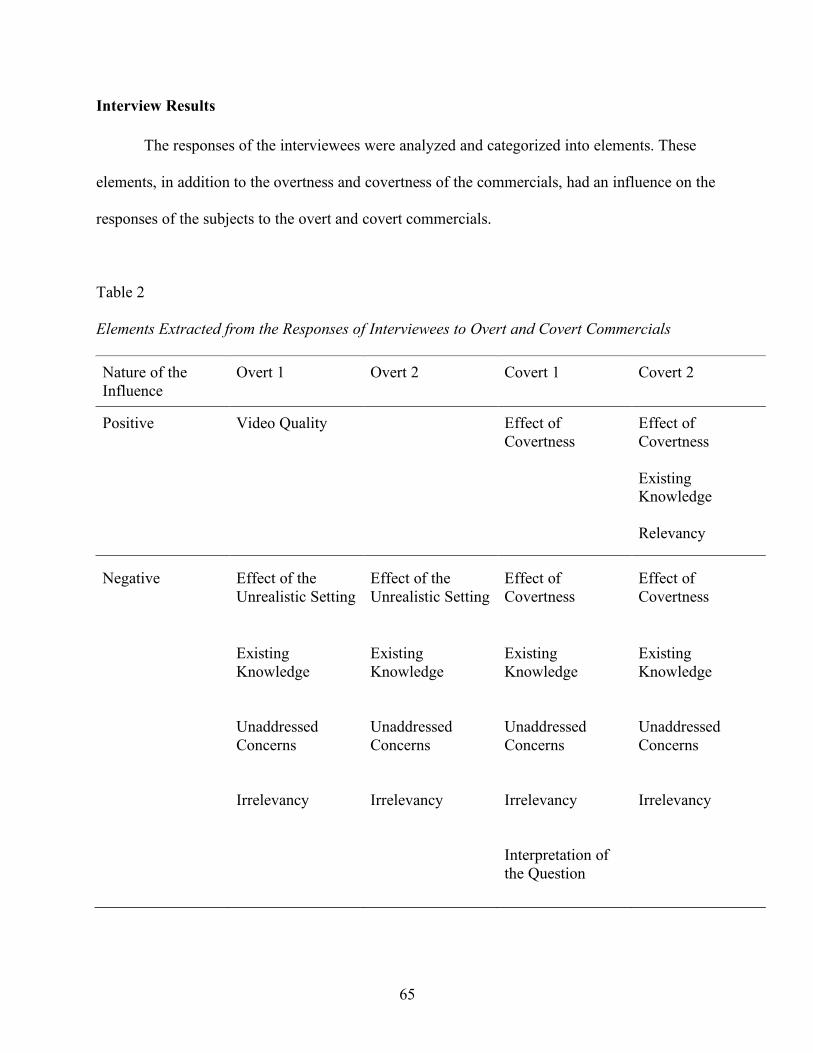
Interview Results
The responses of the interviewees were analyzed and categorized into elements. These
elements, in addition to the overtness and covertness of the commercials, had an influence on the
responses of the subjects to the overt and covert commercials.
Table 2
Elements Extracted from the Responses of Interviewees to Overt and Covert Commercials
Nature of the Influence
Overt 1 Overt 2
Covert 1
Covert 2
Positive
Video Quality Effect of Covertness
Effect of Covertness Existing Knowledge Relevancy
Negative Effect of the Unrealistic Setting
Effect of the Unrealistic Setting
Effect of Covertness
Effect of Covertness
Existing Knowledge Unaddressed Concerns Irrelevancy
Existing Knowledge Unaddressed Concerns Irrelevancy
Existing Knowledge Unaddressed Concerns Irrelevancy Interpretation of the Question
Existing Knowledge Unaddressed Concerns Irrelevancy

66
As shown in Table 2, the nature of the influence of these elements is described as
“positive” or “negative.” That is, the elements are likely to contribute to the positive and/or
negative responses the interviewees had after viewing the overt and covert commercials.
The data recorded in this chapter was reviewed and organized to support the analysis
stage of the research.
67
Analysis
The Analysis chapter will discuss the findings from the responses of the survey and
interview subjects. This chapter will first cover the demographics and advertising skepticism of
the survey and interview subjects. It will then examine the findings from the survey and
interview results. The analysis of the survey results will cover the comparison of responses to
each of the four commercials (two pairs of overt and covert commercials), regarding AIDA
(Attention, Interest, Desire, and “Action”), perceived believability, and brand attitude, and then
address the hypotheses. The analysis of the interview results will investigate elements that
influenced the interviewees’ responses, address the hypotheses, and offer deeper interpretations
of the survey findings.
Demographics
According to survey responses to Question 2 on gender, a total of 60% of participants
(n=128 of the total 212) were female. Based on the responses to Question 3 on age group, All
participants were 18 years old and above, 47% of whom (n=100) were 18-24 years old and 31%
of whom (n=66) were 25-34 years old.
The interview subjects were comprised of six individuals (3 females and 3 males) that
represented three demographic groups (2 per each group), Millennials’ (born in 1981-1996 or 24-
39 years old), Generation X’ (born in 1965-1980 or 40-55 years old), and Baby Boomers’ (born
in 1946-1964 or 56-74 years old).
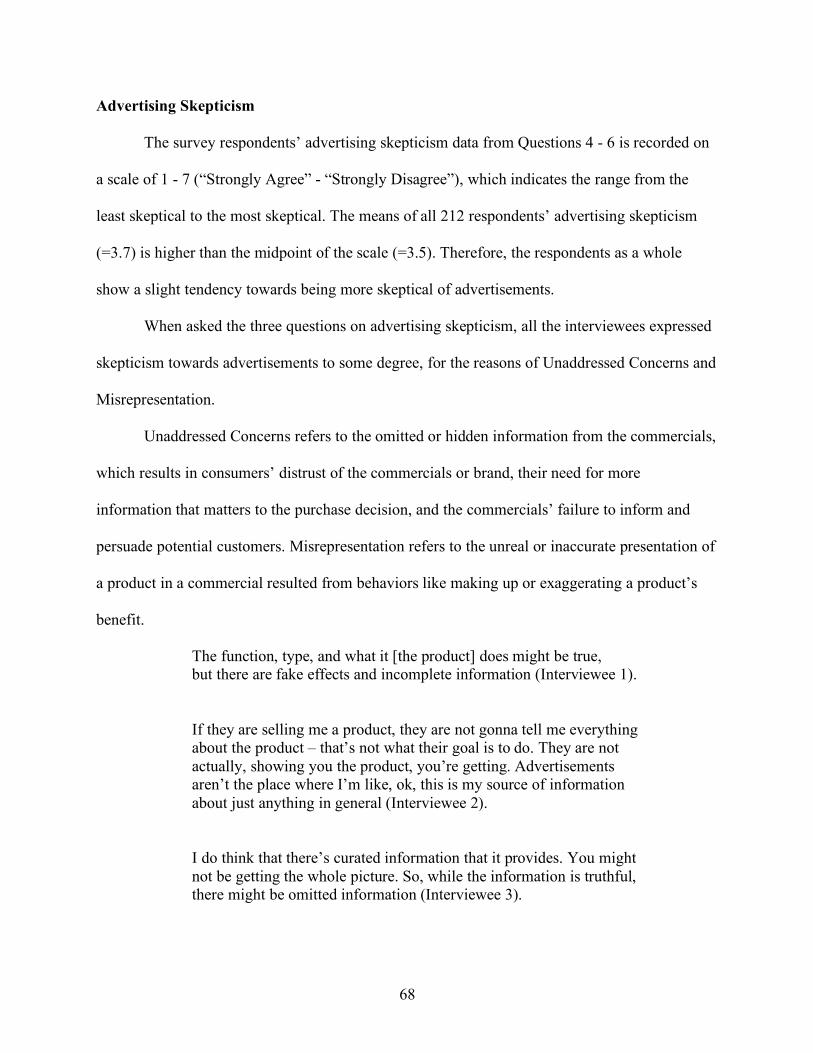
68
Advertising Skepticism
The survey respondents’ advertising skepticism data from Questions 4 - 6 is recorded on
a scale of 1 - 7 (“Strongly Agree” - “Strongly Disagree”), which indicates the range from the
least skeptical to the most skeptical. The means of all 212 respondents’ advertising skepticism
(=3.7) is higher than the midpoint of the scale (=3.5). Therefore, the respondents as a whole
show a slight tendency towards being more skeptical of advertisements.
When asked the three questions on advertising skepticism, all the interviewees expressed
skepticism towards advertisements to some degree, for the reasons of Unaddressed Concerns and
Misrepresentation.
Unaddressed Concerns refers to the omitted or hidden information from the commercials,
which results in consumers’ distrust of the commercials or brand, their need for more
information that matters to the purchase decision, and the commercials’ failure to inform and
persuade potential customers. Misrepresentation refers to the unreal or inaccurate presentation of
a product in a commercial resulted from behaviors like making up or exaggerating a product’s
benefit.
The function, type, and what it [the product] does might be true, but there are fake effects and incomplete information (Interviewee 1).
If they are selling me a product, they are not gonna tell me everything about the product – that’s not what their goal is to do. They are not actually, showing you the product, you’re getting. Advertisements aren’t the place where I’m like, ok, this is my source of information about just anything in general (Interviewee 2).
I do think that there’s curated information that it provides. You might not be getting the whole picture. So, while the information is truthful, there might be omitted information (Interviewee 3).
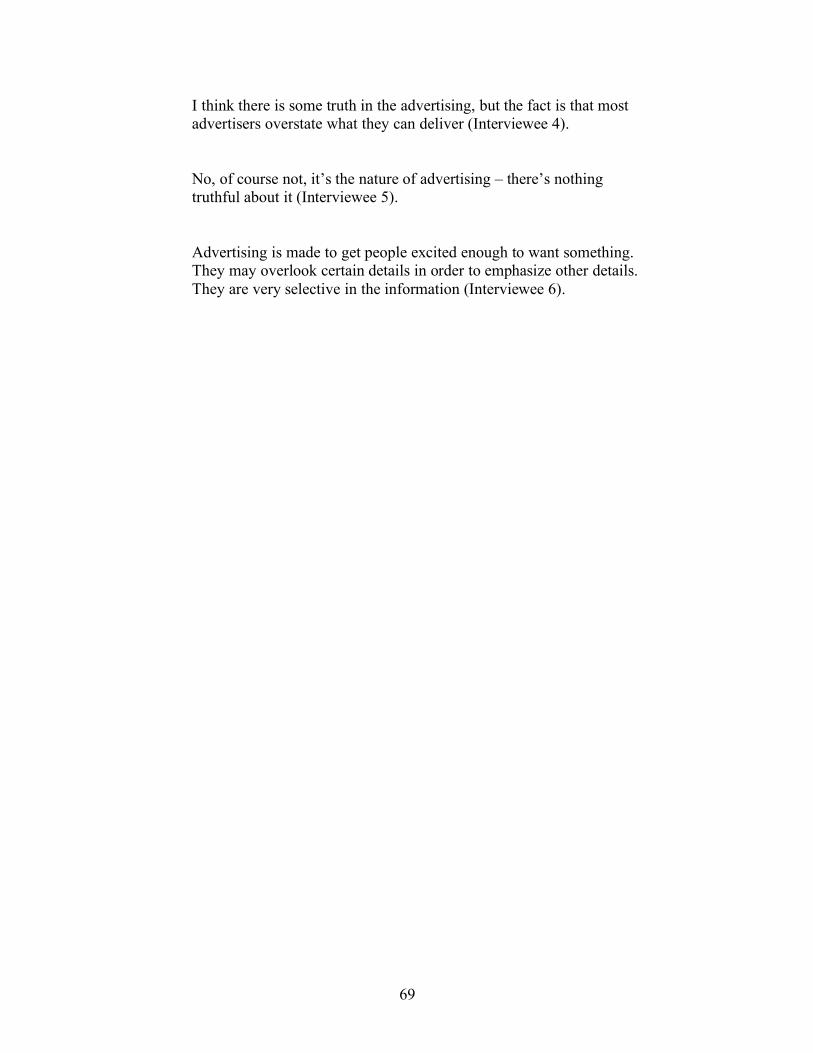
69
I think there is some truth in the advertising, but the fact is that most advertisers overstate what they can deliver (Interviewee 4).
No, of course not, it’s the nature of advertising – there’s nothing truthful about it (Interviewee 5).
Advertising is made to get people excited enough to want something. They may overlook certain details in order to emphasize other details. They are very selective in the information (Interviewee 6).
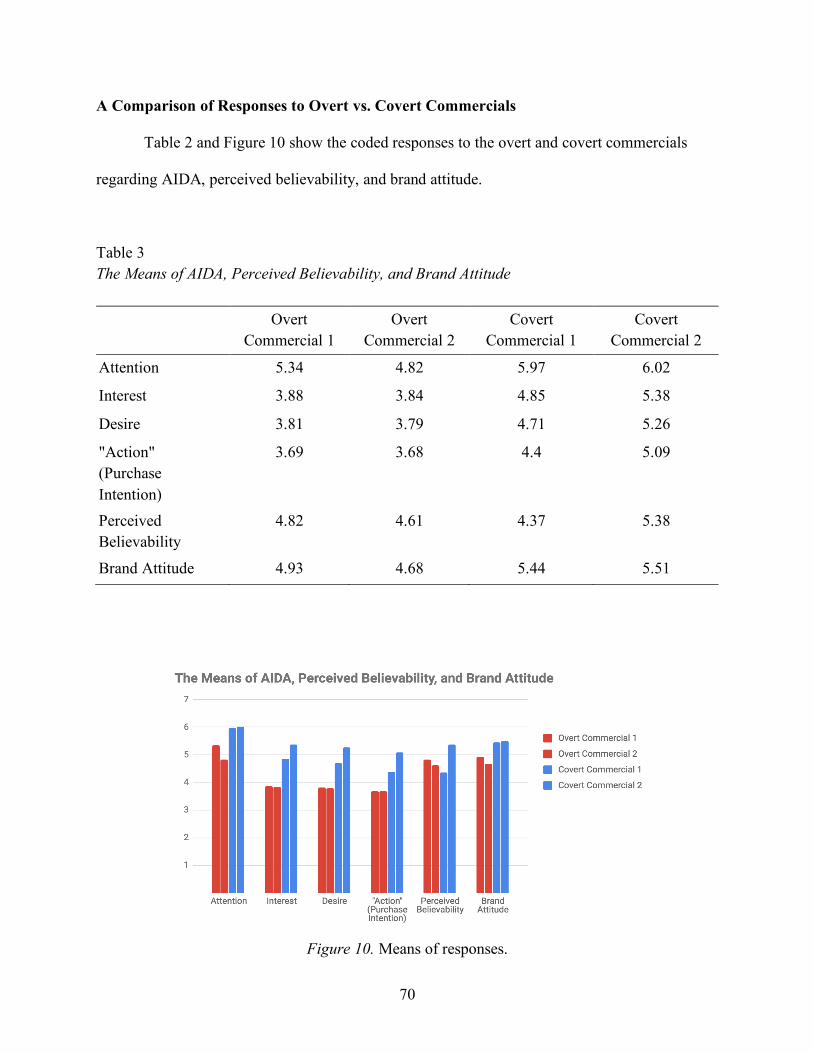
70
A Comparison of Responses to Overt vs. Covert Commercials
Table 2 and Figure 10 show the coded responses to the overt and covert commercials
regarding AIDA, perceived believability, and brand attitude.
Table 3 The Means of AIDA, Perceived Believability, and Brand Attitude
Overt Commercial 1
Overt Commercial 2
Covert Commercial 1
Covert Commercial 2
Attention 5.34 4.82 5.97 6.02
Interest 3.88 3.84 4.85 5.38
Desire 3.81 3.79 4.71 5.26
"Action" (Purchase Intention)
3.69 3.68 4.4 5.09
Perceived Believability
4.82 4.61 4.37 5.38
Brand Attitude 4.93 4.68 5.44 5.51
Figure 10. Means of responses.
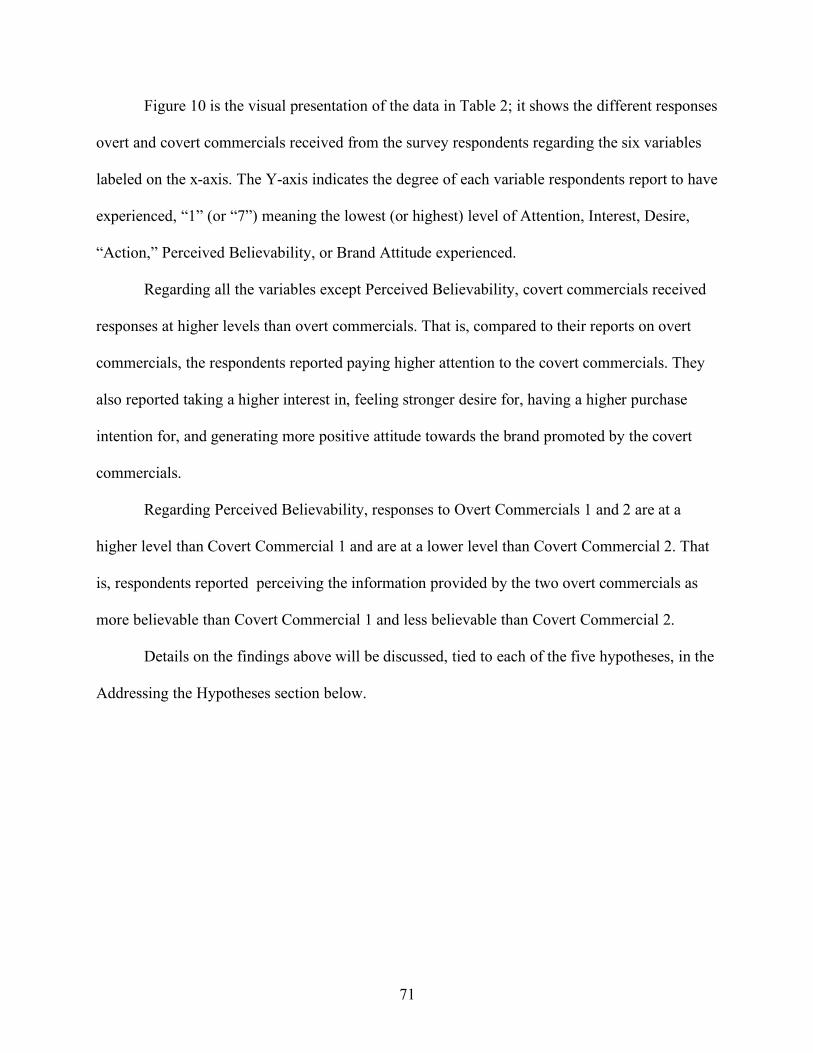
71
Figure 10 is the visual presentation of the data in Table 2; it shows the different responses
overt and covert commercials received from the survey respondents regarding the six variables
labeled on the x-axis. The Y-axis indicates the degree of each variable respondents report to have
experienced, “1” (or “7”) meaning the lowest (or highest) level of Attention, Interest, Desire,
“Action,” Perceived Believability, or Brand Attitude experienced.
Regarding all the variables except Perceived Believability, covert commercials received
responses at higher levels than overt commercials. That is, compared to their reports on overt
commercials, the respondents reported paying higher attention to the covert commercials. They
also reported taking a higher interest in, feeling stronger desire for, having a higher purchase
intention for, and generating more positive attitude towards the brand promoted by the covert
commercials.
Regarding Perceived Believability, responses to Overt Commercials 1 and 2 are at a
higher level than Covert Commercial 1 and are at a lower level than Covert Commercial 2. That
is, respondents reported perceiving the information provided by the two overt commercials as
more believable than Covert Commercial 1 and less believable than Covert Commercial 2.
Details on the findings above will be discussed, tied to each of the five hypotheses, in the
Addressing the Hypotheses section below.
72
Survey Results and the Hypotheses
To compare the effectiveness of covert vs. overt commercials, this research revolves
around the following research question on the effectiveness of covert vs. overt commercials.
RQ: How effective are covert commercials vs. overt commercials towards the
influence of attention, interest, desire, purchase intention, perceived
believability, and brand attitude of consumers?
The five hypotheses below answer the research question on the effectiveness of covert vs.
overt commercials regarding AIDA, brand attitude, perceived believability, and the effects of
advertising skepticism.
H1: Covert commercials generate higher-level outcomes in all four stages of
the AIDA model than overt commercials: gain more attention, induce more
interest, create higher desire, and get stronger purchase intention.
H1 compares the effects of the covert and overt commercials on the four
stages in the AIDA model: Attention, Interest, Desire, and “Action.” Concerning
“Action,” the fourth stage of AIDA, this research examines the respondents’
purchase intention, rather than their purchase action after viewing the
commercials.

73
Figure 11. Overt vs. Covert: AIDA.
Note: On the y-axis, “1” refers to the lowest level of attention/interest/ desire/“action”(purchase intention); “7” refers to the highest level. See details of the 7-point Likert scale for these variables in the Research Design section of the Methodology chapter.
As shown in Figure 11, the covert commercials (Covert 1 and Covert 2) received
higher-level responses in all four stages of AIDA than the overt commercials (Overt 1
and Overt 2), indicated by the four groups of columns. That is, the covert commercials
gained more attention, induced more interest, created higher desire, and got stronger
purchase intention from the respondents than the overt commercials. Hence, H1 is
proved.
In addition, responses that both the overt and covert commercials received
followed the same downward pattern: The level of attention received was higher than the
level of interest, which was higher than the level of desire, which was higher than that of
Attention
Interest
Desire
“Action”(PurchaseIntention)
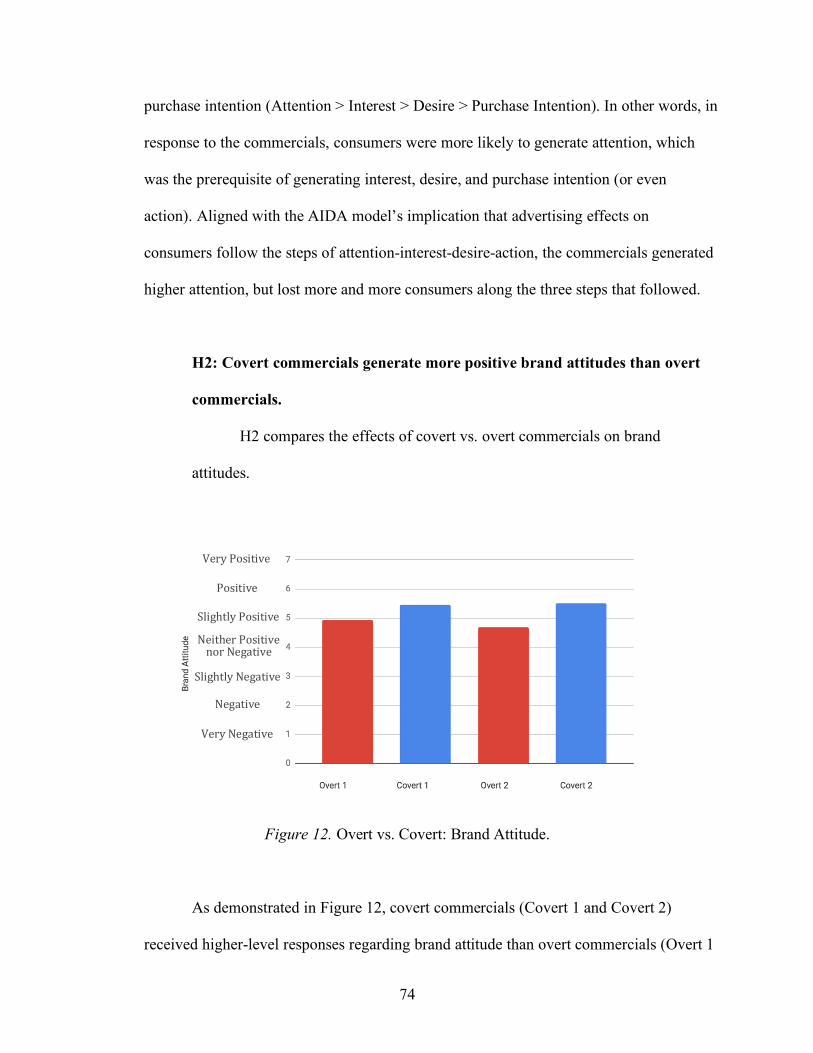
74
purchase intention (Attention > Interest > Desire > Purchase Intention). In other words, in
response to the commercials, consumers were more likely to generate attention, which
was the prerequisite of generating interest, desire, and purchase intention (or even
action). Aligned with the AIDA model’s implication that advertising effects on
consumers follow the steps of attention-interest-desire-action, the commercials generated
higher attention, but lost more and more consumers along the three steps that followed.
H2: Covert commercials generate more positive brand attitudes than overt
commercials.
H2 compares the effects of covert vs. overt commercials on brand
attitudes.
Figure 12. Overt vs. Covert: Brand Attitude.
As demonstrated in Figure 12, covert commercials (Covert 1 and Covert 2)
received higher-level responses regarding brand attitude than overt commercials (Overt 1
VeryPositive
NeitherPositivenorNegative
Positive
SlightlyPositive
Negative
VeryNegative
SlightlyNegative

75
and Overt 2). That is, the covert commercials generated more positive brand attitude than
the overt commercials. Hence, H2 is proved.
H3A: Covert commercials generate higher perceived believability than overt commercials.
H3A compares the effects on perceived believability.
Figure 13. Overt vs. Covert: Perceived Believability.
As displayed in Figure 13, only one of the covert commercials received higher-
level responses regarding perceived believability than the overt commercials. While the
second covert commercial (Covert 2) generated higher perceived believability than both
of the overt commercials (Overt 1 and Overt 2), the first covert commercial (Covert 1)
generated lower perceived believability than Overt 1 and Overt 2.
The result shows that the covert commercials selected for the research have
limited effectiveness of generating perceived believability. That is, respondents do not
VeryBelievable
NeitherBelievablenorUnbelievable
Believable
SlightlyBelievable
Unbelievable
VeryUnbelievable
SlightlyUnbelievable

76
always perceive the information in the covert commercials as more believable than the
information in the overt commercials. Hence, H3A is rejected.
H3B: Less skeptical consumers generate a more positive brand attitude when their perceived believability is higher; this effect is less prominent for more skeptical consumers.
H3B investigates the influence of consumers’ advertising skepticism on
the positive association between perceived believability and brand attitude.
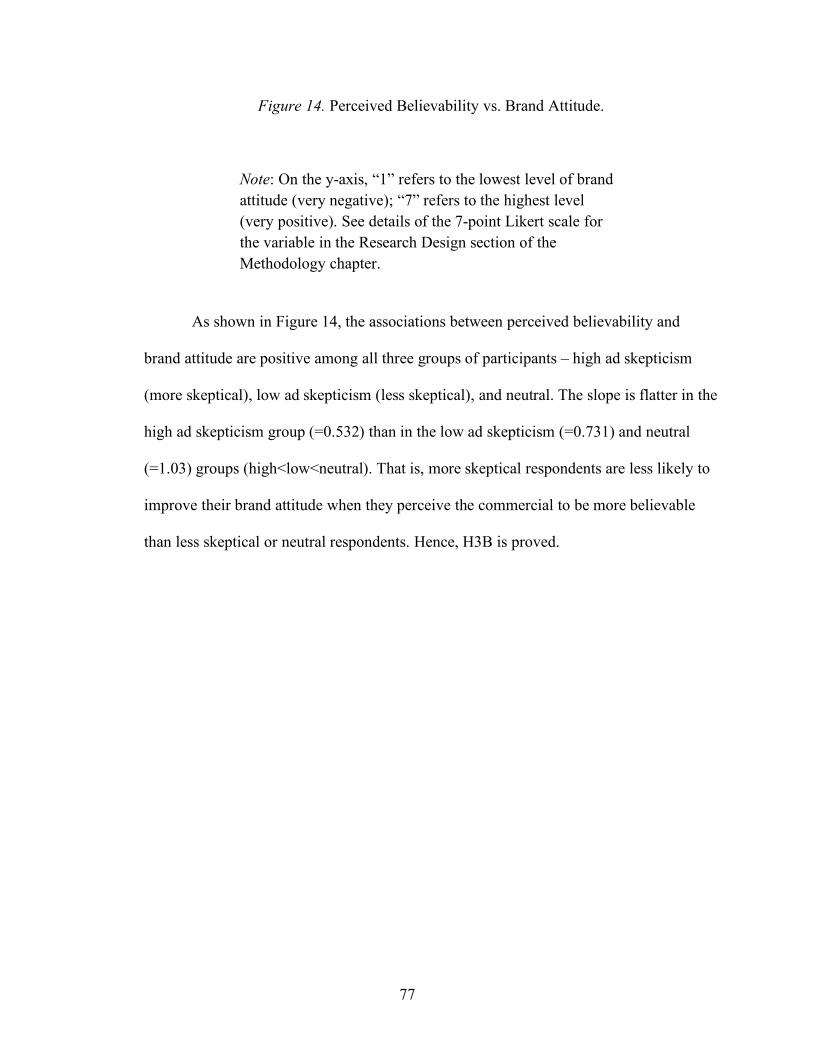
77
Figure 14. Perceived Believability vs. Brand Attitude.
Note: On the y-axis, “1” refers to the lowest level of brand attitude (very negative); “7” refers to the highest level (very positive). See details of the 7-point Likert scale for the variable in the Research Design section of the Methodology chapter.
As shown in Figure 14, the associations between perceived believability and
brand attitude are positive among all three groups of participants – high ad skepticism
(more skeptical), low ad skepticism (less skeptical), and neutral. The slope is flatter in the
high ad skepticism group (=0.532) than in the low ad skepticism (=0.731) and neutral
(=1.03) groups (high<low<neutral). That is, more skeptical respondents are less likely to
improve their brand attitude when they perceive the commercial to be more believable
than less skeptical or neutral respondents. Hence, H3B is proved.

78
H4: More skeptical consumers generate a more negative attitude toward the
brand promoted in the overt commercials than less skeptical consumers; the
relationship is less prominent for the brand promoted in the covert
commercials.
H4 compares the influence of covert and overt commercials on the
negative associations between advertising skepticism and brand attitude.
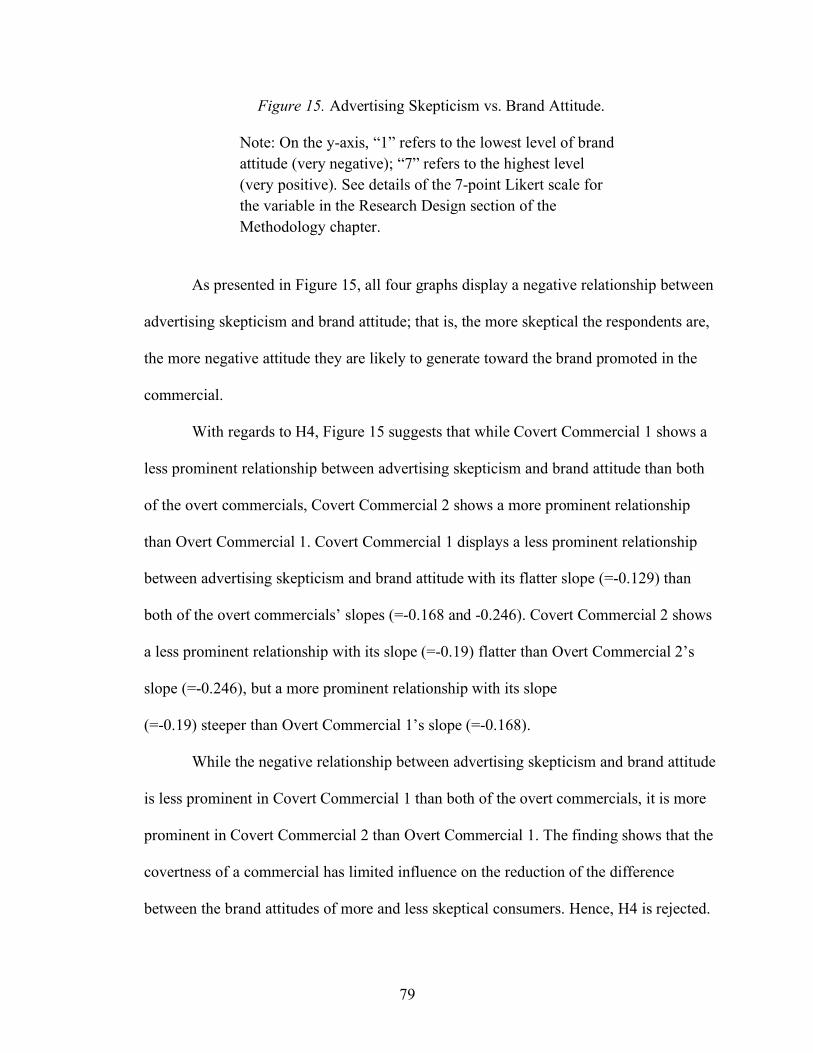
79
Figure 15. Advertising Skepticism vs. Brand Attitude.
Note: On the y-axis, “1” refers to the lowest level of brand attitude (very negative); “7” refers to the highest level (very positive). See details of the 7-point Likert scale for the variable in the Research Design section of the Methodology chapter.
As presented in Figure 15, all four graphs display a negative relationship between
advertising skepticism and brand attitude; that is, the more skeptical the respondents are,
the more negative attitude they are likely to generate toward the brand promoted in the
commercial.
With regards to H4, Figure 15 suggests that while Covert Commercial 1 shows a
less prominent relationship between advertising skepticism and brand attitude than both
of the overt commercials, Covert Commercial 2 shows a more prominent relationship
than Overt Commercial 1. Covert Commercial 1 displays a less prominent relationship
between advertising skepticism and brand attitude with its flatter slope (=-0.129) than
both of the overt commercials’ slopes (=-0.168 and -0.246). Covert Commercial 2 shows
a less prominent relationship with its slope (=-0.19) flatter than Overt Commercial 2’s
slope (=-0.246), but a more prominent relationship with its slope
(=-0.19) steeper than Overt Commercial 1’s slope (=-0.168).
While the negative relationship between advertising skepticism and brand attitude
is less prominent in Covert Commercial 1 than both of the overt commercials, it is more
prominent in Covert Commercial 2 than Overt Commercial 1. The finding shows that the
covertness of a commercial has limited influence on the reduction of the difference
between the brand attitudes of more and less skeptical consumers. Hence, H4 is rejected.
80
This study proves that H1, H2, and H3B are correct in a self-report setting and given the
four commercials selected for the study. As predicted in H1 and H2, the survey subjects
generated higher attention, interest, desire, purchase intention, and brand attitude in response to
covert commercials than was generated in response to overt commercials. As predicted in H3B,
respondents of higher advertising skepticism were less influenced by the positive relationship
between perceived believability and brand attitude.
This research rejects H3A and H4. Different from what is suggested in H3A, the findings
show that respondents do not always perceive the information in the covert commercials as more
believable than in the overt commercials. According to the rejection of H4, covert commercials
are not proven to have an effect of reducing the difference between the brand attitudes of more
and less skeptical respondents.
Interview Results and the Elements of Influence
The elements extracted from the responses of the six interviewees (Interviewees 1 - 6) are
highlighted and analyzed to formulate a deeper interpretation of the survey results, indicate the
limitations of the research, and make recommendations for future study. These elements include
Video Quality, Effect of Covertness, Irrelevancy/Relevancy, Existing Knowledge, Unaddressed
Concerns, Interpretation of the Question, and Effect of the Unrealistic Setting. Interpretation of
the Question and Effect of the Unrealistic Setting are not be discussed in this chapter, but in the
following chapters to substantiate the discussion.
Video Quality
Regarding Overt Commercial 1 and being asked the question on Interest:
81
Maybe. I thought that it was well shot and well composed. But because I’ve been in car repair stores so many times, nobody gets their car fixed in 39 seconds that way [The commercial is 39 seconds long]. I liked the images. I thought the videographers did a really great job of compositions and, you know, providing clarity of the environment (Interviewee 5).
The response of Interviewee 5 reflects how the production quality of the commercial can
influence the interest of the audience towards the brand promoted. High video quality might play
a role in generating the interest of the audience in checking out the brand promoted and what it
offers.
Effect of Covertness
The covertness of the commercial is the use of attractive stories or emotional appeals, and
the priority of gaining attention and making positive associations over delivering the product or
brand information. The effect of covertness was shown positive regarding the responses to
Attention, Interest, and Brand Attitude.
Positive Effect on Attention
The covertness in Covert Commercials 1 and 2 can have a positive effect in generating
attention of the subjects. Being asked the question on Attention paid to Covert Commercial 1,
three interviewees responded positively for the reason that the content or story in the commercial
appealed to them.
A lot of attention. It was very funny. It reminded me of a movie I saw a long time ago. It’s based on a movie called ‘Groundhog Day’ with the same actor, Bill Murray (Interviewee 4). I paid good attention because I liked the movie (Interviewee 6).
82
Because it is quite attractive. What I saw was a complete story line. Although it was full of absurd and dramatic effects, this story could attract me to keep watching (Interviewee 1). It was humorous. [I paid] a lot of attention (Interviewee 5).
Interviewees 4 and 6 displayed the background knowledge of the content of Covert
Commercial 1, as they referred to the movie based on which Covert Commercial 1 was plotted.
They are likely the audience that Jeep (the sponsor of Covert Commercial 1) tries to target –
people who find the story relatable or are connected to the story in a deeper way. The relevancy
of Interviewees 4 and 6 to the content of Covert Commercial 1 might have strengthened the
positive effect of covertness of the commercial on Attention.
Not knowing the background of the commercial being an old movie, Interviewees 1 and 5
might not be in the group of audience that Jeep intends to target with the commercial. Despite
not having the background knowledge, they were still attracted to the story and expressed high
comments on it.
Covert Commercial 2 also received a positive comment on Attention. Being asked the
question on Attention paid to Covert Commercial 2, one interviewee elaborated on how the
covertness of the commercial made them pay attention to the commercial:
It had plots and coherency, and made me fill in the gap of the untold story. It provokes imaginations (Interviewee 1).
The above responses to the question on Attention paid to Covert Commercials 1 and 2
show the positive effect of covertness in gaining the viewers’ attention.
Positive Effect on Interest
The covertness of Covert Commercials 1 and 2 can have a positive effect in inducing
interest of the interviewees in the brand promoted and what it offers. The positive effect of
83
covertness in Covert Commercial 1 on Interest might also have been strengthened by the
relevancy of the interviewees to the background story or by the fact that the interviewees were
successfully targeted by the sponsor, Jeep.
Being asked the question on Interest in the brand promoted in Covert Commercial 1, one
interviewee pointed out that the reason for their increased interest was the relevancy to the
background story of the commercial:
Maybe a little bit more now than I was before. I think it mostly had to do with the fact that it was a take on a movie that I saw before, that I enjoyed watching (Interviewee 4).
Being asked the question on Interest in the brand promoted in Covert Commercial 2, one
interviewee gave a high comment on the commercial and explained how it induced the most
interest in them, among the four commercials shown, to check out the brand promoted and what
it offers:
This would be the most interesting one to check out so far. Because they gave me reasons to have a different experience than not having that brand could offer (Interviewee 6).
The above responses to the question on Interest induced by Covert Commercials 1 and 2
show the positive effect of covertness in inducing the viewers’ interests.
Positive Effect on Brand Attitude
The covertness of Covert Commercials 1 can have a positive effect in inducing the
interest of the interviewees in the brand promoted and what it offers. Being asked the question on
Interest in the brand promoted in Covert Commercial 2, one interviewee expressed a high brand
attitude (rating their brand attitude as 7 out of 7) and explained that the reason was the story in
the commercial:
84
[I would rate it as] 7 [out of 7]. The story is distinctive from others. Very unique (Interviewee 1).
Interviewee 1’s response to the question on the attitude towards the brand promoted by
Covert Commercial 1 shows the positive effect of covertness in increasing the viewers’ brand
attitude.
Irrelevancy/Relevancy
Irrelevancy refers to when the consumers lack the demand for the product promoted (at
least at the moment), do not find the product/brand/commercial content relevant, do not identify
their value or image with the brand’s, and/or are not the target market. Opposite to irrelevancy,
relevancy refers to when the consumers have the demand for the product promoted, find the
product/brand/commercial content relevant, identify their value or image with the brand’s, and/or
are the target market.
Irrelevancy is likely to influence the consumers’ responses towards both overt and covert
commercials negatively.
Negative Influence of Irrelevancy on Responses to Overt Commercials
Regarding the overt commercials, interviewees expressed negative comments regarding
Interest, Desire, Purchase Intention, and Brand Attitude resulting from their irrelevancy to the
promoted brand or product.
Interest. Being asked the question on Interest in checking out the brand and what it offers
after watching the overt commercials, four interviewees in response to Overt Commercial 1 and
85
one interviewee in response to Overt Commercial 2 explained their lack of interest due to their
irrelevancy to the brand or product promoted.
In response to Overt Commercial 1 on Autoavilys’s car service:
I don’t have a car, so [I am] not really interested (Interviewee 1). Not really. Looks like an Italian car repair company, so I’m not sure that it was relevant to my life (Interviewee 3). Not personally, but not because of the commercial (Interviewee 6).
Interviewee 1 lacked an interest in the brand promoted by Overt Commercial 1 because
of their lack of demand for the kind of service provided by the brand. Interviewee 3 might be
open to a new option for car service, but lacked an interest in a car service brand that was not
relevant geographically. Interviewee 6’s lack of interest can be due to their lack of demand for
either the kind of service or for the brand itself due to their established loyalty with another
brand.
In response to Overt Commercial 2 on WSFS’s banking service:
I can see how this could be appealing to some people, they’re like, I just want something local, something that I feel more like they care about the person, right? Me personally, that’s not what I’m looking for in banking (Interviewee 2).
Interviewee 2 found themselves irrelevant to the brand promoted in Overt Commercial 2
because they did not have a demand for what they perceived the brand offered – the local service
and the care for customers.
Desire. Being asked the question on Desire to be connected with the brand and what it
offers after watching Overt Commercial 1 (Autoavilys’s car service), two interviewees stated a
lack of Desire due to their irrelevancy to the brand or product promoted:
86
I don’t have the real need for it (Interviewee 2). I have been going to a service provider for 25 years so it would take a lot for me to leave a current vendor (Interviewee 5). No, I have different loyalty already established (Interviewee 6).
While Interviewee 2’s irrelevancy to the brand originated from a lack of demand for the
kind of service provided by the brand, Interviewees 5 and 6’s irrelevancy did not come from
their lack of demand for the kind of service, but from their established demand for the same kind
of service provided by another brand, which would not be easily swayed by a commercial.
Being asked the same question on Desire after watching Overt Commercial 2 (WSFS’s
bank service), one interviewee expressed no interest in checking out the bank and what it offers,
but showed and explained their Desire to be connected with the bank:
Yeah, ok, I don’t have any issue with it [connecting with the bank]... Because I don’t think I’ve planned on switching banks so I don't have a need for the bank. But I wouldn’t have any issue if I was affiliated with the brand in some way, in the way they presented themselves (Interviewee 4).
Due to their established relationship with their current bank, and hence a lack of demand
for a new bank, Interviewee 4 does not have an interest in checking out the brand. Nonetheless,
they are open to having another option in case of any changes. Therefore, Overt Commercial 2
failed to turn Interviewee 4 into an interested customer due to their irrelevancy or lack of demand
(at least at the moment). However, it successfully exposed the viewer to the brand, induced their
desire to connect, and earned a potential customer.
Purchase Intention. Being asked the question on Purchase Intention after watching the
overt commercials, two interviewees in response to Overt Commercial 1 and two interviewees in
87
response to Overt Commercial 2 showed a lack of intention to purchase from the brand due to
their irrelevancy to the brand or product promoted.
In response to Overt Commercial 1:
No, not their target population (Interviewee 1). No, probably not, not personally, but I can see how this would work on some people (Interviewee 2).
Interviewees 1 and 2 did not see themselves as the target market of the brand promoted
by Overt Commercial 1, and thus lacked purchase intention.
In response to Overt Commercial 2:
When it comes to banking and money, I actually do look a lot to stats, credit card rates and stuff, like loan percentages, like if I go to a different country, can I still use my bank, things like that are more important to me, so I wouldn’t really look into this type of bank [local] (Interviewee 2). I think that if I were looking for a loan for home construction, I would be more interested in purchasing from this brand (Interviewee 4).
Interviewee 2 did not have any purchase intention because of their lack of demand for
local banks like the one promoted by Overt Commercial 2. Interviewee 4 did not have any
purchase intention because of their lack of demand for the service provided by the brand
promoted by Overt Commercial 2 (at least at the moment).
Brand Attitude. Being asked the question on the attitude towards the brand promoted in
the overt commercials, one interviewee in response to Overt Commercial 1 and one interviewee
in response to Overt Commercial 2 did not express a high brand attitude due to their irrelevancy
to the brand or product promoted.
In response to Overt Commercial 1:
88
In the middle. The good thing is that I feel like this thing is pretty convenient, but the bad thing is that because it doesn’t have anything to do with me, I don’t have a car (Interviewee 1).
Interviewee 1 did not have a demand for using the service offered by the promoted brand
in Overt Commercial 1 and thus did not respond with a high brand attitude.
In response to Overt Commercial 2:
If they were a bank in my area and I was dissatisfied with my bank, I would, you know, maybe consider discussing with them, taking over my accounts (Interviewee 5).
Interviewee 5 listed situations in which they might consider working with the brand.
However, they have not encountered those situations yet – they were irrelevant to the brand
promoted by Overt Commercial 2 (at least at the moment).
Negative Influence of Irrelevancy on Responses to Covert Commercials
Regarding the covert commercials, interviewees expressed negative comments regarding
Interest, Desire, and Purchase Intention that resulted from their irrelevancy to the promoted
brand or product.
Interest. Being asked the question on Interest in checking out the brand and what it offers
after watching Covert Commercial 2, one interviewee explained that they lacked the interest due
to their Irrelevancy to the brand or product promoted:
I would say probably not at this time. I know that Google Assistant has this feature, and I think that you can do that. But just not interested (Interviewee 4).
Interviewee 4 did not have a demand for the product introduced in Covert Commercial 2
and, therefore, did not have an interest in checking it out.
89
Desire. Being asked the question on Desire to be connected with the brand and what it
offers after watching the covert commercials, one interviewee in response to Covert Commercial
1 and two interviewees in response to Covert Commercial 2 elaborated on their lack of desire
due to their irrelevancy to the brand or product promoted.
In response to Covert Commercial 1 (Jeep’s):
I’m very happy with the automobile I have now, so I would say probably not. If I were looking for a car and I didn’t have the car I have now, then I might be interested (Interviewee 4).
Interviewee 4 lacked a desire to be connected with the offering of the brand promoted in
Covert Commercial 1 (Jeep’s automobile) because they already had an automobile and did not
need another one (at least at the moment).
In response to Covert Commercial 2 (Google’s):
The particular product they are selling here? No (Interviewee 4). Not until I’m much older. While my memory is good, I just want to know that [the product promoted by Google]’s an option for me later (Interviewee 6).
Interviewees 4 and 6 did not have a desire to be connected with the offering of the
promoted brand in Covert Commercial 2 (Google Assistant) that was presented to be able to
remember memories for those in need (e.g., the elders) and to store photos.
Purchase Intention. Being asked the question on the intention to make a purchase from
the brand promoted in the covert commercials, two interviewees in response to Covert
Commercial 1 elaborated on their lack of Purchase Intention due to their irrelevancy to the brand
or product promoted:
If I had money, why wouldn’t I buy xxx but Jeep… But Jeep is a good option for the same types of car (Interviewee 1).
90
When I would be in need of a new car, maybe yes. Looks fun, I had a Jeep once (Interviewee 5).
Interviewee 1 did not have a purchase intention for the brand promoted by Covert
Commercial 1 because they lacked a demand for it and were not its target market. Interviewee 5
might be the target market of the brand, but did not have a demand for the kind of product
offered by the brand (at least at the moment), which led to their lack of purchase intention.
In response to Covert Commercial 2 (Google’s) and being asked the question on
Perceived Believability of the information presented in the commercial, one interviewee shared a
positive comment on perceived believability, but displayed their irrelevancy to the product:
Yes, I think they were believable but not interesting. Nothing that I can’t do with a piece of paper and a pencil (Interviewee 4).
Interviewee 4 did not have a demand for the product offered by the brand promoted by
Covert Commercial 2 (i.e., Google Assistant), which they perceived to be replaceable, and
therefore were irrelevant to the brand offering.
Positive Influence of Relevancy on Responses to Covert Commercial 2
The relevancy of the interviewees to the brand or product has positive influence on the
responses to Covert Commercial 2, regarding Attention, Interest, and Desire.
Attention. Regarding the question on Attention paid to Covert Commercial 2 (Google’s),
one interviewee gave a positive comment that resulted from their relevancy to the commercial
content and the promoted product:
They did it in a way where they’re like, ok, we’re gonna put a story of a person. But they also showed how their product combined into that lifestyle, which I think a lot of the commercials weren’t as
91
successful. Like for this like, you could see, how does the search engine serve that lifestyle. For Google, they very much wanted to make it [so] you could see yourself doing these things (Interviewee 2).
As they discussed the attention they paid to Covert Commercial 2, Interviewee 2 shared a
positive comment on how Google, promoted by the commercial, made the product seem
relatable to people. The relevancy created by the commercial between consumers and the product
might have been part of the reason that it gained Interviewee 2’s attention.
Interest. Regarding the question on Interest in checking out the brand and what it offers
after watching Covert Commercial 2, one interviewee shared a positive comment due to their
Relevancy to the promoted product:
It is tightly related to my daily needs because I have a lot of photos (Interviewee 1).
Finding the product relevant to their needs, Interviewee 1 showed an interest in checking
it out.
Desire. Regarding the question on Desire to be connected with the brand and what it
offers after watching Covert Commercial 2, one interviewee shared a positive comment due to
their Relevancy to the promoted product:
It’s definitely something I could see myself actually needing on a daily basis (Interviewee 2).
Interviewee 2’s response to the question on Desire reflected the connection between the
relevancy of the product and their decision on whether they had a desire to be connected.
Irrelevancy had a negative influence on the responses to both the overt and covert
commercials, while relevancy positively affected the responses to Covert Commercial 2.
92
Because of irrelevancy, the overt commercials received negative responses regarding Interest,
Desire, Purchase Intention, and Brand Attitude. The covert commercials received negative
responses regarding Interest, Desire, Purchase Intention, but not Brand Attitude. Because of
relevancy, Covert Commercial 2 received positive comments regarding Attention, Interest, and
Desire.
The covert commercials did not receive negative comments regarding Brand Attitude like
the overt commercials did because of the Irrelevancy of the interviewees to the brand or product
promoted. The reason might be that the brands promoted by the selected overt commercials were
lesser-known or that they left a more negative impression among the interviewees, which is
referred to as Existing Knowledge (to be discussed in the following section).
Existing Knowledge
Existing Knowledge refers to when the viewers have been previously exposed to the
brand/product or the same kind of brand/product, had experiences with or knowledge of the
brand or product, established an impression of the brand or product, and/or formulated a
presumption of the industry environment to which the company (i.e., the commercial’s sponsor)
belongs. The influence of Existing Knowledge on the viewers’ responses can be either positive
or negative, and it is applicable to both overt and covert commercials, depending on the
positivity or negativity of the original opinion of the brand, the product, or the associated
industry.
According to the responses of the interviewees, Overt Commercial 1 (Autoavilys’s),
Overt Commercial 2 (WSFS Bank’s), and Covert Commercial 1 (Jeep’s) received negative
93
comments resulting from the interviewees’ Existing Knowledge, while Covert Commercial 2
(Google’s) received positive responses due to the Existing Knowledge.
Negative Influence of Existing Knowledge
With regards to Existing Knowledge, when the viewers have a negative impression of the
brand, product, the kind of commercial, or the industry that is shown in the commercial, their
Attention, Interest, Perceived Believability, and Brand Attitude are likely to be negatively
influenced.
Attention. Being asked the question on the attention paid to Overt Commercial 2 (WSFS
Bank’s), one interviewee referred to their negative impression of the kind of business or the
industry to which the brand belongs (i.e., banking):
Well, banking is a funny business. You know, sometimes you don’t trust the bank (Interviewee 5).
Interviewee 5’s existing knowledge of the kind of business or the industry to which the
promoted brand belongs might have negatively influenced the attention they paid to Overt
Commercial 2.
Interest. Being asked the question on the interest in checking out the brand and its
offering, one interviewee in response to Overt Commercial 2 (WSFS Bank’s) and three
interviewees in response to Covert Commercial 1 (Jeep’s) shared negative comments due to their
Existing Knowledge.
In response to Overt Commercial 2:
This bank seems small, I haven’t heard of it (Interviewee 1).
94
Interviewee 1’s negative comment on the promoted brand in Overt Commercial 2 was
based on their comparison of the brand with the same kind of brands (i.e., other banks) that they
had knowledge of. A negative impression of the promoted brand based on Existing Knowledge
of the same kind of brands might lead to a lack of interest in the promoted brand.
In response to Covert Commercial 1:
The type of demographic that they would hit previously seems to be the type of person that was more rugged, more into the country lifestyle. And one commercial isn’t really gonna change that perspective from me of the brand, so I wouldn’t look into Jeep if I was looking for a new car because it doesn’t go with my lifestyle, or what I think my lifestyle is (Interviewee 2). No, but that has nothing to do with the commercial. I don’t have any interest in a Jeep (Interviewee 3). I have an impression already of the brand, so for me this [the commercial] was entertaining more than it was convincing me (Interviewee 6).
Interviewees 2, 3, and 6 showed Existing Knowledge of the brand promoted in Covert
Commercial 1, which, combined with their Irrelevancy to or lack of demand for the brand, had a
negative impact on their interest in checking out the brand and its offering.
Perceived Believability. Being asked the question on the believability of the information
presented in the commercial, two interviewees in response to Overt Commercial 1 (AutoAvilys’s
car service) and two interviewees in response to Overt Commercial 2 (WSFS’s banking service)
shared negative comments due to their Existing Knowledge that was negative and did not match
up with the information provided by the commercials.
In response to Overt Commercial 1:
95
The only thing that’s a little unbelievable may be that it is not as good or convenient as how it seems, like the environment, and then the service, the attitude... these may not be as perfect [as in the commercial] (Interviewee 1). Yes, except for 39 seconds (Interviewee 5).
For Interviewees 1 and 5, the mismatch between their Existing Knowledge of car service
(regarding the environment, the customer service, and the time needed for finishing the service)
and the presentation of the car service in Overt Commercial 1 lowered their perceived
believability of the brand/service information presented in the commercial.
In response to Overt Commercial 2:
To a certain extent. They can say they guarantee the best… It kind of depends on the employees. Things like service and stuff, that’s more subjective (Interviewee 2). Some of it. You know, banks are kind of funny, and lawyers are kind of funny. They are very conservative. So I think their job is to make the bank win and the customer come second… The bank will always win (Interviewee 5).
Interviewees 2 and 5’s Existing Knowledge of the kind of business or the industry to
which the brand belongs was negative, did not match up with the information presented in Overt
Commercial 2, and had negative influence on their perceived believability of the brand
information presented in Overt Commercial 2.
Brand Attitude. Being asked the question on the attitude towards the brand promoted in
the commercials, two interviewees in response to Overt Commercial 2 (WSFS Bank’s) and one
interviewee in response to Covert Commercial 1 (Jeep’s) did not express a high brand attitude
due to their negative Existing Knowledge.
In response to Overt Commercial 2:
96
Neutral. I’m so used to seeing commercials very much in this format, so it doesn’t really stand out in any way. It’s too similar to other things I see (Interviewee 2). I would say about average. Most banks are trying to convince me that they are interested in me. They are all about the same level (Interviewee 6).
Interviewees 2 and 6 did not have a high brand attitude because they had negative
Existing Knowledge of commercials of the same kind and of brands of the same kind, or of the
industry to which the brand belongs to.
In response to Covert Commercial 1:
Medium. I think I’m more familiar with this brand so that might have adjusted it. I mean, as far as the commercial goes, it was cute and funny, I paid attention to it, but I don’t know if that affected my view of the brand in a more positive way (Interviewee 3).
Interviewee 3 did not develop a positive brand attitude because of their negative Existing
Knowledge of the brand promoted.
Positive Influence of Existing Knowledge
With regards to Existing Knowledge, when the viewers have a positive impression of the
brand, product, the kind of commercial, or the industry that is shown in the commercial, their
Attention, Interest, Perceived Believability, and Brand Attitude are likely to be positively
influenced. Below are examples of positive responses to Covert Commercial 2 (Google’s) due to
positive Existing Knowledge.
Interest. Being asked the question on their Interest in checking out the brand (Google)
and its offering promoted by the commercial, three interviewees displayed positive Existing
Knowledge of the brand and interest in the brand:
97
Google might not disappoint me (Interviewee 1). I think, yeah, maybe to a certain extent. I mean, we all use Google anyways. But I think the nice thing about these commercials is that they displayed what was capable of this system. I think some people might not know that you can use Google to just ask a thing. So like, maybe that’s a good representation that the search engine can do so much more (Interviewee 2). I use Google all of the time. So yes, 1000%. They already own us. They don’t really have to advertise too much (Interviewee 5).
Interviewees 1, 2, and 5’s interest in the brand came from their positive Existing
Knowledge of the brand and could be independent from the commercial shown to them.
Purchase Intention. Being asked the question on the intention to make a purchase from
the brand (Google) promoted by the commercial, one interviewee showed purchase intention and
positive Existing Knowledge of the brand:
I would see myself probably buy something from Google. With Google, I feel like they already are a part of my lifestyle, like I use Google Gmail, I use Google Docs... I already use so many Google products that it feels like this is just like them representing themselves like the way they want to (Interviewee 2).
Interviewee 2, being its ongoing user, implies that they had a positive impression of
Google, which might contribute to their purchase intention and is independent from the
commercial.
Brand Attitude. Being asked the question on the attitude towards the brand (Google)
promoted by the commercial, one interviewee elaborated on their high brand attitude and
referred to their Existing Knowledge of the brand:
98
It’s because of the trust effect brought by Google as a large company. It’s related to the brand’s reputation (Interviewee 1).
Interviewee 1 displayed the knowledge of the scale and reputation of the promoted brand,
which is positive and can have a positive influence on their brand attitude, independent from the
commercial.
The above examples show that positive (or negative) Existing Knowledge can have
positive (or negative) influence on the responses regarding Attention, Interest, Purchase
Intention, Perceived Believability, Brand Attitude, and possibly many other aspects of
consumers’ perceptions or attitudes. The commercials tend to show the positive sides of the
brand and product promoted, and they persuade consumers to pay attention, develop an interest,
make a purchase, and form a positive brand attitude. The biased approach is likely to fail if the
consumers have negative Existing Knowledge of the brand and product, and find that the
commercial does not match up with their Existing Knowledge.
Unaddressed Concerns
Unaddressed Concerns refers to the omitted or hidden information from the commercials,
which results in consumers’ distrust of the commercials or brand, their need for more
information that matters to the purchase decision, and the commercials’ failure to inform and
persuade potential customers. Different from the positive and negative influence of Existing
Knowledge on the viewers’ responses, the influence of Unaddressed Concerns is likely to be
only negative, and is applicable to both overt and covert commercials regarding the effects on
consumers’ Interest, Desire, Purchase Intention, Perceived Believability, and Brand Attitude.
99
Interest
Being asked whether they paid attention to the commercial, one interviewee in response
to Overt Commercial 1 (Autoavilys’s car service) and two interviewees in response to Overt
Commercial 2 (WSFS’s banking service) expressed their concern with the lack of information
that mattered to their judgement of the brand.
In response to Overt Commercial 1, Interviewee 2 implied that the commercial did not
show the aspects that they found essential for them to develop an interest in the brand, if there
was any. The Unaddressed Concerns that are either missing in the commercial or not provided by
the company led to Interviewee 2’s lack of interest in the brand promoted.
I’m not looking for, like, a lifestyle, or a feeling of luxury or friendliness when I’m getting my car fixed. I’m just looking where is it the best work done so I don’t have to come back, and what rates I find are the most suitable for the issue of my car (Interviewee 2).
In response to Overt Commercial 2, Interviewees 1 and 4 suggested that they needed to
look for more information about the brand that was omitted from the commercial and was
essential to their decision-making on whether to try and commit to the brand:
For a bank, I need to know where I can use it, if it covers all the states, if it’s nearby… If I need to look for a bank, I wouldn’t rely on the commercials (Interviewee 1). I would probably at least do a web search on the company (Interviewee 4).
Desire
Being asked the question on Desire to be connected with the brand and its offering
promoted by Overt Commercial 1 (Autoavilys’s car service), three interviewees implied their
Unaddressed Concerns, which led to the lack of Desire:
100
When it comes to fixing your car, or things like that, I think most people go by word of mouth anyways, or they go online because we now have the resources for that (Interviewee 2). I enjoyed watching the high-tech equipment and the things they provide as the service. It was very short and direct, so it captivated my interest. But in the end, I think price of services would be a factor for me as a customer, not the video (Interviewee 5). I would’ve needed words or messages, not just pictures (Interviewee 6).
Interviewee 2 suggested that to develop Desire, they would need word-of-mouth
recommendations or online information as an extra input to make up for the Unaddressed
Concerns missing in the commercial. Interviewees 5 and 6 expressed their needs for other
information that the commercial failed to show, such as price and verbal information. (Overt
Commercial 1 is full of visual elements, but does not contain any verbal information [e.g., words
in written or audio forms] besides the brand name.)
Being asked the question on Desire in response to Overt Commercial 2 (WSFS’s banking
service), Interviewee 4 also displayed the issue with Unaddressed Concerns and the need for
more information, which led to their lack of Desire:
Not without further research (Interviewee 4).
Purchase Intention
Being asked the question on the intention to make a purchase from the brand promoted in
Overt Commercial 1 (Autoavilys’s car service), Interviewee 1 expressed their Unaddressed
Concerns and their need of extra information from their friends, in addition to the information
presented in the commercial. Otherwise, it is unlikely for the commercial alone, without their
other concerns being addressed, to get their purchase intention:

101
If I’m going to buy this thing, besides the commercial as an element, I will also need others’ recommendations; for example, if my friend is recommending me this product on my side, and there is this commercial played in front of me, then I will probably choose it (Interviewee 1).
Being asked the question on Purchase Intention for the brand promoted in Covert
Commercial 2, Interviewee 1 showed a need for more product details (i.e., the product’s storage
and the price for the storage that they needed) that was missing in the commercial and necessary
for the purchase decision. Interviewee 4 suggested that they would appreciate the necessary
information, such as the product name and price, which was not presented in the commercial and
would have helped make the purchase decision.
If I really gonna buy and use it, I would check out information about the storage, and if I have to buy the storage then I'm fine without it (Interviewee 1). The problem is they didn’t mention Google Assistant once in there, so I kind of had to guess that it was Google Assistant. It would be more helpful for branding and sales to actually say what they’re selling (Interviewee 4).
Perceived Believability
Being asked the question on the believability of the information presented in the
commercials, all the interviewees shared the same concern with the incomplete or little
information provided.
In response to Overt Commercial 1:
It wasn’t super informative (Interviewee 6).
In response to Overt Commercial 2:
So little information [for it to be unbelievable] (Interviewee 1). Yes, but not much information presented (Interviewee 6).
102
In response to Covert Commercial 1:
There was really nothing that told me anything about the car (Interviewee 2). I don’t think there was a lot of information to present about the car other than the fact that he was having a good time driving it (Interviewee 4). It made a good impression when I first saw it but I didn’t know what brand it was. I know it was something like a Jeep probably but I didn’t know for sure (Interviewee 6).
Brand Attitude
Being asked the question on the attitude towards the brand promoted by Overt
Commercial 1, which focused on visual elements, but did not use any verbal message besides the
brand name, Interviewee 4 showed a concern with the insufficient information provided, which
led to a brand attitude that was not high.
Neutral. It’s difficult to tell without words or speaking (Interviewee 4).
Being asked the question on Brand Attitude after watching Overt Commercial 2 on
banking service, Interviewee 6 also expressed that the commercial did not address the
information that mattered to them in the development of a brand attitude.
I choose banks because of convenience, not because of the performance or service (Interviewee 6).
As shown in the above examples, Unaddressed Concerns can have negative influence on
the responses regarding Interest in checking out the brand, Desire to be connected with it,
Purchase Intention for the brand’s offering, Perceived Believability of the information provided
103
by the commercial, and Brand Attitude. That is, when the commercials fail to address the
information that matters to the consumers, they will not be able to reach the consumers, get them
to make the purchase, or shape a positive brand attitude in them.
This section analyzes the influence of some of the elements extracted from the interview
responses (Video Quality, Effect of Covertness, Irrelevancy/Relevancy, Existing Knowledge,
and Unaddressed Concerns) on the interviewees’ responses to the commercials regarding the
research variables. Interpretation of the Question and Effect of the Unrealistic Setting will be
discussed in the following chapters to support the further interpretation of the rejection of H3A
and provide recommendations for future study.
Regarding the elements covered in this chapter, higher video quality might generate
better results in the viewers’ interest in checking out the brand promoted by the commercials.
The effect of covertness had a positive effect in the responses to Attention, Interest, and Brand
Attitude. The irrelevancy of the interviewees to the brand promoted had negative influence on
the responses to both the overt and covert commercials, while the relevancy positively affected
the responses to Covert Commercial 2. The positive (or negative) existing knowledge that
interviewees held had positive (or negative) influence on the responses regarding Attention,
Interest, Purchase Intention, Perceived Believability, and Brand Attitude. Interviewees’
unaddressed concerns or the commercials’ incomplete information can have negative influence
on viewers’ Interest, Desire, Purchase Intention, Perceived Believability, and Brand Attitude.
104
Observation and Implications
This chapter will discuss the implications of the research on the deployment of covert
commercials by marketers and businesses. Presenting the results of testing each hypothesis, this
chapter will discuss the key findings from the quantitative (survey) responses and complement
them with the qualitative (interview) outcomes.
Hypotheses 1, 2, and 3A
The findings suggest that covert commercials gained more attention (H1), induced more
interest (H1), created higher desire (H1), got stronger purchase intention (H1), and received more
positive brand attitude (H2) from the survey respondents than overt commercials did.
Limitation of the Results on Attention: Effect of the Unrealistic Setting
Advertisers and businesses should recognize that the results on the higher attention (H1)
gained by covert commercials, as shown in the survey data, might have been influenced by the
varied effect (as experienced by different individuals) of the unrealistic setting of the study.
The interview responses imply the influence of the research setting on the accuracy of the
results on Attention paid to each commercial. Different individuals can be affected differently by
the unrealistic setting of the study.
The interview responses to the question on Attention paid to the overt commercials imply
that the survey and interview setting in this study might skew the research results on Attention,
which partially supports H1. The setting in this study is that the survey and interview subjects
105
were asked to watch the commercials and answer questions afterward. It is not natural or close to
the real-life scenario where people can freely choose when, where, how (i.e., by what media
channels), and how much they are exposed to commercials. Two interviewees reported their
attention to be influenced by the research setting, while the influence of the research setting on
the other interviewees remains unknown. It is possible that the influence varies among different
individuals.
In response to Overt Commercial 1:
Yes. Maybe it is because I already knew that I was supposed to analyze the video a little bit (Interviewee 2).
In response to Overt Commercial 2:
Mostly paid attention. That’s what you asked me to do (Interviewee 5).
The interviewees’ responses reflect the effect of the unrealistic condition (created by the
study setting) on the Attention paid to the commercials; the responses also imply some subjects’
tendency to not pay attention to the commercials if they were not in the research. It is likely that
the results on Attention is swayed by the effect of the research setting.
Limitation of Effect on Purchase Intention, Perceived Believability, and Brand Attitude
Compared to gaining attention, the positive effect of covert commercials is limited in
attaining high purchase intention (H1), perceived believability (H3A), and brand attitude (H2,
H3B, and H4). The effect on purchase intention and brand attitude was found to be negatively
affected by Irrelevancy, Existing Knowledge, and Unaddressed Concerns. The effect on
perceived believability was not found to be negatively affected by Irrelevancy, but by Existing
106
Knowledge and Unaddressed Concerns. Implications for advertisers and businesses are described
below.
Irrelevancy to Relevancy
When consumers find themselves irrelevant to the brand or product promoted in the
commercials, such as lacking any demand or not being the target population, they are less likely
to develop purchase intention or positive brand attitude.
Advertisers and businesses should learn to avoid Irrelevancy and move towards
Relevancy in order to make covert commercials more effective. That is, marketers and
businesses should do research on their target market and make their covert commercials reach
their target audience successfully.
To make sure the right commercials reach the right audience, marketers should first make
sure that they know who they are targeting (in terms of necessary demographics information,
media usage behavior, and interests). They should also design digital strategies to keep track of
the target market’s behaviors in order to learn about their needs in real time; this requires some
kinds of connections or affiliations. Then, they need to make adjustments to the brand and its
offerings, according to the changing needs and wants in the target market: The same people have
specific needs at certain times, different groups within the target population have different needs,
and everyone might experience seasonal changes or follow certain trends in needs and wants.
The strategies might work for promoting purchase intention and brand attitude, but not
for perceived believability. The reason is that perceived believability relies mostly on the
perception of the content in the commercial, rather than on the relevancy of the consumers to the
brand or product promoted.

107
Existing Knowledge
If the consumers have already established a negative impression of the brand or industry
promoted by the commercial, they are less likely to be persuaded by the commercials, let alone
becoming potential or new customers. Commercials themselves, whether they are overt or
covert, do not necessarily work if they were avoided in the first place due to the negative existing
knowledge the consumers have, or if the repeating occurrences of the commercials annoy the
consumers.
Encountering situations like this, advertisers should set up new strategies in addition to
making covert commercials in order to turn the brand image from negative to positive. Working
towards the establishment of a more positive public view on the brand, they might benefit from
research on effective campaigns of others, an improvement of the customer experience with the
service or product, an advancement of technologies relevant to the success of the business, and a
calculated exploration of new marketing activities. The strategies might show results in
improving purchase intention, perceived believability, and brand attitude.
Unaddressed Concerns
The problem with Unaddressed Concerns is that consumers are not able to obtain from
the commercials the information they need for developing purchase intention or for forming a
positive brand image. They may also conclude that the business is not capable of offering what
the consumers need and therefore tries to hide it. Neither of the scenarios yield good outcomes in
purchase intention or brand attitude.
108
Advertisers and businesses might be better off providing all necessary information in
their commercials, whether overt or covert, and improving on the aspects that need to be
elevated. In this way, they can remove the consumers’ need for searching for other details in
addition to watching the commercials, which is an extra step that stops businesses from reaching
and obtaining new customers. Advertisers might also benefit from making the information that
matters to the target market more interesting for them to check out and more accessible to obtain,
providing an intriguing and effortless experience of learning about the brand.
If the business’s offering has not yet met the demands of the target market, research on
customers’ concerns, such as what they care about when considering making the purchase and
execution on improvements, will help. The strategies might be effective in raising purchase
intention, perceived believability, and brand attitude.
Hypothesis 3A: Reason for the Rejection
The interviewees’ responses to the question on Perceived Believability (“Do you think
the information presented in this video is believable?”) after watching Covert Commercial 1
provide an implication for the rejection of H3A, which predicts that covert commercials generate
higher Perceived Believability than overt commercials generate. The rejection is based on the
finding that Covert Commercial 1 is less effective in generating Perceived Believability than the
two overt commercials.
Interpretation of the Question
The finding that the rejection of H3A is based on might have been influenced by the
respondents’ varied interpretations of the question being asked. Three interviewees interpreted
109
“the information presented” as the story in Covert Commercial 1, rather than the promoted
product (Jeep’s automobile); the product was presented as a prop or a supporting object, played a
less significant role in the story, and was meant to be promoted in a subtle way. Due to their
understanding of “the information presented” as the story, the three interviewees suggested that
they would not interpret the information provided by Covert Commercial 1 as believable because
it was a story based on a movie, except Interviewee 6 who gave an open-ended answer and
suggested that the story’s believability was the same as the movie’s.
No, it’s definitely not believable, but I think it’s supposed to be its charm, right (Interviewee 2)? It’s based on a movie that was not like a true, alive story, it was already not a believable movie, so I would say it was more funny than believable (Interviewee 4). As believable as the movie was (Interviewee 6).
In response to the Perceived Believability question, the other three interviewees showed
confusion about the meaning of “the information presented,” recognizing that it could have two
meanings, the story and the product.
I’m wondering if the artistic effects count as believable. What’s believable is the car’s color, size, function, and so on (Interviewee 1). Do I think... like about the brand? I wouldn’t say the story was believable, it was like a movie, right? [About the brand,] I think it was just nice information about a car (Interviewee 3). About the product or about Bill Murray and the groundhog [the characters of the story in the commercial] (Interviewee 5)?
The responses suggest the ambiguity in interpreting the word “the information presented”
in the interview question, which can be the story, the product, or both. Differences in the
110
interpretations of the question were also likely to have influence on the survey respondents’
answers to the question regarding Covert Commercial 1’s Perceived Believability.
Hypothesis 3B
More skeptical survey respondents are found to be less likely to let their perception of the
believability of the commercial guide their brand attitude than less skeptical or neutral
respondents (H3B).
The brand attitude of consumers does not necessarily depend on how believable they
perceive the commercial to be. It partially depends on whether the consumers are relevant to or
have a demand for the brand, how positive their existing knowledge of the brand or industry is,
and how comprehensively the commercial and the brand address all the information needed by
the consumers. If any of the conditions is not met (namely the audience is not the target market,
has a negative impression of the brand or industry, or still needs more information after watching
the commercial), then there is a lower chance for them to be reached – let alone persuaded – by
the covert commercials or any other kinds of commercials.
Hypotheses 3A and 3B
H3A: Covert commercials generate higher perceived believability than overt
commercials.
H3B: Less skeptical consumers generate a more positive brand attitude when their
perceived believability is higher; the effect is less prominent for more skeptical
consumers.
111
H3A and H3B both look into perceived believability. As H3A investigates
whether perceived believability is higher for the covert commercials than for the overt
commercials, H3B examines whether high advertising skepticism would make it hard for
consumers to transfer from having positive perceived believability of the commercials to
developing a positive brand attitude.
H3A is rejected, and H3B is approved. The rejection of H3A suggests that
respondents did not perceive the information in Covert Commercial 1 to be more
believable than the information in either of the overt commercials. That is, the covert
commercial selected for this study was not perceived to be more believable than overt
commercials in this study. Nonetheless, it is possible that the result can be a coincidence
due to the issue with the selection of the commercials.
As H3B is supported by the research findings, advertisers and businesses should
be aware of the fact that positive perceived believability of the commercials does not
necessarily transfer to positive brand attitude, especially among a more skeptical
audience. They would benefit from research on the needs and wants of the more skeptical
consumers.
Hypothesis 4
H4: More skeptical consumers generate a more negative attitude toward the brand
promoted in the overt commercials than less skeptical consumers; the difference
between more and less skeptical consumers in brand attitude is less prominent for
the brand promoted in the covert commercials.
112
The rejection of H4 implies that the covertness of a commercial might not be able
to help reduce the difference between the brand attitudes of more and less skeptical
consumers. Advertisers and businesses might not be able to use covert commercials to
balance the polarized situation between the more and less skeptical consumers regarding
their brand attitude. This conclusion is not necessarily threatening to advertisers and
businesses. It only reflects the limitation of covert commercials in reducing the difference
between the brand attitudes of more and less skeptical consumers, not necessarily the
limitation in raising brand attitudes.
In this chapter, tied to the supported and rejected hypotheses, the quantitative and
qualitative findings provide implications for advertisers and businesses with regards to their
marketing strategies.
Regarding the limitation of the effect of covert commercials on purchase intention,
perceived believability, and brand attitude, advertisers and businesses should learn to avoid
Irrelevancy and move towards Relevancy in order to make the right commercials meet the right
audience. They should also set up new strategies in addition to making covert commercials in
order to turn the brand image from negative to positive. Advertisers and businesses would also
benefit from providing all necessary information in their commercials, whether overt or covert,
and from improving on the aspects that need to be elevated.
H3A and H3B together suggest that advertisers and businesses should research the needs
and wants of the more skeptical consumers. H4 implies that covert commercials might not help
businesses balance the polarized situation between their more and less skeptical consumers
regarding brand attitude.

113
Conclusion
This research answers the research question, tests the hypotheses, provides implications
for advertising strategies, and offers limitations of this research and recommendations for future
study. The mixed-methods research on the effectiveness of covert and overt commercials is
supported by quantitative data collected from the survey responses and qualitative data from the
interview responses. The quantitative data is complemented and further interpreted by the
incorporation of the qualitative data in the analysis. The qualitative data suggests some elements,
apart from the overtness and covertness of the commercials, that might have influence on the
persuading effects of overt and covert commercials on consumers.
Research Question
With respect to the research question, this research suggests that, compared to overt
commercials, covert commercials were more effective towards the influence of attention,
interest, desire, purchase intention, and brand attitude of consumers, but showed limited
influence on perceived believability.
114
Hypotheses
This study supports H1, H2, and H3B in a self-report, questionnaire/interview setting and
given the four commercials selected for the study. As predicted in H1 and H2, the survey
subjects generated higher attention, interest, desire, purchase intention, and brand attitude in
response to covert commercials than in response to overt commercials. It is also found that the
subjects’ responses regarding Attention, Interest, Desire, and Purchase Intention were aligned
with the AIDA model’s implication that advertising effects on consumers follow the steps of
attention-interest-desire-action. They first paid attention to the commercials, the entry stage of
advertising effects. As they moved along the following steps, fewer of them remained in the
process of generating interests, desire, and purchase intention.
As predicted in H3B, respondents of higher advertising skepticism were less influenced
by the positive relationship between perceived believability and brand attitude, as the high
advertising skepticism group showed a less prominent relationship between perceived
believability and brand attitude. That is, when more skeptical audiences perceived the
commercials to be more believable, they were less likely to generate more positive attitudes
toward the brand promoted in the commercials, compared to less skeptical audiences.

115
This research rejects H3A and H4. Different from what is suggested in H3A, the findings
show that respondents do not always perceive the information in the covert commercials as more
believable than in the overt commercials. One of the two covert commercials shown to the
subjects generated lower perceived believability than both of the overt commercials shown.
Respondents’ different interpretations of “information” were likely to affect their answers to the
question regarding Covert Commercial 1’s perceived believability: “Do you think the
information presented in this video is believable?” The different interpretations might skew the
results of the comparison of perceived believability between overt and covert commercials in this
study.
It is predicted in H4 that the covertness in commercials can weaken the negative attitude
that more skeptical consumers have toward the brand promoted. However, the negative
relationship between advertising skepticism and brand attitude is not proven to be less prominent
in covert commercials than in overt commercials. In other words, it is rejected that covert
commercials have an effect of reducing the difference between the brand attitudes of more and
less skeptical respondents.
Implications for Advertising Strategies
The survey and interview findings regarding the effectiveness of covert commercials give
advertisers and businesses insights into covert commercials and their implications for improving
marketing strategies. They suggest that advertisers and businesses are likely to find the use of
covert commercials more helpful in gaining the audience’s attention than in inducing interest,
desire to connect, and purchase intention. The positive effect of covertness on consumers’
116
purchase intention and brand attitude might be interfered with by the negative influence of
Irrelevancy, Existing Knowledge, and Unaddressed Concerns.
It is important for the marketers to be proficient in the following areas: ensuring that the
audience of their covert commercials is relevant or is their target market, creating strategies
around establishing a more positive brand image among the target audience, addressing (in the
commercial) all the necessary information that matters to the audience’s formation of purchase
intention and brand attitude, guaranteeing the truthfulness of the necessary information provided,
and improving or expanding on areas where the target market’s demand is not met.
Limitations and Recommendations
To produce more generalizable results, future research should consider not only
expanding the sample size, but also controlling the following variables in the selection of the
commercials and research sample: the video quality of the commercials; the
irrelevancy/relevancy of the product or brand to the research sample; the existing knowledge of
the research sample regarding the promoted brand, product, or industry; and the completeness of
the necessary information provided in the commercials.
To control for video quality, it is recommended to consider the image resolution, color,
setting, rhythm or pace, sound quality, and more. To control for the irrelevancy/relevancy,
existing knowledge, and the completeness of necessary information, it is recommended to first
investigate the research sample (before the commercial selection and the data collection process)
regarding their interested/uninterested brands/products/industries, existing knowledge of the
brands/products/industries, and the kinds of information that matters to them in making purchase

117
decisions or developing brand attitude. The information about the research sample can guide the
selection of the commercials.
Due to the negative effect of the unrealistic setting on the accuracy of the results on
Attention, which is one of the research variables, it is recommended that future studies create a
more natural or realistic scenario in the collection of the subjects’ responses, instead of collecting
data through a survey link or an interview. It is also important to mimic real-life scenarios
regarding the various media channels through which people are exposed to commercials, in other
words, to investigate which channels are more effective for covert commercials.
118
Glossary
Ad Awareness: “noticing the ad itself, with no indication of differential noticing of any specific
element” (Preston, 1982, p. 4).
Ad Elements Awareness: “awareness of specific parts of an ad” (Preston, 1982, p. 5).
AIDA: A famous model of advertising effects on consumers’ perception, affection, and action,
which includes “Attention,” “Interest,” “Desire,” and “Action.”
AISDALSLove: a model derived from the AIDA model, indicating four more stages of effects
in addition to AIDA.
Association Awareness: “associations established between the product and whatever items the
advertiser chooses” (Preston, 1982, p. 5).
Association Evaluation: How consumers regard the things that the ads associate the product or
brand with (negative, neutral, or positive); Consumers’ evaluation can be different from
advertisers’ opinions or anticipations (Preston, 1982, p. 5).
Covert (Brand Visibility): The brand is not observable. The promotional or selling intentions
are not so obvious or apparent due to the techniques used by advertisers or sponsors.
EEG: A neurophysiological method with which researchers monitor and record electrical
activity of the brain.
Hierarchy-of-Effects (HOE): A kind of models that describe the sequential stages of the
effects of advertisements on consumers. The HOE models “describe the stages that consumers go
through while forming or changing brand attitudes and purchase intentions” (Smith, Chen, &
Yang, 2008, p. 50). AIDA is one of them.
119
Hierarchy-of-Processing: A model of advertising effects that incorporates the consideration of
the role of emotion.
Overt (Brand Visibility): The brand is observable. The promotional or selling intentions are
made obvious or apparent by the advertisers or sponsors.
Product Awareness: “recognition of the specific item being advertised, usually a specific
brand;” “noticing what is advertised” (Preston, 1982, p. 5).
Product Evaluation: Evaluation of the product “based on the immediate advertising input”
(Preston, 1982, p. 6).
Product Perception: “the total picture of the product that the consumer acquires from the ad;”
“an integrated summation of” Association Awareness and Association Evaluation (or “the
consumer's separate responses to the separate associated items”); “reflects only what the
consumer sees the ad communicating” (Preston, 1982, p. 6).
Product Stimulation: Stimulation means “intention to purchase” and “the process of acquiring
an internal stimulus or motivation toward the final step of Action” “based on the immediate
advertising input;” A typical survey question is “Do you intend to purchase this item?” (Preston,
1982, p. 7).
Recall Rate: The likeability or frequency of remembering an object or idea after being exposed
to it.
The Association Model: It includes more variables than the AIDA model and aims at measures
used for research.
120
References
Aryal, B. R. (2005). AIDA model application for TV commercials in Nepal. The Journal of
Nepalese Business Studies, 2(1), 65-71.
Ashley, C., & Leonard, H. A. (2009). Betrayed by the buzz? Covert content and consumer-brand
relationships. Journal of Public Policy & Marketing, 28(2), 212-220.
Balasubramanian, S. K., Karrh, J. A., & Patwardhan, H. (2006). Audience response to product
placements: An integrative framework and future research agenda. Journal of
Advertising, 35(3), 115-141.
Beltramini, R. F. (1982), Advertising perceived believability scale. In Corrigan, D.R., Kraft, F.
B. and Ross, R. H. (Eds). Proceedings of the Southwestern Marketing Association,
Wichita State University, Southwestern Marketing Association, Wichita, 1-3.
Brown, C. L., & Krishna, A. (2004). The Skeptical shopper: A metacognitive account for the
effects of default options on choice. Journal of Consumer Research, 31(3), 529-539.
Chan, F. F. Y. (2019). The perceived effectiveness of overt versus covert promotions. Journal of
Product & Brand Management. doi: 10.1108/JPBM-06-2018-1912
Colley, R. H. (1961). Defining advertising goals for measured advertising results. New York:
Association of National Advertisers.
Google. (2020, January 28). Loretta | Google super bowl commercial 2020 [Video]. Youtube.
https://www.youtube.com/watch?v=6xSxXiHwMrg
Hassan, S., Nadzim, S. Z. A., & Shiratuddin, N. (2015). Strategic use of social media for small
121
business based on the AIDA model. Social and Behavioral Sciences, 172, 262-269. doi:
10.1016/j.sbspro.2015.01.363
Heath, R. (2007). Emotional persuasion in advertising: A hierarchy-of-processing model.
University of Bath School of Management, 1-50. Retrieved from
https://www.researchgate.net/publication/228379310
Jeep. (2020, February 3). Jeep® | “Groundhog day” | Bill Murray + bushy-tailed buddy’s off
script & off road adventures cut [Video]. Youtube.
https://www.youtube.com/watch?v=5QgBRvMmWk4
Karolis Damulis. (2018, June 1). Car service commercial - Autoavilys automobiliu servisas
Klaipedoje [Video]. Youtube. https://www.youtube.com/watch?v=AAs63-raykM
Lagrosen, S. (2005). Effects of the internet on the marketing communication of service to
companies. Journal of Services Marketing, 19(2), 63-69.
Lavidge, R. J., & Steiner, G. A. (1961). A model for predictive measurements of advertising
effectiveness. Journal of Marketing, 25(6), 59-62.
Lee, S. H. (M.), & Hoffman, K. D. (2015). Learning the ShamWow: Creating infomercials to
teach the AIDA model. Marketing Education Review, 25(1), 9-14. doi:
10.1080/10528008.2015.999586
Likert, R. (1932). A technique for the measurement of attitudes. Archives of Psychology, 140,
1-55.
Liljander, V., Gummerus, J., & Söderlund, M. (2014). Young consumers’ responses to suspected
covert and overt blog marketing. Internet Research, 25(4), 610-632.
Obermiller, C., & Spangenberg, E.R. (1998). Development of a scale to measure consumer

122
skepticism toward advertising. Journal of Consumer Psychology, 7(2), 159-186.
PageFair and Adobe. (2017). Global ad blocking report. Retrieved from
http://blog.pagefair.com/2015/ad-blockingreport
Pashootanizadeh, M. & Khalilian, S. (2018). Application of the AIDA model: Measuring the
effectiveness of television programs in encouraging teenagers to use public libraries.
Information and Learning Science, 119(11), 635-651.
Petty, R. D. & Andrews, J. C. (2008). Covert marketing unmasked: A legal and regulatory guide
for practices that mask marketing messages. Journals of Public Policy & Marketing,
27(1), 7-18.
Preston, I. L. (1982).The Association Model of the advertising communication process. Journal
of Advertising, 11(2), 3-15. Retrieved from https://www.jstor.org/stable/4188395
Rawal, P. (2013). AIDA marketing communication model: Stimulating a purchase decision in
the minds of the consumers through a linear progression of steps. IRC’s International
Journal of Multidisciplinary Research in Social & Management Sciences, 1(1), 37-44.
Strong, E. K., Jr. (1925). The psychology of selling and advertising. New York: McGraw-Hill.
Tomažic, T., Boras, D., Jurišic, J., & Lesjak, D. (2014). Covert advertising as inadmissible
presentation of information. Industrial Management & Data Systems, 114(1), 107-122.
Wijaya, B. S. (2012). The development of hierarchy of effects model in advertising.
International Research Journal of Business Studies, 5(1), 73-85.
Wojdynski, B. W., Evans, N. J., & Hoy, M. G. (2018). Measuring sponsorship transparency in
the age of native advertising. Journal of Consumer Affairs, 52(1), 115-137.
WSFS Bank. (2016, July 5). We stand for service - TV commercial [Video]. Youtube.

123
https://www.youtube.com/watch?v=Uu-_GZLg7xE
Yang, T., Lee, D., Kwak, Y., Choi, J., Kim, C., & Kim, S. (2015). Evaluation of TV
commercials using neurophysiological responses. Journal of Physiological Anthropology,
34(19), 1-11.
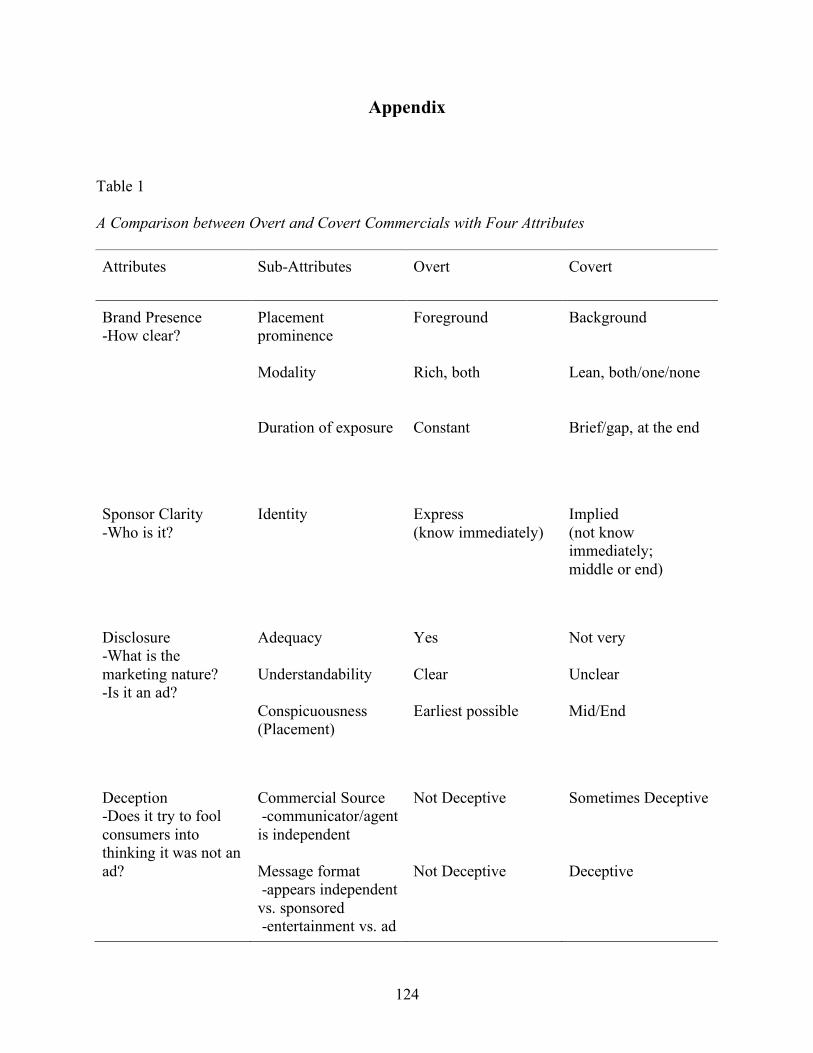
124
Appendix
Table 1
A Comparison between Overt and Covert Commercials with Four Attributes
Attributes Sub-Attributes
Overt
Covert
Brand Presence -How clear?
Placement prominence Modality Duration of exposure
Foreground Rich, both Constant
Background Lean, both/one/none Brief/gap, at the end
Sponsor Clarity -Who is it?
Identity
Express (know immediately)
Implied (not know immediately; middle or end)
Disclosure -What is the marketing nature? -Is it an ad?
Adequacy Understandability Conspicuousness (Placement)
Yes Clear Earliest possible
Not very Unclear Mid/End
Deception -Does it try to fool consumers into thinking it was not an ad?
Commercial Source -communicator/agent is independent Message format -appears independent vs. sponsored -entertainment vs. ad
Not Deceptive Not Deceptive
Sometimes Deceptive Deceptive
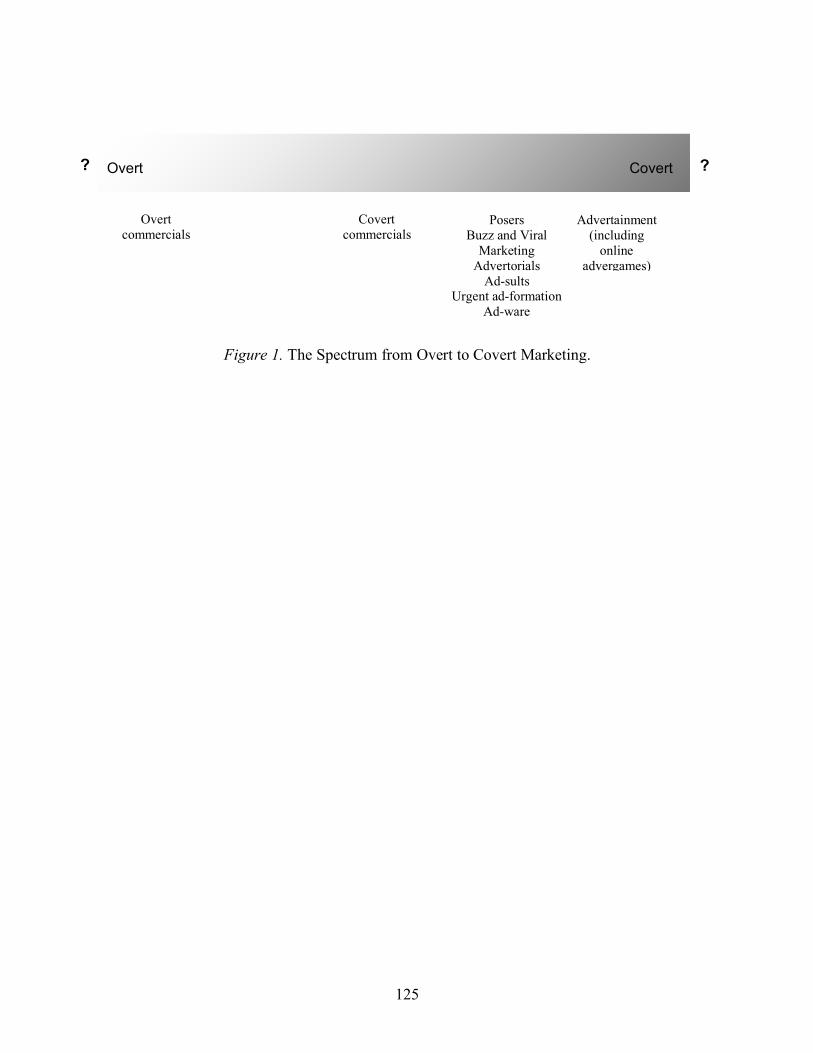
125
Figure 1. The Spectrum from Overt to Covert Marketing.
Overt Covert
Overt commercials
Covert commercials
Posers Buzz and Viral
Marketing Advertorials
Ad-sults Urgent ad-formation
Ad-ware
Advertainment (including
online advergames)
? ?