Temporal evolution of gamma activity in human cortex during an overt and covert word repetition task
12
ORIGINAL RESEARCH ARTICLE published: 03 May 2012 doi: 10.3389/fnhum.2012.00099 Temporal evolution of gamma activity in human cortex during an overt and covert word repetition task Eric C. Leuthardt 1,2,8 *, Xiao-Mei Pei 3 , Jonathan Breshears 2 , Charles Gaona 1 , Mohit Sharma 1 , Zac Freudenberg 7 , Dennis Barbour 1 and Gerwin Schalk 2,3,4,5,6 1 Department of Biomedical Engineering, Washington University in St. Louis, St. Louis, MO, USA 2 Department of Neurological Surgery, School of Medicine, Washington University in St. Louis, St. Louis, MO, USA 3 Brain-Computer Interface R&D Program, Wadsworth Center, New York State Department of Health, Albany, NY, USA 4 Department of Neurology, Albany Medical College, Albany,NY, USA 5 Department of Biomedical Engineering, Rensselaer Polytechnic Institute, Troy, NY,USA 6 Department of Biomedical Sciences, State University of New York, Albany, NY,USA 7 Department of Computer Science, Washington University in St. Louis, St. Louis, MO, USA 8 Center for Innovation in Neuroscience and Technology, Washington University in St.Louis, St. Louis, MO, USA Edited by: Hans-Jochen Heinze, University of Magdeburg, Germany Reviewed by: Christoph S. Herrmann, Carl von Ossietzky University, Germany Alexandra Golby, Harvard Medical School, USA *Correspondence: Eric C. Leuthardt, Department of Neurosurgery, School of Medicine, Washington University in St. Louis, Campus Box 8057, 660 South Euclid, St. Louis, MO 63130, USA. e-mail: [email protected] Several scientists have proposed different models for cortical processing of speech. Classically, the regions participating in language were thought to be modular with a linear sequence of activations. More recently, modern theoretical models have posited a more hierarchical and distributed interaction of anatomic areas for the various stages of speech processing. Traditional imaging techniques can only define the location or time of cortical activation, which impedes the further evaluation and refinement of these models. In this study, we take advantage of recordings from the surface of the brain [electrocorticography (ECoG)], which can accurately detect the location and timing of cortical activations, to study the time course of ECoG high gamma (HG) modulations during an overt and covert word repetition task for different cortical areas. For overt word production, our results show substantial perisylvian cortical activations early in the perceptual phase of the task that were maintained through word articulation. However, this broad activation is attenuated during the expressive phase of covert word repetition. Across the different repetition tasks, the utilization of the different cortical sites within the perisylvian region varied in the degree of activation dependent on which stimulus was provided (auditory or visual cue) and whether the word was to be spoken or imagined. Taken together, the data support current models of speech that have been previously described with functional imaging. Moreover, this study demonstrates that the broad perisylvian speech network activates early and maintains suprathreshold activation throughout the word repetition task that appears to be modulated by the demands of different conditions. Keywords: cortex, electrocorticography, gamma rhythms, human, speech INTRODUCTION Understanding the temporal dynamics of speech processing has been a topic of intense scientific interest for over a century. Speech processing has been studied using different types of neuroimag- ing [e.g., using positron emission tomography (PET) or func- tional magnetic resonance imaging (fMRI)], neurophysiological functional mapping [e.g., magnetoencephalography (MEG), elec- trocorticography (ECoG)], lesional models, or behavioral stud- ies (Price et al., 1996; Fiez and Petersen, 1998; Crone et al., 2001a; Dronkers et al., 2004; Sinai et al., 2005; Pulvermuller et al., 2006; Towle et al., 2008). These and other studies have shown that speech processing involves a widely distributed net- work of cortical areas that are located predominantly in peri- sylvian regions (Scott and Johnsrude, 2003; Specht and Reul, 2003). These regions include the superior temporal gyrus/sulcus, angular gyrus/supramarginal gyrus (i.e., Wernicke’s area), poste- rior inferior frontal regions (i.e., Broca’s area), and motor and premotor regions (Fiez and Petersen, 1998; Heim et al., 2002; Duffau et al., 2003; Billingsley-Marshall et al., 2007; Towle et al., 2008). How these sites interact to accomplish the multiple stages of spectral, acoustic, phonological, semantic, and motoric pro- cessing of human language remains is still studied today. Several models have been proposed to explain the functional relevance and the interplay of these regions in accomplishing speech perception and production. Classically, the regions par- ticipating in language processing were thought to be modular in nature, namely, that certain cognitive operations (i.e., audi- tory, phonological, semantic, and motor preparation/execution) have specific circumscribed regions and interactions occur in hierarchical progression (Binder, 2000). Binder et al. proposed a hierarchical model that projects from the dorsal superior tem- poral gyrus ventrally to the superior temporal sulcus and the middle temporal gyrus, and then posteriorly to the angular gyrus and anteriorly to the temporal pole (Binder et al., 2000). Frontiers in Human Neuroscience www.frontiersin.org May 2012 | Volume6 | Article 99 | 1 HUMAN NEUROSCIENCE
-
Upload
independent -
Category
Documents
-
view
4 -
download
0
Transcript of Temporal evolution of gamma activity in human cortex during an overt and covert word repetition task
ORIGINAL RESEARCH ARTICLEpublished: 03 May 2012
doi: 10.3389/fnhum.2012.00099
Temporal evolution of gamma activity in human cortexduring an overt and covert word repetition taskEric C. Leuthardt 1,2,8*, Xiao-Mei Pei3, Jonathan Breshears 2, Charles Gaona1, Mohit Sharma1,
Zac Freudenberg7, Dennis Barbour1 and Gerwin Schalk2,3,4,5,6
1 Department of Biomedical Engineering, Washington University in St. Louis, St. Louis, MO, USA2 Department of Neurological Surgery, School of Medicine, Washington University in St. Louis, St. Louis, MO, USA3 Brain-Computer Interface R&D Program, Wadsworth Center, New York State Department of Health, Albany, NY, USA4 Department of Neurology, Albany Medical College, Albany, NY, USA5 Department of Biomedical Engineering, Rensselaer Polytechnic Institute, Troy, NY, USA6 Department of Biomedical Sciences, State University of New York, Albany, NY, USA7 Department of Computer Science, Washington University in St. Louis, St. Louis, MO, USA8 Center for Innovation in Neuroscience and Technology, Washington University in St. Louis, St. Louis, MO, USA
Edited by:
Hans-Jochen Heinze, University ofMagdeburg, Germany
Reviewed by:
Christoph S. Herrmann, Carl vonOssietzky University, GermanyAlexandra Golby, Harvard MedicalSchool, USA
*Correspondence:
Eric C. Leuthardt, Department ofNeurosurgery, School of Medicine,Washington University in St. Louis,Campus Box 8057, 660 SouthEuclid, St. Louis, MO 63130, USA.e-mail: [email protected]
Several scientists have proposed different models for cortical processing of speech.Classically, the regions participating in language were thought to be modular with a linearsequence of activations. More recently, modern theoretical models have posited a morehierarchical and distributed interaction of anatomic areas for the various stages of speechprocessing. Traditional imaging techniques can only define the location or time of corticalactivation, which impedes the further evaluation and refinement of these models. In thisstudy, we take advantage of recordings from the surface of the brain [electrocorticography(ECoG)], which can accurately detect the location and timing of cortical activations, tostudy the time course of ECoG high gamma (HG) modulations during an overt andcovert word repetition task for different cortical areas. For overt word production, ourresults show substantial perisylvian cortical activations early in the perceptual phase ofthe task that were maintained through word articulation. However, this broad activationis attenuated during the expressive phase of covert word repetition. Across the differentrepetition tasks, the utilization of the different cortical sites within the perisylvian regionvaried in the degree of activation dependent on which stimulus was provided (auditory orvisual cue) and whether the word was to be spoken or imagined. Taken together, the datasupport current models of speech that have been previously described with functionalimaging. Moreover, this study demonstrates that the broad perisylvian speech networkactivates early and maintains suprathreshold activation throughout the word repetitiontask that appears to be modulated by the demands of different conditions.
Keywords: cortex, electrocorticography, gamma rhythms, human, speech
INTRODUCTIONUnderstanding the temporal dynamics of speech processing hasbeen a topic of intense scientific interest for over a century. Speechprocessing has been studied using different types of neuroimag-ing [e.g., using positron emission tomography (PET) or func-tional magnetic resonance imaging (fMRI)], neurophysiologicalfunctional mapping [e.g., magnetoencephalography (MEG), elec-trocorticography (ECoG)], lesional models, or behavioral stud-ies (Price et al., 1996; Fiez and Petersen, 1998; Crone et al.,2001a; Dronkers et al., 2004; Sinai et al., 2005; Pulvermulleret al., 2006; Towle et al., 2008). These and other studies haveshown that speech processing involves a widely distributed net-work of cortical areas that are located predominantly in peri-sylvian regions (Scott and Johnsrude, 2003; Specht and Reul,2003). These regions include the superior temporal gyrus/sulcus,angular gyrus/supramarginal gyrus (i.e., Wernicke’s area), poste-rior inferior frontal regions (i.e., Broca’s area), and motor and
premotor regions (Fiez and Petersen, 1998; Heim et al., 2002;Duffau et al., 2003; Billingsley-Marshall et al., 2007; Towle et al.,2008). How these sites interact to accomplish the multiple stagesof spectral, acoustic, phonological, semantic, and motoric pro-cessing of human language remains is still studied today.
Several models have been proposed to explain the functionalrelevance and the interplay of these regions in accomplishingspeech perception and production. Classically, the regions par-ticipating in language processing were thought to be modularin nature, namely, that certain cognitive operations (i.e., audi-tory, phonological, semantic, and motor preparation/execution)have specific circumscribed regions and interactions occur inhierarchical progression (Binder, 2000). Binder et al. proposed ahierarchical model that projects from the dorsal superior tem-poral gyrus ventrally to the superior temporal sulcus and themiddle temporal gyrus, and then posteriorly to the angulargyrus and anteriorly to the temporal pole (Binder et al., 2000).
Frontiers in Human Neuroscience www.frontiersin.org May 2012 | Volume 6 | Article 99 | 1
HUMAN NEUROSCIENCE
Leuthardt et al. Gamma rhythm dynamics with speech
This long-standing model has been supported by stroke studiesdating back to the nineteenth century and by many recent brainimaging studies (Lichtheim, 1885; Price, 2000). More recently,modern theoretical models of language processing have emergedthat posit a more distributed interaction of anatomic areas for thevarious stages of speech processing (Pulvermuller, 2005; Hickokand Poeppel, 2007). A fundamental difficulty in the assessmentof these models has been the limitations of traditional func-tional neuroimaging and electrophysiological techniques. Thesetechniques have either high spatial resolution (e.g., fMRI) orhigh temporal resolution (e.g., EEG or MEG) but not both(Boulton et al., 1990; Srinivasan et al., 1998; Freeman et al., 2003).Moreover, the cognitive process of speech is primarily a humanphenomenon, thereby limiting practical utility of intracorticalmicroelectrode recordings, which have proven useful in the studyof other cortical functions in animal models.
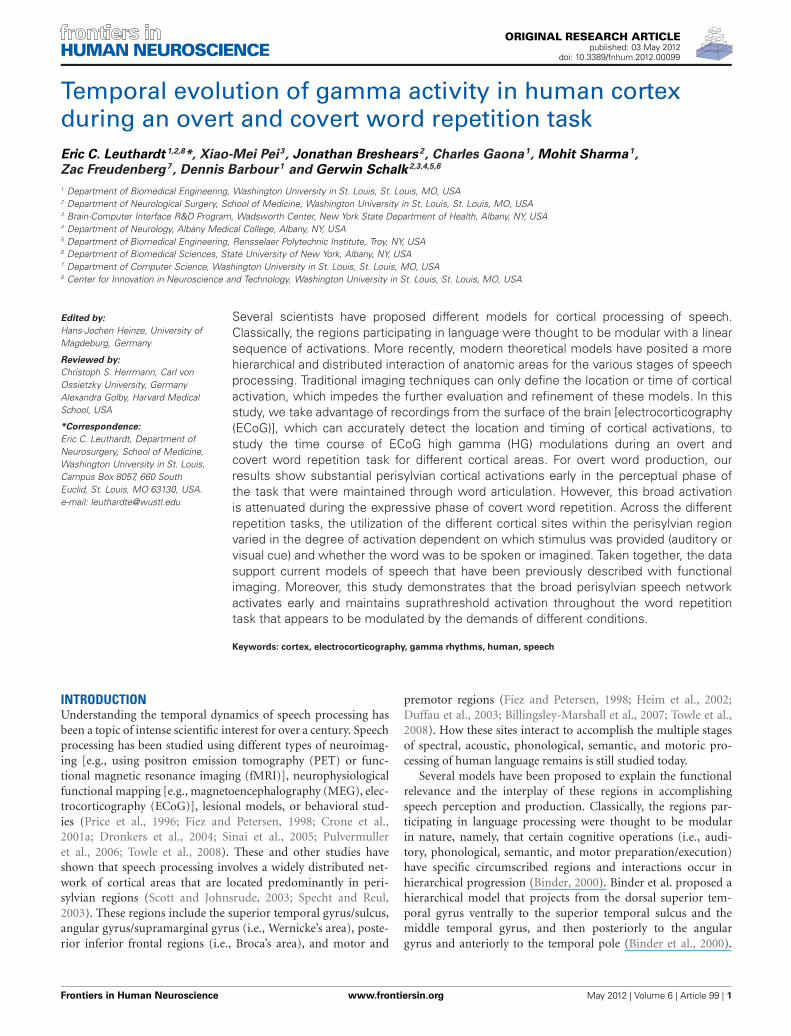
A growing number of recent studies have taken advantageof recordings from the surface of the brain (ECoG) in humanepilepsy patients (Figure 1). In these patients, electrodes areimplanted subdurally on the cortical surface to localize seizurefoci and eloquent cortex, and thus provide a unique opportu-nity to directly evaluate the cortical physiology of importantfunctions such as human speech processing. ECoG combines rel-atively high spatial resolution (5–10 mm inter-electrode distance)with millisecond temporal resolution. In addition, because ECoGis recorded beneath the skull, it can detect a range of physio-logical phenomena, some of which are relatively inconspicuouson the scalp, in particular in single trials (Boulton et al., 1990;Srinivasan et al., 1998; Freeman et al., 2003). Of particular note,variations in the amplitude in high frequencies (i.e., >70 Hz) ofECoG signals, also known as high gamma (HG) activity, haveconsistently been demonstrated to reflect important details ofcortical processing (Crone et al., 1998; Leuthardt et al., 2007; Rayet al., 2008). Moreover, gamma activity has been closely linkedwith single-neuron action potential firing and fMRI bold sig-nal changes (Foucher et al., 2003; Manning et al., 2009). Recentstudies have begun to utilize ECoG to assess the spatiotempo-ral characteristics of speech perception and expression (Croneet al., 1998, 2001a,b; Hart et al., 1998; Ray et al., 2003; Canoltyet al., 2007; Brown et al., 2008; Towle et al., 2008; Chang et al.,2010; Edwards et al., 2010; Wu et al., 2010). These studies haveshown that HG activity demonstrates robust changes associatedwith perception and expression. Summing data across humansubjects has proven quite useful in identifying more generalized
FIGURE 1 | (A) Exemplar electrode array on the surface of the brain.(B) Electrodes as seen on a lateral skull radiograph.
characteristics about cortical processing. This has been success-fully implemented in human motor physiology (Miller et al.,2007). As of yet, however, the population-averaged temporalevolution of gamma activity has not been derived for a simplelanguage task.
To better define the interplay of the cortical regions that par-ticipate in the perception and production of speech, we evaluatedhow gamma activity changes while performing a simple overtand covert word repetition task. To do this, we studied eightpatients with left hemispheric intracranial electrode arrays. Eachpatient repeated a word that was presented as either an auditoryor visual cue. Anatomic regions known to be associated with theprocessing of language were selected. These included the mid-dle superior temporal gyrus (mSTG), posterior superior temporalgyrus (pSTG), posterior middle temporal gyrus (pMTG), angu-lar gyrus (Wernicke’s area, WA), posterior inferior frontal gyrus(Broca’s area, BA), primary motor cortex (M1), and premotorcortex (PM). Changes in HG activity in these areas were definedand related to the timing of cue presentation and subsequentword articulation.
In summary, our study reveals the temporal sequence of corti-cal activations as reflected by classic HG amplitude modulations.Specifically, our results show that subsequent to the reception ofthe cue, perisylvian regions are substantially co-activated duringthe perception of language. This occurs regardless of the type ofcue (i.e., auditory or visual). For the overt tasks, all the perisylvianregions appear to be actively involved throughout the temporalevolution of perception to expression. While performing a covertexpression, however, dorsal temporal regions and perirolandiccortex appear to take on a more dominant role. Taken together,the data supports previous findings of the early and sustainedrole that the perisylvian cortex plays in both the perceptual andexpressive phases of speech.
METHODSSUBJECTSThe subjects in this study were eight patients with intractableepilepsy who underwent temporary placement of subdural elec-trode arrays to localize seizure foci prior to surgical resection(see Figure 1 for an example). They included three men andfive women (see Table 1 for additional information). All gaveinformed consent for the study, which was approved by theInstitutional Review Board of the Washington University Schoolof Medicine and the Human Research Protections Office ofthe U.S. Army Medical Research and Materiel Command. Eachpatient had an electrode grid (15, 48, or 64 contacts) placedover fronto-parietal-temporal regions (see Figure 2 for details).These grids consisted of flat electrodes with an exposed diame-ter of 2.3 mm and an inter-electrode distance of 1 cm, and wereimplanted for approximately 1 week. The electrodes for all sub-jects were localized over the left hemisphere; four of the subjectshad coverage of the temporal lobe. Grid placement and durationof ECoG monitoring were based solely on the requirements ofthe clinical evaluation without any consideration of this study.Following placement of the subdural grid, each patient had post-operative anterior-posterior and lateral radiographs to verify gridlocation.
Frontiers in Human Neuroscience www.frontiersin.org May 2012 | Volume 6 | Article 99 | 2
Leuthardt et al. Gamma rhythm dynamics with speech
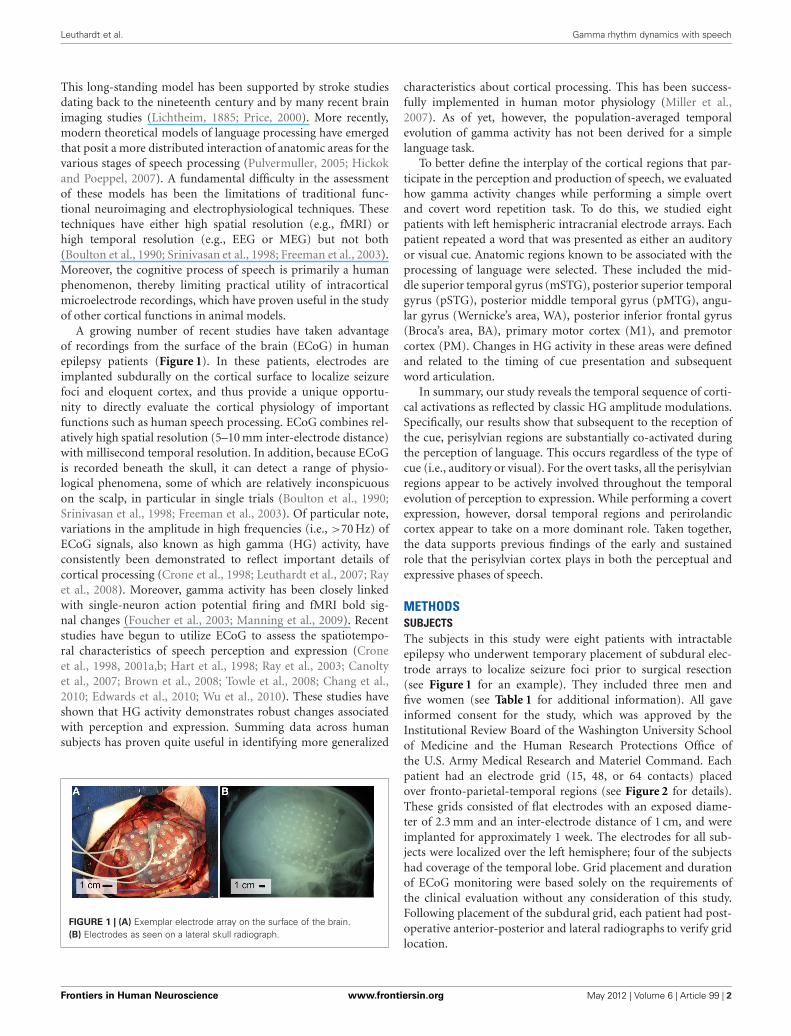
Table 1 | Clinical profiles.
Patient Age Sex Hand Grid Location Tasks
A 16 F R Left frontal-parietal-temporal Actual/imagined speech
B 44 F L Left frontal-parietal-temporal Actual/imagined speech
C 44 M R Left frontal Actual speech
D 58 F R Left frontal Actual/Imagined speech
E 48 F R Left frontal-parietal-temporal Actual/Imagined speech
F 49 F R Left frontal-parietal-temporal Actual/Imagined speech
G 15 M R Left frontal Actual speech
H 55 M R Left frontal-parietal Actual/Imagined speech
FIGURE 2 | Electrode locations. The brain template on the top highlights the location of the central sulcus and Sylvian fissure, and also outlines theapproximate location of relevant Brodmann areas.
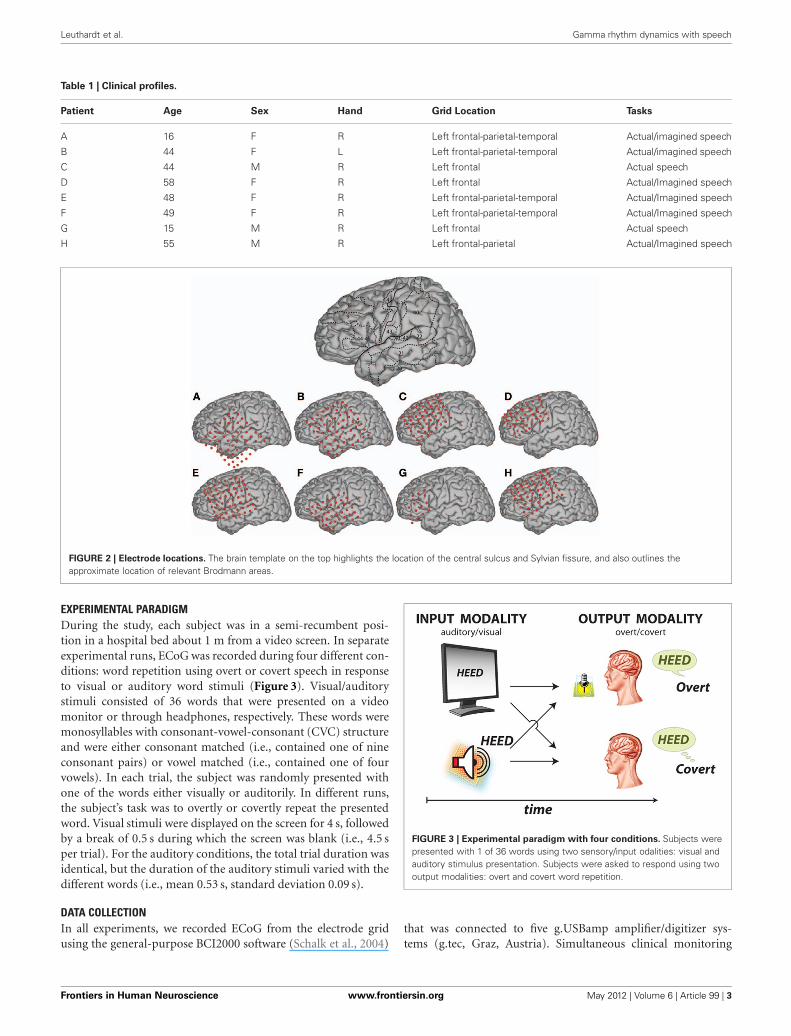
EXPERIMENTAL PARADIGMDuring the study, each subject was in a semi-recumbent posi-tion in a hospital bed about 1 m from a video screen. In separateexperimental runs, ECoG was recorded during four different con-ditions: word repetition using overt or covert speech in responseto visual or auditory word stimuli (Figure 3). Visual/auditorystimuli consisted of 36 words that were presented on a videomonitor or through headphones, respectively. These words weremonosyllables with consonant-vowel-consonant (CVC) structureand were either consonant matched (i.e., contained one of nineconsonant pairs) or vowel matched (i.e., contained one of fourvowels). In each trial, the subject was randomly presented withone of the words either visually or auditorily. In different runs,the subject’s task was to overtly or covertly repeat the presentedword. Visual stimuli were displayed on the screen for 4 s, followedby a break of 0.5 s during which the screen was blank (i.e., 4.5 sper trial). For the auditory conditions, the total trial duration wasidentical, but the duration of the auditory stimuli varied with thedifferent words (i.e., mean 0.53 s, standard deviation 0.09 s).
DATA COLLECTIONIn all experiments, we recorded ECoG from the electrode gridusing the general-purpose BCI2000 software (Schalk et al., 2004)
FIGURE 3 | Experimental paradigm with four conditions. Subjects werepresented with 1 of 36 words using two sensory/input odalities: visual andauditory stimulus presentation. Subjects were asked to respond using twooutput modalities: overt and covert word repetition.
that was connected to five g.USBamp amplifier/digitizer sys-tems (g.tec, Graz, Austria). Simultaneous clinical monitoring
Frontiers in Human Neuroscience www.frontiersin.org May 2012 | Volume 6 | Article 99 | 3

Leuthardt et al. Gamma rhythm dynamics with speech
was achieved using a connector that split the cables comingfrom the patient into one set that was connected to the clin-ical monitoring system and another set that was connected tothe BCI2000/g.USBamp system. Thus, at no time was clinicalcare or clinical data collection affected. All electrodes were ref-erenced to an inactive electrode that was intracranial, but facedthe skull rather than the brain. In a subset of subjects (sub-ject B, D, E, F, H), the verbal response was recorded using amicrophone; in the remaining subjects, speech onset was detectedusing the g.TRIGbox (g.tec, Graz, Austria). The ECoG signalsand microphone signal were amplified, bandpass filtered (0.15–500 Hz), digitized at 1200 Hz, and stored by BCI2000. We col-lected 2–7 experimental runs of ECoG from each patient foreach of the four conditions during one or two sessions. Each runincluded 36 trials (140 trials total per condition, on average). Alleight subjects participated in the experiments using overt wordrepetition; a subset of six subjects participated in experimentsusing covert word repetition. Each dataset was visually inspectedand all artifactual channels were removed prior to analysis.
ANATOMICAL MAPPINGWe used lateral skull radiographs to identify the stereotacticcoordinates of each grid electrode with software (Miller et al.,2007) that duplicated the manual procedure described in (Foxet al., 1985). We defined cortical areas using Talairach’s Co-Planar Stereotaxic Atlas of the Human Brain (Talairach andTournoux, 1988) and a Talairach transformation (Lancaster et al.,2000) (http://www.talairach.org). We obtained a 3D cortical brainmodel from source code provided on the AFNI SUMA website(http://afni.nimh.nih.gov/afni/suma). Finally, we projected eachpatient’s electrode locations on this 3D brain model using a cus-tom Matlab program. The standard error for localization withthis type of methodology has been reported to be less than 3 mm(Miller et al., 2007).
DATA ANALYSISWe first re-referenced the signal from each electrode using a com-mon average reference (CAR) montage. To do this, we obtainedthe CAR-filtered signal S′
hat channel h.
S′h = Sh
1H
H∑
q=1
Sq
H was the total number of channels and Sh was the originalsignal sample at a particular time (Marple, 1987; Schalk et al.,2007).
Every 10 ms, we converted the time-series ECoG signals ofthe previous 167 ms into the frequency domain with an autore-gressive model (Marple, 1987) of order 25. Using this model, wecalculated the spectral amplitudes between 70 and 170 Hz in 2 Hzbins. With a window size of 167 ms, the temporal precision of thefrequency estimates was ±83 ms. We then averaged these spec-tral amplitudes within this band, excluding the 116–124 Hz band,which produced a time course of HG power for each electrode.To determine the task-related difference in ECoG HG power, wecalculated for each electrode the coefficient of determination (r2)
(Wonnacott and Wonnacott, 1977) between the two distributionsof ECoG HG power associated with a particular task (e.g., overtword repetition in response to visual presentation) and rest. Thisanalysis determined, for a particular experimental task, location,and time point, the statistical difference between task and rest.(see Figure 4 for examples of the time-frequency distribution ofr2 values for two locations in subject A). Values of r2 indicates howmuch of the variance in ECoG HG power can be explained by aparticular task. Thus, as an example, if the amplitude increased inthe HF every time the speech task was performed, the coefficientof determination would be 1 (r2 = 1). If the amplitude increasedonly some of the time that the speech task was performed, thecoefficient of determination (r2) would be reduced but largerthan 0 (Leuthardt et al., 2007; Miller et al., 2007; Pei et al., 2010).
Given these time courses of r2 values at each location, we thendetermined the average time course of r2 for different corticalareas that have been shown to be involved in speech process-ing. These areas were Premotor area [PM, Brodmann’s Area (BA)6], primary motor area (M1, BA4), middle superior temporalgyrus (mSTG, middle portion of BA22), posterior superior tem-poral gyrus (pSTG, BA41+42), Broca’s Area (BA44+45), Angulargyrus—Wernicke’s area (WA, BA39+40) and also posterior mid-dle temporal gyrus (pMTG, posterior part of BA21), and areshown in Figure 5. To calculate the r2 time course for each area,we first identified all electrodes in the particular area according totheir Talairach coordinates, and then averaged r2 time courses forall electrodes in that area. Each region had electrode contributionsfrom at least four subjects. It is important to note here that theelectrode locations are determined by lateral skull radiographs toidentify the stereotactic coordinates of each grid electrode usingautomated software (Miller et al., 2007) which invariably leadsto several millimeters of variance in the anatomic localization.Thus, there is likely to be some degree of ambiguity of corticallocalization and some overlap in areas once they are aggregatedacross subjects. At the same time, the areas that we selected weremuch larger than this expected localization error; thus, our resultsshould provide meaningful temporal trends of cortical activationfor these areas. To determine which r2 values (i.e., which task-related ECoG activations) were statistically different from rest, wefirst randomly reshuffled the labels for task and rest and calculatedthe r2 between speech and rest. We then repeated this process5000 times to generate a distribution of random r2 values. Wethen determined the significance level as the r2 value that was atthe 99.7th percentile of that distribution (p = 0.03). Thus, eachof the four conditions resulted in different significance thresholdsthat were used to produce Figures 6 and 7.
In addition, we calculated the temporal envelopes of theauditory stimuli and the subject’s verbal response. To calculatethe temporal envelope of the auditory stimuli, we first squaredthe amplitude of the time course of the auditory stimulus for eachword. Then, we applied to each of these squared amplitude timecourses a low pass filter (cut-off frequency 6 Hz, Butterworth IIRfilter of order 3) to extract the temporal envelope of each wordstimulus. Finally, we normalized each temporal envelope by itsmaximum and averaged those envelopes across all 36 words. Theresulting average time course of the auditory stimuli indicatedtheir general onset, offset, and duration. We applied the same
Frontiers in Human Neuroscience www.frontiersin.org May 2012 | Volume 6 | Article 99 | 4

Leuthardt et al. Gamma rhythm dynamics with speech
FIGURE 4 | Examples of representative r2 time-frequency distributions
for overt word repetition in response to auditory stimulation for subject
A. The two time-frequency distributions were calculated for the
corresponding locations indicated by symbols in the brain on the left. Arrowsmark the onset of the subject’s response. Activations are mostly focused onthe gamma band.
FIGURE 5 | The time course for cortical areas that have been shown to
be involved in speech processing were summated across patients. Theseareas were Premotor area [PM, Brodmann’s Area (BA) 6], primary motor area(M1, BA4), middle superior temporal gyrus (mSTG, middle portion of BA22),posterior superior temporal gyrus (pSTG, BA41+42), Broca’s Area
(BA44+45), Angular gyrus—Wernicke’s area (WA, BA39+40) and alsoposterior middle temporal gyrus (pMTG, posterior part of BA21). The numberin parentheses represents the number of electrodes taken from theseregions across patients. The color maps are the approximate regions of theseelectrode locations on a stereotactic brain.
procedure to determine the average verbal response from themicrophone recordings, which indicated the onset, offset, andduration of word production.
RESULTSONSET OF CORTICAL ACTIVATION DURING WORD REPETITION TASKWe first characterized the ECoG activations early after pre-sentation of the stimuli (Figures 6 and 8). The results pre-sented in these figures show that, with both the auditory andvisual cues and with both overt and covert conditions, sta-tistically significant ECoG activations occurred in all speech-associated areas that we interrogated (i.e., all had statisticallysignificant r2 values during the perceptual phase of the wordrepetition task).
TRENDS IN CORTICAL ACTIVATION THROUGH WORD REPETITION TASKWe next defined the activation time courses across the entireword repetition task to identify trends in cortical activation
throughout the perceptual and expressive phase of the wordrepetition task. The perceptual phase of the task was definedas the first 500 ms subsequent to stimulus presentation, whichencompassed the time of auditory presentation of all cues. Thiswas also in keeping with the time duration of perceptual activa-tions defined by previous ECoG and MEG studies that reportedonset and peak activation between 100 and 400 ms, respec-tively (Rogers et al., 1990; Halgren et al., 2002; Marinkovicet al., 2003; Canolty et al., 2007). The expressive phase wasdefined as 795–1923 ms after stimulus presentation for the visu-ally cued task and 866–1923 ms after stimulus presentation forthe auditory cued task. Visually cued expressive phase pre-ceded auditory cued expression by 173 ms. The expressive phaseswere derived from the recorded microphone data of the overtspeech tasks. The period of time in which the recorded vol-ume was greater than 20% the maximum volume was consideredto be speech. The same time periods were also used for thecovert tasks.
Frontiers in Human Neuroscience www.frontiersin.org May 2012 | Volume 6 | Article 99 | 5

Leuthardt et al. Gamma rhythm dynamics with speech
FIGURE 6 | ECoG high gamma r2 time courses as a function of time
relative to auditory or visual stimulation. The dotted line representsthe statistical threshold for significance (p < 0.03). In all four
conditions (auditory/visual cues and overt/covert speech) there is awidespread activation of all sites early in the perceptual phase ofthe task.
For the overt tasks, we found a prolonged cortical activationof nearly all cortical sites through the perceptual and expres-sive phase of the task (Figures 7A,B). Distinct between the visualand auditory cued task, dorsal temporal lobe (mSTG and pSTG)showed a very large activation early in the perceptual phase ofactivation with the auditory cue, while this region activated muchlater with the visual cue (i.e., during the expressive phase of thetask). For the covert speech condition (Figures 7C,D), all corti-cal regions demonstrated activations during the perceptual phaseof the visual or auditory cued task. The expressive portion of thecovert speech task was different from the overt conditions. Whena visual cue was presented, there was a more prominent activationof dorsal and posterior regions of the temporal lobe and rolandiccortex (WA, M1, and pMTG) through the expressive phase ofcovert articulation. With auditory cues, the pattern was somewhatdifferent. There was a more prominent temporal activation (WA)activation early in the expressive phase with a subsequent promi-nent activation of the rolandic cortex (M1) in the mid-portion ofthe expressive phase of the task. The other cortical sites showed alower level of activation that were still statistically significant.
VARIABILITY OF ACTIVATION FOR DIFFERENT CORTICAL REGIONSAcross cortical regions, the variability in timing of onset of corti-cal activation and relative cortical activation was defined acrossthe four different speech tasks. As mentioned previously, themajority of mean cortical activation onset times occurred earlywithin the first 500 ms. Thus, regardless of task, all perisylvian
areas activated during the perceptual phase of the task (Figure 8).Given the substantial temporal overlap of cortical activation afteronset, we defined the cortical activation as a ratio of total cor-tical activation at any given time to better define the changinglevel of contribution of a given region during the speech task.Thus, the magnitude of cortical activation (as measured by sta-tistically significant r2 of HG power changes) for a given regionwas defined relative to the other sites over time for each ofthe four tasks (Figure 9). Thus, the activation of one region (asdefined by the average statistically significant r2 from all sub-jects) could be defined as a percentage relative to the total corticalactivation (the sum of all statistically significant r2 values at allregions across all patients for a given point in time). As an allor none phenomenon, there is substantial temporal overlap forcortical activation through all the tasks. When viewed relative toother activations, however, there is an alteration in contribut-ing activation over time. There were several notable variations(Figure 9A). First, mSTG and pSTG (in yellow and pink) havedifferent levels of contribution to total cortical activation in theearly perceptual phase (0–350 ms after cue) through the audi-tory and visual cued overt speech tasks. In the auditory condition,there was a larger representation of cortical activity (approx. 60–100%) that accounts for the total cortical activation. This wasreduced in the visual condition (Figure 9B) to approximately 30–40%. Second, in the overt speaking conditions, when speakingafter an auditory cue there was a larger representation of WA(approx. 50%) and an absence of PM activity when compared
Frontiers in Human Neuroscience www.frontiersin.org May 2012 | Volume 6 | Article 99 | 6

Leuthardt et al. Gamma rhythm dynamics with speech
FIGURE 7 | ECoG high gamma r2 time courses throughout the whole
task period (0 represents the time of stimulus presentation). In the overspeech conditions, the barred solid horizontal line in the upper quadrant ofeach figure represents the mean time duration of voice recorded speech.This time duration of speaking is replicated for the covert speech condition,
as represented by the barred dotted line. The dotted line spanning eachfigure represents the statistical threshold for significance (p < 0.03).In all conditions there is a substantial temporal overlap of corticalactivation throughout the perceptual and expressive phases of thetasks.
FIGURE 8 | Variability in onset of cortical activation. Timing of statisticallysignificant cortical activations in terms of onset (earliest time at which siteachieved significance) was averaged across all regions and across all patients.Height of the bar represents mean time of onset for the respective
regions. Error bars represent standard error. Onset of all interrogatedcortical regions showed activations within the perceptual phase of thestimulus presentation. The dashed line represents the offset of the auditorystimulus.
to visual cued overt activations (15% and present, respectively).Conversely, for visual cued overt speech, there was a larger repre-sentation of mSTG (50% vs. 35%) when compared to auditorycued overt speech. Third, when overt and covert speech arecompared there is a larger representation of mSTG, PM, andWA in the latter half of the imagined speaking as compared toactual speaking.
DISCUSSIONIn this study, we characterized ECoG HG activity changes acrossmultiple human subjects that performed a simple overt andcovert word repetition task to better define the temporal evolu-tion of speech-related cortical changes in relevant areas of cortex.We found that during visually and auditory cued overt wordrepetition, there was substantial perisylvian cortical activation
Frontiers in Human Neuroscience www.frontiersin.org May 2012 | Volume 6 | Article 99 | 7

Leuthardt et al. Gamma rhythm dynamics with speech
FIGURE 9 | The magnitude of cortical activation for a given region
relative to the other sites over time for each of the four conditions.
The activation of one region [as defined by the average of statisticallysignificant r2 (p < 0.03) from all subjects] is defined as percentage relativeto the total cortical activation (the sum of all statistically significant r2 valuesat all regions across all patients for a given point in time). The barred solid
horizontal line represents the mean time duration of voicerecorded speech. This time duration of speaking is replicated to thecovert speech condition, as represented by the barred dotted line.Though there is substantial coactivation of perisylvian cortical regionsduring a speech task, the proportion of a given region varies withthe task.
early in the perceptual phase of the task, and this activation wasmaintained through the expressive portion of the word articula-tion. However, This broad activation was attenuated during theexpressive phase of covert word repetition. Across the differentrepetition tasks, the utilization of the different cortical sites withinthe perisylvian region varied to a more limited degree by modalityof stimuli and type of articulation. The pattern of activation wasdependent on which stimulus was provided (auditory or visual)and whether the word was to be overtly or covertly spoken.
RELATIONSHIP TO EXISTING TIMING LITERATUREGenerally, the results of this study confirm and supplement pre-vious studies performed to analyze the temporal evolution ofcortical activity during various word repetition tasks (Canoltyet al., 2007; Dalal et al., 2009; Chang et al., 2010; Edwards et al.,2010; Steinschneider et al., 2011). Beyond ECoG analysis, thenumber of studies on the temporal analysis of speech perceptionand expression in humans has utilized MEG, which detects mag-netic dipoles associated with synaptic transmission in the corticalsulci (Babiloni et al., 2009; Pulvermuller and Shtyrov, 2009).From a perceptual standpoint, all sounds have been thought toactivate middle and pSTG at approximately 100 ms after stimulus
(Rogers et al., 1990). When listening to words and sentences, thereis a sustained activation that starts at 200 ms after the stimulus,reaches a maximum at 400 ms, and is sustained until approximately600–800 ms post stimulus (Halgren et al., 2002; Marinkovic et al.,2003). However, using ECoG, Canolty et al showed that pSTGshowed somewhat earlier activation with word specific processingat 120 ms that subsequently progressed to mid-superior temporalgyrus at 200 ms post stimulus auditory stimuli (Canolty et al.,2007). Since this was a specific word to non-word comparison thiswas the earliest activation associated with semantic and phono-logical processing. Our current study demonstrates that onset ofsignificant activation in temporal regions occurs still earlier withinthe first 0–40 ms of stimulus onset, which likely represents the ear-liest acoustic related activations (Figure 6). Notably, in additionto temporal areas activating early, so to do other frontal regions(BA, M1, PM) activate early within the first 200 ms. These areasremain active throughout the perceptual and expressive phaseof auditory word perception for overt repetition, and becomemore attenuated during the expressive phase of covert repetition(Figure 7). Generally, this same phenomenon is true with visualreading of words as well, with some notable caveats. The sum-mated coverage across all patients was largely frontal and temporal.
Frontiers in Human Neuroscience www.frontiersin.org May 2012 | Volume 6 | Article 99 | 8

Leuthardt et al. Gamma rhythm dynamics with speech
Thus, the earliest MEG activations associated with basic visualfeature analysis detected in the occipital lobe at 100 ms and subse-quent left lateralized activations in the occipital temporal junctionat 150 ms after stimulus (Tarkiainen et al., 1999, 2002) could notbe verified in our study. Reading comprehension has been positedto occur in the left superior temporal cortex at approximately200–600 ms (Simos et al., 1997; Helenius et al., 1998; Halgrenet al., 2002; Pylkkanen and Marantz, 2003). In this study, onsetof activation occurred in dorsal temporal lobe (regions labeledWA, mSTG, pSTG) within the first 200 ms. This activation, aswith auditory stimuli, was not specific to these regions, but wasrather associated with a general activation of all perisylvian areas(Buckner et al., 2000). Also, similar to the auditory condition,there was a maintained cortical activation throughout word artic-ulation, which was reduced to primarily posterior dorsal temporallobe (i.e., area labeled Wernicke’s area) and rolandic cortex duringcovert word expression. The earlier and broader nature of corticalfindings that seem to be present in both this study and thosefound by others (Canolty et al., 2007) likely resides in the signalsubstrate being evaluated. Even though signals at high frequencieshave been detected using EEG and MEG (Lenz et al., 2008), andeven though it has been argued that MEG is more sensitive tohigh frequencies than EEG (Gruber et al., 2008), the analysesmost commonly performed using EEG or MEG rely on frequencycomponents below 40 Hz. This is in contrast to the present study,where we study the temporal progression of activations in thegamma band. These different frequency ranges represent distinctphysiological phenomena. Rhythms at frequencies below 40 Hzare thought to represent inter-regional communication in thebrain (e.g., the mu rhythm that can be detected over sensorimo-tor cortex, which is thought to be produced by thalamocorticalcircuits). These low-frequency rhythms tend to have relativelybroad cortical distributions (Pfurtscheller and Aranibar, 1977;Pfurtscheller, 1989, 1992, 1999). Amplitudes in higher frequencies(i.e., gamma activity, >40 Hz) are thought to be associated withlocal neural activation underneath the electrode (Crone et al.,2006; Leuthardt et al., 2007; Miller et al., 2007; Ray et al., 2008).They also tend to have a more focused spatial distribution thando low-frequency rhythms (Chen and Herrmann, 2001; Milleret al., 2007). Thus, the differences between the two modalities mayrepresent the timing differences between intrinsic cortical changes(seen in ECoG detected gamma changes) versus the modulationof cortex by deeper structures (which were likely detected byearlier studies using MEG).
MODALITY AND TASK-DEPENDENT FINDINGSA number of functional MRI studies (Buckner et al., 2000;Carpentier et al., 2001; Braze et al., 2011) have defined the depen-dence of stimulus modality on topographic cortical activationduring speech processing. Similarly, a number of studies have alsocompared overt versus covert speech articulation (Palmer et al.,2001; Shuster and Lemieux, 2005; Christoffels et al., 2007). Todate, only a few studies have compared the temporal relation-ship of these different regional activations relative to the stimulior to the output [e.g., (Pei et al., 2010)]. With regard to stimulusmodality, similar to results presented by studies by Braze et al.and Carpentier et al., there appears to be a significant degree of
modality independence in the timing profiles of HG activationbetween the visual and auditory cue. One notable feature is theearly activation of all regions in the perisylvian network. Whilethe auditory cue appears to be slightly earlier, all regions weresignificantly active within 500 ms. Notably, this included Broca’sarea. This early activation of Broca’s area supports the notionthat modality-independent abstract linguistic representations arecreated quite early in perception. Once active all these regionsremained significantly active through the expressive phase of thetask. These same trends held true of covert speech articulationsas well. An important caveat to these similarities is the degree towhich a region was active relative to others (i.e., the differencebetween “active—not active” versus level of activation). Whilethe majority of perisylvian regions were statistically above thresh-old throughout the task, some regions showed more substantialand consistent activations than other regions depending on thestage of cognitive operation. As an example there was a muchhigher level of HG amplitude modulation in the superior tem-poral gyrus early during auditory cue (relative to other regions)than with the visual cue, which occurred later during the overtspeaking phase. Thus taken together, while there is a substantialdegree of modality independence (visual vs. auditory) and taskindependence (overt vs. covert) for whether the perisylvian net-work is active or not active (i.e., on or off) there is some modalitydependence on the degree to which it is active over time.
CLINICAL RELEVANCEThe relative similarity in the temporal activations, which appearto be substantially modality independent, could also have impli-cations in the use of HG changes as a clinical technique for brainmapping. The use of HG changes has been proposed as a poten-tial adjunct to current techniques in neurosurgical brain mapping(Sinai et al., 2005; Crone et al., 2006; Leuthardt et al., 2007;Wu et al., 2010). The identification of eloquent cortex prior toresection has been important in reducing the risk of morbid-ity following surgery (Berger et al., 1989; Burchiel et al., 1989;Keles et al., 2004). Due to the inter-individual variability in theanatomic location of language areas, the mapping of these speechareas is especially critical (Price et al., 1996; Srinivasan et al., 1998;Pulvermuller, 2005). To date, electrocortical stimulation (ECS) isconsidered the current “gold standard” for clinical localization.However, ECS mapping is inefficient (sample one anatomic siteat time) and can be hampered by the induction of seizures, whichcan be clinically dangerous (Blume et al., 2004). Given these con-straints, an additional approach to defining speech cortex is theuse of ECoG signals that capture the endogenous cortical activa-tions associated with a particular speech task. These signals canbe acquired without the risk of seizures and can interrogate abroad region of cortex simultaneously. Several studies to date haveattempted to use this approach to map speech cortex and comparethose findings to the results derived using ECS mapping (Sinaiet al., 2005; Wu et al., 2010). Thus far, the results have been mixed.Specifically, the sensitivity and specificity of HG changes pre-dicting a stimulation positive site has varied considerably acrossstudies. A proposed explanation for this variability has been thedifferent nature of the experimental paradigms (auditory repeti-tion vs. visual reading vs. picture naming). The findings in this
Frontiers in Human Neuroscience www.frontiersin.org May 2012 | Volume 6 | Article 99 | 9
Leuthardt et al. Gamma rhythm dynamics with speech
study would argue against that possibility if speech network acti-vation is highly modality-independent. Another possible expla-nation is that a single HG band (70–170 Hz) cannot sufficientlycapture the full complexity of cortical activity. As suggested byGaona et al. (2011), gamma sub-bands may be necessary to morefully capture the impact of differing cognitive operations.
RELATION TO CURRENT MODELS OF LANGUAGE PROCESSINGThe broadly co-activated behavior of the perisylvian regions thatvaries over time could provide evidence to integrate the theoriesput forward by the Pulvermuller group and by the Hickock andPoeppel group (Pulvermuller, 2005; Hickok and Poeppel, 2007).The early activation of all the perisylvian regions within the earlyperceptual phase of cue presentation supports the associative net-work theory described by Pulvermuller. Pulvermuller asserts thatthe semantic lexicon is implemented by an associative networkof activity where distinct neuronal assemblies represent differentword and word classes. All word types, however, share a perisyl-vian assembly. More specific subclasses integrate regions outsidethis core network. Certainly, the early activation of all areas ofthe perisylvian network shown in this study would be consistentwith that assertion. At the same time, the variable nature of thesecortical activations over time could also facilitate an integrationwith some of the proposed theories put forward by supporters ofa dual stream model of speech processing. In the auditory cuedtask, when the ratio of cortical activation is examined, there isclearly an early temporal cortical activation that is dominant. Thiswould be consistent with assertions from Hickock and Peoppeland others that there is an early spectrotemporal analysis thatinvolves the superior spectrotemporal plane (i.e., STG and supe-rior temporal sulcus) (Hickok and Poeppel, 2004). However, itis important to note that, though dominant in early perception,this area is not exclusively activated. Taken together, some of thedifferences proposed by groups such as Pulvermuller and Hickockand Poeppel may be a matter of threshold. A high threshold fordetecting cortical activations would show only early activations inSTG, whereas a low threshold would show the entire perisylvianapparatus. Thus, rather than it being one or the other, the modelsupported here using cortical electrophysiology is one in whichthere is altering cortical prominence of contributing members ofa broadly engaged network. What will be prominent and whenvaries to a degree depending on the stimulus and on the linguisticoutput.
LIMITATIONSThough the findings of this study reveal temporal details of corti-cal activations for distinct cortical areas, which have been difficult
or impossible to acquire with other modalities, there are severallimitations to this work that merit discussion. It is importantto note that the patients recruited from this study are patientswith intractable epilepsy who have been on chronic anti-epilepticmedications. Anti-epileptic medications can alter normal corticalphysiology (Clemens et al., 2006). Averaging across a number ofsubjects should aid in reducing any individual abnormality thatcould potentially skew the results. In addition to variability in thecortical physiology due to individual pharmacologic effects, theremay also be inter-subject variability of functional localization(Ojemann et al., 1989). This subject-specific anatomic variancecould create overlap of timescales that are an artifact of mix-ing different functional sites. The techniques used in this studywere similar to those employed previous ECoG studies, such as(Miller et al., 2007), which summated data across a high num-ber of patients from a similar clinical population for the purposeof mapping cortical physiology as it related to simple motormovements. Given that motor localization is subject to the sameinter-subject variability, the results demonstrated localizationand timescales similar to that identified in other functional andprimate models. Thus, despite the limitations described above,we posit that consolidated information for speech should pro-vide similar generalizable results. Finally, the cognitive paradigmemployed in this study was a simple word repetition task. Thisapproach may not strongly engage higher semantic processing.Even if this study only explicitly tested acoustic and phonologicprocessing, this does not change the fundamental finding thatthere is a broad cortical activation of cortex with significantlyoverlapping time courses to accomplish this task.
CONCLUSIONIn this study, we examined the evolving changes of ECoG gammapower as a marker of focal cortical activation during an overt andcovert word repetition task that was either cued with an auditoryor visual stimulus. We find that there is substantial co-activation ofthe entire perisylvian apparatus during the perceptual phase that ismaintained through overt expression and differentially activatedduring covert expression. This level of regional activation withinthe network varied by stimulus, expression, and time.
ACKNOWLEDGMENTSWe would like to thank our patients for their efforts, withoutwhich this research would not have been possible. This workwas supported by: James S. McDonnell Foundation; Higher BrainFunction; Department of Defense (No. W911NF-07-1-0415 andW911NF-08-1-0216); National Institutes of Health (No. R01-EB000856-06); and the Children’s Discovery Institute.
REFERENCESBabiloni, C., Pizzella, V., Gratta,
C. D., Ferretti, A., and Romani,G. L. (2009). Fundamentals ofelectroencefalography, magne-toencefalography, and functionalmagnetic resonance imaging. Int.Rev. Neurobiol. 86, 67–80.
Berger, M. S., Kincaid, J., Ojemann,G. A., and Lettich, E. (1989). Brainmapping techniques to maximize
resection, safety, and seizure con-trol in children with brain tumors.Neurosurgery 25, 786–792.
Billingsley-Marshall, R. L., Clear, T.,Mencl, W. E., Simos, P. G., Swank,P. R., Men, D., Sarkari, S., Castillo,E. M., and Papanicolaou, A. C.(2007). A comparison of functionalMRI and magnetoencephalographyfor receptive language mapping. J.Neurosci. Methods 161, 306–313.
Binder, J. (2000). The new neu-roanatomy of speech perception.Brain 123 (Pt 12), 2371–2372.
Binder, J. R., Frost, J. A., Hammeke,T. A., Bellgowan, P. S., Springer, J.A., Kaufman, J. N., and Possing,E. T. (2000). Human temporal lobeactivation by speech and nonspeechsounds. Cereb. Cortex 10, 512–528.
Blume, W. T., Jones, D. C., andPathak, P. (2004). Properties of
after-discharges from cortical elec-trical stimulation in focal epilepsies.Clin. Neurophysiol. 115, 982–989.
Boulton, A. A., Baker, G. B., andVanderwolf, C. H. (1990).Neurophysiological Techniques,II: Applications to Neural Systems,Clifton, NJ: Humana Press.
Braze, D., Mencl, W. E., Tabor, W.,Pugh, K. R., Constable, R. T.,Fulbright, R. K., Magnuson, J. S.,
Frontiers in Human Neuroscience www.frontiersin.org May 2012 | Volume 6 | Article 99 | 10

Leuthardt et al. Gamma rhythm dynamics with speech
Van Dyke, J. A., and Shankweiler,D. P. (2011). Unification of sentenceprocessing via ear and eye: an fMRIstudy. Cortex 47, 416–431.
Brown, E. C., Rothermel, R., Nishida,M., Juhasz, C., Muzik, O.,Hoechstetter, K., Sood, S., Chugani,H. T., and Asano, E. (2008). In vivoanimation of auditory-language-induced gamma-oscillations in chil-dren with intractable focal epilepsy.Neuroimage 41, 1120–1131.
Buckner, R. L., Koutstaal, W., Schacter,D. L., and Rosen, B. R. (2000).Functional MRI evidence for arole of frontal and inferior tem-poral cortex in amodal compo-nents of priming. Brain 123 (Pt 3),620–640.
Burchiel, K. J., Clarke, H., Ojemann, G.A., Dacey, R. G., and Winn, H. R.(1989). Use of stimulation mappingand corticography in the excisionof arteriovenous malformationsin sensorimotor and language-related neocortex. Neurosurgery 24,322–327.
Canolty, R. T., Soltani, M., Dalal, S.S., Edwards, E., Dronkers, N. F.,Nagarajan, S. S., Kirsch, H. E.,Barbaro, N. M., and Knight, R. T.(2007). Spatiotemporal dynam-ics of word processing in thehuman brain. Front. Neurosci. 1,185–196.
Carpentier, A., Pugh, K. R., Westerveld,M., Studholme, C., Skrinjar, O.,Thompson, J. L., Spencer, D. D., andConstable, R. T. (2001). FunctionalMRI of language processing:dependence on input modality andtemporal lobe epilepsy. Epilepsia 42,1241–1254.
Chang, E. F., Edwards, E., Nagarajan,S. S., Fogelson, N., Dalal, S. S.,Canolty, R. T., Kirsch, H. E.,Barbaro, N. M., and Knight, R. T.(2010). Cortical spatio-temporaldynamics underlying phonologicaltarget detection in humans. J. Cogn.Neurosci. 23, 1437–1446.
Chen, A. C., and Herrmann, C. S.(2001). Perception of pain coin-cides with the spatial expansionof electroencephalographic dynam-ics in human subjects. Neurosci.Lett. 297, 183–186.
Christoffels, I. K., Formisano, E., andSchiller, N. O. (2007). Neural cor-relates of verbal feedback process-ing: an fMRI study employing overtspeech. Hum. Brain Mapp. 28,868–879.
Clemens, B., Menes, A., Piros, P.,Bessenyei, M., Altmann, A., Jerney,J., Kollar, K., Rosdy, B., Rozsavolgyi,M., Steinecker, K., and Hollody,K. (2006). Quantitative EEG effectsof carbamazepine, oxcarbazepine,
valproate, lamotrigine, and possi-ble clinical relevance of the findings.Epilepsy Res. 70, 190–199.
Crone, N. E., Boatman, D., Gordon, B.,and Hao, L. (2001a). Induced elec-trocorticographic gamma activityduring auditory perception. BrazierAward-winning article, 2001. Clin.Neurophysiol. 112, 565–582.
Crone, N. E., Hao, L., Hart, J. Jr.,Boatman, D., Lesser, R. P., Irizarry,R., and Gordon, B. (2001b).Electrocorticographic gammaactivity during word productionin spoken and sign language.Neurology 57, 2045–2053.
Crone, N. E., Miglioretti, D. L.,Gordon, B., and Lesser, R. P. (1998).Functional mapping of humansensorimotor cortex with electro-corticographic spectral analysis. II.Event-related synchronization inthe gamma band. Brain 121 (Pt 12),2301–2315.
Crone, N. E., Sinai, A., andKorzeniewska, A. (2006). High-frequency gamma oscillations andhuman brain mapping with electro-corticography. Prog. Brain Res. 159,275–295.
Dalal, S. S., Baillet, S., Adam, C.,Ducorps, A., Schwartz, D., Jerbi,K., Bertrand, O., Garnero, L.,Martinerie, J., and Lachaux, J. P.(2009). Simultaneous MEG andintracranial EEG recordings duringattentive reading. Neuroimage 45,1289–1304.
Dronkers, N. F., Wilkins, D. P., VanValin, R. D. Jr., Redfern, B. B., andJaeger, J. J. (2004). Lesion analysisof the brain areas involved in lan-guage comprehension. Cognition 92,145–177.
Duffau, H., Capelle, L., Denvil, D.,Gatignol, P., Sichez, N., Lopes, M.,Sichez, J. P., and Van Effenterre,R. (2003). The role of dominantpremotor cortex in language: astudy using intraoperative func-tional mapping in awake patients.Neuroimage 20, 1903–1914.
Edwards, E., Nagarajan, S. S., Dalal,S. S., Canolty, R. T., Kirsch, H.E., Barbaro, N. M., and Knight,R. T. (2010). Spatiotemporal imag-ing of cortical activation duringverb generation and picture nam-ing. Neuroimage 50, 291–301.
Fiez, J. A., and Petersen, S. E. (1998).Neuroimaging studies of word read-ing. Proc. Natl. Acad. Sci. U.S.A. 95,914–921.
Foucher, J. R., Otzenberger, H., andGounot, D. (2003). The BOLDresponse and the gamma oscillationsrespond differently than evokedpotentials: an interleaved EEG-fMRI study. BMC Neurosci. 4, 22.
Fox, P. T., Perlmutter, J. S., andRaichle, M. E. (1985). A stereotac-tic method of anatomical localiza-tion for positron emission tomog-raphy. J. Comput. Assist. Tomogr. 9,141–153.
Freeman, W. J., Holmes, M. D., Burke,B. C., and Vanhatalo, S. (2003).Spatial spectra of scalp EEG andEMG from awake humans. Clin.Neurophysiol. 114, 1053–1068.
Gaona, C., Sharma, M., Freudenburg,Z., Breshears, J., Bundy, D., Roland,J., Barbour, D., Schalk, G., andLeuthardt, E. (2011). Nonuniformhigh-gamma (60–500 Hz) powerchanges dissociate cognitive taskand anatomy in human cortex.J. Neurosci. 31, 2091–2100.
Gruber, T., Maess, B., Trujillo-Barreto,N. J., and Muller, M. M. (2008).Sources of synchronized inducedGamma-Band responses during asimple object recognition task: areplication study in human MEG.Brain Res. 1196, 74–84.
Halgren, E., Dhond, R. P., Christensen,N., Van Petten, C., Marinkovic,K., Lewine, J. D., and Dale, A.M. (2002). N400-like magnetoen-cephalography responses modulatedby semantic context, word fre-quency, and lexical class in sen-tences. Neuroimage 17, 1101–1116.
Hart, J. Jr., Crone, N. E., Lesser, R.P., Sieracki, J., Miglioretti, D. L.,Hall, C., Sherman, D., and Gordon,B. (1998). Temporal dynamicsof verbal object comprehension.Proc. Natl. Acad. Sci. U.S.A. 95,6498–6503.
Heim, S., Opitz, B., and Friederici, A.D. (2002). Broca’s area in the humanbrain is involved in the selectionof grammatical gender for languageproduction: evidence from event-related functional magnetic reso-nance imaging. Neurosci. Lett. 328,101–104.
Helenius, P., Salmelin, R., Service, E.,and Connolly, J. F. (1998). Distincttime courses of word and contextcomprehension in the left temporalcortex. Brain 121 (Pt 6), 1133–1142.
Hickok, G., and Poeppel, D. (2004).Dorsal and ventral streams: a frame-work for understanding aspects ofthe functional anatomy of language.Cognition 92, 67–99.
Hickok, G., and Poeppel, D. (2007).The cortical organization of speechprocessing. Nat. Rev. Neurosci. 8,393–402.
Keles, G. E., Lundin, D. A., Lamborn, K.R., Chang, E. F., Ojemann, G., andBerger, M. S. (2004). Intraoperativesubcortical stimulation mapping forhemispherical perirolandic gliomaslocated within or adjacent to the
descending motor pathways: eval-uation of morbidity and assess-ment of functional outcome in294 patients. J. Neurosurg. 100,369–375.
Lancaster, J. L., Woldorff, M. G.,Parsons, L. M., Liotti, M., Freitas,C. S., Rainey, L., Kochunov, P.V., Nickerson, D., Mikiten, S. A.,and Fox, P. T. (2000). AutomatedTalairach atlas labels for functionalbrain mapping. Hum. Brain Mapp.10, 120–131.
Lenz, D., Jeschke, M., Schadow,J., Naue, N., Ohl, F. W., andHerrmann, C. S. (2008). HumanEEG very high frequency oscilla-tions reflect the number of matcheswith a template in auditory short-term memory. Brain Res. 1220,81–92.
Leuthardt, E. C., Miller, K. J., Anderson,N., Schalk, G., Dowling, J., Moran,D., Miller, J., and Ojemann, J.G. (2007). Electrocorticographicfrequency alteration mapping(EFAM), a novel clinical tech-nique for mapping motor cortex.Neurosurgery 60, 260–271.
Lichtheim, C. J. (1885). On Aphasia.Brain 7, 433–484.
Manning, J. R., Jacobs, J., Fried, I., andKahana, M. J. (2009). Broadbandshifts in local field potentialpower spectra are correlated withsingle-neuron spiking in humans.J. Neurosci. 29, 13613–13620.
Marinkovic, K., Dhond, R. P., Dale,A. M., Glessner, M., Carr, V., andHalgren, E. (2003). Spatiotemporaldynamics of modality-specificand supramodal word processing.Neuron 38, 487–497.
Marple, S. L. (1987). Digital SpectralAnalysis: With Applications.Englewood Cliffs, NJ: PrenticeHall.
Miller, K. J., Leuthardt, E. C., Schalk, G.,Rao, R. P., Anderson, N. R., Moran,D. W., Miller, J. W., and Ojemann,J. G. (2007). Spectral changes incortical surface potentials duringmotor movement. J. Neurosci. 27,2424–2432.
Miller, K. J., Makeig, S., Hebb, A.O., Rao, R. P., denNijs, M., andOjemann, J. G. (2007). Corticalelectrode localization from X-raysand simple mapping for electrocor-ticographic research: the “Locationon Cortex” (LOC) package forMATLAB. J. Neurosci. Methods 162,303–308.
Ojemann, G., Ojemann, J., Lettich, E.,and Berger, M. (1989). Cortical lan-guage localization in left, dominanthemisphere. An electrical stimula-tion mapping investigation in 117patients. J. Neurosurg. 71, 316–326.
Frontiers in Human Neuroscience www.frontiersin.org May 2012 | Volume 6 | Article 99 | 11

Leuthardt et al. Gamma rhythm dynamics with speech
Palmer, E. D., Rosen, H. J., Ojemann,J. G., Buckner, R. L., Kelley, W.M., and Petersen, S. E. (2001). Anevent-related fMRI study of overtand covert word stem completion.Neuroimage 14, 182–193.
Pei, X., Leuthardt, E. C., Gaona, C.M., Brunner, P., Wolpaw, J. R., andSchalk, G. (2010). Spatiotemporaldynamics of electrocorticographichigh gamma activity duringovert and covert word repetition.Neuroimage 54, 2960–2972.
Pfurtscheller, G. (1989). Functionaltopography during sensorimotoractivation studied with event-related desynchronization mapping.J. Clin. Neurophysiol. 6, 75–84.
Pfurtscheller, G. (1992). Event-relatedsynchronization (ERS): an elec-trophysiological correlate of corti-cal areas at rest. Electroencephalogr.Clin. Neurophysiol. 83, 62–69.
Pfurtscheller, G. (1999). Event-RelatedDesynchronization (ERD) and EventRelated Synchronization (ERS).Baltimore, MD: Williams andWilkins.
Pfurtscheller, G., and Aranibar, A.(1977). Event-related corticaldesynchronization detected bypower measurements of scalpEEG. Electroencephalogr. Clin.Neurophysiol. 42, 817–826.
Price, C. J. (2000). The anatomy oflanguage: contributions from func-tional neuroimaging. J. Anat. 197(Pt 3), 335–359.
Price, C. J., Wise, R. J., Warburton,E. A., Moore, C. J., Howard, D.,Patterson, K., Frackowiak, R. S., andFriston,K.J.(1996).Hearingandsay-ing. The functional neuro-anatomyof auditory word processing.Brain 119 (Pt 3), 919–931.
Pulvermuller, F. (2005). Brain mecha-nisms linking language and action.Nat. Rev. Neurosci. 6, 576–582.
Pulvermuller, F., and Shtyrov, Y. (2009).Spatiotemporal signatures of large-scale synfire chains for speech pro-cessing as revealed by MEG. Cereb.Cortex 19, 79–88.
Pulvermuller, F., Shtyrov, Y.,Ilmoniemi, R. J., and Marslen-Wilson, W. D. (2006). Trackingspeech comprehension in space andtime. Neuroimage 31, 1297–1305.
Pylkkanen, L., and Marantz, A. (2003).Tracking the time course of wordrecognition with MEG. TrendsCogn. Sci. 7, 187–189.
Ray, S., Crone, N. E., Niebur, E.,Franaszczuk, P. J., and Hsiao, S. S.(2008). Neural correlates of high-gamma oscillations (60–200 Hz) inmacaque local field potentials andtheir potential implications in elec-trocorticography. J. Neurosci. 28,11526–11536.
Ray, S., Jouny, C. C., Crone, N. E.,Boatman, D., Thakor, N. V., andFranaszczuk, P. J. (2003). HumanECoG analysis during speech per-ception using matching pursuit:a comparison between stochasticand dyadic dictionaries. IEEE Trans.Biomed. Eng. 50, 1371–1373.
Rogers, R. L., Papanicolaou, A. C.,Baumann, S. B., Saydjari, C.,and Eisenberg, H. M. (1990).Neuromagnetic evidence ofa dynamic excitation patterngenerating the N100 auditoryresponse. Electroencephalogr. Clin.Neurophysiol. 77, 237–240.
Schalk, G., Kubánek, J., Miller, K.J., Anderson, N. R., Leuthardt, E.C., Ojemann, J. G., Limbrick, D.,Moran, D., Gerhardt, L. A., andWolpaw, J. R. (2007). Decodingtwo-dimensional movement trajec-tories using electrocorticographicsignals in humans. J. Neural Eng. 4,264–275.
Schalk, G., McFarland, D. J.,Hinterberger, T., Birbaumer, N.,and Wolpaw, J. R. (2004). BCI2000,a general-purpose brain-computerinterface (BCI) system. IEEE Trans.Biomed. Eng. 51, 1034–1043.
Scott, S. K., and Johnsrude, I. S.(2003). The neuroanatomical andfunctional organization of speechperception. Trends Neurosci. 26,100–107.
Shuster, L. I., and Lemieux, S. K.(2005). An fMRI investigationof covertly and overtly producedmono- and multisyllabic words.Brain Lang. 93, 20–31.
Simos, P. G., Basile, L. F., andPapanicolaou, A. C. (1997). Sourcelocalization of the N400 responsein a sentence-reading paradigmusing evoked magnetic fields andmagnetic resonance imaging. BrainRes. 762, 29–39.
Sinai, A., Bowers, C. W., Crainiceanu,C. M., Boatman, D., Gordon, B.,Lesser, R. P., Lenz, F. A., and Crone,N. E. (2005). Electrocorticographichigh gamma activity versuselectrical cortical stimulationmapping of naming. Brain 128,1556–1570.
Specht, K., and Reul, J. (2003).Functional segregation of thetemporal lobes into highly differ-entiated subsystems for auditoryperception: an auditory rapid event-related fMRI-task. Neuroimage 20,1944–1954.
Srinivasan, R., Nunez, P. L., andSilberstein, R. B. (1998). Spatialfiltering and neocortical dynam-ics: estimates of EEG coherence.IEEE Trans. Biomed. Eng. 45,814–826.
Steinschneider, M., Nourski, K. V.,Kawasaki, H., Oya, H., Brugge, J.F., and Howard, M. A. 3rd. (2011).Intracranial study of speech-elicitedactivity on the human posterolat-eral superior temporal gyrus. Cereb.Cortex. 21, 2332–2347.
Talairach, J., and Tournoux, I. P.(1988). Co-Planar Sterotaxic Atlas ofthe Human Brain. New York, NY:Thieme Medical Publishers.
Tarkiainen, A., Cornelissen, P. L., andSalmelin, R. (2002). Dynamics ofvisual feature analysis and object-level processing in face versusletter-string perception. Brain 125,1125–1136.
Tarkiainen, A., Helenius, P., Hansen, P.C., Cornelissen, P. L., and Salmelin,R. (1999). Dynamics of letter string
perception in the human occipi-totemporal cortex. Brain 122 (Pt11), 2119–2132.
Towle, V. L., Yoon, H. A., Castelle,M., Edgar, J. C., Biassou, N. M.,Frim, D. M., Spire, J. P., andKohrman, M. H. (2008). ECoGgamma activity during a languagetask: differentiating expressive andreceptive speech areas. Brain 131,2013–2027.
Wonnacott, T. H., and Wonnacott,R. (1977). Introductory Statistics.Hoboken, NJ: Wiley.
Wu, M., Wisneski, K., Schalk, G.,Sharma, M., Roland, J., Breshears,J., Gaona, C., and Leuthardt, E.C. (2010). Electrocorticographicfrequency alteration mappingfor extraoperative localization ofspeech cortex. Neurosurgery 66,E407–E409.
Conflict of Interest Statement: Theauthors declare that the researchwas conducted in the absence of anycommercial or financial relationshipsthat could be construed as a potentialconflict of interest.
Received: 24 January 2012; paperpending published: 24 February 2012;accepted: 05 April 2012; publishedonline: 03 May 2012.Citation: Leuthardt EC, Pei X-M,Breshears J, Gaona C, Sharma M,Freudenberg Z, Barbour D and SchalkG (2012) Temporal evolution of gammaactivity in human cortex during an overtand covert word repetition task. Front.Hum. Neurosci. 6:99. doi: 10.3389/fnhum.2012.00099Copyright © 2012 Leuthardt, Pei,Breshears, Gaona, Sharma, Freudenberg,Barbour and Schalk. This is an open-access article distributed under the termsof the Creative Commons AttributionNon Commercial License, which per-mits non-commercial use, distribution,and reproduction in other forums, pro-vided the original authors and source arecredited.
Frontiers in Human Neuroscience www.frontiersin.org May 2012 | Volume 6 | Article 99 | 12