A Role of Eye Vergence in Covert Attention
10
A Role of Eye Vergence in Covert Attention Maria Sole ´ Puig 1 , Laura Pe ´ rez Zapata 1 , J. Antonio Aznar-Casanova 1,2 , Hans Supe `r 1,2,3 * 1 Department Basic Psychology, Faculty of Psychology, University of Barcelona, Barcelona, Spain, 2 Institute for Brain, Cognition and Behavior, University of Barcelona, Barcelona, Spain, 3 Catalan Institution for Research and Advanced Studies, Barcelona, Spain Abstract Covert spatial attention produces biases in perceptual and neural responses in the absence of overt orienting movements. The neural mechanism that gives rise to these effects is poorly understood. Here we report the relation between fixational eye movements, namely eye vergence, and covert attention. Visual stimuli modulate the angle of eye vergence as a function of their ability to capture attention. This illustrates the relation between eye vergence and bottom-up attention. In visual and auditory cue/no-cue paradigms, the angle of vergence is greater in the cue condition than in the no-cue condition. This shows a top-down attention component. In conclusion, observations reveal a close link between covert attention and modulation in eye vergence during eye fixation. Our study suggests a basis for the use of eye vergence as a tool for measuring attention and may provide new insights into attention and perceptual disorders. Citation: Sole ´ Puig M, Pe ´rez Zapata L, Aznar-Casanova JA, Supe `r H (2013) A Role of Eye Vergence in Covert Attention. PLoS ONE 8(1): e52955. doi:10.1371/ journal.pone.0052955 Editor: Susana Martinez-Conde, Barrow Neurological Institute, United States of America Received April 25, 2012; Accepted November 22, 2012; Published January 31, 2013 Copyright: ß 2013 Sole ´ Puig et al. This is an open-access article distributed under the terms of the Creative Commons Attribution License, which permits unrestricted use, distribution, and reproduction in any medium, provided the original author and source are credited. Funding: This work was supported by grants to HS (PSI2010-18139 & SAF2009-10367) from the Spanish Ministry of Education and Science (MICINN) and (2009- SGR-308) from the Catalan government (AGAUR). The funders had no role in study design, data collection and analysis, decision to publish, or preparation of the manuscript. Competing Interests: The authors have declared that no competing interests exist. * E-mail: [email protected] Introduction Humans, like several other animals, have their two eyes positioned on the front of their heads, and provide us with a single visual field. The eyes receive a slightly different projection of the image because of the two eyes’ different positions on the head. Therefore when looking at an object, the eyes must rotate around a vertical axis so that the projection of the image is in the center of the retina in both eyes. Vergence refers to the simultaneous movement of both eyes in opposite directions to obtain single binocular vision. The eyes rotate towards each other (convergence) when looking at an object closer by, while for an object farther away they rotate away from each other (divergence). Vergence is therefore an important cue in depth perception. The angle of vergence (AoEV) corresponds to the angle generated when both eyes focus on one point in space (Fig. 1). Humans receive a surplus of sensory information. To cope with this, spatial attention is shifted to select relevant information at the expense of the rest. Usually, visuospatial attention moves about the environment in tandem with the eyes (overt attention). However, in the absence of overt orienting movements, attention also produces biases in perceptual and neural responses (covert attention; [1–3]). During eye fixation, small fixational eye movements (micro- saccades) relate to covert attention [4,5], but see [6]. These findings corroborate the close connection of oculomotor system with visual attention. Here we report another type of fixational eye movement, namely eye vergence that relates to covert attention. We show that during gaze fixation visual stimuli modulate the AoEV as a function of their ability to capture attention. Vergence angle increases after visual stimulation, and this enhancement correlates with bottom-up and top-down induced shifts in visuospatial attention. The start of the modulation in eye vergence is locked to the onset of the stimulus, while the size of the angle of eye vergence depends on the attentional load that the stimulus receives or attracts. We argue that our observations have implications for theories of attention [7–14], and support a relationship between bottom-up and top-down attention, which are associated with segregated neuronal circuits [15,16]. Finally, our study shows that there is a basis for using eye vergence as a tool for measuring attention, and may provide new insights into attention and perceptual disorders. Results We tested subjects in a visual cue/no-cue paradigm (Experiment 1) and measured the angle of eye vergence (AoEV). Once subjects had fixated on a central cross for 300 ms, 8 vertical bars ( = possible targets) appeared around it (Fig. 2a). Subjects were given a valid cue (a small central line pointing to the target’s position) in 50% of the trials, to inform them about the target location. In the other half of the trials, a no-cue stimulus (a central cross) was presented. Then one ( = target) of the 8 vertical bars was titled (20u) for 100 ms and subjects had to identify the direction of the tilt. Faster reaction times (RT) were found in the cue condition than in the no-cue condition (mean 6 sem RT: 58768.2 ms vs. 688.869.3 ms, t-test , p,0.01, df = 611). Detection performance was also slightly better when the target was cued (92.4% vs. 84.6%). The positions of both eyes were simultaneously monitored during the task to compute the AoEV. Surprisingly, the size of the AoEV was not constant, but was affected by visual stimulation. Once a visual stimulus had been presented (i.e. PLOS ONE | www.plosone.org 1 January 2013 | Volume 8 | Issue 1 | e52955
-
Upload
independent -
Category
Documents
-
view
0 -
download
0
Transcript of A Role of Eye Vergence in Covert Attention
A Role of Eye Vergence in Covert AttentionMaria Sole Puig1, Laura Perez Zapata1, J. Antonio Aznar-Casanova1,2, Hans Super1,2,3*
1 Department Basic Psychology, Faculty of Psychology, University of Barcelona, Barcelona, Spain, 2 Institute for Brain, Cognition and Behavior, University of Barcelona,
Barcelona, Spain, 3 Catalan Institution for Research and Advanced Studies, Barcelona, Spain
Abstract
Covert spatial attention produces biases in perceptual and neural responses in the absence of overt orienting movements.The neural mechanism that gives rise to these effects is poorly understood. Here we report the relation between fixationaleye movements, namely eye vergence, and covert attention. Visual stimuli modulate the angle of eye vergence as a functionof their ability to capture attention. This illustrates the relation between eye vergence and bottom-up attention. In visualand auditory cue/no-cue paradigms, the angle of vergence is greater in the cue condition than in the no-cue condition. Thisshows a top-down attention component. In conclusion, observations reveal a close link between covert attention andmodulation in eye vergence during eye fixation. Our study suggests a basis for the use of eye vergence as a tool formeasuring attention and may provide new insights into attention and perceptual disorders.
Citation: Sole Puig M, Perez Zapata L, Aznar-Casanova JA, Super H (2013) A Role of Eye Vergence in Covert Attention. PLoS ONE 8(1): e52955. doi:10.1371/journal.pone.0052955
Editor: Susana Martinez-Conde, Barrow Neurological Institute, United States of America
Received April 25, 2012; Accepted November 22, 2012; Published January 31, 2013
Copyright: � 2013 Sole Puig et al. This is an open-access article distributed under the terms of the Creative Commons Attribution License, which permitsunrestricted use, distribution, and reproduction in any medium, provided the original author and source are credited.
Funding: This work was supported by grants to HS (PSI2010-18139 & SAF2009-10367) from the Spanish Ministry of Education and Science (MICINN) and (2009-SGR-308) from the Catalan government (AGAUR). The funders had no role in study design, data collection and analysis, decision to publish, or preparation of themanuscript.
Competing Interests: The authors have declared that no competing interests exist.
* E-mail: [email protected]
Introduction
Humans, like several other animals, have their two eyes
positioned on the front of their heads, and provide us with a
single visual field. The eyes receive a slightly different
projection of the image because of the two eyes’ different
positions on the head. Therefore when looking at an object,
the eyes must rotate around a vertical axis so that the
projection of the image is in the center of the retina in both
eyes. Vergence refers to the simultaneous movement of both
eyes in opposite directions to obtain single binocular vision.
The eyes rotate towards each other (convergence) when
looking at an object closer by, while for an object farther
away they rotate away from each other (divergence). Vergence
is therefore an important cue in depth perception. The angle of
vergence (AoEV) corresponds to the angle generated when
both eyes focus on one point in space (Fig. 1).
Humans receive a surplus of sensory information. To cope
with this, spatial attention is shifted to select relevant
information at the expense of the rest. Usually, visuospatial
attention moves about the environment in tandem with the
eyes (overt attention). However, in the absence of overt
orienting movements, attention also produces biases in
perceptual and neural responses (covert attention; [1–3]).
During eye fixation, small fixational eye movements (micro-
saccades) relate to covert attention [4,5], but see [6]. These
findings corroborate the close connection of oculomotor
system with visual attention.
Here we report another type of fixational eye movement,
namely eye vergence that relates to covert attention. We show that
during gaze fixation visual stimuli modulate the AoEV as a
function of their ability to capture attention. Vergence angle
increases after visual stimulation, and this enhancement correlates
with bottom-up and top-down induced shifts in visuospatial
attention. The start of the modulation in eye vergence is locked to
the onset of the stimulus, while the size of the angle of eye vergence
depends on the attentional load that the stimulus receives or
attracts.
We argue that our observations have implications for
theories of attention [7–14], and support a relationship
between bottom-up and top-down attention, which are
associated with segregated neuronal circuits [15,16]. Finally,
our study shows that there is a basis for using eye vergence as a
tool for measuring attention, and may provide new insights
into attention and perceptual disorders.
Results
We tested subjects in a visual cue/no-cue paradigm (Experiment
1) and measured the angle of eye vergence (AoEV). Once subjects
had fixated on a central cross for 300 ms, 8 vertical bars ( =
possible targets) appeared around it (Fig. 2a). Subjects were given a
valid cue (a small central line pointing to the target’s position) in
50% of the trials, to inform them about the target location. In the
other half of the trials, a no-cue stimulus (a central cross) was
presented. Then one ( = target) of the 8 vertical bars was titled
(20u) for 100 ms and subjects had to identify the direction of the
tilt. Faster reaction times (RT) were found in the cue condition
than in the no-cue condition (mean 6 sem RT: 58768.2 ms vs.
688.869.3 ms, t-test, p,0.01, df = 611). Detection performance
was also slightly better when the target was cued (92.4% vs.
84.6%).
The positions of both eyes were simultaneously monitored
during the task to compute the AoEV. Surprisingly, the size of
the AoEV was not constant, but was affected by visual
stimulation. Once a visual stimulus had been presented (i.e.
PLOS ONE | www.plosone.org 1 January 2013 | Volume 8 | Issue 1 | e52955
the presentation of the central fixation spot, the array of
vertical bars and the cue/no-cue stimulus, see Fig. 2a), the
AoEV transiently increased with a mean velocity of
0.4760.06u/s (Fig. 2b). To find out whether the fluctuations
in the AoEV relate to shifts of attention, we compared for all
time samples the average strength of the modulation in AoEV
for the cue and no-cue conditions. We found that the
modulation of the AoEV was significantly (t-test, p,0.01,
df = 611) greater after cue onset (Fig. 2b, blue points). This
difference became significant at 290 ms. The maximum of the
average (non-normalized) AoEV was 350% higher in the cue
condition than in the no-cue condition (mean 6 sem:
maximum of 0.12u60.0068 at 612 ms versus 0.035u60.0066
at 574 ms). The greater increase in the size of the AoEV in the
cue condition was found for all target positions (Fig. 2d),
although it was slightly higher for the horizontally located
targets. As the increase in the AoEV occurred for all target
locations, the observed effects do not reflect the nature of eye
vergence (i.e. horizontal eye movements).
To support the idea that the greater increase in the AoEV
after cue onset represents a cognitive mechanism, we
analyzed the AoEV in subjects who viewed the same visual
stimulation sequence as in Experiment 1, but without any
instructed task (Experiment 2). The results show similar
modulated responses in the AoEV over time, although the
baseline was lower (Fig. 2c, upper panel). However, the
modulation of the AoEV was as strong (t-test, for all time
samples p.0.28, df = 160) after the cue stimulus as after the
no-cue stimulus (Fig. 2c, lower panel). This demonstrates that
the cue-induced change in the AoEV depends on the subject’s
engagement in the task.
Pupil size, which relates to attention [17–19], might
influence the measurement of the AoEV. We therefore
analyzed pupil size. The results show that the size of the pupil
increased during the trial more after cue onset than after no-
cue onset (Fig. 2e). The difference in pupil size between the cue
and no-cue conditions occurred at 572 ms (p,0.01, t-test,
df = 611, blue dots in Fig. 2e), which is ,200 ms later than the
cue vs no-cue difference in AoEV (vertical dotted line in
Fig. 2e). This supports the proposed relation of pupil size with
shifts in visuospatial attention. We also tested for micro-
saccades, which relate to attentional shifts [4,5] but see [6].
Our results show that the differential modulation of the AoEV
in cue and no-cue conditions is independent of the occurrence
of micro-saccades (Fig. 2f). Furthermore we tested the effects of
target eccentricity on the modulation of vergence. Targets
were located at 3.50, 70, and 140 from the fixation cross. As
before, vergence angle increased after cue onset. The increase
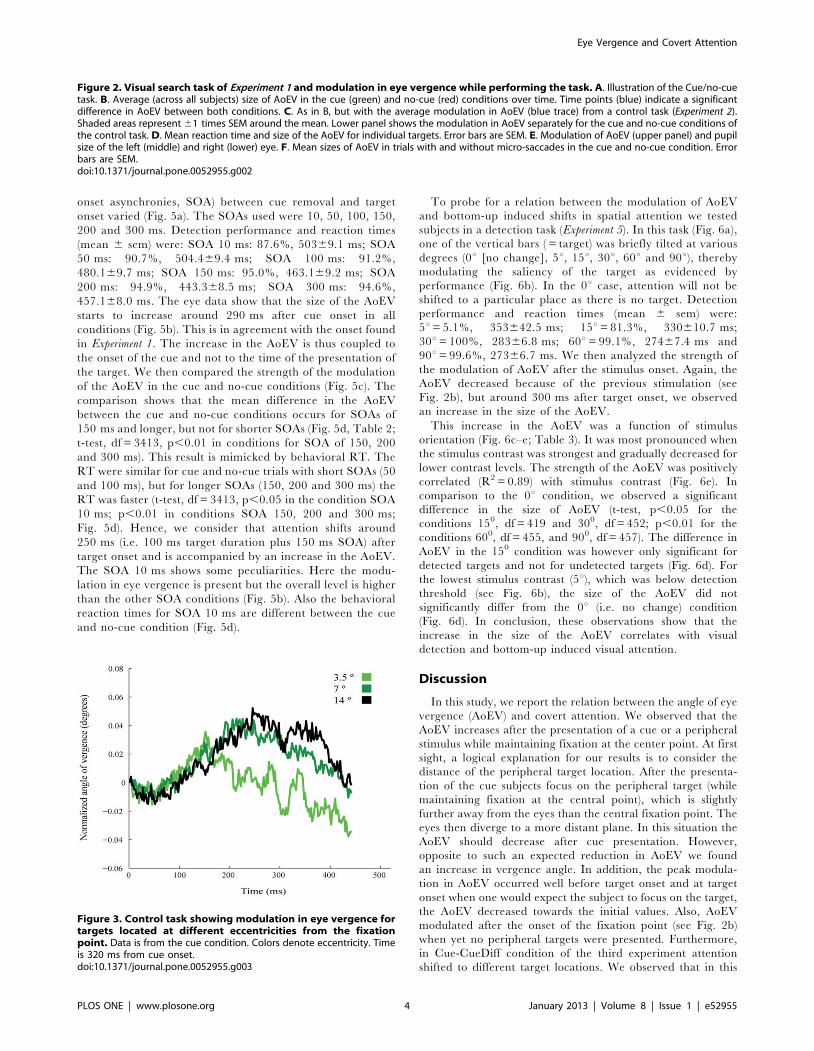
appeared to be weaker for targets at 3.50 than for more
peripheral targets. However, no significant differences in the
modulation strength between all conditions was observed (t-test
for all time samples; 3.5u vs 7u df = 172, 3.5u vs 14u df = 187, 7uvs 14u df = 181; for all p.0.05; Fig. 3).
A possible confounding factor is that the cue and no-cue
stimuli are slightly different, which could produce a
differential effect on fixational eye movements; especially as
cue/no-cue stimuli were presented at the fovea. To exclude
this effect of foveal stimulation, and to provide further
evidence for the role of eye vergence in shifts of visuospatial
attention, we conducted a visual discrimination experiment
(Experiment 3) with two succeeding auditory cues. Auditory
cues (pronounced in their native tongue) were numbers from
0 (NoCue) to 8 (1–8, numbers indicated one of the eight
possible peripheral positions; Fig. 4a). Participants could
practice until they correctly associated the numbers with the
stimulus positions. In 89% of the trials, the first cue was
given and was either valid (80%) or invalid (20%). In the
other trials (11%), a no-cue was presented. The second
stimulus was a valid cue in 89% and a no-cue in 11% of the
trials. Therefore, there were five conditions: 1) CueRCue-
Same, 2) CueRCueDiff, 3) CueRNoCue, 4) NoCueRNo-
Cue, 5) NoCueRCue. Overall performance correct was
91%. Reaction times were (mean 6 sem): CueRCueSame,
48765.14 ms; CueRCueDiff, 520613.73 ms; CueRNoCue,
606632.55 ms; NoCueRNoCue 579619.25 ms; No-
CueRCue, 479627.23 ms. In the CueRCueDiff (i.e. the
first cue is an invalid cue) and NoCueRCue conditions, we
expect a shift of visuospatial attention after the second cue.
In the CueRCueSame and NoCueRNoCue, attention is not
shifted after the second cue. In the CueRNoCue, no shift of
attention to a particular local region is required, as in the no-
cue condition in Experiment 1. This interpretation is depicted
in the lower panel of figure 4c.
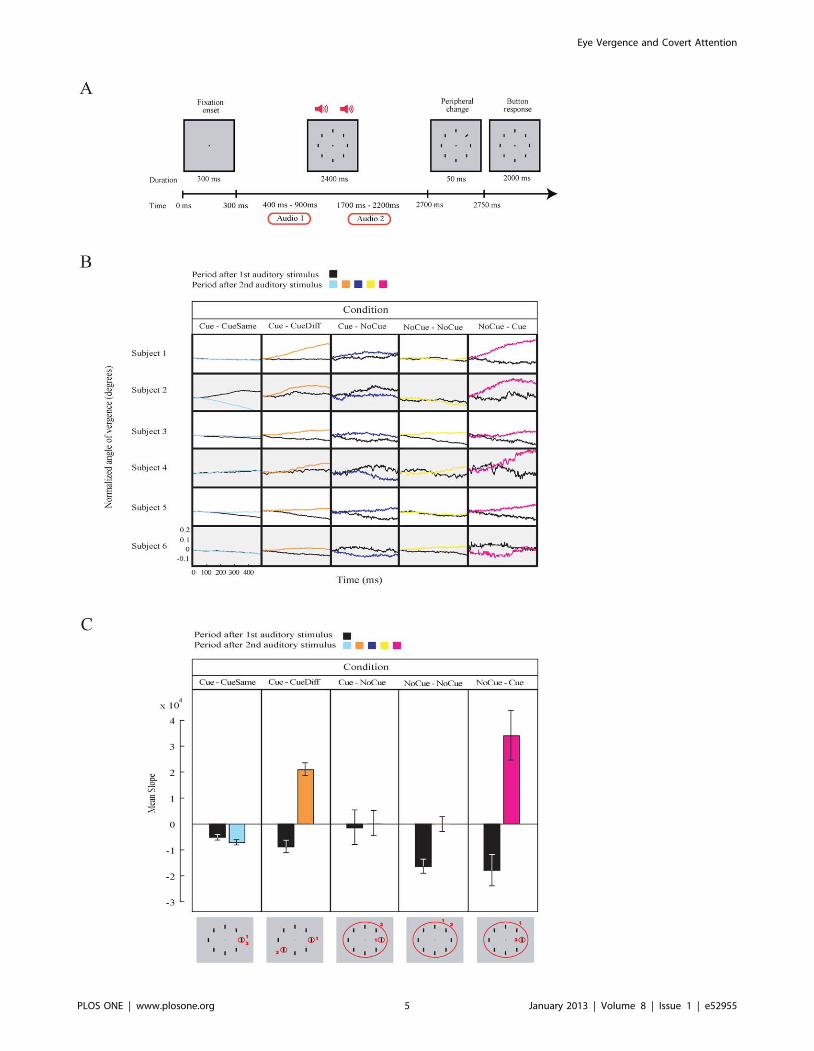
The eye recording results show that initially after cue
presentation the AoEV decreases during the period. This is
because previously the AoEV had increased by the presenta-
tion of the 8 possible targets and at the time of the cue stimulus
eye vergence was still was returning towards baseline levels.
However, compared to the decrease after no-cue condition, the
decrease in the cue condition is much smaller (black traces in
Fig. 4b, and compare the first three black bars to the last two in
Fig. 4c). The difference in AoEV between cue and no-cue
condition was less pronounced, probably because of the
different task and cue types (auditory versus visual) that were
used. After the presentation of the second auditory cue, when
attention is expected to shift in the CueRCueDiff and
NoCueRCue condition, we observed a clear increase in the
size of the AoEV (Fig. 4b,c; Table 1). In contrast, no increase
in the size of the AoEV was noticed in the CueRCueSame and
CueRNoCue conditions. In the NoCueRNoCue condition, a
difference in AoEV was observed because of the lack of
modulation of the AoEV after the first no-cue stimulus (the
AoEV continued to decrease as a consequence of the increase
in the AoEV that resulted from the previous presentation of
the array of vertical bars; see also Fig. 2b) and the second no-
cue stimulus. These findings demonstrate that when an
auditory cue shifts visuospatial attention to a new target, the
AoEV increases.
To better understand the relation between the AoEV and
visuospatial shifts of attention, we tested subjects in a task
(Experiment 4) that was identical to the first visual task
(Experiment 1), except for that fact that the time (stimulus
Figure 1. Schematic explanation of the angle of eye vergence.The eyes focus on a single point in space. The angle of eye vergencerelates to the distance of the focus point to the eyes. For a near pointthe vergence angle (a1) is larger than for a far point (a2). a representsthe angle of eye vergence.doi:10.1371/journal.pone.0052955.g001
Eye Vergence and Covert Attention
PLOS ONE | www.plosone.org 2 January 2013 | Volume 8 | Issue 1 | e52955

Eye Vergence and Covert Attention
PLOS ONE | www.plosone.org 3 January 2013 | Volume 8 | Issue 1 | e52955
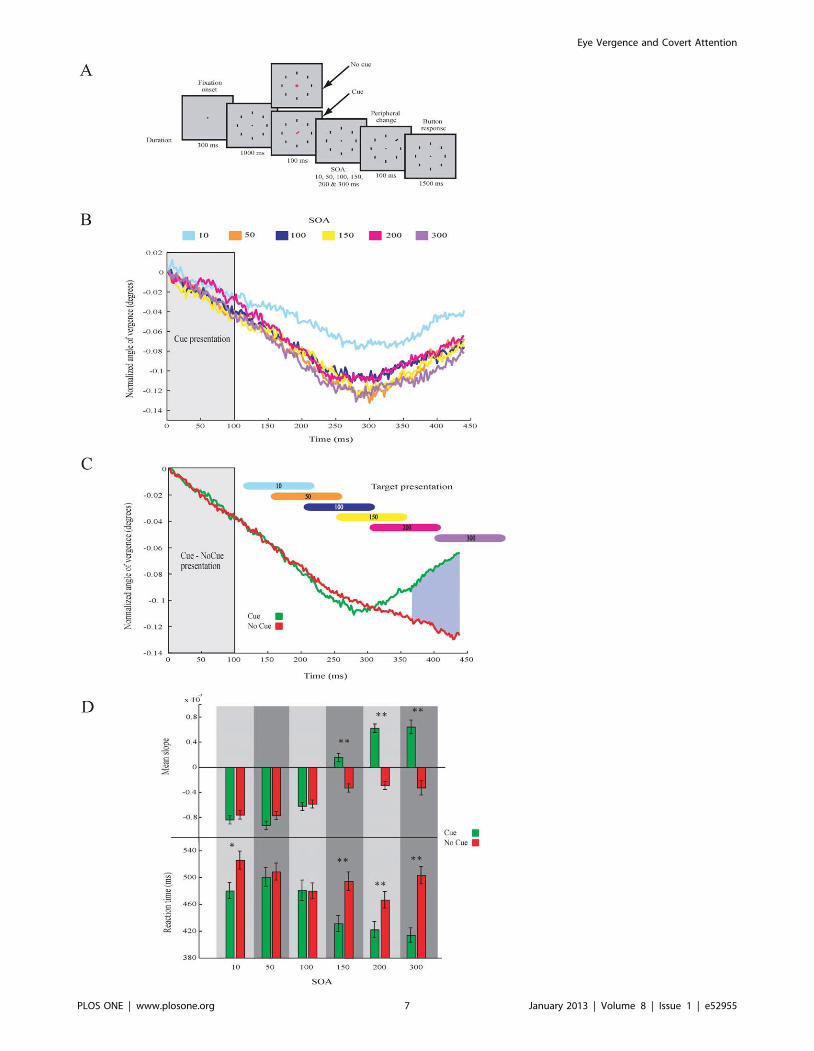
onset asynchronies, SOA) between cue removal and target
onset varied (Fig. 5a). The SOAs used were 10, 50, 100, 150,
200 and 300 ms. Detection performance and reaction times
(mean 6 sem) were: SOA 10 ms: 87.6%, 50369.1 ms; SOA
50 ms: 90.7%, 504.469.4 ms; SOA 100 ms: 91.2%,
480.169.7 ms; SOA 150 ms: 95.0%, 463.169.2 ms; SOA
200 ms: 94.9%, 443.368.5 ms; SOA 300 ms: 94.6%,
457.168.0 ms. The eye data show that the size of the AoEV
starts to increase around 290 ms after cue onset in all
conditions (Fig. 5b). This is in agreement with the onset found
in Experiment 1. The increase in the AoEV is thus coupled to
the onset of the cue and not to the time of the presentation of
the target. We then compared the strength of the modulation
of the AoEV in the cue and no-cue conditions (Fig. 5c). The
comparison shows that the mean difference in the AoEV
between the cue and no-cue conditions occurs for SOAs of
150 ms and longer, but not for shorter SOAs (Fig. 5d, Table 2;
t-test, df = 3413, p,0.01 in conditions for SOA of 150, 200
and 300 ms). This result is mimicked by behavioral RT. The
RT were similar for cue and no-cue trials with short SOAs (50
and 100 ms), but for longer SOAs (150, 200 and 300 ms) the
RT was faster (t-test, df = 3413, p,0.05 in the condition SOA
10 ms; p,0.01 in conditions SOA 150, 200 and 300 ms;
Fig. 5d). Hence, we consider that attention shifts around
250 ms (i.e. 100 ms target duration plus 150 ms SOA) after
target onset and is accompanied by an increase in the AoEV.
The SOA 10 ms shows some peculiarities. Here the modu-
lation in eye vergence is present but the overall level is higher
than the other SOA conditions (Fig. 5b). Also the behavioral
reaction times for SOA 10 ms are different between the cue
and no-cue condition (Fig. 5d).
To probe for a relation between the modulation of AoEV
and bottom-up induced shifts in spatial attention we tested
subjects in a detection task (Experiment 5). In this task (Fig. 6a),
one of the vertical bars ( = target) was briefly tilted at various
degrees (0u [no change], 5u, 15u, 30u, 60u and 90u), thereby
modulating the saliency of the target as evidenced by
performance (Fig. 6b). In the 0u case, attention will not be
shifted to a particular place as there is no target. Detection
performance and reaction times (mean 6 sem) were:
5u = 5.1%, 353642.5 ms; 15u = 81.3%, 330610.7 ms;
30u = 100%, 28366.8 ms; 60u = 99.1%, 27467.4 ms and
90u = 99.6%, 27366.7 ms. We then analyzed the strength of
the modulation of AoEV after the stimulus onset. Again, the
AoEV decreased because of the previous stimulation (see
Fig. 2b), but around 300 ms after target onset, we observed
an increase in the size of the AoEV.
This increase in the AoEV was a function of stimulus
orientation (Fig. 6c–e; Table 3). It was most pronounced when
the stimulus contrast was strongest and gradually decreased for
lower contrast levels. The strength of the AoEV was positively
correlated (R2 = 0.89) with stimulus contrast (Fig. 6e). In
comparison to the 0u condition, we observed a significant
difference in the size of AoEV (t-test, p,0.05 for the
conditions 150, df = 419 and 300, df = 452; p,0.01 for the
conditions 600, df = 455, and 900, df = 457). The difference in
AoEV in the 150 condition was however only significant for
detected targets and not for undetected targets (Fig. 6d). For
the lowest stimulus contrast (5u), which was below detection
threshold (see Fig. 6b), the size of the AoEV did not
significantly differ from the 0u (i.e. no change) condition
(Fig. 6d). In conclusion, these observations show that the
increase in the size of the AoEV correlates with visual
detection and bottom-up induced visual attention.
Discussion
In this study, we report the relation between the angle of eye
vergence (AoEV) and covert attention. We observed that the
AoEV increases after the presentation of a cue or a peripheral
stimulus while maintaining fixation at the center point. At first
sight, a logical explanation for our results is to consider the
distance of the peripheral target location. After the presenta-
tion of the cue subjects focus on the peripheral target (while
maintaining fixation at the central point), which is slightly
further away from the eyes than the central fixation point. The
eyes then diverge to a more distant plane. In this situation the
AoEV should decrease after cue presentation. However,
opposite to such an expected reduction in AoEV we found
an increase in vergence angle. In addition, the peak modula-
tion in AoEV occurred well before target onset and at target
onset when one would expect the subject to focus on the target,
the AoEV decreased towards the initial values. Also, AoEV
modulated after the onset of the fixation point (see Fig. 2b)
when yet no peripheral targets were presented. Furthermore,
in Cue-CueDiff condition of the third experiment attention
shifted to different target locations. We observed that in this
Figure 2. Visual search task of Experiment 1 and modulation in eye vergence while performing the task. A. Illustration of the Cue/no-cuetask. B. Average (across all subjects) size of AoEV in the cue (green) and no-cue (red) conditions over time. Time points (blue) indicate a significantdifference in AoEV between both conditions. C. As in B, but with the average modulation in AoEV (blue trace) from a control task (Experiment 2).Shaded areas represent 61 times SEM around the mean. Lower panel shows the modulation in AoEV separately for the cue and no-cue conditions ofthe control task. D. Mean reaction time and size of the AoEV for individual targets. Error bars are SEM. E. Modulation of AoEV (upper panel) and pupilsize of the left (middle) and right (lower) eye. F. Mean sizes of AoEV in trials with and without micro-saccades in the cue and no-cue condition. Errorbars are SEM.doi:10.1371/journal.pone.0052955.g002
Figure 3. Control task showing modulation in eye vergence fortargets located at different eccentricities from the fixationpoint. Data is from the cue condition. Colors denote eccentricity. Timeis 320 ms from cue onset.doi:10.1371/journal.pone.0052955.g003
Eye Vergence and Covert Attention
PLOS ONE | www.plosone.org 4 January 2013 | Volume 8 | Issue 1 | e52955
Eye Vergence and Covert Attention
PLOS ONE | www.plosone.org 5 January 2013 | Volume 8 | Issue 1 | e52955
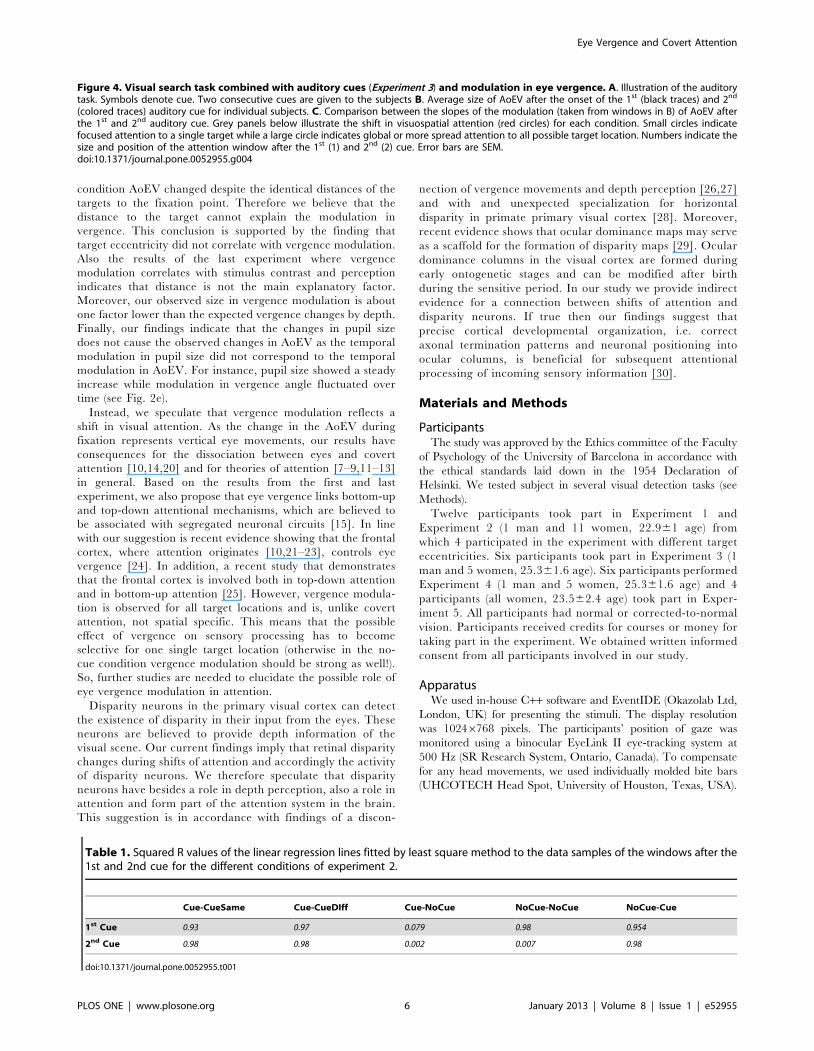
condition AoEV changed despite the identical distances of the
targets to the fixation point. Therefore we believe that the
distance to the target cannot explain the modulation in
vergence. This conclusion is supported by the finding that
target eccentricity did not correlate with vergence modulation.
Also the results of the last experiment where vergence
modulation correlates with stimulus contrast and perception
indicates that distance is not the main explanatory factor.
Moreover, our observed size in vergence modulation is about
one factor lower than the expected vergence changes by depth.
Finally, our findings indicate that the changes in pupil size
does not cause the observed changes in AoEV as the temporal
modulation in pupil size did not correspond to the temporal
modulation in AoEV. For instance, pupil size showed a steady
increase while modulation in vergence angle fluctuated over
time (see Fig. 2e).
Instead, we speculate that vergence modulation reflects a
shift in visual attention. As the change in the AoEV during
fixation represents vertical eye movements, our results have
consequences for the dissociation between eyes and covert
attention [10,14,20] and for theories of attention [7–9,11–13]
in general. Based on the results from the first and last
experiment, we also propose that eye vergence links bottom-up
and top-down attentional mechanisms, which are believed to
be associated with segregated neuronal circuits [15]. In line
with our suggestion is recent evidence showing that the frontal
cortex, where attention originates [10,21–23], controls eye
vergence [24]. In addition, a recent study that demonstrates
that the frontal cortex is involved both in top-down attention
and in bottom-up attention [25]. However, vergence modula-
tion is observed for all target locations and is, unlike covert
attention, not spatial specific. This means that the possible
effect of vergence on sensory processing has to become
selective for one single target location (otherwise in the no-
cue condition vergence modulation should be strong as well!).
So, further studies are needed to elucidate the possible role of
eye vergence modulation in attention.
Disparity neurons in the primary visual cortex can detect
the existence of disparity in their input from the eyes. These
neurons are believed to provide depth information of the
visual scene. Our current findings imply that retinal disparity
changes during shifts of attention and accordingly the activity
of disparity neurons. We therefore speculate that disparity
neurons have besides a role in depth perception, also a role in
attention and form part of the attention system in the brain.
This suggestion is in accordance with findings of a discon-
nection of vergence movements and depth perception [26,27]
and with and unexpected specialization for horizontal
disparity in primate primary visual cortex [28]. Moreover,
recent evidence shows that ocular dominance maps may serve
as a scaffold for the formation of disparity maps [29]. Ocular
dominance columns in the visual cortex are formed during
early ontogenetic stages and can be modified after birth
during the sensitive period. In our study we provide indirect
evidence for a connection between shifts of attention and
disparity neurons. If true then our findings suggest that
precise cortical developmental organization, i.e. correct
axonal termination patterns and neuronal positioning into
ocular columns, is beneficial for subsequent attentional
processing of incoming sensory information [30].
Materials and Methods
ParticipantsThe study was approved by the Ethics committee of the Faculty
of Psychology of the University of Barcelona in accordance with
the ethical standards laid down in the 1954 Declaration of
Helsinki. We tested subject in several visual detection tasks (see
Methods).
Twelve participants took part in Experiment 1 and
Experiment 2 (1 man and 11 women, 22.961 age) from
which 4 participated in the experiment with different target
eccentricities. Six participants took part in Experiment 3 (1
man and 5 women, 25.361.6 age). Six participants performed
Experiment 4 (1 man and 5 women, 25.361.6 age) and 4
participants (all women, 23.562.4 age) took part in Exper-
iment 5. All participants had normal or corrected-to-normal
vision. Participants received credits for courses or money for
taking part in the experiment. We obtained written informed
consent from all participants involved in our study.
ApparatusWe used in-house C++ software and EventIDE (Okazolab Ltd,
London, UK) for presenting the stimuli. The display resolution
was 10246768 pixels. The participants’ position of gaze was
monitored using a binocular EyeLink II eye-tracking system at
500 Hz (SR Research System, Ontario, Canada). To compensate
for any head movements, we used individually molded bite bars
(UHCOTECH Head Spot, University of Houston, Texas, USA).
Figure 4. Visual search task combined with auditory cues (Experiment 3) and modulation in eye vergence. A. Illustration of the auditorytask. Symbols denote cue. Two consecutive cues are given to the subjects B. Average size of AoEV after the onset of the 1st (black traces) and 2nd
(colored traces) auditory cue for individual subjects. C. Comparison between the slopes of the modulation (taken from windows in B) of AoEV afterthe 1st and 2nd auditory cue. Grey panels below illustrate the shift in visuospatial attention (red circles) for each condition. Small circles indicatefocused attention to a single target while a large circle indicates global or more spread attention to all possible target location. Numbers indicate thesize and position of the attention window after the 1st (1) and 2nd (2) cue. Error bars are SEM.doi:10.1371/journal.pone.0052955.g004
Table 1. Squared R values of the linear regression lines fitted by least square method to the data samples of the windows after the1st and 2nd cue for the different conditions of experiment 2.
Cue-CueSame Cue-CueDIff Cue-NoCue NoCue-NoCue NoCue-Cue
1st Cue 0.93 0.97 0.079 0.98 0.954
2nd Cue 0.98 0.98 0.002 0.007 0.98
doi:10.1371/journal.pone.0052955.t001
Eye Vergence and Covert Attention
PLOS ONE | www.plosone.org 6 January 2013 | Volume 8 | Issue 1 | e52955
Eye Vergence and Covert Attention
PLOS ONE | www.plosone.org 7 January 2013 | Volume 8 | Issue 1 | e52955
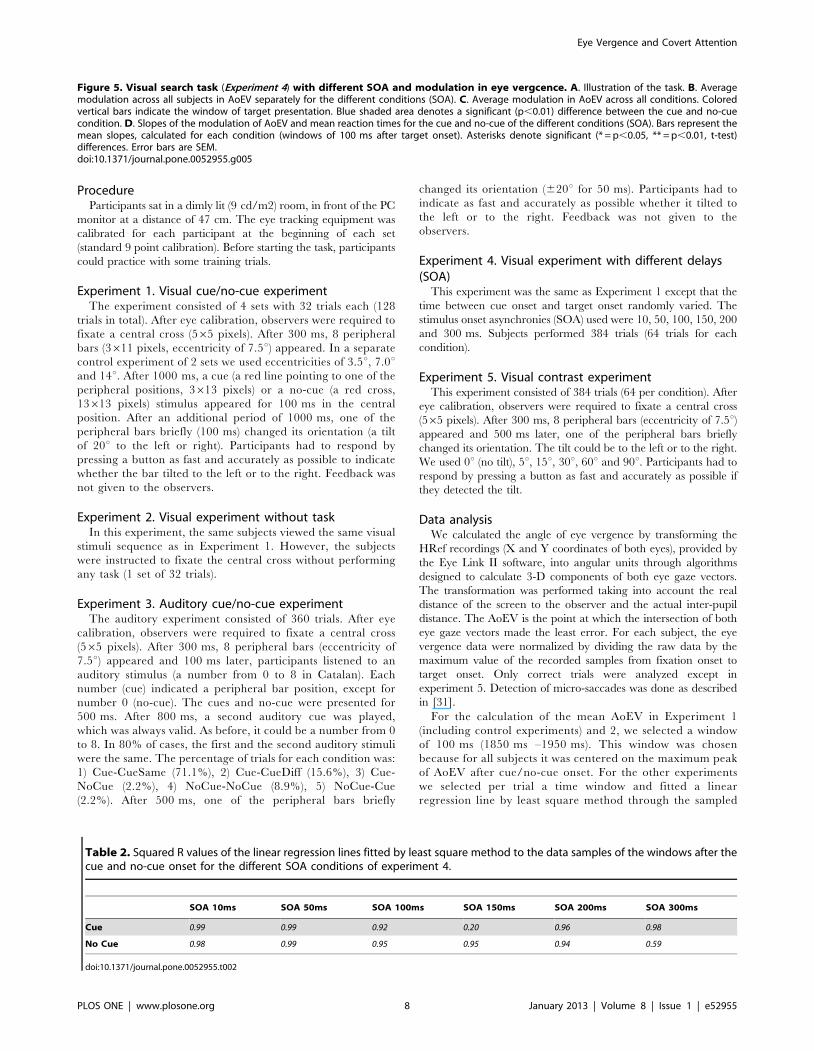
ProcedureParticipants sat in a dimly lit (9 cd/m2) room, in front of the PC
monitor at a distance of 47 cm. The eye tracking equipment was
calibrated for each participant at the beginning of each set
(standard 9 point calibration). Before starting the task, participants
could practice with some training trials.
Experiment 1. Visual cue/no-cue experimentThe experiment consisted of 4 sets with 32 trials each (128
trials in total). After eye calibration, observers were required to
fixate a central cross (565 pixels). After 300 ms, 8 peripheral
bars (3611 pixels, eccentricity of 7.5u) appeared. In a separate
control experiment of 2 sets we used eccentricities of 3.5u, 7.0uand 14u. After 1000 ms, a cue (a red line pointing to one of the
peripheral positions, 3613 pixels) or a no-cue (a red cross,
13613 pixels) stimulus appeared for 100 ms in the central
position. After an additional period of 1000 ms, one of the
peripheral bars briefly (100 ms) changed its orientation (a tilt
of 20u to the left or right). Participants had to respond by
pressing a button as fast and accurately as possible to indicate
whether the bar tilted to the left or to the right. Feedback was
not given to the observers.
Experiment 2. Visual experiment without taskIn this experiment, the same subjects viewed the same visual
stimuli sequence as in Experiment 1. However, the subjects
were instructed to fixate the central cross without performing
any task (1 set of 32 trials).
Experiment 3. Auditory cue/no-cue experimentThe auditory experiment consisted of 360 trials. After eye
calibration, observers were required to fixate a central cross
(565 pixels). After 300 ms, 8 peripheral bars (eccentricity of
7.5u) appeared and 100 ms later, participants listened to an
auditory stimulus (a number from 0 to 8 in Catalan). Each
number (cue) indicated a peripheral bar position, except for
number 0 (no-cue). The cues and no-cue were presented for
500 ms. After 800 ms, a second auditory cue was played,
which was always valid. As before, it could be a number from 0
to 8. In 80% of cases, the first and the second auditory stimuli
were the same. The percentage of trials for each condition was:
1) Cue-CueSame (71.1%), 2) Cue-CueDiff (15.6%), 3) Cue-
NoCue (2.2%), 4) NoCue-NoCue (8.9%), 5) NoCue-Cue
(2.2%). After 500 ms, one of the peripheral bars briefly
changed its orientation (620u for 50 ms). Participants had to
indicate as fast and accurately as possible whether it tilted to
the left or to the right. Feedback was not given to the
observers.
Experiment 4. Visual experiment with different delays(SOA)
This experiment was the same as Experiment 1 except that the
time between cue onset and target onset randomly varied. The
stimulus onset asynchronies (SOA) used were 10, 50, 100, 150, 200
and 300 ms. Subjects performed 384 trials (64 trials for each
condition).
Experiment 5. Visual contrast experimentThis experiment consisted of 384 trials (64 per condition). After
eye calibration, observers were required to fixate a central cross
(565 pixels). After 300 ms, 8 peripheral bars (eccentricity of 7.5u)appeared and 500 ms later, one of the peripheral bars briefly
changed its orientation. The tilt could be to the left or to the right.
We used 0u (no tilt), 5u, 15u, 30u, 60u and 90u. Participants had to
respond by pressing a button as fast and accurately as possible if
they detected the tilt.
Data analysisWe calculated the angle of eye vergence by transforming the
HRef recordings (X and Y coordinates of both eyes), provided by
the Eye Link II software, into angular units through algorithms
designed to calculate 3-D components of both eye gaze vectors.
The transformation was performed taking into account the real
distance of the screen to the observer and the actual inter-pupil
distance. The AoEV is the point at which the intersection of both
eye gaze vectors made the least error. For each subject, the eye
vergence data were normalized by dividing the raw data by the
maximum value of the recorded samples from fixation onset to
target onset. Only correct trials were analyzed except in
experiment 5. Detection of micro-saccades was done as described
in [31].
For the calculation of the mean AoEV in Experiment 1
(including control experiments) and 2, we selected a window
of 100 ms (1850 ms –1950 ms). This window was chosen
because for all subjects it was centered on the maximum peak
of AoEV after cue/no-cue onset. For the other experiments
we selected per trial a time window and fitted a linear
regression line by least square method through the sampled
Figure 5. Visual search task (Experiment 4) with different SOA and modulation in eye vergcence. A. Illustration of the task. B. Averagemodulation across all subjects in AoEV separately for the different conditions (SOA). C. Average modulation in AoEV across all conditions. Coloredvertical bars indicate the window of target presentation. Blue shaded area denotes a significant (p,0.01) difference between the cue and no-cuecondition. D. Slopes of the modulation of AoEV and mean reaction times for the cue and no-cue of the different conditions (SOA). Bars represent themean slopes, calculated for each condition (windows of 100 ms after target onset). Asterisks denote significant (* = p,0.05, ** = p,0.01, t-test)differences. Error bars are SEM.doi:10.1371/journal.pone.0052955.g005
Table 2. Squared R values of the linear regression lines fitted by least square method to the data samples of the windows after thecue and no-cue onset for the different SOA conditions of experiment 4.
SOA 10ms SOA 50ms SOA 100ms SOA 150ms SOA 200ms SOA 300ms
Cue 0.99 0.99 0.92 0.20 0.96 0.98
No Cue 0.98 0.99 0.95 0.95 0.94 0.59
doi:10.1371/journal.pone.0052955.t002
Eye Vergence and Covert Attention
PLOS ONE | www.plosone.org 8 January 2013 | Volume 8 | Issue 1 | e52955

Figure 6. Detection task (Experiment 5) and responses. A. Illustration of the task. B. Detection performance (red) and reaction times (blue). Errorbars are SEM. C. Modulation in AoEV of one subject separately for the different conditions (tilt) and behaviors (detected and undetected). D. Slopes ofthe modulation of the AoEV for the different conditions and behaviors. Asterisks denote significant (* = p,0.05, ** = p,0.01) differences (comparedto condition 00). Error bars are SEM. E. Mean vergence angle of selected window from all conditions plotted as a function of stimulus contrast. A linearregression line (red) is fitted.doi:10.1371/journal.pone.0052955.g006
Eye Vergence and Covert Attention
PLOS ONE | www.plosone.org 9 January 2013 | Volume 8 | Issue 1 | e52955

data points within a window. Windows were 500 ms/100 ms
starting after audio offset/target onset in experiment 3/4. In
experiment 5, a 100 ms window was taken 300 ms from target
onset. These windows were chosen because for all subjects
they coincided with the start of cue or target induced
modulation in eye vergence, when visually inspected.
Acknowledgments
We would like to thank Ilya Korjoukov and Sancho Moro for their
assistance. The IP of this work has been protected by a patent application
(EP 12380018.7).
Author Contributions
Conceived and designed the experiments: HS MSP. Performed the
experiments: MSP LPZ. Analyzed the data: MSP HS. Contributed
reagents/materials/analysis tools: MSP LPZ JAAC HS. Wrote the paper:
MSP HS.
References
1. Posner MI (1980) Orienting of attention. The 7th Sir F.C. Bartlett Lecture.
Quartly Journal Experimental Psychology 32:3–25.
2. Wright RD, Ward LM (2008) Orienting of Attention. Oxford University Press.
3. Bisley JW (2011) The neural basis of visual attention. J Physiology 589: 49–57.
4. Hafed ZM, Clark JJ (2002) Microsaccades as an overt measure of covert
attention shifts. Vision Research 42:2533–2545.
5. Engbert R, Kliegl R (2003) Microsaccades uncover the orientation of covert
attention. Vision Research 43: 1035–1045.
6. Horowitz TS, Fine EM, Fencsik DE, Yurgenson S, Wolfe JM (2007) Fixational
eye movements are not an index of covert attention. Psychol Sci, 18, 356.
7. LaBerge D (1983) Spatial extent of attention to letters and words. J Exp Psychol:
Human Perception and Performance 9:371–379.
8. Eriksen C, St James J (1986) Visual attention within and around the field of focal
attention: A zoom lens model. Perception & Psychophysics 40:225–240.
9. Desimone R, Duncan J (1995) Neural mechanisms of selective visual attention.
Annu Rev Neurosci 18:193–222.
10. Corbetta M (1998) Frontoparietal cortical networks for directing attention and
the eye to visual locations: Identical, independent, or overlapping neural
systems? Proc Natl Acad Sci U S A 95:831–838.
11. Yantis S, Serences JT (2003) Cortical mechanisms of space-based and object-
based attentional control. Curr Opin Neurobiol 13:187–193.
12. Hunt AR, Kingstone A (2003) Covert and overt voluntary attention: linked or
independent? Cogn Brain Res 18:102–105.
13. Maunsell JH, Treue S (2006) Feature-based attention in visual cortex. Trends
Neurosci 29:317–322.
14. Awh E, Armstrong KM, Moore T (2006) Visual and oculomotor selection: links,
causes and implications for spatial attention. Trends Cogn Sci 10:124–30.
15. Corbetta M, Akbudak E, Conturo TE, Snyder AZ, Ollinger JM, et al. (1998) A
common network of functional areas for attention and eye movements. Neuron
21:761–773.
16. Corbetta M, Shulman GL (2002) Control of goal-directed and stimulus-driven
attention in the brain. Nature Rev Neurosci 3:201–15.
17. Hoecks B, Levelt W (1993) Pupillary dilation as a measure of attention: Aquantitative system analysis. Behavior Research Methods, Instruments &
Computers 25:16–26.18. Gabay S, Pertzov Y, Henik A (2011) Orienting of attention, pupil size, and the
norepinephrine system. Attention, Perception & Psychophysics 73:123–9.19. Wierda SM, van Rijnc H, Taatgen NA, Martens S (2012) Pupil dilation
deconvolution reveals the dynamics of attention at high temporal resolution.
Proc Natl Acad Sci U S A. doi:10.1073/pnas.1201858109.20. Ignashchenkova A, Dicke PW, Haarmeier T, Their P (2004) Neuron-specific
contribution of the superior colliculus to overt and covert shifts of attention.Nature Neurosci 7:56–64.
21. Kastner S, Ungerleider LG (2000) Mechanisms of visual attention in the human
cortex. Annu Rev Neurosci 23:315–341.22. Moore T, Armstrong KM, Fallah M (2003) Visuomotor origins of covert spatial
attention. Neuron 40:671–683.23. Thompson KG, Biscoe KL, Sato TR (2005) Neuronal basis of covert spatial
attention in the frontal eye field. J Neurosci, 25:9479–87.24. Gamlin PD, Yoon K (2000) An area for vergence eye movement in primate
frontal cortex. Nature 407:1003–1007.
25. Katsuki F, Constantinidis C (2012) Early involvement of prefrontal cortex invisual bottom-up attention. Nat Neurosci 15:1160–1166.
26. Masson GS, Busettini C, Miles FA (1997) Vergence eye movements in responseto binocular disparity without depth perception. Nature 389:283–286.
27. Cumming BG, Parker AJ (1997) Responses of primary visual cortical neurons to
binocular disparity without depth perception. Nature 389:280–283.28. Cumming BG (2002) An unexpected specialization for horizontal disparity in
primate V1. Nature 418:633–636.29. Kara P, Boyd JD (2009) A micro-architecture for binocular disparity and ocular
dominance in visual cortex. Nature 458:627–631.30. Leigh RJ, Zee DS (2006) The Neurology of Eye Movements. Oxford University
Press, USA, pages 776.
31. Super H, van der Togt C, Spekreijse H, Lamme VA (2004) Correspondence ofpresaccadic activity in the monkey primary visual cortex with saccadic eye
movements. Proc Natl Acad Sci U S A 101:3230–3235.
Table 3. Squared R values of the linear regression lines fittedby least square method to the data samples of the windowsafter the cue and no-cue onset for the different stimuluscontrasts of experiment 5.
06 56 156 306 606 906
Cue 0.97 0.98 0.87 0.70 0.023 0.00
doi:10.1371/journal.pone.0052955.t003
Eye Vergence and Covert Attention
PLOS ONE | www.plosone.org 10 January 2013 | Volume 8 | Issue 1 | e52955